Table of Contents
| | | Page |
| Letter to Shareholders | | 2 |
| Fund Summaries | | |
| Century Shares Trust | | 5 |
| Century Small Cap Select Fund | | 8 |
| Portfolio of Investments | | |
| Century Shares Trust | | 11 |
| Century Small Cap Select Fund | | 13 |
| Statements of Assets and Liabilities | | 16 |
| Statements of Operations | | 17 |
| Statements of Changes in Net Assets | | 18 |
| Financial Highlights | | |
| Century Shares Trust | | 19 |
| Century Small Cap Select Fund | | 20 |
| Notes to Financial Statements | | 22 |
| Report of Independent Registered Public Accounting Firm | | 30 |
| Disclosure of Fund Expenses | | 31 |
| Tax Information | | 32 |
| Trustees and Officers | | 33 |
This report is submitted for the general information of the shareholders of Century Shares Trust and Century Small Cap Select Fund (each a “Fund” and collectively, the “Funds”). It is not authorized for distribution to prospective investors in a Fund unless it is preceded by or accompanied by the Fund’s current prospectus. The prospectus includes important information about the Fund’s objective, risks, charges and expenses, experience of its management, and other information. Please read the prospectus carefully before you invest.
The views expressed in this report are those of the Funds’ Portfolio Managers as of October 31, 2016, the end of the reporting period. Any such views are subject to change at any time and may not reflect the Portfolio Managers’ views on the date that this report is first published or anytime thereafter. These views are intended to assist shareholders in understanding their investments, do not constitute investment advice, and are not intended to predict the performance of any investment. There is no assurance that the Funds will continue to invest in the securities mentioned in this report.
Annual Report | October 31, 2016 | 1 |
| | October 31, 2016 (Unaudited) |
Dear Fellow Shareholders,
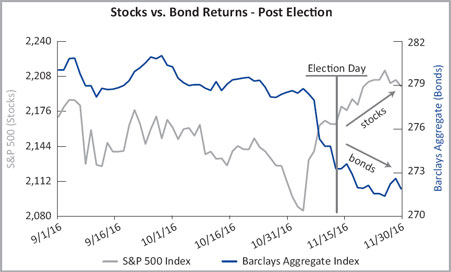
2016 is full of surprises. The Chicago Cubs finally won the World Series, and President-elect Donald Trump’s upset victory and ‘pro-growth’ priorities represent a dramatic shift away from the political status quo. Equity investors have reacted positively to this sea change, since it appears that the next four years may deliver faster economic growth, lower taxes and less regulation. The implications of this election outcome are still rippling through the capital markets and American households. Bond investors seem more cautious on the longer-term potential of rising interest rates and inflation. These conflicting stock and bond reactions (see chart on page 4) represent the divisive uncertainty facing our next President, who aims to accelerate Gross Domestic Product (“GDP”) growth but whose actions and policies are still unknown. How will President Trump govern and what are his first priorities in 2017? Like most investors, we are searching for early answers to these important questions.
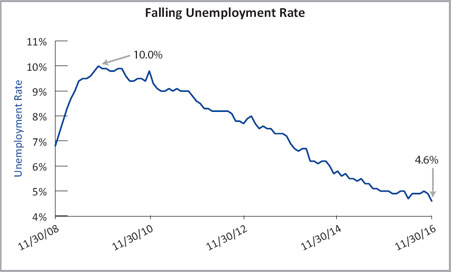
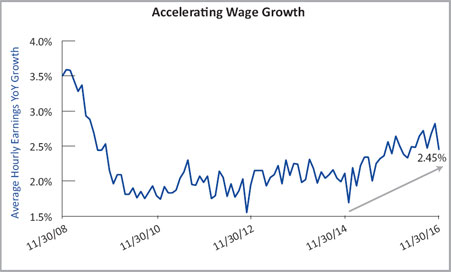
Despite the S&P 500 Index returning +5.8% through the end of October, the year 2016 has seen considerable investor anxiety caused by populist political momentum in the U.S. and U.K., as disenfranchised voters thwarted the political establishment with election upsets. Many workers missed out on the economic gains since the 2008-2009 financial crisis, even though the unemployment rate has dropped from 10% to 4.6% and housing values and investment wealth have reached historic highs. However, average workers have not seen wages grow, and they voiced their ‘populist’ frustration in the form of the “Brexit”1 referendum and electing Donald Trump as the next president of the United States of America.
Source: Bureau of Economic Analysis; Data as of 11/29/2016; Date range: 1/1/2015 - 9/30/2016
The potential for faster growth and rising interest rates
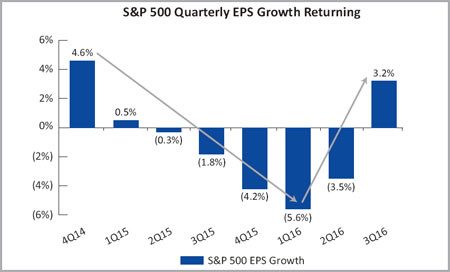
The US economy accelerated towards the second half of 2016 (see GDP and Earnings Per Share (“EPS”)2 charts). In the third quarter, corporate earnings beat expectations and registered their first Year-over-Year growth since the first quarter of 2015. Trump’s pro-growth agenda includes lower taxes, more stimulus spending and less government regulation, which are likely to lead to faster GDP growth and corporate earnings acceleration in 2017 and 2018. Equity valuations are often based on future earnings expectations, so the post-election run up in the S&P 500 Index may indicate the higher earnings outlook for equity investors. However, faster growth may be followed by higher inflation and rising interest rates, which can have a negative impact on bond investors.
Source: FactSet; Data as of 11/29/2016; Date range: 10/1/2014 – 9/30/2016
Past performance is not indicative of future results.
1 | EPS is the portion of a company’s profit allocated to each outstanding share of common stock. EPS serves as an indicator of a company’s profitability. |
2 | Brexit is an abbreviation for “British exit,” which refers to the June 23, 2016, referendum whereby British citizens voted to exit the European Union. |
| | October 31, 2016 (Unaudited) |
Trump and the economy
Bernie Sanders and Donald Trump were both able to tap into average voter frustration by targeting job creation, domestic-oriented programs and skepticism about global trade and diplomatic cooperation. Donald Trump’s key fiscal policy priorities aim to boost current GDP annual growth toward 3%-4% by lowering tax rates, repatriating offshore corporate cash, infrastructure spending and loosening regulations. While lowering corporate tax rates and repatriating offshore cash would benefit most corporations quickly, the ramifications of other Republican policies are industry-specific and unknown until actually implemented.
For instance, energy and financial companies may stand to benefit from less onerous regulatory oversight. Conversely, importers and manufacturers are likely to face headwinds from any trade tariffs, immigration reform and a stronger dollar. Health care patients and providers may also struggle with the possible repeal/ defunding of the Affordable Care Act. If these policies are successful and the economy returns to a higher 3%-4% GDP growth rate, it might be accompanied by stronger inflation, faster wage growth, rising interest rates and a steepening yield curve. Consumer spending may benefit from a surge in wage growth. However, rising interest rates will benefit banks but would be a headwind for borrowers (homebuilders, real estate investment trusts (“REITs”) and utilities) that must finance their purchases with more expensive debt.
Source: Bloomberg; Data as of 11/30/2016; Date range 11/30/2008-11/30/2016
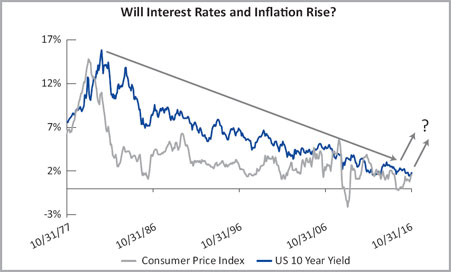
This is an interesting crossroads for investors. Interest rates peaked in 1981, and investors have enjoyed a generational bull market in bonds over the last 35 years. Homeowners, corporations and the economy benefited greatly as inflation ebbed in the early 1980s, and the cost of borrowing3 money declined from 22% in 1981 to 0.41% as of mid November. If the next administration’s policies lead to faster GDP growth, will inflation reemerge as a corrosive force which erodes the current value of money and forces interest rates higher?
A sustained rise in rates could present a significant challenge for fixed income investors as bonds potentially lose their value as interest rates rise. This possible change in trend might lead to a steady outflow in bond funds and make equities or other assets more attractive for investors.
Source: Bureau of Labor Statistics; Data as of 11/30/2016; Date range 11/30/2008-11/30/2016
If interest rates rise, fixed income vehicles (especially bonds with longer term maturities) could be at risk for negative total returns, limiting their utility as shock-absorbers and income generators. Given the potential for this seismic shift in interest rates, prudent investors are reviewing their portfolio allocations for the prospect of rising interest rates.
Past performance is not indicative of future results.
3 | Cost of borrowing refers to the Federal Funds Rate. Source: Bloomberg; Date range: 7/22/1981-11/17/2016 |
Annual Report | October 31, 2016 | 3 |
| | October 31, 2016 (Unaudited) |
Change is afoot
As we turn the page on the divisive political climate, our nation appears to be shifting its governing policies in a new direction, which creates both uncertainty and optimism in the near term. It will take several months to see how our political system will adjust to the new realities of President Trump’s pro-growth agenda and leadership style. This is uncharted territory, and we raise several questions in this letter that will create opportunities and challenges for corporations and investors alike.
We view this transition period between President Obama and President-elect Trump as an important time to research our portfolio companies (and their competitors) for the potential to benefit or be penalized by geopolitical and economic changes. Any potential shift towards rising interest rates could have significant ramifications for the economy and investor behavior. While equity investors appear well positioned to benefit from a pickup in economic growth, bond investors are potentially facing longer term headwinds in the form of rising interest rates.
Source: Bloomberg; Data as of 10/31/2016; Date range: 10/31/1977 - 10/31/2016
Source: Bloomberg; Data as of 11/30/2016; Date range: 9/1/2016 – 11/30/2016
We are keeping a close eye on the shifting political and economic tides and remain optimistic in our pursuit of investing in high quality growth companies that we believe are trading at reasonable valuations. As always, we are grateful for your trust in our stewardship and wish you and your family a happy holiday season.
Respectfully submitted,
Alexander L. Thorndike
Chairman of the Century Funds
Past performance is not indicative of future results.
| CENTURY SHARES TRUST | October 31, 2016 (Unaudited) |
HOW DID THE PORTFOLIO PERFORM?
For the one-year period ended October 31, 2016, Century Shares Trust’s shares returned -2.24%, underperforming the Russell 1000 Growth Index (R1000G), the Fund’s benchmark, which returned +2.28%.
WHAT FACTORS INFLUENCED PERFORMANCE?
The top contributors to relative performance on a sector basis were Real Estate, Financials and Telecommunication Services, resulting mainly from stock selection. The top performing stocks included Equinix, Inc. (data center services), American Tower Corp. (telecommunications REIT), Alphabet, Inc. (online search and advertising), Amazon.com, Inc. (e-commerce) and Microsoft Corp. (software). Equinix continued to benefit from the increase in demand for third party data center space by enterprise companies that are in the early stages of outsourcing their IT infrastructure. American Tower benefited from slow but steady growth during an uncertain macroeconomic environment. Microsoft reported better than expected Windows 10 growth and progress in transitioning its business to “the cloud.” Both Alphabet and Amazon reported strong operating results.
The top detractors from relative performance on a sector basis were Health Care, Industrials and Consumer Staples, resulting mainly from stock selection. The worst performing stocks included Allergan Plc. (pharmaceutical), BorgWarner, Inc. (auto parts), Stericycle, Inc. (waste management), Boeing Company (aerospace) and AmerisourceBergen Corp. (medical distribution). Allergan underperformed as the potential acquisition by Pfizer was called off due to the political debate surrounding tax inversions. BorgWarner underperformed due to concerns regarding Brexit, the Volkswagen scandal fallout and potential production cuts. Stericycle reported weak operating results and increased price competition. Boeing weakened due to a possible accounting probe. AmerisourceBergen encountered headwinds from slowing generic drug pricing trends.
HOW WAS THE PORTFOLIO POSITIONED AT PERIOD END?
The portfolio was diversified across almost every sector while maintaining its largest overweight positions in the Real Estate and Information Technology sectors. Conversely, the portfolio holds its largest underweight positions in the Consumer Staples and Health Care sectors.
We believe the domestic economy remained stable during the past year and accelerated towards the second half of 2016. While GDP and corporate earnings growth were weaker towards the start of the year, the U.S. economy picked up steam in the third quarter as corporate earnings beat expectations and registered their first year-over-year growth since the first quarter of 2015. Additionally, unemployment remained low and wage growth accelerated. Equity markets celebrated Donald Trump’s election, as his pro-growth policies were viewed positively by investors. Coupled with accelerating growth and a Trump administration, the Federal Reserve is considering raising interest rates during its upcoming meeting in December.
The Eurozone has continued to struggle with growth. Adding to slow growth concerns, there has been significant uncertainty around the ultimate economic ramifications of the “Brexit” vote. While the initial fallout has been modest, the full effect of the historic vote will take years to develop.
Further east, economic growth worries also remained intact. China, the world’s second largest economy, has struggled with slowing GDP, high levels of debt and excess capacity. Japan also continued to stagnate despite ultra accommodative economic policies. In addition to Prime Minister Shinzo Abe’s fiscal stimulus, Japan’s central bank has been running negative interest rates and a robust asset-purchase program.
Given this backdrop, we remain concerned about global economic growth but are optimistic about the state of the U.S. economy. As always, we remain focused on investing in high quality, U.S. based companies. Should we see an increase in market volatility, we will approach it as an opportunity to further enhance our portfolio holdings.
Past performance is not indicative of future results. Current performance may be lower or higher than the performance data quoted.
Annual Report | October 31, 2016 | 5 |
| CENTURY SHARES TRUST | October 31, 2016 (Unaudited) |
Risks: The Fund may invest a significant portion of assets in a limited number of companies or in companies within the same market sector. As a result, the Fund may be more susceptible to financial, market and economic events affecting particular companies or sectors and therefore may experience greater price volatility than funds with more diversified portfolios. Please read the Fund’s prospectus for details regarding the Fund’s risk profile.
| Ten Largest Holdings* | |
| ALPHABET, INC. | 6.79% |
| Internet Software & Services | |
| APPLE, INC. | 5.03% |
| Technology Hardware, Storage & Peripherals | |
| VISA, INC., CLASS A | 4.57% |
| IT Services | |
| AMAZON.COM, INC. | 4.45% |
| Internet & Direct Marketing Retail | |
| UNITED PARCEL SERVICE, INC., CLASS B | 4.36% |
| Air Freight & Logistics | |
| MICROSOFT CORP. | 4.35% |
| Software | |
| BORGWARNER, INC. | 3.68% |
| Auto Components | |
| VERISK ANALYTICS, INC. | 3.64% |
| Professional Services | |
| CERNER CORP. | 3.41% |
| Health Care Technology | |
| AMERICAN TOWER CORP. | 3.33% |
| Equity Real Estate Investment Trusts (REITs) | |
| Sector Allocation* | |
| Information Technology | 34.7% |
| Consumer Discretionary | 17.0% |
| Health Care | 11.5% |
| Industrials | 8.0% |
| Real Estate | 7.8% |
| Financials | 6.7% |
| Consumer Staples | 3.3% |
| Materials | 3.1% |
| Telecommunication Services | 2.0% |
| Cash, Cash Equivalents, & Other Net Assets | 5.9% |
| * | Based on the Fund’s net assets at October 31, 2016 and subject to change. |
| CENTURY SHARES TRUST | October 31, 2016 (Unaudited) |
Institutional Shares
The returns shown below represent past performance. Past performance does not guarantee future results. Investment return and principal value of an investment will fluctuate so that an investor’s shares, when sold or redeemed, may be worth more or less than the original cost. Current performance may be higher or lower than the Fund’s past performance. For the most recent month-end performance, please call 800-303-1928.
As stated in the Fund’s current prospectus, the total (gross) operating expenses are 1.11% for the Institutional Shares. The Fund’s total returns include the reinvestment of dividend and capital gain distributions, but have not been adjusted to reflect the deduction of taxes that a shareholder would pay on these distributions or the redemption of Fund shares. Shares held less than 90 days may be subject to a 1% redemption fee.
Average Annual Total Returns October 31, 2016
| | 1 Year | 3 Years | 5 Years | 10 Years |
| Century Shares Trust - Institutional Shares (CENSX) | -2.24% | 8.62% | 12.19% | 6.47% |
Russell 1000® Growth Index | 2.28% | 9.36% | 13.65% | 8.22% |
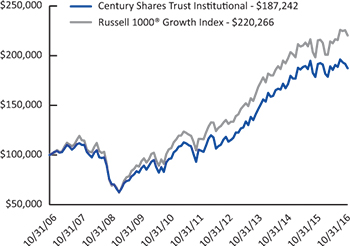
Growth of $100,000 for the 10 year period ended October 31, 2016
The graph and table reflect the change in value of a hypothetical investment in the Fund, including reinvestment of dividends and distributions, compared with the index. Index returns assume reinvestment of dividends and, unlike Fund returns, do not reflect any fees or expenses. It is not possible to invest directly in an index. Minimum initial investment for Institutional Shares is $100,000.
The Russell 1000® Growth Index measures the performance of the large-cap growth segment of the U.S. equity universe. It includes those Russell 1000® companies with higher price-to-book ratios and higher forecasted growth values.
| Annual Report | October 31, 2016 | 7 |
| CENTURY SMALL CAP SELECT FUND | October 31, 2016 (Unaudited) |
HOW DID THE PORTFOLIO PERFORM?
For the one-year period ended October 31, 2016, Century Small Cap Select Fund Institutional Shares returned -6.53% and the Investor Shares returned -6.77%, underperforming the Russell 2000 Growth Index (R2000G), the Fund’s benchmark, which returned -0.49%.
WHAT FACTORS INFLUENCED PERFORMANCE?
The top contributors to relative performance on a sector basis were Financials, Health Care and Materials, resulting mainly from stock selection. The top performing stocks included Gigamon, Inc. (network software), HMS Holdings Corp. (healthcare benefits), Cohen & Steers, Inc. (investment management), Vitae Pharmaceuticals, Inc. (biotechnology) and Scotts Miracle-Gro Company (agricultural products). Gigamon and Scotts Miracle-Gro both delivered strong operating results. HMS benefited from a favorable outcome from a recent lawsuit. Cohen & Steers reported positive real estate investment inflows, and Vitae announced it was being acquired.
The top detractors from relative performance on a sector basis were Information Technology, Industrials and Energy, resulting mainly from stock selection. The worst performing stocks included Acadia Healthcare Company, Inc. (behavioral health services), Demandware, Inc. (IT services), Infinera Corp. (telecommunications), On Assignment, Inc. (staffing) and PFSweb, Inc. (IT services). Acadia was penalized for experiencing delays in gaining regulatory approval for their recent U.K. acquisition. Demandware reported that new contracts and free cash flow margins were below market expectations. Infinera reduced guidance due to slower demand for their optical switches. On Assignment faltered despite delivering favorable earnings results as investors worried that the U.S. employment picture could get worse. PFSweb traded down as one of its largest customers was purchased, initiating concerns over lost revenue.
HOW WAS THE PORTFOLIO POSITIONED AT PERIOD END?
The portfolio was diversified across almost every sector while maintaining its largest overweight positions in the Financials and Consumer Discretionary sectors. Conversely, the portfolio holds its largest underweight positions in the Industrials and Real Estate sectors.
The US economy accelerated towards the second half of 2016. In the third quarter, corporate earnings beat expectations and registered their first Year-over-Year growth since the first quarter of 2015. GDP growth continued to increase, unemployment remained low and wage growth accelerated. Equity markets celebrated Donald Trump’s election, as his pro-growth policies were viewed positively by investors. Coupled with accelerating growth and a Trump administration, the Federal Reserve is considering raising interest rates during its upcoming meeting in December.
The Eurozone continued to battle with slow GDP growth, despite long standing efforts of supportive monetary policy. Additionally, there remains significant uncertainty around the ultimate economic ramifications of “Brexit” and upcoming votes elsewhere in Europe. While the initial fallout has been modest, the full effect of recent populist elections will take years to develop.
Further East, the Chinese economic slowdown has become an increasing source of concern, as weakness has impacted emerging markets that depend upon commodity exports to China. The Japanese economy continued to muddle along, despite an ultra accommodative monetary policy and fiscal stimulus. Japan’s central bank has been running negative interest rates and a robust asset-purchase program.
We are still assessing the economic impact of the recent U.S. election and how President Trump will implement his policies and govern. On balance, we remain encouraged by domestic growth but cautious about the global landscape. As always, we remain focused on investing in high quality domestic growth corporations. Should we see an increase in volatility, we will use it as an opportunity to further optimize our portfolio holdings.
Past performance is not indicative of future results. Current performance may be lower or higher than the performance data quoted.
| CENTURY SMALL CAP SELECT FUND | October 31, 2016 (Unaudited) |
Risks: The Fund invests in smaller companies which pose greater risks than those associated with larger, more established companies. The Fund may invest a significant portion of assets in securities of companies within the same market sector. If the Fund’s portfolio is over weighted in a sector, any negative development affecting that sector will have a greater impact on the Fund than a fund that is not over weighted in that sector. Please read the Fund’s prospectus for details regarding the Fund’s risk profile.
| Ten Largest Holdings* | |
| VAIL RESORTS, INC. | 2.75% |
| Hotels, Restaurants & Leisure | |
| J2 GLOBAL, INC. | 2.73% |
| Internet Software & Services | |
| GRAND CANYON EDUCATION, INC. | 2.70% |
| Diversified Consumer Services | |
| WNS HOLDINGS LTD., SPONSORED ADR | 2.56% |
| IT Services | |
| COHEN & STEERS, INC. | 2.54% |
| Capital Markets | |
| BRIGHT HORIZONS FAMILY SOLUTIONS, INC. | 2.46% |
| Diversified Consumer Services | |
| BALCHEM CORP. | 2.46% |
| Chemicals | |
CHARLES RIVER LABORATORIES INTERNATIONAL, INC. | 2.33% |
| Life Sciences Tools & Services | |
| MERIT MEDICAL SYSTEMS, INC. | 2.28% |
| Health Care Equipment & Supplies | |
| SCOTTS MIRACLE-GRO CO., CLASS A | 2.27% |
| Chemicals | |
| Sector Allocation* | |
| Health Care | 23.3% |
| Information Technology | 22.5% |
| Consumer Discretionary | 17.8% |
| Industrials | 11.4% |
| Financials | 8.2% |
| Materials | 4.7% |
| Consumer Staples | 2.6% |
| Real Estate | 2.6% |
| Energy | 2.1% |
| Telecommunication Services | 1.5% |
| Cash, Cash Equivalents, & Other Net Assets | 3.3% |
| * | Based on the Fund’s net assets at October 31, 2016 and subject to change. |
| Annual Report | October 31, 2016 | 9 |
| CENTURY SMALL CAP SELECT FUND | October 31, 2016 (Unaudited) |
Institutional Shares and Investor Shares
The returns shown below represent past performance. Past performance does not guarantee future results. Investment return and principal value of an investment will fluctuate so that an investor’s shares, when sold or redeemed, may be worth more or less than the original cost. Current performance may be higher or lower than the Fund’s past performance. For the most recent month-end performance, please call 800-303-1928.
As stated in the Fund’s current prospectus, the total (gross) operating expenses are 1.13% for the Institutional Shares and 1.42% for the Investor Shares. The Fund’s total returns include the reinvestment of dividend and capital gain distributions, but have not been adjusted to reflect the deduction of taxes that a shareholder would pay on these distributions or the redemption of Fund shares. Shares held less than 90 days may be subject to a 1% redemption fee.
Average Annual Total Returns October 31, 2016
| | 1 Year | 3 Years | 5 Years | 10 Years |
| Century Small Cap Select Fund - Institutional Shares (CSMCX) | -6.53% | 0.76% | 7.74% | 5.04% |
| Century Small Cap Select Fund - Investor Shares (CSMVX) | -6.77% | 0.44% | 7.40% | 4.69% |
Russell 2000® Growth Index | -0.49% | 3.70% | 11.34% | 6.92% |
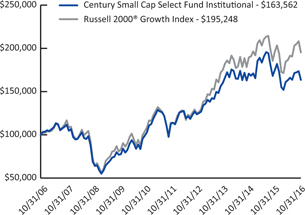
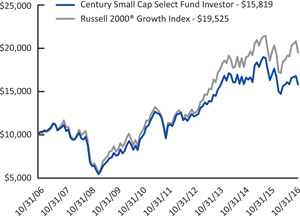
Growth of $100,000 for the 10 year period ended October 31, 2016
Institutional Shares
Growth of $10,000 for the 10 year period ended October 31, 2016
Investor Shares
The graphs and table reflect the change in value of a hypothetical investment in the Fund, including reinvestment of dividends and distributions, compared with the index. Index returns assume reinvestment of dividends and, unlike Fund returns, do not reflect any fees or expenses. It is not possible to invest directly in an index. Minimum initial investment for Institutional Shares is $100,000.
The Russell 2000® Growth Index measures the performance of the small-cap growth segment of the U.S. equity universe. It includes those Russell 2000® companies with higher price-to-value ratios and higher forecasted growth values. Index returns assume reinvestment of dividends but, unlike Fund returns, do not reflect fees or expenses. One cannot invest directly in an index.
| CENTURY SHARES TRUST | October 31, 2016 |
| Shares | | Value | |
| COMMON STOCKS - 94.1% | | | |
| Consumer Discretionary - 17.0% | | | |
| Auto Components - 3.7% | | | |
| | 211,393 | | BorgWarner, Inc. | | $ | 7,576,325 | |
| Diversified Consumer Services - 2.1% | | | | |
| | 184,852 | | H&R Block, Inc. | | | 4,246,050 | |
| Hotels, Restaurants & Leisure - 2.0% | | | | |
| | 78,515 | | Starbucks Corp. | | | 4,166,791 | |
| Internet & Direct Marketing Retail - 4.5% | | | | |
| | 11,579 | | Amazon.com, Inc.(a) | | | 9,145,326 | |
| Multiline Retail - 2.2% | | | | |
| | 60,753 | | Dollar Tree, Inc.(a) | | | 4,589,889 | |
| Specialty Retail - 2.5% | | | | |
| | 41,995 | | Home Depot, Inc. | | | 5,123,810 | |
| Total Consumer Discretionary | | | 34,848,191 | |
| | | | | | | | |
| Consumer Staples - 3.3% | | | | |
| Beverages - 3.3% | | | | |
| | 63,109 | | PepsiCo, Inc. | | | 6,765,285 | |
| Financials - 6.7% | | | | |
| Capital Markets - 6.3% | | | | |
| | 193,360 | | Charles Schwab Corp. | | | 6,129,512 | |
| | 67,916 | | Moody’s Corp. | | | 6,826,916 | |
| | | | | | | 12,956,428 | |
| Diversified Financial Services - 0.4% | | | | |
| | 4 | | Berkshire Hathaway, Inc., Class A(a) | | | 862,800 | |
| Total Financials | | | 13,819,228 | |
| | | | | | | | |
| Health Care - 11.5% | | | | |
| Biotechnology - 2.9% | | | | |
| | 57,811 | | Celgene Corp.(a) | | | 5,907,128 | |
| Health Care Providers & Services - 2.4% | | | | |
| | 71,633 | | AmerisourceBergen Corp. | | | 5,037,233 | |
| Health Care Technology - 3.4% | | | | |
| | 119,744 | | Cerner Corp.(a) | | | 7,014,603 | |
| Pharmaceuticals - 2.8% | | | | |
| | 27,291 | | Allergan PLC(a) | | | 5,702,181 | |
| Total Health Care | | | 23,661,145 | |
| Shares | | | | Value | |
| Industrials - 8.0% | | | |
| Air Freight & Logistics - 4.4% | | | |
| | 83,218 | | United Parcel Service, Inc., Class B | | $ | 8,967,572 | |
| Professional Services - 3.6% | | | | |
| | 91,840 | | Verisk Analytics, Inc.(a) | | | 7,489,552 | |
| Total Industrials | | | 16,457,124 | |
| | | | | | | | |
| Information Technology - 34.7% | | | | |
| Internet Software & Services - 6.8% | | | | |
| | 8,952 | | Alphabet, Inc., Class A(a) | | | 7,250,225 | |
| | 8,547 | | Alphabet, Inc., Class C(a) | | | 6,705,463 | |
| | | | | | | 13,955,688 | |
| IT Services - 9.1% | | | | |
| | 123,560 | | Cognizant Technology Solutions Corp., Class A(a) | | | 6,344,806 | |
| | 113,940 | | Visa, Inc., Class A | | | 9,401,189 | |
| | 154,063 | | Western Union Co. | | | 3,092,045 | |
| | | | | | | 18,838,040 | |
| Semiconductors & Semiconductor Equipment - 3.0% | | | | |
| | 80,205 | | Skyworks Solutions, Inc. | | | 6,170,973 | |
| Software - 8.7% | | | | |
| | 54,872 | | Adobe Systems, Inc.(a) | | | 5,899,289 | |
| | 35,798 | | Citrix Systems, Inc.(a) | | | 3,035,670 | |
| | 149,155 | | Microsoft Corp. | | | 8,937,368 | |
| | | | | | | 17,872,327 | |
| Technology Hardware, Storage & Peripherals - 7.1% | | | | |
| | 91,015 | | Apple, Inc. | | | 10,333,843 | |
| | 71,867 | | Western Digital Corp. | | | 4,199,907 | |
| | | | | | | 14,533,750 | |
| Total Information Technology | | | 71,370,778 | |
| | | | | | | | |
| Materials - 3.1% | | | | |
| Chemicals - 3.1% | | | | |
| | 78,438 | | LyondellBasell Industries NV, Class A | | | 6,239,743 | |
See Notes to Financial Statements
| Annual Report | October 31, 2016 | 11 |
| CENTURY SHARES TRUST | October 31, 2016 |
| Shares | | Value | |
| Real Estate - 7.8% | | | |
| Equity Real Estate Investment Trusts (REITs) - 5.4% | | | |
| | 58,448 | | American Tower Corp. | | $ | 6,849,521 | |
| | 12,142 | | Equinix, Inc. | | | 4,338,094 | |
| | | | | | | 11,187,615 | |
| Real Estate Management & Development - 2.4% | | | | |
| | 190,413 | | CBRE Group, Inc., Class A(a) | | | 4,905,039 | |
| Total Real Estate | | | 16,092,654 | |
| | | | | | | | |
| Telecommunication Services - 2.0% | | | | |
| Diversified Telecommunication Services - 2.0% | | | | |
| | 112,616 | | AT&T, Inc. | | | 4,143,143 | |
| | | | | | | | |
| TOTAL COMMON STOCKS (Cost $142,283,629) | | | 193,397,291 | |
| | | | | | | | |
| SHORT-TERM INVESTMENTS - 6.0% | | | | |
| Money Market Fund - 6.0% | | | | |
| | 12,416,479 | | State Street Institutional U.S. Government Money Market Fund - Investment Class (0.26% 7 Day Yield) | | | 12,416,479 | |
| | | | | | | | |
TOTAL SHORT-TERM INVESTMENTS
(Cost $12,416,479) | | | 12,416,479 | |
| | | | | | | | |
TOTAL INVESTMENTS - 100.1%
(Cost, $154,700,108) | | | 205,813,770 | |
| | | | | | | | |
| Liabilities in Excess of Other Assets - (0.1%) | | | (179,896 | ) |
| NET ASSETS - 100.0% | | $ | 205,633,874 | |
| (a) | Non-income producing security. |
Abbreviations:
NV - Naamloze Vennootschap (Dutch: Limited Liability Company)
PLC - Public Limited Company
See Notes to Financial Statements
| CENTURY SMALL CAP SELECT FUND | October 31, 2016 |
| Shares | | Value | |
| COMMON STOCKS - 96.7% | | | |
| Consumer Discretionary - 17.8% | | | |
| Diversified Consumer Services - 5.2% | | | |
| | 56,715 | | Bright Horizons Family Solutions, Inc.(a) | | $ | 3,794,801 | |
| | 95,608 | | Grand Canyon Education, Inc.(a) | | | 4,172,333 | |
| | | | | | | 7,967,134 | |
| Hotels, Restaurants & Leisure - 2.9% | | | | |
| | 10,944 | | Sonic Corp. | | | 250,727 | |
| | 26,570 | | Vail Resorts, Inc. | | | 4,236,321 | |
| | | | | | | 4,487,048 | |
| Household Durables - 3.4% | | | | |
| | 62,527 | | CalAtlantic Group, Inc. | | | 2,020,873 | |
| | 63,363 | | iRobot Corp.(a) | | | 3,212,504 | |
| | | | | | | 5,233,377 | |
| Multiline Retail - 2.2% | | | | |
| | 78,083 | | Big Lots, Inc. | | | 3,388,802 | |
| Specialty Retail - 4.1% | | | | |
| | 47,116 | | American Eagle Outfitters, Inc. | | | 802,857 | |
| | 41,550 | | Children’s Place, Inc. | | | 3,155,722 | |
| | 144,167 | | Tile Shop Holdings, Inc.(a) | | | 2,443,631 | |
| | | | | | | 6,402,210 | |
| Total Consumer Discretionary | | | 27,478,571 | |
| Consumer Staples - 2.6% | | | | |
| Food & Staples Retailing - 1.0% | | | | |
| | 13,507 | | Casey’s General Stores, Inc. | | | 1,526,156 | |
| Personal Products - 1.6% | | | | |
| | 76,353 | | Inter Parfums, Inc. | | | 2,489,108 | |
| Total Consumer Staples | | | 4,015,264 | |
| | | | | | | | |
| Energy - 2.1% | | | | |
| Energy Equipment & Services - 0.4% | | | | |
| | 41,467 | | Superior Energy Services, Inc. | | | 587,173 | |
| Oil, Gas & Consumable Fuels - 1.7% | | | | |
| | 82,860 | | Matador Resources Co.(a) | | | 1,807,176 | |
| | 124,421 | | Sanchez Energy Corp.(a) | | | 792,562 | |
| | | | | | | 2,599,738 | |
| Total Energy | | | 3,186,911 | |
| Shares | | Value | |
| Financials - 8.2% | | | |
| Banks - 3.6% | | | |
| | 113,590 | | Berkshire Hills Bancorp, Inc. | | $ | 3,356,584 | |
| | 31,697 | | Eagle Bancorp, Inc.(a) | | | 1,557,908 | |
| | 28,174 | | Hanmi Financial Corp. | | | 704,350 | |
| | | | | | | 5,618,842 | |
| Capital Markets - 2.6% | | | | |
| | 105,600 | | Cohen & Steers, Inc. | | | 3,926,208 | |
| Thrifts & Mortgage Finance - 2.0% | | | | |
| | 111,173 | | Washington Federal, Inc. | | | 3,029,464 | |
| Total Financials | | | 12,574,514 | |
| | | | | | | | |
| Health Care - 23.3% | | | | |
| Biotechnology - 2.2% | | | | |
| | 37,210 | | Acceleron Pharma, Inc.(a) | | | 1,042,996 | |
| | 55,912 | | Global Blood Therapeutics, Inc.(a) | | | 975,665 | |
| | 12,055 | | TESARO, Inc.(a) | | | 1,457,208 | |
| | | | | | | 3,475,869 | |
| Health Care Equipment & Supplies - 3.8% | | | | |
| | 38,110 | | Inogen, Inc.(a) | | | 2,045,363 | |
| | 160,084 | | Merit Medical Systems, Inc.(a) | | | 3,513,844 | |
| | 4,729 | | West Pharmaceutical Services, Inc. | | | 359,546 | |
| | | | | | | 5,918,753 | |
| Health Care Providers & Services - 9.2% | | | | |
| | 67,437 | | Acadia Healthcare Co., Inc.(a) | | | 2,425,035 | |
| | 37,861 | | Adeptus Health, Inc., Class A(a) | | | 1,140,373 | |
| | 43,421 | | Almost Family, Inc.(a) | | | 1,704,274 | |
| | 84,782 | | AMN Healthcare Services, Inc.(a) | | | 2,780,850 | |
| | 50,409 | | Diplomat Pharmacy, Inc.(a) | | | 1,167,977 | |
| | 106,464 | | Surgery Partners, Inc.(a) | | | 1,714,070 | |
| | 52,079 | | VCA, Inc.(a) | | | 3,200,775 | |
| | | | | | | 14,133,354 | |
| Health Care Technology - 3.0% | | | | |
| | 65,406 | | Cotiviti Holdings, Inc.(a) | | | 2,019,083 | |
| | 122,100 | | HMS Holdings Corp.(a) | | | 2,572,647 | |
| | | | | | | 4,591,730 | |
See Notes to Financial Statements
| Annual Report | October 31, 2016 | 13 |
| CENTURY SMALL CAP SELECT FUND | October 31, 2016 |
| Shares | | Value | |
| Health Care (continued) | | | |
| Life Sciences Tools & Services - 4.4% | | | |
| | 41,713 | | Cambrex Corp.(a) | | $ | 1,681,034 | |
| | 47,346 | | Charles River Laboratories International, Inc.(a) | | | 3,592,615 | |
| | 28,228 | | PRA Health Sciences, Inc.(a) | | | 1,502,294 | |
| | | | | | | 6,775,943 | |
| Pharmaceuticals - 0.7% | | | | |
| | 35,782 | | Dermira, Inc.(a) | | | 1,121,766 | |
| Total Health Care | | | 36,017,415 | |
| | | | | | | | |
| Industrials - 11.4% | | | | |
| Building Products - 1.5% | | | | |
| | 56,138 | | Simpson Manufacturing Co., Inc. | | | 2,402,706 | |
| Commercial Services & Supplies - 2.1% | | | | |
| | 70,147 | | Herman Miller, Inc. | | | 1,950,087 | |
| | 40,984 | | Team, Inc.(a) | | | 1,260,258 | |
| | | | | | | 3,210,345 | |
| Construction & Engineering - 2.9% | | | | |
| | 30,101 | | Dycom Industries, Inc.(a) | | | 2,315,670 | |
| | 44,600 | | Granite Construction, Inc. | | | 2,192,536 | |
| | | | | | | 4,508,206 | |
| Electrical Equipment - 1.1% | | | | |
| | 32,585 | | AZZ, Inc. | | | 1,735,151 | |
| Professional Services - 1.7% | | | | |
| | 74,381 | | On Assignment, Inc.(a) | | | 2,559,450 | |
| Road & Rail - 1.3% | | | | |
| | 55,136 | | Saia, Inc.(a) | | | 1,965,599 | |
| Trading Companies & Distributors - 0.8% | | | | |
| | 72,704 | | BMC Stock Holdings, Inc.(a) | | | 1,203,251 | |
| Total Industrials | | | 17,584,708 | |
| | | | | | | | |
| Information Technology - 22.5% | | | | |
| Internet Software & Services - 3.9% | | | | |
| | 59,212 | | j2 Global, Inc. | | | 4,212,934 | |
| | 31,031 | | Shutterstock, Inc.(a) | | | 1,830,519 | |
| | | | | | | 6,043,453 | |
| Shares | | Value | |
| Information Technology (continued) | | | |
| IT Services - 4.5% | | | |
| | 22,348 | | EPAM Systems, Inc.(a) | | $ | 1,438,541 | |
| | 217,876 | | PFSweb, Inc.(a) | | | 1,573,064 | |
| | 143,838 | | WNS Holdings Ltd., Sponsored ADR(a) | | | 3,955,545 | |
| | | | | | | 6,967,150 | |
| Semiconductors & Semiconductor Equipment - 3.8% | | | | |
| | 46,028 | | Cavium, Inc.(a) | | | 2,598,280 | |
| | 60,926 | | Inphi Corp.(a) | | | 2,260,355 | |
| | 49,744 | | Integrated Device Technology, Inc.(a) | | | 1,030,198 | |
| | | | | | | 5,888,833 | |
| Software - 10.3% | | | | |
| | 70,368 | | CyberArk Software Ltd.(a) | | | 3,289,704 | |
| | 44,542 | | Gigamon, Inc.(a) | | | 2,463,173 | |
| | 63,467 | | Manhattan Associates, Inc.(a) | | | 3,213,969 | |
| | 50,822 | | Paycom Software, Inc.(a) | | | 2,629,022 | |
| | 122,313 | | RingCentral, Inc., Class A(a) | | | 2,531,879 | |
| | 125,183 | | VASCO Data Security International,
Inc.(a) | | | 1,721,266 | |
| | | | | | | 15,849,013 | |
| Total Information Technology | | | 34,748,449 | |
| | | | | | | | |
| Materials - 4.7% | | | | |
| Chemicals - 4.7% | | | | |
| | 49,984 | | Balchem Corp. | | | 3,793,785 | |
| | 39,808 | | Scotts Miracle-Gro Co., Class A | | | 3,506,687 | |
| Total Materials | | | 7,300,472 | |
| | | | | | | | |
| Real Estate - 2.6% | | | | |
| Equity Real Estate Investment Trusts (REITs) - 2.6% | | | | |
| | 47,883 | | CubeSmart | | | 1,248,310 | |
| | 58,787 | | QTS Realty Trust, Inc., Class A | | | 2,701,850 | |
| Total Real Estate | | | 3,950,160 | |
See Notes to Financial Statements
| CENTURY SMALL CAP SELECT FUND | October 31, 2016 |
| Shares | | Value | |
| Telecommunication Services - 1.5% | | | |
| Wireless Telecommunication Services - 1.5% | | | |
| | 89,236 | | Shenandoah Telecommunications Co. | | $ | 2,355,831 | |
| | | | | | | | |
TOTAL COMMON STOCKS
(Cost $134,356,533) | | | 149,212,295 | |
| | | | | | | | |
| SHORT-TERM INVESTMENTS - 4.9% | | | | |
| Money Market Fund - 4.9% | | | | |
| | 7,526,521 | | State Street Institutional U.S. Government Money Market Fund - Investment Class (0.26% 7 Day Yield) | | | 7,526,521 | |
| | | | | | | | |
TOTAL SHORT-TERM INVESTMENTS
(Cost $7,526,521) | | | 7,526,521 | |
| | | | | | | | |
TOTAL INVESTMENTS - 101.6%
(Cost, $141,883,054) | | | 156,738,816 | |
| | | | | | | | |
| Liabilities in Excess of Other Assets - (1.6%) | | | (2,454,390 | ) |
| | | | | | | | |
| NET ASSETS - 100.0% | | $ | 154,284,426 | |
(a) | Non-income producing security. |
Abbreviations:
ADR - American Depositary Receipt
Ltd. - Limited
See Notes to Financial Statements
| Annual Report | October 31, 2016 | 15 |
| Statements of Assets and Liabilities |
October 31, 2016
| | | Century Shares Trust | | | | Century Small Cap Select Fund | |
| ASSETS: | | | | | | | |
| Investments, at value (Note 1) (cost - see below) | | $ | 205,813,770 | | | | $ | 156,738,816 | |
| Receivable for investments sold | | | – | | | | | 2,540,829 | |
| Receivable for fund shares subscribed | | | 101,555 | | | | | 596,288 | |
| Dividends receivable | | | 56,504 | | | | | 12,047 | |
| Prepaid expenses | | | 5,732 | | | | | 6,080 | |
| Total Assets | | | 205,977,561 | | | | | 159,894,060 | |
| | | | | | | | | | |
| LIABILITIES: | | | | | | | | | |
| Payable to Affiliates: | | | | | | | | | |
| Investment adviser fees (Note 4) | | | 141,572 | | | | | 130,632 | |
| Administration fees (Note 5) | | | 17,696 | | | | | – | |
| Distribution and service fees (Note 6) | | | – | | | | | 24,084 | |
| Payable for investments purchased | | | – | | | | | 4,835,387 | |
| Payable for shares redeemed | | | 51,605 | | | | | 499,523 | |
| Payable to trustees | | | 33,371 | | | | | 26,699 | |
| Payable for professional fees | | | 47,500 | | | | | 47,500 | |
| Accrued expenses and other liabilities | | | 51,943 | | | | | 45,809 | |
| Total Liabilities | | | 343,687 | | | | | 5,609,634 | |
| NET ASSETS | | $ | 205,633,874 | | | | $ | 154,284,426 | |
| | | | | | | | | | |
| NET ASSETS CONSIST OF: | | | | | | | | | |
| Paid-in capital | | $ | 147,813,757 | | | | $ | 145,312,128 | |
| Accumulated net investment income/(loss) | | | 106,641 | | | | | (1,084,772 | ) |
| Accumulated net realized gain/(loss) on investments | | | 6,599,814 | | | | | (4,798,692 | ) |
| Unrealized appreciation in value of investments | | | 51,113,662 | | | | | 14,855,762 | |
| NET ASSETS | | $ | 205,633,874 | | | | $ | 154,284,426 | |
| | | | | | | | | | |
| Net Assets: | | | | | | | | | |
| Institutional Shares | | $ | 205,633,874 | | | | $ | 88,182,222 | |
| Investor Shares | | | N/A | | | | $ | 66,102,204 | |
| Shares Outstanding (Note 2): | | | | | | | | | |
| Institutional Shares | | | 10,317,841 | | | | | 4,015,117 | |
| Investor Shares | | | N/A | | | | | 3,220,546 | |
| Net Asset Value Per Share | | | | | | | | | |
(Represents both the offering and redemption price)(a) | | | | | | | | | |
| Institutional Shares | | $ | 19.93 | | | | $ | 21.96 | |
| Investor Shares | | | N/A | | | | $ | 20.53 | |
| Cost of investments | | $ | 154,700,108 | | | | $ | 141,883,054 | |
(a) | A redemption fee may be assessed for shares redeemed within 90 days after purchase. (Note 1) |
See Notes to Financial Statements
For the Year Ended October 31, 2016
| | | Century Shares Trust | | | Century Small Cap Select Fund | |
| INVESTMENT INCOME: | | | | | | |
| Dividends | | $ | 2,681,605 | | | $ | 1,318,627 | |
| Total Investment Income | | | 2,681,605 | | | | 1,318,627 | |
| | | | | | | | | |
| EXPENSES: | | | | | | | | |
| Investment adviser fees (Notes 4) | | | 1,708,024 | | | | 1,825,158 | |
| Distribution and service fees (Note 6): | | | | | | | | |
| Investor Shares | | | – | | | | 167,351 | |
| Administrative fees | | | 213,503 | | | | – | |
| Transfer agency fees | | | 145,571 | | | | 151,497 | |
| Trustee fees | | | 123,835 | | | | 100,475 | |
| Professional fees | | | 79,559 | | | | 74,710 | |
| Fund accounting fees | | | 35,542 | | | | 33,297 | |
| Registration fees | | | 29,999 | | | | 38,128 | |
| Printing fees | | | 23,081 | | | | 16,786 | |
| Insurance fees | | | 21,288 | | | | 26,819 | |
| Custodian fees | | | 4,061 | | | | 12,044 | |
| Other expenses | | | 17,416 | | | | 21,052 | |
| Total Expenses | | | 2,401,879 | | | | 2,467,317 | |
| | | | | | | | | |
| NET INVESTMENT INCOME/(LOSS) | | | 279,726 | | | | (1,148,690 | ) |
| | | | | | | | | |
| REALIZED AND UNREALIZED GAIN/(LOSS) ON INVESTMENTS: | | | | | | | | |
| Net realized gain/(loss) on investments | | | 6,600,965 | | | | (4,285,311 | ) |
| Net change in unrealized appreciation of investments | | | (11,735,309 | ) | | | (11,785,433 | ) |
| NET REALIZED AND UNREALIZED LOSS ON INVESTMENTS | | | (5,134,344 | ) | | | (16,070,744 | ) |
| NET DECREASE IN NET ASSETS RESULTING FROM OPERATIONS | | $ | (4,854,618 | ) | | $ | (17,219,434 | ) |
See Notes to Financial Statements
| Annual Report | October 31, 2016 | 17 |
| Statements of Changes in Net Assets |
| | | Century Shares Trust | | | Century Small Cap Select Fund | |
| | | For the Year Ended October 31, | | | For the Year Ended October 31, | |
| | | 2016 | | | 2015 | | | 2016 | | | 2015 | |
| OPERATIONS: | | | | | | | | | | | | |
| Net investment income/(loss) | | $ | 279,726 | | | $ | 262,549 | | | $ | (1,148,690 | ) | | $ | (1,971,630 | ) |
| Net realized gain/(loss) on investments | | | 6,600,965 | | | | 7,397,854 | | | | (4,285,311 | ) | | | 57,511,187 | |
| Change in net unrealized appreciation/(depreciation) | | | (11,735,309 | ) | | | 17,286,786 | | | | (11,785,433 | ) | | | (49,085,133 | ) |
| Net increase/(decrease) in net assets resulting from operations | | | (4,854,618 | ) | | | 24,947,189 | | | | (17,219,434 | ) | | | 6,454,424 | |
| | | | | | | | | | | | | | | | | |
| DISTRIBUTIONS TO SHAREHOLDERS: | | | | | | | | | | | | | | | | |
| Institutional Shares | | | | | | | | | | | | | | | | |
| From net investment income | | | (468,505 | ) | | | – | | | | – | | | | – | |
| From net realized gains on investments | | | (7,353,202 | ) | | | (53,335,537 | ) | | | (34,271,035 | ) | | | (33,970,609 | ) |
| Investor Shares | | | | | | | | | | | | | | | | |
| From net realized gains on investments | | | – | | | | – | | | | (21,543,723 | ) | | | (18,018,773 | ) |
| Total distributions | | | (7,821,707 | ) | | | (53,335,537 | ) | | | (55,814,758 | ) | | | (51,989,382 | ) |
| | | | | | | | | | | | | | | | | |
| CAPITAL SHARE TRANSACTIONS: | | | | | | | | | | | | | | | | |
| Increase/(decrease) in net assets from capital share transactions (Note 2) | | | (7,049,692 | ) | | | 31,196,795 | | | | (37,558,710 | ) | | | (73,851,491 | ) |
| Redemption fees | | | 124 | | | | 188 | | | | 16,389 | | | | 22,054 | |
| Net increase/(decrease) from share transactions | | | (7,049,568 | ) | | | 31,196,983 | | | | (37,542,321 | ) | | | (73,829,437 | ) |
| | | | | | | | | | | | | | | | | |
| Total increase/(decrease) | | | (19,725,893 | ) | | | 2,808,635 | | | | (110,576,513 | ) | | | (119,364,395 | ) |
| | | | | | | | | | | | | | | | | |
| NET ASSETS: | | | | | | | | | | | | | | | | |
| Beginning of year | | | 225,359,767 | | | | 222,551,132 | | | | 264,860,939 | | | | 384,225,334 | |
| End of year* | | $ | 205,633,874 | | | $ | 225,359,767 | | | $ | 154,284,426 | | | $ | 264,860,939 | |
| | | | | | | | | | | | | | | | | |
*Including accumulated net investment income/(loss) | | $ | 106,641 | | | $ | 295,420 | | | $ | (1,084,772 | ) | | $ | (973,396 | ) |
See Notes to Financial Statements
| CENTURY SHARES TRUST | For a share outstanding throughout the periods presented |
INSTITUTIONAL SHARES
| | | For the Year Ended October 31, | |
| | | 2016 | | | 2015 | | | 2014 | | | 2013 | | | 2012 | |
| NET ASSET VALUE, BEGINNING OF PERIOD | | $ | 21.14 | | | $ | 24.78 | | | $ | 22.41 | | | $ | 19.81 | | | $ | 20.66 | |
| | | | | | | | | | | | | | | | | | | | | |
| INCOME/(LOSS) FROM OPERATIONS: | | | | | | | | | | | | | | | | | | | | |
Net investment income/(loss)(a) | | | 0.03 | | | | 0.02 | | | | (0.02 | ) | | | 0.03 | | | | 0.05 | |
| Net realized and unrealized gain/(loss) on investments | | | (0.50 | ) | | | 2.39 | | | | 3.72 | | | | 5.09 | | | | 1.28 | |
| Total income/(loss) from investment operations | | | (0.47 | ) | | | 2.41 | | | | 3.70 | | | | 5.12 | | | | 1.33 | |
| LESS DISTRIBUTIONS FROM: | | | | | | | | | | | | | | | | | | | | |
| Net investment income | | | (0.04 | ) | | | – | | | | – | | | | (0.05 | ) | | | (0.06 | ) |
| Net realized gain on investment transactions | | | (0.70 | ) | | | (6.05 | ) | | | (1.33 | ) | | | (2.47 | ) | | | (2.12 | ) |
| Total distributions | | | (0.74 | ) | | | (6.05 | ) | | | (1.33 | ) | | | (2.52 | ) | | | (2.18 | ) |
| REDEMPTION FEES | | | 0.00 | (b) | | | 0.00 | (b) | | | 0.00 | (b) | | | 0.00 | (b) | | | 0.00 | (b) |
| NET ASSET VALUE, END OF PERIOD | | $ | 19.93 | | | $ | 21.14 | | | $ | 24.78 | | | $ | 22.41 | | | $ | 19.81 | |
| | | | | | | | | | | | | | | | | | | | | |
| Total Return | | | (2.24 | %) | | | 11.76 | % | | | 17.29 | % | | | 28.85 | % | | | 7.63 | % |
| RATIOS AND SUPPLEMENTAL DATA | | | | | | | | | | | | | | | | | | | | |
| Net assets, end of period (000's) | | $ | 205,634 | | | $ | 225,360 | | | $ | 222,551 | | | $ | 201,271 | | | $ | 174,534 | |
| Ratio of expenses to average net assets | | | 1.13 | % | | | 1.11 | % | | | 1.09 | % | | | 1.11 | % | | | 1.12 | % |
| Ratio of net investment income/(loss) to average net assets | | | 0.13 | % | | | 0.12 | % | | | (0.06 | %) | | | 0.16 | % | | | 0.24 | % |
| | | | | | | | | | | | | | | | | | | | | |
| Portfolio Turnover Rate | | | 44 | % | | | 46 | % | | | 126 | % | | | 39 | % | | | 79 | % |
(a) | Per share numbers have been calculated using the average shares method. |
(b) | Less than $0.005 per share. |
See Notes to Financial Statements
| Annual Report | October 31, 2016 | 19 |
| CENTURY SMALL CAP SELECT FUND | For a share outstanding throughout the periods presented |
INSTITUTIONAL SHARES
| | | | | | | | | | | | | | | | |
| | | For the Year Ended October 31, | |
| | | 2016 | | | 2015 | | | 2014 | | | 2013 | | | 2012 | |
| NET ASSET VALUE, BEGINNING OF PERIOD | | $ | 30.00 | | | $ | 34.46 | | | $ | 33.94 | | | $ | 26.27 | | | $ | 23.91 | |
| | | | | | | | | | | | | | | | | | | | | |
| INCOME/(LOSS) FROM OPERATIONS: | | | | | | | | | | | | | | | | | | | | |
Net investment loss(a) | | | (0.11 | ) | | | (0.17 | ) | | | (0.24 | ) | | | (0.04 | ) | | | (0.12 | ) |
| Net realized and unrealized gain/(loss) on investments | | | (1.58 | ) | | | 0.87 | | | | 2.48 | | | | 7.71 | | | | 2.48 | |
| Total income/(loss) from investment operations | | | (1.69 | ) | | | 0.70 | | | | 2.24 | | | | 7.67 | | | | 2.36 | |
| LESS DISTRIBUTIONS FROM: | | | | | | | | | | | | | | | | | | | | |
| Net realized gain on investment transactions | | | (6.35 | ) | | | (5.16 | ) | | | (1.72 | ) | | | – | | | | – | |
| Total distributions | | | (6.35 | ) | | | (5.16 | ) | | | (1.72 | ) | | | – | | | | – | |
| REDEMPTION FEES | | | 0.00 | (b) | | | 0.00 | (b) | | | 0.00 | (b) | | | 0.00 | (b) | | | 0.00 | (b) |
| NET ASSET VALUE, END OF PERIOD | | $ | 21.96 | | | $ | 30.00 | | | $ | 34.46 | | | $ | 33.94 | | | $ | 26.27 | |
| | | | | | | | | | | | | | | | | | | | | |
| Total Return | | | (6.53 | %) | | | 2.48 | % | | | 6.79 | % | | | 29.20 | % | | | 9.87 | % |
| RATIOS AND SUPPLEMENTAL DATA | | | | | | | | | | | | | | | | | | | | |
| Net assets, end of period (000's) | | $ | 88,182 | | | $ | 164,141 | | | $ | 266,045 | | | $ | 300,833 | | | $ | 281,480 | |
| Ratio of expenses to average net assets | | | 1.16 | % | | | 1.13 | % | | | 1.11 | % | | | 1.12 | % | | | 1.10 | % |
| Ratio of net investment loss to average net assets | | | (0.47 | %) | | | (0.52 | %) | | | (0.71 | %) | | | (0.14 | %) | | | (0.48 | %) |
| | | | | | | | | | | | | | | | | | | | | |
| Portfolio Turnover Rate | | | 82 | % | | | 69 | % | | | 97 | % | | | 91 | % | | | 53 | % |
(a) | Per share numbers have been calculated using the average shares method. |
(b) | Less than $0.005 per share. |
See Notes to Financial Statements
| CENTURY SMALL CAP SELECT FUND | For a share outstanding throughout the periods presented |
INVESTOR SHARES
| | | For the Year Ended October 31, | |
| | | 2016 | | | 2015 | | | 2014 | | | 2013 | | | 2012 | |
| NET ASSET VALUE, BEGINNING OF PERIOD | | $ | 28.53 | | | $ | 33.12 | | | $ | 32.78 | | | $ | 25.45 | | | $ | 23.25 | |
| | | | | | | | | | | | | | | | | | | | | |
| INCOME/(LOSS) FROM OPERATIONS: | | | | | | | | | | | | | | | | | | | | |
Net investment loss(a) | | | (0.17 | ) | | | (0.26 | ) | | | (0.33 | ) | | | (0.13 | ) | | | (0.21 | ) |
| Net realized and unrealized gain/(loss) on investments | | | (1.48 | ) | | | 0.83 | | | | 2.39 | | | | 7.46 | | | | 2.41 | |
| Total income/(loss) from investment operations | | | (1.65 | ) | | | 0.57 | | | | 2.06 | | | | 7.33 | | | | 2.20 | |
| LESS DISTRIBUTIONS FROM: | | | | | | | | | | | | | | | | | | | | |
| Net realized gain on investment transactions | | | (6.35 | ) | | | (5.16 | ) | | | (1.72 | ) | | | – | | | | – | |
| Total distributions | | | (6.35 | ) | | | (5.16 | ) | | | (1.72 | ) | | | – | | | | – | |
| REDEMPTION FEES | | | 0.00 | (b) | | | 0.00 | (b) | | | 0.00 | (b) | | | 0.00 | (b) | | | 0.00 | (b) |
| NET ASSET VALUE, END OF PERIOD | | $ | 20.53 | | | $ | 28.53 | | | $ | 33.12 | | | $ | 32.78 | | | $ | 25.45 | |
| | | | | | | | | | | | | | | | | | | | | |
| Total Return | | | (6.77 | %) | | | 2.14 | % | | | 6.47 | % | | | 28.80 | % | | | 9.46 | % |
| RATIOS AND SUPPLEMENTAL DATA | | | | | | | | | | | | | | | | | | | | |
| Net assets, end of period (000's) | | $ | 66,102 | | | $ | 100,720 | | | $ | 118,181 | | | $ | 128,029 | | | $ | 111,965 | |
| Ratio of expenses to average net assets | | | 1.46 | % | | | 1.42 | % | | | 1.40 | % | | | 1.41 | % | | | 1.47 | % |
| Ratio of net investment loss to average net assets | | | (0.78 | %) | | | (0.85 | %) | | | (1.00 | %) | | | (0.44 | %) | | | (0.84 | %) |
| | | | | | | | | | | | | | | | | | | | | |
| Portfolio Turnover Rate | | | 82 | % | | | 69 | % | | | 97 | % | | | 91 | % | | | 53 | % |
(a) | Per share numbers have been calculated using the average shares method. |
(b) | Less than $0.005 per share. |
See Notes to Financial Statements
| Annual Report | October 31, 2016 | 21 |
| Notes to Financial Statements |
October 31, 2016
1. SIGNIFICANT ACCOUNTING POLICIES
Century Capital Management Trust (the “Trust”) is registered under the Investment Company Act of 1940, as amended (“1940 Act”) as an open-end management investment company organized as a Massachusetts business trust. Century Shares Trust and Century Small Cap Select Fund, (each a “Fund” and, collectively, the “Funds”) are diversified series of the Trust. The following are significant accounting policies consistently followed by the Funds and are in conformity with accounting principles generally accepted in the United States (“GAAP”). Each Fund is considered an investment company for financial reporting purposes under GAAP.
The investment objective of Century Shares Trust and Century Small Cap Select Fund is to seek long-term capital growth.
A. Security Valuations — Equity securities are valued at the last reported sale price or official closing price on the primary exchange or market on which they are traded, as reported by an independent pricing service. If no sale price or official closing price is reported, market value is generally determined based on quotes or closing prices obtained from a quotation reporting system, established market maker, or reputable pricing service. For unlisted securities and for exchange-listed securities for which there are no reported sales or official closing prices, fair value is generally determined using closing bid prices. In the absence of readily available market quotes, securities and other assets will be valued at fair value, as determined in good faith under procedures established by and under the general supervision of the Funds’ Board of Trustees. Short-term obligations, maturing in 60 days or less, are valued at amortized cost, which approximates fair value unless particular circumstances dictate otherwise (for example, if the issuer’s creditworthiness has become impaired). Investments in open-end mutual funds are valued at their closing net asset value each business day.
A three-tier hierarchy has been established to classify fair value measurements for disclosure purposes. Inputs refer broadly to the assumptions that market participants would use in pricing the asset or liability, including assumptions about risk. Inputs may be observable or unobservable. Observable inputs are inputs that reflect the assumptions market participants would use in pricing the asset or liability that are developed based on market data obtained from sources independent of the reporting entity. Unobservable inputs are inputs that reflect the reporting entity’s own assumptions about the assumptions market participants would use in pricing the asset or liability that are developed based on the best information available.
Various inputs are used in determining the value of each Fund’s investments as of the reporting period end. These inputs are categorized in the following hierarchy under applicable financial accounting standards:
| | Level 1 — | Unadjusted quoted prices in active markets for identical, unrestricted assets or liabilities that the Funds have the ability to access at the measurement date; |
| | Level 2 — | Quoted prices which are not active, quoted prices for similar assets or liabilities in active markets or inputs other than quoted prices that are observable (either directly or indirectly) for substantially the full term of the asset or liability; |
| | Level 3 — | Significant unobservable prices or inputs (including the Fund’s own assumptions in determining the fair value of investments) where there is little or no market activity for the asset or liability at the measurement date. |
The availability of observable inputs can vary from security to security and is affected by a wide variety of factors, including, for example, the type of security, whether the security is new and not yet established in the marketplace, the liquidity of markets, and other characteristics particular to the security. To the extent that valuation is based on models or inputs that are less observable or unobservable in the market, the determination of fair value requires more judgment. Accordingly, the degree of judgment exercised in determining fair value is greatest for instruments categorized in Level 3.
| Notes to Financial Statements |
October 31, 2016
The following is a summary of the inputs used as of October 31, 2016 in valuing the Funds’ investments carried at fair value:
Century Shares Trust
| Investments in Securities at Value* | | Level 1 - Quoted Prices | | | | Level 2 - Other Significant Observable Inputs | | | | Level 3 - Significant Unobservable Inputs | | | | Total | |
| Common Stocks | | $ | 193,397,291 | | | | $ | – | | | | $ | – | | | | $ | 193,397,291 | |
| Short-Term Investments | | | 12,416,479 | | | | | – | | | | | – | | | | | 12,416,479 | |
| TOTAL | | $ | 205,813,770 | | | | $ | – | | | | $ | – | | | | $ | 205,813,770 | |
Century Small Cap Select Fund
| Investments in Securities at Value* | | Level 1 - Quoted Prices | | | | Level 2 - Other Significant Observable Inputs | | | | Level 3 - Significant Unobservable Inputs | | | | Total | |
| Common Stocks | | $ | 149,212,295 | | | | $ | – | | | | $ | – | | | | $ | 149,212,295 | |
| Short-Term Investments | | | 7,526,521 | | | | | – | | | | | – | | | | | 7,526,521 | |
| TOTAL | | $ | 156,738,816 | | | | $ | – | | | | $ | – | | | | $ | 156,738,816 | |
| * | At October 31, 2016 the Funds held investments in common stocks classified as Level 1, with corresponding major categories as shown on each Fund’s Portfolio of Investments. |
The Funds recognize transfers into and out of all levels at the end of the reporting period. There were no transfers into or out of Levels 1 and 2 during the period.
There were no securities classified as Level 3 securities during the period, thus, a reconciliation of assets in which significant unobservable inputs (Level 3) were used is not applicable for these Funds.
B. Security Transactions — Security transactions are recorded on a trade date basis. Gain or loss on sales is determined by the use of the highest cost-method, for both financial reporting and federal income tax purposes. Dividend income is recorded on the ex-dividend date. Payments received from certain investments held by the Funds may be comprised of dividends, capital gains and return of capital. The Funds originally estimate the expected classification of such payments. The amounts may subsequently be reclassified upon receipt of information from the issuer. The Funds may invest in equity securities issued or guaranteed by companies organized and based in countries outside of the United States. These securities may be traded on foreign securities exchanges or in foreign over-the-counter markets. Foreign dividend income is recorded on ex-dividend date or as soon as practicable after the Fund determines the existence of a dividend declaration after exercising reasonable due diligence. Foreign income and capital gain on some foreign securities may be subject to foreign withholding taxes, which are accrued as applicable. Interest income is recorded daily on an accrual basis.
| Annual Report | October 31, 2016 | 23 |
| Notes to Financial Statements |
October 31, 2016
C. Use of Estimates — The preparation of these financial statements in accordance with GAAP incorporates estimates made by management in determining the reported amounts of assets, liabilities, income and expenses of the Funds. Actual results could differ from those estimates.
D. Risks and Uncertainty — Century Shares Trust may invest a significant portion of assets in a limited number of companies. As a result, the Fund may be more susceptible to financial, market and economic events affecting particular companies and therefore may experience greater price volatility than funds with more diversified portfolios.
Century Small Cap Select Fund invests in smaller companies, which generally involves greater risk than investing in larger, more established companies.
Foreign investing involves certain risks and increased volatility not associated with investing solely in the U.S. These risks include currency fluctuations, economic or financial instability, lack of timely or reliable financial information or unfavorable political or legal developments.
At any given time, a significant portion of the assets of each Fund may be invested in securities of companies within the same market sector of the economy. Companies within the same sector often face similar issues and, consequently, may react similarly to changes in market conditions. If a Fund has a significant weighting in one or more sectors, it may be subject to more risk and price volatility.
E. Multiple Classes of Shares — Century Small Cap Select Fund offers two classes of shares, which differ in their respective distribution and service fees. Investment income, realized and unrealized capital gains and losses, the common expenses of the Fund, and certain fund-level expense reductions, if any, are allocated on a pro rata basis to each class based on the relative net assets of each class to the total net assets of the Fund. Certain expense reductions may differ by class. Because transfer agent fees include a per account fee, each class differs with respect to transfer agent fees incurred.
F. Redemption Fees — In general, shares of each Fund may be redeemed at net asset value. However, upon the redemption of shares held less than 90 days, a redemption fee of 1% of the current net asset value of the shares may be assessed and retained by each share class of each Fund for the benefit of the Fund’s remaining shareholders. The redemption fee is accounted for as an addition to paid-in-capital and amounts are shown on the Statement of Changes in Net Assets.
G. Income Tax Information and Distributions to Shareholders — Each year, each Fund intends to qualify as a regulated investment company by distributing all of its taxable income and sufficient net investment income and net realized gains, if any, under Subchapter M of the Internal Revenue Code of 1986 (“Code”), as amended. As a result, no provision for income taxes is required in the accompanying financial statements. Foreign taxes are provided for based on each Fund’s understanding of the tax rules and rates class. Distributions are recorded on the ex-dividend date. Income and capital gain distributions are determined in accordance with income tax regulations, which may differ from generally accepted accounting principles. Capital accounts within the financial statements are adjusted for permanent book and tax differences. Generally accepted accounting principles require that any distributions in excess of tax basis earnings and profits be reported in the financial statements as a tax return of capital.
| Notes to Financial Statements |
October 31, 2016
In order to present accumulated net investment income and accumulated net realized loss more closely to its tax character, the following accounts were increased (decreased) as of October 31, 2016:
| | Paid-In Capital | Accumulated Net Investment Income | Accumulated Net Realized Gain/Loss |
| Century Small Cap Select Fund | (1,037,314) | 1,037,314 | – |
The amount reclassified for Century Small Cap Select Fund was a net operating loss offset to Paid-In Capital of $1,037,314.
These reclassifications have no impact on net assets or the results of operations. The Funds had temporary book/tax differences primarily attributable to wash sales and permanent book/tax differences primarily attributable to net operating losses. Temporary differences will reverse in a subsequent period.
The net unrealized appreciation/depreciation of investments based on federal tax cost as of October 31, 2016 was as follows:
| | | Century Shares Trust | | | Century Small Cap Select Fund | |
| Gross appreciation on investments (excess of value over tax cost) | | $ | 53,871,007 | | | $ | 20,785,803 | |
| Gross depreciation on investments (excess of tax cost over value) | | | (2,881,042 | ) | | | (6,543,144 | ) |
| Net unrealized appreciation | | $ | 50,989,965 | | | $ | 14,242,659 | |
| Cost of investments for federal income tax purposes | | $ | 154,823,805 | | | $ | 142,496,157 | |
As of October 31, 2016, the components of distributable earnings on a tax basis were as follows:
| | | Century Shares Trust | | | Century Small Cap Select Fund | |
| Undistributed ordinary income | | $ | 106,641 | | | $ | – | |
| Accumulated capital gains/(losses) | | | 6,723,511 | | | | (4,185,589 | ) |
| Unrealized appreciation | | | 50,989,965 | | | | 14,242,659 | |
| Other cumulative effect of timing differences | | | – | | | | (1,084,772 | ) |
| Total | | $ | 57,820,117 | | | $ | 8,972,298 | |
| Annual Report | October 31, 2016 | 25 |
| Notes to Financial Statements |
October 31, 2016
The differences between the components of distributable earnings on a tax basis and the amounts reflected in the Statement of Assets and Liabilities are primarily due to wash sales and real estate investment trust basis adjustments.
The tax character of distributions paid by the Funds during the year ended October 31, 2016, were as follows:
| Distributions Paid From: | | Century Shares Trust | | | Century Small Cap Select Fund | |
| Ordinary income | | $ | 1,520,204 | | | $ | – | |
| Long-term capital gains | | | 6,301,503 | | | | 55,814,758 | |
| Total | | $ | 7,821,707 | | | $ | 55,814,758 | |
The tax character of distributions paid by the Funds during the year ended October 31, 2015 was as follows:
| Distributions Paid From: | | Century Shares Trust | | | Century Small Cap Select Fund | |
| Ordinary income | | $ | 5,003,338 | | | $ | 1,161,133 | |
| Long-term capital gains | | | 48,332,199 | | | | 50,828,249 | |
| Total | | $ | 53,335,537 | | | $ | 51,989,382 | |
As of October 31, 2016, Century Small Cap Select Fund had short term capital losses deferred to the next tax year of $4,185,589.
Century Small Cap Select Fund elects to defer to the period ending October 31, 2017, late year ordinary losses in the amount of $1,084,772.
As of October 31, 2016, the Funds had no uncertain tax positions that would require financial statement recognition or disclosure. The Funds file U.S. federal, state, and local tax returns as required. The Funds’ tax returns are subject to examination by the relevant tax authorities until expiration of the applicable statute of limitations which is generally three years after the filing of a tax return, but may extend to four years in certain jurisdictions. Tax returns for open years have incorporated no uncertain positions that require a provision for income taxes.
H. Indemnifications — In the normal course of business, the Funds enter into agreements with service providers that may contain indemnification clauses. The Funds maximum exposure under these arrangements is unknown as this would involve future claims that may be made against the Funds that have not yet occurred.
| Notes to Financial Statements |
October 31, 2016
2. TRANSACTIONS IN SHARES
Century Shares Trust — The number of authorized shares is unlimited. Transactions in Institutional Class shares were as follows:
| | | Institutional | |
| | | For the Year Ended October 31, 2016 | | | For the Year Ended October 31, 2015 | |
| | | Shares | | | Amount | | | Shares | | | Amount | |
| Sold | | | 98,033 | | | $ | 1,952,190 | | | | 194,080 | | | $ | 3,935,550 | |
| Issued to shareholders in reinvestment of distributions | | | 355,390 | | | | 7,146,898 | | | | 2,487,747 | | | | 48,511,068 | |
| | | | 453,423 | | | | 9,099,088 | | | | 2,681,827 | | | | 52,446,618 | |
| Repurchased | | | (798,182 | ) | | | (16,148,780 | ) | | | (1,001,585 | ) | | | (21,249,823 | ) |
| Net Increase/(Decrease) | | | (344,759 | ) | | $ | (7,049,692 | ) | | | 1,680,242 | | | $ | 31,196,795 | |
Century Small Cap Select Fund — The number of authorized shares is unlimited. Transactions in each class of shares were as follows:
| | | Institutional | |
| | | For the Year Ended October 31, 2016 | | | For the Year Ended October 31, 2015 | |
| | | Shares | | | Amount | | | Shares | | | Amount | |
| Sold | | | 547,654 | | | $ | 12,738,016 | | | | 1,010,831 | | | $ | 32,451,401 | |
| Issued to shareholders in reinvestment of distributions | | | 1,444,718 | | | | 33,112,940 | | | | 1,134,797 | | | | 33,033,944 | |
| | | | 1,992,372 | | | | 45,850,956 | | | | 2,145,628 | | | | 65,485,345 | |
| Repurchased | | | (3,448,764 | ) | | | (76,500,718 | ) | | | (4,395,083 | ) | | | (137,236,009 | ) |
| Net Decrease | | | (1,456,392 | ) | | $ | (30,649,762 | ) | | | (2,249,455 | ) | | $ | (71,750,664 | ) |
| Annual Report | October 31, 2016 | 27 |
| Notes to Financial Statements |
October 31, 2016
Century Small Cap Select Fund (continued)
| | | Investor | |
| | | For the Year Ended October 31, 2016 | | | For the Year Ended October 31, 2015 | |
| | | Shares | | | Amount | | | Shares | | | Amount | |
| Sold | | | 236,525 | | | $ | 5,033,490 | | | | 410,619 | | | $ | 12,543,011 | |
| Issued to shareholders in reinvestment of distributions | | | 994,743 | | | | 21,357,127 | | | | 642,483 | | | | 17,835,340 | |
| | | | 1,231,268 | | | | 26,390,617 | | | | 1,053,102 | | | | 30,378,351 | |
| Repurchased | | | (1,540,691 | ) | | | (33,299,565 | ) | | | (1,091,291 | ) | | | (32,479,178 | ) |
| Net Decrease | | | (309,423 | ) | | $ | (6,908,948 | ) | | | (38,189 | ) | | $ | (2,100,827 | ) |
3. INVESTMENT SECURITIES TRANSACTIONS
Century Shares Trust purchases and sales of investment securities (excluding short-term securities and U.S. Government obligations) aggregated $89,929,410 and $103,849,054, respectively, during the year ended October 31, 2016.
Century Small Cap Select Fund purchases and sales of investment securities (excluding short-term securities and U.S. Government obligations) aggregated $154,234,710 and $245,789,620 respectively, during the year ended October 31, 2016.
4. INVESTMENT ADVISER FEE
Century Shares Trust: The Trust has entered into an Investment Advisory Agreement (the “Agreement”) with Century Capital Management, LLC (“CCM”) pursuant to which CCM provides an investment program for Century Shares Trust. Under the Agreement, the Fund pays a monthly management fee based on the Fund’s average daily net assets computed at the following annual rates: 0.80% of the first $500 million and 0.70% of the amounts exceeding $500 million.
Century Small Cap Select Fund: The Trust has entered into an Investment Advisory and Management Services Agreement (the “Agreement”) with CCM pursuant to which CCM provides investment advisory, management and administrative services to Century Small Cap Select Fund. Under the Agreement, the Fund pays a monthly management fee at the annual rate of 0.95% of the Fund’s average daily net assets.
5. ADMINISTRATION FEES
Century Shares Trust: The Trust has entered into an Administration Agreement with CCM pursuant to which CCM provides certain administrative services to Century Shares Trust. Under the agreement, the Fund pays a monthly administration fee at the annual rate of 0.10% of the Fund’s average daily net assets.
Century Small Cap Select Fund: Per the Investment Advisory and Management Services Agreement between the Trust and CCM, Century Small Cap Select Fund may reimburse CCM for expenses associated with having the adviser’s personnel perform shareholder service functions and certain financial, accounting, administrative and clerical services. No reimbursements were paid to CCM during the year ended October 31, 2016.
| Notes to Financial Statements |
October 31, 2016
CCM has entered into a Sub-Administration Agreement with ALPS Fund Services, Inc. (“ALPS”) pursuant to which ALPS provides certain administrative services to each Fund on behalf of CCM. CCM pays ALPS a sub-administration fee for sub-administration services provided to each Fund.
6. DISTRIBUTION FEES AND OTHER PAYMENTS TO FINANCIAL INTERMEDIARIES
The Trust has adopted a Distribution and Service Plan (the “Plan”) pursuant to Rule 12b-1 under the 1940 Act on behalf of Century Small Cap Select Fund. The Plan authorizes the Fund to pay up to 0.25% of the average daily net assets of the Fund’s Investor Shares class for distribution and shareholder services. The Plan may be terminated at any time by the vote of a majority of the independent Trustees or by the vote of the holders of a majority of the outstanding shares of the Investor Shares.
The Trust has entered into agreements with financial intermediaries to provide recordkeeping, processing, shareholder communications and other services to customers of the intermediaries and has agreed to compensate the intermediaries for providing such services. Certain services would be provided by the Funds if the shares of each customer were registered directly with the Funds’ transfer agent.
7. TRUSTEE AND OFFICER FEES
As of October 31, 2016, there were seven Trustees, six of whom are not “interested persons” (within the meaning of the 1940 Act) of the Trust (the “Independent Trustees”). Each Independent Trustee receives a retainer of $4,000 per calendar quarter from the Trust for his or her services. The chairperson of the Audit Committee receives an additional retainer of $1,125 per calendar quarter; the Lead Independent Trustee receives an additional retainer of $750 per calendar quarter; and the Chairpersons of the Oversight and Governance Committee and Nominating Committee each receive an additional retainer of $375 per calendar quarter. In addition, each Independent Trustee is paid a fee of $5,500 for each meeting of the Board of Trustees attended or participated in, as the case may be. The Independent Trustees are not paid an additional fee from the Trust for attendance at and/or participation in meetings of the various committees of the Board. The Independent Trustees are also reimbursed for meeting-related expenses. Officers of the Trust and Trustees who are interested persons of the Trust receive no salary or fees from the Trust.
| Annual Report | October 31, 2016 | 29 |
| Report of Independent Registered Public Accounting Firm |
To the Board of Trustees and Shareholders of Century Capital Management Trust:
We have audited the accompanying statements of assets and liabilities, including the portfolios of investments, of Century Capital Management Trust (the “Trust”) comprising the Century Shares Trust and Century Small Cap Select Fund as of October 31, 2016, and the related statements of operations for the year then ended, the statements of changes in net assets for each of the two years in the period then ended, and the financial highlights for each of the periods presented. These financial statements and financial highlights are the responsibility of the Trust’s management. Our responsibility is to express an opinion on these financial statements and financial highlights based on our audits.
We conducted our audits in accordance with the standards of the Public Company Accounting Oversight Board (United States). Those standards require that we plan and perform the audit to obtain reasonable assurance about whether the financial statements and financial highlights are free of material misstatement. The Trust is not required to have, nor were we engaged to perform, an audit of their internal control over financial reporting. Our audits included consideration of internal control over financial reporting as a basis for designing audit procedures that are appropriate in the circumstances, but not for the purpose of expressing an opinion on the effectiveness of the Trust’s internal control over financial reporting. Accordingly, we express no such opinion. An audit also includes examining, on a test basis, evidence supporting the amounts and disclosures in the financial statements, assessing the accounting principles used and significant estimates made by management, as well as evaluating the overall financial statement presentation. Our procedures included confirmation of securities owned as of October 31, 2016, by correspondence with the custodian and brokers; where replies were not received from brokers, we performed other auditing procedures. We believe that our audits provide a reasonable basis for our opinion.
In our opinion, the financial statements and financial highlights referred to above present fairly, in all material respects, the financial position of each of the funds constituting the Century Capital Management Trust as of October 31, 2016, the results of their operations for the year then ended, the changes in their net assets for each of the two years in the period then ended, and the financial highlights for each of the five years in the period then ended, in conformity with accounting principles generally accepted in the United States of America.
DELOITTE & TOUCHE LLP
Denver, Colorado
December 19, 2016
| Disclosure of Fund Expenses |
October 31, 2016 (Unaudited)
As a shareholder of a Fund, you incur two types of costs: direct costs, such as short-term redemption fees and wire fees, and indirect costs, including management fees, and other fund operating expenses. This example is intended to help you understand your indirect costs, also referred to as “ongoing costs” (in dollars), of investing in the Fund and to compare these costs with the ongoing costs of investing in other mutual funds.
This example is based on an investment of $1,000 invested at the beginning of the period and held for the entire period as indicated below.
Actual Expenses The first line of the table below provides information about actual account values and actual expenses. You may use the information in this line, together with the amount you invested at the beginning of the period, to estimate the expenses that you paid over the period. Simply divide your account value by $1,000 (for example, an $8,600 account value divided by $1,000 = 8.6), then multiply the result by the number in the first line under the heading “Expenses Paid During Period” to estimate the expenses you paid on your account during this period.
Hypothetical Example for Comparison Purposes The second line of the table provides information about hypothetical account values and hypothetical expenses based on the Fund’s actual expense ratio and an assumed rate of return of 5% per year before expenses, which is not the Fund’s actual return. The hypothetical account values and expenses may not be used to estimate the actual ending account balance or expenses you paid for the period. You may use this information to compare ongoing costs of investing in the Fund and other funds. To do so, compare this 5% hypothetical example with the 5% hypothetical examples that appear in the shareholder reports of other funds.
Please note that the expenses shown in the table are meant to highlight your ongoing costs only and do not reflect any direct costs, such as wire fees or low balance fees. Therefore, the second line of the table is useful in comparing ongoing costs only and will not help you determine the relative total costs of owning different funds. In addition, if these direct costs were included, your costs would be higher.
| | Beginning Account Value May 1, 2016 | Ending Account Value October 31, 2016 | Expense Ratio(a) | Expenses Paid During period May 1, 2016 to October 31, 2016(b) |
| Century Shares Trust | | | | |
| Institutional Shares | | | | |
| Actual | $1,000.00 | $1,009.10 | 1.13% | $5.71 |
| Hypothetical (5% return before expenses) | $1,000.00 | $1,019.46 | 1.13% | $5.74 |
| Century Small Cap Select Fund | | | | |
| Institutional Shares | | | | |
| Actual | $1,000.00 | $1,002.30 | 1.15% | $5.79 |
| Hypothetical (5% return before expenses) | $1,000.00 | $1,019.36 | 1.15% | $5.84 |
| Investor Shares | | | | |
| Actual | $1,000.00 | $1,000.50 | 1.42% | $7.14 |
| Hypothetical (5% return before expenses) | $1,000.00 | $1,018.00 | 1.42% | $7.20 |
| (a) | The Fund’s expense ratios have been based on the Fund’s most recent fiscal half year expenses. |
(b) | Expenses are equal to the Fund’s annualized expense ratio multiplied by the average account value over the period, multiplied by the number of days in the most recent fiscal half year (184), divided by 366. |
| Annual Report | October 31, 2016 | 31 |
October 31, 2016 (Unaudited)
The following information represents the tax status of dividends and distributions paid by the Funds during the calendar year ended December 31, 2015. This information is presented to meet regulatory requirements and no current action on your part is required.
| | Century Shares Trust | Century Small Cap Select Fund |
| Dividends Received Deduction | 100.00% | – |
| Qualified Dividend Income | 100.00% | – |
Pursuant to Section 852(b)(3) of the Internal Revenue Code, Century Shares Trust and Century Small Cap Select Fund designate $6,301,503 and $55,814,758 respectively as long-term capital gain distributions.
In early 2016, if applicable, shareholders of record received this information for the distributions paid to them by the Funds during the calendar year 2015 via Form 1099. The Funds will notify shareholders in early 2017 of amounts paid to them by the Funds, if any, during the calendar year 2016.
Please consult a tax advisor if you have questions about federal or state income tax laws, or how to prepare your tax returns.
October 31, 2016 (Unaudited)
The following table provides certain information regarding the Trustees and officers of the Century Funds as of October 31, 2016. Each Trustee’s year of birth is set forth in parentheses after his or her name. Unless otherwise noted, (i) each Trustee and officer has engaged in the principal occupation(s) noted in the table for at least the most recent five years, although not necessarily in the same capacity; and (ii) the address of each Trustee and officer is c/o Century Capital Management, 100 Federal Street, 29th Floor, Boston, MA 02110. Each Trustee’s term of office continues until the election and qualification of a successor, or until such Trustee dies, retires, resigns or is removed in accordance with the Declaration of Trust. Because the Funds do not hold an annual meeting of shareholders, each Trustee will hold office for an indeterminate period.
Name, Year of Birth, Position(s) held with Trust and Length of Time Served | Principal Occupation During Past 5 Years And Other Directorships Held | No. of Portfolios in Fund Complex Overseen |
William Gray (1952)
Trustee, 2006 to present | Senior Advisor, The Blackstone Group LP (private equity firm); Special Advisor, Chi & Partners (communications firm); Advisor, TruEffect, Inc. (advertising data analytics); Advisor, Global Cities of Bloomberg Philanthropies (since April 2015). Formerly, North American CEO, Vice Chairman, Director, Ogilvy Group Inc. (communications firm) (retired 2010); Senior Advisor, Digital Artists (social media technology platform) (through February 2016); Advisor, Idomoo Ltd. (customer video targeting) (through June 2016); Senior Advisor, Orca TV, LLC (campus-based social media firm) (through September 2016). Other Directorships: HealthMarkets, Inc. (health insurance); The New York Public Library; First Tee of Connecticut; SeaWorld Parks & Entertainment (Independent Director, since December 2014). Former Directorships: Zinio Holdings LLC (digital newsstand firm) (through October 2016); Harleysville Group, Inc. (through 2011); American Red Cross of Greater New York (Trustee, 1996 to 2002; Chairman 2002 to 2008; Chairman Emeritus, since 2008). | 2 |
Laura A. Johnson (1954)
Trustee, 2007 to present | Director of the International Land Conservation Network, Lincoln Institute of Land Policy. Formerly, Bullard Fellow, Harvard Forest, Harvard University (2013-2014). President, Massachusetts Audubon Society (1999-2012). Other Directorships: Chairman, Board of Directors, Land Trust Alliance; member, WGBH Board of Overseers; member of the Corporation, Woods Hole Oceanographic Institute; member, Appalachian Mountain Club (AMC) Board of Advisors; member, Mount Auburn Cemetery Council of Visitors. Former Directorships: Fenn School (2001–2006); Winsor School (trustee, 1990-1996; Alumnae board, 2013-2014). | 2 |
Stephen W. Kidder (1952)
Trustee, 2005 to present | Partner, Hemenway & Barnes LLP (law firm). Formerly, Managing Partner, Hemenway & Barnes LLP (through 2014); President, Hemenway Trust Company. Other Directorships: President of the Board, Isabella Stewart Gardner Museum; Vice Chairman, Children’s Hospital Trust; Overseer, Boston Symphony Orchestra (since July 2016). Former Directorships: Vice Chairman, Wellesley College (through July 2016). | 2 |
| Annual Report | October 31, 2016 | 33 |
October 31, 2016 (Unaudited)
Name, Year of Birth, Position(s) held with Trust and Length of Time Served | Principal Occupation During Past 5 Years And Other Directorships Held | No. of Portfolios in Fund Complex Overseen |
Jerry S. Rosenbloom (1939)
Trustee, 1999 to present | Frederick H. Ecker Emeritus Professor of Insurance and Risk Management, The Wharton School, University of Pennsylvania. Fellow, Financial Institutions Center and Fellow, Leonard Davis Institute for Health Economics, The Wharton School. Formerly, Academic Director, Certified Employee Benefit Specialist Program, The Wharton School. Other Directorships: American Institute for Chartered Property Casualty Underwriters; The Insurance Institute of America; member, Abramson Cancer Center Director’s Leadership Council (since March 2016). Former Directorships: Harleysville Mutual Insurance Company and Harleysville Group, Inc. (through April 2012); Advisory Board Member, International Foundation of Employee Benefit Plans (through December 2015). | 2 |
David D. Tripple (1944)
Trustee, 2004 to present | Private investor. Formerly, Chief Executive Officer and Trustee, Pioneer Funds (2000 to 2001); Executive Vice President and Director, The Pioneer Group, Inc. (asset management) (1998 to 2000). Other Directorships: The Calamos Funds (overseeing 26 portfolios in fund complex). | 2 |
Ellen M. Zane (1951)
Trustee, 2007 to present | CEO Emeritus and Vice Chairman, Board of Trustees of Tufts Medical Center. Formerly, President and CEO of Tufts Medical Center and Floating Hospital for Children (2004 to 2011); Network President, Partners Healthcare System (1994 to 2004). Other Directorships: Boston Scientific Corporation; Brooks Automation, Inc.; Parexel International Corporation; Fiduciary Trust Company; Harvard School of Public Health, Health Policy & Management Executive Council; Trustee, Vice Chairman, George Washington University; Trustee, Tufts Medical Center; Chairman, Minuteman Health Plan (since 2012); Director, AgNovos Healthcare, LLC (since 2014). Former Directorships: Lincare Corporation (through August 2012); Haemonetics Corporation (through May 2016); Press Ganey Holdings (through October 2016). | 2 |
October 31, 2016 (Unaudited)
INTERESTED TRUSTEE AND OFFICERS1
Name, Year of Birth, Position(s) held with Trust and Length of Time Served | Principal Occupation During Past 5 Years And Other Directorships Held | No. of Portfolios in Fund Complex Overseen |
Alexander L. Thorndike (1966)
Trustee, 1999 to present;
Chairman and Principal
Executive Officer,
2004 to present | Managing Partner, Century Capital Management, LLC. No other directorships held. | 2 |
Julie Smith (1971)
Principal Financial Officer,
2008 to present | Chief Financial Officer, Century Capital Management, LLC. | N/A |
Jennifer Mortimer (1971)
Secretary and Chief
Compliance Officer, June
2014 to present | Chief Compliance Officer, Century Capital Management, LLC (June 2014 to present). Formerly, Fund Chief Compliance Officer (2012 to June 2014) and Compliance Manager (2011 to 2012), Foreside Compliance Services, LLC. | N/A |
1 | Each person listed is considered an “interested person” of the Trust within the meaning of the 1940 Act by virtue of being an officer or employee of the Adviser. |
The Statement of Additional Information (“SAI”) for each Fund includes additional information about the Trustees. The SAI is available, without charge, upon request. If you would like to request a copy of the SAI, you may do so by calling the following toll-free number: (800) 321-1928.
| Annual Report | October 31, 2016 | 35 |
Fund Information
PORTFOLIO HOLDINGS
Each fund files a complete schedule of its portfolio holdings with the SEC for the first and third quarters of the fund’s fiscal year on Form N-Q. The Forms N-Q are available on the SEC’s website at www.sec.gov, and they may be reviewed and copied at the SEC’s Public Reference Room in Washington, DC. Information on the operation of the SEC’s Public Reference Room may be obtained by calling 1-800-SEC-0330.
PROXY VOTING
A description of the policies and procedures that each fund uses to determine how to vote proxies relating to portfolio securities and each fund’s proxy voting record for the 12-month period ended June 30 are available, without charge, upon request, by calling 1-800-321-1928. You may also obtain a copy of the funds’ proxy voting policies and procedures and proxy voting record on the SEC’s website at www.sec.gov.
FOR MORE INFORMATION
For more information about the Century Funds, please call 1-800-303-1928 or visit www.centuryfunds.com.
| Regular Mailing Address: | Overnight Mailing Address: |
| Century Funds | Century Funds |
| P.O. Box 588 | c/o Atlantic Shareholder Services, LLC |
| Portland, ME 04112 | 3 Canal Plaza, Ground Floor |
| | Portland, ME 04101 |
| | |
| Investment Adviser | Distributor |
| Century Capital Management, LLC | ALPS Distributors, Inc. |
| 100 Federal Street | 1290 Broadway, Suite 1100 |
| Boston, MA 02110 | Denver, CO 80203 |
CENTURYCAPITAL®
100 Federal Street
Boston, Massachusetts 02110