UNITED STATES
SECURITIES AND EXCHANGE COMMISSION
Washington, D.C. 20549
SECURITIES AND EXCHANGE COMMISSION
Washington, D.C. 20549
FORM N-CSR
CERTIFIED SHAREHOLDER REPORT OF REGISTERED
MANAGEMENT INVESTMENT COMPANIES
Investment Company Act file number (811-05037)
Professionally Managed Portfolios
(Exact name of registrant as specified in charter)
(Exact name of registrant as specified in charter)
615 East Michigan Street
Milwaukee, WI 53202
(Address of principal executive offices) (Zip code)
(Address of principal executive offices) (Zip code)
Elaine E. Richards
Professionally Managed Portfolios
c/o U.S. Bank Global Fund Services
2020 E. Financial Way, Ste. 100
Glendora, CA 91741
(Name and address of agent for service)
2020 E. Financial Way, Ste. 100
Glendora, CA 91741
(Name and address of agent for service)
(626) 914-7363
Registrant's telephone number, including area code
Date of fiscal year end: December 31
Date of reporting period: December 31, 2020
Item 1. Report to Stockholders.
Muzinich & Co.
Muzinich Credit Opportunities Fund
Muzinich U.S. High Yield
Corporate Bond Fund
Muzinich Low Duration Fund
Muzinich High Income
Floating Rate Fund
ANNUAL REPORT
December 31, 2020
Important Notice: The U.S. Securities and Exchange Commission will permit funds to make shareholder reports available electronically beginning January 1, 2021. Accordingly, paper copies will no longer be mailed. Instead, at that time, the Muzinich Funds will send a notice, either by mail or e-mail, each time your fund’s updated report is available on our website at www.muzinichusfunds.com/literature. Investors enrolled in electronic delivery will receive the notice by e-mail, with links to the updated report and don’t need to take any action. Investors who are not enrolled in electronic delivery by January 1, 2021 will receive the notice in the mail. All investors who prefer to receive shareholder reports in a printed format may, at any time, choose that option free of charge by calling 1-855-MUZINICH (1-855-689-4642).
Muzinich Funds
| TABLE OF CONTENTS |
| A Message to our Shareholders | 1 | ||
| Sector Allocations | 6 | ||
| Historical Performance | 10 | ||
| Schedules of Investments | 17 | ||
| Statements of Assets and Liabilities | 48 | ||
| Statements of Operations | 51 | ||
| Statements of Changes in Net Assets | 52 | ||
| Financial Highlights | 57 | ||
| Notes to Financial Statements | 64 | ||
| Report of Independent Registered Public Accounting Firm | 77 | ||
| Expense Examples | 78 | ||
| Approval of Investment Advisory Agreement | 80 | ||
| Trustees and Executive Officers | 83 | ||
| Additional Information | 86 | ||
| Privacy Notice | 88 |
(This Page Intentionally Left Blank.)
Muzinich Funds
Dear Investors:
The Muzinich Credit Opportunities Fund (“Credit Opportunities Fund”) finished the year with asset growth from $417,324,951 to $541,125,839, reflecting net inflows and a strong net investment return of +6.30% for the Supra Institutional Class and +6.24% for the Institutional Class. The Fund underperformed the broad global corporate credit markets as reflected in the +7.99% return of the ICE BofAML Global Corporate and High Yield Index (GI00) hedged to USD, which is the Fund’s primary benchmark. Since inception from January 3, 2013, the Fund’s Supra Institutional Class have gained an annualized net return of +5.10%, while the benchmark has also returned +5.10% annualized.
| Since Inception | ||||
| Performance as of December 31, 2020 | 1 Year | 3 Year | 5 Year | (1/3/2013) |
| Credit Opportunities Fund – Supra Institutional | 6.30% | 5.67% | 5.61% | 5.10% |
| ICE BofAML Global Corporate & High Yield Index (GI00) | 7.56% | 5.74% | 6.07% | 4.74% |
| ICE BofAML Global Corporate & High Yield Index (USD 100% Hedged) | 7.99% | 6.45% | 6.67% | 5.10% |
Periods greater than one year are average annual returns.
Performance data quoted represents past performance; past performance does not guarantee future results. The investment return and principal value of an investment will fluctuate so that an investor’s shares, when redeemed, may be worth more or less than their original cost. Current performance of the Fund may be lower or higher than the performance quoted. Performance data currency to the most recent month end may be obtained by calling (1-855-689-4642). The Fund imposes a 1.00% redemption fee on shares held for less than 90 days. Performance data quoted does not reflect the redemption fee. If reflected, total returns would be less.
Expense Ratios1
Gross Expense Ratio: 0.77%
Net Expense Ratio: 0.60%2
1 | Expense ratios are from the Fund’s most recent prospectus dated April 30, 2020 (Supra Institutional Class). See the Financial Highlights in this report for the most current expense ratios. |
2 | The Advisor has contractually agreed to waive its fees and reimburse certain expenses through April 30, 2021. |
The Muzinich U.S. High Yield Corporate Bond Fund (“U.S. High Yield Fund”) began the year with assets of $45,105,476 and grew to $68,764,402, on net inflows and investment performance. The Fund’s Supra Institutional Class gained +6.82% net over this year, outperforming the +6.32% return of the benchmark, the ICE BofAML BB-B U.S. Cash Pay High Yield Constrained Index (JUC4). Institutional Class gained +6.81%.
The Muzinich Low Duration Fund (“Low Duration Fund”) declined from its year end-starting balance of $732,102,499 to $596,418,893, reflecting large net outflows, but positive investment performance. The Supra Institutional Class produced a net gain of +2.64%, vs. +3.34% for the index, ICE BofAML 1-3 Year U.S. Corporate & Government Index (B1A0), which serves as this Fund’s primary benchmark. The Institutional Class gained 2.70%. Since inception on June 30, 2016, the Institutional Class has produced an annualized net return of +3.69% vs. the benchmark’s annualized return of +2.11%.
| Since Inception | |||
| Performance as of December 31, 2020 | 1 Year | 3 Year | (6/30/2016) |
| Low Duration Fund – Supra Institutional | 2.64% | 3.72% | 3.69% |
| ICE BofA ML 1-3 Year U.S. Corporate & Government Index (B1A0) | 3.34% | 3.01% | 2.11% |
Periods greater than one year are average annual returns.
Performance data quoted represents past performance; past performance does not guarantee future results. The investment return and principal value of an investment will fluctuate so that an investor’s shares, when redeemed, may be worth more or less than their original cost. Current performance of the Fund may be lower or higher than the performance quoted. Performance data currency to the most recent month end may be obtained by calling (1-855-689-4642). The Fund imposes a 1.00% redemption fee on shares held for less than 90 days. Performance data quoted does not reflect the redemption fee. If reflected, total returns would be less.
Expense Ratios1
Gross Expense Ratio: 0.60%
Net Expense Ratio: 0.50%2
1 | Expense ratios are from the Fund’s most recent prospectus dated April 30, 2020 (Supra Institutional Class). See the Financial Highlights in this report for the most current expense ratios. |
2 | The Advisor has contractually agreed to waive its fees and reimburse certain expenses through April 30, 2021. |
1
Muzinich Funds
The Muzinich High Income Floating Rate Fund (“Floating Rate Fund”) finished the year with strong asset growth from $11,438,262 to $17,708,055, reflecting net inflows and a positive investment gain over the period. The Fund returned +4.83% over the period and outperformed the +2.78% gain for its benchmark, the Credit Suisse Leveraged Loan Index.
Market
The first quarter of 2020 was completely overshadowed by a collapse in the price of oil, occurring simultaneously with March’s COVID-19 global sell-off. As people across the globe were quarantined and global economies largely shuttered, global fixed income — with the exception of safe-haven Treasuries — and equities alike declined precipitously. However, hugely supportive measures from various central banks (led by the U.S. Federal Reserve, the European Central Bank, Bank of England, and various emerging markets (EM) central banks), were able to help the markets digest economic uncertainties. Aggressive global fiscal stimulus measures by governments, including those in the U.S. and EU, additionally eased investor nerves, facilitating a global credit market rally following the COVID-19 induced panic. Globally, broad government policies designed to support the unemployed and small businesses were enormously helpful in keeping the financial spigots as open as possible in a world that was largely closed to all but the most essential activity. Awash with new liquidity and buoyed by stabilization efforts, investment grade and high yield corporates started rebounding, with surging new issuance across both developed and emerging markets, as companies looked to lock in record cheap financing. Massive new issuance did not, however, dampen investor enthusiasm for fixed income that was being fully supported by monetary and fiscal policy. On the contrary, demand stayed high and prices recovered attractively, first in investment grade credit, followed later in the period by a strong high yield surge. The U.S. bounced back faster than Europe, in general. Loans took longer to recover in both markets amidst unprecedented low rates but presented the market with notable value by the period’s end. Overall, global corporate credit continued to rally for the remainder of the reporting period with some intermittent volatility, driven forward by continued technical support offered widely by central banks and the impending resolution of geopolitical uncertainties that had long weighed on investor sentiment, including, notably, the U.S. election and the U.K.’s successful departure from the European Union, (Brexit). We ended the year as a world with stimulus and light at the end of the COVID-19 tunnel; investors demonstrated confidence by adding credit to their portfolios despite rising COVID-19 cases and death counts. Looking ahead, we see bullish growth outlooks for both commodities and energy as balance sheets continue to be repaired, and for COVID-19 recovery sectors reliant on continued economic reopening.
Performance Factors
Muzinich Credit Opportunities Fund
In 2020, the Credit Opportunities Fund generated positive performance demonstrating its ability to preserve capital when the markets were most strained before recovering quickly and rebounding on good credit selection and full investment. While the Fund generated an attractive positive return, it underperformed its indicative benchmark, the ICE BofA ML Global Corporate and High Yield Index (GI00). The Fund benefitted from defensive positioning at the beginning of Q1. In March, when even high quality assets everywhere came under significant pressure in the rush by investors to sell anything to raise cash and liquidity, the Fund’s defensive U.S. high yield allocations (and conservative positioning more broadly), protected the portfolio during the worst of the drawdown. Specifically, the Fund benefitted from its emphasis on non-cyclical sectors and limited energy exposure. Following the March selloff, the investment team strategically added longer-duration, high quality paper which effectively bolstered returns. By late summer, we started a repositioning program in anticipation of short-term volatility, reallocating from longer duration/higher quality credit to shorter duration/credit focused sectors that offered increased yield and more exposure to opportunities presented by an anticipated reopening of the global economies. As a result of these diligent tactical moves, the Fund was well positioned when U.S. Treasury rates rose in Q3. While the Fund’s longer duration and higher quality U.S. investment grade holdings were negatively impacted, the Fund’s U.S. and emerging market high yield sleeves more than compensated. During the year the Fund also started a small position in global syndicated loans and has continued to benefit from the relative value we have found therein. In Q4, we focused on positioning in anticipation of a positive market response following the U.S. election by reserving 5% cash for “dip buying” opportunities. This decision served the Fund well since we were well-placed to deploy our cash prudently; we also began rotating steadily from “stay-at-home” sectors to “reopening” sectors that saw improvement from the anticipated resumption of normalized economic activities. Throughout the reporting period, we continued to move away from more duration sensitive exposure as we believed interest rates would be increasing for bonds with 10-year maturities and longer; to this effect we have reduced duration primarily in U.S. investment grade holdings and some emerging markets investment grade positions.
2
Muzinich Funds
Muzinich U.S. High Yield Corporate Bond Fund
In this environment, the Muzinich U.S. High Yield Corporate Bond delivered strong positive returns, outperforming its benchmark. Fund performance exceeded the benchmark both when the market was most stressed in March and when the market rallied, showing both strength in risk control and nimbleness around market momentum. At the time of the global sell-off, the Fund’s capital preservation came from underweighting energy and aerospace, and from strong telecom credit selection, though our higher quality energy selections lagged the subsequent market rebound in Q2. For the year, outperformance was driven by credit selection in services, telecom, and capital goods. Strong selection across the 3-5 years duration range bolstered performance. By ratings, the Fund benefitted on a relative basis from superior credit selection of CCC+ rated credits versus the benchmark, while on an absolute basis, the largest contributions came from the BB rated cohort. At the end of the reporting period, we remained focused on fallen angel Exploration and Production (E&P) and pipelines within the energy sector. Additionally, we spent most of the year underweight COVID-19 impacted sectors; preferring to invest in these spaces via secured bonds or short-term paper within the liquidity window. Looking ahead, we see value in staying fully invested since we believe carry will be the largest source of return in the year to come.
Low Duration Fund
In 2020, the Fund generated strong performance and outperformed its benchmark, more than recovering the ground lost in the March sell-off earlier in the year. While the Fund’s European and credit-biased portfolio was perhaps slower to rebound than portfolios led by a stronger Treasury movement, the Fund benefitted over the year as a whole from careful management of its exposure to some of the sectors most impacted by COVID-19 and from taking steps to reduce the beta of the portfolio ahead of expected volatility later in the year. Longer duration EUR names performed well in light of falling rates, with overall portfolio duration remaining within the Fund’s mandate. We maintained a bias towards BBB rated credits with a healthy allocation as well to select high yield bonds as we expect further recovery in credit spreads. The U.S. remained the strongest performing region on an absolute and relative basis, due to the aforementioned strong rally in Treasuries over the reporting period. By industry, our superior credit selection of automotive & auto parts and super retail bolstered relative performance, while on an absolute basis, contributions were led by banking, diversified financial services, and automotive & auto parts. Lower quality credit underperformed higher quality credit while the market was recovering from the pandemic, however the Fund’s bias to BBBs was a net positive during the period. At the end of the year, we focused on names where we saw what we believed to be good liquidity and a demonstrated ability to weather a pandemic-induced storm. We found that the primary market remained one of the most efficient places to deploy cash, and we participated in new issues. As yields globally have fallen back to very low levels in a post-pandemic rally, we view investors’ need for yield as a likely powerful future driver.
Floating Rate Fund
In 2020, the Fund generated a positive return and strongly outperformed its benchmark, the Credit Suisse Leveraged Loan Index (CSLLI). Positive performance was driven by credit selection within the lower rated exposures as investors sought discounts wherever they were still available. On a sector basis, Fund performance was bolstered by superior credit selection in healthcare and technology. Looking forward, we believe that loan valuations coupled with what we see as likely strong technicals, could make for a strong 2021 for the asset class. We believe that the loan market still offers attractive opportunities and that it is likely that retail will begin to return to the market as rate expectations rise. Consequently, we are expecting a total return for the year ahead which exceeds the interest return. Risks to this view could include more defaults than we currently expect, or another exogenous shock to markets generally, but all things being equal, we believe loans could provide attractive returns in 2021.
Outlook
Where do we go from here? At this point, we see fundamentals improving (with the assumption of a successful recovery from COVID-19) and the potential for solid economic numbers in 2H 2021. One of our longer-term concerns with this scenario is a steepening of the yield curve, although we believe that this will likely be manageable given Fed support. Companies have done a great job cutting costs, creating substantial cash flow leverage to an upside scenario. Technicals remain encouraging as corporate credit, particularly leveraged finance including high yield and term loans, remains the only game in town as fixed income investors are likely to look for spread product to mitigate a potential steepening of the Treasury curve. We believe supply should remain elevated from historic norms in 2021, but the absolute amount of debt issued will decline as the challenges posed by COVID-19 recede. As Treasury yields have fallen to low levels in a formidable post-pandemic rally, we view the need for spread as a powerful future driver of fund flows as low yield cash deposits are channeled into higher yielding credit assets in 2021.
3
Muzinich Funds
We appreciate the confidence and trust you have placed in Muzinich.
Sincerely,
 |  |  |
| Anthony DeMeo | Stuart Fuller | Joe Galzerano |
 |  |  |
| Tatjana Greil-Castro | Warren Hyland | Ian Horn |
 |  |  |
| Michael McEachern | Sam McGairl | Bryan Petermann |
 |  |  |
| Torben Ronberg | Thomas Samson | Kevin Ziets |
Opinions expressed are subject to change at any time, are not guaranteed and should not be considered investment advice.
Past performance does not guarantee future results. Short-term performance, in particular, is not a good indication of the Funds’ future performance, and an investment should not be made solely on returns.
References to other funds should not be interpreted as an offer of these securities.
Fund holdings and/or sector allocations are subject to change at any time and are not recommendations to buy or sell any security. Please see the Schedules of Investments for a complete list of holdings.
Mutual fund investing involves risk. Principal loss is possible. Investments in debt securities typically decrease in value when interest rates rise. This risk is usually greater for longer-term debt securities. Investment by the Funds in lower-rated and non-rated securities presents a greater risk of loss to principal and interest than higher-rated securities. Investments in foreign securities involve greater volatility and political, economic and currency risks and differences in accounting methods. These risks are greater for emerging markets. Derivatives involve risks different from, and in certain cases, greater than the risks presented by more traditional investments. These risks are fully disclosed in the prospectus. Floating rate loans may not be fully collateralized and therefore may decline significantly in value. Each Fund will bear its share of the fees and expenses of investments in underlying funds or exchange-traded funds (ETFs). Shareholders will pay higher expenses than would be the case if making direct investments in underlying funds or ETFs. Because the Funds invest in ETFs, they are subject to additional risks that do not apply to conventional mutual funds, including the risks that the market price of an ETF’s shares may trade at a discount to its net asset value (“NAV”), an active secondary trading market may not develop or be maintained, or trading may be halted by the exchange in which they trade, which may impact a Fund’s ability to sell its shares. The Funds invest in high yield debt instruments which tend to be less liquid than higher quality debt instruments. The Funds may make short sales of securities, which involves the risk that losses may exceed the original amount invested. Please note that while the Funds’ prospectus states that the Funds may use leverage, and that they may make short sales of securities, which involve the risk that losses may exceed the original amount invested, the Funds’ portfolio managers do not anticipate engaging in either practice. The Funds will endeavor to limit price fluctuations caused by the changing relative value of currencies in which the Funds invest, but hedging involves costs and there can be no guarantee that the Funds will be perfectly hedged or that the hedging will work as anticipated. Diversification does not assure a profit, nor does it protect against a loss in a declining market.
Must be preceded or accompanied by a prospectus.
4
Muzinich Funds
Bond ratings are grades given to bonds that indicate their credit quality as determined by a private independent rating service. The firm evaluates a bond issuer’s financial strength, or its ability to pay a bond’s principal and interest in a timely fashion. Ratings are expressed as letters ranging from ‘AAA’ which is the highest grade to ‘D,’ which is the lowest grade. In limited situations when the rating agency has not issued a formal rating, the Advisor will classify the security as non-rated.
Index Definitions:
The ICE BofA Merrill Lynch Global Corporate & High Yield Index (GI00) is an unmanaged index tracking the performance of fixed-rate investment grade and below investment grade corporate debt publicly issued in the major domestic and Eurobond markets. Qualifying currencies include AUD, CAD, EUR, JPY, GBP, and USD. Qualifying issues must meet minimum size requirements denominated in the currency of issue, and must have a remaining term of at least one year to maturity.
The ICE BofA Merrill Lynch BB-B US Cash Pay High Yield Constrained Index (JUC4) contains all securities in The BofA Merrill Lynch US Cash Pay High Yield Index rated BB1 through B3, based on an average of Moody’s, S&P and Fitch, but caps issuer exposure at 2%. Index constituents are capitalization-weighted, based on their current amount outstanding, provided the total allocation to an individual issuer does not exceed 2%.
The ICE BofA Merrill Lynch 1-3 Year US Corporate & Government Index (B1A0) is a subset of The BofA Merrill Lynch US Corporate & Government Index including all securities with a remaining term to final maturity less than 3 years.
The ICE BofA ML Global High Yield Index (HW00) tracks the performance of USD, CAD, GBP and EUR denominated below investment grade corporate debt publicly issued in the major domestic or eurobond markets. Qualifying securities must have a below investment grade rating (based on an average of Moody’s, S&P and Fitch), at least 18 months to final maturity at the time of issuance, at least one year remaining term to final maturity as of the rebalancing date, a fixed coupon schedule and a minimum amount outstanding of USD 250 million, EUR 250 million, GBP 100 million, or CAD 100 million.
CS Leveraged Loan Index – The CS Leveraged Loan Index is designed to mirror the investable universe of US dollar denominated leveraged loan market. The index is rebalanced monthly on the last business day of the month instead of daily. Qualifying loans must have a minimum outstanding balance of $100 million for all facilities except TL A facilities (TL A facilities need a minimum outstanding balance of $1 billion), issuers domiciled in developed countries, at least one year long tenor, be rated “5B” or lower, fully funded and priced by a third party vendor at month-end.
Glossary:
U.S. Treasury is a fixed-interest U.S. government debt security with a maturity of more than 10 years.
Duration is a measure of the expected life of a fixed income security that is used to determine the sensitivity of a security’s price to changes in interest rates.
Spreads are the difference between the interest rate received on a bond and the interest rate that would be received at the same time on a similar-duration U.S. government debt security.
Beta is a measure of volatility of a security or portfolio compared to the market as a whole.
Muzinich & Co. is a registered investment adviser. The Muzinich Funds are distributed by Quasar Distributors, LLC.
5
Credit Opportunities Fund
SECTOR ALLOCATIONS at December 31, 2020 (Unaudited) |
| Sector | % of Net Assets | |||
| Healthcare | 10.9 | % | ||
| Banking | 10.1 | % | ||
| Telecommunications | 8.6 | % | ||
| Automotive & Auto Parts | 7.6 | % | ||
| Energy | 7.5 | % | ||
| Diversified Financial Services | 5.8 | % | ||
| Food/Beverage/Tobacco | 5.7 | % | ||
| Cable/Satellite TV | 3.5 | % | ||
| Broadcasting | 3.2 | % | ||
| Technology | 3.1 | % | ||
| Quasi & Foreign Government | 3.0 | % | ||
| Homebuilders/Real Estate | 2.8 | % | ||
| Utilities | 2.3 | % | ||
| Chemicals | 2.0 | % | ||
| Containers | 2.0 | % | ||
| Metals/Mining | 2.0 | % | ||
| Building Materials | 1.8 | % | ||
| Transportation Excluding Air/Rail | 1.7 | % | ||
| Services | 1.5 | % | ||
| Airlines | 1.4 | % | ||
| Capital Goods | 1.3 | % | ||
| Diversified Media | 1.3 | % | ||
| Affiliated Mutual Funds | 1.1 | % | ||
| Super Retail | 0.8 | % | ||
| Insurance | 0.7 | % | ||
| Restaurants | 0.7 | % | ||
| Steel | 0.7 | % | ||
| Consumer-Products | 0.6 | % | ||
| Paper | 0.6 | % | ||
| Leisure | 0.5 | % | ||
| Aerospace/Defense | 0.4 | % | ||
| Food & Drug Retail | 0.4 | % | ||
| Gaming | 0.4 | % | ||
| Environmental | 0.2 | % | ||
| Publishing/Printing | 0.2 | % | ||
| Hotels | 0.1 | % | ||
Cash & Equivalents1 | 3.5 | % | ||
| Total | 100.0 | % | ||
1 | Represents cash and other assets in excess of liabilities. |
6
U.S. High Yield Fund
SECTOR ALLOCATIONS at December 31, 2020 (Unaudited) |
| Sector | % of Net Assets | |||
| Energy | 13.7 | % | ||
| Healthcare | 10.2 | % | ||
| Telecommunications | 7.6 | % | ||
| Cable/Satellite TV | 5.6 | % | ||
| Homebuilders/Real Estate | 5.6 | % | ||
| Automotive & Auto Parts | 5.4 | % | ||
| Broadcasting | 5.1 | % | ||
| Diversified Financial Services | 3.6 | % | ||
| Metals/Mining | 3.3 | % | ||
| Food/Beverage/Tobacco | 3.2 | % | ||
| Building Materials | 3.1 | % | ||
| Chemicals | 3.1 | % | ||
| Gaming | 2.7 | % | ||
| Capital Goods | 2.5 | % | ||
| Banking | 2.4 | % | ||
| Technology | 2.4 | % | ||
| Services | 2.3 | % | ||
| Super Retail | 2.1 | % | ||
| Utilities | 1.8 | % | ||
| Airlines | 1.6 | % | ||
| Restaurants | 1.5 | % | ||
| Leisure | 1.4 | % | ||
| Aerospace/Defense | 1.2 | % | ||
| Diversified Media | 1.1 | % | ||
| Food & Drug Retail | 1.0 | % | ||
| Steel | 0.9 | % | ||
| Containers | 0.7 | % | ||
| Paper | 0.6 | % | ||
| Consumer Products | 0.5 | % | ||
| Publishing/Printing | 0.5 | % | ||
| Insurance | 0.4 | % | ||
| Hotels | 0.1 | % | ||
| Transportation Excluding Air/Rail | 0.1 | % | ||
Cash & Equivalents1 | 2.7 | % | ||
| Total | 100.0 | % | ||
1 | Represents cash and other assets in excess of liabilities. |
7
Low Duration Fund
SECTOR ALLOCATIONS at December 31, 2020 (Unaudited) |
| Sector | % of Net Assets | |||
| Banking | 20.6 | % | ||
| Diversified Financial Services | 16.4 | % | ||
| Automotive & Auto Parts | 9.4 | % | ||
| Homebuilders/Real Estate | 7.6 | % | ||
| Telecommunications | 5.4 | % | ||
| Energy | 5.1 | % | ||
| Chemicals | 3.1 | % | ||
| Technology | 2.7 | % | ||
| Healthcare | 2.6 | % | ||
| Super Retail | 2.3 | % | ||
| Utilities | 2.3 | % | ||
| Services | 2.2 | % | ||
| Airlines | 1.8 | % | ||
| Transportation Excluding Air/Rail | 1.8 | % | ||
| Aerospace/Defense | 1.3 | % | ||
| Capital Goods | 1.3 | % | ||
| Gaming | 1.3 | % | ||
| Leisure | 1.3 | % | ||
| Affiliated Mutual Funds | 1.2 | % | ||
| Food/Beverage/Tobacco | 1.1 | % | ||
| Quasi & Foreign Government | 1.1 | % | ||
| Collateralized Debt Obligation | 0.9 | % | ||
| Food & Drug Retail | 0.8 | % | ||
| Building Materials | 0.7 | % | ||
| Cable/Satellite TV | 0.7 | % | ||
| Diversified Media | 0.7 | % | ||
| Insurance | 0.6 | % | ||
| Broadcasting | 0.5 | % | ||
| Metals/Mining | 0.5 | % | ||
| Containers | 0.3 | % | ||
| Steel | 0.3 | % | ||
| Consumer-Products | 0.2 | % | ||
| Publishing/Printing | 0.2 | % | ||
Cash & Equivalents1 | 1.7 | % | ||
| Total | 100.0 | % | ||
1 | Represents cash and other assets in excess of liabilities. |
8
Floating Rate Fund
SECTOR ALLOCATIONS at December 31, 2020 (Unaudited) |
| Sector | % of Net Assets | |||
| Technology | 14.8 | % | ||
| Healthcare | 12.7 | % | ||
| Services | 7.8 | % | ||
| Telecommunications | 6.5 | % | ||
| Utilities | 5.7 | % | ||
| Capital Goods | 5.5 | % | ||
| Automotive & Auto Parts | 4.6 | % | ||
| Diversified Financial Services | 4.3 | % | ||
| Food/Beverage/Tobacco | 4.2 | % | ||
| Diversified Media | 4.0 | % | ||
| Gaming | 3.1 | % | ||
| Broadcasting | 2.5 | % | ||
| Building Materials | 2.4 | % | ||
| Consumer Products | 2.2 | % | ||
| Insurance | 2.2 | % | ||
| Metals/Mining | 1.9 | % | ||
| Chemicals | 1.8 | % | ||
| Super Retail | 1.8 | % | ||
| Cable/Satellite TV | 1.7 | % | ||
| Environmental | 1.4 | % | ||
| Energy | 1.3 | % | ||
| Containers | 1.1 | % | ||
| Transportation Excluding Air/Rail | 1.1 | % | ||
| Leisure | 1.0 | % | ||
| Restaurants | 0.9 | % | ||
Cash & Equivalents1 | 3.5 | % | ||
| Total | 100.0 | % | ||
1 | Represents cash and other assets in excess of liabilities. |
9
Credit Opportunities Fund
| HISTORICAL PERFORMANCE – SUPRA INSTITUTIONAL CLASS |
Value of $5,000,000 vs. ICE BofAML Global Corporate & High Yield Index (GI00)
and ICE BofAML Global Corporate & High Yield Index (USD 100% Hedged)
(Unaudited)

| Average Annual | Since Inception | Ending Value | |||
Returns for the Periods Ended December 31, 2020 | 1 Year | 3 Year | 5 Year | (1/3/2013) | (12/31/2020) |
Credit Opportunities Fund – Supra Institutional Class | 6.30% | 5.67% | 5.61% | 5.10% | $7,441,731 |
ICE BofAML Global Corporate & | |||||
High Yield Index (GI00) | 7.56% | 5.74% | 6.07% | 4.74% | $7,238,713 |
ICE BofAML Global Corporate & | |||||
High Yield Index (USD 100% Hedged) | 7.99% | 6.45% | 6.67% | 5.10% | $7,440,929 |
This chart illustrates the performance of a hypothetical $5,000,000 investment made on January 3, 2013, and is not intended to imply any future performance. The returns shown do not reflect the deduction of taxes that a shareholder would pay on Fund distributions or the redemption of Fund shares. The returns reflect fee waivers in effect. In the absence of such waivers, total return would be reduced. The chart assumes reinvestment of capital gains, dividends and return of capital, if applicable, for the Fund and dividends for the index.
10
Credit Opportunities Fund
| HISTORICAL PERFORMANCE – INSTITUTIONAL CLASS |
Value of $1,000,000 vs. ICE BofAML Global Corporate & High Yield Index (GI00)
and ICE BofAML Global Corporate & High Yield Index (USD 100% Hedged)
(Unaudited)
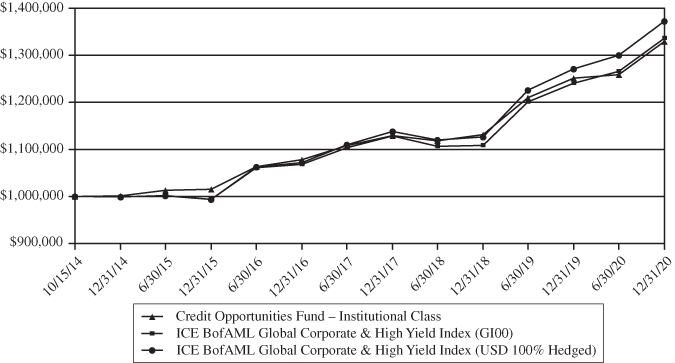
| Average Annual | Since Inception | Ending Value | |||
Returns for the Periods Ended December 31, 2020 | 1 Year | 3 Year | 5 Year | (10/15/2014) | (12/31/2020) |
Credit Opportunities Fund – Institutional Class | 6.24% | 5.59% | 5.54% | 4.69% | $1,329,562 |
ICE BofAML Global Corporate & High Yield Index (GI00) | 7.56% | 5.74% | 6.07% | 4.75% | $1,336,436 |
ICE BofAML Global Corporate & | |||||
High Yield Index (USD 100% Hedged) | 7.99% | 6.45% | 6.67% | 5.23% | $1,372,621 |
This chart illustrates the performance of a hypothetical $1,000,000 investment made on October 15, 2014, and is not intended to imply any future performance. The returns shown do not reflect the deduction of taxes that a shareholder would pay on Fund distributions or the redemption of Fund shares. The returns reflect fee waivers in effect. In the absence of such waivers, total return would be reduced. The chart assumes reinvestment of capital gains, dividends and return of capital, if applicable, for the Fund and dividends for the index.
11
U.S. High Yield Fund
| HISTORICAL PERFORMANCE – SUPRA INSTITUTIONAL CLASS |
Value of $5,000,000 vs. ICE BofAML BB-B
Cash Pay High Yield Constrained Index (JUC4)
(Unaudited)

| Average Annual | Since Inception | Ending Value | ||
Returns for the Periods Ended December 31, 2020 | 1 Year | 3 Year | (3/31/2016) | (12/31/2020) |
U.S. High Yield Fund – Supra Institutional Class | 6.82% | 5.76% | 6.60% | $6,775,401 |
ICE BofAML BB-B Cash Pay | ||||
High Yield Constrained Index (JUC4) | 6.32% | 6.21% | 7.80% | $7,132,344 |
This chart illustrates the performance of a hypothetical $5,000,000 investment made on March 31, 2016, and is not intended to imply any future performance. The returns shown do not reflect the deduction of taxes that a shareholder would pay on Fund distributions or the redemption of Fund shares. The returns reflect fee waivers in effect. In the absence of such waivers, total return would be reduced. The chart assumes reinvestment of capital gains, dividends and return of capital, if applicable, for the Fund and dividends for the index.
12
U.S. High Yield Fund
| HISTORICAL PERFORMANCE – INSTITUTIONAL CLASS |
Value of $1,000,000 vs. ICE BofAML BB-B
Cash Pay High Yield Constrained Index (JUC4)
(Unaudited)

| Average Annual | Since Inception | Ending Value | ||
Returns for the Periods Ended December 31, 2020 | 1 Year | 3 Year | (3/27/2017) | (12/31/2020) |
U.S. High Yield Fund – Institutional Class | 6.81% | 5.73% | 6.03% | $1,246,464 |
ICE BofAML BB-B Cash Pay | ||||
High Yield Constrained Index (JUC4) | 6.32% | 6.21% | 6.42% | $1,266,264 |
This chart illustrates the performance of a hypothetical $1,000,000 investment made on March 27, 2017, and is not intended to imply any future performance. The returns shown do not reflect the deduction of taxes that a shareholder would pay on Fund distributions or the redemption of Fund shares. The returns reflect fee waivers in effect. In the absence of such waivers, total return would be reduced. The chart assumes reinvestment of capital gains, dividends and return of capital, if applicable, for the Fund and dividends for the index.
13
Low Duration Fund
| HISTORICAL PERFORMANCE – SUPRA INSTITUTIONAL CLASS |
Value of $5,000,000 vs. ICE BofAML
1-3 Year U.S. Corporate & Government Index (B1A0)
(Unaudited)

| Average Annual | Since Inception | Ending Value | ||
Returns for the Periods Ended December 31, 2020 | 1 Year | 3 Year | (6/30/2016) | (12/31/2020) |
Low Duration Fund – Supra Institutional Class | 2.64% | 3.72% | 3.69% | $5,885,994 |
ICE BofAML 1-3 Year U.S. Corporate & Government Index (B1A0) | 3.34% | 3.01% | 2.11% | $5,492,102 |
This chart illustrates the performance of a hypothetical $5,000,000 investment made on June 30, 2016, and is not intended to imply any future performance. The returns shown do not reflect the deduction of taxes that a shareholder would pay on Fund distributions or the redemption of Fund shares. The returns reflect fee waivers in effect. In the absence of such waivers, total return would be reduced. The chart assumes reinvestment of capital gains, dividends and return of capital, if applicable, for the Fund and dividends for the index.
14
Low Duration Fund
| HISTORICAL PERFORMANCE – INSTITUTIONAL CLASS |
Value of $1,000,000 vs. ICE BofAML
1-3 Year U.S. Corporate & Government Index (B1A0)
(Unaudited)

| Average Annual | Since Inception | Ending Value | |
Returns for the Periods Ended December 31, 2020 | 1 Year | (4/30/2019) | (12/31/2020) |
Low Duration Fund – Institutional Class | 2.70% | 3.77% | $1,078,397 |
ICE BofAML 1-3 Year U.S. Corporate & Government Index (B1A0) | 3.34% | 3.55% | $1,059,974 |
This chart illustrates the performance of a hypothetical $1,000,000 investment made on April 30, 2019, and is not intended to imply any future performance. The returns shown do not reflect the deduction of taxes that a shareholder would pay on Fund distributions or the redemption of Fund shares. The returns reflect fee waivers in effect. In the absence of such waivers, total return would be reduced. The chart assumes reinvestment of capital gains, dividends and return of capital, if applicable, for the Fund and dividends for the index.
15
Floating Rate Fund
| HISTORICAL PERFORMANCE – INSTITUTIONAL CLASS |
Value of $1,000,000 vs. Credit Suisse Leveraged Loan Index
(Unaudited)

| Average Annual | Since Inception | Ending Value | |
Returns for the Periods Ended December 31, 2020 | 1 Year | (6/29/2018) | (12/31/2020) |
Floating Rate Fund – Institutional Class | 4.83% | 4.21% | $1,108,929 |
Credit Suisse Leveraged Loan Index | 2.78% | 3.82% | $1,096,288 |
This chart illustrates the performance of a hypothetical $1,000,000 investment made on June 29, 2018, and is not intended to imply any future performance. The returns shown do not reflect the deduction of taxes that a shareholder would pay on Fund distributions or the redemption of Fund shares. The returns reflect fee waivers in effect. In the absence of such waivers, total return would be reduced. The chart assumes reinvestment of capital gains, dividends and return of capital, if applicable, for the Fund and dividends for the index.
16
Credit Opportunities Fund
SCHEDULE OF INVESTMENTS at December 31, 2020 |
| Principal | |||||||||
Amount† | Value | ||||||||
| CORPORATE BONDS: 84.8% | |||||||||
| Aerospace/Defense: 0.2% | |||||||||
Carrier Global Corp. | |||||||||
1,100,000 | 2.700%, 2/15/31 | $ | 1,183,921 | ||||||
| Airlines: 1.4% | |||||||||
Delta Air Lines Inc | |||||||||
1,200,000 | 3.400%, 4/19/21 | 1,207,933 | |||||||
950,000 | 7.375%, 1/15/26 | 1,086,099 | |||||||
Delta Air Lines Inc / SkyMiles IP Ltd | |||||||||
1,175,000 | 4.750%, 10/20/28 | 1,283,955 | |||||||
Emirates Airline | |||||||||
1,825,666 | 4.500%, 2/6/25 | 1,859,660 | |||||||
Mileage Plus Holdings LLC / | |||||||||
Mileage Plus Intellectual | |||||||||
Property Assets Ltd | |||||||||
1,975,000 | 6.500%, 6/20/27 | 2,126,828 | |||||||
7,564,475 | |||||||||
| Automotive & Auto Parts: 6.9% | |||||||||
Faurecia SE | |||||||||
EUR | 1,300,000 | 3.750%, 6/15/28 | 1,672,505 | ||||||
FCA Bank SPA | |||||||||
EUR | 750,000 | 0.250%, 2/28/23 | 919,902 | ||||||
Fiat Chrysler Automobiles NV | |||||||||
EUR | 1,250,000 | 3.375%, 7/7/23 | 1,629,800 | ||||||
Ford Motor Co | |||||||||
1,125,000 | 8.500%, 4/21/23 | 1,267,993 | |||||||
Ford Motor Credit Co LLC | |||||||||
2,725,000 | 4.063%, 11/1/24 | 2,866,210 | |||||||
250,000 | 4.542%, 8/1/26 | 267,188 | |||||||
1,937,000 | 4.271%, 1/9/27 | 2,047,167 | |||||||
750,000 | 4.125%, 8/17/27 | 786,562 | |||||||
1,550,000 | 4.000%, 11/13/30 | 1,629,437 | |||||||
General Motors Co | |||||||||
1,735,000 | 5.400%, 10/2/23 | 1,944,004 | |||||||
1,650,000 | 6.125%, 10/1/25 | 2,003,061 | |||||||
3,700,000 | 6.800%, 10/1/27 | 4,760,152 | |||||||
General Motors Financial Co Inc | |||||||||
775,000 | 5.200%, 3/20/23 | 850,139 | |||||||
2,550,000 | 2.700%, 8/20/27 | 2,708,438 | |||||||
Kia Motors Corp | |||||||||
470,000 | 3.250%, 4/21/26 | 515,197 | |||||||
570,000 | 3.500%, 10/25/27 | 621,767 | |||||||
Nissan Motor Co Ltd | |||||||||
481,000 | 3.043%, 9/15/23 | 503,257 | |||||||
325,000 | 3.522%, 9/17/25 | 348,283 | |||||||
EUR | 3,000,000 | 2.652%, 3/17/26 | 3,879,894 | ||||||
Schaeffler AG | |||||||||
EUR | 900,000 | 2.750%, 10/12/25 | 1,166,962 | ||||||
Volkswagen International | |||||||||
Finance NV | |||||||||
EUR | 1,900,000 | 3.500% (5 Year Swap Rate | |||||||
EUR + 3.746%), 6/17/25 1,2,4 | 2,454,028 | ||||||||
ZF Finance GmbH | |||||||||
EUR | 700,000 | 3.000%, 9/21/25 | 887,218 | ||||||
ZF North America Capital Inc | |||||||||
EUR | 1,100,000 | 2.750%, 4/27/23 | 1,381,400 | ||||||
37,110,564 | |||||||||
| Banking: 9.6% | |||||||||
ABN AMRO Bank NV | |||||||||
1,600,000 | 4.400% (5 Year Swap Rate | ||||||||
USD + 2.197%), 3/27/28 1,2 | 1,707,577 | ||||||||
Australia & New Zealand | |||||||||
Banking Group Ltd | |||||||||
410,000 | 2.950% (5 Year CMT | ||||||||
Rate + 1.288%), 7/22/30 1,2 | 432,867 | ||||||||
Banco Bradesco SA | |||||||||
2,319,000 | 3.200%, 1/27/25 | 2,432,075 | |||||||
Banco Daycoval SA | |||||||||
850,000 | 4.250%, 12/13/24 | 886,389 | |||||||
Banco do Brasil SA | |||||||||
971,000 | 4.750%, 3/20/24 | 1,046,253 | |||||||
Bancolombia SA | |||||||||
500,000 | 4.875% (5 Year CMT | ||||||||
Rate + 2.929%), 10/18/27 1,2 | 516,400 | ||||||||
Bank Leumi Le-Israel BM | |||||||||
2,180,000 | 3.275% (5 Year CMT | ||||||||
Rate + 1.631%), 1/29/31 1,2 | 2,269,925 | ||||||||
Bank of Ireland Group PLC | |||||||||
2,075,000 | 4.125% (5 Year CMT | ||||||||
Rate + 2.500%), 9/19/27 1,2 | 2,114,069 | ||||||||
Bank of New Zealand | |||||||||
2,050,000 | 3.500%, 2/20/24 | 2,229,585 | |||||||
Barclays Bank PLC | |||||||||
EUR | 1,305,000 | 6.000%, 1/14/21 | 1,596,627 | ||||||
EUR | 1,875,000 | 6.625%, 3/30/22 | 2,480,563 | ||||||
BBVA Bancomer SA/Texas | |||||||||
1,282,000 | 1.875%, 9/18/25 | 1,296,423 | |||||||
BPCE SA | |||||||||
2,400,000 | 4.500%, 3/15/25 | 2,716,138 | |||||||
Caixa Geral de Depositos SA | |||||||||
EUR | 900,000 | 5.750% (5 Year Swap Rate | |||||||
EUR + 5.500%), 6/28/28 1,2 | 1,210,498 | ||||||||
CaixaBank SA | |||||||||
EUR | 2,400,000 | 2.750% (5 Year Swap Rate | |||||||
EUR + 2.350%), 7/14/28 1,2 | 3,068,937 | ||||||||
CaixaBank SA | |||||||||
EUR | 1,000,000 | 6.750%, 12/13/69 2 | 1,353,884 | ||||||
Commerzbank AG | |||||||||
EUR | 1,800,000 | 7.750%, 3/16/21 | 2,230,784 | ||||||
Danske Bank A/S | |||||||||
EUR | 480,000 | 2.500% (5 Year Swap Rate | |||||||
EUR + 2.500%), 6/21/29 1,2 | 621,337 | ||||||||
The accompanying notes are an integral part of these financial statements.
17
Credit Opportunities Fund
SCHEDULE OF INVESTMENTS at December 31, 2020 (Continued) |
| Principal | |||||||||
Amount† | Value | ||||||||
| CORPORATE BONDS: 84.8% (Continued) | |||||||||
| Banking: 9.6% (Continued) | |||||||||
Deutsche Bank AG | |||||||||
4,100,000 | 2.222% (SOFR + 2.159%), | ||||||||
9/18/24 1,2 | $ | 4,220,598 | |||||||
1,000,000 | 2.129% (SOFR + 1.870%), | ||||||||
11/24/26 1,2 | 1,023,912 | ||||||||
1,250,000 | 4.296% (5 Year Swap Rate | ||||||||
USD + 2.248%), 5/24/28 1,2 | 1,288,732 | ||||||||
Emirates NBD Bank PJSC | |||||||||
860,000 | 2.625%, 2/18/25 | 907,730 | |||||||
Global Bank Corp | |||||||||
800,000 | 5.250% (3 Month LIBOR | ||||||||
USD + 3.300%), 4/16/29 1,2 | 875,500 | ||||||||
Ibercaja Banco SA | |||||||||
EUR | 1,100,000 | 2.750% (5 Year Swap Rate | |||||||
EUR + 2.882%), 7/23/30 1,2 | 1,307,878 | ||||||||
ING Groep NV | |||||||||
600,000 | 4.700% (5 Year Swap Rate | ||||||||
USD + 1.938%), 3/22/28 1,2 | 643,366 | ||||||||
Itau Unibanco Holding SA | |||||||||
450,000 | 5.125%, 5/13/23 | 481,050 | |||||||
National Australia Bank Ltd | |||||||||
2,000,000 | 3.933% (5 Year CMT | ||||||||
Rate + 1.880%), 8/2/34 1,2 | 2,250,177 | ||||||||
QNB Finance Ltd | |||||||||
970,000 | 2.625%, 5/12/25 | 1,023,479 | |||||||
Shinhan Bank Co Ltd | |||||||||
1,000,000 | 4.000%, 4/23/29 | 1,138,195 | |||||||
Societe Generale SA | |||||||||
EUR | 2,200,000 | 1.375% (5 Year Swap Rate | |||||||
EUR + 0.900%), 2/23/28 1,2 | 2,734,838 | ||||||||
Standard Chartered Plc | |||||||||
1,300,000 | 3.516% (5 Year CMT | ||||||||
Rate + 1.850%), 2/12/30 1,2 | 1,361,147 | ||||||||
UniCredit SpA | |||||||||
1,175,000 | 5.861% (5 Year Mid Swap | ||||||||
Rate USD + 3.703%), 6/19/32 1,2 | 1,325,688 | ||||||||
Volksbank Wien AG | |||||||||
EUR | 800,000 | 2.750% (5 Year Swap Rate | |||||||
EURIBOR + 2.550%), 10/6/27 1,2 | 979,728 | ||||||||
51,772,349 | |||||||||
| Broadcasting: 3.0% | |||||||||
Gray Television Inc | |||||||||
1,400,000 | 4.750%, 10/15/30 | 1,428,875 | |||||||
Netflix Inc | |||||||||
1,050,000 | 5.375%, 11/15/29 | 1,239,000 | |||||||
Nexstar Broadcasting Inc | |||||||||
1,975,000 | 4.750%, 11/1/28 | 2,070,047 | |||||||
Scripps Escrow II, Inc. | |||||||||
1,150,000 | 3.875%, 1/15/29 | 1,197,311 | |||||||
Sinclair Television Group, Inc. | |||||||||
950,000 | 4.125%, 12/1/30 | 973,850 | |||||||
Sirius XM Radio Inc | |||||||||
1,425,000 | 3.875%, 8/1/22 | 1,448,156 | |||||||
TEGNA Inc | |||||||||
1,400,000 | 4.750%, 3/15/26 | 1,496,670 | |||||||
2,425,000 | 4.625%, 3/15/28 | 2,484,110 | |||||||
3,475,000 | 5.000%, 9/15/29 | 3,674,317 | |||||||
16,012,336 | |||||||||
| Building Materials: 1.7% | |||||||||
Cemex SAB de CV | |||||||||
EUR | 910,000 | 2.750%, 12/5/24 | 1,125,571 | ||||||
900,000 | 7.375%, 6/5/27 | 1,025,325 | |||||||
640,000 | 5.200%, 9/17/30 | 702,560 | |||||||
500,000 | 5.200%, 9/17/30 | 548,875 | |||||||
Martin Marietta Materials Inc | |||||||||
1,375,000 | 4.250%, 7/2/24 | 1,534,665 | |||||||
Masco Corp | |||||||||
1,550,000 | 2.000%, 10/1/30 | 1,580,135 | |||||||
Standard Industries Inc | |||||||||
800,000 | 4.375%, 7/15/30 | 857,012 | |||||||
WESCO Distribution Inc | |||||||||
1,525,000 | 7.125%, 6/15/25 | 1,679,262 | |||||||
9,053,405 | |||||||||
| Cable/Satellite TV: 2.8% | |||||||||
CCO Holdings LLC / | |||||||||
CCO Holdings Capital Corp | |||||||||
2,925,000 | 5.000%, 2/1/28 | 3,096,112 | |||||||
2,050,000 | 4.750%, 3/1/30 | 2,214,513 | |||||||
1,875,000 | 4.250%, 2/1/31 | 1,978,331 | |||||||
1,925,000 | 4.500%, 5/1/32 | 2,057,767 | |||||||
CSC Holdings LLC | |||||||||
1,575,000 | 5.750%, 1/15/30 | 1,728,570 | |||||||
1,450,000 | 4.125%, 12/1/30 | 1,517,570 | |||||||
2,000,000 | 4.625%, 12/1/30 | 2,090,270 | |||||||
Radiate Holdco LLC / | |||||||||
Radiate Finance Inc | |||||||||
325,000 | 4.500%, 9/15/26 | 335,969 | |||||||
UPCB Finance VII Ltd. | |||||||||
EUR | 275,000 | 3.625%, 6/15/29 | 349,474 | ||||||
15,368,576 | |||||||||
| Capital Goods: 1.1% | |||||||||
Alfa SAB de CV | |||||||||
1,500,000 | 5.250%, 3/25/24 | 1,656,390 | |||||||
KION Group AG | |||||||||
EUR | 1,300,000 | 1.625%, 9/24/25 | 1,646,079 | ||||||
Westinghouse Air Brake | |||||||||
Technologies Corp | |||||||||
1,900,000 | 4.400%, 3/15/24 2 | 2,081,447 | |||||||
Xylem Inc | |||||||||
700,000 | 1.950%, 1/30/28 | �� | 738,575 | ||||||
6,122,491 | |||||||||
| Chemicals: 2.0% | |||||||||
Alpek SAB de CV | |||||||||
2,800,000 | 4.250%, 9/18/29 | 3,073,770 | |||||||
The accompanying notes are an integral part of these financial statements.
18
Credit Opportunities Fund
SCHEDULE OF INVESTMENTS at December 31, 2020 (Continued) |
| Principal | |||||||||
Amount† | Value | ||||||||
| CORPORATE BONDS: 84.8% (Continued) | |||||||||
| Chemicals: 2.0% (Continued) | |||||||||
Equate Petrochemical BV | |||||||||
500,000 | 4.250%, 11/3/26 | $ | 558,767 | ||||||
Ingevity Corp | |||||||||
975,000 | 3.875%, 11/1/28 | 984,141 | |||||||
MEGlobal Canada ULC | |||||||||
500,000 | 5.000%, 5/18/25 | 563,835 | |||||||
500,000 | 5.875%, 5/18/30 | 625,000 | |||||||
Orbia Advance Corp SAB de CV | |||||||||
1,000,000 | 4.000%, 10/4/27 | 1,109,560 | |||||||
Sherwin-Williams Co | |||||||||
650,000 | 3.450%, 6/1/27 | 734,947 | |||||||
1,150,000 | 2.300%, 5/15/30 | 1,202,907 | |||||||
UPL Corp Ltd | |||||||||
1,822,000 | 4.500%, 3/8/28 | 1,940,828 | |||||||
10,793,755 | |||||||||
| Consumer-Products: 0.3% | |||||||||
Church & Dwight Co Inc | |||||||||
900,000 | 3.150%, 8/1/27 | 998,841 | |||||||
Kimberly-Clark de | |||||||||
Mexico SAB de CV | |||||||||
720,000 | 2.431%, 7/1/31 | 745,124 | |||||||
1,743,965 | |||||||||
| Containers: 2.0% | |||||||||
Ardagh Packaging Finance PLC / | |||||||||
Ardagh Holdings USA Inc | |||||||||
537,000 | 6.000%, 2/15/25 | 557,003 | |||||||
EUR | 1,525,000 | 2.125%, 8/15/26 | 1,870,923 | ||||||
Ardagh Pkg Fin/hldgs Usa | |||||||||
300,000 | 4.125%, 8/15/26 | 313,875 | |||||||
Ball Corp | |||||||||
EUR | 1,550,000 | 1.500%, 3/15/27 | 1,949,500 | ||||||
Berry Global Inc | |||||||||
589,000 | 5.125%, 7/15/23 | 597,099 | |||||||
550,000 | 4.875%, 7/15/26 | 591,379 | |||||||
Berry Global Inc | |||||||||
925,000 | 1.570%, 1/15/26 | 934,528 | |||||||
Crown European Holdings SA | |||||||||
EUR | 1,900,000 | 0.750%, 2/15/23 | 2,320,192 | ||||||
Klabin Austria GmbH | |||||||||
280,000 | 5.750%, 4/3/29 | 325,993 | |||||||
Reynolds Group Issuer Inc / | |||||||||
Reynolds Group Issuer LLC / | |||||||||
Reynolds Group Issuer Lu | |||||||||
20,000 | 5.125%, 7/15/23 | 20,256 | |||||||
Sealed Air Corp | |||||||||
EUR | 325,000 | 4.500%, 9/15/23 | 433,648 | ||||||
Silgan Holdings Inc | |||||||||
EUR | 500,000 | 2.250%, 6/1/28 | 621,492 | ||||||
10,535,888 | |||||||||
| Diversified Financial Services: 5.6% | |||||||||
Alliance Data Systems Corp | |||||||||
1,200,000 | 4.750%, 12/15/24 | 1,214,250 | |||||||
CIT Group Inc | |||||||||
1,800,000 | 5.000%, 8/15/22 | 1,910,592 | |||||||
Credit Suisse AG | |||||||||
700,000 | 6.500%, 8/8/23 | 790,049 | |||||||
Credit Suisse Group AG | |||||||||
1,500,000 | 7.500% (5 Year Swap Rate | ||||||||
USD + 4.598%), 12/11/23 1,2,4 | 1,673,699 | ||||||||
Grupo de Inversiones | |||||||||
Suramericana SA | |||||||||
1,500,000 | 5.500%, 4/29/26 | 1,713,248 | |||||||
Icahn Enterprises LP / | |||||||||
Icahn Enterprises Finance Corp | |||||||||
1,200,000 | 4.750%, 9/15/24 | 1,248,378 | |||||||
ICD Funding Ltd | |||||||||
3,000,000 | 3.223%, 4/28/26 | 3,022,950 | |||||||
Intrum AB | |||||||||
EUR | 1,175,000 | 4.875%, 8/15/25 | 1,491,053 | ||||||
Macquarie Bank Ltd | |||||||||
667,000 | 6.625%, 4/7/21 | 677,428 | |||||||
MDGH – GMTN BV | |||||||||
EUR | 760,000 | 3.625%, 5/30/23 | 1,016,279 | ||||||
790,000 | 2.500%, 5/21/26 | 840,339 | |||||||
OneMain Finance Corp | |||||||||
1,000,000 | 7.750%, 10/1/21 | 1,053,750 | |||||||
625,000 | 6.125%, 3/15/24 | 683,594 | |||||||
Power Finance Corp Ltd | |||||||||
2,000,000 | 3.950%, 4/23/30 | 2,140,700 | |||||||
Refinitiv US Holdings Inc | |||||||||
EUR | 1,350,000 | 4.500%, 5/15/26 | 1,739,520 | ||||||
SoftBank Group Corp | |||||||||
300,000 | 5.375%, 7/30/22 | 312,934 | |||||||
EUR | 3,025,000 | 4.000%, 4/20/23 | 3,866,015 | ||||||
SPARC EM SPC Panama | |||||||||
Metro Line 2 SP | |||||||||
75,278 | N/A%, 12/5/22 3 | 73,491 | |||||||
UBS AG | |||||||||
3,400,000 | 5.125%, 5/15/24 | 3,756,150 | |||||||
UBS Group AG | |||||||||
1,100,000 | 7.000% (5 Year Swap Rate | ||||||||
USD + 4.866%), 12/29/49 1,2,4 | 1,254,688 | ||||||||
30,479,107 | |||||||||
| Diversified Media: 1.1% | |||||||||
Adevinta ASA | |||||||||
EUR | 1,575,000 | 2.625%, 11/15/25 | 1,970,265 | ||||||
EUR | 200,000 | 3.000%, 11/15/27 | 253,425 | ||||||
Cable One Inc | |||||||||
1,850,000 | 4.000%, 11/15/30 | 1,925,156 | |||||||
Prosus NV | |||||||||
1,760,000 | 5.500%, 7/21/25 | 2,027,256 | |||||||
6,176,102 | |||||||||
The accompanying notes are an integral part of these financial statements.
19
Credit Opportunities Fund
SCHEDULE OF INVESTMENTS at December 31, 2020 (Continued) |
| Principal | |||||||||
Amount† | Value | ||||||||
| CORPORATE BONDS: 84.8% (Continued) | |||||||||
| Energy: 7.4% | |||||||||
Apache Corp | |||||||||
700,000 | 4.875%, 11/15/27 | $ | 743,050 | ||||||
Blue Racer Midstream LLC / | |||||||||
Blue Racer Finance Corp. | |||||||||
775,000 | 7.625%, 12/15/25 | 827,312 | |||||||
BP Capital Markets Plc | |||||||||
EUR | 1,250,000 | 3.250% (5 Year Swap Rate | |||||||
EUR + 3.880%), 3/22/26 1,2,4 | 1,632,038 | ||||||||
EUR | 775,000 | 3.625% (5 Year Swap Rate | |||||||
EUR + 4.120%), 3/22/29 1,2,4 | 1,037,900 | ||||||||
Cheniere Energy Partners LP | |||||||||
300,000 | 5.625%, 10/1/26 | 312,510 | |||||||
Continental Resources Inc | |||||||||
1,800,000 | 5.750%, 1/15/31 | 2,001,339 | |||||||
Ecopetrol SA | |||||||||
1,000,000 | 6.875%, 4/29/30 | 1,292,500 | |||||||
Energy Transfer Operating LP | |||||||||
775,000 | 3.750%, 5/15/30 | 836,928 | |||||||
EQT Corp | |||||||||
1,100,000 | 7.875%, 2/1/25 2 | 1,254,160 | |||||||
Harvest Midstream I LP | |||||||||
1,450,000 | 7.500%, 9/1/28 | 1,546,063 | |||||||
Leviathan Bond Ltd | |||||||||
630,000 | 5.750%, 6/30/23 | 674,100 | |||||||
775,000 | 6.125%, 6/30/25 | 854,438 | |||||||
870,000 | 6.500%, 6/30/27 | 983,100 | |||||||
Occidental Petroleum Corp | |||||||||
1,375,000 | 3.500%, 8/15/29 | 1,260,559 | |||||||
Occidental Petroleum Corp | |||||||||
350,000 | 5.500%, 12/1/25 | 365,570 | |||||||
Oleoducto Central SA | |||||||||
2,449,000 | 4.000%, 7/14/27 | 2,660,863 | |||||||
Petrobras Global Finance BV | |||||||||
3,077,000 | 7.375%, 1/17/27 | 3,814,218 | |||||||
3,600,000 | 5.093%, 1/15/30 | 4,027,500 | |||||||
Plains All American Pipeline LP / | |||||||||
PAA Finance Corp | |||||||||
2,025,000 | 3.600%, 11/1/24 | 2,160,315 | |||||||
531,000 | 3.800%, 9/15/30 | 571,535 | |||||||
Rockies Express Pipeline LLC | |||||||||
2,425,000 | 3.600%, 5/15/25 | 2,504,346 | |||||||
1,675,000 | 4.950%, 7/15/29 | 1,745,342 | |||||||
1,925,000 | 4.800%, 5/15/30 | 1,978,014 | |||||||
Sabine Pass Liquefaction LLC | |||||||||
2,275,000 | 5.625%, 4/15/23 2 | 2,500,838 | |||||||
Targa Resources Partners LP / | |||||||||
Targa Resources Partners | |||||||||
Finance Corp | |||||||||
775,000 | 4.250%, 11/15/23 | 780,894 | |||||||
Williams Cos Inc | |||||||||
1,500,000 | 4.000%, 9/15/25 | 1,704,850 | |||||||
40,070,282 | |||||||||
| Environmental: 0.2% | |||||||||
Covanta Holding Corp | |||||||||
450,000 | 5.000%, 9/1/30 | 482,034 | |||||||
GFL Environmental Inc | |||||||||
800,000 | 3.750%, 8/1/25 | 821,500 | |||||||
1,303,534 | |||||||||
| Food & Drug Retail: 0.4% | |||||||||
Albertsons Cos Inc / | |||||||||
Safeway Inc / New Albertsons LP / | |||||||||
Albertsons LLC | |||||||||
1,525,000 | 4.625%, 1/15/27 | 1,623,828 | |||||||
Ingles Markets Inc | |||||||||
560,000 | 5.750%, 6/15/23 | 567,344 | |||||||
2,191,172 | |||||||||
| Food/Beverage/Tobacco: 4.9% | |||||||||
BRF SA | |||||||||
1,200,000 | 4.750%, 5/22/24 | 1,291,386 | |||||||
1,062,000 | 4.875%, 1/24/30 | 1,154,272 | |||||||
Bunge Ltd Finance Corp | |||||||||
1,200,000 | 1.630%, 8/17/25 | 1,241,030 | |||||||
Constellation Brands Inc | |||||||||
2,250,000 | 4.750%, 11/15/24 | 2,586,176 | |||||||
1,160,000 | 4.750%, 12/1/25 | 1,375,596 | |||||||
General Mills Inc | |||||||||
1,150,000 | 2.875%, 4/15/30 | 1,277,157 | |||||||
Grupo Bimbo SAB de CV | |||||||||
2,200,000 | 3.875%, 6/27/24 | 2,413,180 | |||||||
Herbalife Nutrition Ltd / | |||||||||
HLF Financing Inc | |||||||||
1,950,000 | 7.875%, 9/1/25 | 2,132,812 | |||||||
J M Smucker Co | |||||||||
1,800,000 | 2.375%, 3/15/30 | 1,909,166 | |||||||
Kraft Heinz Foods Co | |||||||||
1,175,000 | 4.375%, 6/1/46 | 1,273,258 | |||||||
Kraft Heinz Foods Co | |||||||||
325,000 | 3.875%, 5/15/27 | 350,621 | |||||||
MARB BondCo PLC | |||||||||
1,479,000 | 7.000%, 3/15/24 | 1,517,839 | |||||||
Post Holdings Inc | |||||||||
1,200,000 | 5.750%, 3/1/27 | 1,272,750 | |||||||
1,200,000 | 4.625%, 4/15/30 | 1,263,852 | |||||||
Sigma Alimentos S.A. de CV | |||||||||
1,048,000 | 4.125%, 5/2/26 | 1,159,298 | |||||||
Sysco Corp | |||||||||
1,550,000 | 5.950%, 4/1/30 | 2,039,744 | |||||||
Sysco Corp. | |||||||||
1,325,000 | 6.600%, 4/1/50 | 2,043,945 | |||||||
26,302,082 | |||||||||
| Gaming: 0.2% | |||||||||
Caesars Entertainment Inc | |||||||||
1,200,000 | 6.250%, 7/1/25 | 1,279,506 | |||||||
The accompanying notes are an integral part of these financial statements.
20
Credit Opportunities Fund
SCHEDULE OF INVESTMENTS at December 31, 2020 (Continued) |
| Principal | |||||||||
Amount† | Value | ||||||||
| CORPORATE BONDS: 84.8% (Continued) | |||||||||
| Healthcare: 9.7% | |||||||||
AbbVie, Inc. | |||||||||
1,400,000 | 2.950%, 11/21/26 | $ | 1,549,419 | ||||||
AMN Healthcare Inc | |||||||||
1,225,000 | 4.625%, 10/1/27 | 1,285,570 | |||||||
Bausch Health Cos Inc | |||||||||
3,525,000 | 6.125%, 4/15/25 | 3,636,601 | |||||||
1,925,000 | 5.750%, 8/15/27 | 2,068,172 | |||||||
1,900,000 | 6.250%, 2/15/29 | 2,066,611 | |||||||
950,000 | 5.250%, 1/30/30 | 998,564 | |||||||
Becton Dickinson and Co | |||||||||
1,075,000 | 3.363%, 6/6/24 | 1,169,150 | |||||||
1,125,000 | 2.823%, 5/20/30 | 1,237,985 | |||||||
Centene Corp | |||||||||
1,000,000 | 5.375%, 6/1/26 | 1,055,960 | |||||||
1,000,000 | 5.375%, 8/15/26 | 1,058,750 | |||||||
1,975,000 | 3.000%, 10/15/30 | 2,095,771 | |||||||
Cigna Corp | |||||||||
1,625,000 | 2.400%, 3/15/30 | 1,734,008 | |||||||
CVS Health Corp | |||||||||
2,050,000 | 3.000%, 8/15/26 | 2,271,213 | |||||||
2,475,000 | 1.300%, 8/21/27 | 2,488,031 | |||||||
720,000 | 4.300%, 3/25/28 | 857,298 | |||||||
1,575,000 | 3.250%, 8/15/29 | 1,775,789 | |||||||
1,125,000 | 3.750%, 4/1/30 | 1,310,769 | |||||||
Grifols SA | |||||||||
EUR | 2,100,000 | 1.625%, 2/15/25 | 2,576,994 | ||||||
HCA Inc | |||||||||
1,000,000 | 5.875%, 5/1/23 | 1,100,205 | |||||||
2,075,000 | 5.250%, 4/15/25 | 2,424,357 | |||||||
1,200,000 | 3.500%, 9/1/30 | 1,276,093 | |||||||
Health Care Service Corp A | |||||||||
Mutual Legal Reserve Co | |||||||||
1,625,000 | 2.200%, 6/1/30 | 1,702,076 | |||||||
IQVIA Inc | |||||||||
EUR | 2,025,000 | 3.250%, 3/15/25 | 2,506,295 | ||||||
Legacy LifePoint Health LLC | |||||||||
350,000 | 6.750%, 4/15/25 | 376,708 | |||||||
625,000 | 4.375%, 2/15/27 | 627,344 | |||||||
Molina Healthcare Inc | |||||||||
2,950,000 | 5.375%, 11/15/22 2 | 3,128,844 | |||||||
MPH Acquisition Holdings LLC | |||||||||
1,675,000 | 5.750%, 11/1/28 | 1,648,284 | |||||||
Prime Healthcare Services Inc | |||||||||
925,000 | 7.250%, 11/1/25 | 983,969 | |||||||
Providence Service Corp/The | |||||||||
350,000 | 5.875%, 11/15/25 | 370,781 | |||||||
Select Medical Corp | |||||||||
625,000 | 6.250%, 8/15/26 | 674,038 | |||||||
Tenet Healthcare Corp | |||||||||
675,000 | 4.625%, 7/15/24 | 692,564 | |||||||
950,000 | 7.500%, 4/1/25 | 1,039,219 | |||||||
Teva Pharmaceutical Finance Co BV | |||||||||
1,050,000 | 3.650%, 11/10/21 | 1,066,081 | |||||||
Teva Pharmaceutical Finance IV BV | |||||||||
1,000,000 | 3.650%, 11/10/21 | 1,014,775 | |||||||
Upjohn Inc | |||||||||
775,000 | 1.650%, 6/22/25 | 802,425 | |||||||
52,670,713 | |||||||||
| Homebuilders/Real Estate: 2.8% | |||||||||
Crown Castle International Corp | |||||||||
1,350,000 | 3.650%, 9/1/27 | 1,526,331 | |||||||
Equinix Inc | |||||||||
EUR | 700,000 | 2.875%, 2/1/26 | 870,500 | ||||||
1,925,000 | 1.800%, 7/15/27 | 1,984,557 | |||||||
HAT Holdings I LLC / | |||||||||
HAT Holdings II LLC | |||||||||
1,450,000 | 3.750%, 9/15/30 1 | 1,511,625 | |||||||
Howard Hughes Corp | |||||||||
825,000 | 5.375%, 8/1/28 | 888,834 | |||||||
Iron Mountain Inc | |||||||||
1,175,000 | 4.500%, 2/15/31 | 1,232,281 | |||||||
MasTec Inc | |||||||||
1,050,000 | 4.500%, 8/15/28 | 1,103,812 | |||||||
Outfront Media Capital LLC / | |||||||||
Outfront Media Capital Corp | |||||||||
1,475,000 | 5.625%, 2/15/24 | 1,497,280 | |||||||
Samhallsbyggnadsbolaget | |||||||||
i Norden AB | |||||||||
EUR | 1,100,000 | 2.625% (5 Year Swap Rate | |||||||
EUR + 3.227%), 12/14/25 1,2,4 | 1,339,057 | ||||||||
SBA Communications Corp | |||||||||
1,850,000 | 4.875%, 9/1/24 | 1,899,913 | |||||||
Shimao Group Holdings Ltd | |||||||||
1,000,000 | 4.750%, 7/3/22 | 1,024,500 | |||||||
14,878,690 | |||||||||
| Hotels: 0.1% | |||||||||
Park Intermediate Holdings LLC / | |||||||||
PK Domestic Property LLC / | |||||||||
PK Finance Co-Issuer | |||||||||
600,000 | 5.875%, 10/1/28 | 640,125 | |||||||
| Leisure: 0.5% | |||||||||
Carnival Corp | |||||||||
1,150,000 | 11.500%, 4/1/23 | 1,331,901 | |||||||
Expedia Group, Inc. | |||||||||
1,100,000 | 5.000%, 2/15/26 | 1,233,156 | |||||||
2,565,057 | |||||||||
| Metals/Mining: 2.0% | |||||||||
Alcoa Nederland Holding BV | |||||||||
2,000,000 | 5.500%, 12/15/27 | 2,191,040 | |||||||
AngloGold Ashanti Holdings Plc | |||||||||
500,000 | 3.750%, 10/1/30 | 538,520 | |||||||
The accompanying notes are an integral part of these financial statements.
21
Credit Opportunities Fund
SCHEDULE OF INVESTMENTS at December 31, 2020 (Continued) |
Principal | |||||||||
Amount† | Value | ||||||||
| CORPORATE BONDS: 84.8% (Continued) | |||||||||
| Metals/Mining: 2.0% (Continued) | |||||||||
AngloGold Ashanti Holdings PLC | |||||||||
938,000 | 6.500%, 4/15/40 | $ | 1,180,691 | ||||||
Corp Nacional del Cobre de Chile | |||||||||
EUR | 1,610,000 | 2.250%, 7/9/24 | 2,116,380 | ||||||
Gold Fields Orogen | |||||||||
Holdings BVI Ltd | |||||||||
900,000 | 6.125%, 5/15/29 | 1,095,750 | |||||||
Nexa Resources SA | |||||||||
492,000 | 5.375%, 5/4/27 | 547,601 | |||||||
Novelis Corp | |||||||||
1,889,000 | 5.875%, 9/30/26 | 1,976,366 | |||||||
Orano SA | |||||||||
EUR | 1,000,000 | 2.750%, 3/8/28 | 1,286,084 | ||||||
10,932,432 | |||||||||
| Paper: 0.6% | |||||||||
Inversiones CMPC SA | |||||||||
1,200,000 | 4.375%, 4/4/27 | 1,369,872 | |||||||
960,000 | 3.850%, 1/13/30 | 1,076,880 | |||||||
Suzano Austria GmbH | |||||||||
800,000 | 6.000%, 1/15/29 | 963,508 | |||||||
3,410,260 | |||||||||
| Quasi & Foreign Government: 3.0% | |||||||||
Abu Dhabi Government | |||||||||
International Bond | |||||||||
1,818,000 | 2.500%, 9/30/29 | 1,966,012 | |||||||
Colombia Government | |||||||||
International Bond | |||||||||
2,000,000 | 3.000%, 1/30/30 | 2,099,770 | |||||||
Dubai DOF Sukuk Ltd | |||||||||
1,300,000 | 2.763%, 9/9/30 | 1,317,017 | |||||||
Indian Railway Finance Corp Ltd | |||||||||
1,450,000 | 3.730%, 3/29/24 | 1,548,876 | |||||||
1,175,000 | 3.249%, 2/13/30 | 1,253,625 | |||||||
Indonesia Government | |||||||||
International Bond | |||||||||
2,200,000 | 4.750%, 2/11/29 | 2,670,941 | |||||||
Mexico Government | |||||||||
International Bond | |||||||||
2,300,000 | 4.500%, 4/22/29 | 2,704,513 | |||||||
Panama Government | |||||||||
International Bond | |||||||||
1,000,000 | 3.160%, 1/23/30 | 1,109,385 | |||||||
Romanian Government | |||||||||
International Bond | |||||||||
EUR | 1,000,000 | 3.875%, 10/29/35 | 1,499,273 | ||||||
16,169,412 | |||||||||
| Restaurants: 0.4% | |||||||||
1011778 BC ULC / | |||||||||
New Red Finance Inc | |||||||||
529,000 | 4.250%, 5/15/24 | 540,109 | |||||||
1,700,000 | 4.000%, 10/15/30 | 1,724,956 | |||||||
2,265,065 | |||||||||
| Services: 0.8% | |||||||||
Aramark Services Inc | |||||||||
975,000 | 6.375%, 5/1/25 | 1,043,250 | |||||||
New Oriental Education & | |||||||||
Technology Group Inc | |||||||||
1,375,000 | 2.125%, 7/2/25 | 1,364,756 | |||||||
Techem Verwaltungsgesellschaft | |||||||||
675 mbH | |||||||||
EUR | 1,200,000 | 2.000%, 7/15/25 | 1,461,354 | ||||||
Williams Scotsman International Inc | |||||||||
375,000 | 4.625%, 8/15/28 | 388,828 | |||||||
4,258,188 | |||||||||
| Steel: 0.7% | |||||||||
ArcelorMittal SA | |||||||||
EUR | 1,100,000 | 1.000%, 5/19/23 | 1,357,801 | ||||||
Gerdau Trade Inc | |||||||||
1,850,000 | 4.875%, 10/24/27 | 2,148,331 | |||||||
3,506,132 | |||||||||
| Super Retail: 0.7% | |||||||||
Advance Auto Parts Inc | |||||||||
1,350,000 | 1.750%, 10/1/27 | 1,373,178 | |||||||
Hanesbrands Inc | |||||||||
1,525,000 | 5.375%, 5/15/25 | 1,615,387 | |||||||
JSM Global Sarl | |||||||||
400,000 | 4.750%, 10/20/30 | 431,254 | |||||||
Meituan | |||||||||
320,000 | 2.125%, 10/28/25 | 325,434 | |||||||
3,745,253 | |||||||||
| Technology: 1.4% | |||||||||
Broadcom Inc | |||||||||
2,125,000 | 3.150%, 11/15/25 | 2,322,988 | |||||||
J2 Global Inc | |||||||||
1,600,000 | 4.625%, 10/15/30 | 1,691,000 | |||||||
Logan Merger Sub Inc | |||||||||
600,000 | 5.500%, 9/1/27 | 629,250 | |||||||
NXP BV / NXP Funding LLC / | |||||||||
NXP USA Inc | |||||||||
900,000 | 2.700%, 5/1/25 | 969,450 | |||||||
900,000 | 3.150%, 5/1/27 | 993,136 | |||||||
1,025,000 | 3.400%, 5/1/30 | 1,164,664 | |||||||
7,770,488 | |||||||||
The accompanying notes are an integral part of these financial statements.
22
Credit Opportunities Fund
SCHEDULE OF INVESTMENTS at December 31, 2020 (Continued) |
| Principal | |||||||||
Amount† | Value | ||||||||
| CORPORATE BONDS: 84.8% (Continued) | |||||||||
| Telecommunications: 7.7% | |||||||||
America Movil SAB de CV | |||||||||
1,400,000 | 3.625%, 4/22/29 | $ | 1,584,548 | ||||||
AT&T Inc | |||||||||
700,000 | 2.300%, 6/1/27 | 747,447 | |||||||
Cablevision Lightpath LLC | |||||||||
325,000 | 3.875%, 9/15/27 | 327,438 | |||||||
CenturyLink Inc | |||||||||
2,575,000 | 5.125%, 12/15/26 | 2,722,844 | |||||||
CenturyLink Inc | |||||||||
1,625,000 | 4.500%, 1/15/29 | 1,656,484 | |||||||
Level 3 Financing Inc | |||||||||
1,300,000 | 5.375%, 1/15/24 | 1,314,878 | |||||||
3,325,000 | 3.400%, 3/1/27 | 3,627,359 | |||||||
2,475,000 | 3.875%, 11/15/29 | 2,754,267 | |||||||
Ooredoo International Finance Ltd | |||||||||
950,000 | 5.000%, 10/19/25 | 1,110,023 | |||||||
PPF Telecom Group BV | |||||||||
EUR | 1,225,000 | 3.500%, 5/20/24 | 1,589,109 | ||||||
EUR | 850,000 | 2.125%, 1/31/25 | 1,059,164 | ||||||
SES SA | |||||||||
EUR | 1,825,000 | 5.625% (5 Year Swap Rate | |||||||
EUR + 5.401%), 1/29/24 1,2,4 | 2,457,607 | ||||||||
Sprint Corp | |||||||||
1,850,000 | 7.125%, 6/15/24 | 2,166,831 | |||||||
TalkTalk Telecom Group PLC | |||||||||
GBP | 700,000 | 3.875%, 2/20/25 | 936,910 | ||||||
Telecom Italia SPA | |||||||||
EUR | 850,000 | 2.750%, 4/15/25 | 1,090,435 | ||||||
EUR | 400,000 | 2.875%, 1/28/26 | 518,534 | ||||||
Telefonica Europe BV | |||||||||
EUR | 1,000,000 | 5.875% (10 Year Swap Rate | |||||||
EUR + 4.301%), 3/31/24 1,2,4 | 1,377,402 | ||||||||
EUR | 700,000 | 3.875% (8 Year Swap Rate | |||||||
EUR + 2.967%), 6/22/26 1,2,4 | 924,631 | ||||||||
T-Mobile USA Inc | |||||||||
1,000,000 | 6.000%, 3/1/23 | 1,002,500 | |||||||
1,000,000 | 6.000%, 4/15/24 | 1,013,510 | |||||||
2,800,000 | 3.750%, 4/15/27 | 3,191,440 | |||||||
2,675,000 | 3.875%, 4/15/30 | 3,101,529 | |||||||
675,000 | 3.000%, 2/15/41 | 701,051 | |||||||
Vmed O2 UK Financing I PLC | |||||||||
GBP | 1,710,000 | 4.000%, 1/31/29 | 2,397,592 | ||||||
Vodafone Group PLC | |||||||||
EUR | 1,075,000 | 2.625% (5 Year Swap Rate | |||||||
EUR + 3.002%), 8/27/80 1,2 | 1,353,307 | ||||||||
EUR | 750,000 | 3.000% (5 Year Swap Rate | |||||||
EUR + 3.227%), 8/27/80 1,2 | 959,181 | ||||||||
41,686,021 | |||||||||
| Transportation Excluding Air/Rail: 1.7% | |||||||||
Abertis Infraestructuras Finance BV | |||||||||
EUR | 1,200,000 | 3.248% (5 Year Swap Rate | |||||||
EUR + 3.694%), 11/24/25 1,2,4 | 1,523,511 | ||||||||
Autostrade per l’Italia SpA | |||||||||
EUR | 1,075,000 | 1.625%, 6/12/23 | 1,315,903 | ||||||
DP World Crescent Ltd | |||||||||
1,850,000 | 4.848%, 9/26/28 | 2,154,556 | |||||||
DP World PLC | |||||||||
EUR | 2,240,000 | 2.375%, 9/25/26 | 2,865,849 | ||||||
Q-Park Holding I BV | |||||||||
EUR | 1,025,000 | 2.000% (3 Month | |||||||
EURIBOR + 2.000%), 3/1/26 1 | 1,215,401 | ||||||||
9,075,220 | |||||||||
| Utilities: 1.9% | |||||||||
Calpine Corp | |||||||||
525,000 | 4.625%, 2/1/29 | 540,634 | |||||||
525,000 | 5.000%, 2/1/31 | 549,413 | |||||||
Electricite de France SA | |||||||||
EUR | 2,200,000 | 2.875% (5 Year Swap Rate | |||||||
EUR + 3.373%), 12/15/26 1,2,4 | 2,832,772 | ||||||||
Israel Electric Corp Ltd | |||||||||
2,217,000 | 4.250%, 8/14/28 | 2,566,177 | |||||||
National Central Cooling Co PJSC | |||||||||
1,600,000 | 2.500%, 10/21/27 | 1,626,424 | |||||||
NextEra Energy | |||||||||
Operating Partners LP | |||||||||
1,925,000 | 4.250%, 7/15/24 | 2,062,156 | |||||||
10,177,576 | |||||||||
| TOTAL CORPORATE BONDS | |||||||||
| (Cost $432,026,960) | 458,814,142 | ||||||||
| CONVERTIBLE BONDS: 0.5% | |||||||||
| Banking: 0.5% | |||||||||
Societe Generale SA | |||||||||
2,400,000 | 5.000%, 1/17/24 | 2,651,814 | |||||||
| TOTAL CONVERTIBLE BONDS | |||||||||
| (Cost $2,610,079) | 2,651,814 | ||||||||
| Shares | |||||||||
| AFFILIATED MUTUAL FUNDS: 1.1% | |||||||||
604,708 | Muzinich High Income | ||||||||
Floating Rate Fund – | |||||||||
Institutional Class | 5,992,656 | ||||||||
| TOTAL AFFILIATED MUTUAL FUNDS | |||||||||
| (Cost $6,000,000) | 5,992,656 | ||||||||
The accompanying notes are an integral part of these financial statements.
23
Credit Opportunities Fund
SCHEDULE OF INVESTMENTS at December 31, 2020 (Continued) |
| Principal | |||||||
| Amount$ | Value | ||||||
| BANK LOANS: 10.1% | |||||||
| Aerospace/Defense: 0.2% | |||||||
TransDigm Inc | |||||||
1,243,719 | 2.397% (1 Month | ||||||
LIBOR + 2.250%), 12/9/25 1,5 | $ | 1,221,891 | |||||
| Automotive & Auto Parts: 0.7% | |||||||
Clarios Global LP | |||||||
1,221,213 | 3.647% (1 Month | ||||||
LIBOR + 3.500%), 4/30/26 1,5 | 1,219,430 | ||||||
First Brands Group LLC | |||||||
1,242,113 | 8.500% (3 Month | ||||||
LIBOR + 7.500%), 2/2/24 1,5 | 1,240,952 | ||||||
Wheel Pros T/L (10/20) | |||||||
1,050,000 | 6.250% (1 Month | ||||||
LIBOR + 5.250%), 11/8/27 1,5 | 1,036,350 | ||||||
3,496,732 | |||||||
| Broadcasting: 0.2% | |||||||
EW Scripps Co | |||||||
1,243,703 | 2.647% (1 Month | ||||||
LIBOR + 2.500%), 5/1/26 1,5 | 1,233,206 | ||||||
| Building Materials: 0.1% | |||||||
LBM Acquisition LLC | |||||||
325,000 | 4.500%, 12/31/27 1,5,6,7 | 325,406 | |||||
LBM Delayed Draw T/L | |||||||
72,222 | 4.500%, 12/31/27 1,5,6,7 | 72,313 | |||||
397,719 | |||||||
| Cable/Satellite TV: 0.7% | |||||||
CSC Holdings LLC | |||||||
1,243,557 | 2.409% (1 Month | ||||||
LIBOR + 2.250%), 7/17/25 1,5 | 1,228,012 | ||||||
UPC Financing Partnership | |||||||
625,000 | 3.673% (3 Month | ||||||
LIBOR + 3.500%), 1/31/29 1,5 | 627,891 | ||||||
625,000 | 3.677% (3 Months | ||||||
LIBOR + 3.500%), 1/31/29 1,5 | 627,891 | ||||||
Virgin Media Bristol LLC | |||||||
1,250,000 | 3.500%, 1/31/29 1,5,6,7 | 1,251,725 | |||||
3,735,519 | |||||||
| Capital Goods: 0.2% | |||||||
Arvos BidCo Sarl | |||||||
500,000 | 5.500%, 8/30/21 1,5,6,7 | 415,000 | |||||
Raymond Bartlett | |||||||
Snow Holding LLC | |||||||
500,000 | 5.500%, 8/30/21 1,5,6,7 | 415,000 | |||||
830,000 | |||||||
| Consumer-Products: 0.3% | |||||||
Energizer Holdings, Inc. | |||||||
689,167 | 2.750% (1 Month | ||||||
LIBOR + 2.250%), 12/16/27 1,4 | 690,462 | ||||||
500,000 | 2.750%, 12/16/27 1,5,6,7 | 500,940 | |||||
Kronos Acquisition Holdings, Inc. | |||||||
450,000 | 5.250%, 12/31/26 1,5,6,7 | 451,584 | |||||
1,642,986 | |||||||
| Diversified Financial Services: 0.2% | |||||||
Refinitiv US Holdings Inc | |||||||
1,243,655 | 3.397% (1 Month | ||||||
LIBOR + 3.250%), 10/1/25 1,5 | 1,243,400 | ||||||
| Diversified Media: 0.2% | |||||||
Clear Channel Outdoor Holdings B | |||||||
1,246,843 | 3.714% (3 Month | ||||||
LIBOR + 3.500%), 8/21/26 1,5 | 1,203,534 | ||||||
| Energy: 0.1% | |||||||
Consolidated Energy Finance SA | |||||||
696,429 | 2.645% (1 Month | ||||||
LIBOR + 2.500%), 5/7/25 1,5 | 667,701 | ||||||
| Food/Beverage/Tobacco: 0.8% | |||||||
Froneri US Inc | |||||||
1,243,750 | 2.397% (1 Month | ||||||
LIBOR +2.250%), 1/29/27 1,5 | 1,233,800 | ||||||
Upfield USA Corp. | |||||||
1,994,885 | 3.369%, 3/7/25 1,5,6,7 | 1,983,035 | |||||
US Foods Inc | |||||||
1,243,703 | 2.147% (1 Month | ||||||
LIBOR + 2.000%), 9/14/26 1,5 | 1,226,602 | ||||||
4,443,437 | |||||||
| Gaming: 0.2% | |||||||
Caesars Resort Collection LLC | |||||||
1,243,590 | 2.897% (1 Month | ||||||
LIBOR + 2.750%), 12/23/24 1,5 | 1,223,077 | ||||||
| Healthcare: 1.2% | |||||||
Auris Luxembourg III SARL | |||||||
1,243,672 | 3.897% (1 Month | ||||||
LIBOR + 3.750%), 2/27/26 1,5 | 1,204,807 | ||||||
Carestream Health, Inc. | |||||||
1,250,000 | 7.750%, 5/8/23 1,5,6,7 | 1,232,812 | |||||
MPH Acquisition Holdings LLC | |||||||
1,079,797 | 3.750%, 6/7/23 1,5,6,7 | 1,076,849 | |||||
Pluto Acquisition I, Inc. | |||||||
350,000 | 5.500%, 6/22/26 1,5,6,7 | 351,313 | |||||
Sedgwick Claims Management | |||||||
Services Inc | |||||||
1,169,036 | 3.397% (1 Month | ||||||
LIBOR + 3.250%), 12/31/25 1,5 | 1,152,722 | ||||||
The accompanying notes are an integral part of these financial statements.
24
Credit Opportunities Fund
SCHEDULE OF INVESTMENTS at December 31, 2020 (Continued) |
| Principal | |||||||
| Amount$ | Value | ||||||
| BANK LOANS: 10.1% (Continued) | |||||||
| Healthcare: 1.2% (Continued) | |||||||
US Outpatient/ | |||||||
US Radiology (12/20) T/L | |||||||
1,500,000 | 6.250% (3 Month | ||||||
LIBOR + 5.500%), 12/10/27 1,5 | $ | 1,493,902 | |||||
6,512,405 | |||||||
| Insurance: 0.7% | |||||||
Acrisure T/L B | |||||||
1,246,859 | 3.647% (1 Month | ||||||
LIBOR + 3.500%), 2/16/27 1,5 | 1,226,860 | ||||||
AssuredPartners Inc | |||||||
1,243,719 | 3.647% (1 Month | ||||||
LIBOR + 3.500%), 2/12/27 1,5 | 1,227,488 | ||||||
USI Holdings | |||||||
1,243,573 | 3.254% (3 Month | ||||||
LIBOR + 3.000%), 5/16/24 1,5 | 1,227,898 | ||||||
3,682,246 | |||||||
| Publishing/Printing: 0.2% | |||||||
Meredith | |||||||
1,000,000 | 2.646%, 1/31/25 1,5,6,7 | 991,875 | |||||
| Restaurants: 0.3% | |||||||
1011778 BC Unlimited | |||||||
Liability Company | |||||||
1,243,719 | 1.897% (1 Month | ||||||
LIBOR + 1.750%), 11/19/26 1,5 | 1,228,564 | ||||||
IRB Holding Corp. | |||||||
300,000 | 4.250%, 11/19/27 1,5,6,7 | 300,891 | |||||
Zaxby’s Operating | |||||||
Company T/L | |||||||
325,000 | 4.500% (1 Month | ||||||
LIBOR + 3.750), 12/28/27 1,5 | 326,219 | ||||||
1,855,674 | |||||||
| Services: 0.7% | |||||||
Aramark Services Inc | |||||||
1,243,734 | 1.895% (1 Month | ||||||
LIBOR + 1.750), 1/15/27 1,5 | 1,231,496 | ||||||
Revint Intermediate II LLC | |||||||
1,500,000 | 5.750% (1 Month | ||||||
LIBOR + 5.000%), 10/15/27 1,5 | 1,486,875 | ||||||
Summer BC Holdco B SARL | |||||||
1,250,000 | 4.980%, 12/4/26 1,5,6,7 | 1,232,287 | |||||
3,950,658 | |||||||
| Super Retail: 0.1% | |||||||
CP Atlas Buyer, Inc. | |||||||
350,000 | 5.250% (3 Month | ||||||
LIBOR + 4.500%), 11/23/27 1,5 | 351,181 | ||||||
100,000 | 5.250% (3 Month | ||||||
LIBOR + 4.500%), 11/23/27 1,5 | 100,338 | ||||||
451,519 | |||||||
| Technology: 1.7% | |||||||
Ahead Data Blue, LLC | |||||||
1,250,000 | 6.000% (3 Month | ||||||
LIBOR + 5.000%), 10/13/27 1,5 | 1,232,812 | ||||||
CT Technologies T/L | |||||||
625,000 | 6.000% (1 Month | ||||||
LIBOR + 5.000%), 12/10/25 1,5 | 624,219 | ||||||
Dawn Acquisition LLC | |||||||
1,596,193 | 4.004% (3 Month | ||||||
LIBOR + 3.750%), 12/31/25 1,5 | 1,473,318 | ||||||
DCert Buyer (Digicert) | |||||||
1,246,859 | 4.146%, 10/16/26 1,5,6,7 | 1,247,638 | |||||
LogMeIn Inc | |||||||
1,250,000 | 4.903% (1 Month | ||||||
LIBOR + 4.750%), 8/31/27 1,5 | 1,248,444 | ||||||
Plantronics Inc | |||||||
1,250,000 | 2.646% (1 Month | ||||||
LIBOR + 2.500%), 7/2/25 1,5 | 1,225,875 | ||||||
Surf Holdings LLC | |||||||
1,243,750 | 3.726% (3 Month | ||||||
LIBOR + 3.500%), 3/5/27 1,5 | 1,234,733 | ||||||
Synamedia Americas Holdings Inc | |||||||
926,273 | 6.220% (3 Months | ||||||
LIBOR + 6.000%), 10/31/24 1,5 | 840,593 | ||||||
9,127,632 | |||||||
| Telecommunications: 0.9% | |||||||
Altice Financing SA | |||||||
2,500,000 | 2.909%, 7/15/25 1,5,6,7 | 2,453,787 | |||||
Centurylink T/L B (1/20) | |||||||
1,246,851 | 2.397% (1 Month | ||||||
LIBOR + 2.250%), 3/15/27 1,5 | 1,235,630 | ||||||
Consolidated Communications Inc | |||||||
349,125 | 5.750% (1 Month | ||||||
LIBOR + 4.750%), 10/4/27 1,5 | 351,366 | ||||||
Telesat Canada | |||||||
1,024,724 | 2.900% (1 Month | ||||||
LIBOR + 2.750%), 12/7/26 1,5 | 1,017,326 | ||||||
5,058,109 | |||||||
The accompanying notes are an integral part of these financial statements.
25
Credit Opportunities Fund
SCHEDULE OF INVESTMENTS at December 31, 2020 (Continued) |
| Principal | |||||||
| Amount$ | Value | ||||||
| Utilities: 0.4% | |||||||
Edgewater Generation LLC | |||||||
1,236,272 | 3.896% (1 Month | ||||||
LIBOR + 3.750%), 12/12/25 1,5 | $ | 1,214,557 | |||||
Exgen Renewables IV LLC | |||||||
675,000 | 3.750% (3 Months | ||||||
LIBOR + 2.750%), 12/11/27 1,5 | 676,013 | ||||||
1,890,570 | |||||||
| TOTAL BANK LOANS | |||||||
(Cost $54,124,367) | 54,859,890 | ||||||
| TOTAL INVESTMENTS IN SECURITIES: 96.5% | |||||||
(Cost $494,761,406) | 522,318,502 | ||||||
Other Assets in Excess of Liabilities: 3.5% | 18,807,337 | ||||||
| TOTAL NET ASSETS: 100.0% | $ | 541,125,839 | |||||
| † | In U.S. Dollars unless otherwise indicated. |
CMT – United States Constant Maturity Treasury Note
EUR – Euro
EURIBOR – Euro Interbank Offered Rate
GBP – Great Britain Pound
LIBOR – London Interbank Offered Rate
USD – United States Dollar
1 | Variable rate security; rate shown is the rate in effect on December 31, 2020. An index may have a negative rate. Interest rate may also be subject to a cap or floor. |
2 | Fixed-to-variable or fixed-to-float bond; rate shown is the rate in effect on December 31, 2020. An index may have a negative rate. Interest rate may also be subject to a ceiling or floor. |
3 | Zero coupon security. |
4 | Perpetual call date security. Date shown is next call date. |
5 | Bank loans generally pay interest at rates which are periodically determined by reference to a base lending rate plus a premium. All loans carry a variable rate of interest. These base lending rates are generally (i) the Prime Rate offered by one or more major United States banks, (ii) the lending rate offered by one or more European banks such as the London Interbank Offered Rate (“LIBOR”) or (iii) the Certificate of Deposit rate. Bank Loans, while exempt from registration, under the Securities Act of 1933, contain certain restrictions on resale and cannot be sold publicly. Floating rate bank loans often require prepayments from excess cash flow or permit the borrower to repay at its election. The degree to which borrowers repay, whether as a contractual requirement or at their election, cannot be predicted with accuracy. |
6 | All or a portion of the loan may be unfunded. |
7 | Denotes investments purchased on a when-issued or delayed delivery basis. |
SCHEDULE OF FORWARD FOREIGN CURRENCY EXCHANGE CONTRACTS at December 31, 2020 |
The Credit Opportunities Fund had the following forward foreign currency exchange contracts outstanding with the Bank of New York.
| Currency to be | U.S. Dollar Value at | Currency to be | U.S. Dollar Value at | Unrealized Appreciation | |||||||||||
| Settlement Date | Delivered | December 31, 2020 | Received | December 31, 2020 | (Depreciation) | ||||||||||
| 3/15/21 | EUR 77,000,000 | $ | 94,226,563 | $ | 93,604,400 | $ | 93,604,400 | $ | (622,163 | ) | |||||
| 3/15/21 | GBP 3,700,000 | 5,062,100 | $ | 4,894,867 | 4,894,867 | (167,233 | ) | ||||||||
$ | 99,288,663 | $ | 98,499,267 | $ | (789,396 | ) | |||||||||
The accompanying notes are an integral part of these financial statements.
26
U.S. High Yield Fund
SCHEDULE OF INVESTMENTS at December 31, 2020 |
| Principal | |||||||
| Amount | Value | ||||||
| CORPORATE BONDS: 89.7% | |||||||
| Aerospace/Defense: 0.8% | |||||||
Bombardier Inc | |||||||
$ | 150,000 | 6.000%, 10/15/22 | $ | 147,623 | |||
PM General Purchaser LLC | |||||||
75,000 | 9.500%, 10/1/28 | 83,156 | |||||
Spirit AeroSystems, Inc. | |||||||
150,000 | 7.500%, 4/15/25 | 161,157 | |||||
TransDigm Inc | |||||||
170,000 | 6.250%, 3/15/26 | 181,263 | |||||
573,199 | |||||||
| Airlines: 1.6% | |||||||
Delta Air Lines Inc | |||||||
275,000 | 7.375%, 1/15/26 | 314,397 | |||||
Delta Air Lines Inc / SkyMiles IP Ltd | |||||||
100,000 | 4.750%, 10/20/28 | 109,273 | |||||
Mileage Plus Holdings LLC / | |||||||
Mileage Plus Intellectual | |||||||
Property Assets Ltd | |||||||
150,000 | 6.500%, 6/20/27 | 161,531 | |||||
Spirit Loyalty Cayman Ltd / | |||||||
Spirit IP Cayman Ltd. | |||||||
275,000 | 8.000%, 9/20/25 | 309,375 | |||||
United Airlines Holdings Inc | |||||||
175,000 | 4.250%, 10/1/22 | 176,094 | |||||
1,070,670 | |||||||
| Automotive & Auto Parts: 4.3% | |||||||
American Axle & Manufacturing Inc | |||||||
465,000 | 6.250%, 4/1/25 | 481,856 | |||||
American Axle & Manufacturing Inc | |||||||
125,000 | 6.250%, 3/15/26 | 128,906 | |||||
Clarios Global LP / Clarios US Finance Co | |||||||
125,000 | 8.500%, 5/15/27 | 136,008 | |||||
Dana Inc | |||||||
150,000 | 5.500%, 12/15/24 | 153,281 | |||||
Ford Motor Co | |||||||
550,000 | 9.000%, 4/22/25 | 675,012 | |||||
Ford Motor Credit Co LLC | |||||||
200,000 | 4.250%, 9/20/22 | 206,760 | |||||
450,000 | 5.113%, 5/3/29 | 501,728 | |||||
200,000 | 4.000%, 11/13/30 | 210,250 | |||||
Tenneco, Inc. | |||||||
350,000 | 7.875%, 1/15/29 | 393,622 | |||||
Winnebago Industries Inc | |||||||
50,000 | 6.250%, 7/15/28 | 53,844 | |||||
2,941,267 | |||||||
| Banking: 2.4% | |||||||
Dresdner Funding Trust I | |||||||
350,000 | 8.151%, 6/30/31 | 517,552 | |||||
Natwest Group PLC | |||||||
400,000 | 2.574% (3 Month LIBOR | ||||||
USD + 2.320%), 12/30/67 1,2 | 382,120 | ||||||
Standard Chartered PLC | |||||||
400,000 | 7.014% (3 Month LIBOR | ||||||
USD + 1.460%), 1/30/68 1,2 | 520,000 | ||||||
UniCredit SPA | |||||||
200,000 | 7.296% (5 Year Mid Swap Rate | ||||||
USD + 4.914%), 4/2/34 1,3 | 241,902 | ||||||
1,661,574 | |||||||
| Broadcasting: 4.9% | |||||||
Belo Corp | |||||||
125,000 | 7.750%, 6/1/27 | 146,128 | |||||
50,000 | 7.250%, 9/15/27 | 57,678 | |||||
Diamond Sports Group LLC / | |||||||
Diamond Sports Finance Co | |||||||
175,000 | 5.375%, 8/15/26 | 142,516 | |||||
Gray Television Inc | |||||||
425,000 | 5.875%, 7/15/26 | 446,516 | |||||
25,000 | 7.000%, 5/15/27 | 27,406 | |||||
225,000 | 4.750%, 10/15/30 | 229,641 | |||||
iHeartCommunications Inc | |||||||
175,000 | 8.375%, 5/1/27 | 187,123 | |||||
Netflix Inc | |||||||
100,000 | 4.875%, 4/15/28 | 112,933 | |||||
150,000 | 4.875%, 6/15/30 | 172,781 | |||||
Nexstar Broadcasting Inc | |||||||
50,000 | 5.625%, 7/15/27 | 53,641 | |||||
175,000 | 4.750%, 11/1/28 | 183,422 | |||||
Scripps Escrow II, Inc. | |||||||
225,000 | 5.375%, 1/15/31 | 234,984 | |||||
Scripps Escrow Inc | |||||||
475,000 | 5.875%, 7/15/27 | 496,826 | |||||
Sinclair Television Group Inc | |||||||
75,000 | 5.875%, 3/15/26 | 77,380 | |||||
150,000 | 5.125%, 2/15/27 | 153,454 | |||||
Sinclair Television Group Inc | |||||||
75,000 | 4.125%, 12/1/30 | 76,883 | |||||
Sirius XM Radio Inc | |||||||
150,000 | 4.625%, 7/15/24 | 155,625 | |||||
TEGNA Inc | |||||||
275,000 | 4.625%, 3/15/28 | 281,703 | |||||
150,000 | 5.000%, 9/15/29 | 158,604 | |||||
3,395,244 | |||||||
| Building Materials: 3.1% | |||||||
Beacon Roofing Supply Inc | |||||||
275,000 | 4.875%, 11/1/25 | 282,030 | |||||
BMC East LLC | |||||||
125,000 | 5.500%, 10/1/24 | 128,437 | |||||
Cornerstone Building Brands Inc | |||||||
225,000 | 6.125%, 1/15/29 | 239,484 | |||||
Forterra Finance LLC / | |||||||
FRTA Finance Corp | |||||||
100,000 | 6.500%, 7/15/25 | 107,688 | |||||
The accompanying notes are an integral part of these financial statements.
27
U.S. High Yield Fund
SCHEDULE OF INVESTMENTS at December 31, 2020 (Continued) |
| Principal | |||||||
| Amount | Value | ||||||
| CORPORATE BONDS: 89.7% (Continued) | |||||||
| Building Materials: 3.1% (Continued) | |||||||
LBM Acquisition LLC | |||||||
$ | 125,000 | 6.250%, 1/15/29 | $ | 129,297 | |||
New Enterprise Stone & Lime Co Inc | |||||||
300,000 | 6.250%, 3/15/26 | 308,063 | |||||
Srm Escrow Issuer Llc | |||||||
300,000 | 6.000%, 11/1/28 | 316,125 | |||||
SRS Distribution Inc | |||||||
150,000 | 8.250%, 7/1/26 | 159,750 | |||||
WESCO Distribution Inc | |||||||
150,000 | 7.125%, 6/15/25 | 165,173 | |||||
250,000 | 7.250%, 6/15/28 | 284,674 | |||||
2,120,721 | |||||||
| Cable/Satellite TV: 5.2% | |||||||
CCO Holdings LLC / | |||||||
CCO Holdings Capital Corp | |||||||
325,000 | 5.500%, 5/1/26 | 337,238 | |||||
25,000 | 5.875%, 5/1/27 | 25,994 | |||||
100,000 | 5.000%, 2/1/28 | 105,850 | |||||
150,000 | 5.375%, 6/1/29 | 164,608 | |||||
100,000 | 4.750%, 3/1/30 | 108,025 | |||||
75,000 | 4.500%, 5/1/32 | 80,173 | |||||
CSC Holdings LLC | |||||||
200,000 | 5.375%, 2/1/28 | 214,000 | |||||
200,000 | 7.500%, 4/1/28 | 225,277 | |||||
200,000 | 5.750%, 1/15/30 | 219,501 | |||||
200,000 | 4.625%, 12/1/30 | 209,027 | |||||
DISH DBS Corp | |||||||
275,000 | 5.875%, 11/15/24 | 288,750 | |||||
Midcontinent Communications / | |||||||
Midcontinent Finance Corp | |||||||
275,000 | 5.375%, 8/15/27 | 288,354 | |||||
Radiate Holdco LLC / Radiate Finance Inc | |||||||
150,000 | 6.500%, 9/15/28 | 158,344 | |||||
UPC Holding BV | |||||||
875,000 | 5.500%, 1/15/28 | 924,765 | |||||
Virgin Media Secured Finance PLC | |||||||
200,000 | 5.500%, 8/15/26 | 208,125 | |||||
3,558,031 | |||||||
| Capital Goods: 2.5% | |||||||
Amsted Industries Inc | |||||||
250,000 | 4.625%, 5/15/30 | 262,344 | |||||
ATS Automation Tooling Systems Inc | |||||||
125,000 | 6.500%, 6/15/23 | 127,203 | |||||
ATS Automation Tooling Systems Inc | |||||||
100,000 | 4.125%, 12/15/28 | 102,000 | |||||
BCD Acquisition Inc | |||||||
475,000 | 9.625%, 9/15/23 | 487,469 | |||||
GrafTech Finance, Inc. | |||||||
75,000 | 4.625%, 12/15/28 | 75,937 | |||||
Griffon Corp | |||||||
200,000 | 5.750%, 3/1/28 | 211,750 | |||||
JB Poindexter & Co Inc | |||||||
175,000 | 7.125%, 4/15/26 | 185,500 | |||||
Manitowoc Co Inc | |||||||
275,000 | 9.000%, 4/1/26 | 297,516 | |||||
1,749,719 | |||||||
| Chemicals: 3.1% | |||||||
Compass Minerals International Inc | |||||||
150,000 | 6.750%, 12/1/27 | 162,628 | |||||
CVR Partners LP / | |||||||
CVR Nitrogen Finance Corp | |||||||
300,000 | 9.250%, 6/15/23 | 300,687 | |||||
Koppers Inc | |||||||
350,000 | 6.000%, 2/15/25 | 361,156 | |||||
Kraton Polymers LLC / | |||||||
Kraton Polymers Capital Corp | |||||||
275,000 | 7.000%, 4/15/25 | 289,713 | |||||
Kraton Polymers LLC / | |||||||
Kraton Polymers Capital Corp. | |||||||
75,000 | 4.250%, 12/15/25 | 76,601 | |||||
Neon Holdings Inc | |||||||
100,000 | 10.125%, 4/1/26 | 109,750 | |||||
NOVA Chemicals Corp | |||||||
300,000 | 5.250%, 6/1/27 | 320,031 | |||||
Rayonier AM Products, Inc. | |||||||
475,000 | 7.625%, 1/15/26 | 495,900 | |||||
2,116,466 | |||||||
| Consumer-Products: 0.5% | |||||||
Kronos Acquisition Holdings Inc / | |||||||
KIK Custom Products, Inc. | |||||||
25,000 | 5.000%, 12/31/26 | 26,143 | |||||
150,000 | 7.000%, 12/31/27 | 157,334 | |||||
Mattel, Inc. | |||||||
150,000 | 6.750%, 12/31/25 | 158,470 | |||||
341,947 | |||||||
| Containers: 0.7% | |||||||
Ardagh Packaging Finance PLC / | |||||||
Ardagh Holdings USA Inc | |||||||
400,000 | 5.250%, 8/15/27 | 420,324 | |||||
Berry Global Inc | |||||||
75,000 | 4.875%, 7/15/26 | 80,643 | |||||
500,967 | |||||||
| Diversified Financial Services: 3.6% | |||||||
Alliance Data Systems Corp | |||||||
450,000 | 4.750%, 12/15/24 | 455,344 | |||||
225,000 | 7.000%, 1/15/26 | 238,427 | |||||
Fairstone Financial Inc | |||||||
175,000 | 7.875%, 7/15/24 | 186,029 | |||||
The accompanying notes are an integral part of these financial statements.
28
U.S. High Yield Fund
SCHEDULE OF INVESTMENTS at December 31, 2020 (Continued) |
| Principal | |||||||
| Amount | Value | ||||||
| CORPORATE BONDS: 89.7% (Continued) | |||||||
| Diversified Financial Services: 3.6% (Continued) | |||||||
Icahn Enterprises LP / | |||||||
Icahn Enterprises Finance Corp | |||||||
$ | 100,000 | 6.250%, 2/1/22 | $ | 100,472 | |||
75,000 | 6.750%, 2/1/24 | 76,461 | |||||
175,000 | 4.750%, 9/15/24 | 182,055 | |||||
125,000 | 6.250%, 5/15/26 | 132,655 | |||||
125,000 | 5.250%, 5/15/27 | 134,313 | |||||
Ladder Capital Finance Holdings LLLP / | |||||||
Ladder Capital Finance Corp | |||||||
275,000 | 5.250%, 10/1/25 | 274,828 | |||||
Navient Corp | |||||||
150,000 | 6.500%, 6/15/22 | 159,111 | |||||
OneMain Finance Corp | |||||||
387,000 | 8.875%, 6/1/25 | 438,510 | |||||
75,000 | 7.125%, 3/15/26 | 88,781 | |||||
2,466,986 | |||||||
| Diversified Media: 1.1% | |||||||
Advantage Sales & Marketing Inc | |||||||
250,000 | 6.500%, 11/15/28 | 264,844 | |||||
Clear Channel Worldwide Holdings Inc | |||||||
125,000 | 5.125%, 8/15/27 | 126,406 | |||||
Nielsen Finance LLC / | |||||||
Nielsen Finance Co | |||||||
36,000 | 5.000%, 4/15/22 | 36,131 | |||||
175,000 | 5.625%, 10/1/28 | 190,474 | |||||
100,000 | 5.875%, 10/1/30 | 113,313 | |||||
731,168 | |||||||
| Energy: 13.7% | |||||||
Antero Resources Corp | |||||||
150,000 | 5.125%, 12/1/22 | 149,850 | |||||
100,000 | 5.625%, 6/1/23 | 98,125 | |||||
Antero Resources Corp | |||||||
75,000 | 8.375%, 7/15/26 | 76,739 | |||||
Apache Corp | |||||||
100,000 | 3.250%, 4/15/22 | 101,000 | |||||
300,000 | 5.100%, 9/1/40 | 320,437 | |||||
Archrock Partners LP / | |||||||
Archrock Partners Finance Corp | |||||||
350,000 | 6.250%, 4/1/28 | 365,211 | |||||
Blue Racer Midstream LLC / | |||||||
Blue Racer Finance Corp | |||||||
150,000 | 6.625%, 7/15/26 | 151,500 | |||||
Blue Racer Midstream LLC / | |||||||
Blue Racer Finance Corp | |||||||
100,000 | 7.625%, 12/15/25 | 106,750 | |||||
Buckeye Partners LP | |||||||
100,000 | 4.150%, 7/1/23 | 103,062 | |||||
125,000 | 3.950%, 12/1/26 | 126,938 | |||||
50,000 | 5.600%, 10/15/44 | 48,219 | |||||
CITGO Petroleum Corp | |||||||
325,000 | 6.250%, 8/15/22 | 319,312 | |||||
200,000 | 7.000%, 6/15/25 | 199,875 | |||||
Consolidated Energy Finance SA | |||||||
150,000 | 3.967% (3 Month LIBOR | ||||||
USD + 3.750%), 6/15/22 1,2 | 147,282 | ||||||
350,000 | 6.875%, 6/15/25 | 355,469 | |||||
CrownRock LP / CrownRock Finance Inc | |||||||
225,000 | 5.625%, 10/15/25 | 230,199 | |||||
DCP Midstream Operating LP | |||||||
125,000 | 5.600%, 4/1/44 | 129,439 | |||||
Delek Logistics Partners LP / | |||||||
Delek Logistics Finance Corp | |||||||
100,000 | 6.750%, 5/15/25 | 97,365 | |||||
EQM Midstream Partners LP | |||||||
75,000 | 6.500%, 7/1/27 | 84,559 | |||||
300,000 | 6.500%, 7/15/48 | 312,469 | |||||
Genesis Energy LP / | |||||||
Genesis Energy Finance Corp | |||||||
200,000 | 5.625%, 6/15/24 | 195,375 | |||||
175,000 | 7.750%, 2/1/28 | 167,727 | |||||
Genesis Energy LP / | |||||||
Genesis Energy Finance Corp | |||||||
150,000 | 8.000%, 1/15/27 | 148,905 | |||||
Global Partners LP / GLP Finance Corp | |||||||
350,000 | 7.000%, 8/1/27 | 375,527 | |||||
225,000 | 6.875%, 1/15/29 | 243,985 | |||||
Harvest Midstream I LP | |||||||
325,000 | 7.500%, 9/1/28 | 346,531 | |||||
Holly Energy Partners LP / | |||||||
Holly Energy Finance Corp | |||||||
150,000 | 5.000%, 2/1/28 | 151,406 | |||||
Matador Resources Co | |||||||
300,000 | 5.875%, 9/15/26 | 294,375 | |||||
MEG Energy Corp | |||||||
150,000 | 7.000%, 3/31/24 | 151,875 | |||||
150,000 | 7.125%, 2/1/27 | 155,250 | |||||
Murphy Oil Corp | |||||||
150,000 | 6.375%, 12/1/42 | 132,563 | |||||
Murphy Oil Corp. | |||||||
75,000 | 5.875%, 12/1/27 | 74,321 | |||||
Occidental Petroleum Corp | |||||||
50,000 | 8.500%, 7/15/27 | 57,796 | |||||
75,000 | 8.875%, 7/15/30 | 88,172 | |||||
350,000 | 6.625%, 9/1/30 | 380,538 | |||||
250,000 | 6.450%, 9/15/36 | 262,125 | |||||
225,000 | 4.400%, 4/15/46 | 196,463 | |||||
200,000 | 4.100%, 2/15/47 | 163,865 | |||||
Occidental Petroleum Corp | |||||||
75,000 | 5.500%, 12/1/25 | 78,336 | |||||
PBF Holding Co LLC / PBF Finance Corp. | |||||||
250,000 | 6.000%, 2/15/28 | 143,281 | |||||
Rockies Express Pipeline LLC | |||||||
225,000 | 4.950%, 7/15/29 | 234,449 | |||||
175,000 | 4.800%, 5/15/30 | 179,819 | |||||
The accompanying notes are an integral part of these financial statements.
29
U.S. High Yield Fund
SCHEDULE OF INVESTMENTS at December 31, 2020 (Continued) |
| Principal | |||||||
| Amount | Value | ||||||
| CORPORATE BONDS: 89.7% (Continued) | |||||||
| Energy: 13.7% (Continued) | |||||||
Southwestern Energy Co | |||||||
$ | 175,000 | 6.450%, 1/23/25 | $ | 182,328 | |||
125,000 | 7.500%, 4/1/26 | 131,312 | |||||
75,000 | 8.375%, 9/15/28 | 81,516 | |||||
Tallgrass Energy Partners LP / | |||||||
Tallgrass Energy Finance Corp | |||||||
208,000 | 7.500%, 10/1/25 | 224,945 | |||||
Tallgrass Energy Partners LP / | |||||||
Tallgrass Energy Finance Corp | |||||||
175,000 | 6.000%, 12/31/30 | 180,412 | |||||
Targa Resources Partners LP / | |||||||
Targa Resources Partners Finance Corp | |||||||
125,000 | 4.250%, 11/15/23 | 125,951 | |||||
USA Compression Partners LP / | |||||||
USA Compression Finance Corp | |||||||
100,000 | 6.875%, 9/1/27 | 106,927 | |||||
Western Midstream Operating LP | |||||||
125,000 | 4.650%, 7/1/26 | 131,486 | |||||
100,000 | 5.500%, 8/15/48 | 98,659 | |||||
150,000 | 6.250%, 2/1/50 | 165,269 | |||||
WPX Energy Inc | |||||||
100,000 | 5.250%, 10/15/27 | 106,131 | |||||
150,000 | 4.500%, 1/15/30 | 159,225 | |||||
9,440,645 | |||||||
| Food & Drug Retail: 1.0% | |||||||
Albertsons Cos Inc / Safeway Inc / | |||||||
New Albertsons LP / Albertsons LLC | |||||||
82,000 | 5.750%, 3/15/25 | 84,759 | |||||
125,000 | 7.500%, 3/15/26 | 140,116 | |||||
100,000 | 4.625%, 1/15/27 | 106,480 | |||||
50,000 | 5.875%, 2/15/28 | 54,494 | |||||
Parkland Corp/Canada | |||||||
150,000 | 6.000%, 4/1/26 | 157,781 | |||||
100,000 | 5.875%, 7/15/27 | 108,311 | |||||
651,941 | |||||||
| Food/Beverage/Tobacco: 2.8% | |||||||
C&S Group Enterprises LLC | |||||||
150,000 | 5.000%, 12/15/28 | 149,749 | |||||
Herbalife Nutrition Ltd / | |||||||
HLF Financing Inc | |||||||
425,000 | 7.875%, 9/1/25 | 464,844 | |||||
Kraft Heinz Foods Co | |||||||
100,000 | 3.000%, 6/1/26 | 104,502 | |||||
175,000 | 5.000%, 7/15/35 | 212,365 | |||||
125,000 | 4.375%, 6/1/46 | 135,453 | |||||
Post Holdings Inc | |||||||
100,000 | 5.500%, 12/15/29 | 109,252 | |||||
175,000 | 4.625%, 4/15/30 | 184,312 | |||||
Sigma Holdco BV | |||||||
200,000 | 7.875%, 5/15/26 | 205,463 | |||||
Simmons Foods Inc | |||||||
350,000 | 5.750%, 11/1/24 | 358,313 | |||||
1,924,253 | |||||||
| Gaming: 2.7% | |||||||
Caesars Entertainment Inc | |||||||
400,000 | 6.250%, 7/1/25 | 426,502 | |||||
250,000 | 8.125%, 7/1/27 | 277,082 | |||||
MGM Resorts International | |||||||
250,000 | 6.750%, 5/1/25 | 270,994 | |||||
Scientific Games International Inc | |||||||
325,000 | 5.000%, 10/15/25 | 335,770 | |||||
Wynn Las Vegas LLC / | |||||||
Wynn Las Vegas Capital Corp | |||||||
225,000 | 5.500%, 3/1/25 | 235,125 | |||||
Wynn Resorts Finance LLC / | |||||||
Wynn Resorts Capital Corp | |||||||
297,000 | 7.750%, 4/15/25 | 322,235 | |||||
1,867,708 | |||||||
| Healthcare: 9.3% | |||||||
AMN Healthcare Inc | |||||||
125,000 | 4.625%, 10/1/27 | 131,181 | |||||
200,000 | 4.000%, 4/15/29 | 205,000 | |||||
Bausch Health Americas Inc | |||||||
175,000 | 9.250%, 4/1/26 | 195,353 | |||||
200,000 | 8.500%, 1/31/27 | 222,717 | |||||
Bausch Health Cos Inc | |||||||
275,000 | 6.125%, 4/15/25 | 283,706 | |||||
275,000 | 9.000%, 12/15/25 | 304,102 | |||||
25,000 | 5.000%, 1/30/28 | 25,795 | |||||
25,000 | 6.250%, 2/15/29 | 27,192 | |||||
Bausch Health Cos Inc | |||||||
75,000 | 5.000%, 2/15/29 | 77,256 | |||||
100,000 | 5.250%, 2/15/31 | 104,659 | |||||
Centene Corp | |||||||
150,000 | 5.375%, 8/15/26 | 158,812 | |||||
275,000 | 4.250%, 12/15/27 | 292,137 | |||||
150,000 | 4.625%, 12/15/29 | 166,726 | |||||
Cheplapharm Arzneimittel GmbH | |||||||
200,000 | 5.500%, 1/15/28 | 209,250 | |||||
DaVita Inc | |||||||
225,000 | 4.625%, 6/1/30 | 238,922 | |||||
225,000 | 3.750%, 2/15/31 | 228,878 | |||||
Encompass Health Corp | |||||||
50,000 | 5.125%, 3/15/23 | 50,255 | |||||
150,000 | 4.625%, 4/1/31 | 160,688 | |||||
HCA Inc | |||||||
300,000 | 5.875%, 2/15/26 | 345,375 | |||||
Legacy LifePoint Health LLC | |||||||
650,000 | 6.750%, 4/15/25 | 699,601 | |||||
25,000 | 4.375%, 2/15/27 | 25,094 | |||||
The accompanying notes are an integral part of these financial statements.
30
U.S. High Yield Fund
SCHEDULE OF INVESTMENTS at December 31, 2020 (Continued) |
| Principal | |||||||
| Amount | Value | ||||||
| CORPORATE BONDS: 89.7% (Continued) | |||||||
| Healthcare: 9.3% (Continued) | |||||||
Mallinckrodt International Finance SA / | |||||||
Mallinckrodt CB LLC | |||||||
$ | 100,000 | 5.750%, 8/1/22 | $ | 35,000 | |||
MPH Acquisition Holdings LLC | |||||||
225,000 | 5.750%, 11/1/28 | 221,411 | |||||
MPT Operating Partnership LP / | |||||||
MPT Finance Corp | |||||||
150,000 | 4.625%, 8/1/29 | 160,570 | |||||
Ortho-Clinical Diagnostics Inc / | |||||||
Ortho-Clinical Diagnostics SA | |||||||
400,000 | 7.375%, 6/1/25 | 426,750 | |||||
Prime Healthcare Services Inc | |||||||
225,000 | 7.250%, 11/1/25 | 239,344 | |||||
RP Escrow Issuer LLC | |||||||
100,000 | 5.250%, 12/15/25 | 104,631 | |||||
Sabra Health Care LP | |||||||
125,000 | 5.125%, 8/15/26 | 139,529 | |||||
Select Medical Corp | |||||||
150,000 | 6.250%, 8/15/26 | 161,769 | |||||
Tenet Healthcare Corp | |||||||
300,000 | 4.625%, 7/15/24 | 307,806 | |||||
175,000 | 7.500%, 4/1/25 | 191,435 | |||||
150,000 | 5.125%, 5/1/25 | 153,111 | |||||
Verscend Escrow Corp | |||||||
75,000 | 9.750%, 8/15/26 | 81,422 | |||||
6,375,477 | |||||||
| Homebuilders/Real Estate: 5.6% | |||||||
AECOM | |||||||
137,000 | 5.875%, 10/15/24 | 153,136 | |||||
61,000 | 5.125%, 3/15/27 | 68,100 | |||||
Ashton Woods USA LLC / | |||||||
Ashton Woods Finance Co | |||||||
100,000 | 6.625%, 1/15/28 | 105,500 | |||||
Brookfield Residential Properties Inc / | |||||||
Brookfield Residential US Corp | |||||||
175,000 | 6.250%, 9/15/27 | 186,484 | |||||
Century Communities Inc | |||||||
75,000 | 6.750%, 6/1/27 | 80,295 | |||||
Empire Communities Corp. | |||||||
50,000 | 7.000%, 12/15/25 | 52,818 | |||||
HAT Holdings I LLC / | |||||||
HAT Holdings II LLC | |||||||
200,000 | 5.250%, 7/15/24 | 208,396 | |||||
300,000 | 6.000%, 4/15/25 | 321,375 | |||||
200,000 | 3.750%, 9/15/30 | 208,500 | |||||
Howard Hughes Corp | |||||||
125,000 | 5.375%, 8/1/28 | 134,672 | |||||
Iron Mountain Inc | |||||||
300,000 | 5.250%, 7/15/30 | 324,375 | |||||
Mattamy Group Corp | |||||||
100,000 | 5.250%, 12/15/27 | 106,062 | |||||
Pike Corp | |||||||
75,000 | 5.500%, 9/1/28 | 79,406 | |||||
PowerTeam Services LLC | |||||||
200,000 | 9.033%, 12/4/25 | 223,022 | |||||
Service Properties Trust | |||||||
50,000 | 5.000%, 8/15/22 | 51,000 | |||||
50,000 | 4.500%, 6/15/23 | 50,344 | |||||
125,000 | 4.650%, 3/15/24 | 123,984 | |||||
300,000 | 4.350%, 10/1/24 | 296,625 | |||||
100,000 | 5.500%, 12/15/27 | 109,428 | |||||
Shea Homes LP / Shea Homes | |||||||
Funding Corp | |||||||
100,000 | 4.750%, 2/15/28 | 103,688 | |||||
Starwood Property Trust Inc | |||||||
75,000 | 5.500%, 11/1/23 | 78,469 | |||||
Taylor Morrison Communities Inc | |||||||
100,000 | 6.625%, 7/15/27 | 108,450 | |||||
75,000 | 5.125%, 8/1/30 | 84,141 | |||||
Uniti Group LP / Uniti Fiber Holdings | |||||||
Inc / CSL Capital LLC | |||||||
275,000 | 7.875%, 2/15/25 | 295,833 | |||||
Uniti Group LP / Uniti Group Finance | |||||||
Inc / CSL Capital LLC | |||||||
275,000 | 6.000%, 4/15/23 | 281,016 | |||||
3,835,119 | |||||||
| Hotels: 0.1% | |||||||
Park Intermediate Holdings LLC / | |||||||
PK Domestic Property LLC / | |||||||
PK Finance Co-Issuer | |||||||
50,000 | 5.875%, 10/1/28 | 53,344 | |||||
| Insurance: 0.4% | |||||||
Acrisure LLC / Acrisure Finance Inc | |||||||
150,000 | 8.125%, 2/15/24 | 159,144 | |||||
GTCR AP Finance Inc | |||||||
125,000 | 8.000%, 5/15/27 | 136,056 | |||||
295,200 | |||||||
| Leisure: 1.1% | |||||||
Carnival Corp | |||||||
100,000 | 10.500%, 2/1/26 | 116,625 | |||||
NCL Corp Ltd. | |||||||
350,000 | 5.875%, 3/15/26 | 368,793 | |||||
Royal Caribbean Cruises Ltd. | |||||||
275,000 | 9.125%, 6/15/23 | 298,719 | |||||
784,137 | |||||||
| Metals/Mining: 3.3% | |||||||
Cleveland-Cliffs Inc | |||||||
100,000 | 9.875%, 10/17/25 | 117,750 | |||||
275,000 | 6.750%, 3/15/26 | 297,344 | |||||
50,000 | 5.875%, 6/1/27 | 51,062 | |||||
The accompanying notes are an integral part of these financial statements.
31
U.S. High Yield Fund
SCHEDULE OF INVESTMENTS at December 31, 2020 (Continued) |
| Principal | |||||||
| Amount | Value | ||||||
| CORPORATE BONDS: 89.7% (Continued) | |||||||
| Metals/Mining: 3.3% (Continued) | |||||||
First Quantum Minerals Ltd | |||||||
$ | 275,000 | 7.500%, 4/1/25 | $ | 286,688 | |||
Grinding Media Inc / | |||||||
Moly-Cop AltaSteel Ltd | |||||||
125,000 | 7.375%, 12/15/23 | 127,188 | |||||
Hudbay Minerals Inc | |||||||
240,000 | 7.625%, 1/15/25 | 249,750 | |||||
100,000 | 6.125%, 4/1/29 | 108,000 | |||||
Novelis Corp | |||||||
175,000 | 5.875%, 9/30/26 | 183,094 | |||||
75,000 | 4.750%, 1/30/30 | 80,943 | |||||
Perenti Finance Pty Ltd | |||||||
300,000 | 6.500%, 10/7/25 | 319,809 | |||||
Rain CII Carbon LLC / CII Carbon Corp | |||||||
50,000 | 7.250%, 4/1/25 | 50,906 | |||||
SunCoke Energy Partners LP / | |||||||
SunCoke Energy Partners Finance Corp | |||||||
425,000 | 7.500%, 6/15/25 | 422,694 | |||||
2,295,228 | |||||||
| Paper: 0.6% | |||||||
Enviva Partners LP / | |||||||
Enviva Partners Finance Corp | |||||||
125,000 | 6.500%, 1/15/26 | 133,047 | |||||
Mercer International Inc | |||||||
250,000 | 6.500%, 2/1/24 | 254,062 | |||||
50,000 | 7.375%, 1/15/25 | 52,126 | |||||
439,235 | |||||||
| Publishing/Printing: 0.5% | |||||||
Cimpress PLC | |||||||
300,000 | 7.000%, 6/15/26 | 316,443 | |||||
| Restaurants: 1.4% | |||||||
1011778 BC ULC / New Red Finance Inc | |||||||
100,000 | 3.875%, 1/15/28 | 101,727 | |||||
400,000 | 4.000%, 10/15/30 | 405,872 | |||||
IRB Holding Corp | |||||||
100,000 | 7.000%, 6/15/25 | 109,427 | |||||
300,000 | 6.750%, 2/15/26 | 310,125 | |||||
927,151 | |||||||
| Services: 1.2% | |||||||
ASGN Inc | |||||||
100,000 | 4.625%, 5/15/28 | 104,169 | |||||
Garda World Security Corp | |||||||
225,000 | 4.625%, 2/15/27 | 227,812 | |||||
136,000 | 9.500%, 11/1/27 | 150,850 | |||||
Sabre GLBL Inc | |||||||
250,000 | 5.250%, 11/15/23 | 253,750 | |||||
100,000 | 7.375%, 9/1/25 | 108,650 | |||||
845,231 | |||||||
| Steel: 0.9% | |||||||
Allegheny Technologies Inc | |||||||
225,000 | 7.875%, 8/15/23 | 246,813 | |||||
Big River Steel LLC / BRS Finance Corp | |||||||
350,000 | 6.625%, 1/31/29 | 378,656 | |||||
625,469 | |||||||
| Super Retail: 2.0% | |||||||
Abercrombie & Fitch Management Co | |||||||
225,000 | 8.750%, 7/15/25 | 250,453 | |||||
Gap Inc | |||||||
75,000 | 8.625%, 5/15/25 | 83,758 | |||||
75,000 | 8.875%, 5/15/27 | 87,094 | |||||
L Brands Inc | |||||||
150,000 | 6.625%, 10/1/30 | 167,156 | |||||
125,000 | 6.750%, 7/1/36 | 139,500 | |||||
Levi Strauss & Co | |||||||
225,000 | 5.000%, 5/1/25 | 230,906 | |||||
Macy’s Retail Holdings LLC | |||||||
300,000 | 3.450%, 1/15/21 | 299,250 | |||||
Wolverine World Wide Inc | |||||||
125,000 | 6.375%, 5/15/25 | 133,672 | |||||
1,391,789 | |||||||
| Technology: 1.8% | |||||||
CommScope Inc | |||||||
75,000 | 6.000%, 3/1/26 | 79,118 | |||||
CommScope Technologies LLC | |||||||
109,000 | 6.000%, 6/15/25 | 111,600 | |||||
J2 Global Inc | |||||||
200,000 | 4.625%, 10/15/30 | 211,375 | |||||
Logan Merger Sub Inc | |||||||
125,000 | 5.500%, 9/1/27 | 131,094 | |||||
NCR Corp | |||||||
100,000 | 5.000%, 10/1/28 | 105,688 | |||||
75,000 | 5.250%, 10/1/30 | 80,578 | |||||
NortonLifeLock Inc | |||||||
400,000 | 5.000%, 4/15/25 | 409,000 | |||||
Open Text Corp | |||||||
100,000 | 3.875%, 2/15/28 | 104,172 | |||||
1,232,625 | |||||||
| Telecommunications: 5.9% | |||||||
Altice Financing SA | |||||||
200,000 | 5.000%, 1/15/28 | 205,190 | |||||
Altice France Holding SA | |||||||
200,000 | 10.500%, 5/15/27 | 224,875 | |||||
Altice France SA | |||||||
225,000 | 7.375%, 5/1/26 | 237,094 | |||||
CenturyLink Inc | |||||||
150,000 | 5.125%, 12/15/26 | 158,612 | |||||
CenturyLink Inc | |||||||
250,000 | 4.500%, 1/15/29 | 254,844 | |||||
Consolidated Communications Inc | |||||||
75,000 | 6.500%, 10/1/28 | 80,362 | |||||
The accompanying notes are an integral part of these financial statements.
32
U.S. High Yield Fund
SCHEDULE OF INVESTMENTS at December 31, 2020 (Continued) |
| Principal | |||||||
| Amount | Value | ||||||
| CORPORATE BONDS: 89.7% (Continued) | |||||||
| Telecommunications: 5.9% (Continued) | |||||||
Embarq Corp | |||||||
$ | 150,000 | 7.995%, 6/1/36 | $ | 185,299 | |||
GCI LLC | |||||||
350,000 | 4.750%, 10/15/28 | 373,949 | |||||
Hughes Satellite Systems Corp | |||||||
250,000 | 6.625%, 8/1/26 | 283,757 | |||||
Intelsat Jackson Holdings SA | |||||||
150,000 | 8.000%, 2/15/24 | 153,811 | |||||
Qwest Corp | |||||||
175,000 | 7.250%, 9/15/25 | 207,375 | |||||
Sprint Capital Corp | |||||||
125,000 | 6.875%, 11/15/28 | 165,044 | |||||
100,000 | 8.750%, 3/15/32 | 158,438 | |||||
Sprint Corp | |||||||
350,000 | 7.875%, 9/15/23 | 405,667 | |||||
150,000 | 7.625%, 3/1/26 | 186,407 | |||||
Telecom Italia Capital SA | |||||||
175,000 | 7.200%, 7/18/36 | 236,656 | |||||
Telesat Canada / Telesat LLC | |||||||
150,000 | 4.875%, 6/1/27 | 155,719 | |||||
250,000 | 6.500%, 10/15/27 | 261,600 | |||||
Zayo Group Holdings Inc | |||||||
100,000 | 6.125%, 3/1/28 | 105,922 | |||||
4,040,621 | |||||||
| Transportation Excluding Air/Rail: 0.1% | |||||||
XPO Logistics Inc | |||||||
100,000 | 6.125%, 9/1/23 | 101,937 | |||||
| Utilities: 1.5% | |||||||
Calpine Corp | |||||||
50,000 | 5.125%, 3/15/28 | 52,669 | |||||
125,000 | 4.625%, 2/1/29 | 128,722 | |||||
125,000 | 5.000%, 2/1/31 | 130,813 | |||||
Clearway Energy Operating LLC | |||||||
125,000 | 5.750%, 10/15/25 | 131,797 | |||||
175,000 | 5.000%, 9/15/26 | 181,748 | |||||
50,000 | 4.750%, 3/15/28 | 53,672 | |||||
Drax Finco PLC | |||||||
200,000 | 6.625%, 11/1/25 | 209,875 | |||||
Talen Energy Supply LLC | |||||||
75,000 | 7.250%, 5/15/27 | 80,002 | |||||
75,000 | 6.625%, 1/15/28 | 78,595 | |||||
1,047,893 | |||||||
| TOTAL CORPORATE BONDS | |||||||
(Cost $57,944,569) | 61,719,405 | ||||||
| BANK LOANS: 7.6% | |||||||
| Aerospace/Defense: 0.4% | |||||||
Spirit AeroSystems, Inc. | |||||||
260,000 | 6.000%, 1/15/25 1,4,5,6 | 263,305 | |||||
| Automotive & Auto Parts: 1.1% | |||||||
First Brands Group LLC | |||||||
246,870 | 8.500% (3 Month | ||||||
LIBOR + 8.750%), 1/29/21 1,4 | 246,639 | ||||||
IXS Holdings Inc | |||||||
347,309 | 6.000% (6 Month | ||||||
LIBOR + 5.000%), 12/31/20 1,4 | 348,755 | ||||||
Wheel Pros T/L (10/20) | |||||||
175,000 | 6.250% (1 Month | ||||||
LIBOR + 5.250%), 1/111/21 1,4 | 172,725 | ||||||
768,119 | |||||||
| Broadcasting: 0.2% | |||||||
iHeartCommunications Inc | |||||||
124,375 | 4.750% (1 Month | ||||||
LIBOR + 4.750%), 12/31/20 1,4 | 124,841 | ||||||
| Cable/Satellite TV: 0.4% | |||||||
Virgin Media Bristol LLC | |||||||
150,000 | 3.500%, 1/31/29 1,4,5,6 | 150,207 | |||||
Ziggo Financing Partnership | |||||||
150,000 | 2.659% (1 Month | ||||||
LIBOR + 2.500%), 1/15/21 1,4 | 149,344 | ||||||
299,551 | |||||||
| Food/Beverage/Tobacco: 0.4% | |||||||
Froneri US Inc | |||||||
298,500 | 2.397% (1 Month | ||||||
LIBOR + 2.250%), 12/31/20 1,4 | 296,112 | ||||||
| Healthcare: 0.9% | |||||||
NMN Holdings III Corp | |||||||
245,279 | 3.679% (2 Month | ||||||
LIBOR + 3.500%), 1/29/21 1,4 | 241,600 | ||||||
52,622 | 3.679% (2 Month | ||||||
LIBOR + 3.500%), 1/29/21 1,4 | 51,832 | ||||||
Pluto Acquisition I, Inc. | |||||||
50,000 | 5.500%, 6/22/26 1,4,5,6 | 50,188 | |||||
Sedgwick Claims Management Services Inc | |||||||
223,875 | 5.250% (1 Month | ||||||
LIBOR + 4.250%), 12/31/20 1,4 | 225,834 | ||||||
US Outpatient/ | |||||||
US Radiology (12/20) T/L | |||||||
25,000 | 6.250% (3 Month | ||||||
LIBOR + 5.500%), 3/15/21 1,4 | 24,898 | ||||||
594,352 | |||||||
| Leisure: 0.3% | |||||||
Carnival Corp | |||||||
199,000 | 8.500% (1 Month | ||||||
LIBOR + 7.500%), 1/29/21 1,4 | 205,810 | ||||||
| Restaurants: 0.1% | |||||||
Zaxby’s Operating Company T/L | |||||||
50,000 | 4.500% (1 Month | ||||||
LIBOR + 3.750%), 1/29/21 1,4 | 50,187 | ||||||
The accompanying notes are an integral part of these financial statements.
33
U.S. High Yield Fund
SCHEDULE OF INVESTMENTS at December 31, 2020 (Continued) |
| Principal | |||||||
| Amount | Value | ||||||
| BANK LOANS: 7.6% (Continued) | |||||||
| Services: 1.1% | |||||||
Revint Intermediate II LLC | |||||||
$ | 225,000 | 5.750% (1 Month | |||||
LIBOR + 5.000%), 1/15/21 1,4 | $ | 223,031 | |||||
Sabre GLBL Inc. T/L B (12/20) | |||||||
500,000 | 4.750%, 12/31/27 1,4,5,6 | 501,875 | |||||
724,906 | |||||||
| Super Retail: 0.1% | |||||||
CP Atlas Buyer, Inc. | |||||||
50,000 | 5.250% (3 Month | ||||||
LIBOR + 4.500%), 2/26/21 1,4 | 50,169 | ||||||
25,000 | 5.250% (3 Month | ||||||
LIBOR + 4.500%), 2/26/21 1,4 | 25,084 | ||||||
75,253 | |||||||
| Technology: 0.6% | |||||||
CT Technologies T/L | |||||||
75,000 | 6.000% (1 Month | ||||||
LIBOR + 5.000%), 12/10/25 1,4 | 74,906 | ||||||
LogMeIn Inc | |||||||
125,000 | 4.903% (1 Month | ||||||
LIBOR + 4.750%), 1/7/21 1,4 | 124,845 | ||||||
Plantronics Inc | |||||||
100,000 | 2.646% (2 Month | ||||||
LIBOR + 3.500%), 7/2/25 1,4 | 98,070 | ||||||
Synamedia Americas Holdings Inc | |||||||
150,000 | 6.220% (3 Month | ||||||
LIBOR + 6.000%), 12/31/20 1,4 | 136,125 | ||||||
433,946 | |||||||
| Telecommunications: 1.7% | |||||||
Consolidated Communications Inc | |||||||
74,813 | 5.750% (1 Month | ||||||
LIBOR + 4.750%), 10/4/27 1,4 | 75,293 | ||||||
Intelsat Jackson Holdings SA | |||||||
134,636 | 6.500% (3 Month | ||||||
LIBOR + 5.500%), 3/17/21 1,4 | 137,733 | ||||||
550,000 | 8.625%, 1/2/24 4 | 560,510 | |||||
Xplornet Communications Inc | |||||||
248,750 | 4.897% (1 Month | ||||||
LIBOR + 4.750%), 12/31/20 1,4 | 250,087 | ||||||
Zayo Group Holdings Inc | |||||||
155,330 | 3.147% (1 Month | ||||||
LIBOR + 3.000%), 1/30/21 1,4 | 154,734 | ||||||
1,178,357 | |||||||
| Utilities: 0.3% | |||||||
Exgen Renewables IV LLC | |||||||
75,000 | 3.750% (3 Month | ||||||
LIBOR + 2.750%), 2/26/21 1,4 | 75,113 | ||||||
Hamilton Projects Acquiror LLC | |||||||
124,375 | 5.750% (3 Month | ||||||
LIBOR + 4.750%), 12/31/20 1,4 | 124,945 | ||||||
200,058 | |||||||
| TOTAL BANK LOANS | |||||||
(Cost $5,061,311) | 5,214,797 | ||||||
| TOTAL INVESTMENTS IN SECURITIES: 97.3% | |||||||
(Cost $63,005,880) | 66,934,202 | ||||||
Other Assets in Excess of Liabilities: 2.7% | 1,830,200 | ||||||
| TOTAL NET ASSETS: 100.0% | $ | 68,764,402 | |||||
LIBOR – London Interbank Offered Rate
USD – United States Dollar
1 | Variable rate security; rate shown is the rate in effect on December 31, 2020. An index may have a negative rate. Interest rate may also be subject to a cap or floor. |
2 | Perpetual call date security. Date shown is next call date |
3 | Fixed-to-variable or fixed-to-float bond; rate shown is the rate in effect on December 31, 2020. An index may have a negative rate. Interest rate may also be subject to a cap or floor. |
4 | Bank loans generally pay interest at rates which are periodically determined by reference to a base lending rate plus a premium. All loans carry a variable rate of interest. These base lending rates are generally (i) the Prime Rate offered by one or more major United States banks, (ii) the lending rate offered by one or more European banks such as the LIBOR or (iii) the Certificate of Deposit rate. Bank loans, while exempt from registration, under the Securities Act of 1933, contain certain restrictions on resale and cannot be sold publicly. Floating rate bank loans often require prepayments from excess cash flow or permit the borrower to repay at its election. The degree to which borrowers repay, whether as a contractual requirement or at their election, cannot be predicted with accuracy. |
5 | All or a portion of the loan may be unfunded. |
6 | Denotes investments purchased on a when-issued or delayed delivery basis. |
The accompanying notes are an integral part of these financial statements.
34
Low Duration Fund
SCHEDULE OF INVESTMENTS at December 31, 2020 |
| Principal | |||||||||
Amount† | Value | ||||||||
| CORPORATE BONDS: 87.4% | |||||||||
| Aerospace/Defense: 1.3% | |||||||||
Arconic, Inc. | |||||||||
500,000 | 5.125%, 10/1/24 | $ | 551,040 | ||||||
AVIC International Finance | |||||||||
& Investment Ltd | |||||||||
2,000,000 | 4.375%, 5/23/21 | 2,020,160 | |||||||
Rolls-Royce PLC | |||||||||
EUR | 625,000 | 2.125%, 6/18/21 | 767,749 | ||||||
EUR | 2,800,000 | 0.875%, 5/9/24 | 3,232,637 | ||||||
EUR | 675,000 | 4.625%, 2/16/26 | 894,701 | ||||||
7,466,287 | |||||||||
| Airlines: 1.8% | |||||||||
Delta Air Lines Inc / | |||||||||
SkyMiles IP Ltd | |||||||||
900,000 | 4.500%, 10/20/25 | 962,432 | |||||||
Delta Air Lines, Inc. | |||||||||
1,225,000 | 3.625%, 3/15/22 | 1,260,632 | |||||||
1,450,000 | 3.800%, 4/19/23 | 1,489,617 | |||||||
Deutsche Lufthansa AG | |||||||||
EUR | 700,000 | 3.000%, 5/29/26 | 856,475 | ||||||
easyJet PLC | |||||||||
EUR | 1,800,000 | 1.750%, 2/9/23 | 2,208,478 | ||||||
EUR | 500,000 | 1.125%, 10/18/23 | 602,349 | ||||||
Mileage Plus Holdings LLC / | |||||||||
Mileage Plus Intellectual | |||||||||
Property Assets Ltd | |||||||||
875,000 | 6.500%, 6/20/27 | 942,266 | |||||||
Ryanair DAC | |||||||||
EUR | 1,385,000 | 1.125%, 3/10/23 | 1,708,528 | ||||||
EUR | 560,000 | 2.875%, 9/15/25 | 733,176 | ||||||
10,763,953 | |||||||||
| Automotive & Auto Parts: 9.4% | |||||||||
Faurecia SE | |||||||||
EUR | 600,000 | 2.625%, 6/15/25 | 745,875 | ||||||
FCE Bank PLC | |||||||||
EUR | 500,000 | 1.134%, 2/10/22 | 611,275 | ||||||
Ford Motor Co | |||||||||
250,000 | 8.500%, 4/21/23 | 281,776 | |||||||
Ford Motor Credit Co LLC | |||||||||
4,211,000 | 1.296% (3 Month LIBOR | ||||||||
USD + 1.080%), 8/3/22 1 | 4,107,246 | ||||||||
4,000,000 | 1.456% (3 Month LIBOR | ||||||||
USD + 1.235%), 2/15/23 1 | 3,861,329 | ||||||||
825,000 | 3.810%, 1/9/24 | 846,656 | |||||||
EUR | 555,000 | 3.021%, 3/6/24 | 704,205 | ||||||
875,000 | 4.687%, 6/9/25 | 934,610 | |||||||
875,000 | 3.375%, 11/13/25 | 900,034 | |||||||
General Motors Co | |||||||||
2,000,000 | 6.125%, 10/1/25 | 2,427,952 | |||||||
General Motors Financial Co Inc | |||||||||
2,500,000 | 4.200%, 11/6/21 | 2,577,113 | |||||||
Harley-Davidson | |||||||||
Financial Services Inc | |||||||||
EUR | 1,530,000 | 3.875%, 5/19/23 | 2,026,633 | ||||||
EUR | 2,600,000 | 0.900%, 11/19/24 | 3,225,185 | ||||||
Hyundai Capital America | |||||||||
5,000,000 | 5.750%, 4/6/23 | 5,540,674 | |||||||
788,000 | 1.800%, 10/15/25 | 808,815 | |||||||
IHO Verwaltungs GmbH | |||||||||
EUR | 900,000 | 3.625% Cash or 4.000% | |||||||
PIK, 5/15/25 | 1,124,124 | ||||||||
EUR | 2,000,000 | 3.750% Cash or 5.000% | |||||||
PIK, 9/15/26 | 2,518,111 | ||||||||
Jaguar Land Rover Automotive PLC | |||||||||
GBP | 500,000 | 2.750%, 1/24/21 | 686,538 | ||||||
GBP | 900,000 | 5.000%, 2/15/22 | 1,243,829 | ||||||
Nemak SAB de CV | |||||||||
EUR | 1,550,000 | 3.250%, 3/15/24 | 1,934,320 | ||||||
Nissan Motor Co Ltd | |||||||||
EUR | 515,000 | 1.940%, 9/15/23 | 656,228 | ||||||
1,894,000 | 3.043%, 9/15/23 | 1,981,641 | |||||||
1,500,000 | 3.522%, 9/17/25 | 1,607,457 | |||||||
2,000,000 | 4.345%, 9/17/27 | 2,211,588 | |||||||
Pirelli & C SPA | |||||||||
EUR | 5,200,000 | 1.375%, 1/25/23 | 6,406,850 | ||||||
RCI Banque SA | |||||||||
EUR | 2,700,000 | 0.034% (3 Month | |||||||
EURIBOR + 0.580%), 3/12/25 1 | 3,216,601 | ||||||||
Schaeffler AG | |||||||||
EUR | 500,000 | 2.750%, 10/12/25 | 648,312 | ||||||
ZF North America Capital Inc | |||||||||
EUR | 1,900,000 | 2.750%, 4/27/23 | 2,386,054 | ||||||
56,221,031 | |||||||||
| Banking: 18.4% | |||||||||
Abanca Corp Bancaria SA | |||||||||
EUR | 500,000 | 4.625% (5 Year Swap Rate | |||||||
EUR + 5.014%), 4/7/30 1,5 | 640,629 | ||||||||
ABN AMRO Bank NV | |||||||||
8,000,000 | 4.400% (5 Year Swap Rate | ||||||||
USD + 2.197%), 3/27/28 1,5 | 8,537,886 | ||||||||
AIB Group PLC | |||||||||
EUR | 1,200,000 | 2.875% (5 Year Swap Rate | |||||||
EUR + 3.300%), 5/30/31 1,5 | 1,565,738 | ||||||||
AIB Group PLC | |||||||||
EUR | 2,900,000 | 1.875% (5 Year Swap Rate | |||||||
EUR + 2.150%), 11/19/29 1,5 | 3,604,507 | ||||||||
Argenta Spaarbank NV | |||||||||
EUR | 1,200,000 | 3.875% (5 Year Swap Rate | |||||||
EUR + 3.950%), 5/24/26 1,5 | 1,489,107 | ||||||||
Banco Comercial Portugues SA | |||||||||
EUR | 1,400,000 | 3.871% (5 Year Swap Rate | |||||||
EUR + 4.231%), 3/27/30 1,5 | 1,649,704 | ||||||||
The accompanying notes are an integral part of these financial statements.
35
Low Duration Fund
SCHEDULE OF INVESTMENTS at December 31, 2020 (Continued) |
| Principal | |||||||||
Amount† | Value | ||||||||
| CORPORATE BONDS: 87.4% (Continued) | |||||||||
| Banking: 18.4% (Continued) | |||||||||
Banco de Sabadell SA | |||||||||
EUR | 500,000 | 1.750%, 5/10/24 | $ | 633,453 | |||||
EUR | 1,500,000 | 5.375% (5 Year Swap Rate | |||||||
EUR + 5.100%), 12/12/28 1,5 | 2,005,910 | ||||||||
Bank of Ireland Group PLC | |||||||||
GBP | 800,000 | 3.125% (GUKG5 + 2.700%), | |||||||
9/19/27 1,5 | 1,112,415 | ||||||||
1,890,000 | 4.125% (5 Year CMT | ||||||||
Rate + 2.500%), 9/19/27 1,5 | 1,925,586 | ||||||||
EUR | 700,000 | 2.375% (5 Year Swap Rate | |||||||
EUR + 2.800%), 10/14/29 1,5 | 876,892 | ||||||||
Bankia SA | |||||||||
EUR | 3,000,000 | 3.375% (5 Year Swap Rate | |||||||
EUR + 3.350%), 3/15/27 1,5 | 3,774,139 | ||||||||
BNP Paribas SA | |||||||||
EUR | 450,000 | 2.625% (5 Year Swap Rate | |||||||
EUR + 1.830%), 10/14/27 1,5 | 571,770 | ||||||||
Caixa Geral de Depositos SA | |||||||||
EUR | 2,000,000 | 5.750% (5 Year Swap Rate | |||||||
EUR + 5.500%), 6/28/28 1,5 | 2,689,996 | ||||||||
CaixaBank SA | |||||||||
EUR | 2,900,000 | 3.500% (5 Year Swap Rate | |||||||
EUR + 3.350%), 2/15/27 1,5 | 3,654,481 | ||||||||
EUR | 5,000,000 | 2.750% (5 Year Swap Rate | |||||||
EUR + 2.350%), 7/14/28 1,5 | 6,393,619 | ||||||||
Commerzbank AG | |||||||||
500,000 | 8.125%, 9/19/23 | 584,360 | |||||||
Cooperatieve Rabobank UA | |||||||||
800,000 | 4.000% (5 Year Swap Rate | ||||||||
USD + 1.892%), 4/10/29 1,5 | 862,845 | ||||||||
Danske Bank A/S | |||||||||
2,260,000 | 5.000% (1 Year CMT | ||||||||
Rate + 1.730%), 1/12/23 1,5 | 2,352,938 | ||||||||
1,000,000 | 3.244% (3 Month LIBOR | ||||||||
USD + 1.591%), 12/20/25 1,5 | 1,071,291 | ||||||||
EUR | 500,000 | 2.500% (5 Year Swap Rate | |||||||
EUR + 2.500%), 6/21/29 1,5 | 647,226 | ||||||||
Deutsche Bank AG | |||||||||
1,532,000 | 1.463% (3 Month LIBOR | ||||||||
USD + 1.230%), 2/27/23 1 | 1,528,764 | ||||||||
4,400,000 | 4.296% (5 Year Swap Rate | ||||||||
USD + 2.248%), 5/24/28 1,5 | 4,536,338 | ||||||||
Deutsche Bank AG/New York NY | |||||||||
2,100,000 | 2.222% (SOFR + 2.159%), | ||||||||
9/18/24 1,5 | 2,161,770 | ||||||||
375,000 | 3.961% (SOFR + 2.581%), | ||||||||
11/26/25 1,5 | 410,187 | ||||||||
Hamburg Commercial Bank AG | |||||||||
EUR | 1,700,000 | 0.750%, 11/23/23 | 2,093,148 | ||||||
ING Groep NV | |||||||||
1,500,000 | 4.700% (5 Year Swap Rate | ||||||||
USD + 1.938%), 3/22/28 1,5 | 1,608,415 | ||||||||
EUR | 4,000,000 | 2.500% (5 Year Swap Rate | |||||||
EUR + 2.150%), 2/15/29 1,5 | 5,197,024 | ||||||||
Intesa Sanpaolo SPA | |||||||||
700,000 | 3.125%, 7/14/22 | 725,156 | |||||||
800,000 | 5.017%, 6/26/24 | 875,684 | |||||||
EUR | 4,900,000 | 1.360% (3 Month | |||||||
EURIBOR + 1.900%), 9/26/24 1 | 6,021,996 | ||||||||
Liberbank SA | |||||||||
EUR | 4,000,000 | 6.875% (5 Year Swap Rate | |||||||
EUR + 6.701%), 3/14/27 1,5 | 5,182,697 | ||||||||
Natwest Group PLC | |||||||||
5,000,000 | 6.000%, 12/19/23 | 5,716,681 | |||||||
Raiffeisen Bank International AG | |||||||||
EUR | 1,000,000 | 6.000%, 10/16/23 | 1,425,962 | ||||||
Societe Generale SA | |||||||||
EUR | 1,600,000 | 1.375% (5 Year Swap | |||||||
Rate EUR + 0.900%), 2/23/28 1,5 | 1,988,973 | ||||||||
Standard Chartered PLC | |||||||||
738,000 | 1.319% (1 Year CMT | ||||||||
Rate + 1.170%), 10/14/23 1,5 | 746,303 | ||||||||
UniCredit SPA | |||||||||
2,150,000 | 4.129% (3 Month LIBOR | ||||||||
USD + 3.900%), 1/14/22 1 | 2,210,959 | ||||||||
UniCredit SPA | |||||||||
600,000 | 7.830%, 12/4/23 | 712,375 | |||||||
EUR | 6,000,000 | 4.375% (5 Year Swap Rate | |||||||
EUR + 4.316%), 1/3/27 1,5 | 7,605,437 | ||||||||
Unione di Banche Italiane SpA | |||||||||
EUR | 2,903,000 | 4.250% (5 Year Swap Rate | |||||||
EUR + 4.182%), 5/5/26 1,5 | 3,592,624 | ||||||||
Virgin Money UK PLC | |||||||||
GBP | 2,000,000 | 7.875% (GUKG5 + 7.128%), | |||||||
12/14/28 1,5 | 3,113,883 | ||||||||
Volksbank Wien AG | |||||||||
EUR | 4,600,000 | 2.750% (5 Year Swap Rate | |||||||
EURIBOR + 2.550%), 10/6/27 1,5 | 5,633,436 | ||||||||
109,732,304 | |||||||||
| Broadcasting: 0.5% | |||||||||
TEGNA Inc | |||||||||
875,000 | 4.750%, 3/15/26 | 935,419 | |||||||
ViacomCBS Inc | |||||||||
1,600,000 | 4.750%, 5/15/25 | 1,858,304 | |||||||
2,793,723 | |||||||||
| Building Materials: 0.7% | |||||||||
James Hardie International | |||||||||
Finance DAC | |||||||||
200,000 | 4.750%, 1/15/25 | 204,171 | |||||||
EUR | 955,000 | 3.625%, 10/1/26 | 1,206,190 | ||||||
922,000 | 5.000%, 1/15/28 | 982,603 | |||||||
Martin Marietta Materials Inc | |||||||||
1,600,000 | 4.250%, 7/2/24 | 1,785,792 | |||||||
4,178,756 | |||||||||
The accompanying notes are an integral part of these financial statements.
36
Low Duration Fund
SCHEDULE OF INVESTMENTS at December 31, 2020 (Continued) |
| Principal | |||||||||
Amount† | Value | ||||||||
| CORPORATE BONDS: 87.4% (Continued) | |||||||||
| Cable/Satellite TV: 0.7% | |||||||||
DISH DBS Corp | |||||||||
325,000 | 5.875%, 11/15/24 | $ | 341,250 | ||||||
DISH DBS Corp | |||||||||
525,000 | 5.000%, 3/15/23 | 542,719 | |||||||
Radiate Holdco LLC / | |||||||||
Radiate Finance Inc | |||||||||
850,000 | 4.500%, 9/15/26 | 878,687 | |||||||
United Group BV | |||||||||
EUR | 2,000,000 | 4.125% (3 Month | |||||||
EURIBOR + 4.125%), 5/15/25 1 | 2,452,350 | ||||||||
4,215,006 | |||||||||
| Capital Goods: 1.3% | |||||||||
CNH Industrial Capital LLC | |||||||||
550,000 | 4.375%, 4/5/22 | 575,355 | |||||||
CNH Industrial NV | |||||||||
3,000,000 | 4.500%, 8/15/23 | 3,275,233 | |||||||
Platin 1426 GmbH | |||||||||
EUR | 1,800,000 | 5.375%, 6/15/23 | 2,197,213 | ||||||
Westinghouse Air Brake | |||||||||
Technologies Corp | |||||||||
1,425,000 | 4.400%, 3/15/24 | 1,561,085 | |||||||
7,608,886 | |||||||||
| Chemicals: 2.6% | |||||||||
Bluestar Finance Holdings Ltd | |||||||||
2,000,000 | 3.375%, 7/16/24 | 2,027,490 | |||||||
CF Industries Inc | |||||||||
1,500,000 | 3.400%, 12/1/21 | 1,535,523 | |||||||
CNAC HK Finbridge Co Ltd | |||||||||
EUR | 200,000 | 1.750%, 6/14/22 | 244,805 | ||||||
CNRC Capital Ltd | |||||||||
EUR | 2,700,000 | 1.871%, 12/7/21 | 3,317,022 | ||||||
DuPont de Nemours Inc | |||||||||
1,153,000 | 2.169%, 5/1/23 | 1,168,674 | |||||||
Syngenta Finance NV | |||||||||
3,552,000 | 3.933%, 4/23/21 | 3,576,055 | |||||||
2,920,000 | 4.441%, 4/24/23 | 3,066,290 | |||||||
Synthomer PLC | |||||||||
EUR | 575,000 | 3.875%, 7/1/25 | 738,445 | ||||||
15,674,304 | |||||||||
| Consumer-Products: 0.2% | |||||||||
Newell Brands Inc | |||||||||
964,000 | 4.350%, 4/1/23 | 1,012,335 | |||||||
| Containers: 0.3% | |||||||||
SIG Combibloc PurchaseCo SARL | |||||||||
EUR | 900,000 | 1.875%, 6/18/23 | 1,138,510 | ||||||
Trivium Packaging Finance BV | |||||||||
EUR | 500,000 | 3.750% (3 Month | |||||||
EURIBOR + 3.750%), 8/15/26 1 | 612,211 | ||||||||
1,750,721 | |||||||||
| Diversified Financial Services: 15.2% | |||||||||
AerCap Ireland Capital DAC / | |||||||||
AerCap Global Aviation Trust | |||||||||
700,000 | 4.500%, 9/15/23 | 759,427 | |||||||
1,801,000 | 3.150%, 2/15/24 | 1,889,289 | |||||||
Aircastle Ltd | |||||||||
500,000 | 5.125%, 3/15/21 | 504,005 | |||||||
3,325,000 | 5.500%, 2/15/22 | 3,464,103 | |||||||
1,200,000 | 4.400%, 9/25/23 | 1,272,227 | |||||||
897,000 | 4.125%, 5/1/24 | 949,663 | |||||||
AnaCap Financial Europe | |||||||||
SA SICAV-RAIF | |||||||||
EUR | 2,000,000 | 5.000% (3 Month | |||||||
EURIBOR + 5.000%), 8/1/24 1 | 2,101,958 | ||||||||
Aviation Capital Group LLC | |||||||||
1,400,000 | 2.875%, 1/20/22 | 1,417,799 | |||||||
Avolon Holdings Funding Ltd | |||||||||
700,000 | 5.125%, 10/1/23 | 749,781 | |||||||
Azimut Holding SPA | |||||||||
EUR | 1,665,000 | 2.000%, 3/28/22 | 2,072,963 | ||||||
BOC Aviation Ltd | |||||||||
460,000 | 2.750%, 12/2/23 | 476,622 | |||||||
Bracken MidCo1 PLC | |||||||||
GBP | 946,688 | 8.875% Cash or 11.000% | |||||||
PIK, 10/15/23 | 1,282,281 | ||||||||
Cabot Financial Luxembourg SA | |||||||||
GBP | 209,495 | 7.500%, 10/1/23 | 292,443 | ||||||
CDBL Funding 2 | |||||||||
1,050,000 | 3.000%, 8/1/22 | 1,076,941 | |||||||
Credit Suisse AG | |||||||||
3,825,000 | 6.500%, 8/8/23 | 4,317,056 | |||||||
Credit Suisse Group AG | |||||||||
1,800,000 | 7.500% (5 Year Swap Rate | ||||||||
USD + 4.598%), 12/11/23 1,4,5 | 2,008,438 | ||||||||
DAE Funding LLC | |||||||||
500,000 | 5.250%, 11/15/21 | 511,250 | |||||||
1,025,000 | 4.500%, 8/1/22 | 1,039,555 | |||||||
DAE Sukuk Difc Ltd. | |||||||||
1,580,000 | 3.750%, 2/15/26 | 1,627,400 | |||||||
Encore Capital Group, Inc. | |||||||||
GBP | 775,000 | 5.375%, 2/15/26 | 1,084,985 | ||||||
Federal International Finance PT | |||||||||
1,500,000 | 4.125%, 5/10/21 | 1,503,750 | |||||||
Fortune Star BVI Ltd | |||||||||
EUR | 963,000 | 4.350%, 5/6/23 | 1,195,559 | ||||||
Garfunkelux Holdco 3 SA | |||||||||
EUR | 2,675,000 | 6.750%, 11/1/25 | 3,365,931 | ||||||
EUR | 2,700,000 | 6.250% (3 Month | |||||||
EURIBOR + 6.250%), 5/1/26 1 | 3,319,347 | ||||||||
Hoist Finance AB | |||||||||
EUR | 3,500,000 | 2.750%, 4/3/23 | 4,287,165 | ||||||
Huarong Finance 2017 Co Ltd | |||||||||
2,000,000 | 1.363% (3 Month LIBOR | ||||||||
USD + 1.150%), 11/7/22 1 | 1,973,670 | ||||||||
The accompanying notes are an integral part of these financial statements.
37
Low Duration Fund
SCHEDULE OF INVESTMENTS at December 31, 2020 (Continued) |
| Principal | |||||||||
Amount† | Value | ||||||||
| CORPORATE BONDS: 87.4% (Continued) | |||||||||
| Diversified Financial Services: 15.2% (Continued) | |||||||||
Huarong Finance 2019 Co Ltd | |||||||||
520,000 | 1.330% (3 Month LIBOR | ||||||||
USD + 1.125%), 2/24/23 1 | $ | 512,912 | |||||||
1,655,000 | 2.500%, 2/24/23 | 1,676,082 | |||||||
Huarong Universe Investment | |||||||||
Holding Ltd | |||||||||
EUR | 2,500,000 | 1.625%, 12/5/22 | 2,970,119 | ||||||
Icahn Enterprises LP / | |||||||||
Icahn Enterprises Finance Corp | |||||||||
1,050,000 | 6.250%, 2/1/22 | 1,054,961 | |||||||
ICBCIL Finance Co Ltd | |||||||||
1,000,000 | 1.321% (3 Month LIBOR | ||||||||
USD + 1.100%), 5/15/23 1 | 995,858 | ||||||||
International Lease Finance Corp | |||||||||
3,500,000 | 8.625%, 1/15/22 | 3,768,078 | |||||||
Intrum AB | |||||||||
EUR | 203,800 | 2.750%, 7/15/22 | 250,211 | ||||||
EUR | 1,600,000 | 4.875%, 8/15/25 | 2,030,370 | ||||||
IS Hong Kong Investment Ltd | |||||||||
1,000,000 | 2.900%, 12/30/22 | 1,029,420 | |||||||
Jerrold Finco PLC | |||||||||
GBP | 1,500,000 | 6.125%, 1/15/24 | 2,071,767 | ||||||
GBP | 1,075,000 | 4.875%, 1/15/26 | 1,461,098 | ||||||
JIC Zhixin Ltd | |||||||||
1,410,000 | 1.500%, 8/27/25 | 1,411,537 | |||||||
LHC3 PLC | |||||||||
EUR | 1,700,000 | 4.125% Cash or 9.000% | |||||||
PIK, 8/15/24 | 2,118,328 | ||||||||
Lincoln Financing SARL | |||||||||
EUR | 2,500,000 | 3.625%, 4/1/24 | 3,095,337 | ||||||
EUR | 300,000 | 3.875% (3 Month | |||||||
EURIBOR + 3.875%), 4/1/24 1 | 366,933 | ||||||||
Mirae Asset Daewoo Co Ltd | |||||||||
500,000 | 2.125%, 7/30/23 | 507,746 | |||||||
980,000 | 2.625%, 7/30/25 | 1,015,903 | |||||||
Mulhacen Pte Ltd | |||||||||
EUR | 1,528,469 | 6.500% Cash or 7.000% | |||||||
PIK, 8/1/23 | 1,153,023 | ||||||||
OneMain Finance Corp | |||||||||
500,000 | 6.125%, 3/15/24 | 546,875 | |||||||
Park Aerospace Holdings Ltd | |||||||||
2,000,000 | 4.500%, 3/15/23 | 2,096,908 | |||||||
REC Ltd | |||||||||
800,000 | 5.250%, 11/13/23 | 874,681 | |||||||
SIHC International Capital Ltd | |||||||||
1,000,000 | 3.950%, 9/26/21 | 1,017,123 | |||||||
SoftBank Group Corp | |||||||||
EUR | 1,000,000 | 4.000%, 4/20/23 | 1,278,021 | ||||||
UBS AG | |||||||||
6,260,000 | 7.625%, 8/17/22 | 6,930,817 | |||||||
200,000 | 5.125%, 5/15/24 | 220,950 | |||||||
EUR | 3,000,000 | 4.750% (5 Year Swap Rate | |||||||
EUR + 3.400%), 2/12/26 1,5 | 3,688,259 | ||||||||
ZGC International Investment Ltd | |||||||||
2,080,000 | 2.875%, 2/3/23 | 2,092,542 | |||||||
90,779,467 | |||||||||
| Diversified Media: 0.7% | |||||||||
Adevinta ASA | |||||||||
EUR | 675,000 | 2.625%, 11/15/25 | 844,400 | ||||||
Inter Media and Communication SPA | |||||||||
EUR | 1,792,670 | 4.875%, 12/31/22 | 2,184,308 | ||||||
ProSiebenSat.1 Media SE | |||||||||
EUR | 1,000,000 | 2.625%, 4/15/21 | 1,222,864 | ||||||
4,251,572 | |||||||||
| Energy: 5.1% | |||||||||
Antero Resources Corp | |||||||||
800,000 | 5.125%, 12/1/22 | 799,200 | |||||||
CITGO Petroleum Corp | |||||||||
1,075,000 | 6.250%, 8/15/22 | 1,056,187 | |||||||
DCP Midstream Operating LP | |||||||||
675,000 | 4.750%, 9/30/21 | 686,812 | |||||||
Delek & Avner Tamar Bond Ltd | |||||||||
1,335,000 | 5.082%, 12/30/23 | 1,389,342 | |||||||
563,000 | 5.412%, 12/30/25 | 592,275 | |||||||
Energy Transfer Operating LP | |||||||||
1,500,000 | 3.600%, 2/1/23 | 1,571,865 | |||||||
1,875,000 | 4.250%, 3/15/23 | 1,994,354 | |||||||
EP Infrastructure AS | |||||||||
EUR | 2,375,000 | 1.659%, 4/26/24 | 2,999,115 | ||||||
MPLX LP | |||||||||
188,000 | 5.250%, 1/15/25 | 192,936 | |||||||
Petroleos Mexicanos | |||||||||
EUR | 3,300,000 | 2.500%, 8/21/21 | 4,047,345 | ||||||
GBP | 1,962,000 | 8.250%, 6/2/22 | 2,875,199 | ||||||
Plains All American Pipeline LP / | |||||||||
PAA Finance Corp | |||||||||
1,703,000 | 3.650%, 6/1/22 | 1,754,035 | |||||||
2,176,000 | 4.650%, 10/15/25 | 2,434,228 | |||||||
Sabine Pass Liquefaction LLC | |||||||||
3,000,000 | 6.250%, 3/15/22 | 3,158,213 | |||||||
1,789,000 | 5.750%, 5/15/24 | 2,046,238 | |||||||
Sunoco Logistics Partners | |||||||||
Operations LP | |||||||||
1,000,000 | 4.250%, 4/1/24 | 1,083,238 | |||||||
Western Midstream Operating LP | |||||||||
1,400,000 | 4.100%, 2/1/25 1 | 1,445,024 | |||||||
30,125,606 | |||||||||
| Food & Drug Retail: 0.8% | |||||||||
Casino Guichard Perrachon SA | |||||||||
EUR | 800,000 | 1.865%, 6/13/22 | 990,850 | ||||||
Marks & Spencer Plc | |||||||||
GBP | 275,000 | 3.750%, 5/19/26 | 384,814 | ||||||
Quatrim SASU | |||||||||
EUR | 2,775,000 | 5.875%, 1/15/24 | 3,527,949 | ||||||
4,903,613 | |||||||||
The accompanying notes are an integral part of these financial statements.
38
Low Duration Fund
SCHEDULE OF INVESTMENTS at December 31, 2020 (Continued) |
| Principal | |||||||||
Amount† | Value | ||||||||
| CORPORATE BONDS: 87.4% (Continued) | |||||||||
| Food/Beverage/Tobacco: 1.1% | |||||||||
Herbalife Nutrition Ltd / | |||||||||
HLF Financing Inc | |||||||||
850,000 | 7.875%, 9/1/25 | $ | 929,688 | ||||||
Olam International Ltd | |||||||||
1,900,000 | 4.500%, 4/12/21 | 1,910,740 | |||||||
Post Holdings, Inc. | |||||||||
825,000 | 5.000%, 8/15/26 | 853,244 | |||||||
Sigma Alimentos SA de CV | |||||||||
200,000 | 4.125%, 5/2/26 | 221,240 | |||||||
Sigma Alimentos SA de CV | |||||||||
EUR | 700,000 | 2.625%, 2/7/24 | 911,680 | ||||||
Smithfield Foods Inc | |||||||||
1,000,000 | 2.650%, 10/3/21 | 1,009,114 | |||||||
900,000 | 3.350%, 2/1/22 | 912,875 | |||||||
6,748,581 | |||||||||
| Gaming: 1.1% | |||||||||
Caesars Entertainment Inc | |||||||||
1,375,000 | 6.250%, 7/1/25 | 1,466,101 | |||||||
Cirsa Finance International SARL | |||||||||
EUR | 325,000 | 6.250%, 12/20/23 | 397,629 | ||||||
International Game Technology PLC | |||||||||
EUR | 1,500,000 | 3.500%, 6/15/26 | 1,900,351 | ||||||
MGM Resorts International | |||||||||
2,675,000 | 6.750%, 5/1/25 | 2,899,633 | |||||||
6,663,714 | |||||||||
| Healthcare: 1.5% | |||||||||
Becton Dickinson and Co | |||||||||
1,300,000 | 3.363%, 6/6/24 | 1,413,855 | |||||||
GN Store Nord A/S | |||||||||
EUR | 760,000 | 0.750%, 12/6/23 | 933,072 | ||||||
HCA Inc | |||||||||
2,050,000 | 4.750%, 5/1/23 | 2,236,418 | |||||||
MPT Operating Partnership LP / | |||||||||
MPT Finance Corp | |||||||||
EUR | 1,500,000 | 4.000%, 8/19/22 | 1,920,342 | ||||||
GBP | 910,000 | 2.550%, 12/5/23 | 1,267,611 | ||||||
Rossini SARL | |||||||||
EUR | 350,000 | 3.875% (3 Month | |||||||
EURIBOR + 3.875%), 10/30/25 1 | 427,040 | ||||||||
Teva Pharmaceutical Finance | |||||||||
Netherlands III B.V. | |||||||||
850,000 | 2.800%, 7/21/23 | 843,149 | |||||||
9,041,487 | |||||||||
| Homebuilders/Real Estate: 7.6% | |||||||||
American Tower Corp | |||||||||
905,000 | 1.300%, 9/15/25 | 925,111 | |||||||
Atrium European Real Estate Ltd | |||||||||
EUR | 3,000,000 | 3.625%, 10/17/22 | 3,765,508 | ||||||
CPI Property Group SA | |||||||||
EUR | 425,000 | 1.450%, 4/14/22 | 527,385 | ||||||
3,850,000 | 4.750%, 3/8/23 | 4,130,426 | |||||||
DEMIRE Deutsche Mittelstand | |||||||||
Real Estate AG | |||||||||
EUR | 3,000,000 | 1.875%, 10/15/24 | 3,588,675 | ||||||
Equinix Inc | |||||||||
1,800,000 | 1.250%, 7/15/25 | 1,838,225 | |||||||
2,250,000 | 5.375%, 5/15/27 | 2,453,290 | |||||||
Globalworth Real Estate | |||||||||
Investments Ltd | |||||||||
EUR | 1,100,000 | 2.875%, 6/20/22 | 1,386,203 | ||||||
Hammerson PLC | |||||||||
EUR | 5,000,000 | 2.000%, 7/1/22 | 6,021,721 | ||||||
IMMOFINANZ AG | |||||||||
EUR | 3,000,000 | 2.625%, 1/27/23 | 3,790,328 | ||||||
Mercialys SA | |||||||||
EUR | 1,900,000 | 1.787%, 3/31/23 | 2,392,774 | ||||||
NE Property BV | |||||||||
EUR | 3,500,000 | 2.625%, 5/22/23 | 4,453,193 | ||||||
EUR | 4,000,000 | 1.750%, 11/23/24 | 5,016,553 | ||||||
Samhallsbyggnadsbolaget | |||||||||
i Norden AB | |||||||||
EUR | 500,000 | 1.750%, 1/14/25 | 642,669 | ||||||
Service Properties Trust | |||||||||
350,000 | 5.000%, 8/15/22 | 357,000 | |||||||
500,000 | 4.500%, 6/15/23 | 503,438 | |||||||
Vivion Investments SARL | |||||||||
EUR | 3,000,000 | 3.000%, 8/8/24 | 3,396,472 | ||||||
45,188,971 | |||||||||
| Insurance: 0.4% | |||||||||
Galaxy Bidco Ltd | |||||||||
EUR | 2,000,000 | 5.000% (3 Month | |||||||
EURIBOR + 5.000%), 7/31/26 1 | 2,461,243 | ||||||||
| Leisure: 1.3% | |||||||||
Carnival Corp | |||||||||
EUR | 1,500,000 | 1.625%, 2/22/21 | 1,826,967 | ||||||
500,000 | 11.500%, 4/1/23 | 579,087 | |||||||
Carnival Corp | |||||||||
EUR | 800,000 | 1.875%, 11/7/22 | 924,828 | ||||||
CPUK Finance Ltd | |||||||||
GBP | 814,583 | 4.250%, 2/28/47 | 1,122,805 | ||||||
GBP | 510,000 | 6.500%, 8/28/50 | 730,315 | ||||||
Expedia Group, Inc. | |||||||||
1,225,000 | 5.000%, 2/15/26 | 1,373,287 | |||||||
Royal Caribbean Cruises Ltd. | |||||||||
825,000 | 9.125%, 6/15/23 | 896,156 | |||||||
7,453,445 | |||||||||
| Metals/Mining: 0.5% | |||||||||
Gold Fields Orogen Holdings BVI Ltd | |||||||||
1,360,000 | 5.125%, 5/15/24 | 1,508,043 | |||||||
Novelis Corp | |||||||||
1,125,000 | 5.875%, 9/30/26 | 1,177,031 | |||||||
2,685,074 | |||||||||
The accompanying notes are an integral part of these financial statements.
39
Low Duration Fund
SCHEDULE OF INVESTMENTS at December 31, 2020 (Continued) |
Principal | |||||||||
Amount† | Value | ||||||||
| CORPORATE BONDS: 87.4% (Continued) | |||||||||
| Publishing/Printing: 0.2% | |||||||||
Informa PLC | |||||||||
EUR | 900,000 | 2.125%, 10/6/25 | $ | 1,159,977 | |||||
| Quasi & Foreign Government: 1.1% | |||||||||
Chengdu Xingcheng | |||||||||
Investment Group Co Ltd | |||||||||
EUR | 5,300,000 | 2.500%, 3/20/21 | 6,474,706 | ||||||
| Services: 0.4% | |||||||||
RAC Bond Co PLC | |||||||||
GBP | 1,425,000 | 5.000%, 5/6/46 | 1,960,653 | ||||||
Verisure Holding AB | |||||||||
EUR | 365,000 | 3.875%, 7/15/26 | 458,175 | ||||||
2,418,828 | |||||||||
| Steel: 0.3% | |||||||||
Evraz PLC | |||||||||
700,000 | 8.250%, 1/28/21 | 703,675 | |||||||
1,000,000 | 5.250%, 4/2/24 | 1,097,425 | |||||||
1,801,100 | |||||||||
| Super Retail: 1.9% | |||||||||
AA Bond Co Ltd | |||||||||
GBP | 4,207,000 | 2.875%, 1/31/22 | 5,763,647 | ||||||
GBP | 300,000 | 2.750%, 7/31/43 | 404,512 | ||||||
Meituan | |||||||||
770,000 | 2.125%, 10/28/25 | 783,075 | |||||||
PVH Corp | |||||||||
EUR | 3,000,000 | 3.625%, 7/15/24 | 4,009,896 | ||||||
Tendam Brands SAU | |||||||||
EUR | 400,000 | 5.250% (3 Month | |||||||
EURIBOR + 5.250%), 9/15/24 1 | 455,673 | ||||||||
11,416,803 | |||||||||
| Technology: 2.5% | |||||||||
ams AG | |||||||||
EUR | 3,275,000 | 6.000%, 7/31/25 | 4,253,035 | ||||||
Arqiva Broadcast Finance PLC | |||||||||
GBP | 2,000,000 | 6.750%, 9/30/23 | 2,830,320 | ||||||
Broadcom Inc | |||||||||
1,963,000 | 4.250%, 4/15/26 | 2,249,670 | |||||||
Dell International LLC / EMC Corp | |||||||||
325,000 | 5.450%, 6/15/23 | 359,574 | |||||||
Infor Inc | |||||||||
498,000 | 1.750%, 7/15/25 | 517,846 | |||||||
Microchip Technology Inc | |||||||||
2,000,000 | 3.922%, 6/1/21 | 2,028,605 | |||||||
2,000,000 | 4.333%, 6/1/23 | 2,166,475 | |||||||
NXP BV / NXP Funding LLC / | |||||||||
NXP USA Inc | |||||||||
450,000 | 2.700%, 5/1/25 | 484,725 | |||||||
14,890,250 | |||||||||
| Telecommunications: 4.8% | |||||||||
Altice France SA | |||||||||
EUR | 2,000,000 | 2.500%, 1/15/25 | 2,402,959 | ||||||
Bharti Airtel International | |||||||||
Netherlands BV | |||||||||
EUR | 1,100,000 | 3.375%, 5/20/21 | 1,360,974 | ||||||
1,000,000 | 5.125%, 3/11/23 | 1,068,765 | |||||||
Iliad SA | |||||||||
EUR | 700,000 | 0.625%, 11/25/21 | 859,349 | ||||||
EUR | 700,000 | 1.500%, 10/14/24 | 867,560 | ||||||
LCPR Senior Secured | |||||||||
Financing DAC | |||||||||
850,000 | 6.750%, 10/15/27 | 915,875 | |||||||
PLT VII Finance SARL | |||||||||
EUR | 375,000 | 4.625%, 1/5/26 | 477,082 | ||||||
EUR | 375,000 | 4.625% (3 Month EURIBOR | |||||||
+ 4.625%), 1/5/26 1 | 461,552 | ||||||||
PPF Telecom Group BV | |||||||||
EUR | 2,850,000 | 3.500%, 5/20/24 | 3,697,111 | ||||||
EUR | 3,500,000 | 2.125%, 1/31/25 | 4,361,264 | ||||||
Sprint Spectrum Co LLC / Sprint | |||||||||
Spectrum Co II LLC / Sprint | |||||||||
Spectrum Co III LLC | |||||||||
575,000 | 4.738%, 9/20/29 | 624,573 | |||||||
TalkTalk Telecom Group PLC | |||||||||
GBP | 1,650,000 | 3.875%, 2/20/25 | 2,208,431 | ||||||
Telecom Italia SPA | |||||||||
EUR | 2,500,000 | 4.000%, 4/11/24 | 3,308,089 | ||||||
T-Mobile USA Inc | |||||||||
3,800,000 | 3.500%, 4/15/25 | 4,202,724 | |||||||
1,950,000 | 1.500%, 2/15/26 | 2,000,203 | |||||||
28,816,511 | |||||||||
| Transportation Excluding Air/Rail: 1.4% | |||||||||
Firstgroup PLC | |||||||||
GBP | 2,563,000 | 8.750%, 4/8/21 | 3,572,288 | ||||||
Rail Transit International | |||||||||
Development Co Ltd | |||||||||
EUR | 3,500,000 | 1.625%, 6/22/22 | 4,294,835 | ||||||
Rumo Luxembourg SARL | |||||||||
500,000 | 7.375%, 2/9/24 | 519,505 | |||||||
8,386,628 | |||||||||
| Utilities: 2.3% | |||||||||
Beijing Gas Singapore Capital Corp | |||||||||
3,200,000 | 2.750%, 5/31/22 | 3,258,000 | |||||||
ContourGlobal Power Holdings SA | |||||||||
EUR | 1,000,000 | 2.750%, 1/1/26 | 1,217,428 | ||||||
Enel Finance International NV | |||||||||
3,640,000 | 2.875%, 5/25/22 | 3,756,933 | |||||||
Hero Asia Investment Ltd. | |||||||||
200,000 | 1.500%, 11/18/23 | 199,974 | |||||||
The accompanying notes are an integral part of these financial statements.
40
Low Duration Fund
SCHEDULE OF INVESTMENTS at December 31, 2020 (Continued) |
Principal | |||||||||
Amount† | Value | ||||||||
| CORPORATE BONDS: 87.4% (Continued) | |||||||||
| Utilities: 2.3% (Continued) | |||||||||
Vena Energy Capital Pte Ltd | |||||||||
5,450,000 | 3.133%, 2/26/25 | $ | 5,543,911 | ||||||
13,976,246 | |||||||||
| TOTAL CORPORATE BONDS | |||||||||
(Cost $492,852,124) | 521,061,128 | ||||||||
| COLLATERALIZED LOAN OBLIGATIONS: 0.9% | |||||||||
BBAM European CLO I DAC | |||||||||
EUR | 500,000 | 1.600% (3 Month | |||||||
EURIBOR + 1.600%), 1/22/33 1,2 | 615,952 | ||||||||
Carlyle Global Market Strategies | |||||||||
Euro CLO 2015-1 Ltd | |||||||||
EUR | 2,000,000 | 0.960% (3 Month | |||||||
EURIBOR + 0.960%), 1/16/33 1,2 | 2,445,008 | ||||||||
Madison Park Euro Funding VIII DAC | |||||||||
EUR | 1,000,000 | 0.950% (3 Month | |||||||
EURIBOR + 0.950%), 4/15/32 1,2 | 1,216,363 | ||||||||
Penta CLO 7 DAC | |||||||||
EUR | 1,000,000 | 0.950% (3 Month | |||||||
EURIBOR + 0.950%), 1/25/33 1,2 | 1,225,296 | ||||||||
5,502,619 | |||||||||
| TOTAL COLLATERALIZED LOAN OBLIGATIONS | |||||||||
(Cost $4,978,609) | 5,502,619 | ||||||||
| CONVERTIBLE BONDS: 3.6% | |||||||||
| Banking: 2.2% | |||||||||
Abanca Corp Bancaria SA | |||||||||
EUR | 500,000 | 6.125% (5 Year Swap Rate | |||||||
EUR + 5.927%), 1/18/29 1,5 | 665,991 | ||||||||
Barclays PLC | |||||||||
EUR | 750,000 | 2.000% (5 Year Swap Rate | |||||||
EUR + 1.900%), 2/7/28 1,5 | 937,487 | ||||||||
Societe Generale SA | |||||||||
EUR | 3,000,000 | 2.500% (5 Year Swap Rate | |||||||
EUR + 1.830%), 9/16/26 1,5 | 3,725,861 | ||||||||
TSB Banking Group PLC | |||||||||
GBP | 3,500,000 | 5.750% (3 Month LIBOR | |||||||
GBP + 3.430%), 5/6/26 1,5 | 4,854,995 | ||||||||
Unione di Banche Italiane SpA | |||||||||
EUR | 1,000,000 | 4.450% (5 Year Swap Rate | |||||||
EUR + 4.240%), 9/15/27 1,5 | 1,287,434 | ||||||||
Zuercher Kantonalbank | |||||||||
EUR | 1,450,000 | 2.625% (5 Year Swap Rate | |||||||
EUR + 1.850%), 6/15/27 1,5 | 1,830,528 | ||||||||
13,302,296 | |||||||||
| Diversified Financial Services: 1.2% | |||||||||
Arrow Global Finance PLC | |||||||||
GBP | 900,000 | 5.125%, 9/15/24 | 1,233,620 | ||||||
Nykredit Realkredit A/S | |||||||||
EUR | 4,749,000 | 4.000% (5 Year Swap Rate | |||||||
EUR + 2.850%), 6/3/36 1,5 | 5,896,692 | ||||||||
7,130,312 | |||||||||
| Telecommunications: 0.2% | |||||||||
Telecom Italia SPA | |||||||||
EUR | 1,000,000 | 1.125%, 3/26/22 | 1,219,395 | ||||||
| TOTAL CONVERTIBLE BONDS | |||||||||
(Cost $19,945,185) | 21,652,003 | ||||||||
| Shares | |||||||||
| AFFILIATED MUTUAL FUNDS: 1.2% | |||||||||
700,000 | Muzinich High Income | ||||||||
Floating Rate Fund – | |||||||||
Institutional Class | 6,937,000 | ||||||||
| TOTAL AFFILIATED MUTUAL FUNDS | |||||||||
(Cost $7,000,000) | 6,937,000 | ||||||||
| Principal | |||||||||
| Amount | |||||||||
| BANK LOANS: 5.2% | |||||||||
| Chemicals: 0.5% | |||||||||
Colouroz Midco | |||||||||
EUR | 1,428,801 | 5.000% (3 Months EURIBOR | |||||||
+ 4.250%), 9/21/23 1,3 | 1,653,366 | ||||||||
LSF11 Skyscraper Holdco SARL | |||||||||
EUR | 1,000,000 | 4.500%, 7/10/27 1,3,6,7 | 1,226,413 | ||||||
2,879,779 | |||||||||
| Gaming: 0.2% | |||||||||
Gamesys Group PLC | |||||||||
GBP | 1,050,000 | 4.269% (1 Month LIBOR | |||||||
+ 4.250%), 12/5/24 1,3 | 1,433,193 | ||||||||
| Healthcare: 1.1% | |||||||||
HRA | |||||||||
EUR | 1,500,000 | 3.500% (3 Months EURIBOR | |||||||
+ 3.500%), 9/20/24 1,3 | 1,697,320 | ||||||||
Nemera Euro | |||||||||
EUR | 2,000,000 | 4.000% (3 Months EURIBOR | |||||||
+ 4.000%), 1/22/26 1,3 | 2,431,069 | ||||||||
Rodenstock GmbH | |||||||||
EUR | 2,000,000 | 5.250% (6 Months EURIBOR | |||||||
+ 5.250%), 6/15/26 1,3 | 2,424,960 | ||||||||
6,553,349 | |||||||||
| Insurance: 0.2% | |||||||||
Andromeda Investissements | |||||||||
EUR | 888,756 | 3.750% (3 Months LIBOR | |||||||
+ 3.750%), 6/12/26 1,3 | 1,089,814 | ||||||||
The accompanying notes are an integral part of these financial statements.
41
Low Duration Fund
SCHEDULE OF INVESTMENTS at December 31, 2020 (Continued) |
| Principal | |||||||||
Amount† | Value | ||||||||
| BANK LOANS: 5.2% (Continued) | |||||||||
| Services: 1.8% | |||||||||
Assystem Technologies Services | |||||||||
EUR | 3,000,000 | 4.250% (6 Months EURIBOR | |||||||
+ 4.250%), 9/27/24 1,3 | $ | 3,128,932 | |||||||
Fugue Finance BV | |||||||||
EUR | 2,000,000 | 3.250% (3 Months EURIBOR | |||||||
+ 3.250%), 8/30/24 1,3 | 2,416,421 | ||||||||
Markermeer Finance BV | |||||||||
EUR | 1,000,000 | 3.500% (6 Months EURIBOR | |||||||
+ 3.500%), 1/29/27 1,3 | 1,204,332 | ||||||||
Summer (BC) Lux | |||||||||
Consolidator SCA | |||||||||
EUR | 3,000,000 | 4.750% (3 Months EURIBOR | |||||||
+ 4.750%), 12/4/26 1,3 | 3,665,863 | ||||||||
Verisure Holding AB | |||||||||
EUR | 500,000 | 4.000% (3 Months EURIBOR | |||||||
+ 4.000%), 7/20/26 1,3 | 614,138 | ||||||||
11,029,686 | |||||||||
| Super Retail: 0.4% | |||||||||
L1R HB Finance Ltd | |||||||||
GBP | 2,015,319 | 5.273% (3 Months LIBOR | |||||||
+ 5.250%), 8/30/24 1,3 | 2,429,663 | ||||||||
| Technology: 0.2% | |||||||||
Itiviti Group AB | |||||||||
EUR | 999,335 | 4.000% (3 Months EURIBOR | |||||||
+ 4.000%), 3/14/25 1,3 | 1,221,404 | ||||||||
| Telecommunications: 0.4% | |||||||||
Eunetworks Holdings 2 Ltd | |||||||||
EUR | 2,000,000 | 3.250% (1 Month EURIBOR | |||||||
+ 3.250%),, 1/9/25 1,3 | 2,412,744 | ||||||||
| Transportation Excluding Air/Rail: 0.4% | |||||||||
Silk Bidco AS | |||||||||
EUR | 2,000,000 | 4.000% (6 Months EURIBOR | |||||||
+ 4.000%), 2/24/25 1,3 | 2,147,049 | ||||||||
| TOTAL BANK LOANS | |||||||||
(Cost $30,270,782) | 31,196,681 | ||||||||
| TOTAL INVESTMENTS IN SECURITIES: 98.3% | |||||||||
(Cost $555,046,700) | 586,349,431 | ||||||||
Other Assets in Excess of Liabilities: 1.7% | 10,069,462 | ||||||||
| TOTAL NET ASSETS: 100.0% | $ | 596,418,893 | |||||||
| † | In U.S. Dollars unless otherwise indicated. |
CMT – United States Constant Maturity Treasury Note
EUR – Euro
EURIBOR – Euro Interbank Offered Rate
GBP – Great Britain Pound
LIBOR – London Interbank Offered Rate
PIK – Payment-in-Kind – represents the security may pay interest in additional par.
USD – United States Dollar
1 | Variable rate security; rate shown is the rate in effect on December 31, 2020. An index may have a negative rate. Interest rate may also be subject to a cap or floor. |
2 | Denotes investments purchased on a when-issued or delayed delivery basis. |
3 | Bank loans generally pay interest at rates which are periodically determined by reference to a base lending rate plus a premium. All loans carry a variable rate of interest. These base lending rates are generally (i) the Prime Rate offered by one or more major United States banks, (ii) the lending rate offered by one or more European banks such as the London Interbank Offered Rate (“LIBOR”) or (iii) the Certificate of Deposit rate. Bank Loans, while exempt from registration, under the Securities Act of 1933, contain certain restrictions on resale and cannot be sold publicly. Floating rate bank loans often require prepayments from excess cash flow or permit the borrower to repay at its election. The degree to which borrowers repay, whether as a contractual requirement or at their election, cannot be predicted with accuracy. |
4 | Perpetual call date security. Date shown is next call date. |
5 | Fixed-to-variable or fixed-to-float bond; rate shown is the rate in effect on December 31, 2020. An index may have a negative rate. Interest rate may also be subject to a cap or floor. |
6 | All or a portion of the loan may be unfunded. |
7 | Denotes investments purchased on a when-issued or delayed delivery basis. |
The accompanying notes are an integral part of these financial statements.
42
Low Duration Fund
SCHEDULE OF FORWARD FOREIGN CURRENCY EXCHANGE CONTRACTS at December 31, 2020 |
The Low Duration Fund had the following forward foreign currency exchange contracts outstanding with the Bank of New York.
| U.S. Dollar Value at | U.S. Dollar Value at | Unrealized Appreciation | ||||||||||||||||||
| Settlement Date | Currency to be Delivered | December 31, 2020 | Currency to be Received | December 31, 2020 | (Depreciation) | |||||||||||||||
| 1/20/21 | EUR 91,000,000 | $ | 111,226,370 | $ | 106,965,338 | $ | 106,965,338 | $ | (4,261,032 | ) | ||||||||||
| 1/20/21 | GBP 38,500,000 | 52,657,697 | 49,809,337 | 49,809,337 | (2,848,360 | ) | ||||||||||||||
| 3/16/21 | EUR 181,000,000 | 221,498,850 | 220,539,450 | 220,539,450 | (959,400 | ) | ||||||||||||||
| 1/20/21 | 6,603,987 | 6,603,987 | GBP 5,000,000 | 6,838,662 | 234,675 | |||||||||||||||
| 1/20/21 | 23,768,820 | 23,768,820 | EUR 20,000,000 | 24,445,356 | 676,536 | |||||||||||||||
$ | 415,755,724 | $ | 408,598,143 | $ | (7,157,581 | ) | ||||||||||||||
The accompanying notes are an integral part of these financial statements.
43
Floating Rate Fund
SCHEDULE OF INVESTMENTS at December 31, 2020 |
| Principal | |||||||||
Amount† | Value | ||||||||
| CORPORATE BONDS: 5.3% | |||||||||
| Broadcasting: 0.6% | |||||||||
Sinclair Television Group, Inc. | |||||||||
100,000 | 4.125%, 12/1/30 | $ | 102,511 | ||||||
| Building Materials: 0.6% | |||||||||
Srm Escrow Issuer LLC | |||||||||
100,000 | 6.000%, 11/1/28 | 105,375 | |||||||
| Capital Goods: 0.6% | |||||||||
BCD Acquisition Inc | |||||||||
100,000 | 9.625%, 9/15/23 | 102,625 | |||||||
| Diversified Financial Services: 1.2% | |||||||||
Alliance Data Systems Corp | |||||||||
100,000 | 7.000%, 1/15/26 | 105,967 | |||||||
Icahn Enterprises LP / | |||||||||
Icahn Enterprises Finance Corp | |||||||||
100,000 | 6.750%, 2/1/24 | 101,948 | |||||||
207,915 | |||||||||
| Energy: 0.5% | |||||||||
CITGO Petroleum Corp | |||||||||
100,000 | 6.250%, 8/15/22 | 98,250 | |||||||
| Food/Beverage/Tobacco: 0.6% | |||||||||
C&S Group Enterprises LLC | |||||||||
100,000 | 5.000%, 12/15/28 | 99,833 | |||||||
| Leisure: 0.6% | |||||||||
Carnival Corp | |||||||||
100,000 | 10.500%, 2/1/26 | 116,625 | |||||||
| Metals/Mining: 0.6% | |||||||||
SunCoke Energy Partners LP / | |||||||||
SunCoke Energy Partners | |||||||||
Finance Corp | |||||||||
100,000 | 7.500%, 6/15/25 | 99,458 | |||||||
| TOTAL CORPORATE BONDS | |||||||||
(Cost $929,775) | 932,592 | ||||||||
| BANK LOANS: 91.2% | |||||||||
| Automotive & Auto Parts: 4.6% | |||||||||
Autokiniton US Holdings Inc | |||||||||
146,250 | 5.900% (1 Month | ||||||||
LIBOR + 5.750%), 1/29/21 1,2 | 145,519 | ||||||||
Clarios Global LP | |||||||||
146,546 | 3.650% (1 Month | ||||||||
LIBOR + 3.350%), 1/29/21 1,2 | 146,331 | ||||||||
First Brands Group LLC | |||||||||
231,441 | 8.500% (3 Month | ||||||||
LIBOR + 7.500%), 1/29/21 1,2 | 231,224 | ||||||||
IXS Holdings Inc | |||||||||
148,847 | 6.000% (3 Month | ||||||||
LIBOR + 5.000%), 6/30/21 1,2 | 149,467 | ||||||||
Wheel Pros T/L (10/20) | |||||||||
150,000 | 6.250% (1 Month | ||||||||
LIBOR + 5.250%), 1/11/21 1,2 | 148,050 | ||||||||
820,591 | |||||||||
| Broadcasting: 1.9% | |||||||||
The EW Scripps Co | |||||||||
198,992 | 2.650% (1 Month | ||||||||
LIBOR + 5.250%), 1/29/21 1,2 | 197,313 | ||||||||
Gray Television Inc | |||||||||
63,723 | 2.650% (1 Month | ||||||||
LIBOR + 2.500%), 1/4/21 1,2 | 63,404 | ||||||||
iHeartCommunications Inc | |||||||||
74,625 | 4.750% (1 Month | ||||||||
LIBOR + 4.000%), 1/29/21 1,2 | 74,905 | ||||||||
335,622 | |||||||||
| Building Materials: 1.8% | |||||||||
LBM Acquisition LLC | |||||||||
100,000 | 4.500%, 12/31/27 1,2,3,4 | 100,125 | |||||||
LBM Delayed Draw T/L | |||||||||
22,222 | 4.500%, 12/31/27 1,2,3,4 | 22,250 | |||||||
USIC Holdings Inc | |||||||||
196,537 | 4.000% (1 Month | ||||||||
LIBOR + 3.000%), 1/29/21 1,2 | 197,438 | ||||||||
319,813 | |||||||||
| Cable/Satellite TV: 1.7% | |||||||||
CSC Holdings LLC | |||||||||
149,612 | 2.410% (1 Month | ||||||||
LIBOR + 2.250%), 1/15/21 1,2 | 147,742 | ||||||||
Ziggo Financing Partnership | |||||||||
150,000 | 2.660% (1 Month | ||||||||
LIBOR + 2.500%), 1/15/21 1,2 | 149,344 | ||||||||
297,086 | |||||||||
| Capital Goods: 4.9% | |||||||||
Arvos BidCo Sarl | |||||||||
100,000 | 5.500%, 8/30/21 1,2 | 83,000 | |||||||
Big White Acquico GMBH | |||||||||
EUR | 479,485 | 4.250% (1 Month | |||||||
EURIBOR + 4.250%), 1/29/21 1,2 | 568,918 | ||||||||
Raymond Bartlett Snow Holding LLC | |||||||||
100,000 | 5.500%, 8/30/21 1,2 | 83,000 | |||||||
Safety Products/JHC Acquisition Corp | |||||||||
121,935 | 4.650% (1 Month | ||||||||
LIBOR + 4.500%), 1/29/21 1,2 | 115,534 | ||||||||
15,030 | 4.650% (1 Month | ||||||||
LIBOR + 4.500%), 1/29/21 1,2 | 14,241 | ||||||||
864,693 | |||||||||
| Chemicals: 1.8% | |||||||||
Illuminate Buyer LLC | |||||||||
74,813 | 4.150% (1 Month | ||||||||
LIBOR + 4.000%), 1/29/21 1,2 | 74,953 | ||||||||
The accompanying notes are an integral part of these financial statements.
44
Floating Rate Fund
SCHEDULE OF INVESTMENTS at December 31, 2020 (Continued) |
| Principal | |||||||||
Amount† | Value | ||||||||
| BANK LOANS: 91.2% (Continued) | |||||||||
| Chemicals: 1.8% (Continued) | |||||||||
PQ Corp | |||||||||
142,904 | 2.460% (3 Month | ||||||||
LIBOR + 2.250%), 1/29/21 1,2 | $ | 142,190 | |||||||
Rohm Holding GMBH | |||||||||
98,997 | 5.320% (6 Month | ||||||||
LIBOR + 5.000%), 1/29/21 1,2 | 96,357 | ||||||||
313,500 | |||||||||
| Consumer-Products: 2.2% | |||||||||
Kronos Acquisition Holdings, Inc. | |||||||||
50,000 | 5.250%, 12/31/26 1,2,3,4 | 50,176 | |||||||
TGP Holdings III LLC | |||||||||
346,577 | 5.000% (3 Month | ||||||||
LIBOR + 4.000%), 3/31/21 1,2 | 345,928 | ||||||||
396,104 | |||||||||
| Containers: 1.1% | |||||||||
Liqui-Box Holdings Inc | |||||||||
124,375 | 5.500% (3 Month | ||||||||
LIBOR + 4.500%), 2/26/21 1,2 | 111,005 | ||||||||
Tosca Services LLC | |||||||||
75,000 | 5.250% (1 Month | ||||||||
LIBOR + 4.250%), 8/18/27 1,2 | 75,531 | ||||||||
186,536 | |||||||||
| Diversified Financial Services: 3.1% | |||||||||
Datasite T/L | |||||||||
150,000 | 5.000%, 12/10/27 1,2 | 150,375 | |||||||
DRW Holdings LLC | |||||||||
349,122 | 4.40% (1 Month | ||||||||
LIBOR + 4.250%), 1/29/21 1,2 | 346,939 | ||||||||
GBT Group Services BV | |||||||||
48,875 | 2.650% (1 Month | ||||||||
LIBOR + 2.500%), 1/21/21 1,2 | 46,523 | ||||||||
543,837 | |||||||||
| Diversified Media: 4.0% | |||||||||
Adevinta ASA | |||||||||
75,000 | 3.750%, 12/31/27 1,2,3,4 | 75,176 | |||||||
Advantage Sales & Marketing Inc. | |||||||||
225,000 | 6.000% (3 Month | ||||||||
LIBOR + 5.250%), 10/28/27 1,2 | 224,673 | ||||||||
Allen Media LLC | |||||||||
74,426 | 5.750% (3 Month | ||||||||
LIBOR + 5.500%), 3/31/21 1,2 | 74,270 | ||||||||
Clear Channel Outdoor Holdings B | |||||||||
349,116 | 3.710% (3 Month | ||||||||
LIBOR + 3.500%), 1/29/21 1,2 | 336,990 | ||||||||
711,109 | |||||||||
| Energy: 0.8% | |||||||||
Consolidated Energy Finance SA | |||||||||
149,235 | 2.650% (1 Month | ||||||||
LIBOR + 2.500%), 1/25/21 1,2 | 143,079 | ||||||||
| Environmental: 1.4% | |||||||||
Gopher Resource T/L | |||||||||
250,000 | 4.250%, 3/6/25 1,2,3,4 | 248,437 | |||||||
| Food/Beverage/Tobacco: 3.6% | |||||||||
Froneri US Inc | |||||||||
199,000 | 2.400% (1 Month | ||||||||
LIBOR + 2.250%), 1/29/21 1,2 | 197,408 | ||||||||
H-Food Holdings LLC | |||||||||
121,861 | 3.830% (1 Month | ||||||||
LIBOR + 3.690%), 1/29/21 1,2 | 120,023 | ||||||||
US Foods Inc | |||||||||
323,431 | 2.150% (1 Month | ||||||||
LIBOR + 2.000%), 1/29/21 1,2 | 318,984 | ||||||||
636,415 | |||||||||
| Gaming: 3.1% | |||||||||
Caesars Resort Collection LLC | |||||||||
199,500 | 4.650% (1 Month | ||||||||
LIBOR + 4.500%), 7/21/25 1,2 | 200,154 | ||||||||
Golden Nugget Inc | |||||||||
299,580 | 3.250% (2 Month | ||||||||
LIBOR + 2.500%), 2/26/21 1,2 | 290,207 | ||||||||
PCI Gaming Authority | |||||||||
65,870 | 2.650% (1 Month | ||||||||
LIBOR + 2.500%), 1/29/21 1,2 | 65,301 | ||||||||
555,662 | |||||||||
| Healthcare: 12.7% | |||||||||
Air Methods Corp | |||||||||
147,328 | 4.500% (3 Month | ||||||||
LIBOR + 3.500%), 3/31/21 1,2 | 142,687 | ||||||||
Auris Luxembourg III SARL | |||||||||
200,000 | 3.900% (1 Month | ||||||||
LIBOR + 3.750%), 1/29/21 1,2 | 193,750 | ||||||||
BW NHHC Holdco, Inc. | |||||||||
150,000 | 5.220%, 5/15/25 1,2,3,4 | 132,548 | |||||||
Carestream Health, Inc. | |||||||||
350,000 | 7.750%, 5/8/23 1,2,3,4 | 345,188 | |||||||
Heartland Dental LLC | |||||||||
125,000 | 3.646%, 5/21/25 1,2,3,4 | 122,226 | |||||||
Mallinckrodt International Finance SA | |||||||||
463,981 | 5.500% (6 Month | ||||||||
LIBOR + 4.750%), 6/30/21 1,2 | 438,001 | ||||||||
NMN Holdings III Corp | |||||||||
122,639 | 3.680% (2 Month | ||||||||
LIBOR + 3.500%), 1/29/21 1,2 | 120,800 | ||||||||
26,311 | 3.680% (2 Month | ||||||||
LIBOR + 3.500%), 1/29/21 1,2 | 25,916 | ||||||||
Pluto Acquisition I, Inc. | |||||||||
100,000 | 5.500%, 6/22/26 1,2,3,4 | 100,375 | |||||||
Sedgwick Claims | |||||||||
Management Services Inc | |||||||||
149,239 | 3.400% (1 Month | ||||||||
LIBOR + 3.250%), 1/29/21 1,2 | 147,156 | ||||||||
49,750 | 5.250% (1 Month | ||||||||
LIBOR + 4.250%), 1/29/21 1,2 | 50,185 | ||||||||
The accompanying notes are an integral part of these financial statements.
45
Floating Rate Fund
SCHEDULE OF INVESTMENTS at December 31, 2020 (Continued) |
| Principal | |||||||||
Amount† | Value | ||||||||
| BANK LOANS: 91.2% (Continued) | |||||||||
| Healthcare: 12.7% (Continued) | |||||||||
US Outpatient/ US | |||||||||
Radiology (12/20) T/L | |||||||||
75,000 | 6.250% (3 Month | ||||||||
LIBOR + 5.500%), 12/10/27 1,2 | $ | 74,695 | |||||||
US Renal Care, Inc. | |||||||||
350,000 | 5.146%, 6/26/26 1,2,3,4 | 348,878 | |||||||
2,242,405 | |||||||||
| Insurance: 2.2% | |||||||||
AssuredPartners Inc | |||||||||
149,246 | 3.650% (1 Month | ||||||||
LIBOR + 3.500%), 2/1/21 1,2 | 147,299 | ||||||||
USI Holdings | |||||||||
244,937 | 3.250% (3 Month | ||||||||
LIBOR + 3.000%), 3/31/21 1,2 | 241,849 | ||||||||
389,148 | |||||||||
| Leisure: 0.4% | |||||||||
United PF Holdings LLC | |||||||||
68,766 | 4.250% (3 Month | ||||||||
LIBOR + 4.000%), 3/31/21 1,2 | 64,916 | ||||||||
| Metals/Mining: 1.3% | |||||||||
AMG Advanced | |||||||||
Metallurgical Group NV | |||||||||
241,244 | 3.150% (1 Month | ||||||||
LIBOR + 3.000%), 1/29/21 1,2 | 238,832 | ||||||||
| Restaurants: 0.9% | |||||||||
IRB Holding Corp. | |||||||||
50,000 | 4.250%, 11/19/27 1,2,3,4 | 50,149 | |||||||
Zaxby’s Operating Company T/L | |||||||||
100,000 | 4.500% (1 Month | ||||||||
LIBOR + 3.750%), 12/28/27 1,2 | 100,375 | ||||||||
150,524 | |||||||||
| Services: 7.8% | |||||||||
American Residential Services LLC | |||||||||
100,000 | 4.250% (3 Month | ||||||||
LIBOR + 3.500%), 3/31/21 1,2 | 100,125 | ||||||||
APi Group DE Inc | |||||||||
99,000 | 2.650% (1 Month | ||||||||
LIBOR + 2.500%), 1/29/21 1,2 | 98,953 | ||||||||
Aramark Services Inc | |||||||||
149,248 | 1.900% (1 Month | ||||||||
LIBOR + 1.750%), 1/29/21 1,2 | 147,780 | ||||||||
Assystem Technologies Services | |||||||||
EUR | 500,000 | 4.250% (6 Month | |||||||
EURIBOR + 4.250%), 3/31/21 1,2 | 521,489 | ||||||||
Gems Menasa Cayman Ltd | |||||||||
147,764 | 6.000% (6 Month | ||||||||
LIBOR + 5.000%), 5/28/21 1,2 | 147,672 | ||||||||
PetVet Care Centers LLC | |||||||||
24,874 | 5.250% (1 Month | ||||||||
LIBOR + 4.250%), 1/29/21 1,2 | 25,029 | ||||||||
Revint Intermediate II LLC | |||||||||
200,000 | 5.750% (1 Month | ||||||||
LIBOR + 5.000%), 1/15/21 1,2 | 198,250 | ||||||||
Summer BC Holdco B SARL | |||||||||
150,000 | 4.980%, 12/4/26 1,2,3,4 | 147,874 | |||||||
1,387,172 | |||||||||
| Super Retail: 1.8% | |||||||||
CP Atlas Buyer, Inc. | |||||||||
50,000 | 5.250% (3 Month | ||||||||
LIBOR + 4.500%), 11/23/21 1,2 | 50,169 | ||||||||
25,000 | 5.250% (3 Month | ||||||||
LIBOR + 4.500%), 11/23/27 1,2 | 25,084 | ||||||||
Varsity Brands Holding Co, Inc. | |||||||||
250,000 | 4.500%, 12/16/24 1,2,3,4 | 241,340 | |||||||
316,593 | |||||||||
| Technology: 14.8% | |||||||||
Ahead Data Blue, LLC | |||||||||
350,000 | 6.000% (3 Month | ||||||||
LIBOR + 5.000%), 10/13/27 1,2 | 345,188 | ||||||||
Buzz Finco LLC | |||||||||
49,625 | 2.900% (1 Month | ||||||||
LIBOR + 2.750%), 1/29/27 1,2 | 49,439 | ||||||||
CT Technologies T/L (12/20) | |||||||||
175,000 | 5.000% (1 Month | ||||||||
LIBOR + 5.000%), 1/29/21 1,2 | 174,781 | ||||||||
Dawn Acquisition LLC | |||||||||
354,720 | 4.000% (3 Month | ||||||||
LIBOR + 3.750%), 3/31/21 1,2 | 327,414 | ||||||||
DCert Buyer (Digicert) | |||||||||
250,000 | 4.146%, 10/16/26 1,2,3,4 | 250,156 | |||||||
EagleView Technology Corp | |||||||||
148,111 | 3.730% (3 Month | ||||||||
LIBOR + 3.500%), 2/26/21 1,2 | 146,260 | ||||||||
LogMeIn Inc | |||||||||
150,000 | 4.900% (1 Month | ||||||||
LIBOR + 4.750%), 1/7/21 1,2 | 149,813 | ||||||||
Maxar Technologies Ltd | |||||||||
68,134 | 2.900% (1 Month | ||||||||
LIBOR + 2.750%), 1/31/21 1,2 | 67,330 | ||||||||
SuperMoose Borrower LLC | |||||||||
294,000 | 4.000% (3 Month | ||||||||
LIBOR + 3.750%), 3/31/21 1,2 | 275,772 | ||||||||
Surf Holdings LLC | |||||||||
124,375 | 3.730% (3 Month | ||||||||
LIBOR + 3.500%), 3/8/21 1 | 123,473 | ||||||||
Synamedia Americas Holdings Inc | |||||||||
358,402 | 6.220% (6 Month | ||||||||
LIBOR + 6.000%), 12/31/20 1,2 | 325,250 | ||||||||
VeriFone Systems Inc | |||||||||
250,000 | 4.220% (3 Month | ||||||||
LIBOR + 4.000%), 2/22/21 1,2 | 242,500 | ||||||||
The accompanying notes are an integral part of these financial statements.
46
Floating Rate Fund
SCHEDULE OF INVESTMENTS at December 31, 2020 (Continued) |
| Principal | ||||||||
Amount† | Value | |||||||
| BANK LOANS: 91.2% (Continued) | ||||||||
| Technology: 14.8% (Continued) | ||||||||
Veritas US Inc | ||||||||
149,625 | 6.500% (3 Month | |||||||
LIBOR + 5.500%), 3/31/21 1,2 | $ | 149,419 | ||||||
2,626,795 | ||||||||
| Telecommunications: 6.5% | ||||||||
Centurylink T/L B (1/20) | ||||||||
249,370 | 2.400% (1 Month | |||||||
LIBOR + 2.250%), 1/29/21 1,2 | 247,126 | |||||||
Consolidated Communications Inc | ||||||||
74,813 | 5.750% (1 Month | |||||||
LIBOR + 4.750%), 12/31/20 1 | 75,293 | |||||||
Eagle Broadband Investments LLC | ||||||||
100,000 | 3.750% (3 Month | |||||||
LIBOR + 3.000%), 3/31/21 1,2 | 100,078 | |||||||
Level 3 Financing Inc | ||||||||
50,000 | 1.900% (1 Month | |||||||
LIBOR + 1.750%), 1/29/21 1,2 | 49,281 | |||||||
Numericable US LLC | ||||||||
219,460 | 2.900% (1 Month | |||||||
LIBOR + 2.750%), 1/29/21 1,2 | 215,437 | |||||||
Telesat Canada | ||||||||
183,067 | 2.900% (1 Month | |||||||
LIBOR + 2.750%), 1/29/21 1,2 | 181,745 | |||||||
Xplornet Communications Inc | ||||||||
124,375 | 4.900% (1 Month | |||||||
LIBOR + 4.750%), 1/29/21 1,2 | 125,044 | |||||||
Zayo Group Holdings Inc | ||||||||
155,888 | 3.150% (1 Month | |||||||
LIBOR + 3.000%), 1/29/21 1,2 | 155,290 | |||||||
1,149,294 | ||||||||
| Transportation Excluding Air/Rail: 1.1% | ||||||||
Yak Access LLC | ||||||||
233,974 | 5.220% (3 Month | |||||||
LIBOR + 5.000%), 12/31/20 1,2 | 207,652 | |||||||
| Utilities: 5.7% | ||||||||
Calpine Corporation | ||||||||
T/L B5 (11/20) | ||||||||
212,664 | 2.650% (1 Month | |||||||
LIBOR + 2.500%), 1/29/21 1,2 | 211,548 | |||||||
Edgewater Generation LLC | ||||||||
244,030 | 3.900% (1 Month | |||||||
LIBOR + 3.750%), 12/31/20 1,2 | 239,744 | |||||||
Exgen Renewables IV LLC | ||||||||
175,000 | 3.750% (3 Month | |||||||
LIBOR + 2.750%), 12/11/27 1,2 | 175,262 | |||||||
Hamilton Projects Acquiror LLC | ||||||||
74,625 | 5.750% (3 Month | |||||||
LIBOR + 4.750%), 3/31/21 1,2 | 74,967 | |||||||
Heritage Power LLC | ||||||||
323,242 | 7.000% (6 Month | |||||||
LIBOR + 6.000%), 1/29/21 1,2 | 306,828 | |||||||
1,008,349 | ||||||||
| TOTAL BANK LOANS | ||||||||
(Cost $15,966,527) | 16,154,164 | |||||||
| TOTAL INVESTMENTS IN SECURITIES: 96.5% | ||||||||
(Cost $16,896,302) | 17,086,756 | |||||||
Other Assets in Excess of Liabilities: 3.5% | 621,299 | |||||||
| TOTAL NET ASSETS: 100.0% | $ | 17,708,055 | ||||||
| † | In U.S. Dollars unless otherwise indicated. |
EUR – Euro
EURIBOR – Euro Interbank Offered Rate
LIBOR – London Interbank Offered Rate
USD – United States Dollar
1 | Bank loans generally pay interest at rates which are periodically determined by reference to a base lending rate plus a premium. All loans carry a variable rate of interest. These base lending rates are generally (i) the Prime Rate offered by one or more major United States banks, (ii) the lending rate offered by one or more European banks such as the London Interbank Offered Rate (“LIBOR”) or (iii) the Certificate of Deposit rate. Bank Loans, while exempt from registration, under the Securities Act of 1933, contain certain restrictions on resale and cannot be sold publicly. Floating rate bank loans often require prepayments from excess cash flow or permit the borrower to repay at its election. The degree to which borrowers repay, whether as a contractual requirement or at their election, cannot be predicted with accuracy. |
2 | Variable rate security; rate shown is the rate in effect on December 31, 2020. An index may have a negative rate. Interest rate may also be subject to a cap or floor. |
3 | All or a portion of the loan may be unfunded. |
4 | Denotes investments purchased on a when-issued or delayed delivery basis. |
SCHEDULE OF FORWARD FOREIGN CURRENCY EXCHANGE CONTRACTS at December 31, 2020 |
The Floating Rate Fund had the following forward foreign currency exchange contracts outstanding with the Bank of New York.
| U.S. Dollar Value at | U.S. Dollar Value at | Unrealized Appreciation | ||||||||||||||||
| Settlement Date | Currency to be Delivered | December 31, 2020 | Currency to be Received | December 31, 2020 | (Depreciation) | |||||||||||||
| 3/15/21 | EUR 1,200,000 | $ | 1,468,466 | $ | 1,456,732 | $ | 1,456,732 | $ | (11,734 | ) | ||||||||
$ | 1,468,466 | $ | 1,456,732 | $ | (11,734 | ) | ||||||||||||
The accompanying notes are an integral part of these financial statements.
47
Muzinich Funds
STATEMENTS OF ASSETS AND LIABILITIES at December 31, 2020 |
| Credit | Low | |||||||||||||||
| Opportunities | U.S. High | Duration | Floating | |||||||||||||
| Fund | Yield Fund | Fund | Rate Fund | |||||||||||||
| ASSETS | ||||||||||||||||
| Investments in unaffiliated securities, at value (Cost $488,761,406, | ||||||||||||||||
| $63,005,880, $548,046,700, and $16,896,302) (Note 2) | $ | 516,325,846 | $ | 66,934,202 | $ | 579,412,431 | $ | 17,086,756 | ||||||||
| Investments in securities of affiliated issuers, at value (Cost $6,000,000, | ||||||||||||||||
| $—, $7,000,000 and $—) | 5,992,656 | — | 6,937,000 | — | ||||||||||||
| Deposits at broker | 328,349 | 24,076 | — | 121,092 | ||||||||||||
| Cash | 29,909,663 | 2,285,219 | 7,578,614 | 2,477,007 | ||||||||||||
| Foreign currency, at value | ||||||||||||||||
| (Cost $4,657,450, $—, $5,210,467 and $211,678) | 4,719,217 | — | 5,224,442 | 212,822 | ||||||||||||
| Receivables: | ||||||||||||||||
| Fund shares sold | 3,056,824 | — | 1,288,039 | 76,950 | ||||||||||||
| Investment securities sold | — | 77,813 | 4,649 | 1,707,143 | ||||||||||||
| Interest receivable | 5,428,034 | 932,715 | 7,210,560 | 85,708 | ||||||||||||
| Distribution receivable from affiliate | — | — | 29,713 | — | ||||||||||||
| Unrealized appreciation on forward foreign currency exchange contracts | — | — | 911,211 | — | ||||||||||||
| Due from advisor, net | — | — | — | 8,006 | ||||||||||||
| Prepaid expenses | 23,454 | 7,638 | 12,949 | 9,067 | ||||||||||||
| Total assets | 565,784,043 | 70,261,663 | 608,609,608 | 21,784,551 | ||||||||||||
| LIABILITIES | ||||||||||||||||
| Payables | ||||||||||||||||
| Investment securities purchased | 19,341,235 | 1,214,375 | — | 3,940,985 | ||||||||||||
| Fund shares purchased | 667,483 | — | 3,686,184 | 426 | ||||||||||||
| Distribution to shareholders | 3,443,209 | 194,230 | 12,515 | 72,620 | ||||||||||||
| Unrealized depreciation on forward foreign currency exchange contracts | 789,396 | — | 8,068,792 | 11,734 | ||||||||||||
| Investment advisory fees, net | 176,339 | 8,972 | 178,314 | — | ||||||||||||
| Fund accounting fees | 53,808 | 26,799 | 59,699 | 10,233 | ||||||||||||
| Administration fees | 66,163 | 14,649 | 75,627 | 5,635 | ||||||||||||
| Transfer agent fees | 31,355 | 4,284 | 33,666 | 631 | ||||||||||||
| Audit fees | 25,100 | 23,600 | 23,600 | 22,100 | ||||||||||||
| Chief Compliance Officer fees | 3,821 | 3,821 | 3,821 | 3,821 | ||||||||||||
| Custody fees | 14,224 | 1,689 | 26,646 | 3,489 | ||||||||||||
| Trustee fees | 6,133 | 4,269 | 6,421 | 4,063 | ||||||||||||
| Shareholder service fees – Institutional Class | 23,288 | 68 | — | — | ||||||||||||
| Other accrued expenses | 16,650 | 505 | 15,430 | 759 | ||||||||||||
| Total liabilities | 24,658,204 | 1,497,261 | 12,190,715 | 4,076,496 | ||||||||||||
| NET ASSETS | $ | 541,125,839 | $ | 68,764,402 | $ | 596,418,893 | $ | 17,708,055 | ||||||||
The accompanying notes are an integral part of these financial statements.
48
Muzinich Funds
STATEMENTS OF ASSETS AND LIABILITIES at December 31, 2020 (Continued) |
| Credit | Low | |||||||||||||||
| Opportunities | U.S. High | Duration | Floating | |||||||||||||
| Fund | Yield Fund | Fund | Rate Fund | |||||||||||||
| COMPONENTS OF NET ASSETS | ||||||||||||||||
| Paid-in capital | $ | 514,032,784 | $ | 65,547,165 | $ | 596,409,938 | $ | 17,763,060 | ||||||||
| Total distributable (accumulated) earnings (losses) | 27,093,055 | 3,217,237 | 8,955 | (55,005 | ) | |||||||||||
| Net assets | $ | 541,125,839 | $ | 68,764,402 | $ | 596,418,893 | $ | 17,708,055 | ||||||||
| COMPONENTS OF NET ASSET VALUE (Unlimited Shares Authorized) | ||||||||||||||||
Supra Institutional Class1: | ||||||||||||||||
| Net assets | $ | 321,284,948 | $ | 62,859,808 | $ | 592,519,360 | $ | — | ||||||||
| Shares of beneficial interest issued and outstanding | 28,618,920 | 6,310,775 | 58,692,177 | — | ||||||||||||
| Net asset value, offering and redemption price per share | $ | 11.23 | $ | 9.96 | $ | 10.10 | $ | — | ||||||||
| Institutional Class: | ||||||||||||||||
| Net assets | $ | 219,840,891 | $ | 5,904,594 | $ | 3,899,533 | $ | 17,708,055 | ||||||||
| Shares of beneficial interest issued and outstanding | 19,588,076 | 592,257 | 380,020 | 1,787,421 | ||||||||||||
| Net asset value, offering and redemption price per share | $ | 11.22 | $ | 9.97 | $ | 10.26 | $ | 9.91 | ||||||||
1 | This class is not offered for Floating Rate Fund as of December 31, 2020. |
The accompanying notes are an integral part of these financial statements.
49
Muzinich Funds
(This Page Intentionally Left Blank.)
50
Muzinich Funds
STATEMENTS OF OPERATIONS For the Year Ended December 31, 2020 |
| Credit | Low | |||||||||||||||
| Opportunities | U.S. High | Duration | Floating | |||||||||||||
| Fund | Yield Fund | Fund | Rate Fund | |||||||||||||
| INVESTMENT INCOME | ||||||||||||||||
| Interest | $ | 15,451,463 | $ | 3,321,960 | $ | 19,654,557 | $ | 593,921 | ||||||||
| Dividends from affiliated investments | 194,615 | — | 294,310 | — | ||||||||||||
| Dividends from unaffiliated investments | 94,935 | 54,129 | — | — | ||||||||||||
| Consent income | 30,788 | 1,813 | 16,534 | — | ||||||||||||
| Other income | 9,206 | 2,030 | 667 | 417 | ||||||||||||
| Total investment income | 15,781,007 | 3,379,932 | 19,966,068 | 594,338 | ||||||||||||
| EXPENSES | ||||||||||||||||
| Investment advisory fees | 2,816,424 | 312,674 | 2,749,326 | 60,338 | ||||||||||||
| Administration fees | 182,334 | 41,638 | 243,160 | 16,563 | ||||||||||||
| Fund accounting fees | 145,088 | 76,581 | 189,077 | 28,898 | ||||||||||||
| Custody fees | 120,730 | 11,857 | 165,864 | 25,562 | ||||||||||||
| Shareholder service fees – Institutional Class | 111,366 | — | — | — | ||||||||||||
| Transfer agent fees | 88,514 | 11,035 | 106,639 | 1,768 | ||||||||||||
| Registration fees | 58,133 | 29,460 | 54,852 | 20,080 | ||||||||||||
| Miscellaneous expenses | 34,169 | 7,071 | 38,702 | 4,252 | ||||||||||||
| Audit fees | 25,632 | 24,056 | 24,202 | 21,037 | ||||||||||||
| Trustees fees | 23,539 | 16,472 | 25,925 | 15,709 | ||||||||||||
| Chief Compliance Officer fees | 11,739 | 11,710 | 11,806 | 11,739 | ||||||||||||
| Legal fees | 7,994 | 8,366 | 8,234 | 8,285 | ||||||||||||
| Reports to shareholders | 3,763 | 1,841 | 21,350 | 1,572 | ||||||||||||
| Insurance expense | 3,722 | 2,719 | 4,394 | 2,677 | ||||||||||||
| Interest expense | 11 | — | 29,551 | — | ||||||||||||
| Total expenses | 3,633,158 | 555,480 | 3,673,082 | 218,480 | ||||||||||||
| Less: affiliated advisory fees waived | (28,601 | ) | — | (43,504 | ) | — | ||||||||||
| Less: advisory fees waived and expenses absorbed | (705,367 | ) | (225,751 | ) | (608,830 | ) | (140,042 | ) | ||||||||
| Net expenses | 2,899,190 | 329,729 | 3,020,748 | 78,438 | ||||||||||||
| Net investment income (loss) | 12,881,817 | 3,050,203 | 16,945,320 | 515,900 | ||||||||||||
| REALIZED AND UNREALIZED GAIN (LOSS) ON INVESTMENTS | ||||||||||||||||
| Realized gain (loss) on: | ||||||||||||||||
| Unaffiliated investments | 2,675,641 | (205,222 | ) | (12,996,358 | ) | (164,049 | ) | |||||||||
| Forward foreign currency exchange contracts | (4,103,228 | ) | — | (19,934,206 | ) | (153,459 | ) | |||||||||
| Foreign currency and foreign currency transactions | 61,233 | — | 209,578 | 67,606 | ||||||||||||
| Futures contracts | (209,827 | ) | — | — | — | |||||||||||
| Swap contracts | 340,706 | — | — | — | ||||||||||||
| Net realized gain (loss) | (1,235,475 | ) | (205,222 | ) | (32,720,986 | ) | (249,902 | ) | ||||||||
| Change in net unrealized appreciation/depreciation on: | ||||||||||||||||
| Unaffiliated investments | 18,150,256 | 2,815,828 | 32,966,164 | 324,418 | ||||||||||||
| Affiliated investments | 40,656 | — | 21,000 | — | ||||||||||||
| Forward foreign currency exchange contracts | 95,691 | — | (543,536 | ) | 18,843 | |||||||||||
| Foreign currency and foreign currency translation | 49,551 | — | 121,681 | 18,820 | ||||||||||||
| Change in net unrealized appreciation/depreciation | 18,336,154 | 2,815,828 | 32,565,309 | 362,081 | ||||||||||||
| Net realized and unrealized gain (loss) on investments | 17,100,679 | 2,610,606 | (155,677 | ) | 112,179 | |||||||||||
| Net increase (decrease) in net assets resulting from operations | $ | 29,982,496 | $ | 5,660,809 | $ | 16,789,643 | $ | 628,079 | ||||||||
The accompanying notes are an integral part of these financial statements.
51
Credit Opportunities Fund
| STATEMENTS OF CHANGES IN NET ASSETS |
| Year Ended | Year Ended | |||||||
| December 31, 2020 | December 31, 2019 | |||||||
| INCREASE (DECREASE) IN NET ASSETS FROM: | ||||||||
| OPERATIONS | ||||||||
| Net investment income (loss) | $ | 12,881,817 | $ | 12,697,555 | ||||
| Net realized gain (loss) on investments, forward foreign currency exchange contracts, | ||||||||
| foreign currency transactions, futures contracts and swap contracts | (1,235,475 | ) | 18,086,513 | |||||
| Change in unrealized appreciation/depreciation on investments, forward foreign currency | ||||||||
| exchange contracts, foreign currency, foreign currency translation, and futures contracts | 18,336,154 | 9,707,575 | ||||||
| Net increase (decrease) in net assets resulting from operations | 29,982,496 | 40,491,643 | ||||||
| DISTRIBUTIONS TO SHAREHOLDERS | ||||||||
| From earnings: | ||||||||
| Supra Institutional Class | (9,250,936 | ) | (16,519,502 | ) | ||||
| Institutional Class | (5,955,575 | ) | (9,649,372 | ) | ||||
Class A1 | — | (7,136 | ) | |||||
| Total distributions to shareholders | (15,206,511 | ) | (26,176,010 | ) | ||||
| CAPITAL SHARE TRANSACTIONS | ||||||||
| Net increase (decrease) in net assets derived from net change in outstanding shares – | ||||||||
Supra Institutional Class2 | 50,432,322 | 13,060,330 | ||||||
| Net increase (decrease) in net assets derived from net change in outstanding shares – | ||||||||
Institutional Class2 | 58,592,581 | (4,112,961 | ) | |||||
| Net increase (decrease) in net assets derived from net change in outstanding shares – | ||||||||
Class A1,2 | — | (403,696 | ) | |||||
| Total increase (decrease) in net assets from capital share transactions | 109,024,903 | 8,543,673 | ||||||
| Total increase (decrease) in net assets | 123,800,888 | 22,859,306 | ||||||
| NET ASSETS | ||||||||
| Beginning of year | 417,324,951 | 394,465,645 | ||||||
| End of year | $ | 541,125,839 | $ | 417,324,951 | ||||
The accompanying notes are an integral part of these financial statements.
52
Credit Opportunities Fund
STATEMENTS OF CHANGES IN NET ASSETS (Continued) |
2 | Summary of share transactions is as follows: |
| Year Ended | Year Ended | ||||||||||||||||
| December 31, 2020 | December 31, 2019 | ||||||||||||||||
| Supra Institutional Class: | Shares | Value | Shares | Value | |||||||||||||
Shares sold | 7,471,905 | $ | 81,847,942 | 3,769,106 | $ | 41,919,717 | |||||||||||
Shares issued in reinvestment of distributions | 398,207 | 4,358,534 | 676,120 | 7,389,094 | |||||||||||||
Shares redeemed3 | (3,283,707 | ) | (35,774,154 | ) | (3,303,653 | ) | (36,248,481 | ) | |||||||||
Net increase (decrease) | 4,586,405 | $ | 50,432,322 | 1,141,573 | $ | 13,060,330 | |||||||||||
| Year Ended | Year Ended | ||||||||||||||||
| December 31, 2020 | December 31, 2019 | ||||||||||||||||
| Institutional Class: | Shares | Value | Shares | Value | |||||||||||||
Shares sold | 9,884,205 | $ | 107,504,481 | 3,833,373 | $ | 42,136,030 | |||||||||||
Shares redeemed in connection with the conversion of | |||||||||||||||||
Class A shares into Institutional Class Shares1,4 | — | — | 34,768 | 395,833 | |||||||||||||
Shares issued in reinvestment of distributions | 371,324 | 4,050,168 | 694,220 | 7,582,642 | |||||||||||||
Shares redeemed4 | (4,940,373 | ) | (52,962,068 | ) | (4,974,381 | ) | (54,227,466 | ) | |||||||||
Net increase (decrease) | 5,315,156 | $ | 58,592,581 | (412,020 | ) | $ | (4,112,961 | ) | |||||||||
| Year Ended | |||||||||
| December 31, 2019 | |||||||||
| Class A: | Shares | Value | |||||||
Shares sold | 474 | $ | 5,250 | ||||||
Shares issued in reinvestment of distributions | 650 | 7,137 | |||||||
Shares redeemed | (1,797 | ) | (20,250 | ) | |||||
Shares redeemed in connection with the conversion of | |||||||||
Class A shares into Institutional Class Shares1 | (34,818 | ) | (395,833 | ) | |||||
Net increase (decrease) | (35,491 | ) | $ | (403,696 | ) | ||||
1 | Credit Opportunities Fund – Class A shares converted into Institutional Class shares on close of business December 27, 2019. |
3 | Net of redemption fees of $21,646 and $1,528, respectively. |
4 | Net of redemption fees of $22,921 and $7,588, respectively. |
Share Class | Shares Outstanding | Net Assets | NAV Per Share | Share Conversion Ratio | |||||||||||||
Class A | 34,818 | $ | 395,833 | $ | 11.3686 | 0.9986 | |||||||||||
Institutional Class (before conversion) | 13,735,751 | 156,383,550 | 11.3851 | ||||||||||||||
Institutional Class (after conversion) | 13,770,519 | 156,779,383 | 11.3851 | ||||||||||||||
The accompanying notes are an integral part of these financial statements.
53
U.S. High Yield Fund
| STATEMENTS OF CHANGES IN NET ASSETS |
| Year Ended | Year Ended | |||||||
| December 31, 2020 | December 31, 2019 | |||||||
| INCREASE (DECREASE) IN NET ASSETS FROM: | ||||||||
| OPERATIONS | ||||||||
| Net investment income (loss) | $ | 3,050,203 | $ | 2,044,179 | ||||
| Net realized gain (loss) on investments | (205,222 | ) | (170,190 | ) | ||||
| Net change in unrealized appreciation/depreciation on investments | 2,815,828 | 2,784,622 | ||||||
| Net increase (decrease) in net assets resulting from operations | 5,660,809 | 4,658,611 | ||||||
| DISTRIBUTIONS TO SHAREHOLDERS | ||||||||
| Net distributions to shareholders – Supra Institutional Class | (2,845,562 | ) | (2,001,323 | ) | ||||
| Net distributions to shareholders – Institutional Class | (200,655 | ) | (39,177 | ) | ||||
| Total distributions to shareholders | (3,046,217 | ) | (2,040,500 | ) | ||||
| CAPITAL SHARE TRANSACTIONS | ||||||||
| Net increase (decrease) in net assets derived from net change in outstanding shares – | ||||||||
Supra Institutional Class1 | 16,977,580 | 11,384,907 | ||||||
| Net increase (decrease) in net assets derived from net change in outstanding shares – | ||||||||
Institutional Class1 | 4,066,754 | 936,510 | ||||||
| Total increase (decrease) in net assets from capital share transactions | 21,044,334 | 12,321,417 | ||||||
| Total increase (decrease) in net assets | 23,658,926 | 14,939,528 | ||||||
| NET ASSETS | ||||||||
| Beginning of year | 45,105,476 | 30,165,948 | ||||||
| End of year | $ | 68,764,402 | $ | 45,105,476 | ||||
1 | Summary of share transactions is as follows: |
| Year Ended | Year Ended | ||||||||||||||||
| December 31, 2020 | December 31, 2019 | ||||||||||||||||
| Supra Institutional Class: | Shares | Value | Shares | Value | |||||||||||||
Shares sold | 2,314,085 | $ | 20,942,127 | 1,207,945 | $ | 11,660,781 | |||||||||||
Shares issued in reinvestment of distributions | 107,291 | 1,014,857 | 79,329 | 767,691 | |||||||||||||
Shares redeemed | (531,473 | ) | (4,979,404 | ) | (107,340 | ) | (1,043,565 | ) | |||||||||
Net increase (decrease) | 1,889,903 | $ | 16,977,580 | 1,179,934 | $ | 11,384,907 | |||||||||||
| Year Ended | Year Ended | ||||||||||||||||
| December 31, 2020 | December 31, 2019 | ||||||||||||||||
| Institutional Class: | Shares | Value | Shares | Value | |||||||||||||
Shares sold | 610,779 | $ | 5,751,486 | 97,000 | $ | 955,450 | |||||||||||
Shares issued in reinvestment of distributions | 17,168 | 166,044 | 3,020 | 29,210 | |||||||||||||
Shares redeemed | (202,458 | ) | (1,850,776 | ) | (5,000 | ) | (48,150 | ) | |||||||||
Net increase (decrease) | 425,489 | $ | 4,066,754 | 95,020 | $ | 936,510 | |||||||||||
The accompanying notes are an integral part of these financial statements.
54
Low Duration Fund
| STATEMENTS OF CHANGES IN NET ASSETS |
| Year Ended | Year Ended | |||||||
| December 31, 2020 | December 31, 2019 | |||||||
| INCREASE (DECREASE) IN NET ASSETS FROM: | ||||||||
| OPERATIONS | ||||||||
| Net investment income (loss) | $ | 16,945,320 | $ | 16,132,182 | ||||
| Net realized gain (loss) on investments, forward foreign currency exchange contracts, | ||||||||
| and foreign currency transactions | (32,720,986 | ) | 13,551,648 | |||||
| Change in unrealized appreciation/depreciation on investments, forward foreign currency | ||||||||
| exchange contracts, foreign currency, and foreign currency translation | 32,565,309 | 15,814,001 | ||||||
| Net increase (decrease) in net assets resulting from operations | 16,789,643 | 45,497,831 | ||||||
| DISTRIBUTIONS TO SHAREHOLDERS | ||||||||
| Net distributions to shareholders – Supra Institutional Class | (12,915,384 | ) | (14,926,359 | ) | ||||
| Net distributions to shareholders – Institutional Class | (58,952 | ) | (1,079 | ) | ||||
| Total distributions to shareholders | (12,974,336 | ) | (14,927,438 | ) | ||||
| CAPITAL SHARE TRANSACTIONS | ||||||||
| Net increase (decrease) in net assets derived from net change in outstanding shares – | ||||||||
Supra Institutional Class1 | (143,074,632 | ) | 129,553,229 | |||||
| Net increase (decrease) in net assets derived from net change in outstanding shares – | ||||||||
Institutional Class1 | 3,575,719 | 101,016 | ||||||
| Total increase (decrease) in net assets from capital share transactions | (139,498,913 | ) | 129,654,245 | |||||
| Total increase (decrease) in net assets | (135,683,606 | ) | 160,224,638 | |||||
| NET ASSETS | ||||||||
| Beginning of year | 732,102,499 | 571,877,861 | ||||||
| End of year | $ | 596,418,893 | $ | 732,102,499 | ||||
1 | Summary of share transactions is as follows: |
| Year Ended | Year Ended | ||||||||||||||||
| December 31, 2020 | December 31, 2019 | ||||||||||||||||
| Supra Institutional Class: | Shares | Value | Shares | Value | |||||||||||||
Shares sold | 24,568,694 | $ | 235,487,913 | 35,273,136 | $ | 350,548,555 | |||||||||||
Shares issued in reinvestment of distributions | 1,297,389 | 12,880,826 | 1,496,883 | 14,890,533 | |||||||||||||
Shares redeemed2 | (39,981,912 | ) | (391,443,371 | ) | (23,974,491 | ) | (235,885,859 | ) | |||||||||
Net increase (decrease) | (14,115,829 | ) | $ | (143,074,632 | ) | 12,795,528 | $ | 129,553,229 | |||||||||
2 | Net of redemption fees of $21,853 and $2,351, respectively. |
| Year Ended | Period Ended | ||||||||||||||||
| December 31, 2020 | December 31, 20193 | ||||||||||||||||
| Institutional Class: | Shares | Value | Shares | Value | |||||||||||||
Shares sold | 1,060,367 | $ | 10,518,831 | 23,004 | $ | 236,000 | |||||||||||
Shares issued in reinvestment of distributions | 5,593 | 56,898 | 2 | 16 | |||||||||||||
Shares redeemed4 | (695,826 | ) | (7,000,010 | ) | (13,120 | ) | (135,000 | ) | |||||||||
Net increase (decrease) | 370,134 | $ | 3,575,719 | 9,886 | $ | 101,016 | |||||||||||
3 | Institutional Class commenced operations on April 30, 2019. Information presented is for the period from April 30, 2019, to December 31, 2019. |
4 | Net of redemption fees of less than $1, for each period presented. |
The accompanying notes are an integral part of these financial statements.
55
Floating Rate Fund
| STATEMENTS OF CHANGES IN NET ASSETS |
| Year Ended | Year Ended | |||||||
| December 31, 2020 | December 31, 2019 | |||||||
| NET INCREASE (DECREASE) IN NET ASSETS FROM: | ||||||||
| OPERATIONS | ||||||||
| Net investment income (loss) | $ | 515,900 | $ | 496,317 | ||||
| Net realized gain (loss) on investments, forward foreign currency | ||||||||
| exchange contracts, and foreign currency transactions | (249,902 | ) | 55,050 | |||||
| Change in unrealized appreciation/depreciation on investments, forward foreign | ||||||||
| currency exchange contracts, foreign currency, and foreign currency translation | 362,081 | 243,232 | ||||||
| Net increase (decrease) in net assets resulting from operations | 628,079 | 794,599 | ||||||
| DISTRIBUTIONS TO SHAREHOLDERS | ||||||||
| Net distributions to shareholders – Institutional Class | (543,140 | ) | (528,971 | ) | ||||
| CAPITAL SHARE TRANSACTIONS | ||||||||
| Net increase (decrease) in net assets derived from net change in outstanding shares – | ||||||||
Institutional Class1 | 6,184,854 | 25,811 | ||||||
| Total increase (decrease) in net assets | 6,269,793 | 291,439 | ||||||
| NET ASSETS | ||||||||
| Beginning of year | 11,438,262 | 11,146,823 | ||||||
| End of year | $ | 17,708,055 | $ | 11,438,262 | ||||
1 | A summary of share transactions is as follows: |
| Year Ended | Year Ended | ||||||||||||||||
| December 31, 2020 | December 31, 2019 | ||||||||||||||||
| Institutional Class: | Shares | Value | Shares | Value | |||||||||||||
Shares sold | 626,883 | $ | 6,159,751 | — | $ | — | |||||||||||
Shares issued to holders in reinvestment of distributions | 2,684 | 25,529 | 2,614 | 25,811 | |||||||||||||
Shares redeemed | (43 | ) | (426 | ) | — | — | |||||||||||
Net increase (decrease) | 629,524 | $ | 6,184,854 | 2,614 | $ | 25,811 | |||||||||||
The accompanying notes are an integral part of these financial statements.
56
Credit Opportunities Fund
FINANCIAL HIGHLIGHTS For a capital share outstanding throughout each year |
| Year Ended December 31, | ||||||||||||||||||||
| Supra Institutional Class | 2020 | 2019 | 2018 | 2017 | 2016 | |||||||||||||||
| Net asset value, beginning of year | $ | 10.90 | $ | 10.49 | $ | 10.69 | $ | 10.50 | $ | 10.27 | ||||||||||
| INCOME (LOSS) FROM INVESTMENT OPERATIONS: | ||||||||||||||||||||
Net investment income (loss)1 | 0.30 | 0.35 | 0.29 | 0.34 | 0.32 | |||||||||||||||
| Net realized and unrealized gain (loss) on investments | 0.37 | 0.77 | (0.27 | ) | 0.15 | 0.33 | ||||||||||||||
| Total from investment operations | 0.67 | 1.12 | 0.02 | 0.49 | 0.65 | |||||||||||||||
| Redemption fee proceeds | 0.00 | 2 | 0.00 | 2 | 0.00 | 2 | 0.00 | 2 | 0.00 | 2 | ||||||||||
| LESS DISTRIBUTIONS: | ||||||||||||||||||||
| From net investment income | (0.27 | ) | (0.31 | ) | (0.08 | ) | (0.27 | ) | (0.31 | ) | ||||||||||
| From return of capital | — | — | (0.02 | ) | — | — | ||||||||||||||
| From net realized gain | (0.07 | ) | (0.40 | ) | (0.12 | ) | (0.03 | ) | (0.11 | ) | ||||||||||
| Total distributions | (0.34 | ) | (0.71 | ) | (0.22 | ) | (0.30 | ) | (0.42 | ) | ||||||||||
| Net asset value, end of year | $ | 11.23 | $ | 10.90 | $ | 10.49 | $ | 10.69 | $ | 10.50 | ||||||||||
| Total return | 6.30 | % | 10.77 | % | 0.22 | % | 4.70 | % | 6.34 | % | ||||||||||
| SUPPLEMENTAL DATA: | ||||||||||||||||||||
| Net assets, end of year (millions) | $ | 321.3 | $ | 261.9 | $ | 240.1 | $ | 208.4 | $ | 176.9 | ||||||||||
| Portfolio turnover rate | 174 | % | 293 | % | 244 | % | 135 | % | 260 | % | ||||||||||
| RATIO OF EXPENSES TO AVERAGE NET ASSETS: | ||||||||||||||||||||
| Before fees waived and expenses absorbed | 0.75 | % | 0.76 | % | 0.80 | % | 0.83 | % | 0.84 | % | ||||||||||
| After fees waived and expenses absorbed | 0.59 | % | 0.59 | % | 0.60 | % | 0.60 | % | 0.60 | % | ||||||||||
| RATIO OF NET INVESTMENT INCOME (LOSS) TO AVERAGE NET ASSETS: | ||||||||||||||||||||
| Before fees waived and expenses absorbed | 2.61 | % | 3.01 | % | 2.61 | % | 3.00 | % | 2.77 | % | ||||||||||
| After fees waived and expenses absorbed | 2.77 | % | 3.18 | % | 2.81 | % | 3.23 | % | 3.01 | % | ||||||||||
1 | Calculated using the average shares outstanding method. |
2 | Does not round to $0.01 or $(0.01), as applicable. |
The accompanying notes are an integral part of these financial statements.
57
Credit Opportunities Fund
FINANCIAL HIGHLIGHTS For a capital share outstanding throughout each year |
| Year Ended December 31, | ||||||||||||||||||||
| Institutional Class | 2020 | 2019 | 2018 | 2017 | 2016 | |||||||||||||||
| Net asset value, beginning of year | $ | 10.89 | $ | 10.49 | $ | 10.69 | $ | 10.49 | $ | 10.27 | ||||||||||
| INCOME (LOSS) FROM INVESTMENT OPERATIONS: | ||||||||||||||||||||
Net investment income (loss)1 | 0.30 | 0.34 | 0.29 | 0.34 | 0.33 | |||||||||||||||
| Net realized and unrealized gain (loss) on investments | 0.36 | 0.76 | (0.27 | ) | 0.15 | 0.31 | ||||||||||||||
| Total from investment operations | 0.66 | 1.10 | 0.02 | 0.49 | 0.64 | |||||||||||||||
| Redemption fee proceeds | 0.00 | 2 | 0.00 | 2 | 0.00 | 2 | 0.00 | 2 | — | |||||||||||
| LESS DISTRIBUTIONS: | ||||||||||||||||||||
| From net investment income | (0.26 | ) | (0.30 | ) | (0.08 | ) | (0.26 | ) | (0.31 | ) | ||||||||||
| From return of capital | — | — | (0.02 | ) | — | — | ||||||||||||||
| From net realized gain | (0.07 | ) | (0.40 | ) | (0.12 | ) | (0.03 | ) | (0.11 | ) | ||||||||||
| Total distributions | (0.33 | ) | (0.70 | ) | (0.22 | ) | (0.29 | ) | (0.42 | ) | ||||||||||
| Net asset value, end of year | $ | 11.22 | $ | 10.89 | $ | 10.49 | $ | 10.69 | $ | 10.49 | ||||||||||
| Total return | 6.24 | % | 10.60 | % | 0.20 | % | 4.73 | % | 6.20 | % | ||||||||||
| SUPPLEMENTAL DATA: | ||||||||||||||||||||
| Net assets, end of year (millions) | $ | 219.8 | $ | 155.5 | $ | 154.0 | $ | 181.9 | $ | 74.6 | ||||||||||
| Portfolio turnover rate | 174 | % | 293 | % | 244 | % | 135 | % | 260 | % | ||||||||||
| RATIO OF EXPENSES TO AVERAGE NET ASSETS: | ||||||||||||||||||||
| Before fees waived and expenses absorbed | 0.81 | % | 0.82 | % | 0.83 | % | 0.91 | % | 0.90 | % | ||||||||||
| After fees waived and expenses absorbed | 0.65 | % | 0.65 | % | 0.63 | % | 0.67 | % | 0.64 | % | ||||||||||
| RATIO OF NET INVESTMENT INCOME (LOSS) TO AVERAGE NET ASSETS: | ||||||||||||||||||||
| Before fees waived and expenses absorbed | 2.55 | % | 2.95 | % | 2.57 | % | 2.92 | % | 2.81 | % | ||||||||||
| After fees waived and expenses absorbed | 2.71 | % | 3.12 | % | 2.77 | % | 3.16 | % | 3.08 | % | ||||||||||
1 | Calculated using the average shares outstanding method. |
2 | Does not round to $0.01 or $(0.01), as applicable. |
The accompanying notes are an integral part of these financial statements.
58
U.S. High Yield Fund
FINANCIAL HIGHLIGHTS For a capital share outstanding throughout each year/period |
| Period Ended | ||||||||||||||||||||
| Year Ended December 31, | December 31, | |||||||||||||||||||
| Supra Institutional Class | 2020 | 2019 | 2018 | 2017 | 20161 | |||||||||||||||
| Net asset value, beginning of year/period | $ | 9.83 | $ | 9.11 | $ | 9.85 | $ | 10.45 | $ | 10.00 | ||||||||||
| INCOME (LOSS) FROM INVESTMENT OPERATIONS: | ||||||||||||||||||||
Net investment income (loss)2 | 0.51 | 0.51 | 0.50 | 0.51 | 0.41 | |||||||||||||||
| Net realized and unrealized gain (loss) on investments | 0.12 | 0.72 | (0.74 | ) | 0.14 | 0.35 | ||||||||||||||
| Total from investment operations | 0.63 | 1.23 | (0.24 | ) | 0.65 | 0.76 | ||||||||||||||
| LESS DISTRIBUTIONS: | ||||||||||||||||||||
| Distributions from net investment income | (0.50 | ) | (0.51 | ) | (0.50 | ) | (0.58 | ) | (0.30 | ) | ||||||||||
| Distributions from net realized gain | — | — | — | (0.67 | ) | (0.01 | ) | |||||||||||||
| Total distributions | (0.50 | ) | (0.51 | ) | (0.50 | ) | (1.25 | ) | (0.31 | ) | ||||||||||
| Net asset value, end of year/period | $ | 9.96 | $ | 9.83 | $ | 9.11 | $ | 9.85 | $ | 10.45 | ||||||||||
| Total return | 6.82 | % | 13.71 | % | (2.59 | )% | 6.30 | % | 7.74 | %3 | ||||||||||
| SUPPLEMENTAL DATA: | ||||||||||||||||||||
| Net assets, end of year/period (millions) | $ | 62.9 | $ | 43.5 | $ | 29.5 | $ | 19.5 | $ | 83.0 | ||||||||||
| Portfolio turnover rate | 113 | % | 89 | % | 71 | % | 120 | % | 140 | %3 | ||||||||||
| RATIO OF EXPENSES TO AVERAGE NET ASSETS: | ||||||||||||||||||||
| Before fees waived and expenses absorbed | 0.98 | % | 1.21 | % | 1.63 | % | 1.03 | % | 1.83 | %4 | ||||||||||
| After fees waived and expenses absorbed | 0.58 | % | 0.58 | % | 0.58 | % | 0.58 | % | 0.58 | %4 | ||||||||||
| RATIO OF NET INVESTMENT INCOME (LOSS) TO AVERAGE NET ASSETS: | ||||||||||||||||||||
| Before fees waived and expenses absorbed | 4.97 | % | 4.68 | % | 4.18 | % | 4.39 | % | 4.01 | %4 | ||||||||||
| After fees waived and expenses absorbed | 5.37 | % | 5.30 | % | 5.23 | % | 4.84 | % | 5.25 | %4 | ||||||||||
1 | Commenced operations on March 31, 2016. Information presented is for the period from March 31, 2016 to December 31, 2016. |
2 | Calculated based on the average number of shares outstanding. |
3 | Not annualized. |
4 | Annualized. |
The accompanying notes are an integral part of these financial statements.
59
U.S. High Yield Fund
FINANCIAL HIGHLIGHTS For a capital share outstanding throughout each year/period |
| Period Ended | ||||||||||||||||
| Year Ended December 31, | December 31, | |||||||||||||||
| Institutional Class | 2020 | 2019 | 2018 | 20171 | ||||||||||||
| Net asset value, beginning of year/period | $ | 9.84 | $ | 9.12 | $ | 9.86 | $ | 10.46 | ||||||||
| INCOME (LOSS) FROM INVESTMENT OPERATIONS: | ||||||||||||||||
Net investment income (loss)2 | 0.52 | 0.51 | 0.49 | 0.39 | ||||||||||||
| Net realized and unrealized gain (loss) on investments | 0.11 | 0.72 | (0.74 | ) | 0.17 | |||||||||||
| Total from investment operations | 0.63 | 1.23 | (0.25 | ) | 0.56 | |||||||||||
| LESS DISTRIBUTIONS: | ||||||||||||||||
| Distributions from net investment income | (0.50 | ) | (0.51 | ) | (0.49 | ) | (0.49 | ) | ||||||||
| Distributions from net realized gain | — | — | — | (0.67 | ) | |||||||||||
| Total distributions | (0.50 | ) | (0.51 | ) | (0.49 | ) | (1.16 | ) | ||||||||
| Net asset value, end of year/period | $ | 9.97 | $ | 9.84 | $ | 9.12 | $ | 9.86 | ||||||||
| Total return | 6.81 | % | 13.68 | % | (2.67 | )% | 5.47 | %3 | ||||||||
| SUPPLEMENTAL DATA: | ||||||||||||||||
| Net assets, end of year/period (millions) | $ | 5.9 | $ | 1.6 | $ | 0.7 | $ | 2.6 | ||||||||
| Portfolio turnover rate | 113 | % | 89 | % | 71 | % | 120 | %3,4 | ||||||||
| RATIO OF EXPENSES TO AVERAGE NET ASSETS: | ||||||||||||||||
| Before fees waived and expenses absorbed | 0.98 | % | 1.17 | % | 1.68 | % | 1.61 | %5 | ||||||||
| After fees waived and expenses absorbed | 0.58 | % | 0.59 | % | 0.64 | % | 0.68 | %5 | ||||||||
| RATIO OF NET INVESTMENT INCOME (LOSS) TO AVERAGE NET ASSETS: | ||||||||||||||||
| Before fees waived and expenses absorbed | 4.97 | % | 4.74 | % | 4.02 | % | 3.87 | %5 | ||||||||
| After fees waived and expenses absorbed | 5.37 | % | 5.32 | % | 5.06 | % | 4.81 | %5 | ||||||||
1 | Commenced operations on March 27, 2017. Information presented is for the period from March 27, 2017 to December 31, 2017. |
2 | Calculated based on the average number of shares outstanding. |
3 | Not annualized. |
4 | Portfolio turnover calculated at the Fund level. |
5 | Annualized. |
The accompanying notes are an integral part of these financial statements.
60
Low Duration Fund
FINANCIAL HIGHLIGHTS For a capital share outstanding throughout each year/period |
| Period Ended | ||||||||||||||||||||
| Year Ended December 31, | December 31, | |||||||||||||||||||
| Supra Institutional Class | 2020 | 2019 | 2018 | 2017 | 20161 | |||||||||||||||
| Net asset value, beginning of year/period | $ | 10.05 | $ | 9.53 | $ | 10.27 | $ | 10.04 | $ | 10.00 | ||||||||||
| INCOME (LOSS) FROM INVESTMENT OPERATIONS: | ||||||||||||||||||||
Net investment income (loss)2 | 0.27 | 0.26 | 0.25 | 0.24 | 0.09 | |||||||||||||||
| Net realized and unrealized gain (loss) on investments | (0.01 | ) | 0.48 | (0.17 | ) | 0.18 | 0.03 | |||||||||||||
| Total from investment operations | 0.26 | 0.74 | 0.08 | 0.42 | 0.12 | |||||||||||||||
| Redemption fee proceeds | — | — | — | (0.00 | )3 | — | ||||||||||||||
| LESS DISTRIBUTIONS: | ||||||||||||||||||||
| Distributions from net investment income | (0.21 | ) | (0.13 | ) | (0.29 | ) | (0.19 | ) | (0.08 | ) | ||||||||||
| Distributions from net realized gain | — | (0.09 | ) | (0.53 | ) | (0.00 | )3 | — | ||||||||||||
| Total distributions | (0.21 | ) | (0.22 | ) | (0.82 | ) | (0.19 | ) | (0.08 | ) | ||||||||||
| Net asset value, end of year/period | $ | 10.10 | $ | 10.05 | $ | 9.53 | $ | 10.27 | $ | 10.04 | ||||||||||
| Total return | 2.64 | % | 7.86 | % | 0.79 | % | 4.26 | % | 1.19 | %4 | ||||||||||
| SUPPLEMENTAL DATA: | ||||||||||||||||||||
| Net assets, end of year/period (millions) | $ | 592.5 | $ | 732.0 | $ | 571.9 | $ | 705.8 | $ | 263.8 | ||||||||||
| Portfolio turnover rate | 75 | % | 47 | % | 72 | % | 57 | % | 7 | %4 | ||||||||||
| RATIO OF EXPENSES TO AVERAGE NET ASSETS: | ||||||||||||||||||||
| Before fees waived and expenses absorbed | 0.60 | % | 0.59 | % | 0.62 | % | 0.71 | % | 0.96 | %5 | ||||||||||
| After fees waived and expenses absorbed | 0.49 | % | 0.49 | % | 0.50 | % | 0.50 | % | 0.50 | %5 | ||||||||||
| RATIO OF NET INVESTMENT INCOME (LOSS) TO AVERAGE NET ASSETS: | ||||||||||||||||||||
| Before fees waived and expenses absorbed | 2.66 | % | 2.50 | % | 2.32 | % | 2.16 | % | 1.40 | %5 | ||||||||||
| After fees waived and expenses absorbed | 2.77 | % | 2.60 | % | 2.44 | % | 2.37 | % | 1.86 | %5 | ||||||||||
1 | Commenced operations on June 30, 2016. Information presented is for the period from June 30, 2016 to December 31, 2016. |
2 | Calculated using the average shares outstanding method. |
3 | Does not round to $0.01 or $(0.01), as applicable. |
4 | Not annualized. |
5 | Annualized. |
The accompanying notes are an integral part of these financial statements.
61
Low Duration Fund
FINANCIAL HIGHLIGHTS For a capital share outstanding throughout each year/period |
| Year Ended | Period Ended | |||||||
| Institutional Class | December 31, 2020 | December 31, 20191 | ||||||
| Net asset value, beginning of year/period | $ | 10.20 | $ | 10.00 | ||||
| INCOME (LOSS) FROM INVESTMENT OPERATIONS: | ||||||||
Net investment income (loss)2 | 0.28 | 0.17 | ||||||
| Net realized and unrealized gain (loss) on investments | (0.01 | ) | 0.19 | |||||
| Total from investment operations | 0.27 | 0.36 | ||||||
| LESS DISTRIBUTIONS: | ||||||||
| Distributions from net investment income | (0.21 | ) | (0.07 | ) | ||||
| Distributions from net realized gain | — | (0.09 | ) | |||||
| Total distributions | (0.21 | ) | (0.16 | ) | ||||
| Net asset value, end of year/period | $ | 10.26 | $ | 10.20 | ||||
| Total return | 2.70 | % | 3.60 | %3 | ||||
| SUPPLEMENTAL DATA: | ||||||||
| Net assets, end of year/period (millions) | $ | 3.9 | $ | 0.1 | ||||
| Portfolio turnover rate | 75 | % | 47 | %3,5 | ||||
| RATIO OF EXPENSES TO AVERAGE NET ASSETS: | ||||||||
| Before fees waived and expenses absorbed | 0.61 | % | 0.53 | %4 | ||||
| After fees waived and expenses absorbed | 0.50 | % | 0.46 | %4 | ||||
| RATIO OF NET INVESTMENT INCOME (LOSS) TO AVERAGE NET ASSETS: | ||||||||
| Before fees waived and expenses absorbed | 2.68 | % | 2.31 | %4 | ||||
| After fees waived and expenses absorbed | 2.79 | % | 2.38 | %4 | ||||
1 | Commenced operations on April 30, 2019. Information presented is for the period from April 30, 2019 to December 31, 2019. |
2 | Calculated using the average shares outstanding method. |
3 | Not annualized. |
4 | Annualized. |
5 | Portfolio turnover calculated at the Fund level. |
The accompanying notes are an integral part of these financial statements.
62
Floating Rate Fund
FINANCIAL HIGHLIGHTS For a capital share outstanding throughout each year/period |
| Period Ended | ||||||||||||
| Year Ended December 31, | December 31, | |||||||||||
| Institutional Class | 2020 | 2019 | 20181 | |||||||||
| Net asset value, beginning of year/period | $ | 9.88 | $ | 9.65 | $ | 10.00 | ||||||
| INCOME (LOSS) FROM INVESTMENT OPERATIONS: | ||||||||||||
Net investment income (loss)2 | 0.41 | 0.43 | 0.15 | |||||||||
| Net realized and unrealized gain (loss) on investments | 0.04 | 0.26 | (0.28 | ) | ||||||||
| Total from operations | 0.45 | 0.69 | (0.13 | ) | ||||||||
| LESS DISTRIBUTIONS: | ||||||||||||
| Distributions from net investment income | (0.42 | ) | (0.38 | ) | (0.13 | ) | ||||||
| Distributions from net realized gain | — | (0.08 | ) | (0.09 | ) | |||||||
| Total distributions | (0.42 | ) | (0.46 | ) | (0.22 | ) | ||||||
| Net asset value, end of year/period | $ | 9.91 | $ | 9.88 | $ | 9.65 | ||||||
| Total return | 4.83 | % | 7.34 | % | (1.45 | )%3 | ||||||
| SUPPLEMENTAL DATA: | ||||||||||||
| Net assets, end of year/period (millions) | $ | 17.7 | $ | 11.4 | $ | 11.1 | ||||||
| Portfolio turnover rate | 73 | % | 78 | % | 22 | %3 | ||||||
| RATIO OF EXPENSES TO AVERAGE NET ASSETS: | ||||||||||||
| Before fees waived and expenses absorbed | 1.81 | % | 1.86 | % | 2.37 | %4 | ||||||
| After fees waived and expenses absorbed | 0.65 | % | 0.65 | % | 0.65 | %4 | ||||||
| RATIO OF NET INVESTMENT INCOME (LOSS) TO AVERAGE NET ASSETS: | ||||||||||||
| Before fees waived and expenses absorbed | 3.11 | % | 3.13 | % | 1.26 | %4 | ||||||
| After fees waived and expenses absorbed | 4.27 | % | 4.34 | % | 2.98 | %4 | ||||||
1 | Commenced operations on June 29, 2018. Information presented is for the period from June 29, 2018 to December 31, 2018. |
2 | Calculated based on average shares outstanding during the period. |
3 | Not Annualized. |
4 | Annualized. |
The accompanying notes are an integral part of these financial statements.
63
Muzinich Funds
NOTES TO FINANCIAL STATEMENTS December 31, 2020 |
| NOTE 1 – ORGANIZATION |
The Muzinich Credit Opportunities Fund (“Credit Opportunities Fund”), Muzinich U.S. High Yield Corporate Bond Fund (“U.S. High Yield Fund”), Muzinich Low Duration Fund (“Low Duration Fund”) and Muzinich High Income Floating Rate Fund (“Floating Rate Fund”) (each a “Fund,” collectively the “Funds”) are diversified series of shares of beneficial interest of Professionally Managed Portfolios (the “Trust”), which is registered under the Investment Company Act of 1940, as amended (the “1940 Act”) as an open-end management investment company. The Funds are investment companies and accordingly follow the investment company accounting and reporting guidance of the Financial Accounting Standards Board (FASB) Accounting Standard Codification Topic 946 “Financial Services—Investment Companies.” The Funds commenced operations on January 3, 2013, March 31, 2016, June 30, 2016 and June 29, 2018, respectively.
The Funds offer two classes of shares: Institutional shares, and Supra Institutional shares (Class A shares are not available for purchase). Each class of shares has equal rights as to earnings and assets except that each class bears different distribution and shareholder servicing expenses. Each class of shares has exclusive voting rights with respect to matters that affect just that class. Income, expenses (other than expenses attributable to a specific class), and realized and unrealized gains/losses on investments are allocated to each class of shares based on its relative net assets. Currently, the Credit Opportunities Fund offers Supra Institutional and Institutional Class shares, the U.S. High Yield Fund offers Supra Institutional and Institutional Class shares, the Low Duration Fund offers Supra Institutional and Institutional Class shares and the Floating Rate Fund offers Institutional Class shares.
The investment objective of the Credit Opportunities Fund is primarily to provide a high level of income and capital appreciation. The investment objective of the U.S. High Yield Fund is to provide a high level of income on a risk-adjusted basis over a full market cycle. The investment objective of the Low Duration Fund is to protect capital and generate positive returns under most market conditions. The investment objective of the Floating Rate Fund is to provide a high level of income with a focus on principal preservation and reduced exposure to changes in interest rates.
| NOTE 2 – SIGNIFICANT ACCOUNTING POLICIES |
The following is a summary of significant accounting policies consistently followed by the Funds. These policies are in conformity with accounting principles generally accepted in the United States of America (“U.S. GAAP”).
| A. | Security Valuation. All equity securities, which may include Real Estate Investment Trusts (“REITs”), Business Development Companies (“BDCs”) and Master Limited Partnerships (“MLPs”), that are traded on U.S. national or foreign securities exchanges are valued either at the last reported sale price on the exchange on which the security is principally traded or the exchange’s official closing price. If, on a particular day, an exchange-traded security does not trade, then the mean between the most recent quoted bid and asked prices will be used. All equity securities, which may include REITs, BDCs and MLPs that are not traded on a listed exchange are valued at the last sale price in the over-the- counter market. If a non-exchange traded security does not trade on a particular day, then the mean between the last quoted closing bid and asked price will be used. | |
| Debt securities are valued by using an evaluated mean of the bid and asked prices provided by an independent pricing service. The independent pricing service may use various valuation methodologies including matrix pricing and other analytical pricing models as well as market transactions and dealer quotations. These models generally consider such factors as yields or prices of bonds of comparable quality, type of issue, coupon, maturity, ratings and general market conditions. In the absence of a price from a pricing service, securities are valued at their respective fair values as determined in good faith by the Valuation Committee. | ||
| Exchange traded options are valued at the composite price, using the National Best Bid and Offer quotes (“NBBO”). NBBO consists of the highest bid price and lowest ask price across any of the exchanges on which an option is quoted, thus providing a view across the entire U.S. options marketplace. Composite option pricing calculates the mean of the highest bid price and lowest ask price across the exchanges where the option is traded. | ||
| Forward foreign currency exchange contracts are presented at fair value measured by the difference between the forward exchange rates (“forward rates”) at the dates of entry into the contracts and the forward rates at the reporting date, and such differences are included in the Statements of Assets and Liabilities. |
64
Muzinich Funds
NOTES TO FINANCIAL STATEMENTS December 31, 2020 (Continued) |
| Swap contracts, such as credit default swaps, total return swaps, interest rate swaps and currency swaps, are priced by an approved independent pricing service. The independent pricing service includes observable market data inputs in an evaluated valuation methodology. | ||
| Futures contracts are priced by an approved independent pricing service. Futures contracts are valued at the settlement price on the exchange on which they are principally traded. | ||
| Securities for which quotations are not readily available are valued at their respective fair values as determined in good faith by the Valuation Committee. When a security is “fair valued,” consideration is given to the facts and circumstances relevant to the particular situation, including a review of various factors set forth in the pricing procedures adopted by the Board of Trustees (the “Board”). Fair value pricing is an inherently subjective process, and no single standard exists for determining fair value. Different funds could reasonably arrive at different values for the same security. The use of fair value pricing by a fund may cause the net asset value of its shares to differ significantly from the net asset value that would be calculated without regard to such considerations. | ||
| As described above, the Funds utilize various methods to measure the fair value of their investments on a recurring basis. U.S. GAAP establishes a hierarchy that prioritizes inputs to valuation methods. The three levels of inputs are: |
| Level 1 – | Unadjusted quoted prices in active markets for identical assets or liabilities that the Funds have the ability to access. | ||
| Level 2 – | Observable inputs other than quoted prices included in Level 1 that are observable for the asset or liability, either directly or indirectly. These inputs may include quoted prices for the identical instrument on an inactive market, prices for similar instruments, interest rates, prepayment speeds, credit risk, yield curves, default rates and similar data. | ||
| Level 3 – | Unobservable inputs for the asset or liability, to the extent relevant observable inputs are not available; representing the Funds’ own assumptions about the assumptions a market participant would use in valuing the asset or liability, and would be based on the best information available. |
| The availability of observable inputs can vary from security to security and is affected by a wide variety of factors, including, for example, the type of security, whether the security is new and not yet established in the marketplace, the liquidity of markets, and other characteristics particular to the security. To the extent that valuation is based on models or inputs that are less observable or unobservable in the market, the determination of fair value requires more judgment. Accordingly, the degree of judgment exercised in determining fair value is greatest for instruments categorized in Level 3. | ||
| The inputs used to measure fair value may fall into different levels of the fair value hierarchy. In such cases, for disclosure purposes, the level in the fair value hierarchy within which the fair value measurement falls in its entirety, is determined based on the lowest level input that is significant to the fair value measurement in its entirety. | ||
| The following is a summary of the inputs used to value the Funds’ investments and derivative instruments as of December 31, 2020. See the Schedules of Investments for the industry breakouts. |
| Credit Opportunities Fund | ||||||||||||||||||
Description | Level 1 | Level 2 | Level 3 | Total | ||||||||||||||
| Assets: | ||||||||||||||||||
Corporate Bonds | $ | — | $ | 458,814,142 | $ | — | $ | 458,814,142 | ||||||||||
Convertible Bonds | — | 2,651,814 | — | 2,651,814 | ||||||||||||||
Affiliated Mutual Funds | 5,992,656 | — | — | 5,992,656 | ||||||||||||||
Bank Loans | — | 54,859,890 | — | 54,859,890 | ||||||||||||||
| Total Assets | $ | 5,992,656 | $ | 516,325,846 | $ | — | $ | 522,318,502 | ||||||||||
Other Financial Instruments1: | ||||||||||||||||||
Forward Foreign Currency Exchange Contracts | $ | — | $ | (789,396 | ) | $ | — | $ | (789,396 | ) | ||||||||
1 | Other Financial Instruments are derivative instruments not reflected in the Schedule of Investments, such as forward foreign currency exchange contracts, which are presented at the net unrealized appreciation/(depreciation) on the investment. |
65
Muzinich Funds
NOTES TO FINANCIAL STATEMENTS December 31, 2020 (Continued) |
| U.S. High Yield Fund | ||||||||||||||||||
Description | Level 1 | Level 2 | Level 3 | Total | ||||||||||||||
| Assets: | ||||||||||||||||||
Corporate Bonds | $ | — | $ | 61,719,405 | $ | — | $ | 61,719,405 | ||||||||||
Bank Loans | — | 5,214,797 | — | 5,214,797 | ||||||||||||||
| Total Assets | $ | — | $ | 66,934,202 | $ | — | $ | 66,934,202 | ||||||||||
| Low Duration Fund | ||||||||||||||||||
Description | Level 1 | Level 2 | Level 3 | Total | ||||||||||||||
| Assets: | ||||||||||||||||||
Corporate Bonds | $ | — | $ | 521,061,128 | $ | — | $ | 521,061,128 | ||||||||||
Collateralized Loan Obligations | — | 5,502,619 | — | 5,502,619 | ||||||||||||||
Convertible Bonds | — | 21,652,003 | — | 21,652,003 | ||||||||||||||
Affiliated Mutual Funds | 6,937,000 | — | — | 6,937,000 | ||||||||||||||
Bank Loans | — | 31,196,681 | — | 31,196,681 | ||||||||||||||
| Total Assets | $ | 6,937,000 | $ | 579,412,431 | $ | — | $ | 586,349,431 | ||||||||||
Other Financial Instruments1: | ||||||||||||||||||
Forward Foreign Currency Exchange Contracts | $ | — | $ | (7,157,581 | ) | $ | — | $ | (7,157,581 | ) | ||||||||
1 | Other Financial Instruments are derivative instruments not reflected in the Schedule of Investments, such as forward foreign currency exchange contracts, which are presented at the net unrealized appreciation/(depreciation) on the investment. |
| Floating Rate Fund | ||||||||||||||||||
Description | Level 1 | Level 2 | Level 3 | Total | ||||||||||||||
| Assets: | ||||||||||||||||||
Corporate Bonds | $ | — | $ | 932,592 | $ | — | $ | 932,592 | ||||||||||
Bank Loans | — | 16,154,164 | — | 16,154,164 | ||||||||||||||
| Total Assets | $ | — | $ | 17,086,756 | $ | — | $ | 17,086,756 | ||||||||||
Other Financial Instruments1: | ||||||||||||||||||
Forward Foreign Currency Exchange Contracts | $ | — | $ | (11,734 | ) | $ | — | $ | (11,734 | ) | ||||||||
1 | Other Financial Instruments are derivative instruments not reflected in the Schedule of Investments, such as forward foreign currency exchange contracts, which are presented at the net unrealized appreciation/(depreciation) on the investment. |
| The Funds have provided additional disclosures below regarding derivatives and hedging activity intending to improve financial reporting by enabling investors to understand how and why the Funds use forward contracts and swap contracts (types of derivatives), how they are accounted for, and how they affect an entity’s results of operations and financial position. The Funds may use derivatives in various ways. The Funds may, but are not required to, use derivatives for risk management purposes or as part of its investment strategies. Derivatives are financial contracts whose values depend on, or are derived from, the value of an underlying asset, reference rate or index. The Funds may use derivatives to earn income and enhance returns, to hedge or adjust the risk profile of its portfolio, to replace more traditional direct investments and to obtain exposure to otherwise inaccessible markets. | ||
| The Credit Opportunities Fund’s average notional value of forward foreign currency exchange contracts outstanding during the year ended December 31, 2020 was $79,290,104. The Low Duration Fund’s average notional value for forward foreign currency exchange contracts outstanding during the year ended December 31, 2020 was $468,683,012. The Floating Rate Fund’s average notional value for forward foreign currency exchange contracts outstanding during the year ended December 31, 2020 was $2,125,226. Forward foreign currency exchange contracts entered into during the year ended December 31, 2020 were with the Bank of New York for the Credit Opportunities Fund, Low Duration Fund and Floating Rate Fund. The Credit Opportunities Fund’s average notional value of exchange traded futures contracts outstanding during the year ended December 31, 2020 was $30,163,371 and were entered into with Morgan Stanley. The Credit Opportunities Fund entered into swap contract transactions with Credit Suisse Group AG, Deutsche Bank Trust Co., Goldman Sachs & Co., and J.P. Morgan Chase during the year ended December 31, 2020, at an average transaction notional value of $13,800,000, $8,290,000, $7,875,000, and $6,776,250, respectively. |
66
Muzinich Funds
NOTES TO FINANCIAL STATEMENTS December 31, 2020 (Continued) |
| The notional amount for forward foreign currency exchange contracts is calculated based on the currency being sold converted to U.S. dollars. The average notional amount for forward foreign currency exchange contracts is calculated by the dollar value of open contracts at the end of the previous fiscal year and at each quarter end in the current fiscal year. The notional amount for futures contracts represents the U.S. dollar value of the contract as of the day of opening the transaction or latest contract reset date. The notional amount for swap contracts is the principal value. The average notional amount for swap and futures contracts is based on the daily notional amounts. | ||
| The following tables show the effects of derivative instruments on the financial statements. | ||
| Statements of Assets and Liabilities | ||
| Fair values of derivative instruments as of December 31, 2020: | ||
| Credit Opportunities Fund |
| Asset Derivatives as of December 31, 2020 | Liability Derivatives as of December 31, 2020 | ||||||||||||
| Instrument | Balance Sheet Location | Fair Value | Balance Sheet Location | Fair Value | |||||||||
Forward Foreign Currency | Unrealized Appreciation on | Unrealized Depreciation on | |||||||||||
Exchange Contracts | Forward Foreign Currency | Forward Foreign Currency | |||||||||||
| Exchange Contracts | $ | — | Exchange Contracts | $ | 789,396 | ||||||||
$ | — | $ | 789,396 | ||||||||||
| Low Duration Fund | |||||||||||||
| Asset Derivatives as of December 31, 2020 | Liability Derivatives as of December 31, 2020 | ||||||||||||
| Instrument | Balance Sheet Location | Fair Value | Balance Sheet Location | Fair Value | |||||||||
Forward Foreign Currency | Unrealized Appreciation on | Unrealized Depreciation on | |||||||||||
Exchange Contracts | Forward Foreign Currency | Forward Foreign Currency | |||||||||||
| Exchange Contracts | $ | 911,211 | Exchange Contracts | $ | 8,068,792 | ||||||||
$ | 911,211 | $ | 8,068,792 | ||||||||||
| Floating Rate Fund | |||||||||||||
| Asset Derivatives as of December 31, 2020 | Liability Derivatives as of December 31, 2020 | ||||||||||||
| Instrument | Balance Sheet Location | Fair Value | Balance Sheet Location | Fair Value | |||||||||
Forward Foreign Currency | Unrealized Appreciation on | Unrealized Depreciation on | |||||||||||
Exchange Contracts | Forward Foreign Currency | Forward Foreign Currency | |||||||||||
| Exchange Contracts | $ | — | Exchange Contracts | $ | 11,734 | ||||||||
$ | — | $ | 11,734 | ||||||||||
| Statements of Operations | ||
| The effect of derivative instruments on the Statements of Operations for the year ended December 31, 2020: | ||
| Credit Opportunities Fund |
| Location of Gain (Loss) | Realized Gain (Loss) | Change in Unrealized | |||
| on Derivatives | on Derivatives | Appreciation/Depreciation on | |||
Instrument | Recognized in Income | Recognized in Income | Derivatives Recognized in Income | ||
Forward Foreign | Net realized and unrealized | ||||
Currency Exchange | gain (loss) on forward foreign | ||||
Contracts | currency exchange contracts | $(4,103,228) | $95,691 | ||
Credit Default – | Net realized and unrealized | ||||
Swap Contracts | gain (loss) on swap contracts | 340,706 | — | ||
Treasury Futures | Net realized and unrealized | ||||
Contracts | gain (loss) on futures contracts | (209,827) | — |
67
Muzinich Funds
NOTES TO FINANCIAL STATEMENTS December 31, 2020 (Continued) |
| Low Duration Fund | |||||
| Location of Gain (Loss) | Realized Gain (Loss) | Change in Unrealized | |||
| on Derivatives | on Derivatives | Appreciation/Depreciation on | |||
Instrument | Recognized in Income | Recognized in Income | Derivatives Recognized in Income | ||
Forward Foreign | Net realized and unrealized | ||||
Currency Exchange | gain (loss) on forward foreign | ||||
Contracts | currency exchange contracts | $(19,934,206) | $(543,536) | ||
| Floating Rate Fund | |||||
| Location of Gain (Loss) | Realized Gain (Loss) | Change in Unrealized | |||
| on Derivatives | on Derivatives | Appreciation/Depreciation on | |||
Instrument | Recognized in Income | Recognized in Income | Derivatives Recognized in Income | ||
Forward Foreign | Net realized and unrealized | ||||
Currency Exchange | gain (loss) on forward foreign | ||||
Contracts | currency exchange contracts | $(153,459) | $18,843 |
| The U.S. High Yield Fund did not have derivatives activity during the year ended December 31, 2020. | ||
| B. | Swap Contracts. A swap, which may be a customized and privately negotiated agreement or a standardized and exchange- traded contract, obligates two parties to exchange a series of cash flows at specified intervals (payment dates) based upon, or calculated by, reference to changes in specified prices or rates for a specified amount of an underlying asset (the “notional” principal amount). Swaps are entered into on a net basis (i.e., the two payment streams are netted out, with a fund receiving or paying, as applicable, only the net amount of the two payments). Examples of such swaps may include, but are not limited to, currency swaps, interest rate swaps, total return swaps, and credit default swaps. Payments received by the Funds from swap agreements will result in taxable income, either as ordinary income or capital gains. Except for currency swaps, the notional principal amount is used solely to calculate the payment streams but is not exchanged. With respect to currency swaps, actual principal amounts of currencies may be exchanged by the counterparties at the initiation, and again upon the termination, of the transaction. The swap market has grown substantially in recent years, with a large number of banks and investment banking firms acting both as principals and as agents utilizing standardized swap documentation. As a result, the swap market has become well-established and relatively liquid. | |
| C. | Futures Contracts. Each Fund may purchase or sell futures contracts and options thereon to hedge against changes in interest rates, securities (through index futures or options) or currencies. The purchase of futures contracts may be more efficient or cost effective than actually buying the underlying securities or assets. A futures contract is an agreement that obligates the buyer to buy and the seller to sell a specified quantity of an underlying asset (or settle for cash the value of a contract based on an underlying asset, rate or index) at a specific price on the contract maturity date. Upon entering into a futures contract, each Fund is required to pledge to the counterparty an amount of cash, U.S. Government securities or other high quality debt securities equal to the minimum “initial margin” requirements of the exchange or the broker. Pursuant to a contract entered into with a futures commission merchant, each Fund agrees to receive from or pay to the firm an amount of cash equal to the cumulative daily fluctuation in the value of the contract. Such receipts or payments are known as “variation margin” and are recorded by the Funds as unrealized gains or losses. When the contract is closed, the Funds record a gain or loss equal to the difference between the value of the contract at the time it was opened and the value at the time it was closed. Each Fund will cover its current obligations under futures contracts by the segregation of liquid assets or by entering into offsetting transactions or owning positions covering its obligations. The Funds’ use of futures contracts may involve risks that are different from, or possibly greater than, the risks associated with investing directly in securities or other more traditional instruments. These risks include the risk that the value of the futures contracts may not correlate perfectly, or at all, with the value of the assets, reference rates, or indexes that they are designed to track. Other risks include: an illiquid secondary market for a particular instrument and possible exchange- imposed price fluctuation limits, either of which may make it difficult or impossible to close out a position when desired; the risk that adverse price movements in an instrument can result in a loss substantially greater than the Funds’ initial investment in that instrument (in some cases, the potential loss is unlimited); and the risk that a counterparty will not perform its obligations. The Credit Opportunities Fund had futures contracts activity during the year ended December 31, 2020. Realized and unrealized gains and losses are included in the Statements of Operations. The U.S. High Yield Fund, Low Duration Fund and Floating Rate Fund did not have futures contracts activity during the year ended December 31, 2020. The U.S. High Yield Fund, Low Duration Fund and Floating Rate Fund did not have swap contracts activity during the year ended December 31, 2020. |
68
Muzinich Funds
NOTES TO FINANCIAL STATEMENTS December 31, 2020 (Continued) |
| D. | Forward Foreign Currency Exchange Contracts. During the year ended December 31, 2020, the Credit Opportunities Fund, Low Duration Fund and Floating Rate Fund entered into transactions to purchase or sell foreign currencies to protect the U.S. dollar value of the underlying non-U.S. portfolio securities against the effect of possible adverse movements in foreign exchange rates. When entering into a forward foreign currency exchange contract, the Funds agree to receive or deliver a fixed quantity of foreign currency for an agreed-upon price on an agreed future date. The unrealized gain or loss on the contracts and the forward rates at the reporting date is included in the Statements of Assets and Liabilities. Realized and unrealized gains and losses are included in the Statements of Operations. The U.S. High Yield Fund did not have forward foreign currency exchange contract activity during the year ended December 31, 2020. | |
| E. | Foreign Currency. Foreign currency amounts, other than the cost of investments, are translated into U.S. dollar values based upon the spot exchange rate prior to the close of regular trading. The cost of investments is translated at the rates of exchange prevailing on the dates the portfolio securities were acquired. The Funds include foreign exchange gains and losses from interest receivable and other foreign currency denominated payables and receivables in “Change in net unrealized appreciation/depreciation on foreign currency translation” and “Net realized gain (loss) on foreign currency transaction.” The Funds do not isolate that portion of realized and unrealized gain (loss) on investments resulting from changes in foreign exchange rates on investments from fluctuations arising from changes in the market price of securities for financial reporting purposes. Fluctuations in foreign exchange rates on investments are thus included in “Change in net unrealized appreciation/depreciation on investments” and “Net realized gain (loss) on investments” as shown in the Statements of Operations. | |
| F. | Federal Income Taxes. Each Fund has elected to be taxed as a “regulated investment company” and intends to distribute substantially all taxable income to its shareholders and otherwise comply with the provisions of the Internal Revenue Code applicable to regulated investment companies. Therefore, no provision for federal income taxes or excise taxes has been made. | |
| In order to avoid imposition of the excise tax applicable to regulated investment companies, each Fund intends to declare each year as dividends in each calendar year at least 98.0% of its net investment income (earned during the calendar year) and at least 98.2% of its net realized capital gains (earned during the twelve months ended October 31) plus undistributed amounts, if any, from prior years. | ||
| Net capital losses incurred after October 31, and within the taxable year, are deemed to arise on the first business day of each Fund’s next taxable year. | ||
| As of December 31, 2020, the Credit Opportunities Fund deferred, on a tax basis, post-October losses of $1,741,240. The U.S. High Yield Fund, Low Duration Fund, and Floating Rate Fund did not defer any post-October losses as of December 31, 2020. | ||
| As of December 31, 2020, the Funds had the following capital loss carryovers, which do not expire and retain their original character. |
| Credit Opportunities Fund | U.S. High Yield Fund | Low Duration Fund | Floating Rate Fund | |||||||||||||||
| Short-Term Capital Loss Carryovers | $ | — | $ | 130,464 | $ | 14,532,857 | $ | 84,363 | ||||||||||
| Long-Term Capital Loss Carryovers | — | 588,029 | 19,178,802 | 219,409 | ||||||||||||||
| Total | $ | — | $ | 718,493 | $ | 33,711,659 | $ | 303,772 | ||||||||||
| As of December 31, 2020, the Funds did not have any tax positions that did not meet the “more likely-than-not” threshold of being sustained by the applicable tax authority. Generally, tax authorities can examine all the tax returns filed for the last three years. The Funds identify their major tax jurisdictions as U.S. Federal and the Commonwealth of Massachusetts; however, the Funds are not aware of any tax positions for which it is reasonably possible that the total amounts of unrecognized tax benefits will change materially. | ||
| G. | Securities Transactions and Investment Income. Investment securities transactions are accounted for on the trade date. Gains and losses realized on sales of securities are determined on a specific identification basis. Discounts/premiums on debt securities purchased are accreted/amortized over the life of the respective securities using the effective interest method. Dividend income is recorded on the ex-dividend date. Interest income is recorded on an accrual basis. Other non-cash dividends are recognized as investment income at the fair value of the property received. Withholding taxes on foreign dividends and interest have been provided for in accordance with the Trust’s understanding of the applicable country’s tax rules and rates. | |
| H. | Distributions to Shareholders. Distributions to shareholders from net investment income for the Credit Opportunities Fund normally are declared and paid on a quarterly basis. Distributions to shareholders from net investment income for the U.S. |
69
Muzinich Funds
NOTES TO FINANCIAL STATEMENTS December 31, 2020 (Continued) |
| High Yield Fund, Low Duration Fund and Floating Rate Fund normally are declared and paid on a monthly basis. Distributions are recorded on the ex-dividend date. Distributions to shareholders from net realized gains for the Funds normally are declared and paid on an annual basis, if applicable. | ||
| I. | Use of Estimates. The preparation of financial statements in conformity with U.S. GAAP requires management to make estimates and assumptions that affect the reported amounts of assets and liabilities at the date of the financial statements and the reported amount of revenue and expenses during the reporting period. Actual results could differ from those estimates. | |
| J. | Share Valuation. The net asset value (“NAV”) per share of each Fund is calculated by dividing the sum of the value of the securities held by each Fund, plus cash or other assets, minus all liabilities (including estimated accrued expenses) by the total number of shares outstanding for each Fund, rounded to the nearest cent. The Funds’ shares will not be priced on the days on which the NYSE is closed for trading. The offering and redemption price per share for each Fund is equal to each Fund’s net asset value per share. The Funds charge a 1% redemption fee on shares held less than 90 days. The fee is deducted from the redemption proceeds otherwise payable to the shareholder. The Funds will retain the fee charged as paid-in capital and such fees become part of that Funds’ daily NAV calculation. | |
| K. | Guarantees and Indemnifications. In the normal course of business, the Funds enter into contracts with service providers that contain general indemnification clauses. The Funds’ maximum exposure under these arrangements is unknown as this would involve future claims that may be made against the Funds that have not yet occurred. However, based on experience, the Funds expect the risk of loss to be remote. | |
| L. | Illiquid Securities. Pursuant to Rule 22e-4 under the 1940 Act, the Funds have adopted a Board approved liquidity risk management program (the “program”) that requires, among other things, that each Fund limit its illiquid investments that are assets to no more than 15% of net assets. An illiquid investment is any security which may not reasonably be expected to be sold or disposed of in current market conditions in seven calendar days or less without the sale or disposition significantly changing the market value of the investment. If at any time Muzinich & Co., Inc. (the “Advisor”) determines that the value of illiquid investments held by a Fund exceeds 15% of its net asset value, the Advisor will take such steps as it considers appropriate to reduce them as soon as reasonably practicable in accordance with the Funds’ written program. | |
| M. | Variable and Floating Rate Securities. The Funds may invest in variable and floating rate securities. Fixed income securities that have variable or floating rates of interest may, under certain limited circumstances, have varying principal amounts. These securities pay interest at rates that are adjusted periodically according to a specified formula, usually with reference to one or more interest rate indices or market interest rates (the “underlying index”). The interest paid on these securities is a function primarily of the underlying index upon which the interest rate adjustments are based. These adjustments minimize changes in the market value of the obligation. Similar to fixed rate debt instruments, variable and floating rate instruments are subject to changes in value based on changes in market interest rates or changes in the issuer’s creditworthiness. The rate of interest on securities may be tied to U.S. Government Securities or indices on those securities as well as any other rate of interest or index. | |
| Variable and floating rate demand notes of corporations are redeemable upon a specified period of notice. These obligations include master demand notes that permit investment of fluctuating amounts at varying interest rates under direct arrangements with the issuer of the instrument. The issuer of these obligations often has the right, after a given period, to prepay the outstanding principal amount of the obligations upon a specified number of days’ notice. | ||
| Certain securities may have an initial principal amount that varies over time based on an interest rate index, and, accordingly, a Fund might be entitled to less than the initial principal amount of the security upon the security’s maturity. A Fund intends to purchase these securities only when the Advisor believes the interest income from the instrument justifies any principal risks associated with the instrument. The Advisor may attempt to limit any potential loss of principal by purchasing similar instruments that are intended to provide an offsetting increase in principal. There can be no assurance that the Advisor will be able to limit the effects of principal fluctuations and, accordingly, a Fund may incur losses on those securities even if held to maturity without issuer default. | ||
| N. | When-Issued Securities and Forward Commitments. The Funds may purchase securities offered on a “when-issued” and “forward commitment” basis (including a delayed delivery basis). Securities purchased on a “when-issued” or “forward commitment basis” are securities not available for immediate delivery despite the fact that a market exists for those securities. A purchase is made on a “delayed delivery” basis when the transaction is structured to occur sometime in the future. | |
| When these transactions are negotiated, the price, which is generally expressed in yield terms, is fixed at the time the commitment is made, but delivery and payment for the securities take place at a later date. Normally, the settlement date |
70
Muzinich Funds
NOTES TO FINANCIAL STATEMENTS December 31, 2020 (Continued) |
| occurs within two months after the transaction, but delayed settlements beyond two months may be negotiated. During the period between a commitment and settlement, no payment is made for the securities purchased by the purchaser and, thus, no interest accrues to the purchaser from the transaction. At the time a Fund makes the commitment to purchase securities on a when-issued basis or forward commitment, the Fund will record the transaction as a purchase and thereafter reflect the value each day of such securities in determining its NAV. No when-issued or forward commitments will be made by a Fund if, as a result, more than 5% of the Fund’s total assets would be committed to such transactions. | ||
| O. | Deposits at Broker. Deposits at broker represents amounts that are held by third parties under certain of the Funds’ derivative transactions. Such deposits are excluded from cash and equivalents in the Statements of Assets and Liabilities. Interest income earned on such deposits is recorded in “Other income” on the Statements of Operations, if applicable. | |
| P. | Offsetting Agreements. The Funds may subject to netting arrangements, which govern the terms of certain transactions with counterparties. The arrangements allow the Funds to close out and net its total exposure to a counterparty in the event of a default with respect to all transactions governed under a single agreement with a counterparty. | |
| The following table presents derivative financial instruments that are subject to enforceable netting arrangements, collateral arrangements or other similar agreements as of December 31, 2020: | ||
| Credit Opportunities Fund |
| Gross Amounts | Gross Amounts Offset in the Statements of Assets and Liabilities | Net Amounts Presented in the Statements of Assets and Liabilities | Financial Instruments | Cash Collateral Pledged (Received) | ||||||||||||||||||||||
Description | Net Amount | |||||||||||||||||||||||||
| Assets | ||||||||||||||||||||||||||
Forward foreign | ||||||||||||||||||||||||||
currency exchange | ||||||||||||||||||||||||||
contracts | $ | — | $ | — | $ | — | $ | — | $ | — | $ | — | ||||||||||||||
| Liabilities | ||||||||||||||||||||||||||
Forward foreign | ||||||||||||||||||||||||||
currency exchange | ||||||||||||||||||||||||||
contracts | 789,396 | — | 789,396 | — | — | 789,396 | ||||||||||||||||||||
| Low Duration Fund | ||||||||||||||||||||||||||
Gross Amounts Offset in the Statements of Assets and Liabilities | Net Amounts Presented in the Statements of Assets and Liabilities | Cash Collateral Pledged (Received) | ||||||||||||||||||||||||
Financial Instruments | ||||||||||||||||||||||||||
Description | Gross Amounts | Net Amount | ||||||||||||||||||||||||
| Assets | ||||||||||||||||||||||||||
Forward foreign | ||||||||||||||||||||||||||
currency exchange | ||||||||||||||||||||||||||
contracts | $ | 911,211 | $ | — | $ | 911,211 | $ | 911,211 | $ | — | $ | — | ||||||||||||||
| Liabilities | ||||||||||||||||||||||||||
Forward foreign | ||||||||||||||||||||||||||
currency exchange | ||||||||||||||||||||||||||
contracts | 8,068,792 | — | 8,068,792 | (911,211 | ) | — | 7,157,581 | |||||||||||||||||||
| Floating Rate Fund | ||||||||||||||||||||||||||
Gross Amounts Offset in the Statements of Assets and Liabilities | Net Amounts Presented in the Statements of Assets and Liabilities | Financial Instruments | Cash Collateral Pledged (Received) | |||||||||||||||||||||||
Description | Gross Amounts | Net Amount | ||||||||||||||||||||||||
| Assets | ||||||||||||||||||||||||||
Forward foreign | ||||||||||||||||||||||||||
currency exchange | ||||||||||||||||||||||||||
contracts | $ | — | $ | — | $ | — | $ | — | $ | — | $ | — | ||||||||||||||
| Liabilities | ||||||||||||||||||||||||||
Forward foreign | ||||||||||||||||||||||||||
currency exchange | ||||||||||||||||||||||||||
contracts | 11,734 | — | 11,734 | — | — | 11,734 | ||||||||||||||||||||
71
Muzinich Funds
NOTES TO FINANCIAL STATEMENTS December 31, 2020 (Continued) |
| Q. | Reclassification of Capital Accounts. U.S. GAAP requires that certain components of net assets relating to permanent differences be reclassified between financial and tax reporting. These reclassifications have no effect on net assets or net asset value per share. These differences are primarily due to the tax treatment of foreign currency, forward foreign currency exchange contracts and interest on swap contracts. For the year ended December 31, 2020, no adjustments were made. | |
| R. | Subsequent Events. In preparing these financial statements, management has evaluated events and transactions for potential recognition or disclosure through the date the financial statements were issued. Management has determined that there were no subsequent events that would need to be disclosed in the Funds’ financial statements. |
| NOTE 3 – COMMITMENTS AND OTHER RELATED PARTY TRANSACTIONS |
The Advisor provides the Funds with investment management services under an Investment Advisory Agreement (the “Advisory Agreement”). Under the Advisory Agreement, the Advisor furnishes all investment advice, office space, facilities, and most of the personnel needed by each Fund. As compensation for its services, the Advisor is entitled to receive a monthly fee. For the Credit Opportunities Fund, the Advisor is entitled to a monthly fee at the annual rate of 0.60% based upon the average daily net assets of the Fund. For the U.S. High Yield Fund, the Advisor is entitled to a monthly fee at the annual rate of 0.55% based upon the average daily net assets of the Fund. For the Low Duration Fund, the Advisor is entitled to a monthly fee at the annual rate of 0.45% based upon the average daily net assets of the Fund. For the Floating Rate Fund, the Advisor is entitled to a monthly fee at the annual rate of 0.50% based upon the average daily net assets of the Fund. The investment advisory fees incurred by the Funds for the year ended December 31, 2020, are disclosed in the Statements of Operations. The investment advisory fees incurred are paid monthly to the Advisor, net of any monthly waiver or reimbursement discussed below.
The Advisor has contractually agreed to waive its fees and reimburse certain expenses (excluding taxes, leverage interest, portfolio transaction expenses, acquired fund fees and expenses, and extraordinary expenses) to limit total expenses for Institutional Shares and Supra Institutional Shares to 0.70% and 0.60%, respectively, of the Credit Opportunities Fund’s average daily net assets, Class A Shares, Institutional Shares and Supra Institutional Shares to 0.93%, 0.68% and 0.58%, respectively, of the U.S. High Yield Fund’s average daily net assets, Class A Shares, Institutional Shares and Supra Institutional Shares to 0.85%, 0.60% and 0.50%, respectively, of the Low Duration Fund’s average daily net assets and Class A Shares, Institutional Shares and Supra Institutional Shares to 0.90%, 0.65% and 0.55%, respectively, of the Floating Rate Fund’s average net assets. The Operating Expenses Limitation Agreements have an indefinite term and may be terminated at any time, and without payment of any penalty, by the Board, on behalf of the Funds, upon sixty (60) days’ written notice to the Advisor. Any fees waived and/or Fund expenses absorbed by the Advisor pursuant to an agreed-upon expense cap shall be reimbursed by the Funds to the Advisor, if so requested by the Advisor, any time before the end of the third year following the fee waiver and/or expense absorption, provided the aggregate amount of the Funds’ current operating expenses for such year does not exceed the lesser expense cap in place at the time of waiver or at the time of reimbursement. The Funds must pay their current ordinary operating expenses before the Advisor is entitled to any reimbursement of fees and/or expenses. Any such reimbursement is also contingent upon the Board’s review and approval. The amounts of fees waived and expenses absorbed by the Advisor during the year ended December 31, 2020, are disclosed in the Statements of Operations. Any amount due from the Advisor is paid monthly to the Funds, if applicable.
As of December 31, 2020, the remaining cumulative amounts that may be recouped by the Advisor on behalf of the Funds are shown in the following tables. The Advisor may recapture a portion of the unreimbursed amounts no later than the dates as stated.
Expiration | Credit Opportunities Fund | U.S. High Yield Fund | Low Duration Fund | Floating Rate Fund | ||||||||||||
| December 31, 2021 | $ | 805,550 | $ | 279,608 | $ | 864,248 | $ | 93,217 | ||||||||
| December 31, 2022 | 627,223 | 241,670 | 617,857 | 138,558 | ||||||||||||
| December 31, 2023 | 705,367 | 225,751 | 608,830 | 140,042 | ||||||||||||
| Total | $ | 2,138,140 | $ | 747,029 | $ | 2,090,935 | $ | 371,817 | ||||||||
If a Fund invested in other investment vehicles sponsored by the Advisor (“Affiliated Mutual Fund”) during the period, the Advisor waived its advisory fee to the Fund in an amount equal to the overall operating expenses of the other Muzinich Funds Affiliated Mutual Fund in respect to Fund assets so invested. Any amount waived with respect to an investment is an Affiliated Mutual Fund is voluntary and not eligible for reimbursement to the Advisor. Accordingly, the Advisor waived the following fees for the year ended December 31, 2020:
Fund | Amount Waived | |||
| Credit Opportunities Fund | $ | 28,601 | ||
| Low Duration Fund | 43,504 | |||
72
Muzinich Funds
NOTES TO FINANCIAL STATEMENTS December 31, 2020 (Continued) |
U.S. Bancorp Fund Services, LLC, doing business as U.S. Bank Global Fund Services (“Fund Services”), acts as the Funds’ administrator, fund accountant and transfer agent. In those capacities Fund Services maintains the Funds’ books and records, calculates the Funds’ NAV, prepares various federal and state regulatory filings, coordinates the payment of fund expenses, reviews expense accruals and prepares materials supplied to the Board. The officers of the Trust and the Chief Compliance Officer are also employees of Fund Services. Fees paid by the Funds to Fund Services for these services for the year ended December 31, 2020, are disclosed in the Statements of Operations.
Quasar Distributors, LLC (the “Distributor”) acts as the Funds’ principal underwriter in a continuous public offering of the Funds’ shares. U.S. Bank N.A. serves as custodian to the Funds. U.S. Bank N.A. is an affiliate of Fund Services.
The Funds have adopted a Distribution Plan in accordance with Rule 12b-1 under the 1940 Act with respect to Class A shares. The Distribution Plan provides that each Fund may pay a fee to the Distributor, at an annual rate of up to 0.25% of the average daily net assets of Class A shares. No distribution fees are paid by Supra Institutional or Institutional Class shares. These fees may be used by the Distributor to provide compensation for sales support, distribution activities, or shareholder servicing activities. As of December 31, 2020, Class A shares are not offered for the U.S. High Yield Fund, Low Duration Fund and Floating Rate Fund.
Pursuant to a Shareholder Service Plan adopted by the Trust and established by the Funds with respect to the Class A shares and Institutional Class shares of the Funds, the Advisor is authorized to provide, or arrange for others to provide, personal shareholder services relating to the servicing and maintenance of shareholder accounts not otherwise provided to the Funds (“Shareholder Servicing Activities”). Under the Shareholder Service Plan, the Advisor may enter into shareholder service agreements with securities broker-dealers and other securities professionals who provide Shareholder Servicing Activities for their clients invested in the Funds. The shareholder servicing fees incurred by the Funds for the year ended December 31, 2020, are disclosed in the Statements of Operations. As of December 31, 2020, Class A shares are not offered for the U.S. High Yield Fund, Low Duration Fund and Floating Rate Fund.
| NOTE 4 – PURCHASES AND SALES OF SECURITIES |
For the year ended December 31, 2020, the cost of purchases and proceeds from the sales and maturities of securities, excluding short-term investments, were as follows:
| Purchases | Sales/Maturities | |||||||
| Credit Opportunities Fund | $ | 890,074,443 | $ | 758,892,252 | ||||
| U.S. High Yield Fund | 79,787,827 | 62,005,261 | ||||||
| Low Duration Fund | 448,701,397 | 611,227,124 | ||||||
| Floating Rate Fund | 14,122,926 | 8,551,556 | ||||||
For the year ended December 31, 2020, the cost of purchases and proceeds from the sales and maturities of long-term U.S. Government obligations included in the above, were as follows:
| Purchases | Sales/Maturities | |||||||
| Credit Opportunities Fund | $ | 86,963,131 | $ | 86,633,870 | ||||
There were no purchases or sales/maturities of long-term U.S. Government securities for the U.S. High Yield Fund, Low Duration Fund or Floating Rate Fund during the year ended December 31, 2020.
| NOTE 5 – TRANSACTIONS WITH AFFILIATES |
The Muzinich Funds’ transactions with affiliates represent holdings for which the respective Fund and the underlying investee fund have the same investment advisor. The following is a reconciliation of the Muzinich Funds’ transactions with affiliates during the year ended December 31, 2020:
Credit Opportunities Fund
| Share/Par | Change in | |||||||
| Balance | Value as of | Unrealized | Value as of | |||||
| Controlled Company | December 31, | December 31, | Realized | Appreciation/ | December 31, | Dividend and | ||
Affiliated Mutual Fund | 2020 | 2019 | Acquisitions | Dispositions | Gain (Loss) | Depreciation | 2020 | Interest Income |
| Floating Rate Fund | 604,708 | $3,952,000 | $2,000,000 | $— | $— | $40,656 | $5,992,656 | $194,615 |
73
Muzinich Funds
NOTES TO FINANCIAL STATEMENTS December 31, 2020 (Continued) |
Low Duration Fund
| Share/Par | Change in | |||||||
| Balance | Value as of | Unrealized | Value as of | |||||
| Controlled Company | December 31, | December 31, | Realized | Appreciation/ | December 31, | Dividend and | ||
Affiliated Mutual Fund | 2020 | 2019 | Acquisitions | Dispositions | Gain (Loss) | Depreciation | 2020 | Interest Income |
| Floating Rate Fund | 700,000 | $6,916,000 | $— | $— | $— | $21,000 | $6,937,000 | $294,310 |
The Funds did not have investments in majority-owned subsidiaries or other controlled companies.
The U.S. High Yield Fund and Floating Rate Fund had no transactions with Affiliated Companies during the year ended December 31, 2020.
| NOTE 6 – DISTRIBUTIONS TO SHAREHOLDERS |
The tax character of distributions paid during the year ended December 31, 2020, and the year ended December 31, 2019, was as follows:
| Ordinary Income | ||||||||
| December 31, 2020 | December 31, 2019 | |||||||
| Credit Opportunities Fund | $ | 13,943,065 | $ | 25,244,442 | ||||
| U.S. High Yield Fund | 3,046,217 | 2,040,500 | ||||||
| Low Duration Fund | 12,974,336 | 12,116,480 | ||||||
| Floating Rate Fund | 543,140 | 467,277 | ||||||
Long-Term Capital Gains1 | ||||||||
| December 31, 2020 | December 31, 2019 | |||||||
| Credit Opportunities Fund | $ | 1,263,446 | $ | 931,568 | ||||
| U.S. High Yield Fund | — | — | ||||||
| Low Duration Fund | — | 2,810,958 | ||||||
| Floating Rate Fund | — | 61,694 | ||||||
1 Designated as long-term capital gain dividend, pursuant to Internal Revenue Code Section 852(b)(3).
The Funds also designate as distributions of long-term gains, to the extent necessary to fully distribute such capital gains, earnings and profits distributed to shareholders on the redemption of shares.
The cost basis of investments for federal income tax purposes at December 31, 2020, was as follows:
| Credit | Low | |||||||||||||||
| Opportunities | U.S. High | Duration | Floating | |||||||||||||
| Fund | Yield Fund | Fund | Rate Fund | |||||||||||||
| Cost of investments | $ | 494,956,742 | $ | 63,006,137 | $ | 555,046,700 | $ | 16,896,302 | ||||||||
| Gross tax unrealized appreciation | 27,725,075 | 4,149,128 | 33,665,938 | 301,032 | ||||||||||||
| Gross tax unrealized depreciation | (363,315 | ) | (221,063 | ) | (2,363,207 | ) | (110,578 | ) | ||||||||
| Net tax unrealized appreciation (depreciation) | 27,361,760 | 3,928,065 | 31,302,731 | 190,454 | ||||||||||||
| Undistributed ordinary income (loss) | 1,364,122 | 7,665 | 2,194,614 | 38,522 | ||||||||||||
| Undistributed long-term capital gains (losses) | — | — | — | — | ||||||||||||
| Total distributable earnings | 1,364,122 | 7,665 | 2,194,614 | 38,522 | ||||||||||||
| Other distributable (accumulated) gains (losses) | (1,632,827 | ) | (718,493 | ) | (33,488,390 | ) | (283,981 | ) | ||||||||
| Total distributable (accumulated) earnings (losses) | $ | 27,093,055 | $ | 3,217,237 | $ | 8,955 | $ | (55,005 | ) | |||||||
74
Muzinich Funds
NOTES TO FINANCIAL STATEMENTS December 31, 2020 (Continued) |
| NOTE 7 – CREDIT FACILITY |
U.S. Bank N.A. has made available to the Credit Opportunities Fund, U.S. High Yield Fund and Low Duration Fund credit facilities pursuant to a separate Loan and Security Agreement for temporary or extraordinary purposes. Credit facility details for the year ended December 31, 2020, are as follows:
| Credit Opportunities Fund | ||||
| Maximum available credit | $ | 20,000,000 | ||
| Largest amount outstanding on an individual day | 51,000 | |||
| Average daily loan outstanding when in use | 51,000 | |||
| Credit facility outstanding as of December 31, 2020 | — | |||
| Average interest rate when in use | 4.75 | % | ||
| U.S. High Yield Fund | ||||
| Maximum available credit | $ | 4,000,000 | ||
| Largest amount outstanding on an individual day | — | |||
| Average daily loan outstanding when in use | — | |||
| Credit facility outstanding as of December 31, 2020 | — | |||
| Average interest rate when in use | — | |||
| Low Duration Fund | ||||
| Maximum available credit | $ | 50,000,000 | ||
| Largest amount outstanding on an individual day | 50,000,000 | |||
| Average daily loan outstanding when in use | 16,168,063 | |||
| Credit facility outstanding as of December 31, 2020 | — | |||
| Average interest rate when in use | 3.66 | % | ||
Interest expense for the year ended December 31, 2020, is disclosed in the Statements of Operations, if applicable.
| NOTE 8 – SIGNIFICANT SHAREHOLDER HOLDINGS |
As of December 31, 2020, shareholders affiliated with the Funds and/or Advisor owned shares of the Funds as follows:
| % of Total Shares Outstanding Owned | ||
Total Shares Outstanding | by Affiliated Shareholders | |
| Floating Rate Fund | 1,787,421 | 73% |
| NOTE 9 – RISKS ASSOCIATED WITH THE DISCONTINUATION OF THE LONDON INTERBANK OFFERED RATE (“LIBOR”) |
The Funds invest significantly in corporate bonds that have interest rate provisions linked to LIBOR. LIBOR is used extensively in the U.S. and globally as a “benchmark” or “reference rate” for such loans. It is expected that a number of private-sector banks currently reporting information used to set LIBOR will stop doing so after 2021 when their current reporting commitment ends, which could either cause LIBOR to stop publication immediately or cause LIBOR’s regulator to determine that its quality has degraded to the degree that it is no longer representative of its underlying market. The expected discontinuation of LIBOR may impact the functioning, liquidity, and value of these investments.
| NOTE 10 – ELECTION OF TRUSTEES TO THE BOARD OF TRUSTEES OF THE TRUST |
A Special Meeting of Shareholders (the “Meeting”) took place on June 17, 2020. The Meeting was held for all series of the Trust. All Trust shareholders of record, in the aggregate across all series of the Trust, were entitled to attend or submit proxies. As of the record date, April 20, 2020, the Trust had 980,568,279 shares outstanding. The results of the voting for the proposal was as follows:
Proposal: Election of Trustees to the Board of Trustees of the Trust | For Votes | Votes Withheld |
| 1. Eric W. Falkeis | 681,049,390 | 10,981,441 |
| 2. Kathleen T. Barr | 681,250,626 | 10,779,780 |
| 3. Ashi S. Parikh | 681,087,446 | 10,940,163 |
75
Muzinich Funds
NOTES TO FINANCIAL STATEMENTS December 31, 2020 (Continued) |
Accordingly, effective June 17, 2020, the Board of Trustees of Professionally Managed Portfolios consists of the following individuals, each of whom have been elected by shareholders:
Kathleen T. Barr, Independent Trustee | Ashi S. Parikh, Independent Trustee |
Wallace L. Cook, Independent Trustee | Carl A. Froebel, Independent Trustee |
Eric W. Falkeis, Independent Trustee | Steven J. Paggioli, Independent Trustee |
| NOTE 11 – (COVID-19) PANDEMIC |
The global outbreak of COVID-19 (commonly referred to as “coronavirus”) has disrupted economic markets and the prolonged economic impact is uncertain. The ultimate economic fallout from the pandemic, and the long-term impact on economies, markets, industries and individual issuers, are not known. The operational and financial performance of the issuers of securities in which the Funds invest depends on future developments, including the duration and spread of the outbreak, and such uncertainty may in turn adversely affect the value and liquidity of the Funds’ investments, impair the Funds’ ability to satisfy redemption requests, and negatively impact the Funds’ performance.
76
Muzinich Funds
| REPORT OF INDEPENDENT REGISTERED PUBLIC ACCOUNTING FIRM |
To the Shareholders of Muzinich Funds and
The Board of Trustees of Professionally Managed Portfolios
Opinion on the Financial Statements
We have audited the accompanying statement of assets and liabilities of Muzinich Credit Opportunities Fund, Muzinich U.S. High Yield Corporate Bond Fund (“U.S. High Yield Fund”), Muzinich Low Duration Fund (“Low Duration Fund”), and Muzinich High Income Floating Rate Fund (“Floating Rate Fund”) (collectively, the “Funds”), each a series of Professionally Managed Portfolios, including the schedule of investments, as of December 31, 2020, the related statement of operations for the year then ended, the statements of changes in net assets for each of the two years in the period then ended, the financial highlights for each of the five years in the period then ended (with respect to U.S. High Yield Fund, for each of the four years in the period then ended and for the period March 31, 2016 to December 31, 2016; with respect to Low Duration Fund, for each of the four years in the period then ended and for the period June 30, 2016 to December 31, 2016; with respect to Floating Rate Fund, for the two years in the period then ended and for the period June 29, 2018 to December 31, 2018), and the related notes (collectively referred to as the “financial statements”). In our opinion, the financial statements present fairly, in all material respects, the financial position of the Funds as of December 31, 2020, the results of their operations for the year then ended, and the changes in their net assets and financial highlights for the periods indicated above, in conformity with accounting principles generally accepted in the United States of America.
Basis for Opinion
These financial statements are the responsibility of the Funds’ management. Our responsibility is to express an opinion on the Funds’ financial statements based on our audits. We are a public accounting firm registered with the Public Company Accounting Oversight Board (United States) (“PCAOB”) and are required to be independent with respect to the Funds in accordance with the U.S. federal securities laws and the applicable rules and regulations of the Securities and Exchange Commission and the PCAOB. We have served as the auditor of one or more of the funds in the Trust since 1995.
We conducted our audits in accordance with the standards of the PCAOB. Those standards require that we plan and perform the audit to obtain reasonable assurance about whether the financial statements are free of material misstatement, whether due to error or fraud. The Funds are not required to have, nor were we engaged to perform, an audit of its internal control over financial reporting. As part of our audits we are required to obtain an understanding of internal control over financial reporting, but not for the purpose of expressing an opinion on the effectiveness of the Funds’ internal control over financial reporting. Accordingly, we express no such opinion.
Our audits included performing procedures to assess the risks of material misstatement of the financial statements, whether due to error or fraud, and performing procedures that respond to those risks. Such procedures included examining, on a test basis, evidence regarding the amounts and disclosures in the financial statements. Our audits also included evaluating the accounting principles used and significant estimates made by management, as well as evaluating the overall presentation of the financial statements. Our procedures included confirmation of securities owned as of December 31, 2020 by correspondence with the custodian and brokers or through other appropriate auditing procedures where replies from brokers were unable to be obtained. We believe that our audits provide a reasonable basis for our opinion.
| TAIT, WELLER & BAKER LLP |
Philadelphia, Pennsylvania
March 1, 2021
77
Muzinich Funds
EXPENSE EXAMPLES For the Six Months Ended December 31, 2020 (Unaudited) |
As a shareholder of the Funds, you incur two types of costs: (1) transaction costs and (2) ongoing costs, including investment advisory fees, service fees, and other Fund expenses. These examples are intended to help you understand your ongoing costs (in dollars) of investing in the Funds and to compare these costs with the ongoing costs of investing in other mutual funds. These examples are based on an investment of $1,000 invested at the beginning of the period and held for the entire period (July 1, 2020 – December 31, 2020).
Actual Expenses
The “Actual” lines for each respective class of the following tables provide information about actual account values based on actual returns and actual expenses. You will be assessed fees for outgoing wire transfers, returned checks and stop payment orders at prevailing rates charged by Fund Services, the Funds’ transfer agent. If you request that a redemption be made by wire transfer, Fund Services currently charges a $15.00 fee. The Funds charge a redemption fee equal to 1.00% of the net amount of the redemption if you redeem shares within 90 calendar days after you purchase them. To the extent the Funds invest in shares of other investment companies as part of their strategies, you will indirectly bear your proportionate share of any fees and expenses charged by the underlying funds in which the Funds invest in addition to the expenses of the Funds. Actual expenses of the underlying funds may vary. These expenses are not included in the following examples.
The following examples include, but are not limited to, investment advisory fees, shareholder servicing fees, fund accounting fees, fund administration fees, custody fees, and transfer agent fees. However, the following examples do not include portfolio trading commissions and related expenses. You may use the information in this line, together with the amount you invested, to estimate the expenses that you paid over the period. Simply divide your account value by $1,000 (for example, an $8,600 account value divided by $1,000 = 8.6), then multiply the result by the number in the first line under the heading titled “Expenses Paid During the Period” to estimate the expenses you paid on your account during this period.
Hypothetical Example for Comparison Purposes
The “Hypothetical” line for each respective class of the following tables provides information about hypothetical account values and hypothetical expenses based on the Funds’ actual expense ratios and an assumed rate of return of 5% per year before expenses, which is not the Funds’ actual return. The hypothetical account values and expenses may not be used to estimate the actual ending account balance or expenses you paid for the period. You may use this information to compare the ongoing costs of investing in the Funds and other funds. To do so, compare this 5% hypothetical example with the 5% hypothetical examples that appear in the shareholder reports of the other funds. Please note that the expenses shown in the tables are meant to highlight your ongoing costs only and do not reflect any transactional costs, such as redemption fees. Therefore, each hypothetical line of the tables is useful in comparing ongoing costs only and will not help you determine the relative total costs of owning different funds. In addition, if these transactional costs were included, your costs would have been higher.
Credit Opportunities Fund
| Beginning | Ending | Expenses Paid | |
| Account Value | Account Value | During the Period | |
7/1/20 | 12/31/20 | 7/1/2020 – 12/31/20201 | |
| Supra Institutional Class Actual | $1,000.00 | $1,057.30 | $3.05 |
| Hypothetical (5% annual return before taxes) | $1,000.00 | $1,022.17 | $3.00 |
| Beginning | Ending | Expenses Paid | |
| Account Value | Account Value | During the Period | |
7/1/20 | 12/31/20 | 7/1/2020 – 12/31/20201 | |
| Institutional Class Actual | $1,000.00 | $1,056.10 | $3.41 |
| Hypothetical (5% annual return before taxes) | $1,000.00 | $1,021.82 | $3.35 |
1 | Expenses are equal to the annualized net expense ratio for the most recent six-month period. The annualized six-month expense ratios for Supra Institutional Class and Institutional Class shares were 0.59% and 0.66% (reflecting fee waivers in effect), respectively, multiplied by the average account value over the period multiplied by 184/366 (to reflect the one half-year period). |
78
Muzinich Funds
EXPENSE EXAMPLES For the Six Months Ended December 31, 2020 (Unaudited) (Continued) |
| U.S. High Yield Fund | |||
| Beginning | Ending | Expenses Paid | |
| Account Value | Account Value | During the Period | |
7/1/20 | 12/31/20 | 7/1/2020 – 12/31/20202 | |
| Supra Institutional Class Actual | $1,000.00 | $1,100.10 | $3.06 |
| Hypothetical (5% annual return before taxes) | $1,000.00 | $1,022.22 | $2.95 |
| Beginning | Ending | Expenses Paid | |
| Account Value | Account Value | During the Period | |
7/1/20 | 12/31/20 | 7/1/2020- 12/31/20202 | |
| Institutional Class Actual | $1,000.00 | $1,101.20 | $3.06 |
| Hypothetical (5% annual return before taxes) | $1,000.00 | $1,022.22 | $2.95 |
| Low Duration Fund | |||
| Beginning | Ending | Expenses Paid | |
| Account Value | Account Value | During the Period | |
7/1/20 | 12/31/20 | 7/1/2020 – 12/31/20203 | |
| Supra Institutional Class Actual | $1,000.00 | $1,051.40 | $2.58 |
| Hypothetical (5% annual return before taxes) | $1,000.00 | $1,022.62 | $2.54 |
| Beginning | Ending | Expenses Paid | |
| Account Value | Account Value | During the Period | |
7/1/20 | 12/31/20 | 7/1/2020 – 12/31/20203 | |
| Institutional Class Actual | $1,000.00 | $1,052.70 | $2.58 |
| Hypothetical (5% annual return before taxes) | $1,000.00 | $1,022.62 | $2.54 |
| Floating Rate Fund | |||
| Beginning | Ending | Expenses Paid | |
| Account Value | Account Value | During the Period | |
7/1/20 | 12/31/20 | 7/1/2020 – 12/31/20204 | |
| Institutional Class Actual | $1,000.00 | $1,071.50 | $3.38 |
| Hypothetical (5% annual return before taxes) | $1,000.00 | $1,021.87 | $3.30 |
2 | Expenses are equal to the annualized net expense ratio for the most recent six-month period. The annualized six-month expense ratios for Supra Institutional Class and Institutional Class shares were 0.58% and 0.58% (reflecting fee waivers in effect), respectively, multiplied by the average account value over the period multiplied by 184/366 (to reflect the one half-year period). |
3 | Expenses are equal to the annualized net expense ratio for the most recent six-month period. The annualized six-month expense ratios for Supra Institutional Class and Institutional Class shares were 0.50% and 0.50% (reflecting fee waivers in effect), multiplied by the average account value over the period multiplied by 184/366 (to reflect the one half-year period). |
4 | Expenses are equal to the annualized net expense ratio for the most recent six-month period. The annualized six-month expense ratios for Institutional Class shares was 0.65% (reflecting fee waivers in effect, multiplied by the average account value over the period multiplied by 184/366 (to reflect the one half-year period). |
79
Muzinich Funds
APPROVAL OF INVESTMENT ADVISORY AGREEMENT (Unaudited) |
MUZINICH CREDIT OPPORTUNITIES FUND
MUZINICH U.S. HIGH YIELD CORPORATE BOND FUND
MUZINICH LOW DURATION FUND
MUZINICH HIGH INCOME FLOATING RATE FUND
At a meeting held on August 13-14, 2020, the Board (which is comprised of six persons, all of whom are Independent Trustees as defined under the Investment Company Act) considered and approved the continuance of the Investment Advisory Agreement (the “Advisory Agreement”) between Professionally Managed Portfolios (the “Trust”) and Muzinich and Co., Inc. (the “Advisor”) for each of the Muzinich Credit Opportunities Fund, the Muzinich U.S. High Yield Corporate Bond Fund, the Muzinich Low Duration Fund and the Muzinich High Income Floating Rate Fund (each a “Fund,” and together, the “Funds”). At this meeting and at a prior meeting held on May 19-20, 2020, the Board received and reviewed substantial information regarding the Funds, the Advisor and the services provided by the Advisor to the Funds under the Advisory Agreement. This information, together with the information provided to the Board throughout the course of the year, formed the primary (but not exclusive) basis for the Board’s determinations. Below is a summary of the factors considered by the Board and the conclusions that formed the basis for the Board’s approval of the continuance of the Advisory Agreement:
| 1. | The nature, extent and quality of the services provided and to be provided by the Advisor under the Advisory Agreement. The Trustees considered the nature, extent and quality of the Advisor’s overall services provided to the Funds as well as its specific responsibilities in all aspects of day-to-day investment management of the Funds. The Board considered the qualifications, experience and responsibilities of the portfolio managers, as well as the responsibilities of other key personnel of the Advisor involved in the day-to-day activities of the Funds. The Board also considered the resources and compliance structure of the Advisor, including information regarding its compliance program, its chief compliance officer and the Advisor’s compliance record, as well as the Advisor’s cybersecurity program, business continuity plan, and risk management process. Additionally, the Board considered how the Advisor’s business continuity plan has operated during the recent COVID-19 pandemic. The Board also considered the prior relationship between the Advisor and the Trust, as well as the Board’s knowledge of the Advisor’s operations, and noted that during the course of the prior year they had met with certain personnel of the Advisor in person or by video conference to discuss fund performance and investment outlook, as well as, various marketing and compliance topics. The Board concluded that the Advisor had the quality and depth of personnel, resources, investment processes and compliance policies and procedures essential to performing its duties under the Advisory Agreement and that they were satisfied with the nature, overall quality and extent of such management services. | |
| 2. | The Funds’ historical performance and the overall performance of the Advisor. In assessing the quality of the portfolio management delivered by the Advisor, the Board reviewed the performance of each Fund on both an absolute basis, and in comparison to its peer funds utilizing Morningstar classifications, appropriate securities market benchmarks and the Advisor’s similarly managed accounts, all for periods ended March 31, 2020. While the Board considered both short-term and long-term performance, it placed greater emphasis on longer term performance. When reviewing each Fund’s performance against its comparative peer group universe, the Board took into account that the investment objective and strategies of each Fund, as well as its level of risk tolerance, may differ significantly from funds in its respective peer universe. When reviewing the Funds’ performance against broad market benchmarks, the Board took into account the differences in portfolio construction between the Funds and such benchmarks as well as other differences between actively managed funds and passive benchmarks, such as objectives and risks. In assessing periods of relative underperformance or outperformance, the Board took into account that relative performance can be significantly impacted by performance measurement periods and that some periods of underperformance may be transitory in nature while others may reflect more significant underlying issues. | |
| For the Muzinich Credit Opportunities Fund, the Board noted that the Fund outperformed its peer group median for the one-year, three-year and five-year periods. The Board also considered the underperformance of the Fund against its broad-based securities market benchmark for the one-year and three-year periods and the outperformance for the five-year period. The Board noted the Fund’s outperformance compared to the Advisor’s similarly managed account composite for the one-year, three-year and five-year periods and the reasons given by the Advisor for the differences. | ||
| For the Muzinich U.S. High Yield Corporate Bond Fund, the Board noted the Fund outperformed its peer group median for the one-year and three-year periods. The Board noted that the Fund outperformed its broad-based securities market benchmark for the one-year period and three-year periods. The Board also noted the Fund’s underperformance compared to the Advisor’s similarly managed account composite for the one-year and three-year periods and the reasons given by the Advisor for the differences. |
80
Muzinich Funds
APPROVAL OF INVESTMENT ADVISORY AGREEMENT (Unaudited) (Continued) |
| For the Muzinich Low Duration Fund, the Board noted the Fund underperformed its peer group median for the one-year and three-year periods. The Board noted that the Fund underperformed its broad-based securities market benchmark for the one-year and three-year periods. The Board also noted the Fund’s underperformance compared to the Advisor’s similarly managed account composite for the one-year and three-year periods and the reasons given by the Advisor for the differences. | ||
| For the Muzinich High Income Floating Rate Fund, the Board noted the Fund outperformed its peer group median for the one-year period. The Board noted that the Fund outperformed its broad-based securities market benchmark for the one-year period. The Board also noted that the Advisor does not replicate the Fund’s investment strategies in other types of accounts. | ||
| 3. | The costs of the services provided by the Advisor and the structure of the Advisor’s fees under the Advisory Agreement. In considering the advisory fee and total fees and expenses of each Fund, the Board reviewed comparisons to the peer funds and similarly managed accounts for other types of clients advised by the Advisor, as well as all expense waivers and reimbursements. When reviewing fees charged to other similarly managed accounts, the Board took into account the type of account and the differences in the management of that account that might be germane to the difference, if any, in the fees charged to such accounts. | |
| For the Muzinich Credit Opportunities Fund, the Board noted that the Advisor had contractually agreed to maintain an annual expense ratio of 0.70% and 0.60% for the Fund’s Institutional Shares and Supra Institutional Shares, respectively (the “Expense Caps”). The Board noted that the Fund’s advisory fee was above the peer group median and average. The Board also noted the net expense ratio (less Rule 12b-1 fees) was below its peer group median and average. The Board considered that the fees charged to similarly managed separate account clients and a UCITs fund were higher or lower than those charged to the Muzinich Credit Opportunities Fund and that there were a number of factors accounting for those differences. The Board concluded that the fees paid to the Advisor were fair and reasonable in light of the comparative performance and advisory fee information. | ||
| For the Muzinich U.S. High Yield Corporate Bond Fund, the Board noted that the Advisor had contractually agreed to maintain an annual expense ratio of 0.93%, 0.68% and 0.58% for the Fund’s Class A Shares, Institutional Shares and Supra Institutional Shares, respectively (the “Expense Caps”). The Trustees also noted that the advisory fee and net expense ratio (less Rule 12b-1 fees) were lower than its peer group median and average. The Board considered that the fees charged to similarly managed separate account clients and a UCITs fund were higher or lower than those charged to the Muzinich U.S. High Yield Corporate Bond Fund and that there were a number of factors accounting for those differences. The Board concluded that the fees paid to the Advisor were fair and reasonable in light of the comparative performance and advisory fee information. | ||
| For the Muzinich Low Duration Fund, the Board noted that the Advisor had contractually agreed to maintain an annual expense ratio of 0.85%, 0.60% and 0.50% for the Fund’s Class A Shares, Institutional Shares and Supra Institutional Shares, respectively (the “Expense Caps”). The Trustees also noted that the advisory fee and net expense ratio (less Rule 12b-1 fees) were lower than its peer group median and average. The Board considered that the fees charged to similarly managed separate account clients and a UCITs fund were higher or lower than those charged to the Muzinich Low Duration Fund and that there were a number of factors accounting for those differences. The Board concluded that the fees paid to the Advisor were fair and reasonable. | ||
| For the Muzinich High Income Floating Rate Fund, the Board noted that the Advisor had contractually agreed to maintain an annual expense ratio of 0.90%, 0.65% and 0.55% for the Fund’s Class A Shares, Institutional Shares and Supra Institutional Shares, respectively (the “Expense Caps”). The Trustees also noted that the advisory fee and net expense ratio (less Rule 12b-1 fees) were lower than its peer group median and average. The Board further noted that the Advisor does not replicate the Fund’s investment strategy in other types of accounts. The Board concluded that the fees paid to the Advisor were fair and reasonable. | ||
| 4. | Economies of Scale. The Board also considered whether economies of scale were being realized by the Advisor that should be shared with shareholders. The Board noted that the Advisor has contractually agreed to reduce its advisory fees or reimburse Fund expenses so that each Fund does not exceed its specified Expense Caps. The Board noted that at current asset levels, it did not appear that there were additional significant economies of scale being realized by the Advisor that should be shared with shareholders and concluded that it would continue to monitor economies of scale in the future as circumstances changed and assuming asset levels continued to increase. |
81
Muzinich Funds
APPROVAL OF INVESTMENT ADVISORY AGREEMENT (Unaudited) (Continued) |
| 5. | The profits to be realized by the Advisor and its affiliates from their relationship with the Funds. The Board reviewed the Advisor’s financial information and took into account both the direct benefits and the indirect benefits to the Advisor from advising the Funds. The Board considered the profitability to the Advisor from its relationship with the Funds and considered any additional material benefits derived by the Advisor from its relationship with the Funds, including Rule 12b-1 distribution fees for Class A Shares (which are not currently offered for any of the Funds) and particularly benefits to be received in exchange for shareholder servicing fees on Class A and Institutional Class shares paid to the Advisor. The Board also reviewed information regarding fee offsets for separate accounts invested in the Funds and determined that the Advisor was not receiving an advisory fee both at the separate account and at the Fund level for these accounts, and as a result was not receiving additional fall-out benefits from these relationships. Similarly, the Board also considered that, to the extent any of the Funds were invested in another Muzinich Fund, the Advisor was not receiving an advisory fee from both Funds on those assets. After such review, the Board determined that the profitability to the Advisor with respect to the Advisory Agreement was not excessive, and that the Advisor had maintained adequate financial resources to support the services it provides to the Funds. |
No single factor was determinative of the Board’s decision to approve the continuance of the Advisory Agreement, but rather the Board based its determination on the total combination of information available to them. Based on a consideration of all the factors in their totality, the Board determined that the advisory arrangements with the Advisor, including the advisory fee, were fair and reasonable. The Board therefore determined that the continuance of the Advisory Agreement would be in the best interests of the Funds and their shareholders.
82
Muzinich Funds
TRUSTEES AND EXECUTIVE OFFICERS (Unaudited) |
The Board is responsible for the overall management of the Trust, including general supervision and review of the investment activities of the Funds. The Board, in turn, elects the officers of the Trust, who are responsible for the day-to-day operations of the Trust and its separate series. The current Trustees and executive officers of the Trust, their birth dates, positions with the Trust, terms of office with the Trust and length of time served, their principal occupations during the past five years and other directorships are set forth in the table below.
| Number of | |||||
| Portfolios | |||||
| in Fund | Other | ||||
| Position | Term of Office2 | Complex3 | Directorships | ||
| Name, Address | with the | and Length of | Principal Occupation | Overseen | Held During |
And Age | Trust1 | Time Served | During Past Five Years | by Trustees | the Past 5 Years |
| Independent Trustees of the Trust | |||||
Kathleen T. Barr | Trustee | Indefinite Term; | Former owner of a registered | 4 | Independent Director, |
(born 1955) | Since November | investment adviser, Productive | Muzinich BDC, Inc. | ||
c/o U.S. Bank | 2018. | Capital Management, Inc.; | (August 2019 to | ||
Global Fund Services | formerly, Chief Administrative | present); Independent | |||
2020 E. Financial Way | Officer, Senior Vice President and | Trustee for the | |||
Suite 100 | Senior Managing Director of | William Blair Funds | |||
Glendora, CA 91741 | Allegiant Asset Management | (2013 to present) | |||
Company (merged with PNC | (21 series); | ||||
Capital Advisors, LLC in 2009); | Independent Trustee | ||||
formerly, Chief Administrative | for the AmericaFirst | ||||
Officer, Chief Compliance Officer | Quantitative Funds | ||||
and Senior Vice President of PNC | (2012 to 2016). | ||||
Funds and PNC Advantage Funds | |||||
(f/k/a Allegiant Funds) (registered | |||||
investment companies). | |||||
Wallace L. Cook | Trustee | Indefinite Term; | Investment Consultant; formerly, | 4 | Trustee, The Dana |
(born 1939) | Since May 1991. | Chief Executive Officer, Rockefeller | Foundation. | ||
c/o U.S. Bank | Trust Co., (prior thereto Senior Vice | ||||
Global Fund Services | President), and Managing Director, | ||||
2020 E. Financial Way | Rockefeller & Co. (Investment | ||||
Suite 100 | Manager and Financial Advisor); | ||||
Glendora, CA 91741 | formerly, Senior Vice President, | ||||
Norton Simon, Inc. (international | |||||
consumer products conglomerate). | |||||
Eric W. Falkeis | Trustee | Indefinite Term; | Chief Executive Officer, Tidal ETF | 4 | Independent Director, |
(born 1973) | Since September | Services LLC (2018 to present); | Muzinich BDC, Inc. | ||
c/o U.S. Bank | 2011. | formerly, Chief Operating Officer, | (August 2019 to | ||
Global Fund Services | Chairperson | Indefinite Term; | Direxion Funds (2013 to 2018); formerly, | present); Interested | |
2020 E. Financial Way | Since August | Senior Vice President and Chief | Trustee, Tidal ETF | ||
Suite 100 | 2019. | Financial Officer (and other positions), | Trust (2018 to | ||
Glendora, CA 91741 | U.S. Bancorp Fund Services, LLC. | present) (8 series); | |||
Former Interested | |||||
Trustee, Direxion | |||||
Funds (22 series), | |||||
Direxion Shares ETF | |||||
Trust (112 series) and | |||||
Direxion Insurance | |||||
Trust (2013 to 2018). | |||||
83
Muzinich Funds
TRUSTEES AND EXECUTIVE OFFICERS (Unaudited) (Continued) |
| Number of | |||||
| Portfolios | |||||
| in Fund | Other | ||||
| Position | Term of Office2 | Complex3 | Directorships | ||
| Name, Address | with the | and Length of | Principal Occupation | Overseen | Held During |
And Age | Trust1 | Time Served | During Past Five Years | by Trustees | the Past 5 Years |
Carl A. Froebel | Trustee | Indefinite Term; | Formerly, President and Founder, | 4 | None. |
(born 1938) | Since May 1991. | National Investor Data Services, Inc. | |||
c/o U.S. Bank | (investment related computer software). | ||||
Global Fund Services | |||||
2020 E. Financial Way | |||||
Suite 100 | |||||
Glendora, CA 91741 | |||||
Steven J. Paggioli | Trustee | Indefinite Term; | Consultant; formerly, Executive Vice | 4 | Independent Director, |
(born 1950) | Since May 1991. | President, Investment Company | Muzinich BDC, Inc. | ||
c/o U.S. Bank | Administration, LLC (mutual | (August 2019 to | |||
Global Fund Services | fund administrator). | present); Independent | |||
2020 E. Financial Way | Trustee, AMG Funds | ||||
Suite 100 | (49 series); Advisory | ||||
Glendora, CA 91741 | Board Member, | ||||
Sustainable Growth | |||||
Advisers, LP. | |||||
Ashi S. Parikh | Trustee | Indefinite Term; | Investment professional; formerly, | 4 | Independent Trustee, |
(born 1966) | Since June 2020. | Chief Executive and Chief Investment | PNC Funds (2018 to | ||
c/o U.S. Bank | Officer and various other positions, | 2019) (32 series); | |||
Global Fund Services | RidgeWorth Investments, LLC | Interested Trustee, | |||
2020 E. Financial Way | (global investment management firm) | RidgeWorth Funds | |||
Suite 100 | (2006 to 2017); formerly, Chief | (2014 to 2017) | |||
Glendora, CA 91741 | Investment Officer Institutional Growth | (35 series); Board of | |||
Equities, Eagle Asset Management | Directors Member, | ||||
(financial advisor); formerly Sr. Managing | Investment Working | ||||
Director, Growth Equities, Banc One | Group, The Ohio | ||||
Investment Advisors (financial advisor). | State University | ||||
Endowments and | |||||
Foundation (2016 to | |||||
present); Board of | |||||
Directors, World | |||||
Methodist Council, | |||||
Investment | |||||
Committee (2018 to | |||||
present). | |||||
| Officers of the Trust | |||||
Elaine E. Richards | President | Indefinite Term; | Senior Vice President, U.S. Bank | Not | Not |
(born 1968) | Since March 2013. | Global Fund Services since | Applicable. | Applicable. | |
c/o U.S. Bank | Indefinite Term; | July 2007. | |||
Global Fund Services | Since February | ||||
2020 E. Financial Way | 2008. | ||||
Suite 100 | |||||
Glendora, CA 91741 | |||||
Carl G. Gee, J.D. | Vice | Indefinite Term; | Assistant Vice President, U.S. | Not | Not |
(born 1990) | President | Since February | Bank Global Fund Services since | Applicable. | Applicable. |
c/o U.S. Bank | 2021. | August 2016; Summer Associate, | |||
Global Fund Services | Secretary | Husch Blackwell LLP (2015); | |||
615 East Michigan St. | Law Clerk, Brady Corporation (global | ||||
Milwaukee, WI 53202 | printing systems, labels and safety | ||||
products company) (2014 to 2015). | |||||
84
Muzinich Funds
TRUSTEES AND EXECUTIVE OFFICERS (Unaudited) (Continued) |
| Number of | |||||
| Portfolios | |||||
| in Fund | Other | ||||
| Position | Term of Office2 | Complex3 | Directorships | ||
| Name, Address | with the | and Length of | Principal Occupation | Overseen | Held During |
And Age | Trust1 | Time Served | During Past Five Years | by Trustees | the Past 5 Years |
Aaron J. Perkovich | Vice | Indefinite Term; | Vice President, U.S. Bank | Not | Not |
(born 1973) | President | Since March | Global Fund Services since | Applicable. | Applicable. |
c/o U.S. Bank | 2017. | June 2006. | |||
Global Fund Services | Treasurer | Indefinite Term; | |||
615 East Michigan St. | Since August | ||||
Milwaukee, WI 53202 | 2016. | ||||
Melissa Breitzman | Assistant | Indefinite Term; | Assistant Vice President, U.S. | Not | Not |
(born 1983) | Treasurer | Since August | Bank Global Fund Services LLC | Applicable. | Applicable. |
c/o U.S. Bank | 2016. | since June 2005. | |||
Global Fund Services | |||||
615 East Michigan St. | |||||
Milwaukee, WI 53202 | |||||
Craig Benton | Assistant | Indefinite Term; | Assistant Vice President, U.S. | Not | Not |
(born 1985) | Treasurer | Since August | Bank Global Fund Services | Applicable. | Applicable. |
c/o U.S. Bank | 2016. | since November 2007. | |||
Global Fund Services | |||||
615 East Michigan St. | |||||
Milwaukee, WI 53202 | |||||
Cory Akers | Assistant | Indefinite Term; | Assistant Vice President, U.S. | Not | Not |
(born 1978) | Treasurer | Since August | Bank Global Fund Services | Applicable. | Applicable. |
c/o U.S. Bank | 2017. | since October 2006. | |||
Global Fund Services | |||||
615 East Michigan St. | |||||
Milwaukee, WI 53202 | |||||
Donna Barrette | Chief | Indefinite Term; | Senior Vice President and | Not | Not |
(born 1966) | Compliance | Since July 2011. | Compliance Officer, U.S. Bank | Applicable. | Applicable. |
c/o U.S. Bank | Officer, | Global Fund Services since | |||
Global Fund Services | Anti-Money | August 2004. | |||
615 East Michigan St. | Laundering | ||||
Milwaukee, WI 53202 | Officer, | ||||
Vice | |||||
President |
1 | All Trustees of the Trust are not “interested persons” of the Trust as defined under the 1940 Act (“Independent Trustees”). |
2 | Under the terms of the Board’s retirement policy, a Trustee shall retire at the end of the calendar year in which he or she reaches the age of 78 (or, in the case of a Trustee who was over the age of 78 at the time the retirement policy was adopted in 2019, December 31, 2021). |
3 | The Trust is comprised of numerous series managed by unaffiliated investment advisers. The term “Fund Complex” applies only to the Funds. The Funds do not hold themselves out as related to any other series within the Trust for purposes of investment and investor services, nor do they share the same investment advisor with any other series. |
85
Muzinich Funds
QUALIFIED DIVIDEND INCOME/DIVIDENDS RECEIVED DEDUCTION (Unaudited) |
For the fiscal year ended December 31, 2020, certain dividends paid by the Funds may be subject to a maximum tax rate of 20%, as provided for by the Jobs and Growth Tax Relief Reconciliation Act of 2003 and the Tax Cuts and Jobs Act of 2017. The percentage of dividends declared from ordinary income designated as qualified dividend income was as follows:
| Credit Opportunities Fund | 0.00% |
| U.S. High Yield Fund | 0.00% |
| Low Duration Fund | 0.00% |
| Floating Rate Fund | 0.00% |
For corporate shareholders, the percent of ordinary income distributions qualifying for the corporate dividends received deduction for the period ended December 31, 2020, was as follows:
| Credit Opportunities Fund | 0.00% |
| U.S. High Yield Fund | 0.00% |
| Low Duration Fund | 0.00% |
| Floating Rate Fund | 0.00% |
The percentage of taxable ordinary income distributions that are designated as short-term capital gain distributions under Internal Revenue Section 871(K)(2)(C) for the Funds were as follows:
| Credit Opportunities Fund | 15.59% |
| U.S. High Yield Fund | 0.00% |
| Low Duration Fund | 0.00% |
| Floating Rate Fund | 0.00% |
INFORMATION ABOUT PROXY VOTING (Unaudited) |
A description of the policies and procedures that the Funds use to determine how to vote proxies relating to portfolio securities is available without charge, upon request, by calling 1-855-MUZINICH (1-855-689-4642). Furthermore, you can obtain the description on the SEC’s website at www.sec.gov.
Information regarding how the Funds voted proxies relating to portfolio securities during the most recent period ended June 30 is available without charge, upon request, by calling 1-855-MUZINICH (1-855-689-4642). Furthermore, you can obtain the Funds’ proxy voting records on the SEC’s website at www.sec.gov.
INFORMATION ABOUT THE PORTFOLIO HOLDINGS (Unaudited) |
The Funds file their complete schedule of portfolio holdings with the SEC for the first and third quarters of each fiscal year as an exhibit to their reports on Part F of Form N-PORT. The Funds’ Form N-PORT is available on the SEC’s website at www.sec.gov. The Funds’ Form N-PORT may also be obtained by calling toll-free 1-855-MUZINICH (1-855-689-4642).
86
Muzinich Funds
INFORMATION ABOUT HOUSEHOLDING (Unaudited) |
Each year, you are automatically sent an updated prospectus as well as an annual and semi-annual reports for the Funds, if applicable. To reduce expenses, the Funds may mail only one copy of each Fund’s prospectus and each annual and semi-annual report to those addresses shared by two or more accounts. If you wish to receive individual copies of these documents, please call us at 1-855-MUZINICH (1-855-689-4642) (or contact your financial institution). We will begin sending you individual copies thirty days after receiving your request. In addition, see the Important Notice on the cover page for changes that will be made to the distribution of the annual and semi-annual reports after January 1, 2021.
INFORMATION ABOUT THE FUNDS’ TRUSTEES (Unaudited) |
The Statement of Additional Information (“SAI”) includes additional information about the Funds’ Trustees and is available without charge, upon request, by calling 1-855-MUZINICH (1-855-689-4642). Furthermore, you can obtain the SAI on the SEC’s web site at www.sec.gov or the Funds’ website at www.muzinichusfunds.com.
87
Muzinich Funds
PRIVACY NOTICE (Unaudited) |
The Funds collect non-public information about you from the following sources:
| • | Information we receive about you on applications or other forms; |
| • | Information you give us orally; and |
| • | Information about your transactions with us or others. |
We do not disclose any non-public personal information about our shareholders or former shareholders without the shareholder’s authorization, except as permitted by law or in response to inquiries from governmental authorities. We may share information with affiliated parties and unaffiliated third parties with whom we have contracts for servicing the Funds. We will provide unaffiliated third parties with only the information necessary to carry out their assigned responsibility. We maintain physical, electronic and procedural safeguards to protect your non-public personal information and require third parties to treat your non-public information with the same high degree of confidentiality.
In the event that you hold shares of a Fund through a financial intermediary, including, but not limited to, a brokerdealer, bank or trust company, the privacy policy of your financial intermediary would govern how your non-public personal information would be shared by those entities with unaffiliated third parties.
88
(This Page Intentionally Left Blank.)
Advisor
MUZINICH & CO., INC
450 Park Avenue
New York, New York 10022
Distributor
QUASAR DISTRIBUTORS, LLC
111 East Kilbourne Avenue, Suite 2200
Milwaukee, Wisconsin 53202
Custodian
U.S. BANK N.A.
Custody Operations
1555 North RiverCenter Drive, Suite 302
Milwaukee, Wisconsin 53212
Transfer Agent, Fund Accountant,
and Fund Administrator
U.S. BANCORP FUND SERVICES, LLC
615 East Michigan Street
Milwaukee, Wisconsin 53202
Independent Registered Public Accounting Firm
TAIT, WELLER & BAKER LLP
Two Liberty Place
50 South 16th Street, Suite 2900
Philadelphia, Pennsylvania 19102-2529
Legal Counsel
SULLIVAN & WORCESTER LLP
1633 Broadway, 32nd Floor
New York, New York 10019
Fund | Class | Symbol | CUSIP |
Muzinich Credit Opportunities Fund | Supra Institutional Class | MZCSX | 74316J532 |
Institutional Class | MZCIX | 74316J540 | |
Muzinich U.S. High Yield Corporate Bond Fund | Supra Institutional Class | MZHSX | 74316J565 |
Institutional Class | MZHIX | 74316J573 | |
Muzinich Low Duration Fund | Supra Institutional Class | MZLSX | 74316P132 |
Institutional Class | MZLIX | 74316P124 | |
Muzinich High Income Floating Rate Fund | Institutional Class | MZFIX | 74316J615 |
(b) Not applicable.
Item 2. Code of Ethics.
The registrant has adopted a code of ethics that applies to the registrant’s principal executive officer and principal financial officer. The registrant has not made any amendments to its code of ethics during the period covered by this report. The registrant has not granted any waivers from any provisions of the code of ethics during the period covered by this report.
A copy of the registrant’s Code of Ethics is filed herewith.
Item 3. Audit Committee Financial Expert.
The registrant’s Board of Trustees of the Trust has determined that there is at least one audit committee financial expert serving on its audit committee. Ms. Kathleen T. Barr and Messrs. Wallace L. Cook, Carl A. Froebel, Eric W. Falkeis, Steven J. Paggioli, and Ashi S. Parikh are each an “audit committee financial expert” and are considered to be “independent” as each term is defined in Item 3 of Form N-CSR.
Item 4. Principal Accountant Fees and Services.
The registrant has engaged its principal accountant to perform audit services, audit-related services, tax services and other services during the past two fiscal years. “Audit services” refer to performing an audit of the registrant's annual financial statements or services that are normally provided by the accountant in connection with statutory and regulatory filings or engagements for those fiscal years. “Audit-related services” refer to the assurance and related services by the principal accountant that are reasonably related to the performance of the audit. “Tax services” refer to professional services rendered by the principal accountant for tax compliance, tax advice, and tax planning. There were no “Other services” provided by the principal accountant. The following table details the aggregate fees billed or expected to be billed for each of the last two fiscal years for audit fees, audit-related fees, tax fees and other fees by the principal accountant.
Muzinich Credit Opportunities Fund
| FYE 12/31/2020 | FYE 12/31/2019 | |
Audit Fees | $22,400 | $22,400 |
Audit-Related Fees | N/A | N/A |
Tax Fees | $2,700 | $2,700 |
All Other Fees | N/A | N/A |
Muzinich U.S. High Yield Corporate Bond Fund
| FYE 12/31/2020 | FYE 12/31/2019 | |
Audit Fees | $20,900 | $20,900 |
Audit-Related Fees | N/A | N/A |
Tax Fees | $2,700 | $2,700 |
All Other Fees | N/A | N/A |
Muzinich Low Duration Fund
| FYE 12/31/2020 | FYE 12/31/2019 | |
Audit Fees | $20,900 | $20,900 |
Audit-Related Fees | N/A | N/A |
Tax Fees | $2,700 | $2,700 |
All Other Fees | N/A | N/A |
Muzinich High Income Floating Rate Fund
| FYE 12/31/2020 | FYE 12/31/2019 | |
Audit Fees | $19,400 | $19,400 |
Audit-Related Fees | N/A | N/A |
Tax Fees | $2,700 | $2,700 |
All Other Fees | N/A | N/A |
The audit committee has adopted pre-approval policies and procedures that require the audit committee to pre‑approve all audit and non‑audit services of the registrant, including services provided to any entity affiliated with the registrant.
The percentage of fees billed by Tait Weller & Baker LLP applicable to non-audit services pursuant to waiver of pre-approval requirement were as follows:
| FYE 12/31/2020 | FYE 12/31/2019 | |
Audit-Related Fees | 0% | 0% |
Tax Fees | 0% | 0% |
All Other Fees | 0% | 0% |
All of the principal accountant’s hours spent on auditing the registrant’s financial statements were attributed to work performed by full‑time permanent employees of the principal accountant.
The following table indicates the non-audit fees billed or expected to be billed by the registrant’s accountant for services to the registrant and to the registrant’s investment adviser (and any other controlling entity, etc.—not sub-adviser) for the last two years. The audit committee of the board of trustees/directors has considered whether the provision of non-audit services that were rendered to the registrant's investment adviser is compatible with maintaining the principal accountant's independence and has concluded that the provision of such non-audit services by the accountant has not compromised the accountant’s independence.
Non-Audit Related Fees | FYE 12/31/2020 | FYE 12/31/2019 |
Registrant | N/A | N/A |
Registrant’s Investment Advisor | N/A | N/A |
Item 5. Audit Committee of Listed Registrants.
Not applicable to registrants who are not listed issuers (as defined in Rule 10A-3 under the Securities Exchange Act of 1934).
Item 6. Investments.
(a) Schedule of Investments is included as part of the report to shareholders filed under Item 1 of this Form.
(b) Not applicable.
Item 7. Disclosure of Proxy Voting Policies and Procedures for Closed-End Management Investment Companies.
Not applicable to open-end investment companies.
Item 8. Portfolio Managers of Closed-End Management Investment Companies.
Not applicable to open-end investment companies.
Item 9. Purchases of Equity Securities by Closed‑End Management Investment Company and Affiliated Purchasers.
Not applicable to open-end investment companies.
Item 10. Submission of Matters to a Vote of Security Holders.
The registrant has adopted a nominating committee charter that contains the procedures by which shareholders may recommend nominees to the registrant’s board of trustees. There have been no material changes to the procedures by which shareholders may recommend nominees to the registrant’s board of trustees for the period.
Item 11. Controls and Procedures.
(a) | The Registrant’s Principal Executive Officer and Principal Financial Officer have reviewed the Registrant's disclosure controls and procedures (as defined in Rule 30a-3(c) under the Investment Company Act of 1940 (the “Act”)) as of a date within 90 days of the filing of this report, as required by Rule 30a-3(b) under the Act and Rules 13a-15(b) or 15d‑15(b) under the Securities Exchange Act of 1934. Based on their review, such officers have concluded that the disclosure controls and procedures are effective in ensuring that information required to be disclosed in this report is appropriately recorded, processed, summarized and reported and made known to them by others within the Registrant and by the Registrant’s service provider. |
(b) | There were no changes in the Registrant's internal control over financial reporting (as defined in Rule 30a-3(d) under the Act) that occurred during the period covered by this report that has materially affected, or is reasonably likely to materially affect, the Registrant's internal control over financial reporting. |
Item 12. Disclosure of Securities Lending Activities for Closed-End Management Investment Companies
Not applicable to open-end investment companies.
Item 13. Exhibits.
(3) Any written solicitation to purchase securities under Rule 23c‑1 under the Act sent or given during the period covered by the report by or on behalf of the registrant to 10 or more persons. Not applicable to open-end investment companies.
(4) Change in the registrant’s independent public accountant. There was no change in the registrant’s independent public accountant for the period covered by this report.
SIGNATURES
Pursuant to the requirements of the Securities Exchange Act of 1934 and the Investment Company Act of 1940, the registrant has duly caused this report to be signed on its behalf by the undersigned, thereunto duly authorized.
(Registrant) Professionally Managed Portfolios
By (Signature and Title) /s/ Elaine E. Richards
Elaine E. Richards, President/Principal Executive Officer
Date March 10, 2021
Pursuant to the requirements of the Securities Exchange Act of 1934 and the Investment Company Act of 1940, this report has been signed below by the following persons on behalf of the registrant and in the capacities and on the dates indicated.
By (Signature and Title) /s/ Elaine E. Richards
Elaine E. Richards, President/Principal Executive Officer
Date March 10, 2021
By (Signature and Title) /s/ Aaron J. Perkovich
Aaron J. Perkovich, Treasurer/Principal Financial Officer
Date March 10, 2021
* Print the name and title of each signing officer under his or her signature.