UNITED STATES
SECURITIES AND EXCHANGE COMMISSION
Washington, D.C. 20549
SECURITIES AND EXCHANGE COMMISSION
Washington, D.C. 20549
FORM N-CSR
CERTIFIED SHAREHOLDER REPORT OF REGISTERED
MANAGEMENT INVESTMENT COMPANIES
Investment Company Act file number (811-05037)
Professionally Managed Portfolios
(Exact name of registrant as specified in charter)
(Exact name of registrant as specified in charter)
615 East Michigan Street
Milwaukee, WI 53202
(Address of principal executive offices) (Zip code)
(Address of principal executive offices) (Zip code)
Elaine E. Richards
Professionally Managed Portfolios
c/o U.S. Bank Global Fund Services
2020 E. Financial Way, Ste. 100
Glendora, CA 91741
(Name and address of agent for service)
2020 E. Financial Way, Ste. 100
Glendora, CA 91741
(Name and address of agent for service)
(626) 914-7363
Registrant's telephone number, including area code
Date of fiscal year end: March 31
Date of reporting period: March 31, 2021
Item 1. Report to Stockholders.
| (a) | [Insert full text of semi-annual or annual report here] |
ANNUAL REPORT • MARCH 31, 2021 |
Hodges Fund
Small Cap Fund
Small Intrinsic Value Fund
Blue Chip Equity Income Fund
www.hodgesfunds.com
Hodges Capital — Managing Equity Funds Since 1992
Table of Contents
| Shareholder Letter | 1 | ||
| Sector Allocations | 8 | ||
| Performance Charts and Analysis | 10 | ||
| Schedules of Investments | 15 | ||
| Statements of Assets and Liabilities | 22 | ||
| Statements of Operations | 23 | ||
| Statements of Changes in Net Assets | 24 | ||
| Financial Highlights | 28 | ||
| Notes to Financial Statements | 33 | ||
| Report of Independent Registered Public Accounting Firm | 42 | ||
| Expense Examples | 43 | ||
| Trustees and Executive Officers | 45 | ||
| Additional Information | 49 | ||
| Privacy Notice | 51 |
Hodges Mutual Funds
March 31, 2021
Dear Shareholder:
What a difference a year can make! A few weeks ago, we marked the anniversary of the pandemic-driven market low that occurred on March 22, 2020. The S&P 500® Index (“S&P 500®”) is now up more than 75% from a year ago. The only historical comparisons to such recovery are 1982 and 2009, in which the market railed by more than 58% and 69%, respectively. Over the last year, we are pleased to report that all four of the Hodges Funds experienced a substantial improvement in their returns. Much of the Funds’ relative performance over the past twelve months reflected a shift in market leadership that favored fundamental investing and rewarded individual stock selection.
We believe the market’s continued upswing reflects the anticipation of an economic recovery in the months ahead as the pandemic’s impact on the global economy recedes. As the market has begun pricing in an earnings recovery, equity multiples are up considerably from a year ago. According to data published by FactSet, the S&P 500® ended the year at 21.9X forward earnings estimates compared to a five-year average of 17.8X. Although it is essential to point out that much of the P.E. (price/earnings) multiple expansion has occurred among the most prominent growth stocks within the S&P 500®, the inverse of the current P.E. multiple is an earnings yield of 4.57%, which is still above the 10-year Treasury yield of 1.74% at March 31, 2021. As earnings recover, we expect industries hardest hit by the pandemic to experience the lion’s share of the recovery this year. Still, we acknowledge that some business dislocations that occurred in response to the pandemic could be permanent. With this in mind, the Hodges Capital Management investment team has positioned our portfolios to benefit from broader economic growth and earnings improvement across many sectors.
In our opinion, the velocity of the market’s recovery over the past year has been influenced by an unprecedented increase in liquidity. Greater liquidity has resulted from an aggressive monetary response by the Federal Reserve designed and a significant fiscal stimulus to lessen the immediate financial blow from the pandemic on the economy. Federal stimulus combined with a curtailment in consumption over the past year has also increased March U.S. savings to a record $3.1 trillion annualized rate or +13% of discretionary income, according to data provided by Strategas Research. We believe a portion of these savings could support a surge in consumer spending over the next several quarters. As consumption returns and liquidity remains abundant, basic economic principles suggest that the consequences could result in higher inflation somewhere down the road. As we have mentioned in the past, we spend little time trying to predict interest rates, foreign currency fluctuations, or future commodity prices. However, we pay close attention to prices and, more importantly, the pricing power that our portfolio companies exhibit within the goods and services they provide and consume. We see some antidotal signs of higher prices and would not be surprised to see inflation pick up in conjunction with improved economic activity. Long-term rates have recently perked up, as evidenced by the increase in the 10-year Treasury yield from 0.87% on December 31, 2020, to 1.74% on March 31, 2021.
Looking ahead, we would acknowledge that investor sentiment is more bullish today, and some U.S. stocks may trade well ahead of their fundamentals. As a result, we would not be surprised to see normal corrections (5-10%) during the remainder of calendar 2021 as investors digest recent gains. We would also point out that such corrections are a routine mechanism for price discovery within a healthy bull market. Furthermore, we believe current flows into U.S. equities and overall cash levels do not indicate that investors are at a point of euphoria that would be consistent with the end of most bull markets.
Although we are encouraged with the opportunities ahead, we would not be surprised to see volatility arise throughout the following year. Historically we have found bargains during periods of increased volatility as we rigorously look for investments in well-run businesses that control their destiny by relying on ingenuity and well-calculated business decisions. Investors in the Hodges Funds can be assured that we are not changing our core investing discipline, designed to seek quality companies running great businesses with excellent management teams trading at reasonable prices. Furthermore, we see this as an ideal environment for active portfolio managers to carefully select individual stocks that we believe can generate long-term value for shareholders.
1
Hodges Mutual Funds
Returns (Retail Class) as of 3/31/2021:
| Since | |||||
1 Year* | 3 Year* | 5 Year* | 10 Year* | Inception* | |
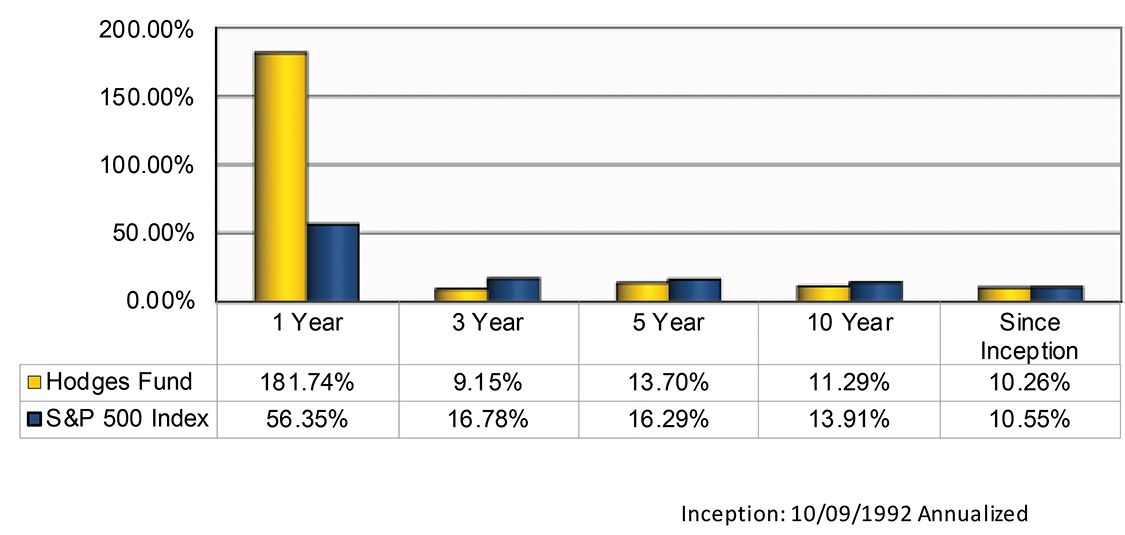
Hodges Fund (10/9/92) | 181.74% | 9.15% | 13.70% | 11.29% | 10.26% |
S&P 500® Index | 56.35% | 16.78% | 16.29% | 13.91% | 10.55% |
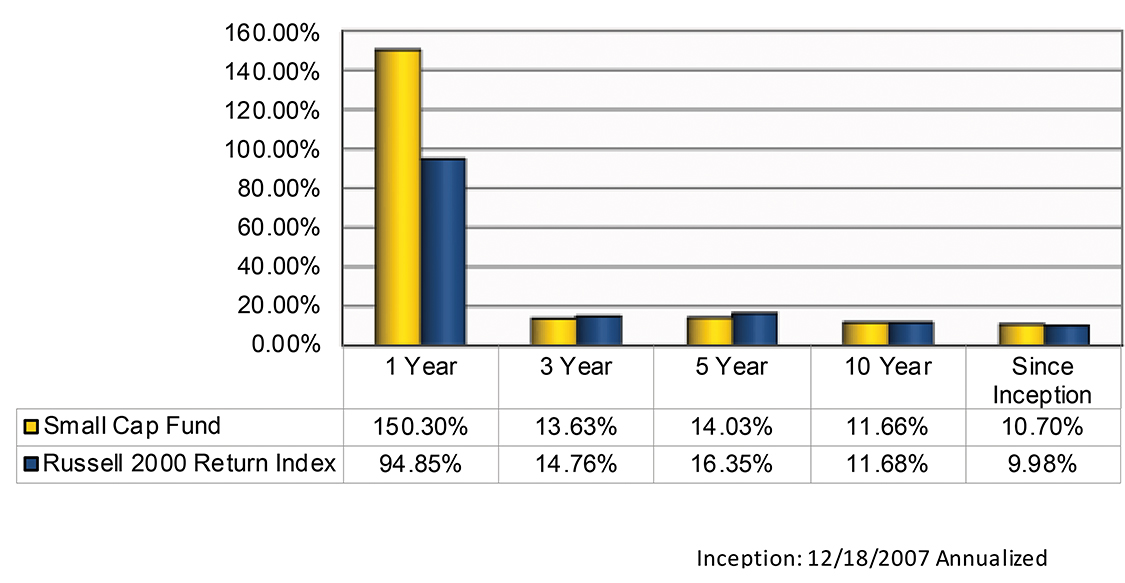
Hodges Small Cap Fund (12/18/07) | 150.30% | 13.63% | 14.03% | 11.66% | 10.70% |
Russell 2000® Return Index | 94.85% | 14.76% | 16.35% | 11.68% | 9.98% |
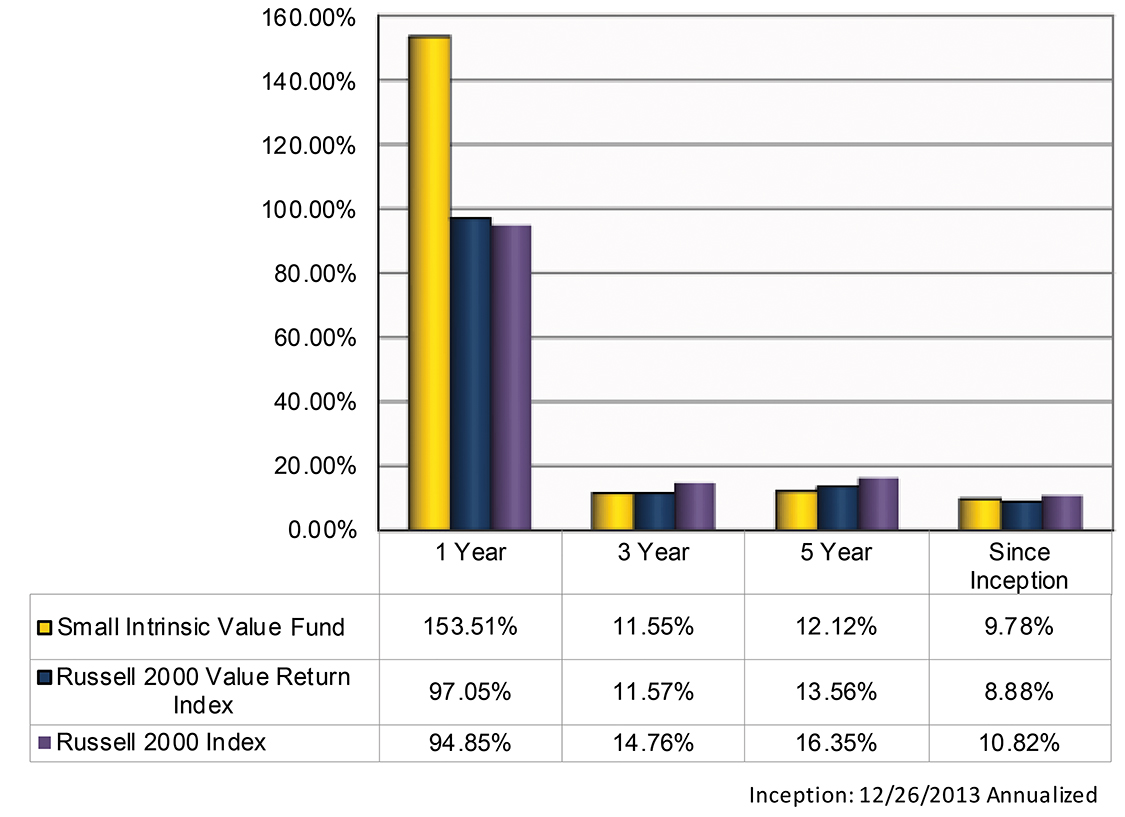
Hodges Small Intrinsic Value Fund (12/26/13) | 153.51% | 11.55% | 12.12% | n/a | 9.78% |
Russell 2000® Value Return Index | 97.05% | 11.57% | 13.56% | n/a | 8.88% |
Russell 2000® Index | 94.85% | 14.76% | 16.35% | n/a | 10.82% |
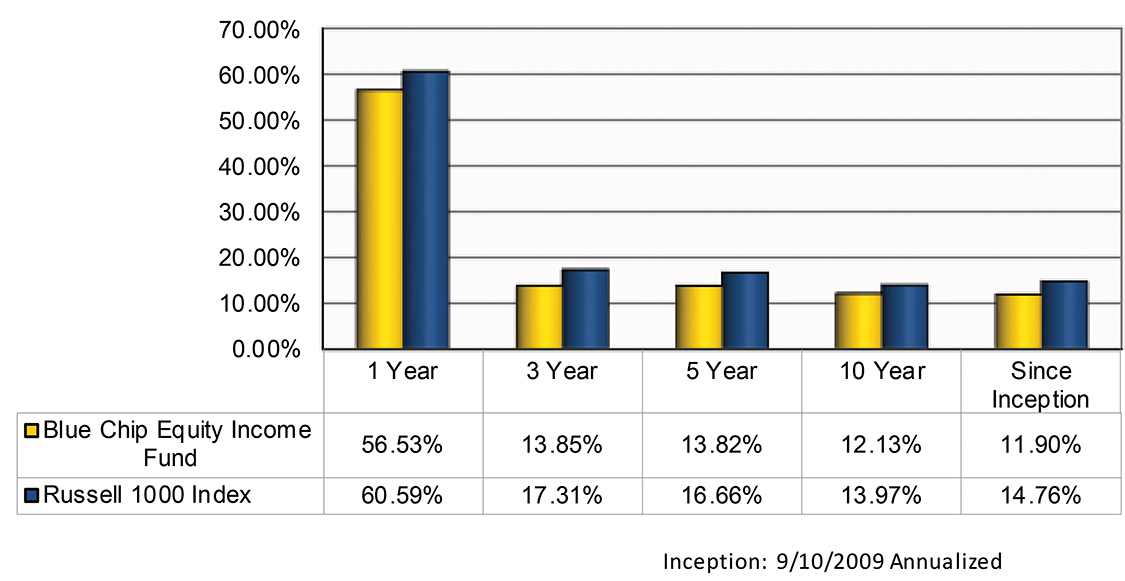
Hodges Blue Chip Equity Income Fund (9/10/09) | 56.53% | 13.85% | 13.82% | 12.13% | 11.90% |
Russell 1000® Index | 60.59% | 17.31% | 16.66% | 13.97% | 14.76% |
| * Average Annualized | ||||||
HDPMX | HDPSX | HDSVX | HDPBX | |||
Gross Expense Ratio1 | 1.34% | 1.31%2 | 2.43% | 1.47% | ||
Net Expense Ratio1 | 1.15%3 | 1.29%4 | 1.30%4 | |||
1 | These expense ratios are from the most recent prospectus dated July 29, 2020 and as supplemented September 9, 2020. | |
2 | Hodges Capital Management, Inc. (the “Advisor”) has contractually agreed to lower its management fee from 0.85% to 0.82% of the Hodges Small Cap Fund’s average daily net assets through August 31, 2021. This waiver may not be terminated without the approval of the Trust’s Board of Trustees (the “Board”). This waiver should not be construed to be a permanent reduction of the management fees of the Advisor. The Advisor has waived its right to receive reimbursement of the portion of its management fees waived pursuant to this advisory fee waiver agreement. | |
3 | The Advisor has contractually agreed to reduce its fees until at least August 31, 2021. This figure excludes Acquired Fund Fees and Expenses, interest, taxes and extraordinary expenses. In addition, the Advisor has contractually agreed to lower its management fee from 0.85% to 0.82% of the Hodges Fund’s average daily net assets through August 31, 2021. This waiver may not be terminated without the approval of the Board. This waiver should not be construed to be a permanent reduction of the management fees of the Advisor. The Advisor has waived its right to receive reimbursement of the portion of its management fees waived pursuant to this advisory fee waiver agreement. | |
4 | The Advisor has contractually agreed to reduce its fees until at least August 31, 2021. This figure excludes Acquired Fund Fees and Expenses, interest, taxes and extraordinary expenses. |
Performance data quoted represents past performance and does not guarantee future results. The investment return and principal value of an investment will fluctuate so that an investor’s shares, when redeemed, may be worth more or less than their original cost. The current performance of the Funds may be lower or higher than the performance quoted. Performance data current to the most recent month-end may be obtained by calling (866) 811-0224. The Funds impose a 1.00% redemption fee on shares held for thirty days or less (60 days or less for Institutional Class shares). Performance data quoted does not reflect the redemption fee. If reflected, total returns would be reduced. Please see the Financial Highlights in this report for the most recent expense ratios.
2
Hodges Mutual Funds
Hodges Fund (HDPMX)
The Hodges Fund’s twelve-month return amounted to a gain of 181.74%, compared to 56.35% for the S&P 500® Index. Relative solid performance over the past year was primarily attributed to a recovery in many of the Fund’s holdings that were disproportionately oversold compared to the broader market during the market’s year-ago meltdown. Furthermore, the Hodges Fund experienced above-average turnover during the past year as we repositioned to take advantage of volatile market conditions. As a result, we upgraded many portfolio holdings into companies that we expect to emerge from the pandemic stronger and generate above-average returns over the next twelve to eighteen months. The outcome of these actions was evident in the Fund’s recent relative performance.
While we are encouraged with the Fund’s performance over the past year, the Hodges Fund’s portfolio managers remain laser-focused on investments where we have the highest conviction based on fundamentals and valuation. The number of positions held in the Fund on March 31, 2021, totaled 47. The top ten holdings represented 35.26% of the Fund’s holdings. They included Texas Pacific Land Trust (TPL), Luby’s Inc. (LUB), The Azek Co. (AZEK), Taylor Morrison Home Corp. (TMHC), Cleveland-Cliffs, Inc. (CLF), General Motors Company (G.M.), The Charles Schwab Corp. (SCHW), Spirit Airlines, Inc. (SAVE), Spirit AeroSystems Holdings (SPR), and Uber Technologies, Inc. (UBER).
Hodges Fund vs S&P 500® Index
As of 3/31/2021
3
Hodges Mutual Funds
Hodges Small Cap Fund (HDPSX)
The Hodges Small Cap Fund (“Small Cap Fund”) experienced a one-year return of 150.30% compared to 94.85% for the Russell 2000® Index as of March 31, 2021. Over the past year, relative performance reflected strength in many of the Fund’s industrial, materials, financial, and consumer discretionary names. Although small caps vastly outperformed large-cap stocks in recent months, we view the current risk-reward for holding small-cap stocks as attractive. We expect this segment of the market to generate above-average relative risk-adjusted returns that could be supported by a substantial earnings recovery for small-cap stocks, attractive relative valuations, and an anticipated pickup in merger and acquisition activity.
The Small Cap Fund remains well diversified across industrials, transportation, financial services, technology, and consumer-related names, which we expect to contribute to the Fund’s long-term performance. The Fund has recently taken profits in several stocks that appeared valued relative to their underlying fundamentals and established several new positions that we view as having an attractive risk/reward profile. The total number of stocks held in the Fund at the end of the fiscal year was 54. The top ten holdings amounted to 35.68% of the Fund’s holdings and included Commercial Metals Co. (CMC), Eagle Materials Inc. (EXP), Hilltop Holdings Inc. (HTH), Texas Pacific Land Trust (TPL), Vista Outdoor Inc. (VSTO), R.H. (R.H.), Boyd Gaming Corp. (BYD), InMode, Inc. (INMD), Tempur Sealy International, Inc. (TPX), and Spirit Airlines, Inc. (SAVE).
Small Cap Fund vs Russell 2000® Return Index
As of 3/31/2021
4
Hodges Mutual Funds
Hodges Small Intrinsic Value Fund (HDSVX)
The Hodges Small Intrinsic Value Fund’s (“Small Intrinsic Value Fund”) return for the last 12 months amounted to 153.51% compared to a 97.05% return for the Russell 2000® Value Index and a 94.85% return for the Russell 2000® Index, as of March 31, 2021. The Fund’s solid relative performance over the past year has been attributed to the Fund’s consumer discretionary, energy, and industrial stocks, which reflected the benefits of individual stock selection. The top ten holdings at year-end represented 31.08% of the Fund’s holdings and included Eagle Materials Inc. (EXP), Delta Apparel Inc. (DLA), Hilltop Holdings Inc. (HTH), Cleveland-Cliffs Inc. (CLF), Ichor Holdings, Ltd. (ICHR), Kimball Electronics, Inc. (K.E.), Covenant Logistics Group, Inc. (CVLG), Whiting Petroleum Corp. (WLL), Horace Mann Educators Corp. (HMN) and Vista Outdoor Inc. (VSTO).
Small Intrinsic Value Fund vs
Russell 2000® Value Return Index & Russell 2000® Index
As of 3/31/2021
5
Hodges Mutual Funds
Hodges Blue Chip Equity Income Fund (HDPBX)
The Hodges Blue Chip Equity Income Fund (“Blue Chip Equity Income Fund”) experienced a total return of 56.53% compared to a 60.59% return for the Russell 1000® Index for the 12 months ending March 31, 2021. Underperformance relative to the Fund’s benchmark was attributed to stock selection among a handful of the consumer, industrial, and financial names. Although large-cap growth stocks have made an impressive move in recent years, we still see the current investing landscape as offering plenty of attractive, high-quality dividend-paying stocks. We are also finding attractive dividend income due to stable corporate profits supporting the ability of companies to pay out dividends. The Blue Chip Equity Income Fund remains well-diversified in companies that we believe can generate above-average income and total returns on a risk-adjusted basis. The top ten holdings on March 31 2021 represented 54.97% of the Fund’s holdings and included ABBVIE Inc. (ABBV), Amazon.com Inc. (AMZN), Apple Inc. (AAPL), Microsoft Corp. (MSFT), Facebook Inc. (F.B.), FedEx Corp. (FDX), Exxon Mobil Corp. (XOM), United Parcel Service (UPS), Chevron Corp. (CVX) and ONEOK, Inc. (OKE).
Blue Chip Equity Income Fund vs Russell 1000® Index
As of 3/31/2021
6
Hodges Mutual Funds
In conclusion, we remain optimistic regarding the long-term investment opportunities surrounding the Hodges Funds. By offering four distinct mutual fund strategies covering most major segments of the domestic equity market, we can serve most financial advisors and individual investors’ diverse needs. Our entire investment team is rigorously studying companies, meeting with management teams, observing trends, and attempting to navigate today’s ever-changing financial markets. Feel free to contact us directly if we can address any specific questions.
Sincerely,
 |  | |
| Craig Hodges | Eric Marshall, CFA | |
| Co-Portfolio Manager | Co-Portfolio Manager | |
 |  |  |
| Gary Bradshaw | Chris Terry, CFA | Derek Maupin |
| Co-Portfolio Manager | Co-Portfolio Manager | Co-Portfolio Manager |
The above discussion is based on the opinions of the author, and is subject to change. It is not intended to be a forecast of future events, a guarantee of future results, and is not a recommendation to buy or sell any security. Portfolio composition and company ownership in the Hodges Funds are subject to daily change.
The Funds’ investment objectives, risks, charges and expenses must be considered carefully before investing. The statutory and summary prospectuses contain this and other important information about the Hodges Funds, and it may be obtained by calling 866-811-0224, or visiting www.hodgesmutualfunds.com. Read it carefully before investing.
Mutual Fund investing involves risk. Principal loss is possible. Investments in foreign securities involve greater volatility and political, economic and currency risks and differences in accounting methods. These risks are greater for investments in emerging markets. Options and future contracts have the risks of unlimited losses of the underlying holdings due to unanticipated market movements and failure to correctly predict the direction of securities prices, interest rates and currency exchange rates. These risks may be greater than risks associated with more traditional investments. Short sales of securities involve the risk that losses may exceed the original amount invested. Investments in debt securities typically decrease in value when interest rates rise. This risk is usually greater for longer term debt securities. Investments in small and medium-capitalization companies involve additional risks such as limited liquidity and greater volatility. Non-diversified funds are more exposed to individual stock volatility than a diversified fund. Investments in companies that demonstrate special situations or turnarounds, meaning companies that have experienced significant business problems but are believed to have favorable prospects for recovery, involve greater risk.
Value investing carries the risk that the market will not recognize a security’s inherent value for a long time, or that a stock judged to be undervalued may be appropriately priced or overvalued.
Diversification does not assure a profit or protect against a loss in a declining market.
Fund holdings and/or sector allocations are subject to change at any time and are not recommendations to buy or sell any security.
Investment performance reflects fee waivers in effect. In the absence of such waivers, total return would be reduced.
The S&P 500® Index is a broad-based unmanaged index of 500 stocks that is widely recognized as representative of the equity market in general. The Russell 1000® Index is a subset of the Russell 3000® Index and consists of the 1,000 largest companies comprising over 90% of the total market capitalization of all listed stocks. The Russell 2000® Index consists of the smallest 2,000 companies in a group of 3,000 U.S. companies in the Russell 3000® Index, as ranked by market capitalization. The Russell 3000® Index is a stock index consisting of the 3000 largest publicly listed companies, representing about 98% of the total capitalization of the entire U.S. stock market. You cannot invest directly in an index. The Russell 2000® Value Index measures the performance of small-cap value segment of the U.S. equity universe. It includes those Russell 2000 companies with lower price-to-book ratios and lower forecasted growth values. The Russell 2000® Value Index is constructed to provide a comprehensive and unbiased barometer for the small-cap value segment. The Index is completely reconstituted annually to ensure larger stocks do not distort the performance and characteristics of the true small-cap opportunity set and that the represented companies continue to reflect value characteristics.
Price/earnings (P/E): The most common measure of how expensive a stock is.
Earnings Growth is not a measure of the Fund’s future performance.
Hodges Capital Management is the Advisor to the Hodges Funds.
Hodges Funds are distributed by Quasar Distributors LLC.
7
Hodges Mutual Funds
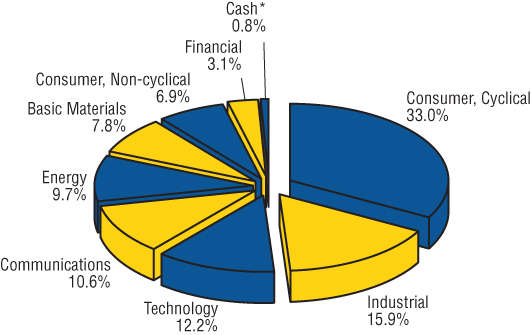
SECTOR ALLOCATIONS At March 31, 2021 (Unaudited) |
(as a percentage of net assets)
Hodges Fund
(HDPMX)
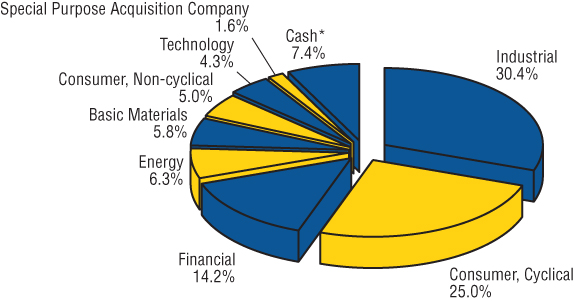
Small Cap Fund
(HDPSX & HDSIX)

* Other assets in excess of liabilities.
8
Hodges Mutual Funds
SECTOR ALLOCATIONS At March 31, 2021 (Unaudited) (Continued) |
(as a percentage of net assets)
Small Intrinsic Value Fund
(HDSVX)
Blue Chip Equity Income Fund
(HDPBX)
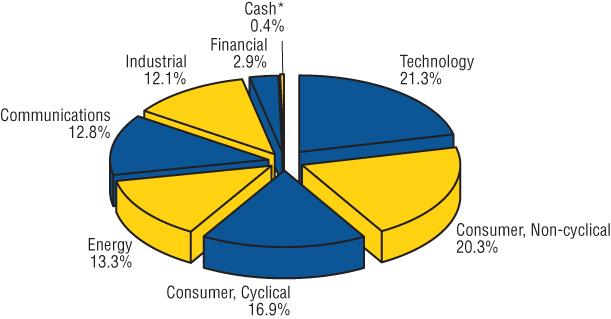
* Other assets in excess of liabilities.
9
Hodges Fund – Retail Class (Unaudited)
Value of $10,000 vs. S&P 500® Index
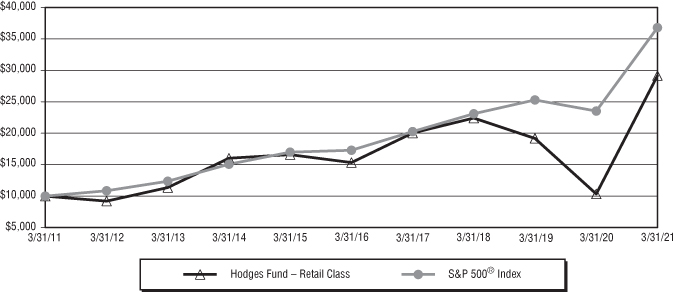
Annualized returns for the periods ended March 31, 2021
| Since Inception | Ending Value | |||||
One Year | Three Year | Five Year | Ten Year | (10/9/92) | (3/31/21) | |
| Hodges Fund – Retail Class | 181.74% | 9.15% | 13.70% | 11.29% | 10.26% | $29,149 |
S&P 500® Index | 56.35% | 16.78% | 16.29% | 13.91% | 10.55% | 36,788 |
This chart illustrates the performance of a hypothetical $10,000 investment made on March 31, 2011, and is not intended to imply any future performance. The returns shown do not reflect the deduction of taxes that a shareholder would pay on Fund distributions or the redemption of Fund shares. The returns reflect fee waivers in effect. In the absence of such waivers, total return would be reduced. The chart assumes reinvestment of capital gains, dividends, and return of capital, if applicable, for a Fund and dividends for an index.
Performance data quoted represents past performance and does not guarantee future results. The investment return and principal value of an investment will fluctuate so that an investor’s shares, when redeemed, may be worth more or less than their original cost. Current performance of the Fund may be lower or higher than the performance quoted. Performance data current to the most recent month end may be obtained by calling (866) 811-0224.
The Fund imposes a 1.00% redemption fee on Retail shares held for less than 30 days. Performance does not reflect the redemption fee. If reflected, total returns would be reduced.
10
Small Cap Fund – Retail Class (Unaudited)
Value of $10,000 vs. Russell 2000® Index
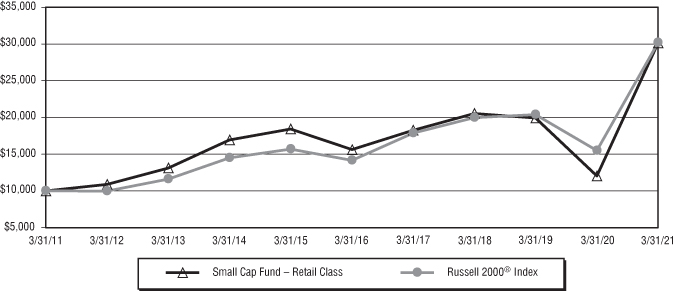
Annualized returns for the periods ended March 31, 2021
| Since Inception | Ending Value | |||||
One Year | Three Year | Five Year | Ten Year | (12/18/07) | (3/31/21) | |
| Small Cap Fund – Retail Class | 150.30% | 13.63% | 14.03% | 11.66% | 10.70% | $30,131 |
Russell 2000® Index | 94.85% | 14.76% | 16.35% | 11.68% | 9.98% | 30,195 |
This chart illustrates the performance of a hypothetical $10,000 investment made on March 31, 2011, and is not intended to imply any future performance. The returns shown do not reflect the deduction of taxes that a shareholder would pay on Fund distributions or the redemption of Fund shares. The returns reflect fee waivers in effect. In the absence of such waivers, total return would be reduced. The chart assumes reinvestment of capital gains, dividends, and return of capital, if applicable, for a Fund and dividends for an index.
Performance data quoted represents past performance and does not guarantee future results. The investment return and principal value of an investment will fluctuate so that an investor’s shares, when redeemed, may be worth more or less than their original cost. Current performance of the Fund may be lower or higher than the performance quoted. Performance data current to the most recent month end may be obtained by calling (866) 811-0224.
The Fund imposes a 1.00% redemption fee on Retail shares held for less than 30 days. Performance does not reflect the redemption fee. If reflected, total returns would be reduced.
11
Small Cap Fund – Institutional Class (Unaudited)
Value of $1,000,000 vs. Russell 2000® Index
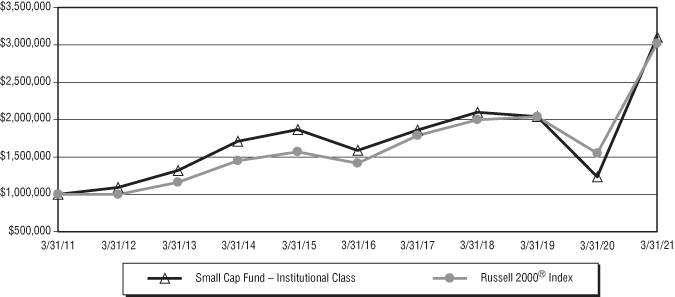
Annualized returns for the periods ended March 31, 2021
| Since Inception | Ending Value | |||||
One Year | Three Year | Five Year | Ten Year | (12/12/08) | (3/31/21) | |
| Small Cap Fund – Institutional Class | 151.14% | 13.92% | 14.34% | 11.99% | 17.63% | $3,102,780 |
Russell 2000® Index | 94.85% | 14.76% | 16.35% | 11.68% | 15.06% | 3,019,486 |
This chart illustrates the performance of a hypothetical $1,000,000 investment made on March 31, 2011, and is not intended to imply any future performance. The returns shown do not reflect the deduction of taxes that a shareholder would pay on Fund distributions or the redemption of Fund shares. The returns reflect fee waivers in effect. In the absence of such waivers, total return would be reduced. The chart assumes reinvestment of capital gains, dividends, and return of capital, if applicable, for a Fund and dividends for an index.
Performance data quoted represents past performance and does not guarantee future results. The investment return and principal value of an investment will fluctuate so that an investor’s shares, when redeemed, may be worth more or less than their original cost. Current performance of the Fund may be lower or higher than the performance quoted. Performance data current to the most recent month end may be obtained by calling (866) 811-0224.
The Fund imposes a 1.00% redemption fee on Institutional shares held for less than 60 days. Performance does not reflect the redemption fee. If reflected, total returns would be reduced.
12
Small Intrinsic Value Fund (Unaudited)
Value of $10,000 vs. Russell 2000® Index & Russell 2000® Value Index
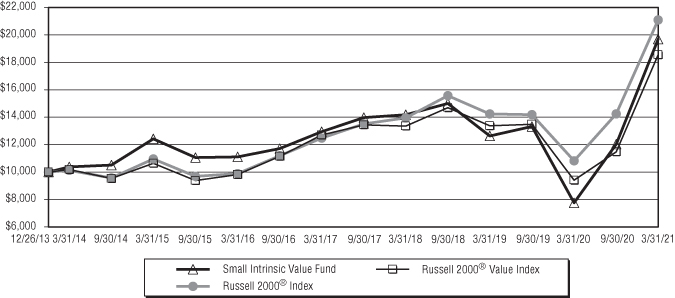
Annualized returns for the periods ended March 31, 2021
| Since Inception | Ending Value | ||||
One Year | Three Year | Five Year | (12/26/13) | (3/31/21) | |
| Small Intrinsic Value Fund | 153.51% | 11.55% | 12.12% | 9.78% | $19,685 |
Russell 2000® Index | 94.85% | 14.76% | 16.35% | 10.82% | 21,087 |
Russell 2000® Value Index | 97.05% | 11.57% | 13.56% | 8.88% | 18,546 |
This chart illustrates the performance of a hypothetical $10,000 investment made on December 26, 2013, and is not intended to imply any future performance. The returns shown do not reflect the deduction of taxes that a shareholder would pay on Fund distributions or the redemption of Fund shares. The returns reflect fee waivers in effect. In the absence of such waivers, total return would be reduced. The chart assumes reinvestment of capital gains, dividends, and return of capital, if applicable, for a Fund and dividends for an index.
Performance data quoted represents past performance and does not guarantee future results. The investment return and principal value of an investment will fluctuate so that an investor’s shares, when redeemed, may be worth more or less than their original cost. Current performance of the Fund may be lower or higher than the performance quoted. Performance data current to the most recent month end may be obtained by calling (866) 811-0224.
The Fund imposes a 1.00% redemption fee on Retail shares held for less than 30 days. Performance does not reflect the redemption fee. If reflected, total returns would be reduced.
13
Blue Chip Equity Income Fund (Unaudited)
Value of $10,000 vs. Russell 1000® Index
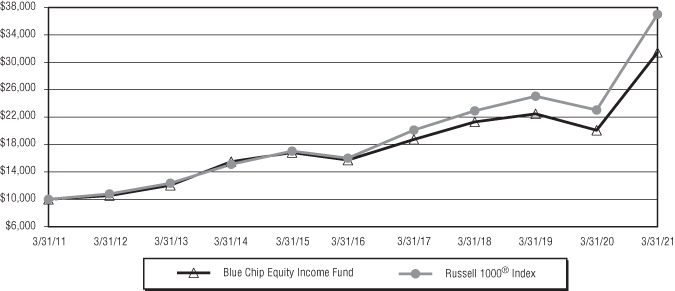
Annualized returns for the periods ended March 31, 2021
| Since Inception | Ending Value | |||||
One Year | Three Year | Five Year | Ten Year | (9/10/09) | (3/31/21) | |
| Blue Chip Equity Income Fund | 56.53% | 13.85% | 13.82% | 12.13% | 11.90% | $31,426 |
Russell 1000® Index | 60.59% | 17.31% | 16.66% | 13.97% | 14.76% | 36,987 |
This chart illustrates the performance of a hypothetical $10,000 investment made on March 31, 2011, and is not intended to imply any future performance. The returns shown do not reflect the deduction of taxes that a shareholder would pay on Fund distributions or the redemption of Fund shares. The returns reflect fee waivers in effect. In the absence of such waivers, total return would be reduced. The chart assumes reinvestment of capital gains, dividends, and return of capital, if applicable, for a Fund and dividends for an index.
Performance data quoted represents past performance and does not guarantee future results. The investment return and principal value of an investment will fluctuate so that an investor’s shares, when redeemed, may be worth more or less than their original cost. Current performance of the Fund may be lower or higher than the performance quoted. Performance data current to the most recent month end may be obtained by calling (866) 811-0224.
The Fund imposes a 1.00% redemption fee on Retail shares held for less than 30 days. Performance does not reflect the redemption fee. If reflected, total returns would be reduced.
14
Hodges Fund
SCHEDULE OF INVESTMENTS at March 31, 2021 |
| Shares | Value | ||||||
| COMMON STOCKS: 97.1% | |||||||
| Aerospace & Defense: 2.9% | |||||||
125,000 | Spirit AeroSystems Holdings, | ||||||
Inc. - Class A | $ | 6,081,250 | |||||
| Airlines: 3.1% | |||||||
175,000 | Spirit Airlines, Inc. 1 | 6,457,500 | |||||
| Apparel & Shoe Retail: 2.4% | |||||||
300,000 | Duluth Holdings, Inc. - Class B 1 | 5,082,000 | |||||
| Auto Manufacturers: 3.3% | |||||||
120,000 | General Motors Co. 1 | 6,895,200 | |||||
| Building Materials: 10.0% | |||||||
150,000 | The AZEK Co, Inc. - Class A 1 | 6,307,500 | |||||
100,000 | Builders FirstSource, Inc. 1 | 4,637,000 | |||||
20,000 | Eagle Materials, Inc. 1 | 2,688,200 | |||||
40,000 | Owens Corning | 3,683,600 | |||||
50,000 | U.S. Concrete, Inc. 1 | 3,666,000 | |||||
20,982,300 | |||||||
| Computers: 1.8% | |||||||
100,000 | NCR Corp. 1 | 3,795,000 | |||||
| Diversified Financial Services: 3.1% | |||||||
100,000 | The Charles Schwab Corp. | 6,518,000 | |||||
| Electrical Components & Equipment: 2.5% | |||||||
200,000 | ChargePoint Holdings, Inc. 1 | 5,340,000 | |||||
| Entertainment: 2.3% | |||||||
80,000 | DraftKings, Inc. - Class A 1 | 4,906,400 | |||||
| Healthcare Products: 1.6% | |||||||
25,000 | Novocure Ltd. 1 | 3,304,500 | |||||
| Home Builders: 2.9% | |||||||
200,000 | Taylor Morrison Home Corp. 1 | 6,162,000 | |||||
| Home Furnishings: 2.2% | |||||||
125,000 | Tempur-Pedic International, Inc. | 4,570,000 | |||||
| Internet: 9.8% | |||||||
25,000 | Airbnb, Inc. - Class A 1 | 4,698,500 | |||||
90,400 | Revolve Group, Inc. - Class A 1 | 4,061,672 | |||||
10,000 | Roku, Inc. - Class A 1 | 3,257,700 | |||||
60,000 | Snap, Inc. - Class A 1 | 3,137,400 | |||||
100,000 | Uber Technologies, Inc. 1 | 5,451,000 | |||||
20,606,272 | |||||||
| Iron & Steel: 5.4% | |||||||
300,000 | Cleveland-Cliffs, Inc. | 6,033,000 | |||||
175,000 | Commercial Metals Co. | 5,397,000 | |||||
11,430,000 | |||||||
| Leisure Time: 7.5% | |||||||
100,000 | Callaway Golf Co. | 2,675,000 | |||||
300,000 | Nautilus, Inc. 1 | 4,692,000 | |||||
130,000 | Norwegian Cruise Line Holdings Ltd. 1 | 3,586,700 | |||||
150,000 | Vista Outdoor, Inc. 1 | 4,810,500 | |||||
15,764,200 | |||||||
| Mining: 2.4% | |||||||
155,000 | Freeport-McMoRan, Inc. 1 | 5,104,150 | |||||
| Office Supplies Retail: 2.3% | |||||||
250,000 | Cricut, Inc. - Class A 1 | 4,947,500 | |||||
| Oil Companies Exploration & Production: 2.2% | |||||||
200,000 | Matador Resources Co. | 4,690,000 | |||||
| Pharmaceuticals: 4.5% | |||||||
135,000 | GoodRx Holdings, Inc. - Class A 1 | 5,267,700 | |||||
60,000 | Pacira BioSciences, Inc. 1 | 4,205,400 | |||||
9,473,100 | |||||||
| Restaurants: 5.6% | |||||||
2,282,390 | Luby’s, Inc. 1,2 | 7,531,887 | |||||
1,425,000 | Waitr Holdings, Inc. 1 | 4,175,250 | |||||
11,707,137 | |||||||
| Semiconductors: 7.7% | |||||||
30,000 | Cree, Inc. 1 | 3,243,900 | |||||
50,000 | Micron Technology, Inc. 1 | 4,410,500 | |||||
120,000 | ON Semiconductor Corp. 1 | 4,993,200 | |||||
20,000 | Skyworks Solutions, Inc. | 3,669,600 | |||||
16,317,200 | |||||||
| Software: 2.7% | |||||||
96,596 | Motorsport Games, Inc. - Class A 1 | 2,246,823 | |||||
10,000 | Twilio, Inc. - Class A 1 | 3,407,600 | |||||
5,654,423 | |||||||
| Textiles: 1.4% | |||||||
1,000,000 | The Dixie Group, Inc. 1,2 | 2,970,000 | |||||
| U.S. Royalty Trusts: 7.5% | |||||||
10,000 | Texas Pacific Land Corp. | 15,894,300 | |||||
| TOTAL COMMON STOCKS | |||||||
(Cost $135,201,776) | 204,652,432 | ||||||
The accompanying notes are an integral part of these financial statements.
15
Hodges Fund
SCHEDULE OF INVESTMENTS at March 31, 2021 (Continued) |
| Contracts | Notional | ||||||||||
| (100 shares per contract) | Value | Value | |||||||||
CALL OPTIONS PURCHASED: 2.1% 1 | |||||||||||
| Healthcare Products: 0.8% | |||||||||||
250 | Intuitive Surgical, Inc., | ||||||||||
Expiration: | |||||||||||
April 2021, | |||||||||||
Exercise Price: | |||||||||||
$675.00 | $ | 18,473,500 | $ | 1,655,000 | |||||||
| Internet: 0.8% | |||||||||||
250 | Facebook, Inc. - Class A, | ||||||||||
Expiration: | |||||||||||
July 2021, | |||||||||||
Exercise Price: | |||||||||||
$250.00 | 7,363,250 | 1,277,500 | |||||||||
150 | Palo Alto | ||||||||||
Networks, Inc., | |||||||||||
Expiration: | |||||||||||
June 2021, | |||||||||||
Exercise Price: | |||||||||||
$300.00 | 4,830,900 | 524,625 | |||||||||
1,802,125 | |||||||||||
| Transportation: 0.5% | |||||||||||
250 | FedEx Corp., | ||||||||||
Expiration: | |||||||||||
July 2021, | |||||||||||
Exercise Price: | |||||||||||
$250.00 | 7,101,000 | 1,021,875 | |||||||||
| TOTAL CALL OPTIONS PURCHASED | |||||||||||
(Cost $5,548,163) | 4,479,000 | ||||||||||
| TOTAL INVESTMENTS IN SECURITIES: 99.2% | |||||||||||
(Cost $140,749,939) | 209,131,432 | ||||||||||
Other Assets in Excess of Liabilities: 0.8% | 1,586,798 | ||||||||||
| TOTAL NET ASSETS: 100.0% | $ | 210,718,230 | |||||||||
1 | Non-income producing security. |
2 | Company is an “affiliated person” of the Fund, as defined in the Investment Company Act of 1940. |
SCHEDULE OF OPTIONS WRITTEN at March 31, 2021 |
| Contracts | Notional | ||||||||||
| (100 shares per contract) | Value | Value | |||||||||
CALL OPTIONS WRITTEN: 0.0% 1,2 | |||||||||||
Oil Companies Exploration & Production: 0.0% 2 | |||||||||||
1,000 | Matador Resources Co., | ||||||||||
Expiration: | |||||||||||
April 2021, | |||||||||||
Exercise Price: | |||||||||||
$25.00 | $ | 2,345,000 | $ | 95,000 | |||||||
| TOTAL CALL OPTIONS WRITTEN | |||||||||||
(Proceeds $210,866) | $ | 95,000 | |||||||||
Percentages are stated as a percent of net assets.
1 | Non-income producing security. |
2 | Does not round to 0.1% or (0.1)%, as applicable. |
The accompanying notes are an integral part of these financial statements.
16
Small Cap Fund
SCHEDULE OF INVESTMENTS at March 31, 2021 |
| Shares | Value | ||||||
| COMMON STOCKS: 99.8% | |||||||
| Airlines: 3.8% | |||||||
130,000 | Hawaiian Holdings, Inc. 1 | $ | 3,467,100 | ||||
150,000 | Spirit Airlines, Inc. 1 | 5,535,000 | |||||
9,002,100 | |||||||
| Apparel & Shoe Retail: 1.8% | |||||||
70,000 | Shoe Carnival, Inc. | 4,331,600 | |||||
| Arts & Crafts Retail: 1.9% | |||||||
200,000 | The Michaels Companies, Inc. 1 | 4,388,000 | |||||
| Automobile Retail: 1.6% | |||||||
25,000 | America’s Car-Mart, Inc. 1 | 3,809,250 | |||||
| Banks: 6.8% | |||||||
225,000 | Hilltop Holdings, Inc. | 7,679,250 | |||||
50,000 | Prosperity Bancshares, Inc. | 3,744,500 | |||||
60,000 | Triumph Bancorp, Inc. 1 | 4,643,400 | |||||
16,067,150 | |||||||
| Building Materials: 8.1% | |||||||
125,000 | The AZEK Co., Inc. - Class A 1 | 5,256,250 | |||||
65,000 | Eagle Materials, Inc. 1 | 8,736,650 | |||||
70,000 | U.S. Concrete, Inc. 1 | 5,132,400 | |||||
19,125,300 | |||||||
| Commercial Services: 1.4% | |||||||
40,000 | Chegg, Inc. 1 | 3,426,400 | |||||
| Computers: 1.6% | |||||||
100,000 | NCR Corp. 1 | 3,795,000 | |||||
| Diversified Retail: 1.9% | |||||||
225,000 | Sally Beauty Holdings, Inc. 1 | 4,529,250 | |||||
| Electrical Components & Equipment: 0.9% | |||||||
31,000 | Encore Wire Corp. | 2,081,030 | |||||
| Electronics: 1.1% | |||||||
100,000 | Kimball Electronics, Inc. 1 | 2,580,000 | |||||
| Entertainment: 0.9% | |||||||
100,000 | Cinemark Holdings, Inc. 1 | 2,041,000 | |||||
| Food: 3.6% | |||||||
145,000 | BellRing Brands, Inc. - Class A 1 | 3,423,450 | |||||
350,000 | SunOpta, Inc. 1 | 5,169,500 | |||||
8,592,950 | |||||||
| Healthcare Products: 3.6% | |||||||
100,000 | Inmode Ltd. 1 | 7,237,000 | |||||
15,000 | Tandem Diabetes Care, Inc. 1 | 1,323,750 | |||||
8,560,750 | |||||||
| Healthcare Services: 1.6% | |||||||
65,000 | Acadia Healthcare Co., Inc. 1 | 3,714,100 | |||||
| Holding Companies-Diversified: 0.5% | |||||||
125,000 | Legato Merger Corp. 1 | 1,266,250 | |||||
| Home Builders: 2.3% | |||||||
175,000 | Taylor Morrison Home Corp. 1 | 5,391,750 | |||||
| Home Furnishings: 7.0% | |||||||
169,055 | Ethan Allen Interiors, Inc. | 4,667,609 | |||||
10,000 | RH 1 | 5,966,000 | |||||
165,000 | Tempur-Pedic International, Inc. | 6,032,400 | |||||
16,666,009 | |||||||
| Insurance: 1.5% | |||||||
11,000 | Goosehead Insurance, Inc. - Class A | 1,178,980 | |||||
100,000 | NMI Holdings, Inc. - Class A 1 | 2,364,000 | |||||
3,542,980 | |||||||
| Internet: 0.6% | |||||||
100,000 | CarParts.com, Inc. 1 | 1,428,000 | |||||
| Iron & Steel: 6.3% | |||||||
250,000 | Cleveland-Cliffs, Inc. | 5,027,500 | |||||
325,000 | Commercial Metals Co. | 10,023,000 | |||||
15,050,500 | |||||||
| Leisure Time: 9.3% | |||||||
50,000 | Brunswick Corp. | 4,768,500 | |||||
100,000 | Callaway Golf Co. | 2,675,000 | |||||
150,000 | Nautilus, Inc. 1 | 2,346,000 | |||||
185,000 | Norwegian Cruise | ||||||
Line Holdings Ltd. 1 | 5,104,150 | ||||||
225,000 | Vista Outdoor, Inc. 1 | 7,215,750 | |||||
22,109,400 | |||||||
| Lodging: 3.1% | |||||||
125,000 | Boyd Gaming Corp. 1 | 7,370,000 | |||||
| Office Supplies Retail: 2.1% | |||||||
250,000 | Cricut, Inc. - Class A 1 | 4,947,500 | |||||
| Oil Companies Exploration & Production: 2.8% | |||||||
175,000 | Matador Resources Co. | 4,103,750 | |||||
16,526 | Pioneer Natural Resources Co. | 2,624,659 | |||||
6,728,409 | |||||||
| Pharmaceuticals: 1.7% | |||||||
100,000 | GoodRx Holdings, Inc. - Class A 1 | 3,902,000 | |||||
| Restaurants: 4.6% | |||||||
50,000 | Brinker International, Inc. 1 | 3,553,000 | |||||
20,000 | Cracker Barrel Old | ||||||
Country Store, Inc. | 3,457,600 | ||||||
40,000 | Texas Roadhouse, Inc. 1 | 3,837,600 | |||||
10,848,200 | |||||||
The accompanying notes are an integral part of these financial statements.
17
Small Cap Fund
SCHEDULE OF INVESTMENTS at March 31, 2021 (Continued) |
| Shares | Value | ||||||
| Semiconductors: 3.5% | |||||||
50,000 | Kulicke & Soffa Industries, Inc. | $ | 2,455,500 | ||||
20,000 | Silicon Motion Technology | ||||||
Corp. - ADR | 1,187,800 | ||||||
35,000 | Synaptics, Inc. 1 | 4,739,700 | |||||
8,383,000 | |||||||
| Software: 3.7% | |||||||
35,000 | Five9, Inc. 1 | 5,471,550 | |||||
70,000 | Upland Software, Inc. 1 | 3,303,300 | |||||
8,774,850 | |||||||
| Transportation: 1.0% | |||||||
38,179 | Kirby Corp. 1 | 2,301,430 | |||||
| U.S. Royalty Trusts: 7.9% | |||||||
11,800 | Texas Pacific Land Corp. | 18,755,274 | |||||
| Vision Services: 1.3% | |||||||
70,000 | National Vision Holdings, Inc. 1 | 3,068,100 | |||||
| TOTAL COMMON STOCKS | |||||||
(Cost $132,219,893) | 236,577,532 | ||||||
| TOTAL INVESTMENTS IN SECURITIES: 99.8% | |||||||
(Cost $132,219,893) | 236,577,532 | ||||||
Other Assets in Excess of Liabilities: 0.2% | 483,356 | ||||||
| TOTAL NET ASSETS: 100.0% | $ | 237,060,888 | |||||
ADR - American Depositary Receipt
1 | Non-income producing security. |
The accompanying notes are an integral part of these financial statements.
18
Small Intrinsic Value Fund
SCHEDULE OF INVESTMENTS at March 31, 2021 |
| Shares | Value | ||||||
| COMMON STOCKS: 92.6% | |||||||
| Apparel: 3.3% | |||||||
20,000 | Delta Apparel, Inc. 1 | $ | 542,600 | ||||
| Apparel & Shoe Retail: 2.6% | |||||||
25,000 | Duluth Holdings, Inc. - Class B 1 | 423,500 | |||||
| Automobile Retail: 1.9% | |||||||
2,000 | America’s Car-Mart, Inc. 1 | 304,740 | |||||
| Banks: 9.7% | |||||||
4,000 | BancFirst Corp. | 282,760 | |||||
13,500 | Hilltop Holdings, Inc. | 460,755 | |||||
4,000 | Independent Bank Group, Inc. | 288,960 | |||||
3,000 | Prosperity Bancshares, Inc. | 224,670 | |||||
4,000 | Triumph Bancorp, Inc. 1 | 309,560 | |||||
1,566,705 | |||||||
| Building Materials: 7.7% | |||||||
9,000 | Builders FirstSource, Inc. 1 | 417,330 | |||||
4,000 | Eagle Materials, Inc. 1 | 537,640 | |||||
4,000 | U.S. Concrete, Inc. 1 | 293,280 | |||||
1,248,250 | |||||||
| Commercial Services: 3.1% | |||||||
6,000 | Franchise Group, Inc. | 216,660 | |||||
120,000 | Research Solutions, Inc. 1 | 278,400 | |||||
495,060 | |||||||
| Computers: 2.6% | |||||||
11,000 | NCR Corp. 1 | 417,450 | |||||
| Diversified Financial Services: 1.8% | |||||||
20,000 | Westwood Holdings Group, Inc. | 289,200 | |||||
| Diversified Retail: 1.5% | |||||||
12,000 | Sally Beauty Holdings, Inc. 1 | 241,560 | |||||
| Electronics: 3.2% | |||||||
20,000 | Kimball Electronics, Inc. 1 | 516,000 | |||||
| Engineering & Construction: 4.3% | |||||||
5,000 | Arcosa, Inc. | 325,450 | |||||
60,000 | Orion Group Holdings, Inc. 1 | 364,200 | |||||
689,650 | |||||||
| Food: 1.0% | |||||||
6,000 | Sprouts Farmers Market, Inc. 1 | 159,720 | |||||
| Healthcare Products: 0.9% | |||||||
35,000 | ViewRay, Inc. 1 | 152,250 | |||||
| Holding Companies-Diversified: 1.6% | |||||||
25,000 | Legato Merger Corp. 1 | 253,250 | |||||
| Home Builders: 2.3% | |||||||
12,000 | Taylor Morrison Home Corp. 1 | 369,720 | |||||
| Home Furnishings: 6.0% | |||||||
16,000 | Bassett Furniture Industries, Inc. | 388,320 | |||||
12,000 | Hamilton Beach Brands | ||||||
Holding Co. - Class A | 217,560 | ||||||
10,000 | Hooker Furniture Corp. | 364,600 | |||||
970,480 | |||||||
| Insurance: 2.7% | |||||||
10,000 | Horace Mann Educators Corp. | 432,100 | |||||
| Iron & Steel: 5.8% | |||||||
25,000 | Cleveland-Cliffs, Inc. | 502,750 | |||||
14,000 | Commercial Metals Co. | 431,760 | |||||
934,510 | |||||||
| Leisure Time: 6.7% | |||||||
3,400 | Brunswick Corp. | 324,258 | |||||
18,000 | Nautilus, Inc. 1 | 281,520 | |||||
15,000 | Vista Outdoor, Inc. 1 | 481,050 | |||||
1,086,828 | |||||||
| Machinery-Diversified: 3.3% | |||||||
10,000 | Ichor Holdings Ltd. 1 | 538,000 | |||||
| Metal Fabrication & Hardware: 2.5% | |||||||
4,500 | Lawson Products, Inc. 1 | 233,370 | |||||
14,500 | TimkenSteel Corp. 1 | 170,375 | |||||
403,745 | |||||||
| Mining: 1.6% | |||||||
33,000 | Equinox Gold Corp. 1 | 263,670 | |||||
| Oil & Gas Exploration & Production: 3.1% | |||||||
14,000 | Whiting Petroleum Corp. 1 | 496,300 | |||||
| Oil Companies Exploration & Production: 3.2% | |||||||
50,000 | Comstock Resources, Inc. 1 | 277,000 | |||||
4,000 | Oasis Petroleum, Inc. | 237,560 | |||||
514,560 | |||||||
| Semiconductors: 1.7% | |||||||
2,000 | Synaptics, Inc. 1 | 270,840 | |||||
| Textiles: 0.7% | |||||||
40,000 | The Dixie Group, Inc. 1,2 | 118,800 | |||||
The accompanying notes are an integral part of these financial statements.
19
Small Intrinsic Value Fund
SCHEDULE OF INVESTMENTS at March 31, 2021 (Continued) |
| Shares | Value | ||||||
| Transportation: 7.8% | |||||||
3,000 | Atlas Air Worldwide Holdings, Inc. 1 | $ | 181,320 | ||||
25,000 | Covenant Transportation | ||||||
Group, Inc. - Class A 1 | 514,750 | ||||||
15,000 | Marten Transport Ltd. | 254,550 | |||||
27,000 | US Xpress Enterprises, Inc. - Class A 1 | 317,250 | |||||
1,267,870 | |||||||
| TOTAL COMMON STOCKS | |||||||
(Cost $10,288,039) | 14,967,358 | ||||||
| TOTAL INVESTMENTS IN SECURITIES: 92.6% | |||||||
(Cost $10,288,039) | 14,967,358 | ||||||
Other Assets in Excess of Liabilities: 7.4% | 1,191,894 | ||||||
| TOTAL NET ASSETS: 100.0% | $ | 16,159,252 | |||||
1 | Non-income producing security. |
2 | Company is an “affiliated person” of the Fund, as defined in the Investment Company Act of 1940. |
The accompanying notes are an integral part of these financial statements.
20
Blue Chip Equity Income Fund
SCHEDULE OF INVESTMENTS at March 31, 2021 |
| Shares | Value | ||||||
| COMMON STOCKS: 99.6% | |||||||
| Beverages: 3.2% | |||||||
6,000 | PepsiCo, Inc. | $ | 848,700 | ||||
| Building Products Retail: 7.4% | |||||||
3,250 | The Home Depot, Inc. | 992,063 | |||||
5,000 | Lowe’s Companies, Inc. | 950,900 | |||||
1,942,963 | |||||||
| Commercial Services: 3.7% | |||||||
4,000 | PayPal Holdings, Inc. 1 | 971,360 | |||||
| Computers: 10.5% | |||||||
18,000 | Apple, Inc. | 2,198,700 | |||||
4,000 | International Business | ||||||
Machines Corp. | 533,040 | ||||||
2,731,740 | |||||||
| Discount Retail: 6.2% | |||||||
4,000 | Target Corp. | 792,280 | |||||
6,000 | Wal-Mart Stores, Inc. | 814,980 | |||||
1,607,260 | |||||||
| Healthcare Products: 1.8% | |||||||
4,000 | Abbott Laboratories | 479,360 | |||||
| Insurance: 2.9% | |||||||
3,000 | Berkshire Hathaway, Inc. - Class B 1 | 766,410 | |||||
| Internet: 12.8% | |||||||
600 | Amazon.com, Inc. 1 | 1,856,448 | |||||
5,000 | Facebook, Inc. - Class A 1 | 1,472,650 | |||||
3,329,098 | |||||||
| Oil Companies Integrated: 9.4% | |||||||
10,000 | Chevron Corp. | 1,047,900 | |||||
25,000 | Exxon Mobil Corp. | 1,395,750 | |||||
2,443,650 | |||||||
| Pharmaceuticals: 11.6% | |||||||
12,000 | AbbVie, Inc. | 1,298,640 | |||||
13,000 | Bristol-Myers Squibb Co. | 820,690 | |||||
5,500 | Johnson & Johnson | 903,925 | |||||
3,023,255 | |||||||
| Pipelines: 3.9% | |||||||
20,000 | ONEOK, Inc. | 1,013,200 | |||||
| Restaurants: 3.3% | |||||||
8,000 | Starbucks Corp. | 874,160 | |||||
| Semiconductors: 3.6% | |||||||
7,000 | QUALCOMM, Inc. | 928,130 | |||||
| Software: 7.2% | |||||||
8,000 | Microsoft Corp. | 1,886,160 | |||||
| Transportation: 12.1% | |||||||
4,000 | FedEx Corp. | 1,136,160 | |||||
4,500 | Union Pacific Corp. | 991,845 | |||||
6,000 | United Parcel Service, Inc. - Class B | 1,019,940 | |||||
3,147,945 | |||||||
| TOTAL COMMON STOCKS | |||||||
(Cost $15,970,542) | 25,993,391 | ||||||
| TOTAL INVESTMENTS IN SECURITIES: 99.6% | |||||||
(Cost $15,970,542) | 25,993,391 | ||||||
Other Assets in Excess of Liabilities: 0.4% | 102,561 | ||||||
| TOTAL NET ASSETS: 100.0% | $ | 26,095,952 | |||||
1 | Non-income producing security. |
The accompanying notes are an integral part of these financial statements.
21
Hodges Mutual Funds
STATEMENTS OF ASSETS AND LIABILITIES at March 31, 2021 |
| Small | Blue Chip | |||||||||||||||
| Small Cap | Intrinsic | Equity | ||||||||||||||
| Hodges Fund | Fund | Value Fund | Income Fund | |||||||||||||
| ASSETS | ||||||||||||||||
Investments in unaffiliated securities, at value | $ | 198,629,545 | $ | 236,577,532 | $ | 14,848,558 | $ | 25,993,391 | ||||||||
(Cost $128,522,724, $132,219,893, $10,208,039, and $15,970,542) | ||||||||||||||||
Investments in affiliated securities, at value | 10,501,887 | — | 118,800 | — | ||||||||||||
(Cost $12,227,215, $—, $80,000, and $—) | ||||||||||||||||
Cash | 556,043 | 870,035 | 1,555,362 | 147,154 | ||||||||||||
Receivables: | ||||||||||||||||
| Investment securities sold | 2,433,552 | 1,101,012 | 149,961 | — | ||||||||||||
| Fund shares sold | 96,812 | 579,441 | 1,232 | 2,480 | ||||||||||||
| Dividends and interest | 58,349 | 80,469 | 8,198 | 12,820 | ||||||||||||
| Due from Advisor, net | — | — | 2,561 | — | ||||||||||||
Prepaid expenses | 26,924 | 28,642 | 18,113 | 14,718 | ||||||||||||
| Total assets | 212,303,112 | 239,237,131 | 16,702,785 | 26,170,563 | ||||||||||||
| LIABILITIES | ||||||||||||||||
Options written, at value (Proceeds $210,866) | 95,000 | — | — | — | ||||||||||||
Payables: | ||||||||||||||||
| Investment securities purchased | 1,024,260 | 1,282,777 | 484,993 | — | ||||||||||||
| Investment advisory fees, net | 121,783 | 162,802 | — | 4,897 | ||||||||||||
| Fund shares redeemed | 117,180 | 475,097 | — | 734 | ||||||||||||
| Distribution fees | 116,810 | 93,606 | 9,155 | 15,226 | ||||||||||||
| Fund administration fees | 21,443 | 26,041 | 6,277 | 7,944 | ||||||||||||
| Audit fees | 21,200 | 21,200 | 21,200 | 21,200 | ||||||||||||
| Sub-transfer agent fees | 18,121 | 44,309 | 1,556 | 1,609 | ||||||||||||
| Fund accounting fees | 12,530 | 15,667 | 2,405 | 3,463 | ||||||||||||
| Transfer agent fees | 11,047 | 12,376 | 5,351 | 5,449 | ||||||||||||
| Trustee fees | 4,249 | 4,370 | 3,908 | 3,989 | ||||||||||||
| Chief Compliance Officer fees | 2,625 | 2,625 | 2,625 | 2,625 | ||||||||||||
| Custody fees | 2,112 | 2,413 | 1,819 | 1,388 | ||||||||||||
| Distribution to shareholders | — | — | — | 1,801 | ||||||||||||
Other accrued expenses | 16,522 | 32,960 | 4,244 | 4,286 | ||||||||||||
| Total liabilities | 1,584,882 | 2,176,243 | 543,533 | 74,611 | ||||||||||||
| NET ASSETS | $ | 210,718,230 | $ | 237,060,888 | $ | 16,159,252 | $ | 26,095,952 | ||||||||
| COMPONENTS OF NET ASSETS | ||||||||||||||||
Paid-in capital | $ | 161,889,802 | $ | 107,230,883 | $ | 11,349,890 | $ | 15,212,901 | ||||||||
Total distributable (accumulated) earnings (losses) | 48,828,428 | 129,830,005 | 4,809,362 | 10,883,051 | ||||||||||||
| Total net assets | $ | 210,718,230 | $ | 237,060,888 | $ | 16,159,252 | $ | 26,095,952 | ||||||||
| Net Asset Value (unlimited shares authorized): | ||||||||||||||||
| Retail Class: | ||||||||||||||||
| Net assets | $ | 210,718,230 | $ | 183,216,214 | $ | 16,159,252 | $ | 26,095,952 | ||||||||
| Shares of beneficial interest issued and outstanding | 3,671,929 | 7,247,327 | 931,803 | 1,338,491 | ||||||||||||
| Net asset value, offering price, and redemption price per share | $ | 57.39 | $ | 25.28 | $ | 17.34 | $ | 19.50 | ||||||||
| Institutional Class: | ||||||||||||||||
| Net assets | $ | 53,844,674 | ||||||||||||||
| Shares of beneficial interest issued and outstanding | 2,030,729 | |||||||||||||||
| Net asset value, offering price, and redemption price per share | $ | 26.51 | ||||||||||||||
The accompanying notes are an integral part of these financial statements.
22
Hodges Mutual Funds
STATEMENTS OF OPERATIONS For the Year Ended March 31, 2021 |
| Small | Blue Chip | |||||||||||||||
| Small Cap | Intrinsic | Equity | ||||||||||||||
| Hodges Fund | Fund | Value Fund | Income Fund | |||||||||||||
| INVESTMENT INCOME | ||||||||||||||||
Dividends from unaffiliated securities | $ | 506,050 | $ | 968,300 | $ | 83,635 | $ | 472,686 | ||||||||
(net of $—, $143, $—, and $— foreign withholding tax, respectively) | ||||||||||||||||
Other income | 473 | 518 | 418 | 423 | ||||||||||||
| Total investment income | 506,523 | 968,818 | 84,053 | 473,109 | ||||||||||||
| EXPENSES | ||||||||||||||||
Investment advisory fees | 1,166,288 | 1,441,315 | 94,691 | 152,994 | ||||||||||||
Distribution fees – Retail Class | 340,544 | 320,032 | 27,850 | 58,844 | ||||||||||||
Fund administration fees | 86,971 | 101,109 | 23,193 | 30,748 | ||||||||||||
Transfer agent fees | 59,574 | 53,338 | 21,599 | 22,630 | ||||||||||||
Sub-transfer agent fees | 52,193 | 122,421 | 3,724 | 5,040 | ||||||||||||
Fund accounting fees | 45,450 | 54,360 | 7,508 | 11,635 | ||||||||||||
Miscellaneous expenses | 37,744 | 52,242 | 5,054 | 10,608 | ||||||||||||
Registration expenses | 30,747 | 42,987 | 24,131 | 23,042 | ||||||||||||
Reports to shareholders | 24,589 | 13,980 | 768 | 4,983 | ||||||||||||
Audit fees | 21,200 | 21,200 | 21,200 | 21,200 | ||||||||||||
Trustees fees | 18,092 | 17,697 | 16,502 | 16,768 | ||||||||||||
Chief Compliance Officer fees | 10,625 | 10,624 | 10,625 | 10,625 | ||||||||||||
Custody fees | 10,546 | 8,714 | 7,641 | 5,694 | ||||||||||||
Legal fees | 8,713 | 8,724 | 8,477 | 8,322 | ||||||||||||
Insurance expenses | 3,021 | 3,264 | 2,677 | 2,725 | ||||||||||||
Interest expense | 2,684 | 4,360 | 695 | 340 | ||||||||||||
| Total expenses | 1,918,981 | 2,276,367 | 276,335 | 386,198 | ||||||||||||
| Less: advisory fees waived | (27,886 | ) | (32,081 | ) | — | — | ||||||||||
| Less: fees waived | (302,379 | ) | (61,633 | ) | (132,627 | ) | (80,210 | ) | ||||||||
| Net expenses | 1,588,716 | 2,182,653 | 143,708 | 305,988 | ||||||||||||
| Net investment income (loss) | (1,082,193 | ) | (1,213,835 | ) | (59,655 | ) | 167,121 | |||||||||
| REALIZED AND UNREALIZED GAIN (LOSS) ON INVESTMENTS | ||||||||||||||||
Net realized gain (loss) on transactions from: | ||||||||||||||||
Unaffiliated investments | (2,548,072 | ) | 33,264,243 | 2,089,023 | 1,901,153 | |||||||||||
Affiliated investments | (1,403,735 | ) | — | 194,392 | — | |||||||||||
Options written | (842,449 | ) | 227,803 | — | — | |||||||||||
| Net realized gain (loss) | (4,794,256 | ) | 33,492,046 | 2,283,415 | 1,901,153 | |||||||||||
Net change in unrealized appreciation/depreciation on: | ||||||||||||||||
Unaffiliated investments | 125,993,153 | 120,713,457 | 6,878,802 | 7,852,494 | ||||||||||||
Affiliated investments | 9,486,265 | — | 213,269 | — | ||||||||||||
Options written | 115,866 | — | — | — | ||||||||||||
| Net change in unrealized appreciation/depreciation | 135,595,284 | 120,713,457 | 7,092,071 | 7,852,494 | ||||||||||||
| Net realized and unrealized gain (loss) on investments | 130,801,028 | 154,205,503 | 9,375,486 | 9,753,647 | ||||||||||||
| Net increase (decrease) in net | ||||||||||||||||
| assets resulting from operations | $ | 129,718,835 | $ | 152,991,668 | $ | 9,315,831 | $ | 9,920,768 | ||||||||
The accompanying notes are an integral part of these financial statements.
23
Hodges Fund
| STATEMENTS OF CHANGES IN NET ASSETS |
| Year Ended | Year Ended | |||||||
| March 31, 2021 | March 31, 2020 | |||||||
| INCREASE (DECREASE) IN NET ASSETS FROM: | ||||||||
| OPERATIONS | ||||||||
Net investment income (loss) | $ | (1,082,193 | ) | $ | (857,505 | ) | ||
Net realized gain (loss) on transactions from: | ||||||||
Unaffiliated investments | (2,548,072 | ) | (9,187,605 | ) | ||||
Affiliated investments | (1,403,735 | ) | (524,147 | ) | ||||
Options written | (842,449 | ) | 344,218 | |||||
Net change in unrealized appreciation/depreciation on: | ||||||||
Unaffiliated investments | 125,993,153 | (61,297,240 | ) | |||||
Affiliated investments | 9,486,265 | (1,089,204 | ) | |||||
Options written | 115,866 | (66,242 | ) | |||||
| Net increase (decrease) in net assets resulting from operations | 129,718,835 | (72,677,725 | ) | |||||
| CAPITAL SHARE TRANSACTIONS | ||||||||
Increase (decrease) in net assets derived from net change | ||||||||
in outstanding shares – Retail Class 1 | 8,432,536 | (36,966,858 | ) | |||||
Increase (decrease) in net assets derived from net change | ||||||||
in outstanding shares – Institutional Class 1 | (5,141,841 | ) | (6,455,643 | ) | ||||
| Total increase (decrease) in net assets from capital share transactions | 3,290,695 | (43,422,501 | ) | |||||
| Total increase (decrease) in net assets | 133,009,530 | (116,100,226 | ) | |||||
| NET ASSETS | ||||||||
Beginning of year | 77,708,700 | 193,808,926 | ||||||
| End of year | $ | 210,718,230 | $ | 77,708,700 | ||||
1 | Summary of share transactions is as follows: |
| Year Ended | Year Ended | |||||||||||||||
| March 31, 2021 | March 31, 2020 | |||||||||||||||
| Shares | Amount | Shares | Amount | |||||||||||||
| Retail Class: | ||||||||||||||||
Shares sold | 717,355 | $ | 34,132,599 | 156,027 | $ | 5,183,838 | ||||||||||
Shares redeemed 2 | (675,320 | ) | (25,700,063 | ) | (1,223,623 | ) | (42,150,696 | ) | ||||||||
Net increase (decrease) | 42,035 | $ | 8,432,536 | (1,067,596 | ) | $ | (36,966,858 | ) | ||||||||
| 2 | Net of redemption fees of $1,729 and $1,565, respectively. |
| Period Ended | Year Ended | |||||||||||||||
August 19, 2020 4 | March 31, 2020 | |||||||||||||||
| Shares | Amount | Shares | Amount | |||||||||||||
| Institutional Class: | ||||||||||||||||
Shares sold | 15,241 | $ | 462,943 | 51,142 | $ | 1,850,794 | ||||||||||
Shares redeemed 3 | (196,654 | ) | (5,604,784 | ) | (294,691 | ) | (8,306,437 | ) | ||||||||
Net increase (decrease) | (181,413 | ) | $ | (5,141,841 | ) | (243,549 | ) | $ | (6,455,643 | ) | ||||||
3 | Net of redemption fees of $230 and $732, respectively. |
4 | Hodges Fund Institutional Class shares liquidated after close of business on August 19, 2020. |
The accompanying notes are an integral part of these financial statements.
24
Small Cap Fund
| STATEMENTS OF CHANGES IN NET ASSETS |
| Year Ended | Year Ended | |||||||
| March 31, 2021 | March 31, 2020 | |||||||
| INCREASE (DECREASE) IN NET ASSETS FROM: | ||||||||
| OPERATIONS | ||||||||
Net investment income (loss) | $ | (1,213,835 | ) | $ | (1,343,459 | ) | ||
Net realized gain (loss) on transactions from: | ||||||||
Unaffiliated investments | 33,264,243 | 11,696,258 | ||||||
Options written | 227,803 | 131,176 | ||||||
Net change in unrealized appreciation/depreciation on: | ||||||||
Unaffiliated investments | 120,713,457 | (101,724,014 | ) | |||||
| Net increase (decrease) in net assets resulting from operations | 152,991,668 | (91,240,039 | ) | |||||
| DISTRIBUTIONS TO SHAREHOLDERS | ||||||||
Net distributions to shareholders – Retail Class | — | (22,054,990 | ) | |||||
Net distributions to shareholders – Institutional Class | — | (5,702,815 | ) | |||||
| Total distributions to shareholders | — | (27,757,805 | ) | |||||
| CAPITAL SHARE TRANSACTIONS | ||||||||
Increase (decrease) in net assets derived from net change | ||||||||
in outstanding shares – Retail Class 1 | (23,660,942 | ) | (173,789,528 | ) | ||||
Increase (decrease) in net assets derived from net change | ||||||||
in outstanding shares – Institutional Class 1 | (15,937,850 | ) | (42,988,730 | ) | ||||
| Total increase (decrease) in net assets from capital share transactions | (39,598,792 | ) | (216,778,258 | ) | ||||
| Total increase (decrease) in net assets | 113,392,876 | (335,776,102 | ) | |||||
| NET ASSETS | ||||||||
Beginning of year | 123,668,012 | 459,444,114 | ||||||
| End of year | $ | 237,060,888 | $ | 123,668,012 | ||||
1 | Summary of share transactions is as follows: |
| Year Ended | Year Ended | |||||||||||||||
| March 31, 2021 | March 31, 2020 | |||||||||||||||
| Shares | Amount | Shares | Amount | |||||||||||||
| Retail Class: | ||||||||||||||||
Shares sold | 778,493 | $ | 16,384,450 | 1,365,200 | $ | 23,438,527 | ||||||||||
Shares issued in reinvestment of distributions | — | — | 1,333,138 | 21,823,466 | ||||||||||||
Shares redeemed 2 | (2,589,012 | ) | (40,045,392 | ) | (13,196,459 | ) | (219,051,521 | ) | ||||||||
Net increase (decrease) | (1,810,519 | ) | $ | (23,660,942 | ) | (10,498,121 | ) | $ | (173,789,528 | ) | ||||||
2 | Net of redemption fees of $1,500 and $2,574, respectively. |
| Year Ended | Year Ended | |||||||||||||||
| March 31, 2021 | March 31, 2020 | |||||||||||||||
| Shares | Amount | Shares | Amount | |||||||||||||
| Institutional Class: | ||||||||||||||||
Shares sold | 396,865 | $ | 6,877,522 | 798,055 | $ | 14,111,388 | ||||||||||
Shares issued in reinvestment of distributions | — | — | 318,206 | 5,447,683 | ||||||||||||
Shares redeemed 3 | (1,414,567 | ) | (22,815,372 | ) | (3,635,003 | ) | (62,547,801 | ) | ||||||||
Net increase (decrease) | (1,017,702 | ) | $ | (15,937,850 | ) | (2,518,742 | ) | $ | (42,988,730 | ) | ||||||
3 | Net of redemption fees of $679 and $1,803, respectively. |
The accompanying notes are an integral part of these financial statements.
25
Small Intrinsic Value Fund
| STATEMENTS OF CHANGES IN NET ASSETS |
| Year Ended | Year Ended | |||||||
| March 31, 2021 | March 31, 2020 | |||||||
| INCREASE (DECREASE) IN NET ASSETS FROM: | ||||||||
| OPERATIONS | ||||||||
Net investment income (loss) | $ | (59,655 | ) | $ | (7,440 | ) | ||
Net realized gain (loss) on transactions from: | ||||||||
Unaffiliated investments | 2,089,023 | (370,164 | ) | |||||
Affiliated investments | 194,392 | (36,653 | ) | |||||
Net change in unrealized appreciation/depreciation on: | ||||||||
Unaffiliated investments | 6,878,802 | (2,637,029 | ) | |||||
Affiliated investments | 213,269 | 76,156 | ||||||
| Net increase (decrease) in net assets resulting from operations | 9,315,831 | (2,975,130 | ) | |||||
| DISTRIBUTIONS TO SHAREHOLDERS | ||||||||
| Total distributions to shareholders | — | (1,809 | ) | |||||
| CAPITAL SHARE TRANSACTIONS | ||||||||
Total increase (decrease) in net assets from capital share transactions 1 | 2,803,560 | (6,680,392 | ) | |||||
| Total increase (decrease) in net assets | 12,119,391 | (9,657,331 | ) | |||||
| NET ASSETS | ||||||||
Beginning of year | 4,039,861 | 13,697,192 | ||||||
| End of year | $ | 16,159,252 | $ | 4,039,861 | ||||
1 | Summary of share transactions is as follows: |
Year Ended | Year Ended | |||||||||||||||
March 31, 2021 | March 31, 2020 | |||||||||||||||
| Shares | Amount | Shares | Amount | |||||||||||||
| Retail Class: | ||||||||||||||||
Shares sold | 605,619 | $ | 5,958,230 | 139,482 | $ | 1,646,718 | ||||||||||
Shares issued in reinvestment of distributions | — | — | 135 | 1,718 | ||||||||||||
Shares redeemed 2 | (264,254 | ) | (3,154,670 | ) | (779,674 | ) | (8,328,828 | ) | ||||||||
Net increase (decrease) | 341,365 | $ | 2,803,560 | (640,057 | ) | $ | (6,680,392 | ) | ||||||||
2 | Net of redemption fees of $76 and $365, respectively. |
The accompanying notes are an integral part of these financial statements.
26
Blue Chip Equity Income Fund
| STATEMENTS OF CHANGES IN NET ASSETS |
| Year Ended | Year Ended | |||||||
| March 31, 2021 | March 31, 2020 | |||||||
| INCREASE (DECREASE) IN NET ASSETS FROM: | ||||||||
| OPERATIONS | ||||||||
Net investment income (loss) | $ | 167,121 | $ | 223,062 | ||||
Net realized gain (loss) on transactions from: | ||||||||
Unaffiliated investments | 1,901,153 | 1,565,612 | ||||||
Net change in unrealized appreciation/depreciation on: | ||||||||
Unaffiliated investments | 7,852,494 | (3,763,648 | ) | |||||
| Net increase (decrease) in net assets resulting from operations | 9,920,768 | (1,974,974 | ) | |||||
| DISTRIBUTIONS TO SHAREHOLDERS | ||||||||
| Total distributions to shareholders | (1,262,481 | ) | (1,922,999 | ) | ||||
| CAPITAL SHARE TRANSACTIONS | ||||||||
Total increase (decrease) in net assets from capital share transactions 1 | (1,373,678 | ) | (1,252,944 | ) | ||||
| Total increase (decrease) in net assets | 7,284,609 | (5,150,917 | ) | |||||
| NET ASSETS | ||||||||
Beginning of year | 18,811,343 | 23,962,260 | ||||||
| End of year | $ | 26,095,952 | $ | 18,811,343 | ||||
1 | Summary of share transactions is as follows: |
Year Ended | Year Ended | |||||||||||||||
March 31, 2021 | March 31, 2020 | |||||||||||||||
| Shares | Amount | Shares | Amount | |||||||||||||
| Retail Class: | ||||||||||||||||
Shares Sold | 123,186 | $ | 2,111,141 | 95,861 | $ | 1,511,851 | ||||||||||
Shares issued in reinvestment of distributions | 64,553 | 1,195,918 | 109,221 | 1,838,468 | ||||||||||||
Shares redeemed 2 | (284,526 | ) | (4,680,737 | ) | (283,121 | ) | (4,603,263 | ) | ||||||||
Net increase (decrease) | (96,787 | ) | $ | (1,373,678 | ) | (78,039 | ) | $ | (1,252,944 | ) | ||||||
2 | Net of redemption fees of $56 and $2,160, respectively. |
The accompanying notes are an integral part of these financial statements.
27
Hodges Fund
FINANCIAL HIGHLIGHTS For a capital share outstanding throughout each year |
RETAIL CLASS
| Year Ended March 31, | ||||||||||||||||||||
| 2021 | 2020 | 2019 | 2018 | 2017 | ||||||||||||||||
Net asset value, beginning of year | $ | 20.36 | $ | 37.76 | $ | 48.44 | $ | 46.60 | $ | 35.68 | ||||||||||
| INCOME FROM INVESTMENT OPERATIONS: | ||||||||||||||||||||
Net investment income (loss) 1 | (0.31 | ) | (0.19 | ) | (0.36 | ) | (0.46 | ) | (0.24 | ) | ||||||||||
| Net realized and unrealized gain (loss) on investments | 37.34 | (17.21 | ) | (7.15 | ) | 5.90 | 11.15 | |||||||||||||
Total from investment operations | 37.03 | (17.40 | ) | (7.51 | ) | 5.44 | 10.91 | |||||||||||||
| LESS DISTRIBUTIONS: | ||||||||||||||||||||
From net realized gain | — | — | (3.17 | ) | (3.60 | ) | — | |||||||||||||
Total distributions | — | — | (3.17 | ) | (3.60 | ) | — | |||||||||||||
Paid-in capital from redemption | 0.00 | 2 | 0.00 | 2 | 0.00 | 2 | 0.00 | 2 | 0.01 | |||||||||||
Net asset value, end of year | $ | 57.39 | $ | 20.36 | $ | 37.76 | $ | 48.44 | $ | 46.60 | ||||||||||
Total return | 181.74 | % | (46.05 | )% | (14.45 | )% | 11.88 | % | 30.64 | % | ||||||||||
| SUPPLEMENTAL DATA: | ||||||||||||||||||||
Net assets, end of year (millions) | $ | 210.7 | $ | 73.9 | $ | 177.4 | $ | 251.9 | $ | 360.8 | ||||||||||
Portfolio turnover rate | 220 | % | 107 | % | 119 | % | 142 | % | 145 | % | ||||||||||
| RATIO OF EXPENSES TO AVERAGE NET ASSETS: | ||||||||||||||||||||
Before fees waived and expenses absorbed | 1.40 | % | 1.37 | % | 1.34 | % | 1.33 | % | 1.30 | % | ||||||||||
After fees waived and expenses absorbed 3,4 | 1.16 | % | 1.18 | % | 1.18 | % | 1.18 | % | 1.30 | % | ||||||||||
| RATIO OF NET INVESTMENT INCOME (LOSS) TO AVERAGE NET ASSETS: | ||||||||||||||||||||
Before fees waived and expenses absorbed | (1.03 | )% | (0.75 | )% | (0.97 | )% | (1.11 | )% | (0.56 | )% | ||||||||||
After fees waived and expenses absorbed 3,4 | (0.79 | )% | (0.56 | )% | (0.81 | )% | (0.96 | )% | (0.56 | )% | ||||||||||
1 | Calculated using the average shares outstanding method. |
2 | Does not round to $0.01 or $(0.01), as applicable. |
3 | Effective April 1, 2017, the Advisor contractually agreed to limit the Retail Class shares’ annual ratio of expenses to 1.18% of the Retail Class’ daily net assets. |
4 | Effective September 1, 2020, the Advisor contractually agreed to limit the Retail Class Shares’ annual ratio of expenses to 0.90% of the Retail Class’ daily net assets. See Note 3. |
The accompanying notes are an integral part of these financial statements.
28
Small Cap Fund
FINANCIAL HIGHLIGHTS For a capital share outstanding throughout each year |
RETAIL CLASS
| Year Ended March 31, | ||||||||||||||||||||
| 2021 | 2020 | 2019 | 2018 | 2017 | ||||||||||||||||
Net asset value, beginning of year | $ | 10.10 | $ | 18.13 | $ | 19.51 | $ | 20.11 | $ | 17.27 | ||||||||||
| INCOME FROM INVESTMENT OPERATIONS: | ||||||||||||||||||||
Net investment income (loss) 1 | (0.13 | ) | (0.07 | ) | (0.12 | ) | (0.13 | ) | (0.01 | ) | ||||||||||
| Net realized and unrealized gain (loss) on investments | 15.31 | (6.58 | ) | (0.54 | ) | 2.35 | 2.91 | |||||||||||||
Total from investment operations | 15.18 | (6.65 | ) | (0.66 | ) | 2.22 | 2.90 | |||||||||||||
| LESS DISTRIBUTIONS: | ||||||||||||||||||||
From net investment income | — | — | — | — | (0.00 | )2 | ||||||||||||||
From net realized gain | — | (1.38 | ) | (0.72 | ) | (2.82 | ) | (0.06 | ) | |||||||||||
Total distributions | — | (1.38 | ) | (0.72 | ) | (2.82 | ) | (0.06 | ) | |||||||||||
Paid-in capital from redemption | 0.00 | 2 | 0.00 | 2 | 0.00 | 2 | 0.00 | 2 | 0.00 | 2 | ||||||||||
Net asset value, end of year | $ | 25.28 | $ | 10.10 | $ | 18.13 | $ | 19.51 | $ | 20.11 | ||||||||||
Total return | 150.30 | % | (39.59 | )% | (2.96 | )% | 12.49 | % | 16.81 | % | ||||||||||
| SUPPLEMENTAL DATA: | ||||||||||||||||||||
Net assets, end of year (millions) | $ | 183.2 | $ | 91.5 | $ | 354.5 | $ | 452.0 | $ | 756.8 | ||||||||||
Portfolio turnover rate | 124 | % | 81 | % | 81 | % | 45 | % | 44 | % | ||||||||||
| RATIO OF EXPENSES TO AVERAGE NET ASSETS: | ||||||||||||||||||||
Before fees waived and expenses absorbed | 1.40 | % | 1.33 | % | 1.29 | % | 1.30 | % | 1.28 | % | ||||||||||
After fees waived and expenses absorbed 3 | 1.35 | % | 1.33 | % | 1.29 | % | 1.30 | % | 1.28 | % | ||||||||||
| RATIO OF NET INVESTMENT INCOME (LOSS) TO AVERAGE NET ASSETS: | ||||||||||||||||||||
Before fees waived and expenses absorbed | (0.83 | )% | (0.43 | )% | (0.60 | )% | (0.68 | )% | (0.08 | )% | ||||||||||
After fees waived and expenses absorbed 3 | (0.78 | )% | (0.43 | )% | (0.60 | )% | (0.68 | )% | (0.08 | )% | ||||||||||
1 | Calculated using the average shares outstanding method. |
2 | Does not round to $0.01 or $(0.01), as applicable. |
3 | Effective September 1, 2020, the Advisor contractually agreed to limit the Retail Class Shares’ annual ratio of expenses to 1.12% of the Retail Class’ daily net assets. See Note 3. |
The accompanying notes are an integral part of these financial statements.
29
Small Cap Fund
FINANCIAL HIGHLIGHTS For a capital share outstanding throughout each year |
INSTITUTIONAL CLASS
| Year Ended March 31, | ||||||||||||||||||||
| 2021 | 2020 | 2019 | 2018 | 2017 | ||||||||||||||||
Net asset value, beginning of year | $ | 10.56 | $ | 18.85 | $ | 20.21 | $ | 20.68 | $ | 17.74 | ||||||||||
| INCOME FROM INVESTMENT OPERATIONS: | ||||||||||||||||||||
Net investment income (loss) 1 | (0.09 | ) | (0.03 | ) | (0.07 | ) | (0.09 | ) | 0.04 | |||||||||||
| Net realized and unrealized gain (loss) on investments | 16.04 | (6.88 | ) | (0.57 | ) | 2.44 | 3.02 | |||||||||||||
Total from investment operations | 15.95 | (6.91 | ) | (0.64 | ) | 2.35 | 3.06 | |||||||||||||
| LESS DISTRIBUTIONS: | ||||||||||||||||||||
From net investment income | — | — | — | — | (0.06 | ) | ||||||||||||||
From net realized gain | — | (1.38 | ) | (0.72 | ) | (2.82 | ) | (0.06 | ) | |||||||||||
Total distributions | — | (1.38 | ) | (0.72 | ) | (2.82 | ) | (0.12 | ) | |||||||||||
Paid-in capital from redemption | 0.00 | 2 | 0.00 | 2 | 0.00 | 2 | 0.00 | 2 | 0.00 | 2 | ||||||||||
Net asset value, end of year | $ | 26.51 | $ | 10.56 | $ | 18.85 | $ | 20.21 | $ | 20.68 | ||||||||||
Total return | 151.14 | % | (39.46 | )% | (2.76 | )% | 12.79 | % | 17.21 | % | ||||||||||
| SUPPLEMENTAL DATA: | ||||||||||||||||||||
Net assets, end of year (millions) | $ | 53.8 | $ | 32.2 | $ | 105.0 | $ | 132.3 | $ | 414.3 | ||||||||||
Portfolio turnover rate | 124 | % | 81 | % | 81 | % | 45 | % | 44 | % | ||||||||||
| RATIO OF EXPENSES TO AVERAGE NET ASSETS: | ||||||||||||||||||||
Before fees waived and expenses absorbed | 1.15 | % | 1.09 | % | 1.04 | % | 1.05 | % | 0.98 | % | ||||||||||
After fees waived and expenses absorbed 3 | 1.10 | % | 1.09 | % | 1.04 | % | 1.05 | % | 0.98 | % | ||||||||||
| RATIO OF NET INVESTMENT INCOME (LOSS) TO AVERAGE NET ASSETS: | ||||||||||||||||||||
Before fees waived and expenses absorbed | (0.58 | )% | (0.18 | )% | (0.35 | )% | (0.44 | )% | 0.18 | % | ||||||||||
After fees waived and expenses absorbed 3 | (0.53 | )% | (0.18 | )% | (0.35 | )% | (0.44 | )% | 0.18 | % | ||||||||||
1 | Calculated using the average shares outstanding method. |
2 | Does not round to $0.01 or $(0.01), as applicable. |
3 | Effective September 1, 2020, the Advisor contractually agreed to limit the Institutional Class Shares’ annual ratio of expenses to 1.12% of the Institutional Class’ daily net assets. See Note 3. |
The accompanying notes are an integral part of these financial statements.
30
Small Intrinsic Value Fund
FINANCIAL HIGHLIGHTS For a capital share outstanding throughout each year |
| Year Ended March 31, | ||||||||||||||||||||
| 2021 | 2020 | 2019 | 2018 | 2017 | ||||||||||||||||
Net asset value, beginning of year | $ | 6.84 | $ | 11.13 | $ | 13.65 | $ | 12.83 | $ | 11.01 | ||||||||||
| INCOME FROM INVESTMENT OPERATIONS: | ||||||||||||||||||||
Net investment income (loss) 1 | (0.06 | ) | (0.01 | ) | (0.08 | ) | (0.07 | ) | (0.00 | )2 | ||||||||||
| Net realized and unrealized gain (loss) on investments | 10.56 | (4.28 | ) | (1.47 | ) | 1.30 | 1.82 | |||||||||||||
Total from investment operations | 10.50 | (4.29 | ) | (1.55 | ) | 1.23 | 1.82 | |||||||||||||
| LESS DISTRIBUTIONS: | ||||||||||||||||||||
From net investment income | — | (0.00 | )2 | — | — | — | ||||||||||||||
From net realized gain | — | — | (0.97 | ) | (0.41 | ) | — | |||||||||||||
Total distributions | — | (0.00 | )2 | (0.97 | ) | (0.41 | ) | — | ||||||||||||
Paid-in capital from redemption | 0.00 | 2 | 0.00 | 2 | 0.00 | 2 | 0.00 | 2 | 0.00 | 2 | ||||||||||
Net asset value, end of year | $ | 17.34 | $ | 6.84 | $ | 11.13 | $ | 13.65 | $ | 12.83 | ||||||||||
Total return | 153.51 | % | (38.53 | )% | (10.91 | )% | 9.55 | % | 16.53 | % | ||||||||||
| SUPPLEMENTAL DATA: | ||||||||||||||||||||
Net assets, end of year (millions) | $ | 16.2 | $ | 4.0 | $ | 13.7 | $ | 81.7 | $ | 110.0 | ||||||||||
Portfolio turnover rate | 136 | % | 115 | % | 137 | % | 103 | % | 113 | % | ||||||||||
| RATIO OF EXPENSES TO AVERAGE NET ASSETS: | ||||||||||||||||||||
Before fees waived and expenses absorbed | 2.48 | % | 2.43 | % | 1.50 | % | 1.38 | % | 1.39 | % | ||||||||||
After fees waived and expenses absorbed | 1.29 | % | 1.29 | % | 1.29 | % | 1.29 | % | 1.29 | % | ||||||||||
| RATIO OF NET INVESTMENT INCOME (LOSS) TO AVERAGE NET ASSETS: | ||||||||||||||||||||
Before fees waived and expenses absorbed | (1.73 | )% | (1.21 | )% | (0.78 | )% | (0.64 | )% | (0.14 | )% | ||||||||||
After fees waived and expenses absorbed | (0.54 | )% | (0.07 | )% | (0.57 | )% | (0.55 | )% | (0.04 | )% | ||||||||||
1 | Calculated using the average shares outstanding method. |
2 | Does not round to $0.01 or $(0.01), as applicable. |
The accompanying notes are an integral part of these financial statements.
31
Blue Chip Equity Income Fund
FINANCIAL HIGHLIGHTS For a capital share outstanding throughout each year |
| Year Ended March 31, | ||||||||||||||||||||
| 2021 | 2020 | 2019 | 2018 | 2017 | ||||||||||||||||
Net asset value, beginning of year | $ | 13.11 | $ | 15.83 | $ | 15.86 | $ | 15.27 | $ | 14.12 | ||||||||||
| INCOME FROM INVESTMENT OPERATIONS: | ||||||||||||||||||||
Net investment income (loss) 1 | 0.13 | 0.15 | 0.12 | 0.15 | 0.17 | |||||||||||||||
| Net realized and unrealized gain (loss) on investments | 7.22 | (1.56 | ) | 0.65 | 1.98 | 1.74 | ||||||||||||||
Total from investment operations | 7.35 | (1.41 | ) | 0.77 | 2.13 | 1.91 | ||||||||||||||
| LESS DISTRIBUTIONS: | ||||||||||||||||||||
From net investment income | (0.12 | ) | (0.15 | ) | (0.12 | ) | (0.15 | ) | (0.18 | ) | ||||||||||
From net realized gain | (0.84 | ) | (1.16 | ) | (0.68 | ) | (1.39 | ) | (0.58 | ) | ||||||||||
Total distributions | (0.96 | ) | (1.31 | ) | (0.80 | ) | (1.54 | ) | (0.76 | ) | ||||||||||
Paid-in capital from redemption | 0.00 | 2 | 0.00 | 2 | 0.00 | 2 | 0.00 | 2 | 0.00 | 2 | ||||||||||
Net asset value, end of year | $ | 19.50 | $ | 13.11 | $ | 15.83 | $ | 15.86 | $ | 15.27 | ||||||||||
Total return | 56.53 | % | (10.66 | )% | 5.52 | % | 13.69 | % | 13.88 | % | ||||||||||
| SUPPLEMENTAL DATA: | ||||||||||||||||||||
Net assets, end of year (millions) | $ | 26.1 | $ | 18.8 | $ | 24.0 | $ | 23.3 | $ | 23.9 | ||||||||||
Portfolio turnover rate | 67 | % | 51 | % | 44 | % | 65 | % | 59 | % | ||||||||||
| RATIO OF EXPENSES TO AVERAGE NET ASSETS: | ||||||||||||||||||||
Before fees waived and expenses absorbed | 1.64 | % | 1.47 | % | 1.48 | % | 1.45 | % | 1.45 | % | ||||||||||
After fees waived and expenses absorbed | 1.30 | % | 1.30 | % | 1.30 | % | 1.30 | % | 1.30 | % | ||||||||||
| RATIO OF NET INVESTMENT INCOME (LOSS) TO AVERAGE NET ASSETS: | ||||||||||||||||||||
Before fees waived and expenses absorbed | 0.37 | % | 0.73 | % | 0.59 | % | 0.77 | % | 1.03 | % | ||||||||||
After fees waived and expenses absorbed | 0.71 | % | 0.90 | % | 0.76 | % | 0.92 | % | 1.18 | % | ||||||||||
1 | Calculated using the average shares outstanding method. |
2 | Does not round to $0.01 or $(0.01), as applicable. |
The accompanying notes are an integral part of these financial statements.
32
Hodges Mutual Funds
NOTES TO FINANCIAL STATEMENTS March 31, 2021 |
| NOTE 1 – ORGANIZATION |
The Hodges Fund, Small Cap Fund, Small Intrinsic Value Fund, and Blue Chip Equity Income Fund (each a “Fund” and collectively the “Funds”) are each a diversified series of shares of beneficial interest of Professionally Managed Portfolios (the “Trust”), which is registered under the Investment Company Act of 1940, as amended (the “1940 Act”) as an open-end management investment company. Each Fund is an investment company and accordingly follows the investment company accounting and reporting guidance of the Financial Accounting Standards Board (FASB) Accounting Standard Codification Topic 946 “Financial Services—Investment Companies”. The Hodges Fund commenced operations on October 9, 1992 and offers a Retail Class of shares only. The Small Cap Fund commenced operations on December 18, 2007. The Small Cap Fund currently offers two classes of shares: Retail Class and Institutional Class. The Retail Class commenced operations on December 18, 2007 and the Institutional Class commenced operations on December 12, 2008. The Small Intrinsic Value Fund commenced operations on December 26, 2013 and offers a Retail Class of shares only. The Blue Chip Equity Income Fund commenced operations on September 10, 2009 and offers a Retail Class of shares only.
Each class of shares has equal rights as to earnings and assets except that each class bears its own distribution expenses. Each class of shares has exclusive voting rights with respect to matters that affect just that class. Income, expenses (other than expenses attributable to a specific class), and realized and unrealized gains or losses on investments are allocated to each class of shares based on its relative net assets.
The investment objective of the Hodges Fund, Small Cap Fund, and Small Intrinsic Value Fund is long-term capital appreciation. The investment objective of the Blue Chip Equity Income Fund is to seek income and long-term capital appreciation.
| NOTE 2 – SIGNIFICANT ACCOUNTING POLICIES |
The following is a summary of significant accounting policies consistently followed by the Funds. These policies are in conformity with accounting principles generally accepted in the United States of America (“U.S. GAAP”).
| A. | Security Valuation. All equity securities, which may include Real Estate Investment Trusts (“REITs”), Business Development Companies (“BDCs”), and Master Limited Partnerships (“MLPs”), that are traded on U.S. or foreign national securities exchanges, are valued at the last reported sale price on the exchange on which the security is principally traded or the exchange’s official closing price, if applicable. If, on a particular day, an exchange-traded security does not trade, then the mean between the most recent quoted bid and asked prices will be used. All equity securities, which may include REITs, BDCs, and MLPs, that are not traded on a listed exchange are valued at the last sale price in the over-the-counter market. If a non-exchange traded security does not trade on a particular day, then the mean between the last quoted closing bid and asked price will be used. | |
| Debt securities are valued by using the evaluated mean price supplied by an approved independent pricing service. The independent pricing service may use various valuation methodologies including, matrix pricing and other analytical pricing models as well as market transactions and dealer quotations. These models generally consider such factors as yields or prices of bonds of comparable quality, type of issue, coupon, maturity, ratings and general market conditions. | ||
| Exchange traded options are valued at the composite price, using the National Best Bid and Offer quotes (“NBBO”). NBBO consists of the highest bid price and lowest ask price across any of the exchanges on which an option is quoted, thus providing a view across the entire U.S. options marketplace. Composite option pricing calculates the mean of the highest bid price and lowest ask price across the exchanges where the option is traded. | ||
| Securities for which quotations are not readily available are valued at their respective fair values as determined in good faith by the Valuation Committee. When a security is “fair valued,” consideration is given to the facts and circumstances relevant to the particular situation, including a review of various factors set forth in the pricing procedures adopted by the Board. Fair value pricing is an inherently subjective process, and no single standard exists for determining fair value. Different funds could reasonably arrive at different values for the same security. The use of fair value pricing by a Fund may cause the net asset value of its shares to differ significantly from the net asset value that would be calculated without regard to such considerations. |
33
Hodges Mutual Funds
NOTES TO FINANCIAL STATEMENTS March 31, 2021 (Continued) |
| As described above, the Funds utilize various methods to measure the fair value of their investments on a recurring basis. U.S. GAAP establishes a hierarchy that prioritizes inputs to valuation methods. The three levels of inputs are: |
| Level 1 – | Unadjusted quoted prices in active markets for identical assets or liabilities that the Funds have the ability to access. | ||
| Level 2 – | Observable inputs other than quoted prices included in Level 1 that are observable for the asset or liability, either directly or indirectly. These inputs may include quoted prices for the identical instrument on an inactive market, prices for similar instruments, interest rates, prepayment speeds, credit risk, yield curves, default rates and similar data. | ||
| Level 3 – | Unobservable inputs for the asset or liability, to the extent relevant observable inputs are not available; representing the Funds’ own assumptions about the assumptions a market participant would use in valuing the asset or liability, and would be based on the best information available. |
| The availability of observable inputs can vary from security to security and is affected by a wide variety of factors, including, for example, the type of security, whether the security is new and not yet established in the marketplace, the liquidity of markets and other characteristics particular to the security. To the extent that valuation is based on models or inputs that are less observable or unobservable in the market, the determination of fair value requires more judgment. Accordingly, the degree of judgment exercised in determining fair value is greatest for instruments categorized in Level 3. | ||
| The inputs used to measure fair value may fall into different levels of the fair value hierarchy. In such cases, for disclosure purposes, the level in the fair value hierarchy within which the fair value measurement falls in its entirety, is determined based on the lowest level input that is significant to the fair value measurement in its entirety. | ||
| The following are summaries of the inputs used to value the Funds’ investments and derivatives or options written as of March 31, 2021. See the Schedules of Investments and Schedule of Options Written for industry breakouts. |
| Hodges Fund: | Level 1 | Level 2 | Level 3 | Total | ||||||||||||||
| Common Stocks | $ | 204,652,432 | $ | — | $ | — | $ | 204,652,432 | ||||||||||
| Call Options Purchased | — | 4,479,000 | — | 4,479,000 | ||||||||||||||
| Total Investments in Securities | $ | 204,652,432 | $ | 4,479,000 | $ | — | $ | 209,131,432 | ||||||||||
| Call Options Written | $ | — | $ | 95,000 | $ | — | $ | 95,000 | ||||||||||
| Total Call Options Written | $ | — | $ | 95,000 | $ | — | $ | 95,000 | ||||||||||
| Small Cap Fund: | Level 1 | Level 2 | Level 3 | Total | ||||||||||||||
| Common Stocks | $ | 236,577,532 | $ | — | $ | — | $ | 236,577,532 | ||||||||||
| Total Investments in Securities | $ | 236,577,532 | $ | — | $ | — | $ | 236,577,532 | ||||||||||
| Small Intrinsic Value Fund: | Level 1 | Level 2 | Level 3 | Total | ||||||||||||||
| Common Stocks | $ | 14,967,358 | $ | — | $ | — | $ | 14,967,358 | ||||||||||
| Total Investments in Securities | $ | 14,967,358 | $ | — | $ | — | $ | 14,967,358 | ||||||||||
| Blue Chip Equity Income Fund: | Level 1 | Level 2 | Level 3 | Total | ||||||||||||||
| Common Stocks | $ | 25,993,391 | $ | — | $ | — | $ | 25,993,391 | ||||||||||
| Total Investments in Securities | $ | 25,993,391 | $ | — | $ | — | $ | 25,993,391 | ||||||||||
| The Funds have adopted financial reporting rules and regulations that require enhanced disclosure regarding derivatives and hedging activity intending to improve financial reporting of derivative instruments by enabling investors to understand how an entity uses derivatives, how derivatives are accounted for, and how derivative instruments affect an entity’s results of operations and financial position. | ||
| Each Fund may invest in options, traded on U.S. and foreign exchanges, on equities, debt and stock indices as a substitute for a comparable market position in the underlying security, to attempt to hedge or limit the exposure of a Fund’s position, and to effect closing transactions. Each Fund may write covered put and call options on securities, securities indices and currencies in which it may invest to serve as a partial hedge against a price decline of the underlying security. |
34
Hodges Mutual Funds
NOTES TO FINANCIAL STATEMENTS March 31, 2021 (Continued) |
| Balance Sheet | ||
| Values of derivative instruments as of March 31, 2021: | ||
| Hodges Fund |
| Asset Derivatives as of | Liability Derivatives as of | |||||||||||
| March 31, 2021 | March 31, 2021 | |||||||||||
Derivative Instruments | Balance Sheet Location | Value | Balance Sheet Location | Value | ||||||||
| Equity Contracts: | Investments in unaffiliated | |||||||||||
| Call Options Purchased | securities, at value | $ | 4,479,000 | None | $ | — | ||||||
| Equity Contracts: | ||||||||||||
| Call Options Written | None | — | Options Written, at value | 95,000 | ||||||||
| Total | $ | 4,479,000 | $ | 95,000 | ||||||||
| The effect of derivative instruments on the Statements of Operations for the year ended March 31, 2021: | ||||||||||||
| Hodges Fund | |||||
| Changes in Unrealized | |||||
| Location of Gain | Realized Gain | Appreciation/Depreciation | |||
| (Loss) on Derivatives | (Loss) on Derivatives | on Derivatives | |||
Derivative Instruments | Recognized in Income | Recognized in Income | Recognized in Income | ||
Equity Contracts: | Realized and Unrealized | ||||
Call Options Purchased | Gain (Loss) on Investments | $8,033,035 | $2,512,264 | ||
Equity Contracts: | Realized and Unrealized | ||||
Call Options Written | Gain (Loss) on Investments | (842,449) | 115,866 |
| Small Cap Fund | |||||
| Changes in Unrealized | |||||
| Location of Gain | Realized Gain | Appreciation/Depreciation | |||
| (Loss) on Derivatives | (Loss) on Derivatives | on Derivatives | |||
Derivative Instruments | Recognized in Income | Recognized in Income | Recognized in Income | ||
Equity Contracts: | Realized and Unrealized | ||||
Call Options Written | Gain (Loss) on Investments | $227,803 | $— |
| The average absolute notional value of options held and written during the year ended March 31, 2021 was $25,678,429 and $288,733 in the Hodges Fund and Small Cap Fund, respectively. | ||
| B. | Foreign Currency. Investment securities and other assets and liabilities denominated in foreign currencies are translated into U.S. dollar amounts at the date of valuation. Purchases and sales of investment securities and income and expense items denominated in foreign currencies are translated into U.S. dollar amounts on the respective dates of such transactions. | |
| The Funds do not isolate that portion of the results of operations resulting from changes in foreign exchange rates on investments from the fluctuations arising from changes in market prices of securities held. Such fluctuations are included with the net unrealized and realized gain or loss from investments. | ||
| The Funds do not isolate net realized foreign exchange gains or losses that arise from sales of foreign currencies, currency gains or losses realized between the trade and settlement dates on securities transactions, and the difference between the amounts of dividends, interest, and foreign withholding taxes recorded on the Funds’ books and the U.S. dollar equivalent of the amounts actually received or paid. Such fluctuations are included with the net realized gain or loss from investments. Net fair values of assets and liabilities, other than investments in securities at fiscal period end, resulting from changes in exchange rates. | ||
| C. | Federal Income Taxes. Each Fund has elected to be taxed as a “regulated investment company” and intends to distribute substantially all taxable income to its shareholders and otherwise comply with the provisions of the Internal Revenue Code applicable to regulated investment companies. Therefore, no provision for federal income taxes or excise taxes has been made. |
35
Hodges Mutual Funds
NOTES TO FINANCIAL STATEMENTS March 31, 2021 (Continued) |
| In order to avoid imposition of the excise tax applicable to regulated investment companies, each Fund intends to declare each year as dividends in each calendar year at least 98.0% of its net investment income (earned during the calendar year) and at least 98.2% of its net realized capital gains (earned during the twelve months ended October 31) plus undistributed amounts, if any, from prior years. | ||
| Net capital losses incurred after October 31 and within the taxable year are deemed to arise on the first business day of each Fund’s next taxable year. Net investment losses incurred after December 31, and within the taxable year, are deemed to arise on the first business day of the Funds’ next taxable year. | ||
| As of March 31, 2021, the Funds did not defer, on a tax basis, any late year or post-October losses. | ||
| As of March 31, 2021, the Funds had the following capital loss carryovers available for federal income tax purposes, which do not expire: |
| Capital Loss Carryovers | ||||||||||
| Short-Term | Long-Term | |||||||||
Hodges Fund | $ | — | $ | 17,065,735 | ||||||
Small Cap Fund | — | — | ||||||||
Small Intrinsic Value Fund | — | — | ||||||||
Blue Chip Equity Income Fund | — | — | ||||||||
| As of March 31, 2021, the Funds did not have any tax positions that did not meet the “more likely-than-not” threshold of being sustained by the applicable tax authority. Generally, tax authorities can examine all the tax returns filed for the last three fiscal years. The Funds identify their major tax jurisdictions as U.S. Federal and the Commonwealth of Massachusetts. As of March 31, 2021, the Funds are not aware of any tax positions for which it is reasonably possible that the total amounts of unrecognized tax benefits will change materially. | ||
| D. | Securities Transactions and Investment Income. Investment securities transactions are accounted for on the trade date. Gains and losses realized on sales of securities are determined on a specific identification basis. Discounts/premiums on debt securities purchased are accreted/amortized over the life of the respective securities using the effective interest method. Dividend income is recorded on the ex-dividend date. Interest income is recorded on an accrual basis. Dividends received from REITs generally are comprised of ordinary income, capital gains, and may include return of capital. Other non-cash dividends are recognized as investment income at the fair value of the property received. Withholding taxes on foreign dividends have been provided for in accordance with the Trust’s understanding of the applicable country’s tax rules and rates. | |
| E. | Distributions to Shareholders. Distributions to shareholders from net investment income and net realized gains, if any, on securities for the Hodges Fund, Small Cap Fund, and Small Intrinsic Value Fund are normally declared and paid on an annual basis. Distributions to shareholders from net investment income for the Blue Chip Equity Income Fund normally are declared and paid on a quarterly basis. Distributions to shareholders from net realized gains on securities normally are declared and paid on an annual basis. Distributions are recorded on the ex-dividend date. | |
| F. | Options Contracts. The Funds may purchase call and put options on securities and indices. As the holder of a call option, each Fund has the right to purchase the underlying security at the exercise price at any time until the expiration date. As a holder of a put option, each Fund has the right to sell the underlying security at the exercise price at any time until the expiration date. The Funds may enter into closing sale transactions with respect to such options, exercise such options, or permit such options to expire. If an option expires on the stipulated date or if a Fund enters into a closing sale transaction, a gain or loss is realized. If a Fund exercises a call option, the cost of the security acquired is increased by the premium paid for the call. Each Fund may write (sell) covered put and call options on securities, security indices, and currencies in which it may invest. When a Fund writes an option, an amount equal to the premium received by a Fund is recorded as a liability and is subsequently adjusted to reflect the current fair value of the option written. Premiums received from writing options that expire unexercised are treated by the Fund on the expiration date as realized gains from investments. The difference between the premium and the amount paid on effecting a closing purchase transaction, including brokerage commissions, is also treated as a realized gain, or, if the premium is less than the amount paid for the closing purchase transaction, as a realized loss. If a call option is exercised, the premium is added to the proceeds from the sale of the underlying security in determining whether a Fund has realized a gain or loss. If a put option is exercised, the premium reduces the cost basis of the securities purchased by the Fund. Each Fund, as writer of an option, bears the market risk of an unfavorable change in the price of the security underlying the written option. |
36
Hodges Mutual Funds
NOTES TO FINANCIAL STATEMENTS March 31, 2021 (Continued) |
| G. | Use of Estimates. The preparation of financial statements in conformity with U.S. GAAP requires management to make estimates and assumptions that affect the reported amounts of assets and liabilities at the date of the financial statements and the reported amount of revenue and expenses during the reporting period. Actual results could differ from those estimates. | |
| H. | Share Valuation. The net asset value (“NAV”) per share of each Fund is calculated by dividing the sum of the value of the securities held by each Fund, plus cash or other assets, minus all liabilities (including estimated accrued expenses) by the total number of shares outstanding for each Fund, rounded to the nearest cent. The Funds’ shares will not be priced on the days on which the New York Stock Exchange is closed for trading. The offering and redemption price per share for each Fund is equal to each Fund’s NAV per share. The Hodges Fund Retail Class, Small Cap Fund Retail Class, Small Intrinsic Value Fund, and Blue Chip Equity Income Fund charge a redemption fee equal to 1% of the net amount of redemptions if redeemed within 30 calendar days after purchase. The Institutional Class of the Small Cap Fund charges a redemption fee equal to 1% of the net amount of redemptions if redeemed within 60 calendar days after purchase. These fees are deducted from the redemption proceeds otherwise payable to the shareholder. Each Fund will retain the fee charged as paid-in capital and such fees become part of that Fund’s daily NAV calculation. | |
| I. | Guarantees and Indemnifications. In the normal course of business, each Fund enters into contracts with service providers that contain general indemnification clauses. The Funds’ maximum exposure under these arrangements is unknown as this would involve future claims that may be made against the Funds that have not yet occurred. However, based on experience, the Funds expect the risk of loss to be remote. | |
| J. | Illiquid Securities. Pursuant to Rule 22e-4 under the 1940 Act, the Funds have adopted a Board approved liquidity risk management program (the “program”) that requires, among other things, that each Fund limit its illiquid investments that are assets to no more than 15% of net assets. An illiquid investment is any investment that each Fund reasonably expects cannot be sold or disposed of in current market conditions in seven calendar days or less without the sale or disposition significantly changing the market value of the investment. | |
| K. | Reclassification of Capital Accounts. U.S. GAAP requires that certain components of net assets relating to permanent differences be reclassified between financial and tax reporting. These reclassifications have no effect on net assets or net asset value per share. For the year ended March 31, 2021, the following adjustments were made 1. |
| Total Distributable | ||||||||||
| (Accumulated) | ||||||||||
| Earnings (Losses) | Paid-in Capital | |||||||||
Hodges Fund | $ | 1,082,193 | $ | (1,082,193 | ) | |||||
Small Cap Fund | (2,867,669 | ) | 2,867,669 | |||||||
Small Intrinsic Value Fund | (662 | ) | 662 | |||||||
Blue Chip Equity Income Fund | (99,720 | ) | 99,720 | |||||||
| 1 These differences are primarily due to adjustments for net operating losses, foreign currency, and reclassification of dividends. | ||||||||||
| L. | Subsequent Events. In preparing these financial statements, the Funds have evaluated events and transactions for potential recognition or disclosure through the date the financial statements were issued. The Funds have determined that there were no subsequent events that would need to be disclosed in the Funds’ financial statements. |
37
Hodges Mutual Funds
NOTES TO FINANCIAL STATEMENTS March 31, 2021 (Continued) |
| NOTE 3 – COMMITMENTS AND OTHER RELATED PARTY TRANSACTIONS |
The Advisor provides the Funds with investment management services under an Investment Advisory Agreement (the “Advisory Agreement”). Under the Advisory Agreement, the Advisor furnishes all investment advice, office space, certain administrative services, and provides most of the personnel needed by the Funds. As compensation for its services, the Advisor is entitled to a monthly fee at the annual rate of 0.85% for the Hodges Fund, Small Cap Fund, and Small Intrinsic Value Fund, and 0.65% for the Blue Chip Equity Income Fund, based upon the average daily net assets of each Fund. Effective as of September 1, 2020, the Advisor has contractually agreed to lower its management fee in the Hodges Fund and Small Cap Fund from 0.85% to 0.82% until August 31, 2021 (the “Management Fee Waiver”). This contractual waiver may not be terminated without the approval of the Board. The Advisor has waived its right to receive reimbursement of the portion of its advisory fees waived pursuant to the advisory fee waiver agreement. For the year ended March 31, 2021, the advisory fees incurred by the Funds are disclosed in the Statements of Operations. The investment advisory fees incurred are paid monthly to the Advisor, net of any monthly waiver or reimbursement discussed below.
The Funds are responsible for their own operating expenses. The Advisor has contractually agreed to limit Fund expenses (excluding Rule 12b-1 fees) as follows by reducing all or a portion of its fees and reimbursing the Fund expenses so that its ratio of expenses to average net assets will not exceed:
| Hodges Fund | 0.90 | % | ||
| Small Cap Fund Retail Class | 1.12 | % | ||
| Small Intrinsic Value Fund | 1.04 | % | ||
| Blue Chip Equity Income Fund | 1.05 | % |
The expense cap will remain in effect until August 31, 2021. The agreement may be terminated at any time by the Board upon 60 days’ written notice to the Advisor, or by the Advisor with the consent of the Board. Any fees waived and/or any Fund expenses absorbed (excluding any fees waived under the Management Fee Waiver) by the Advisor pursuant to an agreed upon expense cap shall be reimbursed by the respective Fund to the Advisor, if so requested by the Advisor, any time before the end of the third year following the period to which the fee waiver and/or expense absorption relates, provided the aggregate amount of the respective Fund’s current operating expenses for such period does not exceed the lesser expense cap in place at the time of waiver or at the time of reimbursement. Each Fund must pay its current ordinary operating expenses before the Advisor is entitled to any reimbursements of fees and/or expenses. Any such reimbursement is also contingent upon Board’s review and approval. For the year ended March 31, 2021, the amount of fees waived and expenses reimbursed by the Advisor are disclosed in the Statements of Operations. Amounts due from the Advisor are paid monthly to the Funds, if applicable.
At March 31, 2021, the cumulative unreimbursed amount paid and/or waived by the Advisor on behalf of the Hodges Fund, Small Cap Fund, Small Intrinsic Value Fund, and Blue Chip Equity Income Fund that may be recouped was $965,913, $61,633, $376,987, and $164,880, respectively. The Advisor may recapture portions of the above amounts no later than the dates stated below:
| March 31, 2022 | March 31, 2023 | March 31, 2024 | ||||||||||
| Hodges Fund | $ | 350,944 | $ | 312,590 | $ | 302,379 | ||||||
| Small Cap Fund | — | — | 61,633 | |||||||||
| Small Intrinsic Value Fund | 129,739 | 114,621 | 132,627 | |||||||||
| Blue Chip Equity Income Fund | 41,586 | 43,084 | 80,210 | |||||||||
U.S. Bancorp Fund Services, LLC, doing business as U.S. Bank Global Fund Services (“Fund Services”), serves as the Funds’ administrator, fund accountant, and transfer agent. In those capacities, Fund Services maintains the Funds’ books and records, calculates each Fund’s NAV, prepares various federal and state regulatory filings, coordinates the payment of the Funds’ expenses, reviews expense accruals, and prepares materials supplied to the Board. The officers of the Trust and the Chief Compliance Officer are also employees of Fund Services. Fees paid by the Funds to Fund Services for these services for the year ended March 31, 2021, are disclosed in the Statements of Operations.
Quasar Distributors, LLC (the “Distributor”) acts as the Funds’ principal underwriter in a continuous public offering of the Funds’ shares. U.S. Bank N.A. serves as custodian to the Funds. U.S. Bank N.A. is an affiliate of Fund Services.
38
Hodges Mutual Funds
NOTES TO FINANCIAL STATEMENTS March 31, 2021 (Continued) |
Each Fund has adopted a Distribution Plan (the “Plan”) in accordance with Rule 12b-1 under the 1940 Act. The Plan provides that each Fund’s Retail Class may pay a fee to the Distributor at an annual rate of up to 0.25% of the average daily net assets of each Fund. The fee is paid to the Distributor for the sale and distribution of a Fund’s shares and services it provides to shareholders. Fees paid by the Funds to the Distributor for services for the year ended March 31, 2021, are disclosed in the Statements of Operations. For the year ended March 31, 2021, First Dallas Securities, an affiliate of the Advisor, received $93,503, $68,982, $5,998, and $13,892 in distribution fees from the Hodges Fund, Small Cap Fund, Small Intrinsic Value Fund, and Blue Chip Equity Income Fund, respectively.
Each Fund has entered into sub-transfer agent arrangements (the “Arrangements”), for sub-transfer agent fees paid to third-party intermediaries, with respect to each Fund. All Arrangements must be approved by the Board. For the year ended March 31, 2021, sub-transfer agent fees incurred by the Funds are disclosed in the Statements of Operations.
For the year ended March 31, 2021 First Dallas Securities received $654,812, $338,807, $43,216, and $7,420 in brokerage commissions with respect to the Hodges Fund, Small Cap Fund, Small Intrinsic Value Fund, and Blue Chip Equity Income Fund for portfolio transactions, respectively.
| NOTE 4 – PURCHASES AND SALES OF SECURITIES |
The cost of purchases and proceeds from the sale or maturity of securities for the Funds, excluding short-term investments, for the year ended March 31, 2021, were as follows:
| Purchases | Sales | |||||||
| Hodges Fund | $ | 283,256,298 | $ | 277,197,780 | ||||
| Small Cap Fund | 205,035,661 | 245,301,032 | ||||||
| Small Intrinsic Value Fund | 15,483,498 | 13,904,325 | ||||||
| Blue Chip Equity Income Fund | 15,320,372 | 17,971,411 | ||||||
There were no purchases or sales of U.S. Government obligations for any of the Funds for the year ended March 31, 2021.
| NOTE 5 – DISTRIBUTIONS TO SHAREHOLDERS |
The tax character of distributions paid during the year ended March 31, 2021, and the year ended March 31, 2020, for each Fund was as follows:
| Small Cap Fund | March 31, 2021 | March 31, 2020 | ||||||
| Distributions paid from: | ||||||||
Long-term capital gain 1 | $ | — | $ | 27,757,805 | ||||
| Total | $ | — | $ | 27,757,805 | ||||
| Small Intrinsic Value Fund | March 31, 2021 | March 31, 2020 | ||||||
| Distributions paid from: | ||||||||
| Ordinary income | $ | — | $ | 1,809 | ||||
| Total | $ | — | $ | 1,809 | ||||
| Blue Chip Equity Income Fund | March 31, 2021 | March 31, 2020 | ||||||
| Distributions paid from: | ||||||||
Long-term capital gain 1 | $ | 1,067,304 | $ | 1,698,976 | ||||
| Ordinary income | 195,177 | 224,023 | ||||||
| Total | $ | 1,262,481 | $ | 1,922,999 | ||||
1 | Designated as long-term capital gain dividend, pursuant to Internal Revenue Code Section 852(b)(3). |
The Hodges Fund did not pay any distributions during the year ended March 31, 2021 or the year ended March 31, 2020.
39
Hodges Mutual Funds
NOTES TO FINANCIAL STATEMENTS March 31, 2021 (Continued) |
As of March 31, 2021, the components of distributable earnings on a tax basis were as follows 1:
| Hodges Fund | Small Cap Fund | |||||||
| Cost of Investments | $ | 142,987,699 | $ | 133,238,963 | ||||
| Gross tax unrealized appreciation | 76,851,417 | 105,815,690 | ||||||
| Gross tax unrealized depreciation | (10,802,684 | ) | (2,477,121 | ) | ||||
| Net unrealized appreciation | 66,048,733 | 103,338,569 | ||||||
| Undistributed ordinary income | — | 13,561,868 | ||||||
| Undistributed long-term capital gain | — | 12,929,568 | ||||||
| Total distributable earnings | — | 26,491,436 | ||||||
| Other accumulated gains/(losses) | (17,220,305 | ) | — | |||||
| Total accumulated gains | $ | 48,828,428 | $ | 129,830,005 | ||||
| Small Intrinsic | Blue Chip Equity | |||||||
| Value Fund | Income Fund | |||||||
| Cost of Investments | $ | 10,373,282 | $ | 15,978,861 | ||||
| Gross tax unrealized appreciation | 4,928,309 | 10,102,670 | ||||||
| Gross tax unrealized depreciation | (334,233 | ) | (88,140 | ) | ||||
| Net unrealized appreciation | 4,594,076 | 10,014,530 | ||||||
| Undistributed ordinary income | 98,068 | 313,586 | ||||||
| Undistributed long-term capital gain | 117,218 | 554,935 | ||||||
| Total distributable earnings | 215,286 | 868,521 | ||||||
| Other accumulated gains/(losses) | — | — | ||||||
| Total accumulated gains | $ | 4,809,362 | $ | 10,883,051 | ||||
1 | The difference between book basis and tax basis unrealized appreciation was primarily attributable to the treatment of wash sale and straddle adjustments. |
| NOTE 6 – INVESTMENTS IN AFFILIATES |
Affiliated companies are those that are “affiliated persons” as defined in Section 2(a)(3) of the 1940 Act. They include, among other entities, issuers 5% or more of whose outstanding voting shares are held by the Fund (“Affiliated Companies”). For the year ended March 31, 2021, the Funds’ had the following transactions with Affiliated Companies:
Hodges Fund
As of March 31, 2021, the value of all securities of Affiliated Companies held in the Hodges Fund amounted to $10,501,887, representing 5.0% of net assets.
| Share | Change in | |||||||||||||||||||||||||||||||
| Balance | Value | Realized | Unrealized | Value | ||||||||||||||||||||||||||||
| Affiliates | March 31, | March 31, | Acqui- | Dispo- | Gain | Appreciation/ | March 31, | Dividend | ||||||||||||||||||||||||
Common Stocks | 2021 | 2020 | sitions | sitions | (Loss) | Depreciation | 2021 | Income | ||||||||||||||||||||||||
The Dixie Group, Inc. 1 | 1,000,000 | $ | 756,329 | $ | — | $ | (159,607 | ) | $ | (1,051,786 | ) | $ | 3,425,064 | $ | 2,970,000 | $ | — | |||||||||||||||
Luby’s, Inc. 1 | 2,282,390 | 1,235,824 | 703,323 | (116,512 | ) | (351,949 | ) | 6,061,201 | 7,531,887 | — | ||||||||||||||||||||||
Total | $ | (1,403,735 | ) | $ | 9,486,265 | $ | 10,501,887 | $ | — | |||||||||||||||||||||||
Small Intrinsic Value Fund
As of March 31, 2021 the value of all securities of Affiliated Companies held in the Small Intrinsic Value Fund amounted to $118,800, representing 0.7% of net assets.
| Share | Change in | |||||||||||||||||||||||||||||||
| Balance | Value | Realized | Unrealized | Value | ||||||||||||||||||||||||||||
| Affiliates | March 31, | March 31, | Acqui- | Dispo- | Gain | Appreciation/ | March 31, | Dividend | ||||||||||||||||||||||||
Common Stocks | 2021 | 2020 | sitions | sitions | (Loss) | Depreciation | 2021 | Income | ||||||||||||||||||||||||
The Dixie Group, Inc. 1 | 40,000 | $ | 101,518 | $ | — | $ | (390,379 | ) | $ | 194,392 | $ | 213,269 | $ | 118,800 | $ | — | ||||||||||||||||
1 | Non-income producing security. |
40
Hodges Mutual Funds
NOTES TO FINANCIAL STATEMENTS March 31, 2021 (Continued) |
The Funds did not have investments in majority-owned subsidiaries or other controlled companies.
The Small Cap and Blue Chip Equity Income Fund had no transactions with Affiliated Companies during the year ended March 31, 2021.
| NOTE 7 – CREDIT FACILITY |
U.S. Bank N.A. has made available to the Funds credit facilities pursuant to separate Loan and Security Agreements for temporary or extraordinary purposes. Credit facility activity for the year ended March 31, 2021, was as follows:
| Small | Small Intrinsic | Blue Chip Equity | ||||||||||||||
| Hodges Fund | Cap Fund | Value Fund | Income Fund | |||||||||||||
| Maximum available credit | $ | 8,000,000 | $ | 12,000,000 | $ | 600,000 | $ | 2,000,000 | ||||||||
| Largest amount outstanding on an individual day | 799,000 | 1,107,000 | 13,000 | 1,454,000 | ||||||||||||
| Average balance when in use | 392,375 | 477,727 | 8,400 | 166,043 | ||||||||||||
| Credit facility outstanding as of March 31, 2021 | — | — | — | — | ||||||||||||
| Average interest rate when in use | 3.25 | % | 3.25 | % | 3.25 | % | 3.25 | % | ||||||||
Interest expense for the year ended March 31, 2021, is disclosed in the Statements of Operations, as applicable.
41
Hodges Mutual Funds
| REPORT OF INDEPENDENT REGISTERED PUBLIC ACCOUNTING FIRM |
To the Board of Trustees of Professionally Managed Portfolios
and Shareholders of the Hodges Funds
Opinion on the Financial Statements
We have audited the accompanying statements of assets and liabilities of Hodges Fund, Hodges Small Cap Fund, Hodges Small Intrinsic Value Fund, and Hodges Blue Chip Equity Income Fund (the “Funds”), each a series of Professionally Managed Portfolios (the “Trust”), including the schedule of investments, as of March 31, 2021, the related statements of operations for the year then ended, the statements of changes in net assets for each of the two years in the period then ended, the financial highlights for each of the five years in the period then ended, and the related notes (collectively referred to as the “financial statements”). In our opinion, the financial statements present fairly, in all material respects, the financial position of the Funds as of March 31, 2021, the results of their operations for the year then ended, the changes in their net assets for each of the two years in the period then ended, and their financial highlights for each of the five years in the period then ended, in conformity with accounting principles generally accepted in the United States of America.
Basis for Opinion
These financial statements are the responsibility of the Funds’ management. Our responsibility is to express an opinion on the Funds’ financial statements based on our audits. We are a public accounting firm registered with the Public Company Accounting Oversight Board (United States) (“PCAOB”) and are required to be independent with respect to the Funds in accordance with the U.S. federal securities laws and the applicable rules and regulations of the Securities and Exchange Commission and the PCAOB. We have served as the auditor of one or more of the funds in the Trust since 1995.
We conducted our audits in accordance with the standards of the PCAOB. Those standards require that we plan and perform the audits to obtain reasonable assurance about whether the financial statements are free of material misstatement, whether due to error or fraud. The Funds are not required to have, nor were we engaged to perform, an audit of the Funds’ internal control over financial reporting. As part of our audits we are required to obtain an understanding of internal control over financial reporting, but not for the purpose of expressing an opinion on the effectiveness of the Funds’ internal control over financial reporting. Accordingly, we express no such opinion.
Our audits included performing procedures to assess the risks of material misstatement of the financial statements, whether due to error or fraud, and performing procedures that respond to those risks. Such procedures included examining, on a test basis, evidence regarding the amounts and disclosures in the financial statements. Our audits also included evaluating the accounting principles used and significant estimates made by management, as well as evaluating the overall presentation of the financial statements. Our procedures included confirmation of securities owned as of March 31, 2021 by correspondence with the custodian and brokers; when replies were not received from brokers, we performed other auditing procedures. We believe that our audits provide a reasonable basis for our opinion.
TAIT, WELLER & BAKER LLP
Philadelphia, Pennsylvania
June 1, 2021
42
Hodges Mutual Funds
EXPENSE EXAMPLES For the Six Months Ended March 31, 2021 (Unaudited) |
As a shareholder of the Funds, you incur two types of costs: (1) transaction costs and (2) ongoing costs, including investment advisory fees, distribution fees, and other Fund expenses. The examples are intended to help you understand your ongoing costs (in dollars) of investing in the Funds and to compare these costs with the ongoing costs of investing in other mutual funds. The examples are based on an investment of $1,000 invested at the beginning of the period and held for the entire period (10/1/20-3/31/21).
Actual Expenses
The “Actual” lines of the following tables provide information about actual account values based on actual returns and actual expenses. Although the Funds charge no sales loads, you will be assessed fees for outgoing wire transfers, returned checks and stop payment orders at prevailing rates charged by Fund Services, the Funds’ transfer agent. If you request that a redemption be made by wire transfer, currently a $15 fee is charged by Fund Services. You will be charged a redemption fee equal to 1% of the net amount of the redemption if you redeem shares within 30 calendar days after you purchase them for the Hodges Fund Retail Class, Small Cap Fund Retail Class, Small Intrinsic Value Fund, and Blue Chip Equity Income Fund. You will be charged a redemption fee equal to 1% of the net amount of the redemption if you redeem shares within 60 calendar days after you purchase them for the Institutional Class of the Small Cap Fund. An Individual Retirement Account will be charged an annual maintenance fee. To the extent the Funds invest in shares of other investment companies as part of their investment strategy, you will indirectly bear your proportionate share of any fees and expenses charged by the underlying funds in which the Funds invest in addition to the expenses of the Funds. Actual expenses of the underlying funds may vary. These expenses are not included in the following examples. The following examples include, but are not limited to, investment advisory fees, fund accounting fees, administration fees, custody fees, and transfer agent fees. However, the following examples do not include portfolio trading commissions and related expenses. You may use the information in this line, together with the amount you invested, to estimate the expenses that you paid over the period. Simply divide your account value by $1,000 (for example, an $8,600 account value divided by $1,000 = 8.6), then multiply the result by the number in the first line under the heading titled, “Expenses Paid During the Period” to estimate the expenses you paid on your account during this period.
Hypothetical Examples for Comparison Purposes
The “Hypothetical” lines of the following tables provide information about hypothetical account values and hypothetical expenses based on the Funds’ actual expense ratios and an assumed rate of return of 5% per year before expenses, which are not the Funds’ actual returns. The hypothetical account values and expenses may not be used to estimate the actual ending account balance or expenses you paid for the period. You may use this information to compare the ongoing costs of investing in each Fund and other funds. To do so, compare this 5% hypothetical example with the 5% hypothetical examples that appear in the shareholder reports of the other funds. Please note that the expenses shown in the table are meant to highlight your ongoing costs only and do not reflect any transaction costs, such as redemption fees. Therefore, the hypothetical lines of the tables are useful in comparing ongoing costs only and will not help you determine the relative total costs of owning different funds. In addition, if these transaction costs were included, your costs would have been higher.
Hodges Fund
| Beginning | Ending | Expenses Paid | |
| Account Value | Account Value | During the Period 1 | |
10/1/20 | 3/31/21 | 10/1/20 – 3/31/21 | |
| HDPMX: | |||
| Actual | $1,000.00 | $1,571.00 | $7.37 |
| Hypothetical (5% annual return before expenses) | 1,000.00 | 1,019.20 | 5.79 |
1 | Expenses are equal to the expense ratio for the most recent six-month period of 1.15% (fee waivers in effect) multiplied by the average account value over the period multiplied by 182/365 (to reflect the one-half year period). |
43
Hodges Mutual Funds
EXPENSE EXAMPLES For the Six Months Ended March 31, 2021 (Unaudited) |
Small Cap Fund
| Beginning | Ending | Expenses Paid | |
| Account Value | Account Value | During the Period 2 | |
10/1/20 | 3/31/21 | 10/1/20 – 3/31/21 | |
| HDPSX: | |||
| Retail Class Actual | $1,000.00 | $1,687.60 | $8.78 |
| Retail Class Hypothetical (5% annual return before expenses) | 1,000.00 | 1,018.40 | 6.59 |
| HDSIX: | |||
| Institutional Class Actual | 1,000.00 | 1,690.20 | 7.11 |
| Institutional Class Hypothetical (5% annual return before expenses) | 1,000.00 | 1,019.65 | |
2 | Expenses are equal to the expense ratio for the most recent six-month period of 1.31% for the Retail Class, and 1.06% for the Institutional Class (fee waivers in effect), multiplied by the average account value over the period multiplied by 182/365 (to reflect the one-half year period). |
Small Intrinsic Value Fund
| Beginning | Ending | Expenses Paid | |
| Account Value | Account Value | During the Period 3 | |
10/1/20 | 3/31/21 | 10/1/20 – 3/31/21 | |
| HDSVX: | |||
| Actual | $1,000.00 | $1,635.80 | $8.48 |
| Hypothetical (5% annual return before expenses) | 1,000.00 | 1,018.55 | 6.49 |
3 | Expenses are equal to the expense ratio for the most recent six-month period of 1.29% (fee waivers in effect) multiplied by the average account value over the period multiplied by 182/365 (to reflect the one-half year period). |
Blue Chip Equity Income Fund
| Beginning | Ending | Expenses Paid | |
| Account Value | Account Value | During the Period 4 | |
10/1/20 | 3/31/21 | 10/1/20 – 3/31/21 | |
| HDPBX: | |||
| Actual | $1,000.00 | $1,130.30 | $6.90 |
| Hypothetical (5% annual return before expenses) | 1,000.00 | 1,018.45 | 6.54 |
4 | Expenses are equal to the expense ratio for the most recent six-month period of 1.30% (fee waivers in effect) multiplied by the average account value over the period multiplied by 182/365 (to reflect the one-half year period). |
44
Hodges Mutual Funds
TRUSTEES AND EXECUTIVE OFFICERS (Unaudited) |
The Board is responsible for the overall management of the Trust, including general supervision and review of the investment activities of the Funds. The Board, in turn, elects the officers of the Trust, who are responsible for the day-to-day operations of the Trust and its separate series. The current Trustees and executive officers of the Trust, their birth dates, positions with the Trust, terms of office with the Trust and length of time served, their principal occupations during the past five years and other directorships are set forth in the table below.
| Number of | |||||
| Portfolios | |||||
| Term of | in Fund | Other | |||
| Positions | Office (2) and | Complex (3) | Directorships | ||
| Name, | with the | Length of | Principal Occupation | Overseen | Held During |
Address and Age | Trust (1) | Time Served | During Past Five Years | by Trustees | Past Five Years |
| Independent Trustees of the Trust | |||||
| Kathleen T. Barr | Trustee | Indefinite | Former owner of a registered investment adviser, | 4 | Independent |
| (born 1955) | Term; Since | Productive Capital Management, Inc.; formerly, | Director, Muzinich | ||
| c/o U.S. Bank Global | November | Chief Administrative Officer, Senior Vice President | BDC, Inc. | ||
| Fund Services | 2018. | and Senior Managing Director of Allegiant Asset | (2019 to present); | ||
| 2020 E. Financial Way | Management Company (merged with PNC Capital | Independent | |||
| Suite 100 | Advisors, LLC in 2009) ; formerly, Chief | Trustee for the | |||
| Glendora, CA 91741 | Administrative Officer, Chief Compliance Officer | William Blair | |||
| and Senior Vice President of PNC Funds and | Funds (2013 | ||||
| PNC Advantage Funds (f/k/a Allegiant Funds) | to present) | ||||
| (registered investment companies). | (21 series); | ||||
| Independent | |||||
| Trustee for the | |||||
| AmericaFirst | |||||
| Quantitative | |||||
| Funds (2012 | |||||
| to 2016). | |||||
| Wallace L. Cook | Trustee | Indefinite | Investment Consultant; formerly, Chief Executive | 4 | Trustee, The Dana |
| (born 1939) | Term; Since | Officer, Rockefeller Trust Co., (prior thereto Senior | Foundation. | ||
| c/o U.S. Bank Global | May 1991. | Vice President), and Managing Director, Rockefeller | |||
| Fund Services | & Co. (Investment Manager and Financial Advisor); | ||||
| 2020 E. Financial Way | formerly, Senior Vice President, Norton Simon, Inc. | ||||
| Suite 100 | (international consumer products conglomerate). | ||||
| Glendora, CA 91741 | |||||
| Eric W. Falkeis | Trustee | Indefinite | Chief Executive Officer, Tidal ETF Services LLC | 4 | Independent |
| (born 1973) | Term; Since | (2018 to present); formerly, Chief Operating Officer, | Director, Muzinich | ||
| c/o U.S. Bank Global | September | Direxion Funds (2013 to 2018); formerly, Senior Vice | BDC, Inc. | ||
| Fund Services | 2011. | President and Chief Financial Officer (and other | (2019 to present); | ||
| 2020 E. Financial Way | Chairperson | Indefinite | positions), U.S. Bancorp Fund Services, LLC | Interested Trustee, | |
| Suite 100 | Term; Since | (1997 to 2013). | Tidal ETF Trust | ||
| Glendora, CA 91741 | August 2019. | (2018 to present) | |||
| (21 series); Former | |||||
| Interested Trustee, | |||||
| Direxion Funds | |||||
| (22 series), | |||||
| Direxion Shares | |||||
| ETF Trust | |||||
| (112 series) and | |||||
| Direxion | |||||
| Insurance Trust | |||||
| (2013 to 2018). | |||||
45
Hodges Mutual Funds
TRUSTEES AND EXECUTIVE OFFICERS (Unaudited) (Continued) |
| Number of | |||||
| Portfolios | |||||
| Term of | in Fund | Other | |||
| Positions | Office (2) and | Complex (3) | Directorships | ||
| Name, | with the | Length of | Principal Occupation | Overseen | Held During |
Address and Age | Trust (1) | Time Served | During Past Five Years | by Trustees | Past Five Years |
| Carl A. Froebel | Trustee | Indefinite | Formerly, President and Founder, National | 4 | None. |
| (born 1938) | Term; Since | Investor Data Services, Inc. (investment | |||
| c/o U.S. Bank Global | May 1991. | related computer software). | |||
| Fund Services | |||||
| 2020 E. Financial Way | |||||
| Suite 100 | |||||
| Glendora, CA 91741 | |||||
| Steven J. Paggioli | Trustee | Indefinite | Consultant; formerly, Executive Vice President, | 4 | Independent |
| (born 1950) | Term; Since | Investment Company Administration, LLC | Director, Muzinich | ||
| c/o U.S. Bank Global | May 1991. | (mutual fund administrator). | BDC, Inc. | ||
| Fund Services | (2019 to present); | ||||
| 2020 E. Financial Way | Independent | ||||
| Suite 100 | Trustee, AMG | ||||
| Glendora, CA 91741 | Funds (1993 | ||||
| to present) | |||||
| (49 series); | |||||
| Advisory Board | |||||
| Member, | |||||
| Sustainable | |||||
| Growth | |||||
| Advisers, LP. | |||||
| Ashi S. Parikh | Trustee | Indefinite | Investment professional; formerly, Chief | 4 | Board of Directors |
| (born 1966) | Term; Since | Executive and Chief Investment Officer and | Member, | ||
| c/o U.S. Bank Global | June 2020. | various other positions, RidgeWorth Investments, | Investment | ||
| Fund Services | LLC (global investment management firm) | Working Group, | |||
| 2020 E. Financial Way | (2006 to 2017); formerly, Chief Investment | The Ohio State | |||
| Suite 100 | Officer Institutional Growth Equities, Eagle | University | |||
| Glendora, CA 91741 | Asset Management (financial advisor); formerly | Endowments and | |||
| Sr. Managing Director, Growth Equities, Banc | Foundation (2016 | ||||
| One Investment Advisors (financial advisor). | to present); Board | ||||
| of Directors, | |||||
| World Methodist | |||||
| Council, | |||||
| Investment | |||||
| Committee (2018 | |||||
| to present). | |||||
| Independent | |||||
| Trustee, PNC | |||||
| Funds (2018 to | |||||
| 2019) (32 series); | |||||
| Interested Trustee, | |||||
| RidgeWorth Funds | |||||
| (2014 to 2017) | |||||
| (35 series). |
46
Hodges Mutual Funds
TRUSTEES AND EXECUTIVE OFFICERS (Unaudited) (Continued) |
Number of | |||||
Portfolios | |||||
Term of | in Fund | Other | |||
Positions | Office (2) and | Complex (3) | Directorships | ||
Name, | with the | Length of | Principal Occupation | Overseen | Held During |
Address and Age | Trust (1) | Time Served | During Past Five Years | by Trustees | Past Five Years |
| Officers of the Trust | |||||
Elaine E. Richards | President | Indefinite | Senior Vice President, U.S. Bank Global | Not | Not |
(born 1968) | Term; Since | Fund Services since July 2007. | Applicable. | Applicable. | |
c/o U.S. Bank Global | March 2013. | ||||
Fund Services | |||||
2020 E. Financial Way | |||||
Suite 100 | |||||
Glendora, CA 91741 | |||||
Carl G. Gee, J.D. | Secretary | Indefinite | Assistant Vice President, U.S. Bank Global | Not | Not |
(born 1990) | & Vice | Term; Since | Fund Services since August 2016; Summer | Applicable. | Applicable. |
c/o U.S. Bank Global | President | February | Associate, Husch Blackwell LLP (2015); Law | ||
Fund Services | 2021. | Clerk, Brady Corporation (global printing | |||
615 East Michigan St. | systems, labels and safety products company) | ||||
Milwaukee, WI 53202 | (2014 to 2015). | ||||
Aaron J. Perkovich | Vice | Indefinite | Vice President, U.S. Bank Global Fund | Not | Not |
(born 1973) | President | Term; Since | Services since June 2006. | Applicable. | Applicable. |
c/o U.S. Bank Global | March 2017. | ||||
Fund Services | Treasurer | Indefinite | |||
615 East Michigan St. | Term; Since | ||||
Milwaukee, WI 53202 | August 2016. | ||||
Melissa Breitzman | Assistant | Indefinite | Assistant Vice President, U.S. Bank Global | Not | Not |
(born 1983) | Treasurer | Term; Since | Fund Services LLC since June 2005. | Applicable. | Applicable. |
c/o U.S. Bank Global | August 2016. | ||||
Fund Services | |||||
615 East Michigan St. | |||||
Milwaukee, WI 53202 | |||||
Craig Benton | Assistant | Indefinite | Assistant Vice President, U.S. Bank Global | Not | Not |
(born 1985) | Treasurer | Term; Since | Fund Services since November 2007. | Applicable. | Applicable. |
c/o U.S. Bank Global | August 2016. | ||||
Fund Services | |||||
615 East Michigan St. | |||||
Milwaukee, WI 53202 | |||||
Cory Akers | Assistant | Indefinite | Assistant Vice President, U.S. Bank Global | Not | Not |
(born 1978) | Treasurer | Term; Since | Fund Services since October 2006. | Applicable. | Applicable. |
c/o U.S. Bank Global | August 2017. | ||||
Fund Services | |||||
615 East Michigan St. | |||||
Milwaukee, WI 53202 | |||||
47
Hodges Mutual Funds
TRUSTEES AND EXECUTIVE OFFICERS (Unaudited) (Continued) |
Number of | |||||
Portfolios | |||||
Term of | in Fund | Other | |||
Positions | Office (2) and | Complex (3) | Directorships | ||
Name, | with the | Length of | Principal Occupation | Overseen | Held During |
Address and Age | Trust (1) | Time Served | During Past Five Years | by Trustees | Past Five Years |
Donna Barrette | Chief | Indefinite | Senior Vice President and Compliance | Not | Not |
(born 1966) | Compliance | Term; Since | Officer, U.S. Bank Global Fund Services | Applicable. | Applicable. |
c/o U.S. Bank Global | Officer | July 2011. | since August 2004. | ||
Fund Services | Anti-Money | ||||
615 East Michigan St. | Laundering | ||||
Milwaukee, WI 53202 | Officer | ||||
Vice | |||||
President |
(1) | All Trustees of the Trust are not “interested persons” of the Trust as defined under the 1940 Act (“Independent Trustees”). |
(2) | Under the terms of the Board’s retirement policy, a Trustee shall retire at the end of the calendar year in which he or she reaches the age of 78 (or, in the case of a Trustee who was over the age of 78 at the time the retirement policy was adopted in 2019, December 31, 2021). |
(3) | The Trust is comprised of numerous series managed by unaffiliated investment advisers. The term “Fund Complex” applies only to the Funds. The Funds do not hold themselves out as related to any other series within the Trust for purposes of investment and investor services, nor do they share the same investment advisor with any other series. |
48
Hodges Mutual Funds
QUALIFIED DIVIDEND INCOME, DIVIDENDS RECEIVED DEDUCTION (Unaudited) |
For the year ended March 31, 2021, certain dividends paid by the Funds may be subject to a maximum tax rate of 20%, as provided for by the Jobs and Growth Tax Relief Reconciliation Act of 2003 and the Tax Cuts and Jobs Act of 2017. The percentage of dividends declared from ordinary income designated as qualified dividend income was as follows:
| Hodges Fund | 0.00 | % | ||
| Small Cap Fund | 0.00 | % | ||
| Small Intrinsic Value Fund | 0.00 | % | ||
| Blue Chip Equity Income Fund | 92.91 | % |
For corporate shareholders, the percent of ordinary income distributions qualifying for the corporate dividends received deduction for the year ended March 31, 2021, was as follows:
| Hodges Fund | 0.00 | % | ||
| Small Cap Fund | 0.00 | % | ||
| Small Intrinsic Value Fund | 0.00 | % | ||
| Blue Chip Equity Income Fund | 92.91 | % |
The percentage of taxable ordinary income distributions that are designated as short-term capital gain distributions under Internal Revenue Section 871 (k)(2)(C) for the year ended March 31, 2021, was as follows:
| Hodges Fund | 0.00 | % | ||
| Small Cap Fund | 0.00 | % | ||
| Small Intrinsic Value Fund | 0.00 | % | ||
| Blue Chip Equity Income Fund | 0.00 | % |
49
Hodges Mutual Funds
INFORMATION ABOUT PROXY VOTING (Unaudited) |
A description of the polices and procedures that the Funds use to determine how to vote proxies relating to portfolio securities is available without charge, upon request, by calling (866) 811-0224. Furthermore, you can obtain the description on the SEC’s website at www.sec.gov.
Information regarding how the Funds voted proxies relating to portfolio securities during the most recent 12-month period ended June 30 is available without charge, upon request, by calling (866) 811-0224. Furthermore, you can obtain the Funds’ proxy voting records on the SEC’s website at www.sec.gov.
INFORMATION ABOUT THE PORTFOLIO HOLDINGS (Unaudited) |
The Funds’ quarterly holdings for the most recent fiscal year can be obtained by accessing the Funds’ website at www.hodgesfunds.com. The Funds file their complete schedule of portfolio holdings with the SEC for the first and third quarters of each fiscal year as an exhibit to their reports on Form N-PORT. The Funds’ Form N -PORT reports are available on the SEC’s website at www.sec.gov. The Funds’ Form N-PORT may also be obtained by calling (866) 811-0224.
INFORMATION ABOUT HOUSEHOLDING (Unaudited) |
Each year, you are automatically sent an updated prospectus as well as annual and semi-annual reports for the Funds, if applicable. In an effort to decrease costs, the Funds intend to reduce the number of duplicate prospectuses, proxy statements, and annual and semi-annual reports you receive by sending only one copy of each to those addresses shared by two or more accounts and to shareholders we reasonably believe are from the same family or household. Once implemented, if you would like to discontinue householding for your accounts, please call toll-free at (866) 811-0224 to request individual copies of these documents. Once the Funds receive notice to stop householding, we will begin sending individual copies thirty days after receiving your request. This policy does not apply to account statements.
INFORMATION ABOUT THE FUNDS’ TRUSTEES (Unaudited) |
The Statement of Additional Information (“SAI”) includes additional information about the Funds’ Trustees and is available without charge, upon request, by calling (866) 811-0224. Furthermore, you can obtain the SAI on the SEC’s web site at www.sec.gov or the Funds’ web site at www.hodgesfunds.com.
50
Hodges Mutual Funds
PRIVACY NOTICE (Unaudited) |
The Funds collect non-public personal information about you from the following sources:
| • | Information we receive about you on applications or other forms; |
| • | Information you give us verbally; and/or |
| • | Information about your transactions with us or others. |
We do not disclose any non-public personal information about our shareholders or former shareholders without the shareholder’s authorization, except as permitted by law or in response to inquiries from governmental authorities. We may share information with affiliated parties and unaffiliated third parties with whom we have contracts for servicing the Funds. We will provide unaffiliated third parties with only the information necessary to carry out their assigned responsibilities. All shareholder records will be disposed of in accordance with applicable law. We maintain physical, electronic and procedural safeguards to protect your non-public personal information and require third parties to treat your non-public personal information with the same high degree of confidentiality.
In the event that you hold shares of a Fund through a financial intermediary, including, but not limited to, a broker-dealer, bank or trust company, the privacy policy of your financial intermediary would govern how your non-public personal information would be shared with unaffiliated third parties.
51
(This Page Intentionally Left Blank.)
ANNUAL REPORT • MARCH 31, 2021 |
| Retail Class | Institutional Class | |||
| Fund | Shares | Shares | ||
| Hodges Fund | ||||
| Ticker Symbol | HDPMX | N/A | ||
| CUSIP | 742935109 | N/A | ||
| Small Cap Fund | ||||
| Ticker Symbol | HDPSX | HDSIX | ||
| CUSIP | 742935299 | 742935224 | ||
| Small Intrinsic Value Fund | ||||
| Ticker Symbol | HDSVX | N/A | ||
| CUSIP | 74316J318 | N/A | ||
| Blue Chip Equity Income Fund | ||||
| Ticker Symbol | HDPBX | N/A | ||
| CUSIP | 742935174 | N/A |
HODGES MUTUAL FUNDS
www.hodgesfunds.com | (866) 811-0224
INVESTMENT ADVISOR
HODGES CAPITAL MANAGEMENT, INC.
2905 Maple Avenue, Dallas, Texas 75201 | (888) 878-4426 | www.hodgescapital.com
CUSTODIAN
U.S. BANK N.A.
1555 N. RiverCenter Drive, Suite 302, Milwaukee,Wisconsin 53212
TRANSFER AGENT
U.S. BANCORP FUND SERVICES, LLC
P.O. Box 701, Milwaukee,Wisconsin 53201-0701 | (866) 811-0224
DISTRIBUTOR
QUASAR DISTRIBUTORS, LLC
111 East Kilbourn Avenue, Suite 2200, Milwaukee,Wisconsin 53202
INDEPENDENT REGISTERED PUBLIC ACCOUNTING FIRM
TAIT, WELLER & BAKER LLP
50 South 16th Street, Suite 2900, Philadelphia, Pennsylvania 19102
LEGAL COUNSEL
SULLIVAN & WORCESTER LLP
1633 Broadway, 32nd Floor, New York, New York 10019
| (b) | Not applicable. |
Item 2. Code of Ethics.
The registrant has adopted a code of ethics that applies to the registrant’s principal executive officer and principal financial officer. The registrant has not made any amendments to its code of ethics during the period covered by this report. The registrant has not granted any waivers from any provisions of the code of ethics during the period covered by this report.
A copy of the registrant’s Code of Ethics is filed herewith.
Item 3. Audit Committee Financial Expert.
The registrant’s Board of Trustees of the Trust has determined that there is at least one audit committee financial expert serving on its audit committee. Ms. Kathleen T. Barr and Messrs. Wallace L. Cook, Carl A. Froebel, Eric W. Falkeis, Steven J. Paggioli, and Ashi S. Parikh are each an “audit committee financial expert” and are considered to be “independent” as each term is defined in Item 3 of Form N-CSR.
Item 4. Principal Accountant Fees and Services.
The registrant has engaged its principal accountant to perform audit services, audit-related services, tax services and other services during the past two fiscal years. “Audit services” refer to performing an audit of the registrant's annual financial statements or services that are normally provided by the accountant in connection with statutory and regulatory filings or engagements for those fiscal years. “Audit-related services” refer to the assurance and related services by the principal accountant that are reasonably related to the performance of the audit. “Tax services” refer to professional services rendered by the principal accountant for tax compliance, tax advice, and tax planning. There were no “Other services” provided by the principal accountant. The following tables detail the aggregate fees billed or expected to be billed for each of the last two fiscal years for audit fees, audit-related fees, tax fees and other fees by the principal accountant.
Hodges Fund
| FYE 3/31/2021 | FYE 3/31/2020 | |
Audit Fees | $18,500 | $23,100 |
Audit-Related Fees | N/A | N/A |
Tax Fees | $2,700 | $2,700 |
All Other Fees | N/A | N/A |
Hodges Small Cap Fund
| FYE 3/31/2021 | FYE 3/31/2020 | |
Audit Fees | $18,500 | $23,100 |
Audit-Related Fees | N/A | N/A |
Tax Fees | $2,700 | $2,700 |
All Other Fees | N/A | N/A |
Hodges Blue Chip Equity Income Fund
| FYE 3/31/2021 | FYE 3/31/2020 | |
Audit Fees | $18,500 | $21,100 |
Audit-Related Fees | N/A | N/A |
Tax Fees | $2,700 | $2,700 |
All Other Fees | N/A | N/A |
Hodges Small Intrinsic Value Fund
| FYE 3/31/2021 | FYE 3/31/2020 | |
Audit Fees | $18,500 | $21,100 |
Audit-Related Fees | N/A | N/A |
Tax Fees | $2,700 | $2,700 |
All Other Fees | N/A | N/A |
The audit committee has adopted pre-approval policies and procedures that require the audit committee to pre‑approve all audit and non‑audit services of the registrant, including services provided to any entity affiliated with the registrant.
The percentages of fees billed by Tait, Weller & Baker LLP applicable to non-audit services pursuant to waiver of pre-approval requirement were as follows:
| FYE 3/31/2021 | FYE 3/31/2020 | |
| Audit-Related Fees | 0% | 0% |
| Tax Fees | 0% | 0% |
| All Other Fees | 0% | 0% |
All of the principal accountant’s hours spent on auditing the registrant’s financial statements were attributed to work performed by full‑time permanent employees of the principal accountant.
The following table indicates the non-audit fees billed or expected to be billed by the registrant’s accountant for services to the registrant and to the registrant’s investment advisor (and any other controlling entity, etc.—not sub-advisor) for the last two years. The audit committee of the board of trustees has considered whether the provision of non-audit services that were rendered to the registrant's investment advisor is compatible with maintaining the principal accountant's independence and has concluded that the provision of such non-audit services by the accountant has not compromised the accountant’s independence.
Non-Audit Related Fees | FYE 3/31/2021 | FYE 3/31/2020 |
Registrant | N/A | N/A |
Registrant’s Investment Advisor | N/A | N/A |
The registrant has not been identified by the U.S. Securities and Exchange Commission as having filed an annual report issued by a registered public accounting firm branch or office that is located in a foreign jurisdiction where the Public Company Accounting Oversight Board is unable to inspect or completely investigate because of a position taken by an authority in that jurisdiction.
The registrant is not a foreign issuer.
Item 5. Audit Committee of Listed Registrants.
Not applicable to registrants who are not listed issuers (as defined in Rule 10A-3 under the Securities Exchange Act of 1934).
Item 6. Investments.
Schedule of Investments is included as part of the report to shareholders filed under Item 1 of this Form.
Item 7. Disclosure of Proxy Voting Policies and Procedures for Closed-End Management Investment Companies.
Not applicable to open-end investment companies.
Item 8. Portfolio Managers of Closed-End Management Investment Companies.
Not applicable to open-end investment companies.
Item 9. Purchases of Equity Securities by Closed‑End Management Investment Company and Affiliated Purchasers.
Not applicable to open-end investment companies.
Item 10. Submission of Matters to a Vote of Security Holders.
The registrant has adopted a nominating committee charter that contains the procedures by which shareholders may recommend nominees to the registrant’s board of trustees. There have been no material changes to the procedures by which shareholders may recommend nominees to the registrant’s board of trustees for the period.
Item 11. Controls and Procedures.
(a) | The Registrant’s Principal Executive Officer and Principal Financial Officer have reviewed the Registrant's disclosure controls and procedures (as defined in Rule 30a-3(c) under the Investment Company Act of 1940 (the “Act”)) as of a date within 90 days of the filing of this report, as required by Rule 30a-3(b) under the Act and Rules 13a-15(b) or 15d‑15(b) under the Securities Exchange Act of 1934. Based on their review, such officers have concluded that the disclosure controls and procedures are effective in ensuring that information required to be disclosed in this report is appropriately recorded, processed, summarized and reported and made known to them by others within the Registrant and by the Registrant’s service provider. |
(b) | There were no changes in the Registrant's internal control over financial reporting (as defined in Rule 30a-3(d) under the Act) that occurred during the period covered by this report that has materially affected, or is reasonably likely to materially affect, the Registrant's internal control over financial reporting. |
Item 12. Disclosure of Securities Lending Activities for Closed-End Management Investment Companies.
Not applicable to open-end investment companies.
Item 13. Exhibits.
(3) Any written solicitation to purchase securities under Rule 23c‑1 under the Act sent or given during the period covered by the report by or on behalf of the registrant to 10 or more persons. Not applicable to open-end investment companies.
(4) Change in the registrant’s independent public accountant. There was no change in the registrant’s independent public accountant for the period covered by this report.
SIGNATURES
Pursuant to the requirements of the Securities Exchange Act of 1934 and the Investment Company Act of 1940, the registrant has duly caused this report to be signed on its behalf by the undersigned, thereunto duly authorized.
(Registrant) Professionally Managed Portfolios
By (Signature and Title) /s/ Elaine E. Richards
Elaine E. Richards, President/Principal Executive Officer
Date June 8, 2021
Pursuant to the requirements of the Securities Exchange Act of 1934 and the Investment Company Act of 1940, this report has been signed below by the following persons on behalf of the registrant and in the capacities and on the dates indicated.
By (Signature and Title) /s/ Elaine E. Richards
Elaine E. Richards, President/Principal Executive Officer
Date June 8, 2021
By (Signature and Title) /s/ Aaron J. Perkovich
Aaron J. Perkovich, Treasurer/Principal Financial Officer
Date June 8, 2021
* Print the name and title of each signing officer under his or her signature.