UNITED STATES
SECURITIES AND EXCHANGE COMMISSION
Washington, D.C. 20549
FORM N-CSR
CERTIFIED SHAREHOLDER REPORT OF REGISTERED
MANAGEMENT INVESTMENT COMPANIES
Investment Company Act file number (811-05037)
Professionally Managed Portfolios
(Exact name of registrant as specified in charter)
615 East Michigan Street
Milwaukee, WI 53202
(Address of principal executive offices) (Zip code)
Jason Hadler
Professionally Managed Portfolios
c/o U.S. Bank Global Fund Services
777 E. Wisconsin Avenue
Milwaukee, WI 53202
(Name and address of agent for service)
(414) 516-1523
Registrant's telephone number, including area code
Date of fiscal year end: March 31
Date of reporting period: September 30, 2022
Item 1. Report to Stockholders.
SEMI-ANNUAL REPORT • SEPTEMBER 30, 2022 |
Hodges Fund
Small Cap Fund
Small Intrinsic Value Fund
Blue Chip Equity Income Fund
www.hodgesfunds.com
Hodges Capital — Managing Equity Funds Since 1992
Table of Contents
| Shareholder Letter | | | 1 |
| | | | |
| Sector Allocations | | | 8 |
| | | | |
| Schedules of Investments | | | 10 |
| | | | |
| Statements of Assets and Liabilities | | | 15 |
| | | | |
| Statements of Operations | | | 16 |
| | | | |
| Statements of Changes in Net Assets | | | 17 |
| | | | |
| Financial Highlights | | | 21 |
| | | | |
| Notes to Financial Statements | | | 26 |
| | | | |
| Expense Examples | | | 34 |
| | | | |
| Statement Regarding Liquidity Risk Management Program | | | 36 |
| | | | |
| Approval of Investment Advisory Agreement | | | 37 |
| | | | |
| Additional Information | | | 40 |
| | | | |
| Privacy Notice | | | 41 |
Hodges Mutual Funds
Dear Board of Directors:
U.S. stocks experienced a dramatic sell-off over the past six months, as global economic uncertainty arose from inflationary pressures and the Fed hiked interest rates at the fastest pace in forty years. As a result, PE multiples further contracted to adjust to the reality of higher interest rates and slower earnings growth. The S&P 500 Index posted a loss of 20.20% in the six months ending September 30, 2022, resulting in a one-year decline of 15.47%. While the recent turbulence in financial markets has been unsettling, three of the four Hodges Mutual Funds outperformed their respective benchmarks over the past six months. While our portfolios remain laser-focused on fundamental investing and individual stock selection, there were few places to hide in the recent quarter as just about every asset class saw the effects of a broad repricing of most risk assets.
As we size up the recent turmoil in financial markets, investors face a wall of uncertainty regarding the trajectory of interest rates and the prospects for changing economic conditions in 2023. Further uncertainty exists from geopolitical unrest, the reliability of global supply chains, and the upcoming midterm elections. In our opinion, the recent sell-off has priced a slowdown in the global economy next year and an appropriate contraction in PE multiples relative to current interest rates. According to the most recent data published by FactSet, the S&P 500 is trading at approximately 15.4X forward earnings estimates compared to 21.2X at the beginning of the year and the five-year average of 18.6X. Although PE multiples have contracted, the inverse of the S&P 500 quarter-end PE multiple reflected an earnings yield of 6.49%, which was still well above the 10-year Treasury yield of 3.83% as of September 30, 2022. The big macro questions are now; how much will the global economy slow next year, and to what degree will it drag on corporate earnings and cash flow? Recent discussions that our investment team has had with public company management teams over the past months suggest earnings for most have held up in the September quarter but visibility over the next couple of quarters is mixed and less certain. However, not every economic slowdown looks the same, and not every business will be affected the same by potential macro headwinds. In this environment, we believe active portfolio management becomes essential to navigate quickly changing business conditions across many sectors. Furthermore, prevailing inflation, a slowdown in the economy, and higher interest rates favored stocks with solid balance sheets whose underlying assets can produce stable cash flow and earnings. Although the market is pricing in a more challenging macro environment for earnings in the balance of the year, we still see a favorable risk/reward in stocks that have the staying power to deal with volatile commodity prices and curtailed discretionary spending. Challenging macro conditions and the recent sell-off in stock prices will likely result in new sector leadership in the months ahead. With this in mind, the Hodges Capital Management investment team has positioned our portfolios to benefit from shifting economic trends and secular and structural changes across different industries.
We spend little time predicting short-term fluctuations in interest rates, foreign currencies, or commodity prices. However, we pay close attention to how prices and, more importantly, the pricing power that our portfolio companies exhibit within the goods and services they produce. For many businesses, inflation and a slowdown in demand could adversely impact profit margins and revenues in the months ahead. Companies that exhibit pricing power and a low threat from substitute products can often pass on higher costs and see profit margins benefit from an inflationary environment. As a result, we are overweighting our portfolios with growth and value stocks that we believe can create shareholder value despite challenging macro conditions.
As we enter the final quarter of 2022, we are reminded of an old Peter Lynch quote; “The key to making money in stocks is not to get scared out of them.” As we attempt to capitalize on the recent sell-off, there is no shortage of scary prevailing macro headlines and economic uncertainty. What we know for sure is what we do not know. We do not know the day that the bear market will bottom, the peak level of interest rates, or the severity of an economic slowdown. We do know that investor sentiment turned negative at the end of September, and the P/E multiples for the Russell 2000 and S&P 500 have contracted since the start of 2022 by 36% and 29%, respectively. Specific sectors of U.S. stocks, such as housing, transportation, retail, semiconductors, and other cyclicals, appear to have priced in a meaningful slowdown in the months ahead. The lack of capital flows into equities, and overall cash levels indicate that investors are defensively positioning portfolios, which is part of the bottoming process for any bear market. The big question in the coming months is: What will investors be willing to pay for future earnings in a rising interest rate environment, and what earnings expectations are priced into individual stock prices? We believe the PE multiple for the broader market has adjusted appropriately to the current interest rate environment. However, this is not true for every stock, as we see the potential to unlock value for many under-the-radar companies in our portfolios.
During the arduous sell-off in September, the investment team at Hodges Capital is rigorously looking for bargains in businesses that we believe are well-run and control their destiny by relying on ingenuity and well-calculated business decisions rather than day-to-day momentum in the stock market. Investors in the Hodges Funds can be assured that we are not changing our core investment discipline, designed to seek out quality companies running great businesses with excellent management teams trading at reasonable prices. Furthermore, we see this as an ideal environment for active portfolio managers to carefully select individual stocks that we believe can generate long-term value for shareholders.
Hodges Mutual Funds
Returns (Retail Class) as of 09/30/2022:
| | | | | | | Since |
| | 6 Months | 1 Year | 3 Years | 5 Years | 10 Years | Inception |
Hodges Fund | | | | | | |
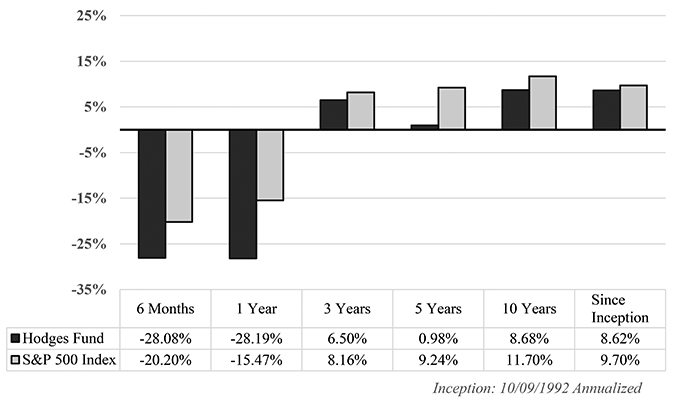
(HDPMX) 10/09/1992 | -28.08% | -28.19% | 6.50% | 0.98% | 8.68% | 8.62% |
S&P 500® Index | -20.20% | -15.47% | 8.16% | 9.24% | 11.70% | 9.70% |
| | | | | | | |
Hodges Small Cap Fund | | | | | | |
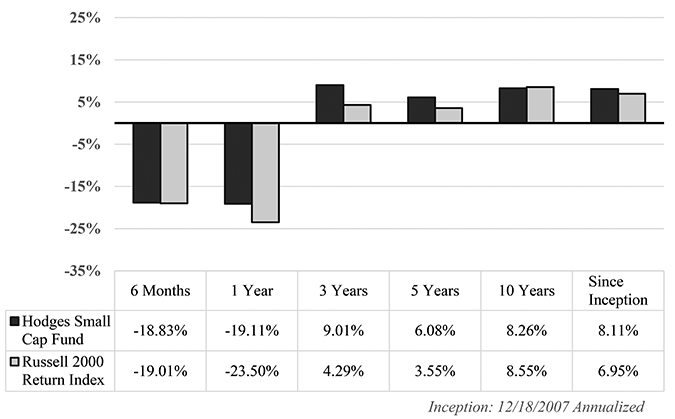
(HDPSX) 12/18/2007 | -18.83% | -19.11% | 9.01% | 6.08% | 8.26% | 8.11% |
Russell 2000® Return Index | -19.01% | -23.50% | 4.29% | 3.55% | 8.55% | 6.95% |
| | | | | | | |
Small Intrinsic Value Fund | | | | | | |
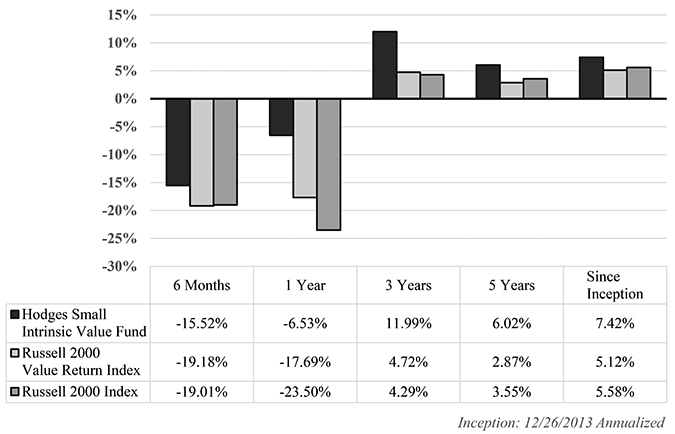
(HDSVX) 12/26/2013 | -15.52% | -6.53% | 11.99% | 6.02% | — | 7.42% |
Russell 2000® Value Return Index | -19.18% | -17.69% | 4.72% | 2.87% | — | 5.12% |
Russell 2000® Index | -19.01% | -23.50% | 4.29% | 3.55% | — | 5.58% |
| | | | | | | |
Blue Chip Equity Income Fund | | | | | | |
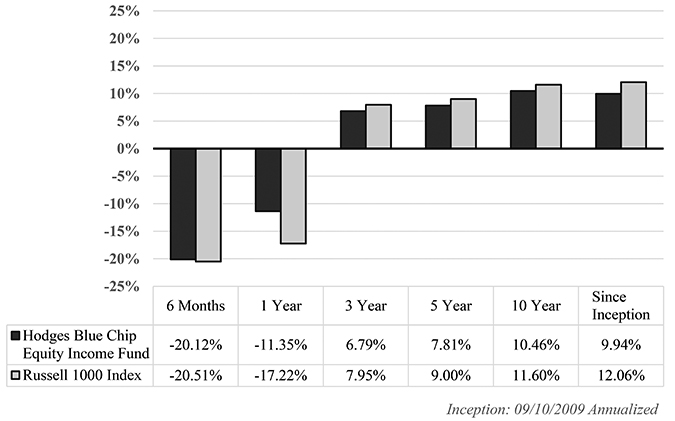
(HDPBX) 09/10/2009 | -20.12% | -11.35% | 6.79% | 7.81% | 10.46% | 9.94% |
Russell 1000® Index | -20.51% | -17.22% | 7.95% | 9.00% | 11.60% | 12.06% |
| | | | | | |
| Average Annualized | | | | | |
| | HDPMX | HDPSX | HDSVX | HDPBX |
| Gross Expense Ratio | 1.35% | 1.38% | 2.05% | 1.49% |
| Net Expense Ratio | 1.17%* | 1.36%* | 1.29%* | 1.30%* |
| | | | | |
| * | The Advisor has contractually agreed to reduce its fees at least until July 31, 2023. This figure excludes Acquired Fund Fees and Expenses, interest, taxes, and extraordinary expenses. The Advisor is permitted, with Board approval, to be reimbursed for fee reduction and/or expense payments made in the prior three years from the date the fees were waived and/or expenses were paid. Please see prospectus for details. |
Performance data quoted represents past performance and does not guarantee future results. The investment return and principal value of an investment will fluctuate so that an investor’s shares, when redeemed, may be worth more or less than their original cost. The current performance of the Funds may be lower or higher than the performance quoted. Performance data current to the most recent month-end may be obtained by calling 866-811-0224. The Funds impose a 1.00% redemption fee on shares held for thirty days or less (60 days or less for Institutional Class shares). Performance data quoted does not reflect the redemption fee. If reflected, total returns would be reduced.
Hodges Mutual Funds
Hodges Fund (HDPMX)
The Hodges Fund’s six-month return for the September 30, 2022 period amounted to a 28.08% decrease compared to a decline of 20.20% for the S&P 500 Index. Furthermore, the Fund’s total one-year return as of September 30, 2022, amounted to a loss of 28.19%, compared to a loss of 15.47% for the S&P 500 Index. The Hodges Fund’s turnover has recently picked up to take advantage of volatile market conditions. We have upgraded many portfolio holdings into stocks that we believe offer above-average returns relative to their downside risks over the next twelve to eighteen months.
While we are disappointed with the Fund’s most recent performance, the Hodges Fund’s portfolio managers remain laser-focused on investments where we have the highest conviction based on fundamentals and relative valuations. The Fund currently holds 35 positions. On September 30, 2022, the top ten holdings represented 51.02% of the Fund’s holdings. They included Texas Pacific Land Corporation (TPL), Matador Resources Company (MTDR), Chesapeake Energy Corporation (CHK), ON Semiconductor Corporation (ON), Uber Technologies Inc. (UBER), Encore Wire Corp. (WIRE), Topgolf Callaway Brands Corp. (MODG), Cleveland-Cliffs Inc. (CLF), CyberArk Software Ltd. (CYBR), and Commercial Metals Company (CMC).
Hodges Fund vs S&P 500® Index
As of 9/30/2022
Hodges Mutual Funds
Hodges Small Cap Fund (HDPSX)
The return for the Hodges Small Cap Fund amounted to a loss of 18.83% for the six months ending September 30, 2022, compared to a loss of 19.01% for the Russell 2000 Index. As of September 30, 2022, the Fund’s one-year return amounted to a loss of 19.11% compared to a loss of 23.50% for the Russell 2000 Index during the same period. Although small-caps have been underperforming large-cap stocks over the past five years, we view the current risk-reward for holding quality small-cap stocks as attractive. While small-cap stocks tend to experience greater volatility during a period of market turmoil, we expect this segment to generate above-average relative risk-adjusted returns over the long term.
The Hodges Small Cap Fund remains well diversified across industrials, transportation, financial services, technology, and consumer-related names, which we expect to contribute to the Fund’s long-term performance. The Fund recently took profits in several stocks that appeared overvalued relative to their underlying fundamentals and established several new positions with an attractive risk/reward profile. The total number of stocks held in the Fund amounted to 50 on September 30, 2022. The top ten holdings amounted to 39.11% of the Fund’s holdings and included SM Energy Company (SM), Matador Resources Company (MTDR), Texas Pacific Land Corporation (TPL), Commercial Metals Company (CMC), Eagle Materials Inc. (EXP), Texas Roadhouse Inc. (TXRH), Vista Outdoor Inc. (VSTO), Diodes Inc. (DIOD), Hilltop Holdings Inc. (HTH), and Taylor Morrison Home Corp. (TMHC).
Small Cap Fund vs Russell 2000® Return Index
As of 9/30/2022
Hodges Mutual Funds
Hodges Small Intrinsic Value Fund (HDSVX)
The Hodges Small Intrinsic Value Fund experienced a loss of 15.52% over the past six months compared to a loss of 19.18% for its benchmark, the Russell 2000 Value Index. The one-year return amounted to a loss of 6.53% compared to a loss of 17.69% for the Russell 2000 Value Index. The Fund’s solid relative performance over the past six months was attributed to several of the Fund’s energy and industrial stocks. The Fund had a total of 42 positions at September 30, 2022. The top holdings represented 35.62% of the Fund’s holdings and included Texas Capital Bancshares, Inc. (TCBI), Chesapeake Energy Corporation (CHK), Chord Energy Corp (CHRD), Eagle Materials Inc (EXP), Stratus Properties Inc. (STRS), Legato Merger Corp. (LGTO), HighPeak Energy Inc. (HPK), Builders FirstSource, Inc. (BLDR), and Vista Outdoor Inc (VSTO).
Small Intrinsic Value Fund vs
Russell 2000® Value Return Index & Russell 2000® Index
As of 9/30/2022
Hodges Mutual Funds
Hodges Blue Chip Equity Income Fund (HDPBX)
The Hodges Blue Chip Equity Income Fund was down 20.12% in the six months ending September 30, 2022, compared to a loss of 20.51% for the Russell 1000 Index. The Fund experienced a total loss of 11.35% compared to a negative return of 17.22% for the Russell 1000 Index on a one-year basis. Positive relative performance over the past year was attributed to stock selection among a handful of the energy, healthcare, and industrial names. The fund also avoided significant declines in many high-profile big-cap technology stocks. Although large-cap stocks have not been immune to prevailing global macro conditions, we see the current investing landscape offering plenty of attractive, high-quality dividend-paying stocks with solid upside potential. We expect underleveraged balance sheets and corporate profits across most blue-chip stocks to support stable dividends over the next several years. The Blue Chip Equity Income Fund remains well-diversified in companies that we believe can generate above-average income and total returns on a risk-adjusted basis. The Fund had a total of 29 positions at September 30, 2022. The top ten holdings at the end of the quarter represented 51.46% of the Fund’s holdings and included Microsoft Corporation (MSFT), Apple Inc. (AAPL), Exxon Mobil Corporation (XOM), Deere & Company (DE), Amazon.com, Inc. (AMZN), PepsiCo Inc. (PEP), Costco Wholesale Corporation (COST), Texas Instruments Incorporated (TXN), Johnson & Johnson (JNJ), and Home Depot Inc (HD).
Blue Chip Equity Income Fund vs Russell 1000® Index
As of 9/30/2022
Hodges Mutual Funds
In conclusion, we remain optimistic regarding the long-term investment opportunities surrounding the Hodges Mutual Funds. By offering four distinct mutual fund strategies covering most segments of the domestic equity market, we can serve most financial advisors’ and individual investors’ diverse needs. Our entire investment team is rigorously studying companies, meeting with management teams, observing trends, and navigating today’s ever-changing financial markets. Feel free to contact us directly if we can address any specific questions.
Sincerely,
 | |  |
| | | |
| Craig Hodges | | Eric Marshall, CFA |
| Co-Portfolio Manager | | Co-Portfolio Manager |
| | | |
 |  |  |
| | | |
| Gary Bradshaw | Chris Terry, CFA | Derek Maupin |
| Co-Portfolio Manager | Co-Portfolio Manager | Co-Portfolio Manager |
The above discussion is based on the opinions of Eric Marshall, CFA, and is subject to change. It is not intended to be a forecast of future events, a guarantee of future results, and is not a recommendation to buy or sell any security. Portfolio composition and company ownership in the Hodges Funds are subject to daily change.
Must be preceded or accompanied by a prospectus.
Mutual fund investing involves risk. Principal loss is possible. Investments in foreign securities involve greater volatility and political, economic and currency risks and differences in accounting methods. These risks are greater for investments in emerging markets. Options and future contracts have the risks of unlimited losses of the underlying holdings due to unanticipated market movements and failure to correctly predict the direction of securities prices, interest rates and currency exchange rates. These risks may be greater than risks associated with more traditional investments. Short sales of securities involve the risk that losses may exceed the original amount invested. Investments in debt securities typically decrease in value when interest rates rise. This risk is usually greater for longer term debt securities. Investments in small and medium capitalization companies involve additional risks such as limited liquidity and greater volatility. Funds that are non-diversified are more exposed to individual stock volatility than a diversified fund. Investments in companies that demonstrate special situations or turnarounds, meaning companies that have experienced significant business problems but are believed to have favorable prospects for recovery, involve greater risk.
Value investing carries the risk that the market will not recognize a security’s inherent value for a long time, or that a stock judged to be undervalued may be appropriately priced or overvalued.
Diversification does not assure a profit or protect against a loss in a declining market.
Fund holdings and/or sector allocations are subject to change at any time and are not recommendations to buy or sell any security.
Investment performance reflects fee waivers in effect. In the absence of such waivers, total return would be reduced.
The S&P 500 Index is a broad-based unmanaged index of 500 stocks that is widely recognized as representative of the equity market in general. The Russell 1000 Index is a subset of the Russell 3000 Index and consists of the 1,000 largest companies comprising over 90% of the total market capitalization of all listed stocks. The Russell 2000 Index consists of the smallest 2,000 companies in a group of 3,000 U.S. companies in the Russell 3000 Index, as ranked by market capitalization. The Russell 2500 Index consists of the smallest 2,500 companies in a group of 3,000 U.S. companies in the Russell 3000 Index, as ranked by market capitalization. The Russell 3000 Index is a stock index consisting of the 3000 largest publicly listed companies, representing about 98% of the total capitalization of the entire U.S. stock market. You cannot invest directly in an index. The Russell 2000 Value Index measures the performance of small-cap value segment of the U.S. equity universe. It includes those Russell 2000 companies with lower price-to-book ratios and lower forecasted growth values. The Russell 2000 Value Index is constructed to provide a comprehensive and unbiased barometer for the small-cap value segment. The Index is completely reconstituted annually to ensure larger stocks do not distort the performance and characteristics of the true small-cap opportunity set and that the represented companies continue to reflect value characteristics.
Cash Flow: A revenue or expense stream that changes a cash account over a given period.
Price/earnings (P/E): The most common measure of how expensive a stock is.
Earnings Growth is not a measure of the Fund’s future performance.
Hodges Capital Management is the Advisor to the Hodges Funds.
Hodges Funds are distributed by Quasar Distributors LLC.
Hodges Mutual Funds
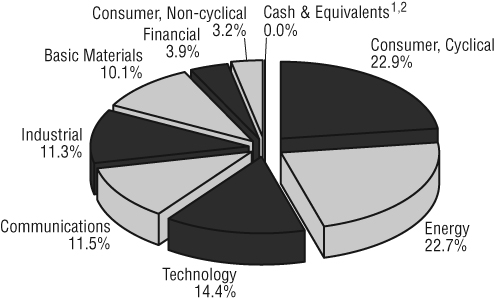
SECTOR ALLOCATIONS At September 30, 2022 (Unaudited) |
(as a percentage of net assets)
Hodges Fund
(HDPMX)
Small Cap Fund
(HDPSX & HDSIX)
1 | Other assets in excess of liabilities. |
2 | Does not round to 0.1%. |
Hodges Mutual Funds
SECTOR ALLOCATIONS At September 30, 2022 (Unaudited) |
(as a percentage of net assets)
Small Intrinsic Value Fund
(HDSVX)
Blue Chip Equity Income Fund
(HDPBX)
1 | Other assets in excess of liabilities. |
Hodges Fund
SCHEDULE OF INVESTMENTS at September 30, 2022 (Unaudited) |
| Shares | | | | Value | |
| COMMON STOCKS: 100% | |
| | |
| Airlines: 2.7% | |
| | 350,000 | | Frontier Group Holdings, Inc. 1 | | $ | 3,395,000 | |
| | |
| Apparel: 3.2% | |
| | 250,000 | | On Holding AG - Class A 1 | | | 4,012,500 | |
| | |
| Auto Manufacturers: 2.5% | |
| | 100,000 | | General Motors Co. | | | 3,209,000 | |
| | |
| Banks: 2.4% | |
| | 75,000 | | Wells Fargo & Co. | | | 3,016,500 | |
| | |
| Building Materials: 6.7% | |
| | 175,000 | | The AZEK Co., Inc. - Class A 1 | | | 2,908,500 | |
| | 50,000 | | Builders FirstSource, Inc. 1 | | | 2,946,000 | |
| | 25,000 | | Eagle Materials, Inc. | | | 2,679,500 | |
| | | | | | | 8,534,000 | |
| | |
| Commercial Services: 1.5% | |
| | 250,000 | | The GEO Group, Inc. 1 | | | 1,925,000 | |
| | | | | |
| Computers: 5.7% | | | | |
| | 30,000 | | CyberArk Software Ltd. 1 | | | 4,498,200 | |
| | 140,000 | | NCR Corp. 1 | | | 2,661,400 | |
| | | | | | | 7,159,600 | |
| | |
| Electrical Components & Equipment: 4.6% | |
| | 50,000 | | Encore Wire Corp. | | | 5,777,000 | |
| | |
| Entertainment: 2.2% | |
| | 225,000 | | Cinemark Holdings, Inc. 1 | | | 2,724,750 | |
| | |
| Healthcare Products: 1.7% | |
| | 600,000 | | ViewRay, Inc. 1 | | | 2,184,000 | |
| | | | | |
| Insurance: 1.5% | | | | |
| | 55,000 | | Goosehead Insurance, Inc. - Class A 1 | | | 1,960,200 | |
| | |
| Internet: 11.5% | |
| | 40,000 | | Airbnb, Inc. - Class A 1 | | | 4,201,600 | |
| | 150,000 | | Revolve Group, Inc. - Class A 1 | | | 3,253,500 | |
| | 300,000 | | Solo Brands, Inc. - Class A 1 | | | 1,140,000 | |
| | 225,000 | | Uber Technologies, Inc. 1 | | | 5,962,500 | |
| | | | | | | 14,557,600 | |
| | |
| Iron & Steel: 7.1% | |
| | 350,000 | | Cleveland-Cliffs, Inc. 1 | | | 4,714,500 | |
| | 120,000 | | Commercial Metals Co. | | | 4,257,600 | |
| | | | | | | 8,972,100 | |
| | | | | |
| Leisure Time: 8.6% | | | | |
| | 225,000 | | Norwegian Cruise Line Holdings Ltd. 1 | | | 2,556,000 | |
| | 278,000 | | Topgolf Callaway Brands Corp. 1 | | | 5,354,280 | |
| | 125,000 | | Vista Outdoor, Inc. 1 | | | 3,040,000 | |
| | | | | | | 10,950,280 | |
| | |
| Mining: 3.0% | |
| | 140,000 | | Freeport-McMoRan, Inc. | | | 3,826,200 | |
| | | | | |
| Oil Companies Exploration & Production: 13.3% | | | | |
| | 75,000 | | Chesapeake Energy Corp. | | | 7,065,750 | |
| | 200,000 | | Matador Resources Co. | | | 9,784,000 | |
| | | | | | | 16,849,750 | |
| | | | | |
| Oil Field Services: 1.0% | | | | |
| | 150,000 | | ProPetro Holding Corp. 1 | | | 1,207,500 | |
| | |
| Restaurants: 0.3% | |
| | 12,456 | | Dutch Bros, Inc. - Class A 1 | | | 388,004 | |
| | |
| Semiconductors: 7.1% | |
| | 50,000 | | Micron Technology, Inc. | | | 2,505,000 | |
| | 105,000 | | ON Semiconductor Corp. 1 | | | 6,544,650 | |
| | | | | | | 9,049,650 | |
| | | | | |
| Software: 1.6% | | | | |
| | 250,000 | | Upland Software, Inc. 1 | | | 2,032,500 | |
| | |
| Sporting Goods: 2.5% | |
| | 75,000 | | Academy Sports & Outdoors, Inc. | | | 3,163,500 | |
| | |
| Textiles: 0.9% | |
| | 1,000,000 | | The Dixie Group, Inc. 1,2 | | | 1,080,000 | |
| | |
| U.S. Royalty Trusts: 8.4% | |
| | 6,000 | | Texas Pacific Land Corp. | | | 10,663,380 | |
| | |
| TOTAL COMMON STOCKS | |
| (Cost $119,308,578) | | | 126,638,014 | |
| | |
| TOTAL INVESTMENTS IN SECURITIES: 100% | |
| (Cost $119,308,578) | | | 126,638,014 | |
Other Assets in Excess of Liabilities: 0.0% 3 | | | 835 | |
| TOTAL NET ASSETS: 100.0% | | $ | 126,638,849 | |
1 | Non-income producing security. |
2 | Company is an “affiliated person” of the Fund, as defined in the Investment Company Act of 1940. |
3 | Does not round to 0.1% or (0.1)%, respectively. |
The accompanying notes are an integral part of these financial statements.
Small Cap Fund
SCHEDULE OF INVESTMENTS at September 30, 2022 (Unaudited) |
| Shares | | | | Value | |
| COMMON STOCKS: 100.0% | |
| | |
| Airlines: 2.6% | |
| | 250,000 | | Frontier Group Holdings, Inc. 1 | | $ | 2,425,000 | |
| | 125,000 | | Hawaiian Holdings, Inc. 1 | | | 1,643,750 | |
| | | | | | | 4,068,750 | |
| | |
| Apparel & Shoe Retail: 1.8% | |
| | 130,000 | | Shoe Carnival, Inc. | | | 2,787,200 | |
| | |
| Banks: 5.4% | |
| | 180,000 | | Hilltop Holdings, Inc. | | | 4,473,000 | |
| | 40,000 | | Prosperity Bancshares, Inc. | | | 2,667,200 | |
| | 25,000 | | Texas Capital BancShares, Inc. 1 | | | 1,475,750 | |
| | | | | | | 8,615,950 | |
| | |
| Building Materials: 5.8% | |
| | 225,000 | | The AZEK Co., Inc. - Class A 1 | | | 3,739,500 | |
| | 52,000 | | Eagle Materials, Inc. | | | 5,573,360 | |
| | | | | | | 9,312,860 | |
| | |
| Commercial Services: 4.3% | |
| | 128,774 | | European Wax Center, | | | | |
| | | | Inc. - Class A | | | 2,375,881 | |
| | 70,000 | | Lawson Products, Inc. 1 | | | 1,971,900 | |
| | 150,000 | | Toast, Inc. - Class A 1 | | | 2,508,000 | |
| | | | | | | 6,855,781 | |
| | |
| Computers: 2.4% | |
| | 140,000 | | NCR Corp. 1 | | | 2,661,400 | |
| | 20,000 | | Super Micro Computer, Inc. 1 | | | 1,101,400 | |
| | | | | | | 3,762,800 | |
| | |
| Electrical Components & Equipment: 2.7% | |
| | 37,000 | | Encore Wire Corp. | | | 4,274,980 | |
| | |
| Electronics: 2.9% | |
| | 45,000 | | Avnet, Inc. | | | 1,625,400 | |
| | 175,000 | | Kimball Electronics, Inc. 1 | | | 3,001,250 | |
| | | | | | | 4,626,650 | |
| | |
| Entertainment: 1.9% | |
| | 250,000 | | Cinemark Holdings, Inc. 1 | | | 3,027,500 | |
| | |
| Food: 2.9% | |
| | 125,000 | | Sprouts Farmers Market, Inc. 1 | | | 3,468,750 | |
| | 125,000 | | SunOpta, Inc. 1 | | | 1,137,500 | |
| | | | | | | 4,606,250 | |
| | |
| Healthcare Products: 4.0% | |
| �� | 150,000 | | Bausch + Lomb Corp. 1 | | | 2,301,000 | |
| | 140,000 | | Inmode Ltd. 1 | | | 4,075,400 | |
| | | | | | | 6,376,400 | |
| | |
| Home Builders: 2.8% | |
| | 190,000 | | Taylor Morrison Home Corp. 1 | | | 4,430,800 | |
| | |
| Home Furnishings: 4.8% | |
| | 165,000 | | Ethan Allen Interiors, Inc. | |
| 3,488,100 | |
| | 17,000 | | RH 1 | | | 4,183,190 | |
| | | | | | | 7,671,290 | |
| | |
| Insurance: 0.7% | |
| | 30,000 | | Goosehead Insurance, Inc. - Class A 1 | | | 1,069,200 | |
| | |
| Internet: 2.3% | |
| | 170,830 | | Revolve Group, Inc. - Class A 1 | | | 3,705,303 | |
| | | | | |
| Iron & Steel: 7.8% | | | | |
| | 320,000 | | Cleveland-Cliffs, Inc. 1 | | | 4,310,400 | |
| | 180,000 | | Commercial Metals Co. | | | 6,386,400 | |
| | 100,000 | | United States Steel Corp. | | | 1,812,000 | |
| | | | | | | 12,508,800 | |
| | |
| Leisure Time: 6.3% | |
| | 50,000 | | Brunswick Corp. | | | 3,272,500 | |
| | 185,000 | | Norwegian Cruise | | | | |
| | | | Line Holdings Ltd. 1 | | | 2,101,600 | |
| | 195,000 | | Vista Outdoor, Inc. 1 | | | 4,742,400 | |
| | | | | | | 10,116,500 | |
| | |
| Lodging: 2.2% | |
| | 75,000 | | Boyd Gaming Corp. | | | 3,573,750 | |
| | |
| Oil Companies Exploration & Production: 13.8% | |
| | 175,000 | | Matador Resources Co. | | | 8,561,000 | |
| | 300,000 | | Permian Resources Corp. - Class A 1 | | | 2,040,000 | |
| | 6,500 | | Pioneer Natural Resources Co. | | | 1,407,445 | |
| | 265,000 | | SM Energy Co. | | | 9,966,650 | |
| | | | | | | 21,975,095 | |
| | |
| Packaging & Containers: 1.1% | |
| | 90,000 | | Graphic Packaging Holding Co. | | | 1,776,600 | |
| | |
| Pharmaceuticals: 0.7% | |
| | 50,000 | | Organon & Co. | | | 1,170,000 | |
| | |
| Restaurants: 3.3% | |
| | 60,000 | | Texas Roadhouse, Inc. | | | 5,235,600 | |
| | |
| Semiconductors: 5.9% | |
| | 70,000 | | Diodes, Inc. 1 | | | 4,543,700 | |
| | 41,000 | | Kulicke & Soffa Industries, Inc. | | | 1,579,730 | |
| | 50,000 | | Silicon Motion | | | | |
| | | | Technology Corp. - ADR | | | 3,259,500 | |
| | | | | | | 9,382,930 | |
| | |
| Software: 1.1% | |
| | 15,000 | | Digi International, Inc. 1 | | | 518,550 | |
| | 150,000 | | Upland Software, Inc. 1 | | | 1,219,500 | |
| | | | | | | 1,738,050 | |
| | |
| Sporting Goods: 2.6% | |
| | 100,000 | | Academy Sports & Outdoors, Inc. | | | 4,218,000 | |
The accompanying notes are an integral part of these financial statements.
Small Cap Fund
SCHEDULE OF INVESTMENTS at September 30, 2022 (Unaudited) (Continued) |
| Shares | | | | Value | |
| Telecommunications: 1.1% | |
| | 150,000 | | DZS, Inc. 1 | | $ | 1,695,000 | |
| | |
| Transportation: 1.5% | |
| | 40,000 | | Matson, Inc. | | | 2,460,800 | |
| | |
| U.S. Royalty Trusts: 5.3% | |
| | 4,800 | | Texas Pacific Land Corp. | | | 8,530,704 | |
| TOTAL COMMON STOCKS | |
(Cost $131,851,735) | | | 159,573,543 | |
| | |
| TOTAL INVESTMENTS IN SECURITIES: 100.0% | |
(Cost $131,851,735) | | | 159,573,543 | |
Liabilities in Excess of Other Assets: (0.0)% | | | (27,062 | ) |
| TOTAL NET ASSETS: 100.0% | | $ | 159,546,481 | |
ADR - American Depository Receipt
1 | Non-income producing security. |
2 | Does not round to 0.1% or (0.1)%, respectively. |
The accompanying notes are an integral part of these financial statements.
Small Intrinsic Value Fund
SCHEDULE OF INVESTMENTS at September 30, 2022 (Unaudited) |
| Shares | | | | Value | |
| COMMON STOCKS: 96.7% | |
| | |
| Banks: 12.4% | |
| | 4,000 | | BancFirst Corp. | | $ | 357,880 | |
| | 13,000 | | Hilltop Holdings, Inc. | | | 323,050 | |
| | 4,000 | | Prosperity Bancshares, Inc. | | | 266,720 | |
| | 13,000 | | Texas Capital BancShares, Inc. 1 | | | 767,390 | |
| | 3,500 | | Triumph Bancorp, Inc. 1 | | | 190,225 | |
| | | | | | | 1,905,265 | |
| | |
| Beverages: 2.9% | |
| | 95,000 | | Farmer Brothers Co. 1 | | | 445,550 | |
| | |
| Building Materials: 6.4% | |
| | 8,000 | | Builders FirstSource, Inc. 1 | | | 471,360 | |
| | 4,800 | | Eagle Materials, Inc. | | | 514,463 | |
| | | | | | | 985,823 | |
| | |
| Commercial Services: 4.2% | |
| | 8,000 | | H&R Block, Inc. | | | 340,320 | |
| | 150,000 | | Research Solutions, Inc. 1 | | | 306,000 | |
| | | | | | | 646,320 | |
| | |
| Computers: 2.4% | |
| | 19,000 | | NCR Corp. 1 | | | 361,190 | |
| | |
| Electrical Components & Equipment: 2.6% | |
| | 3,500 | | Encore Wire Corp. | | | 404,390 | |
| | |
| Electronics: 2.7% | |
| | 24,000 | | Kimball Electronics, Inc. 1 | | | 411,600 | |
| | |
| Entertainment: 2.5% | |
| | 32,000 | | Cinemark Holdings, Inc. 1 | | | 387,520 | |
| | | | | |
| Food: 6.1% | | | | |
| | 4,000 | | John B Sanfilippo & Son, Inc. | | | 302,920 | |
| | 35,000 | | SunOpta, Inc. 1 | | | 318,500 | |
| | 7,500 | | TreeHouse Foods, Inc. 1 | | | 318,150 | |
| | | | | | | 939,570 | |
| | | | | |
| Holding Companies - Diversified: 3.4% | | | | |
| | 50,000 | | Legato Merger Corp. II 1 | | | 526,000 | |
| | |
| Home Builders: 1.5% | |
| | 10,000 | | Taylor Morrison Home Corp. 1 | | | 233,200 | |
| | |
| Home Furnishings: 1.9% | |
| | 14,000 | | Ethan Allen Interiors, Inc. | | | 295,960 | |
| | |
| Insurance: 5.1% | |
| | 10,000 | | Horace Mann Educators Corp. | | | 352,900 | |
| | 40,000 | | Tiptree, Inc. | | | 430,400 | |
| | | | | | | 783,300 | |
| | |
| Internet: 1.3% | |
| | 40,000 | | CarParts.com, Inc. 1 | | | 206,800 | |
| | | | | | | | |
| | |
| Iron & Steel: 5.6% | |
| | 30,000 | | Cleveland-Cliffs, Inc. 1 | | | 404,100 | |
| | 13,000 | | Commercial Metals Co. | | | 461,240 | |
| | | | | | | 865,340 | |
| | |
| Leisure Time: 5.4% | |
| | 5,600 | | Brunswick Corp. | | | 366,520 | |
| | 19,000 | | Vista Outdoor, Inc. 1 | | | 462,080 | |
| | | | | | | 828,600 | |
| | |
| Machinery - Diversified: 2.1% | |
| | 6,000 | | Ichor Holdings Ltd. 1 | | | 145,260 | |
| | 3,000 | | Tennant Co. | | | 169,680 | |
| | | | | | | 314,940 | |
| | |
| Metal Fabrication & Hardware: 1.9% | |
| | 8,000 | | AZZ, Inc. | | | 292,080 | |
| | |
| Oil Companies Exploration & Production: 10.4% | |
| | 6,000 | | Chesapeake Energy Corp. | | | 565,260 | |
| | 4,000 | | Chord Energy Corp. | | | 547,080 | |
| | 22,500 | | HighPeak Energy, Inc. | | | 487,350 | |
| | | | | | | 1,599,690 | |
| | |
| Pharmaceuticals: 2.1% | |
| | 6,000 | | Pacira Pharmaceuticals, Inc. 1 | | | 319,140 | |
| | |
| Real Estate: 3.3% | |
| | 22,000 | | Stratus Properties, Inc. | | | 512,600 | |
| | |
| Semiconductors: 6.2% | |
| | 6,000 | | Diodes, Inc. 1 | | | 389,460 | |
| | 16,000 | | Photronics, Inc. 1 | | | 233,920 | |
| | 5,000 | | Silicon Motion Technology Corp. - ADR | | | 325,950 | |
| | | | | | | 949,330 | |
| | |
| Telecommunications: 3.3% | |
| | 6,000 | | Aviat Networks, Inc. 1 | | | 164,280 | |
| | 30,000 | | DZS, Inc. 1 | | | 339,000 | |
| | | | | | | 503,280 | |
| | |
| Transportation: 1.0% | |
| | | | | | | | |
| | 2,500 | | Matson, Inc. | | | 153,800 | |
| TOTAL COMMON STOCKS | |
(Cost $13,577,063) | | | 14,871,288 | |
| | |
| TOTAL INVESTMENTS IN SECURITIES: 96.7% | |
(Cost $13,577,063) | | | 14,871,288 | |
Other Assets in Excess of Liabilities: 3.3% | | | 512,232 | |
| TOTAL NET ASSETS: 100.0% | | $ | 15,383,520 | |
ADR - American Depository Receipt
1 | Non-income producing security. |
The accompanying notes are an integral part of these financial statements.
Blue Chip Equity Income Fund
SCHEDULE OF INVESTMENTS at September 30, 2022 (Unaudited) |
| Shares | | | | Value | |
| COMMON STOCKS: 99.6% | |
| | |
| Banks: 4.2% | |
| | 12,500 | | Bank of America Corp. | | $ | 377,500 | |
| | 6,000 | | JPMorgan Chase & Co. | | | 627,000 | |
| | | | | | | 1,004,500 | |
| | |
| Beverages: 4.1% | |
| | 6,000 | | PepsiCo, Inc. | | | 979,560 | |
| | |
| Building Products Retail: 6.5% | |
| | 3,250 | | The Home Depot, Inc. | | | 896,805 | |
| | 3,500 | | Lowe’s Companies, Inc. | | | 657,335 | |
| | | | | | | 1,554,140 | |
| | |
| Computers: 6.9% | |
| | 12,000 | | Apple, Inc. | | | 1,658,400 | |
| | |
| Discount Retail: 6.2% | |
| | 2,000 | | Costco Wholesale Corp. | | | 944,540 | |
| | 4,000 | | Dollar Tree, Inc. 1 | | | 544,400 | |
| | | | | | | 1,488,940 | |
| | |
| Diversified Financial Services: 2.8% | |
| | 5,000 | | American Express Co. | | | 674,550 | |
| | |
| Gardening Production Retail: 2.3% | |
| | 3,000 | | Tractor Supply Co. | | | 557,640 | |
| | | | | |
| Insurance: 3.1% | | | | |
| | 4,000 | | Chubb Ltd. | | | 727,520 | |
| | |
| Internet: 5.2% | |
| | 11,000 | | Amazon.com, Inc. 1 | | | 1,243,000 | |
| | |
| Machinery - Construction & Mining: 3.3% | |
| | 4,750 | | Caterpillar, Inc. | | | 779,380 | |
| | |
| Machinery - Diversified: 5.6% | |
| | 4,000 | | Deere & Co. | | | 1,335,560 | |
| | |
| Oil Companies Exploration & Production: 2.1% | |
| | 5,000 | | ConocoPhillips | | | 511,700 | |
| | |
| Oil Companies Integrated: 6.4% | |
| | 17,500 | | Exxon Mobil Corp. | | | 1,527,926 | |
| | |
| Oil Refining & Marketing: 3.1% | |
| | 9,000 | | Phillips 66 | | | 726,480 | |
| | |
| Pharmaceuticals: 8.0% | |
| | 5,000 | | AbbVie, Inc. | | | 671,050 | |
| | 5,500 | | Johnson & Johnson | | | 898,480 | |
| | 4,000 | | Merck & Co., Inc. | | | 344,480 | |
| | | | | | | 1,914,010 | |
| | |
| Pipelines: 3.2% | |
| | 15,000 | | ONEOK, Inc. | | | 768,600 | |
| | | | | | | |
| Semiconductors: 12.6% | | |
| | 5,000 | | NVIDIA Corp. | |
| 606,950 | |
| | 7,000 | | QUALCOMM, Inc. | | | 790,860 | |
| | 10,000 | | Taiwan Semiconductor | | | | |
| | | | Manufacturing Co. Ltd. - ADR | | | 685,600 | |
| | 6,000 | | Texas Instruments, Inc. | | | 928,680 | |
| | | | | | | 3,012,090 | |
| | |
| Software: 10.3% | |
| | 8,000 | | Activision Blizzard, Inc. | | | 594,720 | |
| | 8,000 | | Microsoft Corp. | | | 1,863,200 | |
| | | | | | | 2,457,920 | |
| | |
| Transportation: 3.7% | |
| | 4,500 | | Union Pacific Corp. | | | 876,690 | |
| | |
| TOTAL COMMON STOCKS | |
(Cost $18,986,609) | | | 23,798,605 | |
| | |
| TOTAL INVESTMENTS IN SECURITIES: 99.6% | |
(Cost $18,986,609) | | | 23,798,606 | |
Other Assets in Excess of Liabilities: 0.4% | | | 98,064 | |
| TOTAL NET ASSETS: 100.0% | | $ | 23,896,670 | |
ADR - American Depository Receipt
1 | Non-income producing security. |
The accompanying notes are an integral part of these financial statements.
Hodges Mutual Funds
STATEMENTS OF ASSETS AND LIABILITIES at September 30, 2022 (Unaudited) |
| | | | | | | | | Small | | | Blue Chip | |
| | | | | | Small Cap | | | Intrinsic | | | Equity | |
| | | Hodges Fund | | | Fund | | | Value Fund | | | Income Fund | |
| | | | | | | | | | | | | |
| ASSETS | | | | | | | | | | | | |
| Investments in unaffiliated securities, at value | | $ | 125,558,014 | | | $ | 159,573,543 | | | $ | 14,871,288 | | | $ | 23,798,606 | |
| (Cost $115,853,846, $131,851,735, $13,577,063, and $18,986,609) | | | | | | | | | | | | | | | | |
| Investments in affiliated securities, at value | | | 1,080,000 | | | | — | | | | — | | | | — | |
| (Cost $3,454,732, $—, $— and $—) | | | | | | | | | | | | | | | | |
| Cash | | | 1,518,687 | | | | 313,065 | | | | 880,125 | | | | 134,753 | |
| Receivables: | | | | | | | | | | | | | | | | |
| Investment securities sold | | | — | | | | — | | | | 172,440 | | | | — | |
| Fund shares sold | | | 23,943 | | | | 13,066 | | | | 31,028 | | | | 267 | |
| Dividends and interest | | | 39,449 | | | | 67,115 | | | | 9,950 | | | | 26,676 | |
| Due from Advisor | | | — | | | | — | | | | 586 | | | | — | |
| Prepaid expenses | | | 24,731 | | | | 16,256 | | | | 9,844 | | | | 17,893 | |
| Total assets | | | 128,244,824 | | | | 159,983,045 | | | | 15,975,261 | | | | 23,978,195 | |
| | | | | | | | | | | | | | | | | |
| LIABILITIES | | | | | | | | | | | | | | | | |
| Payables: | | | | | | | | | | | | | | | | |
| Investment securities purchased | | | 1,209,877 | | | | — | | | | 541,155 | | | | — | |
| Distribution fees | | | 133,750 | | | | 92,829 | | | | 13,890 | | | | 21,033 | |
| Investment advisory fees | | | 74,459 | | | | 103,878 | | | | — | | | | 7,546 | |
| Sub-transfer agent fees | | | 50,784 | | | | 42,867 | | | | 1,336 | | | | 1,180 | |
| Fund shares redeemed | | | 48,327 | | | | 75,243 | | | | — | | | | 9,207 | |
| Fund administration fees | | | 26,491 | | | | 20,175 | | | | 3,307 | | | | 3,718 | |
| Fund accounting fees | | | 16,524 | | | | 13,351 | | | | 1,048 | | | | 1,439 | |
| Audit fees | | | 15,084 | | | | 15,099 | | | | 12,023 | | | | 12,088 | |
| Transfer agent fees | | | 8,297 | | | | 7,321 | | | | 3,435 | | | | 3,017 | |
| Custody fees | | | 5,521 | | | | 4,323 | | | | 1,788 | | | | 1,754 | |
| Trustee fees | | | 5,093 | | | | 4,923 | | | | 4,128 | | | | 4,234 | |
| Chief Compliance Officer fees | | | 1,890 | | | | 1,575 | | | | 1,859 | | | | 1,578 | |
| Distribution to shareholders | | | — | | | | — | | | | — | | | | 4,425 | |
| Other accrued expenses | | | 9,878 | | | | 54,980 | | | | 7,772 | | | | 10,306 | |
| Total liabilities | | | 1,605,975 | | | | 436,564 | | | | 591,741 | | | | 81,525 | |
| NET ASSETS | | $ | 126,638,849 | | | $ | 159,546,481 | | | $ | 15,383,520 | | | $ | 23,896,670 | |
| | | | | | | | | | | | | | | | | |
| COMPONENTS OF NET ASSETS | | | | | | | | | | | | | | | | |
| Paid-in capital | | $ | 122,752,502 | | | $ | 111,235,553 | | | $ | 12,655,990 | | | $ | 17,905,136 | |
| Total distributable (accumulated) earnings (losses) | | | 3,886,347 | | | | 48,310,928 | | | | 2,727,530 | | | | 5,991,534 | |
| Total net assets | | $ | 126,638,849 | | | $ | 159,546,481 | | | $ | 15,383,520 | | | $ | 23,896,670 | |
| Net Asset Value (unlimited shares authorized): | | | | | | | | | | | | | | | | |
| Retail Class: | | | | | | | | | | | | | | | | |
| Net assets | | $ | 126,638,849 | | | $ | 124,649,784 | | | $ | 15,383,520 | | | $ | 23,896,670 | |
| Shares of beneficial interest issued and outstanding | | | 2,987,495 | | | | 7,194,396 | | | | 991,788 | | | | 1,454,526 | |
| Net asset value, offering price, and redemption price per share | | $ | 42.39 | | | $ | 17.33 | | | $ | 15.51 | | | $ | 16.43 | |
| Institutional Class: | | | | | | | | | | | | | | | | |
| Net assets | | | | | | $ | 34,896,697 | | | | | | | | | |
| Shares of beneficial interest issued and outstanding | | | | | | | 1,895,202 | | | | | | | | | |
| Net asset value, offering price, and redemption price per share | | | | | | $ | 18.41 | | | | | | | | | |
The accompanying notes are an integral part of these financial statements.
Hodges Mutual Funds
STATEMENTS OF OPERATIONS For the Six Months Ended September 30, 2022 (Unaudited) |
| | | | | | | | | Small | | | Blue Chip | |
| | | | | | Small Cap | | | Intrinsic | | | Equity | |
| | | Hodges Fund | | | Fund | | | Value Fund | | | Income Fund | |
| | | | | | | | | | | | | |
| INVESTMENT INCOME | | | | | | | | | | | | |
| Dividends from unaffiliated securities | | $ | 765,700 | | | $ | 1,743,649 | | | $ | 261,426 | | | $ | 281,581 | |
| (net of $—, $—, $—, and $1,160 foreign withholding tax, respectively) | | | | | | | | | | | | | | | | |
| Other income | | | 1,340 | | | | 1,363 | | | | 1,183 | | | | 1,194 | |
| Total investment income | | | 767,040 | | | | 1,745,012 | | | | 262,609 | | | | 282,775 | |
| | | | | | | | | | | | | | | | | |
| EXPENSES | | | | | | | | | | | | | | | | |
| Investment advisory fees | | | 645,782 | | | | 798,717 | | | | 71,243 | | | | 89,555 | |
| Distribution fees - Retail Class | | | 189,936 | | | | 182,373 | | | | 20,954 | | | | 34,444 | |
| Sub-transfer agent fees | | | 60,864 | | | | 102,541 | | | | 4,413 | | | | 3,987 | |
| Fund administration fees | | | 49,231 | | | | 52,295 | | | | 10,357 | | | | 12,666 | |
| Fund accounting fees | | | 29,230 | | | | 34,855 | | | | 3,451 | | | | 4,966 | |
| Transfer agent fees | | | 23,288 | | | | 23,481 | | | | 9,873 | | | | 9,653 | |
| Registration expenses | | | 12,943 | | | | 23,338 | | | | 10,281 | | | | 10,451 | |
| Audit fees | | | 12,932 | | | | 12,940 | | | | 11,868 | | | | 11,933 | |
| Trustees fees | | | 11,171 | | | | 11,359 | | | | 9,675 | | | | 9,844 | |
| Reports to shareholders | | | 11,042 | | | | 22,578 | | | | 3,552 | | | | 3,361 | |
| Miscellaneous expenses | | | 10,103 | | | | 21,040 | | | | 6,457 | | | | 5,699 | |
| Chief Compliance Officer fees | | | 5,640 | | | | 5,326 | | | | 5,609 | | | | 5,328 | |
| Interest expense | | | 5,500 | | | | 740 | | | | — | | | | — | |
| Custody fees | | | 5,176 | | | | 5,528 | | | | 2,838 | | | | 2,650 | |
| Legal fees | | | 3,599 | | | | 3,599 | | | | 3,542 | | | | 3,561 | |
| Insurance expenses | | | 1,911 | | | | 1,871 | | | | 1,620 | | | | 1,690 | |
| Total expenses | | | 1,078,348 | | | | 1,302,581 | | | | 175,733 | | | | 209,788 | |
| Less: fees waived | | | (181,850 | ) | | | (39,590 | ) | | | (67,613 | ) | | | (30,676 | ) |
| Net expenses | | | 896,498 | | | | 1,262,991 | | | | 108,120 | | | | 179,112 | |
| Net investment income (loss) | | | (129,458 | ) | | | 482,021 | | | | 154,489 | | | | 103,663 | |
| | | | | | | | | | | | | | | | | |
| REALIZED AND UNREALIZED GAIN (LOSS) ON INVESTMENTS | | | | | | | | | | | | | | | | |
| Net realized gain (loss) on transactions from: | | | | | | | | | | | | | | | | |
| Unaffiliated investments | | | (4,157,556 | ) | | | 10,628,934 | | | | 584,630 | | | | (809,616 | ) |
| Affiliated investments | | | 1,931,542 | | | | — | | | | — | | | | — | |
| Options written | | | 191,699 | | | | — | | | | — | | | | — | |
| Net realized gain (loss) | | | (2,034,315 | ) | | | 10,628,934 | | | | 584,630 | | | | (809,616 | ) |
| Net change in unrealized appreciation/depreciation on: | | | | | | | | | | | | | | | | |
| Unaffiliated investments | | | (44,476,936 | ) | | | (49,368,018 | ) | | | (3,579,566 | ) | | | (5,436,497 | ) |
| Affiliated investments | | | (4,410,977 | ) | | | — | | | | — | | | | — | |
| Options written | | | (180,123 | ) | | | 9,010 | | | | — | | | | — | |
| Net unrealized appreciation/depreciation | | | (49,068,036 | ) | | | (49,359,008 | ) | | | (3,579,566 | ) | | | (5,436,497 | ) |
| Net realized and unrealized gain (loss) on investments | | | (51,102,351 | ) | | | (38,730,074 | ) | | | (2,994,936 | ) | | | (6,246,113 | ) |
| Net increase (decrease) in net | | | | | | | | | | | | | | | | |
| assets resulting from operations | | $ | (51,231,809 | ) | | $ | (38,248,053 | ) | | $ | (2,840,447 | ) | | $ | (6,142,450 | ) |
The accompanying notes are an integral part of these financial statements.
Hodges Fund
| STATEMENTS OF CHANGES IN NET ASSETS |
| | | Six Months Ended | | | | |
| | | September 30, 2022 | | | Year Ended | |
| | | (Unaudited) | | | March 31, 2022 | |
| INCREASE (DECREASE) IN NET ASSETS FROM: | | | | | | |
| | | | | | | |
| OPERATIONS | | | | | | |
| Net investment income (loss) | | $ | (129,458 | ) | | $ | (1,697,688 | ) |
| Net realized gain (loss) on transactions from: | | | | | | | | |
| Unaffiliated investments | | | (4,157,556 | ) | | | 20,597,653 | |
| Affiliated investments | | | 1,931,542 | | | | (403,591 | ) |
| Options written | | | 191,699 | | | | 318,088 | |
| Net change in unrealized appreciation/depreciation on: | | | | | | | | |
| Unaffiliated investments | | | (44,476,936 | ) | | | (15,925,717 | ) |
| Affiliated investments | | | (4,410,977 | ) | | | 3,761,573 | |
| Options written | | | (180,123 | ) | | | 64,257 | |
| Net increase (decrease) in net assets resulting from operations | | | (51,231,809 | ) | | | 6,714,575 | |
| | | | | | | | | |
| CAPITAL SHARE TRANSACTIONS | | | | | | | | |
| Total increase (decrease) in net assets from capital share transactions | | | (8,511,939 | ) | | | (31,050,208 | ) |
| Total increase (decrease) in net assets | | | (59,743,748 | ) | | | (24,335,633 | ) |
| | | | | | | | | |
| NET ASSETS | | | | | | | | |
| Beginning of period/year | | | 186,382,597 | | | | 210,718,230 | |
| End of period/year | | $ | 126,638,849 | | | $ | 186,382,597 | |
1 | Summary of share transactions is as follows: |
| | | | Six Months Ended | | | | | | | |
| | | | September 30, 2022 | | | Year Ended | |
| | | | (Unaudited) | | | March 31, 2022 | |
| | | | Shares | | | Amount | | | Shares | | | Amount | |
| | Retail Class: | | | | | | | | | | | | |
| | Shares sold | | | 91,193 | | | $ | 4,496,898 | | | | 588,658 | | | $ | 35,381,517 | |
| | Shares issued in reinvestment of distributions | | | — | | | | — | | | | — | | | | — | |
| | Shares redeemed 2 | | | (267,496 | ) | | | (13,008,837 | ) | | | (1,096,789 | ) | | | (66,431,725 | ) |
| | Net increase (decrease) | | | (176,303 | ) | | $ | (8,511,939 | ) | | | (508,131 | ) | | $ | (31,050,208 | ) |
2 | Net of redemption fees of $1,075 and $4,557, respectively. |
The accompanying notes are an integral part of these financial statements.
Small Cap Fund
| STATEMENTS OF CHANGES IN NET ASSETS |
| | | Six Months Ended | | | | |
| | | September 30, 2022 | | | Year Ended | |
| | | (Unaudited) | | | March 31, 2022 | |
| INCREASE (DECREASE) IN NET ASSETS FROM: | | | | | | |
| | | | | | | |
| OPERATIONS | | | | | | |
| Net investment income (loss) | | $ | 482,021 | | | $ | (1,274,102 | ) |
| Net realized gain (loss) on transactions from: | | | | | | | | |
| Unaffiliated investments | | | 10,628,934 | | | | 31,320,456 | |
| Net change in unrealized appreciation/depreciation on: | | | | | | | | |
| Unaffiliated investments | | | (49,368,018 | ) | | | (27,276,823 | ) |
| Options written | | | 9,010 | | | | — | |
| Net increase (decrease) in net assets resulting from operations | | | (38,248,053 | ) | | | 2,769,531 | |
| | | | | | | | | |
| DISTRIBUTIONS TO SHAREHOLDERS | | | | | | | | |
| Net distributions to shareholders – Retail Class | | | — | | | | (29,838,464 | ) |
| Net distributions to shareholders – Institutional Class | | | — | | | | (8,325,118 | ) |
| Total distributions to shareholders | | | — | | | | (38,163,582 | ) |
| | | | | | | | | |
| CAPITAL SHARE TRANSACTIONS | | | | | | | | |
| Increase (decrease) in net assets derived from | | | | | | | | |
net change in outstanding shares – Retail Class 1 | | | (6,791,299 | ) | | | 5,764,730 | |
| Increase (decrease) in net assets derived from | | | | | | | | |
net change in outstanding shares – Institutional Class 1 | | | (3,296,625 | ) | | | 450,891 | |
| Total increase (decrease) in net assets from capital share transactions | | | (10,087,924 | ) | | | 6,215,621 | |
| Total increase (decrease) in net assets | | | (48,335,977 | ) | | | (29,178,430 | ) |
| | | | | | | | | |
| NET ASSETS | | | | | | | | |
| Beginning of period/year | | | 207,882,458 | | | | 237,060,888 | |
| End of period/year | | $ | 159,546,481 | | | $ | 207,882,458 | |
1 | Summary of share transactions is as follows: |
| | | | Six Months Ended | | | | | | | |
| | | | September 30, 2022 | | | Year Ended | |
| | | | (Unaudited) | | | March 31, 2022 | |
| | | | Shares | | | Amount | | | Shares | | | Amount | |
| | Retail Class: | | | | | | | | | | | | |
| | Shares sold | | | 177,962 | | | $ | 3,662,576 | | | | 938,955 | | | $ | 24,307,825 | |
| | Shares issued in reinvestment of distributions | | | — | | | | — | | | | 1,329,539 | | | | 29,263,158 | |
| | Shares redeemed 2 | | | (528,869 | ) | | | (10,453,875 | ) | | | (1,970,518 | ) | | | (47,806,253 | ) |
| | Net increase (decrease) | | | (350,907 | ) | | $ | (6,791,299 | ) | | | 297,976 | | | $ | 5,764,730 | |
2 | Net of redemption fees of $13,124 and $7,785, respectively. |
| | | | Six Months Ended | | | | | | | |
| | | | September 30, 2022 | | | Year Ended | |
| | | | (Unaudited) | | | March 31, 2022 | |
| | | | Shares | | | Amount | | | Shares | | | Amount | |
| | Institutional Class: | | | | | | | | | | | | |
| | Shares sold | | | 133,687 | | | $ | 2,947,265 | | | | 336,797 | | | $ | 8,610,140 | |
| | Shares issued in reinvestment of distributions | | | — | | | | — | | | | 336,027 | | | | 7,842,879 | |
| | Shares redeemed 3 | | | (304,103 | ) | | | (6,243,890 | ) | | | (637,935 | ) | | | (16,002,128 | ) |
| | Net increase (decrease) | | | (170,416 | ) | | $ | (3,296,625 | ) | | | 34,889 | | | $ | 450,891 | |
3 | Net of redemption fees of $3,802 and $2,273, respectively. |
The accompanying notes are an integral part of these financial statements.
Small Intrinsic Value Fund
| STATEMENTS OF CHANGES IN NET ASSETS |
| | | Six Months Ended | | | | |
| | | September 30, 2022 | | | Year Ended | |
| | | (Unaudited) | | | March 31, 2022 | |
| INCREASE (DECREASE) IN NET ASSETS FROM: | | | | | | |
| | | | | | | |
| OPERATIONS | | | | | | |
| Net investment income (loss) | | $ | 154,489 | | | $ | 15,462 | |
| Net realized gain (loss) on transactions from: | | | | | | | | |
| Unaffiliated investments | | | 584,630 | | | | 1,628,225 | |
| Affiliated investments | | | — | | | | 118,588 | |
| Net change in unrealized appreciation/depreciation on: | | | | | | | | |
| Unaffiliated investments | | | (3,579,566 | ) | | | 233,272 | |
| Affiliated investments | | | — | | | | (38,800 | ) |
| Net increase (decrease) in net assets resulting from operations | | | (2,840,447 | ) | | | 1,956,747 | |
| | | | | | | | | |
| DISTRIBUTIONS TO SHAREHOLDERS | | | | | | | | |
| Total distributions to shareholders | | | — | | | | (1,012,021 | ) |
| | | | | | | | | |
| CAPITAL SHARE TRANSACTIONS | | | | | | | | |
| Total increase (decrease) in net assets from capital share transactions | | | 647,172 | | | | 472,817 | |
| Total increase (decrease) in net assets | | | (2,193,275 | ) | | | 1,417,543 | |
| | | | | | | | | |
| NET ASSETS | | | | | | | | |
| Beginning of period/year | | | 17,576,795 | | | | 16,159,252 | |
| End of period/year | | $ | 15,383,520 | | | $ | 17,576,795 | |
1 | Summary of share transactions is as follows: |
| | | | Six Months Ended | | | | | | | |
| | | | September 30, 2022 | | | Year Ended | |
| | | | (Unaudited) | | | March 31, 2022 | |
| | | | Shares | | | Amount | | | Shares | | | Amount | |
| | Retail Class: | | | | | | | | | | | | |
| | Shares Sold | | | 95,993 | | | $ | 1,712,602 | | | | 200,375 | | | $ | 3,616,763 | |
| | Shares issued in reinvestment of distributions | | | — | | | | — | | | | 54,864 | | | | 986,448 | |
| | Shares redeemed 2 | | | (61,245 | ) | | | (1,065,430 | ) | | | (230,002 | ) | | | (4,130,394 | ) |
| | Net increase (decrease) | | | 34,748 | | | $ | 647,172 | | | | 25,237 | | | $ | 472,817 | |
2 | Net of redemption fees of $37 and $216, respectively. |
The accompanying notes are an integral part of these financial statements.
Blue Chip Equity Income Fund
| STATEMENTS OF CHANGES IN NET ASSETS |
| | | Six Months Ended | | | | |
| | | September 30, 2022 | | | Year Ended | |
| | | (Unaudited) | | | March 31, 2022 | |
| INCREASE (DECREASE) IN NET ASSETS FROM: | | | | | | |
| | | | | | | |
| OPERATIONS | | | | | | |
| Net investment income (loss) | | $ | 103,663 | | | $ | 166,416 | |
| Net realized gain (loss) on transactions from: | | | | | | | | |
| Unaffiliated investments | | | (809,616 | ) | | | 4,150,051 | |
| Net change in unrealized appreciation/depreciation on: | | | | | | | | |
| Unaffiliated investments | | | (5,436,497 | ) | | | 225,645 | |
| Net increase (decrease) in net assets resulting from operations | | | (6,142,450 | ) | | | 4,542,112 | |
| | | | | | | | | |
| DISTRIBUTIONS TO SHAREHOLDERS | | | | | | | | |
| Total distributions to shareholders | | | (108,891 | ) | | | (3,037,713 | ) |
| | | | | | | | | |
| CAPITAL SHARE TRANSACTIONS | | | | | | | | |
| Total increase (decrease) in net assets from capital share transactions | | | 7,611 | | | | 2,540,049 | |
| Total increase (decrease) in net assets | | | (6,243,730 | ) | | | 4,044,448 | |
| | | | | | | | | |
| NET ASSETS | | | | | | | | |
| Beginning of period/year | | | 30,140,400 | | | | 26,095,952 | |
| End of period/year | | $ | 23,896,670 | | | $ | 30,140,400 | |
1 | Summary of share transactions is as follows: |
| | | | Six Months Ended | | | | | | | |
| | | | September 30, 2022 | | | Year Ended | |
| | | | (Unaudited) | | | March 31, 2022 | |
| | | | Shares | | | Amount | | | Shares | | | Amount | |
| | Retail Class: | |
| | | | | | | | | | |
| | Shares Sold | | | 87,267 | | | $ | 1,720,863 | | | | 79,155 | | | $ | 1,701,034 | |
| | Shares issued in reinvestment of distributions | | | 6,045 | | | | 101,867 | | | | 137,990 | | | | 2,874,038 | |
| | Shares redeemed 2 | | | (97,943 | ) | | | (1,815,119 | ) | | | (96,479 | ) | | | (2,035,023 | ) |
| | Net increase (decrease) | | | (4,631 | ) | | $ | 7,611 | | | | 120,666 | | | $ | 2,540,049 | |
2 | Net of redemption fees of $9 and $710, respectively. |
The accompanying notes are an integral part of these financial statements.
Hodges Fund
FINANCIAL HIGHLIGHTS For a capital share outstanding throughout each period/year |
RETAIL CLASS
| | | Six Months | | | | | | | | | | | | | | | | |
| | | Ended | | | | | | | | | | | | | | | | |
| | | September 30, | | |
| |
| | | 2022 | | | Year Ended March 31, |
| | | (Unaudited) | | | 2022 | | | 2021 | | | 2020 | | | 2019 | | | 2018 | |
| Net asset value, beginning of period/year | | $ | 58.91 | | | $ | 57.39 | | | $ | 20.36 | | | $ | 37.76 | | | $ | 48.44 | | | $ | 46.60 | |
| | | | | | | | | | | | | | | | | | | | | | | | | |
| INCOME FROM INVESTMENT OPERATIONS: | | | | | | | | | | | | | | | | | | | | | | | | |
Net investment income (loss) 1 | | | (0.04 | ) | | | (0.46 | ) | | | (0.31 | ) | | | (0.19 | ) | | | (0.36 | ) | | | (0.46 | ) |
| Net realized and unrealized | | | | | | | | | | | | | | | | | | | | | | | | |
| gain (loss) on investments | | | (16.48 | ) | | | 1.98 | | | | 37.34 | | | | (17.21 | ) | | | (7.15 | ) | | | 5.90 | |
| Total from investment operations | | | (16.52 | ) | | | 1.52 | | | | 37.03 | | | | (17.40 | ) | | | (7.51 | ) | | | 5.44 | |
| | | | | | | | | | | | | | | | | | | | | | | | | |
| LESS DISTRIBUTIONS: | | | | | | | | | | | | | | | | | | | | | | | | |
| From net realized gain | | | — | | | | — | | | | — | | | | — | | | | (3.17 | ) | | | (3.60 | ) |
| Total distributions | | | — | | | | — | | | | — | | | | — | | | | (3.17 | ) | | | (3.60 | ) |
| Paid-in capital from redemption fees | | | 0.00 | 2 | | | 0.00 | 2 | | | 0.00 | 2 | | | 0.00 | 2 | | | 0.00 | 2 | | | 0.00 | 2 |
| Reimbursement by Advisor | | | — | | | | 0.00 | 2 | | | — | | | | — | | | | — | | | | — | |
| Net asset value, end of period/year | | $ | 42.39 | | | $ | 58.91 | | | $ | 57.39 | | | $ | 20.36 | | | $ | 37.76 | | | $ | 48.44 | |
| Total return | | | (28.08 | )%3 | | | 2.70 | % | | | 181.74 | % | | | (46.05 | )% | | | (14.45 | )% | | | 11.88 | % |
| | | | | | | | | | | | | | | | | | | | | | | | | |
| SUPPLEMENTAL DATA: | | | | | | | | | | | | | | | | | | | | | | | | |
| Net assets, end of period/year (millions) | | $ | 126.6 | | | $ | 186.4 | | | $ | 210.7 | | | $ | 73.9 | | | $ | 177.4 | | | $ | 251.9 | |
| Portfolio turnover rate | | | 24 | %3 | | | 96 | % | | | 220 | % | | | 107 | % | | | 119 | % | | | 142 | % |
| | | | | | | | | | | | | | | | | | | | | | | | | |
| RATIO OF EXPENSES TO AVERAGE NET ASSETS: |
| Before fees waived and expenses absorbed | | | 1.42 | %4 | | | 1.35 | % | | | 1.40 | % | | | 1.37 | % | | | 1.34 | % | | | 1.33 | % |
After fees waived and expenses absorbed 5,6 | | | 1.18 | %4 | | | 1.17 | % | | | 1.16 | % | | | 1.18 | % | | | 1.18 | % | | | 1.18 | % |
| | | | | | | | | | | | | | | | | | | | | | | | | |
| RATIO OF NET INVESTMENT INCOME (LOSS) TO AVERAGE NET ASSETS: |
| Before fees waived and expenses absorbed | | | (0.41 | )%4 | | | (0.93 | )% | | | (1.03 | )% | | | (0.75 | )% | | | (0.97 | )% | | | (1.11 | )% |
After fees waived and expenses absorbed 5,6 | | | (0.17 | )%4 | | | (0.76 | )% | | | (0.79 | )% | | | (0.56 | )% | | | (0.81 | )% | | | (0.96 | )% |
1 | Calculated using the average shares outstanding method. |
2 | Does not round to $0.01 or $(0.01), as applicable. |
3 | Not annualized. |
4 | Annualized. |
5 | Effective April 1, 2017, the Advisor contractually agreed to limit the Retail Class shares’ annual ratio of expenses to 1.18% of the Retail Class’ daily net assets. See Note 3. |
6 | Effective September 1, 2020, the Advisor contractually agreed to limit the Retail Class shares’ annual ratio of expenses to 1.15% of the Retail Class’ daily net assets. See Note 3. |
The accompanying notes are an integral part of these financial statements.
Small Cap Fund
FINANCIAL HIGHLIGHTS For a capital share outstanding throughout each period/year |
RETAIL CLASS
| | | Six Months | | | | | | | | | | | | | | | | |
| | | Ended | | | | | | | | | | | | | | | | |
| | | September 30, | | |
| | | | | | | | | | | | | |
| | | 2022 | | | Year Ended March 31, |
| | | (Unaudited) | | | 2022 | | | 2021 | | | 2020 | | | 2019 | | | 2018 | |
| Net asset value, beginning of period/year | | $ | 21.35 | | | $ | 25.28 | | | $ | 10.10 | | | $ | 18.13 | | | $ | 19.51 | | | $ | 20.11 | |
| | | | | | | | | | | | | | | | | | | | | | | | | |
| INCOME FROM INVESTMENT OPERATIONS: | |
Net investment income (loss) 1 | | | 0.05 | | | | (0.15 | ) | | | (0.13 | ) | | | (0.07 | ) | | | (0.12 | ) | | | (0.13 | ) |
| Net realized and unrealized | | | | | | | | | | | | | | | | | | | | | | | | |
| gain (loss) on investments | | | (4.07 | ) | | | 0.56 | | | | 15.31 | | | | (6.58 | ) | | | (0.54 | ) | | | 2.35 | |
| Total from investment operations | | | (4.02 | ) | | | 0.41 | | | | 15.18 | | | | (6.65 | ) | | | (0.66 | ) | | | 2.22 | |
| | | | | | | | | | | | | | | | | | | | | | | | | |
| LESS DISTRIBUTIONS: | |
| From net realized gain | | | — | | | | (4.34 | ) | | | — | | | | (1.38 | ) | | | (0.72 | ) | | | (2.82 | ) |
| Total distributions | | | — | | | | (4.34 | ) | | | — | | | | (1.38 | ) | | | (0.72 | ) | | | (2.82 | ) |
| Paid-in capital from redemption | | | 0.00 | 2 | | | 0.00 | 2 | | | 0.00 | 2 | | | 0.00 | 2 | | | 0.00 | 2 | | | 0.00 | 2 |
| Net asset value, end of period/year | | $ | 17.33 | | | $ | 21.35 | | | $ | 25.28 | | | $ | 10.10 | | | $ | 18.13 | | | $ | 19.51 | |
| Total return | | | (18.83 | )%3 | | | 1.12 | % | | | 150.30 | % | | | (39.59 | )% | | | (2.96 | )% | | | 12.49 | % |
| | | | | | | | | | | | | | | | | | | | | | | | | |
| SUPPLEMENTAL DATA: | |
| Net assets, end of period/year (millions) | | $ | 124.6 | | | $ | 161.1 | | | $ | 183.2 | | | $ | 91.5 | | | $ | 354.5 | | | $ | 452.0 | |
| Portfolio turnover rate | | | 34 | %3 | | | 67 | % | | | 124 | % | | | 81 | % | | | 81 | % | | | 45 | % |
| | | | | | | | | | | | | | | | | | | | | | | | | |
| RATIO OF EXPENSES TO AVERAGE NET ASSETS: | |
| Before fees waived and expenses absorbed | | | 1.44 | %4 | | | 1.38 | % | | | 1.40 | % | | | 1.33 | % | | | 1.29 | % | | | 1.30 | % |
After fees waived and expenses absorbed 5 | | | 1.40 | %4 | | | 1.36 | % | | | 1.35 | % | | | 1.33 | % | | | 1.29 | % | | | 1.30 | % |
| | | | | | | | | | | | | | | | | | | | | | | | | |
| RATIO OF NET INVESTMENT INCOME (LOSS) TO AVERAGE NET ASSETS: | |
| Before fees waived and expenses absorbed | | | 0.42 | %4 | | | (0.62 | )% | | | (0.83 | )% | | | (0.43 | )% | | | (0.60 | )% | | | (0.68 | )% |
After fees waived and expenses absorbed 5 | | | 0.46 | %4 | | | (0.60 | )% | | | (0.78 | )% | | | (0.43 | )% | | | (0.60 | )% | | | (0.68 | )% |
1 | Calculated using the average shares outstanding method. |
2 | Does not round to $0.01 or $(0.01), as applicable. |
3 | Not annualized. |
4 | Annualized. |
5 | Effective September 1, 2020, the Advisor contractually agreed to limit the Retail Class shares’ annual ratio of expenses to 1.37% of the Retail Class’ daily net assets. See Note 3. |
The accompanying notes are an integral part of these financial statements.
Small Cap Fund
FINANCIAL HIGHLIGHTS For a capital share outstanding throughout each period/year |
INSTITUTIONAL CLASS
| | | Six Months | | | | | | | | | | | | | | | | |
| | | Ended | | | | | | | | | | | | | | | | |
| | | September 30, | | |
| | | | | | | | | | | | | |
| | | 2022 | | | Year Ended March 31, | |
| | | (Unaudited) | | | 2022 | | | 2021 | | | 2020 | | | 2019 | | | 2018 | |
| Net asset value, beginning of period/year | | $ | 22.66 | | | $ | 26.51 | | | $ | 10.56 | | | $ | 18.85 | | | $ | 20.21 | | | $ | 20.68 | |
| | | | | | | | | | | | | | | | | | | | | | | | | |
| INCOME FROM INVESTMENT OPERATIONS: | |
Net investment income (loss) 1 | | | 0.07 | | | | (0.09 | ) | | | (0.09 | ) | | | (0.03 | ) | | | (0.07 | ) | | | (0.09 | ) |
| Net realized and unrealized | | | | | | | | | | | | | | | | | | | | | | | | |
| gain (loss) on investments | | | (4.32 | ) | | | 0.58 | | | | 16.04 | | | | (6.88 | ) | | | (0.57 | ) | | | 2.44 | |
| Total from investment operations | | | (4.25 | ) | | | 0.49 | | | | 15.95 | | | | (6.91 | ) | | | (0.64 | ) | | | 2.35 | |
| | | | | | | | | | | | | | | | | | | | | | | | | |
| LESS DISTRIBUTIONS: | |
| From net realized gain | | | — | | | | (4.34 | ) | | | — | | | | (1.38 | ) | | | (0.72 | ) | | | (2.82 | ) |
| Total distributions | | | — | | | | (4.34 | ) | | | — | | | | (1.38 | ) | | | (0.72 | ) | | | (2.82 | ) |
| Paid-in capital from redemption | | | 0.00 | 2 | | | 0.00 | 2 | | | 0.00 | 2 | | | 0.00 | 2 | | | 0.00 | 2 | | | 0.00 | 2 |
| Net asset value, end of period/year | | $ | 18.41 | | | $ | 22.66 | | | $ | 26.51 | | | $ | 10.56 | | | $ | 18.85 | | | $ | 20.21 | |
| Total return | | | (18.76 | )%3 | | | 1.34 | % | | | 151.14 | % | | | (39.46 | )% | | | (2.76 | )% | | | 12.79 | % |
| | | | | | | | | | | | | | | | | | | | | | | | | |
| SUPPLEMENTAL DATA: | |
| Net assets, end of period/year (millions) | | $ | 34.9 | | | $ | 46.8 | | | $ | 53.8 | | | $ | 32.2 | | | $ | 105.0 | | | $ | 132.3 | |
| Portfolio turnover rate | | | 34 | %3 | | | 67 | % | | | 124 | % | | | 81 | % | | | 81 | % | | | 45 | % |
| | | | | | | | | | | | | | | | | | | | | | | | | |
| RATIO OF EXPENSES TO AVERAGE NET ASSETS: | |
| Before fees waived and expenses absorbed | | | 1.19 | %4 | | | 1.12 | % | | | 1.15 | % | | | 1.09 | % | | | 1.04 | % | | | 1.05 | % |
After fees waived and expenses absorbed 5 | | | 1.15 | %4 | | | 1.11 | % | | | 1.10 | % | | | 1.09 | % | | | 1.04 | % | | | 1.05 | % |
| | | | | | | | | | | | | | | | | | | | | | | | | |
| RATIO OF NET INVESTMENT INCOME (LOSS) TO AVERAGE NET ASSETS: | |
| Before fees waived and expenses absorbed | | | 0.67 | %4 | | | (0.36 | )% | | | (0.58 | )% | | | (0.18 | )% | | | (0.35 | )% | | | (0.44 | )% |
After fees waived and expenses absorbed 5 | | | 0.71 | %4 | | | (0.35 | )% | | | (0.53 | )% | | | (0.18 | )% | | | (0.35 | )% | | | (0.44 | )% |
1 | Calculated using the average shares outstanding method. |
2 | Does not round to $0.01 or $(0.01), as applicable. |
3 | Not annualized. |
4 | Annualized. |
5 | Effective September 1, 2020, the Advisor contractually agreed to limit the Retail Class shares’ annual ratio of expenses to 1.37% of the Retail Class’ daily net assets. See Note 3. |
The accompanying notes are an integral part of these financial statements.
Small Intrinsic Value Fund
FINANCIAL HIGHLIGHTS For a capital share outstanding throughout each period/year |
RETAIL CLASS
| | | Six Months | | | | | | | | | | | | | | | | |
| | | Ended | | | | | | | | | | | | | | | | |
| | | September 30, | | |
| | | | | | | | | | | | | |
| | | 2022 | | | Year Ended March 31, | |
| | | (Unaudited) | | | 2022 | | | 2021 | | | 2020 | | | 2019 | | | 2018 | |
| Net asset value, beginning of period/year | | $ | 18.37 | | | $ | 17.34 | | | $ | 6.84 | | | $ | 11.13 | | | $ | 13.65 | | | $ | 12.83 | |
| | | | | | | | | | | | | | | | | | | | | | | | | |
| INCOME FROM INVESTMENT OPERATIONS: | |
Net investment income (loss) 1 | | | 0.16 | | | | 0.02 | | | | (0.06 | ) | | | (0.01 | ) | | | (0.08 | ) | | | (0.07 | ) |
| Net realized and unrealized | | | | | | | | | | | | | | | | | | | | | | | | |
| gain (loss) on investments | | | (3.02 | ) | | | 2.15 | | | | 10.56 | | | | (4.28 | ) | | | (1.47 | ) | | | 1.30 | |
| Total from investment operations | | | (2.86 | ) | | | 2.17 | | | | 10.50 | | | | (4.29 | ) | | | (1.55 | ) | | | 1.23 | |
| | | | | | | | | | | | | | | | | | | | | | | | | |
| LESS DISTRIBUTIONS: | |
| From net investment income | | | — | | | | (0.01 | ) | | | — | | | | (0.00 | )2 | | | — | | | | — | |
| From net realized gain | | | — | | | | (1.13 | ) | | | — | | | | — | | | | (0.97 | ) | | | (0.41 | ) |
| Total distributions | | | — | | | | (1.14 | ) | | | — | | | | (0.00 | )2 | | | (0.97 | ) | | | (0.41 | ) |
| Paid-in capital from redemption | | | 0.00 | 2 | | | 0.00 | 2 | | | 0.00 | 2 | | | 0.00 | 2 | | | 0.00 | 2 | | | 0.00 | 2 |
| Net asset value, end of period/year | | $ | 15.51 | | | $ | 18.37 | | | $ | 17.34 | | | $ | 6.84 | | | $ | 11.13 | | | $ | 13.65 | |
| Total return | | | (15.52 | )%3 | | | 12.56 | % | | | 153.51 | % | | | (38.53 | )% | | | (10.91 | )% | | | 9.55 | % |
| | | | | | | | | | | | | | | | | | | | | | | | | |
| SUPPLEMENTAL DATA: | |
| Net assets, end of period/year (millions) | | $ | 15.4 | | | $ | 17.6 | | | $ | 16.2 | | | $ | 4.0 | | | $ | 13.7 | | | $ | 81.7 | |
| Portfolio turnover rate | | | 32 | %3 | | | 62 | % | | | 136 | % | | | 115 | % | | | 137 | % | | | 103 | % |
| | | | | | | | | | | | | | | | | | | | | | | | | |
| RATIO OF EXPENSES TO AVERAGE NET ASSETS: | |
| Before fees waived and expenses absorbed | | | 2.10 | %4 | | | 2.05 | % | | | 2.48 | % | | | 2.43 | % | | | 1.50 | % | | | 1.38 | % |
| After fees waived and expenses absorbed | | | 1.29 | %4 | | | 1.29 | % | | | 1.29 | % | | | 1.29 | % | | | 1.29 | % | | | 1.29 | % |
| | | | | | | | | | | | | | | | | | | | | | | | | |
| RATIO OF NET INVESTMENT INCOME (LOSS) TO AVERAGE NET ASSETS: | |
| Before fees waived and expenses absorbed | | | 1.04 | %4 | | | (0.67 | )% | | | (1.73 | )% | | | (1.21 | )% | | | (0.78 | )% | | | (0.64 | )% |
| After fees waived and expenses absorbed | | | 1.84 | %4 | | | 0.09 | % | | | (0.54 | )% | | | (0.07 | )% | | | (0.57 | )% | | | (0.55 | )% |
1 | Calculated using the average shares outstanding method. |
2 | Does not round to $0.01 or $(0.01), as applicable. |
3 | Not annualized. |
4 | Annualized. |
The accompanying notes are an integral part of these financial statements.
Blue Chip Equity Income Fund
FINANCIAL HIGHLIGHTS For a capital share outstanding throughout each period/year |
RETAIL CLASS
| | | Six Months | | | | | | | | | | | | | | | | |
| | | Ended | | | | | | | | | | | | | | | | |
| | | September 30, | | |
| | | | | | | | | | | | | |
| | | 2022 | | | Year Ended March 31, | |
| | | (Unaudited) | | | 2022 | | | 2021 | | | 2020 | | | 2019 | | | 2018 | |
| Net asset value, beginning of period/year | | $ | 20.66 | | | $ | 19.50 | | | $ | 13.11 | | | $ | 15.83 | | | $ | 15.86 | | | $ | 15.27 | |
| | | | | | | | | | | | | | | | | | | | | | | | | |
| INCOME FROM INVESTMENT OPERATIONS: | |
Net investment income (loss) 1 | | | 0.07 | | | | 0.12 | | | | 0.13 | | | | 0.15 | | | | 0.12 | | | | 0.15 | |
| Net realized and unrealized | | | | | | | | | | | | | | | | | | | | | | | | |
| gain (loss) on investments | | | (4.23 | ) | | | 3.32 | | | | 7.22 | | | | (1.56 | ) | | | 0.65 | | | | 1.98 | |
| Total from investment operations | | | (4.16 | ) | | | 3.44 | | | | 7.35 | | | | (1.41 | ) | | | 0.77 | | | | 2.13 | |
| | | | | | | | | | | | | | | | | | | | | | | | | |
| LESS DISTRIBUTIONS: | |
| From net investment income | | | (0.07 | ) | | | (0.12 | ) | | | (0.12 | ) | | | (0.15 | ) | | | (0.12 | ) | | | (0.15 | ) |
| From net realized gain | | | — | | | | (2.16 | ) | | | (0.84 | ) | | | (1.16 | ) | | | (0.68 | ) | | | (1.39 | ) |
| Total distributions | | | (0.07 | ) | | | (2.28 | ) | | | (0.96 | ) | | | (1.31 | ) | | | (0.80 | ) | | | (1.54 | ) |
| Paid-in capital from redemption | | | 0.00 | 2 | | | 0.00 | 2 | | | 0.00 | 2 | | | 0.00 | 2 | | | 0.00 | 2 | | | 0.00 | 2 |
| Net asset value, end of period/year | | $ | 16.43 | | | $ | 20.66 | | | $ | 19.50 | | | $ | 13.11 | | | $ | 15.83 | | | $ | 15.86 | |
| Total return | | | (20.12 | )%3 | | | 17.59 | % | | | 56.53 | % | | | (10.66 | )% | | | 5.52 | % | | | 13.69 | % |
| | | | | | | | | | | | | | | | | | | | | | | | | |
| SUPPLEMENTAL DATA: | |
| Net assets, end of period/year (millions) | | $ | 23.9 | | | $ | 30.1 | | | $ | 26.1 | | | $ | 18.8 | | | $ | 24.0 | | | $ | 23.3 | |
| Portfolio turnover rate | | | 24 | %3 | | | 79 | % | | | 67 | % | | | 51 | % | | | 44 | % | | | 65 | % |
| | | | | | | | | | | | | | | | | | | | | | | | | |
| RATIO OF EXPENSES TO AVERAGE NET ASSETS: | |
| Before fees waived and expenses absorbed | | | 1.52 | %4 | | | 1.49 | % | | | 1.64 | % | | | 1.47 | % | | | 1.48 | % | | | 1.45 | % |
| After fees waived and expenses absorbed | | | 1.30 | %4 | | | 1.30 | % | | | 1.30 | % | | | 1.30 | % | | | 1.30 | % | | | 1.30 | % |
| | | | | | | | | | | | | | | | | | | | | | | | | |
| RATIO OF NET INVESTMENT INCOME (LOSS) TO AVERAGE NET ASSETS: | |
| Before fees waived and expenses absorbed | | | 0.53 | %4 | | | 0.39 | % | | | 0.37 | % | | | 0.73 | % | | | 0.59 | % | | | 0.77 | % |
| After fees waived and expenses absorbed | | | 0.75 | %4 | | | 0.58 | % | | | 0.71 | % | | | 0.90 | % | | | 0.76 | % | | | 0.92 | % |
1 | Calculated using the average shares outstanding method. |
2 | Does not round to $0.01 or $(0.01), as applicable. |
3 | Not annualized. |
4 | Annualized. |
The accompanying notes are an integral part of these financial statements.
Hodges Mutual Funds
NOTES TO FINANCIAL STATEMENTS September 30, 2022 (Unaudited) |
The Hodges Fund, Small Cap Fund, Small Intrinsic Value Fund, and Blue Chip Equity Income Fund (each a “Fund” and collectively the “Funds”) are each a diversified series of shares of beneficial interest of Professionally Managed Portfolios (the “Trust”), which is registered under the Investment Company Act of 1940, as amended (the “1940 Act”) as an open-end management investment company. Each Fund is an investment company and accordingly follows the investment company accounting and reporting guidance of the Financial Accounting Standards Board (FASB) Accounting Standard Codification Topic 946 “Financial Services—Investment Companies”. The Hodges Fund commenced operations on October 9, 1992. The Hodges Fund currently offers a Retail Class of shares only. The Small Cap Fund commenced operations on December 18, 2007. The Small Cap Fund currently offers two classes of shares: Retail Class and Institutional Class. The Retail Class commenced operations on December 18, 2007 and the Institutional Class commenced operations on December 12, 2008. The Small Intrinsic Value Fund commenced operations on December 26, 2013 and offers a Retail Class of shares only. The Blue Chip Equity Income Fund commenced operations on September 10, 2009 and offers a Retail Class of shares only.
Each class of shares has equal rights as to earnings and assets except that each class bears its own distribution expenses. Each class of shares has exclusive voting rights with respect to matters that affect just that class. Income, expenses (other than expenses attributable to a specific class), and realized and unrealized gains or losses on investments are allocated to each class of shares based on its relative net assets.
The investment objective of the Hodges Fund, Small Cap Fund, and Small Intrinsic Value Fund is long-term capital appreciation. The investment objective of the Blue Chip Equity Income Fund is to seek income and long-term capital appreciation.
| NOTE 2 – SIGNIFICANT ACCOUNTING POLICIES |
The following is a summary of significant accounting policies consistently followed by the Funds. These policies are in conformity with accounting principles generally accepted in the United States of America (“U.S. GAAP”).
| A. | Security Valuation. All equity securities, which may include Real Estate Investment Trusts (“REITs”), Business Development Companies (“BDCs”), and Master Limited Partnerships (“MLPs”), that are traded on U.S. or foreign national securities exchanges, are valued at the last reported sale price on the exchange on which the security is principally traded or the exchange’s official closing price, if applicable. If, on a particular day, an exchange-traded security does not trade, then the mean between the most recent quoted bid and asked prices will be used. All equity securities, which may include REITs, BDCs, and MLPs, that are not traded on a listed exchange are valued at the last sale price in the over-the-counter market. If a non-exchange traded security does not trade on a particular day, then the mean between the last quoted closing bid and asked price will be used. |
| | |
| | Debt securities are valued by using the evaluated mean price supplied by an approved independent pricing service. The independent pricing service may use various valuation methodologies including, matrix pricing and other analytical pricing models as well as market transactions and dealer quotations. These models generally consider such factors as yields or prices of bonds of comparable quality, type of issue, coupon, maturity, ratings and general market conditions. |
| | |
| | Exchange traded options are valued at the composite price, using the National Best Bid and Offer quotes (“NBBO”). NBBO consists of the highest bid price and lowest ask price across any of the exchanges on which an option is quoted, thus providing a view across the entire U.S. options marketplace. Composite option pricing calculates the mean of the highest bid price and lowest ask price across the exchanges where the option is traded. |
| | |
| | Prior to the effectiveness of Rule 2a-5 on September 8, 2022, the Board of Trustees (the “Board”) had delegated day-to-day valuation issues to a Valuation Committee of the Trust, which was comprised of representatives from the Funds’ administrator, U.S. Bancorp Fund Services, LLC, doing business as U.S. Bank Global Fund Services (“Fund Services”). The function of the Valuation Committee was to value securities where current and reliable market quotations were not readily available or the closing price did not represent fair value by following procedures approved by the Board. These procedures considered many factors, including the type of security, size of holding, trading volume and news events. All actions taken by the Valuation Committee were subsequently reviewed and ratified by the Board. The Valuation Committee served until September 7, 2022. Effective September 8, 2022, the Board approved Hodges Capital Management, Inc. (the “Advisor”), as the Funds’ valuation designee under Rule 2a-5. |
Hodges Mutual Funds
NOTES TO FINANCIAL STATEMENTS September 30, 2022 (Unaudited) (Continued) |
| | As described above, the Funds utilize various methods to measure the fair value of their investments on a recurring basis. U.S. GAAP establishes a hierarchy that prioritizes inputs to valuation methods. The three levels of inputs are: |
| | Level 1 – | Unadjusted quoted prices in active markets for identical assets or liabilities that the Funds have the ability to access. |
| | | |
| | Level 2 – | Observable inputs other than quoted prices included in Level 1 that are observable for the asset or liability, either directly or indirectly. These inputs may include quoted prices for the identical instrument on an inactive market, prices for similar instruments, interest rates, prepayment speeds, credit risk, yield curves, default rates and similar data. |
| | | |
| | Level 3 – | Unobservable inputs for the asset or liability, to the extent relevant observable inputs are not available; representing the Funds’ own assumptions about the assumptions a market participant would use in valuing the asset or liability, and would be based on the best information available. |
| | The availability of observable inputs can vary from security to security and is affected by a wide variety of factors, including, for example, the type of security, whether the security is new and not yet established in the marketplace, the liquidity of markets and other characteristics particular to the security. To the extent that valuation is based on models or inputs that are less observable or unobservable in the market, the determination of fair value requires more judgment. Accordingly, the degree of judgment exercised in determining fair value is greatest for instruments categorized in Level 3. |
| | |
| | The inputs used to measure fair value may fall into different levels of the fair value hierarchy. In such cases, for disclosure purposes, the level in the fair value hierarchy within which the fair value measurement falls in its entirety, is determined based on the lowest level input that is significant to the fair value measurement in its entirety. |
| | |
| | The following are summaries of the inputs used to value the Funds’ investments as of September 30, 2022. See the Schedules of Investments for industry breakouts. |
| | Hodges Fund: | | Level 1 | | | Level 2 | | | Level 3 | | | Total | |
| | Common Stocks | | $ | 126,638,014 | | | $ | — | | | $ | — | | | $ | 126,638,014 | |
| | Total Investments in Securities | | $ | 126,638,014 | | | $ | — | | | $ | — | | | $ | 126,638,014 | |
| | | | | | | | | | | | | | |
| | Small Cap Fund: | | Level 1 | | | Level 2 | | | Level 3 | | | Total | |
| | Common Stocks | | $ | 159,573,543 | | | $ | — | | | $ | — | | | $ | 159,573,543 | |
| | Total Investments in Securities | | $ | 159,573,543 | | | $ | — | | | $ | — | | | $ | 159,573,543 | |
| | | | | | | | | | | | | | |
| | Small Intrinsic Value Fund: | | Level 1 | | | Level 2 | | | Level 3 | | | Total | |
| | Common Stocks | | $ | 14,871,288 | | | $ | — | | | $ | — | | | $ | 14,871,288 | |
| | Total Investments in Securities | | $ | 14,871,288 | | | $ | — | | | $ | — | | | $ | 14,871,288 | |
| | | | | | | | | | | | | | |
| | Blue Chip Equity Income Fund: | | Level 1 | | | Level 2 | | | Level 3 | | | Total | |
| | Common Stocks | | $ | 23,798,606 | | | $ | — | | | $ | — | | | $ | 23,798,606 | |
| | Total Investments in Securities | | $ | 23,798,606 | | | $ | — | | | $ | — | | | $ | 23,798,606 | |
| | The Funds have adopted financial reporting rules and regulations that require enhanced disclosure regarding derivatives and hedging activity intending to improve financial reporting of derivative instruments by enabling investors to understand how an entity uses derivatives, how derivatives are accounted for, and how derivative instruments affect an entity’s results of operations and financial position. |
| | |
| | Each Fund may invest in options, traded on U.S. and foreign exchanges, on equities, debt and stock indices as a substitute for a comparable market position in the underlying security, to attempt to hedge or limit the exposure of a Fund’s position, and to effect closing transactions. Each Fund may write covered put and call options on securities, securities indices and currencies in which it may invest to serve as a partial hedge against a price decline of the underlying security. |
Hodges Mutual Funds
NOTES TO FINANCIAL STATEMENTS September 30, 2022 (Unaudited) (Continued) |
| | The effect of derivative instruments on the Statement of Operations for the six months ended September 30, 2022: |
| | |
| | Hodges Fund |
| | | | | Change in Unrealized |
| | | Location of Gain | Realized Gain | Appreciation/Depreciation |
| | | (Loss) on Derivatives | (Loss) on Derivatives | on Derivatives |
| | Derivative Instruments | Recognized in Income | Recognized in Income | Recognized in Income |
| | Equity Contracts: | Realized and Unrealized | | |
| | Call Options Purchased | Gain (Loss) on Investments | $(4,740,517) | $(1,821,884) |
| | | | | |
| | Equity Contracts: | Realized and Unrealized | | |
| | Call Options Written | Gain (Loss) on Investments | 191,699 | (180,123) |
| | | | | |
| | Small Cap Fund | | | |
| | | | | Change in Unrealized |
| | | Location of Gain | Realized Gain | Appreciation/Depreciation |
| | | (Loss) on Derivatives | (Loss) on Derivatives | on Derivatives |
| | Derivative Instruments | Recognized in Income | Recognized in Income | Recognized in Income |
| | Equity Contracts: | Realized and Unrealized | | |
| | Call Options Written | Gain (Loss) on Investments | $ — | $9,010 |
| | The average absolute notional value of options held and written during the six months ended September 30, 2022 was $17,831,870 in the Hodges Fund. |
| | |
| B. | Foreign Currency. Investment securities and other assets and liabilities denominated in foreign currencies are translated into U.S. dollar amounts at the date of valuation. Purchases and sales of investment securities and income and expense items denominated in foreign currencies are translated into U.S. dollar amounts on the respective dates of such transactions. |
| | |
| | The Funds do not isolate that portion of the results of operations resulting from changes in foreign exchange rates on investments from the fluctuations arising from changes in market prices of securities held. Such fluctuations are included with the net unrealized and realized gain or loss from investments. |
| | |
| | The Funds do not isolate net realized foreign exchange gains or losses that arise from sales of foreign currencies, currency gains or losses realized between the trade and settlement dates on securities transactions, and the difference between the amounts of dividends, interest, and foreign withholding taxes recorded on the Funds’ books and the U.S. dollar equivalent of the amounts actually received or paid. Such fluctuations are included with the net realized gain or loss from investments. Net fair values of assets and liabilities, other than investments in securities at fiscal period end, resulting from changes in exchange rates. |
| | |
| C. | Federal Income Taxes. Each Fund has elected to be taxed as a “regulated investment company” and intends to distribute substantially all taxable income to its shareholders and otherwise comply with the provisions of the Internal Revenue Code applicable to regulated investment companies. Therefore, no provision for federal income taxes or excise taxes has been made. |
| | |
| | In order to avoid imposition of the excise tax applicable to regulated investment companies, each Fund intends to declare each year as dividends in each calendar year at least 98.0% of its net investment income (earned during the calendar year) and at least 98.2% of its net realized capital gains (earned during the twelve months ended October 31) plus undistributed amounts, if any, from prior years. |
| | |
| | Net capital losses incurred after October 31 and within the taxable year are deemed to arise on the first business day of each Fund’s next taxable year. Net investment losses incurred after December 31, and within the taxable year, are deemed to arise on the first business day of the Funds’ next taxable year. |
Hodges Mutual Funds
NOTES TO FINANCIAL STATEMENTS September 30, 2022 (Unaudited) (Continued) |
| | As of fiscal year end March 31, 2022, the Funds deferred, on a tax basis, late year and post-October losses of: |
| | | | Late Year Losses | | | Post-October Losses | |
| | Hodges Fund | | $ | — | | | $ | — | |
| | Small Cap Fund | | | — | | | | — | |
| | Small Intrinsic Value Fund | | | 229,843 | | | | — | |
| | Blue Chip Equity Income Fund | | | — | | | | — | |
| | As of September 30, 2022, the Funds did not have any tax positions that did not meet the “more likely-than-not” threshold of being sustained by the applicable tax authority. Generally, tax authorities can examine all the tax returns filed for the last three fiscal years. The Funds identify their major tax jurisdictions as U.S. Federal and the Commonwealth of Massachusetts. As of September 30, 2022, the Funds are not aware of any tax positions for which it is reasonably possible that the total amounts of unrecognized tax benefits will change materially. |
| | |
| D. | Securities Transactions and Investment Income. Investment securities transactions are accounted for on the trade date. Gains and losses realized on sales of securities are determined on a specific identification basis. Discounts/premiums on debt securities purchased are accreted/amortized over the life of the respective securities using the effective interest method. Dividend income is recorded on the ex-dividend date. Interest income is recorded on an accrual basis. Dividends received from REITs generally are comprised of ordinary income, capital gains, and may include return of capital. Other non-cash dividends are recognized as investment income at the fair value of the property received. Withholding taxes on foreign dividends have been provided for in accordance with the Trust’s understanding of the applicable country’s tax rules and rates. |
| | |
| E. | Distributions to Shareholders. Distributions to shareholders from net investment income and net realized gains, if any, on securities for the Hodges Fund, Small Cap Fund, and Small Intrinsic Value Fund are normally declared and paid on an annual basis. Distributions to shareholders from net investment income for the Blue Chip Equity Income Fund normally are declared and paid on a quarterly basis. Distributions to shareholders from net realized gains on securities normally are declared and paid on an annual basis. Distributions are recorded on the ex-dividend date. |
| | |
| F. | Options Contracts. The Funds may purchase call and put options on securities and indices. As the holder of a call option, each Fund has the right to purchase the underlying security at the exercise price at any time until the expiration date. As a holder of a put option, each Fund has the right to sell the underlying security at the exercise price at any time until the expiration date. The Funds may enter into closing sale transactions with respect to such options, exercise such options, or permit such options to expire. If an option expires on the stipulated date or if a Fund enters into a closing sale transaction, a gain or loss is realized. If a Fund exercises a call option, the cost of the security acquired is increased by the premium paid for the call. Each Fund may write (sell) covered put and call options on securities, security indices, and currencies in which it may invest. When a Fund writes an option, an amount equal to the premium received by a Fund is recorded as a liability and is subsequently adjusted to reflect the current fair value of the option written. Premiums received from writing options that expire unexercised are treated by the Fund on the expiration date as realized gains from investments. The difference between the premium and the amount paid on effecting a closing purchase transaction, including brokerage commissions, is also treated as a realized gain, or, if the premium is less than the amount paid for the closing purchase transaction, as a realized loss. If a call option is exercised, the premium is added to the proceeds from the sale of the underlying security in determining whether a Fund has realized a gain or loss. If a put option is exercised, the premium reduces the cost basis of the securities purchased by the Fund. Each Fund, as writer of an option, bears the market risk of an unfavorable change in the price of the security underlying the written option. |
| | |
| G. | Use of Estimates. The preparation of financial statements in conformity with U.S. GAAP requires management to make estimates and assumptions that affect the reported amounts of assets and liabilities at the date of the financial statements and the reported amount of revenue and expenses during the reporting period. Actual results could differ from those estimates. |
| | |
| H. | Share Valuation. The net asset value (“NAV”) per share of each Fund is calculated by dividing the sum of the value of the securities held by each Fund, plus cash or other assets, minus all liabilities (including estimated accrued expenses) by the total number of shares outstanding for each Fund, rounded to the nearest cent. The Funds’ shares will not be priced on the days on which the New York Stock Exchange is closed for trading. The offering and redemption price per share for each Fund is equal to each Fund’s NAV per share. The Hodges Fund Retail Class, Small Cap Fund Retail Class, Small Intrinsic Value Fund, and Blue Chip Equity Income Fund charge a redemption fee equal to 1% of the net amount |
Hodges Mutual Funds
NOTES TO FINANCIAL STATEMENTS September 30, 2022 (Unaudited) (Continued) |
| | of redemptions if redeemed within 30 calendar days after purchase. The Institutional Class of the Small Cap Fund charges a redemption fee equal to 1% of the net amount of redemptions if redeemed within 60 calendar days after purchase. These fees are deducted from the redemption proceeds otherwise payable to the shareholder. Each Fund will retain the fee charged as paid-in capital and such fees become part of that Fund’s daily NAV calculation. |
| | |
| I. | Guarantees and Indemnifications. In the normal course of business, each Fund enters into contracts with service providers that contain general indemnification clauses. The Funds’ maximum exposure under these arrangements is unknown as this would involve future claims that may be made against the Funds that have not yet occurred. However, based on experience, the Funds expect the risk of loss to be remote. |
| | |
| J. | Recently Issued Accounting Pronouncements. In June 2022, the FASB issued Accounting Standards Update 2022-03, which amends Fair Value Measurement (Topic 820): Fair Value Measurement of Equity Securities Subject to Contractual Sale Restrictions (“ASU 2022-03”). ASU 202203 clarifies guidance for fair value measurement of an equity security subject to a contractual sale restriction and establishes new disclosure requirements for such equity securities. ASU 2022-03 is effective for fiscal years beginning after December 15, 2023 and for interim periods within those fiscal years, with early adoption permitted. Management is currently evaluating the impact of these amendments on their financial statements. |
| | |
| K. | Subsequent Events. In preparing these financial statements, the Funds have evaluated events and transactions for potential recognition or disclosure through the date the financial statements were issued. The Funds have determined that there were no subsequent events that would need to be disclosed in the Funds’ financial statements. |
| NOTE 3 – COMMITMENTS AND OTHER RELATED PARTY TRANSACTIONS |
Hodges Capital Management, Inc. (the “Advisor”) provides the Funds with investment management services under an Investment Advisory Agreement (the “Advisory Agreement”). Under the Advisory Agreement, the Advisor furnishes all investment advice, office space, certain administrative services, and provides most of the personnel needed by the Funds. As compensation for its services, the Advisor is entitled to a monthly fee at the annual rate of 0.85% for the Hodges Fund, Small Cap Fund, Small Intrinsic Value Fund, and 0.65% for the Blue Chip Equity Income Fund, based upon the average daily net assets of each Fund. Effective as of September 1, 2020, the Advisor has contractually agreed to lower its management fee in the Hodges Fund and Small Cap Fund from 0.85% to 0.82% until August 31, 2022 (the “Management Fee Waiver”). This contractual waiver may not be terminated without the approval of the Board. The Advisor has waived its right to receive reimbursement of the portion of its advisory fees waived pursuant to the advisory fee waiver agreement. Effective September 1, 2021, the Management Fee Waiver was terminated. For the six months ended September 30, 2022, the advisory fees incurred by the Funds are disclosed in the Statements of Operations. The investment advisory fees incurred are paid monthly to the Advisor, net of any monthly waiver or reimbursement discussed below.
The Funds are responsible for their own operating expenses. The Advisor has contractually agreed to limit Fund expenses as follows by reducing all or a portion of its fees and reimbursing the Fund expenses so that its ratio of expenses to average net assets will not exceed:
| Hodges Fund | | | 0.93 | %1 |
| Small Cap Fund Retail Class | | | 1.15 | %1 |
| Small Intrinsic Value Fund | | | 1.04 | % |
| Blue Chip Equity Income Fund | | | 1.05 | % |
1 | Prior to the termination of the Management Fee Waiver, these amounts were 0.90% and 1.12% for the Hodges Fund and Small Cap Fund, respectively. |
Any fees waived and/or any Fund expenses absorbed (excluding any fees waived under the Management Fee Waiver) by the Advisor pursuant to an agreed upon expense cap shall be reimbursed by the respective Fund to the Advisor, if so requested by the Advisor, any time before the end of the third year following the period to which the fee waiver and/or expense absorption relates, provided the aggregate amount of the respective Fund’s current operating expenses for such period does not exceed the lesser expense cap in place at the time of waiver or at the time of reimbursement. Each Fund must pay its current ordinary operating expenses before the Advisor is entitled to any reimbursements of fees and/or expenses. Any such reimbursement is also contingent upon Board’s review and approval. For the six months ended September 30, 2022, the amount of fees waived and expenses reimbursed by the Advisor are disclosed in the Statements of Operations. Amounts due from the Advisor are paid monthly to the Funds, if applicable.
Hodges Mutual Funds
NOTES TO FINANCIAL STATEMENTS September 30, 2022 (Unaudited) (Continued) |
At September 30, 2022, the cumulative unreimbursed amount paid and/or waived by the Advisor on behalf of the Hodges Fund, Small Cap Fund, Small Intrinsic Value Fund, and Blue Chip Equity Income Fund that may be recouped was $1,182,715, $110,155, $443,265, and $190,586, respectively. The Advisor may recapture portions of the above amounts no later than the dates stated below:
| | | March 31, 2023 | | | March 31, 2024 | | | March 31, 2025 | | | September 30, 2025 | |
| Hodges Fund | | $ | 312,590 | | | $ | 302,379 | | | $ | 378,323 | | | $ | 181,850 | |
| Small Cap Fund | | | — | | | | 61,633 | | | | 10,317 | | | | 39,590 | |
| Small Intrinsic Value Fund | | | 114,621 | | | | 132,627 | | | | 128,404 | | | | 67,613 | |
| Blue Chip Equity Income Fund | | | 43,084 | | | | 80,210 | | | | 54,986 | | | | 30,676 | |
U.S. Bancorp Fund Services, LLC, doing business as U.S. Bank Global Fund Services (“Fund Services”), serves as the Funds’ administrator, fund accountant, and transfer agent. In those capacities, Fund Services maintains the Funds’ books and records, calculates each Fund’s NAV, prepares various federal and state regulatory filings, coordinates the payment of the Funds’ expenses, reviews expense accruals, and prepares materials supplied to the Board. The officers of the Trust and the Chief Compliance Officer are also employees of Fund Services. Fees paid by the Funds to Fund Services for these services for the six months ended September 30, 2022, are disclosed in the Statements of Operations.
Quasar Distributors, LLC (the “Distributor”) acts as the Funds’ principal underwriter in a continuous public offering of the Funds’ shares. U.S. Bank N.A. serves as custodian to the Funds. U.S. Bank N.A. is an affiliate of Fund Services.
Each Fund has adopted a Distribution Plan (the “Plan”) in accordance with Rule 12b-1 under the 1940 Act. The Plan provides that each Fund’s Retail Class may pay a fee to the Distributor at an annual rate of up to 0.25% of the average daily net assets of each Fund. The fee is paid to the Distributor for the sale and distribution of a Fund’s shares and services it provides to shareholders. Fees paid by the Funds to the Distributor for services for the six months ended September 30, 2022, are disclosed in the Statements of Operations. For the six months ended September 30, 2022, First Dallas Securities, an affiliate of the Advisor, received $29,794, $19,976, $2,106, and $4,027 in distribution fees from the Hodges Fund, Small Cap Fund, Small Intrinsic Value Fund, and Blue Chip Equity Income Fund, respectively.
Each Fund has entered into sub-transfer agent arrangements (the “Arrangements”), for sub-transfer agent fees paid to third-party intermediaries, with respect to each Fund. All Arrangements must be approved by the Board. For the six months ended September 30, 2022, sub-transfer agent fees incurred by the Funds are disclosed in the Statements of Operations.
For the six months ended September 30, 2022 First Dallas Securities received $51,567, $21,390, $5,961, and $1,800 in brokerage commissions with respect to the Hodges Fund, Small Cap Fund, Small Intrinsic Value Fund, and Blue Chip Equity Income Fund for portfolio transactions, respectively.
| NOTE 4 – PURCHASES AND SALES OF SECURITIES |
The cost of purchases and proceeds from the sale or maturity of securities for the Funds, excluding short-term investments, for the six months ended September 30, 2022, were as follows:
| | | Purchases | | | Sales | |
| Hodges Fund | | $ | 34,766,230 | | | $ | 39,345,956 | |
| Small Cap Fund | | | 63,333,150 | | | | 70,197,149 | |
| Small Intrinsic Value Fund | | | 6,369,691 | | | | 5,200,924 | |
| Blue Chip Equity Income Fund | | | 6,554,026 | | | | 6,507,957 | |
There were no purchases or sales of U.S. Government obligations for any of the Funds for the six months ended September 30, 2022.
| NOTE 5 – DISTRIBUTIONS TO SHAREHOLDERS |
The tax character of distributions paid during the six months ended September 30, 2022, and the year ended March 31, 2022, for each Fund was as follows:
| Small Cap Fund | | September 30, 2022 | | | March 31, 2022 | |
| Distributions paid from: | | | | | | |
Long-term capital gain 1 | | $ | — | | | $ | 24,601,714 | |
| Ordinary income | | | — | | | | 13,561,868 | |
| Total | | $ | — | | | $ | 38,163,582 | |
Hodges Mutual Funds
NOTES TO FINANCIAL STATEMENTS September 30, 2022 (Unaudited) (Continued) |
| Small Intrinsic Value Fund | | September 30, 2022 | | | March 31, 2022 | |
| Distributions paid from: | | | | | | |
Long-term capital gain 1 | | $ | — | | | $ | 760,153 | |
| Ordinary income | | | — | | | | 251,868 | |
| Total | | $ | — | | | $ | 1,012,021 | |
| | | | | | | | | |
| Blue Chip Equity Income Fund | | September 30, 2022 | | | March 31, 2022 | |
| Distributions paid from: | | | | | | | | |
Long-term capital gain 1 | | $ | — | | | $ | 1,765,782 | |
| Ordinary income | | | 108,891 | | | | 1,271,931 | |
| Total | | $ | 108,891 | | | $ | 3,037,713 | |
1 | Designated as long-term capital gain dividend, pursuant to Internal Revenue Code Section 852(b)(3). |
The Hodges Fund did not pay any distributions during the six months ended September 30, 2022, or the year ended March 31, 2022.
As of the most recent fiscal year ended March 31, 2022, the components of distributable earnings on a tax basis were as follows 1:
| | | Hodges Fund | | | Small Cap Fund | |
| Cost of Investments | | $ | 128,332,856 | | | $ | 129,010,151 | |
| Gross tax unrealized appreciation | | | 64,274,614 | | | | 80,448,176 | |
| Gross tax unrealized depreciation | | | (9,842,251 | ) | | | (4,249,164 | ) |
| Net unrealized appreciation | | | 54,432,363 | | | | 76,199,012 | |
| Undistributed ordinary income | | | 685,793 | | | | — | |
| Undistributed long-term capital gain | | | — | | | | 10,589,812 | |
| Total distributable earnings | | | 685,793 | | | | 10,589,812 | |
| Other accumulated gains/(losses) | | | — | | | | (229,843 | ) |
| Total accumulated gains | | $ | 55,118,156 | | | $ | 86,558,981 | |
| | | | | | | | | |
| | | Small Intrinsic | | | Blue Chip Equity | |
| | | Value Fund | | | Income Fund | |
| Cost of Investments | | $ | 11,911,776 | | | $ | 19,765,286 | |
| Gross tax unrealized appreciation | | | 5,115,514 | | | | 10,486,325 | |
| Gross tax unrealized depreciation | | | (299,832 | ) | | | (237,831 | ) |
| Net unrealized appreciation | | | 4,815,682 | | | | 10,248,494 | |
| Undistributed ordinary income | | | 243,689 | | | | 177,781 | |
| Undistributed long-term capital gain | | | 508,606 | | | | 1,816,600 | |
| Total distributable earnings | | | 752,295 | | | | 1,994,381 | |
| Other accumulated gains/(losses) | | | — | | | | — | |
| Total accumulated gains | | $ | 5,567,977 | | | $ | 12,242,875 | |
1 | The difference between book basis and tax basis unrealized appreciation was primarily attributable to the treatment of wash sale adjustments. |
Hodges Mutual Funds
NOTES TO FINANCIAL STATEMENTS September 30, 2022 (Unaudited) (Continued) |
| NOTE 6 – INVESTMENTS IN AFFILIATES |
Affiliated companies are those that are “affiliated persons” as defined in Section 2(a)(3) of the 1940 Act. They include, among other entities, issuers 5% or more of whose outstanding voting shares are held by the Fund (“Affiliated Companies”). For the six months ended September 30, 2022, the Funds had the following transactions with Affiliated Companies:
Hodges Fund
As of September 30, 2022, the value of all securities of Affiliated Companies held in the Hodges Fund amounted to $1,080,000, representing 0.9% of net assets.
| | | Share | | | | | | | | | | | | | | | Change in | | | | | | | |
| | | Balance | | | Value | | | | | | | | | Realized | | | Unrealized | | | Value | | | | |
| | | September 30, | | | March 31, | | | Acqui- | | | Dispo- | | | Gain | | | Appreciation/ | | | September 30, | | | Dividend | |
| Common Stocks | | 2022 | | | 2022 | | | sitions | | | sitions | | | (Loss) | | | Depreciation | | | 2022 | | | Income | |
The Dixie Group, Inc. 1 | | | 1,000,000 | | | $ | 3,100,000 | | | $ — | | | $ | — | | | $ | — | | | $ | (2,020,000 | ) | | $ | 1,080,000 | | | $ | — | |
Luby’s, Inc. 1 | | | — | | | | 3,732,314 | | | | — | | | | (3,272,879 | ) | | $ | 1,931,542 | | | | (2,390,977 | ) | | | — | | | | — | |
Total | | | | | | | | | | | | | | | | | | $ | 1,931,542 | | | $ | (4,410,977 | ) | | $ | 1,080,000 | | | $ | — | |
1 | Non-income producing security. |
The Small Cap Fund, Small Intrinsic Value Fund, and Blue Chip Equity Income Fund had no transactions with affiliated companies during the six months ended September 30, 2022.
U.S. Bank N.A. has made available to the Funds credit facilities pursuant to separate Loan and Security Agreements for temporary or extraordinary purposes. Credit facility activity for the six months ended September 30, 2022, was as follows:
| | | | | | Small | | | Small Intrinsic | | | Blue Chip Equity | |
| | | Hodges Fund | | | Cap Fund | | | Value Fund | | | Income Fund | |
| Maximum available credit | | $ | 20,000,000 | | | $ | 30,000,000 | | | $ | 1,000,000 | | | $ | 2,000,000 | |
| Largest amount outstanding on an individual day | | | 2,406,000 | | | | 887,000 | | | | — | | | | 271,000 | |
| Average balance when in use | | | 492,308 | | | | 179,333 | | | | — | | | | 242,500 | |
| Credit facility outstanding as of September 30, 2022 | | | — | | | | — | | | | — | | | | — | |
| Average interest rate when in use | | | 4.63 | % | | | 5.31 | % | | | 0.00 | % | | | 5.50 | % |
Interest expense for the six months ended September 30, 2022, is disclosed in the Statements of Operations, if applicable.
| NOTE 8 – (COVID-19) PANDEMIC |
The global outbreak of COVID-19 (commonly referred to as “coronavirus”) has disrupted economic markets and the prolonged economic impact is uncertain. Although vaccines for COVID-19 are becoming more widely available, the ultimate economic fallout from the pandemic, amid the spread of COVID-19 variants, and the long-term impact on economies, markets, industries, and individual companies are not known. The operational and financial performance of individual companies and the market in general depends on future developments, including the duration and spread of the outbreak and the pace of recovery which may vary from market to market, and such uncertainty may in turn adversely affect the value and liquidity of the Funds’ investments, impair the Funds’ ability to satisfy redemption requests, and negatively impact the Funds’ performance.
Hodges Mutual Funds
EXPENSE EXAMPLES For the Six Months Ended September 30, 2022 (Unaudited) |
As a shareholder of the Funds, you incur two types of costs: (1) transaction costs and (2) ongoing costs, including investment advisory fees, distribution fees, and other Fund expenses. The examples are intended to help you understand your ongoing costs (in dollars) of investing in the Funds and to compare these costs with the ongoing costs of investing in other mutual funds. The examples are based on an investment of $1,000 invested at the beginning of the period and held for the entire period (4/1/22-9/30/22).
Actual Expenses
The “Actual” lines of the following tables provide information about actual account values based on actual returns and actual expenses. Although the Funds charge no sales loads, you will be assessed fees for outgoing wire transfers, returned checks and stop payment orders at prevailing rates charged by Fund Services, the Funds’ transfer agent. If you request that a redemption be made by wire transfer, currently a $15 fee is charged by Fund Services. You will be charged a redemption fee equal to 1% of the net amount of the redemption if you redeem shares within 30 calendar days after you purchase them for the Hodges Fund Retail Class, Small Cap Fund Retail Class, Small Intrinsic Value Fund, and Blue Chip Equity Income Fund. You will be charged a redemption fee equal to 1% of the net amount of the redemption if you redeem shares within 60 calendar days after you purchase them for the Institutional Class of the Small Cap Fund. An Individual Retirement Account will be charged an annual maintenance fee. To the extent the Funds invest in shares of other investment companies as part of their investment strategy, you will indirectly bear your proportionate share of any fees and expenses charged by the underlying funds in which the Funds invest in addition to the expenses of the Funds. Actual expenses of the underlying funds may vary. These expenses are not included in the following examples. The following examples include, but are not limited to, investment advisory fees, fund accounting fees, administration fees, custody fees, and transfer agent fees. However, the following examples do not include portfolio trading commissions and related expenses. You may use the information in this line, together with the amount you invested, to estimate the expenses that you paid over the period. Simply divide your account value by $1,000 (for example, an $8,600 account value divided by $1,000 = 8.6), then multiply the result by the number in the first line under the heading titled, “Expenses Paid During the Period” to estimate the expenses you paid on your account during this period.
Hypothetical Examples for Comparison Purposes
The “Hypothetical” lines of the following tables provide information about hypothetical account values and hypothetical expenses based on the Funds’ actual expense ratios and an assumed rate of return of 5% per year before expenses, which are not the Funds’ actual returns. The hypothetical account values and expenses may not be used to estimate the actual ending account balance or expenses you paid for the period. You may use this information to compare the ongoing costs of investing in each Fund and other funds. To do so, compare this 5% hypothetical example with the 5% hypothetical examples that appear in the shareholder reports of the other funds. Please note that the expenses shown in the table are meant to highlight your ongoing costs only and do not reflect any transaction costs, such as redemption fees. Therefore, the hypothetical lines of the tables are useful in comparing ongoing costs only and will not help you determine the relative total costs of owning different funds. In addition, if these transaction costs were included, your costs would have been higher.
Hodges Fund
| | Beginning | Ending | Expenses Paid |
| | Account Value | Account Value | During the Period |
| | 4/1/22 | 9/30/22 | 4/1/22 – 9/30/22 1 |
| HDPMX: | | | |
| Actual | $1,000.00 | $ 719.20 | $5.09 |
| Hypothetical (5% annual return before expenses) | 1,000.00 | 1,019.15 | 5.97 |
1 | Expenses are equal to the expense ratio for the most recent six-month period of 1.18% (fee waivers in effect) multiplied by the average account value over the period multiplied by 183/365 (to reflect the one-half year period). |
Hodges Mutual Funds
EXPENSE EXAMPLES For the Six Months Ended September 30, 2022 (Unaudited) |
Small Cap Fund
| | Beginning | Ending | Expenses Paid |
| | Account Value | Account Value | During the Period |
| | 4/1/22 | 9/30/22 | 4/1/22 – 9/30/22 2 |
| HDPSX: | | | |
| Retail Class Actual | $1,000.00 | $ 811.70 | $6.36 |
| Retail Class Hypothetical (5% annual return before expenses) | 1,000.00 | 1,018.05 | 7.08 |
| | | | |
| HDSIX: | | | |
| Institutional Class Actual | 1,000.00 | 812.40 | 5.22 |
| Institutional Class Hypothetical (5% annual return before expenses) | 1,000.00 | 1,019.30 | 5.82 |
2 | Expenses are equal to the expense ratio for the most recent six-month period of 1.40% for the Retail Class, and 1.15% for the Institutional Class, multiplied by the average account value over the period multiplied by 183/365 (to reflect the one-half year period). |
Small Intrinsic Value Fund
| | Beginning | Ending | Expenses Paid |
| | Account Value | Account Value | During the Period |
| | 4/1/22 | 9/30/22 | 4/1/22 – 9/30/22 3 |
| HDSVX: | | | |
| Actual | $1,000.00 | $ 844.80 | $5.97 |
| Hypothetical (5% annual return before expenses) | 1,000.00 | 1,018.60 | 6.53 |
3 | Expenses are equal to the expense ratio for the most recent six-month period of 1.29% (fee waivers in effect) multiplied by the average account value over the period multiplied by 183/365 (to reflect the one-half year period). |
Blue Chip Equity Income Fund
| | Beginning | Ending | Expenses Paid |
| | Account Value | Account Value | During the Period |
| | 4/1/22 | 9/30/22 | 4/1/22 – 9/30/22 4 |
| HDPBX: | | | |
| Actual | $1,000.00 | $ 798.80 | $5.86 |
| Hypothetical (5% annual return before expenses) | 1,000.00 | 1,018.55 | 6.58 |
4 | Expenses are equal to the expense ratio for the most recent six-month period of 1.30% (fee waivers in effect) multiplied by the average account value over the period multiplied by 183/365 (to reflect the one-half year period). |
Hodges Mutual Funds
STATEMENT REGARDING LIQUIDITY RISK MANAGEMENT PROGRAM (Unaudited) |
Each Fund has adopted a liquidity risk management program (the “program”). The Board has designated the Advisor to serve as the administrator of the program. Personnel of the Advisor conducts the day-to-day operation of the programs pursuant to policies and procedures administered by the Advisor.
Under the program, the Advisor manages each Fund’s liquidity risk, which is the risk that the Funds could not meet shareholder redemption requests without significant dilution of remaining shareholders’ interests in the Funds. This risk is managed by monitoring the degree of liquidity of each Fund’s investments, limiting the amount of each Fund’s illiquid investments, and utilizing various risk management tools and facilities available to each Fund for meeting shareholder redemptions, among other means. The Advisor’s process of determining the degree of liquidity of each Fund’s investments is supported by one or more third-party liquidity assessment vendors.
The Board reviewed a report prepared by the committee regarding the operation and effectiveness of the program for the period January 1, 2021 through December 31, 2021. No significant liquidity events impacting the Funds were noted in the report. In addition, the Advisor provided its assessment that the program had been effective in managing each Fund’s liquidity risk.
Hodges Mutual Funds
APPROVAL OF INVESTMENT ADVISORY AGREEMENT (Unaudited) |
HODGES FUND
HODGES SMALL CAP FUND
HODGES BLUE CHIP EQUITY INCOME FUND
HODGES SMALL INTRINSIC VALUE FUND
At a meeting held on August 17-18, 2022, the Board (which is comprised of five persons, all of whom are Independent Trustees as defined under the Investment Company Act) considered and approved the continuance of the Investment Advisory Agreement (the “Advisory Agreement”) between Professionally Managed Portfolios (the “Trust”) and Hodges Capital Management, Inc. (the “Advisor”) for each of the Hodges Fund, the Hodges Small Cap Fund, the Hodges Blue Chip Equity Income Fund, and the Hodges Small Intrinsic Value Fund (each a “Fund” and together, the “Funds”). At this meeting and at a prior meeting held on June 16, 2022, the Board received and reviewed substantial information regarding the Funds, the Advisor and the services provided by the Advisor to the Funds under the Advisory Agreement. This information, together with the information provided to the Board throughout the course of the year, formed the primary (but not exclusive) basis for the Board’s determinations. Below is a summary of the factors considered by the Board and the conclusions that formed the basis for the Board’s approval of the continuance of the Advisory Agreement:
| 1. | The nature, extent and quality of the services provided and to be provided by the Advisor under the Advisory Agreement. The Trustees considered the nature, extent and quality of the Advisor’s overall services provided to the Funds as well as its specific responsibilities in all aspects of day-to-day investment management of the Funds. The Board considered the qualifications, experience and responsibilities of the portfolio managers, as well as the responsibilities of other key personnel of the Advisor involved in the day-to-day activities of the Funds. The Board also considered the resources and compliance structure of the Advisor, including information regarding its compliance program, its chief compliance officer and the Advisor’s compliance record, as well as the Advisor’s cybersecurity program, business continuity plan, and risk management process. The Board also considered the prior relationship between the Advisor and the Trust, as well as the Board’s knowledge of the Advisor’s operations, and noted that during the course of the prior year they had met with certain personnel of the Advisor to discuss fund performance and investment outlook, as well as, various marketing and compliance topics. The Board took into account the additional resources dedicated by the Advisor to compliance over the past year. The Board concluded that the Advisor had the quality and depth of personnel, resources, investment processes and compliance policies and procedures essential to performing its duties under the Advisory Agreement and that they were satisfied with the nature, overall quality and extent of such management services. |
| | |
| 2. | The Funds’ historical performance and the overall performance of the Advisor. In assessing the quality of the portfolio management delivered by the Advisor, the Board reviewed the short-term and long-term performance of each Fund on both an absolute basis, and in comparison to its peer funds utilizing Morningstar classifications, appropriate securities market benchmarks and the Advisor’s similarly managed accounts (in this regard the Board noted that the Advisor does not replicate the Hodges Small Intrinsic Value Fund’s investment strategy in other types of accounts), all for periods ended March 31, 2022. The Board also considered performance against a smaller group of peers selected by an independent third-party consultant engaged by the Board to assist it in its 15(c) review (the “Cohort”). While the Board considered both short-term and long-term performance, it placed greater emphasis on longer-term performance. When reviewing each Fund’s performance against its comparative peer group universe, the Board took into account that the investment objective and strategies of each Fund, as well as its level of risk tolerance, may differ significantly from funds in its respective peer universe. The Board took into account the relatively high active share of the Funds as compared to peers and noted that the Fund’s deep value strategy has been out of favor for certain periods of time during the performance review period. When reviewing the Funds’ performance against broad market benchmarks, the Board took into account the differences in portfolio construction between the Funds and such benchmarks as well as other differences between actively managed funds and passive benchmarks, such as objectives and risks. In assessing periods of relative underperformance or outperformance, the Board took into account that relative performance can be significantly impacted by performance measurement periods and that some periods of underperformance may be transitory while others may reflect more significant underlying issues. |
| | |
| | For the Hodges Fund, the Board noted that the Fund underperformed its peer group median for the one-year and five-year periods and outperformed for the three-year period. The Board also noted that the Fund underperformed the |
Hodges Mutual Funds
APPROVAL OF INVESTMENT ADVISORY AGREEMENT (Unaudited) (Continued) |
| | average of its Cohort for the one-year and five-year periods and outperformed the average for the three-year period. The Board also considered the performance of the Fund against its broad-based securities market benchmark, noting it underperformed for the one-year, three-year and five-year periods. The Trustees further considered that the Fund had outperformed the Advisor’s composite for the one-year and three-year periods and underperformed for the five-year period, and considered the reasons provided by the Adviser for such differences. |
| | |
| | For the Hodges Small Cap Fund, the Board noted that the Fund outperformed its peer group median for the one-year, three-year, and five-year periods. The Board also noted that the Fund underperformed the average of its Cohort for the one-year period and outperformed for the three-year and five-year periods. The Board also considered the Fund’s outperformance against its broad-based securities market benchmark for the one-year, the three-year and five-year periods. The Board considered that the Fund outperformed the Adviser’s small cap strategy composite for the one-year period and underperformed for the three-year and five-year periods and that such differences were not significant. |
| | |
| | For the Hodges Blue Chip Equity Income Fund, the Board noted that the Fund outperformed its peer group median for the one-year, three-year and five-year periods. The Board also noted that the Fund outperformed the average of its Cohort for the one-year period, three-year and five-year periods. The Board also considered the outperformance of the Fund against its broad-based securities market benchmark for the one-year period and underperformance for the three-year and five-year periods. The Trustees further considered that the Fund had outperformed the Advisor’s composite for the one-year and three-year periods and underperformed for the five-year period, and considered the reasons provided by the Adviser for such differences. |
| | |
| | For the Hodges Small Intrinsic Value Fund, the Board noted that the Fund outperformed its peer group median for the one-year, three-year and five-year periods. The Board also noted that the Fund outperformed the average of its Cohort for the one-year, three-year and five-year periods. The Board also considered the performance of the Fund against its broad-based securities market benchmark, noting it outperformed for the one-year, three-year and five-year periods. |
| | |
| 3. | The costs of the services to be provided by the Advisor and the structure of the Advisor’s fees under the Advisory Agreement. In considering the advisory fee and total fees and expenses of each Fund, the Board reviewed comparisons to the peer funds, as well as all expense waivers and reimbursements. The Trustees noted that the Advisor does not replicate the Hodges Small Intrinsic Value Fund’s investment strategy in separately managed accounts. |
| | |
| | For the Hodges Fund, the Board noted that the Advisor had contractually agreed to maintain an annual expense ratio of 0.93% for the Fund, excluding certain operating expenses and class-level expenses (the “Expense Cap”). The Trustees noted that the Fund’s advisory fee and net expense ratio were above their peer group median and average. The Board noted that the Fund’s net expense ratio was below the average of its Cohort. The Board noted that the fees charged to other similarly managed account clients were higher than, equal to, or lower than those charged to the Hodges Fund depending on the level of assets. The Board concluded that the fees paid to the Advisor were fair and reasonable in light of the comparative performance and advisory fee information. |
| | |
| | For the Hodges Small Cap Fund, the Board noted that the Advisor had contractually agreed to maintain an annual expense ratio of 1.15% for the Fund, excluding certain operating expenses and class-level expenses (the “Expense Cap”). The Trustees noted that the Fund’s advisory fee and net expense ratio (less Rule 12b-1 fees) were above their peer group median and average. The Board noted that the Fund’s net expense ratio (less Rule 12b-1 fees) was above the average of its Cohort. The Board noted that the fees charged to other similarly managed account clients were higher than, equal to, or lower than those charged to the Hodges Small Cap Fund depending on the level of assets. The Board concluded that the fees paid to the Advisor were fair and reasonable in light of the comparative performance and advisory fee information. |
| | |
| | For the Hodges Blue Chip Equity Income Fund, the Board noted that the Advisor had contractually agreed to maintain an annual expense ratio of 1.05% for the Fund, excluding certain operating expenses and class-level expenses (the “Expense Cap”). The Trustees noted that the Fund’s advisory fee and net expense ratio were above their peer group median and average. The Board noted that the Fund’s net expense ratio was above the average of its Cohort. The Board noted that the fees charged to other similarly managed account clients were higher than, equal to, or lower than those charged to the Hodges Blue Chip Equity Income Fund depending on the level of assets. The Board concluded that the fees paid to the Advisor were fair and reasonable in light of the comparative performance and advisory fee information. |
Hodges Mutual Funds
APPROVAL OF INVESTMENT ADVISORY AGREEMENT (Unaudited) (Continued) |
| | For the Hodges Small Intrinsic Value Fund, the Board noted that the Advisor had contractually agreed to maintain an annual expense ratio of 1.04% for the Fund, excluding certain operating expenses and class-level expenses (the “Expense Cap”). The Trustees noted that the Fund’s advisory fee and the net expense ratio were above their peer group median and average. The Board noted that the Fund’s net expense ratio was below the average of its Cohort. The Board concluded that the fees paid to the Advisor were fair and reasonable in light of the comparative performance and advisory fee information. |
| | |
| 4. | Economies of Scale. The Board also considered whether economies of scale were being realized by the Advisor that should be shared with shareholders. The Board noted that the Advisor has contractually agreed to reduce its advisory fees or reimburse Fund expenses so that each Fund does not exceed its specified Expense Cap. The Board noted that at current asset levels, it did not appear that there were additional significant economies of scale being realized by the Advisor that should be shared with shareholders and concluded that it would continue to monitor economies of scale in the future as circumstances changed and assuming asset levels continued to increase. |
| | |
| 5. | The profits to be realized by the Advisor and its affiliates from their relationship with the Funds. The Board reviewed the Advisor’s financial information and took into account both the direct benefits and the indirect benefits to the Advisor from advising the Funds. The Board considered the profitability to the Advisor from its relationship with the Funds and considered any additional material benefits derived by the Advisor from its relationship with the Funds. In particular, the Trustees discussed and considered the fall-out benefits that the Advisor may receive from the Funds as a result of its affiliated broker dealer – First Dallas Securities – selling shares of the Funds and accordingly being able to receive Rule 12b-1 fees. Additionally, the Trustees considered that the Advisor regularly uses First Dallas Securities to execute trades for the Funds and receives commissions from those trades. The Trustees also considered benefits received in exchange for “soft dollars” and Rule 12b-1 fees paid to the Advisor. After such review, the Board determined that the profitability to the Advisor with respect to the Advisory Agreement was not excessive, and that the Advisor had maintained adequate financial resources to support the services it provides to the Funds. |
No single factor was determinative of the Board’s decision to approve the continuance of the Advisory Agreement, but rather the Board based its determination on the total combination of information available to them. Based on a consideration of all the factors in their totality, the Board determined that the advisory arrangements with the Advisor, including each Fund’s advisory fee, were fair and reasonable. The Board therefore determined that the continuance of the Advisory Agreement would be in the best interests of the Funds and their shareholders.
Hodges Mutual Funds
INFORMATION ABOUT PROXY VOTING (Unaudited) |
A description of the polices and procedures that the Funds use to determine how to vote proxies relating to portfolio securities is available without charge, upon request, by calling (866) 811-0224. Furthermore, you can obtain the description on the SEC’s website at www.sec.gov.
Information regarding how the Funds voted proxies relating to portfolio securities during the most recent 12-month period ended June 30 is available without charge, upon request, by calling (866) 811-0224. Furthermore, you can obtain the Funds’ proxy voting records on the SEC’s website at www.sec.gov.
INFORMATION ABOUT THE PORTFOLIO HOLDINGS (Unaudited) |
The Funds file their complete schedule of portfolio holdings with the SEC for the first and third quarters of each fiscal year as an exhibit to their reports on Form N-PORT. The Funds’ Form N-PORT is available on the SEC’s website at www.sec.gov. The Funds’ Form N-PORT may also be obtained by calling (866) 811-0224.
INFORMATION ABOUT HOUSEHOLDING (Unaudited) |
Each year, you are automatically sent an updated prospectus as well as annual and semi-annual reports for the Funds, if applicable. To reduce expenses, the Funds may mail only one copy of each Fund’s prospectus and each annual and semi-annual report to those addresses shared by two or more accounts. If you wish to receive individual copies of these documents, please call us at (866) 811-0224. We will begin sending you individual copies thirty days after receiving your request. This policy does not apply to account statements.
INFORMATION ABOUT THE FUNDS’ TRUSTEES (Unaudited) |
The Statement of Additional Information (“SAI”) includes additional information about the Funds’ Trustees and is available without charge, upon request, by calling (866) 811-0224. Furthermore, you can obtain the SAI on the SEC’s web site at www.sec.gov or the Funds’ web site at www.hodgesfunds.com.
Hodges Mutual Funds
PRIVACY NOTICE (Unaudited) |
The Funds collect non-public personal information about you from the following sources:
| • | Information we receive about you on applications or other forms; |
| | |
| • | Information you give us verbally; and/or |
| | |
| • | Information about your transactions with us or others. |
We do not disclose any non-public personal information about our shareholders or former shareholders without the shareholder’s authorization, except as permitted by law or in response to inquiries from governmental authorities. We may share information with affiliated parties and unaffiliated third parties with whom we have contracts for servicing the Funds. We will provide unaffiliated third parties with only the information necessary to carry out their assigned responsibilities. All shareholder records will be disposed of in accordance with applicable law. We maintain physical, electronic and procedural safeguards to protect your non-public personal information and require third parties to treat your non-public personal information with the same high degree of confidentiality.
In the event that you hold shares of a Fund through a financial intermediary, including, but not limited to, a broker-dealer, bank or trust company, the privacy policy of your financial intermediary would govern how your non-public personal information would be shared with unaffiliated third parties.
SEMI-ANNUAL REPORT • SEPTEMBER 30, 2022 |
| | | Retail Class | Institutional Class |
| | Fund | Shares | Shares |
| | Hodges Fund | | |
| | Ticker Symbol | HDPMX | N/A |
| | CUSIP | 742935109 | N/A |
| | Small Cap Fund | | |
| | Ticker Symbol | HDPSX | HDSIX |
| | CUSIP | 742935299 | 742935224 |
| | Small Intrinsic Value Fund | | |
| | Ticker Symbol | HDSVX | N/A |
| | CUSIP | 74316J318 | N/A |
| | Blue Chip Equity Income Fund | | |
| | Ticker Symbol | HDPBX | N/A |
| | CUSIP | 742935174 | N/A |
HODGES MUTUAL FUNDS
www.hodgesfunds.com | (866) 811-0224
INVESTMENT ADVISOR
HODGES CAPITAL MANAGEMENT, INC.
2905 Maple Avenue, Dallas, Texas 75201 | (888) 878-4426 | www.hodgescapital.com
CUSTODIAN
U.S. BANK N.A.
1555 N. RiverCenter Drive, Suite 302, Milwaukee,Wisconsin 53212
TRANSFER AGENT, FUND ACCOUNTANT, AND FUND ADMINISTRATOR
U.S. BANCORP FUND SERVICES, LLC
P.O. Box 701, Milwaukee,Wisconsin 53201-0701 | (866) 811-0224
DISTRIBUTOR
QUASAR DISTRIBUTORS, LLC
111 East Kilbourn Avenue, Suite 2200, Milwaukee,Wisconsin 53202
INDEPENDENT REGISTERED PUBLIC ACCOUNTING FIRM
TAIT, WELLER & BAKER LLP
50 South 16th Street, Suite 2900, Philadelphia, Pennsylvania 19102
LEGAL COUNSEL
SULLIVAN & WORCESTER LLP
1633 Broadway, 32nd Floor, New York, New York 10019
Item 2. Code of Ethics.
Not applicable for semi-annual reports.
Item 3. Audit Committee Financial Expert.
Not applicable for semi-annual reports.
Item 4. Principal Accountant Fees and Services.
Not applicable for semi-annual reports.
Item 5. Audit Committee of Listed Registrants.
Not applicable to registrants who are not listed issuers (as defined in Rule 10A-3 under the Securities Exchange Act of 1934).
Item 6. Investments.
(a) Schedule of Investments is included as part of the report to shareholders filed under Item 1 of this Form.
(b) Not applicable.
Item 7. Disclosure of Proxy Voting Policies and Procedures for Closed-End Management Investment Companies.
Not applicable to open-end investment companies.
Item 8. Portfolio Managers of Closed-End Management Investment Companies.
Not applicable to open-end investment companies.
Item 9. Purchases of Equity Securities by Closed‑End Management Investment Company and Affiliated Purchasers.
Not applicable to open-end investment companies.
Item 10. Submission of Matters to a Vote of Security Holders.
The registrant has adopted a nominating committee charter that contains the procedures by which shareholders may recommend nominees to the registrant’s board of trustees. There have been no material changes to the procedures by which shareholders may recommend nominees to the registrant’s board of trustees for the period.
Item 11. Controls and Procedures.
| (a) | The Registrant’s President and Treasurer have reviewed the Registrant's disclosure controls and procedures (as defined in Rule 30a-3(c) under the Investment Company Act of 1940 (the “Act”)) as of a date within 90 days of the filing of this report, as required by Rule 30a-3(b) under the Act and Rules 13a-15(b) or 15d‑15(b) under the Securities Exchange Act of 1934. Based on their review, such officers have concluded that the disclosure controls and procedures are effective in ensuring that information required to be disclosed in this report is appropriately recorded, processed, summarized and reported and made known to them by others within the Registrant and by the Registrant’s service provider. |
| (b) | There were no changes in the Registrant's internal control over financial reporting (as defined in Rule 30a-3(d) under the Act) that occurred during the period covered by this report that has materially affected, or is reasonably likely to materially affect, the Registrant's internal control over financial reporting. |
Item 12. Disclosure of Securities Lending Activities for Closed-End Management Investment Companies
Not applicable to open-end investment companies.
Item 13. Exhibits.
| (a) | (1) Any code of ethics or amendment thereto, that is subject of the disclosure required by Item 2, to the extent that the registrant intends to satisfy Item 2 requirements through filing an exhibit. Incorporated by reference to previous Form N-CSR filing. |
(3) Any written solicitation to purchase securities under Rule 23c‑1 under the Act sent or given during the period covered by the report by or on behalf of the registrant to 10 or more persons. Not applicable to open-end investment companies.
(4) Change in the registrant’s independent public accountant. There was no change in the registrant’s independent public accountant for the period covered by this report.
SIGNATURES
Pursuant to the requirements of the Securities Exchange Act of 1934 and the Investment Company Act of 1940, the registrant has duly caused this report to be signed on its behalf by the undersigned, thereunto duly authorized.
(Registrant) Professionally Managed Portfolios
By (Signature and Title) /s/Jason Hadler
Jason Hadler, President/Principal Executive Officer
Date December 7, 2022
Pursuant to the requirements of the Securities Exchange Act of 1934 and the Investment Company Act of 1940, this report has been signed below by the following persons on behalf of the registrant and in the capacities and on the dates indicated.
By (Signature and Title) /s/Jason Hadler
Jason Hadler, President/Principal Executive Officer
Date December 7, 2022
By (Signature and Title) /s/Craig Benton
Craig Benton, Treasurer/Principal Financial Officer
Date December 7, 2022
* Print the name and title of each signing officer under his or her signature.