| | Semi-Annual Report For the Six Months Ended October 31, 2022 | |
Osterweis Short Duration Credit Fund
(formerly Zeo Short Duration Income Fund)
Osterweis Sustainable Credit Fund
(formerly Zeo Sustainable Credit Fund)
Important Notice:
Beginning on January 1, 2021, as permitted by regulations adopted by the Securities and Exchange Commission, paper copies of the Funds’ annual and semi-annual shareholder reports are no longer sent by mail, unless you specifically request paper copies of the reports. Instead, the reports are made available on the Funds’ website at www.osterweis.com/literature, and you will be notified by mail each time a report is posted and provided with a website to access the report. If you already elected to receive shareholder reports electronically, you will not be affected by this change and you need not take any action.
If you would like to receive paper copies and have not done so already, you may elect to receive paper copies of all future reports free of charge by contacting your financial intermediary or, if you invest directly with the Osterweis Funds, calling (866) 236-0050. Your election to receive paper reports will apply to all funds held within your account(s).
Disclosures
Past performance does not guarantee future results. This commentary contains the current opinions of the authors as of the referenced date, which are subject to change at any time. This commentary has been distributed for informational purposes only and is not a recommendation or offer of any particular security, strategy, or investment product. Information contained herein has been obtained from sources believed to be reliable but is not guaranteed.
Fund holdings and sector allocations are subject to change at any time and should not be considered a recommendation to buy or sell any security. Current and future portfolio holdings are subject to risk. Please refer to the Schedule of Investments for complete fund holdings.
No part of this document may be reproduced in any form, or referred to in any other publication, without the express written permission of Osterweis Capital Management.
The Bloomberg U.S. Aggregate Bond Index (Agg) is widely regarded as the standard for measuring U.S. investment grade bond market performance.
The ICE BofA Single-B U.S. High Yield Index is a subset of ICE BofA U.S. High Yield Index including all securities rated B1 through B3.
The ICE 0-2 Yr Duration BB-B U.S. High Yield Constrained Index contains all securities in the ICE BofA U.S. High Yield Index rated BB1 through B3 with a duration-to-worst of less than two years.
The Commodity Research Bureau Index measures the aggregated price direction of various commodity sectors and is designed to isolate and reveal the directional movement of prices in overall commodity trades.
These indices reflect the reinvestment of dividends and/or interest income. These indices do not incur expenses except where noted and are not available for investment.
All currency figures are shown in USD.
Treasuries (including bonds, notes, and bills) are securities sold by the federal government to consumers and investors to fund its operations. They are all backed by “the full faith and credit of the United States government” and thus are considered free of default risk.
Credit ratings breakdowns are based on ratings from Standard and Poor’s, which is a private independent rating service that assigns grades to bonds to represent their credit quality. The issues are evaluated based on such factors as the bond issuer’s financial strength and its ability to pay a bond’s principal and interest in a timely fashion. Standard and Poor’s ratings are expressed as letters ranging from ‘AAA’, which is the highest grade, to ‘D’, which is the lowest grade. A rating of BBB- or higher is considered investment grade and a rating below BBB- is considered non-investment grade. A rating of AAA is assumed for Freddie Mac, Fannie Mae, and Ginnie Mae securities.
The Global Industry Classification Standard (GICS) was developed by and is the exclusive property and a service mark of MSCI Inc. (MSCI) and Standard & Poor’s (S&P), a division of The McGraw-Hill Companies, Inc. and is licensed for use by Osterweis Capital Management.
Neither MSCI, S&P, nor any other party involved in making or compiling the GICS classifications makes any express or implied warranties or representations with respect to such standard or classification (or the results to be obtained by the use thereof), and all such parties hereby expressly disclaim all warranties of originality, accuracy, completeness, merchantability, and fitness for a particular purpose with respect to any such standard or classification. Without limiting any of the foregoing, in no event shall MSCI, S&P, any of their affiliates or any third party involved in making or compiling the GICS, or any GICS classifications have any liability for any direct, indirect, special, punitive, consequential, or any other damages (including lost profits), even if notified of the possibility of such damages.
Any ICE index data referenced herein is the property of ICE Data Indices, LLC, its affiliates (“ICE Data”) and/or its Third Party Suppliers and has been licensed for use by Osterweis Capital Management. ICE Data and its Third Party Suppliers accept no liability in connection with its use. See https://www.osterweis.com/glossary for a full copy of the Disclaimer.
Source for any Bloomberg index is Bloomberg Index Services Limited. BLOOMBERG® is a trademark and service mark of Bloomberg Finance L.P. and its affiliates (collectively “Bloomberg”). Bloomberg owns all proprietary rights in the Bloomberg Indices. Bloomberg does not approve or endorse this material, or guarantees the accuracy or completeness of any information herein, or makes any warranty, express or implied, as to the results to be obtained therefrom and, to the maximum extent allowed by law, neither shall have any liability or responsibility for injury or damages arising in connection therewith.
This document must be preceded or accompanied by a current prospectus. Please refer to the prospectus for important information about the investment company including objectives, risks, charges and expenses.
Osterweis Capital Management is the adviser to the Osterweis Funds, which are distributed by Quasar Distributors, LLC. [OSTE-20221221-0723]
Table of Contents
| Standardized Performance Summary | | 2 |
| Sector Allocations | | 3 |
| Schedules of Investments | | 4 |
| Financial Statements | | |
| Statements of Assets and Liabilities | | 8 |
| Statements of Operations | | 9 |
| Statements of Changes in Net Assets | | |
| Osterweis Short Duration Credit Fund | | 10 |
| Osterweis Sustainable Credit Fund | | 11 |
| Financial Highlights | | |
| Osterweis Short Duration Credit Fund | | 12 |
| Osterweis Sustainable Credit Fund | | 13 |
| Notes to Financial Statements | | 14 |
| Expense Examples | | 22 |
| Additional Information | | 23 |
| Privacy Notice | | 24 |
Osterweis Funds | Fund Overview (Unaudited)
Average Annual Total Returns
Periods Ended October 31, 2022
| | | | | | | Since Inception |
| | Six Months | 1 Yr. | 3 Yr. | 5 Yr. | 10 Yr. | (May 31, 2011) |
Osterweis Short Duration Credit Fund 1 | -6.14% | -9.45% | -1.42% | 0.44% | 1.75% | 1.90% |
Bloomberg U.S. Aggregate Bond Index 2 | -6.86
| -15.68
| -3.77
| -0.54
| 0.74
| 1.43
|
| ICE BofA 0-2Yr Duration BB-B High Yield Constrained Index | -0.42
| -1.86
| 1.01
| 2.28
| 3.24
| 3.51
|
Gross Expense Ratio as of 10/10/2022: 0.85% 3 | | | | | | |
| | | | | | | |
| | | | | | | Since Inception |
| | Six Months | 1 Yr. | 3 Yr. | 5 Yr. | 10 Yr. | (May 31, 2019) |
Osterweis Sustainable Credit Fund 4 | -5.84% | -8.54% | -1.57% | — | — | -1.08% |
Bloomberg U.S. Aggregate Bond Index 5 | -6.86
| -15.68
| -3.77
| — | — | -2.24
|
| ICE BofA Single-B U.S. HY Index | -4.94
| -10.51
| -0.32
| — | — | 0.77
|
Gross/Net Expense Ratio as of 10/10/2022: 2.22%/0.99% 3,6
1 | The Zeo Short Duration Income Fund, a series of Northern Lights Fund Trust, reorganized into the Osterweis Short Duration Credit Fund following the close of business on October 7, 2022. Other Expenses are based on estimated amounts for the current fiscal year. |
2 | Effective August 10, 2022, the primary benchmark changed from the Bloomberg U.S. Aggregate Bond Index to the ICE BofA 0-2 Year Duration BB-B U.S. High Yield Constrained Index as the ICE BofA 0-2 Year Duration BB-B U.S. High Yield Constrained Index is more closely aligned with the Fund’s principal investment strategies and portfolio holdings. |
3 | As of most recent Prospectus dated October 10, 2022. Please see the Fund’s Financial Highlights in this report for the most recent expense ratio. |
4 | The Zeo Sustainable Credit Fund, a series of Northern Lights Fund Trust, reorganized into the Osterweis Sustainable Credit Fund following the close of business on October 7, 2022. Other Expenses are based on estimated amounts for the current fiscal year. |
5 | Effective August 10, 2022, the primary benchmark changed from the Bloomberg U.S. Aggregate Bond Index to the ICE BofA Single-B U.S. High Yield Index as the ICE BofA Single-B U.S. High Yield Index is more closely aligned with the Fund’s principal investment strategies and portfolio holdings. |
6 | The Adviser has contractually agreed to waive certain fees through October 10, 2024. The net expense ratio is applicable to investors. |
The performance data quoted above represents past performance. Past performance does not guarantee future results. The investment return and principal value of an investment will fluctuate so that an investor’s shares, when redeemed, may be worth more or less than their original cost. Current performance of the Fund may be lower or higher than the performance quoted. Performance data current to the most recent month-end may be obtained by calling (866) 236-0050.
Effective at the close of business on October 7, 2022, the Zeo Short Duration Credit Fund and the Zeo Sustainable Credit Fund, each a series of Northern Lights Fund Trust (the “Predecessor Short Duration Credit Fund” and the “Predecessor Sustainable Credit Fund”), reorganized into the Osterweis Short Duration Credit Fund and the Osterweis Sustainable Credit Fund (the “Reorganization”). Performance information shown prior to the close of business on October 7, 2022 is that of the Predecessor Short Duration Credit Fund and the Predecessor Sustainable Credit Fund. Other Expenses are based on estimated amounts for the current fiscal year.
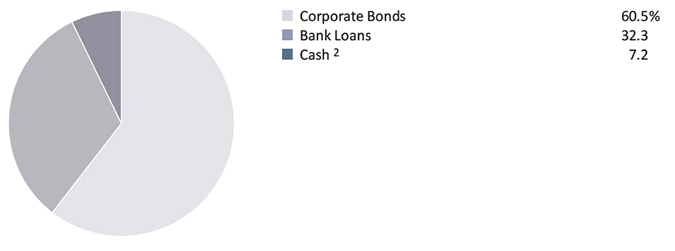
Sector Allocations (Unaudited)
Osterweis Short Duration Credit Fund 1
Asset Allocation (% of Net Assets) (Unaudited)
Osterweis Sustainable Credit Fund 3
Asset Allocation (% of Net Assets) (Unaudited)
1 | The Zeo Short Duration Income Fund, a series of Northern Lights Fund Trust, reorganized into the Osterweis Short Duration Credit Fund following the close of business on October 7, 2022. |
2 | Cash, cash equivalents and other assets less liabilities. |
3 | The Zeo Sustainable Credit Fund, a series of Northern Lights Fund Trust, reorganized into the Osterweis Sustainable Credit Fund following the close of business on October 7, 2022. |
Short Duration Credit Fund | Schedule of Investments at October 31, 2022 (Unaudited)
| Principal | | | | | |
| Amount | | | | Value | |
| Bonds: 60.5% | | | |
| Corporate Bonds: 60.5% | | | |
| | | | | | |
| Air Freight & Logistics: 4.0% | | | |
| | | Western Global Airlines LLC | | | |
| $ | 8,623,000 | | 10.375%, 08/15/2025 | | $ | 7,255,866 | |
| | | | | |
| Auto Components: 3.5% | | | | |
| | | | Patrick Industries, Inc. | | | | |
| | 1,482,000 | | 7.500%, 10/15/2027 | | | 1,364,962 | |
| | 1,957,000 | | 4.750%, 05/01/2029 | | | 1,480,637 | |
| | | | Tenneco, Inc. | | | | |
| | 3,654,000 | | 7.875%, 01/15/2029 | | | 3,626,175 | |
| | | | | | | 6,471,774 | |
| Commercial Services & Supplies: 4.9% | | | | |
| | | | Cimpress PLC | | | | |
| | 9,585,000 | | 7.000%, 06/15/2026 | | | 5,748,028 | |
| | | | RR Donnelley & Sons Co. | | | | |
| | 3,949,000 | | 6.125%, 11/01/2026 | | | 3,203,824 | |
| | | | | | | 8,951,852 | |
| Computers & Peripherals: 3.9% | | | | |
| | | | Diebold Nixdorf, Inc. | | | | |
| | 14,389,000 | | 8.500%, 04/15/2024 | | | 7,240,436 | |
| | | | | |
| Construction & Engineering: 5.1% | | | | |
| | | | Brundage-Bone Concrete | | | | |
| | | | Pumping Holdings, Inc. | | | | |
| | 4,558,000 | | 6.000%, 02/01/2026 | | | 4,156,431 | |
| | | | Great Lakes Dredge & Dock Corp. | | | | |
| | 1,847,000 | | 5.250%, 06/01/2029 | | | 1,463,219 | |
| | | | IEA Energy Services LLC | | | | |
| | 3,862,000 | | 6.625%, 08/15/2029 | | | 3,693,638 | |
| | | | | | | 9,313,288 | |
| Consumer Finance: 6.0% | | | | |
| | | | Bread Financial Holdings, Inc. | | | | |
| | 1,940,000 | | 4.750%, 12/15/2024 | | | 1,698,317 | |
| | 5,658,000 | | 7.000%, 01/15/2026 | | | 4,885,541 | |
| | | | PRA Group, Inc. | | | | |
| | 4,560,000 | | 7.375%, 09/01/2025 | | | 4,374,331 | |
| | | | | | | 10,958,189 | |
| Diversified Consumer Services: 5.5% | | | | |
| | | | Cengage Learning, Inc. | | | | |
| | 10,598,000 | | 9.500%, 06/15/2024 | | | 10,044,890 | |
| | | | | |
| Food Products: 2.2% | | | | |
| | | | B&G Foods, Inc. | | | | |
| | 4,817,000 | | 5.250%, 09/15/2027 | | | 4,041,198 | |
| | | | | |
| Hotels, Restaurants & Leisure: 1.1% | | | | |
| | | | Arrow Bidco LLC | | | | |
| | 1,985,000 | | 9.500%, 03/15/2024 | | | 1,997,228 | |
| | | | | |
| Household Durables: 3.5% | | | | |
| | | | American Greetings Corp. | | | | |
| | 6,683,000 | | 8.750%, 04/15/2025 | | | 6,401,747 | |
| | | | | |
| IT Services: 1.1% | | | | |
| | | | Virtusa Corp. | | | | |
| | 2,797,000 | | 7.125%, 12/15/2028 | | | 2,010,559 | |
| | | | | |
| Machinery: 6.6% | | | | |
| | | | Granite US Holdings Corp. | | | | |
| | 6,731,000 | | 11.000%, 10/01/2027 | | | 6,303,447 | |
| | | | Werner FinCo L.P. / | | | | |
| | | | Werner FinCo, Inc. | | | | |
| | 6,706,000 | | 8.750%, 07/15/2025 | | | 5,693,126 | |
| | | | | | | 11,996,573 | |
| Paper & Forest Products: 1.4% | | | | |
| | | | Resolute Forest Products, Inc. | | | | |
| | 2,540,000 | | 4.875%, 03/01/2026 | | | 2,510,968 | |
| | | | | |
| Road & Rail: 6.1% | | | | |
| | | | Getty Images, Inc. | | | | |
| | 7,127,000 | | 9.750%, 03/01/2027 | | | 7,062,750 | |
| | | | Millennium Escrow Corp. | | | | |
| | 5,564,000 | | 6.625%, 08/01/2026 | | | 4,020,073 | |
| | | | | | | 11,082,823 | |
| Software: 1.5% | | | | |
| | | | Veritas U.S., Inc / | | | | |
| | | | Veritas Bermuda Ltd. | | | | |
| | 3,244,000 | | 7.500%, 09/01/2025 | | | 2,736,561 | |
| | | | | |
| Specialty Retail: 4.1% | | | | |
| | | | At Home Group, Inc. | | | | |
| | 1,976,000 | | 4.875%, 07/15/2028 | | | 1,417,610 | |
| | | | The Men’s Wearhouse LLC | | | | |
| | 45,285,000 | | 7.000%, 07/01/2022 1,5 | | | 298,881 | |
| | | | The Michaels Cos., Inc | | | | |
| | 6,338,000 | | 5.250%, 05/01/2028 | | | 4,515,825 | |
| | | | The Michaels Cos., Inc. | | | | |
| | 2,428,000 | | 7.875%, 05/01/2029 | | | 1,351,655 | |
| | | | | | | 7,583,971 | |
| Total Corporate Bonds | | | | |
| (Cost $158,505,585) | | | 110,597,923 | |
| | | | | |
| Total Bonds | | | | |
| (Cost $158,505,585) | | | 110,597,923 | |
The accompanying notes are an integral part of these financial statements.
Short Duration Credit Fund | Schedule of Investments at October 31, 2022 (Unaudited) (Continued)
| Principal | | | | | |
| Amount | | | | Value | |
| Bank Loans: 32.3% | | | |
| | | | | | |
| Beverages: 3.1% | | | |
| | | Chill Merger Sub, Inc. | | | |
| $ | 6,416,070 | | 7.174% (1 month LIBOR + 3.500%), | | | |
| | | | 3/20/20242 2,3 | | $ | 5,633,534 | |
| | | | | |
| Chemicals: 3.4% | | | | |
| | | | AgroFresh, Inc. | | | | |
| | 6,199,109 | | 10.004% (1 month LIBOR + 6.250%), | | | | |
| | | | 12/31/2024 2,3 | | | 6,144,867 | |
| | | | | |
| Commercial Services & Supplies: 0.7% | | | | |
| | | | LRS Holdings LLC | | | | |
| | 1,435,155 | | 8.004% (1 month LIBOR + 4.250%), | | | | |
| | | | 8/31/2028 2,3 | | | 1,377,749 | |
| | | | | |
| Construction and Engineering: 6.4% | | | | |
| | | | Cast & Crew LLC | | | | |
| | 11,840,945 | | 7.254% (1 month LIBOR + 3.500%), | | | | |
| | | | 2/9/2026 2,3 | | | 11,666,646 | |
| | | | | |
| Diversified Consumer Services: 2.0% | | | | |
| | | | APX Group, Inc. | | | | |
| | 3,960,000 | | 6.730%, (Prime + 2.250%), | | | | |
| | | | 7/10/2028 2,3 | | | 3,654,030 | |
| | | | | |
| Machinery: 0.9% | | | | |
| | | | Werner FinCo L.P. | | | | |
| | 1,818,290 | | 7.674% (2 months LIBOR + 4.000%), | | | | |
| | | | 07/24/2024 2,3 | | | 1,660,699 | |
| | | | | |
| Software: 14.4% | | | | |
| | | | A&V Holdings Midco LLC | | | | |
| | 2,455,907 | | 9.545% (3 months LIBOR + 5.375%), | | | | |
| | | | 3/10/2027 2,3 | | | 2,394,510 | |
| | | | Avaya Holdings Corp. | | | | |
| | 2,000,000 | | 11.959% (1 month SOFR + 10.000%), | | | | |
| | | | 12/15/2027 2,3 | | | 1,267,500 | |
| | | | Hyland Software, Inc. | | | | |
| | 3,298,392 | | 7.254% (1 month LIBOR + 3.500%), | | | | |
| | | | 7/1/2024 2,3 | | | 3,225,101 | |
| | | | Hyland Software, Inc. | | | | |
| | 12,892,000 | | 10.004% (1 month LIBOR + 6.250%), | | | | |
| | | | 7/7/2025 2,3 | | | 12,395,723 | |
| | | | Magenta Buyer LLC | | | | |
| | 4,583,700 | | 9.170% (3 months LIBOR + 4.750%), | | | | |
| | | | 7/27/2028 2,3 | | | 4,027,926 | |
| | | | Veritas U.S., Inc. | | | | |
| | 3,733,037 | | 8.674% (3 months LIBOR + 5.000%), | | | | |
| | | | 9/1/2025 2,3 | | | 3,020,661 | |
| | | | | | | 26,331,421 | |
| Specialty Retail: 1.4% | | | | |
| | | | At Home Group, Inc. | | | | |
| | 3,210,570 | | 7.743% (3 months LIBOR + 4.000%), | | | | |
| | | | 7/24/2028 2,3 | | | 2,547,812 | |
| | | | | |
| Total Bank Loans | | | | |
| (Cost $63,272,641) | | | 59,016,758 | |
| | | | | | | | |
| Shares | | | | | | |
| Short-Term Investments: 6.8% | | | | |
| | | | | | | | |
| Money Market Funds: 6.8% | | | | |
| | 12,511,843 | | U.S. Bank Money Market | | | | |
| | | | Deposit Account, 2.750% 4 | | | 12,511,843 | |
| | | | | |
| Total Money Market Funds | | | | |
| (Cost $12,511,843) | | | 12,511,843 | |
| | | | | |
| Total Short-Term Investments | | | | |
| (Cost $12,511,843) | | | 12,511,843 | |
| | | | | |
| Total Investments in Securities: 99.6% | | | | |
| (Cost $234,290,069) | | | 182,126,524 | |
| Other Assets in Excess of Liabilities: 0.4% | | | 651,961 | |
| Total Net Assets: 100.0% | | $ | 182,778,485 | |
LIBOR – London Interbank Offered Rate
SOFR – Secured Overnight Financing Rate
Prime – United States Federal Reserve Overnight Rate
1 | Security is fair valued under the Board of Trustees and is categorized as a Level 3 security. Significant unobservable inputs were used to determine fair value (see Note 2A). |
2 | Variable rate security; rate shown is the rate in effect on October 31, 2022. An index may have a negative rate. Interest rate may also be subject to a cap or floor. |
3 | Bank loans generally pay interest at rates which are periodically determined by reference to a base lending rate plus a premium. All loans carry a variable rate of interest. These base lending rates are generally (i) the Prime Rate offered by one or more major United States banks, (ii) the lending rate offered by one or more European banks such as the London Interbank Offered Rate (“LIBOR”) or (iii) the Certificate of Deposit rate. Bank Loans, while exempt from registration, under the Securities Act of 1933, contain certain restrictions on resale and cannot be sold publicly. Floating rate bank loans often require prepayments from excess cash flow or permit the borrower to repay at its election. The degree to which borrowers repay, whether as a contractual requirement or at their election, cannot be predicted with accuracy. |
4 | The Money Market Deposit Account (the “MMDA”) is a short-term investment vehicle in which the Fund holds cash balances. The MMDA will bear interest at a variable rate that is determined based on conditions and may change daily and by any amount. The rate shown is as of October 31, 2022. |
5 | Security is in default. |
The Global Industry Classifications Standard (GICS®) sector and industry classifications was developed by and is the exclusive property of MSCI, Inc. and Standard & Poor’s (“S&P”). GICS® is a service mark of MSCI, Inc. and S&P and has been licensed for use by Osterweis Capital Management.
The accompanying notes are an integral part of these financial statements.
Sustainable Credit Fund | Schedule of Investments at October 31, 2022 (Unaudited)
| Principal | | | | | |
| Amount | | | | Value | |
| Bonds: 51.7% | | | |
| Corporate Bonds: 51.7% | | | |
| | | | | | |
| Air Freight & Logistics: 2.3% | | | |
| | | Western Global Airlines LLC | | | |
| $ | 145,000 | | 10.375%, 08/15/2025 | | $ | 122,011 | |
| | | | | |
| Auto Components: 5.9% | | | | |
| | | | Patrick Industries, Inc. | | | | |
| | 227,000 | | 4.750%, 05/01/2029 | | | 171,745 | |
| | | | Tenneco, Inc. | | | | |
| | 139,000 | | 5.125%, 04/15/2029 | | | 138,055 | |
| | | | | | | 309,800 | |
| Commercial Services & Supplies: 2.0% | | | | |
| | | | Cimpress PLC | | | | |
| | 179,000 | | 7.000%, 06/15/2026 | | | 107,345 | |
| | | | | |
| Computers & Peripherals: 3.5% | | | | |
| | | | Diebold Nixdorf, Inc. | | | | |
| | 373,000 | | 8.500%, 04/15/2024 | | | 187,691 | |
| | | | | |
| Construction & Engineering: 7.4% | | | | |
| | | | Brundage-Bone Concrete | | | | |
| | | | Pumping Holdings, Inc. | | | | |
| | 122,000 | | 6.000%, 02/01/2026 | | | 111,251 | |
| | | | Great Lakes Dredge & Dock Corp. | | | | |
| | 131,000 | | 5.250%, 06/01/2029 | | | 103,780 | |
| | | | IEA Energy Services LLC | | | | |
| | 187,000 | | 6.625%, 08/15/2029 | | | 178,848 | |
| | | | | | | 393,879 | |
| Consumer Finance: 2.1% | | | | |
| | | | Bread Financial Holdings, Inc. | | | | |
| | 60,000 | | 4.750%, 12/15/2024 | | | 52,525 | |
| | 65,000 | | 7.000%, 01/15/2026 | | | 56,126 | |
| | | | | | | 108,651 | |
| Diversified Consumer Services: 5.2% | | | | |
| | | | Cengage Learning, Inc. | | | | |
| | 292,000 | | 9.500%, 06/15/2024 | | | 276,761 | |
| | | | | |
| Household Durables: 2.4% | | | | |
| | | | American Greetings Corp. | | | | |
| | 132,000 | | 8.750%, 04/15/2025 | | | 126,445 | |
| | | | | |
| Interactive Media & Services: 2.9% | | | | |
| | | | Cars.com, Inc. | | | | |
| | 177,000 | | 6.375%, 11/01/2028 | | | 153,629 | |
| | | | | |
| IT Services: 2.8% | | | | |
| | | | Virtusa Corp. | | | | |
| | 203,000 | | 7.125%, 12/15/2028 | | | 145,922 | |
| | | | | |
| Machinery: 5.4% | | | | |
| | | | Granite US Holdings Corp. | | | | |
| | 139,000 | | 11.000%, 10/01/2027 | | | 130,171 | |
| | | | Werner FinCo L.P. / | | | | |
| | | | Werner FinCo, Inc. | | | | |
| | 183,000 | | 8.750%, 07/15/2025 | | | 155,359 | |
| | | | | | | 285,530 | |
| Road & Rail: 3.7% | | | | |
| | | | Getty Images, Inc. | | | | |
| | 91,000 | | 9.750%, 03/01/2027 | | | 90,179 | |
| | | | Millennium Escrow Corp. | | | | |
| | 149,000 | | 6.625%, 08/01/2026 | | | 107,655 | |
| | | | | | | 197,834 | |
| Software: 1.9% | | | | |
| | | | Veritas U.S., Inc / Veritas Bermuda Ltd. | | | | |
| | 121,000 | | 7.500%, 09/01/2025 | | | 102,073 | |
| | | | | |
| Specialty Retail: 4.2% | | | | |
| | | | The Men’s Wearhouse LLC | | | | |
| | 1,795,000 | | 7.000%, 07/01/2023 1,5 | | | 11,847 | |
| | | | The Michaels Cos., Inc | | | | |
| | 161,000 | | 5.250%, 05/01/2028 | | | 114,712 | |
| | | | The Michaels Cos., Inc. | | | | |
| | 172,000 | | 7.875%, 05/01/2029 | | | 95,752 | |
| | | | | | | 222,311 | |
| Total Corporate Bonds | | | | |
| (Cost $4,099,529) | | | 2,739,882 | |
| | | | | |
| Total Bonds | | | | |
| (Cost $4,099,529) | | | 2,739,882 | |
The accompanying notes are an integral part of these financial statements.
Sustainable Credit Fund | Schedule of Investments at October 31, 2022 (Unaudited) (Continued)
| Principal | | | | | |
| Amount | | | | Value | |
| Bank Loans: 45.5% | | | |
| | | | | | |
| Beverages: 0.9% | | | |
| | | Chill Merger Sub, Inc. | | | |
| $ | 56,000 | | 7.174% (1 month LIBOR + 3.500%), | | | |
| | | | 3/20/2024 2,3 | | $ | 49,170 | |
| | | | | |
| Chemicals: 8.7% | | | | |
| | | | AgroFresh, Inc. | | | | |
| | 464,974 | | 10.004% (1 month LIBOR + 6.250%), | | | | |
| | | | 12/31/2024 2,3 | | | 460,905 | |
| | | | | |
| Commercial Services & Supplies: 1.0% | | | | |
| | | | LRS Holdings LLC | | | | |
| | 53,595 | | 8.004% (1 month LIBOR + 4.250%), | | | | |
| | | | 8/31/2028 2,3 | | | 51,451 | |
| | | | | |
| Construction & Engineering: 7.2% | | | | |
| | | | Cast & Crew LLC | | | | |
| | 389,889 | | 7.254% (1 month LIBOR + 3.500%), | | | | |
| | | | 2/9/2026 2,3 | | | 384,150 | |
| | | | | |
| Machinery: 2.6% | | | | |
| | | | Werner FinCo L.P. | | | | |
| | 150,622 | | 7.674% (2 months LIBOR + 4.000%), | | | | |
| | | | 07/24/2024 2,3 | | | 137,567 | |
| | | | | |
| Software: 21.3% | | | | |
| | | | A&V Holdings Midco LLC | | | | |
| | 296,835 | | 9.545% (3 months LIBOR + 5.375%), | | | | |
| | | | 3/10/2027 2,3 | | | 289,415 | |
| | | | Hyland Software, Inc. | | | | |
| | 382,800 | | 10.004% (1 month LIBOR + 6.250%), | | | | |
| | | | 7/7/2025 2,3 | | | 368,064 | |
| | | | Magenta Buyer LLC | | | | |
| | 366,300 | | 9.170% (3 months LIBOR + 4.750%), | | | | |
| | | | 7/27/2028 2,3 | | | 321,886 | |
| | | | Veritas U.S., Inc. | | | | |
| | 184,106 | | 8.674% (3 months LIBOR + 5.000%), | | | | |
| | | | 9/1/2025 2,3 | | | 148,973 | |
| | | | | | | 1,128,338 | |
| Specialty Retail: 3.8% | | | | |
| | | | At Home Group, Inc. | | | | |
| | 254,430 | | 7.743% (3 months LIBOR + 4.000%), | | | | |
| | | | 7/24/2028 2,3 | | | 201,908 | |
| | | | | |
| Total Bank Loans | | | | |
| (Cost $2,548,312) | | | 2,413,489 | |
| | | | | | | | |
| Shares | | | | | | |
| Short-Term Investments: 2.4% | | | | |
| | | | | | | | |
| Money Market Funds: 2.4% | | | | |
| | | | | | | | |
| | 127,251 | | U.S. Bank Money Market | | | | |
| | | | Deposit Account, 2.750% 4 | |
| 127,251 | |
| | | | | |
| Total Money Market Funds | | | | |
| (Cost $127,251) | | | 127,251 | |
| | | | | |
| Total Short-Term Investments | | | | |
| (Cost $127,251) | | | 127,251 | |
| | | | | |
| Total Investments in Securities: 99.6% | | | | |
| (Cost $6,775,092) | | | 5,280,622 | |
| Other Assets in Excess of Liabilities: 0.4% | | | 20,644 | |
| Total Net Assets: 100.0% | | $ | 5,301,266 | |
LIBOR – London Interbank Offered Rate
1 | Security is fair valued under the Board of Trustees and is categorized as a Level 3 security. Significant unobservable inputs were used to determine fair value. |
2 | Variable rate security; rate shown is the rate in effect on October 31, 2022. An index may have a negative rate. Interest rate may also be subject to a cap or floor. |
3 | Bank loans generally pay interest at rates which are periodically determined by reference to a base lending rate plus a premium. All loans carry a variable rate of interest. These base lending rates are generally (i) the Prime Rate offered by one or more major United States banks, (ii) the lending rate offered by one or more European banks such as the London Interbank Offered Rate (“LIBOR”) or (iii) the Certificate of Deposit rate. Bank Loans, while exempt from registration, under the Securities Act of 1933, contain certain restrictions on resale and cannot be sold publicly. Floating rate bank loans often require prepayments from excess cash flow or permit the borrower to repay at its election. The degree to which borrowers repay, whether as a contractual requirement or at their election, cannot be predicted with accuracy. |
4 | The Money Market Deposit Account (the “MMDA”) is a short-term investment vehicle in which the Fund holds cash balances. The MMDA will bear interest at a variable rate that is determined based on conditions and may change daily and by any amount. The rate shown is as of October 31, 2022. |
5 | Security is in default. |
The Global Industry Classifications Standard (GICS®) sector and industry classifications was developed by and is the exclusive property of MSCI, Inc. and Standard & Poor’s (“S&P”). GICS® is a service mark of MSCI, Inc. and S&P and has been licensed for use by Osterweis Capital Management.
The accompanying notes are an integral part of these financial statements.
Statements of Assets and Liabilities at October 31, 2022 (Unaudited)
| | | Short Duration | | | Sustainable | |
| | | Credit Fund 1 | | | Credit Fund 2 | |
| ASSETS | | | | | | |
| Investments in unaffiliated securities, at value (cost $234,290,069, and $6,775,092, respectively) | | $ | 182,126,524 | | | $ | 5,280,622 | |
| Cash | | | 149,887 | | | | 407 | |
| Receivables: | | | | | | | | |
| Due from advisor, net | | | — | | | | 9,597 | |
| Fund shares sold | | | 13,459 | | | | — | |
| Dividends and interest | | | 2,558,832 | | | | 79,628 | |
| Prepaid expenses | | | 22,233 | | | | 2,626 | |
| Total assets | | | 184,870,935 | | | | 5,372,880 | |
| | | | | | | | | |
| LIABILITIES | | | | | | | | |
| Payables: | | | | | | | | |
| Investment securities purchased | | | 1,720,440 | | | | 49,560 | |
| Fund shares redeemed | | | 188,608 | | | | — | |
| Investment advisory fees, net | | | 116,177 | | | | — | |
| Administration fees | | | 13,770 | | | | 1,555 | |
| Custody fees | | | 1,826 | | | | 2,166 | |
| Fund accounting fees | | | 1,159 | | | | 512 | |
| Transfer agent fees | | | 31,849 | | | | 2,682 | |
| Trustee fees | | | 4,063 | | | | 2,225 | |
| Audit fees | | | 11,555 | | | | 10,754 | |
| Chief Compliance Officer fees | | | 754 | | | | 754 | |
| Other accrued expenses | | | 2,249 | | | | 1,406 | |
| Total Liabilities | | | 2,092,450 | | | | 71,614 | |
| NET ASSETS | | $ | 182,778,485 | | | $ | 5,301,266 | |
| | | | | | | | | |
| COMPUTATION OF NET ASSETS: | | | | | | | | |
| Net assets value (unlimited shares authorized): | | $ | 182,778,485 | | | $ | 5,301,266 | |
| Shares (unlimited number of shares authorized without par value) | | | 22,038,623 | | | | 636,407 | |
| Net assets value, offering, and redemption price per share | | $ | 8.29 | | | $ | 8.33 | |
| | | | | | | | | |
| COMPONENTS OF NET ASSETS: | | | | | | | | |
| Paid-in capital | | $ | 234,496,155 | | | $ | 6,210,763 | |
| Total distributable (accumulated) earnings (losses) | | | (51,717,670 | ) | | | (909,497 | ) |
| Net assets | | $ | 182,778,485 | | | $ | 5,301,266 | |
1 | The Zeo Short Duration Income Fund, a series of Northern Lights Fund Trust, reorganized into the Osterweis Short Duration Credit Fund following the close of business on October 7, 2022. |
2 | The Zeo Sustainable Credit Fund, a series of Northern Lights Fund Trust, reorganized into the Osterweis Sustainable Credit Fund following the close of business on October 7, 2022. |
The accompanying notes are an integral part of these financial statements.
Statements of Operations For the Six Months Ended October 31, 2022 (Unaudited)
| | | Short Duration | | | Sustainable | |
| | | Credit Fund 1 | | | Credit Fund 2 | |
| INVESTMENT INCOME | | | | | | |
| Income: | | | | | | |
| Interest | | $ | 7,067,277 | | | $ | 223,853 | |
| Total investment income | | | 7,067,277 | | | | 223,853 | |
| | | | | | | | | |
| EXPENSES | | | | | | | | |
| Investment advisory fees | | | 705,937 | | | | 2,610 | |
| Administration fees | | | 94,524 | | | | 13,686 | |
| Sub-transfer agent fees | | | 60,560 | | | | 1,720 | |
| Registration fees | | | 21,740 | | | | 5,130 | |
| Transfer agent fees | | | 18,323 | | | | 9,364 | |
| Custody fees | | | 10,511 | | | | 3,572 | |
| Audit fees | | | 9,996 | | | | 10,856 | |
| Trustee fees | | | 8,493 | | | | 8,845 | |
| Legal fees | | | 6,424 | | | | 7,325 | |
| Reports to shareholders | | | 4,492 | | | | 687 | |
| Fund accounting fees | | | 2,417 | | | | 512 | |
| Insurance expense | | | 2,186 | | | | 2,009 | |
| Miscellaneous expense | | | 1,418 | | | | 2,137 | |
| Chief Compliance Officer fees | | | 754 | | | | 754 | |
| Other expenses | | | 9,110 | | | | 4,140 | |
| Total expenses | | | 956,885 | | | | 73,347 | |
| Fees (waived) recouped by the Adviser | | | — | | | | (44,802 | ) |
| Net expenses | | | 956,885 | | | | 28,545 | |
| Net investment income (loss) | | | 6,110,392 | | | | 195,308 | |
| | | | | | | | | |
| REALIZED AND UNREALIZED GAIN (LOSS) ON INVESTMENTS | | | | | | | | |
| Net realized gain (loss) on: | | | | | | | | |
| Unaffiliated investments | | | (2,042,667 | ) | | | (85,292 | ) |
| Change in net unrealized appreciation/depreciation on: | | | | | | | | |
| Investments | | | (16,817,233 | ) | | | (479,961 | ) |
| Net realized and unrealized gain (loss) on investments | | | (18,859,900 | ) | | | (565,253 | ) |
| Net increase (decrease) in net assets resulting from operations | | $ | (12,749,508 | ) | | $ | (369,945 | ) |
1 | The Zeo Short Duration Income Fund, a series of Northern Lights Fund Trust, reorganized into the Osterweis Short Duration Credit Fund following the close of business on October 7, 2022. |
2 | The Zeo Sustainable Credit Fund, a series of Northern Lights Fund Trust, reorganized into the Osterweis Sustainable Credit Fund following the close of business on October 7, 2022. |
The accompanying notes are an integral part of these financial statements.
Short Duration Credit Fund 2 | Statements of Changes in Net Assets
| | | Six Months Ended | | | | |
| | | October 31, 2022 | | | Year Ended | |
| | | (Unaudited) | | | April 30, 2022 | |
| INCREASE (DECREASE) IN NET ASSETS FROM: | | | | | | |
| OPERATIONS | | | | | | |
| Net investment income (loss) | | $ | 6,110,392 | | | $ | 10,355,856 | |
| Net realized gain (loss) on investments and futures contracts | | | (2,042,667 | ) | | | 1,618,162 | |
| Change in net unrealized appreciation/depreciation on investments and futures contracts | | | (16,817,233 | ) | | | (14,491,254 | ) |
| Net increase (decrease) in net assets resulting from operations | | | (12,749,508 | ) | | | (2,517,236 | ) |
| | | | | | | | | |
| DISTRIBUTIONS TO SHAREHOLDERS | | | | | | | | |
| Net distributions to shareholders | | | (6,104,336 | ) | | | (10,226,272 | )3 |
| | | | | | | | | |
| CAPITAL SHARE TRANSACTIONS | | | | | | | | |
Net increase (decrease) in net assets derived from net change in outstanding shares 2 | | | (15,978,638 | ) | | | (438,877 | ) |
| Total increase (decrease) in net assets | | | (34,832,482 | ) | | | (13,182,385 | ) |
| | | | | | | | | |
| NET ASSETS | | | | | | | | |
| Beginning of period/year | | | 217,610,967 | | | | 230,793,352 | |
| End of period/year | | $ | 182,778,485 | | | $ | 217,610,967 | |
1 | A summary of share transactions is as follows: |
| | | | Six Months Ended | | | | | | | |
| | | | October 31, 2022 | | | Year Ended | |
| | | | (Unaudited) | | | April 30, 2022 | |
| | | | Shares | | | Value | | | Shares | | | Value | |
| | Shares sold | | | 1,975,606 | | | $ | 17,019,728 | | | | 7,806,845 | | | $ | 75,005,512 | |
| | Shares issued in reinvestment of distributions | | | 647,420 | | | | 5,516,987 | | | | 963,283 | | | | 9,238,077 | |
| | Shares redeemed 3 | | | (4,445,212 | ) | | | (38,515,353 | ) | | | (8,789,923 | ) | | | (84,682,466 | ) |
| | Net increase (decrease) | | | (1,822,186 | ) | | $ | (15,978,638 | ) | | | (19,795 | ) | | $ | (438,877 | ) |
2 | The Zeo Short Duration Income Fund, a series of Northern Lights Fund Trust, reorganized into the Osterweis Short Duration Credit Fund following the close of business on October 7, 2022. Activity presented prior to close of business October 7, 2022 represents the historical operating results of the Northern Lights Trust. See Note 9. |
3 | Net of redemption fees of $0 and $4,088, respectively. |
The accompanying notes are an integral part of these financial statements.
Sustainable Credit Fund 2 | Statements of Changes in Net Assets
| | | Six Months Ended | | | | |
| | | October 31, 2022 | | | Year Ended | |
| | | (Unaudited) | | | April 30, 2022 | |
| INCREASE (DECREASE) IN NET ASSETS FROM: | | | | | | |
| OPERATIONS | | | | | | |
| Net investment income (loss) | | $ | 195,308 | | | $ | 447,597 | |
| Net realized gain (loss) on investments and futures contracts | | | (85,292 | ) | | | 420,078 | |
| Change in net unrealized appreciation/depreciation on investments and futures contracts | | | (479,961 | ) | | | (659,019 | ) |
| Net increase (decrease) in net assets resulting from operations | | | (369,945 | ) | | | 208,656 | |
| | | | | | | | | |
| DISTRIBUTIONS TO SHAREHOLDERS | | | | | | | | |
| Net distributions to shareholders | | | (194,736 | ) | | | (443,074 | )3 |
| | | | | | | | | |
| CAPITAL SHARE TRANSACTIONS | | | | | | | | |
Net increase (decrease) in net assets derived from net change in outstanding shares 2 | | | (537,887 | ) | | | (12,800,565 | ) |
| Total increase (decrease) in net assets | | | (1,102,568 | ) | | | (13,034,983 | ) |
| | | | | | | | | |
| NET ASSETS | | | | | | | | |
| Beginning of period/year | | | 6,403,834 | | | | 19,438,817 | |
| End of period/year | | $ | 5,301,266 | | | $ | 6,403,834 | |
1 | A summary of share transactions is as follows: |
| | | | Six Months Ended | | | | | | | |
| | | | October 31, 2022 | | | Year Ended | |
| | | | (Unaudited) | | | April 30, 2022 | |
| | | | Shares | | | Value | | | Shares | | | Value | |
| | Shares sold | | | 7,281 | | | $ | 64,110 | | | | 262,363 | | | $ | 2,552,463 | |
| | Shares issued in reinvestment of distributions | | | 16,499 | | | | 140,626 | | | | 35,349 | | | | 341,096 | |
| | Shares redeemed 3 | | | (86,686 | ) | | | (742,623 | ) | | | (1,607,980 | ) | | | (15,694,124 | ) |
| | Net increase (decrease) | | | (62,906 | ) | | $ | (537,887 | ) | | | (1,310,268 | ) | | $ | (12,800,565 | ) |
2 | The Zeo Sustainable Credit Fund, a series of Northern Lights Fund Trust, reorganized into the Osterweis Sustainable Credit Fund following the close of business on October 7, 2022. Activity presented prior to close of business October 7, 2022 represents the historical operating results of the Northern Lights Trust. See Note 9. |
3 | Net of redemption fees of $0 and $416, respectively. |
The accompanying notes are an integral part of these financial statements.
Short Duration Credit Fund 1 | Financial Highlights
For a capital share outstanding throughout each period/year
| | | Six Months | | | | | | | | | | | | | | | | |
| | | Ended | | | | | | | | | | | | | | | | |
| | | October 31, | | | Year Ended April 30, | |
| | | 2022 | | | |
| | | (Unaudited) | | | 2022 | | | 2021 | | | 2020 | | | 2019 | | | 2018 | |
| Net asset value, beginning of period/year | | $ | 9.12 | | | $ | 9.66 | | | $ | 9.15 | | | $ | 9.99 | | | $ | 9.95 | | | $ | 9.97 | |
| | | | | | | | | | | | | | | | | | | | | | | | | |
| INCOME FROM INVESTMENT OPERATIONS: | | | | | | | | | | | | | | | | | | | | | |
Net investment income (loss) 2 | | | 0.27 | | | | 0.43 | | | | 0.40 | | | | 0.39 | | | | 0.35 | | | | 0.25 | |
| Net realized and unrealized | | | | | | | | | | | | | | | | | | | | | | | | |
| gain (loss) on investments | | | (0.81 | ) | | | (0.54 | ) | | | 0.53 | | | | (0.83 | ) | | | 0.03 | | | | (0.02 | ) |
| Total from investment operations | | | (0.54 | ) | | | (0.11 | ) | | | 0.93 | | | | (0.44 | ) | | | 0.38 | | | | 0.23 | |
| Paid-in-capital redemption fees | | | — | | | | 0.00 | 5 | | | 0.00 | 5 | | | 0.00 | 5 | | | 0.00 | 5 | | | 0.00 | 5 |
| | | | | | | | | | | | | | | | | | | | | | | | | |
| LESS DISTRIBUTIONS: | | | | | | | | | | | | | | | | | | | | | | | | |
| From net investment income | | | (0.29 | ) | | | (0.43 | ) | | | (0.42 | ) | | | (0.40 | ) | | | (0.34 | ) | | | (0.25 | ) |
| Net asset value, end of period/year | | $ | 8.29 | | | $ | 9.12 | | | $ | 9.66 | | | $ | 9.15 | | | $ | 9.99 | | | $ | 9.95 | |
| Total return | | | (6.14 | )%3 | | | (1.30 | )% | | | 10.33 | % | | | (4.63 | )% | | | 3.92 | % | | | 2.28 | % |
| | | | | | | | | | | | | | | | | | | | | | | | | |
| SUPPLEMENTAL DATA: | | | | | | | | | | | | | | | | | | | | | | | | |
| Net assets, end of period/year (millions) | | $ | 182.8 | | | $ | 217.6 | | | $ | 230.8 | | | $ | 305.2 | | | $ | 377.4 | | | $ | 279.0 | |
| Portfolio turnover rate | | | 11 | %3 | | | 131 | % | | | 94 | % | | | 95 | % | | | 135 | % | | | 152 | % |
| | | | | | | | | | | | | | | | | | | | | | | | | |
| RATIOS OF EXPENSES TO AVERAGE NET ASSETS: | | | | | | | | | | | | | | | | | | | | |
| Ratio of expenses to average net assets | | | 0.98 | %4 | | | 0.99 | %6 | | | 1.05 | % | | | 1.01 | % | | | 1.01 | % | | | 1.27 | % |
| | | | | | | | | | | | | | | | | | | | | | | | | |
| RATIOS OF NET INVESTMENT INCOME TO AVERAGE NET ASSETS: | | | | | | | | | | | | | | | | | |
| Ratio of net investment income | | | | | | | | | | | | | | | | | | | | | | | | |
| to average net assets | | | 6.25 | %4 | | | 4.46 | % | | | 4.28 | % | | | 3.97 | % | | | 3.48 | % | | | 2.51 | % |
1 | The Zeo Short Duration Income Fund, a series of Northern Lights Fund Trust, reorganized into the Osterweis Short Duration Credit Fund following the close of business on October 7, 2022. |
2 | Calculated based on average shares outstanding during the period. |
3 | Not Annualized. |
4 | Annualized. |
5 | Less than $(0.00) or $0.00. |
6 | Effective July 1, 2021, the operating expense limitation was reduced to 0.99% from 1.25% |
The accompanying notes are an integral part of these financial statements.
Sustainable Credit Fund 1 | Financial Highlights
For a capital share outstanding throughout each period/year
| | | Six Months | | | | | | | | | | |
| | | Ended | | | | | | | | | | |
| | | October 31, | | | Year Ended April 30, | |
| | | 2022 | | | |
| | | (Unaudited) | | | 2022 | | | 2021 | | | 2020 2 | |
| Net asset value, beginning of period/year | | $ | 6.02 | | | $ | 9.67 | | | $ | 9.14 | | | $ | 10.00 | |
| | | | | | | | | | | | | | | | | |
| INCOME FROM INVESTMENT OPERATIONS: | | | | | | | | | | | | | | | | |
Net investment income (loss) 3 | | | 0.30 | | | | 0.45 | | | | 0.33 | | | | 0.25 | |
| Net realized and unrealized gain (loss) on investments | | | 2.30 | | | | (0.43 | ) | | | 0.52 | | | | (0.89 | ) |
| Total from investment operations | | | 2.60 | | | | 0.02 | | | | 0.85 | | | | (0.64 | ) |
| Paid-in-capital redemption fees | | | — | | | | 0.00 | 7 | | | — | | | | 0.00 | 7 |
| | | | | | | | | | | | | | | | | |
| LESS DISTRIBUTIONS: | | | | | | | | | | | | | | | | |
| From net investment income | | | (0.29 | ) | | | (0.53 | ) | | | (0.32 | ) | | | (0.22 | ) |
| Net asset value, end of period/year | | $ | 8.33 | | | $ | 9.16 | | | $ | 9.67 | | | $ | 9.14 | |
| Total return | | | (5.84 | )%4 | | | 0.04 | % | | | 9.41 | % | | | (6.53 | )%4 |
| | | | | | | | | | | | | | | | | |
| SUPPLEMENTAL DATA: | | | | | | | | | | | | | | | | |
| Net assets, end of period/year (millions) | | $ | 5.3 | | | $ | 6.4 | | | $ | 19.4 | | | $ | 10.3 | |
| Portfolio turnover rate | | | 11 | %4 | | | 69 | % | | | 75 | % | | | 62 | %4 |
| | | | | | | | | | | | | | | | | |
| RATIOS OF EXPENSES TO AVERAGE NET ASSETS: | | | | | | | | | | | | | | | | |
| Before fees/expenses waived or recouped | | | 2.54 | %5 | | | 2.32 | % | | | 1.66 | % | | | 2.51 | %5 |
| After fees/expenses waived or recouped | | | 0.99 | %5 | | | 1.08 | %6 | | | 1.25 | % | | | 1.25 | %5 |
| | | | | | | | | | | | | | | | | |
| RATIOS OF NET INVESTMENT INCOME TO AVERAGE NET ASSETS: | | | | | | | | | | | | | | | | |
| Before fees/expenses waived or recouped | | | 5.21 | %5 | | | 3.48 | % | | | 3.07 | % | | | 1.58 | %5 |
| After fees/expenses waived or recouped | | | 6.77 | %5 | | | 4.72 | % | | | 3.48 | % | | | 2.85 | %5 |
1 | The Zeo Sustainable Credit Fund, a series of Northern Lights Fund Trust, reorganized into the Osterweis Sustainable Credit Fund following the close of business on October 7, 2022. |
2 | The Fund commenced operations on June 5, 2019. |
3 | Calculated based on average shares outstanding during the period. |
4 | Not Annualized. |
5 | Annualized. |
6 | Effective July 1, 2021, the operating expense limitation was reduced to 0.99% from 1.25%. |
7 | Does not round to $(0.00) or $0.00. |
The accompanying notes are an integral part of these financial statements.
Notes to Financial Statements at October 31, 2022 (Unaudited)
The Osterweis Short Duration Credit Fund, previously the Zeo Short Duration Income Fund, and the Osterweis Sustainable Credit Fund, previously the Zeo Sustainable Credit Fund, (each a “Fund”, collectively the “Funds”) are each a series of shares of beneficial interest of Professionally Managed Portfolios (the “Trust”), which is registered under the Investment Company Act of 1940, as amended (the “1940 Act”) as an open-end management investment company. The Funds are investment companies and accordingly follow the investment company accounting and reporting guidance of the Financial Accounting Standards Board (FASB) Accounting Standard Codification Topic 946 “Financial Services — Investment Companies.” The Funds reorganized from the Zeo Short Duration Income Fund and the Zeo Sustainable Credit Fund to the Osterweis Short Duration Fund and the Osterweis Sustainable Credit Fund at the close of business October 7, 2022, and assumed the performance history of the Zeo Short Duration Income Fund and the Zeo Sustainable Credit Fund, which commenced operations on May 31, 2011 and May 31, 2019, respectively.
The investment objective of the Osterweis Short Duration Credit Fund is to seek low volatility and absolute returns consisting of income and moderate capital appreciation. The investment objective of the Osterweis Sustainable Credit Fund is to seek risk-adjustment total returns consisting of income and moderate capital appreciation. Osterweis Capital Management, Inc. and Osterweis Capital Management, LLC may be referred to individually or collectively as the “Adviser” or “Advisers” throughout this report. Prior to close of business October 7, 2022, Osterweis Capital Management, LLC served as the Funds’ interim adviser pursuant to an agreement dated April 14, 2022, and prior to that date, Zeo Capital Advisors, LLC served as the Funds’ investment adviser (the “Predecessor Adviser”).
| Note 2 – Significant Accounting Policies |
The following is a summary of significant accounting policies consistently followed by the Funds. These policies are in conformity with accounting principles generally accepted in the United States of America (“U.S. GAAP”).
| | A. | Security Valuation. All equity securities, which may include Real Estate Investment Trusts (“REITs”), Business Development Companies (“BDCs”) and Master Limited Partnerships (“MLPs”), that are traded on U.S. national or foreign securities exchanges are valued either at the last reported sale price on the exchange on which the security is principally traded or the exchange’s official closing price. If, on a particular day, an exchange-traded security does not trade, then the mean between the most recent quoted bid and asked prices will be used. All equity securities which may include REITs, BDCs and MLPs that are not traded on a listed exchange are valued at the last sale price in the over-the-counter market. If a non-exchange traded security does not trade on a particular day, then the mean between the last quoted closing bid and asked price will be used. |
| | | |
| | | Debt securities are valued by using the evaluated mean price supplied by an approved independent pricing service. The independent pricing service may use various valuation methodologies including matrix pricing and other analytical pricing models as well as market transactions and dealer quotations. These models generally consider such factors as yields or prices of bonds of comparable quality, type of issue, coupon, maturity, ratings and general market conditions. In the absence of a price from a pricing service, securities are valued at their respective fair values as determined in good faith by the Valuation Committee. |
| | | |
| | | Under Rule 2a-5, the Board approved Osterweis Capital Management, as the Funds’ valuation designee to perform Fair Value determinations. |
| | | |
| | | Under Rule 2a-5 the Board of Trustees (the “Board”) has designated Osterweis Capital Management (the “Adviser”) to perform Fair Value determinations for the Funds’ investments, subject to board oversight and certain reporting. |
| | | |
| | | As described above, the Funds utilize various methods to measure the fair value of their investments on a recurring basis. U.S. GAAP establishes a hierarchy that prioritizes inputs to valuation methods. The three levels of inputs are: |
| | Level 1 – | Unadjusted quoted prices in active markets for identical assets or liabilities that the Funds have the ability to access. |
Notes to Financial Statements at October 31, 2022 (Unaudited) (Continued)
| | Level 2 – | Observable inputs other than quoted prices included in Level 1 that are observable for the asset or liability, either directly or indirectly. These inputs may include quoted prices for the identical instrument on an inactive market, prices for similar instruments, interest rates, prepayment speeds, credit risk, yield curves, default rates and similar data. |
| | | |
| | Level 3 – | Unobservable inputs for the asset or liability, to the extent relevant observable inputs are not available, representing the Funds’ own assumptions about the assumptions a market participant would use in valuing the asset or liability, and would be based on the best information available. |
| | | The availability of observable inputs can vary from security to security and is affected by a wide variety of factors, including, for example, the type of security, whether the security is new and not yet established in the marketplace, the liquidity of markets, and other characteristics particular to the security. To the extent that valuation is based on models or inputs that are less observable or unobservable in the market, the determination of fair value requires more judgment. Accordingly, the degree of judgment exercised in determining fair value is greatest for instruments categorized in Level 3. |
| | | |
| | | The inputs used to measure fair value may fall into different levels of the fair value hierarchy. In such cases, for disclosure purposes, the level in the fair value hierarchy within which the fair value measurement falls in its entirety is determined based on the lowest level input that is significant to the fair value measurement in its entirety. The Adviser, as the Funds’ Valuation Designee, oversees valuation techniques. |
| | | |
| | | The following is a summary of the inputs used to value the Fund’s investments as of October 31, 2022: |
| | Osterweis Short Duration Credit Fund | | Level 1 | | | Level 2 | | | Level 3 | | | Total | |
| | Assets: | | | | | | | | | | | | |
| | Corporate Bonds 1,2 | | $ | — | | | $ | 110,299,042 | | | $ | 298,881 | | | $ | 110,597,923 | |
| | Bank Loans 1 | | | — | | | | 59,016,758 | | | | — | | | | 59,016,758 | |
| | Short-Term Investments | | | 12,511,843 | | | | — | | | | — | | | | 12,511,843 | |
| | Total Assets: | | $ | 12,511,843 | | | $ | 169,315,800 | | | $ | 298,881 | | | $ | 182,126,524 | |
| | | | | | | | | | | | | | | | | | |
| | 1 See Schedule of Investments for industry breakouts. | | | | | | | | | | | | | | | | |
| | 2 See Schedule of Investments for disclosure of Level 3 securities. | | | | | | | | | | | | | | | | |
| | | The following is a reconciliation of the Fund’s Level 3 assets for which significant unobservable inputs were used to determine fair value: |
| | | | Corporate Bonds | | | Total | |
| | Balance as of April 30, 2022 | | $ | — | | | $ | — | |
| | Acquisitions | | | 298,881 | | | | 298,881 | |
| | Dispositions | | | — | | | | — | |
| | Accrued discounts/premiums | | | — | | | | — | |
| | Realized gain (loss) | | | — | | | | — | |
| | Change in unrealized appreciation/depreciation | | | — | | | | — | |
| | Transfer in and/or out of Level 3 | | | — | | | | — | |
| | Balance as of October 31, 2022 | | $ | 298,881 | | | $ | 298,881 | |
| | Change in unrealized appreciation/depreciation | | | | | | | | |
| | for Level 3 investments held at October 31, 2022 | | $ | — | | | $ | — | |
| | | Fair Value | | | |
| | Type of Security | at 10/31/22 | Valuation Techniques | Unobservable Input | Input Value(s) |
| | Corporate Bonds | $298,881 | Estimated Proceeds | Market Data | $0.66 |
| | | Significant increases (decreases) in any of those inputs in isolation would result in a significantly higher (lower) fair value measurement. Increases in the adjustment to yield would decrease price and decreases in the adjustment to yield would increase price. |
Notes to Financial Statements at October 31, 2022 (Unaudited) (Continued)
| | | The Adviser, as the Funds’ Valuation Designee, oversees valuation techniques. |
| | Osterweis Sustainable Credit Fund | | Level 1 | | | Level 2 | | | Level 3 | | | Total | |
| | Assets: | | | | | | | | | | | | |
| | Corporate Bonds 1,2 | | $ | — | | | $ | 2,728,035 | | | $ | 11,847 | | | $ | 2,739,882 | |
| | Bank Loans 1 | | | — | | | | 2,413,489 | | | | — | | | | 2,413,489 | |
| | Short-Term Investments | | | 127,251 | | | | — | | | | — | | | | 127,251 | |
| | Total Assets: | | $ | 127,251 | | | $ | 5,141,524 | | | $ | 11,847 | | | $ | 5,280,622 | |
| | | | | | | | | | | | | | | | | | |
| | 1 See Schedule of Investments for industry breakouts. | | | | | | | | | | | | | | | | |
| | 2 See Schedule of Investments for disclosure of Level 3 securities. | | | | | | | | | | | | | | | | |
| | | The Following is a reconciliation of the Fund’s Level 3 assets for which significant unobservable inputs were used to determine fair value: |
| | | | Corporate Bonds | | | Total | |
| | Balance as of April 30, 2022 | | $ | — | | | $ | — | |
| | Acquisitions | | | 11,847 | | | | 11,847 | |
| | Dispositions | | | — | | | | — | |
| | Accrued discounts/premiums | | | — | | | | — | |
| | Realized gain (loss) | | | — | | | | — | |
| | Change in unrealized appreciation/depreciation | | | — | | | | — | |
| | Transfer in and/or out of Level 3 | | | — | | | | — | |
| | Balance as of October 31, 2022 | | $ | 11,847 | | | $ | 11,847 | |
| | Change in unrealized appreciation/depreciation | | | | | | | | |
| | for Level 3 investments held at October 31, 2022 | | $ | — | | | $ | — | |
| | | Fair Value | | | |
| | Type of Security | at 10/31/22 | Valuation Techniques | Unobservable Input | Input Value(s) |
| | Corporate Bonds | $11,847 | Estimated Proceeds | Market Data | $0.66 |
| | | Significant increases (decreases) in any of those inputs in isolation would result in a significantly higher (lower) fair value measurement. Increases in the adjustment to yield would decrease price and decreases in the adjustment to yield would increase price. |
| | | |
| | | The Adviser, as the Funds’ Valuation Designee, oversees valuation techniques. |
| | | |
| | B. | Foreign Currency. Foreign currency amounts, other than the cost of investments, are translated into U.S. dollar values based upon the spot exchange rate prior to the close of regular trading. The cost of investments is translated at the rates of exchange prevailing on the dates the portfolio securities were acquired. The Funds include foreign exchange gains and losses from dividends receivable, interest receivable and other foreign currency denominated payables and receivables in Change in net unrealized appreciation/depreciation on foreign currency translation and Net realized gain (loss) on foreign currency translation. The Funds do not isolate that portion of realized and unrealized gain (loss) on investments resulting from changes in foreign exchange rates on investments from fluctuations arising from changes in the market price of securities for financial reporting purposes. Fluctuations in foreign exchange rates on investments are thus included in Change in net unrealized appreciation/depreciation on investments and Net realized gain (loss) on investments. |
| | | |
| | C. | Federal Income Taxes. Each Fund has elected to be taxed as a “regulated investment company” and intends to distribute substantially all taxable income to its shareholders and otherwise comply with the provisions of the Internal Revenue Code applicable to regulated investment companies. Therefore, no provision for federal income taxes or excise taxes has been made. |
| | | |
| | | In order to avoid imposition of the excise tax applicable to regulated investment companies, each Fund intends to declare each year as dividends, in each calendar year, at least 98.0% of its net investment income (earned during the calendar year) and 98.2% of its net realized capital gains (earned during the twelve months ended October 31) plus undistributed amounts, if any, from prior years. |
Notes to Financial Statements at October 31, 2022 (Unaudited) (Continued)
| | | Net capital losses incurred after October 31, and within the taxable year, are deemed to arise on the first business day of each Fund’s next taxable year. Net investment losses incurred after December 31, and within the taxable year, are deemed to arise on the first business day of the Fund’s next taxable year. |
| | | |
| | | As of the most recent fiscal year end April 30,2022, there were no late-year or post-October losses for the Funds. |
| | | |
| | | As of the most recent fiscal year end April 30, 2022, the Funds had the following capital loss carryovers available for federal income tax purposes: |
| | | | Capital Loss Carryovers | |
| | | | Short-Term | | | Long-Term | |
| | Osterweis Short Duration Credit Fund | | $ | 6,134,182 | | | $ | 12,743,669 | |
| | Osterweis Sustainable Credit Fund | | | — | | | | — | |
| | | As of the most recent fiscal year ended April 30, 2022 the Osterweis Sustainable Credit Fund utilized $3,999 of capital loss carryforwards. |
| | | |
| | | As of October 31, 2022, the Funds did not have any tax positions that did not meet the “more likely-than-not” threshold of being sustained by the applicable tax authority. Generally, tax authorities can examine all the tax returns filed for the last three years. The Funds identify their major tax jurisdictions as U.S. Federal and the Commonwealth of Massachusetts; however, as of October 31, 2022, the Funds are not aware of any tax positions for which it is reasonably possible that the total amounts of unrecognized tax benefits will change materially. |
| | | |
| | D. | Security Transactions and Investment Income. Investment securities transactions are accounted for on the trade date. Gains and losses realized on sales of securities are determined on an identified cost basis. Discounts/premiums on debt securities purchased are accreted/amortized over the life of the respective securities using the effective interest method. Dividend income is recorded on the ex-dividend date. Dividends received from REITs and MLPs are generally comprised of ordinary income, capital gains and may include return of capital. Interest income is recorded on an accrual basis. Withholding taxes on foreign dividends have been provided for in accordance with the Trust’s understanding of the applicable country’s tax rules and rates. |
| | | |
| | E. | Distributions to Shareholders. Distributions to shareholders from net investment income for the Funds normally are declared and paid on a monthly basis, and distributions to shareholders from net realized gains on securities normally are declared and paid on an annual basis. Distributions are recorded on the ex-dividend date. |
| | | |
| | F. | Use of Estimates. The preparation of financial statements in conformity with U.S. GAAP requires management to make estimates and assumptions that affect the reported amounts of assets and liabilities at the date of the financial statements and the reported amount of revenue and expenses during the reporting period. Actual results could differ from those estimates. |
| | | |
| | G. | Share Valuation. The net asset value (“NAV”) per share of each Fund is calculated by dividing the sum of the value of the securities held by each Fund, plus cash and other assets, minus all liabilities by the total number of shares outstanding for each Fund, rounded to the nearest cent. The Funds’ shares will not be priced on the days on which the New York Stock Exchange is closed for trading. The offering and redemption price per share for each Fund is equal to each Fund’s net asset value per share. |
| | | |
| | H. | Guarantees and Indemnifications. In the normal course of business, the Funds enter into contracts with service providers that contain general indemnification clauses. The Funds’ maximum exposure under these arrangements is unknown as this would involve future claims that may be made against the Funds that have not yet occurred. However, based on experience, the Funds expect the risk of loss to be remote. |
| | | |
| | I. | Illiquid Securities. Pursuant to Rule 22e-4 under the 1940 Act, the Funds have adopted a Board approved liquidity risk management program that requires, among other things, that the Funds limit their illiquid investments that are assets to no more than 15% of net assets. An illiquid investment is any security which may not reasonably be expected to be sold or disposed of in current market conditions in seven calendar days or less without the sale or disposition significantly changing the market value of the investment. |
Notes to Financial Statements at October 31, 2022 (Unaudited) (Continued)
| | J. | Recently Issued Accounting Pronouncements. In June 2022, the FASB issued Accounting Standards Update 2022-03, which amends Fair Value Measurement (Topic 820): Fair Value Measurement of Equity Securities Subject to Contractual Sale Restrictions (“ASU 2022-03”). ASU 2022-03 clarifies guidance for fair value measurement of an equity security subject to a contractual sale restriction and establishes new disclosure requirements for such equity securities. ASU 2022-03 is effective for fiscal years beginning after December 15, 2023 and for interim periods within those fiscal years, with early adoption permitted. Management is currently evaluating the impact of these amendments on the financial statements. |
| | | |
| | | In March 2020, the FASB issued Accounting Standards Update 2020-04, Reference Rate Reform (Topic 848) – Facilitation of the Effects of Reference Rate Reform on Financial Reporting (“ASU 2020-04”), which provides optional, temporary relief with respect to the financial reporting of contracts subject to certain types of modifications due to the planned discontinuation of the London Interbank Offered Rate (“LIBOR”) and other interbank offered rates as of the end of 2021. The temporary relief provided by ASU 2020-04 is effective for certain reference rate related contract modifications that occur during the period from March 12, 2020 through December 31, 2022. Management is evaluating the impact of ASU 2020-04 on the fund’s investments, derivatives, debt and other contracts that will undergo reference rate-related modifications as a result of the reference rate reform. The Financial Accounting Standards Board (“FASB”) approved an (optional) 2-year extension, until December 31, 2024, for temporary relief of transitioning away from the LIBOR. LIBOR is set to expire June 30, 2023. Companies were initially provided temporary relief through December 31, 2022 to update contracts moving away from LIBOR. |
| | | |
| | K. | Subsequent Events. In preparing these financial statements, the Funds have evaluated events and transactions for potential recognition or disclosure through the date the financial statements were issued. The Funds have determined that there were no subsequent events that would need to be disclosed in the Funds’ financial statements. |
| Note 3 – Commitments and Other Related Party Transactions |
The Advisers provide the Funds with investment management services under separate Investment Advisory Agreements (the “Advisory Agreements”). Under the Advisory Agreements, the Advisers furnish all investment advice, office space, certain administrative services, and most of the personnel needed by each Fund. As compensation for their services, the Advisers are entitled to a monthly fee. The Adviser is entitled to a monthly fee at an annual rate of 0.75% of the average daily net assets for the Osterweis Short Duration Credit Fund and Osterweis Sustainable Credit Fund. The amount of investment advisory fees incurred by the Funds for the six months ended October 31, 2022 is disclosed in the Statements of Operations. The investment advisory fees incurred are paid monthly to the Adviser, net of any waiver or reimbursement discussed below.
The Adviser has contractually agreed to limit the annual ratio of expenses (Expense Cap) for the Osterweis Sustainable Credit Fund and Osterweis Short Duration Credit Fund, by reducing all or a portion of their fees and reimbursing Fund expenses so that the Fund’s ratios of expenses to average net assets will not exceed 0.99%. The Operating Expenses Limitation Agreement has an indefinite term and may be terminated at any time, and without payment of any penalty, by the Board, on behalf of the Fund, upon sixty (60) days’ written notice to the Adviser. Any fees waived and/or any Fund expenses absorbed by the Adviser pursuant to an agreed-upon expense cap shall be reimbursed by the Fund to the Adviser, if so requested by the Adviser, any time before the end of the third year following the fee waiver and/or expense absorption, provided the aggregate amount of the Fund’s current operating expenses for such year does not exceed the lesser expense cap in place at the time of waiver or at the time of reimbursement. The Fund must pay its current ordinary operating expenses before the Adviser is entitled to any reimbursements of fees and/or expenses. Any such reimbursement is also contingent upon Board review and approval. Any amount due from the Adviser is paid monthly to the Fund, if applicable.
For the six months ended October 31, 2022, the Adviser waived $44,802 in fees in the Osterweis Sustainable Credit Fund. As of October 31, 2022, the remaining cumulative amount the Adviser may be reimbursed is $44,802 for the Osterweis Sustainable Credit Fund. For the six months ended October 31, 2022, there were no fees waived in the Osterweis
Notes to Financial Statements at October 31, 2022 (Unaudited) (Continued)
Short Duration Credit Fund. Note, the six-month period referenced above includes the period for which the Zeo Short Duration Income Fund and Zeo Sustainable Credit Fund, each a series of Northern Lights Fund Trust (together, the “Predecessor Funds”), were managed by the Adviser through October 7, 2022. The Adviser served as interim investment adviser of the Predecessor Funds from May 1-September 28, 2022 and as investment adviser from September 28-October 7, 2022, upon which time, the Predecessor Funds were reorganized into the Funds.
The Adviser may recapture a portion of the above no later than the years as stated below:
| | | October 31, 2025 |
| | Osterweis Sustainable Credit Fund | $44,802 |
Effective close of business, October 7, 2022, U.S. Bancorp Fund Services, LLC, doing business as U.S. Bank Global Fund Services (“Fund Services”), became the Funds’ administrator, fund accountant and transfer agent. In those capacities Fund Services maintains the Funds’ books and records, calculates the Funds’ NAV, prepares various federal and state regulatory filings, coordinates the payment of fund expenses, reviews expense accruals and prepares materials supplied to the Board. The officers of the Trust and the Chief Compliance Officer are also employees of Fund Services. Any fees paid prior to the close of business October 7, 2022 were paid to Ultimus Fund Solutions, LLC, the predecessor service provider. Fees paid by the Funds to Fund Services and Ultimus Fund Solutions, LLC for these services for the six months ended October 31, 2022, are disclosed in the Statements of Operations.
Effective close of business October 7, 2022, Quasar Distributors, LLC (the “Distributor”) became the Funds’ principal underwriter in a continuous public offering of the Funds’ shares. Prior to October 7, 2022, Northern Lights Distributors, LLC served as the Funds’ principal underwriter. U.S. Bank N.A. serves as custodian to the Funds. U.S. Bank N.A. is an affiliate of Fund Services.
The Funds have entered into Sub-Transfer Agent Arrangements (the “Arrangements”). All Arrangements must be approved by the Board. For the six months ended October 31, 2022, the Sub-Transfer Agent Fees and Transfer Agent Fees incurred by the Funds are disclosed in the Statements of Operations.
| Note 4 – Purchases and Sales of Securities |
For the six months ended October 31, 2022, the cost of purchases and proceeds from sales and maturities of securities, excluding short-term investments, were as follows:
| | | | Purchases | | | Sales | |
| | Osterweis Short Duration Credit Fund | | $ | 20,908,695 | | | $ | 40,475,151 | |
| | Osterweis Sustainable Credit Fund | | | 564,505 | | | | 1,169,388 | |
For the six months ended October 31, 2022, there were no purchases or sales of U.S. Government obligations in the Funds.
| Note 5 – Distributions to Shareholders |
The tax character of distributions paid during the six months ended October 31, 2022 and the year ended April 30, 2022, was as follows:
| | | | Ordinary Income | |
| | | | October 31, 2022 | | | April 30, 2022 | |
| | Osterweis Short Duration Credit Fund | | $ | 6,104,336 | | | $ | 10,226,272 | |
| | Osterweis Sustainable Credit Fund | | | 194,736 | | | | 443,074 | |
| | | | | | | | | | |
| | | | Long-Term Capital Gains1 | |
| | | | October 31, 2022 | | | April 30, 2022 | |
| | Osterweis Short Duration Credit Fund | | $ | — | | | $ | — | |
| | Osterweis Sustainable Credit Fund | | | — | | | | — | |
| | 1 | Designated as long-term capital gain dividend, pursuant to Internal Revenue Code Section 852(b)(3). |
Notes to Financial Statements at October 31, 2022 (Unaudited) (Continued)
The cost basis of investments for federal income tax purposes at most recent fiscal year end, April 30, 2022, was as follows:
| | | | Osterweis | | | Osterweis | |
| | | | Short Duration | | | Sustainable | |
| | | | Credit Fund | | | Credit Fund | |
| | Cost of investments | | $ | 220,636,192 | | | $ | 6,601,545 | |
| | Gross tax unrealized appreciation | | | 21,295,698 | | | | 701,129 | |
| | Gross tax unrealized depreciation | | | (35,411,574 | ) | | | (1,063,187 | ) |
| | Net tax unrealized appreciation/depreciation | | | (14,115,876 | ) | | | (362,058 | ) |
| | Undistributed ordinary income | | | 129,901 | | | | 17,242 | |
| | Undistributed long-term capital gain | | | — | | | | — | |
| | Total distributable earnings | | | 129,901 | | | | 17,242 | |
| | Other accumulated gain/(loss) | | | (18,877,851 | ) | | | — | |
| | Total distributable (accumulated) earnings (losses) | | $ | (32,863,826 | ) | | $ | (344,816 | ) |
The tax difference between book basis and tax basis unrealized appreciation is attributable to wash sale deferrals.
U.S. Bank N.A. has made available to the Osterweis Short Duration Fund credit facilities pursuant to separate Loan and Security Agreements for temporary or extraordinary purposes. Credit facility details for the six months ended October 31, 2022, are as follows:
| | | | Osterweis | |
| | | | Short Duration | |
| | | | Credit Fund | |
| | Maximum available credit | | $ | 13,000,000 | |
| | Largest amount outstanding on an individual day | | | — | |
| | Average balance when in use | | | — | |
| | Credit facility outstanding as of October 31, 2022 | | | — | |
| | Average interest rate when in use | | | — | |
Interest expenses for the six months ended October 31, 2022, are disclosed in the Statements of Operations, as applicable.
| Note 7 – Risks Associated with the Discontinuation of the London Interbank Offered Rate (“LIBOR”) |
The Funds invest significantly in corporate bonds that have interest rate provisions linked to LIBOR. LIBOR is used extensively in the U.S. and globally as a “benchmark” or “reference rate” for such loans. It is expected that a number of private-sector banks currently reporting information used to set LIBOR will stop doing so after 2021 when their current reporting commitment ends, which could either cause LIBOR to stop publication immediately or cause LIBOR’s regulator to determine that its quality has degraded to the degree that it is no longer representative of its underlying market. The expected discontinuation of LIBOR may impact the functioning, liquidity, and value of these.
| Note 8 – (COVID-19) Pandemic |
The global outbreak of COVID-19 (commonly referred to as “coronavirus”) has disrupted economic markets and the prolonged economic impact is uncertain. Although vaccines for COVID-19 are widely available, the ultimate economic fallout from the pandemic, amid the spread of COVID-19 variants, and the long-term impact on economies, markets, industries and individual companies are not known. The operational and financial performance of individual companies and the market in general depends on future developments, including the duration and spread of any future outbreaks and the pace of recovery which may vary from market to market, and such uncertainty may in turn adversely affect the value and liquidity of the Fund’s investments, impair the Fund’s ability to satisfy redemption requests, and negatively impact the Fund’s performance.
Notes to Financial Statements at October 31, 2022 (Unaudited) (Continued)
| Note 9 – Fund Reorganization |
The Board of Trustees (the “Board”) of Northern Lights Fund Trust (the “Trust”) has approved the reorganization (the “Reorganization”) of the Zeo Short Duration Income Fund and Zeo Sustainable Credit Fund (each a “Predecessor Fund”) into a corresponding new series of the Professionally Managed Portfolios (each an “Acquiring Fund”), to be managed by Osterweis Capital Management, LLC the investment adviser of the Predecessor Funds. As the Osterweis Sustainable Credit Fund and the Osterweis Short Duration Credit Fund have no history prior to the Reorganization, they assumed the accounting and performance history of the Zeo Short Duration Income Fund and the Zeo Sustainable Credit Fund, respectively.
For the Osterweis Short Duration Credit Fund and the Osterweis Sustainable Credit Fund, the Reorganization was accomplished by a tax-free exchange of 1,504,729 shares for 1,504,729 shares and 66,159 shares for 66,159 shares, respectively.
| Note 10 – Special Meeting of Shareholders (Unaudited) |
At a special meeting held on September 28, 2022, the shareholders of both the Zeo Short Duration Income Fund and the Zeo Sustainable Credit Fund voted to approve the Reorganization discussed in Note 9. The results of the meeting is as follows:
Zeo Short Duration Income Fund
For 53.37% Against 0.03% Abstain 0.05 %
Zeo Sustainable Credit Fund
For 64.49% Against 0.00% Abstain 0.00%
Expense Examples For the Six Months Ended October 31, 2022 (Unaudited)
As a shareholder of the Funds, you incur ongoing costs, including investment advisory fees and other Fund expenses. These examples are intended to help you understand your ongoing costs (in dollars) of investing in the Funds and to compare these costs with the ongoing costs of investing in other mutual funds. These examples are based on an investment of $1,000 invested at the beginning of the period and held for the entire period (May 1, 2022– October 31, 2022).
Actual Expenses
The “Actual” line for each of the following tables provides information about actual account values based on actual returns and actual expenses. Although the Funds charge no sales load or other transaction fees, you will be assessed fees for outgoing wire transfers, returned checks and stop payment orders at prevailing rates charged by Fund Services, the Funds’ transfer agent. If you request that a redemption be made by wire transfer, the Funds’ transfer agent currently charges a $15.00 fee. An Individual Retirement Account will be charged an annual maintenance fee. To the extent the Funds invest in shares of other investment companies as part of their strategies, you will indirectly bear your proportionate share of any fees and expenses charged by the underlying funds in which the Funds invest in addition to the expenses of the Funds. Actual expenses of the underlying funds may vary. These expenses are not included in the following examples. The following examples include, but are not limited to, investment advisory fees, fund accounting fees, fund administration fees, custody fees and transfer agent fees. However, the following examples do not include portfolio trading commissions and related expenses. You may use the information in this line, together with the amount you invested, to estimate the expenses that you paid over the period. Simply divide your account value by $1,000 (for example, an $8,600 account value divided by $1,000 = 8.6), then multiply the result by the number in the first line under the heading titled “Expenses Paid During the Period” to estimate the expenses you paid on your account during this period.
Hypothetical Example for Comparison Purposes
The “Hypothetical” line for each of the following tables provides information about hypothetical account values and hypothetical expenses based on the Funds’ actual expense ratios and an assumed rate of return of 5% per year before expenses, which is not the Funds’ actual return. The hypothetical account values and expenses may not be used to estimate the actual ending account balance or expenses you paid for the period. You may use this information to compare the ongoing costs of investing in the Funds and other funds. To do so, compare this 5% hypothetical example with the 5% hypothetical examples that appear in the shareholder reports of the other funds.
| | Beginning | Ending | |
| | Account Value | Account Value | Expenses Paid |
| | 5/1/22 | 10/31/22 | During the Period 1 |
| Short Duration Credit Fund | | | |
| Actual | $1,000.00 | $ 938.60 | $4.79 |
| Hypothetical (5% annual return before expenses) | 1,000.00 | 1,020.27 | 4.99 |
| | | | |
| Sustainable Credit Fund | | | |
| Actual | 1,000.00 | 941.60 | 4.84 |
| Hypothetical (5% annual return before expenses) | 1,000.00 | 1,020.21 | 5.04 |
1 | Expenses are equal to the annualized net expense ratio for the most recent six-month period. The annualized six-month expense ratios for the Osterweis Short Duration Credit Fund and Osterweis Sustainable Credit Fund were 0.98% and 0.99% (reflecting fee waivers and recoupments in effect), respectively, multiplied by the average account value over the period multiplied by 183/365 (to reflect the one-half year period. |
Additional Information
| Information About Proxy Voting |
A description of the policies and procedures that the Funds use to determine how to vote proxies relating to portfolio securities is available upon request without charge by calling toll-free at (866) 236-0050 or by accessing the U.S. Securities and Exchange Commission’s (SEC) website at www.sec.gov.
Information regarding how the Funds voted proxies relating to portfolio securities during the most recent twelve months ended June 30 is available upon request without charge by calling toll-free at (866) 236-0050 or by accessing the SEC’s website at www.sec.gov.
| Information About the Portfolio Holdings |
The Funds’ quarterly holdings for the most recent fiscal year can be obtained by accessing the Funds’ website at www.osterweis.com/literature. The Funds file their complete schedule of portfolio holdings with the SEC for the first and third quarters of each fiscal year as an exhibit to their reports on Form N-PORT. The Funds’ Form N-PORT is available on the SEC’s website at www.sec.gov. The Fund’s Form N-PORT may also be obtained by calling (866) 236-0050.
In an effort to conserve resources, the Funds intend to reduce the number of duplicate prospectuses, supplements, and certain other shareholder documents you receive by sending only one copy of each to those addresses shared by two ore more accounts. Call (866) 236-0050 to request individual copies of documents; if your shares are held through a Financial Intermediary, please contact them directly. The Funds will begin sending individual copies 30 days after receiving your request to stop householding. This policy does not apply to account statements.
| Information About the Funds Trustees |
The Statement of Additional Information (“SAI”) includes additional information about the Funds’ Trustees and is available without charge, upon request, by calling (866) 236-0050. Furthermore, you can obtain the SAI on the SEC’s website at www.sec.gov or the Funds’ website at www.osterweis.com.
Osterweis Funds | Privacy Notice (Unaudited)
The Funds collect non-public information about you from the following sources:
• Information we receive about you on applications or other forms;
• Information you give us orally; and
• Information about your transactions with us or others.
The Funds do not disclose any non-public personal information about our customers or former customers without the customer’s authorization, except as permitted by law or in response to inquiries from governmental authorities. The Funds may share information with affiliated parties and unaffiliated third parties with whom we have contracts for servicing the Funds. The Funds will provide unaffiliated third parties with only the information necessary to carry out their assigned responsibility. The Funds maintain physical, electronic and procedural safeguards to guard your non-public personal information and require third parties to treat your non-public information with the same high degree of confidentially.
In the event that you hold shares of a Fund through a financial intermediary, including, but not limited to, a broker-dealer, bank or trust company, the privacy policy of your financial intermediary would govern how your non-public personal information would be shared by those entities with unaffiliated third parties.
(This Page Intentionally Left Blank.)
Advisers
OSTERWEIS CAPITAL MANAGEMENT, LLC
One Maritime Plaza, Suite 800
San Francisco, CA 94111
Distributor
QUASAR DISTRIBUTORS, LLC
111 East Kilbourn Avenue, Suite 2200
Milwaukee, WI 53202
Custodian
U.S. BANK N.A.
Custody Operations
1555 North RiverCenter Drive, Suite 302
Milwaukee, WI 53212
Transfer Agent, Fund Accountant and Fund Administrator
U.S. BANCORP FUND SERVICES, LLC
615 East Michigan Street
Milwaukee, WI 53202
(866) 236-0050
Independent Registered Public Accounting Firm
TAIT, WELLER & BAKER LLP
Two Liberty Place
50 South 16th Street, Suite 2900
Philadelphia, PA 19102
Legal Counsel
SULLIVAN & WORCESTER LLP
1633 Broadway, 32nd Floor
New York, NY 10019
Fund Information
| Fund | Symbol | CUSIP |
| Osterweis Short Duration Credit Fund | ZEOIX | 74316P694 |
| Osterweis Sustainable Credit Fund | ZSRIX | 74316P686 |
OWRPSEMI – 1022
Item 2. Code of Ethics.
Not applicable for semi-annual reports.
Item 3. Audit Committee Financial Expert.
Not applicable for semi-annual reports.
Item 4. Principal Accountant Fees and Services.
Not applicable for semi-annual reports.
Item 5. Audit Committee of Listed Registrants.
Not applicable to registrants who are not listed issuers (as defined in Rule 10A-3 under the Securities Exchange Act of 1934).
Item 6. Investments.
(a) Schedule of Investments is included as part of the report to shareholders filed under Item 1 of this Form.
(b) Not applicable.
Item 7. Disclosure of Proxy Voting Policies and Procedures for Closed-End Management Investment Companies.
Not applicable to open-end investment companies.
Item 8. Portfolio Managers of Closed-End Management Investment Companies.
Not applicable to open-end investment companies.
Item 9. Purchases of Equity Securities by Closed‑End Management Investment Company and Affiliated Purchasers.
Not applicable to open-end investment companies.
Item 10. Submission of Matters to a Vote of Security Holders.
There have been no material changes to the procedures by which shareholders may recommend nominees to the registrant’s board of Trustees.
Item 11. Controls and Procedures.
| (a) | The Registrant’s President/Principal Executive Officer and Treasurer/Principal Financial Officer have reviewed the Registrant's disclosure controls and procedures (as defined in Rule 30a-3(c) under the Investment Company Act of 1940 (the “Act”)) as of a date within 90 days of the filing of this report, as required by Rule 30a-3(b) under the Act and Rules 13a-15(b) or 15d‑15(b) under the Securities Exchange Act of 1934. Based on their review, such officers have concluded that the disclosure controls and procedures are effective in ensuring that information required to be disclosed in this report is appropriately recorded, processed, summarized and reported and made known to them by others within the Registrant and by the Registrant’s service provider. |
| (b) | There were no changes in the Registrant's internal control over financial reporting (as defined in Rule 30a-3(d) under the Act) that occurred during the period covered by this report that have materially affected, or are reasonably likely to materially affect, the Registrant's internal control over financial reporting. |
Item 12. Disclosure of Securities Lending Activities for Closed-End Management Investment Companies
Not applicable to open-end investment companies.
Item 13. Exhibits.
| (a) | (1) Any code of ethics or amendment thereto, that is the subject of the disclosure required by Item 2, to the extent that the registrant intends to satisfy Item 2 requirements through filing an exhibit. Incorporated by reference to previous Form N-CSR filing. |
(3) Any written solicitation to purchase securities under Rule 23c‑1 under the Act sent or given during the period covered by the report by or on behalf of the registrant to 10 or more persons. Not applicable to open-end investment companies.
(4) Change in the registrant’s independent public accountant. There was no change in the registrant’s independent public accountant for the period covered by this report.
SIGNATURES
Pursuant to the requirements of the Securities Exchange Act of 1934 and the Investment Company Act of 1940, the registrant has duly caused this report to be signed on its behalf by the undersigned, thereunto duly authorized.
(Registrant) Professionally Managed Portfolios
By (Signature and Title) /s/Jason Hadler
Jason Hadler, President/Principal Executive Officer
Date 1/5/23
Pursuant to the requirements of the Securities Exchange Act of 1934 and the Investment Company Act of 1940, this report has been signed below by the following persons on behalf of the registrant and in the capacities and on the dates indicated.
By (Signature and Title) /s/Jason Hadler
Jason Hadler, President/Principal Executive Officer
Date 1/5/23
By (Signature and Title) /s/Craig Benton
Craig Benton, Treasurer/Principal Financial Officer
Date 1/5/23
* Print the name and title of each signing officer under his or her signature.