UNITED STATES
SECURITIES AND EXCHANGE COMMISSION
Washington, D.C. 20549
FORM N-CSR
CERTIFIED SHAREHOLDER REPORT OF REGISTERED
MANAGEMENT INVESTMENT COMPANIES
| Investment Company Act file number | 811-05038 | | |
| | | |
| | Clearwater Investment Trust | |
| | (Exact name of registrant as specified in charter) | |
| | 2000 Wells Fargo Place, 30 East 7th Street, Saint Paul, Minnesota 55101-4930 | |
| | (Address of principal executive offices) (Zip code) | |
Stephen G. Simon
Fiduciary Counselling, Inc.
2000 Wells Fargo Place, 30 E. 7thStreet
Saint Paul, Minnesota 55101-4930
Copy to:
John V. O’Hanlon, Esq.
Dechert LLP
One International Place, 40th Floor
100 Oliver Street
| | Boston, Massachusetts 02110 | |
| | (Name and address of agent for service) | |
| | Registrant’s telephone number, including area code: | | 651-228-0935 | |
| | | | | |
| | Date of fiscal year end: | | December 31 | |
| | | | | |
| | Date of reporting period: | | June 30, 2019 | |
Item 1. Reports to Stockholders
| (a) | The following is a copy of the report transmitted to shareholders pursuant to Rule 30e-1 under the Investment Company Act of 1940 (17 CFR 270.30e-1) |
CLEARWATER INVESTMENT TRUST
Clearwater Core Equity Fund
Clearwater Small Companies Fund
Clearwater Tax-Exempt Bond Fund
Clearwater International Fund
Semi-annual Report
for the period ended
June 30, 2019
Management Discussion of Clearwater Funds’ Performance
Clearwater Core Equity Fund
The Clearwater Core Equity Fund (the “Core Equity Fund” or the “Fund”) seeks long-term growth of capital. Under normal market conditions, the Core Equity Fund pursues its investment objective by investing at least 80% of its net assets, plus the amount of any borrowings for investment purposes, in equity securities of U.S. companies. The Core Equity Fund’s assets are managed in a “multi-manager, multi-style” approach. As of June 30, 2019, the Fund had three subadvisers that provide day-to-day management of Fund assets. Parametric Portfolio Associates LLC (“Parametric”), with approximately 40% to 60% of the Fund’s assets, manages its portion of the Fund’s assets to track the Russell 1000® Index as closely as possible without requiring the Fund to realize taxable gains. The remaining Fund assets are divided between AQR Capital Management, LLC (“AQR”) and O’Shaughnessy Asset Management, LLC (“OSAM”), who both utilize an active management style.
2019 Year-To-Date Market Overview:
Domestic large capitalization equities, as defined by the Russell 1000® Index, generated nearly 20% returns in the first half of 2019, driven by a more accommodative monetary policy stance from the Federal Reserve. The strong returns during the period occurred despite headwinds from tariff negotiations and signs of a slowing global economy.
2019 Year-To-Date Performance and 2019 Outlook:
The Core Equity Fund gained 17.0%, net of fees, in the first half of 2019, compared to an increase of 18.8% for the Russell 1000® Index, the Fund’s benchmark. Parametric, the subadviser that follows a tax-managed passive strategy, underperformed the Fund’s benchmark. Both active subadvisers, AQR and OSAM, underperformed the Fund’s benchmark as well, as their preference for stocks they believe to be underpriced relative to their value, with higher momentum and higher quality, was out of favor during the period.
Each of the three subadvisers comment on the performance of their specific portions of the Fund and provide a market outlook for the next six months in the paragraphs below. For comparison of the subadvisers’ capabilities, performance is shown gross of fees. The Fund pays a single advisory fee to Clearwater Management Co., Inc., which in turn pays the subadvisers out of its advisory fee.
Although the overall performance of the Core Equity Fund is measured against its benchmark, as stated above, each of the underlying subadvisers may manage their portion of the Fund against a different benchmark that aligns more closely with their strategy. In each section below, the subadvisers discuss their view of the market over the last six months, the performance of their portfolios with respect to the benchmark against which their particular portfolio is managed and their outlook for the next six months.
AQR Commentary
General Market Overview:
We trade a set of strategies based on the value, momentum, and quality signals of individual securities that seek a positive expected return versus the appropriate benchmark, in a variety of economic environments. Because our investment approach employs a systematic set of rules based on economic intuition and testing to seek to ensure they are robust across time, macro environments, and geographies, we typically do not offer general market overviews.
2019 Performance for the 6-month period ending June 30, 2019:
The portion of the Core Equity Fund managed by AQR (the “Portfolio”) underperformed the Russell 1000® Index (the “benchmark”) in the first six months of 2019, returning 15.8%, gross of fees, while the benchmark returned 18.8%. Stock selection within sectors detracted from performance, while sector allocation contributed positively. The largest detractor was the Health Care sector, where both stock selection and sector allocation underperformed.
2019 Remaining Year Outlook:
In terms of sector positioning, we are currently overweight Financials while being underweight Energy. With respect to long-term attractiveness, we believe that valuations are currently less attractive in the U.S.
OSAM Commentary
General Market Overview:
2019 has been a strong year for returns in global equity markets and a few key themes emerged for the year. Growth outperformed value (the Russell 1000® Growth Index outperformed the Russell 1000®Value Index by 5.3% in the first six months of 2019) and large capitalization stocks outperformed small capitalization stocks (the Russell 1000® Index outperformed the Russell 2000® Index by 1.9%). During the first quarter, we saw what can be considered a classic “junk rally”, defined as a period where expensive, low quality, and high volatility names outperform. However, a defensive trend retrenched in the second quarter. While the market continues to reach new highs, investors have settled into a conservative tact, which is supported by the outperformance of low volatility stocks.
2019 Performance for the 6-month period ending June 30, 2019:
The portion of the Core Equity Fund managed by OSAM (the “Portfolio”) underperformed the Russell 1000® Index (the “benchmark”) for the first six months of 2019, returning 16.5% (gross of fees), while the benchmark returned 18.8%.
In the first quarter, having a smaller average market capitalization than the benchmark was additive to performance. We assess our performance by looking at the top decile of stocks within the following selection factors: shareholder yield (a combination of dividend yield and share repurchase yield), value, and momentum. These selection factors detracted from performance during the period. From the top deciles of our selection factors, we then eliminate low quality stocks. Doing so detracted from our performance relative to the benchmark. Finally, our portfolio construction methodology, which seeks to overweight stocks qualifying in our model most frequently, recently, and with the highest overall factor score, had a positive impact.
Moving to the second quarter, having a smaller average market capitalization than the benchmark detracted from performance. Our focus on the top decile of stocks by value, momentum, and shareholder yield, was additive to performance. Eliminating low quality stocks detracted from our performance relative to the benchmark. Finally, our portfolio construction methodology had a negative impact on performance. This was primarily related to poor stock selection within the Technology sector.
2019 Remaining Year Outlook:
Growth (as measured by the Russell 1000® Growth Index) has continued to outperform value (as measured by the Russell 1000® Value Index) during the first six months of 2019. Based on our research, we believe we are positioned well for the remainder of 2019. Our investment process favors portfolio companies that have higher levels of return on capital, lower reliance on external financing, and trade at what we believe are deep discounts across many valuation factors relative to the benchmark. As of June 30, 2019, the Portfolio’s holdings were returning capital to shareholders (via dividends and share repurchases) at a rate of 6.1% versus the benchmark at 2.8%. We believe that these combined advantages can only be delivered by a portfolio which is distinct from the
benchmark. We also believe that our Portfolio continues to represent a unique take on the U.S. equity market. We expect to continue to focus on our market niche – quality companies, often trading at what we believe are out-of-favor prices, which are aggressively returning capital to equity shareholders through dividends and share repurchases.
Parametric Commentary
General Market Overview:
Market returns for the first half of 2019 were quite strong, recovering from a pessimistic outlook late last year, and finishing near record highs. The market rallied during the first four months of the year, encouraged by strong earnings and the prospect of a trade deal with China. Market sentiment turned negative in May with increased tariffs on Chinese products and the threat of new tariffs and the coinciding retaliatory announcements by China. Market sentiment turned positive after the G-20 summit announcement that the trade war would be put on pause and that trade talks would resume.
2019 Performance for the 6-month period ending June 30, 2019:
The portion of the Core Equity Fund managed by Parametric (the “Portfolio”) underperformed the Russell 1000® Index (the “benchmark”) in the first six months of 2019, returning 18.0%, gross of fees, while the benchmark returned 18.8%. Most of the underperformance was attributable to small over and underweights to individual stocks within the Technology, Consumer Discretionary, and Communication sectors. An underweight to Netflix detracted from performance as the stock returned 37.2% in the first six months of 2019. Underweights to several stocks in the Technology sector (including Microsoft and Apple) also contributed to the underperformance.
2019 Remaining Year Outlook:
Although the trade war has paused pending further negotiations, market uncertainty remains for the second half of 2019. If a comprehensive trade deal remains elusive, we believe the tariffs will drag down the economic expansion. On the other hand, the Federal Reserve’s stance on monetary policy has become more accommodative. The market has priced in a rate cut in July, however, it’s highly uncertain if or when the Federal Reserve will cut rates, after leaving rates unchanged year-to-date in 2019.
Clearwater Small Companies Fund
The Clearwater Small Companies Fund (the “Small Companies Fund” or the “Fund”) seeks long-term growth of capital. Under normal market conditions, the Fund invests at least 80% of its net assets, plus the amount of any borrowings for investment purposes, in equity securities of small companies. The Fund defines “small companies” as issuers with market capitalizations no greater than that of the largest market capitalization company included in the Russell 2000® Index at the time of purchase. Equity securities consist primarily of exchange-traded common and preferred stocks and convertible securities. The Fund uses a “multi-style, multi-manager” approach with three subadvisers who employ distinct investment styles: Cooke & Bieler, L.P. (“Cooke & Bieler”), Kennedy Capital Management Inc. (“Kennedy”), and Pzena Investment Management, LLC (“Pzena”). At June 30, 2019, Kennedy managed about 60% of the Fund while Cooke & Bieler and Pzena each managed about 20%.
2019 Year-To-Date Market Overview:
Domestic small capitalization equities, as defined by the Russell 2000® Index, generated returns of more than 15% in the first half of 2019, driven by a more accommodative monetary policy stance from the Federal Reserve. The strong returns during the period occurred despite headwinds from tariff negotiations and signs of a slowing global economy.
2019 Year-To-Date Performance and 2019 Outlook:
The Small Companies Fund gained 16.4%, net of fees, in the first half of 2019, compared to an increase of 17.0% for the Russell 2000® Index, the Fund’s benchmark. Cooke & Bieler outperformed the Fund’s benchmark, while Kennedy slightly underperformed and Pzena underperformed to a greater extent.
Each of the three subadvisers comment on the performance of their specific portions of the Fund and provide a market outlook for the next six months in the paragraphs below. For comparison of the subadvisers’ capabilities, performance is shown gross of fees. The Fund pays a single advisory fee to Clearwater Management Co., Inc., which in turn pays the subadvisers out of its advisory fee.
Although the overall performance of the Small Companies Fund is measured against its benchmark, as stated above, each of the underlying subadvisers may manage their portion of the Fund against a different benchmark that aligns more closely with their strategy. In each section below, the subadvisers discuss their view of the market over the last six months, the performance of their portfolios with respect to the benchmark against which their particular portfolio is managed and their outlook for the next six months.
Cooke & Bieler Commentary
General Market Overview:
The rally that began late last year continued through April but was upended in May by renewed concerns about the economy and a more protracted trade war, then was revived in June by the Federal Reserve’s clear pivot toward monetary easing. The June rally was enough to push major indices into positive territory for the second quarter, capping a strong first half of the year that saw stocks up by double digits.
2019 Performance for the 6-month period ending June 30, 2019:
The portion of the Small Companies Fund managed by Cooke & Bieler (the “Portfolio”) outperformed the Russell 2000® Value Index (the “benchmark”) in the first six months of 2019, returning 20.8%, gross of fees, while the benchmark returned 13.5%. Stock selection within sectors drove the majority of the Portfolio’s outperformance and was positive in every sector in which the Portfolio held a position. Results were particularly strong in the Consumer Discretionary and Industrials sectors, which included a number of 2018’s most significant detractors. Cooke &
Bieler’s style often generates strong stock selection results in the benchmark’s weakest-performing sectors. Significant individual contributors to the Portfolio’s return included Winnebago, Woodward, Colfax, Air Lease, and Quanex Building Products. Major detractors were Nautilus, Mednax, Gates Industrial, National Western Life Group, and American Eagle Outfitters. The impact of sector allocation was negative, with the Portfolio’s overweight in the Consumer Discretionary sector – where stock selection was very strong – accounting for the biggest drag.
2019 Remaining Year Outlook:
Over the last 15 years – a period that saw two oil price spikes, a global financial crisis, unprecedented monetary intervention and countless political shocks – the benchmark has generated a fairly typical 7.3% annualized return. In other words, the confusion and cross currents of the second quarter were par for the course and in our view presented opportunities to profit from others’ impatience rather than causes for alarm. We believe that the business environment remains mostly positive, albeit with pockets of weakness emerging as trade tensions begin to take their toll. We also believe that valuations, broadly speaking, seem fair – neither compellingly cheap, nor worryingly expensive. This combination leads us to believe returns will be volatile, but positive over time.
Kennedy Commentary
General Market Overview:
Thus far 2019 has been a whirlwind, as the prospect of a more accommodative monetary policy in the U.S. more than offset a complex and uncertain trade policy backdrop. Companies with a connection to Mexico or China saw their stock prices tossed about as the media wrestled with interpretations of phrases released by the current U.S. administration. We heard from management teams that trade was being disrupted as customers and intermediaries strove to interpret potential landed costs.
While some see the domestic ten-year government treasury yield of about 2% as extremely low, we are reminded that relative interest rates hold a great amount of importance with those who allocate funds globally. The U.S. government can borrow funds for 10 years at 2% per year, but France can borrow money for about 0.2% per year, and the German government enjoys the luxury of a negative interest rate.
What does all of this mean for stocks? In our minds, there are two important, related impacts. If an investor can get a consistent stream of cash flows (e.g., a U.S. utility), they will pay a historically lofty price. This has driven and sustained those stocks’ P/E ratios well above previously established norms. For companies that have a strong competitive advantage in large, untapped markets with comparatively low trade friction (e.g., U.S. software companies), investors have also been inclined to afford historically high valuations to those companies.
2019 Performance for the 6-month period ending June 30, 2019:
The portion of the Small Companies Fund managed by Kennedy (the “Portfolio”) underperformed the Russell 2000® Index (the “benchmark”) in the first six months of 2019, returning 16.6%, gross of fees, while the benchmark returned 17.0%. Positive stock selection in the Financials and Materials sectors was offset by negative stock selection in the Health Care sector. The Portfolio’s positive aggregate selection effect through the first six months of the year was more than offset by the drag on performance associated with a 4.9% cash weighting given the strong absolute performance of the equity markets.
2019 Remaining Year Outlook:
The second half of 2019 will see the ramp up of the Democratic presidential debates and further machinations in the trade and geopolitical environment. We believe that these developments will likely create volatility in certain companies, sectors, and the market as a whole. In the end, we believe this market environment bodes well for Kennedy. We may be viewed as somewhat obstinate stalwarts when it comes to our investment approach, but we typically direct our client’s funds towards investments that make sense for the longer term. We do not turn a blind
eye to the developments in the world around us, but we do have the self-discipline to withstand some near-term perturbations in our quest for longer term outperformance. We’d expect this type of environment to present us with opportunities to buy into longer term cash flow streams that will be temporarily under-appreciated by the majority of investors. While we cannot – and would not – predict how we’ll perform versus our peers in the near term, this does seem to be shaping up to be a market full of opportunities.
Pzena Commentary
General Market Overview:
Markets were positive in the first half of the year, rotating through risk-on and risk-off periods with international trade uncertainty driving much of the sentiment. U.S. small capitalization stocks underperformed their larger capitalization peers and value continued to underperform growth across all market capitalizations.
2019 Performance for the 6-month period ending June 30, 2019:
The portion of the Small Companies Fund managed by Pzena (the “Portfolio”) outperformed the Russell 2000® Value Index (the “benchmark”) in the first six months of 2019, returning 14.0%, gross of fees, while the benchmark returned 13.5%. The outperformance was driven roughly equally by both stock selection and sector allocation. The largest individual contributor was REV Group (specialty vehicle manufacturer of firetrucks, ambulances, shuttle buses, and RVs), which reported weaker than expected sales due to manufacturing delays but has moved past supply chain issues and is well positioned to improve production, in our estimation. We believe the company continues to face extended lead times from its suppliers but has gotten past the worst of its operational issues and is better positioned for the rest of the year. Car rental company Avis was additive to performance on news that competitor Hertz was doing a rights offering, as its competitive position should strengthen while Hertz deals with balance sheet issues. Door and window manufacturer JELD-WEN performed well as it showed progress on its past operational issues and focused on pricing and profitability.
Energy was the only detracting sector. Realogy was the largest individual detractor after reporting weak quarterly results driven by lower sales and soft margins that were impacted by negative operating leverage, as well as continued upward pressure on commission splits. Celestica, an outsourced manufacturer, fell after it reported disappointing earnings due to weakness in the semiconductor capital equipment and digital display markets. These are both areas where end markets are weak and Celestica has high fixed costs but the company is adjusting its cost structure and we believe remains well positioned to capitalize on volume recovery. C&J Energy Services, an oil service company, traded down on lower oil prices. While facing the continued challenging pricing environment, C&J is merging with peer Keane Group to remove duplicative costs.
2019 Remaining Year Outlook:
The challenging environment for value and small capitalization stocks continues to create investment opportunities across a range of sectors. We still are not yet finding opportunities in perceived “safe” sectors including Real Estate and Utilities but we believe there are many opportunities in light of the market adjustments in recent months.
Clearwater Tax-Exempt Bond Fund
The Clearwater Tax-Exempt Bond Fund (the “Tax-Exempt Bond Fund” or the “Fund”) seeks high current income that is exempt from U.S. federal income tax, consistent with preservation of capital. Under normal market conditions, the Fund invests at least 80% of its net assets, plus the amount of any borrowings for investment purposes, in tax-exempt bonds, which are debt obligations issued by or for the U.S. states, territories, and possessions and the District of Columbia. The interest on these securities is generally exempt from both U.S. regular federal income tax and U.S. federal alternative minimum tax. However, the Fund may invest up to 20% of its assets in securities that generate interest income subject to federal alternative minimum tax for individuals. The Fund invests in both revenue bonds, which are backed by and payable only from the revenues derived from a specific facility or specific revenue source, and in general obligation bonds, which are secured by the full faith, credit and taxation power of the issuing municipality. The Fund’s subadviser, Sit Fixed Income Advisors II, LLC (“Sit”), provides day-to-day management for the Fund. It should be noted that the Fund is not a money market fund and is not intended to be a money market fund substitute. Under normal market conditions, the Fund’s investments may be more susceptible than a money market fund to interest rate risk and credit risks relevant to the Fund’s investments.
Sit has provided the commentary below regarding the Tax-Exempt Bond Fund. The Fund pays a single advisory fee to Clearwater Management Co., Inc., which in turn pays the subadviser out of its advisory fee.
Sit Commentary
General Market Overview:
Tax-exempt municipal bonds delivered strong returns in the first half of 2019, supported by record flows of almost $44 billion into tax-exempt municipal bond funds, and modest municipal issuance volume, which was slightly above that of the first six months of 2018, but about 18% below the first half average since 2001. The U.S. Treasury yield curve inverted in March of 2019 and remained inverted at the end of June. Ultra-short yields fell approximately 25-40 basis points in the first half of the year compared to short to intermediate yields, which fell 70-75 basis points and long U.S. Treasury yields, which fell by about 50 basis points. Meanwhile, the municipal yield curve flattened somewhat with short and intermediate tax-exempt yields down roughly 50-65 basis points compared to the 30-year maturity, which was down about 70 basis points. Credit fundamentals remain generally sound as credit spreads tightened during the first half of the year. State government general fund revenue collections continue to be strong and state budgets remain largely healthy, despite a few notable exceptions such as Illinois, New Jersey and Connecticut. Puerto Rico bonds rallied significantly in the first six months of 2019 as the Financial Oversight and Management Board for Puerto Rico reached agreements with various creditor groups and the debt restructuring process proceeded through U.S. District Court. The U.S. Federal Reserve kept short-term interest rates unchanged through the first six months of 2019. Finally, direct and indirect retail demand remained solid during the period in the wake of the tax legislation passed in December 2017 that capped state and local (“SALT”) tax deductions.
2019 Performance for the 6-month period ending June 30, 2019:
The Tax-Exempt Bond Fund returned 5.2%, net of fees, for the six months ended June 30, 2019. The Fund’s benchmark, the Barclays Municipal Bond 5 Year (4-6) Index (the “benchmark”), returned 3.8% over the same period.
In the first half of 2019, the Fund continued the strategy of hedging interest rate risk by shorting U.S. Treasury futures. The Fund’s average life duration, a measure of the Fund’s sensitivity to changes in interest rates, began the year at 4.6 years, where it remained at the end of the period. For comparison, the Fund’s benchmark had a duration of 4.0 years at December 31, 2018, and 3.9 years at June 30, 2019. The Fund’s significant overweight in housing
bonds was a primary reason for the outperformance in the first six months of 2019, as housing was one of the better performing sectors in the market. Credit quality played a large role as well, with lower investment grade rated bonds and non-rated bonds outperforming those of higher credit quality as investors sought yield. BBB-rated bonds in the benchmark returned 6.6%, while AAA-rated bonds returned 4.6% for the period. Another factor that contributed positively to performance was the Fund’s position in closed-end funds, which returned 14.5% during the period. The Fund’s yield fell during the period, but the Fund continues to maintain a significant yield advantage over its benchmark.
2019 Remaining Year Outlook:
Political discord in Washington D.C. and evolving trade policies will continue to add political risk to the financial markets in the second half of 2019. We expect U.S. real GDP growth to slow after a strong first quarter. GDP grew at a 3.1% annual rate in the first quarter, driven largely by gains in two of its more volatile components, inventories and net exports. The second quarter growth numbers are expected to be weaker due in part to lower government spending and trade tensions, which have likely contributed to a reversal in the net exports and inventory investment trends of the beginning of the year. However, we believe a recession is unlikely in 2019 as consumer spending continues to stay resilient. A great deal of uncertainty remains regarding the direction of interest rates and the shape of the yield curve in 2019. The tightening cycle appears to be over. The Federal Reserve held interest rates steady in June but signaled easing during the remainder of the year in response to increased economic uncertainty and a drop in expected inflation. We expect gross municipal supply in the second half of 2019 to be greater than the first half of 2019, but not exceeding maturities and redemptions. We believe negative net supply will provide solid technical support for the market. We also expect strong retail demand from residents of high-income tax states to continue in the wake of the virtual elimination of the SALT deduction.
Regarding credit, we expect credit spreads to modestly widen the remainder of the year, which will dampen the performance of lower investment grade and non-rated bonds. Progress has been made in Puerto Rico including a recent deal struck with general obligation bondholders, which was a major milestone, but the situation is unlikely to be fully resolved in 2019. We expect that Illinois, New Jersey and Connecticut related concerns will continue to weigh on the market, however it is a positive sign that all now have fully adopted budgets for fiscal year 2020. Furthermore, the funding of retirement pension and healthcare obligations for states and large local municipalities will in our view remain a hot topic and the subject of negative media reports about the municipal market. We believe that the Fund’s use of revenue and non-rated bonds as well as closed-end funds, have positioned it opportunistically for the economic and interest rate environment that we expect in the second half of 2019. We expect that investment of new cash flows will be focused on maturities in the 5 to 30-year range.
Clearwater International Fund
The Clearwater International Fund (the “International Fund” or the “Fund”) seeks long-term growth of capital. The Fund generally invests at least 80% of the value of its net assets, plus the amount of any borrowings for investment purposes, in equity securities of companies organized or located outside the United States and doing a substantial amount of business outside the United States. The Fund diversifies its investments among many different countries throughout the world and may invest in companies of any size. The Fund does not intend to invest more than 20% of its net assets in the equity securities of developing or emerging market issuers. The Fund uses a “multi-style, multi-manager” approach. The Fund’s adviser allocates portions of the Fund’s assets among subadvisers who employ distinct investment styles. The Fund currently has four subadvisers that provide day-to-day management of Fund assets. Parametric Portfolio Associates LLC (“Parametric”) manages its portion of the portfolio (approximately 40%) to track the MSCI World Ex U.S.A. Index – Net Dividends as closely as possible without requiring the Fund to realize taxable gains. The Fund’s other three subadvisers, Artisan Partners Limited Partnership (“Artisan”), Templeton Investment Counsel, LLC (“Templeton”) and WCM Investment Management, LLC (“WCM”), utilize an active management style and manage the remaining 60% of the Fund.
2019 Year-To-Date Market Overview:
As defined by the Fund’s benchmark, the MSCI World Ex U.S.A. Index - Net Dividends (the “benchmark”), large and mid-capitalization, international developed market stocks generated nearly 15% returns during the first half of 2019, driven by renewed prospects of a U.S. trade deal with China and a more accommodative monetary policy stance from some of the world’s central banks. During the period, U.S. dollar-based investors also benefitted slightly from a weaker dollar versus other international currencies.
2019 Year-To-Date Performance and 2019 Outlook:
The International Fund returned 16.3%, net of fees, during the first six months of 2019, compared to an increase of 14.6% for the benchmark. Parametric, the subadviser that follows a tax-managed passive strategy, slightly outperformed the benchmark while WCM, one of the three active subadvisers, significantly outperformed the benchmark. The other two active subadvisers, Artisan and Templeton, performed in line with the benchmark during the period.
Each of the four subadvisers comment on the performance of their specific portions of the Fund and provide a market outlook for the next six months in the paragraphs below. For comparison of the subadvisers’ capabilities, performance is shown gross of fees. The Fund pays a single advisory fee to Clearwater Management Co., Inc., which in turn pays the subadvisers out of its advisory fee.
Although the overall performance of the International Fund is measured against its benchmark, as stated above, each of the underlying subadvisers may manage their portion of the Fund against a different benchmark that aligns more closely with their strategy. In each section below, the subadvisers discuss their view of the market over the last six months, the performance of their portfolios with respect to the benchmark against which their particular portfolio is managed and their outlook for the next six months.
Artisan Partners Commentary
General Market Overview:
Measured in U.S. dollar terms, the MSCI EAFE Index (the “benchmark”) returned 14.0% during the six months ended June 30, 2019. Emerging markets trailed developed markets as ongoing trade tensions have pressured major emerging market countries—namely, China. U.S. markets led European markets as economic growth generally remains robust in the U.S., while there are signs of slowing in Europe. In general, markets have remained volatile during the period on heightened protectionist rhetoric. Overall, U.S. dollar-based investors benefited from a modestly weaker dollar. In local currency terms, the benchmark returned 13.7% during the period.
2019 Performance for the 6-month period ending June 30, 2019:
The portion of the International Fund managed by Artisan (the “Portfolio”) outperformed the benchmark in the first six months of 2019, returning 14.9%, gross of fees, while the benchmark returned 14.0%. Performance of the following stocks had a positive impact on the Portfolio during the period: Arch Capital Group, Panalpina Welttransport, Samsung Electronics, Richemont and Compass Group. Notable detractors in the period included: Baidu, Bankia, NAVER, Fresenius Medical Care and John Wood Group.
2019 Remaining Year Outlook:
As markets have risen thus far in 2019, the Portfolio’s attractiveness, as measured by the discount to intrinsic value, has accordingly narrowed. However, we still believe the Portfolio holds strong businesses that are trading at attractive valuations.
Parametric Commentary
General Market Overview:
For the first half of 2019, global markets rallied strongly from the December 2018 lows. Global markets rebounded on the renewed prospects of a U.S. trade deal with China. The rally was widespread across all economic sectors and countries. The Technology sector had the highest returns followed by Materials and Industrials. From a country perspective, Switzerland had the highest returns, followed by New Zealand.
2019 Performance for the 6-month period ending June 30, 2019:
The portion of the International Fund managed by Parametric (the “Portfolio”) outperformed the MSCI World Ex U.S.A. Index - Net Dividends (the “benchmark”) in the first six months of 2019, returning 15.3%, gross of fees, while the benchmark returned 14.6%. Nearly all the outperformance was attributable to small over and underweights to individual stocks within the Materials sector. In particular, a moderate overweight to Fortescue Metals Group contributed positively to performance as the stock returned 141.6% during the period. A small overweight to Rio Tinto contributed positively as the stock returned 40.5% during the period.
2019 Remaining Year Outlook:
The rest of the world has been caught in the crossfire of the trade war between the U.S. and China. Given China’s large market and imports, a slowdown in their economy due to the trade war directly affects the rest of the world. We believe this risk factor will persist into the foreseeable future.
Templeton Commentary
General Market Overview:
International small capitalization stocks underperformed their larger capitalization counterparts during the period. International stocks (large and small) overall rose during the period as optimism for renewed central bank easing ultimately overcame concerns about softening economic growth and ongoing international trade disputes. Trade drama dominated the headlines during the period, with the U.S. alternately reporting progress and setbacks in
negotiations with China, Mexico, India and the European Union. Unsurprisingly, the World Trade Organization forecasted a decline in global trade this year, blaming tariffs and retaliatory measures, as well as weaker economic growth and volatile markets. The European Central Bank also cited the threat of protectionism as it reiterated its pledge not to raise interest rates and that it would continue its monetary stimulus program. The International Monetary Fund subsequently downgraded its 2019 Euro area growth outlook to 1.3% (from 1.6% in January) and also reduced its global growth estimate to 3.3% (from 3.5% in January), warning specifically of the risks of a “no-deal” Brexit for the global economy. On that front, British Prime Minister Theresa May promised to resign after repeatedly failing to deliver a Brexit solution, adding to the uncertainty surrounding the United Kingdom’s planned divorce from the European Union. China’s economy appeared to be slowing more than initially thought, with retail sales growth hitting 16-year lows and industrial production expanding at the slowest rate in a decade. In response to the slowdown, the People’s Bank of China injected further liquidity into the system in May.
2019 Performance for the 6-month period ending June 30, 2019:
The portion of the International Fund managed by Templeton (the “Portfolio”) outperformed the MSCI All-Country World Ex U.S.A. Small Cap Index - Net Dividends (the “benchmark”) during the first six months of 2019, returning 15.0%, gross of fees, while the benchmark returned 11.6%. Stock selection was the most significant factor driving outperformance during the period, particularly in the Consumer Discretionary, Health Care and Technology sectors. Sector allocation also contributed, as an underweight in Health Care and an overweight in Technology proved beneficial. Regionally, stock selection was positive in North America, Asia and Europe, while stock selection in Latin America detracted from performance.
2019 Remaining Year Outlook:
Looking ahead, we remain optimistic on the prospects for international small capitalization value stocks and believe that companies whose fundamentals are underappreciated by a market focused on the short term should be well-positioned for outperformance over time.
WCM Commentary
General Market Overview:
While global markets finished higher at the end of the period, the path to that result was eventful. Markets started strong at the beginning of the period, only to retreat sharply in May, and then reverse upward in June. The concerns were the usual suspects: interest rates, macroeconomics, and trade. Equity outflows jumped as the quarter ended. This stresses the importance of the old adage: “it is time in the market, not timing the market”. We still see examples of intelligent, well-reasoned investors getting rattled and reacting to the concern du jour, believing they can successfully trade around it. For example, central bank cadence shifted from expectations for a 25 basis point rate hike to rate cuts, with as much as a 50 basis point rate cut hoped for by the end of the period. We believe that predicting rates is unknowable and is expiring knowledge. During the period, the best performing factor was momentum, in all geographies. Momentum ideas are especially popular in an environment where growth is hard to find, like it is today. The concern about momentum is that investors pile into high momentum stocks, sometimes without supporting fundamentals. This can be called the “fear of missing out” effect. We consider secular growth ideas to be the key cohort to long term portfolio upside. But we also take what the market gives us. Here, the market is rewarding secular growth and is not in our view giving us many opportunities to add to it.
2019 Performance for the 6-month period ending June 30, 2019:
The portion of the International Fund managed by WCM (the “Portfolio”) significantly outperformed the MSCI All-Country World Ex U.S.A. Growth Index - Net Dividends (the “benchmark”) during the first six months of 2019, returning 25.1%, gross of fees, while the benchmark returned 17.2%. Most of our outperformance can be attributed to stock selection. Stock selection was the strongest in the Financials (AIA Group Limited, HDFC Bank Limited Sponsored ADR, Chubb Limited), Consumer Discretionary (Adidas AG, LVMH Moet Hennessy Louis
Vuitton SE, Dollarama Inc.) and Industrials (Canadian Pacific Railway Limited, Experian PLC, Atlas Copco AB Class A) sectors. Energy (Core Laboratories NV) was the worst performing sector relative to the benchmark, followed by Real Estate (no exposure) and Utilities (no exposure).
From a sector allocation perspective, our overweight to Technology and Consumer Discretionary and our underweight to Energy contributed positively to performance. Our underweight to Financials, Communication Services and Materials detracted from performance.
2019 Remaining Year Outlook:
While we are pleased with our returns, it is good to remember that this period was a bit more atypical given the performance dispersion of value and growth stocks. In other words, we don’t expect this kind of backdrop to continue uninterrupted. We are a bit puzzled that our cupboard of cyclical growth ideas is a little bare right now given the weakness in value stocks, but our research team continues to search for interesting global growth opportunities.
Fund Expense Example
(unaudited)
As a shareholder of the Clearwater Core Equity Fund (“Core Equity Fund”), Clearwater Small Companies Fund (“Small Companies Fund”), Clearwater Tax-Exempt Bond Fund (“Tax-Exempt Bond Fund”), and Clearwater International Fund (“International Fund” and together with the Core Equity Fund, Small Companies Fund and Tax-Exempt Bond Fund, the “Funds”), you incur costs, including management fees and other Fund expenses. This example is intended to help you understand your ongoing costs (in dollars) of investing in the Funds and to compare these costs with the ongoing costs of investing in other mutual funds. In addition to the ongoing costs which the Funds pay directly, you as a shareholder indirectly bear the expenses of any outside exchange traded funds or mutual funds in which the Funds invest. (These are also referred to as “acquired funds” and those indirect expenses represent the Funds’ pro rata portion of the cumulative expense charged by the acquired funds.)
The example provided is based on an investment of $1,000 invested at the beginning of the period and held for the six-month period ended June 30, 2019.
Actual Expenses
The first section of the table on the following page provides information about actual account values and actual expenses. You may use the information in this section, together with the amount you invested, to estimate the expenses that you incurred over the period. Simply divide your account value by $1,000 (for example, an $8,600 account value divided by $1,000 = 8.6), then multiply the result by the number in the first section under the heading entitled “Expenses Paid During the Period January 1, 2019 through June 30, 2019” to estimate the expenses attributable to your investment during this period.
Hypothetical Example for Comparison Purposes
The second section of the table below provides information about hypothetical account values and hypothetical expenses based on the Fund’s actual expense ratio and an assumed rate of return of 5% per year before expenses, which is not the Fund’s actual return. Thus, you should not use the hypothetical account values and expenses to estimate the actual ending account balance or your expenses for the period. Rather, these figures are provided to enable you to compare the ongoing costs of investing in the Funds and other mutual funds. To do so, compare this 5% hypothetical example with the 5% hypothetical examples that appear in the shareholder reports of the other mutual funds.
Please note that the expenses shown in the second section of the table are meant to highlight your ongoing costs only. Therefore, the second section of the table is useful in comparing ongoing costs only, and will not help you compare the relative total costs of the Funds to other mutual funds that charge transaction costs and/or sales charges or redemption fees.
| Actual returns | Beginning Account
Value January 1, 2019 | Ending Account Value
June 30, 2019 | Expenses Paid During the
Period January 1, 2019
through June 30, 2019* |
| Core Equity Fund | $1,000.00 | $1,170.20 | $1.88 |
| Small Companies Fund | $1,000.00 | $1,163.80 | $5.26 |
| Tax-Exempt Bond Fund | $1,000.00 | $1,051.60 | $1.63 |
| International Fund | $1,000.00 | $1,163.40 | $3.65 |
Hypothetical 5% return
(before expenses) | | | |
| Core Equity Fund | $1,000.00 | $1,023.06 | $1.76 |
| Small Companies Fund | $1,000.00 | $1,019.93 | $4.91 |
| Tax-Exempt Bond Fund | $1,000.00 | $1,023.21 | $1.61 |
| International Fund | $1,000.00 | $1,021.42 | $3.41 |
| * | Expenses are equal to the Fund’s annualized expense ratios, multiplied by the average account value over the period, multiplied by 181/365 (to reflect the one-half year period). Expense ratios for the most recent one-half year period may differ from expense ratios based on one-year data in the Financial Highlights. |
The annualized expense ratios (reflecting voluntary fee waivers in effect during the period) are as follows:
| Core Equity Fund | 0.35% |
| Small Companies Fund | 0.98% |
| Tax-Exempt Bond Fund | 0.32% |
| International Fund | 0.68% |
Quarterly Portfolio Schedule of Investments
The Funds file a complete schedule of their portfolio holdings as of the close of the first and third quarters of their fiscal years with the Securities and Exchange Commission (the “SEC”) on Form N-PORT. Shareholders may request portfolio holdings information free of charge by calling the Transfer Agent toll free at 1- 855-684-9144 or by sending a written request to: The Northern Trust Company, P.O. Box 4766, Chicago, IL 60680-4766 Attn: Clear-water Investment Trust Funds. These filings are also available on the SEC’s Internet site athttp://www.sec.gov.
Voting Proxies on Fund Portfolio Securities
The Funds have established Proxy Voting Policies and Procedures (“Policies”) that the Funds use to determine how to vote proxies relating to portfolio securities. They also report, on Form N-PX, how the Funds voted any such proxies during the most recent 12-month period ended June 30. Shareholders may request copies of the Policies or Form N-PX free of charge by calling Fiduciary Counselling, Inc. toll free at 1-888-228-0935 or by sending a written request to: Fiduciary Counselling, Inc., 30 East 7th Street, Suite 2000, St. Paul, MN 55101 Attn: Clearwater Investment Trust Funds. Form N-PX is also available from the EDGAR database on the SEC’s Internet site athttp://www.sec.gov.
Clearwater Investment Trust
Financial Statements
For the Six Months Ended June 30, 2019 (Unaudited)
Table of Contents
CLEARWATER INVESTMENT TRUST
Statements of Assets and Liabilities
June 30, 2019 (unaudited)
| | | | | | | | | | | | | |
| | | Core Equity
Fund | | | Small Companies
Fund | | | Tax-Exempt
Bond Fund | | | International
Fund | |
| Assets | | | | | | | | | | | | | | | | |
| Investments in securities, at fair value (including securities on loan of: $0, $8,957,844, $0 and $5,659,580, respectively); (identified cost: $265,867,393, $331,648,389, $513,691,870 and $446,372,333, respectively) | | $ | 507,460,771 | | | | 356,276,671 | | | | 540,640,297 | | | | 615,018,443 | |
| Foreign currencies, at value (cost: $0, $0, $0 and $629,405, respectively) | | | - | | | | - | | | | - | | | | 629,866 | |
| Cash (restricted: $0, $0, $281,880 and $0, respectively) | | | 644 | | | | - | | | | 3,608,444 | | | | 66 | |
| Receivable for securities sold | | | - | | | | 599,967 | | | | 862,160 | | | | 319,341 | |
| Receivable for variation margin on futures contracts | | | - | | | | - | | | | 5,750 | | | | - | |
| Receivable for shares of beneficial interest sold | | | 169,000 | | | | - | | | | 107,000 | | | | - | |
| Accrued dividend and interest receivable | | | 507,969 | | | | 383,640 | | | | 5,450,085 | | | | 1,395,921 | |
| Foreign tax reclaim receivable | | | 3,498 | | | | - | | | | - | | | | 1,165,243 | |
| Unrealized appreciation on forward foreign currency exchange contracts | | | - | | | | - | | | | - | | | | 38,285 | |
| Total assets | | | 508,141,882 | | | | 357,260,278 | | | | 550,673,736 | | | | 618,567,165 | |
| Liabilities | | | | | | | | | | | | | | | | |
| Payables for investment securities purchased | | | - | | | | 2,196,992 | | | | 3,135,584 | | | | 962,644 | |
| Payable for fund shares redeemed | | | - | | | | 30,500 | | | | - | | | | - | |
| Accrued investment advisory fee | | | 438,871 | | | | 833,691 | | | | 431,752 | | | | 1,007,999 | |
| Payable for dividend distribution | | | - | | | | - | | | | 303,713 | | | | - | |
| Payable for variation margin on futures contracts | | | - | | | | - | | | | 3,375 | | | | - | |
| Payable upon return of securities loaned | | | - | | | | 9,158,405 | | | | - | | | | 7,027,654 | |
| Unrealized depreciation on forward foreign currency exchange contracts | | | - | | | | - | | | | - | | | | 29,970 | |
| Deferred foreign capital gains taxes payable | | | - | | | | - | | | | - | | | | 34,476 | |
| Short-term financing | | | 761,296 | | | | - | | | | - | | | | - | |
| Total liabilities | | | 1,200,167 | | | | 12,219,588 | | | | 3,874,424 | | | | 9,062,743 | |
| Net assets | | $ | 506,941,715 | | | | 345,040,690 | | | | 546,799,312 | | | | 609,504,422 | |
| Capital | | | | | | | | | | | | | | | | |
| Capital Stock and additional paid-in capital (authorized unlimited number of shares at no par value for each Fund: 11,428,347, 19,900,020, 54,122,001 and 37,204,343 shares, respectively) | | $ | 257,813,370 | | | | 319,966,057 | | | | 521,549,514 | | | | 432,295,131 | |
| Distributable earnings | | | 249,128,345 | | | | 25,074,633 | | | | 25,249,798 | | | | 177,209,291 | |
| Net assets | | $ | 506,941,715 | | | | 345,040,690 | | | | 546,799,312 | | | | 609,504,422 | |
| Net asset value per share of outstanding capital stock | | $ | 44.36 | | | | 17.34 | | | | 10.10 | | | | 16.38 | |
See accompanying notes to financial statements.
CLEARWATER INVESTMENT TRUST
Statements of Operations
for the six months ended June 30, 2019 (unaudited)
| | | Core Equity
Fund | | | Small Companies
Fund | | | Tax-Exempt
Bond Fund | | | International
Fund | |
| Investment income: | | | | | | | | | | | | | | | | |
| Income: | | | | | | | | | | | | | | | | |
| Dividends (net of foreign taxes withheld of $5,700, $3,380, $0 and $890,522, respectively) | | $ | 4,768,135 | | | | 2,568,991 | | | | 671,725 | | | | 9,969,669 | |
| Interest | | | 2,360 | | | | - | | | | 11,495,562 | | | | - | |
| Net income from securities loaned | | | - | | | | 4,244 | | | | - | | | | 74,073 | |
| Total income | | | 4,770,495 | | | | 2,573,235 | | | | 12,167,287 | | | | 10,043,742 | |
| Expenses: | | | | | | | | | | | | | | | | |
| Investment advisory fee | | | 2,220,214 | | | | 2,272,380 | | | | 1,596,582 | | | | 2,861,027 | |
| Voluntary fee reduction | | | (1,356,800 | ) | | | (622,801 | ) | | | (745,067 | ) | | | (915,525 | ) |
| Other expenses | | | 185 | | | | - | | | | - | | | | 185 | |
| Total net expenses | | | 863,599 | | | | 1,649,579 | | | | 851,515 | | | | 1,945,687 | |
| Net investment income | | | 3,906,896 | | | | 923,656 | | | | 11,315,772 | | | | 8,098,055 | |
| Net realized gain (loss) on: | | | | | | | | | | | | | | | | |
| Security transactions | | | 24,505,191 | | | | 930,505 | | | | 538,201 | | | | 5,145,877 | |
| Forward foreign currency exchange contracts | | | - | | | | - | | | | - | | | | (53,373 | ) |
| Foreign currency transactions | | | (6 | ) | | | - | | | | - | | | | (6,854 | ) |
| Futures contracts | | | - | | | | - | | | | (2,868,464 | ) | | | - | |
| Net increase (decrease) in unrealized appreciation/depreciation on: | | | | | | | | | | | | | | | | |
| Security transactions (net of increase (decrease) in deferred foreign taxes of $0, $0, $0 and $(34,476), respectively) | | | 48,276,762 | | | | 48,224,371 | | | | 16,902,084 | | | | 72,114,920 | |
| Forward foreign currency exchange contracts | | | - | | | | - | | | | - | | | | 52,930 | |
| Futures contracts | | | - | | | | - | | | | 1,334,378 | | | | - | |
| Translation of other assets and liabilities denominated in foreign currencies | | | 13 | | | | - | | | | - | | | | 565 | |
| Net gain (loss) on investments | | | 72,781,960 | | | | 49,154,876 | | | | 15,906,199 | | | | 77,254,065 | |
| Net increase (decrease) in net assets resulting from operations | | $ | 76,688,856 | | | | 50,078,532 | | | | 27,221,971 | | | | 85,352,120 | |
See accompanying notes to financial statements.
CLEARWATER INVESTMENT TRUST
Statements of Changes in Net Assets
for the six months ended June 30, 2019 (unaudited) and the year ended December 31, 2018
| | | Core Equity Fund | | | Small Companies Fund | |
| | | | 06/30/2019 | | | | 12/31/2018 | | | | 06/30/2019 | | | | 12/31/2018 | |
| Operations: | | | | | | | | | | | | | | | | |
| Net investment income | | $ | 3,906,896 | | | | 7,754,414 | | | | 923,656 | | | | 1,227,135 | |
| Net realized gain | | | 24,505,185 | | | | 54,663,683 | | | | 930,505 | | | | 24,516,139 | |
| Net increase (decrease) in unrealized appreciation/depreciation | | | 48,276,775 | | | | (94,000,932 | ) | | | 48,224,371 | | | | (69,388,527 | ) |
| Net increase (decrease) in net assets resulting from operations | | | 76,688,856 | | | | (31,582,835 | ) | | | 50,078,532 | | | | (43,645,253 | ) |
| Distributions to shareholders | | | - | | | | (28,188,556 | ) | | | - | | | | (31,837,966 | ) |
| Capital share transactions: | | | | | | | | | | | | | | | | |
| Proceeds from shares sold | | | 26,326,254 | | | | 52,599,700 | | | | 3,015,200 | | | | 3,357,200 | |
| Reinvestment of distributions from net investment income and net realized gain | | | - | | | | 28,187,392 | | | | - | | | | 31,837,966 | |
| Payments for shares redeemed | | | (52,947,301 | ) | | | (102,533,603 | ) | | | (13,973,931 | ) | | | (23,511,008 | ) |
| Net increase (decrease) in net assets from capital share transactions | | | (26,621,047 | ) | | | (21,746,511 | ) | | | (10,958,731 | ) | | | 11,684,158 | |
| Total increase (decrease) in net assets | | | 50,067,809 | | | | (81,517,902 | ) | | | 39,119,801 | | | | (63,799,061 | ) |
| Net assets: | | | | | | | | | | | | | | | | |
| At the beginning of the year | | | 456,873,906 | | | | 538,391,808 | | | | 305,920,889 | | | | 369,719,950 | |
| At the end of the year | | $ | 506,941,715 | | | | 456,873,906 | | | | 345,040,690 | | | | 305,920,889 | |
| | | Tax-Exempt Bond Fund | | | International Fund | |
| | | | 06/30/2019 | | | | 12/31/2018 | | | | 06/30/2019 | | | | 12/31/2018 | |
| Operations: | | | | | | | | | | | | | | | | |
| Net investment income | | $ | 11,315,772 | | | | 22,454,249 | | | | 8,098,055 | | | | 10,808,402 | |
| Net realized gain (loss) | | | (2,330,263 | ) | | | 3,454,386 | | | | 5,085,650 | | | | 12,136,620 | |
| Net increase (decrease) in unrealized appreciation/depreciation | | | 18,236,462 | | | | (17,587,001 | ) | | | 72,168,415 | | | | (108,837,773 | ) |
| Net increase (decrease) in net assets resulting from operations | | | 27,221,971 | | | | 8,321,634 | | | | 85,352,120 | | | | (85,892,751 | ) |
| Distributions to shareholders | | | (11,971,958 | ) | | | (29,103,950 | ) | | | - | | | | (26,624,900 | ) |
| Capital share transactions: | | | | | | | | | | | | | | | | |
| Proceeds from shares sold | | | 10,997,500 | | | | 21,685,452 | | | | 21,022,200 | | | | 7,693,600 | |
| Reinvestment of distributions from net investment income and net realized gain | | | 11,916,224 | | | | 29,094,769 | | | | - | | | | 26,624,900 | |
| Payments for shares redeemed | | | (20,849,419 | ) | | | (25,668,816 | ) | | | (21,578,356 | ) | | | (21,734,393 | ) |
| Net increase (decrease) in net assets from capital share transactions | | | 2,064,305 | | | | 25,111,405 | | | | (556,156 | ) | | | 12,584,107 | |
| Total increase (decrease) in net assets | | | 17,314,318 | | | | 4,329,089 | | | | 84,795,964 | | | | (99,933,544 | ) |
| Net assets: | | | | | | | | | | | | | | | | |
| At the beginning of the year | | | 529,484,994 | | | | 525,155,905 | | | | 524,708,458 | | | | 624,642,002 | |
| At the end of the year | | $ | 546,799,312 | | | | 529,484,994 | | | | 609,504,422 | | | | 524,708,458 | |
See accompanying notes to financial statements.
CLEARWATER INVESTMENT TRUST
Financial Highlights
Per share data (rounded to the nearest cent) for a share of capital stock outstanding throughout the years or period ended and selected information for each year or period ended is as follows:
| | | June 30, | | | Year ended December 31, | |
| Core Equity Fund | | 2019
(Unaudited) | | | 2018 | | | 2017 | | | 2016 | | | 2015 | | | 2014 | |
| Net asset value, beginning of period | | $ | 37.97 | | | | 43.21 | | | | 37.43 | | | | 35.57 | | | | 39.41 | | | | 37.77 | |
| Income (loss) from investment operations: | | | | | | | | | | | | | | | | | | | | | | | | |
| Net investment income | | | 0.35 | | | | 0.68 | | | | 0.64 | | | | 0.65 | | | | 0.64 | | | | 0.60 | |
| Net realized and unrealized gains (losses) | | | 6.04 | | | | (3.46 | ) | | | 8.03 | | | | 3.27 | | | | (0.96 | ) | | | 2.91 | |
| Total from investment operations | | | 6.39 | | | | (2.78 | ) | | | 8.67 | | | | 3.92 | | | | (0.32 | ) | | | 3.51 | |
| Less distributions to shareholders from: | | | | | | | | | | | | | | | | | | | | | | | | |
| Net investment income | | | - | | | | (0.67 | ) | | | (0.65 | ) | | | (0.49 | ) | | | (0.60 | ) | | | (0.63 | ) |
| Net realized gain | | | - | | | | (1.79 | ) | | | (2.24 | ) | | | (1.57 | ) | | | (2.92 | ) | | | (1.24 | ) |
| Total distributions to shareholders: | | | - | | | | (2.46 | ) | | | (2.89 | ) | | | (2.06 | ) | | | (3.52 | ) | | | (1.87 | ) |
| Net asset value, end of period | | $ | 44.36 | | | | 37.97 | | | | 43.21 | | | | 37.43 | | | | 35.57 | | | | 39.41 | |
| Total return (a) | | | 17.02 | % | | | (6.61 | )% | | | 23.26 | % | | | 10.98 | % | | | (0.71 | )% | | | 9.23 | % |
| Net assets, end of period (000s omitted) | | $ | 506,942 | | | | 456,874 | | | | 538,392 | | | | 466,482 | | | | 492,418 | | | | 541,017 | |
| Ratio of expenses, net of waivers, to average net assets (b), (c), (d), (e), (f), (g), (h) | | | 0.35 | % | | | 0.38 | % | | | 0.39 | % | | | 0.43 | % | | | 0.42 | % | | | 0.50 | % |
| Ratio of expenses, before waivers, to average net assets (b), (c), (d), (e), (f), (g), (h) | | | 0.90 | % | | | 0.90 | % | | | 0.90 | % | | | 0.90 | % | | | 0.90 | % | | | 0.90 | % |
| Ratio of net investment income (loss), net of waivers, to average net assets (c), (d), (e), (f), (g), (h) | | | 1.58 | % | | | 1.47 | % | | | 1.51 | % | | | 1.63 | % | | | 1.52 | % | | | 1.50 | % |
| Ratio of net investment income (loss), before waivers, to average net assets (c), (d), (e), (f), (g), (h) | | | 1.03 | % | | | 0.95 | % | | | 1.00 | % | | | 1.16 | % | | | 1.02 | % | | | 1.10 | % |
| Portfolio turnover rate (excluding short-term securities) | | | 15.03 | % | | | 34.64 | % | | | 31.13 | % | | | 44.11 | % | | | 94.07 | % | | | 13.54 | % |
| (a) | Total return figures are based on the change in net asset value of a share during the period and assume reinvestment of distributions at net asset value. Total return is not annualized for periods of less than one year. |
| (b) | In addition to fees and expenses which the Fund bears directly, the Fund indirectly bears a pro rata share of the fees and expenses of any acquired funds in which it invests. Such indirect expenses are not included in the above reported expense ratios. |
| (c) | Annualized for periods less than one year. |
| (d) | Effective December 12, 2018 the investment advisory fee, net of voluntary waivers, decreased to 0.35%. Also effective December 12, 2018, the Adviser increased the voluntary waiver to 0.55%. |
| (e) | Effective September 22, 2017, the investment advisory fee, net of voluntary waivers, increased to 0.38%. Also effective September 22, 2017, the Adviser decreased the voluntary waiver to 0.52%. |
| (f) | Effective March 16, 2017, the investment advisory fee, net of voluntary waivers, decreased to 0.37%. Also effective March 16, 2017, the Adviser increased the voluntary waiver to 0.53%. |
| (g) | Effective March 16, 2016, the investment advisory fee, net of voluntary waivers, increased to 0.44%. Also effective March 16, 2016, the Adviser decreased the voluntary waiver to 0.46%. |
| (h) | Effective March 16, 2015, the investment advisory fee, net of voluntary waivers,decreased to 0.40%. Also effective March 16, 2015, the Adviser increased the voluntary waiver to 0.50%. |
See accompanying notes to financial statements.
CLEARWATER INVESTMENT TRUST
Financial Highlights
Per share data (rounded to the nearest cent) for a share of capital stock outstanding throughout the years or period ended and selected information for each year or period ended is as follows:
| | | June 30, | | | Year ended December 31, | |
| Small Companies Fund | | 2019
(Unaudited) | | | 2018 | | | 2017 | | | 2016 | | | 2015 | | | 2014 | |
| Net asset value, beginning of period | | $ | 14.90 | | | | 18.92 | | | | 19.79 | | | | 17.18 | | | | 20.30 | | | | 22.35 | |
| Income (loss) from investment operations: | | | | | | | | | | | | | | | | | | | | | | | | |
| Net investment income | | | 0.98 | | | | 0.07 | | | | 0.02 | | | | 0.07 | | | | 0.07 | | | | 0.05 | |
| Net realized and unrealized gains (losses) | | | 1.46 | | | | (2.37 | ) | | | 2.58 | | | | 3.30 | | | | (0.90 | ) | | | 1.10 | |
| Total from investment operations | | | 2.44 | | | | (2.30 | ) | | | 2.60 | | | | 3.37 | | | | (0.83 | ) | | | 1.15 | |
| Less distributions to shareholders from: | | | | | | | | | | | | | | | | | | | | | | | | |
| Net investment income | | | - | | | | (0.07 | ) | | | (0.03 | ) | | | (0.05 | ) | | | (0.06 | ) | | | (0.04 | ) |
| Net realized gain | | | - | | | | (1.65 | ) | | | (3.44 | ) | | | (0.71 | ) | | | (2.23 | ) | | | (3.16 | ) |
| Total distributions to shareholders: | | | - | | | | (1.72 | ) | | | (3.47 | ) | | | (0.76 | ) | | | (2.29 | ) | | | (3.20 | ) |
| Net asset value, end of period | | $ | 17.34 | | | | 14.90 | | | | 18.92 | | | | 19.79 | | | | 17.18 | | | | 20.30 | |
| Total return (a) | | | 16.38 | % | | | (12.49 | )% | | | 13.46 | % | | | 19.67 | % | | | (3.96 | )% | | | 5.03 | % |
| Net assets, end of period (000s omitted) | | $ | 345,041 | | | | 305,921 | | | | 369,720 | | | | 343,393 | | | | 299,380 | | | | 333,888 | |
| Ratio of expenses, net of waivers, to average net assets (b), (c), (d), (e), (f), (g), (h) | | | 0.98 | % | | | 1.03 | % | | | 0.99 | % | | | 1.02 | % | | | 0.97 | % | | | 0.94 | % |
| Ratio of expenses, before waivers, to average net assets (b), (c), (d), (e), (f), (g), (h) | | | 1.35 | % | | | 1.35 | % | | | 1.35 | % | | | 1.35 | % | | | 1.35 | % | | | 1.35 | % |
| Ratio of net investment income (loss), net of waivers, to average net assets (c), (d), (e), (f), (g), (h) | | | 0.55 | % | | | 0.33 | % | | | 0.11 | % | | | 0.28 | % | | | 0.22 | % | | | 0.24 | % |
| Ratio of net investment income (loss), before waivers, to average net assets (c), (d), (e), (f), (g), (h) | | | 0.18 | % | | | 0.01 | % | | | (0.25 | )% | | | (0.05 | )% | | | (0.16 | )% | | | (0.17 | )% |
| Portfolio turnover rate (excluding short-term securities) | | | 30.80 | % | | | 63.08 | % | | | 113.85 | % | | | 78.82 | % | | | 58.71 | % | | | 55.51 | % |
| (a) | Total return figures are based on the change in net asset value of a share during the period and assume reinvestment of distributions at net asset value. Total return is not annualized for periods of less than one year. |
| (b) | In addition to fees and expenses which the Fund bears directly, the Fund indirectly bears a pro rata share of the fees and expenses of any acquired funds in which it invests. Such indirect expenses are not included in the above reported expense ratios. |
| (c) | Annualized for periods less than one year. |
| (d) | Effective December 12, 2018, the investment advisory fee, net of voluntary waivers, decreased to 0.98%. Also effective December 12, 2018, the Adviser increased the voluntary waiver to 0.37%. |
| (e) | Effective September 22, 2017, the investment advisory fee, net of voluntary waivers, increased to 1.03%. Also effective March 16, 2017, the Adviser decreased the voluntary waiver to 0.32%. |
| (f) | Effective March 16, 2017, the investment advisory fee, net of voluntary waivers, decreased to 0.96%. Also effective March 16, 2017, the Adviser increased the voluntary waiver to 0.39%. |
| (g) | Effective March 16, 2016, the investment advisory fee, net of voluntary waivers, increased to 1.03%. Also effective March 16, 2016, the Adviser decreased the voluntary waiver to 0.32%. |
| (h) | Effective March 16, 2015, the investment advisory fee, net of voluntary waivers, increased to 0.98%. Also effective March 16, 2015, the Adviser decreased the voluntary waiver to 0.37%. |
See accompanying notes to financial statements.
CLEARWATER INVESTMENT TRUST
Financial Highlights
Per share data (rounded to the nearest cent) for a share of capital stock outstanding throughout the years or period ended and selected information for each year or period ended is as follows:
| | | June 30, | | | Year ended December 31, | |
| Tax-Exempt Bond Fund | | 2019
(Unaudited) | | | 2018 | | | 2017 | | | 2016 | | | 2015 | | | 2014 | |
| Net asset value, beginning of period | | $ | 9.82 | | | | 10.21 | | | | 9.93 | | | | 10.16 | | | | 10.16 | | | | 9.23 | |
| Income (loss) from investment operations: | | | | | | | | | | | | | | | | | | | | | | | | |
| Net investment income | | | 0.17 | | | | 0.42 | | | | 0.45 | | | | 0.46 | | | | 0.42 | | | | 0.44 | |
| Net realized and unrealized gains (losses) | | | (0.07 | ) | | | (0.26 | ) | | | 0.38 | | | | (0.23 | ) | | | 0.04 | | | | 0.95 | |
| Total from investment operations | | | 0.10 | | | | 0.16 | | | | 0.83 | | | | 0.23 | | | | 0.46 | | | | 1.39 | |
| Less distributions to shareholders from: | | | | | | | | | | | | | | | | | | | | | | | | |
| Net investment income | | | 0.18 | | | | (0.45 | ) | | | (0.49 | ) | | | (0.44 | ) | | | (0.42 | ) | | | (0.44 | ) |
| Net realized gain | | | - | | | | (0.10 | ) | | | (0.06 | ) | | | (0.02 | ) | | | (0.04 | ) | | | (0.02 | ) |
| Total distributions to shareholders: | | | 0.18 | | | | (0.55 | ) | | | (0.55 | ) | | | (0.46 | ) | | | (0.46 | ) | | | (0.46 | ) |
| Net asset value, end of period | | $ | 10.10 | | | | 9.82 | | | | 10.21 | | | | 9.93 | | | | 10.16 | | | | 10.16 | |
| Total return (a) | | | 5.16 | % | | | 1.59 | % | | | 8.54 | % | | | 2.28 | % | | | 4.73 | % | | | 15.29 | % |
| Net assets, end of period (000s omitted) | | $ | 546,799 | | | | 529,485 | | | | 525,156 | | | | 484,856 | | | | 512,773 | | | | 507,982 | |
| Ratio of expenses, net of waivers, to average net assets (b), (c), (d), (e) | | | 0.32 | % | | | 0.34 | % | | | 0.34 | % | | | 0.34 | % | | | 0.34 | % | | | 0.33 | % |
| Ratio of expenses, before waivers, to average net assets (b), (c), (d), (e) | | | 0.60 | % | | | 0.60 | % | | | 0.60 | % | | | 0.60 | % | | | 0.60 | % | | | 0.60 | % |
| Ratio of net investment income (loss), net of waivers, to average net assets (c), (d), (e) | | | 4.25 | % | | | 4.22 | % | | | 4.35 | % | | | 4.54 | % | | | 4.23 | % | | | 4.48 | % |
| Ratio of net investment income (loss), before waivers, to average net assets (c), (d), (e) | | | 3.97 | % | | | 3.96 | % | | | 4.09 | % | | | 4.28 | % | | | 3.97 | % | | | 4.21 | % |
| Portfolio turnover rate (excluding short-term securities) | | | 5.64 | % | | | 11.36 | % | | | 13.28 | % | | | 13.48 | % | | | 18.93 | % | | | 22.25 | % |
| (a) | Total return figures are based on the change in net asset value of a share during the period and assume reinvestment of distributions at net asset value. Total return is not annualized for periods of less than one year. |
| (b) | In addition to fees and expenses which the Fund bears directly, the Fund indirectly bears a pro rata share of the fees and expenses of any acquired funds in which it invests. Such indirect expenses are not included in the above reported expense ratios. |
| (c) | Annualized for periods less than one year. |
| (d) | Effective December 12, 2018, the investment advisory fee, net of voluntary waivers, decreased to 0.32%. Also effective December 12, 2018, the Adviser increased the voluntary waiver to 0.28%. |
| (e) | Effective March 16, 2015, the investment advisory fee, net of voluntary waivers, increased to 0.34%. Also effective March 16, 2015, the Adviser decreased the voluntary waiver to 0.26%. |
See accompanying notes to financial statements.
CLEARWATER INVESTMENT TRUST
Financial Highlights
Per share data (rounded to the nearest cent) for a share of capital stock outstanding throughout the years or period ended and selected information for each year or period ended is as follows:
| | | June 30, | | | Year ended December 31, | |
| International Fund | | 2019
(Unaudited) | | | 2018 | | | 2017 | | | 2016 | | | 2015 | | | 2014 | |
| Net asset value, beginning of period | | $ | 14.08 | | | | 17.23 | | | | 14.04 | | | | 14.02 | | | | 14.41 | | | | 15.76 | |
| Income (loss) from investment operations: | | | | | | | | | | | | | | | | | | | | | | | | |
| Net investment income | | | 0.22 | | | | 0.30 | | | | 0.27 | | | | 0.27 | | | | 0.28 | | | | 0.35 | |
| Net realized and unrealized gains (losses) | | | 2.08 | | | | (2.70 | ) | | | 3.44 | | | | 0.02 | | | | (0.31 | ) | | | (1.08 | ) |
| Total from investment operations | | | 2.30 | | | | (2.40 | ) | | | 3.71 | | | | 0.29 | | | | (0.03 | ) | | | (0.73 | ) |
| Less distributions to shareholders from: | | | | | | | | | | | | | | | | | | | | | | | | |
| Net investment income | | | - | | | | (0.29 | ) | | | (0.30 | ) | | | (0.27 | ) | | | (0.28 | ) | | | (0.36 | ) |
| Net realized gain | | | - | | | | (0.46 | ) | | | (0.22 | ) | | | - | (a) | | | (0.08 | ) | | | (0.26 | ) |
| Total distributions to shareholders: | | | - | | | | (0.75 | ) | | | (0.52 | ) | | | (0.27 | ) | | | (0.36 | ) | | | (0.62 | ) |
| Net asset value, end of period | | $ | 16.38 | | | | 14.08 | | | | 17.23 | | | | 14.04 | | | | 14.02 | | | | 14.41 | |
| Total return (b) | | | 16.34 | % | | | (14.01 | )% | | | 26.54 | % | | | 2.09 | % | | | (0.15 | )% | | | (4.70 | )% |
| Net assets, end of period (000s omitted) | | $ | 609,504 | | | | 524,708 | | | | 624,642 | | | | 508,999 | | | | 491,184 | | | | 481,943 | |
| Ratio of expenses, net of waivers, to average net assets (c), (d), (e), (f), (g), (h) | | | 0.68 | % | | | 0.68 | % | | | 0.67 | % | | | 0.70 | % | | | 0.69 | % | | | 0.67 | % |
| Ratio of expenses, before waivers, to average net assets (c), (d), (e), (f), (g), (h) | | | 1.00 | % | | | 1.00 | % | | | 1.00 | % | | | 1.00 | % | | | 1.00 | % | | | 1.00 | % |
| Ratio of net investment income (loss), net of waivers, to average net assets (d), (e), (f), (g), (h) | | | 2.83 | % | | | 1.79 | % | | | 1.67 | % | | | 1.90 | % | | | 1.87 | % | | | 2.22 | % |
| Ratio of net investment income (loss), before waivers, to average net assets (d), (e), (f), (g), (h) | | | 2.51 | % | | | 1.47 | % | | | 1.34 | % | | | 1.60 | % | | | 1.56 | % | | | 1.89 | % |
| Portfolio turnover rate (excluding short-term securities) | | | 12.11 | % | | | 19.57 | % | | | 36.17 | % | | | 37.21 | % | | | 18.49 | % | | | 15.33 | % |
| (a) | Per share amounts from distributions paid from net realized gain were less than $0.01 per share. |
| (b) | Total return figures are based on the change in net asset value of a share during the period and assume reinvestment of distributions at net asset value. Total return is not annualized for periods of less than one year. |
| (c) | In addition to fees and expenses which the Fund bears directly, the Fund indirectly bears a pro rata share of the fees and expenses of any acquired funds in which it invests. Such indirect expenses are not included in the above reported expense ratios. |
| (d) | Annualized for periods less than one year. |
| (e) | Effective September 22, 2017, the investment advisory fee, net of voluntary waivers, increased to 0.68%. Also effective September 22, 2017, the Adviser decreased the voluntary waiver to 0.32%. |
| (f) | Effective March 16, 2017, the investment advisory fee, net of voluntary waivers, decreased to 0.65%. Also effective March 16, 2017, the Adviser increased the voluntary waiver to 0.35%. |
| (g) | Effective March 16, 2016, the investment advisory fee, net of voluntary waivers, increased to 0.70%. Also effective March 16, 2016, the Adviser decreased the voluntary waiver to 0.30%. |
| (h) | Effective March 16, 2015, the investment advisory fee, net of voluntary waivers, increased to 0.69%. Also effective March 16, 2015, the Adviser decreased the voluntary waiver to 0.31%. |
See accompanying notes to financial statements.
CLEARWATER INVESTMENT TRUST
Notes to Financial Statements (unaudited)
June 30, 2019
Clearwater Investment Trust (the “Trust”) was established on January 12, 1987 as a Massachusetts business trust and is registered under the Investment Company Act of 1940 (as amended) as a diversified open end management investment company and presently includes four series: Clearwater Core Equity Fund (“Core Equity Fund”), Clearwater Small Companies Fund (“Small Companies Fund”), Clearwater Tax-Exempt Bond Fund (“Tax-Exempt Bond Fund”), and Clearwater International Fund (“International Fund” and together with the Core Equity Fund, Small Companies Fund and Tax-Exempt Bond Fund, the “Funds”). Clearwater Management Co., Inc. (the “Adviser”) serves as the investment adviser for each of the Funds and is responsible for the oversight of each of the Fund’s subadvisers. The Trust’s declaration of trust permits the Board of Trustees to create additional funds in the future. The investment objective of the Core Equity, Small Companies, and International Funds is long-term capital growth. The investment objective of the Tax-Exempt Bond Fund is high current income that is exempt from United States (“U.S.”) federal income tax, consistent with preservation of capital.
Fiduciary Counselling, Inc. (“FCI”) acts as subadviser to each of the Funds. FCI does not provide day-to-day management, but provides the Funds with various investment-related services, including investment strategy advice, manager recommendations and related duties as requested by the Adviser. FCI also provides certain services related to due diligence, performance reporting, compliance, and other administrative functions, which support the investment management services and subadviser oversight services provided to the Funds by the Adviser.
The Northern Trust Company serves as the custodian, administrator, accounting services agent and transfer agent for the Trust.
Under normal market conditions, the Core Equity Fund pursues its investment objective by investing at least 80% of its net assets, plus the amount of any borrowings for investment purposes, in equity securities of U.S. companies. The equity securities in which the Fund primarily invests are common and preferred stocks. The Fund employs a multi-style (growth and value) and multi-manager approach whereby portions of the Fund are allocated to different subadvisers who employ distinct investment styles. The Fund’s Adviser allocates portions of the Fund’s assets among subadvisers. The Fund currently allocates assets among the following subadvisers who provide day-to-day management for the Fund: Parametric Portfolio Associates, LLC (“Parametric”), AQR Capital Management (“AQR”), and O’Shaughnessy Asset Management (“OSAM”). The allocation among subadvisers will vary over time, but the current intent of the Fund’s Adviser is that under normal market conditions approximately 60% of the Fund’s total assets will be allocated to Parametric; the remaining assets will be allocated to one or more of the Fund’s two other subadvisers that provide day-to-day management. Parametric manages its portion of the Fund’s assets using a passive management strategy to seek investment results that track, before fees and expenses, the investment results of the Russell 1000® Index as closely as possible without requiring the Fund to realize taxable gains. In addition, as noted above, FCI also acts as a subadviser to the Fund but does not provide day-to-day management.
Under normal market conditions, the Small Companies Fund invests at least 80% of its net assets, plus the amount of any borrowings for investment purposes, in equity securities of small companies. The Fund defines “small companies” as issuers with market capitalizations no greater than that of the largest capitalization company included in the Russell 2000® Index at the time of purchase. The equity securities the Fund invests in consist primarily of exchange-traded common and preferred stocks. The Fund may also invest in a type of equity security called a convertible security to reduce volatility or correlation risk in the portfolio. A convertible security generally
CLEARWATER INVESTMENT TRUST
Notes to Financial Statements (unaudited)
June 30, 2019
entitles the holder to receive interest paid or accrued on debt securities or the dividend paid on preferred stock until the convertible security matures or is redeemed, converted or exchanged. It is intended that the Fund holds a portion of its portfolio for more than two years to allow for the change that prompted the relevant security’s purchase to yield results. The Fund uses a “multi-style, multi-manager” approach. The Fund’s Adviser allocates portions of the Fund’s assets between subadvisers who employ distinct investment styles. The Fund currently allocates assets between the following subadvisers who provide day-to-day management for the Fund: Kennedy Capital Management, Inc. (“KCM”), Cooke & Bieler, L.P. (“Cooke & Bieler”), and Pzena Investment Management, LLC (“Pzena”). FCI also acts as a subadviser to the Fund but does not provide day-to-day management.
Under normal market conditions, the Tax-Exempt Bond Fund invests at least 80% of its net assets, plus the amount of any borrowings for investment purposes, in tax-exempt bonds, which are debt obligations issued by or for the U.S. states, territories and possessions and the District of Columbia. The interest on these bonds is generally exempt from both U.S. regular federal income tax and U.S. federal alternative minimum tax. However, the Fund may invest up to 20% of its net assets in bonds that generate interest income subject to federal alternative minimum tax for individuals. The Fund invests in both revenue bonds, which are backed by and payable only from the revenues derived from a specific facility or specific revenue source, and in general obligation bonds, which are secured by the full faith, credit and taxation power of the issuing municipality. The Fund currently has one subadviser that provides day-to-day management for the Fund, Sit Fixed Income Advisors II, LLC (“Sit”). FCI also acts as a subadviser to the Fund but does not provide day-to-day management.
Under normal market conditions, the International Fund intends to invest at least 80% of the value of its net assets, plus the amount of any borrowings for investment purposes, in equity securities of companies organized or located outside the United States and doing a substantial amount of business outside the United States. Equity securities in which the Fund invests include common and preferred stock, sponsored and unsponsored American Depositary Receipts, European Depositary Receipts, Global Depositary Receipts, exchange-traded funds, and other investment companies. The Fund diversifies its investments among a number of different countries throughout the world, and may invest in companies of any size. The Fund does not intend to invest more than 20% of its net assets in the equity securities of developing or emerging market issuers. In order to hedge against adverse movements in currency exchange rates, the Fund may enter into foreign currency exchange contracts. The Fund does not intend to invest in foreign currency exchange contracts, options, futures contracts or options in futures contracts for speculative purposes. The Fund uses a “multi-style, multi-manager” approach. The Fund’s assets are allocated to different subadvisers who employ distinct investment styles. The Fund currently allocates assets among the following subadvisers who provide day-to-day management for the Fund: Parametric, Artisan Partners Limited Partnership (“Artisan Partners”), WCM Investment Management, LLC (“WCM”) and Templeton Investment Counsel, LLC (“Templeton”). The allocation among subadvisers will vary over time, but the current intent of the Fund’s Adviser is that under normal market conditions approximately 40% of the Fund’s assets will be allocated to Parametric, and the remaining assets will be allocated to one or more of the Fund’s three other subadvisers that provide day-to-day management of the Fund. Parametric manages its portion of the Fund’s assets using a passive management strategy to seek investment results that track, before fees and expenses, the investment results of the MSCI World Ex U.S.A. Index - Net Dividends as closely as possible without requiring the Fund to realize taxable gains. FCI also acts as a subadviser to the Fund but does not provide day-to-day management.
CLEARWATER INVESTMENT TRUST
Notes to Financial Statements (unaudited)
June 30, 2019
| (2) | Summary of Significant Accounting Policies |
The Funds are investment companies and follow accounting and reporting guidance under Financial Accounting Standards Board (“FASB”) Accounting Standards Codification (“ASC”) Topic 946,“Financial Services-Investment Companies.”
The significant accounting policies followed by the Funds are as follows:
| (a) | Investments in Securities |
Investments in U.S. and foreign equity securities are valued at the last sales price or the regular trading session closing price on the principal exchange or market where they are traded. Foreign security values are stated in U.S. dollars. Equity securities which have not traded on the date of valuation or securities for which sales prices are not generally reported are valued at the mean between the last bid and asked prices. Debt securities are valued on the basis of evaluated prices provided by independent pricing services when such prices are believed to reflect the fair value of such securities or broker provided prices. Such prices may be determined by taking into account other similar securities’ prices, yields, maturities, call features, ratings, prepayment speeds, credit risks, cash flows, institutional size trading in similar groups of securities and developments related to specific securities. Shares of open end investment companies are valued at their daily net asset value (“NAV”). Shares of closed-end funds and exchange traded funds are valued at the last sales price or the regular trading session closing price on the principal exchange or market where they are traded.
Securities for which no market quotations are readily available (including those for which trading has been suspended), or when the Adviser becomes aware that a significant event impacting the value of a security or group of securities has occurred after the closing of the exchange on which the security or securities principally trade, but before the calculation of the NAV, are valued at fair value as determined in good faith using procedures established by the Board of Trustees. This may occur particularly with respect to certain foreign securities held by the International Fund, whereby the Board of Trustees may use adjustment factors obtained from an independent evaluation service that are intended to reflect more accurately the fair value of these foreign securities as of the time the Fund’s NAV is calculated. The procedures consider, among others, the following factors to determine a security’s fair value: the nature and pricing history (if any) of the security; whether any dealer quotations for the security are available; and possible valuation methodologies that could be used to determine the fair value of the security. These procedures are used by the Valuation Committee, in accordance with the procedures established by the Board of Trustees, to determine the fair value of the security or securities. Such determinations are then submitted for review and ratification by the Board of Trustees. The use of fair valuation involves the risk that the values used by the Funds to price their investments may be higher or lower than the values used by other unaffiliated investment companies and investors to price the same investments.
Security transactions are accounted for on the trade date, which is the date the securities are purchased or sold. Realized gains and losses are calculated on an identified cost basis. Dividend income is recognized on the ex-dividend date or, for foreign securities, as soon as the information is available. Interest income, is recognized on an accrual basis and includes amortization of premiums and accretion of discounts using the effective yield method.
CLEARWATER INVESTMENT TRUST
Notes to Financial Statements (unaudited)
June 30, 2019
| (b) | Foreign Currency Translation |
The International Fund invests in securities which are purchased and sold in foreign currencies as a principal investment strategy. The costs of purchases, proceeds from sales of investments, interest and dividend income are translated into U.S. dollars using the spot market rate of exchange prevailing on the respective dates of such transactions. The value of the International Fund’s net assets, as measured in U.S. dollars, may be affected favorably or unfavorably by changes in foreign currency exchange rates and exchange control regulations. The gains or losses, if any, on investments resulting from changes in foreign exchange rates are recorded within net realized gain (loss) on security transactions and within net increase (decrease) in unrealized appreciation/depreciation on security transactions on the Statements of Operations. The realized gains or losses, if any, on translation of other assets and liabilities denominated in foreign currencies are recorded within net realized gain (loss) on foreign currency transactions on the Statements of Operations. The International Fund also will incur costs in converting U.S. dollars to local currencies, and vice versa. Risks may arise upon investing in foreign securities including, but not limited to, political, social or economic instability in the country of the issuer, the difficulty of predicting international trade patterns, the possibility of the imposition of exchange controls, expropriation, limits on removal of currency or other assets, nationalization of assets, foreign withholding and income tax and possible delays in the settlement of foreign stock exchange transactions. The principal markets on which these securities trade may have less volume and liquidity, and may be more volatile, than securities markets in the U.S.
The International Fund invests in long or short financial futures contracts for hedging purposes or to gain exposure to the equity market. When used as a hedge, the Fund will purchase and sell various kinds of futures contracts. The International Fund will also enter into closing purchase and sale transactions with respect to any such futures contracts. The futures contracts may be based on various securities and securities indices. The International Fund bears the market risk arising from changes in the value of these financial instruments. At the time the International Fund enters into a futures contract, it is generally required to make a margin deposit with the custodian or broker of a specified amount of liquid assets. Futures are marked to market each day with the change in value reflected in the unrealized appreciation or depreciation. Risk may arise as a result of the potential inability of the counterparties to meet the terms of their contracts. Credit risk is mitigated to the extent that the exchange on which a particular futures contract is traded assumes the risk of a counterparty defaulting on its obligations under the contract. The Statements of Operations include any realized gains or losses on closed futures contracts within Net realized gains (losses) on futures contracts, and any unrealized gains or losses on open futures contracts within Net increase (decrease) in unrealized appreciation/depreciation on futures contracts. Additional information on derivative instruments and how these positions may impact the financial statements is found in Note 8, Derivative Instruments.
| (d) | Forward Foreign Currency Exchange Contracts |
The International Fund enters into forward foreign currency exchange contracts for the purchase or sale of a specific foreign currency at a fixed price on a future date as a hedge against adverse movements in foreign currency exchange rates, specific transactions or the portfolio position. The objective of the International Fund’s foreign currency hedging transactions is to reduce the risk that the U.S. dollar value of the International Fund’s foreign currency denominated securities will decline in value due to changes in foreign currency exchange rates. Forward foreign currency exchange contracts are marked-to-market daily at the applicable exchange rates. Any resulting unrealized gains or losses are recorded on forward foreign currency exchange contracts within net increase (decrease) in unrealized appreciation/depreciation on the Statements of Operations. The International Fund records
CLEARWATER INVESTMENT TRUST
Notes to Financial Statements (unaudited)
June 30, 2019
any realized gains or losses at the time the forward foreign currency exchange contract is offset by entering into a closing transaction with the same counterparty or is extinguished by delivery of the currency. Realized gains or losses, if any, are recorded within Net realized gain (loss) on forward foreign currency exchange contracts on the Statements of Operations. Risks may arise upon entering into forward foreign currency exchange contracts from the potential of the issuer to default on its obligations under the contract and from unanticipated movements in the value of a foreign currency relative to the U.S. dollar. The contractual amounts of forward foreign currency exchange contracts do not necessarily represent the amounts potentially subject to risk. The measurement of risks associated with these instruments is meaningful only when all related and offsetting transactions are considered. The International Fund bears the market risk from changes in foreign currency exchange rates and the credit risk if the issuer fails to perform. Additional information on derivative instruments and how these positions may impact the financial statements is found in Note 8, Derivative Instruments.
The International Fund routinely enters into spot contracts in order to buy or sell a certain amount of foreign currency at the current market rate. The International Fund may enter into spot contracts in order to make payments, or to receive payments, based on investment trading activity in a foreign currency. A spot contract allows the International Fund to buy or sell foreign currency on the day it chooses to deal. From time to time, the Core Equity Fund may also enter into spot contracts in order to make or receive payments due to investment trading activity in a foreign currency on a non-U.S. exchange. Spot contracts are marked-to-market daily at the applicable exchange rates. Any resulting unrealized gains or losses are recorded in translation of other assets and liabilities denominated in foreign currencies within net increase (decrease) in unrealized appreciation/depreciation on the Statements of Operations. Unrealized gains or losses on outstanding spot contracts are recorded in payables for investment securities purchased or receivable for securities sold, respectively, on the Statements of Assets and Liabilities. The Funds record any realized gains or losses at the time the spot contract settles. Realized gains or losses, if any, are included within Net realized gain (loss) on foreign currency transactions on the Statements of Operations. Risks may arise upon entering into spot contracts from unanticipated movements in the value of a foreign currency relative to the U.S. dollar in a short period of time. The Funds bear the market risk from changes in foreign currency exchange rates.
| (f) | Master Limited Partnerships |
The International Fund invests in Master Limited Partnerships (“MLPs”). The benefits derived from the Fund’s investments in MLPs are largely dependent on the MLPs being treated as partnerships for federal income tax purposes. If any of the MLPs held by the Fund were treated as corporations for U.S. federal income tax purposes, the after-tax return to the Fund with respect to its investments in such MLPs would be materially reduced, causing a decline in the value of the common stock. The Fund must include its allocable share of an MLP’s taxable income in its reportable taxable income, whether or not it receives a distribution in cash from the MLP. In such case, the Fund may have to liquidate securities to make required distributions to shareholders.
| (g) | Delayed Delivery Transactions and When-Issued Securities |
Certain Funds may engage in securities transactions on a when-issued or delayed-delivery basis. In these transactions, the securities’ prices and yields are fixed on the date of the commitment, with payment and delivery scheduled for a future date. During this period, the securities are subject to market fluctuations. When delayed-delivery purchases are outstanding, a Fund will segregate liquid assets on its records in amounts sufficient to meet
CLEARWATER INVESTMENT TRUST
Notes to Financial Statements (unaudited)
June 30, 2019
the purchase price. A Fund may dispose of or renegotiate a delayed-delivery transaction, which may result in a capital gain or loss.
| (h) | Short-Term Investments |
The Core Equity, Small Companies, Tax-Exempt Bond, and International Funds currently invest in the U.S. Government Select Portfolio, a money market portfolio of Northern Institutional Funds, an investment company advised by Northern Trust Investments, Inc. The U.S. Government Select Portfolio primarily invests in securities issued by the U.S. government, government agencies, and government-sponsored enterprises.
The balances disclosed as foreign tax reclaim receivable, if any, represent net amounts withheld by foreign governments on dividend income earned in the respective countries subject to reclaims. All reclaims are paid directly to the applicable Funds.
The Trust’s policy is to comply with the requirements of the Internal Revenue Code applicable to regulated investment companies. On a calendar-year basis, the Funds intend to distribute substantially all of their net investment income and net realized gains, if any, to avoid the payment of federal income and excise taxes. Therefore, no income tax provision is required. Each Fund is treated as a separate entity for federal income tax purposes.
Management has analyzed the Funds’ tax positions taken on federal tax returns for all open tax years and has concluded that as of December 31, 2018, no provision for income tax is required in the Funds’ financial statements. The Funds’ federal and state income and federal excise tax returns for the 2015, 2016, 2017 and 2018 tax years for which the applicable statutes of limitations have not expired remain subject to examination by the Internal Revenue Service and state departments of revenue. Net investment income and net realized gain (loss) for the Funds may differ for financial statement and tax purposes. The character of distributions made during the year from net investment income or net realized gains, if any, may differ from their ultimate characterization for federal income tax purposes. Also, due to the timing of dividend distributions, the fiscal year in which amounts are distributed may differ from the year that the income or realized gain (loss) were recorded by the Funds. The Trust has analyzed the Funds’ tax positions and has concluded that no liability for unrecognized tax benefits should be recorded related to uncertain tax positions. Further, the Trust is not aware of any tax positions for which it is reasonably possible that the total amounts of unrecognized tax benefits will significantly change in the next twelve months. The tax character of distributions by the Funds during the years ended December 31, 2018 and 2017 was as follows:
| | | Tax-Exempt | | Ordinary Income* | |
| | | 2018 | | 2017 | | 2018 | | 2017 | |
| Core Equity Fund | | $ | — | | $ | — | | $ | 7,833,537 | | $ | 7,688,471 | |
| Small Companies Fund | | | — | | | — | | | 13,643,176 | | | 8,674,016 | |
| Tax-Exempt Bond Fund | | | 23,513,734 | | | 24,359,964 | | | 2,426,996 | | | 1,189,281 | |
| International Fund | | | — | | | — | | | 10,507,300 | | | 10,724,142 | |
CLEARWATER INVESTMENT TRUST
Notes to Financial Statements (unaudited)
June 30, 2019
| | | Long-Term Capital Gains** | |
| | | 2018 | | 2017 | |
| Core Equity Fund | | $ | 20,355,019 | | $ | 26,497,925 | |
| Small Companies Fund | | | 18,194,790 | | | 49,069,167 | |
| Tax-Exempt Bond Fund | | | 3,154,039 | | | 2,113,229 | |
| International Fund | | | 16,117,600 | | | 7,930,041 | |
* In addition to the ordinary income distributions, during 2018 the following Funds utilized equalization accounting for tax purposes whereby a portion of redemption payments were treated as distributions of ordinary income in the following amounts:
| Core Equity Fund | | $ | 199,375 | |
| International Fund | | $ | 116,598 | |
** In addition to the long-term capital gain distributions, during 2018 the following Funds utilized equalization accounting for tax purposes whereby a portion of redemption payments were treated as distributions of long-term capital gains in the following amounts:
| Core Equity Fund | | $ | 1,594,736 | |
| Small Companies | | $ | 816,626 | |
| International Fund | | $ | 603,033 | |
As of June 30, 2019, the components of distributable earnings on a tax basis were as follows:
| | Core
Equity Fund | | Small
Companies
Fund | | Tax-Exempt
Bond Fund | | International
Fund | |
| Undistributed ordinary income | $ | 3,939,223 | | $ | 991,853 | | $ | — | | $ | 8,452,390 | |
| Undistributed tax-exempt income | | — | | | — | | | 538,829 | | | — | |
| Undistributed capital gain | | 4,071,767 | | | 637,802 | | | — | | | 4,019,766 | |
| Accumulated capital losses and other | | — | | | — | | | (4,078,892 | ) | | — | |
| Unrealized appreciation | | 241,117,355 | | | 23,444,978 | | | 28,789,861 | | | 164,737,135 | |
| Total | $ | 249,128,345 | | $ | 25,074,633 | | $ | 25,249,798 | | $ | 177,209,291 | |
Distributions to shareholders are determined in accordance with federal income tax regulations, which may differ from such amounts recorded in accordance with U.S. generally accepted accounting principles (“U.S. GAAP”) for financial reporting purposes. Accordingly, the Funds may make reclassifications among certain of their capital accounts in order to reflect the tax treatment for certain permanent differences that exist between federal income
CLEARWATER INVESTMENT TRUST
Notes to Financial Statements (unaudited)
June 30, 2019
tax regulations and U.S. GAAP. These reclassifications are reported in order to reflect the tax treatment for certain permanent differences that exist between income tax regulations and U.S. GAAP. At December 31, 2018, the Funds utilized equalization accounting whereby a portion of redemption payments were treated as distributions. These reclassifications have no impact on the total net assets or the NAV per share of the Funds. At June 30, 2019, reclassifications have been recorded among the following capital accounts on the Statements of Assets and Liabilities:
| | Core
Equity Fund | | Small Companies
Fund | | Tax-Exempt
Bond Fund | | International
Fund | |
| Undistributed (overdistributed) net investment income | $ | 118 | | $ | 68,197 | | $ | (6,676 | ) | $ | (52,742 | ) |
| Accumulated net realized gain (loss) | | (20,681,059 | ) | | (68,197 | ) | | 6,676 | | | 52,742 | |
| Additional paid-in capital | | 20,680,941 | | | — | | | — | | | — | |
| (k) | Distributions to Shareholders |
Distributions to shareholders from net investment income, if any, are declared annually for the Core Equity, Small Companies, and International Funds and declared daily, payable monthly, for the Tax-Exempt Bond Fund. Distributions to shareholders from net realized gains, if any, are declared annually for all Funds. Distributions are paid in cash or reinvested in additional shares at the direction of the shareholders. During the year ended December 31, 2018, the Core Equity, Small Companies and International Funds utilized equalization accounting with respect to distributions to shareholders, in order to keep remaining shareholders’ interest in undistributed income from being affected.
The preparation of financial statements in conformity with U.S. GAAP requires management to make estimates and assumptions that affect the reported amounts of assets and liabilities and disclosure of contingent assets and liabilities at the date of the financial statements and the reported amounts of increase and decrease in net assets from operations during the period. Actual results could differ from those estimates.
Under each Fund’s organizational documents, its officers and directors are indemnified against certain liabilities arising out of the performance of their duties to each Fund. In addition, certain of each Fund’s contracts with its service providers contain general indemnification clauses. Each Fund’s maximum exposure under these arrangements is unknown since the amount of any future claims that may be made against each Fund cannot be determined and each Fund has no historical basis for predicting the likelihood of any such claims. The Funds believe that the likelihood of any such claims is remote.
| (3) | Fair Value Measurements |
Fair value is an estimate of the price the Funds would receive upon selling a security in a timely transaction to an independent buyer in the principal or most advantageous market for the security. This guidance establishes a three-tier hierarchy to maximize the use of observable market data and minimize the use of unobservable inputs and to establish classification of fair value measurements for disclosure purposes. Various inputs are used in determining the value of the Funds’ investments, as described in Note 2(a). These inputs are summarized in the three broad levels listed below.
CLEARWATER INVESTMENT TRUST
Notes to Financial Statements (unaudited)
June 30, 2019
| • | Level 1 – Unadjusted quoted market prices in active markets for identical securities on the measurement date. |
| • | Level 2 – Other significant observable inputs including quoted prices for similar investments, interest rates, prepayment speeds, credit risk, etc. or quoted prices for identical or similar assets in markets that are not active. Inputs that are derived principally from or corroborated by observable market data are also considered Level 2 measurement. An adjustment to any observable input that is significant to the fair value may render the measurement a Level 3 measurement. |
| • | Level 3 – Valuations based on unobservable inputs, which may include the Adviser’s own assumptions in determining the fair value of an investment. |
The inputs or methodology used for valuing securities are not necessarily an indication of the risk associated with investing in those securities and other financial instruments, if any. The following is a summary of the inputs used in valuing each Fund’s investments and other financial instruments, if any, which are carried at fair value, as of June 30, 2019.
| | Core Equity Fund (a) | |
| | | Level 1 | | | Level 2 | | | Level 3 | | | Total | |
| Common Stocks | $ | 504,969,571 | | $ | — | | $ | — | | $ | 504,969,571 | |
| Short-Term Investments | | 2,491,200 | | | — | | | — | | | 2,491,200 | |
| Total | $ | 507,460,771 | | $ | — | | $ | — | | $ | 507,460,771 | |
(a) For the Core Equity Fund, the investment value is comprised of equity securities and short-term investments. See the Fund’s Schedule of Investments for industry classification. Investments in equity and short-term securities generally are valued at the last sales price or the regular trading session closing price on the principal exchange or market where they are traded. Investments in rights generally are determined by taking into account the terms of the rights as well as the value of the underlying equity securities, which are determined by the valuation methodology described above.
| | Small Companies Fund (b) | |
| | | Level 1 | | | Level 2 | | | Level 3 | | | Total | |
| Common Stocks | $ | 328,003,056 | | $ | — | | $ | — | | $ | 328,003,056 | |
| Convertible Bonds | | — | | | 252,502 | | | — | | | 252,502 | |
| Convertible Preferred Stocks | | 59,009 | | | 100,100 | | | — | | | 159,109 | |
| Investment Companies | | 1,694,172 | | | — | | | — | | | 1,694,172 | |
| Master Limited Partnerships | | 361,452 | | | — | | | — | | | 361,452 | |
| Preferred Stocks | | 3,867,521 | | | — | | | — | | | 3,867,521 | |
| Short-Term Investments | | 21,938,859 | | | — | | | — | | | 21,938,859 | |
| Total | $ | 355,924,069 | | $ | 352,602 | | $ | — | | $ | 356,276,671 | |
(b) For the Small Companies Fund, the investment value is comprised of equity securities, convertible bonds, investment companies, master limited partnerships and short-term investments. See the Fund’s Schedule of Investments for industry classification. Investments in equity and short-term securities generally are valued at the
CLEARWATER INVESTMENT TRUST
Notes to Financial Statements (unaudited)
June 30, 2019
last sales price or the regular trading session closing price on the principal exchange or market where they are traded.
| | Tax-Exempt Bond Fund (c) | |
| | | Level 1 | | | Level 2 | | | Level 3 | | | Total | |
| Closed-End Funds | $ | 27,482,641 | | $ | — | | $ | — | | $ | 27,482,641 | |
| Municipal Bonds | | | | | | | | | | | | |
| Airports | | — | | | 2,772,735 | | | — | | | 2,772,735 | |
| Development | | — | | | 40,593,318 | | | — | | | 40,593,318 | |
| Education | | — | | | 38,840,661 | | | — | | | 38,840,661 | |
| Facilities | | — | | | 2,911,070 | | | — | | | 2,911,070 | |
| General | | — | | | 46,393,248 | | | — | | | 46,393,248 | |
| General Obligations | | — | | | 20,397,278 | | | — | | | 20,397,278 | |
| Higher Education | | — | | | 17,255,765 | | | — | | | 17,255,765 | |
| Housing | | — | | | 23,890,356 | | | — | | | 23,890,356 | |
| Medical | | — | | | 27,991,758 | | | — | | | 27,991,758 | |
| Mello-Roos | | — | | | 696,102 | | | — | | | 696,102 | |
| Multifamily Housing | | — | | | 41,683,466 | | | — | | | 41,683,466 | |
| Nursing Home | | — | | | 71,724,244 | | | — | | | 71,724,244 | |
| Power | | — | | | 3,897,504 | | | — | | | 3,897,504 | |
| School District | | — | | | 34,868,769 | | | — | | | 34,868,769 | |
| Single Family Housing | | — | | | 105,675,517 | | | — | | | 105,675,517 | |
| Student Loan | | — | | | 739,214 | | | — | | | 739,214 | |
| Tobacco Settlement | | — | | | 1,457,060 | | | — | | | 1,457,060 | |
| Transportation | | — | | | 7,414,893 | | | — | | | 7,414,893 | |
| Water | | — | | | 7,244,176 | | | — | | | 7,244,176 | |
| Short-Term Investments | | 16,710,522 | | | — | | | — | | | 16,710,522 | |
| Total | $ | 44,193,163 | | $ | 496,447,134 | | $ | — | | $ | 540,640,297 | |
(c) For the Tax-Exempt Bond Fund, the investment value is comprised of closed-end funds, municipal bonds, and short-term investments. Investments in closed-end funds and short-term securities generally are valued at the last sales price or the regular trading session closing price on the principal exchange or market where they are traded. Investments in municipal bonds generally are based on valuations using adjusted evaluated prices provided by the primary pricing provider. The Board of Trustees has delegated to the Valuation Committee the responsibility to determine in good faith the fair value of securities for which no price quotation is available from an approved pricing service or broker-dealer at the time the Tax-Exempt Bond Fund’s NAV is calculated, including securities for which the prices do not represent fair value or for which a significant event occurs that materially affects the value
CLEARWATER INVESTMENT TRUST
Notes to Financial Statements (unaudited)
June 30, 2019
of the security after the close of the market on which the security principally trades and before the time the Tax-Exempt Bond Fund’s NAV is calculated.
Tax-Exempt Bond Fund
Other Financial Instruments | | Level 1 | | | Level 2 | | | Level 3 | | | Total | |
| Liabilities | | | | | | | | | | | | | | | | |
| Futures Contracts | | $ | (621,074 | ) | | $ | — | | | $ | — | | | $ | (621,074 | ) |
| Net Other Financial Instruments | | $ | (621,074 | ) | | $ | — | | | $ | — | | | $ | (621,074 | ) |
The futures contracts outstanding at June 30, 2019 are considered Level 1 investments due to the contracts being marked-to-market daily at the applicable exchange rates that have been adjusted from the initial quoted rate. Futures contracts are shown on a gross basis in the above table, but the net increase/(decrease) in unrealized appreciation/(depreciation) on futures contracts is shown on the Statements of Operations.
| | | International Fund (d) | |
| | | Level 1 | | | Level 2 | | | Level 3 | | | Total | |
| Common Stocks | | $ | 577,741,964 | | | $ | — | | | $ | —* | | | $ | 577,741,964 | |
| Preferred Stocks | | | 5,678,419 | | | | — | | | | — | | | | 5,678,419 | |
| Rights | | | 29,514 | | | | — | | | | — | | | | 29,514 | |
| Investment Companies | | | 2,135,280 | | | | — | | | | — | | | | 2,135,280 | |
| Warrants | | | 160,736 | | | | — | | | | — | | | | 160,736 | |
| Short-Term Investments | | | 29,272,530 | | | | — | | | | — | | | | 29,272,530 | |
| Total | | $ | 615,018,443 | | | $ | — | | | $ | — | | | $ | 615,018,443 | |
* Security has been deemed worthless and is a Level 3 investment.
(d) For the International Fund, the investment value is comprised of equity securities, rights, investment companies and short-term investments. See the Fund’s Schedule of Investments for additional information on industry sector and currency concentration information. Investments in equity and short-term securities generally are valued at the last sales price or the regular trading session closing price on the principal exchange or market where they are traded. Shares of open end investment companies are valued at their daily net asset value.
There were no significant Level 3 valuations at June 30, 2019.
International Fund
Other Financial Instruments | | Level 1 | | | Level 2 | | | Level 3 | | | Total | |
| Assets | | | | | | | | | | | | | | | | |
| Forward foreign currency exchange contracts | | $ | — | | | $ | 38,285 | | | $ | — | | | $ | 38,285 | |
| Liabilities | | | | | | | | | | | | | | | | |
| Forward foreign currency exchange contracts | | | — | | | | (29,970 | ) | | | — | | | | (29,970 | ) |
| Net Other Financial Instruments | | $ | — | | | $ | 8,315 | | | $ | — | | | $ | 8,315 | |
CLEARWATER INVESTMENT TRUST
Notes to Financial Statements (unaudited)
June 30, 2019
The forward foreign currency exchange contracts outstanding at June 30, 2019 are considered Level 2 investments due to the contracts being marked-to-market daily at the applicable exchange rates that have been adjusted from the initial quoted rate. Forward foreign currency exchange contracts are shown on a gross basis in the above table and on the Statements of Assets and Liabilities.
| (4) | Investment Security Transactions |
The cost of purchases and proceeds from sales of securities (excluding short-term securities) for the period ended June 30, 2019, were as follows:
| | | | Purchases | | | Sales | |
| Core Equity Fund | | | $ | 73,767,852 | | | $ | 94,668,104 | |
| Small Companies Fund | | | | 99,547,316 | | | | 108,655,399 | |
| Tax-Exempt Bond Fund | | | | 28,021,611 | | | | 39,997,947 | |
| International Fund | | | | 67,312,458 | | | | 67,139,797 | |
The difference between book basis and tax basis net unrealized appreciation (depreciation) is attributable primarily to the tax deferral of losses on wash sales, deferral of post-October currency and capital losses for tax purposes, and the recharacterization of income recognition on investments in PFICs.
At June 30, 2019, for federal income tax purposes, gross unrealized appreciation, gross unrealized depreciation, net unrealized appreciation (depreciation) on investments (including the effects of foreign currency translation and derivative instruments, if any) and the cost basis of investments (including derivative instruments, if any) were as follows:
| Funds | | | Unrealized
Appreciation | | | Unrealized
Depreciation | | | Net
Appreciation
(Depreciation) | | | Cost Basis of
Investments | |
| Core Equity Fund | | | | 243,933,710 | | | | (2,816,355 | ) | | | 241,117,355 | | | | 266,343,416 | |
| Small Companies Fund | | | | 46,821,354 | | | | (23,376,378 | ) | | | 23,444,976 | | | | 332,831,695 | |
| Tax-Exempt Bond Fund | | | | 34,733,277 | | | | (5,943,416 | ) | | | 28,789,861 | | | | 511,850,437 | |
| International Fund | | | | 189,854,244 | | | | (25,090,114 | ) | | | 164,764,130 | | | | 450,254,313 | |
CLEARWATER INVESTMENT TRUST
Notes to Financial Statements (unaudited)
June 30, 2019
| (5) | Capital Share Transactions |
Transactions in capital shares for the six months ended June 30, 2019 and the fiscal year ended December 31, 2018 were as follows:
| | | Core Equity Fund | | | Small Companies Fund | |
| | | 2019 | | | 2018 | | | 2019 | | | 2018 | |
| Sold | | | 617,221 | | | | 1,199,527 | | | | 179,819 | | | | 187,783 | |
| Issued for reinvestment of distributions | | | — | | | | 718,516 | | | | — | | | | 2,068,744 | |
| Redeemed | | | (1,221,168 | ) | | | (2,345,677 | ) | | | (816,315 | ) | | | (1,257,751 | ) |
| Net Increase (decrease) | | | (603,947 | ) | | | (427,634 | ) | | | (636,496 | ) | | | 998,776 | |
| | | Tax-Exempt Bond Fund | | | International Fund | |
| | | 2019 | | | 2018 | | | 2019 | | | 2018 | |
| Sold | | | 1,102,667 | | | | 2,150,381 | | | | 1,345,909 | | | | 487,916 | |
| Issued for reinvestment of distributions | | | 1,194,918 | | | | 2,915,620 | | | | — | | | | 1,865,795 | |
| Redeemed | | | (2,093,984 | ) | | | (2,565,535 | ) | | | (1,402,566 | ) | | | (1,354,485 | ) |
| Net Increase (decrease) | | | 203,601 | | | | 2,500,466 | | | | (56,657 | ) | | | 999,226 | |
| (6) | Capital Loss Carryforward |
For the period subsequent to October 31, 2018 through the fiscal year ended December 31, 2018, the following funds incurred capital losses and/or late year losses which the Funds intend to treat as having been incurred in the following fiscal year.
| | | | Short-Term | | | Long-Term | | | Late-year
Gain/Loss | | | Total | |
| Small Companies Fund | | | $ | 208,244 | | | $ | — | | | $ | — | | | $ | 208,244 | |
| Tax-Exempt Bond Fund | | | | 1,113,974 | | | | 1,671,900 | | | | — | | | | 2,785,874 | |
| International Fund | | | | 1,799,449 | | | | — | | | | 353,719 | | | | 2,153,168 | |
At June 30, 2019, one Fund had the following short term capital loss carry-forwards and long term capital loss carry forwards available to offset future net capital gains which do not expire. Future utilization of the capital loss carry-forward, may be limited.
| | | | Short-Term | | | Long-Term | | | Late-year
Gain/Loss | | | Total | |
| Tax-Exempt Bond Fund | | | $ | 1,602,751 | | | $ | 2,172,331 | | | $ | — | | | $ | 3,775,082 | |
CLEARWATER INVESTMENT TRUST
Notes to Financial Statements (unaudited)
June 30, 2019
| (7) | Expenses and Related-Party Transactions |
The Trust has a contract for investment advisory services with the Adviser. Under terms of separate agreements, Core Equity Fund, Small Companies Fund, Tax-Exempt Bond Fund and International Fund each pay an investment advisory fee equal to an annual rate of 0.90%, 1.35%, 0.60% and 1.00%, respectively, of each Fund’s average daily net assets. The Adviser is responsible for the payment or reimbursement of all the Funds’ expenses, except brokerage, taxes, interest, and extraordinary expenses. The Adviser has periodically modified its management fee for each of the Funds through voluntary waivers. For the period ending June 30, 2019, voluntary waivers on management fees were as follows:
| | Management Fees Voluntary Waivers % |
| Core Equity Fund | (0.55) |
| Small Companies Fund | (0.37) |
| Tax-Exempt Bond Fund | (0.28) |
| International Fund | (0.32) |
The Adviser has periodically modified its management fee for each of the Funds through voluntary waivers. Effective September 22, 2017, the net management fee actually paid for the International Fund due to the Adviser’s modification of the voluntary waiver for the Fund was 0.68%. Effective December 12, 2018, the net management fees actually paid for the Core Equity Fund, the Small Companies Fund and the Tax-Exempt Bond Fund due to the Adviser’s modification of the voluntary waivers for those Funds were 0.35%, 0.98% and 0.32%, respectively. The Adviser currently intends to continue these voluntary waivers indefinitely. However, the Adviser may terminate these voluntary arrangements at any time.
In addition to fees and expenses which the Funds bear directly, the Funds indirectly bear a pro rata share of the fees and expenses of any acquired funds in which they invest, such as short-term investments in mutual funds or other investment companies and investments in closed-end funds. Such indirect expenses are not included in any of the reported expense ratios.
The Adviser has entered into subadvisory contracts with independent investment advisory firms for each Fund to provide daily investment management services. The subadvisory fees are based on each subadviser’s proportional net assets it currently manages within each Fund and are paid directly by the Adviser. For each subadviser, the fee schedule is detailed according to the following schedule:
The subadvisory fee for the Core Equity Fund, payable to Parametric and OSAM is equal to an annual rate of 0.15% and 0.35% of the portions of net assets managed, respectively.
CLEARWATER INVESTMENT TRUST
Notes to Financial Statements (unaudited)
June 30, 2019
The subadvisory fee for the Core Equity Fund, payable to AQR for its portion of net assets managed is based on the following annual rates:
| | AQR |
| First $100 million | 0.25% |
| Next $100 million | 0.23% |
| Next $100 million | 0.21% |
| All assets in excess of $300 million | 0.20% |
The subadvisory fee for the Small Companies Fund, payable to KCM for its portion of net assets managed is based on the following annual rates:
| Clearwater Small Cap Core Net Assets | Percent |
| Up to and including $50 Million | 0.75% |
| Next $50 million | 0.70% |
| Over $100 Million | 0.60% |
| Clearwater Micro Cap Core AssetsPercent | | Net Assets |
| 0.80% | | All Assets |
The subadvisory fee for the Small Companies Fund, payable to Cooke & Bieler for its portion of net assets managed is based on the following annual rates:
| | Cooke &
Bieler |
| First $15 million | 1.00% |
| Next $20 million | 0.765% |
| Next $25 million | 0.7225% |
| All assets in excess of $60 million | 0.68% |
The subadvisory fee for the Small Companies Fund, payable to Pzena for its portion of net assets managed is 1.00%.
CLEARWATER INVESTMENT TRUST
Notes to Financial Statements (unaudited)
June 30, 2019
The subadvisory fee for the Tax-Exempt Bond Fund, payable to Sit for Sit’s portion of net assets managed is based on the following annual rates:
| | Sit |
| Up to and including $20 Million | 0.40% |
| Next $30 Million | 0.30% |
| Next $25 Million | 0.25% |
| Next $175 Million | 0.20% |
| Over $250 Million | 0.18% |
The subadvisory fee for the International Fund, payable to Parametric and WCM, is equal to an annual rate of 0.15% and 0.80% of the portions of net assets managed, respectively.
The subadvisory fee for the International Fund, payable to Artisan Partners and Templeton for each of their respective portions of net assets managed is based on the following annual rates:
| | Artisan
Partners |
| First $50 million | 0.80% |
| Next $50 million | 0.60% |
| All assets in excess of $100 million | 0.50% |
| | Templeton |
| First $25 million | 0.95% |
| Next $25 million | 0.85% |
| Next $50 million | 0.75% |
| Next $150 million | 0.65% |
| Next $250 million | 0.55% |
| Over $500 million | 0.50% |
The Adviser has also engaged FCI as a subadviser for each Fund. FCI regularly provides the Funds with various investment-related services, including investment strategy advice, manager recommendations and related duties as requested by the Adviser. FCI also provides certain services related to due diligence, performance reporting, compliance, and other administrative functions, which support the investment management services and subadviser oversight services provided to the Trust by the Adviser. For its services, FCI is compensated with a subadvisory fee payable by the Adviser of 0.20% of each Fund’s average daily net assets, paid on a quarterly basis. FCI is compensated out of the investment advisory fees the Adviser receives from the respective Funds. FCI has agreed to waive the difference between the amount calculated under the subadvisory fee schedule and an amount determined by multiplying the total number of hours worked by FCI in providing services under the subadvisory agreement by an hourly rate that is approved by the Adviser.
CLEARWATER INVESTMENT TRUST
Notes to Financial Statements (unaudited)
June 30, 2019
| (8) | Derivative Instruments |
Information concerning the types of derivatives in which the Tax-Exempt Bond Fund and International Fund invest, the objectives for using them and their related risks can be found in Note 2 (c) and (d). Below are the types of derivatives held in the Tax-Exempt Bond Fund and International Fund by location as presented in the Statements of Assets and Liabilities as of June 30, 2019, with additional detail on the net amounts impacting the Statements of Assets and Liabilities. The futures contracts and forward foreign currency exchange contracts presented below are not subject to master netting agreements or other similar agreements.
| | | ASSETS | | | | LIABILITIES |
| | | | | | | | | | | | | | |
| Name of Fund | | Derivative Type | | Statements of Assets and
Liabilities Location | | | Value | | Statements of Assets and
Liabilities Location | | | Value | | | Counterparty |
Tax-Exempt Bond
Fund | | Futures contract | | Net unrealized
appreciation on futures
contracts | | $ | — | | Net unrealized
depreciation on futures
contracts | | $ | 621,074 | * | | Northern Trust |
| International Fund | | Forward foreign
currency exchange
contracts | | Unrealized appreciation
on forward foreign
currency exchange
contracts | | $ | 38,285 | | Unrealized depreciation
on forward foreign
currency exchange
contracts | | $ | 29,970 | | | Northern Trust |
* Represents cumulative appreciation/depreciation on futures contracts as in the Schedules of Investments. Only the variation margin receivable/payable is reported within the Statement of Assets and Liabilities for futures contracts.
The following tables set forth by primary risk exposure the Tax-Exempt Bond Fund’s and International Fund’s net realized gain (loss) and net increase (decrease) in appreciation/depreciation on futures contracts and forward foreign currency exchange contracts for the six months ended June 30, 2019:
| Name of Fund | | | Derivative Type | | Statements of Operations
Location | | Value | | Name of Fund | | | Derivative Type | | Statements of Operations
Locations | | Value | |
Tax-Exempt
Bond Fund | | | Futures contracts | | Net realized gain (loss)
on futures contracts | | $ | (2,868,464 | ) | | | | | Futures contracts | | Net increase
(decrease) in
unrealized
appreciation/
depreciation
on futures contracts | | $ | 1,334,378 | |
| International Fund | | | Forward foreign
currency exchange
contracts | | Net realized gain
(loss) on forward
foreign currency
exchange contracts | | $ | (53,373 | ) | | | | | Forward foreign
currency exchange
contracts | | Net increase
(decrease) in
unrealized
appreciation/depreciation
on forward foreign
currency exchange
contracts | | $ | 52,930 | |
CLEARWATER INVESTMENT TRUST
Notes to Financial Statements (unaudited)
June 30, 2019
Derivative transactions are measured in terms of the notional amount. The following table presents, for the Tax-Exempt Bond Fund and International Fund, the number of transactions and weighted average notional amounts of forward foreign currency exchange contracts, which is indicative of the volume of derivative activity, for the six months ended June 30, 2019.
| Tax-Exempt Bond Fund | |
| Future Contracts | |
Number of
Transactions | | | | Weighted
Average Notional
Amount | |
| 1,335 | | | $ | 68,996,928 | |
| International Fund | |
| Forward Foreign Currency | |
| Exchange Contracts | |
Number of
Transactions | | | | Weighted
Average Notional
Amount | |
| 11 | | | $ | 6,785,589 | |
ReFlow Fund, LLC (“ReFlow”) provides each Fund with a potential source of cash to meet net shareholder redemptions through share purchases for a fee. The Fund then generally redeems those shares when it experiences net sales. The shares may be redeemed in-kind in accordance with the Fund’s redemption in-kind policies. The Fund is generally required to redeem the shares purchased by ReFlow within 30 days (15 days if redeemed in-kind). As such, the proceeds received from ReFlow’s purchase of fund shares is treated as a liability on the statement of assets and liabilities. The fee paid on outstanding shares owned by ReFlow is based on an auction starting at a minimum bid of 0.20% and is paid by the Adviser under the unified advisory fee agreement. As of June 30, 2019, the Fund’s ReFlow account had a balance of $761,296.
| | | | Average Amount
Outstanding for
Days in Use | |
| Core Equity Fund | | | $ | 529,063 | |
| (10) | Portfolio Securities Loaned |
The Clearwater Small Companies Fund and the Clearwater International Fund participate in a securities lending program and have loaned portions of their investment portfolios at June 30, 2019. Under the program, the Funds loan securities to borrowers who post collateral for those loaned securities. The Securities Finance Trust Company serves as the Funds’ securities lending agent (the lending agent) who operates and maintains the securities lending program. The loans are governed by a securities lending agreement between the lending agent, acting on behalf of
CLEARWATER INVESTMENT TRUST
Notes to Financial Statements (unaudited)
June 30, 2019
the Funds, and each borrowing counterparty. The fair value of securities on loan as of June 30, 2019 is recognized within investments in securities, at fair value, on the Funds’ Statements of Assets and Liabilities.
Each borrower receives a negotiated interest rate, which is generally referred to as the rebate rate, on the cash that it delivers to the Funds as collateral for the securities loaned and agrees to pay a negotiated rate with respect to the loaned securities. The amount of these rates for each securities lending transaction may differ depending on several factors, including the demand for the security, tax considerations and the credit quality of the borrower. A net payment is generally made by the borrower with respect to these rates upon termination of the loan (the Net Rate). The value of the securities loan will be marked-to-market daily, and the borrower will be required to provide additional collateral if the posted amount falls below certain negotiated levels, and the lending agent (on behalf of the Funds) will be required to return collateral to the borrower if the amount of collateral posted is greater than such negotiated levels.
During the reporting period, the cash collateral received from borrowers related to the Funds’ securities lending activities was invested in the Fidelity Investments Money Market Government Portfolio and the daily residual was swept into the Northern Institutional Fund-U.S Government Select Portfolio. The short-term investments purchased with the cash collateral in the amount of $9,158,405 and $7,027,654 are included in Investment in Securities on the Statement of Assets and Liabilities of the Clearwater Small Companies Fund and the Clearwater International Fund, respectively.
The Funds provide compensation to the lending agent in connection with operating and maintaining the securities lending program. The lending agent is compensated in an amount of 15% of gross revenues for the 12 month period commencing as of implementation date. The fee will then be increased to 20% for the first $1 million of gross revenues and 15% of any gross revenues in excess of $ 1 million. The revenues derived from the securities lending activities of the Funds depend on many factors, including the value of the securities available to be loaned, the demand for the securities available to be loaned, the actual percentage of the Fund’s securities that are on loan (the utilization rate), the amount earned from the investment of any collateral and the amount of the fees or profit retained by the lending agent. All compensation, costs and expenses associated with the securities lending program are considered transaction charges that are borne by the Funds and are not an obligation of the Manager under the securities lending agency agreement. These transaction charges are netted with the income from securities lending and included in net income from securities loaned on the accompanying Statement of Operations.
The Funds’ securities lending program involves certain risks, including counterparty or borrower risk, collateral investment risk, replacement risk, operational, legal, tax and accounting risks. In the event the borrower does not meet its contractual obligation to return the securities, the Funds may be exposed to the risk of loss of reacquiring the loaned securities at prevailing market prices using the proceeds of the sale of the collateral.
CLEARWATER INVESTMENT TRUST
Notes to Financial Statements (unaudited)
June 30, 2019
The following is information on the securities lending activities by the lending agent for the Funds as of June 30, 2019:
| | | | Gross Amounts of
Securities Loaned in
Statement of Assets,
Liabilities | | | % of Net Assets | | | Cash Collateral Received | |
| Small Companies Fund | | | $ | 8,957,844 | | | | 1.02% | | | $ | 9,158,405 | |
| International Fund | | | | 5,659,580 | | | | 1.24 | | | | 7,027,654 | |
At June 30, 2019, there were no offsetting of securities and they are presented on a gross basis.
CLEARWATER INVESTMENT TRUST
Schedule of Investments - Clearwater Core Equity Fund
June 30, 2019 (unaudited)
| Shares | | | Security | | Cost | | | Fair value (a) | | | Percent of
net assets | |
| Common Stocks: | | | | | | | | | | | | |
| | Communication Services: | | | | | | | | | | | | |
| | 18,873 | | | ACTIVISION BLIZZARD, INC. | | $ | 289,106 | | | | 890,806 | | | | | |
| | 6,317 | | | ALPHABET, INC., CLASS A(b) | | | 2,636,989 | | | | 6,840,048 | | | | | |
| | 4,679 | | | ALPHABET, INC., CLASS C(b) | | | 1,801,776 | | | | 5,057,578 | | | | | |
| | 17,181 | | | AMC NETWORKS, INC., CLASS A(b) | | | 1,032,433 | | | | 936,193 | | | | | |
| | 73,716 | | | AT&T, INC. | | | 1,280,506 | | | | 2,470,223 | | | | | |
| | 300 | | | CABLE ONE, INC. | | | 113,966 | | | | 351,297 | | | | | |
| | 1,900 | | | CARS.COM, INC.(b) | | | 14,708 | | | | 37,468 | | | | | |
| | 2,214 | | | CENTURYLINK, INC. | | | 32,921 | | | | 26,037 | | | | | |
| | 1,929 | | | CHARTER COMMUNICATIONS, INC., CLASS A(b) | | | 79,053 | | | | 762,302 | | | | | |
| | 100 | | | CLEAR CHANNEL OUTDOOR HOLDINGS, INC.(b) | | | 101 | | | | 472 | | | | | |
| | 79,256 | | | COMCAST CORP., CLASS A | | | 1,393,118 | | | | 3,350,944 | | | | | |
| | 1,000 | | | DISCOVERY, INC., CLASS A(b) | | | 28,210 | | | | 30,700 | | | | | |
| | 2,939 | | | DISH NETWORK CORP., CLASS A(b) | | | 116,148 | | | | 112,887 | | | | | |
| | 11,266 | | | ELECTRONIC ARTS, INC.(b) | | | 280,102 | | | | 1,140,795 | | | | | |
| | 30,240 | | | FACEBOOK, INC., CLASS A(b) | | | 1,594,219 | | | | 5,836,320 | | | | | |
| | 2,257 | | | FOX CORP., CLASS A | | | 93,778 | | | | 82,696 | | | | | |
| | 1,360 | | | GCI LIBERTY, INC., CLASS A(b) | | | 51,149 | | | | 83,586 | | | | | |
| | 1,972 | | | IAC/INTERACTIVECORP(b) | | | 156,820 | | | | 428,969 | | | | | |
| | 15,600 | | | INTERPUBLIC GROUP OF (THE) COS., INC. | | | 40,950 | | | | 352,404 | | | | | |
| | 5,832 | | | LIBERTY GLOBAL PLC, CLASS A(b)(c) | | | 42,377 | | | | 157,406 | | | | | |
| | 7,374 | | | LIBERTY GLOBAL PLC, CLASS C(b)(c) | | | 51,974 | | | | 195,632 | | | | | |
| | 1,500 | | | LIONS GATE ENTERTAINMENT CORP., CLASS A | | | 27,387 | | | | 18,375 | | | | | |
| | 1,600 | | | LIVE NATION ENTERTAINMENT, INC.(b) | | | 88,717 | | | | 106,000 | | | | | |
| | 1,100 | | | MATCH GROUP, INC. | | | 31,366 | | | | 73,997 | | | | | |
| | 1,200 | | | NETFLIX, INC.(b) | | | 421,679 | | | | 440,784 | | | | | |
| | 2,375 | | | NEWS CORP., CLASS A | | | 7,170 | | | | 32,039 | | | | | |
| | 27,391 | | | OMNICOM GROUP, INC. | | | 1,946,173 | | | | 2,244,692 | | | | | |
| | 14,300 | | | SIRIUS XM HOLDINGS, INC. | | | 90,452 | | | | 79,794 | | | | | |
| | 9,840 | | | SPRINT CORP.(b) | | | 21,187 | | | | 64,649 | | | | | |
| | 5,700 | | | TEGNA, INC. | | | 26,227 | | | | 86,355 | | | | | |
| | 1,900 | | | TELEPHONE & DATA SYSTEMS, INC. | | | 50,350 | | | | 57,760 | | | | | |
| | 11,308 | | | T-MOBILE U.S., INC.(b) | | | 563,139 | | | | 838,375 | | | | | |
| | 5,675 | | | TRIPADVISOR, INC.(b) | | | 303,974 | | | | 262,696 | | | | | |
| | 34,931 | | | TWDC ENTERPRISES 18 CORP. | | | 1,209,569 | | | | 4,877,764 | | | | | |
| | 8,700 | | | TWITTER, INC.(b) | | | 197,336 | | | | 303,630 | | | | | |
| | 79,188 | | | VERIZON COMMUNICATIONS, INC. | | | 3,698,307 | | | | 4,524,010 | | | | | |
| | 127,267 | | | VIACOM, INC., CLASS B | | | 3,887,605 | | | | 3,801,465 | | | | | |
| | 800 | | | YELP, INC.(b) | | | 26,800 | | | | 27,344 | | | | | |
| | 1,000 | | | ZAYO GROUP HOLDINGS, INC.(b) | | | 26,680 | | | | 32,910 | | | | | |
| | | | | | | | 23,754,522 | | | | 47,017,402 | | | | 9.28 | % |
| | Consumer Discretionary: | | | | | | | | | | | |
| | 1,800 | | | ADIENT PLC | | | 38,861 | | | | 43,686 | | | | | |
| | 1,500 | | | ADVANCE AUTO PARTS, INC. | | | 53,558 | | | | 231,210 | | | | | |
| | 4,867 | | | AMAZON.COM, INC.(b) | | | 1,444,189 | | | | 9,216,297 | | | | | |
| | 500 | | | APTIV PLC(c) | | | 30,790 | | | | 40,415 | | | | | |
| | 1,100 | | | AUTOLIV, INC.(c) | | | 13,982 | | | | 77,561 | | | | | |
| | 2,539 | | | AUTOZONE, INC.(b) | | | 2,185,068 | | | | 2,791,554 | | | | | |
| | 48,711 | | | BEST BUY CO., INC. | | | 1,665,845 | | | | 3,396,618 | | | | | |
| | 1,400 | | | BIG LOTS, INC. | | | 15,477 | | | | 40,054 | | | | | |
| | 200 | | | BOOKING HOLDINGS, INC.(b) | | | 26,315 | | | | 374,942 | | | | | |
| | 28,006 | | | BORGWARNER, INC. | | | 1,000,054 | | | | 1,175,692 | | | | | |
| | 831 | | | BURLINGTON STORES, INC.(b) | | | 85,265 | | | | 141,395 | | | | | |
| | 8,300 | | | CAESARS ENTERTAINMENT CORP.(b) | | | 66,994 | | | | 98,106 | | | | | |
| | 3,068 | | | CARMAX, INC.(b) | | | 33,093 | | | | 266,394 | | | | | |
| | 4,600 | | | D.R. HORTON, INC. | | | 22,057 | | | | 198,398 | | | | | |
| | 4,874 | | | DARDEN RESTAURANTS, INC. | | | 434,713 | | | | 593,312 | | | | | |
| | 12,863 | | | DICK’S SPORTING GOODS, INC. | | | 402,463 | | | | 445,446 | | | | | |
| | 3,089 | | | DOLLAR GENERAL CORP. | | | 207,226 | | | | 417,509 | | | | | |
| | 5,224 | | | DOLLAR TREE, INC.(b) | | | 52,773 | | | | 561,005 | | | | | |
| | 900 | | | DOMINO’S PIZZA, INC. | | | 90,041 | | | | 250,452 | | | | | |
| | 51,633 | | | EBAY, INC. | | | 1,643,431 | | | | 2,039,504 | | | | | |
| | 3,055 | | | EXPEDIA GROUP, INC. | | | 219,155 | | | | 406,407 | | | | | |
| | 791 | | | FLOOR & DECOR HOLDINGS, INC., CLASS A(b) | | | 22,319 | | | | 33,143 | | | | | |
| | 30,458 | | | FOOT LOCKER, INC. | | | 1,350,478 | | | | 1,276,799 | | | | | |
| | 38,163 | | | FORD MOTOR CO. | | | 164,117 | | | | 390,408 | | | | | |
| | 1,300 | | | FRONTDOOR, INC.(b) | | | 30,172 | | | | 56,615 | | | | | |
| See accompanying notes to financial statements. | 28 | (Continued) |
CLEARWATER INVESTMENT TRUST
Schedule of Investments - Clearwater Core Equity Fund
June 30, 2019 (unaudited)
| Shares | | | Security | | Cost | | | Fair value (a) | | | Percent of
net assets | |
| Consumer Discretionary (Cont’d): |
| | 1,336 | | | GAMESTOP CORP., CLASS A | | $ | 5,383 | | | | 7,308 | | | | | |
| | 5,579 | | | GARMIN LTD.(c) | | | 202,757 | | | | 445,204 | | | | | |
| | 2,018 | | | GARRETT MOTION, INC.(b)(c) | | | 16,668 | | | | 30,976 | | | | | |
| | 6,433 | | | GENERAL MOTORS CO. | | | 211,146 | | | | 247,863 | | | | | |
| | 15,000 | | | GENTEX CORP. | | | 106,860 | | | | 369,150 | | | | | |
| | 4,856 | | | GENUINE PARTS CO. | | | 261,724 | | | | 502,984 | | | | | |
| | 322 | | | GRAHAM HOLDINGS CO., CLASS B | | | 215,889 | | | | 222,190 | | | | | |
| | 578 | | | GRAND CANYON EDUCATION, INC.(b) | | | 68,338 | | | | 67,638 | | | | | |
| | 2,000 | | | HANESBRANDS, INC. | | | 10,095 | | | | 34,440 | | | | | |
| | 400 | | | HASBRO, INC. | | | 10,206 | | | | 42,272 | | | | | |
| | 900 | | | HILTON GRAND VACATIONS, INC.(b) | | | 23,760 | | | | 28,638 | | | | | |
| | 13,767 | | | HOME DEPOT (THE), INC. | | | 1,998,411 | | | | 2,863,123 | | | | | |
| | 27,540 | | | KOHL’S CORP. | | | 1,190,199 | | | | 1,309,527 | | | | | |
| | 971 | | | KONTOOR BRANDS, INC.(b) | | | 5,113 | | | | 27,207 | | | | | |
| | 2,790 | | | L BRANDS, INC. | | | 31,188 | | | | 72,819 | | | | | |
| | 4,011 | | | LAS VEGAS SANDS CORP. | | | 105,390 | | | | 237,010 | | | | | |
| | 2,900 | | | LENNAR CORP., CLASS A | | | 37,613 | | | | 140,534 | | | | | |
| | 58 | | | LENNAR CORP., CLASS B | | | 652 | | | | 2,234 | | | | | |
| | 589 | | | LIBERTY EXPEDIA HOLDINGS, INC., CLASS A(b) | | | 13,315 | | | | 28,148 | | | | | |
| | 1,200 | | | LKQ CORP.(b) | | | 14,970 | | | | 31,932 | | | | | |
| | 400 | | | LOWE’S COS., INC. | | | 34,236 | | | | 40,364 | | | | | |
| | 12,636 | | | LULULEMON ATHLETICA, INC.(b)(c) | | | 1,760,088 | | | | 2,277,134 | | | | | |
| | 3,800 | | | MACY’S, INC. | | | 47,081 | | | | 81,548 | | | | | |
| | 3,038 | | | MARRIOTT INTERNATIONAL, INC., CLASS A | | | 63,603 | | | | 426,201 | | | | | |
| | 294 | | | MARRIOTT VACATIONS WORLDWIDE CORP. | | | 4,103 | | | | 28,342 | | | | | |
| | 10,620 | | | MCDONALD’S CORP. | | | 433,348 | | | | 2,205,349 | | | | | |
| | 7,000 | | | MGM RESORTS INTERNATIONAL | | | 64,629 | | | | 199,990 | | | | | |
| | 600 | | | MOHAWK INDUSTRIES, INC.(b) | | | 26,796 | | | | 88,482 | | | | | |
| | 600 | | | MURPHY USA, INC.(b) | | | 4,392 | | | | 50,418 | | | | | |
| | 5,915 | | | NEWELL BRANDS, INC. | | | 73,613 | | | | 91,209 | | | | | |
| | 24,127 | | | NIKE, INC., CLASS B | | | 782,108 | | | | 2,025,462 | | | | | |
| | 4,300 | | | NORDSTROM, INC. | | | 45,233 | | | | 136,998 | | | | | |
| | 15,508 | | | NORWEGIAN CRUISE LINE HOLDINGS LTD.(b) | | | 879,554 | | | | 831,694 | | | | | |
| | 503 | | | NVR, INC.(b) | | | 1,170,386 | | | | 1,695,236 | | | | | |
| | 2,300 | | | O’REILLY AUTOMOTIVE, INC.(b) | | | 511,946 | | | | 849,436 | | | | | |
| | 800 | | | PENSKE AUTOMOTIVE GROUP, INC. | | | 32,264 | | | | 37,840 | | | | | |
| | 300 | | | POLARIS INDUSTRIES, INC. | | | 23,007 | | | | 27,369 | | | | | |
| | 370 | | | POOL CORP. | | | 34,226 | | | | 70,670 | | | | | |
| | 21,954 | | | PULTEGROUP, INC. | | | 313,334 | | | | 694,185 | | | | | |
| | 1,561 | | | PVH CORP. | | | 109,470 | | | | 147,733 | | | | | |
| | 9,200 | | | QURATE RETAIL, INC.(b) | | | 21,448 | | | | 113,988 | | | | | |
| | 1,500 | | | RALPH LAUREN CORP. | | | 31,320 | | | | 170,385 | | | | | |
| | 4,743 | | | ROSS STORES, INC. | | | 176,855 | | | | 470,126 | | | | | |
| | 3,870 | | | ROYAL CARIBBEAN CRUISES LTD. | | | 82,045 | | | | 469,083 | | | | | |
| | 2,241 | | | SERVICEMASTER GLOBAL HOLDINGS, INC.(b) | | | 119,559 | | | | 116,734 | | | | | |
| | 4,933 | | | SKECHERS U.S.A., INC., CLASS A(b) | | | 162,556 | | | | 155,340 | | | | | |
| | 41,170 | | | STARBUCKS CORP. | | | 1,263,743 | | | | 3,451,281 | | | | | |
| | 5,000 | | | TAPESTRY, INC. | | | 19,161 | | | | 158,650 | | | | | |
| | 1,700 | | | TARGET CORP. | | | 105,311 | | | | 147,237 | | | | | |
| | 1,260 | | | TESLA, INC.(b) | | | 165,777 | | | | 281,560 | | | | | |
| | 1,900 | | | THOR INDUSTRIES, INC. | | | 22,316 | | | | 111,055 | | | | | |
| | 1,400 | | | TIFFANY & CO. | | | 35,210 | | | | 131,096 | | | | | |
| | 20,188 | | | TJX (THE) COS., INC. | | | 86,033 | | | | 1,067,541 | | | | | |
| | 1,466 | | | TOPBUILD CORP.(b) | | | 11,809 | | | | 121,326 | | | | | |
| | 753 | | | ULTA BEAUTY, INC.(b) | | | 117,541 | | | | 261,208 | | | | | |
| | 200 | | | VAIL RESORTS, INC. | | | 42,166 | | | | 44,636 | | | | | |
| | 1,100 | | | VEONEER, INC.(b)(c) | | | 5,428 | | | | 19,041 | | | | | |
| | 6,800 | | | VF CORP. | | | 81,950 | | | | 593,980 | | | | | |
| | 400 | | | VISTEON CORP.(b) | | | 24,116 | | | | 23,432 | | | | | |
| | 600 | | | WAYFAIR, INC., CLASS A(b) | | | 49,325 | | | | 87,600 | | | | | |
| | 2,100 | | | WHIRLPOOL CORP. | | | 89,510 | | | | 298,956 | | | | | |
| | 637 | | | WILLIAMS-SONOMA, INC. | | | 36,201 | | | | 41,405 | | | | | |
| | 1,800 | | | WYNN RESORTS LTD. | | | 52,106 | | | | 223,182 | | | | | |
| | 2,716 | | | YUM CHINA HOLDINGS, INC.(c) | | | 5,770 | | | | 125,479 | | | | | |
| | 16,116 | | | YUM! BRANDS, INC. | | | 1,376,408 | | | | 1,783,558 | | | | | |
| | | | | | | | 26,425,194 | | | | 53,747,658 | | | | 10.60 | % |
| See accompanying notes to financial statements. | 29 | (Continued) |
CLEARWATER INVESTMENT TRUST
Schedule of Investments - Clearwater Core Equity Fund
June 30, 2019 (unaudited)
| Shares | | | Security | | Cost | | | Fair value (a) | | | Percent of
net assets | |
| | Consumer Staples: | | | | | | | | | | | | |
| | 16,050 | | | ALTRIA GROUP, INC. | | $ | 1,001,123 | | | | 759,967 | | | | | |
| | 10,300 | | | ARCHER-DANIELS-MIDLAND CO. | | | 188,618 | | | | 420,240 | | | | | |
| | 7,290 | | | BROWN-FORMAN CORP., CLASS B | | | 57,343 | | | | 404,085 | | | | | |
| | 28,466 | | | CHURCH & DWIGHT CO., INC. | | | 1,479,914 | | | | 2,079,726 | | | | | |
| | 57,881 | | | COCA-COLA (THE) CO. | | | 869,464 | | | | 2,947,301 | | | | | |
| | 1,380 | | | COLGATE-PALMOLIVE CO. | | | 43,344 | | | | 98,905 | | | | | |
| | 31,341 | | | CONAGRA BRANDS, INC. | | | 1,047,535 | | | | 831,163 | | | | | |
| | 6,277 | | | COSTCO WHOLESALE CORP. | | | 226,000 | | | | 1,658,760 | | | | | |
| | 4,680 | | | ESTEE LAUDER (THE) COS., INC., CLASS A | | | 203,878 | | | | 856,955 | | | | | |
| | 12,400 | | | GENERAL MILLS, INC. | | | 277,055 | | | | 651,248 | | | | | |
| | 5,300 | | | HERBALIFE NUTRITION LTD.(b) | | | 36,401 | | | | 226,628 | | | | | |
| | 1,642 | | | HERSHEY (THE) CO. | | | 60,568 | | | | 220,077 | | | | | |
| | 4,800 | | | HORMEL FOODS CORP. | | | 43,206 | | | | 194,592 | | | | | |
| | 1,700 | | | INGREDION, INC. | | | 48,103 | | | | 140,233 | | | | | |
| | 1,300 | | | JM SMUCKER (THE) CO. | | | 60,304 | | | | 149,747 | | | | | |
| | 7,643 | | | KEURIG DR. PEPPER, INC. | | | – | | | | 220,883 | | | | | |
| | 3,336 | | | KIMBERLY-CLARK CORP. | | | 278,758 | | | | 444,622 | | | | | |
| | 3,714 | | | KRAFT HEINZ (THE) CO. | | | 26,692 | | | | 115,283 | | | | | |
| | 115,158 | | | KROGER (THE) CO. | | | 2,380,744 | | | | 2,500,080 | | | | | |
| | 633 | | | LAMB WESTON HOLDINGS, INC. | | | 7,452 | | | | 40,107 | | | | | |
| | 700 | | | MCCORMICK & CO., INC. (NON VOTING) | | | 21,613 | | | | 108,507 | | | | | |
| | 4,160 | | | MOLSON COORS BREWING CO., CLASS B | | | 192,976 | | | | 232,960 | | | | | |
| | 6,969 | | | MONDELEZ INTERNATIONAL, INC., CLASS A | | | 94,887 | | | | 375,629 | | | | | |
| | 8,354 | | | MONSTER BEVERAGE CORP.(b) | | | 258,761 | | | | 533,236 | | | | | |
| | 232 | | | NU SKIN ENTERPRISES, INC., CLASS A | | | 8,194 | | | | 11,442 | | | | | |
| | 32,255 | | | PEPSICO, INC. | | | 2,820,673 | | | | 4,229,598 | | | | | |
| | 18,929 | | | PHILIP MORRIS INTERNATIONAL, INC. | | | 554,556 | | | | 1,486,494 | | | | | |
| | 1,600 | | | PILGRIM’S PRIDE CORP.(b) | | | 24,829 | | | | 40,624 | | | | | |
| | 700 | | | POST HOLDINGS, INC.(b) | | | 43,421 | | | | 72,779 | | | | | |
| | 55,929 | | | PROCTER & GAMBLE (THE) CO. | | | 2,551,422 | | | | 6,132,615 | | | | | |
| | 500 | | | SPECTRUM BRANDS HOLDINGS, INC. | | | 24,845 | | | | 26,885 | | | | | |
| | 7,700 | | | SYSCO CORP. | | | 117,906 | | | | 544,544 | | | | | |
| | 34,672 | | | TYSON FOODS, INC., CLASS A | | | 1,798,281 | | | | 2,799,417 | | | | | |
| | 20,914 | | | WALGREENS BOOTS ALLIANCE, INC. | | | 523,669 | | | | 1,143,368 | | | | | |
| | 12,104 | | | WALMART, INC. | | | 905,704 | | | | 1,337,371 | | | | | |
| | | | | | | | 18,278,239 | | | | 34,036,071 | | | | 6.71 | % |
| | Energy: | | | | | | | | | | | | |
| | 5,460 | | | ANADARKO PETROLEUM CORP. | | | 193,761 | | | | 385,258 | | | | | |
| | 1,162 | | | APERGY CORP.(b) | | | 18,689 | | | | 38,973 | | | | | |
| | 43,402 | | | CABOT OIL & GAS CORP. | | | 1,166,001 | | | | 996,510 | | | | | |
| | 31,075 | | | CHEVRON CORP. | | | 1,373,345 | | | | 3,866,973 | | | | | |
| | 500 | | | CIMAREX ENERGY CO. | | | 32,151 | | | | 29,665 | | | | | |
| | 3,600 | | | CNX RESOURCES CORP.(b) | | | 25,763 | | | | 26,316 | | | | | |
| | 2,200 | | | CONCHO RESOURCES, INC. | | | 101,031 | | | | 226,996 | | | | | |
| | 66,289 | | | CONOCOPHILLIPS | | | 3,267,289 | | | | 4,043,629 | | | | | |
| | 450 | | | CONSOL ENERGY, INC.(b) | | | 5,125 | | | | 11,974 | | | | | |
| | 2,000 | | | CONTINENTAL RESOURCES, INC.(b) | | | 20,765 | | | | 84,180 | | | | | |
| | 1,337 | | | DIAMONDBACK ENERGY, INC. | | | 80,335 | | | | 145,693 | | | | | |
| | 9,794 | | | ENBRIDGE, INC.(c) | | | 137,797 | | | | 353,367 | | | | | |
| | 1,400 | | | EOG RESOURCES, INC. | | | 89,752 | | | | 130,424 | | | | | |
| | 4,000 | | | EQT CORP. | | | 72,343 | | | | 63,240 | | | | | |
| | 40,851 | | | EXXON MOBIL CORP. | | | 1,591,403 | | | | 3,130,412 | | | | | |
| | 10,158 | | | HALLIBURTON CO. | | | 138,080 | | | | 230,993 | | | | | |
| | 3,100 | | | HELMERICH & PAYNE, INC. | | | 39,003 | | | | 156,922 | | | | | |
| | 37,590 | | | HOLLYFRONTIER CORP. | | | 2,363,333 | | | | 1,739,665 | | | | | |
| | 7,312 | | | KINDER MORGAN, INC. | | | 58,585 | | | | 152,674 | | | | | |
| | 3,652 | | | MARATHON PETROLEUM CORP. | | | 134,026 | | | | 204,074 | | | | | |
| | 3,000 | | | MURPHY OIL CORP. | | | 39,255 | | | | 73,950 | | | | | |
| | 4,022 | | | NATIONAL OILWELL VARCO, INC. | | | 51,730 | | | | 89,409 | | | | | |
| | 6,000 | | | OCCIDENTAL PETROLEUM CORP. | | | 54,261 | | | | 301,680 | | | | | |
| | 2,000 | | | ONEOK, INC. | | | 19,065 | | | | 137,620 | | | | | |
| | 31,900 | | | PARSLEY ENERGY, INC., CLASS A(b) | | | 509,926 | | | | 606,419 | | | | | |
| | 2,400 | | | PATTERSON-UTI ENERGY, INC. | | | 24,857 | | | | 27,624 | | | | | |
| | 8,722 | | | PHILLIPS 66 | | | 458,328 | | | | 815,856 | | | | | |
| | 2,530 | | | PIONEER NATURAL RESOURCES CO. | | | 144,428 | | | | 389,266 | | | | | |
| | 2,600 | | | RANGE RESOURCES CORP. | | | 24,900 | | | | 18,148 | | | | | |
| | 2,500 | | | RPC, INC. | | | 24,681 | | | | 18,025 | | | | | |
| See accompanying notes to financial statements. | 30 | (Continued) |
CLEARWATER INVESTMENT TRUST
Schedule of Investments - Clearwater Core Equity Fund
June 30, 2019 (unaudited)
| Shares | | | Security | | Cost | | | Fair value (a) | | | Percent of
net assets | |
| | Energy (Cont’d): | | | | | | | | | | | | |
| | 13,336 | | | SCHLUMBERGER LTD. | | $ | 222,256 | | | | 529,973 | | | | | |
| | 1,000 | | | TARGA RESOURCES CORP. | | | 18,740 | | | | 39,260 | | | | | |
| | 17,219 | | | VALERO ENERGY CORP. | | | 752,442 | | | | 1,474,119 | | | | | |
| | 6,100 | | | WPX ENERGY, INC.(b) | | | 60,768 | | | | 70,211 | | | | | |
| | | | | | | | 13,314,214 | | | | 20,609,498 | | | | 4.07 | % |
| | Financials: | | | | | | | | | | | | |
| | 15,982 | | | AFLAC, INC. | | | 520,002 | | | | 875,973 | | | | | |
| | 500 | | | ALLEGHANY CORP.(b) | | | 140,685 | | | | 340,555 | | | | | |
| | 9,753 | | | ALLSTATE (THE) CORP. | | | 296,804 | | | | 991,783 | | | | | |
| | 19,826 | | | ALLY FINANCIAL, INC. | | | 404,611 | | | | 614,408 | | | | | |
| | 3,633 | | | AMERICAN EXPRESS CO. | | | 111,938 | | | | 448,457 | | | | | |
| | 3,400 | | | AMERICAN FINANCIAL GROUP, INC. | | | 210,306 | | | | 348,398 | | | | | |
| | 5,500 | | | AMERICAN INTERNATIONAL GROUP, INC. | | | 129,086 | | | | 293,040 | | | | | |
| | 26,274 | | | AMERIPRISE FINANCIAL, INC. | | | 2,605,145 | | | | 3,813,934 | | | | | |
| | 848 | | | AON PLC(c) | | | 32,575 | | | | 163,647 | | | | | |
| | 31,505 | | | ARCH CAPITAL GROUP LTD.(b)(c) | | | 759,687 | | | | 1,168,205 | | | | | |
| | 2,300 | | | ARTHUR J. GALLAGHER & CO. | | | 80,002 | | | | 201,457 | | | | | |
| | 4,900 | | | ASSURANT, INC. | | | 218,575 | | | | 521,262 | | | | | |
| | 32,332 | | | ASSURED GUARANTY LTD.(c) | | | 1,194,637 | | | | 1,360,531 | | | | | |
| | 1,165 | | | ATHENE HOLDING LTD., CLASS A(b) | | | 51,104 | | | | 50,165 | | | | | |
| | 1,300 | | | AXIS CAPITAL HOLDINGS LTD.(c) | | | 43,361 | | | | 77,545 | | | | | |
| | 194,143 | | | BANK OF AMERICA CORP. | | | 3,110,057 | | | | 5,630,147 | | | | | |
| | 10,000 | | | BANK OF NEW YORK MELLON (THE) CORP. | | | 206,454 | | | | 441,500 | | | | | |
| | 7,900 | | | BB&T CORP. | | | 173,879 | | | | 388,127 | | | | | |
| | 27,906 | | | BERKSHIRE HATHAWAY, INC., CLASS B(b) | | | 3,620,611 | | | | 5,948,722 | | | | | |
| | 11,926 | | | BRIGHTHOUSE FINANCIAL, INC.(b) | | | 443,135 | | | | 437,565 | | | | | |
| | 620 | | | CANNAE HOLDINGS, INC.(b) | | | 2,893 | | | | 17,968 | | | | | |
| | 22,243 | | | CAPITAL ONE FINANCIAL CORP. | | | 1,525,515 | | | | 2,018,330 | | | | | |
| | 17,900 | | | CHARLES SCHWAB (THE) CORP. | | | 156,088 | | | | 719,401 | | | | | |
| | 6,250 | | | CHUBB LTD.(c) | | | 587,621 | | | | 920,562 | | | | | |
| | 47,842 | | | CITIGROUP, INC. | | | 2,692,501 | | | | 3,350,375 | | | | | |
| | 865 | | | CME GROUP, INC. | | | 31,878 | | | | 167,905 | | | | | |
| | 4,871 | | | COMERICA, INC. | | | 409,337 | | | | 353,829 | | | | | |
| | 500 | | | CREDIT ACCEPTANCE CORP.(b) | | | 86,421 | | | | 241,915 | | | | | |
| | 18,084 | | | DISCOVER FINANCIAL SERVICES | | | 813,653 | | | | 1,403,138 | | | | | |
| | 10,182 | | | E*TRADE FINANCIAL CORP. | | | 276,402 | | | | 454,117 | | | | | |
| | 469 | | | FAIRFAX FINANCIAL HOLDINGS LTD.(c) | | | 86,576 | | | | 229,679 | | | | | |
| | 1,863 | | | FIDELITY NATIONAL FINANCIAL, INC. | | | 15,560 | | | | 75,079 | | | | | |
| | 113,213 | | | FIFTH THIRD BANCORP | | | 2,937,895 | | | | 3,158,643 | | | | | |
| | 400 | | | FIRST CITIZENS BANCSHARES, INC., CLASS A | | | 57,523 | | | | 180,108 | | | | | |
| | 30,500 | | | FIRST HORIZON NATIONAL CORP. | | | 193,065 | | | | 455,365 | | | | | |
| | 47,824 | | | FRANKLIN RESOURCES, INC. | | | 1,452,675 | | | | 1,664,275 | | | | | |
| | 8,500 | | | GOLDMAN SACHS GROUP (THE), INC. | | | 723,237 | | | | 1,739,100 | | | | | |
| | 3,000 | | | HANOVER INSURANCE GROUP (THE), INC. | | | 215,948 | | | | 384,900 | | | | | |
| | 30,246 | | | HARTFORD FINANCIAL SERVICES GROUP (THE), INC. | | | 1,394,762 | | | | 1,685,307 | | | | | |
| | 35,000 | | | HUNTINGTON BANCSHARES, INC. | | | 169,770 | | | | 483,700 | | | | | |
| | 505 | | | INTERCONTINENTAL EXCHANGE, INC. | | | 12,819 | | | | 43,400 | | | | | |
| | 2,700 | | | INVESCO LTD. | | | 32,170 | | | | 55,242 | | | | | |
| | 15,903 | | | JANUS HENDERSON GROUP PLC(c) | | | 222,792 | | | | 340,324 | | | | | |
| | 74,743 | | | JPMORGAN CHASE & CO. | | | 3,141,402 | | | | 8,356,267 | | | | | |
| | 5,904 | | | KEYCORP | | | 30,107 | | | | 104,796 | | | | | |
| | 1,852 | | | LEGG MASON, INC. | | | 25,956 | | | | 70,895 | | | | | |
| | 1,100 | | | LINCOLN NATIONAL CORP. | | | 22,715 | | | | 70,895 | | | | | |
| | 200 | | | MARKEL CORP.(b) | | | 67,789 | | | | 217,920 | | | | | |
| | 5,684 | | | MARSH & MCLENNAN COS., INC. | | | 240,120 | | | | 566,979 | | | | | |
| | 1,300 | | | MERCURY GENERAL CORP. | | | 38,018 | | | | 81,250 | | | | | |
| | 11,412 | | | METLIFE, INC. | | | 482,154 | | | | 566,834 | | | | | |
| | 2,200 | | | MOODY’S CORP. | | | 77,502 | | | | 429,682 | | | | | |
| | 16,800 | | | MORGAN STANLEY | | | 240,305 | | | | 736,008 | | | | | |
| | 3,900 | | | MSCI, INC. | | | 124,722 | | | | 931,281 | | | | | |
| | 5,900 | | | NASDAQ, INC. | | | 240,309 | | | | 567,403 | | | | | |
| | 1,700 | | | NEW RESIDENTIAL INVESTMENT CORP. | | | 23,886 | | | | 26,163 | | | | | |
| | 4,539 | | | PACWEST BANCORP | | | 65,912 | | | | 176,249 | | | | | |
| | 9,025 | | | PNC FINANCIAL SERVICES GROUP (THE), INC. | | | 331,251 | | | | 1,238,952 | | | | | |
| | 24,483 | | | POPULAR, INC. | | | 1,311,326 | | | | 1,327,958 | | | | | |
| | 5,628 | | | PRINCIPAL FINANCIAL GROUP, INC. | | | 175,248 | | | | 325,974 | | | | | |
| | 9,491 | | | PROGRESSIVE (THE) CORP. | | | 285,859 | | | | 758,616 | | | | | |
| See accompanying notes to financial statements. | 31 | (Continued) |
CLEARWATER INVESTMENT TRUST
Schedule of Investments - Clearwater Core Equity Fund
June 30, 2019 (unaudited)
| Shares | | | Security | | Cost | | | Fair value (a) | | | Percent of
net assets | |
| | Financials (Cont’d): | | | | | | | | | | | | |
| | 8,100 | | | PRUDENTIAL FINANCIAL, INC. | | $ | 246,520 | | | | 818,100 | | | | | |
| | 17,302 | | | REGIONS FINANCIAL CORP. | | | 116,601 | | | | 258,492 | | | | | |
| | 3,371 | | | REINSURANCE GROUP OF AMERICA, INC. | | | 296,860 | | | | 525,977 | | | | | |
| | 800 | | | RENAISSANCERE HOLDINGS LTD.(c) | | | 81,779 | | | | 142,408 | | | | | |
| | 3,151 | | | ROYAL BANK OF CANADA(c) | | | 75,538 | | | | 250,189 | | | | | |
| | 735 | | | S&P GLOBAL, INC. | | | 24,183 | | | | 167,426 | | | | | |
| | 7,500 | | | SEI INVESTMENTS CO. | | | 108,537 | | | | 420,750 | | | | | |
| | 10,100 | | | SLM CORP. | | | 36,679 | | | | 98,172 | | | | | |
| | 5,825 | | | SUNTRUST BANKS, INC. | | | 141,999 | | | | 366,101 | | | | | |
| | 4,737 | | | SYNCHRONY FINANCIAL | | | 128,601 | | | | 164,232 | | | | | |
| | 3,657 | | | SYNOVUS FINANCIAL CORP. | | | 49,372 | | | | 127,995 | | | | | |
| | 3,549 | | | T. ROWE PRICE GROUP, INC. | | | 106,978 | | | | 389,361 | | | | | |
| | 5,800 | | | TCF FINANCIAL CORP. | | | 51,852 | | | | 120,582 | | | | | |
| | 2,600 | | | TFS FINANCIAL CORP. | | | 25,038 | | | | 46,982 | | | | | |
| | 2,468 | | | TORCHMARK CORP. | | | 145,321 | | | | 220,787 | | | | | |
| | 8,514 | | | TRAVELERS (THE) COS., INC. | | | 814,739 | | | | 1,273,013 | | | | | |
| | 17,585 | | | US BANCORP | | | 318,503 | | | | 921,454 | | | | | |
| | 26,345 | | | VOYA FINANCIAL, INC. | | | 1,415,896 | | | | 1,456,878 | | | | | |
| | 9,159 | | | W.R. BERKLEY CORP. | | | 273,043 | | | | 603,853 | | | | | |
| | 1,800 | | | WASHINGTON FEDERAL, INC. | | | 23,535 | | | | 62,874 | | | | | |
| | 58,124 | | | WELLS FARGO & CO. | | | 730,988 | | | | 2,750,428 | | | | | |
| | 2,604 | | | WILLIS TOWERS WATSON PLC(c) | | | 454,330 | | | | 498,770 | | | | | |
| | 2,600 | | | ZIONS BANCORP N.A. | | | 49,361 | | | | 119,548 | | | | | |
| | | | | | | | 41,090,589 | | | | 72,616,577 | | | | 14.32 | % |
| | Health Care: | | | | | | | | | | | | |
| | 17,530 | | | ABBOTT LABORATORIES | | | 620,869 | | | | 1,474,273 | | | | | |
| | 21,711 | | | ABBVIE, INC. | | | 939,598 | | | | 1,578,824 | | | | | |
| | 1,000 | | | ACADIA HEALTHCARE CO., INC.(b) | | | 25,720 | | | | 34,950 | | | | | |
| | 4,120 | | | AGILENT TECHNOLOGIES, INC. | | | 181,587 | | | | 307,640 | | | | | |
| | 2,076 | | | ALEXION PHARMACEUTICALS, INC.(b) | | | 140,496 | | | | 271,914 | | | | | |
| | 737 | | | ALIGN TECHNOLOGY, INC.(b) | | | 64,241 | | | | 201,717 | | | | | |
| | 800 | | | ALKERMES PLC(b)(c) | | | 23,616 | | | | 18,032 | | | | | |
| | 1,059 | | | ALLERGAN PLC | | | 37,006 | | | | 177,308 | | | | | |
| | 17,659 | | | AMERISOURCEBERGEN CORP. | | | 1,003,487 | | | | 1,505,606 | | | | | |
| | 25,126 | | | AMGEN, INC. | | | 4,710,321 | | | | 4,630,219 | | | | | |
| | 9,418 | | | ANTHEM, INC. | | | 1,019,367 | | | | 2,657,854 | | | | | |
| | 193 | | | AVANOS MEDICAL, INC.(b) | | | 3,014 | | | | 8,417 | | | | | |
| | 8,439 | | | BAXTER INTERNATIONAL, INC. | | | 397,601 | | | | 691,154 | | | | | |
| | 3,965 | | | BECTON DICKINSON AND CO. | | | 492,312 | | | | 999,220 | | | | | |
| | 8,394 | | | BIOGEN, INC.(b) | | | 2,205,500 | | | | 1,963,105 | | | | | |
| | 400 | | | BIOMARIN PHARMACEUTICAL, INC.(b) | | | 34,064 | | | | 34,260 | | | | | |
| | 1,000 | | | BLUEBIRD BIO, INC.(b) | | | 120,239 | | | | 127,200 | | | | | |
| | 32,800 | | | BOSTON SCIENTIFIC CORP.(b) | | | 182,160 | | | | 1,409,744 | | | | | |
| | 25,160 | | | BRISTOL-MYERS SQUIBB CO. | | | 731,159 | | | | 1,141,006 | | | | | |
| | 2,145 | | | BRUKER CORP. | | | 43,219 | | | | 107,143 | | | | | |
| | 500 | | | CANTEL MEDICAL CORP. | | | 37,230 | | | | 40,320 | | | | | |
| | 4,706 | | | CARDINAL HEALTH, INC. | | | 224,605 | | | | 221,653 | | | | | |
| | 7,680 | | | CELGENE CORP.(b) | | | 355,305 | | | | 709,939 | | | | | |
| | 3,704 | | | CENTENE CORP.(b) | | | 106,465 | | | | 194,238 | | | | | |
| | 3,600 | | | CERNER CORP. | | | 40,604 | | | | 263,880 | | | | | |
| | 3,963 | | | CHARLES RIVER LABORATORIES INTERNATIONAL, INC.(b) | | | 560,082 | | | | 562,350 | | | | | |
| | 7,043 | | | CIGNA CORP. | | | 236,147 | | | | 1,109,576 | | | | | |
| | 200 | | | COOPER (THE) COS., INC. | | | 50,902 | | | | 67,378 | | | | | |
| | 1,520 | | | COVETRUS, INC.(b) | | | 18,619 | | | | 37,179 | | | | | |
| | 7,625 | | | CVS HEALTH CORP. | | | 236,748 | | | | 415,486 | | | | | |
| | 10,529 | | | DANAHER CORP. | | | 287,475 | | | | 1,504,805 | | | | | |
| | 5,632 | | | DENTSPLY SIRONA, INC. | | | 152,472 | | | | 328,683 | | | | | |
| | 1,500 | | | DEXCOM, INC.(b) | | | 87,311 | | | | 224,760 | | | | | |
| | 9,526 | | | EDWARDS LIFESCIENCES CORP.(b) | | | 248,804 | | | | 1,759,833 | | | | | |
| | 23,999 | | | ELI LILLY & CO. | | | 2,072,167 | | | | 2,658,849 | | | | | |
| | 1,400 | | | EXACT SCIENCES CORP.(b) | | | 111,825 | | | | 165,256 | | | | | |
| | 85,227 | | | EXELIXIS, INC.(b) | | | 1,770,708 | | | | 1,821,301 | | | | | |
| | 25,720 | | | GILEAD SCIENCES, INC. | | | 207,436 | | | | 1,737,643 | | | | | |
| | 12,271 | | | HCA HEALTHCARE, INC. | | | 1,526,051 | | | | 1,658,671 | | | | | |
| | 3,800 | | | HENRY SCHEIN, INC.(b) | | | 67,547 | | | | 265,620 | | | | | |
| | 6,608 | | | HOLOGIC, INC.(b) | | | 92,603 | | | | 317,316 | | | | | |
| | 224 | | | HUMANA, INC. | | | 53,999 | | | | 59,427 | | | | | |
| See accompanying notes to financial statements. | 32 | (Continued) |
CLEARWATER INVESTMENT TRUST
Schedule of Investments - Clearwater Core Equity Fund
June 30, 2019 (unaudited)
| Shares | | | Security | | Cost | | | Fair value (a) | | | Percent of
net assets | |
| | Health Care (Cont’d): | | | | | | | | | | | | |
| | 200 | | | ICU MEDICAL, INC.(b) | | $ | 45,928 | | | | 50,382 | | | | | |
| | 2,299 | | | IDEXX LABORATORIES, INC.(b) | | | 98,745 | | | | 632,984 | | | | | |
| | 2,300 | | | ILLUMINA, INC.(b) | | | 98,233 | | | | 846,745 | | | | | |
| | 1,900 | | | INCYTE CORP.(b) | | | 120,835 | | | | 161,424 | | | | | |
| | 900 | | | INSULET CORP.(b) | | | 71,397 | | | | 107,442 | | | | | |
| | 6,500 | | | INTERCEPT PHARMACEUTICALS, INC.(b) | | | 416,369 | | | | 517,205 | | | | | |
| | 462 | | | INTUITIVE SURGICAL, INC.(b) | | | 100,629 | | | | 242,342 | | | | | |
| | 6,867 | | | IONIS PHARMACEUTICALS, INC.(b) | | | 472,980 | | | | 441,342 | | | | | |
| | 5,314 | | | IQVIA HOLDINGS, INC.(b) | | | 558,261 | | | | 855,023 | | | | | |
| | 1,980 | | | JAZZ PHARMACEUTICALS PLC(b)(c) | | | 246,791 | | | | 282,269 | | | | | |
| | 22,372 | | | JOHNSON & JOHNSON | | | 1,280,869 | | | | 3,115,972 | | | | | |
| | 842 | | | LABORATORY CORP. OF AMERICA HOLDINGS(b) | | | 53,269 | | | | 145,582 | | | | | |
| | 5,700 | | | MCKESSON CORP. | | | 202,596 | | | | 766,023 | | | | | |
| | 17,316 | | | MEDNAX, INC.(b) | | | 432,758 | | | | 436,883 | | | | | |
| | 9,400 | | | MEDTRONIC PLC(c) | | | 790,465 | | | | 915,466 | | | | | |
| | 85,283 | | | MERCK & CO., INC. | | | 4,021,975 | | | | 7,150,980 | | | | | |
| | 1,317 | | | METTLER-TOLEDO INTERNATIONAL, INC.(b) | | | 123,051 | | | | 1,106,280 | | | | | |
| | 5,243 | | | MOLINA HEALTHCARE, INC.(b) | | | 698,340 | | | | 750,483 | | | | | |
| | 4,027 | | | MYLAN N.V.(b) | | | 70,353 | | | | 76,674 | | | | | |
| | 5,440 | | | NEKTAR THERAPEUTICS(b) | | | 176,322 | | | | 193,555 | | | | | |
| | 300 | | | PENUMBRA, INC.(b) | | | 36,663 | | | | 48,000 | | | | | |
| | 100,224 | | | PFIZER, INC. | | | 2,892,366 | | | | 4,341,704 | | | | | |
| | 4,736 | | | PRA HEALTH SCIENCES, INC.(b) | | | 460,319 | | | | 469,574 | | | | | |
| | 4,791 | | | RESMED, INC. | | | 129,046 | | | | 584,646 | | | | | |
| | 200 | | | SAGE THERAPEUTICS, INC.(b) | | | 19,160 | | | | 36,618 | | | | | |
| | 9,742 | | | STERIS PLC | | | 1,135,558 | | | | 1,450,389 | | | | | |
| | 1,800 | | | TELEFLEX, INC. | | | 195,858 | | | | 596,070 | | | | | |
| | 11,147 | | | THERMO FISHER SCIENTIFIC, INC. | | | 1,195,862 | | | | 3,273,651 | | | | | |
| | 13,546 | | | UNITEDHEALTH GROUP, INC. | | | 1,342,430 | | | | 3,305,359 | | | | | |
| | 14,933 | | | UNIVERSAL HEALTH SERVICES, INC., CLASS B | | | 1,667,213 | | | | 1,947,114 | | | | | |
| | 1,880 | | | VAREX IMAGING CORP.(b) | | | 19,829 | | | | 57,622 | | | | | |
| | 5,199 | | | VARIAN MEDICAL SYSTEMS, INC.(b) | | | 193,000 | | | | 707,740 | | | | | |
| | 499 | | | VEEVA SYSTEMS, INC., CLASS A(b) | | | 19,015 | | | | 80,893 | | | | | |
| | 900 | | | VERTEX PHARMACEUTICALS, INC.(b) | | | 22,442 | | | | 165,042 | | | | | |
| | 2,600 | | | WATERS CORP.(b) | | | 60,997 | | | | 559,624 | | | | | |
| | 4,304 | | | ZIMMER BIOMET HOLDINGS, INC. | | | 233,961 | | | | 506,753 | | | | | |
| | 9,420 | | | ZOETIS, INC. | | | 809,953 | | | | 1,069,076 | | | | | |
| | | | | | | | 42,034,519 | | | | 73,458,680 | | | | 14.49 | % |
| | Industrials: | | | | | | | | | | | | |
| | 6,987 | | | 3M CO. | | | 417,187 | | | | 1,211,127 | | | | | |
| | 923 | | | ACCO BRANDS CORP. | | | 3,137 | | | | 7,264 | | | | | |
| | 300 | | | ACUITY BRANDS, INC. | | | 34,488 | | | | 41,373 | | | | | |
| | 4,642 | | | AGCO CORP. | | | 225,963 | | | | 360,080 | | | | | |
| | 900 | | | AIR LEASE CORP. | | | 17,685 | | | | 37,206 | | | | | |
| | 1,533 | | | ALLEGION PLC(c) | | | 40,913 | | | | 169,473 | | | | | |
| | 400 | | | AMERCO | | | 120,202 | | | | 151,420 | | | | | |
| | 1,700 | | | AMERICAN AIRLINES GROUP, INC. | | | 67,419 | | | | 55,437 | | | | | |
| | 5,175 | | | AMETEK, INC. | | | 73,220 | | | | 470,097 | | | | | |
| | 8,303 | | | BOEING (THE) CO. | | | 814,972 | | | | 3,022,375 | | | | | |
| | 1,200 | | | BWX TECHNOLOGIES, INC. | | | 54,215 | | | | 62,520 | | | | | |
| | 5,604 | | | CARLISLE COS., INC. | | | 470,886 | | | | 786,858 | | | | | |
| | 10,504 | | | CATERPILLAR, INC. | | | 272,491 | | | | 1,431,590 | | | | | |
| | 3,200 | | | CINTAS CORP. | | | 258,101 | | | | 759,328 | | | | | |
| | 5,739 | | | CRANE CO. | | | 189,222 | | | | 478,862 | | | | | |
| | 3,724 | | | CSX CORP. | | | 136,592 | | | | 288,126 | | | | | |
| | 4,932 | | | CUMMINS, INC. | | | 518,505 | | | | 845,049 | | | | | |
| | 7,300 | | | DEERE & CO. | | | 199,160 | | | | 1,209,683 | | | | | |
| | 16,300 | | | DELTA AIR LINES, INC. | | | 416,507 | | | | 925,025 | | | | | |
| | 24,630 | | | DOVER CORP. | | | 1,980,175 | | | | 2,467,926 | | | | | |
| | 16,254 | | | EATON CORP. PLC | | | 495,276 | | | | 1,353,633 | | | | | |
| | 2,280 | | | EXPEDITORS INTERNATIONAL OF WASHINGTON, INC. | | | 112,692 | | | | 172,961 | | | | | |
| | 5,753 | | | FEDEX CORP. | | | 113,466 | | | | 944,585 | | | | | |
| | 782 | | | FLUOR CORP. | | | 10,432 | | | | 26,346 | | | | | |
| | 3,953 | | | FORTIVE CORP. | | | 71,279 | | | | 322,249 | | | | | |
| | 4,300 | | | FORTUNE BRANDS HOME & SECURITY, INC. | | | 33,889 | | | | 245,659 | | | | | |
| | 1,400 | | | GATX CORP. | | | 24,276 | | | | 111,006 | | | | | |
| | 2,828 | | | GENERAL DYNAMICS CORP. | | | 423,356 | | | | 514,187 | | | | | |
| See accompanying notes to financial statements. | 33 | (Continued) |
CLEARWATER INVESTMENT TRUST
Schedule of Investments - Clearwater Core Equity Fund
June 30, 2019 (unaudited)
| Shares | | | Security | | Cost | | | Fair value (a) | | | Percent of
net assets | |
| | Industrials (Cont’d): | | | | | | | | | | | | |
| | 94,400 | | | GENERAL ELECTRIC CO. | | $ | 715,085 | | | | 991,200 | | | | | |
| | 2,200 | | | HARRIS CORP. | | | 152,508 | | | | 416,086 | | | | | |
| | 875 | | | HEICO CORP. | | | 61,334 | | | | 117,084 | | | | | |
| | 2,156 | | | HEICO CORP., CLASS A | | | 109,365 | | | | 222,866 | | | | | |
| | 360 | | | HERC HOLDINGS, INC.(b) | | | 5,808 | | | | 16,499 | | | | | |
| | 9,188 | | | HONEYWELL INTERNATIONAL, INC. | | | 265,803 | | | | 1,604,133 | | | | | |
| | 1,200 | | | HUBBELL, INC. | | | 43,310 | | | | 156,480 | | | | | |
| | 1,423 | | | HUNTINGTON INGALLS INDUSTRIES, INC. | | | 192,370 | | | | 319,805 | | | | | |
| | 2,271 | | | IDEX CORP. | | | 140,770 | | | | 390,930 | | | | | |
| | 4,824 | | | ILLINOIS TOOL WORKS, INC. | | | 155,812 | | | | 727,507 | | | | | |
| | 10,505 | | | INGERSOLL-RAND PLC | | | 631,190 | | | | 1,330,668 | | | | | |
| | 1,468 | | | JACOBS ENGINEERING GROUP, INC. | | | 29,713 | | | | 123,884 | | | | | |
| | 2,100 | | | JB HUNT TRANSPORT SERVICES, INC. | | | 40,530 | | | | 191,961 | | | | | |
| | 13,203 | | | JETBLUE AIRWAYS CORP.(b) | | | 81,151 | | | | 244,123 | | | | | |
| | 859 | | | JOHNSON CONTROLS INTERNATIONAL PLC | | | 16,341 | | | | 35,485 | | | | | |
| | 1,700 | | | KANSAS CITY SOUTHERN | | | 27,158 | | | | 207,094 | | | | | |
| | 1,596 | | | L3 TECHNOLOGIES, INC. | | | 122,430 | | | | 391,291 | | | | | |
| | 5,697 | | | LENNOX INTERNATIONAL, INC. | | | 1,235,207 | | | | 1,566,675 | | | | | |
| | 1,400 | | | LINCOLN ELECTRIC HOLDINGS, INC. | | | 28,970 | | | | 115,248 | | | | | |
| | 1,684 | | | LOCKHEED MARTIN CORP. | | | 232,821 | | | | 612,201 | | | | | |
| | 1,200 | | | MANITOWOC (THE) CO., INC.(b) | | | 10,053 | | | | 21,360 | | | | | |
| | 2,475 | | | MANPOWERGROUP, INC. | | | 81,957 | | | | 239,085 | | | | | |
| | 15,263 | | | MASCO CORP. | | | 139,724 | | | | 598,920 | | | | | |
| | 200 | | | MIDDLEBY (THE) CORP.(b) | | | 20,548 | | | | 27,140 | | | | | |
| | 1,100 | | | NIELSEN HOLDINGS PLC | | | 29,762 | | | | 24,860 | | | | | |
| | 577 | | | NORDSON CORP. | | | 57,299 | | | | 81,536 | | | | | |
| | 1,702 | | | NORFOLK SOUTHERN CORP. | | | 117,419 | | | | 339,260 | | | | | |
| | 5,973 | | | NORTHROP GRUMMAN CORP. | | | 516,333 | | | | 1,929,936 | | | | | |
| | 2,519 | | | NVENT ELECTRIC PLC(c) | | | 24,113 | | | | 62,446 | | | | | |
| | 10,230 | | | OSHKOSH CORP. | | | 527,523 | | | | 854,103 | | | | | |
| | 1,100 | | | OWENS CORNING | | | 22,578 | | | | 64,020 | | | | | |
| | 9,067 | | | PACCAR, INC. | | | 128,927 | | | | 649,741 | | | | | |
| | 4,628 | | | PARKER-HANNIFIN CORP. | | | 350,966 | | | | 786,806 | | | | | |
| | 2,519 | | | PENTAIR PLC(c) | | | 49,295 | | | | 93,707 | | | | | |
| | 4,100 | | | QUANTA SERVICES, INC. | | | 52,132 | | | | 156,579 | | | | | |
| | 3,198 | | | RAYTHEON CO. | | | 164,018 | | | | 556,068 | | | | | |
| | 14,185 | | | REPUBLIC SERVICES, INC. | | | 880,819 | | | | 1,228,988 | | | | | |
| | 1,531 | | | RESIDEO TECHNOLOGIES, INC.(b) | | | 8,723 | | | | 33,559 | | | | | |
| | 9,210 | | | ROCKWELL AUTOMATION, INC. | | | 692,444 | | | | 1,508,874 | | | | | |
| | 2,580 | | | ROLLINS, INC. | | | 67,194 | | | | 92,545 | | | | | |
| | 700 | | | ROPER TECHNOLOGIES, INC. | | | 94,317 | | | | 256,382 | | | | | |
| | 2,015 | | | SNAP-ON, INC. | | | 191,097 | | | | 333,765 | | | | | |
| | 19,364 | | | SOUTHWEST AIRLINES CO. | | | 628,876 | | | | 983,304 | | | | | |
| | 17,499 | | | SPIRIT AEROSYSTEMS HOLDINGS, INC., CLASS A | | | 1,213,853 | | | | 1,423,894 | | | | | |
| | 2,557 | | | STANLEY BLACK & DECKER, INC. | | | 72,048 | | | | 369,768 | | | | | |
| | 600 | | | STERICYCLE, INC.(b) | | | 18,858 | | | | 28,650 | | | | | |
| | 47,961 | | | TEXTRON, INC. | | | 2,638,281 | | | | 2,543,851 | | | | | |
| | 5,162 | | | TIMKEN (THE) CO. | | | 171,352 | | | | 265,017 | | | | | |
| | 1,596 | | | TORO (THE) CO. | | | 76,510 | | | | 106,772 | | | | | |
| | 500 | | | TRANSDIGM GROUP, INC.(b) | | | 176,409 | | | | 241,900 | | | | | |
| | 8,643 | | | UNION PACIFIC CORP. | | | 137,416 | | | | 1,461,618 | | | | | |
| | 7,361 | | | UNITED CONTINENTAL HOLDINGS, INC.(b) | | | 505,701 | | | | 644,456 | | | | | |
| | 3,540 | | | UNITED PARCEL SERVICE, INC., CLASS B | | | 166,527 | | | | 365,576 | | | | | |
| | 2,565 | | | UNITED RENTALS, INC.(b) | | | 196,251 | | | | 340,196 | | | | | |
| | 11,340 | | | UNITED TECHNOLOGIES CORP. | | | 444,920 | | | | 1,476,468 | | | | | |
| | 3,634 | | | VERISK ANALYTICS, INC. | | | 459,914 | | | | 532,236 | | | | | |
| | 180 | | | VERITIV CORP.(b) | | | 1,653 | | | | 3,496 | | | | | |
| | 700 | | | W.W. GRAINGER, INC. | | | 30,601 | | | | 187,761 | | | | | |
| | 1,707 | | | WABTEC CORP. | | | 60,644 | | | | 122,494 | | | | | |
| | 975 | | | WASTE CONNECTIONS, INC. | | | 42,575 | | | | 93,190 | | | | | |
| | 26,746 | | | WASTE MANAGEMENT, INC. | | | 1,728,843 | | | | 3,085,686 | | | | | |
| | 4,800 | | | WELBILT, INC.(b) | | | 37,515 | | | | 80,160 | | | | | |
| | 1,600 | | | XYLEM, INC. | | | 30,618 | | | | 133,824 | | | | | |
| | | | | | | | 24,949,988 | | | | 52,682,662 | | | | 10.39 | % |
| | Information Technology: | | | | | | | | | | | | |
| | 4,949 | | | ACCENTURE PLC, CLASS A(c) | | | 304,426 | | | | 914,427 | | | | | |
| | 8,492 | | | ADOBE, INC.(b) | | | 643,139 | | | | 2,502,168 | | | | | |
| See accompanying notes to financial statements. | 34 | (Continued) |
CLEARWATER INVESTMENT TRUST
Schedule of Investments - Clearwater Core Equity Fund
June 30, 2019 (unaudited)
| Shares | | | Security | | Cost | | | Fair value (a) | | | Percent of
net assets | |
| | Information Technology (Cont’d): | | | | | | | | | | | | |
| | 10,700 | | | ADVANCED MICRO DEVICES, INC.(b) | | $ | 115,242 | | | | 324,959 | | | | | |
| | 12,236 | | | AKAMAI TECHNOLOGIES, INC.(b) | | | 641,680 | | | | 980,593 | | | | | |
| | 2,067 | | | ALLIANCE DATA SYSTEMS CORP. | | | 141,798 | | | | 289,649 | | | | | |
| | 4,065 | | | AMDOCS LTD. | | | 200,086 | | | | 252,396 | | | | | |
| | 400 | | | AMPHENOL CORP., CLASS A | | | 35,916 | | | | 38,376 | | | | | |
| | 8,600 | | | ANALOG DEVICES, INC. | | | 120,368 | | | | 970,682 | | | | | |
| | 2,736 | | | ANSYS, INC.(b) | | | 217,083 | | | | 560,388 | | | | | |
| | 67,723 | | | APPLE, INC. | | | 3,319,688 | | | | 13,403,736 | | | | | |
| | 7,400 | | | APPLIED MATERIALS, INC. | | | 134,145 | | | | 332,334 | | | | | |
| | 1,109 | | | ARISTA NETWORKS, INC.(b) | | | 215,910 | | | | 287,919 | | | | | |
| | 4,877 | | | ARROW ELECTRONICS, INC.(b) | | | 267,343 | | | | 347,584 | | | | | |
| | 1,300 | | | ATLASSIAN CORP. PLC, CLASS A(b)(c) | | | 116,368 | | | | 170,092 | | | | | |
| | 2,586 | | | AUTODESK, INC.(b) | | | 163,995 | | | | 421,259 | | | | | |
| | 8,749 | | | AUTOMATIC DATA PROCESSING, INC. | | | 687,276 | | | | 1,446,472 | | | | | |
| | 7,371 | | | BLACK KNIGHT, INC.(b) | | | 272,636 | | | | 443,366 | | | | | |
| | 9,493 | | | BOOZ ALLEN HAMILTON HOLDING CORP. | | | 296,190 | | | | 628,532 | | | | | |
| | 5,291 | | | BROADCOM, INC. | | | 497,844 | | | | 1,523,067 | | | | | |
| | 3,413 | | | BROADRIDGE FINANCIAL SOLUTIONS, INC. | | | 106,898 | | | | 435,772 | | | | | |
| | 38,178 | | | CADENCE DESIGN SYSTEMS, INC.(b) | | | 1,879,777 | | | | 2,703,384 | | | | | |
| | 14,463 | | | CDK GLOBAL, INC. | | | 781,533 | | | | 715,051 | | | | | |
| | 7,000 | | | CDW CORP. | | | 292,424 | | | | 777,000 | | | | | |
| | 95,434 | | | CISCO SYSTEMS, INC. | | | 2,057,712 | | | | 5,223,103 | | | | | |
| | 30,520 | | | CITRIX SYSTEMS, INC. | | | 3,140,985 | | | | 2,995,233 | | | | | |
| | 10,090 | | | COGNEX CORP. | | | 458,211 | | | | 484,118 | | | | | |
| | 2,700 | | | COGNIZANT TECHNOLOGY SOLUTIONS CORP., CLASS A | | | 25,751 | | | | 171,153 | | | | | |
| | 400 | | | COHERENT, INC.(b) | | | 51,825 | | | | 54,548 | | | | | |
| | 6,700 | | | CORELOGIC, INC.(b) | | | 76,313 | | | | 280,261 | | | | | |
| | 36,119 | | | CORNING, INC. | | | 620,203 | | | | 1,200,234 | | | | | |
| | 2,700 | | | CYPRESS SEMICONDUCTOR CORP. | | | 3,261 | | | | 60,048 | | | | | |
| | 1,635 | | | DELL TECHNOLOGIES, INC., CLASS C(b) | | | 75,203 | | | | 83,058 | | | | | |
| | 700 | | | DOCUSIGN, INC.(b) | | | 29,771 | | | | 34,797 | | | | | |
| | 2,000 | | | DOLBY LABORATORIES, INC., CLASS A | | | 43,420 | | | | 129,200 | | | | | |
| | 6,467 | | | DXC TECHNOLOGY CO. | | | 221,083 | | | | 356,655 | | | | | |
| | 1,640 | | | ECHOSTAR CORP., CLASS A(b) | | | 25,986 | | | | 72,685 | | | | | |
| | 400 | | | ELASTIC N.V.(b) | | | 28,596 | | | | 29,864 | | | | | |
| | 1,107 | | | EPAM SYSTEMS, INC.(b) | | | 184,369 | | | | 191,622 | | | | | |
| | 300 | | | EURONET WORLDWIDE, INC.(b) | | | 25,458 | | | | 50,472 | | | | | |
| | 1,300 | | | F5 NETWORKS, INC.(b) | | | 30,063 | | | | 189,319 | | | | | |
| | 11,102 | | | FIDELITY NATIONAL INFORMATION SERVICES, INC. | | | 388,684 | | | | 1,361,993 | | | | | |
| | 1,000 | | | FIRST SOLAR, INC.(b) | | | 46,410 | | | | 65,680 | | | | | |
| | 9,784 | | | FISERV, INC.(b) | | | 172,685 | | | | 891,909 | | | | | |
| | 2,135 | | | FLEETCOR TECHNOLOGIES, INC.(b) | | | 508,464 | | | | 599,615 | | | | | |
| | 10,928 | | | FORTINET, INC.(b) | | | 830,687 | | | | 839,598 | | | | | |
| | 200 | | | GARTNER, INC.(b) | | | 25,570 | | | | 32,188 | | | | | |
| | 3,800 | | | GLOBAL PAYMENTS, INC. | | | 113,707 | | | | 608,494 | | | | | |
| | 1,700 | | | GODADDY, INC., CLASS A(b) | | | 98,073 | | | | 119,255 | | | | | |
| | 18,800 | | | HEWLETT PACKARD ENTERPRISE CO. | | | 102,062 | | | | 281,060 | | | | | |
| | 27,110 | | | HP, INC. | | | 537,314 | | | | 563,617 | | | | | |
| | 64,628 | | | INTEL CORP. | | | 374,306 | | | | 3,093,742 | | | | | |
| | 4,878 | | | INTERNATIONAL BUSINESS MACHINES CORP. | | | 495,522 | | | | 672,676 | | | | | |
| | 11,087 | | | INTUIT, INC. | | | 1,217,652 | | | | 2,897,366 | | | | | |
| | 500 | | | IPG PHOTONICS CORP.(b) | | | 74,090 | | | | 77,125 | | | | | |
| | 17,060 | | | KEYSIGHT TECHNOLOGIES, INC.(b) | | | 1,039,524 | | | | 1,532,159 | | | | | |
| | 8,428 | | | LAM RESEARCH CORP. | | | 666,550 | | | | 1,583,116 | | | | | |
| | 6,916 | | | LEIDOS HOLDINGS, INC. | | | 504,371 | | | | 552,243 | | | | | |
| | 827 | | | LOGMEIN, INC. | | | 17,893 | | | | 60,933 | | | | | |
| | 1,721 | | | MANHATTAN ASSOCIATES, INC.(b) | | | 112,154 | | | | 119,317 | | | | | |
| | 3,770 | | | MARVELL TECHNOLOGY GROUP LTD. | | | 20,234 | | | | 89,990 | | | | | |
| | 6,855 | | | MASTERCARD, INC., CLASS A | | | 1,234,187 | | | | 1,813,353 | | | | | |
| | 2,141 | | | MICRO FOCUS INTERNATIONAL PLC ADR(c)(d) | | | 76,184 | | | | 56,073 | | | | | |
| | 4,200 | | | MICROCHIP TECHNOLOGY, INC. | | | 38,962 | | | | 364,140 | | | | | |
| | 61,009 | | | MICRON TECHNOLOGY, INC.(b) | | | 1,566,411 | | | | 2,354,337 | | | | | |
| | 111,818 | | | MICROSOFT CORP. | | | 3,722,823 | | | | 14,979,139 | | | | | |
| | 500 | | | MKS INSTRUMENTS, INC. | | | 32,310 | | | | 38,945 | | | | | |
| | 11,445 | | | NETAPP, INC. | | | 876,626 | | | | 706,156 | | | | | |
| | 1,500 | | | NUTANIX, INC., CLASS A(b) | | | 63,843 | | | | 38,910 | | | | | |
| | 3,491 | | | NVIDIA CORP. | | | 68,182 | | | | 573,327 | | | | | |
| See accompanying notes to financial statements. | 35 | (Continued) |
CLEARWATER INVESTMENT TRUST
Schedule of Investments - Clearwater Core Equity Fund
June 30, 2019 (unaudited)
| Shares | | | Security | | Cost | | | Fair value (a) | | | Percent of
net assets | |
| | Information Technology (Cont’d): | | | | | | | | | | | | |
| | 38,526 | | | NXP SEMICONDUCTORS N.V.(c) | | $ | 3,533,140 | | | | 3,760,523 | | | | | |
| | 1,100 | | | OKTA, INC.(b) | | | 68,912 | | | | 135,861 | | | | | |
| | 46,947 | | | ON SEMICONDUCTOR CORP.(b) | | | 1,052,859 | | | | 948,799 | | | | | |
| | 25,467 | | | ORACLE CORP. | | | 1,298,208 | | | | 1,450,855 | | | | | |
| | 2,800 | | | PALO ALTO NETWORKS, INC.(b) | | | 116,508 | | | | 570,528 | | | | | |
| | 1,952 | | | PAYCHEX, INC. | | | 139,107 | | | | 160,630 | | | | | |
| | 2,263 | | | PAYCOM SOFTWARE, INC.(b) | | | 359,075 | | | | 513,067 | | | | | |
| | 9,660 | | | PAYPAL HOLDINGS, INC.(b) | | | 822,409 | | | | 1,105,684 | | | | | |
| | 907 | | | PERSPECTA, INC. | | | 8,504 | | | | 21,233 | | | | | |
| | 600 | | | PROOFPOINT, INC.(b) | | | 56,232 | | | | 72,150 | | | | | |
| | 2,700 | | | PTC, INC.(b) | | | 107,547 | | | | 242,352 | | | | | |
| | 2,400 | | | PURE STORAGE, INC., CLASS A(b) | | | 43,850 | | | | 36,648 | | | | | |
| | 1,700 | | | QUALCOMM, INC. | | | 21,216 | | | | 129,319 | | | | | |
| | 4,950 | | | RED HAT, INC.(b) | | | 195,072 | | | | 929,412 | | | | | |
| | 800 | | | RINGCENTRAL, INC., CLASS A(b) | | | 67,416 | | | | 91,936 | | | | | |
| | 3,100 | | | SABRE CORP. | | | 62,820 | | | | 68,820 | | | | | |
| | 7,600 | | | SALESFORCE.COM, INC.(b) | | | 86,710 | | | | 1,153,148 | | | | | |
| | 54,321 | | | SEAGATE TECHNOLOGY PLC | | | 1,896,747 | | | | 2,559,606 | | | | | |
| | 2,100 | | | SERVICENOW, INC.(b) | | | 273,110 | | | | 576,597 | | | | | |
| | 300 | | | SKYWORKS SOLUTIONS, INC. | | | 22,041 | | | | 23,181 | | | | | |
| | 500 | | | SPLUNK, INC.(b) | | | 40,835 | | | | 62,875 | | | | | |
| | 3,300 | | | SQUARE, INC., CLASS A(b) | | | 131,052 | | | | 239,349 | | | | | |
| | 5,100 | | | SWITCH, INC., CLASS A | | | 38,659 | | | | 66,759 | | | | | |
| | 14,419 | | | SYMANTEC CORP. | | | 71,242 | | | | 313,757 | | | | | |
| | 5,744 | | | SYNOPSYS, INC.(b) | | | 341,335 | | | | 739,195 | | | | | |
| | 700 | | | TABLEAU SOFTWARE, INC., CLASS A(b) | | | 61,023 | | | | 116,214 | | | | | |
| | 4,600 | | | TERADYNE, INC. | | | 82,730 | | | | 220,386 | | | | | |
| | 28,440 | | | TEXAS INSTRUMENTS, INC. | | | 952,040 | | | | 3,263,774 | | | | | |
| | 2,356 | | | TOTAL SYSTEM SERVICES, INC. | | | 183,880 | | | | 302,204 | | | | | |
| | 7,720 | | | TRIMBLE, INC.(b) | | | 113,413 | | | | 348,249 | | | | | |
| | 605 | | | UBIQUITI NETWORKS, INC. | | | 87,252 | | | | 79,557 | | | | | |
| | 200 | | | VERISIGN, INC.(b) | | | 23,200 | | | | 41,832 | | | | | |
| | 787 | | | VERSUM MATERIALS, INC. | | | 4,722 | | | | 40,593 | | | | | |
| | 28,480 | | | VISA, INC., CLASS A | | | 1,119,204 | | | | 4,942,704 | | | | | |
| | 7,800 | | | VISHAY INTERTECHNOLOGY, INC. | | | 48,931 | | | | 128,856 | | | | | |
| | 5,192 | | | VMWARE, INC., CLASS A | | | 411,139 | | | | 868,154 | | | | | |
| | 6,045 | | | WESTERN DIGITAL CORP. | | | 99,733 | | | | 287,440 | | | | | |
| | 71,219 | | | WESTERN UNION (THE) CO. | | | 1,363,843 | | | | 1,416,546 | | | | | |
| | 300 | | | WEX, INC.(b) | | | 41,025 | | | | 62,430 | | | | | |
| | 1,700 | | | WORKDAY, INC., CLASS A(b) | | | 254,727 | | | | 349,486 | | | | | |
| | 3,238 | | | WORLDPAY, INC., CLASS A(b) | | | 290,063 | | | | 396,817 | | | | | |
| | 6,750 | | | XILINX, INC. | | | 47,180 | | | | 795,960 | | | | | |
| | 2,795 | | | ZEBRA TECHNOLOGIES CORP., CLASS A(b) | | | 414,834 | | | | 585,525 | | | | | |
| | 1,300 | | | ZENDESK, INC.(b) | | | 79,216 | | | | 115,739 | | | | | |
| | | | | | | | 50,108,216 | | | | 109,376,782 | | | | 21.58 | % |
| | Materials: | | | | | | | | | | | | | | | |
| | 1,075 | | | AIR PRODUCTS & CHEMICALS, INC. | | | 43,205 | | | | 243,348 | | | | | |
| | 1,300 | | | ALBEMARLE CORP. | | | 29,153 | | | | 91,533 | | | | | |
| | 13,770 | | | AMCOR PLC(b)(c) | | | 60,200 | | | | 158,217 | | | | | |
| | 700 | | | ASHLAND GLOBAL HOLDINGS, INC. | | | 12,006 | | | | 55,979 | | | | | |
| | 3,165 | | | AVERY DENNISON CORP. | | | 207,899 | | | | 366,127 | | | | | |
| | 2,592 | | | BALL CORP. | | | 140,020 | | | | 181,414 | | | | | |
| | 4,112 | | | CELANESE CORP. | | | 313,618 | | | | 443,274 | | | | | |
| | 3,100 | | | CF INDUSTRIES HOLDINGS, INC. | | | 129,445 | | | | 144,801 | | | | | |
| | 2,400 | | | CHEMOURS (THE) CO. | | | 69,007 | | | | 57,600 | | | | | |
| | 7,262 | | | CORTEVA, INC.(b) | | | 88,857 | | | | 214,737 | | | | | |
| | 1,800 | | | CROWN HOLDINGS, INC.(b) | | | 57,831 | | | | 109,980 | | | | | |
| | 7,262 | | | DOW, INC. | | | 147,036 | | | | 358,089 | | | | | |
| | 7,262 | | | DUPONT DE NEMOURS, INC. | | | 212,802 | | | | 545,158 | | | | | |
| | 3,000 | | | EASTMAN CHEMICAL CO. | | | 58,012 | | | | 233,490 | | | | | |
| | 3,891 | | | ECOLAB, INC. | | | 133,579 | | | | 768,239 | | | | | |
| | 4,400 | | | ELEMENT SOLUTIONS, INC.(b) | | | 42,294 | | | | 45,496 | | | | | |
| | 51,418 | | | FREEPORT-MCMORAN, INC. | | | 503,061 | | | | 596,963 | | | | | |
| | 238 | | | INTERNATIONAL FLAVORS & FRAGRANCES, INC. | | | 5,120 | | | | 34,532 | | | | | |
| | 30,628 | | | INTERNATIONAL PAPER CO. | | | 1,087,636 | | | | 1,326,805 | | | | | |
| | 4,450 | | | LINDE PLC(c) | | | 723,931 | | | | 893,560 | | | | | |
| | 23,861 | | | LYONDELLBASELL INDUSTRIES N.V., CLASS A | | | 2,063,758 | | | | 2,055,148 | | | | | |
| See accompanying notes to financial statements. | 36 | (Continued) |
CLEARWATER INVESTMENT TRUST
Schedule of Investments - Clearwater Core Equity Fund
June 30, 2019 (unaudited)
| Shares | | | Security | | Cost | | | Fair value (a) | | | Percent of
net assets | |
| | Materials (Cont’d): | | | | | | | | | | | | |
| | 700 | | | MARTIN MARIETTA MATERIALS, INC. | | $ | 27,965 | | | | 161,077 | | | | | |
| | 3,200 | | | MOSAIC (THE) CO. | | | 54,200 | | | | 80,096 | | | | | |
| | 7,400 | | | NEWMONT GOLDCORP CORP. | | | 136,530 | | | | 284,678 | | | | | |
| | 5,844 | | | NUCOR CORP. | | | 99,313 | | | | 322,004 | | | | | |
| | 3,100 | | | OLIN CORP. | | | 65,390 | | | | 67,921 | | | | | |
| | 3,245 | | | PACKAGING CORP. OF AMERICA | | | 133,051 | | | | 309,313 | | | | | |
| | 5,572 | | | PPG INDUSTRIES, INC. | | | 131,983 | | | | 650,308 | | | | | |
| | 6,625 | | | RELIANCE STEEL & ALUMINUM CO. | | | 325,929 | | | | 626,858 | | | | | |
| | 600 | | | ROYAL GOLD, INC. | | | 22,314 | | | | 61,494 | | | | | |
| | 2,400 | | | RPM INTERNATIONAL, INC. | | | 24,657 | | | | 146,664 | | | | | |
| | 500 | | | SCOTTS MIRACLE-GRO (THE) CO. | | | 37,765 | | | | 49,250 | | | | | |
| | 1,400 | | | SEALED AIR CORP. | | | 24,528 | | | | 59,892 | | | | | |
| | 857 | | | SHERWIN-WILLIAMS (THE) CO. | | | 41,646 | | | | 392,755 | | | | | |
| | 3,600 | | | SONOCO PRODUCTS CO. | | | 74,519 | | | | 235,224 | | | | | |
| | 3,234 | | | SOUTHERN COPPER CORP.(c) | | | 38,445 | | | | 125,641 | | | | | |
| | 26,431 | | | STEEL DYNAMICS, INC. | | | 719,954 | | | | 798,216 | | | | | |
| | 4,392 | | | VALVOLINE, INC. | | | 24,184 | | | | 85,776 | | �� | | | |
| | 2,100 | | | VULCAN MATERIALS CO. | | | 63,441 | | | | 288,351 | | | | | |
| | 2,242 | | | WESTROCK CO. | | | 24,357 | | | | 81,766 | | | | | |
| | | | | | | | 8,198,641 | | | | 13,751,774 | | | | 2.71 | % |
| | Real Estate: | | | | | | | | | | | | | | | |
| | 2,100 | | | ALEXANDRIA REAL ESTATE EQUITIES, INC. | | | 106,143 | | | | 296,289 | | | | | |
| | 9,673 | | | AMERICAN TOWER CORP. | | | 1,556,483 | | | | 1,977,645 | | | | | |
| | 3,629 | | | APARTMENT INVESTMENT & MANAGEMENT CO., CLASS A | | | 44,956 | | | | 181,886 | | | | | |
| | 1,734 | | | AVALONBAY COMMUNITIES, INC. | | | 193,548 | | | | 352,314 | | | | | |
| | 3,388 | | | BOSTON PROPERTIES, INC. | | | 171,468 | | | | 437,052 | | | | | |
| | 2,600 | | | BRANDYWINE REALTY TRUST | | | 27,832 | | | | 37,232 | | | | | |
| | 900 | | | CAMDEN PROPERTY TRUST | | | 24,065 | | | | 93,951 | | | | | |
| | 5,500 | | | COLONY CAPITAL, INC. | | | 29,068 | | | | 27,500 | | | | | |
| | 1,545 | | | CORECIVIC, INC. | | | 22,130 | | | | 32,074 | | | | | |
| | 500 | | | CORESITE REALTY CORP. | | | 43,409 | | | | 57,585 | | | | | |
| | 4,700 | | | CROWN CASTLE INTERNATIONAL CORP. | | | 193,063 | | | | 612,645 | | | | | |
| | 500 | | | DIGITAL REALTY TRUST, INC. | | | 26,734 | | | | 58,895 | | | | | |
| | 5,200 | | | DOUGLAS EMMETT, INC. | | | 45,222 | | | | 207,168 | | | | | |
| | 1,700 | | | DUKE REALTY CORP. | | | 28,435 | | | | 53,737 | | | | | |
| | 845 | | | EQUINIX, INC. | | | 65,492 | | | | 426,125 | | | | | |
| | 5,446 | | | EQUITY LIFESTYLE PROPERTIES, INC. | | | 574,160 | | | | 660,818 | | | | | |
| | 5,416 | | | EQUITY RESIDENTIAL | | | 174,162 | | | | 411,183 | | | | | |
| | 875 | | | ESSEX PROPERTY TRUST, INC. | | | 116,032 | | | | 255,439 | | | | | |
| | 1,500 | | | EXTRA SPACE STORAGE, INC. | | | 130,992 | | | | 159,150 | | | | | |
| | 900 | | | FEDERAL REALTY INVESTMENT TRUST | | | 48,326 | | | | 115,884 | | | | | |
| | 1,046 | | | FOUR CORNERS PROPERTY TRUST, INC. | | | 8,807 | | | | 28,587 | | | | | |
| | 7,000 | | | HCP, INC. | | | 75,334 | | | | 223,860 | | | | | |
| | 1,800 | | | HOSPITALITY PROPERTIES TRUST | | | 23,171 | | | | 45,000 | | | | | |
| | 12,222 | | | HOST HOTELS & RESORTS, INC. | | | 93,479 | | | | 222,685 | | | | | |
| | 678 | | | HOWARD HUGHES (THE) CORP.(b) | | | 20,502 | | | | 83,964 | | | | | |
| | 700 | | | JBG SMITH PROPERTIES | | | 17,888 | | | | 27,538 | | | | | |
| | 700 | | | JONES LANG LASALLE, INC. | | | 39,951 | | | | 98,483 | | | | | |
| | 6,601 | | | KIMCO REALTY CORP. | | | 67,254 | | | | 121,986 | | | | | |
| | 3,900 | | | LAMAR ADVERTISING CO., CLASS A | | | 41,016 | | | | 314,769 | | | | | |
| | 1,100 | | | LIBERTY PROPERTY TRUST | | | 23,353 | | | | 55,044 | | | | | |
| | 600 | | | LIFE STORAGE, INC. | | | 48,946 | | | | 57,048 | | | | | |
| | 5,123 | | | MACERICH (THE) CO. | | | 111,630 | | | | 171,569 | | | | | |
| | 1,800 | | | MID-AMERICA APARTMENT COMMUNITIES, INC. | | | 132,698 | | | | 211,968 | | | | | |
| | 800 | | | OMEGA HEALTHCARE INVESTORS, INC. | | | 25,945 | | | | 29,400 | | | | | |
| | 10,169 | | | PROLOGIS, INC. | | | 257,893 | | | | 814,537 | | | | | |
| | 1,424 | | | PUBLIC STORAGE | | | 135,843 | | | | 339,154 | | | | | |
| | 6,972 | | | RAYONIER, INC. | | | 74,591 | | | | 211,252 | | | | | |
| | 2,700 | | | REALTY INCOME CORP. | | | 55,485 | | | | 186,219 | | | | | |
| | 3,900 | | | REGENCY CENTERS CORP. | | | 85,344 | | | | 260,286 | | | | | |
| | 9,800 | | | RETAIL PROPERTIES OF AMERICA, INC., CLASS A | | | 80,756 | | | | 115,248 | | | | | |
| | 1,224 | | | RETAIL VALUE, INC. | | | 33,005 | | | | 42,595 | | | | | |
| | 4,942 | | | SBA COMMUNICATIONS CORP.(b) | | | 792,573 | | | | 1,111,159 | | | | | |
| | 4,598 | | | SIMON PROPERTY GROUP, INC. | | | 555,000 | | | | 734,577 | | | | | |
| | 1,900 | | | SL GREEN REALTY CORP. | | | 58,204 | | | | 152,703 | | | | | |
| | 2,800 | | | STORE CAPITAL CORP. | | | 73,379 | | | | 92,932 | | | | | |
| | 1,100 | | | SUN COMMUNITIES, INC. | | | 83,590 | | | | 141,009 | | | | | |
| See accompanying notes to financial statements. | 37 | (Continued) |
CLEARWATER INVESTMENT TRUST
Schedule of Investments - Clearwater Core Equity Fund
June 30, 2019 (unaudited)
| Shares | | | Security | | Cost | | | Fair value (a) | | | Percent of
net assets | |
| | Real Estate (Cont’d): | | | | | | | | | | | | |
| | 2,100 | | | TAUBMAN CENTERS, INC. | | $ | 52,545 | | | | 85,743 | | | | | |
| | 4,100 | | | UDR, INC. | | | 64,026 | | | | 184,049 | | | | | |
| | 1,300 | | | URBAN EDGE PROPERTIES | | | 18,730 | | | | 22,529 | | | | | |
| | 3,527 | | | VENTAS, INC. | | | 150,097 | | | | 241,070 | | | | | |
| | 800 | | | VORNADO REALTY TRUST | | | 29,237 | | | | 51,280 | | | | | |
| | 1,715 | | | WASHINGTON PRIME GROUP, INC. | | | 8,005 | | | | 6,551 | | | | | |
| | 2,100 | | | WEINGARTEN REALTY INVESTORS | | | 29,916 | | | | 57,582 | | | | | |
| | 4,600 | | | WELLTOWER, INC. | | | 273,029 | | | | 375,038 | | | | | |
| | 5,416 | | | WEYERHAEUSER CO. | | | 75,648 | | | | 142,657 | | | | | |
| | | | | | | | 7,338,590 | | | | 13,514,643 | | | | 2.67 | % |
| | Utilities: | | | | | | | | | | | | | | | |
| | 3,000 | | | AES CORP. | | | 32,870 | | | | 50,280 | | | | | |
| | 2,000 | | | ALLIANT ENERGY CORP. | | | 24,835 | | | | 98,160 | | | | | |
| | 1,600 | | | AMEREN CORP. | | | 40,872 | | | | 120,176 | | | | | |
| | 8,554 | | | AMERICAN ELECTRIC POWER CO., INC. | | | 477,380 | | | | 752,838 | | | | | |
| | 1,735 | | | AQUA AMERICA, INC. | | | 22,973 | | | | 71,777 | | | | | |
| | 13,200 | | | AVANGRID, INC. | | | 502,113 | | | | 666,600 | | | | | |
| | 5,800 | | | CENTERPOINT ENERGY, INC. | | | 66,308 | | | | 166,054 | | | | | |
| | 13,300 | | | CMS ENERGY CORP. | | | 259,708 | | | | 770,203 | | | | | |
| | 7,775 | | | CONSOLIDATED EDISON, INC. | | | 539,780 | | | | 681,712 | | | | | |
| | 12,073 | | | DOMINION ENERGY, INC. | | | 450,978 | | | | 933,484 | | | | | |
| | 6,243 | | | DTE ENERGY CO. | | | 510,391 | | | | 798,355 | | | | | |
| | 14,004 | | | DUKE ENERGY CORP. | | | 721,544 | | | | 1,235,713 | | | | | |
| | 8,325 | | | EDISON INTERNATIONAL | | | 179,967 | | | | 561,188 | | | | | |
| | 3,164 | | | ENTERGY CORP. | | | 68,368 | | | | 325,671 | | | | | |
| | 2,974 | | | EVERGY, INC. | | | 67,407 | | | | 178,886 | | | | | |
| | 4,961 | | | EVERSOURCE ENERGY | | | 125,492 | | | | 375,845 | | | | | |
| | 38,749 | | | EXELON CORP. | | | 1,463,785 | | | | 1,857,627 | | | | | |
| | 5,500 | | | FIRSTENERGY CORP. | | | 176,693 | | | | 235,455 | | | | | |
| | 900 | | | NATIONAL FUEL GAS CO. | | | 20,790 | | | | 47,475 | | | | | |
| | 4,400 | | | NEXTERA ENERGY, INC. | | | 204,691 | | | | 901,384 | | | | | |
| | 6,900 | | | NISOURCE, INC. | | | 43,973 | | | | 198,720 | | | | | |
| | 1,200 | | | NRG ENERGY, INC. | | | 33,011 | | | | 42,144 | | | | | |
| | 14,491 | | | OGE ENERGY CORP. | | | 421,639 | | | | 616,737 | | | | | |
| | 10,448 | | | PINNACLE WEST CAPITAL CORP. | | | 807,416 | | | | 983,052 | | | | | |
| | 700 | | | PPL CORP. | | | 10,384 | | | | 21,707 | | | | | |
| | 1,200 | | | PUBLIC SERVICE ENTERPRISE GROUP, INC. | | | 51,552 | | | | 70,584 | | | | | |
| | 3,200 | | | SEMPRA ENERGY | | | 174,758 | | | | 439,808 | | | | | |
| | 8,600 | | | SOUTHERN (THE) CO. | | | 176,010 | | | | 475,408 | | | | | |
| | 5,426 | | | UGI CORP. | | | 80,112 | | | | 289,803 | | | | | |
| | 1,600 | | | WEC ENERGY GROUP, INC. | | | 91,440 | | | | 133,392 | | | | | |
| | 968 | | | XCEL ENERGY, INC. | | | 36,241 | | | | 57,586 | | | | | |
| | | | | | | | 7,883,481 | | | | 14,157,824 | | | | 2.79 | % |
| | | | Sub-total Common Stocks: | | | 263,376,193 | | | | 504,969,571 | | | | 99.61 | % |
| | Short-Term Investments: | | | | | | | | | | | | |
| | 2,491,200 | | | NORTHERN INSTITUTIONAL FUNDS - U.S. GOVERNMENT SELECT PORTFOLIO, 2.25%(e) | | | 2,491,200 | | | | 2,491,200 | | | | | |
| | | | Sub-total Short-Term Investments: | | | 2,491,200 | | | | 2,491,200 | | | | 0.49 | % |
| | | | | Grand total | | $ | 265,867,393 | | | | 507,460,771 | | | | 100.10 | % |
Notes to Schedule of Investments:
| (a) | Investments are valued in accordance with procedures described in note 2 to the financial statements. |
| (b) | Non-income producing assets. |
| (c) | Foreign security values are stated in U.S. dollars. As of June 30, 2019, the value of foreign stocks or depositary receipts of companies based outside of the United States represented 3.25% of net assets. |
| (d) | Securities are American Depositary Receipts of companies based outside of the United States representing 0.01% of net assets as of June 30, 2019. |
| (e) | The short-term investment is a money market portfolio of the investment company, Northern Institutional Funds. At December 31, 2018, the value of the Clearwater Core Equity Fund’s investment in the U.S. Government Select Portfolio of the Northern Institutional Funds was $4,473,835 with net sales of $1,982,635 during the six months ended June 30, 2019. |
| See accompanying notes to financial statements. | 38 | (Continued) |
CLEARWATER INVESTMENT TRUST
Schedule of Investments - Clearwater Core Equity Fund
June 30, 2019 (unaudited)
Clearwater Core Equity Fund Portfolio Diversification
(as a percentage of net assets)

| See accompanying notes to financial statements. | 39 | (Continued) |
CLEARWATER INVESTMENT TRUST
Schedule of Investments - Clearwater Small Companies Fund
June 30, 2019 (unaudited)
| | Shares | | | Security | | Cost | | Fair value (a) | | | Percent of
net assets | |
| Common Stocks: | | | | | | | | |
| | Communication Services: | | | | | | | | | | |
| | 109,240 | | | ALASKA COMMUNICATIONS SYSTEMS GROUP, INC.(b) | | $ | 200,768 | | | 186,800 | | | | |
| | 26,394 | | | BEASLEY BROADCAST GROUP, INC., CLASS A | | | 85,517 | | | 84,989 | | | | |
| | 14,301 | | | GANNETT CO., INC. | | | 112,160 | | | 116,696 | | | | |
| | 5,089 | | | HEMISPHERE MEDIA GROUP, INC.(b) | | | 70,598 | | | 65,750 | | | | |
| | 17,382 | | | IMAX CORP.(b)(c) | | | 339,065 | | | 351,116 | | | | |
| | 115,656 | | | MARCHEX, INC., CLASS B(b) | | | 282,313 | | | 543,583 | | | | |
| | 20,368 | | | ORBCOMM, INC.(b) | | | 148,890 | | | 147,668 | | | | |
| | 53,166 | | | READING INTERNATIONAL, INC., CLASS A(b) | | | 788,350 | | | 690,095 | | | | |
| | 5,348 | | | SAGA COMMUNICATIONS, INC., CLASS A | | | 174,892 | | | 167,072 | | | | |
| | | | | | | | 2,202,553 | | | 2,353,769 | | | 0.68 | % |
| | Consumer Discretionary: | | | | | | | | | | |
| | 120,500 | | | AMERICAN EAGLE OUTFITTERS, INC. | | | 2,323,315 | | | 2,036,450 | | | | |
| | 151,119 | | | BBX CAPITAL CORP. | | | 895,393 | | | 741,994 | | | | |
| | 11,546 | | | BLUEGREEN VACATIONS CORP. | | | 120,054 | | | 134,973 | | | | |
| | 81,501 | | | CALLAWAY GOLF CO. | | | 1,318,602 | | | 1,398,557 | | | | |
| | 72,043 | | | CARRIAGE SERVICES, INC. | | | 1,579,913 | | | 1,369,537 | | | | |
| | 15,688 | | | CHILDREN’S PLACE (THE), INC. | | | 1,712,128 | | | 1,496,321 | | | | |
| | 282,097 | | | CLARUS CORP. | | | 1,759,123 | | | 4,073,481 | | | | |
| | 21,625 | | | CROWN CRAFTS, INC. | | | 103,151 | | | 101,638 | | | | |
| | 68,112 | | | CSS INDUSTRIES, INC. | | | 1,066,662 | | | 332,387 | | | | |
| | 93,048 | | | DEL FRISCO’S RESTAURANT GROUP, INC.(b) | | | 689,852 | | | 740,662 | | | | |
| | 10,143 | | | DORMAN PRODUCTS, INC.(b) | | | 845,836 | | | 883,861 | | | | |
| | 68,800 | | | EXTENDED STAY AMERICA, INC. | | | 1,351,173 | | | 1,162,032 | | | | |
| | 97,891 | | | FIESTA RESTAURANT GROUP, INC.(b) | | | 1,387,972 | | | 1,286,288 | | | | |
| | 175,902 | | | FULL HOUSE RESORTS, INC.(b) | | | 396,501 | | | 328,937 | | | | |
| | 33,782 | | | G-III APPAREL GROUP LTD.(b) | | | 918,237 | | | 993,866 | | | | |
| | 55,200 | | | GILDAN ACTIVEWEAR, INC.(c) | | | 1,641,636 | | | 2,135,136 | | | | |
| | 20,200 | | | HELEN OF TROY LTD.(b) | | | 2,032,428 | | | 2,637,918 | | | | |
| | 11,036 | | | IROBOT CORP.(b)(d) | | | 821,346 | | | 1,011,339 | | | | |
| | 19,346 | | | LAKELAND INDUSTRIES, INC.(b) | | | 216,942 | | | 216,675 | | | | |
| | 194,252 | | | LIFETIME BRANDS, INC. | | | 2,029,553 | | | 1,837,624 | | | | |
| | 11,440 | | | LITHIA MOTORS, INC., CLASS A | | | 606,812 | | | 1,358,843 | | | | |
| | 29,100 | | | MALIBU BOATS, INC., CLASS A(b) | | | 944,242 | | | 1,130,535 | | | | |
| | 9,565 | | | MARINEMAX, INC.(b) | | | 165,230 | | | 157,249 | | | | |
| | 20,841 | | | MARRIOTT VACATIONS WORLDWIDE CORP. | | | 1,813,254 | | | 2,009,072 | | | | |
| | 46,111 | | | MASTERCRAFT BOAT HOLDINGS, INC.(b) | | | 1,142,859 | | | 903,315 | | | | |
| | 41,420 | | | MOTORCAR PARTS OF AMERICA, INC.(b) | | | 755,108 | | | 886,802 | | | | |
| | 424,919 | | | OFFICE DEPOT, INC. | | | 998,472 | | | 875,333 | | | | |
| | 79,136 | | | PARTY CITY HOLDCO, INC.(b) | | | 1,128,456 | | | 580,067 | | | | |
| | 78,778 | | | PENN NATIONAL GAMING, INC.(b) | | | 1,761,039 | | | 1,517,264 | | | | |
| | 99,274 | | | POTBELLY CORP.(b) | | | 1,077,136 | | | 505,305 | | | | |
| | 25,179 | | | RED LION HOTELS CORP.(b) | | | 189,618 | | | 179,023 | | | | |
| | 61,370 | | | SKYLINE CHAMPION CORP.(b) | | | 1,260,056 | | | 1,680,311 | | | | |
| | 2,056 | | | STANDARD MOTOR PRODUCTS, INC. | | | 96,247 | | | 93,219 | | | | |
| | 85,299 | | | TWIN RIVER WORLDWIDE HOLDINGS, INC.(b)(d) | | | 2,660,550 | | | 2,537,639 | | | | |
| | 7,584 | | | UNIFI, INC.(b) | | | 152,019 | | | 137,801 | | | | |
| | 33,500 | | | WILLIAMS-SONOMA, INC.(d) | | | 1,628,979 | | | 2,177,500 | | | | |
| | 91,400 | | | WINNEBAGO INDUSTRIES, INC. | | | 2,935,774 | | | 3,532,610 | | | | |
| | | | | | | | 42,525,668 | | | 45,181,564 | | | 13.09 | % |
| | Consumer Staples: | | | | | | | | | | |
| | 14,333 | | | CALAVO GROWERS, INC. | | | 1,183,861 | | | 1,386,574 | | | | |
| | 67,962 | | | CENTRAL GARDEN & PET CO., CLASS A(b) | | | 2,126,426 | | | 1,674,584 | | | | |
| | 2,787 | | | COFFEE HOLDING CO., INC.(b) | | | 12,265 | | | 11,399 | | | | |
| | 33,810 | | | PERFORMANCE FOOD GROUP CO.(b) | | | 1,090,573 | | | 1,353,414 | | | | |
| | 36,550 | | | PRIMO WATER CORP.(b) | | | 456,656 | | | 449,565 | | | | |
| | 30,708 | | | SPECTRUM BRANDS HOLDINGS, INC. | | | 1,703,480 | | | 1,651,169 | | | | |
| | 391,113 | | | SUNOPTA, INC.(b)(c)(d) | | | 2,034,092 | | | 1,286,762 | | | | |
| | 39,757 | | | UNIVERSAL CORP. | | | 2,167,649 | | | 2,416,033 | | | | |
| | | | | | | | 10,775,002 | | | 10,229,500 | | | 2.96 | % |
| | Energy: | | | | | | | | | | |
| | 34,247 | | | BERRY PETROLEUM CORP. | | | 398,174 | | | 363,018 | | | | |
| | 150,629 | | | C&J ENERGY SERVICES, INC.(b) | | | 2,213,171 | | | 1,774,410 | | | | |
| | 60,751 | | | MURPHY OIL CORP. | | | 1,560,712 | | | 1,497,512 | | | | |
| | 45,544 | | | OIL STATES INTERNATIONAL, INC.(b) | | | 1,138,368 | | | 833,455 | | | | |
| | 17,053 | | | PROFIRE ENERGY, INC.(b) | | | 28,972 | | | 25,750 | | | | |
| See accompanying notes to financial statements. | 40 | (Continued) |
CLEARWATER INVESTMENT TRUST
Schedule of Investments - Clearwater Small Companies Fund
June 30, 2019 (unaudited)
| | Shares | | | Security | | Cost | | Fair value (a) | | | Percent of
net assets | |
| | Energy (Cont’d): | | | | | | | | | | |
| | 62,524 | | | SM ENERGY CO. | | $ | 1,452,040 | | | 782,801 | | | | |
| | 31,728 | | | SOLARIS OILFIELD INFRASTRUCTURE, INC., CLASS A(d) | | | 568,859 | | | 475,285 | | | | |
| | 21,501 | | | WORLD FUEL SERVICES CORP. | | | 774,156 | | | 773,176 | | | | |
| | | | | | | | 8,134,452 | | | 6,525,407 | | | 1.89 | % |
| | Financials: | | | | | | | | | | |
| | 20,146 | | | AMBAC FINANCIAL GROUP, INC.(b) | | | 366,156 | | | 339,460 | | | | |
| | 105,399 | | | AMERICAN EQUITY INVESTMENT LIFE HOLDING CO. | | | 2,735,795 | | | 2,862,637 | | | | |
| | 28,078 | | | AMERIS BANCORP | | | 855,284 | | | 1,100,377 | | | | |
| | 13,813 | | | ARGO GROUP INTERNATIONAL HOLDINGS LTD.(c) | | | 723,465 | | | 1,022,853 | | | | |
| | 107,251 | | | ASSOCIATED BANC-CORP | | | 2,470,813 | | | 2,267,286 | | | | |
| | 40,013 | | | AXIS CAPITAL HOLDINGS LTD.(c) | | | 2,105,370 | | | 2,386,775 | | | | |
| | 36,559 | | | BANCORP (THE), INC.(b) | | | 337,429 | | | 326,106 | | | | |
| | 2,354 | | | BANKWELL FINANCIAL GROUP, INC. | | | 68,210 | | | 67,560 | | | | |
| | 24,775 | | | BCB BANCORP, INC. | | | 303,494 | | | 343,134 | | | | |
| | 29,078 | | | BLACKROCK CAPITAL INVESTMENT CORP. | | | 178,103 | | | 175,340 | | | | |
| | 77,621 | | | BLACKROCK TCP CAPITAL CORP. | | | 1,118,482 | | | 1,106,099 | | | | |
| | 57,137 | | | CANNAE HOLDINGS, INC.(b) | | | 1,107,118 | | | 1,655,830 | | | | |
| | 22,437 | | | CAROLINA FINANCIAL CORP. | | | 795,621 | | | 787,314 | | | | |
| | 9,471 | | | CB FINANCIAL SERVICES, INC. | | | 255,287 | | | 224,936 | | | | |
| | 36,233 | | | CENTERSTATE BANK CORP. | | | 891,755 | | | 834,446 | | | | |
| | 1,879 | | | CENTRAL VALLEY COMMUNITY BANCORP | | | 37,299 | | | 40,342 | | | | |
| | 1,908 | | | CITIZENS HOLDING CO. | | | 41,875 | | | 39,362 | | | | |
| | 54,317 | | | CM FINANCE, INC. | | | 394,667 | | | 413,352 | | | | |
| | 5,771 | | | CNB FINANCIAL CORP. | | | 93,783 | | | 162,973 | | | | |
| | 197,746 | | | CNO FINANCIAL GROUP, INC. | | | 3,612,146 | | | 3,298,403 | | | | |
| | 27,893 | | | COMMERCE BANCSHARES, INC. | | | 1,395,407 | | | 1,664,096 | | | | |
| | 50,776 | | | CRAWFORD & CO., CLASS A | | | 437,434 | | | 534,671 | | | | |
| | 6,782 | | | CRAWFORD & CO., CLASS B | | | 52,628 | | | 63,140 | | | | |
| | 101,211 | | | DONEGAL GROUP, INC., CLASS A | | | 1,520,565 | | | 1,545,492 | | | | |
| | 10,563 | | | DYNEX CAPITAL, INC. | | | 188,561 | | | 176,936 | | | | |
| | 9,170 | | | EAGLE BANCORP MONTANA, INC. | | | 167,190 | | | 152,222 | | | | |
| | 43,260 | | | EMC INSURANCE GROUP, INC. | | | 1,284,571 | | | 1,558,658 | | | | |
| | 19,339 | | | ENTERPRISE FINANCIAL SERVICES CORP. | | | 786,061 | | | 804,502 | | | | |
| | 33,303 | | | ESSENT GROUP LTD.(b) | | | 1,387,483 | | | 1,564,908 | | | | |
| | 137,437 | | | EXANTAS CAPITAL CORP. | | | 1,236,260 | | | 1,554,412 | | | | |
| | 8,365 | | | FARMERS NATIONAL BANC CORP. | | | 87,755 | | | 124,053 | | | | |
| | 76,048 | | | FIDUS INVESTMENT CORP. | | | 1,080,978 | | | 1,212,966 | | | | |
| | 27,248 | | | FIRST HAWAIIAN, INC. | | | 698,862 | | | 704,906 | | | | |
| | 31,785 | | | FIRST MERCHANTS CORP. | | | 1,309,231 | | | 1,204,652 | | | | |
| | 77,252 | | | FIRST MIDWEST BANCORP, INC. | | | 1,720,204 | | | 1,581,348 | | | | |
| | 15,500 | | | FIRSTCASH, INC. | | | 923,675 | | | 1,550,310 | | | | |
| | 47,600 | | | GLACIER BANCORP, INC. | | | 2,014,105 | | | 1,930,180 | | | | |
| | 23,674 | | | HANCOCK WHITNEY CORP. | | | 1,178,375 | | | 948,380 | | | | |
| | 36,343 | | | HERITAGE COMMERCE CORP. | | | 409,547 | | | 445,202 | | | | |
| | 147,427 | | | HOPE BANCORP, INC. | | | 2,439,921 | | | 2,031,544 | | | | |
| | 52,522 | | | HUNT COS. FINANCE TRUST, INC. | | | 179,449 | | | 179,100 | | | | |
| | 13,289 | | | LANDMARK BANCORP, INC. | | | 354,013 | | | 318,272 | | | | |
| | 4,350 | | | LCNB CORP. | | | 66,448 | | | 82,650 | | | | |
| | 3,860 | | | LENDINGTREE, INC.(b)(d) | | | 957,133 | | | 1,621,316 | | | | |
| | 18,427 | | | LUTHER BURBANK CORP. | | | 193,359 | | | 200,670 | | | | |
| | 24,892 | | | MACKINAC FINANCIAL CORP. | | | 352,609 | | | 393,294 | | | | |
| | 31,662 | | | MVC CAPITAL, INC. | | | 286,618 | | | 291,607 | | | | |
| | 3,500 | | | NATIONAL WESTERN LIFE GROUP, INC., CLASS A | | | 1,164,873 | | | 899,500 | | | | |
| | 45,235 | | | NEW MOUNTAIN FINANCE CORP. | | | 613,896 | | | 631,933 | | | | |
| | 298,912 | | | OAKTREE SPECIALTY LENDING CORP. | | | 1,350,809 | | | 1,620,103 | | | | |
| | 163,263 | | | OAKTREE STRATEGIC INCOME CORP. | | | 1,373,924 | | | 1,386,103 | | | | |
| | 14,825 | | | OCEANFIRST FINANCIAL CORP. | | | 381,331 | | | 368,401 | | | | |
| | 1,581 | | | OCONEE FEDERAL FINANCIAL CORP. | | | 36,347 | | | 36,284 | | | | |
| | 20,619 | | | PENNANTPARK FLOATING RATE CAPITAL LTD.(d) | | | 239,812 | | | 238,356 | | | | |
| | 185,761 | | | PENNANTPARK INVESTMENT CORP. | | | 1,285,128 | | | 1,174,010 | | | | |
| | 4,319 | | | PENNS WOODS BANCORP, INC. | | | 181,459 | | | 195,435 | | | | |
| | 21,263 | | | PEOPLES BANCORP OF NORTH CAROLINA, INC. | | | 501,748 | | | 638,953 | | | | |
| | 52,800 | | | PRA GROUP, INC.(b) | | | 1,491,319 | | | 1,485,792 | | | | |
| | 4,800 | | | RENAISSANCERE HOLDINGS LTD.(c) | | | 607,018 | | | 854,448 | | | | |
| | 3,636 | | | SALISBURY BANCORP, INC. | | | 137,808 | | | 141,804 | | | | |
| | 6,307 | | | SHORE BANCSHARES, INC. | | | 86,022 | | | 103,056 | | | | |
| | 2,336 | | | SIERRA BANCORP | | | 40,971 | | | 63,352 | | | | |
| See accompanying notes to financial statements. | 41 | (Continued) |
CLEARWATER INVESTMENT TRUST
Schedule of Investments - Clearwater Small Companies Fund
June 30, 2019 (unaudited)
| | Shares | | | Security | | Cost | | Fair value (a) | | | Percent of
net assets | |
| | Financials (Cont’d): | | | | | | | | | | |
| | 47,025 | | | SIMMONS FIRST NATIONAL CORP., CLASS A | | $ | 1,428,180 | | | 1,093,802 | | | | |
| | 26,121 | | | SOUTHERN NATIONAL BANCORP OF VIRGINIA, INC. | | | 415,576 | | | 399,913 | | | | |
| | 2,508 | | | SOUTHWEST GEORGIA FINANCIAL CORP. | | | 51,887 | | | 52,292 | | | | |
| | 27,690 | | | STIFEL FINANCIAL CORP. | | | 1,354,417 | | | 1,635,371 | | | | |
| | 25,038 | | | SUMMIT STATE BANK | | | 321,064 | | | 275,418 | | | | |
| | 48,613 | | | SYNOVUS FINANCIAL CORP. | | | 1,568,049 | | | 1,701,455 | | | | |
| | 173,794 | | | TCF FINANCIAL CORP. | | | 2,906,776 | | | 3,613,177 | | | | |
| | 125,700 | | | UMPQUA HOLDINGS CORP. | | | 2,227,631 | | | 2,085,363 | | | | |
| | 9,024 | | | UNITED BANCORP, INC. | | | 118,401 | | | 101,700 | | | | |
| | 5,918 | | | UNITED BANCSHARES, INC. | | | 128,716 | | | 119,366 | | | | |
| | 13,436 | | | UNITED FINANCIAL BANCORP, INC. | | | 184,429 | | | 190,523 | | | | |
| | 15,665 | | | UNITY BANCORP, INC. | | | 226,203 | | | 355,596 | | | | |
| | 43,503 | | | WALKER & DUNLOP, INC. | | | 984,090 | | | 2,314,795 | | | | |
| | 36,189 | | | WEBSTER FINANCIAL CORP. | | | 1,749,738 | | | 1,728,749 | | | | |
| | 20,006 | | | WEST BANCORPORATION, INC. | | | 422,370 | | | 424,527 | | | | |
| | 898 | | | WHITEHORSE FINANCE, INC. | | | 12,351 | | | 12,348 | | | | |
| | 32,236 | | | WSFS FINANCIAL CORP. | | | 1,348,832 | | | 1,331,347 | | | | |
| | | | | | | | 66,141,769 | | | 71,167,344 | | | 20.63 | % |
| | Health Care: | | | | | | | | | | |
| | 31,480 | | | AMN HEALTHCARE SERVICES, INC.(b) | | | 1,588,056 | | | 1,707,790 | | | | |
| | 34,000 | | | BIOTELEMETRY, INC.(b) | | | 1,375,275 | | | 1,637,100 | | | | |
| | 26,355 | | | BRUKER CORP. | | | 740,335 | | | 1,316,432 | | | | |
| | 7,610 | | | CAMBREX CORP.(b) | | | 300,897 | | | 356,224 | | | | |
| | 43,300 | | | CUTERA, INC.(b) | | | 1,002,116 | | | 899,774 | | | | |
| | 21,843 | | | EMERGENT BIOSOLUTIONS, INC.(b) | | | 695,870 | | | 1,055,235 | | | | |
| | 41,397 | | | GLOBUS MEDICAL, INC., CLASS A(b) | | | 2,046,331 | | | 1,751,093 | | | | |
| | 26,348 | | | HARVARD BIOSCIENCE, INC.(b) | | | 53,223 | | | 52,696 | | | | |
| | 15,600 | | | HILL-ROM HOLDINGS, INC. | | | 1,188,688 | | | 1,632,072 | | | | |
| | 5,795 | | | ICU MEDICAL, INC.(b) | | | 851,819 | | | 1,459,818 | | | | |
| | 43,381 | | | INFUSYSTEM HOLDINGS, INC.(b) | | | 182,107 | | | 186,538 | | | | |
| | 13,731 | | | INTEGRA LIFESCIENCES HOLDINGS CORP.(b) | | | 793,219 | | | 766,876 | | | | |
| | 11,325 | | | INTRICON CORP.(b) | | | 257,639 | | | 264,552 | | | | |
| | 28,021 | | | INVACARE CORP. | | | 167,383 | | | 145,429 | | | | |
| | 22,034 | | | LHC GROUP, INC.(b) | | | 1,450,806 | | | 2,634,826 | | | | |
| | 2,478 | | | LIGAND PHARMACEUTICALS, INC.(b) | | | 271,751 | | | 282,864 | | | | |
| | 10,142 | | | LIVANOVA PLC(b)(c) | | | 1,115,990 | | | 729,818 | | | | |
| | 9,169 | | | LUMINEX CORP. | | | 221,244 | | | 189,248 | | | | |
| | 12,002 | | | MAGELLAN HEALTH, INC.(b) | | | 753,802 | | | 890,909 | | | | |
| | 68,000 | | | MEDNAX, INC.(b) | | | 2,604,302 | | | 1,715,640 | | | | |
| | 27,231 | | | NANOVIBRONIX, INC.(b)(d) | | | 132,728 | | | 78,970 | | | | |
| | 18,850 | | | OMNICELL, INC.(b) | | | 664,818 | | | 1,621,666 | | | | |
| | 7,257 | | | ORASURE TECHNOLOGIES, INC.(b) | | | 62,287 | | | 67,345 | | | | |
| | 9,552 | | | ORTHOFIX MEDICAL, INC.(b) | | | 487,255 | | | 505,110 | | | | |
| | 15,241 | | | PREMIER, INC., CLASS A(b) | | | 443,721 | | | 596,076 | | | | |
| | 27,039 | | | PROVIDENCE SERVICE (THE) CORP.(b) | | | 1,751,093 | | | 1,550,416 | | | | |
| | 51,191 | | | PSYCHEMEDICS CORP. | | | 735,870 | | | 516,517 | | | | |
| | 76,419 | | | STREAMLINE HEALTH SOLUTIONS, INC.(b) | | | 88,634 | | | 115,393 | | | | |
| | 37,600 | | | SYNEOS HEALTH, INC.(b) | | | 1,732,066 | | | 1,920,984 | | | | |
| | 43,209 | | | TIVITY HEALTH, INC.(b) | | | 1,223,896 | | | 710,356 | | | | |
| | 81,720 | | | TRIPLE-S MANAGEMENT CORP., CLASS B(b) | | | 1,988,370 | | | 1,949,022 | | | | |
| | 114,475 | | | VAREX IMAGING CORP.(b) | | | 3,265,257 | | | 3,508,659 | | | | |
| | | | | | | | 30,236,848 | | | 32,815,448 | | | 9.51 | % |
| | Industrials: | | | | | | | | | | |
| | 168,502 | | | ACTUANT CORP., CLASS A | | | 4,274,601 | | | 4,180,535 | | | | |
| | 63,600 | | | AIR LEASE CORP. | | | 2,390,380 | | | 2,629,224 | | | | |
| | 11,684 | | | AIR TRANSPORT SERVICES GROUP, INC.(b) | | | 231,323 | | | 285,090 | | | | |
| | 1,132 | | | ALAMO GROUP, INC. | | | 88,287 | | | 113,121 | | | | |
| | 15,008 | | | ALBANY INTERNATIONAL CORP., CLASS A | | | 579,755 | | | 1,244,313 | | | | |
| | 14,100 | | | AMERICAN WOODMARK CORP.(b) | | | 1,164,533 | | | 1,193,142 | | | | |
| | 3,672 | | | APOGEE ENTERPRISES, INC. | | | 134,468 | | | 159,512 | | | | |
| | 92,183 | | | ARC DOCUMENT SOLUTIONS, INC.(b) | | | 363,444 | | | 188,053 | | | | |
| | 79,219 | | | ARMSTRONG FLOORING, INC.(b) | | | 1,089,732 | | | 780,307 | | | | |
| | 29,766 | | | ASGN, INC.(b) | | | 1,248,008 | | | 1,803,820 | | | | |
| | 8,618 | | | ASTRONICS CORP.(b) | | | 187,912 | | | 346,616 | | | | |
| | 69,786 | | | AVIS BUDGET GROUP, INC.(b) | | | 2,473,365 | | | 2,453,676 | | | | |
| | 25,026 | | | BRINK’S (THE) CO. | | | 1,673,767 | | | 2,031,611 | | | | |
| | 9,810 | | | CBIZ, INC.(b) | | | 194,940 | | | 192,178 | | | | |
| See accompanying notes to financial statements. | 42 | (Continued) |
CLEARWATER INVESTMENT TRUST
Schedule of Investments - Clearwater Small Companies Fund
June 30, 2019 (unaudited)
| | Shares | | | Security | | Cost | | Fair value (a) | | | Percent of
net assets | |
| | Industrials (Cont’d): | | | | | | | | | | |
| | 77,180 | | | COLFAX CORP.(b) | | $ | 2,289,036 | | | 2,163,355 | | | | |
| | 32,520 | | | COLUMBUS MCKINNON CORP. | | | 916,069 | | | 1,364,864 | | | | |
| | 2,387 | | | CURTISS-WRIGHT CORP. | | | 164,301 | | | 303,459 | | | | |
| | 27,600 | | | DONALDSON CO., INC. | | | 1,249,708 | | | 1,403,736 | | | | |
| | 6,815 | | | DUCOMMUN, INC.(b) | | | 221,380 | | | 307,152 | | | | |
| | 119,500 | | | GATES INDUSTRIAL CORP. PLC(b) | | | 1,811,727 | | | 1,363,495 | | | | |
| | 51,675 | | | GIBRALTAR INDUSTRIES, INC.(b) | | | 1,489,069 | | | 2,085,603 | | | | |
| | 11,900 | | | GORMAN-RUPP (THE) CO. | | | 360,214 | | | 390,677 | | | | |
| | 12,263 | | | HARSCO CORP.(b) | | | 47,393 | | | 336,497 | | | | |
| | 24,300 | | | HEXCEL CORP. | | | 1,486,940 | | | 1,965,384 | | | | |
| | 73,806 | | | INTERFACE, INC. | | | 1,409,300 | | | 1,131,446 | | | | |
| | 125,028 | | | JELD-WEN HOLDING, INC.(b) | | | 3,484,070 | | | 2,654,344 | | | | |
| | 20,807 | | | KADANT, INC. | | | 1,610,911 | | | 1,889,484 | | | | |
| | 22,249 | | | KENNAMETAL, INC. | | | 781,139 | | | 822,990 | | | | |
| | 155,726 | | | LSI INDUSTRIES, INC. | | | 878,526 | | | 568,400 | | | | |
| | 43,109 | | | MASONITE INTERNATIONAL CORP.(b) | | | 2,828,344 | | | 2,270,982 | | | | |
| | 4,771 | | | MCGRATH RENTCORP | | | 158,938 | | | 296,518 | | | | |
| | 29,142 | | | MERCURY SYSTEMS, INC.(b) | | | 1,213,083 | | | 2,050,140 | | | | |
| | 5,524 | | | MSA SAFETY, INC. | | | 493,439 | | | 582,174 | | | | |
| | 45,458 | | | NAVIGANT CONSULTING, INC. | | | 970,907 | | | 1,054,171 | | | | |
| | 87,170 | | | NOW, INC.(b) | | | 967,183 | | | 1,286,629 | | | | |
| | 6,479 | | | PARK-OHIO HOLDINGS CORP. | | | 229,982 | | | 211,151 | | | | |
| | 162,760 | | | PGT INNOVATIONS, INC.(b) | | | 2,550,705 | | | 2,721,347 | | | | |
| | 106,190 | | | PIONEER POWER SOLUTIONS, INC.(b) | | | 627,210 | | | 504,402 | | | | |
| | 95,300 | | | QUANEX BUILDING PRODUCTS CORP. | | | 2,016,841 | | | 1,800,217 | | | | |
| | 172,626 | | | REV GROUP, INC. | | | 2,066,215 | | | 2,487,541 | | | | |
| | 33,000 | | | RUSH ENTERPRISES, INC., CLASS A | | | 1,376,111 | | | 1,205,160 | | | | |
| | 34,968 | | | RYDER SYSTEM, INC. | | | 2,252,825 | | | 2,038,634 | | | | |
| | 15,432 | | | SITEONE LANDSCAPE SUPPLY, INC.(b) | | | 1,146,380 | | | 1,069,438 | | | | |
| | 14,363 | | | SKYWEST, INC. | | | 461,154 | | | 871,403 | | | | |
| | 14,842 | | | SPX CORP.(b) | | | 324,558 | | | 490,083 | | | | |
| | 181,239 | | | STEELCASE, INC., CLASS A | | | 2,589,944 | | | 3,099,187 | | | | |
| | 77,126 | | | TEREX CORP. | | | 2,856,752 | | | 2,421,756 | | | | |
| | 22,527 | | | THERMON GROUP HOLDINGS, INC.(b) | | | 499,907 | | | 577,817 | | | | |
| | 41,679 | | | TITAN MACHINERY, INC.(b) | | | 640,930 | | | 857,754 | | | | |
| | 10,364 | | | TPI COMPOSITES, INC.(b) | | | 279,039 | | | 256,198 | | | | |
| | 68,793 | | | TRIMAS CORP.(b) | | | 1,808,640 | | | 2,130,519 | | | | |
| | 10,386 | | | VALMONT INDUSTRIES, INC. | | | 1,523,166 | | | 1,317,049 | | | | |
| | 32,261 | | | VIAD CORP. | | | 1,641,372 | | | 2,136,969 | | | | |
| | 59,791 | | | WESCO AIRCRAFT HOLDINGS, INC.(b) | | | 569,019 | | | 663,680 | | | | |
| | 28,737 | | | WOODWARD, INC. | | | 1,422,401 | | | 3,251,879 | | | | |
| | | | | | | | 67,809,343 | | | 74,004,882 | | | 21.45 | % |
| | Information Technology: | | | | | | | | | | |
| | 45,503 | | | ADESTO TECHNOLOGIES CORP.(b)(d) | | | 239,580 | | | 370,849 | | | | |
| | 41,834 | | | ANIXTER INTERNATIONAL, INC.(b) | | | 2,898,060 | | | 2,497,908 | | | | |
| | 24,921 | | | ASTRONOVA, INC. | | | 433,683 | | | 643,959 | | | | |
| | 27,698 | | | AUDIOCODES LTD.(c) | | | 392,268 | | | 428,765 | | | | |
| | 69,627 | | | AVIAT NETWORKS, INC.(b) | | | 1,229,827 | | | 953,890 | | | | |
| | 11,693 | | | AXT, INC.(b) | | | 50,256 | | | 46,304 | | | | |
| | 15,966 | | | BELDEN, INC. | | | 908,428 | | | 951,095 | | | | |
| | 27,550 | | | BRIGHTCOVE, INC.(b) | | | 218,248 | | | 284,591 | | | | |
| | 234,090 | | | CELESTICA, INC.(b)(c) | | | 2,491,392 | | | 1,598,835 | | | | |
| | 70,510 | | | COHU, INC. | | | 1,212,658 | | | 1,087,969 | | | | |
| | 12,358 | | | COMMVAULT SYSTEMS, INC.(b) | | | 636,255 | | | 613,204 | | | | |
| | 18,686 | | | COMTECH TELECOMMUNICATIONS CORP. | | | 461,483 | | | 525,263 | | | | |
| | 72,220 | | | CYPRESS SEMICONDUCTOR CORP. | | | 962,775 | | | 1,606,173 | | | | |
| | 102,385 | | | DSP GROUP, INC.(b) | | | 1,306,291 | | | 1,470,249 | | | | |
| | 25,800 | | | ENTEGRIS, INC. | | | 712,668 | | | 962,856 | | | | |
| | 10,022 | | | EURONET WORLDWIDE, INC.(b) | | | 448,175 | | | 1,686,101 | | | | |
| | 7,187 | | | EVERBRIDGE, INC.(b) | | | 689,525 | | | 642,661 | | | | |
| | 35,311 | | | EVO PAYMENTS, INC., CLASS A(b) | | | 842,266 | | | 1,113,356 | | | | |
| | 100,897 | | | FIREEYE, INC.(b) | | | 1,658,322 | | | 1,494,285 | | | | |
| | 133,620 | | | FRANKLIN WIRELESS CORP.(b) | | | 287,454 | | | 327,369 | | | | |
| | 119,539 | | | FREQUENCY ELECTRONICS, INC.(b) | | | 1,117,791 | | | 1,361,549 | | | | |
| | 28,392 | | | IMMERSION CORP.(b) | | | 213,889 | | | 216,063 | | | | |
| | 18,008 | | | INSIGHT ENTERPRISES, INC.(b) | | | 725,635 | | | 1,048,066 | | | | |
| | 10,188 | | | ITERIS, INC.(b) | | | 47,374 | | | 52,672 | | | | |
| See accompanying notes to financial statements. | 43 | (Continued) |
CLEARWATER INVESTMENT TRUST
Schedule of Investments - Clearwater Small Companies Fund
June 30, 2019 (unaudited)
| | Shares | | | Security | | Cost | | Fair value (a) | | | Percent of
net assets | |
| | Information Technology (Cont’d): | | | | | | | | | | |
| | 66,624 | | | JABIL, INC. | | $ | 1,382,706 | | | 2,105,318 | | | | |
| | 85,971 | | | KBR, INC. | | | 1,548,044 | | | 2,144,117 | | | | |
| | 6,983 | | | KEMET CORP. | | | 116,888 | | | 131,350 | | | | |
| | 19,181 | | | LUMENTUM HOLDINGS, INC.(b) | | | 1,039,951 | | | 1,024,457 | | | | |
| | 6,190 | | | MKS INSTRUMENTS, INC. | | | 444,669 | | | 482,139 | | | | |
| | 70,714 | | | MONOTYPE IMAGING HOLDINGS, INC. | | | 1,214,140 | | | 1,190,824 | | | | |
| | 6,300 | | | MTS SYSTEMS CORP. | | | 325,933 | | | 368,739 | | | | |
| | 19,122 | | | NOVANTA, INC.(b) | | | 577,472 | | | 1,803,205 | | | | |
| | 12,429 | | | OSI SYSTEMS, INC.(b) | | | 883,641 | | | 1,399,878 | | | | |
| | 45,909 | | | PERFICIENT, INC.(b) | | | 726,814 | | | 1,575,597 | | | | |
| | 35,040 | | | PLEXUS CORP.(b) | | | 1,963,116 | | | 2,045,285 | | | | |
| | 35,591 | | | PROS HOLDINGS, INC.(b) | | | 1,006,892 | | | 2,251,487 | | | | |
| | 96,547 | | | RIBBON COMMUNICATIONS, INC.(b) | | | 493,954 | | | 472,115 | | | | |
| | 3,444 | | | ROGERS CORP.(b) | | | 398,157 | | | 594,365 | | | | |
| | 65,846 | | | SCANSOURCE, INC.(b) | | | 2,514,326 | | | 2,143,946 | | | | |
| | 354,747 | | | SERVICESOURCE INTERNATIONAL, INC.(b) | | | 348,239 | | | 337,010 | | | | |
| | 258,208 | | | STEEL CONNECT, INC.(b) | | | 431,614 | | | 469,939 | | | | |
| | 33,900 | | | SUPER MICRO COMPUTER, INC.(b) | | | 708,973 | | | 655,965 | | | | |
| | 10,408 | | | SYNNEX CORP. | | | 273,545 | | | 1,024,147 | | | | |
| | 261,542 | | | TIVO CORP. | | | 2,825,064 | | | 1,927,564 | | | | |
| | 105,225 | | | UNISYS CORP.(b)(d) | | | 1,143,984 | | | 1,022,787 | | | | |
| | 25,167 | | | VIRTUSA CORP.(b) | | | 1,188,166 | | | 1,118,170 | | | | |
| | | | | | | | 41,740,591 | | | 48,272,436 | | | 13.99 | % |
| | Materials: | | | | | | | | | | |
| | 11,705 | | | AMERICAN VANGUARD CORP. | | | 210,316 | | | 180,374 | | | | |
| | 40,000 | | | H.B. FULLER CO. | | | 2,190,810 | | | 1,856,000 | | | | |
| | 30,554 | | | INGEVITY CORP.(b) | | | 1,967,758 | | | 3,213,364 | | | | |
| | 10,025 | | | INNOPHOS HOLDINGS, INC. | | | 321,097 | | | 291,828 | | | | |
| | 29,795 | | | KOPPERS HOLDINGS, INC.(b) | | | 579,129 | | | 874,781 | | | | |
| | 6,778 | | | MATERION CORP. | | | 344,347 | | | 459,616 | | | | |
| | 11,547 | | | MERCER INTERNATIONAL, INC.(c) | | | 157,306 | | | 178,632 | | | | |
| | 60,268 | | | PQ GROUP HOLDINGS, INC.(b) | | | 966,309 | | | 955,248 | | | | |
| | 29,000 | | | RELIANCE STEEL & ALUMINUM CO. | | | 2,272,423 | | | 2,743,980 | | | | |
| | 76,000 | | | SCHWEITZER-MAUDUIT INTERNATIONAL, INC. | | | 3,021,050 | | | 2,521,680 | | | | |
| | | | | | | | 12,030,545 | | | 13,275,503 | | | 3.85 | % |
| | Real Estate: | | | | | | | | | | |
| | 54,500 | | | BLUEROCK RESIDENTIAL GROWTH REIT, INC. | | | 466,274 | | | 640,375 | | | | |
| | 27,853 | | | CATCHMARK TIMBER TRUST, INC., CLASS A | | | 276,424 | | | 291,064 | | | | |
| | 15,901 | | | CITY OFFICE REIT, INC.(c) | | | 154,948 | | | 190,653 | | | | |
| | 67,067 | | | DIAMONDROCK HOSPITALITY CO. | | | 728,909 | | | 693,473 | | | | |
| | 60,323 | | | EASTERLY GOVERNMENT PROPERTIES, INC. | | | 999,169 | | | 1,092,449 | | | | |
| | 70,635 | | | EMPIRE STATE REALTY TRUST, INC., CLASS A | | | 1,095,355 | | | 1,046,104 | | | | |
| | 40,802 | | | ESSENTIAL PROPERTIES REALTY TRUST, INC. | | | 841,130 | | | 817,672 | | | | |
| | 26,700 | | | HFF, INC., CLASS A | | | 949,848 | | | 1,214,316 | | | | |
| | 4,136 | | | INNOVATIVE INDUSTRIAL PROPERTIES, INC.(d) | | | 432,858 | | | 511,044 | | | | |
| | 18,712 | | | INVESTORS REAL ESTATE TRUST | | | 1,011,436 | | | 1,097,833 | | | | |
| | 30,340 | | | MARCUS & MILLICHAP, INC.(b) | | | 789,156 | | | 935,989 | | | | |
| | 101,573 | | | MONMOUTH REAL ESTATE INVESTMENT CORP. | | | 1,331,019 | | | 1,376,314 | | | | |
| | 3,926 | | | ONE LIBERTY PROPERTIES, INC. | | | 115,636 | | | 113,697 | | | | |
| | 61,402 | | | PHYSICIANS REALTY TRUST | | | 1,025,793 | | | 1,070,851 | | | | |
| | 10,945 | | | QTS REALTY TRUST, INC., CLASS A | | | 497,351 | | | 505,440 | | | | |
| | 69,283 | | | REALOGY HOLDINGS CORP. | | | 1,827,617 | | | 501,609 | | | | |
| | 25,289 | | | RETAIL OPPORTUNITY INVESTMENTS CORP. | | | 495,618 | | | 433,201 | | | | |
| | 58,182 | | | RPT REALTY | | | 690,980 | | | 704,584 | | | | |
| | 36,692 | | | STAG INDUSTRIAL, INC. | | | 546,142 | | | 1,109,566 | | | | |
| | 48,651 | | | STRATUS PROPERTIES, INC.(b) | | | 1,343,562 | | | 1,577,752 | | | | |
| | 8,263 | | | TEJON RANCH CO.(b) | | | 142,978 | | | 137,083 | | | | |
| | 112,173 | | | UMH PROPERTIES, INC. | | | 1,474,457 | | | 1,392,067 | | | | |
| | 46,594 | | | XENIA HOTELS & RESORTS, INC. | | | 1,059,497 | | | 971,485 | | | | |
| | | | | | | | 18,296,157 | | | 18,424,621 | | | 5.34 | % |
| | Utilities: | | | | | | | | | | |
| | 7,344 | | | ALLETE, INC. | | | 218,367 | | | 611,094 | | | | |
| | 17,625 | | | EL PASO ELECTRIC CO. | | | 1,047,990 | | | 1,152,675 | | | | |
| | 170,761 | | | PURE CYCLE CORP.(b) | | | 1,216,968 | | | 1,810,067 | | | | |
| | 18,266 | | | SJW GROUP | | | 1,121,249 | | | 1,110,025 | | | | |
| See accompanying notes to financial statements. | 44 | (Continued) |
CLEARWATER INVESTMENT TRUST
Schedule of Investments - Clearwater Small Companies Fund
June 30, 2019 (unaudited)
| | Shares | | | Security | | Cost | | Fair value (a) | | | Percent of
net assets | |
| | Utilities (Cont’d): | | | | | | | | | | |
| | 12,735 | | | SPIRE, INC. | | $ | 612,564 | | | 1,068,721 | | | | |
| | | | | | | | 4,217,138 | | | 5,752,582 | | | 1.67 | % |
| | | | Sub-total Common Stocks: | | | 304,110,066 | | | 328,003,056 | | | 95.06 | % |
| Convertible Bonds: | | | | | | |
| | Health Care: | | | | | | | | | | |
| | 340,000 | | | INVACARE CORP., 4.50%, 6/1/22 | | | 283,190 | | | 252,502 | | | | |
| | | | | | | | 283,190 | | | 252,502 | | | 0.07 | % |
| | | | Sub-total Convertible Bonds: | | | 283,190 | | | 252,502 | | | 0.07 | % |
| Convertible Preferred Stocks: | | | | | | |
| | Real Estate: | | | | | | | | | | |
| | 6,660 | | | WHEELER REAL ESTATE INVESTMENT TRUST, INC. (Step to 10.75% on 9/21/2023), 8.75%(e) | | | 64,211 | | | 100,100 | | | | |
| | 4,224 | | | WHEELER REAL ESTATE INVESTMENT TRUST, INC., 9.00% | | | 47,126 | | | 59,009 | | | | |
| | | | | | | | 111,337 | | | 159,109 | | | 0.05 | % |
| | | | Sub-total Convertible Preferred Stocks: | | | 111,337 | | | 159,109 | | | 0.05 | % |
| Investment Companies: | | | | | | |
| | Financials: | | | | | | | | | | |
| | 10,895 | | | ISHARES RUSSELL 2000 ETF(d) | | | 1,646,649 | | | 1,694,172 | | | | |
| | | | | | | | 1,646,649 | | | 1,694,172 | | | 0.49 | % |
| | | | Sub-total Investment Companies: | | | 1,646,649 | | | 1,694,172 | | | 0.49 | % |
| Master Limited Partnerships: | | | | | | |
| | Industrials: | | | | | | | | | | |
| | 25,818 | | | STEEL PARTNERS HOLDINGS L.P.(b) | | | 359,035 | | | 361,452 | | | | |
| | | | | | | | 359,035 | | | 361,452 | | | 0.11 | % |
| | | | Sub-total Master Limited Partnerships: | | | 359,035 | | | 361,452 | | | 0.11 | % |
| Preferred Stocks: | | | | | | |
| | Industrials: | | | | | | | | | | |
| | 184,080 | | | STEEL PARTNERS HOLDINGS L.P., 6.00% | | | 3,199,053 | | | 3,867,521 | | | | |
| | | | | | | | 3,199,053 | | | 3,867,521 | | | 1.12 | % |
| | | | Sub-total Preferred Stocks: | | | 3,199,053 | | | 3,867,521 | | | 1.12 | % |
| Rights: | | | | | | |
| | Consumer Discretionary: | | | | | | | | | | |
| | 55,700 | | | MEDIA GENERAL, INC. (CONTINGENT VALUE RIGHTS)(b) | | | - | | | - | | | | |
| | | | | | | | - | | | - | | | 0.00 | % |
| | | | Sub-total Rights: | | | - | | | - | | | 0.00 | % |
| Warrants: | | | | | | |
| | Health Care: | | | | | | | | | | |
| | 19,977 | | | NANOVIBRONIX, INC.(b)(f) | | | 200 | | | - | | | | |
| | | | | | | | 200 | | | - | | | 0.00 | % |
| | | | Sub-total Warrants: | | | 200 | | | - | | | 0.00 | % |
| Short-Term Investments: | | | | | | |
| | 9,158,405 | | | FIDELITY INVESTMENTS MONEY MARKET GOVERNMENT PORTFOLIO(g) | | | 9,158,405 | | | 9,158,405 | | | | |
| | 12,780,454 | | | NORTHERN INSTITUTIONAL FUNDS - U.S. GOVERNMENT SELECT PORTFOLIO, 2.25%(h) | | | 12,780,454 | | | 12,780,454 | | | | |
| | | | Sub-total Short-Term Investments: | | | 21,938,859 | | | 21,938,859 | | | 6.36 | % |
| | | | | Grand total | | $ | 331,648,389 | | | 356,276,671 | | | 103.26 | % |
Notes to Schedule of Investments:
| (a) | Investments are valued in accordance with procedures described in note 2 to the financial statements. |
| (b) | Non-income producing assets. |
| (c) | Foreign security values are stated in U.S. dollars. As of June 30, 2019, the value of foreign stocks or depositary receipts of companies based outside of the United States represented 3.24% of net assets. |
| (d) | Security is either wholly or partially on loan. |
| (e) | For step bonds, the coupon rate disclosed is the current rate in effect. |
| (f) | Security has been deemed worthless and is a Level 3 investment. |
| (g) | Investment relates to cash collateral received from portfolio securities loaned. |
| See accompanying notes to financial statements. | 45 | (Continued) |
CLEARWATER INVESTMENT TRUST
Schedule of Investments - Clearwater Small Companies Fund
June 30, 2019 (unaudited)
| (h) | The short-term investment is a money market portfolio of the investment company, Northern Institutional Funds. At December 31, 2018, the value of the Clearwater Small Companies Fund’s investment in the U.S. Government Select Portfolio of the Northern Institutional Funds was $12,345,333 with net purchases of $435,121 during the six months ended June 30, 2019. |
| See accompanying notes to financial statements. | 46 | (Continued) |
CLEARWATER INVESTMENT TRUST
Schedule of Investments - Clearwater Small Companies Fund
June 30, 2019 (unaudited)
Clearwater Small Companies Fund Portfolio Diversification
(as a percentage of net assets)

| See accompanying notes to financial statements. | 47 | (Continued) |
CLEARWATER INVESTMENT TRUST
Schedule of Investments - Clearwater Tax-Exempt Bond Fund
June 30, 2019 (unaudited)
| | | | | | Maturity | | | Coupon | | | | | | | | | Percent of | |
| Par/Shares | | | Security | | date | | | rate | | | Cost | | | Fair value (a) | | | net assets | |
| Closed-End Funds: | | | | | | | | | | | | | | | | |
| | 227,600 | | | BLACKROCK LONG-TERM MUNICIPAL ADVANTAGE TRUST | | | $ | 2,360,733 | | | | 2,874,588 | | | | | |
| | 54,180 | | | BLACKROCK MUNICIPAL INCOME QUALITY TRUST | | | | 739,165 | | | | 745,517 | | | | | |
| | 19,200 | | | BLACKROCK MUNIENHANCED FUND INC | | | | 201,815 | | | | 213,120 | | | | | |
| | 58,171 | | | BLACKROCK MUNIHOLDINGS FUND II INC | | | | 822,153 | | | | 877,800 | | | | | |
| | 91,327 | | | BLACKROCK MUNIHOLDINGS INVESTMENT QUALITY FUND | | | | 1,010,095 | | | | 1,214,649 | | | | | |
| | 77,015 | | | BLACKROCK MUNIHOLDINGS QUALITY FUND II INC | | | | 972,439 | | | | 968,849 | | | | | |
| | 35,700 | | | BLACKROCK MUNIHOLDINGS QUALITY FUND INC | | | | 474,032 | | | | 443,751 | | | | | |
| | 55,111 | | | BLACKROCK MUNIYIELD INVESTMENT QUALITY FUND | | | | 701,111 | | | | 762,185 | | | | | |
| | 142,461 | | | BLACKROCK MUNIYIELD MICHIGAN QUALITY FUND INC | | | | 1,846,525 | | | | 1,957,414 | | | | | |
| | 51,700 | | | BLACKROCK MUNIYIELD PENNSYLVANIA QUALITY FUND | | | | 729,423 | | | | 724,834 | | | | | |
| | 102,096 | | | BLACKROCK MUNIYIELD QUALITY FUND II INC | | | | 1,309,732 | | | | 1,282,326 | | | | | |
| | 118,472 | | | BLACKROCK MUNIYIELD QUALITY FUND III INC | | | | 1,572,465 | | | | 1,563,830 | | | | | |
| | 36,970 | | | BNY MELLON STRATEGIC MUNICIPAL BOND FUND INC | | | | 301,534 | | | | 293,172 | | | | | |
| | 83,165 | | | DWS MUNICIPAL INCOME TRUST | | | | 940,535 | | | | 937,270 | | | | | |
| | 178,050 | | | INVESCO ADVANTAGE MUNICIPAL INCOME TRUST II | | | | 1,985,371 | | | | 1,958,550 | | | | | |
| | 113,205 | | | INVESCO MUNICIPAL OPPORTUNITY TRUST | | | | 1,410,253 | | | | 1,392,422 | | | | | |
| | 60,000 | | | INVESCO MUNICIPAL TRUST | | | | 773,718 | | | | 739,200 | | | | | |
| | 76,122 | | | INVESCO QUALITY MUNICIPAL INCOME TRUST | | | | 868,956 | | | | 945,435 | | | | | |
| | 60,000 | | | INVESCO TRUST FOR INVESTMENT GRADE MUNICIPALS | | | | 774,122 | | | | 760,200 | | | | | |
| | 53,000 | | | NUVEEN AMT-FREE MUNICIPAL CREDIT INCOME FUND | | | | 748,312 | | | | 841,110 | | | | | |
| | 245,475 | | | NUVEEN AMT-FREE QUALITY MUNICIPAL INCOME FUND | | | | 3,273,528 | | | | 3,390,010 | | | | | |
| | 19,000 | | | NUVEEN CONNECTICUT QUALITY MUNICIPAL INCOME FUND | | | | 247,059 | | | | 246,430 | | | | | |
| | 15,963 | | | NUVEEN MICHIGAN QUALITY MUNICIPAL INCOME FUND | | | | 214,604 | | | | 216,458 | | | | | |
| | 52,779 | | | NUVEEN PENNSYLVANIA QUALITY MUNICIPAL INCOME FUND | | | | 723,142 | | | | 720,433 | | | | | |
| | 54,741 | | | NUVEEN QUALITY MUNICIPAL INCOME FUND | | | | 752,960 | | | | 766,374 | | | | | |
| | 28,000 | | | PUTNAM MUNICIPAL OPPORTUNITIES TRUST | | | | 371,050 | | | | 354,480 | | | | | |
| | 19,613 | | | WESTERN ASSET MUNICIPAL PARTNERS FUND INC | | | | 246,036 | | | | 292,234 | | | | | |
| | | | Sub-total Closed-End Funds: | | | | 26,370,868 | | | | 27,482,641 | | | | 5.03 | % |
| Municipal Bonds: | | | | | | | | | | | | | | | | |
| | 500,000 | | | 9TH AVENUE MET DIST #2 CO | | | 12/1/2048 | | | | 5.00 | | | | 500,000 | | | | 519,425 | | | | | |
| | 2,350,000 | | | ACALANES CA UNION HIGH SCH DIST (Step to 6.55% on 8/1/2024)(b) | | | 8/1/2039 | | | | 0.00 | | | | 1,695,982 | | | | 2,429,148 | | | | | |
| | 1,000,000 | | | AEROTROPOLIS REGL TRANPRTN AUTH CO SPL REVENUE | | | 12/1/2051 | | | | 5.00 | | | | 1,015,450 | | | | 1,017,300 | | | | | |
| | 1,000,000 | | | ALACHUA CNTY FL HLTH FACS AUTH CCRC | | | 10/1/2032 | | | | 8.00 | | | | 1,086,359 | | | | 1,138,500 | | | | | |
| | 640,000 | | | ALASKA ST HSG FIN CORP MTGE REVENUE | | | 12/1/2037 | | | | 4.13 | | | | 629,830 | | | | 656,749 | | | | | |
| | 500,000 | | | ALASKA ST HSG FIN CORP MTGE REVENUE | | | 12/1/2040 | | | | 4.63 | | | | 495,000 | | | | 505,910 | | | | | |
| | 350,000 | | | ALASKA ST INDL DEV & EXPORT AUTH CMNTY PROVIDER REVENUE(c) | | | 12/1/2010 | | | | 5.40 | | | | 350,000 | | | | 17,500 | | | | | |
| | 610,000 | | | ALLEGHENY CNTY PA INDL DEV AUTH CHRT SCH REVENUE | | | 8/15/2026 | | | | 5.90 | | | | 610,000 | | | | 628,532 | | | | | |
| | 500,000 | | | ALTA LAKES CMNTY DEV DIST FL SPL ASSMNT | | | 5/1/2039 | | | | 4.40 | | | | 497,360 | | | | 499,970 | | | | | |
| | 1,000,000 | | | ALVORD CA UNIF SCH DIST | | | 8/1/2036 | | | | 5.25 | | | | 1,014,628 | | | | 1,140,130 | | | | | |
| | 1,000,000 | | | ALVORD CA UNIF SCH DIST (Step to 7.35% on 8/1/2026)(b) | | | 8/1/2046 | | | | 0.00 | | | | 602,588 | | | | 1,104,690 | | | | | |
| | 1,000,000 | | | APPLE VLY MN SENIOR LIVING REVENUE | | | 1/1/2047 | | | | 5.00 | | | | 978,056 | | | | 1,026,090 | | | | | |
| | 500,000 | | | ARIZONA ST INDL DEV AUTH EDU REVENUE(d) | | | 7/15/2038 | | | | 5.75 | | | | 523,504 | | | | 560,350 | | | | | |
| | 1,000,000 | | | ARIZONA ST INDL DEV AUTH MF HSG REVENUE | | | 1/1/2038 | | | | 5.38 | | | | 1,000,000 | | | | 1,026,660 | | | | | |
| | 1,835,000 | | | ARLINGTON TX HGR EDU FIN CORP EDU REVENUE | | | 8/15/2028 | | | | 7.00 | | | | 1,802,201 | | | | 1,940,090 | | | | | |
| | 500,000 | | | ARLINGTON TX HGR EDU FIN CORP EDU REVENUE | | | 6/15/2036 | | | | 5.00 | | | | 505,785 | | | | 509,950 | | | | | |
| | 650,000 | | | ARLINGTON TX SPL TAX REVENUE | | | 2/15/2041 | | | | 5.00 | | | | 699,328 | | | | 729,391 | | | | | |
| | 400,000 | | | ASTURIA FL CMNTY DEV DIST SPL ASSMNT | | | 5/1/2034 | | | | 5.75 | | | | 400,000 | | | | 413,348 | | | | | |
| | 500,000 | | | ATHENS-CLARKE CNTY GA UNIF GOVT DEV AUTH REVENUE | | | 6/15/2039 | | | | 5.00 | | | | 511,509 | | | | 556,205 | | | | | |
| | 500,000 | | | ATLANTA GA ARPT REVENUE | | | 1/1/2030 | | | | 6.00 | | | | 503,907 | | | | 534,555 | | | | | |
| | 1,350,000 | | | BAY CNTY FL EDUCTNL FACS REVENUE | | | 9/1/2030 | | | | 5.25 | | | | 1,260,747 | | | | 1,389,015 | | | | | |
| | 1,000,000 | | | BELLALAGO FL EDUCTNL FACS BENEFIT DIST CAPITAL IMPT REVENUE | | | 5/1/2030 | | | | 4.38 | | | | 986,815 | | | | 1,094,400 | | | | | |
| | 1,195,000 | | | BELLWOOD IL | | | 12/1/2027 | | | | 5.88 | | | | 1,187,564 | | | | 1,346,873 | | | | | |
| | 865,000 | | | BEXAR CNTY TX HSG FIN CORP(e)(f) | | | 2/1/2035 | | | | 3.75 | | | | 865,000 | | | | 896,477 | | | | | |
| See accompanying notes to financial statements. | 48 | (Continued) |
CLEARWATER INVESTMENT TRUST
Schedule of Investments - Clearwater Tax-Exempt Bond Fund
June 30, 2019 (unaudited)
| | | | | | Maturity | | | Coupon | | | | | | | | | Percent of | |
| Par/Shares | | | Security | | date | | | rate | | | Cost | | | Fair value (a) | | | net assets | |
| Municipal Bonds (Cont’d): | | | | | | | | | | | | | | | | | | | | |
| | 2,000,000 | | | BEXAR CNTY TX REVENUE | | | 8/15/2039 | | | | 5.00 | | | $ | 2,062,317 | | | | 2,180,500 | | | | | |
| | 500,000 | | | BLACKBURN CREEK CMNTY DEV DISTFL CAP IMPT REVENUE | | | 5/1/2035 | | | | 6.25 | | | | 500,000 | | | | 541,730 | | | | | |
| | 225,000 | | | BLACKBURN CREEK CMNTY DEV DISTFL CAP IMPT REVENUE | | | 5/1/2045 | | | | 6.25 | | | | 225,000 | | | | 241,364 | | | | | |
| | 1,500,000 | | | BOLINGBROOK IL SPL SVC AREA SPL TAX | | | 3/1/2030 | | | | 4.00 | | | | 1,555,112 | | | | 1,647,930 | | | | | |
| | 750,000 | | | BROADWAY STATION MET DIST #2 CO | | | 12/1/2048 | | | | 5.13 | | | | 750,000 | | | | 780,893 | | | | | |
| | 650,000 | | | BUFFALO HIGHLANDS MET DIST | | | 12/1/2038 | | | | 5.25 | | | | 651,939 | | | | 669,344 | | | | | |
| | 1,150,000 | | | BURBANK IL EDUCTNL FACS REVENUE(d) | | | 9/1/2035 | | | | 6.00 | | | | 1,150,000 | | | | 1,269,853 | | | | | |
| | 1,000,000 | | | BUREAU CNTY TWP IL HIGH SCH DIST #502 | | | 10/1/2043 | | | | 6.63 | | | | 1,037,603 | | | | 1,224,320 | | | | | |
| | 380,000 | | | BUTLER CNTY PA GEN AUTH REVENUE (Floating, ICE LIBOR USD 3M + 0.70%)(e) | | | 10/1/2034 | | | | 2.25 | | | | 380,000 | | | | 365,229 | | | | | |
| | 500,000 | | | CALIFORNIA ST HLTH FACS FING AUTH REVENUE | | | 8/15/2033 | | | | 5.50 | | | | 502,669 | | | | 542,575 | | | | | |
| | 1,500,000 | | | CALIFORNIA ST SCH FACS FING AUTH REVENUE | | | 8/1/2029 | | | | 6.00 | | | | 1,492,612 | | | | 1,936,545 | | | | | |
| | 1,370,000 | | | CAPITAL TRUST AGY FL CHRT SCH REVENUE | | | 2/1/2035 | | | | 5.38 | | | | 1,370,000 | | | | 1,409,456 | | | | | |
| | 750,000 | | | CAPITAL TRUST AGY FL REVENUE | | | 4/1/2035 | | | | 7.00 | | | | 750,000 | | | | 752,340 | | | | | |
| | 1,750,000 | | | CAPITAL TRUST AGY FL REVENUE(d) | | | 12/1/2035 | | | | 6.75 | | | | 1,746,431 | | | | 1,804,845 | | | | | |
| | 750,000 | | | CAPITAL TRUST AGY FL REVENUE(d) | | | 7/1/2037 | | | | 6.75 | | | | 750,000 | | | | 788,228 | | | | | |
| | 750,000 | | | CAPITAL TRUST AGY FL SENIOR LIVING REVENUE(d) | | | 8/1/2027 | | | | 5.00 | | | | 750,000 | | | | 772,268 | | | | | |
| | 750,000 | | | CAPITAL TRUST AGY FL SENIOR LIVING REVENUE(d) | | | 8/1/2032 | | | | 5.38 | | | | 750,000 | | | | 779,085 | | | | | |
| | 500,000 | | | CAPITAL TRUST AGY FL STUDENT HSG REVENUE(d) | | | 12/1/2043 | | | | 5.25 | | | | 515,703 | | | | 518,780 | | | | | |
| | 1,000,000 | | | CARLSBAD CA UNIF SCH DIST (Step to 6.13% on 8/1/2021)(b) | | | 8/1/2031 | | | | 0.00 | | | | 880,421 | | | | 1,226,120 | | | | | |
| | 705,000 | | | CARMEL IN REVENUE(c) | | | 11/15/2022 | | | | 6.00 | | | | 699,554 | | | | 493,500 | | | | | |
| | 1,000,000 | | | CARMEL IN REVENUE(c) | | | 11/15/2027 | | | | 7.00 | | | | 1,011,374 | | | | 700,000 | | | | | |
| | 750,000 | | | CELEBRATION POINTE CMNTY DEV DIST #1 FL SPL ASSMNT REVENUE(d) | | | 5/1/2032 | | | | 5.00 | | | | 754,809 | | | | 806,505 | | | | | |
| | 1,000,000 | | | CENTRL BRADFORD PROGRESS AUTH PA | | | 12/1/2031 | | | | 5.50 | | | | 1,011,231 | | | | 1,081,060 | | | | | |
| | 365,000 | | | CHANDLER PARK ACADEMY MI PUBLIC SCH ACADEMY REVENUE | | | 11/1/2022 | | | | 5.00 | | | | 328,558 | | | | 365,533 | | | | | |
| | 1,000,000 | | | CHICAGO HEIGHTS IL | | | 12/1/2029 | | | | 4.50 | | | | 1,054,043 | | | | 1,085,630 | | | | | |
| | 1,000,000 | | | CHICAGO IL MIDWAY ARPT REVENUE | | | 1/1/2035 | | | | 5.25 | | | | 1,001,246 | | | | 1,110,950 | | | | | |
| | 1,000,000 | | | CHICAGO IL PARK DIST | | | 1/1/2028 | | | | 5.00 | | | | 1,093,277 | | | | 1,115,930 | | | | | |
| | 1,000,000 | | | CLACKAMAS CNTY OR HOSP FAC AUTH REVENUE | | | 11/15/2052 | | | | 5.00 | | | | 1,044,400 | | | | 1,118,500 | | | | | |
| | 1,500,000 | | | CLOVIS CA UNIF SCH DIST(g) | | | 8/1/2030 | | | | 0.00 | | | | 768,937 | | | | 930,705 | | | | | |
| | 650,000 | | | CMWLTH FING AUTH PA TOBACCO MASTER SETTLEMENT PAYMENT REV | | | 6/1/2039 | | | | 4.00 | | | | 646,885 | | | | 706,667 | | | | | |
| | 750,000 | | | COLLIER CNTY FL INDL DEV AUTH | | | 10/1/2039 | | | | 6.25 | | | | 737,308 | | | | 807,742 | | | | | |
| | 750,000 | | | COLLIER CNTY FLA INDL DEV AUTH CONTINUING CARE CMNTY REV(d) | | | 5/15/2026 | | | | 7.25 | | | | 750,000 | | | | 743,708 | | | | | |
| | 1,750,000 | | | COLLIER CNTY FLA INDL DEV AUTH CONTINUING CARE CMNTY REV(d) | | | 5/15/2044 | | | | 8.13 | | | | 1,915,608 | | | | 1,737,785 | | | | | |
| | 500,000 | | | COLORADO SCIENCE AND TECH PARK MET DIST #1 | | | 12/1/2033 | | | | 5.00 | | | | 506,106 | | | | 527,845 | | | | | |
| | 1,000,000 | | | COLORADO ST EDUCTNL & CULTURAL FACS AUTH REVENUE | | | 7/1/2034 | | | | 5.60 | | | | 994,919 | | | | 1,025,670 | | | | | |
| | 1,000,000 | | | COLORADO ST EDUCTNL & CULTURAL FACS AUTH REVENUE(d) | | | 9/1/2046 | | | | 5.00 | | | | 1,006,106 | | | | 1,011,170 | | | | | |
| | 1,250,000 | | | COLORADO ST HLTH FACS AUTH HOSP REVENUE | | | 12/1/2048 | | | | 5.00 | | | | 1,312,861 | | | | 1,416,462 | | | | | |
| | 1,000,000 | | | COLORADO ST HLTH FACS AUTH REVENUE | | | 8/1/2033 | | | | 7.63 | | | | 989,306 | | | | 1,122,290 | | | | | |
| | 1,000,000 | | | COLTON CA JT UNIF SCH DIST (Step to 5.80% on 8/1/2021)(b) | | | 8/1/2035 | | | | 0.00 | | | | 887,698 | | | | 1,093,310 | | | | | |
| | 1,000,000 | | | CONNECTICUT ST HSG FIN AUTH HSG FIN PROGRAM | | | 11/15/2035 | | | | 3.88 | | | | 1,000,000 | | | | 1,066,220 | | | | | |
| | 515,000 | | | CONNECTICUT ST HSG FIN AUTH HSG MTGE FIN PROGRAM | | | 5/15/2038 | | | | 3.95 | | | | 515,000 | | | | 538,644 | | | | | |
| | 5,000,000 | | | CONNECTICUT ST HSG FIN AUTH HSG MTGE FIN PROGRAM | | | 11/15/2047 | | | | 3.65 | | | | 5,000,000 | | | | 5,063,600 | | | | | |
| | 500,000 | | | COPPERLEAF CO MET DIST #2 | | | 12/1/2030 | | | | 5.25 | | | | 500,000 | | | | 524,450 | | | | | |
| See accompanying notes to financial statements. | 49 | (Continued) |
CLEARWATER INVESTMENT TRUST
Schedule of Investments - Clearwater Tax-Exempt Bond Fund
June 30, 2019 (unaudited)
| | | | | | Maturity | | | Coupon | | | | | | | | | Percent of | |
| Par/Shares | | | Security | | date | | | rate | | | Cost | | | Fair value (a) | | | net assets | |
| Municipal Bonds (Cont’d): | | | | | | | | | | | | | | | | | | | | |
| | 500,000 | | | COPPERLEAF CO MET DIST #2 | | | 12/1/2045 | | | | 5.75 | | | $ | 500,000 | | | | 524,300 | | | | | |
| | 1,105,000 | | | CORONA-NORCO CA UNIF SCH DIST | | | 8/1/2039 | | | | 6.80 | | | | 1,104,306 | | | | 1,498,015 | | | | | |
| | 637,000 | | | CORTLAND IL SPL TAX REVENUE(c) | | | 3/1/2017 | | | | 5.50 | | | | 633,881 | | | | 127,400 | | | | | |
| | 500,000 | | | COVENTRY OH LOCAL SCH DIST | | | 11/1/2037 | | | | 5.25 | | | | 502,717 | | | | 535,160 | | | | | |
| | 750,000 | | | CRYSTAL CO CROSSING MET DIST | | | 12/1/2040 | | | | 5.25 | | | | 750,000 | | | | 770,078 | | | | | |
| | 1,000,000 | | | DALLAS-FORT WORTH TX INTERNATIONAL ARPT REVENUE | | | 11/1/2037 | | | | 5.25 | | | | 1,006,150 | | | | 1,127,230 | | | | | |
| | 2,000,000 | | | DAMON RUN IN CONSERVANCY DIST | | | 7/1/2025 | | | | 6.10 | | | | 2,000,000 | | | | 2,007,560 | | | | | |
| | 1,000,000 | | | DAMON RUN IN CONSERVANCY DIST | | | 1/1/2027 | | | | 6.38 | | | | 1,000,000 | | | | 1,003,950 | | | | | |
| | 800,000 | | | DAUPHIN CNTY PA GEN AUTH UNIV REVENUE(d) | | | 10/15/2022 | | | | 4.00 | | | | 798,695 | | | | 811,008 | | | | | |
| | 1,000,000 | | | DAVIE FL EDUCTNL FACS REVENUE | | | 4/1/2042 | | | | 6.00 | | | | 1,014,671 | | | | 1,128,620 | | | | | |
| | 500,000 | | | DAVIESS CNTY IN HOSP ASSN LEASE RENTAL REVENUE | | | 1/15/2029 | | | | 5.25 | | | | 492,609 | | | | 521,490 | | | | | |
| | 1,000,000 | | | DAYTON-MONTGOMERY CNTY OH PORT AUTH PROJ REVENUE | | | 1/15/2040 | | | | 7.00 | | | | 1,000,000 | | | | 1,026,160 | | | | | |
| | 500,000 | | | DECATUR IL | | | 3/1/2034 | | | | 5.00 | | | | 510,408 | | | | 552,130 | | | | | |
| | 1,000,000 | | | DEKALB/KANE/LA SALLE CNTYS IL CMNTY CLG DIST #523(g) | | | 2/1/2029 | | | | 0.00 | | | | 603,980 | | | | 583,140 | | | | | |
| | 210,000 | | | DELAWARE ST HSG AUTH REVENUE | | | 7/1/2031 | | | | 5.20 | | | | 210,000 | | | | 210,399 | | | | | |
| | 1,000,000 | | | DENVER CO URBAN RENEWAL AUTH TAX INCR REVENUE(d) | | | 12/1/2039 | | | | 5.25 | | | | 985,158 | | | | 1,057,120 | | | | | |
| | 500,000 | | | DIST OF COLUMBIA HSG FIN AGY MF HSG REVENUE | | | 7/1/2033 | | | | 5.45 | | | | 500,000 | | | | 528,010 | | | | | |
| | 1,000,000 | | | DIST OF COLUMBIA HSG FIN AGY MF HSG REVENUE | | | 6/1/2040 | | | | 4.90 | | | | 1,000,000 | | | | 1,065,160 | | | | | |
| | 1,000,000 | | | DIST OF COLUMBIA HSG FIN AGY MF HSG REVENUE | | | 6/1/2041 | | | | 5.00 | | | | 1,000,000 | | | | 1,076,770 | | | | | |
| | 1,200,000 | | | DIST OF COLUMBIA REVENUE | | | 7/1/2037 | | | | 5.00 | | | | 1,200,000 | | | | 1,287,948 | | | | | |
| | 1,000,000 | | | DISTRICT OF COLUMBIA HSG FIN AGY | | | 9/1/2043 | | | | 4.05 | | | | 1,000,000 | | | | 1,070,510 | | | | | |
| | 1,000,000 | | | DOUGLAS CNTY CO MF REVENUE | | | 10/1/2029 | | | | 4.50 | | | | 1,000,000 | | | | 1,044,170 | | | | | |
| | 500,000 | | | DOWDEN WEST CMNTY DEV DIST FL SPL ASSMNT REVENUE(d) | | | 5/1/2039 | | | | 5.40 | | | | 500,000 | | | | 524,855 | | | | | |
| | 3,000,000 | | | DUBLIN CA UNIF SCH DIST(g) | | | 8/1/2034 | | | | 0.00 | | | | 1,163,189 | | | | 1,167,960 | | | | | |
| | 1,000,000 | | | EAST CHICAGO IN SAN DIST REVENUE | | | 7/15/2035 | | | | 4.00 | | | | 993,270 | | | | 1,067,170 | | | | | |
| | 1,500,000 | | | EAST MORGAN CNTY CO HOSP DIST COPS | | | 12/1/2038 | | | | 5.88 | | | | 1,500,000 | | | | 1,509,990 | | | | | |
| | 2,045,000 | | | EDEN TWP CA HOSP DIST COPS | | | 6/1/2030 | | | | 6.00 | | | | 2,028,770 | | | | 2,133,548 | | | | | |
| | 750,000 | | | EL PASO DE ROBLES CA REDEV AGY TAX ALLOCATION REVENUE | | | 7/1/2033 | | | | 6.38 | | | | 743,458 | | | | 752,820 | | | | | |
| | 1,000,000 | | | EL PASO TX DOWNTOWN DEV CORP SPL REVENUE | | | 8/15/2038 | | | | 7.25 | | | | 1,046,909 | | | | 1,217,790 | | | | | |
| | 1,000,000 | | | ENCINITAS CA UNION SCH DIST (Step to 6.75% on 8/1/2022)(b) | | | 8/1/2035 | | | | 0.00 | | | | 815,054 | | | | 1,266,060 | | | | | |
| | 1,155,000 | | | ENTERPRISE CA ELEM SCH DIST (Step to 6.20% on 8/1/2021)(b) | | | 8/1/2035 | | | | 0.00 | | | | 1,017,029 | | | | 1,412,958 | | | | | |
| | 1,000,000 | | | ERIE CNTY PA HOSP AUTH | | | 7/1/2027 | | | | 7.00 | | | | 1,000,000 | | | | 1,055,260 | | | | | |
| | 1,000,000 | | | ESCAMBIA CNTY FL HSG FIN AUTH SF MTGE REVENUE | | | 10/1/2049 | | | | 3.75 | | | | 1,000,000 | | | | 1,029,820 | | | | | |
| | 600,000 | | | ESCONDIDO CA SPL TAX | | | 9/1/2036 | | | | 5.00 | | | | 636,526 | | | | 696,102 | | | | | |
| | 750,000 | | | EVANSVILLE IN MF HSG REVENUE | | | 1/1/2038 | | | | 5.45 | | | | 750,000 | | | | 777,338 | | | | | |
| | 500,000 | | | FAIRFAX CNTY VA REDEV & HSG AUTH MF REVENUE | | | 8/1/2039 | | | | 5.60 | | | | 500,000 | | | | 501,025 | | | | | |
| | 1,000,000 | | | FESTIVAL RANCH AZ CMNTY FACS DIST | | | 7/15/2024 | | | | 6.25 | | | | 1,000,095 | | | | 1,005,790 | | | | | |
| | 315,000 | | | FIDDLERS CREEK FL CDD #2 SPL ASSMNT REVENUE(c) | | | 5/1/2013 | | | | 5.75 | | | | 314,118 | | | | 198,450 | | | | | |
| | 715,000 | | | FISHHAWK CCD IV FL SPL ASSMNT REVENUE | | | 5/1/2033 | | | | 7.00 | | | | 715,000 | | | | 793,643 | | | | | |
| | 1,000,000 | | | FLORIDA ST DEV FIN CORP EDUCTNL FACS REVENUE(d) | | | 6/15/2035 | | | | 6.00 | | | | 1,000,948 | | | | 1,095,020 | | | | | |
| | 140,000 | | | FLORIDA ST HSG FIN CORP REVENUE | | | 7/1/2026 | | | | 5.00 | | | | 140,068 | | | | 142,575 | | | | | |
| | 825,000 | | | FLORIDA ST HSG FIN CORP REVENUE | | | 7/1/2035 | | | | 3.75 | | | | 825,000 | | | | 860,599 | | | | | |
| | 605,000 | | | FLORIDA ST HSG FIN CORP REVENUE | | | 7/1/2039 | | | | 4.20 | | | | 605,000 | | | | 619,260 | | | | | |
| | 2,000,000 | | | FLORIDA ST HSG FIN CORP REVENUE | | | 1/1/2045 | | | | 4.20 | | | | 2,000,000 | | | | 2,159,260 | | | | | |
| | 1,200,000 | | | FORT SILL APACHE TRIBE OK ECONDEV AUTH GAMING ENTERPRISE REV(d) | | | 8/25/2026 | | | | 8.50 | | | | 1,200,000 | | | | 1,344,456 | | | | | |
| | 1,000,000 | | | FRANKLIN CNTY KS UNIF SCH DIST #290 | | | 9/1/2039 | | | | 4.75 | | | | 1,037,276 | | | | 1,127,650 | | | | | |
| | 1,000,000 | | | FRANKLIN TN HLTH & EDUCTNL FACS BRD REVENUE(d) | | | 6/1/2027 | | | | 6.50 | | | | 1,000,000 | | | | 1,050,670 | | | | | |
| | 845,000 | | | FULTON CNTY GA DEV AUTH | | | 11/1/2028 | | | | 5.25 | | | | 735,013 | | | | 845,084 | | | | | |
| See accompanying notes to financial statements. | 50 | (Continued) |
CLEARWATER INVESTMENT TRUST
Schedule of Investments - Clearwater Tax-Exempt Bond Fund
June 30, 2019 (unaudited)
| | | | | | Maturity | | | Coupon | | | | | | | | | Percent of | |
| Par/Shares | | | Security | | date | | | rate | | | Cost | | | Fair value (a) | | | net assets | |
| Municipal Bonds (Cont’d): | | | | | | | | | | | | | | | | | | | | |
| | 3,500,000 | | | GEORGIA ST HSG & FIN AUTH REVENUE | | | 12/1/2037 | | | | 3.80 | | | $ | 3,500,000 | | | | 3,602,585 | | | | | |
| | 2,000,000 | | | GEORGIA ST HSG & FIN AUTH REVENUE | | | 12/1/2037 | | | | 4.00 | | | | 2,000,000 | | | | 2,048,000 | | | | | |
| | 1,000,000 | | | GEORGIA ST HSG & FIN AUTH REVENUE | | | 12/1/2038 | | | | 3.85 | | | | 1,000,000 | | | | 1,062,600 | | | | | |
| | 1,000,000 | | | GEORGIA ST HSG & FIN AUTH REVENUE | | | 12/1/2039 | | | | 4.00 | | | | 1,000,000 | | | | 1,062,010 | | | | | |
| | 2,500,000 | | | GEORGIA ST HSG & FIN AUTH REVENUE | | | 12/1/2040 | | | | 3.80 | | | | 2,500,000 | | | | 2,609,300 | | | | | |
| | 1,000,000 | | | GEORGIA ST HSG & FIN AUTH REVENUE | | | 12/1/2041 | | | | 3.85 | | | | 1,003,439 | | | | 1,027,090 | | | | | |
| | 1,950,000 | | | GEORGIA ST HSG & FIN AUTH REVENUE | | | 12/1/2043 | | | | 3.90 | | | | 1,942,526 | | | | 1,997,911 | | | | | |
| | 1,100,000 | | | GEORGIA ST HSG & FIN AUTH REVENUE | | | 12/1/2048 | | | | 4.00 | | | | 1,100,000 | | | | 1,162,007 | | | | | |
| | 2,000,000 | | | GEORGIA ST HSG & FIN AUTH REVENUE | | | 12/1/2048 | | | | 4.20 | | | | 2,014,157 | | | | 2,146,760 | | | | | |
| | 600,000 | | | GLENDALE AZ INDL DEV AUTH | | | 11/15/2036 | | | | 5.00 | | | | 616,141 | | | | 645,990 | | | | | |
| | 550,000 | | | GLENDALE AZ INDL DEV AUTH | | | 11/15/2046 | | | | 5.25 | | | | 558,357 | | | | 578,419 | | | | | |
| | 1,500,000 | | | GRAND PARKWAY TRANSPRTN CORP TX SYS TOLL REVENUE (Step to 5.50% on 10/1/2023)(b) | | | 10/1/2035 | | | | 0.00 | | | | 1,190,294 | | | | 1,567,695 | | | | | |
| | 950,000 | | | HAMILTON CNTY OH HLTH CARE REVENUE | | | 1/1/2031 | | | | 6.13 | | | | 930,820 | | | | 1,012,462 | | | | | |
| | 1,250,000 | | | HARRIS CNTY TX CULTURAL EDU FACS FIN CORP REVENUE | | | 8/15/2021 | | | | 6.75 | | | | 1,250,000 | | | | 1,258,137 | | | | | |
| | 1,500,000 | | | HARTNELL CA CMNTY CLG DIST (Step to 7.00% on 8/1/2022)(b) | | | 8/1/2034 | | | | 0.00 | | | | 1,213,260 | | | | 1,702,605 | | | | | |
| | 3,500,000 | | | HEALDSBURG CA UNIF SCH DIST (Step to 4.60% on 8/1/2022)(b) | | | 8/1/2037 | | | | 0.00 | | | | 3,039,788 | | | | 3,421,215 | | | | | |
| | 1,000,000 | | | HELENDALE CA SCH DIST (Step to 6.25% on 8/1/2019)(b) | | | 8/1/2034 | | | | 0.00 | | | | 994,180 | | | | 1,348,360 | | | | | |
| | 750,000 | | | HEMPSTEAD TOWN NY LOCAL DEV CORP REVENUE | | | 9/1/2038 | | | | 5.00 | | | | 753,612 | | | | 833,467 | | | | | |
| | 800,000 | | | HERITAGE HARBOUR FL N CDD SPL ASSMNT | | | 5/1/2034 | | | | 5.00 | | | | 800,000 | | | | 870,248 | | | | | |
| | 1,000,000 | | | HIDALGO CNTY TX REGL MOBILITY AUTH VEHICLE REGISTRATION FEE | | | 12/1/2038 | | | | 5.25 | | | | 1,018,111 | | | | 1,144,980 | | | | | |
| | 1,500,000 | | | HOUSTON TX HGR EDU FIN CORP | | | 9/1/2038 | | | | 5.50 | | | | 1,521,676 | | | | 1,669,995 | | | | | |
| | 750,000 | | | IDAHO ST HLTH FACS AUTH REVENUE | | | 10/1/2024 | | | | 7.00 | | | | 750,000 | | | | 831,525 | | | | | |
| | 750,000 | | | IDAHO ST HLTH FACS AUTH REVENUE | | | 10/1/2029 | | | | 7.38 | | | | 743,283 | | | | 828,330 | | | | | |
| | 1,000,000 | | | IDAHO ST HLTH FACS AUTH REVENUE | | | 10/1/2044 | | | | 8.00 | | | | 1,047,664 | | | | 1,128,000 | | | | | |
| | 1,500,000 | | | ILLINOIS ST | | | 2/1/2030 | | | | 4.00 | | | | 1,493,529 | | | | 1,635,420 | | | | | |
| | 500,000 | | | ILLINOIS ST | | | 7/1/2033 | | | | 5.50 | | | | 498,790 | | | | 550,025 | | | | | |
| | 1,000,000 | | | ILLINOIS ST EDUCTNL FACS AUTH | | | 11/1/2036 | | | | 4.50 | | | | 1,000,000 | | | | 1,068,060 | | | | | |
| | 675,000 | | | ILLINOIS ST FIN AUTH EDUCTNL FAC REVENUE | | | 2/1/2034 | | | | 6.00 | | | | 680,332 | | | | 738,052 | | | | | |
| | 515,000 | | | ILLINOIS ST FIN AUTH REVENUE | | | 8/15/2026 | | | | 6.00 | | | | 515,000 | | | | 515,433 | | | | | |
| | 500,000 | | | ILLINOIS ST FIN AUTH REVENUE | | | 5/15/2036 | | | | 5.00 | | | | 501,419 | | | | 533,465 | | | | | |
| | 750,000 | | | ILLINOIS ST FIN AUTH REVENUE | | | 12/1/2037 | | | | 5.00 | | | | 767,313 | | | | 802,035 | | | | | |
| | 500,000 | | | ILLINOIS ST FIN AUTH REVENUE | | | 5/1/2038 | | | | 5.25 | | | | 509,002 | | | | 532,675 | | | | | |
| | 1,450,000 | | | ILLINOIS ST FIN AUTH REVENUE | | | 5/15/2038 | | | | 5.13 | | | | 1,409,554 | | | | 1,497,777 | | | | | |
| | 1,000,000 | | | ILLINOIS ST FIN AUTH REVENUE | | | 5/15/2045 | | | | 5.00 | | | | 1,062,516 | | | | 1,081,160 | | | | | |
| | 395,000 | | | ILLINOIS ST HSG DEV AUTH | | | 7/1/2034 | | | | 4.95 | | | | 395,000 | | | | 407,857 | | | | | |
| | 1,000,000 | | | ILLINOIS ST HSG DEV AUTH REVENUE | | | 4/1/2041 | | | | 3.88 | | | | 1,000,000 | | | | 1,049,830 | | | | | |
| | 1,000,000 | | | ILLINOIS ST SALES TAX REVENUE | | | 6/15/2033 | | | | 5.00 | | | | 1,074,622 | | | | 1,139,530 | | | | | |
| | 1,500,000 | | | ILLINOIS ST SPORTS FACS AUTH | | | 6/15/2031 | | | | 5.25 | | | | 1,575,919 | | | | 1,676,715 | | | | | |
| | 1,000,000 | | | IMPERIAL CA CMNTY CLG DIST | | | 8/1/2040 | | | | 6.75 | | | | 1,007,737 | | | | 1,321,060 | | | | | |
| | 3,000,000 | | | INDIANA ST FIN AUTH REVENUE | | | 9/15/2030 | | | | 6.50 | | | | 3,024,362 | | | | 3,254,760 | | | | | |
| | 500,000 | | | INDIANA ST FIN AUTH REVENUE | | | 11/15/2031 | | | | 5.50 | | | | 494,239 | | | | 533,520 | | | | | |
| | 1,000,000 | | | INDIANA ST FIN AUTH REVENUE | | | 11/15/2033 | | | | 6.50 | | | | 988,447 | | | | 1,108,130 | | | | | |
| | 1,000,000 | | | INDIANA ST FIN AUTH REVENUE | | | 3/1/2041 | | | | 5.00 | | | | 1,025,057 | | | | 1,068,720 | | | | | |
| | 500,000 | | | INDIANA ST FIN AUTH REVENUE | | | 11/15/2041 | | | | 5.88 | | | | 527,007 | | | | 560,665 | | | | | |
| | 1,000,000 | | | INDIANA ST FIN AUTH REVENUE | | | 11/15/2041 | | | | 6.00 | | | | 987,773 | | | | 1,128,620 | | | | | |
| | 1,000,000 | | | INDIANA ST FIN AUTH REVENUE | | | 11/15/2046 | | | | 5.25 | | | | 1,032,639 | | | | 1,124,400 | | | | | |
| | 1,500,000 | | | INDIANA ST HSG & CMNTY DEV AUTH MF HSG REVENUE | | | 1/1/2036 | | | | 5.75 | | | | 1,500,000 | | | | 1,521,120 | | | | | |
| | 1,500,000 | | | IOWA ST FIN AUTH REVENUE | | | 5/15/2036 | | | | 5.00 | | | | 1,632,541 | | | | 1,653,360 | | | | | |
| | 700,000 | | | KALISPEL TRIBE OF INDIANS PRIORITY DIST WA REVENUE(d) | | | 1/1/2038 | | | | 5.25 | | | | 686,169 | | | | 769,916 | | | | | |
| | 630,000 | | | KANSAS CITY MO INDL DEV AUTH | | | 9/1/2023 | | | | 5.45 | | | | 630,000 | | | | 643,860 | | | | | |
| | 1,000,000 | | | KANSAS CITY MO INDL DEV AUTH | | | 11/20/2039 | | | | 5.10 | | | | 1,000,000 | | | | 1,014,270 | | | | | |
| | 1,300,000 | | | KANSAS CITY MO INDL DEV AUTH SENIOR LIVING FACS REVENUE(d) | | | 11/15/2036 | | | | 5.75 | | | | 1,300,000 | | | | 1,169,311 | | | | | |
| | 885,000 | | | KENTUCKY ST HSG CORP HSG REVENUE | | | 7/1/2028 | | | | 3.75 | | | | 874,995 | | | | 925,958 | | | | | |
| | 550,000 | | | KING CNTY WA HSG AUTH | | | 5/1/2028 | | | | 5.20 | | | | 550,000 | | | | 551,496 | | | | | |
| See accompanying notes to financial statements. | 51 | (Continued) |
CLEARWATER INVESTMENT TRUST
Schedule of Investments - Clearwater Tax-Exempt Bond Fund
June 30, 2019 (unaudited)
| | | | | | Maturity | | | Coupon | | | | | | | | | Percent of | |
| Par/Shares | | | Security | | date | | | rate | | | Cost | | | Fair value (a) | | | net assets | |
| Municipal Bonds (Cont’d): | | | | | | | | | | | | | | | | | | | | |
| | 1,000,000 | | | KIRKWOOD MO INDL DEV AUTH RETMNT CMNTY REVENUE | | | 5/15/2037 | | | | 5.25 | | | $ | 1,019,307 | | | | 1,119,430 | | | | | |
| | 500,000 | | | LAKE CNTY IL SCH DIST #33 | | | 12/1/2040 | | | | 5.00 | | | | 519,429 | | | | 543,110 | | | | | |
| | 750,000 | | | LAKE CNTY OH PORT & ECON DEV AUTH LEASE REVENUE(d) | | | 12/1/2037 | | | | 6.50 | | | | 750,000 | | | | 774,443 | | | | | |
| | 240,000 | | | LAKEWOOD RANCH FL STEWARDSHIP DIST SPL ASSMNT REVENUE | | | 5/1/2025 | | | | 4.25 | | | | 239,626 | | | | 246,989 | | | | | |
| | 1,600,000 | | | LAKEWOOD RANCH FL STEWARDSHIP DIST SPL ASSMNT REVENUE | | | 5/1/2030 | | | | 7.40 | | | | 1,588,217 | | | | 1,737,552 | | | | | |
| | 730,000 | | | LAKEWOOD RANCH FL STEWARDSHIP DIST SPL ASSMNT REVENUE | | | 5/1/2033 | | | | 6.70 | | | | 730,000 | | | | 791,210 | | | | | |
| | 1,000,000 | | | LAKEWOOD RANCH FL STEWARDSHIP DIST SPL ASSMNT REVENUE | | | 5/1/2034 | | | | 5.35 | | | | 1,000,000 | | | | 1,083,970 | | | | | |
| | 1,300,000 | | | LAKEWOOD RANCH FL STEWARDSHIP DIST SPL ASSMNT REVENUE | | | 5/1/2036 | | | | 5.00 | | | | 1,300,000 | | | | 1,353,196 | | | | | |
| | 750,000 | | | LAKEWOOD RANCH FL STEWARDSHIP DIST SPL ASSMNT REVENUE(d) | | | 5/1/2037 | | | | 5.00 | | | | 744,740 | | | | 789,135 | | | | | |
| | 750,000 | | | LAKEWOOD RANCH FL STEWARDSHIP DIST SPL ASSMNT REVENUE | | | 5/1/2037 | | | | 5.25 | | | | 745,647 | | | | 809,310 | | | | | |
| | 700,000 | | | LAKEWOOD RANCH FL STEWARDSHIP DIST SPL ASSMNT REVENUE | | | 5/1/2038 | | | | 5.00 | | | | 700,000 | | | | 726,740 | | | | | |
| | 1,000,000 | | | LAKEWOOD RANCH FL STEWARDSHIP DIST SPL ASSMNT REVENUE(d) | | | 5/1/2039 | | | | 5.30 | | | | 1,000,000 | | | | 1,065,380 | | | | | |
| | 500,000 | | | LAKEWOOD RANCH FL STEWARDSHIP DIST SPL ASSMNT REVENUE | | | 5/1/2049 | | | | 4.50 | | | | 492,713 | | | | 501,945 | | | | | |
| | 1,000,000 | | | LAMBERTSON FARMS CO MET DIST #1 REVENUE | | | 12/15/2025 | | | | 5.00 | | | | 991,140 | | | | 1,026,160 | | | | | |
| | 500,000 | | | LAMBERTSON FARMS CO MET DIST #1 REVENUE | | | 12/15/2035 | | | | 5.50 | | | | 500,000 | | | | 518,325 | | | | | |
| | 750,000 | | | LEWISVILLE TX COMB CONTRACT REVENUE | | | 9/1/2024 | | | | 3.00 | | | | 744,667 | | | | 773,513 | | | | | |
| | 465,000 | | | LEXINGTON OAKS FL CDD SPL ASSMNT REVENUE | | | 5/1/2033 | | | | 5.65 | | | | 465,000 | | | | 485,079 | | | | | |
| | 750,000 | | | LEYDEN ROCK MET DIST #10 | | | 12/1/2045 | | | | 5.00 | | | | 766,724 | | | | 779,910 | | | | | |
| | 1,000,000 | | | LITTLETON VLG MET DIST #2 COLO SPL REV | | | 12/1/2045 | | | | 5.38 | | | | 996,467 | | | | 1,031,810 | | | | | |
| | 315,000 | | | LONG LAKE RANCH CMNTY DEV DIST FLA CAP IMPT REV | | | 5/1/2024 | | | | 5.63 | | | | 315,000 | | | | 326,176 | | | | | |
| | 225,000 | | | LONG LAKE RANCH CMNTY DEV DISTFLA CAP IMPT REV | | | 5/1/2026 | | | | 4.00 | | | | 224,733 | | | | 228,060 | | | | | |
| | 500,000 | | | LONG LAKE RESERVE CMNTY DEV DIST SPL ASSMNT | | | 5/1/2038 | | | | 5.00 | | | | 498,765 | | | | 519,500 | | | | | |
| | 1,000,000 | | | LOUISIANA ST ENERGY & PWR AUTH PWR PROJ REVENUE | | | 6/1/2038 | | | | 5.25 | | | | 1,010,535 | | | | 1,119,360 | | | | | |
| | 500,000 | | | LOUISIANA ST LOCAL GOVT ENVRNMNTL FACS & CMNTY DEV AUTH | | | 11/15/2025 | | | | 5.25 | | | | 526,207 | | | | 537,225 | | | | | |
| | 1,000,000 | | | LOUISIANA ST LOCAL GOVT ENVRNMNTL FACS & CMNTY DEV AUTH | | | 11/15/2030 | | | | 6.00 | | | | 1,013,120 | | | | 1,116,780 | | | | | |
| | 700,000 | | | LOUISIANA ST LOCAL GOVT ENVRNMNTL FACS & CMNTY DEV AUTH REVE(d) | | | 11/1/2037 | | | | 5.65 | | | | 700,000 | | | | 778,785 | | | | | |
| | 1,000,000 | | | LOUISIANA ST LOCAL GOVT ENVRNMNTL FACS & CMNTY DEV AUTH REVE(d) | | | 7/1/2039 | | | | 5.00 | | | | 1,069,786 | | | | 1,079,170 | | | | | |
| | 750,000 | | | LOUISIANA ST LOCAL GOVT ENVRNMNTL FACS & CMNTY DEV AUTH REVE(d) | | | 11/1/2044 | | | | 4.40 | | | | 750,000 | | | | 755,228 | | | | | |
| | 700,000 | | | LOUISIANA ST LOCAL GOVT ENVRNMNTL FACS & CMNTY DEV AUTH REVENUE(d) | | | 11/1/2039 | | | | 5.50 | | | | 700,000 | | | | 747,999 | | | | | |
| | 500,000 | | | LOUISIANA ST PUBLIC FACS AUTH HOSP REVENUE | | | 7/1/2035 | | | | 5.00 | | | | 532,445 | | | | 565,546 | | | | | |
| | 750,000 | | | LOUISIANA ST PUBLIC FACS AUTH REVENUE | | | 5/1/2031 | | | | 6.50 | | | | 747,495 | | | | 789,202 | | | | | |
| | 400,000 | | | LOUISIANA ST PUBLIC FACS AUTH REVENUE (Floating, ICE LIBOR USD 3M + 0.70%)(e) | | | 2/15/2036 | | | | 2.39 | | | | 400,000 | | | | 386,948 | | | | | |
| | 500,000 | | | LUCAS CNTY OH HLTH CARE FACS REVENUE | | | 8/15/2030 | | | | 5.50 | | | | 493,831 | | | | 531,150 | | | | | |
| | 1,500,000 | | | LUCAS MET HSG AUTH OH COPS | | | 11/1/2036 | | | | 5.00 | | | | 1,557,634 | | | | 1,638,795 | | | | | |
| | 1,480,000 | | | LUZERNE CNTY PA | | | 11/1/2026 | | | | 7.00 | | | | 1,484,874 | | | | 1,505,841 | | | | | |
| | 1,000,000 | | | MACON & MOULTRIE CNTYS IL CMNTY SCH DIST #3 MOUNT ZION | | | 12/1/2041 | | | | 5.50 | | | | 1,017,986 | | | | 1,122,010 | | | | | |
| | 1,000,000 | | | MACON CNTY IL SCH DIST #61 | | | 1/1/2037 | | | | 5.25 | | | | 1,006,710 | | | | 1,046,610 | | | | | |
| See accompanying notes to financial statements. | 52 | (Continued) |
CLEARWATER INVESTMENT TRUST
Schedule of Investments - Clearwater Tax-Exempt Bond Fund
June 30, 2019 (unaudited)
| Par/Shares | | | Security | | Maturity
date | | Coupon
rate | | Cost | | Fair value (a) | | Percent of
net assets | |
| Municipal Bonds (Cont’d): | | | | | | | | | | | | | | |
| 1,080,000 | | | MACOUPIN SANGAMON & MONTGOMERY CNTYS IL CMNTY SCH DIST #34 | | 12/1/2037 | | | 4.25 | | $ | 1,107,501 | | | 1,136,246 | | | | |
| 250,000 | | | MAGNOLIA CREEK FL CDD CAPITAL IMPT REVENUE(c) | | 5/1/2014 | | | 5.60 | | | 250,000 | | | 45,000 | | | | |
| 1,000,000 | | | MAINE ST HSG AUTH MTGE PURCHASE | | 11/15/2035 | | | 4.00 | | | 1,000,000 | | | 1,052,720 | | | | |
| 1,000,000 | | | MAINE ST HSG AUTH MTGE PURCHASE | | 11/15/2036 | | | 3.90 | | | 1,000,000 | | | 1,060,180 | | | | |
| 1,500,000 | | | MAINE ST HSG AUTH MTGE PURCHASE | | 11/15/2040 | | | 3.85 | | | 1,500,000 | | | 1,560,990 | | | | |
| 500,000 | | | MAINE ST HSG AUTH MTGE PURCHASE | | 11/15/2042 | | | 4.05 | | | 500,000 | | | 526,190 | | | | |
| 430,000 | | | MAINE ST HSG AUTH MTGE REVENUE | | 11/15/2037 | | | 4.50 | | | 430,000 | | | 450,090 | | | | |
| 1,000,000 | | | MALTA IL TAX INCR REVENUE(c) | | 12/30/2025 | | | 5.75 | | | 1,000,000 | | | 320,000 | | | | |
| 500,000 | | | MANATEE CNTY FL SCH BRD COPS | | 7/1/2031 | | | 5.63 | | | 496,742 | | | 542,395 | | | | |
| 800,000 | | | MARICOPA CNTY AZ INDL DEV AUTH EDU REVENUE | | 7/1/2035 | | | 5.00 | | | 844,952 | | | 846,408 | | | | |
| 750,000 | | | MARICOPA CNTY AZ INDL DEV AUTH SENIOR LIVING FACS REVENUE(d) | | 1/1/2036 | | | 5.75 | | | 742,070 | | | 786,240 | | | | |
| 462,000 | | | MARQUIS VA CMNTY DEV AUTH REVENUE(g) | | 9/1/2041 | | | 0.00 | | | 149,271 | | | 26,177 | | | | |
| 349,000 | | | MARQUIS VA CMNTY DEV AUTH REVENUE | | 9/1/2041 | | | 5.63 | | | 374,582 | | | 232,033 | | | | |
| 745,000 | | | MARSHALL CREEK FL CDD SPL ASSMNT | | 5/1/2032 | | | 5.00 | | | 758,165 | | | 764,258 | | | | |
| 750,000 | | | MARTINEZ CA UNIF SCH DIST | | 8/1/2035 | | | 6.13 | | | 747,939 | | | 933,195 | | | | |
| 500,000 | | | MARYLAND ST CMNTY DEV ADMIN DEPT HSG & CMNTY DEV | | 7/1/2031 | | | 4.50 | | | 500,000 | | | 525,500 | | | | |
| 568,716 | | | MASHANTUCKET WSTRN PEQUOT TRIBE CT | | 7/1/2031 | | | 6.05 | | | 586,336 | | | 19,479 | | | | |
| 775,000 | | | MASSACHUSETTS ST DEV FIN AGY REVENUE | | 7/1/2030 | | | 6.38 | | | 767,428 | | | 810,340 | | | | |
| 700,000 | | | MASSACHUSETTS ST DEV FIN AGY REVENUE(d) | | 10/1/2047 | | | 5.00 | | | 747,784 | | | 761,600 | | | | |
| 1,500,000 | | | MASSACHUSETTS ST DEV FIN AGY REVENUE | | 6/1/2049 | | | 4.00 | | | 1,518,384 | | | 1,580,670 | | | | |
| 530,000 | | | MASSACHUSETTS ST EDUCTNL FING AUTH | | 1/1/2028 | | | 5.25 | | | 530,000 | | | 537,690 | | | | |
| 700,000 | | | MASSACHUSETTS ST HSG FIN AGY | | 12/1/2033 | | | 5.00 | | | 700,000 | | | 748,195 | | | | |
| 700,000 | | | MASSACHUSETTS ST HSG FIN AGY | | 12/1/2038 | | | 5.15 | | | 700,000 | | | 747,782 | | | | |
| 1,000,000 | | | MASSACHUSETTS ST HSG FIN AGY | | 12/1/2043 | | | 5.00 | | | 1,000,000 | | | 1,075,040 | | | | |
| 625,000 | | | MASSACHUSETTS ST HSG FIN AGY HSG REVENUE | | 6/1/2040 | | | 5.05 | | | 625,000 | | | 625,444 | | | | |
| 2,770,000 | | | MASSACHUSETTS ST HSG FIN AGY HSG REVENUE | | 12/1/2043 | | | 4.00 | | | 2,770,000 | | | 2,839,721 | | | | |
| 1,975,000 | | | MASSACHUSETTS ST HSG FIN AGY HSG REVENUE | | 6/1/2046 | | | 4.20 | | | 1,975,000 | | | 2,103,533 | | | | |
| 160,000 | | | MEAD NE TAX INCR REVENUE(c) | | 7/1/2012 | | | 5.13 | | | 160,000 | | | 6,640 | | | | |
| 1,000,000 | | | MEDFORD OR HOSP FACS AUTH REVENUE | | 10/1/2042 | | | 5.00 | | | 1,024,973 | | | 1,080,690 | | | | |
| 600,000 | | | MERRILLVILLE IN ECON DEV REVENUE | | 4/1/2036 | | | 5.75 | | | 600,000 | | | 589,818 | | | | |
| 500,000 | | | MET PIER & EXPOSITION AUTH IL REVENUE | | 6/15/2057 | | | 5.00 | | | 520,272 | | | 548,705 | | | | |
| 135,000 | | | MIAMI-DADE CNTY FL HLTH FACS AUTH HOSP REVENUE | | 8/1/2030 | | | 6.00 | | | 131,055 | | | 141,082 | | | | |
| 750,000 | | | MICHIGAN ST FIN AUTH REVENUE | | 11/15/2035 | | | 5.25 | | | 745,886 | | | 783,345 | | | | |
| 1,850,000 | | | MICHIGAN ST HSG DEV AUTH | | 10/1/2035 | | | 4.10 | | | 1,850,000 | | | 1,954,876 | | | | |
| 1,000,000 | | | MICHIGAN ST HSG DEV AUTH | | 12/1/2036 | | | 3.70 | | | 1,000,000 | | | 1,044,220 | | | | |
| 600,000 | | | MICHIGAN ST HSG DEV AUTH | | 10/1/2042 | | | 3.75 | | | 600,000 | | | 623,022 | | | | |
| 1,650,000 | | | MICHIGAN ST HSG DEV AUTH | | 10/1/2043 | | | 4.00 | | | 1,650,000 | | | 1,749,495 | | | | |
| 230,000 | | | MICHIGAN ST HSG DEV AUTH | | 12/1/2045 | | | 3.70 | | | 230,000 | | | 234,108 | | | | |
| 2,500,000 | | | MICHIGAN ST HSG DEV AUTH SF MTGE REVENUE | | 12/1/2038 | | | 4.13 | | | 2,500,000 | | | 2,696,775 | | | | |
| 1,000,000 | | | MICHIGAN ST HSG DEV AUTH SF MTGE REVENUE | | 6/1/2049 | | | 4.00 | | | 1,003,684 | | | 1,056,230 | | | | |
| 500,000 | | | MICHIGAN ST PUBLIC EDUCTNL FACS AUTH | | 11/1/2028 | | | 6.35 | | | 500,000 | | | 500,905 | | | | |
| 185,000 | | | MINNESOTA ST HSG FIN AGY | | 7/1/2034 | | | 5.05 | | | 185,000 | | | 185,000 | | | | |
| 375,000 | | | MINNESOTA ST HSG FIN AGY | | 1/1/2040 | | | 5.10 | | | 375,000 | | | 375,000 | | | | |
| 1,000,000 | | | MISHAWAKA IN MF HSG REVENUE(d) | | 1/1/2038 | | | 5.38 | | | 1,000,000 | | | 1,031,290 | | | | |
| 1,000,000 | | | MISSISSIPPI ST DEV BANK SPL OBLG | | 10/1/2031 | | | 6.50 | | | 979,308 | | | 1,055,390 | | | | |
| 1,000,000 | | | MISSISSIPPI ST DEV BANK SPL OBLG(d) | | 11/1/2039 | | | 4.55 | | | 1,000,000 | | | 1,011,320 | | | | |
| 975,000 | | | MISSOURI ST HSG DEV COMMISSION SF MTGE REVENUE | | 11/1/2048 | | | 3.80 | | | 975,000 | | | 1,024,257 | | | | |
See accompanying notes to financial statements. | 53 | (Continued) |
CLEARWATER INVESTMENT TRUST
Schedule of Investments - Clearwater Tax-Exempt Bond Fund
June 30, 2019 (unaudited)
| Par/Shares | | | Security | | Maturity
date | | Coupon
rate | | Cost | | Fair value (a) | | Percent of
net assets | |
| Municipal Bonds (Cont’d): | | | | | | | | | | | | | | |
| 500,000 | | | MISSOURI ST HSG DEV COMMISSION SF MTGE REVENUE | | 11/1/2049 | | | 3.35 | | $ | 500,000 | | | 500,685 | | | | |
| 920,000 | | | MONTANA ST BRD OF HSG | | 12/1/2038 | | | 3.75 | | | 920,000 | | | 944,334 | | | | |
| 600,000 | | | MONTANA ST BRD OF HSG | | 12/1/2038 | | | 5.20 | | | 600,000 | | | 649,158 | | | | |
| 1,000,000 | | | MONTANA ST BRD OF HSG | | 6/1/2045 | | | 4.00 | | | 1,000,000 | | | 1,065,600 | | | | |
| 935,000 | | | MONTANA ST BRD OF HSG SF MTGE | | 12/1/2037 | | | 3.95 | | | 935,000 | | | 991,614 | | | | |
| 835,000 | | | MONTANA ST BRD OF HSG SF MTGE | | 12/1/2038 | | | 4.00 | | | 837,168 | | | 883,330 | | | | |
| 500,000 | | | MONTGOMERY CNTY MD HSG OPPORTUNITIES COMMISSION MF REVENUE | | 7/1/2037 | | | 5.13 | | | 500,000 | | | 513,565 | | | | |
| 890,000 | | | MONTGOMERY CNTY MD HSG OPPORTUNITIES COMMISSION SF MTGE REVENUE | | 7/1/2038 | | | 4.00 | | | 890,000 | | | 906,260 | | | | |
| 700,000 | | | MORONGO BAND OF MISSION INDIANS CA REVENUE(d) | | 10/1/2042 | | | 5.00 | | | 700,000 | | | 778,491 | | | | |
| 611,973 | | | MOUNT CARBON CO MET DIST REVENUE | | 6/1/2043 | | | 7.00 | | | 611,972 | | | 550,775 | | | | |
| 200,000 | | | MOUNT CARBON CO MET DIST REVENUE(c) | | 6/1/2043 | | | 8.00 | | | - | | | 44,000 | | | | |
| 500,000 | | | MULTNOMAH CNTY OR HOSP FACS AUTH REVENUE | | 12/1/2029 | | | 5.00 | | | 515,817 | | | 537,915 | | | | |
| 615,000 | | | MUNSTER IN ECON DEV TAX INCR REVENUE | | 7/15/2026 | | | 4.75 | | | 613,164 | | | 675,627 | | | | |
| 323,000 | | | N CENTRL TEXAS ST HLTH FAC DEV CORP | | 2/15/2025 | | | 5.38 | | | 323,000 | | | 323,388 | | | | |
| 355,000 | | | N SPRINGS FL IMPT DIST | | 5/1/2027 | | | 6.00 | | | 355,000 | | | 376,790 | | | | |
| 1,000,000 | | | N TX TOLLWAY AUTH REVENUE | | 1/1/2034 | | | 6.00 | | | 1,000,000 | | | 1,068,540 | | | | |
| 1,000,000 | | | N TX TOLLWAY AUTH REVENUE | | 1/1/2042 | | | 6.20 | | | 999,250 | | | 1,221,100 | | | | |
| 600,000 | | | NASHVILLE MET DEV & HSG AGY TN TAX INCR REVENUE(d) | | 6/1/2036 | | | 5.13 | | | 600,000 | | | 652,050 | | | | |
| 1,000,000 | | | NATRONA CNTY WY HOSP REVENUE | | 9/15/2031 | | | 6.35 | | | 1,000,000 | | | 1,083,690 | | | | |
| 500,000 | | | NAVAJO NATION AZ(d) | | 12/1/2030 | | | 5.50 | | | 525,605 | | | 563,410 | | | | |
| 570,000 | | | NEBRASKA ST INVESTMENT FIN AUTH SF HSG REVENUE | | 9/1/2035 | | | 3.75 | | | 570,000 | | | 605,790 | | | | |
| 970,000 | | | NEBRASKA ST INVESTMENT FIN AUTH SF HSG REVENUE | | 9/1/2035 | | | 3.90 | | | 970,000 | | | 1,017,016 | | | | |
| 940,000 | | | NEVADA ST HSG DIV SF MTGE REVENUE | | 10/1/2039 | | | 3.85 | | | 940,000 | | | 969,159 | | | | |
| 105,000 | | | NEVADA ST HSG DIV SF MTGE REVENUE | | 10/1/2040 | | | 5.10 | | | 105,000 | | | 105,689 | | | | |
| 1,000,000 | | | NEW HAMPSHIRE ST HLTH & EDU FACS AUTH REVENUE | | 1/1/2034 | | | 6.00 | | | 975,361 | | | 1,067,770 | | | | |
| 1,000,000 | | | NEW HAMPSHIRE ST HSG FIN AUTH MF REVENUE | | 7/1/2031 | | | 5.20 | | | 1,000,000 | | | 1,049,160 | | | | |
| 1,500,000 | | | NEW HAMPSHIRE ST HSG FIN AUTH MF REVENUE | | 7/1/2052 | | | 4.00 | | | 1,500,000 | | | 1,569,345 | | | | |
| 255,000 | | | NEW HAMPSHIRE ST HSG FIN AUTH SF REVENUE | | 7/1/2034 | | | 5.38 | | | 255,000 | | | 257,917 | | | | |
| 1,000,000 | | | NEW HOPE CULTURAL ED FACS FIN CORP TX RETIREMENT FAC REVENUE | | 10/1/2034 | | | 5.00 | | | 1,006,600 | | | 1,080,620 | | | | |
| 750,000 | | | NEW HOPE CULTURAL ED FACS FIN CORP TX RETIREMENT FAC REVENUE | | 1/1/2035 | | | 5.50 | | | 761,336 | | | 807,705 | | | | |
| 750,000 | | | NEW HOPE CULTURAL EDU FACS FIN CORP TX EDU REVENUE(d) | | 8/15/2036 | | | 5.00 | | | 754,020 | | | 766,290 | | | | |
| 1,000,000 | | | NEW HOPE CULTURAL EDU FACS FIN CORP TX EDU REVENUE | | 8/15/2036 | | | 5.50 | | | 1,003,325 | | | 1,029,730 | | | | |
| 1,000,000 | | | NEW HOPE CULTURAL EDU FACS FIN CORP TX EDU REVENUE(d) | | 8/15/2037 | | | 6.00 | | | 1,016,379 | | | 1,067,820 | | | | |
| 1,100,000 | | | NEW HOPE CULTURAL EDU FACS FIN CORP TX STUDENT HSG REV | | 4/1/2046 | | | 5.00 | | | 1,136,552 | | | 1,213,916 | | | | |
| 750,000 | | | NEW JERSEY ST ECON DEV AUTH | | 6/15/2037 | | | 5.00 | | | 779,752 | | | 858,397 | | | | |
| 500,000 | | | NEW JERSEY ST ECON DEV AUTH | | 6/15/2042 | | | 5.00 | | | 538,540 | | | 560,695 | | | | |
| 750,000 | | | NEW JERSEY ST ECON DEV AUTH REVENUE | | 7/15/2047 | | | 5.00 | | | 799,486 | | | 828,757 | | | | |
| 1,000,000 | | | NEW JERSEY ST HSG & MTGE FIN AGY MF CONDUIT REVENUE | | 1/1/2030 | | | 3.60 | | | 1,000,000 | | | 1,042,040 | | | | |
| 1,000,000 | | | NEW JERSEY ST HSG & MTGE FIN AGY MF REVENUE | | 5/1/2041 | | | 4.95 | | | 968,990 | | | 1,007,310 | | | | |
| 825,000 | | | NEW JERSEY ST HSG & MTGE FIN AGY REVENUE | | 10/1/2030 | | | 4.50 | | | 825,000 | | | 863,131 | | | | |
| 3,425,000 | | | NEW JERSEY ST HSG & MTGE FIN AGY REVENUE | | 10/1/2035 | | | 3.75 | | | 3,425,000 | | | 3,632,966 | | | | |
| 1,000,000 | | | NEW JERSEY ST HSG & MTGE FIN AGY REVENUE | | 4/1/2049 | | | 4.00 | | | 1,002,922 | | | 1,061,810 | | | | |
See accompanying notes to financial statements. | 54 | (Continued) |
CLEARWATER INVESTMENT TRUST
Schedule of Investments - Clearwater Tax-Exempt Bond Fund
June 30, 2019 (unaudited)
| Par/Shares | | | Security | | Maturity
date | | Coupon
rate | | Cost | | Fair value (a) | | Percent of
net assets | |
| Municipal Bonds (Cont’d): | | | | | | | | | | | | | | | |
| 500,000 | | | NEW JERSEY ST TRANSPRTN TRUST FUND AUTH | | 6/15/2041 | | | 5.25 | | $ | 508,421 | | | 556,035 | | | | |
| 195,000 | | | NEW MEXICO ST MTGE FIN AUTH | | 9/1/2029 | | | 4.80 | | | 195,000 | | | 195,472 | | | | |
| 395,000 | | | NEW MEXICO ST MTGE FIN AUTH | | 9/1/2034 | | | 5.00 | | | 395,000 | | | 396,288 | | | | |
| 655,000 | | | NEW MEXICO ST MTGE FIN AUTH | | 9/1/2042 | | | 3.90 | | | 655,000 | | | 668,578 | | | | |
| 975,000 | | | NEW MEXICO ST MTGE FIN AUTH | | 9/1/2042 | | | 4.13 | | | 975,000 | | | 1,005,069 | | | | |
| 1,530,000 | | | NEW MEXICO ST MTGE FIN AUTH | | 7/1/2043 | | | 3.85 | | | 1,530,000 | | | 1,612,880 | | | | |
| 905,000 | | | NEW MEXICO ST MTGE FIN AUTH | | 9/1/2046 | | | 3.80 | | | 905,000 | | | 937,716 | | | | |
| 770,000 | | | NEW MEXICO ST MTGE FIN AUTH | | 7/1/2048 | | | 3.90 | | | 770,000 | | | 811,087 | | | | |
| 1,000,000 | | | NEW MEXICO ST MTGE FIN AUTH | | 7/1/2048 | | | 4.00 | | | 1,002,099 | | | 1,056,800 | | | | |
| 1,000,000 | | | NEW MEXICO ST MTGE FIN AUTH | | 7/1/2049 | | | 4.00 | | | 1,000,000 | | | 1,070,270 | | | | |
| 115,000 | | | NEW RIVER FL CDD CAPITAL IMPT REVENUE(c) | | 5/1/2013 | | | 5.00 | | | 114,821 | | | 1 | | | | |
| 1,000,000 | | | NEW YORK CITY NY HSG DEV CORP MF HSG REVENUE | | 11/1/2037 | | | 3.80 | | | 1,000,000 | | | 1,024,020 | | | | |
| 1,000,000 | | | NEW YORK CITY NY HSG DEV CORP MF HSG REVENUE | | 11/1/2039 | | | 4.30 | | | 1,000,000 | | | 1,048,630 | | | | |
| 600,000 | | | NEW YORK CITY NY HSG DEV CORP MF HSG REVENUE | | 11/1/2042 | | | 3.85 | | | 601,709 | | | 623,550 | | | | |
| 1,000,000 | | | NEW YORK CITY NY HSG DEV CORP MF HSG REVENUE | | 11/1/2047 | | | 3.65 | | | 1,000,000 | | | 1,027,630 | | | | |
| 1,000,000 | | | NEW YORK CITY NY HSG DEV CORP MF HSG REVENUE | | 11/1/2049 | | | 3.95 | | | 1,000,000 | | | 1,052,010 | | | | |
| 2,000,000 | | | NEW YORK CITY NY MUNI WTR FIN AUTH WTR & SWR SYS REVENUE | | 6/15/2038 | | | 5.00 | | | 2,112,142 | | | 2,243,020 | | | | |
| 1,000,000 | | | NEW YORK ST HSG FIN AGY | | 11/1/2041 | | | 4.10 | | | 1,000,000 | | | 1,061,930 | | | | |
| 1,000,000 | | | NEW YORK ST HSG FIN AGY | | 11/1/2042 | | | 4.00 | | | 1,000,000 | | | 1,056,640 | | | | |
| 1,000,000 | | | NEW YORK ST HSG FIN AGY | | 11/1/2048 | | | 3.95 | | | 1,000,000 | | | 1,051,090 | | | | |
| 1,500,000 | | | NEW YORK ST HSG FIN AGY REVENUE | | 11/1/2034 | | | 3.65 | | | 1,500,000 | | | 1,556,925 | | | | |
| 500,000 | | | NEW YORK ST HSG FIN AGY REVENUE | | 11/1/2045 | | | 5.10 | | | 500,000 | | | 542,880 | | | | |
| 4,000,000 | | | NEW YORK ST HSG FIN AGY REVENUE | | 5/1/2048 | | | 4.10 | | | 4,000,000 | | | 4,100,120 | | | | |
| 940,000 | | | NEW YORK ST MTGE AGY HOMEOWNER MTGE REVENUE | | 10/1/2036 | | | 3.90 | | | 940,000 | | | 993,326 | | | | |
| 435,000 | | | NEW YORK ST MTGE AGY HOMEOWNER MTGE REVENUE | | 10/1/2042 | | | 3.75 | | | 435,000 | | | 442,456 | | | | |
| 1,000,000 | | | NEW YORK ST MTGE AGY HOMEOWNER MTGE REVENUE | | 10/1/2043 | | | 4.20 | | | 1,000,000 | | | 1,079,990 | | | | |
| 1,490,000 | | | NEW YORK ST MTGE AGY HOMEOWNER MTGE REVENUE | | 10/1/2048 | | | 3.80 | | | 1,490,000 | | | 1,548,259 | | | | |
| 1,000,000 | | | NORTH CAROLINA ST HSG FIN AGY HOME OWNERSHIP REVENUE | | 7/1/2037 | | | 3.85 | | | 1,000,000 | | | 1,056,930 | | | | |
| 995,000 | | | NORTH CAROLINA ST HSG FIN AGY HOME OWNERSHIP REVENUE | | 1/1/2041 | | | 3.95 | | | 1,007,887 | | | 1,046,471 | | | | |
| 1,000,000 | | | NORTH CAROLINA ST HSG FIN AGY HOME OWNERSHIP REVENUE | | 1/1/2048 | | | 4.00 | | | 1,000,000 | | | 1,056,730 | | | | |
| 600,000 | | | NORTH CAROLINA ST MED CARE COMMISSION RETMNT FACS REVENUE | | 10/1/2038 | | | 5.00 | | | 596,299 | | | 651,786 | | | | |
| 480,000 | | | NORTH DAKOTA ST HSG FIN AGY | | 7/1/2048 | | | 4.00 | | | 509,825 | | | 515,141 | | | | |
| 565,000 | | | NORTH LAS VEGAS NV LOCAL IMPT(d) | | 12/1/2027 | | | 4.00 | | | 552,351 | | | 581,470 | | | | |
| 565,000 | | | NORTH LAS VEGAS NV LOCAL IMPT(d) | | 12/1/2037 | | | 5.00 | | | 566,150 | | | 604,510 | | | | |
| 500,000 | | | NORTH SPRINGS FL IMPT DIST | | 5/1/2044 | | | 6.50 | | | 500,000 | | | 522,685 | | | | |
| 1,000,000 | | | NTHRN IL UNIV | | 4/1/2026 | | | 5.50 | | | 1,001,737 | | | 1,025,760 | | | | |
| 1,400,000 | | | NTHRN PALM BEACH CNTY FL IMPT DIST | | 8/1/2029 | | | 5.00 | | | 1,407,001 | | | 1,494,248 | | | | |
| 500,000 | | | NTHRN PALM BEACH CNTY FL IMPT DIST | | 8/1/2037 | | | 5.00 | | | 509,969 | | | 532,085 | | | | |
| 2,000,000 | | | OAK PARK CA UNIF SCH DIST (Step to 7.10% on 8/1/2021)(b) | | 8/1/2038 | | | 0.00 | | | 1,730,807 | | | 2,567,380 | | | | |
| 580,000 | | | OAKLAND CNTY MI ECON DEV CORP LTD OBLG REVENUE | | 12/1/2020 | | | 6.50 | | | 579,297 | | | 590,063 | | | | |
| 920,000 | | | OHIO ST HSG FIN AGY RSDL MTGE REVENUE | | 9/1/2039 | | | 3.35 | | | 825,892 | | | 936,321 | | | | |
| 1,495,000 | | | OHIO ST HSG FIN AGY RSDL MTGE REVENUE | | 9/1/2048 | | | 4.00 | | | 1,495,000 | | | 1,597,647 | | | | |
| 1,500,000 | | | OHIO ST HSG FIN AGY RSDL MTGE REVENUE | | 3/1/2049 | | | 4.00 | | | 1,500,000 | | | 1,589,790 | | | | |
| 1,000,000 | | | OHIO ST HSG FIN AGY RSDL MTGE REVENUE | | 9/1/2049 | | | 3.35 | | | 1,000,000 | | | 1,006,170 | | | | |
| 50,000 | | | OKLAHOMA ST HSG FIN AGY SF MTGE REVENUE | | 3/1/2032 | | | 5.15 | | | 50,000 | | | 50,075 | | | | |
| 1,000,000 | | | ORANGE CNTY FL HLTH FACS AUTH REVENUE | | 8/1/2034 | | | 5.00 | | | 1,037,654 | | | 1,103,390 | | | | |
See accompanying notes to financial statements. | 55 | (Continued) |
CLEARWATER INVESTMENT TRUST
Schedule of Investments - Clearwater Tax-Exempt Bond Fund
June 30, 2019 (unaudited)
| Par/Shares | | | Security | | Maturity
date | | Coupon
rate | | Cost | | Fair value (a) | | Percent of
net assets | |
| Municipal Bonds (Cont’d): | | | | | | | | | | | | | | | |
| 750,000 | | | ORANGE CNTY FL HLTH FACS AUTH REVENUE | | 8/1/2035 | | | 5.00 | | $ | 778,631 | | | 839,925 | | | | |
| 1,000,000 | | | ORANGE CNTY FL HLTH FACS AUTH REVENUE | | 8/1/2047 | | | 5.00 | | | 1,071,483 | | | 1,095,790 | | | | |
| 655,000 | | | ORANGE CNTY FL HSG FIN AUTH | | 9/1/2035 | | | 3.80 | | | 655,000 | | | 683,309 | | | | |
| 2,000,000 | | | OREGON ST | | 12/1/2039 | | | 3.90 | | | 2,000,000 | | | 2,068,840 | | | | |
| 645,000 | | | OREGON ST HSG & CMNTY SVCS DEPT MTGE REVENUE | | 7/1/2035 | | | 3.75 | | | 645,000 | | | 667,839 | | | | |
| 780,000 | | | OREGON ST HSG & CMNTY SVCS DEPT MTGE REVENUE | | 7/1/2038 | | | 4.00 | | | 780,000 | | | 796,084 | | | | |
| 1,280,000 | | | OREGON ST HSG & CMNTY SVCS DEPT MTGE REVENUE | | 7/1/2048 | | | 3.75 | | | 1,280,000 | | | 1,325,709 | | | | |
| 500,000 | | | PALISADE CO MET DIST #2 LIMITED TAX | | 12/1/2046 | | | 5.00 | | | 511,074 | | | 511,390 | | | | |
| 500,000 | | | PALM BEACH CNTY FL HLTH FACS AUTH REVENUE | | 6/1/2034 | | | 7.25 | | | 500,000 | | | 561,570 | | | | |
| 1,200,000 | | | PALM BEACH CNTY FL HLTH FACS AUTH REVENUE | | 5/15/2036 | | | 5.00 | | | 1,306,033 | | | 1,330,464 | | | | |
| 500,000 | | | PALM BEACH CNTY FL HLTH FACS AUTH REVENUE | | 6/1/2049 | | | 7.50 | | | 492,658 | | | 564,410 | | | | |
| 1,000,000 | | | PELL CITY AL SPL CARE FACS FING AUTH REVENUE | | 12/1/2031 | | | 5.00 | | | 1,026,759 | | | 1,072,530 | | | | |
| 500,000 | | | PENNSYLVANIA ST HGR EDUCTNL FACS AUTH REVENUE (Floating, ICE LIBOR USD 3M + 0.65%)(e) | | 7/1/2039 | | | 2.20 | | | 500,000 | | | 438,290 | | | | |
| 1,000,000 | | | PENNSYLVANIA ST HSG FIN AGY SF MTGE REVENUE | | 10/1/2038 | | | 3.95 | | | 1,000,000 | | | 1,059,450 | | | | |
| 490,000 | | | PENNSYLVANIA ST HSG FIN AGY SF MTGE REVENUE | | 10/1/2038 | | | 4.00 | | | 490,000 | | | 503,642 | | | | |
| 3,200,000 | | | PENNSYLVANIA ST HSG FIN AGY SF MTGE REVENUE | | 10/1/2040 | | | 4.05 | | | 3,200,000 | | | 3,343,146 | | | | |
| 1,835,000 | | | PENNSYLVANIA ST HSG FIN AGY SF MTGE REVENUE | | 10/1/2042 | | | 3.65 | | | 1,835,000 | | | 1,899,629 | | | | |
| 535,000 | | | PENNSYLVANIA ST HSG FIN AGY SF MTGE REVENUE | | 10/1/2042 | | | 3.70 | | | 535,000 | | | 542,560 | | | | |
| 745,000 | | | PENNSYLVANIA ST HSG FIN AGY SF MTGE REVENUE | | 10/1/2042 | | | 4.00 | | | 745,000 | | | 783,598 | | | | |
| 1,000,000 | | | PENNSYLVANIA ST HSG FIN AGY SF MTGE REVENUE | | 10/1/2047 | | | 4.00 | | | 1,000,000 | | | 1,056,380 | | | | |
| 1,000,000 | | | PENNSYLVANIA ST HSG FIN AGY SF MTGE REVENUE | | 10/1/2049 | | | 3.40 | | �� | 1,000,000 | | | 1,010,950 | | | | |
| 1,935,000 | | | PENNSYLVANIA ST TURNPIKE COMMISSION TURNPIKE REVENUE | | 12/1/2035 | | | 5.13 | | | 1,929,302 | | | 2,038,058 | | | | |
| 1,500,000 | | | PENNSYLVANIA ST TURNPIKE COMMISSION TURNPIKE REVENUE (Step to 4.60% on 12/1/2021)(b) | | 12/1/2037 | | | 0.00 | | | 1,340,215 | | | 1,519,500 | | | | |
| 1,000,000 | | | PEORIA AZ INDL DEV AUTH | | 11/15/2029 | | | 5.25 | | | 1,000,000 | | | 1,018,180 | | | | |
| 300,000 | | | PHILADELPHIA PA AUTH FOR INDL DEV REVENUES | | 6/15/2023 | | | 6.13 | | | 300,000 | | | 320,841 | | | | |
| 750,000 | | | PHILADELPHIA PA AUTH FOR INDL DEV REVENUES | | 8/1/2036 | | | 5.63 | | | 739,835 | | | 785,363 | | | | |
| 1,000,000 | | | PHOENIX AZ INDL DEV AUTH EDU REVENUE(d) | | 7/1/2036 | | | 5.13 | | | 985,983 | | | 1,076,920 | | | | |
| 750,000 | | | PHOENIX AZ INDL DEV AUTH EDU REVENUE | | 7/1/2042 | | | 6.30 | | | 778,421 | | | 822,757 | | | | |
| 2,500,000 | | | PHOENIX AZ INDL DEV AUTH LEASE REVENUE | | 6/1/2034 | | | 5.25 | | | 2,516,755 | | | 2,721,700 | | | | |
| 1,000,000 | | | PIKE PLACE MARKET WA PRESERVATION & DEV AUTH SPL OBLG | | 12/1/2040 | | | 5.00 | | | 1,053,790 | | | 1,151,280 | | | | |
| 900,000 | | | PIMA CNTY AZ INDL DEV AUTH EDU REVENUE(d) | | 12/1/2026 | | | 5.25 | | | 900,000 | | | 951,408 | | | | |
| 10,000 | | | PIMA CNTY AZ INDL DEV AUTH EDU REVENUE | | 7/1/2031 | | | 6.75 | | | 7,859 | | | 10,081 | | | | |
| 1,370,000 | | | PIMA CNTY AZ INDL DEV AUTH EDU REVENUE(d) | | 6/15/2035 | | | 5.38 | | | 1,465,035 | | | 1,489,286 | | | | |
| 750,000 | | | PIMA CNTY AZ INDL DEV AUTH EDU REVENUE(d) | | 6/15/2037 | | | 4.75 | | | 736,654 | | | 768,443 | | | | |
| 2,625,000 | | | PITTSBURG CALIF UNI SCH DIST FING AUTH REV(g) | | 9/1/2031 | | | 0.00 | | | 1,331,155 | | | 1,246,376 | | | | |
| 725,000 | | | POINCIANA FL W CDD SPL ASSMNT | | 5/1/2030 | | | 5.38 | | | 717,613 | | | 765,470 | | | | |
| 750,000 | | | POLK CNTY OR HOSP FAC AUTH REVENUE | | 7/1/2035 | | | 5.13 | | | 750,000 | | | 792,547 | | | | |
See accompanying notes to financial statements. | 56 | (Continued) |
CLEARWATER INVESTMENT TRUST
Schedule of Investments - Clearwater Tax-Exempt Bond Fund
June 30, 2019 (unaudited)
| Par/Shares | | | Security | | Maturity
date | | Coupon
rate | | Cost | | Fair value (a) | | Percent of
net assets | |
| Municipal Bonds (Cont’d): | | | | | | | | | | | | | | | |
| 2,000,000 | | | PORT SAINT LUCIE FL RESEARCH FACS REVENUE | | 5/1/2033 | | | 5.00 | | $ | 2,013,634 | | | 2,058,360 | | | | |
| 1,000,000 | | | PROMENADE CASTLE ROCK CO MET DIST #1 | | 12/1/2025 | | | 5.13 | | | 1,000,000 | | | 1,053,190 | | | | |
| 200,000 | | | PUBLIC FIN AUTH WI CCRC REVENUE(d) | | 6/1/2020 | | | 7.00 | | | 199,563 | | | 207,318 | | | | |
| 1,500,000 | | | PUBLIC FIN AUTH WI CCRC REVENUE(d) | | 6/1/2046 | | | 8.25 | | | 1,539,938 | | | 1,668,300 | | | | |
| 16,520 | | | PUBLIC FIN AUTH WI CONFERENCE CENTER & HOTEL REVENUE(d)(g) | | 1/1/2046 | | | 0.00 | | | 836 | | | 551 | | | | |
| 18,299 | | | PUBLIC FIN AUTH WI CONFERENCE CENTER & HOTEL REVENUE(d)(g) | | 1/1/2047 | | | 0.00 | | | 907 | | | 606 | | | | |
| 17,930 | | | PUBLIC FIN AUTH WI CONFERENCE CENTER & HOTEL REVENUE(d)(g) | | 1/1/2048 | | | 0.00 | | | 875 | | | 590 | | | | |
| 17,786 | | | PUBLIC FIN AUTH WI CONFERENCE CENTER & HOTEL REVENUE(d)(g) | | 1/1/2049 | | | 0.00 | | | 853 | | | 581 | | | | |
| 17,496 | | | PUBLIC FIN AUTH WI CONFERENCE CENTER & HOTEL REVENUE(d)(g) | | 1/1/2050 | | | 0.00 | | | 826 | | | 567 | | | | |
| 18,980 | | | PUBLIC FIN AUTH WI CONFERENCE CENTER & HOTEL REVENUE(d)(g) | | 1/1/2051 | | | 0.00 | | | 883 | | | 611 | | | | |
| 451,406 | | | PUBLIC FIN AUTH WI CONFERENCE CENTER & HOTEL REVENUE(d)(e)(f) | | 7/1/2051 | | | 3.75 | | | 449,050 | | | 405,530 | | | | |
| 19,357 | | | PUBLIC FIN AUTH WI CONFERENCE CENTER & HOTEL REVENUE(d)(g) | | 1/1/2052 | | | 0.00 | | | 886 | | | 619 | | | | |
| 19,095 | | | PUBLIC FIN AUTH WI CONFERENCE CENTER & HOTEL REVENUE(d)(g) | | 1/1/2053 | | | 0.00 | | | 862 | | | 607 | | | | |
| 18,909 | | | PUBLIC FIN AUTH WI CONFERENCE CENTER & HOTEL REVENUE(d)(g) | | 1/1/2054 | | | 0.00 | | | 841 | | | 599 | | | | |
| 18,634 | | | PUBLIC FIN AUTH WI CONFERENCE CENTER & HOTEL REVENUE(d)(g) | | 1/1/2055 | | | 0.00 | | | 817 | | | 586 | | | | |
| 18,360 | | | PUBLIC FIN AUTH WI CONFERENCE CENTER & HOTEL REVENUE(d)(g) | | 1/1/2056 | | | 0.00 | | | 795 | | | 574 | | | | |
| 95,189 | | | PUBLIC FIN AUTH WI CONFERENCE CENTER & HOTEL REVENUE(d) | | 7/1/2056 | | | 5.50 | | | 95,098 | | | 90,964 | | | | |
| 18,454 | | | PUBLIC FIN AUTH WI CONFERENCE CENTER & HOTEL REVENUE(d)(g) | | 1/1/2057 | | | 0.00 | | | 1,573 | | | 574 | | | | |
| 18,165 | | | PUBLIC FIN AUTH WI CONFERENCE CENTER & HOTEL REVENUE(d)(g) | | 1/1/2058 | | | 0.00 | | | 763 | | | 562 | | | | |
| 17,992 | | | PUBLIC FIN AUTH WI CONFERENCE CENTER & HOTEL REVENUE(d)(g) | | 1/1/2059 | | | 0.00 | | | 747 | | | 554 | | | | |
| 17,834 | | | PUBLIC FIN AUTH WI CONFERENCE CENTER & HOTEL REVENUE(d)(g) | | 1/1/2060 | | | 0.00 | | | 733 | | | 547 | | | | |
| 17,573 | | | PUBLIC FIN AUTH WI CONFERENCE CENTER & HOTEL REVENUE(d)(g) | | 1/1/2061 | | | 0.00 | | | 714 | | | 537 | | | | |
| 17,400 | | | PUBLIC FIN AUTH WI CONFERENCE CENTER & HOTEL REVENUE(d)(g) | | 1/1/2062 | | | 0.00 | | | 699 | | | 529 | | | | |
| 17,125 | | | PUBLIC FIN AUTH WI CONFERENCE CENTER & HOTEL REVENUE(d)(g) | | 1/1/2063 | | | 0.00 | | | 681 | | | 518 | | | | |
| 16,967 | | | PUBLIC FIN AUTH WI CONFERENCE CENTER & HOTEL REVENUE(d)(g) | | 1/1/2064 | | | 0.00 | | | 668 | | | 510 | | | | |
| 16,823 | | | PUBLIC FIN AUTH WI CONFERENCE CENTER & HOTEL REVENUE(d)(g) | | 1/1/2065 | | | 0.00 | | | 656 | | | 504 | | | | |
| 16,731 | | | PUBLIC FIN AUTH WI CONFERENCE CENTER & HOTEL REVENUE(d)(g) | | 1/1/2066 | | | 0.00 | | | 646 | | | 499 | | | | |
| 215,987 | | | PUBLIC FIN AUTH WI CONFERENCE CENTER & HOTEL REVENUE(d)(g) | | 1/1/2067 | | | 0.00 | | | 8,022 | | | 6,424 | | | | |
| 535,000 | | | PUBLIC FIN AUTH WI REVENUE | | 4/1/2025 | | | 5.00 | | | 537,647 | | | 571,000 | | | | |
| 1,250,000 | | | PUBLIC FIN AUTH WI REVENUE(d) | | 11/1/2028 | | | 6.25 | | | 1,250,000 | | | 1,395,950 | | | | |
| 600,000 | | | PUBLIC FIN AUTH WI REVENUE | | 4/1/2032 | | | 5.50 | | | 600,000 | | | 633,876 | | | | |
| 1,000,000 | | | PUBLIC FIN AUTH WI REVENUE(d) | | 1/1/2033 | | | 6.13 | | | 988,611 | | | 1,092,700 | | | | |
| 341,645 | | | PUBLIC FIN AUTH WI REVENUE(g) | | 10/1/2042 | | | 0.00 | | | 377,495 | | | 65,018 | | | | |
| 515,000 | | | PUBLIC FIN AUTH WI REVENUE | | 10/1/2042 | | | 7.00 | | | 536,400 | | | 524,213 | | | | |
| 450,000 | | | PUBLIC FIN AUTH WI REVENUE(d) | | 12/1/2048 | | | 5.50 | | | 450,000 | | | 481,352 | | | | |
| 1,130,000 | | | PUBLIC FIN AUTH WI SENIOR LIVING REVENUE(d) | | 11/15/2024 | | | 5.00 | | | 1,127,329 | | | 1,221,462 | | | | |
| 520,000 | | | PUBLIC FIN AUTH WIS ED REV(d) | | 6/15/2049 | | | 5.00 | | | 527,596 | | | 544,211 | | | | |
| 1,500,000 | | | PUERTO RICO CMWLTH | | 7/1/2035 | | | 5.00 | | | 1,500,000 | | | 1,573,290 | | | | |
| 930,000 | | | QUECHAN INDIAN TRIBE AZ FORT YUMA INDIAN RESERVATION | | 5/1/2025 | | | 9.75 | | | 930,000 | | | 1,024,748 | | | | |
| 750,000 | | | RED RIVER TX HLTH FACS DEV CORP RETIREMENT FAC REVENUE | | 11/15/2034 | | | 7.50 | | | 746,530 | | | 868,987 | | | | |
| 1,000,000 | | | REDONDO BEACH CA UNIF SCH DIST | | 8/1/2034 | | | 6.38 | | | 997,855 | | | 1,305,790 | | | | |
See accompanying notes to financial statements. | 57 | (Continued) |
CLEARWATER INVESTMENT TRUST
Schedule of Investments - Clearwater Tax-Exempt Bond Fund
June 30, 2019 (unaudited)
| Par/Shares | | | Security | | Maturity date | | Coupon
rate | | | Cost | | | Fair value (a) | | | Percent of
net assets | |
| Municipal Bonds (Cont’d): | |
| 750,000 | | | REEF-SUNSET CA UNIF SCH DIST (Step to 4.85% on 8/1/2021)(b) | | 8/1/2038 | | | 0.00 | | | $ | 678,739 | | | | 767,805 | | | | | |
| 665,000 | | | RHODE ISLAND ST HSG & MTGE FIN CORP | | 10/1/2028 | | | 4.00 | | | | 662,434 | | | | 684,657 | | | | | |
| 750,000 | | | RHODE ISLAND ST HSG & MTGE FIN CORP | | 10/1/2037 | | | 3.90 | | | | 750,000 | | | | 770,115 | | | | | |
| 1,000,000 | | | RIVERSIDE CA CMNTY PPTYS DEV INC LEASE REVENUE | | 10/15/2038 | | | 6.00 | | | | 1,013,535 | | | | 1,204,110 | | | | | |
| 1,000,000 | | | ROCHESTER MN | | 9/1/2038 | | | 5.13 | | | | 1,000,000 | | | | 1,028,660 | | | | | |
| 500,000 | | | ROWLEY MA | | 5/1/2027 | | | 4.00 | | | | 500,000 | | | | 500,930 | | | | | |
| 1,500,000 | | | S TAHOE CA JT PWRS FING AUTH LEASE REVENUE | | 10/1/2030 | | | 5.00 | | | | 1,595,197 | | | | 1,725,135 | | | | | |
| 425,000 | | | S WSTRN IL DEV AUTH(c) | | 10/1/2022 | | | 7.00 | | | | 425,000 | | | | 246,500 | | | | | |
| 350,000 | | | SACRAMENTO CNTY CA WTR FING AUTH REVENUE (Floating, ICE LIBOR USD 3M + 0.57%)(e) | | 6/1/2039 | | | 2.26 | | | | 350,000 | | | | 330,628 | | | | | |
| 750,000 | | | SAINT LOUIS CNTY MO INDL DEV AUTH SENIOR LIVING FACS | | 9/1/2042 | | | 5.00 | | | | 759,850 | | | | 788,437 | | | | | |
| 750,000 | | | SAINT TAMMANY LA PUBLIC TRUST FING AUTH | | 11/15/2037 | | | 5.25 | | | | 758,704 | | | | 803,842 | | | | | |
| 500,000 | | | SAN DIEGO CA HSG AUTH MF HSG REVENUE | | 5/1/2029 | | | 5.00 | | | | 500,000 | | | | 526,170 | | | | | |
| 1,500,000 | | | SAN GABRIEL CA UNIF SCH DIST | | 8/1/2039 | | | 5.35 | | | | 1,496,760 | | | | 1,662,705 | | | | | |
| 1,000,000 | | | SAN JOSE CA FING AUTH | | 6/1/2039 | | | 5.00 | | | | 1,031,526 | | | | 1,128,280 | | | | | |
| 500,000 | | | SANTA MONICA CA REDEV AGY | | 7/1/2036 | | | 5.88 | | | | 505,288 | | | | 544,375 | | | | | |
| 1,000,000 | | | SCHERERVILLE IN ECON DEV REVENUE | | 1/15/2030 | | | 6.00 | | | | 1,009,451 | | | | 1,142,440 | | | | | |
| 1,000,000 | | | SCOTTS BLUFF CNTY NE HOSP AUTH | | 2/1/2037 | | | 5.25 | | | | 1,045,075 | | | | 1,104,650 | | | | | |
| 770,000 | | | SEATTLE WA HSG AUTH POOLED HSG REVENUE | | 9/15/2033 | | | 5.75 | | | | 778,572 | | | | 871,324 | | | | | |
| 500,000 | | | SEVEN OAKS FL CMNTY DEV DIST SPL ASSMNT REVENUE | | 5/1/2033 | | | 5.50 | | | | 490,508 | | | | 526,560 | | | | | |
| 150,000 | | | SHELBY CNTY TN HLTH EDUCTNL & HSG FACS BRD REVENUE(c) | | 1/1/2019 | | | 5.35 | | | | 134,965 | | | | 375 | | | | | |
| 625,000 | | | SHELBY CNTY TN HLTH EDUCTNL & HSG FACS BRD REVENUE(c) | | 1/1/2029 | | | 5.55 | | | | 556,862 | | | | 1,563 | | | | | |
| 130,000 | | | SHELBY CNTY TN HLTH EDUCTNL & HSG FACS BRD REVENUE(c) | | 1/1/2029 | | | 6.00 | | | | - | | | | 1 | | | | | |
| 525,000 | | | SHERIDAN AR SCH DIST #37 | | 2/1/2047 | | | 4.00 | | | | 533,892 | | | | 539,054 | | | | | |
| 190,000 | | | SILVERLEAF FL CDD CAPITAL IMPT REVENUE | | 5/1/2044 | | | 6.75 | | | | 186,609 | | | | 205,322 | | | | | |
| 500,000 | | | SNOHOMISH CNTY WA HSG AUTH | | 4/1/2044 | | | 4.00 | | | | 508,896 | | | | 528,175 | | | | | |
| 200,000 | | | SOUTH CAROLINA ST EDU ASSISTANCE AUTH | | 10/1/2029 | | | 5.10 | | | | 198,420 | | | | 201,524 | | | | | |
| 1,000,000 | | | SOUTH CAROLINA ST PUBLIC SVC AUTH REVENUE | | 12/1/2038 | | | 5.00 | | | | 1,041,949 | | | | 1,115,070 | | | | | |
| 1,400,000 | | | SOUTH CAROLINA ST PUBLIC SVC AUTH REVENUE | | 12/1/2043 | | | 5.75 | | | | 1,446,694 | | | | 1,663,074 | | | | | |
| 500,000 | | | SOUTH DAKOTA ST HLTH & EDUCTNL FACS AUTH | | 9/1/2032 | | | 5.00 | | | | 499,500 | | | | 515,105 | | | | | |
| 1,000,000 | | | SPRINGDALE AR SALES & USE REVENUE | | 4/1/2041 | | | 3.60 | | | | 971,986 | | | | 1,025,680 | | | | | |
| 500,000 | | | ST VRAIN LAKES MET DIST #2 | | 12/1/2037 | | | 5.00 | | | | 500,000 | | | | 518,850 | | | | | |
| 1,000,000 | | | STC MET DIST #2 CO | | 12/1/2038 | | | 6.00 | | | | 972,024 | | | | 1,032,880 | | | | | |
| 142,538 | | | STERLING HILL FL CDD CAPITAL IMPT REVENUE(c) | | 11/1/2010 | | | 5.50 | | | | 142,538 | | | | 91,224 | | | | | |
| 1,000,000 | | | SUGAR LAND TX DEV CORP SALES TAX REVENUE | | 2/15/2033 | | | 5.00 | | | | 1,055,845 | | | | 1,104,360 | | | | | |
| 2,320,000 | | | SULPHUR SPRINGS CA UNION SCH DIST COPS | | 12/1/2037 | | | 6.50 | | | | 2,318,211 | | | | 2,848,851 | | | | | |
| 1,500,000 | | | SUTTER BUTTE CA FLOOD AGY ASSMNT REVENUE | | 10/1/2038 | | | 4.00 | | | | 1,484,037 | | | | 1,577,025 | | | | | |
| 1,100,000 | | | TALLAHASSEE FL HLTH FACS REVENUE | | 12/1/2040 | | | 5.00 | | | | 1,149,774 | | | | 1,222,936 | | | | | |
| 500,000 | | | TALLMAN GULCH MET DIST CO | | 12/1/2047 | | | 5.25 | | | | 500,000 | | | | 507,310 | | | | | |
| 1,000,000 | | | TARRANT CNTY TX CULTURAL EDU FACS FIN CORP HOSP REVENUE | | 11/15/2038 | | | 5.00 | | | | 1,048,326 | | | | 1,105,110 | | | | | |
| 1,000,000 | | | TARRANT CNTY TX CULTURAL EDU FACS FIN CORP RETMNT FAC REVENUE(c) | | 11/15/2022 | | | 5.50 | | | | 1,000,000 | | | | 700,000 | | | | | |
| 750,000 | | | TARRANT CNTY TX CULTURAL EDU FACS FIN CORP RETMNT FAC REVENUE | | 11/15/2024 | | | 5.63 | | | | 750,000 | | | | 756,023 | | | | | |
| 750,000 | | | TARRANT CNTY TX CULTURAL EDU FACS FIN CORP RETMNT FAC REVENUE | | 11/15/2035 | | | 5.00 | | | | 772,660 | | | | 758,925 | | | | | |
| See accompanying notes to financial statements. | 58 | (Continued) |
CLEARWATER INVESTMENT TRUST
Schedule of Investments - Clearwater Tax-Exempt Bond Fund
June 30, 2019 (unaudited)
| Par/Shares | | | Security | | Maturity date | | Coupon
rate | | | Cost | | | Fair value (a) | | | Percent of
net assets | |
| Municipal Bonds (Cont’d): | |
| 1,485,000 | | | TARRANT CNTY TX CULTURAL EDU FACS FIN CORP RETMNT FAC REVENUE | | 11/15/2037 | | | 6.63 | | $ | | 1,507,271 | | | | 1,704,810 | | | | | |
| 750,000 | | | TAYLOR MI BROWNFIELD REDEV AUTH | | 5/1/2032 | | | 5.00 | | | | 779,314 | | | | 833,482 | | | | | |
| 500,000 | | | TEMPE AZ INDL DEV AUTH REVENUE(d) | | 10/1/2024 | | | 4.70 | | | | 498,821 | | | | 512,965 | | | | | |
| 500,000 | | | TEMPE AZ INDL DEV AUTH REVENUE(d) | | 10/1/2037 | | | 6.00 | | | | 502,857 | | | | 570,380 | | | | | |
| 820,000 | | | TENNESSEE HSG DEV AGY RSDL FING PROGRAM REVENUE | | 1/1/2031 | | | 3.60 | | | | 826,968 | | | | 836,876 | | | | | |
| 985,000 | | | TENNESSEE HSG DEV AGY RSDL FING PROGRAM REVENUE | | 7/1/2042 | | | 3.85 | | | | 985,000 | | | | 1,035,511 | | | | | |
| 985,000 | | | TENNESSEE HSG DEV AGY RSDL FING PROGRAM REVENUE | | 7/1/2042 | | | 3.90 | | | | 985,000 | | | | 1,033,285 | | | | | |
| 2,000,000 | | | TENNESSEE HSG DEV AGY RSDL FING PROGRAM REVENUE | | 7/1/2044 | | | 4.00 | | | | 2,014,951 | | | | 2,135,420 | | | | | |
| 990,000 | | | TENNESSEE HSG DEV AGY RSDL FING PROGRAM REVENUE | | 1/1/2049 | | | 3.95 | | | | 990,000 | | | | 1,042,044 | | | | | |
| 1,985,000 | | | TENNESSEE HSG DEV AGY RSDL FING PROGRAM REVENUE | | 1/1/2049 | | | 4.05 | | | | 1,985,000 | | | | 2,109,718 | | | | | |
| 520,000 | | | TENNESSEE ST HSG DEV AGY | | 1/1/2035 | | | 3.85 | | | | 520,000 | | | | 545,345 | | | | | |
| 1,000,000 | | | TEXAS ST AFFORDABLE HSG CORP SF MTGE REVENUE | | 3/1/2050 | | | 4.00 | | | | 1,025,790 | | | | 1,062,110 | | | | | |
| 1,000,000 | | | TEXAS ST DEPT OF HSG & CMNTY AFFAIRS | | 9/1/2048 | | | 4.25 | | | | 1,019,355 | | | | 1,067,950 | | | | | |
| 700,000 | | | TOBACCO SETTLEMENT FING CORP NJ | | 6/1/2046 | | | 5.00 | | | | 704,967 | | | | 750,393 | | | | | |
| 500,000 | | | TOLOMATO FL CDD | | 5/1/2037 | | | 4.25 | | | | 500,000 | | | | 500,395 | | | | | |
| 50,000 | | | TOLOMATO FL CDD (Step to 6.61% on 5/1/2022)(b) | | 5/1/2040 | | | 0.00 | | | | 46,434 | | | | 42,261 | | | | | |
| 115,000 | | | TOLOMATO FL CDD (Step to 6.61% on 11/1/2024)(b) | | 5/1/2040 | | | 0.00 | | | | 79,609 | | | | 78,889 | | | | | |
| 185,000 | | | TOLOMATO FL CDD (Step to 6.61% on 11/1/2021)(b) | | 5/1/2040 | | | 0.00 | | | | 160,015 | | | | 154,257 | | | | | |
| 1,500,000 | | | TOLOMATO FL CDD | | 5/1/2040 | | | 3.75 | | | | 1,441,127 | | | | 1,567,275 | | | | | |
| 125,000 | | | TOLOMATO FL CDD(c) | | 5/1/2040 | | | 6.61 | | | | - | | | | 1 | | | | | |
| 85,000 | | | TOLOMATO FL CDD | | 5/1/2040 | | | 6.61 | | | | 83,333 | | | | 85,246 | | | | | |
| 1,000,000 | | | TRACY CA JT UNIF SCH DIST (Step to 7.30% on 8/1/2027)(b) | | 8/1/2041 | | | 0.00 | | | | 653,501 | | | | 954,600 | | | | | |
| 600,000 | | | TRAVIS CNTY TX HLTH FACS DEV CORP | | 1/1/2046 | | | 7.13 | | | | 630,608 | | | | 650,160 | | | | | |
| 750,000 | | | TRAVIS CNTY TX HLTH FACS DEV CORP(e)(f) | | 1/1/2047 | | | 5.25 | | | | 750,000 | | | | 772,058 | | | | | |
| 700,000 | | | TROUT CREEK CDD FL CAPITAL IMPT REVENUE | | 5/1/2038 | | | 5.38 | | | | 700,000 | | | | 739,494 | | | | | |
| 500,000 | | | TSR CDD FL SPL ASSMNT REVENUE | | 11/1/2035 | | | 5.38 | | | | 498,648 | | | | 540,925 | | | | | |
| 1,250,000 | | | TUSTIN CA UNIF SCH DIST (Step to 6.00%on 8/1/2019)(b) | | 8/1/2028 | | | 0.00 | | | | 1,239,530 | | | | 1,364,462 | | | | | |
| 485,000 | | | UNIVERSAL ACADEMY MI PUBLIC SCH ACADEMY REVENUE | | 12/1/2023 | | | 6.50 | | | | 480,424 | | | | 501,650 | | | | | |
| 750,000 | | | UPPER IL RIVER VLY DEV AUTH(d) | | 12/1/2022 | | | 4.00 | | | | 745,258 | | | | 749,265 | | | | | |
| 750,000 | | | UPPER IL RIVER VLY DEV AUTH(d) | | 12/1/2037 | | | 5.25 | | | | 767,100 | | | | 779,423 | | | | | |
| 1,000,000 | | | UTAH ST CHRT SCH FIN AUTH CHRT SCH REVENUE(d) | | 7/15/2033 | | | 4.65 | | | | 989,793 | | | | 1,010,980 | | | | | |
| 1,500,000 | | | UTAH ST CHRT SCH FIN AUTH CHRT SCH REVENUE | | 10/15/2033 | | | 6.50 | | | | 1,500,000 | | | | 1,502,835 | | | | | |
| 1,000,000 | | | UTAH ST CHRT SCH FIN AUTH CHRT SCH REVENUE(d) | | 4/15/2045 | | | 6.00 | | | | 1,007,067 | | | | 1,013,780 | | | | | |
| 120,000 | | | UTAH ST HSG CORP SF MTGE REVENUE | | 1/1/2033 | | | 5.75 | | | | 120,000 | | | | 121,870 | | | | | |
| 490,000 | | | VANCOUVER WA HSG AUTH | | 3/1/2025 | | | 5.00 | | | | 481,862 | | | | 502,103 | | | | | |
| 1,000,000 | | | VANCOUVER WA HSG AUTH | | 8/1/2034 | | | 3.75 | | | | 983,007 | | | | 1,057,310 | | | | | |
| 500,000 | | | VELOCITY MET DIST #3 CO | | 12/1/2039 | | | 5.38 | | | | 500,000 | | | | 518,050 | | | | | |
| 680,000 | | | VERMONT ST HSG FIN AGY | | 5/1/2032 | | | 4.88 | | | | 677,363 | | | | 725,370 | | | | | |
| 1,000,000 | | | VIRGINIA ST HSG DEV AUTH | | 7/1/2033 | | | 4.13 | | | | 1,000,000 | | | | 1,055,640 | | | | | |
| 3,500,000 | | | VIRGINIA ST HSG DEV AUTH CMWLTH MTGE | | 1/1/2038 | | | 3.88 | | | | 3,490,250 | | | | 3,610,985 | | | | | |
| 1,170,000 | | | VLG FL CDD #7 SPL ASSMNT REVENUE | | 5/1/2036 | | | 4.00 | | | | 1,162,907 | | | | 1,233,355 | | | | | |
| 530,000 | | | WASHINGTON ST HSG FIN COMMISSION(d) | | 7/1/2025 | | | 6.00 | | | | 532,621 | | | | 579,820 | | | | | |
| 1,000,000 | | | WASHINGTON ST HSG FIN COMMISSION(d) | | 1/1/2031 | | | 5.00 | | | | 1,001,506 | | | | 1,107,950 | | | | | |
| 750,000 | | | WASHINGTON ST HSG FIN COMMISSION(d) | | 7/1/2031 | | | 5.00 | | | | 795,623 | | | | 813,780 | | | | | |
| 675,000 | | | WASHINGTON ST HSG FIN COMMISSION(d) | | 1/1/2035 | | | 5.75 | | | | 675,000 | | | | 690,937 | | | | | |
| See accompanying notes to financial statements. | 59 | (Continued) |
CLEARWATER INVESTMENT TRUST
Schedule of Investments - Clearwater Tax-Exempt Bond Fund
June 30, 2019 (unaudited)
| Par/Shares | | | Security | | Maturity date | | Coupon
rate | | | Cost | | | Fair value (a) | | | Percent of
net assets | |
| Municipal Bonds (Cont’d): | |
| 600,000 | | | WASHINGTON ST HSG FIN COMMISSION(d) | | 7/1/2036 | | | 5.00 | | $ | | 633,291 | | | | 635,556 | | | | | |
| 500,000 | | | WASHINGTON ST HSG FIN COMMISSION(d) | | 1/1/2038 | | | 5.00 | | | | 542,992 | | | | 559,785 | | | | | |
| 955,000 | | | WASHINGTON ST HSG FIN COMMISSION | | 12/1/2047 | | | 4.00 | | | | 1,010,030 | | | | 1,004,421 | | | | | |
| 4,000 | | | WATERS EDGE FL CDD CAPITAL IMPT REVENUE | | 5/1/2039 | | | 5.35 | | | | 4,000 | | | | 4,000 | | | | | |
| 105,000 | | | WATERS EDGE FL CDD CAPITAL IMPT REVENUE | | 5/1/2039 | | | 6.60 | | | | 104,236 | | | | 105,588 | | | | | |
| 1,500,000 | | | WEST VIRGINIA ST HSG DEV FUND | | 11/1/2032 | | | 3.75 | | | | 1,500,000 | | | | 1,580,895 | | | | | |
| 495,000 | | | WEST VIRGINIA ST HSG DEV FUND | | 11/1/2047 | | | 4.13 | | | | 495,000 | | | | 513,290 | | | | | |
| 1,500,000 | | | WEST VLY CITY UT MUNI BLDG AUTH LEASE REVENUE | | 2/1/2039 | | | 5.00 | | | | 1,648,636 | | | | 1,753,815 | | | | | |
| 550,000 | | | WESTCHESTER CO NY LOCAL DEV CORP REVENUE | | 1/1/2034 | | | 5.00 | | | | 566,513 | | | | 585,481 | | | | | |
| 685,000 | | | WESTMONT IL PARK DIST(g) | | 12/1/2031 | | | 0.00 | | | | 331,170 | | | | 387,710 | | | | | |
| 685,000 | | | WESTMONT IL PARK DIST(g) | | 12/1/2033 | | | 0.00 | | | | 288,463 | | | | 338,417 | | | | | |
| 1,350,000 | | | WICHITA KS HLTH CARE FACS REVENUE | | 5/15/2034 | | | 6.25 | | | | 1,350,000 | | | | 1,351,890 | | | | | |
| 600,000 | | | WICHITA KS HLTH CARE FACS REVENUE | | 12/1/2036 | | | 5.25 | | | | 604,552 | | | | 648,084 | | | | | |
| 1,000,000 | | | WINDSHIRE PARK CO MET DIST #2 | | 12/1/2047 | | | 6.50 | | | | 1,084,351 | | | | 1,105,650 | | | | | |
| 740,000 | | | WIREGRASS FL CDD CAPITAL IMPT REVENUE | | 5/1/2035 | | | 5.38 | | | | 736,039 | | | | 787,005 | | | | | |
| 630,000 | | | WISCONSIN ST HLTH & EDUCTNL FACS AUTH REVENUE | | 7/1/2030 | | | 5.75 | | | | 632,296 | | | | 657,367 | | | | | |
| 1,300,000 | | | WISCONSIN ST HLTH & EDUCTNL FACS AUTH REVENUE | | 8/15/2032 | | | 5.00 | | | | 1,392,249 | | | | 1,484,054 | | | | | |
| 700,000 | | | WISCONSIN ST HLTH & EDUCTNL FACS AUTH REVENUE | | 6/1/2037 | | | 5.00 | | | | 733,821 | | | | 749,315 | | | | | |
| 500,000 | | | WISCONSIN ST HLTH & EDUCTNL FACS AUTH REVENUE | | 9/15/2040 | | | 5.00 | | | | 516,435 | | | | 524,465 | | | | | |
| 2,000,000 | | | WISCONSIN ST HLTH & EDUCTNL FACS AUTH REVENUE | | 8/15/2043 | | | 5.00 | | | | 2,063,862 | | | | 2,164,180 | | | | | |
| 1,400,000 | | | WISCONSIN ST HLTH & EDUCTNL FACS AUTH REVENUE | | 9/15/2045 | | | 5.00 | | | | 1,443,283 | | | | 1,462,958 | | | | | |
| 2,000,000 | | | WISCONSIN ST HLTH & EDUCTNL FACS AUTH REVENUE | | 10/1/2048 | | | 5.13 | | | | 1,962,824 | | | | 2,130,500 | | | | | |
| 500,000 | | | WISCONSIN ST HSG & ECON DEV AUTH | | 11/1/2035 | | | 3.88 | | | | 500,000 | | | | 526,530 | | | | | |
| 1,000,000 | | | WISCONSIN ST HSG & ECON DEV AUTH | | 11/1/2040 | | | 4.00 | | | | 1,000,000 | | | | 1,045,690 | | | | | |
| 1,000,000 | | | WISCONSIN ST HSG & ECON DEV AUTH | | 11/1/2042 | | | 3.90 | | | | 1,004,315 | | | | 1,053,820 | | | | | |
| 1,500,000 | | | WISCONSIN ST HSG & ECON DEV AUTH | | 5/1/2055 | | | 4.15 | | | | 1,500,000 | | | | 1,584,630 | | | | | |
| 935,000 | | | WYANDOTTE CNTY KS KANSAS CITY UNIF GOVT SPL OBLG REVENUE | | 9/1/2032 | | | 5.75 | | | | 929,007 | | | | 1,018,224 | | | | | |
| 750,000 | | | WYNNFIELD LAKES FL CDD | | 5/1/2036 | | | 4.50 | | | | 745,204 | | | | 797,062 | | | | | |
| 1,000,000 | | | WYOMING ST CMNTY DEV AUTH HSG REVENUE | | 12/1/2038 | | | 3.90 | | | | 1,000,000 | | | | 1,059,580 | | | | | |
| 1,645,000 | | | WYOMING ST CMNTY DEV AUTH HSG REVENUE | | 12/1/2038 | | | 4.05 | | | | 1,645,000 | | | | 1,692,524 | | | | | |
| 350,934 | | | ZEPHYR RIDGE FL CDD CAPITAL IMPT REVENUE(c) | | 5/1/2013 | | | 5.25 | | | | 351,276 | | | | 294,784 | | | | | |
| | Sub-total Municipal Bonds: | | | | | | | | | 470,610,480 | | | | 496,447,134 | | | | 90.79 | % |
| Short-Term Investments: | | | | | | | | | | | | | | | | | |
| 16,710,522 | | | NORTHERN INSTITUTIONAL FUNDS - U.S. GOVERNMENT SELECT PORTFOLIO, 2.25%(h) | | | | | | | | | 16,710,522 | | | | 16,710,522 | | | | | |
| | Sub-total Short-Term Investments: | | | | | | | | | 16,710,522 | | | | 16,710,522 | | | | 3.05 | % |
| | | | Grand total | | | | | | | $ | | 513,691,870 | | | | 540,640,297 | | | | 98.87 | % |
Notes to Schedule of Investments:
| (a) | Investments are valued in accordance with procedures described in note 2 to the financial statements. |
| (b) | For step bonds, the coupon rate disclosed is the current rate in effect. |
| (c) | Non-income producing assets. For long-term debt securities, item identified is in default as to payment of interest and/or principal. |
| (d) | Securities exempt from registration under Rule 144A of the Securities Act of 1933. These securities may be resold in transactions exempt from registration, normally to qualified institutional buyers. The value of these securities is determined by valuations supplied by a pricing service or brokers, or, if not available, in accordance with procedures established by the Board of Trustees. |
| (e) | Variable rate security. Rate as of June 30, 2019 is disclosed. |
| (f) | These securities are remarketed by an agent, and the rate at which these securities are set are determined by general market conditions and supply and demand. |
| See accompanying notes to financial statements. | 60 | (Continued) |
CLEARWATER INVESTMENT TRUST
Schedule of Investments - Clearwater Tax-Exempt Bond Fund
June 30, 2019 (unaudited)
| (h) | The short-term investment is a money market portfolio of the investment company, Northern Institutional Funds. At December 31, 2018, the value of the Clearwater Tax-Exempt Bond Fund’s investment in the U.S. Government Select Portfolio of the Northern Institutional Funds was $4,274,380 with net purchases of $12,436,142 for the six months ended June 30, 2019. |
Diversification of investments representing geographic diversification, as a percentage of total investments at fair value, is as follows:
| Geographical Diversification | | | Percent | |
| Florida | | | 10.86 | % |
| Illinois | | | 10.31 | |
| California | | | 8.99 | |
| Texas | | | 6.32 | |
| New York | | | 5.07 | |
| Colorado | | | 4.20 | |
| Wisconsin | | | 4.12 | |
| Pennsylvania | | | 3.97 | |
| Georgia | | | 3.77 | |
| Indiana | | | 3.76 | |
| Other | | | 38.63 | |
| | | | 100.00 | % |
At June 30, 2019, the Fund had open futures contracts as follows:
| Type | | Number of
Contracts | | | Notional Amount | | | Contract Position | | Contract Exp. | | | Value and Unrealized Appreciation (Depreciation) | |
| 10-Year U.S. Treasury Note | | | 108 | | | $ | (13,820,625 | ) | | Short | | | 9/19 | | | $ | (269,516 | ) |
| U.S. Treasury Long Bond | | | 46 | | | | (7,157,313 | ) | | Short | | | 9/19 | | | | (217,215 | ) |
| 5-Year U.S. Treasury Note | | | 88 | | | | (10,397,750 | ) | | Short | | | 9/19 | | | | (134,343 | ) |
| | | | | | | | | | | | | | | | | $ | (621,074 | ) |
| See accompanying notes to financial statements. | 61 | (Continued) |
CLEARWATER INVESTMENT TRUST
Schedule of Investments - Clearwater Tax-Exempt Bond Fund
June 30, 2019 (unaudited)
Clearwater Tax-Exempt Bond Fund Portfolio Diversification
(as a percentage of net assets)
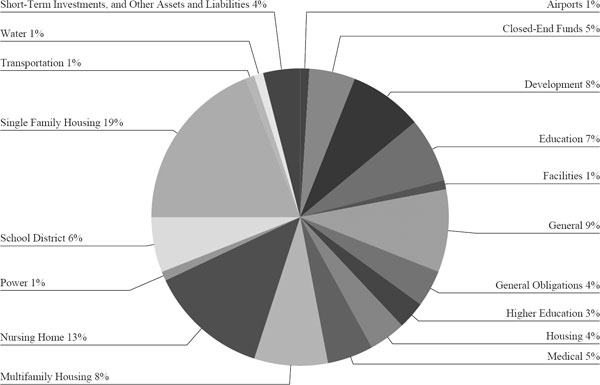
| See accompanying notes to financial statements. | 62 | (Continued) |
CLEARWATER INVESTMENT TRUST
Schedule of Investments - Clearwater International Fund
June 30, 2019 (unaudited)
| Shares | | | Security (a) | | Cost | | Fair value | | Percent of
net assets | |
| Common Stocks: | | | | | | | |
| Australia: | | | | | | | |
| 4,830 | | | AGL ENERGY LTD. | | $ | 56,687 | | | 67,852 | | | | |
| 23,329 | | | ALUMINA LTD. | | | 18,928 | | | 38,161 | | | | |
| 41,047 | | | APA GROUP | | | 230,317 | | | 311,224 | | | | |
| 2,724 | | | ARISTOCRAT LEISURE LTD. | | | 41,431 | | | 58,748 | | | | |
| 2,554 | | | ASX LTD. | | | 51,631 | | | 147,692 | | | | |
| 65,176 | | | AUSTRALIA & NEW ZEALAND BANKING GROUP LTD. | | | 917,668 | | | 1,290,800 | | | | |
| 70,369 | | | BENDIGO & ADELAIDE BANK LTD. | | | 468,821 | | | 572,082 | | | | |
| 179,910 | | | BGP HOLDINGS PLC(b)(c) | | | - | | | - | | | | |
| 11,117 | | | BHP GROUP LTD. | | | 128,168 | | | 321,241 | | | | |
| 23,686 | | | BORAL LTD. | | | 75,396 | | | 85,139 | | | | |
| 17,400 | | | BRAMBLES LTD. | | | 64,294 | | | 157,338 | | | | |
| 8,604 | | | CHALLENGER LTD. | | | 47,284 | | | 40,109 | | | | |
| 7,457 | | | COCA-COLA AMATIL LTD. | | | 47,691 | | | 53,504 | | | | |
| 971 | | | COCHLEAR LTD. | | | 35,893 | | | 141,001 | | | | |
| 19,339 | | | COLES GROUP LTD.(b) | | | 154,507 | | | 181,252 | | | | |
| 27,611 | | | COMMONWEALTH BANK OF AUSTRALIA | | | 1,066,004 | | | 1,604,633 | | | | |
| 41,351 | | | CSL LTD. | | | 2,613,904 | | | 6,241,551 | | | | |
| 14,184 | | | DEXUS | | | 62,970 | | | 129,253 | | | | |
| 97,180 | | | FORTESCUE METALS GROUP LTD. | | | 212,026 | | | 615,392 | | | | |
| 18,737 | | | GOODMAN GROUP | | | 48,414 | | | 197,709 | | | | |
| 12,754 | | | GPT GROUP (THE) | | | 47,798 | | | 55,067 | | | | |
| 17,655 | | | HARVEY NORMAN HOLDINGS LTD. | | | 46,984 | | | 50,446 | | | | |
| 18,683 | | | INCITEC PIVOT LTD. | | | 30,152 | | | 44,727 | | | | |
| 46,677 | | | INSURANCE AUSTRALIA GROUP LTD. | | | 120,292 | | | 270,677 | | | | |
| 12,403 | | | LENDLEASE GROUP | | | 80,469 | | | 113,198 | | | | |
| 7,617 | | | MACQUARIE GROUP LTD. | | | 165,840 | | | 670,525 | | | | |
| 24,195 | | | MIRVAC GROUP | | | 46,656 | | | 53,166 | | | | |
| 21,604 | | | NATIONAL AUSTRALIA BANK LTD. | | | 287,411 | | | 405,265 | | | | |
| 10,055 | | | NEWCREST MINING LTD. | | | 111,010 | | | 225,539 | | | | |
| 65,479 | | | ORIGIN ENERGY LTD. | | | 315,103 | | | 336,037 | | | | |
| 16,330 | | | ORORA LTD. | | | 16,762 | | | 37,145 | | | | |
| 416 | | | PERPETUAL LTD. | | | 7,027 | | | 12,336 | | | | |
| 2,468 | | | RAMSAY HEALTH CARE LTD. | | | 49,765 | | | 125,167 | | | | |
| 20,500 | | | SANTOS LTD. | | | 45,732 | | | 101,896 | | | | |
| 77,291 | | | SCENTRE GROUP | | | 170,541 | | | 208,367 | | | | |
| 5,884 | | | SEEK LTD. | | | 49,598 | | | 87,409 | | | | |
| 9,824 | | | SONIC HEALTHCARE LTD. | | | 79,849 | | | 186,907 | | | | |
| 101,955 | | | SOUTH32 LTD. | | | 70,421 | | | 227,617 | | | | |
| 11,647 | | | STAR ENTERTAINMENT GROUP (THE) LTD. | | | 31,304 | | | 33,688 | | | | |
| 43,370 | | | STOCKLAND | | | 115,690 | | | 126,968 | | | | |
| 7,589 | | | SUNCORP GROUP LTD. | | | 71,620 | | | 71,766 | | | | |
| 9,837 | | | SYDNEY AIRPORT | | | 33,263 | | | 55,525 | | | | |
| 16,365 | | | TABCORP HOLDINGS LTD. | | | 33,181 | | | 51,126 | | | | |
| 38,770 | | | TELSTRA CORP. LTD. | | | 84,588 | | | 104,791 | | | | |
| 27,592 | | | TRANSURBAN GROUP | | | 166,408 | | | 285,528 | | | | |
| 12,264 | | | TREASURY WINE ESTATES LTD. | | | 49,093 | | | 128,460 | | | | |
| 77,784 | | | VICINITY CENTRES | | | 126,700 | | | 133,790 | | | | |
| 17,677 | | | WESFARMERS LTD. | | | 430,202 | | | 448,751 | | | | |
| 78,500 | | | WESTPAC BANKING CORP. | | | 1,161,598 | | | 1,562,946 | | | | |
| 10,214 | | | WOODSIDE PETROLEUM LTD. | | | 228,766 | | | 260,728 | | | | |
| 6,250 | | | WOOLWORTHS GROUP LTD. | | | 142,746 | | | 145,807 | | | | |
| 7,869 | | | WORLEYPARSONS LTD. | | | 62,034 | | | 81,264 | | | | |
| | | | | | | 10,820,637 | | | 18,957,310 | | | 3.11 | % |
| Austria: | | | | | | | |
| 4,693 | | | ERSTE GROUP BANK A.G.(b) | | | 106,346 | | | 174,181 | | | | |
| 93 | | | IMMOFINANZ A.G.(b) | | | - | | | 2,424 | | | | |
| 992 | | | OMV A.G. | | | 48,797 | | | 48,335 | | | | |
| 2,309 | | | RAIFFEISEN BANK INTERNATIONAL A.G. | | | 56,546 | | | 54,165 | | | | |
| 313 | | | STRABAG S.E. (BEARER) | | | 5,505 | | | 10,855 | | | | |
| | | | | | | 217,194 | | | 289,960 | | | 0.05 | % |
| Belgium: | | | | | | | |
| 7,120 | | | AGEAS | | | 106,908 | | | 370,075 | | | | |
| 13,180 | | | ANHEUSER-BUSCH INBEV S.A./N.V. | | | 452,184 | | | 1,166,587 | | | | |
| 12,562 | | | BARCO N.V. | | | 982,918 | | | 2,645,443 | | | | |
| 23,739 | | | GROUPE BRUXELLES LAMBERT S.A. | | | 2,076,742 | | | 2,329,009 | | | | |
| 4,347 | | | KBC GROUP N.V. | | | 101,356 | | | 284,913 | | | | |
See accompanying notes to financial statements. | 63 | (Continued) |
CLEARWATER INVESTMENT TRUST
Schedule of Investments - Clearwater International Fund
June 30, 2019 (unaudited)
| Shares | | | Security (a) | | Cost | | Fair value | | Percent of
net assets | |
| Belgium (Cont’d): | | | | | | | |
| 74,799 | | | ONTEX GROUP N.V. | | $ | 2,261,661 | | | 1,206,065 | | | | |
| 2,190 | | | PROXIMUS SADP | | | 49,577 | | | 64,547 | | | | |
| 495 | | | SOLVAY S.A., CLASS A | | | 49,166 | | | 51,277 | | | | |
| 969 | | | TELENET GROUP HOLDING N.V. | | | 45,566 | | | 53,991 | | | | |
| 1,972 | | | UCB S.A. | | | 98,732 | | | 163,513 | | | | |
| | | | | | | 6,224,810 | | | 8,335,420 | | | 1.37 | % |
| Brazil: | | | | | | | |
| 891,700 | | | CAMIL ALIMENTOS S.A.(b) | | | 2,235,422 | | | 1,667,315 | | | | |
| 446,700 | | | GRENDENE S.A. | | | 1,146,997 | | | 907,371 | | | | |
| 122,300 | | | M DIAS BRANCO S.A.(b) | | | 1,386,494 | | | 1,240,852 | | | | |
| | | | | | | 4,768,913 | | | 3,815,538 | | | 0.63 | % |
| Canada: | | | | | | | |
| 2,489 | | | AGNICO EAGLE MINES LTD. | | | 77,836 | | | 127,610 | | | | |
| 4,817 | | | ALIMENTATION COUCHE-TARD, INC., CLASS B | | | 138,408 | | | 303,134 | | | | |
| 31,523 | | | ALTAGAS LTD. | | | 346,931 | | | 476,859 | | | | |
| 2,039 | | | ATCO LTD., CLASS I | | | 61,318 | | | 68,727 | | | | |
| 19,100 | | | BADGER DAYLIGHTING LTD. | | | 325,157 | | | 696,879 | | | | |
| 1,818 | | | BANK OF MONTREAL | | | 92,929 | | | 137,327 | | | | |
| 5,979 | | | BANK OF NOVA SCOTIA (THE) | | | 229,315 | | | 321,151 | | | | |
| 40,918 | | | BARRICK GOLD CORP. | | | 384,639 | | | 645,852 | | | | |
| 8,112 | | | BLACKBERRY LTD.(b) | | | 59,603 | | | 60,458 | | | | |
| 49,653 | | | BOMBARDIER, INC., CLASS B(b) | | | 48,169 | | | 83,415 | | | | |
| 17,842 | | | BROOKFIELD ASSET MANAGEMENT, INC., CLASS A | | | 164,184 | | | 853,577 | | | | |
| 11,740 | | | CAE, INC. | | | 85,345 | | | 315,655 | | | | |
| 6,179 | | | CAMECO CORP. | | | 63,421 | | | 66,247 | | | | |
| 290,300 | | | CANACCORD GENUITY GROUP, INC. | | | 1,083,675 | | | 1,330,075 | | | | |
| 17,800 | | | CANADA GOOSE HOLDINGS, INC.(b) | | | 373,770 | | | 689,002 | | | | |
| 6,639 | | | CANADIAN IMPERIAL BANK OF COMMERCE | | | 268,953 | | | 522,076 | | | | |
| 15,994 | | | CANADIAN NATIONAL RAILWAY CO. | | | 292,557 | | | 1,480,259 | | | | |
| 20,842 | | | CANADIAN NATURAL RESOURCES LTD. | | | 431,693 | | | 561,972 | | | | |
| 3,606 | | | CANADIAN PACIFIC RAILWAY LTD. | | | 112,878 | | | 849,298 | | | | |
| 20,435 | | | CANADIAN PACIFIC RAILWAY LTD. (NEW YORK EXCHANGE) | | | 2,575,070 | | | 4,807,129 | | | | |
| 744 | | | CANADIAN TIRE CORP. LTD., CLASS A | | | 50,047 | | | 81,061 | | | | |
| 4,317 | | | CANADIAN UTILITIES LTD., CLASS A | | | 103,924 | | | 121,841 | | | | |
| 83,565 | | | CANADIAN WESTERN BANK | | | 1,743,613 | | | 1,906,101 | | | | |
| 1,538 | | | CANOPY GROWTH CORP.(b)(d) | | | 41,295 | | | 62,093 | | | | |
| 1,570 | | | CCL INDUSTRIES, INC., CLASS B | | | 45,979 | | | 76,992 | | | | |
| 6,978 | | | CGI, INC.(b) | | | 55,128 | | | 536,478 | | | | |
| 32,000 | | | COMPUTER MODELLING GROUP LTD. | | | 165,063 | | | 177,893 | | | | |
| 167 | | | CONSTELLATION SOFTWARE, INC. | | | 49,225 | | | 157,397 | | | | |
| 32,459 | | | CRESCENT POINT ENERGY CORP. | | | 105,391 | | | 107,325 | | | | |
| 2,955 | | | CRONOS GROUP, INC.(b) | | | 52,375 | | | 47,409 | | | | |
| 54,517 | | | DOLLARAMA, INC. | | | 2,070,798 | | | 1,917,909 | | | | |
| 7,455 | | | ECN CAPITAL CORP. | | | 17,223 | | | 24,024 | | | | |
| 9,184 | | | ENBRIDGE, INC. | | | 333,714 | | | 331,719 | | | | |
| 40,173 | | | ENCANA CORP. | | | 253,707 | | | 206,149 | | | | |
| 211 | | | FAIRFAX FINANCIAL HOLDINGS LTD. | | | 52,589 | | | 103,564 | | | | |
| 3,611 | | | FINNING INTERNATIONAL, INC. | | | 63,013 | | | 65,820 | | | | |
| 5,843 | | | FIRST QUANTUM MINERALS LTD. | | | 37,831 | | | 55,505 | | | | |
| 6,289 | | | FORTIS, INC. | | | 195,157 | | | 248,333 | | | | |
| 2,389 | | | FRANCO-NEVADA CORP. | | | 109,265 | | | 202,770 | | | | |
| 616 | | | GEORGE WESTON LTD. | | | 47,137 | | | 46,743 | | | | |
| 6,104 | | | GILDAN ACTIVEWEAR, INC. | | | 33,435 | | | 236,227 | | | | |
| 346,100 | | | GRAN TIERRA ENERGY, INC.(b) | | | 841,948 | | | 541,793 | | | | |
| 7,617 | | | HUSKY ENERGY, INC. | | | 75,526 | | | 72,183 | | | | |
| 78,692 | | | IMPERIAL OIL LTD. | | | 2,773,968 | | | 2,178,895 | | | | |
| 3,057 | | | INTER PIPELINE LTD. | | | 44,071 | | | 47,552 | | | | |
| 1,100 | | | INTERNATIONAL PETROLEUM CORP.(b) | | | 2,833 | | | 4,880 | | | | |
| 1,988 | | | KEYERA CORP. | | | 40,155 | | | 51,159 | | | | |
| 33,281 | | | KINROSS GOLD CORP.(b) | | | 62,810 | | | 128,595 | | | | |
| 2,077 | | | LOBLAW COS. LTD. | | | 71,240 | | | 106,344 | | | | |
| 9,476 | | | MAGNA INTERNATIONAL, INC. | | | 61,549 | | | 471,503 | | | | |
| 31,473 | | | MANULIFE FINANCIAL CORP. | | | 380,571 | | | 571,996 | | | | |
| 1,723 | | | METHANEX CORP. | | | 23,658 | | | 78,220 | | | | |
| 3,000 | | | METRO, INC. | | | 54,328 | | | 112,573 | | | | |
| 111,900 | | | MULLEN GROUP LTD. | | | 1,576,565 | | | 811,767 | | | | |
See accompanying notes to financial statements. | 64 | (Continued) |
CLEARWATER INVESTMENT TRUST
Schedule of Investments - Clearwater International Fund
June 30, 2019 (unaudited)
| Shares | | | Security (a) | | Cost | | Fair value | | Percent of
net assets | |
| Canada (Cont’d): | | | | | | | |
| 52,200 | | | NORTH WEST (THE) CO., INC.(d) | | $ | 1,129,519 | | | 1,191,446 | | | | |
| 13,432 | | | NUTRIEN LTD. | | | 376,707 | | | 718,500 | | | | |
| 2,600 | | | ONEX CORP. | | | 105,376 | | | 156,828 | | | | |
| 6,564 | | | OPEN TEXT CORP. | | | 72,477 | | | 270,871 | | | | |
| 23,139 | | | PEMBINA PIPELINE CORP. | | | 537,455 | | | 861,385 | | | | |
| 7,859 | | | PRAIRIESKY ROYALTY LTD. | | | 100,764 | | | 110,424 | | | | |
| 3,681 | | | RESTAURANT BRANDS INTERNATIONAL, INC. | | | 137,022 | | | 255,988 | | | | |
| 2,701 | | | RITCHIE BROS. AUCTIONEERS, INC. | | | 50,064 | | | 89,824 | | | | |
| 9,354 | | | ROGERS COMMUNICATIONS, INC., CLASS B | | | 221,766 | | | 500,718 | | | | |
| 27,066 | | | ROYAL BANK OF CANADA | | | 909,444 | | | 2,150,936 | | | | |
| 34,200 | | | RUSSEL METALS, INC. | | | 642,295 | | | 577,160 | | | | |
| 4,800 | | | SAPUTO, INC. | | | 103,951 | | | 143,683 | | | | |
| 6,983 | | | SEVEN GENERATIONS ENERGY LTD., CLASS A(b) | | | 46,325 | | | 34,234 | | | | |
| 6,379 | | | SHAW COMMUNICATIONS, INC., CLASS B | | | 97,658 | | | 130,157 | | | | |
| 49,100 | | | SHAWCOR LTD. | | | 1,138,755 | | | 686,886 | | | | |
| 711 | | | SHOPIFY, INC., CLASS A(b) | | | 161,836 | | | 213,688 | | | | |
| 18,470 | | | SHOPIFY, INC., CLASS A (NEW YORK EXCHANGE)(b) | | | 2,192,928 | | | 5,543,771 | | | | |
| 2,748 | | | SMARTCENTRES REAL ESTATE INVESTMENT TRUST | | | 63,857 | | | 69,689 | | | | |
| 2,740 | | | SNC-LAVALIN GROUP, INC. | | | 51,508 | | | 55,405 | | | | |
| 2,648 | | | STARS GROUP (THE), INC.(b) | | | 43,347 | | | 45,193 | | | | |
| 11,810 | | | SUN LIFE FINANCIAL, INC. | | | 235,812 | | | 489,066 | | | | |
| 28,774 | | | SUNCOR ENERGY, INC. | | | 661,700 | | | 897,574 | | | | |
| 12,747 | | | TC ENERGY CORP. | | | 530,210 | | | 631,923 | | | | |
| 19,201 | | | TECK RESOURCES LTD., CLASS B | | | 97,101 | | | 443,094 | | | | |
| 4,548 | | | TELUS CORP. | | | 59,716 | | | 168,125 | | | | |
| 8,041 | | | THOMSON REUTERS CORP. | | | 206,631 | | | 518,731 | | | | |
| 30,016 | | | TORONTO-DOMINION BANK (THE) | | | 557,894 | | | 1,753,903 | | | | |
| 3,676 | | | TOURMALINE OIL CORP. | | | 46,277 | | | 46,822 | | | | |
| 104 | | | TRISURA GROUP LTD.(b) | | | 490 | | | 2,382 | | | | |
| 3,709 | | | VERMILION ENERGY, INC. | | | 80,183 | | | 80,578 | | | | |
| 1,150 | | | WEST FRASER TIMBER CO. LTD. | | | 48,190 | | | 52,426 | | | | |
| 6,930 | | | WHEATON PRECIOUS METALS CORP. | | | 108,261 | | | 167,594 | | | | |
| 25,967 | | | YAMANA GOLD, INC. | | | 47,753 | | | 65,832 | | | | |
| | | | | | | 29,714,254 | | | 45,412,351 | | | 7.45 | % |
| China: | | | | | | | |
| 22,179 | | | BAIDU, INC. ADR(b)(e) | | | 3,175,349 | | | 2,602,927 | | | | |
| 1,644,500 | | | CHINA ZHENGTONG AUTO SERVICES HOLDINGS LTD. | | | 948,150 | | | 682,077 | | | | |
| 3,815,000 | | | GOODBABY INTERNATIONAL HOLDINGS LTD.(b) | | | 1,823,865 | | | 864,415 | | | | |
| 1,279,700 | | | GREATVIEW ASEPTIC PACKAGING CO. LTD. | | | 621,913 | | | 730,630 | | | | |
| 81,900 | | | HOLLYSYS AUTOMATION TECHNOLOGIES LTD. | | | 1,736,888 | | | 1,556,100 | | | | |
| 126,500 | | | SHANGHAI HAOHAI BIOLOGICAL TECHNOLOGY CO. LTD., CLASS H(f) | | | 723,708 | | | 689,850 | | | | |
| 88,355 | | | TENCENT HOLDINGS LTD. | | | 1,179,522 | | | 3,988,117 | | | | |
| 3,050,500 | | | XTEP INTERNATIONAL HOLDINGS LTD. | | | 1,295,642 | | | 1,839,274 | | | | |
| | | | | | | 11,505,037 | | | 12,953,390 | | | 2.12 | % |
| Denmark: | | | | | | | |
| 74 | | | AP MOLLER - MAERSK A/S, CLASS A | | | 64,278 | | | 85,903 | | | | |
| 87 | | | AP MOLLER - MAERSK A/S, CLASS B | | | 75,031 | | | 107,912 | | | | |
| 1,846 | | | CARLSBERG A/S, CLASS B | | | 110,654 | | | 244,722 | | | | |
| 31,910 | | | CHR HANSEN HOLDING A/S | | | 1,384,338 | | | 2,996,477 | | | | |
| 1,500 | | | COLOPLAST A/S, CLASS B | | | 27,666 | | | 169,512 | | | | |
| 12,200 | | | DANSKE BANK A/S | | | 119,186 | | | 192,828 | | | | |
| 3,896 | | | DEMANT A/S(b) | | | 70,444 | | | 121,139 | | | | |
| 352 | | | DRILLING CO. OF 1972 (THE) A/S(b) | | | 22,714 | | | 27,348 | | | | |
| 27,718 | | | DSV A/S | | | 2,173,520 | | | 2,721,910 | | | | |
| 200 | | | FLSMIDTH & CO. A/S | | | 6,012 | | | 9,046 | | | | |
| 808 | | | GENMAB A/S(b) | | | 101,229 | | | 148,573 | | | | |
| 1,206 | | | H LUNDBECK A/S | | | 47,122 | | | 47,640 | | | | |
| 1,574 | | | ISS A/S | | | 47,072 | | | 47,502 | | | | |
| 72,477 | | | MATAS A/S | | | 691,581 | | | 786,143 | | | | |
| 44,542 | | | NILFISK HOLDING A/S(b) | | | 2,368,316 | | | 1,244,487 | | | | |
| 20,983 | | | NOVO NORDISK A/S, CLASS B | | | 231,686 | | | 1,069,265 | | | | |
| 3,773 | | | NOVOZYMES A/S, CLASS B | | | 100,500 | | | 175,943 | | | | |
| 864 | | | ORSTED A/S(f) | | | 68,168 | | | 74,710 | | | | |
| 3,622 | | | PANDORA A/S | | | 57,734 | | | 128,842 | | | | |
| 3,250 | | | TOPDANMARK A/S | | | 33,362 | | | 183,291 | | | | |
| 1,838 | | | TRYG A/S | | | 51,447 | | | 59,753 | | | | |
See accompanying notes to financial statements. | 65 | (Continued) |
CLEARWATER INVESTMENT TRUST
Schedule of Investments - Clearwater International Fund
June 30, 2019 (unaudited)
| Shares | | | Security (a) | | Cost | | Fair value | | Percent of
net assets | |
| Denmark (Cont’d): | | | | | | | |
| 3,244 | | | VESTAS WIND SYSTEMS A/S | | $ | 150,564 | | | 280,211 | | | | |
| | | | | | | 8,002,624 | | | 10,923,157 | | | 1.79 | % |
| Finland: | | | | | | | |
| 2,770 | | | ELISA OYJ | | | 86,574 | | | 135,157 | | | | |
| 2,247 | | | FORTUM OYJ | | | 48,145 | | | 49,658 | | | | |
| 67,513 | | | HUHTAMAKI OYJ | | | 2,033,207 | | | 2,775,968 | | | | |
| 1,396 | | | KESKO OYJ, CLASS B | | | 30,705 | | | 77,655 | | | | |
| 4,902 | | | KONE OYJ, CLASS B | | | 86,493 | | | 289,294 | | | | |
| 21,225 | | | NESTE OYJ | | | 67,704 | | | 720,187 | | | | |
| 71,621 | | | NOKIA OYJ | | | 251,740 | | | 355,568 | | | | |
| 2,240 | | | NOKIAN RENKAAT OYJ | | | 31,307 | | | 69,943 | | | | |
| 1,960 | | | ORION OYJ, CLASS B | | | 49,561 | | | 71,832 | | | | |
| 104,213 | | | OUTOTEC OYJ(b) | | | 825,394 | | | 550,317 | | | | |
| 1,697 | | | SAMPO OYJ, CLASS A | | | 56,535 | | | 80,081 | | | | |
| 15,829 | | | STORA ENSO OYJ (REGISTERED) | | | 75,698 | | | 186,021 | | | | |
| 11,934 | | | UPM-KYMMENE OYJ | | | 99,928 | | | 317,134 | | | | |
| 1,849 | | | VALMET OYJ | | | 14,443 | | | 46,087 | | | | |
| 7,056 | | | WARTSILA OYJ ABP | | | 56,960 | | | 102,338 | | | | |
| | | | | | | 3,814,394 | | | 5,827,240 | | | 0.96 | % |
| France: | | | | | | | |
| 1,275 | | | ACCOR S.A. | | | 29,826 | | | 54,730 | | | | |
| 3,443 | | | AEROPORTS DE PARIS | | | 334,974 | | | 607,613 | | | | |
| 2,197 | | | AIR LIQUIDE S.A. | | | 282,858 | | | 307,405 | | | | |
| 10,877 | | | AIRBUS S.E. | | | 357,319 | | | 1,542,072 | | | | |
| 1,093 | | | ARKEMA S.A. | | | 77,841 | | | 101,640 | | | | |
| 435 | | | ATOS S.E. | | | 30,494 | | | 36,366 | | | | |
| 30,343 | | | AXA S.A. | | | 403,058 | | | 797,020 | | | | |
| 19,939 | | | BNP PARIBAS S.A. | | | 847,533 | | | 946,923 | | | | |
| 16,698 | | | BOLLORE S.A. | | | 52,911 | | | 73,671 | | | | |
| 2,871 | | | BOUYGUES S.A. | | | 90,917 | | | 106,328 | | | | |
| 3,068 | | | CAPGEMINI S.E. | | | 111,959 | | | 381,481 | | | | |
| 9,962 | | | CARREFOUR S.A. | | | 171,901 | | | 192,346 | | | | |
| 4,755 | | | CIE DE SAINT-GOBAIN | | | 143,782 | | | 185,322 | | | | |
| 3,404 | | | CIE GENERALE DES ETABLISSEMENTS MICHELIN S.C.A. | | | 180,725 | | | 431,775 | | | | |
| 2,114 | | | CNP ASSURANCES | | | 47,863 | | | 47,980 | | | | |
| 1,133 | | | COVIVIO | | | 96,781 | | | 118,591 | | | | |
| 28,386 | | | CREDIT AGRICOLE S.A. | | | 231,498 | | | 340,368 | | | | |
| 9,359 | | | DANONE S.A. | | | 473,663 | | | 792,838 | | | | |
| 39 | | | DASSAULT AVIATION S.A. | | | 55,701 | | | 56,054 | | | | |
| 572 | | | DASSAULT SYSTEMES S.E. | | | 84,567 | | | 91,254 | | | | |
| 1,781 | | | EDENRED | | | 26,435 | | | 90,849 | | | | |
| 988 | | | EIFFAGE S.A. | | | 97,231 | | | 97,673 | | | | |
| 9,390 | | | ELECTRICITE DE FRANCE S.A. | | | 135,489 | | | 118,359 | | | | |
| 67,951 | | | ENGIE S.A. | | | 864,155 | | | 1,030,743 | | | | |
| 15,893 | | | ESSILORLUXOTTICA S.A. | | | 1,815,129 | | | 2,069,236 | | | | |
| 19,656 | | | ESSILORLUXOTTICA S.A. (NEW YORK EXCHANGE) | | | 2,401,182 | | | 2,564,759 | | | | |
| 2,946 | | | EURAZEO S.E. | | | 77,882 | | | 205,349 | | | | |
| 178 | | | EUROFINS SCIENTIFIC S.E. | | | 77,699 | | | 78,735 | | | | |
| 3,770 | | | EUTELSAT COMMUNICATIONS S.A. | | | 67,301 | | | 70,476 | | | | |
| 711 | | | GECINA S.A. | | | 70,962 | | | 106,396 | | | | |
| 9,468 | | | GETLINK S.E. | | | 72,457 | | | 151,694 | | | | |
| 99 | | | HERMES INTERNATIONAL | | | 65,266 | | | 71,394 | | | | |
| 793 | | | ICADE | | | 62,060 | | | 72,679 | | | | |
| 414 | | | ILIAD S.A. | | | 49,209 | | | 46,492 | | | | |
| 1,437 | | | IMERYS S.A. | | | 67,443 | | | 76,178 | | | | |
| 537 | | | IPSEN S.A. | | | 66,787 | | | 73,275 | | | | |
| 1,026 | | | KERING S.A. | | | 174,510 | | | 606,782 | | | | |
| 3,189 | | | KLEPIERRE S.A. | | | 86,463 | | | 106,901 | | | | |
| 2,119 | | | LAGARDERE S.C.A. | | | 50,227 | | | 55,178 | | | | |
| 4,882 | | | LEGRAND S.A. | | | 111,114 | | | 356,950 | | | | |
| 6,266 | | | L’OREAL S.A. | | | 661,338 | | | 1,784,830 | | | | |
| 15,183 | | | LVMH MOET HENNESSY LOUIS VUITTON S.E. | | | 2,146,556 | | | 6,462,136 | | | | |
| 34,916 | | | MAISONS DU MONDE S.A.(f) | | | 935,554 | | | 832,174 | | | | |
| 24,258 | | | NATIXIS S.A.(d) | | | 89,060 | | | 97,619 | | | | |
| 24,865 | | | NEXANS S.A. | | | 713,492 | | | 834,648 | | | | |
| 37,227 | | | ORANGE S.A. | | | 404,850 | | | 586,917 | | | | |
| 21,161 | | | PERNOD RICARD S.A. | | | 3,242,150 | | | 3,899,275 | | | | |
See accompanying notes to financial statements. | 66 | (Continued) |
CLEARWATER INVESTMENT TRUST
Schedule of Investments - Clearwater International Fund
June 30, 2019 (unaudited)
| Shares | | | Security (a) | | Cost | | Fair value | | Percent of
net assets | |
| France (Cont’d): | | | | | | | |
| 12,969 | | | PEUGEOT S.A. | | $ | 78,174 | | | 319,569 | | | | |
| 1,889 | | | PUBLICIS GROUPE S.A. | | | 105,153 | | | 99,731 | | | | |
| 4,895 | | | RENAULT S.A. | | | 134,511 | | | 307,750 | | | | |
| 7,377 | | | REXEL S.A. | | | 83,781 | | | 93,656 | | | | |
| 2,982 | | | SAFRAN S.A. | | | 163,488 | | | 436,909 | | | | |
| 18,369 | | | SANOFI | | | 1,038,393 | | | 1,585,562 | | | | |
| 278 | | | SCHNEIDER ELECTRIC S.E. | | | 8,838 | | | 25,261 | | | | |
| 7,138 | | | SCHNEIDER ELECTRIC S.E. (EURONEXT PARIS EXCHANGE) | | | 267,356 | | | 647,382 | | | | |
| 1,813 | | | SCOR S.E. | | | 36,441 | | | 79,494 | | | | |
| 3,283 | | | SES S.A. | | | 48,195 | | | 51,330 | | | | |
| 23,077 | | | SODEXO S.A. | | | 2,035,387 | | | 2,697,560 | | | | |
| 3,361 | | | SUEZ | | | 45,101 | | | 48,498 | | | | |
| 1,413 | | | THALES S.A. | | | 81,763 | | | 174,570 | | | | |
| 22,629 | | | TOTAL S.A. | | | 1,069,449 | | | 1,267,916 | | | | |
| 29,495 | | | UBISOFT ENTERTAINMENT S.A.(b) | | | 2,694,474 | | | 2,308,809 | | | | |
| 4,924 | | | UNIBAIL-RODAMCO-WESTFIELD | | | 751,592 | | | 737,679 | | | | |
| 1,700 | | | VALEO S.A. | | | 48,218 | | | 55,286 | | | | |
| 13,671 | | | VEOLIA ENVIRONNEMENT S.A. | | | 145,445 | | | 332,980 | | | | |
| 7,810 | | | VINCI S.A. | | | 316,569 | | | 799,800 | | | | |
| 85,570 | | | VIVENDI S.A. | | | 1,659,477 | | | 2,355,673 | | | | |
| 1,345 | | | WENDEL S.A. | | | 91,561 | | | 183,375 | | | | |
| 174 | | | WORLDLINE S.A./FRANCE(b)(f) | | | 10,981 | | | 12,663 | | | | |
| | | | | | | 29,652,519 | | | 44,380,927 | | | 7.28 | % |
| Germany: | | | | | | | |
| 1,491 | | | 1&1 DRILLISCH A.G. | | | 47,218 | | | 49,710 | | | | |
| 18,269 | | | ADIDAS A.G. | | | 2,799,756 | | | 5,640,054 | | | | |
| 8,277 | | | ALLIANZ S.E. (REGISTERED) | | | 727,077 | | | 1,995,297 | | | | |
| 5,539 | | | AROUNDTOWN S.A. | | | 46,672 | | | 45,638 | | | | |
| 1,267 | | | AXEL SPRINGER S.E. | | | 68,418 | | | 89,252 | | | | |
| 15,026 | | | BASF S.E. | | | 542,099 | | | 1,092,141 | | | | |
| 14,878 | | | BAYER A.G. (REGISTERED) | | | 779,041 | | | 1,030,969 | | | | |
| 2,206 | | | BEIERSDORF A.G. | | | 146,950 | | | 264,766 | | | | |
| 1,188 | | | BRENNTAG A.G. | | | 43,546 | | | 58,506 | | | | |
| 29,496 | | | COMMERZBANK A.G. | | | 190,394 | | | 211,939 | | | | |
| 916 | | | CONTINENTAL A.G. | | | 47,943 | | | 133,552 | | | | |
| 17,639 | | | DAIMLER A.G. (REGISTERED) | | | 589,913 | | | 981,304 | | | | |
| 1,107 | | | DELIVERY HERO S.E.(b)(f) | | | 44,619 | | | 50,212 | | | | |
| 4,525 | | | DEUTSCHE BOERSE A.G. | | | 273,152 | | | 640,085 | | | | |
| 2,487 | | | DEUTSCHE LUFTHANSA A.G. (REGISTERED) | | | 29,539 | | | 42,617 | | | | |
| 17,828 | | | DEUTSCHE POST A.G. (REGISTERED) | | | 210,542 | | | 585,867 | | | | |
| 72,227 | | | DEUTSCHE TELEKOM A.G. (REGISTERED) | | | 948,582 | | | 1,249,351 | | | | |
| 3,463 | | | DEUTSCHE WOHNEN S.E. | | | 80,362 | | | 127,072 | | | | |
| 11,958 | | | E.ON S.E. | | | 90,058 | | | 129,869 | | | | |
| 35,030 | | | FRESENIUS MEDICAL CARE A.G. & CO. KGAA | | | 2,824,854 | | | 2,750,044 | | | | |
| 6,867 | | | FRESENIUS S.E. & CO. KGAA | | | 150,261 | | | 372,308 | | | | |
| 30,325 | | | GERRESHEIMER A.G. | | | 2,097,876 | | | 2,232,746 | | | | |
| 74,076 | | | GRAND CITY PROPERTIES S.A. | | | 1,180,489 | | | 1,693,060 | | | | |
| 2,246 | | | HANNOVER RUECK S.E. | | | 94,321 | | | 363,168 | | | | |
| 3,952 | | | HEIDELBERGCEMENT A.G. | | | 143,515 | | | 319,780 | | | | |
| 15,108 | | | HELLA GMBH & CO. KGAA | | | 689,859 | | | 746,956 | | | | |
| 671 | | | HENKEL A.G. & CO. KGAA | | | 49,267 | | | 61,612 | | | | |
| 2,600 | | | HOCHTIEF A.G. | | | 108,936 | | | 316,637 | | | | |
| 1,280 | | | HUGO BOSS A.G. | | | 70,065 | | | 85,146 | | | | |
| 21,437 | | | INFINEON TECHNOLOGIES A.G. | | | 117,250 | | | 379,047 | | | | |
| 1,006 | | | INNOGY S.E.(f) | | | 46,650 | | | 47,702 | | | | |
| 53,010 | | | JENOPTIK A.G. | | | 1,022,648 | | | 1,714,900 | | | | |
| 1,054 | | | KION GROUP A.G. | | | 60,202 | | | 66,445 | | | | |
| 877 | | | LANXESS A.G. | | | 48,124 | | | 52,116 | | | | |
| 2,050 | | | MERCK KGAA | | | 86,079 | | | 214,364 | | | | |
| 2,757 | | | METRO A.G. | | | 44,306 | | | 50,395 | | | | |
| 206 | | | MTU AERO ENGINES A.G. | | | 46,193 | | | 49,074 | | | | |
| 3,091 | | | MUENCHENER RUECKVERSICHERUNGS-GESELLSCHAFT A.G. IN MUENCHEN (REGISTERED) | | | 382,823 | | | 775,711 | | | | |
| 2,170 | | | OSRAM LICHT A.G. | | | 64,123 | | | 71,459 | | | | |
| 3,467 | | | RATIONAL A.G. | | | 1,197,168 | | | 2,387,078 | | | | |
| 887 | | | RTL GROUP S.A. | | | 46,355 | | | 45,428 | | | | |
See accompanying notes to financial statements. | 67 | (Continued) |
CLEARWATER INVESTMENT TRUST
Schedule of Investments - Clearwater International Fund
June 30, 2019 (unaudited)
| Shares | | | Security (a) | | Cost | | Fair value | | Percent of
net assets | |
| Germany (Cont’d): | | | | | | | |
| 3,608 | | | RWE A.G. | | $ | 78,041 | | | 88,905 | | | | |
| 17,103 | | | SAP S.E. | | | 683,559 | | | 2,348,519 | | | | |
| 13,106 | | | SIEMENS A.G. (REGISTERED) | | | 795,701 | | | 1,558,836 | | | | |
| 25,092 | | | STABILUS S.A. | | | 1,403,791 | | | 1,164,110 | | | | |
| 6,797 | | | THYSSENKRUPP A.G. | | | 100,339 | | | 99,123 | | | | |
| 7,071 | | | TUI A.G. - CDI | | | 57,698 | | | 69,180 | | | | |
| 6,877 | | | TUI A.G. - CDI (LONDON INTERNATIONAL EXCHANGE) | | | 70,312 | | | 67,457 | | | | |
| 4,249 | | | UNIPER S.E. | | | 47,803 | | | 128,664 | | | | |
| 1,918 | | | UNITED INTERNET A.G. (REGISTERED) | | | 68,585 | | | 63,160 | | | | |
| 404 | | | VOLKSWAGEN A.G. | | | 40,235 | | | 69,436 | | | | |
| 3,076 | | | VONOVIA S.E. | | | 118,729 | | | 146,904 | | | | |
| 1,746 | | | WIRECARD A.G. | | | 227,274 | | | 293,935 | | | | |
| 1,182 | | | ZALANDO S.E.(b)(f) | | | 46,492 | | | 52,445 | | | | |
| 13,091 | | | ZOOPLUS A.G.(b)(d) | | | 2,675,446 | | | 1,783,316 | | | | |
| | | | | | | 24,691,250 | | | 37,147,367 | | | 6.09 | % |
| Greece: | | | | | | | |
| 6,746 | | | HELLENIC TELECOMMUNICATIONS ORGANIZATION S.A. | | | 54,075 | | | 99,721 | | | | |
| | | | | | | 54,075 | | | 99,721 | | | 0.02 | % |
| Hong Kong: | | | | | | | |
| 625,000 | | | AIA GROUP LTD. | | | 3,380,759 | | | 6,740,690 | | | | |
| 181,500 | | | BOC HONG KONG HOLDINGS LTD. | | | 447,601 | | | 714,457 | | | | |
| 56,044 | | | CK ASSET HOLDINGS LTD. | | | 165,366 | | | 438,712 | | | | |
| 52,044 | | | CK HUTCHISON HOLDINGS LTD. | | | 307,834 | | | 512,998 | | | | |
| 10,000 | | | CK INFRASTRUCTURE HOLDINGS LTD. | | | 46,496 | | | 81,544 | | | | |
| 34,500 | | | CLP HOLDINGS LTD. | | | 236,618 | | | 380,698 | | | | |
| 18,000 | | | GALAXY ENTERTAINMENT GROUP LTD. | | | 39,054 | | | 121,318 | | | | |
| 15,300 | | | HANG SENG BANK LTD. | | | 175,457 | | | 380,948 | | | | |
| 25,331 | | | HENDERSON LAND DEVELOPMENT CO. LTD. | | | 45,544 | | | 139,598 | | | | |
| 113,364 | | | HONG KONG & CHINA GAS CO. LTD. | | | 169,115 | | | 251,349 | | | | |
| 11,800 | | | HONG KONG EXCHANGES & CLEARING LTD. | | | 203,281 | | | 416,611 | | | | |
| 1,300 | | | JARDINE MATHESON HOLDINGS LTD. | | | 83,934 | | | 81,926 | | | | |
| 314,500 | | | JOHNSON ELECTRIC HOLDINGS LTD. | | | 751,765 | | | 671,539 | | | | |
| 40,500 | | | LINK REIT | | | 84,196 | | | 497,715 | | | | |
| 30,500 | | | MTR CORP. LTD. | | | 88,703 | | | 205,371 | | | | |
| 43,500 | | | NWS HOLDINGS LTD. | | | 52,824 | | | 89,431 | | | | |
| 2,237,000 | | | PAX GLOBAL TECHNOLOGY LTD. | | | 1,124,872 | | | 910,642 | | | | |
| 190,000 | | | PCCW LTD. | | | 77,805 | | | 109,694 | | | | |
| 19,500 | | | POWER ASSETS HOLDINGS LTD. | | | 108,242 | | | 140,290 | | | | |
| 27,400 | | | SINO LAND CO. LTD. | | | 29,978 | | | 45,949 | | | | |
| 9,000 | | | SUN HUNG KAI PROPERTIES LTD. | | | 81,725 | | | 152,656 | | | | |
| 19,000 | | | SWIRE PACIFIC LTD., CLASS A | | | 127,857 | | | 233,496 | | | | |
| 362,400 | | | TECHTRONIC INDUSTRIES CO. LTD. | | | 1,289,286 | | | 2,774,239 | | | | |
| 1,944,000 | | | VALUE PARTNERS GROUP LTD. | | | 1,566,460 | | | 1,296,547 | | | | |
| 158,900 | | | VTECH HOLDINGS LTD. | | | 2,090,137 | | | 1,421,856 | | | | |
| 83,500 | | | WH GROUP LTD.(f) | | | 45,547 | | | 84,658 | | | | |
| 18,000 | | | WHARF HOLDINGS (THE) LTD. | | | 46,295 | | | 47,698 | | | | |
| 6,000 | | | WHARF REAL ESTATE INVESTMENT CO. LTD. | | | 34,958 | | | 42,283 | | | | |
| 19,000 | | | WHEELOCK & CO. LTD. | | | 30,489 | | | 136,206 | | | | |
| 15,000 | | | YUE YUEN INDUSTRIAL HOLDINGS LTD. | | | 30,233 | | | 41,092 | | | | |
| | | | | | | 12,962,431 | | | 19,162,211 | | | 3.14 | % |
| India: | | | | | | | |
| 320,448 | | | BHARTI INFRATEL LTD. | | | 1,534,665 | | | 1,239,733 | | | | |
| 302,908 | | | DCB BANK LTD. | | | 676,881 | | | 1,040,447 | | | | |
| 148,065 | | | HCL TECHNOLOGIES LTD. | | | 1,804,523 | | | 2,283,690 | | | | |
| 34,260 | | | HDFC BANK LTD. ADR(e) | | | 2,077,940 | | | 4,455,170 | | | | |
| 912,624 | | | WELSPUN INDIA LTD. | | | 703,935 | | | 758,895 | | | | |
| | | | | | | 6,797,944 | | | 9,777,935 | | | 1.60 | % |
| Ireland: | | | | | | | |
| 25,592 | | | ACCENTURE PLC, CLASS A | | | 2,980,667 | | | 4,728,634 | | | | |
| 1,332 | | | AERCAP HOLDINGS N.V.(b) | | | 50,212 | | | 69,277 | | | | |
| 30,866 | | | AIB GROUP PLC | | | 132,903 | | | 126,212 | | | | |
| 16,075 | | | CRH PLC | | | 247,660 | | | 524,421 | | | | |
| 757 | | | DCC PLC | | | 66,565 | | | 67,487 | | | | |
| 618 | | | FLUTTER ENTERTAINMENT PLC | | | 48,168 | | | 46,478 | | | | |
| 13,131 | | | ICON PLC(b) | | | 869,539 | | | 2,021,780 | | | | |
| 11,673 | | | JAMES HARDIE INDUSTRIES PLC - CDI | | | 105,224 | | | 153,247 | | | | |
See accompanying notes to financial statements. | 68 | (Continued) |
CLEARWATER INVESTMENT TRUST
Schedule of Investments - Clearwater International Fund
June 30, 2019 (unaudited)
| | | | | | | | | | | | | |
| Shares | | | Security (a) | | Cost | | | Fair value | | | Percent of
net assets | |
| | Ireland (Cont’d): | | | | | | | | | | | | | | | |
| | 3,425 | | | KERRY GROUP PLC, CLASS A | | $ | 234,436 | | | | 408,930 | | | | | |
| | 2,065 | | | KINGSPAN GROUP PLC | | | 100,718 | | | | 112,146 | | | | | |
| | 234 | | | PERRIGO CO. PLC | | | 9,702 | | | | 11,143 | | | | | |
| | | | | | | | 4,845,794 | | | | 8,269,755 | | | | 1.36 | % |
| | Isle of Man: | | | | | | | | | | | | | | | |
| | 11,103 | | | GVC HOLDINGS PLC | | | 86,182 | | | | 91,905 | | | | | |
| | | | | | | | 86,182 | | | | 91,905 | | | | 0.01 | % |
| | Israel: | | | | | | | | | | | | | | | |
| | 1,123 | | | AZRIELI GROUP LTD. | | | 65,459 | | | | 75,207 | | | | | |
| | 21,007 | | | BANK HAPOALIM B.M. | | | 79,922 | | | | 155,751 | | | | | |
| | 9,921 | | | BANK LEUMI LE-ISRAEL B.M. | | | 67,446 | | | | 71,611 | | | | | |
| | 2,094 | | | CHECK POINT SOFTWARE TECHNOLOGIES LTD.(b) | | | 161,340 | | | | 242,087 | | | | | |
| | 338 | | | ELBIT SYSTEMS LTD. | | | 43,582 | | | | 50,291 | | | | | |
| | 9,132 | | | ISRAEL CHEMICALS LTD. | | | 47,288 | | | | 47,825 | | | | | |
| | 5,900 | | | MIZRAHI TEFAHOT BANK LTD.(b) | | | 51,135 | | | | 136,010 | | | | | |
| | 2,937 | | | NICE LTD.(b) | | | 148,741 | | | | 399,221 | | | | | |
| | 324 | | | WIX.COM LTD.(b) | | | 47,649 | | | | 46,040 | | | | | |
| | | | | | | | 712,562 | | | | 1,224,043 | | | | 0.20 | % |
| | Italy: | | | | | | | | | | | | | | | |
| | 25,746 | | | ASSICURAZIONI GENERALI S.P.A. | | | 314,340 | | | | 484,807 | | | | | |
| | 3,782 | | | ATLANTIA S.P.A. | | | 66,043 | | | | 98,525 | | | | | |
| | 25,272 | | | BANCA MEDIOLANUM S.P.A. | | | 87,322 | | | | 186,071 | | | | | |
| | 85,116 | | | ENEL S.P.A. | | | 300,516 | | | | 594,262 | | | | | |
| | 1,211 | | | FERRARI N.V. | | | 46,128 | | | | 196,640 | | | | | |
| | 1,022 | | | FERRARI N.V. (NEW YORK EXCHANGE) | | | 7,568 | | | | 164,971 | | | | | |
| | 73,214 | | | INTERPUMP GROUP S.P.A. | | | 1,392,438 | | | | 2,252,789 | | | | | |
| | 426,636 | | | INTESA SANPAOLO S.P.A. | | | 902,250 | | | | 913,010 | | | | | |
| | 10,070 | | | LEONARDO S.P.A. | | | 50,331 | | | | 127,617 | | | | | |
| | 10,830 | | | MEDIOBANCA BANCA DI CREDITO FINANZIARIO S.P.A. | | | 70,955 | | | | 111,646 | | | | | |
| | 1,157 | | | MONCLER S.P.A. | | | 45,613 | | | | 49,467 | | | | | |
| | 3,764 | | | PRYSMIAN S.P.A. | | | 70,326 | | | | 77,683 | | | | | |
| | 1,669 | | | RECORDATI S.P.A. | | | 68,164 | | | | 69,574 | | | | | |
| | 695 | | | RIZZOLI CORRIERE DELLA SERA MEDIAGROUP S.P.A. | | | 460 | | | | 737 | | | | | |
| | 76,191 | | | SNAM S.P.A. | | | 276,534 | | | | 378,689 | | | | | |
| | 216,632 | | | TECHNOGYM S.P.A.(f) | | | 1,366,577 | | | | 2,411,593 | | | | | |
| | 99,406 | | | TELECOM ITALIA S.P.A. (RSP) | | | 46,425 | | | | 51,555 | | | | | |
| | 11,743 | | | TENARIS S.A. | | | 131,805 | | | | 153,693 | | | | | |
| | 34,652 | | | TERNA RETE ELETTRICA NAZIONALE S.P.A. | | | 130,368 | | | | 220,656 | | | | | |
| | 18,585 | | | TOD’S S.P.A.(d) | | | 1,234,884 | | | | 867,721 | | | | | |
| | 95,230 | | | UNIPOLSAI ASSICURAZIONI S.P.A.(d) | | | 153,826 | | | | 244,618 | | | | | |
| | | | | | | | 6,762,873 | | | | 9,656,324 | | | | 1.58 | % |
| | Japan: | | | | | | | | | | | | | | | |
| | 1,400 | | | ABC-MART, INC. | | | 51,583 | | | | 91,156 | | | | | |
| | 4,700 | | | AEON CO. LTD. | | | 52,433 | | | | 80,691 | | | | | |
| | 4,800 | | | AEON FINANCIAL SERVICE CO. LTD. | | | 49,903 | | | | 77,243 | | | | | |
| | 3,600 | | | AEON MALL CO. LTD. | | | 50,736 | | | | 54,159 | | | | | |
| | 2,300 | | | AISIN SEIKI CO. LTD. | | | 37,584 | | | | 79,145 | | | | | |
| | 15,000 | | | AJINOMOTO CO., INC. | | | 116,767 | | | | 259,890 | | | | | |
| | 2,500 | | | ALFRESA HOLDINGS CORP. | | | 24,420 | | | | 61,633 | | | | | |
| | 2,000 | | | AMADA HOLDINGS CO. LTD. | | | 10,582 | | | | 22,502 | | | | | |
| | 1,400 | | | ANA HOLDINGS, INC. | | | 35,110 | | | | 46,331 | | | | | |
| | 56,300 | | | ANICOM HOLDINGS, INC. | | | 1,226,702 | | | | 2,013,045 | | | | | |
| | 2,700 | | | AOZORA BANK LTD. | | | 65,561 | | | | 64,761 | | | | | |
| | 60,800 | | | ASAHI CO. LTD. | | | 851,839 | | | | 685,738 | | | | | |
| | 5,600 | | | ASAHI GROUP HOLDINGS LTD. | | | 85,235 | | | | 251,653 | | | | | |
| | 31,000 | | | ASAHI KASEI CORP. | | | 147,138 | | | | 330,228 | | | | | |
| | 135,100 | | | ASICS CORP. | | | 2,200,712 | | | | 1,462,335 | | | | | |
| | 37,000 | | | ASTELLAS PHARMA, INC. | | | 236,149 | | | | 526,782 | | | | | |
| | 1,900 | | | BANDAI NAMCO HOLDINGS, INC. | | | 33,289 | | | | 92,167 | | | | | |
| | 6,600 | | | BANK OF KYOTO (THE) LTD. | | | 216,700 | | | | 254,965 | | | | | |
| | 13,800 | | | BRIDGESTONE CORP. | | | 205,726 | | | | 542,963 | | | | | |
| | 5,200 | | | BROTHER INDUSTRIES LTD. | | | 38,445 | | | | 98,150 | | | | | |
| | 136,300 | | | BUNKA SHUTTER CO. LTD. | | | 1,071,837 | | | | 1,032,854 | | | | | |
| | 5,800 | | | CANON, INC. | | | 164,347 | | | | 169,242 | | | | | |
| | 2,700 | | | CENTRAL JAPAN RAILWAY CO. | | | 229,516 | | | | 540,426 | | | | | |
| | 9,700 | | | CHIBA BANK (THE) LTD. | | | 47,640 | | | | 47,324 | | | | | |
| See accompanying notes to financial statements. | 69 | (Continued) |
CLEARWATER INVESTMENT TRUST
Schedule of Investments - Clearwater International Fund
June 30, 2019 (unaudited)
| | | | | | | | | | | | | |
| Shares | | | Security (a) | | Cost | | | Fair value | | | Percent of
net assets | |
| | Japan (Cont’d): | | | | | | | | | | | | | | | |
| | 4,500 | | | CHUGAI PHARMACEUTICAL CO. LTD. | | $ | 82,278 | | | | 293,837 | | | | | |
| | 7,900 | | | CITIZEN WATCH CO. LTD. | | | 31,581 | | | | 40,520 | | | | | |
| | 2,600 | | | COCA-COLA BOTTLERS JAPAN HOLDINGS, INC. | | | 64,917 | | | | 65,811 | | | | | |
| | 1,300 | | | CYBERAGENT, INC. | | | 48,658 | | | | 47,085 | | | | | |
| | 2,500 | | | DAI NIPPON PRINTING CO. LTD. | | | 46,806 | | | | 53,239 | | | | | |
| | 127,700 | | | DAIBIRU CORP. | | | 1,267,518 | | | | 1,186,805 | | | | | |
| | 900 | | | DAIFUKU CO. LTD. | | | 45,843 | | | | 50,503 | | | | | |
| | 16,500 | | | DAI-ICHI LIFE HOLDINGS, INC. | | | 198,959 | | | | 248,690 | | | | | |
| | 9,700 | | | DAIICHI SANKYO CO. LTD. | | | 150,922 | | | | 506,975 | | | | | |
| | 4,500 | | | DAIKIN INDUSTRIES LTD. | | | 124,473 | | | | 587,047 | | | | | |
| | 1,200 | | | DAITO TRUST CONSTRUCTION CO. LTD. | | | 117,985 | | | | 152,873 | | | | | |
| | 13,600 | | | DAIWA HOUSE INDUSTRY CO. LTD. | | | 194,625 | | | | 396,212 | | | | | |
| | 38 | | | DAIWA HOUSE REIT INVESTMENT CORP. | | | 83,440 | | | | 91,674 | | | | | |
| | 29,500 | | | DAIWA SECURITIES GROUP, INC. | | | 115,554 | | | | 129,175 | | | | | |
| | 8,200 | | | DENSO CORP. | | | 185,234 | | | | 344,763 | | | | | |
| | 2,800 | | | DENTSU, INC. | | | 46,871 | | | | 97,649 | | | | | |
| | 8,300 | | | DESCENTE LTD. | | | 48,196 | | | | 145,576 | | | | | |
| | 47,200 | | | DOWA HOLDINGS CO. LTD. | | | 1,563,071 | | | | 1,512,554 | | | | | |
| | 7,000 | | | EAST JAPAN RAILWAY CO. | | | 392,789 | | | | 654,454 | | | | | |
| | 3,400 | | | EISAI CO. LTD. | | | 112,861 | | | | 192,083 | | | | | |
| | 6,600 | | | ELECTRIC POWER DEVELOPMENT CO. LTD. | | | 148,031 | | | | 149,857 | | | | | |
| | 22,400 | | | EN-JAPAN, INC. | | | 845,777 | | | | 871,567 | | | | | |
| | 7,200 | | | FAMILYMART UNY HOLDINGS CO. LTD. | | | 52,590 | | | | 171,761 | | | | | |
| | 3,100 | | | FANUC CORP. | | | 243,447 | | | | 573,046 | | | | | |
| | 1,300 | | | FAST RETAILING CO. LTD. | | | 188,734 | | | | 785,317 | | | | | |
| | 4,200 | | | FUJI ELECTRIC CO. LTD. | | | 51,969 | | | | 144,720 | | | | | |
| | 84,100 | | | FUJI OIL HOLDINGS, INC. | | | 1,844,803 | | | | 2,535,130 | | | | | |
| | 8,800 | | | FUJIFILM HOLDINGS CORP. | | | 165,274 | | | | 445,897 | | | | | |
| | 1,800 | | | FUJITSU LTD. | | | 64,886 | | | | 125,415 | | | | | |
| | 14,000 | | | FUKUOKA FINANCIAL GROUP, INC. | | | 230,551 | | | | 255,419 | | | | | |
| | 3,200 | | | FURUKAWA ELECTRIC CO. LTD. | | | 65,376 | | | | 93,642 | | | | | |
| | 40,800 | | | HACHIJUNI BANK (THE) LTD. | | | 176,428 | | | | 166,129 | | | | | |
| | 3,000 | | | HAMAMATSU PHOTONICS K.K. | | | 52,686 | | | | 116,728 | | | | | |
| | 2,400 | | | HANKYU HANSHIN HOLDINGS, INC. | | | 57,098 | | | | 85,925 | | | | | |
| | 341 | | | HIROSE ELECTRIC CO. LTD. | | | 28,677 | | | | 38,017 | | | | | |
| | 1,600 | | | HISAMITSU PHARMACEUTICAL CO., INC. | | | 66,399 | | | | 63,145 | | | | | |
| | 19,000 | | | HITACHI LTD. | | | 295,895 | | | | 695,924 | | | | | |
| | 6,200 | | | HITACHI METALS LTD. | | | 47,471 | | | | 69,985 | | | | | |
| | 10,400 | | | HONDA MOTOR CO. LTD. | | | 248,947 | | | | 268,645 | | | | | |
| | 5,300 | | | HOYA CORP. | | | 112,594 | | | | 405,752 | | | | | |
| | 71,400 | | | IDEC CORP. | | | 1,644,104 | | | | 1,337,736 | | | | | |
| | 254,800 | | | IDOM, INC.(d) | | | 1,560,383 | | | | 682,996 | | | | | |
| | 16,000 | | | INPEX CORP. | | | 149,502 | | | | 144,143 | | | | | |
| | 18,200 | | | ITOCHU CORP. | | | 192,005 | | | | 347,828 | | | | | |
| | 4,000 | | | J FRONT RETAILING CO. LTD. | | | 31,099 | | | | 45,819 | | | | | |
| | 7,000 | | | JAPAN EXCHANGE GROUP, INC. | | | 56,090 | | | | 111,153 | | | | | |
| | 10 | | | JAPAN REAL ESTATE INVESTMENT CORP. | | | 49,036 | | | | 60,845 | | | | | |
| | 24 | | | JAPAN RETAIL FUND INVESTMENT CORP. | | | 41,483 | | | | 48,528 | | | | | |
| | 3,600 | | | JGC CORP. | | | 47,805 | | | | 49,351 | | | | | |
| | 5,000 | | | JTEKT CORP. | | | 36,670 | | | | 60,567 | | | | | |
| | 84,700 | | | JXTG HOLDINGS, INC. | | | 326,972 | | | | 419,827 | | | | | |
| | 6,500 | | | KAJIMA CORP. | | | 44,950 | | | | 89,106 | | | | | |
| | 2,100 | | | KANSAI PAINT CO. LTD. | | | 12,205 | | | | 44,000 | | | | | |
| | 10,000 | | | KAO CORP. | | | 208,279 | | | | 761,490 | | | | | |
| | 3,500 | | | KAWASAKI HEAVY INDUSTRIES LTD. | | | 71,135 | | | | 82,229 | | | | | |
| | 29,862 | | | KDDI CORP. | | | 239,416 | | | | 759,879 | | | | | |
| | 1,200 | | | KEIO CORP. | | | 36,571 | | | | 78,913 | | | | | |
| | 2,500 | | | KEISEI ELECTRIC RAILWAY CO. LTD. | | | 23,110 | | | | 91,012 | | | | | |
| | 9,262 | | | KEYENCE CORP. | | | 2,216,041 | | | | 5,680,991 | | | | | |
| | 6,000 | | | KIKKOMAN CORP. | | | 52,867 | | | | 261,003 | | | | | |
| | 1,200 | | | KINTETSU GROUP HOLDINGS CO. LTD. | | | 35,697 | | | | 57,432 | | | | | |
| | 10,000 | | | KIRIN HOLDINGS CO. LTD. | | | 103,112 | | | | 215,508 | | | | | |
| | 16,900 | | | KOBAYASHI PHARMACEUTICAL CO. LTD. | | | 451,749 | | | | 1,208,542 | | | | | |
| | 2,100 | | | KOMATSU LTD. | | | 48,104 | | | | 50,642 | | | | | |
| | 2,300 | | | KONAMI HOLDINGS CORP. | | | 50,313 | | | | 107,731 | | | | | |
| | 21,000 | | | KUBOTA CORP. | | | 129,773 | | | | 349,237 | | | | | |
| | 4,100 | | | KYOCERA CORP. | | | 137,688 | | | | 267,528 | | | | | |
| See accompanying notes to financial statements. | 70 | (Continued) |
CLEARWATER INVESTMENT TRUST
Schedule of Investments - Clearwater International Fund
June 30, 2019 (unaudited)
| | | | | | | | | | | | | |
| Shares | | | Security (a) | | Cost | | | Fair value | | | Percent of
net assets | |
| | Japan (Cont’d): | | | | | | | | | | | | | | | |
| | 5,000 | | | KYOWA HAKKO KIRIN CO. LTD. | | $ | 54,616 | | | | 89,923 | | | | | |
| | 8,000 | | | KYUSHU ELECTRIC POWER CO., INC. | | | 70,471 | | | | 78,505 | | | | | |
| | 2,200 | | | LAWSON, INC. | | | 100,677 | | | | 105,496 | | | | | |
| | 9,600 | | | LIXIL GROUP CORP. | | | 116,604 | | | | 151,727 | | | | | |
| | 4,800 | | | M3, INC. | | | 51,468 | | | | 87,661 | | | | | |
| | 3,200 | | | MAKITA CORP. | | | 82,169 | | | | 108,631 | | | | | |
| | 32,000 | | | MARUBENI CORP. | | | 162,807 | | | | 211,622 | | | | | |
| | 6,500 | | | MARUI GROUP CO. LTD. | | | 32,287 | | | | 132,273 | | | | | |
| | 11,400 | | | MAZDA MOTOR CORP. | | | 95,886 | | | | 118,901 | | | | | |
| | 2,400 | | | MEIJI HOLDINGS CO. LTD. | | | 38,749 | | | | 171,405 | | | | | |
| | 48,500 | | | MEITEC CORP. | | | 1,582,401 | | | | 2,487,641 | | | | | |
| | 8,700 | | | MINEBEA MITSUMI, INC. | | | 84,406 | | | | 147,266 | | | | | |
| | 1,900 | | | MISUMI GROUP, INC. | | | 46,858 | | | | 47,617 | | | | | |
| | 36,800 | | | MITSUBISHI CHEMICAL HOLDINGS CORP. | | | 149,792 | | | | 256,882 | | | | | |
| | 18,300 | | | MITSUBISHI CORP. | | | 250,540 | | | | 482,048 | | | | | |
| | 40,000 | | | MITSUBISHI ELECTRIC CORP. | | | 322,861 | | | | 526,457 | | | | | |
| | 18,000 | | | MITSUBISHI ESTATE CO. LTD. | | | 215,299 | | | | 334,740 | | | | | |
| | 8,500 | | | MITSUBISHI GAS CHEMICAL CO., INC. | | | 75,149 | | | | 113,212 | | | | | |
| | 5,700 | | | MITSUBISHI HEAVY INDUSTRIES LTD. | | | 185,317 | | | | 248,005 | | | | | |
| | 13,300 | | | MITSUBISHI MOTORS CORP. | | | 60,808 | | | | 63,653 | | | | | |
| | 5,700 | | | MITSUBISHI TANABE PHARMA CORP. | | | 65,869 | | | | 63,442 | | | | | |
| | 203,500 | | | MITSUBISHI UFJ FINANCIAL GROUP, INC. | | | 954,505 | | | | 966,396 | | | | | |
| | 27,000 | | | MITSUBISHI UFJ LEASE & FINANCE CO. LTD. | | | 83,878 | | | | 142,995 | | | | | |
| | 16,600 | | | MITSUI & CO. LTD. | | | 168,396 | | | | 270,059 | | | | | |
| | 7,400 | | | MITSUI CHEMICALS, INC. | | | 87,469 | | | | 183,052 | | | | | |
| | 2,600 | | | MITSUI FUDOSAN CO. LTD. | | | 64,528 | | | | 63,001 | | | | | |
| | 204,100 | | | MIZUHO FINANCIAL GROUP, INC. | | | 310,898 | | | | 295,506 | | | | | |
| | 63,800 | | | MORITA HOLDINGS CORP. | | | 1,126,115 | | | | 1,115,457 | | | | | |
| | 8,280 | | | MS&AD INSURANCE GROUP HOLDINGS, INC. | | | 177,615 | | | | 262,650 | | | | | |
| | 10,800 | | | MURATA MANUFACTURING CO. LTD. | | | 162,615 | | | | 484,831 | | | | | |
| | 75,900 | | | N FIELD CO. LTD. | | | 1,350,940 | | | | 494,901 | | | | | |
| | 3,100 | | | NEXON CO. LTD.(b) | | | 47,074 | | | | 44,912 | | | | | |
| | 5,000 | | | NGK INSULATORS LTD. | | | 63,091 | | | | 72,856 | | | | | |
| | 4,100 | | | NGK SPARK PLUG CO. LTD. | | | 48,644 | | | | 76,893 | | | | | |
| | 3,000 | | | NH FOODS LTD. | | | 72,315 | | | | 128,414 | | | | | |
| | 41,700 | | | NICHIHA CORP. | | | 1,152,569 | | | | 1,162,255 | | | | | |
| | 3,900 | | | NIDEC CORP. | | | 129,234 | | | | 532,649 | | | | | |
| | 83,000 | | | NIHON PARKERIZING CO. LTD. | | | 1,128,819 | | | | 919,186 | | | | | |
| | 2,600 | | | NINTENDO CO. LTD. | | | 285,625 | | | | 952,316 | | | | | |
| | 22 | | | NIPPON BUILDING FUND, INC. | | | 90,970 | | | | 150,591 | | | | | |
| | 1,700 | | | NIPPON EXPRESS CO. LTD. | | | 60,747 | | | | 90,349 | | | | | |
| | 26 | | | NIPPON PROLOGIS REIT, INC. | | | 54,492 | | | | 60,023 | | | | | |
| | 15,200 | | | NIPPON TELEGRAPH & TELEPHONE CORP. | | | 342,697 | | | | 707,308 | | | | | |
| | 5,000 | | | NISSAN CHEMICAL CORP. | | | 50,851 | | | | 225,154 | | | | | |
| | 28,200 | | | NISSAN MOTOR CO. LTD. | | | 201,166 | | | | 201,819 | | | | | |
| | 3,670 | | | NISSHIN SEIFUN GROUP, INC. | | | 31,991 | | | | 83,704 | | | | | |
| | 1,200 | | | NISSIN FOODS HOLDINGS CO. LTD. | | | 43,959 | | | | 77,243 | | | | | |
| | 2,700 | | | NITORI HOLDINGS CO. LTD. | | | 87,310 | | | | 357,613 | | | | | |
| | 3,200 | | | NITTO DENKO CORP. | | | 77,639 | | | | 157,811 | | | | | |
| | 67,300 | | | NOMURA HOLDINGS, INC. | | | 225,895 | | | | 236,828 | | | | | |
| | 8,400 | | | NOMURA REAL ESTATE HOLDINGS, INC. | | | 130,390 | | | | 180,442 | | | | | |
| | 46 | | | NOMURA REAL ESTATE MASTER FUND, INC. | | | 64,976 | | | | 70,697 | | | | | |
| | 9,801 | | | NOMURA RESEARCH INSTITUTE LTD. | | | 43,930 | | | | 156,994 | | | | | |
| | 7,000 | | | NSK LTD. | | | 50,459 | | | | 62,329 | | | | | |
| | 7,000 | | | NTT DATA CORP. | | | 36,520 | | | | 93,169 | | | | | |
| | 23,800 | | | NTT DOCOMO, INC. | | | 362,981 | | | | 554,631 | | | | | |
| | 12,000 | | | OBAYASHI CORP. | | | 48,665 | | | | 118,091 | | | | | |
| | 33,200 | | | OLYMPUS CORP. | | | 211,415 | | | | 368,290 | | | | | |
| | 1,100 | | | OMRON CORP. | | | 31,828 | | | | 57,339 | | | | | |
| | 6,100 | | | ONO PHARMACEUTICAL CO. LTD. | | | 61,884 | | | | 109,309 | | | | | |
| | 4,800 | | | ORIENTAL LAND CO. LTD. | | | 113,097 | | | | 593,906 | | | | | |
| | 15,500 | | | ORIX CORP. | | | 185,456 | | | | 231,174 | | | | | |
| | 2,400 | | | OSAKA GAS CO. LTD. | | | 36,678 | | | | 41,783 | | | | | |
| | 7,300 | | | OTSUKA HOLDINGS CO. LTD. | | | 217,894 | | | | 238,063 | | | | | |
| | 1,800 | | | PAN PACIFIC INTERNATIONAL HOLDINGS CORP. | | | 114,304 | | | | 114,196 | | | | | |
| | 33,300 | | | PANASONIC CORP. | | | 217,151 | | | | 277,235 | | | | | |
| | 2,600 | | | PARK24 CO. LTD. | | | 51,627 | | | | 60,506 | | | | | |
| See accompanying notes to financial statements. | 71 | (Continued) |
CLEARWATER INVESTMENT TRUST
Schedule of Investments - Clearwater International Fund
June 30, 2019 (unaudited)
| | | | | | | | | | | | | |
| Shares | | | Security (a) | | Cost | | | Fair value | | | Percent of
net assets | |
| | Japan (Cont’d): | | | | | | | | | | | | | | | |
| | 65,100 | | | QOL HOLDINGS CO. LTD. | | $ | 940,398 | | | | 998,705 | | | | | |
| | 8,400 | | | RAKUTEN, INC. | | | 40,327 | | | | 99,726 | | | | | |
| | 10,400 | | | RECRUIT HOLDINGS CO. LTD. | | | 256,808 | | | | 346,683 | | | | | |
| | 10,300 | | | RENESAS ELECTRONICS CORP.(b) | | | 48,441 | | | | 51,111 | | | | | |
| | 81,100 | | | RESONA HOLDINGS, INC. | | | 337,234 | | | | 337,443 | | | | | |
| | 1,200 | | | RINNAI CORP. | | | 52,047 | | | | 76,242 | | | | | |
| | 4,200 | | | ROHM CO. LTD. | | | 166,807 | | | | 282,039 | | | | | |
| | 13,000 | | | SANTEN PHARMACEUTICAL CO. LTD. | | | 85,886 | | | | 215,230 | | | | | |
| | 13,720 | | | SBI HOLDINGS, INC. | | | 111,165 | | | | 339,389 | | | | | |
| | 3,400 | | | SECOM CO. LTD. | | | 133,812 | | | | 292,460 | | | | | |
| | 7,300 | | | SEGA SAMMY HOLDINGS, INC. | | | 68,324 | | | | 88,631 | | | | | |
| | 8,400 | | | SEIBU HOLDINGS, INC. | | | 139,989 | | | | 139,929 | | | | | |
| | 13,000 | | | SEKISUI CHEMICAL CO. LTD. | | | 66,177 | | | | 195,093 | | | | | |
| | 6,000 | | | SEKISUI HOUSE LTD. | | | 44,394 | | | | 98,808 | | | | | |
| | 13,400 | | | SEVEN & I HOLDINGS CO. LTD. | | | 301,391 | | | | 453,399 | | | | | |
| | 6,400 | | | SHARP CORP. | | | 61,105 | | | | 70,165 | | | | | |
| | 4,000 | | | SHIMADZU CORP. | | | 25,419 | | | | 98,020 | | | | | |
| | 1,000 | | | SHIMAMURA CO. LTD. | | | 61,206 | | | | 74,665 | | | | | |
| | 1,500 | | | SHIMANO, INC. | | | 58,204 | | | | 223,021 | | | | | |
| | 9,200 | | | SHIN-ETSU CHEMICAL CO. LTD. | | | 461,684 | | | | 856,300 | | | | | |
| | 4,000 | | | SHIONOGI & CO. LTD. | | | 67,679 | | | | 230,358 | | | | | |
| | 5,900 | | | SHISEIDO CO. LTD. | | | 88,706 | | | | 444,408 | | | | | |
| | 1,600 | | | SHOWA DENKO K.K. | | | 46,625 | | | | 47,044 | | | | | |
| | 900 | | | SMC CORP. | | | 106,941 | | | | 335,324 | | | | | |
| | 19,900 | | | SOFTBANK CORP. | | | 248,181 | | | | 258,313 | | | | | |
| | 36,800 | | | SOFTBANK GROUP CORP. | | | 412,233 | | | | 1,762,946 | | | | | |
| | 9,000 | | | SOMPO HOLDINGS, INC. | | | 202,248 | | | | 347,345 | | | | | |
| | 18,800 | | | SONY CORP. | | | 260,756 | | | | 984,857 | | | | | |
| | 28,300 | | | SQUARE ENIX HOLDINGS CO. LTD. | | | 952,262 | | | | 905,579 | | | | | |
| | 2,700 | | | STANLEY ELECTRIC CO. LTD. | | | 30,745 | | | | 66,314 | | | | | |
| | 5,700 | | | SUBARU CORP. | | | 26,572 | | | | 138,462 | | | | | |
| | 9,300 | | | SUMCO CORP. | | | 108,434 | | | | 110,584 | | | | | |
| | 25,000 | | | SUMITOMO CHEMICAL CO. LTD. | | | 74,256 | | | | 115,939 | | | | | |
| | 17,500 | | | SUMITOMO CORP. | | | 207,148 | | | | 264,979 | | | | | |
| | 4,000 | | | SUMITOMO DAINIPPON PHARMA CO. LTD. | | | 45,511 | | | | 75,797 | | | | | |
| | 8,800 | | | SUMITOMO ELECTRIC INDUSTRIES LTD. | | | 75,679 | | | | 115,453 | | | | | |
| | 2,400 | | | SUMITOMO HEAVY INDUSTRIES LTD. | | | 39,379 | | | | 82,475 | | | | | |
| | 14,700 | | | SUMITOMO MITSUI FINANCIAL GROUP, INC. | | | 509,559 | | | | 518,928 | | | | | |
| | 1,931 | | | SUMITOMO MITSUI TRUST HOLDINGS, INC. | | | 54,164 | | | | 69,958 | | | | | |
| | 4,000 | | | SUMITOMO REALTY & DEVELOPMENT CO. LTD. | | | 110,500 | | | | 142,763 | | | | | |
| | 9,300 | | | SUZUKI MOTOR CORP. | | | 199,522 | | | | 436,815 | | | | | |
| | 2,600 | | | SYSMEX CORP. | | | 51,707 | | | | 169,459 | | | | | |
| | 8,700 | | | T&D HOLDINGS, INC. | | | 83,668 | | | | 94,371 | | | | | |
| | 124,900 | | | TADANO LTD. | | | 1,390,588 | | | | 1,300,957 | | | | | |
| | 1,400 | | | TAIHEIYO CEMENT CORP. | | | 29,931 | | | | 42,332 | | | | | |
| | 3,400 | | | TAISEI CORP. | | | 55,809 | | | | 123,461 | | | | | |
| | 1,597 | | | TAKEDA PHARMACEUTICAL CO. LTD. | | | 53,934 | | | | 56,628 | | | | | |
| | 1,100 | | | TDK CORP. | | | 52,815 | | | | 85,090 | | | | | |
| | 28,800 | | | TECHNOPRO HOLDINGS, INC. | | | 1,094,943 | | | | 1,527,951 | | | | | |
| | 5,800 | | | TEIJIN LTD. | | | 67,529 | | | | 98,823 | | | | | |
| | 11,600 | | | TERUMO CORP. | | | 117,165 | | | | 345,369 | | | | | |
| | 2,000 | | | THK CO. LTD. | | | 29,290 | | | | 47,767 | | | | | |
| | 1,500 | | | TOHO CO. LTD. | | | 25,533 | | | | 63,720 | | | | | |
| | 3,400 | | | TOHO GAS CO. LTD. | | | 81,221 | | | | 125,038 | | | | | |
| | 7,200 | | | TOHOKU ELECTRIC POWER CO., INC. | | | 56,650 | | | | 72,725 | | | | | |
| | 14,400 | | | TOKIO MARINE HOLDINGS, INC. | | | 359,676 | | | | 721,102 | | | | | |
| | 28,100 | | | TOKYO ELECTRIC POWER CO. HOLDINGS, INC.(b) | | | 104,659 | | | | 146,475 | | | | | |
| | 3,300 | | | TOKYO ELECTRON LTD. | | | 135,391 | | | | 462,793 | | | | | |
| | 6,000 | | | TOKYO GAS CO. LTD. | | | 103,615 | | | | 141,214 | | | | | |
| | 9,800 | | | TOKYO TATEMONO CO. LTD. | | | 110,919 | | | | 108,803 | | | | | |
| | 12,500 | | | TOKYU CORP. | | | 103,448 | | | | 221,560 | | | | | |
| | 20,000 | | | TOKYU FUDOSAN HOLDINGS CORP. | | | 69,576 | | | | 110,374 | | | | | |
| | 3,000 | | | TOPPAN PRINTING CO. LTD. | | | 46,386 | | | | 45,495 | | | | | |
| | 17,000 | | | TORAY INDUSTRIES, INC. | | | 70,413 | | | | 129,169 | | | | | |
| | 3,200 | | | TOSHIBA CORP. | | | 104,204 | | | | 99,578 | | | | | |
| | 3,000 | | | TOTO LTD. | | | 30,029 | | | | 118,397 | | | | | |
| | 3,000 | | | TOYO SUISAN KAISHA LTD. | | | 74,690 | | | | 123,545 | | | | | |
| See accompanying notes to financial statements. | 72 | (Continued) |
CLEARWATER INVESTMENT TRUST
Schedule of Investments - Clearwater International Fund
June 30, 2019 (unaudited)
| | | | | | | | | | | | | |
| Shares | | | Security (a) | | Cost | | | Fair value | | | Percent of
net assets | |
| | Japan (Cont’d): | | | | | | | | | | | | | | | |
| | 4,000 | | | TOYOTA INDUSTRIES CORP. | | $ | 101,266 | | | | 220,006 | | | | | |
| | 46,662 | | | TOYOTA MOTOR CORP. | | | 1,594,403 | | | | 2,894,546 | | | | | |
| | 1,800 | | | TOYOTA TSUSHO CORP. | | | 14,973 | | | | 54,510 | | | | | |
| | 900 | | | TREND MICRO, INC. | | | 26,540 | | | | 40,110 | | | | | |
| | 84,900 | | | TSUMURA & CO. | | | 2,476,141 | | | | 2,366,317 | | | | | |
| | 7,800 | | | UNICHARM CORP. | | | 68,794 | | | | 234,691 | | | | | |
| | 60 | | | UNITED URBAN INVESTMENT CORP. | | | 85,311 | | | | 100,506 | | | | | |
| | 4,900 | | | USS CO. LTD. | | | 56,003 | | | | 96,487 | | | | | |
| | 1,400 | | | WELCIA HOLDINGS CO. LTD. | | | 48,069 | | | | 56,940 | | | | | |
| | 4,100 | | | WEST JAPAN RAILWAY CO. | | | 134,756 | | | | 331,453 | | | | | |
| | 488,200 | | | YAHOO JAPAN CORP. | | | 2,062,286 | | | | 1,430,888 | | | | | |
| | 2,500 | | | YAKULT HONSHA CO. LTD. | | | 74,984 | | | | 147,243 | | | | | |
| | 16,300 | | | YAMADA DENKI CO. LTD. | | | 56,674 | | | | 72,115 | | | | | |
| | 63,800 | | | YAMAGUCHI FINANCIAL GROUP, INC. | | | 475,563 | | | | 435,531 | | | | | |
| | 8,300 | | | YAMAHA MOTOR CO. LTD. | | | 106,577 | | | | 147,424 | | | | | |
| | 3,000 | | | YAMATO HOLDINGS CO. LTD. | | | 46,642 | | | | 60,966 | | | | | |
| | 4,000 | | | YAMAZAKI BAKING CO. LTD. | | | 44,679 | | | | 60,437 | | | | | |
| | 5,000 | | | YASKAWA ELECTRIC CORP. | | | 48,019 | | | | 169,735 | | | | | |
| | 87,400 | | | ZOJIRUSHI CORP.(d) | | | 1,233,394 | | | | 931,434 | | | | | |
| | | | | | | | 60,249,444 | | | | 86,256,233 | | | | 14.15 | % |
| | Macau: | | | | | | | | | | | | | | | |
| | 172,800 | | | SANDS CHINA LTD. | | | 551,191 | | | | 826,207 | | | | | |
| | | | | | | | 551,191 | | | | 826,207 | | | | 0.14 | % |
| | Mexico: | | | | | | | | | | | | | | | |
| | 4,536 | | | FRESNILLO PLC | | | 46,047 | | | | 50,128 | | | | | |
| | 953,834 | | | WAL-MART DE MEXICO S.A.B. DE C.V. | | | 2,392,185 | | | | 2,604,019 | | | | | |
| | | | | | | | 2,438,232 | | | | 2,654,147 | | | | 0.44 | % |
| | Netherlands: | | | | | | | | | | | | | | | |
| | 18,479 | | | AALBERTS N.V. | | | 561,003 | | | | 726,401 | | | | | |
| | 7,521 | | | ABN AMRO GROUP N.V. - CVA(f) | | | 166,330 | | | | 160,908 | | | | | |
| | 37,400 | | | ACCELL GROUP N.V. | | | 686,051 | | | | 1,031,293 | | | | | |
| | 58 | | | ADYEN N.V.(b)(f) | | | 47,253 | | | | 44,755 | | | | | |
| | 52,608 | | | AEGON N.V. | | | 212,484 | | | | 261,894 | | | | | |
| | 11,694 | | | AKZO NOBEL N.V. | | | 922,336 | | | | 1,098,885 | | | | | |
| | 94,103 | | | ARCADIS N.V. | | | 1,756,343 | | | | 1,786,976 | | | | | |
| | 27,560 | | | ARCELORMITTAL | | | 380,361 | | | | 493,142 | | | | | |
| | 7,173 | | | ASML HOLDING N.V. | | | 106,863 | | | | 1,498,660 | | | | | |
| | 11,055 | | | ASML HOLDING N.V. (REGISTERED) | | | 1,888,738 | | | | 2,298,666 | | | | | |
| | 3,610 | | | EXOR N.V. | | | 90,616 | | | | 252,864 | | | | | |
| | 40,073 | | | FLOW TRADERS(f) | | | 1,155,056 | | | | 1,170,161 | | | | | |
| | 2,765 | | | HEINEKEN HOLDING N.V. | | | 148,540 | | | | 290,199 | | | | | |
| | 3,662 | | | HEINEKEN N.V. | | | 128,663 | | | | 408,661 | | | | | |
| | 370,499 | | | ING GROEP N.V. | | | 3,857,128 | | | | 4,295,518 | | | | | |
| | 119,927 | | | INTERTRUST N.V.(f) | | | 2,206,316 | | | | 2,477,825 | | | | | |
| | 18,515 | | | KONINKLIJKE AHOLD DELHAIZE N.V. | | | 223,304 | | | | 416,394 | | | | | |
| | 3,281 | | | KONINKLIJKE DSM N.V. | | | 122,903 | | | | 405,541 | | | | | |
| | 51,375 | | | KONINKLIJKE KPN N.V. | | | 108,346 | | | | 157,730 | | | | | |
| | 20,095 | | | KONINKLIJKE PHILIPS N.V. | | | 343,642 | | | | 872,528 | | | | | |
| | 1,264 | | | NN GROUP N.V. | | | 37,113 | | | | 50,880 | | | | | |
| | 24,776 | | | NXP SEMICONDUCTORS N.V. | | | 2,109,835 | | | | 2,418,385 | | | | | |
| | 659,001 | | | POSTNL N.V. | | | 2,337,187 | | | | 1,141,635 | | | | | |
| | 8,117 | | | QIAGEN N.V.(b) | | | 119,394 | | | | 329,413 | | | | | |
| | 3,238 | | | RANDSTAD N.V. | | | 99,928 | | | | 177,837 | | | | | |
| | 70,285 | | | ROYAL DUTCH SHELL PLC, CLASS A | | | 1,810,548 | | | | 2,296,173 | | | | | |
| | 81,662 | | | ROYAL DUTCH SHELL PLC, CLASS B | | | 1,800,118 | | | | 2,676,669 | | | | | |
| | 6,193 | | | WOLTERS KLUWER N.V. | | | 101,075 | | | | 450,833 | | | | | |
| | | | | | | | 23,527,474 | | | | 29,690,826 | | | | 4.87 | % |
| | New Zealand: | | | | | | | | | | | | | | | |
| | 4,399 | | | A2 MILK CO. LTD.(b) | | | 45,605 | | | | 43,353 | | | | | |
| | 16,545 | | | AUCKLAND INTERNATIONAL AIRPORT LTD. | | | 50,086 | | | | 109,482 | | | | | |
| | 13,965 | | | FLETCHER BUILDING LTD. | | | 46,455 | | | | 45,501 | | | | | |
| | 6,185 | | | RYMAN HEALTHCARE LTD. | | | 47,219 | | | | 48,822 | | | | | |
| See accompanying notes to financial statements. | 73 | (Continued) |
CLEARWATER INVESTMENT TRUST
Schedule of Investments - Clearwater International Fund
June 30, 2019 (unaudited)
| Shares | | | Security (a) | | Cost | | | Fair value | | | Percent of
net assets | |
| | New Zealand (Cont’d): | | | | | | | | | | |
| | 169,758 | | | SPARK NEW ZEALAND LTD. | | $ | 404,492 | | | | 456,174 | | | | | |
| | | | | | | | 593,857 | | | | 703,332 | | | | 0.12 | % |
| | Norway: | | | | | | | | | | | | | | | |
| | 1,208 | | | ADEVINTA ASA, CLASS B(b) | | | 11,661 | | | | 13,311 | | | | | |
| | 13,773 | | | DNB ASA | | | 87,874 | | | | 256,232 | | | | | |
| | 11,584 | | | EQUINOR ASA | | | 201,737 | | | | 228,748 | | | | | |
| | 7,669 | | | MOWI ASA | | | 162,203 | | | | 179,309 | | | | | |
| | 15,494 | | | ORKLA ASA | | | 115,249 | | | | 137,459 | | | | | |
| | 15,551 | | | TELENOR ASA | | | 230,159 | | | | 330,145 | | | | | |
| | 95,239 | | | XXL ASA(d)(f) | | | 1,046,049 | | | | 318,638 | | | | | |
| | 2,500 | | | YARA INTERNATIONAL ASA | | | 58,115 | | | | 121,271 | | | | | |
| | | | | | | | 1,913,047 | | | | 1,585,113 | | | | 0.26 | % |
| | Poland: | | | | | | | | | | | | | | | |
| | 23,373 | | | CCC S.A. | | | 1,230,729 | | | | 1,055,452 | | | | | |
| | | | | | | | 1,230,729 | | | | 1,055,452 | | | | 0.17 | % |
| | Portugal: | | | | | | | | | | | | | | | |
| | 20,567 | | | EDP - ENERGIAS DE PORTUGAL S.A. | | | 48,529 | | | | 78,158 | | | | | |
| | 9,917 | | | GALP ENERGIA SGPS S.A. | | | 137,193 | | | | 152,516 | | | | | |
| | 9,417 | | | JERONIMO MARTINS SGPS S.A. | | | 105,677 | | | | 151,680 | | | | | |
| | | | | | | | 291,399 | | | | 382,354 | | | | 0.06 | % |
| | Singapore: | | | | | | | | | | | | | | | |
| | 49,500 | | | ASCENDAS REAL ESTATE INVESTMENT TRUST | | | 104,920 | | | | 114,146 | | | | | |
| | 133,000 | | | CAPITALAND LTD. | | | 268,012 | | | | 346,999 | | | | | |
| | 46,700 | | | CAPITALAND MALL TRUST | | | 54,337 | | | | 90,777 | | | | | |
| | 11,600 | | | CITY DEVELOPMENTS LTD. | | | 55,211 | | | | 81,192 | | | | | |
| | 28,300 | | | DBS GROUP HOLDINGS LTD. | | | 159,243 | | | | 542,992 | | | | | |
| | 2,600 | | | JARDINE CYCLE & CARRIAGE LTD. | | | 62,114 | | | | 69,622 | | | | | |
| | 29,800 | | | KEPPEL CORP. LTD. | | | 94,163 | | | | 146,687 | | | | | |
| | 7,840 | | | KEPPEL REIT | | | 3,183 | | | | 7,301 | | | | | |
| | 6,000 | | | OVERSEA-CHINESE BANKING CORP. LTD. | | | 33,180 | | | | 50,554 | | | | | |
| | 12,100 | | | SATS LTD. | | | 45,122 | | | | 46,683 | | | | | |
| | 12,000 | | | SINGAPORE AIRLINES LTD. | | | 70,334 | | | | 82,217 | | | | | |
| | 13,000 | | | SINGAPORE EXCHANGE LTD. | | | 40,226 | | | | 76,098 | | | | | |
| | 70,000 | | | SINGAPORE PRESS HOLDINGS LTD. | | | 120,788 | | | | 126,238 | | | | | |
| | 23,700 | | | SINGAPORE TECHNOLOGIES ENGINEERING LTD. | | | 65,893 | | | | 72,519 | | | | | |
| | 146,400 | | | SINGAPORE TELECOMMUNICATIONS LTD. | | | 263,973 | | | | 378,714 | | | | | |
| | 4,600 | | | UNITED OVERSEAS BANK LTD. | | | 26,071 | | | | 88,838 | | | | | |
| | 28,000 | | | UOL GROUP LTD. | | | 110,140 | | | | 156,245 | | | | | |
| | 4,100 | | | VENTURE CORP. LTD. | | | 47,813 | | | | 49,364 | | | | | |
| | 35,400 | | | WILMAR INTERNATIONAL LTD. | | | 68,955 | | | | 96,807 | | | | | |
| | | | | | | | 1,693,678 | | | | 2,623,993 | | | | 0.43 | % |
| | South Africa: | | | | | | | | | | | | | | | |
| | 13,348 | | | INVESTEC PLC | | | 83,096 | | | | 86,621 | | | | | |
| | 2,357 | | | NEDBANK GROUP LTD. | | | 39,047 | | | | 42,371 | | | | | |
| | 73,408 | | | OLD MUTUAL LTD. | | | 87,200 | | | | 109,464 | | | | | |
| | | | | | | | 209,343 | | | | 238,456 | | | | 0.04 | % |
| | South Korea: | | | | | | | | | | | | | | | |
| | 175,038 | | | BNK FINANCIAL GROUP, INC. | | | 1,674,948 | | | | 1,135,439 | | | | | |
| | 240,085 | | | DGB FINANCIAL GROUP, INC. | | | 2,473,822 | | | | 1,694,620 | | | | | |
| | 9,547 | | | HYUNDAI MOTOR CO. | | | 1,214,492 | | | | 1,157,563 | | | | | |
| | 655 | | | KT&G CORP. | | | 64,255 | | | | 55,876 | | | | | |
| | 19,381 | | | NAVER CORP. | | | 2,363,685 | | | | 1,913,510 | | | | | |
| | 150,914 | | | SAMSUNG ELECTRONICS CO. LTD. | | | 4,713,544 | | | | 6,142,950 | | | | | |
| | | | | | | | 12,504,746 | | | | 12,099,958 | | | | 1.98 | % |
| | Spain: | | | | | | | | | | | | | | | |
| | 1,260 | | | ACCIONA S.A. | | | 78,312 | | | | 135,251 | | | | | |
| | 1,798 | | | ACS ACTIVIDADES DE CONSTRUCCION Y SERVICIOS S.A. | | | 53,125 | | | | 71,783 | | | | | |
| | 583 | | | AENA S.M.E. S.A.(f) | | | 50,200 | | | | 115,548 | | | | | |
| | 45,592 | | | AMADEUS IT GROUP S.A. | | | 3,362,764 | | | | 3,611,360 | | | | | |
| | 127,837 | | | BANCO BILBAO VIZCAYA ARGENTARIA S.A. | | | 731,627 | | | | 714,752 | | | | | |
| | 132,745 | | | BANCO SANTANDER S.A. | | | 579,999 | | | | 615,928 | | | | | |
| | 557,498 | | | BANKIA S.A. | | | 2,012,006 | | | | 1,317,309 | | | | | |
| | 13,291 | | | BANKINTER S.A. | | | 93,679 | | | | 91,556 | | | | | |
| | 183,293 | | | CAIXABANK S.A. | | | 508,053 | | | | 524,808 | | | | | |
| | 42,130 | | | CONSTRUCCIONES Y AUXILIAR DE FERROCARRILES S.A. | | | 1,805,290 | | | | 1,930,613 | | | | | |
| See accompanying notes to financial statements. | 74 | (Continued) |
CLEARWATER INVESTMENT TRUST
Schedule of Investments - Clearwater International Fund
June 30, 2019 (unaudited)
| Shares | | | Security (a) | | Cost | | | Fair value | | | Percent of
net assets | |
| | Spain (Cont’d): | | | | | | | | | | |
| | 10,362 | | | ENAGAS S.A. | | $ | 213,104 | | | | 276,538 | | | | | |
| | 5,653 | | | FERROVIAL S.A. | | | 95,037 | | | | 144,695 | | | | | |
| | 15,282 | | | GRIFOLS S.A. | | | 273,864 | | | | 451,806 | | | | | |
| | 56,440 | | | IBERDROLA S.A. | | | 286,201 | | | | 562,584 | | | | | |
| | 11,150 | | | INDUSTRIA DE DISENO TEXTIL S.A. | | | 278,217 | | | | 335,351 | | | | | |
| | 21,686 | | | MAPFRE S.A. | | | 49,735 | | | | 63,399 | | | | | |
| | 16,489 | | | NATURGY ENERGY GROUP S.A. | | | 264,629 | | | | 454,304 | | | | | |
| | 26,579 | | | RED ELECTRICA CORP. S.A. | | | 390,097 | | | | 553,534 | | | | | |
| | 48,123 | | | REPSOL S.A. | | | 589,690 | | | | 754,324 | | | | | |
| | 2,970 | | | SIEMENS GAMESA RENEWABLE ENERGY S.A. | | | 45,075 | | | | 49,374 | | | | | |
| | 7,285 | | | TELEFONICA S.A. | | | 60,973 | | | | 59,817 | | | | | |
| | | | | | | | 11,821,677 | | | | 12,834,634 | | | | 2.11 | % |
| | Sweden: | | | | | | | | | | | | | | | |
| | 3,022 | | | ALFA LAVAL AB | | | 66,859 | | | | 65,932 | | | | | |
| | 22,200 | | | ASSA ABLOY AB, CLASS B | | | 89,466 | | | | 501,799 | | | | | |
| | 78,299 | | | ATLAS COPCO AB, CLASS A | | | 1,891,878 | | | | 2,502,560 | | | | | |
| | 4,000 | | | ATLAS COPCO AB, CLASS B | | | 22,805 | | | | 114,752 | | | | | |
| | 315,176 | | | CLOETTA AB, CLASS B | | | 1,231,417 | | | | 1,025,001 | | | | | |
| | 157,239 | | | DOMETIC GROUP AB(f) | | | 1,090,159 | | | | 1,574,397 | | | | | |
| | 7,501 | | | ELECTROLUX AB, CLASS B | | | 95,788 | | | | 191,682 | | | | | |
| | 9,604 | | | EPIROC AB, CLASS A | | | 18,146 | | | | 99,989 | | | | | |
| | 4,000 | | | EPIROC AB, CLASS B | | | 7,248 | | | | 39,620 | | | | | |
| | 8,600 | | | ESSITY AB, CLASS B | | | 62,137 | | | | 264,312 | | | | | |
| | 151,656 | | | GRANGES AB | | | 1,645,421 | | | | 1,737,663 | | | | | |
| | 14,726 | | | HENNES & MAURITZ AB, CLASS B | | | 222,503 | | | | 262,228 | | | | | |
| | 3,700 | | | HEXAGON AB, CLASS B | | | 56,830 | | | | 205,437 | | | | | |
| | 17,500 | | | HUSQVARNA AB, CLASS B | | | 64,201 | | | | 163,690 | | | | | |
| | 8,270 | | | INDUSTRIVARDEN AB, CLASS C | | | 85,948 | | | | 183,280 | | | | | |
| | 10,953 | | | INVESTOR AB, CLASS B | | | 150,033 | | | | 526,174 | | | | | |
| | 3,786 | | | KINNEVIK AB, CLASS B | | | 71,401 | | | | 98,460 | | | | | |
| | 3,301 | | | LUNDIN PETROLEUM AB | | | 46,595 | | | | 102,341 | | | | | |
| | 1,031 | | | MILLICOM INTERNATIONAL CELLULAR S.A. SDR | | | 60,294 | | | | 58,011 | | | | | |
| | 142 | | | MODERN TIMES GROUP MTG AB, CLASS B(b) | | | 2,063 | | | | 1,590 | | | | | |
| | 142 | | | NORDIC ENTERTAINMENT GROUP AB, CLASS B | | | 2,874 | | | | 3,334 | | | | | |
| | 13,973 | | | SANDVIK AB | | | 86,678 | | | | 256,704 | | | | | |
| | 13,348 | | | SECURITAS AB, CLASS B | | | 106,689 | | | | 234,154 | | | | | |
| | 37,385 | | | SKANDINAVISKA ENSKILDA BANKEN AB, CLASS A | | | 159,849 | | | | 345,904 | | | | | |
| | 2,800 | | | SKANSKA AB, CLASS B | | | 23,703 | | | | 50,566 | | | | | |
| | 8,600 | | | SVENSKA CELLULOSA AB S.C.A., CLASS B | | | 15,915 | | | | 74,737 | | | | | |
| | 30,392 | | | SVENSKA HANDELSBANKEN AB, CLASS A | | | 201,057 | | | | 300,708 | | | | | |
| | 14,125 | | | SWEDBANK AB, CLASS A | | | 213,236 | | | | 212,115 | | | | | |
| | 1,561 | | | SWEDISH MATCH AB | | | 60,521 | | | | 65,895 | | | | | |
| | 59,340 | | | TELEFONAKTIEBOLAGET LM ERICSSON, CLASS B | | | 304,553 | | | | 562,973 | | | | | |
| | 10,851 | | | TELIA CO. AB | | | 46,872 | | | | 48,190 | | | | | |
| | 70,265 | | | TETHYS OIL AB | | | 524,483 | | | | 563,715 | | | | | |
| | 114,560 | | | THULE GROUP AB (THE)(f) | | | 1,725,582 | | | | 2,830,028 | | | | | |
| | 25,108 | | | VOLVO AB, CLASS B | | | 162,740 | | | | 398,407 | | | | | |
| | | | | | | | 10,615,944 | | | | 15,666,348 | | | | 2.57 | % |
| | Switzerland: | | | | | | | | | | | | | | | |
| | 243,552 | | | ABB LTD. (REGISTERED)(d) | | | 4,795,509 | | | | 4,887,506 | | | | | |
| | 3,728 | | | ADECCO GROUP A.G. (REGISTERED) | | | 131,290 | | | | 224,016 | | | | | |
| | 65,922 | | | ALCON, INC.(b) | | | 3,562,403 | | | | 4,070,660 | | | | | |
| | 484 | | | BALOISE HOLDING A.G. (REGISTERED) | | | 26,452 | | | | 85,674 | | | | | |
| | 6,776 | | | BUCHER INDUSTRIES A.G. (REGISTERED) | | | 1,918,564 | | | | 2,335,020 | | | | | |
| | 35 | | | CHOCOLADEFABRIKEN LINDT & SPRUENGLI A.G. (PARTICIPATION CERTIFICATE) | | | 50,308 | | | | 254,738 | | | | | |
| | 3 | | | CHOCOLADEFABRIKEN LINDT & SPRUENGLI A.G. (REGISTERED) | | | 75,352 | | | | 244,007 | | | | | |
| | 26,027 | | | CHUBB LTD. | | | 2,316,495 | | | | 3,833,517 | | | | | |
| | 41,860 | | | CIE FINANCIERE RICHEMONT S.A. (REGISTERED) | | | 2,844,261 | | | | 3,552,225 | | | | | |
| | 24,343 | | | CREDIT SUISSE GROUP A.G. (REGISTERED)(b) | | | 277,976 | | | | 291,882 | | | | | |
| | 776 | | | DUFRY A.G. (REGISTERED)(b) | | | 66,344 | | | | 65,724 | | | | | |
| | 6,064 | | | GEBERIT A.G. (REGISTERED) | | | 2,038,004 | | | | 2,832,600 | | | | | |
| | 140 | | | GIVAUDAN S.A. (REGISTERED) | | | 76,496 | | | | 395,247 | | | | | |
| | 121,887 | | | GLENCORE PLC(b) | | | 266,010 | | | | 423,120 | | | | | |
| | 1,807 | | | IDORSIA LTD.(b) | | | 18,603 | | | | 41,279 | | | | | |
| | 4,134 | | | JULIUS BAER GROUP LTD.(b) | | | 87,890 | | | | 184,044 | | | | | |
| See accompanying notes to financial statements. | 75 | (Continued) |
CLEARWATER INVESTMENT TRUST
Schedule of Investments - Clearwater International Fund
June 30, 2019 (unaudited)
| Shares | | | Security (a) | | Cost | | | Fair value | | | Percent of
net assets | |
| | Switzerland (Cont’d): | | | | | | | | | | | | | | | |
| | 57,414 | | | LAFARGEHOLCIM LTD. (REGISTERED)(b) | | $ | 2,827,133 | | | | 2,803,652 | | | | | |
| | 10,914 | | | LANDIS+GYR GROUP A.G.(b) | | | 783,131 | | | | 869,252 | | | | | |
| | 29,110 | | | LOGITECH INTERNATIONAL S.A. (REGISTERED) | | | 439,082 | | | | 1,157,414 | | | | | |
| | 897 | | | LONZA GROUP A.G. (REGISTERED)(b) | | | 50,452 | | | | 302,675 | | | | | |
| | 121,888 | | | NESTLE S.A. (REGISTERED) | | | 6,211,689 | | | | 12,618,317 | | | | | |
| | 58,652 | | | NOVARTIS A.G. (REGISTERED) | | | 2,694,983 | | | | 5,359,310 | | | | | |
| | 13,878 | | | PANALPINA WELTTRANSPORT HOLDING A.G.(b) | | | 1,257,152 | | | | 3,022,396 | | | | | |
| | 11,930 | | | PARGESA HOLDING S.A. (BEARER) | | | 797,491 | | | | 919,619 | | | | | |
| | 12,406 | | | ROCHE HOLDING A.G. (GENUSSCHEIN) | | | 1,614,189 | | | | 3,490,379 | | | | | |
| | 1,381 | | | SCHINDLER HOLDING A.G. (PARTICIPATION CERTIFICATE) | | | 108,493 | | | | 307,408 | | | | | |
| | 589 | | | SCHINDLER HOLDING A.G. (REGISTERED) | | | 68,597 | | | | 128,636 | | | | | |
| | 121 | | | SGS S.A. (REGISTERED) | | | 130,564 | | | | 308,264 | | | | | |
| | 20,095 | | | SIKA A.G. (REGISTERED) | | | 2,115,111 | | | | 3,429,448 | | | | | |
| | 1,300 | | | SONOVA HOLDING A.G. (REGISTERED) | | | 84,464 | | | | 295,370 | | | | | |
| | 7,867 | | | STMICROELECTRONICS N.V. | | | 36,286 | | | | 139,551 | | | | | |
| | 635 | | | SULZER A.G. (REGISTERED) | | | 30,609 | | | | 69,406 | | | | | |
| | 948 | | | SWATCH GROUP (THE) A.G. (BEARER) | | | 247,633 | | | | 271,426 | | | | | |
| | 743 | | | SWISS LIFE HOLDING A.G. (REGISTERED) | | | 101,194 | | | | 368,227 | | | | | |
| | 777 | | | SWISS PRIME SITE A.G. (REGISTERED)(b) | | | 65,303 | | | | 67,854 | | | | | |
| | 504 | | | SWISS RE A.G. | | | 37,466 | | | | 51,236 | | | | | |
| | 196 | | | SWISSCOM A.G. (REGISTERED) | | | 49,924 | | | | 98,402 | | | | | |
| | 18,807 | | | TE CONNECTIVITY LTD. | | | 367,716 | | | | 1,801,334 | | | | | |
| | 2,993 | | | TECAN GROUP A.G. (REGISTERED) | | | 540,256 | | | | 776,304 | | | | | |
| | 328,277 | | | UBS GROUP A.G. (REGISTERED)(b) | | | 5,092,423 | | | | 3,900,853 | | | | | |
| | 675 | | | VIFOR PHARMA A.G. | | | 92,698 | | | | 97,530 | | | | | |
| | 4,668 | | | ZURICH INSURANCE GROUP A.G. | | | 912,788 | | | | 1,625,336 | | | | | |
| | | | | | | | 45,308,784 | | | | 68,000,858 | | | | 11.16 | % |
| | Taiwan: | | | | | | | | | | | | | | | |
| | 628,975 | | | CHICONY ELECTRONICS CO. LTD. | | | 1,612,040 | | | | 1,547,149 | | | | | |
| | 310,000 | | | GIANT MANUFACTURING CO. LTD. | | | 1,680,584 | | | | 2,425,345 | | | | | |
| | 2,584,000 | | | KING YUAN ELECTRONICS CO. LTD. | | | 2,583,228 | | | | 2,229,630 | | | | | |
| | 325,000 | | | MERIDA INDUSTRY CO. LTD. | | | 1,702,164 | | | | 1,920,105 | | | | | |
| | 86,596 | | | TAIWAN SEMICONDUCTOR MANUFACTURING CO. LTD. ADR(e) | | | 1,572,435 | | | | 3,391,965 | | | | | |
| | 668,000 | | | TRIPOD TECHNOLOGY CORP. | | | 1,830,581 | | | | 2,365,782 | | | | | |
| | | | | | | | 10,981,032 | | | | 13,879,976 | | | | 2.28 | % |
| | United Arab Emirates: | | | | | | | | | | |
| | 1,623 | | | NMC HEALTH PLC | | | 52,645 | | | | 49,529 | | | | | |
| | | | | | | | 52,645 | | | | 49,529 | | | | 0.01 | % |
| | United Kingdom: | | | | | | | | | | |
| | 25,248 | | | 3I GROUP PLC | | | 88,645 | | | | 357,029 | | | | | |
| | 2,834 | | | ADMIRAL GROUP PLC | | | 35,119 | | | | 79,467 | | | | | |
| | 4,408 | | | AMCOR PLC - CDI | | | 47,017 | | | | 50,102 | | | | | |
| | 54,172 | | | ANGLO AMERICAN PLC | | | 423,475 | | | | 1,544,120 | | | | | |
| | 1,885 | | | ASHTEAD GROUP PLC | | | 47,343 | | | | 53,958 | | | | | |
| | 4,863 | | | ASSOCIATED BRITISH FOODS PLC | | | 145,660 | | | | 152,109 | | | | | |
| | 26,375 | | | ASTRAZENECA PLC | | | 983,695 | | | | 2,156,404 | | | | | |
| | 14,221 | | | AUTO TRADER GROUP PLC(f) | | | 68,171 | | | | 98,932 | | | | | |
| | 63,027 | | | AVIVA PLC | | | 232,916 | | | | 333,371 | | | | | |
| | 55,115 | | | BABCOCK INTERNATIONAL GROUP PLC | | | 362,895 | | | | 320,709 | | | | | |
| | 49,840 | | | BAE SYSTEMS PLC | | | 250,267 | | | | 313,560 | | | | | |
| | 359,028 | | | BARCLAYS PLC | | | 727,568 | | | | 683,010 | | | | | |
| | 16,560 | | | BELLWAY PLC | | | 446,950 | | | | 585,696 | | | | | |
| | 2,391 | | | BERKELEY GROUP HOLDINGS (THE) PLC | | | 71,739 | | | | 113,290 | | | | | |
| | 40,832 | | | BOVIS HOMES GROUP PLC | | | 419,632 | | | | 535,658 | | | | | |
| | 300,692 | | | BP PLC | | | 1,798,895 | | | | 2,094,905 | | | | | |
| | 15,241 | | | BRITISH AMERICAN TOBACCO PLC | | | 352,059 | | | | 532,077 | | | | | |
| | 25,757 | | | BRITISH LAND (THE) CO. PLC | | | 165,814 | | | | 176,111 | | | | | |
| | 141,091 | | | BT GROUP PLC | | | 386,591 | | | | 352,014 | | | | | |
| | 5,069 | | | BUNZL PLC | | | 39,524 | | | | 133,704 | | | | | |
| | 8,202 | | | BURBERRY GROUP PLC | | | 40,549 | | | | 193,948 | | | | | |
| | 288,402 | | | CARD FACTORY PLC | | | 748,536 | | | | 644,245 | | | | | |
| | 15,837 | | | CNH INDUSTRIAL N.V. | | | 77,673 | | | | 162,398 | | | | | |
| | 1,447 | | | COCA-COLA EUROPEAN PARTNERS PLC | | | 55,218 | | | | 81,756 | | | | | |
| | 384,633 | | | COMPASS GROUP PLC | | | 5,095,491 | | | | 9,217,329 | | | | | |
| | 2,276 | | | CRODA INTERNATIONAL PLC | | | 82,785 | | | | 147,989 | | | | | |
| See accompanying notes to financial statements. | 76 | (Continued) |
CLEARWATER INVESTMENT TRUST
Schedule of Investments - Clearwater International Fund
June 30, 2019 (unaudited)
| Shares | | | Security (a) | | Cost | | | Fair value | | | Percent of
net assets | |
| | United Kingdom (Cont’d): | | | | | | | | | | | | |
| | 137,282 | | | DE LA RUE PLC | | $ | 849,109 | | | | 531,741 | | | | | |
| | 41,623 | | | DIAGEO PLC | | | 507,983 | | | | 1,788,753 | | | | | |
| | 159,763 | | | EXPERIAN PLC | | | 2,795,109 | | | | 4,836,922 | | | | | |
| | 3,956 | | | FERGUSON PLC | | | 70,457 | | | | 281,340 | | | | | |
| | 24,413 | | | FIAT CHRYSLER AUTOMOBILES N.V. | | | 161,492 | | | | 340,504 | | | | | |
| | 10,222 | | | FIAT CHRYSLER AUTOMOBILES N.V. (NEW YORK EXCHANGE) | | | 17,872 | | | | 141,268 | | | | | |
| | 24,200 | | | G4S PLC | | | 66,908 | | | | 63,924 | | | | | |
| | 55,766 | | | GLAXOSMITHKLINE PLC | | | 838,777 | | | | 1,116,549 | | | | | |
| | 89,143 | | | GREGGS PLC | | | 854,506 | | | | 2,601,501 | | | | | |
| | 312,478 | | | HSBC HOLDINGS PLC | | | 2,135,600 | | | | 2,606,786 | | | | | |
| | 77,708 | | | IMI PLC | | | 1,026,734 | | | | 1,024,353 | | | | | |
| | 19,522 | | | IMPERIAL BRANDS PLC | | | 460,901 | | | | 457,858 | | | | | |
| | 8,754 | | | INFORMA PLC | | | 85,956 | | | | 92,828 | | | | | |
| | 1,271 | | | INTERCONTINENTAL HOTELS GROUP PLC | | | 52,040 | | | | 83,482 | | | | | |
| | 32,745 | | | INTERNATIONAL CONSOLIDATED AIRLINES GROUP S.A. - CDI | | | 90,834 | | | | 197,938 | | | | | |
| | 735 | | | INTERTEK GROUP PLC | | | 46,188 | | | | 51,356 | | | | | |
| | 36,802 | | | ITV PLC | | | 44,524 | | | | 50,476 | | | | | |
| | 105,901 | | | JOHN WOOD GROUP PLC | | | 996,756 | | | | 607,890 | | | | | |
| | 2,248 | | | JOHNSON MATTHEY PLC | | | 35,933 | | | | 95,038 | | | | | |
| | 37,981 | | | KINGFISHER PLC | | | 80,172 | | | | 103,655 | | | | | |
| | 17,324 | | | LAND SECURITIES GROUP PLC | | | 143,577 | | | | 183,309 | | | | | |
| | 17,003 | | | LEGAL & GENERAL GROUP PLC | | | 46,196 | | | | 58,193 | | | | | |
| | 3,327,334 | | | LLOYDS BANKING GROUP PLC | | | 2,589,084 | | | | 2,391,238 | | | | | |
| | 6,030 | | | LONDON STOCK EXCHANGE GROUP PLC | | | 69,795 | | | | 420,107 | | | | | |
| | 1,188,932 | | | MAN GROUP PLC | | | 2,205,976 | | | | 2,352,400 | | | | | |
| | 20,302 | | | MARKS & SPENCER GROUP PLC | | | 68,937 | | | | 54,324 | | | | | |
| | 7,217 | | | MEGGITT PLC | | | 16,687 | | | | 48,026 | | | | | |
| | 69,531 | | | MELROSE INDUSTRIES PLC | | | 130,566 | | | | 159,692 | | | | | |
| | 5,728 | | | MONDI PLC | | | 122,446 | | | | 130,210 | | | | | |
| | 53,010 | | | NATIONAL GRID PLC | | | 449,994 | | | | 562,661 | | | | | |
| | 2,148 | | | NEXT PLC | | | 36,823 | | | | 150,741 | | | | | |
| | 34,908 | | | OXFORD INSTRUMENTS PLC | | | 539,512 | | | | 571,875 | | | | | |
| | 7,366 | | | PEARSON PLC | | | 69,206 | | | | 76,650 | | | | | |
| | 5,463 | | | PERSIMMON PLC | | | 133,937 | | | | 138,547 | | | | | |
| | 34,240 | | | PRUDENTIAL PLC | | | 488,505 | | | | 746,170 | | | | | |
| | 26,127 | | | RECKITT BENCKISER GROUP PLC | | | 1,598,579 | | | | 2,061,804 | | | | | |
| | 39,546 | | | RELX PLC | | | 394,798 | | | | 956,914 | | | | | |
| | 166,592 | | | RELX PLC (LONDON EXCHANGE) | | | 1,862,041 | | | | 4,039,806 | | | | | |
| | 19,426 | | | RIO TINTO LTD. | | | 611,119 | | | | 1,415,081 | | | | | |
| | 34,005 | | | RIO TINTO PLC | | | 893,598 | | | | 2,107,627 | | | | | |
| | 26,467 | | | ROLLS-ROYCE HOLDINGS PLC(b) | | | 303,269 | | | | 282,473 | | | | | |
| | 792,214 | | | ROYAL BANK OF SCOTLAND GROUP PLC | | | 2,701,955 | | | | 2,211,347 | | | | | |
| | 15,117 | | | ROYAL MAIL PLC | | | 45,749 | | | | 40,680 | | | | | |
| | 20,657 | | | SAGE GROUP (THE) PLC | | | 74,323 | | | | 210,496 | | | | | |
| | 16,135 | | | SEGRO PLC | | | 67,053 | | | | 149,623 | | | | | |
| | 4,954 | | | SEVERN TRENT PLC | | | 76,220 | | | | 128,847 | | | | | |
| | 708,993 | | | SIG PLC | | | 1,519,587 | | | | 1,167,800 | | | | | |
| | 26,103 | | | SMITH & NEPHEW PLC | | | 251,030 | | | | 565,199 | | | | | |
| | 5,789 | | | SMITHS GROUP PLC | | | 93,822 | | | | 115,055 | | | | | |
| | 92,045 | | | STANDARD CHARTERED PLC | | | 654,783 | | | | 834,847 | | | | | |
| | 39,027 | | | STANDARD LIFE ABERDEEN PLC | | | 134,038 | | | | 146,011 | | | | | |
| | 72,176 | | | TAYLOR WIMPEY PLC | | | 122,883 | | | | 144,594 | | | | | |
| | 1,191,723 | | | TESCO PLC | | | 3,857,602 | | | | 3,430,943 | | | | | |
| | 3,749 | | | TRAVIS PERKINS PLC | | | 51,659 | | | | 60,680 | | | | | |
| | 13,782 | | | UNILEVER N.V. - CVA | | | 483,796 | | | | 839,366 | | | | | |
| | 24,244 | | | UNILEVER PLC | | | 545,189 | | | | 1,506,952 | | | | | |
| | 10,230 | | | UNITED UTILITIES GROUP PLC | | | 76,454 | | | | 101,698 | | | | | |
| | 3,770 | | | WEIR GROUP (THE) PLC | | | 44,042 | | | | 74,042 | | | | | |
| | 5,178 | | | WHITBREAD PLC | | | 168,592 | | | | 304,394 | | | | | |
| | 9,098 | | | WILLIS TOWERS WATSON PLC | | | 1,345,985 | | | | 1,742,631 | | | | | |
| | 20,383 | | | WM MORRISON SUPERMARKETS PLC | | | 52,509 | | | | 52,133 | | | | | |
| | 26,869 | | | WPP PLC | | | 181,268 | | | | 337,879 | | | | | |
| | | | | | | | 49,735,262 | | | | 71,261,118 | | | | 11.69 | % |
| | United States: | | | | | | | | | | | | | | | |
| | 18,668 | | | ALLERGAN PLC | | | 3,056,480 | | | | 3,125,583 | | | | | |
| See accompanying notes to financial statements. | 77 | (Continued) |
CLEARWATER INVESTMENT TRUST
Schedule of Investments - Clearwater International Fund
June 30, 2019 (unaudited)
| Shares | | | Security (a) | | Cost | | | Fair value | | | Percent of
net assets | |
| | United States (Cont’d): | | | | | | | | | | |
| | 139,081 | | | ARCH CAPITAL GROUP LTD.(b) | | $ | 1,909,195 | | | | 5,157,123 | | | | | |
| | 20,310 | | | AXIS CAPITAL HOLDINGS LTD. | | | 1,037,094 | | | | 1,211,492 | | | | | |
| | 4,931 | | | BAUSCH HEALTH COS., INC.(b) | | | 117,766 | | | | 124,409 | | | | | |
| | 4,351 | | | CARNIVAL PLC | | | 131,345 | | | | 192,234 | | | | | |
| | 5,495 | | | METTLER-TOLEDO INTERNATIONAL, INC.(b) | | | 3,193,600 | | | | 4,615,800 | | | | | |
| | 3,157 | | | NEWMONT GOLDCORP CORP. | | | 101,845 | | | | 121,068 | | | | | |
| | 197,078 | | | ONESPAWORLD HOLDINGS LTD.(b) | | | 1,970,780 | | | | 3,054,709 | | | | | |
| | 29,129 | | | RESMED, INC. | | | 3,095,272 | | | | 3,554,612 | | | | | |
| | 3,687 | | | WORLDPAY, INC., CLASS A(b) | | | 289,883 | | | | 451,842 | | | | | |
| | | | | | | | 14,903,260 | | | | 21,608,872 | | | | 3.55 | % |
| | | | Sub-total Common Stocks: | | | 410,255,237 | | | | 577,741,960 | | | | 94.79 | % |
| Preferred Stocks: | | | | | | |
| | Brazil: | | | | | | | | | | | | | | | |
| | 236,375 | | | ALPARGATAS S.A.(b) | | | 607,813 | | | | 1,256,374 | | | | | |
| | 245,250 | | | TELEFONICA BRASIL S.A. ADR, 3.04%(e)(g) | | | 3,100,786 | | | | 3,193,155 | | | | | |
| | | | | | | | 3,708,599 | | | | 4,449,529 | | | | 0.73 | % |
| | Germany: | | | | | | | | | | | | | | | |
| | 1,521 | | | BAYERISCHE MOTOREN WERKE A.G., 6.46%(g) | | | 49,612 | | | | 94,432 | | | | | |
| | 1,427 | | | HENKEL A.G. & CO. KGAA, 2.13%(g) | | | 121,338 | | | | 139,580 | | | | | |
| | 1,443 | | | PORSCHE AUTOMOBIL HOLDING S.E., 3.85%(g) | | | 60,635 | | | | 93,757 | | | | | |
| | 272 | | | SARTORIUS A.G., 0.34%(g) | | | 45,992 | | | | 55,765 | | | | | |
| | 1,014 | | | VOLKSWAGEN A.G., 3.23%(g) | | | 139,988 | | | | 170,901 | | | | | |
| | | | | | | | 417,565 | | | | 554,435 | | | | 0.09 | % |
| | South Korea: | | | | | | | | | | | | | | | |
| | 1,888 | | | HYUNDAI MOTOR CO. LTD. (2ND PREFERRED), 4.66%(g) | | | 176,037 | | | | 141,112 | | | | | |
| | 16,100 | | | SAMSUNG ELECTRONICS CO. LTD., 3.69%(g) | | | 366,307 | | | | 533,343 | | | | | |
| | | | | | | | 542,344 | | | | 674,455 | | | | 0.11 | % |
| | | | Sub-total Preferred Stocks: | | | 4,668,508 | | | | 5,678,419 | | | | 0.93 | % |
| Rights: | | | | | | | | | | | |
| | Spain: | | | | | | | | | | | | | | | |
| | 1,798 | | | ACS ACTIVIDADES DE CONSTRUCCION Y SERVICIOS S.A. (MADRID EXCHANGE)(b) | | | 2,971 | | | | 2,821 | | | | | |
| | 48,123 | | | REPSOL S.A. (MADRID EXCHANGE)(b) | | | 27,261 | | | | 26,693 | | | | | |
| | | | | | | | 30,232 | | | | 29,514 | | | | 0.00 | % |
| | | | Sub-total Rights: | | | 30,232 | | | | 29,514 | | | | 0.00 | % |
| Investment Companies: | | | | | | | | | | | |
| | United States: | | | | | | | | | | | | | | | |
| | 37,200 | | | ISHARES MSCI EAFE SMALL-CAP ETF | | | 2,145,822 | | | | 2,135,280 | | | | | |
| | | | | | | | 2,145,822 | | | | 2,135,280 | | | | 0.35 | % |
| | | | Sub-total Investment Companies: | | | 2,145,822 | | | | 2,135,280 | | | | 0.35 | % |
| Warrants: | | | | | | | | | | | |
| | United States: | | | | | | | | | | | | | | | |
| | 34,272 | | | ONESPAWORLD HOLDINGS LTD. (b) | | | - | | | | 160,736 | | | | | |
| | | | | | | | - | | | | 160,736 | | | | 0.03 | % |
| | | | Sub-total Warrants: | | | - | | | | 160,736 | | | | 0.03 | % |
| Short-Term Investments: | | | | | | | | | | | |
| | 7,027,654 | | | FIDELITY INVESTMENTS MONEY MARKET GOVERNMENT PORTFOLIO(h) | | | 7,027,654 | | | | 7,027,654 | | | | | |
| | 22,244,880 | | | NORTHERN INSTITUTIONAL FUNDS - U.S. GOVERNMENT SELECT PORTFOLIO, 2.25%(i) | | | 22,244,880 | | | | 22,244,880 | | | | | |
| | | | Sub-total Short-Term Investments: | | | 29,272,534 | | | | 29,272,534 | | | | 4.80 | % |
| | | | | Grand total | | $ | 446,372,333 | | | | 615,018,443 | | | | 100.90 | % |
Notes to Schedule of Investments:
| (a) | Investments are valued in accordance with procedures described in note 2 to the financial statements. |
| (b) | Non-income producing assets. |
| (c) | Security has been deemed worthless and is a Level 3 investment. |
| (d) | Security is either wholly or partially on loan. |
| (e) | Securities are American Depositary Receipts of companies based outside of the United States representing 2.23% of net assets as of June 30, 2019. |
| See accompanying notes to financial statements. | 78 | (Continued) |
CLEARWATER INVESTMENT TRUST
Schedule of Investments - Clearwater International Fund
June 30, 2019 (unaudited)
| (f) | Securities exempt from registration under Rule 144A of the Securities Act of 1933. These securities may be resold in transactions exempt from registration, normally to qualified institutional buyers. The value of these securities is determined by valuations supplied by a pricing service or brokers, or, if not available, in accordance with procedures established by the Board of Trustees. |
| (g) | Current yield is disclosed. Dividends are calculated based on a percentage of the issuer’s net income. |
| (h) | Investment relates to cash collateral received from portfolio securities loaned. |
| (i) | The short-term investment is a money market portfolio of the investment company, Northern Institutional Funds. At December 31, 2018, the value of the Clearwater International Fund’s investment in the U.S. Government Select Portfolio of the Northern Institutional Funds was $15,216,595 with net purchases of $7,028,285 during the six months ended June 30, 2019. |
At June 30, 2019, the industry sectors for the Clearwater International Fund were:
| Industry Sector | | Percent of
Long-Term
Investments | |
| Communication Services | | | 5.44 | % |
| Consumer Discretionary | | | 15.93 | |
| Consumer Staples | | | 9.28 | |
| Energy | | | 3.54 | |
| Financials | | | 17.62 | |
| Health Care | | | 9.93 | |
| Industrials | | | 17.02 | |
| Information Technology | | | 11.70 | |
| Materials | | | 6.17 | |
| Real Estate | | | 1.83 | |
| Utilities | | | 1.54 | |
| | | | 100.00 | % |
At June 30, 2019, the Clearwater International Fund’s investments were denominated in the following currencies:
| Concentration by Currency | | Percent of
Long-Term
Investments | |
| Euro | | | 24.44 | % |
| Japanese Yen | | | 14.73 | |
| British Pound | | | 12.20 | |
| United States Dollar | | | 11.93 | |
| Swiss Franc | | | 10.35 | |
| Canadian Dollar | | | 6.03 | |
| Other currencies | | | 20.32 | |
| | | | 100.00 | % |
At June 30, 2019, the Clearwater International Fund had outstanding forward foreign currency exchange contracts as follows:
| | | | | | | | | | | | | | |
| | | Contract Settlement
Date | | Contract Amount | | | Unrealized Appreciation
(Depreciation) | |
| Counterparty | | | Deliver | | | Receive | | | |
| Northern Trust | | 11/13/2019 | | CNH | 19,488,032 | | | USD | 2,865,164 | | | $ | 32,373 | |
| Northern Trust | | 11/13/2019 | | USD | 528,501 | | | CNH | 3,676,463 | | | $ | 5,912 | |
| | | | | | | | | | | | | $ | 38,285 | |
| Northern Trust | | 07/23/2019 | | JPY | 104,443,581 | | | USD | 940,543 | | | $ | (29,970 | ) |
| | | | | | | | | | | | | $ | (29,970 | ) |
| | | | | | | | | | | | | $ | 8,315 | |
| See accompanying notes to financial statements. | 79 | (Continued) |
CLEARWATER INVESTMENT TRUST
Schedule of Investments - Clearwater International Fund
June 30, 2019 (unaudited)
Clearwater International Fund Portfolio Diversification
(as a percentage of net assets)
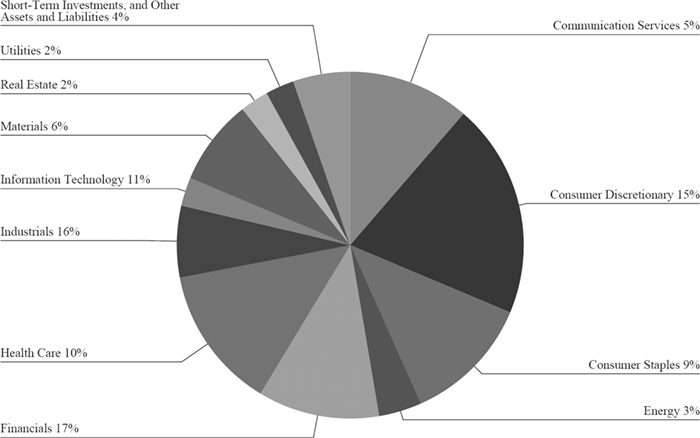
| See accompanying notes to financial statements. | 80 | (Continued) |
Item 1. Reports to Stockholders (cont.).
Item 2. Code of Ethics
Not applicable to this filing.
Item 3. Audit Committee Financial Expert
Not applicable to this filing.
Item 4. Principal Accountant Fees and Services
Not applicable to this filing.
Item 5. Audit Committee of Listed Registrants
Not applicable to this filing.
Item 6. Investments
| (a) | Schedule of Investments is included as part of the report to shareholders filed under Item 1 of this report on Form N-CSR. |
Item 7. Disclosure of Proxy Voting Policies and Procedures for Closed-End Management Investment Companies
Not applicable (the Trust is an open-end management investment company).
Item 8. Portfolio Managers of Closed-End Management Investment Companies
Not applicable (the Trust is an open-end management investment company).
Item 9. Purchases of Equity Securities by Closed-End Management Investment Company and Affiliated Purchasers
Not applicable (the Trust is an open-end management investment company).
Item 10. Submission of Matters to a Vote of Security Holders
There have been no material changes to the procedures by which shareholders may recommend nominees to the Board of Trustees.
Item 11. Controls and Procedures
| | (a) | The Trust’s principal executive officer and principal financial officer have concluded that the Trust’s |
disclosure controls and procedures (as defined in Rule 30a-3(c) under the Investment Company Act of 1940, as amended (the “1940 Act”)) are effective based on the principal executive officer and principal financial officer’s evaluation of these controls and procedures, as required by Rule 30a-3(b) under the 1940 Act, as of a date within 90 days of the filing date of this document.
| | (b) | There have been no significant changes in the Trust’s internal control over financial reporting (as defined in Rule 30a-3(d) under the 1940 Act) that occurred during the period covered by this report that have materially affected, or are reasonably likely to materially affect, the Trust’s internal control over financial reporting. |
Item 12. Disclosure of Securities Lending Activities for Closed-End Management Investment Companies
Not applicable (the Trust is an open-end management investment company).
Item 13. Exhibits
| (a)(1) | Not applicable to this filing. |
| (a)(2) | Certifications pursuant to Section 302 of the Sarbanes-Oxley Act of 2002 and required by Rule 30a-2(a) under the 1940 Act. |
| (a)(3) | No written solicitations to purchase securities were sent or delivered during the period covered by this report by or on behalf of the Trust. |
| (b) | Certifications pursuant to Section 906 of the Sarbanes-Oxley Act of 2002 and required by Rule 30a-2(b) under the 1940 Act. |
SIGNATURES
Pursuant to the requirements of the Securities Exchange Act of 1934 and the Investment Company Act of 1940, the registrant has duly caused this report to be signed on its behalf by the undersigned, thereunto duly authorized.
| | Clearwater Investment Trust |
| | | |
| | By | /s/ Justin H. Weyerhaeuser |
| | | Justin H. Weyerhaeuser |
| | | President (Principal Executive Officer) and |
| | | Treasurer (Principal Financial Officer) |
| | | |
| | Date: August 30, 2019 |
Pursuant to the requirements of the Securities Exchange Act of 1934 and the Investment Company Act of 1940, this report has been signed below by the following persons on behalf of the registrant and in the capacities and on the dates indicated.
| | Clearwater Investment Trust |
| | | |
| | By | /s/ Justin H. Weyerhaeuser |
| | | Justin H. Weyerhaeuser |
| | | President (Principal Executive Officer) |
| | | |
| | Date: August 30, 2019 |
| | Clearwater Investment Trust |
| | | |
| | By | /s/ Justin H. Weyerhaeuser |
| | | Justin H. Weyerhaeuser |
| | | Treasurer (Principal Financial Officer) |
| | | |
| | Date: August 30, 2019 |