UNITED STATES
SECURITIES AND EXCHANGE COMMISSION
Washington, D.C. 20549
FORM N-CSR
CERTIFIED SHAREHOLDER REPORT OF REGISTERED
MANAGEMENT INVESTMENT COMPANIES
Investment Company Act file number 811-05038
Clearwater Investment Trust
(Exact name of registrant as specified in charter)
2000 Wells Fargo Place, 30 East 7th Street, Saint Paul, Minnesota 55101-4930
(Address of principal executive offices) (Zip code)
Jason K. Mitchell
Fiduciary Counselling, Inc.
2000 Wells Fargo Place, 30 E. 7th Street
Saint Paul, Minnesota 55101-4930
Copy to:
John V. O’Hanlon, Esq.
Dechert LLP
One International Place, 40th Floor
100 Oliver Street
Boston, Massachusetts 02110
(Name and address of agent for service)
Registrant’s telephone number, including area code: 651-228-0935
Date of fiscal year end: December 31
Date of reporting period: June 30, 2021
Item 1. Reports to Stockholders
| (a) | The following is a copy of the report transmitted to shareholders pursuant to Rule 30e-1 under the Investment Company Act of 1940 (17 CFR 270.30e-1) |
CLEARWATER INVESTMENT TRUST
Clearwater Core Equity Fund
Clearwater Select Equity Fund
Clearwater Tax-Exempt Bond Fund
Clearwater International Fund
Semi-annual Report
for the period ended
June 30, 2021
Clearwater Investment Trust
Financial Statements
For the Six Months Ended June 30, 2021 (Unaudited)
Table of Contents
Fund Expense Example
(unaudited)
As a shareholder of the Clearwater Core Equity Fund (“Core Equity Fund”), Clearwater Select Equity Fund (“Select Equity Fund”), Clearwater Tax-Exempt Bond Fund (“Tax-Exempt Bond Fund”), and Clearwater International Fund (“International Fund” and together with the Core Equity Fund, Select Equity Fund and Tax-Exempt Bond Fund, the “Funds”), you incur costs, including management fees and other Fund expenses. This example is intended to help you understand your ongoing costs (in dollars) of investing in the Funds and to compare these costs with the ongoing costs of investing in other mutual funds. In addition to the ongoing costs which the Funds pay directly, you as a shareholder indirectly bear the expenses of any outside exchange traded funds or mutual funds in which the Funds invest. (These are also referred to as “acquired funds” and those indirect expenses represent the Funds’ pro rata portion of the cumulative expense charged by the acquired funds.)
The example provided is based on an investment of $1,000 invested at the beginning of the period and held for the six-month period ended June 30, 2021.
Actual Expenses
The first section of the table on the following page provides information about actual account values and actual expenses. You may use the information in this section, together with the amount you invested, to estimate the expenses that you incurred over the period. Simply divide your account value by $1,000 (for example, an $8,600 account value divided by $1,000 = $8.6), then multiply the result by the number in the first section under the heading entitled “Expenses Paid During the Period January 1, 2021 through June 30, 2021” to estimate the expenses attributable to your investment during this period.
Hypothetical Example for Comparison Purposes
The second section of the table below provides information about hypothetical account values and hypothetical expenses based on the Fund’s actual expense ratio and an assumed rate of return of 5% per year before expenses, which is not the Fund’s actual return. Thus, you should not use the hypothetical account values and expenses to estimate the actual ending account balance or your expenses for the period. Rather, these figures are provided to enable you to compare the ongoing costs of investing in the Funds and other mutual funds. To do so, compare this 5% hypothetical example with the 5% hypothetical examples that appear in the shareholder reports of the other mutual funds.
Please note that the expenses shown in the second section of the table are meant to highlight your ongoing costs only. Therefore, the second section of the table is useful in comparing ongoing costs only, and will not help you compare the relative total costs of the Funds to other mutual funds that charge transaction costs and/or sales charges or redemption fees.
| Actual returns | Beginning Account
Value January 1, 2021 | Ending Account Value
June 30, 2021 | Expenses Paid During the
Period January 1, 2021 through June 30, 2021* |
| Core Equity Fund | $1,000.00 | $1,163.70 | $1.63 |
| Select Equity Fund | $1,000.00 | $1,158.30 | $4.76 |
| Tax-Exempt Bond Fund | $1,000.00 | $1,026.30 | $1.46 |
| International Fund | $1,000.00 | $1,120.50 | $3.55 |
Hypothetical 5% return
(before expenses) | | | |
| Core Equity Fund | $1,000.00 | $1,023.28 | $1.53 |
| Select Equity Fund | $1,000.00 | $1,020.38 | $4.46 |
| Tax-Exempt Bond Fund | $1,000.00 | $1,023.36 | $1.45 |
| International Fund | $1,000.00 | $1,021.45 | $3.38 |
| * | Expenses are equal to the Fund’s annualized expense ratios, multiplied by the average account value over the period, multiplied by 181/365 (to reflect the one-half year period). Expense ratios for the most recent one-half year period may differ from expense ratios based on one-year data in the Financial Highlights. |
The annualized expense ratios (reflecting voluntary fee waivers in effect during the period) are as follows:
| | |
| Core Equity Fund | 0.30% |
| Select Equity Fund | 0.89% |
| Tax-Exempt Bond Fund | 0.29% |
| International Fund | 0.67% |
Quarterly Portfolio Schedule of Investments
The Funds file a complete schedule of their portfolio holdings as of the close of the first and third quarters of their fiscal years with the Securities and Exchange Commission (the “SEC”) on Form N-PORT. Shareholders may request portfolio holdings information free of charge by calling the Transfer Agent toll free at 1- 855-684-9144 or by sending a written request to: The Northern Trust Company, P.O. Box 4766, Chicago, IL 60680-4766 Attn: Clearwater Investment Trust Funds. These filings are also available on the SEC's Internet site at http://www.sec.gov.
Voting Proxies on Fund Portfolio Securities
The Funds have established Proxy Voting Policies and Procedures (“Policies”) that the Funds use to determine how to vote proxies relating to portfolio securities. They also report, on Form N-PX, how the Funds voted any such proxies during the most recent 12-month period ended June 30. Shareholders may request copies of the Policies or Form N-PX free of charge by calling Fiduciary Counselling, Inc. toll free at 1-888-228-0935 or by sending a written request to: Fiduciary Counselling, Inc., 30 East 7th Street, Suite 2000, St. Paul, MN 55101 Attn: Clearwater Investment Trust Funds. The Policies and Form N-PX are also available from the EDGAR database on the SEC's Internet site at http://www.sec.gov.
CLEARWATER INVESTMENT TRUST
Statements of Assets and Liabilities
June 30, 2021 (unaudited)
| | | Core Equity
Fund | | Select Equity
Fund | | Tax-Exempt
Bond Fund | | International
Fund |
| Assets | | | | | | | | |
| Investments in securities, at fair value (including securities on loan of: $0, $0, $0 and $6,093,749, respectively); (identified cost: $379,189,657, $458,001,592, $654,118,014 and $675,045,881, respectively) | $ | 789,829,958 | | 549,276,639 | | 689,201,866 | | 1,049,479,346 |
| Foreign currencies, at value (cost: $0, $0, $0 and $2,925,304, respectively) | | - | | - | | - | | 2,899,743 |
| Cash | | - | | - | | - | | 52,959 |
| Receivable for securities sold | | - | | 5,660,839 | | - | | 1,292,178 |
| Receivable for shares of beneficial interest sold | | 208,000 | | - | | - | | 122,700 |
| Accrued dividend and interest receivable | | 554,386 | | 242,463 | | 5,646,356 | | 1,355,295 |
| Foreign tax reclaim receivable | | 3,396 | | - | | - | | 1,380,804 |
| Unrealized appreciation on forward foreign currency exchange contracts | | - | | - | | - | | 48,688 |
| Total assets | | 790,595,740 | | 555,179,941 | | 694,848,222 | | 1,056,631,713 |
| Liabilities | | | | | | | | |
| Payables for investment securities purchased | | - | | 6,303,302 | | 6,045,851 | | 2,817,415 |
| Payable for fund shares redeemed | | - | | 533,281 | | 657,037 | | 56,188 |
| Accrued investment advisory fee | | 537,120 | | 1,119,786 | | 461,486 | | 1,617,110 |
| Payable for dividend distribution | | - | | - | | 174,427 | | - |
| Payable upon return of securities loaned | | - | | - | | - | | 6,400,482 |
| Deferred foreign capital gains taxes payable | | - | | - | | - | | 1,131,218 |
| Total liabilities | | 537,120 | | 7,956,369 | | 7,338,801 | | 12,022,413 |
| Net assets | $ | 790,058,620 | | 547,223,572 | | 687,509,421 | | 1,044,609,300 |
| Capital | | | | | | | | |
| Capital Stock and additional paid-in capital (authorized unlimited number of shares at no par value for each Fund: 12,319,280, 23,517,270, 67,280,985 and 46,246,125 shares outstanding, respectively) | $ | 364,160,654 | | 381,472,098 | | 656,159,472 | | 605,639,584 |
| Distributable earnings | | 425,897,966 | | 165,751,474 | | 31,349,949 | | 438,969,716 |
| Net assets | $ | 790,058,620 | | 547,223,572 | | 687,509,421 | | 1,044,609,300 |
| Net asset value per share of outstanding capital stock | $ | 64.13 | | 23.27 | | 10.22 | | 22.59 |
See accompanying notes to financial statements.
CLEARWATER INVESTMENT TRUST
Statements of Operations
for the six months ended June 30, 2021 (unaudited)
| | | Core Equity
Fund | | Select Equity
Fund | | Tax-Exempt
Bond Fund | | International
Fund |
| Investment income: | | | | | | | | |
| Income: | | | | | | | | |
| Dividends (net of foreign taxes withheld of $5,170, $2,867, $0 and $1,399,423, respectively) | $ | 5,050,815 | | 3,366,477 | | 880,046 | | 11,668,101 |
| Interest | | - | | - | | 11,480,155 | | 1,234 |
| Net income from securities loaned | | - | | 8,417 | | - | | 220,768 |
| Total income | | 5,050,815 | | 3,374,894 | | 12,360,201 | | 11,890,103 |
| Expenses: | | | | | | | | |
| Investment advisory fee | | 3,046,424 | | 3,390,867 | | 1,882,018 | | 4,632,690 |
| Other expenses | | - | | 185 | | 185 | | - |
| Total expenses | | 3,046,424 | | 3,391,052 | | 1,882,203 | | 4,632,690 |
| Less: waivers of investment advisory fee or other expense reimbursements | | (2,015,011) | | (1,156,657) | | (972,379) | | (1,506,593) |
| Net expenses | | 1,031,413 | | 2,234,395 | | 909,824 | | 3,126,097 |
| Net investment income | | 4,019,402 | | 1,140,499 | | 11,450,377 | | 8,764,006 |
| Net realized gain (loss) on: | | | | | | | | |
| Security transactions | | 26,732,201 | | 70,365,326 | | (172,878) | | 50,307,627 |
| Forward foreign currency exchange contracts | | - | | - | | - | | (185,815) |
| Foreign currency transactions | | - | | - | | - | | 19,951 |
| Net increase (decrease) in unrealized appreciation/depreciation on: | | | | | | | | |
| Security transactions (net of increase (decrease) in deferred foreign taxes of $0, $0, $0 and $(530,377), respectively) | | 71,776,226 | | (88,395) | | 5,162,435 | | 44,580,052 |
| Forward foreign currency exchange contracts | | - | | - | | - | | 245,836 |
| Translation of other assets and liabilities denominated in foreign currencies | | - | | - | | - | | (182,939) |
| Net gain (loss) on investments | | 98,508,427 | | 70,276,931 | | 4,989,557 | | 94,784,712 |
| Net increase (decrease) in net assets resulting from operations | $ | 102,527,829 | | 71,417,430 | | 16,439,934 | | 103,548,718 |
See accompanying notes to financial statements.
CLEARWATER INVESTMENT TRUST
Statements of Changes in Net Assets
for the six months ended June 30, 2021 (unaudited) and the year ended December 31, 2020
| | | Core Equity
Fund | | Select Equity
Fund |
| | | 06/30/2021 | | 12/31/2020 | | 06/30/2021 | | 12/31/2020 |
| Operations: | | | | | | | | |
| Net investment income | $ | 4,019,402 | | 7,797,355 | | 1,140,499 | | 2,445,660 |
| Net realized gain | | 26,732,201 | | 12,227,897 | | 70,365,326 | | 11,929,774 |
| Net increase (decrease) in unrealized appreciation/depreciation | | 71,776,226 | | 64,243,645 | | (88,395) | | 45,122,529 |
| Net increase in net assets resulting from operations | | 102,527,829 | | 84,268,897 | | 71,417,430 | | 59,497,963 |
| Distributions to shareholders | | - | | (10,529,448) | | - | | (9,407,511) |
| Capital share transactions: | | | | | | | | |
| Proceeds from shares sold | | 82,254,156 | | 63,017,560 | | 71,544,796 | | 50,471,692 |
| Reinvestment of distributions from net investment income and net realized gain | | - | | 10,528,034 | | - | | 9,377,725 |
| Payments for shares redeemed | | (11,707,768) | | (73,471,942) | | (51,712,965) | | (27,390,079) |
| Net increase in net assets from capital share transactions | | 70,546,388 | | 73,652 | | 19,831,831 | | 32,459,338 |
| Total increase in net assets | | 173,074,217 | | 73,813,101 | | 91,249,261 | | 82,549,790 |
| Net assets: | | | | | | | | |
| At the beginning of the period | | 616,984,403 | | 543,171,302 | | 455,974,311 | | 373,424,521 |
| At the end of the period | $ | 790,058,620 | | 616,984,403 | | 547,223,572 | | 455,974,311 |
| | | Tax-Exempt
Bond Fund | | International
Fund |
| | | 06/30/2021 | | 12/31/2020 | | 06/30/2021 | | 12/31/2020 |
| Operations: | | | | | | | | |
| Net investment income | $ | 11,450,377 | | 23,002,865 | | 8,764,006 | | 8,167,518 |
| Net realized gain (loss) | | (172,878) | | 385,724 | | 50,141,763 | | 17,480,415 |
| Net increase in unrealized appreciation/depreciation | | 5,162,435 | | 619,138 | | 44,642,949 | | 113,749,692 |
| Net increase in net assets resulting from operations | | 16,439,934 | | 24,007,727 | | 103,548,718 | | 139,397,625 |
| Distributions to shareholders | | (11,450,436) | | (24,360,229) | | - | | (16,448,467) |
| Capital share transactions: | | | | | | | | |
| Proceeds from shares sold | | 80,556,520 | | 40,880,400 | | 88,740,487 | | 42,915,665 |
| Reinvestment of distributions from net investment income and net realized gain | | 11,393,495 | | 24,589,531 | | - | | 16,448,468 |
| Payments for shares redeemed | | (26,268,960) | | (51,555,147) | | (15,464,137) | | (26,380,075) |
| Net increase in net assets from capital share transactions | | 65,681,055 | | 13,914,784 | | 73,276,350 | | 32,984,058 |
| Total increase in net assets | | 70,670,553 | | 13,562,282 | | 176,825,068 | | 155,933,216 |
| Net assets: | | | | | | | | |
| At the beginning of the period | | 616,838,868 | | 603,276,586 | | 867,784,232 | | 711,851,016 |
| At the end of the period | $ | 687,509,421 | | 616,838,868 | | 1,044,609,300 | | 867,784,232 |
See accompanying notes to financial statements.
CLEARWATER INVESTMENT TRUST
Financial Highlights
Per share data (rounded to the nearest cent) for a share of capital stock outstanding throughout the years or period ended and selected information for each year or period ended is as follows:
| | | | June 30,
2021
(Unaudited) | | Year ended December 31, |
Core Equity
Fund | | | | 2020 | | 2019 | | 2018 | | 2017 | | 2016 |
| Net asset value, beginning of period | | $ | 55.11 | | 48.14 | | 37.97 | | 43.21 | | 37.43 | | 35.57 |
| Income (loss) from investment operations: | | | | | | | | | | | | | |
| Net investment income | | | 0.33 | | 0.71 | | 0.72 | | 0.68 | | 0.64 | | 0.65 |
| Net realized and unrealized gains (losses) | | | 8.69 | | 7.22 | | 10.32 | | (3.46) | | 8.03 | | 3.27 |
| Total from investment operations | | | 9.02 | | 7.93 | | 11.04 | | (2.78) | | 8.67 | | 3.92 |
| Less distributions to shareholders from: | | | | | | | | | | | | | |
| Net investment income | | | - | | (0.71) | | (0.66) | | (0.67) | | (0.65) | | (0.49) |
| Net realized gain | | | - | | (0.25) | | (0.21) | | (1.79) | | (2.24) | | (1.57) |
| Total distributions to shareholders: | | | - | | (0.96) | | (0.87) | | (2.46) | | (2.89) | | (2.06) |
| Net asset value, end of period | | $ | 64.13 | | 55.11 | | 48.14 | | 37.97 | | 43.21 | | 37.43 |
| Total return (a) | | | 16.37 % | | 16.54 % | | 29.11 % | | (6.61)% | | 23.26 % | | 10.98 % |
| Net assets, end of period (000s omitted) | | $ | 790,059 | | 616,984 | | 543,171 | | 456,874 | | 538,392 | | 466,482 |
| Ratio of expenses, net of waivers, to average net assets (b), (c), (d), (e), (f), (g), (h), (i) | | | 0.30 % | | 0.31 % | | 0.35 % | | 0.38 % | | 0.39 % | | 0.43 % |
| Ratio of expenses, before waivers, to average net assets (b), (c), (d), (e), (f), (g), (h), (i) | | | 0.90 % | | 0.90 % | | 0.90 % | | 0.90 % | | 0.90 % | | 0.90 % |
| Ratio of net investment income (loss), net of waivers, to average net assets (c), (d), (e), (f), (g), (h), (i) | | | 1.19 % | | 1.49 % | | 1.54 % | | 1.47 % | | 1.51 % | | 1.63 % |
| Ratio of net investment income (loss), before waivers, to average net assets (c), (d), (e), (f), (g), (h), (i) | | | 0.59 % | | 0.90 % | | 0.99 % | | 0.95 % | | 1.00 % | | 1.16 % |
| Portfolio turnover rate (excluding short-term securities) | | | 12.85 % | | 37.16 % | | 33.73 % | | 34.64 % | | 31.13 % | | 44.11 % |
| | |
| (a) | Total return figures are based on the change in net asset value of a share during the period and assume reinvestment of distributions at net asset value. Total return is not annualized for periods of less than one year. |
| (b) | In addition to fees and expenses which the Fund bears directly, the Fund indirectly bears a pro rata share of the fees and expenses of any acquired funds in which it invests. Such indirect expenses are not included in the above reported expense ratios and are excluded from the voluntary waivers reflected above and described in the below footnotes. |
| (c) | Annualized for periods less than one year. |
| (d) | Effective April 1, 2021, the investment advisory fee, net of voluntary waivers, decreased to 0.30%. Also effective April 1, 2021, the Adviser increased the voluntary waiver to 0.60%. |
| (e) | Effective January 1, 2020, the investment advisory fee, net of voluntary waivers, decreased to 0.31%. Also effective January 1, 2020, the Adviser increased the voluntary waiver to 0.59%. |
| (f) | Effective December 12, 2018, the investment advisory fee, net of voluntary waivers, decreased to 0.35%. Also effective December 12, 2018, the Adviser increased the voluntary waiver to 0.55%. |
| (g) | Effective September 22, 2017, the investment advisory fee, net of voluntary waivers, increased to 0.38%. Also effective September 22, 2017, the Adviser decreased the voluntary waiver to 0.52%. |
| (h) | Effective March 16, 2017, the investment advisory fee, net of voluntary waivers, decreased to 0.37%. Also effective March 16, 2017, the Adviser increased the voluntary waiver to 0.53%. |
| (i) | Effective March 16, 2016, the investment advisory fee, net of voluntary waivers, increased to 0.44%. Also effective March 16, 2016, the Adviser decreased the voluntary waiver to 0.46%. |
See accompanying notes to financial statements.
CLEARWATER INVESTMENT TRUST
Financial Highlights
Per share data (rounded to the nearest cent) for a share of capital stock outstanding throughout the years or period ended and selected information for each year or period ended is as follows:
| | | | June 30,
2021
(Unaudited) | | Year ended December 31, |
Select Equity
Fund | | | | 2020 | | 2019 | | 2018 | | 2017 | | 2016 |
| Net asset value, beginning of period | | $ | 20.09 | | 18.45 | | 14.90 | | 18.92 | | 19.79 | | 17.18 |
| Income (loss) from investment operations: | | | | | | | | | | | | | |
| Net investment income | | | 0.05 | | 0.11 | | 0.14 | | 0.07 | | 0.02 | | 0.07 |
| Net realized and unrealized gains (losses) | | | 3.13 | | 1.95 | | 3.79 | | (2.37) | | 2.58 | | 3.30 |
| Total from investment operations | | | 3.18 | | 2.06 | | 3.93 | | (2.30) | | 2.60 | | 3.37 |
| Less distributions to shareholders from: | | | | | | | | | | | | | |
| Net investment income | | | - | | (0.11) | | (0.11) | | (0.07) | | (0.03) | | (0.05) |
| Net realized gain | | | - | | (0.31) | | (0.27) | | (1.65) | | (3.44) | | (0.71) |
| Total distributions to shareholders: | | | - | | (0.42) | | (0.38) | | (1.72) | | (3.47) | | (0.76) |
| Net asset value, end of period | | $ | 23.27 | | 20.09 | | 18.45 | | 14.90 | | 18.92 | | 19.79 |
| Total return (a) | | | 15.83 % | | 11.25 % | | 26.40 % | | (12.49)% | | 13.46 % | | 19.67 % |
| Net assets, end of period (000s omitted) | | $ | 547,224 | | 455,974 | | 373,425 | | 305,921 | | 369,720 | | 343,393 |
| Ratio of expenses, net of waivers, to average net assets (b), (c), (d), (e), (f), (g), (h), (i), (j) | | | 0.89 % | | 0.94 % | | 0.98 % | | 1.03 % | | 0.99 % | | 1.02 % |
| Ratio of expenses, before waivers, to average net assets (b), (c), (d), (e), (f), (g), (h), (i), (j) | | | 1.35 % | | 1.35 % | | 1.35 % | | 1.35 % | | 1.35 % | | 1.35 % |
| Ratio of net investment income (loss), net of waivers, to average net assets (c), (d), (e), (f), (g), (h), (i), (j) | | | 0.45 % | | 0.70 % | | 0.64 % | | 0.33 % | | 0.11 % | | 0.28 % |
| Ratio of net investment income (loss), before waivers, to average net assets (c), (d), (e), (f), (g), (h), (i), (j) | | | (0.01)% | | 0.29 % | | 0.27 % | | 0.01 % | | (0.25)% | | (0.05)% |
| Portfolio turnover rate (excluding short-term securities) | | | 54.54 % | | 102.30 % | | 64.32 % | | 63.08 % | | 113.85 % | | 78.82 % |
| | |
| (a) | Total return figures are based on the change in net asset value of a share during the period and assume reinvestment of distributions at net asset value. Total return is not annualized for periods of less than one year. |
| (b) | In addition to fees and expenses which the Fund bears directly, the Fund indirectly bears a pro rata share of the fees and expenses of any acquired funds in which it invests. Such indirect expenses are not included in the above reported expense ratios and are excluded from the voluntary waivers reflected above and described in the below footnotes. |
| (c) | Annualized for periods less than one year. |
| (d) | Effective April 1, 2021, the investment advisory fee, net of voluntary waivers, decreased to 0.87%. Also effective April 1, 2021, the Adviser increased the voluntary waiver to 0.48%. |
| (e) | Effective October 1, 2020, the investment advisory fee, net of voluntary waivers, decreased to 0.91%. Also effective October 1, 2020, the Adviser increased the voluntary waiver to 0.44%. |
| (f) | Effective January 1, 2020, the investment advisory fee, net of voluntary waivers, decreased to 0.95%. Also effective January 1, 2020, the Adviser increased the voluntary waiver to 0.40%. |
| (g) | Effective December 12, 2018, the investment advisory fee, net of voluntary waivers, decreased to 0.98%. Also effective December 12, 2018, the Adviser increased the voluntary waiver to 0.37%. |
| (h) | Effective September 22, 2017, the investment advisory fee, net of voluntary waivers, increased to 1.03%. Also effective September 22, 2017, the Adviser decreased the voluntary waiver to 0.32%. |
| (i) | Effective March 16, 2017, the investment advisory fee, net of voluntary waivers, decreased to 0.96%. Also effective March 16, 2017, the Adviser increased the voluntary waiver to 0.39%. |
| (j) | Effective March 16, 2016, the investment advisory fee, net of voluntary waivers, increased to 1.03%. Also effective March 16, 2016, the Adviser decreased the voluntary waiver to 0.32%. |
See accompanying notes to financial statements.
CLEARWATER INVESTMENT TRUST
Financial Highlights
Per share data (rounded to the nearest cent) for a share of capital stock outstanding throughout the years or period ended and selected information for each year or period ended is as follows:
| | | | June 30,
2021
(Unaudited) | | Year ended December 31, |
Tax-Exempt
Bond Fund | | | | 2020 | | 2019 | | 2018 | | 2017 | | 2016 |
| Net asset value, beginning of period | | $ | 10.14 | | 10.13 | | 9.82 | | 10.21 | | 9.93 | | 10.16 |
| Income (loss) from investment operations: | | | | | | | | | | | | | |
| Net investment income | | | 0.18 | | 0.39 | | 0.40 | | 0.42 | | 0.45 | | 0.46 |
| Net realized and unrealized gains (losses) | | | 0.08 | | 0.03 | | 0.34 | | (0.26) | | 0.38 | | (0.23) |
| Total from investment operations | | | 0.26 | | 0.42 | | 0.74 | | 0.16 | | 0.83 | | 0.23 |
| Less distributions to shareholders from: | | | | | | | | | | | | | |
| Net investment income | | | (0.18) | | (0.41) | | (0.43) | | (0.45) | | (0.49) | | (0.44) |
| Net realized gain | | | - | | - | | - | | (0.10) | | (0.06) | | (0.02) |
| Total distributions to shareholders: | | | (0.18) | | (0.41) | | (0.43) | | (0.55) | | (0.55) | | (0.46) |
| Net asset value, end of period | | $ | 10.22 | | 10.14 | | 10.13 | | 9.82 | | 10.21 | | 9.93 |
| Total return (a) | | | 2.63 % | | 4.26 % | | 7.69 % | | 1.59 % | | 8.54 % | | 2.28 % |
| Net assets, end of period (000s omitted) | | $ | 687,509 | | 616,839 | | 603,277 | | 529,485 | | 525,156 | | 484,856 |
| Ratio of expenses, net of waivers, to average net assets (b), (c), (d), (e) | | | 0.29 % | | 0.29 % | | 0.32 % | | 0.34 % | | 0.34 % | | 0.34 % |
| Ratio of expenses, before waivers, to average net assets (b), (c), (d), (e) | | | 0.60 % | | 0.60 % | | 0.60 % | | 0.60 % | | 0.60 % | | 0.60 % |
| Ratio of net investment income (loss), net of waivers, to average net assets (c), (d), (e) | | | 3.65 % | | 3.85 % | | 4.05 % | | 4.22 % | | 4.35 % | | 4.54 % |
| Ratio of net investment income (loss), before waivers, to average net assets (c), (d), (e) | | | 3.34 % | | 3.54 % | | 3.77 % | | 3.96 % | | 4.09 % | | 4.28 % |
| Portfolio turnover rate (excluding short-term securities) | | | 5.82 % | | 17.21 % | | 12.53 % | | 11.36 % | | 13.28 % | | 13.48 % |
| | |
| (a) | Total return figures are based on the change in net asset value of a share during the period and assume reinvestment of distributions at net asset value. Total return is not annualized for periods of less than one year. |
| (b) | In addition to fees and expenses which the Fund bears directly, the Fund indirectly bears a pro rata share of the fees and expenses of any acquired funds in which it invests. Such indirect expenses are not included in the above reported expense ratios and are excluded from the voluntary waivers reflected above and described in the below footnotes. |
| (c) | Annualized for periods less than one year. |
| (d) | Effective January 1, 2020, the investment advisory fee, net of voluntary waivers, decreased to 0.29%. Also effective January 1, 2020, the Adviser increased the voluntary waiver to 0.31%. |
| (e) | Effective December 12, 2018, the investment advisory fee, net of voluntary waivers, decreased to 0.32%. Also effective December 12, 2018, the Adviser increased the voluntary waiver to 0.28%. |
See accompanying notes to financial statements.
CLEARWATER INVESTMENT TRUST
Financial Highlights
Per share data (rounded to the nearest cent) for a share of capital stock outstanding throughout the years or period ended and selected information for each year or period ended is as follows:
| | | | June 30,
2021
(Unaudited) | | Year ended December 31, |
International
Fund | | | | 2020 | | 2019 | | 2018 | | 2017 | | 2016 |
| Net asset value, beginning of period | | $ | 20.16 | | 17.28 | | 14.08 | | 17.23 | | 14.04 | | 14.02 |
| Income (loss) from investment operations: | | | | | | | | | | | | | |
| Net investment income | | | 0.19 | | 0.20 | | 0.29 | | 0.30 | | 0.27 | | 0.27 |
| Net realized and unrealized gains (losses) | | | 2.24 | | 3.07 | | 3.43 | | (2.70) | | 3.44 | | 0.02 |
| Total from investment operations | | | 2.43 | | 3.27 | | 3.72 | | (2.40) | | 3.71 | | 0.29 |
| Less distributions to shareholders from: | | | | | | | | | | | | | |
| Net investment income | | | - | | (0.17) | | (0.30) | | (0.29) | | (0.30) | | (0.27) |
| Net realized gain | | | - | | (0.22) | | (0.22) | | (0.46) | | (0.22) | | - (a) |
| Total distributions to shareholders: | | | - | | (0.39) | | (0.52) | | (0.75) | | (0.52) | | (0.27) |
| Net asset value, end of period | | $ | 22.59 | | 20.16 | | 17.28 | | 14.08 | | 17.23 | | 14.04 |
| Total return (b) | | | 12.05 % | | 19.02 % | | 26.47 % | | (14.01)% | | 26.54 % | | 2.09 % |
| Net assets, end of period (000s omitted) | | $ | 1,044,609 | | 867,784 | | 711,851 | | 524,708 | | 624,642 | | 508,999 |
| Ratio of expenses, net of waivers, to average net assets (c), (d), (e), (f), (g), (h), (i), (j) | | | 0.67 % | | 0.66 % | | 0.68 % | | 0.68 % | | 0.67 % | | 0.70 % |
| Ratio of expenses, before waivers, to average net assets (c), (d), (e), (f), (g), (h), (i), (j) | | | 1.00 % | | 1.00 % | | 1.00 % | | 1.00 % | | 1.00 % | | 1.00 % |
| Ratio of net investment income (loss), net of waivers, to average net assets (d), (e), (f), (g), (h), (i), (j) | | | 1.90 % | | 1.17 % | | 1.88 % | | 1.79 % | | 1.67 % | | 1.90 % |
| Ratio of net investment income (loss), before waivers, to average net assets (d), (e), (f), (g), (h), (i), (j) | | | 1.57 % | | 0.83 % | | 1.56 % | | 1.47 % | | 1.34 % | | 1.60 % |
| Portfolio turnover rate (excluding short-term securities) | | | 19.52 % | | 39.61 % | | 49.69 % | | 19.57 % | | 36.17 % | | 37.21 % |
| | |
| (a) | Per share amounts from distributions paid from net realized gain were less than $0.01 per share. |
| (b) | Total return figures are based on the change in net asset value of a share during the period and assume reinvestment of distributions at net asset value. Total return is not annualized for periods of less than one year. |
| (c) | In addition to fees and expenses which the Fund bears directly, the Fund indirectly bears a pro rata share of the fees and expenses of any acquired funds in which it invests. Such indirect expenses are not included in the above reported expense ratios and are excluded from the voluntary waivers reflected above and described in the below footnotes. |
| (d) | Annualized for periods less than one year. |
| (e) | Effective April 1, 2021, the investment advisory fee, net of voluntary waivers, decreased to 0.67%. Also effective April 1, 2021, the Adviser increased the voluntary waiver to 0.33%. |
| (f) | Effective October 1, 2020, the investment advisory fee, net of voluntary waivers, increased to 0.68%. Also effective October 1, 2020, the Adviser decreased the voluntary waiver to 0.32%. |
| (g) | Effective January 1, 2020, the investment advisory fee, net of voluntary waivers, decreased to 0.65%. Also effective January 1, 2020, the Adviser increased the voluntary waiver to 0.35%. |
| (h) | Effective September 22, 2017, the investment advisory fee, net of voluntary waivers, increased to 0.68%. Also effective September 22, 2017, the Adviser decreased the voluntary waiver to 0.32%. |
| (i) | Effective March 16, 2017, the investment advisory fee, net of voluntary waivers, decreased to 0.65%. Also effective March 16, 2017, the Adviser increased the voluntary waiver to 0.35%. |
| (j) | Effective March 16, 2016, the investment advisory fee, net of voluntary waivers, increased to 0.70%. Also effective March 16, 2016, the Adviser decreased the voluntary waiver to 0.30%. |
See accompanying notes to financial statements.
CLEARWATER INVESTMENT TRUST
Notes to Financial Statements (unaudited)
June 30, 2021
(1) Organization
Clearwater Investment Trust (the “Trust”) was established on January 12, 1987 as a Massachusetts business trust and is registered under the Investment Company Act of 1940, as amended (the “1940 Act”), as a diversified open end management investment company and presently includes four series: Clearwater Core Equity Fund (“Core Equity Fund”), Clearwater Select Equity Fund ("Select Equity Fund"), Clearwater Tax-Exempt Bond Fund (“Tax-Exempt Bond Fund”), and Clearwater International Fund (“International Fund” and together with the Core Equity Fund, Select Equity Fund and Tax-Exempt Bond Fund, the “Funds”). Clearwater Management Co., Inc. (the “Adviser”) serves as the investment adviser for each of the Funds and is responsible for the oversight of each of the Fund’s subadvisers. The Trust’s declaration of trust permits the Board of Trustees to create additional funds in the future. The investment objective of the Core Equity, Select Equity, and International Funds is long-term capital growth. The investment objective of the Tax-Exempt Bond Fund is high current income that is exempt from United States (“U.S.”) federal income tax, consistent with preservation of capital.
Fiduciary Counselling, Inc. (“FCI”) acts as subadviser to each of the Funds. FCI does not provide day-to-day management, but provides the Funds with various investment-related services, including investment strategy advice, manager recommendations and related duties as requested by the Adviser. FCI also provides certain services related to due diligence, performance reporting, compliance, and other administrative functions, which support the investment management services and subadviser oversight services provided to the Funds by the Adviser.
The Northern Trust Company serves as the custodian, administrator, accounting services agent and transfer agent for the Trust.
Under normal market conditions, the Core Equity Fund pursues its investment objective by investing at least 80% of its net assets, plus the amount of any borrowings for investment purposes, in equity securities of U.S. companies. The equity securities in which the Fund primarily invests are common and preferred stocks. The Fund employs a multi-style (growth and value) and multi-manager approach whereby portions of the Fund are allocated to different subadvisers who employ distinct investment styles. The Fund’s Adviser allocates portions of the Fund’s assets among subadvisers. The Fund currently allocates assets among the following subadvisers who provide day-to-day management for the Fund: Parametric Portfolio Associates LLC (“Parametric”), AQR Capital Management, LLC (“AQR”), and O’Shaughnessy Asset Management, LLC (“OSAM”). The allocation among subadvisers will vary over time, but the current intent of the Fund’s Adviser is that under normal market conditions approximately 40% to 60% of the Fund’s total assets will be allocated to Parametric; the remaining assets will be allocated to one or more of the Fund’s two other subadvisers that provide day-to-day management. Parametric manages its portion of the Fund’s assets using a passive management strategy to seek investment results that track, before fees and expenses, the investment results of the Russell 1000® Index as closely as possible without requiring the Fund to realize taxable gains. In addition, as noted above, FCI also acts as a subadviser to the Fund but does not provide day-to-day management.
Under normal market conditions, the Select Equity Fund invests at least 80% of its net assets, plus the amount of any borrowings for investment purposes, in equity securities. Equity securities in which the Fund invests consist primarily of exchange-traded common and preferred stocks. The Fund may also invest in a type of equity security called a convertible security to reduce volatility or correlation risk in the portfolio. A convertible security generally entitles the holder to receive interest paid or accrued on debt securities or the dividend paid on preferred stock until the convertible security matures or is redeemed, converted or exchanged. While the Fund is permitted to invest in
CLEARWATER INVESTMENT TRUST
Notes to Financial Statements (unaudited)
June 30, 2021
securities of any market capitalization, the Fund invests primarily in securities of micro-, small- and medium-sized companies. The Fund may obtain exposure to equity securities through investment in exchange-traded funds and other investment companies. The Fund uses a “multi-style, multi-manager” approach. The Fund’s Adviser allocates portions of the Fund’s assets among subadvisers who employ distinct investment styles. The Fund currently allocates assets among the following subadvisers who provide day-to-day management for the Fund: Cooke & Bieler, L.P. (“Cooke & Bieler”), Jackson Square Partners, LLC (“Jackson Square”), Parametric and Pzena Investment Management LLC (“Pzena”). The allocation among subadvisers will vary over time, but the current intent of the Fund’s adviser is that under normal market conditions approximately 25% of the Fund’s assets will be allocated to Parametric and the remaining assets will be allocated to one or more of the Fund’s three other subadvisers that provide day-to-day management of the Fund. The percentage of the Fund’s assets allocated to Parametric will change from time to time in the discretion of CMC and could be higher or lower in the future. Parametric manages its portion of the Fund’s assets using a passive management strategy to seek investment results that track, before fees and expenses, the investment results of the S&P SmallCap 600® Index as closely as possible without requiring the Fund to realize taxable gains. FCI also acts as a subadviser to the Fund but does not provide day-to-day management. Effective June 11, 2021, the Trust terminated the subadvisory agreement with Kennedy Capital Management, Inc., one of the subadvisers to the Select Equity Fund.
Under normal market conditions, the Tax-Exempt Bond Fund invests at least 80% of its net assets, plus the amount of any borrowings for investment purposes, in tax-exempt bonds, which are debt obligations issued by or for the U.S. states, territories and possessions and the District of Columbia. The interest on these bonds is generally exempt from both U.S. regular federal income tax and U.S. federal alternative minimum tax. However, the Fund may invest up to 20% of its net assets in bonds that generate interest income subject to federal alternative minimum tax for individuals. The Fund invests in both revenue bonds, which are backed by and payable only from the revenues derived from a specific facility or specific revenue source, and in general obligation bonds, which are secured by the full faith, credit and taxation power of the issuing municipality. The Fund currently has one subadviser that provides day-to-day management for the Fund, Sit Fixed Income Advisors II, LLC (“Sit”). FCI also acts as a subadviser to the Fund but does not provide day-to-day management.
Under normal market conditions, the International Fund intends to invest at least 80% of the value of its net assets, plus the amount of any borrowings for investment purposes, in equity securities of companies organized or located outside the United States and doing a substantial amount of business outside the United States. Equity securities in which the Fund invests include common and preferred stock, sponsored and unsponsored American Depositary Receipts, European Depositary Receipts, Global Depositary Receipts, exchange-traded funds, and other investment companies. The Fund diversifies its investments among a number of different countries throughout the world, and may invest in companies of any size. The Fund does not intend to invest more than 20% of its net assets in the equity securities of developing or emerging market issuers (including frontier market issuers). In order to hedge against adverse movements in currency exchange rates, the Fund may enter into foreign currency exchange contracts. The Fund may use options, futures contracts, and options on futures contracts to attempt to manage market or business risks. The Fund does not intend to invest in foreign currency exchange contracts, options, futures contracts, or options on futures contracts for speculative purposes. The Fund uses a “multi-style, multi-manager” approach. The Fund’s assets are allocated to different subadvisers who employ distinct investment styles. The Fund currently allocates assets among the following subadvisers who provide day-to-day management for the Fund: Parametric, Artisan Partners Limited Partnership (“Artisan Partners”), WCM Investment Management, LLC (“WCM”) and LSV Asset Management (“LSV”). The allocation among subadvisers will vary over time, but the current intent of the Fund’s Adviser is that under normal market conditions approximately 30% of the Fund’s assets will be allocated to Parametric, and the remaining assets will be allocated to one or more of the Fund’s
CLEARWATER INVESTMENT TRUST
Notes to Financial Statements (unaudited)
June 30, 2021
three other subadvisers that provide day-to-day management of the Fund. Parametric manages its portion of the Fund’s assets using a passive management strategy to seek investment results that track, before fees and expenses, the investment results of the MSCI World Ex U.S.A. Index - Net Dividends as closely as possible without requiring the Fund to realize taxable gains. FCI also acts as a subadviser to the Fund but does not provide day-to-day management.
(2) Summary of Significant Accounting Policies
The Funds are investment companies and follow accounting and reporting guidance under Financial Accounting Standards Board (“FASB”) Accounting Standards Codification (“ASC”) Topic 946, “Financial Services-Investment Companies.”
The significant accounting policies followed by the Funds are as follows:
(a) Investments in Securities
Investments in U.S. and foreign equity securities are valued at the last sales price or the regular trading session closing price on the principal exchange or market where they are traded. Foreign security values are stated in U.S. dollars. Equity securities which have not traded on the date of valuation or securities for which sales prices are not generally reported are valued at the mean between the last bid and asked prices. Debt securities are valued on the basis of evaluated prices provided by independent pricing services when such prices are believed to reflect the fair value of such securities or broker provided prices. Such prices may be determined by taking into account other similar securities’ prices, yields, maturities, call features, ratings, prepayment speeds, credit risks, cash flows, institutional size trading in similar groups of securities and developments related to specific securities. Shares of open end investment companies are valued at their daily net asset value (“NAV”). Shares of closed-end funds and exchange traded funds are valued at the last sales price or the regular trading session closing price on the principal exchange or market where they are traded.
Securities for which no market quotations are readily available (including those for which trading has been suspended), or when the Adviser becomes aware that a significant event impacting the value of a security or group of securities has occurred after the closing of the exchange on which the security or securities principally trade, but before the calculation of the NAV, are valued at fair value as determined in good faith using procedures established by the Board of Trustees. This may occur particularly with respect to certain foreign securities held by the International Fund, whereby the Board of Trustees may use adjustment factors obtained from an independent evaluation service that are intended to reflect more accurately the fair value of these foreign securities as of the time the Fund’s NAV is calculated. The procedures consider, among others, the following factors to determine a security’s fair value: the nature and pricing history (if any) of the security; whether any dealer quotations for the security are available; and possible valuation methodologies that could be used to determine the fair value of the security. These procedures are used by the Valuation Committee, in accordance with the procedures established by the Board of Trustees, to determine the fair value of the security or securities. Such determinations are then submitted for review and ratification by the Board of Trustees. The use of fair valuation involves the risk that the values used by the Funds to price their investments may be higher or lower than the values used by other unaffiliated investment companies and investors to price the same investments.
CLEARWATER INVESTMENT TRUST
Notes to Financial Statements (unaudited)
June 30, 2021
Security transactions are accounted for on the trade date, which is the date the securities are purchased or sold. Realized gains and losses are calculated on an identified cost basis. Dividend income is recognized on the ex-dividend date or, for foreign securities, as soon as the information is available. Interest income, is recognized on an accrual basis and includes amortization of premiums and accretion of discounts using the effective yield method.
(b) Foreign Currency Translation
The International Fund invests in securities which are purchased and sold in foreign currencies as a principal investment strategy. The costs of purchases, proceeds from sales of investments, interest and dividend income are translated into U.S. dollars using the spot market rate of exchange prevailing on the respective dates of such transactions. The value of the International Fund’s net assets, as measured in U.S. dollars, may be affected favorably or unfavorably by changes in foreign currency exchange rates and exchange control regulations. The gains or losses, if any, on investments resulting from changes in foreign exchange rates are recorded within net realized gain (loss) on security transactions and within net increase (decrease) in unrealized appreciation/depreciation on security transactions on the Statements of Operations. The realized gains or losses, if any, on translation of other assets and liabilities denominated in foreign currencies are recorded within net realized gain (loss) on foreign currency transactions on the Statements of Operations. The International Fund also will incur costs in converting U.S. dollars to local currencies, and vice versa. Risks may arise upon investing in foreign securities including, but not limited to, political, social or economic instability in the country of the issuer, the difficulty of predicting international trade patterns, the possibility of the imposition of exchange controls, expropriation, limits on removal of currency or other assets, nationalization of assets, foreign withholding and income tax and possible delays in the settlement of foreign stock exchange transactions. The principal markets on which these securities trade may have less volume and liquidity, and may be more volatile, than securities markets in the U.S.
(c) Forward Foreign Currency Exchange Contracts
The International Fund enters into forward foreign currency exchange contracts for the purchase or sale of a specific foreign currency at a fixed price on a future date as a hedge against adverse movements in foreign currency exchange rates, specific transactions or the portfolio position. The objective of the International Fund’s foreign currency hedging transactions is to reduce the risk that the U.S. dollar value of the International Fund’s foreign currency denominated securities will decline in value due to changes in foreign currency exchange rates. Forward foreign currency exchange contracts are marked-to-market daily at the applicable exchange rates. Any resulting unrealized gains or losses are recorded on forward foreign currency exchange contracts within net increase (decrease) in unrealized appreciation/depreciation on the Statements of Operations. The International Fund records any realized gains or losses at the time the forward foreign currency exchange contract is offset by entering into a closing transaction with the same counterparty or is extinguished by delivery of the currency. Realized gains or losses, if any, are recorded within Net realized gain (loss) on forward foreign currency exchange contracts on the Statements of Operations. Risks may arise upon entering into forward foreign currency exchange contracts from the potential of the counterparty to default on its obligations under the contract and from unanticipated movements in the value of a foreign currency relative to the U.S. dollar. The contractual amounts of forward foreign currency exchange contracts do not necessarily represent the amounts potentially subject to risk. The measurement of risks associated with these instruments is meaningful only when all related and offsetting transactions are considered. The International Fund bears the market risk from changes in foreign currency exchange rates and the credit risk if the issuer fails to perform. Additional information on derivative instruments and how these positions may impact the financial statements is found in Note 8, Derivative Instruments.
CLEARWATER INVESTMENT TRUST
Notes to Financial Statements (unaudited)
June 30, 2021
(d) Spot Contracts
The International Fund routinely enters into spot contracts in order to buy or sell a certain amount of foreign currency at the current market rate. The International Fund may enter into spot contracts in order to make payments, or to receive payments, based on investment trading activity in a foreign currency. A spot contract allows the International Fund to buy or sell foreign currency on the day it chooses to deal. From time to time, the Core Equity Fund may also enter into spot contracts in order to make or receive payments due to investment trading activity in a foreign currency on a non-U.S. exchange. Spot contracts are marked-to-market daily at the applicable exchange rates. Any resulting unrealized gains or losses are recorded in translation of other assets and liabilities denominated in foreign currencies within net increase (decrease) in unrealized appreciation/depreciation on the Statements of Operations. Unrealized gains or losses on outstanding spot contracts are recorded in payables for investment securities purchased or receivable for securities sold, respectively, on the Statements of Assets and Liabilities. The Funds record any realized gains or losses at the time the spot contract settles. Realized gains or losses, if any, are included within Net realized gain (loss) on foreign currency transactions on the Statements of Operations. Risks may arise upon entering into spot contracts from unanticipated movements in the value of a foreign currency relative to the U.S. dollar in a short period of time. The Funds bear the market risk from changes in foreign currency exchange rates.
(e) Master Limited Partnerships
The International Fund invests in Master Limited Partnerships (“MLPs”). The benefits derived from the Fund's investments in MLPs are largely dependent on the MLPs being treated as partnerships for federal income tax purposes. If any of the MLPs held by the Fund were treated as corporations for U.S. federal income tax purposes, the after-tax return to the Fund with respect to its investments in such MLPs would be materially reduced, causing a decline in the value of the common stock. The Fund must include its allocable share of an MLP’s taxable income in its reportable taxable income, whether or not it receives a distribution in cash from the MLP. In such case, the Fund may have to liquidate securities to make required distributions to shareholders.
(f) Delayed Delivery Transactions and When-Issued Securities
Certain Funds may engage in securities transactions on a when-issued or delayed-delivery basis. In these transactions, the securities’ prices and yields are fixed on the date of the commitment, with payment and delivery scheduled for a future date. During this period, the securities are subject to market fluctuations. When delayed-delivery purchases are outstanding, a Fund will segregate liquid assets on its records in amounts sufficient to meet the purchase price. A Fund may dispose of or renegotiate a delayed-delivery transaction, which may result in a capital gain or loss.
(g) Short-Term Investments
The Core Equity, Select Equity, Tax-Exempt Bond, and International Funds currently invest in Institutional Shares of the U.S. Government Select Portfolio, a money market portfolio of Northern Institutional Funds, an investment company advised by Northern Trust Investments, Inc. The U.S. Government Select Portfolio primarily invests in securities issued by the U.S. government, government agencies, and government-sponsored enterprises.
CLEARWATER INVESTMENT TRUST
Notes to Financial Statements (unaudited)
June 30, 2021
(h) Recoverable Taxes
The balances disclosed as foreign tax reclaim receivable, if any, represent net amounts withheld by foreign governments on dividend income earned in the respective countries subject to reclaims. All reclaims are paid directly to the applicable Funds.
(i) Federal Taxes
The Trust’s policy is to comply with the requirements of the Internal Revenue Code applicable to regulated investment companies. On a calendar-year basis, the Funds intend to distribute substantially all of their net investment income and net realized gains, if any, to avoid the payment of federal income and excise taxes. Therefore, no income tax provision is required. Each Fund is treated as a separate entity for federal income tax purposes.
The Funds may be subject to taxes imposed by countries in which they invest. Such taxes are generally based on income and/or capital gains earned. Taxes are accrued based on net investment income, net realized gains and net unrealized appreciation as such income and/or gains are recorded. Taxes accrued on unrealized gains are reflected as a liability on the Statements of Assets and Liabilities under the caption deferred foreign capital gains taxes payable and as a reduction in net increase (decrease) in unrealized appreciation/depreciation on security transactions on the Statements of Operations. When assets subject to capital gains tax are sold, accrued taxes are relieved, and the actual amount of the taxes paid is reflected on the Statements of Operations as a reduction in net realized gain (loss) on security transactions.
Management has analyzed the Funds’ tax positions taken on federal tax returns for all open tax years and has concluded that as of December 31, 2020, no provision for income tax is required in the Funds’ financial statements. The Funds’ federal and state income and federal excise tax returns for the 2017, 2018, 2019 and 2020 tax years for which the applicable statutes of limitations have not expired remain subject to examination by the Internal Revenue Service and state departments of revenue. Net investment income and net realized gain (loss) for the Funds may differ for financial statement and tax purposes. The character of distributions made during the year from net investment income or net realized gains, if any, may differ from their ultimate characterization for federal income tax purposes. Also, due to the timing of dividend distributions, the fiscal year in which amounts are distributed may differ from the year that the income or realized gain was recorded by the Funds. The Trust has analyzed the Funds’ tax positions and has concluded that no liability for unrecognized tax benefits should be recorded related to uncertain tax positions. Further, the Trust is not aware of any tax positions for which it is reasonably possible that
CLEARWATER INVESTMENT TRUST
Notes to Financial Statements (unaudited)
June 30, 2021
the total amounts of unrecognized tax benefits will significantly change in the next twelve months. The tax character of distributions by the Funds during the years ended December 31, 2020 and 2019 was as follows:
| | | | |
| | Tax-Exempt | | Ordinary Income* |
| | 2020 | | 2019 | | 2020 | | 2019 |
| Core Equity Fund | $ — | | $ — | | $ 7,801,407 | | $ 7,398,837 |
| Select Equity Fund | — | | — | | 2,530,143 | | 2,265,820 |
| Tax-Exempt Bond Fund | 24,459,185 | | 23,538,099 | | 131,738 | | 426,352 |
| International Fund | — | | — | | 8,365,704 | | 12,139,749 |
| | | | | | | | |
| | |
| | Long-Term Capital Gains** |
| | 2020 | | 2019 |
| Core Equity Fund | $ 2,728,041 | | $ 2,349,736 |
| Select Equity Fund | 6,877,368 | | 5,292,066 |
| Tax-Exempt Bond Fund | — | | — |
| International Fund | 8,082,763 | | 8,846,708 |
| | | | |
| * | In addition to the ordinary income distributions, during 2020 the following Funds utilized equalization accounting for tax purposes whereby a portion of redemption payments were treated as distributions of ordinary income in the following amounts: |
| | |
| Core Equity Fund | $ 57,748 |
| Select Equity Fund | $ 90,250 |
| International Fund | $ 52,163 |
| | |
| | |
| ** | In addition to the long-term capital gain distributions, during 2020 the following Funds utilized equalization accounting for tax purposes whereby a portion of redemption payments were treated as distributions of long-term capital gains in the following amounts: |
CLEARWATER INVESTMENT TRUST
Notes to Financial Statements (unaudited)
June 30, 2021
| | |
| Select Equity Fund | $ 6,194 |
| International Fund | $ 114,539 |
| | |
| | |
As of December 31, 2020, the components of distributable earnings on a tax basis were as follows:
| | Core
Equity Fund | | Select Equity Fund | | Tax-Exempt
Bond Fund | | International
Fund |
| Undistributed ordinary income | $ 32,283 | | $ 4,795,617 | | $ — | | $ 3,645,841 |
| Undistributed tax-exempt income | — | | — | | 262,478 | | — |
| Undistributed capital gain | — | | 329,131 | | — | | 8,005,605 |
| Accumulated capital losses and other | (14,476,359) | | — | | (3,697,492) | | — |
| Unrealized appreciation/depreciation | 337,814,213 | | 89,209,296 | | 29,795,465 | | 323,769,552 |
| Total | $ 323,370,137 | | $ 94,334,044 | | $ 26,360,451 | | $ 335,420,998 |
Distributions to shareholders are determined in accordance with federal income tax regulations, which may differ from such amounts recorded in accordance with U.S. generally accepted accounting principles ("U.S. GAAP") for financial reporting purposes. Accordingly, the Funds may make reclassifications among certain of their capital accounts in order to reflect the tax treatment for certain permanent differences that exist between federal income tax regulations and U.S. GAAP. These reclassifications are reported in order to reflect the tax treatment for certain permanent differences that exist between income tax regulations and U.S. GAAP. The primary reasons for permanent differences are the Funds use of equalization accounting whereby a portion of redemption payments were treated as distributions and realized gains on in-kind redemptions that are not recognized for tax purposes. These reclassifications have no impact on the total net assets or the NAV per share of the Funds. At December 31, 2020, reclassifications have been recorded among the following capital accounts on the Statements of Assets and Liabilities:
| | Core
Equity Fund | | Select Equity Fund | | Tax-Exempt
Bond Fund | | International
Fund |
| Distributable earnings | $ (27,521,488) | | $ (2,857,696) | | $ 56,579 | | $ (166,702) |
| Additional paid-in capital | 27,521,488 | | 2,857,696 | | (56,579) | | 166,702 |
(j) Distributions to Shareholders
Distributions to shareholders from net investment income, if any, are declared annually for the Core Equity, Select Equity, and International Funds and declared daily, payable monthly, for the Tax-Exempt Bond Fund. Distributions to shareholders from net realized gains, if any, are declared annually for all Funds. Distributions are paid in cash or reinvested in additional shares at the direction of the shareholders. During the year ended December 31, 2020, the Core Equity, Select Equity and International Funds utilized equalization accounting with respect to distributions to shareholders, in order to keep remaining shareholders’ interest in undistributed income from being affected.
CLEARWATER INVESTMENT TRUST
Notes to Financial Statements (unaudited)
June 30, 2021
(k) Use of Estimates
The preparation of financial statements in conformity with U.S. GAAP requires management to make estimates and assumptions that affect the reported amounts of assets and liabilities and disclosure of contingent assets and liabilities at the date of the financial statements and the reported amounts of increase and decrease in net assets from operations during the period. Actual results could differ from those estimates.
(l) Indemnification
Under each Fund’s organizational documents, its officers and directors are indemnified against certain liabilities arising out of the performance of their duties to each Fund. In addition, certain of each Fund’s contracts with its service providers contain general indemnification clauses. Each Fund’s maximum exposure under these arrangements is unknown since the amount of any future claims that may be made against each Fund cannot be determined and each Fund has no historical basis for predicting the likelihood of any such claims. The Funds believe that the likelihood of any such claims is remote.
(3) Fair Value Measurements
Fair value is an estimate of the price the Funds would receive upon selling a security in a timely transaction to an independent buyer in the principal or most advantageous market for the security. This guidance establishes a three-tier hierarchy to maximize the use of observable market data and minimize the use of unobservable inputs and to establish classification of fair value measurements for disclosure purposes. Various inputs are used in determining the value of the Funds’ investments, as described in Note 2(a). These inputs are summarized in the three broad levels listed below.
| • | Level 1 – Unadjusted quoted market prices in active markets for identical securities on the measurement date. |
| • | Level 2 – Other significant observable inputs including quoted prices for similar investments, interest rates, prepayment speeds, credit risk, etc. or quoted prices for identical or similar assets in markets that are not active. Inputs that are derived principally from or corroborated by observable market data are also considered Level 2 measurement. An adjustment to any observable input that is significant to the fair value may render the measurement a Level 3 measurement. |
| • | Level 3 – Valuations based on unobservable inputs, which may include the Adviser’s own assumptions in determining the fair value of an investment. |
The inputs or methodology used for valuing securities are not necessarily an indication of the risk associated with investing in those securities and other financial instruments, if any. The following is a summary of the inputs used in valuing each Fund’s investments and other financial instruments, if any, which are carried at fair value, as of June 30, 2021.
| | Core Equity Fund (a) |
| | Level 1 | Level 2 | Level 3 | Total |
| Common Stocks | $ 786,637,678 | $ — | $ — | $ 786,637,678 |
| Preferred Stocks | 38,428 | — | — | 38,428 |
| Short-Term Investments | 3,153,852 | — | — | 3,153,852 |
CLEARWATER INVESTMENT TRUST
Notes to Financial Statements (unaudited)
June 30, 2021
| | Core Equity Fund (a) |
| | Level 1 | Level 2 | Level 3 | Total |
| Total | $ 789,829,958 | $ — | $ — | $ 789,829,958 |
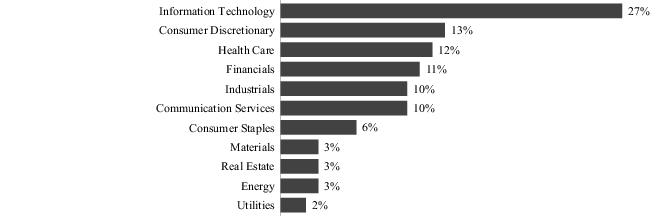
(a) For the Core Equity Fund, the investment value is comprised of equity securities and short-term investments. See the Fund’s Schedule of Investments for industry classification. Investments in equity and short-term securities generally are valued at the last sales price or the regular trading session closing price on the principal exchange or market where they are traded. Investments in rights generally are determined by taking into account the terms of the rights as well as the value of the underlying equity securities, which are determined by the valuation methodology described above.
| | Select Equity Fund (b) |
| | Level 1 | Level 2 | Level 3 | Total |
| Common Stocks | $ 538,830,386 | $ — | $ — | $ 538,830,386 |
| Convertible Preferred Stocks | 365,824 | — | — | 365,824 |
| Master Limited Partnerships | 306,313 | — | — | 306,313 |
| Rights | — | — | —* | —* |
| Warrants | — | — | —* | —* |
| Short-Term Investments | 9,774,116 | — | — | 9,774,116 |
| Total | $ 549,276,639 | $ — | $ —* | $ 549,276,639 |
| * Security has been deemed worthless and is a Level 3 investment. |
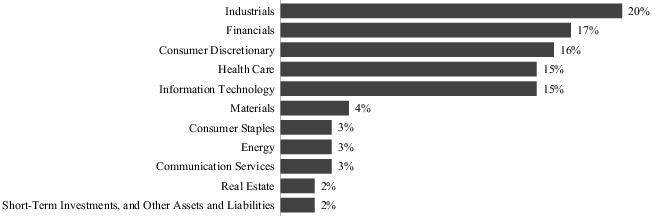
(b) For the Select Equity Fund, the investment value is comprised of equity securities, convertible bonds, master limited partnerships, rights, warrants and short-term investments. See the Fund’s Schedule of Investments for industry classification. Investments in equity and short-term securities generally are valued at the last sales price or the regular trading session closing price on the principal exchange or market where they are traded.
There were no significant Level 3 valuations at June 30, 2021.
| | Tax-Exempt Bond Fund (c) |
| | Level 1 | Level 2 | Level 3 | Total |
| Closed-End Funds | $ 42,064,834 | $ — | $ — | $ 42,064,834 |
| Municipal Bonds | | | | |
| Alabama | — | 1,563,017 | — | 1,563,017 |
| Alaska | — | 14,438 | — | 14,438 |
| Arizona | — | 17,470,521 | — | 17,470,521 |
| Arkansas | — | 1,584,119 | — | 1,584,119 |
| California | — | 46,685,397 | — | 46,685,397 |
| Colorado | — | 37,422,960 | — | 37,422,960 |
| Connecticut | — | 9,353,011 | — | 9,353,011 |
CLEARWATER INVESTMENT TRUST
Notes to Financial Statements (unaudited)
June 30, 2021
| | Tax-Exempt Bond Fund (c) |
| | Level 1 | Level 2 | Level 3 | Total |
| District of Columbia | $ — | $ 5,724,308 | $ — | $ 5,724,308 |
| Florida | — | 84,941,433 | — | 84,941,433 |
| Georgia | — | 17,651,993 | — | 17,651,993 |
| Idaho | — | 2,011,314 | — | 2,011,314 |
| Illinois | — | 33,219,461 | — | 33,219,461 |
| Indiana | — | 10,410,910 | — | 10,410,910 |
| Iowa | — | 2,289,549 | — | 2,289,549 |
| Kansas | — | 2,128,547 | — | 2,128,547 |
| Kentucky | — | 461,993 | — | 461,993 |
| Louisiana | — | 11,512,722 | — | 11,512,722 |
| Maine | — | 2,742,223 | — | 2,742,223 |
| Maryland | — | 5,275,379 | — | 5,275,379 |
| Massachusetts | — | 20,478,328 | — | 20,478,328 |
| Michigan | — | 20,027,023 | — | 20,027,023 |
| Minnesota | — | 4,309,236 | — | 4,309,236 |
| Mississippi | — | 1,130,780 | — | 1,130,780 |
| Missouri | — | 7,481,621 | — | 7,481,621 |
| Montana | — | 3,653,255 | — | 3,653,255 |
| Nebraska | — | 620,767 | — | 620,767 |
| Nevada | — | 4,028,244 | — | 4,028,244 |
| New Hampshire | — | 4,208,800 | — | 4,208,800 |
| New Jersey | — | 13,593,264 | — | 13,593,264 |
| New Mexico | — | 7,575,461 | — | 7,575,461 |
| New York | — | 44,269,278 | — | 44,269,278 |
| North Carolina | — | 5,872,507 | — | 5,872,507 |
| North Dakota | — | 4,159,470 | — | 4,159,470 |
| Ohio | — | 14,732,651 | — | 14,732,651 |
| Oklahoma | — | 3,341,493 | — | 3,341,493 |
| Oregon | — | 12,587,323 | — | 12,587,323 |
| Pennsylvania | — | 16,743,428 | — | 16,743,428 |
| Puerto Rico | — | 1,548,287 | — | 1,548,287 |
| Rhode Island | — | 2,076,955 | — | 2,076,955 |
| South Carolina | — | 8,071,644 | — | 8,071,644 |
| South Dakota | — | 501,615 | — | 501,615 |
| Tennessee | — | 10,022,761 | — | 10,022,761 |
| Texas | — | 43,748,536 | — | 43,748,536 |
| Utah | — | 1,842,171 | — | 1,842,171 |
| Vermont | — | 946,948 | — | 946,948 |
| Virginia | — | 2,754,617 | — | 2,754,617 |
| Washington | — | 18,488,271 | — | 18,488,271 |
| West Virginia | — | 3,609,601 | — | 3,609,601 |
CLEARWATER INVESTMENT TRUST
Notes to Financial Statements (unaudited)
June 30, 2021
| | Tax-Exempt Bond Fund (c) |
| | Level 1 | Level 2 | Level 3 | Total |
| Wisconsin | $ — | $ 23,273,727 | $ — | $ 23,273,727 |
| Wyoming | — | 2,002,496 | — | 2,002,496 |
| Short-Term Investments | 46,973,179 | — | — | 46,973,179 |
| Total | $ 89,038,013 | $ 600,163,853 | $ — | $ 689,201,866 |
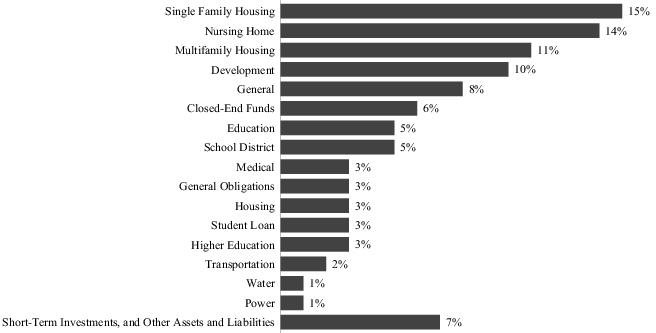
(c) For the Tax-Exempt Bond Fund, the investment value is comprised of closed-end funds, municipal bonds, and short-term investments. Investments in closed-end funds and short-term securities generally are valued at the last sales price or the regular trading session closing price on the principal exchange or market where they are traded. Investments in municipal bonds generally are based on valuations using adjusted evaluated prices provided by the primary pricing provider. The Board of Trustees has delegated to the Valuation Committee the responsibility to determine in good faith the fair value of securities for which no price quotation is available from an approved pricing service or broker-dealer at the time the Tax-Exempt Bond Fund’s NAV is calculated, including securities for which the prices do not represent fair value or for which a significant event occurs that materially affects the value of the security after the close of the market on which the security principally trades and before the time the Tax-Exempt Bond Fund’s NAV is calculated.
| | International Fund (d) |
| | Level 1 | Level 2 | Level 3 | Total |
| Common Stocks | | | | |
| Australia | $ 40,127,748 | $ — | $ —* | $ 40,127,748 |
| France | 69,848,817 | — | 667,227 | 70,516,044 |
| Thailand | — | 493,831 | — | 493,831 |
| All other countries | 888,720,723 | — | — | 888,720,723 |
| Convertible Bonds | — | 86,413 | — | 86,413 |
| Preferred Stocks | 9,476,833 | — | — | 9,476,833 |
| Warrants | 2,221,501 | — | — | 2,221,501 |
| Short-Term Investments | 37,836,253 | — | — | 37,836,253 |
| Total | $1,048,231,875 | $ 580,244 | $ 667,227 | $1,049,479,346 |
| * Security has been deemed worthless and is a Level 3 investment. |
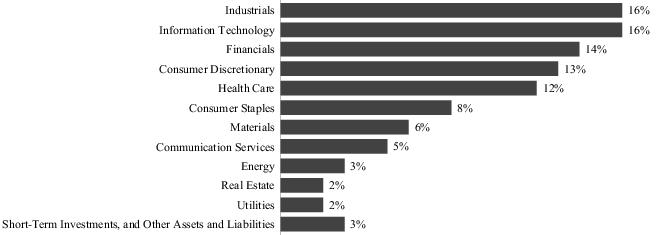
(d) For the International Fund, the investment value is comprised of equity securities, warrants, convertible bonds and short-term investments. See the Fund’s Schedule of Investments for additional information on industry sector and currency concentration information. Investments in equity and short-term securities generally are valued at the last sales price or the regular trading session closing price on the principal exchange or market where they are traded.
CLEARWATER INVESTMENT TRUST
Notes to Financial Statements (unaudited)
June 30, 2021
There were no significant Level 3 valuations for which significant unobservable inputs were used at June 30, 2021.
International Fund
Other Financial Instruments | | Level 1 | Level 2 | Level 3 | Total |
| Assets | | | | | |
| Forward foreign currency exchange contracts | | $ — | $ 48,688 | $ — | $ 48,688 |
The forward foreign currency exchange contracts outstanding at June 30, 2021 are considered Level 2 investments due to the contracts being marked-to-market daily at the applicable exchange rates that have been adjusted from the initial quoted rate. Forward foreign currency exchange contracts are shown on a gross basis in the above table and on the Statements of Assets and Liabilities.
(4) Investment Security Transactions
The cost of purchases and proceeds from sales of securities (excluding short-term securities) for the period ended June 30, 2021, were as follows:
| | Purchases | | Sales |
| Core Equity Fund | $ 162,404,765 | | $ 86,713,270 |
| Select Equity Fund | 290,411,341 | | 265,397,912 |
| Tax-Exempt Bond Fund | 76,350,132 | | 35,333,345 |
| International Fund | 253,714,798 | | 174,053,172 |
| | | | |
| | | | |
The difference between book basis and tax basis net unrealized appreciation (depreciation) is attributable primarily to the tax deferral of losses on wash sales, deferral of post-October currency and capital losses for tax purposes, and the recharacterization of income recognition on investments in passive foreign investment companies.
CLEARWATER INVESTMENT TRUST
Notes to Financial Statements (unaudited)
June 30, 2021
At June 30, 2021, for federal income tax purposes, gross unrealized appreciation, gross unrealized depreciation, net unrealized appreciation (depreciation) on investments (including the effects of foreign currency translation and derivative instruments, if any) and the cost basis of investments (including derivative instruments, if any) were as follows:
| Funds | | Unrealized
Appreciation | | Unrealized
Depreciation | | Net
Appreciation
(Depreciation) | | Cost Basis of
Investments |
| Core Equity Fund | | $ 410,563,958 | | $ (942,833) | | $ 409,621,125 | | $ 380,208,833 |
| Select Equity Fund | | 96,428,211 | | (6,600,719) | | 89,827,492 | | 459,449,147 |
| Tax-Exempt Bond Fund | | 46,056,717 | | (11,098,817) | | 34,957,900 | | 654,243,966 |
| International Fund | | 382,761,250 | | (12,832,862) | | 369,928,388 | | 679,599,646 |
| | | | | | | | | |
| | | | | | | | | |
(5) Capital Share Transactions
Transactions in capital shares for the six months ended June 30, 2021 and the fiscal year ended December 31, 2020 were as follows:
| | Core Equity Fund | | Select Equity Fund |
| | 2021 | | 2020 | | 2021 | | 2020 |
| Sold | 1,317,923 | | 1,356,005 | | 3,097,131 | | 3,565,994 |
| Issued for reinvestment of distributions | — | | 196,822 | | — | | 482,393 |
| Redeemed | (193,647) | | (1,641,622) | | (2,279,227) | | (1,589,669) |
| Net Increase (decrease) | 1,124,276 | | (88,795) | | 817,904 | | 2,458,718 |
| | Tax-Exempt Bond Fund | | International Fund |
| | 2021 | | 2020 | | 2021 | | 2020 |
| Sold | 7,906,514 | | 4,046,480 | | 3,933,515 | | 2,607,637 |
| Issued for reinvestment of distributions | 1,123,253 | | 2,463,261 | | — | | 848,734 |
| Redeemed | (2,598,900) | | (5,188,108) | | (722,882) | | (1,622,611) |
| Net Increase (decrease) | 6,430,867 | | 1,321,633 | | 3,210,633 | | 1,833,760 |
CLEARWATER INVESTMENT TRUST
Notes to Financial Statements (unaudited)
June 30, 2021
(6) Capital Loss Carryforward
At December 31, 2020, the Funds had the following short term capital loss carry-forwards and long term capital loss carry forwards available to offset future net capital gains which do not expire. Future utilization of the capital loss carry-forward may be limited.
| | Short-Term | Long-Term | Late-year
Gain/Loss | Total |
| Core Equity Fund | $ 14,476,359 | $ — | $ — | $ 14,476,359 |
| Tax-Exempt Bond Fund | 2,245,374 | 1,334,632 | — | 3,580,006 |
(7) Expenses and Related-Party Transactions
The Trust has a contract for investment advisory services with the Adviser. Under terms of separate agreements, Core Equity Fund, Select Equity Fund, Tax-Exempt Bond Fund and International Fund each pay an investment advisory fee equal to an annual rate of 0.90%, 1.35%, 0.60% and 1.00%, respectively, of each Fund’s average daily net assets. Management fees are calculated and accrued daily, and are paid quarterly. The Adviser is responsible for the payment or reimbursement of all the Funds’ expenses, except brokerage, taxes, interest, and extraordinary expenses. The Adviser has periodically modified its management fee for each of the Funds through voluntary waivers. For the period ending June 30, 2021, voluntary waivers on management fees were as follows:
| | Management Fees Voluntary Waivers |
| | Voluntary Waivers %
Prior to
April 1, 2021 | | Voluntary Waivers %
Effective
April 1, 2021 |
| Core Equity Fund | (0.59) | | (0.60) |
| Select Equity Fund | (0.44) | | (0.48) |
| Tax-Exempt Bond Fund | (0.31) | | (0.31) |
| International Fund | (0.32) | | (0.33) |
The Adviser has periodically modified its management fee for each of the Funds through voluntary waivers. Effective January 1, 2020, the net management fee actually paid for the Tax-Exempt Bond Fund due to the Adviser’s modification of the voluntary waivers for the Fund was 0.29%. Effective April 1, 2021, the net management fees actually paid for the Core Equity Fund, Select Equity Fund and International Fund due to the Adviser’s modification of the voluntary waivers for those Funds were 0.30%, 0.87% and 0.67%, respectively.
The Adviser currently intends to continue these voluntary waivers indefinitely. However, the Adviser may terminate these voluntary arrangements at any time.
In addition to fees and expenses which the Funds bear directly, the Funds indirectly bear a pro rata share of the fees and expenses of any acquired funds in which they invest, such as short-term investments in mutual funds or other investment companies and investments in closed-end funds. Such indirect expenses are not included in any of the reported expense ratios and are excluded from the voluntary waivers described above.
CLEARWATER INVESTMENT TRUST
Notes to Financial Statements (unaudited)
June 30, 2021
The Adviser has entered into subadvisory contracts with independent investment advisory firms for each Fund to provide daily investment management services. The subadvisory fees are based on each subadviser’s proportional net assets it currently manages within each Fund and are paid directly by the Adviser.
The Adviser has also engaged FCI as a subadviser for each Fund. FCI regularly provides the Funds with various investment-related services, including investment strategy advice, manager recommendations and related duties as requested by the Adviser. FCI also provides certain services related to due diligence, performance reporting, compliance, and other administrative functions, which support the investment management services and subadviser oversight services provided to the Trust by the Adviser. For its services, FCI is compensated with a subadvisory fee payable by the Adviser of 0.20% of each Fund’s average daily net assets, paid on a quarterly basis. FCI is compensated out of the investment advisory fees the Adviser receives from the respective Funds. FCI has agreed to waive the difference between the amount calculated under the subadvisory fee schedule and an amount determined by multiplying the total number of hours worked by FCI in providing services under the subadvisory agreement by an hourly rate that is approved by the Adviser.
(8) Derivative Instruments
Information concerning the types of derivatives in which the International Fund invests, the objectives for using them and their related risks can be found in Note 2(c). Below are the types of derivatives held in the International Fund by location as presented in the Statements of Assets and Liabilities as of June 30, 2021, with additional detail on the net amounts impacting the Statements of Assets and Liabilities. The forward foreign currency exchange contracts presented below are not subject to master netting agreements or other similar agreements.
| ASSETS | LIABILITIES |
| Name of Fund | Derivative Type | Statements of Assets and
Liabilities Location | Value | | Statements of Assets and
Liabilities Location | Value | Counterparty |
| International Fund | Forward foreign
currency exchange
contracts | Unrealized appreciation
on forward foreign
currency exchange
contracts | $ 48,688 | | Unrealized depreciation
on forward foreign
currency exchange
contracts | $ — | Northern Trust |
The following table sets forth, by primary risk exposure, the International Fund’s net realized gain (loss) and net increase (decrease) in appreciation/depreciation on forward foreign currency exchange contracts for the six months ended June 30, 2021:
| Name of Fund | Derivative Type | Statements of
Operations Location | Value | | Name of Fund | Derivative Type | Statements of
Operations Location | Value |
| International Fund | Forward foreign
currency exchange
contracts | Net realized gain
(loss) on forward
foreign currency
exchange contracts | $ (185,815) | | International Fund | Forward foreign
currency exchange
contracts | Net increase
(decrease) in
unrealized
appreciation/depreciation
on forward foreign
currency exchange
contracts | $ 245,836 |
| | | | | | | | | |
Derivative transactions are measured in terms of the notional amount. The following table presents, for the International Fund, the number of transactions and weighted average notional amount of forward foreign currency exchange contracts, which is indicative of the volume of derivative activity, for the six months ended June 30, 2021.
CLEARWATER INVESTMENT TRUST
Notes to Financial Statements (unaudited)
June 30, 2021
| International Fund |
Forward Foreign Currency Exchange
Contracts |
Number of
Transactions | Weighted
Average Notional
Amount |
| 23 | $ 6,170,358 |
(9) Short-term Financing
ReFlow Fund, LLC ("ReFlow") provides each Fund with a potential source of cash to meet net shareholder redemptions through share purchases for a fee. The Fund then generally redeems those shares when it experiences net sales. The shares may be redeemed in-kind in accordance with the Fund’s redemption in-kind policies. The Fund is generally required to redeem the shares purchased by ReFlow within 30 days (15 days if redeemed in-kind). As such, the proceeds received from ReFlow’s purchase of fund shares is treated as a liability on the Statement of Assets and Liabilities. The fee paid on outstanding shares owned by ReFlow is based on an auction starting at a minimum bid of 0.20% and is paid by the Adviser under the unified advisory fee agreement. For the six months ended June 30, 2021, the Core Equity Fund had total redemptions in kind of $4,302,740, resulting in realized gains of $3,363,467. For the six months ended June 30, 2021, the Select Equity Fund had total redemptions in kind of $23,982,109, resulting in realized gains of $10,663,592. For the six months ended June 30, 2021, the International Fund had total redemptions in kind of $88,921, resulting in realized gains of $88,280. These realized gains are not recognized for tax purposes as discussed in Note 2. As of June 30, 2021, the Funds' ReFlow accounts had zero balances. During the six months ended June 30, 2021, the Funds had the following activity:
| | Average Amount
Oustanding for
Days in Use | | Days Used |
| Core Equity Fund | $ 3,934 | | 48 |
| Select Equity Fund | 24,079 | | 94 |
| International Fund | 2,140 | | 14 |
| | | | |
| | | | |
(10) Portfolio Securities Loaned
The Select Equity Fund and the International Fund participate in a securities lending program and have loaned portions of their investment portfolios during the six months ended June 30, 2021. Under the program, the Funds loan securities to borrowers who post collateral for those loaned securities. The Securities Finance Trust Company serves as the Funds’ securities lending agent (the lending agent) who operates and maintains the securities lending program. The loans are governed by a securities lending agreement between the lending agent, acting on behalf of the Funds, and each borrowing counterparty. The fair value of securities on loan as of June 30, 2021 is recognized within investments in securities, at fair value, on the Statements of Assets and Liabilities.
CLEARWATER INVESTMENT TRUST
Notes to Financial Statements (unaudited)
June 30, 2021
Each borrower receives a negotiated interest rate, which is generally referred to as the rebate rate, on the cash that it delivers to the Funds as collateral for the securities loaned and agrees to pay a negotiated rate with respect to the loaned securities. The amount of these rates for each securities lending transaction may differ depending on several factors, including the demand for the security, tax considerations and the credit quality of the borrower. A net payment is generally made by the borrower with respect to these rates upon termination of the loan (the Net Rate). The value of the securities loan will be marked-to-market daily, and the borrower will be required to provide additional collateral if the posted amount falls below certain negotiated levels, and the lending agent (on behalf of the Funds) will be required to return collateral to the borrower if the amount of collateral posted is greater than such negotiated levels.
During the reporting period, the cash collateral received from borrowers related to the Funds’ securities lending activities was invested in the Institutional Shares of Fidelity Investments Money Market Government Portfolio and the daily residual was swept into the Northern Institutional Fund-U.S Government Select Portfolio. The short-term investments purchased with the cash collateral in the amount of $6,400,482 is included in Investments in Securities on the Statement of Assets and Liabilities of the International Fund.
The Funds provide compensation to the lending agent in connection with operating and maintaining the securities lending program. The lending agent is compensated in an amount of 15% of gross revenues for the 12 month period commencing as of implementation date. The fee will then be increased to 20% for the first $1 million of gross revenues and 15% of any gross revenues in excess of $ 1 million. The revenues derived from the securities lending activities of the Funds depend on many factors, including the value of the securities available to be loaned, the demand for the securities available to be loaned, the actual percentage of the Fund’s securities that are on loan (the utilization rate), the amount earned from the investment of any collateral and the amount of the fees or profit retained by the lending agent. All compensation, costs and expenses associated with the securities lending program are considered transaction charges that are borne by the Funds and are not an obligation of the Manager under the securities lending agency agreement. These transaction charges are netted with the income from securities lending and included in net income from securities loaned on the accompanying Statement of Operations.
The Funds’ securities lending program involves certain risks, including counterparty or borrower risk, collateral investment risk, replacement risk, operational, legal, tax and accounting risks. In the event the borrower does not meet its contractual obligation to return the securities, the Funds may be exposed to the risk of loss of reacquiring the loaned securities at prevailing market prices using the proceeds of the sale of the collateral.
The following is information on the securities lending activities by the lending agent as of June 30, 2021:
| | Gross Amounts of
Securities Loaned in
Statement of Assets
and
Liabilities | % of Net Assets | Cash Collateral
Received |
| International Fund | $ 6,093,749 | 0.58 % | $ 6,400,482 |
At June 30, 2021, there were no offsetting of securities and they are presented on a gross basis.
CLEARWATER INVESTMENT TRUST
Notes to Financial Statements (unaudited)
June 30, 2021
(11) Recent Market Events
U.S. and international markets have experienced significant periods of volatility in recent months and years due to a number of economic, political and global macro factors including the impact of the coronavirus as a global pandemic and related public health issues, growth concerns in the U.S. and overseas, uncertainties regarding interest rates, trade tensions and the threat of tariffs imposed by the U.S. and other countries. In particular, the spread of the novel coronavirus worldwide has resulted in disruptions to supply chains and customer activity, stress on the global healthcare system, rising unemployment claims, quarantines, cancellations, market declines, the closing of borders, restrictions on travel and widespread concern and uncertainty. Health crises and related political, social and economic disruptions caused by the spread of the recent coronavirus outbreak may also exacerbate other pre-existing political, social and economic risks in certain countries. It is not possible to know the extent of these impacts, and they may be short term or may last for an extended period of time. These developments as well as other events could result in further market volatility and negatively affect financial asset prices, the liquidity of certain securities and the normal operations of securities exchanges and other markets, despite government efforts to address market disruptions. In addition, the Funds may face challenges with respect to their day-to-day operations if key personnel of the Funds’ investment adviser or other service providers are unavailable due to quarantines and restrictions on travel related to the coronavirus outbreak. As a result, the risk environment remains elevated. The Adviser will monitor developments and seek to manage each Fund in a manner consistent with achieving the Fund’s investment objective, but there can be no assurance that it will be successful in doing so.
(12) Subsequent Events
Management has evaluated subsequent events for the Funds through the date the financial statements were issued and has concluded that there are no additional events that require financial statement disclosure and/or adjustments to the financial statements.
Review of Liquidity Risk Management Program
The Trust has adopted and implemented a liquidity risk management program (the “Program”) in accordance with Rule 22e-4 under the 1940 Act that applies to each series of the Trust (each series, a “Fund”). The Program seeks to assess and manage each Fund’s liquidity risk, i.e., the risk that a Fund is unable to satisfy redemption requests without significantly diluting remaining investors’ interests in the Fund. The Board has designated the Trust’s Valuation and Liquidity Committee to administer the Program (the “Program Administrator”). Certain aspects of the Program may rely on third parties to perform certain functions.
The Program is comprised of various components designed to support the assessment and/or management of liquidity risk, including: (1) the periodic assessment (no less frequently than annually) of certain factors that influence a Fund’s liquidity risk; (2) the periodic classification (no less frequently than monthly) of a Fund’s investments into one of four liquidity categories that reflect an estimate of their liquidity under current market conditions; (3) a 15% limit on the acquisition of “illiquid investments” (as defined under Rule 22e-4); (4) for a Fund that does not invest primarily in “highly liquid investments” (as defined under Rule 22e-4), the determination of a minimum percentage of the Fund’s assets that will generally be invested in highly liquid investments; and (5) periodic reporting to the Board.
At a meeting of the Board on March 5, 2021, the Program Administrator provided a written report to the Board (the “Annual Report”) addressing the operation, and the adequacy and effectiveness of the implementation, of the Program, for the period from January 1, 2020 through December 31, 2020. Among other things, the Annual Report and related materials discussed: (i) the results of the liquidity risk assessment undertaken by the Program Administrator; (ii) the liquidity classification process and the roles of various parties in classifying a Fund’s investments into liquidity categories; and (iii) the impact of the COVID-19 pandemic on the Funds' liquidity during the reporting period. The Annual Report indicated that the Program Administrator considers the Program to be operating effectively to assess and manage each Fund’s liquidity risk, and further believes that the Program has been and continues to be adequately and effectively implemented to monitor and (as applicable) respond to the Funds’ liquidity developments.
There can be no assurance that the Program will achieve its objectives under all circumstances in the future. Please refer to the prospectus for more information regarding a Fund’s exposure to liquidity risk and other risks to which it may be subject.
CLEARWATER INVESTMENT TRUST
Schedule of Investments - Clearwater Core Equity Fund
June 30, 2021 (unaudited)
| Shares | | Security | | Cost | | Fair value (a) | | Percent of
net assets |
| Common Stocks: | | | | | | |
| Communication Services: | | | | | | |
| 27,624 | | ACTIVISION BLIZZARD, INC. | | $ 1,475,764 | | 2,636,435 | | |
| 5,502 | | ALPHABET, INC., CLASS A(b) | | 3,508,002 | | 13,434,729 | | |
| 4,079 | | ALPHABET, INC., CLASS C(b) | | 1,734,443 | | 10,223,279 | | |
| 2,000 | | ALTICE U.S.A., INC., CLASS A(b) | | 43,775 | | 68,280 | | |
| 130,132 | | AT&T, INC. | | 3,321,394 | | 3,745,199 | | |
| 400 | | CABLE ONE, INC. | | 294,734 | | 765,124 | | |
| 1,790 | | CHARTER COMMUNICATIONS, INC., CLASS A(b) | | 1,105,807 | | 1,291,395 | | |
| 3,718 | | CINEMARK HOLDINGS, INC.(b) | | 43,220 | | 81,610 | | |
| 57,895 | | COMCAST CORP., CLASS A | | 638,613 | | 3,301,173 | | |
| 32,752 | | DISCOVERY, INC., CLASS A(b) | | 711,145 | | 1,004,831 | | |
| 5,100 | | DISH NETWORK CORP., CLASS A(b) | | 163,688 | | 213,180 | | |
| 19,277 | | ELECTRONIC ARTS, INC. | | 1,290,070 | | 2,772,611 | | |
| 34,767 | | FACEBOOK, INC., CLASS A(b) | | 2,956,547 | | 12,088,834 | | |
| 2,300 | | FOX CORP., CLASS A | | 84,173 | | 85,399 | | |
| 700 | | IAC/INTERACTIVECORP(b) | | 106,729 | | 107,919 | | |
| 8,174 | | INTERPUBLIC GROUP OF (THE) COS., INC. | | 204,631 | | 265,573 | | |
| 1,888 | | LIBERTY BROADBAND CORP., CLASS C(b) | | 230,152 | | 327,870 | | |
| 3,857 | | LIBERTY GLOBAL PLC, CLASS A(b)(c) | | 29,803 | | 104,756 | | |
| 3,674 | | LIBERTY GLOBAL PLC, CLASS C(b)(c) | | 29,018 | | 99,345 | | |
| 2,000 | | LIBERTY MEDIA CORP.-LIBERTY FORMULA ONE, CLASS C(b) | | 54,522 | | 96,420 | | |
| 2,000 | | LIBERTY MEDIA CORP.-LIBERTY SIRIUSXM, CLASS C(b) | | 88,275 | | 92,780 | | |
| 1,000 | | LIVE NATION ENTERTAINMENT, INC.(b) | | 87,470 | | 87,590 | | |
| 127,771 | | LUMEN TECHNOLOGIES, INC. | | 1,322,502 | | 1,736,408 | | |
| 500 | | MADISON SQUARE GARDEN SPORTS CORP.(b) | | 88,199 | | 86,285 | | |
| 4,046 | | MATCH GROUP, INC.(b) | | 234,961 | | 652,417 | | |
| 4,111 | | NETFLIX, INC.(b) | | 1,369,837 | | 2,171,471 | | |
| 21,583 | | NEWS CORP., CLASS A | | 526,161 | | 556,194 | | |
| 700 | | NEXSTAR MEDIA GROUP, INC., CLASS A | | 44,492 | | 103,516 | | |
| 8,206 | | OMNICOM GROUP, INC. | | 557,793 | | 656,398 | | |
| 5,603 | | PINTEREST, INC., CLASS A(b) | | 402,690 | | 442,357 | | |
| 1,157 | | ROKU, INC.(b) | | 351,862 | | 531,352 | | |
| 4,600 | | SKILLZ, INC.(b) | | 88,394 | | 99,912 | | |
| 1,500 | | SPOTIFY TECHNOLOGY S.A.(b)(c) | | 234,360 | | 413,385 | | |
| 10,237 | | T-MOBILE U.S., INC.(b) | | 444,022 | | 1,482,625 | | |
| 3,305 | | TRIPADVISOR, INC.(b) | | 56,130 | | 133,192 | | |
| 9,852 | | TWITTER, INC.(b) | | 231,498 | | 677,916 | | |
| 81,405 | | VERIZON COMMUNICATIONS, INC. | | 3,803,132 | | 4,561,122 | | |
| 44,537 | | VIACOMCBS, INC., CLASS B | | 1,841,060 | | 2,013,072 | | |
| 26,606 | | WALT DISNEY (THE) CO.(b) | | 672,652 | | 4,676,537 | | |
| 12,880 | | ZILLOW GROUP, INC., CLASS C(b) | | 1,620,097 | | 1,574,194 | | |
| 6,930 | | ZYNGA, INC., CLASS A(b) | | 68,439 | | 73,666 | | |
| | | | | 32,160,256 | | 75,536,351 | | 9.56% |
| Consumer Discretionary: | | | | | | |
| 2,200 | | 2U, INC.(b) | | 40,782 | | 91,674 | | |
| 1,500 | | ADVANCE AUTO PARTS, INC. | | 53,558 | | 307,710 | | |
| 6,165 | | AMAZON.COM, INC.(b) | | 8,069,976 | | 21,208,586 | | |
| 6,076 | | APTIV PLC(b)(c) | | 834,359 | | 955,937 | | |
| 2,400 | | ARAMARK | | 47,393 | | 89,400 | | |
| 1,100 | | AUTOLIV, INC.(c) | | 13,982 | | 107,536 | | |
| 11,207 | | AUTONATION, INC.(b) | | 295,112 | | 1,062,536 | | |
| 800 | | AUTOZONE, INC.(b) | | 571,776 | | 1,193,776 | | |
| 35,363 | | BEST BUY CO., INC. | | 1,508,927 | | 4,066,038 | | |
| 1,400 | | BIG LOTS, INC. | | 15,477 | | 92,414 | | |
| 642 | | BOOKING HOLDINGS, INC.(b) | | 903,937 | | 1,404,754 | | |
| 11,464 | | BORGWARNER, INC. | | 318,786 | | 556,463 | | |
| 728 | | BURLINGTON STORES, INC.(b) | | 99,207 | | 234,409 | | |
| 1,600 | | CAESARS ENTERTAINMENT, INC.(b) | | 166,125 | | 166,000 | | |
| 3,068 | | CARMAX, INC.(b) | | 33,093 | | 396,232 | | |
| 4,135 | | CARNIVAL CORP.(b) | | 68,324 | | 108,999 | | |
| 1,926 | | CARTER'S, INC. | | 156,040 | | 198,705 | | |
| 2,300 | | CARVANA CO.(b) | | 419,338 | | 694,186 | | |
| 1,200 | | CHEGG, INC.(b) | | 90,419 | | 99,732 | | |
| 200 | | CHIPOTLE MEXICAN GRILL, INC.(b) | | 285,322 | | 310,068 | | |
| 4,600 | | D.R. HORTON, INC. | | 22,057 | | 415,702 | | |
| 2,326 | | DARDEN RESTAURANTS, INC. | | 108,803 | | 339,573 | | |
| See accompanying notes to financial statements. | 31 | (Continued) |
CLEARWATER INVESTMENT TRUST
Schedule of Investments - Clearwater Core Equity Fund
June 30, 2021 (unaudited)
| Shares | | Security | | Cost | | Fair value (a) | | Percent of
net assets |
| Consumer Discretionary (Cont'd): | | | | | | |
| 3,139 | | DICK'S SPORTING GOODS, INC. | | $ 111,723 | | 314,496 | | |
| 4,189 | | DOLLAR GENERAL CORP. | | 412,982 | | 906,458 | | |
| 5,224 | | DOLLAR TREE, INC.(b) | | 52,773 | | 519,788 | | |
| 1,100 | | DOMINO'S PIZZA, INC. | | 154,333 | | 513,139 | | |
| 600 | | DOORDASH, INC., CLASS A(b) | | 103,932 | | 106,998 | | |
| 3,600 | | DRAFTKINGS, INC., CLASS A(b) | | 176,423 | | 187,812 | | |
| 94,998 | | EBAY, INC. | | 3,690,916 | | 6,669,810 | | |
| 1,200 | | ETSY, INC.(b) | | 218,574 | | 247,008 | | |
| 1,096 | | EXPEDIA GROUP, INC.(b) | | 128,851 | | 179,426 | | |
| 500 | | FIVE BELOW, INC.(b) | | 93,725 | | 96,635 | | |
| 959 | | FLOOR & DECOR HOLDINGS, INC., CLASS A(b) | | 27,966 | | 101,366 | | |
| 19,572 | | FOOT LOCKER, INC. | | 464,589 | | 1,206,222 | | |
| 22,863 | | FORD MOTOR CO.(b) | | 83,119 | | 339,744 | | |
| 1,300 | | FRONTDOOR, INC.(b) | | 30,172 | | 64,766 | | |
| 700 | | GAMESTOP CORP., CLASS A(b) | | 140,266 | | 149,898 | | |
| 3,967 | | GAP (THE), INC. | | 30,461 | | 133,490 | | |
| 5,273 | | GARMIN LTD.(c) | | 188,068 | | 762,687 | | |
| 18,885 | | GENERAL MOTORS CO.(b) | | 947,148 | | 1,117,425 | | |
| 15,000 | | GENTEX CORP. | | 106,860 | | 496,350 | | |
| 3,450 | | GENUINE PARTS CO. | | 102,424 | | 436,321 | | |
| 15,839 | | HANESBRANDS, INC. | | 137,760 | | 295,714 | | |
| 1,000 | | HASBRO, INC. | | 68,163 | | 94,520 | | |
| 1,600 | | HILTON WORLDWIDE HOLDINGS, INC.(b) | | 115,613 | | 192,992 | | |
| 16,900 | | HOME DEPOT (THE), INC. | | 2,866,381 | | 5,389,241 | | |
| 30,418 | | INTERNATIONAL GAME TECHNOLOGY PLC(b) | | 167,706 | | 728,815 | | |
| 4,697 | | JUST EAT TAKEAWAY.COM N.V. ADR(b)(c)(d) | | 86,798 | | 85,767 | | |
| 6,950 | | KOHL'S CORP. | | 55,508 | | 383,015 | | |
| 971 | | KONTOOR BRANDS, INC. | | 5,113 | | 54,774 | | |
| 24,338 | | L BRANDS, INC. | | 1,343,996 | | 1,753,796 | | |
| 2,338 | | LAS VEGAS SANDS CORP.(b) | | 14,654 | | 123,189 | | |
| 19,551 | | LENNAR CORP., CLASS A | | 941,531 | | 1,942,392 | | |
| 58 | | LENNAR CORP., CLASS B | | 652 | | 4,724 | | |
| 25,712 | | LKQ CORP.(b) | | 858,102 | | 1,265,545 | | |
| 6,524 | | LOWE'S COS., INC. | | 1,218,399 | | 1,265,460 | | |
| 4,767 | | LULULEMON ATHLETICA, INC.(b)(c) | | 606,562 | | 1,739,812 | | |
| 3,038 | | MARRIOTT INTERNATIONAL, INC., CLASS A(b) | | 63,603 | | 414,748 | | |
| 294 | | MARRIOTT VACATIONS WORLDWIDE CORP.(b) | | 4,103 | | 46,834 | | |
| 10,620 | | MCDONALD'S CORP. | | 433,348 | | 2,453,114 | | |
| 6,200 | | MGM RESORTS INTERNATIONAL | | 52,336 | | 264,430 | | |
| 3,152 | | MOHAWK INDUSTRIES, INC.(b) | | 495,274 | | 605,783 | | |
| 600 | | MURPHY U.S.A, INC. | | 4,392 | | 80,022 | | |
| 4,915 | | NEWELL BRANDS, INC. | | 52,223 | | 135,015 | | |
| 15,700 | | NIKE, INC., CLASS B | | 979,807 | | 2,425,493 | | |
| 4,300 | | NORDSTROM, INC.(b) | | 45,233 | | 157,251 | | |
| 3,900 | | NORWEGIAN CRUISE LINE HOLDINGS LTD.(b) | | 131,493 | | 114,699 | | |
| 103 | | NVR, INC.(b) | | 133,164 | | 512,250 | | |
| 900 | | O'REILLY AUTOMOTIVE, INC.(b) | | 27,059 | | 509,589 | | |
| 2,716 | | PELOTON INTERACTIVE, INC., CLASS A(b) | | 399,483 | | 336,838 | | |
| 6,500 | | PENN NATIONAL GAMING, INC.(b) | | 505,737 | | 497,185 | | |
| 4,707 | | PENSKE AUTOMOTIVE GROUP, INC. | | 191,281 | | 355,331 | | |
| 900 | | PLANET FITNESS, INC., CLASS A(b) | | 45,306 | | 67,725 | | |
| 1,225 | | POOL CORP. | | 308,981 | | 561,858 | | |
| 19,770 | | PULTEGROUP, INC. | | 397,530 | | 1,078,849 | | |
| 2,342 | | PVH CORP.(b) | | 101,514 | | 251,976 | | |
| 17,636 | | QURATE RETAIL, INC., CLASS A | | 45,988 | | 230,855 | | |
| 1,500 | | RALPH LAUREN CORP. | | 31,320 | | 176,715 | | |
| 7,143 | | ROSS STORES, INC. | | 487,088 | | 885,732 | | |
| 2,570 | | ROYAL CARIBBEAN CRUISES LTD.(b) | | 65,723 | | 219,170 | | |
| 3,200 | | SIX FLAGS ENTERTAINMENT CORP.(b) | | 48,149 | | 138,496 | | |
| 23,500 | | STARBUCKS CORP. | | 154,545 | | 2,627,535 | | |
| 52,717 | | TAPESTRY, INC.(b) | | 2,171,935 | | 2,292,135 | | |
| 19,082 | | TARGET CORP. | | 1,931,359 | | 4,612,883 | | |
| 11,644 | | TESLA, INC.(b) | | 4,467,492 | | 7,914,427 | | |
| 1,900 | | THOR INDUSTRIES, INC. | | 22,316 | | 214,700 | | |
| 20,188 | | TJX (THE) COS., INC. | | 86,033 | | 1,361,075 | | |
| 764 | | TOLL BROTHERS, INC. | | 47,899 | | 44,167 | | |
| 1,466 | | TOPBUILD CORP.(b) | | 11,809 | | 289,945 | | |
| See accompanying notes to financial statements. | 32 | (Continued) |
CLEARWATER INVESTMENT TRUST
Schedule of Investments - Clearwater Core Equity Fund
June 30, 2021 (unaudited)
| Shares | | Security | | Cost | | Fair value (a) | | Percent of
net assets |
| Consumer Discretionary (Cont'd): | | | | | | |
| 500 | | TRACTOR SUPPLY CO. | | $ 90,114 | | 93,030 | | |
| 23,166 | | TRAVEL + LEISURE CO. | | 477,832 | | 1,377,219 | | |
| 200 | | ULTA BEAUTY, INC.(b) | | 68,268 | | 69,154 | | |
| 200 | | VAIL RESORTS, INC.(b) | | 64,008 | | 63,304 | | |
| 1,100 | | VEONEER, INC.(b)(c) | | 5,428 | | 25,355 | | |
| 6,800 | | VF CORP. | | 81,950 | | 557,872 | | |
| 2,100 | | VROOM, INC.(b) | | 93,574 | | 87,906 | | |
| 707 | | WAYFAIR, INC., CLASS A(b) | | 179,150 | | 223,207 | | |
| 3,000 | | WENDY'S (THE) CO. | | 43,280 | | 70,260 | | |
| 7,417 | | WHIRLPOOL CORP. | | 755,937 | | 1,617,054 | | |
| 7,835 | | WILLIAMS-SONOMA, INC. | | 1,074,836 | | 1,250,858 | | |
| 1,400 | | WYNDHAM HOTELS & RESORTS, INC. | | 46,408 | | 101,206 | | |
| 1,600 | | WYNN RESORTS LTD.(b) | | 32,322 | | 195,680 | | |
| 4,800 | | YUM CHINA HOLDINGS, INC.(c) | | 300,749 | | 318,000 | | |
| | | | | 47,132,415 | | 101,896,955 | | 12.90% |
| Consumer Staples: | | | | | | |
| 73,621 | | ALTRIA GROUP, INC. | | 3,158,053 | | 3,510,249 | | |
| 10,300 | | ARCHER-DANIELS-MIDLAND CO. | | 188,618 | | 624,180 | | |
| 700 | | BEYOND MEAT, INC.(b) | | 51,107 | | 110,243 | | |
| 500 | | BOSTON BEER (THE) CO., INC., CLASS A(b) | | 267,930 | | 510,400 | | |
| 7,290 | | BROWN-FORMAN CORP., CLASS B | | 57,343 | | 546,313 | | |
| 17,416 | | CHURCH & DWIGHT CO., INC. | | 917,098 | | 1,484,192 | | |
| 4,272 | | CLOROX (THE) CO. | | 669,152 | | 768,576 | | |
| 56,139 | | COCA-COLA (THE) CO. | | 844,179 | | 3,037,681 | | |
| 1,580 | | COLGATE-PALMOLIVE CO. | | 60,561 | | 128,533 | | |
| 2,600 | | CONAGRA BRANDS, INC. | | 51,531 | | 94,588 | | |
| 1,600 | | CONSTELLATION BRANDS, INC., CLASS A | | 202,589 | | 374,224 | | |
| 4,249 | | COSTCO WHOLESALE CORP. | | 249,816 | | 1,681,202 | | |
| 5,723 | | DARLING INGREDIENTS, INC.(b) | | 391,867 | | 386,302 | | |
| 3,951 | | ESTEE LAUDER (THE) COS., INC., CLASS A | | 980,643 | | 1,256,734 | | |
| 3,709 | | FLOWERS FOODS, INC. | | 79,756 | | 89,758 | | |
| 600 | | FRESHPET, INC.(b) | | 97,422 | | 97,776 | | |
| 15,951 | | GENERAL MILLS, INC. | | 464,670 | | 971,894 | | |
| 5,300 | | HERBALIFE NUTRITION LTD.(b) | | 36,401 | | 279,469 | | |
| 1,642 | | HERSHEY (THE) CO. | | 60,568 | | 286,004 | | |
| 4,800 | | HORMEL FOODS CORP. | | 43,206 | | 229,200 | | |
| 1,700 | | INGREDION, INC. | | 48,104 | | 153,850 | | |
| 15,819 | | J M SMUCKER (THE) CO. | | 1,707,093 | | 2,049,668 | | |
| 15,195 | | KELLOGG CO. | | 968,132 | | 977,494 | | |
| 7,443 | | KEURIG DR. PEPPER, INC. | | 177,316 | | 262,291 | | |
| 1,550 | | KIMBERLY-CLARK CORP. | | 69,760 | | 207,359 | | |
| 7,714 | | KRAFT HEINZ (THE) CO. | | 189,080 | | 314,577 | | |
| 131,591 | | KROGER (THE) CO. | | 3,455,788 | | 5,041,251 | | |
| 1,133 | | LAMB WESTON HOLDINGS, INC. | | 47,287 | | 91,388 | | |
| 1,400 | | MCCORMICK & CO., INC. (NON VOTING) | | 21,613 | | 123,648 | | |
| 1,300 | | MOLSON COORS BEVERAGE CO., CLASS B(b) | | 37,841 | | 69,797 | | |
| 13,369 | | MONDELEZ INTERNATIONAL, INC., CLASS A | | 499,793 | | 834,760 | | |
| 5,164 | | MONSTER BEVERAGE CORP.(b) | | 225,908 | | 471,731 | | |
| 232 | | NU SKIN ENTERPRISES, INC., CLASS A | | 8,194 | | 13,143 | | |
| 28,470 | | PEPSICO, INC. | | 2,496,174 | | 4,218,400 | | |
| 23,364 | | PHILIP MORRIS INTERNATIONAL, INC. | | 1,774,594 | | 2,315,606 | | |
| 700 | | POST HOLDINGS, INC.(b) | | 43,421 | | 75,929 | | |
| 34,396 | | PROCTER & GAMBLE (THE) CO. | | 1,138,085 | | 4,641,052 | | |
| 30,797 | | SPROUTS FARMERS MARKET, INC.(b) | | 653,520 | | 765,305 | | |
| 7,700 | | SYSCO CORP. | | 117,906 | | 598,675 | | |
| 36,721 | | TYSON FOODS, INC., CLASS A | | 2,277,715 | | 2,708,541 | | |
| 2,700 | | US FOODS HOLDING CORP.(b) | | 45,757 | | 103,572 | | |
| 19,224 | | WALGREENS BOOTS ALLIANCE, INC. | | 331,290 | | 1,011,375 | | |
| 26,879 | | WALMART, INC. | | 2,819,326 | | 3,790,477 | | |
| | | | | 28,026,207 | | 47,307,407 | | 5.99% |
| Energy: | | | | | | |
| 1 | | ANTERO MIDSTREAM CORP. | | 2 | | 10 | | |
| 7,500 | | APA CORP. | | 44,218 | | 162,225 | | |
| 11,248 | | BAKER HUGHES CO. | | 192,633 | | 257,242 | | |
| 5,900 | | CABOT OIL & GAS CORP. | | 94,022 | | 103,014 | | |
| 2,200 | | CHENIERE ENERGY, INC.(b) | | 73,298 | | 190,828 | | |
| 30,735 | | CHEVRON CORP. | | 1,497,952 | | 3,219,184 | | |
| See accompanying notes to financial statements. | 33 | (Continued) |
CLEARWATER INVESTMENT TRUST
Schedule of Investments - Clearwater Core Equity Fund
June 30, 2021 (unaudited)
| Shares | | Security | | Cost | | Fair value (a) | | Percent of
net assets |
| Energy (Cont'd): | | | | | | |
| 2,700 | | CIMAREX ENERGY CO. | | $ 45,271 | | 195,615 | | |
| 69,076 | | CONOCOPHILLIPS | | 2,321,525 | | 4,206,728 | | |
| 2,000 | | CONTINENTAL RESOURCES, INC. | | 20,765 | | 76,060 | | |
| 1,100 | | DIAMONDBACK ENERGY, INC. | | 96,431 | | 103,279 | | |
| 9,794 | | ENBRIDGE, INC.(c) | | 137,797 | | 392,152 | | |
| 12,548 | | EOG RESOURCES, INC. | | 570,060 | | 1,047,005 | | |
| 111,222 | | EQUITRANS MIDSTREAM CORP. | | 795,458 | | 946,499 | | |
| 37,951 | | EXXON MOBIL CORP. | | 1,897,273 | | 2,393,949 | | |
| 8,300 | | HALLIBURTON CO. | | 196,372 | | 191,896 | | |
| 9,061 | | HELMERICH & PAYNE, INC. | | 214,605 | | 295,661 | | |
| 2,600 | | HESS CORP. | | 90,342 | | 227,032 | | |
| 69,589 | | KINDER MORGAN, INC. | | 1,058,430 | | 1,268,608 | | |
| 60,333 | | MARATHON OIL CORP. | | 733,740 | | 821,736 | | |
| 3,800 | | MARATHON PETROLEUM CORP. | | 243,566 | | 229,596 | | |
| 26,489 | | NOV, INC.(b) | | 371,064 | | 405,812 | | |
| 6,794 | | OCCIDENTAL PETROLEUM CORP. | | 76,837 | | 212,448 | | |
| 3,900 | | ONEOK, INC. | | 47,522 | | 216,996 | | |
| 6,900 | | PBF ENERGY, INC., CLASS A(b) | | 45,787 | | 105,570 | | |
| 2,500 | | PHILLIPS 66 | | 181,547 | | 214,550 | | |
| 1,500 | | PIONEER NATURAL RESOURCES CO. | | 108,478 | | 243,780 | | |
| 10,333 | | SCHLUMBERGER N.V. | | 133,707 | | 330,759 | | |
| 468 | | TEXAS PACIFIC LAND CORP. | | 781,998 | | 748,678 | | |
| 8,079 | | VALERO ENERGY CORP. | | 257,608 | | 630,808 | | |
| 37,607 | | WILLIAMS (THE) COS., INC. | | 694,036 | | 998,466 | | |
| | | | | 13,022,344 | | 20,436,186 | | 2.59% |
| Financials: | | | | | | |
| 4,100 | | AFLAC, INC. | | 199,392 | | 220,006 | | |
| 700 | | ALLEGHANY CORP.(b) | | 275,499 | | 466,949 | | |
| 23,877 | | ALLSTATE (THE) CORP. | | 1,691,617 | | 3,114,516 | | |
| 8,204 | | ALLY FINANCIAL, INC. | | 427,294 | | 408,887 | | |
| 7,533 | | AMERICAN EXPRESS CO. | | 755,196 | | 1,244,678 | | |
| 2,208 | | AMERICAN FINANCIAL GROUP, INC. | | 135,743 | | 275,382 | | |
| 9,600 | | AMERICAN INTERNATIONAL GROUP, INC. | | 347,113 | | 456,960 | | |
| 1,802 | | AMERICAN NATIONAL GROUP, INC. | | 126,290 | | 267,687 | | |
| 11,193 | | AMERIPRISE FINANCIAL, INC. | | 945,013 | | 2,785,714 | | |
| 13,600 | | ANNALY CAPITAL MANAGEMENT, INC. | | 80,993 | | 120,768 | | |
| 1,848 | | AON PLC, CLASS A | | 223,031 | | 441,228 | | |
| 15,811 | | ARCH CAPITAL GROUP LTD.(b)(c) | | 307,170 | | 615,680 | | |
| 2,300 | | ARTHUR J. GALLAGHER & CO. | | 80,002 | | 322,184 | | |
| 4,900 | | ASSURANT, INC. | | 218,575 | | 765,282 | | |
| 1,400 | | ATHENE HOLDING LTD., CLASS A(b)(c) | | 89,136 | | 94,500 | | |
| 1,000 | | AXIS CAPITAL HOLDINGS LTD.(c) | | 28,371 | | 49,010 | | |
| 141,958 | | BANK OF AMERICA CORP. | | 2,217,634 | | 5,852,928 | | |
| 1,200 | | BANK OF HAWAII CORP. | | 101,843 | | 101,064 | | |
| 10,000 | | BANK OF NEW YORK MELLON (THE) CORP. | | 206,454 | | 512,300 | | |
| 25,451 | | BERKSHIRE HATHAWAY, INC., CLASS B(b) | | 3,392,217 | | 7,073,342 | | |
| 1,400 | | BLACKROCK, INC. | | 1,229,820 | | 1,224,958 | | |
| 13,767 | | BLACKSTONE GROUP (THE), INC. | | 1,281,357 | | 1,337,326 | | |
| 2,000 | | BRIGHTHOUSE FINANCIAL, INC.(b) | | 48,875 | | 91,080 | | |
| 1,700 | | BROWN & BROWN, INC. | | 88,516 | | 90,338 | | |
| 620 | | CANNAE HOLDINGS, INC.(b) | | 2,893 | | 21,024 | | |
| 7,647 | | CAPITAL ONE FINANCIAL CORP. | | 232,495 | | 1,182,914 | | |
| 800 | | CBOE GLOBAL MARKETS, INC. | | 94,440 | | 95,240 | | |
| 18,208 | | CHARLES SCHWAB (THE) CORP. | | 192,267 | | 1,325,724 | | |
| 4,785 | | CHUBB LTD.(c) | | 533,940 | | 760,528 | | |
| 9,450 | | CINCINNATI FINANCIAL CORP. | | 1,141,031 | | 1,102,059 | | |
| 76,982 | | CITIGROUP, INC. | | 4,072,993 | | 5,446,477 | | |
| 9,030 | | CITIZENS FINANCIAL GROUP, INC. | | 226,262 | | 414,206 | | |
| 3,865 | | CME GROUP, INC. | | 617,382 | | 822,008 | | |
| 1,400 | | COMERICA, INC. | | 98,978 | | 99,876 | | |
| 500 | | CREDIT ACCEPTANCE CORP.(b) | | 86,421 | | 227,055 | | |
| 8,202 | | DISCOVER FINANCIAL SERVICES | | 125,376 | | 970,215 | | |
| 968 | | EVEREST RE GROUP LTD.(c) | | 255,641 | | 243,946 | | |
| 469 | | FAIRFAX FINANCIAL HOLDINGS LTD.(c) | | 86,576 | | 205,380 | | |
| 2,163 | | FIDELITY NATIONAL FINANCIAL, INC. | | 29,212 | | 94,004 | | |
| 10,565 | | FIFTH THIRD BANCORP | | 109,297 | | 403,900 | | |
| 400 | | FIRST CITIZENS BANCSHARES, INC., CLASS A | | 57,523 | | 333,096 | | |
| See accompanying notes to financial statements. | 34 | (Continued) |
CLEARWATER INVESTMENT TRUST
Schedule of Investments - Clearwater Core Equity Fund
June 30, 2021 (unaudited)
| Shares | | Security | | Cost | | Fair value (a) | | Percent of
net assets |
| Financials (Cont'd): | | | | | | |
| 30,500 | | FIRST HORIZON CORP. | | $ 193,065 | | 527,040 | | |
| 600 | | FIRST REPUBLIC BANK | | 114,738 | | 112,302 | | |
| 7,610 | | GOLDMAN SACHS GROUP (THE), INC. | | 814,108 | | 2,888,223 | | |
| 3,000 | | HANOVER INSURANCE GROUP (THE), INC. | | 215,948 | | 406,920 | | |
| 3,700 | | HARTFORD FINANCIAL SERVICES GROUP (THE), INC. | | 62,228 | | 229,289 | | |
| 43,846 | | HUNTINGTON BANCSHARES, INC. | | 221,604 | | 625,686 | | |
| 5,905 | | INTERCONTINENTAL EXCHANGE, INC. | | 612,683 | | 700,924 | | |
| 15,903 | | JANUS HENDERSON GROUP PLC(c) | | 222,792 | | 617,195 | | |
| 47,492 | | JPMORGAN CHASE & CO. | | 1,723,282 | | 7,386,906 | | |
| 61,371 | | KEYCORP | | 1,178,677 | | 1,267,311 | | |
| 1,500 | | KKR & CO., INC. | | 84,763 | | 88,860 | | |
| 4,200 | | LEMONADE, INC.(b) | | 428,105 | | 459,522 | | |
| 400 | | LENDINGTREE, INC.(b) | | 79,587 | | 84,752 | | |
| 1,500 | | LINCOLN NATIONAL CORP. | | 92,697 | | 94,260 | | |
| 5,278 | | LPL FINANCIAL HOLDINGS, INC. | | 775,362 | | 712,424 | | |
| 1,500 | | M&T BANK CORP. | | 225,235 | | 217,965 | | |
| 200 | | MARKEL CORP.(b) | | 67,789 | | 237,342 | | |
| 5,684 | | MARSH & MCLENNAN COS., INC. | | 240,120 | | 799,625 | | |
| 8,064 | | MERCURY GENERAL CORP. | | 491,828 | | 523,757 | | |
| 6,691 | | METLIFE, INC. | | 264,176 | | 400,456 | | |
| 6,600 | | MGIC INVESTMENT CORP. | | 91,778 | | 89,760 | | |
| 800 | | MOODY'S CORP. | | 28,632 | | 289,896 | | |
| 44,330 | | MORGAN STANLEY | | 1,102,683 | | 4,064,618 | | |
| 200 | | MSCI, INC. | | 6,396 | | 106,616 | | |
| 5,900 | | NASDAQ, INC. | | 240,309 | | 1,037,220 | | |
| 800 | | NORTHERN TRUST CORP. | | 95,303 | | 92,496 | | |
| 13,267 | | OLD REPUBLIC INTERNATIONAL CORP. | | 347,511 | | 330,481 | | |
| 2,326 | | ONEMAIN HOLDINGS, INC. | | 40,168 | | 139,351 | | |
| 2,485 | | PACWEST BANCORP | | 28,898 | | 102,283 | | |
| 5,300 | | PEOPLE'S UNITED FINANCIAL, INC. | | 92,093 | | 90,842 | | |
| 7,114 | | PNC FINANCIAL SERVICES GROUP (THE), INC. | | 273,331 | | 1,357,067 | | |
| 18,122 | | POPULAR, INC. | | 634,042 | | 1,360,056 | | |
| 1,800 | | PRINCIPAL FINANCIAL GROUP, INC. | | 37,586 | | 113,742 | | |
| 20,010 | | PROGRESSIVE (THE) CORP. | | 1,423,987 | | 1,965,182 | | |
| 2,794 | | PROSPERITY BANCSHARES, INC. | | 206,358 | | 200,609 | | |
| 5,900 | | PRUDENTIAL FINANCIAL, INC. | | 182,565 | | 604,573 | | |
| 700 | | RAYMOND JAMES FINANCIAL, INC. | | 89,754 | | 90,930 | | |
| 11,139 | | REGIONS FINANCIAL CORP. | | 66,543 | | 224,785 | | |
| 700 | | REINSURANCE GROUP OF AMERICA, INC. | | 81,074 | | 79,800 | | |
| 1,400 | | RENAISSANCERE HOLDINGS LTD.(c) | | 172,613 | | 208,348 | | |
| 3,151 | | ROYAL BANK OF CANADA(c) | | 75,539 | | 319,228 | | |
| 2,600 | | S&P GLOBAL, INC. | | 999,432 | | 1,067,170 | | |
| 7,500 | | SEI INVESTMENTS CO. | | 108,537 | | 464,775 | | |
| 300 | | SIGNATURE BANK | | 74,502 | | 73,695 | | |
| 18,352 | | SLM CORP. | | 93,484 | | 384,291 | | |
| 1,714 | | STATE STREET CORP. | | 127,826 | | 141,028 | | |
| 300 | | SVB FINANCIAL GROUP(b) | | 172,212 | | 166,929 | | |
| 54,689 | | SYNCHRONY FINANCIAL | | 1,341,215 | | 2,653,510 | | |
| 3,657 | | SYNOVUS FINANCIAL CORP. | | 49,372 | | 160,469 | | |
| 7,548 | | T. ROWE PRICE GROUP, INC. | | 832,475 | | 1,494,278 | | |
| 19,700 | | TRAVELERS (THE) COS., INC. | | 2,031,574 | | 2,949,287 | | |
| 14,494 | | TRUIST FINANCIAL CORP. | | 331,939 | | 804,417 | | |
| 16,200 | | TWO HARBORS INVESTMENT CORP. | | 70,556 | | 122,472 | | |
| 17,585 | | US BANCORP | | 318,503 | | 1,001,817 | | |
| 7,855 | | W R BERKLEY CORP. | | 230,563 | | 584,648 | | |
| 1,800 | | WASHINGTON FEDERAL, INC. | | 23,535 | | 57,204 | | |
| 1,700 | | WEBSTER FINANCIAL CORP. | | 92,850 | | 90,678 | | |
| 49,461 | | WELLS FARGO & CO. | | 674,289 | | 2,240,089 | | |
| 3,568 | | WESTERN ALLIANCE BANCORP | | 154,269 | | 331,289 | | |
| 42 | | WHITE MOUNTAINS INSURANCE GROUP LTD. | | 47,881 | | 48,217 | | |
| 1,300 | | WILLIS TOWERS WATSON PLC(c) | | 330,952 | | 299,026 | | |
| 2,600 | | ZIONS BANCORP N.A. | | 49,361 | | 137,436 | | |
| | | | | 44,041,155 | | 88,201,786 | | 11.16% |
| Health Care: | | | | | | |
| 400 | | 10X GENOMICS, INC., CLASS A(b) | | 79,156 | | 78,328 | | |
| 18,734 | | ABBOTT LABORATORIES | | 926,152 | | 2,171,833 | | |
| 25,030 | | ABBVIE, INC. | | 1,254,809 | | 2,819,379 | | |
| See accompanying notes to financial statements. | 35 | (Continued) |
CLEARWATER INVESTMENT TRUST
Schedule of Investments - Clearwater Core Equity Fund
June 30, 2021 (unaudited)
| Shares | | Security | | Cost | | Fair value (a) | | Percent of
net assets |
| Health Care (Cont'd): | | | | | | |
| 500 | | ABIOMED, INC.(b) | | $ 107,418 | | 156,055 | | |
| 500 | | ACCELERON PHARMA, INC.(b) | | 48,935 | | 62,745 | | |
| 1,800 | | ADAPTIVE BIOTECHNOLOGIES CORP.(b) | | 45,536 | | 73,548 | | |
| 2,257 | | AGILENT TECHNOLOGIES, INC. | | 178,455 | | 333,607 | | |
| 1,200 | | AGIOS PHARMACEUTICALS, INC.(b) | | 44,843 | | 66,132 | | |
| 3,344 | | ALEXION PHARMACEUTICALS, INC.(b) | | 358,351 | | 614,326 | | |
| 2,178 | | ALIGN TECHNOLOGY, INC.(b) | | 646,282 | | 1,330,758 | | |
| 1,200 | | ALNYLAM PHARMACEUTICALS, INC.(b) | | 181,534 | | 203,424 | | |
| 7,200 | | AMERISOURCEBERGEN CORP. | | 115,968 | | 824,328 | | |
| 13,704 | | AMGEN, INC. | | 2,846,624 | | 3,340,350 | | |
| 6,046 | | ANTHEM, INC. | | 702,079 | | 2,308,363 | | |
| 193 | | AVANOS MEDICAL, INC.(b) | | 3,014 | | 7,019 | | |
| 3,700 | | AVANTOR, INC.(b) | | 41,168 | | 131,387 | | |
| 14,190 | | BAXTER INTERNATIONAL, INC. | | 861,584 | | 1,142,295 | | |
| 2,885 | | BECTON DICKINSON AND CO. | | 255,655 | | 701,603 | | |
| 11,130 | | BIOGEN, INC.(b) | | 3,292,076 | | 3,853,985 | | |
| 2,100 | | BIOMARIN PHARMACEUTICAL, INC.(b) | | 167,416 | | 175,224 | | |
| 2,273 | | BIO-RAD LABORATORIES, INC., CLASS A(b) | | 1,149,621 | | 1,464,471 | | |
| 2,183 | | BIO-TECHNE CORP. | | 881,435 | | 982,918 | | |
| 32,800 | | BOSTON SCIENTIFIC CORP.(b) | | 182,160 | | 1,402,528 | | |
| 53,326 | | BRISTOL-MYERS SQUIBB CO. | | 2,503,135 | | 3,563,243 | | |
| 2,145 | | BRUKER CORP. | | 43,219 | | 162,977 | | |
| 1,000 | | CARDINAL HEALTH, INC. | | 26,001 | | 57,090 | | |
| 1,800 | | CATALENT, INC.(b) | | 103,746 | | 194,616 | | |
| 8,372 | | CENTENE CORP.(b) | | 468,667 | | 610,570 | | |
| 5,800 | | CERNER CORP. | | 213,165 | | 453,328 | | |
| 241 | | CHARLES RIVER LABORATORIES INTERNATIONAL, INC.(b) | | 31,337 | | 89,151 | | |
| 5,278 | | CIGNA CORP. | | 714,937 | | 1,251,256 | | |
| 200 | | COOPER (THE) COS., INC. | | 50,902 | | 79,254 | | |
| 23,230 | | CVS HEALTH CORP. | | 1,312,838 | | 1,938,311 | | |
| 9,229 | | DANAHER CORP. | | 272,153 | | 2,476,694 | | |
| 5,332 | | DENTSPLY SIRONA, INC. | | 141,306 | | 337,302 | | |
| 1,500 | | DEXCOM, INC.(b) | | 87,312 | | 640,500 | | |
| 11,778 | | EDWARDS LIFESCIENCES CORP.(b) | | 161,745 | | 1,219,848 | | |
| 4,900 | | ELANCO ANIMAL HEALTH, INC.(b) | | 111,286 | | 169,981 | | |
| 10,244 | | ELI LILLY & CO. | | 564,949 | | 2,351,203 | | |
| 4,100 | | EXELIXIS, INC.(b) | | 93,259 | | 74,702 | | |
| 17,143 | | GILEAD SCIENCES, INC. | | 144,642 | | 1,180,467 | | |
| 18,303 | | HCA HEALTHCARE, INC. | | 2,651,228 | | 3,783,962 | | |
| 3,800 | | HENRY SCHEIN, INC.(b) | | 67,547 | | 281,922 | | |
| 27,356 | | HOLOGIC, INC.(b) | | 1,549,268 | | 1,825,192 | | |
| 7,825 | | HORIZON THERAPEUTICS PLC(b) | | 252,398 | | 732,733 | | |
| 1,948 | | HUMANA, INC. | | 718,193 | | 862,419 | | |
| 6,784 | | IDEXX LABORATORIES, INC.(b) | | 2,082,530 | | 4,284,435 | | |
| 2,300 | | ILLUMINA, INC.(b) | | 98,233 | | 1,088,383 | | |
| 1,957 | | INCYTE CORP.(b) | | 125,794 | | 164,642 | | |
| 300 | | INSULET CORP.(b) | | 84,738 | | 82,353 | | |
| 1,562 | | INTUITIVE SURGICAL, INC.(b) | | 650,350 | | 1,436,478 | | |
| 2,400 | | IONIS PHARMACEUTICALS, INC.(b) | | 88,553 | | 95,736 | | |
| 5,634 | | IQVIA HOLDINGS, INC.(b) | | 560,732 | | 1,365,231 | | |
| 27,083 | | JOHNSON & JOHNSON | | 1,991,237 | | 4,461,653 | | |
| 2,225 | | LABORATORY CORP. OF AMERICA HOLDINGS(b) | | 413,449 | | 613,766 | | |
| 500 | | MASIMO CORP.(b) | | 110,177 | | 121,225 | | |
| 6,061 | | MCKESSON CORP. | | 254,847 | | 1,159,106 | | |
| 9,700 | | MEDTRONIC PLC(c) | | 960,275 | | 1,204,061 | | |
| 39,478 | | MERCK & CO., INC. | | 1,057,231 | | 3,070,204 | | |
| 1,317 | | METTLER-TOLEDO INTERNATIONAL, INC.(b) | | 123,051 | | 1,824,493 | | |
| 3,815 | | MODERNA, INC.(b) | | 506,030 | | 896,449 | | |
| 5,255 | | MOLINA HEALTHCARE, INC.(b) | | 1,021,212 | | 1,329,830 | | |
| 1,500 | | NEUROCRINE BIOSCIENCES, INC.(b) | | 141,717 | | 145,980 | | |
| 900 | | NOVAVAX, INC.(b) | | 162,900 | | 191,079 | | |
| 1,086 | | NOVOCURE LTD.(b)(c) | | 221,168 | | 240,897 | | |
| 3,948 | | ORGANON & CO.(b) | | 51,528 | | 119,460 | | |
| 300 | | PENUMBRA, INC.(b) | | 36,663 | | 82,218 | | |
| 1,421 | | PERKINELMER, INC. | | 218,549 | | 219,417 | | |
| 7,122 | | PERRIGO CO. PLC(c) | | 294,437 | | 326,544 | | |
| 60,066 | | PFIZER, INC. | | 1,062,577 | | 2,352,185 | | |
| See accompanying notes to financial statements. | 36 | (Continued) |
CLEARWATER INVESTMENT TRUST
Schedule of Investments - Clearwater Core Equity Fund
June 30, 2021 (unaudited)
| Shares | | Security | | Cost | | Fair value (a) | | Percent of
net assets |
| Health Care (Cont'd): | | | | | | |
| 2,600 | | PPD, INC.(b) | | $ 45,518 | | 119,834 | | |
| 2,000 | | QIAGEN N.V.(b)(c) | | 83,380 | | 96,760 | | |
| 700 | | QUIDEL CORP.(b) | | 76,390 | | 89,684 | | |
| 1,093 | | REGENERON PHARMACEUTICALS, INC.(b) | | 551,163 | | 610,484 | | |
| 400 | | REPLIGEN CORP.(b) | | 46,604 | | 79,848 | | |
| 4,791 | | RESMED, INC. | | 129,046 | | 1,181,077 | | |
| 2,000 | | ROYALTY PHARMA PLC, CLASS A | | 92,224 | | 81,980 | | |
| 400 | | STERIS PLC | | 80,548 | | 82,520 | | |
| 3,700 | | STRYKER CORP. | | 924,061 | | 961,001 | | |
| 1,600 | | TELADOC HEALTH, INC.(b) | | 287,711 | | 266,064 | | |
| 1,800 | | TELEFLEX, INC. | | 195,858 | | 723,222 | | |
| 4,526 | | THERMO FISHER SCIENTIFIC, INC. | | 1,432,927 | | 2,283,231 | | |
| 900 | | ULTRAGENYX PHARMACEUTICAL, INC.(b) | | 85,950 | | 85,815 | | |
| 6,118 | | UNITED THERAPEUTICS CORP.(b) | | 616,285 | | 1,097,630 | | |
| 17,091 | | UNITEDHEALTH GROUP, INC. | | 2,997,601 | | 6,843,920 | | |
| 2,036 | | UNIVERSAL HEALTH SERVICES, INC., CLASS B | | 38,822 | | 298,132 | | |
| 1,880 | | VAREX IMAGING CORP.(b) | | 19,829 | | 50,422 | | |
| 1,800 | | VEEVA SYSTEMS, INC., CLASS A(b) | | 318,742 | | 559,710 | | |
| 900 | | VERTEX PHARMACEUTICALS, INC.(b) | | 22,442 | | 181,467 | | |
| 62,870 | | VIATRIS, INC. | | 799,333 | | 898,412 | | |
| 6,468 | | WATERS CORP.(b) | | 908,449 | | 2,235,406 | | |
| 2,248 | | WEST PHARMACEUTICAL SERVICES, INC. | | 628,826 | | 807,257 | | |
| 4,304 | | ZIMMER BIOMET HOLDINGS, INC. | | 233,961 | | 692,169 | | |
| 5,047 | | ZOETIS, INC. | | 802,332 | | 940,559 | | |
| | | | | 50,389,484 | | 96,723,756 | | 12.24% |
| Industrials: | | | | | | |
| 6,987 | | 3M CO. | | 417,187 | | 1,387,828 | | |
| 923 | | ACCO BRANDS CORP. | | 3,138 | | 7,966 | | |
| 3,338 | | ACUITY BRANDS, INC. | | 362,545 | | 624,306 | | |
| 11,607 | | ADT, INC. | | 45,143 | | 125,240 | | |
| 5,973 | | AGCO CORP. | | 421,122 | | 778,760 | | |
| 8,255 | | AIR LEASE CORP. | | 223,546 | | 344,564 | | |
| 8,739 | | ALASKA AIR GROUP, INC.(b) | | 564,179 | | 527,049 | | |
| 1,533 | | ALLEGION PLC(c) | | 40,913 | | 213,547 | | |
| 5,175 | | AMETEK, INC. | | 73,220 | | 690,862 | | |
| 5,987 | | BOEING (THE) CO.(b) | | 851,967 | | 1,434,246 | | |
| 9,793 | | BOOZ ALLEN HAMILTON HOLDING CORP. | | 322,665 | | 834,168 | | |
| 1,200 | | BWX TECHNOLOGIES, INC. | | 54,215 | | 69,744 | | |
| 7,460 | | C.H. ROBINSON WORLDWIDE, INC. | | 760,154 | | 698,778 | | |
| 1,436 | | CACI INTERNATIONAL, INC., CLASS A(b) | | 305,354 | | 366,352 | | |
| 2,996 | | CARLISLE COS., INC. | | 114,358 | | 573,374 | | |
| 10,640 | | CARRIER GLOBAL CORP. | | 57,007 | | 517,104 | | |
| 10,504 | | CATERPILLAR, INC. | | 272,491 | | 2,285,986 | | |
| 4,200 | | CINTAS CORP. | | 616,293 | | 1,604,400 | | |
| 3,500 | | CLARIVATE PLC(b)(c) | | 91,022 | | 96,355 | | |
| 1,347 | | COPA HOLDINGS S.A., CLASS A(b)(c) | | 105,441 | | 101,470 | | |
| 3,100 | | COPART, INC.(b) | | 271,982 | | 408,673 | | |
| 4,720 | | COSTAR GROUP, INC.(b) | | 419,684 | | 390,910 | | |
| 3,948 | | CRANE CO. | | 66,572 | | 364,677 | | |
| 36,072 | | CSX CORP. | | 841,694 | | 1,157,190 | | |
| 11,748 | | CUMMINS, INC. | | 1,835,519 | | 2,864,280 | | |
| 6,193 | | DEERE & CO. | | 173,017 | | 2,184,333 | | |
| 9,200 | | DELTA AIR LINES, INC.(b) | | 93,252 | | 397,992 | | |
| 1,525 | | DOVER CORP. | | 32,899 | | 229,665 | | |
| 24,644 | | EATON CORP. PLC | | 1,418,732 | | 3,651,748 | | |
| 700 | | EQUIFAX, INC. | | 162,086 | | 167,657 | | |
| 3,980 | | EXPEDITORS INTERNATIONAL OF WASHINGTON, INC. | | 259,722 | | 503,868 | | |
| 1,600 | | FASTENAL CO. | | 84,013 | | 83,200 | | |
| 2,153 | | FEDEX CORP. | | 99,607 | | 642,304 | | |
| 3,325 | | FORTIVE CORP. | | 36,012 | | 231,885 | | |
| 4,300 | | FORTUNE BRANDS HOME & SECURITY, INC. | | 33,889 | | 428,323 | | |
| 1,400 | | GATX CORP. | | 24,276 | | 123,858 | | |
| 2,750 | | GENERAC HOLDINGS, INC.(b) | | 704,688 | | 1,141,662 | | |
| 837 | | GENERAL DYNAMICS CORP. | | 116,523 | | 157,574 | | |
| 89,000 | | GENERAL ELECTRIC CO. | | 889,756 | | 1,197,940 | | |
| 20,900 | | GRAFTECH INTERNATIONAL LTD. | | 154,560 | | 242,858 | | |
| 875 | | HEICO CORP. | | 61,334 | | 121,993 | | |
| See accompanying notes to financial statements. | 37 | (Continued) |
CLEARWATER INVESTMENT TRUST
Schedule of Investments - Clearwater Core Equity Fund
June 30, 2021 (unaudited)
| Shares | | Security | | Cost | | Fair value (a) | | Percent of
net assets |
| Industrials (Cont'd): | | | | | | |
| 2,156 | | HEICO CORP., CLASS A | | $ 109,365 | | 267,732 | | |
| 360 | | HERC HOLDINGS, INC.(b) | | 5,808 | | 40,345 | | |
| 9,188 | | HONEYWELL INTERNATIONAL, INC. | | 265,803 | | 2,015,388 | | |
| 25,039 | | HOWMET AEROSPACE, INC.(b) | | 299,194 | | 863,094 | | |
| 1,200 | | HUBBELL, INC. | | 43,310 | | 224,208 | | |
| 2,262 | | HUNTINGTON INGALLS INDUSTRIES, INC. | | 317,705 | | 476,716 | | |
| 1,500 | | IAA, INC.(b) | | 45,882 | | 81,810 | | |
| 2,271 | | IDEX CORP. | | 140,770 | | 499,734 | | |
| 3,533 | | IHS MARKIT LTD.(c) | | 350,442 | | 398,028 | | |
| 4,824 | | ILLINOIS TOOL WORKS, INC. | | 155,812 | | 1,078,453 | | |
| 2,382 | | INGERSOLL RAND, INC.(b) | | 18,866 | | 116,265 | | |
| 1,468 | | JACOBS ENGINEERING GROUP, INC. | | 29,713 | | 195,861 | | |
| 2,100 | | JB HUNT TRANSPORT SERVICES, INC. | | 40,530 | | 342,195 | | |
| 30,273 | | JETBLUE AIRWAYS CORP.(b) | | 590,554 | | 507,981 | | |
| 16,052 | | JOHNSON CONTROLS INTERNATIONAL PLC | | 431,153 | | 1,101,649 | | |
| 800 | | KANSAS CITY SOUTHERN | | 235,820 | | 226,696 | | |
| 3,003 | | KNIGHT-SWIFT TRANSPORTATION HOLDINGS, INC. | | 129,205 | | 136,516 | | |
| 16,105 | | L3HARRIS TECHNOLOGIES, INC. | | 2,650,347 | | 3,481,096 | | |
| 500 | | LANDSTAR SYSTEM, INC. | | 79,050 | | 79,010 | | |
| 1,847 | | LEIDOS HOLDINGS, INC. | | 129,494 | | 186,732 | | |
| 600 | | LENNOX INTERNATIONAL, INC. | | 17,874 | | 210,480 | | |
| 1,400 | | LINCOLN ELECTRIC HOLDINGS, INC. | | 28,970 | | 184,394 | | |
| 3,675 | | LOCKHEED MARTIN CORP. | | 1,136,126 | | 1,390,436 | | |
| 2,800 | | LYFT, INC., CLASS A(b) | | 100,728 | | 169,344 | | |
| 1,200 | | MANITOWOC (THE) CO., INC.(b) | | 10,053 | | 29,400 | | |
| 2,475 | | MANPOWERGROUP, INC. | | 81,957 | | 294,302 | | |
| 40,193 | | MASCO CORP. | | 1,633,595 | | 2,367,770 | | |
| 1,300 | | MERCURY SYSTEMS, INC.(b) | | 85,863 | | 86,164 | | |
| 500 | | MSA SAFETY, INC. | | 80,875 | | 82,790 | | |
| 3,039 | | MSC INDUSTRIAL DIRECT CO., INC., CLASS A | | 189,928 | | 272,689 | | |
| 577 | | NORDSON CORP. | | 57,299 | | 126,657 | | |
| 2,060 | | NORFOLK SOUTHERN CORP. | | 364,097 | | 546,745 | | |
| 8,418 | | NORTHROP GRUMMAN CORP. | | 1,879,921 | | 3,059,354 | | |
| 2,519 | | NVENT ELECTRIC PLC(c) | | 24,113 | | 78,694 | | |
| 4,964 | | OLD DOMINION FREIGHT LINE, INC. | | 808,017 | | 1,259,863 | | |
| 8,384 | | OSHKOSH CORP. | | 360,335 | | 1,044,982 | | |
| 5,320 | | OTIS WORLDWIDE CORP. | | 90,693 | | 435,016 | | |
| 1,551 | | OWENS CORNING | | 70,452 | | 151,843 | | |
| 1,056 | | PACCAR, INC. | | 46,858 | | 94,248 | | |
| 4,628 | | PARKER-HANNIFIN CORP. | | 350,966 | | 1,421,305 | | |
| 2,519 | | PENTAIR PLC(c) | | 49,295 | | 170,007 | | |
| 21,936 | | QUANTA SERVICES, INC. | | 1,639,893 | | 1,986,744 | | |
| 19,941 | | RAYTHEON TECHNOLOGIES CORP. | | 831,614 | | 1,701,167 | | |
| 12,257 | | REPUBLIC SERVICES, INC. | | 732,074 | | 1,348,393 | | |
| 1,000 | | ROBERT HALF INTERNATIONAL, INC. | | 87,950 | | 88,970 | | |
| 9,420 | | ROLLINS, INC. | | 221,629 | | 322,164 | | |
| 1,100 | | ROPER TECHNOLOGIES, INC. | | 277,735 | | 517,220 | | |
| 28,679 | | SCHNEIDER NATIONAL, INC., CLASS B | | 662,710 | | 624,342 | | |
| 5,014 | | SNAP-ON, INC. | | 1,030,901 | | 1,120,278 | | |
| 22,389 | | SOUTHWEST AIRLINES CO.(b) | | 986,432 | | 1,188,632 | | |
| 1,500 | | SPIRIT AEROSYSTEMS HOLDINGS, INC., CLASS A | | 25,470 | | 70,785 | | |
| 2,557 | | STANLEY BLACK & DECKER, INC. | | 72,048 | | 524,159 | | |
| 600 | | STERICYCLE, INC.(b) | | 18,858 | | 42,930 | | |
| 10,200 | | SUNRUN, INC.(b) | | 486,902 | | 568,956 | | |
| 200 | | TELEDYNE TECHNOLOGIES, INC.(b) | | 86,702 | | 83,766 | | |
| 1,400 | | TEXTRON, INC. | | 92,538 | | 96,278 | | |
| 11,246 | | TIMKEN (THE) CO. | | 499,847 | | 906,315 | | |
| 1,596 | | TORO (THE) CO. | | 76,510 | | 175,368 | | |
| 13,345 | | TRANE TECHNOLOGIES PLC(c) | | 1,010,252 | | 2,457,348 | | |
| 200 | | TRANSDIGM GROUP, INC.(b) | | 62,989 | | 129,458 | | |
| 800 | | TRANSUNION | | 84,920 | | 87,848 | | |
| 18,100 | | UBER TECHNOLOGIES, INC.(b) | | 659,532 | | 907,172 | | |
| 5,802 | | UNION PACIFIC CORP. | | 351,907 | | 1,276,034 | | |
| 3,828 | | UNITED AIRLINES HOLDINGS, INC.(b) | | 147,236 | | 200,166 | | |
| 6,957 | | UNITED PARCEL SERVICE, INC., CLASS B | | 811,963 | | 1,446,847 | | |
| 9,365 | | UNITED RENTALS, INC.(b) | | 900,551 | | 2,987,529 | | |
| 1,494 | | VERISK ANALYTICS, INC. | | 255,892 | | 261,032 | | |
| See accompanying notes to financial statements. | 38 | (Continued) |
CLEARWATER INVESTMENT TRUST
Schedule of Investments - Clearwater Core Equity Fund
June 30, 2021 (unaudited)
| Shares | | Security | | Cost | | Fair value (a) | | Percent of
net assets |
| Industrials (Cont'd): | | | | | | |
| 33 | | VERITIV CORP.(b) | | $ 510 | | 2,027 | | |
| 2,400 | | VIRGIN GALACTIC HOLDINGS, INC.(b) | | 86,465 | | 110,400 | | |
| 975 | | WASTE CONNECTIONS, INC. | | 42,575 | | 116,444 | | |
| 17,554 | | WASTE MANAGEMENT, INC. | | 879,219 | | 2,459,491 | | |
| 1,200 | | WESTINGHOUSE AIR BRAKE TECHNOLOGIES CORP. | | 21,945 | | 98,760 | | |
| 700 | | WW GRAINGER, INC. | | 30,601 | | 306,600 | | |
| 600 | | XPO LOGISTICS, INC.(b) | | 89,748 | | 83,934 | | |
| 1,600 | | XYLEM, INC. | | 30,618 | | 191,936 | | |
| | | | | 40,315,351 | | 80,260,174 | | 10.16% |
| Information Technology: | | | | | | |
| 6,772 | | ACCENTURE PLC, CLASS A(c) | | 789,956 | | 1,996,318 | | |
| 8,947 | | ADOBE, INC.(b) | | 1,806,133 | | 5,239,721 | | |
| 14,200 | | ADVANCED MICRO DEVICES, INC.(b) | | 350,560 | | 1,333,806 | | |
| 12,626 | | AKAMAI TECHNOLOGIES, INC.(b) | | 715,662 | | 1,472,192 | | |
| 2,695 | | ALLIANCE DATA SYSTEMS CORP. | | 114,079 | | 280,792 | | |
| 1,136 | | ALTERYX, INC., CLASS A(b) | | 125,648 | | 97,719 | | |
| 4,065 | | AMDOCS LTD. | | 200,086 | | 314,468 | | |
| 1,400 | | AMPHENOL CORP., CLASS A | | 95,701 | | 95,774 | | |
| 4,400 | | ANALOG DEVICES, INC. | | 82,698 | | 757,504 | | |
| 1,400 | | ANAPLAN, INC.(b) | | 47,612 | | 74,620 | | |
| 1,200 | | ANSYS, INC.(b) | | 30,630 | | 416,472 | | |
| 261,812 | | APPLE, INC. | | 6,208,173 | | 35,857,772 | | |
| 10,372 | | APPLIED MATERIALS, INC. | | 760,094 | | 1,476,973 | | |
| 300 | | ARISTA NETWORKS, INC.(b) | | 106,419 | | 108,693 | | |
| 7,925 | | ARROW ELECTRONICS, INC.(b) | | 483,101 | | 902,103 | | |
| 1,800 | | ATLASSIAN CORP. PLC, CLASS A(b)(c) | | 206,509 | | 462,348 | | |
| 4,847 | | AUTODESK, INC.(b) | | 725,032 | | 1,414,839 | | |
| 6,766 | | AUTOMATIC DATA PROCESSING, INC. | | 361,211 | | 1,343,863 | | |
| 1,400 | | BIGCOMMERCE HOLDINGS, INC., CLASS 1(b) | | 73,444 | | 90,888 | | |
| 600 | | BILL.COM HOLDINGS, INC.(b) | | 96,396 | | 109,908 | | |
| 20,661 | | BLACK KNIGHT, INC.(b) | | 1,461,752 | | 1,611,145 | | |
| 4,991 | | BROADCOM, INC. | | 1,176,093 | | 2,379,908 | | |
| 3,413 | | BROADRIDGE FINANCIAL SOLUTIONS, INC. | | 106,898 | | 551,302 | | |
| 13,500 | | CADENCE DESIGN SYSTEMS, INC.(b) | | 415,110 | | 1,847,070 | | |
| 1,522 | | CDK GLOBAL, INC. | | 19,712 | | 75,628 | | |
| 7,000 | | CDW CORP. | | 292,424 | | 1,222,550 | | |
| 8,331 | | CERENCE, INC.(b) | | 197,675 | | 889,001 | | |
| 67,140 | | CISCO SYSTEMS, INC. | | 1,392,044 | | 3,558,420 | | |
| 7,807 | | CITRIX SYSTEMS, INC. | | 821,116 | | 915,527 | | |
| 2,200 | | CLOUDFLARE, INC., CLASS A(b) | | 78,522 | | 232,848 | | |
| 1,200 | | COGNEX CORP. | | 60,629 | | 100,860 | | |
| 5,800 | | COGNIZANT TECHNOLOGY SOLUTIONS CORP., CLASS A | | 247,236 | | 401,708 | | |
| 4,830 | | CONCENTRIX CORP.(b) | | 290,324 | | 776,664 | | |
| 15,600 | | CORNING, INC. | | 85,176 | | 638,040 | | |
| 468 | | COUPA SOFTWARE, INC.(b) | | 69,825 | | 122,667 | | |
| 1,700 | | CROWDSTRIKE HOLDINGS, INC., CLASS A(b) | | 247,592 | | 427,227 | | |
| 2,100 | | DATADOG, INC., CLASS A(b) | | 179,184 | | 218,568 | | |
| 3,000 | | DATTO HOLDING CORP.(b) | | 77,153 | | 83,520 | | |
| 37,860 | | DELL TECHNOLOGIES, INC., CLASS C(b) | | 2,592,047 | | 3,773,506 | | |
| 2,800 | | DOCUSIGN, INC.(b) | | 393,007 | | 782,796 | | |
| 2,000 | | DOLBY LABORATORIES, INC., CLASS A | | 43,420 | | 196,580 | | |
| 2,300 | | DROPBOX, INC., CLASS A(b) | | 42,360 | | 69,713 | | |
| 2,100 | | DXC TECHNOLOGY CO.(b) | | 84,709 | | 81,774 | | |
| 5,362 | | ECHOSTAR CORP., CLASS A(b) | | 110,183 | | 130,243 | | |
| 600 | | ELASTIC N.V.(b) | | 80,298 | | 87,456 | | |
| 2,900 | | ENPHASE ENERGY, INC.(b) | | 433,158 | | 532,527 | | |
| 1,986 | | EPAM SYSTEMS, INC.(b) | | 687,521 | | 1,014,767 | | |
| 500 | | EURONET WORLDWIDE, INC.(b) | | 56,700 | | 67,675 | | |
| 1,300 | | F5 NETWORKS, INC.(b) | | 30,063 | | 242,658 | | |
| 300 | | FAIR ISAAC CORP.(b) | | 80,682 | | 150,804 | | |
| 12,959 | | FIDELITY NATIONAL INFORMATION SERVICES, INC. | | 538,426 | | 1,835,902 | | |
| 3,900 | | FIREEYE, INC.(b) | | 44,602 | | 78,858 | | |
| 9,784 | | FISERV, INC.(b) | | 172,685 | | 1,045,812 | | |
| 600 | | FIVE9, INC.(b) | | 64,638 | | 110,034 | | |
| 800 | | FLEETCOR TECHNOLOGIES, INC.(b) | | 196,482 | | 204,848 | | |
| 12,590 | | FORTINET, INC.(b) | | 1,590,284 | | 2,998,812 | | |
| 6,251 | | GARTNER, INC.(b) | | 1,434,294 | | 1,513,992 | | |
| See accompanying notes to financial statements. | 39 | (Continued) |
CLEARWATER INVESTMENT TRUST
Schedule of Investments - Clearwater Core Equity Fund
June 30, 2021 (unaudited)
| Shares | | Security | | Cost | | Fair value (a) | | Percent of
net assets |
| Information Technology (Cont'd): | | | | | | |
| 5,373 | | GLOBAL PAYMENTS, INC. | | $ 587,223 | | 1,007,652 | | |
| 1,000 | | GODADDY, INC., CLASS A(b) | | 55,242 | | 86,960 | | |
| 800 | | GUIDEWIRE SOFTWARE, INC.(b) | | 84,696 | | 90,176 | | |
| 18,800 | | HEWLETT PACKARD ENTERPRISE CO. | | 102,062 | | 274,104 | | |
| 94,017 | | HP, INC. | | 2,478,367 | | 2,838,373 | | |
| 300 | | HUBSPOT, INC.(b) | | 159,021 | | 174,816 | | |
| 109,601 | | INTEL CORP. | | 5,013,126 | | 6,153,000 | | |
| 22,045 | | INTERNATIONAL BUSINESS MACHINES CORP. | | 2,512,066 | | 3,231,577 | | |
| 3,500 | | INTUIT, INC. | | 75,843 | | 1,715,595 | | |
| 13,175 | | JABIL, INC. | | 259,881 | | 765,731 | | |
| 1,424 | | JACK HENRY & ASSOCIATES, INC. | | 226,588 | | 232,838 | | |
| 1,700 | | JFROG LTD.(b)(c) | | 76,137 | | 77,384 | | |
| 3,300 | | JUNIPER NETWORKS, INC. | | 91,234 | | 90,255 | | |
| 600 | | KEYSIGHT TECHNOLOGIES, INC.(b) | | 62,572 | | 92,646 | | |
| 1,015 | | KLA CORP. | | 354,783 | | 329,073 | | |
| 6,727 | | LAM RESEARCH CORP. | | 765,234 | | 4,377,259 | | |
| 6,557 | | MARVELL TECHNOLOGY, INC. | | 147,377 | | 382,470 | | |
| 12,674 | | MASTERCARD, INC., CLASS A | | 3,367,999 | | 4,627,151 | | |
| 1,900 | | MEDALLIA, INC.(b) | | 44,418 | | 64,125 | | |
| 4,200 | | MICROCHIP TECHNOLOGY, INC. | | 38,962 | | 628,908 | | |
| 32,060 | | MICRON TECHNOLOGY, INC.(b) | | 581,201 | | 2,724,459 | | |
| 121,095 | | MICROSOFT CORP. | | 7,434,661 | | 32,804,635 | | |
| 500 | | MKS INSTRUMENTS, INC. | | 32,310 | | 88,975 | | |
| 500 | | MONGODB, INC.(b) | | 160,175 | | 180,760 | | |
| 1,800 | | MOTOROLA SOLUTIONS, INC. | | 378,752 | | 390,330 | | |
| 1,200 | | NCINO, INC.(b) | | 84,357 | | 71,904 | | |
| 8,093 | | NETAPP, INC. | | 388,845 | | 662,169 | | |
| 900 | | NEW RELIC, INC.(b) | | 42,264 | | 60,273 | | |
| 22,781 | | NORTONLIFELOCK, INC. | | 207,695 | | 620,099 | | |
| 1,600 | | NUANCE COMMUNICATIONS, INC.(b) | | 87,341 | | 87,104 | | |
| 2,500 | | NUTANIX, INC., CLASS A(b) | | 86,793 | | 95,550 | | |
| 9,391 | | NVIDIA CORP. | | 2,021,474 | | 7,513,739 | | |
| 3,900 | | NXP SEMICONDUCTORS N.V.(c) | | 334,138 | | 802,308 | | |
| 3,297 | | OKTA, INC.(b) | | 513,168 | | 806,710 | | |
| 12,791 | | ON SEMICONDUCTOR CORP.(b) | | 481,458 | | 489,639 | | |
| 115,529 | | ORACLE CORP. | | 6,968,396 | | 8,992,777 | | |
| 17,600 | | PALANTIR TECHNOLOGIES, INC., CLASS A(b) | | 447,485 | | 463,936 | | |
| 4,328 | | PALO ALTO NETWORKS, INC.(b) | | 704,819 | | 1,605,904 | | |
| 3,466 | | PAYCHEX, INC. | | 336,752 | | 371,902 | | |
| 1,553 | | PAYCOM SOFTWARE, INC.(b) | | 217,948 | | 564,469 | | |
| 12,661 | | PAYPAL HOLDINGS, INC.(b) | | 1,727,011 | | 3,690,428 | | |
| 600 | | PROOFPOINT, INC.(b) | | 56,232 | | 104,256 | | |
| 6,152 | | PTC, INC.(b) | | 621,090 | | 869,032 | | |
| 4,500 | | PURE STORAGE, INC., CLASS A(b) | | 85,978 | | 87,885 | | |
| 4,379 | | QORVO, INC.(b) | | 519,351 | | 856,751 | | |
| 30,324 | | QUALCOMM, INC. | | 3,119,380 | | 4,334,209 | | |
| 1,500 | | RINGCENTRAL, INC., CLASS A(b) | | 152,618 | | 435,870 | | |
| 9,472 | | SALESFORCE.COM, INC.(b) | | 407,800 | | 2,313,725 | | |
| 37,005 | | SEAGATE TECHNOLOGY HOLDINGS PLC(c) | | 1,243,545 | | 3,253,850 | | |
| 2,100 | | SERVICENOW, INC.(b) | | 273,110 | | 1,154,055 | | |
| 3,089 | | SKYWORKS SOLUTIONS, INC. | | 243,391 | | 592,316 | | |
| 5,391 | | SLACK TECHNOLOGIES, INC., CLASS A(b) | | 232,940 | | 238,821 | | |
| 900 | | SMARTSHEET, INC., CLASS A(b) | | 39,015 | | 65,088 | | |
| 1,200 | | SNOWFLAKE, INC., CLASS A(b) | | 297,959 | | 290,160 | | |
| 1,300 | | SPLUNK, INC.(b) | | 142,677 | | 187,954 | | |
| 4,600 | | SQUARE, INC., CLASS A(b) | | 477,684 | | 1,121,480 | | |
| 1,938 | | SS&C TECHNOLOGIES HOLDINGS, INC. | | 86,602 | | 139,652 | | |
| 2,209 | | STONECO LTD., CLASS A(b)(c) | | 155,915 | | 148,136 | | |
| 4,757 | | SYNNEX CORP. | | 144,301 | | 579,212 | | |
| 6,082 | | SYNOPSYS, INC.(b) | | 540,689 | | 1,677,355 | | |
| 4,600 | | TERADYNE, INC. | | 82,730 | | 616,216 | | |
| 27,872 | | TEXAS INSTRUMENTS, INC. | | 942,644 | | 5,359,786 | | |
| 2,820 | | TRADE DESK (THE), INC., CLASS A(b) | | 216,507 | | 218,155 | | |
| 19,538 | | TRIMBLE, INC.(b) | | 996,229 | | 1,598,795 | | |
| 1,514 | | TWILIO, INC., CLASS A(b) | | 399,324 | | 596,758 | | |
| 2,100 | | UBIQUITI, INC. | | 357,603 | | 655,599 | | |
| 1,500 | | UNITY SOFTWARE, INC.(b) | | 161,848 | | 164,745 | | |
| See accompanying notes to financial statements. | 40 | (Continued) |
CLEARWATER INVESTMENT TRUST
Schedule of Investments - Clearwater Core Equity Fund
June 30, 2021 (unaudited)
| Shares | | Security | | Cost | | Fair value (a) | | Percent of
net assets |
| Information Technology (Cont'd): | | | | | | |
| 400 | | VERISIGN, INC.(b) | | $ 66,960 | | 91,076 | | |
| 19,148 | | VISA, INC., CLASS A | | 2,058,291 | | 4,477,185 | | |
| 7,800 | | VISHAY INTERTECHNOLOGY, INC. | | 48,931 | | 175,890 | | |
| 3,772 | | VMWARE, INC., CLASS A(b) | | 190,784 | | 603,407 | | |
| 5,845 | | WESTERN DIGITAL CORP.(b) | | 90,457 | | 415,989 | | |
| 60,931 | | WESTERN UNION (THE) CO. | | 1,165,310 | | 1,399,585 | | |
| 200 | | WIX.COM LTD.(b)(c) | | 57,196 | | 58,056 | | |
| 1,900 | | WORKDAY, INC., CLASS A(b) | | 339,952 | | 453,606 | | |
| 24,464 | | XEROX HOLDINGS CORP. | | 374,155 | | 574,659 | | |
| 7,695 | | XILINX, INC. | | 186,834 | | 1,113,005 | | |
| 5,648 | | ZEBRA TECHNOLOGIES CORP., CLASS A(b) | | 1,532,276 | | 2,990,560 | | |
| 1,300 | | ZENDESK, INC.(b) | | 79,216 | | 187,642 | | |
| 2,300 | | ZOOM VIDEO COMMUNICATIONS, INC., CLASS A(b) | | 581,479 | | 890,169 | | |
| 700 | | ZSCALER, INC.(b) | | 136,262 | | 151,242 | | |
| | | | | 87,918,307 | | 216,388,278 | | 27.39% |
| Materials: | | | | | | |
| 2,475 | | AIR PRODUCTS AND CHEMICALS, INC. | | 446,622 | | 712,008 | | |
| 1,300 | | ALBEMARLE CORP. | | 29,152 | | 218,998 | | |
| 14,670 | | AMCOR PLC(c) | | 71,018 | | 168,118 | | |
| 700 | | ASHLAND GLOBAL HOLDINGS, INC. | | 12,006 | | 61,250 | | |
| 3,165 | | AVERY DENNISON CORP. | | 207,899 | | 665,410 | | |
| 3,000 | | BALL CORP. | | 243,017 | | 243,060 | | |
| 4,210 | | CABOT CORP. | | 129,002 | | 239,675 | | |
| 16,337 | | CELANESE CORP. | | 1,176,262 | | 2,476,689 | | |
| 2,605 | | CHEMOURS (THE) CO. | | 28,384 | | 90,654 | | |
| 6,162 | | CORTEVA, INC. | | 77,857 | | 273,285 | | |
| 1,800 | | CROWN HOLDINGS, INC. | | 57,831 | | 183,978 | | |
| 7,262 | | DOW, INC. | | 147,036 | | 459,539 | | |
| 7,262 | | DUPONT DE NEMOURS, INC. | | 212,802 | | 562,151 | | |
| 21,296 | | EASTMAN CHEMICAL CO. | | 1,573,767 | | 2,486,308 | | |
| 3,191 | | ECOLAB, INC. | | 114,294 | | 657,250 | | |
| 700 | | FMC CORP. | | 83,405 | | 75,740 | | |
| 29,746 | | FREEPORT-MCMORAN, INC. | | 622,998 | | 1,103,874 | | |
| 15,846 | | HUNTSMAN CORP. | | 249,978 | | 420,236 | | |
| 2,138 | | INTERNATIONAL FLAVORS & FRAGRANCES, INC. | | 280,273 | | 319,417 | | |
| 38,587 | | INTERNATIONAL PAPER CO. | | 1,300,493 | | 2,365,769 | | |
| 5,779 | | LINDE PLC(c) | | 1,098,676 | | 1,670,709 | | |
| 10,374 | | LYONDELLBASELL INDUSTRIES N.V., CLASS A | | 520,142 | | 1,067,173 | | |
| 700 | | MARTIN MARIETTA MATERIALS, INC. | | 27,965 | | 246,267 | | |
| 7,400 | | NEWMONT CORP. | | 136,530 | | 469,012 | | |
| 5,844 | | NUCOR CORP. | | 99,313 | | 560,615 | | |
| 1,768 | | PACKAGING CORP. OF AMERICA | | 176,100 | | 239,423 | | |
| 5,172 | | PPG INDUSTRIES, INC. | | 123,888 | | 878,051 | | |
| 8,237 | | RELIANCE STEEL & ALUMINUM CO. | | 663,588 | | 1,242,963 | | |
| 600 | | ROYAL GOLD, INC. | | 22,314 | | 68,460 | | |
| 2,400 | | RPM INTERNATIONAL, INC. | | 24,657 | | 212,832 | | |
| 500 | | SCOTTS MIRACLE-GRO (THE) CO. | | 37,765 | | 95,960 | | |
| 1,400 | | SEALED AIR CORP. | | 24,528 | | 82,950 | | |
| 400 | | SHERWIN-WILLIAMS (THE) CO. | | 111,978 | | 108,980 | | |
| 2,509 | | SILGAN HOLDINGS, INC. | | 89,461 | | 104,124 | | |
| 3,600 | | SONOCO PRODUCTS CO. | | 74,519 | | 240,840 | | |
| 3,034 | | SOUTHERN COPPER CORP.(c) | | 36,068 | | 195,147 | | |
| 11,903 | | STEEL DYNAMICS, INC. | | 182,235 | | 709,419 | | |
| 4,392 | | VALVOLINE, INC. | | 24,184 | | 142,564 | | |
| 2,100 | | VULCAN MATERIALS CO. | | 63,441 | | 365,547 | | |
| 2,242 | | WESTROCK CO. | | 24,357 | | 119,319 | | |
| | | | | 10,625,805 | | 22,603,764 | | 2.86% |
| Real Estate: | | | | | | |
| 2,129 | | ALEXANDRIA REAL ESTATE EQUITIES, INC. | | 110,363 | | 387,350 | | |
| 3,152 | | AMERICAN HOMES 4 RENT, CLASS A | | 102,424 | | 122,455 | | |
| 4,980 | | AMERICAN TOWER CORP. | | 684,176 | | 1,345,297 | | |
| 2,837 | | AMERICOLD REALTY TRUST | | 108,267 | | 107,380 | | |
| 3,708 | | APARTMENT INCOME REIT CORP. | | 79,206 | | 175,870 | | |
| 3,708 | | APARTMENT INVESTMENT AND MANAGEMENT CO., CLASS A | | 73,924 | | 24,881 | | |
| 1,034 | | AVALONBAY COMMUNITIES, INC. | | 90,095 | | 215,785 | | |
| 14,826 | | BOSTON PROPERTIES, INC. | | 1,269,857 | | 1,698,911 | | |
| See accompanying notes to financial statements. | 41 | (Continued) |
CLEARWATER INVESTMENT TRUST
Schedule of Investments - Clearwater Core Equity Fund
June 30, 2021 (unaudited)
| Shares | | Security | | Cost | | Fair value (a) | | Percent of
net assets |
| Real Estate (Cont'd): | | | | | | |
| 46,503 | | BRIXMOR PROPERTY GROUP, INC. | | $ 409,622 | | 1,064,454 | | |
| 2,153 | | CAMDEN PROPERTY TRUST | | 123,455 | | 285,639 | | |
| 1,200 | | CBRE GROUP, INC., CLASS A(b) | | 107,193 | | 102,876 | | |
| 500 | | CORESITE REALTY CORP. | | 43,021 | | 67,300 | | |
| 4,700 | | CROWN CASTLE INTERNATIONAL CORP. | | 183,007 | | 916,970 | | |
| 2,027 | | CUBESMART | | 52,679 | | 93,891 | | |
| 1,242 | | CYRUSONE, INC. | | 71,196 | | 88,828 | | |
| 3,157 | | DIGITAL REALTY TRUST, INC. | | 355,268 | | 475,002 | | |
| 24,200 | | DIGITALBRIDGE GROUP, INC.(b) | | 47,800 | | 191,180 | | |
| 5,200 | | DOUGLAS EMMETT, INC. | | 42,689 | | 174,824 | | |
| 3,200 | | DUKE REALTY CORP. | | 101,873 | | 151,520 | | |
| 315 | | EPR PROPERTIES(b) | | 6,839 | | 16,594 | | |
| 1,052 | | EQUINIX, INC. | | 213,293 | | 844,335 | | |
| 1,905 | | EQUITY COMMONWEALTH | | 50,488 | | 49,911 | | |
| 1,600 | | EQUITY LIFESTYLE PROPERTIES, INC. | | 26,661 | | 118,896 | | |
| 5,416 | | EQUITY RESIDENTIAL | | 174,162 | | 417,032 | | |
| 4,777 | | ESSEX PROPERTY TRUST, INC. | | 1,054,951 | | 1,433,148 | | |
| 600 | | EXTRA SPACE STORAGE, INC. | | 98,202 | | 98,292 | | |
| 900 | | FEDERAL REALTY INVESTMENT TRUST | | 47,642 | | 105,453 | | |
| 1,046 | | FOUR CORNERS PROPERTY TRUST, INC. | | 8,347 | | 28,880 | | |
| 2,070 | | GAMING AND LEISURE PROPERTIES, INC. | | 56,601 | | 95,903 | | |
| 7,000 | | HEALTHPEAK PROPERTIES, INC. | | 70,562 | | 233,030 | | |
| 10,022 | | HOST HOTELS & RESORTS, INC.(b) | | 68,301 | | 171,276 | | |
| 678 | | HOWARD HUGHES (THE) CORP.(b) | | 20,502 | | 66,078 | | |
| 6,000 | | INVITATION HOMES, INC. | | 224,375 | | 223,740 | | |
| 2,000 | | IRON MOUNTAIN, INC. | | 90,735 | | 84,640 | | |
| 700 | | JBG SMITH PROPERTIES | | 17,888 | | 22,057 | | |
| 700 | | JONES LANG LASALLE, INC.(b) | | 39,951 | | 136,822 | | |
| 4,001 | | KIMCO REALTY CORP. | | 37,026 | | 83,421 | | |
| 4,678 | | LAMAR ADVERTISING CO., CLASS A | | 75,755 | | 488,477 | | |
| 1,800 | | MID-AMERICA APARTMENT COMMUNITIES, INC. | | 132,698 | | 303,156 | | |
| 2,500 | | OMEGA HEALTHCARE INVESTORS, INC. | | 91,768 | | 90,725 | | |
| 5,300 | | OPENDOOR TECHNOLOGIES, INC.(b) | | 87,217 | | 93,969 | | |
| 14,011 | | OUTFRONT MEDIA, INC.(b) | | 169,061 | | 336,684 | | |
| 10,911 | | PROLOGIS, INC. | | 280,831 | | 1,304,192 | | |
| 1,735 | | PUBLIC STORAGE | | 227,274 | | 521,697 | | |
| 6,972 | | RAYONIER, INC. | | 74,591 | | 250,504 | | |
| 4,000 | | REALTY INCOME CORP. | | 146,533 | | 266,960 | | |
| 3,900 | | REGENCY CENTERS CORP. | | 85,345 | | 249,873 | | |
| 1,780 | | REXFORD INDUSTRIAL REALTY, INC. | | 87,624 | | 101,371 | | |
| 2,100 | | SBA COMMUNICATIONS CORP. | | 214,169 | | 669,270 | | |
| 9,577 | | SIMON PROPERTY GROUP, INC. | | 1,133,688 | | 1,249,607 | | |
| 2,400 | | STORE CAPITAL CORP. | | 86,393 | | 82,824 | | |
| 1,133 | | SUN COMMUNITIES, INC. | | 87,255 | | 194,196 | | |
| 4,100 | | UDR, INC. | | 63,318 | | 200,818 | | |
| 13,505 | | VENTAS, INC. | | 737,808 | | 771,136 | | |
| 2,020 | | VEREIT, INC. | | 48,318 | | 92,779 | | |
| 23,413 | | VICI PROPERTIES, INC. | | 659,008 | | 726,271 | | |
| 2,584 | | WEINGARTEN REALTY INVESTORS | | 36,731 | | 82,869 | | |
| 4,500 | | WELLTOWER, INC. | | 351,703 | | 373,950 | | |
| 57,504 | | WEYERHAEUSER CO. | | 1,856,526 | | 1,979,288 | | |
| 1,800 | | WP CAREY, INC. | | 137,642 | | 134,316 | | |
| | | | | 13,233,897 | | 22,484,853 | | 2.85% |
| Utilities: | | | | | | |
| 3,700 | | AES (THE) CORP. | | 51,047 | | 96,459 | | |
| 2,000 | | ALLIANT ENERGY CORP. | | 24,835 | | 111,520 | | |
| 1,700 | | AMEREN CORP. | | 48,382 | | 136,068 | | |
| 4,800 | | AMERICAN ELECTRIC POWER CO., INC. | | 280,084 | | 406,032 | | |
| 700 | | AMERICAN WATER WORKS CO., INC. | | 112,353 | | 107,891 | | |
| 2,600 | | ATMOS ENERGY CORP. | | 255,011 | | 249,886 | | |
| 13,200 | | AVANGRID, INC. | | 502,113 | | 678,876 | | |
| 5,800 | | CENTERPOINT ENERGY, INC. | | 66,308 | | 142,216 | | |
| 13,300 | | CMS ENERGY CORP. | | 259,708 | | 785,764 | | |
| 16,530 | | CONSOLIDATED EDISON, INC. | | 1,188,808 | | 1,185,532 | | |
| 12,073 | | DOMINION ENERGY, INC. | | 450,978 | | 888,211 | | |
| 2,300 | | DTE ENERGY CO. | | 84,036 | | 298,080 | | |
| 7,532 | | DUKE ENERGY CORP. | | 247,003 | | 743,559 | | |
| See accompanying notes to financial statements. | 42 | (Continued) |
CLEARWATER INVESTMENT TRUST
Schedule of Investments - Clearwater Core Equity Fund
June 30, 2021 (unaudited)
| Shares | | Security | | Cost | | Fair value (a) | | Percent of
net assets |
| Utilities (Cont'd): | | | | | | |
| 4,425 | | EDISON INTERNATIONAL | | $ 136,263 | | 255,853 | | |
| 764 | | ENTERGY CORP. | | 46,655 | | 76,171 | | |
| 2,035 | | ESSENTIAL UTILITIES, INC. | | 37,362 | | 93,000 | | |
| 2,974 | | EVERGY, INC. | | 67,407 | | 179,719 | | |
| 4,961 | | EVERSOURCE ENERGY | | 125,492 | | 398,071 | | |
| 10,500 | | EXELON CORP. | | 480,432 | | 465,255 | | |
| 5,500 | | FIRSTENERGY CORP. | | 168,113 | | 204,655 | | |
| 900 | | NATIONAL FUEL GAS CO. | | 20,790 | | 47,025 | | |
| 17,554 | | NEXTERA ENERGY, INC. | | 203,346 | | 1,286,357 | | |
| 23,173 | | NISOURCE, INC. | | 444,987 | | 567,738 | | |
| 38,432 | | NRG ENERGY, INC. | | 1,268,718 | | 1,548,810 | | |
| 4,800 | | OGE ENERGY CORP. | | 43,344 | | 161,520 | | |
| 14,659 | | PG&E CORP.(b) | | 151,109 | | 149,082 | | |
| 2,400 | | PINNACLE WEST CAPITAL CORP. | | 71,637 | | 196,728 | | |
| 8,500 | | PPL CORP. | | 236,326 | | 237,745 | | |
| 17,961 | | PUBLIC SERVICE ENTERPRISE GROUP, INC. | | 886,484 | | 1,072,990 | | |
| 3,300 | | SEMPRA ENERGY | | 188,982 | | 437,184 | | |
| 8,600 | | SOUTHERN (THE) CO. | | 176,010 | | 520,386 | | |
| 4,650 | | UGI CORP. | | 51,203 | | 215,341 | | |
| 5,600 | | VISTRA CORP. | | 91,125 | | 103,880 | | |
| 3,555 | | WEC ENERGY GROUP, INC. | | 268,790 | | 316,217 | | |
| 6,593 | | XCEL ENERGY, INC. | | 421,096 | | 434,347 | | |
| | | | | 9,156,337 | | 14,798,168 | | 1.87% |
| | | Sub-total Common Stocks: | | 376,021,558 | | 786,637,678 | | 99.57% |
| Preferred Stocks: | | | | | | |
| Consumer Discretionary: | | | | | | |
| 355 | | QURATE RETAIL, INC., 8.00% | | 14,247 | | 38,428 | | |
| | | | | 14,247 | | 38,428 | | 0.00% |
| | | Sub-total Preferred Stocks: | | 14,247 | | 38,428 | | 0.00% |
| Short-Term Investments: | | | | | | |
| 3,153,852 | | NORTHERN INSTITUTIONAL FUNDS - U.S. GOVERNMENT SELECT PORTFOLIO, INSTITUTIONAL SHARES, 0.03%(e) | | 3,153,852 | | 3,153,852 | | |
| | | Sub-total Short-Term Investments: | | 3,153,852 | | 3,153,852 | | 0.40% |
| | | Grand total | | $ 379,189,657 | | 789,829,958 | | 99.97% |
| Notes to Schedule of Investments: |
| (a) | Investments are valued in accordance with procedures described in Note 2 to the financial statements. |
| (b) | Non-income producing assets. |
| (c) | Foreign security values are stated in U.S. dollars. As of June 30, 2021, the value of foreign stocks or depositary receipts of companies based outside of the United States represented 2.86% of net assets. |
| (d) | Securities are American Depositary Receipts of companies based outside of the United States representing 0.01% of net assets as of June 30, 2021. |
| (e) | The short-term investment is a money market portfolio of the investment company, Northern Institutional Funds. At December 31, 2020, the value of the Clearwater Core Equity Fund's investment in the U.S. Government Select Portfolio of the Northern Institutional Funds was $7,392,427 with net sales of $4,238,575 during the six months ended June 30, 2021. |
| See accompanying notes to financial statements. | 43 | (Continued) |
CLEARWATER INVESTMENT TRUST
Schedule of Investments - Clearwater Core Equity Fund
June 30, 2021 (unaudited)
Clearwater Core Equity Fund Portfolio Diversification
(as a percentage of net assets)
| See accompanying notes to financial statements. | 44 | (Continued) |
CLEARWATER INVESTMENT TRUST
Schedule of Investments - Clearwater Select Equity Fund
June 30, 2021 (unaudited)
| Shares | | Security | | Cost | | Fair value (a) | | Percent of
net assets |
| Common Stocks: | | | | | | |
| Communication Services: | | | | | | |
| 4,636 | | AMC NETWORKS, INC., CLASS A(b) | | $ 261,607 | | 309,685 | | |
| 3,960 | | ATN INTERNATIONAL, INC. | | 182,002 | | 180,140 | | |
| 2,932 | | CINCINNATI BELL, INC.(b) | | 43,797 | | 45,211 | | |
| 6,405 | | COGENT COMMUNICATIONS HOLDINGS, INC. | | 468,279 | | 492,480 | | |
| 3,841 | | CONSOLIDATED COMMUNICATIONS HOLDINGS, INC.(b) | | 20,535 | | 33,762 | | |
| 4,700 | | EW SCRIPPS (THE) CO., CLASS A | | 101,924 | | 95,833 | | |
| 23,415 | | LIBERTY BROADBAND CORP., CLASS C(b) | | 3,443,713 | | 4,066,249 | | |
| 6,643 | | MEREDITH CORP.(b) | | 235,665 | | 288,572 | | |
| 195,369 | | NEW YORK TIMES (THE) CO., CLASS A | | 8,759,126 | | 8,508,320 | | |
| 2,477 | | QUINSTREET, INC.(b) | | 41,581 | | 46,023 | | |
| 3,588 | | SAGA COMMUNICATIONS, INC., CLASS A | | 67,673 | | 77,680 | | |
| 7,249 | | SCHOLASTIC CORP. | | 278,852 | | 274,665 | | |
| 5,678 | | SHENANDOAH TELECOMMUNICATIONS CO. | | 276,925 | | 275,440 | | |
| 2,066 | | SPOK HOLDINGS, INC. | | 19,790 | | 19,875 | | |
| 4,181 | | TECHTARGET, INC.(b) | | 309,012 | | 323,986 | | |
| | | | | 14,510,481 | | 15,037,921 | | 2.75% |
| Consumer Discretionary: | | | | | | |
| 3,200 | | AARON'S (THE) CO., INC. | | 100,245 | | 102,368 | | |
| 7,423 | | ABERCROMBIE & FITCH CO., CLASS A(b) | | 258,012 | | 344,650 | | |
| 23,926 | | AMERICAN AXLE & MANUFACTURING HOLDINGS, INC.(b) | | 239,652 | | 247,634 | | |
| 80,720 | | AMERICAN EAGLE OUTFITTERS, INC. | | 1,466,455 | | 3,029,422 | | |
| 909 | | AMERICAN PUBLIC EDUCATION, INC.(b) | | 26,610 | | 25,761 | | |
| 1,096 | | AMERICA'S CAR-MART, INC.(b) | | 162,878 | | 155,325 | | |
| 2,571 | | ASBURY AUTOMOTIVE GROUP, INC.(b) | | 382,734 | | 440,592 | | |
| 16,090 | | BED BATH & BEYOND, INC.(b) | | 401,345 | | 535,636 | | |
| 4,556 | | BIG LOTS, INC. | | 262,446 | | 300,742 | | |
| 6,265 | | BJ'S RESTAURANTS, INC.(b) | | 307,101 | | 307,862 | | |
| 10,476 | | BLOOMIN' BRANDS, INC.(b) | | 219,368 | | 284,319 | | |
| 77,453 | | BLUEGREEN VACATIONS HOLDING CORP.(b) | | 898,535 | | 1,394,154 | | |
| 3,895 | | BOOT BARN HOLDINGS, INC.(b) | | 290,294 | | 327,375 | | |
| 6,041 | | BRINKER INTERNATIONAL, INC.(b) | | 346,424 | | 373,636 | | |
| 3,353 | | BUCKLE (THE), INC. | | 132,096 | | 166,812 | | |
| 2,030 | | CALERES, INC. | | 21,290 | | 55,399 | | |
| 5,798 | | CALLAWAY GOLF CO.(b) | | 162,684 | | 195,567 | | |
| 303 | | CARRIAGE SERVICES, INC. | | 5,308 | | 11,202 | | |
| 2,074 | | CATO (THE) CORP., CLASS A | | 16,670 | | 34,988 | | |
| 1,343 | | CAVCO INDUSTRIES, INC.(b) | | 277,442 | | 298,401 | | |
| 4,526 | | CENTURY COMMUNITIES, INC. | | 313,348 | | 301,160 | | |
| 5,791 | | CHEESECAKE FACTORY (THE), INC.(b) | | 334,450 | | 313,756 | | |
| 1,725 | | CHILDREN'S PLACE (THE), INC.(b) | | 113,870 | | 160,529 | | |
| 2,400 | | CHUY'S HOLDINGS, INC.(b) | | 113,969 | | 89,424 | | |
| 1,666 | | CONN'S, INC.(b) | | 19,489 | | 42,483 | | |
| 6,116 | | CORE-MARK HOLDING CO., INC. | | 250,271 | | 275,281 | | |
| 956 | | CROCS, INC.(b) | | 93,641 | | 111,393 | | |
| 167,340 | | DANA, INC. | | 2,111,003 | | 3,975,998 | | |
| 6,900 | | DAVE & BUSTER'S ENTERTAINMENT, INC.(b) | | 240,316 | | 280,140 | | |
| 32,138 | | DESIGNER BRANDS, INC., CLASS A(b) | | 508,161 | | 531,884 | | |
| 3,169 | | DINE BRANDS GLOBAL, INC.(b) | | 253,027 | | 282,833 | | |
| 3,832 | | DORMAN PRODUCTS, INC.(b) | | 345,307 | | 397,263 | | |
| 1,141 | | EL POLLO LOCO HOLDINGS, INC.(b) | | 17,103 | | 20,869 | | |
| 4,841 | | ETHAN ALLEN INTERIORS, INC. | | 149,383 | | 133,612 | | |
| 112,471 | | FARFETCH LTD., CLASS A(b)(c) | | 4,043,331 | | 5,664,040 | | |
| 15,875 | | FIVERR INTERNATIONAL LTD.(b)(c) | | 2,674,606 | | 3,849,529 | | |
| 7,700 | | GAMESTOP CORP., CLASS A(b) | | 1,615,749 | | 1,648,878 | | |
| 4,900 | | GENESCO, INC.(b) | | 294,847 | | 312,032 | | |
| 4,058 | | GENTHERM, INC.(b) | | 289,017 | | 288,321 | | |
| 2,387 | | G-III APPAREL GROUP LTD.(b) | | 34,366 | | 78,437 | | |
| 121,376 | | GILDAN ACTIVEWEAR, INC.(c) | | 2,859,852 | | 4,481,202 | | |
| 2,440 | | GOODYEAR TIRE & RUBBER (THE) CO.(b) | | 49,931 | | 41,843 | | |
| 2,347 | | GROUP 1 AUTOMOTIVE, INC. | | 339,126 | | 362,447 | | |
| 4,613 | | GUESS?, INC. | | 131,037 | | 121,783 | | |
| 89,600 | | HANESBRANDS, INC. | | 1,290,069 | | 1,672,832 | | |
| 3,245 | | HAVERTY FURNITURE COS., INC. | | 159,619 | | 138,756 | | |
| 21,500 | | HELEN OF TROY LTD.(b) | | 3,500,941 | | 4,904,580 | | |
| 3,700 | | HIBBETT, INC.(b) | | 284,908 | | 331,631 | | |
| 58,638 | | HOOKER FURNITURE CORP. | | 1,347,057 | | 2,031,220 | | |
| See accompanying notes to financial statements. | 45 | (Continued) |
CLEARWATER INVESTMENT TRUST
Schedule of Investments - Clearwater Select Equity Fund
June 30, 2021 (unaudited)
| Shares | | Security | | Cost | | Fair value (a) | | Percent of
net assets |
| Consumer Discretionary (Cont'd): | | | | | | |
| 3,404 | | INSTALLED BUILDING PRODUCTS, INC. | | $ 372,612 | | 416,513 | | |
| 3,834 | | IROBOT CORP.(b) | | 362,472 | | 358,057 | | |
| 6,261 | | KONTOOR BRANDS, INC. | | 351,846 | | 353,183 | | |
| 6,603 | | LA-Z-BOY, INC. | | 223,537 | | 244,575 | | |
| 4,096 | | LCI INDUSTRIES | | 560,988 | | 538,296 | | |
| 3,063 | | LGI HOMES, INC.(b) | | 497,543 | | 496,022 | | |
| 114,100 | | LIFETIME BRANDS, INC. | | 972,700 | | 1,708,077 | | |
| 1,246 | | LUMBER LIQUIDATORS HOLDINGS, INC.(b) | | 17,493 | | 26,291 | | |
| 4,435 | | M/I HOMES, INC.(b) | | 286,880 | | 260,201 | | |
| 42,908 | | MACY'S, INC.(b) | | 703,307 | | 813,536 | | |
| 31,240 | | MALIBU BOATS, INC., CLASS A(b) | | 1,560,435 | | 2,290,829 | | |
| 889 | | MARINEMAX, INC.(b) | | 20,195 | | 43,330 | | |
| 5,209 | | MDC HOLDINGS, INC. | | 253,694 | | 263,575 | | |
| 4,938 | | MERITAGE HOMES CORP.(b) | | 496,160 | | 464,567 | | |
| 4,394 | | MONRO, INC. | | 262,755 | | 279,063 | | |
| 79,706 | | MOTORCAR PARTS OF AMERICA, INC.(b) | | 1,466,568 | | 1,788,603 | | |
| 7,350 | | ODP (THE) CORP.(b) | | 300,033 | | 352,873 | | |
| 2,646 | | OXFORD INDUSTRIES, INC. | | 226,381 | | 261,531 | | |
| 50,009 | | PAPA JOHN'S INTERNATIONAL, INC. | | 4,494,029 | | 5,222,940 | | |
| 3,496 | | PATRICK INDUSTRIES, INC. | | 239,004 | | 255,208 | | |
| 41,936 | | PERDOCEO EDUCATION CORP.(b) | | 542,512 | | 514,555 | | |
| 4,157 | | PETMED EXPRESS, INC. | | 139,444 | | 132,400 | | |
| 32,737 | | PVH CORP.(b) | | 2,540,343 | | 3,522,174 | | |
| 2,225 | | REGIS CORP.(b) | | 20,464 | | 20,826 | | |
| 7,190 | | RENT-A-CENTER, INC. | | 387,137 | | 381,573 | | |
| 2,351 | | RUTH'S HOSPITALITY GROUP, INC.(b) | | 20,747 | | 54,144 | | |
| 15,837 | | SALLY BEAUTY HOLDINGS, INC.(b) | | 286,943 | | 349,523 | | |
| 4,746 | | SHAKE SHACK, INC., CLASS A(b) | | 399,087 | | 507,917 | | |
| 3,134 | | SHUTTERSTOCK, INC. | | 290,762 | | 307,665 | | |
| 7,160 | | SIGNET JEWELERS LTD.(b) | | 439,243 | | 578,456 | | |
| 3,290 | | SLEEP NUMBER CORP.(b) | | 316,785 | | 361,735 | | |
| 3,535 | | SONIC AUTOMOTIVE, INC., CLASS A | | 155,651 | | 158,156 | | |
| 2,490 | | STAMPS.COM, INC.(b) | | 496,785 | | 498,722 | | |
| 2,964 | | STANDARD MOTOR PRODUCTS, INC. | | 135,447 | | 128,489 | | |
| 10,168 | | STEVEN MADDEN LTD. | | 380,709 | | 444,952 | | |
| 56,458 | | STITCH FIX, INC., CLASS A(b) | | 2,326,622 | | 3,404,417 | | |
| 61,030 | | STONERIDGE, INC.(b) | | 1,331,924 | | 1,800,385 | | |
| 1,506 | | STURM RUGER & CO., INC. | | 99,536 | | 135,510 | | |
| 2,546 | | TUPPERWARE BRANDS CORP.(b) | | 72,528 | | 60,468 | | |
| 1,272 | | UNIFI, INC.(b) | | 18,074 | | 30,986 | | |
| 5,700 | | UNIVERSAL ELECTRONICS, INC.(b) | | 225,710 | | 276,450 | | |
| 7,913 | | VISTA OUTDOOR, INC.(b) | | 267,754 | | 366,214 | | |
| 91,032 | | VROOM, INC.(b) | | 3,902,374 | | 3,810,600 | | |
| 69,324 | | WINNEBAGO INDUSTRIES, INC. | | 2,849,321 | | 4,711,259 | | |
| 10,867 | | WOLVERINE WORLD WIDE, INC. | | 326,658 | | 365,566 | | |
| 55,812 | | WYNDHAM HOTELS & RESORTS, INC. | | 2,990,783 | | 4,034,649 | | |
| 2,300 | | ZUMIEZ, INC.(b) | | 101,562 | | 112,677 | | |
| | | | | 64,488,920 | | 84,983,739 | | 15.53% |
| Consumer Staples: | | | | | | |
| 5,803 | | ANDERSONS (THE), INC. | | 163,955 | | 177,166 | | |
| 8,395 | | B&G FOODS, INC. | | 253,899 | | 275,356 | | |
| 2,447 | | CALAVO GROWERS, INC. | | 179,242 | | 155,189 | | |
| 4,429 | | CAL-MAINE FOODS, INC. | | 167,553 | | 160,374 | | |
| 4,316 | | CELSIUS HOLDINGS, INC.(b) | | 279,715 | | 328,405 | | |
| 5,471 | | CENTRAL GARDEN & PET CO., CLASS A(b) | | 238,390 | | 264,249 | | |
| 1,424 | | CHEFS' WAREHOUSE (THE), INC.(b) | | 36,595 | | 45,326 | | |
| 1,000 | | COCA-COLA CONSOLIDATED, INC. | | 373,118 | | 402,130 | | |
| 7,108 | | EDGEWELL PERSONAL CARE CO. | | 298,542 | | 312,041 | | |
| 3,500 | | ELF BEAUTY, INC.(b) | | 106,038 | | 94,990 | | |
| 3,758 | | FRESH DEL MONTE PRODUCE, INC. | | 131,817 | | 123,563 | | |
| 196,235 | | GROCERY OUTLET HOLDING CORP.(b) | | 7,485,654 | | 6,801,505 | | |
| 9,830 | | INGREDION, INC. | | 883,869 | | 889,615 | | |
| 3,844 | | INTER PARFUMS, INC. | | 279,759 | | 276,768 | | |
| 1,652 | | J & J SNACK FOODS CORP. | | 263,991 | | 288,125 | | |
| 2,978 | | JOHN B. SANFILIPPO & SON, INC. | | 227,582 | | 263,762 | | |
| 1,492 | | MEDIFAST, INC. | | 393,944 | | 422,206 | | |
| 2,612 | | NATIONAL BEVERAGE CORP. | | 116,343 | | 123,365 | | |
| See accompanying notes to financial statements. | 46 | (Continued) |
CLEARWATER INVESTMENT TRUST
Schedule of Investments - Clearwater Select Equity Fund
June 30, 2021 (unaudited)
| Shares | | Security | | Cost | | Fair value (a) | | Percent of
net assets |
| Consumer Staples (Cont'd): | | | | | | |
| 43,208 | | NATURE'S SUNSHINE PRODUCTS, INC. | | $ 398,015 | | 750,523 | | |
| 3,067 | | PRICESMART, INC. | | 270,183 | | 279,128 | | |
| 11,191 | | SIMPLY GOOD FOODS (THE) CO.(b) | | 385,972 | | 408,583 | | |
| 1,856 | | SPARTANNASH CO. | | 34,032 | | 35,839 | | |
| 25,159 | | SPECTRUM BRANDS HOLDINGS, INC. | | 1,560,457 | | 2,139,521 | | |
| 8,055 | | UNITED NATURAL FOODS, INC.(b) | | 291,854 | | 297,874 | | |
| 49,422 | | UNIVERSAL CORP. | | 2,518,191 | | 2,815,571 | | |
| 1,260 | | USANA HEALTH SCIENCES, INC.(b) | | 121,258 | | 129,062 | | |
| 19,987 | | VECTOR GROUP LTD. | | 260,363 | | 282,616 | | |
| 1,735 | | WD-40 CO. | | 401,542 | | 444,663 | | |
| | | | | 18,121,873 | | 18,987,515 | | 3.47% |
| Energy: | | | | | | |
| 9,497 | | ARCHROCK, INC. | | 70,615 | | 84,618 | | |
| 2,788 | | BONANZA CREEK ENERGY, INC. | | 132,449 | | 131,231 | | |
| 1,386 | | BRISTOW GROUP, INC.(b) | | 33,470 | | 35,495 | | |
| 5,993 | | CALLON PETROLEUM CO.(b) | | 270,517 | | 345,736 | | |
| 10,621 | | CORE LABORATORIES N.V.(c) | | 474,544 | | 413,688 | | |
| 43,253 | | DMC GLOBAL, INC.(b) | | 1,889,757 | | 2,431,251 | | |
| 7,255 | | DRIL-QUIP, INC.(b) | | 254,833 | | 245,437 | | |
| 8,543 | | GREEN PLAINS, INC.(b) | | 243,196 | | 287,216 | | |
| 6,213 | | HELIX ENERGY SOLUTIONS GROUP, INC.(b) | | 20,042 | | 35,476 | | |
| 12,750 | | HELMERICH & PAYNE, INC. | | 390,192 | | 416,033 | | |
| 14,740 | | MATADOR RESOURCES CO. | | 498,723 | | 530,787 | | |
| 86,451 | | MURPHY OIL CORP. | | 823,486 | | 2,012,579 | | |
| 2,200 | | NABORS INDUSTRIES LTD.(b) | | 258,990 | | 251,328 | | |
| 501,528 | | NEXTIER OILFIELD SOLUTIONS, INC.(b) | | 1,531,334 | | 2,387,273 | | |
| 115,661 | | NOV, INC.(b) | | 1,184,635 | | 1,771,927 | | |
| 16,721 | | OCEANEERING INTERNATIONAL, INC.(b) | | 282,545 | | 260,346 | | |
| 2,364 | | PAR PACIFIC HOLDINGS, INC.(b) | | 17,723 | | 39,763 | | |
| 28,137 | | PATTERSON-UTI ENERGY, INC. | | 259,044 | | 279,682 | | |
| 16,355 | | PBF ENERGY, INC., CLASS A(b) | | 249,859 | | 250,232 | | |
| 13,224 | | PDC ENERGY, INC. | | 446,873 | | 605,527 | | |
| 24,800 | | PROPETRO HOLDING CORP.(b) | | 268,216 | | 227,168 | | |
| 36,068 | | RANGE RESOURCES CORP.(b) | | 428,107 | | 604,500 | | |
| 6,555 | | RENEWABLE ENERGY GROUP, INC.(b) | | 439,210 | | 408,639 | | |
| 258 | | REX AMERICAN RESOURCES CORP.(b) | | 16,958 | | 23,266 | | |
| 16,175 | | SM ENERGY CO. | | 334,790 | | 398,390 | | |
| 90,097 | | SOUTHWESTERN ENERGY CO.(b) | | 418,247 | | 510,850 | | |
| 16,300 | | TALOS ENERGY, INC.(b) | | 288,899 | | 254,932 | | |
| 183,349 | | TECHNIPFMC PLC(c) | | 1,287,155 | | 1,659,308 | | |
| 7,800 | | US SILICA HOLDINGS, INC.(b) | | 107,372 | | 90,168 | | |
| | | | | 12,921,781 | | 16,992,846 | | 3.11% |
| Financials: | | | | | | |
| 4,626 | | ALLEGIANCE BANCSHARES, INC. | | 160,533 | | 177,823 | | |
| 118,724 | | AMERICAN EQUITY INVESTMENT LIFE HOLDING CO. | | 3,240,453 | | 3,837,160 | | |
| 11,569 | | AMERIS BANCORP | | 613,028 | | 585,738 | | |
| 1,700 | | AMERISAFE, INC. | | 106,093 | | 101,473 | | |
| 17,153 | | APOLLO COMMERCIAL REAL ESTATE FINANCE, INC. | | 282,277 | | 273,590 | | |
| 46,620 | | ARGO GROUP INTERNATIONAL HOLDINGS LTD.(c) | | 2,058,845 | | 2,416,315 | | |
| 3,448 | | ARMOUR RESIDENTIAL REIT, INC. | | 29,192 | | 39,376 | | |
| 190,850 | | ASSOCIATED BANC-CORP | | 3,227,122 | | 3,908,608 | | |
| 12,795 | | ASSURED GUARANTY LTD.(c) | | 575,337 | | 607,507 | | |
| 85,286 | | AXIS CAPITAL HOLDINGS LTD.(c) | | 4,244,552 | | 4,179,867 | | |
| 5,888 | | AXOS FINANCIAL, INC.(b) | | 276,095 | | 273,144 | | |
| 1,500 | | B RILEY FINANCIAL, INC. | | 105,297 | | 113,250 | | |
| 2,140 | | BANC OF CALIFORNIA, INC. | | 21,614 | | 37,536 | | |
| 953 | | BANCFIRST CORP. | | 42,865 | | 59,496 | | |
| 6,263 | | BANCORP (THE), INC.(b) | | 165,004 | | 144,112 | | |
| 17,028 | | BANKUNITED, INC. | | 669,145 | | 726,925 | | |
| 4,976 | | BANNER CORP. | | 240,267 | | 269,749 | | |
| 10,100 | | BERKSHIRE HILLS BANCORP, INC. | | 163,915 | | 276,841 | | |
| 8,764 | | BLUCORA, INC.(b) | | 159,641 | | 151,705 | | |
| 19,380 | | BOSTON PRIVATE FINANCIAL HOLDINGS, INC. | | 295,226 | | 285,855 | | |
| 7,079 | | BRIGHTSPHERE INVESTMENT GROUP, INC. | | 129,382 | | 165,861 | | |
| 10,997 | | BROOKLINE BANCORP, INC. | | 150,063 | | 164,405 | | |
| 20,819 | | CADENCE BANCORP | | 434,141 | | 434,701 | | |
| 22,759 | | CAPITOL FEDERAL FINANCIAL, INC. | | 275,216 | | 268,101 | | |
| See accompanying notes to financial statements. | 47 | (Continued) |
CLEARWATER INVESTMENT TRUST
Schedule of Investments - Clearwater Select Equity Fund
June 30, 2021 (unaudited)
| Shares | | Security | | Cost | | Fair value (a) | | Percent of
net assets |
| Financials (Cont'd): | | | | | | |
| 3,803 | | CAPSTEAD MORTGAGE CORP. | | $ 20,118 | | 23,350 | | |
| 59,772 | | CARLYLE GROUP (THE), INC. | | 1,712,585 | | 2,778,203 | | |
| 10,300 | | CENTRAL PACIFIC FINANCIAL CORP. | | 274,491 | | 268,418 | | |
| 1,400 | | CITY HOLDING CO. | | 109,800 | | 105,336 | | |
| 183,228 | | CNO FINANCIAL GROUP, INC. | | 3,293,087 | | 4,327,845 | | |
| 9,521 | | COLUMBIA BANKING SYSTEM, INC. | | 331,019 | | 367,130 | | |
| 23,672 | | COMMERCE BANCSHARES, INC. | �� | 1,162,429 | | 1,764,984 | | |
| 7,316 | | COMMUNITY BANK SYSTEM, INC. | | 510,964 | | 553,455 | | |
| 3,043 | | CUSTOMERS BANCORP, INC.(b) | | 131,265 | | 118,647 | | |
| 16,966 | | CVB FINANCIAL CORP. | | 354,919 | | 349,330 | | |
| 5,085 | | DIME COMMUNITY BANCSHARES, INC. | | 157,278 | | 170,958 | | |
| 4,918 | | EAGLE BANCORP, INC. | | 233,210 | | 275,801 | | |
| 4,487 | | EHEALTH, INC.(b) | | 291,742 | | 262,041 | | |
| 6,500 | | EMPLOYERS HOLDINGS, INC. | | 270,726 | | 278,200 | | |
| 3,291 | | ENCORE CAPITAL GROUP, INC.(b) | | 137,067 | | 155,960 | | |
| 7,800 | | ENOVA INTERNATIONAL, INC.(b) | | 265,910 | | 266,838 | | |
| 55,880 | | ESSENT GROUP LTD. | | 1,802,274 | | 2,511,806 | | |
| 7,020 | | FB FINANCIAL CORP. | | 261,110 | | 261,986 | | |
| 6,800 | | FIRST BANCORP | | 292,547 | | 278,188 | | |
| 29,015 | | FIRST BANCORP | | 359,764 | | 345,859 | | |
| 9,800 | | FIRST COMMONWEALTH FINANCIAL CORP. | | 148,627 | | 137,886 | | |
| 11,112 | | FIRST FINANCIAL BANCORP | | 280,624 | | 262,577 | | |
| 18,008 | | FIRST HAWAIIAN, INC. | | 504,507 | | 510,347 | | |
| 210,750 | | FIRST MIDWEST BANCORP, INC. | | 3,530,878 | | 4,179,173 | | |
| 57,010 | | FIRSTCASH, INC. | | 3,843,082 | | 4,357,844 | | |
| 6,199 | | FLAGSTAR BANCORP, INC. | | 241,106 | | 262,032 | | |
| 70,893 | | GENWORTH FINANCIAL, INC., CLASS A(b) | | 294,998 | | 276,483 | | |
| 56,400 | | GLACIER BANCORP, INC. | | 2,341,032 | | 3,106,512 | | |
| 8,499 | | GREAT WESTERN BANCORP, INC. | | 287,546 | | 278,682 | | |
| 7,489 | | GREEN DOT CORP., CLASS A(b) | | 366,289 | | 350,860 | | |
| 2,221 | | HANMI FINANCIAL CORP. | | 20,334 | | 42,332 | | |
| 375 | | HCI GROUP, INC. | | 16,590 | | 37,286 | | |
| 3,600 | | HERITAGE FINANCIAL CORP. | | 103,091 | | 90,072 | | |
| 8,714 | | HILLTOP HOLDINGS, INC. | | 319,716 | | 317,190 | | |
| 2,945 | | HOMESTREET, INC. | | 132,692 | | 119,979 | | |
| 190,923 | | HOPE BANCORP, INC. | | 2,024,157 | | 2,707,288 | | |
| 3,351 | | HORACE MANN EDUCATORS CORP. | | 126,647 | | 125,394 | | |
| 197,889 | | HUNTINGTON BANCSHARES, INC. | | 2,012,269 | | 2,823,880 | | |
| 3,499 | | INDEPENDENT BANK CORP. | | 270,982 | | 264,175 | | |
| 3,676 | | INDEPENDENT BANK GROUP, INC. | | 216,549 | | 271,950 | | |
| 62,369 | | INVESCO MORTGAGE CAPITAL, INC. | | 249,173 | | 243,239 | | |
| 49,811 | | INVESTCORP CREDIT MANAGEMENT BDC, INC. | | 263,519 | | 274,957 | | |
| 29,936 | | INVESTORS BANCORP, INC. | | 445,026 | | 426,887 | | |
| 4,389 | | JAMES RIVER GROUP HOLDINGS LTD.(c) | | 171,614 | | 164,675 | | |
| 1,468 | | KKR REAL ESTATE FINANCE TRUST, INC. | | 22,900 | | 31,753 | | |
| 7,609 | | LAKELAND BANCORP, INC. | | 78,421 | | 133,005 | | |
| 178,484 | | LENDINGCLUB CORP.(b) | | 2,897,131 | | 3,235,915 | | |
| 5,261 | | META FINANCIAL GROUP, INC. | | 264,060 | | 266,364 | | |
| 3,329 | | MR COOPER GROUP, INC.(b) | | 72,942 | | 110,057 | | |
| 3,328 | | NATIONAL BANK HOLDINGS CORP., CLASS A | | 123,416 | | 125,599 | | |
| 6,189 | | NATIONAL WESTERN LIFE GROUP, INC., CLASS A | | 1,732,789 | | 1,388,750 | | |
| 7,804 | | NBT BANCORP, INC. | | 295,140 | | 280,710 | | |
| 60,758 | | NEW YORK MORTGAGE TRUST, INC. | | 281,994 | | 271,588 | | |
| 10,956 | | NMI HOLDINGS, INC., CLASS A(b) | | 238,021 | | 246,291 | | |
| 9,561 | | NORTHFIELD BANCORP, INC. | | 159,339 | | 156,800 | | |
| 9,241 | | NORTHWEST BANCSHARES, INC. | | 97,101 | | 126,047 | | |
| 6,326 | | OFG BANCORP | | 154,340 | | 139,931 | | |
| 15,137 | | OLD NATIONAL BANCORP | | 229,990 | | 266,563 | | |
| 12,909 | | PACIFIC PREMIER BANCORP, INC. | | 575,388 | | 545,922 | | |
| 3,513 | | PALOMAR HOLDINGS, INC.(b) | | 279,260 | | 265,091 | | |
| 2,139 | | PARK NATIONAL CORP. | | 233,601 | | 251,161 | | |
| 13,853 | | PENNYMAC MORTGAGE INVESTMENT TRUST | | 276,046 | | 291,744 | | |
| 2,144 | | PIPER SANDLER COS. | | 245,213 | | 277,777 | | |
| 7,035 | | PRA GROUP, INC.(b) | | 273,256 | | 270,636 | | |
| 413 | | PREFERRED BANK | | 20,848 | | 26,131 | | |
| 4,000 | | PROASSURANCE CORP. | | 101,825 | | 91,000 | | |
| 11,430 | | PROVIDENT FINANCIAL SERVICES, INC. | | 277,237 | | 261,633 | | |
| See accompanying notes to financial statements. | 48 | (Continued) |
CLEARWATER INVESTMENT TRUST
Schedule of Investments - Clearwater Select Equity Fund
June 30, 2021 (unaudited)
| Shares | | Security | | Cost | | Fair value (a) | | Percent of
net assets |
| Financials (Cont'd): | | | | | | |
| 11,200 | | READY CAPITAL CORP. | | $ 176,653 | | 177,744 | | |
| 23,300 | | REDWOOD TRUST, INC. | | 270,904 | | 281,231 | | |
| 6,930 | | RENAISSANCERE HOLDINGS LTD.(c) | | 995,697 | | 1,031,323 | | |
| 6,555 | | RENASANT CORP. | | 228,861 | | 262,200 | | |
| 3,100 | | S&T BANCORP, INC. | | 102,568 | | 97,030 | | |
| 1,597 | | SAFETY INSURANCE GROUP, INC. | | 132,277 | | 125,013 | | |
| 7,792 | | SEACOAST BANKING CORP. OF FLORIDA | | 224,654 | | 266,097 | | |
| 33,200 | | SELECTIVE INSURANCE GROUP, INC. | | 2,097,443 | | 2,694,180 | | |
| 7,565 | | SERVISFIRST BANCSHARES, INC. | | 466,735 | | 514,269 | | |
| 20,079 | | SIMMONS FIRST NATIONAL CORP., CLASS A | | 615,815 | | 589,118 | | |
| 26,500 | | SIRIUSPOINT LTD.(b)(c) | | 272,338 | | 266,855 | | |
| 6,605 | | SOUTHSIDE BANCSHARES, INC. | | 260,953 | | 252,509 | | |
| 4,702 | | STEWART INFORMATION SERVICES CORP. | | 271,978 | | 266,556 | | |
| 2,857 | | STONEX GROUP, INC.(b) | | 178,058 | | 173,334 | | |
| 3,551 | | TRIUMPH BANCORP, INC.(b) | | 292,563 | | 263,662 | | |
| 4,309 | | TRUPANION, INC.(b) | | 396,962 | | 495,966 | | |
| 7,700 | | TRUSTCO BANK CORP. NY | | 266,601 | | 264,726 | | |
| 36,600 | | TWO HARBORS INVESTMENT CORP. | | 296,282 | | 276,696 | | |
| 330,405 | | UMPQUA HOLDINGS CORP. | | 4,859,238 | | 6,095,972 | | |
| 5,730 | | UNITED BANCORP, INC. | | 65,799 | | 84,002 | | |
| 8,363 | | UNITED COMMUNITY BANKS, INC. | | 205,433 | | 267,700 | | |
| 5,832 | | UNIVERSAL INSURANCE HOLDINGS, INC. | | 90,547 | | 80,948 | | |
| 99,255 | | UNIVEST FINANCIAL CORP. | | 2,214,764 | | 2,617,354 | | |
| 7,651 | | VERITEX HOLDINGS, INC. | | 283,414 | | 270,922 | | |
| 957 | | VIRTUS INVESTMENT PARTNERS, INC. | | 206,594 | | 265,826 | | |
| 3,819 | | WALKER & DUNLOP, INC. | | 389,296 | | 398,627 | | |
| 74,273 | | WEBSTER FINANCIAL CORP. | | 2,936,136 | | 3,961,722 | | |
| 4,582 | | WESTAMERICA BANCORP | | 270,799 | | 265,893 | | |
| 21,989 | | WISDOMTREE INVESTMENTS, INC. | | 146,049 | | 136,332 | | |
| 852 | | WORLD ACCEPTANCE CORP.(b) | | 133,091 | | 136,524 | | |
| 106,151 | | WSFS FINANCIAL CORP. | | 4,724,818 | | 4,945,575 | | |
| | | | | 80,852,234 | | 93,481,547 | | 17.08% |
| Health Care: | | | | | | |
| 109,820 | | 1LIFE HEALTHCARE, INC.(b) | | 5,079,537 | | 3,630,649 | | |
| 9,494 | | ABIOMED, INC.(b) | | 2,646,194 | | 2,963,172 | | |
| 809 | | ADDUS HOMECARE CORP.(b) | | 76,118 | | 70,577 | | |
| 15,997 | | ALLSCRIPTS HEALTHCARE SOLUTIONS, INC.(b) | | 270,142 | | 296,104 | | |
| 6,271 | | AMN HEALTHCARE SERVICES, INC.(b) | | 561,958 | | 608,162 | | |
| 6,761 | | AMPHASTAR PHARMACEUTICALS, INC.(b) | | 131,405 | | 136,302 | | |
| 5,497 | | ANGIODYNAMICS, INC.(b) | | 137,677 | | 149,134 | | |
| 758 | | ANIKA THERAPEUTICS, INC.(b) | | 27,364 | | 32,814 | | |
| 7,124 | | AVANOS MEDICAL, INC.(b) | | 284,481 | | 259,100 | | |
| 17,077 | | BIO-TECHNE CORP. | | 4,813,291 | | 7,689,090 | | |
| 4,000 | | CARA THERAPEUTICS, INC.(b) | | 56,305 | | 57,080 | | |
| 7,054 | | CARDIOVASCULAR SYSTEMS, INC.(b) | | 277,115 | | 300,853 | | |
| 3,255 | | COHERUS BIOSCIENCES, INC.(b) | | 58,253 | | 45,017 | | |
| 7,895 | | COLLEGIUM PHARMACEUTICAL, INC.(b) | | 182,155 | | 186,638 | | |
| 18,142 | | COMMUNITY HEALTH SYSTEMS, INC.(b) | | 286,119 | | 280,112 | | |
| 760 | | COMPUTER PROGRAMS AND SYSTEMS, INC. | | 17,092 | | 25,255 | | |
| 3,891 | | CONMED CORP. | | 512,204 | | 534,740 | | |
| 12,890 | | CORCEPT THERAPEUTICS, INC.(b) | | 265,184 | | 283,580 | | |
| 1,306 | | CORVEL CORP.(b) | | 147,590 | | 175,396 | | |
| 13,826 | | COVETRUS, INC.(b) | | 345,915 | | 373,302 | | |
| 2,680 | | CROSS COUNTRY HEALTHCARE, INC.(b) | | 19,502 | | 44,247 | | |
| 4,564 | | CRYOLIFE, INC.(b) | | 131,517 | | 129,618 | | |
| 1,298 | | CUTERA, INC.(b) | | 19,385 | | 63,641 | | |
| 12,711 | | CYTOKINETICS, INC.(b) | | 260,840 | | 251,551 | | |
| 620 | | EAGLE PHARMACEUTICALS, INC.(b) | | 28,743 | | 26,536 | | |
| 5,972 | | ENANTA PHARMACEUTICALS, INC.(b) | | 273,936 | | 262,828 | | |
| 51,900 | | ENDO INTERNATIONAL PLC(b)(c) | | 282,319 | | 242,892 | | |
| 6,891 | | ENSIGN GROUP (THE), INC. | | 533,020 | | 597,243 | | |
| 3,600 | | FULGENT GENETICS, INC.(b) | | 284,584 | | 332,028 | | |
| 6,165 | | GLAUKOS CORP.(b) | | 518,153 | | 522,977 | | |
| 11,056 | | HANGER, INC.(b) | | 260,305 | | 279,496 | | |
| 74,297 | | HEALTHEQUITY, INC.(b) | | 4,080,745 | | 5,979,423 | | |
| 6,003 | | HEALTHSTREAM, INC.(b) | | 155,957 | | 167,724 | | |
| 1,274 | | HESKA CORP.(b) | | 235,118 | | 292,676 | | |
| See accompanying notes to financial statements. | 49 | (Continued) |
CLEARWATER INVESTMENT TRUST
Schedule of Investments - Clearwater Select Equity Fund
June 30, 2021 (unaudited)
| Shares | | Security | | Cost | | Fair value (a) | | Percent of
net assets |
| Health Care (Cont'd): | | | | | | |
| 30,300 | | HILL-ROM HOLDINGS, INC. | | $ 2,747,703 | | 3,441,777 | | |
| 4,307 | | INOGEN, INC.(b) | | 270,775 | | 280,687 | | |
| 4,394 | | INTEGER HOLDINGS CORP.(b) | | 384,345 | | 413,915 | | |
| 50,650 | | INTEGRA LIFESCIENCES HOLDINGS CORP.(b) | | 2,934,093 | | 3,456,356 | | |
| 2,704 | | INVACARE CORP.(b) | | 19,534 | | 21,821 | | |
| 1,779 | | JOINT (THE) CORP. | | 126,928 | | 149,294 | | |
| 3,112 | | LANNETT CO., INC.(b) | | 17,883 | | 14,533 | | |
| 11,580 | | LANTHEUS HOLDINGS, INC.(b) | | 291,037 | | 320,071 | | |
| 4,753 | | LEMAITRE VASCULAR, INC. | | 270,435 | | 290,028 | | |
| 7,580 | | LUMINEX CORP. | | 270,042 | | 278,944 | | |
| 3,006 | | MAGELLAN HEALTH, INC.(b) | | 241,202 | | 283,165 | | |
| 11,880 | | MEDNAX, INC.(b) | | 345,421 | | 358,182 | | |
| 2,275 | | MERIDIAN BIOSCIENCE, INC.(b) | | 34,164 | | 50,459 | | |
| 6,408 | | MERIT MEDICAL SYSTEMS, INC.(b) | | 373,407 | | 414,341 | | |
| 315 | | MESA LABORATORIES, INC. | | 73,341 | | 85,419 | | |
| 1,681 | | MODIVCARE, INC.(b) | | 247,914 | | 285,888 | | |
| 10,091 | | MYRIAD GENETICS, INC.(b) | | 238,624 | | 308,583 | | |
| 4,918 | | NATUS MEDICAL, INC.(b) | | 134,537 | | 127,770 | | |
| 15,549 | | NEOGENOMICS, INC.(b) | | 659,019 | | 702,348 | | |
| 28,588 | | NEVRO CORP.(b) | | 4,540,803 | | 4,739,604 | | |
| 5,500 | | NEXTGEN HEALTHCARE, INC.(b) | | 103,268 | | 91,245 | | |
| 5,757 | | OMNICELL, INC.(b) | | 834,874 | | 871,898 | | |
| 6,625 | | ORTHOFIX MEDICAL, INC.(b) | | 262,931 | | 265,729 | | |
| 10,361 | | OWENS & MINOR, INC. | | 429,347 | | 438,581 | | |
| 305,262 | | PACIFIC BIOSCIENCES OF CALIFORNIA, INC.(b) | | 5,727,187 | | 10,675,012 | | |
| 5,119 | | PACIRA BIOSCIENCES, INC.(b) | | 293,551 | | 310,621 | | |
| 1,490 | | PENNANT GROUP (THE), INC.(b) | | 57,269 | | 60,941 | | |
| 71,713 | | PHIBRO ANIMAL HEALTH CORP., CLASS A | | 1,765,216 | | 2,071,071 | | |
| 5,356 | | PRESTIGE CONSUMER HEALTHCARE, INC.(b) | | 260,020 | | 279,048 | | |
| 5,378 | | R1 RCM, INC.(b) | | 100,768 | | 119,607 | | |
| 8,451 | | RADNET, INC.(b) | | 246,867 | | 284,714 | | |
| 4,398 | | REGENXBIO, INC.(b) | | 168,470 | | 170,862 | | |
| 14,412 | | SELECT MEDICAL HOLDINGS CORP. | | 570,173 | | 609,051 | | |
| 511 | | SIMULATIONS PLUS, INC. | | 31,714 | | 28,059 | | |
| 31,273 | | SPECTRUM PHARMACEUTICALS, INC.(b) | | 132,759 | | 117,274 | | |
| 8,738 | | SUPERNUS PHARMACEUTICALS, INC.(b) | | 259,272 | | 269,043 | | |
| 623 | | SURMODICS, INC.(b) | | 26,247 | | 33,798 | | |
| 37,300 | | SYNEOS HEALTH, INC.(b) | | 1,798,691 | | 3,337,977 | | |
| 1,888 | | TABULA RASA HEALTHCARE, INC.(b) | | 102,589 | | 94,400 | | |
| 1,700 | | TACTILE SYSTEMS TECHNOLOGY, INC.(b) | | 98,189 | | 88,400 | | |
| 75,998 | | TANDEM DIABETES CARE, INC.(b) | | 7,787,356 | | 7,402,205 | | |
| 2,165 | | TIVITY HEALTH, INC.(b) | | 27,633 | | 56,961 | | |
| 117,120 | | TRIPLE-S MANAGEMENT CORP.(b) | | 2,683,452 | | 2,608,262 | | |
| 26,821 | | TWIST BIOSCIENCE CORP.(b) | | 3,347,397 | | 3,573,898 | | |
| 2,251 | | US PHYSICAL THERAPY, INC. | | 239,952 | | 260,823 | | |
| 6,100 | | VANDA PHARMACEUTICALS, INC.(b) | | 101,845 | | 131,211 | | |
| 154,914 | | VAREX IMAGING CORP.(b) | | 3,924,032 | | 4,154,793 | | |
| 7,677 | | VERICEL CORP.(b) | | 465,153 | | 403,042 | | |
| 7,584 | | XENCOR, INC.(b) | | 277,290 | | 261,572 | | |
| | | | | 69,604,942 | | 82,383,240 | | 15.06% |
| Industrials: | | | | | | |
| 7,087 | | AAON, INC. | | 425,572 | | 443,575 | | |
| 6,800 | | AAR CORP.(b) | | 185,283 | | 263,500 | | |
| 8,984 | | ABM INDUSTRIES, INC. | | 435,282 | | 398,440 | | |
| 8,500 | | ACUITY BRANDS, INC. | | 1,022,673 | | 1,589,755 | | |
| 10,357 | | AEROJET ROCKETDYNE HOLDINGS, INC. | | 472,084 | | 500,140 | | |
| 3,000 | | AEROVIRONMENT, INC.(b) | | 295,360 | | 300,450 | | |
| 59,820 | | AIR LEASE CORP. | | 1,976,792 | | 2,496,887 | | |
| 555 | | ALAMO GROUP, INC. | | 55,130 | | 84,737 | | |
| 4,124 | | ALBANY INTERNATIONAL CORP., CLASS A | | 338,386 | | 368,108 | | |
| 2,294 | | ALLEGIANT TRAVEL CO.(b) | | 416,783 | | 445,036 | | |
| 56,661 | | AMERICAN WOODMARK CORP.(b) | | 4,761,130 | | 4,628,637 | | |
| 3,438 | | APOGEE ENTERPRISES, INC. | | 135,651 | | 140,030 | | |
| 5,666 | | APPLIED INDUSTRIAL TECHNOLOGIES, INC. | | 439,505 | | 515,946 | | |
| 4,795 | | ARCBEST CORP. | | 289,087 | | 279,021 | | |
| 6,464 | | ARCOSA, INC. | | 362,083 | | 379,695 | | |
| 13,310 | | ARMSTRONG WORLD INDUSTRIES, INC. | | 1,146,385 | | 1,427,631 | | |
| See accompanying notes to financial statements. | 50 | (Continued) |
CLEARWATER INVESTMENT TRUST
Schedule of Investments - Clearwater Select Equity Fund
June 30, 2021 (unaudited)
| Shares | | Security | | Cost | | Fair value (a) | | Percent of
net assets |
| Industrials (Cont'd): | | | | | | |
| 4,592 | | ASTEC INDUSTRIES, INC. | | $ 260,907 | | 289,021 | | |
| 3,875 | | ATLAS AIR WORLDWIDE HOLDINGS, INC.(b) | | 233,956 | | 263,926 | | |
| 5,369 | | AZZ, INC. | | 186,789 | | 278,007 | | |
| 6,227 | | BARNES GROUP, INC. | | 326,456 | | 319,134 | | |
| 5,235 | | BOISE CASCADE CO. | | 258,108 | | 305,462 | | |
| 5,267 | | BRADY CORP., CLASS A | | 288,699 | | 295,163 | | |
| 96,310 | | BRIGHTVIEW HOLDINGS, INC.(b) | | 1,453,253 | | 1,552,517 | | |
| 46,856 | | BWX TECHNOLOGIES, INC. | | 2,612,184 | | 2,723,271 | | |
| 4,890 | | CHART INDUSTRIES, INC.(b) | | 615,067 | | 715,505 | | |
| 1,067 | | CIRCOR INTERNATIONAL, INC.(b) | | 25,949 | | 34,784 | | |
| 93,100 | | COLFAX CORP.(b) | | 2,639,381 | | 4,264,911 | | |
| 5,086 | | COMFORT SYSTEMS U.S.A, INC. | | 366,726 | | 400,726 | | |
| 14,245 | | CORECIVIC, INC.(b) | | 142,575 | | 149,145 | | |
| 6,038 | | DELUXE CORP. | | 248,013 | | 288,435 | | |
| 1,443 | | DXP ENTERPRISES, INC.(b) | | 28,742 | | 48,052 | | |
| 3,872 | | ECHO GLOBAL LOGISTICS, INC.(b) | | 133,686 | | 119,025 | | |
| 3,910 | | ENCORE WIRE CORP. | | 308,718 | | 296,339 | | |
| 198,870 | | ENERPAC TOOL GROUP CORP. | | 4,507,691 | | 5,293,920 | | |
| 2,940 | | ENPRO INDUSTRIES, INC. | | 272,027 | | 285,621 | | |
| 3,134 | | ESCO TECHNOLOGIES, INC. | | 270,771 | | 294,001 | | |
| 6,943 | | EXPONENT, INC. | | 608,950 | | 619,385 | | |
| 6,982 | | FEDERAL SIGNAL CORP. | | 273,036 | | 280,886 | | |
| 560 | | FORRESTER RESEARCH, INC.(b) | | 17,882 | | 25,648 | | |
| 4,386 | | FORWARD AIR CORP. | | 397,238 | | 393,644 | | |
| 6,099 | | FRANKLIN ELECTRIC CO., INC. | | 422,136 | | 491,701 | | |
| 79,520 | | GATES INDUSTRIAL CORP. PLC(b) | | 1,136,485 | | 1,436,926 | | |
| 3,765 | | GIBRALTAR INDUSTRIES, INC.(b) | | 269,078 | | 287,307 | | |
| 6,646 | | GMS, INC.(b) | | 265,923 | | 319,939 | | |
| 21,940 | | GORMAN-RUPP (THE) CO. | | 660,955 | | 755,614 | | |
| 47,699 | | GRACO, INC. | | 2,999,779 | | 3,610,814 | | |
| 7,163 | | GRANITE CONSTRUCTION, INC. | | 255,186 | | 297,479 | | |
| 5,992 | | GREENBRIER (THE) COS., INC. | | 280,132 | | 261,131 | | |
| 3,800 | | GRIFFON CORP. | | 104,448 | | 97,394 | | |
| 12,708 | | HARSCO CORP.(b) | | 249,268 | | 259,497 | | |
| 5,076 | | HAWAIIAN HOLDINGS, INC.(b) | | 107,106 | | 123,702 | | |
| 5,600 | | HEARTLAND EXPRESS, INC. | | 105,537 | | 95,928 | | |
| 3,503 | | HEIDRICK & STRUGGLES INTERNATIONAL, INC. | | 160,320 | | 156,059 | | |
| 20,600 | | HEXCEL CORP.(b) | | 1,205,331 | | 1,285,440 | | |
| 11,380 | | HILLENBRAND, INC. | | 502,521 | | 501,630 | | |
| 6,236 | | HNI CORP. | | 271,569 | | 274,197 | | |
| 4,559 | | HUB GROUP, INC., CLASS A(b) | | 273,675 | | 300,803 | | |
| 74,610 | | IAA, INC.(b) | | 3,715,652 | | 4,069,229 | | |
| 2,477 | | INTERFACE, INC. | | 26,026 | | 37,898 | | |
| 144,955 | | JELD-WEN HOLDING, INC.(b) | | 3,016,121 | | 3,806,518 | | |
| 4,302 | | JOHN BEAN TECHNOLOGIES CORP. | | 596,680 | | 613,551 | | |
| 2,916 | | KAMAN CORP. | | 156,999 | | 146,966 | | |
| 977 | | KELLY SERVICES, INC., CLASS A(b) | | 18,133 | | 23,419 | | |
| 7,187 | | KORN FERRY | | 481,869 | | 521,417 | | |
| 1,700 | | LINDSAY CORP. | | 233,406 | | 280,976 | | |
| 151,390 | | LYFT, INC., CLASS A(b) | | 5,516,573 | | 9,156,067 | | |
| 3,019 | | MANTECH INTERNATIONAL CORP., CLASS A | | 266,174 | | 261,264 | | |
| 20,766 | | MASTEC, INC.(b) | | 1,155,469 | | 2,203,273 | | |
| 5,886 | | MATSON, INC. | | 368,011 | | 376,704 | | |
| 5,022 | | MATTHEWS INTERNATIONAL CORP., CLASS A | | 201,777 | | 180,591 | | |
| 11,118 | | MERITOR, INC.(b) | | 253,519 | | 260,384 | | |
| 31,292 | | MOOG, INC., CLASS A | | 1,990,313 | | 2,630,406 | | |
| 121,799 | | MRC GLOBAL, INC.(b) | | 1,102,011 | | 1,144,911 | | |
| 6,122 | | MUELLER INDUSTRIES, INC. | | 278,853 | | 265,144 | | |
| 1,782 | | MYR GROUP, INC.(b) | | 161,641 | | 162,020 | | |
| 351 | | NATIONAL PRESTO INDUSTRIES, INC. | | 30,447 | | 35,679 | | |
| 10,300 | | NOW, INC.(b) | | 104,911 | | 97,747 | | |
| 139,999 | | PGT INNOVATIONS, INC.(b) | | 2,075,149 | | 3,252,177 | | |
| 31,891 | | PITNEY BOWES, INC. | | 234,353 | | 279,684 | | |
| 615 | | POWELL INDUSTRIES, INC. | | 16,562 | | 19,034 | | |
| 3,788 | | PROTO LABS, INC.(b) | | 364,790 | | 347,738 | | |
| 6,098 | | QUANEX BUILDING PRODUCTS CORP. | | 159,132 | | 151,474 | | |
| 6,489 | | RAVEN INDUSTRIES, INC. | | 271,714 | | 375,389 | | |
| See accompanying notes to financial statements. | 51 | (Continued) |
CLEARWATER INVESTMENT TRUST
Schedule of Investments - Clearwater Select Equity Fund
June 30, 2021 (unaudited)
| Shares | | Security | | Cost | | Fair value (a) | | Percent of
net assets |
| Industrials (Cont'd): | | | | | | |
| 19,831 | | RESIDEO TECHNOLOGIES, INC.(b) | | $ 504,082 | | 594,930 | | |
| 1,915 | | RESOURCES CONNECTION, INC. | | 22,152 | | 27,499 | | |
| 179,411 | | REV GROUP, INC. | | 2,063,809 | | 2,814,959 | | |
| 55,300 | | RUSH ENTERPRISES, INC., CLASS A | | 1,677,611 | | 2,391,172 | | |
| 46,290 | | RYDER SYSTEM, INC. | | 2,381,779 | | 3,440,736 | | |
| 3,492 | | SAIA, INC.(b) | | 639,939 | | 731,539 | | |
| 5,909 | | SKYWEST, INC.(b) | | 264,974 | | 254,501 | | |
| 5,956 | | SPX CORP.(b) | | 367,295 | | 363,793 | | |
| 5,589 | | SPX FLOW, INC. | | 284,309 | | 364,626 | | |
| 3,163 | | STANDEX INTERNATIONAL CORP. | | 267,845 | | 300,200 | | |
| 371,456 | | STEELCASE, INC., CLASS A | | 4,808,240 | | 5,612,700 | | |
| 3,086 | | TEAM, INC.(b) | | 19,078 | | 20,676 | | |
| 3,587 | | TENNANT CO. | | 282,214 | | 286,422 | | |
| 93,747 | | TEREX CORP. | | 3,133,785 | | 4,464,232 | | |
| 88,121 | | TRIMAS CORP.(b) | | 2,420,110 | | 2,672,710 | | |
| 13,722 | | TRIUMPH GROUP, INC.(b) | | 258,836 | | 284,732 | | |
| 94,128 | | TRUEBLUE, INC.(b) | | 1,791,383 | | 2,645,938 | | |
| 8,109 | | UFP INDUSTRIES, INC. | | 610,096 | | 602,823 | | |
| 2,274 | | UNIFIRST CORP. | | 466,752 | | 533,571 | | |
| 6,066 | | US ECOLOGY, INC.(b) | | 240,201 | | 227,596 | | |
| 2,020 | | VERITIV CORP.(b) | | 134,284 | | 124,068 | | |
| 2,695 | | VIAD CORP.(b) | | 134,445 | | 134,346 | | |
| 2,988 | | VICOR CORP.(b) | | 261,017 | | 315,951 | | |
| 9,866 | | WABASH NATIONAL CORP. | | 157,713 | | 157,856 | | |
| 3,744 | | WATTS WATER TECHNOLOGIES, INC., CLASS A | | 504,830 | | 546,287 | | |
| 25,460 | | WOODWARD, INC. | | 2,325,824 | | 3,128,525 | | |
| | | | | 87,322,327 | | 108,095,725 | | 19.75% |
| Information Technology: | | | | | | |
| 17,194 | | 3D SYSTEMS CORP.(b) | | 550,103 | | 687,244 | | |
| 15,234 | | 8X8, INC.(b) | | 431,503 | | 422,896 | | |
| 7,505 | | ADTRAN, INC. | | 127,208 | | 154,978 | | |
| 5,099 | | ADVANCED ENERGY INDUSTRIES, INC. | | 485,589 | | 574,708 | | |
| 2,000 | | AGILYSYS, INC.(b) | | 102,655 | | 113,740 | | |
| 6,215 | | ALARM.COM HOLDINGS, INC.(b) | | 479,041 | | 526,410 | | |
| 58,287 | | ANAPLAN, INC.(b) | | 3,445,319 | | 3,106,697 | | |
| 84,272 | | AVNET, INC. | | 2,883,820 | | 3,377,622 | | |
| 7,100 | | AXCELIS TECHNOLOGIES, INC.(b) | | 286,711 | | 286,982 | | |
| 3,906 | | BADGER METER, INC. | | 341,366 | | 383,257 | | |
| 1,679 | | BEL FUSE, INC., CLASS B | | 17,796 | | 24,178 | | |
| 95,737 | | BELDEN, INC. | | 3,730,774 | | 4,841,420 | | |
| 2,504 | | BENCHMARK ELECTRONICS, INC. | | 50,443 | | 71,264 | | |
| 26,487 | | BILL.COM HOLDINGS, INC.(b) | | 2,903,087 | | 4,851,889 | | |
| 237 | | BM TECHNOLOGIES, INC.(b) | | 2,972 | | 2,948 | | |
| 7,630 | | BOTTOMLINE TECHNOLOGIES DE, INC.(b) | | 310,611 | | 282,920 | | |
| 464,833 | | CELESTICA, INC.(b)(c) | | 3,745,044 | | 3,648,939 | | |
| 3,035 | | CEVA, INC.(b) | | 125,119 | | 143,556 | | |
| 7,831 | | COHU, INC.(b) | | 284,359 | | 288,102 | | |
| 6,266 | | CSG SYSTEMS INTERNATIONAL, INC. | | 281,089 | | 295,630 | | |
| 3,800 | | CTS CORP. | | 116,389 | | 141,208 | | |
| 8,231 | | DAKTRONICS, INC.(b) | | 33,876 | | 54,242 | | |
| 20,658 | | DIEBOLD NIXDORF, INC.(b) | | 239,317 | | 265,249 | | |
| 1,486 | | DIGI INTERNATIONAL, INC.(b) | | 22,009 | | 29,883 | | |
| 5,184 | | DIODES, INC.(b) | | 401,896 | | 413,528 | | |
| 58,523 | | DOLBY LABORATORIES, INC., CLASS A | | 5,180,923 | | 5,752,226 | | |
| 21,331 | | DSP GROUP, INC.(b) | | 273,381 | | 315,699 | | |
| 51,432 | | ELASTIC N.V.(b) | | 5,952,389 | | 7,496,728 | | |
| 3,120 | | EPLUS, INC.(b) | | 259,523 | | 270,473 | | |
| 6,431 | | EVERTEC, INC. | | 251,372 | | 280,713 | | |
| 5,600 | | EXLSERVICE HOLDINGS, INC.(b) | | 552,774 | | 595,056 | | |
| 24,637 | | EXTREME NETWORKS, INC.(b) | | 271,148 | | 274,949 | | |
| 4,290 | | FABRINET(b)(c) | | 365,278 | | 411,282 | | |
| 2,107 | | FARO TECHNOLOGIES, INC.(b) | | 140,104 | | 163,861 | | |
| 10,352 | | FORMFACTOR, INC.(b) | | 298,251 | | 377,434 | | |
| 62,363 | | FRANKLIN WIRELESS CORP.(b) | | 107,247 | | 571,869 | | |
| 114,670 | | FREQUENCY ELECTRONICS, INC.(b) | | 1,030,568 | | 1,123,766 | | |
| 61,270 | | HARMONIC, INC.(b) | | 433,093 | | 522,020 | | |
| 5,100 | | ICHOR HOLDINGS LTD.(b) | | 267,197 | | 274,380 | | |
| See accompanying notes to financial statements. | 52 | (Continued) |
CLEARWATER INVESTMENT TRUST
Schedule of Investments - Clearwater Select Equity Fund
June 30, 2021 (unaudited)
| Shares | | Security | | Cost | | Fair value (a) | | Percent of
net assets |
| Information Technology (Cont'd): | | | | | | |
| 4,907 | | INSIGHT ENTERPRISES, INC.(b) | | $ 494,214 | | 490,749 | | |
| 3,533 | | INTERDIGITAL, INC. | | 268,713 | | 258,015 | | |
| 5,956 | | ITRON, INC.(b) | | 557,345 | | 595,481 | | |
| 14,139 | | KNOWLES CORP.(b) | | 248,724 | | 279,104 | | |
| 8,312 | | KULICKE & SOFFA INDUSTRIES, INC.(c) | | 463,177 | | 508,694 | | |
| 8,670 | | LIVEPERSON, INC.(b) | | 479,819 | | 548,291 | | |
| 9,433 | | MAXLINEAR, INC.(b) | | 331,388 | | 400,808 | | |
| 5,687 | | METHODE ELECTRONICS, INC. | | 274,179 | | 279,857 | | |
| 1,176 | | MICROSTRATEGY, INC., CLASS A(b) | | 640,374 | | 781,452 | | |
| 4,800 | | MKS INSTRUMENTS, INC. | | 509,584 | | 854,160 | | |
| 7,361 | | NETGEAR, INC.(b) | | 249,087 | | 282,074 | | |
| 5,074 | | ONESPAN, INC.(b) | | 124,513 | | 129,590 | | |
| 33,053 | | ONTO INNOVATION, INC.(b) | | 1,257,962 | | 2,414,191 | | |
| 2,718 | | OSI SYSTEMS, INC.(b) | | 196,905 | | 276,258 | | |
| 903 | | PDF SOLUTIONS, INC.(b) | | 17,553 | | 16,417 | | |
| 3,595 | | PERFICIENT, INC.(b) | | 277,403 | | 289,110 | | |
| 11,238 | | PHOTRONICS, INC.(b) | | 160,989 | | 148,454 | | |
| 3,701 | | PLANTRONICS, INC.(b) | | 137,368 | | 154,443 | | |
| 31,580 | | PLEXUS CORP.(b) | | 2,352,712 | | 2,886,728 | | |
| 8,544 | | POWER INTEGRATIONS, INC. | | 629,993 | | 701,121 | | |
| 5,921 | | PROGRESS SOFTWARE CORP. | | 259,131 | | 273,846 | | |
| 13,855 | | RAMBUS, INC.(b) | | 262,845 | | 328,502 | | |
| 2,415 | | ROGERS CORP.(b) | | 439,134 | | 484,932 | | |
| 79,791 | | SAILPOINT TECHNOLOGIES HOLDINGS, INC.(b) | | 3,205,291 | | 4,074,926 | | |
| 6,913 | | SANMINA CORP.(b) | | 278,974 | | 269,330 | | |
| 88,673 | | SCANSOURCE, INC.(b) | | 3,163,692 | | 2,494,371 | | |
| 3,866 | | SPS COMMERCE, INC.(b) | | 342,789 | | 386,020 | | |
| 79,521 | | SUPER MICRO COMPUTER, INC.(b) | | 2,332,038 | | 2,797,549 | | |
| 3,897 | | SYKES ENTERPRISES, INC.(b) | | 146,685 | | 209,269 | | |
| 4,194 | | TTEC HOLDINGS, INC. | | 416,647 | | 432,359 | | |
| 5,905 | | TTM TECHNOLOGIES, INC.(b) | | 68,078 | | 84,442 | | |
| 5,714 | | ULTRA CLEAN HOLDINGS, INC.(b) | | 282,357 | | 306,956 | | |
| 10,550 | | UNISYS CORP.(b) | | 157,377 | | 267,021 | | |
| 79,609 | | VARONIS SYSTEMS, INC.(b) | | 3,315,995 | | 4,587,071 | | |
| 11,702 | | VEECO INSTRUMENTS, INC.(b) | | 282,094 | | 281,316 | | |
| 25,208 | | VIAVI SOLUTIONS, INC.(b) | | 438,003 | | 445,173 | | |
| 32,721 | | VONAGE HOLDINGS CORP.(b) | | 448,104 | | 471,510 | | |
| 22,653 | | WIX.COM LTD.(b)(c) | | 5,900,412 | | 6,575,713 | | |
| 13,030 | | XPERI HOLDING CORP. | | 228,835 | | 289,787 | | |
| | | | | 68,421,827 | | 80,775,036 | | 14.76% |
| Materials: | | | | | | |
| 5,372 | | ADVANSIX, INC.(b) | | 157,700 | | 160,408 | | |
| 17,698 | | ALLEGHENY TECHNOLOGIES, INC.(b) | | 404,216 | | 369,003 | | |
| 10,959 | | AMERICAN VANGUARD CORP. | | 183,571 | | 191,892 | | |
| 13,509 | | ARCONIC CORP.(b) | | 441,374 | | 481,191 | | |
| 6,352 | | BALCHEM CORP. | | 825,337 | | 833,763 | | |
| 6,492 | | CARPENTER TECHNOLOGY CORP. | | 279,730 | | 261,108 | | |
| 2,446 | | CENTURY ALUMINUM CO.(b) | | 17,115 | | 31,529 | | |
| 612 | | CLEARWATER PAPER CORP.(b) | | 20,484 | | 17,730 | | |
| 7,298 | | CLEVELAND-CLIFFS, INC.(b) | | 112,144 | | 157,345 | | |
| 7,340 | | DOMTAR CORP.(b) | | 355,792 | | 403,406 | | |
| 13,146 | | FERRO CORP.(b) | | 283,247 | | 283,559 | | |
| 1,570 | | FUTUREFUEL CORP. | | 18,184 | | 15,072 | | |
| 9,478 | | GCP APPLIED TECHNOLOGIES, INC.(b) | | 232,070 | | 220,458 | | |
| 13,002 | | GLATFELTER CORP. | | 180,625 | | 181,638 | | |
| 45,526 | | H.B. FULLER CO. | | 2,514,876 | | 2,895,909 | | |
| 1,166 | | HAWKINS, INC. | | 25,673 | | 38,186 | | |
| 2,962 | | INNOSPEC, INC. | | 285,621 | | 268,387 | | |
| 2,320 | | KAISER ALUMINUM CORP. | | 290,355 | | 286,497 | | |
| 1,120 | | KOPPERS HOLDINGS, INC.(b) | | 19,868 | | 36,232 | | |
| 1,882 | | KRATON CORP.(b) | | 32,648 | | 60,770 | | |
| 19,594 | | LIVENT CORP.(b) | | 382,621 | | 379,340 | | |
| 3,600 | | MATERION CORP. | | 269,565 | | 271,260 | | |
| 19,368 | | MYERS INDUSTRIES, INC. | | 407,598 | | 406,728 | | |
| 2,502 | | NEENAH, INC. | | 132,223 | | 125,525 | | |
| 21,814 | | O-I GLASS, INC.(b) | | 365,347 | | 356,223 | | |
| 91,437 | | OLIN CORP. | | 1,478,866 | | 4,229,876 | | |
| See accompanying notes to financial statements. | 53 | (Continued) |
CLEARWATER INVESTMENT TRUST
Schedule of Investments - Clearwater Select Equity Fund
June 30, 2021 (unaudited)
| Shares | | Security | | Cost | | Fair value (a) | | Percent of
net assets |
| Materials (Cont'd): | | | | | | |
| 149,039 | | ORION ENGINEERED CARBONS S.A.(b)(c) | | $ 2,025,655 | | 2,830,251 | | |
| 1,699 | | QUAKER CHEMICAL CORP. | | 366,383 | | 402,986 | | |
| 15,350 | | RELIANCE STEEL & ALUMINUM CO. | | 1,432,641 | | 2,316,315 | | |
| 78,214 | | SCHWEITZER-MAUDUIT INTERNATIONAL, INC. | | 2,963,726 | | 3,158,281 | | |
| 2,698 | | STEPAN CO. | | 305,359 | | 324,488 | | |
| 1,877 | | TREDEGAR CORP. | | 28,938 | | 25,846 | | |
| 5,308 | | TRINSEO S.A. | | 322,663 | | 317,631 | | |
| 846 | | US CONCRETE, INC.(b) | | 19,856 | | 62,435 | | |
| 2,731 | | WARRIOR MET COAL, INC. | | 40,792 | | 46,973 | | |
| | | | | 17,222,863 | | 22,448,241 | | 4.10% |
| Real Estate: | | | | | | |
| 12,900 | | ACADIA REALTY TRUST | | 227,627 | | 283,284 | | |
| 8,604 | | AGREE REALTY CORP. | | 608,938 | | 606,496 | | |
| 14,298 | | ALEXANDER & BALDWIN, INC. | | 278,338 | | 261,939 | | |
| 7,378 | | AMERICAN ASSETS TRUST, INC. | | 270,992 | | 275,126 | | |
| 20,415 | | ARMADA HOFFLER PROPERTIES, INC. | | 272,319 | | 271,315 | | |
| 19,213 | | BRANDYWINE REALTY TRUST | | 238,245 | | 263,410 | | |
| 12,757 | | CARETRUST REIT, INC. | | 274,345 | | 296,345 | | |
| 3,700 | | CENTERSPACE | | 289,281 | | 291,930 | | |
| 10,277 | | CHATHAM LODGING TRUST(b) | | 143,626 | | 132,265 | | |
| 126 | | CTO REALTY GROWTH, INC. | | 6,828 | | 6,714 | | |
| 231,783 | | DIAMONDROCK HOSPITALITY CO.(b) | | 1,761,079 | | 2,248,295 | | |
| 68,140 | | DIVERSIFIED HEALTHCARE TRUST | | 273,807 | | 284,825 | | |
| 13,035 | | EASTERLY GOVERNMENT PROPERTIES, INC. | | 282,227 | | 274,778 | | |
| 15,934 | | ESSENTIAL PROPERTIES REALTY TRUST, INC. | | 417,886 | | 430,855 | | |
| 10,160 | | FOUR CORNERS PROPERTY TRUST, INC. | | 288,449 | | 280,518 | | |
| 51,900 | | FRANKLIN STREET PROPERTIES CORP. | | 274,153 | | 272,994 | | |
| 4,241 | | GEO GROUP (THE), INC. | | 37,601 | | 30,196 | | |
| 1,826 | | GETTY REALTY CORP. | | 52,146 | | 56,880 | | |
| 8,045 | | GLOBAL NET LEASE, INC. | | 156,173 | | 148,833 | | |
| 3,298 | | HERSHA HOSPITALITY TRUST(b) | | 18,358 | | 35,486 | | |
| 30,213 | | INDEPENDENCE REALTY TRUST, INC. | | 508,914 | | 550,783 | | |
| 10,781 | | INDUSTRIAL LOGISTICS PROPERTIES TRUST | | 264,847 | | 281,815 | | |
| 3,311 | | INNOVATIVE INDUSTRIAL PROPERTIES, INC. | | 458,949 | | 632,467 | | |
| 8,750 | | ISTAR, INC. | | 117,320 | | 181,387 | | |
| 12,293 | | KITE REALTY GROUP TRUST | | 216,566 | | 270,569 | | |
| 39,003 | | LEXINGTON REALTY TRUST | | 485,595 | | 466,086 | | |
| 2,400 | | LTC PROPERTIES, INC. | | 101,417 | | 92,136 | | |
| 15,834 | | MACK-CALI REALTY CORP. | | 251,362 | | 271,553 | | |
| 891 | | MARCUS & MILLICHAP, INC.(b) | | 25,083 | | 34,633 | | |
| 2,400 | | NATIONAL STORAGE AFFILIATES TRUST | | 107,266 | | 121,344 | | |
| 9,100 | | OFFICE PROPERTIES INCOME TRUST | | 260,848 | | 266,721 | | |
| 968 | | RE/MAX HOLDINGS, INC., CLASS A | | 30,056 | | 32,263 | | |
| 16,058 | | REALOGY HOLDINGS CORP.(b) | | 238,724 | | 292,577 | | |
| 15,639 | | RETAIL OPPORTUNITY INVESTMENTS CORP. | | 238,313 | | 276,185 | | |
| 28,440 | | RETAIL PROPERTIES OF AMERICA, INC., CLASS A | | 295,951 | | 325,638 | | |
| 9,841 | | RPT REALTY | | 136,450 | | 127,736 | | |
| 716 | | SAFEHOLD, INC. | | 40,289 | | 56,206 | | |
| 690 | | SAUL CENTERS, INC. | | 20,472 | | 31,361 | | |
| 20,172 | | SERVICE PROPERTIES TRUST | | 286,656 | | 254,167 | | |
| 29,019 | | SITE CENTERS CORP. | | 377,451 | | 437,026 | | |
| 3,485 | | ST. JOE (THE) CO. | | 158,754 | | 155,466 | | |
| 13,079 | | SUMMIT HOTEL PROPERTIES, INC.(b) | | 118,339 | | 122,027 | | |
| 37,424 | | UNITI GROUP, INC. | | 391,245 | | 396,320 | | |
| 321 | | UNIVERSAL HEALTH REALTY INCOME TRUST | | 20,634 | | 19,758 | | |
| 7,023 | | URSTADT BIDDLE PROPERTIES, INC., CLASS A | | 136,743 | | 136,106 | | |
| 11,186 | | WASHINGTON REAL ESTATE INVESTMENT TRUST | | 257,812 | | 257,278 | | |
| 32,519 | | WHITESTONE REIT | | 262,670 | | 268,282 | | |
| 15,710 | | XENIA HOTELS & RESORTS, INC.(b) | | 307,589 | | 294,248 | | |
| | | | | 12,288,733 | | 13,404,622 | | 2.45% |
| Utilities: | | | | | | |
| 3,607 | | AMERICAN STATES WATER CO. | | 286,265 | | 286,973 | | |
| 9,242 | | AVISTA CORP. | | 415,431 | | 394,356 | | |
| 6,711 | | CALIFORNIA WATER SERVICE GROUP | | 367,840 | | 372,729 | | |
| 2,438 | | CHESAPEAKE UTILITIES CORP. | | 265,239 | | 293,365 | | |
| 2,908 | | NORTHWEST NATURAL HOLDING CO. | | 142,166 | | 152,728 | | |
| 8,644 | | PURE CYCLE CORP.(b) | | 77,254 | | 119,460 | | |
| See accompanying notes to financial statements. | 54 | (Continued) |
CLEARWATER INVESTMENT TRUST
Schedule of Investments - Clearwater Select Equity Fund
June 30, 2021 (unaudited)
| Shares | | Security | | Cost | | Fair value (a) | | Percent of
net assets |
| Utilities (Cont'd): | | | | | | |
| 13,914 | | SOUTH JERSEY INDUSTRIES, INC. | | $ 361,100 | | 360,790 | | |
| 4,900 | | UNITIL CORP. | | 265,456 | | 259,553 | | |
| | | | | 2,180,751 | | 2,239,954 | | 0.41% |
| | | Sub-total Common Stocks: | | 447,936,732 | | 538,830,386 | | 98.47% |
| Convertible Preferred Stocks: | | | | | | |
| Real Estate: | | | | | | |
| 7,930 | | WHEELER REAL ESTATE INVESTMENT TRUST, INC. (Step to 10.75% on 9/21/2023), 8.75%(b)(d) | | 78,860 | | 142,264 | | |
| 14,904 | | WHEELER REAL ESTATE INVESTMENT TRUST, INC.(b) | | 147,635 | | 223,560 | | |
| | | | | 226,495 | | 365,824 | | 0.07% |
| | | Sub-total Convertible Preferred Stocks: | | 226,495 | | 365,824 | | 0.07% |
| Master Limited Partnerships: | | | | | | |
| Industrials: | | | | | | |
| 10,519 | | STEEL PARTNERS HOLDINGS L.P.(b) | | 64,050 | | 306,313 | | |
| | | | | 64,050 | | 306,313 | | 0.05% |
| | | Sub-total Master Limited Partnerships: | | 64,050 | | 306,313 | | 0.05% |
| Rights: | | | | | | |
| Communication Services: | | | | | | |
| 55,700 | | MEDIA GENERAL, INC. (CONTINGENT VALUE RIGHTS)(b)(e) | | - | | - | | |
| | | | | - | | - | | 0.00% |
| | | Sub-total Rights: | | - | | - | | 0.00% |
| Warrants: | | | | | | |
| Health Care: | | | | | | |
| 19,977 | | NANOVIBRONIX, INC.(b)(e) | | 199 | | - | | |
| | | | | 199 | | - | | 0.00% |
| | | Sub-total Warrants: | | 199 | | - | | 0.00% |
| Short-Term Investments: | | | | | | |
| 9,774,116 | | NORTHERN INSTITUTIONAL FUNDS - U.S. GOVERNMENT SELECT PORTFOLIO, INSTITUTIONAL SHARES, 0.03%(f) | | 9,774,116 | | 9,774,116 | | |
| | | Sub-total Short-Term Investments: | | 9,774,116 | | 9,774,116 | | 1.79% |
| | | Grand total | | $ 458,001,592 | | 549,276,639 | | 100.38% |
| Notes to Schedule of Investments: |
| (a) | Investments are valued in accordance with procedures described in Note 2 to the financial statements. |
| (b) | Non-income producing assets. |
| (c) | Foreign security values are stated in U.S. dollars. As of June 30, 2021, the value of foreign stocks or depositary receipts of companies based outside of the United States represented 7.12% of net assets. |
| (d) | For step bonds, the coupon rate disclosed is the current rate in effect. |
| (e) | Security has been deemed worthless and is a Level 3 investment. |
| (f) | The short-term investment is a money market portfolio of the investment company, Northern Institutional Funds. At December 31, 2020, the value of the Clearwater Select Equity Fund's investment in the U.S. Government Select Portfolio of the Northern Institutional Funds was $16,222,989 with net sales of $6,448,873 during the six months ended June 30, 2021. |
| See accompanying notes to financial statements. | 55 | (Continued) |
CLEARWATER INVESTMENT TRUST
Schedule of Investments - Clearwater Select Equity Fund
June 30, 2021 (unaudited)
Clearwater Select Equity Fund Portfolio Diversification
(as a percentage of net assets)
| See accompanying notes to financial statements. | 56 | (Continued) |
CLEARWATER INVESTMENT TRUST
Schedule of Investments - Clearwater Tax-Exempt Bond Fund
June 30, 2021 (unaudited)
| Par/Shares | | Security | | Maturity
date | | Coupon
rate | | Cost | | Fair value (a) | | Percent of
net assets |
| Closed-End Funds: | | | | | | | | | | | | |
| 171,624 | | BLACKROCK LONG-TERM MUNICIPAL ADVANTAGE TRUST | | $ 1,699,110 | | 2,335,803 | | |
| 44,180 | | BLACKROCK MUNICIPAL INCOME QUALITY TRUST | | 601,735 | | 692,742 | | |
| 7,902 | | BLACKROCK MUNICIPAL INCOME TRUST II | | 98,055 | | 124,457 | | |
| 114,491 | | BLACKROCK MUNIHOLDINGS FUND INC | | 1,778,275 | | 1,921,159 | | |
| 97,827 | | BLACKROCK MUNIHOLDINGS INVESTMENT QUALITY FUND | | 1,105,342 | | 1,444,905 | | |
| 46,838 | | BLACKROCK MUNIHOLDINGS NEW JERSEY QUALITY FUND INC | | 651,076 | | 747,066 | | |
| 83,977 | | BLACKROCK MUNIHOLDINGS QUALITY FUND II INC | | 1,060,121 | | 1,176,518 | | |
| 157,958 | | BLACKROCK MUNIYIELD MICHIGAN QUALITY FUND INC | | 2,064,776 | | 2,434,133 | | |
| 51,700 | | BLACKROCK MUNIYIELD PENNSYLVANIA QUALITY FUND | | 729,423 | | 814,792 | | |
| 102,096 | | BLACKROCK MUNIYIELD QUALITY FUND II INC | | 1,309,732 | | 1,479,371 | | |
| 118,472 | | BLACKROCK MUNIYIELD QUALITY FUND III INC | | 1,572,465 | | 1,759,309 | | |
| 12,559 | | BLACKROCK MUNIYIELD QUALITY FUND INC | | 176,260 | | 210,363 | | |
| 46,128 | | BNY MELLON STRATEGIC MUNICIPAL BOND FUND INC | | 328,494 | | 379,633 | | |
| 177,634 | | DWS MUNICIPAL INCOME TRUST | | 2,001,406 | | 2,172,464 | | |
| 176,750 | | INVESCO ADVANTAGE MUNICIPAL INCOME TRUST II | | 1,953,225 | | 2,158,118 | | |
| 149,405 | | INVESCO MUNICIPAL OPPORTUNITY TRUST | | 1,829,532 | | 2,031,908 | | |
| 101,614 | | INVESCO MUNICIPAL TRUST | | 1,260,658 | | 1,394,144 | | |
| 32,803 | | INVESCO PENNSYLVANIA VALUE MUNICIPAL INCOME TRUST | | 437,919 | | 438,904 | | |
| 175,986 | | INVESCO QUALITY MUNICIPAL INCOME TRUST | | 2,142,479 | | 2,375,811 | | |
| 60,173 | | INVESCO TRUST FOR INVESTMENT GRADE MUNICIPALS | | 767,136 | | 843,625 | | |
| 76,437 | | INVESCO VALUE MUNICIPAL INCOME TRUST | | 1,148,019 | | 1,260,446 | | |
| 83,434 | | NUVEEN AMT-FREE MUNICIPAL CREDIT INCOME FUND | | 1,220,326 | | 1,490,131 | | |
| 345,957 | | NUVEEN AMT-FREE QUALITY MUNICIPAL INCOME FUND | | 4,713,175 | | 5,431,525 | | |
| 41,980 | | NUVEEN NEW JERSEY QUALITY MUNICIPAL INCOME FUND | | 644,981 | | 654,468 | | |
| 74,266 | | NUVEEN PENNSYLVANIA QUALITY MUNICIPAL INCOME FUND | | 1,045,803 | | 1,121,417 | | |
| 316,457 | | NUVEEN QUALITY MUNICIPAL INCOME FUND | | 4,618,075 | | 5,066,477 | | |
| 7,436 | | PUTNAM MUNICIPAL OPPORTUNITIES TRUST | | 98,540 | | 105,145 | | |
| | | Sub-total Closed-End Funds: | | | | | | 37,056,138 | | 42,064,834 | | 6.12% |
| Municipal Bonds: | | | | | | | | | | |
| Alabama | | | | | | | | | | |
| 500,000 | | MOBILE CNTY AL LTD OBLG(b) | | 11/1/2045 | | 4.00 | | 500,000 | | 546,625 | | |
| 1,000,000 | | PELL CITY AL SPL CARE FACS FING AUTH REVENUE | | 12/1/2031 | | 5.00 | | 1,004,803 | | 1,016,392 | | |
| | | | | | | 1,504,803 | | 1,563,017 | | 0.23% |
| Alaska | | | | | | | | | | |
| 350,000 | | ALASKA ST INDL DEV & EXPORT AUTH CMNTY PROVIDER REVENUE(c) | | 12/1/2010 | | 5.40 | | 350,000 | | 14,438 | | |
| | | | | | | 350,000 | | 14,438 | | 0.00% |
| Arizona | | | | | | | | | | |
| 1,250,000 | | ARIZONA ST INDL DEV AUTH ECON DEV REVENUE(b) | | 7/1/2030 | | 6.75 | | 1,238,293 | | 1,464,933 | | |
| 1,250,000 | | ARIZONA ST INDL DEV AUTH ECON DEV REVENUE(b) | | 7/1/2050 | | 7.75 | | 1,237,596 | | 1,499,730 | | |
| 400,000 | | ARIZONA ST INDL DEV AUTH ECON DEV REVENUE(b) | | 7/1/2051 | | 6.00 | | 400,000 | | 441,090 | | |
| 500,000 | | ARIZONA ST INDL DEV AUTH EDU REVENUE(b) | | 7/15/2038 | | 5.75 | | 517,626 | | 587,826 | | |
| 700,000 | | GLENDALE AZ INDL DEV AUTH | | 11/15/2036 | | 5.00 | | 721,407 | | 757,845 | | |
| 550,000 | | GLENDALE AZ INDL DEV AUTH | | 11/15/2046 | | 5.25 | | 556,382 | | 557,146 | | |
| 800,000 | | MARICOPA CNTY AZ INDL DEV AUTH EDU REVENUE | | 7/1/2035 | | 5.00 | | 833,368 | | 887,056 | | |
| 870,000 | | MARICOPA CNTY AZ INDL DEV AUTH EDU REVENUE(b) | | 7/1/2052 | | 6.00 | | 912,919 | | 1,047,634 | | |
| 500,000 | | NAVAJO NATION AZ(b) | | 12/1/2030 | | 5.50 | | 518,407 | | 566,366 | | |
| 1,000,000 | | PHOENIX AZ INDL DEV AUTH EDU REVENUE(b) | | 7/1/2036 | | 5.13 | | 987,066 | | 1,129,617 | | |
| 1,000,000 | | PHOENIX AZ INDL DEV AUTH EDU REVENUE(b) | | 9/1/2045 | | 5.00 | | 1,042,524 | | 1,135,143 | | |
| 2,500,000 | | PHOENIX AZ INDL DEV AUTH LEASE REVENUE | | 6/1/2034 | | 5.25 | | 2,505,534 | | 2,609,657 | | |
| 700,000 | | PIMA CNTY AZ INDL DEV AUTH EDU REVENUE(b) | | 12/1/2026 | | 5.25 | | 700,000 | | 738,133 | | |
| 10,000 | | PIMA CNTY AZ INDL DEV AUTH EDU REVENUE | | 7/1/2031 | | 6.75 | | 8,071 | | 10,151 | | |
| 1,370,000 | | PIMA CNTY AZ INDL DEV AUTH EDU REVENUE(b) | | 6/15/2035 | | 5.38 | | 1,435,621 | | 1,505,425 | | |
| 750,000 | | PIMA CNTY AZ INDL DEV AUTH EDU REVENUE(b) | | 6/15/2037 | | 4.75 | | 737,634 | | 763,078 | | |
| See accompanying notes to financial statements. | 57 | (Continued) |
CLEARWATER INVESTMENT TRUST
Schedule of Investments - Clearwater Tax-Exempt Bond Fund
June 30, 2021 (unaudited)
| Par/Shares | | Security | | Maturity
date | | Coupon
rate | | Cost | | Fair value (a) | | Percent of
net assets |
| Arizona (Cont'd): | | | | | | | | | | |
| 690,000 | | QUECHAN INDIAN TRIBE AZ FORT YUMA INDIAN RESERVATION | | 5/1/2025 | | 9.75 | | $ 690,000 | | 713,905 | | |
| 500,000 | | TEMPE AZ INDL DEV AUTH REVENUE(b) | | 10/1/2024 | | 4.70 | | 499,236 | | 500,442 | | |
| 500,000 | | TEMPE AZ INDL DEV AUTH REVENUE(b) | | 10/1/2037 | | 6.00 | | 502,285 | | 555,344 | | |
| | | | | | | 16,043,969 | | 17,470,521 | | 2.54% |
| Arkansas | | | | | | | | | | |
| 525,000 | | SHERIDAN AR SCH DIST #37 | | 2/1/2047 | | 4.00 | | 527,081 | | 536,693 | | |
| 1,000,000 | | SPRINGDALE AR SALES & USE REVENUE | | 4/1/2041 | | 3.60 | | 973,715 | | 1,047,426 | | |
| | | | | | | 1,500,796 | | 1,584,119 | | 0.23% |
| California | | | | | | | | | | |
| 2,350,000 | | ACALANES CA UNION HIGH SCH DIST (Step to 6.55% on 8/1/2024)(d) | | 8/1/2039 | | 0.00 | | 1,928,416 | | 2,745,542 | | |
| 1,000,000 | | ALVORD CA UNIF SCH DIST | | 8/1/2036 | | 5.25 | | 1,007,825 | | 1,105,902 | | |
| 1,000,000 | | ALVORD CA UNIF SCH DIST (Step to 7.35% on 8/1/2026)(d) | | 8/1/2046 | | 0.00 | | 696,004 | | 1,296,841 | | |
| 650,000 | | CALIFORNIA PUBLIC FIN AUTH SENIOR LIVING REVENUE(b) | | 5/15/2029 | | 3.13 | | 650,000 | | 658,828 | | |
| 500,000 | | CALIFORNIA PUBLIC FIN AUTH SENIOR LIVING REVENUE(b) | | 11/15/2051 | | 5.00 | | 526,905 | | 576,871 | | |
| 500,000 | | CALIFORNIA PUBLIC FIN AUTH SENIOR LIVING REVENUE(b) | | 11/15/2056 | | 5.00 | | 523,506 | | 573,671 | | |
| 500,000 | | CALIFORNIA ST HLTH FACS FING AUTH REVENUE | | 8/15/2033 | | 5.50 | | 500,164 | | 503,193 | | |
| 1,500,000 | | CALIFORNIA ST SCH FACS FING AUTH REVENUE | | 8/1/2029 | | 6.00 | | 1,489,760 | | 1,894,488 | | |
| 750,000 | | CALIFORNIA ST STWD CMNTYS DEV AUTH REVENUE | | 10/1/2042 | | 6.00 | | 764,436 | | 803,666 | | |
| 1,000,000 | | CARLSBAD CA UNIF SCH DIST (Step to 6.13% on 8/1/2021)(d) | | 8/1/2031 | | 0.00 | | 992,344 | | 1,379,790 | | |
| 1,000,000 | | COLTON CA JT UNIF SCH DIST (Step to 5.80% on 8/1/2021)(d) | | 8/1/2035 | | 0.00 | | 994,812 | | 1,250,454 | | |
| 1,105,000 | | CORONA-NORCO CA UNIF SCH DIST | | 8/1/2039 | | 6.80 | | 1,103,501 | | 1,503,205 | | |
| 750,000 | | EL PASO DE ROBLES CA REDEV AGY TAX ALLOCATION REVENUE | | 7/1/2033 | | 6.38 | | 744,075 | | 753,477 | | |
| 1,000,000 | | ENCINITAS CA UNION SCH DIST (Step to 6.75% on 8/1/2022)(d) | | 8/1/2035 | | 0.00 | | 930,290 | | 1,473,883 | | |
| 1,155,000 | | ENTERPRISE CA ELEM SCH DIST (Step to 6.20% on 8/1/2021)(d) | | 8/1/2035 | | 0.00 | | 1,148,193 | | 1,643,377 | | |
| 600,000 | | ESCONDIDO CA SPL TAX | | 9/1/2036 | | 5.00 | | 625,617 | | 700,722 | | |
| 1,500,000 | | HARTNELL CA CMNTY CLG DIST (Step to 7.00% on 8/1/2022)(d) | | 8/1/2034 | | 0.00 | | 1,392,225 | | 1,864,612 | | |
| 3,500,000 | | HEALDSBURG CA UNIF SCH DIST (Step to 4.60% on 8/1/2022)(d) | | 8/1/2037 | | 0.00 | | 3,327,936 | | 3,878,119 | | |
| 1,000,000 | | HELENDALE CA SCH DIST | | 8/1/2034 | | 6.25 | | 998,535 | | 1,378,529 | | |
| 1,000,000 | | IMPERIAL CA CMNTY CLG DIST | | 8/1/2040 | | 6.75 | | 1,006,220 | | 1,249,371 | | |
| 750,000 | | MARTINEZ CA UNIF SCH DIST | | 8/1/2035 | | 6.13 | | 747,182 | | 884,621 | | |
| 2,000,000 | | OAK PARK CA UNIF SCH DIST (Step to 7.10% on 8/1/2021)(d) | | 8/1/2038 | | 0.00 | | 1,988,663 | | 2,934,799 | | |
| 1,000,000 | | REDONDO BEACH CA UNIF SCH DIST | | 8/1/2034 | | 6.38 | | 996,844 | | 1,279,365 | | |
| 750,000 | | REEF-SUNSET CA UNIF SCH DIST (Step to 4.85% on 8/1/2021)(d) | | 8/1/2038 | | 0.00 | | 746,794 | | 870,082 | | |
| 1,000,000 | | RIVERSIDE CA CMNTY PPTYS DEV INC LEASE REVENUE | | 10/15/2038 | | 6.00 | | 1,007,625 | | 1,132,716 | | |
| 1,500,000 | | S TAHOE CA JT PWRS FING AUTH LEASE REVENUE | | 10/1/2030 | | 5.00 | | 1,561,061 | | 1,688,648 | | |
| 350,000 | | SACRAMENTO CNTY CA WTR FING AUTH REVENUE (Floating, ICE LIBOR USD 3M + 0.57%)(e) | | 6/1/2039 | | 0.66 | | 350,000 | | 342,754 | | |
| 500,000 | | SAN DIEGO CA HSG AUTH MF HSG REVENUE | | 5/1/2029 | | 5.00 | | 500,000 | | 501,478 | | |
| 1,500,000 | | SAN GABRIEL CA UNIF SCH DIST | | 8/1/2039 | | 5.35 | | 1,495,307 | | 1,579,929 | | |
| 1,000,000 | | SAN JOSE CA FING AUTH LEASE REVENUE | | 6/1/2039 | | 5.00 | | 1,016,063 | | 1,080,255 | | |
| 500,000 | | SANTA MONICA CA REDEV AGY | | 7/1/2036 | | 5.88 | | 500,000 | | 504,962 | | |
| 2,185,000 | | SULPHUR SPRINGS CA UNION SCH DIST COPS | | 12/1/2037 | | 6.50 | | 2,183,541 | | 2,678,545 | | |
| 1,500,000 | | SUTTER BUTTE CA FLOOD AGY ASSMNT REVENUE | | 10/1/2038 | | 4.00 | | 1,485,179 | | 1,600,545 | | |
| See accompanying notes to financial statements. | 58 | (Continued) |
CLEARWATER INVESTMENT TRUST
Schedule of Investments - Clearwater Tax-Exempt Bond Fund
June 30, 2021 (unaudited)
| Par/Shares | | Security | | Maturity
date | | Coupon
rate | | Cost | | Fair value (a) | | Percent of
net assets |
| California (Cont'd): | | | | | | | | | | |
| 1,000,000 | | TRACY CA JT UNIF SCH DIST (Step to 7.30% on 8/1/2027)(d) | | 8/1/2041 | | 0.00 | | $ 740,854 | | 1,116,292 | | |
| 1,250,000 | | TUSTIN CA UNIF SCH DIST | | 8/1/2028 | | 6.00 | | 1,244,631 | | 1,255,865 | | |
| | | | | | | 37,914,508 | | 46,685,397 | | 6.79% |
| Colorado | | | | | | | | | | |
| 500,000 | | 9TH AVENUE MET DIST #2 CO | | 12/1/2048 | | 5.00 | | 500,000 | | 537,495 | | |
| 500,000 | | BASELINE MET DIST #1 CO SPL REVENUE | | 12/1/2051 | | 5.00 | | 534,754 | | 536,572 | | |
| 1,000,000 | | BRIGHTON CROSSING MET DIST #6 CO | | 12/1/2050 | | 5.00 | | 1,015,933 | | 1,105,741 | | |
| 750,000 | | BROADWAY STATION MET DIST #2 CO | | 12/1/2048 | | 5.13 | | 750,000 | | 819,644 | | |
| 1,000,000 | | BROADWAY STATION MET DIST #3 CO | | 12/1/2049 | | 5.00 | | 1,022,596 | | 1,100,423 | | |
| 650,000 | | BUFFALO HIGHLANDS MET DIST | | 12/1/2038 | | 5.25 | | 651,487 | | 700,245 | | |
| 500,000 | | CLEAR CREEK TRANSIT MET DIST #2 CO | | 12/1/2050 | | 5.00 | | 521,429 | | 549,638 | | |
| 1,000,000 | | COLORADO ST EDUCTNL & CULTURAL FACS AUTH REVENUE | | 7/1/2034 | | 5.60 | | 995,377 | | 1,004,058 | | |
| 1,000,000 | | COLORADO ST EDUCTNL & CULTURAL FACS AUTH REVENUE | | 9/1/2046 | | 5.00 | | 1,000,497 | | 1,003,712 | | |
| 1,250,000 | | COLORADO ST HLTH FACS AUTH HOSP REVENUE | | 12/1/2048 | | 5.00 | | 1,303,832 | | 1,466,162 | | |
| 1,000,000 | | COLORADO ST HLTH FACS AUTH HOSP REVENUE | | 12/1/2050 | | 4.00 | | 1,050,690 | | 1,144,398 | | |
| 1,000,000 | | COLORADO ST HLTH FACS AUTH REVENUE | | 8/1/2033 | | 7.63 | | 990,222 | | 1,067,744 | | |
| 750,000 | | COPPERLEAF CO MET DIST #4 | | 12/1/2049 | | 5.00 | | 779,299 | | 817,141 | | |
| 1,000,000 | | CREEKWALK MARKETPLACE BUSINESS IMPT DIST CO(b) | | 12/1/2039 | | 5.50 | | 1,000,000 | | 1,122,327 | | |
| 750,000 | | CRYSTAL CO CROSSING MET DIST | | 12/1/2040 | | 5.25 | | 750,000 | | 819,484 | | |
| 1,500,000 | | DENVER CO CITY & CNTY MF HSG REVENUE | | 2/1/2039 | | 2.05 | | 1,500,000 | | 1,496,152 | | |
| 1,000,000 | | DIATC MET DIST CO(b) | | 12/1/2049 | | 5.00 | | 1,054,865 | | 1,082,746 | | |
| 1,000,000 | | DOUGLAS CNTY CO MF REVENUE | | 10/1/2029 | | 4.50 | | 1,000,000 | | 1,007,008 | | |
| 1,000,000 | | GREEN VALLEY RANCH EAST MET DIST #6 CO | | 12/1/2050 | | 5.88 | | 1,000,000 | | 1,112,619 | | |
| 500,000 | | HASKINS STATION CO MET DIST | | 12/1/2039 | | 5.00 | | 516,216 | | 545,337 | | |
| 500,000 | | HUNTERS OVERLOOK METRO DIST #5 CO | | 12/1/2049 | | 5.00 | | 524,573 | | 543,601 | | |
| 500,000 | | JOHNSTOWN VLG MET DIST #2 CO | | 12/1/2050 | | 5.00 | | 503,724 | | 545,369 | | |
| 655,000 | | LAMBERTSON FARMS CO MET DIST #1 REVENUE | | 12/15/2025 | | 5.00 | | 646,140 | | 623,578 | | |
| 500,000 | | LAMBERTSON FARMS CO MET DIST #1 REVENUE | | 12/15/2035 | | 5.50 | | 500,000 | | 453,576 | | |
| 2,000,000 | | LEGATO CMNTY AUTH CO LTD TAX SUPPORTED REVENUE (Step to 5.00% on 12/1/2026)(d) | | 12/1/2051 | | 0.00 | | 1,572,244 | | 1,583,202 | | |
| 500,000 | | LEGATO CMNTY AUTH CO LTD TAX SUPPORTED REVENUE | | 12/1/2051 | | 5.00 | | 529,306 | | 541,945 | | |
| 750,000 | | LEYDEN ROCK MET DIST #10 | | 12/1/2045 | | 5.00 | | 765,749 | | 778,609 | | |
| 1,000,000 | | LITTLETON VLG MET DIST #2 COLO SPL REVENUE | | 12/1/2045 | | 5.38 | | 996,595 | | 1,031,641 | | |
| 750,000 | | MIRABELLE MET DIST #2 CO | | 12/1/2049 | | 5.00 | | 788,979 | | 814,133 | | |
| 583,045 | | MOUNT CARBON CO MET DIST REVENUE (Step to 0.00% on 6/1/2033)(d) | | 6/1/2043 | | 7.00 | | 583,045 | | 583,209 | | |
| 200,000 | | MOUNT CARBON CO MET DIST REVENUE(c) | | 6/1/2043 | | 8.00 | | - | | 44,000 | | |
| 1,000,000 | | PAINTED PRAIRIE PUB IMPT AUTH CO | | 12/1/2039 | | 5.00 | | 1,032,146 | | 1,102,229 | | |
| 500,000 | | PALISADE CO MET DIST #2 LIMITED TAX | | 12/1/2046 | | 5.00 | | 510,467 | | 518,665 | | |
| 650,000 | | PEAK MET DIST #1 CO(b) | | 12/1/2051 | | 5.00 | | 676,609 | | 717,115 | | |
| 1,400,000 | | REUNION MET DIST CO SPL REVENUE | | 12/1/2044 | | 3.63 | | 1,346,412 | | 1,393,397 | | |
| 500,000 | | RIVERVIEW MET DIST CO | | 12/1/2051 | | 5.00 | | 537,371 | | 537,823 | | |
| 500,000 | | ST VRAIN LAKES MET DIST #2 | | 12/1/2037 | | 5.00 | | 500,000 | | 533,918 | | |
| 1,000,000 | | STC MET DIST #2 CO | | 12/1/2049 | | 5.00 | | 1,050,490 | | 1,090,140 | | |
| 1,000,000 | | THOMPSON CROSSING MET DIST #4 CO | | 12/1/2049 | | 5.00 | | 1,047,994 | | 1,082,429 | | |
| 1,000,000 | | TRANSPORT MET DIST #3 CO | | 12/1/2041 | | 5.00 | | 1,023,087 | | 1,131,333 | | |
| 750,000 | | TRANSPORT MET DIST #3 CO | | 12/1/2051 | | 5.00 | | 754,724 | | 839,079 | | |
| 700,000 | | VAUXMONT MET DIST CO | | 12/15/2050 | | 3.25 | | 700,000 | | 748,524 | | |
| 1,000,000 | | WINDSHIRE PARK CO MET DIST #2 | | 12/1/2047 | | 6.50 | | 1,073,597 | | 1,146,799 | | |
| | | | | | | 35,600,449 | | 37,422,960 | | 5.44% |
| See accompanying notes to financial statements. | 59 | (Continued) |
CLEARWATER INVESTMENT TRUST
Schedule of Investments - Clearwater Tax-Exempt Bond Fund
June 30, 2021 (unaudited)
| Par/Shares | | Security | | Maturity
date | | Coupon
rate | | Cost | | Fair value (a) | | Percent of
net assets |
| Connecticut | | | | | | | | | | |
| 500,000 | | CONNECTICUT ST HLTH & EDUCTNL FACS AUTH REVENUE(b) | | 1/1/2027 | | 3.25 | | $ 500,000 | | 511,708 | | |
| 500,000 | | CONNECTICUT ST HLTH & EDUCTNL FACS AUTH REVENUE(b) | | 1/1/2055 | | 5.00 | | 513,403 | | 556,580 | | |
| 535,000 | | CONNECTICUT ST HSG FIN AUTH HSG MTGE FIN PROGRAM | | 11/15/2035 | | 3.88 | | 535,000 | | 584,526 | | |
| 500,000 | | CONNECTICUT ST HSG FIN AUTH HSG MTGE FIN PROGRAM | | 5/15/2038 | | 3.95 | | 500,000 | | 516,725 | | |
| 2,000,000 | | CONNECTICUT ST HSG FIN AUTH HSG MTGE FIN PROGRAM | | 5/15/2045 | | 3.85 | | 2,044,753 | | 2,064,926 | | |
| 5,000,000 | | CONNECTICUT ST HSG FIN AUTH HSG MTGE FIN PROGRAM | | 11/15/2047 | | 3.65 | | 5,000,000 | | 5,031,035 | | |
| 583,408 | | MASHANTUCKET WSTRN PEQUOT TRIBE CT | | 7/1/2031 | | 6.05 | | 594,188 | | 87,511 | | |
| | | | | | | 9,687,344 | | 9,353,011 | | 1.36% |
| District of Columbia | | | | | | | | | | |
| 500,000 | | DIST OF COLUMBIA HSG FIN AGY MF HSG REVENUE | | 7/1/2033 | | 5.45 | | 500,000 | | 501,464 | | |
| 1,000,000 | | DIST OF COLUMBIA HSG FIN AGY MF HSG REVENUE | | 6/1/2040 | | 4.90 | | 1,000,000 | | 1,015,011 | | |
| 1,000,000 | | DIST OF COLUMBIA HSG FIN AGY MF HSG REVENUE | | 6/1/2041 | | 5.00 | | 1,000,000 | | 1,014,867 | | |
| 665,000 | | DIST OF COLUMBIA REVENUE | | 7/1/2027 | | 4.13 | | 622,041 | | 709,974 | | |
| 1,250,000 | | DIST OF COLUMBIA REVENUE | | 7/1/2042 | | 5.00 | | 1,097,782 | | 1,346,788 | | |
| 1,000,000 | | DISTRICT OF COLUMBIA HSG FIN AGY | | 9/1/2043 | | 4.05 | | 1,000,000 | | 1,136,204 | | |
| | | | | | | 5,219,823 | | 5,724,308 | | 0.83% |
| Florida | | | | | | | | | | |
| 1,000,000 | | ALACHUA CNTY FL HLTH FACS AUTH CCRC | | 10/1/2032 | | 8.00 | | 1,046,966 | | 1,085,933 | | |
| 550,000 | | ARTISAN LAKES EAST CDD FL CAPITAL IMPT REVENUE(b) | | 5/1/2052 | | 4.00 | | 581,564 | | 582,513 | | |
| 390,000 | | ASTURIA FL CMNTY DEV DIST SPL ASSMNT | | 5/1/2034 | | 5.75 | | 390,000 | | 420,601 | | |
| 1,000,000 | | BELLALAGO FL EDUCTNL FACS BENEFIT DIST CAPITAL IMPT REVENUE | | 5/1/2030 | | 4.38 | | 988,793 | | 1,105,258 | | |
| 500,000 | | BLACKBURN CREEK CMNTY DEV DISTFL CAP IMPT REVENUE | | 5/1/2035 | | 6.25 | | 500,000 | | 571,073 | | |
| 180,000 | | BLACKBURN CREEK CMNTY DEV DISTFL CAP IMPT REVENUE | | 5/1/2045 | | 6.25 | | 180,000 | | 203,964 | | |
| 1,370,000 | | CAPITAL TRUST AGY FL CHRT SCH REVENUE | | 2/1/2035 | | 5.38 | | 1,370,000 | | 1,453,225 | | |
| 525,000 | | CAPITAL TRUST AGY FL EDUCTNL FACS REVENUE(b) | | 7/1/2051 | | 4.00 | | 564,354 | | 564,826 | | |
| 485,000 | | CAPITAL TRUST AGY FL EDUCTNL FACS REVENUE | | 6/1/2056 | | 4.00 | | 519,576 | | 517,697 | | |
| 900,000 | | CAPITAL TRUST AGY FL EDUCTNL FACS REVENUE(b) | | 6/1/2056 | | 5.00 | | 979,213 | | 979,953 | | |
| 445,000 | | CAPITAL TRUST AGY FL EDUCTNL FACS REVENUE(b) | | 7/1/2056 | | 4.00 | | 474,423 | | 474,815 | | |
| 750,000 | | CAPITAL TRUST AGY FL REVENUE | | 4/1/2035 | | 7.00 | | 750,000 | | 400,053 | | |
| 1,750,000 | | CAPITAL TRUST AGY FL REVENUE(b)(c)(f) | | 12/1/2035 | | 6.75 | | 1,745,953 | | 560,000 | | |
| 750,000 | | CAPITAL TRUST AGY FL REVENUE(b)(c)(f) | | 7/1/2037 | | 6.75 | | 750,000 | | 228,750 | | |
| 500,000 | | CAPITAL TRUST AGY FL STUDENT HSG REVENUE(b) | | 12/1/2043 | | 5.25 | | 512,932 | | 593,258 | | |
| 710,000 | | CELEBRATION POINTE CMNTY DEV DIST #1 FL SPL ASSMNT REVENUE(b) | | 5/1/2032 | | 5.00 | | 713,549 | | 790,634 | | |
| 500,000 | | CFM FL CDD REVENUE | | 5/1/2051 | | 4.00 | | 518,947 | | 524,873 | | |
| 750,000 | | COLLIER CNTY FLA INDL DEV AUTH CONTINUING CARE CMNTY REVENUE(b)(c)(f) | | 5/15/2026 | | 7.25 | | 750,000 | | 510,000 | | |
| 1,750,000 | | COLLIER CNTY FLA INDL DEV AUTH CONTINUING CARE CMNTY REVENUE(b)(c)(f) | | 5/15/2044 | | 8.13 | | 1,913,765 | | 1,190,000 | | |
| 1,000,000 | | DAVIE FL EDUCTNL FACS REVENUE | | 4/1/2042 | | 6.00 | | 1,007,226 | | 1,100,179 | | |
| 1,000,000 | | EAST NASSAU STEWARDSHIP DIST FL SPL ASSMNT REVENUE | | 5/1/2051 | | 4.00 | | 1,024,542 | | 1,044,637 | | |
| See accompanying notes to financial statements. | 60 | (Continued) |
CLEARWATER INVESTMENT TRUST
Schedule of Investments - Clearwater Tax-Exempt Bond Fund
June 30, 2021 (unaudited)
| Par/Shares | | Security | | Maturity
date | | Coupon
rate | | Cost | | Fair value (a) | | Percent of
net assets |
| Florida (Cont'd): | | | | | | | | | | |
| 630,000 | | ESCAMBIA CNTY FL HSG FIN AUTH SF MTGE REVENUE | | 10/1/2049 | | 3.75 | | $ 630,000 | | 676,935 | | |
| 615,000 | | FISHHAWK CCD IV FL SPL ASSMNT REVENUE | | 5/1/2033 | | 7.00 | | 615,000 | | 671,144 | | |
| 1,350,000 | | FLORIDA DEV FIN CORP SURFACE TRANPRTN FAC REVENUE(b) | | 1/1/2049 | | 7.38 | | 1,292,698 | | 1,484,390 | | |
| 1,000,000 | | FLORIDA ST DEPT OF EDU CMNTY CLG CAPITAL IMPT REVENUE | | 7/1/2030 | | 4.38 | | 1,000,000 | | 1,002,463 | | |
| 1,000,000 | | FLORIDA ST DEV FIN CORP EDUCTNL FACS REVENUE(b) | | 6/15/2035 | | 6.00 | | 1,000,666 | | 1,143,502 | | |
| 920,000 | | FLORIDA ST DEV FIN CORP EDUCTNL FACS REVENUE(b) | | 6/1/2040 | | 5.00 | | 947,480 | | 1,032,893 | | |
| 2,000,000 | | FLORIDA ST DEV FIN CORP SENIOR LIVING REVENUE(b) | | 6/1/2050 | | 5.25 | | 2,037,919 | | 2,292,454 | | |
| 1,350,000 | | FLORIDA ST DEV FIN CORP SENIOR LIVING REVENUE | | 6/1/2051 | | 5.00 | | 1,500,909 | | 1,558,686 | | |
| 500,000 | | FLORIDA ST HSG FIN CORP REVENUE | | 7/1/2035 | | 3.75 | | 500,000 | | 521,108 | | |
| 245,000 | | FLORIDA ST HSG FIN CORP REVENUE | | 7/1/2039 | | 4.20 | | 245,000 | | 248,470 | | |
| 1,300,000 | | FLORIDA ST HSG FIN CORP REVENUE | | 1/1/2045 | | 4.20 | | 1,300,000 | | 1,411,521 | | |
| 2,000,000 | | FLORIDA ST HSG FIN CORP REVENUE | | 7/1/2046 | | 2.10 | | 2,000,000 | | 1,954,944 | | |
| 800,000 | | FLORIDA ST HSG FIN CORP REVENUE | | 7/1/2049 | | 3.30 | | 800,000 | | 827,399 | | |
| 1,000,000 | | FRERC CDD FL | | 11/1/2040 | | 5.38 | | 1,000,000 | | 1,082,934 | | |
| 700,000 | | GRANDE PINES CDD FL SPL ASSMNT REVENUE | | 5/1/2041 | | 3.75 | | 699,002 | | 721,486 | | |
| 650,000 | | HARBOR BAY FL CDD CAPITAL IMPT REVENUE | | 5/1/2048 | | 4.10 | | 645,778 | | 705,122 | | |
| 700,000 | | HERITAGE HARBOUR FL N CDD SPL ASSMNT | | 5/1/2034 | | 5.00 | | 700,000 | | 825,016 | | |
| 1,000,000 | | HOLLYWOOD BEACH FL CMNTY DEV DIST REVENUE | | 10/1/2045 | | 4.00 | | 1,100,488 | | 1,156,506 | | |
| 710,000 | | LAKE CNTY FLA RETMNT FAC REVENUE | | 8/15/2050 | | 5.75 | | 724,371 | | 811,957 | | |
| 600,000 | | LAKES OF SARASOTA CDD FL IMPT REVENUE | | 5/1/2031 | | 3.88 | | 595,865 | | 614,536 | | |
| 500,000 | | LAKES OF SARASOTA CDD FL IMPT REVENUE | | 5/1/2031 | | 4.13 | | 498,589 | | 514,447 | | |
| 385,000 | | LAKES OF SARASOTA CDD FL IMPT REVENUE | | 5/1/2041 | | 4.13 | | 383,700 | | 396,443 | | |
| 235,000 | | LAKEWOOD RANCH FL STEWARDSHIP DIST SPL ASSMNT REVENUE | | 5/1/2025 | | 4.25 | | 234,749 | | 247,481 | | |
| 700,000 | | LAKEWOOD RANCH FL STEWARDSHIP DIST SPL ASSMNT REVENUE | | 5/1/2033 | | 6.70 | | 700,000 | | 745,244 | | |
| 1,000,000 | | LAKEWOOD RANCH FL STEWARDSHIP DIST SPL ASSMNT REVENUE | | 5/1/2034 | | 5.35 | | 1,000,000 | | 1,166,974 | | |
| 1,200,000 | | LAKEWOOD RANCH FL STEWARDSHIP DIST SPL ASSMNT REVENUE | | 5/1/2036 | | 5.00 | | 1,200,000 | | 1,321,452 | | |
| 750,000 | | LAKEWOOD RANCH FL STEWARDSHIP DIST SPL ASSMNT REVENUE(b) | | 5/1/2037 | | 5.00 | | 745,124 | | 840,308 | | |
| 750,000 | | LAKEWOOD RANCH FL STEWARDSHIP DIST SPL ASSMNT REVENUE | | 5/1/2037 | | 5.25 | | 745,959 | | 848,186 | | |
| 700,000 | | LAKEWOOD RANCH FL STEWARDSHIP DIST SPL ASSMNT REVENUE | | 5/1/2038 | | 5.00 | | 700,000 | | 789,214 | | |
| 1,000,000 | | LAKEWOOD RANCH FL STEWARDSHIP DIST SPL ASSMNT REVENUE | | 5/1/2039 | | 5.30 | | 1,000,000 | | 1,163,959 | | |
| 580,000 | | LAKEWOOD RANCH FL STEWARDSHIP DIST SPL ASSMNT REVENUE(b) | | 5/1/2040 | | 3.63 | | 575,676 | | 610,223 | | |
| 1,000,000 | | LAKEWOOD RANCH FL STEWARDSHIP DIST SPL ASSMNT REVENUE(b) | | 5/1/2040 | | 3.75 | | 1,000,000 | | 1,060,166 | | |
| 630,000 | | LAKEWOOD RANCH FL STEWARDSHIP DIST SPL ASSMNT REVENUE | | 5/1/2049 | | 4.00 | | 626,749 | | 668,690 | | |
| 425,000 | | LAKEWOOD RANCH FL STEWARDSHIP DIST SPL ASSMNT REVENUE | | 5/1/2049 | | 4.50 | | 419,011 | | 468,366 | | |
| 1,440,000 | | LAKEWOOD RANCH FL STEWARDSHIP DIST SPL ASSMNT REVENUE | | 5/1/2050 | | 4.00 | | 1,436,153 | | 1,526,333 | | |
| 465,000 | | LEXINGTON OAKS FL CDD SPL ASSMNT REVENUE | | 5/1/2033 | | 5.65 | | 465,000 | | 470,903 | | |
| 270,000 | | LONG LAKE RANCH CMNTY DEV DIST FLA CAP IMPT REVENUE | | 5/1/2024 | | 5.63 | | 270,000 | | 282,379 | | |
| 500,000 | | LT RANCH CDD FL CAPITAL IMPT REVENUE | | 5/1/2040 | | 4.00 | | 505,554 | | 536,661 | | |
| 250,000 | | MAGNOLIA CREEK FL CDD CAPITAL IMPT REVENUE(c) | | 5/1/2014 | | 5.60 | | 250,000 | | 45,000 | | |
| See accompanying notes to financial statements. | 61 | (Continued) |
CLEARWATER INVESTMENT TRUST
Schedule of Investments - Clearwater Tax-Exempt Bond Fund
June 30, 2021 (unaudited)
| Par/Shares | | Security | | Maturity
date | | Coupon
rate | | Cost | | Fair value (a) | | Percent of
net assets |
| Florida (Cont'd): | | | | | | | | | | |
| 735,000 | | MARSHALL CREEK FL CDD SPL ASSMNT | | 5/1/2032 | | 5.00 | | $ 743,923 | | 784,852 | | |
| 500,000 | | MIAMI BEACH FL HLTH FACS AUTH | | 11/15/2044 | | 5.00 | | 522,360 | | 552,989 | | |
| 135,000 | | MIAMI-DADE CNTY FL HLTH FACS AUTH HOSP REVENUE | | 8/1/2030 | | 6.00 | | 131,055 | | 135,611 | | |
| 245,000 | | N SPRINGS FL IMPT DIST | | 5/1/2027 | | 6.00 | | 245,000 | | 270,791 | | |
| 115,000 | | NEW RIVER FL CDD CAPITAL IMPT REVENUE(c) | | 5/1/2013 | | 5.00 | | 114,821 | | 1 | | |
| 1,120,000 | | NORTH RIVER RANCH CDD FL CAPITAL IMPT REVENUE | | 5/1/2035 | | 4.20 | | 1,120,000 | | 1,173,860 | | |
| 500,000 | | NORTH SPRINGS FL IMPT DIST | | 5/1/2044 | | 6.50 | | 500,000 | | 557,867 | | |
| 1,400,000 | | NTHRN PALM BEACH CNTY FL IMPT DIST | | 8/1/2029 | | 5.00 | | 1,404,440 | | 1,525,849 | | |
| 500,000 | | NTHRN PALM BEACH CNTY FL IMPT DIST | | 8/1/2037 | | 5.00 | | 507,840 | | 576,189 | | |
| 1,000,000 | | ORANGE CNTY FL HLTH FACS AUTH REVENUE | | 8/1/2034 | | 5.00 | | 1,023,781 | | 1,100,208 | | |
| 750,000 | | ORANGE CNTY FL HLTH FACS AUTH REVENUE | | 8/1/2035 | | 5.00 | | 770,023 | | 847,793 | | |
| 1,000,000 | | ORANGE CNTY FL HLTH FACS AUTH REVENUE | | 8/1/2047 | | 5.00 | | 1,051,969 | | 1,089,204 | | |
| 210,000 | | ORANGE CNTY FL HSG FIN AUTH | | 9/1/2035 | | 3.80 | | 210,000 | | 221,708 | | |
| 500,000 | | PALM BEACH CNTY FL HLTH FACS AUTH REVENUE | | 6/1/2034 | | 7.25 | | 500,000 | | 533,843 | | |
| 1,200,000 | | PALM BEACH CNTY FL HLTH FACS AUTH REVENUE | | 5/15/2036 | | 5.00 | | 1,277,766 | | 1,381,864 | | |
| 1,000,000 | | PALM BEACH CNTY FL HLTH FACS AUTH REVENUE | | 6/1/2049 | | 7.50 | | 1,022,969 | | 1,067,554 | | |
| 2,935,000 | | PALM BEACH CNTY FL HLTH FACS AUTH REVENUE | | 5/15/2053 | | 4.00 | | 2,872,399 | | 3,238,198 | | |
| 500,000 | | PALM BEACH CNTY FL HLTH FACS AUTH REVENUE | | 6/1/2055 | | 5.00 | | 512,477 | | 544,346 | | |
| 500,000 | | PARKER ROAD FL CDD CAPITAL IMPT REVENUE | | 5/1/2050 | | 4.10 | | 498,296 | | 531,582 | | |
| 500,000 | | PARKVIEW AT LONG LAKE RANCH CDD FL SPL ASSMNET | | 5/1/2051 | | 4.00 | | 503,699 | | 527,782 | | |
| 1,000,000 | | PINELLAS CNTY FL HSG FIN AUTH SF HSG REVENUE | | 3/1/2052 | | 3.00 | | 1,090,388 | | 1,088,358 | | |
| 500,000 | | PINELLAS CNTY FL INDL DEV AUTH INDL DEV REVENUE | | 7/1/2039 | | 5.00 | | 547,354 | | 602,152 | | |
| 700,000 | | POINCIANA FL W CDD SPL ASSMNT | | 5/1/2030 | | 5.38 | | 693,890 | | 775,085 | | |
| 560,000 | | RIVER LANDING CDD FL CAP IMPT REVENUE | | 11/1/2035 | | 4.25 | | 558,193 | | 606,991 | | |
| 1,900,000 | | SAINT JOHNS CNTY FL INDL DEV AUTH REVENUE | | 8/1/2055 | | 4.00 | | 2,008,582 | | 2,082,734 | | |
| 880,000 | | SANDRIDGE CMNTY DEV DIST FL SPL ASSMNT REVENUE | | 5/1/2031 | | 3.88 | | 880,000 | | 902,790 | | |
| 730,000 | | SANDRIDGE CMNTY DEV DIST FL SPL ASSMNT REVENUE | | 5/1/2051 | | 4.00 | | 719,938 | | 744,860 | | |
| 155,000 | | SILVERLEAF FL CDD CAPITAL IMPT REVENUE | | 5/1/2044 | | 6.75 | | 152,325 | | 172,079 | | |
| 600,000 | | SOUTHERN GROVE CMNTY DEV DIST #5 SPL ASSMNT | | 5/1/2048 | | 4.00 | | 633,965 | | 635,512 | | |
| 142,538 | | STERLING HILL FL CDD CAPITAL IMPT REVENUE(c) | | 11/1/2010 | | 5.50 | | 142,538 | | 85,523 | | |
| 1,100,000 | | TALLAHASSEE FL HLTH FACS REVENUE | | 12/1/2040 | | 5.00 | | 1,134,281 | | 1,246,738 | | |
| 500,000 | | TOLOMATO FL CDD | | 5/1/2037 | | 4.25 | | 500,000 | | 556,938 | | |
| 50,000 | | TOLOMATO FL CDD (Step to 6.61% on 5/1/2022)(d) | | 5/1/2040 | | 0.00 | | 52,044 | | 44,561 | | |
| 185,000 | | TOLOMATO FL CDD (Step to 6.61% on 11/1/2021)(d) | | 5/1/2040 | | 0.00 | | 182,059 | | 180,409 | | |
| 115,000 | | TOLOMATO FL CDD (Step to 6.61% on 11/1/2024)(d) | | 5/1/2040 | | 0.00 | | 90,917 | | 87,711 | | |
| 1,490,000 | | TOLOMATO FL CDD | | 5/1/2040 | | 3.75 | | 1,435,267 | | 1,662,820 | | |
| 125,000 | | TOLOMATO FL CDD | | 5/1/2040 | | 6.61 | | - | | 1 | | |
| 700,000 | | TROUT CREEK CDD FL CAPITAL IMPT REVENUE | | 5/1/2038 | | 5.38 | | 700,000 | | 798,594 | | |
| 385,000 | | TROUT CREEK CDD FL CAPITAL IMPT REVENUE | | 5/1/2040 | | 4.00 | | 389,313 | | 407,301 | | |
| 500,000 | | TSR CDD FL SPL ASSMNT REVENUE | | 11/1/2035 | | 5.38 | | 498,758 | | 582,968 | | |
| See accompanying notes to financial statements. | 62 | (Continued) |
CLEARWATER INVESTMENT TRUST
Schedule of Investments - Clearwater Tax-Exempt Bond Fund
June 30, 2021 (unaudited)
| Par/Shares | | Security | | Maturity
date | | Coupon
rate | | Cost | | Fair value (a) | | Percent of
net assets |
| Florida (Cont'd): | | | | | | | | | | |
| 1,500,000 | | UNIVERSITY PARK RECREATION DIST FL ON-AD VALOREM ASSMNT | | 5/1/2050 | | 3.50 | | $ 1,500,000 | | 1,657,973 | | |
| 1,105,000 | | VLG FL CDD #7 SPL ASSMNT REVENUE | | 5/1/2036 | | 4.00 | | 1,098,881 | | 1,200,491 | | |
| 4,000 | | WATERS EDGE FL CDD CAPITAL IMPT REVENUE | | 5/1/2039 | | 5.35 | | 4,000 | | 4,004 | | |
| 80,000 | | WATERS EDGE FL CDD CAPITAL IMPT REVENUE | | 5/1/2039 | | 6.60 | | 79,414 | | 80,898 | | |
| 655,000 | | WIREGRASS FL CDD CAPITAL IMPT REVENUE | | 5/1/2035 | | 5.38 | | 651,790 | | 717,611 | | |
| 1,000,000 | | WIREGRASS II CDD FL CAPITAL IMPROVEMENT REVENUE | | 5/1/2050 | | 3.88 | | 985,450 | | 1,047,609 | | |
| 750,000 | | WYNNFIELD LAKES FL CDD | | 5/1/2036 | | 4.50 | | 745,600 | | 804,083 | | |
| 350,934 | | ZEPHYR RIDGE FL CDD CAPITAL IMPT REVENUE(c) | | 5/1/2013 | | 5.25 | | 351,276 | | 154,411 | | |
| | | | | | | 82,732,284 | | 84,941,433 | | 12.36% |
| Georgia | | | | | | | | | | |
| 500,000 | | ATHENS-CLARKE CNTY GA UNIF GOVT DEV AUTH REVENUE | | 6/15/2039 | | 5.00 | | 505,936 | | 544,107 | | |
| 1,350,000 | | COBB CNTY GA DEV AUTH(b) | | 12/1/2039 | | 5.00 | | 1,414,628 | | 1,414,135 | | |
| 3,500,000 | | GEORGIA ST HSG & FIN AUTH REVENUE | | 12/1/2037 | | 3.80 | | 3,500,000 | | 3,587,984 | | |
| 2,000,000 | | GEORGIA ST HSG & FIN AUTH REVENUE | | 12/1/2037 | | 4.00 | | 2,000,000 | | 2,015,224 | | |
| 905,000 | | GEORGIA ST HSG & FIN AUTH REVENUE | | 12/1/2038 | | 3.85 | | 905,000 | | 972,459 | | |
| 2,500,000 | | GEORGIA ST HSG & FIN AUTH REVENUE | | 12/1/2040 | | 3.80 | | 2,500,000 | | 2,642,522 | | |
| 1,000,000 | | GEORGIA ST HSG & FIN AUTH REVENUE | | 12/1/2041 | | 3.85 | | 1,001,480 | | 1,023,373 | | |
| 1,950,000 | | GEORGIA ST HSG & FIN AUTH REVENUE | | 12/1/2043 | | 3.90 | | 1,938,806 | | 1,994,499 | | |
| 895,000 | | GEORGIA ST HSG & FIN AUTH REVENUE | | 12/1/2048 | | 4.00 | | 895,000 | | 936,945 | | |
| 605,000 | | GEORGIA ST HSG & FIN AUTH REVENUE | | 12/1/2048 | | 4.20 | | 605,000 | | 662,267 | | |
| 1,750,000 | | GEORGIA ST HSG & FIN AUTH REVENUE | | 12/1/2049 | | 3.25 | | 1,750,000 | | 1,858,478 | | |
| | | | | | | 17,015,850 | | 17,651,993 | | 2.57% |
| Idaho | | | | | | | | | | |
| 570,000 | | IDAHO ST HLTH FACS AUTH REVENUE | | 10/1/2024 | | 7.00 | | 570,000 | | 492,708 | | |
| 750,000 | | IDAHO ST HLTH FACS AUTH REVENUE | | 10/1/2029 | | 7.38 | | 744,229 | | 648,586 | | |
| 1,000,000 | | IDAHO ST HLTH FACS AUTH REVENUE | | 10/1/2044 | | 8.00 | | 1,031,480 | | 870,020 | | |
| | | | | | | 2,345,709 | | 2,011,314 | | 0.29% |
| Illinois | | | | | | | | | | |
| 1,195,000 | | BELLWOOD IL | | 12/1/2027 | | 5.88 | | 1,189,012 | | 1,290,877 | | |
| 1,495,000 | | BOLINGBROOK IL SPL SVC AREA SPL TAX | | 3/1/2030 | | 4.00 | | 1,536,961 | | 1,728,864 | | |
| 1,250,000 | | BURBANK IL EDUCTNL FACS REVENUE(b) | | 9/1/2035 | | 6.00 | | 1,258,403 | | 1,381,261 | | |
| 1,000,000 | | BUREAU CNTY TWP IL HIGH SCH DIST #502 | | 10/1/2043 | | 6.63 | | 1,021,721 | | 1,151,223 | | |
| 1,000,000 | | CHICAGO HEIGHTS IL | | 12/1/2029 | | 4.50 | | 1,038,491 | | 1,110,323 | | |
| 1,000,000 | | CHICAGO IL MIDWAY ARPT REVENUE | | 1/1/2035 | | 5.25 | | 1,000,562 | | 1,069,376 | | |
| 1,000,000 | | CHICAGO IL PARK DIST | | 1/1/2028 | | 5.00 | | 1,053,248 | | 1,091,559 | | |
| 750,000 | | CHICAGO IL PARK DIST | | 1/1/2042 | | 4.00 | | 770,124 | | 863,170 | | |
| 637,000 | | CORTLAND IL SPL TAX REVENUE(c) | | 3/1/2017 | | 5.50 | | 633,881 | | 15,925 | | |
| 500,000 | | DECATUR IL | | 3/1/2034 | | 5.00 | | 506,213 | | 557,700 | | |
| 830,000 | | EVANSTON ILL EDL FAC REV(b) | | 4/1/2041 | | 4.38 | | 828,342 | | 845,526 | | |
| 1,500,000 | | ILLINOIS ST | | 2/1/2030 | | 4.00 | | 1,494,551 | | 1,712,972 | | |
| 500,000 | | ILLINOIS ST | | 7/1/2033 | | 5.50 | | 498,790 | | 542,698 | | |
| 1,000,000 | | ILLINOIS ST EDUCTNL FACS AUTH | | 11/1/2036 | | 4.50 | | 1,000,000 | | 1,122,352 | | |
| 675,000 | | ILLINOIS ST FIN AUTH EDUCTNL FAC REVENUE | | 2/1/2034 | | 6.00 | | 678,177 | | 729,446 | | |
| 600,000 | | ILLINOIS ST FIN AUTH REVENUE | | 5/15/2027 | | 6.13 | | 600,000 | | 602,095 | | |
| 500,000 | | ILLINOIS ST FIN AUTH REVENUE | | 5/15/2036 | | 5.00 | | 501,054 | | 562,823 | | |
| 750,000 | | ILLINOIS ST FIN AUTH REVENUE | | 12/1/2037 | | 5.00 | | 762,447 | | 845,362 | | |
| 500,000 | | ILLINOIS ST FIN AUTH REVENUE | | 5/1/2038 | | 5.25 | | 508,124 | | 531,897 | | |
| 1,450,000 | | ILLINOIS ST FIN AUTH REVENUE | | 5/15/2038 | | 5.13 | | 1,411,527 | | 1,543,620 | | |
| 1,500,000 | | ILLINOIS ST FIN AUTH REVENUE | | 5/15/2045 | | 5.00 | | 1,563,258 | | 1,664,947 | | |
| See accompanying notes to financial statements. | 63 | (Continued) |
CLEARWATER INVESTMENT TRUST
Schedule of Investments - Clearwater Tax-Exempt Bond Fund
June 30, 2021 (unaudited)
| Par/Shares | | Security | | Maturity
date | | Coupon
rate | | Cost | | Fair value (a) | | Percent of
net assets |
| Illinois (Cont'd): | | | | | | | | | | |
| 1,000,000 | | ILLINOIS ST HSG DEV AUTH MF REVENUE | | 7/1/2044 | | 3.15 | | $ 1,000,000 | | 1,064,839 | | |
| 465,000 | | ILLINOIS ST HSG DEV AUTH REVENUE | | 4/1/2041 | | 3.88 | | 465,000 | | 498,518 | | |
| 1,000,000 | | ILLINOIS ST SALES TAX REVENUE | | 6/15/2033 | | 5.00 | | 1,060,175 | | 1,224,104 | | |
| 1,500,000 | | ILLINOIS ST SPORTS FACS AUTH | | 6/15/2031 | | 5.25 | | 1,547,113 | | 1,664,916 | | |
| 500,000 | | LAKE CNTY IL SCH DIST #33 | | 12/1/2040 | | 5.00 | | 513,933 | | 567,382 | | |
| 1,000,000 | | MACON & MOULTRIE CNTYS IL CMNTY SCH DIST #3 MOUNT ZION | | 12/1/2041 | | 5.50 | | 1,010,332 | | 1,127,562 | | |
| 1,080,000 | | MACOUPIN SANGAMON & MONTGOMERY CNTYS IL CMNTY SCH DIST #34 | | 12/1/2037 | | 4.25 | | 1,095,590 | | 1,169,164 | | |
| 1,000,000 | | MALTA IL TAX INCR REVENUE(c) | | 12/30/2025 | | 5.75 | | 1,000,000 | | 350,000 | | |
| 500,000 | | MET PIER & EXPOSITION AUTH IL REVENUE | | 6/15/2057 | | 5.00 | | 516,131 | | 600,159 | | |
| 500,000 | | RICHTON PARK IL PUBLIC LIBRARY DIST | | 12/15/2032 | | 4.50 | | 514,215 | | 528,183 | | |
| 750,000 | | ROCKFORD IL | | 12/15/2030 | | 4.00 | | 750,000 | | 752,128 | | |
| 360,000 | | S WSTRN IL DEV AUTH(c) | | 10/1/2022 | | 7.00 | | 360,000 | | 208,800 | | |
| 385,000 | | UPPER IL RIVER VLY DEV AUTH(b) | | 12/1/2022 | | 4.00 | | 383,948 | | 390,862 | | |
| 750,000 | | UPPER IL RIVER VLY DEV AUTH(b) | | 12/1/2037 | | 5.25 | | 766,517 | | 815,418 | | |
| 465,000 | | UPPER IL RIVER VLY DEV AUTH(b) | | 1/1/2045 | | 5.00 | | 491,507 | | 495,535 | | |
| 685,000 | | WESTMONT IL PARK DIST(g) | | 12/1/2031 | | 0.00 | | 372,301 | | 425,156 | | |
| 685,000 | | WESTMONT IL PARK DIST(g) | | 12/1/2033 | | 0.00 | | 325,236 | | 372,719 | | |
| | | | | | | 32,026,884 | | 33,219,461 | | 4.83% |
| Indiana | | | | | | | | | | |
| 1,000,000 | | EAST CHICAGO IN SAN DIST REVENUE | | 7/15/2035 | | 4.00 | | 993,270 | | 1,077,330 | | |
| 500,000 | | INDIANA ST FIN AUTH REVENUE | | 11/15/2031 | | 5.50 | | 494,924 | | 507,159 | | |
| 1,000,000 | | INDIANA ST FIN AUTH REVENUE | | 11/15/2033 | | 6.50 | | 989,484 | | 1,089,742 | | |
| 1,000,000 | | INDIANA ST FIN AUTH REVENUE | | 3/1/2041 | | 5.00 | | 1,006,528 | | 1,032,373 | | |
| 500,000 | | INDIANA ST FIN AUTH REVENUE | | 11/15/2041 | | 5.88 | | 515,303 | | 543,150 | | |
| 1,000,000 | | INDIANA ST FIN AUTH REVENUE | | 11/15/2041 | | 6.00 | | 988,323 | | 1,089,173 | | |
| 1,000,000 | | INDIANA ST FIN AUTH REVENUE | | 11/15/2046 | | 5.25 | | 1,024,863 | | 1,147,636 | | |
| 1,500,000 | | INDIANA ST HSG & CMNTY DEV AUTH MF HSG REVENUE | | 1/1/2036 | | 5.75 | | 1,500,000 | | 1,553,647 | | |
| 600,000 | | MERRILLVILLE IN ECON DEV REVENUE | | 4/1/2036 | | 5.75 | | 600,000 | | 628,636 | | |
| 615,000 | | MUNSTER IN ECON DEV TAX INCR REVENUE | | 7/15/2026 | | 4.75 | | 613,625 | | 654,612 | | |
| 1,000,000 | | SCHERERVILLE IN ECON DEV REVENUE | | 1/15/2030 | | 6.00 | | 1,004,341 | | 1,087,452 | | |
| | | | | | | 9,730,661 | | 10,410,910 | | 1.51% |
| Iowa | | | | | | | | | | |
| 1,500,000 | | IOWA ST FIN AUTH REVENUE | | 5/15/2036 | | 5.00 | | 1,597,208 | | 1,727,330 | | |
| 500,000 | | IOWA ST HGR EDU LOAN AUTH | | 11/1/2030 | | 5.00 | | 517,222 | | 562,219 | | |
| | | | | | | 2,114,430 | | 2,289,549 | | 0.33% |
| Kansas | | | | | | | | | | |
| 1,000,000 | | FRANKLIN CNTY KS UNIF SCH DIST #290 | | 9/1/2039 | | 4.75 | | 1,026,187 | | 1,176,271 | | |
| 935,000 | | WYANDOTTE CNTY KS KANSAS CITY UNIF GOVT SPL OBLG REVENUE | | 9/1/2032 | | 5.75 | | 929,653 | | 952,276 | | |
| | | | | | | 1,955,840 | | 2,128,547 | | 0.31% |
| Kentucky | | | | | | | | | | |
| 450,000 | | KENTUCKY ST HSG CORP HSG REVENUE | | 7/1/2028 | | 3.75 | | 445,896 | | 461,993 | | |
| | | | | | | 445,896 | | 461,993 | | 0.07% |
| Louisiana | | | | | | | | | | |
| 1,000,000 | | LOUISIANA PUB FACS AUTH REVENUE(b) | | 6/1/2051 | | 5.00 | | 1,068,493 | | 1,070,155 | | |
| 1,000,000 | | LOUISIANA ST ENERGY & PWR AUTH PWR PROJ REVENUE | | 6/1/2038 | | 5.25 | | 1,005,410 | | 1,091,637 | | |
| 650,000 | | LOUISIANA ST LOCAL GOVT ENVRNMNTL FACS & CMNTY DEV AUTH | | 11/15/2025 | | 5.25 | | 677,636 | | 697,806 | | |
| 1,000,000 | | LOUISIANA ST LOCAL GOVT ENVRNMNTL FACS & CMNTY DEV AUTH | | 11/15/2030 | | 6.00 | | 1,009,500 | | 1,120,652 | | |
| 700,000 | | LOUISIANA ST LOCAL GOVT ENVRNMNTL FACS & CMNTY DEV AUTH REVE(b) | | 11/1/2037 | | 5.65 | | 700,000 | | 846,830 | | |
| See accompanying notes to financial statements. | 64 | (Continued) |
CLEARWATER INVESTMENT TRUST
Schedule of Investments - Clearwater Tax-Exempt Bond Fund
June 30, 2021 (unaudited)
| Par/Shares | | Security | | Maturity
date | | Coupon
rate | | Cost | | Fair value (a) | | Percent of
net assets |
| Louisiana (Cont'd): | | | | | | | | | | |
| 1,000,000 | | LOUISIANA ST LOCAL GOVT ENVRNMNTL FACS & CMNTY DEV AUTH REVE(b) | | 7/1/2039 | | 5.00 | | $ 1,058,019 | | 1,046,947 | | |
| 600,000 | | LOUISIANA ST LOCAL GOVT ENVRNMNTL FACS & CMNTY DEV AUTH REVENUE(b) | | 11/1/2039 | | 5.50 | | 600,000 | | 691,043 | | |
| 900,000 | | LOUISIANA ST LOCAL GOVT ENVRNMNTL FACS & CMNTY DEV AUTH REVENUE(b) | | 11/1/2044 | | 4.00 | | 900,000 | | 982,522 | | |
| 750,000 | | LOUISIANA ST LOCAL GOVT ENVRNMNTL FACS & CMNTY DEV AUTH REVENUE(b) | | 11/1/2044 | | 4.40 | | 750,000 | | 833,731 | | |
| 1,250,000 | | LOUISIANA ST LOCAL GOVT ENVRNMNTL FACS & CMNTY DEV AUTH REVENUE(b) | | 11/1/2046 | | 4.00 | | 1,250,000 | | 1,377,737 | | |
| 500,000 | | LOUISIANA ST PUBLIC FACS AUTH HOSP REVENUE | | 7/1/2035 | | 5.00 | | 522,429 | | 573,981 | | |
| 370,000 | | LOUISIANA ST PUBLIC FACS AUTH REVENUE (Floating, ICE LIBOR USD 3M + 0.70%)(e) | | 2/15/2036 | | 0.80 | | 370,000 | | 368,000 | | |
| 750,000 | | SAINT TAMMANY LA PUBLIC TRUST FING AUTH | | 11/15/2037 | | 5.25 | | 755,730 | | 811,681 | | |
| | | | | | | 10,667,217 | | 11,512,722 | | 1.67% |
| Maine | | | | | | | | | | |
| 580,000 | | MAINE ST HSG AUTH MTGE PURCHASE | | 11/15/2036 | | 3.90 | | 580,000 | | 624,404 | | |
| 1,500,000 | | MAINE ST HSG AUTH MTGE PURCHASE | | 11/15/2040 | | 3.85 | | 1,500,000 | | 1,580,499 | | |
| 500,000 | | MAINE ST HSG AUTH MTGE PURCHASE | | 11/15/2042 | | 4.05 | | 500,000 | | 537,320 | | |
| | | | | | | 2,580,000 | | 2,742,223 | | 0.40% |
| Maryland | | | | | | | | | | |
| 500,000 | | MARYLAND ST CMNTY DEV ADMIN DEPT HSG & CMNTY DEV | | 7/1/2031 | | 4.50 | | 500,000 | | 501,354 | | |
| 1,250,000 | | MARYLAND ST CMNTY DEV ADMIN DEPT HSG & CMNTY DEV | | 9/1/2041 | | 1.95 | | 1,250,000 | | 1,225,053 | | |
| 1,250,000 | | MARYLAND ST HLTH & HGR EDUCTNL FACS AUTH REVENUE | | 7/1/2048 | | 4.00 | | 1,222,493 | | 1,447,287 | | |
| 1,050,000 | | MONTGOMERY CNTY MD HSG OPPNTYS COMMN MFH & RECONSTR DEV REVENUE | | 7/1/2052 | | 2.10 | | 1,050,000 | | 1,035,323 | | |
| 500,000 | | MONTGOMERY CNTY MD HSG OPPORTUNITIES COMMISSION MF REVENUE | | 7/1/2037 | | 5.13 | | 500,000 | | 504,318 | | |
| 555,000 | | MONTGOMERY CNTY MD HSG OPPORTUNITIES COMMISSION SF MTGE REVENUE | | 7/1/2038 | | 4.00 | | 555,000 | | 562,044 | | |
| | | | | | | 5,077,493 | | 5,275,379 | | 0.77% |
| Massachusetts | | | | | | | | | | |
| 4,000,000 | | MASSACHUSETTS ST DEV FIN AGY MF REVENUE | | 1/1/2042 | | 2.30 | | 4,000,000 | | 3,970,456 | | |
| 700,000 | | MASSACHUSETTS ST DEV FIN AGY REVENUE(b) | | 10/1/2047 | | 5.00 | | 740,125 | | 766,926 | | |
| 1,500,000 | | MASSACHUSETTS ST DEV FIN AGY REVENUE | | 6/1/2049 | | 4.00 | | 1,515,215 | | 1,700,417 | | |
| 155,000 | | MASSACHUSETTS ST EDUCTNL FING AUTH | | 1/1/2028 | | 5.25 | | 155,000 | | 156,501 | | |
| 1,225,000 | | MASSACHUSETTS ST EDUCTNL FING AUTH | | 7/1/2034 | | 3.63 | | 1,236,793 | | 1,288,224 | | |
| 1,000,000 | | MASSACHUSETTS ST EDUCTNL FING AUTH | | 7/1/2037 | | 2.00 | | 1,000,000 | | 999,423 | | |
| 1,500,000 | | MASSACHUSETTS ST EDUCTNL FING AUTH | | 7/1/2048 | | 3.75 | | 1,445,565 | | 1,576,590 | | |
| 1,700,000 | | MASSACHUSETTS ST EDUCTNL FING AUTH | | 7/1/2051 | | 3.00 | | 1,710,183 | | 1,709,696 | | |
| 700,000 | | MASSACHUSETTS ST HSG FIN AGY | | 12/1/2033 | | 5.00 | | 700,000 | | 741,042 | | |
| 700,000 | | MASSACHUSETTS ST HSG FIN AGY | | 12/1/2038 | | 5.15 | | 700,000 | | 740,422 | | |
| 1,000,000 | | MASSACHUSETTS ST HSG FIN AGY | | 12/1/2043 | | 5.00 | | 1,000,000 | | 1,052,176 | | |
| 2,700,000 | | MASSACHUSETTS ST HSG FIN AGY HSG REVENUE | | 12/1/2043 | | 4.00 | | 2,700,000 | | 2,755,493 | | |
| 1,860,000 | | MASSACHUSETTS ST HSG FIN AGY HSG REVENUE | | 6/1/2046 | | 4.20 | | 1,860,000 | | 2,011,780 | | |
| See accompanying notes to financial statements. | 65 | (Continued) |
CLEARWATER INVESTMENT TRUST
Schedule of Investments - Clearwater Tax-Exempt Bond Fund
June 30, 2021 (unaudited)
| Par/Shares | | Security | | Maturity
date | | Coupon
rate | | Cost | | Fair value (a) | | Percent of
net assets |
| Massachusetts (Cont'd): | | | | | | | | | | |
| 500,000 | | MASSACHUSETTS ST HSG FIN AGY HSG REVENUE | | 6/1/2063 | | 2.80 | | $ 500,000 | | 507,615 | | |
| 500,000 | | ROWLEY MA | | 5/1/2027 | | 4.00 | | 500,000 | | 501,567 | | |
| | | | | | | 19,762,881 | | 20,478,328 | | 2.98% |
| Michigan | | | | | | | | | | |
| 190,000 | | CHANDLER PARK ACADEMY MI PUBLIC SCH ACADEMY REVENUE | | 11/1/2022 | | 5.00 | | 181,772 | | 190,424 | | |
| 500,000 | | KALAMAZOO MI ECON DEV CORP | | 5/15/2043 | | 5.00 | | 530,103 | | 572,177 | | |
| 750,000 | | MICHIGAN ST FIN AUTH REVENUE | | 11/15/2035 | | 5.25 | | 746,221 | | 817,634 | | |
| 500,000 | | MICHIGAN ST FIN AUTH REVENUE | | 11/15/2042 | | 5.00 | | 513,003 | | 528,369 | | |
| 1,850,000 | | MICHIGAN ST HSG DEV AUTH RENTAL HSG REVENUE | | 10/1/2035 | | 4.10 | | 1,850,000 | | 1,991,734 | | |
| 600,000 | | MICHIGAN ST HSG DEV AUTH RENTAL HSG REVENUE | | 10/1/2042 | | 3.75 | | 600,000 | | 646,591 | | |
| 1,650,000 | | MICHIGAN ST HSG DEV AUTH RENTAL HSG REVENUE | | 10/1/2043 | | 4.00 | | 1,650,000 | | 1,819,385 | | |
| 2,250,000 | | MICHIGAN ST HSG DEV AUTH RENTAL HSG REVENUE | | 10/1/2054 | | 3.50 | | 2,323,894 | | 2,404,826 | | |
| 1,750,000 | | MICHIGAN ST HSG DEV AUTH RENTAL HSG REVENUE | | 10/1/2056 | | 2.70 | | 1,750,000 | | 1,753,203 | | |
| 575,000 | | MICHIGAN ST HSG DEV AUTH SF MTGE REVENUE | | 12/1/2036 | | 3.70 | | 575,000 | | 610,833 | | |
| 850,000 | | MICHIGAN ST HSG DEV AUTH SF MTGE REVENUE | | 6/1/2049 | | 4.00 | | 852,521 | | 897,847 | | |
| 1,000,000 | | MICHIGAN ST HSG DEV AUTH SF MTGE REVENUE | | 6/1/2050 | | 3.15 | | 1,000,000 | | 1,050,800 | | |
| 5,000,000 | | MICHIGAN ST HSG DEV AUTH SF MTGE REVENUE | | 6/1/2051 | | 2.75 | | 4,875,117 | | 5,136,690 | | |
| 420,000 | | MICHIGAN ST PUBLIC EDUCTNL FACS AUTH | | 11/1/2028 | | 6.35 | | 420,000 | | 421,041 | | |
| 750,000 | | TAYLOR MI BROWNFIELD REDEV AUTH | | 5/1/2032 | | 5.00 | | 767,879 | | 842,899 | | |
| 330,000 | | UNIVERSAL ACADEMY MI PUBLIC SCH ACADEMY REVENUE | | 12/1/2023 | | 6.50 | | 328,183 | | 342,570 | | |
| | | | | | | 18,963,693 | | 20,027,023 | | 2.91% |
| Minnesota | | | | | | | | | | |
| 950,000 | | APPLE VLY MN SENIOR LIVING REVENUE | | 1/1/2047 | | 5.00 | | 929,885 | | 691,055 | | |
| 1,000,000 | | APPLE VY MN SENIOR HSG REVENUE | | 9/1/2058 | | 5.00 | | 980,000 | | 1,049,720 | | |
| 2,500,000 | | MINNESOTA ST OFFICE OF HGR EDU REVENUE | | 11/1/2038 | | 2.65 | | 2,370,630 | | 2,568,461 | | |
| | | | | | | 4,280,515 | | 4,309,236 | | 0.63% |
| Mississippi | | | | | | | | | | |
| 1,000,000 | | MISSISSIPPI ST DEV BANK SPL OBLG(b) | | 11/1/2039 | | 4.55 | | 1,000,000 | | 1,130,780 | | |
| | | | | | | 1,000,000 | | 1,130,780 | | 0.16% |
| Missouri | | | | | | | | | | |
| 500,000 | | JOPLIN MO INDL DEV AUTH SALES TAX REVENUE | | 11/1/2040 | | 3.50 | | 495,059 | | 506,774 | | |
| 1,300,000 | | KANSAS CITY MO INDL DEV AUTH SENIOR LIVING FACS REVENUE(b)(c)(f) | | 11/15/2036 | | 5.75 | | 1,300,000 | | 455,650 | | |
| 1,000,000 | | KIRKWOOD MO INDL DEV AUTH RETMNT CMNTY REVENUE | | 5/15/2037 | | 5.25 | | 1,015,083 | | 1,145,704 | | |
| 1,000,000 | | MISSOURI ST HLTH & EDUCTNL FACS AUTH | | 2/1/2042 | | 5.00 | | 910,102 | | 1,119,607 | | |
| 2,000,000 | | MISSOURI ST HLTH & EDUCTNL FACS AUTH | | 2/1/2048 | | 4.00 | | 2,071,428 | | 2,236,730 | | |
| 700,000 | | MISSOURI ST HSG DEV COMMISSION SF MTGE REVENUE | | 11/1/2048 | | 3.80 | | 700,000 | | 757,287 | | |
| 455,000 | | MISSOURI ST HSG DEV COMMISSION SF MTGE REVENUE | | 11/1/2049 | | 3.35 | | 455,000 | | 486,592 | | |
| 750,000 | | SAINT LOUIS CNTY MO INDL DEV AUTH SENIOR LIVING FACS | | 9/1/2042 | | 5.00 | | 753,797 | | 773,277 | | |
| | | | | | | 7,700,469 | | 7,481,621 | | 1.09% |
| Montana | | | | | | | | | | |
| 765,000 | | MONTANA ST BRD OF HSG | | 12/1/2038 | | 3.75 | | 765,000 | | 785,019 | | |
| 430,000 | | MONTANA ST BRD OF HSG | | 12/1/2038 | | 5.20 | | 430,000 | | 454,816 | | |
| 825,000 | | MONTANA ST BRD OF HSG | | 6/1/2045 | | 4.00 | | 825,000 | | 913,807 | | |
| 735,000 | | MONTANA ST BRD OF HSG SF MTGE | | 12/1/2037 | | 3.95 | | 735,000 | | 805,132 | | |
| See accompanying notes to financial statements. | 66 | (Continued) |
CLEARWATER INVESTMENT TRUST
Schedule of Investments - Clearwater Tax-Exempt Bond Fund
June 30, 2021 (unaudited)
| Par/Shares | | Security | | Maturity
date | | Coupon
rate | | Cost | | Fair value (a) | | Percent of
net assets |
| Montana (Cont'd): | | | | | | | | | | |
| 650,000 | | MONTANA ST BRD OF HSG SF MTGE | | 12/1/2038 | | 4.00 | | $ 651,160 | | 694,481 | | |
| | | | | | | 3,406,160 | | 3,653,255 | | 0.53% |
| Nebraska | | | | | | | | | | |
| 160,000 | | MEAD NE TAX INCR REVENUE(c) | | 7/1/2012 | | 5.13 | | 160,000 | | 6,640 | | |
| 595,000 | | NEBRASKA ST INVESTMENT FIN AUTH SF HSG REVENUE | | 9/1/2042 | | 3.05 | | 595,000 | | 614,127 | | |
| | | | | | | 755,000 | | 620,767 | | 0.09% |
| Nevada | | | | | | | | | | |
| 645,000 | | NEVADA ST HSG DIV SF MTGE REVENUE | | 10/1/2039 | | 3.85 | | 645,000 | | 662,700 | | |
| 690,000 | | NEVADA ST HSG DIV SF MTGE REVENUE | | 10/1/2049 | | 3.35 | | 690,000 | | 731,724 | | |
| 1,500,000 | | NEVADA ST HSG DIV SF MTGE REVENUE | | 10/1/2051 | | 2.45 | | 1,500,000 | | 1,497,661 | | |
| 505,000 | | NORTH LAS VEGAS NV LOCAL IMPT(b) | | 12/1/2027 | | 4.00 | | 496,024 | | 555,632 | | |
| 505,000 | | NORTH LAS VEGAS NV LOCAL IMPT(b) | | 12/1/2037 | | 5.00 | | 505,821 | | 580,527 | | |
| | | | | | | 3,836,845 | | 4,028,244 | | 0.59% |
| New Hampshire | | | | | | | | | | |
| 1,350,000 | | NATIONAL FIN AUTH NH SENIOR LIVING REVENUE | | 1/1/2041 | | 4.00 | | 1,471,295 | | 1,511,350 | | |
| 1,000,000 | | NEW HAMPSHIRE ST HSG FIN AUTH MF REVENUE | | 7/1/2031 | | 5.20 | | 1,000,000 | | 1,002,635 | | |
| 1,500,000 | | NEW HAMPSHIRE ST HSG FIN AUTH MF REVENUE | | 7/1/2052 | | 4.00 | | 1,500,000 | | 1,629,579 | | |
| 65,000 | | NEW HAMPSHIRE ST HSG FIN AUTH SF REVENUE | | 7/1/2034 | | 5.38 | | 65,000 | | 65,236 | | |
| | | | | | | 4,036,295 | | 4,208,800 | | 0.61% |
| New Jersey | | | | | | | | | | |
| 750,000 | | NEW JERSEY ST ECON DEV AUTH | | 6/15/2037 | | 5.00 | | 774,454 | | 931,654 | | |
| 500,000 | | NEW JERSEY ST ECON DEV AUTH | | 6/15/2042 | | 5.00 | | 530,533 | | 606,397 | | |
| 750,000 | | NEW JERSEY ST ECON DEV AUTH REVENUE | | 7/15/2047 | | 5.00 | | 788,615 | | 863,123 | | |
| 2,500,000 | | NEW JERSEY ST HGR EDU ASSISTANCE AUTH STUDENT LOAN REVENUE | | 12/1/2039 | | 3.50 | | 2,493,252 | | 2,705,726 | | |
| 1,000,000 | | NEW JERSEY ST HGR EDU ASSISTANCE AUTH STUDENT LOAN REVENUE | | 12/1/2050 | | 4.25 | | 988,398 | | 1,057,889 | | |
| 1,000,000 | | NEW JERSEY ST HSG & MTGE FIN AGY MF CONDUIT REVENUE | | 1/1/2030 | | 3.60 | | 1,000,000 | | 1,036,514 | | |
| 3,070,000 | | NEW JERSEY ST HSG & MTGE FIN AGY REVENUE | | 10/1/2035 | | 3.75 | | 3,070,000 | | 3,388,567 | | |
| 925,000 | | NEW JERSEY ST HSG & MTGE FIN AGY REVENUE | | 4/1/2049 | | 4.00 | | 927,165 | | 1,006,766 | | |
| 500,000 | | NEW JERSEY ST TRANSPRTN TRUST FUND AUTH | | 12/15/2039 | | 4.00 | | 525,264 | | 582,341 | | |
| 500,000 | | NEW JERSEY ST TRANSPRTN TRUST FUND AUTH | | 6/15/2041 | | 5.25 | | 505,860 | | 582,327 | | |
| 700,000 | | TOBACCO SETTLEMENT FING CORP NJ | | 6/1/2046 | | 5.00 | | 704,031 | | 831,960 | | |
| | | | | | | 12,307,572 | | 13,593,264 | | 1.98% |
| New Mexico | | | | | | | | | | |
| 525,000 | | NEW MEXICO ST MTGE FIN AUTH | | 9/1/2042 | | 3.90 | | 525,000 | | 530,540 | | |
| 680,000 | | NEW MEXICO ST MTGE FIN AUTH | | 9/1/2042 | | 4.13 | | 680,000 | | 688,178 | | |
| 1,385,000 | | NEW MEXICO ST MTGE FIN AUTH | | 7/1/2043 | | 3.85 | | 1,385,000 | | 1,482,151 | | |
| 685,000 | | NEW MEXICO ST MTGE FIN AUTH | | 9/1/2046 | | 3.80 | | 685,000 | | 716,516 | | |
| 630,000 | | NEW MEXICO ST MTGE FIN AUTH | | 7/1/2048 | | 3.90 | | 630,000 | | 682,548 | | |
| 850,000 | | NEW MEXICO ST MTGE FIN AUTH | | 7/1/2048 | | 4.00 | | 851,416 | | 926,106 | | |
| 965,000 | | NEW MEXICO ST MTGE FIN AUTH | | 7/1/2049 | | 3.35 | | 965,000 | | 1,021,817 | | |
| 870,000 | | NEW MEXICO ST MTGE FIN AUTH | | 7/1/2049 | | 4.00 | | 870,000 | | 950,702 | | |
| 545,000 | | NEW MEXICO ST MTGE FIN AUTH | | 7/1/2050 | | 3.00 | | 546,187 | | 576,903 | | |
| | | | | | | 7,137,603 | | 7,575,461 | | 1.10% |
| New York | | | | | | | | | | |
| 1,000,000 | | BUFFALO & ERIE CNTY NY INDL LAND DEV CORP REVENUE | | 11/1/2040 | | 4.00 | | 1,039,788 | | 1,167,669 | | |
| 750,000 | | HEMPSTEAD TOWN NY LOCAL DEV CORP REVENUE | | 9/1/2038 | | 5.00 | | 751,969 | | 813,266 | | |
| 500,000 | | MET TRANSPRTN AUTH NY REVENUE | | 11/15/2027 | | 5.00 | | 536,400 | | 529,712 | | |
| 705,000 | | MONROE CNTY NY INDL DEV CORP REVENUE | | 1/1/2030 | | 4.00 | | 635,274 | | 781,450 | | |
| See accompanying notes to financial statements. | 67 | (Continued) |
CLEARWATER INVESTMENT TRUST
Schedule of Investments - Clearwater Tax-Exempt Bond Fund
June 30, 2021 (unaudited)
| Par/Shares | | Security | | Maturity
date | | Coupon
rate | | Cost | | Fair value (a) | | Percent of
net assets |
| New York (Cont'd): | | | | | | | | | | |
| 1,000,000 | | NEW YORK CITY NY HSG DEV CORP MF HSG REVENUE | | 11/1/2037 | | 3.80 | | $ 1,000,000 | | 1,013,926 | | |
| 1,000,000 | | NEW YORK CITY NY HSG DEV CORP MF HSG REVENUE | | 11/1/2039 | | 4.30 | | 1,000,000 | | 1,045,954 | | |
| 600,000 | | NEW YORK CITY NY HSG DEV CORP MF HSG REVENUE | | 11/1/2042 | | 3.85 | | 601,234 | | 650,936 | | |
| 3,000,000 | | NEW YORK CITY NY HSG DEV CORP MF HSG REVENUE | | 5/1/2045 | | 3.90 | | 2,838,750 | | 3,140,544 | | |
| 1,000,000 | | NEW YORK CITY NY HSG DEV CORP MF HSG REVENUE | | 11/1/2047 | | 3.65 | | 1,000,000 | | 1,062,110 | | |
| 1,000,000 | | NEW YORK CITY NY HSG DEV CORP MF HSG REVENUE | | 11/1/2049 | | 3.95 | | 1,000,000 | | 1,086,790 | | |
| 1,000,000 | | NEW YORK CITY NY HSG DEV CORP MF HSG REVENUE | | 11/1/2055 | | 3.00 | | 1,000,000 | | 1,031,371 | | |
| 2,500,000 | | NEW YORK CITY NY HSG DEV CORP MF HSG REVENUE | | 11/1/2056 | | 2.60 | | 2,500,000 | | 2,495,785 | | |
| 2,000,000 | | NEW YORK CITY NY HSG DEV CORP MF HSG REVENUE | | 11/1/2060 | | 2.80 | | 2,000,000 | | 2,019,461 | | |
| 2,000,000 | | NEW YORK CITY NY MUNI WTR FIN AUTH WTR & SWR SYS REVENUE | | 6/15/2038 | | 5.00 | | 2,057,360 | | 2,178,068 | | |
| 1,000,000 | | NEW YORK ST HSG FIN AGY | | 11/1/2041 | | 4.10 | | 1,000,000 | | 1,088,919 | | |
| 1,000,000 | | NEW YORK ST HSG FIN AGY | | 11/1/2042 | | 4.00 | | 1,000,000 | | 1,082,729 | | |
| 1,000,000 | | NEW YORK ST HSG FIN AGY | | 11/1/2048 | | 3.95 | | 1,000,000 | | 1,094,188 | | |
| 5,000,000 | | NEW YORK ST HSG FIN AGY AFFORDABLE HSG REVENUE | | 11/1/2056 | | 2.75 | | 5,000,000 | | 4,969,350 | | |
| 1,500,000 | | NEW YORK ST HSG FIN AGY REVENUE | | 11/1/2034 | | 3.65 | | 1,500,000 | | 1,578,150 | | |
| 500,000 | | NEW YORK ST HSG FIN AGY REVENUE | | 11/1/2045 | | 5.10 | | 500,000 | | 529,602 | | |
| 4,000,000 | | NEW YORK ST HSG FIN AGY REVENUE | | 5/1/2048 | | 4.10 | | 4,000,000 | | 4,063,157 | | |
| 905,000 | | NEW YORK ST MTGE AGY HOMEOWNER MTGE REVENUE | | 10/1/2036 | | 3.90 | | 905,000 | | 963,188 | | |
| 230,000 | | NEW YORK ST MTGE AGY HOMEOWNER MTGE REVENUE | | 10/1/2042 | | 3.75 | | 230,000 | | 232,647 | | |
| 1,500,000 | | NEW YORK ST MTGE AGY HOMEOWNER MTGE REVENUE | | 10/1/2045 | | 2.45 | | 1,500,000 | | 1,490,069 | | |
| 1,000,000 | | NEW YORK ST MTGE AGY HOMEOWNER MTGE REVENUE | | 10/1/2046 | | 2.50 | | 995,038 | | 1,004,848 | | |
| 1,395,000 | | NEW YORK ST MTGE AGY HOMEOWNER MTGE REVENUE | | 10/1/2048 | | 3.80 | | 1,395,000 | | 1,491,602 | | |
| 1,990,000 | | NEW YORK ST MTGE AGY HOMEOWNER MTGE REVENUE | | 10/1/2049 | | 2.95 | | 1,990,000 | | 2,073,445 | | |
| 1,500,000 | | NEW YORK ST MTGE AGY HOMEOWNER MTGE REVENUE | | 4/1/2050 | | 2.55 | | 1,500,000 | | 1,500,213 | | |
| 1,250,000 | | NEW YORK ST TRANSPRTN DEV CORP SPL FAC REVENUE | | 10/1/2030 | | 4.00 | | 1,245,185 | | 1,510,473 | | |
| 550,000 | | WESTCHESTER CNTY NY LOCAL DEV CORP REVENUE | | 1/1/2034 | | 5.00 | | 557,363 | | 579,656 | | |
| | | | | | | 42,278,361 | | 44,269,278 | | 6.44% |
| North Carolina | | | | | | | | | | |
| 1,750,000 | | MECKLENBURG CNTY NC MF HSG REVENUE | | 1/1/2036 | | 5.38 | | 1,750,000 | | 1,786,186 | | |
| 410,000 | | NORTH CAROLINA ST EDU ASSISTANCE AUTH | | 6/1/2039 | | 3.13 | | 405,819 | | 417,632 | | |
| 850,000 | | NORTH CAROLINA ST HSG FIN AGY HOME OWNERSHIP REVENUE | | 1/1/2041 | | 3.95 | | 858,366 | | 924,256 | | |
| 835,000 | | NORTH CAROLINA ST HSG FIN AGY HOME OWNERSHIP REVENUE | | 1/1/2048 | | 4.00 | | 835,000 | | 906,853 | | |
| 1,000,000 | | NORTH CAROLINA ST MED CARE COMMISSION HLTH CARE FACS REVENUE | | 11/1/2037 | | 5.00 | | 1,074,917 | | 1,166,517 | | |
| 600,000 | | NORTH CAROLINA ST MED CARE COMMISSION RETMNT FACS REVENUE | | 10/1/2038 | | 5.00 | | 596,540 | | 671,063 | | |
| | | | | | | 5,520,642 | | 5,872,507 | | 0.85% |
| North Dakota | | | | | | | | | | |
| 1,085,000 | | NORTH DAKOTA ST HSG FIN AGY | | 1/1/2044 | | 3.05 | | 1,085,000 | | 1,123,475 | | |
| 2,000,000 | | NORTH DAKOTA ST HSG FIN AGY | | 7/1/2044 | | 2.35 | | 2,000,000 | | 2,011,835 | | |
| 1,000,000 | | NORTH DAKOTA ST HSG FIN AGY | | 7/1/2044 | | 2.50 | | 1,000,000 | | 1,024,160 | | |
| | | | | | | 4,085,000 | | 4,159,470 | | 0.61% |
| See accompanying notes to financial statements. | 68 | (Continued) |
CLEARWATER INVESTMENT TRUST
Schedule of Investments - Clearwater Tax-Exempt Bond Fund
June 30, 2021 (unaudited)
| Par/Shares | | Security | | Maturity
date | | Coupon
rate | | Cost | | Fair value (a) | | Percent of
net assets |
| Ohio | | | | | | | | | | |
| 750,000 | | BUTLER CNTY OH PORT AUTH PUBLIC INFRASTRUCTURE REVENUE | | 12/1/2041 | | 5.00 | | $ 750,000 | | 752,030 | | |
| 1,000,000 | | COLUMBUS-FRANKLIN CNTY OH FIN AUTH DEV REVENUE | | 5/15/2045 | | 3.00 | | 1,022,409 | | 1,014,587 | | |
| 1,500,000 | | COLUMBUS-FRANKLIN CNTY OH FIN AUTH DEV REVENUE | | 5/15/2049 | | 4.00 | | 1,588,242 | | 1,661,558 | | |
| 2,000,000 | | FRANKLIN CNTY OH HLTH CARE FACS REVENUE | | 7/1/2045 | | 4.00 | | 2,043,388 | | 2,238,151 | | |
| 750,000 | | LAKE CNTY OH PORT & ECON DEV AUTH LEASE REVENUE(b)(c)(f) | | 12/1/2037 | | 6.50 | | 750,000 | | 266,250 | | |
| 500,000 | | LUCAS CNTY OH HLTH CARE FACS REVENUE | | 8/15/2030 | | 5.50 | | 494,678 | | 502,395 | | |
| 1,500,000 | | LUCAS MET HSG AUTH OH COPS | | 11/1/2036 | | 5.00 | | 1,541,084 | | 1,661,306 | | |
| 2,000,000 | | OHIO ST HGR EDUCTNL FAC COMMISSION | | 11/1/2049 | | 4.00 | | 2,036,907 | | 2,100,517 | | |
| 665,000 | | OHIO ST HSG FIN AGY RSDL MTGE REVENUE | | 9/1/2039 | | 3.35 | | 601,515 | | 699,392 | | |
| 870,000 | | OHIO ST HSG FIN AGY RSDL MTGE REVENUE | | 9/1/2048 | | 4.00 | | 870,000 | | 939,011 | | |
| 1,005,000 | | OHIO ST HSG FIN AGY RSDL MTGE REVENUE | | 3/1/2049 | | 4.00 | | 1,005,000 | | 1,069,773 | | |
| 755,000 | | OHIO ST HSG FIN AGY RSDL MTGE REVENUE | | 9/1/2049 | | 3.35 | | 755,000 | | 801,198 | | |
| 1,000,000 | | REVERE OH LOCAL SCH DIST | | 12/1/2043 | | 4.00 | | 1,022,720 | | 1,026,483 | | |
| | | | | | | 14,480,943 | | 14,732,651 | | 2.14% |
| Oklahoma | | | | | | | | | | |
| 970,000 | | FORT SILL APACHE TRIBE OK ECON DEV AUTH GAMING ENTERPRISE REVENUE(b) | | 8/25/2026 | | 8.50 | | 970,000 | | 981,662 | | |
| 2,000,000 | | OKLAHOMA ST DEV FIN AUTH | | 8/1/2049 | | 5.00 | | 2,203,641 | | 2,359,831 | | |
| | | | | | | 3,173,641 | | 3,341,493 | | 0.49% |
| Oregon | | | | | | | | | | |
| 1,000,000 | | CLACKAMAS CNTY OR HOSP FAC AUTH REVENUE | | 11/15/2047 | | 5.00 | | 970,850 | | 1,103,203 | | |
| 500,000 | | CLACKAMAS CNTY OR HOSP FAC AUTH REVENUE | | 11/15/2055 | | 5.38 | | 501,976 | | 555,961 | | |
| 1,000,000 | | MEDFORD OR HOSP FACS AUTH REVENUE | | 10/1/2042 | | 5.00 | | 1,013,792 | | 1,066,358 | | |
| 500,000 | | MULTNOMAH CNTY OR HOSP FACS AUTH REVENUE | | 12/1/2029 | | 5.00 | | 506,823 | | 526,191 | | |
| 2,000,000 | | OREGON ST | | 12/1/2039 | | 3.90 | | 2,000,000 | | 2,086,803 | | |
| 280,000 | | OREGON ST HSG & CMNTY SVCS DEPT MTGE REVENUE | | 7/1/2035 | | 3.75 | | 280,000 | | 305,742 | | |
| 685,000 | | OREGON ST HSG & CMNTY SVCS DEPT MTGE REVENUE | | 7/1/2038 | | 4.00 | | 685,000 | | 707,488 | | |
| 1,070,000 | | OREGON ST HSG & CMNTY SVCS DEPT MTGE REVENUE | | 7/1/2048 | | 3.75 | | 1,070,000 | | 1,141,221 | | |
| 2,000,000 | | POLK CNTY OR HOSP FAC AUTH REVENUE | | 7/1/2024 | | 4.00 | | 2,000,000 | | 2,001,390 | | |
| 1,240,000 | | POLK CNTY OR HOSP FAC AUTH REVENUE | | 7/1/2035 | | 5.13 | | 1,254,688 | | 1,296,187 | | |
| 1,000,000 | | POLK CNTY OR HOSP FAC AUTH REVENUE | | 7/1/2055 | | 5.13 | | 964,912 | | 1,044,817 | | |
| 650,000 | | YAMHILL CNTY OR HOSP AUTH | | 11/15/2056 | | 5.00 | | 744,953 | | 751,962 | | |
| | | | | | | 11,992,994 | | 12,587,323 | | 1.83% |
| Pennsylvania | | | | | | | | | | |
| 480,000 | | ALLEGHENY CNTY PA INDL DEV AUTH CHRT SCH REVENUE | | 8/15/2026 | | 5.90 | | 480,000 | | 481,640 | | |
| 375,000 | | BUTLER CNTY PA GEN AUTH REVENUE (Floating, ICE LIBOR USD 3M + 0.70%)(e) | | 10/1/2034 | | 0.84 | | 375,000 | | 365,897 | | |
| 650,000 | | CMWLTH FING AUTH PA TOBACCO MASTER SETTLEMENT PAYMENT REVENUE | | 6/1/2039 | | 4.00 | | 647,098 | | 745,870 | | |
| 400,000 | | DAUPHIN CNTY PA GEN AUTH UNIV REVENUE(b) | | 10/15/2022 | | 4.00 | | 399,734 | | 405,872 | | |
| 500,000 | | MONTGOMERY CNTY PA INDL DEV AUTH | | 11/15/2033 | | 5.00 | | 520,269 | | 594,211 | | |
| 1,250,000 | | MONTGOMERY CNTY PA INDL DEV AUTH | | 11/15/2036 | | 5.00 | | 1,261,708 | | 1,471,338 | | |
| See accompanying notes to financial statements. | 69 | (Continued) |
CLEARWATER INVESTMENT TRUST
Schedule of Investments - Clearwater Tax-Exempt Bond Fund
June 30, 2021 (unaudited)
| Par/Shares | | Security | | Maturity
date | | Coupon
rate | | Cost | | Fair value (a) | | Percent of
net assets |
| Pennsylvania (Cont'd): | | | | | | | | | | |
| 1,000,000 | | PENNSYLVANIA HGR EDU ASSISTANCE AGY LOAN REVENUE | | 6/1/2042 | | 2.63 | | $ 1,001,969 | | 1,004,611 | | |
| 1,700,000 | | PENNSYLVANIA HGR EDU ASSISTANCE AGY LOAN REVENUE | | 6/1/2047 | | 3.00 | | 1,700,000 | | 1,697,266 | | |
| 1,000,000 | | PENNSYLVANIA ST ECON DEV FING AUTH UPMC REVENUE | | 4/15/2045 | | 4.00 | | 1,035,238 | | 1,173,019 | | |
| 500,000 | | PENNSYLVANIA ST HGR EDUCTNL FACS AUTH REVENUE (Floating, ICE LIBOR USD 3M + 0.65%)(e) | | 7/1/2039 | | 0.79 | | 500,000 | | 461,557 | | |
| 1,760,000 | | PENNSYLVANIA ST HSG FIN AGY SF MTGE REVENUE | | 10/1/2042 | | 3.65 | | 1,760,000 | | 1,827,343 | | |
| 535,000 | | PENNSYLVANIA ST HSG FIN AGY SF MTGE REVENUE | | 10/1/2042 | | 3.70 | | 535,000 | | 538,047 | | |
| 260,000 | | PENNSYLVANIA ST HSG FIN AGY SF MTGE REVENUE | | 10/1/2047 | | 4.00 | | 260,000 | | 271,851 | | |
| 1,000,000 | | PENNSYLVANIA ST HSG FIN AGY SF MTGE REVENUE | | 10/1/2049 | | 3.40 | | 1,000,000 | | 1,058,313 | | |
| 1,500,000 | | PENNSYLVANIA ST TURNPIKE COMMISSION TURNPIKE REVENUE (Step to 4.60% on 12/1/2021)(d) | | 12/1/2037 | | 0.00 | | 1,468,410 | | 1,695,973 | | |
| 1,000,000 | | PENNSYLVANIA ST TURNPIKE COMMISSION TURNPIKE REVENUE | | 12/1/2042 | | 3.00 | | 1,048,771 | | 1,072,480 | | |
| 200,000 | | PHILADELPHIA PA AUTH FOR INDL DEV REVENUES | | 6/15/2023 | | 6.13 | | 200,000 | | 214,639 | | |
| 750,000 | | PHILADELPHIA PA AUTH FOR INDL DEV REVENUES | | 8/1/2036 | | 5.63 | | 740,581 | | 848,911 | | |
| 750,000 | | PHILADELPHIA PA AUTH FOR INDL DEV REVENUES | | 6/15/2049 | | 5.00 | | 774,864 | | 814,590 | | |
| | | | | | | 15,708,642 | | 16,743,428 | | 2.44% |
| Puerto Rico | | | | | | | | | | |
| 1,500,000 | | PUERTO RICO CMWLTH | | 7/1/2035 | | 5.00 | | 1,500,000 | | 1,548,287 | | |
| | | | | | | 1,500,000 | | 1,548,287 | | 0.23% |
| Rhode Island | | | | | | | | | | |
| 750,000 | | RHODE ISLAND ST HSG & MTGE FIN CORP | | 10/1/2037 | | 3.90 | | 750,000 | | 768,505 | | |
| 1,250,000 | | RHODE ISLAND ST STUDENT LOAN AUTH STUDENT LOAN REVENUE | | 12/1/2037 | | 3.63 | | 1,238,534 | | 1,308,450 | | |
| | | | | | | 1,988,534 | | 2,076,955 | | 0.30% |
| South Carolina | | | | | | | | | | |
| 650,000 | | BERKELEY CNTY SC ASSMNT REVENUE | | 11/1/2040 | | 4.25 | | 647,435 | | 737,118 | | |
| 90,000 | | SOUTH CAROLINA ST EDU ASSISTANCE AUTH | | 10/1/2029 | | 5.10 | | 89,400 | | 90,058 | | |
| 1,245,000 | | SOUTH CAROLINA ST HSG FIN & DEV AUTH MTGE REVENUE | | 7/1/2045 | | 3.05 | | 1,245,000 | | 1,311,324 | | |
| 665,000 | | SOUTH CAROLINA ST JOBS-ECON DEV AUTH ECON DEV REVENUE | | 4/1/2054 | | 4.00 | | 688,089 | | 719,571 | | |
| 1,250,000 | | SOUTH CAROLINA ST JOBS-ECON DEV AUTH HOSP FACS REVENUE | | 12/1/2044 | | 4.00 | | 1,295,541 | | 1,483,800 | | |
| 1,000,000 | | SOUTH CAROLINA ST JOBS-ECON DEV AUTH SOL WST DISP REVENUE(b) | | 6/1/2031 | | 6.00 | | 1,000,000 | | 1,024,984 | | |
| 1,000,000 | | SOUTH CAROLINA ST PUBLIC SVC AUTH REVENUE | | 12/1/2038 | | 5.00 | | 1,025,881 | | 1,119,598 | | |
| 1,400,000 | | SOUTH CAROLINA ST PUBLIC SVC AUTH REVENUE | | 12/1/2043 | | 5.75 | | 1,426,788 | | 1,585,191 | | |
| | | | | | | 7,418,134 | | 8,071,644 | | 1.17% |
| South Dakota | | | | | | | | | | |
| 500,000 | | SOUTH DAKOTA ST HLTH & EDUCTNL FACS AUTH | | 9/1/2032 | | 5.00 | | 499,500 | | 501,615 | | |
| | | | | | | 499,500 | | 501,615 | | 0.07% |
| Tennessee | | | | | | | | | | |
| 1,000,000 | | FRANKLIN TN HLTH & EDUCTNL FACS BRD REVENUE(b)(c)(f) | | 6/1/2027 | | 6.50 | | 1,000,000 | | 300,000 | | |
| 600,000 | | NASHVILLE MET DEV & HSG AGY TN TAX INCR REVENUE(b) | | 6/1/2036 | | 5.13 | | 600,000 | | 693,239 | | |
| 1,350,000 | | SHELBY CNTY TN HLTH EDUCTNL & HSG FACS BRD RETMNT FACS REVENUE | | 10/1/2039 | | 5.50 | | 1,342,211 | | 1,456,151 | | |
| 150,000 | | SHELBY CNTY TN HLTH EDUCTNL & HSG FACS BRD REVENUE | | 1/1/2019 | | 5.35 | | 134,966 | | 375 | | |
| See accompanying notes to financial statements. | 70 | (Continued) |
CLEARWATER INVESTMENT TRUST
Schedule of Investments - Clearwater Tax-Exempt Bond Fund
June 30, 2021 (unaudited)
| Par/Shares | | Security | | Maturity
date | | Coupon
rate | | Cost | | Fair value (a) | | Percent of
net assets |
| Tennessee (Cont'd): | | | | | | | | | | |
| 625,000 | | SHELBY CNTY TN HLTH EDUCTNL & HSG FACS BRD REVENUE(c) | | 1/1/2029 | | 5.55 | | $ 556,862 | | 1,563 | | |
| 130,000 | | SHELBY CNTY TN HLTH EDUCTNL & HSG FACS BRD REVENUE | | 1/1/2029 | | 6.00 | | - | | 1 | | |
| 570,000 | | TENNESSEE HSG DEV AGY RSDL FING PROGRAM REVENUE | | 1/1/2031 | | 3.60 | | 572,145 | | 585,222 | | |
| 865,000 | | TENNESSEE HSG DEV AGY RSDL FING PROGRAM REVENUE | | 7/1/2042 | | 3.85 | | 865,000 | | 936,907 | | |
| 775,000 | | TENNESSEE HSG DEV AGY RSDL FING PROGRAM REVENUE | | 7/1/2042 | | 3.90 | | 775,000 | | 849,762 | | |
| 1,855,000 | | TENNESSEE HSG DEV AGY RSDL FING PROGRAM REVENUE | | 7/1/2044 | | 4.00 | | 1,866,188 | | 1,968,775 | | |
| 880,000 | | TENNESSEE HSG DEV AGY RSDL FING PROGRAM REVENUE | | 1/1/2049 | | 3.95 | | 880,000 | | 948,904 | | |
| 1,670,000 | | TENNESSEE HSG DEV AGY RSDL FING PROGRAM REVENUE | | 1/1/2049 | | 4.05 | | 1,670,000 | | 1,833,338 | | |
| 420,000 | | TENNESSEE ST HSG DEV AGY | | 1/1/2035 | | 3.85 | | 420,000 | | 448,524 | | |
| | | | | | | 10,682,372 | | 10,022,761 | | 1.46% |
| Texas | | | | | | | | | | |
| 500,000 | | ARLINGTON TX HGR EDU FIN CORP EDU REVENUE | | 6/15/2036 | | 5.00 | | 500,000 | | 501,416 | | |
| 650,000 | | ARLINGTON TX SPL TAX REVENUE | | 2/15/2041 | | 5.00 | | 682,879 | | 726,876 | | |
| 795,000 | | BEXAR CNTY TX HSG FIN CORP(h) | | 2/1/2035 | | 3.75 | | 795,000 | | 819,596 | | |
| 2,000,000 | | BEXAR CNTY TX REVENUE | | 8/15/2039 | | 5.00 | | 2,023,303 | | 2,092,853 | | |
| 675,000 | | BRAZORIA CNTY TX MUNI UTILITYDIST #28 | | 9/1/2032 | | 4.00 | | 678,085 | | 679,256 | | |
| 1,000,000 | | BRAZOS TX HGR EDU AUTH STUDENT LOAN PROGRAM REVENUE | | 4/1/2040 | | 3.00 | | 1,003,815 | | 965,197 | | |
| 1,000,000 | | CENTRL TX REGL MOBILITY AUTH REVENUE | | 1/1/2045 | | 4.00 | | 1,091,649 | | 1,158,418 | | |
| 625,000 | | CLIFTON TX HGR EDU FIN CORP EDU REVENUE | | 12/1/2035 | | 5.00 | | 644,647 | | 708,312 | | |
| 1,000,000 | | DALLAS-FORT WORTH TX INTERNATIONAL ARPT REVENUE | | 11/1/2037 | | 5.25 | | 1,003,478 | | 1,108,882 | | |
| 1,350,000 | | DANBURY TX HGR EDU AUTH INC EDU REVENUE | | 8/15/2049 | | 5.13 | | 1,381,007 | | 1,389,381 | | |
| 1,500,000 | | EL PASO CNTY TX HOSP DIST | | 8/15/2043 | | 5.00 | | 1,561,290 | | 1,592,893 | | |
| 1,000,000 | | EL PASO TX DOWNTOWN DEV CORP SPL REVENUE | | 8/15/2038 | | 7.25 | | 1,025,575 | | 1,144,418 | | |
| 1,000,000 | | FORT BEND CNTY TX MUNI UTILITY DIST #23 | | 9/1/2033 | | 4.00 | | 1,004,537 | | 1,006,305 | | |
| 610,000 | | FORT BEND CNTY TX MUNI UTILITY DIST #50 | | 9/1/2029 | | 4.00 | | 612,767 | | 613,846 | | |
| 800,000 | | GILMER TX ECON DEV CORP SALES TAX REVENUE | | 7/15/2030 | | 5.00 | | 801,164 | | 801,400 | | |
| 1,500,000 | | GRAND PARKWAY TRANSPRTN CORP TX SYS TOLL REVENUE (Step to 5.50% on 10/1/2023)(d) | | 10/1/2035 | | 0.00 | | 1,326,008 | | 1,744,545 | | |
| 2,000,000 | | GRAND PARKWAY TRANSPRTN CORP TX SYS TOLL REVENUE | | 10/1/2050 | | 3.00 | | 2,157,254 | | 2,140,168 | | |
| 560,000 | | HARRIS CNTY TX MUNI UTILITY DIST #400 | | 9/1/2033 | | 4.00 | | 562,541 | | 563,531 | | |
| 1,000,000 | | HIDALGO CNTY TX REGL MOBILITY AUTH VEHICLE REGISTRATION FEE | | 12/1/2038 | | 5.25 | | 1,010,380 | | 1,118,964 | | |
| 1,500,000 | | HOUSTON TX HGR EDU FIN CORP | | 9/1/2038 | | 5.50 | | 1,508,391 | | 1,590,732 | | |
| 750,000 | | LEWISVILLE TX COMB CONTRACT REVENUE | | 9/1/2024 | | 3.00 | | 746,629 | | 771,043 | | |
| 1,000,000 | | MEADOWHILL TX REGL MUNI UTILITY DIST | | 10/1/2034 | | 4.00 | | 1,032,170 | | 1,040,910 | | |
| 273,000 | | N CENTRL TEXAS ST HLTH FAC DEV CORP | | 2/15/2025 | | 5.38 | | 273,000 | | 222,927 | | |
| 1,000,000 | | N TX TOLLWAY AUTH REVENUE | | 1/1/2042 | | 6.20 | | 998,859 | | 1,202,001 | | |
| 1,000,000 | | NEW HOPE CULTURAL ED FACS FIN CORP TX RETIREMENT FAC REVENUE | | 10/1/2034 | | 5.00 | | 1,005,413 | | 1,103,465 | | |
| 750,000 | | NEW HOPE CULTURAL ED FACS FIN CORP TX RETIREMENT FAC REVENUE | | 1/1/2035 | | 5.50 | | 757,578 | | 794,410 | | |
| 500,000 | | NEW HOPE CULTURAL ED FACS FIN CORP TX RETIREMENT FAC REVENUE | | 10/1/2049 | | 5.25 | | 507,242 | | 549,477 | | |
| 1,000,000 | | NEW HOPE CULTURAL ED FACS FIN CORP TX RETIREMENT FAC REVENUE | | 11/1/2049 | | 4.00 | | 1,131,120 | | 1,134,940 | | |
| See accompanying notes to financial statements. | 71 | (Continued) |
CLEARWATER INVESTMENT TRUST
Schedule of Investments - Clearwater Tax-Exempt Bond Fund
June 30, 2021 (unaudited)
| Par/Shares | | Security | | Maturity
date | | Coupon
rate | | Cost | | Fair value (a) | | Percent of
net assets |
| Texas (Cont'd): | | | | | | | | | | |
| 1,100,000 | | NEW HOPE CULTURAL ED FACS FIN CORP TX RETIREMENT FAC REVENUE | | 1/1/2055 | | 5.00 | | $ 1,145,191 | | 1,153,212 | | |
| 750,000 | | NEW HOPE CULTURAL EDU FACS FIN CORP TX EDU REVENUE(b) | | 8/15/2036 | | 5.00 | | 750,246 | | 752,748 | | |
| 1,000,000 | | NEW HOPE CULTURAL EDU FACS FIN CORP TX EDU REVENUE | | 8/15/2036 | | 5.50 | | 1,000,205 | | 1,004,194 | | |
| 670,000 | | NEW HOPE CULTURAL EDU FACS FIN CORP TX EDU REVENUE(b) | | 8/15/2049 | | 5.00 | | 689,491 | | 704,864 | | |
| 1,000,000 | | NEW HOPE CULTURAL EDU FACS FIN CORP TX RETMNT CMNTY REVENUE(b) | | 12/1/2025 | | 10.00 | | 1,000,000 | | 1,075,243 | | |
| 645,000 | | NEW HOPE CULTURAL EDU FACS FIN CORP TX SENIOR LIVING REVENUE | | 7/1/2025 | | 4.00 | | 633,307 | | 610,259 | | |
| 1,100,000 | | NEW HOPE CULTURAL EDU FACS FIN CORP TX STUDENT HSG REVENUE | | 4/1/2046 | | 5.00 | | 1,122,045 | | 1,219,940 | | |
| 750,000 | | RED RIVER TX HLTH FACS DEV CORP RETIREMENT FAC REVENUE | | 11/15/2034 | | 7.50 | | 746,791 | | 835,433 | | |
| 1,000,000 | | SUGAR LAND TX DEV CORP SALES TAX REVENUE | | 2/15/2033 | | 5.00 | | 1,025,861 | | 1,072,754 | | |
| 1,000,000 | | TARRANT CNTY TX CULTURAL EDU FACS FIN CORP HOSP REVENUE | | 11/15/2038 | | 5.00 | | 1,024,212 | | 1,088,927 | | |
| 1,000,000 | | TARRANT CNTY TX CULTURAL EDU FACS FIN CORP RETMNT FAC REVENUE(c) | | 11/15/2022 | | 5.50 | | 1,000,000 | | 450,000 | | |
| 425,000 | | TARRANT CNTY TX CULTURAL EDU FACS FIN CORP RETMNT FAC REVENUE | | 11/15/2024 | | 5.63 | | 425,000 | | 425,907 | | |
| 750,000 | | TEXAS ST AFFORDABLE HSG CORP SF MTGE REVENUE | | 3/1/2050 | | 4.00 | | 765,881 | | 804,799 | | |
| 2,000,000 | | TEXAS ST DEPT OF HSG & CMNTY AFFAIRS | | 9/1/2044 | | 3.63 | | 2,039,885 | | 2,173,114 | | |
| 995,000 | | TEXAS ST DEPT OF HSG & CMNTY AFFAIRS | | 9/1/2048 | | 4.25 | | 1,010,099 | | 1,090,980 | | |
| | | | | | | 42,203,995 | | 43,748,536 | | 6.36% |
| Utah | | | | | | | | | | |
| 60,000 | | UTAH ST HSG CORP SF MTGE REVENUE | | 1/1/2033 | | 5.75 | | 60,000 | | 60,148 | | |
| 1,500,000 | | WEST VLY CITY UT MUNI BLDG AUTH LEASE REVENUE | | 2/1/2039 | | 5.00 | | 1,613,163 | | 1,782,023 | | |
| | | | | | | 1,673,163 | | 1,842,171 | | 0.27% |
| Vermont | | | | | | | | | | |
| 155,000 | | VERMONT ST HSG FIN AGY | | 5/1/2032 | | 4.88 | | 154,470 | | 162,423 | | |
| 765,000 | | VERMONT ST STUDENT ASSISTANCE CORP EDU LOAN REVENUE | | 6/15/2036 | | 3.38 | | 758,334 | | 784,525 | | |
| | | | | | | 912,804 | | 946,948 | | 0.14% |
| Virginia | | | | | | | | | | |
| 500,000 | | FAIRFAX CNTY VA REDEV & HSG AUTH MF REVENUE | | 8/1/2039 | | 5.60 | | 500,000 | | 501,516 | | |
| 462,000 | | MARQUIS VA CMNTY DEV AUTH REVENUE(g) | | 9/1/2041 | | 0.00 | | 165,288 | | 27,409 | | |
| 349,000 | | MARQUIS VA CMNTY DEV AUTH REVENUE | | 9/1/2041 | | 5.63 | | 373,459 | | 172,628 | | |
| 1,000,000 | | VIRGINIA ST HSG DEV AUTH | | 7/1/2033 | | 4.13 | | 1,000,000 | | 1,038,107 | | |
| 1,000,000 | | VIRGINIA ST HSG DEV AUTH | | 9/1/2050 | | 2.50 | | 1,000,000 | | 1,014,957 | | |
| | | | | | | 3,038,747 | | 2,754,617 | | 0.40% |
| Washington | | | | | | | | | | |
| 700,000 | | KALISPEL TRIBE OF INDIANS PRIORITY DIST WA REVENUE(b) | | 1/1/2038 | | 5.25 | | 687,093 | | 842,060 | | |
| 400,000 | | KING CNTY WA HSG AUTH | | 5/1/2028 | | 5.20 | | 400,000 | | 405,906 | | |
| 1,500,000 | | KING CNTY WA HSG AUTH | | 11/1/2039 | | 3.00 | | 1,468,832 | | 1,614,860 | | |
| 1,000,000 | | KING CNTY WA HSG AUTH | | 8/1/2040 | | 3.00 | | 1,037,922 | | 1,074,974 | | |
| 1,000,000 | | PIKE PLACE MARKET WA PRESERVATION & DEV AUTH SPL OBLG | | 12/1/2040 | | 5.00 | | 1,038,484 | | 1,083,245 | | |
| 1,000,000 | | SEATTLE WA HSG AUTH | | 6/1/2052 | | 3.00 | | 1,024,218 | | 1,042,383 | | |
| 770,000 | | SEATTLE WA HSG AUTH POOLED HSG REVENUE | | 9/15/2033 | | 5.75 | | 774,738 | | 864,061 | | |
| 500,000 | | SNOHOMISH CNTY WA HSG AUTH | | 4/1/2044 | | 4.00 | | 507,327 | | 555,231 | | |
| 1,000,000 | | VANCOUVER WA HSG AUTH | | 8/1/2034 | | 3.75 | | 984,732 | | 1,092,521 | | |
| See accompanying notes to financial statements. | 72 | (Continued) |
CLEARWATER INVESTMENT TRUST
Schedule of Investments - Clearwater Tax-Exempt Bond Fund
June 30, 2021 (unaudited)
| Par/Shares | | Security | | Maturity
date | | Coupon
rate | | Cost | | Fair value (a) | | Percent of
net assets |
| Washington (Cont'd): | | | | | | | | | | |
| 1,500,000 | | VANCOUVER WA HSG AUTH | | 6/1/2038 | | 3.00 | | $ 1,496,032 | | 1,598,322 | | |
| 1,500,000 | | VANCOUVER WA HSG AUTH | | 12/1/2051 | | 3.30 | | 1,500,000 | | 1,601,424 | | |
| 530,000 | | WASHINGTON ST HSG FIN COMMISSION NONPROFIT HSG REVENUE(b) | | 7/1/2025 | | 6.00 | | 531,847 | | 589,474 | | |
| 1,000,000 | | WASHINGTON ST HSG FIN COMMISSION NONPROFIT HSG REVENUE(b) | | 1/1/2031 | | 5.00 | | 1,001,157 | | 1,113,000 | | |
| 750,000 | | WASHINGTON ST HSG FIN COMMISSION NONPROFIT HSG REVENUE(b) | | 7/1/2031 | | 5.00 | | 784,098 | | 817,515 | | |
| 675,000 | | WASHINGTON ST HSG FIN COMMISSION NONPROFIT HSG REVENUE(b) | | 1/1/2035 | | 5.75 | | 675,000 | | 733,153 | | |
| 600,000 | | WASHINGTON ST HSG FIN COMMISSION NONPROFIT HSG REVENUE(b) | | 7/1/2036 | | 5.00 | | 624,719 | | 659,395 | | |
| 500,000 | | WASHINGTON ST HSG FIN COMMISSION NONPROFIT HSG REVENUE(b) | | 1/1/2038 | | 5.00 | | 533,680 | | 579,941 | | |
| 1,000,000 | | WASHINGTON ST HSG FIN COMMISSION NONPROFIT HSG REVENUE(b) | | 1/1/2044 | | 5.00 | | 1,077,070 | | 1,128,038 | | |
| 1,000,000 | | WASHINGTON ST HSG FIN COMMISSION NONPROFIT HSG REVENUE(b) | | 7/1/2048 | | 5.00 | | 1,082,243 | | 1,092,768 | | |
| | | | | | | 17,229,192 | | 18,488,271 | | 2.69% |
| West Virginia | | | | | | | | | | |
| 1,500,000 | | WEST VIRGINIA ST HSG DEV FUND | | 11/1/2032 | | 3.75 | | 1,500,000 | | 1,594,957 | | |
| 2,000,000 | | WEST VIRGINIA ST HSG DEV FUND | | 11/1/2051 | | 2.50 | | 2,000,000 | | 2,014,644 | | |
| | | | | | | 3,500,000 | | 3,609,601 | | 0.53% |
| Wisconsin | | | | | | | | | | |
| 16,520 | | PUBLIC FIN AUTH WI CONFERENCE CENTER & HOTEL REVENUE(b)(f)(g) | | 1/1/2046 | | 0.00 | | 1,418 | | 532 | | |
| 18,299 | | PUBLIC FIN AUTH WI CONFERENCE CENTER & HOTEL REVENUE(b)(f)(g) | | 1/1/2047 | | 0.00 | | 1,518 | | 567 | | |
| 17,930 | | PUBLIC FIN AUTH WI CONFERENCE CENTER & HOTEL REVENUE(b)(f)(g) | | 1/1/2048 | | 0.00 | | 1,448 | �� | 548 | | |
| 17,786 | | PUBLIC FIN AUTH WI CONFERENCE CENTER & HOTEL REVENUE(b)(f)(g) | | 1/1/2049 | | 0.00 | | 1,398 | | 533 | | |
| 17,496 | | PUBLIC FIN AUTH WI CONFERENCE CENTER & HOTEL REVENUE(b)(f)(g) | | 1/1/2050 | | 0.00 | | 1,339 | | 504 | | |
| 18,980 | | PUBLIC FIN AUTH WI CONFERENCE CENTER & HOTEL REVENUE(b)(f)(g) | | 1/1/2051 | | 0.00 | | 1,417 | | 539 | | |
| 446,246 | | PUBLIC FIN AUTH WI CONFERENCE CENTER & HOTEL REVENUE(b)(e)(f)(i) | | 7/1/2051 | | 4.00 | | 443,916 | | 312,335 | | |
| 19,357 | | PUBLIC FIN AUTH WI CONFERENCE CENTER & HOTEL REVENUE(b)(f)(g) | | 1/1/2052 | | 0.00 | | 1,406 | | 529 | | |
| 19,095 | | PUBLIC FIN AUTH WI CONFERENCE CENTER & HOTEL REVENUE(b)(f)(g) | | 1/1/2053 | | 0.00 | | 1,352 | | 513 | | |
| 18,909 | | PUBLIC FIN AUTH WI CONFERENCE CENTER & HOTEL REVENUE(b)(f)(g) | | 1/1/2054 | | 0.00 | | 1,307 | | 495 | | |
| 18,634 | | PUBLIC FIN AUTH WI CONFERENCE CENTER & HOTEL REVENUE(b)(f)(g) | | 1/1/2055 | | 0.00 | | 1,258 | | 478 | | |
| 18,360 | | PUBLIC FIN AUTH WI CONFERENCE CENTER & HOTEL REVENUE(b)(f)(g) | | 1/1/2056 | | 0.00 | | 1,210 | | 464 | | |
| 100,837 | | PUBLIC FIN AUTH WI CONFERENCE CENTER & HOTEL REVENUE(b)(c)(f) | | 7/1/2056 | | 5.50 | | 100,665 | | 79,509 | | |
| 18,454 | | PUBLIC FIN AUTH WI CONFERENCE CENTER & HOTEL REVENUE(b)(f)(g) | | 1/1/2057 | | 0.00 | | 1,976 | | 454 | | |
| 18,165 | | PUBLIC FIN AUTH WI CONFERENCE CENTER & HOTEL REVENUE(b)(f)(g) | | 1/1/2058 | | 0.00 | | 1,136 | | 438 | | |
| 17,992 | | PUBLIC FIN AUTH WI CONFERENCE CENTER & HOTEL REVENUE(b)(f)(g) | | 1/1/2059 | | 0.00 | | 1,100 | | 427 | | |
| 17,834 | | PUBLIC FIN AUTH WI CONFERENCE CENTER & HOTEL REVENUE(b)(f)(g) | | 1/1/2060 | | 0.00 | | 1,068 | | 410 | | |
| 17,573 | | PUBLIC FIN AUTH WI CONFERENCE CENTER & HOTEL REVENUE(b)(f)(g) | | 1/1/2061 | | 0.00 | | 1,031 | | 395 | | |
| 17,400 | | PUBLIC FIN AUTH WI CONFERENCE CENTER & HOTEL REVENUE(b)(f)(g) | | 1/1/2062 | | 0.00 | | 1,000 | | 381 | | |
| See accompanying notes to financial statements. | 73 | (Continued) |
CLEARWATER INVESTMENT TRUST
Schedule of Investments - Clearwater Tax-Exempt Bond Fund
June 30, 2021 (unaudited)
| Par/Shares | | Security | | Maturity
date | | Coupon
rate | | Cost | | Fair value (a) | | Percent of
net assets |
| Wisconsin (Cont'd): | | | | | | | | | | |
| 17,125 | | PUBLIC FIN AUTH WI CONFERENCE CENTER & HOTEL REVENUE(b)(f)(g) | | 1/1/2063 | | 0.00 | | $ 966 | | 369 | | |
| 16,967 | | PUBLIC FIN AUTH WI CONFERENCE CENTER & HOTEL REVENUE(b)(f)(g) | | 1/1/2064 | | 0.00 | | 939 | | 359 | | |
| 16,823 | | PUBLIC FIN AUTH WI CONFERENCE CENTER & HOTEL REVENUE(b)(f)(g) | | 1/1/2065 | | 0.00 | | 913 | | 345 | | |
| 16,731 | | PUBLIC FIN AUTH WI CONFERENCE CENTER & HOTEL REVENUE(b)(f)(g) | | 1/1/2066 | | 0.00 | | 890 | | 327 | | |
| 215,987 | | PUBLIC FIN AUTH WI CONFERENCE CENTER & HOTEL REVENUE(b)(f)(g) | | 1/1/2067 | | 0.00 | | 10,660 | | 3,942 | | |
| 520,000 | | PUBLIC FIN AUTH WI EDU REVENUE(b) | | 6/15/2049 | | 5.00 | | 525,660 | | 566,777 | | |
| 500,000 | | PUBLIC FIN AUTH WI HLTHCARE FACS REVENUE | | 7/1/2046 | | 4.00 | | 547,522 | | 578,711 | | |
| 305,000 | | PUBLIC FIN AUTH WI REVENUE | | 4/1/2025 | | 5.00 | | 306,031 | | 332,473 | | |
| 1,250,000 | | PUBLIC FIN AUTH WI REVENUE(b) | | 11/1/2028 | | 6.25 | | 1,250,000 | | 1,316,851 | | |
| 600,000 | | PUBLIC FIN AUTH WI REVENUE | | 4/1/2032 | | 5.50 | | 600,000 | | 620,315 | | |
| 1,000,000 | | PUBLIC FIN AUTH WI REVENUE(b) | | 1/1/2033 | | 6.13 | | 989,763 | | 871,334 | | |
| 221,000 | | PUBLIC FIN AUTH WI REVENUE(g) | | 10/1/2042 | | 0.00 | | 242,103 | | 99,726 | | |
| 515,000 | | PUBLIC FIN AUTH WI REVENUE | | 10/1/2042 | | 7.00 | | 521,473 | | 522,022 | | |
| 13,694 | | PUBLIC FIN AUTH WI REVENUE(b)(c)(f) | | 12/1/2048 | | 5.50 | | 13,694 | | 6,847 | | |
| 975,000 | | PUBLIC FIN AUTH WI REVENUE(b) | | 11/15/2053 | | 4.75 | | 990,031 | | 1,038,525 | | |
| 905,000 | | PUBLIC FIN AUTH WI SENIOR LIVING REVENUE(b) | | 11/15/2024 | | 5.00 | | 903,591 | | 954,386 | | |
| 500,000 | | WISCONSIN ST HLTH & EDUCTNL FACS AUTH REVENUE | | 8/1/2032 | | 5.00 | | 535,288 | | 537,331 | | |
| 1,300,000 | | WISCONSIN ST HLTH & EDUCTNL FACS AUTH REVENUE | | 8/15/2032 | | 5.00 | | 1,361,541 | | 1,474,853 | | |
| 700,000 | | WISCONSIN ST HLTH & EDUCTNL FACS AUTH REVENUE | | 6/1/2037 | | 5.00 | | 729,861 | | 774,977 | | |
| 500,000 | | WISCONSIN ST HLTH & EDUCTNL FACS AUTH REVENUE | | 9/15/2040 | | 5.00 | | 508,973 | | 537,655 | | |
| 1,840,000 | | WISCONSIN ST HLTH & EDUCTNL FACS AUTH REVENUE | | 8/15/2043 | | 5.00 | | 1,871,489 | | 2,025,042 | | |
| 1,400,000 | | WISCONSIN ST HLTH & EDUCTNL FACS AUTH REVENUE | | 9/15/2045 | | 5.00 | | 1,423,644 | | 1,500,066 | | |
| 650,000 | | WISCONSIN ST HLTH & EDUCTNL FACS AUTH REVENUE | | 11/1/2046 | | 5.00 | | 672,819 | | 699,951 | | |
| 1,500,000 | | WISCONSIN ST HLTH & EDUCTNL FACS AUTH REVENUE | | 10/1/2048 | | 5.13 | | 1,472,975 | | 1,571,563 | | |
| 500,000 | | WISCONSIN ST HSG & ECON DEV AUTH HSG REVENUE | | 11/1/2035 | | 3.88 | | 500,000 | | 535,949 | | |
| 1,000,000 | | WISCONSIN ST HSG & ECON DEV AUTH HSG REVENUE | | 11/1/2040 | | 4.00 | | 1,000,000 | | 1,071,115 | | |
| 1,000,000 | | WISCONSIN ST HSG & ECON DEV AUTH HSG REVENUE | | 11/1/2042 | | 3.90 | | 1,003,255 | | 1,086,854 | | |
| 1,500,000 | | WISCONSIN ST HSG & ECON DEV AUTH HSG REVENUE | | 5/1/2055 | | 4.15 | | 1,500,000 | | 1,626,875 | | |
| 2,500,000 | | WISCONSIN ST HSG & ECON DEV AUTH HSG REVENUE | | 11/1/2056 | | 2.70 | | 2,500,000 | | 2,518,136 | | |
| | | | | | | 22,551,044 | | 23,273,727 | | 3.39% |
| Wyoming | | | | | | | | | | |
| 335,000 | | WYOMING ST CMNTY DEV AUTH HSG REVENUE | | 12/1/2038 | | 3.90 | | 335,000 | | 351,121 | | |
| 1,615,000 | | WYOMING ST CMNTY DEV AUTH HSG REVENUE | | 12/1/2038 | | 4.05 | | 1,615,000 | | 1,651,375 | | |
| | | | | | | 1,950,000 | | 2,002,496 | | 0.29% |
| | | Sub-total Municipal Bonds: | | | | 570,088,697 | | 600,163,853 | | 87.30% |
| Short-Term Investments: | | | | | | | | | | |
| 46,973,179 | | NORTHERN INSTITUTIONAL FUNDS - U.S. GOVERNMENT SELECT PORTFOLIO, INSTITUTIONAL SHARES, 0.03%(j) | | 46,973,179 | | 46,973,179 | | |
| | | Sub-total Short-Term Investments: | | | | | | 46,973,179 | | 46,973,179 | | 6.83% |
| | | Grand total | | | | | | $ 654,118,014 | | 689,201,866 | | 100.25% |
| Notes to Schedule of Investments: |
| (a) | Investments are valued in accordance with procedures described in Note 2 to the financial statements. |
| See accompanying notes to financial statements. | 74 | (Continued) |
CLEARWATER INVESTMENT TRUST
Schedule of Investments - Clearwater Tax-Exempt Bond Fund
June 30, 2021 (unaudited)
| (b) | Securities exempt from registration under Rule 144A of the Securities Act of 1933. These securities may be resold in transactions exempt from registration, normally to qualified institutional buyers. The value of these securities is determined by valuations supplied by a pricing service or brokers, or, if not available, in accordance with procedures established by the Board of Trustees. |
| (c) | Non-income producing assets. For long-term debt securities, item identified is in default as to payment of interest and/or principal. |
| (d) | For step bonds, the coupon rate disclosed is the current rate in effect. |
| (e) | Variable rate security. Rate as of June 30, 2021 is disclosed. |
| (f) | Restricted security that has been deemed illiquid. At June 30, 2021, the value of these restricted illiquid securities amounted to $3,922,890 or 0.57% of net assets. Additional information on these restricted illiquid securities is as follows: |
| SECURITY | AQUISITION DATE | ACQUISITION COST |
| CAPITAL TRUST AGY FL REVENUE, 6.75%, 12/1/35 | 12/2/15-1/21/16 | $1,748,875 |
| CAPITAL TRUST AGY FL REVENUE, 6.75%, 7/1/37 | 6/28/17 | 750,000 |
| COLLIER CNTY FLA INDL DEV AUTH CONTINUING CARE CMNTY REVENUE, 7.25%, 5/15/26 | 12/16/13 | 750,000 |
| COLLIER CNTY FLA INDL DEV AUTH CONTINUING CARE CMNTY REVENUE, 8.13%, 5/15/44 | 6/27/17-4/12/18 | 1,961,290 |
| FRANKLIN TN HLTH & EDUCTNL FACS BRD REVENUE, 6.50%, 6/1/27 | 5/24/17 | 1,000,000 |
| KANSAS CITY MO INDL DEV AUTH SENIOR LIVING FACS REVENUE, 5.75%, 11/15/36 | 12/18/15 | 1,300,000 |
| LAKE CNTY OH PORT & ECON DEV AUTH LEASE REVENUE, 6.50%, 12/1/37 | 10/27/17 | 750,000 |
| PUBLIC FIN AUTH WI CONFERENCE CENTER & HOTEL REVENUE, 5.50%, 1/1/46-1/1/67 | 3/26/18-8/26/20 | 49-443,916 |
| PUBLIC FIN AUTH WI REVENUE, 5.50%, 12/1/48 | 3/26/19 | 13,694 |
| (g) | Zero coupon bond. |
| (h) | Security has converted to a fixed rate as of February 1, 2015, and will be going forward. |
| (i) | These securities are remarketed by an agent and the rate at which these securities are set are determined by general market conditions and supply and demand. |
| (j) | The short-term investment is a money market portfolio of the investment company, Northern Institutional Funds. At December 31, 2020, the value of the Clearwater Tax-Exempt Bond Fund's investment in the U.S. Government Select Portfolio of the Northern Institutional Funds was $14,385,751 with net purchases of $32,587,428 for the six months ended June 30, 2021. |
Diversification of investments representing geographic diversification, as a percentage of total investments at fair value (excluding closed-end funds), is as follows:
| Geographical Diversification | | Percent |
| Florida | | 13.13% |
| Illinois | | 12.39 |
| California | | 7.21 |
| New York | | 6.84 |
| Texas | | 6.76 |
| Colorado | | 5.78 |
| Wisconsin | | 3.60 |
| Massachusetts | | 3.16 |
| Michigan | | 3.09 |
| Washington | | 2.86 |
| Other | | 35.18 |
| | | 100.00% |
| See accompanying notes to financial statements. | 75 | (Continued) |
CLEARWATER INVESTMENT TRUST
Schedule of Investments - Clearwater Tax-Exempt Bond Fund
June 30, 2021 (unaudited)
Clearwater Tax-Exempt Bond Fund Portfolio Diversification
(as a percentage of net assets)
| See accompanying notes to financial statements. | 76 | (Continued) |
CLEARWATER INVESTMENT TRUST
Schedule of Investments - Clearwater International Fund
June 30, 2021 (unaudited)
| Shares | | Security | | Cost | | Fair value (a) | | Percent of
net assets |
| Common Stocks: | | | | | | |
| Argentina: | | | | | | |
| 3,844 | | MERCADOLIBRE, INC.(b) | | $ 2,166,754 | | 5,988,145 | | |
| | | | | 2,166,754 | | 5,988,145 | | 0.57% |
| Australia: | | | | | | |
| 275,180 | | ADAIRS LTD. | | 331,893 | | 877,078 | | |
| 4,181 | | AFTERPAY LTD.(b) | | 326,265 | | 370,527 | | |
| 8,450 | | AGL ENERGY LTD. | | 53,835 | | 51,964 | | |
| 102,780 | | ALLIANCE AVIATION SERVICES LTD.(b) | | 167,434 | | 350,713 | | |
| 89,441 | | APA GROUP | | 554,557 | | 596,979 | | |
| 7,539 | | ARISTOCRAT LEISURE LTD. | | 180,352 | | 243,625 | | |
| 2,554 | | ASX LTD. | | 51,631 | | 148,844 | | |
| 38,671 | | AUSTRALIA & NEW ZEALAND BANKING GROUP LTD. | | 598,008 | | 816,387 | | |
| 195,700 | | AVENTUS GROUP | | 351,688 | | 462,310 | | |
| 250,708 | | BEACH ENERGY LTD. | | 466,720 | | 233,143 | | |
| 179,910 | | BGP HOLDINGS PLC(b)(c) | | - | | - | | |
| 34,014 | | BHP GROUP LTD. | | 1,030,232 | | 1,238,962 | | |
| 14,611 | | BHP GROUP PLC | | 432,459 | | 430,503 | | |
| 37,600 | | BLUESCOPE STEEL LTD. | | 301,071 | | 619,231 | | |
| 17,400 | | BRAMBLES LTD. | | 64,294 | | 149,282 | | |
| 49,542 | | CEDAR WOODS PROPERTIES LTD. | | 234,956 | | 249,303 | | |
| 971 | | COCHLEAR LTD. | | 35,893 | | 183,266 | | |
| 23,914 | | COLES GROUP LTD. | | 211,394 | | 306,497 | | |
| 25,277 | | COMMONWEALTH BANK OF AUSTRALIA | | 1,320,475 | | 1,893,184 | | |
| 5,261 | | COMPUTERSHARE LTD. | | 65,617 | | 66,679 | | |
| 40,757 | | CSL LTD. | | 2,555,215 | | 8,717,036 | | |
| 14,184 | | DEXUS | | 62,970 | | 113,500 | | |
| 21,495 | | ENDEAVOUR GROUP LTD.(b) | | 106,011 | | 101,396 | | |
| 97,180 | | FORTESCUE METALS GROUP LTD. | | 212,026 | | 1,701,023 | | |
| 22,072 | | GOODMAN GROUP | | 76,819 | | 350,425 | | |
| 35,107 | | GPT GROUP (THE) | | 96,585 | | 129,010 | | |
| 26,295 | | INSURANCE AUSTRALIA GROUP LTD. | | 61,991 | | 101,755 | | |
| 5,256 | | LENDLEASE CORP. LTD. | | 26,287 | | 45,172 | | |
| 7,819 | | MACQUARIE GROUP LTD. | | 175,414 | | 917,283 | | |
| 28,402 | | MEDIBANK PVT LTD. | | 67,643 | | 67,308 | | |
| 25,670 | | MINERAL RESOURCES LTD. | | 246,214 | | 1,034,368 | | |
| 573,700 | | MOUNT GIBSON IRON LTD. | | 260,031 | | 406,583 | | |
| 235,206 | | NANOSONICS LTD.(b) | | 1,017,142 | | 1,035,425 | | |
| 44,772 | | NATIONAL AUSTRALIA BANK LTD. | | 551,214 | | 880,383 | | |
| 10,080 | | NEWCREST MINING LTD. | | 123,804 | | 191,104 | | |
| 8,927 | | NORTHERN STAR RESOURCES LTD. | | 75,475 | | 65,475 | | |
| 202,700 | | NRW HOLDINGS LTD. | | 416,699 | | 222,702 | | |
| 16,730 | | ORIGIN ENERGY LTD. | | 56,132 | | 56,585 | | |
| 128,100 | | PACT GROUP HOLDINGS LTD. | | 339,625 | | 355,454 | | |
| 168,508 | | PEXA GROUP LTD.(b) | | 2,193,050 | | 2,164,762 | | |
| 256,036 | | QANTAS AIRWAYS LTD.(b) | | 746,678 | | 894,786 | | |
| 8,626 | | QBE INSURANCE GROUP LTD. | | 74,924 | | 69,801 | | |
| 2,805 | | RAMSAY HEALTH CARE LTD. | | 60,296 | | 132,422 | | |
| 513 | | REA GROUP LTD. | | 65,462 | | 65,030 | | |
| 169,500 | | REGIS RESOURCES LTD. | | 501,445 | | 299,995 | | |
| 18,171 | | RIO TINTO LTD. | | 570,958 | | 1,725,767 | | |
| 321,800 | | RURAL FUNDS GROUP | | 463,060 | | 639,535 | | |
| 173,937 | | SANTOS LTD. | | 509,938 | | 924,848 | | |
| 186,510 | | SCENTRE GROUP | | 296,462 | | 383,253 | | |
| 22,739 | | SEEK LTD. | | 233,310 | | 565,140 | | |
| 102,600 | | SMARTGROUP CORP. LTD. | | 452,529 | | 567,853 | | |
| 39,820 | | SONIC HEALTHCARE LTD. | | 470,951 | | 1,146,740 | | |
| 57,859 | | SOUTH32 LTD. | | 37,235 | | 127,137 | | |
| 224,900 | | ST. BARBARA LTD. | | 384,573 | | 287,572 | | |
| 33,184 | | STOCKLAND | | 95,300 | | 115,970 | | |
| 7,540 | | SUNCORP GROUP LTD. | | 65,648 | | 62,823 | | |
| 75,800 | | SUPER RETAIL GROUP LTD. | | 517,213 | | 733,885 | | |
| 30,856 | | TABCORP HOLDINGS LTD. | | 79,836 | | 119,868 | | |
| 60,497 | | TPG TELECOM LTD. | | 232,968 | | 284,014 | | |
| 46,395 | | TRANSURBAN GROUP | | 410,134 | | 495,118 | | |
| 12,261 | | TREASURY WINE ESTATES LTD. | | 49,081 | | 107,399 | | |
| 19,261 | | WESFARMERS LTD. | | 785,725 | | 853,687 | | |
| 49,866 | | WESTPAC BANKING CORP. | | 687,565 | | 965,217 | | |
| See accompanying notes to financial statements. | 77 | (Continued) |
CLEARWATER INVESTMENT TRUST
Schedule of Investments - Clearwater International Fund
June 30, 2021 (unaudited)
| Shares | | Security | | Cost | | Fair value (a) | | Percent of
net assets |
| Australia (Cont'd): | | | | | | |
| 21,495 | | WOOLWORTHS GROUP LTD. | | $ 704,508 | | 614,662 | | |
| | | | | 23,994,920 | | 40,127,748 | | 3.84% |
| Austria: | | | | | | |
| 15,700 | | BAWAG GROUP A.G.(b)(d) | | 600,064 | | 835,498 | | |
| 1,821 | | ERSTE GROUP BANK A.G. | | 28,050 | | 66,807 | | |
| 93 | | IMMOFINANZ A.G.(b) | | - | | 2,090 | | |
| 32,264 | | RAIFFEISEN BANK INTERNATIONAL A.G. | | 563,262 | | 730,709 | | |
| 313 | | STRABAG S.E. (BEARER) | | 5,505 | | 13,417 | | |
| 57,900 | | TELEKOM AUSTRIA A.G.(b) | | 422,512 | | 494,315 | | |
| 631 | | UBM DEVELOPMENT A.G. | | 28,973 | | 31,051 | | |
| 21,794 | | VIENNA INSURANCE GROUP A.G. WIENER VERSICHERUNG GRUPPE | | 595,919 | | 598,248 | | |
| 23,500 | | WIENERBERGER A.G. | | 561,499 | | 905,617 | | |
| | | | | 2,805,784 | | 3,677,752 | | 0.35% |
| Belgium: | | | | | | |
| 7,478 | | AGEAS S.A./N.V. | | 117,910 | | 414,978 | | |
| 13,472 | | ANHEUSER-BUSCH INBEV S.A./N.V. | | 550,209 | | 971,405 | | |
| 19,000 | | BPOST S.A.(b) | | 195,697 | | 227,320 | | |
| 102,700 | | ECONOCOM GROUP S.A./N.V. | | 381,201 | | 389,685 | | |
| 623 | | ELIA GROUP S.A./N.V. | | 70,644 | | 65,746 | | |
| 1,214 | | ETABLISSEMENTS FRANZ COLRUYT N.V. | | 76,863 | | 67,887 | | |
| 51,898 | | GROUPE BRUXELLES LAMBERT S.A. | | 4,670,667 | | 5,805,501 | | |
| 4,347 | | KBC GROUP N.V. | | 101,356 | | 331,432 | | |
| 21,394 | | ONTEX GROUP N.V.(b) | | 501,601 | | 266,363 | | |
| 1,187 | | SOLVAY S.A. | | 162,618 | | 150,882 | | |
| 14,669 | | TELENET GROUP HOLDING N.V. | | 602,718 | | 552,078 | | |
| 10,700 | | TESSENDERLO GROUP S.A.(b) | | 470,608 | | 451,676 | | |
| 2,235 | | UCB S.A. | | 146,706 | | 233,637 | | |
| 3,778 | | UMICORE S.A. | | 181,243 | | 230,708 | | |
| | | | | 8,230,041 | | 10,159,298 | | 0.97% |
| Brazil: | | | | | | |
| 129,000 | | CAMIL ALIMENTOS S.A.(b) | | 274,164 | | 247,428 | | |
| 911,435 | | EMPREENDIMENTOS PAGUE MENOS S/A(b) | | 1,474,699 | | 2,061,531 | | |
| 279,500 | | GRUPO SBF S.A.(b) | | 1,359,959 | | 2,150,000 | | |
| 810,200 | | MAGAZINE LUIZA S.A. | | 3,488,047 | | 3,445,199 | | |
| 106,600 | | PETROBRAS DISTRIBUIDORA S.A. | | 500,792 | | 571,814 | | |
| 292,780 | | TELEFONICA BRASIL S.A. ADR(e) | | 3,543,112 | | 2,488,630 | | |
| | | | | 10,640,773 | | 10,964,602 | | 1.05% |
| Canada: | | | | | | |
| 3,684 | | AGNICO EAGLE MINES LTD. | | 175,554 | | 222,776 | | |
| 203,456 | | ALIMENTATION COUCHE-TARD, INC., CLASS B | | 6,064,354 | | 7,476,138 | | |
| 144,400 | | B2GOLD CORP. | | 744,752 | | 605,744 | | |
| 9,938 | | BANK OF MONTREAL | | 995,398 | | 1,018,653 | | |
| 17,410 | | BANK OF NOVA SCOTIA (THE) | | 1,032,410 | | 1,132,296 | | |
| 40,918 | | BARRICK GOLD CORP. | | 384,639 | | 846,352 | | |
| 9,080 | | BLACKBERRY LTD.(b) | | 137,241 | | 110,973 | | |
| 187 | | BROOKFIELD ASSET MANAGEMENT REINSURANCE PARTNERS LTD., CLASS A(b) | | 12,903 | | 9,728 | | |
| 27,148 | | BROOKFIELD ASSET MANAGEMENT, INC., CLASS A | | 174,133 | | 1,384,005 | | |
| 11,000 | | BRP, INC. (SUB VOTING) | | 430,510 | | 860,762 | | |
| 60,944 | | CAE, INC.(b) | | 1,130,918 | | 1,877,091 | | |
| 3,047 | | CAMECO CORP. | | 65,105 | | 58,403 | | |
| 14,528 | | CANADIAN IMPERIAL BANK OF COMMERCE | | 674,491 | | 1,653,796 | | |
| 15,994 | | CANADIAN NATIONAL RAILWAY CO. | | 292,557 | | 1,687,687 | | |
| 2,525 | | CANADIAN NATURAL RESOURCES LTD. | | 63,248 | | 91,663 | | |
| 118,300 | | CANADIAN PACIFIC RAILWAY LTD. | | 2,627,882 | | 9,098,453 | | |
| 5,809 | | CANADIAN TIRE CORP. LTD., CLASS A | | 625,049 | | 919,243 | | |
| 5,101 | | CANOPY GROWTH CORP.(b)(f) | | 162,431 | | 123,369 | | |
| 12,100 | | CARGOJET, INC. | | 1,059,318 | | 1,796,356 | | |
| 35,300 | | CASCADES, INC. | | 347,472 | | 434,558 | | |
| 122,850 | | CENOVUS ENERGY, INC. | | 838,647 | | 1,175,380 | | |
| 45,100 | | CENTERRA GOLD, INC. | | 366,388 | | 342,361 | | |
| 6,978 | | CGI, INC.(b) | | 55,128 | | 632,207 | | |
| 49,500 | | CI FINANCIAL CORP. | | 728,975 | | 908,458 | | |
| 52,600 | | COMINAR REAL ESTATE INVESTMENT TRUST | | 431,053 | | 463,793 | | |
| 389 | | CONSTELLATION SOFTWARE, INC. | | 383,428 | | 589,152 | | |
| See accompanying notes to financial statements. | 78 | (Continued) |
CLEARWATER INVESTMENT TRUST
Schedule of Investments - Clearwater International Fund
June 30, 2021 (unaudited)
| Shares | | Security | | Cost | | Fair value (a) | | Percent of
net assets |
| Canada (Cont'd): | | | | | | |
| 112,500 | | CORUS ENTERTAINMENT, INC., CLASS B | | $ 343,872 | | 577,202 | | |
| 35,300 | | DESCARTES SYSTEMS GROUP (THE), INC.(b) | | 1,505,666 | | 2,441,327 | | |
| 33,293 | | DOCEBO, INC.(b) | | 1,953,077 | | 1,970,292 | | |
| 6,582 | | DOLLARAMA, INC. | | 86,132 | | 301,277 | | |
| 25,600 | | DOREL INDUSTRIES, INC., CLASS B(b) | | 175,448 | | 322,581 | | |
| 55,355 | | ECN CAPITAL CORP. | | 167,414 | | 415,296 | | |
| 1,395 | | EMERA, INC. | | 65,709 | | 63,290 | | |
| 34,408 | | ENBRIDGE, INC. | | 1,303,694 | | 1,377,597 | | |
| 72,100 | | ENERPLUS CORP. | | 414,689 | | 518,241 | | |
| 232 | | FAIRFAX FINANCIAL HOLDINGS LTD. | | 62,350 | | 101,739 | | |
| 13,960 | | FIRSTSERVICE CORP. | | 1,415,071 | | 2,394,349 | | |
| 7,213 | | FORTIS, INC. | | 318,068 | | 319,278 | | |
| 3,307 | | FRANCO-NEVADA CORP. | | 250,125 | | 479,910 | | |
| 703 | | GEORGE WESTON LTD. | | 53,025 | | 67,005 | | |
| 6,104 | | GILDAN ACTIVEWEAR, INC. | | 33,435 | | 225,360 | | |
| 19,500 | | IA FINANCIAL CORP., INC. | | 882,358 | | 1,061,677 | | |
| 134,297 | | IMPERIAL OIL LTD. | | 3,266,605 | | 4,093,047 | | |
| 2,692 | | INTACT FINANCIAL CORP. | | 348,937 | | 365,731 | | |
| 1,100 | | INTERNATIONAL PETROLEUM CORP.(b) | | 2,833 | | 5,051 | | |
| 35,289 | | KINROSS GOLD CORP. | | 70,483 | | 223,759 | | |
| 3,144 | | KIRKLAND LAKE GOLD LTD. | | 131,117 | | 121,159 | | |
| 1,583 | | LIGHTSPEED POS, INC. (SUB VOTING)(b) | | 119,690 | | 132,491 | | |
| 2,635 | | LOBLAW COS. LTD. | | 98,724 | | 162,169 | | |
| 15,024 | | LULULEMON ATHLETICA, INC.(b) | | 2,731,614 | | 5,483,309 | | |
| 9,753 | | MAGNA INTERNATIONAL, INC. | | 71,192 | | 903,518 | | |
| 16,906 | | MANULIFE FINANCIAL CORP. | | 309,575 | | 332,774 | | |
| 7,672 | | METRO, INC. | | 277,337 | | 367,818 | | |
| 19,328 | | NATIONAL BANK OF CANADA | | 618,005 | | 1,446,482 | | |
| 7,072 | | NUTRIEN LTD. | | 134,278 | | 428,507 | | |
| 6,564 | | OPEN TEXT CORP. | | 72,477 | | 333,336 | | |
| 2,051 | | PAN AMERICAN SILVER CORP. | | 64,762 | | 58,572 | | |
| 3,306 | | PARKLAND CORP. | | 93,254 | | 106,840 | | |
| 4,522 | | PEMBINA PIPELINE CORP. | | 33,296 | | 143,693 | | |
| 49,000 | | PIZZA PIZZA ROYALTY CORP. | | 343,236 | | 428,098 | | |
| 2,306 | | POWER CORP. OF CANADA | | 75,505 | | 72,886 | | |
| 1,104 | | RESTAURANT BRANDS INTERNATIONAL, INC. | | 74,858 | | 71,133 | | |
| 27,894 | | RIOCAN REAL ESTATE INVESTMENT TRUST | | 313,497 | | 496,853 | | |
| 2,701 | | RITCHIE BROS. AUCTIONEERS, INC. | | 50,064 | | 160,129 | | |
| 9,320 | | ROGERS COMMUNICATIONS, INC., CLASS B | | 220,803 | | 495,473 | | |
| 27,055 | | ROYAL BANK OF CANADA | | 908,895 | | 2,741,076 | | |
| 2,157 | | SAPUTO, INC. | | 65,009 | | 64,331 | | |
| 2,970 | | SHAW COMMUNICATIONS, INC., CLASS B | | 51,544 | | 86,038 | | |
| 2,021 | | SHOPIFY, INC., CLASS A(b) | | 1,187,664 | | 2,955,639 | | |
| 4,781 | | SHOPIFY, INC., CLASS A (NEW YORK EXCHANGE)(b) | | 830,336 | | 6,984,945 | | |
| 12,101 | | SUN LIFE FINANCIAL, INC. | | 245,097 | | 623,988 | | |
| 191,971 | | SUNCOR ENERGY, INC. | | 4,105,432 | | 4,597,950 | | |
| 11,598 | | TC ENERGY CORP. | | 512,602 | | 573,912 | | |
| 31,989 | | TECK RESOURCES LTD., CLASS B | | 174,290 | | 736,759 | | |
| 9,096 | | TELUS CORP. | | 59,716 | | 203,992 | | |
| 1,099 | | TFI INTERNATIONAL, INC. | | 33,700 | | 100,334 | | |
| 8,040 | | THOMSON REUTERS CORP. | | 206,603 | | 798,617 | | |
| 30,273 | | TORONTO-DOMINION BANK (THE) | | 576,490 | | 2,121,503 | | |
| 31,200 | | TOURMALINE OIL CORP. | | 584,707 | | 891,752 | | |
| 104 | | TRISURA GROUP LTD.(b) | | 490 | | 13,909 | | |
| 16,800 | | WAJAX CORP. | | 206,860 | | 326,079 | | |
| 26,600 | | WESTSHORE TERMINALS INVESTMENT CORP. | | 397,133 | | 366,512 | | |
| 7,160 | | WHEATON PRECIOUS METALS CORP. | | 124,839 | | 315,604 | | |
| 2,517 | | WSP GLOBAL, INC. | | 284,375 | | 293,812 | | |
| 25,967 | | YAMANA GOLD, INC. | | 47,753 | | 109,348 | | |
| | | | | 49,159,794 | | 89,494,746 | | 8.57% |
| Chile: | | | | | | |
| 1,115,900 | | AGUAS ANDINAS S.A., CLASS A | | 339,399 | | 229,443 | | |
| 5,893,187 | | ENEL CHILE S.A. | | 532,931 | | 339,039 | | |
| 198,200 | | VINA CONCHA Y TORO S.A. | | 327,546 | | 349,392 | | |
| | | | | 1,199,876 | | 917,874 | | 0.09% |
| China: | | | | | | |
| 290,000 | | AGILE GROUP HOLDINGS LTD. | | 352,847 | | 375,745 | | |
| See accompanying notes to financial statements. | 79 | (Continued) |
CLEARWATER INVESTMENT TRUST
Schedule of Investments - Clearwater International Fund
June 30, 2021 (unaudited)
| Shares | | Security | | Cost | | Fair value (a) | | Percent of
net assets |
| China (Cont'd): | | | | | | |
| 34,000 | | AIRTAC INTERNATIONAL GROUP | | $ 500,090 | | 1,311,799 | | |
| 9,617 | | ALIBABA GROUP HOLDING LTD. ADR(b)(e) | | 1,989,057 | | 2,180,943 | | |
| 342,000 | | ANHUI CONCH CEMENT CO. LTD., CLASS H | | 1,843,725 | | 1,814,768 | | |
| 291,500 | | ASIA CEMENT CHINA HOLDINGS CORP. | | 362,392 | | 228,265 | | |
| 656,000 | | CHINA BLUECHEMICAL LTD., CLASS H | | 177,444 | | 191,791 | | |
| 408,000 | | CHINA MEDICAL SYSTEM HOLDINGS LTD. | | 472,941 | | 1,074,611 | | |
| 1,191,000 | | CHINA SUNTIEN GREEN ENERGY CORP. LTD., CLASS H | | 329,834 | | 584,433 | | |
| 1,474,000 | | FRIENDTIMES, INC. | | 541,834 | | 415,757 | | |
| 430,500 | | HENGAN INTERNATIONAL GROUP CO. LTD. | | 2,996,257 | | 2,883,196 | | |
| 1,036,000 | | LONKING HOLDINGS LTD. | | 439,861 | | 334,912 | | |
| 187,500 | | NETDRAGON WEBSOFT HOLDINGS LTD. | | 425,716 | | 499,884 | | |
| 182,800 | | SHENZHOU INTERNATIONAL GROUP HOLDINGS LTD. | | 3,828,238 | | 4,616,911 | | |
| 65,555 | | TENCENT HOLDINGS LTD. | | 439,984 | | 4,930,788 | | |
| 325,318 | | WUXI BIOLOGICS CAYMAN, INC.(b)(d) | | 3,273,702 | | 5,962,257 | | |
| 412,000 | | ZHEJIANG EXPRESSWAY CO. LTD., CLASS H | | 352,185 | | 366,668 | | |
| | | | | 18,326,107 | | 27,772,728 | | 2.66% |
| Czech Republic: | | | | | | |
| 701 | | PHILIP MORRIS CR A.S. | | 402,293 | | 465,450 | | |
| | | | | 402,293 | | 465,450 | | 0.04% |
| Denmark: | | | | | | |
| 6,224 | | ALK-ABELLO A/S(b) | | 1,795,441 | | 2,969,457 | | |
| 2,366 | | AMBU A/S, CLASS B | | 103,268 | | 90,962 | | |
| 44 | | AP MOLLER - MAERSK A/S, CLASS A | | 35,560 | | 122,221 | | |
| 79 | | AP MOLLER - MAERSK A/S, CLASS B | | 93,026 | | 227,064 | | |
| 2,203 | | CARLSBERG A/S, CLASS B | | 194,278 | | 410,653 | | |
| 1,288 | | CHR HANSEN HOLDING A/S | | 81,573 | | 116,246 | | |
| 1,864 | | COLOPLAST A/S, CLASS B | | 85,624 | | 305,849 | | |
| 22,200 | | D/S NORDEN A/S | | 318,702 | | 706,223 | | |
| 6,700 | | DANSKE BANK A/S | | 54,825 | | 117,894 | | |
| 4,348 | | DEMANT A/S(b) | | 81,241 | | 244,743 | | |
| 38,501 | | DSV PANALPINA A/S | | 3,974,252 | | 8,978,706 | | |
| 804 | | GENMAB A/S(b) | | 100,710 | | 328,972 | | |
| 791 | | GN STORE NORD A/S | | 68,656 | | 69,095 | | |
| 6,944 | | ISS A/S(b) | | 96,080 | | 162,991 | | |
| 31,679 | | NOVO NORDISK A/S, CLASS B | | 1,107,315 | | 2,654,040 | | |
| 3,923 | | NOVOZYMES A/S, CLASS B | | 147,978 | | 295,699 | | |
| 3,214 | | ORSTED A/S(d) | | 398,342 | | 450,998 | | |
| 2,600 | | PANDORA A/S | | 18,150 | | 349,500 | | |
| 146 | | ROCKWOOL INTERNATIONAL A/S, CLASS B | | 73,144 | | 71,076 | | |
| 24,412 | | ROYAL UNIBREW A/S | | 1,788,907 | | 3,109,477 | | |
| 4,300 | | SOLAR A/S, CLASS B | | 269,282 | | 373,689 | | |
| 3,250 | | TOPDANMARK A/S | | 33,362 | | 169,153 | | |
| 6,542 | | TRYG A/S | | 155,996 | | 160,596 | | |
| 24,172 | | VESTAS WIND SYSTEMS A/S | | 421,255 | | 943,561 | | |
| | | | | 11,496,967 | | 23,428,865 | | 2.24% |
| Egypt: | | | | | | |
| 323,300 | | EASTERN CO. S.A.E. | | 244,707 | | 244,097 | | |
| | | | | 244,707 | | 244,097 | | 0.02% |
| Finland: | | | | | | |
| 67,200 | | CITYCON OYJ | | 608,486 | | 572,518 | | |
| 2,770 | | ELISA OYJ | | 86,574 | | 165,277 | | |
| 27,200 | | KEMIRA OYJ | | 447,150 | | 428,312 | | |
| 5,584 | | KESKO OYJ, CLASS B | | 30,705 | | 206,251 | | |
| 5,273 | | KONE OYJ, CLASS B | | 105,699 | | 430,169 | | |
| 21,225 | | NESTE OYJ | | 67,704 | | 1,299,652 | | |
| 181,487 | | NOKIA OYJ(b) | | 869,964 | | 971,728 | | |
| 426,086 | | NOKIA OYJ ADR(b)(e) | | 1,771,048 | | 2,266,778 | | |
| 2,767 | | NOKIAN RENKAAT OYJ | | 44,372 | | 111,717 | | |
| 12,792 | | NORDEA BANK ABP | | 143,704 | | 142,387 | | |
| 1,960 | | ORION OYJ, CLASS B | | 49,561 | | 84,248 | | |
| 19,504 | | QT GROUP OYJ(b) | | 1,366,997 | | 2,282,622 | | |
| 26,500 | | SANOMA OYJ | | 282,423 | | 439,285 | | |
| 18,590 | | STORA ENSO OYJ (REGISTERED) | | 105,291 | | 339,133 | | |
| 11,934 | | UPM-KYMMENE OYJ | | 99,928 | | 451,409 | | |
| See accompanying notes to financial statements. | 80 | (Continued) |
CLEARWATER INVESTMENT TRUST
Schedule of Investments - Clearwater International Fund
June 30, 2021 (unaudited)
| Shares | | Security | | Cost | | Fair value (a) | | Percent of
net assets |
| Finland (Cont'd): | | | | | | |
| 1,849 | | VALMET OYJ | | $ 14,443 | | 80,638 | | |
| | | | | 6,094,049 | | 10,272,124 | | 0.98% |
| France: | | | | | | |
| 8,528 | | AIR LIQUIDE S.A. | | 1,473,827 | | 1,493,149 | | |
| 11,027 | | AIRBUS S.E.(b) | | 366,293 | | 1,417,882 | | |
| 4,729 | | ALSTOM S.A.(b) | | 263,622 | | 238,820 | | |
| 4,707 | | ARKEMA S.A. | | 419,345 | | 590,504 | | |
| 33,641 | | AXA S.A. | | 511,057 | | 853,044 | | |
| 13,720 | | BNP PARIBAS S.A. | | 901,591 | | 860,115 | | |
| 1,593 | | BOUYGUES S.A. | | 66,087 | | 58,915 | | |
| 3,062 | | CAPGEMINI S.E. | | 111,713 | | 588,184 | | |
| 4,610 | | CARREFOUR S.A. | | 81,861 | | 90,659 | | |
| 19,252 | | CIE DE SAINT-GOBAIN | | 430,348 | | 1,267,870 | | |
| 3,235 | | CIE GENERALE DES ETABLISSEMENTS MICHELIN S.C.A. | | 167,080 | | 515,929 | | |
| 37,390 | | COFACE S.A. | | 449,179 | | 453,106 | | |
| 7,706 | | COVIVIO | | 482,654 | | 658,989 | | |
| 35,568 | | CREDIT AGRICOLE S.A. | | 349,163 | | 498,253 | | |
| 107,052 | | DANONE S.A. | | 6,908,273 | | 7,536,245 | | |
| 2,244 | | DASSAULT SYSTEMES S.E. | | 518,528 | | 544,138 | | |
| 4,189 | | EDENRED | | 167,025 | | 238,669 | | |
| 417 | | EIFFAGE S.A. | | 34,325 | | 42,424 | | |
| 4,637 | | ELECTRICITE DE FRANCE S.A. | | 67,797 | | 63,341 | | |
| 31,027 | | ENGIE S.A. | | 443,493 | | 425,075 | | |
| 591 | | ESSILORLUXOTTICA S.A. | | 53,785 | | 109,279 | | |
| 3,524 | | ESSILORLUXOTTICA S.A. (EURONEXT PARIS EXCHANGE) | | 630,630 | | 650,355 | | |
| 2,901 | | EURAZEO S.E. | | 76,265 | | 252,830 | | |
| 3,561 | | EUROFINS SCIENTIFIC S.E.(b) | | 313,124 | | 407,045 | | |
| 564 | | GECINA S.A. | | 51,331 | | 86,404 | | |
| 9,197 | | GETLINK S.E. | | 70,409 | | 143,405 | | |
| 538 | | HERMES INTERNATIONAL | | 767,480 | | 783,701 | | |
| 3,791 | | ILIAD S.A. | | 536,902 | | 554,705 | | |
| 3,399 | | INFOTEL S.A. | | 145,404 | | 202,324 | | |
| 6,762 | | IPSEN S.A. | | 538,954 | | 703,343 | | |
| 9,500 | | KAUFMAN & BROAD S.A. | | 362,957 | | 451,711 | | |
| 1,376 | | KERING S.A. | | 493,902 | | 1,202,483 | | |
| 4,545 | | KLEPIERRE S.A. | | 71,744 | | 117,108 | | |
| 4,848 | | LEGRAND S.A. | | 109,851 | | 513,113 | | |
| 6,266 | | L'OREAL S.A. | | 661,338 | | 2,792,160 | | |
| 16,241 | | LVMH MOET HENNESSY LOUIS VUITTON S.E. | | 3,128,716 | | 12,735,162 | | |
| 14,296 | | MERSEN S.A.(b) | | 465,081 | | 556,856 | | |
| 8,798 | | NEXITY S.A. | | 431,993 | | 440,031 | | |
| 4,443 | | ORANGE S.A. | | 52,948 | | 50,655 | | |
| 21,072 | | PERNOD RICARD S.A. | | 3,239,543 | | 4,677,403 | | |
| 1,012 | | PUBLICIS GROUPE S.A. | | 69,526 | | 64,727 | | |
| 23,074 | | RENAULT S.A.(b) | | 423,958 | | 932,566 | | |
| 15,000 | | RUBIS S.C.A. | | 702,061 | | 666,807 | | |
| 26,106 | | SAFRAN S.A. | | 2,887,181 | | 3,619,281 | | |
| 18,384 | | SANOFI | | 1,045,438 | | 1,926,145 | | |
| 630 | | SARTORIUS STEDIM BIOTECH | | 286,388 | | 297,987 | | |
| 278 | | SCHNEIDER ELECTRIC S.E. | | 8,838 | | 43,727 | | |
| 8,998 | | SCHNEIDER ELECTRIC S.E. (EURONEXT PARIS EXCHANGE) | | 561,880 | | 1,415,613 | | |
| 1,821 | | SCOR S.E.(b) | | 36,624 | | 57,911 | | |
| 2,146 | | SEB S.A. | | 361,074 | | 387,800 | | |
| 7,067 | | SES S.A. | | 53,499 | | 53,982 | | |
| 13,970 | | SOCIETE GENERALE S.A. | | 192,352 | | 411,804 | | |
| 3,699 | | SOCIETE POUR L'INFORMATIQUE INDUSTRIELLE | | 108,264 | | 130,267 | | |
| 7,150 | | SODEXO S.A.(b)(g) | | 647,363 | | 667,227 | | |
| 32,364 | | SODEXO S.A. (EURONEXT PARIS EXCHANGE)(b) | | 2,820,501 | | 3,020,161 | | |
| 8,931 | | SOITEC(b) | | 738,478 | | 1,968,669 | | |
| 2,685 | | SUEZ S.A.(b) | | 65,882 | | 63,834 | | |
| 801 | | TELEPERFORMANCE | | 315,346 | | 325,112 | | |
| 51,800 | | TELEVISION FRANCAISE 1 | | 458,222 | | 523,621 | | |
| 1,413 | | THALES S.A. | | 81,763 | | 144,157 | | |
| 35,951 | | TOTALENERGIES S.E. | | 1,484,806 | | 1,626,506 | | |
| 878 | | UNIBAIL-RODAMCO-WESTFIELD(b) | | 76,229 | | 75,989 | | |
| 3,269 | | VALEO S.A. | | 58,895 | | 98,340 | | |
| See accompanying notes to financial statements. | 81 | (Continued) |
CLEARWATER INVESTMENT TRUST
Schedule of Investments - Clearwater International Fund
June 30, 2021 (unaudited)
| Shares | | Security | | Cost | | Fair value (a) | | Percent of
net assets |
| France (Cont'd): | | | | | | |
| 13,514 | | VEOLIA ENVIRONNEMENT S.A. | | $ 143,775 | | 408,137 | | |
| 10,500 | | VICAT S.A. | | 406,419 | | 507,353 | | |
| 8,179 | | VINCI S.A. | | 345,228 | | 872,746 | | |
| 105,169 | | VIVENDI S.A. | | 2,332,359 | | 3,532,869 | | |
| 6,004 | | WENDEL S.E. | | 462,932 | | 807,322 | | |
| | | | | 43,590,899 | | 70,516,044 | | 6.75% |
| Georgia: | | | | | | |
| 21,875 | | BANK OF GEORGIA GROUP PLC(b) | | 355,261 | | 406,690 | | |
| | | | | 355,261 | | 406,690 | | 0.04% |
| Germany: | | | | | | |
| 3,994 | | ADIDAS A.G. | | 192,837 | | 1,486,595 | | |
| 9,283 | | ALLIANZ S.E. (REGISTERED) | | 904,298 | | 2,314,839 | | |
| 38,556 | | AROUNDTOWN S.A. | | 192,935 | | 300,823 | | |
| 6,098 | | AURUBIS A.G. | | 286,000 | | 565,152 | | |
| 16,979 | | BASF S.E. | | 730,503 | | 1,337,627 | | |
| 18,298 | | BAYER A.G. (REGISTERED) | | 1,017,140 | | 1,111,096 | | |
| 8,787 | | BAYERISCHE MOTOREN WERKE A.G. | | 501,991 | | 930,538 | | |
| 348 | | BECHTLE A.G. | | 66,267 | | 64,640 | | |
| 2,206 | | BEIERSDORF A.G. | | 146,950 | | 266,154 | | |
| 3,087 | | BRENNTAG S.E. | | 221,455 | | 287,049 | | |
| 359 | | CARL ZEISS MEDITEC A.G. (BEARER) | | 66,721 | | 69,365 | | |
| 11,875 | | COMMERZBANK A.G.(b) | | 95,296 | | 84,231 | | |
| 1,042 | | CONTINENTAL A.G. | | 57,443 | | 153,184 | | |
| 931 | | COVESTRO A.G.(d) | | 62,021 | | 60,120 | | |
| 23,800 | | CROPENERGIES A.G. | | 337,485 | | 305,350 | | |
| 10,838 | | DAIMLER A.G. (REGISTERED) | | 1,032,767 | | 967,692 | | |
| 3,850 | | DELIVERY HERO S.E.(b)(d) | | 362,066 | | 508,556 | | |
| 35,109 | | DEUTSCHE BANK A.G. (REGISTERED)(b) | | 514,053 | | 457,353 | | |
| 4,525 | | DEUTSCHE BOERSE A.G. | | 273,152 | | 789,804 | | |
| 15,996 | | DEUTSCHE EUROSHOP A.G. | | 435,440 | | 379,345 | | |
| 37,890 | | DEUTSCHE PFANDBRIEFBANK A.G.(d) | | 469,871 | | 374,610 | | |
| 18,572 | | DEUTSCHE POST A.G. (REGISTERED) | | 230,768 | | 1,263,168 | | |
| 45,493 | | DEUTSCHE TELEKOM A.G. (REGISTERED) | | 638,820 | | 960,839 | | |
| 9,111 | | DEUTSCHE WOHNEN S.E. | | 295,363 | | 557,238 | | |
| 82,454 | | E.ON S.E. | | 724,674 | | 953,647 | | |
| 31,111 | | ECKERT & ZIEGLER STRAHLEN- UND MEDIZINTECHNIK A.G. | | 1,172,525 | | 3,554,339 | | |
| 23,600 | | FREENET A.G. | | 557,311 | | 557,435 | | |
| 72,207 | | FRESENIUS MEDICAL CARE A.G. & CO. KGAA | | 5,462,206 | | 5,996,787 | | |
| 5,986 | | FRESENIUS S.E. & CO. KGAA | | 123,269 | | 312,272 | | |
| 1,537 | | GEA GROUP A.G. | | 63,629 | | 62,257 | | |
| 17,795 | | HAMBURGER HAFEN UND LOGISTIK A.G. | | 443,620 | | 447,329 | | |
| 2,246 | | HANNOVER RUECK S.E. | | 94,321 | | 375,777 | | |
| 3,671 | | HEIDELBERGCEMENT A.G. | | 131,196 | | 314,888 | | |
| 26,638 | | HELLA GMBH & CO. KGAA(b) | | 1,225,907 | | 1,824,408 | | |
| 2,873 | | HELLOFRESH S.E.(b) | | 264,186 | | 279,278 | | |
| 863 | | HENKEL A.G. & CO. KGAA | | 84,255 | | 79,459 | | |
| 2,623 | | HOCHTIEF A.G. | | 110,564 | | 201,418 | | |
| 2,391 | | HYPOPORT S.E.(b) | | 875,924 | | 1,236,116 | | |
| 21,681 | | INFINEON TECHNOLOGIES A.G. | | 131,828 | | 869,453 | | |
| 6,898 | | JOST WERKE A.G.(d) | | 220,852 | | 411,419 | | |
| 589 | | KION GROUP A.G. | | 64,769 | | 62,773 | | |
| 1,283 | | KNORR-BREMSE A.G. | | 158,078 | | 147,568 | | |
| 464 | | LEG IMMOBILIEN S.E. | | 67,948 | | 66,820 | | |
| 19,771 | | MENSCH UND MASCHINE SOFTWARE S.E. | | 1,401,583 | | 1,423,018 | | |
| 2,159 | | MERCK KGAA | | 96,589 | | 413,958 | | |
| 907 | | MTU AERO ENGINES A.G. | | 231,941 | | 224,667 | | |
| 3,139 | | MUENCHENER RUECKVERSICHERUNGS-GESELLSCHAFT A.G. IN MUENCHEN (REGISTERED) | | 392,853 | | 859,612 | | |
| 19,095 | | PROSIEBENSAT.1 MEDIA S.E. | | 286,490 | | 379,818 | | |
| 7,700 | | PUBLITY A.G.(b)(f) | | 286,657 | | 172,014 | | |
| 667 | | PUMA S.E. | | 75,344 | | 79,525 | | |
| 6,900 | | RHEINMETALL A.G. | | 824,004 | | 681,534 | | |
| 7,480 | | RWE A.G. | | 218,301 | | 271,049 | | |
| 18,462 | | SAP S.E. | | 879,469 | | 2,601,564 | | |
| 1,584 | | SCOUT24 A.G.(d) | | 128,614 | | 133,580 | | |
| 13,327 | | SIEMENS A.G. (REGISTERED) | | 815,103 | | 2,111,529 | | |
| See accompanying notes to financial statements. | 82 | (Continued) |
CLEARWATER INVESTMENT TRUST
Schedule of Investments - Clearwater International Fund
June 30, 2021 (unaudited)
| Shares | | Security | | Cost | | Fair value (a) | | Percent of
net assets |
| Germany (Cont'd): | | | | | | |
| 6,383 | | SIEMENS ENERGY A.G.(b) | | $ 163,952 | | 192,395 | | |
| 4,963 | | SIEMENS HEALTHINEERS A.G.(d) | | 287,514 | | 304,130 | | |
| 3,600 | | SILTRONIC A.G. | | 264,192 | | 599,752 | | |
| 8,584 | | STEICO S.E. | | 1,079,312 | | 1,125,740 | | |
| 2,275 | | SYMRISE A.G. | | 309,441 | | 316,966 | | |
| 8,898 | | TEAMVIEWER A.G.(b)(d) | | 425,080 | | 334,672 | | |
| 188,717 | | TELEFONICA DEUTSCHLAND HOLDING A.G. | | 459,389 | | 497,891 | | |
| 141,527 | | TUI A.G. - CDI(b)(f) | | 344,740 | | 723,386 | | |
| 4,171 | | UNIPER S.E. | | 46,925 | | 153,615 | | |
| 404 | | VOLKSWAGEN A.G. | | 40,235 | | 132,599 | | |
| 7,564 | | VONOVIA S.E. | | 341,426 | | 488,991 | | |
| 1,639 | | ZALANDO S.E.(b)(d) | | 99,033 | | 198,134 | | |
| | | | | 30,606,891 | | 47,768,950 | | 4.57% |
| Greece: | | | | | | |
| 6,746 | | HELLENIC TELECOMMUNICATIONS ORGANIZATION S.A. | | 54,075 | | 113,187 | | |
| | | | | 54,075 | | 113,187 | | 0.01% |
| Hong Kong: | | | | | | |
| 775,000 | | AIA GROUP LTD. | | 4,989,423 | | 9,632,227 | | |
| 46,000 | | BOC HONG KONG HOLDINGS LTD. | | 63,016 | | 156,112 | | |
| 32,300 | | BUDWEISER BREWING CO. APAC LTD.(d) | | 108,231 | | 101,922 | | |
| 1,462,000 | | CITIC TELECOM INTERNATIONAL HOLDINGS LTD. | | 547,331 | | 483,925 | | |
| 55,044 | | CK ASSET HOLDINGS LTD. | | 164,491 | | 379,990 | | |
| 46,044 | | CK HUTCHISON HOLDINGS LTD. | | 286,941 | | 358,778 | | |
| 11,000 | | CK INFRASTRUCTURE HOLDINGS LTD. | | 68,007 | | 65,595 | | |
| 56,500 | | CLP HOLDINGS LTD. | | 455,988 | | 558,866 | | |
| 22,000 | | ESR CAYMAN LTD.(b)(d) | | 70,189 | | 74,237 | | |
| 998,000 | | FIRST PACIFIC CO. LTD. | | 376,906 | | 340,623 | | |
| 729 | | FUTU HOLDINGS LTD. ADR(b)(e) | | 107,330 | | 130,557 | | |
| 20,000 | | GALAXY ENTERTAINMENT GROUP LTD.(b) | | 55,028 | | 160,092 | | |
| 2,228,000 | | GEMDALE PROPERTIES & INVESTMENT CORP. LTD. | | 413,300 | | 284,085 | | |
| 26,000 | | HANG LUNG PROPERTIES LTD. | | 66,378 | | 63,156 | | |
| 15,300 | | HANG SENG BANK LTD. | | 175,457 | | 305,634 | | |
| 27,331 | | HENDERSON LAND DEVELOPMENT CO. LTD. | | 52,934 | | 129,539 | | |
| 200,950 | | HONG KONG & CHINA GAS CO. LTD. | | 291,377 | | 312,128 | | |
| 20,900 | | HONG KONG EXCHANGES & CLEARING LTD. | | 750,311 | | 1,245,768 | | |
| 19,800 | | HONGKONG LAND HOLDINGS LTD. | | 94,231 | | 94,248 | | |
| 3,800 | | JARDINE MATHESON HOLDINGS LTD. | | 238,649 | | 242,896 | | |
| 40,500 | | LINK REIT | | 84,195 | | 392,518 | | |
| 30,500 | | MTR CORP. LTD. | | 88,703 | | 169,896 | | |
| 28,000 | | NEW WORLD DEVELOPMENT CO. LTD. | | 132,032 | | 145,512 | | |
| 388,000 | | PAX GLOBAL TECHNOLOGY LTD. | | 368,074 | | 446,253 | | |
| 172,123 | | PCCW LTD. | | 70,484 | | 90,226 | | |
| 392,000 | | PERFECT MEDICAL HEALTH MANAGEMENT LTD. | | 140,251 | | 473,573 | | |
| 54,500 | | POWER ASSETS HOLDINGS LTD. | | 303,629 | | 334,470 | | |
| 185,000 | | SHENZHEN INTERNATIONAL HOLDINGS LTD. | | 343,057 | | 255,902 | | |
| 102,000 | | SITC INTERNATIONAL HOLDINGS CO. LTD. | | 105,746 | | 426,297 | | |
| 20,000 | | SUN HUNG KAI PROPERTIES LTD. | | 256,567 | | 298,031 | | |
| 40,000 | | SWIRE PACIFIC LTD., CLASS A | | 207,757 | | 271,241 | | |
| 29,500 | | TECHTRONIC INDUSTRIES CO. LTD. | | 416,945 | | 515,204 | | |
| 600,000 | | UNITED LABORATORIES INTERNATIONAL HOLDINGS (THE) LTD. | | 352,686 | | 492,253 | | |
| 469,800 | | VALUETRONICS HOLDINGS LTD. | | 216,550 | | 211,370 | | |
| 83,500 | | WH GROUP LTD.(d) | | 45,547 | | 75,065 | | |
| 21,000 | | WHARF HOLDINGS (THE) LTD. | | 43,463 | | 80,059 | | |
| 14,000 | | WHARF REAL ESTATE INVESTMENT CO. LTD. | | 80,781 | | 81,411 | | |
| 442,000 | | XINYI GLASS HOLDINGS LTD. | | 576,517 | | 1,801,746 | | |
| 358,000 | | YUEXIU TRANSPORT INFRASTRUCTURE LTD. | | 311,883 | | 207,488 | | |
| | | | | 13,520,385 | | 21,888,893 | | 2.10% |
| India: | | | | | | |
| 57,089 | | COMPUTER AGE MANAGEMENT SERVICES LTD. | | 1,172,396 | | 2,144,697 | | |
| 162,521 | | CREDITACCESS GRAMEEN LTD.(b) | | 1,595,042 | | 1,639,859 | | |
| 59,400 | | CYIENT LTD. | | 429,128 | | 686,940 | | |
| 687,800 | | FIRSTSOURCE SOLUTIONS LTD. | | 375,974 | | 1,729,910 | | |
| 461,861 | | HCL TECHNOLOGIES LTD. | | 3,641,164 | | 6,111,130 | | |
| 73,400 | | HDFC BANK LTD. ADR(e) | | 2,515,893 | | 5,367,008 | | |
| 114,700 | | HINDUSTAN PETROLEUM CORP. LTD. | | 431,628 | | 452,442 | | |
| See accompanying notes to financial statements. | 83 | (Continued) |
CLEARWATER INVESTMENT TRUST
Schedule of Investments - Clearwater International Fund
June 30, 2021 (unaudited)
| Shares | | Security | | Cost | | Fair value (a) | | Percent of
net assets |
| India (Cont'd): | | | | | | |
| 512,864 | | INDIAN ENERGY EXCHANGE LTD.(d) | | $ 1,267,399 | | 2,588,469 | | |
| 593,770 | | INDUS TOWERS LTD. | | 2,438,222 | | 1,906,407 | | |
| 40,400 | | JUBILANT INGREVIA LTD.(b) | | 36,087 | | 284,507 | | |
| 40,400 | | JUBILANT PHARMOVA LTD.(b) | | 278,630 | | 397,994 | | |
| 42,000 | | MPHASIS LTD. | | 670,244 | | 1,205,925 | | |
| 322,000 | | NMDC LTD. | | 521,633 | | 797,527 | | |
| 1,107,100 | | SJVN LTD. | | 377,346 | | 415,554 | | |
| 230,194 | | SYNGENE INTERNATIONAL LTD.(b)(d) | | 1,015,687 | | 1,806,433 | | |
| 32,195 | | WNS HOLDINGS LTD. ADR(b)(e) | | 2,027,505 | | 2,571,415 | | |
| | | | | 18,793,978 | | 30,106,217 | | 2.88% |
| Indonesia: | | | | | | |
| 4,097,000 | | ADARO ENERGY TBK PT | | 470,816 | | 340,475 | | |
| 8,471,800 | | BANK BTPN SYARIAH TBK PT | | 2,105,926 | | 1,682,675 | | |
| 1,072,100 | | INDOFOOD SUKSES MAKMUR TBK PT | | 478,001 | | 456,567 | | |
| 2,022,800 | | MATAHARI DEPARTMENT STORE TBK PT(b) | | 317,587 | | 272,729 | | |
| | | | | 3,372,330 | | 2,752,446 | | 0.26% |
| Ireland: | | | | | | |
| 19,100 | | ACCENTURE PLC, CLASS A | | 2,195,030 | | 5,630,489 | | |
| 1,530 | | AERCAP HOLDINGS N.V.(b) | | 38,135 | | 78,351 | | |
| 98,175 | | CRH PLC | | 2,985,105 | | 4,947,468 | | |
| 53,200 | | DALATA HOTEL GROUP PLC(b) | | 299,929 | | 241,919 | | |
| 2,146 | | DCC PLC | | 158,386 | | 175,680 | | |
| 168,218 | | EXPERIAN PLC | | 3,216,304 | | 6,482,910 | | |
| 2,502 | | FLUTTER ENTERTAINMENT PLC - CDI(b) | | 390,820 | | 453,022 | | |
| 12,468 | | ICON PLC(b) | | 825,262 | | 2,577,260 | | |
| 11,485 | | JAMES HARDIE INDUSTRIES PLC - CDI | | 103,360 | | 389,919 | | |
| 3,255 | | KERRY GROUP PLC, CLASS A | | 214,085 | | 454,663 | | |
| 724 | | KINGSPAN GROUP PLC | | 50,166 | | 68,370 | | |
| 1,899 | | KINGSPAN GROUP PLC (EURONEXT DUBLIN EXCHANGE) | | 184,274 | | 177,617 | | |
| 17,539 | | RYANAIR HOLDINGS PLC(b) | | 235,787 | | 331,918 | | |
| 5,306 | | SMURFIT KAPPA GROUP PLC | | 238,771 | | 287,840 | | |
| | | | | 11,135,414 | | 22,297,426 | | 2.13% |
| Isle of Man: | | | | | | |
| 8,963 | | ENTAIN PLC(b) | | 96,395 | | 216,416 | | |
| | | | | 96,395 | | 216,416 | | 0.02% |
| Israel: | | | | | | |
| 59,916 | | BANK HAPOALIM B.M.(b) | | 291,187 | | 480,776 | | |
| 1,532 | | CHECK POINT SOFTWARE TECHNOLOGIES LTD.(b) | | 119,497 | | 177,911 | | |
| 33,142 | | GLOBAL-E ONLINE LTD.(b) | | 829,776 | | 1,891,745 | | |
| 115,300 | | ICL GROUP LTD. | | 461,518 | | 781,953 | | |
| 29,044 | | MIZRAHI TEFAHOT BANK LTD.(b) | | 475,042 | | 894,443 | | |
| 32,537 | | NEOGAMES S.A.(b) | | 1,558,353 | | 2,000,049 | | |
| 3,072 | | NICE LTD.(b) | | 169,095 | | 750,250 | | |
| | | | | 3,904,468 | | 6,977,127 | | 0.67% |
| Italy: | | | | | | |
| 285,200 | | A2A S.P.A. | | 555,841 | | 583,015 | | |
| 21,262 | | ASSICURAZIONI GENERALI S.P.A. | | 276,719 | | 426,199 | | |
| 33,941 | | ATLANTIA S.P.A.(b) | | 448,114 | | 614,549 | | |
| 25,272 | | BANCA MEDIOLANUM S.P.A. | | 87,322 | | 245,843 | | |
| 8,879 | | DAVIDE CAMPARI-MILANO N.V. | | 120,451 | | 118,917 | | |
| 156,771 | | ENEL S.P.A. | | 999,500 | | 1,455,900 | | |
| 6,067 | | ENI S.P.A. | | 59,383 | | 73,882 | | |
| 26,190 | | FERRARI N.V. | | 4,044,633 | | 5,403,535 | | |
| 1,022 | | FERRARI N.V. (NEW YORK EXCHANGE) | | 7,571 | | 210,583 | | |
| 3,831 | | FINECOBANK BANCA FINECO S.P.A.(b) | | 65,128 | | 66,776 | | |
| 40,589 | | INTERPUMP GROUP S.P.A. | | 734,996 | | 2,403,533 | | |
| 147,412 | | INTESA SANPAOLO S.P.A. | | 401,625 | | 407,182 | | |
| 375,900 | | IREN S.P.A. | | 999,472 | | 1,072,411 | | |
| 28,600 | | LA DORIA S.P.A. | | 361,264 | | 645,693 | | |
| 77,659 | | LEONARDO S.P.A.(b) | | 617,417 | | 627,277 | | |
| 14,266 | | MEDIOBANCA BANCA DI CREDITO FINANZIARIO S.P.A.(b) | | 130,639 | | 166,622 | | |
| 1,054 | | MONCLER S.P.A. | | 73,908 | | 71,312 | | |
| 7,465 | | NEXI S.P.A.(b)(d) | | 146,208 | | 163,844 | | |
| 10,709 | | POSTE ITALIANE S.P.A.(d) | | 156,534 | | 141,585 | | |
| 3,687 | | PRYSMIAN S.P.A. | | 133,903 | | 132,161 | | |
| See accompanying notes to financial statements. | 84 | (Continued) |
CLEARWATER INVESTMENT TRUST
Schedule of Investments - Clearwater International Fund
June 30, 2021 (unaudited)
| Shares | | Security | | Cost | | Fair value (a) | | Percent of
net assets |
| Italy (Cont'd): | | | | | | |
| 1,776 | | RECORDATI INDUSTRIA CHIMICA E FARMACEUTICA S.P.A. | | $ 103,529 | | 101,504 | | |
| 70,149 | | SNAM S.P.A. | | 252,658 | | 405,499 | | |
| 231,262 | | TENARIS S.A. | | 2,055,795 | | 2,520,621 | | |
| 22,527 | | TENARIS S.A. ADR(e) | | 482,262 | | 493,341 | | |
| 39,609 | | TERNA S.P.A. | | 160,166 | | 295,137 | | |
| 19,504 | | UNICREDIT S.P.A. | | 172,969 | | 230,112 | | |
| 71,681 | | UNIPOL GRUPPO S.P.A. | | 376,844 | | 390,301 | | |
| 95,230 | | UNIPOLSAI ASSICURAZIONI S.P.A. | | 153,826 | | 276,426 | | |
| | | | | 14,178,677 | | 19,743,760 | | 1.89% |
| Japan: | | | | | | |
| 1,500 | | ABC-MART, INC. | | 56,540 | | 86,007 | | |
| 30,600 | | ADEKA CORP. | | 390,224 | | 574,292 | | |
| 2,600 | | ADVANTEST CORP. | | 233,722 | | 234,268 | | |
| 11,300 | | AEON CO. LTD. | | 230,053 | | 303,619 | | |
| 600 | | AEON REIT INVESTMENT CORP. | | 728,822 | | 888,429 | | |
| 1,400 | | AGC, INC. | | 61,586 | | 58,725 | | |
| 2,300 | | AISIN CORP. | | 37,584 | | 98,339 | | |
| 15,000 | | AJINOMOTO CO., INC. | | 116,767 | | 389,396 | | |
| 2,500 | | ALFRESA HOLDINGS CORP. | | 24,420 | | 37,333 | | |
| 7,900 | | ANA HOLDINGS, INC.(b) | | 180,960 | | 185,740 | | |
| 15,600 | | ARCS CO. LTD. | | 325,913 | | 339,256 | | |
| 5,900 | | ASAHI GROUP HOLDINGS LTD. | | 103,152 | | 275,682 | | |
| 32,500 | | ASAHI KASEI CORP. | | 157,083 | | 357,048 | | |
| 22,100 | | ASAHI YUKIZAI CORP. | | 276,792 | | 266,167 | | |
| 9,300 | | ASANUMA CORP. | | 324,412 | | 377,542 | | |
| 37,000 | | ASTELLAS PHARMA, INC. | | 236,149 | | 644,282 | | |
| 63,100 | | ASTENA HOLDINGS CO. LTD. | | 295,237 | | 361,237 | | |
| 3,900 | | BANDAI NAMCO HOLDINGS, INC. | | 182,051 | | 270,590 | | |
| 10,800 | | BAYCURRENT CONSULTING, INC. | | 945,192 | | 3,878,842 | | |
| 27,800 | | BENGO4.COM, INC.(b)(f) | | 2,961,598 | | 2,432,297 | | |
| 13,800 | | BRIDGESTONE CORP. | | 205,726 | | 627,922 | | |
| 32,100 | | BROTHER INDUSTRIES LTD. | | 541,898 | | 640,584 | | |
| 48,400 | | BUNKA SHUTTER CO. LTD. | | 363,296 | | 482,715 | | |
| 22,200 | | CANON, INC.(f) | | 528,426 | | 502,170 | | |
| 2,300 | | CAPCOM CO. LTD. | | 70,251 | | 67,285 | | |
| 2,700 | | CENTRAL JAPAN RAILWAY CO. | | 229,516 | | 409,514 | | |
| 18,600 | | CHUBU ELECTRIC POWER CO., INC. | | 230,205 | | 227,362 | | |
| 13,500 | | CHUGAI PHARMACEUTICAL CO. LTD. | | 82,278 | | 534,921 | | |
| 4,300 | | CHUGOKU ELECTRIC POWER (THE) CO., INC. | | 50,812 | | 39,247 | | |
| 28,400 | | CREDIT SAISON CO. LTD. | | 361,395 | | 346,133 | | |
| 27,500 | | CRESCO LTD. | | 342,183 | | 471,803 | | |
| 8,000 | | CYBERAGENT, INC. | | 165,447 | | 171,745 | | |
| 4,000 | | DAI NIPPON PRINTING CO. LTD. | | 70,827 | | 84,576 | | |
| 1,800 | | DAIFUKU CO. LTD. | | 155,471 | | 163,482 | | |
| 17,100 | | DAI-ICHI LIFE HOLDINGS, INC. | | 346,541 | | 313,078 | | |
| 30,600 | | DAIICHI SANKYO CO. LTD. | | 185,743 | | 659,541 | | |
| 4,600 | | DAIKIN INDUSTRIES LTD. | | 136,302 | | 856,690 | | |
| 19,000 | | DAITRON CO. LTD. | | 328,045 | | 342,563 | | |
| 10,000 | | DAIWA HOUSE INDUSTRY CO. LTD. | | 103,706 | | 300,194 | | |
| 17,500 | | DAIWA SECURITIES GROUP, INC. | | 60,410 | | 96,105 | | |
| 28,000 | | DAIWABO HOLDINGS CO. LTD. | | 223,879 | | 480,634 | | |
| 8,200 | | DENSO CORP. | | 185,234 | | 559,411 | | |
| 3,300 | | DENTSU GROUP, INC. | | 56,753 | | 118,075 | | |
| 200 | | DISCO CORP. | | 63,361 | | 61,119 | | |
| 3,600 | | EAST JAPAN RAILWAY CO. | | 188,040 | | 256,872 | | |
| 19,700 | | EBARA CORP. | | 478,039 | | 969,972 | | |
| 17,800 | | ECO'S CO. LTD. | | 285,796 | | 314,999 | | |
| 4,200 | | EISAI CO. LTD. | | 190,676 | | 413,025 | | |
| 28,300 | | ELEMATEC CORP. | | 262,160 | | 333,451 | | |
| 68,800 | | ENEOS HOLDINGS, INC. | | 278,957 | | 287,908 | | |
| 20,400 | | EXEDY CORP. | | 319,517 | | 299,128 | | |
| 3,500 | | FANUC CORP. | | 398,163 | | 844,165 | | |
| 1,300 | | FAST RETAILING CO. LTD. | | 188,734 | | 978,613 | | |
| 50,120 | | FEED ONE CO. LTD. | | 432,664 | | 331,141 | | |
| 19,800 | | FERROTEC HOLDINGS CORP. | | 139,635 | | 608,641 | | |
| 34,200 | | FJ NEXT CO. LTD. | | 337,056 | | 311,231 | | |
| 13,700 | | FREEE K.K.(b) | | 258,932 | | 1,259,076 | | |
| See accompanying notes to financial statements. | 85 | (Continued) |
CLEARWATER INVESTMENT TRUST
Schedule of Investments - Clearwater International Fund
June 30, 2021 (unaudited)
| Shares | | Security | | Cost | | Fair value (a) | | Percent of
net assets |
| Japan (Cont'd): | | | | | | |
| 31,700 | | FUJI CORP. | | $ 564,353 | | 725,338 | | |
| 4,700 | | FUJI ELECTRIC CO. LTD. | | 61,631 | | 219,569 | | |
| 8,700 | | FUJIFILM HOLDINGS CORP. | | 163,215 | | 645,207 | | |
| 3,500 | | FUJITSU LTD. | | 311,816 | | 655,295 | | |
| 41,400 | | FUKUOKA FINANCIAL GROUP, INC. | | 523,630 | | 722,576 | | |
| 35,800 | | FURUNO ELECTRIC CO. LTD. | | 322,070 | | 323,536 | | |
| 40 | | GLP J-REIT | | 68,979 | | 68,986 | | |
| 8,600 | | GMO FINANCIAL GATE, INC. | | 1,759,208 | | 1,676,727 | | |
| 400 | | GMO PAYMENT GATEWAY, INC. | | 36,072 | | 52,100 | | |
| 119,800 | | HACHIJUNI BANK (THE) LTD. | | 476,117 | | 386,052 | | |
| 3,000 | | HAMAMATSU PHOTONICS K.K. | | 52,686 | | 180,926 | | |
| 2,200 | | HANKYU HANSHIN HOLDINGS, INC. | | 51,221 | | 67,825 | | |
| 55,300 | | HASEKO CORP. | | 721,604 | | 757,609 | | |
| 341 | | HIROSE ELECTRIC CO. LTD. | | 29,327 | | 49,878 | | |
| 19,000 | | HITACHI LTD. | | 295,895 | | 1,087,889 | | |
| 7,000 | | HITACHI METALS LTD.(b) | | 55,542 | | 133,831 | | |
| 16,700 | | HONDA MOTOR CO. LTD. | | 542,319 | | 533,642 | | |
| 800 | | HOSHIZAKI CORP. | | 74,957 | | 67,978 | | |
| 6,500 | | HOYA CORP. | | 270,235 | | 861,830 | | |
| 5,700 | | HULIC CO. LTD. | | 48,487 | | 64,134 | | |
| 13,900 | | IDEMITSU KOSAN CO. LTD. | | 334,248 | | 335,692 | | |
| 26,100 | | INNOTECH CORP. | | 231,054 | | 320,920 | | |
| 1,000 | | INVINCIBLE INVESTMENT CORP. | | 580,735 | | 385,256 | | |
| 1,100 | | ITO EN LTD. | | 67,597 | | 65,250 | | |
| 24,300 | | ITOCHU CORP. | | 362,362 | | 699,942 | | |
| 2,100 | | ITOCHU TECHNO-SOLUTIONS CORP. | | 64,301 | | 65,025 | | |
| 21,900 | | JACCS CO. LTD. | | 467,646 | | 512,534 | | |
| 30,400 | | JAPAN AVIATION ELECTRONICS INDUSTRY LTD. | | 458,316 | | 537,155 | | |
| 53,600 | | JAPAN ELEVATOR SERVICE HOLDINGS CO. LTD. | | 574,239 | | 1,245,737 | | |
| 9,100 | | JAPAN EXCHANGE GROUP, INC. | | 105,836 | | 202,322 | | |
| 63 | | JAPAN METROPOLITAN FUND INVEST | | 65,317 | | 68,277 | | |
| 13,600 | | JAPAN POST BANK CO. LTD. | | 119,517 | | 114,216 | | |
| 9,000 | | JAPAN POST HOLDINGS CO. LTD.(b) | | 75,125 | | 73,745 | | |
| 11 | | JAPAN REAL ESTATE INVESTMENT CORP. | | 68,697 | | 67,627 | | |
| 20,900 | | JAPAN TOBACCO, INC. | | 420,034 | | 394,785 | | |
| 35,000 | | JEOL LTD. | | 2,035,271 | | 2,047,797 | | |
| 2,300 | | JSR CORP. | | 66,413 | | 69,562 | | |
| 4,500 | | KAJIMA CORP. | | 25,084 | | 56,992 | | |
| 2,100 | | KAKAKU.COM, INC. | | 65,355 | | 63,419 | | |
| 26,900 | | KANAMOTO CO. LTD. | | 620,666 | | 619,382 | | |
| 57,300 | | KANDENKO CO. LTD. | | 547,713 | | 447,177 | | |
| 12,300 | | KANEKA CORP. | | 387,968 | | 495,454 | | |
| 4,800 | | KANSAI ELECTRIC POWER (THE) CO., INC. | | 46,503 | | 45,777 | | |
| 2,000 | | KANSAI PAINT CO. LTD. | | 10,449 | | 50,965 | | |
| 10,000 | | KAO CORP. | | 208,279 | | 615,239 | | |
| 29,762 | | KDDI CORP. | | 238,488 | | 928,263 | | |
| 1,200 | | KEIO CORP. | | 36,571 | | 70,534 | | |
| 2,400 | | KEISEI ELECTRIC RAILWAY CO. LTD. | | 22,185 | | 76,583 | | |
| 14,524 | | KEYENCE CORP. | | 1,492,958 | | 7,330,309 | | |
| 6,000 | | KIKKOMAN CORP. | | 52,867 | | 395,877 | | |
| 14,500 | | KIRIN HOLDINGS CO. LTD. | | 197,074 | | 282,704 | | |
| 67,600 | | KITZ CORP. | | 466,295 | | 459,409 | | |
| 80,600 | | KOBE BUSSAN CO. LTD. | | 1,709,644 | | 2,539,268 | | |
| 14,900 | | KOMATSU LTD. | | 426,588 | | 370,237 | | |
| 2,300 | | KONAMI HOLDINGS CORP. | | 50,313 | | 138,089 | | |
| 400 | | KOSE CORP. | | 66,142 | | 62,937 | | |
| 21,800 | | KUBOTA CORP. | | 139,630 | | 440,925 | | |
| 6,900 | | KUREHA CORP. | | 316,117 | | 399,361 | | |
| 1,400 | | KURITA WATER INDUSTRIES LTD. | | 66,953 | | 67,168 | | |
| 5,000 | | KYOCERA CORP. | | 194,900 | | 309,105 | | |
| 7,500 | | KYOWA KIRIN CO. LTD. | | 141,932 | | 265,989 | | |
| 14,900 | | KYUSHU RAILWAY CO. | | 317,651 | | 336,103 | | |
| 27,400 | | LASERTEC CORP. | | 4,549,907 | | 5,324,866 | | |
| 13,100 | | LINTEC CORP. | | 259,789 | | 284,180 | | |
| 2,500 | | LIXIL CORP. | | 65,962 | | 64,652 | | |
| 6,500 | | M3, INC. | | 154,876 | | 474,679 | | |
| 2,900 | | MAKITA CORP. | | 92,361 | | 136,523 | | |
| See accompanying notes to financial statements. | 86 | (Continued) |
CLEARWATER INVESTMENT TRUST
Schedule of Investments - Clearwater International Fund
June 30, 2021 (unaudited)
| Shares | | Security | | Cost | | Fair value (a) | | Percent of
net assets |
| Japan (Cont'd): | | | | | | |
| 7,100 | | MARUBENI CORP. | | $ 64,663 | | 61,743 | | |
| 7,100 | | MARUI GROUP CO. LTD. | | 41,710 | | 133,443 | | |
| 14,600 | | MATSUMOTOKIYOSHI HOLDINGS CO. LTD. | | 542,531 | | 644,610 | | |
| 7,700 | | MAZDA MOTOR CORP.(b) | | 38,348 | | 72,360 | | |
| 1,100 | | MEDIA DO CO. LTD. | | 61,027 | | 45,101 | | |
| 2,500 | | MEIJI HOLDINGS CO. LTD. | | 44,976 | | 149,647 | | |
| 12,800 | | MELCO HOLDINGS, INC. | | 351,215 | | 610,649 | | |
| 6,200 | | MERCARI, INC.(b) | | 176,315 | | 329,268 | | |
| 8,700 | | MINEBEA MITSUMI, INC. | | 84,406 | | 230,157 | | |
| 597 | | MIRAI CORP. | | 328,940 | | 278,899 | | |
| 7,600 | | MISUMI GROUP, INC. | | 252,212 | | 257,221 | | |
| 24,900 | | MITSUBISHI CHEMICAL HOLDINGS CORP. | | 102,543 | | 209,228 | | |
| 29,000 | | MITSUBISHI CORP. | | 544,828 | | 790,423 | | |
| 40,000 | | MITSUBISHI ELECTRIC CORP. | | 322,860 | | 580,584 | | |
| 24,100 | | MITSUBISHI ESTATE CO. LTD. | | 330,161 | | 389,717 | | |
| 9,200 | | MITSUBISHI GAS CHEMICAL CO., INC. | | 84,078 | | 195,105 | | |
| 26,600 | | MITSUBISHI HC CAPITAL, INC. | | 82,462 | | 142,464 | | |
| 2,300 | | MITSUBISHI HEAVY INDUSTRIES LTD. | | 72,944 | | 67,678 | | |
| 207,700 | | MITSUBISHI UFJ FINANCIAL GROUP, INC. | | 1,170,331 | | 1,121,930 | | |
| 20,800 | | MITSUBOSHI BELTING LTD. | | 335,754 | | 327,648 | | |
| 25,900 | | MITSUI & CO. LTD. | | 408,813 | | 582,951 | | |
| 7,400 | | MITSUI CHEMICALS, INC. | | 87,469 | | 255,448 | | |
| 6,000 | | MITSUI FUDOSAN CO. LTD. | | 149,162 | | 138,962 | | |
| 24,000 | | MITSUI-SOKO HOLDINGS CO. LTD. | | 510,010 | | 545,695 | | |
| 1,500 | | MIURA CO. LTD. | | 67,565 | | 65,012 | | |
| 21,000 | | MIZUHO FINANCIAL GROUP, INC. | | 303,161 | | 300,081 | | |
| 31,000 | | MONEY FORWARD, INC.(b) | | 1,899,670 | | 1,978,397 | | |
| 7,600 | | MONOTARO CO. LTD. | | 113,793 | | 179,918 | | |
| 6,380 | | MS&AD INSURANCE GROUP HOLDINGS, INC. | | 134,923 | | 184,230 | | |
| 37,400 | | MUGEN ESTATE CO. LTD. | | 216,786 | | 168,324 | | |
| 11,300 | | MURATA MANUFACTURING CO. LTD. | | 194,637 | | 862,745 | | |
| 20,200 | | NANTO BANK (THE) LTD. | | 470,557 | | 334,015 | | |
| 4,400 | | NEC CORP. | | 207,656 | | 226,545 | | |
| 8,300 | | NEXON CO. LTD. | | 193,618 | | 184,984 | | |
| 3,800 | | NGK SPARK PLUG CO. LTD. | | 38,830 | | 56,301 | | |
| 2,900 | | NH FOODS LTD. | | 69,814 | | 112,768 | | |
| 16,700 | | NICHIAS CORP. | | 297,341 | | 420,149 | | |
| 9,100 | | NIDEC CORP. | | 279,427 | | 1,054,615 | | |
| 2,600 | | NIHON M&A CENTER, INC. | | 63,143 | | 67,425 | | |
| 16,600 | | NIKKON HOLDINGS CO. LTD. | | 337,754 | | 361,302 | | |
| 2,600 | | NINTENDO CO. LTD. | | 285,625 | | 1,512,327 | | |
| 32 | | NIPPON BUILDING FUND, INC. | | 154,544 | | 199,613 | | |
| 1,700 | | NIPPON EXPRESS CO. LTD. | | 60,747 | | 129,457 | | |
| 12,600 | | NIPPON PAINT HOLDINGS CO. LTD. | | 184,966 | | 171,032 | | |
| 26 | | NIPPON PROLOGIS REIT, INC. | | 54,492 | | 82,731 | | |
| 16,000 | | NIPPON SYSTEMWARE CO. LTD. | | 308,869 | | 325,631 | | |
| 30,400 | | NIPPON TELEGRAPH & TELEPHONE CORP. | | 342,697 | | 792,050 | | |
| 3,100 | | NIPPON YUSEN K.K. | | 39,009 | | 157,100 | | |
| 60,900 | | NISHI-NIPPON FINANCIAL HOLDINGS, INC. | | 426,037 | | 346,449 | | |
| 5,300 | | NISSAN CHEMICAL CORP. | | 61,593 | | 259,526 | | |
| 3,670 | | NISSHIN SEIFUN GROUP, INC. | | 31,991 | | 53,682 | | |
| 1,200 | | NISSIN FOODS HOLDINGS CO. LTD. | | 43,959 | | 86,413 | | |
| 2,800 | | NITORI HOLDINGS CO. LTD. | | 102,246 | | 495,504 | | |
| 3,200 | | NITTO DENKO CORP. | | 77,639 | | 238,787 | | |
| 3,500 | | NITTO FUJI FLOUR MILLING CO. LTD. | | 211,323 | | 223,052 | | |
| 115,600 | | NOMURA HOLDINGS, INC. | | 418,073 | | 590,825 | | |
| 32,900 | | NOMURA REAL ESTATE HOLDINGS, INC. | | 674,503 | | 834,531 | | |
| 45 | | NOMURA REAL ESTATE MASTER FUND, INC. | | 76,065 | | 72,141 | | |
| 10,301 | | NOMURA RESEARCH INSTITUTE LTD. | | 53,983 | | 340,755 | | |
| 16,700 | | NTT DATA CORP. | | 180,781 | | 260,508 | | |
| 13,300 | | OBAYASHI CORP. | | 58,485 | | 105,710 | | |
| 1,200 | | OBIC CO. LTD. | | 222,542 | | 223,700 | | |
| 35,800 | | OKI ELECTRIC INDUSTRY CO. LTD. | | 358,218 | | 328,047 | | |
| 33,200 | | OLYMPUS CORP. | | 211,415 | | 659,846 | | |
| 4,300 | | OMRON CORP. | | 279,424 | | 340,996 | | |
| 5,000 | | ONO PHARMACEUTICAL CO. LTD. | | 43,040 | | 111,571 | | |
| 700 | | ORACLE CORP. JAPAN | | 62,997 | | 53,558 | | |
| See accompanying notes to financial statements. | 87 | (Continued) |
CLEARWATER INVESTMENT TRUST
Schedule of Investments - Clearwater International Fund
June 30, 2021 (unaudited)
| Shares | | Security | | Cost | | Fair value (a) | | Percent of
net assets |
| Japan (Cont'd): | | | | | | |
| 4,800 | | ORIENTAL LAND CO. LTD. | | $ 113,097 | | 683,955 | | |
| 3,600 | | OSAKA GAS CO. LTD. | | 68,964 | | 67,045 | | |
| 2,000 | | OTSUKA CORP. | | 108,606 | | 104,955 | | |
| 6,900 | | OTSUKA HOLDINGS CO. LTD. | | 218,680 | | 286,136 | | |
| 6,000 | | PAN PACIFIC INTERNATIONAL HOLDINGS CORP. | | 134,819 | | 124,542 | | |
| 23,600 | | PANASONIC CORP. | | 155,879 | | 273,080 | | |
| 4,100 | | PERSOL HOLDINGS CO. LTD. | | 37,131 | | 81,007 | | |
| 50,600 | | PLAID, INC.(b)(f) | | 795,547 | | 1,260,730 | | |
| 21,700 | | RAKUTEN GROUP, INC. | | 201,106 | | 244,942 | | |
| 23,000 | | RECRUIT HOLDINGS CO. LTD. | | 1,056,465 | | 1,132,454 | | |
| 22,900 | | RENESAS ELECTRONICS CORP.(b) | | 246,018 | | 247,562 | | |
| 184,100 | | RESONA HOLDINGS, INC. | | 558,258 | | 707,930 | | |
| 5,700 | | RICOH CO. LTD. | | 72,611 | | 63,980 | | |
| 1,200 | | RINNAI CORP. | | 52,047 | | 114,173 | | |
| 16,700 | | RION CO. LTD. | | 361,265 | | 439,391 | | |
| 700 | | ROHM CO. LTD. | | 33,806 | | 64,710 | | |
| 34,600 | | SANKI ENGINEERING CO. LTD. | | 423,298 | | 437,580 | | |
| 13,000 | | SANTEN PHARMACEUTICAL CO. LTD. | | 85,886 | | 179,036 | | |
| 13,620 | | SBI HOLDINGS, INC. | | 110,355 | | 322,187 | | |
| 1,200 | | SCSK CORP. | | 68,449 | | 71,506 | | |
| 3,400 | | SECOM CO. LTD. | | 133,812 | | 258,424 | | |
| 7,100 | | SEGA SAMMY HOLDINGS, INC. | | 66,480 | | 93,180 | | |
| 49,400 | | SEIKITOKYU KOGYO CO. LTD. | | 333,527 | | 377,520 | | |
| 12,800 | | SEKISUI CHEMICAL CO. LTD. | | 65,116 | | 218,797 | | |
| 6,600 | | SEKISUI HOUSE LTD. | | 53,502 | | 135,363 | | |
| 62,900 | | SEVEN & I HOLDINGS CO. LTD. | | 2,130,871 | | 2,999,067 | | |
| 2,900 | | SG HOLDINGS CO. LTD. | | 72,049 | | 76,040 | | |
| 8,500 | | SHARP CORP. | | 147,068 | | 140,245 | | |
| 4,000 | | SHIMADZU CORP. | | 25,419 | | 154,642 | | |
| 1,500 | | SHIMANO, INC. | | 58,204 | | 355,777 | | |
| 9,200 | | SHIN-ETSU CHEMICAL CO. LTD. | | 461,684 | | 1,538,647 | | |
| 36,500 | | SHINOKEN GROUP CO. LTD. | | 314,113 | | 400,500 | | |
| 5,500 | | SHIONOGI & CO. LTD. | | 144,687 | | 286,696 | | |
| 7,800 | | SHISEIDO CO. LTD. | | 233,507 | | 573,687 | | |
| 20,200 | | SK-ELECTRONICS CO. LTD. | | 355,639 | | 187,281 | | |
| 1,300 | | SMC CORP. | | 300,071 | | 768,216 | | |
| 48,800 | | SOFTBANK CORP. | | 627,313 | | 638,470 | | |
| 37,200 | | SOFTBANK GROUP CORP. | | 425,837 | | 2,603,448 | | |
| 7,300 | | SOMPO HOLDINGS, INC. | | 175,746 | | 269,803 | | |
| 23,500 | | SONY GROUP CORP. | | 544,421 | | 2,287,704 | | |
| 1,200 | | SQUARE ENIX HOLDINGS CO. LTD. | | 61,743 | | 59,517 | | |
| 3,300 | | STANLEY ELECTRIC CO. LTD. | | 41,403 | | 95,499 | | |
| 5,700 | | SUBARU CORP. | | 26,572 | | 112,440 | | |
| 3,000 | | SUMCO CORP. | | 70,415 | | 73,586 | | |
| 9,200 | | SUMITOMO CORP. | | 86,527 | | 123,224 | | |
| 5,600 | | SUMITOMO ELECTRIC INDUSTRIES LTD. | | 44,717 | | 82,618 | | |
| 17,100 | | SUMITOMO HEAVY INDUSTRIES LTD. | | 494,606 | | 471,002 | | |
| 12,900 | | SUMITOMO MITSUI FINANCIAL GROUP, INC. | | 457,665 | | 444,727 | | |
| 2,100 | | SUNTORY BEVERAGE & FOOD LTD. | | 82,017 | | 79,013 | | |
| 5,800 | | SUZUKI MOTOR CORP. | | 104,611 | | 245,428 | | |
| 2,600 | | SYSMEX CORP. | | 51,707 | | 308,925 | | |
| 13,700 | | T RAD CO. LTD.(b) | | 264,171 | | 329,382 | | |
| 72,200 | | T&D HOLDINGS, INC. | | 714,836 | | 933,248 | | |
| 3,200 | | TAISEI CORP. | | 53,806 | | 104,847 | | |
| 1,200 | | TAISHO PHARMACEUTICAL HOLDINGS CO. LTD. | | 68,449 | | 64,269 | | |
| 109,800 | | TAKARA LEBEN CO. LTD. | | 430,207 | | 332,083 | | |
| 27,400 | | TAKEDA PHARMACEUTICAL CO. LTD. | | 929,262 | | 917,238 | | |
| 67,900 | | TATSUTA ELECTRIC WIRE AND CABLE CO. LTD. | | 299,490 | | 336,765 | | |
| 2,400 | | TDK CORP. | | 205,914 | | 291,426 | | |
| 13,200 | | TERUMO CORP. | | 181,972 | | 534,915 | | |
| 2,000 | | THK CO. LTD. | | 29,290 | | 59,679 | | |
| 3,800 | | TIS, INC. | | 95,685 | | 97,039 | | |
| 1,500 | | TOHO CO. LTD. | | 25,533 | | 61,839 | | |
| 3,600 | | TOHO GAS CO. LTD. | | 88,559 | | 176,282 | | |
| 4,100 | | TOHOKU ELECTRIC POWER CO., INC. | | 31,947 | | 32,108 | | |
| 14,700 | | TOKIO MARINE HOLDINGS, INC. | | 373,679 | | 675,886 | | |
| 20,900 | | TOKYO ELECTRIC POWER CO. HOLDINGS, INC.(b) | | 55,631 | | 62,082 | | |
| See accompanying notes to financial statements. | 88 | (Continued) |
CLEARWATER INVESTMENT TRUST
Schedule of Investments - Clearwater International Fund
June 30, 2021 (unaudited)
| Shares | | Security | | Cost | | Fair value (a) | | Percent of
net assets |
| Japan (Cont'd): | | | | | | |
| 3,300 | | TOKYO ELECTRON LTD. | | $ 135,391 | | 1,428,183 | | |
| 6,000 | | TOKYO GAS CO. LTD. | | 103,615 | | 113,254 | | |
| 3,400 | | TOKYO SEIMITSU CO. LTD. | | 111,580 | | 153,940 | | |
| 51,200 | | TOKYO STEEL MANUFACTURING CO. LTD. | | 317,332 | | 510,640 | | |
| 12,500 | | TOKYU CORP. | | 103,448 | | 170,012 | | |
| 20,000 | | TOKYU FUDOSAN HOLDINGS CORP. | | 69,576 | | 120,257 | | |
| 3,800 | | TOPPAN, INC. | | 54,628 | | 61,056 | | |
| 9,400 | | TORAY INDUSTRIES, INC. | | 64,883 | | 62,537 | | |
| 7,000 | | TOSHIBA CORP. | | 304,417 | | 302,759 | | |
| 3,000 | | TOTO LTD. | | 30,029 | | 155,273 | | |
| 75,200 | | TOYO CONSTRUCTION CO. LTD. | | 312,593 | | 383,801 | | |
| 3,000 | | TOYO SUISAN KAISHA LTD. | | 74,690 | | 115,442 | | |
| 4,000 | | TOYOTA INDUSTRIES CORP. | | 101,266 | | 346,010 | | |
| 46,662 | | TOYOTA MOTOR CORP. | | 1,594,403 | | 4,078,384 | | |
| 1,700 | | TOYOTA TSUSHO CORP. | | 14,142 | | 80,337 | | |
| 1,500 | | TREND MICRO, INC. | | 57,273 | | 78,581 | | |
| 700 | | TSURUHA HOLDINGS, INC. | | 87,771 | | 81,345 | | |
| 19,200 | | UBE INDUSTRIES LTD. | | 387,205 | | 388,684 | | |
| 7,700 | | UNICHARM CORP. | | 67,055 | | 309,816 | | |
| 5,500 | | USS CO. LTD. | | 64,763 | | 95,945 | | |
| 7,200 | | V TECHNOLOGY CO. LTD. | | 262,608 | | 346,082 | | |
| 19,000 | | VALOR HOLDINGS CO. LTD. | | 422,334 | | 387,200 | | |
| 3,000 | | WELCIA HOLDINGS CO. LTD. | | 54,205 | | 98,024 | | |
| 4,100 | | WEST JAPAN RAILWAY CO. | | 134,756 | | 233,758 | | |
| 3,000 | | YAKULT HONSHA CO. LTD. | | 122,644 | | 169,855 | | |
| 16,300 | | YAMADA HOLDINGS CO. LTD. | | 56,674 | | 75,268 | | |
| 46,400 | | YAMAGUCHI FINANCIAL GROUP, INC. | | 326,523 | | 264,797 | | |
| 4,600 | | YAMAHA MOTOR CO. LTD. | | 46,377 | | 125,046 | | |
| 2,400 | | YAMATO HOLDINGS CO. LTD. | | 65,142 | | 68,266 | | |
| 4,000 | | YAMAZAKI BAKING CO. LTD. | | 44,679 | | 56,384 | | |
| 5,000 | | YASKAWA ELECTRIC CORP. | | 48,019 | | 244,385 | | |
| 3,100 | | YOKOGAWA ELECTRIC CORP. | | 39,797 | | 46,321 | | |
| 10,100 | | YUASA TRADING CO. LTD. | | 293,394 | | 273,649 | | |
| 46,900 | | Z HOLDINGS CORP. | | 163,149 | | 235,059 | | |
| | | | | 81,391,447 | | 131,212,227 | | 12.56% |
| Jersey: | | | | | | |
| 225,761 | | XLMEDIA PLC(b) | | 175,370 | | 159,271 | | |
| | | | | 175,370 | | 159,271 | | 0.02% |
| Macau: | | | | | | |
| 18,400 | | SANDS CHINA LTD.(b) | | 30,745 | | 77,493 | | |
| | | | | 30,745 | | 77,493 | | 0.01% |
| Malaysia: | | | | | | |
| 503,500 | | FRENCKEN GROUP LTD. | | 337,380 | | 700,190 | | |
| 274,300 | | RHB BANK BHD. | | 377,864 | | 356,791 | | |
| | | | | 715,244 | | 1,056,981 | | 0.10% |
| Mexico: | | | | | | |
| 201,200 | | BANCO DEL BAJIO S.A.(d) | | 360,811 | | 360,937 | | |
| 83,646 | | CONTROLADORA VUELA CIA DE AVIACION S.A.B. DE C.V. ADR(b)(e) | | 1,542,052 | | 1,606,839 | | |
| 98,826 | | GRUMA S.A.B. DE C.V., CLASS B | | 1,117,451 | | 1,104,616 | | |
| 76,900 | | QUALITAS CONTROLADORA S.A.B. DE C.V. | | 281,555 | | 358,422 | | |
| | | | | 3,301,869 | | 3,430,814 | | 0.33% |
| Netherlands: | | | | | | |
| 2,119 | | ADYEN N.V.(b)(d) | | 3,947,516 | | 5,177,222 | | |
| 266,723 | | AEGON N.V. | | 664,548 | | 1,106,618 | | |
| 2,925 | | AKZO NOBEL N.V. | | 135,104 | | 361,399 | | |
| 598 | | ARGENX S.E.(b) | | 190,737 | | 180,886 | | |
| 208 | | ASM INTERNATIONAL N.V. | | 68,462 | | 68,318 | | |
| 259 | | ASML HOLDING N.V. | | 178,059 | | 177,939 | | |
| 17,303 | | ASML HOLDING N.V. (REGISTERED) | | 1,855,539 | | 11,953,604 | | |
| 14,000 | | ASR NEDERLAND N.V. | | 434,452 | | 541,010 | | |
| 34,688 | | BE SEMICONDUCTOR INDUSTRIES N.V. | | 2,900,715 | | 2,942,533 | | |
| 3,610 | | EXOR N.V. | | 90,616 | | 289,194 | | |
| 51,500 | | FORFARMERS N.V. | | 322,452 | | 304,109 | | |
| 980 | | HEINEKEN HOLDING N.V. | | 24,979 | | 98,715 | | |
| 3,746 | | HEINEKEN N.V. | | 138,669 | | 453,954 | | |
| See accompanying notes to financial statements. | 89 | (Continued) |
CLEARWATER INVESTMENT TRUST
Schedule of Investments - Clearwater International Fund
June 30, 2021 (unaudited)
| Shares | | Security | | Cost | | Fair value (a) | | Percent of
net assets |
| Netherlands (Cont'd): | | | | | | |
| 681,554 | | ING GROEP N.V. | | $ 6,680,673 | | 9,002,822 | | |
| 19,595 | | INTERTRUST N.V.(b)(d) | | 321,331 | | 352,704 | | |
| 1,004 | | JUST EAT TAKEAWAY.COM N.V.(b)(d) | | 90,569 | | 92,704 | | |
| 17,656 | | KONINKLIJKE AHOLD DELHAIZE N.V. | | 203,381 | | 524,856 | | |
| 3,368 | | KONINKLIJKE DSM N.V. | | 132,647 | | 628,594 | | |
| 54,610 | | KONINKLIJKE KPN N.V. | | 115,548 | | 170,562 | | |
| 20,502 | | KONINKLIJKE PHILIPS N.V. | | 343,630 | | 1,015,925 | | |
| 295,741 | | MELTWATER HOLDING B.V.(b) | | 2,005,311 | | 1,576,399 | | |
| 117,200 | | ORDINA N.V. | | 366,521 | | 525,306 | | |
| 8,280 | | PROSUS N.V.(b) | | 866,617 | | 809,691 | | |
| 8,117 | | QIAGEN N.V.(b) | | 119,394 | | 392,304 | | |
| 3,238 | | RANDSTAD N.V. | | 99,928 | | 247,645 | | |
| 97,281 | | ROYAL DUTCH SHELL PLC, CLASS A | | 1,347,119 | | 1,946,942 | | |
| 47,757 | | ROYAL DUTCH SHELL PLC, CLASS B | | 746,557 | | 924,211 | | |
| 23,800 | | SIGNIFY N.V.(d) | | 640,632 | | 1,505,300 | | |
| 39,694 | | STELLANTIS N.V. | | 185,597 | | 779,150 | | |
| 10,222 | | STELLANTIS N.V. (NEW YORK EXCHANGE) | | 17,872 | | 201,476 | | |
| 24,128 | | TOPICUS.COM, INC. (SUB VOTING)(b) | | 1,348,119 | | 1,752,764 | | |
| 6,193 | | WOLTERS KLUWER N.V. | | 101,075 | | 622,129 | | |
| | | | | 26,684,369 | | 46,726,985 | | 4.47% |
| New Zealand: | | | | | | |
| 22,132 | | AUCKLAND INTERNATIONAL AIRPORT LTD.(b) | | 81,563 | | 112,469 | | |
| 9,790 | | FISHER & PAYKEL HEALTHCARE CORP. LTD. | | 206,195 | | 212,961 | | |
| 31,147 | | HALLENSTEIN GLASSON HOLDINGS LTD. | | 115,879 | | 162,200 | | |
| 13,314 | | MERCURY NZ LTD. | | 62,294 | | 62,074 | | |
| 22,654 | | MERIDIAN ENERGY LTD. | | 87,458 | | 84,401 | | |
| 25,819 | | SPARK NEW ZEALAND LTD. | | 88,568 | | 86,628 | | |
| 2,103 | | XERO LTD.(b) | | 217,111 | | 216,226 | | |
| | | | | 859,068 | | 936,959 | | 0.09% |
| Norway: | | | | | | |
| 5,164 | | ADEVINTA ASA(b) | | 100,965 | | 98,960 | | |
| 2,949 | | AKER BP ASA | | 36,352 | | 93,983 | | |
| 30,851 | | BAKKAFROST P/F | | 2,252,823 | | 2,547,582 | | |
| 9,642 | | DNB ASA | | 47,473 | | 210,082 | | |
| 9,067 | | EQUINOR ASA | | 160,201 | | 191,846 | | |
| 42,800 | | EUROPRIS ASA(d) | | 273,502 | | 268,427 | | |
| 3,851 | | GJENSIDIGE FORSIKRING ASA | | 87,163 | | 84,890 | | |
| 229,300 | | KITRON ASA | | 329,744 | | 528,899 | | |
| 1,133,775 | | MERCELL HOLDING ASA(b) | | 1,406,304 | | 1,066,599 | | |
| 7,831 | | MOWI ASA | | 217,612 | | 199,182 | | |
| 23,955 | | NORSK HYDRO ASA | | 48,328 | | 152,853 | | |
| 27,385 | | ORKLA ASA | | 250,109 | | 278,934 | | |
| 1,563 | | SCHIBSTED ASA, CLASS B | | 65,783 | | 65,097 | | |
| 57,040 | | STOREBRAND ASA | | 364,067 | | 516,730 | | |
| 8,005 | | TELENOR ASA | | 138,454 | | 134,902 | | |
| 2,970 | | YARA INTERNATIONAL ASA | | 77,370 | | 156,328 | | |
| | | | | 5,856,250 | | 6,595,294 | | 0.63% |
| Philippines: | | | | | | |
| 9,000 | | GLOBE TELECOM, INC. | | 319,161 | | 339,240 | | |
| | | | | 319,161 | | 339,240 | | 0.03% |
| Poland: | | | | | | |
| 37,500 | | CYFROWY POLSAT S.A. | | 259,610 | | 294,453 | | |
| 100,480 | | INPOST S.A.(b) | | 1,961,563 | | 2,016,634 | | |
| | | | | 2,221,173 | | 2,311,087 | | 0.22% |
| Portugal: | | | | | | |
| 29,226 | | ALTRI SGPS S.A. | | 199,601 | | 181,591 | | |
| 47,157 | | EDP - ENERGIAS DE PORTUGAL S.A. | | 195,181 | | 249,947 | | |
| 9,417 | | JERONIMO MARTINS SGPS S.A. | | 105,676 | | 171,736 | | |
| 123,300 | | NAVIGATOR (THE) CO. S.A. | | 307,999 | | 421,357 | | |
| | | | | 808,457 | | 1,024,631 | | 0.10% |
| Russia: | | | | | | |
| 67,546 | | HEADHUNTER GROUP PLC ADR(e) | | 1,685,135 | | 2,861,924 | | |
| See accompanying notes to financial statements. | 90 | (Continued) |
CLEARWATER INVESTMENT TRUST
Schedule of Investments - Clearwater International Fund
June 30, 2021 (unaudited)
| Shares | | Security | | Cost | | Fair value (a) | | Percent of
net assets |
| Russia (Cont'd): | | | | | | |
| 257,400 | | RUSHYDRO PJSC ADR(e) | | $ 218,665 | | 291,892 | | |
| | | | | 1,903,800 | | 3,153,816 | | 0.30% |
| Singapore: | | | | | | |
| 302,700 | | AEM HOLDINGS LTD. | | 265,969 | | 862,156 | | |
| 34,200 | | ASCENDAS REAL ESTATE INVESTMENT TRUST | | 77,136 | | 75,028 | | |
| 41,900 | | CAPITALAND INTEGRATED COMMERCIAL TRUST | | 45,389 | | 65,123 | | |
| 19,500 | | CAPITALAND LTD. | | 25,645 | | 53,800 | | |
| 7,200 | | CITY DEVELOPMENTS LTD. | | 27,082 | | 39,033 | | |
| 28,200 | | DBS GROUP HOLDINGS LTD. | | 158,529 | | 625,152 | | |
| 3,000 | | JARDINE CYCLE & CARRIAGE LTD. | | 41,532 | | 47,654 | | |
| 54,700 | | KEPPEL CORP. LTD. | | 186,918 | | 222,510 | | |
| 7,840 | | KEPPEL REIT | | 3,183 | | 6,880 | | |
| 41,600 | | MAPLETREE COMMERCIAL TRUST | | 66,942 | | 66,822 | | |
| 43,300 | | MAPLETREE LOGISTICS TRUST | | 66,079 | | 66,011 | | |
| 59,300 | | OVERSEA-CHINESE BANKING CORP. LTD. | | 528,595 | | 526,984 | | |
| 13,000 | | SINGAPORE EXCHANGE LTD. | | 40,226 | | 108,083 | | |
| 29,900 | | SINGAPORE TECHNOLOGIES ENGINEERING LTD. | | 87,658 | | 86,051 | | |
| 91,900 | | SINGAPORE TELECOMMUNICATIONS LTD. | | 161,923 | | 156,504 | | |
| 29,600 | | UNITED OVERSEAS BANK LTD. | | 465,994 | | 568,359 | | |
| 15,000 | | UOL GROUP LTD. | | 49,917 | | 81,431 | | |
| 52,900 | | VENTURE CORP. LTD. | | 626,316 | | 755,714 | | |
| 46,300 | | WILMAR INTERNATIONAL LTD. | | 98,345 | | 154,942 | | |
| | | | | 3,023,378 | | 4,568,237 | | 0.44% |
| South Africa: | | | | | | |
| 92,000 | | ADCOCK INGRAM HOLDINGS LTD. | | 249,383 | | 285,406 | | |
| 33,591 | | AFRICAN RAINBOW MINERALS LTD. | | 339,096 | | 600,662 | | |
| 42,500 | | BARLOWORLD LTD. | | 289,872 | | 317,083 | | |
| 79,610 | | INVESTEC PLC | | 490,976 | | 317,489 | | |
| 117,469 | | METAIR INVESTMENTS LTD. | | 184,301 | | 185,088 | | |
| 68,600 | | OCEANA GROUP LTD. | | 268,470 | | 314,465 | | |
| 83,378 | | TELKOM S.A. SOC LTD. | | 425,342 | | 270,745 | | |
| 5,284 | | THUNGELA RESOURCES LTD. - CDI(b) | | 1,910 | | 14,546 | | |
| | | | | 2,249,350 | | 2,305,484 | | 0.22% |
| South Korea: | | | | | | |
| 15,700 | | DAESANG CORP. | | 366,086 | | 386,871 | | |
| 20,489 | | DB HITEK CO. LTD. | | 270,468 | | 1,135,296 | | |
| 2,392 | | DL E&C CO. LTD.(b) | | 210,584 | | 301,615 | | |
| 1,907 | | DL HOLDINGS CO. LTD. | | 140,872 | | 135,470 | | |
| 9,900 | | GS HOLDINGS CORP. | | 371,567 | | 406,584 | | |
| 8,250 | | HUONS CO. LTD. | | 416,763 | | 455,668 | | |
| 3,500 | | HYUNDAI GLOVIS CO. LTD. | | 391,747 | | 649,558 | | |
| 46,124 | | HYUNDAI GREENFOOD CO. LTD. | | 465,431 | | 440,290 | | |
| 23,300 | | JW LIFE SCIENCE CORP. | | 391,190 | | 403,454 | | |
| 18,600 | | KC TECH CO. LTD. | | 295,116 | | 484,758 | | |
| 18,400 | | KT CORP. | | 365,565 | | 519,576 | | |
| 30,770 | | LG UPLUS CORP. | | 348,896 | | 419,411 | | |
| 10,183 | | LOTTE FINE CHEMICAL CO. LTD. | | 404,389 | | 596,793 | | |
| 4,775 | | MAEIL DAIRIES CO. LTD. | | 380,764 | | 327,760 | | |
| 18,306 | | NAVER CORP. | | 2,376,573 | | 6,786,623 | | |
| 127,981 | | SAMSUNG ELECTRONICS CO. LTD. | | 3,860,780 | | 9,171,129 | | |
| 14,251 | | SAMSUNG SECURITIES CO. LTD. | | 434,059 | | 568,825 | | |
| 13,200 | | UNITEST, INC.(b) | | 143,601 | | 265,489 | | |
| 10,200 | | VIEWORKS CO. LTD. | | 234,573 | | 338,294 | | |
| | | | | 11,869,024 | | 23,793,464 | | 2.28% |
| Spain: | | | | | | |
| 1,260 | | ACCIONA S.A. | | 78,312 | | 190,192 | | |
| 2,458 | | ACS ACTIVIDADES DE CONSTRUCCION Y SERVICIOS S.A. | | 54,736 | | 65,840 | | |
| 68,500 | | AMADEUS IT GROUP S.A.(b) | | 4,923,089 | | 4,818,201 | | |
| 256,570 | | BANCO BILBAO VIZCAYA ARGENTARIA S.A.(b) | | 764,978 | | 1,590,504 | | |
| 385,386 | | BANCO SANTANDER S.A.(b) | | 691,255 | | 1,471,220 | | |
| 698,678 | | CAIXABANK S.A. | | 2,686,699 | | 2,149,019 | | |
| 8,655 | | CELLNEX TELECOM S.A.(b)(d) | | 535,462 | | 551,311 | | |
| 24,100 | | CIA DE DISTRIBUCION INTEGRAL LOGISTA HOLDINGS S.A. | | 458,757 | | 495,518 | | |
| 2,904 | | EDP RENOVAVEIS S.A. | | 67,249 | | 67,284 | | |
| 2,531 | | ENAGAS S.A. | | 38,143 | | 58,477 | | |
| 61,100 | | FAES FARMA S.A. | | 274,848 | | 243,864 | | |
| See accompanying notes to financial statements. | 91 | (Continued) |
CLEARWATER INVESTMENT TRUST
Schedule of Investments - Clearwater International Fund
June 30, 2021 (unaudited)
| Shares | | Security | | Cost | | Fair value (a) | | Percent of
net assets |
| Spain (Cont'd): | | | | | | |
| 3,681 | | FERROVIAL S.A. | | $ 57,668 | | 108,027 | | |
| 65,535 | | FLUIDRA S.A. | | 2,370,508 | | 2,599,337 | | |
| 15,282 | | GRIFOLS S.A. | | 273,863 | | 413,875 | | |
| 88,419 | | IBERDROLA S.A. | | 685,073 | | 1,077,784 | | |
| 12,882 | | INDUSTRIA DE DISENO TEXTIL S.A. | | 424,211 | | 453,815 | | |
| 87,000 | | MEDIASET ESPANA COMUNICACION S.A.(b) | | 475,447 | | 545,718 | | |
| 13,196 | | MIQUEL Y COSTAS & MIQUEL S.A. | | 241,236 | | 255,988 | | |
| 16,093 | | NATURGY ENERGY GROUP S.A. | | 256,441 | | 413,704 | | |
| 165,300 | | PROSEGUR CIA DE SEGURIDAD S.A. | | 415,152 | | 540,972 | | |
| 26,230 | | RED ELECTRICA CORP. S.A.(f) | | 359,845 | | 486,905 | | |
| 26,092 | | REPSOL S.A. | | 199,651 | | 326,526 | | |
| 2,773 | | SIEMENS GAMESA RENEWABLE ENERGY S.A. | | 40,458 | | 92,593 | | |
| 15,853 | | TELEFONICA S.A. | | 77,080 | | 74,082 | | |
| | | | | 16,450,161 | | 19,090,756 | | 1.83% |
| Sweden: | | | | | | |
| 2,059 | | ALFA LAVAL AB | | 75,220 | | 72,731 | | |
| 22,200 | | ASSA ABLOY AB, CLASS B | | 89,466 | | 668,742 | | |
| 92,904 | | ATLAS COPCO AB, CLASS A | | 2,467,075 | | 5,688,377 | | |
| 7,490 | | ATLAS COPCO AB, CLASS B | | 208,281 | | 393,837 | | |
| 46,600 | | AVANZA BANK HOLDING AB | | 394,684 | | 1,453,306 | | |
| 34,700 | | BILIA AB, CLASS A | | 639,435 | | 735,106 | | |
| 32,900 | | BOLIDEN AB | | 800,179 | | 1,264,778 | | |
| 195,400 | | CLOETTA AB, CLASS B | | 556,844 | | 583,134 | | |
| 142,260 | | DOMETIC GROUP AB(d) | | 2,417,066 | | 2,422,780 | | |
| 7,501 | | ELECTROLUX AB, CLASS B | | 79,015 | | 207,989 | | |
| 7,501 | | ELECTROLUX PROFESSIONAL AB, CLASS B(b) | | 16,773 | | 53,158 | | |
| 2,258 | | EMBRACER GROUP AB(b) | | 68,068 | | 61,080 | | |
| 14,982 | | EPIROC AB, CLASS A | | 125,453 | | 341,371 | | |
| 4,533 | | EPIROC AB, CLASS B | | 12,252 | | 88,959 | | |
| 4,793 | | EQT AB | | 180,375 | | 173,953 | | |
| 12,164 | | ESSITY AB, CLASS B | | 182,417 | | 403,377 | | |
| 28,712 | | EVOLUTION AB(d) | | 4,545,568 | | 4,537,235 | | |
| 3,001 | | H & M HENNES & MAURITZ AB, CLASS B(b) | | 76,391 | | 71,184 | | |
| 58,593 | | HEMNET GROUP AB(b) | | 804,897 | | 1,317,950 | | |
| 25,557 | | HEXAGON AB, CLASS B | | 56,077 | | 378,662 | | |
| 80,300 | | HUMANA AB(b) | | 413,356 | | 630,532 | | |
| 38,321 | | HUSQVARNA AB, CLASS B | | 174,072 | | 509,120 | | |
| 1,386 | | ICA GRUPPEN AB | | 67,772 | | 64,505 | | |
| 8,270 | | INDUSTRIVARDEN AB, CLASS C | | 85,948 | | 302,656 | | |
| 44,840 | | INVESTOR AB, CLASS B | | 160,645 | | 1,033,488 | | |
| 56,909 | | INWIDO AB | | 320,042 | | 984,159 | | |
| 45,297 | | KAMBI GROUP PLC(b) | | 1,378,118 | | 2,252,650 | | |
| 203,990 | | KINDRED GROUP PLC SDR | | 2,850,458 | | 3,197,586 | | |
| 3,000 | | KINNEVIK AB, CLASS B(b) | | 51,225 | | 120,097 | | |
| 7,801 | | KNOW IT AB | | 144,666 | | 255,685 | | |
| 14,800 | | LOOMIS AB | | 372,004 | | 462,949 | | |
| 29,428 | | LUNDIN ENERGY AB | | 485,724 | | 1,041,212 | | |
| 44,500 | | MEKONOMEN AB(b) | | 323,086 | | 735,245 | | |
| 17,252 | | NIBE INDUSTRIER AB, CLASS B | | 185,475 | | 181,468 | | |
| 77,913 | | NOBIA AB | | 452,973 | | 664,592 | | |
| 62,300 | | NOBINA AB(d) | | 428,072 | | 565,629 | | |
| 111,174 | | NORDNET AB PUBL | | 1,376,391 | | 1,876,478 | | |
| 77,000 | | RESURS HOLDING AB(d) | | 449,843 | | 380,407 | | |
| 21,507 | | SANDVIK AB | | 297,557 | | 549,354 | | |
| 51,229 | | SDIPTECH AB, CLASS B(b) | | 1,429,979 | | 2,612,900 | | |
| 30,362 | | SECTRA AB, CLASS B(b) | | 1,335,076 | | 2,350,384 | | |
| 14,236 | | SECURITAS AB, CLASS B | | 116,133 | | 224,733 | | |
| 8,940 | | SINCH AB(b)(d) | | 165,196 | | 150,426 | | |
| 63,171 | | SKANDINAVISKA ENSKILDA BANKEN AB, CLASS A | | 322,937 | | 816,017 | | |
| 2,634 | | SKANSKA AB, CLASS B | | 22,223 | | 69,866 | | |
| 2,390 | | SKF AB, CLASS B | | 64,698 | | 60,852 | | |
| 8,600 | | SVENSKA CELLULOSA AB S.C.A., CLASS B | | 15,915 | | 140,937 | | |
| 11,864 | | SVENSKA HANDELSBANKEN AB, CLASS A | | 54,195 | | 133,860 | | |
| 40,373 | | SWEDBANK AB, CLASS A | | 450,232 | | 751,218 | | |
| 141,945 | | SWEDENCARE AB | | 1,689,949 | | 1,907,395 | | |
| 8,012 | | SWEDISH MATCH AB | | 76,140 | | 68,323 | | |
| 59,340 | | TELEFONAKTIEBOLAGET LM ERICSSON, CLASS B | | 307,816 | | 745,798 | | |
| See accompanying notes to financial statements. | 92 | (Continued) |
CLEARWATER INVESTMENT TRUST
Schedule of Investments - Clearwater International Fund
June 30, 2021 (unaudited)
| Shares | | Security | | Cost | | Fair value (a) | | Percent of
net assets |
| Sweden (Cont'd): | | | | | | |
| 35,506 | | TETHYS OIL AB | | $ 259,465 | | 242,291 | | |
| 29,300 | | TRELLEBORG AB, CLASS B | | 420,080 | | 680,281 | | |
| 61,390 | | VITEC SOFTWARE GROUP AB, CLASS B | | 1,058,120 | | 2,539,356 | | |
| 26,685 | | VOLVO AB, CLASS B | | 185,306 | | 642,016 | | |
| | | | | 31,786,423 | | 50,862,174 | | 4.87% |
| Switzerland: | | | | | | |
| 314,184 | | ABB LTD. (REGISTERED) | | 6,204,490 | | 10,658,996 | | |
| 2,686 | | ADECCO GROUP A.G. (REGISTERED) | | 82,183 | | 182,483 | | |
| 78,163 | | ALCON, INC. | | 4,262,050 | | 5,472,466 | | |
| 4,090 | | BACHEM HOLDING A.G., CLASS B (REGISTERED) | | 1,674,664 | | 2,422,394 | | |
| 484 | | BALOISE HOLDING A.G. (REGISTERED) | | 26,452 | | 75,484 | | |
| 38 | | BARRY CALLEBAUT A.G. (REGISTERED) | | 89,009 | | 88,300 | | |
| 34 | | CHOCOLADEFABRIKEN LINDT & SPRUENGLI A.G. (PARTICIPATION CERTIFICATE) | | 48,855 | | 338,254 | | |
| 3 | | CHOCOLADEFABRIKEN LINDT & SPRUENGLI A.G. (REGISTERED) | | 75,352 | | 314,185 | | |
| 55,263 | | CIE FINANCIERE RICHEMONT S.A., CLASS A (REGISTERED) | | 4,101,751 | | 6,686,509 | | |
| 1,773 | | COCA-COLA HBC A.G. - CDI(b) | | 66,058 | | 64,111 | | |
| 211,206 | | CREDIT SUISSE GROUP A.G. (REGISTERED) | | 2,335,117 | | 2,212,384 | | |
| 1,842 | | DUFRY A.G. (REGISTERED)(b) | | 46,550 | | 109,097 | | |
| 54,800 | | EFG INTERNATIONAL A.G.(b) | | 442,650 | | 449,535 | | |
| 73 | | EMS-CHEMIE HOLDING A.G. (REGISTERED) | | 70,272 | | 71,718 | | |
| 990 | | GEBERIT A.G. (REGISTERED) | | 85,632 | | 742,567 | | |
| 180 | | GIVAUDAN S.A. (REGISTERED) | | 265,250 | | 837,114 | | |
| 176,036 | | GLOBAL BLUE GROUP HOLDING A.G.(b)(f) | | 1,904,662 | | 1,746,277 | | |
| 6,000 | | HELVETIA HOLDING A.G. (REGISTERED) | | 567,039 | | 645,231 | | |
| 74,687 | | HOLCIM LTD.(b) | | 3,820,093 | | 4,480,009 | | |
| 1,807 | | IDORSIA LTD.(b) | | 18,603 | | 49,684 | | |
| 18,059 | | JULIUS BAER GROUP LTD. | | 558,057 | | 1,178,495 | | |
| 1,056 | | KUEHNE + NAGEL INTERNATIONAL A.G. (REGISTERED) | | 369,591 | | 361,340 | | |
| 2,941 | | LOGITECH INTERNATIONAL S.A. (REGISTERED) | | 409,374 | | 356,321 | | |
| 8,799 | | LONZA GROUP A.G. (REGISTERED) | | 4,734,164 | | 6,236,568 | | |
| 93,507 | | NESTLE S.A. (REGISTERED) | | 4,136,343 | | 11,644,287 | | |
| 127,934 | | NOVARTIS A.G. (REGISTERED) | | 8,909,827 | | 11,658,897 | | |
| 187 | | PARTNERS GROUP HOLDING A.G. | | 285,016 | | 283,254 | | |
| 22,519 | | POLYPEPTIDE GROUP A.G.(b)(d) | | 1,586,631 | | 2,078,490 | | |
| 12,511 | | ROCHE HOLDING A.G. | | 1,764,746 | | 4,713,006 | | |
| 565 | | ROCHE HOLDING A.G. (BEARER) | | 229,871 | | 229,481 | | |
| 1,381 | | SCHINDLER HOLDING A.G. (PARTICIPATION CERTIFICATE) | | 108,493 | | 422,397 | | |
| 589 | | SCHINDLER HOLDING A.G. (REGISTERED) | | 68,597 | | 172,132 | | |
| 120 | | SGS S.A. (REGISTERED) | | 129,434 | | 370,149 | | |
| 22,224 | | SIKA A.G. (REGISTERED) | | 2,668,402 | | 7,265,885 | | |
| 1,308 | | SONOVA HOLDING A.G. (REGISTERED) | | 84,414 | | 491,958 | | |
| 32,211 | | STMICROELECTRONICS N.V. | | 517,002 | | 1,168,933 | | |
| 104 | | STRAUMANN HOLDING A.G. (REGISTERED) | | 159,661 | | 165,793 | | |
| 635 | | SULZER A.G. (REGISTERED) | | 30,609 | | 87,709 | | |
| 743 | | SWISS LIFE HOLDING A.G. (REGISTERED) | | 101,194 | | 361,041 | | |
| 2,866 | | SWISS RE A.G. | | 268,522 | | 258,583 | | |
| 194 | | SWISSCOM A.G. (REGISTERED) | | 49,414 | | 110,749 | | |
| 4,281 | | TECAN GROUP A.G. (REGISTERED) | | 1,062,892 | | 2,120,951 | | |
| 1,181 | | TEMENOS A.G. (REGISTERED) | | 194,298 | | 189,675 | | |
| 390,672 | | UBS GROUP A.G. (REGISTERED) | | 5,337,154 | | 5,978,833 | | |
| 7,700 | | VALIANT HOLDING A.G. (REGISTERED) | | 734,240 | | 763,134 | | |
| 5,296 | | VAT GROUP A.G.(d) | | 716,991 | | 1,760,659 | | |
| 5,000 | | VETROPACK HOLDING A.G. (REGISTERED) | | 256,087 | | 301,540 | | |
| 938 | | VIFOR PHARMA A.G. | | 126,146 | | 121,400 | | |
| 8,800 | | VONTOBEL HOLDING A.G. (REGISTERED) | | 640,427 | | 685,739 | | |
| 37,478 | | WIZZ AIR HOLDINGS PLC(b)(d) | | 1,435,315 | | 2,420,565 | | |
| 7,800 | | ZEHNDER GROUP A.G. (REGISTERED) | | 303,280 | | 743,540 | | |
| 4,209 | | ZURICH INSURANCE GROUP A.G. | | 808,512 | | 1,688,604 | | |
| | | | | 64,971,436 | | 104,036,906 | | 9.96% |
| Taiwan: | | | | | | |
| 305,000 | | ASIA CEMENT CORP. | | 434,632 | | 554,993 | | |
| 26,000 | | ASPEED TECHNOLOGY, INC. | | 1,734,314 | | 1,875,639 | | |
| 50,000 | | BIOTEQUE CORP. | | 216,137 | | 213,549 | | |
| 125,000 | | CHC HEALTHCARE GROUP | | 178,135 | | 165,994 | | |
| See accompanying notes to financial statements. | 93 | (Continued) |
CLEARWATER INVESTMENT TRUST
Schedule of Investments - Clearwater International Fund
June 30, 2021 (unaudited)
| Shares | | Security | | Cost | | Fair value (a) | | Percent of
net assets |
| Taiwan (Cont'd): | | | | | | |
| 146,000 | | CHIPBOND TECHNOLOGY CORP. | | $ 286,157 | | 377,281 | | |
| 419,000 | | CHIPMOS TECHNOLOGIES, INC. | | 449,603 | | 715,815 | | |
| 179,000 | | ESON PRECISION IND CO. LTD. | | 236,267 | | 445,854 | | |
| 145,000 | | JARLLYTEC CO. LTD. | | 327,630 | | 394,993 | | |
| 334,000 | | POU CHEN CORP. | | 370,948 | | 471,106 | | |
| 90,000 | | RADIANT OPTO-ELECTRONICS CORP. | | 361,908 | | 392,463 | | |
| 220,000 | | SIGURD MICROELECTRONICS CORP. | | 403,537 | | 442,172 | | |
| 207,000 | | SINBON ELECTRONICS CO. LTD. | | 2,007,728 | | 2,035,639 | | |
| 1,260,000 | | SINOPAC FINANCIAL HOLDINGS CO. LTD.(b) | | 492,562 | | 621,804 | | |
| 111,000 | | SOFT-WORLD INTERNATIONAL CORP. | | 433,933 | | 416,312 | | |
| 225,000 | | TAIWAN HON CHUAN ENTERPRISE CO. LTD. | | 422,583 | | 620,996 | | |
| 67,950 | | TAIWAN SEMICONDUCTOR MANUFACTURING CO. LTD. ADR(e) | | 1,042,978 | | 8,164,872 | | |
| 82,000 | | TOPCO SCIENTIFIC CO. LTD. | | 252,353 | | 367,878 | | |
| 189,000 | | UNIVERSAL VISION BIOTECHNOLOGY CO. LTD. | | 1,629,150 | | 2,340,242 | | |
| 644,000 | | WISTRON CORP. | | 522,109 | | 716,519 | | |
| 90,000 | | ZHEN DING TECHNOLOGY HOLDING LTD. | | 335,681 | | 339,166 | | |
| | | | | 12,138,345 | | 21,673,287 | | 2.08% |
| Thailand: | | | | | | |
| 432,100 | | PRUKSA HOLDING PCL (REGISTERED) | | 233,658 | | 186,052 | | |
| 301,200 | | THAI VEGETABLE OIL PCL (REGISTERED) | | 265,122 | | 307,779 | | |
| | | | | 498,780 | | 493,831 | | 0.05% |
| Turkey: | | | | | | |
| 53,800 | | COCA-COLA ICECEK A.S. | | 315,265 | | 480,426 | | |
| 264,300 | | HACI OMER SABANCI HOLDING A.S. | | 413,563 | | 269,863 | | |
| 186,400 | | TURKCELL ILETISIM HIZMETLERI A.S. | | 453,929 | | 344,680 | | |
| | | | | 1,182,757 | | 1,094,969 | | 0.11% |
| United Kingdom: | | | | | | |
| 26,524 | | 3I GROUP PLC | | 99,606 | | 430,381 | | |
| 163,000 | | 888 HOLDINGS PLC | | 318,087 | | 865,384 | | |
| 5,798 | | ADMIRAL GROUP PLC | | 162,162 | | 252,161 | | |
| 38,656 | | AGGREKO PLC | | 408,897 | | 460,936 | | |
| 52,849 | | ANGLO AMERICAN PLC | | 409,100 | | 2,099,971 | | |
| 8,350 | | ASHTEAD GROUP PLC | | 608,070 | | 619,572 | | |
| 6,299 | | ASSOCIATED BRITISH FOODS PLC | | 206,560 | | 193,089 | | |
| 26,375 | | ASTRAZENECA PLC | | 983,695 | | 3,167,953 | | |
| 14,791 | | AUTO TRADER GROUP PLC(b)(d) | | 75,659 | | 129,596 | | |
| 1,340 | | AVEVA GROUP PLC | | 66,337 | | 68,732 | | |
| 56,768 | | AVIVA PLC | | 197,801 | | 318,742 | | |
| 42,248 | | AVON RUBBER PLC | | 1,834,215 | | 1,528,834 | | |
| 73,500 | | BABCOCK INTERNATIONAL GROUP PLC(b) | | 428,762 | | 294,850 | | |
| 51,473 | | BAE SYSTEMS PLC | | 335,182 | | 371,678 | | |
| 113,471 | | BAKKAVOR GROUP PLC(d) | | 166,389 | | 202,798 | | |
| 215,648 | | BARCLAYS PLC | | 531,489 | | 510,461 | | |
| 9,400 | | BELLWAY PLC | | 411,711 | | 421,298 | | |
| 23,121 | | BERKELEY GROUP HOLDINGS PLC | | 1,374,996 | | 1,469,632 | | |
| 316,546 | | BP PLC | | 1,279,382 | | 1,379,316 | | |
| 37,597 | | BRITISH AMERICAN TOBACCO PLC | | 1,169,586 | | 1,456,222 | | |
| 93,984 | | BRITISH LAND (THE) CO. PLC | | 402,942 | | 643,410 | | |
| 157,812 | | BT GROUP PLC(b) | | 426,357 | | 423,505 | | |
| 5,069 | | BUNZL PLC | | 39,524 | | 167,515 | | |
| 8,193 | | BURBERRY GROUP PLC(b) | | 40,501 | | 234,148 | | |
| 53,800 | | CARETECH HOLDINGS PLC | | 347,241 | | 451,739 | | |
| 151,289 | | CNH INDUSTRIAL N.V. | | 1,394,492 | | 2,498,019 | | |
| 3,655 | | COCA-COLA EUROPACIFIC PARTNERS PLC | | 227,876 | | 216,815 | | |
| 513,300 | | COMPASS GROUP PLC(b) | | 6,968,103 | | 10,806,930 | | |
| 2,457 | | CRODA INTERNATIONAL PLC | | 92,898 | | 250,421 | | |
| 45,558 | | DIAGEO PLC | | 703,140 | | 2,181,136 | | |
| 53,838 | | DIPLOMA PLC | | 1,892,349 | | 2,162,728 | | |
| 177,500 | | DIRECT LINE INSURANCE GROUP PLC | | 614,920 | | 699,777 | | |
| 108,100 | | DRAX GROUP PLC | | 316,682 | | 634,326 | | |
| 40,654 | | EASYJET PLC(b) | | 523,562 | | 503,206 | | |
| 4,107 | | FERGUSON PLC | | 80,053 | | 570,962 | | |
| 90,969 | | GLAXOSMITHKLINE PLC | | 1,526,511 | | 1,786,136 | | |
| 6,101 | | HALMA PLC | | 236,064 | | 227,192 | | |
| 346,015 | | HSBC HOLDINGS PLC | | 1,913,777 | | 1,997,376 | | |
| See accompanying notes to financial statements. | 94 | (Continued) |
CLEARWATER INVESTMENT TRUST
Schedule of Investments - Clearwater International Fund
June 30, 2021 (unaudited)
| Shares | | Security | | Cost | | Fair value (a) | | Percent of
net assets |
| United Kingdom (Cont'd): | | | | | | |
| 13,706 | | IMPERIAL BRANDS PLC | | $ 313,306 | | 295,200 | | |
| 51,372 | | INCHCAPE PLC | | 314,977 | | 546,118 | | |
| 21,041 | | INFORMA PLC(b) | | 99,674 | | 145,996 | | |
| 246,597 | | INTEGRAFIN HOLDINGS PLC | | 1,600,413 | | 1,756,756 | | |
| 2,594 | | INTERCONTINENTAL HOTELS GROUP PLC(b) | | 150,347 | | 172,596 | | |
| 32,745 | | INTERNATIONAL CONSOLIDATED AIRLINES GROUP S.A. - CDI(b) | | 60,221 | | 78,587 | | |
| 876 | | INTERTEK GROUP PLC | | 66,548 | | 67,011 | | |
| 423,658 | | J SAINSBURY PLC | | 1,107,817 | | 1,592,873 | | |
| 8,056 | | JD SPORTS FASHION PLC | | 79,356 | | 102,412 | | |
| 2,128 | | JOHNSON MATTHEY PLC | | 33,879 | | 90,459 | | |
| 145,400 | | JUPITER FUND MANAGEMENT PLC | | 563,632 | | 567,192 | | |
| 323,974 | | KINGFISHER PLC | | 863,159 | | 1,633,519 | | |
| 58,758 | | LAND SECURITIES GROUP PLC | | 385,246 | | 548,965 | | |
| 75,442 | | LEGAL & GENERAL GROUP PLC | | 295,684 | | 268,829 | | |
| 6,374,389 | | LLOYDS BANKING GROUP PLC | | 4,290,780 | | 4,116,981 | | |
| 6,030 | | LONDON STOCK EXCHANGE GROUP PLC | | 69,795 | | 664,802 | | |
| 370,300 | | MAN GROUP PLC | | 651,704 | | 921,769 | | |
| 300,659 | | MARSTON'S PLC(b) | | 477,602 | | 365,785 | | |
| 7,217 | | MEGGITT PLC(b) | | 16,687 | | 46,043 | | |
| 82,104 | | MELROSE INDUSTRIES PLC | | 127,947 | | 176,154 | | |
| 76,500 | | MICRO FOCUS INTERNATIONAL PLC | | 472,028 | | 578,849 | | |
| 2,523 | | MONDI PLC | | 69,967 | | 66,346 | | |
| 145,235 | | MORGAN ADVANCED MATERIALS PLC | | 467,561 | | 709,190 | | |
| 48,576 | | NATIONAL GRID PLC | | 455,444 | | 618,733 | | |
| 320,113 | | NATWEST GROUP PLC | | 420,567 | | 899,795 | | |
| 6,959 | | NEXT PLC(b) | | 416,496 | | 756,249 | | |
| 7,667 | | OCADO GROUP PLC(b) | | 208,324 | | 212,433 | | |
| 103,083 | | OSB GROUP PLC | | 483,067 | | 661,640 | | |
| 5,461 | | PEARSON PLC | | 66,033 | | 62,700 | | |
| 1,435 | | PERSIMMON PLC | | 63,384 | | 58,717 | | |
| 44,329 | | PRUDENTIAL PLC | | 912,949 | | 842,234 | | |
| 12,212 | | RECKITT BENCKISER GROUP PLC | | 510,135 | | 1,080,636 | | |
| 109,800 | | REDDE NORTHGATE PLC | | 378,816 | | 606,027 | | |
| 57,235 | | REDROW PLC | | 447,916 | | 484,382 | | |
| 51,587 | | RELX PLC | | 687,193 | | 1,375,086 | | |
| 250,548 | | RELX PLC (LONDON EXCHANGE) | | 3,965,505 | | 6,650,929 | | |
| 23,058 | | RENTOKIL INITIAL PLC | | 117,249 | | 157,886 | | |
| 34,005 | | RIO TINTO PLC | | 893,599 | | 2,798,357 | | |
| 147,948 | | ROLLS-ROYCE HOLDINGS PLC(b) | | 205,894 | | 202,446 | | |
| 77,712 | | ROYAL MAIL PLC(b) | | 220,280 | | 620,699 | | |
| 21,729 | | SAGE GROUP (THE) PLC | | 84,580 | | 205,655 | | |
| 19,952 | | SEGRO PLC | | 126,264 | | 302,078 | | |
| 114,270 | | SENIOR PLC(b) | | 287,158 | | 239,476 | | |
| 13,084 | | SEVERN TRENT PLC | | 276,407 | | 452,658 | | |
| 26,103 | | SMITH & NEPHEW PLC | | 251,030 | | 564,192 | | |
| 3,522 | | SMITHS GROUP PLC | | 47,264 | | 77,464 | | |
| 93,139 | | SOFTCAT PLC | | 1,215,896 | | 2,288,184 | | |
| 414,000 | | SPEEDY HIRE PLC(b) | | 294,411 | | 412,334 | | |
| 1,528 | | SPIRAX-SARCO ENGINEERING PLC | | 283,272 | | 287,778 | | |
| 13,021 | | SSE PLC | | 281,406 | | 270,269 | | |
| 19,391 | | STANDARD CHARTERED PLC | | 133,989 | | 123,657 | | |
| 82,413 | | STHREE PLC | | 315,585 | | 526,119 | | |
| 101,900 | | STOCK SPIRITS GROUP PLC | | 321,342 | | 368,606 | | |
| 77,600 | | TATE & LYLE PLC | | 713,986 | | 792,629 | | |
| 166,687 | | TEAM17 GROUP PLC(b) | | 1,381,492 | | 1,683,220 | | |
| 763,285 | | TESCO PLC | | 2,436,330 | | 2,354,023 | | |
| 148,000 | | TP ICAP GROUP PLC | | 641,118 | | 400,039 | | |
| 126,800 | | TYMAN PLC | | 343,290 | | 789,311 | | |
| 46,428 | | UNILEVER PLC | | 1,863,396 | | 2,716,990 | | |
| 8,137 | | UNITED UTILITIES GROUP PLC | | 56,989 | | 109,678 | | |
| 555,361 | | VODAFONE GROUP PLC | | 906,849 | | 932,171 | | |
| 2,809 | | WHITBREAD PLC(b) | | 69,922 | | 121,311 | | |
| 350,711 | | WM MORRISON SUPERMARKETS PLC | | 857,907 | | 1,196,837 | | |
| See accompanying notes to financial statements. | 95 | (Continued) |
CLEARWATER INVESTMENT TRUST
Schedule of Investments - Clearwater International Fund
June 30, 2021 (unaudited)
| Shares | | Security | | Cost | | Fair value (a) | | Percent of
net assets |
| United Kingdom (Cont'd): | | | | | | |
| 64,102 | | WPP PLC | | $ 434,931 | | 863,846 | | |
| | | | | 65,470,673 | | 94,376,853 | | 9.04% |
| United States: | | | | | | |
| 14,361 | | AON PLC, CLASS A | | 2,828,524 | | 3,428,832 | | |
| 204,870 | | ARCH CAPITAL GROUP LTD.(b) | | 4,328,234 | | 7,977,638 | | |
| 2,079 | | BAUSCH HEALTH COS., INC.(b) | | 64,993 | | 61,015 | | |
| 248,400 | | DIVERSIFIED ENERGY CO. PLC | | 347,000 | | 361,480 | | |
| 8,900 | | EPAM SYSTEMS, INC.(b) | | 3,944,466 | | 4,547,544 | | |
| 3,424 | | FIDELITY NATIONAL INFORMATION SERVICES, INC. | | 289,873 | | 485,078 | | |
| 3,801 | | METTLER-TOLEDO INTERNATIONAL, INC.(b) | | 2,193,058 | | 5,265,677 | | |
| 3,157 | | NEWMONT CORP. | | 101,845 | | 200,152 | | |
| 28,584 | | RESMED, INC. | | 3,032,387 | | 7,046,528 | | |
| 21,063 | | STERIS PLC | | 3,359,220 | | 4,345,297 | | |
| 451 | | WHITE MOUNTAINS INSURANCE GROUP LTD. | | 470,051 | | 517,761 | | |
| | | | | 20,959,651 | | 34,237,002 | | 3.28% |
| | | Sub-total Common Stocks: | | 629,237,769 | | 999,858,346 | | 95.72% |
| Preferred Stocks: | | | | | | |
| Brazil: | | | | | | |
| 61,706 | | AZUL S.A. ADR(b)(e) | | 513,930 | | 1,629,038 | | |
| 263,400 | | CIA DE SANEAMENTO DO PARANA(b) | | 350,150 | | 221,892 | | |
| | | | | 864,080 | | 1,850,930 | | 0.18% |
| Germany: | | | | | | |
| 1,739 | | BAYERISCHE MOTOREN WERKE A.G., 2.50%(h) | | 59,403 | | 156,301 | | |
| 3,800 | | DRAEGERWERK A.G. & CO. KGAA, 0.24%(h) | | 311,648 | | 359,567 | | |
| 2,539 | | HENKEL A.G. & CO. KGAA, 2.08%(h) | | 287,923 | | 268,066 | | |
| 10,197 | | JUNGHEINRICH A.G., 1.02%(h) | | 253,285 | | 498,395 | | |
| 441 | | SARTORIUS A.G., 0.16%(h) | | 118,147 | | 229,560 | | |
| 2,800 | | STO S.E. & CO. KGAA, 0.17%(h) | | 304,841 | | 610,898 | | |
| 3,082 | | VOLKSWAGEN A.G., 2.29%(h) | | 867,365 | | 771,827 | | |
| | | | | 2,202,612 | | 2,894,614 | | 0.28% |
| South Korea: | | | | | | |
| 72,295 | | SAMSUNG ELECTRONICS CO. LTD., 1.95%(h) | | 3,016,400 | | 4,731,289 | | |
| | | | | 3,016,400 | | 4,731,289 | | 0.45% |
| | | Sub-total Preferred Stocks: | | 6,083,092 | | 9,476,833 | | 0.91% |
| Warrants: | | | | | | |
| United Kingdom: | | | | | | |
| 117,372 | | HSBC BANK PLC(b) | | 1,809,949 | | 2,221,496 | | |
| | | | | 1,809,949 | | 2,221,496 | | 0.21% |
| United States: | | | | | | |
| 1 | | CENOVUS ENERGY, INC.(b) | | 4 | | 5 | | |
| | | | | 4 | | 5 | | 0.00% |
| | | Sub-total Warrants: | | 1,809,953 | | 2,221,501 | | 0.21% |
| Convertible Bonds: | | | | | | |
| Switzerland: | | | | | | |
| 71,000 | | CREDIT SUISSE GROUP GUERNSEY VII LTD., 3.00%, 11/12/2021(d)(f) | | 78,814 | | 86,413 | | |
| | | | | 78,814 | | 86,413 | | 0.01% |
| | | Sub-total Convertible Bonds: | | 78,814 | | 86,413 | | 0.01% |
| Short-Term Investments: | | | | | | |
| 6,400,482 | | FIDELITY INVESTMENTS MONEY MARKET GOVERNMENT PORTFOLIO, INSTITUTIONAL SHARES(i) | | 6,400,482 | | 6,400,482 | | |
| 31,435,771 | | NORTHERN INSTITUTIONAL FUNDS - U.S. GOVERNMENT SELECT PORTFOLIO, INSTITUTIONAL SHARES, 0.03%(j) | | 31,435,771 | | 31,435,771 | | |
| | | Sub-total Short-Term Investments: | | 37,836,253 | | 37,836,253 | | 3.62% |
| | | Grand total | | $ 675,045,881 | | 1,049,479,346 | | 100.47% |
| Notes to Schedule of Investments: |
| (a) | Investments are valued in accordance with procedures described in Note 2 to the financial statements. |
| (b) | Non-income producing assets. |
| (c) | Security has been deemed worthless and is a Level 3 investment. |
| See accompanying notes to financial statements. | 96 | (Continued) |
CLEARWATER INVESTMENT TRUST
Schedule of Investments - Clearwater International Fund
June 30, 2021 (unaudited)
| (d) | Securities exempt from registration under Rule 144A of the Securities Act of 1933. These securities may be resold in transactions exempt from registration, normally to qualified institutional buyers. The value of these securities is determined by valuations supplied by a pricing service or brokers, or, if not available, in accordance with procedures established by the Board of Trustees. |
| (e) | Securities are American Depositary Receipts of companies based outside of the United States representing 2.88% of net assets as of June 30, 2021. |
| (f) | Security is either wholly or partially on loan. |
| (g) | This is a Level 3 security. |
| (h) | Current yield is disclosed. Dividends are calculated based on a percentage of the issuer’s net income. |
| (i) | Investment relates to cash collateral received from portfolio securities loaned. |
| (j) | The short-term investment is a money market portfolio of the investment company, Northern Institutional Funds. At December 31, 2020, the value of the Clearwater International Fund’s investment in the U.S. Government Select Portfolio of the Northern Institutional Funds was $25,824,393 with net purchases of $5,611,378 during the six months ended June 30, 2021. |
At June 30, 2021, the industry sectors for the Clearwater International Fund were:
| Industry Sector | | Percent of
Long-Term
Investments |
| Communication Services | | 4.88% |
| Consumer Discretionary | | 13.12 |
| Consumer Staples | | 8.59 |
| Energy | | 2.97 |
| Financials | | 14.92 |
| Health Care | | 12.53 |
| Industrials | | 16.64 |
| Information Technology | | 16.35 |
| Materials | | 6.21 |
| Real Estate | | 2.14 |
| Utilities | | 1.65 |
| | | 100.00% |
At June 30, 2021, the Clearwater International Fund’s investments were denominated in the following currencies:
| Concentration by Currency | | Percent of
Long-Term
Investments |
| Euro | | 22.13% |
| Japanese Yen | | 12.97 |
| United States Dollar | | 12.39 |
| British Pound | | 10.36 |
| Swiss Franc | | 9.76 |
| Canadian Dollar | | 6.43 |
| Swedish Krona | | 5.04 |
| Other currencies | | 20.92 |
| | | 100.00% |
At June 30, 2021, the Clearwater International Fund had outstanding forward foreign currency exchange contracts as follows:
| Counterparty | | Contract
Settlement
Date | | Contract Amount
| | Unrealized
Appreciation
(Depreciation) |
| | | Deliver | | Receive | |
| Northern Trust | | 10/21/2021 | | JPY | 222,284,589 | | USD | 2,051,818 | | $48,688 |
| See accompanying notes to financial statements. | 97 | (Continued) |
CLEARWATER INVESTMENT TRUST
Schedule of Investments - Clearwater International Fund
June 30, 2021 (unaudited)
Clearwater International Fund Portfolio Diversification
(as a percentage of net assets)
| See accompanying notes to financial statements. | 98 | |
Item 1. Reports to Stockholders (cont.).
Item 2. Code of Ethics
Not applicable to this filing.
Item 3. Audit Committee Financial Expert
Not applicable to this filing.
Item 4. Principal Accountant Fees and Services
Not applicable to this filing.
Item 5. Audit Committee of Listed Registrants
Not applicable to this filing.
Item 6. Investments
| (a) | Schedule of Investments is included as part of the report to shareholders filed under Item 1 of this report on Form N-CSR. |
Item 7. Disclosure of Proxy Voting Policies and Procedures for Closed-End Management Investment Companies
Not applicable (the Trust is an open-end management investment company).
Item 8. Portfolio Managers of Closed-End Management Investment Companies
Not applicable (the Trust is an open-end management investment company).
Item 9. Purchases of Equity Securities by Closed-End Management Investment Company and Affiliated Purchasers
Not applicable (the Trust is an open-end management investment company).
Item 10. Submission of Matters to a Vote of Security Holders
There have been no material changes to the procedures by which shareholders may recommend nominees to the Board of Trustees.
Item 11. Controls and Procedures
| (a) | The Trust’s principal executive officer and principal financial officer have concluded that the Trust’s disclosure controls and procedures (as defined in Rule 30a-3(c) under the Investment Company Act of 1940, as amended (the “1940 Act”)) are effective based on the principal executive officer and principal financial officer’s evaluation of these controls and procedures, as required by Rule 30a-3(b) under the 1940 Act, as of a date within 90 days of the filing date of this document. |
| (b) | There have been no significant changes in the Trust’s internal control over financial reporting (as defined in Rule 30a-3(d) under the 1940 Act) that occurred during the period covered by this report that have materially affected, or are reasonably likely to materially affect, the Trust’s internal control over financial reporting. |
Item 12. Disclosure of Securities Lending Activities for Closed-End Management Investment Companies
Not applicable (the Trust is an open-end management investment company).
Item 13. Exhibits
SIGNATURES
Pursuant to the requirements of the Securities Exchange Act of 1934 and the Investment Company Act of 1940, the registrant has duly caused this report to be signed on its behalf by the undersigned, thereunto duly authorized.
| | |
| Clearwater Investment Trust |
| |
| By | | /s/ Justin H. Weyerhaeuser |
| | Justin H. Weyerhaeuser |
| | President (Principal Executive Officer) and |
| | Treasurer (Principal Financial Officer) |
|
| Date: August 26, 2021 |
Pursuant to the requirements of the Securities Exchange Act of 1934 and the Investment Company Act of 1940, this report has been signed below by the following persons on behalf of the registrant and in the capacities and on the dates indicated.
| | |
| Clearwater Investment Trust |
| |
| By | | /s/ Justin H. Weyerhaeuser |
| | Justin H. Weyerhaeuser |
| | President (Principal Executive Officer) |
|
| Date: August 26, 2021 |
|
| Clearwater Investment Trust |
| |
| By | | /s/ Justin H. Weyerhaeuser |
| | Justin H. Weyerhaeuser |
| | Treasurer (Principal Financial Officer) |
|
| Date: August 26, 2021 |