UNITED STATES
SECURITIES AND EXCHANGE COMMISSION
Washington, D.C. 20549
FORM N-CSR
CERTIFIED SHAREHOLDER REPORT OF REGISTERED
MANAGEMENT INVESTMENT COMPANIES
Investment Company Act file number 811-05038
Clearwater Investment Trust
(Exact name of registrant as specified in charter)
2000 Wells Fargo Place, 30 East 7th Street, Saint Paul, Minnesota 55101-4930
(Address of principal executive offices) (Zip code)
Jason K. Mitchell
Fiduciary Counselling, Inc.
2000 Wells Fargo Place, 30 E. 7th Street
Saint Paul, Minnesota 55101-4930
Copy to:
John V. O’Hanlon, Esq.
Dechert LLP
One International Place, 40th Floor
100 Oliver Street
Boston, Massachusetts 02110
(Name and address of agent for service)
Registrant’s telephone number, including area code: 651-228-0935
Date of fiscal year end: December 31
Date of reporting period: December 31, 2023
Item 1. Reports to Stockholders
| (a) | The following is a copy of the report transmitted to shareholders pursuant to Rule 30e-1 under the Investment Company Act of 1940 (17 CFR 270.30e-1) |
CLEARWATER INVESTMENT TRUST
Clearwater Core Equity Fund
Clearwater Select Equity Fund
Clearwater Tax-Exempt Bond Fund
Clearwater International Fund
Annual Report
for the year ended
December 31, 2023
Clearwater Investment Trust
Financial Statements
For the Year Ended December 31, 2023
Table of Contents
Management Discussion of Clearwater Funds’ Performance
Clearwater Core Equity Fund
The Clearwater Core Equity Fund (the “Core Equity Fund” or the “Fund”) seeks long-term growth of capital. Under normal market conditions, the Core Equity Fund pursues its investment objective by investing at least 80% of its net assets, plus the amount of any borrowings for investment purposes, in equity securities of U.S. companies. The Core Equity Fund's assets are managed in a “multi-manager, multi-style” approach. As of December 31, 2023, the Fund had two subadvisers that provide day-to-day management of Fund assets. Parametric Portfolio Associates LLC (“Parametric”), with approximately 40% - 60% of the Fund’s assets, manages its portion of the Fund’s assets to track the S&P 500® Index as closely as possible without requiring the Fund to realize taxable gains. The remaining Fund assets are managed by AQR Capital Management, LLC (“AQR”), who utilizes an active management style targeting the factors of value, momentum and quality.
2023 Market Overview:
Domestic large capitalization equities, as defined by the Russell 1000® Index, the Fund’s benchmark (the “benchmark”), increased 26.5% in 2023. Strong market performance was mainly driven by declining inflation and the U.S. Federal Reserve signaling a shift toward softening its monetary policy in 2024. Large cap growth stocks, particularly the mega-cap technology stocks, significantly outperformed their value counterparts in 2023, as measured by the Russell 1000® Growth Index and the Russell 1000® Value Index. As a result, the Information Technology and Communication Services sectors posted significant gains, while the Energy and Utilities sectors posted negative returns in 2023.
2023 Performance:
The Core Equity Fund returned 25.7%, net of fees, in 2023 compared to an increase of 26.5% for the benchmark. Parametric, the subadviser that follows a tax-managed passive strategy, generated performance that was in line with the benchmark in 2023. The active subadviser, AQR, generated slight underperformance versus the benchmark in 2023.
From a Fund-level perspective, positive sector positioning was more than offset by underperformance from stock selection to the Fund’s returns relative to the benchmark. Sector positioning contributed positively to the Fund’s returns relative to the benchmark due to underweight positions in the Health Care and Utilities sectors, and overweight positions in the Information Technology sector. The underperformance in stock selection was mainly attributed to the Information Technology and Financials sectors.
Clearwater Select Equity Fund
The Clearwater Select Equity Fund (the “Select Equity Fund” or the “Fund”) seeks long-term growth of capital. Under normal market conditions, the Fund invests at least 80% of its net assets, plus the amount of any borrowings for investment purposes, in equity securities. Equity securities consist primarily of exchange-traded common and preferred stocks and convertible securities. While the Fund is permitted to invest in securities of any market capitalization, the Fund invests primarily in securities of micro-, small- and medium-sized companies. The Fund uses a “multi-style, multi-manager” approach. The Fund’s adviser allocates portions of the Fund’s assets among subadvisers who employ distinct investment styles. The Fund currently allocates assets among the following subadvisers who provide day-to-day management for the Fund: Cooke & Bieler, L.P (“Cooke & Bieler”), Jackson Square Partners, LLC (“Jackson Square”), Parametric Portfolio Associates LLC (“Parametric”), Pzena Investment Management LLC (“Pzena”), Wasatch Global Investors (“Wasatch”) and Rice Hall James & Associates, LLC (“RHJ”). Parametric manages its portion of the Fund’s assets (approximately 15%) to track the S&P 600® Index as closely as possible without requiring the Fund to realize taxable gains. The other subadvisers utilize an active management style and manage the remaining 85% of the Fund. The performance of each subadviser is compared to the Fund’s benchmark below, although each subadviser may manage its portion of the Fund against a different benchmark that aligns more closely with its strategy.
2023 Market Overview:
Domestic small capitalization equities, as defined by the Russell 2000® Index, the Fund’s benchmark (the “benchmark”), increased by 16.9% in 2023. Strong market performance was mainly driven by declining inflation and the U.S. Federal Reserve signaling a shift toward softening its monetary policy in 2024. To a lesser degree than in the U.S. large cap space, U.S. small cap growth stocks also outperformed small cap value stocks in 2023, as measured by the Russell 2000® Growth Index and the Russell 2000® Value Index. The Industrials, Information Technology, and Consumer Discretionary sectors experienced significant gains, while Utilities was the only sector to post negative returns in 2023.
2023 Performance:
The Select Equity Fund increased 20.0%, net of fees, during 2023 compared to an increase of 16.9% for the benchmark. The Fund’s outperformance was driven by strong performance from the value-oriented managers Cooke & Bieler and Pzena. The Fund’s growth-oriented managers, Jackson Square, Wasatch and RHJ, underperformed the benchmark. Parametric, the subadviser that follows a tax-managed passive strategy, performed in line with the benchmark.
From a Fund-level perspective, sector positioning and stock selection both drove the Fund’s outperformance. Sector positioning contributed positively to the Fund’s returns relative to the benchmark due to underweight positions in the Utilities and Health Care sectors, and overweight positions in the Industrials sector. Stock selection also contributed positively to the Fund’s returns relative to the benchmark, as strong stock selection within the Industrials and Consumer Discretionary sectors more than offset poor stock selection in the Health Care sector.
Clearwater Tax-Exempt Bond Fund
The Clearwater Tax-Exempt Bond Fund (the “Tax-Exempt Bond Fund” or the “Fund”) seeks high current income that is exempt from U.S. federal income tax, consistent with preservation of capital. Under normal market conditions, the Fund invests at least 80% of its net assets, plus the amount of any borrowings for investment purposes, in tax-exempt bonds, which are debt obligations issued by or for the U.S. states, territories, and possessions and the District of Columbia. The interest on these securities is generally exempt from both U.S. regular federal income tax and U.S. federal alternative minimum tax. However, the Fund may invest up to 20% of its assets in securities that generate interest income subject to federal alternative minimum tax for individuals. The Fund invests in both revenue bonds, which are backed by and payable only from the revenues derived from a specific facility or specific revenue source, and in general obligation bonds, which are secured by the full faith, credit and taxation power of the issuing municipality. The Fund has two active subadvisers, Sit Fixed Income Advisors II, LLC (“Sit”) and MacKay Shields, LLC (“MacKay Shields”), that provide day-to-day management for the Fund. It should be noted that the Fund is not a money market fund and is not intended to be a money market fund substitute. Under normal market conditions, the Fund’s investments may be more susceptible than a money market fund to interest rate risk and credit risks relevant to the Fund’s investments.
2023 Market Overview:
As defined by the Fund’s benchmark, the Bloomberg Municipal Bond 5 Year (4-6) Index (the “benchmark”), intermediate duration municipal bonds posted a 4.3% gain in 2023. Tax-exempt municipal bonds delivered strong returns across the board in 2023, albeit via a circuitous path, as solid returns in the first half of the year gave way to a turbulent early autumn marked by rising rates and negative fund flows, before a strong rally to close the year. The U.S. Federal Reserve continued to combat inflation with 100 basis points of short-term interest rate hikes to start the year before pausing in September. As a result, U.S. Treasury yields were mixed for the year with ultrashort yields moving up 50-100 basis points, short yields declining slightly by 15-20 basis points, and intermediate and long yields closing the year up less than just 5 basis points. The net result for 2023 was a steeper inversion on the front end of the U.S. Treasury yield curve. The municipal yield curve moved down across the board, as intermediate yields fell by 25-35 basis points. State government general fund revenues rose again in 2023, albeit modestly, but state budget forecasts indicate a decline for many in 2024. Municipal credit fundamentals remained largely sound with credit spreads narrowing modestly throughout the year, pushing municipal bond prices higher.
2023 Performance:
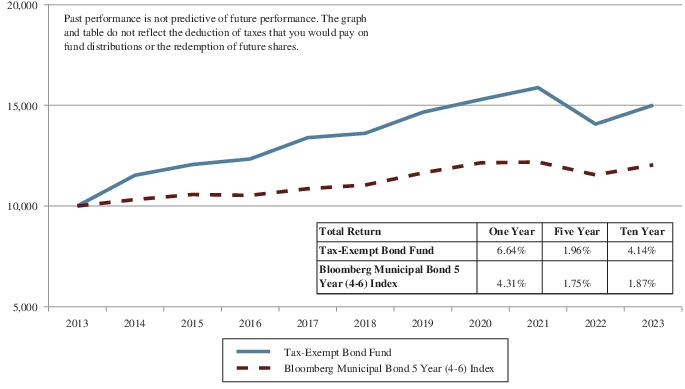
The Tax-Exempt Bond Fund increased 6.6%, net of fees, in 2023 compared to an increase of 4.3% for the benchmark. The Fund’s outperformance relative to the benchmark was driven by strong performance from both Sit and MacKay Shields.
The Fund’s average life duration, a measure of the Fund’s sensitivity to changes in interest rates, increased from 4.8 years at the beginning of the year to 5.6 years at the end of the year. For comparison, the duration of the Fund’s benchmark began the year at 3.8 years and was 3.6 years as of December 31, 2023. Thus, the Fund’s performance was primarily driven by duration as the Fund benefitted from a larger weighting of long duration bonds relative to the benchmark. From a sector perspective, the Fund’s overweight to multi-family housing bonds (with a large concentration in senior living facilities) enhanced performance relative to the benchmark. Slightly offsetting those factors was the Fund’s allocation to closed-end funds and other revenue bonds, which underperformed the benchmark.
Clearwater International Fund
The Clearwater International Fund (the “International Fund” or the “Fund”) seeks long-term growth of capital. The Fund generally invests at least 80% of the value of its net assets, plus the amount of any borrowings for investment purposes, in equity securities of companies organized or located outside the United States and doing a substantial amount of business outside the United States. The Fund diversifies its investments among many different countries throughout the world and may invest in companies of any size. The Fund uses a “multi-style, multi-manager” approach. The Fund’s adviser allocates portions of the Fund’s assets among subadvisers who employ distinct investment styles. The Fund currently has four subadvisers that provide day-to-day management of Fund assets. Parametric Portfolio Associates LLC (“Parametric”) manages its portion of the portfolio (approximately 25%) to track the MSCI World Ex U.S.A. Index – Net Dividends as closely as possible without requiring the Fund to realize taxable gains. The Fund’s other three subadvisers, Artisan Partners Limited Partnership (“Artisan”), LSV Asset Management (“LSV”) and WCM Investment Management, LLC (“WCM”), utilize an active management style and manage the remaining 75% of the Fund. WCM manages two strategies for the Fund – a large capitalization strategy and a small capitalization strategy. The performance of each subadviser is compared to the Fund’s benchmark below, although each subadviser may manage its portion of the Fund against a different benchmark that aligns more closely with its strategy.
2023 Market Overview:
As defined by the Fund’s benchmark, the MSCI World Ex U.S.A. Index - Net Dividends (the “benchmark”), international developed market large and mid-capitalization stocks increased by 17.9% in 2023. Strong market performance was mainly driven by declining inflation and weaker monetary policy signaled from global central banks in 2024 despite concerns regarding the war in Eastern Europe. To a lesser degree than in 2022, a stronger U.S. dollar relative to other international currencies was a headwind that negatively impacted returns for U.S. dollar-based investors. Growth stocks outperformed value stocks in the international developed markets as measured by the MSCI World Ex U.S.A. Value Index - Net Dividends and the MSCI World Ex U.S.A. Growth Index - Net Dividends. International large capitalization stocks outperformed international small capitalization stocks, as measured by the benchmark and the MSCI World Ex U.S.A. Small Cap Index - Net Dividends.
2023 Performance:
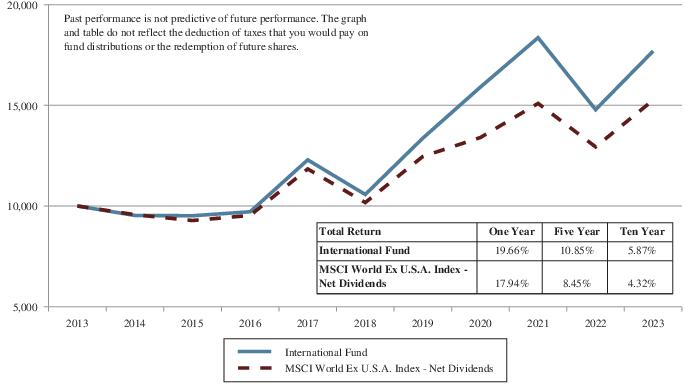
The International Fund increased 19.7%, net of fees, in 2023 compared to an increase of 17.9% for the benchmark. Artisan, WCM’s small capitalization growth strategy, and LSV were the primary drivers of the Fund’s outperformance. Their outperformance was slightly offset by underperformance from WCM’s large capitalization growth strategy. Parametric, the subadviser that follows a tax-managed passive strategy, slightly outperformed the benchmark in 2023.
From a Fund-level perspective, sector positioning and stock selection both drove the Fund’s outperformance. Sector positioning contributed positively to the Fund’s returns relative to the benchmark due to underweight positions in the Consumer Staples sector and overweight positions in the Information Technology sector. Stock selection also contributed positively to the Fund’s returns relative to the benchmark, as strong stock selection within the Health Care and Consumer Staples sectors more than offset poor stock selection in the Information Technology sector.
Comparison of the Change in Value of a $10,000 Investment in the Core Equity Fund and the Russell 1000® Index
Comparison of the Change in Value of a $10,000 Investment in the Select Equity Fund and the Russell 2000® Index
Comparison of the Change in Value of a $10,000 Investment in the Tax-Exempt Bond Fund and the Bloomberg Municipal Bond 5 Year (4-6) Index
Comparison of the Change in Value of a $10,000 Investment in the International Fund and the MSCI World Ex U.S.A. Index - Net Dividends
Fund Expense Example
(unaudited)
As a shareholder of the Clearwater Core Equity Fund (“Core Equity Fund”), Clearwater Select Equity Fund (“Select Equity Fund”), Clearwater Tax-Exempt Bond Fund (“Tax-Exempt Bond Fund”), and Clearwater International Fund (“International Fund” and together with the Core Equity Fund, Select Equity Fund and Tax-Exempt Bond Fund, the “Funds”), you incur costs, including management fees and other Fund expenses. This example is intended to help you understand your ongoing costs (in dollars) of investing in the Funds and to compare these costs with the ongoing costs of investing in other mutual funds. In addition to the ongoing costs which the Funds pay directly, you as a shareholder indirectly bear the expenses of any outside exchange traded funds or mutual funds in which the Funds invest. (These are also referred to as “acquired funds” and those indirect expenses represent the Funds’ pro rata portion of the cumulative expense charged by the acquired funds.)
The example provided is based on an investment of $1,000 invested at the beginning of the period and held for the six-month period ended December 31, 2023.
Actual Expenses
The first section of the table on the following page provides information about actual account values and actual expenses. You may use the information in this section, together with the amount you invested, to estimate the expenses that you incurred over the period. Simply divide your account value by $1,000 (for example, an $8,600 account value divided by $1,000 = $8.6), then multiply the result by the number in the first section under the heading entitled “Expenses Paid During the Period July 1, 2023 through December 31, 2023” to estimate the expenses attributable to your investment during this period.
Hypothetical Example for Comparison Purposes
The second section of the table below provides information about hypothetical account values and hypothetical expenses based on the Fund’s actual expense ratio and an assumed rate of return of 5% per year before expenses, which is not the Fund’s actual return. Thus, you should not use the hypothetical account values and expenses to estimate the actual ending account balance or your expenses for the period. Rather, these figures are provided to enable you to compare the ongoing costs of investing in the Funds and other mutual funds. To do so, compare this 5% hypothetical example with the 5% hypothetical examples that appear in the shareholder reports of the other mutual funds.
Please note that the expenses shown in the second section of the table are meant to highlight your ongoing costs only. Therefore, the second section of the table is useful in comparing ongoing costs only, and will not help you compare the relative total costs of the Funds to other mutual funds that charge transaction costs and/or sales charges or redemption fees.
| Actual returns | Beginning Account
Value July 1, 2023 | Ending Account Value
December 31, 2023 | Expenses Paid During the
Period July 1, 2023 through
December 31, 2023* |
| Core Equity Fund | $1,000.00 | $1,087.60 | $1.32 |
| Select Equity Fund | $1,000.00 | $1,106.60 | $5.10 |
| Tax-Exempt Bond Fund | $1,000.00 | $1,034.50 | $1.54 |
| International Fund | $1,000.00 | $1,066.60 | $3.70 |
Hypothetical 5% return
(before expenses) | | | |
| Core Equity Fund | $1,000.00 | $1,023.95 | $1.28 |
| Select Equity Fund | $1,000.00 | $1,020.37 | $4.89 |
| Tax-Exempt Bond Fund | $1,000.00 | $1,023.69 | $1.53 |
| International Fund | $1,000.00 | $1,021.63 | $3.62 |
| * | Expenses are equal to the Fund’s annualized expense ratios, multiplied by the average account value over the period, multiplied by 184/365 (to reflect the one-half year period). Expense ratios for the most recent one-half year period may differ from expense ratios based on one-year data in the Financial Highlights. |
The annualized expense ratios (reflecting voluntary fee waivers in effect during the period) are as follows:
| | |
| Core Equity Fund | 0.26% |
| Select Equity Fund | 0.96% |
| Tax-Exempt Bond Fund | 0.30% |
| International Fund | 0.71% |
Approval of Investment Management and Subadvisory Agreements
Clearwater Management Co., Inc. (“CMC”) is responsible for managing the investment programs and strategies for the Core Equity Fund, Select Equity Fund, Tax-Exempt Bond Fund, and International Fund (collectively, the “Funds”). CMC also provides other administrative services to the Funds and these services, as well as its investment management services, are provided to the Funds under an agreement (the “Management Agreement”). CMC conducts due diligence when selecting each subadviser (collectively, the “Subadvisers”) for the Funds and oversees the performance of the Subadvisers. The Subadvisers provide portfolio management and related services for the Funds under individual subadvisory agreements (the “Subadvisory Agreements”).
The Trust’s Board of Trustees (the “Board” or “Trustees”) met periodically throughout the year to address a broad range of agenda items. For example, at each regularly scheduled meeting, the Trustees reviewed information about the investment performance and financial results of the Funds. On an annual basis, the Trustees, including the Trustees who are not “interested persons” of the Trust (the “Independent Trustees”), consider the renewal of the Management Agreement and the Subadvisory Agreements. In addition, the Trustees may periodically consider the retention of new subadvisers.
Approval of New FCI Subadvisory Agreement
At a meeting of the Trustees held on May 18, 2023, the Trustees, including all of the Independent Trustees, unanimously voted to approve the new subadvisory agreement among CMC, Fiduciary Counselling, Inc. (“FCI”), and the Trust on behalf of each Fund (the “New Subadvisory Agreement”) in connection with the restructuring of FCI’s ownership (the “Restructuring”) and to recommend that shareholders of each Fund vote for the approval of the New FCI Subadvisory Agreement.
Prior to its approval of the New FCI Subadvisory Agreement, the Board reviewed, among other matters, the nature, extent, and quality of the services currently being provided by FCI under the existing subadvisory agreement with FCI (the “Existing FCI Subadvisory Agreement”) and the nature, extent, and quality of the services to be provided under the New FCI Subadvisory Agreement. A substantial portion of this review was conducted as part of, and in conjunction with, the Board’s annual review of the Funds’ investment management and subadvisory agreements (including the Existing FCI Subadvisory Agreement), which were most recently approved for continuation at a meeting of the Board held on December 8, 2022. During the review process that led to its approval of the Existing FCI Subadvisory Agreement on December 8, 2022, the Board was aware that it would likely be asked in the near future to consider approval of the New FCI Subadvisory Agreement.
In connection with its approval of the New FCI Subadvisory Agreement on May 18, 2023, the Board considered its prior conclusions in connection with its December 8, 2022 approval of the Existing FCI Subadvisory Agreement, including the Board’s general satisfaction with the nature and quality of the services being provided under the Existing FCI Subadvisory Agreement. Prior to the May 18, 2023 meeting, the Trustees requested, received, and reviewed written responses from FCI to questions posed on behalf of the Trustees relating to the anticipated impact of the Restructuring on FCI’s organizational structure, personnel, services, and compliance program. In connection with the Trustees’ consideration of the New FCI Subadvisory Agreement, counsel to the Funds and Trustees reviewed with the Trustees the various factors relevant to their consideration of the agreement and the Trustees’ responsibilities related to their review.
In approving the New Subadvisory Agreement, the Trustees considered a number of factors, including those discussed below, that they believed to be relevant. No single factor determined whether or not the New FCI Subadvisory Agreement would be approved but rather the totality of factors considered was determinative.
Nature, Extent, and Quality of Services Provided
The Trustees considered the nature, extent, and quality of services provided by FCI, as well as FCI’s investment expertise, resources, capabilities, and financial condition. The Trustees considered that FCI provides, in addition to investment management services, certain services related to due diligence, performance reporting, compliance, and other administrative functions that support the investment management services and subadviser oversight services provided by CMC. The Trustees noted that FCI does not expect any changes in staffing or services as a result of the Restructuring.
The Trustees concluded that they were satisfied with the nature and quality of the services to be provided under the New FCI Subadvisory Agreement.
Investment Performance
The Trustees noted that FCI does not have day-to-day management of portfolio assets, but instead provides CMC with investment strategy advice, manager recommendations, and related duties as requested by CMC. The Trustees considered that they had concluded as part of the annual review of agreements that they were generally satisfied with CMC’s and the subadvisers’ investment performance to date.
Subadvisory Fee
The Trustees evaluated the proposed subadvisory fee schedule under the New FCI Subadvisory Agreement, noting that the proposed subadvisory fee schedule is the same as the fee schedule under the Existing FCI Subadvisory Agreement. The Trustees noted that FCI would continue to waive its fee in an amount equal to the difference between the amount calculated under the subadvisory fee schedule and a fixed amount agreed to with CMC. The Trustees further noted that, although CMC is responsible for payment of the subadvisory fee to FCI, CMC shares the benefits of FCI’s fee waiver with the Funds through voluntary management fee waivers.
Benefits to the Subadviser
The Trustees considered the ancillary benefits that accrue to FCI due to its relationship with the Trust and concluded that significant ancillary benefits do not result from the arrangement.
Profitability
The Trustees considered that FCI is an independent firm and that the subadvisory fee to be charged is the result of arm’s length bargaining between FCI and CMC.
Economies of Scale
The Trustees noted that CMC, not the Fund, pays the subadvisory fee to FCI and that the Trustees consider on an annual basis whether economies of scale might be realized by CMC as a Fund’s assets grow and whether there also might be benefits from such growth for the Fund’s shareholders.
Other Considerations
The Trustees considered CMC’s judgment and recommendation that continuing to retain FCI as a subadviser would add value to the Fund’s shareholders.
Conclusion
Based on the factors described above, the Trustees, including all of the Independent Trustees, concluded that the approval of the New FCI Subadvisory Agreement was in the best interests of each Fund and its shareholders and approved the New FCI Subadvisory Agreement.
Approval of Investment Management and Subadvisory Agreements (All Funds)
At their meetings on November 2 and December 7, 2023, the Trustees considered the renewal of the Management Agreement and the Subadvisory Agreements for AQR Capital Management, LLC, Artisan Partners Limited Partnership, Cooke & Bieler, L.P., FCI, Jackson Square Partners, LLC, Parametric Portfolio Associates LLC, Pzena Investment Management, LLC, Rice Hall James & Associates, LLC, Sit Fixed Income Advisors II, LLC, LSV Asset Management, Wasatch Global Investors and WCM Investment Management, LLC.
Prior to the November 2, 2023 meeting, the Trustees requested, received, and reviewed written responses from CMC and the Subadvisers to questions posed to them on behalf of the Trustees and supporting materials relating to those questions and responses. The information presented at the meeting, including comparative performance and expense data, was designed to assist the Trustees in making their determination as to the renewal of the Management Agreement and Subadvisory Agreements. At this meeting, counsel to the Funds and Trustees reviewed with the Trustees the various factors relevant to their consideration of the Agreements, and the Trustees’ responsibilities related to their review.
At the November 2 and December 7, 2023 meetings, the Trustees considered a number of factors, including those discussed below, that they believed to be relevant. No single factor determined whether or not an agreement would be approved but rather the totality of factors considered was determinative. Following an analysis and discussion of the factors described below, the Trustees, including all of the Independent Trustees, unanimously approved the renewal of the Management Agreement and the Subadvisory Agreements.
Nature, Extent, and Quality of Services Provided
The Trustees considered information presented as to the nature, extent, and quality of services provided by CMC and the Subadvisers, as well as their investment expertise, resources, and capabilities. The Trustees considered the quality of the Subadvisers previously recommended by CMC, as well as the ongoing work performed by CMC to recommend enhancements to individual fund management. The Trustees reviewed information regarding the financial condition of CMC and the Subadvisers related to their ongoing ability to provide services specified under the Management Agreement and Subadvisory Agreements. The Trustees considered that FCI provides, in addition to investment management services, certain services related to due diligence, performance reporting, compliance, and other administrative functions that support the investment management services and Subadviser oversight services provided by CMC.
Based on their analysis of the data presented, the Trustees concluded that they were generally satisfied with the nature and quality of the services being provided under the Agreements.
Investment Performance
The Trustees reviewed specific information as to the investment performance of the Funds over various periods of time as compared to the performance of their respective benchmark indices and peer groups. On a quarterly basis, the Trustees reviewed reports summarizing the net assets, redemptions, and purchases of shares of the Funds, as well as information regarding the performance of each Subadviser compared to the benchmark against which its particular portfolio is measured.
The Trustees made certain observations and findings as to each Fund’s performance as set forth below.
Core Equity Fund. The Trustees noted that the Fund had outperformed its benchmark, the Russell 1000 Index, for the 1- and 3-year periods ended September 30, 2023, and underperformed its benchmark for the 5- and 10-year periods ended September 30, 2023.
Select Equity Fund. The Trustees noted that the Fund had outperformed its benchmark, the Russell 2000 Index, for the 1-year period ended September 30, 2023, and underperformed its benchmark for the 3-, 5- and 10-year periods ended September 30, 2023. The Trustees considered Subadviser changes for the Fund in recent years.
Tax-Exempt Bond Fund. The Trustees noted that the Fund had outperformed its benchmark, the Bloomberg Municipal Bond 5 Year (4-6) Index, for the 1- and 10-year periods ended September 30, 2023, and underperformed its benchmark for the 3- and 5-year periods ended September 30, 2023.
International Fund. The Trustees noted that the Fund had outperformed its benchmark, the MSCI World Ex U.S.A. Index - Net Dividends, for the 5- and 10-year periods ended September 30, 2023, and underperformed its benchmark for the 1- and 3-year periods ended September 30, 2023.
The Trustees noted that the performance of each Fund was in the range of the performance of peer funds presented for comparison for the 3-, 5- and 10-year periods ended September 30, 2023.
The Trustees concluded that they were generally satisfied with CMC’s and the Subadvisers’ investment performance to date.
Comparative Fees and Cost of Services Provided
The Trustees reviewed the fees paid to CMC and the Subadvisers. The Trustees reviewed reports describing both the management fees charged by CMC and the total expense ratios of the Funds in comparison to those of similarly situated funds. In addition, on a quarterly basis, the Trustees reviewed information as to the expense ratios of the Funds compared to the median expense ratio of a peer group of funds with comparable investment strategies. The Trustees also reviewed information provided by each of the Subadvisers, including comparative fee information detailing the fees they charge to other clients, as applicable.
The Trustees noted the ongoing efforts of CMC to reduce expenses charged to shareholders through oversight of service providers and by voluntarily waiving a portion of the management fee payable to CMC as specified in the Funds’ prospectus. In this regard, the Board considered that, effective January 1, 2024, CMC has voluntarily agreed to waive (i) the management fee for the Core Equity Fund from the contractual fee of 0.90% to 0.26%; (ii) the management fee for the Select Equity Fund from the contractual fee of 1.35% to 0.96%; (iii) the management fee for the Tax-Exempt Bond Fund from the contractual fee of 0.60% to 0.32%; and (iv) the management fee for the International Fund from the contractual fee of 1.00% to 0.73%.
The Trustees noted that the Core Equity Fund’s expense ratio, after management fee waiver, was lower than that of the peer funds and the Morningstar category median and average presented for comparison. With respect to the Tax-Exempt Bond Fund and International Fund, the Trustees noted that the Funds’ expense ratios, after management fee waiver, were lower than that of the Morningstar category median and average and almost all of the peer funds presented for comparison. The Trustees noted that the Select Equity Fund’s expense ratio, after management fee waiver, was higher than that of the Morningstar category median and average but was within the range of peer funds presented for comparison and was reasonable based on the Fund’s Subadviser allocation.
Management Profitability
The Trustees reviewed CMC’s level of profitability with respect to the Funds, particularly noting CMC’s payment of fees and expenses typically absorbed by mutual fund shareholders. The Trustees concluded that profitability levels for CMC were reasonable. The Trustees considered that the Subadvisers are each independent firms and the subadvisory fees charged are the result of arm’s length bargaining between them and CMC.
Economies of Scale
The Trustees considered whether economies of scale might be realized by CMC as the Funds’ assets grow and whether there also might be benefits from such growth for the Funds’ shareholders. The Trustees noted that the Funds have been in operation for a number of years and, based on their distribution strategy, the Funds will probably not see significant increases in size. However, the Trustees determined that they would continue to monitor the assets of the Funds and consider whether there were additional opportunities to realize benefits from economies of scale for shareholders in the future.
Conclusion
Based on the factors described above, the Trustees, including all of the Independent Trustees, concluded that the investment management fees and subadvisory fees were fair and reasonable in view of the investment performance and quality of services provided. In reaching this conclusion, no single factor was considered determinative.
Quarterly Portfolio Schedule of Investments
The Funds file a complete schedule of their portfolio holdings as of the close of the first and third quarters of their fiscal years with the U.S. Securities and Exchange Commission (the “SEC”) on Form N-PORT. Shareholders may request portfolio holdings information free of charge by calling the Transfer Agent toll free at 1-855-684-9144 or by sending a written request to: The Northern Trust Company, P.O. Box 4766, Chicago, IL 60680-4766 Attn: Clearwater Investment Trust Funds. These filings are also available on the SEC's Internet site at http://www.sec.gov.
Voting Proxies on Fund Portfolio Securities
The Funds have established Proxy Voting Policies and Procedures (“Policies”) that the Funds use to determine how to vote proxies relating to portfolio securities. They also report, on Form N-PX, how the Funds voted any such proxies during the most recent 12-month period ended June 30. Shareholders may request copies of the Policies or Form N-PX free of charge by calling Fiduciary Counselling, Inc. toll free at 1-888-228-0935 or by sending a written request to: Fiduciary Counselling, Inc., 30 East 7th Street, Suite 2000, St. Paul, MN 55101 Attn: Clearwater Investment Trust Funds. The Policies and Form N-PX are also available from the EDGAR database on the SEC's Internet site at http://www.sec.gov.
Shareholder Meeting Results
A special meeting of shareholders was held on September 14, 2023. All shareholders of record at the close of business on June 30, 2023 were entitled to attend or submit proxies. The results of votes taken among shareholders on each proposal before them are reported below.
Proposal 1: Election of Dylan Ambauen, Sara G. Dent, Julia LW Heidmann, Charles W. Rasmussen, Laura E. Rasmussen, Lindsay R. Shack, David M. Weyerhaeuser and Justin H. Weyerhaeuser to the Board of Trustees of the Trust
| Trustee | | Shares Voted for All | | Shares Voted Withhold All | | Shares Voted for all Except | | Shares Voted to Abstain | | % of Total Shares Voted for All |
| Dylan Ambauen | | 163,120,395 | | 0 | | 0 | | 0 | | 98.69% |
| Sara G. Dent | | 163,120,395 | | 0 | | 0 | | 0 | | 98.69% |
Julia LW
Heidmann | | 163,120,395 | | 0 | | 0 | | 0 | | 98.69% |
Charles W.
Rasmussen | | 163,120,395 | | 0 | | 0 | | 0 | | 98.69% |
Laura E.
Rasmussen | | 163,120,395 | | 0 | | 0 | | 0 | | 98.69% |
Lindsay R.
Shack | | 163,120,395 | | 0 | | 0 | | 0 | | 98.69% |
David M.
Weyerhaeuser | | 163,120,395 | | 0 | | 0 | | 0 | | 98.69% |
Justin H.
Weyerhaeuser | | 163,120,395 | | 0 | | 0 | | 0 | | 98.69% |
Proposal 2: Approval of new subadvisory agreement between the Trust and FCI
| Fund Name | | Shares Outstanding | | Shares Voted for Proposal | | Shares Voted Against Proposal | | Shares Voted to Abstain | | % of Total Shares Voted for Proposal |
| Core Equity Fund | | 12,568,572 | | 12,501,448 | | 0 | | 0 | | 99.47% |
| Select Equity Fund | | 23,927,208 | | 23,596,906 | | 0 | | 0 | | 98.62% |
| Tax-Exempt Bond Fund | | 77,503,234 | | 76,429,960 | | 0 | | 0 | | 98.62% |
International
Fund | | 51,281,885 | | 50,592,081 | | 0 | | 0 | | 98.65% |
EXECUTIVE OFFICERS AND TRUSTEES
(As of February 2024)
Information About the Independent Trustees
| Name and Age | Positions Held With the Funds | Term of Office | Principal Occupation or Employment During the Last Five Years and Other Relevant Experience | Number of Portfolios in the Fund Complex to Be Overseen by the Trustee | Other Directorships Held by the Trustee During the Last 5 Years |
Charles W. Rasmussen1 (57)
30 East 7th Street
Saint Paul,
Minnesota 55101 | Trustee, Chair of the Board | As Trustee:
Tenure: 2000 -
Present Term: Indefinite
As Chair:
Tenure: 2020 -
Present Term: Indefinite | President (2002-Present) and Chief Executive Officer (2002-2020), P&G Manufacturing, Inc. (air filtration equipment) | 4 | Forest History Society. (non-profit, 2018-Present) Nu Star Inc. (private company 2014- Present) |
Sara G. Dent (65)
30 East 7th Street
Saint Paul,
Minnesota 55101 | Trustee, Chair of the Governance and Nominating Committee | As Trustee:
Tenure: 2013 - Present
Term: Indefinite
As Chair of the Governance and Nominating Committee:
Tenure: 2019 - Present
Term: Indefinite | Private Investor | 4 | Woods Hole Oceanographic Institution (non-profit, 2022-Present) |
Laura E. Rasmussen1 (60)
30 East 7th Street
Saint Paul,
Minnesota 55101 | Trustee | Trustee:
Tenure: 2000 - Present
Term: Indefinite | Business Owner, 3 Kittens Needle Arts (textile sales, 2006- Present) | 4 | None |
Lindsay R. Schack (46)
30 East 7th Street
Saint Paul,
Minnesota 55101 | Trustee | Tenure: 2015 - Present
Term: Indefinite | Owner and Architect, LS Architecture (2013 – Present) | 4 | None |
David M. Weyerhaeuser (65)
30 East 7th Street
Saint Paul,
Minnesota 55101 | Trustee | Tenure: 2016 - Present
Term: Indefinite | Vice President, Sales and Marketing, Northwest Hardwoods (lumber manufacturer and distributor, 1991 – 2016) | 4 | R.D. Merill Company
Inc. (private company,
1992 - Present)
|
Dylan Ambauen (41)
30 East 7th Street
Saint Paul, Minnesota
55101 | Trustee, Chair of the Audit
Committee | As Trustee:
Tenure: 2022 - Present
Term: Indefinite
As Chair of the Audit Committee:
Tenure: 2023 – Present
Term: Indefinite | CEO, Seattle Pottery
LLC (2019-Present),
Vice President, Sunrise
Pest Management (2008-
Present) | 4 | None |
1 Mr. Rasmussen and Ms. Rasmussen are siblings-in-law.
Information about the Funds’ Executive Officers and Interested Trustees
| Name and Age | Positions Held With the Funds | Term of Office | Principal Occupation or Employment During the Last Five Years and Other Relevant Experience | Number of Portfolios in the Fund Complex to Be Overseen by the Officer/ Trustee | Other Directorships Held by the Officer/ Trustee During the Last 5 Years |
Julia LW Heidmann
2(65)
30 East 7th Street
Saint Paul,
Minnesota 55101 | Trustee | Tenure: 2022 -
Present
Term: Indefinite | Docent (2006-Present),
San Francisco Zoo | 4 | Member of the Board of Directors,
Conservation & Education Committee,
San Francisco Zoo
(non-profit, 2016-Present) |
Justin H. Weyerhaeuser
3(50)
30 East 7th Street
Saint Paul,
Minnesota 55101 | Trustee, President and Treasurer | As Trustee:
Tenure: 2008 – Present
Term: Indefinite
As President and Treasurer
Tenure: 2013 - Present
Term: Reappointed Annually | Private Investor (February 2013 - Present) | 4 | None |
Jason K. Mitchell (47)
30 East 7th Street
Saint Paul, Minnesota
55101 | Secretary
and Chief
Compliance
Officer | As Secretary:
Tenure: 2021 –
Present
Term: Reappointed
Annually
As Chief
Compliance
Officer:
Tenure: 2021 –
Present
Term:
Reappointed
Annually | Chief Compliance Officer,
Fiduciary Counselling, Inc.
(March 2021 –Present),
Chief Compliance Officer,
Clearwater Management
Co., Inc. (March 2021
–Present), Chief
Compliance Officer,
Summit Creek Advisors,
LLC (February 2014
–March 2021) | N/A | N/A |
Shari L. Clifford (55)
30 East 7th Street
Saint Paul,
Minnesota 55101 | Assistant Treasurer | Tenure: 2014 - Present
Term: Reappointed Annually | Chief Financial Officer and Treasurer, Fiduciary Counselling, Inc. (February 2014-Present) | N/A | N/A |
2 Ms. Heidmann is an interested Trustee due to her sister's position as a director of CMC.
3 Mr. Justin H. Weyerhaeuser is an interested Trustee due to his position as the Funds’ President and Treasurer.
Additional information about the Funds' Directors is available in the Funds’ Statement of Additional Information (“SAI”). The SAI is available without charge, upon request, by contacting the transfer agent at 1-855-684-9144 or writing the Funds at The Northern Trust Company, P.O. Box 4766, Chicago, IL 60680-4766. The Funds do not have an internet website.
Federal Tax Information
(unaudited)
Qualified Dividend Income. Under the Jobs and Growth Tax Relief Reconciliation Act of 2003 (the “Act”), 100.00% of ordinary dividends paid during the year ended December 31, 2023 for the Core Equity Fund, 100.00% of ordinary dividends paid during the year ended December 31, 2023 for the Select Equity Fund and 81.00% of ordinary dividends paid during the year ended December 31, 2023 for the International Fund are designated as “qualified dividend income”, as defined in the Act, subject to reduced tax rates in 2023.
Corporate Dividends-Received Deduction. 100.00%, and 100.00% of the dividends distributed during the year ended December 31, 2023, for the Core Equity and Select Equity Funds, respectively, qualify for the dividends-received deduction for corporate shareholders.
Distribution Information. For purposes of Section 19 of the 1940 Act, the Funds estimated the periodic sources of any dividends paid during the period covered by this report in accordance with good accounting practice. Core Equity Fund and Select Equity Fund did not issue a Section 19(a) notice because at the time the Funds did not believe that such a notice was necessary. Pursuant to Rule 19a-1(e) under the 1940 Act, the information in the table below includes the sources of the Core Equity Fund's and Select Equity Fund's distributions paid during the year ended December 31, 2023. Please note that the information in the table below is for financial accounting purposes only. Form 1099-DIV received by shareholders for the calendar year specifies how shareholders should characterize and report distributions paid by the Funds during the year for U.S. federal income tax purposes. The Funds' distributions during the year ended December 31, 2023, were paid from:
| | Ex-Date | | Ordinary Income | | Return of Capital |
| Core Equity Fund | 12/15/2023 | | 0.985677 | | 0.005950 |
| Select Equity Fund | 12/15/2023 | | 0.075014 | | 0.005181 |
Report of Independent Registered Public Accounting Firm
To the Shareholders and Board of Trustees Clearwater Investment Trust:
Opinion on the Financial Statements
We have audited the accompanying statements of assets and liabilities of Clearwater Core Equity Fund, Clearwater Select Equity Fund, Clearwater Tax-Exempt Bond Fund, and Clearwater International Fund (collectively, the Funds), including the schedules of investments, as of December 31, 2023, the related statements of operations for the year then ended, the statements of changes in net assets for each of the years in the two-year period then ended, and the related notes (collectively, the financial statements) and the financial highlights for each of the years in the five-year period then ended. In our opinion, the financial statements and financial highlights of each Fund present fairly, in all material respects, the financial position of each Fund as of December 31, 2023, the results of its operations for the year then ended, the changes in its net assets for each of the years in the two-year period then ended, and the financial highlights for each of the years in the five-year period then ended, in conformity with U.S. generally accepted accounting principles.
Basis for Opinion
These financial statements and financial highlights are the responsibility of the Funds' management. Our responsibility is to express an opinion on these financial statements and financial highlights based on our audits. We are a public accounting firm registered with the Public Company Accounting Oversight Board (United States) (PCAOB) and are required to be independent with respect to the Funds in accordance with the U.S. federal securities laws and the applicable rules and regulations of the Securities and Exchange Commission and the PCAOB.
We conducted our audits in accordance with the standards of the PCAOB. Those standards require that we plan and perform the audit to obtain reasonable assurance about whether the financial statements and financial highlights are free of material misstatement, whether due to error or fraud. Our audits included performing procedures to assess the risks of material misstatement of the financial statements and financial highlights, whether due to error or fraud, and performing procedures that respond to those risks. Such procedures included examining, on a test basis, evidence regarding the amounts and disclosures in the financial statements and financial highlights. Such procedures also included confirmation of securities owned as of December 31, 2023, by correspondence with custodians and brokers. Our audits also included evaluating the accounting principles used and significant estimates made by management, as well as evaluating the overall presentation of the financial statements and financial highlights. We believe that our audits provide a reasonable basis for our opinion.
/s/ KPMG LLP
We have served as the auditor of one or more Clearwater Investment Trust investment companies since 1992.
Minneapolis, Minnesota
February 22, 2024
CLEARWATER INVESTMENT TRUST
Statements of Assets and Liabilities
December 31, 2023
| | | Core Equity
Fund | | Select Equity
Fund | | Tax-Exempt
Bond Fund | | International
Fund |
| Assets | | | | | | | | |
| Investments in securities, at fair value (including securities on loan of: $0, $568,323, $0 and $7,192,387, respectively); (identified cost: $447,747,890, $378,672,243, $751,806,495 and $758,729,344, respectively) | $ | 872,195,335 | | 427,884,119 | | 693,874,010 | | 1,025,725,047 |
| Foreign currencies, at value (cost: $0, $13,975, $0 and $2,690,532, respectively) | | - | | 13,275 | | - | | 2,316,196 |
| Cash (restricted: $0, $0, $2,376,575 and $0, respectively) | | - | | 1,190 | | 2,976,274 | | - |
| Receivable for securities sold | | - | | 2,071,877 | | 6,985 | | 28,444 |
| Receivable for variation margin on futures contracts | | - | | - | | 28,125 | | - |
| Receivable for shares of beneficial interest sold | | 26,600 | | 245,700 | | 349,500 | | 173,700 |
| Accrued dividend and interest receivable | | 807,473 | | 267,784 | | 8,065,345 | | 1,348,375 |
| Foreign tax reclaim receivable | | 3,137 | | 311 | | - | | 2,349,222 |
| Total assets | | 873,032,545 | | 430,484,256 | | 705,300,239 | | 1,031,940,984 |
| Liabilities | | | | | | | | |
| Payables for investment securities purchased | | - | | 1,730,923 | | 3,986,764 | | 5,705,672 |
| Payable for fund shares redeemed | | 43,016 | | - | | - | | - |
| Accrued investment advisory fee | | 514,472 | | 902,587 | | 515,986 | | 1,705,466 |
| Payable for dividend distribution | | - | | - | | 288,013 | | - |
| Payable for variation margin on futures contracts | | - | | - | | 45,727 | | - |
| Payable upon return of securities loaned | | - | | 581,616 | | - | | 8,061,365 |
| Deferred foreign capital gains taxes payable | | - | | - | | - | | 1,086,698 |
| Short-term financing | | 506,319 | | 205,500 | | - | | - |
| Total liabilities | | 1,063,807 | | 3,420,626 | | 4,836,490 | | 16,559,201 |
| Net assets | $ | 871,968,738 | | 427,063,630 | | 700,463,749 | | 1,015,381,783 |
| Capital | | | | | | | | |
| Capital Stock and additional paid-in capital (authorized unlimited number of shares at no par value for each Fund: 12,580,630, 23,713,642, 80,004,703 and 51,697,285 shares outstanding, respectively) | $ | 472,391,162 | | 433,873,904 | | 778,322,064 | | 759,034,745 |
| Distributable earnings | | 399,577,576 | | (6,810,274) | | (77,858,315) | | 256,347,038 |
| Net assets | $ | 871,968,738 | | 427,063,630 | | 700,463,749 | | 1,015,381,783 |
| Net asset value per share of outstanding capital stock | $ | 69.31 | | 18.01 | | 8.76 | | 19.64 |
See accompanying notes to financial statements.
CLEARWATER INVESTMENT TRUST
Statements of Operations
Year ended December 31, 2023
| | | Core Equity
Fund | | Select Equity
Fund | | Tax-Exempt
Bond Fund | | International
Fund |
| Investment income: | | | | | | | | |
| Income: | | | | | | | | |
| Dividends (net of foreign taxes withheld of $3,852, $25,020, $0 and $2,106,201, respectively) | $ | 13,843,611 | | 4,672,224 | | 1,997,890 | | 22,143,066 |
| Interest | | - | | - | | 28,664,311 | | - |
| Tax reclaims | | - | | - | | - | | 1,223,516 |
| Net income from securities loaned | | - | | 50,785 | | - | | 90,170 |
| Total income | | 13,843,611 | | 4,723,009 | | 30,662,201 | | 23,456,752 |
| Expenses: | | | | | | | | |
| Investment advisory fee | | 7,053,473 | | 5,164,035 | | 3,872,498 | | 9,466,123 |
| Other expenses | | - | | - | | 185 | | - |
| Total expenses | | 7,053,473 | | 5,164,035 | | 3,872,683 | | 9,466,123 |
| Less: waivers of investment advisory fee or other expense reimbursements | | (5,039,496) | | (1,482,390) | | (1,967,504) | | (2,769,462) |
| Net expenses | | 2,013,977 | | 3,681,645 | | 1,905,179 | | 6,696,661 |
| Net investment income | | 11,829,634 | | 1,041,364 | | 28,757,022 | | 16,760,091 |
| Net realized gain (loss) on: | | | | | | | | |
| Security transactions | | 10,666,582 | | (13,085,251) | | (16,864,926) | | 24,173,277 |
| Foreign currency transactions | | - | | 965 | | - | | (269,519) |
| Futures contracts | | - | | - | | 6,075,622 | | - |
| Net increase (decrease) in unrealized appreciation/depreciation on: | | | | | | | | |
| Security transactions (net of increase (decrease) in deferred foreign taxes of $0, $0, $0 and $(526,441), respectively) | | 158,649,433 | | 84,147,902 | | 28,927,857 | | 128,877,629 |
| Futures contracts | | - | | - | | (5,572,877) | | - |
| Translation of other assets and liabilities denominated in foreign currencies | | - | | 694 | | - | | 185,196 |
| Net gain (loss) on investments | | 169,316,015 | | 71,064,310 | | 12,565,676 | | 152,966,583 |
| Net increase (decrease) in net assets resulting from operations | $ | 181,145,649 | | 72,105,674 | | 41,322,698 | | 169,726,674 |
See accompanying notes to financial statements.
CLEARWATER INVESTMENT TRUST
Statements of Changes in Net Assets
Years ended December 31, 2023 and 2022
| | | Core Equity
Fund | | Select Equity
Fund |
| | | 12/31/2023 | | 12/31/2022 | | 12/31/2023 | | 12/31/2022 |
| Operations: | | | | | | | | |
| Net investment income | $ | 11,829,634 | | 11,379,906 | | 1,041,364 | | 680,794 |
| Net realized gain (loss) | | 10,666,582 | | 37,472,242 | | (13,084,286) | | (15,549,580) |
| Net increase (decrease) in unrealized appreciation/depreciation | | 158,649,433 | | (198,246,913) | | 84,148,596 | | (95,778,035) |
| Net increase (decrease) in net assets resulting from operations | | 181,145,649 | | (149,394,765) | | 72,105,674 | | (110,646,821) |
| Distributions to shareholders | | (12,352,174) | | (10,752,052) | | (1,896,867) | | (8,125,618) |
| Capital share transactions: | | | | | | | | |
| Proceeds from shares sold | | 68,918,661 | | 182,656,902 | | 19,158,752 | | 101,322,691 |
| Reinvestment of distributions from net investment income and net realized gain | | 12,351,716 | | 10,752,052 | | 1,896,564 | | 8,125,618 |
| Payments for shares redeemed | | (96,265,333) | | (194,680,866) | | (29,147,108) | | (159,796,228) |
| Net decrease in net assets from capital share transactions | | (14,994,956) | | (1,271,912) | | (8,091,792) | | (50,347,919) |
| Total increase (decrease) in net assets | | 153,798,519 | | (161,418,729) | | 62,117,015 | | (169,120,358) |
| Net assets: | | | | | | | | |
| At the beginning of the year | | 718,170,219 | | 879,588,948 | | 364,946,615 | | 534,066,973 |
| At the end of the year | $ | 871,968,738 | | 718,170,219 | | 427,063,630 | | 364,946,615 |
| | | Tax-Exempt
Bond Fund | | International
Fund |
| | | 12/31/2023 | | 12/31/2022 | | 12/31/2023 | | 12/31/2022 |
| Operations: | | | | | | | | |
| Net investment income | $ | 28,757,022 | | 24,660,929 | | 16,760,091 | | 17,843,079 |
| Net realized gain (loss) | | (10,789,304) | | 3,263,503 | | 23,903,758 | | 10,433,826 |
| Net increase (decrease) in unrealized appreciation/depreciation | | 23,354,980 | | (114,954,989) | | 129,062,825 | | (231,476,926) |
| Net increase (decrease) in net assets resulting from operations | | 41,322,698 | | (87,030,557) | | 169,726,674 | | (203,200,021) |
| Distributions to shareholders | | (28,876,661) | | (30,033,721) | | (23,498,478) | | (11,587,443) |
| Capital share transactions: | | | | | | | | |
| Proceeds from shares sold | | 250,097,392 | | 248,834,683 | | 44,485,551 | | 149,605,328 |
| Reinvestment of distributions from net investment income and net realized gain | | 28,845,923 | | 29,988,685 | | 23,498,478 | | 11,587,443 |
| Payments for shares redeemed | | (156,560,083) | | (328,618,503) | | (76,876,505) | | (159,304,656) |
| Net increase (decrease) in net assets from capital share transactions | | 122,383,232 | | (49,795,135) | | (8,892,476) | | 1,888,115 |
| Total increase (decrease) in net assets | | 134,829,269 | | (166,859,413) | | 137,335,720 | | (212,899,349) |
| Net assets: | | | | | | | | |
| At the beginning of the year | | 565,634,480 | | 732,493,893 | | 878,046,063 | | 1,090,945,412 |
| At the end of the year | $ | 700,463,749 | | 565,634,480 | | 1,015,381,783 | | 878,046,063 |
See accompanying notes to financial statements.
CLEARWATER INVESTMENT TRUST
Financial Highlights
Per share data (rounded to the nearest cent) for a share of capital stock outstanding throughout the years ended and selected information for each year ended is as follows:
| | | | Year ended December 31, | |
Core Equity
Fund | | | 2023 | | 2022 | | 2021 | | 2020 | 2019 | |
| Net asset value, beginning of year | | $ | 55.93 | | 68.01 | | 55.11 | | 48.14 | 37.97 | |
| Income (loss) from investment operations: | | | | | | | | | | | |
| Net investment income | | | 0.97 | | 0.81 | | 0.72 | | 0.71 | 0.72 | |
| Net realized and unrealized gains (losses) | | | 13.40 | | (12.06) | | 14.36 | | 7.22 | 10.32 | |
| Total from investment operations | | | 14.37 | | (11.25) | | 15.08 | | 7.93 | 11.04 | |
| Less distributions to shareholders from: | | | | | | | | | | | |
| Net investment income | | | (0.99) | | (0.76) | | (0.69) | | (0.71) | (0.66) | |
| Net realized gain | | | - | | (0.07) | | (1.49) | | (0.25) | (0.21) | |
| Total distributions to shareholders: | | | (0.99) | | (0.83) | | (2.18) | | (0.96) | (0.87) | |
| Net asset value, end of year | | $ | 69.31 | | 55.93 | | 68.01 | | 55.11 | 48.14 | |
| Total return (a) | | | 25.71 % | | (16.58)% | | 27.44 % | | 16.54 % | 29.11 % | |
| Net assets, end of year (000s omitted) | | $ | 871,969 | | 718,170 | | 879,589 | | 616,984 | 543,171 | |
| Ratio of expenses, net of waivers, to average net assets (b), (c), (d), (e), (f), (g), (h), (i) | | | 0.26 % | | 0.26 % | | 0.29 % | | 0.31 % | 0.35 % | |
| Ratio of expenses, before waivers, to average net assets (b), (c), (d), (e), (f), (g), (h), (i) | | | 0.90 % | | 0.90 % | | 0.90 % | | 0.90 % | 0.90 % | |
| Ratio of net investment income (loss), net of waivers, to average net assets (c), (d), (e), (f), (g), (h), (i) | | | 1.51 % | | 1.50 % | | 1.13 % | | 1.49 % | 1.54 % | |
| Ratio of net investment income (loss), before waivers, to average net assets (c), (d), (e), (f), (g), (h), (i) | | | 0.87 % | | 0.86 % | | 0.52 % | | 0.90 % | 0.99 % | |
| Portfolio turnover rate (excluding short-term securities) | | | 67.52 % | | 62.80 % | | 33.97 % | | 37.16 % | 33.73 % | |
| | |
| (a) | Total return figures are based on the change in net asset value of a share during the year and assume reinvestment of distributions at net asset value. |
| (b) | In addition to fees and expenses which the Fund bears directly, the Fund indirectly bears a pro rata share of the fees and expenses of any acquired funds in which it invests. Such indirect expenses are not included in the above reported expense ratios and are excluded from the voluntary waivers reflected above and described in the below footnotes. |
| (c) | Effective April 1, 2023, the investment advisory fee, net of voluntary waivers, decreased to 0.25%. Also effective April 1, 2023, the Adviser increased the voluntary waiver to 0.65%. |
| (d) | Effective January 1, 2023, the investment advisory fee, net of voluntary waivers, increased to 0.28%. Also effective January 1, 2023, the Adviser decreased the voluntary waiver to 0.62%. |
| (e) | Effective July 1, 2022, the investment advisory fee, net of voluntary waivers, increased to 0.27%. Also effective July 1, 2022, the Adviser decreased the voluntary waiver to 0.63%. |
| (f) | Effective April 1, 2022, the investment advisory fee, net of voluntary waivers, increased to 0.26%. Also effective April 1, 2022, the Adviser decreased the voluntary waiver to 0.64%. |
| (g) | Effective October 1, 2021, the investment advisory fee, net of voluntary waivers, decreased to 0.25%. Also effective October 1, 2021, the Adviser increased the voluntary waiver to 0.65%. |
| (h) | Effective April 1, 2021, the investment advisory fee, net of voluntary waivers, decreased to 0.30%. Also effective April 1, 2021, the Adviser increased the voluntary waiver to 0.60%. |
| (i) | Effective January 1, 2020, the investment advisory fee, net of voluntary waivers, decreased to 0.31%. Also effective January 1, 2020, the Adviser increased the voluntary waiver to 0.59%. |
See accompanying notes to financial statements.
CLEARWATER INVESTMENT TRUST
Financial Highlights
Per share data (rounded to the nearest cent) for a share of capital stock outstanding throughout the years ended and selected information for each year ended is as follows:
| | | | Year ended December 31, | |
Select Equity
Fund | | | 2023 | | 2022 | | 2021 | | 2020 | 2019 | |
| Net asset value, beginning of year | | $ | 15.08 | | 19.76 | | 20.09 | | 18.45 | 14.90 | |
| Income (loss) from investment operations: | | | | | | | | | | | |
| Net investment income | | | 0.05 | | 0.03 | | 0.07 | | 0.11 | 0.14 | |
| Net realized and unrealized gains (losses) | | | 2.96 | | (4.37) | | 2.20 | | 1.95 | 3.79 | |
| Total from investment operations | | | 3.01 | | (4.34) | | 2.27 | | 2.06 | 3.93 | |
| Less distributions to shareholders from: | | | | | | | | | | | |
| Net investment income | | | (0.08) | | - | | (0.06) | | (0.11) | (0.11) | |
| Net realized gain | | | - | | (0.34) | | (2.54) | | (0.31) | (0.27) | |
| Total distributions to shareholders: | | | (0.08) | | (0.34) | | (2.60) | | (0.42) | (0.38) | |
| Net asset value, end of year | | $ | 18.01 | | 15.08 | | 19.76 | | 20.09 | 18.45 | |
| Total return (a) | | | 19.97 % | | (22.01)% | | 11.77 % | | 11.25 % | 26.40 % | |
| Net assets, end of year (000s omitted) | | $ | 427,064 | | 364,947 | | 534,067 | | 455,974 | 373,425 | |
| Ratio of expenses, net of waivers, to average net assets (b), (c), (d), (e), (f), (g), (h), (i) | | | 0.96 % | | 0.94 % | | 0.88 % | | 0.94 % | 0.98 % | |
| Ratio of expenses, before waivers, to average net assets (b), (c), (d), (e), (f), (g), (h), (i) | | | 1.35 % | | 1.35 % | | 1.35 % | | 1.35 % | 1.35 % | |
| Ratio of net investment income (loss), net of waivers, to average net assets (c), (d), (e), (f), (g), (h), (i) | | | 0.27 % | | 0.16 % | | 0.26 % | | 0.70 % | 0.64 % | |
| Ratio of net investment income (loss), before waivers, to average net assets (c), (d), (e), (f), (g), (h), (i) | | | (0.12)% | | (0.25)% | | (0.21)% | | 0.29 % | 0.27 % | |
| Portfolio turnover rate (excluding short-term securities) | | | 50.13 % | | 55.76 % | | 109.01 % | | 102.30 % | 64.32 % | |
| | |
| (a) | Total return figures are based on the change in net asset value of a share during the year and assume reinvestment of distributions at net asset value. |
| (b) | In addition to fees and expenses which the Fund bears directly, the Fund indirectly bears a pro rata share of the fees and expenses of any acquired funds in which it invests. Such indirect expenses are not included in the above reported expense ratios and are excluded from the voluntary waivers reflected above and described in the below footnotes. |
| (c) | Effective October 1, 2023, the investment advisory fee, net of voluntary waivers, decreased to 0.94%. Also effective October 1, 2023, the Adviser increased the voluntary waiver to 0.41%. |
| (d) | Effective July 1, 2022, the investment advisory fee, net of voluntary waivers, increased to 0.97%. Also effective July 1, 2022, the Adviser decreased the voluntary waiver to 0.38%. |
| (e) | Effective April 1, 2022, the investment advisory fee, net of voluntary waivers, increased to 0.93%. Also effective April 1, 2022, the Adviser decreased the voluntary waiver to 0.42%. |
| (f) | Effective October 1, 2021, the investment advisory fee, net of voluntary waivers, increased to 0.89%. Also effective October 1, 2021, the Adviser decreased the voluntary waiver to 0.46%. |
| (g) | Effective April 1, 2021, the investment advisory fee, net of voluntary waivers, decreased to 0.87%. Also effective April 1, 2021, the Adviser increased the voluntary waiver to 0.48%. |
| (h) | Effective October 1, 2020, the investment advisory fee, net of voluntary waivers, decreased to 0.91%. Also effective October 1, 2020, the Adviser increased the voluntary waiver to 0.44%. |
| (i) | Effective January 1, 2020, the investment advisory fee, net of voluntary waivers, decreased to 0.95%. Also effective January 1, 2020, the Adviser increased the voluntary waiver to 0.40%. |
See accompanying notes to financial statements.
CLEARWATER INVESTMENT TRUST
Financial Highlights
Per share data (rounded to the nearest cent) for a share of capital stock outstanding throughout the years ended and selected information for each year ended is as follows:
| | | | Year ended December 31, | |
Tax-Exempt
Bond Fund | | | 2023 | | 2022 | | 2021 | | 2020 | 2019 | |
| Net asset value, beginning of year | | $ | 8.59 | | 10.17 | | 10.14 | | 10.13 | 9.82 | |
| Income (loss) from investment operations: | | | | | | | | | | | |
| Net investment income | | | 0.38 | | 0.34 | | 0.36 | | 0.39 | 0.40 | |
| Net realized and unrealized gains (losses) | | | 0.17 | | (1.50) | | 0.03 | | 0.03 | 0.34 | |
| Total from investment operations | | | 0.55 | | (1.16) | | 0.39 | | 0.42 | 0.74 | |
| Less distributions to shareholders from: | | | | | | | | | | | |
| Net investment income | | | (0.38) | | (0.35) | | (0.36) | | (0.41) | (0.43) | |
| Net realized gain | | | - | | (0.07) | | - | | - | - | |
| Total distributions to shareholders: | | | (0.38) | | (0.42) | | (0.36) | | (0.41) | (0.43) | |
| Net asset value, end of year | | $ | 8.76 | | 8.59 | | 10.17 | | 10.14 | 10.13 | |
| Total return (a) | | | 6.64 % | | (11.39)% | | 3.89 % | | 4.26 % | 7.69 % | |
| Net assets, end of year (000s omitted) | | $ | 700,464 | | 565,634 | | 732,494 | | 616,839 | 603,277 | |
| Ratio of expenses, net of waivers, to average net assets (b), (c), (d), (e), (f), (g) | | | 0.30 % | | 0.27 % | | 0.28 % | | 0.29 % | 0.32 % | |
| Ratio of expenses, before waivers, to average net assets (b), (c), (d), (e), (f), (g) | | | 0.60 % | | 0.60 % | | 0.60 % | | 0.60 % | 0.60 % | |
| Ratio of net investment income (loss), net of waivers, to average net assets (c), (d), (e), (f), (g) | | | 4.45 % | | 3.79 % | | 3.52 % | | 3.85 % | 4.05 % | |
| Ratio of net investment income (loss), before waivers, to average net assets (c), (d), (e), (f), (g) | | | 4.15 % | | 3.46 % | | 3.20 % | | 3.54 % | 3.77 % | |
| Portfolio turnover rate (excluding short-term securities) | | | 47.10 % | | 29.22 % | | 16.91 % | | 17.21 % | 12.53 % | |
| | |
| (a) | Total return figures are based on the change in net asset value of a share during the year and assume reinvestment of distributions at net asset value. |
| (b) | In addition to fees and expenses which the Fund bears directly, the Fund indirectly bears a pro rata share of the fees and expenses of any acquired funds in which it invests. Such indirect expenses are not included in the above reported expense ratios and are excluded from the voluntary waivers reflected above and described in the below footnotes. |
| (c) | Effective October 1, 2023, the investment advisory fee, net of voluntary waivers, increased to 0.31%. Also effective October 1, 2023, the Adviser decreased the voluntary waiver to 0.29%. |
| (d) | Effective January 1, 2023, the investment advisory fee, net of voluntary waivers, increased to 0.29%. Also effective January 1, 2023, the Adviser decreased the voluntary waiver to 0.31%. |
| (e) | Effective July 1, 2022, the investment advisory fee, net of voluntary waivers, increased to 0.28%. Also effective July 1, 2022, the Adviser decreased the voluntary waiver to 0.32%. |
| (f) | Effective October 1, 2021, the investment advisory fee, net of voluntary waivers, decreased to 0.27%. Also effective October 1, 2021, the Adviser increased the voluntary waiver to 0.33%. |
| (g) | Effective January 1, 2020, the investment advisory fee, net of voluntary waivers, decreased to 0.29%. Also effective January 1, 2020, the Adviser increased the voluntary waiver to 0.31%. |
See accompanying notes to financial statements.
CLEARWATER INVESTMENT TRUST
Financial Highlights
Per share data (rounded to the nearest cent) for a share of capital stock outstanding throughout the years ended and selected information for each year ended is as follows:
| | | | Year ended December 31, | |
International
Fund | | | 2023 | | 2022 | | 2021 | | 2020 | 2019 | |
| Net asset value, beginning of year | | $ | 16.81 | | 21.14 | | 20.16 | | 17.28 | 14.08 | |
| Income (loss) from investment operations: | | | | | | | | | | | |
| Net investment income | | | 0.33 | | 0.34 | | 0.36 | | 0.20 | 0.29 | |
| Net realized and unrealized gains (losses) | | | 2.96 | | (4.45) | | 2.68 | | 3.07 | 3.43 | |
| Total from investment operations | | | 3.29 | | (4.11) | | 3.04 | | 3.27 | 3.72 | |
| Less distributions to shareholders from: | | | | | | | | | | | |
| Net investment income | | | (0.46) | | (0.16) | | (0.42) | | (0.17) | (0.30) | |
| Net realized gain | | | - | | (0.06) | | (1.64) | | (0.22) | (0.22) | |
| Total distributions to shareholders: | | | (0.46) | | (0.22) | | (2.06) | | (0.39) | (0.52) | |
| Net asset value, end of year | | $ | 19.64 | | 16.81 | | 21.14 | | 20.16 | 17.28 | |
| Total return (a) | | | 19.66 % | | (19.45)% | | 15.39 % | | 19.02 % | 26.47 % | |
| Net assets, end of year (000s omitted) | | $ | 1,015,382 | | 878,046 | | 1,090,945 | | 867,784 | 711,851 | |
| Ratio of expenses, net of waivers, to average net assets (b), (c), (d), (e), (f), (g), (h), (i), (j), (k) | | | 0.71 % | | 0.66 % | | 0.65 % | | 0.66 % | 0.68 % | |
| Ratio of expenses, before waivers, to average net assets (b), (c), (d), (e), (f), (g), (h), (i), (j), (k) | | | 1.00 % | | 1.00 % | | 1.00 % | | 1.00 % | 1.00 % | |
| Ratio of net investment income (loss), net of waivers, to average net assets (c), (d), (e), (f), (g), (h), (i), (j), (k) | | | 1.77 % | | 1.99 % | | 1.61 % | | 1.17 % | 1.88 % | |
| Ratio of net investment income (loss), before waivers, to average net assets (c), (d), (e), (f), (g), (h), (i), (j), (k) | | | 1.48 % | | 1.65 % | | 1.26 % | | 0.83 % | 1.56 % | |
| Portfolio turnover rate (excluding short-term securities) | | | 29.09 % | | 73.81 % | | 39.50 % | | 39.61 % | 49.69 % | |
| | |
| (a) | Total return figures are based on the change in net asset value of a share during the year and assume reinvestment of distributions at net asset value. |
| (b) | In addition to fees and expenses which the Fund bears directly, the Fund indirectly bears a pro rata share of the fees and expenses of any acquired funds in which it invests. Such indirect expenses are not included in the above reported expense ratios and are excluded from the voluntary waivers reflected above and described in the below footnotes. |
| (c) | Effective October 1, 2023, the investment advisory fee, net of voluntary waivers, increased to 0.72%. Also effective October 1, 2023, the Adviser decreased the voluntary waiver to 0.28%. |
| (d) | Effective April 1, 2023, the investment advisory fee, net of voluntary waivers, decreased to 0.70%. Also effective April 1, 2023, the Adviser increased the voluntary waiver to 0.30%. |
| (e) | Effective January 1, 2023, the investment advisory fee, net of voluntary waivers, increased to 0.71%. Also effective January 1, 2023, the Adviser decreased the voluntary waiver to 0.29%. |
| (f) | Effective July 1, 2022, the investment advisory fee, net of voluntary waivers, increased to 0.70%. Also effective July 1, 2022, the Adviser decreased the voluntary waiver to 0.30%. |
| (g) | Effective April 1, 2022, the investment advisory fee, net of voluntary waivers, increased to 0.65%. Also effective April 1, 2022, the Adviser decreased the voluntary waiver to 0.35%. |
| (h) | Effective October 1, 2021, the investment advisory fee, net of voluntary waivers, decreased to 0.60%. Also effective October 1, 2021, the Adviser increased the voluntary waiver to 0.40%. |
| (i) | Effective April 1, 2021, the investment advisory fee, net of voluntary waivers, decreased to 0.67%. Also effective April 1, 2021, the Adviser increased the voluntary waiver to 0.33%. |
| (j) | Effective October 1, 2020, the investment advisory fee, net of voluntary waivers, increased to 0.68%. Also effective October 1, 2020, the Adviser decreased the voluntary waiver to 0.32%. |
| (k) | Effective January 1, 2020, the investment advisory fee, net of voluntary waivers, decreased to 0.65%. Also effective January 1, 2020, the Adviser increased the voluntary waiver to 0.35%. |
See accompanying notes to financial statements.
CLEARWATER INVESTMENT TRUST
Notes to Financial Statements December 31, 2023
(1) Organization
Clearwater Investment Trust (the “Trust”) was established on January 12, 1987 as a Massachusetts business trust and is registered under the Investment Company Act of 1940, as amended (the “1940 Act”), as a diversified open end management investment company and presently includes four series: Clearwater Core Equity Fund (“Core Equity Fund”), Clearwater Select Equity Fund ("Select Equity Fund"), Clearwater Tax-Exempt Bond Fund (“Tax-Exempt Bond Fund”) and Clearwater International Fund (“International Fund” and together with the Core Equity Fund, Select Equity Fund and Tax-Exempt Bond Fund, the “Funds”). Clearwater Management Co., Inc. (the “Adviser”) serves as the investment adviser for each of the Funds and is responsible for the oversight of each of the Fund’s subadvisers. The Trust’s declaration of trust permits the Board of Trustees to create additional funds in the future. The investment objective of the Core Equity, Select Equity and International Funds is long-term capital growth. The investment objective of the Tax-Exempt Bond Fund is high current income that is exempt from United States (“U.S.”) federal income tax, consistent with preservation of capital.
Fiduciary Counselling, Inc. (“FCI”) acts as subadviser to each of the Funds. FCI does not provide day-to-day management, but provides the Funds with various investment-related services, including investment strategy advice, manager recommendations and related duties as requested by the Adviser. FCI also provides certain services related to due diligence, performance reporting, compliance, and other administrative functions, which support the investment management services and subadviser oversight services provided to the Funds by the Adviser.
The Northern Trust Company serves as the custodian, administrator, accounting services agent and transfer agent for the Trust.
Under normal market conditions, the Core Equity Fund pursues its investment objective by investing at least 80% of its net assets, plus the amount of any borrowings for investment purposes, in equity securities of U.S. companies. The equity securities in which the Fund primarily invests are common and preferred stocks. The Fund employs a multi-style (growth and value) and multi-manager approach whereby portions of the Fund are allocated to different subadvisers who employ distinct investment styles. The Fund’s Adviser allocates portions of the Fund’s assets among subadvisers. The Fund currently allocates assets among the following subadvisers who provide day-to-day management for the Fund: Parametric Portfolio Associates LLC (“Parametric”) and AQR Capital Management, LLC (“AQR”). The allocation among subadvisers will vary over time, but the current intent of the Fund’s Adviser is that under normal market conditions approximately 40% to 60% of the Fund’s total assets will be allocated to Parametric and the remaining assets will be allocated to AQR. Parametric manages its portion of the Fund’s assets using a passive management strategy to seek investment results that track, before fees and expenses, the investment results of the S&P 500® Index (the “Index”) as closely as possible without requiring the Fund to realize taxable gains. Parametric utilizes a representative sampling strategy, meaning that it does not intend that the portion of the Fund’s assets it manages will be invested in all the components of the Index at any given time. In addition, as noted above, FCI also acts as a subadviser to the Fund but does not provide day-to-day management.
Under normal market conditions, the Select Equity Fund invests at least 80% of its net assets, plus the amount of any borrowings for investment purposes, in equity securities. Equity securities in which the Fund invests consist primarily of exchange-traded common and preferred stocks. The Fund may also invest in a type of equity security called a convertible security to reduce volatility or correlation risk in the portfolio. A convertible security generally entitles the holder to receive interest paid or accrued on debt securities or the dividend paid on preferred stock until the convertible security matures or is redeemed, converted or exchanged. While the Fund is permitted to invest in
CLEARWATER INVESTMENT TRUST
Notes to Financial Statements December 31, 2023
securities of any market capitalization, the Fund invests primarily in securities of micro-, small- and medium-sized companies. The Fund may obtain exposure to equity securities through investment in exchange-traded funds and other investment companies. The Fund uses a “multi-style, multi-manager” approach. The Fund’s Adviser allocates portions of the Fund’s assets among subadvisers who employ distinct investment styles. The Fund currently allocates assets among the following subadvisers who provide day-to-day management for the Fund: Cooke & Bieler, L.P., Jackson Square Partners, LLC, Parametric, Pzena Investment Management LLC, Rice Hall James & Associates, LLC and Wasatch Global Investors. The allocation among subadvisers will vary over time, but the current intent of the Fund’s adviser is that under normal market conditions approximately 15% of the Fund’s assets will be allocated to Parametric and the remaining assets will be allocated to one or more of the Fund’s five other subadvisers that provide day-to-day management of the Fund. The percentage of the Fund’s assets allocated to Parametric will change from time to time in the discretion of the Adviser and could be higher or lower in the future. Parametric manages its portion of the Fund’s assets using a passive management strategy to seek investment results that track, before fees and expenses, the investment results of the S&P SmallCap 600® Index as closely as possible without requiring the Fund to realize taxable gains. FCI also acts as a subadviser to the Fund but does not provide day-to-day management.
Under normal market conditions, the Tax-Exempt Bond Fund invests at least 80% of its net assets, plus the amount of any borrowings for investment purposes, in tax-exempt bonds, which are debt obligations issued by or for the U.S. states, territories and possessions and the District of Columbia. The interest on these bonds is generally exempt from both U.S. regular federal income tax and U.S. federal alternative minimum tax. However, the Fund may invest up to 20% of its net assets in bonds that generate interest income subject to federal alternative minimum tax for individuals. The Fund invests in both revenue bonds, which are backed by and payable only from the revenues derived from a specific facility or specific revenue source, and in general obligation bonds, which are secured by the full faith, credit and taxation power of the issuing municipality. The Fund uses a “multi-style, multi-manager” approach. The Fund’s Adviser allocates portions of the Fund’s assets among subadvisers who employ distinct investment styles. The Fund currently allocates assets among the following subadvisers who provide day-to-day management to the Fund: MacKay Shields LLC and Sit Fixed Income Advisors II, LLC. FCI also acts as a subadviser to the Fund but does not provide day-to-day management.
Under normal market conditions, the International Fund intends to invest at least 80% of the value of its net assets, plus the amount of any borrowings for investment purposes, in equity securities of companies organized or located outside the U.S. and doing a substantial amount of business outside the U.S. Equity securities in which the Fund invests include common and preferred stock, sponsored and unsponsored American Depositary Receipts, European Depositary Receipts, Global Depositary Receipts, exchange-traded funds and other investment companies. The Fund diversifies its investments among a number of different countries throughout the world, and may invest in companies of any size. The Fund does not intend to invest more than 20% of its net assets in the equity securities of developing or emerging market issuers (including frontier market issuers). In order to hedge against adverse movements in currency exchange rates, the Fund may enter into foreign currency exchange contracts. The Fund may use options, futures contracts, and options on futures contracts to attempt to manage market or business risks. The Fund does not intend to invest in foreign currency exchange contracts, options, futures contracts, or options on futures contracts for speculative purposes. The Fund uses a “multi-style, multi-manager” approach. The Fund’s assets are allocated to different subadvisers who employ distinct investment styles. The Fund currently allocates assets among the following subadvisers who provide day-to-day management for the Fund: Parametric, Artisan Partners Limited Partnership, WCM Investment Management, LLC and LSV Asset Management. The allocation among subadvisers will vary over time, but the current intent of the Fund’s Adviser is that under normal market conditions approximately 25% of the Fund’s assets will be allocated to Parametric, and the remaining assets will be
CLEARWATER INVESTMENT TRUST
Notes to Financial Statements December 31, 2023
allocated to one or more of the Fund’s three other subadvisers that provide day-to-day management of the Fund. Parametric manages its portion of the Fund’s assets using a passive management strategy to seek investment results that track, before fees and expenses, the investment results of the MSCI World Ex U.S.A. Index - Net Dividends as closely as possible without requiring the Fund to realize taxable gains. FCI also acts as a subadviser to the Fund but does not provide day-to-day management.
(2) Summary of Significant Accounting Policies
The Funds are investment companies and follow accounting and reporting guidance under Financial Accounting Standards Board (“FASB”) Accounting Standards Codification (“ASC”) Topic 946, “Financial Services-Investment Companies.”
The significant accounting policies followed by the Funds are as follows:
(a) Investments in Securities
Investments in U.S. and foreign equity securities are valued at the last sales price or the regular trading session closing price on the principal exchange or market where they are traded. Foreign security values are stated in U.S. dollars. Equity securities which have not traded on the date of valuation or securities for which sales prices are not generally reported are valued at the mean between the last bid and asked prices. Debt securities are valued on the basis of evaluated prices provided by independent pricing services when such prices are believed to reflect the fair value of such securities or broker provided prices. Such prices may be determined by taking into account other similar securities’ prices, yields, maturities, call features, ratings, prepayment speeds, credit risks, cash flows, institutional size trading in similar groups of securities and developments related to specific securities. Shares of open end investment companies are valued at their daily net asset value (“NAV”). Shares of closed-end funds and exchange traded funds are valued at the last sales price or the regular trading session closing price on the principal exchange or market where they are traded.
With respect to the Funds' investments that do not have readily available market quotations, the Board of Trustees has designated the Adviser as the valuation designee to perform fair valuations pursuant to Rule 2a-5 under the 1940 Act. This may occur particularly with respect to certain foreign equity securities held by a Fund, whereby the valuation designee may use adjustment factors obtained from an independent evaluation service that are intended to reflect more accurately the fair value of these foreign securities as of the time the Fund’s NAV is calculated. The use of fair valuation involves the risk that the values used by the Funds to price their investments may be higher or lower than the values used by other unaffiliated investment companies and investors to price the same investments.
Security transactions are accounted for on the trade date, which is the date the securities are purchased or sold. Realized gains and losses are calculated on an identified cost basis. Dividend income is recognized on the ex-dividend date or, for foreign securities, as soon as the information is available. Interest income, is recognized on an accrual basis and includes amortization of premiums and accretion of discounts using the effective yield method.
Non cash dividends are recognized as investment income at the fair value of the property received.
Participatory notes in which the International Fund invests are financial instruments that must have Indian securities as the underlying assets. Brokers and foreign institutional investors registered with the Securities and Exchange Board of India (SEBI) issue the participatory notes and invest on behalf of the foreign investors. Brokers
CLEARWATER INVESTMENT TRUST
Notes to Financial Statements December 31, 2023
must report their participatory note issuance status to the regulatory board each quarter. The notes allow foreign investors to participate in the Indian markets without registering with the SEBI. Participatory notes are categorized within the Level 1 of the fair value hierarchy.
(b) Foreign Currency Translation
The International Fund invests in securities which are purchased and sold in foreign currencies as a principal investment strategy. The costs of purchases, proceeds from sales of investments, interest and dividend income are translated into U.S. dollars using the spot market rate of exchange prevailing on the respective dates of such transactions. The value of the International Fund’s net assets, as measured in U.S. dollars, may be affected favorably or unfavorably by changes in foreign currency exchange rates and exchange control regulations. The gains or losses, if any, on investments resulting from changes in foreign exchange rates are recorded within net realized gain (loss) on security transactions and within net increase (decrease) in unrealized appreciation/depreciation on security transactions on the Statements of Operations. The realized gains or losses, if any, on translation of other assets and liabilities denominated in foreign currencies are recorded within net realized gain (loss) on foreign currency transactions on the Statements of Operations. The International Fund also will incur costs in converting U.S. dollars to local currencies, and vice versa. Risks may arise upon investing in foreign securities including, but not limited to, political, social or economic instability in the country of the issuer, the difficulty of predicting international trade patterns, the possibility of the imposition of exchange controls, expropriation, limits on removal of currency or other assets, nationalization of assets, foreign withholding and income tax and possible delays in the settlement of foreign stock exchange transactions. The principal markets on which these securities trade may have less volume and liquidity, and may be more volatile, than securities markets in the U.S.
(c) Futures Contracts
The Tax-Exempt Bond Fund invests in long and short financial futures contracts for hedging purposes or to gain exposure to interest rate risk. When used as a hedge, the Fund will purchase and sell various kinds of futures contracts. The Fund will also enter into closing purchase and sale transactions with respect to any such futures contracts. The futures contracts may be based on various interest rates or indices. The Fund bears the market risk arising from changes in the value of these financial instruments. At the time the Fund enters into a futures contract, it is generally required to make a margin deposit with the custodian or broker of a specified amount of liquid assets. Futures are marked-to-market each day with the change in value reflected in the unrealized appreciation or depreciation. Risk may arise as a result of the potential inability of the counterparties to meet the terms of their contracts. Credit risk is mitigated to the extent that the exchange on which a particular futures contract is traded assumes the risk of a counterparty defaulting on its obligations under the contract. The Statements of Operations include any realized gains or losses on closed futures contracts within Net realized gain (loss) on: Futures contracts, and any unrealized gains or losses on open futures contracts within Net increase (decrease) in unrealized appreciation/depreciation on: Futures contracts. Additional information on derivative instruments and how these positions may impact the financial statements is found in Note 8, Derivative Instruments.
(d) Forward Foreign Currency Exchange Contracts
The International Fund enters into forward foreign currency exchange contracts for the purchase or sale of a specific foreign currency at a fixed price on a future date as a hedge against adverse movements in foreign currency exchange rates, specific transactions or the portfolio position. The objective of the International Fund’s foreign currency hedging transactions is to reduce the risk that the U.S. dollar value of the International Fund’s foreign currency denominated securities will decline in value due to changes in foreign currency exchange rates. Forward
CLEARWATER INVESTMENT TRUST
Notes to Financial Statements December 31, 2023
foreign currency exchange contracts are marked-to-market daily at the applicable exchange rates. Any resulting unrealized gains or losses are recorded on forward foreign currency exchange contracts within net increase (decrease) in unrealized appreciation/depreciation on the Statements of Operations. The International Fund records any realized gains or losses at the time the forward foreign currency exchange contract is offset by entering into a closing transaction with the same counterparty or is extinguished by delivery of the currency. Realized gains or losses, if any, are recorded within Net realized gain (loss) on forward foreign currency exchange contracts on the Statements of Operations. Risks may arise upon entering into forward foreign currency exchange contracts from the potential of the counterparty to default on its obligations under the contract and from unanticipated movements in the value of a foreign currency relative to the U.S. dollar. The contractual amounts of forward foreign currency exchange contracts do not necessarily represent the amounts potentially subject to risk. The measurement of risks associated with these instruments is meaningful only when all related and offsetting transactions are considered. The International Fund bears the market risk from changes in foreign currency exchange rates and the credit risk if the issuer fails to perform. There were no outstanding forward foreign currency exchange contracts as of December 31, 2023.
(e) Spot Contracts
The International Fund routinely enters into spot contracts in order to buy or sell a certain amount of foreign currency at the current market rate. The International Fund may enter into spot contracts in order to make payments, or to receive payments, based on investment trading activity in a foreign currency. A spot contract allows the International Fund to buy or sell foreign currency on the day it chooses to deal. From time to time, the Core Equity Fund may also enter into spot contracts in order to make or receive payments due to investment trading activity in a foreign currency on a non-U.S. exchange. Spot contracts are marked-to-market daily at the applicable exchange rates. Any resulting unrealized gains or losses are recorded in translation of other assets and liabilities denominated in foreign currencies within net increase (decrease) in unrealized appreciation/depreciation on the Statements of Operations. Unrealized gains or losses on outstanding spot contracts are recorded in payables for investment securities purchased or receivable for securities sold, respectively, on the Statements of Assets and Liabilities. The Funds record any realized gains or losses at the time the spot contract settles. Realized gains or losses, if any, are included within Net realized gain (loss) on foreign currency transactions on the Statements of Operations. Risks may arise upon entering into spot contracts from unanticipated movements in the value of a foreign currency relative to the U.S. dollar in a short period of time. The Funds bear the market risk from changes in foreign currency exchange rates.
(f) Master Limited Partnerships
The International Fund invests in Master Limited Partnerships (“MLPs”). The benefits derived from the Fund's investments in MLPs are largely dependent on the MLPs being treated as partnerships for federal income tax purposes. If any of the MLPs held by the Fund were treated as corporations for U.S. federal income tax purposes, the after-tax return to the Fund with respect to its investments in such MLPs would be materially reduced, causing a decline in the value of the common stock. The Fund must include its allocable share of an MLP’s taxable income in its reportable taxable income, whether or not it receives a distribution in cash from the MLP. In such case, the Fund may have to liquidate securities to make required distributions to shareholders.
CLEARWATER INVESTMENT TRUST
Notes to Financial Statements December 31, 2023
(g) Delayed Delivery Transactions and When-Issued Securities
Certain Funds may engage in securities transactions on a when-issued or delayed-delivery basis. In these transactions, the securities’ prices and yields are fixed on the date of the commitment, with payment and delivery scheduled for a future date. During this period, the securities are subject to market fluctuations. A Fund may dispose of or renegotiate a delayed-delivery transaction, which may result in a capital gain or loss.
(h) Short-Term Investments
The Core Equity, Select Equity, Tax-Exempt Bond and International Funds currently invest in Institutional Shares of the U.S. Government Select Portfolio, a money market portfolio of Northern Institutional Funds, an investment company advised by Northern Trust Investments, Inc. The U.S. Government Select Portfolio primarily invests in securities issued by the U.S. government, government agencies, and government-sponsored enterprises.
(i) Recoverable Taxes
The balances disclosed as foreign tax reclaim receivable, if any, represent net amounts withheld by foreign governments on dividend income earned in the respective countries subject to reclaims. All reclaims are paid directly to the applicable Funds.
(j) Federal Taxes
The Trust’s policy is to comply with the requirements of the Internal Revenue Code applicable to regulated investment companies. On a calendar-year basis, the Funds intend to distribute substantially all of their net investment income and net realized gains, if any, to avoid the payment of federal income and excise taxes. Therefore, no income tax provision is required. Each Fund is treated as a separate entity for federal income tax purposes.
The Funds may be subject to taxes imposed by countries in which they invest. Such taxes are generally based on income and/or capital gains earned. Taxes are accrued based on net investment income, net realized gains and net unrealized appreciation as such income and/or gains are recorded. Taxes accrued on unrealized gains are reflected as a liability on the Statements of Assets and Liabilities under the caption deferred foreign capital gains taxes payable and as a reduction in net increase (decrease) in unrealized appreciation/depreciation on security transactions on the Statements of Operations. When assets subject to capital gains tax are sold, accrued taxes are relieved, and the actual amount of the taxes paid is reflected on the Statements of Operations as a reduction in net realized gain (loss) on security transactions.
Management has analyzed the Funds’ tax positions taken on federal tax returns for all open tax years and has concluded that as of December 31, 2023, no provision for income tax is required in the Funds’ financial statements. The Funds’ federal and state income and federal excise tax returns for the 2020, 2021, 2022, and 2023 tax years for which the applicable statutes of limitations have not expired remain subject to examination by the Internal Revenue Service and state departments of revenue. Net investment income and net realized gain (loss) for the Funds may differ for financial statement and tax purposes. The character of distributions made during the year from net investment income or net realized gains, if any, may differ from their ultimate characterization for federal income tax purposes. Also, due to the timing of dividend distributions, the fiscal year in which amounts are distributed may differ from the year that the income or realized gain was recorded by the Funds. The Trust has analyzed the Funds’ tax positions and has concluded that no liability for unrecognized tax benefits should be recorded related to uncertain tax positions. Further, the Trust is not aware of any tax positions for which it is reasonably possible that
CLEARWATER INVESTMENT TRUST
Notes to Financial Statements December 31, 2023
the total amounts of unrecognized tax benefits will significantly change in the next twelve months. The tax character of distributions by the Funds during the years ended December 31, 2023 and 2022 was as follows:
| | | | |
| | Tax-Exempt | | Ordinary Income |
| | 2023 | | 2022 | | 2023 | | 2022 |
| Core Equity Fund | $ — | | $ — | | $ 12,223,108 | | $ 9,858,156 |
| Select Equity Fund | — | | — | | 1,761,996 | | 3,612,091 |
| Tax-Exempt Bond Fund | 27,234,076 | | 24,829,757 | | 1,611,581 | | 398,516 |
| International Fund | — | | — | | 23,498,478 | | 8,561,325 |
| | | | | | | | |
| | | | |
| | Long-Term Capital Gains | | Tax Return of Capital |
| | 2023 | | 2022 | | 2023 | | 2022 |
| Core Equity Fund | $ — | | $ 893,896 | | $ 129,066 | | $ — |
| Select Equity Fund | — | | 4,513,527 | | 134,871 | | — |
| Tax-Exempt Bond Fund | — | | 4,760,355 | | — | | — |
| International Fund | — | | 3,026,118 | | — | | — |
| | | | | | | | |
As of December 31, 2023, the components of distributable earnings on a tax basis were as follows:
| | Core
Equity Fund | | Select Equity Fund | | Tax-Exempt
Bond Fund | | International
Fund |
| Undistributed ordinary income | $ — | | $ — | | $ — | | $ 2,118,924 |
| Undistributed tax-exempt income | — | | — | | 229,215 | | — |
| Accumulated capital losses and other | (22,084,993) | | (53,102,319) | | (19,462,085) | | (1,881,157) |
| Unrealized appreciation/depreciation | 421,662,569 | | 46,292,045 | | (58,337,431) | | 256,109,271 |
| Other temporary differences | — | | — | | (288,014) | | — |
| Total | $ 399,577,576 | | $ (6,810,274) | | $ (77,858,315) | | $ 256,347,038 |
Distributions to shareholders are determined in accordance with federal income tax regulations, which may differ from such amounts recorded in accordance with U.S. generally accepted accounting principles ("U.S. GAAP") for financial reporting purposes. Accordingly, the Funds may make reclassifications among certain of their capital accounts in order to reflect the tax treatment for certain permanent differences that exist between federal income tax regulations and U.S. GAAP. These reclassifications are reported in order to reflect the tax treatment for certain permanent differences that exist between income tax regulations and U.S. GAAP. The primary reasons for permanent differences are the Funds realization of gains on in-kind redemptions that are not recognized for tax purposes. These reclassifications have no impact on the total net assets or the NAV per share of the Funds. At
CLEARWATER INVESTMENT TRUST
Notes to Financial Statements December 31, 2023
December 31, 2023, reclassifications have been recorded among the following capital accounts on the Statements of Assets and Liabilities:
| | Core
Equity Fund | | Select Equity Fund | | Tax-Exempt
Bond Fund | | International
Fund |
| Distributable earnings | $ (27,714,265) | | $ (2,993,556) | | $ — | | $ (11,225,680) |
| Additional paid-in capital | 27,714,265 | | 2,993,556 | | — | | 11,225,680 |
(k) Distributions to Shareholders
Distributions to shareholders from net investment income, if any, are declared annually for the Core Equity, Select Equity and International Funds and declared daily, payable monthly, for the Tax-Exempt Bond Fund. Distributions to shareholders from net realized gains, if any, are declared annually for all Funds. Distributions are paid in cash or reinvested in additional shares at the direction of the shareholders.
(l) Use of Estimates
The preparation of financial statements in conformity with U.S. GAAP requires management to make estimates and assumptions that affect the reported amounts of assets and liabilities and disclosure of contingent assets and liabilities at the date of the financial statements and the reported amounts of increase and decrease in net assets from operations during the period. Actual results could differ from those estimates.
(m) Indemnification
Under each Fund’s organizational documents, its officers and directors are indemnified against certain liabilities arising out of the performance of their duties to each Fund. In addition, certain of each Fund’s contracts with its service providers contain general indemnification clauses. Each Fund’s maximum exposure under these arrangements is unknown since the amount of any future claims that may be made against each Fund cannot be determined and each Fund has no historical basis for predicting the likelihood of any such claims. The Funds believe that the likelihood of any such claims is remote.
(n) Cash and Restricted Cash
Cash, including cash denominated in foreign currencies, represents cash on hand and demand deposits held at financial institutions. Cash equivalents include short-term, highly liquid investments of sufficient credit quality that are readily convertible to known amounts of cash and have original maturities of three months or less. Cash equivalents are carried at cost, plus accrued interest, which approximates fair value. Cash equivalents are held to meet short-term liquidity requirements, rather than for investment purposes. Cash and cash equivalents are held at major financial institutions and are subject to credit risk to the extent those balances exceed applicable Federal Deposit Insurance Corporation (FDIC) or Securities Investor Protection Corporation (SIPC) limitations.
Restricted cash is subject to a legal or contractual restriction by third parties as well as a restriction as to withdrawal or use, including restrictions that require the funds to be used for a specified purpose and restrictions that limit the purpose for which the funds can be used. The Funds consider cash collateral posted with counterparties for derivative contracts to be restricted cash.
CLEARWATER INVESTMENT TRUST
Notes to Financial Statements December 31, 2023
(3) Fair Value Measurements
Fair value is an estimate of the price the Funds would receive upon selling a security in a timely transaction to an independent buyer in the principal or most advantageous market for the security. This guidance establishes a three-tier hierarchy to maximize the use of observable market data and minimize the use of unobservable inputs and to establish classification of fair value measurements for disclosure purposes. Various inputs are used in determining the value of the Funds’ investments, as described in Note 2(a). These inputs are summarized in the three broad levels listed below.
| • | Level 1 – Unadjusted quoted market prices in active markets for identical securities on the measurement date. |
| • | Level 2 – Other significant observable inputs including quoted prices for similar investments, interest rates, prepayment speeds, credit risk, etc. or quoted prices for identical or similar assets in markets that are not active. Inputs that are derived principally from or corroborated by observable market data are also considered Level 2 measurement. An adjustment to any observable input that is significant to the fair value may render the measurement a Level 3 measurement. |
| • | Level 3 – Valuations based on unobservable inputs, which may include the Adviser’s own assumptions in determining the fair value of an investment. |
The inputs or methodology used for valuing securities are not necessarily an indication of the risk associated with investing in those securities and other financial instruments, if any. The following is a summary of the inputs used in valuing each Fund’s investments and other financial instruments, if any, which are carried at fair value, as of December 31, 2023.
| | Core Equity Fund (a) |
| | Level 1 | Level 2 | Level 3 | Total |
| Common Stocks | $ 867,037,507 | $ — | $ — | $ 867,037,507 |
| Escrows | — | — | —* | — |
| Rights | — | — | —* | — |
| Short-Term Investments | 5,157,828 | — | — | 5,157,828 |
| Total | $ 872,195,335 | $ — | $ — | $ 872,195,335 |
| * Security has been deemed worthless and is a Level 3 investment. |
(a) For the Core Equity Fund, the investment value is comprised of equity securities, escrows, rights and short-term investments. See the Fund’s Schedule of Investments for industry classification. Investments in equity and short-term securities generally are valued at the last sales price or the regular trading session closing price on the principal exchange or market where they are traded. Investments in rights generally are determined by taking into account the terms of the rights as well as the value of the underlying equity securities, which are determined by the valuation methodology described above.
There were no significant Level 3 valuations at December 31, 2023.
CLEARWATER INVESTMENT TRUST
Notes to Financial Statements December 31, 2023
| | Select Equity Fund (b) |
| | Level 1 | Level 2 | Level 3 | Total |
| Common Stocks | $ 418,351,721 | $ — | $ —* | $ 418,351,721 |
| Escrows | — | — | —* | — |
| Short-Term Investments | 9,532,398 | — | — | 9,532,398 |
| Total | $ 427,884,119 | $ — | $ — | $ 427,884,119 |
| * Security has been deemed worthless and is a Level 3 investment. |
(b) For the Select Equity Fund, the investment value is comprised of equity securities, escrows and short-term investments. See the Fund’s Schedule of Investments for industry classification. Investments in equity and short-term securities generally are valued at the last sales price or the regular trading session closing price on the principal exchange or market where they are traded.
There were no significant Level 3 valuations at December 31, 2023.
| | Tax-Exempt Bond Fund (c) |
| | Level 1 | Level 2 | Level 3 | Total |
| Closed-End Funds | $ 24,958,207 | $ — | $ — | $ 24,958,207 |
| Municipal Bonds | | | | |
| Alabama | — | 1,561,804 | — | 1,561,804 |
| Alaska | — | 385 | — | 385 |
| Arizona | — | 8,936,063 | — | 8,936,063 |
| Arkansas | — | 2,722,071 | — | 2,722,071 |
| California | — | 34,866,144 | — | 34,866,144 |
| Colorado | — | 24,192,196 | — | 24,192,196 |
| Connecticut | — | 2,795,400 | — | 2,795,400 |
| District of Columbia | — | 7,142,632 | — | 7,142,632 |
| Florida | — | 91,526,267 | — | 91,526,267 |
| Georgia | — | 5,931,623 | — | 5,931,623 |
| Idaho | — | 6,575,119 | — | 6,575,119 |
| Illinois | — | 29,186,066 | — | 29,186,066 |
| Indiana | — | 11,154,078 | — | 11,154,078 |
| Iowa | — | 8,511,591 | — | 8,511,591 |
| Kansas | — | 2,281,502 | — | 2,281,502 |
| Kentucky | — | 5,426,958 | — | 5,426,958 |
| Louisiana | — | 13,873,537 | — | 13,873,537 |
| Maine | — | 2,534,046 | — | 2,534,046 |
| Maryland | — | 5,920,306 | — | 5,920,306 |
| Massachusetts | — | 16,444,655 | — | 16,444,655 |
| Michigan | — | 26,014,214 | — | 26,014,214 |
| Minnesota | — | 12,392,557 | — | 12,392,557 |
CLEARWATER INVESTMENT TRUST
Notes to Financial Statements December 31, 2023
| | Tax-Exempt Bond Fund (c) |
| | Level 1 | Level 2 | Level 3 | Total |
| Mississippi | $ — | $ 1,264,268 | $ — | $ 1,264,268 |
| Missouri | — | 12,234,345 | — | 12,234,345 |
| Montana | — | 3,132,074 | — | 3,132,074 |
| Nebraska | — | 3,531,859 | — | 3,531,859 |
| Nevada | — | 4,733,699 | — | 4,733,699 |
| New Hampshire | — | 2,666,484 | — | 2,666,484 |
| New Jersey | — | 19,634,294 | — | 19,634,294 |
| New Mexico | — | 12,778,266 | — | 12,778,266 |
| New York | — | 41,439,127 | — | 41,439,127 |
| North Carolina | — | 10,468,727 | — | 10,468,727 |
| North Dakota | — | 5,901,744 | — | 5,901,744 |
| Ohio | — | 24,896,301 | — | 24,896,301 |
| Oklahoma | — | 6,168,043 | — | 6,168,043 |
| Oregon | — | 5,478,372 | — | 5,478,372 |
| Pennsylvania | — | 14,026,778 | — | 14,026,778 |
| Puerto Rico | — | 1,507,278 | — | 1,507,278 |
| Rhode Island | — | 918,672 | — | 918,672 |
| South Carolina | — | 8,787,495 | — | 8,787,495 |
| South Dakota | — | 1,579,503 | — | 1,579,503 |
| Tennessee | — | 15,243,288 | — | 15,243,288 |
| Texas | — | 57,970,182 | — | 57,970,182 |
| Utah | — | 39,289,120 | — | 39,289,120 |
| Vermont | — | 359,605 | — | 359,605 |
| Virgin Islands, U.S. | — | 495,460 | — | 495,460 |
| Virginia | — | 10,468,470 | — | 10,468,470 |
| Washington | — | 8,682,171 | — | 8,682,171 |
| West Virginia | — | 4,367,858 | — | 4,367,858 |
| Wisconsin | — | 10,794,750 | — | 10,794,750 |
| Short-Term Investments | 20,108,356 | — | — | 20,108,356 |
| Total | $ 45,066,563 | $ 648,807,447 | $ — | $ 693,874,010 |
(c) For the Tax-Exempt Bond Fund, the investment value is comprised of closed-end funds, municipal bonds and short-term investments. Investments in closed-end funds and short-term securities generally are valued at the last sales price or the regular trading session closing price on the principal exchange or market where they are traded. Investments in municipal bonds generally are based on valuations using adjusted evaluated prices provided by the primary pricing provider. The Board of Trustees has designated to the Adviser the responsibility to determine in good faith the fair value of securities for which no price quotation is available from an approved pricing service or broker-dealer at the time the Tax-Exempt Bond Fund’s NAV is calculated, including securities for which the prices do not represent fair value or for which a significant event occurs that materially affects the value of the security
CLEARWATER INVESTMENT TRUST
Notes to Financial Statements December 31, 2023
after the close of the market on which the security principally trades and before the time the Tax-Exempt Bond Fund’s NAV is calculated.
Tax-Exempt Bond Fund
Other Financial Instruments | | Level 1 | | Level 2 | | Level 3 | | Total |
| Liabilities | | | | | | | | |
| Futures Contracts | | $ (4,401,978) | | $ — | | $ — | | $ (4,401,978) |
The futures contracts outstanding at December 31, 2023 are considered Level 1 investments due to the contracts being marked-to-market daily at the applicable exchange rates that have been adjusted from the initial quoted rate. Futures contracts are shown on a gross basis in the above table, but the net increase/(decrease) in unrealized appreciation/(depreciation) on futures contracts is shown on the Statements of Operations.
| | International Fund (d) |
| | Level 1 | Level 2 | Level 3 | Total |
| Common Stocks | | | | |
| Brazil | $ 2,112,003 | $ 5,601,133 | $ — | $ 7,713,136 |
| Egypt | — | 724,032 | — | 724,032 |
| Israel | — | 2,742,692 | — | 2,742,692 |
| Russia | — | — | —* | — |
| Saudi Arabia | — | 3,673,945 | — | 3,673,945 |
| South Korea | — | 26,502,862 | — | 26,502,862 |
| Thailand | — | 1,077,373 | — | 1,077,373 |
| All other countries | 925,458,838 | — | — | 925,458,838 |
| Participatory Notes | 4,749,764 | — | — | 4,749,764 |
| Preferred Stocks | 2,333,750 | 4,592,653 | — | 6,926,403 |
| Warrants | — | — | —* | — |
| Short-Term Investments | 46,156,002 | — | — | 46,156,002 |
| Total | $ 980,810,357 | $ 44,914,690 | $ — | $1,025,725,047 |
| * Security has been deemed worthless and is a Level 3 investment. |
(d) For the International Fund, the investment value is comprised of equity securities, participatory notes, preferred stocks, warrants and short-term investments. See the Fund’s Schedule of Investments for additional information on industry sector and currency concentration information. Investments in equity and short-term securities generally are valued at the last sales price or the regular trading session closing price on the principal exchange or market where they are traded.
There were no significant Level 3 valuations at December 31, 2023.
CLEARWATER INVESTMENT TRUST
Notes to Financial Statements December 31, 2023
(4) Investment Security Transactions
The cost of purchases and proceeds from sales of securities (excluding short-term securities) for the year ended December 31, 2023, were as follows:
| | | Purchases | | Sales |
| Core Equity Fund | | $ 526,763,335 | | $ 542,040,746 |
| Select Equity Fund | | 186,809,622 | | 192,567,189 |
| Tax-Exempt Bond Fund | | 413,134,298 | | 286,244,891 |
| International Fund | | 265,022,064 | | 290,822,736 |
| | | | | |
| | | | | |
The difference between book basis and tax basis net unrealized appreciation (depreciation) is attributable primarily to the tax deferral of losses on wash sales, deferral of post-October capital losses for tax purposes, and the recharacterization of income recognition on investments in passive foreign investment companies.
At December 31, 2023, for federal income tax purposes, gross unrealized appreciation, gross unrealized depreciation, net unrealized appreciation (depreciation) on investments (including the effects of foreign currency translation and derivative instruments, if any) and the cost basis of investments (including derivative instruments, if any) were as follows:
| Funds | | Unrealized
Appreciation | | Unrealized
Depreciation | | Net
Appreciation
(Depreciation) | | Cost Basis of
Investments |
| Core Equity Fund | | $ 422,449,757 | | $ (787,185) | | $ 421,662,572 | | $ 450,532,763 |
| Select Equity Fund | | 77,635,274 | | (31,343,229) | | 46,292,045 | | 381,591,387 |
| Tax-Exempt Bond Fund | | 12,125,011 | | (70,462,443) | | (58,337,432) | | 747,809,464 |
| International Fund | | 294,175,319 | | (37,238,169) | | 256,937,150 | | 768,787,897 |
| | | | | | | | | |
| | | | | | | | | |
(5) Capital Share Transactions
Transactions in capital shares for the years ended December 31, 2023 and 2022 were as follows:
| | Core Equity Fund | | Select Equity Fund |
| | 2023 | | 2022 | | 2023 | | 2022 |
| Sold | 1,102,343 | | 3,253,680 | | 1,179,421 | | 6,428,117 |
| Issued for reinvestment of distributions | 180,238 | | 185,284 | | 107,698 | | 529,356 |
| Redeemed | (1,543,257) | | (3,531,380) | | (1,776,719) | | (9,785,689) |
| Net increase (decrease) | (260,676) | | (92,416) | | (489,600) | | (2,828,216) |
CLEARWATER INVESTMENT TRUST
Notes to Financial Statements December 31, 2023
| | Tax-Exempt Bond Fund | | International Fund |
| | 2023 | | 2022 | | 2023 | | 2022 |
| Sold | 28,837,453 | | 28,665,852 | | 2,413,778 | | 9,105,670 |
| Issued for reinvestment of distributions | 3,371,399 | | 3,372,319 | | 1,225,155 | | 678,819 |
| Redeemed | (18,032,068) | | (38,269,711) | | (4,162,141) | | (9,177,483) |
| Net increase (decrease) | 14,176,784 | | (6,231,540) | | (523,208) | | 607,006 |
(6) Capital Loss Carryforward
At December 31, 2023, the Funds had the following short term capital loss carry-forwards and long term capital loss carry forwards available to offset future net capital gains which do not expire. Future utilization of the capital loss carry-forward may be limited. During the year ended December 31, 2023, the International Fund utilized $11,492,286 in capital loss carryforwards to offset capital gains.
| | Short-Term | Long-Term | Total |
| Core Equity Fund | $ 22,084,993 | $ — | $ 22,084,993 |
| Select Equity Fund | 34,001,571 | 19,076,488 | 53,078,059 |
| Tax-Exempt Bond Fund | 2,162,268 | 17,299,817 | 19,462,085 |
| International Fund | 1,881,157 | — | 1,881,157 |
(7) Expenses and Related-Party Transactions
The Trust has a contract for investment advisory services with the Adviser. Under terms of separate agreements, Core Equity Fund, Select Equity Fund, Tax-Exempt Bond Fund and International Fund each pay an investment advisory fee equal to an annual rate of 0.90%, 1.35%, 0.60% and 1.00%, respectively, of each Fund’s average daily net assets. Management fees are calculated and accrued daily, and are paid quarterly. The Adviser is responsible for the payment or reimbursement of all the Funds’ expenses, except brokerage, taxes, interest, and extraordinary
CLEARWATER INVESTMENT TRUST
Notes to Financial Statements December 31, 2023
expenses. The Adviser has periodically modified its management fee for each of the Funds through voluntary waivers. For the year ended December 31, 2023, voluntary waivers on management fees were as follows:
| | Management Fees Voluntary Waivers |
| | Voluntary Waiver % Prior to April 1, 2023 | | Voluntary Waiver % Effective from April 1, 2023 to October 1, 2023 | | Voluntary Waiver % Effective October 1, 2023 |
| Core Equity Fund | (0.62) | | (0.65) | | (0.65) |
| Select Equity Fund | (0.38) | | (0.38) | | (0.41) |
| Tax-Exempt Bond Fund | (0.31) | | (0.31) | | (0.29) |
| International Fund | (0.29) | | (0.30) | | (0.28) |
Effective January 1, 2023, the net management fees actually paid for the Core Equity Fund, Tax-Exempt Bond Fund and International Fund due to the Adviser’s modification of the voluntary waivers for those Funds were 0.28%, 0.29% and 0.71%, respectively. Effective April 1, 2023, the net management fees actually paid for the Core Equity Fund and International Fund due to the Adviser’s modification of the voluntary waivers for those Funds were 0.25% and 0.70%, respectively. Effective October 1, 2023, the net management fees actually paid for the Select Equity Fund, Tax-Exempt Bond Fund and International Fund due to the Adviser’s modification of the voluntary waivers for those Funds were 0.94%, 0.31% and 0.72%, respectively.
The Adviser currently intends to continue these voluntary waivers indefinitely. However, the Adviser may terminate these voluntary arrangements at any time.
In addition to fees and expenses which the Funds bear directly, the Funds indirectly bear a pro rata share of the fees and expenses of any acquired funds in which they invest, such as short-term investments in mutual funds or other investment companies and investments in closed-end funds. Such indirect expenses are not included in any of the reported expense ratios and are excluded from the voluntary waivers described above.
The Adviser has entered into subadvisory contracts with independent investment advisory firms for each Fund to provide daily investment management services. The subadvisory fees are based on each subadviser’s proportional net assets it currently manages within each Fund and are paid directly by the Adviser.
The Adviser has also engaged FCI as a subadviser for each Fund. FCI regularly provides the Funds with various investment-related services, including investment strategy advice, manager recommendations and related duties as requested by the Adviser. FCI also provides certain services related to due diligence, performance reporting, compliance, and other administrative functions, which support the investment management services and subadviser oversight services provided to the Trust by the Adviser. For its services, FCI is compensated with a subadvisory fee payable by the Adviser of 0.20% of each Fund’s average daily net assets, paid on a quarterly basis. FCI is compensated out of the investment advisory fees the Adviser receives from the respective Funds. FCI has agreed to waive the difference between the amount calculated under the subadvisory fee schedule and an amount
CLEARWATER INVESTMENT TRUST
Notes to Financial Statements December 31, 2023
determined by multiplying the total number of hours worked by FCI in providing services under the subadvisory agreement by an hourly rate that is approved by the Adviser.
(8) Derivative Instruments
Information concerning the types of derivatives in which the Tax-Exempt Bond Fund invests, the objectives for using them and their related risks can be found in Note 2 (c). Below are the types of derivatives held in the Tax-Exempt Bond Fund by location as presented in the Statements of Assets and Liabilities as of December 31, 2023, with additional detail on the net amounts impacting the Statements of Assets and Liabilities. The futures contracts presented below are not subject to master netting agreements or other similar agreements.
| ASSETS | LIABILITIES |
| Name of Fund | Derivative Type | Statements of Assets and
Liabilities Location | Value | | Statements of Assets and
Liabilities Location | Value | Counterparty |
| Tax-Exempt Bond Fund | Futures contracts | Unrealized appreciation
on futures contracts | $ — | | Unrealized depreciation
on futures contracts | $4,401,978* | RBC Capital Markets, LLC/J.P. Morgan Securities, LLC |
| * | Represents cumulative appreciation/depreciation on futures contracts as in the Schedules of Investments. Only the variation margin receivable/payable is reported within the Statements of Assets and Liabilities for futures contracts. |
The following table sets forth, by primary risk exposure, the Tax-Exempt Bond Fund's net realized gain (loss) and net increase (decrease) in appreciation/depreciation on futures contracts for the year ended December 31, 2023:
| Name of Fund | Derivative Type | Statements of
Operations Location | Value | | Name of Fund | Derivative Type | Statements of
Operations Location | Value |
| Tax-Exempt Bond Fund | Futures contracts | Net realized gain (loss)
on futures contracts | $ 6,075,622 | | Tax-Exempt Bond Fund | Futures contracts | Net increase
(decrease) in
unrealized
appreciation/
depreciation
on futures contracts | $ (5,572,877) |
| | | | | | | | | |
Derivative transactions are measured in terms of the notional amount. The following table presents, for the Tax-Exempt Bond Fund, the number of transactions and weighted average notional amount of futures contracts, which is indicative of the volume of derivative activity, for the year ended December 31, 2023.
| Tax-Exempt Bond Fund |
| Future Contracts |
Number of
Transactions | Weighted
Average Notional
Amount |
| 1,155 | $ 13,572,707 |
CLEARWATER INVESTMENT TRUST
Notes to Financial Statements December 31, 2023
(9) Short-term Financing
ReFlow Fund, LLC ("ReFlow") provides each Fund with a potential source of cash to meet net shareholder redemptions through share purchases for a fee. The Fund then generally redeems those shares when it experiences net sales. The shares may be redeemed in-kind in accordance with the Fund’s redemption in-kind policies. The Fund is generally required to redeem the shares purchased by ReFlow within 30 days (15 days if redeemed in-kind). As such, the proceeds received from ReFlow’s purchase of fund shares is treated as a liability on the Statements of Assets and Liabilities. The fee paid on outstanding shares owned by ReFlow is based on an auction starting at a minimum bid of 0.20% prior to November 1, 2023, and 0.14% thereafter, and is paid by the Adviser under the unified advisory fee agreement. For the year ended December 31, 2023, the Core Equity Fund had total redemptions in kind of $39,365,088, resulting in realized gains of $26,992,095. For the year ended December 31, 2023, the Select Equity Fund had total redemptions in kind of $4,785,522, resulting in realized gains of $3,123,013. For the year ended December 31, 2023, the International Fund had total redemptions in kind of $20,592,800, resulting in realized gains of $11,117,364. These realized gains are not recognized for tax purposes as discussed in Note 2. During the year ended December 31, 2023, the Funds had the following activity:
| | Average Amount
Oustanding for
Days in Use | | Days Used |
| Core Equity Fund | $ 9,745 | | 155 |
| Select Equity Fund | 11,799 | | 56 |
| International Fund | 23,197 | | 112 |
| | | | |
| | | | |
(10) Portfolio Securities Loaned
The Select Equity Fund and the International Fund participate in a securities lending program and have loaned portions of their investment portfolios during the year ended December 31, 2023. Under the program, the Funds loan securities to borrowers who post collateral for those loaned securities. The Securities Finance Trust Company serves as the Funds’ securities lending agent (the lending agent) who operates and maintains the securities lending program. The loans are governed by a securities lending agreement between the lending agent, acting on behalf of the Funds, and each borrowing counterparty. The fair value of securities on loan as of December 31, 2023 is recognized within investments in securities, at fair value, on the Statements of Assets and Liabilities.
Each borrower receives a negotiated interest rate, which is generally referred to as the rebate rate, on the cash that it delivers to the Funds as collateral for the securities loaned and agrees to pay a negotiated rate with respect to the loaned securities. The amount of these rates for each securities lending transaction may differ depending on several factors, including the demand for the security, tax considerations and the credit quality of the borrower. A net payment is generally made by the borrower with respect to these rates upon termination of the loan (the Net Rate). The value of the securities loan will be marked-to-market daily, and the borrower will be required to provide additional collateral if the posted amount falls below certain negotiated levels, and the lending agent (on behalf of the Funds) will be required to return collateral to the borrower if the amount of collateral posted is greater than such negotiated levels.
CLEARWATER INVESTMENT TRUST
Notes to Financial Statements December 31, 2023
During the reporting period, the cash collateral received from borrowers related to the Funds’ securities lending activities was invested in the Institutional Shares of Fidelity Investments Money Market Government Portfolio and the daily residual was swept into the Northern Institutional Fund-U.S Government Select Portfolio. The short-term investments purchased with the cash collateral in the amount of $581,616 and $8,061,365 are included in Investments in Securities on the Statements of Assets and Liabilities of the Select Equity Fund and International Fund, respectively.
The Funds provide compensation to the lending agent in connection with operating and maintaining the securities lending program. The lending agent is compensated in an amount of 15% of gross revenues for the 12 month period commencing as of implementation date. The fee will then be increased to 20% for the first $1 million of gross revenues and 15% of any gross revenues in excess of $1 million. The revenues derived from the securities lending activities of the Funds depend on many factors, including the value of the securities available to be loaned, the demand for the securities available to be loaned, the actual percentage of the Fund’s securities that are on loan (the utilization rate), the amount earned from the investment of any collateral and the amount of the fees or profit retained by the lending agent. All compensation, costs and expenses associated with the securities lending program are considered transaction charges that are borne by the Funds and are not an obligation of the Manager under the securities lending agency agreement. These transaction charges are netted with the income from securities lending and included in net income from securities loaned on the accompanying Statements of Operations.
The Funds’ securities lending program involves certain risks, including counterparty or borrower risk, collateral investment risk, replacement risk, operational, legal, tax and accounting risks. In the event the borrower does not meet its contractual obligation to return the securities, the Funds may be exposed to the risk of loss of reacquiring the loaned securities at prevailing market prices using the proceeds of the sale of the collateral.
The following is information on the securities lending activities by the lending agent as of December 31, 2023:
| | Gross Amounts of
Securities Loaned in
Statements of Assets
and
Liabilities | % of Net Assets | Cash Collateral
Received |
| Select Equity Fund | $ 568,323 | 0.13 % | $ 581,616 |
| International Fund | 7,192,387 | 0.71 % | 8,061,365 |
At December 31, 2023, there were no offsetting of securities and they are presented on a gross basis.
(11) Recent Market Events
U.S. and international markets have experienced significant periods of volatility due to a number of economic, political and global macro factors including the impact of global diseases and related public health issues, growth concerns in the U.S. and overseas, rising and high interest rates, trade tensions, and armed conflicts in multiple locations. In particular, the events have resulted in disruptions to supply chains and customer activity, stress on the global healthcare system, cancellations and market declines. Related political, social and economic disruptions may also exacerbate other pre-existing political, social and economic risks in certain countries. It is not possible to know the extent of these impacts, and they may be short term or may last for an extended period of time. These developments as well as other events could result in further market volatility and negatively affect financial asset prices, the liquidity of certain securities and the normal operations of securities exchanges and other markets,
CLEARWATER INVESTMENT TRUST
Notes to Financial Statements December 31, 2023
despite government efforts to address market disruptions. As a result, the risk environment remains elevated. The Adviser will monitor developments and seek to manage each Fund in a manner consistent with achieving the Fund’s investment objective, but there can be no assurance that it will be successful in doing so.
(12) Subsequent Events
Effective January 1, 2024, CMC has voluntarily agreed to waive a portion of the management fee for the Core Equity Fund, Select Equity Fund, Tax-Exempt Bond Fund and International Fund to achieve an effective management fee rate equal to 0.26%, 0.96%, 0.32% and 0.73%, respectively, of each Fund’s average daily net assets. It is CMC’s current intent to continue these fee reductions indefinitely. Nonetheless, the investment manager may terminate any voluntary fee reduction at any time.
Management has evaluated subsequent events for the Funds through the date the financial statements were issued and has concluded that there are no additional events that require financial statement disclosure and/or adjustments to the financial statements.
CLEARWATER INVESTMENT TRUST
Schedule of Investments - Clearwater Core Equity Fund
December 31, 2023
| Shares | | Security | | Cost | | Fair value (a) | | Percent of
net assets |
| Common Stocks: | | | | | | |
| Communication Services: | | | | | | |
| 132,892 | | ALPHABET, INC., CLASS A(b) | | $ 5,325,209 | | 18,563,684 | | |
| 78,260 | | ALPHABET, INC., CLASS C(b) | | 3,696,186 | | 11,029,182 | | |
| 83,117 | | AT&T, INC. | | 1,151,568 | | 1,394,703 | | |
| 1,429 | | CHARTER COMMUNICATIONS, INC., CLASS A(b) | | 491,189 | | 555,424 | | |
| 67,600 | | COMCAST CORP., CLASS A | | 1,026,668 | | 2,964,260 | | |
| 8,300 | | ELECTRONIC ARTS, INC. | | 116,945 | | 1,135,523 | | |
| 3,500 | | FOX CORP., CLASS A | | 108,355 | | 103,845 | | |
| 1,800 | | FOX CORP., CLASS B | | 51,499 | | 49,770 | | |
| 3,574 | | INTERPUBLIC GROUP OF (THE) COS., INC. | | 55,609 | | 116,655 | | |
| 183 | | LIBERTY GLOBAL LTD., CLASS A(b) | | 1,707 | | 3,252 | | |
| 1,900 | | LIVE NATION ENTERTAINMENT, INC.(b) | | 130,374 | | 177,840 | | |
| 1,138 | | MATCH GROUP, INC.(b) | | 33,597 | | 41,537 | | |
| 54,851 | | META PLATFORMS, INC., CLASS A(b) | | 6,723,514 | | 19,415,060 | | |
| 5,874 | | NETFLIX, INC.(b) | | 1,261,830 | | 2,859,933 | | |
| 2,675 | | NEWS CORP., CLASS A | | 12,252 | | 65,671 | | |
| 2,595 | | OMNICOM GROUP, INC. | | 81,950 | | 224,494 | | |
| 6,200 | | PARAMOUNT GLOBAL, CLASS B | | 66,996 | | 91,698 | | |
| 11,646 | | PLAYTIKA HOLDING CORP.(b)(c) | | 106,636 | | 101,553 | | |
| 2,000 | | TAKE-TWO INTERACTIVE SOFTWARE, INC.(b) | | 216,815 | | 321,900 | | |
| 13,937 | | T-MOBILE U.S., INC. | | 1,097,267 | | 2,234,519 | | |
| 37,983 | | VERIZON COMMUNICATIONS, INC. | | 1,170,308 | | 1,431,959 | | |
| 24,518 | | WALT DISNEY (THE) CO. | | 486,137 | | 2,213,730 | | |
| 8,502 | | WARNER BROS. DISCOVERY, INC.(b) | | 79,548 | | 96,753 | | |
| | | | | 23,492,159 | | 65,192,945 | | 7.48% |
| Consumer Discretionary: | | | | | | |
| 5,800 | | AIRBNB, INC., CLASS A(b) | | 786,456 | | 789,612 | | |
| 158,111 | | AMAZON.COM, INC.(b) | | 11,994,063 | | 24,023,385 | | |
| 14,300 | | APTIV PLC(b)(c) | | 1,242,313 | | 1,282,996 | | |
| 23,316 | | AUTONATION, INC.(b) | | 2,768,302 | | 3,501,597 | | |
| 1,319 | | AUTOZONE, INC.(b) | | 1,572,143 | | 3,410,420 | | |
| 3,400 | | BATH & BODY WORKS, INC. | | 107,274 | | 146,744 | | |
| 10,519 | | BEST BUY CO., INC. | | 456,135 | | 823,427 | | |
| 1,289 | | BOOKING HOLDINGS, INC.(b) | | 2,757,890 | | 4,572,367 | | |
| 24,600 | | BORGWARNER, INC. | | 794,298 | | 881,910 | | |
| 2,900 | | CAESARS ENTERTAINMENT, INC.(b) | | 114,937 | | 135,952 | | |
| 2,168 | | CARMAX, INC.(b) | | 58,264 | | 166,372 | | |
| 13,300 | | CARNIVAL CORP.(b) | | 118,105 | | 246,582 | | |
| 400 | | CHIPOTLE MEXICAN GRILL, INC.(b) | | 558,552 | | 914,784 | | |
| 4,400 | | D.R. HORTON, INC. | | 453,043 | | 668,712 | | |
| 1,700 | | DARDEN RESTAURANTS, INC. | | 112,210 | | 279,310 | | |
| 5,900 | | EBAY, INC. | | 115,326 | | 257,358 | | |
| 1,700 | | ETSY, INC.(b) | | 103,136 | | 137,785 | | |
| 12,508 | | EXPEDIA GROUP, INC.(b) | | 1,162,573 | | 1,898,589 | | |
| 22,163 | | FORD MOTOR CO. | | 72,512 | | 270,167 | | |
| 13,928 | | GAP (THE), INC. | | 139,153 | | 291,235 | | |
| 2,200 | | GARMIN LTD.(c) | | 40,557 | | 282,788 | | |
| 75,170 | | GENERAL MOTORS CO. | | 2,454,030 | | 2,700,106 | | |
| 3,450 | | GENUINE PARTS CO. | | 102,425 | | 477,825 | | |
| 10,855 | | H&R BLOCK, INC. | | 368,543 | | 525,056 | | |
| 526 | | HASBRO, INC. | | 17,206 | | 26,858 | | |
| 1,600 | | HILTON WORLDWIDE HOLDINGS, INC. | | 115,613 | | 291,344 | | |
| 20,826 | | HOME DEPOT (THE), INC. | | 4,023,383 | | 7,217,250 | | |
| 2,535 | | LAS VEGAS SANDS CORP. | | 21,685 | | 124,747 | | |
| 13,949 | | LENNAR CORP., CLASS A | | 1,527,131 | | 2,078,959 | | |
| 15,160 | | LKQ CORP. | | 410,648 | | 724,496 | | |
| 8,246 | | LOWE'S COS., INC. | | 1,537,267 | | 1,835,147 | | |
| 1,600 | | LULULEMON ATHLETICA, INC.(b)(c) | | 633,744 | | 818,064 | | |
| 137,990 | | MACY'S, INC. | | 1,552,160 | | 2,776,359 | | |
| 2,938 | | MARRIOTT INTERNATIONAL, INC., CLASS A | | 61,838 | | 662,548 | | |
| 4,802 | | MCDONALD'S CORP. | | 92,470 | | 1,423,841 | | |
| 3,506 | | MGM RESORTS INTERNATIONAL(b) | | 139,053 | | 156,648 | | |
| 600 | | MOHAWK INDUSTRIES, INC.(b) | | 26,796 | | 62,100 | | |
| 16,567 | | NIKE, INC., CLASS B | | 987,686 | | 1,798,679 | | |
| 390 | | NVR, INC.(b) | | 1,376,867 | | 2,730,176 | | |
| 8,786 | | PENSKE AUTOMOTIVE GROUP, INC. | | 1,159,421 | | 1,410,241 | | |
| 40 | | PHINIA, INC. | | 880 | | 1,212 | | |
CLEARWATER INVESTMENT TRUST
Schedule of Investments - Clearwater Core Equity Fund
December 31, 2023
| Shares | | Security | | Cost | | Fair value (a) | | Percent of
net assets |
| Consumer Discretionary (Cont'd): | | | | | | |
| 870 | | POOL CORP. | | $ 187,171 | | 346,878 | | |
| 48,773 | | PULTEGROUP, INC. | | 3,140,928 | | 5,034,349 | | |
| 3,341 | | PVH CORP. | | 247,023 | | 408,003 | | |
| 4,443 | | ROSS STORES, INC. | | 455,544 | | 614,867 | | |
| 3,708 | | ROYAL CARIBBEAN CRUISES LTD.(b) | | 148,859 | | 480,149 | | |
| 23,500 | | STARBUCKS CORP. | | 154,545 | | 2,256,235 | | |
| 5,800 | | TAPESTRY, INC. | | 163,077 | | 213,498 | | |
| 36,728 | | TESLA, INC.(b) | | 7,655,072 | | 9,126,174 | | |
| 11,583 | | TJX (THE) COS., INC. | | 300,825 | | 1,086,601 | | |
| 47,360 | | TOLL BROTHERS, INC. | | 2,759,279 | | 4,868,134 | | |
| 500 | | TRACTOR SUPPLY CO. | | 90,114 | | 107,515 | | |
| 9,857 | | TRAVEL + LEISURE CO. | | 360,177 | | 385,310 | | |
| 700 | | ULTA BEAUTY, INC.(b) | | 244,098 | | 342,993 | | |
| 6,925 | | VF CORP. | | 83,617 | | 130,190 | | |
| 15,254 | | WILLIAMS-SONOMA, INC. | | 1,830,184 | | 3,077,952 | | |
| 1,554 | | WYNN RESORTS LTD. | | 31,066 | | 141,585 | | |
| 3,600 | | YUM! BRANDS, INC. | | 428,099 | | 470,376 | | |
| | | | | 60,415,766 | | 101,914,557 | | 11.69% |
| Consumer Staples: | | | | | | |
| 56,264 | | ALTRIA GROUP, INC. | | 2,446,204 | | 2,269,690 | | |
| 10,300 | | ARCHER-DANIELS-MIDLAND CO. | | 188,618 | | 743,866 | | |
| 10,068 | | CHURCH & DWIGHT CO., INC. | | 241,887 | | 952,030 | | |
| 1,700 | | CLOROX (THE) CO. | | 210,031 | | 242,403 | | |
| 69,073 | | COCA-COLA (THE) CO. | | 1,562,344 | | 4,070,472 | | |
| 11,480 | | COLGATE-PALMOLIVE CO. | | 780,184 | | 915,071 | | |
| 1,900 | | CONAGRA BRANDS, INC. | | 26,153 | | 54,454 | | |
| 1,823 | | CONSTELLATION BRANDS, INC., CLASS A | | 251,171 | | 440,710 | | |
| 4,852 | | COSTCO WHOLESALE CORP. | | 909,621 | | 3,202,708 | | |
| 2,900 | | DOLLAR GENERAL CORP. | | 337,464 | | 394,255 | | |
| 2,024 | | DOLLAR TREE, INC.(b) | | 34,800 | | 287,509 | | |
| 3,400 | | ESTEE LAUDER (THE) COS., INC., CLASS A | | 359,046 | | 497,250 | | |
| 22,700 | | GENERAL MILLS, INC. | | 935,900 | | 1,478,678 | | |
| 1,642 | | HERSHEY (THE) CO. | | 60,568 | | 306,134 | | |
| 4,800 | | HORMEL FOODS CORP. | | 43,206 | | 154,128 | | |
| 1,300 | | J M SMUCKER (THE) CO. | | 60,305 | | 164,294 | | |
| 3,048 | | KEURIG DR. PEPPER, INC. | | 19,052 | | 101,559 | | |
| 4,450 | | KIMBERLY-CLARK CORP. | | 417,244 | | 540,720 | | |
| 3,705 | | KRAFT HEINZ (THE) CO. | | 26,475 | | 137,011 | | |
| 61,326 | | KROGER (THE) CO. | | 1,479,051 | | 2,803,211 | | |
| 1,833 | | LAMB WESTON HOLDINGS, INC. | | 73,271 | | 198,129 | | |
| 1,400 | | MCCORMICK & CO., INC. (NON VOTING) | | 21,613 | | 95,788 | | |
| 38,917 | | MOLSON COORS BEVERAGE CO., CLASS B | | 2,292,148 | | 2,382,110 | | |
| 17,969 | | MONDELEZ INTERNATIONAL, INC., CLASS A | | 803,237 | | 1,301,495 | | |
| 2,272 | | MONSTER BEVERAGE CORP.(b) | | 64,265 | | 130,890 | | |
| 21,513 | | PEPSICO, INC. | | 2,301,389 | | 3,653,768 | | |
| 16,212 | | PHILIP MORRIS INTERNATIONAL, INC. | | 1,313,114 | | 1,525,225 | | |
| 29,726 | | PROCTER & GAMBLE (THE) CO. | | 1,297,936 | | 4,356,048 | | |
| 222 | | SEABOARD CORP. | | 803,150 | | 792,562 | | |
| 7,100 | | SYSCO CORP. | | 110,707 | | 519,223 | | |
| 4,367 | | TARGET CORP. | | 377,406 | | 621,948 | | |
| 5,367 | | TYSON FOODS, INC., CLASS A | | 167,122 | | 288,476 | | |
| 29,450 | | WALGREENS BOOTS ALLIANCE, INC. | | 466,301 | | 768,940 | | |
| 45,743 | | WALMART, INC. | | 5,379,202 | | 7,211,384 | | |
| | | | | 25,860,185 | | 43,602,139 | | 5.00% |
| Energy: | | | | | | |
| 4,100 | | APA CORP. | | 160,622 | | 147,108 | | |
| 12,293 | | BAKER HUGHES CO. | | 275,534 | | 420,175 | | |
| 978 | | CHENIERE ENERGY, INC. | | 147,347 | | 166,954 | | |
| 42,376 | | CHEVRON CORP. | | 2,817,664 | | 6,320,804 | | |
| 22,923 | | CONOCOPHILLIPS | | 557,203 | | 2,660,673 | | |
| 10,000 | | COTERRA ENERGY, INC. | | 213,988 | | 255,200 | | |
| 15,326 | | DEVON ENERGY CORP. | | 590,311 | | 694,268 | | |
| 2,300 | | DIAMONDBACK ENERGY, INC. | | 359,557 | | 356,684 | | |
| 11,899 | | EOG RESOURCES, INC. | | 797,033 | | 1,439,184 | | |
| 200 | | EQT CORP. | | 7,794 | | 7,732 | | |
| 69,655 | | EXXON MOBIL CORP. | | 4,331,281 | | 6,964,107 | | |
| 1,100 | | HALLIBURTON CO. | | 42,613 | | 39,765 | | |
CLEARWATER INVESTMENT TRUST
Schedule of Investments - Clearwater Core Equity Fund
December 31, 2023
| Shares | | Security | | Cost | | Fair value (a) | | Percent of
net assets |
| Energy (Cont'd): | | | | | | |
| 4,762 | | HESS CORP. | | $ 402,564 | | 686,490 | | |
| 66,777 | | HF SINCLAIR CORP. | | 2,982,246 | | 3,710,798 | | |
| 49,812 | | KINDER MORGAN, INC. | | 676,557 | | 878,684 | | |
| 9,400 | | MARATHON OIL CORP. | | 110,345 | | 227,104 | | |
| 22,974 | | MARATHON PETROLEUM CORP. | | 2,170,626 | | 3,408,423 | | |
| 7,335 | | OCCIDENTAL PETROLEUM CORP. | | 106,521 | | 437,973 | | |
| 7,700 | | ONEOK, INC. | | 271,699 | | 540,694 | | |
| 7,468 | | PHILLIPS 66 | | 544,052 | | 994,289 | | |
| 3,856 | | PIONEER NATURAL RESOURCES CO. | | 582,280 | | 867,137 | | |
| 19,733 | | SCHLUMBERGER N.V. | | 697,128 | | 1,026,905 | | |
| 2,900 | | TARGA RESOURCES CORP. | | 189,675 | | 251,923 | | |
| 33,793 | | VALERO ENERGY CORP. | | 3,211,310 | | 4,393,090 | | |
| 11,500 | | WILLIAMS (THE) COS., INC. | | 123,340 | | 400,545 | | |
| | | | | 22,369,290 | | 37,296,709 | | 4.28% |
| Financials: | | | | | | |
| 4,579 | | AFLAC, INC. | | 225,517 | | 377,768 | | |
| 8,300 | | ALLSTATE (THE) CORP. | | 197,623 | | 1,161,834 | | |
| 7,933 | | AMERICAN EXPRESS CO. | | 715,083 | | 1,486,168 | | |
| 36,540 | | AMERICAN INTERNATIONAL GROUP, INC. | | 1,839,014 | | 2,475,585 | | |
| 1,418 | | AMERIPRISE FINANCIAL, INC. | | 201,942 | | 538,599 | | |
| 2,548 | | AON PLC, CLASS A | | 406,718 | | 741,519 | | |
| 3,211 | | ARCH CAPITAL GROUP LTD.(b) | | 104,134 | | 238,481 | | |
| 700 | | ARTHUR J. GALLAGHER & CO. | | 45,962 | | 157,416 | | |
| 4,900 | | ASSURANT, INC. | | 218,575 | | 825,601 | | |
| 59,283 | | AXIS CAPITAL HOLDINGS LTD. | | 3,362,766 | | 3,282,500 | | |
| 93,602 | | BANK OF AMERICA CORP. | | 689,814 | | 3,151,579 | | |
| 10,000 | | BANK OF NEW YORK MELLON (THE) CORP. | | 206,454 | | 520,500 | | |
| 40,366 | | BERKSHIRE HATHAWAY, INC., CLASS B(b) | | 7,928,396 | | 14,396,938 | | |
| 1,700 | | BLACKROCK, INC. | | 1,093,208 | | 1,380,060 | | |
| 6,700 | | BLACKSTONE, INC. | | 670,538 | | 877,164 | | |
| 8,148 | | BRIGHTHOUSE FINANCIAL, INC.(b) | | 346,933 | | 431,192 | | |
| 1,700 | | BROWN & BROWN, INC. | | 88,516 | | 120,887 | | |
| 7,747 | | CAPITAL ONE FINANCIAL CORP. | | 241,908 | | 1,015,787 | | |
| 19,408 | | CHARLES SCHWAB (THE) CORP. | | 268,271 | | 1,335,270 | | |
| 5,185 | | CHUBB LTD.(c) | | 608,428 | | 1,171,810 | | |
| 200 | | CINCINNATI FINANCIAL CORP. | | 20,055 | | 20,692 | | |
| 100,321 | | CITIGROUP, INC. | | 4,054,666 | | 5,160,512 | | |
| 4,794 | | CME GROUP, INC. | | 685,657 | | 1,009,616 | | |
| 5,836 | | CNA FINANCIAL CORP. | | 247,377 | | 246,921 | | |
| 2,000 | | COMERICA, INC. | | 80,100 | | 111,620 | | |
| 79,228 | | COREBRIDGE FINANCIAL, INC. | | 1,588,177 | | 1,716,078 | | |
| 1,087 | | EURONET WORLDWIDE, INC.(b) | | 97,942 | | 110,320 | | |
| 10,061 | | EVEREST RE GROUP LTD. | | 3,866,253 | | 3,557,368 | | |
| 469 | | FAIRFAX FINANCIAL HOLDINGS LTD.(c) | | 86,576 | | 431,837 | | |
| 7,803 | | FIDELITY NATIONAL INFORMATION SERVICES, INC. | | 135,503 | | 468,726 | | |
| 10,565 | | FIFTH THIRD BANCORP | | 109,297 | | 364,387 | | |
| 266 | | FIRST CITIZENS BANCSHARES, INC., CLASS A | | 382,120 | | 377,446 | | |
| 5,632 | | FISERV, INC.(b) | | 123,748 | | 748,155 | | |
| 300 | | FLEETCOR TECHNOLOGIES, INC.(b) | | 52,039 | | 84,783 | | |
| 9,651 | | GLOBAL PAYMENTS, INC. | | 999,951 | | 1,225,677 | | |
| 100 | | GLOBE LIFE, INC. | | 11,345 | | 12,172 | | |
| 7,579 | | GOLDMAN SACHS GROUP (THE), INC. | | 807,418 | | 2,923,751 | | |
| 1,200 | | HARTFORD FINANCIAL SERVICES GROUP (THE), INC. | | 26,940 | | 96,456 | | |
| 43,846 | | HUNTINGTON BANCSHARES, INC. | | 221,602 | | 557,721 | | |
| 7,140 | | INTERCONTINENTAL EXCHANGE, INC. | | 634,550 | | 916,990 | | |
| 6,200 | | INVESCO LTD. | | 87,258 | | 110,608 | | |
| 50,092 | | JPMORGAN CHASE & CO. | | 2,064,862 | | 8,520,649 | | |
| 20,104 | | KEYCORP | | 178,289 | | 289,498 | | |
| 32,300 | | LINCOLN NATIONAL CORP. | | 703,014 | | 871,131 | | |
| 7,377 | | MARSH & MCLENNAN COS., INC. | | 675,052 | | 1,397,720 | | |
| 17,381 | | MASTERCARD, INC., CLASS A | | 4,572,414 | | 7,413,170 | | |
| 1,300 | | MERCURY GENERAL CORP. | | 38,019 | | 48,503 | | |
| 5,731 | | METLIFE, INC. | | 201,149 | | 378,991 | | |
| 84,222 | | MGIC INVESTMENT CORP. | | 1,181,306 | | 1,624,642 | | |
| 2,100 | | MOODY'S CORP. | | 584,216 | | 820,176 | | |
| 1,000 | | MSCI, INC. | | 462,200 | | 565,650 | | |
| 5,100 | | NASDAQ, INC. | | 42,534 | | 296,514 | | |
CLEARWATER INVESTMENT TRUST
Schedule of Investments - Clearwater Core Equity Fund
December 31, 2023
| Shares | | Security | | Cost | | Fair value (a) | | Percent of
net assets |
| Financials (Cont'd): | | | | | | |
| 29,237 | | NCR ATLEOS CORP.(b) | | $ 515,725 | | 710,167 | | |
| 90,602 | | NEW YORK COMMUNITY BANCORP, INC. | | 870,265 | | 926,858 | | |
| 15,387 | | OLD REPUBLIC INTERNATIONAL CORP. | | 449,681 | | 452,378 | | |
| 16,168 | | PAYPAL HOLDINGS, INC.(b) | | 831,528 | | 992,877 | | |
| 7,114 | | PNC FINANCIAL SERVICES GROUP (THE), INC. | | 273,331 | | 1,101,603 | | |
| 10,575 | | POPULAR, INC. | | 728,404 | | 867,890 | | |
| 1,800 | | PRINCIPAL FINANCIAL GROUP, INC. | | 37,586 | | 141,606 | | |
| 7,588 | | PROGRESSIVE (THE) CORP. | | 837,867 | | 1,208,617 | | |
| 5,900 | | PRUDENTIAL FINANCIAL, INC. | | 182,566 | | 611,889 | | |
| 1,050 | | RAYMOND JAMES FINANCIAL, INC. | | 89,754 | | 117,075 | | |
| 6,699 | | REGIONS FINANCIAL CORP. | | 27,215 | | 129,827 | | |
| 9,764 | | REINSURANCE GROUP OF AMERICA, INC. | | 1,439,746 | | 1,579,620 | | |
| 9,024 | | RENAISSANCERE HOLDINGS LTD. | | 1,840,829 | | 1,768,704 | | |
| 4,500 | | S&P GLOBAL, INC. | | 1,430,397 | | 1,982,340 | | |
| 1,200 | | STATE STREET CORP. | | 76,367 | | 92,952 | | |
| 97,904 | | SYNCHRONY FINANCIAL | | 2,491,860 | | 3,738,954 | | |
| 3,549 | | T. ROWE PRICE GROUP, INC. | | 106,978 | | 382,192 | | |
| 2,620 | | TRAVELERS (THE) COS., INC. | | 93,128 | | 499,084 | | |
| 51,594 | | TRUIST FINANCIAL CORP. | | 1,332,829 | | 1,904,850 | | |
| 50,945 | | UNUM GROUP | | 2,011,582 | | 2,303,733 | | |
| 20,785 | | US BANCORP | | 423,741 | | 899,575 | | |
| 27,637 | | VISA, INC., CLASS A | | 5,298,811 | | 7,195,293 | | |
| 11,782 | | W R BERKLEY CORP. | | 230,551 | | 833,223 | | |
| 51,027 | | WELLS FARGO & CO. | | 729,863 | | 2,511,549 | | |
| 353,918 | | WESTERN UNION (THE) CO. | | 3,985,059 | | 4,218,703 | | |
| 1,300 | | WILLIS TOWERS WATSON PLC(c) | | 274,247 | | 313,560 | | |
| 2,700 | | ZIONS BANCORP N.A. | | 52,466 | | 118,449 | | |
| | | | | 71,143,805 | | 115,768,706 | | 13.28% |
| Health Care: | | | | | | |
| 12,534 | | ABBOTT LABORATORIES | | 251,106 | | 1,379,617 | | |
| 28,733 | | ABBVIE, INC. | | 1,965,926 | | 4,452,753 | | |
| 13,870 | | AGILENT TECHNOLOGIES, INC. | | 1,392,858 | | 1,928,346 | | |
| 136 | | ALIGN TECHNOLOGY, INC.(b) | | 25,361 | | 37,264 | | |
| 5,700 | | AMERISOURCEBERGEN CORP. | | 95,209 | | 1,170,666 | | |
| 18,057 | | AMGEN, INC. | | 3,517,325 | | 5,200,777 | | |
| 38 | | AVANOS MEDICAL, INC.(b) | | 563 | | 852 | | |
| 11,500 | | BAXTER INTERNATIONAL, INC. | | 425,181 | | 444,590 | | |
| 3,909 | | BECTON, DICKINSON AND CO. | | 611,824 | | 953,131 | | |
| 300 | | BIO-RAD LABORATORIES, INC., CLASS A(b) | | 83,253 | | 96,867 | | |
| 32,800 | | BOSTON SCIENTIFIC CORP.(b) | | 182,160 | | 1,896,168 | | |
| 25,280 | | BRISTOL-MYERS SQUIBB CO. | | 811,175 | | 1,297,117 | | |
| 17,065 | | CARDINAL HEALTH, INC. | | 1,525,564 | | 1,720,152 | | |
| 11,143 | | CENTENE CORP.(b) | | 641,692 | | 826,922 | | |
| 11,337 | | CIGNA GROUP (THE) | | 2,397,193 | | 3,394,865 | | |
| 700 | | COOPER (THE) COS., INC. | | 219,407 | | 264,908 | | |
| 24,630 | | CVS HEALTH CORP. | | 1,296,339 | | 1,944,785 | | |
| 7,360 | | DANAHER CORP. | | 177,000 | | 1,702,662 | | |
| 5,632 | | DENTSPLY SIRONA, INC. | | 150,673 | | 200,443 | | |
| 6,100 | | DEXCOM, INC.(b) | | 96,726 | | 756,949 | | |
| 2,556 | | ELEVANCE HEALTH, INC. | | 775,579 | | 1,205,307 | | |
| 11,700 | | ELI LILLY & CO. | | 1,707,276 | | 6,820,164 | | |
| 32,791 | | EXELIXIS, INC.(b) | | 544,681 | | 786,656 | | |
| 4,382 | | GE HEALTHCARE TECHNOLOGIES, INC. | | 212,654 | | 338,816 | | |
| 53,092 | | GILEAD SCIENCES, INC. | | 2,891,922 | | 4,300,983 | | |
| 100 | | HCA HEALTHCARE, INC. | | 21,749 | | 27,068 | | |
| 12,808 | | HOLOGIC, INC.(b) | | 601,798 | | 915,132 | | |
| 3,858 | | HUMANA, INC. | | 1,681,836 | | 1,766,231 | | |
| 3,400 | | IDEXX LABORATORIES, INC.(b) | | 1,206,584 | | 1,887,170 | | |
| 2,500 | | ILLUMINA, INC.(b) | | 120,185 | | 348,100 | | |
| 1,700 | | INSULET CORP.(b) | | 278,321 | | 368,866 | | |
| 4,800 | | INTUITIVE SURGICAL, INC.(b) | | 899,342 | | 1,619,328 | | |
| 100 | | IONIS PHARMACEUTICALS, INC.(b) | | 3,269 | | 5,059 | | |
| 3,773 | | IQVIA HOLDINGS, INC.(b) | | 448,528 | | 872,997 | | |
| 22,561 | | JOHNSON & JOHNSON | | 1,310,615 | | 3,536,211 | | |
| 500 | | LABORATORY CORP. OF AMERICA HOLDINGS | | 10,088 | | 113,645 | | |
| 5,365 | | MCKESSON CORP. | | 1,200,461 | | 2,483,888 | | |
| 39,478 | | MERCK & CO., INC. | | 1,057,231 | | 4,303,892 | | |
CLEARWATER INVESTMENT TRUST
Schedule of Investments - Clearwater Core Equity Fund
December 31, 2023
| Shares | | Security | | Cost | | Fair value (a) | | Percent of
net assets |
| Health Care (Cont'd): | | | | | | |
| 400 | | METTLER-TOLEDO INTERNATIONAL, INC.(b) | | $ 426,640 | | 485,184 | | |
| 4,415 | | MODERNA, INC.(b) | | 446,112 | | 439,072 | | |
| 4,100 | | MOLINA HEALTHCARE, INC.(b) | | 997,794 | | 1,481,371 | | |
| 3,547 | | ORGANON & CO. | | 39,446 | | 51,148 | | |
| 79,966 | | PFIZER, INC. | | 1,572,685 | | 2,302,221 | | |
| 1,400 | | QUEST DIAGNOSTICS, INC. | | 174,774 | | 193,032 | | |
| 1,608 | | REGENERON PHARMACEUTICALS, INC.(b) | | 923,531 | | 1,412,290 | | |
| 4,000 | | RESMED, INC. | | 81,990 | | 688,080 | | |
| 1,200 | | STERIS PLC | | 207,009 | | 263,820 | | |
| 2,500 | | STRYKER CORP. | | 638,016 | | 748,650 | | |
| 3,822 | | THERMO FISHER SCIENTIFIC, INC. | | 1,362,457 | | 2,028,679 | | |
| 10,440 | | UNITED THERAPEUTICS CORP.(b) | | 2,340,103 | | 2,295,652 | | |
| 14,097 | | UNITEDHEALTH GROUP, INC. | | 3,696,141 | | 7,421,648 | | |
| 2,838 | | UNIVERSAL HEALTH SERVICES, INC., CLASS B | | 257,448 | | 432,625 | | |
| 7,705 | | VERTEX PHARMACEUTICALS, INC.(b) | | 2,020,274 | | 3,135,087 | | |
| 139,532 | | VIATRIS, INC. | | 1,284,136 | | 1,511,132 | | |
| 700 | | WATERS CORP.(b) | | 16,422 | | 230,461 | | |
| 1,100 | | WEST PHARMACEUTICAL SERVICES, INC. | | 356,129 | | 387,332 | | |
| 11,574 | | ZIMMER BIOMET HOLDINGS, INC. | | 997,483 | | 1,408,556 | | |
| 6,047 | | ZOETIS, INC. | | 858,592 | | 1,193,496 | | |
| | | | | 49,535,836 | | 89,478,883 | | 10.26% |
| Industrials: | | | | | | |
| 12,787 | | 3M CO. | | 942,469 | | 1,397,875 | | |
| 1,400 | | A O SMITH CORP. | | 72,742 | | 115,416 | | |
| 18,995 | | ACUITY BRANDS, INC. | | 3,090,908 | | 3,890,746 | | |
| 11,316 | | AGCO CORP. | | 1,301,240 | | 1,373,876 | | |
| 100 | | ALLEGION PLC(c) | | 10,618 | | 12,669 | | |
| 73,822 | | ALLISON TRANSMISSION HOLDINGS, INC. | | 3,185,889 | | 4,292,749 | | |
| 8,800 | | AMERICAN AIRLINES GROUP, INC.(b) | | 126,329 | | 120,912 | | |
| 5,175 | | AMETEK, INC. | | 73,221 | | 853,306 | | |
| 6,866 | | AUTOMATIC DATA PROCESSING, INC. | | 382,249 | | 1,599,572 | | |
| 500 | | AXON ENTERPRISE, INC.(b) | | 94,810 | | 129,165 | | |
| 7,387 | | BOEING (THE) CO.(b) | | 989,117 | | 1,925,495 | | |
| 2,213 | | BROADRIDGE FINANCIAL SOLUTIONS, INC. | | 89,066 | | 455,325 | | |
| 27,796 | | BUILDERS FIRSTSOURCE, INC.(b) | | 2,108,800 | | 4,640,264 | | |
| 14,740 | | CARRIER GLOBAL CORP. | | 258,135 | | 846,813 | | |
| 14,635 | | CATERPILLAR, INC. | | 1,167,890 | | 4,327,130 | | |
| 2,200 | | CERIDIAN HCM HOLDING, INC.(b) | | 127,379 | | 147,664 | | |
| 4,300 | | CINTAS CORP. | | 667,194 | | 2,591,438 | | |
| 8,943 | | CONCENTRIX CORP. | | 861,626 | | 878,292 | | |
| 11,500 | | COPART, INC.(b) | | 296,588 | | 563,500 | | |
| 2,452 | | CRANE CO. | | 257,108 | | 289,679 | | |
| 36,272 | | CSX CORP. | | 810,618 | | 1,257,550 | | |
| 300 | | CUMMINS, INC. | | 9,224 | | 71,871 | | |
| 3,593 | | DEERE & CO. | | 249,608 | | 1,436,733 | | |
| 1,940 | | DELTA AIR LINES, INC. | | 27,009 | | 78,046 | | |
| 225 | | DOVER CORP. | | 26,143 | | 34,607 | | |
| 11,904 | | EATON CORP. PLC | | 223,705 | | 2,866,721 | | |
| 3,561 | | EMCOR GROUP, INC. | | 649,186 | | 767,146 | | |
| 900 | | EQUIFAX, INC. | | 149,184 | | 222,561 | | |
| 2,900 | | EXPEDITORS INTERNATIONAL OF WASHINGTON, INC. | | 275,171 | | 368,880 | | |
| 300 | | FASTENAL CO. | | 15,808 | | 19,431 | | |
| 2,856 | | FEDEX CORP. | | 262,842 | | 722,482 | | |
| 7,076 | | FORTIVE CORP. | | 372,199 | | 521,006 | | |
| 112,174 | | GATES INDUSTRIAL CORP. PLC(b) | | 1,259,261 | | 1,505,375 | | |
| 900 | | GENERAC HOLDINGS, INC.(b) | | 111,312 | | 116,316 | | |
| 4,751 | | GENERAL DYNAMICS CORP. | | 962,857 | | 1,233,692 | | |
| 53,235 | | GENERAL ELECTRIC CO. | | 5,390,451 | | 6,794,383 | | |
| 13,888 | | HONEYWELL INTERNATIONAL, INC. | | 1,142,851 | | 2,912,453 | | |
| 25,039 | | HOWMET AEROSPACE, INC. | | 299,194 | | 1,355,111 | | |
| 8,071 | | HUBBELL, INC. | | 1,883,912 | | 2,654,794 | | |
| 1,800 | | HUNTINGTON INGALLS INDUSTRIES, INC. | | 381,786 | | 467,352 | | |
| 1,371 | | IDEX CORP. | | 119,804 | | 297,658 | | |
| 4,824 | | ILLINOIS TOOL WORKS, INC. | | 155,812 | | 1,263,599 | | |
| 4,000 | | INGERSOLL RAND, INC. | | 219,892 | | 309,360 | | |
| 100 | | JB HUNT TRANSPORT SERVICES, INC. | | 18,983 | | 19,974 | | |
| 1,359 | | JOHNSON CONTROLS INTERNATIONAL PLC | | 41,734 | | 78,333 | | |
CLEARWATER INVESTMENT TRUST
Schedule of Investments - Clearwater Core Equity Fund
December 31, 2023
| Shares | | Security | | Cost | | Fair value (a) | | Percent of
net assets |
| Industrials (Cont'd): | | | | | | |
| 1,352 | | L3HARRIS TECHNOLOGIES, INC. | | $ 46,888 | | 284,758 | | |
| 3,369 | | LOCKHEED MARTIN CORP. | | 1,271,213 | | 1,526,966 | | |
| 5,346 | | MANPOWERGROUP, INC. | | 373,362 | | 424,847 | | |
| 4,963 | | MASCO CORP. | | 206,868 | | 332,422 | | |
| 16,140 | | MSC INDUSTRIAL DIRECT CO., INC., CLASS A | | 1,342,700 | | 1,634,336 | | |
| 2,477 | | NORFOLK SOUTHERN CORP. | | 379,182 | | 585,513 | | |
| 4,671 | | NORTHROP GRUMMAN CORP. | | 1,057,684 | | 2,186,682 | | |
| 3,900 | | OLD DOMINION FREIGHT LINE, INC. | | 666,126 | | 1,580,787 | | |
| 8,522 | | OSHKOSH CORP. | | 744,636 | | 923,870 | | |
| 5,320 | | OTIS WORLDWIDE CORP. | | 90,693 | | 475,980 | | |
| 28,767 | | OWENS CORNING | | 2,660,172 | | 4,264,132 | | |
| 45,465 | | PACCAR, INC. | | 3,288,062 | | 4,439,657 | | |
| 4,628 | | PARKER-HANNIFIN CORP. | | 350,966 | | 2,132,120 | | |
| 4,185 | | PAYCHEX, INC. | | 426,655 | | 498,475 | | |
| 4,187 | | PAYCOM SOFTWARE, INC. | | 632,884 | | 865,537 | | |
| 2,719 | | PENTAIR PLC(c) | | 57,667 | | 197,699 | | |
| 200 | | QUANTA SERVICES, INC. | | 29,452 | | 43,160 | | |
| 22,328 | | RAYTHEON TECHNOLOGIES CORP. | | 983,016 | | 1,878,678 | | |
| 682 | | RB GLOBAL, INC. | | 35,812 | | 45,619 | | |
| 3,217 | | REPUBLIC SERVICES, INC. | | 303,852 | | 530,515 | | |
| 1,400 | | ROBERT HALF INTERNATIONAL, INC. | | 100,238 | | 123,088 | | |
| 1,400 | | ROCKWELL AUTOMATION, INC. | | 373,784 | | 434,672 | | |
| 9,734 | | ROLLINS, INC. | | 233,074 | | 425,084 | | |
| 17,901 | | RYDER SYSTEM, INC. | | 1,534,307 | | 2,059,689 | | |
| 11,916 | | SCHNEIDER NATIONAL, INC., CLASS B | | 313,365 | | 303,262 | | |
| 8,400 | | SOUTHWEST AIRLINES CO. | | 223,146 | | 242,592 | | |
| 2,157 | | STANLEY BLACK & DECKER, INC. | | 66,841 | | 211,602 | | |
| 14,290 | | TEXTRON, INC. | | 991,624 | | 1,149,202 | | |
| 10,805 | | TRANE TECHNOLOGIES PLC(c) | | 554,386 | | 2,635,340 | | |
| 600 | | TRANSDIGM GROUP, INC. | | 296,945 | | 606,960 | | |
| 15,900 | | UBER TECHNOLOGIES, INC.(b) | | 964,897 | | 978,963 | | |
| 5,902 | | UNION PACIFIC CORP. | | 369,465 | | 1,449,649 | | |
| 4,400 | | UNITED AIRLINES HOLDINGS, INC.(b) | | 175,501 | | 181,544 | | |
| 3,640 | | UNITED PARCEL SERVICE, INC., CLASS B | | 177,964 | | 572,317 | | |
| 4,560 | | UNITED RENTALS, INC. | | 773,617 | | 2,614,795 | | |
| 2,121 | | VERALTO CORP. | | 14,727 | | 174,473 | | |
| 494 | | VERISK ANALYTICS, INC. | | 83,738 | | 117,997 | | |
| 2,626 | | VERTIV HOLDINGS CO., CLASS A | | 117,276 | | 126,127 | | |
| 8,650 | | WASTE MANAGEMENT, INC. | | 135,675 | | 1,549,215 | | |
| 1,200 | | WESTINGHOUSE AIR BRAKE TECHNOLOGIES CORP. | | 21,945 | | 152,280 | | |
| 3,200 | | XYLEM, INC. | | 174,704 | �� | 365,952 | | |
| | | | | 53,807,033 | | 99,153,876 | | 11.37% |
| Information Technology: | | | | | | |
| 13,372 | | ACCENTURE PLC, CLASS A(c) | | 2,608,625 | | 4,692,369 | | |
| 16,570 | | ADOBE, INC.(b) | | 4,058,639 | | 9,885,662 | | |
| 24,373 | | ADVANCED MICRO DEVICES, INC.(b) | | 272,579 | | 3,592,824 | | |
| 100 | | AKAMAI TECHNOLOGIES, INC.(b) | | 10,626 | | 11,835 | | |
| 6,700 | | AMPHENOL CORP., CLASS A | | 490,412 | | 664,171 | | |
| 4,449 | | ANALOG DEVICES, INC. | | 96,633 | | 883,393 | | |
| 400 | | ANSYS, INC.(b) | | 88,560 | | 145,152 | | |
| 293,487 | | APPLE, INC. | | 19,668,556 | | 56,505,052 | | |
| 21,259 | | APPLIED MATERIALS, INC. | | 2,082,643 | | 3,445,446 | | |
| 47,075 | | APPLOVIN CORP., CLASS A(b) | | 620,345 | | 1,875,939 | | |
| 3,800 | | ARISTA NETWORKS, INC.(b) | | 451,504 | | 894,938 | | |
| 25,853 | | ARROW ELECTRONICS, INC.(b) | | 2,957,278 | | 3,160,529 | | |
| 5,955 | | AUTODESK, INC.(b) | | 953,618 | | 1,449,923 | | |
| 25,946 | | AVNET, INC. | | 1,082,080 | | 1,307,678 | | |
| 9,415 | | BROADCOM, INC. | | 4,501,532 | | 10,509,494 | | |
| 10,400 | | CADENCE DESIGN SYSTEMS, INC.(b) | | 653,073 | | 2,832,648 | | |
| 7,000 | | CDW CORP. | | 292,424 | | 1,591,240 | | |
| 138,519 | | CISCO SYSTEMS, INC. | | 4,809,995 | | 6,997,980 | | |
| 8,451 | | COGNIZANT TECHNOLOGY SOLUTIONS CORP., CLASS A | | 386,009 | | 638,304 | | |
| 15,600 | | CORNING, INC. | | 85,176 | | 475,020 | | |
| 33,850 | | DXC TECHNOLOGY CO.(b) | | 797,345 | | 774,150 | | |
| 2,400 | | ENPHASE ENERGY, INC.(b) | | 184,897 | | 317,136 | | |
| 1,054 | | EPAM SYSTEMS, INC.(b) | | 184,809 | | 313,396 | | |
| 100 | | F5, INC.(b) | | 14,240 | | 17,898 | | |
CLEARWATER INVESTMENT TRUST
Schedule of Investments - Clearwater Core Equity Fund
December 31, 2023
| Shares | | Security | | Cost | | Fair value (a) | | Percent of
net assets |
| Information Technology (Cont'd): | | | | | | |
| 3,581 | | FAIR ISAAC CORP.(b) | | $ 1,606,592 | | 4,168,320 | | |
| 27,615 | | FORTINET, INC.(b) | | 393,491 | | 1,616,306 | | |
| 357 | | GARTNER, INC.(b) | | 91,624 | | 161,046 | | |
| 22,781 | | GEN DIGITAL, INC. | | 207,695 | | 519,862 | | |
| 373 | | GODADDY, INC., CLASS A(b) | | 26,125 | | 39,598 | | |
| 210,060 | | HEWLETT PACKARD ENTERPRISE CO. | | 2,677,255 | | 3,566,819 | | |
| 39,925 | | HP, INC. | | 881,267 | | 1,201,343 | | |
| 66,750 | | INTEL CORP. | | 1,612,200 | | 3,354,187 | | |
| 11,723 | | INTERNATIONAL BUSINESS MACHINES CORP. | | 1,192,830 | | 1,917,297 | | |
| 3,680 | | INTUIT, INC. | | 523,934 | | 2,300,110 | | |
| 24,332 | | JABIL, INC. | | 1,916,929 | | 3,099,897 | | |
| 400 | | KEYSIGHT TECHNOLOGIES, INC.(b) | | 32,788 | | 63,636 | | |
| 5,476 | | KLA CORP. | | 1,781,428 | | 3,183,199 | | |
| 4,493 | | LAM RESEARCH CORP. | | 421,510 | | 3,519,187 | | |
| 8,368 | | MICROCHIP TECHNOLOGY, INC. | | 38,920 | | 754,626 | | |
| 30,599 | | MICRON TECHNOLOGY, INC. | | 583,167 | | 2,611,319 | | |
| 149,578 | | MICROSOFT CORP. | | 17,086,218 | | 56,247,311 | | |
| 600 | | MONOLITHIC POWER SYSTEMS, INC. | | 229,398 | | 378,468 | | |
| 1,900 | | MOTOROLA SOLUTIONS, INC. | | 402,783 | | 594,871 | | |
| 158,676 | | NCR CORP.(b) | | 2,347,767 | | 2,683,211 | | |
| 50,685 | | NVIDIA CORP. | | 5,762,194 | | 25,100,226 | | |
| 3,825 | | NXP SEMICONDUCTORS N.V.(c) | | 327,712 | | 878,526 | | |
| 5,010 | | ON SEMICONDUCTOR CORP.(b) | | 212,913 | | 418,485 | | |
| 19,877 | | ORACLE CORP. | | 1,256,311 | | 2,095,632 | | |
| 1,200 | | PALO ALTO NETWORKS, INC.(b) | | 366,707 | | 353,856 | | |
| 2,400 | | PTC, INC.(b) | | 82,674 | | 419,904 | | |
| 20,802 | | QUALCOMM, INC. | | 2,221,108 | | 3,008,593 | | |
| 9,989 | | RINGCENTRAL, INC., CLASS A(b) | | 319,207 | | 339,127 | | |
| 900 | | ROPER TECHNOLOGIES, INC. | | 194,232 | | 490,653 | | |
| 16,319 | | SALESFORCE, INC.(b) | | 1,674,560 | | 4,294,182 | | |
| 5,500 | | SEAGATE TECHNOLOGY HOLDINGS PLC | | 51,728 | | 469,535 | | |
| 2,655 | | SERVICENOW, INC.(b) | | 534,127 | | 1,875,731 | | |
| 14,580 | | SKYWORKS SOLUTIONS, INC. | | 1,266,263 | | 1,639,084 | | |
| 2,400 | | SOLAREDGE TECHNOLOGIES, INC.(b)(c) | | 187,238 | | 224,640 | | |
| 5,300 | | SYNOPSYS, INC.(b) | | 438,338 | | 2,729,023 | | |
| 7,524 | | TD SYNNEX CORP. | | 672,396 | | 809,658 | | |
| 800 | | TE CONNECTIVITY LTD. | | 98,296 | | 112,400 | | |
| 600 | | TELEDYNE TECHNOLOGIES, INC.(b) | | 226,008 | | 267,774 | | |
| 18,339 | | TERADATA CORP.(b) | | 689,130 | | 797,930 | | |
| 4,600 | | TERADYNE, INC. | | 82,730 | | 499,192 | | |
| 27,783 | | TEXAS INSTRUMENTS, INC. | | 936,448 | | 4,735,890 | | |
| 7,049 | | TRIMBLE, INC.(b) | | 94,849 | | 375,007 | | |
| 500 | | TYLER TECHNOLOGIES, INC.(b) | | 190,425 | | 209,060 | | |
| 1,176 | | VERISIGN, INC.(b) | | 200,718 | | 242,209 | | |
| 5,145 | | WESTERN DIGITAL CORP.(b) | | 87,708 | | 269,444 | | |
| 400 | | ZEBRA TECHNOLOGIES CORP., CLASS A(b) | | 43,396 | | 109,332 | | |
| 17,519 | | ZOOM VIDEO COMMUNICATIONS, INC., CLASS A(b) | | 1,140,704 | | 1,259,791 | | |
| | | | | 100,763,639 | | 258,987,674 | | 29.70% |
| Materials: | | | | | | |
| 3,094 | | AIR PRODUCTS AND CHEMICALS, INC. | | 525,323 | | 847,137 | | |
| 2,300 | | ALBEMARLE CORP. | | 199,861 | | 332,304 | | |
| 32,570 | | AMCOR PLC(c) | | 224,047 | | 313,975 | | |
| 4,165 | | AVERY DENNISON CORP. | | 371,149 | | 841,996 | | |
| 11,110 | | BERRY GLOBAL GROUP, INC. | | 614,155 | | 748,703 | | |
| 1,200 | | CELANESE CORP. | | 115,535 | | 186,444 | | |
| 30,337 | | CF INDUSTRIES HOLDINGS, INC. | | 2,117,573 | | 2,411,791 | | |
| 8,562 | | CORTEVA, INC. | | 200,802 | | 410,291 | | |
| 8,062 | | DOW, INC. | | 185,436 | | 442,120 | | |
| 7,362 | | DUPONT DE NEMOURS, INC. | | 218,512 | | 566,359 | | |
| 4,261 | | EASTMAN CHEMICAL CO. | | 318,699 | | 382,723 | | |
| 3,991 | | ECOLAB, INC. | | 236,070 | | 791,615 | | |
| 1,500 | | FMC CORP. | | 75,028 | | 94,575 | | |
| 18,800 | | FREEPORT-MCMORAN, INC. | | 279,545 | | 800,316 | | |
| 14,771 | | HUNTSMAN CORP. | | 356,079 | | 371,195 | | |
| 3,421 | | INTERNATIONAL FLAVORS & FRAGRANCES, INC. | | 222,567 | | 276,998 | | |
| 9,341 | | INTERNATIONAL PAPER CO. | | 310,484 | | 337,677 | | |
| 6,465 | | LINDE PLC | | 1,521,181 | | 2,655,240 | | |
CLEARWATER INVESTMENT TRUST
Schedule of Investments - Clearwater Core Equity Fund
December 31, 2023
| Shares | | Security | | Cost | | Fair value (a) | | Percent of
net assets |
| Materials (Cont'd): | | | | | | |
| 20,732 | | LYONDELLBASELL INDUSTRIES N.V., CLASS A | | $ 1,355,517 | | 1,971,199 | | |
| 700 | | MARTIN MARIETTA MATERIALS, INC. | | 27,965 | | 349,237 | | |
| 46,711 | | MOSAIC (THE) CO. | | 1,522,307 | | 1,668,984 | | |
| 278 | | NEWMARKET CORP. | | 149,378 | | 151,741 | | |
| 7,400 | | NEWMONT CORP. | | 136,530 | | 306,286 | | |
| 9,103 | | NUCOR CORP. | | 1,252,497 | | 1,584,286 | | |
| 1,000 | | PACKAGING CORP. OF AMERICA | | 114,697 | | 162,910 | | |
| 5,172 | | PPG INDUSTRIES, INC. | | 123,888 | | 773,473 | | |
| 10,609 | | RELIANCE STEEL & ALUMINUM CO. | | 2,557,143 | | 2,967,125 | | |
| 1,400 | | SEALED AIR CORP. | | 24,528 | | 51,128 | | |
| 12,860 | | STEEL DYNAMICS, INC. | | 1,363,296 | | 1,518,766 | | |
| 37,980 | | UNITED STATES STEEL CORP. | | 1,235,387 | | 1,847,727 | | |
| 2,100 | | VULCAN MATERIALS CO. | | 63,441 | | 476,721 | | |
| 8,135 | | WESTLAKE CORP. | | 856,316 | | 1,138,575 | | |
| 3,358 | | WESTROCK CO. | | 99,509 | | 139,424 | | |
| | | | | 18,974,445 | | 27,919,041 | | 3.20% |
| Real Estate: | | | | | | |
| 2,129 | | ALEXANDRIA REAL ESTATE EQUITIES, INC. | | 110,363 | | 269,893 | | |
| 6,280 | | AMERICAN TOWER CORP. | | 786,190 | | 1,355,726 | | |
| 1,934 | | AVALONBAY COMMUNITIES, INC. | | 225,956 | | 362,084 | | |
| 3,388 | | BOSTON PROPERTIES, INC. | | 169,359 | | 237,736 | | |
| 900 | | CAMDEN PROPERTY TRUST | | 21,980 | | 89,361 | | |
| 15,300 | | CROWN CASTLE, INC. | | 1,126,465 | | 1,762,407 | | |
| 2,357 | | DIGITAL REALTY TRUST, INC. | | 262,628 | | 317,205 | | |
| 916 | | EQUINIX, INC. | | 128,836 | | 737,737 | | |
| 5,416 | | EQUITY RESIDENTIAL | | 174,162 | | 331,243 | | |
| 675 | | ESSEX PROPERTY TRUST, INC. | | 73,174 | | 167,360 | | |
| 3,200 | | EXTRA SPACE STORAGE, INC. | | 340,075 | | 513,056 | | |
| 1,000 | | FEDERAL REALTY INVESTMENT TRUST | | 55,846 | | 103,050 | | |
| 70 | | GAMING AND LEISURE PROPERTIES, INC. | | 2,761 | | 3,455 | | |
| 7,000 | | HEALTHPEAK PROPERTIES, INC. | | 63,668 | | 138,600 | | |
| 10,322 | | HOST HOTELS & RESORTS, INC. | | 73,056 | | 200,969 | | |
| 7,700 | | INVITATION HOMES, INC. | | 228,811 | | 262,647 | | |
| 2,300 | | IRON MOUNTAIN, INC. | | 103,917 | | 160,954 | | |
| 6,872 | | KIMCO REALTY CORP. | | 64,575 | | 146,442 | | |
| 1,800 | | MID-AMERICA APARTMENT COMMUNITIES, INC. | | 132,698 | | 242,028 | | |
| 11,718 | | PROLOGIS, INC. | | 308,464 | | 1,562,009 | | |
| 1,735 | | PUBLIC STORAGE | | 227,274 | | 529,175 | | |
| 4,002 | | REALTY INCOME CORP. | | 82,345 | | 229,795 | | |
| 3,900 | | REGENCY CENTERS CORP. | | 85,344 | | 261,300 | | |
| 3,800 | | SBA COMMUNICATIONS CORP. | | 554,353 | | 964,022 | | |
| 7,934 | | SIMON PROPERTY GROUP, INC. | | 704,821 | | 1,131,706 | | |
| 33 | | SUN COMMUNITIES, INC. | | 3,122 | | 4,411 | | |
| 4,100 | | UDR, INC. | | 63,318 | | 156,989 | | |
| 100 | | VENTAS, INC. | | 4,045 | | 4,984 | | |
| 13,565 | | VICI PROPERTIES, INC. | | 322,828 | | 432,452 | | |
| 6,400 | | WELLTOWER, INC. | | 403,819 | | 577,088 | | |
| 4,916 | | WEYERHAEUSER CO. | | 62,194 | | 170,929 | | |
| | | | | 6,966,447 | | 13,426,813 | | 1.54% |
| Utilities: | | | | | | |
| 3,000 | | AES (THE) CORP. | | 32,870 | | 57,750 | | |
| 2,000 | | ALLIANT ENERGY CORP. | | 24,835 | | 102,600 | | |
| 1,700 | | AMEREN CORP. | | 48,382 | | 122,978 | | |
| 3,000 | | AMERICAN ELECTRIC POWER CO., INC. | | 134,395 | | 243,660 | | |
| 2,600 | | AMERICAN WATER WORKS CO., INC. | | 308,898 | | 343,174 | | |
| 400 | | ATMOS ENERGY CORP. | | 43,880 | | 46,360 | | |
| 6,000 | | CENTERPOINT ENERGY, INC. | | 71,768 | | 171,420 | | |
| 10,200 | | CMS ENERGY CORP. | | 115,866 | | 592,314 | | |
| 4,975 | | CONSOLIDATED EDISON, INC. | | 318,863 | | 452,576 | | |
| 3,500 | | CONSTELLATION ENERGY CORP. | | 137,851 | | 409,115 | | |
| 15,373 | | DOMINION ENERGY, INC. | | 546,490 | | 722,531 | | |
| 8,900 | | DTE ENERGY CO. | | 709,034 | | 981,314 | | |
| 7,151 | | DUKE ENERGY CORP. | | 220,926 | | 693,933 | | |
| 4,325 | | EDISON INTERNATIONAL | | 135,088 | | 309,194 | | |
| 2,864 | | ENTERGY CORP. | | 233,541 | | 289,808 | | |
| 22,374 | | EVERGY, INC. | | 1,024,899 | | 1,167,923 | | |
| 4,961 | | EVERSOURCE ENERGY | | 125,492 | | 306,193 | | |
CLEARWATER INVESTMENT TRUST
Schedule of Investments - Clearwater Core Equity Fund
December 31, 2023
| Shares | | Security | | Cost | | Fair value (a) | | Percent of
net assets |
| Utilities (Cont'd): | | | | | | |
| 10,500 | | EXELON CORP. | | $ 342,581 | | 376,950 | | |
| 6,800 | | FIRSTENERGY CORP. | | 186,942 | | 249,288 | | |
| 114,955 | | HAWAIIAN ELECTRIC INDUSTRIES, INC. | | 1,512,824 | | 1,631,211 | | |
| 30,654 | | NEXTERA ENERGY, INC. | | 1,028,039 | | 1,861,924 | | |
| 7,100 | | NISOURCE, INC. | | 49,003 | | 188,505 | | |
| 10,300 | | PG&E CORP. | | 139,468 | | 185,709 | | |
| 13,100 | | PINNACLE WEST CAPITAL CORP. | | 782,497 | | 941,104 | | |
| 9,600 | | PPL CORP. | | 221,808 | | 260,160 | | |
| 1,200 | | PUBLIC SERVICE ENTERPRISE GROUP, INC. | | 51,552 | | 73,380 | | |
| 7,400 | | SEMPRA ENERGY | | 239,277 | | 553,002 | | |
| 11,800 | | SOUTHERN (THE) CO. | | 382,948 | | 827,416 | | |
| 1,600 | | WEC ENERGY GROUP, INC. | | 91,440 | | 134,672 | | |
| | | | | 9,261,457 | | 14,296,164 | | 1.64% |
| | | Sub-total Common Stocks: | | 442,590,062 | | 867,037,507 | | 99.44% |
| Escrows: | | | | | | |
| Communication Services: | | | | | | |
| 1,360 | | GCI LIBERTY, INC., CLASS A(b)(d) | | - | | - | | |
| | | | | - | | - | | 0.00% |
| | | Sub-total Escrows: | | - | | - | | 0.00% |
| Rights: | | | | | | |
| Health Care: | | | | | | |
| 300 | | ABIOMED, INC. (CONTINGENT VALUE RIGHTS)(b)(d) | | - | | - | | |
| | | | | - | | - | | 0.00% |
| | | Sub-total Rights: | | - | | - | | 0.00% |
| Short-Term Investments: | | | | | | |
| 5,157,828 | | NORTHERN INSTITUTIONAL FUNDS - U.S. GOVERNMENT SELECT PORTFOLIO, INSTITUTIONAL SHARES, 5.24%(e) | | 5,157,828 | | 5,157,828 | | |
| | | Sub-total Short-Term Investments: | | 5,157,828 | | 5,157,828 | | 0.59% |
| | | Grand total | | $ 447,747,890 | | 872,195,335 | | 100.03% |
| Notes to Schedule of Investments: |
| (a) | Investments are valued in accordance with procedures described in Note 2 to the financial statements. |
| (b) | Non-income producing assets. |
| (c) | Foreign security values are stated in U.S. dollars. As of December 31, 2023, the value of foreign stocks or depositary receipts of companies based outside of the United States represented 1.53% of net assets. |
| (d) | Security has been deemed worthless and is a Level 3 investment. |
| (e) | The short-term investment is a money market portfolio of the investment company, Northern Institutional Funds. At December 31, 2022, the value of the Clearwater Core Equity Fund's investment in the U.S. Government Select Portfolio of the Northern Institutional Funds was $4,611,528 with net purchases of $546,300 during the fiscal year ended December 31, 2023. |
CLEARWATER INVESTMENT TRUST
Schedule of Investments - Clearwater Core Equity Fund
December 31, 2023
Clearwater Core Equity Fund Portfolio Diversification
(as a percentage of net assets)
CLEARWATER INVESTMENT TRUST
Schedule of Investments - Clearwater Select Equity Fund
December 31, 2023
| Shares | | Security | | Cost | | Fair value (a) | | Percent of
net assets |
| Common Stocks: | | | | | | |
| Communication Services: | | | | | | |
| 6,100 | | AMC NETWORKS, INC., CLASS A(b) | | $ 75,828 | | 114,619 | | |
| 3,500 | | CARS.COM, INC.(b) | | 42,390 | | 66,395 | | |
| 2,400 | | COGENT COMMUNICATIONS HOLDINGS, INC. | | 128,057 | | 182,544 | | |
| 46,000 | | DISH NETWORK CORP., CLASS A(b) | | 168,135 | | 265,420 | | |
| 98,945 | | EVENTBRITE, INC., CLASS A(b) | | 803,944 | | 827,180 | | |
| 2,200 | | EW SCRIPPS (THE) CO., CLASS A(b) | | 16,362 | | 17,578 | | |
| 15,200 | | GOGO, INC.(b) | | 169,547 | | 153,976 | | |
| 300 | | MADISON SQUARE GARDEN SPORTS CORP.(b) | | 52,237 | | 54,549 | | |
| 94,904 | | NEW YORK TIMES (THE) CO., CLASS A | | 3,923,515 | | 4,649,347 | | |
| 1,900 | | QUINSTREET, INC.(b) | | 20,972 | | 24,358 | | |
| 16,405 | | SCHOLASTIC CORP. | | 632,408 | | 618,469 | | |
| 600 | | SHENANDOAH TELECOMMUNICATIONS CO. | | 11,024 | | 12,972 | | |
| 15,523 | | SHUTTERSTOCK, INC. | | 1,069,364 | | 749,450 | | |
| 16,195 | | TECHTARGET, INC.(b) | | 622,203 | | 564,558 | | |
| 7,800 | | THRYV HOLDINGS, INC.(b) | | 144,188 | | 158,730 | | |
| 151,687 | | THUNDERBIRD ENTERTAINMENT GROUP, INC.(b)(c) | | 536,158 | | 265,585 | | |
| 81,402 | | WARNER MUSIC GROUP CORP., CLASS A | | 2,466,155 | | 2,913,378 | | |
| 3,804 | | YELP, INC.(b) | | 111,139 | | 180,081 | | |
| | | | | 10,993,626 | | 11,819,189 | | 2.77% |
| Consumer Discretionary: | | | | | | |
| 26,412 | | 1-800-FLOWERS.COM, INC., CLASS A(b) | | 843,160 | | 284,721 | | |
| 3,958 | | ABERCROMBIE & FITCH CO., CLASS A(b) | | 241,057 | | 349,175 | | |
| 3,746 | | ACADEMY SPORTS & OUTDOORS, INC. | | 164,776 | | 247,236 | | |
| 67,428 | | ADIENT PLC(b) | | 2,434,321 | | 2,451,682 | | |
| 30,600 | | ADVANCE AUTO PARTS, INC. | | 2,088,753 | | 1,867,518 | | |
| 122,110 | | AMERICAN EAGLE OUTFITTERS, INC. | | 2,036,201 | | 2,583,848 | | |
| 400 | | AMERICA'S CAR-MART, INC.(b) | | 24,862 | | 30,308 | | |
| 64,221 | | ARHAUS, INC.(b) | | 565,017 | | 761,019 | | |
| 500 | | ASBURY AUTOMOTIVE GROUP, INC.(b) | | 84,891 | | 112,485 | | |
| 16,947 | | BEYOND, INC.(b) | | 387,686 | | 469,262 | | |
| 8,963 | | BLOOMIN' BRANDS, INC. | | 192,078 | | 252,308 | | |
| 1,295 | | BOOT BARN HOLDINGS, INC.(b) | | 77,565 | | 99,404 | | |
| 1,900 | | BRINKER INTERNATIONAL, INC.(b) | | 49,107 | | 82,042 | | |
| 200 | | BUCKLE (THE), INC. | | 6,390 | | 9,504 | | |
| 143,518 | | CARPARTS.COM, INC.(b) | | 686,861 | | 453,517 | | |
| 83,077 | | CENTURY CASINOS, INC.(b) | | 1,201,087 | | 405,416 | | |
| 1,929 | | CENTURY COMMUNITIES, INC. | | 86,775 | | 175,809 | | |
| 5,608 | | CHUY'S HOLDINGS, INC.(b) | | 117,797 | | 214,394 | | |
| 3,000 | | CRACKER BARREL OLD COUNTRY STORE, INC. | | 197,270 | | 231,240 | | |
| 131,462 | | DANA, INC. | | 1,573,541 | | 1,920,660 | | |
| 12,893 | | DENNY'S CORP.(b) | | 207,499 | | 140,276 | | |
| 64,538 | | DREAM FINDERS HOMES, INC., CLASS A(b) | | 1,076,513 | | 2,293,035 | | |
| 300 | | ETHAN ALLEN INTERIORS, INC. | | 6,708 | | 9,576 | | |
| 7,800 | | FOOT LOCKER, INC. | | 132,332 | | 242,970 | | |
| 4,500 | | FRONTDOOR, INC.(b) | | 94,527 | | 158,490 | | |
| 70,102 | | FULL HOUSE RESORTS, INC.(b) | | 574,991 | | 376,448 | | |
| 86,237 | | GAP (THE), INC. | | 1,191,533 | | 1,803,216 | | |
| 64,672 | | GEN RESTAURANT GROUP, INC.(b) | | 784,555 | | 506,382 | | |
| 28,735 | | GENESCO, INC.(b) | | 848,158 | | 1,011,759 | | |
| 60,299 | | GENTEX CORP. | | 1,737,195 | | 1,969,365 | | |
| 987 | | G-III APPAREL GROUP LTD.(b) | | 14,210 | | 33,538 | | |
| 90,428 | | GILDAN ACTIVEWEAR, INC.(c) | | 2,171,785 | | 2,989,550 | | |
| 1,300 | | GREEN BRICK PARTNERS, INC.(b) | | 28,259 | | 67,522 | | |
| 900 | | GROUP 1 AUTOMOTIVE, INC. | | 129,981 | | 274,266 | | |
| 1,100 | | GUESS?, INC. | | 16,379 | | 25,366 | | |
| 208,430 | | HANESBRANDS, INC.(b) | | 2,442,906 | | 929,598 | | |
| 21,980 | | HASBRO, INC. | | 953,393 | | 1,122,299 | | |
| 800 | | HAVERTY FURNITURE COS., INC. | | 20,316 | | 28,400 | | |
| 27,031 | | HELEN OF TROY LTD.(b) | | 4,124,213 | | 3,265,615 | | |
| 47,911 | | HOOKER FURNISHINGS CORP. | | 1,123,840 | | 1,249,519 | | |
| 1,901 | | INSTALLED BUILDING PRODUCTS, INC. | | 234,460 | | 347,541 | | |
| 900 | | KOHL'S CORP. | | 18,585 | | 25,812 | | |
| 2,100 | | KONTOOR BRANDS, INC. | | 72,197 | | 131,082 | | |
| 600 | | LA-Z-BOY, INC. | | 13,860 | | 22,152 | | |
| 700 | | LGI HOMES, INC.(b) | | 57,078 | | 93,212 | | |
| 1,500 | | M/I HOMES, INC.(b) | | 57,345 | | 206,610 | | |
| See accompanying notes to financial statements. | 57 | (Continued) |
CLEARWATER INVESTMENT TRUST
Schedule of Investments - Clearwater Select Equity Fund
December 31, 2023
| Shares | | Security | | Cost | | Fair value (a) | | Percent of
net assets |
| Consumer Discretionary (Cont'd): | | | | | | |
| 38,500 | | MALIBU BOATS, INC., CLASS A(b) | | $ 2,133,292 | | 2,110,570 | | |
| 575 | | MARINEMAX, INC.(b) | | 13,007 | | 22,367 | | |
| 3,500 | | MDC HOLDINGS, INC. | | 99,518 | | 193,375 | | |
| 1,348 | | MERITAGE HOMES CORP. | | 96,515 | | 234,822 | | |
| 300 | | MONARCH CASINO & RESORT, INC. | | 18,189 | | 20,745 | | |
| 171,284 | | NEWELL BRANDS, INC. | | 1,581,436 | | 1,486,745 | | |
| 2,300 | | ODP (THE) CORP.(b) | | 82,462 | | 129,490 | | |
| 800 | | OXFORD INDUSTRIES, INC. | | 67,825 | | 80,000 | | |
| 6,433 | | PATRICK INDUSTRIES, INC. | | 476,724 | | 645,552 | | |
| 154,471 | | PELOTON INTERACTIVE, INC., CLASS A(b) | | 2,866,204 | | 940,728 | | |
| 3,600 | | PERDOCEO EDUCATION CORP. | | 37,564 | | 63,216 | | |
| 21,629 | | PVH CORP. | | 1,050,702 | | 2,641,333 | | |
| 1,400 | | SHAKE SHACK, INC., CLASS A(b) | | 65,264 | | 103,768 | | |
| 28,469 | | SHOE CARNIVAL, INC. | | 717,622 | | 860,048 | | |
| 2,100 | | SIGNET JEWELERS LTD. | | 118,747 | | 225,246 | | |
| 4,000 | | SIX FLAGS ENTERTAINMENT CORP.(b) | | 73,577 | | 100,320 | | |
| 28,885 | | SKYLINE CHAMPION CORP.(b) | | 1,767,337 | | 2,145,000 | | |
| 7,587 | | SLEEP NUMBER CORP.(b) | | 662,541 | | 112,515 | | |
| 823 | | SONIC AUTOMOTIVE, INC., CLASS A | | 28,187 | | 46,261 | | |
| 100 | | STANDARD MOTOR PRODUCTS, INC. | | 3,250 | | 3,981 | | |
| 1,777 | | STEVEN MADDEN LTD. | | 50,250 | | 74,634 | | |
| 72,800 | | STONERIDGE, INC.(b) | | 1,522,075 | | 1,424,696 | | |
| 1,200 | | STRATEGIC EDUCATION, INC. | | 69,846 | | 110,844 | | |
| 39,408 | | STRIDE, INC.(b) | | 1,394,783 | | 2,339,653 | | |
| 5,500 | | TRI POINTE HOMES, INC.(b) | | 86,442 | | 194,700 | | |
| 2,100 | | UPBOUND GROUP, INC. | | 46,462 | | 71,337 | | |
| 622 | | URBAN OUTFITTERS, INC.(b) | | 13,851 | | 22,199 | | |
| 72,578 | | VF CORP. | | 1,475,450 | | 1,364,466 | | |
| 2,000 | | VISTA OUTDOOR, INC.(b) | | 48,955 | | 59,140 | | |
| 57,468 | | WINNEBAGO INDUSTRIES, INC. | | 2,623,516 | | 4,188,268 | | |
| 3,600 | | WOLVERINE WORLD WIDE, INC. | | 27,599 | | 32,004 | | |
| 45,511 | | WYNDHAM HOTELS & RESORTS, INC. | | 2,595,020 | | 3,659,540 | | |
| | | | | 53,106,225 | | 58,032,710 | | 13.59% |
| Consumer Staples: | | | | | | |
| 1,800 | | ANDERSONS (THE), INC. | | 56,519 | | 103,572 | | |
| 1,800 | | B&G FOODS, INC. | | 14,360 | | 18,900 | | |
| 32,739 | | BRC, INC., CLASS A(b)(d) | | 135,843 | | 118,843 | | |
| 400 | | CENTRAL GARDEN & PET CO., CLASS A(b) | | 13,784 | | 17,616 | | |
| 35,182 | | CHEFS' WAREHOUSE (THE), INC.(b) | | 983,185 | | 1,035,406 | | |
| 4,733 | | EDGEWELL PERSONAL CARE CO. | | 162,686 | | 173,370 | | |
| 809 | | ELF BEAUTY, INC.(b) | | 63,176 | | 116,771 | | |
| 54,900 | | FLOWERS FOODS, INC. | | 1,456,895 | | 1,235,799 | | |
| 1,100 | | FRESH DEL MONTE PRODUCE, INC. | | 25,905 | | 28,875 | | |
| 119,186 | | GROCERY OUTLET HOLDING CORP.(b) | | 3,504,266 | | 3,213,255 | | |
| 15,800 | | HAIN CELESTIAL GROUP (THE), INC.(b) | | 173,149 | | 173,010 | | |
| 23,200 | | HALOWS CO. LTD.(c) | | 550,683 | | 705,872 | | |
| 84,322 | | HILTON FOOD GROUP PLC(c) | | 600,587 | | 859,848 | | |
| 13,130 | | INGREDION, INC. | | 1,203,344 | | 1,424,999 | | |
| 900 | | INTER PARFUMS, INC. | | 68,995 | | 129,609 | | |
| 700 | | J & J SNACK FOODS CORP. | | 91,908 | | 116,998 | | |
| 63 | | J M SMUCKER (THE) CO. | | 6,960 | | 7,962 | | |
| 744 | | JOHN B. SANFILIPPO & SON, INC. | | 55,342 | | 76,662 | | |
| 226,568 | | MAMAMANCINI'S HOLDINGS, INC.(b) | | 720,048 | | 1,112,449 | | |
| 600 | | MEDIFAST, INC. | | 39,462 | | 40,332 | | |
| 1,000 | | NATIONAL BEVERAGE CORP.(b) | | 39,795 | | 49,720 | | |
| 9,800 | | NU SKIN ENTERPRISES, INC., CLASS A | | 182,027 | | 190,316 | | |
| 1,300 | | PRICESMART, INC. | | 76,855 | | 98,514 | | |
| 4,357 | | SIMPLY GOOD FOODS (THE) CO.(b) | | 146,160 | | 172,537 | | |
| 27,924 | | SPECTRUM BRANDS HOLDINGS, INC. | | 1,804,599 | | 2,227,497 | | |
| 314 | | TREEHOUSE FOODS, INC.(b) | | 12,704 | | 13,015 | | |
| 10,900 | | UNITED NATURAL FOODS, INC.(b) | | 165,304 | | 176,907 | | |
| 45,602 | | UNIVERSAL CORP. | | 2,437,199 | | 3,069,927 | | |
| 27,734 | | USANA HEALTH SCIENCES, INC.(b) | | 2,564,985 | | 1,486,542 | | |
| 5,100 | | VECTOR GROUP LTD. | | 45,813 | | 57,528 | | |
| 300 | | WD-40 CO. | | 59,193 | | 71,721 | | |
| | | | | 17,461,731 | | 18,324,372 | | 4.29% |
| See accompanying notes to financial statements. | 58 | (Continued) |
CLEARWATER INVESTMENT TRUST
Schedule of Investments - Clearwater Select Equity Fund
December 31, 2023
| Shares | | Security | | Cost | | Fair value (a) | | Percent of
net assets |
| Energy: | | | | | | |
| 7,300 | | ARCHROCK, INC. | | $ 46,991 | | 112,420 | | |
| 7,490 | | BAYTEX ENERGY CORP.(c) | | 23,594 | | 24,867 | | |
| 5,800 | | CALIFORNIA RESOURCES CORP. | | 299,314 | | 317,144 | | |
| 3,400 | | CALLON PETROLEUM CO.(b) | | 111,610 | | 110,160 | | |
| 362 | | CHEVRON CORP. | | 35,198 | | 53,996 | | |
| 2,000 | | CIVITAS RESOURCES, INC. | | 114,995 | | 136,760 | | |
| 2,417 | | CONSOL ENERGY, INC. | | 199,557 | | 242,981 | | |
| 900 | | CORE LABORATORIES, INC. | | 14,787 | | 15,894 | | |
| 1,061 | | CVR ENERGY, INC. | | 28,107 | | 32,148 | | |
| 85,051 | | DMC GLOBAL, INC.(b) | | 3,183,962 | | 1,600,660 | | |
| 1,700 | | DORIAN LPG LTD. | | 24,290 | | 74,579 | | |
| 1,900 | | DRIL-QUIP, INC.(b) | | 39,103 | | 44,213 | | |
| 8,300 | | GREEN PLAINS, INC.(b) | | 206,735 | | 209,326 | | |
| 3,180 | | HELIX ENERGY SOLUTIONS GROUP, INC.(b) | | 19,514 | | 32,690 | | |
| 44,364 | | HIGHPEAK ENERGY, INC.(d) | | 508,366 | | 631,743 | | |
| 3,300 | | NORTHERN OIL AND GAS, INC. | | 103,014 | | 122,331 | | |
| 134,834 | | NOV, INC. | | 1,634,007 | | 2,734,434 | | |
| 3,994 | | OCEANEERING INTERNATIONAL, INC.(b) | | 50,619 | | 84,992 | | |
| 1,100 | | OIL STATES INTERNATIONAL, INC.(b) | | 5,060 | | 7,469 | | |
| 900 | | PAR PACIFIC HOLDINGS, INC.(b) | | 17,127 | | 32,733 | | |
| 4,662 | | PATTERSON-UTI ENERGY, INC. | | 50,004 | | 50,350 | | |
| 580 | | PBF ENERGY, INC., CLASS A | | 19,990 | | 25,497 | | |
| 3,446 | | PROPETRO HOLDING CORP.(b) | | 24,164 | | 28,877 | | |
| 774 | | REX AMERICAN RESOURCES CORP.(b) | | 16,958 | | 36,610 | | |
| 3,209 | | SM ENERGY CO. | | 87,806 | | 124,253 | | |
| 1,300 | | TALOS ENERGY, INC.(b) | | 17,956 | | 18,499 | | |
| 740 | | VITAL ENERGY, INC.(b) | | 34,720 | | 33,663 | | |
| 1,700 | | WORLD KINECT CORP. | | 35,884 | | 38,726 | | |
| | | | | 6,953,432 | | 6,978,015 | | 1.63% |
| Financials: | | | | | | |
| 56,948 | | AFC GAMMA, INC. | | 955,695 | | 685,084 | | |
| 19,143 | | A-MARK PRECIOUS METALS, INC. | | 549,851 | | 579,076 | | |
| 12,802 | | AMERICAN EQUITY INVESTMENT LIFE HOLDING CO.(b) | | 369,328 | | 714,352 | | |
| 1,100 | | APOLLO COMMERCIAL REAL ESTATE FINANCE, INC. | | 9,266 | | 12,914 | | |
| 3,300 | | ARBOR REALTY TRUST, INC. | | 40,942 | | 50,094 | | |
| 2,900 | | ARTISAN PARTNERS ASSET MANAGEMENT, INC., CLASS A | | 97,923 | | 128,122 | | |
| 119,510 | | ASSOCIATED BANC-CORP | | 2,084,499 | | 2,556,319 | | |
| 300 | | ASSURED GUARANTY LTD. | | 14,439 | | 22,449 | | |
| 49,287 | | AXIS CAPITAL HOLDINGS LTD. | | 2,539,237 | | 2,729,021 | | |
| 19,812 | | AXOS FINANCIAL, INC.(b) | | 899,206 | | 1,081,735 | | |
| 13,532 | | BANC OF CALIFORNIA, INC. | | 160,944 | | 181,735 | | |
| 1,000 | | BANCFIRST CORP. | | 86,100 | | 97,330 | | |
| 2,400 | | BANCORP (THE), INC.(b) | | 53,353 | | 92,544 | | |
| 3,900 | | BANK OF HAWAII CORP. | | 184,962 | | 282,594 | | |
| 8,000 | | BERKSHIRE HILLS BANCORP, INC. | | 167,165 | | 198,640 | | |
| 27,399 | | BREAD FINANCIAL HOLDINGS, INC. | | 820,363 | | 902,523 | | |
| 8,500 | | BRIGHTSPHERE INVESTMENT GROUP, INC. | | 148,663 | | 162,860 | | |
| 30,735 | | CALIFORNIA BANCORP(b) | | 595,916 | | 760,999 | | |
| 25,400 | | CAPITOL FEDERAL FINANCIAL, INC. | | 118,242 | | 163,830 | | |
| 600 | | CITY HOLDING CO. | | 53,184 | | 66,156 | | |
| 142,239 | | CNO FINANCIAL GROUP, INC. | | 2,639,568 | | 3,968,468 | | |
| 168,038 | | COLUMBIA BANKING SYSTEM, INC. | | 3,928,832 | | 4,483,254 | | |
| 48,697 | | COMMERCE BANCSHARES, INC. | | 2,163,977 | | 2,600,901 | | |
| 600 | | COMMUNITY BANK SYSTEM, INC. | | 25,494 | | 31,266 | | |
| 3,352 | | CUSTOMERS BANCORP, INC.(b) | | 58,243 | | 193,142 | | |
| 39,505 | | DONNELLEY FINANCIAL SOLUTIONS, INC.(b) | | 1,833,026 | | 2,463,927 | | |
| 6,600 | | EAGLE BANCORP, INC. | | 153,548 | | 198,924 | | |
| 700 | | ELLINGTON FINANCIAL, INC. | | 7,644 | | 8,897 | | |
| 400 | | EMPLOYERS HOLDINGS, INC. | | 13,746 | | 15,760 | | |
| 3,000 | | ENCORE CAPITAL GROUP, INC.(b) | | 132,681 | | 152,250 | | |
| 1,800 | | ENOVA INTERNATIONAL, INC.(b) | | 54,842 | | 99,648 | | |
| 21,255 | | ESQUIRE FINANCIAL HOLDINGS, INC. | | 635,894 | | 1,061,900 | | |
| 50,710 | | ESSENT GROUP LTD. | | 1,910,505 | | 2,674,445 | | |
| 2,259 | | EVERTEC, INC. | | 68,287 | | 92,483 | | |
| 140,645 | | EZCORP, INC., CLASS A(b) | | 1,072,289 | | 1,229,237 | | |
| 13,690 | | FEDERAL AGRICULTURAL MORTGAGE CORP., CLASS C | | 1,793,029 | | 2,617,802 | | |
| 60,458 | | FIDUCIAN GROUP LTD.(c) | | 328,653 | | 255,022 | | |
| See accompanying notes to financial statements. | 59 | (Continued) |
CLEARWATER INVESTMENT TRUST
Schedule of Investments - Clearwater Select Equity Fund
December 31, 2023
| Shares | | Security | | Cost | | Fair value (a) | | Percent of
net assets |
| Financials (Cont'd): | | | | | | |
| 13,275 | | FIRST HAWAIIAN, INC. | | $ 251,449 | | 303,467 | | |
| 31,235 | | FIRST WESTERN FINANCIAL, INC.(b) | | 579,196 | | 619,390 | | |
| 11,733 | | FIRSTCASH HOLDINGS, INC. | | 713,810 | | 1,271,740 | | |
| 2,200 | | FRANKLIN BSP REALTY TRUST, INC. | | 24,406 | | 29,722 | | |
| 19,868 | | GENWORTH FINANCIAL, INC., CLASS A(b) | | 71,184 | | 132,718 | | |
| 83,474 | | GLACIER BANCORP, INC. | | 3,322,985 | | 3,449,146 | | |
| 1,000 | | HANMI FINANCIAL CORP. | | 16,390 | | 19,400 | | |
| 18,506 | | HCI GROUP, INC. | | 1,006,322 | | 1,617,424 | | |
| 2,500 | | HILLTOP HOLDINGS, INC. | | 66,017 | | 88,025 | | |
| 4,200 | | HOPE BANCORP, INC. | | 38,242 | | 50,736 | | |
| 909 | | HUNTINGTON BANCSHARES, INC. | | 9,494 | | 11,562 | | |
| 200 | | INDEPENDENT BANK CORP. | | 9,914 | | 13,162 | | |
| 5,000 | | INDEPENDENT BANK GROUP, INC. | | 188,792 | | 254,400 | | |
| 52,230 | | JDC GROUP A.G.(b)(c) | | 1,191,985 | | 1,124,357 | | |
| 80,242 | | KINGSWAY FINANCIAL SERVICES, INC.(b) | | 693,718 | | 674,033 | | |
| 10,600 | | KKR REAL ESTATE FINANCE TRUST, INC. | | 125,701 | | 140,238 | | |
| 3,400 | | LAKELAND FINANCIAL CORP. | | 190,694 | | 221,544 | | |
| 245,732 | | LENDINGCLUB CORP.(b) | | 3,271,372 | | 2,147,698 | | |
| 5,700 | | LINCOLN NATIONAL CORP. | | 135,815 | | 153,729 | | |
| 4,680 | | LPL FINANCIAL HOLDINGS, INC. | | 883,224 | | 1,065,262 | | |
| 12,405 | | MARKETAXESS HOLDINGS, INC. | | 3,144,540 | | 3,632,804 | | |
| 2,100 | | MERCURY GENERAL CORP. | | 60,597 | | 78,351 | | |
| 100,448 | | MORTGAGE ADVICE BUREAU HOLDINGS LTD.(c) | | 1,219,053 | | 1,049,896 | | |
| 2,600 | | MR COOPER GROUP, INC.(b) | | 103,966 | | 169,312 | | |
| 9,200 | | NCR ATLEOS CORP.(b) | | 209,072 | | 223,468 | | |
| 3,590 | | NEW YORK COMMUNITY BANCORP, INC. | | 28,581 | | 36,726 | | |
| 14,300 | | NEW YORK MORTGAGE TRUST, INC. | | 118,511 | | 121,979 | | |
| 2,724 | | NMI HOLDINGS, INC., CLASS A(b) | | 39,406 | | 80,848 | | |
| 8,300 | | NORTHWEST BANCSHARES, INC. | | 85,461 | | 103,584 | | |
| 995 | | OFG BANCORP | | 22,845 | | 37,293 | | |
| 157,249 | | OLD NATIONAL BANCORP | | 2,300,391 | | 2,655,936 | | |
| 8,430 | | PACIFIC PREMIER BANCORP, INC. | | 180,370 | | 245,397 | | |
| 1,700 | | PALOMAR HOLDINGS, INC.(b) | | 85,371 | | 94,350 | | |
| 1,100 | | PATHWARD FINANCIAL, INC. | | 36,415 | | 58,223 | | |
| 39,100 | | PAYONEER GLOBAL, INC.(b) | | 185,622 | | 203,711 | | |
| 70,797 | | PERELLA WEINBERG PARTNERS | | 795,165 | | 865,847 | | |
| 500 | | PIPER SANDLER COS. | | 52,300 | | 87,435 | | |
| 8,500 | | PRA GROUP, INC.(b) | | 160,118 | | 222,700 | | |
| 2,100 | | PROG HOLDINGS, INC.(b) | | 33,764 | | 64,911 | | |
| 4,100 | | RADIAN GROUP, INC. | | 99,409 | | 117,055 | | |
| 3,700 | | READY CAPITAL CORP. | | 34,581 | | 37,925 | | |
| 2,300 | | REDWOOD TRUST, INC. | | 13,410 | | 17,043 | | |
| 12,160 | | RENAISSANCERE HOLDINGS LTD. | | 2,025,587 | | 2,383,360 | | |
| 40,849 | | RYAN SPECIALTY HOLDINGS, INC.(b) | | 1,629,866 | | 1,757,324 | | |
| 3,300 | | SEACOAST BANKING CORP. OF FLORIDA | | 70,378 | | 93,918 | | |
| 5,000 | | SERVISFIRST BANCSHARES, INC. | | 235,081 | | 333,150 | | |
| 1,310 | | SIMMONS FIRST NATIONAL CORP., CLASS A | | 21,676 | | 25,990 | | |
| 25,612 | | SKYWARD SPECIALTY INSURANCE GROUP, INC.(b) | | 562,557 | | 867,735 | | |
| 31,210 | | STEWART INFORMATION SERVICES CORP. | | 1,311,025 | | 1,833,587 | | |
| 1,773 | | STONEX GROUP, INC.(b) | | 72,388 | | 130,901 | | |
| 30,910 | | SYNOVUS FINANCIAL CORP. | | 857,377 | | 1,163,762 | | |
| 2,800 | | TOMPKINS FINANCIAL CORP. | | 136,519 | | 168,644 | | |
| 800 | | TRIUMPH FINANCIAL, INC.(b) | | 46,438 | | 64,144 | | |
| 1,000 | | TRUPANION, INC.(b) | | 26,610 | | 30,510 | | |
| 11,400 | | UNITED COMMUNITY BANKS, INC. | | 276,626 | | 333,564 | | |
| 500 | | UNIVERSAL INSURANCE HOLDINGS, INC. | | 4,870 | | 7,990 | | |
| 57,749 | | UNIVEST FINANCIAL CORP. | | 1,067,701 | | 1,272,210 | | |
| 200 | | VIRTUS INVESTMENT PARTNERS, INC. | | 32,442 | | 48,352 | | |
| 1,978 | | WALKER & DUNLOP, INC. | | 160,362 | | 219,578 | | |
| 50,457 | | WEBSTER FINANCIAL CORP. | | 2,111,257 | | 2,561,197 | | |
| 6,000 | | WISDOMTREE, INC. | | 28,964 | | 41,580 | | |
| 82,359 | | WSFS FINANCIAL CORP. | | 3,633,834 | | 3,782,749 | | |
| | | | | 62,880,752 | | 74,328,495 | | 17.41% |
| Health Care: | | | | | | |
| 11,255 | | ADDUS HOMECARE CORP.(b) | | 943,675 | | 1,045,027 | | |
| 16,700 | | AGILITI, INC.(b) | | 134,177 | | 132,264 | | |
| 25,147 | | AMICUS THERAPEUTICS, INC.(b) | | 167,175 | | 356,836 | | |
| See accompanying notes to financial statements. | 60 | (Continued) |
CLEARWATER INVESTMENT TRUST
Schedule of Investments - Clearwater Select Equity Fund
December 31, 2023
| Shares | | Security | | Cost | | Fair value (a) | | Percent of
net assets |
| Health Care (Cont'd): | | | | | | |
| 3,600 | | AMN HEALTHCARE SERVICES, INC.(b) | | $ 241,223 | | 269,568 | | |
| 2,100 | | AMPHASTAR PHARMACEUTICALS, INC.(b) | | 60,514 | | 129,885 | | |
| 700 | | ANI PHARMACEUTICALS, INC.(b) | | 22,511 | | 38,598 | | |
| 99,937 | | BIOCRYST PHARMACEUTICALS, INC.(b) | | 791,857 | | 598,623 | | |
| 88,914 | | BIOMERICA, INC.(b) | | 277,205 | | 111,142 | | |
| 104,321 | | BIOTE CORP., CLASS A(b) | | 370,875 | | 515,346 | | |
| 43,666 | | BIO-TECHNE CORP. | | 2,702,016 | | 3,369,269 | | |
| 10,219 | | CHARLES RIVER LABORATORIES INTERNATIONAL, INC.(b) | | 2,143,604 | | 2,415,772 | | |
| 4,289 | | COMMUNITY HEALTH SYSTEMS, INC.(b) | | 10,209 | | 13,425 | | |
| 14,158 | | COMPUTER PROGRAMS AND SYSTEMS, INC.(b) | | 523,913 | | 158,570 | | |
| 1,100 | | CONMED CORP. | | 90,438 | | 120,461 | | |
| 3,494 | | CORCEPT THERAPEUTICS, INC.(b) | | 69,996 | | 113,485 | | |
| 400 | | CORVEL CORP.(b) | | 55,868 | | 98,884 | | |
| 39,581 | | CROSS COUNTRY HEALTHCARE, INC.(b) | | 934,568 | | 896,114 | | |
| 3,700 | | CYTOKINETICS, INC.(b) | | 178,589 | | 308,913 | | |
| 76,640 | | DENTSPLY SIRONA, INC. | | 2,419,631 | | 2,727,618 | | |
| 1,200 | | DYNAVAX TECHNOLOGIES CORP.(b) | | 13,631 | | 16,776 | | |
| 1,800 | | ENHABIT, INC.(b) | | 14,594 | | 18,630 | | |
| 2,225 | | ENSIGN GROUP (THE), INC. | | 171,080 | | 249,667 | | |
| 42,772 | | ESTABLISHMENT LABS HOLDINGS, INC.(b)(c) | | 1,771,985 | | 1,107,367 | | |
| 64,026 | | EVOLUS, INC.(b) | | 554,733 | | 674,194 | | |
| 5,400 | | FULGENT GENETICS, INC.(b) | | 147,668 | | 156,114 | | |
| 441 | | GLAUKOS CORP.(b) | | 21,574 | | 35,055 | | |
| 72,085 | | HARROW HEALTH, INC.(b) | | 931,164 | | 807,352 | | |
| 300 | | HEALTHSTREAM, INC. | | 6,462 | | 8,109 | | |
| 2,500 | | ICU MEDICAL, INC.(b) | | 222,292 | | 249,350 | | |
| 84,719 | | INFUSYSTEM HOLDINGS, INC.(b) | | 871,159 | | 892,938 | | |
| 22,169 | | INMODE LTD.(b)(c) | | 834,684 | | 493,039 | | |
| 25,062 | | INOTIV, INC.(b) | | 707,095 | | 91,977 | | |
| 7,111 | | INSMED, INC.(b) | | 127,319 | | 220,370 | | |
| 27,945 | | INTEGER HOLDINGS CORP.(b) | | 2,186,526 | | 2,768,791 | | |
| 46,430 | | INTEGRA LIFESCIENCES HOLDINGS CORP.(b) | | 2,421,730 | | 2,022,026 | | |
| 63,999 | | IOVANCE BIOTHERAPEUTICS, INC.(b) | | 639,150 | | 520,312 | | |
| 47,116 | | KINIKSA PHARMACEUTICALS LTD., CLASS A(b) | | 655,380 | | 826,415 | | |
| 34,884 | | LEMAITRE VASCULAR, INC. | | 1,823,586 | | 1,980,016 | | |
| 13,507 | | LIGAND PHARMACEUTICALS, INC.(b) | | 1,363,484 | | 964,670 | | |
| 22,257 | | MASIMO CORP.(b) | | 3,236,774 | | 2,608,743 | | |
| 3,012 | | MERIT MEDICAL SYSTEMS, INC.(b) | | 176,915 | | 228,791 | | |
| 9,340 | | MIRUM PHARMACEUTICALS, INC.(b) | | 207,001 | | 275,717 | | |
| 4,724 | | MOLINA HEALTHCARE, INC.(b) | | 1,359,113 | | 1,706,828 | | |
| 3,800 | | MYRIAD GENETICS, INC.(b) | | 74,960 | | 72,732 | | |
| 5,700 | | NEOGENOMICS, INC.(b) | | 54,524 | | 92,226 | | |
| 13,977 | | NEXUS A.G.(c) | | 1,125,566 | | 898,021 | | |
| 128,451 | | OCUPHIRE PHARMA, INC.(b) | | 293,364 | | 386,637 | | |
| 5,286 | | OMNIAB, INC.(b)(e) | | - | | - | | |
| 5,286 | | OMNIAB, INC. (EARNOUT SHARES)(b)(e) | | - | | - | | |
| 184,095 | | OMNIAB, INC. (NASDAQ GLOBAL MARKET EXCHANGE)(b) | | 1,133,819 | | 1,135,866 | | |
| 63,852 | | OPTIMIZERX CORP.(b) | | 1,613,338 | | 913,722 | | |
| 126,067 | | OPTINOSE, INC.(b) | | 256,243 | | 162,626 | | |
| 2,400 | | ORASURE TECHNOLOGIES, INC.(b) | | 9,502 | | 19,680 | | |
| 25,800 | | ORGANON & CO. | | 299,822 | | 372,036 | | |
| 23,921 | | ORTHOPEDIATRICS CORP.(b) | | 1,178,133 | | 777,672 | | |
| 500 | | OWENS & MINOR, INC.(b) | | 7,800 | | 9,635 | | |
| 256,847 | | PACIFIC BIOSCIENCES OF CALIFORNIA, INC.(b) | | 2,794,795 | | 2,519,669 | | |
| 43,127 | | PACIRA BIOSCIENCES, INC.(b) | | 1,714,175 | | 1,455,105 | | |
| 1,600 | | PEDIATRIX MEDICAL GROUP, INC.(b) | | 14,765 | | 14,880 | | |
| 65,940 | | PENNANT GROUP (THE), INC.(b) | | 845,402 | | 917,885 | | |
| 60,620 | | PERRIGO CO. PLC(c) | | 2,344,376 | | 1,950,752 | | |
| 62,055 | | PHIBRO ANIMAL HEALTH CORP., CLASS A | | 1,583,227 | | 718,597 | | |
| 12,300 | | PREMIER, INC., CLASS A | | 260,096 | | 275,028 | | |
| 2,500 | | PRESTIGE CONSUMER HEALTHCARE, INC.(b) | | 110,887 | | 153,050 | | |
| 11,700 | | PRIVIA HEALTH GROUP, INC.(b) | | 263,646 | | 269,451 | | |
| 24,703 | | PUMA BIOTECHNOLOGY, INC.(b) | | 96,596 | | 106,964 | | |
| 8,400 | | REGENXBIO, INC.(b) | | 138,731 | | 150,780 | | |
| 25,005 | | REVANCE THERAPEUTICS, INC.(b) | | 341,973 | | 219,794 | | |
| 17,381 | | RHYTHM PHARMACEUTICALS, INC.(b) | | 205,913 | | 799,005 | | |
| 15,354 | | ROCKET PHARMACEUTICALS, INC.(b) | | 302,659 | | 460,159 | | |
| See accompanying notes to financial statements. | 61 | (Continued) |
CLEARWATER INVESTMENT TRUST
Schedule of Investments - Clearwater Select Equity Fund
December 31, 2023
| Shares | | Security | | Cost | | Fair value (a) | | Percent of
net assets |
| Health Care (Cont'd): | | | | | | |
| 7,826 | | SCHOLAR ROCK HOLDING CORP.(b) | | $ 241,813 | | 147,129 | | |
| 14,392 | | SCPHARMACEUTICALS, INC.(b) | | 150,839 | | 90,238 | | |
| 3,800 | | SELECT MEDICAL HOLDINGS CORP. | | 86,664 | | 89,300 | | |
| 8,210 | | SHOCKWAVE MEDICAL, INC.(b) | | 1,467,664 | | 1,564,498 | | |
| 49,295 | | STAAR SURGICAL CO.(b) | | 2,522,947 | | 1,538,497 | | |
| 33,509 | | SUPERNUS PHARMACEUTICALS, INC.(b) | | 1,136,508 | | 969,750 | | |
| 12,948 | | TRAVERE THERAPEUTICS, INC.(b) | | 387,837 | | 116,402 | | |
| 12,390 | | UROGEN PHARMA LTD.(b) | | 233,788 | | 185,850 | | |
| 418 | | US PHYSICAL THERAPY, INC. | | 32,458 | | 38,932 | | |
| 13,083 | | UTAH MEDICAL PRODUCTS, INC. | | 1,515,866 | | 1,101,850 | | |
| 148,734 | | VAREX IMAGING CORP.(b) | | 3,338,564 | | 3,049,047 | | |
| 2,500 | | VERICEL CORP.(b) | | 60,043 | | 89,025 | | |
| 20,263 | | VERONA PHARMA PLC ADR(b)(c)(f) | | 305,616 | | 402,828 | | |
| 110,353 | | VIEMED HEALTHCARE, INC.(b) | | 575,900 | | 866,271 | | |
| 9,017 | | VIR BIOTECHNOLOGY, INC.(b) | | 82,704 | | 90,711 | | |
| 3,600 | | XENCOR, INC.(b) | | 68,020 | | 76,428 | | |
| 15,137 | | Y-MABS THERAPEUTICS, INC.(b) | | 338,168 | | 103,234 | | |
| | | | | 62,212,854 | | 57,715,009 | | 13.52% |
| Industrials: | | | | | | |
| 2,550 | | AAON, INC. | | 92,592 | | 188,367 | | |
| 500 | | AAR CORP.(b) | | 18,655 | | 31,200 | | |
| 8,700 | | ACUITY BRANDS, INC. | | 1,293,694 | | 1,782,021 | | |
| 39,603 | | ADENTRA, INC.(c) | | 950,130 | | 955,517 | | |
| 69,301 | | AIR LEASE CORP. | | 2,469,830 | | 2,906,484 | | |
| 310 | | ALAMO GROUP, INC. | | 40,969 | | 65,159 | | |
| 700 | | ALBANY INTERNATIONAL CORP., CLASS A | | 55,495 | | 68,754 | | |
| 600 | | ALLEGIANT TRAVEL CO. | | 44,820 | | 49,566 | | |
| 20,818 | | ALLIED MOTION TECHNOLOGIES, INC. | | 674,690 | | 628,912 | | |
| 52,121 | | AMERICAN WOODMARK CORP.(b) | | 3,847,354 | | 4,839,435 | | |
| 33,450 | | API GROUP CORP.(b) | | 709,230 | | 1,157,370 | | |
| 200 | | APOGEE ENTERPRISES, INC. | | 7,740 | | 10,682 | | |
| 1,460 | | APPLIED INDUSTRIAL TECHNOLOGIES, INC. | | 152,746 | | 252,127 | | |
| 1,766 | | ARCBEST CORP. | | 104,075 | | 212,291 | | |
| 1,800 | | ARCOSA, INC. | | 108,698 | | 148,752 | | |
| 71,570 | | ARIS WATER SOLUTIONS, INC., CLASS A | | 959,848 | | 600,472 | | |
| 19,480 | | ARMSTRONG WORLD INDUSTRIES, INC. | | 1,763,195 | | 1,915,274 | | |
| 700 | | AZZ, INC. | | 25,907 | | 40,663 | | |
| 1,177 | | BOISE CASCADE CO. | | 67,222 | | 152,257 | | |
| 26,426 | | BOWMAN CONSULTING GROUP LTD.(b) | | 353,893 | | 938,652 | | |
| 2,600 | | BRADY CORP., CLASS A | | 111,195 | | 152,594 | | |
| 118,890 | | BRIGHTVIEW HOLDINGS, INC.(b) | | 1,410,582 | | 1,001,054 | | |
| 22,166 | | BWX TECHNOLOGIES, INC. | | 1,194,217 | | 1,700,797 | | |
| 16,648 | | CLEAN HARBORS, INC.(b) | | 2,276,955 | | 2,905,242 | | |
| 1,100 | | COMFORT SYSTEMS U.S.A., INC. | | 105,717 | | 226,237 | | |
| 20,398 | | CONSTRUCTION PARTNERS, INC., CLASS A(b) | | 543,711 | | 887,721 | | |
| 4,555 | | CRA INTERNATIONAL, INC. | | 434,152 | | 450,262 | | |
| 1,639 | | CSG SYSTEMS INTERNATIONAL, INC. | | 64,966 | | 87,211 | | |
| 11,793 | | DUCOMMUN, INC.(b) | | 549,001 | | 613,944 | | |
| 843 | | DXP ENTERPRISES, INC.(b) | | 19,189 | | 28,409 | | |
| 1,500 | | DYCOM INDUSTRIES, INC.(b) | | 152,532 | | 172,635 | | |
| 800 | | ENCORE WIRE CORP. | | 91,748 | | 170,880 | | |
| 79,205 | | ENERPAC TOOL GROUP CORP. | | 1,643,152 | | 2,462,483 | | |
| 900 | | ENPRO, INC. | | 77,086 | | 141,066 | | |
| 4,400 | | ENVIRI CORP.(b) | | 19,868 | | 39,600 | | |
| 26,623 | | ESAB CORP. | | 1,031,392 | | 2,306,084 | | |
| 1,000 | | ESCO TECHNOLOGIES, INC. | | 74,760 | | 117,030 | | |
| 3,316 | | FEDERAL SIGNAL CORP. | | 119,424 | | 254,470 | | |
| 3,400 | | FORWARD AIR CORP. | | 220,322 | | 213,758 | | |
| 43,554 | | FRANKLIN COVEY CO.(b) | | 1,963,024 | | 1,895,906 | | |
| 169,940 | | GATES INDUSTRIAL CORP. PLC(b) | | 2,363,036 | | 2,280,595 | | |
| 1,400 | | GIBRALTAR INDUSTRIES, INC.(b) | | 56,403 | | 110,572 | | |
| 22,345 | | GLOBAL INDUSTRIAL CO. | | 762,142 | | 867,880 | | |
| 26,805 | | GMS, INC.(b) | | 1,226,640 | | 2,209,536 | | |
| 25,840 | | GORMAN-RUPP (THE) CO. | | 792,796 | | 918,095 | | |
| 34,842 | | GRACO, INC. | | 2,134,929 | | 3,022,892 | | |
| 32,846 | | GRAHAM CORP.(b) | | 350,705 | | 623,089 | | |
| 15,355 | | GRANITE CONSTRUCTION, INC. | | 651,195 | | 780,955 | | |
| See accompanying notes to financial statements. | 62 | (Continued) |
CLEARWATER INVESTMENT TRUST
Schedule of Investments - Clearwater Select Equity Fund
December 31, 2023
| Shares | | Security | | Cost | | Fair value (a) | | Percent of
net assets |
| Industrials (Cont'd): | | | | | | |
| 800 | | GRIFFON CORP. | | $ 49,360 | | 48,760 | | |
| 27,983 | | HEXCEL CORP. | | 2,012,617 | | 2,063,746 | | |
| 809 | | HILLENBRAND, INC. | | 27,576 | | 38,711 | | |
| 41,534 | | HOWMET AEROSPACE, INC. | | 1,391,048 | | 2,247,820 | | |
| 1,973 | | HUB GROUP, INC., CLASS A(b) | | 129,965 | | 181,398 | | |
| 7,555 | | ICF INTERNATIONAL, INC. | | 657,778 | | 1,013,050 | | |
| 131,145 | | INTERFACE, INC. | | 1,042,609 | | 1,655,050 | | |
| 144,146 | | JELD-WEN HOLDING, INC.(b) | | 1,344,786 | | 2,721,476 | | |
| 45,300 | | JETBLUE AIRWAYS CORP.(b) | | 208,674 | | 251,415 | | |
| 9,339 | | JOHN BEAN TECHNOLOGIES CORP. | | 1,148,023 | | 928,764 | | |
| 458,899 | | JOHNSON SERVICE GROUP PLC(c) | | 867,423 | | 828,269 | | |
| 2,755 | | KADANT, INC. | | 592,569 | | 772,254 | | |
| 33,721 | | KARAT PACKAGING, INC. | | 658,747 | | 837,967 | | |
| 1,900 | | KELLY SERVICES, INC., CLASS A | | 26,974 | | 41,078 | | |
| 561,410 | | KNIGHTS GROUP HOLDINGS PLC(c) | | 710,556 | | 797,895 | | |
| 29,939 | | KORN FERRY | | 1,445,663 | | 1,776,880 | | |
| 2,047 | | LIQUIDITY SERVICES, INC.(b) | | 35,414 | | 35,229 | | |
| 36,117 | | MASONITE INTERNATIONAL CORP.(b) | | 3,440,655 | | 3,057,665 | | |
| 99,843 | | MASTERBRAND, INC.(b) | | 883,434 | | 1,482,669 | | |
| 1,500 | | MATSON, INC. | | 98,158 | | 164,400 | | |
| 2,100 | | MATTHEWS INTERNATIONAL CORP., CLASS A | | 48,981 | | 76,965 | | |
| 2,400 | | MILLERKNOLL, INC. | | 35,057 | | 64,032 | | |
| 1,500 | | MOOG, INC., CLASS A | | 111,928 | | 217,170 | | |
| 246,161 | | MRC GLOBAL, INC.(b) | | 2,220,436 | | 2,710,233 | | |
| 600 | | MYR GROUP, INC.(b) | | 57,948 | | 86,778 | | |
| 1,800 | | NV5 GLOBAL, INC.(b) | | 177,456 | | 200,016 | | |
| 8,200 | | OPENLANE, INC.(b) | | 102,236 | | 121,442 | | |
| 88,793 | | PGT INNOVATIONS, INC.(b) | | 1,485,593 | | 3,613,875 | | |
| 3,800 | | PITNEY BOWES, INC. | | 9,567 | | 16,720 | | |
| 400 | | QUANEX BUILDING PRODUCTS CORP. | | 7,672 | | 12,228 | | |
| 106,201 | | RADIANT LOGISTICS, INC.(b) | | 682,740 | | 705,175 | | |
| 145,459 | | RESIDEO TECHNOLOGIES, INC.(b) | | 2,531,090 | | 2,737,538 | | |
| 97,206 | | REV GROUP, INC. | | 1,019,163 | | 1,766,233 | | |
| 42,945 | | RUSH ENTERPRISES, INC., CLASS A | | 814,245 | | 2,160,133 | | |
| 14,458 | | RXO, INC.(b) | | 230,373 | | 336,293 | | |
| 22,020 | | SITEONE LANDSCAPE SUPPLY, INC.(b) | | 2,817,776 | | 3,578,250 | | |
| 404 | | SKYWEST, INC.(b) | | 7,102 | | 21,089 | | |
| 1,600 | | SPX TECHNOLOGIES, INC.(b) | | 88,269 | | 161,616 | | |
| 600 | | STANDEX INTERNATIONAL CORP. | | 52,056 | | 95,028 | | |
| 382,017 | | STEELCASE, INC., CLASS A | | 4,671,535 | | 5,164,870 | | |
| 12,394 | | STERLING INFRASTRUCTURE, INC.(b) | | 279,384 | | 1,089,804 | | |
| 1,100 | | SUN COUNTRY AIRLINES HOLDINGS, INC.(b) | | 15,521 | | 17,303 | | |
| 30,700 | | SUNPOWER CORP.(b) | | 129,099 | | 148,281 | | |
| 47,710 | | TECNOGLASS, INC. | | 1,994,513 | | 2,180,824 | | |
| 124 | | TENNANT CO. | | 7,135 | | 11,494 | | |
| 4,708 | | TEREX CORP. | | 141,611 | | 270,522 | | |
| 3,000 | | TRINITY INDUSTRIES, INC. | | 65,630 | | 79,770 | | |
| 112,956 | | TRUEBLUE, INC.(b) | | 1,774,269 | | 1,732,745 | | |
| 2,300 | | TTEC HOLDINGS, INC. | | 41,463 | | 49,841 | | |
| 700 | | UNIFIRST CORP. | | 124,775 | | 128,037 | | |
| 4,100 | | VICOR CORP.(b) | | 154,368 | | 184,254 | | |
| 17,127 | | WESTINGHOUSE AIR BRAKE TECHNOLOGIES CORP. | | 1,539,488 | | 2,173,416 | | |
| 23,015 | | WILLDAN GROUP, INC.(b) | | 926,598 | | 494,822 | | |
| 21,380 | | WOODWARD, INC. | | 1,947,193 | | 2,910,459 | | |
| | | | | 77,265,921 | | 99,846,704 | | 23.38% |
| Information Technology: | | | | | | |
| 13,600 | | A10 NETWORKS, INC. | | 166,129 | | 179,112 | | |
| 800 | | ADEIA, INC. | | 6,456 | | 9,912 | | |
| 1,442 | | ADVANCED ENERGY INDUSTRIES, INC. | | 112,976 | | 157,063 | | |
| 900 | | AGILYSYS, INC.(b) | | 47,400 | | 76,338 | | |
| 700 | | ALARM.COM HOLDINGS, INC.(b) | | 34,067 | | 45,234 | | |
| 6,500 | | ALPHA & OMEGA SEMICONDUCTOR LTD.(b) | | 142,394 | | 169,390 | | |
| 200,394 | | ARLO TECHNOLOGIES, INC.(b) | | 1,272,690 | | 1,907,751 | | |
| 12,230 | | ARROW ELECTRONICS, INC.(b) | | 1,209,867 | | 1,495,118 | | |
| 15,398 | | ASPEN TECHNOLOGY, INC.(b) | | 2,871,880 | | 3,389,870 | | |
| 47,056 | | AVNET, INC. | | 1,794,449 | | 2,371,622 | | |
| 11,560 | | AXCELIS TECHNOLOGIES, INC.(b) | | 1,545,988 | | 1,499,216 | | |
| See accompanying notes to financial statements. | 63 | (Continued) |
CLEARWATER INVESTMENT TRUST
Schedule of Investments - Clearwater Select Equity Fund
December 31, 2023
| Shares | | Security | | Cost | | Fair value (a) | | Percent of
net assets |
| Information Technology (Cont'd): | | | | | | |
| 1,636 | | BADGER METER, INC. | | $ 165,863 | | 252,549 | | |
| 27,798 | | BELDEN, INC. | | 1,129,794 | | 2,147,395 | | �� |
| 96,475 | | BIGCOMMERCE HOLDINGS, INC., CLASS 1(b) | | 857,490 | | 938,702 | | |
| 28,450 | | BILL HOLDINGS, INC.(b) | | 2,099,645 | | 2,321,235 | | |
| 6,790 | | CAMBIUM NETWORKS CORP.(b) | | 110,627 | | 40,740 | | |
| 1,917 | | CERENCE, INC.(b) | | 31,514 | | 37,688 | | |
| 21,681 | | CEVA, INC.(b) | | 981,297 | | 492,376 | | |
| 11,173 | | CLIMB GLOBAL SOLUTIONS, INC. | | 525,299 | | 612,616 | | |
| 41,496 | | CODA OCTOPUS GROUP, INC.(b) | | 338,237 | | 248,976 | | |
| 2,000 | | COHU, INC.(b) | | 53,244 | | 70,780 | | |
| 12,371 | | CONSENSUS CLOUD SOLUTIONS, INC.(b) | | 539,463 | | 324,244 | | |
| 39,337 | | DIGI INTERNATIONAL, INC.(b) | | 976,465 | | 1,022,762 | | |
| 76,121 | | DIGITAL TURBINE, INC.(b) | | 1,315,485 | | 522,190 | | |
| 4,300 | | DIODES, INC.(b) | | 290,459 | | 346,236 | | |
| 712 | | DOLBY LABORATORIES, INC., CLASS A | | 48,539 | | 61,360 | | |
| 2,100 | | DOUBLEVERIFY HOLDINGS, INC.(b) | | 75,071 | | 77,238 | | |
| 2,200 | | DXC TECHNOLOGY CO.(b) | | 45,974 | | 50,314 | | |
| 19,239 | | ELASTIC N.V.(b) | | 1,789,115 | | 2,168,235 | | |
| 20,191 | | ENTEGRIS, INC. | | 1,888,828 | | 2,419,286 | | |
| 5,900 | | ENVESTNET, INC.(b) | | 224,296 | | 292,168 | | |
| 6,700 | | EXTREME NETWORKS, INC.(b) | | 89,336 | | 118,188 | | |
| 200 | | FABRINET(b)(c) | | 32,165 | | 38,066 | | |
| 29,254 | | FD TECHNOLOGIES PLC(b)(c) | | 664,314 | | 428,819 | | |
| 105,093 | | GRID DYNAMICS HOLDINGS, INC.(b) | | 1,485,511 | | 1,400,890 | | |
| 76,321 | | HARMONIC, INC.(b) | | 971,870 | | 995,226 | | |
| 3,900 | | ICHOR HOLDINGS LTD.(b) | | 102,746 | | 131,157 | | |
| 11,352 | | IMPINJ, INC.(b) | | 611,557 | | 1,022,021 | | |
| 2,200 | | INSIGHT ENTERPRISES, INC.(b) | | 232,325 | | 389,818 | | |
| 1,700 | | INTERDIGITAL, INC. | | 73,063 | | 184,518 | | |
| 4,100 | | ITRON, INC.(b) | | 232,581 | | 309,591 | | |
| 44,431 | | ITURAN LOCATION AND CONTROL LTD.(c) | | 1,181,251 | | 1,210,300 | | |
| 19,851 | | KIMBALL ELECTRONICS, INC.(b) | | 472,939 | | 534,984 | | |
| 5,500 | | KULICKE & SOFFA INDUSTRIES, INC.(c) | | 245,069 | | 300,960 | | |
| 168,510 | | LANTRONIX, INC.(b) | | 877,638 | | 987,469 | | |
| 19,991 | | LATTICE SEMICONDUCTOR CORP.(b) | | 1,255,888 | | 1,379,179 | | |
| 2,600 | | LIVERAMP HOLDINGS, INC.(b) | | 48,085 | | 98,488 | | |
| 124,755 | | LUNA INNOVATIONS, INC.(b) | | 870,150 | | 829,621 | | |
| 8,900 | | MAXLINEAR, INC.(b) | | 187,062 | | 211,553 | | |
| 20,520 | | MKS INSTRUMENTS, INC. | | 1,864,761 | | 2,110,892 | | |
| 900 | | N-ABLE, INC.(b) | | 10,980 | | 11,925 | | |
| 24,384 | | NAPCO SECURITY TECHNOLOGIES, INC. | | 529,971 | | 835,152 | | |
| 23,811 | | OKTA, INC.(b) | | 1,404,983 | | 2,155,610 | | |
| 1,700 | | ONESPAN, INC.(b) | | 15,193 | | 18,224 | | |
| 1,879 | | ONTO INNOVATION, INC.(b) | | 132,741 | | 287,299 | | |
| 800 | | OSI SYSTEMS, INC.(b) | | 59,840 | | 103,240 | | |
| 1,000 | | PDF SOLUTIONS, INC.(b) | | 24,850 | | 32,140 | | |
| 3,800 | | PERFICIENT, INC.(b) | | 234,066 | | 250,116 | | |
| 3,700 | | PHOTRONICS, INC.(b) | | 80,912 | | 116,069 | | |
| 140 | | POWER INTEGRATIONS, INC. | | 8,400 | | 11,495 | | |
| 12,654 | | PROGRESS SOFTWARE CORP. | | 566,039 | | 687,112 | | |
| 52,543 | | RADWARE LTD.(b)(c) | | 1,773,335 | | 876,417 | | |
| 1,800 | | RAMBUS, INC.(b) | | 46,397 | | 122,850 | | |
| 20,410 | | RAPID7, INC.(b) | | 770,620 | | 1,165,411 | | |
| 39,896 | | RED VIOLET, INC.(b) | | 1,059,826 | | 796,723 | | |
| 214,973 | | REPOSITRAK, INC. | | 1,185,108 | | 2,151,880 | | |
| 2,900 | | SANMINA CORP.(b) | | 151,429 | | 148,973 | | |
| 73,232 | | SCANSOURCE, INC.(b) | | 2,744,147 | | 2,900,720 | | |
| 10,112 | | SITIME CORP.(b) | | 1,259,111 | | 1,234,473 | | |
| 6,223 | | SOLARWINDS CORP.(b) | | 52,445 | | 77,725 | | |
| 25,154 | | SOUNDTHINKING, INC.(b) | | 728,600 | | 642,433 | | |
| 1,168 | | SPS COMMERCE, INC.(b) | | 143,291 | | 226,405 | | |
| 13,700 | | TTM TECHNOLOGIES, INC.(b) | | 219,685 | | 216,597 | | |
| 145 | | ULTRA CLEAN HOLDINGS, INC.(b) | | 3,816 | | 4,950 | | |
| 71,610 | | UPLAND SOFTWARE, INC.(b) | | 824,683 | | 302,910 | | |
| 43,226 | | VEECO INSTRUMENTS, INC.(b) | | 975,514 | | 1,341,303 | | |
| 27,000 | | VIAVI SOLUTIONS, INC.(b) | | 222,530 | | 271,890 | | |
| 58,654 | | WALKME LTD.(b)(c) | | 543,164 | | 625,838 | | |
| See accompanying notes to financial statements. | 64 | (Continued) |
CLEARWATER INVESTMENT TRUST
Schedule of Investments - Clearwater Select Equity Fund
December 31, 2023
| Shares | | Security | | Cost | | Fair value (a) | | Percent of
net assets |
| Information Technology (Cont'd): | | | | | | |
| 109,531 | | WEAVE COMMUNICATIONS, INC.(b) | | $ 616,181 | | 1,256,321 | | |
| 30,330 | | WIX.COM LTD.(b)(c) | | 3,915,169 | | 3,731,197 | | |
| 700 | | XEROX HOLDINGS CORP. | | 13,013 | | 12,831 | | |
| | | | | 54,505,351 | | 61,045,685 | | 14.29% |
| Materials: | | | | | | |
| 1,000 | | ALPHA METALLURGICAL RESOURCES, INC. | | 263,150 | | 338,920 | | |
| 123,523 | | ASPEN AEROGELS, INC.(b) | | 896,805 | | 1,949,193 | | |
| 5,585 | | ATI, INC.(b) | | 163,313 | | 253,950 | | |
| 50,716 | | AXALTA COATING SYSTEMS LTD.(b) | | 1,234,484 | | 1,722,823 | | |
| 62 | | BALCHEM CORP. | | 7,550 | | 9,223 | | |
| 1,800 | | CARPENTER TECHNOLOGY CORP. | | 58,388 | | 127,440 | | |
| 24,073 | | CLEARWATER PAPER CORP.(b) | | 870,902 | | 869,517 | | |
| 33,558 | | FMC CORP. | | 3,969,694 | | 2,115,832 | | |
| 137,680 | | FORAN MINING CORP.(b)(c) | | 383,954 | | 405,231 | | |
| 7,150 | | H.B. FULLER CO. | | 357,419 | | 582,081 | | |
| 13,703 | | HAYNES INTERNATIONAL, INC. | | 533,388 | | 781,756 | | |
| 14,172 | | INGEVITY CORP.(b) | | 706,904 | | 669,202 | | |
| 1,387 | | INNOSPEC, INC. | | 121,931 | | 170,934 | | |
| 2,900 | | KAISER ALUMINUM CORP. | | 173,657 | | 206,451 | | |
| 22,680 | | KOPPERS HOLDINGS, INC. | | 523,575 | | 1,161,670 | | |
| 19,700 | | LIVENT CORP.(b) | | 269,409 | | 354,206 | | |
| 700 | | MATERION CORP. | | 55,545 | | 91,091 | | |
| 1,700 | | MINERALS TECHNOLOGIES, INC. | | 86,510 | | 121,227 | | |
| 396 | | O-I GLASS, INC.(b) | | 6,082 | | 6,486 | | |
| 51,753 | | OLIN CORP. | | 1,062,872 | | 2,792,074 | | |
| 112,779 | | ORION S.A. | | 1,312,689 | | 3,127,362 | | |
| 1,000 | | QUAKER CHEMICAL CORP. | | 149,993 | | 213,420 | | |
| 8,599 | | SMITH-MIDLAND CORP.(b) | | 194,143 | | 339,660 | | |
| 7,900 | | SUNCOKE ENERGY, INC. | | 48,142 | | 84,846 | | |
| 2,092 | | SYLVAMO CORP. | | 94,999 | | 102,738 | | |
| 1,500 | | TIMKENSTEEL CORP.(b) | | 22,828 | | 35,175 | | |
| 106,137 | | TRIMAS CORP. | | 2,926,058 | | 2,688,450 | | |
| 1,900 | | WARRIOR MET COAL, INC. | | 55,153 | | 115,843 | | |
| | | | | 16,549,537 | | 21,436,801 | | 5.02% |
| Real Estate: | | | | | | |
| 3,900 | | ACADIA REALTY TRUST | | 49,022 | | 66,261 | | |
| 11,200 | | ALEXANDER & BALDWIN, INC. | | 184,669 | | 213,024 | | |
| 300 | | AMERICAN ASSETS TRUST, INC. | | 5,417 | | 6,753 | | |
| 5,000 | | ARMADA HOFFLER PROPERTIES, INC. | | 49,599 | | 61,850 | | |
| 5,346 | | CARETRUST REIT, INC. | | 91,157 | | 119,643 | | |
| 3,100 | | CENTERSPACE | | 165,666 | | 180,420 | | |
| 5,800 | | COMMUNITY HEALTHCARE TRUST, INC. | | 153,787 | | 154,512 | | |
| 23,200 | | CUSHMAN & WAKEFIELD PLC(b) | | 195,001 | | 250,560 | | |
| 146,871 | | DIAMONDROCK HOSPITALITY CO. | | 1,117,573 | | 1,379,119 | | |
| 13,929 | | ESSENTIAL PROPERTIES REALTY TRUST, INC. | | 302,827 | | 356,025 | | |
| 3,900 | | EXP WORLD HOLDINGS, INC. | | 53,832 | | 60,528 | | |
| 10,300 | | FOUR CORNERS PROPERTY TRUST, INC. | | 233,984 | | 260,590 | | |
| 24,300 | | GLOBAL NET LEASE, INC. | | 220,758 | | 241,785 | | |
| 5,200 | | HIGHWOODS PROPERTIES, INC. | | 93,891 | | 119,392 | | |
| 22,500 | | HUDSON PACIFIC PROPERTIES, INC. | | 118,703 | | 209,475 | | |
| 3,034 | | INNOVATIVE INDUSTRIAL PROPERTIES, INC. | | 222,878 | | 305,888 | | |
| 16,700 | | KENNEDY-WILSON HOLDINGS, INC. | | 189,299 | | 206,746 | | |
| 30,700 | | LXP INDUSTRIAL TRUST | | 267,374 | | 304,544 | | |
| 5,038 | | MARCUS & MILLICHAP, INC. | | 164,238 | | 220,060 | | |
| 5,066 | | NEXPOINT RESIDENTIAL TRUST, INC. | | 161,291 | | 174,421 | | |
| 12,100 | | OUTFRONT MEDIA, INC. | | 122,828 | | 168,916 | | |
| 2,800 | | PEBBLEBROOK HOTEL TRUST | | 38,433 | | 44,744 | | |
| 555 | | REGENCY CENTERS CORP. | | 24,356 | | 37,185 | | |
| 16,721 | | RETAIL OPPORTUNITY INVESTMENTS CORP. | | 201,193 | | 234,596 | | |
| 40,897 | | RMR GROUP (THE), INC., CLASS A | | 1,003,876 | | 1,154,522 | | |
| 7,900 | | RPT REALTY | | 56,742 | | 101,357 | | |
| 8,600 | | SAFEHOLD, INC. | | 149,582 | | 201,240 | | |
| 6,800 | | SITE CENTERS CORP. | | 72,391 | | 92,684 | | |
| 3,100 | | SL GREEN REALTY CORP. | | 92,873 | | 140,027 | | |
| 1,800 | | ST. JOE (THE) CO. | | 57,905 | | 108,324 | | |
| 5,600 | | TANGER, INC. | | 77,646 | | 155,232 | | |
| 44,800 | | UNITI GROUP, INC. | | 148,965 | | 258,944 | | |
| See accompanying notes to financial statements. | 65 | (Continued) |
CLEARWATER INVESTMENT TRUST
Schedule of Investments - Clearwater Select Equity Fund
December 31, 2023
| Shares | | Security | | Cost | | Fair value (a) | | Percent of
net assets |
| Real Estate (Cont'd): | | | | | | |
| 4,600 | | URBAN EDGE PROPERTIES | | $ 60,500 | | 84,180 | | |
| 2,500 | | WHITESTONE REIT | | 21,843 | | 30,725 | | |
| | | | | 6,170,099 | | 7,704,272 | | 1.80% |
| Utilities: | | | | | | |
| 3,655 | | AMERICAN STATES WATER CO. | | 290,717 | | 293,935 | | |
| 8,000 | | AVISTA CORP. | | 260,863 | | 285,920 | | |
| 2,544 | | CHESAPEAKE UTILITIES CORP. | | 230,336 | | 268,723 | | |
| 2,800 | | MIDDLESEX WATER CO. | | 180,479 | | 183,736 | | |
| 300 | | NORTHWEST NATURAL HOLDING CO. | | 11,322 | | 11,682 | | |
| 900 | | OTTER TAIL CORP. | | 66,600 | | 76,473 | | |
| | | | | 1,040,317 | | 1,120,469 | | 0.26% |
| | | Sub-total Common Stocks: | | 369,139,845 | | 418,351,721 | | 97.96% |
| Escrows: | | | | | | |
| Communication Services: | | | | | | |
| 39,067 | | GCI LIBERTY, INC., CLASS A(b)(e) | | - | | - | | |
| | | | | - | | - | | 0.00% |
| | | Sub-total Escrows: | | - | | - | | 0.00% |
| Short-Term Investments: | | | | | | |
| 581,616 | | FIDELITY INVESTMENTS MONEY MARKET GOVERNMENT PORTFOLIO, INSTITUTIONAL SHARES(g) | | 581,616 | | 581,616 | | |
| 8,950,782 | | NORTHERN INSTITUTIONAL FUNDS - U.S. GOVERNMENT SELECT PORTFOLIO, INSTITUTIONAL SHARES, 5.24%(h) | | 8,950,782 | | 8,950,782 | | |
| | | Sub-total Short-Term Investments: | | 9,532,398 | | 9,532,398 | | 2.23% |
| | | Grand total | | $ 378,672,243 | | 427,884,119 | | 100.19% |
| Notes to Schedule of Investments: |
| (a) | Investments are valued in accordance with procedures described in Note 2 to the financial statements. |
| (b) | Non-income producing assets. |
| (c) | Foreign security values are stated in U.S. dollars. As of December 31, 2023, the value of foreign stocks or depositary receipts of companies based outside of the United States represented 5.23% of net assets. |
| (d) | Security is either wholly or partially on loan. |
| (e) | Security has been deemed worthless and is a Level 3 investment. |
| (f) | Securities are American Depositary Receipts of companies based outside of the United States representing 0.09% of net assets as of December 31, 2023. |
| (g) | Investment relates to cash collateral received from portfolio securities loaned. |
| (h) | The short-term investment is a money market portfolio of the investment company, Northern Institutional Funds. At December 31, 2022, the value of the Clearwater Select Equity Fund's investment in the U.S. Government Select Portfolio of the Northern Institutional Funds was $12,324,435 with net sales of $3,373,653 during the fiscal year ended December 31, 2023. |
| See accompanying notes to financial statements. | 66 | (Continued) |
CLEARWATER INVESTMENT TRUST
Schedule of Investments - Clearwater Select Equity Fund
December 31, 2023
Clearwater Select Equity Fund Portfolio Diversification
(as a percentage of net assets)
| See accompanying notes to financial statements. | 67 | (Continued) |
CLEARWATER INVESTMENT TRUST
Schedule of Investments - Clearwater Tax-Exempt Bond Fund
December 31, 2023
| Par/Shares | | Security | | Maturity
date | | Coupon
rate | | Cost | | Fair value (a) | | Percent of
net assets |
| Closed-End Funds: | | | | | | | | | | | | |
| 105,231 | | BLACKROCK LONG-TERM MUNICIPAL ADVANTAGE TRUST | | $ 947,393 | | 1,076,513 | | |
| 54,667 | | BLACKROCK MUNICIPAL INCOME FUND INC | | 605,200 | | 636,324 | | |
| 14,351 | | BLACKROCK MUNICIPAL INCOME QUALITY TRUST | | 192,771 | | 160,875 | | |
| 88,691 | | BLACKROCK MUNIHOLDINGS FUND INC | | 1,357,256 | | 1,056,310 | | |
| 27,182 | | BLACKROCK MUNIHOLDINGS NEW JERSEY QUALITY FUND INC | | 368,005 | | 310,147 | | |
| 82,054 | | BLACKROCK MUNIHOLDINGS QUALITY FUND II INC | | 1,027,819 | | 822,181 | | |
| 128,111 | | BLACKROCK MUNIYIELD MICHIGAN QUALITY FUND INC | | 1,643,186 | | 1,455,341 | | |
| 48,700 | | BLACKROCK MUNIYIELD PENNSYLVANIA QUALITY FUND | | 681,140 | | 566,381 | | |
| 66,132 | | BLACKROCK MUNIYIELD QUALITY FUND II INC | | 791,016 | | 684,466 | | |
| 96,091 | | BLACKROCK MUNIYIELD QUALITY FUND III INC | | 1,260,393 | | 1,118,499 | | |
| 48,128 | | BNY MELLON STRATEGIC MUNICIPAL BOND FUND INC | | 344,865 | | 274,811 | | |
| 177,771 | | DWS MUNICIPAL INCOME TRUST | | 2,003,096 | | 1,580,384 | | |
| 167,452 | | INVESCO ADVANTAGE MUNICIPAL INCOME TRUST II | | 1,842,369 | | 1,414,969 | | |
| 158,905 | | INVESCO MUNICIPAL OPPORTUNITY TRUST | | 1,926,111 | | 1,527,077 | | |
| 108,737 | | INVESCO MUNICIPAL TRUST | | 1,334,350 | | 1,036,264 | | |
| 55,087 | | INVESCO PENNSYLVANIA VALUE MUNICIPAL INCOME TRUST | | 735,915 | | 550,870 | | |
| 190,374 | | INVESCO QUALITY MUNICIPAL INCOME TRUST | | 2,318,517 | | 1,810,457 | | |
| 70,073 | | INVESCO TRUST FOR INVESTMENT GRADE MUNICIPALS | | 893,781 | | 693,022 | | |
| 81,582 | | INVESCO VALUE MUNICIPAL INCOME TRUST | | 1,232,582 | | 956,957 | | |
| 56,334 | | NUVEEN AMT-FREE MUNICIPAL CREDIT INCOME FUND | | 795,858 | | 665,868 | | |
| 212,362 | | NUVEEN AMT-FREE QUALITY MUNICIPAL INCOME FUND | | 2,802,706 | | 2,335,982 | | |
| 71,998 | | NUVEEN NEW JERSEY QUALITY MUNICIPAL INCOME FUND | | 1,101,444 | | 848,136 | | |
| 84,266 | | NUVEEN PENNSYLVANIA QUALITY MUNICIPAL INCOME FUND | | 1,197,701 | | 975,800 | | |
| 209,657 | | NUVEEN QUALITY MUNICIPAL INCOME FUND | | 2,955,449 | | 2,400,573 | | |
| | | Sub-total Closed-End Funds: | | | | | | 30,358,923 | | 24,958,207 | | 3.56% |
| Municipal Bonds: | | | | | | | | | | |
| Alabama | | | | | | | | | | |
| 400,000 | | MOBILE CNTY AL LTD OBLG(b) | | 11/1/2045 | | 4.00 | | 400,000 | | 352,537 | | |
| 915,000 | | STADIUM TRACE VLG IMPT DIST DEV INCENTIVE ANTIC BONDS | | 3/1/2036 | | 3.63 | | 915,000 | | 748,612 | | |
| 500,000 | | TUSCALOOSA CNTY AL INDL DEV AUTH GULF OPPORTUNITY ZONE(b) | | 5/1/2044 | | 5.25 | | 458,995 | | 460,655 | | |
| | | | | | | 1,773,995 | | 1,561,804 | | 0.22% |
| Alaska | | | | | | | | | | |
| 350,000 | | ALASKA ST INDL DEV & EXPORT AUTH CMNTY PROVIDER REVENUE(c) | | 12/1/2010 | | 5.40 | | 350,000 | | 385 | | |
| | | | | | | 350,000 | | 385 | | 0.00% |
| Arizona | | | | | | | | | | |
| 2,000,000 | | ARIZONA BRD OF RGTS UNIV ARIZONA SYS REVENUE | | 6/1/2046 | | 5.00 | | 2,046,500 | | 2,063,659 | | |
| 1,250,000 | | ARIZONA ST INDL DEV AUTH ECON DEV REVENUE(b)(c)(d) | | 7/1/2030 | | 6.75 | | 1,239,818 | | 75,000 | | |
| 1,250,000 | | ARIZONA ST INDL DEV AUTH ECON DEV REVENUE(b)(c)(d) | | 7/1/2050 | | 7.75 | | 1,237,783 | | 75,000 | | |
| 400,000 | | ARIZONA ST INDL DEV AUTH ECON DEV REVENUE(b)(c)(d) | | 7/1/2051 | | 6.00 | | 400,000 | | 24,000 | | |
| 1,000,000 | | ARIZONA ST INDL DEV AUTH MF HSG REVENUE(e) | | 1/1/2042 | | 5.00 | | 1,035,961 | | 1,043,066 | | |
| 155,000 | | ARIZONA ST INDL DEV AUTH REVENUE(b)(f)(g) | | 10/1/2028 | | 4.70 | | 155,000 | | 137,339 | | |
| 550,000 | | GLENDALE AZ INDL DEV AUTH | | 11/15/2046 | | 5.25 | | 553,620 | | 403,244 | | |
| 500,000 | | NAVAJO NATION AZ(b) | | 12/1/2030 | | 5.50 | | 508,433 | | 511,896 | | |
| 2,000,000 | | PHOENIX AZ CIVIC IMPT CORP WTR SYS REVENUE | | 7/1/2039 | | 5.00 | | 2,067,800 | | 2,079,535 | | |
| 1,000,000 | | PHOENIX AZ INDL DEV AUTH EDU REVENUE(b) | | 7/1/2036 | | 5.13 | | 988,588 | | 1,003,126 | | |
| 650,000 | | PIMA CNTY AZ INDL DEV AUTH SENIOR LIVING REVENUE(b) | | 11/15/2035 | | 6.25 | | 650,000 | | 667,280 | | |
| 500,000 | | TEMPE AZ | | 1/1/2029 | | 5.00 | | 500,000 | | 500,702 | | |
| 500,000 | | TEMPE AZ INDL DEV AUTH REVENUE(b) | | 10/1/2037 | | 6.00 | | 501,468 | | 352,216 | | |
| | | | | | | 11,884,971 | | 8,936,063 | | 1.28% |
| Arkansas | | | | | | | | | | |
| 1,000,000 | | ARKANSAS ST DEV FIN AUTH INDL DEV REVENUE(b) | | 9/1/2049 | | 4.50 | | 891,706 | | 992,420 | | |
| 1,000,000 | | BENTONVILLE AR SALES & USE TAX | | 11/1/2046 | | 4.13 | | 993,366 | | 1,012,478 | | |
| See accompanying notes to financial statements. | 68 | (Continued) |
CLEARWATER INVESTMENT TRUST
Schedule of Investments - Clearwater Tax-Exempt Bond Fund
December 31, 2023
| Par/Shares | | Security | | Maturity
date | | Coupon
rate | | Cost | | Fair value (a) | | Percent of
net assets |
| Arkansas (Cont'd): | | | | | | | | | | |
| 925,000 | | MOUNTAIN HOME AR SALES & USE TAX REVENUE | | 9/1/2038 | | 2.00 | | $ 925,000 | | 717,173 | | |
| | | | | | | 2,810,072 | | 2,722,071 | | 0.39% |
| California | | | | | | | | | | |
| 2,350,000 | | ACALANES CA UNION HIGH SCH DIST (Step to 6.55% on 8/1/2024)(h) | | 8/1/2039 | | 0.00 | | 2,263,446 | | 2,673,884 | | |
| 1,000,000 | | ALVORD CA UNIF SCH DIST (Step to 7.35% on 8/1/2026)(h) | | 8/1/2046 | | 0.00 | | 833,115 | | 1,161,460 | | |
| 650,000 | | CALIFORNIA PUBLIC FIN AUTH SENIOR LIVING REVENUE(b) | | 5/15/2029 | | 3.13 | | 650,000 | | 639,714 | | |
| 930,000 | | CALIFORNIA SCH FIN AUTH SCH FAC REVENUE(b) | | 7/1/2033 | | 5.00 | | 969,896 | | 987,388 | | |
| 500,000 | | CALIFORNIA ST MUNI FIN AUTH MOBILE HOME PARK REVENUE | | 8/15/2053 | | 5.25 | | 519,860 | | 526,092 | | |
| 1,500,000 | | CALIFORNIA ST SCH FACS FING AUTH REVENUE | | 8/1/2029 | | 6.00 | | 1,485,701 | | 1,641,594 | | |
| 250,000 | | CALIFORNIA ST STWD CMNTYS DEV AUTH STWD REVENUE | | 9/2/2033 | | 4.75 | | 248,084 | | 257,038 | | |
| 1,000,000 | | CARLSBAD CA UNIF SCH DIST | | 8/1/2031 | | 6.13 | | 995,347 | | 1,215,694 | | |
| 1,000,000 | | CENTRL CA UNIF SCH DIST | | 8/1/2043 | | 5.00 | | 1,036,446 | | 1,043,144 | | |
| 1,000,000 | | COLTON CA JT UNIF SCH DIST | | 8/1/2035 | | 5.80 | | 999,108 | | 1,082,212 | | |
| 1,105,000 | | CORONA-NORCO CA UNIF SCH DIST | | 8/1/2039 | | 6.80 | | 1,102,333 | | 1,273,498 | | |
| 750,000 | | EL PASO DE ROBLES CA REDEV AGY TAX ALLOCATION REVENUE | | 7/1/2033 | | 6.38 | | 744,966 | | 751,904 | | |
| 1,000,000 | | ENCINITAS CA UNION SCH DIST | | 8/1/2035 | | 6.75 | | 998,603 | | 1,320,116 | | |
| 1,155,000 | | ENTERPRISE CA ELEM SCH DIST | | 8/1/2035 | | 6.20 | | 1,152,877 | | 1,437,685 | | |
| 1,000,000 | | HELENDALE CA SCH DIST | | 8/1/2034 | | 6.25 | | 997,538 | | 1,197,925 | | |
| 1,000,000 | | IMPERIAL CA CMNTY CLG DIST | | 8/1/2040 | | 6.75 | | 1,004,478 | | 1,064,462 | | |
| 750,000 | | MARTINEZ CA UNIF SCH DIST | | 8/1/2035 | | 6.13 | | 746,101 | | 764,400 | | |
| 2,000,000 | | OAK PARK CA UNIF SCH DIST | | 8/1/2038 | | 7.10 | | 1,997,814 | | 2,490,538 | | |
| 1,000,000 | | REDONDO BEACH CA UNIF SCH DIST | | 8/1/2034 | | 6.38 | | 995,393 | | 1,101,383 | | |
| 750,000 | | RIVER ISLANDS CA PUBLIC FING AUTH SPL TAX | | 9/1/2052 | | 5.25 | | 809,432 | | 825,139 | | |
| 350,000 | | SACRAMENTO CNTY CA WTR FING AUTH REVENUE (Floating, 3M CME Term SOFR + 0.57%)(f) | | 6/1/2039 | | 4.35 | | 350,000 | | 302,674 | | |
| 960,000 | | SAN DIEGO CA HSG AUTH MF HSG REVENUE(i) | | 10/15/2042 | | 5.30 | | 965,695 | | 964,340 | | |
| 1,000,000 | | SAN DIEGO CNTY CA REGL ARPT AUTH AIRPORT REVENUE | | 7/1/2038 | | 5.25 | | 1,026,250 | | 1,129,936 | | |
| 1,000,000 | | SAN FRANCISCO CALIF CITY & CNTY ARPTS COMMN INTL ARPT REV | | 5/1/2033 | | 5.00 | | 1,025,469 | | 1,146,360 | | |
| 1,250,000 | | SAN FRANCISCO CALIF CITY & CNTY ARPTS COMMN INTL ARPT REV | | 5/1/2039 | | 5.00 | | 1,251,808 | | 1,251,260 | | |
| 2,000,000 | | SAN JOAQUIN HILLS CA TRANSPRTN CORRIDOR AGY TOLL ROAD REV | | 1/15/2049 | | 5.25 | | 2,024,726 | | 2,007,593 | | |
| 1,000,000 | | SAN JOSE CA FING AUTH LEASE REVENUE | | 6/1/2039 | | 5.00 | | 1,000,000 | | 1,001,316 | | |
| 500,000 | | SANTA MONICA CA REDEV AGY | | 7/1/2036 | | 5.88 | | 500,000 | | 501,200 | | |
| 1,910,000 | | SULPHUR SPRINGS CA UNION SCH DIST COPS | | 12/1/2037 | | 6.50 | | 1,909,092 | | 2,044,655 | | |
| 1,000,000 | | TRACY CA JT UNIF SCH DIST (Step to 7.30% on 8/1/2027)(h) | | 8/1/2041 | | 0.00 | | 866,643 | | 1,061,540 | | |
| | | | | | | 31,470,221 | | 34,866,144 | | 4.98% |
| Colorado | | | | | | | | | | |
| 1,000,000 | | BASELINE MET DIST #1 CO SPL REVENUE | | 12/1/2051 | | 5.00 | | 968,628 | | 906,627 | | |
| 1,400,000 | | COLLIERS HILL MET DIST #2 CO(j) | | 12/15/2047 | | 5.75 | | 1,400,000 | | 1,344,078 | | |
| 1,040,000 | | COLORADO EDUCTNL & CULTURAL AUTH REVENUE(b) | | 7/1/2043 | | 6.00 | | 1,040,000 | | 1,040,548 | | |
| 1,000,000 | | COLORADO ST EDUCTNL & CULTURAL FACS AUTH REVENUE | | 7/1/2034 | | 5.60 | | 996,027 | | 1,002,092 | | |
| 600,000 | | COLORADO ST HLTH FACS AUTH REVENUE | | 5/15/2030 | | 3.50 | | 600,000 | | 543,464 | | |
| 1,000,000 | | COLORADO ST HLTH FACS AUTH REVENUE | | 8/1/2033 | | 7.63 | | 991,581 | | 1,000,030 | | |
| 735,000 | | COLORADO ST HLTH FACS AUTH REVENUE | | 5/15/2049 | | 5.00 | | 774,374 | | 473,234 | | |
| 1,670,000 | | COLORADO ST HLTH FACS AUTH REVENUE | | 5/15/2058 | | 5.00 | | 1,718,249 | | 1,021,533 | | |
| See accompanying notes to financial statements. | 69 | (Continued) |
CLEARWATER INVESTMENT TRUST
Schedule of Investments - Clearwater Tax-Exempt Bond Fund
December 31, 2023
| Par/Shares | | Security | | Maturity
date | | Coupon
rate | | Cost | | Fair value (a) | | Percent of
net assets |
| Colorado (Cont'd): | | | | | | | | | | |
| 1,480,000 | | COLORADO ST HSG & FIN AUTH | | 11/1/2052 | | 6.00 | | $ 1,561,485 | | 1,597,589 | | |
| 1,500,000 | | CROSSROADS MET DIST #1 CO | | 12/1/2051 | | 6.50 | | 1,476,269 | | 1,468,706 | | |
| 1,500,000 | | DENVER CO CITY & CNTY MF HSG REVENUE | | 2/1/2039 | | 2.05 | | 1,500,000 | | 1,113,419 | | |
| 870,000 | | DENVER CO CONVENTION CENTER HOTEL AUTH REVENUE | | 12/1/2030 | | 5.00 | | 892,735 | | 897,661 | | |
| 965,000 | | DOUGLAS CNTY CO MF REVENUE | | 10/1/2029 | | 4.50 | | 965,000 | | 965,987 | | |
| 1,000,000 | | GREEN VALLEY RANCH EAST MET DIST #6 CO | | 12/1/2050 | | 5.88 | | 1,000,000 | | 998,059 | | |
| 1,000,000 | | JOHNSTOWN PLAZA MET DIST CO | | 12/1/2046 | | 4.25 | | 947,302 | | 823,110 | | |
| 648,000 | | LAMBERTSON FARMS CO MET DIST #1 REVENUE | | 12/15/2025 | | 5.00 | | 639,140 | | 637,670 | | |
| 2,000,000 | | LEGATO CMNTY AUTH CO LTD TAX SUPPORTED REVENUE (Step to 5.00% on 12/1/2026)(h) | | 12/1/2051 | | 0.00 | | 1,775,623 | | 1,373,906 | | |
| 184,432 | | MOUNT CARBON CO MET DIST REVENUE(c) | | 6/1/2043 | | 8.00 | | - | | 184,432 | | |
| 1,344,536 | | REUNION MET DIST CO SPL REVENUE | | 12/1/2044 | | 3.63 | | 1,296,633 | | 1,016,878 | | |
| 500,000 | | RIVERVIEW MET DIST CO | | 12/1/2051 | | 5.00 | | 526,550 | | 437,705 | | |
| 1,000,000 | | RUDOLPH FARMS MET DIST #6 CO REVENUE SUPPORTED | | 6/1/2052 | | 6.50 | | 1,000,000 | | 993,513 | | |
| 1,000,000 | | TRANSPORT MET DIST #3 CO | | 12/1/2041 | | 5.00 | | 1,021,826 | | 855,769 | | |
| 1,000,000 | | TREE FARM MET DIST CO(b) | | 12/1/2041 | | 4.50 | | 1,000,000 | | 903,861 | | |
| 1,000,000 | | WESTGATE MET DIST CO | | 12/1/2051 | | 5.13 | | 1,000,000 | | 873,113 | | |
| 1,000,000 | | WINDLER PUB IMPT AUTH CO LTD TAX SUPPORTED REVENUE | | 12/1/2041 | | 4.00 | | 1,000,000 | | 703,555 | | |
| 1,000,000 | | WINDSHIRE PARK CO MET DIST #2 | | 12/1/2047 | | 6.50 | | 1,058,380 | | 1,015,657 | | |
| | | | | | | 27,149,802 | | 24,192,196 | | 3.45% |
| Connecticut | | | | | | | | | | |
| 2,000,000 | | CONNECTICUT ST HSG FIN AUTH HSG MTGE FIN PROGRAM | | 5/15/2045 | | 3.85 | | 2,005,998 | | 1,957,431 | | |
| 583,408 | | MASHANTUCKET WSTRN PEQUOT TRIBE CT | | 7/1/2031 | | 6.05 | | 585,141 | | 129,808 | | |
| 650,000 | | STAMFORD CT HSG AUTH(b) | | 12/1/2027 | | 11.00 | | 650,000 | | 708,161 | | |
| | | | | | | 3,241,139 | | 2,795,400 | | 0.40% |
| District of Columbia | | | | | | | | | | |
| 1,485,000 | | DIST OF COLUMBIA HSG FIN AGY MF HSG MTGE REVENUE | | 6/15/2031 | | 4.45 | | 1,485,000 | | 1,486,128 | | |
| 1,000,000 | | DIST OF COLUMBIA HSG FIN AGY MF HSG REVENUE | | 6/1/2041 | | 5.00 | | 1,000,000 | | 1,000,895 | | |
| 3,500,000 | | DISTRICT OF COLUMBIA HSG FIN AGY | | 3/1/2042 | | 2.50 | | 3,500,000 | | 2,696,138 | | |
| 1,000,000 | | DISTRICT OF COLUMBIA HSG FIN AGY | | 9/1/2043 | | 4.05 | | 1,000,000 | | 957,439 | | |
| 1,000,000 | | MET WASHINGTON DC ARPTS AUTH ARPT SYS REVENUE | | 10/1/2034 | | 5.00 | | 997,500 | | 1,002,032 | | |
| | | | | | | 7,982,500 | | 7,142,632 | | 1.02% |
| Florida | | | | | | | | | | |
| 550,000 | | ARTISAN LAKES EAST CDD FL CAPITAL IMPT REVENUE(b) | | 5/1/2052 | | 4.00 | | 574,509 | | 429,266 | | |
| 385,000 | | ASTURIA FL CMNTY DEV DIST SPL ASSMNT | | 5/1/2034 | | 5.75 | | 385,000 | | 388,142 | | |
| 250,000 | | AVE MARIA FL STEWARDSHIP CMNTY DIST CAPITAL IMPT REVENUE(b) | | 5/1/2033 | | 4.50 | | 249,041 | | 248,605 | | |
| 1,000,000 | | AVE MARIA FL STEWARDSHIP CMNTY DIST CAPITAL IMPT REVENUE | | 5/1/2052 | | 4.00 | | 1,014,846 | | 782,256 | | |
| 1,000,000 | | AVE MARIA FL STEWARDSHIP CMNTY DIST CAPITAL IMPT REVENUE(b) | | 5/1/2053 | | 5.50 | | 998,459 | | 993,747 | | |
| 495,000 | | BLACKBURN CREEK CMNTY DEV DIST FL CAP IMPT REVENUE | | 5/1/2035 | | 6.25 | | 495,000 | | 512,178 | | |
| 170,000 | | BLACKBURN CREEK CMNTY DEV DIST FL CAP IMPT REVENUE | | 5/1/2045 | | 6.25 | | 170,000 | | 174,072 | | |
| 1,500,000 | | BROWARD CNTY FL ARPT SYS REVENUE | | 10/1/2038 | | 5.00 | | 1,569,974 | | 1,594,370 | | |
| 525,000 | | CAPITAL TRUST AGY FL EDUCTNL FACS REVENUE(b) | | 7/1/2051 | | 4.00 | | 555,676 | | 384,444 | | |
| 485,000 | | CAPITAL TRUST AGY FL EDUCTNL FACS REVENUE | | 6/1/2056 | | 4.00 | | 510,948 | | 421,213 | | |
| 1,415,000 | | CAPITAL TRUST AGY FL EDUCTNL FACS REVENUE(b) | | 6/1/2056 | | 5.00 | | 1,510,015 | | 1,196,151 | | |
| See accompanying notes to financial statements. | 70 | (Continued) |
CLEARWATER INVESTMENT TRUST
Schedule of Investments - Clearwater Tax-Exempt Bond Fund
December 31, 2023
| Par/Shares | | Security | | Maturity
date | | Coupon
rate | | Cost | | Fair value (a) | | Percent of
net assets |
| Florida (Cont'd): | | | | | | | | | | |
| 445,000 | | CAPITAL TRUST AGY FL EDUCTNL FACS REVENUE(b) | | 7/1/2056 | | 4.00 | | $ 467,961 | | 315,952 | | |
| 750,000 | | CAPITAL TRUST AGY FL REVENUE(c) | | 4/1/2035 | | 7.00 | | 750,000 | | 592,500 | | |
| 1,750,000 | | CAPITAL TRUST AGY FL REVENUE(b)(c)(d) | | 12/1/2035 | | 6.75 | | 1,745,953 | | 573,125 | | |
| 750,000 | | CAPITAL TRUST AGY FL REVENUE(b)(c)(d) | | 7/1/2037 | | 6.75 | | 750,000 | | 165,000 | | |
| 500,000 | | CFM FL CDD REVENUE | | 5/1/2051 | | 4.00 | | 514,728 | | 396,844 | | |
| 1,100,000 | | COBBLESTONE CDD FL SPL ASSMNT REVENUE(b) | | 5/1/2053 | | 4.30 | | 1,085,508 | | 912,030 | | |
| 1,000,000 | | COLLIER CNTY FL EDUCTNL FACS AUTH REVENUE | | 6/1/2038 | | 5.25 | | 1,018,528 | | 1,046,783 | | |
| 559,270 | | COLLIER CNTY FLA INDL DEV AUTH CONTINUING CARE CMNTY REV(b)(c)(d) | | 5/15/2026 | | 7.25 | | 559,270 | | 17,897 | | |
| 1,304,964 | | COLLIER CNTY FLA INDL DEV AUTH CONTINUING CARE CMNTY REV(b)(c)(d) | | 5/15/2044 | | 8.13 | | 1,414,997 | | 41,759 | | |
| 1,000,000 | | EAST NASSAU STEWARDSHIP DIST FL SPL ASSMNT REVENUE | | 5/1/2051 | | 4.00 | | 1,019,111 | | 792,628 | | |
| 1,000,000 | | ELEVATION POINTE CMNTY DEV DIST FL SPL ASSMNT REVENUE | | 5/1/2032 | | 4.40 | | 1,000,000 | | 972,747 | | |
| 500,000 | | ENTRADA CMNTY DEV DIST FL CAPITAL IMPT REVENUE | | 5/1/2043 | | 5.60 | | 500,000 | | 511,936 | | |
| 800,000 | | ENTRADA CMNTY DEV DIST FL CAPITAL IMPT REVENUE(b) | | 5/1/2052 | | 4.00 | | 835,066 | | 640,381 | | |
| 1,000,000 | | FLORIDA DEV FIN CORP SURFACE TRANPRTN FAC REVENUE(b)(f)(g) | | 1/1/2049 | | 6.25 | | 1,000,000 | | 999,888 | | |
| 1,350,000 | | FLORIDA DEV FIN CORP SURFACE TRANPRTN FAC REVENUE(b) | | 1/1/2049 | | 7.38 | | 1,294,389 | | 1,357,919 | | |
| 2,000,000 | | FLORIDA ST DEV FIN CORP EDUCTNL FACS REVENUE(b)(k) | | 4/23/2058 | | 6.25 | | 1,986,894 | | 1,982,372 | | |
| 1,000,000 | | FLORIDA ST DEV FIN CORP SENIOR LIVING REVENUE(b) | | 11/15/2030 | | 5.00 | | 1,000,000 | | 914,261 | | |
| 590,000 | | FLORIDA ST HSG FIN CORP REVENUE | | 1/1/2045 | | 4.20 | | 590,000 | | 592,325 | | |
| 965,000 | | FLORIDA ST HSG FIN CORP REVENUE | | 7/1/2046 | | 3.25 | | 965,000 | | 838,939 | | |
| 1,000,000 | | FLORIDA ST HSG FIN CORP REVENUE | | 7/1/2048 | | 4.55 | | 1,000,000 | | 1,009,290 | | |
| 2,265,000 | | FLORIDA ST HSG FIN CORP REVENUE | | 1/1/2052 | | 2.30 | | 2,265,000 | | 1,569,937 | | |
| 1,495,000 | | FLORIDA ST HSG FIN CORP REVENUE | | 7/1/2052 | | 4.55 | | 1,495,000 | | 1,504,849 | | |
| 1,500,000 | | FLORIDA ST HSG FIN CORP REVENUE | | 1/1/2054 | | 6.25 | | 1,593,990 | | 1,690,127 | | |
| 1,000,000 | | FORT LAUDERDAL FL SPL ASSMNT(b) | | 7/1/2048 | | 4.00 | | 1,038,677 | | 807,539 | | |
| 965,000 | | FRERC CDD FL | | 11/1/2040 | | 5.38 | | 965,000 | | 908,381 | | |
| 700,000 | | GRANDE PINES CDD FL SPL ASSMNT REVENUE | | 5/1/2041 | | 3.75 | | 699,091 | | 575,799 | | |
| 1,000,000 | | HACIENDA NORTH CDD FL SPL ASSMNT REVENUE | | 5/1/2053 | | 6.50 | | 1,000,000 | | 1,057,160 | | |
| 650,000 | | HARBOR BAY FL CDD CAPITAL IMPT REVENUE | | 5/1/2048 | | 4.10 | | 646,006 | | 534,493 | | |
| 700,000 | | HERITAGE HARBOUR FL N CDD SPL ASSMNT | | 5/1/2034 | | 5.00 | | 700,000 | | 714,838 | | |
| 1,000,000 | | HYDE PARK CDD #1 FL SPL ASSMNT | | 5/1/2052 | | 4.00 | | 991,577 | | 788,295 | | |
| 1,000,000 | | JULINGTON CREEK PLANTATION FLCDD | | 5/1/2043 | | 5.50 | | 1,099,484 | | 1,120,779 | | |
| 1,000,000 | | LAKE CNTY FLA RETMNT FAC REVENUE | | 8/15/2055 | | 5.75 | | 978,140 | | 872,259 | | |
| 1,750,000 | | LAKELAND FL HOSP SYS REVENUE | | 11/15/2045 | | 5.00 | | 1,746,500 | | 1,758,563 | | |
| 500,000 | | LAKES OF SARASOTA CDD FL IMPT REVENUE | | 5/1/2031 | | 3.88 | | 497,309 | | 483,097 | | |
| 500,000 | | LAKES OF SARASOTA CDD FL IMPT REVENUE | | 5/1/2031 | | 4.13 | | 498,896 | | 486,250 | | |
| 385,000 | | LAKES OF SARASOTA CDD FL IMPT REVENUE | | 5/1/2041 | | 4.13 | | 383,812 | | 341,453 | | |
| 135,000 | | LAKEWOOD RANCH FL STEWARDSHIP DIST SPL ASSMNT REVENUE | | 5/1/2025 | | 4.25 | | 134,947 | | 134,973 | | |
| 900,000 | | LAKEWOOD RANCH FL STEWARDSHIP DIST SPL ASSMNT REVENUE | | 5/1/2034 | | 5.35 | | 900,000 | | 929,974 | | |
| 1,000,000 | | LAKEWOOD RANCH FL STEWARDSHIP DIST SPL ASSMNT REVENUE | | 5/1/2036 | | 5.00 | | 1,000,000 | | 1,007,289 | | |
| 750,000 | | LAKEWOOD RANCH FL STEWARDSHIP DIST SPL ASSMNT REVENUE(b) | | 5/1/2037 | | 5.00 | | 745,662 | | 754,513 | | |
| 745,000 | | LAKEWOOD RANCH FL STEWARDSHIP DIST SPL ASSMNT REVENUE | | 5/1/2037 | | 5.25 | | 741,421 | | 754,461 | | |
| See accompanying notes to financial statements. | 71 | (Continued) |
CLEARWATER INVESTMENT TRUST
Schedule of Investments - Clearwater Tax-Exempt Bond Fund
December 31, 2023
| Par/Shares | | Security | | Maturity
date | | Coupon
rate | | Cost | | Fair value (a) | | Percent of
net assets |
| Florida (Cont'd): | | | | | | | | | | |
| 700,000 | | LAKEWOOD RANCH FL STEWARDSHIP DIST SPL ASSMNT REVENUE | | 5/1/2038 | | 5.00 | | $ 700,000 | | 703,996 | | |
| 1,000,000 | | LAKEWOOD RANCH FL STEWARDSHIP DIST SPL ASSMNT REVENUE | | 5/1/2039 | | 5.30 | | 1,000,000 | | 1,013,915 | | |
| 580,000 | | LAKEWOOD RANCH FL STEWARDSHIP DIST SPL ASSMNT REVENUE(b) | | 5/1/2040 | | 3.63 | | 576,095 | | 482,715 | | |
| 1,000,000 | | LAKEWOOD RANCH FL STEWARDSHIP DIST SPL ASSMNT REVENUE(b) | | 5/1/2040 | | 3.75 | | 1,000,000 | | 848,911 | | |
| 1,250,000 | | LAKEWOOD RANCH FL STEWARDSHIP DIST SPL ASSMNT REVENUE | | 5/1/2043 | | 6.13 | | 1,250,000 | | 1,301,207 | | |
| 630,000 | | LAKEWOOD RANCH FL STEWARDSHIP DIST SPL ASSMNT REVENUE | | 5/1/2049 | | 4.00 | | 626,749 | | 511,845 | | |
| 225,000 | | LAKEWOOD RANCH FL STEWARDSHIP DIST SPL ASSMNT REVENUE | | 5/1/2049 | | 4.50 | | 221,980 | | 198,696 | | |
| 940,000 | | LAKEWOOD RANCH FL STEWARDSHIP DIST SPL ASSMNT REVENUE | | 5/1/2050 | | 4.00 | | 926,401 | | 755,933 | | |
| 1,440,000 | | LAKEWOOD RANCH FL STEWARDSHIP DIST SPL ASSMNT REVENUE | | 5/1/2052 | | 4.00 | | 1,506,560 | | 1,137,638 | | |
| 1,000,000 | | LAKEWOOD RANCH FL STEWARDSHIP DIST UTILITY REVENUE | | 10/1/2053 | | 5.25 | | 1,066,715 | | 1,106,427 | | |
| 1,300,000 | | LAUREL ROAD CDD FL CAPITAL IMPT REVENUE | | 5/1/2031 | | 3.13 | | 1,300,000 | | 1,119,332 | | |
| 1,000,000 | | LEE CNTY FL HSG FIN AUTH MF MTGE | | 1/1/2040 | | 4.55 | | 1,000,000 | | 1,019,343 | | |
| 1,000,000 | | LEE CNTY FL INDL DEV AUTH HLTHCR FACS REVENUE | | 11/15/2049 | | 5.00 | | 971,250 | | 959,320 | | |
| 90,000 | | LONG LAKE RANCH CMNTY DEV DIST FLA CAP IMPT REV | | 5/1/2024 | | 5.63 | | 90,000 | | 90,285 | | |
| 735,000 | | MARSHALL CREEK FL CDD SPL ASSMNT | | 5/1/2032 | | 5.00 | | 738,280 | | 738,179 | | |
| 400,000 | | MEADOW VIEW AT TWIN CREEKS CDD FL SPL ASSMNT | | 5/1/2052 | | 3.75 | | 396,545 | | 299,705 | | |
| 500,000 | | MEADOW VIEW AT TWIN CREEKS CDD FL SPL ASSMNT | | 5/1/2052 | | 4.00 | | 515,061 | | 393,800 | | |
| 500,000 | | MIAMI BEACH FL HLTH FACS AUTH | | 11/15/2044 | | 5.00 | | 506,033 | | 503,634 | | |
| 1,000,000 | | MIAMI-DADE CNTY FL AVIATION REVENUE | | 10/1/2033 | | 5.00 | | 1,005,568 | | 1,004,426 | | |
| 160,000 | | N SPRINGS FL IMPT DIST | | 5/1/2027 | | 6.00 | | 160,000 | | 164,096 | | |
| 115,000 | | NEW RIVER FL CDD CAPITAL IMPT REVENUE(c) | | 5/1/2013 | | 5.00 | | 114,821 | | 1 | | |
| 720,000 | | NORTH RIVER RANCH CDD FL CAPITAL IMPT REVENUE | | 5/1/2035 | | 4.20 | | 720,000 | | 675,945 | | |
| 2,000,000 | | NORTH RIVER RANCH IMPT STEWARDSHIP DIST FL SPL ASSMNT REVENU | | 5/1/2033 | | 5.75 | | 2,000,000 | | 2,017,752 | | |
| 750,000 | | NORTH RIVER RANCH IMPT STEWARDSHIP DIST FL SPL ASSMNT REVENU | | 5/1/2035 | | 6.80 | | 750,000 | | 750,172 | | |
| 500,000 | | NORTH SPRINGS FL IMPT DIST | | 5/1/2044 | | 6.50 | | 500,000 | | 512,719 | | |
| 1,400,000 | | NTHRN PALM BEACH CNTY FL IMPT DIST | | 8/1/2029 | | 5.00 | | 1,400,889 | | 1,405,404 | | |
| 500,000 | | NTHRN PALM BEACH CNTY FL IMPT DIST | | 8/1/2037 | | 5.00 | | 504,883 | | 501,759 | | |
| 1,000,000 | | ORANGE CNTY FL HLTH FACS AUTH REVENUE | | 8/1/2034 | | 5.00 | | 1,004,738 | | 1,005,491 | | |
| 1,250,000 | | ORANGE CNTY FL HLTH FACS AUTH REVENUE | | 8/1/2040 | | 5.00 | | 1,242,750 | | 1,259,223 | | |
| 1,000,000 | | PALM BEACH CNTY FL HLTH FACS AUTH REVENUE(b) | | 7/1/2027 | | 11.50 | | 1,000,000 | | 1,133,690 | | |
| 1,000,000 | | PALM BEACH CNTY FL HLTH FACS AUTH REVENUE | | 6/1/2041 | | 4.00 | | 1,026,042 | | 825,415 | | |
| 2,935,000 | | PALM BEACH CNTY FL HLTH FACS AUTH REVENUE | | 5/15/2053 | | 4.00 | | 2,852,293 | | 1,806,057 | | |
| 1,000,000 | | PALM COAST PARK FL CDD SPL ASSMNT REVENUE | | 5/1/2042 | | 5.00 | | 996,369 | | 960,492 | | |
| 560,000 | | PALM COAST PARK FL CDD SPL ASSMNT REVENUE | | 5/1/2043 | | 5.40 | | 560,000 | | 562,854 | | |
| 700,000 | | PALM COAST PARK FL CDD SPL ASSMNT REVENUE | | 5/1/2052 | | 4.00 | | 727,957 | | 551,807 | | |
| 500,000 | | PARKER ROAD FL CDD CAPITAL IMPT REVENUE | | 5/1/2050 | | 4.10 | | 498,377 | | 372,893 | | |
| 500,000 | | PARKVIEW AT LONG LAKE RANCH CDD FL SPL ASSMNET | | 5/1/2051 | | 4.00 | | 502,776 | | 394,919 | | |
| See accompanying notes to financial statements. | 72 | (Continued) |
CLEARWATER INVESTMENT TRUST
Schedule of Investments - Clearwater Tax-Exempt Bond Fund
December 31, 2023
| Par/Shares | | Security | | Maturity
date | | Coupon
rate | | Cost | | Fair value (a) | | Percent of
net assets |
| Florida (Cont'd): | | | | | | | | | | |
| 500,000 | | PINELLAS CNTY FL INDL DEV AUTH INDL DEV REVENUE | | 7/1/2039 | | 5.00 | | $ 533,990 | | 501,904 | | |
| 580,000 | | POINCIANA FL W CDD SPL ASSMNT | | 5/1/2030 | | 5.38 | | 576,134 | | 594,583 | | |
| 1,000,000 | | POITRAS EAST CDD FL SPL ASSMNT REVENUE | | 5/1/2052 | | 5.25 | | 996,990 | | 991,183 | | |
| 315,000 | | RIVER LANDING CDD FL CAP IMPT REVENUE | | 11/1/2035 | | 4.25 | | 314,120 | | 291,684 | | |
| 490,000 | | ROLLING HILLS FL CDD CAPITAL IMPT REVENUE | | 5/1/2032 | | 3.65 | | 490,000 | | 450,398 | | |
| 1,000,000 | | SAINT JOHNS CNTY FL INDL DEV AUTH REVENUE | | 8/1/2055 | | 4.00 | | 1,039,612 | | 837,249 | | |
| 725,000 | | SANDRIDGE CMNTY DEV DIST FL SPL ASSMNT REVENUE | | 5/1/2051 | | 4.00 | | 715,462 | | 618,525 | | |
| 1,000,000 | | SAWYERS LANDING CDD FL SPL ASSMNT REVENUE | | 5/1/2041 | | 4.13 | | 991,997 | | 792,867 | | |
| 2,250,000 | | SAWYERS LANDING CDD FL SPL ASSMNT REVENUE | | 5/1/2053 | | 4.25 | | 2,198,185 | | 1,689,532 | | |
| 145,000 | | SILVERLEAF FL CDD CAPITAL IMPT REVENUE | | 5/1/2044 | | 6.75 | | 142,623 | | 147,461 | | |
| 400,000 | | SOUTHERN GROVE CMNTY DEV DIST #5 SPL ASSMNT | | 5/1/2048 | | 4.00 | | 418,118 | | 327,183 | | |
| 142,538 | | STERLING HILL FL CDD CAPITAL IMPT REVENUE(c) | | 11/1/2010 | | 5.50 | | 142,538 | | 66,993 | | |
| 650,000 | | SUNBRIDGE STEWARDSHIP DIST FL SPL ASSMNT REVENUE | | 5/1/2042 | | 5.20 | | 650,000 | | 639,395 | | |
| 115,000 | | TOLOMATO FL CDD (Step to 6.61% on 11/1/2024)(h) | | 5/1/2040 | | 0.00 | | 107,336 | | 108,855 | | |
| 1,480,000 | | TOLOMATO FL CDD | | 5/1/2040 | | 3.75 | | 1,430,729 | | 1,467,184 | | |
| 125,000 | | TOLOMATO FL CDD(c) | | 5/1/2040 | | 6.61 | | - | | 1 | | |
| 1,000,000 | | TRADITION CDD #9 FL SPL ASSMNT | | 5/1/2052 | | 4.00 | | 1,049,869 | | 787,658 | | |
| 700,000 | | TROUT CREEK CDD FL CAPITAL IMPT REVENUE | | 5/1/2038 | | 5.38 | | 700,000 | | 707,497 | | |
| 385,000 | | TROUT CREEK CDD FL CAPITAL IMPT REVENUE | | 5/1/2040 | | 4.00 | | 388,365 | | 330,938 | | |
| 1,005,000 | | TROUT CREEK CDD FL CAPITAL IMPT REVENUE | | 5/1/2052 | | 5.50 | | 999,241 | | 998,315 | | |
| 450,000 | | TSR CDD FL SPL ASSMNT REVENUE | | 11/1/2035 | | 5.38 | | 449,021 | | 460,928 | | |
| 1,500,000 | | UNIVERSITY PARK RECREATION DIST FL ON-AD VALOREM ASSMNT | | 5/1/2050 | | 3.50 | | 1,500,000 | | 1,303,752 | | |
| 750,000 | | VIERA STEWARDSHIP DIST FL SPL ASSMNT REVENUE | | 5/1/2053 | | 4.00 | | 779,953 | | 569,300 | | |
| 700,000 | | VIERA STEWARDSHIP DIST FL SPL ASSMNT REVENUE | | 5/1/2054 | | 5.50 | | 693,813 | | 699,941 | | |
| 1,000,000 | | VILLAGE CDD #15 SPL ASSMNT REVENUE(b) | | 5/1/2028 | | 4.25 | | 1,000,000 | | 1,000,497 | | |
| 1,000,000 | | VILLAGE CDD #15 SPL ASSMNT REVENUE(b) | | 5/1/2038 | | 4.85 | | 1,000,000 | | 997,500 | | |
| 500,000 | | WATERSET SOUTH CDD FL SPL ASSMNT REVENUE | | 5/1/2053 | | 6.10 | | 500,000 | | 511,927 | | |
| 900,000 | | WINDWARD AT LAKEWOOD RANCH CDD FL CAPITAL IMPT | | 5/1/2052 | | 4.25 | | 904,356 | | 740,999 | | |
| 655,000 | | WIREGRASS FL CDD CAPITAL IMPT REVENUE | | 5/1/2035 | | 5.38 | | 652,206 | | 660,245 | | |
| 1,000,000 | | WIREGRASS II CDD FL CAPITAL IMPROVEMENT REVENUE | | 5/1/2050 | | 3.88 | | 986,165 | | 777,913 | | |
| 1,000,000 | | WIREGRASS II CDD FL CAPITAL IMPROVEMENT REVENUE | | 5/1/2052 | | 5.25 | | 995,552 | | 964,934 | | |
| 750,000 | | WYNNFIELD LAKES FL CDD | | 5/1/2036 | | 4.50 | | 746,148 | | 750,837 | | |
| 350,934 | | ZEPHYR RIDGE FL CDD CAPITAL IMPT REVENUE(c) | | 5/1/2013 | | 5.25 | | 351,276 | | 54,044 | | |
| | | | | | | 104,054,316 | | 91,526,267 | | 13.07% |
| Georgia | | | | | | | | | | |
| 500,000 | | ATHENS-CLARKE CNTY GA UNIF GOVT DEV AUTH REVENUE | | 6/15/2039 | | 5.00 | | 500,000 | | 500,293 | | |
| 1,250,000 | | GAINESVILLE & HALL CNTY GA DEV AUTH EDUCTNL FACS REVENUE(b) | | 9/1/2044 | | 6.25 | | 1,214,711 | | 1,139,377 | | |
| 1,950,000 | | GEORGIA ST HSG & FIN AUTH REVENUE | | 12/1/2043 | | 3.90 | | 1,936,000 | | 1,918,249 | | |
| 895,000 | | GEORGIA ST HSG & FIN AUTH REVENUE | | 12/1/2048 | | 4.00 | | 895,000 | | 858,777 | | |
| See accompanying notes to financial statements. | 73 | (Continued) |
CLEARWATER INVESTMENT TRUST
Schedule of Investments - Clearwater Tax-Exempt Bond Fund
December 31, 2023
| Par/Shares | | Security | | Maturity
date | | Coupon
rate | | Cost | | Fair value (a) | | Percent of
net assets |
| Georgia (Cont'd): | | | | | | | | | | |
| 1,000,000 | | MAIN STREET NATURAL GAS INC GA GAS SUPPLY REVENUE (Floating, U.S. SOFR + 1.70%)(f) | | 12/1/2053 | | 5.31 | | $ 1,000,000 | | 1,009,959 | | |
| 500,000 | | SUNBRIDGE STEWARDSHIP DIST FL SPL ASSMNT REVENUE | | 5/1/2042 | | 5.40 | | 500,000 | | 504,968 | | |
| | | | | | | 6,045,711 | | 5,931,623 | | 0.85% |
| Idaho | | | | | | | | | | |
| 130,000 | | IDAHO ST HLTH FACS AUTH REVENUE | | 10/1/2028 | | 8.00 | | 130,000 | | 121,035 | | |
| 570,000 | | IDAHO ST HLTH FACS AUTH REVENUE | | 10/1/2031 | | 3.80 | | 570,000 | | 481,529 | | |
| 750,000 | | IDAHO ST HLTH FACS AUTH REVENUE | | 10/1/2033 | | 4.00 | | 744,365 | | 612,884 | | |
| 1,000,000 | | IDAHO ST HLTH FACS AUTH REVENUE | | 10/1/2050 | | 4.50 | | 1,026,902 | | 692,153 | | |
| 2,500,000 | | IDAHO ST HSG & FIN ASSN SF MTGE REVENUE | | 1/1/2048 | | 4.75 | | 2,500,000 | | 2,579,368 | | |
| 2,000,000 | | IDAHO ST HSG & FIN ASSN SF MTGE REVENUE | | 7/1/2048 | | 4.75 | | 2,000,000 | | 2,088,150 | | |
| | | | | | | 6,971,267 | | 6,575,119 | | 0.94% |
| Illinois | | | | | | | | | | |
| 1,250,000 | | BURBANK IL EDUCTNL FACS REVENUE(b) | | 9/1/2035 | | 6.00 | | 1,253,515 | | 1,248,841 | | |
| 1,000,000 | | CHICAGO IL MIDWAY ARPT REVENUE | | 1/1/2035 | | 5.25 | | 1,000,000 | | 1,001,682 | | |
| 1,000,000 | | CHICAGO IL MIDWAY ARPT REVENUE | | 1/1/2043 | | 5.75 | | 1,041,242 | | 1,147,436 | | |
| 1,000,000 | | CHICAGO IL O'HARE INTERNATIONAL ARPT REVENUE | | 1/1/2046 | | 5.00 | | 1,007,942 | | 1,006,229 | | |
| 1,000,000 | | CHICAGO IL O'HARE INTERNATIONAL ARPT REVENUE | | 1/1/2053 | | 5.50 | | 1,056,947 | | 1,079,066 | | |
| 1,000,000 | | CHICAGO IL O'HARE INTERNATIONAL ARPT SPL FAC REVENUE | | 7/1/2048 | | 5.00 | | 990,000 | | 1,007,789 | | |
| 750,000 | | CHICAGO IL PARK DIST | | 1/1/2042 | | 4.00 | | 764,830 | | 750,621 | | |
| 500,000 | | DECATUR IL | | 3/1/2034 | | 5.00 | | 500,406 | | 501,368 | | |
| 830,000 | | EVANSTON ILL EDL FAC REV(b) | | 4/1/2041 | | 4.38 | | 828,482 | | 626,668 | | |
| 1,500,000 | | ILLINOIS ST | | 2/1/2039 | | 5.00 | | 1,501,107 | | 1,500,740 | | |
| 1,500,000 | | ILLINOIS ST | | 5/1/2047 | | 5.50 | | 1,603,237 | | 1,647,865 | | |
| 1,000,000 | | ILLINOIS ST EDUCTNL FACS AUTH | | 11/1/2036 | | 4.50 | | 1,000,000 | | 1,004,549 | | |
| 675,000 | | ILLINOIS ST FIN AUTH EDUCTNL FAC REVENUE | | 2/1/2034 | | 6.00 | | 675,111 | | 675,323 | | |
| 500,000 | | ILLINOIS ST FIN AUTH REVENUE | | 5/15/2036 | | 5.00 | | 500,544 | | 226,250 | | |
| 750,000 | | ILLINOIS ST FIN AUTH REVENUE | | 12/1/2037 | | 5.00 | | 755,703 | | 758,852 | | |
| 1,450,000 | | ILLINOIS ST FIN AUTH REVENUE | | 5/15/2038 | | 5.13 | | 1,414,304 | | 1,250,895 | | |
| 1,500,000 | | ILLINOIS ST FIN AUTH REVENUE | | 5/15/2045 | | 5.00 | | 1,523,461 | | 1,179,567 | | |
| 1,000,000 | | ILLINOIS ST FIN AUTH REVENUE | | 11/15/2045 | | 5.00 | | 1,018,723 | | 1,013,595 | | |
| 300,000 | | ILLINOIS ST FIN AUTH REVENUE(f)(l) | | 7/15/2055 | | 4.50 | | 300,000 | | 300,000 | | |
| 1,250,000 | | ILLINOIS ST HSG DEV AUTH REVENUE | | 10/1/2048 | | 4.75 | | 1,250,000 | | 1,286,305 | | |
| 2,455,000 | | ILLINOIS ST HSG DEV AUTH REVENUE | | 4/1/2053 | | 5.25 | | 2,601,620 | | 2,624,764 | | |
| 1,000,000 | | ILLINOIS ST SALES TAX REVENUE | | 6/15/2033 | | 5.00 | | 1,040,407 | | 1,048,685 | | |
| 1,500,000 | | ILLINOIS ST SPORTS FACS AUTH | | 6/15/2031 | | 5.25 | | 1,507,601 | | 1,510,895 | | |
| 500,000 | | LAKE CNTY IL SCH DIST #33 | | 12/1/2040 | | 5.00 | | 506,363 | | 515,206 | | |
| 1,000,000 | | LINCOLNWOOD IL TAX INCREMENT ALLOCATION REVENUE NTS COPS(b) | | 1/1/2041 | | 4.82 | | 1,000,000 | | 931,352 | | |
| 1,080,000 | | MACOUPIN SANGAMON & MONTGOMERY CNTYS IL CMNTY SCH DIST #34 | | 12/1/2037 | | 4.25 | | 1,080,000 | | 1,080,203 | | |
| 1,000,000 | | MALTA IL TAX INCR REVENUE(c) | | 12/30/2025 | | 5.75 | | 1,000,000 | | 250,000 | | |
| 750,000 | | ROCKFORD IL | | 12/15/2030 | | 4.00 | | 750,000 | | 750,343 | | |
| 325,000 | | S WSTRN IL DEV AUTH REV(c) | | 10/1/2022 | | 7.00 | | 325,000 | | 260,000 | | |
| 1,000,000 | | UNIV OF ILLINOIS IL REVENUES | | 4/1/2044 | | 5.00 | | 1,001,405 | | 1,000,977 | | |
| | | | | | | 30,797,950 | | 29,186,066 | | 4.17% |
| Indiana | | | | | | | | | | |
| 1,500,000 | | INDIANA FIN AUTH EDUCTNL FACS REVENUE | | 7/1/2047 | | 5.00 | | 1,534,383 | | 1,530,197 | | |
| 700,000 | | INDIANA FIN AUTH EDUCTNL FACS REVENUE | | 6/1/2051 | | 5.00 | | 760,894 | | 566,397 | | |
| 500,000 | | INDIANA ST FIN AUTH HOSP REVENUE | | 12/1/2040 | | 5.00 | | 505,407 | | 509,791 | | |
| 565,000 | | INDIANA ST FIN AUTH HSG REVENUE | | 11/20/2027 | | 4.80 | | 565,000 | | 567,925 | | |
| 1,500,000 | | INDIANA ST FIN AUTH REVENUE | | 11/15/2041 | | 4.00 | | 1,683,414 | | 1,325,695 | | |
| 1,000,000 | | INDIANA ST FIN AUTH REVENUE | | 11/15/2046 | | 5.25 | | 1,014,059 | | 1,002,305 | | |
| 1,500,000 | | INDIANA ST HSG & CMNTY DEV AUTH MF HSG REVENUE | | 1/1/2036 | | 5.75 | | 1,500,000 | | 1,430,058 | | |
| See accompanying notes to financial statements. | 74 | (Continued) |
CLEARWATER INVESTMENT TRUST
Schedule of Investments - Clearwater Tax-Exempt Bond Fund
December 31, 2023
| Par/Shares | | Security | | Maturity
date | | Coupon
rate | | Cost | | Fair value (a) | | Percent of
net assets |
| Indiana (Cont'd): | | | | | | | | | | |
| 1,000,000 | | INDIANA ST HSG & CMNTY DEV AUTH SF MTGE REVENUE | | 7/1/2053 | | 5.75 | | $ 1,087,981 | | 1,070,984 | | |
| 2,000,000 | | INDIANAPOLIS IN LOCAL PUBLIC IMPT BOND BANK | | 1/1/2031 | | 5.00 | | 2,000,000 | | 2,007,563 | | |
| 600,000 | | MERRILLVILLE IN ECON DEV REVENUE | | 4/1/2036 | | 5.75 | | 600,000 | | 527,246 | | |
| 615,000 | | MUNSTER IN ECON DEV TAX INCR REVENUE | | 7/15/2026 | | 4.75 | | 614,266 | | 615,917 | | |
| | | | | | | 11,865,404 | | 11,154,078 | | 1.59% |
| Iowa | | | | | | | | | | |
| 1,415,000 | | DES MOINES IA | | 6/1/2038 | | 1.75 | | 870,570 | | 1,023,247 | | |
| 1,500,000 | | IOWA ST FIN AUTH REVENUE | | 5/15/2038 | | 7.25 | | 1,500,000 | | 1,557,596 | | |
| 1,500,000 | | IOWA ST FIN AUTH REVENUE | | 5/15/2048 | | 5.00 | | 1,615,970 | | 1,144,325 | | |
| 1,000,000 | | IOWA ST FIN AUTH REVENUE | | 5/15/2053 | | 4.00 | | 1,088,949 | | 615,352 | | |
| 1,000,000 | | IOWA ST FIN AUTH SF MTGE REVENUE | | 7/1/2042 | | 4.05 | | 1,000,000 | | 995,973 | | |
| 2,000,000 | | IOWA ST FIN AUTH SF MTGE REVENUE | | 7/1/2053 | | 5.50 | | 2,109,233 | | 2,136,866 | | |
| 1,000,000 | | IOWA ST HGR EDU LOAN AUTH REVENUE | | 10/1/2052 | | 5.38 | | 1,018,311 | | 1,038,232 | | |
| | | | | | | 9,203,033 | | 8,511,591 | | 1.22% |
| Kansas | | | | | | | | | | |
| 935,000 | | WYANDOTTE CNTY KS KANSAS CITY UNIF GOVT SPL OBLG REVENUE | | 9/1/2032 | | 5.75 | | 930,572 | | 869,694 | | |
| 1,435,000 | | WYANDOTTE CNTY KS KANSAS CITY UNIF GOVT SPL OBLG REVENUE(b) | | 9/1/2035 | | 5.25 | | 1,421,938 | | 1,411,808 | | |
| | | | | | | 2,352,510 | | 2,281,502 | | 0.33% |
| Kentucky | | | | | | | | | | |
| 250,000 | | ASHLAND KY MED CENTER REVENUE | | 2/1/2040 | | 5.00 | | 239,841 | | 253,544 | | |
| 1,000,000 | | CHRISTIAN CNTY KY SCH DIST FIN CORP | | 10/1/2041 | | 5.00 | | 1,056,072 | | 1,118,265 | | |
| 1,500,000 | | KENTUCKY ST ECON DEV FIN AUTH | | 1/1/2045 | | 5.00 | | 1,488,210 | | 1,506,481 | | |
| 1,500,000 | | KENTUCKY ST HSG CORP SF MTGE | | 7/1/2043 | | 4.70 | | 1,500,000 | | 1,548,553 | | |
| 1,000,000 | | WSTRN KY UNIV | | 9/1/2033 | | 4.75 | | 1,002,303 | | 1,000,115 | | |
| | | | | | | 5,286,426 | | 5,426,958 | | 0.77% |
| Louisiana | | | | | | | | | | |
| 1,000,000 | | CAPITAL AREA FIN AUTH LA SF MTGE REVENUE | | 10/1/2053 | | 5.50 | | 1,020,322 | | 1,062,345 | | |
| 580,000 | | LOUISIANA PUB FACS AUTH REVENUE(b) | | 6/1/2031 | | 4.00 | | 595,592 | | 534,930 | | |
| 1,000,000 | | LOUISIANA PUB FACS AUTH REVENUE(b) | | 6/1/2051 | | 5.00 | | 1,055,425 | | 799,466 | | |
| 1,000,000 | | LOUISIANA ST HSG CORP MF HSG REVENUE | | 7/1/2026 | | 5.00 | | 1,032,179 | | 1,032,744 | | |
| 975,000 | | LOUISIANA ST HSG CORP SF MTGE REVENUE | | 12/1/2042 | | 4.05 | | 975,000 | | 961,138 | | |
| 1,250,000 | | LOUISIANA ST HSG CORP SF MTGE REVENUE | | 12/1/2046 | | 2.55 | | 1,250,000 | | 912,704 | | |
| 1,000,000 | | LOUISIANA ST HSG CORP SF MTGE REVENUE | | 6/1/2054 | | 5.75 | | 1,069,369 | | 1,092,860 | | |
| 345,000 | | LOUISIANA ST LOCAL GOVT ENVRNMNTL FACS & CMNTY DEV AUTH | | 11/15/2025 | | 5.50 | | 344,655 | | 343,648 | | |
| 1,000,000 | | LOUISIANA ST LOCAL GOVT ENVRNMNTL FACS & CMNTY DEV AUTH | | 11/15/2030 | | 6.00 | | 1,004,354 | | 1,001,309 | | |
| 500,000 | | LOUISIANA ST LOCAL GOVT ENVRNMNTL FACS & CMNTY DEV AUTH REVE(b) | | 11/1/2037 | | 5.65 | | 500,000 | | 527,993 | | |
| 1,000,000 | | LOUISIANA ST LOCAL GOVT ENVRNMNTL FACS & CMNTY DEV AUTH REVE(b) | | 7/1/2039 | | 5.00 | | 1,041,886 | | 854,879 | | |
| 500,000 | | LOUISIANA ST LOCAL GOVT ENVRNMNTL FACS & CMNTY DEV AUTH REVE(b) | | 11/1/2039 | | 5.50 | | 500,000 | | 521,006 | | |
| 900,000 | | LOUISIANA ST LOCAL GOVT ENVRNMNTL FACS & CMNTY DEV AUTH REVE(b) | | 11/1/2044 | | 4.00 | | 900,000 | | 787,479 | | |
| 645,000 | | LOUISIANA ST LOCAL GOVT ENVRNMNTL FACS & CMNTY DEV AUTH REVE(b) | | 11/1/2044 | | 4.40 | | 645,000 | | 609,601 | | |
| See accompanying notes to financial statements. | 75 | (Continued) |
CLEARWATER INVESTMENT TRUST
Schedule of Investments - Clearwater Tax-Exempt Bond Fund
December 31, 2023
| Par/Shares | | Security | | Maturity
date | | Coupon
rate | | Cost | | Fair value (a) | | Percent of
net assets |
| Louisiana (Cont'd): | | | | | | | | | | |
| 1,150,000 | | LOUISIANA ST LOCAL GOVT ENVRNMNTL FACS & CMNTY DEV AUTH REVE(b) | | 11/1/2046 | | 4.00 | | $ 1,150,000 | | 998,673 | | |
| 500,000 | | LOUISIANA ST PUBLIC FACS AUTH HOSP REVENUE | | 7/1/2035 | | 5.00 | | 508,807 | | 508,023 | | |
| 335,000 | | LOUISIANA ST PUBLIC FACS AUTH REVENUE (Floating, 3M CME Term SOFR + 0.70%)(f) | | 2/15/2036 | | 4.48 | | 335,000 | | 314,093 | | |
| 1,000,000 | | NEW ORLEANS LA AVIATION BRD | | 1/1/2048 | | 5.00 | | 1,011,021 | | 1,010,646 | | |
| | | | | | | 14,938,610 | | 13,873,537 | | 1.98% |
| Maine | | | | | | | | | | |
| 2,500,000 | | MAINE ST HSG AUTH MTGE PURCHASE | | 11/15/2053 | | 4.70 | | 2,500,000 | | 2,534,046 | | |
| | | | | | | 2,500,000 | | 2,534,046 | | 0.36% |
| Maryland | | | | | | | | | | |
| 500,000 | | MARYLAND ST CMNTY DEV ADMIN DEPT HSG & CMNTY DEV | | 7/1/2031 | | 4.50 | | 500,000 | | 500,747 | | |
| 1,000,000 | | MARYLAND ST CMNTY DEV ADMIN DEPT HSG & CMNTY DEV | | 9/1/2044 | | 2.55 | | 1,000,000 | | 767,159 | | |
| 1,000,000 | | MARYLAND ST CMNTY DEV ADMIN DEPT HSG & CMNTY DEV | | 3/1/2047 | | 5.05 | | 1,000,000 | | 1,037,904 | | |
| 975,000 | | MARYLAND ST CMNTY DEV ADMIN DEPT HSG & CMNTY DEV | | 9/1/2052 | | 5.00 | | 1,019,726 | | 1,012,015 | | |
| 1,500,000 | | MARYLAND ST STADIUM AUTH REVENUE | | 5/1/2036 | | 5.00 | | 1,554,015 | | 1,564,741 | | |
| 500,000 | | MONTGOMERY CNTY MD HSG OPPORTUNITIES COMMISSION MF REVENUE | | 7/1/2037 | | 5.13 | | 500,000 | | 508,632 | | |
| 545,000 | | MONTGOMERY CNTY MD HSG OPPORTUNITIES COMMISSION SF MTGE REVE | | 7/1/2038 | | 4.00 | | 545,000 | | 529,108 | | |
| | | | | | | 6,118,741 | | 5,920,306 | | 0.85% |
| Massachusetts | | | | | | | | | | |
| 1,000,000 | | MASSACHUSETTS ST BAY TRANSPRTN AUTH SALES TAX REVENUE(m) | | 7/1/2031 | | 0.00 | | 748,816 | | 760,722 | | |
| 4,000,000 | | MASSACHUSETTS ST DEV FIN AGY MF REVENUE | | 1/1/2042 | | 2.30 | | 4,000,000 | | 2,825,115 | | |
| 1,500,000 | | MASSACHUSETTS ST DEV FIN AGY REVENUE | | 6/1/2049 | | 4.00 | | 1,510,892 | | 1,621,017 | | |
| 810,000 | | MASSACHUSETTS ST EDUCTNL FING AUTH | | 7/1/2033 | | 3.50 | | 777,940 | | 782,471 | | |
| 1,000,000 | | MASSACHUSETTS ST EDUCTNL FING AUTH | | 7/1/2037 | | 2.00 | | 1,000,000 | | 877,681 | | |
| 1,500,000 | | MASSACHUSETTS ST EDUCTNL FING AUTH | | 7/1/2048 | | 3.75 | | 1,448,538 | | 1,247,040 | | |
| 1,700,000 | | MASSACHUSETTS ST EDUCTNL FING AUTH | | 7/1/2051 | | 3.00 | | 1,707,945 | | 1,197,781 | | |
| 265,000 | | MASSACHUSETTS ST HSG FIN AGY | | 12/1/2033 | | 5.00 | | 265,000 | | 265,197 | | |
| 270,000 | | MASSACHUSETTS ST HSG FIN AGY | | 12/1/2038 | | 5.15 | | 270,000 | | 270,192 | | |
| 310,000 | | MASSACHUSETTS ST HSG FIN AGY | | 12/1/2043 | | 5.00 | | 310,000 | | 310,150 | | |
| 2,025,000 | | MASSACHUSETTS ST HSG FIN AGY HSG REVENUE | | 12/1/2043 | | 4.00 | | 2,025,000 | | 2,024,975 | | |
| 2,000,000 | | MASSACHUSETTS ST HSG FIN AGY HSG REVENUE | | 12/1/2048 | | 4.90 | | 2,000,000 | | 2,052,273 | | |
| 1,000,000 | | MASSACHUSETTS ST SCH BLDG AUTH SALES TAX REVENUE | | 8/15/2037 | | 5.00 | | 1,022,647 | | 1,026,558 | | |
| 1,500,000 | | SOMERVILLE MA | | 10/15/2038 | | 2.00 | | 1,007,841 | | 1,183,483 | | |
| | | | | | | 18,094,619 | | 16,444,655 | | 2.35% |
| Michigan | | | | | | | | | | |
| 655,000 | | MICHIGAN ST FIN AUTH LTD OBLIG REVENUE | | 12/1/2031 | | 3.00 | | 650,882 | | 565,966 | | |
| 545,000 | | MICHIGAN ST FIN AUTH LTD OBLIG REVENUE | | 12/1/2039 | | 4.25 | | 546,940 | | 430,934 | | |
| 1,000,000 | | MICHIGAN ST HSG DEV AUTH MF REVENUE(n) | | 2/1/2026 | | 5.00 | | 1,009,828 | | 1,012,834 | | |
| 1,500,000 | | MICHIGAN ST HSG DEV AUTH RENTAL HSG REVENUE | | 10/1/2048 | | 5.00 | | 1,500,000 | | 1,616,969 | | |
| 1,000,000 | | MICHIGAN ST HSG DEV AUTH RENTAL HSG REVENUE | | 10/1/2049 | | 3.35 | | 1,041,481 | | 836,770 | | |
| See accompanying notes to financial statements. | 76 | (Continued) |
CLEARWATER INVESTMENT TRUST
Schedule of Investments - Clearwater Tax-Exempt Bond Fund
December 31, 2023
| Par/Shares | | Security | | Maturity
date | | Coupon
rate | | Cost | | Fair value (a) | | Percent of
net assets |
| Michigan (Cont'd): | | | | | | | | | | |
| 1,000,000 | | MICHIGAN ST HSG DEV AUTH SF MTGE REVENUE | | 12/1/2040 | | 5.20 | | $ 1,000,000 | | 1,072,832 | | |
| 1,000,000 | | MICHIGAN ST HSG DEV AUTH SF MTGE REVENUE | | 12/1/2048 | | 4.90 | | 1,000,000 | | 1,026,136 | | |
| 1,500,000 | | MICHIGAN ST HSG DEV AUTH SF MTGE REVENUE | | 12/1/2048 | | 4.95 | | 1,500,000 | | 1,546,556 | | |
| 205,000 | | MICHIGAN ST HSG DEV AUTH SF MTGE REVENUE | | 6/1/2050 | | 3.15 | | 205,000 | | 191,391 | | |
| 5,000,000 | | MICHIGAN ST HSG DEV AUTH SF MTGE REVENUE | | 6/1/2051 | | 2.75 | | 4,881,973 | | 3,657,866 | | |
| 6,500,000 | | MICHIGAN ST HSG DEV AUTH SF MTGE REVENUE | | 6/1/2052 | | 2.50 | | 6,500,000 | | 4,454,698 | | |
| 5,000,000 | | MICHIGAN ST HSG DEV AUTH SF MTGE REVENUE | | 12/1/2053 | | 4.95 | | 5,000,000 | | 5,091,765 | | |
| 1,500,000 | | MICHIGAN ST HSG DEV AUTH SF MTGE REVENUE | | 6/1/2054 | | 5.75 | | 1,585,047 | | 1,624,666 | | |
| 285,000 | | MICHIGAN ST PUBLIC EDUCTNL FACS AUTH(c) | | 11/1/2028 | | 6.35 | | 285,000 | | 285,241 | | |
| 1,000,000 | | MICHIGAN ST TRUNK LINE | | 11/15/2044 | | 5.50 | | 1,112,660 | | 1,185,636 | | |
| 750,000 | | TAYLOR MI BROWNFIELD REDEV AUTH | | 5/1/2032 | | 5.00 | | 752,205 | | 754,389 | | |
| 750,000 | | UNIVERSAL ACADEMY MI PUBLIC SCH ACADEMY REVENUE | | 12/1/2040 | | 4.00 | | 818,326 | | 659,565 | | |
| | | | | | | 29,389,342 | | 26,014,214 | | 3.71% |
| Minnesota | | | | | | | | | | |
| 950,000 | | APPLE VLY MN SENIOR LIVING REVENUE | | 1/1/2047 | | 5.00 | | 930,911 | | 556,751 | | |
| 1,585,000 | | ELK RIVER MN INDEP SCH DIST #728 | | 2/1/2039 | | 2.50 | | 1,270,851 | | 1,315,489 | | |
| 1,000,000 | | LAUDERDALE MN MF REVENUE | | 1/1/2040 | | 5.13 | | 991,907 | | 940,176 | | |
| 2,000,000 | | MINNESOTA ST HGR EDU FACS AUTH REVENUE | | 10/1/2047 | | 5.00 | | 2,063,409 | | 2,105,214 | | |
| 995,000 | | MINNESOTA ST HSG FIN AGY | | 7/1/2051 | | 2.50 | | 806,414 | | 698,072 | | |
| 4,940,000 | | MINNESOTA ST HSG FIN AGY | | 1/1/2053 | | 6.00 | | 5,229,397 | | 5,326,811 | | |
| 1,615,000 | | MINNESOTA ST OFFICE OF HGR EDU REVENUE | | 11/1/2038 | | 2.65 | | 1,540,967 | | 1,450,044 | | |
| | | | | | | 12,833,856 | | 12,392,557 | | 1.77% |
| Mississippi | | | | | | | | | | |
| 400,000 | | MISSISSIPPI DEV BK SPL OBLIG(b) | | 11/1/2036 | | 3.63 | | 400,000 | | 364,324 | | |
| 900,000 | | MISSISSIPPI ST DEV BANK SPL OBLG(b) | | 11/1/2039 | | 4.55 | | 900,000 | | 899,944 | | |
| | | | | | | 1,300,000 | | 1,264,268 | | 0.18% |
| Missouri | | | | | | | | | | |
| 360,000 | | JOPLIN MO INDL DEV AUTH SALES TAX REV | | 11/1/2040 | | 3.50 | | 356,778 | | 331,098 | | |
| 306,825 | | KANSAS CITY MO INDL DEV AUTH SENIOR LIVING FACS REVENUE | | 11/15/2046 | | 2.00 | | 396,462 | | 14,327 | | |
| 687,493 | | KANSAS CITY MO INDL DEV AUTH SENIOR LIVING FACS REVENUE | | 11/15/2046 | | 5.00 | | 889,141 | | 486,978 | | |
| 1,025,000 | | MISSOURI JT MUNI ELEC UTILITY COMMISSION PWR PROJ REVENUE | | 12/1/2036 | | 5.00 | | 1,037,366 | | 1,043,387 | | |
| 1,000,000 | | MISSOURI ST ENVRNMNTL IMPT & ENERGY RESOURCES AUTH | | 9/1/2033 | | 2.90 | | 947,179 | | 948,872 | | |
| 2,000,000 | | MISSOURI ST HLTH & EDUCTNL FACS AUTH | | 2/1/2048 | | 4.00 | | 2,049,896 | | 1,609,025 | | |
| 1,000,000 | | MISSOURI ST HLTH & EDUCTNL FACS AUTH HLTH FACS REVENUE | | 11/15/2038 | | 5.00 | | 1,000,000 | | 1,000,747 | | |
| 1,000,000 | | MISSOURI ST HSG DEV COMMISSION SF MTGE REVENUE | | 11/1/2043 | | 4.75 | | 1,007,475 | | 1,036,475 | | |
| 975,000 | | MISSOURI ST HSG DEV COMMISSION SF MTGE REVENUE | | 11/1/2047 | | 3.25 | | 975,000 | | 839,167 | | |
| 1,000,000 | | MISSOURI ST HSG DEV COMMISSION SF MTGE REVENUE | | 11/1/2048 | | 4.55 | | 1,000,000 | | 1,004,803 | | |
| 2,500,000 | | MISSOURI ST HSG DEV COMMISSION SF MTGE REVENUE | | 11/1/2053 | | 5.15 | | 2,541,694 | | 2,616,342 | | |
| 500,000 | | SAINT LOUIS CNTY MO PATTONVILLE SCH DIST #R-3 | | 3/1/2043 | | 5.25 | | 545,082 | | 559,948 | | |
| 1,000,000 | | WENTZVILLE MO SCH DIST #R-4 | | 3/1/2039 | | 1.88 | | 715,538 | | 743,176 | | |
| | | | | | | 13,461,611 | | 12,234,345 | | 1.75% |
| Montana | | | | | | | | | | |
| 1,000,000 | | FORSYTH MT POLL CONTROL REVENUE | | 7/1/2028 | | 3.88 | | 1,000,000 | | 1,020,814 | | |
| See accompanying notes to financial statements. | 77 | (Continued) |
CLEARWATER INVESTMENT TRUST
Schedule of Investments - Clearwater Tax-Exempt Bond Fund
December 31, 2023
| Par/Shares | | Security | | Maturity
date | | Coupon
rate | | Cost | | Fair value (a) | | Percent of
net assets |
| Montana (Cont'd): | | | | | | | | | | |
| 310,000 | | MONTANA ST BRD OF HSG | | 12/1/2038 | | 5.20 | | $ 310,000 | | 308,264 | | |
| 1,000,000 | | MONTANA ST BRD OF HSG SF MTGE | | 12/1/2042 | | 2.55 | | 1,000,000 | | 797,351 | | |
| 1,000,000 | | MONTANA ST BRD OF HSG SF MTGE | | 6/1/2052 | | 4.55 | | 1,000,000 | | 1,005,645 | | |
| | | | | | | 3,310,000 | | 3,132,074 | | 0.45% |
| Nebraska | | | | | | | | | | |
| 160,000 | | MEAD NE TAX INCR REVENUE(c) | | 7/1/2012 | | 5.13 | | 160,000 | | 6,640 | | |
| 1,745,000 | | NEBRASKA ST INVESTMENT FIN AUTH SF HSG REVENUE | | 9/1/2040 | | 4.35 | | 1,745,000 | | 1,809,189 | | |
| 165,000 | | NEBRASKA ST INVESTMENT FIN AUTH SF HSG REVENUE | | 9/1/2042 | | 3.05 | | 165,000 | | 143,143 | | |
| 1,000,000 | | NEBRASKA ST INVESTMENT FIN AUTH SF HSG REVENUE | | 9/1/2048 | | 4.65 | | 1,000,000 | | 1,013,219 | | |
| 545,000 | | OMAHA NE PUBLIC PWR DIST SEPARATE ELEC REVENUE | | 2/1/2046 | | 5.00 | | 551,866 | | 559,668 | | |
| | | | | | | 3,621,866 | | 3,531,859 | | 0.50% |
| Nevada | | | | | | | | | | |
| 700,000 | | LAS VEGAS NV SPL ASSMNT DIST #817 | | 6/1/2048 | | 6.00 | | 696,443 | | 727,492 | | |
| 1,000,000 | | LAS VEGAS VLY NV WTR DIST | | 6/1/2046 | | 5.00 | | 1,025,574 | | 1,028,799 | | |
| 1,250,000 | | NEVADA ST HSG DIV SF MTGE REVENUE | | 4/1/2046 | | 2.60 | | 1,250,000 | | 924,397 | | |
| 1,480,000 | | NEVADA ST HSG DIV SF MTGE REVENUE | | 10/1/2051 | | 2.45 | | 1,480,000 | | 1,048,276 | | |
| 1,000,000 | | NEVADA ST HSG DIV SF MTGE REVENUE | | 10/1/2053 | | 4.55 | | 1,000,000 | | 1,004,735 | | |
| | | | | | | 5,452,017 | | 4,733,699 | | 0.68% |
| New Hampshire | | | | | | | | | | |
| 1,000,000 | | NATIONAL FIN AUTH LEASE REVENUE | | 6/1/2051 | | 5.25 | | 1,072,870 | | 1,108,322 | | |
| 1,500,000 | | NEW HAMPSHIRE ST BUSINESS FIN AUTH WTR FAC REVENUE | | 4/1/2048 | | 5.00 | | 1,500,000 | | 1,558,162 | | |
| | | | | | | 2,572,870 | | 2,666,484 | | 0.38% |
| New Jersey | | | | | | | | | | |
| 1,000,000 | | CAMDEN CNTY NJ IMPT AUTH CHRT SCH REVENUE(b) | | 7/15/2042 | | 5.00 | | 1,040,041 | | 1,023,791 | | |
| 500,000 | | NEW JERSEY ST ECON DEV AUTH | | 6/15/2042 | | 5.00 | | 519,596 | | 522,568 | | |
| 1,765,000 | | NEW JERSEY ST HGR EDU ASSISTANCE AUTH STUDENT LOAN REVENUE | | 12/1/2039 | | 3.50 | | 1,760,718 | | 1,704,077 | | |
| 1,000,000 | | NEW JERSEY ST HGR EDU ASSISTANCE AUTH STUDENT LOAN REVENUE | | 12/1/2041 | | 4.00 | | 968,838 | | 987,510 | | |
| 1,000,000 | | NEW JERSEY ST HGR EDU ASSISTANCE AUTH STUDENT LOAN REVENUE | | 12/1/2050 | | 4.25 | | 988,918 | | 927,853 | | |
| 2,675,000 | | NEW JERSEY ST HSG & MTGE FIN AGY REVENUE | | 10/1/2035 | | 3.75 | | 2,675,000 | | 2,661,105 | | |
| 3,950,000 | | NEW JERSEY ST HSG & MTGE FIN AGY REVENUE | | 10/1/2042 | | 4.50 | | 3,950,000 | | 4,037,238 | | |
| 1,220,000 | | NEW JERSEY ST HSG & MTGE FIN AGY REVENUE | | 10/1/2046 | | 2.30 | | 1,220,000 | | 840,019 | | |
| 875,000 | | NEW JERSEY ST HSG & MTGE FIN AGY REVENUE | | 4/1/2049 | | 4.00 | | 876,351 | | 829,174 | | |
| 4,000,000 | | NEW JERSEY ST HSG & MTGE FIN AGY REVENUE | | 10/1/2053 | | 4.80 | | 4,000,000 | | 4,076,176 | | |
| 1,455,000 | | NEW JERSEY ST HSG & MTGE FIN AGY REVENUE | | 10/1/2053 | | 5.00 | | 1,523,817 | | 1,515,205 | | |
| 500,000 | | NEW JERSEY ST TRANSPRTN TRUST FUND AUTH | | 6/15/2041 | | 5.25 | | 502,285 | | 509,578 | | |
| | | | | | | 20,025,564 | | 19,634,294 | | 2.80% |
| New Mexico | | | | | | | | | | |
| 980,000 | | NEW MEXICO ST MTGE FIN AUTH | | 7/1/2043 | | 3.85 | | 980,000 | | 957,710 | | |
| 650,000 | | NEW MEXICO ST MTGE FIN AUTH | | 9/1/2047 | | 2.70 | | 488,495 | | 498,962 | | |
| 1,975,000 | | NEW MEXICO ST MTGE FIN AUTH | | 9/1/2047 | | 3.95 | | 1,975,000 | | 1,910,646 | | |
| 485,000 | | NEW MEXICO ST MTGE FIN AUTH | | 3/1/2048 | | 3.75 | | 489,239 | | 479,824 | | |
| 425,000 | | NEW MEXICO ST MTGE FIN AUTH | | 7/1/2048 | | 3.90 | | 425,000 | | 404,662 | | |
| 590,000 | | NEW MEXICO ST MTGE FIN AUTH | | 7/1/2048 | | 4.00 | | 590,634 | | 567,890 | | |
| 690,000 | | NEW MEXICO ST MTGE FIN AUTH | | 7/1/2049 | | 3.35 | | 690,000 | | 604,709 | | |
| 605,000 | | NEW MEXICO ST MTGE FIN AUTH | | 7/1/2049 | | 4.00 | | 605,000 | | 575,150 | | |
| 1,370,000 | | NEW MEXICO ST MTGE FIN AUTH | | 7/1/2050 | | 3.00 | | 1,395,530 | | 1,209,632 | | |
| 990,000 | | NEW MEXICO ST MTGE FIN AUTH | | 7/1/2051 | | 2.35 | | 990,000 | | 730,466 | | |
| 1,210,000 | | NEW MEXICO ST MTGE FIN AUTH | | 7/1/2051 | | 2.63 | | 1,210,000 | | 873,387 | | |
| 1,975,000 | | NEW MEXICO ST MTGE FIN AUTH | | 9/1/2052 | | 2.80 | | 1,975,000 | | 1,466,848 | | |
| See accompanying notes to financial statements. | 78 | (Continued) |
CLEARWATER INVESTMENT TRUST
Schedule of Investments - Clearwater Tax-Exempt Bond Fund
December 31, 2023
| Par/Shares | | Security | | Maturity
date | | Coupon
rate | | Cost | | Fair value (a) | | Percent of
net assets |
| New Mexico (Cont'd): | | | | | | | | | | |
| 1,000,000 | | NEW MEXICO ST MTGE FIN AUTH | | 9/1/2052 | | 4.30 | | $ 1,000,000 | | 985,522 | | |
| 1,500,000 | | NEW MEXICO ST MTGE FIN AUTH | | 9/1/2053 | | 4.70 | | 1,500,000 | | 1,512,858 | | |
| | | | | | | 14,313,898 | | 12,778,266 | | 1.82% |
| New York | | | | | | | | | | |
| 1,000,000 | | DUTCHESS CNTY NY LOCAL DEV CORP MF | | 10/1/2040 | | 5.00 | | 1,000,000 | | 1,096,841 | | |
| 750,000 | | HEMPSTEAD TOWN NY LOCAL DEV CORP REVENUE | | 9/1/2038 | | 5.00 | | 750,000 | | 750,621 | | |
| 1,830,000 | | LONG ISLAND NY PWR AUTH ELEC SYS REVENUE | | 9/1/2044 | | 5.00 | | 1,844,814 | | 1,840,914 | | |
| 610,000 | | MONROE CNTY NY INDL DEV CORP REVENUE | | 1/1/2030 | | 4.00 | | 564,641 | | 559,125 | | |
| 600,000 | | NEW YORK CITY NY HSG DEV CORP MF HSG REVENUE | | 11/1/2042 | | 3.85 | | 600,588 | | 588,000 | | |
| 3,000,000 | | NEW YORK CITY NY HSG DEV CORP MF HSG REVENUE | | 5/1/2045 | | 3.90 | | 2,838,750 | | 2,874,360 | | |
| 1,000,000 | | NEW YORK CITY NY HSG DEV CORP MF HSG REVENUE | | 11/1/2047 | | 3.65 | | 1,000,000 | | 900,189 | | |
| 1,000,000 | | NEW YORK CITY NY HSG DEV CORP MF HSG REVENUE | | 11/1/2049 | | 3.95 | | 1,000,000 | | 926,287 | | |
| 2,250,000 | | NEW YORK CITY NY HSG DEV CORP MF HSG REVENUE | | 11/1/2056 | | 2.60 | | 2,250,000 | | 1,475,701 | | |
| 1,000,000 | | NEW YORK CITY NY HSG DEV CORP REVENUE | | 8/1/2040 | | 2.40 | | 720,227 | | 773,758 | | |
| 2,000,000 | | NEW YORK ST CONVENTION CENTER DEV CORP REVENUE | | 11/15/2040 | | 5.00 | | 2,025,884 | | 2,032,672 | | |
| 1,000,000 | | NEW YORK ST HSG FIN AGY | | 11/1/2042 | | 4.00 | | 1,000,000 | | 1,001,898 | | |
| 2,000,000 | | NEW YORK ST HSG FIN AGY AFFORDABLE HSG REVENUE | | 11/1/2046 | | 2.60 | | 2,000,000 | | 1,480,947 | | |
| 500,000 | | NEW YORK ST HSG FIN AGY REVENUE | | 11/1/2045 | | 5.10 | | 500,000 | | 500,280 | | |
| 2,930,000 | | NEW YORK ST HSG FIN AGY REVENUE | | 5/1/2048 | | 4.10 | | 2,930,000 | | 2,918,613 | | |
| 1,700,000 | | NEW YORK ST MTGE AGY HOMEOWNER MTGE REVENUE | | 10/1/2045 | | 2.45 | | 1,606,007 | | 1,236,000 | | |
| 980,000 | | NEW YORK ST MTGE AGY HOMEOWNER MTGE REVENUE | | 10/1/2046 | | 2.50 | | 975,493 | | 708,830 | | |
| 3,435,000 | | NEW YORK ST MTGE AGY HOMEOWNER MTGE REVENUE | | 10/1/2047 | | 3.30 | | 3,435,000 | | 3,016,284 | | |
| 960,000 | | NEW YORK ST MTGE AGY HOMEOWNER MTGE REVENUE | | 10/1/2048 | | 3.80 | | 960,000 | | 904,534 | | |
| 5,000,000 | | NEW YORK ST MTGE AGY HOMEOWNER MTGE REVENUE | | 10/1/2048 | | 4.80 | | 5,000,000 | | 5,110,171 | | |
| 1,875,000 | | NEW YORK ST MTGE AGY HOMEOWNER MTGE REVENUE | | 10/1/2049 | | 2.95 | | 1,875,000 | | 1,481,434 | | |
| 1,435,000 | | NEW YORK ST MTGE AGY HOMEOWNER MTGE REVENUE | | 4/1/2050 | | 2.55 | | 1,435,000 | | 1,043,932 | | |
| 2,030,000 | | NEW YORK ST MTGE AGY HOMEOWNER MTGE REVENUE | | 10/1/2053 | | 4.65 | | 2,030,000 | | 2,052,729 | | |
| 1,250,000 | | NEW YORK ST TRANSPRTN DEV CORP SPL FAC REVENUE | | 10/1/2030 | | 4.00 | | 1,246,317 | | 1,227,150 | | |
| 1,000,000 | | NEW YORK ST TRANSPRTN DEV CORP SPL FAC REVENUE | | 4/1/2035 | | 6.00 | | 1,023,510 | | 1,113,996 | | |
| 1,500,000 | | NEW YORK ST TRANSPRTN DEV CORP SPL FAC REVENUE | | 7/1/2041 | | 5.00 | | 1,494,660 | | 1,501,531 | | |
| 700,000 | | NEW YORK ST TRANSPRTN DEV CORP SPL FAC REVENUE | | 6/30/2044 | | 5.50 | | 735,010 | | 772,070 | | |
| 650,000 | | WESTCHESTER CNTY NY LOCAL DEV CORP REVENUE(b) | | 7/1/2029 | | 3.60 | | 650,000 | | 622,585 | | |
| 650,000 | | WESTCHESTER CNTY NY LOCAL DEV CORP REVENUE(b) | | 7/1/2046 | | 5.00 | | 680,518 | | 547,042 | | |
| 500,000 | | WESTERN REGL OFF-TRACK BETTING CORP REVENUE(b) | | 12/1/2041 | | 4.13 | | 494,666 | | 380,633 | | |
| | | | | | | 44,666,085 | | 41,439,127 | | 5.92% |
| North Carolina | | | | | | | | | | |
| 1,000,000 | | GTR ASHEVILLE REGL ARPT AUTH NC ARPT SYS REVENUE | | 7/1/2052 | | 5.50 | | 1,059,078 | | 1,094,652 | | |
| 1,625,000 | | MECKLENBURG CNTY NC MF HSG REVENUE | | 1/1/2036 | | 5.38 | | 1,625,000 | | 1,628,757 | | |
| 60,000 | | NORTH CAROLINA ST EDU ASSISTANCE AUTH | | 6/1/2039 | | 3.13 | | 59,454 | | 56,842 | | |
| See accompanying notes to financial statements. | 79 | (Continued) |
CLEARWATER INVESTMENT TRUST
Schedule of Investments - Clearwater Tax-Exempt Bond Fund
December 31, 2023
| Par/Shares | | Security | | Maturity
date | | Coupon
rate | | Cost | | Fair value (a) | | Percent of
net assets |
| North Carolina (Cont'd): | | | | | | | | | | |
| 2,500,000 | | NORTH CAROLINA ST HSG FIN AGY HOME OWNERSHIP REVENUE | | 7/1/2042 | | 3.50 | | $ 2,500,000 | | 2,221,275 | | |
| 2,000,000 | | NORTH CAROLINA ST HSG FIN AGY HOME OWNERSHIP REVENUE | | 7/1/2046 | | 4.40 | | 2,000,000 | | 2,028,798 | | |
| 1,500,000 | | NORTH CAROLINA ST HSG FIN AGY HOME OWNERSHIP REVENUE | | 7/1/2046 | | 5.00 | | 1,501,974 | | 1,580,286 | | |
| 750,000 | | NORTH CAROLINA ST HSG FIN AGY HOME OWNERSHIP REVENUE | | 1/1/2055 | | 6.25 | | 800,156 | | 829,962 | | |
| 1,000,000 | | NORTH CAROLINA ST MED CARE COMMISSION HLTH CARE FACS REVENUE | | 11/1/2037 | | 5.00 | | 1,041,478 | | 1,028,155 | | |
| | | | | | | 10,587,140 | | 10,468,727 | | 1.49% |
| North Dakota | | | | | | | | | | |
| 795,000 | | GRAND FORKS ND HLTH CARE SYS REVENUE | | 12/1/2035 | | 5.00 | | 840,807 | | 918,150 | | |
| 410,000 | | NORTH DAKOTA ST HSG FIN AGY | | 7/1/2043 | | 3.05 | | 410,766 | | 355,463 | | |
| 985,000 | | NORTH DAKOTA ST HSG FIN AGY | | 1/1/2044 | | 3.05 | | 985,000 | | 835,724 | | |
| 920,000 | | NORTH DAKOTA ST HSG FIN AGY | | 7/1/2044 | | 2.50 | | 920,000 | | 699,067 | | |
| 1,000,000 | | NORTH DAKOTA ST HSG FIN AGY | | 7/1/2048 | | 5.10 | | 1,000,000 | | 1,034,615 | | |
| 985,000 | | NORTH DAKOTA ST HSG FIN AGY | | 1/1/2053 | | 4.00 | | 1,028,229 | | 986,745 | | |
| 1,000,000 | | NORTH DAKOTA ST HSG FIN AGY | | 7/1/2053 | | 5.75 | | 1,084,850 | | 1,071,980 | | |
| | | | | | | 6,269,652 | | 5,901,744 | | 0.84% |
| Ohio | | | | | | | | | | |
| 500,000 | | CLEVELAND-CUYAHOGA CNTY OH PORT AUTH TAX INCREMENT FING REV(b) | | 12/1/2055 | | 4.50 | | 500,000 | | 424,501 | | |
| 1,500,000 | | CLOVERLEAF OH LOCAL SCH DIST COPS | | 12/1/2047 | | 5.75 | | 1,559,067 | | 1,627,989 | | |
| 830,000 | | COLUMBUS-FRANKLIN CNTY OH FIN AUTH DEV REVENUE | | 5/15/2045 | | 3.00 | | 844,584 | | 640,558 | | |
| 1,400,000 | | COLUMBUS-FRANKLIN CNTY OH FIN AUTH DEV REVENUE | | 5/15/2049 | | 4.00 | | 1,458,351 | | 1,315,438 | | |
| 585,000 | | DAYTON OH ARPT REVENUE | | 12/1/2025 | | 5.00 | | 585,000 | | 585,235 | | |
| 2,000,000 | | FRANKLIN CNTY OH HLTH CARE FACS REVENUE | | 7/1/2045 | | 4.00 | | 2,042,282 | | 1,552,702 | | |
| 750,000 | | LAKE CNTY OH PORT & ECON DEV AUTH LEASE REVENUE(b)(c)(d) | | 12/1/2037 | | 6.50 | | 750,000 | | 217,500 | | |
| 1,500,000 | | LUCAS MET HSG AUTH OH COPS | | 11/1/2036 | | 5.00 | | 1,518,298 | | 1,536,262 | | |
| 400,000 | | OHIO ST HGR EDUCTNL FAC COMMISSION(f)(l) | | 1/1/2043 | | 4.50 | | 400,000 | | 400,000 | | |
| 2,000,000 | | OHIO ST HGR EDUCTNL FAC COMMISSION | | 11/1/2049 | | 4.00 | | 2,026,999 | | 1,502,078 | | |
| 1,000,000 | | OHIO ST HSG FIN AGY MF HSG REVENUE(b) | | 3/1/2026 | | 6.25 | | 1,000,000 | | 1,010,698 | | |
| 505,000 | | OHIO ST HSG FIN AGY RSDL MTGE REVENUE | | 9/1/2039 | | 3.35 | | 461,518 | | 465,894 | | |
| 3,950,000 | | OHIO ST HSG FIN AGY RSDL MTGE REVENUE | | 9/1/2046 | | 2.85 | | 3,950,000 | | 2,987,388 | | |
| 950,000 | | OHIO ST HSG FIN AGY RSDL MTGE REVENUE | | 9/1/2047 | | 4.55 | | 950,000 | | 960,511 | | |
| 2,395,000 | | OHIO ST HSG FIN AGY RSDL MTGE REVENUE | | 9/1/2047 | | 5.10 | | 2,395,000 | | 2,529,344 | | |
| 495,000 | | OHIO ST HSG FIN AGY RSDL MTGE REVENUE | | 9/1/2048 | | 4.00 | | 495,000 | | 475,073 | | |
| 1,150,000 | | OHIO ST HSG FIN AGY RSDL MTGE REVENUE | | 9/1/2048 | | 4.50 | | 1,151,290 | | 1,158,299 | | |
| 625,000 | | OHIO ST HSG FIN AGY RSDL MTGE REVENUE | | 3/1/2049 | | 4.00 | | 625,000 | | 599,976 | | |
| 3,615,000 | | OHIO ST HSG FIN AGY RSDL MTGE REVENUE | | 9/1/2051 | | 2.45 | | 3,635,594 | | 2,505,079 | | |
| 1,950,000 | | OHIO ST HSG FIN AGY RSDL MTGE REVENUE | | 9/1/2051 | | 2.75 | | 1,950,000 | | 1,406,386 | | |
| 960,000 | | OHIO ST HSG FIN AGY RSDL MTGE REVENUE | | 3/1/2052 | | 5.00 | | 1,005,821 | | 995,390 | | |
| | | | | | | 29,303,804 | | 24,896,301 | | 3.55% |
| Oklahoma | | | | | | | | | | |
| 2,000,000 | | OKLAHOMA ST DEV FIN AUTH | | 8/1/2049 | | 5.00 | | 2,146,696 | | 1,958,403 | | |
| 1,000,000 | | OKLAHOMA ST HSG FIN AGY SF MTGE REVENUE | | 9/1/2043 | | 4.50 | | 1,001,298 | | 1,022,487 | | |
| See accompanying notes to financial statements. | 80 | (Continued) |
CLEARWATER INVESTMENT TRUST
Schedule of Investments - Clearwater Tax-Exempt Bond Fund
December 31, 2023
| Par/Shares | | Security | | Maturity
date | | Coupon
rate | | Cost | | Fair value (a) | | Percent of
net assets |
| Oklahoma (Cont'd): | | | | | | | | | | |
| 1,000,000 | | OKLAHOMA ST HSG FIN AGY SF MTGE REVENUE | | 9/1/2047 | | 5.05 | | $ 1,000,000 | | 1,039,783 | | |
| 1,975,000 | | OKLAHOMA ST HSG FIN AGY SF MTGE REVENUE | | 9/1/2053 | | 6.25 | | 2,107,174 | | 2,147,370 | | |
| | | | | | | 6,255,168 | | 6,168,043 | | 0.88% |
| Oregon | | | | | | | | | | |
| 425,000 | | OREGON ST HSG & CMNTY SVCS DEPT MTGE REVENUE | | 7/1/2038 | | 4.00 | | 425,000 | | 408,389 | | |
| 1,000,000 | | OREGON ST HSG & CMNTY SVCS DEPT MTGE REVENUE | | 1/1/2042 | | 3.70 | | 1,000,000 | | 969,545 | | |
| 2,000,000 | | OREGON ST HSG & CMNTY SVCS DEPT MTGE REVENUE | | 1/1/2045 | | 2.38 | | 1,820,872 | | 1,438,595 | | |
| 1,050,000 | | OREGON ST HSG & CMNTY SVCS DEPT MTGE REVENUE | | 1/1/2046 | | 4.70 | | 1,050,000 | | 1,081,948 | | |
| 785,000 | | OREGON ST HSG & CMNTY SVCS DEPT MTGE REVENUE | | 7/1/2048 | | 3.75 | | 785,000 | | 724,283 | | |
| 1,000,000 | | POLK CNTY OR HOSP FAC AUTH REVENUE | | 7/1/2055 | | 5.13 | | 965,898 | | 855,612 | | |
| | | | | | | 6,046,770 | | 5,478,372 | | 0.78% |
| Pennsylvania | | | | | | | | | | |
| 370,000 | | BUTLER CNTY PA GEN AUTH REVENUE (Floating, ICE LIBOR USD 3M + 0.70%)(f) | | 10/1/2034 | | 4.46 | | 370,000 | | 339,776 | | |
| 1,500,000 | | COATESVILLE PA AREA SCH DIST | | 11/15/2037 | | 5.25 | | 1,559,511 | | 1,667,574 | | |
| 500,000 | | MONTGOMERY CNTY PA INDL DEV AUTH | | 11/15/2033 | | 5.00 | | 511,386 | | 515,991 | | |
| 785,000 | | PENNSYLVANIA HGR EDU ASSISTANCE AGY LOAN REVENUE | | 6/1/2042 | | 2.63 | | 786,147 | | 699,232 | | |
| 1,700,000 | | PENNSYLVANIA HGR EDU ASSISTANCE AGY LOAN REVENUE | | 6/1/2047 | | 3.00 | | 1,700,000 | | 1,310,576 | | |
| 1,000,000 | | PENNSYLVANIA ST ECON DEV FING AUTH UPMC REVENUE | | 4/15/2045 | | 4.00 | | 1,026,282 | | 993,464 | | |
| 1,000,000 | | PENNSYLVANIA ST HGR EDUCTNL FACS AUTH REVENUE | | 10/1/2034 | | 5.00 | | 1,028,243 | | 1,034,495 | | |
| 500,000 | | PENNSYLVANIA ST HGR EDUCTNL FACS AUTH REVENUE (Floating, 3M CME Term SOFR + 0.65%)(f) | | 7/1/2039 | | 4.40 | | 500,000 | | 429,731 | | |
| 1,685,000 | | PENNSYLVANIA ST HSG FIN AGY SF MTGE REVENUE | | 10/1/2042 | | 3.65 | | 1,685,000 | | 1,586,158 | | |
| 1,000,000 | | PENNSYLVANIA ST HSG FIN AGY SF MTGE REVENUE | | 10/1/2046 | | 3.00 | | 1,029,026 | | 774,612 | | |
| 1,000,000 | | PENNSYLVANIA ST HSG FIN AGY SF MTGE REVENUE | | 10/1/2049 | | 3.40 | | 1,000,000 | | 853,336 | | |
| 2,000,000 | | PENNSYLVANIA ST HSG FIN AGY SF MTGE REVENUE | | 10/1/2051 | | 2.55 | | 2,000,000 | | 1,416,643 | | |
| 640,000 | | PENNSYLVANIA ST HSG FIN AGY SF MTGE REVENUE | | 10/1/2051 | | 3.00 | | 637,126 | | 625,172 | | |
| 1,000,000 | | PENNSYLVANIA ST TURNPIKE COMMISSION TURNPIKE REVENUE | | 12/1/2045 | | 5.00 | | 1,021,914 | | 1,013,756 | | |
| 750,000 | | PHILADELPHIA PA AUTH FOR INDL DEV REVENUES | | 8/1/2036 | | 5.63 | | 741,643 | | 766,262 | | |
| | | | | | | 15,596,278 | | 14,026,778 | | 2.00% |
| Puerto Rico | | | | | | | | | | |
| 1,500,000 | | PUERTO RICO SALES TAX FING CORP SALES TAX REVENUE | | 7/1/2040 | | 4.55 | | 1,462,680 | | 1,507,278 | | |
| | | | | | | 1,462,680 | | 1,507,278 | | 0.22% |
| Rhode Island | | | | | | | | | | |
| 960,000 | | RHODE ISLAND ST STUDENT LOAN AUTH STUDENT LOAN REVENUE | | 12/1/2037 | | 3.63 | | 952,219 | | 918,672 | | |
| | | | | | | 952,219 | | 918,672 | | 0.13% |
| South Carolina | | | | | | | | | | |
| 650,000 | | BERKELEY CNTY SC ASSMNT REVENUE | | 11/1/2040 | | 4.25 | | 647,661 | | 573,922 | | |
| 1,000,000 | | PATRIOTS ENERGY GROUP FING AGY SC GAS SPLY REVENUE (Floating, U.S. SOFR + 1.90%)(f) | | 2/1/2054 | | 5.52 | | 1,000,000 | | 1,011,351 | | |
| 1,000,000 | | SOUTH CAROLINA JOBS-ECON DEV AUTH | | 11/15/2053 | | 7.50 | | 1,000,000 | | 1,030,766 | | |
| 960,000 | | SOUTH CAROLINA ST HSG FIN & DEV AUTH MTGE REVENUE | | 7/1/2037 | | 3.20 | | 960,000 | | 878,965 | | |
| See accompanying notes to financial statements. | 81 | (Continued) |
CLEARWATER INVESTMENT TRUST
Schedule of Investments - Clearwater Tax-Exempt Bond Fund
December 31, 2023
| Par/Shares | | Security | | Maturity
date | | Coupon
rate | | Cost | | Fair value (a) | | Percent of
net assets |
| South Carolina (Cont'd): | | | | | | | | | | |
| 1,100,000 | | SOUTH CAROLINA ST HSG FIN & DEV AUTH MTGE REVENUE | | 7/1/2045 | | 3.05 | | $ 1,100,000 | | 918,450 | | |
| 1,000,000 | | SOUTH CAROLINA ST HSG FIN & DEV AUTH MTGE REVENUE | | 7/1/2048 | | 4.90 | | 1,000,000 | | 1,026,017 | | |
| 665,000 | | SOUTH CAROLINA ST JOBS-ECON DEV AUTH ECON DEV REVENUE | | 4/1/2054 | | 4.00 | | 686,505 | | 489,180 | | |
| 950,000 | | SOUTH CAROLINA ST JOBS-ECON DEV AUTH EDUCTNL FACS REVENUE(b) | | 6/15/2043 | | 7.00 | | 939,995 | | 971,668 | | |
| 1,000,000 | | SOUTH CAROLINA ST JOBS-ECON DEV AUTH SOL WST DISP REVENUE(b) | | 6/1/2031 | | 6.00 | | 1,000,000 | | 884,590 | | |
| 1,000,000 | | SOUTH CAROLINA ST PUBLIC SVC AUTH REVENUE | | 12/1/2038 | | 5.00 | | 1,003,871 | | 1,002,586 | | |
| | | | | | | 9,338,032 | | 8,787,495 | | 1.25% |
| South Dakota | | | | | | | | | | |
| 2,000,000 | | SOUTH DAKOTA ST HSG DEV AUTH | | 11/1/2042 | | 2.50 | | 2,000,000 | | 1,579,503 | | |
| | | | | | | 2,000,000 | | 1,579,503 | | 0.23% |
| Tennessee | | | | | | | | | | |
| 1,000,000 | | FRANKLIN TN HLTH & EDUCTNL FACS BRD REVENUE(b)(c)(d) | | 6/1/2027 | | 6.50 | | 1,000,000 | | 110,000 | | |
| 600,000 | | NASHVILLE MET DEV & HSG AGY TN TAX INCR REVENUE(b) | | 6/1/2036 | | 5.13 | | 600,000 | | 609,311 | | |
| 150,000 | | SHELBY CNTY TN HLTH EDUCTNL & HSG FACS BRD REVENUE(c) | | 1/1/2019 | | 5.35 | | 134,966 | | 1 | | |
| 625,000 | | SHELBY CNTY TN HLTH EDUCTNL & HSG FACS BRD REVENUE(c) | | 1/1/2029 | | 5.55 | | 556,863 | | 6 | | |
| 130,000 | | SHELBY CNTY TN HLTH EDUCTNL & HSG FACS BRD REVENUE(c) | | 1/1/2029 | | 6.00 | | - | | 1 | | |
| 3,000,000 | | TENNESSEE HSG DEV AGY RSDL FIN PROGRAM REVENUE | | 7/1/2042 | | 3.50 | | 3,000,000 | | 2,794,917 | | |
| 495,000 | | TENNESSEE HSG DEV AGY RSDL FIN PROGRAM REVENUE | | 7/1/2042 | | 3.85 | | 495,000 | | 486,995 | | |
| 430,000 | | TENNESSEE HSG DEV AGY RSDL FIN PROGRAM REVENUE | | 7/1/2042 | | 3.90 | | 430,000 | | 425,843 | | |
| 1,000,000 | | TENNESSEE HSG DEV AGY RSDL FIN PROGRAM REVENUE | | 7/1/2042 | | 4.25 | | 1,000,000 | | 1,010,151 | | |
| 2,980,000 | | TENNESSEE HSG DEV AGY RSDL FIN PROGRAM REVENUE | | 7/1/2046 | | 2.38 | | 2,855,170 | | 2,094,458 | | |
| 800,000 | | TENNESSEE HSG DEV AGY RSDL FIN PROGRAM REVENUE | | 7/1/2046 | | 2.55 | | 800,000 | | 585,955 | | |
| 500,000 | | TENNESSEE HSG DEV AGY RSDL FIN PROGRAM REVENUE | | 7/1/2048 | | 4.70 | | 500,000 | | 511,332 | | |
| 1,000,000 | | TENNESSEE HSG DEV AGY RSDL FIN PROGRAM REVENUE | | 7/1/2048 | | 5.35 | | 1,000,000 | | 1,060,353 | | |
| 605,000 | | TENNESSEE HSG DEV AGY RSDL FIN PROGRAM REVENUE | | 1/1/2049 | | 3.95 | | 605,000 | | 572,500 | | |
| 1,990,000 | | TENNESSEE HSG DEV AGY RSDL FIN PROGRAM REVENUE | | 7/1/2051 | | 2.50 | | 1,990,000 | | 1,320,837 | | |
| 1,975,000 | | TENNESSEE HSG DEV AGY RSDL FIN PROGRAM REVENUE | | 7/1/2053 | | 4.70 | | 1,973,781 | | 2,001,924 | | |
| 1,500,000 | | TENNESSEE HSG DEV AGY RSDL FIN PROGRAM REVENUE | | 1/1/2054 | | 6.25 | | 1,581,351 | | 1,658,704 | | |
| | | | | | | 18,522,131 | | 15,243,288 | | 2.18% |
| Texas | | | | | | | | | | |
| 1,000,000 | | ALAMITO TX PUBLIC FACS CORP MF HSG REVENUE(o) | | 8/1/2044 | | 5.00 | | 1,027,742 | | 1,032,368 | | |
| 1,000,000 | | ARLINGTON TX HGR EDU FIN CORP EDU REVENUE(b) | | 6/1/2053 | | 6.00 | | 980,980 | | 1,008,252 | | |
| 2,000,000 | | AUSTIN TX ARPT SYS REVENUE | | 11/15/2044 | | 5.00 | | 2,008,379 | | 2,005,063 | | |
| 1,000,000 | | BRAZOS TX HGR EDU AUTH STUDENT LOAN PROGRAM REV | | 4/1/2040 | | 3.00 | | 1,002,822 | | 856,727 | | |
| 625,000 | | CLIFTON TX HGR EDU FIN CORP EDU REVENUE | | 12/1/2035 | | 5.00 | | 632,462 | | 634,618 | | |
| 2,000,000 | | CRANDALL TX INDEP SCH DIST | | 8/15/2036 | | 5.00 | | 2,069,434 | | 2,071,666 | | |
| 1,000,000 | | CYPRESS-FAIRBANKS TX INDEP SCH DIST | | 2/15/2041 | | 2.25 | | 707,375 | | 754,466 | | |
| 1,000,000 | | DALLAS TX INDEP SCH DIST | | 2/15/2042 | | 2.00 | | 651,542 | | 710,909 | | |
| 750,000 | | DALLAS TX SPL TAX REVENUE(b)(p) | | 8/15/2053 | | 6.25 | | 751,925 | | 761,521 | | |
| 420,000 | | EDINBURG TX ECON DEV CORP SALES TAX REVENUE | | 8/15/2031 | | 3.00 | | 420,000 | | 366,831 | | |
| See accompanying notes to financial statements. | 82 | (Continued) |
CLEARWATER INVESTMENT TRUST
Schedule of Investments - Clearwater Tax-Exempt Bond Fund
December 31, 2023
| Par/Shares | | Security | | Maturity
date | | Coupon
rate | | Cost | | Fair value (a) | | Percent of
net assets |
| Texas (Cont'd): | | | | | | | | | | |
| 700,000 | | EDINBURG TX ECON DEV CORP SALES TAX REVENUE | | 8/15/2046 | | 3.38 | | $ 690,702 | | 515,393 | | |
| 1,500,000 | | FORT WORTH TX | | 3/1/2040 | | 2.00 | | 1,058,604 | | 1,113,234 | | |
| 1,000,000 | | GEORGETOWN TX INDEP SCH DIST | | 8/15/2035 | | 2.50 | | 871,007 | | 912,305 | | |
| 1,000,000 | | GEORGETOWN TX INDEP SCH DIST | | 8/15/2035 | | 5.00 | | 1,026,276 | | 1,030,247 | | |
| 1,500,000 | | GRAND PARKWAY TRANSPRTN CORP TX SYS TOLL REVENUE | | 10/1/2035 | | 5.50 | | 1,496,702 | | 1,678,010 | | |
| 1,125,000 | | GTR TEXOMA TX UTILITY AUTH CONTRACT REVENUE | | 10/1/2032 | | 5.00 | | 1,286,682 | | 1,327,461 | | |
| 2,000,000 | | HOUSTON TX ARPT SYS REVENUE | | 7/1/2048 | | 5.25 | | 2,137,181 | | 2,175,255 | | |
| 1,000,000 | | HSG SYNERGY PFC TX MF HSG REVENUE(q) | | 2/1/2027 | | 5.00 | | 1,023,389 | | 1,030,222 | | |
| 1,000,000 | | MATAGORDA CNTY TX NAV DIST #1 | | 11/1/2029 | | 2.60 | | 890,144 | | 917,390 | | |
| 1,000,000 | | MATAGORDA CNTY TX NAV DIST #1 | | 5/1/2030 | | 4.25 | | 1,000,000 | | 1,001,190 | | |
| 273,000 | | N CENTRL TEXAS ST HLTH FAC DEV CORP(c) | | 2/15/2025 | | 5.38 | | 273,000 | | 150,150 | | |
| 1,000,000 | | N TX TOLLWAY AUTH REVENUE | | 1/1/2042 | | 6.20 | | 998,299 | | 1,031,350 | | |
| 2,000,000 | | NEW HOPE CULTURAL ED FACS FIN CORP TX RETIREMENT FAC REVENUE | | 10/1/2027 | | 5.50 | | 1,969,773 | | 1,941,329 | | |
| 470,000 | | NEW HOPE CULTURAL ED FACS FIN CORP TX RETIREMENT FAC REVENUE | | 1/1/2029 | | 4.00 | | 434,076 | | 426,351 | | |
| 1,500,000 | | NEW HOPE CULTURAL ED FACS FIN CORP TX RETIREMENT FAC REVENUE | | 10/1/2033 | | 6.50 | | 1,500,000 | | 1,477,531 | | |
| 1,000,000 | | NEW HOPE CULTURAL ED FACS FIN CORP TX RETIREMENT FAC REVENUE | | 10/1/2034 | | 5.00 | | 1,003,755 | | 923,786 | | |
| 500,000 | | NEW HOPE CULTURAL ED FACS FIN CORP TX RETIREMENT FAC REVENUE | | 10/1/2049 | | 5.25 | | 506,429 | | 399,714 | | |
| 1,000,000 | | NEW HOPE CULTURAL ED FACS FIN CORP TX RETIREMENT FAC REVENUE | | 11/1/2049 | | 4.00 | | 1,093,354 | | 854,509 | | |
| 1,100,000 | | NEW HOPE CULTURAL ED FACS FIN CORP TX RETIREMENT FAC REVENUE | | 1/1/2055 | | 5.00 | | 1,138,726 | | 782,784 | | |
| 1,039,746 | | NEW HOPE CULTURAL ED FACS FIN CORP TX RETIREMENT FAC REVENUE(f)(g) | | 11/15/2061 | | 2.00 | | 1,039,746 | | 391,073 | | |
| 1,000,000 | | NEW HOPE CULTURAL EDU FACS FIN CORP TX RETMNT CMNTY REVENUE(b) | | 12/1/2028 | | 12.00 | | 1,000,000 | | 1,059,104 | | |
| 645,000 | | NEW HOPE CULTURAL EDU FACS FIN CORP TX SENIOR LIVING REVENUE | | 7/1/2025 | | 4.00 | | 638,869 | | 290,250 | | |
| 1,100,000 | | NEW HOPE CULTURAL EDU FACS FIN CORP TX STUDENT HSG REV | | 4/1/2046 | | 5.00 | | 1,102,098 | | 1,100,415 | | |
| 700,000 | | NEW HOPE CULTURAL EDU FACS FINCORP TX EDU REVENUE(b) | | 8/15/2039 | | 5.00 | | 694,750 | | 703,922 | | |
| 2,000,000 | | NEW HOPE CULTURAL EDU FACS FINCORP TX EDU REVENUE(b) | | 8/15/2051 | | 5.00 | | 1,990,000 | | 1,909,041 | | |
| 250,000 | | NORTHWEST TX INDEP SCH DIST | | 2/15/2040 | | 5.00 | | 274,450 | | 282,782 | | |
| 250,000 | | NORTHWEST TX INDEP SCH DIST | | 2/15/2041 | | 5.00 | | 273,163 | | 281,824 | | |
| 1,000,000 | | PECOS BARSTOW TOYAH TX INDEP SCH DIST | | 2/15/2042 | | 5.00 | | 1,018,699 | | 1,024,694 | | |
| 1,000,000 | | SAN ANTONIO TX WTR REVENUE | | 5/15/2039 | | 5.00 | | 1,021,510 | | 1,019,439 | | |
| 1,000,000 | | SUGAR LAND TX DEV CORP SALES TAX REVENUE | | 2/15/2033 | | 5.00 | | 1,000,000 | | 1,001,006 | | |
| 1,000,000 | | TEXAS ST | | 10/1/2036 | | 5.00 | | 1,019,769 | | 1,027,488 | | |
| 3,500,000 | | TEXAS ST AFFORDABLE HSG CORP SF MTGE REVENUE | | 3/1/2053 | | 4.88 | | 3,584,490 | | 3,568,792 | | |
| 635,000 | | TEXAS ST DEPT OF HSG & CMNTY AFFAIRS | | 9/1/2048 | | 4.25 | | 641,004 | | 630,790 | | |
| 1,000,000 | | TEXAS ST DEPT OF HSG & CMNTY AFFAIRS | | 3/1/2050 | | 3.00 | | 721,446 | | 788,937 | | |
| 1,500,000 | | TEXAS ST DEPT OF HSG & CMNTY AFFAIRS | | 9/1/2052 | | 5.25 | | 1,537,925 | | 1,585,595 | | |
| 2,445,000 | | TEXAS ST DEPT OF HSG & CMNTY AFFAIRS | | 9/1/2052 | | 5.50 | | 2,622,820 | | 2,612,758 | | |
| 1,000,000 | | TEXAS ST DEPT OF HSG & CMNTY AFFAIRS | | 9/1/2053 | | 5.25 | | 1,031,522 | | 1,058,526 | | |
| 3,500,000 | | TEXAS ST DEPT OF HSG & CMNTY AFFAIRS RESDL MTG REVENUE | | 1/1/2048 | | 5.13 | | 3,556,342 | | 3,726,755 | | |
| 485,000 | | TEXAS ST DEPT OF HSG & CMNTY AFFAIRS RESDL MTG REVENUE | | 7/1/2051 | | 2.50 | | 488,563 | | 341,638 | | |
| See accompanying notes to financial statements. | 83 | (Continued) |
CLEARWATER INVESTMENT TRUST
Schedule of Investments - Clearwater Tax-Exempt Bond Fund
December 31, 2023
| Par/Shares | | Security | | Maturity
date | | Coupon
rate | | Cost | | Fair value (a) | | Percent of
net assets |
| Texas (Cont'd): | | | | | | | | | | |
| 4,750,000 | | TEXAS ST DEPT OF HSG & CMNTY AFFAIRS RESDL MTG REVENUE | | 1/1/2052 | | 3.13 | | $ 4,832,292 | | 3,674,721 | | |
| | | | | | | 60,740,218 | | 57,970,182 | | 8.28% |
| Utah | | | | | | | | | | |
| 1,000,000 | | BLACK DESERT PUB INFRASTRUCTURE DIST(b) | | 3/1/2051 | | 4.00 | | 1,010,084 | | 755,270 | | |
| 2,000,000 | | INTERMOUNTAIN PWR AGY UT PWR SPLY REVENUE | | 7/1/2043 | | 5.25 | | 2,216,535 | | 2,293,698 | | |
| 1,000,000 | | JORDAN VLY UT WTR CONSERVANCY DIST WTR REVENUE | | 10/1/2046 | | 5.00 | | 1,025,729 | | 1,036,839 | | |
| 1,000,000 | | JORDANELLE RIDGE PUBLIC INFRASTRUCTURE DIST #2 UT(b) | | 3/1/2054 | | 7.75 | | 1,000,000 | | 1,015,179 | | |
| 850,000 | | MILITARY INSTALLATION DEV AUTH UT TAX ALLOCATION REVENUE | | 6/1/2041 | | 4.00 | | 875,680 | | 683,447 | | |
| 2,000,000 | | MILITARY INSTALLATION DEV AUTH UT TAX ALLOCATION REVENUE | | 6/1/2052 | | 4.00 | | 2,029,926 | | 1,479,293 | | |
| 500,000 | | RED BRIDGE PUBLIC INFRASTRUCTURE DIST #1 UT(b) | | 2/1/2041 | | 4.13 | | 500,000 | | 399,289 | | |
| 1,000,000 | | SALT LAKE CITY UT ARPT REVENUE | | 7/1/2039 | | 5.25 | | 1,057,545 | | 1,119,941 | | |
| 1,000,000 | | UTAH CNTY UT HOSP REVENUE | | 5/15/2045 | | 5.00 | | 1,005,110 | | 1,003,668 | | |
| 1,000,000 | | UTAH HSG CORP SF MTGE REVENUE | | 1/1/2054 | | 5.00 | | 1,000,000 | | 1,032,522 | | |
| 1,000,000 | | UTAH INFRASTRUCTURE AGY TELECOMUNICATION REVENUE | | 10/15/2033 | | 5.50 | | 1,032,844 | | 1,094,902 | | |
| 2,000,000 | | UTAH INFRASTRUCTURE AGY TELECOMUNICATION REVENUE | | 10/15/2037 | | 5.00 | | 2,013,576 | | 2,021,804 | | |
| 825,000 | | UTAH ST CHRT SCH FIN AUTH CHRT SCH REVENUE(b) | | 6/15/2027 | | 4.25 | | 825,000 | | 788,235 | | |
| 900,000 | | UTAH ST CHRT SCH FIN AUTH CHRT SCH REVENUE(b) | | 12/15/2031 | | 3.50 | | 896,898 | | 764,469 | | |
| 915,000 | | UTAH ST CHRT SCH FIN AUTH CHRT SCH REVENUE(b) | | 6/15/2032 | | 5.25 | | 915,000 | | 916,956 | | |
| 5,134,161 | | UTAH ST HSG CORP | | 12/21/2052 | | 6.00 | | 5,320,938 | | 5,521,895 | | |
| 2,417,834 | | UTAH ST HSG CORP | | 1/21/2053 | | 6.50 | | 2,518,324 | | 2,668,346 | | |
| 3,865,635 | | UTAH ST HSG CORP | | 4/21/2053 | | 5.50 | | 3,952,965 | | 3,970,830 | | |
| 2,975,509 | | UTAH ST HSG CORP | | 5/21/2053 | | 6.50 | | 3,095,069 | | 3,308,855 | | |
| 4,001,273 | | UTAH ST HSG CORP | | 6/21/2053 | | 6.00 | | 4,096,903 | | 4,305,435 | | |
| 2,749,158 | | UTAH ST HSG CORP | | 9/21/2053 | | 6.50 | | 2,834,576 | | 3,088,217 | | |
| 20,000 | | UTAH ST HSG CORP SF MTGE REVENUE | | 1/1/2033 | | 5.75 | | 20,000 | | 20,030 | | |
| | | | | | | 39,242,702 | | 39,289,120 | | 5.61% |
| Vermont | | | | | | | | | | |
| 375,000 | | VERMONT ST STUDENT ASSISTANCE CORP EDU LOAN REVENUE | | 6/15/2036 | | 3.38 | | 372,170 | | 359,605 | | |
| | | | | | | 372,170 | | 359,605 | | 0.05% |
| Virgin Islands, U.S. | | | | | | | | | | |
| 500,000 | | VIRGIN ISLANDS PUBLIC FIN AUTH REVENUE(b) | | 10/1/2024 | | 5.00 | | 494,743 | | 495,460 | | |
| | | | | | | 494,743 | | 495,460 | | 0.07% |
| Virginia | | | | | | | | | | |
| 1,500,000 | | BOTETOURT CNTY VA RSDL CARE FAC REVENUE | | 7/1/2044 | | 6.00 | | 1,505,412 | | 1,501,356 | | |
| 3,000,000 | | CHESAPEAKE BAY VA BRIDGE & TUNNEL DIST REVENUE | | 7/1/2041 | | 5.00 | | 3,074,250 | | 3,103,879 | | |
| 500,000 | | FAIRFAX CNTY VA REDEV & HSG AUTH MF REVENUE | | 8/1/2039 | | 5.60 | | 500,000 | | 501,245 | | |
| 1,000,000 | | JAMES CITY CNTY VA ECON DEV AUTH RSDL CARE FAC REVENUE | | 12/1/2058 | | 6.88 | | 1,005,610 | | 1,059,211 | | |
| 462,000 | | MARQUIS VA CMNTY DEV AUTH REVENUE(m) | | 9/1/2041 | | 0.00 | | 187,783 | | 1,155 | | |
| 349,000 | | MARQUIS VA CMNTY DEV AUTH REVENUE(c) | | 9/1/2041 | | 5.63 | | 373,459 | | 122,150 | | |
| 850,000 | | VIRGINIA BEACH VA DEV AUTH RSDL CARE FAC REVENUE | | 9/1/2030 | | 6.25 | | 850,000 | | 871,417 | | |
| 500,000 | | VIRGINIA BEACH VA DEV AUTH RSDL CARE FAC REVENUE | | 9/1/2043 | | 6.50 | | 501,004 | | 532,411 | | |
| 1,000,000 | | VIRGINIA ST HSG DEV AUTH | | 10/1/2043 | | 5.35 | | 1,000,000 | | 1,000,942 | | |
| 1,000,000 | | VIRGINIA ST HSG DEV AUTH | | 9/1/2050 | | 2.50 | | 1,000,000 | | 691,345 | | |
| See accompanying notes to financial statements. | 84 | (Continued) |
CLEARWATER INVESTMENT TRUST
Schedule of Investments - Clearwater Tax-Exempt Bond Fund
December 31, 2023
| Par/Shares | | Security | | Maturity
date | | Coupon
rate | | Cost | | Fair value (a) | | Percent of
net assets |
| Virginia (Cont'd): | | | | | | | | | | |
| 1,000,000 | | VIRGINIA ST HSG DEV AUTH CMWLTH MTGE | | 11/1/2048 | | 5.25 | | $ 1,000,000 | | 1,083,359 | | |
| | | | | | | 10,997,518 | | 10,468,470 | | 1.49% |
| Washington | | | | | | | | | | |
| 1,500,000 | | FRANKLIN CNTY WA SCH DIST #1 PASCO | | 12/1/2040 | | 5.50 | | 1,725,814 | | 1,774,674 | | |
| 700,000 | | KALISPEL TRIBE OF INDIANS PRIORITY DIST WA REVENUE(b) | | 1/1/2038 | | 5.25 | | 688,396 | | 722,809 | | |
| 295,000 | | KING CNTY WA HSG AUTH | | 5/1/2028 | | 5.20 | | 295,000 | | 299,389 | | |
| 1,000,000 | | KING CNTY WA SWR REVENUE | | 7/1/2036 | | 5.00 | | 1,042,382 | | 1,048,572 | | |
| 1,000,000 | | PIKE PLACE MARKET WA PRESERVATION & DEV AUTH SPL OBLG | | 12/1/2040 | | 5.00 | | 1,017,521 | | 1,012,962 | | |
| 500,000 | | SEATTLE WA HSG AUTH | | 6/1/2054 | | 2.50 | | 486,438 | | 317,941 | | |
| 1,500,000 | | VANCOUVER WA HSG AUTH | | 6/1/2038 | | 3.00 | | 1,496,500 | | 1,309,453 | | |
| 515,000 | | WALLA WALLA CNTY WA SCH DIST #300 TOUCHET | | 12/1/2029 | | 4.00 | | 515,000 | | 515,045 | | |
| 1,000,000 | | WASHINGTON ST HLTH CARE FACS AUTH | | 10/1/2025 | | 5.00 | | 1,000,000 | | 1,000,523 | | |
| 230,000 | | WASHINGTON ST HSG FIN COMMISSION NONPROFIT HSG REVENUE(b) | | 7/1/2025 | | 6.00 | | 230,323 | | 235,110 | | |
| 500,000 | | WASHINGTON ST HSG FIN COMMISSION NONPROFIT HSG REVENUE(b) | | 1/1/2038 | | 5.00 | | 521,017 | | 445,693 | | |
| | | | | | | 9,018,391 | | 8,682,171 | | 1.24% |
| West Virginia | | | | | | | | | | |
| 1,500,000 | | WEST VIRGINIA ST HSG DEV FUND | | 11/1/2048 | | 4.55 | | 1,500,000 | | 1,514,480 | | |
| 1,885,000 | | WEST VIRGINIA ST HSG DEV FUND | | 11/1/2051 | | 2.50 | | 1,885,000 | | 1,352,295 | | |
| 1,470,000 | | WEST VIRGINIA ST HSG DEV FUND | | 11/1/2053 | | 4.85 | | 1,470,000 | | 1,501,083 | | |
| | | | | | | 4,855,000 | | 4,367,858 | | 0.62% |
| Wisconsin | | | | | | | | | | |
| 16,520 | | PUBLIC FIN AUTH WI CONFERENCE CENTER & HOTEL REVENUE(b)(d)(m) | | 1/1/2046 | | 0.00 | | 2,228 | | 413 | | |
| 18,299 | | PUBLIC FIN AUTH WI CONFERENCE CENTER & HOTEL REVENUE(b)(d)(m) | | 1/1/2047 | | 0.00 | | 2,371 | | 425 | | |
| 17,930 | | PUBLIC FIN AUTH WI CONFERENCE CENTER & HOTEL REVENUE(b)(d)(m) | | 1/1/2048 | | 0.00 | | 2,246 | | 394 | | |
| 17,786 | | PUBLIC FIN AUTH WI CONFERENCE CENTER & HOTEL REVENUE(b)(d)(m) | | 1/1/2049 | | 0.00 | | 2,154 | | 368 | | |
| 17,496 | | PUBLIC FIN AUTH WI CONFERENCE CENTER & HOTEL REVENUE(b)(d)(m) | | 1/1/2050 | | 0.00 | | 2,050 | | 336 | | |
| 18,980 | | PUBLIC FIN AUTH WI CONFERENCE CENTER & HOTEL REVENUE(b)(d)(m) | | 1/1/2051 | | 0.00 | | 2,154 | | 345 | | |
| 446,246 | | PUBLIC FIN AUTH WI CONFERENCE CENTER & HOTEL REVENUE(b)(c)(d)(f)(g) | | 7/1/2051 | | 3.75 | | 443,916 | | 252,619 | | |
| 19,357 | | PUBLIC FIN AUTH WI CONFERENCE CENTER & HOTEL REVENUE(b)(d)(m) | | 1/1/2052 | | 0.00 | | 2,124 | | 327 | | |
| 19,095 | | PUBLIC FIN AUTH WI CONFERENCE CENTER & HOTEL REVENUE(b)(d)(m) | | 1/1/2053 | | 0.00 | | 2,029 | | 306 | | |
| 18,909 | | PUBLIC FIN AUTH WI CONFERENCE CENTER & HOTEL REVENUE(b)(d)(m) | | 1/1/2054 | | 0.00 | | 1,949 | | 285 | | |
| 18,634 | | PUBLIC FIN AUTH WI CONFERENCE CENTER & HOTEL REVENUE(b)(d)(m) | | 1/1/2055 | | 0.00 | | 1,864 | | 265 | | |
| 18,360 | | PUBLIC FIN AUTH WI CONFERENCE CENTER & HOTEL REVENUE(b)(d)(m) | | 1/1/2056 | | 0.00 | | 1,781 | | 248 | | |
| 106,459 | | PUBLIC FIN AUTH WI CONFERENCE CENTER & HOTEL REVENUE(b)(c)(d) | | 7/1/2056 | | 5.50 | | 104,505 | | 58,432 | | |
| 18,454 | | PUBLIC FIN AUTH WI CONFERENCE CENTER & HOTEL REVENUE(b)(d)(m) | | 1/1/2057 | | 0.00 | | 2,526 | | 236 | | |
| 18,165 | | PUBLIC FIN AUTH WI CONFERENCE CENTER & HOTEL REVENUE(b)(d)(m) | | 1/1/2058 | | 0.00 | | 1,646 | | 219 | | |
| 17,992 | | PUBLIC FIN AUTH WI CONFERENCE CENTER & HOTEL REVENUE(b)(d)(m) | | 1/1/2059 | | 0.00 | | 1,586 | | 206 | | |
| 17,834 | | PUBLIC FIN AUTH WI CONFERENCE CENTER & HOTEL REVENUE(b)(d)(m) | | 1/1/2060 | | 0.00 | | 1,529 | | 192 | | |
| 17,573 | | PUBLIC FIN AUTH WI CONFERENCE CENTER & HOTEL REVENUE(b)(d)(m) | | 1/1/2061 | | 0.00 | | 1,466 | | 178 | | |
| See accompanying notes to financial statements. | 85 | (Continued) |
CLEARWATER INVESTMENT TRUST
Schedule of Investments - Clearwater Tax-Exempt Bond Fund
December 31, 2023
| Par/Shares | | Security | | Maturity
date | | Coupon
rate | | Cost | | Fair value (a) | | Percent of
net assets |
| Wisconsin (Cont'd): | | | | | | | | | | |
| 17,400 | | PUBLIC FIN AUTH WI CONFERENCE CENTER & HOTEL REVENUE(b)(d)(m) | | 1/1/2062 | | 0.00 | | $ 1,414 | | 166 | | |
| 17,125 | | PUBLIC FIN AUTH WI CONFERENCE CENTER & HOTEL REVENUE(b)(d)(m) | | 1/1/2063 | | 0.00 | | 1,355 | | 155 | | |
| 16,967 | | PUBLIC FIN AUTH WI CONFERENCE CENTER & HOTEL REVENUE(b)(d)(m) | | 1/1/2064 | | 0.00 | | 1,309 | | 147 | | |
| 16,823 | | PUBLIC FIN AUTH WI CONFERENCE CENTER & HOTEL REVENUE(b)(d)(m) | | 1/1/2065 | | 0.00 | | 1,265 | | 137 | | |
| 16,731 | | PUBLIC FIN AUTH WI CONFERENCE CENTER & HOTEL REVENUE(b)(d)(m) | | 1/1/2066 | | 0.00 | | 1,225 | | 126 | | |
| 215,987 | | PUBLIC FIN AUTH WI CONFERENCE CENTER & HOTEL REVENUE(b)(d)(m) | | 1/1/2067 | | 0.00 | | 14,272 | | 1,466 | | |
| 520,000 | | PUBLIC FIN AUTH WI EDU REVENUE(b) | | 6/15/2049 | | 5.00 | | 522,966 | | 466,905 | | |
| 1,000,000 | | PUBLIC FIN AUTH WI HOTEL REVENUE | | 2/1/2052 | | 5.00 | | 1,049,391 | | 1,017,546 | | |
| 1,000,000 | | PUBLIC FIN AUTH WI HOTEL REVENUE(b) | | 2/1/2062 | | 6.00 | | 1,000,000 | | 1,027,982 | | |
| 1,250,000 | | PUBLIC FIN AUTH WI REVENUE(b) | | 6/1/2028 | | 3.00 | | 1,250,000 | | 1,162,413 | | |
| 1,250,000 | | PUBLIC FIN AUTH WI REVENUE(b)(c)(d) | | 11/1/2028 | | 6.25 | | 1,250,000 | | 687,500 | | |
| 1,000,000 | | PUBLIC FIN AUTH WI REVENUE(b)(d) | | 1/1/2033 | | 6.13 | | 991,417 | | 450,000 | | |
| 250,000 | | PUBLIC FIN AUTH WI REVENUE(b) | | 10/1/2034 | | 5.00 | | 246,588 | | 255,614 | | |
| 1,695,000 | | PUBLIC FIN AUTH WI REVENUE(b) | | 11/15/2053 | | 4.75 | | 1,716,235 | | 1,244,746 | | |
| 245,000 | | PUBLIC FIN AUTH WI SENIOR LIVING REVENUE(b) | | 11/15/2024 | | 5.00 | | 244,895 | | 248,149 | | |
| 80,000 | | RACINE CNTY WI | | 3/1/2026 | | 4.00 | | 80,021 | | 80,072 | | |
| 500,000 | | WISCONSIN ST HLTH & EDUCTNL FACS AUTH REVENUE | | 8/1/2032 | | 5.00 | | 519,010 | | 425,892 | | |
| 330,000 | | WISCONSIN ST HLTH & EDUCTNL FACS AUTH REVENUE | | 3/15/2033 | | 4.50 | | 334,952 | | 339,984 | | |
| 700,000 | | WISCONSIN ST HLTH & EDUCTNL FACS AUTH REVENUE | | 6/1/2037 | | 5.00 | | 724,381 | | 655,072 | | |
| 1,410,000 | | WISCONSIN ST HLTH & EDUCTNL FACS AUTH REVENUE | | 6/1/2041 | | 5.00 | | 1,415,384 | | 1,258,879 | | |
| 1,500,000 | | WISCONSIN ST HLTH & EDUCTNL FACS AUTH REVENUE | | 4/1/2057 | | 5.13 | | 1,500,000 | | 1,156,005 | | |
| | | | | | | 13,446,204 | | 10,794,750 | | 1.54% |
| | | Sub-total Municipal Bonds: | | | | 701,339,216 | | 648,807,447 | | 92.63% |
| Short-Term Investments: | | | | | | | | | | |
| 20,108,356 | | NORTHERN INSTITUTIONAL FUNDS - U.S. GOVERNMENT SELECT PORTFOLIO, INSTITUTIONAL SHARES, 5.24%(r) | | 20,108,356 | | 20,108,356 | | |
| | | Sub-total Short-Term Investments: | | | | | | 20,108,356 | | 20,108,356 | | 2.87% |
| | | Grand total | | | | | | $ 751,806,495 | | 693,874,010 | | 99.06% |
| Notes to Schedule of Investments: |
| (a) | Investments are valued in accordance with procedures described in Note 2 to the financial statements. |
| (b) | Securities exempt from registration under Rule 144A of the Securities Act of 1933. These securities may be resold in transactions exempt from registration, normally to qualified institutional buyers. The value of these securities is determined by valuations supplied by a pricing service or brokers, or, if not available, in accordance with procedures established by the Board of Trustees of Clearwater Investment Trust. |
| (c) | Non-income producing assets. For long-term debt securities, item identified is in default as to payment of interest and/or principal. |
| (d) | Restricted security that has been deemed illiquid. At December 31, 2023, the value of these restricted illiquid securities amounted to $2,754,772 or 0.39% of net assets. Additional information on these restricted illiquid securities is as follows: |
| SECURITY | ACQUISITION DATE | ACQUISITION COST |
| ARIZONA ST INDL DEV AUTH ECON DEV REVENUE, 7.75%, 7/1/2030 - 7/1/2051 | 8/12/2020-6/4/2021 | $400,000 - 1,237,500 |
| CAPITAL TRUST AGY FL REVENUE, 6.75%, 12/1/2035 | 12/2/2015-1/21/2016 | 1,748,875 |
| CAPITAL TRUST AGY FL REVENUE, 6.75%, 7/1/2037 | 6/28/2017 | 750,000 |
| COLLIER CNTY FLA INDL DEV AUTH CONTINUING CARE CMNTY REV, 7.25%, 5/15/2026 | 12/16/2013 | 585,483 |
| See accompanying notes to financial statements. | 86 | (Continued) |
CLEARWATER INVESTMENT TRUST
Schedule of Investments - Clearwater Tax-Exempt Bond Fund
December 31, 2023
| SECURITY | ACQUISITION DATE | ACQUISITION COST |
| COLLIER CNTY FLA INDL DEV AUTH CONTINUING CARE CMNTY REV, 8.13%, 5/15/2044 | 6/27/2017-4/12/2018 | $1,531,071 |
| FRANKLIN TN HLTH & EDUCTNL FACS BRD REVENUE, 6.50%, 6/1/2027 | 5/24/2017 | 1,000,000 |
| LAKE CNTY OH PORT & ECON DEV AUTH LEASE REVENUE, 6.50%, 12/1/2037 | 10/27/2017 | 750,000 |
| PUBLIC FIN AUTH WI CONFERENCE CENTER & HOTEL REVENUE, 5.50%, 1/1/2046 - 1/1/2067 | 3/26/2018-3/8/2022 | 49 - 443,916 |
| PUBLIC FIN AUTH WI REVENUE, 6.25%, 11/1/2028 - 1/1/2033 | 4/3/2017-8/16/2018 | 988,170 - 1,250,000 |
| (e) | Security has converted to a fixed rate as of December 14, 2023, and will be going forward. |
| (f) | Variable or floating rate security. Rate as of December 31, 2023 is disclosed. |
| (g) | These securities are remarketed by an agent, and the rate at which these securities are set are determined by general market conditions and supply and demand. |
| (h) | For step bonds, the coupon rate disclosed is the current rate in effect. |
| (i) | Security has converted to a fixed rate as of September 1, 2007, and will be going forward. |
| (j) | Security has converted to a fixed rate as of December 16, 2022, and will be going forward. |
| (k) | Security has converted to a fixed rate as of April 24, 2023, and will be going forward. |
| (l) | Rate is determined by a remarketing agent which, in its judgment, on the basis of prevailing financial markets, will be the lowest interest rate necessary to enable the remarketing agent to sell the bonds at a price equal to 100% of the principal amount. |
| (m) | Zero coupon bond. |
| (n) | Security has converted to a fixed rate as of June 21, 2023, and will be going forward. |
| (o) | Security has converted to a fixed rate as of August 3, 2023, and will be going forward. |
| (p) | Security has converted to a fixed rate as of November 28, 2023, and will be going forward. |
| (q) | Security has converted to a fixed rate as of July 21, 2023, and will be going forward. |
| (r) | The short-term investment is a money market portfolio of the investment company, Northern Institutional Funds. At December 31, 2022, the value of the Clearwater Tax-Exempt Bond Fund's investment in the U.S. Government Select Portfolio of the Northern Institutional Funds was $11,705,149 with net purchases of $8,403,207 during the fiscal year ended December 31, 2023. |
Diversification of investments representing geographic diversification, as a percentage of total investments at fair value (excluding closed-end funds), is as follows:
| Geographical Diversification | | Percent |
| Florida | | 13.68% |
| Texas | | 8.67 |
| Illinois | | 7.37 |
| New York | | 6.19 |
| Utah | | 5.87 |
| California | | 5.21 |
| Michigan | | 3.89 |
| Ohio | | 3.72 |
| Colorado | | 3.62 |
| New Jersey | | 2.94 |
| Other | | 38.84 |
| | | 100.00% |
| See accompanying notes to financial statements. | 87 | (Continued) |
CLEARWATER INVESTMENT TRUST
Schedule of Investments - Clearwater Tax-Exempt Bond Fund
December 31, 2023
At December 31, 2023, the Tax-Exempt Bond Fund had open futures contracts as follows:
| Type | | Number of
Contracts | | Notional
Amount
(000s) | | Contract
Position | | Contract
Exp. | | Value and
Unrealized
Appreciation
(Depreciation)
(000s) |
| 10-Year U.S. Treasury Note | | 497 | | $(56,107) | | Short | | 3/24 | | $(1,896) |
| U.S. Treasury Long Bond | | 100 | | (12,494) | | Short | | 3/24 | | (943) |
| Ultra 10-Year U.S. Treasury Note | | 100 | | (11,802) | | Short | | 3/24 | | (471) |
| 2-Year U.S. Treasury Note | | 163 | | (33,564) | | Short | | 3/24 | | (349) |
| 5-Year U.S. Treasury Note | | 295 | | (32,088) | | Short | | 3/24 | | (743) |
| | | | | | | | | | | $(4,402) |
| See accompanying notes to financial statements. | 88 | (Continued) |
CLEARWATER INVESTMENT TRUST
Schedule of Investments - Clearwater Tax-Exempt Bond Fund
December 31, 2023
Clearwater Tax-Exempt Bond Fund Portfolio Diversification
(as a percentage of net assets)
| See accompanying notes to financial statements. | 89 | (Continued) |
CLEARWATER INVESTMENT TRUST
Schedule of Investments - Clearwater International Fund
December 31, 2023
| Shares | | Security | | Cost | | Fair value (a) | | Percent of
net assets |
| Common Stocks: | | | | | | |
| Australia: | | | | | | |
| 275,180 | | ADAIRS LTD.(b) | | $ 331,893 | | 339,414 | | |
| 10,590 | | ANZ GROUP HOLDINGS LTD. | | 95,677 | | 187,053 | | |
| 2,554 | | ASX LTD. | | 51,631 | | 109,751 | | |
| 40,983 | | ATLASSIAN CORP., CLASS A(c) | | 9,989,368 | | 9,748,216 | | |
| 445,000 | | BEACH ENERGY LTD. | | 647,241 | | 485,192 | | |
| 45,302 | | BHP GROUP LTD. | | 1,107,240 | | 1,556,210 | | |
| 49,300 | | BLUESCOPE STEEL LTD. | | 459,311 | | 786,134 | | |
| 17,400 | | BRAMBLES LTD. | | 64,294 | | 161,258 | | |
| 151,800 | | CEDAR WOODS PROPERTIES LTD. | | 545,697 | | 516,186 | | |
| 971 | | COCHLEAR LTD. | | 35,893 | | 197,626 | | |
| 11,330 | | COMMONWEALTH BANK OF AUSTRALIA | | 245,530 | | 863,189 | | |
| 9,576 | | CSL LTD. | | 226,091 | | 1,870,553 | | |
| 649,200 | | EMECO HOLDINGS LTD. | | 351,482 | | 296,406 | | |
| 97,180 | | FORTESCUE LTD. | | 212,026 | | 1,921,801 | | |
| 19,923 | | GOODMAN GROUP | | 57,689 | | 343,486 | | |
| 1,039,600 | | GRANGE RESOURCES LTD. | | 584,855 | | 329,423 | | |
| 208,100 | | HELIA GROUP LTD. | | 425,619 | | 616,872 | | |
| 88,434 | | HUB24 LTD. | | 1,304,410 | | 2,168,878 | | |
| 47,401 | | LENDLEASE CORP. LTD. | | 192,448 | | 241,292 | | |
| 7,819 | | MACQUARIE GROUP LTD. | | 175,414 | | 978,428 | | |
| 174,400 | | METCASH LTD. | | 556,523 | | 414,769 | | |
| 44,772 | | NATIONAL AUSTRALIA BANK LTD. | | 551,215 | | 936,653 | | |
| 403,300 | | NEW HOPE CORP. LTD.(b) | | 712,713 | | 1,418,117 | | |
| 64,600 | | NICK SCALI LTD. | | 464,540 | | 542,347 | | |
| 26,749 | | NORTHERN STAR RESOURCES LTD. | | 133,395 | | 248,814 | | |
| 281,600 | | OCEANAGOLD CORP. | | 576,630 | | 539,802 | | |
| 378,300 | | PACT GROUP HOLDINGS LTD.(c) | | 787,238 | | 220,413 | | |
| 166,000 | | QANTAS AIRWAYS LTD.(c) | | 569,833 | | 607,458 | | |
| 2,468 | | RAMSAY HEALTH CARE LTD. | | 49,765 | | 88,481 | | |
| 18,171 | | RIO TINTO LTD. | | 570,958 | | 1,679,827 | | |
| 20,500 | | SANTOS LTD. | | 45,732 | | 106,170 | | |
| 5,884 | | SEEK LTD. | | 49,598 | | 107,178 | | |
| 39,820 | | SONIC HEALTHCARE LTD. | | 470,951 | | 870,502 | | |
| 57,859 | | SOUTH32 LTD. | | 37,235 | | 131,295 | | |
| 469,503 | | STEADFAST GROUP LTD. | | 1,876,070 | | 1,862,067 | | |
| 297,819 | | STOCKLAND | | 734,663 | | 903,122 | | |
| 75,800 | | SUPER RETAIL GROUP LTD. | | 517,213 | | 814,582 | | |
| 13,099 | | TRANSURBAN GROUP | | 36,728 | | 122,380 | | |
| 12,261 | | TREASURY WINE ESTATES LTD. | | 49,081 | | 90,070 | | |
| 462,400 | | VICINITY LTD. | | 579,585 | | 642,809 | | |
| 10,565 | | WASHINGTON H SOUL PATTINSON & CO. LTD. | | 183,547 | | 235,928 | | |
| 8,635 | | WESFARMERS LTD. | | 249,487 | | 335,642 | | |
| 11,122 | | WOODSIDE ENERGY GROUP LTD. | | 204,237 | | 235,406 | | |
| | | | | 27,110,746 | | 36,871,200 | | 3.63% |
| Austria: | | | | | | |
| 18,200 | | BAWAG GROUP A.G.(c)(d) | | 714,959 | | 964,009 | | |
| 1,727 | | ERSTE GROUP BANK A.G. | | 28,884 | | 70,027 | | |
| 14,475 | | EUROTELESITES A.G.(c) | | 59,356 | | 58,006 | | |
| 3,577 | | OMV A.G. | | 129,822 | | 157,045 | | |
| 313 | | STRABAG S.E.(c) | | 5,505 | | 14,305 | | |
| 57,900 | | TELEKOM AUSTRIA A.G.(c) | | 363,157 | | 488,978 | | |
| 21,794 | | VIENNA INSURANCE GROUP A.G. WIENER VERSICHERUNG GRUPPE | | 595,919 | | 637,577 | | |
| 23,500 | | WIENERBERGER A.G. | | 561,499 | | 783,992 | | |
| | | | | 2,459,101 | | 3,173,939 | | 0.31% |
| Belgium: | | | | | | |
| 7,120 | | AGEAS S.A./N.V. | | 106,908 | | 308,982 | | |
| 42,700 | | BPOST S.A. | | 321,554 | | 219,855 | | |
| 16,207 | | D'IETEREN GROUP | | 2,488,037 | | 3,165,045 | | |
| 102,700 | | ECONOCOM GROUP S.A./N.V. | | 381,201 | | 291,375 | | |
| 38,644 | | GROUPE BRUXELLES LAMBERT N.V. | | 3,321,966 | | 3,038,320 | | |
| 3,413 | | KBC GROUP N.V. | | 77,680 | | 221,244 | | |
| 10,200 | | TESSENDERLO GROUP S.A. | | 441,457 | | 318,103 | | |
| 2,245 | | UCB S.A. | | 107,034 | | 195,543 | | |
| See accompanying notes to financial statements. | 90 | (Continued) |
CLEARWATER INVESTMENT TRUST
Schedule of Investments - Clearwater International Fund
December 31, 2023
| Shares | | Security | | Cost | | Fair value (a) | | Percent of
net assets |
| Belgium (Cont'd): | | | | | | |
| 4,564 | | WAREHOUSES DE PAUW CVA | | $ 120,972 | | 143,595 | | |
| | | | | 7,366,809 | | 7,902,062 | | 0.78% |
| Brazil: | | | | | | |
| 129,000 | | CAMIL ALIMENTOS S.A.(c) | | 274,164 | | 223,742 | | |
| 171,378 | | CI&T, INC., CLASS A(c) | | 2,244,853 | | 901,448 | | |
| 353,300 | | GPS PARTICIPACOES E EMPREENDIMENTOS S.A.(d) | | 1,332,837 | | 1,366,393 | | |
| 801,308 | | GRUPO SBF S.A. | | 2,298,374 | | 1,925,116 | | |
| 235,400 | | ODONTOPREV S.A. | | 566,205 | | 562,906 | | |
| 110,654 | | TELEFONICA BRASIL S.A. ADR(e) | | 1,073,674 | | 1,210,555 | | |
| 497,059 | | VAMOS LOCACAO DE CAMINHOES MAQUINAS E EQUIPAMENTOS S.A. | | 1,450,382 | | 1,024,553 | | |
| 106,600 | | VIBRA ENERGIA S.A.(c) | | 500,792 | | 498,423 | | |
| | | | | 9,741,281 | | 7,713,136 | | 0.76% |
| Canada: | | | | | | |
| 3,840 | | AGNICO EAGLE MINES LTD. | | 146,646 | | 210,624 | | |
| 109,091 | | ALIMENTATION COUCHE-TARD, INC. | | 3,155,681 | | 6,424,188 | | |
| 7,866 | | ALTAGAS LTD. | | 135,598 | | 165,150 | | |
| 57,800 | | ARTIS REAL ESTATE INVESTMENT TRUST | | 534,679 | | 289,207 | | |
| 163,600 | | B2GOLD CORP. | | 818,860 | | 517,327 | | |
| 785 | | BANK OF MONTREAL | | 34,168 | | 77,668 | | |
| 2,936 | | BANK OF NOVA SCOTIA (THE) | | 67,574 | | 142,954 | | |
| 12,636 | | BROOKFIELD CORP. | | 405,931 | | 506,956 | | |
| 11,000 | | BRP, INC. (SUB VOTING) | | 430,510 | | 787,155 | | |
| 4,325 | | CAE, INC.(c) | | 68,280 | | 93,377 | | |
| 25,292 | | CANADIAN IMPERIAL BANK OF COMMERCE | | 945,298 | | 1,217,788 | | |
| 4,615 | | CANADIAN NATURAL RESOURCES LTD. | | 252,893 | | 302,375 | | |
| 66,608 | | CANADIAN NATURAL RESOURCES LTD. (TORONTO EXCHANGE) | | 4,429,179 | | 4,363,790 | | |
| 155,521 | | CANADIAN PACIFIC KANSAS CITY LTD. | | 6,851,130 | | 12,295,490 | | |
| 9,100 | | CANADIAN TIRE CORP. LTD., CLASS A | | 967,543 | | 966,418 | | |
| 24,599 | | CARGOJET, INC. | | 1,977,581 | | 2,212,341 | | |
| 47,300 | | CASCADES, INC. | | 494,913 | | 454,420 | | |
| 13,725 | | CCL INDUSTRIES, INC., CLASS B | | 551,253 | | 617,239 | | |
| 102,961 | | CELESTICA, INC.(c) | | 2,555,820 | | 3,014,698 | | |
| 42,208 | | CENOVUS ENERGY, INC. | | 703,458 | | 702,763 | | |
| 4,854 | | CGI, INC.(c) | | 385,356 | | 520,397 | | |
| 57,700 | | CI FINANCIAL CORP. | | 896,767 | | 647,087 | | |
| 307 | | CONSTELLATION SOFTWARE, INC. | | 271,176 | | 761,162 | | |
| 18,415 | | DESCARTES SYSTEMS GROUP (THE), INC.(c) | | 710,356 | | 1,547,219 | | |
| 6,582 | | DOLLARAMA, INC. | | 86,132 | | 474,333 | | |
| 14,353 | | ENBRIDGE, INC. | | 514,690 | | 516,995 | | |
| 72,100 | | ENERPLUS CORP. | | 414,689 | | 1,105,129 | | |
| 54,522 | | EXCHANGE INCOME CORP. | | 2,177,878 | | 1,855,735 | | |
| 332 | | FAIRFAX FINANCIAL HOLDINGS LTD. | | 109,228 | | 306,308 | | |
| 317 | | FIRSTSERVICE CORP. | | 37,450 | | 51,352 | | |
| 19,500 | | IA FINANCIAL CORP., INC. | | 882,358 | | 1,329,335 | | |
| 3,196 | | IMPERIAL OIL LTD. | | 141,353 | | 182,779 | | |
| 415 | | INTACT FINANCIAL CORP. | | 33,776 | | 63,848 | | |
| 1,100 | | INTERNATIONAL PETROLEUM CORP.(c) | | 2,833 | | 13,240 | | |
| 42,876 | | KINROSS GOLD CORP. | | 152,204 | | 259,400 | | |
| 2,635 | | LOBLAW COS. LTD. | | 101,823 | | 255,098 | | |
| 921 | | LUMINE GROUP, INC.(c) | | 9,604 | | 20,783 | | |
| 7,954 | | MAGNA INTERNATIONAL, INC. | | 389,994 | | 469,922 | | |
| 14,440 | | MANULIFE FINANCIAL CORP. | | 232,014 | | 319,124 | | |
| 3,000 | | METRO, INC. | | 54,328 | | 155,292 | | |
| 73,700 | | MULLEN GROUP LTD. | | 791,421 | | 780,912 | | |
| 19,328 | | NATIONAL BANK OF CANADA | | 618,005 | | 1,473,249 | | |
| 20,020 | | NORTHLAND POWER, INC. | | 322,864 | | 363,670 | | |
| 10,766 | | ONEX CORP. | | 493,620 | | 751,804 | | |
| 7,493 | | OPEN TEXT CORP. | | 205,449 | | 314,856 | | |
| 7,809 | | PARKLAND CORP. | | 166,853 | | 251,706 | | |
| 23,037 | | PEMBINA PIPELINE CORP. | | 732,001 | | 792,934 | | |
| 49,000 | | PIZZA PIZZA ROYALTY CORP. | | 343,236 | | 544,342 | | |
| 2,253 | | POWER CORP. OF CANADA | | 51,403 | | 64,425 | | |
| 148,802 | | PRAIRIESKY ROYALTY LTD. | | 2,406,917 | | 2,605,341 | | |
| 41,090 | | QUEBECOR, INC., CLASS B | | 926,060 | | 977,440 | | |
| 3,916 | | RESTAURANT BRANDS INTERNATIONAL, INC. | | 219,594 | | 305,957 | | |
| See accompanying notes to financial statements. | 91 | (Continued) |
CLEARWATER INVESTMENT TRUST
Schedule of Investments - Clearwater International Fund
December 31, 2023
| Shares | | Security | | Cost | | Fair value (a) | | Percent of
net assets |
| Canada (Cont'd): | | | | | | |
| 32,980 | | RIOCAN REAL ESTATE INVESTMENT TRUST | | $ 459,381 | | 463,445 | | |
| 3,754 | | ROGERS COMMUNICATIONS, INC., CLASS B | | 149,916 | | 175,725 | | |
| 3,338 | | ROYAL BANK OF CANADA | | 337,599 | | 337,572 | | |
| 16,691 | | SHOPIFY, INC., CLASS A(c) | | 464,706 | | 1,300,229 | | |
| 10,500 | | STELCO HOLDINGS, INC. | | 316,173 | | 397,717 | | |
| 126,363 | | SUNCOR ENERGY, INC. | | 2,605,067 | | 4,048,232 | | |
| 4,531 | | TC ENERGY CORP. | | 158,244 | | 177,117 | | |
| 9,096 | | TELUS CORP. | | 177,914 | | 161,868 | | |
| 1,358 | | TFI INTERNATIONAL, INC. | | 127,516 | | 184,722 | | |
| 37,221 | | THOMSON REUTERS CORP. | | 4,124,408 | | 5,441,926 | | |
| 1,036 | | THOMSON REUTERS CORP. (NEW YORK EXCHANGE) | | 108,812 | | 151,484 | | |
| 3,802 | | TOURMALINE OIL CORP. | | 171,069 | | 170,983 | | |
| 416 | | TRISURA GROUP LTD.(c) | | 490 | | 10,674 | | |
| 31,500 | | WAJAX CORP. | | 462,770 | | 719,599 | | |
| 34,100 | | WASTE CONNECTIONS, INC. | | 4,863,881 | | 5,090,107 | | |
| 7,242 | | WHEATON PRECIOUS METALS CORP. | | 227,571 | | 357,320 | | |
| 1,466 | | WSP GLOBAL, INC. | | 166,444 | | 205,498 | | |
| | | | | 55,330,388 | | 74,837,320 | | 7.37% |
| Chile: | | | | | | |
| 318,400 | | CENCOSUD S.A. | | 432,618 | | 598,123 | | |
| 198,200 | | VINA CONCHA Y TORO S.A. | | 327,546 | | 233,428 | | |
| | | | | 760,164 | | 831,551 | | 0.08% |
| China: | | | | | | |
| 654,000 | | 3SBIO, INC.(c)(d) | | 426,195 | | 629,837 | | |
| 470,676 | | ALIBABA GROUP HOLDING LTD. | | 7,732,305 | | 4,556,971 | | |
| 362,762 | | ANHUI CONCH CEMENT CO. LTD., CLASS H | | 1,917,989 | | 838,090 | | |
| 1,147,000 | | AVICHINA INDUSTRY & TECHNOLOGY CO. LTD., CLASS H | | 523,500 | | 492,086 | | |
| 656,000 | | CHINA BLUECHEMICAL LTD., CLASS H | | 177,444 | | 165,502 | | |
| 1,191,000 | | CHINA SUNTIEN GREEN ENERGY CORP. LTD., CLASS H | | 329,834 | | 433,174 | | |
| 267,500 | | HENGAN INTERNATIONAL GROUP CO. LTD. | | 1,790,483 | | 995,181 | | |
| 246,574 | | HUALI INDUSTRIAL GROUP CO. LTD., CLASS A | | 1,665,371 | | 1,821,540 | | |
| 1,015,500 | | LI NING CO. LTD. | | 2,788,123 | | 2,718,057 | | |
| 187,500 | | NETDRAGON WEBSOFT HOLDINGS LTD. | | 425,716 | | 297,272 | | |
| 289,500 | | SINOTRUK HONG KONG LTD. | | 559,233 | | 567,989 | | |
| 57,200 | | TRIP.COM GROUP LTD.(c) | | 1,173,491 | | 2,033,517 | | |
| 412,000 | | ZHEJIANG EXPRESSWAY CO. LTD., CLASS H | | 352,185 | | 274,895 | | |
| | | | | 19,861,869 | | 15,824,111 | | 1.56% |
| Czech Republic: | | | | | | |
| 516 | | PHILIP MORRIS CR A.S. | | 296,125 | | 360,401 | | |
| | | | | 296,125 | | 360,401 | | 0.03% |
| Denmark: | | | | | | |
| 113,555 | | ALK-ABELLO A/S(c) | | 1,539,811 | | 1,701,803 | | |
| 44 | | AP MOLLER - MAERSK A/S, CLASS A | | 35,560 | | 78,061 | | |
| 65 | | AP MOLLER - MAERSK A/S, CLASS B | | 52,319 | | 116,857 | | |
| 1,300 | | CARLSBERG A/S, CLASS B | | 50,752 | | 163,022 | | |
| 2,288 | | COLOPLAST A/S, CLASS B | | 117,799 | | 261,575 | | |
| 22,200 | | D/S NORDEN A/S | | 318,702 | | 1,055,311 | | |
| 12,005 | | DANSKE BANK A/S | | 141,793 | | 320,716 | | |
| 3,896 | | DEMANT A/S(c) | | 70,444 | | 170,779 | | |
| 2,447 | | DSV A/S | | 121,246 | | 429,594 | | |
| 2,834 | | GENMAB A/S(c) | | 904,871 | | 904,419 | | |
| 27,000 | | MATAS A/S | | 379,536 | | 461,415 | | |
| 1,918 | | NOVO NORDISK A/S ADR(e) | | 108,060 | | 198,417 | | |
| 138,123 | | NOVO NORDISK A/S, CLASS B | | 8,331,300 | | 14,279,276 | | |
| 2,460 | | NOVOZYMES A/S, CLASS B | | 38,505 | | 135,191 | | |
| 2,802 | | PANDORA A/S | | 27,668 | | 387,227 | | |
| 12,200 | | PER AARSLEFF HOLDING A/S | | 552,758 | | 582,656 | | |
| 245 | | ROCKWOOL A/S, CLASS B | | 37,155 | | 71,693 | | |
| 6,562 | | SOLAR A/S, CLASS B | | 419,879 | | 451,868 | | |
| 40,800 | | SPAR NORD BANK A/S | | 620,981 | | 644,080 | | |
| 3,250 | | TOPDANMARK A/S | | 33,362 | | 155,168 | | |
| 16,220 | | VESTAS WIND SYSTEMS A/S(c) | | 150,564 | | 514,749 | | |
| | | | | 14,053,065 | | 23,083,877 | | 2.27% |
| Egypt: | | | | | | |
| 159,800 | | ABOU KIR FERTILIZERS & CHEMICAL INDUSTRIES | | 416,951 | | 430,644 | | |
| See accompanying notes to financial statements. | 92 | (Continued) |
CLEARWATER INVESTMENT TRUST
Schedule of Investments - Clearwater International Fund
December 31, 2023
| Shares | | Security | | Cost | | Fair value (a) | | Percent of
net assets |
| Egypt (Cont'd): | | | | | | |
| 323,300 | | EASTERN CO. S.A.E. | | $ 244,707 | | 293,388 | | |
| | | | | 661,658 | | 724,032 | | 0.07% |
| Finland: | | | | | | |
| 9,600 | | CARGOTEC OYJ, CLASS B | | 522,724 | | 558,510 | | |
| 27,200 | | KEMIRA OYJ | | 447,150 | | 504,161 | | |
| 5,584 | | KESKO OYJ, CLASS B | | 30,705 | | 110,498 | | |
| 3,256 | | KONE OYJ, CLASS B | | 35,674 | | 162,326 | | |
| 23,500 | | KONECRANES OYJ | | 864,459 | | 1,057,949 | | |
| 21,225 | | NESTE OYJ | | 67,704 | | 754,724 | | |
| 356,640 | | NOKIA OYJ | | 1,440,460 | | 1,201,611 | | |
| 650,241 | | NOKIA OYJ ADR(e) | | 2,827,006 | | 2,223,824 | | |
| 46,541 | | NORDEA BANK ABP | | 419,121 | | 575,507 | | |
| 1,960 | | ORION OYJ, CLASS B | | 49,561 | | 84,970 | | |
| 15,829 | | STORA ENSO OYJ (REGISTERED) | | 75,698 | | 218,867 | | |
| 11,934 | | UPM-KYMMENE OYJ | | 99,929 | | 448,725 | | |
| 38,449 | | VALMET OYJ | | 999,027 | | 1,108,259 | | |
| | | | | 7,879,218 | | 9,009,931 | | 0.89% |
| France: | | | | | | |
| 4,611 | | AIR LIQUIDE S.A. | | 539,629 | | 896,506 | | |
| 10,358 | | AIRBUS S.E. | | 325,383 | | 1,598,344 | | |
| 14,341 | | ALTEN S.A. | | 2,053,881 | | 2,130,953 | | |
| 4,199 | | ARKEMA S.A. | | 378,617 | | 477,455 | | |
| 21,399 | | AXA S.A. | | 257,534 | | 696,655 | | |
| 15,160 | | BNP PARIBAS S.A. | | 712,479 | | 1,047,499 | | |
| 23,266 | | CAPGEMINI S.E. | | 3,625,198 | | 4,847,950 | | |
| 9,832 | | CARREFOUR S.A. | | 151,251 | | 179,797 | | |
| 17,497 | | CIE DE SAINT-GOBAIN | | 382,786 | | 1,287,592 | | |
| 8,124 | | CIE GENERALE DES ETABLISSEMENTS MICHELIN S.C.A. | | 78,557 | | 291,117 | | |
| 37,390 | | COFACE S.A. | | 449,179 | | 488,716 | | |
| 12,299 | | COVIVIO S.A. | | 523,586 | | 660,952 | | |
| 43,315 | | CREDIT AGRICOLE S.A. | | 349,095 | | 614,552 | | |
| 181,899 | | DANONE S.A. | | 11,232,535 | | 11,783,379 | | |
| 4,893 | | DASSAULT SYSTEMES S.E. | | 167,866 | | 238,941 | | |
| 3,422 | | EDENRED | | 102,446 | | 204,526 | | |
| 26,507 | | ENGIE S.A. | | 331,812 | | 465,799 | | |
| 591 | | ESSILORLUXOTTICA S.A. | | 53,785 | | 118,273 | | |
| 2,068 | | ESSILORLUXOTTICA S.A. (EURONEXT PARIS EXCHANGE) | | 286,293 | | 414,587 | | |
| 2,901 | | EURAZEO S.E. | | 76,265 | | 230,104 | | |
| 17,295 | | GAZTRANSPORT ET TECHNIGAZ S.A. | | 2,150,908 | | 2,289,229 | | |
| 9,197 | | GETLINK S.E. | | 70,409 | | 168,185 | | |
| 376 | | HERMES INTERNATIONAL | | 464,612 | | 796,466 | | |
| 3,399 | | INFOTEL S.A. | | 145,404 | | 198,873 | | |
| 8,900 | | IPSEN S.A. | | 736,413 | | 1,060,134 | | |
| 9,500 | | KAUFMAN & BROAD S.A. | | 362,957 | | 315,675 | | |
| 1,026 | | KERING S.A. | | 174,510 | | 451,928 | | |
| 671 | | KLEPIERRE S.A.(c) | | 8,398 | | 18,282 | | |
| 4,848 | | LEGRAND S.A. | | 109,851 | | 503,618 | | |
| 18,023 | | L'OREAL S.A. | | 5,629,103 | | 8,966,354 | | |
| 11,162 | | LVMH MOET HENNESSY LOUIS VUITTON S.E. | | 1,461,688 | | 9,039,632 | | |
| 58,600 | | MERCIALYS S.A. | | 617,151 | | 643,357 | | |
| 14,296 | | MERSEN S.A. | | 465,081 | | 555,529 | | |
| 14,900 | | NEXITY S.A. | | 742,412 | | 277,163 | | |
| 25,890 | | ORANGE S.A. ADR(e) | | 251,572 | | 295,923 | | |
| 2,734 | | PERNOD RICARD S.A. | | 171,347 | | 482,157 | | |
| 3,242 | | PUBLICIS GROUPE S.A. | | 158,840 | | 300,637 | | |
| 2,858 | | RENAULT S.A. | | 56,206 | | 116,439 | | |
| 37,800 | | REXEL S.A. | | 752,778 | | 1,033,635 | | |
| 77,079 | | SAFRAN S.A. | | 10,523,325 | | 13,568,669 | | |
| 11,014 | | SANOFI S.A. ADR(e) | | 429,868 | | 547,726 | | |
| 278 | | SCHNEIDER ELECTRIC S.E. | | 8,838 | | 55,938 | | |
| 29,705 | | SCHNEIDER ELECTRIC S.E. (EURONEXT PARIS EXCHANGE) | | 3,234,006 | | 5,961,082 | | |
| 14,443 | | SOCIETE GENERALE S.A. | | 201,715 | | 383,063 | | |
| 4,900 | | SOCIETE POUR L'INFORMATIQUE INDUSTRIELLE | | 168,159 | | 377,573 | | |
| 7,150 | | SODEXO S.A.(c) | | 647,363 | | 786,325 | | |
| 4,719 | | SODEXO S.A.(c) | | 415,153 | | 518,974 | | |
| 42,944 | | SODEXO S.A. (EURONEXT PARIS EXCHANGE) | | 3,698,178 | | 4,722,788 | | |
| See accompanying notes to financial statements. | 93 | (Continued) |
CLEARWATER INVESTMENT TRUST
Schedule of Investments - Clearwater International Fund
December 31, 2023
| Shares | | Security | | Cost | | Fair value (a) | | Percent of
net assets |
| France (Cont'd): | | | | | | |
| 9,709 | | SOITEC(c) | | $ 835,838 | | 1,734,213 | | |
| 51,800 | | TELEVISION FRANCAISE 1 | | 458,222 | | 408,012 | | |
| 1,413 | | THALES S.A. | | 81,763 | | 208,946 | | |
| 35,335 | | TOTALENERGIES S.E. ADR(e) | | 1,732,392 | | 2,380,872 | | |
| 13,514 | | VEOLIA ENVIRONNEMENT S.A. | | 143,775 | | 426,080 | | |
| 10,500 | | VICAT S.A. | | 406,419 | | 380,780 | | |
| 7,810 | | VINCI S.A. | | 316,569 | | 980,304 | | |
| 22,858 | | VIVENDI S.E. | | 196,031 | | 244,165 | | |
| | | | | 60,105,431 | | 89,872,423 | | 8.85% |
| Georgia: | | | | | | |
| 11,300 | | TBC BANK GROUP PLC | | 401,480 | | 407,620 | | |
| | | | | 401,480 | | 407,620 | | 0.04% |
| Germany: | | | | | | |
| 18,537 | | ADIDAS A.G. | | 1,875,103 | | 3,768,636 | | |
| 7,853 | | ALLIANZ S.E. (REGISTERED) | | 680,763 | | 2,097,542 | | |
| 6,098 | | AURUBIS A.G. | | 286,000 | | 499,910 | | |
| 9,733 | | BASF S.E. | | 392,845 | | 524,129 | | |
| 66,638 | | BAYER A.G. (REGISTERED) | | 3,791,039 | | 2,473,992 | | |
| 3,104 | | BAYERISCHE MOTOREN WERKE A.G. | | 225,884 | | 345,339 | | |
| 828 | | BEIERSDORF A.G. | | 35,556 | | 124,039 | | |
| 7,674 | | BRENNTAG S.E. | | 528,393 | | 705,016 | | |
| 3,380 | | COVESTRO A.G.(c)(d) | | 99,223 | | 196,567 | | |
| 35,100 | | CROPENERGIES A.G. | | 435,527 | | 445,609 | | |
| 5,205 | | DAIMLER TRUCK HOLDING A.G. | | 126,102 | | 195,481 | | |
| 14,087 | | DEUTSCHE BANK A.G. (REGISTERED) | | 136,469 | | 192,277 | | |
| 4,525 | | DEUTSCHE BOERSE A.G. | | 273,152 | | 931,637 | | |
| 22,387 | | DEUTSCHE LUFTHANSA A.G. (REGISTERED)(c) | | 128,838 | | 198,899 | | |
| 54,300 | | DEUTSCHE PFANDBRIEFBANK A.G.(b)(d) | | 673,490 | | 371,356 | | |
| 17,828 | | DEUTSCHE POST A.G. | | 210,542 | | 882,801 | | |
| 44,230 | | DEUTSCHE TELEKOM A.G. (REGISTERED) | | 728,220 | | 1,062,003 | | |
| 80,415 | | EVOTEC S.E.(c) | | 1,837,518 | | 1,889,114 | | |
| 23,600 | | FREENET A.G. | | 557,311 | | 660,189 | | |
| 49,183 | | FRESENIUS MEDICAL CARE A.G. | | 3,285,510 | | 2,061,060 | | |
| 6,137 | | FRESENIUS S.E. & CO. KGAA | | 142,558 | | 190,173 | | |
| 2,246 | | HANNOVER RUECK S.E. | | 94,321 | | 536,310 | | |
| 4,440 | | HEIDELBERG MATERIALS A.G. | | 183,098 | | 396,730 | | |
| 20,563 | | INFINEON TECHNOLOGIES A.G. | | 112,405 | | 858,080 | | |
| 6,898 | | JOST WERKE S.E.(d) | | 220,853 | | 336,585 | | |
| 1,916 | | KION GROUP A.G. | | 36,282 | | 81,793 | | |
| 8,791 | | MERCEDES-BENZ GROUP A.G. | | 481,778 | | 607,037 | | |
| 2,159 | | MERCK KGAA | | 96,589 | | 343,452 | | |
| 904 | | MTU AERO ENGINES A.G. | | 139,764 | | 194,854 | | |
| 3,091 | | MUENCHENER RUECKVERSICHERUNGS-GESELLSCHAFT A.G. IN MUENCHEN (REGISTERED) | | 382,823 | | 1,279,957 | | |
| 6,900 | | PUBLITY A.G.(b)(c) | | 253,482 | | 132,540 | | |
| 39,372 | | PUMA S.E. | | 1,826,316 | | 2,195,838 | | |
| 662 | | RHEINMETALL A.G. | | 105,250 | | 209,744 | | |
| 3,230 | | RWE A.G. | | 68,611 | | 146,838 | | |
| 5,716 | | SAP S.E. | | 742,068 | | 880,144 | | |
| 1,116 | | SAP S.E. ADR(e) | | 104,801 | | 172,522 | | |
| 66,355 | | SCHOTT PHARMA A.G. & CO. KGAA(c) | | 2,042,649 | | 2,461,287 | | |
| 48,294 | | SCOUT24 S.E.(d) | | 3,082,535 | | 3,420,637 | | |
| 12,193 | | SIEMENS A.G. (REGISTERED) | | 724,684 | | 2,287,202 | | |
| 17,300 | | UNITED INTERNET A.G. (REGISTERED) | | 656,976 | | 440,026 | | |
| 404 | | VOLKSWAGEN A.G. | | 40,235 | | 52,828 | | |
| | | | | 27,845,563 | | 36,850,173 | | 3.63% |
| Greece: | | | | | | |
| 6,746 | | HELLENIC TELECOMMUNICATIONS ORGANIZATION S.A. | | 54,075 | | 96,070 | | |
| | | | | 54,075 | | 96,070 | | 0.01% |
| Hong Kong: | | | | | | |
| 220,400 | | AIA GROUP LTD. | | 733,244 | | 1,920,756 | | |
| 46,000 | | BOC HONG KONG HOLDINGS LTD. | | 63,016 | | 124,890 | | |
| 408,000 | | CHINA MEDICAL SYSTEM HOLDINGS LTD. | | 472,941 | | 723,150 | | |
| 1,462,000 | | CITIC TELECOM INTERNATIONAL HOLDINGS LTD. | | 547,331 | | 614,120 | | |
| 48,544 | | CK ASSET HOLDINGS LTD. | | 130,843 | | 243,699 | | |
| 2,000 | | CLP HOLDINGS LTD. | | 13,542 | | 16,508 | | |
| See accompanying notes to financial statements. | 94 | (Continued) |
CLEARWATER INVESTMENT TRUST
Schedule of Investments - Clearwater International Fund
December 31, 2023
| Shares | | Security | | Cost | | Fair value (a) | | Percent of
net assets |
| Hong Kong (Cont'd): | | | | | | |
| 998,000 | | FIRST PACIFIC CO. LTD. | | $ 376,906 | | 397,487 | | |
| 18,000 | | GALAXY ENTERTAINMENT GROUP LTD. | | 39,054 | | 100,852 | | |
| 608,500 | | GRAND PHARMACEUTICAL GROUP LTD. | | 389,449 | | 318,725 | | |
| 25,331 | | HENDERSON LAND DEVELOPMENT CO. LTD. | | 45,544 | | 78,019 | | |
| 11,800 | | HONG KONG EXCHANGES & CLEARING LTD. | | 203,281 | | 404,995 | | |
| 134,000 | | KINGBOARD HOLDINGS LTD. | | 630,206 | | 320,563 | | |
| 40,500 | | LINK REIT | | 84,196 | | 227,435 | | |
| 16,500 | | MTR CORP. LTD. | | 38,268 | | 64,026 | | |
| 388,000 | | PAX GLOBAL TECHNOLOGY LTD. | | 368,074 | | 300,621 | | |
| 2,786,000 | | SINOFERT HOLDINGS LTD.(c) | | 377,076 | | 324,680 | | |
| 1,024,000 | | SSY GROUP LTD. | | 465,746 | | 647,827 | | |
| 49,500 | | SWIRE PACIFIC LTD., CLASS A | | 316,208 | | 419,024 | | |
| 7,000 | | TECHTRONIC INDUSTRIES CO. LTD. | | 44,938 | | 83,415 | | |
| 600,000 | | UNITED LABORATORIES INTERNATIONAL HOLDINGS (THE) LTD. | | 352,686 | | 538,644 | | |
| 469,800 | | VALUETRONICS HOLDINGS LTD. | | 216,550 | | 211,806 | | |
| 626,000 | | VSTECS HOLDINGS LTD. | | 568,356 | | 352,744 | | |
| 418,000 | | XINYI GLASS HOLDINGS LTD. | | 481,711 | | 468,935 | | |
| 358,000 | | YUEXIU TRANSPORT INFRASTRUCTURE LTD. | | 311,883 | | 194,852 | | |
| | | | | 7,271,049 | | 9,097,773 | | 0.90% |
| Hungary: | | | | | | |
| 67,212 | | WIZZ AIR HOLDINGS PLC(c)(d) | | 1,897,819 | | 1,894,203 | | |
| | | | | 1,897,819 | | 1,894,203 | | 0.19% |
| India: | | | | | | |
| 93,900 | | AMARA RAJA ENERGY & MOBILITY LTD. | | 730,323 | | 920,790 | | |
| 511,000 | | CESC LTD. | | 527,922 | | 813,658 | | |
| 266,600 | | FIRSTSOURCE SOLUTIONS LTD. | | 267,193 | | 592,222 | | |
| 295,800 | | GUJARAT STATE FERTILIZERS & CHEMICALS LTD. | | 528,092 | | 858,105 | | |
| 478,371 | | HCL TECHNOLOGIES LTD. | | 4,024,070 | | 8,428,171 | | |
| 241,084 | | ICICI BANK LTD. ADR(e) | | 5,388,431 | | 5,747,442 | | |
| 361,262 | | INDUS TOWERS LTD.(c) | | 1,198,293 | | 864,150 | | |
| 20,200 | | JUBILANT PHARMOVA LTD. | | 134,435 | | 132,407 | | |
| 142,600 | | KARNATAKA BANK (THE) LTD. | | 387,774 | | 401,082 | | |
| 52,500 | | LG BALAKRISHNAN & BROS. LTD. | | 457,964 | | 793,837 | | |
| 108,100 | | LIC HOUSING FINANCE LTD. | | 554,741 | | 696,428 | | |
| 44,300 | | MAHARASHTRA SEAMLESS LTD. | | 407,595 | | 492,623 | | |
| 345,400 | | MARKSANS PHARMA LTD. | | 218,954 | | 668,687 | | |
| 451,872 | | MUTHOOT MICROFIN LTD.(c) | | 1,575,748 | | 1,363,809 | | |
| 342,300 | | NAVA LTD. | | 535,317 | | 1,802,743 | | |
| 454,600 | | NMDC LTD. | | 552,018 | | 1,145,326 | | |
| 454,600 | | NMDC STEEL LTD.(c) | | 218,274 | | 280,800 | | |
| 182,100 | | OIL INDIA LTD. | | 563,046 | | 814,391 | | |
| 199,800 | | PETRONET LNG LTD. | | 538,925 | | 534,593 | | |
| 460,200 | | REDINGTON LTD. | | 919,384 | | 977,763 | | |
| 164,578 | | UPL LTD. | | 1,497,243 | | 1,161,448 | | |
| | | | | 21,225,742 | | 29,490,475 | | 2.90% |
| Indonesia: | | | | | | |
| 4,097,000 | | ADARO ENERGY INDONESIA TBK PT | | 470,816 | | 633,296 | | |
| 8,194,900 | | ERAJAYA SWASEMBADA TBK PT | | 345,258 | | 226,734 | | |
| 1,094,700 | | INDOFOOD SUKSES MAKMUR TBK PT | | 488,225 | | 458,584 | | |
| 1,324,000 | | MATAHARI DEPARTMENT STORE TBK PT | | 151,981 | | 171,982 | | |
| | | | | 1,456,280 | | 1,490,596 | | 0.15% |
| Ireland: | | | | | | |
| 15,389 | | ACCENTURE PLC, CLASS A | | 1,757,998 | | 5,400,154 | | |
| 1,876 | | AERCAP HOLDINGS N.V.(c) | | 87,898 | | 139,424 | | |
| 90,100 | | DALATA HOTEL GROUP PLC | | 399,713 | | 459,532 | | |
| 3,568 | | DCC PLC | | 188,706 | | 262,781 | | |
| 139,342 | | EXPERIAN PLC | | 2,536,011 | | 5,687,146 | | |
| 2,158 | | FLUTTER ENTERTAINMENT PLC - CDI(c) | | 240,212 | | 381,172 | | |
| 35,712 | | ICON PLC(c) | | 6,358,868 | | 10,108,996 | | |
| 920 | | KERRY GROUP PLC, CLASS A | | 50,283 | | 79,890 | | |
| 17,539 | | RYANAIR HOLDINGS PLC(c) | | 235,787 | | 369,333 | | |
| | | | | 11,855,476 | | 22,888,428 | | 2.25% |
| Israel: | | | | | | |
| 48,641 | | BANK HAPOALIM B.M. | | 229,967 | | 435,841 | | |
| See accompanying notes to financial statements. | 95 | (Continued) |
CLEARWATER INVESTMENT TRUST
Schedule of Investments - Clearwater International Fund
December 31, 2023
| Shares | | Security | | Cost | | Fair value (a) | | Percent of
net assets |
| Israel (Cont'd): | | | | | | |
| 35,900 | | HAREL INSURANCE INVESTMENTS & FINANCIAL SERVICES LTD. | | $ 422,925 | | 280,994 | | |
| 115,300 | | ICL GROUP LTD. | | 461,518 | | 580,303 | | |
| 29,044 | | MIZRAHI TEFAHOT BANK LTD. | | 475,042 | | 1,122,811 | | |
| 5,800 | | RAMI LEVY CHAIN STORES HASHIKMA MARKETING 2006 LTD. | | 397,897 | | 322,743 | | |
| | | | | 1,987,349 | | 2,742,692 | | 0.27% |
| Italy: | | | | | | |
| 416,800 | | A2A S.P.A. | | 806,512 | | 855,375 | | |
| 42,000 | | BANCA IFIS S.P.A. | | 804,497 | | 727,945 | | |
| 25,272 | | BANCA MEDIOLANUM S.P.A. | | 87,322 | | 238,090 | | |
| 51,325 | | ENEL S.P.A. | | 241,364 | | 381,324 | | |
| 1 | | ENI S.P.A. | | - | | 17 | | |
| 21,534 | | ENI S.P.A. ADR(e) | | 477,488 | | 732,371 | | |
| 30,086 | | FERRARI N.V. | | 4,760,627 | | 10,136,742 | | |
| 375,900 | | IREN S.P.A. | | 999,472 | | 818,745 | | |
| 2,133 | | IVECO GROUP N.V.(c) | | 4,835 | | 19,182 | | |
| 75,670 | | LEONARDO S.P.A. | | 606,153 | | 1,247,609 | | |
| 44,692 | | MEDIOBANCA BANCA DI CREDITO FINANZIARIO S.P.A. | | 349,727 | | 552,829 | | |
| 121,800 | | MFE-MEDIAFOREUROPE N.V., CLASS A | | 475,447 | | 317,059 | | |
| 910 | | MONCLER S.P.A. | | 37,687 | | 55,956 | | |
| 244,500 | | PIAGGIO & C S.P.A. | | 596,766 | | 803,809 | | |
| 104,200 | | PIRELLI & C S.P.A.(d) | | 506,260 | | 566,761 | | |
| 4,902 | | PRYSMIAN S.P.A. | | 148,153 | | 222,794 | | |
| 234,481 | | TECHNOPROBE S.P.A.(c) | | 1,553,658 | | 2,237,804 | | |
| 5,562 | | TENARIS S.A. | | 72,215 | | 96,677 | | |
| 34,652 | | TERNA - RETE ELETTRICA NAZIONALE | | 130,368 | | 288,971 | | |
| 63,644 | | UNICREDIT S.P.A. | | 671,591 | | 1,725,932 | | |
| 71,681 | | UNIPOL GRUPPO S.P.A. | | 376,844 | | 408,481 | | |
| | | | | 13,706,986 | | 22,434,473 | | 2.21% |
| Japan: | | | | | | |
| 30,600 | | ADEKA CORP. | | 390,224 | | 622,851 | | |
| 136,000 | | ADVANTEST CORP. | | 4,678,703 | | 4,626,894 | | |
| 4,700 | | AEON CO. LTD. | | 52,433 | | 105,033 | | |
| 600 | | AEON REIT INVESTMENT CORP. | | 728,822 | | 601,702 | | |
| 2,300 | | AISIN CORP. | | 37,584 | | 80,467 | | |
| 15,000 | | AJINOMOTO CO., INC. | | 116,767 | | 578,723 | | |
| 23,000 | | ARCS CO. LTD. | | 480,595 | | 453,801 | | |
| 5,500 | | ASAHI GROUP HOLDINGS LTD. | | 83,346 | | 205,099 | | |
| 13,000 | | ASAHI KASEI CORP. | | 46,220 | | 95,794 | | |
| 22,100 | | ASAHI YUKIZAI CORP | | 276,792 | | 594,819 | | |
| 37,000 | | ASTELLAS PHARMA, INC. | | 236,149 | | 442,426 | | |
| 4,500 | | BANDAI NAMCO HOLDINGS, INC. | | 14,652 | | 90,207 | | |
| 66,800 | | BAYCURRENT CONSULTING, INC. | | 1,310,812 | | 2,345,580 | | |
| 13,800 | | BRIDGESTONE CORP. | | 205,726 | | 571,574 | | |
| 32,100 | | BROTHER INDUSTRIES LTD. | | 541,898 | | 512,348 | | |
| 48,400 | | BUNKA SHUTTER CO. LTD. | | 363,296 | | 481,254 | | |
| 32,500 | | CHIBA BANK (THE) LTD. | | 178,628 | | 234,761 | | |
| 13,500 | | CHUGAI PHARMACEUTICAL CO. LTD. | | 82,278 | | 511,468 | | |
| 55,900 | | CONCORDIA FINANCIAL GROUP LTD. | | 180,730 | | 255,554 | | |
| 28,400 | | CREDIT SAISON CO. LTD. | | 361,395 | | 523,587 | | |
| 27,500 | | CRESCO LTD. | | 342,183 | | 374,273 | | |
| 10,600 | | DAI-ICHI LIFE HOLDINGS, INC. | | 182,119 | | 224,931 | | |
| 29,100 | | DAIICHI SANKYO CO. LTD. | | 150,922 | | 799,115 | | |
| 4,500 | | DAIKIN INDUSTRIES LTD. | | 124,473 | | 733,564 | | |
| 29,500 | | DAITRON CO. LTD.(b) | | 489,565 | | 586,025 | | |
| 7,400 | | DAIWA HOUSE INDUSTRY CO. LTD. | | 74,451 | | 224,204 | | |
| 28,000 | | DAIWABO HOLDINGS CO. LTD. | | 223,879 | | 613,021 | | |
| 32,800 | | DENSO CORP. | | 185,234 | | 494,791 | | |
| 3,300 | | DENTSU GROUP, INC. | | 56,753 | | 84,677 | | |
| 3,100 | | EISAI CO. LTD. | | 127,178 | | 155,044 | | |
| 40,800 | | ELEMATEC CORP. | | 418,802 | | 507,251 | | |
| 20,400 | | EXEDY CORP. | | 319,517 | | 375,302 | | |
| 13,000 | | FANUC CORP. | | 182,941 | | 382,348 | | |
| 3,900 | | FAST RETAILING CO. LTD. | | 188,734 | | 967,809 | | |
| 34,200 | | FJ NEXT HOLDINGS CO. LTD. | | 337,056 | | 270,932 | | |
| 31,700 | | FUJI CORP. | | 564,353 | | 545,195 | | |
| See accompanying notes to financial statements. | 96 | (Continued) |
CLEARWATER INVESTMENT TRUST
Schedule of Investments - Clearwater International Fund
December 31, 2023
| Shares | | Security | | Cost | | Fair value (a) | | Percent of
net assets |
| Japan (Cont'd): | | | | | | |
| 4,700 | | FUJI ELECTRIC CO. LTD. | | $ 61,631 | | 202,300 | | |
| 36,100 | | FUJI PHARMA CO. LTD. | | 376,394 | | 445,233 | | |
| 8,700 | | FUJIFILM HOLDINGS CORP. | | 163,215 | | 522,802 | | |
| 2,400 | | FUJITSU LTD. | | 131,326 | | 362,128 | | |
| 35,800 | | FURUNO ELECTRIC CO. LTD. | | 322,070 | | 470,732 | | |
| 34,900 | | GMO PAYMENT GATEWAY, INC. | | 2,345,139 | | 2,425,179 | | |
| 28,100 | | GUNGHO ONLINE ENTERTAINMENT, INC. | | 437,266 | | 468,632 | | |
| 109,800 | | GUNMA BANK (THE) LTD. | | 500,229 | | 537,319 | | |
| 3,000 | | HAMAMATSU PHOTONICS K.K. | | 52,686 | | 123,404 | | |
| 141 | | HIROSE ELECTRIC CO. LTD. | | 11,109 | | 15,965 | | |
| 19,000 | | HITACHI LTD. | | 295,895 | | 1,370,426 | | |
| 45,600 | | HONDA MOTOR CO. LTD. | | 370,123 | | 474,111 | | |
| 10,500 | | HORIBA LTD. | | 551,352 | | 821,383 | | |
| 5,300 | | HOYA CORP. | | 112,594 | | 662,500 | | |
| 72,100 | | IDOM, INC. | | 435,748 | | 496,007 | | |
| 40,800 | | INNOTECH CORP. | | 377,287 | | 486,417 | | |
| 15,200 | | INPEX CORP. | | 144,096 | | 205,308 | | |
| 141,600 | | INTEGRAL CORP.(c) | | 2,195,461 | | 2,671,319 | | |
| 18,200 | | ITOCHU CORP. | | 192,005 | | 744,393 | | |
| 21,720 | | ITOHAM YONEKYU HOLDINGS, INC. | | 686,193 | | 593,834 | | |
| 21,900 | | JACCS CO. LTD. | | 467,646 | | 806,106 | | |
| 85,000 | | JAPAN ELEVATOR SERVICE HOLDINGS CO. LTD. | | 913,228 | | 1,409,433 | | |
| 7,000 | | JAPAN EXCHANGE GROUP, INC. | | 56,090 | | 148,092 | | |
| 52,800 | | JAPAN LIFELINE CO. LTD. | | 391,231 | | 472,953 | | |
| 15,900 | | JAPAN PETROLEUM EXPLORATION CO. LTD. | | 536,302 | | 590,894 | | |
| 14,300 | | JAPAN TOBACCO, INC.(b) | | 255,669 | | 369,670 | | |
| 61,100 | | JEOL LTD. | | 2,950,084 | | 2,682,333 | | |
| 18,900 | | KAGA ELECTRONICS CO. LTD. | | 477,103 | | 821,681 | | |
| 3,500 | | KAJIMA CORP. | | 15,004 | | 58,495 | | |
| 26,900 | | KANAMOTO CO. LTD. | | 620,666 | | 558,223 | | |
| 57,300 | | KANDENKO CO. LTD. | | 547,713 | | 559,996 | | |
| 12,300 | | KANEKA CORP. | | 387,968 | | 312,472 | | |
| 2,000 | | KANSAI PAINT CO. LTD. | | 10,449 | | 34,170 | | |
| 9,000 | | KAO CORP. | | 183,106 | | 370,213 | | |
| 29,762 | | KDDI CORP. | | 238,488 | | 946,896 | | |
| 2,400 | | KEISEI ELECTRIC RAILWAY CO. LTD. | | 22,185 | | 113,430 | | |
| 16,524 | | KEYENCE CORP. | | 2,207,423 | | 7,279,935 | | |
| 6,000 | | KIKKOMAN CORP. | | 52,867 | | 367,404 | | |
| 67,600 | | KITZ CORP. | | 466,295 | | 578,196 | | |
| 54,500 | | KOBE BUSSAN CO. LTD. | | 1,140,657 | | 1,610,262 | | |
| 10,100 | | KOMATSU LTD. | | 197,184 | | 264,176 | | |
| 22,400 | | KOMERI CO. LTD. | | 432,959 | | 490,894 | | |
| 2,300 | | KONAMI GROUP CORP. | | 50,313 | | 120,432 | | |
| 21,000 | | KUBOTA CORP. | | 129,773 | | 316,117 | | |
| 20,700 | | KUREHA CORP. | | 316,117 | | 422,809 | | |
| 1,600 | | KYOCERA CORP. | | 11,033 | | 23,353 | | |
| 5,000 | | KYOWA KIRIN CO. LTD. | | 54,616 | | 84,043 | | |
| 96,400 | | M&A RESEARCH INSTITUTE HOLDINGS, INC.(b)(c) | | 2,278,412 | | 3,059,504 | | |
| 4,800 | | M3, INC. | | 51,468 | | 79,421 | | |
| 19,100 | | MARUBENI CORP. | | 186,544 | | 301,875 | | |
| 6,500 | | MARUI GROUP CO. LTD. | | 32,287 | | 109,002 | | |
| 7,700 | | MAZDA MOTOR CORP. | | 38,348 | | 83,198 | | |
| 396,100 | | MEBUKI FINANCIAL GROUP, INC. | | 843,829 | | 1,204,874 | | |
| 4,800 | | MEIJI HOLDINGS CO. LTD. | | 38,749 | | 114,009 | | |
| 12,800 | | MELCO HOLDINGS, INC. | | 351,215 | | 312,738 | | |
| 30,300 | | MICRONICS JAPAN CO. LTD. | | 291,217 | | 788,660 | | |
| 8,700 | | MINEBEA MITSUMI, INC. | | 84,406 | | 178,844 | | |
| 597 | | MIRAI CORP. | | 328,940 | | 183,969 | | |
| 48,300 | | MIRAIT ONE CORP | | 598,489 | | 636,806 | | |
| 4,500 | | MITSUBISHI CHEMICAL GROUP CORP. | | 14,284 | | 27,574 | | |
| 52,500 | | MITSUBISHI CORP. | | 230,376 | | 839,069 | | |
| 19,400 | | MITSUBISHI ELECTRIC CORP. | | 185,711 | | 275,040 | | |
| 8,500 | | MITSUBISHI GAS CHEMICAL CO., INC. | | 75,149 | | 135,970 | | |
| 12,900 | | MITSUBISHI HC CAPITAL, INC. | | 33,945 | | 86,622 | | |
| 1,200 | | MITSUBISHI HEAVY INDUSTRIES LTD. | | 45,240 | | 70,136 | | |
| 21,200 | | MITSUBISHI SHOKUHIN CO. LTD. | | 523,817 | | 723,206 | | |
| 127,100 | | MITSUBISHI UFJ FINANCIAL GROUP, INC. | | 634,731 | | 1,092,068 | | |
| See accompanying notes to financial statements. | 97 | (Continued) |
CLEARWATER INVESTMENT TRUST
Schedule of Investments - Clearwater International Fund
December 31, 2023
| Shares | | Security | | Cost | | Fair value (a) | | Percent of
net assets |
| Japan (Cont'd): | | | | | | |
| 16,600 | | MITSUI & CO. LTD. | | $ 187,177 | | 623,736 | | |
| 7,400 | | MITSUI CHEMICALS, INC. | | 87,469 | | 219,481 | | |
| 4,800 | | MITSUI OSK LINES LTD. | | 108,940 | | 153,770 | | |
| 24,000 | | MITSUI-SOKO HOLDINGS CO. LTD. | | 510,010 | | 800,851 | | |
| 26,000 | | MIZUHO FINANCIAL GROUP, INC. | | 302,862 | | 444,858 | | |
| 20,400 | | MUGEN ESTATE CO. LTD. | | 117,733 | | 156,545 | | |
| 32,400 | | MURATA MANUFACTURING CO. LTD. | | 162,615 | | 687,753 | | |
| 20,200 | | NANTO BANK (THE) LTD. | | 470,557 | | 349,704 | | |
| 4,500 | | NEC CORP. | | 151,340 | | 266,489 | | |
| 16,700 | | NICHIAS CORP. | | 297,341 | | 401,511 | | |
| 6,800 | | NIDEC CORP. | | 96,057 | | 274,652 | | |
| 16,600 | | NIKKON HOLDINGS CO. LTD. | | 337,754 | | 362,610 | | |
| 69,900 | | NINTENDO CO. LTD. | | 2,300,273 | | 3,648,185 | | |
| 11,300 | | NIPPON EXPRESS HOLDINGS, INC. | | 569,619 | | 642,257 | | |
| 760,000 | | NIPPON TELEGRAPH & TELEPHONE CORP. | | 342,697 | | 928,709 | | |
| 9,300 | | NIPPON YUSEN K.K. | | 39,009 | | 288,300 | | |
| 60,900 | | NISHI-NIPPON FINANCIAL HOLDINGS, INC. | | 426,037 | | 704,453 | | |
| 5,000 | | NISSAN CHEMICAL CORP. | | 50,851 | | 195,248 | | |
| 42,500 | | NISSAN MOTOR CO. LTD. | | 138,126 | | 167,046 | | |
| 3,600 | | NISSIN FOODS HOLDINGS CO. LTD. | | 43,959 | | 125,643 | | |
| 3,000 | | NITERRA CO. LTD. | | 28,359 | | 71,255 | | |
| 2,700 | | NITORI HOLDINGS CO. LTD. | | 87,310 | | 361,532 | | |
| 3,200 | | NITTO DENKO CORP. | | 77,639 | | 239,433 | | |
| 7,000 | | NITTO FUJI FLOUR MILLING CO. LTD. | | 211,323 | | 239,291 | | |
| 26,000 | | NITTO KOGYO CORP. | | 446,429 | | 663,830 | | |
| 24,800 | | NOMURA REAL ESTATE HOLDINGS, INC. | | 548,769 | | 652,363 | | |
| 9,801 | | NOMURA RESEARCH INSTITUTE LTD. | | 43,930 | | 285,063 | | |
| 16,000 | | NSW, INC. | | 308,868 | | 322,837 | | |
| 7,000 | | NTT DATA GROUP CORP. | | 36,519 | | 99,241 | | |
| 27,100 | | OBAYASHI CORP. | | 184,757 | | 234,482 | | |
| 51,100 | | OKAMURA CORP. | | 721,626 | | 790,057 | | |
| 33,200 | | OLYMPUS CORP. | | 211,415 | | 480,458 | | |
| 1,100 | | OMRON CORP. | | 31,828 | | 51,357 | | |
| 5,000 | | ONO PHARMACEUTICAL CO. LTD. | | 43,040 | | 89,220 | | |
| 24,000 | | ORIENTAL LAND CO. LTD. | | 113,097 | | 893,787 | | |
| 24,900 | | PANASONIC HOLDINGS CORP. | | 190,748 | | 246,616 | | |
| 41,000 | | PERSOL HOLDINGS CO. LTD. | | 37,131 | | 70,398 | | |
| 123,100 | | PLUS ALPHA CONSULTING CO. LTD. | | 2,503,023 | | 2,476,842 | | |
| 121,000 | | RAKUS CO. LTD. | | 1,645,963 | | 2,241,933 | | |
| 2,400 | | RECRUIT HOLDINGS CO. LTD. | | 31,274 | | 101,498 | | |
| 45,300 | | RESONA HOLDINGS, INC. | | 172,185 | | 230,195 | | |
| 3,600 | | RINNAI CORP. | | 52,047 | | 83,438 | | |
| 26,600 | | RION CO. LTD. | | 502,380 | | 460,123 | | |
| 1,600 | | ROHM CO. LTD. | | 13,823 | | 30,667 | | |
| 24,300 | | S FOODS, INC. | | 538,392 | | 567,862 | | |
| 13,620 | | SBI HOLDINGS, INC. | | 110,355 | | 306,402 | | |
| 1,200 | | SECOM CO. LTD. | | 44,072 | | 86,426 | | |
| 12,700 | | SEKISUI CHEMICAL CO. LTD. | | 64,585 | | 183,069 | | |
| 6,000 | | SEKISUI HOUSE LTD. | | 44,394 | | 133,277 | | |
| 73,300 | | SEVEN & I HOLDINGS CO. LTD. | | 2,598,954 | | 2,908,606 | | |
| 15,600 | | SHIBAURA MECHATRONICS CORP. | | 411,582 | | 657,191 | | |
| 10,700 | | SHIFT, INC.(c) | | 1,405,130 | | 2,718,255 | | |
| 4,000 | | SHIMADZU CORP. | | 25,419 | | 111,830 | | |
| 1,500 | | SHIMANO, INC. | | 58,204 | | 232,287 | | |
| 46,000 | | SHIN-ETSU CHEMICAL CO. LTD. | | 461,684 | | 1,930,369 | | |
| 4,000 | | SHIONOGI & CO. LTD. | | 67,679 | | 192,851 | | |
| 5,800 | | SHISEIDO CO. LTD. | | 87,058 | | 174,905 | | |
| 28,900 | | SHIZUOKA FINANCIAL GROUP, INC. | | 174,482 | | 244,933 | | |
| 900 | | SMC CORP. | | 106,941 | | 483,574 | | |
| 21,000 | | SOFTBANK CORP. | | 210,925 | | 262,053 | | |
| 36,800 | | SOFTBANK GROUP CORP. | | 412,233 | | 1,642,428 | | |
| 33,400 | | SOJITZ CORP. | | 711,933 | | 754,461 | | |
| 5,700 | | SOMPO HOLDINGS, INC. | | 114,918 | | 278,774 | | |
| 12,300 | | SONY GROUP CORP. | | 861,111 | | 1,169,809 | | |
| 5,700 | | SUBARU CORP. | | 26,572 | | 104,540 | | |
| 17,900 | | SUMITOMO CORP. | | 237,245 | | 390,499 | | |
| 40,400 | | SUMITOMO HEAVY INDUSTRIES LTD.(b) | | 1,122,628 | | 1,018,596 | | |
| See accompanying notes to financial statements. | 98 | (Continued) |
CLEARWATER INVESTMENT TRUST
Schedule of Investments - Clearwater International Fund
December 31, 2023
| Shares | | Security | | Cost | | Fair value (a) | | Percent of
net assets |
| Japan (Cont'd): | | | | | | |
| 10,200 | | SUMITOMO MITSUI FINANCIAL GROUP, INC. | | $ 308,888 | | 497,702 | | |
| 1,600 | | SUMITOMO REALTY & DEVELOPMENT CO. LTD. | | 36,088 | | 47,591 | | |
| 5,800 | | SUZUKI MOTOR CORP. | | 104,611 | | 248,166 | | |
| 34,100 | | SWCC CORP. | | 593,339 | | 691,432 | | |
| 2,600 | | SYSMEX CORP. | | 51,707 | | 144,899 | | |
| 20,100 | | T RAD CO. LTD. | | 425,712 | | 439,777 | | |
| 2,200 | | TAISEI CORP. | | 19,821 | | 75,237 | | |
| 3,600 | | TDK CORP. | | 62,321 | | 171,498 | | |
| 11,600 | | TERUMO CORP. | | 117,165 | | 380,250 | | |
| 51,400 | | TOAGOSEI CO. LTD. | | 437,472 | | 500,148 | | |
| 1,000 | | TOHO CO. LTD. | | 13,412 | | 33,823 | | |
| 43,200 | | TOKIO MARINE HOLDINGS, INC. | | 359,676 | | 1,081,226 | | |
| 32,700 | | TOKYO ELECTRIC POWER CO. HOLDINGS, INC.(c) | | 107,478 | | 171,269 | | |
| 9,900 | | TOKYO ELECTRON LTD. | | 135,391 | | 1,773,223 | | |
| 8,200 | | TOKYO GAS CO. LTD. | | 148,002 | | 188,309 | | |
| 51,200 | | TOKYO STEEL MANUFACTURING CO. LTD. | | 317,332 | | 627,835 | | |
| 3,000 | | TOTO LTD. | | 30,029 | | 79,000 | | |
| 1,000 | | TOYO SUISAN KAISHA LTD. | | 25,714 | | 51,631 | | |
| 33,300 | | TOYOTA BOSHOKU CORP. | | 638,507 | | 528,431 | | |
| 4,000 | | TOYOTA INDUSTRIES CORP. | | 101,266 | | 326,241 | | |
| 90,500 | | TOYOTA MOTOR CORP. | | 1,282,111 | | 1,662,697 | | |
| 1,700 | | TOYOTA TSUSHO CORP. | | 14,142 | | 100,167 | | |
| 32,900 | | TPR CO. LTD. | | 424,011 | | 397,600 | | |
| 21,900 | | TRANSCOSMOS, INC. | | 679,057 | | 468,287 | | |
| 900 | | TREND MICRO, INC. | | 26,539 | | 48,179 | | |
| 50,900 | | TSUGAMI CORP. | | 536,991 | | 438,606 | | |
| 7,700 | | UNICHARM CORP. | | 67,055 | | 278,401 | | |
| 800 | | USS CO. LTD. | | 3,505 | | 16,091 | | |
| 19,000 | | VALOR HOLDINGS CO. LTD. | | 422,334 | | 328,929 | | |
| 25,500 | | VISIONAL, INC.(c) | | 1,210,269 | | 1,624,043 | | |
| 23,000 | | WARABEYA NICHIYO HOLDINGS CO. LTD. | | 372,710 | | 558,688 | | |
| 2,600 | | YAKULT HONSHA CO. LTD. | | 22,252 | | 58,399 | | |
| 83,700 | | YAMAGUCHI FINANCIAL GROUP, INC. | | 555,179 | | 750,035 | | |
| 13,800 | | YAMAHA MOTOR CO. LTD. | | 46,377 | | 123,270 | | |
| 5,000 | | YASKAWA ELECTRIC CORP. | | 48,019 | | 208,865 | | |
| 10,100 | | YUASA TRADING CO. LTD. | | 293,394 | | 339,532 | | |
| | | | | 79,014,636 | | 122,357,270 | | 12.05% |
| Jordan: | | | | | | |
| 60,416 | | HIKMA PHARMACEUTICALS PLC | | 1,331,049 | | 1,377,696 | | |
| | | | | 1,331,049 | | 1,377,696 | | 0.14% |
| Lithuania: | | | | | | |
| 969,678 | | BALTIC CLASSIFIEDS GROUP PLC | | 2,166,176 | | 2,923,140 | | |
| | | | | 2,166,176 | | 2,923,140 | | 0.29% |
| Macau: | | | | | | |
| 4,800 | | SANDS CHINA LTD.(c) | | 9,373 | | 14,046 | | |
| | | | | 9,373 | | 14,046 | | 0.00% |
| Malaysia: | | | | | | |
| 503,500 | | FRENCKEN GROUP LTD. | | 337,380 | | 515,041 | | |
| 274,300 | | RHB BANK BHD. | | 377,864 | | 325,339 | | |
| | | | | 715,244 | | 840,380 | | 0.08% |
| Mexico: | | | | | | |
| 201,200 | | BANCO DEL BAJIO S.A.(d) | | 360,811 | | 672,997 | | |
| 216,217 | | CONTROLADORA VUELA CIA DE AVIACION S.A.B. DE C.V. ADR(c)(e) | | 1,744,166 | | 2,028,115 | | |
| 107,949 | | GRUMA S.A.B. DE C.V., CLASS B | | 1,224,860 | | 1,977,931 | | |
| 212,771 | | GRUPO AEROPORTUARIO DEL CENTRO NORTE S.A.B. DE C.V. | | 1,987,240 | | 2,252,383 | | |
| 186,700 | | MEGACABLE HOLDINGS S.A.B. DE C.V. - CPO | | 409,781 | | 416,917 | | |
| 295,176 | | PROLOGIS PROPERTY MEXICO S.A. DE C.V.(b) | | 979,507 | | 1,403,655 | | |
| 39,900 | | PROMOTORA Y OPERADORA DE INFRAESTRUCTURA S.A.B. DE C.V. | | 362,988 | | 431,684 | | |
| 177,029 | | QUALITAS CONTROLADORA S.A.B. DE C.V. | | 862,306 | | 1,788,743 | | |
| See accompanying notes to financial statements. | 99 | (Continued) |
CLEARWATER INVESTMENT TRUST
Schedule of Investments - Clearwater International Fund
December 31, 2023
| Shares | | Security | | Cost | | Fair value (a) | | Percent of
net assets |
| Mexico (Cont'd): | | | | | | |
| 196,500 | | REGIONAL S.A.B. DE C.V. | | $ 1,565,400 | | 1,877,749 | | |
| | | | | 9,497,059 | | 12,850,174 | | 1.26% |
| Netherlands: | | | | | | |
| 6,726 | | ADYEN N.V.(c)(d) | | 9,001,577 | | 8,662,201 | | |
| 143,900 | | AEGON LTD. | | 363,250 | | 833,689 | | |
| 459 | | AKZO NOBEL N.V. | | 18,664 | | 37,912 | | |
| 13,927 | | ASM INTERNATIONAL N.V. | | 4,198,520 | | 7,225,346 | | |
| 3,454 | | ASML HOLDING N.V. | | 2,010,380 | | 2,599,352 | | |
| 13,826 | | ASML HOLDING N.V. (REGISTERED) | | 3,767,967 | | 10,465,176 | | |
| 21,600 | | ASR NEDERLAND N.V. | | 788,307 | | 1,018,195 | | |
| 30,400 | | EUROCOMMERCIAL PROPERTIES N.V. | | 737,194 | | 745,034 | | |
| 3,610 | | EXOR N.V. | | 90,616 | | 360,666 | | |
| 51,500 | | FORFARMERS N.V. | | 322,452 | | 135,311 | | |
| 980 | | HEINEKEN HOLDING N.V. | | 24,979 | | 82,871 | | |
| 2,822 | | HEINEKEN N.V. | | 79,167 | | 286,425 | | |
| 17,656 | | KONINKLIJKE AHOLD DELHAIZE N.V. | | 203,381 | | 507,067 | | |
| 65,970 | | KONINKLIJKE KPN N.V. | | 190,999 | | 227,076 | | |
| 285,101 | | KONINKLIJKE PHILIPS N.V.(c) | | 5,971,047 | | 6,636,235 | | |
| 15,956 | | KONINKLIJKE PHILIPS N.V. (REGISTERED)(c) | | 244,727 | | 372,254 | | |
| 2,587 | | PROSUS N.V.(c) | | 61,381 | | 77,067 | | |
| 8,117 | | QIAGEN N.V.(c) | | 119,394 | | 353,054 | | |
| 209 | | RANDSTAD N.V. | | 4,033 | | 13,087 | | |
| 23,800 | | SIGNIFY N.V.(d) | | 640,632 | | 796,628 | | |
| 49,916 | | STELLANTIS N.V. | | 203,470 | | 1,165,466 | | |
| 97,212 | | UNIVERSAL MUSIC GROUP N.V. | | 2,511,442 | | 2,769,857 | | |
| 6,193 | | WOLTERS KLUWER N.V. | | 101,075 | | 879,891 | | |
| | | | | 31,654,654 | | 46,249,860 | | 4.55% |
| New Zealand: | | | | | | |
| 31,147 | | HALLENSTEIN GLASSON HOLDINGS LTD. | | 115,879 | | 102,386 | | |
| | | | | 115,879 | | 102,386 | | 0.01% |
| Norway: | | | | | | |
| 6,359 | | ADEVINTA ASA(c) | | 37,714 | | 70,350 | | |
| 30,933 | | AKER BP ASA | | 1,041,758 | | 899,684 | | |
| 32,200 | | ATEA ASA(c) | | 360,833 | | 409,477 | | |
| 829,647 | | AUTOSTORE HOLDINGS LTD.(c)(d) | | 1,109,965 | | 1,631,546 | | |
| 40,966 | | BAKKAFROST P/F | | 2,065,305 | | 2,145,091 | | |
| 12,068 | | DNB BANK ASA | | 82,736 | | 256,566 | | |
| 1,416 | | EQUINOR ASA ADR(e) | | 34,019 | | 44,802 | | |
| 65,300 | | EUROPRIS ASA(d) | | 420,002 | | 493,290 | | |
| 62,974 | | KONGSBERG GRUPPEN ASA | | 2,565,924 | | 2,884,684 | | |
| 23,955 | | NORSK HYDRO ASA | | 48,328 | | 161,274 | | |
| 35,300 | | SPAREBANK 1 SR-BANK ASA | | 380,636 | | 447,856 | | |
| 2,400 | | YARA INTERNATIONAL ASA | | 55,523 | | 85,324 | | |
| | | | | 8,202,743 | | 9,529,944 | | 0.94% |
| Poland: | | | | | | |
| 24,000 | | ASSECO POLAND S.A. | | 487,128 | | 445,873 | | |
| 18,905 | | CYFROWY POLSAT S.A.(c) | | 130,878 | | 59,241 | | |
| 281,626 | | ORANGE POLSKA S.A. | | 506,882 | | 582,613 | | |
| | | | | 1,124,888 | | 1,087,727 | | 0.11% |
| Portugal: | | | | | | |
| 20,567 | | EDP - ENERGIAS DE PORTUGAL S.A. | | 48,529 | | 103,421 | | |
| 14,452 | | GALP ENERGIA SGPS S.A. | | 143,129 | | 212,830 | | |
| 9,417 | | JERONIMO MARTINS SGPS S.A. | | 105,677 | | 239,522 | | |
| 123,300 | | NAVIGATOR (THE) CO. S.A. | | 307,999 | | 482,943 | | |
| 365,400 | | SONAE SGPS S.A. | | 405,827 | | 364,860 | | |
| | | | | 1,011,161 | | 1,403,576 | | 0.14% |
| Russia: | | | | | | |
| 152,020 | | CIAN PLC ADR(c)(e)(f) | | 2,339,655 | | - | | |
| 3,168 | | GLOBALTRANS INVESTMENT PLC GDR (REGISTERED)(c)(f) | | 21,771 | | - | | |
| 25,740,000 | | RUSHYDRO PJSC(b)(f) | | 218,665 | | - | | |
| | | | | 2,580,091 | | - | | 0.00% |
| Saudi Arabia: | | | | | | |
| 49,721 | | ALDREES PETROLEUM AND TRANSPORT SERVICES CO. | | 1,681,515 | | 2,344,622 | | |
| See accompanying notes to financial statements. | 100 | (Continued) |
CLEARWATER INVESTMENT TRUST
Schedule of Investments - Clearwater International Fund
December 31, 2023
| Shares | | Security | | Cost | | Fair value (a) | | Percent of
net assets |
| Saudi Arabia (Cont'd): | | | | | | |
| 23,384 | | BUPA ARABIA FOR COOPERATIVE INSURANCE CO. | | $ 1,170,021 | | 1,329,323 | | |
| | | | | 2,851,536 | | 3,673,945 | | 0.36% |
| Singapore: | | | | | | |
| 779,800 | | AZTECH GLOBAL LTD. | | 481,808 | | 549,509 | | |
| 5,000 | | CITY DEVELOPMENTS LTD. | | 23,356 | | 25,194 | | |
| 28,200 | | DBS GROUP HOLDINGS LTD. | | 158,529 | | 713,894 | | |
| 39,200 | | KEPPEL CORP. LTD. | | 150,880 | | 209,997 | | |
| 13,480 | | KEPPEL REIT | | 5,756 | | 9,499 | | |
| 5,200 | | OVERSEA-CHINESE BANKING CORP. LTD. | | 43,484 | | 51,222 | | |
| 401,033 | | SEATRIUM LTD.(c) | | 39,737 | | 35,857 | | |
| 51,700 | | SINGAPORE AIRLINES LTD. | | 194,072 | | 256,982 | | |
| 13,000 | | SINGAPORE EXCHANGE LTD. | | 40,226 | | 96,829 | | |
| 4,600 | | UNITED OVERSEAS BANK LTD. | | 26,071 | | 99,163 | | |
| 48,200 | | VENTURE CORP. LTD. | | 558,851 | | 497,065 | | |
| | | | | 1,722,770 | | 2,545,211 | | 0.25% |
| South Africa: | | | | | | |
| 134,900 | | ADCOCK INGRAM HOLDINGS LTD. | | 394,451 | | 443,214 | | |
| 33,591 | | AFRICAN RAINBOW MINERALS LTD. | | 339,096 | | 367,265 | | |
| 45,442 | | ASTRAL FOODS LTD. | | 337,713 | | 364,107 | | |
| 42,500 | | BARLOWORLD LTD. | | 242,391 | | 183,545 | | |
| 132,200 | | INVESTEC PLC | | 773,831 | | 896,130 | | |
| 68,600 | | OCEANA GROUP LTD. | | 268,470 | | 265,025 | | |
| 22,787 | | TELKOM S.A. SOC LTD.(c) | | 116,245 | | 37,047 | | |
| 5,284 | | THUNGELA RESOURCES LTD. | | 1,910 | | 42,998 | | |
| 63,900 | | TIGER BRANDS LTD. | | 577,274 | | 703,153 | | |
| 42,500 | | ZEDA LTD.(c) | | 47,481 | | 29,623 | | |
| | | | | 3,098,862 | | 3,332,107 | | 0.33% |
| South Korea: | | | | | | |
| 25,000 | | DAESANG CORP. | | 545,401 | | 402,247 | | |
| 20,489 | | DB HITEK CO. LTD. | | 270,468 | | 927,872 | | |
| 4,784 | | DL E&C CO. LTD. | | 210,584 | | 133,525 | | |
| 31,100 | | DOOSAN BOBCAT, INC. | | 908,313 | | 1,212,146 | | |
| 9,900 | | GS HOLDINGS CORP. | | 371,567 | | 314,001 | | |
| 42,027 | | HANA MATERIALS, INC. | | 1,526,442 | | 1,629,701 | | |
| 34,354 | | HPSP CO. LTD. | | 854,366 | | 1,160,941 | | |
| 9,075 | | HUONS CO. LTD. | | 416,763 | | 270,061 | | |
| 3,500 | | HYUNDAI GLOVIS CO. LTD. | | 391,747 | | 519,030 | | |
| 15,994 | | HYUNDAI GREEN FOOD/NEW(c) | | 265,187 | | 142,444 | | |
| 23,300 | | JW LIFE SCIENCE CORP. | | 391,190 | | 232,317 | | |
| 18,600 | | KC TECH CO. LTD. | | 295,116 | | 385,005 | | |
| 138,222 | | KOREA REAL ESTATE INVESTMENT & TRUST CO. LTD. | | 296,250 | | 126,079 | | |
| 25,300 | | KT CORP. | | 539,161 | | 674,600 | | |
| 64,100 | | LG UPLUS CORP. | | 723,972 | | 508,874 | | |
| 10,183 | | LOTTE FINE CHEMICAL CO. LTD. | | 404,389 | | 457,524 | | |
| 4,775 | | MAEIL DAIRIES CO. LTD. | | 380,763 | | 152,732 | | |
| 17,812 | | NAVER CORP. | | 2,195,643 | | 3,082,738 | | |
| 58,100 | | PARTRON CO. LTD. | | 410,901 | | 366,639 | | |
| 202,165 | | SAMSUNG ELECTRONICS CO. LTD. | | 7,725,882 | | 12,295,658 | | |
| 14,251 | | SAMSUNG SECURITIES CO. LTD. | | 434,059 | | 424,887 | | |
| 14,900 | | VIEWORKS CO. LTD. | | 386,364 | | 312,462 | | |
| 39,900 | | YOUNG POONG PRECISION CORP. | | 405,022 | | 393,741 | | |
| 10,700 | | YOUNGONE CORP. | | 365,651 | | 377,638 | | |
| | | | | 20,715,201 | | 26,502,862 | | 2.61% |
| Spain: | | | | | | |
| 1,260 | | ACCIONA S.A. | | 78,312 | | 185,417 | | |
| 9,041 | | ACS ACTIVIDADES DE CONSTRUCCION Y SERVICIOS S.A. | | 206,316 | | 400,829 | | |
| 1,333 | | AENA SME S.A.(d) | | 146,281 | | 241,484 | | |
| 6,379 | | AMADEUS IT GROUP S.A. | | 179,436 | | 456,891 | | |
| 17,442 | | BANCO BILBAO VIZCAYA ARGENTARIA S.A. ADR(e) | | 84,304 | | 158,897 | | |
| 51,052 | | BANCO SANTANDER S.A. | | 144,309 | | 213,008 | | |
| 58,923 | | BANCO SANTANDER S.A. ADR(e) | | 194,636 | | 243,941 | | |
| 60,498 | | CAIXABANK S.A. | | 164,673 | | 248,848 | | |
| 31,300 | | CIA DE DISTRIBUCION INTEGRAL LOGISTA HOLDINGS S.A. | | 607,086 | | 845,873 | | |
| 140,872 | | FAES FARMA S.A. | | 588,215 | | 491,429 | | |
| 39 | | FERROVIAL S.E. | | 588 | | 1,422 | | |
| 69,814 | | IBERDROLA S.A. | | 430,525 | | 914,835 | | |
| See accompanying notes to financial statements. | 101 | (Continued) |
CLEARWATER INVESTMENT TRUST
Schedule of Investments - Clearwater International Fund
December 31, 2023
| Shares | | Security | | Cost | | Fair value (a) | | Percent of
net assets |
| Spain (Cont'd): | | | | | | |
| 38,700 | | INDRA SISTEMAS S.A. | | $ 579,171 | | 598,120 | | |
| 12,493 | | INDUSTRIA DE DISENO TEXTIL S.A. | | 239,195 | | 543,805 | | |
| 27,680 | | MIQUEL Y COSTAS & MIQUEL S.A. | | 387,291 | | 359,965 | | |
| 10,622 | | NATURGY ENERGY GROUP S.A. | | 164,427 | | 316,606 | | |
| 3,948 | | REDEIA CORP. S.A. | | 37,712 | | 64,984 | | |
| 31,112 | | REPSOL S.A. | | 268,381 | | 461,955 | | |
| 21,125 | | TELEFONICA S.A. ADR(e) | | 69,434 | | 82,388 | | |
| | | | | 4,570,292 | | 6,830,697 | | 0.67% |
| Sweden: | | | | | | |
| 2,065 | | ALLEIMA AB | | 1,539 | | 15,687 | | |
| 22,200 | | ASSA ABLOY AB, CLASS B | | 89,466 | | 638,968 | | |
| 284,824 | | ATLAS COPCO AB, CLASS A | | 1,803,725 | | 4,900,948 | | |
| 15,920 | | ATLAS COPCO AB, CLASS B | | 22,691 | | 235,816 | | |
| 182,649 | | BEIJER REF AB | | 1,826,161 | | 2,442,914 | | |
| 34,700 | | BILIA AB, CLASS A | | 639,435 | | 463,077 | | |
| 18,000 | | BOLIDEN AB | | 418,169 | | 561,270 | | |
| 195,400 | | CLOETTA AB, CLASS B | | 556,844 | | 354,919 | | |
| 7,501 | | ELECTROLUX PROFESSIONAL AB, CLASS B | | 16,773 | | 40,903 | | |
| 9,604 | | EPIROC AB, CLASS A | | 18,146 | | 192,536 | | |
| 4,000 | | EPIROC AB, CLASS B | | 7,248 | | 69,958 | | |
| 8,600 | | ESSITY AB, CLASS B | | 62,137 | | 213,166 | | |
| 55,005 | | EVOLUTION AB(d) | | 7,020,959 | | 6,556,284 | | |
| 369,216 | | FORTNOX AB | | 1,932,513 | | 2,206,646 | | |
| 10,131 | | H & M HENNES & MAURITZ AB, CLASS B(b) | | 98,015 | | 177,407 | | |
| 25,557 | | HEXAGON AB, CLASS B | | 56,077 | | 306,475 | | |
| 130,200 | | HUMANA AB(c) | | 538,994 | | 363,386 | | |
| 17,500 | | HUSQVARNA AB, CLASS B | | 64,201 | | 143,976 | | |
| 8,270 | | INDUSTRIVARDEN AB, CLASS C | | 85,948 | | 269,188 | | |
| 43,812 | | INVESTOR AB, CLASS B | | 150,033 | | 1,014,282 | | |
| 49,100 | | INWIDO AB | | 276,126 | | 658,168 | | |
| 36,400 | | KINDRED GROUP PLC SDR | | 177,628 | | 336,642 | | |
| 7,801 | | KNOW IT AB | | 144,666 | | 121,121 | | |
| 14,800 | | LOOMIS AB | | 372,004 | | 392,669 | | |
| 44,500 | | MEKO AB | | 323,086 | | 482,677 | | |
| 158,618 | | MUNTERS GROUP AB(d) | | 1,825,811 | | 2,571,278 | | |
| 303,554 | | NCAB GROUP AB | | 1,816,371 | | 2,204,563 | | |
| 111,669 | | NORDNET AB PUBL | | 1,288,217 | | 1,893,248 | | |
| 29,428 | | ORRON ENERGY AB(c) | | 485,724 | | 23,225 | | |
| 77,000 | | RESURS HOLDING AB(d) | | 417,550 | | 182,307 | | |
| 45,280 | | SAAB AB, CLASS B | | 2,278,707 | | 2,727,741 | | |
| 16,008 | | SANDVIK AB | | 135,894 | | 346,156 | | |
| 84,900 | | SECURITAS AB, CLASS B | | 649,198 | | 829,804 | | |
| 35,236 | | SKANDINAVISKA ENSKILDA BANKEN AB, CLASS A | | 139,725 | | 484,903 | | |
| 2,634 | | SKANSKA AB, CLASS B | | 22,223 | | 47,621 | | |
| 8,600 | | SVENSKA CELLULOSA AB S.C.A., CLASS B | | 15,915 | | 128,837 | | |
| 12,497 | | SVENSKA HANDELSBANKEN AB, CLASS A | | 60,798 | | 135,613 | | |
| 12,741 | | SWEDBANK AB, CLASS A | | 176,972 | | 256,815 | | |
| 35,506 | | TETHYS OIL AB | | 259,465 | | 152,975 | | |
| 53,514 | | THULE GROUP AB(d) | | 1,241,344 | | 1,456,427 | | |
| 24,387 | | VOLVO AB, CLASS B | | 156,616 | | 632,763 | | |
| | | | | 27,673,114 | | 37,233,359 | | 3.67% |
| Switzerland: | | | | | | |
| 217,551 | | ABB LTD. (REGISTERED) | | 4,365,749 | | 9,648,240 | | |
| 4,727 | | ALCON, INC. | | 75,580 | | 368,920 | | |
| 384 | | AVOLTA A.G.(c) | | 8,927 | | 15,103 | | |
| 19,923 | | BACHEM HOLDING A.G. | | 1,371,228 | | 1,539,736 | | |
| 484 | | BALOISE HOLDING A.G. (REGISTERED) | | 26,452 | | 75,847 | | |
| 54 | | BARRY CALLEBAUT A.G. (REGISTERED) | | 86,515 | | 91,108 | | |
| 34 | | CHOCOLADEFABRIKEN LINDT & SPRUENGLI A.G. (PARTICIPATION CERTIFICATE) | | 48,855 | | 407,895 | | |
| 3 | | CHOCOLADEFABRIKEN LINDT & SPRUENGLI A.G. (REGISTERED) | | 75,352 | | 363,831 | | |
| 42,234 | | CIE FINANCIERE RICHEMONT S.A. (REGISTERED) | | 2,994,717 | | 5,812,479 | | |
| 1,200 | | DORMAKABA HOLDING A.G. | | 436,003 | | 647,762 | | |
| 22,925 | | DSM-FIRMENICH A.G. | | 1,731,031 | | 2,328,341 | | |
| 54,800 | | EFG INTERNATIONAL A.G.(c) | | 442,650 | | 703,692 | | |
| 44,301 | | GARMIN LTD. | | 4,741,247 | | 5,694,450 | | |
| See accompanying notes to financial statements. | 102 | (Continued) |
CLEARWATER INVESTMENT TRUST
Schedule of Investments - Clearwater International Fund
December 31, 2023
| Shares | | Security | | Cost | | Fair value (a) | | Percent of
net assets |
| Switzerland (Cont'd): | | | | | | |
| 990 | | GEBERIT A.G. (REGISTERED) | | $ 85,632 | | 634,457 | | |
| 140 | | GIVAUDAN S.A. (REGISTERED) | | 76,496 | | 579,942 | | |
| 235,567 | | GLOBAL BLUE GROUP HOLDING A.G.(c) | | 2,097,127 | | 1,114,232 | | |
| 5,640 | | HELVETIA HOLDING A.G. (REGISTERED) | | 533,016 | | 777,214 | | |
| 70,081 | | HOLCIM A.G.(c) | | 3,377,641 | | 5,501,156 | | |
| 3,711 | | JULIUS BAER GROUP LTD. | | 74,659 | | 208,042 | | |
| 897 | | LONZA GROUP A.G. (REGISTERED) | | 50,452 | | 377,229 | | |
| 117,259 | | MEDMIX A.G.(d) | | 4,422,551 | | 2,648,976 | | |
| 100,497 | | NESTLE S.A. (REGISTERED) | | 5,000,489 | | 11,651,462 | | |
| 121,636 | | NOVARTIS A.G. (REGISTERED) | | 9,025,991 | | 12,274,237 | | |
| 3,868 | | NOVARTIS A.G. ADR(e) | | 295,798 | | 390,552 | | |
| 11,952 | | ROCHE HOLDING A.G. | | 1,552,784 | | 3,474,543 | | |
| 31,985 | | SANDOZ GROUP A.G.(c) | | 720,213 | | 1,029,088 | | |
| 773 | | SANDOZ GROUP A.G. ADR(c)(e) | | 16,416 | | 24,744 | | |
| 755 | | SCHINDLER HOLDING A.G. (PARTICIPATION CERTIFICATE) | | 34,888 | | 188,784 | | |
| 3,000 | | SGS S.A. (REGISTERED) | | 129,434 | | 258,748 | | |
| 3,517 | | SIKA A.G. (REGISTERED) | | 117,252 | | 1,144,525 | | |
| 1,308 | | SONOVA HOLDING A.G. (REGISTERED) | | 84,414 | | 426,747 | | |
| 635 | | SULZER A.G. (REGISTERED) | | 20,376 | | 64,855 | | |
| 743 | | SWISS LIFE HOLDING A.G. (REGISTERED) | | 101,194 | | 515,917 | | |
| 967 | | SWISS RE A.G. | | 77,541 | | 108,721 | | |
| 194 | | SWISSCOM A.G. (REGISTERED) | | 49,415 | | 116,716 | | |
| 589,759 | | UBS GROUP A.G. (REGISTERED) | | 11,506,694 | | 18,301,777 | | |
| 7,700 | | VALIANT HOLDING A.G. (REGISTERED) | | 734,240 | | 873,408 | | |
| 8,800 | | VETROPACK HOLDING A.G. (REGISTERED) | | 405,746 | | 409,108 | | |
| 6,700 | | ZEHNDER GROUP A.G. (REGISTERED) | | 261,335 | | 426,193 | | |
| 4,209 | | ZURICH INSURANCE GROUP A.G. | | 808,513 | | 2,199,960 | | |
| | | | | 58,064,613 | | 93,418,737 | | 9.20% |
| Taiwan: | | | | | | |
| 140,406 | | ASIA VITAL COMPONENTS CO. LTD. | | 526,616 | | 1,539,454 | | |
| 219,000 | | CHICONY ELECTRONICS CO. LTD. | | 585,753 | | 1,248,758 | | |
| 146,000 | | CHIPBOND TECHNOLOGY CORP. | | 286,157 | | 343,944 | | |
| 419,000 | | CHIPMOS TECHNOLOGIES, INC. | | 449,603 | | 576,815 | | |
| 57,537 | | INNODISK CORP. | | 327,828 | | 584,922 | | |
| 102,000 | | INSYDE SOFTWARE CORP. | | 407,878 | | 862,449 | | |
| 383,000 | | KINDOM DEVELOPMENT CO. LTD. | | 503,834 | | 484,826 | | |
| 660,000 | | POU CHEN CORP. | | 670,549 | | 664,505 | | |
| 220,000 | | RADIANT OPTO-ELECTRONICS CORP. | | 841,929 | | 953,390 | | |
| 105,000 | | SERCOMM CORP. | | 398,506 | | 460,159 | | |
| 220,000 | | SIGURD MICROELECTRONICS CORP. | | 403,537 | | 467,376 | | |
| 146,000 | | SINO-AMERICAN SILICON PRODUCTS, INC. | | 723,315 | | 932,406 | | |
| 225,000 | | TAIWAN HON CHUAN ENTERPRISE CO. LTD. | | 422,583 | | 916,407 | | |
| 157,000 | | TAIWAN SURFACE MOUNTING TECHNOLOGY CORP. | | 456,051 | | 490,585 | | |
| 84,369 | | TOPCO SCIENTIFIC CO. LTD. | | 263,727 | | 501,697 | | |
| 57,000 | | UNITED INTEGRATED SERVICES CO. LTD. | | 402,404 | | 491,243 | | |
| 149,100 | | USERJOY TECHNOLOGY CO. LTD. | | 374,944 | | 378,938 | | |
| 187,000 | | ZHEN DING TECHNOLOGY HOLDING LTD. | | 694,432 | | 664,147 | | |
| | | | | 8,739,646 | | 12,562,021 | | 1.24% |
| Thailand: | | | | | | |
| 500,300 | | POLYPLEX THAILAND PCL (REGISTERED) | | 376,789 | | 148,042 | | |
| 432,100 | | PRUKSA HOLDING PCL (REGISTERED) | | 233,658 | | 153,180 | | |
| 1,424,300 | | SUPALAI PCL (REGISTERED) | | 958,379 | | 776,151 | | |
| | | | | 1,568,826 | | 1,077,373 | | 0.11% |
| Turkey: | | | | | | |
| 104,100 | | BIM BIRLESIK MAGAZALAR A.S. | | 669,519 | | 1,062,416 | | |
| 53,800 | | COCA-COLA ICECEK A.S. | | 315,265 | | 959,386 | | |
| 270,800 | | TURKCELL ILETISIM HIZMETLERI A.S. | | 605,645 | | 515,525 | | |
| | | | | 1,590,429 | | 2,537,327 | | 0.25% |
| United Kingdom: | | | | | | |
| 27,355 | | 3I GROUP PLC | | 109,603 | | 844,156 | | |
| 2,834 | | ADMIRAL GROUP PLC | | 35,119 | | 96,956 | | |
| 540,200 | | AIRTEL AFRICA PLC(d) | | 753,867 | | 896,513 | | |
| 52,849 | | ANGLO AMERICAN PLC | | 409,100 | | 1,327,475 | | |
| 6,588 | | ASHTEAD GROUP PLC | | 294,400 | | 458,666 | | |
| 136,091 | | ASSOCIATED BRITISH FOODS PLC | | 3,192,429 | | 4,105,997 | | |
| 67,917 | | ASTRAZENECA PLC | | 8,490,006 | | 9,176,464 | | |
| See accompanying notes to financial statements. | 103 | (Continued) |
CLEARWATER INVESTMENT TRUST
Schedule of Investments - Clearwater International Fund
December 31, 2023
| Shares | | Security | | Cost | | Fair value (a) | | Percent of
net assets |
| United Kingdom (Cont'd): | | | | | | |
| 559,882 | | BAE SYSTEMS PLC | | $ 6,618,185 | | 7,925,124 | | |
| 113,471 | | BAKKAVOR GROUP PLC(d) | | 166,389 | | 117,155 | | |
| 26,000 | | BANK OF GEORGIA GROUP PLC | | 447,200 | | 1,317,351 | | |
| 14,400 | | BELLWAY PLC | | 632,327 | | 471,355 | | |
| 62,893 | | BERKELEY GROUP HOLDINGS PLC | | 3,336,564 | | 3,758,209 | | |
| 101,626 | | BP PLC | | 527,172 | | 603,839 | | |
| 5,069 | | BUNZL PLC | | 39,524 | | 206,112 | | |
| 8,193 | | BURBERRY GROUP PLC | | 40,501 | | 147,876 | | |
| 279,516 | | BYTES TECHNOLOGY GROUP PLC | | 1,849,273 | | 2,180,465 | | |
| 157,500 | | CENTRAL ASIA METALS PLC | | 465,909 | | 362,969 | | |
| 206,696 | | CNH INDUSTRIAL N.V. | | 1,938,431 | | 2,528,257 | | |
| 405,182 | | COMPASS GROUP PLC | | 6,293,881 | | 11,083,345 | | |
| 30,300 | | COMPUTACENTER PLC | | 956,431 | | 1,078,323 | | |
| 2,276 | | CRODA INTERNATIONAL PLC | | 82,787 | | 146,506 | | |
| 41,855 | | DIPLOMA PLC | | 1,308,881 | | 1,911,014 | | |
| 108,100 | | DRAX GROUP PLC | | 316,682 | | 674,756 | | |
| 40,217 | | FERGUSON PLC | | 5,275,167 | | 7,732,964 | | |
| 41,500 | | FRASERS GROUP PLC(c) | | 437,788 | | 481,636 | | |
| 14,578 | | GAMES WORKSHOP GROUP PLC | | 1,215,545 | | 1,834,029 | | |
| 80,331 | | GSK PLC | | 1,296,250 | | 1,484,917 | | |
| 23,259 | | HALEON PLC ADR(e) | | 141,587 | | 191,422 | | |
| 47,273 | | HSBC HOLDINGS PLC ADR(e) | | 1,366,273 | | 1,916,447 | | |
| 13,311 | | INCHCAPE PLC | | 79,317 | | 121,398 | | |
| 25,000 | | INFORMA PLC | | 150,330 | | 248,939 | | |
| 6,095 | | INTERTEK GROUP PLC | | 263,505 | | 329,871 | | |
| 518,146 | | J SAINSBURY PLC | | 1,239,535 | | 1,998,536 | | |
| 29,785 | | JOHNSON MATTHEY PLC | | 563,804 | | 644,464 | | |
| 234,700 | | JUPITER FUND MANAGEMENT PLC | | 895,723 | | 279,416 | | |
| 317,088 | | KINGFISHER PLC | | 820,444 | | 983,361 | | |
| 6,008 | | LAND SECURITIES GROUP PLC | | 44,636 | | 53,974 | | |
| 7,455,949 | | LLOYDS BANKING GROUP PLC | | 4,944,762 | | 4,534,228 | | |
| 6,030 | | LONDON STOCK EXCHANGE GROUP PLC | | 69,795 | | 712,813 | | |
| 278,852 | | M&G PLC | | 497,048 | | 790,496 | | |
| 370,300 | | MAN GROUP PLC/JERSEY | | 651,704 | | 1,097,879 | | |
| 27,190 | | MELROSE INDUSTRIES PLC | | 78,639 | | 196,648 | | |
| 456,400 | | MITIE GROUP PLC | | 439,408 | | 577,678 | | |
| 145,235 | | MORGAN ADVANCED MATERIALS PLC | | 467,561 | | 523,900 | | |
| 87,608 | | NATIONAL GRID PLC | | 1,075,428 | | 1,181,464 | | |
| 1,518 | | NATIONAL GRID PLC ADR(e) | | 85,245 | | 103,209 | | |
| 1 | | NATWEST GROUP PLC | | - | | 3 | | |
| 148,623 | | NATWEST GROUP PLC ADR(e) | | 420,566 | | 836,747 | | |
| 2,141 | | NEXT PLC | | 36,699 | | 221,542 | | |
| 123,700 | | OSB GROUP PLC | | 637,568 | | 732,554 | | |
| 199,288 | | PEARSON PLC | | 2,080,268 | | 2,449,285 | | |
| 79,693 | | PHOENIX GROUP HOLDINGS PLC | | 448,649 | | 543,660 | | |
| 217,800 | | QINETIQ GROUP PLC | | 947,859 | | 857,842 | | |
| 8,289 | | RECKITT BENCKISER GROUP PLC | | 303,157 | | 572,654 | | |
| 151,700 | | REDDE NORTHGATE PLC | | 615,982 | | 702,880 | | |
| 57,235 | | REDROW PLC | | 447,916 | | 449,036 | | |
| 384,600 | | REGIONAL REIT LTD.(d)(g) | | 487,088 | | 172,561 | | |
| 21,616 | | RELX PLC | | 156,210 | | 854,772 | | |
| 183,813 | | RELX PLC (LONDON EXCHANGE) | | 2,548,998 | | 7,286,645 | | |
| 120,868 | | ROLLS-ROYCE HOLDINGS PLC(c) | | 107,369 | | 461,731 | | |
| 241,240 | | RS GROUP PLC | | 2,656,948 | | 2,520,242 | | |
| 24,928 | | SAGE GROUP (THE) PLC | | 108,477 | | 372,556 | | |
| 73,436 | | SEGRO PLC | | 593,626 | | 829,717 | | |
| 251,400 | | SERCO GROUP PLC | | 450,433 | | 519,445 | | |
| 4,954 | | SEVERN TRENT PLC | | 76,220 | | 162,854 | | |
| 1 | | SHELL PLC | | - | | 33 | | |
| 28,480 | | SHELL PLC ADR(e) | | 1,380,420 | | 1,873,984 | | |
| 414,000 | | SPEEDY HIRE PLC | | 294,411 | | 173,615 | | |
| 108,800 | | STANDARD CHARTERED PLC | | 699,097 | | 924,454 | | |
| 82,413 | | STHREE PLC | | 315,585 | | 439,100 | | |
| 12,700 | | STOLT-NIELSEN LTD. | | 390,340 | | 389,379 | | |
| 148,000 | | TP ICAP GROUP PLC | | 641,118 | | 368,430 | | |
| 126,800 | | TYMAN PLC | | 343,290 | | 508,313 | | |
| 138,197 | | UNILEVER PLC | | 7,111,058 | | 6,693,807 | | |
| See accompanying notes to financial statements. | 104 | (Continued) |
CLEARWATER INVESTMENT TRUST
Schedule of Investments - Clearwater International Fund
December 31, 2023
| Shares | | Security | | Cost | | Fair value (a) | | Percent of
net assets |
| United Kingdom (Cont'd): | | | | | | |
| 3,192 | | UNILEVER PLC ADR(e) | | $ 117,253 | | 154,748 | | |
| 8,137 | | UNITED UTILITIES GROUP PLC | | 56,989 | | 109,889 | | |
| 2,756 | | WHITBREAD PLC | | 54,937 | | 128,433 | | |
| 27,611 | | WILLIS TOWERS WATSON PLC | | 6,143,025 | | 6,659,773 | | |
| 94,600 | | WINCANTON PLC | | 471,523 | | 376,215 | | |
| 261,904 | | WISE PLC, CLASS A(c) | | 2,149,173 | | 2,917,726 | | |
| 2 | | WPP PLC | | 15 | | 19 | | |
| 3,418 | | WPP PLC ADR(e) | | 138,696 | | 162,594 | | |
| | | | | 93,835,118 | | 121,865,810 | | 12.00% |
| United States: | | | | | | |
| 23,592 | | AON PLC, CLASS A | | 5,455,711 | | 6,865,744 | | |
| 210,924 | | ARCH CAPITAL GROUP LTD.(c) | | 7,067,151 | | 15,665,325 | | |
| 40,000 | | BROOKFIELD RENEWABLE CORP., CLASS A | | 934,625 | | 1,151,600 | | |
| 22,056 | | ELASTIC N.V.(c) | | 1,687,305 | | 2,485,711 | | |
| 12,420 | | EPAM SYSTEMS, INC.(c) | | 5,205,464 | | 3,692,963 | | |
| 80,708 | | LIBERTY GLOBAL LTD., CLASS A(c) | | 2,249,780 | | 1,434,181 | | |
| 57,550 | | LIBERTY GLOBAL LTD., CLASS C(c) | | 1,685,769 | | 1,072,732 | | |
| 11,569 | | LINDE PLC | | 3,845,830 | | 4,751,504 | | |
| 57,621 | | SENSATA TECHNOLOGIES HOLDING PLC | | 3,138,865 | | 2,164,821 | | |
| 25,289 | | STERIS PLC | | 4,244,379 | | 5,559,787 | | |
| | | | | 35,514,879 | | 44,844,368 | | 4.42% |
| Uruguay: | | | | | | |
| 13,063 | | GLOBANT S.A.(c) | | 2,204,343 | | 3,108,733 | | |
| 6,181 | | MERCADOLIBRE, INC.(c) | | 8,659,048 | | 9,713,689 | | |
| | | | | 10,863,391 | | 12,822,422 | | 1.26% |
| Vietnam: | | | | | | |
| 584,195 | | FPT CORP. | | 1,773,579 | | 2,313,954 | | |
| | | | | 1,773,579 | | 2,313,954 | | 0.23% |
| | | Sub-total Common Stocks: | | 703,332,883 | | 967,892,878 | | 95.32% |
| Preferred Stocks: | | | | | | |
| Brazil: | | | | | | |
| 263,400 | | CIA DE SANENA DO PARANA(c) | | 350,151 | | 318,870 | | |
| 179,200 | | CIA ENERGETICA DE MINAS GERAIS, 0.51%(h) | | 357,186 | | 422,548 | | |
| | | | | 707,337 | | 741,418 | | 0.07% |
| Chile: | | | | | | |
| 223,300 | | EMBOTELLADORA ANDINA S.A., CLASS B, 5.66%(h) | | 477,638 | | 555,075 | | |
| | | | | 477,638 | | 555,075 | | 0.05% |
| Germany: | | | | | | |
| 1,521 | | BAYERISCHE MOTOREN WERKE A.G., 9.80%(h) | | 49,612 | | 151,036 | | |
| 27,400 | | JUNGHEINRICH A.G., 2.28%(h) | | 758,041 | | 1,004,846 | | |
| 1,772 | | PORSCHE AUTOMOBIL HOLDING S.E., 5.70%(h) | | 82,185 | | 90,611 | | |
| 272 | | SARTORIUS A.G., 0.49%(h) | | 45,992 | | 100,052 | | |
| 2,800 | | STO S.E. & CO. KGAA, 0.25%(h) | | 304,841 | | 432,130 | | |
| | | | | 1,240,671 | | 1,778,675 | | 0.18% |
| South Korea: | | | | | | |
| 79,865 | | SAMSUNG ELECTRONICS CO. LTD., 2.50%(h) | | 3,317,974 | | 3,851,235 | | |
| | | | | 3,317,974 | | 3,851,235 | | 0.38% |
| | | Sub-total Preferred Stocks: | | 5,743,620 | | 6,926,403 | | 0.68% |
| Warrants: | | | | | | |
| Canada: | | | | | | |
| 307 | | CONSTELLATION SOFTWARE, INC.(c)(f) | | - | | - | | |
| | | | | - | | - | | 0.00% |
| | | Sub-total Warrants: | | - | | - | | 0.00% |
| Participatory Notes: | | | | | | |
| United Kingdom: | | | | | | |
| 225,415 | | RYANAIR HOLDINGS PLC, ISSUED BY HSBC BANK PLC, EXPIRES 10/31/24(c) | | 3,496,839 | | 4,749,764 | | |
| | | | | 3,496,839 | | 4,749,764 | | 0.47% |
| | | Sub-total Participatory Notes: | | 3,496,839 | | 4,749,764 | | 0.47% |
| Short-Term Investments: | | | | | | |
| 8,061,365 | | FIDELITY INVESTMENTS MONEY MARKET GOVERNMENT PORTFOLIO, INSTITUTIONAL SHARES(i) | | 8,061,365 | | 8,061,365 | | |
| See accompanying notes to financial statements. | 105 | (Continued) |
CLEARWATER INVESTMENT TRUST
Schedule of Investments - Clearwater International Fund
December 31, 2023
| Shares | | Security | | Cost | | Fair value (a) | | Percent of
net assets |
| Short-Term Investments: | |
| 38,094,637 | | NORTHERN INSTITUTIONAL FUNDS - U.S. GOVERNMENT SELECT PORTFOLIO, INSTITUTIONAL SHARES, 5.24%(j) | | $ 38,094,637 | | 38,094,637 | | |
| | | Sub-total Short-Term Investments: | | 46,156,002 | | 46,156,002 | | 4.55% |
| | | Grand total | | $ 758,729,344 | | 1,025,725,047 | | 101.02% |
| Notes to Schedule of Investments: |
| (a) | Investments are valued in accordance with procedures described in Note 2 to the financial statements. |
| (b) | Security is either wholly or partially on loan. |
| (c) | Non-income producing assets. |
| (d) | Securities exempt from registration under Rule 144A of the Securities Act of 1933. These securities may be resold in transactions exempt from registration, normally to qualified institutional buyers. The value of these securities is determined by valuations supplied by a pricing service or brokers, or, if not available, in accordance with procedures established by the Board of Trustees of Clearwater Investment Trust. |
| (e) | Securities are American Depositary Receipts of companies based outside of the United States representing 2.14% of net assets as of December 31, 2023. |
| (f) | Security has been deemed worthless and is a Level 3 investment. |
| (g) | Restricted security that has been deemed illiquid. At December 31, 2023, the value of these restricted illiquid securities amounted to $172,561 or 0.02% of net assets. Additional information on these restricted illiquid securities is as follows: |
| SECURITY | ACQUISITION DATE | ACQUISITION COST |
| Regional REIT Ltd. | 1/7/22 | $ 487,088 |
| (h) | Current yield is disclosed. Dividends are calculated based on a percentage of the issuer’s net income. |
| (i) | Investment relates to cash collateral received from portfolio securities loaned. |
| (j) | The short-term investment is a money market portfolio of the investment company, Northern Institutional Funds. At December 31, 2022, the value of the Clearwater International Equity Fund's investment in the U.S. Government Select Portfolio of the Northern Institutional Funds was $22,771,623 with net purchases of $15,323,014 during the year ended December 31, 2023. |
At December 31, 2023, the industry sectors for the International Fund were:
| Industry Sector | | Percent of
Long-Term
Investments |
| Communication Services | | 3.74% |
| Consumer Discretionary | | 13.12 |
| Consumer Staples | | 8.28 |
| Energy | | 3.49 |
| Financials | | 17.12 |
| Health Care | | 10.67 |
| Industrials | | 20.18 |
| Information Technology | | 15.91 |
| Materials | | 5.06 |
| Real Estate | | 1.32 |
| Utilities | | 1.11 |
| | | 100.00% |
At December 31, 2023, the International Fund’s investments were denominated in the following currencies:
| Concentration by Currency | | Percent of
Long-Term
Investments |
| Euro | | 21.88% |
| United States Dollar | | 16.68 |
| Japanese Yen | | 12.49 |
| See accompanying notes to financial statements. | 106 | (Continued) |
CLEARWATER INVESTMENT TRUST
Schedule of Investments - Clearwater International Fund
December 31, 2023
| Concentration by Currency | | Percent of
Long-Term
Investments |
| British Pound | | 12.22 |
| Swiss Franc | | 8.56 |
| Other currencies | | 28.17 |
| | | 100.00% |
| See accompanying notes to financial statements. | 107 | (Continued) |
CLEARWATER INVESTMENT TRUST
Schedule of Investments - Clearwater International Fund
December 31, 2023
Clearwater International Fund Portfolio Diversification
(as a percentage of net assets)
| See accompanying notes to financial statements. | 108 | (Continued) |
Item 1. Reports to Stockholders (cont.).
Item 2. Code of Ethics
As of December 31, 2023, the Board of Trustees of Clearwater Investment Trust (the “Trust”) has adopted a code of ethics that applies to the Trust’s President/Principal Executive Officer and Treasurer/Principal Financial Officer (“Code of Ethics”). For the fiscal year ended December 31, 2023, there were no amendments to any provision of the Code of Ethics, nor were there any waivers granted from a provision of the Code of Ethics.
Item 3. Audit Committee Financial Expert
The Board of Trustees of the Trust consists of eight members, six of whom are Independent Trustees as defined by the Investment Company Act of 1940, as amended (the “1940 Act”). The Board of Trustees does not include an “audit committee financial expert” (as defined in Item 3 of Form N-CSR). Given the restrictive nature of the definition of an “audit committee financial expert,” the Board of Trustees has determined that no current member of the Board of Trustees of the Trust qualifies as an “audit committee financial expert.” Furthermore, the Board of Trustees has determined that given the nature of investment company financial statements in general and the investment policies of the Trust’s fund offerings in particular that the Independent Trustees possess the necessary skills and experience to perform the functions of the Audit Committee.
Item 4. Principal Accountant Fees and Services
| | | | | | | | | | |
| | | 2023 | | | 2022 | |
(a) Audit Fees | | $ | 129,400 | | | $ | 125,435 | |
(b) Audit-Related Fees | | $ | 0 | | | $ | 0 | |
(c) Tax Fees1 | | $ | 69,973 | | | $ | 41,633 | |
(d) All Other Fees | | $ | 0 | | | $ | 0 | |
| 1 | Tax Fees are the aggregate amount billed by the Trust’s principal accountant for tax compliance, tax advice, international tax reclaim filings and tax planning during the fiscal year. |
(e)
| | 1. | The audit committee has adopted pre-approval policies and procedures regarding the provision of audit or non-audit services to the Trust, as described in paragraph (c)(7) of Rule 2-01 of Regulation S-X. |
The policies and procedures provide that, if pre-approval of non-audit services is requested other than at a regularly scheduled Audit Committee Meeting, Fund management shall present such request to the Audit Committee Chair, or committee member if a Chair is not designated, for review of the proposal and determination if a special session of the Audit Committee is required. If the Chair or member determines the request requires a special session, the Audit Committee Chair will call a session per standard protocols and invite non-members as required. If the request is deemed in adherence to the independence of the auditor and to the benefit of the Fund, the Chair or designee may grant the pre-approval without a special session.
The Chair, designee or Audit Committee shall review the purpose, terms and risks of the request in addition to assurances of maintaining auditor independence and adherence to Regulation S-X, paragraph (c)(7) of Rule 2-01. If the pre-approval request is approved, the request will be presented at the next regularly scheduled Audit Committee for ratification.
| | 2. | No services were pre-approved by the audit committee pursuant to paragraph (c)(7)(i)(C) of Rule 2-01 of Regulation S-X. |
| | (g) | Non-Audit Related Fees Provided to the Trust or to the Trust’s Investment Adviser. |
| | | | |
2023=$18,050 | | | 2022= $17,190 | |
| | (h) | For the most recent fiscal year, the Audit Committee has determined that the provision of non-audit services to Clearwater Management Company and its affiliates was compatible with maintaining the principal accountant’s independence. |
Item 5. Audit Committee of Listed Registrants
Not applicable (the Funds are not listed issuers).
Item 6. Investments
| (a) | Schedule of Investments is included as part of the report to shareholders filed under Item 1 of this report on Form N-CSR. |
Item 7. Disclosure of Proxy Voting Policies and Procedures for Closed-End Management Investment Companies
Not applicable (the Trust is an open-end management investment company).
Item 8. Portfolio Managers of Closed-End Management Investment Companies
Not applicable (the Trust is an open-end management investment company).
Item 9. Purchases of Equity Securities by Closed-End Management Investment Company and Affiliated Purchasers
Not applicable (the Trust is an open-end management investment company).
Item 10. Submission of Matters to a Vote of Security Holders
There have been no material changes to the procedures by which shareholders may recommend nominees to the Board of Trustees.
Item 11. Controls and Procedures
| (a) | The Trust’s principal executive officer and principal financial officer have concluded that the Trust’s disclosure controls and procedures (as defined in Rule 30a-3(c) under the Investment Company Act of 1940, as amended (the “1940 Act”)) are effective based on the principal executive officer and principal financial officer’s evaluation of these controls and procedures, as required by Rule 30a-3(b) under the 1940 Act, as of a date within 90 days of the filing date of this document. |
| (b) | There have been no significant changes in the Trust’s internal control over financial reporting (as defined in Rule 30a-3(d) under the 1940 Act) that occurred during the period covered by this report that have materially affected, or are reasonably likely to materially affect, the Trust’s internal control over financial reporting. |
Item 12. Disclosure of Securities Lending Activities for Closed-End Management Investment Companies
Not applicable (the Trust is an open-end management investment company).
Item 13. Recovery of Erroneously Awarded Compensation
Item 14. Exhibits
SIGNATURES
Pursuant to the requirements of the Securities Exchange Act of 1934 and the Investment Company Act of 1940, the registrant has duly caused this report to be signed on its behalf by the undersigned, thereunto duly authorized.
| | |
| Clearwater Investment Trust |
| |
| By | | /s/ Justin H. Weyerhaeuser |
| | Justin H. Weyerhaeuser |
| | President (Principal Executive Officer) and |
| | Treasurer (Principal Financial Officer) |
| |
| Date: | | March 1, 2024 |
Pursuant to the requirements of the Securities Exchange Act of 1934 and the Investment Company Act of 1940, this report has been signed below by the following persons on behalf of the registrant and in the capacities and on the dates indicated.
| | |
| Clearwater Investment Trust |
| |
| By | | /s/ Justin H. Weyerhaeuser |
| | Justin H. Weyerhaeuser |
| | President (Principal Executive Officer) |
| |
| Date: | | March 1, 2024 |
|
| Clearwater Investment Trust |
| |
| By | | /s/ Justin H. Weyerhaeuser |
| | Justin H. Weyerhaeuser |
| | Treasurer (Principal Financial Officer) |
| |
| Date: | | March 1, 2024 |