UNITED STATES
SECURITIES AND EXCHANGE COMMISSION
Washington, D.C. 20549
FORM N-CSR
CERTIFIED SHAREHOLDER REPORT OF REGISTERED
MANAGEMENT INVESTMENT COMPANIES
Investment Company Act file number 811-05038
Clearwater Investment Trust
(Exact name of registrant as specified in charter)
2000 Wells Fargo Place, 30 East 7th Street, Saint Paul, Minnesota 55101-4930
(Address of principal executive offices) (Zip code)
Karen P. Rau
Fiduciary Counselling, Inc.
2000 Wells Fargo Place, 30 E. 7th Street
Saint Paul, Minnesota 55101-4930
Copy to:
John V. O’Hanlon, Esq.
Dechert LLP
One International Place, 40th Floor
100 Oliver Street
Boston, Massachusetts 02110
(Name and address of agent for service)
Registrant’s telephone number, including area code: 651-228-0935
Date of fiscal year end: December 31
Date of reporting period: December 31, 2020
Item 1. Reports to Stockholders
| (a) | The following is a copy of the report transmitted to shareholders pursuant to Rule 30e-1 under the Investment Company Act of 1940 (17 CFR 270.30e-1) |
CLEARWATER INVESTMENT TRUST
Clearwater Core Equity Fund
Clearwater Select Equity Fund
(formerly, Clearwater Small Companies Fund)
Clearwater Tax-Exempt Bond Fund
Clearwater International Fund
Annual Report
for the year ended
December 31, 2020
Management Discussion of Clearwater Funds’ Performance
Clearwater Core Equity Fund
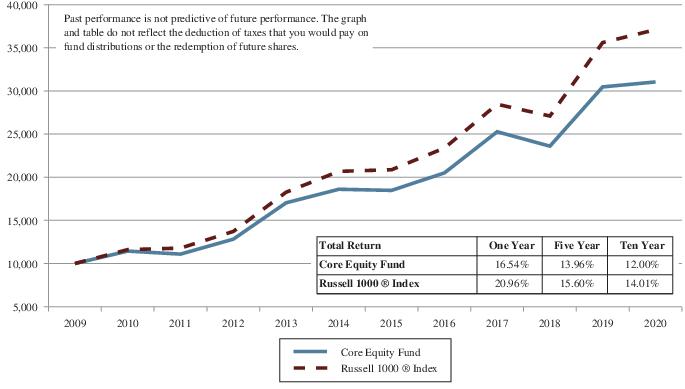
The Clearwater Core Equity Fund (the “Core Equity Fund” or the “Fund”) seeks long-term growth of capital. Under normal market conditions, the Core Equity Fund pursues its investment objective by investing at least 80% of its net assets, plus the amount of any borrowings for investment purposes, in equity securities of U.S. companies. The Core Equity Fund's assets are managed in a “multi-manager, multi-style” approach. As of December 31, 2020, the Fund had three subadvisers that provide day-to-day management of Fund assets. Parametric Portfolio Associates LLC (“Parametric”), with approximately 40% to 60% of the Fund’s assets, manages its portion of the Fund’s assets to track the Russell 1000® Index as closely as possible without requiring the Fund to realize taxable gains. The remaining Fund assets are divided between AQR Capital Management, LLC (“AQR”) and O’Shaughnessy Asset Management, LLC (“OSAM”), who both utilize an active management style.
2020 Market Overview:
Domestic large capitalization equities, as defined by the Russell 1000® Index, the Fund's benchmark (the "benchmark"), generated more than 20% returns in 2020, driven by the unprecedented levels of fiscal and monetary stimulus needed to combat the COVID-19 pandemic. The market was also propelled by large technology-oriented companies and the meteoric rise of electric vehicle maker, Tesla. Value stocks significantly underperformed growth stocks as measured by the Russell 1000® Value Index and the Russell 1000® Growth Index.
2020 Performance:
The Core Equity Fund gained 16.5%, net of fees, in 2020 compared to an increase of 21.0% for the benchmark.
Parametric, the subadviser that follows a tax-managed passive strategy, underperformed the benchmark in 2020. Both active managers, AQR and OSAM, underperformed the benchmark in 2020. OSAM underperformed by a larger margin than AQR due to OSAM’s larger overweight to companies with the cheapest valuations. These companies performed poorly in 2020 relative to companies with more expensive valuations.
From an overall portfolio perspective, sector positioning was neutral from a relative return standpoint. Underweight positions in Utilities and Energy helped to offset the negative impact of an overweight position in Financials. Stock selection was the primary driver of the Fund’s underperformance, particularly underweight positions in Amazon, Apple, Netflix, Microsoft and Tesla.
Clearwater Select Equity Fund
The Clearwater Select Equity Fund (the “Select Equity Fund” or the “Fund”) seeks long-term growth of capital. Under normal market conditions, the Fund invests at least 80% of its net assets, plus the amount of any borrowings for investment purposes, in equity securities. Equity securities consist primarily of exchange-traded common and preferred stocks and convertible securities. While the Fund is permitted to invest in securities of any market capitalization, the Fund invests primarily in securities of micro-, small- and medium-sized companies. The Fund uses a “multi-style, multi-manager” approach. The Fund’s adviser allocates portions of the Fund’s assets among subadvisers who employ distinct investment styles. The Fund currently allocates assets among the following subadvisers who provide day-to-day management for the Fund: Cooke & Bieler, L.P (“Cooke & Bieler”), Jackson Square Partners, LLC (“Jackson Square”), Kennedy Capital Management, Inc. (“KCM”), Parametric Portfolio Associates LLC (“Parametric”) and Pzena Investment Management LLC (“Pzena”). Parametric manages its portion of the Fund’s assets (approximately 10%) to track the S&P 600® Index as closely as possible without requiring the Fund to realize taxable gains. The other subadvisers utilize an active management style and manage the remaining 90% of the Fund. The performance of each subadviser is compared to the Fund’s benchmark below, although each subadviser may manage its portion of the Fund against a different benchmark that aligns more closely with its strategy.
2020 Market Overview:
Domestic small capitalization equities, as defined by the Russell 2000® Index, the Fund’s benchmark (the “benchmark”), generated a 20% return in 2020, driven by the unprecedented levels of fiscal and monetary stimulus needed to combat the COVID-19 pandemic. Value stocks significantly underperformed growth stocks as measured by the Russell 2000® Value Index and the Russell 2000® Growth Index.
2020 Performance:
The Select Equity Fund gained 11.3%, net of fees, during 2020 compared to a gain of 20.0% for the benchmark.
The Fund’s underperformance was driven by the two subadvisers with the largest value tilts, as small capitalization value stocks significantly underperformed growth stocks in 2020. Pzena, the subadviser with the most value-oriented portfolio, underperformed the benchmark. Cooke and Bieler, the other value-oriented subadviser, performed better than Pzena but still underperformed the benchmark. KCM’s micro-capitalization strategy underperformed the benchmark as well. Parametric, the subadviser that follows a tax-managed passive strategy, outperformed the benchmark in 2020 as did Jackson Square, the subadviser that employs a growth-oriented strategy.
From an overall portfolio perspective, sector positioning detracted from a relative return standpoint, driven by an underweight position in Health Care and an overweight position in Financials. Poor stock selection in the Health Care, Industrials and Financials sectors was the primary driver of the Fund’s underperformance.
Clearwater Tax-Exempt Bond Fund
The Clearwater Tax-Exempt Bond Fund (the “Tax-Exempt Bond Fund” or the “Fund”) seeks high current income that is exempt from U.S. federal income tax, consistent with preservation of capital. Under normal market conditions, the Fund invests at least 80% of its net assets, plus the amount of any borrowings for investment purposes, in tax-exempt bonds, which are debt obligations issued by or for the U.S. states, territories, and possessions and the District of Columbia. The interest on these securities is generally exempt from both U.S. regular federal income tax and U.S. federal alternative minimum tax. However, the Fund may invest up to 20% of its assets in securities that generate interest income subject to federal alternative minimum tax for individuals. The Fund invests in both revenue bonds, which are backed by and payable only from the revenues derived from a specific facility or specific revenue source, and in general obligation bonds, which are secured by the full faith, credit and taxation power of the issuing municipality. The Fund’s subadviser, Sit Fixed Income Advisors II, LLC (“Sit”), provides day-to-day management for the Fund. It should be noted that the Fund is not a money market fund and is not intended to be a money market fund substitute. Under normal market conditions, the Fund’s investments may be more susceptible than a money market fund to interest rate risk and credit risks relevant to the Fund’s investments.
2020 Market Overview:
As defined by the Fund’s benchmark, the Barclays Municipal Bond 5 Year (4-6) Index (the “benchmark”), intermediate duration municipal bonds generated mid-single digit returns in 2020, supported by almost $40 billion of positive fund flows into tax-exempt municipal bond funds. The U.S. Federal Reserve cut short-term interest rates to near zero in response to the COVID-19 pandemic and U.S. Treasury yields hit record lows in March of 2020. The municipal bond yield curve steepened with short-term tax-exempt yields down roughly 90 basis points in 2020 compared to intermediate and long-term yields down 70-75 basis points.
As the economy suffered through various stages of shutdown in response to the pandemic, the impact on credit fundamentals was mixed. Credit spreads widened dramatically in the first half of the year in response to sharply negative fund flows, before tightening in the second half of the year. State government general fund revenue forecasts were decreased after the initial shock of the pandemic but revised upward in the latter half of the year. Nonetheless, states had to make cuts and, in some cases, draw on reserves to balance budgets.
2020 Performance:
The Tax-Exempt Bond Fund gained 4.2%, net of fees, in 2020 compared to an increase of 4.3% for the benchmark. In 2020, the Fund did not hedge interest rate risk by utilizing short positions in U.S. Treasury futures. The Fund’s average life duration, a measure of the Fund’s sensitivity to changes in interest rates, decreased from 4.9 years at the beginning of the year, to 4.5 years at the end of the year. For comparison, the benchmark had a duration of 3.9 years as of December 31, 2019 and December 31, 2020. The Fund’s longer duration and security selection of single-family mortgage revenue bonds aided performance. Another contributing factor was the Fund’s position in closed-end funds, which returned more than 9% in 2020.
Detracting from performance was the Fund’s 26% allocation to non-rated bonds. Non-rated bonds and lower investment grade rated bonds underperformed those of higher credit quality as investors reduced credit exposure in the spring. The Fund’s yield fell during the year, but the Fund continues to maintain a yield advantage over its benchmark.
Clearwater International Fund
The Clearwater International Fund (the “International Fund” or the “Fund”) seeks long-term growth of capital. The Fund generally invests at least 80% of the value of its net assets, plus the amount of any borrowings for investment purposes, in equity securities of companies organized or located outside the United States and doing a substantial amount of business outside the United States. The Fund diversifies its investments among many different countries throughout the world and may invest in companies of any size. The Fund uses a “multi-style, multi-manager” approach. The Fund’s adviser allocates portions of the Fund’s assets among subadvisers who employ distinct investment styles. The Fund currently has four subadvisers that provide day-to-day management of Fund assets. Parametric Portfolio Associates LLC (“Parametric”) manages its portion of the portfolio (approximately 30%) to track the MSCI World Ex U.S.A. Index – Net Dividends as closely as possible without requiring the Fund to realize taxable gains. The Fund’s other three subadvisers, Artisan Partners Limited Partnership (“Artisan”), LSV Asset Management (“LSV”) and WCM Investment Management, LLC (“WCM”), utilize an active management style and manage the remaining 70% of the Fund. WCM manages two strategies for the Fund – a large capitalization strategy and a small capitalization strategy. The performance of each subadviser is compared to the Fund’s benchmark below, although each subadviser may manage its portion of the Fund against a different benchmark that aligns more closely with its strategy.
2020 Market Overview:
As defined by the Fund’s benchmark, the MSCI World Ex U.S.A. Index - Net Dividends (the “benchmark”), large and mid-capitalization, international developed market stocks returned nearly 8% in 2020. International equities proved resilient in 2020, recovering from the sharp first quarter selloff due to the COVID-19 pandemic to finish the year in positive territory. A weakening dollar versus international currencies bolstered returns for U.S. dollar-based investors. There was wide performance dispersion at the sector level, with Technology leading by a meaningful margin. Conversely, Energy stocks performed very poorly. Value stocks significantly underperformed growth stocks as measured by the MSCI World Ex U.S.A. Value Index - Net Dividends and the MSCI World Ex U.S.A. Growth Index - Net Dividends. International small capitalization stocks outperformed international large capitalization stocks, as measured by the MSCI World Ex U.S.A. Index - Net Dividends and the MSCI World Ex U.S.A. Small Cap Index - Net Dividends.
2020 Performance:
The International Fund gained 19.0%, net of fees, in 2020 compared to an increase of 7.6% for the benchmark.
All of the Fund’s subadvisers outperformed the benchmark in 2020, with the exception of LSV. LSV’s strategy invests in small capitalization and value-oriented stocks – the segment of the international equity market that experienced the worst performance in 2020. WCM was the primary driver of the Fund’s outperformance, as both of its growth-oriented strategies performed very well. WCM’s small capitalization strategy in particular was a bright spot, generating a nearly 60% return in 2020. Artisan and Parametric outperformed the benchmark as well.
From an overall portfolio perspective, sector positioning was additive from a relative return standpoint, driven by an overweight position in Technology and underweight positions in Financials and Energy. Strong stock selection within the Technology, Industrials, Health Care, and Consumer Discretionary sectors was the primary driver of the Fund’s outperformance.
Comparison of the Change in Value of a $10,000 Investment in the Core Equity Fund and the Russell 1000® Index
Comparison of the Change in Value of a $10,000 Investment in the Select Equity Fund (formerly, Small Companies Fund) and the Russell 2000® Index
Comparison of the Change in Value of a $10,000 Investment in the Tax-Exempt Bond Fund and the Barclays Capital U.S. Municipal Bond 5 Year (4-6) Index
Comparison of the Change in Value of a $10,000 Investment in the International Fund and the MSCI World Ex U.S.A. Index - Net Dividends
Fund Expense Example
(unaudited)
As a shareholder of the Clearwater Core Equity Fund (“Core Equity Fund”), Clearwater Select Equity Fund (formerly, Clearwater Small Companies Fund) (“Select Equity Fund”), Clearwater Tax-Exempt Bond Fund (“Tax-Exempt Bond Fund”), and Clearwater International Fund (“International Fund” and together with the Core Equity Fund, Select Equity Fund and Tax-Exempt Bond Fund, the “Funds”), you incur costs, including management fees and other Fund expenses. This example is intended to help you understand your ongoing costs (in dollars) of investing in the Funds and to compare these costs with the ongoing costs of investing in other mutual funds. In addition to the ongoing costs which the Funds pay directly, you as a shareholder indirectly bear the expenses of any outside exchange traded funds or mutual funds in which the Funds invest. (These are also referred to as “acquired funds” and those indirect expenses represent the Funds’ pro rata portion of the cumulative expense charged by the acquired funds.)
The example provided is based on an investment of $1,000 invested at the beginning of the period and held for the six-month period ended December 31, 2020.
Actual Expenses
The first section of the table on the following page provides information about actual account values and actual expenses. You may use the information in this section, together with the amount you invested, to estimate the expenses that you incurred over the period. Simply divide your account value by $1,000 (for example, an $8,600 account value divided by $1,000 = $8.6), then multiply the result by the number in the first section under the heading entitled “Expenses Paid During the Period July 1, 2020 through December 31, 2020” to estimate the expenses attributable to your investment during this period.
Hypothetical Example for Comparison Purposes
The second section of the table below provides information about hypothetical account values and hypothetical expenses based on the Fund’s actual expense ratio and an assumed rate of return of 5% per year before expenses, which is not the Fund’s actual return. Thus, you should not use the hypothetical account values and expenses to estimate the actual ending account balance or your expenses for the period. Rather, these figures are provided to enable you to compare the ongoing costs of investing in the Funds and other mutual funds. To do so, compare this 5% hypothetical example with the 5% hypothetical examples that appear in the shareholder reports of the other mutual funds.
Please note that the expenses shown in the second section of the table are meant to highlight your ongoing costs only. Therefore, the second section of the table is useful in comparing ongoing costs only, and will not help you compare the relative total costs of the Funds to other mutual funds that charge transaction costs and/or sales charges or redemption fees.
| Actual returns | Beginning Account
Value July 1, 2020 | Ending Account Value
December 31, 2020 | Expenses Paid During the
Period July 1, 2020 through
December 31, 2020* |
| Core Equity Fund | $1,000.00 | $1,232.40 | $1.74 |
| Select Equity Fund | $1,000.00 | $1,374.70 | $5.54 |
| Tax-Exempt Bond Fund | $1,000.00 | $1,044.10 | $1.49 |
| International Fund | $1,000.00 | $1,281.40 | $3.82 |
Hypothetical 5% return
(before expenses) | | | |
| Core Equity Fund | $1,000.00 | $1,023.58 | $1.58 |
| Select Equity Fund | $1,000.00 | $1,020.47 | $4.72 |
| Tax-Exempt Bond Fund | $1,000.00 | $1,023.68 | $1.48 |
| International Fund | $1,000.00 | $1,021.79 | $3.38 |
| * | Expenses are equal to the Fund’s annualized expense ratios, multiplied by the average account value over the period, multiplied by 184/366 (to reflect the one-half year period). Expense ratios for the most recent one-half year period may differ from expense ratios based on one-year data in the Financial Highlights. |
The annualized expense ratios (reflecting voluntary fee waivers in effect during the period) are as follows:
| | |
| Core Equity Fund | 0.31% |
| Select Equity Fund | 0.94% |
| Tax-Exempt Bond Fund | 0.29% |
| International Fund | 0.66% |
Approval of Investment Management and Subadvisory Agreements
Clearwater Management Co., Inc. (“CMC”) is responsible for managing the investment programs and strategies for the Core Equity Fund, Select Equity Fund (formerly, Small Companies Fund), Tax-Exempt Bond Fund, and International Fund (collectively, the “Funds”). CMC also provides other administrative services to the Funds and these services, as well as its investment management services, are provided to the Funds under an agreement (the “Management Agreement”). CMC conducts due diligence when selecting each subadviser (collectively, the “Subadvisers”) for the Funds and oversees the performance of the Subadvisers. The Subadvisers provide portfolio management and related services for the Funds under individual subadvisory agreements (the “Subadvisory Agreements”).
The Trust’s Board of Trustees (the “Board” or “Trustees”) met periodically throughout the year to address a broad range of agenda items. For example, at each regularly scheduled meeting, the Trustees reviewed information about the investment performance and financial results of the Funds. On an annual basis, the Trustees, including the Trustees who are not “interested persons” of the Trust (the “Independent Trustees”), consider the renewal of the Management Agreement and the Subadvisory Agreements. In addition, the Trustees periodically consider the retention of new subadvisers.
Approval of Subadvisory Agreement – Jackson Square Partners, LLC (Select Equity Fund)
At a meeting held on September 18, 2020, the Trustees considered a new subadvisory agreement with Jackson Square Partners, LLC (“Jackson Square”) (the “Jackson Square Agreement”) for the Select Equity Fund. At this meeting, the Trustees met with representatives of Jackson Square and received a presentation discussing Jackson Square’s organizational structure, background, and investment philosophy and process.
In advance of the meeting on September 18, 2020, the Trustees received written information that included: information as to the proposed allocation of assets among the Fund’s subadvisers; a summary of information about Jackson Square, including its investment professionals, process, philosophy, past performance and proposed subadvisory fees; and report from the Trust’s Interim Chief Compliance Officer as to her review of Jackson Square’s compliance program.
At the September 18, 2020 meeting, counsel to the Select Equity Fund and Trustees reviewed with the Trustees the various factors relevant to their consideration of the Jackson Square Agreement and the Trustees’ responsibilities related to their review. The Trustees reviewed and analyzed a number of factors that the Trustees deemed relevant with respect to the Jackson Square Agreement. These factors included: the nature, extent, and quality of the services to be provided to the Fund by Jackson Square; Jackson Square’s investment process; Jackson Square’s historical performance record for its SMID-Cap Growth strategy; the qualifications and experience of the investment professionals who would be responsible for the management of their allocation of the Fund’s assets; and Jackson Square’s overall resources.
No single factor determined whether or not the agreement would be approved but rather the totality of factors considered was determinative. Following an analysis and discussion of the factors described below, the Trustees, including all of the Independent Trustees, approved the Jackson Square Agreement.
Nature, Extent, and Quality of Services Provided
The Trustees considered the specific investment processes Jackson Square would use in managing its allocation of the Fund’s assets. The Trustees looked at the qualifications of Jackson Square’s investment team who would be responsible for managing its allocation of the Fund’s assets. The Trustees concluded that the nature, extent, and quality of the subadvisory services expected to be provided by Jackson Square were appropriate for the Fund.
Investment Performance
The Trustees discussed Jackson Square’s performance record for the strategy it would use in managing its allocation of the Fund’s assets as compared to its strategy benchmark and the Fund’s benchmark. The Trustees noted that the strategy’s performance compared favorably to its strategy benchmark for the period since its inception in April 2005. The Trustees concluded that this data supported the decision to approve the Jackson Square Agreement.
Subadvisory Fee
The Trustees evaluated the proposed subadvisory fee schedule, which was negotiated at arm’s length by CMC. The Trustees noted that CMC, not the Fund, would pay the subadvisory fee to Jackson Square. The Trustees concluded that the proposed subadvisory fee schedule was reasonable given the nature, extent and quality of the subadvisory services to be performed by Jackson Square.
Benefits to the Subadviser
The Trustees considered the ancillary benefits that could accrue to Jackson Square due to its relationship with the Fund and noted that the relationship would be limited to the provision of subadvisory services. The Trustees concluded that no significant ancillary benefits would result from the Jackson Square Agreement.
Profitability
The Trustees considered that Jackson Square is an independent firm and that the subadvisory fee to be charged is the result of arm’s length bargaining between Jackson Square and CMC.
Economies of Scale
The Trustees noted that CMC, not the Fund, would pay the subadvisory fee to Jackson Square and that the Trustees consider on an annual basis whether economies of scale might be realized by CMC as the Fund’s assets grow and whether there also might be benefits from such growth for the Fund’s shareholders.
Other Considerations
The Trustees considered CMC’s judgment and recommendation that adding Jackson Square as a subadviser would add value to the Fund’s shareholders and would be complementary to the Fund’s other subadvisers.
Conclusion
The Board considered that due to the COVID-19 pandemic, the Securities and Exchange Commission (“SEC”) had issued temporary exemptive relief from the in-person meeting requirements under Section 15(c) of the 1940 Act, permitting fund boards to approve investment advisory agreements telephonically or through the use of virtual communication where all participants can hear each other and be heard simultaneously. The Board noted that in accordance with a condition of the SEC relief, it would ratify all actions taken pursuant to the relief at its next in-person meeting.
After full consideration of the factors described above along with other information, with no single factor identified as being of paramount importance, the Trustees, including all of the Independent Trustees, concluded that the approval of the Jackson Square Agreement was in the best interests of the Fund and its shareholders and approved the Jackson Square Agreement, with the proposed fee to be paid by CMC out of its management fee.
Approval of Investment Management and Subadvisory Agreements (All Funds)
At their meetings on November 6 and December 10, 2020, the Trustees considered the renewal of the Management Agreement and the Subadvisory Agreements for AQR Capital Management, LLC, Artisan Partners Limited Partnership, Cooke & Bieler, L.P., Fiduciary Counselling, Inc. (“FCI”), Kennedy Capital Management, Inc., O’Shaughnessy Asset Management, LLC, Parametric Portfolio Associates LLC (“Parametric”) (with respect to the Core Equity Fund and International Fund), Pzena Investment Management, LLC, Sit Fixed Income Advisors II, LLC, LSV Asset Management and WCM Investment Management, LLC. In addition, in connection with an anticipated transaction in which Morgan Stanley is expected to acquire Eaton Vance Corp., Parametric’s parent company, resulting in a change of control of Parametric (the “Transaction”), the Trustees considered new Subadvisory Agreements for Parametric with respect to each of the Core Equity Fund, Select Equity Fund and International Fund (the “New Parametric Agreements” and, collectively with the Management Agreement and Subadvisory Agreements, the “Agreements”). The Trustees considered that they had approved a Subadvsory Agreement for Parametric with respect to the Select Equity Fund during their June 18, 2020 meeting. The Trustees noted that the New Parametric Agreements would take effect upon the closing of the Transaction and the termination of the current Subadvisory Agreements with Parametric (“Current Parametric Agreements”).
Prior to the November 6, 2020 meeting, the Trustees requested, received, and reviewed written responses from CMC and the Subadvisers to questions posed to them on behalf of the Trustees and supporting materials relating to those questions and responses. The information presented at the meeting, including comparative performance and expense data, was designed to assist the Trustees in making their determination as to the renewal of the Management Agreement and Subadvisory Agreements and the approval of the New Parametric Agreements. At this meeting, counsel to the Funds and Trustees reviewed with the Trustees the various factors relevant to their consideration of the Agreements, and the Trustees’ responsibilities related to their review.
At the November 6 and December 10, 2020 meetings, the Trustees considered a number of factors, including those discussed below, that they believed to be relevant. No single factor determined whether or not an agreement would be approved but rather the totality of factors considered was determinative. In considering the approval of the New Parametric Agreements, the Trustees considered that the terms and conditions of the New Parametric Agreements are substantially identical to the terms and conditions of the Current Parametric Agreements. Following an analysis and discussion of the factors described below, the Trustees, including all of the Independent Trustees, approved the renewal of the Management Agreement and the Subadvisory Agreements and approved the New Parametric Agreements.
Nature, Extent, and Quality of Services Provided
The Trustees considered information presented as to the nature, extent, and quality of services provided by CMC and the Subadvisers, as well as their investment expertise, resources, and capabilities. The Trustees considered the quality of the Subadvisers previously recommended by CMC, as well as the ongoing work performed by CMC to recommend enhancements to individual fund management. The Trustees reviewed information regarding the financial condition of CMC and the Subadvisers related to their ongoing ability to provide services specified under the Management Agreement and Subadvisory Agreements. The Trustees considered that FCI provides, in addition to investment management services, certain services related to due diligence, performance reporting, compliance, and other administrative functions that support the investment management services and Subadviser oversight services provided by CMC.
The Trustees considered that there are no material changes expected with respect to the nature, extent or quality of services provided to the Funds and their shareholders under the New Parametric Agreements. In addition, the Trustees noted that that there would be no changes to the portfolio management team that is primarily responsible for the day-to-day management of the Funds in connection with the Transaction. The Trustees also reviewed information regarding the anticipated impact of the change in control on the management structure and personnel of Parametric.
Based on their analysis of the data presented, the Trustees concluded that they were generally satisfied with the nature and quality of the services being provided under the Agreements.
Investment Performance
The Trustees reviewed specific information as to the investment performance of the Funds over various periods of time as compared to the performance of their respective benchmark indices and peer groups. On a quarterly basis, the Trustees reviewed reports summarizing the net assets, redemptions, and purchases of shares of the Funds, as well as information regarding the performance of each Subadviser compared to the benchmark against which its particular portfolio is measured. The Trustees concluded that they were generally satisfied with CMC’s and the Subadvisers’ investment performance to date.
Comparative Fees and Cost of Services Provided
The Trustees reviewed the fees paid to CMC and the Subadvisers. The Trustees reviewed reports describing both the management fees charged by CMC and the total expense ratios of the Funds in comparison to those of similarly situated funds. In addition, on a quarterly basis, the Trustees reviewed information as to the expense ratios of the Funds compared to the median expense ratio of a peer group of funds with comparable investment strategies. The Trustees considered that the fees payable to Parametric under the New Parametric Agreements would not differ from those under the Current Parametric Agreements. The Trustees also reviewed information provided by each of the Subadvisers as to fees they charge to other clients, as applicable.
The Trustees noted the ongoing efforts of CMC to reduce expenses charged to shareholders through oversight of service providers and by voluntarily waiving a portion of the management fee payable to CMC as specified in the Funds’ prospectus. In this regard, the Board considered that, effective January 1, 2020, CMC has voluntarily agreed to waive: (i) the management fee for the Core Equity Fund from the contractual fee of 0.90% to 0.31%; and (ii) the management fee for the Tax-Exempt Bond Fund from the contractual fee of 0.60% to 0.29%. Further, the Board considered that, effective October 1, 2020, CMC has voluntarily agreed to waive: (i) the management fee for the Select Equity Fund from the contractual fee of 1.35% to 0.91%; and (ii) the management fee for the International Fund from the contractual fee of 1.00% to 0.68%.
Management Profitability
The Trustees reviewed CMC’s level of profitability with respect to the Funds, particularly noting CMC’s payment of fees and expenses typically absorbed by mutual fund shareholders. The Trustees concluded that profitability levels for CMC were reasonable. The Trustees considered that the Subadvisers are each independent firms and the subadvisory fees charged are the result of arm’s length bargaining between them and CMC.
Economies of Scale
The Trustees considered whether economies of scale might be realized by CMC as the Funds’ assets grow and whether there also might be benefits from such growth for the Funds’ shareholders. The Trustees noted that the Funds have been in operation for a number of years and, based on their distribution strategy, the Funds will probably not see significant increases in size. However, the Trustees determined that they would continue to monitor the assets of the Funds and consider whether there were additional opportunities to realize benefits from economies of scale for shareholders in the future.
Conclusion
The Board considered that due to the COVID-19 pandemic, the SEC had issued temporary exemptive relief from the in-person meeting requirements under Section 15(c) of the 1940 Act, permitting fund boards to approve investment advisory agreements telephonically or through the use of virtual communication where all participants can hear each other and be heard simultaneously. The Board noted that in accordance with a condition of the SEC relief, it would ratify all actions taken pursuant to the relief at its next in-person meeting. Based on the factors described above, the Trustees, including all of the Independent Trustees, concluded that the investment management fees and subadvisory fees were fair and reasonable in view of the investment performance and quality of services provided. In reaching this conclusion, no single factor was considered determinative.
Quarterly Portfolio Schedule of Investments
The Funds file a complete schedule of their portfolio holdings as of the close of the first and third quarters of their fiscal years with the Securities and Exchange Commission (the “SEC”) on Form N-PORT. Shareholders may request portfolio holdings information free of charge by calling the Transfer Agent toll free at 1- 855-684-9144 or by sending a written request to: The Northern Trust Company, P.O. Box 4766, Chicago, IL 60680-4766 Attn: Clearwater Investment Trust Funds. These filings are also available on the SEC's Internet site at http://www.sec.gov.
Voting Proxies on Fund Portfolio Securities
The Funds have established Proxy Voting Policies and Procedures (“Policies”) that the Funds use to determine how to vote proxies relating to portfolio securities. They also report, on Form N-PX, how the Funds voted any such proxies during the most recent 12-month period ended June 30. Shareholders may request copies of the Policies or Form N-PX free of charge by calling Fiduciary Counselling, Inc. toll free at 1-888-228-0935 or by sending a written request to: Fiduciary Counselling, Inc., 30 East 7th Street, Suite 2000, St. Paul, MN 55101 Attn: Clearwater Investment Trust Funds. Form N-PX is also available from the EDGAR database on the SEC's Internet site at http://www.sec.gov.
EXECUTIVE OFFICERS AND TRUSTEES
(As of February 2020)
Information About the Independent Trustees
| Name and Age | Positions Held With the Funds | Term of Office | Principal Occupation or Employment During the Last Five Years and Other Relevant Experience | Number of Portfolios in the Fund Complex to Be Overseen by the Trustee | Other Directorships Held by the Trustee During the Last 5 Years |
Charles W. Rasmussen1(54)
30 East 7th Street
Saint Paul,
Minnesota 55101 | Trustee, Chair of the Board | As Trustee:
Tenure: 2000 - Present
Term: Indefinite
As Chair
Tenure: 2020 - Present
Term: Indefinite | President and Chief Executive Officer, P&G Manufacturing, Inc. (air filtration equipment, 2002- Present) | 4 | Forest History Society. (non-profit, 2018-Present) Nu Star Inc. (private company 2014- Present) |
Sara G. Dent (62)
30 East 7th Street
Saint Paul,
Minnesota 55101 | Trustee, Chair of the Governance and Nominating Committee | As Trustee:
Tenure: 2013- Present
Term: Indefinite
As Chair of the Governance and Nominating Committee:
Tenure: 2019 - Present
Term: Indefinite | Private Investor | 4 | None |
Laura E. Rasmussen1 (57)
30 East 7th Street
Saint Paul,
Minnesota 55101 | Trustee, Chair of the Audit Committee | As Trustee:
Tenure: 2000- Present
Term: Indefinite
As Chair of the Audit Committee:
Tenure: 2016 – Present
Term: Indefinite | Business Owner, 3 Kittens Needle Arts (textile sales, 2006- Present) | 4 | None |
Lindsay R. Schack (43)
30 East 7th Street
Saint Paul,
Minnesota 55101 | Trustee | Tenure: 2015- Present
Term: Indefinite | Owner and Architect, LS Architecture (2013 – Present) | 4 | None |
David M. Weyerhaeuser (62)
30 East 7th Street
Saint Paul,
Minnesota 55101 | Trustee | Tenure: 2016- Present
Term: Indefinite | Vice President, Sales and Marketing, Northwest Hardwoods (lumber manufacturer and distributor, 1991 – 2016) | 4 | Chicago Capital, LLC
(investment adviser, 2018 - Present)
R.D. Merrill Company, Inc. (private company, 1992 – Present) |
1 Mr. Rasmussen and Ms. Rasmussen are siblings-in-law.
Information about the Funds’ Executive Officers and Interested Trustees
| Name and Age | Positions Held With the Funds | Term of Office | Principal Occupation or Employment During the Last Five Years and Other Relevant Experience | Number of Portfolios in the Fund Complex to Be Overseen by the Officer/ Trustee | Other Directorships Held by the Officer/ Trustee During the Last 5 Years |
E. Rodman Titcomb, Jr.2(72)
30 East 7th Street
Saint Paul,
Minnesota 55101 | Trustee | Tenure: 2016 – Present
Term: Indefinite | Retired Chairman and Chief Executive
Officer, Rock Island
Company (Private
Investment Company)
(1998-2013) | 4 | None |
Justin H. Weyerhaeuser
3(47)
30 East 7th Street
Saint Paul,
Minnesota 55101 | Trustee, President and Treasurer | As Trustee:
Tenure: 2008 – Present
Term: Indefinite
As President and Treasurer
Tenure: 2013- Present
Term: Reappointed Annually | Private Investor (February 2013 - Present) | 4 | None |
Karen P. Rau (61)
30 East 7th Street Saint Paul, Minnesota 55101 | Secretary and Interim Chief Compliance Officer | As Secretary:
Tenure: 2020 – Present
Term: Reappointed Annually
As Interim Chief Compliance Officer:
Tenure: 2020 – Present
Term: Reappointed Annually | Chief Compliance
Officer, Fiduciary
Counselling, Inc.
(February 2020-Present),
Chief Compliance
Officer, Clearwater
Management Co., Inc.
(February 2020-Present), Senior Compliance
Analyst, Fiduciary
Counselling, Inc.
(August 2016-February
2020), Regional
Manager, Fifth Third Bank (October 2013-
July 2016) | N/A | N/A |
Shari L. Clifford (52)
30 East 7th Street
Saint Paul,
Minnesota 55101 | Assistant Treasurer | Tenure: 2014 - Present
Term: Reappointed Annually | Chief Financial Officer and Treasurer, Fiduciary Counselling, Inc. (February 2014-Present) Controller and Finance Director, Woodbury Financial Services, Inc. November 2007 - February 2014) | N/A | N/A |
2 Mr. Titcomb is an interested Trustee due to his brother’s position as a director of CMC.
3 Mr. Justin H. Weyerhaeuser is an interested Trustee due to his position as the Funds’ President and Treasurer.
Additional information about the Funds' Directors is available in the Funds’ Statement of Additional Information (“SAI”). The SAI is available without charge, upon request, by contacting the transfer agent at 1-855-684-9144 or writing the Funds at The Northern Trust Company, P.O. Box 4766, Chicago, IL 60680-4766. The Funds do not have an internet website.
Federal Tax Information
(unaudited)
Qualified Dividend Income. Under the Jobs and Growth Tax Relief Reconciliation Act of 2003 (the “Act”), 100.00% of ordinary dividends paid during the fiscal year ended December 31, 2020 for the Core Equity Fund, 100.00% of ordinary dividends paid during the fiscal year ended December 31, 2020 for the Select Equity Fund, and 100.00% of ordinary dividends paid during the fiscal year ended December 31, 2020 for the International Fund are designated as “qualified dividend income”, as defined in the Act, subject to reduced tax rates in 2020.
Corporate Dividends-Received Deduction. 100.00%, 100.00%, and 0.48% of the dividends distributed during the fiscal year ended December 31, 2020, for the Core Equity, Select Equity, and International Funds, respectively, qualify for the dividends-received deduction for corporate shareholders.
Capital Gain Distribution. The following Funds made capital gain distributions in December 2020, and hereby designated these long-term capital gain distributions as follows:
| Fund | Long-Term Capital Gain |
| Core Equity Fund | $ 2,728,041 |
| Select Equity Fund | 6,877,368 (1) |
| Tax-Exempt Bond Fund | — |
| International Fund | 8,082,763 (2) |
| (1) | During the fiscal year 2020, Select Equity Fund designated long-term capital gain distributions in the amount of $6,883,562. Select Equity Fund utilized equalization accounting for tax purposes, whereby a portion of redemption payments were treated as distributions of long-term capital gain. As a result the Fund paid long-term capital gain distributions in the amount of $6,877,368. |
| (2) | During the fiscal year 2020, International Fund designated long-term capital gain distributions in the amount of $8,197,302. International Fund utilized equalization accounting for tax purposes, whereby a portion of redemption payments were treated as distributions of long-term capital gain. As a result the Fund paid long-term capital gain distributions in the amount of $8,082,763. |
Clearwater Investment Trust
Financial Statements
For the Fiscal Year Ended December 31, 2020
Table of Contents
Report of Independent Registered Public Accounting Firm
To the Shareholders and Board of Trustees
Clearwater Investment Trust:
Opinion on the Financial Statements
We have audited the accompanying statements of assets and liabilities of Clearwater Core Equity Fund, Clearwater Select Equity Fund, Clearwater Tax-Exempt Bond Fund, and Clearwater International Fund (collectively, the Funds), including the schedules of investments, as of December 31, 2020, the related statements of operations for the year then ended, the statements of changes in net assets for each of the years in the two-year period then ended, and the related notes (collectively, the financial statements) and the financial highlights for each of the years in the five-year period then ended. In our opinion, the financial statements and financial highlights of each Fund present fairly, in all material respects, the financial position of each Fund as of December 31, 2020, the results of its operations for the year then ended, the changes in its net assets for each of the years in the two-year period then ended, and the financial highlights for each of the years in the five-year period then ended, in conformity with U.S. generally accepted accounting principles.
Basis for Opinion
These financial statements and financial highlights are the responsibility of the Funds’ management. Our responsibility is to express an opinion on these financial statements and financial highlights based on our audits. We are a public accounting firm registered with the Public Company Accounting Oversight Board (United States) (PCAOB) and are required to be independent with respect to the Funds in accordance with the U.S. federal securities laws and the applicable rules and regulations of the Securities and Exchange Commission and the PCAOB.
We conducted our audits in accordance with the standards of the PCAOB. Those standards require that we plan and perform the audit to obtain reasonable assurance about whether the financial statements and financial highlights are free of material misstatement, whether due to error or fraud. Our audits included performing procedures to assess the risks of material misstatement of the financial statements and financial highlights, whether due to error or fraud, and performing procedures that respond to those risks. Such procedures included examining, on a test basis, evidence regarding the amounts and disclosures in the financial statements and financial highlights. Such procedures also included confirmation of securities owned as of December 31, 2020, by correspondence with custodians and brokers. Our audits also included evaluating the accounting principles used and significant estimates made by management, as well as evaluating the overall presentation of the financial statements and financial highlights. We believe that our audits provide a reasonable basis for our opinion.
/s/ KPMG LLP
We have served as the auditor of one or more Clearwater Investment Trust investment companies since 1992.
Minneapolis, Minnesota
February 24, 2021
CLEARWATER INVESTMENT TRUST
Statements of Assets and Liabilities
December 31, 2020
| | | Core Equity
Fund | | Select Equity
Fund | | Tax-Exempt
Bond Fund | | International
Fund |
| Assets | | | | | | | | |
| Investments in securities, at fair value (including securities on loan of: $0, $5,350,655, $0 and $8,943,913, respectively); (identified cost: $281,004,811, $374,644,528, $580,742,803 and $542,331,698, respectively) | $ | 619,868,886 | | 466,007,970 | | 610,664,220 | | 871,654,734 |
| Foreign currencies, at value (cost: $0, $0, $0 and $2,596,734, respectively) | | - | | - | | - | | 2,678,656 |
| Receivable for securities sold | | - | | 1,663,488 | | 140,000 | | 3,129,542 |
| Receivable for shares of beneficial interest sold | | 1,669,100 | | - | | 1,188,400 | | 1,255,500 |
| Accrued dividend and interest receivable | | 509,999 | | 212,786 | | 5,604,845 | | 812,076 |
| Foreign tax reclaim receivable | | 2,296 | | - | | - | | 1,190,698 |
| Unrealized appreciation on forward foreign currency exchange contracts | | - | | - | | - | | 14,142 |
| Total assets | | 622,050,281 | | 467,884,244 | | 617,597,465 | | 880,735,348 |
| Liabilities | | | | | | | | |
| Payables for investment securities purchased | | 4,512,208 | | 5,392,914 | | 102,615 | | 1,288,896 |
| Payable for fund shares redeemed | | 104,072 | | 130,593 | | 97,871 | | 36,334 |
| Accrued investment advisory fee | | 449,598 | | 924,733 | | 440,625 | | 1,344,762 |
| Payable for dividend distribution | | - | | - | | 117,486 | | - |
| Payable upon return of securities loaned | | - | | 5,461,693 | | - | | 9,468,993 |
| Unrealized depreciation on forward foreign currency exchange contracts | | - | | - | | - | | 211,290 |
| Deferred foreign capital gains taxes payable | | - | | - | | - | | 600,841 |
| Total liabilities | | 5,065,878 | | 11,909,933 | | 758,597 | | 12,951,116 |
| Net assets | $ | 616,984,403 | | 455,974,311 | | 616,838,868 | | 867,784,232 |
| Capital | | | | | | | | |
| Capital Stock and additional paid-in capital (authorized unlimited number of shares at no par value for each Fund: 11,195,004, 22,699,366, 60,850,118 and 43,035,492 shares outstanding, respectively) | $ | 293,614,266 | | 361,640,267 | | 590,478,417 | | 532,363,234 |
| Distributable earnings | | 323,370,137 | | 94,334,044 | | 26,360,451 | | 335,420,998 |
| Net assets | $ | 616,984,403 | | 455,974,311 | | 616,838,868 | | 867,784,232 |
| Net asset value per share of outstanding capital stock | $ | 55.11 | | 20.09 | | 10.14 | | 20.16 |
See accompanying notes to financial statements.
CLEARWATER INVESTMENT TRUST
Statements of Operations
Year ended December 31, 2020
| | | Core Equity
Fund | | Select Equity
Fund | | Tax-Exempt
Bond Fund | | International
Fund |
| Investment income: | | | | | | | | |
| Income: | | | | | | | | |
| Dividends (net of foreign taxes withheld of $7,728, $2,444, $0 and $1,231,612, respectively) | $ | 9,415,528 | | 5,631,152 | | 1,569,647 | | 12,606,711 |
| Interest | | - | | 46,379 | | 23,165,771 | | 1,992 |
| Net income from securities loaned | | - | | 28,704 | | - | | 143,213 |
| Total income | | 9,415,528 | | 5,706,235 | | 24,735,418 | | 12,751,916 |
| Expenses: | | | | | | | | |
| Investment advisory fee | | 4,697,362 | | 4,691,221 | | 3,584,581 | | 6,961,354 |
| Voluntary fee reduction | | (3,079,374) | | (1,430,646) | | (1,852,028) | | (2,377,141) |
| Other expenses | | 185 | | - | | - | | 185 |
| Total net expenses | | 1,618,173 | | 3,260,575 | | 1,732,553 | | 4,584,398 |
| Net investment income | | 7,797,355 | | 2,445,660 | | 23,002,865 | | 8,167,518 |
| Net realized gain (loss) on: | | | | | | | | |
| Security transactions | | 12,227,897 | | 11,929,774 | | 385,724 | | 17,827,731 |
| Forward foreign currency exchange contracts | | - | | - | | - | | (367,915) |
| Foreign currency transactions | | - | | - | | - | | 20,599 |
| Net increase (decrease) in unrealized appreciation/depreciation on: | | | | | | | | |
| Security transactions (net of increase (decrease) in deferred foreign taxes of $0, $0, $0 and $(396,374), respectively) | | 64,243,645 | | 45,122,529 | | 619,138 | | 113,778,857 |
| Forward foreign currency exchange contracts | | - | | - | | - | | (172,271) |
| Translation of other assets and liabilities denominated in foreign currencies | | - | | - | | - | | 143,106 |
| Net gain (loss) on investments | | 76,471,542 | | 57,052,303 | | 1,004,862 | | 131,230,107 |
| Net increase (decrease) in net assets resulting from operations | $ | 84,268,897 | | 59,497,963 | | 24,007,727 | | 139,397,625 |
See accompanying notes to financial statements.
CLEARWATER INVESTMENT TRUST
Statements of Changes in Net Assets
Years ended December 31, 2020 and 2019
| | | Core Equity
Fund | | Select Equity
Fund |
| | | 12/31/2020 | | 12/31/2019 | | 12/31/2020 | | 12/31/2019 |
| Operations: | | | | | | | | |
| Net investment income | $ | 7,797,355 | | 7,810,733 | | 2,445,660 | | 2,201,885 |
| Net realized gain | | 12,227,897 | | 39,171,072 | | 11,929,774 | | 7,694,544 |
| Net increase in unrealized appreciation/depreciation | | 64,243,645 | | 81,303,827 | | 45,122,529 | | 69,837,002 |
| Net increase in net assets resulting from operations | | 84,268,897 | | 128,285,632 | | 59,497,963 | | 79,733,431 |
| Distributions to shareholders | | (10,529,448) | | (9,748,573) | | (9,407,511) | | (7,557,886) |
| Capital share transactions: | | | | | | | | |
| Proceeds from shares sold | | 63,017,560 | | 46,023,492 | | 50,471,692 | | 7,397,888 |
| Reinvestment of distributions from net investment income and net realized gain | | 10,528,034 | | 9,732,390 | | 9,377,725 | | 7,557,886 |
| Payments for shares redeemed | | (73,471,942) | | (87,995,545) | | (27,390,079) | | (19,627,687) |
| Net increase (decrease) in net assets from capital share transactions | | 73,652 | | (32,239,663) | | 32,459,338 | | (4,671,913) |
| Total increase in net assets | | 73,813,101 | | 86,297,396 | | 82,549,790 | | 67,503,632 |
| Net assets: | | | | | | | | |
| At the beginning of the year | | 543,171,302 | | 456,873,906 | | 373,424,521 | | 305,920,889 |
| At the end of the year | $ | 616,984,403 | | 543,171,302 | | 455,974,311 | | 373,424,521 |
| | | Tax-Exempt
Bond Fund | | International
Fund |
| | | 12/31/2020 | | 12/31/2019 | | 12/31/2020 | | 12/31/2019 |
| Operations: | | | | | | | | |
| Net investment income | $ | 23,002,865 | | 22,637,160 | | 8,167,518 | | 11,402,417 |
| Net realized gain (loss) | | 385,724 | | (3,127,404) | | 17,480,415 | | 12,114,317 |
| Net increase in unrealized appreciation/depreciation | | 619,138 | | 21,211,388 | | 113,749,692 | | 118,505,646 |
| Net increase in net assets resulting from operations | | 24,007,727 | | 40,721,144 | | 139,397,625 | | 142,022,380 |
| Distributions to shareholders | | (24,360,229) | | (24,064,555) | | (16,448,467) | | (20,986,457) |
| Capital share transactions: | | | | | | | | |
| Proceeds from shares sold | | 40,880,400 | | 65,972,600 | | 42,915,665 | | 76,508,600 |
| Reinvestment of distributions from net investment income and net realized gain | | 24,589,531 | | 23,964,450 | | 16,448,468 | | 20,986,457 |
| Payments for shares redeemed | | (51,555,147) | | (32,802,047) | | (26,380,075) | | (31,388,422) |
| Net increase in net assets from capital share transactions | | 13,914,784 | | 57,135,003 | | 32,984,058 | | 66,106,635 |
| Total increase in net assets | | 13,562,282 | | 73,791,592 | | 155,933,216 | | 187,142,558 |
| Net assets: | | | | | | | | |
| At the beginning of the year | | 603,276,586 | | 529,484,994 | | 711,851,016 | | 524,708,458 |
| At the end of the year | $ | 616,838,868 | | 603,276,586 | | 867,784,232 | | 711,851,016 |
See accompanying notes to financial statements.
CLEARWATER INVESTMENT TRUST
Financial Highlights
Per share data (rounded to the nearest cent) for a share of capital stock outstanding throughout the years or period ended and selected information for each year or period ended is as follows:
| | | | Year ended December 31, | |
Core Equity
Fund | | | 2020 | | 2019 | | 2018 | | 2017 | | 2016 |
| Net asset value, beginning of year | | $ | 48.14 | | 37.97 | | 43.21 | | 37.43 | | 35.57 |
| Income (loss) from investment operations: | | | | | | | | | | | |
| Net investment income | | | 0.71 | | 0.72 | | 0.68 | | 0.64 | | 0.65 |
| Net realized and unrealized gains (losses) | | | 7.22 | | 10.32 | | (3.46) | | 8.03 | | 3.27 |
| Total from investment operations | | | 7.93 | | 11.04 | | (2.78) | | 8.67 | | 3.92 |
| Less distributions to shareholders from: | | | | | | | | | | | |
| Net investment income | | | (0.71) | | (0.66) | | (0.67) | | (0.65) | | (0.49) |
| Net realized gain | | | (0.25) | | (0.21) | | (1.79) | | (2.24) | | (1.57) |
| Total distributions to shareholders: | | | (0.96) | | (0.87) | | (2.46) | | (2.89) | | (2.06) |
| Net asset value, end of year | | $ | 55.11 | | 48.14 | | 37.97 | | 43.21 | | 37.43 |
| Total return (a) | | | 16.54 % | | 29.11 % | | (6.61)% | | 23.26 % | | 10.98 % |
| Net assets, end of year (000s omitted) | | $ | 616,984 | | 543,171 | | 456,874 | | 538,392 | | 466,482 |
| Ratio of expenses, net of waivers, to average net assets (b), (c), (d), (e), (f), (g) | | | 0.31 % | | 0.35 % | | 0.38 % | | 0.39 % | | 0.43 % |
| Ratio of expenses, before waivers, to average net assets (b), (c), (d), (e), (f), (g) | | | 0.90 % | | 0.90 % | | 0.90 % | | 0.90 % | | 0.90 % |
| Ratio of net investment income (loss), net of waivers, to average net assets (c), (d), (e), (f), (g) | | | 1.49 % | | 1.54 % | | 1.47 % | | 1.51 % | | 1.63 % |
| Ratio of net investment income (loss), before waivers, to average net assets (c), (d), (e), (f), (g) | | | 0.90 % | | 0.99 % | | 0.95 % | | 1.00 % | | 1.16 % |
| Portfolio turnover rate (excluding short-term securities) | | | 37.16 % | | 33.73 % | | 34.64 % | | 31.13 % | | 44.11 % |
| | |
| (a) | Total return figures are based on the change in net asset value of a share during the year and assume reinvestment of distributions at net asset value. |
| (b) | In addition to fees and expenses which the Fund bears directly, the Fund indirectly bears a pro rata share of the fees and expenses of any acquired funds in which it invests. Such indirect expenses are not included in the above reported expense ratios. |
| (c) | Effective January 1, 2020, the investment advisory fee, net of voluntary waivers, decreased to 0.31%. Also effective January 1, 2020, the Adviser increased the voluntary waiver to 0.59%. |
| (d) | Effective December 12, 2018, the investment advisory fee, net of voluntary waivers, decreased to 0.35%. Also effective December 12, 2018, the Adviser increased the voluntary waiver to 0.55%. |
| (e) | Effective September 22, 2017, the investment advisory fee, net of voluntary waivers, increased to 0.38%. Also effective September 22, 2017, the Adviser decreased the voluntary waiver to 0.52%. |
| (f) | Effective March 16, 2017, the investment advisory fee, net of voluntary waivers, decreased to 0.37%. Also effective March 16, 2017, the Adviser increased the voluntary waiver to 0.53%. |
| (g) | Effective March 16, 2016, the investment advisory fee, net of voluntary waivers, increased to 0.44%. Also effective March 16, 2016, the Adviser decreased the voluntary waiver to 0.46%. |
See accompanying notes to financial statements.
CLEARWATER INVESTMENT TRUST
Financial Highlights
Per share data (rounded to the nearest cent) for a share of capital stock outstanding throughout the years or period ended and selected information for each year or period ended is as follows:
| | | | Year ended December 31, | |
Select Equity
Fund | | | 2020 | | 2019 | | 2018 | | 2017 | | 2016 |
| Net asset value, beginning of year | | $ | 18.45 | | 14.90 | | 18.92 | | 19.79 | | 17.18 |
| Income (loss) from investment operations: | | | | | | | | | | | |
| Net investment income | | | 0.11 | | 0.14 | | 0.07 | | 0.02 | | 0.07 |
| Net realized and unrealized gains (losses) | | | 1.95 | | 3.79 | | (2.37) | | 2.58 | | 3.30 |
| Total from investment operations | | | 2.06 | | 3.93 | | (2.30) | | 2.60 | | 3.37 |
| Less distributions to shareholders from: | | | | | | | | | | | |
| Net investment income | | | (0.11) | | (0.11) | | (0.07) | | (0.03) | | (0.05) |
| Net realized gain | | | (0.31) | | (0.27) | | (1.65) | | (3.44) | | (0.71) |
| Total distributions to shareholders: | | | (0.42) | | (0.38) | | (1.72) | | (3.47) | | (0.76) |
| Net asset value, end of year | | $ | 20.09 | | 18.45 | | 14.90 | | 18.92 | | 19.79 |
| Total return (a) | | | 11.25 % | | 26.40 % | | (12.49)% | | 13.46 % | | 19.67 % |
| Net assets, end of year (000s omitted) | | $ | 455,974 | | 373,425 | | 305,921 | | 369,720 | | 343,393 |
| Ratio of expenses, net of waivers, to average net assets (b), (c), (d), (e), (f), (g), (h) | | | 0.94 % | | 0.98 % | | 1.03 % | | 0.99 % | | 1.02 % |
| Ratio of expenses, before waivers, to average net assets (b), (c), (d), (e), (f), (g), (h) | | | 1.35 % | | 1.35 % | | 1.35 % | | 1.35 % | | 1.35 % |
| Ratio of net investment income (loss), net of waivers, to average net assets (c), (d), (e), (f), (g), (h) | | | 0.70 % | | 0.64 % | | 0.33 % | | 0.11 % | | 0.28 % |
| Ratio of net investment income (loss), before waivers, to average net assets (c), (d), (e), (f), (g), (h) | | | 0.29 % | | 0.27 % | | 0.01 % | | (0.25)% | | (0.05)% |
| Portfolio turnover rate (excluding short-term securities) | | | 102.30 % | | 64.32 % | | 63.08 % | | 113.85 % | | 78.82 % |
| | |
| (a) | Total return figures are based on the change in net asset value of a share during the year and assume reinvestment of distributions at net asset value. |
| (b) | In addition to fees and expenses which the Fund bears directly, the Fund indirectly bears a pro rata share of the fees and expenses of any acquired funds in which it invests. Such indirect expenses are not included in the above reported expense ratios. |
| (c) | Effective October 1, 2020, the investment advisory fee, net of voluntary waivers, decreased to 0.91%. Also effective October 1, 2020, the Adviser increased the voluntary waiver to 0.44%. |
| (d) | Effective January 1, 2020, the investment advisory fee, net of voluntary waivers, decreased to 0.95%. Also effective January 1, 2020, the Adviser increased the voluntary waiver to 0.40%. |
| (e) | Effective December 12, 2018, the investment advisory fee, net of voluntary waivers, decreased to 0.98%. Also effective December 12, 2018, the Adviser increased the voluntary waiver to 0.37%. |
| (f) | Effective September 22, 2017, the investment advisory fee, net of voluntary waivers, increased to 1.03%. Also effective September 22, 2017, the Adviser decreased the voluntary waiver to 0.32%. |
| (g) | Effective March 16, 2017, the investment advisory fee, net of voluntary waivers, decreased to 0.96%. Also effective March 16, 2017, the Adviser increased the voluntary waiver to 0.39%. |
| (h) | Effective March 16, 2016, the investment advisory fee, net of voluntary waivers, increased to 1.03%. Also effective March 16, 2016, the Adviser decreased the voluntary waiver to 0.32%. |
See accompanying notes to financial statements.
CLEARWATER INVESTMENT TRUST
Financial Highlights
Per share data (rounded to the nearest cent) for a share of capital stock outstanding throughout the years or period ended and selected information for each year or period ended is as follows:
| | | | Year ended December 31, | |
Tax-Exempt
Bond Fund | | | 2020 | | 2019 | | 2018 | | 2017 | | 2016 |
| Net asset value, beginning of year | | $ | 10.13 | | 9.82 | | 10.21 | | 9.93 | | 10.16 |
| Income (loss) from investment operations: | | | | | | | | | | | |
| Net investment income | | | 0.39 | | 0.40 | | 0.42 | | 0.45 | | 0.46 |
| Net realized and unrealized gains (losses) | | | 0.03 | | 0.34 | | (0.26) | | 0.38 | | (0.23) |
| Total from investment operations | | | 0.42 | | 0.74 | | 0.16 | | 0.83 | | 0.23 |
| Less distributions to shareholders from: | | | | | | | | | | | |
| Net investment income | | | (0.41) | | (0.43) | | (0.45) | | (0.49) | | (0.44) |
| Net realized gain | | | - | | - | | (0.10) | | (0.06) | | (0.02) |
| Total distributions to shareholders: | | | (0.41) | | (0.43) | | (0.55) | | (0.55) | | (0.46) |
| Net asset value, end of year | | $ | 10.14 | | 10.13 | | 9.82 | | 10.21 | | 9.93 |
| Total return (a) | | | 4.26 % | | 7.69 % | | 1.59 % | | 8.54 % | | 2.28 % |
| Net assets, end of year (000s omitted) | | $ | 616,839 | | 603,277 | | 529,485 | | 525,156 | | 484,856 |
| Ratio of expenses, net of waivers, to average net assets (b), (c), (d) | | | 0.29 % | | 0.32 % | | 0.34 % | | 0.34 % | | 0.34 % |
| Ratio of expenses, before waivers, to average net assets (b), (c), (d) | | | 0.60 % | | 0.60 % | | 0.60 % | | 0.60 % | | 0.60 % |
| Ratio of net investment income (loss), net of waivers, to average net assets (c), (d) | | | 3.85 % | | 4.05 % | | 4.22 % | | 4.35 % | | 4.54 % |
| Ratio of net investment income (loss), before waivers, to average net assets (c), (d) | | | 3.54 % | | 3.77 % | | 3.96 % | | 4.09 % | | 4.28 % |
| Portfolio turnover rate (excluding short-term securities) | | | 17.21 % | | 12.53 % | | 11.36 % | | 13.28 % | | 13.48 % |
| | |
| (a) | Total return figures are based on the change in net asset value of a share during the year and assume reinvestment of distributions at net asset value. |
| (b) | In addition to fees and expenses which the Fund bears directly, the Fund indirectly bears a pro rata share of the fees and expenses of any acquired funds in which it invests. Such indirect expenses are not included in the above reported expense ratios. |
| (c) | Effective January 1, 2020, the investment advisory fee, net of voluntary waivers, decreased to 0.29%. Also effective January 1, 2020, the Adviser increased the voluntary waiver to 0.31%. |
| (d) | Effective December 12, 2018, the investment advisory fee, net of voluntary waivers, decreased to 0.32%. Also effective December 12, 2018, the Adviser increased the voluntary waiver to 0.28%. |
See accompanying notes to financial statements.
CLEARWATER INVESTMENT TRUST
Financial Highlights
Per share data (rounded to the nearest cent) for a share of capital stock outstanding throughout the years or period ended and selected information for each year or period ended is as follows:
| | | | Year ended December 31, | |
International
Fund | | | 2020 | | 2019 | | 2018 | | 2017 | | 2016 |
| Net asset value, beginning of year | | $ | 17.28 | | 14.08 | | 17.23 | | 14.04 | | 14.02 |
| Income (loss) from investment operations: | | | | | | | | | | | |
| Net investment income | | | 0.20 | | 0.29 | | 0.30 | | 0.27 | | 0.27 |
| Net realized and unrealized gains (losses) | | | 3.07 | | 3.43 | | (2.70) | | 3.44 | | 0.02 |
| Total from investment operations | | | 3.27 | | 3.72 | | (2.40) | | 3.71 | | 0.29 |
| Less distributions to shareholders from: | | | | | | | | | | | |
| Net investment income | | | (0.17) | | (0.30) | | (0.29) | | (0.30) | | (0.27) |
| Net realized gain | | | (0.22) | | (0.22) | | (0.46) | | (0.22) | | - (a) |
| Total distributions to shareholders: | | | (0.39) | | (0.52) | | (0.75) | | (0.52) | | (0.27) |
| Net asset value, end of year | | $ | 20.16 | | 17.28 | | 14.08 | | 17.23 | | 14.04 |
| Total return (b) | | | 19.02 % | | 26.47 % | | (14.01)% | | 26.54 % | | 2.09 % |
| Net assets, end of year (000s omitted) | | $ | 867,784 | | 711,851 | | 524,708 | | 624,642 | | 508,999 |
| Ratio of expenses, net of waivers, to average net assets (c), (d), (e), (f), (g), (h) | | | 0.66 % | | 0.68 % | | 0.68 % | | 0.67 % | | 0.70 % |
| Ratio of expenses, before waivers, to average net assets (c), (d), (e), (f), (g), (h) | | | 1.00 % | | 1.00 % | | 1.00 % | | 1.00 % | | 1.00 % |
| Ratio of net investment income (loss), net of waivers, to average net assets (d), (e), (f), (g), (h) | | | 1.17 % | | 1.88 % | | 1.79 % | | 1.67 % | | 1.90 % |
| Ratio of net investment income (loss), before waivers, to average net assets (d), (e), (f), (g), (h) | | | 0.83 % | | 1.56 % | | 1.47 % | | 1.34 % | | 1.60 % |
| Portfolio turnover rate (excluding short-term securities) | | | 39.61 % | | 49.69 % | | 19.57 % | | 36.17 % | | 37.21 % |
| | |
| (a) | Per share amounts from distributions paid from net realized gain were less than $0.01 per share. |
| (b) | Total return figures are based on the change in net asset value of a share during the year and assume reinvestment of distributions at net asset value. |
| (c) | In addition to fees and expenses which the Fund bears directly, the Fund indirectly bears a pro rata share of the fees and expenses of any acquired funds in which it invests. Such indirect expenses are not included in the above reported expense ratios. |
| (d) | Effective October 1, 2020, the investment advisory fee, net of voluntary waivers, increased to 0.68%. Also effective October 1, 2020, the Adviser decreased the voluntary waiver to 0.32%. |
| (e) | Effective January 1, 2020, the investment advisory fee, net of voluntary waivers, decreased to 0.65%. Also effective January 1, 2020, the Adviser increased the voluntary waiver to 0.35%. |
| (f) | Effective September 22, 2017, the investment advisory fee, net of voluntary waivers, increased to 0.68%. Also effective September 22, 2017, the Adviser decreased the voluntary waiver to 0.32%. |
| (g) | Effective March 16, 2017, the investment advisory fee, net of voluntary waivers, decreased to 0.65%. Also effective March 16, 2017, the Adviser increased the voluntary waiver to 0.35%. |
| (h) | Effective March 16, 2016, the investment advisory fee, net of voluntary waivers, increased to 0.70%. Also effective March 16, 2016, the Adviser decreased the voluntary waiver to 0.30%. |
See accompanying notes to financial statements.
CLEARWATER INVESTMENT TRUST
Notes to Financial Statements
December 31, 2020
(1) Organization
Clearwater Investment Trust (the “Trust”) was established on January 12, 1987 as a Massachusetts business trust and is registered under the Investment Company Act of 1940, as amended (the “1940 Act”), as a diversified open end management investment company and presently includes four series: Clearwater Core Equity Fund (“Core Equity Fund”), Clearwater Select Equity Fund (formerly, Clearwater Small Companies Fund) ("Select Equity Fund"), Clearwater Tax-Exempt Bond Fund (“Tax-Exempt Bond Fund”), and Clearwater International Fund (“International Fund” and together with the Core Equity Fund, Select Equity Fund and Tax-Exempt Bond Fund, the “Funds”). Clearwater Management Co., Inc. (the “Adviser”) serves as the investment adviser for each of the Funds and is responsible for the oversight of each of the Fund’s subadvisers. The Trust’s declaration of trust permits the Board of Trustees to create additional funds in the future. The investment objective of the Core Equity, Select Equity, and International Funds is long-term capital growth. The investment objective of the Tax-Exempt Bond Fund is high current income that is exempt from United States (“U.S.”) federal income tax, consistent with preservation of capital.
Fiduciary Counselling, Inc. (“FCI”) acts as subadviser to each of the Funds. FCI does not provide day-to-day management, but provides the Funds with various investment-related services, including investment strategy advice, manager recommendations and related duties as requested by the Adviser. FCI also provides certain services related to due diligence, performance reporting, compliance, and other administrative functions, which support the investment management services and subadviser oversight services provided to the Funds by the Adviser.
The Northern Trust Company serves as the custodian, administrator, accounting services agent and transfer agent for the Trust.
Under normal market conditions, the Core Equity Fund pursues its investment objective by investing at least 80% of its net assets, plus the amount of any borrowings for investment purposes, in equity securities of U.S. companies. The equity securities in which the Fund primarily invests are common and preferred stocks. The Fund employs a multi-style (growth and value) and multi-manager approach whereby portions of the Fund are allocated to different subadvisers who employ distinct investment styles. The Fund’s Adviser allocates portions of the Fund’s assets among subadvisers. The Fund currently allocates assets among the following subadvisers who provide day-to-day management for the Fund: Parametric Portfolio Associates LLC (“Parametric”), AQR Capital Management, LLC (“AQR”), and O’Shaughnessy Asset Management, LLC (“OSAM”). The allocation among subadvisers will vary over time, but the current intent of the Fund’s Adviser is that under normal market conditions approximately 40% to 60% of the Fund’s total assets will be allocated to Parametric; the remaining assets will be allocated to one or more of the Fund’s two other subadvisers that provide day-to-day management. Parametric manages its portion of the Fund’s assets using a passive management strategy to seek investment results that track, before fees and expenses, the investment results of the Russell 1000® Index as closely as possible without requiring the Fund to realize taxable gains. In addition, as noted above, FCI also acts as a subadviser to the Fund but does not provide day-to-day management.
Under normal market conditions, the Select Equity Fund invests at least 80% of its net assets, plus the amount of any borrowings for investment purposes, in equity securities. Equity securities in which the Fund invests consist primarily of exchange-traded common and preferred stocks. The Fund may also invest in a type of equity security called a convertible security to reduce volatility or correlation risk in the portfolio. A convertible security generally entitles the holder to receive interest paid or accrued on debt securities or the dividend paid on preferred stock until
CLEARWATER INVESTMENT TRUST
Notes to Financial Statements
December 31, 2020
the convertible security matures or is redeemed, converted or exchanged. While the Fund is permitted to invest in securities of any market capitalization, the Fund invests primarily in securities of micro-, small- and medium-sized companies. The Fund uses a “multi-style, multi-manager” approach. The Fund’s Adviser allocates portions of the Fund’s assets among subadvisers who employ distinct investment styles. The Fund currently allocates assets among the following subadvisers who provide day-to-day management for the Fund: Kennedy Capital Management, Inc. (“KCM”), Cooke & Bieler, L.P. (“Cooke & Bieler”), Jackson Square Partners, LLC (“Jackson Square”) (appointed September 18, 2020), Parametric (appointed June 18, 2020) and Pzena Investment Management LLC (“Pzena”). The allocation among subadvisers will vary over time, but the current intent of the Fund’s adviser is that under normal market conditions approximately 10% of the Fund’s assets will be allocated to Parametric and the remaining assets will be allocated to one or more of the Fund’s four other subadvisers that provide day-to-day management of the Fund. Parametric manages its portion of the Fund’s assets using a passive management strategy to seek investment results that track, before fees and expenses, the investment results of the S&P SmallCap 600® Index as closely as possible without requiring the Fund to realize taxable gains. FCI also acts as a subadviser to the Fund but does not provide day-to-day management.
Under normal market conditions, the Tax-Exempt Bond Fund invests at least 80% of its net assets, plus the amount of any borrowings for investment purposes, in tax-exempt bonds, which are debt obligations issued by or for the U.S. states, territories and possessions and the District of Columbia. The interest on these bonds is generally exempt from both U.S. regular federal income tax and U.S. federal alternative minimum tax. However, the Fund may invest up to 20% of its net assets in bonds that generate interest income subject to federal alternative minimum tax for individuals. The Fund invests in both revenue bonds, which are backed by and payable only from the revenues derived from a specific facility or specific revenue source, and in general obligation bonds, which are secured by the full faith, credit and taxation power of the issuing municipality. The Fund currently has one subadviser that provides day-to-day management for the Fund, Sit Fixed Income Advisors II, LLC (“Sit”). FCI also acts as a subadviser to the Fund but does not provide day-to-day management.
Under normal market conditions, the International Fund intends to invest at least 80% of the value of its net assets, plus the amount of any borrowings for investment purposes, in equity securities of companies organized or located outside the United States and doing a substantial amount of business outside the United States. Equity securities in which the Fund invests include common and preferred stock, sponsored and unsponsored American Depositary Receipts, European Depositary Receipts, Global Depositary Receipts, exchange-traded funds, and other investment companies. The Fund diversifies its investments among a number of different countries throughout the world, and may invest in companies of any size. The Fund does not intend to invest more than 20% of its net assets in the equity securities of developing or emerging market issuers (including frontier market issuers). In order to hedge against adverse movements in currency exchange rates, the Fund may enter into foreign currency exchange contracts. The Fund may use options, futures contracts, and options on futures contracts to attempt to manage market or business risks. The Fund does not intend to invest in foreign currency exchange contracts, options, futures contracts, or options on futures contracts for speculative purposes. The Fund uses a “multi-style, multi-manager” approach. The Fund’s assets are allocated to different subadvisers who employ distinct investment styles. The Fund currently allocates assets among the following subadvisers who provide day-to-day management for the Fund: Parametric, Artisan Partners Limited Partnership (“Artisan Partners”), WCM Investment Management, LLC (“WCM”) and LSV Asset Management (“LSV”). The allocation among subadvisers will vary over time, but the current intent of the Fund’s Adviser is that under normal market conditions approximately 30% of the Fund’s assets will be allocated to Parametric, and the remaining assets will be allocated to one or more of the Fund’s three other subadvisers that provide day-to-day management of the Fund. Parametric manages its portion of the Fund’s assets using a passive management strategy to seek investment results that track, before fees and expenses,
CLEARWATER INVESTMENT TRUST
Notes to Financial Statements
December 31, 2020
the investment results of the MSCI World Ex U.S.A. Index - Net Dividends as closely as possible without requiring the Fund to realize taxable gains. FCI also acts as a subadviser to the Fund but does not provide day-to-day management.
(2) Summary of Significant Accounting Policies
The Funds are investment companies and follow accounting and reporting guidance under Financial Accounting Standards Board (“FASB”) Accounting Standards Codification (“ASC”) Topic 946, “Financial Services-Investment Companies.”
The significant accounting policies followed by the Funds are as follows:
(a) Investments in Securities
Investments in U.S. and foreign equity securities are valued at the last sales price or the regular trading session closing price on the principal exchange or market where they are traded. Foreign security values are stated in U.S. dollars. Equity securities which have not traded on the date of valuation or securities for which sales prices are not generally reported are valued at the mean between the last bid and asked prices. Debt securities are valued on the basis of evaluated prices provided by independent pricing services when such prices are believed to reflect the fair value of such securities or broker provided prices. Such prices may be determined by taking into account other similar securities’ prices, yields, maturities, call features, ratings, prepayment speeds, credit risks, cash flows, institutional size trading in similar groups of securities and developments related to specific securities. Shares of open end investment companies are valued at their daily net asset value (“NAV”). Shares of closed-end funds and exchange traded funds are valued at the last sales price or the regular trading session closing price on the principal exchange or market where they are traded.
Securities for which no market quotations are readily available (including those for which trading has been suspended), or when the Adviser becomes aware that a significant event impacting the value of a security or group of securities has occurred after the closing of the exchange on which the security or securities principally trade, but before the calculation of the NAV, are valued at fair value as determined in good faith using procedures established by the Board of Trustees. This may occur particularly with respect to certain foreign securities held by the International Fund, whereby the Board of Trustees may use adjustment factors obtained from an independent evaluation service that are intended to reflect more accurately the fair value of these foreign securities as of the time the Fund’s NAV is calculated. The procedures consider, among others, the following factors to determine a security’s fair value: the nature and pricing history (if any) of the security; whether any dealer quotations for the security are available; and possible valuation methodologies that could be used to determine the fair value of the security. These procedures are used by the Valuation Committee, in accordance with the procedures established by the Board of Trustees, to determine the fair value of the security or securities. Such determinations are then submitted for review and ratification by the Board of Trustees. The use of fair valuation involves the risk that the values used by the Funds to price their investments may be higher or lower than the values used by other unaffiliated investment companies and investors to price the same investments.
Security transactions are accounted for on the trade date, which is the date the securities are purchased or sold. Realized gains and losses are calculated on an identified cost basis. Dividend income is recognized on the ex-dividend date or, for foreign securities, as soon as the information is available. Interest income, is recognized on an accrual basis and includes amortization of premiums and accretion of discounts using the effective yield method.
CLEARWATER INVESTMENT TRUST
Notes to Financial Statements
December 31, 2020
(b) Foreign Currency Translation
The International Fund invests in securities which are purchased and sold in foreign currencies as a principal investment strategy. The costs of purchases, proceeds from sales of investments, interest and dividend income are translated into U.S. dollars using the spot market rate of exchange prevailing on the respective dates of such transactions. The value of the International Fund’s net assets, as measured in U.S. dollars, may be affected favorably or unfavorably by changes in foreign currency exchange rates and exchange control regulations. The gains or losses, if any, on investments resulting from changes in foreign exchange rates are recorded within net realized gain (loss) on security transactions and within net increase (decrease) in unrealized appreciation/depreciation on security transactions on the Statements of Operations. The realized gains or losses, if any, on translation of other assets and liabilities denominated in foreign currencies are recorded within net realized gain (loss) on foreign currency transactions on the Statements of Operations. The International Fund also will incur costs in converting U.S. dollars to local currencies, and vice versa. Risks may arise upon investing in foreign securities including, but not limited to, political, social or economic instability in the country of the issuer, the difficulty of predicting international trade patterns, the possibility of the imposition of exchange controls, expropriation, limits on removal of currency or other assets, nationalization of assets, foreign withholding and income tax and possible delays in the settlement of foreign stock exchange transactions. The principal markets on which these securities trade may have less volume and liquidity, and may be more volatile, than securities markets in the U.S.
(c) Forward Foreign Currency Exchange Contracts
The International Fund enters into forward foreign currency exchange contracts for the purchase or sale of a specific foreign currency at a fixed price on a future date as a hedge against adverse movements in foreign currency exchange rates, specific transactions or the portfolio position. The objective of the International Fund’s foreign currency hedging transactions is to reduce the risk that the U.S. dollar value of the International Fund’s foreign currency denominated securities will decline in value due to changes in foreign currency exchange rates. Forward foreign currency exchange contracts are marked-to-market daily at the applicable exchange rates. Any resulting unrealized gains or losses are recorded on forward foreign currency exchange contracts within net increase (decrease) in unrealized appreciation/depreciation on the Statements of Operations. The International Fund records any realized gains or losses at the time the forward foreign currency exchange contract is offset by entering into a closing transaction with the same counterparty or is extinguished by delivery of the currency. Realized gains or losses, if any, are recorded within Net realized gain (loss) on forward foreign currency exchange contracts on the Statements of Operations. Risks may arise upon entering into forward foreign currency exchange contracts from the potential of the counterparty to default on its obligations under the contract and from unanticipated movements in the value of a foreign currency relative to the U.S. dollar. The contractual amounts of forward foreign currency exchange contracts do not necessarily represent the amounts potentially subject to risk. The measurement of risks associated with these instruments is meaningful only when all related and offsetting transactions are considered. The International Fund bears the market risk from changes in foreign currency exchange rates and the credit risk if the issuer fails to perform. Additional information on derivative instruments and how these positions may impact the financial statements is found in Note 8, Derivative Instruments.
(d) Spot Contracts
The International Fund routinely enters into spot contracts in order to buy or sell a certain amount of foreign currency at the current market rate. The International Fund may enter into spot contracts in order to make payments, or to receive payments, based on investment trading activity in a foreign currency. A spot contract allows the International Fund to buy or sell foreign currency on the day it chooses to deal. From time to time, the Core Equity
CLEARWATER INVESTMENT TRUST
Notes to Financial Statements
December 31, 2020
Fund may also enter into spot contracts in order to make or receive payments due to investment trading activity in a foreign currency on a non-U.S. exchange. Spot contracts are marked-to-market daily at the applicable exchange rates. Any resulting unrealized gains or losses are recorded in translation of other assets and liabilities denominated in foreign currencies within net increase (decrease) in unrealized appreciation/depreciation on the Statements of Operations. Unrealized gains or losses on outstanding spot contracts are recorded in payables for investment securities purchased or receivable for securities sold, respectively, on the Statements of Assets and Liabilities. The Funds record any realized gains or losses at the time the spot contract settles. Realized gains or losses, if any, are included within Net realized gain (loss) on foreign currency transactions on the Statements of Operations. Risks may arise upon entering into spot contracts from unanticipated movements in the value of a foreign currency relative to the U.S. dollar in a short period of time. The Funds bear the market risk from changes in foreign currency exchange rates.
(e) Master Limited Partnerships
The International Fund invests in Master Limited Partnerships (“MLPs”). The benefits derived from the Fund's investments in MLPs are largely dependent on the MLPs being treated as partnerships for federal income tax purposes. If any of the MLPs held by the Fund were treated as corporations for U.S. federal income tax purposes, the after-tax return to the Fund with respect to its investments in such MLPs would be materially reduced, causing a decline in the value of the common stock. The Fund must include its allocable share of an MLP’s taxable income in its reportable taxable income, whether or not it receives a distribution in cash from the MLP. In such case, the Fund may have to liquidate securities to make required distributions to shareholders.
(f) Delayed Delivery Transactions and When-Issued Securities
Certain Funds may engage in securities transactions on a when-issued or delayed-delivery basis. In these transactions, the securities’ prices and yields are fixed on the date of the commitment, with payment and delivery scheduled for a future date. During this period, the securities are subject to market fluctuations. When delayed-delivery purchases are outstanding, a Fund will segregate liquid assets on its records in amounts sufficient to meet the purchase price. A Fund may dispose of or renegotiate a delayed-delivery transaction, which may result in a capital gain or loss.
(g) Short-Term Investments
The Core Equity, Select Equity, Tax-Exempt Bond, and International Funds currently invest in the U.S. Government Select Portfolio, a money market portfolio of Northern Institutional Funds, an investment company advised by Northern Trust Investments, Inc. The U.S. Government Select Portfolio primarily invests in securities issued by the U.S. government, government agencies, and government-sponsored enterprises.
(h) Recoverable Taxes
The balances disclosed as foreign tax reclaim receivable, if any, represent net amounts withheld by foreign governments on dividend income earned in the respective countries subject to reclaims. All reclaims are paid directly to the applicable Funds.
CLEARWATER INVESTMENT TRUST
Notes to Financial Statements
December 31, 2020
(i) Federal Taxes
The Trust’s policy is to comply with the requirements of the Internal Revenue Code applicable to regulated investment companies. On a calendar-year basis, the Funds intend to distribute substantially all of their net investment income and net realized gains, if any, to avoid the payment of federal income and excise taxes. Therefore, no income tax provision is required. Each Fund is treated as a separate entity for federal income tax purposes.
Management has analyzed the Funds’ tax positions taken on federal tax returns for all open tax years and has concluded that as of December 31, 2020, no provision for income tax is required in the Funds’ financial statements. The Funds’ federal and state income and federal excise tax returns for the 2017, 2018, 2019, and 2020 tax years for which the applicable statutes of limitations have not expired remain subject to examination by the Internal Revenue Service and state departments of revenue. Net investment income and net realized gain (loss) for the Funds may differ for financial statement and tax purposes. The character of distributions made during the year from net investment income or net realized gains, if any, may differ from their ultimate characterization for federal income tax purposes. Also, due to the timing of dividend distributions, the fiscal year in which amounts are distributed may differ from the year that the income or realized gain was recorded by the Funds. The Trust has analyzed the Funds’ tax positions and has concluded that no liability for unrecognized tax benefits should be recorded related to uncertain tax positions. Further, the Trust is not aware of any tax positions for which it is reasonably possible that the total amounts of unrecognized tax benefits will significantly change in the next twelve months. The tax character of distributions by the Funds during the years ended December 31, 2020 and 2019 was as follows:
| | | | |
| | Tax-Exempt | | Ordinary Income* |
| | 2020 | | 2019 | | 2020 | | 2019 |
| Core Equity Fund | $ — | | $ — | | $ 7,801,407 | | $ 7,398,837 |
| Select Equity Fund | — | | — | | 2,530,143 | | 2,265,820 |
| Tax-Exempt Bond Fund | 24,459,185 | | 23,538,099 | | 131,738 | | 426,352 |
| International Fund | — | | — | | 8,365,704 | | 12,139,749 |
| | | | | | | | |
| | |
| | Long-Term Capital Gains** |
| | 2020 | | 2019 |
| Core Equity Fund | $ 2,728,041 | | $ 2,349,736 |
| Select Equity Fund | 6,877,368 | | 5,292,066 |
| Tax-Exempt Bond Fund | — | | — |
| International Fund | 8,082,763 | | 8,846,708 |
| | | | |
CLEARWATER INVESTMENT TRUST
Notes to Financial Statements
December 31, 2020
| * | In addition to the ordinary income distributions, during 2020 the following Funds utilized equalization accounting for tax purposes whereby a portion of redemption payments were treated as distributions of ordinary income in the following amounts: |
| | |
| Core Equity Fund | $ 57,748 |
| Select Equity Fund | $ 90,250 |
| International Fund | $ 52,163 |
| | |
| | |
| ** | In addition to the long-term capital gain distributions, during 2020 the following Funds utilized equalization accounting for tax purposes whereby a portion of redemption payments were treated as distributions of long-term capital gains in the following amounts: |
| | |
| Select Equity Fund | $ 6,194 |
| International Fund | $ 114,539 |
| | |
| | |
As of December 31, 2020, the components of distributable earnings on a tax basis were as follows:
| | Core
Equity Fund | | Select Equity Fund | | Tax-Exempt
Bond Fund | | International
Fund |
| Undistributed ordinary income | $ 32,283 | | $ 4,795,617 | | $ — | | $ 3,645,841 |
| Undistributed tax-exempt income | — | | — | | 262,478 | | — |
| Undistributed capital gain | — | | 329,131 | | — | | 8,005,605 |
| Accumulated capital losses and other | (14,476,359) | | — | | (3,697,492) | | — |
| Unrealized appreciation/depreciation | 337,814,213 | | 89,209,296 | | 29,795,465 | | 323,769,552 |
| Total | $ 323,370,137 | | $ 94,334,044 | | $ 26,360,451 | | $ 335,420,998 |
Distributions to shareholders are determined in accordance with federal income tax regulations, which may differ from such amounts recorded in accordance with U.S. generally accepted accounting principles ("U.S. GAAP") for financial reporting purposes. Accordingly, the Funds may make reclassifications among certain of their capital accounts in order to reflect the tax treatment for certain permanent differences that exist between federal income tax regulations and U.S. GAAP. These reclassifications are reported in order to reflect the tax treatment for certain permanent differences that exist between income tax regulations and U.S. GAAP. The primary reasons for permanent differences are the Funds use of equalization accounting whereby a portion of redemption payments were treated as distributions and realized gains on in-kind redemptions that are not recognized for tax purposes. These reclassifications have no impact on the total net assets or the NAV per share of the Funds. At December 31,
CLEARWATER INVESTMENT TRUST
Notes to Financial Statements
December 31, 2020
2020, reclassifications have been recorded among the following capital accounts on the Statements of Assets and Liabilities:
| | Core
Equity Fund | | Select Equity Fund | | Tax-Exempt
Bond Fund | | International
Fund |
| Distributable earnings | $ (27,521,488) | | $ (2,857,696) | | $ 56,579 | | $ (166,702) |
| Additional paid-in capital | 27,521,488 | | 2,857,696 | | (56,579) | | 166,702 |
(j) Distributions to Shareholders
Distributions to shareholders from net investment income, if any, are declared annually for the Core Equity, Select Equity, and International Funds and declared daily, payable monthly, for the Tax-Exempt Bond Fund. Distributions to shareholders from net realized gains, if any, are declared annually for all Funds. Distributions are paid in cash or reinvested in additional shares at the direction of the shareholders. During the year ended December 31, 2020, the Core Equity, Select Equity and International Funds utilized equalization accounting with respect to distributions to shareholders, in order to keep remaining shareholders’ interest in undistributed income from being affected.
(k) Use of Estimates
The preparation of financial statements in conformity with U.S. GAAP requires management to make estimates and assumptions that affect the reported amounts of assets and liabilities and disclosure of contingent assets and liabilities at the date of the financial statements and the reported amounts of increase and decrease in net assets from operations during the period. Actual results could differ from those estimates.
(l) Indemnification
Under each Fund’s organizational documents, its officers and directors are indemnified against certain liabilities arising out of the performance of their duties to each Fund. In addition, certain of each Fund’s contracts with its service providers contain general indemnification clauses. Each Fund’s maximum exposure under these arrangements is unknown since the amount of any future claims that may be made against each Fund cannot be determined and each Fund has no historical basis for predicting the likelihood of any such claims. The Funds believe that the likelihood of any such claims is remote.
(3) Fair Value Measurements
Fair value is an estimate of the price the Funds would receive upon selling a security in a timely transaction to an independent buyer in the principal or most advantageous market for the security. This guidance establishes a three-tier hierarchy to maximize the use of observable market data and minimize the use of unobservable inputs and to establish classification of fair value measurements for disclosure purposes. Various inputs are used in determining the value of the Funds’ investments, as described in Note 2(a). These inputs are summarized in the three broad levels listed below.
| • | Level 1 – Unadjusted quoted market prices in active markets for identical securities on the measurement date. |
| • | Level 2 – Other significant observable inputs including quoted prices for similar investments, interest rates, prepayment speeds, credit risk, etc. or quoted prices for identical or similar assets in markets that are not active. Inputs that are derived principally from or corroborated by observable market data are also considered Level 2 |
CLEARWATER INVESTMENT TRUST
Notes to Financial Statements
December 31, 2020
measurement. An adjustment to any observable input that is significant to the fair value may render the measurement a Level 3 measurement.
| • | Level 3 – Valuations based on unobservable inputs, which may include the Adviser’s own assumptions in determining the fair value of an investment. |
The inputs or methodology used for valuing securities are not necessarily an indication of the risk associated with investing in those securities and other financial instruments, if any. The following is a summary of the inputs used in valuing each Fund’s investments and other financial instruments, if any, which are carried at fair value, as of December 31, 2020.
| | Core Equity Fund (a) |
| | Level 1 | Level 2 | Level 3 | Total |
| Common Stocks | $ 612,441,314 | $ — | $ — | $ 612,441,314 |
| Preferred Stocks | 35,145 | — | — | 35,145 |
| Short-Term Investments | 7,392,427 | — | — | 7,392,427 |
| Total | $ 619,868,886 | $ — | $ — | $ 619,868,886 |
(a) For the Core Equity Fund, the investment value is comprised of equity securities and short-term investments. See the Fund’s Schedule of Investments for industry classification. Investments in equity and short-term securities generally are valued at the last sales price or the regular trading session closing price on the principal exchange or market where they are traded. Investments in rights generally are determined by taking into account the terms of the rights as well as the value of the underlying equity securities, which are determined by the valuation methodology described above.
| | Select Equity Fund (b) |
| | Level 1 | Level 2 | Level 3 | Total |
| Common Stocks | $ 433,889,322 | $ — | $ — | $ 433,889,322 |
| Convertible Preferred Stocks | 551,419 | — | — | 551,419 |
| Investment Companies | 5,926,027 | — | — | 5,926,027 |
| Master Limited Partnerships | 681,066 | — | — | 681,066 |
| Preferred Stocks | 3,275,454 | — | — | 3,275,454 |
| Rights | — | — | —* | —* |
| Warrants | — | — | —* | —* |
| Short-Term Investments | 21,684,682 | — | — | 21,684,682 |
| Total | $ 466,007,970 | $ — | $ —* | $ 466,007,970 |
| * Security has been deemed worthless and is a Level 3 investment. |
CLEARWATER INVESTMENT TRUST
Notes to Financial Statements
December 31, 2020
(b) For the Select Equity Fund, the investment value is comprised of equity securities, convertible bonds, investment companies, master limited partnerships, rights, warrants and short-term investments. See the Fund’s Schedule of Investments for industry classification. Investments in equity and short-term securities generally are valued at the last sales price or the regular trading session closing price on the principal exchange or market where they are traded.
There were no significant Level 3 valuations at December 31, 2020.
| | Tax-Exempt Bond Fund (c) |
| | Level 1 | Level 2 | Level 3 | Total |
| Closed-End Funds | $ 36,954,212 | $ — | $ — | $ 36,954,212 |
| Municipal Bonds | | | | |
| Alabama | — | 1,547,910 | — | 1,547,910 |
| Alaska | — | 17,500 | — | 17,500 |
| Arizona | — | 18,540,724 | — | 18,540,724 |
| Arkansas | — | 1,595,827 | — | 1,595,827 |
| California | — | 45,359,954 | — | 45,359,954 |
| Colorado | — | 31,051,553 | — | 31,051,553 |
| Connecticut | — | 9,368,891 | — | 9,368,891 |
| District of Columbia | — | 5,675,342 | — | 5,675,342 |
| Florida | — | 75,586,715 | — | 75,586,715 |
| Georgia | — | 20,469,222 | — | 20,469,222 |
| Idaho | — | 1,971,438 | — | 1,971,438 |
| Illinois | — | 33,187,507 | — | 33,187,507 |
| Indiana | — | 10,893,556 | — | 10,893,556 |
| Iowa | — | 2,162,190 | — | 2,162,190 |
| Kansas | — | 2,800,176 | — | 2,800,176 |
| Kentucky | — | 498,921 | — | 498,921 |
| Louisiana | — | 8,895,620 | — | 8,895,620 |
| Maine | — | 4,309,660 | — | 4,309,660 |
| Maryland | — | 3,366,067 | — | 3,366,067 |
| Massachusetts | — | 14,214,056 | — | 14,214,056 |
| Michigan | — | 19,437,522 | — | 19,437,522 |
| Minnesota | — | 4,266,785 | — | 4,266,785 |
| Mississippi | — | 1,060,720 | — | 1,060,720 |
| Missouri | — | 6,942,587 | — | 6,942,587 |
| Montana | — | 4,297,728 | — | 4,297,728 |
| Nebraska | — | 752,714 | — | 752,714 |
| Nevada | — | 2,783,600 | — | 2,783,600 |
| New Hampshire | — | 2,780,625 | — | 2,780,625 |
| New Jersey | — | 13,656,889 | — | 13,656,889 |
| New Mexico | — | 8,303,999 | — | 8,303,999 |
| New York | — | 35,525,112 | — | 35,525,112 |
| North Carolina | — | 6,155,313 | — | 6,155,313 |
CLEARWATER INVESTMENT TRUST
Notes to Financial Statements
December 31, 2020
| | Tax-Exempt Bond Fund (c) |
| | Level 1 | Level 2 | Level 3 | Total |
| North Dakota | $ — | $ 2,201,494 | $ — | $ 2,201,494 |
| Ohio | — | 15,652,810 | — | 15,652,810 |
| Oklahoma | — | 3,270,911 | — | 3,270,911 |
| Oregon | — | 12,204,029 | — | 12,204,029 |
| Pennsylvania | — | 14,717,335 | — | 14,717,335 |
| Puerto Rico | — | 1,570,110 | — | 1,570,110 |
| Rhode Island | — | 2,775,180 | — | 2,775,180 |
| South Carolina | — | 7,032,758 | — | 7,032,758 |
| South Dakota | — | 501,095 | — | 501,095 |
| Tennessee | — | 10,953,372 | — | 10,953,372 |
| Texas | — | 41,042,373 | — | 41,042,373 |
| Utah | — | 1,890,223 | — | 1,890,223 |
| Vermont | — | 1,681,906 | — | 1,681,906 |
| Virginia | — | 4,854,164 | — | 4,854,164 |
| Washington | — | 17,219,903 | — | 17,219,903 |
| West Virginia | — | 1,620,255 | — | 1,620,255 |
| Wisconsin | — | 20,632,889 | — | 20,632,889 |
| Wyoming | — | 2,027,027 | — | 2,027,027 |
| Short-Term Investments | 14,385,751 | — | — | 14,385,751 |
| Total | $ 51,339,963 | $ 559,324,257 | $ — | $ 610,664,220 |
(c) For the Tax-Exempt Bond Fund, the investment value is comprised of closed-end funds, municipal bonds, and short-term investments. Investments in closed-end funds and short-term securities generally are valued at the last sales price or the regular trading session closing price on the principal exchange or market where they are traded. Investments in municipal bonds generally are based on valuations using adjusted evaluated prices provided by the primary pricing provider. The Board of Trustees has delegated to the Valuation Committee the responsibility to determine in good faith the fair value of securities for which no price quotation is available from an approved pricing service or broker-dealer at the time the Tax-Exempt Bond Fund’s NAV is calculated, including securities for which the prices do not represent fair value or for which a significant event occurs that materially affects the value of the security after the close of the market on which the security principally trades and before the time the Tax-Exempt Bond Fund’s NAV is calculated.
| | International Fund (d) |
| | Level 1 | Level 2 | Level 3 | Total |
| Common Stocks | | | | |
| Australia | $ 37,170,479 | $ — | $ —* | $ 37,170,479 |
| Canada | 64,625,080 | — | 1,172 | 64,626,252 |
| France | 48,409,624 | — | 604,623 | 49,014,247 |
| South Korea | 23,539,458 | — | 328,546 | 23,868,004 |
| Thailand | — | 519,584 | — | 519,584 |
CLEARWATER INVESTMENT TRUST
Notes to Financial Statements
December 31, 2020
| | International Fund (d) |
| | Level 1 | Level 2 | Level 3 | Total |
| All other countries | $ 650,159,856 | $ — | $ — | $ 650,159,856 |
| Preferred Stocks | 7,239,202 | — | — | 7,239,202 |
| Rights | 8,650 | — | — | 8,650 |
| Warrants | 3,755,074 | — | — | 3,755,074 |
| Short-Term Investments | 35,293,386 | — | — | 35,293,386 |
| Total | $ 870,200,809 | $ 519,584 | $ 934,341 | $ 871,654,734 |
| * Security has been deemed worthless and is a Level 3 investment. |
(d) For the International Fund, the investment value is comprised of equity securities, rights, warrants, investment companies and short-term investments. See the Fund’s Schedule of Investments for additional information on industry sector and currency concentration information. Investments in equity and short-term securities generally are valued at the last sales price or the regular trading session closing price on the principal exchange or market where they are traded.
There were no significant Level 3 valuations for which significant unobservable inputs were used at December 31, 2020.
International Fund
Other Financial Instruments | | Level 1 | | Level 2 | | Level 3 | | Total |
| Assets | | | | | | | | |
| Forward foreign currency exchange contracts | | $ — | | $ 14,142 | | $ — | | $ 14,142 |
| Liabilities | | | | | | | | |
| Forward foreign currency exchange contracts | | — | | (211,290) | | — | | (211,290) |
| Net Other Financial Instruments | | $ — | | $ (197,148) | | $ — | | $ (197,148) |
The forward foreign currency exchange contracts outstanding at December 31, 2020 are considered Level 2 investments due to the contracts being marked-to-market daily at the applicable exchange rates that have been adjusted from the initial quoted rate. Forward foreign currency exchange contracts are shown on a gross basis in the above table and on the Statements of Assets and Liabilities.
(4) Investment Security Transactions
The cost of purchases and proceeds from sales of securities (excluding short-term securities) for the year ended December 31, 2020, were as follows:
| | Purchases | | Sales |
| Core Equity Fund | $ 193,224,295 | | $ 197,134,404 |
| Select Equity Fund | 371,100,599 | | 347,317,420 |
CLEARWATER INVESTMENT TRUST
Notes to Financial Statements
December 31, 2020
| | Purchases | | Sales |
| Tax-Exempt Bond Fund | $ 119,721,699 | | $ 100,189,426 |
| International Fund | 294,083,386 | | 266,753,515 |
| | | | |
| | | | |
The difference between book basis and tax basis net unrealized appreciation (depreciation) is attributable primarily to the tax deferral of losses on wash sales, deferral of post-October currency and capital losses for tax purposes, and the recharacterization of income recognition on investments in passive foreign investment companies.
At December 31, 2020, for federal income tax purposes, gross unrealized appreciation, gross unrealized depreciation, net unrealized appreciation (depreciation) on investments (including the effects of foreign currency translation and derivative instruments, if any) and the cost basis of investments (including derivative instruments, if any) were as follows:
| Funds | | Unrealized
Appreciation | | Unrealized
Depreciation | | Net
Appreciation
(Depreciation) | | Cost Basis of
Investments |
| Core Equity Fund | | $ 338,613,448 | | $ (799,233) | | $ 337,814,215 | | $ 282,054,671 |
| Select Equity Fund | | 97,179,938 | | (7,970,644) | | 89,209,294 | | 376,798,676 |
| Tax-Exempt Bond Fund | | 41,648,475 | | (11,853,010) | | 29,795,465 | | 580,868,755 |
| International Fund | | 338,659,374 | | (14,478,293) | | 324,181,081 | | 547,473,653 |
| | | | | | | | | |
| | | | | | | | | |
(5) Capital Share Transactions
Transactions in capital shares for the years ended December 31, 2020 and 2019 were as follows:
| | Core Equity Fund | | Select Equity Fund |
| | 2020 | | 2019 | | 2020 | | 2019 |
| Sold | 1,356,005 | | 1,044,814 | | 3,565,994 | | 428,526 |
| Issued for reinvestment of distributions | 196,822 | | 204,376 | | 482,393 | | 412,774 |
| Redeemed | (1,641,622) | | (1,997,685) | | (1,589,669) | | (1,137,168) |
| Net Increase (decrease) | (88,795) | | (748,495) | | 2,458,718 | | (295,868) |
CLEARWATER INVESTMENT TRUST
Notes to Financial Statements
December 31, 2020
| | Tax-Exempt Bond Fund | | International Fund |
| | 2020 | | 2019 | | 2020 | | 2019 |
| Sold | 4,046,480 | | 6,498,951 | | 2,607,637 | | 4,699,885 |
| Issued for reinvestment of distributions | 2,463,261 | | 2,381,364 | | 848,734 | | 1,224,414 |
| Redeemed | (5,188,108) | | (3,270,230) | | (1,622,611) | | (1,983,567) |
| Net Increase (decrease) | 1,321,633 | | 5,610,085 | | 1,833,760 | | 3,940,732 |
(6) Capital Loss Carryforward
At December 31, 2020, the Funds had the following short term capital loss carry-forwards and long term capital loss carry forwards available to offset future net capital gains which do not expire. Future utilization of the capital loss carry-forward may be limited.
| | Short-Term | Long-Term | Late-year
Gain/Loss | Total |
| Core Equity Fund | $ 14,476,359 | $ — | $ — | $ 14,476,359 |
| Tax-Exempt Bond Fund | 2,245,374 | 1,334,632 | — | 3,580,006 |
(7) Expenses and Related-Party Transactions
The Trust has a contract for investment advisory services with the Adviser. Under terms of separate agreements, Core Equity Fund, Select Equity Fund, Tax-Exempt Bond Fund and International Fund each pay an investment advisory fee equal to an annual rate of 0.90%, 1.35%, 0.60% and 1.00%, respectively, of each Fund’s average daily net assets. The Adviser is responsible for the payment or reimbursement of all the Funds’ expenses, except brokerage, taxes, interest, and extraordinary expenses. The Adviser has periodically modified its management fee for each of the Funds through voluntary waivers. For the year ended December 31, 2020, voluntary waivers on management fees were as follows:
| | Management Fees Voluntary Waivers |
| | Voluntary Waiver %
Prior to
October 1, 2020 | | Voluntary Waivers %
Effective
October 1, 2020 |
| Core Equity Fund | (0.59) | | (0.59) |
| Select Equity Fund | (0.40) | | (0.44) |
| Tax-Exempt Bond Fund | (0.31) | | (0.31) |
| International Fund | (0.35) | | (0.32) |
The Adviser has periodically modified its management fee for each of the Funds through voluntary waivers. Effective January 1, 2020, the net management fees actually paid for the Core Equity Fund, Select Equity Fund, Tax-Exempt Bond Fund and International Fund due to the Adviser’s modification of the voluntary waivers for those Funds were 0.31%, 0.95%, 0.29% and 0.65%, respectively. Effective October 1, 2020, the net management fees actually paid for the Select Equity Fund and the International Fund due to the Adviser’s modification of the voluntary waivers for those Funds were 0.91% and 0.68%, respectively.
CLEARWATER INVESTMENT TRUST
Notes to Financial Statements
December 31, 2020
The Adviser currently intends to continue these voluntary waivers indefinitely. However, the Adviser may terminate these voluntary arrangements at any time.
In addition to fees and expenses which the Funds bear directly, the Funds indirectly bear a pro rata share of the fees and expenses of any acquired funds in which they invest, such as short-term investments in mutual funds or other investment companies and investments in closed-end funds. Such indirect expenses are not included in any of the reported expense ratios.
The Adviser has entered into subadvisory contracts with independent investment advisory firms for each Fund to provide daily investment management services. The subadvisory fees are based on each subadviser’s proportional net assets it currently manages within each Fund and are paid directly by the Adviser.
The Adviser has also engaged FCI as a subadviser for each Fund. FCI regularly provides the Funds with various investment-related services, including investment strategy advice, manager recommendations and related duties as requested by the Adviser. FCI also provides certain services related to due diligence, performance reporting, compliance, and other administrative functions, which support the investment management services and subadviser oversight services provided to the Trust by the Adviser. For its services, FCI is compensated with a subadvisory fee payable by the Adviser of 0.20% of each Fund’s average daily net assets, paid on a quarterly basis. FCI is compensated out of the investment advisory fees the Adviser receives from the respective Funds. FCI has agreed to waive the difference between the amount calculated under the subadvisory fee schedule and an amount determined by multiplying the total number of hours worked by FCI in providing services under the subadvisory agreement by an hourly rate that is approved by the Adviser.
(8) Derivative Instruments
Information concerning the types of derivatives in which the International Fund invests, the objectives for using them and their related risks can be found in Note 2(c). Below are the types of derivatives held in the International Fund by location as presented in the Statements of Assets and Liabilities as of December 31, 2020, with additional detail on the net amounts impacting the Statements of Assets and Liabilities. The forward foreign currency exchange contracts presented below are not subject to master netting agreements or other similar agreements.
| ASSETS | LIABILITIES |
| Name of Fund | Derivative Type | Statements of Assets and
Liabilities Location | Value | | Statements of Assets and
Liabilities Location | Value | Counterparty |
| International Fund | Forward foreign
currency exchange
contracts | Unrealized appreciation
on forward foreign
currency exchange
contracts | $ 14,142 | | Unrealized depreciation
on forward foreign
currency exchange
contracts | $ 211,290 | Northern Trust |
CLEARWATER INVESTMENT TRUST
Notes to Financial Statements
December 31, 2020
The following table sets forth, by primary risk exposure, the International Fund’s net realized gain (loss) and net increase (decrease) in appreciation/depreciation on forward foreign currency exchange contracts for the year ended December 31, 2020:
| Name of Fund | Derivative Type | Statements of
Operations Location | Value | | Name of Fund | Derivative Type | Statements of
Operations Location | Value |
| International Fund | Forward foreign
currency exchange
contracts | Net realized gain
(loss) on forward
foreign currency
exchange contracts | $ (367,915) | | International Fund | Forward foreign
currency exchange
contracts | Net increase
(decrease) in
unrealized
appreciation/depreciation
on forward foreign
currency exchange
contracts | $ (172,271) |
| | | | | | | | | |
Derivative transactions are measured in terms of the notional amount. The following table presents, for the International Fund, the number of transactions and weighted average notional amount of forward foreign currency exchange contracts, which is indicative of the volume of derivative activity, for the year ended December 31, 2020.
| International Fund |
Forward Foreign Currency Exchange
Contracts |
Number of
Transactions | Weighted
Average Notional
Amount |
| 46 | $ 8,365,693 |
(9) Short-term Financing
ReFlow Fund, LLC ("ReFlow") provides each Fund with a potential source of cash to meet net shareholder redemptions through share purchases for a fee. The Fund then generally redeems those shares when it experiences net sales. The shares may be redeemed in-kind in accordance with the Fund’s redemption in-kind policies. The Fund is generally required to redeem the shares purchased by ReFlow within 30 days (15 days if redeemed in-kind). As such, the proceeds received from ReFlow’s purchase of fund shares is treated as a liability on the statement of assets and liabilities. The fee paid on outstanding shares owned by ReFlow is based on an auction starting at a minimum bid of 0.20% and is paid by the Adviser under the unified advisory fee agreement. For the year ended December 31, 2020, the Core Equity Fund had total redemptions in kind of $31,142,456, resulting in realized gains of $27,463,741. For the year ended December 31, 2020, the Select Equity Fund had total redemptions in kind of $7,251,804, resulting in realized gains of $2,761,252. These realized gains are not recognized for tax purposes as
CLEARWATER INVESTMENT TRUST
Notes to Financial Statements
December 31, 2020
discussed in Note 2. As of December 31, 2020, the Funds' ReFlow accounts had zero balances. During the year ended December 31, 2020, the Funds had the following activity:
| | Average Amount
Oustanding for
Days in Use | | Days Used |
| Core Equity Fund | $ 12,577 | | 126 |
| Select Equity Fund | 16,700 | | 61 |
| | | | |
| | | | |
(10) Portfolio Securities Loaned
The Select Equity Fund and the International Fund participate in a securities lending program and have loaned portions of their investment portfolios at December 31, 2020. Under the program, the Funds loan securities to borrowers who post collateral for those loaned securities. The Securities Finance Trust Company serves as the Funds’ securities lending agent (the lending agent) who operates and maintains the securities lending program. The loans are governed by a securities lending agreement between the lending agent, acting on behalf of the Funds, and each borrowing counterparty. The fair value of securities on loan as of December 31, 2020 is recognized within investments in securities, at fair value, on the Funds’ Statements of Assets and Liabilities.
Each borrower receives a negotiated interest rate, which is generally referred to as the rebate rate, on the cash that it delivers to the Funds as collateral for the securities loaned and agrees to pay a negotiated rate with respect to the loaned securities. The amount of these rates for each securities lending transaction may differ depending on several factors, including the demand for the security, tax considerations and the credit quality of the borrower. A net payment is generally made by the borrower with respect to these rates upon termination of the loan (the Net Rate). The value of the securities loan will be marked-to-market daily, and the borrower will be required to provide additional collateral if the posted amount falls below certain negotiated levels, and the lending agent (on behalf of the Funds) will be required to return collateral to the borrower if the amount of collateral posted is greater than such negotiated levels.
During the reporting period, the cash collateral received from borrowers related to the Funds’ securities lending activities was invested in the Fidelity Investments Money Market Government Portfolio and the daily residual was swept into the Northern Institutional Fund-U.S Government Select Portfolio. The short-term investments purchased with the cash collateral in the amount of $5,461,693 and $9,468,993 are included in Investments in Securities on the Statement of Assets and Liabilities of the Select Equity Fund and the International Fund, respectively.
The Funds provide compensation to the lending agent in connection with operating and maintaining the securities lending program. The lending agent is compensated in an amount of 15% of gross revenues for the 12 month period commencing as of implementation date. The fee will then be increased to 20% for the first $1 million of gross revenues and 15% of any gross revenues in excess of $ 1 million. The revenues derived from the securities lending activities of the Funds depend on many factors, including the value of the securities available to be loaned, the demand for the securities available to be loaned, the actual percentage of the Fund’s securities that are on loan (the utilization rate), the amount earned from the investment of any collateral and the amount of the fees or profit
CLEARWATER INVESTMENT TRUST
Notes to Financial Statements
December 31, 2020
retained by the lending agent. All compensation, costs and expenses associated with the securities lending program are considered transaction charges that are borne by the Funds and are not an obligation of the Manager under the securities lending agency agreement. These transaction charges are netted with the income from securities lending and included in net income from securities loaned on the accompanying Statement of Operations.
The Funds’ securities lending program involves certain risks, including counterparty or borrower risk, collateral investment risk, replacement risk, operational, legal, tax and accounting risks. In the event the borrower does not meet its contractual obligation to return the securities, the Funds may be exposed to the risk of loss of reacquiring the loaned securities at prevailing market prices using the proceeds of the sale of the collateral.
The following is information on the securities lending activities by the lending agent for the Funds as of December 31, 2020:
| | Gross Amounts of
Securities Loaned in
Statement of Assets
and
Liabilities | % of Net Assets | Cash Collateral
Received |
| Select Equity Fund | $ 5,350,655 | 1.17 % | $ 5,461,693 |
| International Fund | 8,943,913 | 1.03 % | 9,468,993 |
At December 31, 2020, there were no offsetting of securities and they are presented on a gross basis.
(11) Recent Market Events
U.S. and international markets have experienced significant periods of volatility in recent months and years due to a number of economic, political and global macro factors including the impact of the coronavirus as a global pandemic and related public health issues, growth concerns in the U.S. and overseas, uncertainties regarding interest rates, trade tensions and the threat of tariffs imposed by the U.S. and other countries. In particular, the spread of the novel coronavirus worldwide has resulted in disruptions to supply chains and customer activity, stress on the global healthcare system, rising unemployment claims, quarantines, cancellations, market declines, the closing of borders, restrictions on travel and widespread concern and uncertainty. Health crises and related political, social and economic disruptions caused by the spread of the recent coronavirus outbreak may also exacerbate other pre-existing political, social and economic risks in certain countries. It is not possible to know the extent of these impacts, and they may be short term or may last for an extended period of time. These developments as well as other events could result in further market volatility and negatively affect financial asset prices, the liquidity of certain securities and the normal operations of securities exchanges and other markets, despite government efforts to address market disruptions. In addition, the Funds may face challenges with respect to their day-to-day operations if key personnel of the Funds’ investment adviser or other service providers are unavailable due to quarantines and restrictions on travel related to the coronavirus outbreak. As a result, the risk environment remains elevated. The Adviser will monitor developments and seek to manage each Fund in a manner consistent with achieving the Fund’s investment objective, but there can be no assurance that it will be successful in doing so.
CLEARWATER INVESTMENT TRUST
Notes to Financial Statements
December 31, 2020
(12) Subsequent Events
Management has evaluated subsequent events for the Funds through the date the financial statements were issued and has concluded that there are no additional events that require financial statement disclosure and/or adjustments to the financial statements.
CLEARWATER INVESTMENT TRUST
Schedule of Investments - Clearwater Core Equity Fund
December 31, 2020
| Shares | | Security | | Cost | | Fair value (a) | | Percent of
net assets |
| Common Stocks: | | | | | | |
| Communication Services: | | | | | | |
| 27,647 | | ACTIVISION BLIZZARD, INC. | | $ 1,369,097 | | 2,567,024 | | |
| 5,002 | | ALPHABET, INC., CLASS A(b) | | 2,292,897 | | 8,766,705 | | |
| 4,079 | | ALPHABET, INC., CLASS C(b) | | 1,734,443 | | 7,145,919 | | |
| 2,000 | | ALTICE U.S.A., INC., CLASS A(b) | | 43,775 | | 75,740 | | |
| 147,503 | | AT&T, INC. | | 3,933,657 | | 4,242,186 | | |
| 300 | | CABLE ONE, INC. | | 113,966 | | 668,316 | | |
| 165,227 | | CENTURYLINK, INC. | | 1,662,872 | | 1,610,963 | | |
| 590 | | CHARTER COMMUNICATIONS, INC., CLASS A(b) | | 292,304 | | 390,314 | | |
| 6,161 | | CINEMARK HOLDINGS, INC. | | 65,739 | | 107,263 | | |
| 57,795 | | COMCAST CORP., CLASS A | | 632,884 | | 3,028,458 | | |
| 54,186 | | DISCOVERY, INC., CLASS A(b) | | 1,150,730 | | 1,630,457 | | |
| 385 | | DISH NETWORK CORP., CLASS A(b) | | 4,926 | | 12,451 | | |
| 29,670 | | ELECTRONIC ARTS, INC. | | 2,694,992 | | 4,260,612 | | |
| 31,337 | | FACEBOOK, INC., CLASS A(b) | | 1,845,029 | | 8,560,015 | | |
| 300 | | IAC/INTERACTIVECORP(b) | | 11,572 | | 56,805 | | |
| 3,574 | | INTERPUBLIC GROUP OF (THE) COS., INC. | | 55,609 | | 84,060 | | |
| 789 | | LIBERTY BROADBAND CORP., CLASS C(b) | | 51,149 | | 124,922 | | |
| 5,832 | | LIBERTY GLOBAL PLC, CLASS A(b)(c) | | 42,377 | | 141,251 | | |
| 7,374 | | LIBERTY GLOBAL PLC, CLASS C(b)(c) | | 51,974 | | 174,395 | | |
| 1,800 | | LIBERTY MEDIA CORP.-LIBERTY FORMULA ONE, CLASS C(b) | | 45,464 | | 76,680 | | |
| 4,046 | | MATCH GROUP, INC.(b) | | 234,961 | | 611,715 | | |
| 4,262 | | NETFLIX, INC.(b) | | 1,436,618 | | 2,304,591 | | |
| 2,375 | | NEWS CORP., CLASS A | | 7,170 | | 42,679 | | |
| 700 | | NEXSTAR MEDIA GROUP, INC., CLASS A | | 44,492 | | 76,433 | | |
| 2,195 | | OMNICOM GROUP, INC. | | 52,802 | | 136,902 | | |
| 1,003 | | PINTEREST, INC., CLASS A(b) | | 66,108 | | 66,098 | | |
| 697 | | ROKU, INC.(b) | | 102,347 | | 231,418 | | |
| 1,200 | | SPOTIFY TECHNOLOGY S.A.(b)(c) | | 149,087 | | 377,592 | | |
| 326 | | TAKE-TWO INTERACTIVE SOFTWARE, INC.(b) | | 67,743 | | 67,740 | | |
| 1,544 | | TEGNA, INC. | | 7,743 | | 21,539 | | |
| 27,736 | | T-MOBILE U.S., INC.(b) | | 1,959,091 | | 3,740,200 | | |
| 3,305 | | TRIPADVISOR, INC.(b) | | 56,130 | | 95,118 | | |
| 9,852 | | TWITTER, INC.(b) | | 231,498 | | 533,486 | | |
| 67,275 | | VERIZON COMMUNICATIONS, INC. | | 2,992,840 | | 3,952,406 | | |
| 17,550 | | VIACOMCBS, INC., CLASS B | | 547,501 | | 653,913 | | |
| 27,007 | | WALT DISNEY (THE) CO.(b) | | 679,844 | | 4,893,128 | | |
| 5,837 | | ZILLOW GROUP, INC., CLASS C(b) | | 522,967 | | 757,643 | | |
| 6,930 | | ZYNGA, INC., CLASS A(b) | | 68,439 | | 68,399 | | |
| | | | | 27,322,837 | | 62,355,536 | | 10.11% |
| Consumer Discretionary: | | | | | | |
| 1,500 | | ADVANCE AUTO PARTS, INC. | | 53,557 | | 236,265 | | |
| 5,545 | | AMAZON.COM, INC.(b) | | 5,939,422 | | 18,059,677 | | |
| 2,400 | | ARAMARK | | 47,393 | | 92,352 | | |
| 1,100 | | AUTOLIV, INC.(c) | | 13,982 | | 101,310 | | |
| 13,174 | | AUTONATION, INC.(b) | | 340,741 | | 919,413 | | |
| 800 | | AUTOZONE, INC.(b) | | 571,776 | | 948,352 | | |
| 57,075 | | BEST BUY CO., INC. | | 3,242,872 | | 5,695,514 | | |
| 1,400 | | BIG LOTS, INC. | | 15,477 | | 60,102 | | |
| 1,461 | | BOOKING HOLDINGS, INC.(b) | | 2,144,770 | | 3,254,041 | | |
| 11,464 | | BORGWARNER, INC. | | 318,786 | | 442,969 | | |
| 831 | | BURLINGTON STORES, INC.(b) | | 85,265 | | 217,348 | | |
| 3,068 | | CARMAX, INC.(b) | | 33,093 | | 289,803 | | |
| 13,535 | | CARNIVAL CORP. | | 157,667 | | 293,168 | | |
| 6,400 | | CARTER'S, INC. | | 551,077 | | 602,048 | | |
| 2,300 | | CARVANA CO.(b) | | 419,338 | | 550,942 | | |
| 5,227 | | D.R. HORTON, INC. | | 58,864 | | 360,245 | | |
| 2,326 | | DARDEN RESTAURANTS, INC. | | 108,803 | | 277,073 | | |
| 3,139 | | DICK'S SPORTING GOODS, INC. | | 111,723 | | 176,443 | | |
| 3,389 | | DOLLAR GENERAL CORP. | | 248,398 | | 712,707 | | |
| 5,224 | | DOLLAR TREE, INC.(b) | | 52,773 | | 564,401 | | |
| 1,100 | | DOMINO'S PIZZA, INC. | | 154,333 | | 421,806 | | |
| 97,936 | | EBAY, INC. | | 3,842,233 | | 4,921,284 | | |
| 822 | | EXPEDIA GROUP, INC. | | 13,985 | | 108,833 | | |
| 48,759 | | EXTENDED STAY AMERICA, INC. | | 641,568 | | 722,121 | | |
| 959 | | FLOOR & DECOR HOLDINGS, INC., CLASS A(b) | | 27,966 | | 89,043 | | |
| See accompanying notes to financial statements. | 28 | (Continued) |
CLEARWATER INVESTMENT TRUST
Schedule of Investments - Clearwater Core Equity Fund
December 31, 2020
| Shares | | Security | | Cost | | Fair value (a) | | Percent of
net assets |
| Consumer Discretionary (Cont'd): | | | | | | |
| 19,572 | | FOOT LOCKER, INC. | | $ 464,589 | | 791,492 | | |
| 22,163 | | FORD MOTOR CO. | | 72,511 | | 194,813 | | |
| 1,300 | | FRONTDOOR, INC.(b) | | 30,172 | | 65,273 | | |
| 18,248 | | GAP (THE), INC. | | 140,118 | | 368,427 | | |
| 5,273 | | GARMIN LTD.(c) | | 188,068 | | 630,967 | | |
| 14,081 | | GENERAL MOTORS CO. | | 351,158 | | 586,333 | | |
| 15,000 | | GENTEX CORP. | | 106,860 | | 508,950 | | |
| 3,450 | | GENUINE PARTS CO. | | 102,424 | | 346,483 | | |
| 17,381 | | HANESBRANDS, INC. | | 159,064 | | 253,415 | | |
| 400 | | HASBRO, INC. | | 10,206 | | 37,416 | | |
| 1,600 | | HILTON WORLDWIDE HOLDINGS, INC. | | 115,613 | | 178,016 | | |
| 15,500 | | HOME DEPOT (THE), INC. | | 2,435,136 | | 4,117,110 | | |
| 30,418 | | INTERNATIONAL GAME TECHNOLOGY PLC | | 167,706 | | 515,281 | | |
| 6,950 | | KOHL'S CORP. | | 55,508 | | 282,796 | | |
| 971 | | KONTOOR BRANDS, INC. | | 5,113 | | 39,384 | | |
| 3,290 | | L BRANDS, INC. | | 38,158 | | 122,355 | | |
| 2,338 | | LAS VEGAS SANDS CORP. | | 14,654 | | 139,345 | | |
| 23,722 | | LENNAR CORP., CLASS A | | 978,272 | | 1,808,328 | | |
| 58 | | LENNAR CORP., CLASS B | | 652 | | 3,550 | | |
| 15,160 | | LKQ CORP.(b) | | 410,648 | | 534,238 | | |
| 924 | | LOWE'S COS., INC. | | 153,051 | | 148,311 | | |
| 4,767 | | LULULEMON ATHLETICA, INC.(b)(c) | | 606,562 | | 1,659,059 | | |
| 3,038 | | MARRIOTT INTERNATIONAL, INC., CLASS A | | 63,603 | | 400,773 | | |
| 294 | | MARRIOTT VACATIONS WORLDWIDE CORP. | | 4,103 | | 40,343 | | |
| 10,620 | | MCDONALD'S CORP. | | 433,348 | | 2,278,840 | | |
| 14,196 | | MGM RESORTS INTERNATIONAL | | 282,561 | | 447,316 | | |
| 600 | | MOHAWK INDUSTRIES, INC.(b) | | 26,796 | | 84,570 | | |
| 600 | | MURPHY U.S.A., INC. | | 4,392 | | 78,522 | | |
| 4,915 | | NEWELL BRANDS, INC. | | 52,223 | | 104,345 | | |
| 10,000 | | NIKE, INC., CLASS B | | 221,030 | | 1,414,700 | | |
| 4,300 | | NORDSTROM, INC. | | 45,233 | | 134,203 | | |
| 103 | | NVR, INC.(b) | | 133,164 | | 420,226 | | |
| 900 | | O'REILLY AUTOMOTIVE, INC.(b) | | 27,059 | | 407,313 | | |
| 6,746 | | PELOTON INTERACTIVE, INC., CLASS A(b) | | 911,774 | | 1,023,503 | | |
| 4,707 | | PENSKE AUTOMOTIVE GROUP, INC. | | 191,281 | | 279,549 | | |
| 900 | | PLANET FITNESS, INC., CLASS A(b) | | 45,306 | | 69,867 | | |
| 1,225 | | POOL CORP. | | 308,981 | | 456,312 | | |
| 22,616 | | PULTEGROUP, INC. | | 357,667 | | 975,202 | | |
| 2,342 | | PVH CORP. | | 101,514 | | 219,890 | | |
| 20,045 | | QURATE RETAIL, INC., CLASS A | | 55,417 | | 219,894 | | |
| 1,500 | | RALPH LAUREN CORP. | | 31,320 | | 155,610 | | |
| 4,543 | | ROSS STORES, INC. | | 175,795 | | 557,926 | | |
| 5,222 | | ROYAL CARIBBEAN CRUISES LTD. | | 115,541 | | 390,031 | | |
| 5,700 | | SIX FLAGS ENTERTAINMENT CORP. | | 96,791 | | 194,370 | | |
| 23,500 | | STARBUCKS CORP. | | 154,545 | | 2,514,030 | | |
| 4,800 | | TAPESTRY, INC. | | 14,970 | | 149,184 | | |
| 22,005 | | TARGET CORP. | | 2,265,472 | | 3,884,543 | | |
| 10,129 | | TESLA, INC.(b) | | 2,998,722 | | 7,147,731 | | |
| 1,900 | | THOR INDUSTRIES, INC. | | 22,316 | | 176,681 | | |
| 1,400 | | TIFFANY & CO. | | 35,210 | | 184,030 | | |
| 20,188 | | TJX (THE) COS., INC. | | 86,033 | | 1,378,639 | | |
| 1,466 | | TOPBUILD CORP.(b) | | 11,809 | | 269,861 | | |
| 553 | | ULTA BEAUTY, INC.(b) | | 73,007 | | 158,799 | | |
| 1,100 | | VEONEER, INC.(b)(c) | | 5,428 | | 23,430 | | |
| 6,800 | | VF CORP. | | 81,950 | | 580,788 | | |
| 407 | | WAYFAIR, INC., CLASS A(b) | | 88,670 | | 91,905 | | |
| 3,000 | | WENDY'S (THE) CO. | | 43,280 | | 65,760 | | |
| 7,417 | | WHIRLPOOL CORP. | | 755,937 | | 1,338,694 | | |
| 2,773 | | WILLIAMS-SONOMA, INC. | | 149,190 | | 282,402 | | |
| 23,166 | | WYNDHAM DESTINATIONS, INC. | | 477,832 | | 1,039,227 | | |
| 1,400 | | WYNDHAM HOTELS & RESORTS, INC. | | 46,408 | | 83,216 | | |
| 1,600 | | WYNN RESORTS LTD. | | 32,322 | | 180,528 | | |
| 900 | | YUM CHINA HOLDINGS, INC.(c) | | 40,023 | | 51,381 | | |
| | | | | 36,870,128 | | 83,402,736 | | 13.52% |
| Consumer Staples: | | | | | | |
| 59,262 | | ALTRIA GROUP, INC. | | 2,422,222 | | 2,429,742 | | |
| 10,300 | | ARCHER-DANIELS-MIDLAND CO. | | 188,618 | | 519,223 | | |
| See accompanying notes to financial statements. | 29 | (Continued) |
CLEARWATER INVESTMENT TRUST
Schedule of Investments - Clearwater Core Equity Fund
December 31, 2020
| Shares | | Security | | Cost | | Fair value (a) | | Percent of
net assets |
| Consumer Staples (Cont'd): | | | | | | |
| 700 | | BEYOND MEAT, INC.(b) | | $ 51,107 | | 87,500 | | |
| 500 | | BOSTON BEER (THE) CO., INC., CLASS A(b) | | 267,930 | | 497,145 | | |
| 7,290 | | BROWN-FORMAN CORP., CLASS B | | 57,343 | | 579,045 | | |
| 1,266 | | CAMPBELL SOUP CO. | | 61,512 | | 61,211 | | |
| 17,416 | | CHURCH & DWIGHT CO., INC. | | 917,098 | | 1,519,198 | | |
| 4,072 | | CLOROX (THE) CO. | | 633,918 | | 822,218 | | |
| 56,139 | | COCA-COLA (THE) CO. | | 844,179 | | 3,078,663 | | |
| 1,280 | | COLGATE-PALMOLIVE CO. | | 36,019 | | 109,453 | | |
| 1,900 | | CONAGRA BRANDS, INC. | | 26,152 | | 68,894 | | |
| 1,600 | | CONSTELLATION BRANDS, INC., CLASS A | | 202,589 | | 350,480 | | |
| 4,049 | | COSTCO WHOLESALE CORP. | | 173,164 | | 1,525,582 | | |
| 1,646 | | ESTEE LAUDER (THE) COS., INC., CLASS A | | 288,146 | | 438,149 | | |
| 3,709 | | FLOWERS FOODS, INC. | | 79,756 | | 83,935 | | |
| 22,764 | | GENERAL MILLS, INC. | | 832,581 | | 1,338,523 | | |
| 5,300 | | HERBALIFE NUTRITION LTD.(b) | | 36,401 | | 254,665 | | |
| 1,642 | | HERSHEY (THE) CO. | | 60,568 | | 250,126 | | |
| 4,800 | | HORMEL FOODS CORP. | | 43,206 | | 223,728 | | |
| 1,700 | | INGREDION, INC. | | 48,104 | | 133,739 | | |
| 12,793 | | J M SMUCKER (THE) CO. | | 1,343,553 | | 1,478,871 | | |
| 1,643 | | KEURIG DR. PEPPER, INC. | | (27,168) | | 52,576 | | |
| 1,972 | | KIMBERLY-CLARK CORP. | | 125,773 | | 265,885 | | |
| 3,714 | | KRAFT HEINZ (THE) CO. | | 26,692 | | 128,727 | | |
| 112,392 | | KROGER (THE) CO. | | 2,816,565 | | 3,569,570 | | |
| 633 | | LAMB WESTON HOLDINGS, INC. | | 7,452 | | 49,842 | | |
| 1,400 | | MCCORMICK & CO., INC. (NON VOTING) | | 21,613 | | 133,840 | | |
| 1,300 | | MOLSON COORS BEVERAGE CO., CLASS B | | 37,841 | | 58,747 | | |
| 6,969 | | MONDELEZ INTERNATIONAL, INC., CLASS A | | 94,887 | | 407,477 | | |
| 5,164 | | MONSTER BEVERAGE CORP.(b) | | 225,908 | | 477,567 | | |
| 232 | | NU SKIN ENTERPRISES, INC., CLASS A | | 8,194 | | 12,674 | | |
| 24,270 | | PEPSICO, INC. | | 1,881,046 | | 3,599,241 | | |
| 11,902 | | PHILIP MORRIS INTERNATIONAL, INC. | | 711,597 | | 985,367 | | |
| 700 | | POST HOLDINGS, INC.(b) | | 43,421 | | 70,707 | | |
| 34,396 | | PROCTER & GAMBLE (THE) CO. | | 1,138,085 | | 4,785,859 | | |
| 12,432 | | SYSCO CORP. | | 389,192 | | 923,200 | | |
| 17,551 | | TYSON FOODS, INC., CLASS A | | 793,641 | | 1,130,986 | | |
| 2,700 | | US FOODS HOLDING CORP.(b) | | 45,757 | | 89,937 | | |
| 25,358 | | WALGREENS BOOTS ALLIANCE, INC. | | 671,031 | | 1,011,277 | | |
| 19,018 | | WALMART, INC. | | 1,729,702 | | 2,741,445 | | |
| | | | | 19,355,395 | | 36,345,014 | | 5.89% |
| Energy: | | | | | | |
| 1 | | ANTERO MIDSTREAM CORP. | | 2 | | 8 | | |
| 7,500 | | APACHE CORP. | | 44,218 | | 106,425 | | |
| 6,600 | | BAKER HUGHES CO. | | 77,964 | | 137,610 | | |
| 2,200 | | CHENIERE ENERGY, INC.(b) | | 73,298 | | 132,066 | | |
| 29,032 | | CHEVRON CORP. | | 1,322,946 | | 2,451,753 | | |
| 2,700 | | CIMAREX ENERGY CO. | | 45,271 | | 101,277 | | |
| 1,700 | | CONCHO RESOURCES, INC. | | 49,631 | | 99,195 | | |
| 47,305 | | CONOCOPHILLIPS | | 1,379,970 | | 1,891,727 | | |
| 2,000 | | CONTINENTAL RESOURCES, INC. | | 20,765 | | 32,600 | | |
| 9,794 | | ENBRIDGE, INC.(c) | | 137,797 | | 313,310 | | |
| 12,548 | | EOG RESOURCES, INC. | | 570,060 | | 625,769 | | |
| 16,551 | | EXXON MOBIL CORP. | | 628,157 | | 682,232 | | |
| 3,100 | | HELMERICH & PAYNE, INC. | | 39,003 | | 71,796 | | |
| 2,600 | | HESS CORP. | | 90,342 | | 137,254 | | |
| 18,112 | | KINDER MORGAN, INC. | | 193,956 | | 247,591 | | |
| 5,994 | | OCCIDENTAL PETROLEUM CORP. | | 53,941 | | 103,756 | | |
| 3,900 | | ONEOK, INC. | | 47,522 | | 149,682 | | |
| 6,900 | | PBF ENERGY, INC., CLASS A | | 45,787 | | 48,990 | | |
| 1,000 | | PHILLIPS 66 | | 50,510 | | 69,940 | | |
| 1,500 | | PIONEER NATURAL RESOURCES CO. | | 108,477 | | 170,835 | | |
| 9,633 | | SCHLUMBERGER N.V. | | 108,848 | | 210,288 | | |
| 8,079 | | VALERO ENERGY CORP. | | 257,608 | | 457,029 | | |
| 37,307 | | WILLIAMS (THE) COS., INC. | | 685,696 | | 748,005 | | |
| | | | | 6,031,769 | | 8,989,138 | | 1.46% |
| Financials: | | | | | | |
| 500 | | ALLEGHANY CORP. | | 140,685 | | 301,845 | | |
| 26,983 | | ALLSTATE (THE) CORP. | | 2,018,400 | | 2,966,241 | | |
| See accompanying notes to financial statements. | 30 | (Continued) |
CLEARWATER INVESTMENT TRUST
Schedule of Investments - Clearwater Core Equity Fund
December 31, 2020
| Shares | | Security | | Cost | | Fair value (a) | | Percent of
net assets |
| Financials (Cont'd): | | | | | | |
| 3,633 | | AMERICAN EXPRESS CO. | | $ 111,938 | | 439,266 | | |
| 2,208 | | AMERICAN FINANCIAL GROUP, INC. | | 135,743 | | 193,465 | | |
| 5,500 | | AMERICAN INTERNATIONAL GROUP, INC. | | 129,086 | | 208,230 | | |
| 1,689 | | AMERICAN NATIONAL GROUP, INC. | | 113,808 | | 162,347 | | |
| 13,465 | | AMERIPRISE FINANCIAL, INC. | | 1,169,211 | | 2,616,654 | | |
| 13,600 | | ANNALY CAPITAL MANAGEMENT, INC. | | 80,993 | | 114,920 | | |
| 1,848 | | AON PLC, CLASS A | | 223,031 | | 390,427 | | |
| 15,811 | | ARCH CAPITAL GROUP LTD.(b)(c) | | 307,170 | | 570,303 | | |
| 2,300 | | ARTHUR J. GALLAGHER & CO. | | 80,002 | | 284,533 | | |
| 4,900 | | ASSURANT, INC. | | 218,575 | | 667,478 | | |
| 1,000 | | AXIS CAPITAL HOLDINGS LTD.(c) | | 28,371 | | 50,390 | | |
| 115,825 | | BANK OF AMERICA CORP. | | 1,176,757 | | 3,510,656 | | |
| 10,000 | | BANK OF NEW YORK MELLON (THE) CORP. | | 206,454 | | 424,400 | | |
| 22,651 | | BERKSHIRE HATHAWAY, INC., CLASS B(b) | | 2,584,621 | | 5,252,087 | | |
| 2,000 | | BRIGHTHOUSE FINANCIAL, INC.(b) | | 48,875 | | 72,410 | | |
| 620 | | CANNAE HOLDINGS, INC.(b) | | 2,893 | | 27,447 | | |
| 9,258 | | CAPITAL ONE FINANCIAL CORP. | | 345,636 | | 915,153 | | |
| 19,308 | | CHARLES SCHWAB (THE) CORP. | | 201,859 | | 1,024,096 | | |
| 2,385 | | CHUBB LTD.(c) | | 126,355 | | 367,099 | | |
| 47,964 | | CITIGROUP, INC. | | 1,875,338 | | 2,957,460 | | |
| 7,030 | | CITIZENS FINANCIAL GROUP, INC. | | 131,016 | | 251,393 | | |
| 1,965 | | CME GROUP, INC. | | 203,851 | | 357,728 | | |
| 500 | | CREDIT ACCEPTANCE CORP.(b) | | 86,421 | | 173,070 | | |
| 8,202 | | DISCOVER FINANCIAL SERVICES | | 125,376 | | 742,527 | | |
| 173 | | EVEREST RE GROUP LTD.(c) | | 39,843 | | 40,498 | | |
| 469 | | FAIRFAX FINANCIAL HOLDINGS LTD.(c) | | 86,576 | | 159,901 | | |
| 1,863 | | FIDELITY NATIONAL FINANCIAL, INC. | | 15,560 | | 72,825 | | |
| 10,565 | | FIFTH THIRD BANCORP | | 109,297 | | 291,277 | | |
| 400 | | FIRST CITIZENS BANCSHARES, INC., CLASS A | | 57,523 | | 229,708 | | |
| 30,500 | | FIRST HORIZON CORP. | | 193,065 | | 389,180 | | |
| 15,329 | | GOLDMAN SACHS GROUP (THE), INC. | | 1,896,007 | | 4,042,411 | | |
| 3,000 | | HANOVER INSURANCE GROUP (THE), INC. | | 215,948 | | 350,760 | | |
| 19,283 | | HARTFORD FINANCIAL SERVICES GROUP (THE), INC. | | 719,250 | | 944,481 | | |
| 35,000 | | HUNTINGTON BANCSHARES, INC. | | 169,771 | | 442,050 | | |
| 505 | | INTERCONTINENTAL EXCHANGE, INC. | | 12,819 | | 58,221 | | |
| 15,903 | | JANUS HENDERSON GROUP PLC(c) | | 222,792 | | 517,007 | | |
| 47,492 | | JPMORGAN CHASE & CO. | | 1,723,282 | | 6,034,808 | | |
| 5,904 | | KEYCORP | | 30,107 | | 96,885 | | |
| 2,200 | | LEMONADE, INC.(b) | | 236,890 | | 269,500 | | |
| 200 | | MARKEL CORP.(b) | | 67,789 | | 206,660 | | |
| 200 | | MARKETAXESS HOLDINGS, INC. | | 100,378 | | 114,112 | | |
| 5,684 | | MARSH & MCLENNAN COS., INC. | | 240,120 | | 665,028 | | |
| 2,748 | | MERCURY GENERAL CORP. | | 112,368 | | 143,473 | | |
| 5,091 | | METLIFE, INC. | | 162,948 | | 239,023 | | |
| 800 | | MOODY'S CORP. | | 28,632 | | 232,192 | | |
| 78,857 | | MORGAN STANLEY | | 2,295,591 | | 5,404,070 | | |
| 200 | | MSCI, INC. | | 6,396 | | 89,306 | | |
| 5,900 | | NASDAQ, INC. | | 240,309 | | 783,166 | | |
| 2,326 | | ONEMAIN HOLDINGS, INC. | | 40,168 | | 112,020 | | |
| 2,485 | | PACWEST BANCORP | | 28,898 | | 63,119 | | |
| 7,214 | | PNC FINANCIAL SERVICES GROUP (THE), INC. | | 276,365 | | 1,074,886 | | |
| 17,728 | | POPULAR, INC. | | 602,360 | | 998,441 | | |
| 1,800 | | PRINCIPAL FINANCIAL GROUP, INC. | | 37,586 | | 89,298 | | |
| 19,810 | | PROGRESSIVE (THE) CORP. | | 1,409,765 | | 1,958,813 | | |
| 5,900 | | PRUDENTIAL FINANCIAL, INC. | | 182,565 | | 460,613 | | |
| 16,006 | | RAYMOND JAMES FINANCIAL, INC. | | 1,016,976 | | 1,531,294 | | |
| 12,839 | | REGIONS FINANCIAL CORP. | | 73,436 | | 206,965 | | |
| 800 | | RENAISSANCERE HOLDINGS LTD.(c) | | 81,779 | | 132,656 | | |
| 3,151 | | ROYAL BANK OF CANADA(c) | | 75,539 | | 258,571 | | |
| 7,500 | | SEI INVESTMENTS CO. | | 108,537 | | 431,025 | | |
| 18,352 | | SLM CORP. | | 93,485 | | 227,381 | | |
| 20,892 | | STATE STREET CORP. | | 1,076,086 | | 1,520,520 | | |
| 48,997 | | SYNCHRONY FINANCIAL | | 1,089,720 | | 1,700,686 | | |
| 3,657 | | SYNOVUS FINANCIAL CORP. | | 49,372 | | 118,377 | | |
| 3,549 | | T. ROWE PRICE GROUP, INC. | | 106,978 | | 537,283 | | |
| 2,946 | | TCF FINANCIAL CORP. | | 51,834 | | 109,061 | | |
| 15,374 | | TRAVELERS (THE) COS., INC. | | 1,378,221 | | 2,158,048 | | |
| See accompanying notes to financial statements. | 31 | (Continued) |
CLEARWATER INVESTMENT TRUST
Schedule of Investments - Clearwater Core Equity Fund
December 31, 2020
| Shares | | Security | | Cost | | Fair value (a) | | Percent of
net assets |
| Financials (Cont'd): | | | | | | |
| 12,994 | | TRUIST FINANCIAL CORP. | | $ 242,181 | | 622,802 | | |
| 16,200 | | TWO HARBORS INVESTMENT CORP. | | 70,556 | | 103,194 | | |
| 17,585 | | US BANCORP | | 318,503 | | 819,285 | | |
| 1,741 | | VIRTU FINANCIAL, INC., CLASS A | | 40,442 | | 43,821 | | |
| 7,855 | | W R BERKLEY CORP. | | 230,563 | | 521,729 | | |
| 1,800 | | WASHINGTON FEDERAL, INC. | | 23,535 | | 46,332 | | |
| 47,427 | | WELLS FARGO & CO. | | 593,148 | | 1,431,347 | | |
| 2,568 | | WESTERN ALLIANCE BANCORP | | 59,789 | | 153,952 | | |
| 2,600 | | ZIONS BANCORP N.A. | | 49,361 | | 112,944 | | |
| | | | | 30,263,474 | | 64,402,630 | | 10.44% |
| Health Care: | | | | | | |
| 12,534 | | ABBOTT LABORATORIES | | 251,181 | | 1,372,348 | | |
| 22,394 | | ABBVIE, INC. | | 940,731 | | 2,399,517 | | |
| 300 | | ABIOMED, INC.(b) | | 44,070 | | 97,260 | | |
| 500 | | ACCELERON PHARMA, INC.(b) | | 48,935 | | 63,970 | | |
| 1,800 | | ADAPTIVE BIOTECHNOLOGIES CORP.(b) | | 45,536 | | 106,434 | | |
| 1,457 | | AGILENT TECHNOLOGIES, INC. | | 63,335 | | 172,640 | | |
| 1,200 | | AGIOS PHARMACEUTICALS, INC.(b) | | 44,843 | | 51,996 | | |
| 5,390 | | ALEXION PHARMACEUTICALS, INC.(b) | | 376,663 | | 842,134 | | |
| 1,527 | | ALIGN TECHNOLOGY, INC.(b) | | 209,497 | | 815,998 | | |
| 1,200 | | ALNYLAM PHARMACEUTICALS, INC.(b) | | 181,534 | | 155,964 | | |
| 7,200 | | AMERISOURCEBERGEN CORP. | | 115,968 | | 703,872 | | |
| 12,608 | | AMGEN, INC. | | 2,249,705 | | 2,898,831 | | |
| 6,808 | | ANTHEM, INC. | | 847,250 | | 2,185,981 | | |
| 193 | | AVANOS MEDICAL, INC.(b) | | 3,014 | | 8,855 | | |
| 3,700 | | AVANTOR, INC.(b) | | 41,167 | | 104,155 | | |
| 9,290 | | BAXTER INTERNATIONAL, INC. | | 461,892 | | 745,430 | | |
| 2,885 | | BECTON DICKINSON AND CO. | | 255,655 | | 721,885 | | |
| 13,363 | | BIOGEN, INC.(b) | | 3,758,348 | | 3,272,064 | | |
| 2,814 | | BIO-RAD LABORATORIES, INC., CLASS A(b) | | 1,417,545 | | 1,640,393 | | |
| 32,800 | | BOSTON SCIENTIFIC CORP.(b) | | 182,160 | | 1,179,160 | | |
| 42,856 | | BRISTOL-MYERS SQUIBB CO. | | 1,784,752 | | 2,658,358 | | |
| 2,145 | | BRUKER CORP. | | 43,219 | | 116,109 | | |
| 1,000 | | CARDINAL HEALTH, INC. | | 26,001 | | 53,560 | | |
| 1,500 | | CATALENT, INC.(b) | | 72,507 | | 156,105 | | |
| 3,672 | | CENTENE CORP.(b) | | 139,553 | | 220,430 | | |
| 3,600 | | CERNER CORP. | | 40,604 | | 282,528 | | |
| 241 | | CHARLES RIVER LABORATORIES INTERNATIONAL, INC.(b) | | 31,337 | | 60,216 | | |
| 3,495 | | CIGNA CORP. | | 248,939 | | 727,589 | | |
| 200 | | COOPER (THE) COS., INC. | | 50,902 | | 72,664 | | |
| 17,037 | | CVS HEALTH CORP. | | 769,515 | | 1,163,627 | | |
| 9,229 | | DANAHER CORP. | | 272,153 | | 2,050,130 | | |
| 13,580 | | DAVITA, INC.(b) | | 1,012,201 | | 1,594,292 | | |
| 5,332 | | DENTSPLY SIRONA, INC. | | 141,306 | | 279,184 | | |
| 1,500 | | DEXCOM, INC.(b) | | 87,311 | | 554,580 | | |
| 11,778 | | EDWARDS LIFESCIENCES CORP.(b) | | 161,745 | | 1,074,507 | | |
| 3,800 | | ELANCO ANIMAL HEALTH, INC.(b) | | 74,580 | | 116,546 | | |
| 22,273 | | ELI LILLY AND CO. | | 2,036,893 | | 3,760,573 | | |
| 1,413 | | EXACT SCIENCES CORP.(b) | | 187,220 | | 187,208 | | |
| 4,554 | | EXELIXIS, INC.(b) | | 79,617 | | 91,399 | | |
| 17,143 | | GILEAD SCIENCES, INC. | | 144,642 | | 998,751 | | |
| 12,584 | | HCA HEALTHCARE, INC. | | 1,662,272 | | 2,069,565 | | |
| 3,800 | | HENRY SCHEIN, INC.(b) | | 67,547 | | 254,068 | | |
| 27,356 | | HOLOGIC, INC.(b) | | 1,549,268 | | 1,992,337 | | |
| 6,925 | | HORIZON THERAPEUTICS PLC(b) | | 168,428 | | 506,564 | | |
| 2,313 | | HUMANA, INC. | | 797,781 | | 948,954 | | |
| 5,691 | | IDEXX LABORATORIES, INC.(b) | | 1,548,942 | | 2,844,760 | | |
| 2,300 | | ILLUMINA, INC.(b) | | 98,233 | | 851,000 | | |
| 1,957 | | INCYTE CORP.(b) | | 125,794 | | 170,220 | | |
| 1,462 | | INTUITIVE SURGICAL, INC.(b) | | 560,949 | | 1,196,062 | | |
| 6,100 | | IOVANCE BIOTHERAPEUTICS, INC.(b) | | 253,092 | | 283,040 | | |
| 5,634 | | IQVIA HOLDINGS, INC.(b) | | 560,732 | | 1,009,444 | | |
| 444 | | JAZZ PHARMACEUTICALS PLC(b)(c) | | 66,274 | | 73,282 | | |
| 24,983 | | JOHNSON & JOHNSON | | 1,645,033 | | 3,931,825 | | |
| 842 | | LABORATORY CORP. OF AMERICA HOLDINGS(b) | | 53,269 | | 171,389 | | |
| 500 | | MASIMO CORP.(b) | | 110,177 | | 134,190 | | |
| 6,227 | | MCKESSON CORP. | | 278,873 | | 1,083,000 | | |
| See accompanying notes to financial statements. | 32 | (Continued) |
CLEARWATER INVESTMENT TRUST
Schedule of Investments - Clearwater Core Equity Fund
December 31, 2020
| Shares | | Security | | Cost | | Fair value (a) | | Percent of
net assets |
| Health Care (Cont'd): | | | | | | |
| 12,348 | | MEDTRONIC PLC(c) | | $ 1,077,575 | | 1,446,445 | | |
| 43,396 | | MERCK & CO., INC. | | 1,384,084 | | 3,549,793 | | |
| 1,317 | | METTLER-TOLEDO INTERNATIONAL, INC.(b) | | 123,051 | | 1,500,959 | | |
| 2,715 | | MODERNA, INC.(b) | | 283,655 | | 283,636 | | |
| 6,475 | | MOLINA HEALTHCARE, INC.(b) | | 1,208,423 | | 1,377,103 | | |
| 800 | | NEUROCRINE BIOSCIENCES, INC.(b) | | 72,192 | | 76,680 | | |
| 386 | | NOVOCURE LTD.(b)(c) | | 66,797 | | 66,793 | | |
| 3,700 | | OAK STREET HEALTH, INC.(b) | | 230,718 | | 226,292 | | |
| 300 | | PENUMBRA, INC.(b) | | 36,663 | | 52,500 | | |
| 1,200 | | PERRIGO CO. PLC(c) | | 53,711 | | 53,664 | | |
| 73,602 | | PFIZER, INC. | | 1,394,608 | | 2,709,290 | | |
| 2,600 | | PPD, INC.(b) | | 45,518 | | 88,972 | | |
| 2,000 | | QIAGEN N.V.(b)(c) | | 83,380 | | 105,700 | | |
| 1,255 | | QUIDEL CORP.(b) | | 270,774 | | 225,461 | | |
| 193 | | REGENERON PHARMACEUTICALS, INC.(b) | | 95,376 | | 93,240 | | |
| 400 | | REPLIGEN CORP.(b) | | 46,604 | | 76,652 | | |
| 8,022 | | RESMED, INC. | | 644,542 | | 1,705,156 | | |
| 700 | | SAREPTA THERAPEUTICS, INC.(b) | | 66,178 | | 119,343 | | |
| 2,100 | | SEAGEN, INC.(b) | | 357,076 | | 367,794 | | |
| 900 | | TELADOC HEALTH, INC.(b) | | 179,423 | | 179,964 | | |
| 1,800 | | TELEFLEX, INC. | | 195,858 | | 740,826 | | |
| 3,026 | | THERMO FISHER SCIENTIFIC, INC. | | 769,422 | | 1,409,450 | | |
| 6,118 | | UNITED THERAPEUTICS CORP.(b) | | 616,285 | | 928,651 | | |
| 15,291 | | UNITEDHEALTH GROUP, INC. | | 2,299,636 | | 5,362,248 | | |
| 2,036 | | UNIVERSAL HEALTH SERVICES, INC., CLASS B | | 38,822 | | 279,950 | | |
| 1,880 | | VAREX IMAGING CORP.(b) | | 19,829 | | 31,358 | | |
| 5,199 | | VARIAN MEDICAL SYSTEMS, INC.(b) | | 193,000 | | 909,877 | | |
| 1,800 | | VEEVA SYSTEMS, INC., CLASS A(b) | | 318,742 | | 490,050 | | |
| 3,000 | | VERTEX PHARMACEUTICALS, INC.(b) | | 509,278 | | 709,020 | | |
| 22,977 | | VIATRIS, INC.(b) | | 294,682 | | 430,589 | | |
| 8,978 | | WATERS CORP.(b) | | 1,428,708 | | 2,221,337 | | |
| 2,248 | | WEST PHARMACEUTICAL SERVICES, INC. | | 628,826 | | 636,881 | | |
| 4,304 | | ZIMMER BIOMET HOLDINGS, INC. | | 233,961 | | 663,203 | | |
| 1,047 | | ZOETIS, INC. | | 108,002 | | 173,278 | | |
| | | | | 43,866,089 | | 82,569,098 | | 13.38% |
| Industrials: | | | | | | |
| 6,987 | | 3M CO. | | 417,187 | | 1,221,258 | | |
| 923 | | ACCO BRANDS CORP. | | 3,137 | | 7,799 | | |
| 1,508 | | ACUITY BRANDS, INC. | | 138,403 | | 182,604 | | |
| 11,607 | | ADT, INC. | | 45,143 | | 91,115 | | |
| 5,973 | | AGCO CORP. | | 421,122 | | 615,757 | | |
| 8,255 | | AIR LEASE CORP. | | 223,546 | | 366,687 | | |
| 2,194 | | ALASKA AIR GROUP, INC. | | 107,932 | | 114,088 | | |
| 1,533 | | ALLEGION PLC(c) | | 40,913 | | 178,411 | | |
| 5,175 | | AMETEK, INC. | | 73,221 | | 625,864 | | |
| 3,387 | | BOEING (THE) CO. | | 231,093 | | 725,021 | | |
| 1,200 | | BWX TECHNOLOGIES, INC. | | 54,215 | | 72,336 | | |
| 6,460 | | C.H. ROBINSON WORLDWIDE, INC. | | 668,058 | | 606,400 | | |
| 2,996 | | CARLISLE COS., INC. | | 114,358 | | 467,915 | | |
| 10,640 | | CARRIER GLOBAL CORP. | | 57,007 | | 401,341 | | |
| 10,504 | | CATERPILLAR, INC. | | 272,491 | | 1,911,938 | | |
| 3,200 | | CINTAS CORP. | | 258,101 | | 1,131,072 | | |
| 2,094 | | COPA HOLDINGS S.A., CLASS A(c) | | 168,818 | | 161,720 | | |
| 2,000 | | COPART, INC.(b) | | 143,195 | | 254,500 | | |
| 6,700 | | CORELOGIC, INC. | | 76,313 | | 518,044 | | |
| 72 | | COSTAR GROUP, INC.(b) | | 66,549 | | 66,548 | | |
| 3,948 | | CRANE CO. | | 66,572 | | 306,602 | | |
| 7,324 | | CSX CORP. | | 382,113 | | 664,653 | | |
| 12,207 | | CUMMINS, INC. | | 1,914,242 | | 2,772,210 | | |
| 7,300 | | DEERE & CO. | | 199,160 | | 1,964,065 | | |
| 10,100 | | DELTA AIR LINES, INC. | | 100,965 | | 406,121 | | |
| 1,525 | | DOVER CORP. | | 32,899 | | 192,531 | | |
| 19,882 | | EATON CORP. PLC | | 752,240 | | 2,388,623 | | |
| 2,980 | | EXPEDITORS INTERNATIONAL OF WASHINGTON, INC. | | 166,704 | | 283,428 | | |
| 3,048 | | FEDEX CORP. | | 345,904 | | 791,322 | | |
| 3,325 | | FORTIVE CORP. | | 36,012 | | 235,476 | | |
| 37,334 | | FORTUNE BRANDS HOME & SECURITY, INC. | | 1,772,776 | | 3,200,270 | | |
| See accompanying notes to financial statements. | 33 | (Continued) |
CLEARWATER INVESTMENT TRUST
Schedule of Investments - Clearwater Core Equity Fund
December 31, 2020
| Shares | | Security | | Cost | | Fair value (a) | | Percent of
net assets |
| Industrials (Cont'd): | | | | | | |
| 1,400 | | GATX CORP. | | $ 24,276 | | 116,452 | | |
| 1,328 | | GENERAC HOLDINGS, INC.(b) | | 286,861 | | 302,000 | | |
| 837 | | GENERAL DYNAMICS CORP. | | 116,523 | | 124,562 | | |
| 50,000 | | GENERAL ELECTRIC CO. | | 348,445 | | 540,000 | | |
| 20,900 | | GRAFTECH INTERNATIONAL LTD. | | 154,560 | | 222,794 | | |
| 875 | | HEICO CORP. | | 61,334 | | 115,850 | | |
| 2,156 | | HEICO CORP., CLASS A | | 109,365 | | 252,381 | | |
| 360 | | HERC HOLDINGS, INC.(b) | | 5,808 | | 23,908 | | |
| 9,188 | | HONEYWELL INTERNATIONAL, INC. | | 265,803 | | 1,954,288 | | |
| 25,039 | | HOWMET AEROSPACE, INC. | | 299,194 | | 714,613 | | |
| 1,200 | | HUBBELL, INC. | | 43,310 | | 188,148 | | |
| 2,695 | | HUNTINGTON INGALLS INDUSTRIES, INC. | | 389,034 | | 459,444 | | |
| 1,500 | | IAA, INC.(b) | | 45,883 | | 97,470 | | |
| 2,271 | | IDEX CORP. | | 140,770 | | 452,383 | | |
| 1,533 | | IHS MARKIT LTD.(c) | | 137,138 | | 137,709 | | |
| 4,824 | | ILLINOIS TOOL WORKS, INC. | | 155,812 | | 983,517 | | |
| 2,382 | | INGERSOLL RAND, INC.(b) | | 18,866 | | 108,524 | | |
| 1,468 | | JACOBS ENGINEERING GROUP, INC. | | 29,713 | | 159,953 | | |
| 2,100 | | JB HUNT TRANSPORT SERVICES, INC. | | 40,530 | | 286,965 | | |
| 37,751 | | JOHNSON CONTROLS INTERNATIONAL PLC | | 982,980 | | 1,758,819 | | |
| 1,603 | | KNIGHT-SWIFT TRANSPORTATION HOLDINGS, INC. | | 67,050 | | 67,037 | | |
| 5,743 | | L3HARRIS TECHNOLOGIES, INC. | | 554,157 | | 1,085,542 | | |
| 600 | | LENNOX INTERNATIONAL, INC. | | 17,874 | | 164,382 | | |
| 1,400 | | LINCOLN ELECTRIC HOLDINGS, INC. | | 28,970 | | 162,750 | | |
| 3,232 | | LOCKHEED MARTIN CORP. | | 941,979 | | 1,147,295 | | |
| 1,800 | | LYFT, INC., CLASS A(b) | | 50,324 | | 88,434 | | |
| 1,200 | | MANITOWOC (THE) CO., INC.(b) | | 10,053 | | 15,972 | | |
| 2,475 | | MANPOWERGROUP, INC. | | 81,957 | | 223,196 | | |
| 17,786 | | MASCO CORP. | | 272,383 | | 976,985 | | |
| 3,039 | | MSC INDUSTRIAL DIRECT CO., INC., CLASS A | | 189,928 | | 256,461 | | |
| 577 | | NORDSON CORP. | | 57,299 | | 115,948 | | |
| 760 | | NORFOLK SOUTHERN CORP. | | 14,546 | | 180,584 | | |
| 4,673 | | NORTHROP GRUMMAN CORP. | | 480,108 | | 1,423,957 | | |
| 2,519 | | NVENT ELECTRIC PLC(c) | | 24,113 | | 58,668 | | |
| 7,166 | | OLD DOMINION FREIGHT LINE, INC. | | 1,065,858 | | 1,398,660 | | |
| 8,384 | | OSHKOSH CORP. | | 360,335 | | 721,611 | | |
| 5,320 | | OTIS WORLDWIDE CORP. | | 90,693 | | 359,366 | | |
| 1,100 | | OWENS CORNING | | 22,578 | | 83,336 | | |
| 1,067 | | PACCAR, INC. | | 47,468 | | 92,061 | | |
| 4,628 | | PARKER-HANNIFIN CORP. | | 350,966 | | 1,260,713 | | |
| 2,519 | | PENTAIR PLC(c) | | 49,295 | | 133,734 | | |
| 7,595 | | QUANTA SERVICES, INC. | | 238,800 | | 546,992 | | |
| 13,341 | | RAYTHEON TECHNOLOGIES CORP. | | 243,956 | | 954,015 | | |
| 12,257 | | REPUBLIC SERVICES, INC. | | 732,074 | | 1,180,349 | | |
| 9,420 | | ROLLINS, INC. | | 221,629 | | 368,039 | | |
| 700 | | ROPER TECHNOLOGIES, INC. | | 94,317 | | 301,763 | | |
| 7,699 | | SCHNEIDER NATIONAL, INC., CLASS B | | 158,671 | | 159,369 | | |
| 700 | | SNAP-ON, INC. | | 17,991 | | 119,798 | | |
| 18,647 | | SOUTHWEST AIRLINES CO. | | 424,513 | | 869,137 | | |
| 1,500 | | SPIRIT AEROSYSTEMS HOLDINGS, INC., CLASS A | | 25,470 | | 58,635 | | |
| 2,557 | | STANLEY BLACK & DECKER, INC. | | 72,048 | | 456,578 | | |
| 600 | | STERICYCLE, INC.(b) | | 18,858 | | 41,598 | | |
| 11,246 | | TIMKEN (THE) CO. | | 499,847 | | 869,991 | | |
| 1,596 | | TORO (THE) CO. | | 76,510 | | 151,365 | | |
| 10,505 | | TRANE TECHNOLOGIES PLC(c) | | 490,333 | | 1,524,906 | | |
| 200 | | TRANSDIGM GROUP, INC.(b) | | 62,989 | | 123,770 | | |
| 11,000 | | UBER TECHNOLOGIES, INC.(b) | | 307,924 | | 561,000 | | |
| 5,202 | | UNION PACIFIC CORP. | | 230,095 | | 1,083,160 | | |
| 1,928 | | UNITED AIRLINES HOLDINGS, INC.(b) | | 38,137 | | 83,386 | | |
| 4,957 | | UNITED PARCEL SERVICE, INC., CLASS B | | 392,428 | | 834,759 | | |
| 12,194 | | UNITED RENTALS, INC.(b) | | 1,319,924 | | 2,827,911 | | |
| 794 | | VERISK ANALYTICS, INC. | | 137,235 | | 164,826 | | |
| 180 | | VERITIV CORP.(b) | | 1,653 | | 3,742 | | |
| 700 | | W.W. GRAINGER, INC. | | 30,601 | | 285,838 | | |
| 975 | | WASTE CONNECTIONS, INC. | | 42,575 | | 100,006 | | |
| 17,554 | | WASTE MANAGEMENT, INC. | | 879,219 | | 2,070,143 | | |
| 1,200 | | WESTINGHOUSE AIR BRAKE TECHNOLOGIES CORP. | | 21,945 | | 87,840 | | |
| See accompanying notes to financial statements. | 34 | (Continued) |
CLEARWATER INVESTMENT TRUST
Schedule of Investments - Clearwater Core Equity Fund
December 31, 2020
| Shares | | Security | | Cost | | Fair value (a) | | Percent of
net assets |
| Industrials (Cont'd): | | | | | | |
| 1,600 | | XYLEM, INC. | | $ 30,618 | | 162,864 | | |
| | | | | 24,594,888 | | 57,933,971 | | 9.39% |
| Information Technology: | | | | | | |
| 2,200 | | 2U, INC.(b) | | 40,782 | | 88,022 | | |
| 6,272 | | ACCENTURE PLC, CLASS A(c) | | 650,019 | | 1,638,309 | | |
| 9,323 | | ADOBE, INC.(b) | | 2,002,597 | | 4,662,619 | | |
| 12,800 | | ADVANCED MICRO DEVICES, INC.(b) | | 228,637 | | 1,173,888 | | |
| 12,626 | | AKAMAI TECHNOLOGIES, INC.(b) | | 715,662 | | 1,325,604 | | |
| 2,695 | | ALLIANCE DATA SYSTEMS CORP. | | 114,079 | | 199,699 | | |
| 1,236 | | ALTERYX, INC., CLASS A(b) | | 140,231 | | 150,532 | | |
| 4,065 | | AMDOCS LTD. | | 200,086 | | 288,330 | | |
| 4,400 | | ANALOG DEVICES, INC. | | 82,698 | | 650,012 | | |
| 1,400 | | ANAPLAN, INC.(b) | | 47,612 | | 100,590 | | |
| 1,200 | | ANSYS, INC.(b) | | 30,630 | | 436,560 | | |
| 266,656 | | APPLE, INC. | | 5,594,743 | | 35,382,585 | | |
| 7,400 | | APPLIED MATERIALS, INC. | | 134,145 | | 638,620 | | |
| 7,925 | | ARROW ELECTRONICS, INC.(b) | | 483,101 | | 771,102 | | |
| 1,800 | | ATLASSIAN CORP. PLC, CLASS A(b)(c) | | 206,509 | | 420,966 | | |
| 4,347 | | AUTODESK, INC.(b) | | 578,347 | | 1,327,313 | | |
| 6,766 | | AUTOMATIC DATA PROCESSING, INC. | | 361,211 | | 1,192,169 | | |
| 20,661 | | BLACK KNIGHT, INC.(b) | | 1,461,752 | | 1,825,399 | | |
| 9,493 | | BOOZ ALLEN HAMILTON HOLDING CORP. | | 296,190 | | 827,600 | | |
| 2,791 | | BROADCOM, INC. | | 153,147 | | 1,222,039 | | |
| 3,413 | | BROADRIDGE FINANCIAL SOLUTIONS, INC. | | 106,898 | | 522,872 | | |
| 279 | | CACI INTERNATIONAL, INC., CLASS A(b) | | 53,328 | | 69,563 | | |
| 11,400 | | CADENCE DESIGN SYSTEMS, INC.(b) | | 154,632 | | 1,555,302 | | |
| 1,522 | | CDK GLOBAL, INC. | | 19,712 | | 78,885 | | |
| 7,000 | | CDW CORP. | | 292,424 | | 922,530 | | |
| 9,515 | | CERENCE, INC.(b) | | 225,769 | | 956,067 | | |
| 62,989 | | CISCO SYSTEMS, INC. | | 1,024,504 | | 2,818,758 | | |
| 16,649 | | CITRIX SYSTEMS, INC. | | 1,882,236 | | 2,166,035 | | |
| 2,200 | | CLOUDFLARE, INC., CLASS A(b) | | 78,522 | | 167,178 | | |
| 1,000 | | COGNEX CORP. | | 44,753 | | 80,285 | | |
| 2,700 | | COGNIZANT TECHNOLOGY SOLUTIONS CORP., CLASS A | | 25,751 | | 221,265 | | |
| 5,060 | | CONCENTRIX CORP.(b) | | 306,734 | | 499,422 | | |
| 15,600 | | CORNING, INC. | | 85,176 | | 561,600 | | |
| 368 | | COUPA SOFTWARE, INC.(b) | | 45,753 | | 124,719 | | |
| 1,700 | | CROWDSTRIKE HOLDINGS, INC., CLASS A(b) | | 247,592 | | 360,094 | | |
| 2,100 | | DATADOG, INC., CLASS A(b) | | 179,184 | | 206,724 | | |
| 26,194 | | DELL TECHNOLOGIES, INC., CLASS C(b) | | 1,682,758 | | 1,919,758 | | |
| 2,800 | | DOCUSIGN, INC.(b) | | 393,007 | | 622,440 | | |
| 2,000 | | DOLBY LABORATORIES, INC., CLASS A | | 43,420 | | 194,260 | | |
| 2,300 | | DROPBOX, INC., CLASS A(b) | | 42,360 | | 51,037 | | |
| 1,640 | | ECHOSTAR CORP., CLASS A(b) | | 21,050 | | 34,752 | | |
| 954 | | EPAM SYSTEMS, INC.(b) | | 163,143 | | 341,866 | | |
| 300 | | EURONET WORLDWIDE, INC.(b) | | 25,458 | | 43,476 | | |
| 300 | | EVERBRIDGE, INC.(b) | | 42,279 | | 44,721 | | |
| 1,300 | | F5 NETWORKS, INC.(b) | | 30,063 | | 228,722 | | |
| 300 | | FAIR ISAAC CORP.(b) | | 80,682 | | 153,312 | | |
| 12,959 | | FIDELITY NATIONAL INFORMATION SERVICES, INC. | | 538,426 | | 1,833,180 | | |
| 3,900 | | FIREEYE, INC.(b) | | 44,602 | | 89,934 | | |
| 9,784 | | FISERV, INC.(b) | | 172,685 | | 1,114,006 | | |
| 600 | | FIVE9, INC.(b) | | 64,638 | | 104,640 | | |
| 200 | | FLEETCOR TECHNOLOGIES, INC.(b) | | 33,618 | | 54,566 | | |
| 5,523 | | FORTINET, INC.(b) | | 393,491 | | 820,331 | | |
| 3,873 | | GLOBAL PAYMENTS, INC. | | 299,961 | | 834,322 | | |
| 800 | | GODADDY, INC., CLASS A(b) | | 39,006 | | 66,360 | | |
| 18,800 | | HEWLETT PACKARD ENTERPRISE CO. | | 102,062 | | 222,780 | | |
| 11,910 | | HP, INC. | | 179,763 | | 292,867 | | |
| 1,200 | | INPHI CORP.(b) | | 136,907 | | 192,564 | | |
| 44,778 | | INTEL CORP. | | 1,098,574 | | 2,230,840 | | |
| 10,385 | | INTERNATIONAL BUSINESS MACHINES CORP. | | 1,046,892 | | 1,307,264 | | |
| 3,500 | | INTUIT, INC. | | 75,843 | | 1,329,475 | | |
| 13,175 | | JABIL, INC. | | 259,881 | | 560,333 | | |
| 2,780 | | JACK HENRY & ASSOCIATES, INC. | | 497,186 | | 450,332 | | |
| 400 | | KEYSIGHT TECHNOLOGIES, INC.(b) | | 32,788 | | 52,836 | | |
| 6,727 | | LAM RESEARCH CORP. | | 765,234 | | 3,176,960 | | |
| See accompanying notes to financial statements. | 35 | (Continued) |
CLEARWATER INVESTMENT TRUST
Schedule of Investments - Clearwater Core Equity Fund
December 31, 2020
| Shares | | Security | | Cost | | Fair value (a) | | Percent of
net assets |
| Information Technology (Cont'd): | | | | | | |
| 1,626 | | LEIDOS HOLDINGS, INC. | | $ 88,882 | | 170,925 | | |
| 3,770 | | MARVELL TECHNOLOGY GROUP LTD. | | 20,234 | | 179,226 | | |
| 8,874 | | MASTERCARD, INC., CLASS A | | 1,993,235 | | 3,167,486 | | |
| 1,900 | | MEDALLIA, INC.(b) | | 44,418 | | 63,118 | | |
| 4,200 | | MICROCHIP TECHNOLOGY, INC. | | 38,962 | | 580,062 | | |
| 35,739 | | MICRON TECHNOLOGY, INC.(b) | | 686,417 | | 2,686,858 | | |
| 111,661 | | MICROSOFT CORP. | | 4,788,071 | | 24,835,640 | | |
| 500 | | MKS INSTRUMENTS, INC. | | 32,310 | | 75,225 | | |
| 600 | | MONOLITHIC POWER SYSTEMS, INC. | | 216,282 | | 219,738 | | |
| 6,993 | | NETAPP, INC. | | 301,461 | | 463,216 | | |
| 900 | | NEW RELIC, INC.(b) | | 42,264 | | 58,860 | | |
| 36,573 | | NORTONLIFELOCK, INC. | | 432,755 | | 759,987 | | |
| 9,984 | | NVIDIA CORP. | | 1,873,485 | | 5,213,645 | | |
| 3,900 | | NXP SEMICONDUCTORS N.V.(c) | | 334,138 | | 620,139 | | |
| 3,297 | | OKTA, INC.(b) | | 513,168 | | 838,295 | | |
| 78,139 | | ORACLE CORP. | | 4,233,408 | | 5,054,812 | | |
| 2,800 | | PALO ALTO NETWORKS, INC.(b) | | 116,508 | | 995,092 | | |
| 466 | | PAYCHEX, INC. | | 27,642 | | 43,422 | | |
| 1,553 | | PAYCOM SOFTWARE, INC.(b) | | 217,948 | | 702,344 | | |
| 9,661 | | PAYPAL HOLDINGS, INC.(b) | | 957,404 | | 2,262,606 | | |
| 907 | | PERSPECTA, INC. | | 8,504 | | 21,841 | | |
| 3,800 | | PLURALSIGHT, INC., CLASS A(b) | | 42,888 | | 79,648 | | |
| 600 | | PROOFPOINT, INC.(b) | | 56,232 | | 81,846 | | |
| 2,400 | | PTC, INC.(b) | | 82,674 | | 287,064 | | |
| 4,379 | | QORVO, INC.(b) | | 519,351 | | 728,096 | | |
| 32,187 | | QUALCOMM, INC. | | 3,011,850 | | 4,903,368 | | |
| 1,500 | | RINGCENTRAL, INC., CLASS A(b) | | 152,618 | | 568,455 | | |
| 8,372 | | SALESFORCE.COM, INC.(b) | | 147,727 | | 1,863,021 | | |
| 73,221 | | SEAGATE TECHNOLOGY PLC | | 2,960,810 | | 4,551,417 | | |
| 2,100 | | SERVICENOW, INC.(b) | | 273,110 | | 1,155,903 | | |
| 6,675 | | SKYWORKS SOLUTIONS, INC. | | 640,777 | | 1,020,474 | | |
| 1,591 | | SLACK TECHNOLOGIES, INC., CLASS A(b) | | 67,217 | | 67,204 | | |
| 900 | | SMARTSHEET, INC., CLASS A(b) | | 39,015 | | 62,361 | | |
| 1,400 | | SPLUNK, INC.(b) | | 162,032 | | 237,846 | | |
| 3,000 | | SQUARE, INC., CLASS A(b) | | 111,050 | | 652,920 | | |
| 1,938 | | SS&C TECHNOLOGIES HOLDINGS, INC. | | 86,602 | | 140,990 | | |
| 809 | | STONECO LTD., CLASS A(b)(c) | | 67,899 | | 67,891 | | |
| 4,757 | | SYNNEX CORP. | | 144,301 | | 387,410 | | |
| 6,082 | | SYNOPSYS, INC.(b) | | 540,689 | | 1,576,698 | | |
| 4,600 | | TERADYNE, INC. | | 82,730 | | 551,494 | | |
| 27,872 | | TEXAS INSTRUMENTS, INC. | | 942,644 | | 4,574,631 | | |
| 82 | | TRADE DESK (THE), INC., CLASS A(b) | | 65,683 | | 65,682 | | |
| 7,049 | | TRIMBLE, INC.(b) | | 94,849 | | 470,662 | | |
| 1,014 | | TWILIO, INC., CLASS A(b) | | 219,999 | | 343,239 | | |
| 2,100 | | UBIQUITI, INC. | | 357,604 | | 584,871 | | |
| 200 | | VERISIGN, INC.(b) | | 23,200 | | 43,280 | | |
| 13,548 | | VISA, INC., CLASS A | | 785,954 | | 2,963,354 | | |
| 7,800 | | VISHAY INTERTECHNOLOGY, INC. | | 48,931 | | 161,538 | | |
| 3,772 | | VMWARE, INC., CLASS A(b) | | 190,784 | | 529,061 | | |
| 1,330 | | VONTIER CORP.(b) | | 7,056 | | 44,422 | | |
| 5,845 | | WESTERN DIGITAL CORP. | | 90,457 | | 323,755 | | |
| 140,231 | | WESTERN UNION (THE) CO. | | 2,695,326 | | 3,076,668 | | |
| 1,000 | | WORKDAY, INC., CLASS A(b) | | 137,260 | | 239,610 | | |
| 24,464 | | XEROX HOLDINGS CORP. | | 374,155 | | 567,320 | | |
| 7,695 | | XILINX, INC. | | 186,834 | | 1,090,920 | | |
| 3,514 | | ZEBRA TECHNOLOGIES CORP., CLASS A(b) | | 707,518 | | 1,350,536 | | |
| 1,300 | | ZENDESK, INC.(b) | | 79,216 | | 186,056 | | |
| 2,300 | | ZOOM VIDEO COMMUNICATIONS, INC., CLASS A(b) | | 581,479 | | 775,836 | | |
| | | | | 60,346,940 | | 169,389,275 | | 27.45% |
| Materials: | | | | | | |
| 1,075 | | AIR PRODUCTS AND CHEMICALS, INC. | | 43,205 | | 293,711 | | |
| 1,300 | | ALBEMARLE CORP. | | 29,152 | | 191,776 | | |
| 13,770 | | AMCOR PLC(c) | | 60,200 | | 162,073 | | |
| 700 | | ASHLAND GLOBAL HOLDINGS, INC. | | 12,006 | | 55,440 | | |
| 3,165 | | AVERY DENNISON CORP. | | 207,899 | | 490,923 | | |
| 4,210 | | CABOT CORP. | | 129,002 | | 188,945 | | |
| 16,337 | | CELANESE CORP. | | 1,176,262 | | 2,122,830 | | |
| See accompanying notes to financial statements. | 36 | (Continued) |
CLEARWATER INVESTMENT TRUST
Schedule of Investments - Clearwater Core Equity Fund
December 31, 2020
| Shares | | Security | | Cost | | Fair value (a) | | Percent of
net assets |
| Materials (Cont'd): | | | | | | |
| 4,500 | | CHEMOURS (THE) CO. | | $ 49,032 | | 111,555 | | |
| 7,262 | | CORTEVA, INC. | | 88,857 | | 281,185 | | |
| 1,800 | | CROWN HOLDINGS, INC.(b) | | 57,831 | | 180,360 | | |
| 7,262 | | DOW, INC. | | 147,036 | | 403,041 | | |
| 10,454 | | DUPONT DE NEMOURS, INC. | | 408,910 | | 743,384 | | |
| 13,243 | | EASTMAN CHEMICAL CO. | | 759,205 | | 1,328,008 | | |
| 3,191 | | ECOLAB, INC. | | 114,294 | | 690,405 | | |
| 15,800 | | FREEPORT-MCMORAN, INC. | | 103,648 | | 411,116 | | |
| 15,846 | | HUNTSMAN CORP. | | 249,978 | | 398,368 | | |
| 238 | | INTERNATIONAL FLAVORS & FRAGRANCES, INC. | | 5,120 | | 25,904 | | |
| 38,587 | | INTERNATIONAL PAPER CO. | | 1,300,493 | | 1,918,546 | | |
| 4,679 | | LINDE PLC(c) | | 777,044 | | 1,232,963 | | |
| 9,574 | | LYONDELLBASELL INDUSTRIES N.V., CLASS A | | 429,495 | | 877,553 | | |
| 700 | | MARTIN MARIETTA MATERIALS, INC. | | 27,965 | | 198,779 | | |
| 24,755 | | NEWMONT CORP. | | 929,653 | | 1,482,577 | | |
| 5,844 | | NUCOR CORP. | | 99,313 | | 310,842 | | |
| 8,317 | | PACKAGING CORP. OF AMERICA | | 742,458 | | 1,146,997 | | |
| 5,172 | | PPG INDUSTRIES, INC. | | 123,888 | | 745,906 | | |
| 6,625 | | RELIANCE STEEL & ALUMINUM CO. | | 325,929 | | 793,344 | | |
| 600 | | ROYAL GOLD, INC. | | 22,314 | | 63,816 | | |
| 2,400 | | RPM INTERNATIONAL, INC. | | 24,657 | | 217,872 | | |
| 500 | | SCOTTS MIRACLE-GRO (THE) CO. | | 37,765 | | 99,570 | | |
| 1,400 | | SEALED AIR CORP. | | 24,528 | | 64,106 | | |
| 2,509 | | SILGAN HOLDINGS, INC. | | 89,461 | | 93,034 | | |
| 3,600 | | SONOCO PRODUCTS CO. | | 74,519 | | 213,300 | | |
| 3,234 | | SOUTHERN COPPER CORP.(c) | | 38,445 | | 210,598 | | |
| 11,903 | | STEEL DYNAMICS, INC. | | 182,235 | | 438,864 | | |
| 4,392 | | VALVOLINE, INC. | | 24,184 | | 101,631 | | |
| 2,100 | | VULCAN MATERIALS CO. | | 63,441 | | 311,451 | | |
| 2,242 | | WESTROCK CO. | | 24,357 | | 97,594 | | |
| | | | | 9,003,781 | | 18,698,367 | | 3.03% |
| Real Estate: | | | | | | |
| 2,129 | | ALEXANDRIA REAL ESTATE EQUITIES, INC. | | 110,363 | | 379,430 | | |
| 2,252 | | AMERICAN HOMES 4 RENT, CLASS A | | 67,576 | | 67,560 | | |
| 4,180 | | AMERICAN TOWER CORP. | | 469,721 | | 938,243 | | |
| 1,837 | | AMERICOLD REALTY TRUST | | 68,589 | | 68,575 | | |
| 3,708 | | APARTMENT INCOME REIT CORP.(b) | | 79,206 | | 142,424 | | |
| 3,708 | | APARTMENT INVESTMENT AND MANAGEMENT CO., CLASS A | | 73,976 | | 19,581 | | |
| 19,853 | | APPLE HOSPITALITY REIT, INC. | | 155,660 | | 256,302 | | |
| 734 | | AVALONBAY COMMUNITIES, INC. | | 31,138 | | 117,756 | | |
| 14,826 | | BOSTON PROPERTIES, INC. | | 1,269,857 | | 1,401,502 | | |
| 46,503 | | BRIXMOR PROPERTY GROUP, INC. | | 409,622 | | 769,625 | | |
| 2,153 | | CAMDEN PROPERTY TRUST | | 123,455 | | 215,128 | | |
| 24,200 | | COLONY CAPITAL, INC. | | 45,138 | | 116,402 | | |
| 500 | | CORESITE REALTY CORP. | | 43,021 | | 62,640 | | |
| 4,700 | | CROWN CASTLE INTERNATIONAL CORP. | | 183,007 | | 748,193 | | |
| 2,027 | | CUBESMART | | 52,679 | | 68,128 | | |
| 1,142 | | CYRUSONE, INC. | | 63,059 | | 83,537 | | |
| 2,657 | | DIGITAL REALTY TRUST, INC. | | 291,684 | | 370,678 | | |
| 5,200 | | DOUGLAS EMMETT, INC. | | 42,689 | | 151,736 | | |
| 1,700 | | DUKE REALTY CORP. | | 28,435 | | 67,949 | | |
| 315 | | EPR PROPERTIES | | 6,839 | | 10,238 | | |
| 852 | | EQUINIX, INC. | | 70,491 | | 608,481 | | |
| 1,905 | | EQUITY COMMONWEALTH | | 50,488 | | 51,968 | | |
| 1,600 | | EQUITY LIFESTYLE PROPERTIES, INC. | | 26,661 | | 101,376 | | |
| 5,416 | | EQUITY RESIDENTIAL | | 174,162 | | 321,061 | | |
| 4,777 | | ESSEX PROPERTY TRUST, INC. | | 1,054,951 | | 1,134,155 | | |
| 900 | | FEDERAL REALTY INVESTMENT TRUST | | 47,642 | | 76,608 | | |
| 1,046 | | FOUR CORNERS PROPERTY TRUST, INC. | | 8,347 | | 31,139 | | |
| 2,071 | | GAMING AND LEISURE PROPERTIES, INC. | | 56,627 | | 87,793 | | |
| 7,000 | | HEALTHPEAK PROPERTIES, INC. | | 70,562 | | 211,610 | | |
| 70,821 | | HOST HOTELS & RESORTS, INC. | | 798,690 | | 1,036,111 | | |
| 678 | | HOWARD HUGHES (THE) CORP.(b) | | 20,502 | | 53,515 | | |
| 700 | | JBG SMITH PROPERTIES | | 17,888 | | 21,889 | | |
| 700 | | JONES LANG LASALLE, INC.(b) | | 39,951 | | 103,859 | | |
| 4,001 | | KIMCO REALTY CORP. | | 37,026 | | 60,055 | | |
| See accompanying notes to financial statements. | 37 | (Continued) |
CLEARWATER INVESTMENT TRUST
Schedule of Investments - Clearwater Core Equity Fund
December 31, 2020
| Shares | | Security | | Cost | | Fair value (a) | | Percent of
net assets |
| Real Estate (Cont'd): | | | | | | |
| 4,678 | | LAMAR ADVERTISING CO., CLASS A | | $ 75,755 | | 389,303 | | |
| 6,311 | | MID-AMERICA APARTMENT COMMUNITIES, INC. | | 643,774 | | 799,541 | | |
| 15,318 | | OUTFRONT MEDIA, INC. | | 184,437 | | 299,620 | | |
| 10,911 | | PROLOGIS, INC. | | 280,831 | | 1,087,390 | | |
| 2,146 | | PUBLIC STORAGE | | 320,090 | | 495,576 | | |
| 6,972 | | RAYONIER, INC. | | 74,591 | | 204,837 | | |
| 2,600 | | REALTY INCOME CORP. | | 47,877 | | 161,642 | | |
| 3,900 | | REGENCY CENTERS CORP. | | 85,345 | | 177,801 | | |
| 1,380 | | REXFORD INDUSTRIAL REALTY, INC. | | 67,784 | | 67,772 | | |
| 2,100 | | SBA COMMUNICATIONS CORP. | | 214,169 | | 592,473 | | |
| 1,594 | | SIMON PROPERTY GROUP, INC. | | 75,050 | | 135,936 | | |
| 1,133 | | SUN COMMUNITIES, INC. | | 87,255 | | 172,159 | | |
| 4,100 | | UDR, INC. | | 63,318 | | 157,563 | | |
| 2,020 | | VEREIT, INC. | | 48,318 | | 76,336 | | |
| 4,300 | | VICI PROPERTIES, INC. | | 66,376 | | 109,650 | | |
| 21,812 | | WEINGARTEN REALTY INVESTORS | | 307,488 | | 472,666 | | |
| 24,590 | | WEYERHAEUSER CO. | | 648,431 | | 824,503 | | |
| | | | | 9,380,591 | | 16,180,015 | | 2.62% |
| Utilities: | | | | | | |
| 3,000 | | AES (THE) CORP. | | 32,870 | | 70,500 | | |
| 2,000 | | ALLIANT ENERGY CORP. | | 24,835 | | 103,060 | | |
| 1,600 | | AMEREN CORP. | | 40,872 | | 124,896 | | |
| 3,406 | | AMERICAN ELECTRIC POWER CO., INC. | | 147,690 | | 283,618 | | |
| 13,200 | | AVANGRID, INC. | | 502,113 | | 599,940 | | |
| 5,800 | | CENTERPOINT ENERGY, INC. | | 66,308 | | 125,512 | | |
| 13,300 | | CMS ENERGY CORP. | | 259,708 | | 811,433 | | |
| 4,875 | | CONSOLIDATED EDISON, INC. | | 311,551 | | 352,316 | | |
| 12,073 | | DOMINION ENERGY, INC. | | 450,978 | | 907,890 | | |
| 2,300 | | DTE ENERGY CO. | | 84,036 | | 279,243 | | |
| 12,117 | | DUKE ENERGY CORP. | | 582,142 | | 1,109,432 | | |
| 4,425 | | EDISON INTERNATIONAL | | 136,263 | | 277,978 | | |
| 464 | | ENTERGY CORP. | | 13,970 | | 46,326 | | |
| 1,735 | | ESSENTIAL UTILITIES, INC. | | 22,973 | | 82,048 | | |
| 2,974 | | EVERGY, INC. | | 67,407 | | 165,087 | | |
| 4,961 | | EVERSOURCE ENERGY | | 125,492 | | 429,176 | | |
| 1,968 | | EXELON CORP. | | 81,552 | | 83,089 | | |
| 5,500 | | FIRSTENERGY CORP. | | 168,113 | | 168,355 | | |
| 11,849 | | HAWAIIAN ELECTRIC INDUSTRIES, INC. | | 393,467 | | 419,336 | | |
| 900 | | NATIONAL FUEL GAS CO. | | 20,790 | | 37,017 | | |
| 18,254 | | NEXTERA ENERGY, INC. | | 255,154 | | 1,408,296 | | |
| 6,900 | | NISOURCE, INC. | | 43,973 | | 158,286 | | |
| 38,596 | | NRG ENERGY, INC. | | 1,261,589 | | 1,449,280 | | |
| 4,800 | | OGE ENERGY CORP. | | 43,344 | | 152,928 | | |
| 5,459 | | PG&E CORP.(b) | | 52,004 | | 68,019 | | |
| 2,400 | | PINNACLE WEST CAPITAL CORP. | | 71,637 | | 191,880 | | |
| 700 | | PPL CORP. | | 10,384 | | 19,740 | | |
| 14,873 | | PUBLIC SERVICE ENTERPRISE GROUP, INC. | | 687,970 | | 867,096 | | |
| 3,200 | | SEMPRA ENERGY | | 174,757 | | 407,712 | | |
| 8,600 | | SOUTHERN (THE) CO. | | 176,010 | | 528,298 | | |
| 4,650 | | UGI CORP. | | 51,203 | | 162,564 | | |
| 1,655 | | WEC ENERGY GROUP, INC. | | 96,502 | | 152,310 | | |
| 1,993 | | XCEL ENERGY, INC. | | 104,588 | | 132,873 | | |
| | | | | 6,562,245 | | 12,175,534 | | 1.97% |
| | | Sub-total Common Stocks: | | 273,598,137 | | 612,441,314 | | 99.26% |
| Preferred Stocks: | | | | | | |
| Consumer Discretionary: | | | | | | |
| 355 | | QURATE RETAIL, INC. | | 14,247 | | 35,145 | | |
| | | | | 14,247 | | 35,145 | | 0.01% |
| | | Sub-total Preferred Stocks: | | 14,247 | | 35,145 | | 0.01% |
| Short-Term Investments: | | | | | | |
| 7,392,427 | | NORTHERN INSTITUTIONAL FUNDS - U.S. GOVERNMENT SELECT PORTFOLIO, 0.02%(d) | | 7,392,427 | | 7,392,427 | | |
| | | Sub-total Short-Term Investments: | | 7,392,427 | | 7,392,427 | | 1.20% |
| | | Grand total | | $ 281,004,811 | | 619,868,886 | | 100.47% |
| See accompanying notes to financial statements. | 38 | (Continued) |
CLEARWATER INVESTMENT TRUST
Schedule of Investments - Clearwater Core Equity Fund
December 31, 2020
| Notes to Schedule of Investments: |
| (a) | Investments are valued in accordance with procedures described in Note 2 to the financial statements. |
| (b) | Non-income producing assets. |
| (c) | Foreign security values are stated in U.S. dollars. As of December 31, 2020, the value of foreign stocks or depositary receipts of companies based outside of the United States represented 2.25% of net assets. |
| (d) | The short-term investment is a money market portfolio of the investment company, Northern Institutional Funds. At December 31, 2019, the value of the Clearwater Core Equity Fund's investment in the U.S. Government Select Portfolio of the Northern Institutional Funds was $2,916,876 with net purchases of $4,475,551 during the fiscal year ended December 31, 2020. |
| See accompanying notes to financial statements. | 39 | (Continued) |
CLEARWATER INVESTMENT TRUST
Schedule of Investments - Clearwater Core Equity Fund
December 31, 2020
Clearwater Core Equity Fund Portfolio Diversification
(as a percentage of net assets)
| See accompanying notes to financial statements. | 40 | (Continued) |
CLEARWATER INVESTMENT TRUST
Schedule of Investments - Clearwater Select Equity Fund
December 31, 2020
| Shares | | Security | | Cost | | Fair value (a) | | Percent of
net assets |
| Common Stocks: | | | | | | |
| Communication Services: | | | | | | |
| 198,622 | | ALASKA COMMUNICATIONS SYSTEMS GROUP, INC. | | $ 424,318 | | 732,915 | | |
| 579 | | AMC NETWORKS, INC., CLASS A(b) | | 20,717 | | 20,711 | | |
| 2,932 | | CINCINNATI BELL, INC.(b) | | 43,796 | | 44,801 | | |
| 1,337 | | COGENT COMMUNICATIONS HOLDINGS, INC. | | 80,058 | | 80,046 | | |
| 3,841 | | CONSOLIDATED COMMUNICATIONS HOLDINGS, INC.(b) | | 20,535 | | 18,782 | | |
| 67,836 | | EW SCRIPPS (THE) CO., CLASS A | | 834,148 | | 1,037,212 | | |
| 9,690 | | GLU MOBILE, INC.(b) | | 71,372 | | 87,307 | | |
| 22,017 | | HEMISPHERE MEDIA GROUP, INC.(b) | | 184,653 | | 228,096 | | |
| 5,964 | | IRIDIUM COMMUNICATIONS, INC.(b) | | 160,341 | | 234,534 | | |
| 18,803 | | LIBERTY BROADBAND CORP., CLASS C(b) | | 2,661,428 | | 2,977,809 | | |
| 1,313 | | MEREDITH CORP. | | 20,521 | | 25,210 | | |
| 86,597 | | NEW YORK TIMES (THE) CO., CLASS A | | 3,674,716 | | 4,483,127 | | |
| 2,477 | | QUINSTREET, INC.(b) | | 41,581 | | 53,107 | | |
| 53,016 | | SAGA COMMUNICATIONS, INC., CLASS A | | 1,463,808 | | 1,273,444 | | |
| 5,758 | | SCHOLASTIC CORP. | | 124,466 | | 143,950 | | |
| 447 | | SHENANDOAH TELECOMMUNICATIONS CO. | | 21,209 | | 19,333 | | |
| 10,718 | | SPOK HOLDINGS, INC. | | 101,973 | | 119,291 | | |
| 381 | | TECHTARGET, INC.(b) | | 14,301 | | 22,521 | | |
| 4,593 | | THRYV HOLDINGS, INC.(b) | | 44,846 | | 62,006 | | |
| 12,314 | | VONAGE HOLDINGS CORP.(b) | | 133,673 | | 158,543 | | |
| | | | | 10,142,460 | | 11,822,745 | | 2.59% |
| Consumer Discretionary: | | | | | | |
| 2,673 | | ABERCROMBIE & FITCH CO., CLASS A | | 27,872 | | 54,422 | | |
| 6,038 | | AMERICAN AXLE & MANUFACTURING HOLDINGS, INC.(b) | | 43,448 | | 50,357 | | |
| 189,700 | | AMERICAN EAGLE OUTFITTERS, INC. | | 3,387,557 | | 3,807,279 | | |
| 909 | | AMERICAN PUBLIC EDUCATION, INC.(b) | | 26,610 | | 27,706 | | |
| 1,030 | | ASBURY AUTOMOTIVE GROUP, INC.(b) | | 88,312 | | 150,112 | | |
| 4,586 | | BED BATH & BEYOND, INC. | | 52,282 | | 81,447 | | |
| 1,930 | | BIG LOTS, INC. | | 78,615 | | 82,855 | | |
| 565 | | BJ'S RESTAURANTS, INC.(b) | | 13,681 | | 21,747 | | |
| 3,673 | | BLOOMIN' BRANDS, INC. | | 38,034 | | 71,330 | | |
| 165,146 | | BLUEGREEN VACATIONS CORP.(c) | | 1,349,647 | | 1,311,259 | | |
| 95,667 | | BLUEGREEN VACATIONS HOLDING CORP. | | 1,804,990 | | 1,294,375 | | |
| 8,351 | | BOOT BARN HOLDINGS, INC.(b) | | 175,092 | | 362,099 | | |
| 2,305 | | BRINKER INTERNATIONAL, INC. | | 106,218 | | 130,394 | | |
| 1,060 | | BUCKLE (THE), INC. | | 17,193 | | 30,952 | | |
| 2,030 | | CALERES, INC. | | 21,289 | | 31,770 | | |
| 2,980 | | CALLAWAY GOLF CO. | | 71,570 | | 71,550 | | |
| 7,975 | | CAPRI HOLDINGS LTD.(b)(d) | | 123,897 | | 334,950 | | |
| 67,640 | | CARRIAGE SERVICES, INC. | | 1,263,456 | | 2,118,485 | | |
| 2,074 | | CATO (THE) CORP., CLASS A | | 16,670 | | 19,890 | | |
| 460 | | CAVCO INDUSTRIES, INC.(b) | | 85,256 | | 80,707 | | |
| 1,644 | | CENTURY COMMUNITIES, INC.(b) | | 50,732 | | 71,974 | | |
| 2,233 | | CHEESECAKE FACTORY (THE), INC. | | 47,155 | | 82,755 | | |
| 759 | | CHILDREN'S PLACE (THE), INC.(b) | | 21,260 | | 38,026 | | |
| 76,876 | | CLARUS CORP. | | 488,112 | | 1,183,890 | | |
| 1,666 | | CONN'S, INC.(b) | | 19,489 | | 19,476 | | |
| 3,663 | | COOPER TIRE & RUBBER CO. | | 101,122 | | 148,352 | | |
| 9,941 | | CORE-MARK HOLDING CO., INC. | | 243,771 | | 291,967 | | |
| 3,256 | | CROCS, INC.(b) | | 110,131 | | 204,021 | | |
| 143,089 | | DANA, INC. | | 1,419,582 | | 2,793,097 | | |
| 2,530 | | DAVE & BUSTER'S ENTERTAINMENT, INC. | | 30,706 | | 75,951 | | |
| 2,938 | | DESIGNER BRANDS, INC., CLASS A | | 18,059 | | 22,476 | | |
| 663 | | DINE BRANDS GLOBAL, INC. | | 28,696 | | 38,454 | | |
| 1,651 | | DORMAN PRODUCTS, INC.(b) | | 108,287 | | 143,340 | | |
| 1,141 | | EL POLLO LOCO HOLDINGS, INC.(b) | | 17,103 | | 20,652 | | |
| 1,508 | | ETHAN ALLEN INTERIORS, INC. | | 17,324 | | 30,477 | | |
| 71,600 | | EXTENDED STAY AMERICA, INC. | | 1,391,461 | | 1,060,396 | | |
| 46,669 | | FARFETCH LTD., CLASS A(b)(d) | | 1,135,587 | | 2,977,949 | | |
| 36,001 | | FIESTA RESTAURANT GROUP, INC.(b) | | 375,056 | | 410,411 | | |
| 12,096 | | FIVE BELOW, INC.(b) | | 1,552,000 | | 2,116,558 | | |
| 12,744 | | FIVERR INTERNATIONAL LTD.(b)(d) | | 1,981,827 | | 2,486,354 | | |
| 3,843 | | FOSSIL GROUP, INC.(b) | | 15,973 | | 33,319 | | |
| 163,919 | | FULL HOUSE RESORTS, INC.(b) | | 336,196 | | 644,202 | | |
| 3,969 | | GAMESTOP CORP., CLASS A(b)(c) | | 16,258 | | 74,776 | | |
| 31,524 | | GAN LTD.(b)(c)(d) | | 488,622 | | 639,307 | | |
| See accompanying notes to financial statements. | 41 | (Continued) |
CLEARWATER INVESTMENT TRUST
Schedule of Investments - Clearwater Select Equity Fund
December 31, 2020
| Shares | | Security | | Cost | | Fair value (a) | | Percent of
net assets |
| Consumer Discretionary (Cont'd): | | | | | | |
| 2,667 | | GENTHERM, INC.(b) | | $ 101,951 | | 173,942 | | |
| 2,387 | | G-III APPAREL GROUP LTD.(b) | | 34,366 | | 56,667 | | |
| 140,300 | | GILDAN ACTIVEWEAR, INC.(d) | | 3,431,431 | | 3,929,803 | | |
| 913 | | GROUP 1 AUTOMOTIVE, INC. | | 59,610 | | 119,731 | | |
| 1,751 | | GUESS?, INC. | | 16,316 | | 39,608 | | |
| 79,700 | | HANESBRANDS, INC. | | 1,097,900 | | 1,162,026 | | |
| 1,118 | | HAVERTY FURNITURE COS., INC. | | 17,384 | �� | 30,935 | | |
| 12,220 | | HELEN OF TROY LTD.(b) | | 1,236,433 | | 2,715,162 | | |
| 58,638 | | HOOKER FURNITURE CORP. | | 1,347,057 | | 1,891,076 | | |
| 873 | | INSTALLED BUILDING PRODUCTS, INC.(b) | | 73,640 | | 88,985 | | |
| 924 | | IROBOT CORP.(b) | | 74,197 | | 74,188 | | |
| 1,295 | | KONTOOR BRANDS, INC. | | 52,537 | | 52,525 | | |
| 2,457 | | LA-Z-BOY, INC. | | 67,314 | | 97,887 | | |
| 1,374 | | LCI INDUSTRIES | | 152,143 | | 178,180 | | |
| 1,164 | | LGI HOMES, INC.(b) | | 113,699 | | 123,209 | | |
| 208,031 | | LIFETIME BRANDS, INC. | | 1,964,923 | | 3,162,071 | | |
| 1,246 | | LUMBER LIQUIDATORS HOLDINGS, INC.(b) | | 17,493 | | 38,302 | | |
| 1,629 | | M/I HOMES, INC.(b) | | 53,545 | | 72,148 | | |
| 16,345 | | MACY'S, INC.(c) | | 107,310 | | 183,881 | | |
| 19,700 | | MALIBU BOATS, INC., CLASS A(b) | | 456,225 | | 1,230,068 | | |
| 889 | | MARINEMAX, INC.(b) | | 20,195 | | 31,142 | | |
| 2,597 | | MDC HOLDINGS, INC. | | 101,344 | | 126,214 | | |
| 1,931 | | MERITAGE HOMES CORP.(b) | | 148,992 | | 159,925 | | |
| 3,018 | | MICHAELS (THE) COS., INC.(b) | | 20,821 | | 39,264 | | |
| 1,430 | | MONRO, INC. | | 72,095 | | 76,219 | | |
| 79,706 | | MOTORCAR PARTS OF AMERICA, INC.(b) | | 1,466,568 | | 1,563,832 | | |
| 1,832 | | MOVADO GROUP, INC.(b) | | 19,444 | | 30,448 | | |
| 2,578 | | ODP (THE) CORP. | | 54,723 | | 75,535 | | |
| 646 | | OXFORD INDUSTRIES, INC. | | 27,145 | | 42,319 | | |
| 43,234 | | PAPA JOHN'S INTERNATIONAL, INC. | | 3,747,599 | | 3,668,405 | | |
| 1,179 | | PATRICK INDUSTRIES, INC. | | 65,976 | | 80,585 | | |
| 1,636 | | PERDOCEO EDUCATION CORP.(b) | | 20,676 | | 20,663 | | |
| 770 | | PETMED EXPRESS, INC. | | 22,469 | | 24,686 | | |
| 17,047 | | PVH CORP. | | 828,451 | | 1,600,543 | | |
| 2,225 | | REGIS CORP.(b) | | 20,464 | | 20,448 | | |
| 2,585 | | RENT-A-CENTER, INC. | | 68,779 | | 98,980 | | |
| 2,351 | | RUTH'S HOSPITALITY GROUP, INC. | | 20,747 | | 41,683 | | |
| 5,771 | | SALLY BEAUTY HOLDINGS, INC.(b) | | 54,974 | | 75,254 | | |
| 23,409 | | SELECT INTERIOR CONCEPTS, INC., CLASS A(b) | | 150,431 | | 167,374 | | |
| 1,875 | | SHAKE SHACK, INC., CLASS A(b) | | 93,633 | | 158,963 | | |
| 1,129 | | SHUTTERSTOCK, INC. | | 44,199 | | 80,949 | | |
| 2,129 | | SIGNET JEWELERS LTD. | | 54,880 | | 58,058 | | |
| 777 | | SLEEP NUMBER CORP.(b) | | 44,739 | | 63,605 | | |
| 892 | | SONIC AUTOMOTIVE, INC., CLASS A | | 30,582 | | 34,404 | | |
| 736 | | STAMPS.COM, INC.(b) | | 145,242 | | 144,396 | | |
| 735 | | STANDARD MOTOR PRODUCTS, INC. | | 29,509 | | 29,738 | | |
| 3,094 | | STEVEN MADDEN LTD. | | 70,023 | | 109,280 | | |
| 60,387 | | STITCH FIX, INC., CLASS A(b) | | 1,886,236 | | 3,545,925 | | |
| 49,300 | | STONERIDGE, INC.(b) | | 938,444 | | 1,490,339 | | |
| 306 | | STURM RUGER & CO., INC. | | 19,869 | | 19,911 | | |
| 2,546 | | TUPPERWARE BRANDS CORP.(b) | | 72,528 | | 82,465 | | |
| 52,115 | | UNIFI, INC.(b) | | 848,349 | | 924,520 | | |
| 4,124 | | UNIVERSAL ELECTRONICS, INC.(b) | | 152,597 | | 216,345 | | |
| 3,098 | | VISTA OUTDOOR, INC.(b) | | 47,234 | | 73,608 | | |
| 58,762 | | WINNEBAGO INDUSTRIES, INC. | | 1,874,865 | | 3,522,194 | | |
| 3,529 | | WOLVERINE WORLD WIDE, INC. | | 77,930 | | 110,281 | | |
| 44,968 | | WYNDHAM HOTELS & RESORTS, INC. | | 2,191,001 | | 2,672,898 | | |
| 3,271 | | YETI HOLDINGS, INC.(b) | | 142,676 | | 223,965 | | |
| | | | | 44,978,101 | | 62,667,623 | | 13.74% |
| Consumer Staples: | | | | | | |
| 978 | | ANDERSONS (THE), INC. | | 19,289 | | 23,971 | | |
| 2,890 | | B&G FOODS, INC.(c) | | 72,055 | | 80,140 | | |
| 1,361 | | CALAVO GROWERS, INC. | | 84,804 | | 94,494 | | |
| 1,927 | | CAL-MAINE FOODS, INC.(b) | | 76,285 | | 72,339 | | |
| 1,971 | | CENTRAL GARDEN & PET CO., CLASS A(b) | | 66,265 | | 71,606 | | |
| 1,424 | | CHEFS' WAREHOUSE (THE), INC.(b) | | 36,595 | | 36,582 | | |
| 247 | | COCA-COLA CONSOLIDATED, INC. | | 57,136 | | 65,769 | | |
| See accompanying notes to financial statements. | 42 | (Continued) |
CLEARWATER INVESTMENT TRUST
Schedule of Investments - Clearwater Select Equity Fund
December 31, 2020
| Shares | | Security | | Cost | | Fair value (a) | | Percent of
net assets |
| Consumer Staples (Cont'd): | | | | | | |
| 1,381 | | FRESH DEL MONTE PRODUCE, INC. | | $ 33,253 | | 33,241 | | |
| 142,180 | | GROCERY OUTLET HOLDING CORP.(b) | | 5,539,069 | | 5,580,565 | | |
| 572 | | J & J SNACK FOODS CORP. | | 77,729 | | 88,872 | | |
| 14,516 | | JOHN B. SANFILIPPO & SON, INC. | | 1,152,542 | | 1,144,732 | | |
| 138,195 | | LANDEC CORP.(b) | | 1,395,976 | | 1,499,416 | | |
| 646 | | MEDIFAST, INC. | | 108,263 | | 126,836 | | |
| 853 | | MGP INGREDIENTS, INC. | | 31,102 | | 40,142 | | |
| 490 | | NATIONAL BEVERAGE CORP. | | 33,897 | | 41,601 | | |
| 97,901 | | NATURE'S SUNSHINE PRODUCTS, INC.(b) | | 940,930 | | 1,463,620 | | |
| 654 | | PRICESMART, INC. | | 52,189 | | 59,573 | | |
| 20,078 | | SENECA FOODS CORP., CLASS A(b) | | 699,111 | | 801,112 | | |
| 3,322 | | SIMPLY GOOD FOODS (THE) CO.(b) | | 104,199 | | 104,178 | | |
| 121,511 | | SPARTANNASH CO. | | 2,288,114 | | 2,115,506 | | |
| 16,915 | | SPECTRUM BRANDS HOLDINGS, INC. | | 880,456 | | 1,335,947 | | |
| 424,029 | | SUNOPTA, INC.(b)(d) | | 1,218,307 | | 4,948,418 | | |
| 3,114 | | UNITED NATURAL FOODS, INC.(b) | | 52,800 | | 49,731 | | |
| 39,420 | | UNIVERSAL CORP. | | 1,947,137 | | 1,916,206 | | |
| 329 | | USANA HEALTH SCIENCES, INC.(b) | | 25,067 | | 25,366 | | |
| 7,458 | | VECTOR GROUP LTD. | | 72,236 | | 86,886 | | |
| 749 | | WD-40 CO. | | 153,736 | | 198,994 | | |
| | | | | 17,218,542 | | 22,105,843 | | 4.85% |
| Energy: | | | | | | |
| 9,497 | | ARCHROCK, INC. | | 70,615 | | 82,244 | | |
| 1,330 | | BONANZA CREEK ENERGY, INC.(b) | | 20,228 | | 25,709 | | |
| 1,386 | | BRISTOW GROUP, INC.(b) | | 33,470 | | 36,479 | | |
| 9,180 | | CALLON PETROLEUM CO.(b) | | 49,625 | | 120,809 | | |
| 4,231 | | CONSOL ENERGY, INC.(b) | | 18,219 | | 30,505 | | |
| 1,872 | | CORE LABORATORIES N.V.(d) | | 33,935 | | 49,627 | | |
| 22,533 | | DMC GLOBAL, INC. | | 637,373 | | 974,552 | | |
| 2,317 | | DORIAN LPG LTD.(b) | | 17,440 | | 28,244 | | |
| 2,055 | | DRIL-QUIP, INC.(b) | | 60,496 | | 60,869 | | |
| 1,659 | | GREEN PLAINS, INC.(b) | | 17,283 | | 21,849 | | |
| 6,213 | | HELIX ENERGY SOLUTIONS GROUP, INC.(b) | | 20,042 | | 26,095 | | |
| 6,710 | | HELMERICH & PAYNE, INC. | | 104,513 | | 155,404 | | |
| 5,849 | | MATADOR RESOURCES CO.(b) | | 43,375 | | 70,539 | | |
| 91,419 | | MURPHY OIL CORP. | | 731,154 | | 1,106,170 | | |
| 115,661 | | NATIONAL OILWELL VARCO, INC.(b) | | 1,184,635 | | 1,588,026 | | |
| 274,742 | | NEXTIER OILFIELD SOLUTIONS, INC.(b) | | 507,671 | | 945,112 | | |
| 3,452 | | OCEANEERING INTERNATIONAL, INC.(b) | | 19,181 | | 27,443 | | |
| 2,364 | | PAR PACIFIC HOLDINGS, INC.(b) | | 17,723 | | 33,049 | | |
| 6,061 | | PATTERSON-UTI ENERGY, INC. | | 21,552 | | 31,881 | | |
| 2,902 | | PBF ENERGY, INC., CLASS A | | 19,202 | | 20,604 | | |
| 5,102 | | PDC ENERGY, INC.(b) | | 67,785 | | 104,744 | | |
| 11,333 | | RANGE RESOURCES CORP.(b) | | 75,993 | | 75,931 | | |
| 708 | | RENEWABLE ENERGY GROUP, INC.(b) | | 50,148 | | 50,141 | | |
| 258 | | REX AMERICAN RESOURCES CORP.(b) | | 16,958 | | 18,955 | | |
| 14,234 | | SOUTHWESTERN ENERGY CO.(b) | | 42,494 | | 42,417 | | |
| 5,541 | | TALOS ENERGY, INC.(b) | | 38,487 | | 45,658 | | |
| 159,749 | | TECHNIPFMC PLC(d) | | 1,120,551 | | 1,501,641 | | |
| | | | | 5,040,148 | | 7,274,697 | | 1.60% |
| Financials: | | | | | | |
| 11,792 | | 1ST CONSTITUTION BANCORP | | 195,370 | | 187,139 | | |
| 1,457 | | ALLEGIANCE BANCSHARES, INC. | | 36,424 | | 49,727 | | |
| 9,608 | | ALTABANCORP | | 197,654 | | 268,255 | | |
| 65,817 | | AMERICAN EQUITY INVESTMENT LIFE HOLDING CO. | | 1,571,540 | | 1,820,498 | | |
| 570 | | AMERIS BANCORP | | 21,706 | | 21,700 | | |
| 8,567 | | APOLLO COMMERCIAL REAL ESTATE FINANCE, INC. | | 76,579 | | 95,693 | | |
| 34,288 | | ARGO GROUP INTERNATIONAL HOLDINGS LTD.(d) | | 1,415,051 | | 1,498,386 | | |
| 3,448 | | ARMOUR RESIDENTIAL REIT, INC. | | 29,192 | | 37,204 | | |
| 42,017 | | ASSOCIATED BANC-CORP | | 507,910 | | 716,390 | | |
| 4,272 | | ASSURED GUARANTY LTD.(d) | | 119,856 | | 134,525 | | |
| 54,522 | | AXIS CAPITAL HOLDINGS LTD.(d) | | 2,718,034 | | 2,747,364 | | |
| 2,771 | | AXOS FINANCIAL, INC.(b) | | 55,910 | | 103,996 | | |
| 2,140 | | BANC OF CALIFORNIA, INC. | | 21,614 | | 31,479 | | |
| 953 | | BANCFIRST CORP. | | 42,865 | | 55,941 | | |
| 43,227 | | BANCORP (THE), INC.(b) | | 391,530 | | 590,049 | | |
| 12,493 | | BANK OF MARIN BANCORP | | 394,948 | | 429,010 | | |
| See accompanying notes to financial statements. | 43 | (Continued) |
CLEARWATER INVESTMENT TRUST
Schedule of Investments - Clearwater Select Equity Fund
December 31, 2020
| Shares | | Security | | Cost | | Fair value (a) | | Percent of
net assets |
| Financials (Cont'd): | | | | | | |
| 4,296 | | BANKUNITED, INC. | | $ 99,866 | | 149,415 | | |
| 24,059 | | BANKWELL FINANCIAL GROUP, INC. | | 540,717 | | 470,353 | | |
| 1,876 | | BANNER CORP. | | 65,693 | | 87,403 | | |
| 164,155 | | BARINGS BDC, INC. | | 1,367,879 | | 1,510,223 | | |
| 6,521 | | BERKSHIRE HILLS BANCORP, INC. | | 67,292 | | 111,640 | | |
| 9,339 | | BLACKROCK TCP CAPITAL CORP. | | 120,899 | | 104,970 | | |
| 8,948 | | BOSTON PRIVATE FINANCIAL HOLDINGS, INC. | | 54,538 | | 75,611 | | |
| 20,286 | | BRIDGE BANCORP, INC. | | 497,592 | | 490,515 | | |
| 3,329 | | BRIGHTSPHERE INVESTMENT GROUP, INC. | | 42,433 | | 64,183 | | |
| 4,213 | | BROOKLINE BANCORP, INC. | | 39,081 | | 50,725 | | |
| 2,426 | | CADENCE BANCORP | | 39,852 | | 39,835 | | |
| 6,732 | | CAPITOL FEDERAL FINANCIAL, INC. | | 75,740 | | 84,150 | | |
| 3,803 | | CAPSTEAD MORTGAGE CORP. | | 20,118 | | 22,095 | | |
| 54,777 | | CARLYLE GROUP (THE), INC. | | 1,331,410 | | 1,722,189 | | |
| 1,837 | | CITY HOLDING CO. | | 111,779 | | 127,763 | | |
| 148,600 | | CNO FINANCIAL GROUP, INC. | | 2,487,716 | | 3,303,378 | | |
| 3,820 | | COLUMBIA BANKING SYSTEM, INC. | | 101,216 | | 137,138 | | |
| 21,872 | | COMMERCE BANCSHARES, INC. | | 991,681 | | 1,437,027 | | |
| 2,756 | | COMMUNITY BANK SYSTEM, INC. | | 152,076 | | 171,726 | | |
| 12,983 | | COMMUNITY BANKERS TRUST CORP. | | 112,842 | | 87,635 | | |
| 35,200 | | COWEN, INC., CLASS A | | 546,540 | | 914,848 | | |
| 102,514 | | CRAWFORD & CO., CLASS A | | 792,781 | | 757,578 | | |
| 1,676 | | CRAWFORD & CO., CLASS B | | 9,524 | | 12,067 | | |
| 1,545 | | CUSTOMERS BANCORP, INC.(b) | | 16,791 | | 28,088 | | |
| 6,872 | | CVB FINANCIAL CORP. | | 121,949 | | 134,004 | | |
| 2,298 | | DIME COMMUNITY BANCSHARES, INC. | | 31,131 | | 36,239 | | |
| 101,211 | | DONEGAL GROUP, INC., CLASS A | | 1,520,565 | | 1,424,039 | | |
| 1,921 | | DONNELLEY FINANCIAL SOLUTIONS, INC.(b) | | 16,285 | | 32,599 | | |
| 23,675 | | EAGLE BANCORP MONTANA, INC. | | 419,309 | | 502,383 | | |
| 1,718 | | EAGLE BANCORP, INC. | | 51,468 | | 70,953 | | |
| 487 | | EHEALTH, INC.(b) | | 36,822 | | 34,387 | | |
| 2,593 | | EMPLOYERS HOLDINGS, INC. | | 75,526 | | 83,469 | | |
| 1,484 | | ENCORE CAPITAL GROUP, INC.(b) | | 48,257 | | 57,802 | | |
| 1,604 | | ENOVA INTERNATIONAL, INC.(b) | | 22,712 | | 39,731 | | |
| 66,400 | | ESSENT GROUP LTD. | | 2,095,008 | | 2,868,480 | | |
| 920 | | FB FINANCIAL CORP. | | 26,566 | | 31,952 | | |
| 2,241 | | FIRST COMMONWEALTH FINANCIAL CORP. | | 16,878 | | 24,517 | | |
| 11,613 | | FIRST FINANCIAL BANCORP | | 153,305 | | 203,576 | | |
| 1,800 | | FIRST HAWAIIAN, INC. | | 41,133 | | 42,444 | | |
| 18,024 | | FIRST MID BANCSHARES, INC. | | 545,632 | | 606,688 | | |
| 40,830 | | FIRST MIDWEST BANCORP, INC. | | 450,414 | | 650,014 | | |
| 37,942 | | FIRST NORTHWEST BANCORP | | 461,554 | | 591,895 | | |
| 28,117 | | FIRST WESTERN FINANCIAL, INC.(b) | | 363,016 | | 550,250 | | |
| 36,100 | | FIRSTCASH, INC. | | 2,488,500 | | 2,528,444 | | |
| 1,899 | | FLAGSTAR BANCORP, INC. | | 55,987 | | 77,403 | | |
| 55,696 | | FLUSHING FINANCIAL CORP. | | 862,560 | | 926,781 | | |
| 61,800 | | GLACIER BANCORP, INC. | | 2,494,408 | | 2,843,418 | | |
| 2,943 | | GRANITE POINT MORTGAGE TRUST, INC. | | 19,414 | | 29,401 | | |
| 7,906 | | GREAT SOUTHERN BANCORP, INC. | | 307,623 | | 386,603 | | |
| 3,625 | | GREAT WESTERN BANCORP, INC. | | 47,061 | | 75,762 | | |
| 2,602 | | GREEN DOT CORP., CLASS A(b) | | 131,289 | | 145,192 | | |
| 34,978 | | HANMI FINANCIAL CORP. | | 395,890 | | 396,650 | | |
| 51,679 | | HARBORONE BANCORP, INC. | | 499,041 | | 561,234 | | |
| 375 | | HCI GROUP, INC. | | 16,590 | | 19,612 | | |
| 3,000 | | HERITAGE FINANCIAL CORP. | | 57,598 | | 70,170 | | |
| 3,479 | | HOMESTREET, INC. | | 83,790 | | 117,416 | | |
| 47,992 | | HOPE BANCORP, INC. | | 358,345 | | 523,593 | | |
| 1,373 | | HORACE MANN EDUCATORS CORP. | | 48,818 | | 57,721 | | |
| 58,547 | | HORIZON BANCORP, INC. | | 643,230 | | 928,555 | | |
| 1,006 | | INDEPENDENT BANK CORP. | | 71,617 | | 73,478 | | |
| 1,953 | | INDEPENDENT BANK GROUP, INC. | | 74,619 | | 122,102 | | |
| 11,469 | | INVESCO MORTGAGE CAPITAL, INC. | | 35,464 | | 38,765 | | |
| 2,919 | | INVESTAR HOLDING CORP. | | 47,572 | | 48,280 | | |
| 120,556 | | INVESTCORP CREDIT MANAGEMENT BDC, INC. | | 775,277 | | 573,847 | | |
| 1,630 | | JAMES RIVER GROUP HOLDINGS LTD.(d) | | 71,912 | | 80,114 | | |
| 422 | | KINSALE CAPITAL GROUP, INC. | | 65,542 | | 84,455 | | |
| 1,468 | | KKR REAL ESTATE FINANCE TRUST, INC. | | 22,900 | | 26,307 | | |
| See accompanying notes to financial statements. | 44 | (Continued) |
CLEARWATER INVESTMENT TRUST
Schedule of Investments - Clearwater Select Equity Fund
December 31, 2020
| Shares | | Security | | Cost | | Fair value (a) | | Percent of
net assets |
| Financials (Cont'd): | | | | | | |
| 113,211 | | LAKELAND BANCORP, INC. | | $ 1,549,861 | | 1,437,780 | | |
| 28,247 | | LCNB CORP. | | 461,145 | | 414,948 | | |
| 50,834 | | MACKINAC FINANCIAL CORP. | | 749,363 | | 648,642 | | |
| 17,066 | | MAINSTREET BANCSHARES, INC.(b) | | 299,743 | | 288,586 | | |
| 238 | | MEGALITH FINANCIAL ACQUISITION CORP(b) | | 2,972 | | 3,338 | | |
| 1,169 | | META FINANCIAL GROUP, INC. | | 20,305 | | 42,739 | | |
| 3,129 | | MR COOPER GROUP, INC.(b) | | 67,200 | | 97,093 | | |
| 660 | | NATIONAL BANK HOLDINGS CORP., CLASS A | | 16,757 | | 21,622 | | |
| 5,689 | | NATIONAL WESTERN LIFE GROUP, INC., CLASS A | | 1,646,680 | | 1,174,437 | | |
| 2,590 | | NBT BANCORP, INC. | | 73,547 | | 83,139 | | |
| 14,393 | | NEW YORK MORTGAGE TRUST, INC. | | 34,396 | | 53,110 | | |
| 4,524 | | NMI HOLDINGS, INC., CLASS A(b) | | 65,445 | | 102,469 | | |
| 5,240 | | NORTHFIELD BANCORP, INC. | | 52,376 | | 64,609 | | |
| 7,463 | | NORTHWEST BANCSHARES, INC. | | 71,466 | | 95,079 | | |
| 378,294 | | OAKTREE SPECIALTY LENDING CORP. | | 1,663,627 | | 2,107,098 | | |
| 138,654 | | OAKTREE STRATEGIC INCOME CORP. | | 1,117,920 | | 1,074,568 | | |
| 2,740 | | OFG BANCORP | | 34,981 | | 50,800 | | |
| 8,796 | | OLD NATIONAL BANCORP | | 112,946 | | 145,662 | | |
| 4,826 | | PACIFIC PREMIER BANCORP, INC. | | 99,138 | | 151,199 | | |
| 744 | | PALOMAR HOLDINGS, INC.(b) | | 65,063 | | 66,097 | | |
| 839 | | PARK NATIONAL CORP. | | 75,067 | | 88,103 | | |
| 4,648 | | PEAPACK-GLADSTONE FINANCIAL CORP. | | 99,854 | | 105,788 | | |
| 5,566 | | PENNS WOODS BANCORP, INC. | | 155,350 | | 144,772 | | |
| 3,509 | | PENNYMAC MORTGAGE INVESTMENT TRUST | | 60,397 | | 61,723 | | |
| 24,067 | | PEOPLES BANCORP OF NORTH CAROLINA, INC. | | 484,305 | | 554,022 | | |
| 44,143 | | PIONEER BANCORP, INC.(b) | | 556,957 | | 466,591 | | |
| 494 | | PIPER SANDLER COS. | | 33,799 | | 49,845 | | |
| 2,431 | | PRA GROUP, INC.(b) | | 89,381 | | 96,413 | | |
| 413 | | PREFERRED BANK | | 20,848 | | 20,844 | | |
| 3,353 | | PROASSURANCE CORP. | | 45,882 | | 59,650 | | |
| 3,992 | | PROVIDENT FINANCIAL SERVICES, INC. | | 53,301 | | 71,696 | | |
| 2,849 | | READY CAPITAL CORP. | | 25,718 | | 35,470 | | |
| 10,091 | | RED RIVER BANCSHARES, INC. | | 405,499 | | 500,009 | | |
| 6,963 | | REDWOOD TRUST, INC. | | 45,819 | | 61,135 | | |
| 2,873 | | RENASANT CORP. | | 76,728 | | 96,763 | | |
| 742 | | SAFETY INSURANCE GROUP, INC. | | 57,750 | | 57,802 | | |
| 2,815 | | SEACOAST BANKING CORP. OF FLORIDA(b) | | 52,406 | | 82,902 | | |
| 20,000 | | SELECTIVE INSURANCE GROUP, INC. | | 1,150,261 | | 1,339,600 | | |
| 1,524 | | SERVISFIRST BANCSHARES, INC. | | 51,290 | | 61,402 | | |
| 15,346 | | SHORE BANCSHARES, INC. | | 224,884 | | 224,052 | | |
| 6,591 | | SIMMONS FIRST NATIONAL CORP., CLASS A | | 105,067 | | 142,300 | | |
| 51,322 | | SOUTHERN NATIONAL BANCORP OF VIRGINIA, INC. | | 785,943 | | 621,509 | | |
| 779 | | SOUTHSIDE BANCSHARES, INC. | | 20,080 | | 24,172 | | |
| 2,216 | | STEWART INFORMATION SERVICES CORP. | | 69,731 | | 107,166 | | |
| 349 | | STONEX GROUP, INC.(b) | | 19,802 | | 20,207 | | |
| 22,763 | | SUMMIT STATE BANK | | 288,477 | | 301,610 | | |
| 9,809 | | SURO CAPITAL CORP. | | 124,054 | | 128,400 | | |
| 134,943 | | TCF FINANCIAL CORP. | | 3,942,775 | | 4,995,590 | | |
| 8,300 | | THIRD POINT REINSURANCE LTD.(b)(d) | | 60,222 | | 79,016 | | |
| 653 | | TOMPKINS FINANCIAL CORP. | | 39,591 | | 46,102 | | |
| 1,156 | | TRIUMPH BANCORP, INC.(b) | | 31,483 | | 56,124 | | |
| 1,476 | | TRUPANION, INC.(b) | | 105,797 | | 176,692 | | |
| 5,783 | | TRUSTCO BANK CORP. NY | | 33,499 | | 38,573 | | |
| 284,839 | | UMPQUA HOLDINGS CORP. | | 4,046,718 | | 4,312,462 | | |
| 16,486 | | UNITED BANCORP, INC. | | 204,353 | | 217,285 | | |
| 5,970 | | UNITED BANCSHARES, INC. | | 129,860 | | 146,026 | | |
| 4,681 | | UNITED COMMUNITY BANKS, INC. | | 83,634 | | 133,128 | | |
| 68,687 | | UNITED SECURITY BANCSHARES | | 584,690 | | 484,243 | | |
| 45,536 | | UNITY BANCORP, INC. | | 742,802 | | 799,157 | | |
| 84,836 | | UNIVEST FINANCIAL CORP. | | 1,831,888 | | 1,745,925 | | |
| 2,866 | | VERITEX HOLDINGS, INC. | | 48,563 | | 73,542 | | |
| 388 | | VIRTUS INVESTMENT PARTNERS, INC. | | 49,590 | | 84,196 | | |
| 3,729 | | WADDELL & REED FINANCIAL, INC., CLASS A | | 58,547 | | 94,978 | | |
| 277 | | WALKER & DUNLOP, INC. | | 25,492 | | 25,490 | | |
| 74,223 | | WEBSTER FINANCIAL CORP. | | 2,862,929 | | 3,128,499 | | |
| 49,930 | | WEST BANCORP, INC. | | 947,785 | | 963,649 | | |
| 1,130 | | WESTAMERICA BANCORP | | 62,984 | | 62,478 | | |
| See accompanying notes to financial statements. | 45 | (Continued) |
CLEARWATER INVESTMENT TRUST
Schedule of Investments - Clearwater Select Equity Fund
December 31, 2020
| Shares | | Security | | Cost | | Fair value (a) | | Percent of
net assets |
| Financials (Cont'd): | | | | | | |
| 3,856 | | WISDOMTREE INVESTMENTS, INC. | | $ 20,654 | | 20,630 | | |
| 48,963 | | WSFS FINANCIAL CORP. | | 1,774,070 | | 2,197,459 | | |
| | | | | 64,726,323 | | 72,996,841 | | 16.01% |
| Health Care: | | | | | | |
| 9,747 | | ABIOMED, INC.(b) | | 2,611,055 | | 3,159,977 | | |
| 2,762 | | ADDUS HOMECARE CORP.(b) | | 202,878 | | 323,403 | | |
| 8,678 | | ALLSCRIPTS HEALTHCARE SOLUTIONS, INC.(b) | | 57,150 | | 125,310 | | |
| 2,454 | | AMN HEALTHCARE SERVICES, INC.(b) | | 131,517 | | 167,486 | | |
| 4,267 | | ANGIODYNAMICS, INC.(b) | | 39,027 | | 65,413 | | |
| 758 | | ANIKA THERAPEUTICS, INC.(b) | | 27,364 | | 34,307 | | |
| 27,924 | | AVID BIOSERVICES, INC.(b) | | 251,316 | | 322,243 | | |
| 16,050 | | BIO-TECHNE CORP. | | 3,901,125 | | 5,096,677 | | |
| 1,837 | | BIOTELEMETRY, INC.(b) | | 132,425 | | 132,411 | | |
| 2,254 | | CARDIOVASCULAR SYSTEMS, INC.(b) | | 72,322 | | 98,635 | | |
| 3,255 | | COHERUS BIOSCIENCES, INC.(b) | | 58,253 | | 56,572 | | |
| 6,953 | | COMMUNITY HEALTH SYSTEMS, INC.(b) | | 24,308 | | 51,661 | | |
| 760 | | COMPUTER PROGRAMS AND SYSTEMS, INC. | | 17,092 | | 20,398 | | |
| 1,523 | | CONMED CORP. | | 107,871 | | 170,576 | | |
| 5,151 | | CORCEPT THERAPEUTICS, INC.(b) | | 91,306 | | 134,750 | | |
| 236 | | CORVEL CORP.(b) | | 17,275 | | 25,016 | | |
| 4,687 | | COVETRUS, INC.(b) | | 88,788 | | 134,704 | | |
| 2,680 | | CROSS COUNTRY HEALTHCARE, INC.(b) | | 19,502 | | 23,772 | | |
| 33,658 | | CRYOLIFE, INC.(b) | | 626,877 | | 794,665 | | |
| 28,383 | | CUTERA, INC.(b) | | 370,025 | | 684,314 | | |
| 3,656 | | CYTOKINETICS, INC.(b) | | 61,810 | | 75,972 | | |
| 620 | | EAGLE PHARMACEUTICALS, INC.(b) | | 28,743 | | 28,873 | | |
| 472 | | ENANTA PHARMACEUTICALS, INC.(b) | | 21,792 | | 19,871 | | |
| 16,143 | | ENDO INTERNATIONAL PLC(b)(d) | | 49,160 | | 115,907 | | |
| 2,178 | | ENSIGN GROUP (THE), INC. | | 116,465 | | 158,820 | | |
| 124,960 | | EVOLENT HEALTH, INC., CLASS A(b) | | 1,411,562 | | 2,003,109 | | |
| 2,497 | | GLAUKOS CORP.(b) | | 97,525 | | 187,924 | | |
| 1,056 | | HANGER, INC.(b) | | 16,338 | | 23,221 | | |
| 123,201 | | HARVARD BIOSCIENCE, INC.(b) | | 235,024 | | 528,532 | | |
| 76,184 | | HEALTHEQUITY, INC.(b) | | 3,997,076 | | 5,310,787 | | |
| 30,403 | | HEALTHSTREAM, INC.(b) | | 642,118 | | 664,002 | | |
| 341 | | HESKA CORP.(b) | | 31,451 | | 49,667 | | |
| 21,500 | | HILL-ROM HOLDINGS, INC. | | 1,810,413 | | 2,106,355 | | |
| 4,590 | | HMS HOLDINGS CORP.(b) | | 136,351 | | 168,683 | | |
| 25,346 | | INFUSYSTEM HOLDINGS, INC.(b) | | 141,371 | | 475,998 | | |
| 607 | | INOGEN, INC.(b) | | 20,310 | | 27,121 | | |
| 1,693 | | INTEGER HOLDINGS CORP.(b) | | 111,654 | | 137,455 | | |
| 47,870 | | INTEGRA LIFESCIENCES HOLDINGS CORP.(b) | | 2,690,548 | | 3,107,720 | | |
| 2,704 | | INVACARE CORP. | | 19,534 | | 24,201 | | |
| 12,390 | | IRHYTHM TECHNOLOGIES, INC.(b) | | 2,821,377 | | 2,939,032 | | |
| 52,636 | | KADMON HOLDINGS, INC.(b) | | 225,938 | | 218,439 | | |
| 3,112 | | LANNETT CO., INC.(b) | | 17,883 | | 20,290 | | |
| 1,794 | | LEMAITRE VASCULAR, INC. | | 58,384 | | 72,657 | | |
| 877 | | LUMINEX CORP. | | 18,557 | | 20,276 | | |
| 2,293 | | MAGELLAN HEALTH, INC.(b) | | 130,930 | | 189,952 | | |
| 5,736 | | MEDNAX, INC.(b) | | 140,795 | | 140,761 | | |
| 2,275 | | MERIDIAN BIOSCIENCE, INC.(b) | | 34,164 | | 42,520 | | |
| 2,957 | | MERIT MEDICAL SYSTEMS, INC.(b) | | 128,856 | | 164,143 | | |
| 215 | | MESA LABORATORIES, INC. | | 46,939 | | 61,628 | | |
| 3,980 | | MYRIAD GENETICS, INC.(b) | | 46,034 | | 78,705 | | |
| 4,319 | | NATUS MEDICAL, INC.(b) | | 78,201 | | 86,553 | | |
| 5,523 | | NEOGENOMICS, INC.(b) | | 195,554 | | 297,358 | | |
| 20,062 | | NEVRO CORP.(b) | | 2,966,869 | | 3,472,732 | | |
| 38,876 | | NEXTGEN HEALTHCARE, INC.(b) | | 354,781 | | 709,098 | | |
| 2,083 | | OMNICELL, INC.(b) | | 147,271 | | 250,002 | | |
| 189,256 | | ORASURE TECHNOLOGIES, INC.(b) | | 2,141,483 | | 2,003,275 | | |
| 1,025 | | ORTHOFIX MEDICAL, INC.(b) | | 31,385 | | 44,055 | | |
| 3,746 | | OWENS & MINOR, INC. | | 37,718 | | 101,329 | | |
| 217,979 | | PACIFIC BIOSCIENCES OF CALIFORNIA, INC.(b) | | 2,985,294 | | 5,654,375 | | |
| 2,249 | | PACIRA BIOSCIENCES, INC.(b) | | 121,845 | | 134,580 | | |
| 890 | | PENNANT GROUP (THE), INC.(b) | | 24,365 | | 51,673 | | |
| 13,070 | | PHIBRO ANIMAL HEALTH CORP., CLASS A | | 246,412 | | 253,819 | | |
| 164 | | PROVIDENCE SERVICE (THE) CORP.(b) | | 22,737 | | 22,735 | | |
| See accompanying notes to financial statements. | 46 | (Continued) |
CLEARWATER INVESTMENT TRUST
Schedule of Investments - Clearwater Select Equity Fund
December 31, 2020
| Shares | | Security | | Cost | | Fair value (a) | | Percent of
net assets |
| Health Care (Cont'd): | | | | | | |
| 4,478 | | R1 RCM, INC.(b) | | $ 76,243 | | 107,562 | | |
| 2,451 | | RADNET, INC.(b) | | 39,172 | | 47,966 | | |
| 1,527 | | REGENXBIO, INC.(b) | | 44,600 | | 69,265 | | |
| 5,204 | | SELECT MEDICAL HOLDINGS CORP.(b) | | 82,873 | | 143,943 | | |
| 511 | | SIMULATIONS PLUS, INC. | | 31,714 | | 36,751 | | |
| 2,284 | | SUPERNUS PHARMACEUTICALS, INC.(b) | | 48,152 | | 57,465 | | |
| 8,617 | | SURMODICS, INC.(b) | | 339,944 | | 375,012 | | |
| 33,400 | | SYNEOS HEALTH, INC.(b) | | 1,431,924 | | 2,275,542 | | |
| 1,368 | | TACTILE SYSTEMS TECHNOLOGY, INC.(b) | | 45,580 | | 61,478 | | |
| 53,114 | | TANDEM DIABETES CARE, INC.(b) | | 5,604,454 | | 5,081,948 | | |
| 2,165 | | TIVITY HEALTH, INC.(b) | | 27,633 | | 42,412 | | |
| 93,545 | | TRIPLE-S MANAGEMENT CORP., CLASS B(b) | | 2,136,298 | | 1,997,186 | | |
| 551 | | US PHYSICAL THERAPY, INC. | | 46,874 | | 66,258 | | |
| 136,924 | | VAREX IMAGING CORP.(b) | | 3,514,931 | | 2,283,892 | | |
| 2,612 | | XENCOR, INC.(b) | | 90,485 | | 113,962 | | |
| | | | | 47,071,370 | | 56,627,137 | | 12.42% |
| Industrials: | | | | | | |
| 2,233 | | AAON, INC. | | 123,232 | | 148,785 | | |
| 16,794 | | AAR CORP. | | 338,661 | | 608,279 | | |
| 3,557 | | ABM INDUSTRIES, INC. | | 120,321 | | 134,597 | | |
| 15,600 | | ACUITY BRANDS, INC. | | 1,754,219 | | 1,889,004 | | |
| 1,617 | | AEGION CORP.(b) | | 24,543 | | 30,707 | | |
| 3,956 | | AEROJET ROCKETDYNE HOLDINGS, INC.(b) | | 147,108 | | 209,075 | | |
| 845 | | AEROVIRONMENT, INC.(b) | | 54,807 | | 73,431 | | |
| 53,320 | | AIR LEASE CORP. | | 1,690,020 | | 2,368,474 | | |
| 16,233 | | AIR TRANSPORT SERVICES GROUP, INC.(b) | | 321,228 | | 508,742 | | |
| 555 | | ALAMO GROUP, INC. | | 55,130 | | 76,562 | | |
| 853 | | ALBANY INTERNATIONAL CORP., CLASS A | | 45,690 | | 62,627 | | |
| 748 | | ALLEGIANT TRAVEL CO. | | 80,014 | | 141,552 | | |
| 30,731 | | AMERICAN WOODMARK CORP.(b) | | 2,474,609 | | 2,884,104 | | |
| 2,066 | | APPLIED INDUSTRIAL TECHNOLOGIES, INC. | | 125,566 | | 161,127 | | |
| 1,349 | | ARCBEST CORP. | | 37,892 | | 57,562 | | |
| 2,574 | | ARCOSA, INC. | | 102,643 | | 141,390 | | |
| 1,206 | | ASTEC INDUSTRIES, INC. | | 53,461 | | 69,803 | | |
| 44,623 | | ASTRONICS CORP.(b) | | 483,555 | | 590,362 | | |
| 1,395 | | ATLAS AIR WORLDWIDE HOLDINGS, INC.(b) | | 64,070 | | 76,083 | | |
| 43,729 | | AVIS BUDGET GROUP, INC.(b) | | 1,345,149 | | 1,631,092 | | |
| 11,949 | | AZZ, INC. | | 379,066 | | 566,861 | | |
| 2,068 | | BARNES GROUP, INC. | | 77,523 | | 104,827 | | |
| 2,186 | | BOISE CASCADE CO. | | 82,334 | | 104,491 | | |
| 462 | | BRADY CORP., CLASS A | | 19,898 | | 24,403 | | |
| 38,440 | | BRIGHTVIEW HOLDINGS, INC.(b) | | 555,436 | | 581,213 | | |
| 37,900 | | BWX TECHNOLOGIES, INC. | | 2,056,531 | | 2,284,612 | | |
| 37,471 | | CECO ENVIRONMENTAL CORP.(b) | | 262,308 | | 260,798 | | |
| 1,534 | | CHART INDUSTRIES, INC.(b) | | 109,625 | | 180,690 | | |
| 36,386 | | CIRCOR INTERNATIONAL, INC.(b) | | 1,231,089 | | 1,398,678 | | |
| 75,680 | | COLFAX CORP.(b) | | 1,792,096 | | 2,894,003 | | |
| 7,806 | | COLUMBUS MCKINNON CORP. | | 211,941 | | 300,063 | | |
| 1,430 | | COMFORT SYSTEMS U.S.A, INC. | | 72,885 | | 75,304 | | |
| 5,072 | | CORECIVIC, INC. | | 32,724 | | 33,222 | | |
| 148,180 | | COVANTA HOLDING CORP. | | 1,133,545 | | 1,945,603 | | |
| 36,380 | | CPI AEROSTRUCTURES, INC.(b) | | 88,436 | | 139,372 | | |
| 1,435 | | CUBIC CORP. | | 63,497 | | 89,027 | | |
| 728 | | DELUXE CORP. | | 21,265 | | 21,258 | | |
| 1,443 | | DXP ENTERPRISES, INC.(b) | | 28,742 | | 32,078 | | |
| 1,253 | | ENCORE WIRE CORP. | | 58,883 | | 75,894 | | |
| 152,524 | | ENERPAC TOOL GROUP CORP. | | 3,358,747 | | 3,448,568 | | |
| 1,434 | | ESCO TECHNOLOGIES, INC. | | 116,528 | | 148,017 | | |
| 1,828 | | EXPONENT, INC. | | 153,488 | | 164,575 | | |
| 3,216 | | FEDERAL SIGNAL CORP. | | 92,803 | | 106,675 | | |
| 560 | | FORRESTER RESEARCH, INC.(b) | | 17,882 | | 23,464 | | |
| 1,921 | | FORWARD AIR CORP. | | 94,009 | | 147,610 | | |
| 1,145 | | FOUNDATION BUILDING MATERIALS, INC.(b) | | 16,762 | | 21,995 | | |
| 2,045 | | FRANKLIN ELECTRIC CO., INC. | | 101,427 | | 141,534 | | |
| 69,600 | | GATES INDUSTRIAL CORP. PLC(b) | | 957,226 | | 888,096 | | |
| 1,805 | | GIBRALTAR INDUSTRIES, INC.(b) | | 84,384 | | 129,852 | | |
| 2,411 | | GMS, INC.(b) | | 55,860 | | 73,487 | | |
| See accompanying notes to financial statements. | 47 | (Continued) |
CLEARWATER INVESTMENT TRUST
Schedule of Investments - Clearwater Select Equity Fund
December 31, 2020
| Shares | | Security | | Cost | | Fair value (a) | | Percent of
net assets |
| Industrials (Cont'd): | | | | | | |
| 19,000 | | GORMAN-RUPP (THE) CO. | | $ 560,570 | | 616,550 | | |
| 38,431 | | GRACO, INC. | | 2,311,195 | | 2,780,483 | | |
| 56,241 | | GRAHAM CORP. | | 811,797 | | 853,738 | | |
| 2,495 | | GRANITE CONSTRUCTION, INC. | | 44,279 | | 66,641 | | |
| 1,905 | | GREENBRIER (THE) COS., INC. | | 41,695 | | 69,304 | | |
| 5,198 | | H&E EQUIPMENT SERVICES, INC. | | 69,435 | | 154,952 | | |
| 1,308 | | HARSCO CORP.(b) | | 20,364 | | 23,518 | | |
| 4,075 | | HAWAIIAN HOLDINGS, INC. | | 55,364 | | 72,128 | | |
| 1,393 | | HEIDRICK & STRUGGLES INTERNATIONAL, INC. | | 29,329 | | 40,926 | | |
| 19,600 | | HEXCEL CORP. | | 1,157,602 | | 950,404 | | |
| 925 | | HILLENBRAND, INC. | | 32,774 | | 36,815 | | |
| 1,731 | | HUB GROUP, INC., CLASS A(b) | | 86,321 | | 98,667 | | |
| 39,600 | | IAA, INC.(b) | | 1,665,204 | | 2,573,208 | | |
| 2,151 | | ICF INTERNATIONAL, INC. | | 152,213 | | 159,884 | | |
| 977 | | INSTEEL INDUSTRIES, INC. | | 18,377 | | 21,758 | | |
| 2,477 | | INTERFACE, INC. | | 26,026 | | 26,009 | | |
| 86,337 | | JELD-WEN HOLDING, INC.(b) | | 1,409,641 | | 2,189,506 | | |
| 1,691 | | JOHN BEAN TECHNOLOGIES CORP. | | 137,915 | | 192,554 | | |
| 7,600 | | KADANT, INC. | | 672,505 | | 1,071,448 | | |
| 1,476 | | KAMAN CORP. | | 58,477 | | 84,324 | | |
| 977 | | KELLY SERVICES, INC., CLASS A | | 18,133 | | 20,097 | | |
| 473 | | KORN FERRY | | 20,580 | | 20,576 | | |
| 579 | | LINDSAY CORP. | | 54,200 | | 74,378 | | |
| 284,533 | | LSI INDUSTRIES, INC. | | 1,583,756 | | 2,435,602 | | |
| 1,251 | | LYDALL, INC.(b) | | 16,937 | | 37,568 | | |
| 109,236 | | LYFT, INC., CLASS A(b) | | 2,997,885 | | 5,366,765 | | |
| 20,766 | | MASTEC, INC.(b) | | 1,155,469 | | 1,415,826 | | |
| 1,111 | | MATSON, INC. | | 63,304 | | 63,294 | | |
| 2,075 | | MATTHEWS INTERNATIONAL CORP., CLASS A | | 39,214 | | 61,005 | | |
| 4,042 | | MERITOR, INC.(b) | | 76,835 | | 112,812 | | |
| 21,220 | | MOOG, INC., CLASS A | | 1,078,937 | | 1,682,746 | | |
| 3,030 | | MUELLER INDUSTRIES, INC. | | 78,800 | | 106,383 | | |
| 643 | | MYR GROUP, INC.(b) | | 19,666 | | 38,644 | | |
| 351 | | NATIONAL PRESTO INDUSTRIES, INC. | | 30,447 | | 31,039 | | |
| 57,118 | | NN, INC.(b) | | 368,294 | | 375,265 | | |
| 10,500 | | NV5 GLOBAL, INC.(b) | | 405,950 | | 827,190 | | |
| 1,539 | | PARK AEROSPACE CORP. | | 16,372 | | 20,638 | | |
| 140,735 | | PGT INNOVATIONS, INC.(b) | | 1,954,781 | | 2,862,550 | | |
| 6,784 | | PITNEY BOWES, INC. | | 16,863 | | 41,789 | | |
| 615 | | POWELL INDUSTRIES, INC. | | 16,562 | | 18,136 | | |
| 1,421 | | PROTO LABS, INC.(b) | | 159,264 | | 217,981 | | |
| 1,688 | | QUANEX BUILDING PRODUCTS CORP. | | 22,061 | | 37,423 | | |
| 1,914 | | RAVEN INDUSTRIES, INC. | | 39,098 | | 63,334 | | |
| 6,575 | | RESIDEO TECHNOLOGIES, INC.(b) | | 74,730 | | 139,785 | | |
| 1,915 | | RESOURCES CONNECTION, INC. | | 22,152 | | 24,072 | | |
| 173,867 | | REV GROUP, INC. | | 1,963,728 | | 1,531,768 | | |
| 45,750 | | RUSH ENTERPRISES, INC., CLASS A | | 1,261,715 | | 1,894,965 | | |
| 55,461 | | RYDER SYSTEM, INC. | | 2,918,177 | | 3,425,271 | | |
| 1,392 | | SAIA, INC.(b) | | 165,159 | | 251,674 | | |
| 1,075 | | SEACOR HOLDINGS, INC.(b) | | 28,849 | | 44,559 | | |
| 62,535 | | SHYFT GROUP (THE), INC. | | 1,008,264 | | 1,774,743 | | |
| 2,379 | | SPX CORP.(b) | | 95,034 | | 129,751 | | |
| 9,280 | | SPX FLOW, INC.(b) | | 279,576 | | 537,869 | | |
| 727 | | STANDEX INTERNATIONAL CORP. | | 39,599 | | 56,357 | | |
| 285,200 | | STEELCASE, INC., CLASS A | | 3,589,547 | | 3,864,460 | | |
| 3,086 | | TEAM, INC.(b) | | 19,078 | | 33,637 | | |
| 530 | | TENNANT CO. | | 33,777 | | 37,190 | | |
| 97,863 | | TEREX CORP. | | 3,300,507 | | 3,414,440 | | |
| 49,602 | | TITAN MACHINERY, INC.(b) | | 725,153 | | 969,719 | | |
| 55,279 | | TRIMAS CORP.(b) | | 1,411,070 | | 1,750,686 | | |
| 2,722 | | TRIUMPH GROUP, INC. | | 20,706 | | 34,188 | | |
| 75,132 | | TRUEBLUE, INC.(b) | | 1,225,183 | | 1,404,217 | | |
| 3,336 | | UFP INDUSTRIES, INC. | | 159,029 | | 185,315 | | |
| 835 | | UNIFIRST CORP. | | 142,857 | | 176,761 | | |
| 3,524 | | US ECOLOGY, INC. | | 118,418 | | 128,027 | | |
| 6,132 | | VECTRUS, INC.(b) | | 249,903 | | 304,883 | | |
| 1,394 | | VIAD CORP. | | 25,927 | | 50,421 | | |
| See accompanying notes to financial statements. | 48 | (Continued) |
CLEARWATER INVESTMENT TRUST
Schedule of Investments - Clearwater Select Equity Fund
December 31, 2020
| Shares | | Security | | Cost | | Fair value (a) | | Percent of
net assets |
| Industrials (Cont'd): | | | | | | |
| 988 | | VICOR CORP.(b) | | $ 72,341 | | 91,113 | | |
| 4,675 | | WABASH NATIONAL CORP. | | 47,573 | | 80,550 | | |
| 1,484 | | WATTS WATER TECHNOLOGIES, INC., CLASS A | | 117,203 | | 180,603 | | |
| 18,500 | | WOODWARD, INC. | | 1,455,405 | | 2,248,305 | | |
| | | | | 62,934,009 | | 81,048,815 | | 17.77% |
| Information Technology: | | | | | | |
| 10,802 | | 3D SYSTEMS CORP.(b) | | 56,986 | | 113,205 | | |
| 6,589 | | 8X8, INC.(b) | | 104,347 | | 227,123 | | |
| 3,058 | | ADTRAN, INC. | | 32,282 | | 45,167 | | |
| 2,042 | | ADVANCED ENERGY INDUSTRIES, INC.(b) | | 137,503 | | 198,013 | | |
| 679 | | AGILYSYS, INC.(b) | | 14,129 | | 26,060 | | |
| 2,350 | | ALARM.COM HOLDINGS, INC.(b) | | 135,048 | | 243,107 | | |
| 43,755 | | ANAPLAN, INC.(b) | | 2,616,601 | | 3,143,797 | | |
| 15,683 | | ASTRONOVA, INC. | | 151,377 | | 167,024 | | |
| 34,644 | | ASURE SOFTWARE, INC.(b) | | 246,185 | | 245,972 | | |
| 16,813 | | AVIAT NETWORKS, INC.(b) | | 304,989 | | 574,164 | | |
| 76,140 | | AVNET, INC. | | 2,567,566 | | 2,673,275 | | |
| 37,818 | | AXT, INC.(b) | | 145,896 | | 361,918 | | |
| 1,458 | | BADGER METER, INC. | | 92,421 | | 137,139 | | |
| 1,679 | | BEL FUSE, INC., CLASS B | | 17,796 | | 25,235 | | |
| 77,753 | | BELDEN, INC. | | 2,855,595 | | 3,257,851 | | |
| 2,504 | | BENCHMARK ELECTRONICS, INC. | | 50,443 | | 67,633 | | |
| 21,269 | | BILL.COM HOLDINGS, INC.(b) | | 1,933,244 | | 2,903,218 | | |
| 930 | | BOTTOMLINE TECHNOLOGIES DE, INC.(b) | | 44,754 | | 49,048 | | |
| 3,938 | | BROOKS AUTOMATION, INC. | | 172,076 | | 267,193 | | |
| 1,426 | | CARDTRONICS PLC, CLASS A(b)(d) | | 29,131 | | 50,338 | | |
| 336,762 | | CELESTICA, INC.(b)(d) | | 2,710,015 | | 2,717,669 | | |
| 1,216 | | CEVA, INC.(b) | | 44,668 | | 55,328 | | |
| 20,710 | | COHU, INC. | | 271,008 | | 790,708 | | |
| 1,959 | | COMTECH TELECOMMUNICATIONS CORP. | | 29,694 | | 40,532 | | |
| 1,766 | | CSG SYSTEMS INTERNATIONAL, INC. | | 70,000 | | 79,594 | | |
| 2,782 | | CTS CORP. | | 58,247 | | 95,506 | | |
| 8,231 | | DAKTRONICS, INC. | | 33,876 | | 38,521 | | |
| 3,858 | | DIEBOLD NIXDORF, INC.(b) | | 23,906 | | 41,126 | | |
| 1,486 | | DIGI INTERNATIONAL, INC.(b) | | 22,009 | | 28,085 | | |
| 2,401 | | DIODES, INC.(b) | | 118,436 | | 169,271 | | |
| 36,107 | | DOLBY LABORATORIES, INC., CLASS A | | 3,026,025 | | 3,507,073 | | |
| 119,189 | | DSP GROUP, INC.(b) | | 1,586,913 | | 1,977,346 | | |
| 2,099 | | EBIX, INC. | | 43,890 | | 79,699 | | |
| 31,887 | | ELASTIC N.V.(b) | | 3,436,513 | | 4,659,647 | | |
| 720 | | EPLUS, INC.(b) | | 48,694 | | 63,324 | | |
| 3,272 | | EVERTEC, INC. | | 93,000 | | 128,655 | | |
| 1,883 | | EXLSERVICE HOLDINGS, INC.(b) | | 116,337 | | 160,300 | | |
| 8,040 | | EXTREME NETWORKS, INC.(b) | | 32,929 | | 55,396 | | |
| 1,961 | | FABRINET(b)(d) | | 125,617 | | 152,154 | | |
| 8,092 | | FARO TECHNOLOGIES, INC.(b) | | 394,833 | | 571,538 | | |
| 5,507 | | FORMFACTOR, INC.(b) | | 131,485 | | 236,911 | | |
| 159,873 | | FRANKLIN WIRELESS CORP.(b) | | 758,030 | | 3,757,015 | | |
| 143,401 | | FREQUENCY ELECTRONICS, INC.(b) | | 1,341,205 | | 1,550,165 | | |
| 28,981 | | GUIDEWIRE SOFTWARE, INC.(b) | | 3,069,061 | | 3,730,724 | | |
| 77,613 | | HARMONIC, INC.(b) | | 458,603 | | 573,560 | | |
| 97,061 | | IDENTIV, INC.(b) | | 491,985 | | 825,018 | | |
| 1,935 | | INSIGHT ENTERPRISES, INC.(b) | | 111,211 | | 147,234 | | |
| 893 | | ITRON, INC.(b) | | 69,090 | | 85,639 | | |
| 5,139 | | KNOWLES CORP.(b) | | 77,505 | | 94,712 | | |
| 4,811 | | KULICKE & SOFFA INDUSTRIES, INC.(d) | | 103,904 | | 153,038 | | |
| 16,967 | | LIGHTPATH TECHNOLOGIES, INC., CLASS A(b) | | 49,539 | | 66,511 | | |
| 142,032 | | LIMELIGHT NETWORKS, INC.(b) | | 558,810 | | 566,708 | | |
| 2,917 | | LIVEPERSON, INC.(b) | | 126,326 | | 181,525 | | |
| 79,983 | | LIVERAMP HOLDINGS, INC.(b) | | 4,162,048 | | 5,853,956 | | |
| 1,485 | | MANTECH INTERNATIONAL CORP., CLASS A | | 100,992 | | 132,076 | | |
| 2,686 | | MAXLINEAR, INC.(b) | | 67,981 | | 102,578 | | |
| 1,980 | | METHODE ELECTRONICS, INC. | | 56,960 | | 75,794 | | |
| 189 | | MICROSTRATEGY, INC., CLASS A(b) | | 68,083 | | 73,436 | | |
| 7,300 | | MKS INSTRUMENTS, INC. | | 737,449 | | 1,098,285 | | |
| 1,840 | | NEOPHOTONICS CORP.(b) | | 14,306 | | 16,726 | | |
| 2,361 | | NETGEAR, INC.(b) | | 56,551 | | 95,927 | | |
| See accompanying notes to financial statements. | 49 | (Continued) |
CLEARWATER INVESTMENT TRUST
Schedule of Investments - Clearwater Select Equity Fund
December 31, 2020
| Shares | | Security | | Cost | | Fair value (a) | | Percent of
net assets |
| Information Technology (Cont'd): | | | | | | |
| 3,475 | | NIC, INC. | | $ 83,735 | | 89,759 | | |
| 1,037 | | ONESPAN, INC.(b) | | 19,889 | | 21,445 | | |
| 40,310 | | ONTO INNOVATION, INC.(b) | | 1,239,772 | | 1,916,740 | | |
| 14,566 | | OSI SYSTEMS, INC.(b) | | 1,069,671 | | 1,357,843 | | |
| 903 | | PDF SOLUTIONS, INC.(b) | | 17,553 | | 19,505 | | |
| 2,494 | | PERFICIENT, INC.(b) | | 80,051 | | 118,839 | | |
| 14,245 | | PFSWEB, INC.(b) | | 40,877 | | 95,869 | | |
| 70,315 | | PHOTRONICS, INC.(b) | | 754,849 | | 784,715 | | |
| 39,856 | | PLANTRONICS, INC. | | 372,143 | | 1,077,308 | | |
| 16,013 | | PLEXUS CORP.(b) | | 966,076 | | 1,252,377 | | |
| 2,642 | | POWER INTEGRATIONS, INC. | | 158,518 | | 216,274 | | |
| 2,889 | | PROGRESS SOFTWARE CORP. | | 106,362 | | 130,554 | | |
| 7,080 | | RAMBUS, INC.(b) | | 102,818 | | 123,617 | | |
| 480 | | ROGERS CORP.(b) | | 67,600 | | 74,539 | | |
| 64,223 | | SAILPOINT TECHNOLOGIES HOLDINGS, INC.(b) | | 2,437,182 | | 3,419,233 | | |
| 1,148 | | SANMINA CORP.(b) | | 27,674 | | 36,610 | | |
| 65,846 | | SCANSOURCE, INC.(b) | | 2,514,326 | | 1,737,017 | | |
| 741,117 | | SERVICESOURCE INTERNATIONAL, INC.(b) | | 1,006,316 | | 1,304,366 | | |
| 1,164 | | SMART GLOBAL HOLDINGS, INC.(b) | | 30,796 | | 43,801 | | |
| 1,915 | | SPS COMMERCE, INC.(b) | | 143,863 | | 207,950 | | |
| 139,846 | | STEEL CONNECT, INC.(b) | | 88,256 | | 110,059 | | |
| 35,245 | | SUPER MICRO COMPUTER, INC.(b) | | 708,392 | | 1,115,857 | | |
| 2,048 | | SYKES ENTERPRISES, INC.(b) | | 70,529 | | 77,148 | | |
| 17,285 | | TRANSACT TECHNOLOGIES, INC.(b) | | 122,723 | | 122,724 | | |
| 1,006 | | TTEC HOLDINGS, INC. | | 46,035 | | 73,368 | | |
| 6,274 | | TTM TECHNOLOGIES, INC.(b) | | 72,311 | | 86,550 | | |
| 745 | | ULTRA CLEAN HOLDINGS, INC.(b) | | 19,154 | | 23,207 | | |
| 202,512 | | UNISYS CORP.(b) | | 2,240,402 | | 3,985,436 | | |
| 24,500 | | VARONIS SYSTEMS, INC.(b) | | 2,794,246 | | 4,008,445 | | |
| 10,065 | | VIAVI SOLUTIONS, INC.(b) | | 120,773 | | 150,723 | | |
| 800 | | VIRTUSA CORP.(b) | | 40,287 | | 40,904 | | |
| 9,324 | | VISHAY PRECISION GROUP, INC.(b) | | 248,591 | | 293,520 | | |
| 13,951 | | WIX.COM LTD.(b)(d) | | 3,611,105 | | 3,487,192 | | |
| 171,920 | | XPERI HOLDING CORP. | | 2,413,568 | | 3,593,128 | | |
| 93,583 | | ZIX CORP.(b) | | 632,749 | | 807,621 | | |
| | | | | 61,075,295 | | 81,609,733 | | 17.90% |
| Materials: | | | | | | |
| 1,495 | | ADVANSIX, INC.(b) | | 17,055 | | 29,885 | | |
| 8,874 | | ALLEGHENY TECHNOLOGIES, INC.(b) | | 81,059 | | 148,817 | | |
| 2,099 | | AMERICAN VANGUARD CORP. | | 31,339 | | 32,576 | | |
| 5,643 | | ARCONIC CORP.(b) | | 83,038 | | 168,161 | | |
| 42,000 | | AXALTA COATING SYSTEMS LTD.(b) | | 641,517 | | 1,199,100 | | |
| 1,760 | | BALCHEM CORP. | | 164,751 | | 202,787 | | |
| 1,610 | | CARPENTER TECHNOLOGY CORP. | | 41,174 | | 46,883 | | |
| 2,446 | | CENTURY ALUMINUM CO.(b) | | 17,115 | | 26,979 | | |
| 612 | | CLEARWATER PAPER CORP.(b) | | 20,484 | | 23,103 | | |
| 13,416 | | CLEVELAND-CLIFFS, INC. | | 117,306 | | 195,337 | | |
| 4,390 | | FERRO CORP.(b) | | 49,722 | | 64,226 | | |
| 1,570 | | FUTUREFUEL CORP. | | 18,184 | | 19,939 | | |
| 2,880 | | GCP APPLIED TECHNOLOGIES, INC.(b) | | 53,386 | | 68,112 | | |
| 41,133 | | H.B. FULLER CO. | | 2,158,526 | | 2,133,980 | | |
| 583 | | HAWKINS, INC. | | 25,673 | | 30,497 | | |
| 227 | | INNOSPEC, INC. | | 20,598 | | 20,596 | | |
| 1,120 | | KOPPERS HOLDINGS, INC.(b) | | 19,868 | | 34,899 | | |
| 1,882 | | KRATON CORP.(b) | | 32,648 | | 52,301 | | |
| 8,541 | | LIVENT CORP.(b) | | 53,380 | | 160,912 | | |
| 487 | | MATERION CORP. | | 27,725 | | 31,032 | | |
| 2,794 | | MERCER INTERNATIONAL, INC.(d) | | 20,568 | | 28,639 | | |
| 1,910 | | MYERS INDUSTRIES, INC. | | 27,366 | | 39,690 | | |
| 107,011 | | OLIN CORP. | | 1,753,670 | | 2,628,190 | | |
| 2,253 | | OLYMPIC STEEL, INC. | | 24,280 | | 30,032 | | |
| 77,141 | | ORION ENGINEERED CARBONS S.A.(d) | | 629,041 | | 1,322,197 | | |
| 693 | | QUAKER CHEMICAL CORP. | | 128,226 | | 175,599 | | |
| 18,300 | | RELIANCE STEEL & ALUMINUM CO. | | 1,494,148 | | 2,191,425 | | |
| 73,659 | | SCHWEITZER-MAUDUIT INTERNATIONAL, INC. | | 2,787,521 | | 2,961,828 | | |
| 1,154 | | STEPAN CO. | | 110,502 | | 137,695 | | |
| 8,610 | | SUNCOKE ENERGY, INC. | | 25,724 | | 37,454 | | |
| See accompanying notes to financial statements. | 50 | (Continued) |
CLEARWATER INVESTMENT TRUST
Schedule of Investments - Clearwater Select Equity Fund
December 31, 2020
| Shares | | Security | | Cost | | Fair value (a) | | Percent of
net assets |
| Materials (Cont'd): | | | | | | |
| 7,386 | | TIMKENSTEEL CORP.(b) | | $ 26,484 | | 34,493 | | |
| 59,332 | | TREDEGAR CORP. | | 1,047,385 | | 990,844 | | |
| 2,198 | | TRINSEO S.A. | | 48,917 | | 112,560 | | |
| 846 | | US CONCRETE, INC.(b) | | 19,856 | | 33,815 | | |
| 2,731 | | WARRIOR MET COAL, INC. | | 40,792 | | 58,225 | | |
| | | | | 11,859,028 | | 15,472,808 | | 3.39% |
| Real Estate: | | | | | | |
| 7,710 | | ACADIA REALTY TRUST | | 94,002 | | 109,405 | | |
| 3,689 | | AGREE REALTY CORP. | | 239,707 | | 245,614 | | |
| 4,425 | | ALEXANDER & BALDWIN, INC. | | 53,431 | | 76,022 | | |
| 57,850 | | ALPINE INCOME PROPERTY TRUST, INC. | | 925,018 | | 867,172 | | |
| 4,968 | | AMERICAN ASSETS TRUST, INC. | | 129,822 | | 143,476 | | |
| 3,015 | | ARMADA HOFFLER PROPERTIES, INC. | | 28,885 | | 33,828 | | |
| 70,406 | | BLUEROCK RESIDENTIAL GROWTH REIT, INC. | | 527,145 | | 892,044 | | |
| 9,103 | | BRANDYWINE REALTY TRUST | | 93,265 | | 108,417 | | |
| 4,965 | | CARETRUST REIT, INC. | | 86,221 | | 110,124 | | |
| 3,809 | | CHATHAM LODGING TRUST | | 23,679 | | 41,137 | | |
| 1,777 | | CTO REALTY GROWTH, INC. | | 71,533 | | 74,918 | | |
| 148,995 | | DIAMONDROCK HOSPITALITY CO. | | 897,728 | | 1,229,209 | | |
| 7,840 | | DIVERSIFIED HEALTHCARE TRUST | | 32,003 | | 32,301 | | |
| 53,303 | | EQUITY COMMONWEALTH | | 1,575,914 | | 1,454,106 | | |
| 3,841 | | ESSENTIAL PROPERTIES REALTY TRUST, INC. | | 69,521 | | 81,429 | | |
| 3,754 | | FOUR CORNERS PROPERTY TRUST, INC. | | 86,702 | | 111,757 | | |
| 4,241 | | GEO GROUP (THE), INC. | | 37,602 | | 37,575 | | |
| 1,826 | | GETTY REALTY CORP. | | 52,146 | | 50,288 | | |
| 57,452 | | GLOBAL MEDICAL REIT, INC. | | 579,899 | | 750,323 | | |
| 3,298 | | HERSHA HOSPITALITY TRUST | | 18,358 | | 26,021 | | |
| 133,000 | | INDEPENDENCE REALTY TRUST, INC. | | 1,271,418 | | 1,786,190 | | |
| 3,481 | | INDUSTRIAL LOGISTICS PROPERTIES TRUST | | 71,070 | | 81,072 | | |
| 663 | | INNOVATIVE INDUSTRIAL PROPERTIES, INC. | | 121,422 | | 121,415 | | |
| 54,469 | | ISTAR, INC. | | 522,604 | | 808,865 | | |
| 41,938 | | KITE REALTY GROUP TRUST | | 467,821 | | 627,392 | | |
| 16,096 | | LEXINGTON REALTY TRUST | | 169,420 | | 170,940 | | |
| 4,469 | | MACK-CALI REALTY CORP. | | 57,409 | | 55,684 | | |
| 891 | | MARCUS & MILLICHAP, INC.(b) | | 25,083 | | 33,172 | | |
| 3,311 | | NATIONAL STORAGE AFFILIATES TRUST | | 94,043 | | 119,295 | | |
| 24,973 | | NEXPOINT RESIDENTIAL TRUST, INC. | | 653,584 | | 1,056,608 | | |
| 39,335 | | PLYMOUTH INDUSTRIAL REIT, INC. | | 501,117 | | 590,025 | | |
| 34,628 | | POSTAL REALTY TRUST, INC., CLASS A | | 444,259 | | 584,521 | | |
| 968 | | RE/MAX HOLDINGS, INC., CLASS A | | 30,056 | | 35,167 | | |
| 75,443 | | REALOGY HOLDINGS CORP.(b) | | 1,873,483 | | 989,812 | | |
| 39,750 | | REDFIN CORP.(b) | | 1,863,825 | | 2,728,042 | | |
| 6,031 | | RETAIL OPPORTUNITY INVESTMENTS CORP. | | 65,628 | | 80,755 | | |
| 12,377 | | RETAIL PROPERTIES OF AMERICA, INC., CLASS A | | 84,751 | | 105,947 | | |
| 4,749 | | RPT REALTY | | 30,317 | | 41,079 | | |
| 716 | | SAFEHOLD, INC. | | 40,289 | | 51,903 | | |
| 690 | | SAUL CENTERS, INC. | | 20,472 | | 21,859 | | |
| 7,941 | | SITE CENTERS CORP. | | 59,761 | | 80,363 | | |
| 1,667 | | ST. JOE (THE) CO. | | 31,303 | | 70,764 | | |
| 67,215 | | STRATUS PROPERTIES, INC.(b) | | 1,777,879 | | 1,713,982 | | |
| 3,340 | | SUMMIT HOTEL PROPERTIES, INC. | | 18,266 | | 30,093 | | |
| 7,677 | | TANGER FACTORY OUTLET CENTERS, INC.(c) | | 48,409 | | 76,463 | | |
| 39,401 | | UMH PROPERTIES, INC. | | 459,654 | | 583,529 | | |
| 10,364 | | UNITI GROUP, INC. | | 96,701 | | 121,570 | | |
| 321 | | UNIVERSAL HEALTH REALTY INCOME TRUST | | 20,634 | | 20,631 | | |
| 3,979 | | URSTADT BIDDLE PROPERTIES, INC., CLASS A | | 37,490 | | 56,223 | | |
| 2,744 | | WASHINGTON REAL ESTATE INVESTMENT TRUST | | 58,175 | | 59,353 | | |
| 4,519 | | WHITESTONE REIT | | 29,258 | | 36,016 | | |
| 7,444 | | XENIA HOTELS & RESORTS, INC. | | 66,151 | | 113,149 | | |
| | | | | 16,734,333 | | 19,527,045 | | 4.28% |
| Utilities: | | | | | | |
| 1,970 | | AMERICAN STATES WATER CO. | | 152,237 | | 156,635 | | |
| 5,095 | | AVISTA CORP. | | 180,419 | | 204,513 | | |
| 2,207 | | CALIFORNIA WATER SERVICE GROUP | | 111,140 | | 119,244 | | |
| 844 | | CHESAPEAKE UTILITIES CORP. | | 74,972 | | 91,329 | | |
| 2,025 | | NORTHWEST NATURAL HOLDING CO. | | 93,857 | | 93,130 | | |
| 181,666 | | PURE CYCLE CORP.(b) | | 1,352,320 | | 2,040,109 | | |
| See accompanying notes to financial statements. | 51 | (Continued) |
CLEARWATER INVESTMENT TRUST
Schedule of Investments - Clearwater Select Equity Fund
December 31, 2020
| Shares | | Security | | Cost | | Fair value (a) | | Percent of
net assets |
| Utilities (Cont'd): | | | | | | |
| 1,442 | | SOUTH JERSEY INDUSTRIES, INC. | | $ 33,896 | | 31,075 | | |
| | | | | 1,998,841 | | 2,736,035 | | 0.60% |
| | | Sub-total Common Stocks: | | 343,778,450 | | 433,889,322 | | 95.15% |
| Convertible Preferred Stocks: | | | | | | |
| Real Estate: | | | | | | |
| 17,923 | | WHEELER REAL ESTATE INVESTMENT TRUST, INC.(b) | | 179,170 | | 232,999 | | |
| 17,641 | | WHEELER REAL ESTATE INVESTMENT TRUST, INC. (Step to 10.75% on 9/21/2023), 8.75%(b)(e) | | 220,408 | | 318,420 | | |
| | | | | 399,578 | | 551,419 | | 0.12% |
| | | Sub-total Convertible Preferred Stocks: | | 399,578 | | 551,419 | | 0.12% |
| Investment Companies: | | | | | | |
| Financials: | | | | | | |
| 83,500 | | SPDR S&P REGIONAL BANKING ETF(c) | | 4,022,171 | | 4,337,825 | | |
| 10,313 | | VANECK VECTORS OIL SERVICES ETF | | 1,369,995 | | 1,588,202 | | |
| | | | | 5,392,166 | | 5,926,027 | | 1.30% |
| | | Sub-total Investment Companies: | | 5,392,166 | | 5,926,027 | | 1.30% |
| Master Limited Partnerships: | | | | | | |
| Industrials: | | | | | | |
| 63,355 | | STEEL PARTNERS HOLDINGS L.P.(b) | | 698,582 | | 681,066 | | |
| | | | | 698,582 | | 681,066 | | 0.15% |
| | | Sub-total Master Limited Partnerships: | | 698,582 | | 681,066 | | 0.15% |
| Preferred Stocks: | | | | | | |
| Industrials: | | | | | | |
| 165,427 | | STEEL PARTNERS HOLDINGS L.P. | | 2,690,870 | | 3,275,454 | | |
| | | | | 2,690,870 | | 3,275,454 | | 0.72% |
| | | Sub-total Preferred Stocks: | | 2,690,870 | | 3,275,454 | | 0.72% |
| Rights: | | | | | | |
| Communication Services: | | | | | | |
| 55,700 | | MEDIA GENERAL, INC. (CONTINGENT VALUE RIGHTS)(b)(f) | | - | | - | | |
| | | | | - | | - | | 0.00% |
| | | Sub-total Rights: | | - | | - | | 0.00% |
| Warrants: | | | | | | |
| Health Care: | | | | | | |
| 19,977 | | NANOVIBRONIX, INC.(b)(f) | | 200 | | - | | |
| | | | | 200 | | - | | 0.00% |
| | | Sub-total Warrants: | | 200 | | - | | 0.00% |
| Short-Term Investments: | | | | | | |
| 5,461,693 | | FIDELITY INVESTMENTS MONEY MARKET GOVERNMENT PORTFOLIO(g) | | 5,461,693 | | 5,461,693 | | |
| 16,222,989 | | NORTHERN INSTITUTIONAL FUNDS - U.S. GOVERNMENT SELECT PORTFOLIO, 0.02%(h) | | 16,222,989 | | 16,222,989 | | |
| | | Sub-total Short-Term Investments: | | 21,684,682 | | 21,684,682 | | 4.76% |
| | | Grand total | | $ 374,644,528 | | 466,007,970 | | 102.20% |
| Notes to Schedule of Investments: |
| (a) | Investments are valued in accordance with procedures described in Note 2 to the financial statements. |
| (b) | Non-income producing assets. |
| (c) | Security is either wholly or partially on loan. |
| (d) | Foreign security values are stated in U.S. dollars. As of December 31, 2020, the value of foreign stocks or depositary receipts of companies based outside of the United States represented 6.46% of net assets. |
| (e) | For step bonds, the coupon rate disclosed is the current rate in effect. |
| (f) | Security has been deemed worthless and is a Level 3 investment. |
| (g) | Investment relates to cash collateral received from portfolio securities loaned. |
| (h) | The short-term investment is a money market portfolio of the investment company, Northern Institutional Funds. At December 31, 2019, the value of the Clearwater Select Equity Fund's investment in the U.S. Government Select Portfolio of the Northern Institutional Funds was $9,691,925 with net purchases of $6,531,064 during the fiscal year ended December 31, 2020. |
| See accompanying notes to financial statements. | 52 | (Continued) |
CLEARWATER INVESTMENT TRUST
Schedule of Investments - Clearwater Select Equity Fund
December 31, 2020
Clearwater Select Equity Fund Portfolio Diversification
(as a percentage of net assets)
| See accompanying notes to financial statements. | 53 | (Continued) |
CLEARWATER INVESTMENT TRUST
Schedule of Investments - Clearwater Tax-Exempt Bond Fund
December 31, 2020
| Par/Shares | | Security | | Maturity
date | | Coupon
rate | | Cost | | Fair value (a) | | Percent of
net assets |
| Closed-End Funds: | | | | | | | | | | | | |
| 171,824 | | BLACKROCK LONG-TERM MUNICIPAL ADVANTAGE TRUST | | $ 1,701,436 | | 2,185,601 | | |
| 54,180 | | BLACKROCK MUNICIPAL INCOME QUALITY TRUST | | 739,165 | | 821,911 | | |
| 17,900 | | BLACKROCK MUNIENHANCED FUND INC | | 188,128 | | 214,442 | | |
| 58,171 | | BLACKROCK MUNIHOLDINGS FUND II INC | | 822,153 | | 877,800 | | |
| 91,327 | | BLACKROCK MUNIHOLDINGS INVESTMENT QUALITY FUND | | 1,010,095 | | 1,285,884 | | |
| 46,838 | | BLACKROCK MUNIHOLDINGS NEW JERSEY QUALITY FUND INC | | 651,076 | | 677,277 | | |
| 83,977 | | BLACKROCK MUNIHOLDINGS QUALITY FUND II INC | | 1,060,120 | | 1,146,286 | | |
| 74,300 | | BLACKROCK MUNIHOLDINGS QUALITY FUND INC | | 956,132 | | 982,246 | | |
| 55,111 | | BLACKROCK MUNIYIELD INVESTMENT QUALITY FUND | | 701,111 | | 790,678 | | |
| 157,958 | | BLACKROCK MUNIYIELD MICHIGAN QUALITY FUND INC | | 2,064,776 | | 2,301,448 | | |
| 51,700 | | BLACKROCK MUNIYIELD PENNSYLVANIA QUALITY FUND | | 729,423 | | 771,364 | | |
| 102,096 | | BLACKROCK MUNIYIELD QUALITY FUND II INC | | 1,309,732 | | 1,427,302 | | |
| 118,472 | | BLACKROCK MUNIYIELD QUALITY FUND III INC | | 1,572,465 | | 1,711,920 | | |
| 42,549 | | BNY MELLON STRATEGIC MUNICIPAL BOND FUND INC | | 298,824 | | 334,861 | | |
| 177,634 | | DWS MUNICIPAL INCOME TRUST | | 2,001,406 | | 2,065,883 | | |
| 182,050 | | INVESCO ADVANTAGE MUNICIPAL INCOME TRUST II | | 2,023,491 | | 2,066,268 | | |
| 149,405 | | INVESCO MUNICIPAL OPPORTUNITY TRUST | | 1,829,532 | | 1,915,372 | | |
| 101,614 | | INVESCO MUNICIPAL TRUST | | 1,260,657 | | 1,302,692 | | |
| 144,886 | | INVESCO QUALITY MUNICIPAL INCOME TRUST | | 1,745,440 | | 1,889,313 | | |
| 65,173 | | INVESCO TRUST FOR INVESTMENT GRADE MUNICIPALS | | 834,173 | | 860,935 | | |
| 24,934 | | INVESCO VALUE MUNICIPAL INCOME TRUST | | 327,100 | | 390,217 | | |
| 83,434 | | NUVEEN AMT-FREE MUNICIPAL CREDIT INCOME FUND | | 1,220,326 | | 1,400,023 | | |
| 300,875 | | NUVEEN AMT-FREE QUALITY MUNICIPAL INCOME FUND | | 4,065,667 | | 4,543,213 | | |
| 15,963 | | NUVEEN MICHIGAN QUALITY MUNICIPAL INCOME FUND | | 214,604 | | 235,614 | | |
| 52,779 | | NUVEEN PENNSYLVANIA QUALITY MUNICIPAL INCOME FUND | | 723,142 | | 763,712 | | |
| 234,784 | | NUVEEN QUALITY MUNICIPAL INCOME FUND | | 3,323,368 | | 3,608,630 | | |
| 28,000 | | PUTNAM MUNICIPAL OPPORTUNITIES TRUST | | 371,050 | | 383,320 | | |
| | | Sub-total Closed-End Funds: | | | | | | 33,744,592 | | 36,954,212 | | 5.99% |
| Municipal Bonds: | | | | | | | | | | |
| Alabama | | | | | | | | | | |
| 500,000 | | MOBILE CNTY AL LTD OBLG(b) | | 11/1/2045 | | 4.00 | | 500,000 | | 513,460 | | |
| 1,000,000 | | PELL CITY AL SPL CARE FACS FING AUTH REVENUE | | 12/1/2031 | | 5.00 | | 1,010,414 | | 1,034,450 | | |
| | | | | | | 1,510,414 | | 1,547,910 | | 0.25% |
| Alaska | | | | | | | | | | |
| 350,000 | | ALASKA ST INDL DEV & EXPORT AUTH CMNTY PROVIDER REVENUE(c) | | 12/1/2010 | | 5.40 | | 350,000 | | 17,500 | | |
| | | | | | | 350,000 | | 17,500 | | 0.00% |
| Arizona | | | | | | | | | | |
| 1,250,000 | | ARIZONA ST INDL DEV AUTH ECON DEV REVENUE(b) | | 7/1/2030 | | 6.75 | | 1,237,828 | | 1,276,288 | | |
| 1,250,000 | | ARIZONA ST INDL DEV AUTH ECON DEV REVENUE(b) | | 7/1/2050 | | 7.75 | | 1,237,540 | | 1,280,288 | | |
| 500,000 | | ARIZONA ST INDL DEV AUTH EDU REVENUE(b) | | 7/15/2038 | | 5.75 | | 519,148 | | 575,880 | | |
| 1,000,000 | | ARIZONA ST INDL DEV AUTH MF HSG REVENUE | | 1/1/2038 | | 5.38 | | 1,000,000 | | 984,140 | | |
| 700,000 | | GLENDALE AZ INDL DEV AUTH | | 11/15/2036 | | 5.00 | | 722,180 | | 757,813 | | |
| 550,000 | | GLENDALE AZ INDL DEV AUTH | | 11/15/2046 | | 5.25 | | 556,892 | | 553,542 | | |
| 800,000 | | MARICOPA CNTY AZ INDL DEV AUTH EDU REVENUE | | 7/1/2035 | | 5.00 | | 836,351 | | 850,816 | | |
| 870,000 | | MARICOPA CNTY AZ INDL DEV AUTH EDU REVENUE(b) | | 7/1/2052 | | 6.00 | | 915,439 | | 1,018,439 | | |
| 500,000 | | NAVAJO NATION AZ(b) | | 12/1/2030 | | 5.50 | | 520,256 | | 557,095 | | |
| 1,000,000 | | PEORIA AZ INDL DEV AUTH | | 11/15/2029 | | 5.25 | | 1,000,000 | | 1,002,350 | | |
| 1,000,000 | | PHOENIX AZ INDL DEV AUTH EDU REVENUE(b) | | 7/1/2036 | | 5.13 | | 986,785 | | 1,101,480 | | |
| 1,000,000 | | PHOENIX AZ INDL DEV AUTH EDU REVENUE(b) | | 9/1/2045 | | 5.00 | | 1,044,368 | | 1,071,940 | | |
| 2,500,000 | | PHOENIX AZ INDL DEV AUTH LEASE REVENUE | | 6/1/2034 | | 5.25 | | 2,508,425 | | 2,626,150 | | |
| 700,000 | | PIMA CNTY AZ INDL DEV AUTH EDU REVENUE(b) | | 12/1/2026 | | 5.25 | | 700,000 | | 731,031 | | |
| 10,000 | | PIMA CNTY AZ INDL DEV AUTH EDU REVENUE | | 7/1/2031 | | 6.75 | | 8,015 | | 10,123 | | |
| 1,370,000 | | PIMA CNTY AZ INDL DEV AUTH EDU REVENUE(b) | | 6/15/2035 | | 5.38 | | 1,443,152 | | 1,484,244 | | |
| See accompanying notes to financial statements. | 54 | (Continued) |
CLEARWATER INVESTMENT TRUST
Schedule of Investments - Clearwater Tax-Exempt Bond Fund
December 31, 2020
| Par/Shares | | Security | | Maturity
date | | Coupon
rate | | Cost | | Fair value (a) | | Percent of
net assets |
| Arizona (Cont'd): | | | | | | | | | | |
| 750,000 | | PIMA CNTY AZ INDL DEV AUTH EDU REVENUE(b) | | 6/15/2037 | | 4.75 | | $ 737,381 | | 763,080 | | |
| 815,000 | | QUECHAN INDIAN TRIBE AZ FORT YUMA INDIAN RESERVATION | | 5/1/2025 | | 9.75 | | 815,000 | | 855,285 | | |
| 500,000 | | TEMPE AZ INDL DEV AUTH REVENUE(b) | | 10/1/2024 | | 4.70 | | 499,130 | | 501,215 | | |
| 500,000 | | TEMPE AZ INDL DEV AUTH REVENUE(b) | | 10/1/2037 | | 6.00 | | 502,433 | | 539,525 | | |
| | | | | | | 17,790,323 | | 18,540,724 | | 3.01% |
| Arkansas | | | | | | | | | | |
| 525,000 | | SHERIDAN AR SCH DIST #37 | | 2/1/2047 | | 4.00 | | 528,821 | | 546,357 | | |
| 1,000,000 | | SPRINGDALE AR SALES & USE REVENUE | | 4/1/2041 | | 3.60 | | 973,274 | | 1,049,470 | | |
| | | | | | | 1,502,095 | | 1,595,827 | | 0.26% |
| California | | | | | | | | | | |
| 2,350,000 | | ACALANES CA UNION HIGH SCH DIST (Step to 6.55% on 8/1/2024)(d) | | 8/1/2039 | | 0.00 | | 1,867,527 | | 2,736,246 | | |
| 1,000,000 | | ALVORD CA UNIF SCH DIST | | 8/1/2036 | | 5.25 | | 1,009,582 | | 1,130,880 | | |
| 1,000,000 | | ALVORD CA UNIF SCH DIST (Step to 7.35% on 8/1/2026)(d) | | 8/1/2046 | | 0.00 | | 671,389 | | 1,300,380 | | |
| 500,000 | | CALIFORNIA ST HLTH FACS FING AUTH REVENUE | | 8/15/2033 | | 5.50 | | 500,812 | | 514,490 | | |
| 1,500,000 | | CALIFORNIA ST SCH FACS FING AUTH REVENUE | | 8/1/2029 | | 6.00 | | 1,490,504 | | 1,934,370 | | |
| 750,000 | | CALIFORNIA ST STWD CMNTYS DEV AUTH REVENUE | | 10/1/2042 | | 6.00 | | 769,943 | | 824,640 | | |
| 1,000,000 | | CARLSBAD CA UNIF SCH DIST (Step to 6.13% on 8/1/2021)(d) | | 8/1/2031 | | 0.00 | | 963,112 | | 1,386,800 | | |
| 1,000,000 | | COLTON CA JT UNIF SCH DIST (Step to 5.80% on 8/1/2021)(d) | | 8/1/2035 | | 0.00 | | 966,832 | | 1,261,930 | | |
| 1,105,000 | | CORONA-NORCO CA UNIF SCH DIST | | 8/1/2039 | | 6.80 | | 1,103,712 | | 1,556,271 | | |
| 750,000 | | EL PASO DE ROBLES CA REDEV AGY TAX ALLOCATION REVENUE | | 7/1/2033 | | 6.38 | | 743,913 | | 753,113 | | |
| 1,000,000 | | ENCINITAS CA UNION SCH DIST (Step to 6.75% on 8/1/2022)(d) | | 8/1/2035 | | 0.00 | | 900,052 | | 1,491,450 | | |
| 1,155,000 | | ENTERPRISE CA ELEM SCH DIST (Step to 6.20% on 8/1/2021)(d) | | 8/1/2035 | | 0.00 | | 1,113,827 | | 1,658,488 | | |
| 600,000 | | ESCONDIDO CA SPL TAX | | 9/1/2036 | | 5.00 | | 628,393 | | 705,552 | | |
| 1,500,000 | | HARTNELL CA CMNTY CLG DIST (Step to 7.00% on 8/1/2022)(d) | | 8/1/2034 | | 0.00 | | 1,345,237 | | 1,874,325 | | |
| 3,500,000 | | HEALDSBURG CA UNIF SCH DIST (Step to 4.60% on 8/1/2022)(d) | | 8/1/2037 | | 0.00 | | 3,253,456 | | 3,885,000 | | |
| 1,000,000 | | HELENDALE CA SCH DIST | | 8/1/2034 | | 6.25 | | 998,717 | | 1,421,440 | | |
| 1,000,000 | | IMPERIAL CA CMNTY CLG DIST | | 8/1/2040 | | 6.75 | | 1,006,618 | | 1,285,830 | | |
| 750,000 | | MARTINEZ CA UNIF SCH DIST | | 8/1/2035 | | 6.13 | | 747,380 | | 907,200 | | |
| 2,000,000 | | OAK PARK CA UNIF SCH DIST (Step to 7.10% on 8/1/2021)(d) | | 8/1/2038 | | 0.00 | | 1,920,853 | | 2,949,500 | | |
| 1,000,000 | | REDONDO BEACH CA UNIF SCH DIST | | 8/1/2034 | | 6.38 | | 997,109 | | 1,300,500 | | |
| 750,000 | | REEF-SUNSET CA UNIF SCH DIST (Step to 4.85% on 8/1/2021)(d) | | 8/1/2038 | | 0.00 | | 729,134 | | 850,387 | | |
| 1,000,000 | | RIVERSIDE CA CMNTY PPTYS DEV INC LEASE REVENUE | | 10/15/2038 | | 6.00 | | 1,009,153 | | 1,160,880 | | |
| 1,500,000 | | S TAHOE CA JT PWRS FING AUTH LEASE REVENUE | | 10/1/2030 | | 5.00 | | 1,569,757 | | 1,721,475 | | |
| 350,000 | | SACRAMENTO CNTY CA WTR FING AUTH REVENUE (Floating, ICE LIBOR USD 3M + 0.57%)(e) | | 6/1/2039 | | 0.72 | | 350,000 | | 312,155 | | |
| 500,000 | | SAN DIEGO CA HSG AUTH MF HSG REVENUE | | 5/1/2029 | | 5.00 | | 500,000 | | 506,120 | | |
| 1,500,000 | | SAN GABRIEL CA UNIF SCH DIST | | 8/1/2039 | | 5.35 | | 1,495,684 | | 1,600,890 | | |
| 1,000,000 | | SAN JOSE CA FING AUTH LEASE REVENUE | | 6/1/2039 | | 5.00 | | 1,020,022 | | 1,088,320 | | |
| 500,000 | | SANTA MONICA CA REDEV AGY | | 7/1/2036 | | 5.88 | | 501,375 | | 512,020 | | |
| 2,185,000 | | SULPHUR SPRINGS CA UNION SCH DIST COPS | | 12/1/2037 | | 6.50 | | 2,183,518 | | 2,720,395 | | |
| 1,500,000 | | SUTTER BUTTE CA FLOOD AGY ASSMNT REVENUE | | 10/1/2038 | | 4.00 | | 1,484,888 | | 1,600,620 | | |
| 1,000,000 | | TRACY CA JT UNIF SCH DIST (Step to 7.30% on 8/1/2027)(d) | | 8/1/2041 | | 0.00 | | 717,977 | | 1,116,850 | | |
| 1,250,000 | | TUSTIN CA UNIF SCH DIST | | 8/1/2028 | | 6.00 | | 1,244,591 | | 1,291,437 | | |
| | | | | | | 35,805,067 | | 45,359,954 | | 7.35% |
| See accompanying notes to financial statements. | 55 | (Continued) |
CLEARWATER INVESTMENT TRUST
Schedule of Investments - Clearwater Tax-Exempt Bond Fund
December 31, 2020
| Par/Shares | | Security | | Maturity
date | | Coupon
rate | | Cost | | Fair value (a) | | Percent of
net assets |
| Colorado | | | | | | | | | | |
| 500,000 | | 9TH AVENUE MET DIST #2 CO | | 12/1/2048 | | 5.00 | | $ 500,000 | | 528,860 | | |
| 1,000,000 | | AEROTROPOLIS REGL TRANPRTN AUTH CO SPL REVENUE | | 12/1/2051 | | 5.00 | | 1,014,320 | | 1,044,610 | | |
| 1,000,000 | | BRIGHTON CROSSING MET DIST #6 CO | | 12/1/2050 | | 5.00 | | 1,016,321 | | 1,018,250 | | |
| 750,000 | | BROADWAY STATION MET DIST #2 CO | | 12/1/2048 | | 5.13 | | 750,000 | | 796,665 | | |
| 1,000,000 | | BROADWAY STATION MET DIST #3 CO | | 12/1/2049 | | 5.00 | | 1,022,892 | | 1,060,210 | | |
| 650,000 | | BUFFALO HIGHLANDS MET DIST | | 12/1/2038 | | 5.25 | | 651,604 | | 686,160 | | |
| 1,000,000 | | COLORADO ST EDUCTNL & CULTURAL FACS AUTH REVENUE | | 7/1/2034 | | 5.60 | | 995,258 | | 1,003,830 | | |
| 1,000,000 | | COLORADO ST EDUCTNL & CULTURAL FACS AUTH REVENUE | | 9/1/2046 | | 5.00 | | 1,001,933 | | 1,011,610 | | |
| 1,250,000 | | COLORADO ST HLTH FACS AUTH HOSP REVENUE | | 12/1/2048 | | 5.00 | | 1,306,149 | | 1,441,787 | | |
| 1,000,000 | | COLORADO ST HLTH FACS AUTH HOSP REVENUE | | 12/1/2050 | | 4.00 | | 1,052,106 | | 1,114,200 | | |
| 1,000,000 | | COLORADO ST HLTH FACS AUTH REVENUE | | 8/1/2033 | | 7.63 | | 989,980 | | 1,068,860 | | |
| 750,000 | | COPPERLEAF CO MET DIST #4 | | 12/1/2049 | | 5.00 | | 780,137 | | 788,123 | | |
| 1,000,000 | | CREEKWALK MARKETPLACE BUSINESS IMPT DIST CO(b) | | 12/1/2039 | | 5.50 | | 1,000,000 | | 1,061,600 | | |
| 750,000 | | CRYSTAL CO CROSSING MET DIST | | 12/1/2040 | | 5.25 | | 750,000 | | 789,547 | | |
| 1,000,000 | | DENVER CO URBAN RENEWAL AUTH TAX INCR REVENUE(b) | | 12/1/2039 | | 5.25 | | 985,789 | | 1,062,980 | | |
| 1,000,000 | | DIATC MET DIST CO(b) | | 12/1/2049 | | 5.00 | | 1,058,485 | | 1,050,720 | | |
| 1,000,000 | | DOUGLAS CNTY CO MF REVENUE | | 10/1/2029 | | 4.50 | | 1,000,000 | | 1,021,880 | | |
| 1,000,000 | | GREEN VALLEY RANCH EAST MET DIST #6 CO | | 12/1/2050 | | 5.88 | | 1,000,000 | | 1,065,460 | | |
| 500,000 | | HASKINS STATION CO MET DIST | | 12/1/2039 | | 5.00 | | 516,376 | | 526,670 | | |
| 500,000 | | HUNTERS OVERLOOK METRO DIST #5 CO | | 12/1/2049 | | 5.00 | | 525,962 | | 531,040 | | |
| 500,000 | | JOHNSTOWN VLG MET DIST #2 CO | | 12/1/2050 | | 5.00 | | 503,938 | | 519,125 | | |
| 655,000 | | LAMBERTSON FARMS CO MET DIST #1 REVENUE | | 12/15/2025 | | 5.00 | | 646,140 | | 595,447 | | |
| 500,000 | | LAMBERTSON FARMS CO MET DIST #1 REVENUE | | 12/15/2035 | | 5.50 | | 500,000 | | 415,805 | | |
| 750,000 | | LEYDEN ROCK MET DIST #10 | | 12/1/2045 | | 5.00 | | 766,000 | | 779,738 | | |
| 1,000,000 | | LITTLETON VLG MET DIST #2 COLO SPL REVENUE | | 12/1/2045 | | 5.38 | | 996,562 | | 1,030,700 | | |
| 750,000 | | MIRABELLE MET DIST #2 CO | | 12/1/2049 | | 5.00 | | 791,025 | | 779,655 | | |
| 583,045 | | MOUNT CARBON CO MET DIST REVENUE (Step to 0.00% on 6/1/2033)(d) | | 6/1/2043 | | 7.00 | | 583,045 | | 583,045 | | |
| 200,000 | | MOUNT CARBON CO MET DIST REVENUE(c) | | 6/1/2043 | | 8.00 | | - | | 44,000 | | |
| 1,000,000 | | PAINTED PRAIRIE PUB IMPT AUTH CO | | 12/1/2039 | | 5.00 | | 1,032,430 | | 1,076,650 | | |
| 500,000 | | PALISADE CO MET DIST #2 LIMITED TAX | | 12/1/2046 | | 5.00 | | 510,623 | | 516,250 | | |
| 1,000,000 | | PROMENADE CASTLE ROCK CO MET DIST #1 | | 12/1/2025 | | 5.13 | | 1,000,000 | | 1,031,720 | | |
| 500,000 | | ST VRAIN LAKES MET DIST #2 | | 12/1/2037 | | 5.00 | | 500,000 | | 528,885 | | |
| 1,000,000 | | STC MET DIST #2 CO | | 12/1/2049 | | 5.00 | | 1,053,232 | | 1,043,190 | | |
| 500,000 | | TALLMAN GULCH MET DIST CO | | 12/1/2047 | | 5.25 | | 500,000 | | 521,910 | | |
| 1,000,000 | | THOMPSON CROSSING MET DIST #4 CO | | 12/1/2049 | | 5.00 | | 1,050,603 | | 1,049,530 | | |
| 700,000 | | VAUXMONT MET DIST CO | | 12/15/2050 | | 3.25 | | 700,000 | | 753,011 | | |
| 1,000,000 | | WINDSHIRE PARK CO MET DIST #2 | | 12/1/2047 | | 6.50 | | 1,076,378 | | 1,109,830 | | |
| | | | | | | 30,127,288 | | 31,051,553 | | 5.03% |
| Connecticut | | | | | | | | | | |
| 500,000 | | CONNECTICUT ST HLTH & EDUCTNL FACS AUTH REVENUE(b) | | 1/1/2027 | | 3.25 | | 500,000 | | 506,450 | | |
| 500,000 | | CONNECTICUT ST HLTH & EDUCTNL FACS AUTH REVENUE(b) | | 1/1/2055 | | 5.00 | | 513,738 | | 535,760 | | |
| 545,000 | | CONNECTICUT ST HSG FIN AUTH HSG MTGE FIN PROGRAM | | 11/15/2035 | | 3.88 | | 545,000 | | 605,855 | | |
| 515,000 | | CONNECTICUT ST HSG FIN AUTH HSG MTGE FIN PROGRAM | | 5/15/2038 | | 3.95 | | 515,000 | | 541,945 | | |
| 2,000,000 | | CONNECTICUT ST HSG FIN AUTH HSG MTGE FIN PROGRAM | | 5/15/2045 | | 3.85 | | 2,052,125 | | 2,082,360 | | |
| 5,000,000 | | CONNECTICUT ST HSG FIN AUTH HSG MTGE FIN PROGRAM | | 11/15/2047 | | 3.65 | | 5,000,000 | | 5,058,600 | | |
| See accompanying notes to financial statements. | 56 | (Continued) |
CLEARWATER INVESTMENT TRUST
Schedule of Investments - Clearwater Tax-Exempt Bond Fund
December 31, 2020
| Par/Shares | | Security | | Maturity
date | | Coupon
rate | | Cost | | Fair value (a) | | Percent of
net assets |
| Connecticut (Cont'd): | | | | | | | | | | |
| 583,408 | | MASHANTUCKET WSTRN PEQUOT TRIBE CT | | 7/1/2031 | | 6.05 | | $ 595,923 | | 37,921 | | |
| | | | | | | 9,721,786 | | 9,368,891 | | 1.52% |
| District of Columbia | | | | | | | | | | |
| 500,000 | | DIST OF COLUMBIA HSG FIN AGY MF HSG REVENUE | | 7/1/2033 | | 5.45 | | 500,000 | | 509,115 | | |
| 1,000,000 | | DIST OF COLUMBIA HSG FIN AGY MF HSG REVENUE | | 6/1/2040 | | 4.90 | | 1,000,000 | | 1,033,110 | | |
| 1,000,000 | | DIST OF COLUMBIA HSG FIN AGY MF HSG REVENUE | | 6/1/2041 | | 5.00 | | 1,000,000 | | 1,032,710 | | |
| 665,000 | | DIST OF COLUMBIA REVENUE | | 7/1/2027 | | 4.13 | | 619,022 | | 675,155 | | |
| 1,250,000 | | DIST OF COLUMBIA REVENUE | | 7/1/2042 | | 5.00 | | 1,095,952 | | 1,269,362 | | |
| 1,000,000 | | DISTRICT OF COLUMBIA HSG FIN AGY | | 9/1/2043 | | 4.05 | | 1,000,000 | | 1,155,890 | | |
| | | | | | | 5,214,974 | | 5,675,342 | | 0.92% |
| Florida | | | | | | | | | | |
| 1,000,000 | | ALACHUA CNTY FL HLTH FACS AUTH CCRC | | 10/1/2032 | | 8.00 | | 1,057,144 | | 1,104,110 | | |
| 395,000 | | ASTURIA FL CMNTY DEV DIST SPL ASSMNT | | 5/1/2034 | | 5.75 | | 395,000 | | 422,488 | | |
| 1,000,000 | | BELLALAGO FL EDUCTNL FACS BENEFIT DIST CAPITAL IMPT REVENUE | | 5/1/2030 | | 4.38 | | 988,285 | | 1,114,390 | | |
| 500,000 | | BLACKBURN CREEK CMNTY DEV DISTFL CAP IMPT REVENUE | | 5/1/2035 | | 6.25 | | 500,000 | | 564,945 | | |
| 185,000 | | BLACKBURN CREEK CMNTY DEV DISTFL CAP IMPT REVENUE | | 5/1/2045 | | 6.25 | | 185,000 | | 207,379 | | |
| 1,370,000 | | CAPITAL TRUST AGY FL CHRT SCH REVENUE | | 2/1/2035 | | 5.38 | | 1,370,000 | | 1,431,184 | | |
| 750,000 | | CAPITAL TRUST AGY FL REVENUE | | 4/1/2035 | | 7.00 | | 750,000 | | 471,945 | | |
| 1,750,000 | | CAPITAL TRUST AGY FL REVENUE(b)(c)(f) | | 12/1/2035 | | 6.75 | | 1,745,953 | | 700,000 | | |
| 750,000 | | CAPITAL TRUST AGY FL REVENUE(b)(c)(f) | | 7/1/2037 | | 6.75 | | 750,000 | | 300,000 | | |
| 750,000 | | CAPITAL TRUST AGY FL SENIOR LIVING REVENUE(b) | | 8/1/2027 | | 5.00 | | 750,000 | | 688,680 | | |
| 750,000 | | CAPITAL TRUST AGY FL SENIOR LIVING REVENUE(b) | | 8/1/2032 | | 5.38 | | 750,000 | | 657,083 | | |
| 500,000 | | CAPITAL TRUST AGY FL STUDENT HSG REVENUE(b) | | 12/1/2043 | | 5.25 | | 513,645 | | 536,725 | | |
| 710,000 | | CELEBRATION POINTE CMNTY DEV DIST #1 FL SPL ASSMNT REVENUE(b) | | 5/1/2032 | | 5.00 | | 713,808 | | 779,608 | | |
| 750,000 | | COLLIER CNTY FL INDL DEV AUTH | | 10/1/2039 | | 6.25 | | 737,797 | | 759,795 | | |
| 750,000 | | COLLIER CNTY FLA INDL DEV AUTH CONTINUING CARE CMNTY REVENUE(b)(c)(f) | | 5/15/2026 | | 7.25 | | 750,000 | | 580,313 | | |
| 1,750,000 | | COLLIER CNTY FLA INDL DEV AUTH CONTINUING CARE CMNTY REVENUE(b)(c)(f) | | 5/15/2044 | | 8.13 | | 1,913,765 | | 1,354,063 | | |
| 1,000,000 | | DAVIE FL EDUCTNL FACS REVENUE | | 4/1/2042 | | 6.00 | | 1,009,149 | | 1,128,050 | | |
| 835,000 | | ESCAMBIA CNTY FL HSG FIN AUTH SF MTGE REVENUE | | 10/1/2049 | | 3.75 | | 835,000 | | 911,653 | | |
| 715,000 | | FISHHAWK CCD IV FL SPL ASSMNT REVENUE | | 5/1/2033 | | 7.00 | | 715,000 | | 791,047 | | |
| 1,350,000 | | FLORIDA DEV FIN CORP SURFACE TRANPRTN FAC REVENUE(b) | | 1/1/2049 | | 7.38 | | 1,292,396 | | 1,319,922 | | |
| 1,000,000 | | FLORIDA ST DEPT OF EDU CMNTY CLG CAPITAL IMPT REVENUE | | 7/1/2030 | | 4.38 | | 1,005,042 | | 1,013,060 | | |
| 1,000,000 | | FLORIDA ST DEV FIN CORP EDUCTNL FACS REVENUE(b) | | 6/15/2035 | | 6.00 | | 1,000,739 | | 1,132,390 | | |
| 920,000 | | FLORIDA ST DEV FIN CORP EDUCTNL FACS REVENUE(b) | | 6/1/2040 | | 5.00 | | 948,708 | | 981,704 | | |
| 2,000,000 | | FLORIDA ST DEV FIN CORP SENIOR LIVING REVENUE(b) | | 6/1/2050 | | 5.25 | | 2,038,824 | | 2,225,160 | | |
| 620,000 | | FLORIDA ST HSG FIN CORP REVENUE | | 7/1/2035 | | 3.75 | | 620,000 | | 665,384 | | |
| 485,000 | | FLORIDA ST HSG FIN CORP REVENUE | | 7/1/2039 | | 4.20 | | 485,000 | | 497,780 | | |
| 1,610,000 | | FLORIDA ST HSG FIN CORP REVENUE | | 1/1/2045 | | 4.20 | | 1,610,000 | | 1,779,066 | | |
| 945,000 | | FLORIDA ST HSG FIN CORP REVENUE | | 7/1/2049 | | 3.30 | | 945,000 | | 1,015,346 | | |
| 1,000,000 | | FRERC CDD FL | | 11/1/2040 | | 5.38 | | 1,000,000 | | 1,044,550 | | |
| 650,000 | | HARBOR BAY FL CDD CAPITAL IMPT REVENUE | | 5/1/2048 | | 4.10 | | 645,736 | | 695,266 | | |
| See accompanying notes to financial statements. | 57 | (Continued) |
CLEARWATER INVESTMENT TRUST
Schedule of Investments - Clearwater Tax-Exempt Bond Fund
December 31, 2020
| Par/Shares | | Security | | Maturity
date | | Coupon
rate | | Cost | | Fair value (a) | | Percent of
net assets |
| Florida (Cont'd): | | | | | | | | | | |
| 800,000 | | HERITAGE HARBOUR FL N CDD SPL ASSMNT | | 5/1/2034 | | 5.00 | | $ 800,000 | | 921,088 | | |
| 1,000,000 | | HOLLYWOOD BEACH FL CMNTY DEV DIST REVENUE | | 10/1/2045 | | 4.00 | | 1,104,646 | | 1,148,900 | | |
| 710,000 | | LAKE CNTY FLA RETMNT FAC REVENUE | | 8/15/2050 | | 5.75 | | 724,380 | | 763,669 | | |
| 240,000 | | LAKEWOOD RANCH FL STEWARDSHIP DIST SPL ASSMNT REVENUE | | 5/1/2025 | | 4.25 | | 239,714 | | 249,982 | | |
| 1,500,000 | | LAKEWOOD RANCH FL STEWARDSHIP DIST SPL ASSMNT REVENUE | | 5/1/2030 | | 7.40 | | 1,490,011 | | 1,534,665 | | |
| 700,000 | | LAKEWOOD RANCH FL STEWARDSHIP DIST SPL ASSMNT REVENUE | | 5/1/2033 | | 6.70 | | 700,000 | | 749,987 | | |
| 1,000,000 | | LAKEWOOD RANCH FL STEWARDSHIP DIST SPL ASSMNT REVENUE | | 5/1/2034 | | 5.35 | | 1,000,000 | | 1,137,440 | | |
| 1,300,000 | | LAKEWOOD RANCH FL STEWARDSHIP DIST SPL ASSMNT REVENUE | | 5/1/2036 | | 5.00 | | 1,300,000 | | 1,418,443 | | |
| 750,000 | | LAKEWOOD RANCH FL STEWARDSHIP DIST SPL ASSMNT REVENUE(b) | | 5/1/2037 | | 5.00 | | 745,025 | | 818,610 | | |
| 750,000 | | LAKEWOOD RANCH FL STEWARDSHIP DIST SPL ASSMNT REVENUE | | 5/1/2037 | | 5.25 | | 745,878 | | 833,708 | | |
| 700,000 | | LAKEWOOD RANCH FL STEWARDSHIP DIST SPL ASSMNT REVENUE | | 5/1/2038 | | 5.00 | | 700,000 | | 765,100 | | |
| 1,000,000 | | LAKEWOOD RANCH FL STEWARDSHIP DIST SPL ASSMNT REVENUE | | 5/1/2039 | | 5.30 | | 1,000,000 | | 1,122,850 | | |
| 580,000 | | LAKEWOOD RANCH FL STEWARDSHIP DIST SPL ASSMNT REVENUE(b) | | 5/1/2040 | | 3.63 | | 575,597 | | 596,408 | | |
| 1,000,000 | | LAKEWOOD RANCH FL STEWARDSHIP DIST SPL ASSMNT REVENUE(b) | | 5/1/2040 | | 3.75 | | 1,000,000 | | 1,036,640 | | |
| 630,000 | | LAKEWOOD RANCH FL STEWARDSHIP DIST SPL ASSMNT REVENUE | | 5/1/2049 | | 4.00 | | 626,749 | | 656,252 | | |
| 470,000 | | LAKEWOOD RANCH FL STEWARDSHIP DIST SPL ASSMNT REVENUE | | 5/1/2049 | | 4.50 | | 463,319 | | 505,762 | | |
| 1,440,000 | | LAKEWOOD RANCH FL STEWARDSHIP DIST SPL ASSMNT REVENUE | | 5/1/2050 | | 4.00 | | 1,436,517 | | 1,496,619 | | |
| 465,000 | | LEXINGTON OAKS FL CDD SPL ASSMNT REVENUE | | 5/1/2033 | | 5.65 | | 465,000 | | 473,965 | | |
| 315,000 | | LONG LAKE RANCH CMNTY DEV DIST FLA CAP IMPT REVENUE | | 5/1/2024 | | 5.63 | | 315,000 | | 326,803 | | |
| 500,000 | | LT RANCH CDD FL CAPITAL IMPT REVENUE | | 5/1/2040 | | 4.00 | | 505,814 | | 527,460 | | |
| 250,000 | | MAGNOLIA CREEK FL CDD CAPITAL IMPT REVENUE(c) | | 5/1/2014 | | 5.60 | | 250,000 | | 45,000 | | |
| 735,000 | | MARSHALL CREEK FL CDD SPL ASSMNT | | 5/1/2032 | | 5.00 | | 744,969 | | 777,711 | | |
| 500,000 | | MIAMI BEACH FL HLTH FACS AUTH | | 11/15/2044 | | 5.00 | | 525,441 | | 549,110 | | |
| 135,000 | | MIAMI-DADE CNTY FL HLTH FACS AUTH HOSP REVENUE | | 8/1/2030 | | 6.00 | | 131,055 | | 135,487 | | |
| 300,000 | | N SPRINGS FL IMPT DIST | | 5/1/2027 | | 6.00 | | 300,000 | | 327,894 | | |
| 115,000 | | NEW RIVER FL CDD CAPITAL IMPT REVENUE(c) | | 5/1/2013 | | 5.00 | | 114,821 | | 1 | | |
| 1,120,000 | | NORTH RIVER RANCH CDD FL CAPITAL IMPT REVENUE | | 5/1/2035 | | 4.20 | | 1,120,000 | | 1,134,616 | | |
| 500,000 | | NORTH SPRINGS FL IMPT DIST | | 5/1/2044 | | 6.50 | | 500,000 | | 551,350 | | |
| 1,400,000 | | NTHRN PALM BEACH CNTY FL IMPT DIST | | 8/1/2029 | | 5.00 | | 1,405,100 | | 1,525,524 | | |
| 500,000 | | NTHRN PALM BEACH CNTY FL IMPT DIST | | 8/1/2037 | | 5.00 | | 508,390 | | 566,100 | | |
| 1,000,000 | | ORANGE CNTY FL HLTH FACS AUTH REVENUE | | 8/1/2034 | | 5.00 | | 1,027,347 | | 1,103,010 | | |
| 750,000 | | ORANGE CNTY FL HLTH FACS AUTH REVENUE | | 8/1/2035 | | 5.00 | | 772,237 | | 846,360 | | |
| 1,000,000 | | ORANGE CNTY FL HLTH FACS AUTH REVENUE | | 8/1/2047 | | 5.00 | | 1,056,971 | | 1,091,600 | | |
| 440,000 | | ORANGE CNTY FL HSG FIN AUTH | | 9/1/2035 | | 3.80 | | 440,000 | | 471,055 | | |
| 500,000 | | PALM BEACH CNTY FL HLTH FACS AUTH REVENUE | | 6/1/2034 | | 7.25 | | 500,000 | | 544,660 | | |
| 1,200,000 | | PALM BEACH CNTY FL HLTH FACS AUTH REVENUE | | 5/15/2036 | | 5.00 | | 1,284,990 | | 1,298,220 | | |
| 1,000,000 | | PALM BEACH CNTY FL HLTH FACS AUTH REVENUE | | 6/1/2049 | | 7.50 | | 1,033,623 | | 1,089,090 | | |
| 1,935,000 | | PALM BEACH CNTY FL HLTH FACS AUTH REVENUE | | 5/15/2053 | | 4.00 | | 1,785,478 | | 1,966,734 | | |
| See accompanying notes to financial statements. | 58 | (Continued) |
CLEARWATER INVESTMENT TRUST
Schedule of Investments - Clearwater Tax-Exempt Bond Fund
December 31, 2020
| Par/Shares | | Security | | Maturity
date | | Coupon
rate | | Cost | | Fair value (a) | | Percent of
net assets |
| Florida (Cont'd): | | | | | | | | | | |
| 500,000 | | PALM BEACH CNTY FL HLTH FACS AUTH REVENUE | | 6/1/2055 | | 5.00 | | $ 512,697 | | 529,130 | | |
| 500,000 | | PARKER ROAD FL CDD CAPITAL IMPT REVENUE | | 5/1/2050 | | 4.10 | | 498,280 | | 518,815 | | |
| 500,000 | | PARKVIEW AT LONG LAKE RANCH CDD FL SPL ASSMNET | | 5/1/2051 | | 4.00 | | 503,872 | | 518,915 | | |
| 500,000 | | PINELLAS CNTY FL INDL DEV AUTH INDL DEV REVENUE | | 7/1/2039 | | 5.00 | | 549,886 | | 590,045 | | |
| 710,000 | | POINCIANA FL W CDD SPL ASSMNT | | 5/1/2030 | | 5.38 | | 703,534 | | 771,706 | | |
| 560,000 | | RIVER LANDING CDD FL CAP IMPT REVENUE | | 11/1/2035 | | 4.25 | | 558,148 | | 578,687 | | |
| 1,900,000 | | SAINT JOHNS CNTY FL INDL DEV AUTH REVENUE | | 8/1/2055 | | 4.00 | | 2,014,919 | | 2,049,055 | | |
| 495,000 | | SEVEN OAKS FL CMNTY DEV DIST SPL ASSMNT REVENUE | | 5/1/2033 | | 5.50 | | 486,307 | | 505,365 | | |
| 160,000 | | SILVERLEAF FL CDD CAPITAL IMPT REVENUE | | 5/1/2044 | | 6.75 | | 157,214 | | 177,226 | | |
| 142,538 | | STERLING HILL FL CDD CAPITAL IMPT REVENUE(c) | | 11/1/2010 | | 5.50 | | 142,538 | | 85,523 | | |
| 1,100,000 | | TALLAHASSEE FL HLTH FACS REVENUE | | 12/1/2040 | | 5.00 | | 1,138,249 | | 1,227,204 | | |
| 500,000 | | TOLOMATO FL CDD | | 5/1/2037 | | 4.25 | | 500,000 | | 549,540 | | |
| 50,000 | | TOLOMATO FL CDD (Step to 6.61% on 5/1/2022)(d) | | 5/1/2040 | | 0.00 | | 50,581 | | 41,176 | | |
| 185,000 | | TOLOMATO FL CDD (Step to 6.61% on 11/1/2021)(d) | | 5/1/2040 | | 0.00 | | 176,278 | | 171,859 | | |
| 115,000 | | TOLOMATO FL CDD (Step to 6.61% on 11/1/2024)(d) | | 5/1/2040 | | 0.00 | | 87,948 | | 82,931 | | |
| 1,490,000 | | TOLOMATO FL CDD | | 5/1/2040 | | 3.75 | | 1,434,307 | | 1,693,087 | | |
| 125,000 | | TOLOMATO FL CDD(c) | | 5/1/2040 | | 6.61 | | - | | 1 | | |
| 700,000 | | TROUT CREEK CDD FL CAPITAL IMPT REVENUE | | 5/1/2038 | | 5.38 | | 700,000 | | 785,897 | | |
| 385,000 | | TROUT CREEK CDD FL CAPITAL IMPT REVENUE | | 5/1/2040 | | 4.00 | | 389,491 | | 401,120 | | |
| 500,000 | | TSR CDD FL SPL ASSMNT REVENUE | | 11/1/2035 | | 5.38 | | 498,730 | | 565,100 | | |
| 1,500,000 | | UNIVERSITY PARK RECREATION DIST FL ON-AD VALOREM ASSMNT | | 5/1/2050 | | 3.50 | | 1,500,000 | | 1,676,340 | | |
| 1,125,000 | | VLG FL CDD #7 SPL ASSMNT REVENUE | | 5/1/2036 | | 4.00 | | 1,118,619 | | 1,217,869 | | |
| 4,000 | | WATERS EDGE FL CDD CAPITAL IMPT REVENUE | | 5/1/2039 | | 5.35 | | 4,000 | | 4,003 | | |
| 85,000 | | WATERS EDGE FL CDD CAPITAL IMPT REVENUE | | 5/1/2039 | | 6.60 | | 84,379 | | 86,092 | | |
| 735,000 | | WIREGRASS FL CDD CAPITAL IMPT REVENUE | | 5/1/2035 | | 5.38 | | 731,312 | | 795,351 | | |
| 1,000,000 | | WIREGRASS II CDD FL CAPITAL IMPROVEMENT REVENUE | | 5/1/2050 | | 3.88 | | 985,316 | | 1,024,760 | | |
| 750,000 | | WYNNFIELD LAKES FL CDD | | 5/1/2036 | | 4.50 | | 745,498 | | 804,548 | | |
| 350,934 | | ZEPHYR RIDGE FL CDD CAPITAL IMPT REVENUE(c) | | 5/1/2013 | | 5.25 | | 351,276 | | 154,411 | | |
| | | | | | | 74,082,442 | | 75,586,715 | | 12.25% |
| Georgia | | | | | | | | | | |
| 500,000 | | ATHENS-CLARKE CNTY GA UNIF GOVT DEV AUTH REVENUE | | 6/15/2039 | | 5.00 | | 507,366 | | 546,930 | | |
| 500,000 | | ATLANTA GA ARPT REVENUE | | 1/1/2030 | | 6.00 | | 500,000 | | 500,000 | | |
| 1,350,000 | | COBB CNTY GA DEV AUTH(b) | | 12/1/2039 | | 5.00 | | 1,416,564 | | 1,380,119 | | |
| 745,000 | | FULTON CNTY GA DEV AUTH | | 11/1/2028 | | 5.25 | | 649,560 | | 745,611 | | |
| 3,500,000 | | GEORGIA ST HSG & FIN AUTH REVENUE | | 12/1/2037 | | 3.80 | | 3,500,000 | | 3,617,810 | | |
| 2,000,000 | | GEORGIA ST HSG & FIN AUTH REVENUE | | 12/1/2037 | | 4.00 | | 2,000,000 | | 2,035,860 | | |
| 925,000 | | GEORGIA ST HSG & FIN AUTH REVENUE | | 12/1/2038 | | 3.85 | | 925,000 | | 1,014,170 | | |
| 370,000 | | GEORGIA ST HSG & FIN AUTH REVENUE | | 12/1/2039 | | 4.00 | | 370,000 | | 392,385 | | |
| 2,500,000 | | GEORGIA ST HSG & FIN AUTH REVENUE | | 12/1/2040 | | 3.80 | | 2,500,000 | | 2,673,650 | | |
| 1,000,000 | | GEORGIA ST HSG & FIN AUTH REVENUE | | 12/1/2041 | | 3.85 | | 1,001,980 | | 1,031,830 | | |
| 1,950,000 | | GEORGIA ST HSG & FIN AUTH REVENUE | | 12/1/2043 | | 3.90 | | 1,939,756 | | 2,009,455 | | |
| See accompanying notes to financial statements. | 59 | (Continued) |
CLEARWATER INVESTMENT TRUST
Schedule of Investments - Clearwater Tax-Exempt Bond Fund
December 31, 2020
| Par/Shares | | Security | | Maturity
date | | Coupon
rate | | Cost | | Fair value (a) | | Percent of
net assets |
| Georgia (Cont'd): | | | | | | | | | | |
| 895,000 | | GEORGIA ST HSG & FIN AUTH REVENUE | | 12/1/2048 | | 4.00 | | $ 895,000 | | 963,834 | | |
| 1,500,000 | | GEORGIA ST HSG & FIN AUTH REVENUE | | 12/1/2048 | | 4.20 | | 1,505,981 | | 1,675,425 | | |
| 1,750,000 | | GEORGIA ST HSG & FIN AUTH REVENUE | | 12/1/2049 | | 3.25 | | 1,750,000 | | 1,882,143 | | |
| | | | | | | 19,461,207 | | 20,469,222 | | 3.32% |
| Idaho | | | | | | | | | | |
| 570,000 | | IDAHO ST HLTH FACS AUTH REVENUE | | 10/1/2024 | | 7.00 | | 570,000 | | 484,745 | | |
| 750,000 | | IDAHO ST HLTH FACS AUTH REVENUE | | 10/1/2029 | | 7.38 | | 743,981 | | 636,653 | | |
| 1,000,000 | | IDAHO ST HLTH FACS AUTH REVENUE | | 10/1/2044 | | 8.00 | | 1,035,700 | | 850,040 | | |
| | | | | | | 2,349,681 | | 1,971,438 | | 0.32% |
| Illinois | | | | | | | | | | |
| 1,195,000 | | BELLWOOD IL | | 12/1/2027 | | 5.88 | | 1,188,637 | | 1,310,772 | | |
| 1,495,000 | | BOLINGBROOK IL SPL SVC AREA SPL TAX | | 3/1/2030 | | 4.00 | | 1,540,250 | | 1,745,203 | | |
| 1,250,000 | | BURBANK IL EDUCTNL FACS REVENUE(b) | | 9/1/2035 | | 6.00 | | 1,259,315 | | 1,348,550 | | |
| 1,000,000 | | BUREAU CNTY TWP IL HIGH SCH DIST #502 | | 10/1/2043 | | 6.63 | | 1,025,833 | | 1,182,200 | | |
| 1,000,000 | | CHICAGO HEIGHTS IL | | 12/1/2029 | | 4.50 | | 1,042,457 | | 1,114,510 | | |
| 1,000,000 | | CHICAGO IL MIDWAY ARPT REVENUE | | 1/1/2035 | | 5.25 | | 1,000,739 | | 1,083,330 | | |
| 1,000,000 | | CHICAGO IL PARK DIST | | 1/1/2028 | | 5.00 | | 1,063,463 | | 1,093,310 | | |
| 750,000 | | CHICAGO IL PARK DIST | | 1/1/2042 | | 4.00 | | 771,127 | | 840,742 | | |
| 637,000 | | CORTLAND IL SPL TAX REVENUE(c) | | 3/1/2017 | | 5.50 | | 633,881 | | 95,550 | | |
| 500,000 | | DECATUR IL | | 3/1/2034 | | 5.00 | | 507,285 | | 563,100 | | |
| 1,500,000 | | ILLINOIS ST | | 2/1/2030 | | 4.00 | | 1,494,288 | | 1,662,570 | | |
| 500,000 | | ILLINOIS ST | | 7/1/2033 | | 5.50 | | 498,790 | | 534,265 | | |
| 1,000,000 | | ILLINOIS ST EDUCTNL FACS AUTH | | 11/1/2036 | | 4.50 | | 1,000,000 | | 1,120,940 | | |
| 675,000 | | ILLINOIS ST FIN AUTH EDUCTNL FAC REVENUE | | 2/1/2034 | | 6.00 | | 678,738 | | 718,666 | | |
| 600,000 | | ILLINOIS ST FIN AUTH REVENUE | | 5/15/2027 | | 6.13 | | 600,000 | | 601,524 | | |
| 500,000 | | ILLINOIS ST FIN AUTH REVENUE | | 5/15/2036 | | 5.00 | | 501,148 | | 538,375 | | |
| 750,000 | | ILLINOIS ST FIN AUTH REVENUE | | 12/1/2037 | | 5.00 | | 763,697 | | 820,425 | | |
| 500,000 | | ILLINOIS ST FIN AUTH REVENUE | | 5/1/2038 | | 5.25 | | 508,351 | | 522,190 | | |
| 1,450,000 | | ILLINOIS ST FIN AUTH REVENUE | | 5/15/2038 | | 5.13 | | 1,411,017 | | 1,378,689 | | |
| 1,500,000 | | ILLINOIS ST FIN AUTH REVENUE | | 5/15/2045 | | 5.00 | | 1,570,740 | | 1,581,510 | | |
| 1,000,000 | | ILLINOIS ST HSG DEV AUTH MF REVENUE | | 7/1/2044 | | 3.15 | | 1,000,000 | | 1,068,570 | | |
| 650,000 | | ILLINOIS ST HSG DEV AUTH REVENUE | | 4/1/2041 | | 3.88 | | 650,000 | | 714,961 | | |
| 1,000,000 | | ILLINOIS ST SALES TAX REVENUE | | 6/15/2033 | | 5.00 | | 1,063,872 | | 1,163,330 | | |
| 1,500,000 | | ILLINOIS ST SPORTS FACS AUTH | | 6/15/2031 | | 5.25 | | 1,554,492 | | 1,680,900 | | |
| 500,000 | | LAKE CNTY IL SCH DIST #33 | | 12/1/2040 | | 5.00 | | 515,342 | | 573,300 | | |
| 1,000,000 | | MACON & MOULTRIE CNTYS IL CMNTY SCH DIST #3 MOUNT ZION | | 12/1/2041 | | 5.50 | | 1,012,305 | | 1,152,210 | | |
| 1,000,000 | | MACON CNTY IL SCH DIST #61 | | 1/1/2037 | | 5.25 | | 1,000,000 | | 1,000,000 | | |
| 1,080,000 | | MACOUPIN SANGAMON & MONTGOMERY CNTYS IL CMNTY SCH DIST #34 | | 12/1/2037 | | 4.25 | | 1,098,629 | | 1,159,628 | | |
| 1,000,000 | | MALTA IL TAX INCR REVENUE(c) | | 12/30/2025 | | 5.75 | | 1,000,000 | | 320,000 | | |
| 500,000 | | MET PIER & EXPOSITION AUTH IL REVENUE | | 6/15/2057 | | 5.00 | | 517,194 | | 561,220 | | |
| 500,000 | | RICHTON PARK IL PUBLIC LIBRARY DIST | | 12/15/2032 | | 4.50 | | 518,950 | | 526,460 | | |
| 750,000 | | ROCKFORD IL | | 12/15/2030 | | 4.00 | | 750,000 | | 751,365 | | |
| 375,000 | | S WSTRN IL DEV AUTH(c) | | 10/1/2022 | | 7.00 | | 375,000 | | 217,500 | | |
| 385,000 | | UPPER IL RIVER VLY DEV AUTH(b) | | 12/1/2022 | | 4.00 | | 383,594 | | 389,712 | | |
| 750,000 | | UPPER IL RIVER VLY DEV AUTH(b) | | 12/1/2037 | | 5.25 | | 766,667 | | 793,530 | | |
| 465,000 | | UPPER IL RIVER VLY DEV AUTH(b) | | 1/1/2045 | | 5.00 | | 493,653 | | 485,014 | | |
| 685,000 | | WESTMONT IL PARK DIST(g) | | 12/1/2031 | | 0.00 | | 361,597 | | 412,439 | | |
| 685,000 | | WESTMONT IL PARK DIST(g) | | 12/1/2033 | | 0.00 | | 315,656 | | 360,947 | | |
| | | | | | | 32,436,707 | | 33,187,507 | | 5.38% |
| Indiana | | | | | | | | | | |
| 216,724 | | CARMEL IN REVENUE(c) | | 11/15/2022 | | 6.00 | | 220,448 | | 5,269 | | |
| 307,411 | | CARMEL IN REVENUE(c) | | 11/15/2027 | | 7.00 | | 299,835 | | 7,473 | | |
| 500,000 | | DAVIESS CNTY IN HOSP ASSN LEASE RENTAL REVENUE | | 1/15/2029 | | 5.25 | | 493,535 | | 500,710 | | |
| 1,000,000 | | EAST CHICAGO IN SAN DIST REVENUE | | 7/15/2035 | | 4.00 | | 993,270 | | 1,081,140 | | |
| 500,000 | | INDIANA ST FIN AUTH REVENUE | | 11/15/2031 | | 5.50 | | 494,746 | | 511,775 | | |
| See accompanying notes to financial statements. | 60 | (Continued) |
CLEARWATER INVESTMENT TRUST
Schedule of Investments - Clearwater Tax-Exempt Bond Fund
December 31, 2020
| Par/Shares | | Security | | Maturity
date | | Coupon
rate | | Cost | | Fair value (a) | | Percent of
net assets |
| Indiana (Cont'd): | | | | | | | | | | |
| 1,000,000 | | INDIANA ST FIN AUTH REVENUE | | 11/15/2033 | | 6.50 | | $ 989,213 | | 1,071,650 | | |
| 1,000,000 | | INDIANA ST FIN AUTH REVENUE | | 3/1/2041 | | 5.00 | | 1,011,247 | | 1,055,370 | | |
| 500,000 | | INDIANA ST FIN AUTH REVENUE | | 11/15/2041 | | 5.88 | | 518,315 | | 539,110 | | |
| 1,000,000 | | INDIANA ST FIN AUTH REVENUE | | 11/15/2041 | | 6.00 | | 988,180 | | 1,083,340 | | |
| 1,000,000 | | INDIANA ST FIN AUTH REVENUE | | 11/15/2046 | | 5.25 | | 1,026,867 | | 1,089,750 | | |
| 1,500,000 | | INDIANA ST HSG & CMNTY DEV AUTH MF HSG REVENUE | | 1/1/2036 | | 5.75 | | 1,500,000 | | 1,542,945 | | |
| 600,000 | | MERRILLVILLE IN ECON DEV REVENUE | | 4/1/2036 | | 5.75 | | 600,000 | | 622,704 | | |
| 615,000 | | MUNSTER IN ECON DEV TAX INCR REVENUE | | 7/15/2026 | | 4.75 | | 613,506 | | 667,170 | | |
| 1,000,000 | | SCHERERVILLE IN ECON DEV REVENUE | | 1/15/2030 | | 6.00 | | 1,005,671 | | 1,115,150 | | |
| | | | | | | 10,754,833 | | 10,893,556 | | 1.77% |
| Iowa | | | | | | | | | | |
| 1,500,000 | | IOWA ST FIN AUTH REVENUE | | 5/15/2036 | | 5.00 | | 1,606,237 | | 1,622,775 | | |
| 500,000 | | IOWA ST HGR EDU LOAN AUTH | | 11/1/2030 | | 5.00 | | 517,370 | | 539,415 | | |
| | | | | | | 2,123,607 | | 2,162,190 | | 0.35% |
| Kansas | | | | | | | | | | |
| 1,000,000 | | FRANKLIN CNTY KS UNIF SCH DIST #290 | | 9/1/2039 | | 4.75 | | 1,029,013 | | 1,205,580 | | |
| 700,000 | | WICHITA KS HLTH CARE FACS REVENUE | | 12/1/2036 | | 5.25 | | 710,281 | | 712,040 | | |
| 935,000 | | WYANDOTTE CNTY KS KANSAS CITY UNIF GOVT SPL OBLG REVENUE | | 9/1/2032 | | 5.75 | | 929,486 | | 882,556 | | |
| | | | | | | 2,668,780 | | 2,800,176 | | 0.45% |
| Kentucky | | | | | | | | | | |
| 475,000 | | KENTUCKY ST HSG CORP HSG REVENUE | | 7/1/2028 | | 3.75 | | 470,401 | | 498,921 | | |
| | | | | | | 470,401 | | 498,921 | | 0.08% |
| Louisiana | | | | | | | | | | |
| 1,000,000 | | LOUISIANA ST ENERGY & PWR AUTH PWR PROJ REVENUE | | 6/1/2038 | | 5.25 | | 1,006,730 | | 1,103,060 | | |
| 650,000 | | LOUISIANA ST LOCAL GOVT ENVRNMNTL FACS & CMNTY DEV AUTH | | 11/15/2025 | | 5.25 | | 680,482 | | 687,746 | | |
| 1,000,000 | | LOUISIANA ST LOCAL GOVT ENVRNMNTL FACS & CMNTY DEV AUTH | | 11/15/2030 | | 6.00 | | 1,010,440 | | 1,092,580 | | |
| 700,000 | | LOUISIANA ST LOCAL GOVT ENVRNMNTL FACS & CMNTY DEV AUTH REVE(b) | | 11/1/2037 | | 5.65 | | 700,000 | | 792,449 | | |
| 1,000,000 | | LOUISIANA ST LOCAL GOVT ENVRNMNTL FACS & CMNTY DEV AUTH REVE(b) | | 7/1/2039 | | 5.00 | | 1,061,052 | | 1,004,800 | | |
| 600,000 | | LOUISIANA ST LOCAL GOVT ENVRNMNTL FACS & CMNTY DEV AUTH REVENUE(b) | | 11/1/2039 | | 5.50 | | 600,000 | | 655,794 | | |
| 1,000,000 | | LOUISIANA ST LOCAL GOVT ENVRNMNTL FACS & CMNTY DEV AUTH REVENUE(b) | | 11/1/2044 | | 4.00 | | 1,000,000 | | 1,026,920 | | |
| 750,000 | | LOUISIANA ST LOCAL GOVT ENVRNMNTL FACS & CMNTY DEV AUTH REVENUE(b) | | 11/1/2044 | | 4.40 | | 750,000 | | 788,467 | | |
| 500,000 | | LOUISIANA ST PUBLIC FACS AUTH HOSP REVENUE | | 7/1/2035 | | 5.00 | | 525,004 | | 573,213 | | |
| 385,000 | | LOUISIANA ST PUBLIC FACS AUTH REVENUE (Floating, ICE LIBOR USD 3M + 0.70%)(e) | | 2/15/2036 | | 0.85 | | 385,000 | | 377,774 | | |
| 750,000 | | SAINT TAMMANY LA PUBLIC TRUST FING AUTH | | 11/15/2037 | | 5.25 | | 756,498 | | 792,817 | | |
| | | | | | | 8,475,206 | | 8,895,620 | | 1.44% |
| Maine | | | | | | | | | | |
| 1,000,000 | | MAINE ST HSG AUTH MTGE PURCHASE | | 11/15/2035 | | 4.00 | | 1,000,000 | | 1,074,890 | | |
| 1,000,000 | | MAINE ST HSG AUTH MTGE PURCHASE | | 11/15/2036 | | 3.90 | | 1,000,000 | | 1,092,310 | | |
| 1,500,000 | | MAINE ST HSG AUTH MTGE PURCHASE | | 11/15/2040 | | 3.85 | | 1,500,000 | | 1,598,655 | | |
| 500,000 | | MAINE ST HSG AUTH MTGE PURCHASE | | 11/15/2042 | | 4.05 | | 500,000 | | 543,805 | | |
| | | | | | | 4,000,000 | | 4,309,660 | | 0.70% |
| Maryland | | | | | | | | | | |
| 500,000 | | MARYLAND ST CMNTY DEV ADMIN DEPT HSG & CMNTY DEV | | 7/1/2031 | | 4.50 | | 500,000 | | 508,595 | | |
| See accompanying notes to financial statements. | 61 | (Continued) |
CLEARWATER INVESTMENT TRUST
Schedule of Investments - Clearwater Tax-Exempt Bond Fund
December 31, 2020
| Par/Shares | | Security | | Maturity
date | | Coupon
rate | | Cost | | Fair value (a) | | Percent of
net assets |
| Maryland (Cont'd): | | | | | | | | | | |
| 1,250,000 | | MARYLAND ST HLTH & HGR EDUCTNL FACS AUTH REVENUE | | 7/1/2048 | | 4.00 | | $ 1,222,217 | | 1,451,362 | | |
| 500,000 | | MONTGOMERY CNTY MD HSG OPPORTUNITIES COMMISSION MF REVENUE | | 7/1/2037 | | 5.13 | | 500,000 | | 503,890 | | |
| 890,000 | | MONTGOMERY CNTY MD HSG OPPORTUNITIES COMMISSION SF MTGE REVENUE | | 7/1/2038 | | 4.00 | | 890,000 | | 902,220 | | |
| | | | | | | 3,112,217 | | 3,366,067 | | 0.55% |
| Massachusetts | | | | | | | | | | |
| 700,000 | | MASSACHUSETTS ST DEV FIN AGY REVENUE(b) | | 10/1/2047 | | 5.00 | | 742,084 | | 750,729 | | |
| 1,500,000 | | MASSACHUSETTS ST DEV FIN AGY REVENUE | | 6/1/2049 | | 4.00 | | 1,516,025 | | 1,648,785 | | |
| 250,000 | | MASSACHUSETTS ST EDUCTNL FING AUTH | | 1/1/2028 | | 5.25 | | 250,000 | | 251,617 | | |
| 1,500,000 | | MASSACHUSETTS ST EDUCTNL FING AUTH | | 7/1/2034 | | 3.63 | | 1,515,345 | | 1,587,675 | | |
| 1,500,000 | | MASSACHUSETTS ST EDUCTNL FING AUTH | | 7/1/2048 | | 3.75 | | 1,445,004 | | 1,543,845 | | |
| 700,000 | | MASSACHUSETTS ST HSG FIN AGY | | 12/1/2033 | | 5.00 | | 700,000 | | 752,640 | | |
| 700,000 | | MASSACHUSETTS ST HSG FIN AGY | | 12/1/2038 | | 5.15 | | 700,000 | | 751,065 | | |
| 1,000,000 | | MASSACHUSETTS ST HSG FIN AGY | | 12/1/2043 | | 5.00 | | 1,000,000 | | 1,065,100 | | |
| 2,735,000 | | MASSACHUSETTS ST HSG FIN AGY HSG REVENUE | | 12/1/2043 | | 4.00 | | 2,735,000 | | 2,815,710 | | |
| 1,860,000 | | MASSACHUSETTS ST HSG FIN AGY HSG REVENUE | | 6/1/2046 | | 4.20 | | 1,860,000 | | 2,034,580 | | |
| 500,000 | | MASSACHUSETTS ST HSG FIN AGY HSG REVENUE | | 6/1/2063 | | 2.80 | | 500,000 | | 511,035 | | |
| 500,000 | | ROWLEY MA | | 5/1/2027 | | 4.00 | | 500,000 | | 501,275 | | |
| | | | | | | 13,463,458 | | 14,214,056 | | 2.30% |
| Michigan | | | | | | | | | | |
| 190,000 | | CHANDLER PARK ACADEMY MI PUBLIC SCH ACADEMY REVENUE | | 11/1/2022 | | 5.00 | | 178,932 | | 190,374 | | |
| 500,000 | | KALAMAZOO MI ECON DEV CORP | | 5/15/2043 | | 5.00 | | 531,219 | | 545,105 | | |
| 750,000 | | MICHIGAN ST FIN AUTH REVENUE | | 11/15/2035 | | 5.25 | | 746,134 | | 794,408 | | |
| 500,000 | | MICHIGAN ST FIN AUTH REVENUE | | 11/15/2042 | | 5.00 | | 517,589 | | 530,060 | | |
| 860,000 | | MICHIGAN ST HSG DEV AUTH | | 12/1/2036 | | 3.70 | | 860,000 | | 932,025 | | |
| 1,850,000 | | MICHIGAN ST HSG DEV AUTH RENTAL HSG REVENUE | | 10/1/2035 | | 4.10 | | 1,850,000 | | 2,017,184 | | |
| 600,000 | | MICHIGAN ST HSG DEV AUTH RENTAL HSG REVENUE | | 10/1/2042 | | 3.75 | | 600,000 | | 650,940 | | |
| 1,650,000 | | MICHIGAN ST HSG DEV AUTH RENTAL HSG REVENUE | | 10/1/2043 | | 4.00 | | 1,650,000 | | 1,829,520 | | |
| 2,250,000 | | MICHIGAN ST HSG DEV AUTH RENTAL HSG REVENUE | | 10/1/2054 | | 3.50 | | 2,328,459 | | 2,405,385 | | |
| 635,000 | | MICHIGAN ST HSG DEV AUTH SF MTGE REVENUE | | 12/1/2038 | | 4.13 | | 635,000 | | 667,842 | | |
| 1,000,000 | | MICHIGAN ST HSG DEV AUTH SF MTGE REVENUE | | 6/1/2049 | | 4.00 | | 1,003,149 | | 1,097,680 | | |
| 1,000,000 | | MICHIGAN ST HSG DEV AUTH SF MTGE REVENUE | | 6/1/2050 | | 3.15 | | 1,000,000 | | 1,051,240 | | |
| 5,000,000 | | MICHIGAN ST HSG DEV AUTH SF MTGE REVENUE | | 6/1/2051 | | 2.75 | | 4,873,814 | | 5,108,850 | | |
| 420,000 | | MICHIGAN ST PUBLIC EDUCTNL FACS AUTH | | 11/1/2028 | | 6.35 | | 420,000 | | 420,949 | | |
| 750,000 | | TAYLOR MI BROWNFIELD REDEV AUTH | | 5/1/2032 | | 5.00 | | 770,809 | | 851,648 | | |
| 330,000 | | UNIVERSAL ACADEMY MI PUBLIC SCH ACADEMY REVENUE | | 12/1/2023 | | 6.50 | | 327,845 | | 344,312 | | |
| | | | | | | 18,292,950 | | 19,437,522 | | 3.15% |
| Minnesota | | | | | | | | | | |
| 1,000,000 | | APPLE VLY MN SENIOR LIVING REVENUE | | 1/1/2047 | | 5.00 | | 978,626 | | 679,470 | | |
| 1,000,000 | | APPLE VY MN SENIOR HSG REVENUE | | 9/1/2058 | | 5.00 | | 980,000 | | 1,037,740 | | |
| 2,500,000 | | MINNESOTA ST OFFICE OF HGR EDU REVENUE | | 11/1/2038 | | 2.65 | | 2,367,826 | | 2,549,575 | | |
| | | | | | | 4,326,452 | | 4,266,785 | | 0.69% |
| See accompanying notes to financial statements. | 62 | (Continued) |
CLEARWATER INVESTMENT TRUST
Schedule of Investments - Clearwater Tax-Exempt Bond Fund
December 31, 2020
| Par/Shares | | Security | | Maturity
date | | Coupon
rate | | Cost | | Fair value (a) | | Percent of
net assets |
| Mississippi | | | | | | | | | | |
| 1,000,000 | | MISSISSIPPI ST DEV BANK SPL OBLG(b) | | 11/1/2039 | | 4.55 | | $ 1,000,000 | | 1,060,720 | | |
| | | | | | | 1,000,000 | | 1,060,720 | | 0.17% |
| Missouri | | | | | | | | | | |
| 1,300,000 | | KANSAS CITY MO INDL DEV AUTH SENIOR LIVING FACS REVENUE(b)(c)(f) | | 11/15/2036 | | 5.75 | | 1,300,000 | | 455,650 | | |
| 1,000,000 | | KIRKWOOD MO INDL DEV AUTH RETMNT CMNTY REVENUE | | 5/15/2037 | | 5.25 | | 1,016,173 | | 1,097,190 | | |
| 1,000,000 | | MISSOURI ST HLTH & EDUCTNL FACS AUTH | | 2/1/2042 | | 5.00 | | 908,969 | | 1,109,580 | | |
| 2,000,000 | | MISSOURI ST HLTH & EDUCTNL FACS AUTH | | 2/1/2048 | | 4.00 | | 2,075,504 | | 2,098,460 | | |
| 825,000 | | MISSOURI ST HSG DEV COMMISSION SF MTGE REVENUE | | 11/1/2048 | | 3.80 | | 825,000 | | 900,892 | | |
| 475,000 | | MISSOURI ST HSG DEV COMMISSION SF MTGE REVENUE | | 11/1/2049 | | 3.35 | | 475,000 | | 506,920 | | |
| 750,000 | | SAINT LOUIS CNTY MO INDL DEV AUTH SENIOR LIVING FACS | | 9/1/2042 | | 5.00 | | 755,345 | | 773,895 | | |
| | | | | | | 7,355,991 | | 6,942,587 | | 1.13% |
| Montana | | | | | | | | | | |
| 850,000 | | MONTANA ST BRD OF HSG | | 12/1/2038 | | 3.75 | | 850,000 | | 878,790 | | |
| 485,000 | | MONTANA ST BRD OF HSG | | 12/1/2038 | | 5.20 | | 485,000 | | 521,661 | | |
| 985,000 | | MONTANA ST BRD OF HSG | | 6/1/2045 | | 4.00 | | 985,000 | | 1,105,239 | | |
| 865,000 | | MONTANA ST BRD OF HSG SF MTGE | | 12/1/2037 | | 3.95 | | 865,000 | | 962,044 | | |
| 765,000 | | MONTANA ST BRD OF HSG SF MTGE | | 12/1/2038 | | 4.00 | | 766,524 | | 829,994 | | |
| | | | | | | 3,951,524 | | 4,297,728 | | 0.70% |
| Nebraska | | | | | | | | | | |
| 160,000 | | MEAD NE TAX INCR REVENUE(c) | | 7/1/2012 | | 5.13 | | 160,000 | | 6,640 | | |
| 700,000 | | NEBRASKA ST INVESTMENT FIN AUTH SF HSG REVENUE | | 9/1/2042 | | 3.05 | | 700,000 | | 746,074 | | |
| | | | | | | 860,000 | | 752,714 | | 0.12% |
| Nevada | | | | | | | | | | |
| 765,000 | | NEVADA ST HSG DIV SF MTGE REVENUE | | 10/1/2039 | | 3.85 | | 765,000 | | 804,635 | | |
| 825,000 | | NEVADA ST HSG DIV SF MTGE REVENUE | | 10/1/2049 | | 3.35 | | 825,000 | | 883,014 | | |
| 505,000 | | NORTH LAS VEGAS NV LOCAL IMPT(b) | | 12/1/2027 | | 4.00 | | 495,426 | | 538,532 | | |
| 505,000 | | NORTH LAS VEGAS NV LOCAL IMPT(b) | | 12/1/2037 | | 5.00 | | 505,874 | | 557,419 | | |
| | | | | | | 2,591,300 | | 2,783,600 | | 0.45% |
| New Hampshire | | | | | | | | | | |
| 1,000,000 | | NEW HAMPSHIRE ST HSG FIN AUTH MF REVENUE | | 7/1/2031 | | 5.20 | | 1,000,000 | | 1,016,780 | | |
| 1,500,000 | | NEW HAMPSHIRE ST HSG FIN AUTH MF REVENUE | | 7/1/2052 | | 4.00 | | 1,500,000 | | 1,638,420 | | |
| 125,000 | | NEW HAMPSHIRE ST HSG FIN AUTH SF REVENUE | | 7/1/2034 | | 5.38 | | 125,000 | | 125,425 | | |
| | | | | | | 2,625,000 | | 2,780,625 | | 0.45% |
| New Jersey | | | | | | | | | | |
| 750,000 | | NEW JERSEY ST ECON DEV AUTH | | 6/15/2037 | | 5.00 | | 775,815 | | 904,687 | | |
| 500,000 | | NEW JERSEY ST ECON DEV AUTH | | 6/15/2042 | | 5.00 | | 532,581 | | 586,800 | | |
| 750,000 | | NEW JERSEY ST ECON DEV AUTH REVENUE | | 7/15/2047 | | 5.00 | | 791,411 | | 842,573 | | |
| 2,500,000 | | NEW JERSEY ST HGR EDU ASSISTANCE AUTH STUDENT LOAN REVENUE | | 12/1/2039 | | 3.50 | | 2,493,123 | | 2,609,600 | | |
| 1,000,000 | | NEW JERSEY ST HGR EDU ASSISTANCE AUTH STUDENT LOAN REVENUE | | 12/1/2050 | | 4.25 | | 988,301 | | 1,040,640 | | |
| 1,000,000 | | NEW JERSEY ST HSG & MTGE FIN AGY MF CONDUIT REVENUE | | 1/1/2030 | | 3.60 | | 1,000,000 | | 1,048,520 | | |
| 3,225,000 | | NEW JERSEY ST HSG & MTGE FIN AGY REVENUE | | 10/1/2035 | | 3.75 | | 3,225,000 | | 3,622,417 | | |
| 955,000 | | NEW JERSEY ST HSG & MTGE FIN AGY REVENUE | | 4/1/2049 | | 4.00 | | 957,377 | | 1,053,212 | | |
| 500,000 | | NEW JERSEY ST TRANSPRTN TRUST FUND AUTH | | 12/15/2039 | | 4.00 | | 526,541 | | 562,465 | | |
| 500,000 | | NEW JERSEY ST TRANSPRTN TRUST FUND AUTH | | 6/15/2041 | | 5.25 | | 506,520 | | 568,865 | | |
| See accompanying notes to financial statements. | 63 | (Continued) |
CLEARWATER INVESTMENT TRUST
Schedule of Investments - Clearwater Tax-Exempt Bond Fund
December 31, 2020
| Par/Shares | | Security | | Maturity
date | | Coupon
rate | | Cost | | Fair value (a) | | Percent of
net assets |
| New Jersey (Cont'd): | | | | | | | | | | |
| 700,000 | | TOBACCO SETTLEMENT FING CORP NJ | | 6/1/2046 | | 5.00 | | $ 704,272 | | 817,110 | | |
| | | | | | | 12,500,941 | | 13,656,889 | | 2.21% |
| New Mexico | | | | | | | | | | |
| 560,000 | | NEW MEXICO ST MTGE FIN AUTH | | 9/1/2042 | | 3.90 | | 560,000 | | 571,015 | | |
| 760,000 | | NEW MEXICO ST MTGE FIN AUTH | | 9/1/2042 | | 4.13 | | 760,000 | | 776,887 | | |
| 1,490,000 | | NEW MEXICO ST MTGE FIN AUTH | | 7/1/2043 | | 3.85 | | 1,490,000 | | 1,638,583 | | |
| 760,000 | | NEW MEXICO ST MTGE FIN AUTH | | 9/1/2046 | | 3.80 | | 760,000 | | 803,525 | | |
| 695,000 | | NEW MEXICO ST MTGE FIN AUTH | | 7/1/2048 | | 3.90 | | 695,000 | | 760,483 | | |
| 980,000 | | NEW MEXICO ST MTGE FIN AUTH | | 7/1/2048 | | 4.00 | | 981,742 | | 1,078,539 | | |
| 990,000 | | NEW MEXICO ST MTGE FIN AUTH | | 7/1/2049 | | 3.35 | | 990,000 | | 1,062,042 | | |
| 935,000 | | NEW MEXICO ST MTGE FIN AUTH | | 7/1/2049 | | 4.00 | | 935,000 | | 1,031,866 | | |
| 550,000 | | NEW MEXICO ST MTGE FIN AUTH | | 7/1/2050 | | 3.00 | | 551,264 | | 581,059 | | |
| | | | | | | 7,723,006 | | 8,303,999 | | 1.35% |
| New York | | | | | | | | | | |
| 1,000,000 | | BUFFALO & ERIE CNTY NY INDL LAND DEV CORP REVENUE | | 11/1/2040 | | 4.00 | | 1,041,362 | | 1,074,270 | | |
| 750,000 | | HEMPSTEAD TOWN NY LOCAL DEV CORP REVENUE | | 9/1/2038 | | 5.00 | | 752,391 | | 803,310 | | |
| 750,000 | | MONROE CNTY NY INDL DEV CORP REVENUE | | 1/1/2030 | | 4.00 | | 672,431 | | 795,803 | | |
| 1,250,000 | | MONROE CNTY NY INDL DEV CORP REVENUE | | 1/1/2050 | | 5.00 | | 1,333,565 | | 1,358,838 | | |
| 1,000,000 | | NEW YORK CITY NY HSG DEV CORP MF HSG REVENUE | | 11/1/2037 | | 3.80 | | 1,000,000 | | 1,022,590 | | |
| 1,000,000 | | NEW YORK CITY NY HSG DEV CORP MF HSG REVENUE | | 11/1/2039 | | 4.30 | | 1,000,000 | | 1,058,910 | | |
| 600,000 | | NEW YORK CITY NY HSG DEV CORP MF HSG REVENUE | | 11/1/2042 | | 3.85 | | 601,355 | | 650,520 | | |
| 3,000,000 | | NEW YORK CITY NY HSG DEV CORP MF HSG REVENUE | | 5/1/2045 | | 3.90 | | 2,838,750 | | 3,141,150 | | |
| 1,000,000 | | NEW YORK CITY NY HSG DEV CORP MF HSG REVENUE | | 11/1/2047 | | 3.65 | | 1,000,000 | | 1,053,740 | | |
| 1,000,000 | | NEW YORK CITY NY HSG DEV CORP MF HSG REVENUE | | 11/1/2049 | | 3.95 | | 1,000,000 | | 1,082,840 | | |
| 1,000,000 | | NEW YORK CITY NY HSG DEV CORP MF HSG REVENUE | | 11/1/2055 | | 3.00 | | 1,000,000 | | 1,030,340 | | |
| 2,000,000 | | NEW YORK CITY NY HSG DEV CORP MF HSG REVENUE | | 11/1/2060 | | 2.80 | | 2,000,000 | | 2,018,080 | | |
| 2,000,000 | | NEW YORK CITY NY MUNI WTR FIN AUTH WTR & SWR SYS REVENUE | | 6/15/2038 | | 5.00 | | 2,071,328 | | 2,211,260 | | |
| 1,000,000 | | NEW YORK ST HSG FIN AGY | | 11/1/2041 | | 4.10 | | 1,000,000 | | 1,095,880 | | |
| 1,000,000 | | NEW YORK ST HSG FIN AGY | | 11/1/2042 | | 4.00 | | 1,000,000 | | 1,088,790 | | |
| 1,000,000 | | NEW YORK ST HSG FIN AGY | | 11/1/2048 | | 3.95 | | 1,000,000 | | 1,087,140 | | |
| 1,500,000 | | NEW YORK ST HSG FIN AGY REVENUE | | 11/1/2034 | | 3.65 | | 1,500,000 | | 1,596,945 | | |
| 500,000 | | NEW YORK ST HSG FIN AGY REVENUE | | 11/1/2045 | | 5.10 | | 500,000 | | 531,135 | | |
| 4,000,000 | | NEW YORK ST HSG FIN AGY REVENUE | | 5/1/2048 | | 4.10 | | 4,000,000 | | 4,089,240 | | |
| 930,000 | | NEW YORK ST MTGE AGY HOMEOWNER MTGE REVENUE | | 10/1/2036 | | 3.90 | | 930,000 | | 1,000,940 | | |
| 435,000 | | NEW YORK ST MTGE AGY HOMEOWNER MTGE REVENUE | | 10/1/2042 | | 3.75 | | 435,000 | | 443,891 | | |
| 45,000 | | NEW YORK ST MTGE AGY HOMEOWNER MTGE REVENUE | | 10/1/2043 | | 4.20 | | 45,000 | | 46,141 | | |
| 1,465,000 | | NEW YORK ST MTGE AGY HOMEOWNER MTGE REVENUE | | 10/1/2048 | | 3.80 | | 1,465,000 | | 1,584,764 | | |
| 2,000,000 | | NEW YORK ST MTGE AGY HOMEOWNER MTGE REVENUE | | 10/1/2049 | | 2.95 | | 2,000,000 | | 2,129,440 | | |
| 1,500,000 | | NEW YORK ST MTGE AGY HOMEOWNER MTGE REVENUE | | 4/1/2050 | | 2.55 | | 1,500,000 | | 1,522,335 | | |
| 1,250,000 | | NEW YORK ST TRANSPRTN DEV CORP SPL FAC REVENUE | | 10/1/2030 | | 4.00 | | 1,244,974 | | 1,429,650 | | |
| 550,000 | | WESTCHESTER CNTY NY LOCAL DEV CORP REVENUE | | 1/1/2034 | | 5.00 | | 559,720 | | 577,170 | | |
| | | | | | | 33,490,876 | | 35,525,112 | | 5.76% |
| North Carolina | | | | | | | | | | |
| 1,750,000 | | MECKLENBURG CNTY NC MF HSG REVENUE | | 1/1/2036 | | 5.38 | | 1,750,000 | | 1,786,277 | | |
| 500,000 | | NORTH CAROLINA ST EDU ASSISTANCE AUTH | | 6/1/2039 | | 3.13 | | 494,798 | | 510,160 | | |
| See accompanying notes to financial statements. | 64 | (Continued) |
CLEARWATER INVESTMENT TRUST
Schedule of Investments - Clearwater Tax-Exempt Bond Fund
December 31, 2020
| Par/Shares | | Security | | Maturity
date | | Coupon
rate | | Cost | | Fair value (a) | | Percent of
net assets |
| North Carolina (Cont'd): | | | | | | | | | | |
| 955,000 | | NORTH CAROLINA ST HSG FIN AGY HOME OWNERSHIP REVENUE | | 1/1/2041 | | 3.95 | | $ 965,163 | | 1,054,387 | | |
| 915,000 | | NORTH CAROLINA ST HSG FIN AGY HOME OWNERSHIP REVENUE | | 1/1/2048 | | 4.00 | | 915,000 | | 1,007,223 | | |
| 1,000,000 | | NORTH CAROLINA ST MED CARE COMMISSION HLTH CARE FACS REVENUE | | 11/1/2037 | | 5.00 | | 1,081,229 | | 1,144,700 | | |
| 600,000 | | NORTH CAROLINA ST MED CARE COMMISSION RETMNT FACS REVENUE | | 10/1/2038 | | 5.00 | | 596,477 | | 652,566 | | |
| | | | | | | 5,802,667 | | 6,155,313 | | 1.00% |
| North Dakota | | | | | | | | | | |
| 1,110,000 | | NORTH DAKOTA ST HSG FIN AGY | | 1/1/2044 | | 3.05 | | 1,110,000 | | 1,181,984 | | |
| 1,000,000 | | NORTH DAKOTA ST HSG FIN AGY | | 7/1/2044 | | 2.50 | | 1,000,000 | | 1,019,510 | | |
| | | | | | | 2,110,000 | | 2,201,494 | | 0.36% |
| Ohio | | | | | | | | | | |
| 750,000 | | BUTLER CNTY OH PORT AUTH PUBLIC INFRASTRUCTURE REVENUE | | 12/1/2041 | | 5.00 | | 750,000 | | 751,732 | | |
| 1,500,000 | | COLUMBUS-FRANKLIN CNTY OH FIN AUTH DEV REVENUE | | 5/15/2049 | | 4.00 | | 1,593,126 | | 1,663,590 | | |
| 500,000 | | COVENTRY OH LOCAL SCH DIST | | 11/1/2037 | | 5.25 | | 501,004 | | 520,605 | | |
| 1,000,000 | | DAYTON-MONTGOMERY CNTY OH PORT AUTH PROJ REVENUE | | 1/15/2040 | | 7.00 | | 1,000,000 | | 898,220 | | |
| 2,000,000 | | FRANKLIN CNTY OH HLTH CARE FACS REVENUE | | 7/1/2045 | | 4.00 | | 2,043,597 | | 2,103,260 | | |
| 750,000 | | LAKE CNTY OH PORT & ECON DEV AUTH LEASE REVENUE(b)(c)(f) | | 12/1/2037 | | 6.50 | | 750,000 | | 262,500 | | |
| 500,000 | | LUCAS CNTY OH HLTH CARE FACS REVENUE | | 8/15/2030 | | 5.50 | | 494,458 | | 511,455 | | |
| 1,500,000 | | LUCAS MET HSG AUTH OH COPS | | 11/1/2036 | | 5.00 | | 1,545,331 | | 1,681,665 | | |
| 2,000,000 | | OHIO ST HGR EDUCTNL FAC COMMISSION | | 11/1/2049 | | 4.00 | | 2,038,770 | | 1,968,880 | | |
| 755,000 | | OHIO ST HSG FIN AGY RSDL MTGE REVENUE | | 9/1/2039 | | 3.35 | | 681,610 | | 805,389 | | |
| 1,095,000 | | OHIO ST HSG FIN AGY RSDL MTGE REVENUE | | 9/1/2048 | | 4.00 | | 1,095,000 | | 1,192,991 | | |
| 1,215,000 | | OHIO ST HSG FIN AGY RSDL MTGE REVENUE | | 3/1/2049 | | 4.00 | | 1,215,000 | | 1,299,054 | | |
| 890,000 | | OHIO ST HSG FIN AGY RSDL MTGE REVENUE | | 9/1/2049 | | 3.35 | | 890,000 | | 952,069 | | |
| 1,000,000 | | REVERE OH LOCAL SCH DIST | | 12/1/2043 | | 4.00 | | 1,034,885 | | 1,041,400 | | |
| | | | | | | 15,632,781 | | 15,652,810 | | 2.54% |
| Oklahoma | | | | | | | | | | |
| 970,000 | | FORT SILL APACHE TRIBE OK ECON DEV AUTH GAMING ENTERPRISE REVENUE(b) | | 8/25/2026 | | 8.50 | | 970,000 | | 1,020,071 | | |
| 2,000,000 | | OKLAHOMA ST DEV FIN AUTH | | 8/1/2049 | | 5.00 | | 2,214,406 | | 2,250,840 | | |
| | | | | | | 3,184,406 | | 3,270,911 | | 0.53% |
| Oregon | | | | | | | | | | |
| 1,000,000 | | CLACKAMAS CNTY OR HOSP FAC AUTH REVENUE | | 11/15/2047 | | 5.00 | | 970,850 | | 1,074,970 | | |
| 500,000 | | CLACKAMAS CNTY OR HOSP FAC AUTH REVENUE | | 11/15/2055 | | 5.38 | | 502,105 | | 537,230 | | |
| 1,000,000 | | MEDFORD OR HOSP FACS AUTH REVENUE | | 10/1/2042 | | 5.00 | | 1,016,655 | | 1,058,430 | | |
| 500,000 | | MULTNOMAH CNTY OR HOSP FACS AUTH REVENUE | | 12/1/2029 | | 5.00 | | 509,124 | | 522,060 | | |
| 2,000,000 | | OREGON ST | | 12/1/2039 | | 3.90 | | 2,000,000 | | 2,112,320 | | |
| 460,000 | | OREGON ST HSG & CMNTY SVCS DEPT MTGE REVENUE | | 7/1/2035 | | 3.75 | | 460,000 | | 510,789 | | |
| 745,000 | | OREGON ST HSG & CMNTY SVCS DEPT MTGE REVENUE | | 7/1/2038 | | 4.00 | | 745,000 | | 775,858 | | |
| 1,200,000 | | OREGON ST HSG & CMNTY SVCS DEPT MTGE REVENUE | | 7/1/2048 | | 3.75 | | 1,200,000 | | 1,294,932 | | |
| 2,000,000 | | POLK CNTY OR HOSP FAC AUTH REVENUE | | 7/1/2024 | | 4.00 | | 2,000,000 | | 2,007,140 | | |
| 1,240,000 | | POLK CNTY OR HOSP FAC AUTH REVENUE | | 7/1/2035 | | 5.13 | | 1,256,354 | | 1,283,400 | | |
| See accompanying notes to financial statements. | 65 | (Continued) |
CLEARWATER INVESTMENT TRUST
Schedule of Investments - Clearwater Tax-Exempt Bond Fund
December 31, 2020
| Par/Shares | | Security | | Maturity
date | | Coupon
rate | | Cost | | Fair value (a) | | Percent of
net assets |
| Oregon (Cont'd): | | | | | | | | | | |
| 1,000,000 | | POLK CNTY OR HOSP FAC AUTH REVENUE | | 7/1/2055 | | 5.13 | | $ 964,729 | | 1,026,900 | | |
| | | | | | | 11,624,817 | | 12,204,029 | | 1.98% |
| Pennsylvania | | | | | | | | | | |
| 480,000 | | ALLEGHENY CNTY PA INDL DEV AUTH CHRT SCH REVENUE | | 8/15/2026 | | 5.90 | | 480,000 | | 481,483 | | |
| 375,000 | | BUTLER CNTY PA GEN AUTH REVENUE (Floating, ICE LIBOR USD 3M + 0.70%)(e) | | 10/1/2034 | | 0.86 | | 375,000 | | 354,394 | | |
| 650,000 | | CMWLTH FING AUTH PA TOBACCO MASTER SETTLEMENT PAYMENT REVENUE | | 6/1/2039 | | 4.00 | | 647,044 | | 749,190 | | |
| 400,000 | | DAUPHIN CNTY PA GEN AUTH UNIV REVENUE(b) | | 10/15/2022 | | 4.00 | | 399,635 | | 404,848 | | |
| 500,000 | | MONTGOMERY CNTY PA INDL DEV AUTH | | 11/15/2033 | | 5.00 | | 521,931 | | 585,495 | | |
| 1,250,000 | | MONTGOMERY CNTY PA INDL DEV AUTH | | 11/15/2036 | | 5.00 | | 1,262,650 | | 1,452,087 | | |
| 1,700,000 | | PENNSYLVANIA HGR EDU ASSISTANCE AGY LOAN REVENUE | | 6/1/2047 | | 3.00 | | 1,700,000 | | 1,700,238 | | |
| 1,000,000 | | PENNSYLVANIA ST ECON DEV FING AUTH UPMC REVENUE | | 4/15/2045 | | 4.00 | | 1,036,922 | | 1,155,740 | | |
| 500,000 | | PENNSYLVANIA ST HGR EDUCTNL FACS AUTH REVENUE (Floating, ICE LIBOR USD 3M + 0.65%)(e) | | 7/1/2039 | | 0.81 | | 500,000 | | 442,410 | | |
| 1,835,000 | | PENNSYLVANIA ST HSG FIN AGY SF MTGE REVENUE | | 10/1/2042 | | 3.65 | | 1,835,000 | | 1,950,330 | | |
| 535,000 | | PENNSYLVANIA ST HSG FIN AGY SF MTGE REVENUE | | 10/1/2042 | | 3.70 | | 535,000 | | 539,783 | | |
| 280,000 | | PENNSYLVANIA ST HSG FIN AGY SF MTGE REVENUE | | 10/1/2047 | | 4.00 | | 280,000 | | 303,114 | | |
| 1,000,000 | | PENNSYLVANIA ST HSG FIN AGY SF MTGE REVENUE | | 10/1/2049 | | 3.40 | | 1,000,000 | | 1,067,990 | | |
| 1,500,000 | | PENNSYLVANIA ST TURNPIKE COMMISSION TURNPIKE REVENUE (Step to 4.60% on 12/1/2021)(d) | | 12/1/2037 | | 0.00 | | 1,435,255 | | 1,691,700 | | |
| 200,000 | | PHILADELPHIA PA AUTH FOR INDL DEV REVENUES | | 6/15/2023 | | 6.13 | | 200,000 | | 212,720 | | |
| 750,000 | | PHILADELPHIA PA AUTH FOR INDL DEV REVENUES | | 8/1/2036 | | 5.63 | | 740,387 | | 836,460 | | |
| 750,000 | | PHILADELPHIA PA AUTH FOR INDL DEV REVENUES | | 6/15/2049 | | 5.00 | | 777,083 | | 789,353 | | |
| | | | | | | 13,725,907 | | 14,717,335 | | 2.39% |
| Puerto Rico | | | | | | | | | | |
| 1,500,000 | | PUERTO RICO CMWLTH | | 7/1/2035 | | 5.00 | | 1,500,000 | | 1,570,110 | | |
| | | | | | | 1,500,000 | | 1,570,110 | | 0.25% |
| Rhode Island | | | | | | | | | | |
| 665,000 | | RHODE ISLAND ST HSG & MTGE FIN CORP | | 10/1/2028 | | 4.00 | | 662,789 | | 669,243 | | |
| 750,000 | | RHODE ISLAND ST HSG & MTGE FIN CORP | | 10/1/2037 | | 3.90 | | 750,000 | | 776,250 | | |
| 1,250,000 | | RHODE ISLAND ST STUDENT LOAN AUTH STUDENT LOAN REVENUE | | 12/1/2037 | | 3.63 | | 1,238,284 | | 1,329,687 | | |
| | | | | | | 2,651,073 | | 2,775,180 | | 0.45% |
| South Carolina | | | | | | | | | | |
| 650,000 | | BERKELEY CNTY SC ASSMNT REVENUE | | 11/1/2040 | | 4.25 | | 647,393 | | 699,998 | | |
| 115,000 | | SOUTH CAROLINA ST EDU ASSISTANCE AUTH | | 10/1/2029 | | 5.10 | | 114,197 | | 115,039 | | |
| 1,250,000 | | SOUTH CAROLINA ST HSG FIN & DEV AUTH MTGE REVENUE | | 7/1/2045 | | 3.05 | | 1,250,000 | | 1,330,162 | | |
| 665,000 | | SOUTH CAROLINA ST JOBS-ECON DEV AUTH ECON DEV REVENUE | | 4/1/2054 | | 4.00 | | 688,385 | | 681,878 | | |
| 1,250,000 | | SOUTH CAROLINA ST JOBS-ECON DEV AUTH HOSP FACS REVENUE | | 12/1/2044 | | 4.00 | | 1,297,685 | | 1,449,825 | | |
| 1,000,000 | | SOUTH CAROLINA ST PUBLIC SVC AUTH REVENUE | | 12/1/2038 | | 5.00 | | 1,029,993 | | 1,132,640 | | |
| 1,400,000 | | SOUTH CAROLINA ST PUBLIC SVC AUTH REVENUE | | 12/1/2043 | | 5.75 | | 1,431,915 | | 1,623,216 | | |
| | | | | | | 6,459,568 | | 7,032,758 | | 1.14% |
| See accompanying notes to financial statements. | 66 | (Continued) |
CLEARWATER INVESTMENT TRUST
Schedule of Investments - Clearwater Tax-Exempt Bond Fund
December 31, 2020
| Par/Shares | | Security | | Maturity
date | | Coupon
rate | | Cost | | Fair value (a) | | Percent of
net assets |
| South Dakota | | | | | | | | | | |
| 500,000 | | SOUTH DAKOTA ST HLTH & EDUCTNL FACS AUTH | | 9/1/2032 | | 5.00 | | $ 499,500 | | 501,095 | | |
| | | | | | | 499,500 | | 501,095 | | 0.08% |
| Tennessee | | | | | | | | | | |
| 1,000,000 | | FRANKLIN TN HLTH & EDUCTNL FACS BRD REVENUE(b)(c)(f) | | 6/1/2027 | | 6.50 | | 1,000,000 | | 300,000 | | |
| 600,000 | | NASHVILLE MET DEV & HSG AGY TN TAX INCR REVENUE(b) | | 6/1/2036 | | 5.13 | | 600,000 | | 646,926 | | |
| 1,350,000 | | SHELBY CNTY TN HLTH EDUCTNL & HSG FACS BRD RETMNT FACS REVENUE | | 10/1/2039 | | 5.50 | | 1,342,090 | | 1,369,507 | | |
| 150,000 | | SHELBY CNTY TN HLTH EDUCTNL & HSG FACS BRD REVENUE(c) | | 1/1/2019 | | 5.35 | | 134,965 | | 375 | | |
| 625,000 | | SHELBY CNTY TN HLTH EDUCTNL & HSG FACS BRD REVENUE(c) | | 1/1/2029 | | 5.55 | | 556,862 | | 1,562 | | |
| 130,000 | | SHELBY CNTY TN HLTH EDUCTNL & HSG FACS BRD REVENUE(c) | | 1/1/2029 | | 6.00 | | - | | 1 | | |
| 635,000 | | TENNESSEE HSG DEV AGY RSDL FING PROGRAM REVENUE | | 1/1/2031 | | 3.60 | | 638,160 | | 660,470 | | |
| 960,000 | | TENNESSEE HSG DEV AGY RSDL FING PROGRAM REVENUE | | 7/1/2042 | | 3.85 | | 960,000 | | 1,057,824 | | |
| 900,000 | | TENNESSEE HSG DEV AGY RSDL FING PROGRAM REVENUE | | 7/1/2042 | | 3.90 | | 900,000 | | 994,419 | | |
| 2,000,000 | | TENNESSEE HSG DEV AGY RSDL FING PROGRAM REVENUE | | 7/1/2044 | | 4.00 | | 2,012,806 | | 2,250,400 | | |
| 970,000 | | TENNESSEE HSG DEV AGY RSDL FING PROGRAM REVENUE | | 1/1/2049 | | 3.95 | | 970,000 | | 1,048,551 | | |
| 1,905,000 | | TENNESSEE HSG DEV AGY RSDL FING PROGRAM REVENUE | | 1/1/2049 | | 4.05 | | 1,905,000 | | 2,114,379 | | |
| 475,000 | | TENNESSEE ST HSG DEV AGY | | 1/1/2035 | | 3.85 | | 475,000 | | 508,958 | | |
| | | | | | | 11,494,883 | | 10,953,372 | | 1.78% |
| Texas | | | | | | | | | | |
| 500,000 | | ARLINGTON TX HGR EDU FIN CORP EDU REVENUE | | 6/15/2036 | | 5.00 | | 501,384 | | 503,900 | | |
| 650,000 | | ARLINGTON TX SPL TAX REVENUE | | 2/15/2041 | | 5.00 | | 687,082 | | 734,747 | | |
| 815,000 | | BEXAR CNTY TX HSG FIN CORP(h) | | 2/1/2035 | | 3.75 | | 815,000 | | 847,518 | | |
| 2,000,000 | | BEXAR CNTY TX REVENUE | | 8/15/2039 | | 5.00 | | 2,033,303 | | 2,110,760 | | |
| 675,000 | | BRAZORIA CNTY TX MUNI UTILITYDIST #28 | | 9/1/2032 | | 4.00 | | 687,102 | | 684,774 | | |
| 1,000,000 | | BRAZOS TX HGR EDU AUTH STUDENT LOAN PROGRAM REVENUE | | 4/1/2040 | | 3.00 | | 1,004,003 | | 989,180 | | |
| 1,000,000 | | CENTRL TX REGL MOBILITY AUTH REVENUE | | 1/1/2045 | | 4.00 | | 1,095,815 | | 1,139,080 | | |
| 625,000 | | CLIFTON TX HGR EDU FIN CORP EDU REVENUE | | 12/1/2035 | | 5.00 | | 646,921 | | 687,944 | | |
| 1,000,000 | | DALLAS-FORT WORTH TX INTERNATIONAL ARPT REVENUE | | 11/1/2037 | | 5.25 | | 1,004,167 | | 1,119,260 | | |
| 1,350,000 | | DANBURY TX HGR EDU AUTH INC EDU REVENUE | | 8/15/2049 | | 5.13 | | 1,394,409 | | 1,399,761 | | |
| 1,500,000 | | EL PASO CNTY TX HOSP DIST | | 8/15/2043 | | 5.00 | | 1,575,104 | | 1,567,965 | | |
| 1,000,000 | | EL PASO TX DOWNTOWN DEV CORP SPL REVENUE | | 8/15/2038 | | 7.25 | | 1,031,123 | | 1,172,990 | | |
| 1,000,000 | | FORT BEND CNTY TX MUNI UTILITY DIST #23 | | 9/1/2033 | | 4.00 | | 1,017,796 | | 1,013,740 | | |
| 610,000 | | FORT BEND CNTY TX MUNI UTILITY DIST #50 | | 9/1/2029 | | 4.00 | | 620,856 | | 621,072 | | |
| 800,000 | | GILMER TX ECON DEV CORP SALES TAX REVENUE | | 7/15/2030 | | 5.00 | | 816,151 | | 817,528 | | |
| 1,500,000 | | GRAND PARKWAY TRANSPRTN CORP TX SYS TOLL REVENUE (Step to 5.50% on 10/1/2023)(d) | | 10/1/2035 | | 0.00 | | 1,290,711 | | 1,765,125 | | |
| 560,000 | | HARRIS CNTY TX MUNI UTILITY DIST #400 | | 9/1/2033 | | 4.00 | | 569,969 | | 567,694 | | |
| 1,000,000 | | HIDALGO CNTY TX REGL MOBILITY AUTH VEHICLE REGISTRATION FEE | | 12/1/2038 | | 5.25 | | 1,012,369 | | 1,143,400 | | |
| 1,500,000 | | HOUSTON TX HGR EDU FIN CORP | | 9/1/2038 | | 5.50 | | 1,511,799 | | 1,630,020 | | |
| 750,000 | | LEWISVILLE TX COMB CONTRACT REVENUE | | 9/1/2024 | | 3.00 | | 746,133 | | 776,992 | | |
| 1,000,000 | | MEADOWHILL TX REGL MUNI UTILITY DIST | | 10/1/2034 | | 4.00 | | 1,044,765 | | 1,047,840 | | |
| See accompanying notes to financial statements. | 67 | (Continued) |
CLEARWATER INVESTMENT TRUST
Schedule of Investments - Clearwater Tax-Exempt Bond Fund
December 31, 2020
| Par/Shares | | Security | | Maturity
date | | Coupon
rate | | Cost | | Fair value (a) | | Percent of
net assets |
| Texas (Cont'd): | | | | | | | | | | |
| 273,000 | | N CENTRL TEXAS ST HLTH FAC DEV CORP | | 2/15/2025 | | 5.38 | | $ 273,000 | | 219,457 | | |
| 1,000,000 | | N TX TOLLWAY AUTH REVENUE | | 1/1/2042 | | 6.20 | | 998,961 | | 1,188,580 | | |
| 1,000,000 | | NEW HOPE CULTURAL ED FACS FIN CORP TX RETIREMENT FAC REVENUE | | 10/1/2034 | | 5.00 | | 1,005,718 | | 1,060,470 | | |
| 750,000 | | NEW HOPE CULTURAL ED FACS FIN CORP TX RETIREMENT FAC REVENUE | | 1/1/2035 | | 5.50 | | 758,554 | | 789,682 | | |
| 500,000 | | NEW HOPE CULTURAL ED FACS FIN CORP TX RETIREMENT FAC REVENUE | | 10/1/2049 | | 5.25 | | 507,392 | | 523,245 | | |
| 1,100,000 | | NEW HOPE CULTURAL ED FACS FIN CORP TX RETIREMENT FAC REVENUE | | 1/1/2055 | | 5.00 | | 1,146,399 | | 1,128,391 | | |
| 750,000 | | NEW HOPE CULTURAL EDU FACS FIN CORP TX EDU REVENUE(b) | | 8/15/2036 | | 5.00 | | 751,219 | | 757,718 | | |
| 1,000,000 | | NEW HOPE CULTURAL EDU FACS FIN CORP TX EDU REVENUE | | 8/15/2036 | | 5.50 | | 1,001,013 | | 1,015,720 | | |
| 670,000 | | NEW HOPE CULTURAL EDU FACS FIN CORP TX EDU REVENUE(b) | | 8/15/2049 | | 5.00 | | 692,380 | | 698,207 | | |
| 1,000,000 | | NEW HOPE CULTURAL EDU FACS FIN CORP TX RETMNT CMNTY REVENUE(b) | | 12/1/2025 | | 10.00 | | 1,000,000 | | 1,004,710 | | |
| 645,000 | | NEW HOPE CULTURAL EDU FACS FIN CORP TX SENIOR LIVING REVENUE | | 7/1/2025 | | 4.00 | | 631,986 | | 589,653 | | |
| 1,100,000 | | NEW HOPE CULTURAL EDU FACS FIN CORP TX STUDENT HSG REVENUE | | 4/1/2046 | | 5.00 | | 1,125,755 | | 1,185,074 | | |
| 750,000 | | RED RIVER TX HLTH FACS DEV CORP RETIREMENT FAC REVENUE | | 11/15/2034 | | 7.50 | | 746,722 | | 819,427 | | |
| 1,000,000 | | SUGAR LAND TX DEV CORP SALES TAX REVENUE | | 2/15/2033 | | 5.00 | | 1,033,514 | | 1,094,370 | | |
| 1,000,000 | | TARRANT CNTY TX CULTURAL EDU FACS FIN CORP HOSP REVENUE | | 11/15/2038 | | 5.00 | | 1,030,379 | | 1,091,740 | | |
| 1,000,000 | | TARRANT CNTY TX CULTURAL EDU FACS FIN CORP RETMNT FAC REVENUE(c) | | 11/15/2022 | | 5.50 | | 1,000,000 | | 600,000 | | |
| 570,000 | | TARRANT CNTY TX CULTURAL EDU FACS FIN CORP RETMNT FAC REVENUE | | 11/15/2024 | | 5.63 | | 570,000 | | 570,958 | | |
| 950,000 | | TEXAS ST AFFORDABLE HSG CORP SF MTGE REVENUE | | 3/1/2050 | | 4.00 | | 971,230 | | 1,061,321 | | |
| 2,000,000 | | TEXAS ST DEPT OF HSG & CMNTY AFFAIRS | | 9/1/2044 | | 3.63 | | 2,042,306 | | 2,194,420 | | |
| 1,000,000 | | TEXAS ST DEPT OF HSG & CMNTY AFFAIRS | | 9/1/2048 | | 4.25 | | 1,016,239 | | 1,107,940 | | |
| | | | | | | 39,408,729 | | 41,042,373 | | 6.65% |
| Utah | | | | | | | | | | |
| 75,000 | | UTAH ST HSG CORP SF MTGE REVENUE | | 1/1/2033 | | 5.75 | | 75,000 | | 75,163 | | |
| 1,500,000 | | WEST VLY CITY UT MUNI BLDG AUTH LEASE REVENUE | | 2/1/2039 | | 5.00 | | 1,622,239 | | 1,815,060 | | |
| | | | | | | 1,697,239 | | 1,890,223 | | 0.31% |
| Vermont | | | | | | | | | | |
| 680,000 | | VERMONT ST HSG FIN AGY | | 5/1/2032 | | 4.88 | | 677,594 | | 729,144 | | |
| 915,000 | | VERMONT ST STUDENT ASSISTANCE CORP EDU LOAN REVENUE | | 6/15/2036 | | 3.38 | | 906,826 | | 952,762 | | |
| | | | | | | 1,584,420 | | 1,681,906 | | 0.27% |
| Virginia | | | | | | | | | | |
| 500,000 | | FAIRFAX CNTY VA REDEV & HSG AUTH MF REVENUE | | 8/1/2039 | | 5.60 | | 500,000 | | 501,375 | | |
| 462,000 | | MARQUIS VA CMNTY DEV AUTH REVENUE(g) | | 9/1/2041 | | 0.00 | | 161,175 | | 23,738 | | |
| 349,000 | | MARQUIS VA CMNTY DEV AUTH REVENUE | | 9/1/2041 | | 5.63 | | 373,598 | | 177,986 | | |
| 1,000,000 | | VIRGINIA ST HSG DEV AUTH | | 7/1/2033 | | 4.13 | | 1,000,000 | | 1,049,840 | | |
| 1,000,000 | | VIRGINIA ST HSG DEV AUTH | | 9/1/2050 | | 2.50 | | 1,000,000 | | 1,018,110 | | |
| 2,005,000 | | VIRGINIA ST HSG DEV AUTH CMWLTH MTGE | | 1/1/2038 | | 3.88 | | 1,995,250 | | 2,083,115 | | |
| | | | | | | 5,030,023 | | 4,854,164 | | 0.79% |
| Washington | | | | | | | | | | |
| 700,000 | | KALISPEL TRIBE OF INDIANS PRIORITY DIST WA REVENUE(b) | | 1/1/2038 | | 5.25 | | 686,852 | | 792,036 | | |
| See accompanying notes to financial statements. | 68 | (Continued) |
CLEARWATER INVESTMENT TRUST
Schedule of Investments - Clearwater Tax-Exempt Bond Fund
December 31, 2020
| Par/Shares | | Security | | Maturity
date | | Coupon
rate | | Cost | | Fair value (a) | | Percent of
net assets |
| Washington (Cont'd): | | | | | | | | | | |
| 445,000 | | KING CNTY WA HSG AUTH | | 5/1/2028 | | 5.20 | | $ 445,000 | | 450,923 | | |
| 1,500,000 | | KING CNTY WA HSG AUTH | | 11/1/2039 | | 3.00 | | 1,468,211 | | 1,608,015 | | |
| 1,000,000 | | KING CNTY WA HSG AUTH | | 8/1/2040 | | 3.00 | | 1,039,763 | | 1,086,090 | | |
| 1,000,000 | | PIKE PLACE MARKET WA PRESERVATION & DEV AUTH SPL OBLG | | 12/1/2040 | | 5.00 | | 1,042,401 | | 1,088,370 | | |
| 770,000 | | SEATTLE WA HSG AUTH POOLED HSG REVENUE | | 9/15/2033 | | 5.75 | | 775,726 | | 884,099 | | |
| 500,000 | | SNOHOMISH CNTY WA HSG AUTH | | 4/1/2044 | | 4.00 | | 507,727 | | 558,735 | | |
| 1,000,000 | | VANCOUVER WA HSG AUTH | | 8/1/2034 | | 3.75 | | 984,289 | | 1,105,160 | | |
| 1,500,000 | | VANCOUVER WA HSG AUTH | | 6/1/2038 | | 3.00 | | 1,495,944 | | 1,580,730 | | |
| 1,500,000 | | VANCOUVER WA HSG AUTH | | 12/1/2051 | | 3.30 | | 1,500,000 | | 1,603,440 | | |
| 530,000 | | WASHINGTON ST HSG FIN COMMISSION(b) | | 7/1/2025 | | 6.00 | | 532,049 | | 575,882 | | |
| 1,000,000 | | WASHINGTON ST HSG FIN COMMISSION(b) | | 1/1/2031 | | 5.00 | | 1,001,248 | | 1,083,740 | | |
| 750,000 | | WASHINGTON ST HSG FIN COMMISSION(b) | | 7/1/2031 | | 5.00 | | 787,065 | | 808,432 | | |
| 675,000 | | WASHINGTON ST HSG FIN COMMISSION(b) | | 1/1/2035 | | 5.75 | | 675,000 | | 709,263 | | |
| 600,000 | | WASHINGTON ST HSG FIN COMMISSION(b) | | 7/1/2036 | | 5.00 | | 626,928 | | 625,698 | | |
| 500,000 | | WASHINGTON ST HSG FIN COMMISSION(b) | | 1/1/2038 | | 5.00 | | 536,073 | | 552,420 | | |
| 1,000,000 | | WASHINGTON ST HSG FIN COMMISSION(b) | | 1/1/2044 | | 5.00 | | 1,081,303 | | 1,081,780 | | |
| 1,000,000 | | WASHINGTON ST HSG FIN COMMISSION(b) | | 7/1/2048 | | 5.00 | | 1,087,885 | | 1,025,090 | | |
| | | | | | | 16,273,464 | | 17,219,903 | | 2.79% |
| West Virginia | | | | | | | | | | |
| 1,500,000 | | WEST VIRGINIA ST HSG DEV FUND | | 11/1/2032 | | 3.75 | | 1,500,000 | | 1,620,255 | | |
| | | | | | | 1,500,000 | | 1,620,255 | | 0.26% |
| Wisconsin | | | | | | | | | | |
| 1,500,000 | | PUBLIC FIN AUTH WI CCRC REVENUE(b) | | 6/1/2046 | | 8.25 | | 1,532,273 | | 1,558,290 | | |
| 16,520 | | PUBLIC FIN AUTH WI CONFERENCE CENTER & HOTEL REVENUE(b)(f)(g) | | 1/1/2046 | | 0.00 | | 1,267 | | 453 | | |
| 18,299 | | PUBLIC FIN AUTH WI CONFERENCE CENTER & HOTEL REVENUE(b)(f)(g) | | 1/1/2047 | | 0.00 | | 1,360 | | 482 | | |
| 17,930 | | PUBLIC FIN AUTH WI CONFERENCE CENTER & HOTEL REVENUE(b)(f)(g) | | 1/1/2048 | | 0.00 | | 1,299 | | 466 | | |
| 17,786 | | PUBLIC FIN AUTH WI CONFERENCE CENTER & HOTEL REVENUE(b)(f)(g) | | 1/1/2049 | | 0.00 | | 1,257 | | 452 | | |
| 17,496 | | PUBLIC FIN AUTH WI CONFERENCE CENTER & HOTEL REVENUE(b)(f)(g) | | 1/1/2050 | | 0.00 | | 1,207 | | 427 | | |
| 18,980 | | PUBLIC FIN AUTH WI CONFERENCE CENTER & HOTEL REVENUE(b)(f)(g) | | 1/1/2051 | | 0.00 | | 1,279 | | 454 | | |
| 446,246 | | PUBLIC FIN AUTH WI CONFERENCE CENTER & HOTEL REVENUE(b)(e)(f)(i) | | 7/1/2051 | | 3.75 | | 443,916 | | 293,768 | | |
| 19,357 | | PUBLIC FIN AUTH WI CONFERENCE CENTER & HOTEL REVENUE(b)(f)(g) | | 1/1/2052 | | 0.00 | | 1,271 | | 445 | | |
| 19,095 | | PUBLIC FIN AUTH WI CONFERENCE CENTER & HOTEL REVENUE(b)(f)(g) | | 1/1/2053 | | 0.00 | | 1,225 | | 431 | | |
| 18,909 | | PUBLIC FIN AUTH WI CONFERENCE CENTER & HOTEL REVENUE(b)(f)(g) | | 1/1/2054 | | 0.00 | | 1,187 | | 415 | | |
| 18,634 | | PUBLIC FIN AUTH WI CONFERENCE CENTER & HOTEL REVENUE(b)(f)(g) | | 1/1/2055 | | 0.00 | | 1,144 | | 400 | | |
| 18,360 | | PUBLIC FIN AUTH WI CONFERENCE CENTER & HOTEL REVENUE(b)(f)(g) | | 1/1/2056 | | 0.00 | | 1,103 | | 387 | | |
| 100,837 | | PUBLIC FIN AUTH WI CONFERENCE CENTER & HOTEL REVENUE(b)(c)(f) | | 7/1/2056 | | 5.50 | | 100,665 | | 75,483 | | |
| 18,454 | | PUBLIC FIN AUTH WI CONFERENCE CENTER & HOTEL REVENUE(b)(f)(g) | | 1/1/2057 | | 0.00 | | 1,872 | | 378 | | |
| 18,165 | | PUBLIC FIN AUTH WI CONFERENCE CENTER & HOTEL REVENUE(b)(f)(g) | | 1/1/2058 | | 0.00 | | 1,040 | | 363 | | |
| 17,992 | | PUBLIC FIN AUTH WI CONFERENCE CENTER & HOTEL REVENUE(b)(f)(g) | | 1/1/2059 | | 0.00 | | 1,010 | | 353 | | |
| 17,834 | | PUBLIC FIN AUTH WI CONFERENCE CENTER & HOTEL REVENUE(b)(f)(g) | | 1/1/2060 | | 0.00 | | 982 | | 338 | | |
| 17,573 | | PUBLIC FIN AUTH WI CONFERENCE CENTER & HOTEL REVENUE(b)(f)(g) | | 1/1/2061 | | 0.00 | | 950 | | 324 | | |
| See accompanying notes to financial statements. | 69 | (Continued) |
CLEARWATER INVESTMENT TRUST
Schedule of Investments - Clearwater Tax-Exempt Bond Fund
December 31, 2020
| Par/Shares | | Security | | Maturity
date | | Coupon
rate | | Cost | | Fair value (a) | | Percent of
net assets |
| Wisconsin (Cont'd): | | | | | | | | | | |
| 17,400 | | PUBLIC FIN AUTH WI CONFERENCE CENTER & HOTEL REVENUE(b)(f)(g) | | 1/1/2062 | | 0.00 | | $ 923 | | 313 | | |
| 17,125 | | PUBLIC FIN AUTH WI CONFERENCE CENTER & HOTEL REVENUE(b)(f)(g) | | 1/1/2063 | | 0.00 | | 892 | | 301 | | |
| 16,967 | | PUBLIC FIN AUTH WI CONFERENCE CENTER & HOTEL REVENUE(b)(f)(g) | | 1/1/2064 | | 0.00 | | 869 | | 293 | | |
| 16,823 | | PUBLIC FIN AUTH WI CONFERENCE CENTER & HOTEL REVENUE(b)(f)(g) | | 1/1/2065 | | 0.00 | | 847 | | 280 | | |
| 16,731 | | PUBLIC FIN AUTH WI CONFERENCE CENTER & HOTEL REVENUE(b)(f)(g) | | 1/1/2066 | | 0.00 | | 827 | | 265 | | |
| 215,987 | | PUBLIC FIN AUTH WI CONFERENCE CENTER & HOTEL REVENUE(b)(f)(g) | | 1/1/2067 | | 0.00 | | 9,980 | | 3,180 | | |
| 520,000 | | PUBLIC FIN AUTH WI EDU REVENUE(b) | | 6/15/2049 | | 5.00 | | 526,158 | | 546,239 | | |
| 445,000 | | PUBLIC FIN AUTH WI REVENUE | | 4/1/2025 | | 5.00 | | 446,684 | | 474,361 | | |
| 1,250,000 | | PUBLIC FIN AUTH WI REVENUE(b) | | 11/1/2028 | | 6.25 | | 1,250,000 | | 1,346,862 | | |
| 600,000 | | PUBLIC FIN AUTH WI REVENUE | | 4/1/2032 | | 5.50 | | 600,000 | | 624,798 | | |
| 1,000,000 | | PUBLIC FIN AUTH WI REVENUE(b) | | 1/1/2033 | | 6.13 | | 989,462 | | 870,990 | | |
| 341,000 | | PUBLIC FIN AUTH WI REVENUE(g) | | 10/1/2042 | | 0.00 | | 374,357 | | 53,529 | | |
| 515,000 | | PUBLIC FIN AUTH WI REVENUE | | 10/1/2042 | | 7.00 | | 524,026 | | 515,340 | | |
| 13,694 | | PUBLIC FIN AUTH WI REVENUE(b)(c)(f) | | 12/1/2048 | | 5.50 | | 13,694 | | 6,847 | | |
| 905,000 | | PUBLIC FIN AUTH WI SENIOR LIVING REVENUE(b) | | 11/15/2024 | | 5.00 | | 903,402 | | 942,015 | | |
| 500,000 | | WISCONSIN ST HLTH & EDUCTNL FACS AUTH REVENUE | | 8/1/2032 | | 5.00 | | 538,368 | | 534,185 | | |
| 1,300,000 | | WISCONSIN ST HLTH & EDUCTNL FACS AUTH REVENUE | | 8/15/2032 | | 5.00 | | 1,369,393 | | 1,486,758 | | |
| 700,000 | | WISCONSIN ST HLTH & EDUCTNL FACS AUTH REVENUE | | 6/1/2037 | | 5.00 | | 730,878 | | 753,627 | | |
| 500,000 | | WISCONSIN ST HLTH & EDUCTNL FACS AUTH REVENUE | | 9/15/2040 | | 5.00 | | 510,878 | | 523,165 | | |
| 1,840,000 | | WISCONSIN ST HLTH & EDUCTNL FACS AUTH REVENUE | | 8/15/2043 | | 5.00 | | 1,878,486 | | 1,953,767 | | |
| 1,400,000 | | WISCONSIN ST HLTH & EDUCTNL FACS AUTH REVENUE | | 9/15/2045 | | 5.00 | | 1,428,658 | | 1,458,968 | | |
| 650,000 | | WISCONSIN ST HLTH & EDUCTNL FACS AUTH REVENUE | | 11/1/2046 | | 5.00 | | 673,088 | | 684,047 | | |
| 1,500,000 | | WISCONSIN ST HLTH & EDUCTNL FACS AUTH REVENUE | | 10/1/2048 | | 5.13 | | 1,472,754 | | 1,564,200 | | |
| 500,000 | | WISCONSIN ST HSG & ECON DEV AUTH | | 11/1/2035 | | 3.88 | | 500,000 | | 540,705 | | |
| 1,000,000 | | WISCONSIN ST HSG & ECON DEV AUTH | | 11/1/2040 | | 4.00 | | 1,000,000 | | 1,080,840 | | |
| 1,000,000 | | WISCONSIN ST HSG & ECON DEV AUTH | | 11/1/2042 | | 3.90 | | 1,003,526 | | 1,096,900 | | |
| 1,500,000 | | WISCONSIN ST HSG & ECON DEV AUTH | | 5/1/2055 | | 4.15 | | 1,500,000 | | 1,636,005 | | |
| | | | | | | 20,344,457 | | 20,632,889 | | 3.35% |
| Wyoming | | | | | | | | | | |
| 335,000 | | WYOMING ST CMNTY DEV AUTH HSG REVENUE | | 12/1/2038 | | 3.90 | | 335,000 | | 355,874 | | |
| 1,615,000 | | WYOMING ST CMNTY DEV AUTH HSG REVENUE | | 12/1/2038 | | 4.05 | | 1,615,000 | | 1,671,153 | | |
| | | | | | | 1,950,000 | | 2,027,027 | | 0.33% |
| | | Sub-total Municipal Bonds: | | | | 532,612,460 | | 559,324,257 | | 90.68% |
| Short-Term Investments: | | | | | | | | | | |
| 14,385,751 | | NORTHERN INSTITUTIONAL FUNDS - U.S. GOVERNMENT SELECT PORTFOLIO, 0.02%(j) | | 14,385,751 | | 14,385,751 | | |
| | | Sub-total Short-Term Investments: | | | | | | 14,385,751 | | 14,385,751 | | 2.33% |
| | | Grand total | | | | | | $ 580,742,803 | | 610,664,220 | | 99.00% |
| Notes to Schedule of Investments: |
| (a) | Investments are valued in accordance with procedures described in Note 2 to the financial statements. |
| (b) | Securities exempt from registration under Rule 144A of the Securities Act of 1933. These securities may be resold in transactions exempt from registration, normally to qualified institutional buyers. The value of these securities is determined by valuations supplied by a pricing service or brokers, or, if not available, in accordance with procedures established by the Board of Trustees. |
| (c) | Non-income producing assets. For long-term debt securities, item identified is in default as to payment of interest and/or principal. |
| (d) | For step bonds, the coupon rate disclosed is the current rate in effect. |
| (e) | Variable rate security. Rate as of December 31, 2020 is disclosed. |
| See accompanying notes to financial statements. | 70 | (Continued) |
CLEARWATER INVESTMENT TRUST
Schedule of Investments - Clearwater Tax-Exempt Bond Fund
December 31, 2020
| (f) | Restricted security that has been deemed illiquid. At December 31, 2020, the value of these restricted illiquid securities amounted to $4,339,824 or 0.70% of net assets. Additional information on these restricted illiquid securities is as follows: |
| SECURITY | AQUISITION DATE | ACQUISITION COST |
| CAPITAL TRUST AGY FL REVENUE, 6.75%, 12/1/35 | 12/2/15-1/21/16 | $1,748,875 |
| CAPITAL TRUST AGY FL REVENUE, 6.75%, 7/1/37 | 6/28/17 | 750,000 |
| COLLIER CNTY FLA INDL DEV AUTH CONTINUING CARE CMNTY REVENUE, 7.25%, 5/15/26 | 12/16/13 | 750,000 |
| COLLIER CNTY FLA INDL DEV AUTH CONTINUING CARE CMNTY REVENUE, 8.13%, 5/15/44 | 6/27/17-4/12/18 | 1,961,290 |
| FRANKLIN TN HLTH & EDUCTNL FACS BRD REVENUE, 6.50%, 6/1/27 | 5/24/17 | 1,000,000 |
| KANSAS CITY MO INDL DEV AUTH SENIOR LIVING FACS REVENUE, 5.75%, 11/15/36 | 12/18/15 | 1,300,000 |
| LAKE CNTY OH PORT & ECON DEV AUTH LEASE REVENUE, 6.50%, 12/1/37 | 10/27/17 | 750,000 |
| PUBLIC FIN AUTH WI CONFERENCE CENTER & HOTEL REVENUE, 5.50%, 1/1/46-1/1/67 | 3/26/18-8/26/20 | 49-443,916 |
| PUBLIC FIN AUTH WI REVENUE, 5.50%, 12/1/48 | 3/26/19 | 13,694 |
| (g) | Zero coupon bond. |
| (h) | Security has converted to a fixed rate as of February 1, 2015, and will be going forward. |
| (i) | These securities are remarketed by an agent and the rate at which these securities are set is determined by general market conditions and supply and demand. |
| (j) | The short-term investment is a money market portfolio of the investment company, Northern Institutional Funds. At December 31, 2019, the value of the Clearwater Tax-Exempt Bond Fund's investment in the U.S. Government Select Portfolio of the Northern Institutional Funds was $22,581,520 with net sales of $8,195,769 during the fiscal year ended December 31, 2020. |
Diversification of investments representing geographic diversification, as a percentage of total investments at fair value (excluding closed-end funds), is as follows:
| Geographical Diversification | | Percent |
| Florida | | 13.18% |
| Illinois | | 8.29 |
| California | | 7.91 |
| Texas | | 7.15 |
| New York | | 6.19 |
| Colorado | | 5.41 |
| Wisconsin | | 3.60 |
| Georgia | | 3.57 |
| Michigan | | 3.39 |
| Arizona | | 3.23 |
| Other | | 38.08 |
| | | 100.00% |
| | | |
| See accompanying notes to financial statements. | 71 | (Continued) |
CLEARWATER INVESTMENT TRUST
Schedule of Investments - Clearwater Tax-Exempt Bond Fund
December 31, 2020
Clearwater Tax-Exempt Bond Fund Portfolio Diversification
(as a percentage of net assets)
| See accompanying notes to financial statements. | 72 | (Continued) |
CLEARWATER INVESTMENT TRUST
Schedule of Investments - Clearwater International Fund
December 31, 2020
| Shares | | Security | | Cost | | Fair value (a) | | Percent of
net assets |
| Common Stocks: | | | | | | |
| Argentina: | | | | | | |
| 6,791 | | GLOBANT S.A.(b) | | $ 656,623 | | 1,477,790 | | |
| 6,860 | | MERCADOLIBRE, INC.(b) | | 4,372,901 | | 11,492,009 | | |
| | | | | 5,029,524 | | 12,969,799 | | 1.50% |
| Australia: | | | | | | |
| 275,180 | | ADAIRS LTD. | | 331,893 | | 700,095 | | |
| 102,780 | | ALLIANCE AVIATION SERVICES LTD.(b) | | 167,434 | | 304,275 | | |
| 89,441 | | APA GROUP | | 554,557 | | 665,411 | | |
| 72,400 | | APPEN LTD. | | 1,177,023 | | 1,378,116 | | |
| 5,412 | | ARISTOCRAT LEISURE LTD. | | 111,219 | | 129,344 | | |
| 2,792 | | ASX LTD. | | 61,614 | | 154,980 | | |
| 19,807 | | AUSTRALIA & NEW ZEALAND BANKING GROUP LTD. | | 188,757 | | 346,634 | | |
| 195,700 | | AVENTUS GROUP | | 351,688 | | 413,397 | | |
| 250,708 | | BEACH ENERGY LTD. | | 466,720 | | 348,876 | | |
| 179,910 | | BGP HOLDINGS PLC(b)(c) | | - | | - | | |
| 10,935 | | BHP GROUP LTD. | | 182,389 | | 357,699 | | |
| 37,600 | | BLUESCOPE STEEL LTD. | | 301,071 | | 506,705 | | |
| 17,400 | | BRAMBLES LTD. | | 64,294 | | 142,194 | | |
| 49,542 | | CEDAR WOODS PROPERTIES LTD. | | 234,956 | | 238,715 | | |
| 971 | | COCHLEAR LTD. | | 35,893 | | 141,484 | | |
| 19,339 | | COLES GROUP LTD. | | 154,507 | | 270,457 | | |
| 11,157 | | COMMONWEALTH BANK OF AUSTRALIA | | 235,177 | | 706,268 | | |
| 42,926 | | CSL LTD. | | 2,884,375 | | 9,371,503 | | |
| 14,184 | | DEXUS | | 62,970 | | 102,790 | | |
| 97,180 | | FORTESCUE METALS GROUP LTD. | | 212,026 | | 1,755,397 | | |
| 22,072 | | GOODMAN GROUP | | 76,819 | | 321,780 | | |
| 35,107 | | GPT GROUP (THE) | | 96,585 | | 121,796 | | |
| 46,448 | | INSURANCE AUSTRALIA GROUP LTD. | | 119,637 | | 168,303 | | |
| 10,015 | | LENDLEASE CORP. LTD. | | 61,130 | | 101,146 | | |
| 7,819 | | MACQUARIE GROUP LTD. | | 175,414 | | 834,766 | | |
| 25,670 | | MINERAL RESOURCES LTD. | | 246,214 | | 741,146 | | |
| 573,700 | | MOUNT GIBSON IRON LTD. | | 260,031 | | 406,911 | | |
| 365,120 | | NANOSONICS LTD.(b) | | 1,580,324 | | 2,260,359 | | |
| 44,772 | | NATIONAL AUSTRALIA BANK LTD. | | 551,214 | | 780,084 | | |
| 7,157 | | NEWCREST MINING LTD. | | 59,115 | | 142,246 | | |
| 172,543 | | NRW HOLDINGS LTD. | | 346,544 | | 388,424 | | |
| 299,682 | | NUIX LTD.(b) | | 1,193,135 | | 1,906,079 | | |
| 151,303 | | ORIGIN ENERGY LTD. | | 535,873 | | 555,240 | | |
| 256,036 | | QANTAS AIRWAYS LTD.(b) | | 746,678 | | 957,346 | | |
| 2,805 | | RAMSAY HEALTH CARE LTD. | | 60,296 | | 134,465 | | |
| 169,500 | | REGIS RESOURCES LTD. | | 501,445 | | 488,728 | | |
| 18,171 | | RIO TINTO LTD. | | 570,958 | | 1,594,637 | | |
| 321,800 | | RURAL FUNDS GROUP | | 463,060 | | 640,077 | | |
| 173,937 | | SANTOS LTD. | | 509,938 | | 840,787 | | |
| 186,510 | | SCENTRE GROUP | | 296,462 | | 399,736 | | |
| 22,739 | | SEEK LTD. | | 233,310 | | 500,149 | | |
| 102,600 | | SMARTGROUP CORP. LTD. | | 452,529 | | 540,249 | | |
| 39,820 | | SONIC HEALTHCARE LTD. | | 470,951 | | 986,980 | | |
| 57,859 | | SOUTH32 LTD. | | 37,235 | | 110,178 | | |
| 33,184 | | STOCKLAND | | 95,300 | | 106,938 | | |
| 75,800 | | SUPER RETAIL GROUP LTD. | | 517,213 | | 615,352 | | |
| 11,916 | | SYDNEY AIRPORT(b) | | 40,965 | | 58,886 | | |
| 30,856 | | TABCORP HOLDINGS LTD. | | 79,836 | | 92,775 | | |
| 13,099 | | TRANSURBAN GROUP | | 36,728 | | 137,948 | | |
| 12,261 | | TREASURY WINE ESTATES LTD. | | 49,081 | | 88,855 | | |
| 1,320 | | WESFARMERS LTD. | | 31,901 | | 51,290 | | |
| 38,203 | | WESTPAC BANKING CORP. | | 452,674 | | 570,497 | | |
| 365,833 | | ZIP CO. LTD.(b)(d) | | 1,035,422 | | 1,491,986 | | |
| | | | | 19,762,580 | | 37,170,479 | | 4.28% |
| Austria: | | | | | | |
| 15,700 | | BAWAG GROUP A.G.(b)(e) | | 600,064 | | 728,836 | | |
| 1,821 | | ERSTE GROUP BANK A.G.(b) | | 28,050 | | 55,482 | | |
| 93 | | IMMOFINANZ A.G.(b) | | - | | 1,928 | | |
| 32,264 | | RAIFFEISEN BANK INTERNATIONAL A.G.(b) | | 563,262 | | 657,447 | | |
| 313 | | STRABAG S.E. (BEARER) | | 5,505 | | 10,879 | | |
| 57,900 | | TELEKOM AUSTRIA A.G. | | 422,512 | | 447,743 | | |
| 631 | | UBM DEVELOPMENT A.G. | | 28,973 | | 27,597 | | |
| See accompanying notes to financial statements. | 73 | (Continued) |
CLEARWATER INVESTMENT TRUST
Schedule of Investments - Clearwater International Fund
December 31, 2020
| Shares | | Security | | Cost | | Fair value (a) | | Percent of
net assets |
| Austria (Cont'd): | | | | | | |
| 21,794 | | VIENNA INSURANCE GROUP A.G. WIENER VERSICHERUNG GRUPPE | | $ 595,919 | | 553,793 | | |
| 23,500 | | WIENERBERGER A.G. | | 561,499 | | 748,725 | | |
| | | | | 2,805,784 | | 3,232,430 | | 0.37% |
| Belgium: | | | | | | |
| 7,478 | | AGEAS S.A./N.V. | | 117,910 | | 398,125 | | |
| 10,113 | | ANHEUSER-BUSCH INBEV S.A./N.V. | | 285,546 | | 704,333 | | |
| 19,000 | | BPOST S.A.(b) | | 195,697 | | 197,064 | | |
| 3,446 | | GALAPAGOS N.V.(b) | | 387,990 | | 338,805 | | |
| 42,970 | | GROUPE BRUXELLES LAMBERT S.A. | | 3,752,289 | | 4,331,830 | | |
| 4,347 | | KBC GROUP N.V.(b) | | 101,356 | | 304,186 | | |
| 21,394 | | ONTEX GROUP N.V.(b) | | 501,601 | | 287,496 | | |
| 9,969 | | TELENET GROUP HOLDING N.V. | | 411,318 | | 427,226 | | |
| 1,080 | | UCB S.A. | | 30,239 | | 111,462 | | |
| 1,502 | | UMICORE S.A. | | 44,422 | | 72,094 | | |
| 66,839 | | UNIFIEDPOST GROUP S.A.(b) | | 1,565,637 | | 2,041,347 | | |
| | | | | 7,394,005 | | 9,213,968 | | 1.06% |
| Brazil: | | | | | | |
| 129,000 | | CAMIL ALIMENTOS S.A. | | 274,164 | | 274,928 | | |
| 983,793 | | EMPREENDIMENTOS PAGUE MENOS S/A(b) | | 1,628,036 | | 1,708,408 | | |
| 261,600 | | GRUPO SBF S.A.(b) | | 1,440,655 | | 1,496,814 | | |
| 261,793 | | TELEFONICA BRASIL S.A. ADR(f) | | 3,275,608 | | 2,316,868 | | |
| | | | | 6,618,463 | | 5,797,018 | | 0.67% |
| Canada: | | | | | | |
| 2,027 | | AGNICO EAGLE MINES LTD. | | 57,973 | | 142,666 | | |
| 12,428 | | ALIMENTATION COUCHE-TARD, INC., CLASS B | | 223,779 | | 423,542 | | |
| 78,700 | | B2GOLD CORP. | | 426,606 | | 440,829 | | |
| 785 | | BANK OF MONTREAL | | 34,168 | | 59,684 | | |
| 2,936 | | BANK OF NOVA SCOTIA (THE) | | 67,574 | | 158,690 | | |
| 40,918 | | BARRICK GOLD CORP. | | 384,639 | | 932,219 | | |
| 27,148 | | BROOKFIELD ASSET MANAGEMENT, INC., CLASS A | | 174,133 | | 1,122,262 | | |
| 11,000 | | BRP, INC. (SUB VOTING) | | 430,510 | | 726,679 | | |
| 99,782 | | CAE, INC. | | 2,116,944 | | 2,764,798 | | |
| 14,528 | | CANADIAN IMPERIAL BANK OF COMMERCE | | 674,491 | | 1,240,855 | | |
| 15,994 | | CANADIAN NATIONAL RAILWAY CO. | | 292,557 | | 1,758,347 | | |
| 21,450 | | CANADIAN PACIFIC RAILWAY LTD. | | 2,829,484 | | 7,436,500 | | |
| 3,606 | | CANADIAN PACIFIC RAILWAY LTD. | | 112,878 | | 1,250,811 | | |
| 5,809 | | CANADIAN TIRE CORP. LTD., CLASS A | | 625,049 | | 763,626 | | |
| 10,300 | | CARGOJET, INC. | | 764,310 | | 1,738,353 | | |
| 35,300 | | CASCADES, INC. | | 347,472 | | 403,500 | | |
| 45,100 | | CENTERRA GOLD, INC. | | 366,388 | | 522,252 | | |
| 6,978 | | CGI, INC.(b) | | 55,128 | | 553,624 | | |
| 52,600 | | COMINAR REAL ESTATE INVESTMENT TRUST | | 431,053 | | 335,129 | | |
| 167 | | CONSTELLATION SOFTWARE, INC. | | 49,226 | | 216,857 | | |
| 112,500 | | CORUS ENTERTAINMENT, INC., CLASS B | | 343,872 | | 378,270 | | |
| 34,700 | | DESCARTES SYSTEMS GROUP (THE), INC.(b) | | 1,469,024 | | 2,029,551 | | |
| 20,569 | | DOCEBO, INC.(b) | | 1,215,537 | | 1,337,171 | | |
| 6,582 | | DOLLARAMA, INC. | | 86,132 | | 268,265 | | |
| 25,600 | | DOREL INDUSTRIES, INC., CLASS B(b) | | 175,448 | | 300,266 | | |
| 110,655 | | ECN CAPITAL CORP. | | 366,000 | | 562,446 | | |
| 4,440 | | ENBRIDGE, INC. | | 133,440 | | 142,000 | | |
| 72,100 | | ENERPLUS CORP. | | 414,689 | | 225,436 | | |
| 28,366 | | EQUINOX GOLD CORP.(b) | | 177,520 | | 293,487 | | |
| 211 | | FAIRFAX FINANCIAL HOLDINGS LTD. | | 52,589 | | 71,916 | | |
| 15,430 | | FIRSTSERVICE CORP. | | 1,564,619 | | 2,111,882 | | |
| 1,025 | | FORTIS, INC. | | 32,011 | | 41,873 | | |
| 2,389 | | FRANCO-NEVADA CORP. | | 109,265 | | 299,540 | | |
| 6,104 | | GILDAN ACTIVEWEAR, INC. | | 33,435 | | 170,666 | | |
| 208,410 | | HUSKY ENERGY, INC. | | 454,613 | | 1,031,490 | | |
| 19,500 | | IA FINANCIAL CORP., INC. | | 882,358 | | 845,322 | | |
| 131,986 | | IMPERIAL OIL LTD. | | 3,667,588 | | 2,505,131 | | |
| 415 | | INTACT FINANCIAL CORP. | | 33,776 | | 49,139 | | |
| 1,100 | | INTERNATIONAL PETROLEUM CORP.(b) | | 2,833 | | 2,437 | | |
| 9,377 | | KINAXIS, INC.(b) | | 589,323 | | 1,328,500 | | |
| 35,289 | | KINROSS GOLD CORP. | | 70,483 | | 258,936 | | |
| 2,064 | | LOBLAW COS. LTD. | | 70,779 | | 101,846 | | |
| See accompanying notes to financial statements. | 74 | (Continued) |
CLEARWATER INVESTMENT TRUST
Schedule of Investments - Clearwater International Fund
December 31, 2020
| Shares | | Security | | Cost | | Fair value (a) | | Percent of
net assets |
| Canada (Cont'd): | | | | | | |
| 16,050 | | LULULEMON ATHLETICA, INC.(b) | | $ 2,949,042 | | 5,585,881 | | |
| 9,753 | | MAGNA INTERNATIONAL, INC. | | 71,192 | | 690,426 | | |
| 3,590 | | MANULIFE FINANCIAL CORP. | | 39,610 | | 63,881 | | |
| 3,000 | | METRO, INC. | | 54,328 | | 133,868 | | |
| 19,328 | | NATIONAL BANK OF CANADA | | 618,005 | | 1,087,798 | | |
| 18,700 | | NFI GROUP, INC. | | 423,076 | | 353,903 | | |
| 6,762 | | NUTRIEN LTD. | | 114,296 | | 325,324 | | |
| 6,564 | | OPEN TEXT CORP. | | 72,477 | | 298,265 | | |
| 1,612 | | PARKLAND CORP. | | 43,114 | | 51,150 | | |
| 4,522 | | PEMBINA PIPELINE CORP. | | 33,296 | | 106,931 | | |
| 49,000 | | PIZZA PIZZA ROYALTY CORP. | | 343,236 | | 354,152 | | |
| 27,894 | | RIOCAN REAL ESTATE INVESTMENT TRUST | | 313,497 | | 367,055 | | |
| 2,701 | | RITCHIE BROS. AUCTIONEERS, INC. | | 50,064 | | 187,748 | | |
| 9,320 | | ROGERS COMMUNICATIONS, INC., CLASS B | | 220,803 | | 433,894 | | |
| 27,055 | | ROYAL BANK OF CANADA | | 908,896 | | 2,223,020 | | |
| 1,375 | | SHOPIFY, INC., CLASS A(b) | | 371,506 | | 1,552,608 | | |
| 5,100 | | SHOPIFY, INC., CLASS A (NEW YORK EXCHANGE)(b) | | 955,921 | | 5,772,945 | | |
| 12,101 | | SUN LIFE FINANCIAL, INC. | | 245,097 | | 538,076 | | |
| 139,563 | | SUNCOR ENERGY, INC. | | 2,930,123 | | 2,340,852 | | |
| 3,667 | | TC ENERGY CORP. | | 103,969 | | 149,083 | | |
| 31,989 | | TECK RESOURCES LTD., CLASS B | | 174,290 | | 580,522 | | |
| 9,096 | | TELUS CORP. | | 59,716 | | 180,148 | | |
| 10,700 | | TFI INTERNATIONAL, INC. | | 328,109 | | 550,845 | | |
| 8,040 | | THOMSON REUTERS CORP. | | 206,603 | | 658,031 | | |
| 310 | | TOPICUS.COM, INC.(b)(g) | | 1,161 | | 1,172 | | |
| 30,009 | | TORONTO-DOMINION BANK (THE) | | 557,653 | | 1,695,536 | | |
| 104 | | TRISURA GROUP LTD.(b) | | 490 | | 7,277 | | |
| 16,800 | | WAJAX CORP. | | 206,860 | | 225,557 | | |
| 26,600 | | WESTSHORE TERMINALS INVESTMENT CORP. | | 397,133 | | 325,787 | | |
| 6,930 | | WHEATON PRECIOUS METALS CORP. | | 114,647 | | 289,417 | | |
| 25,967 | | YAMANA GOLD, INC. | | 47,753 | | 148,307 | | |
| | | | | 35,365,659 | | 64,626,252 | | 7.45% |
| Chile: | | | | | | |
| 1,115,900 | | AGUAS ANDINAS S.A., CLASS A | | 339,399 | | 359,648 | | |
| 5,893,187 | | ENEL CHILE S.A. | | 532,931 | | 457,852 | | |
| 144,000 | | VINA CONCHA Y TORO S.A. | | 235,454 | | 250,039 | | |
| | | | | 1,107,784 | | 1,067,539 | | 0.12% |
| China: | | | | | | |
| 290,000 | | AGILE GROUP HOLDINGS LTD. | | 352,847 | | 386,046 | | |
| 53,000 | | AIRTAC INTERNATIONAL GROUP | | 728,716 | | 1,697,630 | | |
| 291,500 | | ASIA CEMENT CHINA HOLDINGS CORP. | | 362,392 | | 265,839 | | |
| 23,419 | | BAIDU, INC. ADR(b)(f) | | 2,479,644 | | 5,064,125 | | |
| 656,000 | | CHINA BLUECHEMICAL LTD., CLASS H | | 177,444 | | 104,081 | | |
| 408,000 | | CHINA MEDICAL SYSTEM HOLDINGS LTD. | | 472,941 | | 455,763 | | |
| 1,191,000 | | CHINA SUNTIEN GREEN ENERGY CORP. LTD., CLASS H | | 329,834 | | 365,637 | | |
| 67,500 | | HENGAN INTERNATIONAL GROUP CO. LTD. | | 472,174 | | 478,010 | | |
| 113,500 | | NETDRAGON WEBSOFT HOLDINGS LTD. | | 247,813 | | 254,452 | | |
| 16,000 | | SILERGY CORP. | | 513,608 | | 1,372,340 | | |
| 177,653 | | SINOSEAL HOLDING CO. LTD., CLASS A | | 1,142,232 | | 1,300,396 | | |
| 70,155 | | TENCENT HOLDINGS LTD. | | 625,552 | | 5,103,860 | | |
| 109,396 | | TRIP.COM GROUP LTD. ADR(b)(f) | | 3,108,824 | | 3,689,927 | | |
| 347,814 | | WUXI BIOLOGICS CAYMAN, INC.(b)(e) | | 3,516,349 | | 4,612,126 | | |
| 412,000 | | ZHEJIANG EXPRESSWAY CO. LTD., CLASS H | | 352,185 | | 348,096 | | |
| | | | | 14,882,555 | | 25,498,328 | | 2.94% |
| Czech Republic: | | | | | | |
| 88,400 | | MONETA MONEY BANK A.S.(b)(e) | | 268,732 | | 279,884 | | |
| 701 | | PHILIP MORRIS CR A.S. | | 402,294 | | 488,276 | | |
| | | | | 671,026 | | 768,160 | | 0.09% |
| Denmark: | | | | | | |
| 5,605 | | ALK-ABELLO A/S(b) | | 1,511,731 | | 2,299,997 | | |
| 44 | | AP MOLLER - MAERSK A/S, CLASS A | | 35,561 | | 91,360 | | |
| 65 | | AP MOLLER - MAERSK A/S, CLASS B | | 52,319 | | 145,045 | | |
| 1,537 | | CARLSBERG A.S., CLASS B | | 70,497 | | 246,025 | | |
| 1,178 | | CHR HANSEN HOLDING A/S(b) | | 71,480 | | 121,118 | | |
| 1,500 | | COLOPLAST A/S, CLASS B | | 27,666 | | 228,875 | | |
| 22,200 | | D/S NORDEN A/S | | 318,702 | | 399,370 | | |
| See accompanying notes to financial statements. | 75 | (Continued) |
CLEARWATER INVESTMENT TRUST
Schedule of Investments - Clearwater International Fund
December 31, 2020
| Shares | | Security | | Cost | | Fair value (a) | | Percent of
net assets |
| Denmark (Cont'd): | | | | | | |
| 6,700 | | DANSKE BANK A/S(b) | | $ 54,825 | | 110,688 | | |
| 4,348 | | DEMANT A/S(b) | | 81,241 | | 171,710 | | |
| 53,585 | | DSV PANALPINA A/S | | 5,133,001 | | 8,971,292 | | |
| 804 | | GENMAB A/S(b) | | 100,710 | | 325,036 | | |
| 6,944 | | ISS A/S(b) | | 96,080 | | 120,133 | | |
| 21,394 | | NOVO NORDISK A/S, CLASS B | | 252,539 | | 1,498,219 | | |
| 2,460 | | NOVOZYMES A/S, CLASS B | | 38,505 | | 141,122 | | |
| 864 | | ORSTED A/S(e) | | 68,168 | | 176,348 | | |
| 6,500 | | PANDORA A/S | | 182,141 | | 726,561 | | |
| 30,100 | | ROYAL UNIBREW A/S | | 2,123,264 | | 3,491,015 | | |
| 2,699 | | SOLAR A/S, CLASS B | | 116,641 | | 159,484 | | |
| 3,250 | | TOPDANMARK A/S | | 33,362 | | 140,938 | | |
| 3,362 | | VESTAS WIND SYSTEMS A/S | | 160,514 | | 794,367 | | |
| | | | | 10,528,947 | | 20,358,703 | | 2.35% |
| Egypt: | | | | | | |
| 323,300 | | EASTERN CO. S.A.E. | | 244,707 | | 268,012 | | |
| | | | | 244,707 | | 268,012 | | 0.03% |
| Finland: | | | | | | |
| 2,770 | | ELISA OYJ | | 86,574 | | 151,839 | | |
| 5,584 | | KESKO OYJ, CLASS B | | 30,705 | | 143,529 | | |
| 5,273 | | KONE OYJ, CLASS B | | 105,699 | | 428,119 | | |
| 21,225 | | NESTE OYJ | | 67,704 | | 1,533,991 | | |
| 3,741 | | NOKIAN RENKAAT OYJ | | 60,808 | | 131,713 | | |
| 1,960 | | ORION OYJ, CLASS B | | 49,561 | | 89,863 | | |
| 36,100 | | SANOMA OYJ | | 389,480 | | 605,956 | | |
| 18,590 | | STORA ENSO OYJ (REGISTERED) | | 105,291 | | 355,305 | | |
| 11,934 | | UPM-KYMMENE OYJ | | 99,929 | | 444,227 | | |
| 1,849 | | VALMET OYJ | | 14,443 | | 52,766 | | |
| | | | | 1,010,194 | | 3,937,308 | | 0.45% |
| France: | | | | | | |
| 2,327 | | AEROPORTS DE PARIS(b) | | 211,828 | | 301,619 | | |
| 11,027 | | AIRBUS S.E.(b) | | 366,293 | | 1,209,438 | | |
| 4,707 | | ARKEMA S.A. | | 419,345 | | 537,654 | | |
| 27,762 | | AXA S.A. | | 358,341 | | 661,758 | | |
| 3,062 | | CAPGEMINI S.E. | | 111,713 | | 474,320 | | |
| 19,252 | | CIE DE SAINT-GOBAIN(b) | | 430,348 | | 881,970 | | |
| 5,399 | | CIE DES ALPES | | 143,643 | | 125,714 | | |
| 3,235 | | CIE GENERALE DES ETABLISSEMENTS MICHELIN S.C.A. | | 167,080 | | 414,766 | | |
| 37,390 | | COFACE S.A.(b) | | 449,179 | | 375,012 | | |
| 7,706 | | COVIVIO | | 482,654 | | 709,348 | | |
| 29,989 | | CREDIT AGRICOLE S.A.(b) | | 267,369 | | 378,084 | | |
| 40,253 | | DANONE S.A. | | 2,430,956 | | 2,643,652 | | |
| 1,736 | | EDENRED | | 25,484 | | 98,426 | | |
| 417 | | EIFFAGE S.A.(b) | | 34,325 | | 40,265 | | |
| 4,785 | | ENGIE S.A.(b) | | 49,329 | | 73,187 | | |
| 970 | | ESSILORLUXOTTICA S.A. | | 88,277 | | 153,043 | | |
| 523 | | ESSILORLUXOTTICA S.A. (EURONEST PARIS EXCHANGE) | | 50,804 | | 81,495 | | |
| 2,901 | | EURAZEO S.E.(b) | | 76,265 | | 196,692 | | |
| 564 | | GECINA S.A. | | 51,331 | | 87,022 | | |
| 9,197 | | GETLINK S.E.(b) | | 70,409 | | 159,320 | | |
| 3,791 | | ILIAD S.A. | | 536,903 | | 778,517 | | |
| 3,399 | | INFOTEL S.A. | | 145,404 | | 179,798 | | |
| 6,762 | | IPSEN S.A. | | 538,954 | | 560,908 | | |
| 9,500 | | KAUFMAN & BROAD S.A. | | 362,957 | | 424,768 | | |
| 1,026 | | KERING S.A. | | 174,510 | | 745,029 | | |
| 4,545 | | KLEPIERRE S.A. | | 71,744 | | 102,109 | | |
| 4,848 | | LEGRAND S.A. | | 109,851 | | 432,347 | | |
| 6,266 | | L'OREAL S.A. | | 661,338 | | 2,379,130 | | |
| 15,748 | | LVMH MOET HENNESSY LOUIS VUITTON S.E. | | 2,401,142 | | 9,828,973 | | |
| 14,296 | | MERSEN S.A.(b) | | 465,081 | | 432,251 | | |
| 8,798 | | NEXITY S.A. | | 431,993 | | 381,127 | | |
| 22,059 | | PERNOD RICARD S.A. | | 3,404,966 | | 4,225,506 | | |
| 12,760 | | PEUGEOT S.A.(b) | | 76,914 | | 348,709 | | |
| 23,074 | | RENAULT S.A.(b) | | 423,958 | | 1,008,015 | | |
| 17,591 | | SAFRAN S.A.(b) | | 1,652,583 | | 2,491,771 | | |
| 18,127 | | SANOFI | | 1,018,143 | | 1,742,800 | | |
| See accompanying notes to financial statements. | 76 | (Continued) |
CLEARWATER INVESTMENT TRUST
Schedule of Investments - Clearwater International Fund
December 31, 2020
| Shares | | Security | | Cost | | Fair value (a) | | Percent of
net assets |
| France (Cont'd): | | | | | | |
| 278 | | SCHNEIDER ELECTRIC S.E. | | $ 8,838 | | 40,635 | | |
| 7,138 | | SCHNEIDER ELECTRIC S.E. (EURONEXT PARIS EXCHANGE) | | 267,356 | | 1,031,592 | | |
| 1,821 | | SCOR S.E.(b) | | 36,624 | | 58,775 | | |
| 13,970 | | SOCIETE GENERALE S.A.(b) | | 192,352 | | 290,505 | | |
| 3,699 | | SOCIETE POUR L'INFORMATIQUE INDUSTRIELLE | | 108,264 | | 112,972 | | |
| 7,150 | | SODEXO S.A.(b)(g) | | 647,363 | | 604,623 | | |
| 27,126 | | SODEXO S.A. (EURONEXT PARIS EXCHANGE) | | 2,341,517 | | 2,293,846 | | |
| 9,980 | | SOITEC(b) | | 824,319 | | 1,942,196 | | |
| 51,800 | | TELEVISION FRANCAISE 1(b) | | 458,222 | | 417,025 | | |
| 1,413 | | THALES S.A. | | 81,763 | | 129,292 | | |
| 20,803 | | TOTAL S.E. | | 742,470 | | 897,114 | | |
| 3,269 | | VALEO S.A. | | 58,895 | | 128,913 | | |
| 13,514 | | VEOLIA ENVIRONNEMENT S.A. | | 143,775 | | 330,353 | | |
| 10,500 | | VICAT S.A. | | 406,419 | | 440,619 | | |
| 8,179 | | VINCI S.A. | | 345,228 | | 812,939 | | |
| 96,188 | | VIVENDI S.A. | | 2,011,947 | | 3,099,863 | | |
| 6,004 | | WENDEL S.E. | | 462,932 | | 718,442 | | |
| | | | | 27,899,698 | | 49,014,247 | | 5.65% |
| Georgia: | | | | | | |
| 21,875 | | BANK OF GEORGIA GROUP PLC(b) | | 355,261 | | 364,952 | | |
| | | | | 355,261 | | 364,952 | | 0.04% |
| Germany: | | | | | | |
| 3,994 | | ADIDAS A.G.(b) | | 192,837 | | 1,453,535 | | |
| 9,283 | | ALLIANZ S.E. (REGISTERED) | | 904,298 | | 2,276,054 | | |
| 167,709 | | ARCH CAPITAL GROUP LTD.(b) | | 3,055,645 | | 6,049,264 | | |
| 38,556 | | AROUNDTOWN S.A. | | 192,935 | | 288,264 | | |
| 6,098 | | AURUBIS A.G. | | 286,000 | | 474,243 | | |
| 13,539 | | BASF S.E. | | 453,717 | | 1,070,464 | | |
| 9,247 | | BAYER A.G. (REGISTERED) | | 437,916 | | 543,988 | | |
| 8,787 | | BAYERISCHE MOTOREN WERKE A.G. | | 501,991 | | 775,363 | | |
| 2,206 | | BEIERSDORF A.G. | | 146,950 | | 254,512 | | |
| 1,188 | | BRENNTAG A.G. | | 43,546 | | 91,927 | | |
| 1,042 | | CONTINENTAL A.G. | | 57,443 | | 154,346 | | |
| 1,858 | | DELIVERY HERO S.E.(b)(e) | | 87,405 | | 288,268 | | |
| 4,594 | | DEUTSCHE BOERSE A.G. | | 283,234 | | 781,507 | | |
| 15,996 | | DEUTSCHE EUROSHOP A.G.(b) | | 435,440 | | 360,541 | | |
| 37,890 | | DEUTSCHE PFANDBRIEFBANK A.G.(b)(e) | | 469,871 | | 407,106 | | |
| 18,572 | | DEUTSCHE POST A.G. (REGISTERED) | | 230,768 | | 918,884 | | |
| 33,147 | | DEUTSCHE TELEKOM A.G. (REGISTERED) | | 373,793 | | 605,588 | | |
| 9,111 | | DEUTSCHE WOHNEN S.E. | | 295,363 | | 486,289 | | |
| 82,454 | | E.ON S.E. | | 724,674 | | 913,016 | | |
| 40,577 | | ECKERT & ZIEGLER STRAHLEN- UND MEDIZINTECHNIK A.G. | | 1,578,887 | | 2,222,759 | | |
| 40,921 | | EVOTEC S.E.(b) | | 933,333 | | 1,513,732 | | |
| 23,600 | | FREENET A.G. | | 557,311 | | 495,748 | | |
| 57,089 | | FRESENIUS MEDICAL CARE A.G. & CO. KGAA | | 4,363,557 | | 4,756,458 | | |
| 5,544 | | FRESENIUS S.E. & CO. KGAA | | 99,810 | | 256,284 | | |
| 17,795 | | HAMBURGER HAFEN UND LOGISTIK A.G. | | 443,620 | | 400,872 | | |
| 2,246 | | HANNOVER RUECK S.E. | | 94,321 | | 357,520 | | |
| 3,671 | | HEIDELBERGCEMENT A.G. | | 131,196 | | 274,552 | | |
| 23,695 | | HELLA GMBH & CO. KGAA(b) | | 1,045,191 | | 1,531,296 | | |
| 2,730 | | HOCHTIEF A.G. | | 118,140 | | 265,308 | | |
| 2,640 | | HYPOPORT S.E.(b) | | 965,203 | | 1,660,955 | | |
| 21,681 | | INFINEON TECHNOLOGIES A.G. | | 131,828 | | 831,414 | | |
| 6,898 | | JOST WERKE A.G.(b)(e) | | 220,852 | | 363,201 | | |
| 2,159 | | MERCK KGAA | | 96,589 | | 370,179 | | |
| 3,139 | | MUENCHENER RUECKVERSICHERUNGS-GESELLSCHAFT A.G. IN MUENCHEN (REGISTERED) | | 392,853 | | 931,080 | | |
| 19,095 | | PROSIEBENSAT.1 MEDIA S.E.(b) | | 286,490 | | 320,868 | | |
| 7,700 | | PUBLITY A.G.(b)(d) | | 286,657 | | 314,184 | | |
| 3,999 | | RHEINMETALL A.G. | | 520,402 | | 422,976 | | |
| 4,035 | | RWE A.G. | | 88,431 | | 170,408 | | |
| 17,103 | | SAP S.E. | | 683,559 | | 2,240,242 | | |
| 13,327 | | SIEMENS A.G. (REGISTERED) | | 815,103 | | 1,913,335 | | |
| 6,663 | | SIEMENS ENERGY A.G.(b) | | 171,144 | | 244,196 | | |
| 3,600 | | SILTRONIC A.G.(d) | | 264,192 | | 563,376 | | |
| See accompanying notes to financial statements. | 77 | (Continued) |
CLEARWATER INVESTMENT TRUST
Schedule of Investments - Clearwater International Fund
December 31, 2020
| Shares | | Security | | Cost | | Fair value (a) | | Percent of
net assets |
| Germany (Cont'd): | | | | | | |
| 14,908 | | TEAMVIEWER A.G.(b)(e) | | $ 723,646 | | 798,248 | | |
| 188,717 | | TELEFONICA DEUTSCHLAND HOLDING A.G. | | 459,389 | | 519,881 | | |
| 141,527 | | TUI A.G. - CDI(d) | | 548,893 | | 887,179 | | |
| 4,171 | | UNIPER S.E. | | 46,925 | | 143,897 | | |
| 404 | | VOLKSWAGEN A.G. | | 40,235 | | 83,952 | | |
| 7,564 | | VONOVIA S.E. | | 341,426 | | 552,216 | | |
| 1,753 | | ZALANDO S.E.(b)(e) | | 111,430 | | 195,010 | | |
| | | | | 25,734,439 | | 43,794,485 | | 5.05% |
| Greece: | | | | | | |
| 6,746 | | HELLENIC TELECOMMUNICATIONS ORGANIZATION S.A. | | 54,075 | | 108,620 | | |
| | | | | 54,075 | | 108,620 | | 0.01% |
| Hong Kong: | | | | | | |
| 799,800 | | AIA GROUP LTD. | | 5,192,801 | | 9,800,902 | | |
| 46,000 | | BOC HONG KONG HOLDINGS LTD. | | 63,016 | | 139,440 | | |
| 1,462,000 | | CITIC TELECOM INTERNATIONAL HOLDINGS LTD. | | 547,331 | | 460,149 | | |
| 52,544 | | CK ASSET HOLDINGS LTD. | | 147,485 | | 269,754 | | |
| 24,544 | | CK HUTCHISON HOLDINGS LTD. | | 120,441 | | 171,279 | | |
| 35,500 | | CLP HOLDINGS LTD. | | 245,345 | | 328,329 | | |
| 722,000 | | FIRST PACIFIC CO. LTD. | | 288,855 | | 230,036 | | |
| 18,000 | | GALAXY ENTERTAINMENT GROUP LTD. | | 39,054 | | 139,891 | | |
| 2,228,000 | | GEMDALE PROPERTIES & INVESTMENT CORP. LTD. | | 413,300 | | 319,006 | | |
| 15,300 | | HANG SENG BANK LTD. | | 175,457 | | 263,866 | | |
| 27,331 | | HENDERSON LAND DEVELOPMENT CO. LTD. | �� | 52,934 | | 106,645 | | |
| 11,800 | | HONG KONG EXCHANGES & CLEARING LTD. | | 203,281 | | 646,892 | | |
| 40,500 | | LINK REIT | | 84,196 | | 368,825 | | |
| 3,559 | | MELCO RESORTS & ENTERTAINMENT LTD. (ADR)(f) | | 66,558 | | 66,019 | | |
| 30,500 | | MTR CORP. LTD. | | 88,703 | | 170,549 | | |
| 20,520 | | PACIFIC CENTURY PREMIUM DEVELOPMENTS LTD.(b) | | 4,660 | | 2,171 | | |
| 172,123 | | PCCW LTD. | | 70,484 | | 103,685 | | |
| 392,000 | | PERFECT SHAPE MEDICAL LTD. | | 140,251 | | 162,818 | | |
| 20,500 | | POWER ASSETS HOLDINGS LTD. | | 109,641 | | 111,062 | | |
| 185,000 | | SHENZHEN INTERNATIONAL HOLDINGS LTD. | | 343,057 | | 298,770 | | |
| 289,000 | | SITC INTERNATIONAL HOLDINGS CO. LTD. | | 303,932 | | 624,043 | | |
| 8,000 | | SUN HUNG KAI PROPERTIES LTD. | | 65,036 | | 103,193 | | |
| 40,000 | | SWIRE PACIFIC LTD., CLASS A | | 207,758 | | 221,865 | | |
| 7,000 | | TECHTRONIC INDUSTRIES CO. LTD. | | 44,938 | | 99,865 | | |
| 600,000 | | UNITED LABORATORIES INTERNATIONAL HOLDINGS (THE) LTD. | | 352,686 | | 425,672 | | |
| 469,800 | | VALUETRONICS HOLDINGS LTD. | | 216,550 | | 209,732 | | |
| 83,500 | | WH GROUP LTD.(e) | | 45,547 | | 70,010 | | |
| 21,000 | | WHARF HOLDINGS (THE) LTD. | | 43,463 | | 56,479 | | |
| 418,000 | | XINYI GLASS HOLDINGS LTD. | | 481,711 | | 1,167,334 | | |
| 358,000 | | YUEXIU TRANSPORT INFRASTRUCTURE LTD. | | 311,883 | | 243,825 | | |
| | | | | 10,470,354 | | 17,382,106 | | 2.00% |
| India: | | | | | | |
| 78,535 | | COMPUTER AGE MANAGEMENT SERVICES LTD. | | 1,612,818 | | 1,940,817 | | |
| 118,090 | | CREDITACCESS GRAMEEN LTD.(b) | | 1,303,357 | | 1,221,587 | | |
| 35,957 | | CYIENT LTD. | | 257,802 | | 252,475 | | |
| 687,800 | | FIRSTSOURCE SOLUTIONS LTD. | | 375,974 | | 955,441 | | |
| 348,853 | | HCL TECHNOLOGIES LTD. | | 2,207,470 | | 4,517,293 | | |
| 103,300 | | HDFC BANK LTD. ADR(b)(f) | | 4,095,407 | | 7,464,458 | | |
| 114,700 | | HINDUSTAN PETROLEUM CORP. LTD. | | 431,628 | | 342,055 | | |
| 704,044 | | INDIAN ENERGY EXCHANGE LTD.(e) | | 1,766,781 | | 2,195,937 | | |
| 530,918 | | INDUS TOWERS LTD. | | 2,205,681 | | 1,670,483 | | |
| 40,400 | | JUBILANT LIFE SCIENCES LTD. | | 314,717 | | 467,157 | | |
| 42,000 | | MPHASIS LTD. | | 670,244 | | 885,180 | | |
| 322,000 | | NMDC LTD. | | 521,633 | | 504,368 | | |
| 1,107,100 | | SJVN LTD. | | 377,345 | | 376,521 | | |
| 254,392 | | SYNGENE INTERNATIONAL LTD.(b)(e) | | 1,124,396 | | 2,226,833 | | |
| 28,649 | | WNS HOLDINGS LTD. ADR(b)(f) | | 1,727,311 | | 2,064,161 | | |
| | | | | 18,992,564 | | 27,084,766 | | 3.12% |
| Indonesia: | | | | | | |
| 4,097,000 | | ADARO ENERGY TBK PT | | 470,816 | | 416,990 | | |
| 5,314,800 | | BANK BTPN SYARIAH TBK PT | | 1,314,458 | | 1,418,541 | | |
| See accompanying notes to financial statements. | 78 | (Continued) |
CLEARWATER INVESTMENT TRUST
Schedule of Investments - Clearwater International Fund
December 31, 2020
| Shares | | Security | | Cost | | Fair value (a) | | Percent of
net assets |
| Indonesia (Cont'd): | | | | | | |
| 2,022,800 | | MATAHARI DEPARTMENT STORE TBK PT(b) | | $ 317,587 | | 183,564 | | |
| | | | | 2,102,861 | | 2,019,095 | | 0.23% |
| Ireland: | | | | | | |
| 26,850 | | ACCENTURE PLC, CLASS A | | 3,237,653 | | 7,013,489 | | |
| 1,530 | | AERCAP HOLDINGS N.V.(b) | | 38,135 | | 69,737 | | |
| 92,999 | | CRH PLC | | 2,719,809 | | 3,865,088 | | |
| 65,382 | | DALATA HOTEL GROUP PLC(b) | | 368,686 | | 302,323 | | |
| 2,146 | | DCC PLC | | 158,386 | | 151,956 | | |
| 162,850 | | EXPERIAN PLC | | 2,920,631 | | 6,184,306 | | |
| 904 | | FLUTTER ENTERTAINMENT PLC(b) | | 76,633 | | 184,320 | | |
| 13,350 | | ICON PLC(b) | | 903,981 | | 2,602,983 | | |
| 11,485 | | JAMES HARDIE INDUSTRIES PLC - CDI(b) | | 103,360 | | 338,414 | | |
| 3,255 | | KERRY GROUP PLC, CLASS A | | 214,084 | | 471,212 | | |
| 17,539 | | RYANAIR HOLDINGS PLC(b) | | 235,787 | | 348,288 | | |
| 1,812 | | SMURFIT KAPPA GROUP PLC | | 50,442 | | 84,207 | | |
| | | | | 11,027,587 | | 21,616,323 | | 2.49% |
| Isle of Man: | | | | | | |
| 8,963 | | ENTAIN PLC(b) | | 96,395 | | 138,932 | | |
| | | | | 96,395 | | 138,932 | | 0.02% |
| Israel: | | | | | | |
| 74,833 | | BANK HAPOALIM B.M. | | 372,182 | | 512,090 | | |
| 1,532 | | CHECK POINT SOFTWARE TECHNOLOGIES LTD.(b) | | 119,497 | | 203,618 | | |
| 115,300 | | ICL GROUP LTD. | | 461,518 | | 587,004 | | |
| 29,044 | | MIZRAHI TEFAHOT BANK LTD. | | 475,042 | | 671,091 | | |
| 3,072 | | NICE LTD.(b) | | 169,095 | | 860,384 | | |
| | | | | 1,597,334 | | 2,834,187 | | 0.33% |
| Italy: | | | | | | |
| 285,200 | | A2A S.P.A. | | 555,841 | | 454,507 | | |
| 43,970 | | AMPLIFON S.P.A.(b) | | 1,045,263 | | 1,828,491 | | |
| 18,874 | | ASSICURAZIONI GENERALI S.P.A. | | 228,503 | | 328,799 | | |
| 34,463 | | ATLANTIA S.P.A.(b) | | 455,057 | | 619,527 | | |
| 25,272 | | BANCA MEDIOLANUM S.P.A.(b) | | 87,322 | | 219,202 | | |
| 11,397 | | EL.EN. S.P.A.(b) | | 291,927 | | 369,660 | | |
| 84,847 | | ENEL S.P.A. | | 298,823 | | 857,835 | | |
| 4,500 | | ENI S.P.A. | | 39,200 | | 46,992 | | |
| 18,061 | | FERRARI N.V. | | 2,343,203 | | 4,162,416 | | |
| 1,022 | | FERRARI N.V. (NEW YORK EXCHANGE) | | 7,571 | | 234,569 | | |
| 44,854 | | INTERPUMP GROUP S.P.A. | | 794,570 | | 2,210,466 | | |
| 26,311 | | INTESA SANPAOLO S.P.A.(b) | | 41,384 | | 61,476 | | |
| 173,553 | | IREN S.P.A. | | 474,559 | | 450,757 | | |
| 28,600 | | LA DORIA S.P.A. | | 361,264 | | 477,968 | | |
| 12,059 | | LEONARDO S.P.A. | | 61,595 | | 87,065 | | |
| 70,149 | | SNAM S.P.A. | | 252,658 | | 394,294 | | |
| 49,687 | | SOCIETA CATTOLICA DI ASSICURAZIONI S.C.(b) | | 431,869 | | 278,371 | | |
| 206,785 | | TENARIS S.A. | | 1,840,520 | | 1,673,348 | | |
| 20,158 | | TENARIS S.A. ADR(d)(f) | | 440,588 | | 321,520 | | |
| 39,609 | | TERNA RETE ELETTRICA NAZIONALE S.P.A. | | 160,166 | | 302,427 | | |
| 29,771 | | UNICREDIT S.P.A.(b) | | 261,654 | | 278,156 | | |
| 71,681 | | UNIPOL GRUPPO S.P.A.(b) | | 376,844 | | 342,395 | | |
| 95,230 | | UNIPOLSAI ASSICURAZIONI S.P.A. | | 153,826 | | 252,453 | | |
| | | | | 11,004,207 | | 16,252,694 | | 1.87% |
| Japan: | | | | | | |
| 1,500 | | ABC-MART, INC. | | 56,540 | | 83,386 | | |
| 30,600 | | ADEKA CORP. | | 390,224 | | 533,733 | | |
| 4,700 | | AEON CO. LTD. | | 52,433 | | 154,080 | | |
| 600 | | AEON REIT INVESTMENT CORP. | | 728,822 | | 767,033 | | |
| 2,700 | | AI INSIDE, INC.(b) | | 2,171,882 | | 1,919,326 | | |
| 2,300 | | AISIN SEIKI CO. LTD. | | 37,584 | | 68,941 | | |
| 15,000 | | AJINOMOTO CO., INC. | | 116,767 | | 339,572 | | |
| 2,500 | | ALFRESA HOLDINGS CORP. | | 24,420 | | 45,736 | | |
| 15,600 | | ARCS CO. LTD. | | 325,913 | | 350,360 | | |
| 9,000 | | AS ONE CORP. | | 968,007 | | 1,538,424 | | |
| 5,500 | | ASAHI GROUP HOLDINGS LTD. | | 83,346 | | 226,062 | | |
| 32,500 | | ASAHI KASEI CORP. | | 157,083 | | 331,909 | | |
| 22,100 | | ASAHI YUKIZAI CORP. | | 276,792 | | 323,404 | | |
| See accompanying notes to financial statements. | 79 | (Continued) |
CLEARWATER INVESTMENT TRUST
Schedule of Investments - Clearwater International Fund
December 31, 2020
| Shares | | Security | | Cost | | Fair value (a) | | Percent of
net assets |
| Japan (Cont'd): | | | | | | |
| 9,300 | | ASANUMA CORP. | | $ 324,412 | | 358,472 | | |
| 37,000 | | ASTELLAS PHARMA, INC. | | 236,149 | | 571,188 | | |
| 1,500 | | BANDAI NAMCO HOLDINGS, INC. | | 14,652 | | 129,669 | | |
| 16,500 | | BAYCURRENT CONSULTING, INC. | | 1,502,068 | | 2,890,756 | | |
| 13,800 | | BRIDGESTONE CORP.(d) | | 205,726 | | 452,271 | | |
| 32,100 | | BROTHER INDUSTRIES LTD. | | 541,898 | | 660,933 | | |
| 48,400 | | BUNKA SHUTTER CO. LTD. | | 363,296 | | 456,086 | | |
| 2,700 | | CENTRAL JAPAN RAILWAY CO. | | 229,516 | | 381,512 | | |
| 53,000 | | CHUBU ELECTRIC POWER CO., INC. | | 655,961 | | 638,022 | | |
| 13,500 | | CHUGAI PHARMACEUTICAL CO. LTD. | | 82,278 | | 719,486 | | |
| 28,400 | | CREDIT SAISON CO. LTD. | | 361,395 | | 326,206 | | |
| 18,200 | | CRESCO LTD. | | 227,100 | | 230,904 | | |
| 29,100 | | DAIICHI SANKYO CO. LTD. | | 150,922 | | 996,257 | | |
| 4,600 | | DAIKIN INDUSTRIES LTD. | | 136,302 | | 1,021,084 | | |
| 19,000 | | DAITRON CO. LTD. | | 328,045 | | 290,000 | | |
| 10,000 | | DAIWA HOUSE INDUSTRY CO. LTD. | | 103,706 | | 296,741 | | |
| 17,500 | | DAIWA SECURITIES GROUP, INC. | | 60,410 | | 79,657 | | |
| 5,600 | | DAIWABO HOLDINGS CO. LTD. | | 223,879 | | 497,874 | | |
| 8,200 | | DENSO CORP. | | 185,234 | | 487,132 | | |
| 3,300 | | DENTSU GROUP, INC. | | 56,753 | | 97,957 | | |
| 3,600 | | EAST JAPAN RAILWAY CO. | | 188,040 | | 240,046 | | |
| 19,700 | | EBARA CORP. | | 478,039 | | 642,962 | | |
| 17,800 | | ECO'S CO. LTD. | | 285,796 | | 358,224 | | |
| 57,500 | | EGUARANTEE, INC. | | 1,459,265 | | 1,252,409 | | |
| 3,400 | | EISAI CO. LTD. | | 112,861 | | 242,747 | | |
| 28,300 | | ELEMATEC CORP. | | 262,160 | | 277,642 | | |
| 20,500 | | ENEOS HOLDINGS, INC. | | 76,331 | | 73,538 | | |
| 20,400 | | EXEDY CORP. | | 319,517 | | 250,320 | | |
| 2,600 | | FANUC CORP. | | 182,941 | | 638,574 | | |
| 1,300 | | FAST RETAILING CO. LTD. | | 188,734 | | 1,164,215 | | |
| 50,120 | | FEED ONE CO. LTD. | | 432,664 | | 422,298 | | |
| 54,400 | | FERROTEC HOLDINGS CORP.(d) | | 435,460 | | 926,731 | | |
| 34,200 | | FJ NEXT CO. LTD. | | 337,056 | | 326,582 | | |
| 15,000 | | FREEE K.K.(b)(d) | | 276,205 | | 1,467,241 | | |
| 31,700 | | FUJI CORP. | | 564,353 | | 832,910 | | |
| 4,700 | | FUJI ELECTRIC CO. LTD. | | 61,631 | | 169,101 | | |
| 10,400 | | FUJIBO HOLDINGS, INC. | | 287,084 | | 387,778 | | |
| 8,700 | | FUJIFILM HOLDINGS CORP. | | 163,215 | | 458,192 | | |
| 2,300 | | FUJITSU LTD. | | 106,202 | | 332,008 | | |
| 41,400 | | FUKUOKA FINANCIAL GROUP, INC. | | 523,630 | | 734,940 | | |
| 35,800 | | FURUNO ELECTRIC CO. LTD. | | 322,070 | | 420,911 | | |
| 400 | | GMO PAYMENT GATEWAY, INC. | | 36,072 | | 53,615 | | |
| 119,800 | | HACHIJUNI BANK (THE) LTD. | | 476,117 | | 397,960 | | |
| 3,000 | | HAMAMATSU PHOTONICS K.K. | | 52,686 | | 171,420 | | |
| 2,200 | | HANKYU HANSHIN HOLDINGS, INC. | | 51,221 | | 73,081 | | |
| 55,300 | | HASEKO CORP. | | 721,604 | | 633,576 | | |
| 12,300 | | HENNGE K.K.(b)(d) | | 308,022 | | 991,100 | | |
| 341 | | HIROSE ELECTRIC CO. LTD. | | 29,327 | | 51,684 | | |
| 19,000 | | HITACHI LTD. | | 295,895 | | 748,003 | | |
| 7,000 | | HITACHI METALS LTD. | | 55,542 | | 106,164 | | |
| 5,300 | | HOYA CORP. | | 112,594 | | 732,468 | | |
| 5,700 | | HULIC CO. LTD. | | 48,487 | | 62,545 | | |
| 26,100 | | INNOTECH CORP. | | 231,054 | | 254,794 | | |
| 13,800 | | INTAGE HOLDINGS, INC. | | 121,039 | | 151,158 | | |
| 1,300 | | INVINCIBLE INVESTMENT CORP. | | 761,926 | | 417,365 | | |
| 23,900 | | ITOCHU CORP. | | 349,303 | | 686,065 | | |
| 63,100 | | IWAKI & CO. LTD. | | 295,237 | | 314,721 | | |
| 21,900 | | JACCS CO. LTD. | | 467,646 | | 387,712 | | |
| 30,400 | | JAPAN AVIATION ELECTRONICS INDUSTRY LTD. | | 458,316 | | 464,884 | | |
| 81,400 | | JAPAN ELEVATOR SERVICE HOLDINGS CO. LTD. | | 900,999 | | 2,068,603 | | |
| 7,000 | | JAPAN EXCHANGE GROUP, INC. | | 56,090 | | 178,839 | | |
| 105,400 | | JAPAN MATERIAL CO. LTD. | | 1,339,600 | | 1,443,374 | | |
| 4,500 | | KAJIMA CORP. | | 25,084 | | 60,230 | | |
| 9,100 | | KANAMOTO CO. LTD. | | 198,233 | | 195,299 | | |
| 57,300 | | KANDENKO CO. LTD. | | 547,713 | | 484,460 | | |
| 12,300 | | KANEKA CORP. | | 387,968 | | 430,032 | | |
| 4,800 | | KANSAI ELECTRIC POWER (THE) CO., INC. | | 46,503 | | 45,264 | | |
| See accompanying notes to financial statements. | 80 | (Continued) |
CLEARWATER INVESTMENT TRUST
Schedule of Investments - Clearwater International Fund
December 31, 2020
| Shares | | Security | | Cost | | Fair value (a) | | Percent of
net assets |
| Japan (Cont'd): | | | | | | |
| 2,000 | | KANSAI PAINT CO. LTD. | | $ 10,449 | | 61,498 | | |
| 10,000 | | KAO CORP. | | 208,279 | | 771,875 | | |
| 29,762 | | KDDI CORP. | | 238,488 | | 883,737 | | |
| 1,200 | | KEIO CORP. | | 36,571 | | 92,974 | | |
| 2,400 | | KEISEI ELECTRIC RAILWAY CO. LTD. | | 22,185 | | 81,120 | | |
| 15,124 | | KEYENCE CORP. | | 1,669,929 | | 8,495,395 | | |
| 6,000 | | KIKKOMAN CORP. | | 52,867 | | 416,638 | | |
| 1,200 | | KINTETSU GROUP HOLDINGS CO. LTD. | | 35,697 | | 52,530 | | |
| 9,900 | | KIRIN HOLDINGS CO. LTD. | | 101,976 | | 233,370 | | |
| 67,600 | | KITZ CORP. | | 466,295 | | 410,491 | | |
| 69,800 | | KOBE BUSSAN CO. LTD. | | 1,392,771 | | 2,149,668 | | |
| 2,300 | | KONAMI HOLDINGS CORP. | | 50,313 | | 129,195 | | |
| 21,800 | | KUBOTA CORP. | | 139,630 | | 475,249 | | |
| 6,900 | | KUREHA CORP. | | 316,117 | | 485,817 | | |
| 4,000 | | KYOCERA CORP. | | 133,049 | | 245,063 | | |
| 49,000 | | KYOSAN ELECTRIC MANUFACTURING CO. LTD. | | 177,172 | | 200,261 | | |
| 5,000 | | KYOWA KIRIN CO. LTD. | | 54,616 | | 136,265 | | |
| 32,000 | | LASERTEC CORP. | | 990,944 | | 3,753,039 | | |
| 13,100 | | LINTEC CORP. | | 259,789 | | 289,011 | | |
| 5,100 | | M3, INC. | | 59,204 | | 481,229 | | |
| 1,900 | | MAKITA CORP. | | 46,157 | | 95,133 | | |
| 7,100 | | MARUI GROUP CO. LTD. | | 41,710 | | 124,596 | | |
| 14,600 | | MATSUMOTOKIYOSHI HOLDINGS CO. LTD. | | 542,531 | | 622,149 | | |
| 7,700 | | MAZDA MOTOR CORP. | | 38,348 | | 51,604 | | |
| 19,300 | | MEDIA DO CO. LTD. | | 1,096,323 | | 1,385,047 | | |
| 2,400 | | MEIJI HOLDINGS CO. LTD. | | 38,749 | | 168,747 | | |
| 12,800 | | MELCO HOLDINGS, INC. | | 351,215 | | 415,283 | | |
| 6,200 | | MERCARI, INC.(b) | | 176,315 | | 274,708 | | |
| 8,700 | | MINEBEA MITSUMI, INC. | | 84,406 | | 172,559 | | |
| 597 | | MIRAI CORP. | | 328,940 | | 222,310 | | |
| 24,900 | | MITSUBISHI CHEMICAL HOLDINGS CORP. | | 102,543 | | 150,526 | | |
| 17,500 | | MITSUBISHI CORP. | | 230,376 | | 430,657 | | |
| 40,000 | | MITSUBISHI ELECTRIC CORP. | | 322,860 | | 603,167 | | |
| 15,000 | | MITSUBISHI ESTATE CO. LTD. | | 173,227 | | 240,715 | | |
| 9,200 | | MITSUBISHI GAS CHEMICAL CO., INC. | | 84,078 | | 211,077 | | |
| 26,600 | | MITSUBISHI UFJ LEASE & FINANCE CO. LTD. | | 82,462 | | 127,519 | | |
| 20,800 | | MITSUBOSHI BELTING LTD. | | 335,754 | | 342,252 | | |
| 14,000 | | MITSUI & CO. LTD. | | 128,045 | | 256,191 | | |
| 7,400 | | MITSUI CHEMICALS, INC. | | 87,469 | | 216,793 | | |
| 20,400 | | MITSUI-SOKO HOLDINGS CO. LTD. | | 427,810 | | 454,804 | | |
| 3,800 | | MONOTARO CO. LTD. | | 113,793 | | 193,211 | | |
| 6,080 | | MS&AD INSURANCE GROUP HOLDINGS, INC. | | 125,874 | | 184,953 | | |
| 37,400 | | MUGEN ESTATE CO. LTD. | | 216,786 | | 170,963 | | |
| 11,000 | | MURATA MANUFACTURING CO. LTD. | | 171,994 | | 992,882 | | |
| 20,200 | | NANTO BANK (THE) LTD. | | 470,557 | | 340,791 | | |
| 3,800 | | NGK SPARK PLUG CO. LTD. | | 38,830 | | 64,882 | | |
| 2,900 | | NH FOODS LTD. | | 69,814 | | 127,510 | | |
| 16,700 | | NICHIAS CORP. | | 297,341 | | 396,575 | | |
| 7,800 | | NIDEC CORP. | | 129,234 | | 980,524 | | |
| 7,500 | | NIKKON HOLDINGS CO. LTD. | | 150,366 | | 150,138 | | |
| 2,600 | | NINTENDO CO. LTD. | | 285,625 | | 1,657,624 | | |
| 22 | | NIPPON BUILDING FUND, INC. | | 90,970 | | 127,413 | | |
| 1,700 | | NIPPON EXPRESS CO. LTD. | | 60,747 | | 114,096 | | |
| 26 | | NIPPON PROLOGIS REIT, INC. | | 54,492 | | 81,081 | | |
| 30,400 | | NIPPON TELEGRAPH & TELEPHONE CORP. | | 342,697 | | 778,879 | | |
| 3,100 | | NIPPON YUSEN K.K. | | 39,009 | | 72,115 | | |
| 60,900 | | NISHI-NIPPON FINANCIAL HOLDINGS, INC. | | 426,037 | | 388,679 | | |
| 5,300 | | NISSAN CHEMICAL CORP. | | 61,593 | | 331,587 | | |
| 3,670 | | NISSHIN SEIFUN GROUP, INC. | | 31,991 | | 58,326 | | |
| 1,200 | | NISSIN FOODS HOLDINGS CO. LTD. | | 43,959 | | 102,736 | | |
| 2,800 | | NITORI HOLDINGS CO. LTD. | | 102,246 | | 586,277 | | |
| 3,200 | | NITTO DENKO CORP. | | 77,639 | | 286,049 | | |
| 3,500 | | NITTO FUJI FLOUR MILLING CO. LTD. | | 211,323 | | 223,379 | | |
| 144,800 | | NOMURA HOLDINGS, INC. | | 534,256 | | 764,283 | | |
| 32,900 | | NOMURA REAL ESTATE HOLDINGS, INC. | | 674,503 | | 727,429 | | |
| 10,301 | | NOMURA RESEARCH INSTITUTE LTD. | | 53,983 | | 368,623 | | |
| 8,300 | | NTT DATA CORP. | | 48,334 | | 113,421 | | |
| See accompanying notes to financial statements. | 81 | (Continued) |
CLEARWATER INVESTMENT TRUST
Schedule of Investments - Clearwater International Fund
December 31, 2020
| Shares | | Security | | Cost | | Fair value (a) | | Percent of
net assets |
| Japan (Cont'd): | | | | | | |
| 13,300 | | OBAYASHI CORP. | | $ 58,485 | | 114,639 | | |
| 64,700 | | OISIX RA DAICHI, INC.(b) | | 2,119,555 | | 1,958,138 | | |
| 35,800 | | OKI ELECTRIC INDUSTRY CO. LTD. | | 358,218 | | 315,857 | | |
| 33,200 | | OLYMPUS CORP. | | 211,415 | | 725,542 | | |
| 1,100 | | OMRON CORP. | | 31,828 | | 98,010 | | |
| 5,000 | | ONO PHARMACEUTICAL CO. LTD. | | 43,040 | | 150,501 | | |
| 4,800 | | ORIENTAL LAND CO. LTD. | | 113,097 | | 792,136 | | |
| 5,500 | | OTSUKA HOLDINGS CO. LTD. | | 158,190 | | 235,330 | | |
| 21,600 | | PANASONIC CORP. | | 133,086 | | 249,042 | | |
| 4,100 | | PERSOL HOLDINGS CO. LTD. | | 37,131 | | 73,896 | | |
| 67,600 | | PLAID, INC.(b) | | 1,039,450 | | 2,432,173 | | |
| 43,100 | | RAKUS CO. LTD. | | 310,836 | | 998,452 | | |
| 8,400 | | RAKUTEN, INC. | | 40,327 | | 80,864 | | |
| 2,400 | | RECRUIT HOLDINGS CO. LTD. | | 31,274 | | 100,435 | | |
| 184,100 | | RESONA HOLDINGS, INC. | | 558,258 | | 642,580 | | |
| 1,200 | | RINNAI CORP. | | 52,047 | | 139,228 | | |
| 16,700 | | RION CO. LTD. | | 361,264 | | 583,056 | | |
| 600 | | ROHM CO. LTD. | | 24,642 | | 58,050 | | |
| 34,600 | | SANKI ENGINEERING CO. LTD. | | 423,298 | | 406,467 | | |
| 13,000 | | SANTEN PHARMACEUTICAL CO. LTD. | | 85,886 | | 210,886 | | |
| 13,620 | | SBI HOLDINGS, INC. | | 110,355 | | 322,775 | | |
| 3,400 | | SECOM CO. LTD. | | 133,812 | | 313,378 | | |
| 7,100 | | SEGA SAMMY HOLDINGS, INC. | | 66,480 | | 111,875 | | |
| 49,400 | | SEIKITOKYU KOGYO CO. LTD. | | 333,527 | | 400,922 | | |
| 12,800 | | SEKISUI CHEMICAL CO. LTD. | | 65,116 | | 242,227 | | |
| 6,600 | | SEKISUI HOUSE LTD. | | 53,502 | | 134,231 | | |
| 57,500 | | SEVEN & I HOLDINGS CO. LTD. | | 1,880,751 | | 2,037,601 | | |
| 4,000 | | SHIMADZU CORP. | | 25,419 | | 155,344 | | |
| 1,500 | | SHIMANO, INC. | | 58,204 | | 349,886 | | |
| 9,200 | | SHIN-ETSU CHEMICAL CO. LTD. | | 461,684 | | 1,607,360 | | |
| 36,500 | | SHINOKEN GROUP CO. LTD. | | 314,113 | | 393,439 | | |
| 14,900 | | SHINSEI BANK LTD. | | 192,874 | | 183,409 | | |
| 4,000 | | SHIONOGI & CO. LTD. | | 67,679 | | 218,294 | | |
| 5,800 | | SHISEIDO CO. LTD. | | 87,058 | | 400,841 | | |
| 20,200 | | SK-ELECTRONICS CO. LTD. | | 355,639 | | 259,800 | | |
| 1,100 | | SMC CORP. | | 183,450 | | 670,621 | | |
| 37,200 | | SOFTBANK GROUP CORP. | | 425,837 | | 2,903,081 | | |
| 5,700 | | SOMPO HOLDINGS, INC. | | 114,918 | | 230,363 | | |
| 23,400 | | SONY CORP. | | 534,651 | | 2,330,822 | | |
| 3,300 | | STANLEY ELECTRIC CO. LTD. | | 41,403 | | 106,266 | | |
| 5,700 | | SUBARU CORP. | | 26,572 | | 113,856 | | |
| 7,800 | | SUMITOMO CORP. | | 67,035 | | 103,151 | | |
| 5,600 | | SUMITOMO ELECTRIC INDUSTRIES LTD. | | 44,717 | | 74,112 | | |
| 17,100 | | SUMITOMO HEAVY INDUSTRIES LTD. | | 494,606 | | 421,642 | | |
| 5,800 | | SUZUKI MOTOR CORP. | | 104,611 | | 268,613 | | |
| 2,600 | | SYSMEX CORP. | | 51,707 | | 312,237 | | |
| 13,700 | | T RAD CO. LTD. | | 264,171 | | 177,793 | | |
| 72,200 | | T&D HOLDINGS, INC. | | 714,836 | | 850,975 | | |
| 2,200 | | TAISEI CORP. | | 19,821 | | 75,745 | | |
| 109,800 | | TAKARA LEBEN CO. LTD. | | 430,207 | | 326,460 | | |
| 74,100 | | TATSUTA ELECTRIC WIRE AND CABLE CO. LTD. | | 327,189 | | 538,948 | | |
| 1,200 | | TDK CORP. | | 61,120 | | 180,601 | | |
| 11,600 | | TERUMO CORP. | | 117,165 | | 484,424 | | |
| 2,000 | | THK CO. LTD. | | 29,290 | | 64,500 | | |
| 1,500 | | TOHO CO. LTD. | | 25,533 | | 63,193 | | |
| 3,600 | | TOHO GAS CO. LTD. | | 88,559 | | 238,129 | | |
| 4,100 | | TOHOKU ELECTRIC POWER CO., INC. | | 31,947 | | 33,751 | | |
| 14,400 | | TOKIO MARINE HOLDINGS, INC. | | 359,676 | | 740,257 | | |
| 3,300 | | TOKYO ELECTRON LTD. | | 135,391 | | 1,227,253 | | |
| 6,000 | | TOKYO GAS CO. LTD. | | 103,615 | | 138,531 | | |
| 11,200 | | TOKYO SEIMITSU CO. LTD. | | 346,916 | | 526,076 | | |
| 51,200 | | TOKYO STEEL MANUFACTURING CO. LTD. | | 317,332 | | 331,234 | | |
| 12,500 | | TOKYU CORP. | | 103,448 | | 155,077 | | |
| 20,000 | | TOKYU FUDOSAN HOLDINGS CORP. | | 69,576 | | 106,532 | | |
| 3,000 | | TOTO LTD. | | 30,029 | | 180,137 | | |
| 75,200 | | TOYO CONSTRUCTION CO. LTD. | | 312,593 | | 319,721 | | |
| 3,000 | | TOYO SUISAN KAISHA LTD. | | 74,690 | | 145,852 | | |
| See accompanying notes to financial statements. | 82 | (Continued) |
CLEARWATER INVESTMENT TRUST
Schedule of Investments - Clearwater International Fund
December 31, 2020
| Shares | | Security | | Cost | | Fair value (a) | | Percent of
net assets |
| Japan (Cont'd): | | | | | | |
| 4,000 | | TOYOTA INDUSTRIES CORP. | | $ 101,266 | | 317,273 | | |
| 46,662 | | TOYOTA MOTOR CORP. | | 1,594,403 | | 3,595,850 | | |
| 1,700 | | TOYOTA TSUSHO CORP. | | 14,142 | | 68,573 | | |
| 900 | | TREND MICRO, INC. | | 26,540 | | 51,775 | | |
| 19,200 | | UBE INDUSTRIES LTD. | | 387,205 | | 348,094 | | |
| 7,700 | | UNICHARM CORP. | | 67,055 | | 364,809 | | |
| 5,500 | | USS CO. LTD. | | 64,763 | | 111,113 | | |
| 7,200 | | V TECHNOLOGY CO. LTD. | | 262,608 | | 410,014 | | |
| 3,000 | | WELCIA HOLDINGS CO. LTD. | | 54,205 | | 113,166 | | |
| 4,100 | | WEST JAPAN RAILWAY CO. | | 134,756 | | 214,381 | | |
| 1,300 | | YAKULT HONSHA CO. LTD. | | 22,252 | | 65,469 | | |
| 16,300 | | YAMADA HOLDINGS CO. LTD. | | 56,674 | | 86,508 | | |
| 46,400 | | YAMAGUCHI FINANCIAL GROUP, INC. | | 326,523 | | 261,086 | | |
| 4,600 | | YAMAHA MOTOR CO. LTD. | | 46,377 | | 93,733 | | |
| 4,000 | | YAMAZAKI BAKING CO. LTD. | | 44,679 | | 66,786 | | |
| 5,000 | | YASKAWA ELECTRIC CORP. | | 48,019 | | 248,414 | | |
| 3,100 | | YOKOGAWA ELECTRIC CORP. | | 39,797 | | 61,667 | | |
| 10,100 | | YUASA TRADING CO. LTD. | | 293,394 | | 324,260 | | |
| 25,500 | | Z HOLDINGS CORP. | | 64,236 | | 154,203 | | |
| | | | | 62,975,744 | | 117,176,437 | | 13.50% |
| Jersey: | | | | | | |
| 217,400 | | XLMEDIA PLC(b) | | 170,743 | | 96,621 | | |
| | | | | 170,743 | | 96,621 | | 0.01% |
| Macau: | | | | | | |
| 18,400 | | SANDS CHINA LTD. | | 30,745 | | 80,816 | | |
| | | | | 30,745 | | 80,816 | | 0.01% |
| Malaysia: | | | | | | |
| 274,300 | | RHB BANK BHD. | | 377,864 | | 371,643 | | |
| | | | | 377,864 | | 371,643 | | 0.04% |
| Mexico: | | | | | | |
| 201,200 | | BANCO DEL BAJIO S.A.(b)(e) | | 360,811 | | 275,823 | | |
| 76,900 | | QUALITAS CONTROLADORA S.A.B. DE C.V. | | 281,555 | | 414,034 | | |
| 346,392 | | REGIONAL S.A.B. DE C.V.(b) | | 1,288,348 | | 1,603,191 | | |
| | | | | 1,930,714 | | 2,293,048 | | 0.26% |
| Netherlands: | | | | | | |
| 14,796 | | ABN AMRO BANK N.V. - C.V.A.(b)(e) | | 146,576 | | 144,966 | | |
| 1,907 | | ADYEN N.V.(b)(e) | | 3,391,131 | | 4,438,053 | | |
| 266,723 | | AEGON N.V. | | 664,548 | | 1,054,099 | | |
| 2,925 | | AKZO NOBEL N.V. | | 135,104 | | 313,952 | | |
| 9,048 | | ALTICE EUROPE N.V.(b) | | 43,578 | | 58,893 | | |
| 7,173 | | ASML HOLDING N.V. | | 106,863 | | 3,483,689 | | |
| 14,000 | | ASML HOLDING N.V. (REGISTERED) | | 2,739,871 | | 6,828,080 | | |
| 14,000 | | ASR NEDERLAND N.V. | | 434,452 | | 561,837 | | |
| 3,610 | | EXOR N.V. | | 90,615 | | 292,041 | | |
| 51,500 | | FORFARMERS N.V. | | 322,452 | | 335,966 | | |
| 980 | | HEINEKEN HOLDING N.V. | | 24,979 | | 92,246 | | |
| 3,662 | | HEINEKEN N.V. | | 128,663 | | 408,089 | | |
| 13,823 | | IMCD N.V. | | 1,051,880 | | 1,760,456 | | |
| 621,274 | | ING GROEP N.V.(b) | | 6,025,031 | | 5,799,362 | | |
| 19,595 | | INTERTRUST N.V.(b)(e) | | 321,331 | | 332,263 | | |
| 17,656 | | KONINKLIJKE AHOLD DELHAIZE N.V. | | 203,381 | | 498,470 | | |
| 3,368 | | KONINKLIJKE DSM N.V. | | 132,647 | | 579,324 | | |
| 54,610 | | KONINKLIJKE KPN N.V. | | 115,548 | | 165,919 | | |
| 20,502 | | KONINKLIJKE PHILIPS N.V.(b) | | 343,630 | | 1,096,526 | | |
| 16,544 | | NXP SEMICONDUCTORS N.V. | | 1,380,402 | | 2,630,661 | | |
| 117,200 | | ORDINA N.V. | | 366,521 | | 411,635 | | |
| 8,117 | | QIAGEN N.V.(b) | | 119,394 | | 420,940 | | |
| 3,238 | | RANDSTAD N.V.(b) | | 99,928 | | 210,602 | | |
| 97,281 | | ROYAL DUTCH SHELL PLC, CLASS A | | 1,347,119 | | 1,726,486 | | |
| 41,601 | | ROYAL DUTCH SHELL PLC, CLASS B | | 624,228 | | 716,465 | | |
| 23,800 | | SIGNIFY N.V.(b)(e) | | 640,632 | | 1,003,969 | | |
| 6,193 | | WOLTERS KLUWER N.V. | | 101,075 | | 522,486 | | |
| | | | | 21,101,579 | | 35,887,475 | | 4.14% |
| New Zealand: | | | | | | |
| 15,712 | | AUCKLAND INTERNATIONAL AIRPORT LTD.(b) | | 47,473 | | 85,690 | | |
| See accompanying notes to financial statements. | 83 | (Continued) |
CLEARWATER INVESTMENT TRUST
Schedule of Investments - Clearwater International Fund
December 31, 2020
| Shares | | Security | | Cost | | Fair value (a) | | Percent of
net assets |
| New Zealand (Cont'd): | | | | | | |
| 31,147 | | HALLENSTEIN GLASSON HOLDINGS LTD. | | $ 115,879 | | 149,029 | | |
| | | | | 163,352 | | 234,719 | | 0.03% |
| Norway: | | | | | | |
| 2,949 | | AKER BP ASA | | 36,352 | | 74,359 | | |
| 25,540 | | BAKKAFROST P/F(b) | | 1,776,703 | | 1,824,445 | | |
| 9,200 | | DNB ASA(b) | | 37,422 | | 180,261 | | |
| 155,600 | | KITRON ASA | | 178,558 | | 328,830 | | |
| 23,955 | | NORSK HYDRO ASA | | 48,328 | | 111,362 | | |
| 10,286 | | ORKLA ASA | | 69,398 | | 104,369 | | |
| 228,209 | | PEXIP HOLDING ASA(b) | | 1,881,258 | | 1,748,646 | | |
| 57,040 | | STOREBRAND ASA(b) | | 364,067 | | 427,089 | | |
| 2,793 | | YARA INTERNATIONAL ASA | | 67,399 | | 115,965 | | |
| | | | | 4,459,485 | | 4,915,326 | | 0.57% |
| Philippines: | | | | | | |
| 9,000 | | GLOBE TELECOM, INC. | | 319,161 | | 380,439 | | |
| | | | | 319,161 | | 380,439 | | 0.04% |
| Poland: | | | | | | |
| 37,500 | | CYFROWY POLSAT S.A. | | 259,610 | | 303,959 | | |
| | | | | 259,610 | | 303,959 | | 0.04% |
| Portugal: | | | | | | |
| 85,477 | | ALTRI SGPS S.A. | | 583,770 | | 538,823 | | |
| 20,567 | | EDP - ENERGIAS DE PORTUGAL S.A. | | 48,529 | | 129,548 | | |
| 9,417 | | JERONIMO MARTINS SGPS S.A. | | 105,676 | | 158,989 | | |
| 123,300 | | NAVIGATOR (THE) CO. S.A.(b) | | 307,999 | | 376,272 | | |
| | | | | 1,045,974 | | 1,203,632 | | 0.14% |
| Russia: | | | | | | |
| 56,840 | | HEADHUNTER GROUP PLC ADR(f) | | 1,196,958 | | 1,719,410 | | |
| 257,400 | | RUSHYDRO PJSC ADR(f) | | 218,665 | | 277,477 | | |
| | | | | 1,415,623 | | 1,996,887 | | 0.23% |
| Singapore: | | | | | | |
| 302,700 | | AEM HOLDINGS LTD. | | 265,969 | | 790,190 | | |
| 33,500 | | CAPITALAND INTEGRATED COMMERCIAL TRUST | | 31,763 | | 54,752 | | |
| 19,500 | | CAPITALAND LTD. | | 25,645 | | 48,396 | | |
| 7,200 | | CITY DEVELOPMENTS LTD. | | 27,082 | | 43,420 | | |
| 28,200 | | DBS GROUP HOLDINGS LTD. | | 158,529 | | 534,298 | | |
| 503,500 | | FRENCKEN GROUP LTD. | | 337,379 | | 502,890 | | |
| 3,000 | | JARDINE CYCLE & CARRIAGE LTD. | | 41,532 | | 44,378 | | |
| 21,000 | | KEPPEL CORP. LTD. | | 53,869 | | 85,487 | | |
| 7,840 | | KEPPEL REIT | | 3,183 | | 6,644 | | |
| 6,000 | | OVERSEA-CHINESE BANKING CORP. LTD. | | 32,488 | | 45,672 | | |
| 13,000 | | SINGAPORE EXCHANGE LTD. | | 40,226 | | 91,283 | | |
| 4,600 | | UNITED OVERSEAS BANK LTD. | | 26,071 | | 78,627 | | |
| 15,000 | | UOL GROUP LTD. | | 49,917 | | 87,508 | | |
| 48,200 | | VENTURE CORP. LTD. | | 558,851 | | 708,266 | | |
| 43,600 | | WILMAR INTERNATIONAL LTD. | | 88,595 | | 153,405 | | |
| | | | | 1,741,099 | | 3,275,216 | | 0.38% |
| South Africa: | | | | | | |
| 92,000 | | ADCOCK INGRAM HOLDINGS LTD. | | 249,383 | | 287,989 | | |
| 33,591 | | AFRICAN RAINBOW MINERALS LTD. | | 339,096 | | 598,695 | | |
| 42,500 | | BARLOWORLD LTD. | | 289,872 | | 263,474 | | |
| 79,610 | | INVESTEC PLC | | 490,976 | | 203,907 | | |
| 117,469 | | METAIR INVESTMENTS LTD.(b) | | 184,301 | | 149,884 | | |
| 68,600 | | OCEANA GROUP LTD. | | 268,470 | | 299,935 | | |
| 83,378 | | TELKOM S.A. SOC LTD. | | 425,342 | | 174,246 | | |
| | | | | 2,247,440 | | 1,978,130 | | 0.23% |
| South Korea: | | | | | | |
| 4,300 | | DAELIM INDUSTRIAL CO. LTD.(g) | | 351,532 | | 328,546 | | |
| 15,700 | | DAESANG CORP. | | 366,086 | | 376,494 | | |
| 21,500 | | DAEWON PHARMACEUTICAL CO. LTD.(b) | | 277,342 | | 383,964 | | |
| 20,489 | | DB HITEK CO. LTD. | | 270,468 | | 961,925 | | |
| 5,268 | | DOUZONE BIZON CO. LTD. | | 283,767 | | 504,347 | | |
| 9,900 | | GS HOLDINGS CORP. | | 371,567 | | 342,212 | | |
| 8,250 | | HUONS CO. LTD. | | 416,763 | | 469,345 | | |
| 3,500 | | HYUNDAI GLOVIS CO. LTD. | | 391,747 | | 592,838 | | |
| See accompanying notes to financial statements. | 84 | (Continued) |
CLEARWATER INVESTMENT TRUST
Schedule of Investments - Clearwater International Fund
December 31, 2020
| Shares | | Security | | Cost | | Fair value (a) | | Percent of
net assets |
| South Korea (Cont'd): | | | | | | |
| 46,124 | | HYUNDAI GREENFOOD CO. LTD. | | $ 465,431 | | 371,947 | | |
| 23,300 | | JW LIFE SCIENCE CORP. | | 391,190 | | 445,066 | | |
| 18,600 | | KC TECH CO. LTD. | | 295,116 | | 526,512 | | |
| 18,400 | | KT CORP. | | 365,564 | | 406,518 | | |
| 30,770 | | LG UPLUS CORP. | | 348,896 | | 332,825 | | |
| 10,183 | | LOTTE FINE CHEMICAL CO. LTD. | | 404,389 | | 517,446 | | |
| 4,775 | | MAEIL DAIRIES CO. LTD. | | 380,764 | | 307,256 | | |
| 20,760 | | NAVER CORP. | | 2,604,217 | | 5,589,892 | | |
| 2,560 | | SAMJIN PHARMACEUTICAL CO. LTD. | | 55,267 | | 64,218 | | |
| 134,886 | | SAMSUNG ELECTRONICS CO. LTD. | | 3,974,583 | | 10,057,780 | | |
| 14,251 | | SAMSUNG SECURITIES CO. LTD. | | 434,059 | | 530,657 | | |
| 18,900 | | UNITEST, INC. | | 206,195 | | 473,239 | | |
| 10,200 | | VIEWORKS CO. LTD. | | 234,573 | | 284,977 | | |
| | | | | 12,889,516 | | 23,868,004 | | 2.75% |
| Spain: | | | | | | |
| 1,260 | | ACCIONA S.A. | | 78,312 | | 179,634 | | |
| 2,420 | | ACS ACTIVIDADES DE CONSTRUCCION Y SERVICIOS S.A. | | 53,419 | | 80,266 | | |
| 583 | | AENA S.M.E. S.A.(b)(e) | | 50,199 | | 101,278 | | |
| 72,599 | | AMADEUS IT GROUP S.A. | | 5,249,182 | | 5,282,411 | | |
| 256,570 | | BANCO BILBAO VIZCAYA ARGENTARIA S.A. | | 764,978 | | 1,264,725 | | |
| 284,591 | | BANCO DE SABADELL S.A. | | 262,572 | | 123,075 | | |
| 385,386 | | BANCO SANTANDER S.A.(b) | | 691,255 | | 1,194,908 | | |
| 888,411 | | BANKIA S.A. | | 2,454,906 | | 1,572,639 | | |
| 23,111 | | CAIXABANK S.A. | | 39,733 | | 59,319 | | |
| 24,100 | | CIA DE DISTRIBUCION INTEGRAL LOGISTA HOLDINGS S.A. | | 458,757 | | 466,946 | | |
| 2,531 | | ENAGAS S.A. | | 38,143 | | 55,548 | | |
| 61,100 | | FAES FARMA S.A. | | 274,848 | | 260,503 | | |
| 5,382 | | FERROVIAL S.A. | | 90,111 | | 148,593 | | |
| 15,282 | | GRIFOLS S.A. | | 273,864 | | 445,822 | | |
| 62,004 | | IBERDROLA S.A. | | 341,951 | | 886,242 | | |
| 2,120 | | INDUSTRIA DE DISENO TEXTIL S.A. | | 14,078 | | 67,441 | | |
| 87,000 | | MEDIASET ESPANA COMUNICACION S.A.(b) | | 475,447 | | 452,768 | | |
| 13,196 | | MIQUEL Y COSTAS & MIQUEL S.A. | | 241,236 | | 237,300 | | |
| 16,093 | | NATURGY ENERGY GROUP S.A. | | 256,441 | | 372,754 | | |
| 128,100 | | PROSEGUR CIA DE SEGURIDAD S.A. | | 305,625 | | 381,531 | | |
| 33,279 | | RED ELECTRICA CORP. S.A. | | 472,607 | | 681,992 | | |
| 25,223 | | REPSOL S.A. | | 190,751 | | 254,213 | | |
| 2,773 | | SIEMENS GAMESA RENEWABLE ENERGY S.A. | | 40,458 | | 112,097 | | |
| | | | | 13,118,873 | | 14,682,005 | | 1.69% |
| Sweden: | | | | | | |
| 22,200 | | ASSA ABLOY AB, CLASS B | | 89,466 | | 546,393 | | |
| 98,478 | | ATLAS COPCO AB, CLASS A | | 2,692,388 | | 5,040,241 | | |
| 3,980 | | ATLAS COPCO AB, CLASS B | | 22,691 | | 178,161 | | |
| 64,280 | | AVANZA BANK HOLDING AB | | 542,475 | | 1,820,366 | | |
| 41,106 | | BEIJER REF AB | | 950,509 | | 1,880,536 | | |
| 32,900 | | BOLIDEN AB | | 800,179 | | 1,165,232 | | |
| 7,501 | | ELECTROLUX AB, CLASS B | | 79,015 | | 174,451 | | |
| 7,501 | | ELECTROLUX PROFESSIONAL AB, CLASS B(b) | | 16,773 | | 42,466 | | |
| 10,554 | | EPIROC AB, CLASS A | | 27,811 | | 191,964 | | |
| 4,533 | | EPIROC AB, CLASS B | | 12,252 | | 76,582 | | |
| 8,600 | | ESSITY AB, CLASS B | | 62,137 | | 276,472 | | |
| 3,651 | | HEXAGON AB, CLASS B | | 56,077 | | 332,724 | | |
| 80,300 | | HUMANA AB(b) | | 413,356 | | 577,782 | | |
| 38,321 | | HUSQVARNA AB, CLASS B | | 174,072 | | 496,036 | | |
| 8,270 | | INDUSTRIVARDEN AB, CLASS C(b) | | 85,948 | | 266,868 | | |
| 99,027 | | INDUTRADE AB(b) | | 997,352 | | 2,120,735 | | |
| 11,210 | | INVESTOR AB, CLASS B | | 160,645 | | 816,402 | | |
| 56,909 | | INWIDO AB(b) | | 320,042 | | 833,479 | | |
| 60,962 | | KAMBI GROUP PLC(b) | | 1,428,219 | | 2,874,867 | | |
| 55,400 | | KINDRED GROUP PLC(b) | | 287,801 | | 542,445 | | |
| 3,000 | | KINNEVIK AB, CLASS A(b) | | 51,225 | | 151,502 | | |
| 7,801 | | KNOW IT AB(b) | | 144,665 | | 295,349 | | |
| 29,428 | | LUNDIN ENERGY AB | | 485,724 | | 795,110 | | |
| 44,500 | | MEKONOMEN AB(b) | | 323,086 | | 492,726 | | |
| 77,913 | | NOBIA AB(b) | | 452,973 | | 623,580 | | |
| 46,408 | | NOBINA AB(b)(e) | | 300,038 | | 390,888 | | |
| 180,065 | | NORDNET AB PUBL(b) | | 2,036,287 | | 2,825,416 | | |
| See accompanying notes to financial statements. | 85 | (Continued) |
CLEARWATER INVESTMENT TRUST
Schedule of Investments - Clearwater International Fund
December 31, 2020
| Shares | | Security | | Cost | | Fair value (a) | | Percent of
net assets |
| Sweden (Cont'd): | | | | | | |
| 77,000 | | RESURS HOLDING AB(b)(e) | | $ 449,843 | | 421,143 | | |
| 14,651 | | SANDVIK AB(b) | | 121,756 | | 358,458 | | |
| 29,115 | | SECTRA AB, CLASS B(b) | | 1,225,853 | | 2,595,636 | | |
| 14,236 | | SECURITAS AB, CLASS B | | 116,133 | | 229,694 | | |
| 63,171 | | SKANDINAVISKA ENSKILDA BANKEN AB, CLASS A(b) | | 322,937 | | 648,786 | | |
| 2,634 | | SKANSKA AB, CLASS B | | 22,223 | | 67,134 | | |
| 8,600 | | SVENSKA CELLULOSA AB S.C.A., CLASS B(b) | | 15,915 | | 149,786 | | |
| 11,864 | | SVENSKA HANDELSBANKEN AB, CLASS A(b) | | 54,195 | | 119,107 | | |
| 40,373 | | SWEDBANK AB, CLASS A(b) | | 450,231 | | 707,200 | | |
| 59,340 | | TELEFONAKTIEBOLAGET LM ERICSSON, CLASS B | | 307,815 | | 704,210 | | |
| 35,506 | | TETHYS OIL AB | | 259,465 | | 212,321 | | |
| 29,300 | | TRELLEBORG AB, CLASS B(b) | | 420,080 | | 649,916 | | |
| 67,845 | | VITEC SOFTWARE GROUP AB, CLASS B | | 1,167,900 | | 2,811,895 | | |
| 26,685 | | VOLVO AB, CLASS B(b) | | 185,306 | | 628,562 | | |
| | | | | 18,132,858 | | 36,132,621 | | 4.16% |
| Switzerland: | | | | | | |
| 301,961 | | ABB LTD. (REGISTERED) | | 5,704,726 | | 8,428,167 | | |
| 2,686 | | ADECCO GROUP A.G. (REGISTERED) | | 82,183 | | 179,491 | | |
| 79,027 | | ALCON, INC.(b) | | 4,286,881 | | 5,252,399 | | |
| 484 | | BALOISE HOLDING A.G. (REGISTERED) | | 26,452 | | 86,106 | | |
| 1,098 | | BUCHER INDUSTRIES A.G. (REGISTERED) | | 236,188 | | 503,048 | | |
| 34 | | CHOCOLADEFABRIKEN LINDT & SPRUENGLI A.G. (PARTICIPATION CERTIFICATE) | | 48,855 | | 331,436 | | |
| 3 | | CHOCOLADEFABRIKEN LINDT & SPRUENGLI A.G. (REGISTERED) | | 75,352 | | 299,559 | | |
| 64,979 | | CIE FINANCIERE RICHEMONT S.A., CLASS A (REGISTERED) | | 4,466,620 | | 5,877,689 | | |
| 4,900 | | DKSH HOLDING A.G. | | 291,993 | | 368,344 | | |
| 5,142 | | DUFRY A.G. (REGISTERED)(b) | | 334,095 | | 322,820 | | |
| 990 | | GEBERIT A.G. (REGISTERED) | | 85,632 | | 619,742 | | |
| 140 | | GIVAUDAN S.A. (REGISTERED) | | 76,496 | | 589,857 | | |
| 166,472 | | GLOBAL BLUE GROUP HOLDING A.G.(b)(d) | | 1,784,501 | | 2,164,136 | | |
| 6,000 | | HELVETIA HOLDING A.G. (REGISTERED) | | 567,039 | | 633,006 | | |
| 1,807 | | IDORSIA LTD.(b) | | 18,603 | | 52,089 | | |
| 18,059 | | JULIUS BAER GROUP LTD. | | 558,057 | | 1,040,336 | | |
| 69,285 | | LAFARGEHOLCIM LTD. (REGISTERED)(b) | | 3,487,890 | | 3,805,079 | | |
| 3,700 | | LANDIS+GYR GROUP A.G.(b) | | 249,447 | | 290,049 | | |
| 8,897 | | LONZA GROUP A.G. (REGISTERED) | | 4,748,143 | | 5,716,270 | | |
| 95,191 | | NESTLE S.A. (REGISTERED) | | 4,276,199 | | 11,210,453 | | |
| 77,648 | | NOVARTIS A.G. (REGISTERED) | | 4,439,288 | | 7,336,784 | | |
| 11,952 | | ROCHE HOLDING A.G. | | 1,552,784 | | 4,171,657 | | |
| 1,381 | | SCHINDLER HOLDING A.G. (PARTICIPATION CERTIFICATE) | | 108,493 | | 372,198 | | |
| 589 | | SCHINDLER HOLDING A.G. (REGISTERED) | | 68,597 | | 158,610 | | |
| 120 | | SGS S.A. (REGISTERED) | | 129,434 | | 361,911 | | |
| 23,517 | | SIKA A.G. (REGISTERED) | | 2,905,576 | | 6,423,145 | | |
| 1,308 | | SONOVA HOLDING A.G. (REGISTERED)(b) | | 84,414 | | 339,817 | | |
| 32,211 | | STMICROELECTRONICS N.V. | | 517,002 | | 1,191,535 | | |
| 635 | | SULZER A.G. (REGISTERED) | | 30,609 | | 66,778 | | |
| 743 | | SWISS LIFE HOLDING A.G. (REGISTERED) | | 101,194 | | 346,112 | | |
| 194 | | SWISSCOM A.G. (REGISTERED) | | 49,414 | | 104,549 | | |
| 3,809 | | TECAN GROUP A.G. (REGISTERED) | | 742,603 | | 1,866,423 | | |
| 421,319 | | UBS GROUP A.G. (REGISTERED) | | 5,949,702 | | 5,934,540 | | |
| 7,700 | | VALIANT HOLDING A.G. (REGISTERED) | | 734,240 | | 752,344 | | |
| 8,463 | | VAT GROUP A.G.(e) | | 1,264,987 | | 2,110,731 | | |
| 5,000 | | VETROPACK HOLDING A.G. (REGISTERED)(b) | | 256,087 | | 337,174 | | |
| 6,700 | | VONTOBEL HOLDING A.G. (REGISTERED) | | 477,708 | | 531,278 | | |
| 41,000 | | WIZZ AIR HOLDINGS PLC(b)(e) | | 1,586,770 | | 2,558,921 | | |
| 7,800 | | ZEHNDER GROUP A.G. (REGISTERED) | | 303,280 | | 520,705 | | |
| 13,115 | | ZUR ROSE GROUP A.G.(b) | | 3,157,380 | | 4,192,415 | | |
| 4,209 | | ZURICH INSURANCE GROUP A.G. | | 808,513 | | 1,775,739 | | |
| | | | | 56,673,427 | | 89,223,442 | | 10.28% |
| Taiwan: | | | | | | |
| 305,000 | | ASIA CEMENT CORP. | | 434,632 | | 468,930 | | |
| 50,000 | | BIOTEQUE CORP. | | 216,137 | | 236,672 | | |
| 125,000 | | CHC HEALTHCARE GROUP | | 178,135 | | 175,947 | | |
| 146,000 | | CHIPBOND TECHNOLOGY CORP. | | 286,157 | | 345,021 | | |
| 419,000 | | CHIPMOS TECHNOLOGIES, INC. | | 449,603 | | 512,230 | | |
| See accompanying notes to financial statements. | 86 | (Continued) |
CLEARWATER INVESTMENT TRUST
Schedule of Investments - Clearwater International Fund
December 31, 2020
| Shares | | Security | | Cost | | Fair value (a) | | Percent of
net assets |
| Taiwan (Cont'd): | | | | | | |
| 179,000 | | ESON PRECISION IND CO. LTD. | | $ 236,267 | | 403,256 | | |
| 38,000 | | GLOBALWAFERS CO. LTD. | | 372,583 | | 957,506 | | |
| 145,000 | | JARLLYTEC CO. LTD. | | 327,630 | | 363,816 | | |
| 241,000 | | MIRLE AUTOMATION CORP. | | 311,936 | | 377,393 | | |
| 90,000 | | RADIANT OPTO-ELECTRONICS CORP. | | 361,908 | | 365,150 | | |
| 62,000 | | SCI PHARMTECH, INC. | | 252,185 | | 185,351 | | |
| 1,260,000 | | SINOPAC FINANCIAL HOLDINGS CO. LTD. | | 492,562 | | 513,453 | | |
| 225,000 | | TAIWAN HON CHUAN ENTERPRISE CO. LTD. | | 422,583 | | 482,864 | | |
| 90,850 | | TAIWAN SEMICONDUCTOR MANUFACTURING CO. LTD. ADR(f) | | 1,815,476 | | 9,906,284 | | |
| 82,000 | | TOPCO SCIENTIFIC CO. LTD. | | 252,353 | | 348,744 | | |
| 210,000 | | UNIVERSAL VISION BIOTECHNOLOGY CO. LTD. | | 1,850,194 | | 1,786,248 | | |
| 644,000 | | WISTRON CORP. | | 522,109 | | 710,513 | | |
| 90,000 | | ZHEN DING TECHNOLOGY HOLDING LTD. | | 335,681 | | 365,151 | | |
| | | | | 9,118,131 | | 18,504,529 | | 2.13% |
| Thailand: | | | | | | |
| 432,100 | | PRUKSA HOLDING PCL (REGISTERED) | | 233,658 | | 180,282 | | |
| 301,200 | | THAI VEGETABLE OIL PCL (REGISTERED) | | 265,122 | | 339,302 | | |
| | | | | 498,780 | | 519,584 | | 0.06% |
| Turkey: | | | | | | |
| 53,800 | | COCA-COLA ICECEK A.S. | | 315,265 | | 476,260 | | |
| 186,400 | | TURKCELL ILETISIM HIZMETLERI A.S. | | 453,929 | | 403,745 | | |
| | | | | 769,194 | | 880,005 | | 0.10% |
| United Kingdom: | | | | | | |
| 26,524 | | 3I GROUP PLC | | 99,606 | | 420,025 | | |
| 163,000 | | 888 HOLDINGS PLC | | 318,087 | | 636,387 | | |
| 3,206 | | ADMIRAL GROUP PLC | | 44,520 | | 127,405 | | |
| 38,656 | | AGGREKO PLC | | 408,897 | | 330,917 | | |
| 52,849 | | ANGLO AMERICAN PLC | | 411,011 | | 1,752,211 | | |
| 1,979 | | ASSOCIATED BRITISH FOODS PLC(b) | | 61,249 | | 61,270 | | |
| 26,375 | | ASTRAZENECA PLC | | 983,695 | | 2,641,607 | | |
| 14,995 | | AUTO TRADER GROUP PLC(e) | | 74,948 | | 122,214 | | |
| 55,018 | | AVIVA PLC | | 187,586 | | 244,671 | | |
| 43,292 | | AVON RUBBER PLC | | 1,898,207 | | 1,873,737 | | |
| 73,500 | | BABCOCK INTERNATIONAL GROUP PLC(b) | | 428,761 | | 281,331 | | |
| 19,513 | | BAE SYSTEMS PLC | | 93,862 | | 130,432 | | |
| 113,471 | | BAKKAVOR GROUP PLC(b)(e) | | 166,389 | | 125,689 | | |
| 9,400 | | BELLWAY PLC | | 411,711 | | 379,850 | | |
| 2,391 | | BERKELEY GROUP HOLDINGS PLC | | 71,739 | | 155,049 | | |
| 120,204 | | BP PLC | | 405,112 | | 418,838 | | |
| 27,424 | | BRITISH AMERICAN TOBACCO PLC | | 764,176 | | 1,015,563 | | |
| 93,984 | | BRITISH LAND (THE) CO. PLC | | 402,942 | | 628,478 | | |
| 5,069 | | BUNZL PLC | | 39,524 | | 169,345 | | |
| 8,193 | | BURBERRY GROUP PLC(b) | | 40,501 | | 200,494 | | |
| 53,800 | | CARETECH HOLDINGS PLC | | 347,241 | | 384,043 | | |
| 135,923 | | CNH INDUSTRIAL N.V.(b) | | 1,161,363 | | 1,714,470 | | |
| 450,363 | | COMPASS GROUP PLC | | 5,712,921 | | 8,394,328 | | |
| 2,457 | | CRODA INTERNATIONAL PLC | | 92,898 | | 221,622 | | |
| 41,565 | | DIAGEO PLC | | 506,960 | | 1,635,859 | | |
| 177,500 | | DIRECT LINE INSURANCE GROUP PLC | | 614,920 | | 774,313 | | |
| 108,100 | | DRAX GROUP PLC | | 316,682 | | 554,350 | | |
| 40,654 | | EASYJET PLC | | 523,562 | | 461,433 | | |
| 4,107 | | FERGUSON PLC | | 80,053 | | 498,954 | | |
| 49,106 | | FEVERTREE DRINKS PLC | | 1,228,171 | | 1,696,943 | | |
| 17,467 | | FIAT CHRYSLER AUTOMOBILES N.V.(b) | | 108,686 | | 312,823 | | |
| 10,222 | | FIAT CHRYSLER AUTOMOBILES N.V. (NEW YORK EXCHANGE)(b) | | 17,872 | | 184,916 | | |
| 64,350 | | GAN LTD.(b)(d) | | 1,411,844 | | 1,305,018 | | |
| 52,259 | | GLAXOSMITHKLINE PLC | | 768,484 | | 959,049 | | |
| 62,503 | | HSBC HOLDINGS PLC(b) | | 310,096 | | 323,814 | | |
| 2,417 | | IMPERIAL BRANDS PLC | | 41,769 | | 50,752 | | |
| 51,391 | | INCHCAPE PLC(b) | | 315,109 | | 452,234 | | |
| 21,041 | | INFORMA PLC(b) | | 99,674 | | 157,967 | | |
| 272,520 | | INTEGRAFIN HOLDINGS PLC | | 1,780,953 | | 2,072,051 | | |
| 2,594 | | INTERCONTINENTAL HOTELS GROUP PLC(b) | | 150,347 | | 166,368 | | |
| 32,745 | | INTERNATIONAL CONSOLIDATED AIRLINES GROUP S.A.(b)(d) | | 60,221 | | 71,645 | | |
| See accompanying notes to financial statements. | 87 | (Continued) |
CLEARWATER INVESTMENT TRUST
Schedule of Investments - Clearwater International Fund
December 31, 2020
| Shares | | Security | | Cost | | Fair value (a) | | Percent of
net assets |
| United Kingdom (Cont'd): | | | | | | |
| 423,658 | | J SAINSBURY PLC | | $ 1,107,817 | | 1,306,440 | | |
| 8,056 | | JD SPORTS FASHION PLC(b) | | 79,356 | | 94,743 | | |
| 43,200 | | JET2 PLC(b) | | 431,313 | | 844,787 | | |
| 2,128 | | JOHNSON MATTHEY PLC | | 33,879 | | 70,568 | | |
| 40,500 | | JUPITER FUND MANAGEMENT PLC | | 144,407 | | 156,404 | | |
| 325,255 | | KINGFISHER PLC(b) | | 867,860 | | 1,202,702 | | |
| 58,758 | | LAND SECURITIES GROUP PLC | | 385,246 | | 541,409 | | |
| 5,699,750 | | LLOYDS BANKING GROUP PLC(b) | | 3,927,062 | | 2,840,282 | | |
| 6,030 | | LONDON STOCK EXCHANGE GROUP PLC | | 69,795 | | 742,802 | | |
| 191,900 | | MAN GROUP PLC | | 264,558 | | 362,144 | | |
| 300,659 | | MARSTON'S PLC(b) | | 477,602 | | 310,830 | | |
| 7,217 | | MEGGITT PLC(b) | | 16,687 | | 46,040 | | |
| 68,053 | | MELROSE INDUSTRIES PLC(b) | | 95,941 | | 165,698 | | |
| 61,400 | | MICRO FOCUS INTERNATIONAL PLC(b) | | 366,236 | | 356,093 | | |
| 145,235 | | MORGAN ADVANCED MATERIALS PLC | | 467,561 | | 617,674 | | |
| 22,756 | | NATIONAL GRID PLC | | 142,793 | | 269,178 | | |
| 829,067 | | NATWEST GROUP PLC(b) | | 1,897,188 | | 1,900,730 | | |
| 6,959 | | NEXT PLC(b) | | 416,496 | | 674,334 | | |
| 39,805 | | NINETY ONE PLC | | 72,784 | | 124,761 | | |
| 103,083 | | OSB GROUP PLC(b) | | 483,067 | | 597,132 | | |
| 12,212 | | RECKITT BENCKISER GROUP PLC | | 510,135 | | 1,092,508 | | |
| 109,800 | | REDDE NORTHGATE PLC | | 378,816 | | 399,403 | | |
| 57,235 | | REDROW PLC(b) | | 447,916 | | 447,307 | | |
| 47,054 | | RELX PLC | | 574,910 | | 1,151,395 | | |
| 167,555 | | RELX PLC (LONDON EXCHANGE) | | 1,911,025 | | 4,107,182 | | |
| 23,058 | | RENTOKIL INITIAL PLC(b) | | 117,249 | | 160,686 | | |
| 34,005 | | RIO TINTO PLC | | 893,598 | | 2,543,651 | | |
| 27,049 | | ROLLS-ROYCE HOLDINGS PLC(b) | | 19,223 | | 41,151 | | |
| 77,712 | | ROYAL MAIL PLC(b) | | 220,280 | | 358,878 | | |
| 20,657 | | SAGE GROUP (THE) PLC | | 74,323 | | 164,406 | | |
| 16,135 | | SEGRO PLC | | 67,053 | | 209,084 | | |
| 114,270 | | SENIOR PLC(b) | | 287,158 | | 139,466 | | |
| 13,084 | | SEVERN TRENT PLC | | 276,407 | | 409,556 | | |
| 241,203 | | SMITH & NEPHEW PLC | | 5,167,465 | | 4,980,661 | | |
| 3,071 | | SMITHS GROUP PLC | | 37,103 | | 63,183 | | |
| 130,483 | | SOFTCAT PLC | | 1,714,988 | | 2,451,704 | | |
| 414,000 | | SPEEDY HIRE PLC(b) | | 294,411 | | 403,095 | | |
| 420 | | SPIRAX-SARCO ENGINEERING PLC | | 63,135 | | 64,873 | | |
| 82,413 | | STHREE PLC(b) | | 315,585 | | 335,845 | | |
| 101,900 | | STOCK SPIRITS GROUP PLC | | 321,342 | | 373,453 | | |
| 77,600 | | TATE & LYLE PLC | | 713,986 | | 715,660 | | |
| 184,280 | | TEAM17 GROUP PLC(b) | | 1,542,672 | | 2,016,023 | | |
| 834,488 | | TESCO PLC | | 2,095,522 | | 2,640,650 | | |
| 148,000 | | TP ICAP PLC | | 641,118 | | 482,093 | | |
| 320,826 | | TRAINLINE PLC(b)(e) | | 1,228,950 | | 2,035,705 | | |
| 126,800 | | TYMAN PLC(b) | | 343,290 | | 607,764 | | |
| 10,104 | | UNILEVER PLC | | 262,590 | | 611,808 | | |
| 24,244 | | UNILEVER PLC (LONDON EXCHANGE) | | 545,189 | | 1,456,109 | | |
| 8,137 | | UNITED UTILITIES GROUP PLC | | 56,989 | | 99,590 | | |
| 719,183 | | VODAFONE GROUP PLC | | 1,199,817 | | 1,189,424 | | |
| 2,809 | | WHITBREAD PLC(b) | | 69,922 | | 119,081 | | |
| 6,577 | | WILLIS TOWERS WATSON PLC | | 971,931 | | 1,385,642 | | |
| 324,500 | | WM MORRISON SUPERMARKETS PLC | | 792,191 | | 786,997 | | |
| 64,102 | | WPP PLC | | 434,931 | | 701,276 | | |
| | | | | 59,301,217 | | 82,078,525 | | 9.46% |
| United States: | | | | | | |
| 15,350 | | AON PLC, CLASS A | | 3,033,130 | | 3,242,994 | | |
| 248,400 | | DIVERSIFIED GAS & OIL PLC | | 347,000 | | 383,846 | | |
| 3,424 | | FIDELITY NATIONAL INFORMATION SERVICES, INC. | | 289,873 | | 484,359 | | |
| 4,064 | | METTLER-TOLEDO INTERNATIONAL, INC.(b) | | 2,384,814 | | 4,631,660 | | |
| 3,157 | | NEWMONT CORP. | | 101,845 | | 188,939 | | |
| 30,550 | | RESMED, INC. | | 3,313,357 | | 6,493,708 | | |
| 182,902 | | SCHLUMBERGER N.V. | | 2,956,937 | | 3,992,751 | | |
| 22,500 | | STERIS PLC | | 3,599,549 | | 4,264,650 | | |
| See accompanying notes to financial statements. | 88 | (Continued) |
CLEARWATER INVESTMENT TRUST
Schedule of Investments - Clearwater International Fund
December 31, 2020
| Shares | | Security | | Cost | | Fair value (a) | | Percent of
net assets |
| United States (Cont'd): | | | | | | |
| 74 | | WHITE MOUNTAINS INSURANCE GROUP LTD. | | $ 70,039 | | 74,049 | | |
| | | | | 16,096,544 | | 23,756,956 | | 2.74% |
| | | Sub-total Common Stocks: | | 499,593,676 | | 825,358,422 | | 95.11% |
| Preferred Stocks: | | | | | | |
| Brazil: | | | | | | |
| 90,712 | | AZUL S.A. ADR(b)(f) | | 934,154 | | 2,070,048 | | |
| 263,400 | | CIA DE SANEAMENTO DO PARANA(b) | | 350,151 | | 258,623 | | |
| | | | | 1,284,305 | | 2,328,671 | | 0.27% |
| Germany: | | | | | | |
| 1,739 | | BAYERISCHE MOTOREN WERKE A.G., 4.62%(h) | | 59,403 | | 117,270 | | |
| 3,800 | | DRAEGERWERK A.G. & CO. KGAA, 0.29%(h) | | 311,648 | | 291,534 | | |
| 10,197 | | JUNGHEINRICH A.G., 1.24%(h) | | 253,285 | | 455,932 | | |
| 312 | | SARTORIUS A.G., 0.10%(h) | | 56,342 | | 130,965 | | |
| 2,800 | | STO S.E. & CO. KGAA, 0.23%(h) | | 304,841 | | 442,628 | | |
| | | | | 985,519 | | 1,438,329 | | 0.17% |
| South Korea: | | | | | | |
| 51,248 | | SAMSUNG ELECTRONICS CO. LTD., 1.90%(h) | | 1,582,592 | | 3,472,202 | | |
| | | | | 1,582,592 | | 3,472,202 | | 0.40% |
| | | Sub-total Preferred Stocks: | | 3,852,416 | | 7,239,202 | | 0.84% |
| Rights: | | | | | | |
| Spain: | | | | | | |
| 25,223 | | REPSOL S.A.(b) | | 8,907 | | 8,650 | | |
| | | | | 8,907 | | 8,650 | | 0.00% |
| | | Sub-total Rights: | | 8,907 | | 8,650 | | 0.00% |
| Warrants: | | | | | | |
| Ireland: | | | | | | |
| 420,500 | | ANHUI SUNHERE PHARMACEUTICAL EXCIPIENTS CO. LTD.(b) | | 1,559,288 | | 1,112,366 | | |
| | | | | 1,559,288 | | 1,112,366 | | 0.13% |
| Switzerland: | | | | | | |
| 128,698 | | CIE FINANCIERE RICHEMONT S.A.(b) | | - | | 33,436 | | |
| | | | | - | | 33,436 | | 0.00% |
| United Kingdom: | | | | | | |
| 131,193 | | HSBC BANK PLC(b) | | 2,024,025 | | 2,609,272 | | |
| | | | | 2,024,025 | | 2,609,272 | | 0.30% |
| | | Sub-total Warrants: | | 3,583,313 | | 3,755,074 | | 0.43% |
| Short-Term Investments: | | | | | | |
| 9,468,993 | | FIDELITY INVESTMENTS MONEY MARKET GOVERNMENT PORTFOLIO(i) | | 9,468,993 | | 9,468,993 | | |
| 25,824,393 | | NORTHERN INSTITUTIONAL FUNDS - U.S. GOVERNMENT SELECT PORTFOLIO, 0.02%(j) | | 25,824,393 | | 25,824,393 | | |
| | | Sub-total Short-Term Investments: | | 35,293,386 | | 35,293,386 | | 4.07% |
| | | Grand total | | $ 542,331,698 | | 871,654,734 | | 100.45% |
| Notes to Schedule of Investments: |
| (a) | Investments are valued in accordance with procedures described in Note 2 to the financial statements. |
| (b) | Non-income producing assets. |
| (c) | Security has been deemed worthless and is a Level 3 investment. |
| (d) | Security is either wholly or partially on loan. |
| (e) | Securities exempt from registration under Rule 144A of the Securities Act of 1933. These securities may be resold in transactions exempt from registration, normally to qualified institutional buyers. The value of these securities is determined by valuations supplied by a pricing service or brokers, or, if not available, in accordance with procedures established by the Board of Trustees. |
| (f) | Securities are American Depositary Receipts of companies based outside of the United States representing 4.03% of net assets as of December 31, 2020. |
| (g) | This is a Level 3 security. |
| (h) | Current yield is disclosed. Dividends are calculated based on a percentage of the issuer’s net income. |
| (i) | Investment relates to cash collateral received from portfolio securities loaned. |
| See accompanying notes to financial statements. | 89 | (Continued) |
CLEARWATER INVESTMENT TRUST
Schedule of Investments - Clearwater International Fund
December 31, 2020
| (j) | The short-term investment is a money market portfolio of the investment company, Northern Institutional Funds. At December 31, 2019, the value of the Clearwater International Fund's investment in the U.S. Government Select Portfolio of the Northern Institutional Funds was $32,652,940 with net sales of $6,828,547 during the fiscal year ended December 31, 2020. |
At December 31, 2020, the industry sectors for the Clearwater International Fund were:
| Industry Sector | | Percent of
Long-Term
Investments |
| Communication Services | | 5.25% |
| Consumer Discretionary | | 12.20 |
| Consumer Staples | | 7.82 |
| Energy | | 2.74 |
| Financials | | 15.22 |
| Health Care | | 13.38 |
| Industrials | | 16.38 |
| Information Technology | | 17.77 |
| Materials | | 5.89 |
| Real Estate | | 1.93 |
| Utilities | | 1.42 |
| | | 100.00% |
At December 31, 2020, the Clearwater International Fund’s investments were denominated in the following currencies:
| Concentration by Currency | | Percent of
Long-Term
Investments |
| Euro | | 20.29% |
| United States Dollar | | 14.86 |
| Japanese Yen | | 14.01 |
| British Pound | | 10.61 |
| Swiss Franc | | 9.97 |
| Canadian Dollar | | 5.50 |
| Other currencies | | 24.76 |
| | | 100.00% |
At December 31, 2020, the Clearwater International Fund had outstanding forward foreign currency exchange contracts as follows:
| | | | Contract Amount
| | |
| Counterparty | | Contract
Settlement
Date | Deliver | | Receive | | Unrealized
Appreciation
(Depreciation) |
| Northern Trust | | 04/22/2021 | USD | 1,694,664 | | CNH | 11,194,658 | | $ 14,142 |
| Northern Trust | | 04/22/2021 | CNH | 41,242,460 | | USD | 6,109,585 | | $(185,864) |
| Northern Trust | | 04/22/2021 | JPY | 126,864,332 | | USD | 1,204,895 | | (25,426) |
| | | | | | | | | | $(211,290) |
| | | | | | | | | | $(197,148) |
| See accompanying notes to financial statements. | 90 | (Continued) |
CLEARWATER INVESTMENT TRUST
Schedule of Investments - Clearwater International Fund
December 31, 2020
Clearwater International Fund Portfolio Diversification
(as a percentage of net assets)
| See accompanying notes to financial statements. | 91 | (Continued) |
Item 1. Reports to Stockholders (cont.).
Item 2. Code of Ethics
As of December 31, 2020, the Board of Trustees of Clearwater Investment Trust (the “Trust”) has adopted a code of ethics that applies to the Trust’s President/Principal Executive Officer and Treasurer/Principal Financial Officer (“Code of Ethics”). For the fiscal year ended December 31, 2020, there were no amendments to any provision of the Code of Ethics, nor were there any waivers granted from a provision of the Code of Ethics.
Item 3. Audit Committee Financial Expert
The Board of Trustees of the Trust consists of seven members, five of whom are Independent Trustees as defined by the Investment Company Act of 1940, as amended (the “1940 Act”). The Board of Trustees does not include an “audit committee financial expert” (as defined in Item 3 of Form N-CSR). Given the restrictive nature of the definition of an “audit committee financial expert,” the Board of Trustees has determined that no current member of the Board of Trustees of the Trust qualifies as an “audit committee financial expert.” Furthermore, the Board of Trustees has determined that given the nature of investment company financial statements in general and the investment policies of the Trust’s fund offerings in particular that the independent trustees possess the necessary skills and experience to perform the functions of the audit committee.
Item 4. Principal Accountant Fees and Services
| | | | | | | | |
| | | 2020 | | 2019 | | |
(a) | | Audit Fees | | $113,800 | | $111,600 |
(b) | | Audit-Related Fees | | $0 | | $0 |
(c) | | Tax Fees1 | | $33,314 | | $32,204 |
(d) | | All Other Fees | | $0 | | $0 |
1Tax Fees are the aggregate amount billed by the Trust’s principal accountant for tax compliance, tax advice, international tax reclaim filings and tax planning during the fiscal year.
| | 1. | The audit committee has adopted pre-approval policies and procedures regarding the provision of audit or non-audit services to the trust, as described in paragraph (c)(7) of Rule 2-01 of Regulation S-X. |
The policies and procedures provide that, if pre-approval of non-audit services is requested other than at a regularly scheduled Audit Committee Meeting, Fund management shall present such request to the Audit Committee Chair, or committee member if a Chair is not designated, for review of the proposal and determination if a special session of the Audit Committee is required. If the Chair or member determines the request requires a special session, the Audit Committee Chair will call a session per standard protocols and invite non-members as required. If the request is deemed in adherence to the independence of the auditor and to the benefit of the Fund, the Chair or designee may grant the pre-approval without a special session.
The Chair, designee or Audit Committee shall review the purpose, terms and risks of the request in addition to assurances of maintaining auditor independence and adherence to Regulation S-X, paragraph (c)(7) of Rule 2-01. If the pre-approval request is approved, the request will be presented at the next regularly scheduled Audit Committee for ratification.
| | 2. | No services were pre-approved by the audit committee pursuant to paragraph (c)(7)(i)(C) of Rule 2-01 of Regulation S-X. |
| | (g) | Non-Audit Related Fees Provided to the Trust or to the Trust’s Investment Adviser. |
2020= $$16,050 2019= $17,000
| | (h) | For the most recent fiscal year, the Audit Committee has determined that the provision of non-audit services to Clearwater Management Company and its affiliates was compatible with maintaining the principal accountant’s independence. |
Item 5. Audit Committee of Listed Registrants
Not applicable (the Funds are not listed issuers).
Item 6. Investments
| (a) | Schedule of Investments is included as part of the report to shareholders filed under Item 1 of this report on Form N-CSR. |
Item 7. Disclosure of Proxy Voting Policies and Procedures for Closed-End Management Investment Companies
Not applicable (the Trust is an open-end management investment company).
Item 8. Portfolio Managers of Closed-End Management Investment Companies
Not applicable (the Trust is an open-end management investment company).
Item 9. Purchases of Equity Securities by Closed-End Management Investment Company and Affiliated Purchasers
Not applicable (the Trust is an open-end management investment company).
Item 10. Submission of Matters to a Vote of Security Holders
There have been no material changes to the procedures by which shareholders may recommend nominees to the Board of Trustees.
Item 11. Controls and Procedures
| (a) | The Trust’s principal executive officer and principal financial officer have concluded that the Trust’s disclosure controls and procedures (as defined in Rule 30a-3(c) under the Investment Company Act of 1940, as amended (the “1940 Act”)) are effective based on the principal executive officer and principal financial officer’s evaluation of these controls and procedures, as required by Rule 30a-3(b) under the 1940 Act, as of a date within 90 days of the filing date of this document. |
| (b) | There have been no significant changes in the Trust’s internal control over financial reporting (as defined in Rule 30a-3(d) under the 1940 Act) that occurred during the period covered by this report that have materially affected, or are reasonably likely to materially affect, the Trust’s internal control over financial reporting. |
Item 12. Disclosure of Securities Lending Activities for Closed-End Management Investment Companies
Not applicable (the Trust is an open-end management investment company).
Item 13. Exhibits
SIGNATURES
Pursuant to the requirements of the Securities Exchange Act of 1934 and the Investment Company Act of 1940, the registrant has duly caused this report to be signed on its behalf by the undersigned, thereunto duly authorized.
| | |
| Clearwater Investment Trust |
|
| By /s/ Justin H. Weyerhaeuser |
| Justin H. Weyerhaeuser |
| President (Principal Executive Officer) and |
| Treasurer (Principal Financial Officer) |
|
| Date: March 3, 2021 |
Pursuant to the requirements of the Securities Exchange Act of 1934 and the Investment Company Act of 1940, this report has been signed below by the following persons on behalf of the registrant and in the capacities and on the dates indicated.
| | |
| Clearwater Investment Trust |
|
| By /s/ Justin H. Weyerhaeuser |
| Justin H. Weyerhaeuser |
| President (Principal Executive Officer) |
|
| Date: March 3, 2021 |
| | |
| Clearwater Investment Trust |
|
| By /s/ Justin H. Weyerhaeuser |
| Justin H. Weyerhaeuser |
| Treasurer (Principal Financial Officer) |
|
| Date: March 3, 2021 |