UNITED STATES
SECURITIES AND EXCHANGE COMMISSION
Washington, D.C. 20549
FORM N-CSR
CERTIFIED SHAREHOLDER REPORT OF REGISTERED
MANAGEMENT INVESTMENT COMPANIES
| Investment Company Act file number | 811-05038 | ||
| Clearwater Investment Trust | |||
| (Exact name of registrant as specified in charter) | |||
| 2000 Wells Fargo Place, 30 East 7th Street, Saint Paul, Minnesota 55101-4930 |
(Address of principal executive offices) (Zip code)
Stephen G. Simon
Fiduciary Counselling, Inc.
2000 Wells Fargo Place, 30 E. 7th Street
Saint Paul, Minnesota 55101-4930
Copy to:
| John V. O’Hanlon, Esq. Dechert LLP One International Place, 40th Floor 100 Oliver Street Boston, Massachusetts 02110 | ||
| (Name and address of agent for service) |
| Registrant’s telephone number,including area code: | 651-228-0935 |
| Date of fiscal year end: | December 31 |
| Date of reporting period: | December 31, 2017 |
Item 1. Reports to Stockholders
CLEARWATER INVESTMENT TRUST
Clearwater Core Equity Fund
Clearwater Small Companies Fund
Clearwater Tax-Exempt Bond Fund
Clearwater International Fund
Annual Report
for the year ended
December 31, 2017
Management Discussion of Clearwater Funds’ Performance
Clearwater Core Equity Fund
The Clearwater Core Equity Fund seeks long-term growth of capital. Current income, to the extent income is produced by the stocks held by the Fund, is a secondary objective. Under normal market conditions, the Clearwater Core Equity Fund pursues its investment objective by investing at least 80% of its net assets, plus the amount of any borrowings for investment purposes, in equity securities of U.S. companies. The Clearwater Core Equity Fund’s assets are managed in a “multi-manager, multi-style” approach. As of December 31, 2017, the Core Equity Fund had three subadvisers that provide day-today management of Fund assets. Parametric Portfolio Associates LLC, (“Parametric”), with approximately 60% of the Fund’s assets, manages its portion of the Fund’s assets to mirror the Russell 1000® Index as closely as possible without requiring the Fund to realize taxable gains. The remaining 40% of the Fund’s assets are divided between AQR Capital Management, LLC (“AQR”) and O’Shaughnessy Asset Management, LLC (“OSAM”), who both utilize an active management style.
2017 Market Overview:
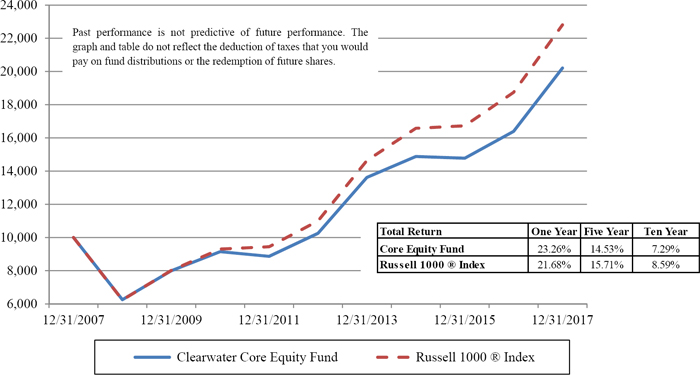
Domestic large capitalization equities, as defined by the Russell 1000® Index, returned more than 20% in 2017, bolstered by strong employment data, accelerating GDP growth, and the passage of tax reform legislation, which we believe should boost corporate earnings in 2018 and beyond.
2017 Performance and 2018 Outlook:
The Clearwater Core Equity Fund gained 23.3%, net of fees, in 2017 compared to an increase of 21.7% for the Russell 1000® Index, the Fund’s benchmark. Parametric, the subadviser that follows a tax-managed passive strategy, outperformed the Fund’s benchmark. Both active managers, AQR and OSAM, also outperformed the Fund’s benchmark. This was mostly driven by their preference for high quality and high momentum stocks, which performed well in 2017.
Each of the three subadvisers comment on the performance of their respective portfolios and their outlook for the next year in the paragraphs below. For comparison of the subadvisers’ capabilities, performance is shown gross of fees. The Fund pays a single advisory fee to Clearwater Management Company, which in turn pays the subadvisers out of its advisory fee.
Although the overall performance of the Clearwater Core Equity Fund is measured against its benchmark, as stated above, each of the underlying subadvisers may manage their portion of the Fund against a different benchmark that aligns more closely with their strategy. In each section below, the subadvisers discuss their view of the market over the last twelve months, the performance of their portfolios with respect to the benchmark against which their portfolio is managed and their outlook for the next twelve months.
A-1
AQR Commentary
General Market Overview:
We trade a set of strategies based on the value, momentum, and profitability signals of individual securities that seek a positive expected return versus the appropriate benchmark, in a variety of economic environments. Because our investment approach employs a systematic set of rules based on economic intuition and testing to seek to ensure they are robust across time, macro environments, and geographies, we typically do not offer general market overviews.
2017 Performance:
The portion of the Clearwater Core Equity Fund managed by AQR outperformed the Russell 1000® Index (the “benchmark”) in 2017, returning 24.04%, gross of fees, while the benchmark returned 21.69%. Stock selection within sectors detracted from performance while sector selection contributed positively to performance. Poor stock selection in the Consumer Discretionary sector was the primary driver of the underperformance. The strategy performed best in the Energy sector, where sector selection had positive returns, while stock selection returns were flat.
2018 Outlook:
In terms of sector positioning, we are currently overweight Information Technology while being underweight Energy. With respect to long-term attractiveness, we believe that valuations are currently less attractive in the U.S.
OSAM Commentary
General Market Overview:
2017 was a strong year for returns in global equity markets, and a few key themes emerged over the course of the year. Growth outperformed value by a wide margin (the Russell 1000® Growth Index outperformed the Russell 1000® Value Index by 16.56% in 2017) and large capitalization stocks outperformed small capitalization stocks (the Russell 1000® Index outperformed the Russell 2000® Index by 7.05%). Volatility in U.S. markets was extraordinarily low in 2017. In fact, the standard deviation of returns for the S&P 500 Index was the second lowest in the last 90 years. This has led to some speculation that the market is due for a correction and increased volatility; however, we do not believe there is clear historical evidence of that happening in the past.
2017 Performance:
The portion of the Clearwater Core Equity Fund managed by OSAM (the “Portfolio”) outperformed the Russell 1000® Index (the “benchmark”) in 2017, returning 25.46%, gross of fees, while the benchmark returned 21.69%. In 2017 the momentum factor was the strongest contributor to the Portfolio’s performance, followed by quality. The shareholder yield factor (dividend yield plus share repurchase yield) was neutral and the value factor was the largest detractor from the Portfolio’s performance.
2018 Outlook:
Based on our key factor themes, we believe the Portfolio is well positioned relative to its benchmark and to the overall market. We believe that the Portfolio’s companies have higher levels of return on capital, lower reliance on external financing, and trade at deep discounts across many valuation factors relative to the benchmark. They also returned capital to shareholders at more than two times the rate of the benchmark (shareholder yield of 4.9% versus 2.2% for the benchmark). We believe that these combined advantages can only be delivered by a portfolio which is distinct from the benchmark. We believe that our high active share means that the Portfolio looks different than the benchmark and continues to represent a
A-2
unique take on the U.S. equity market. As we head into 2018, we expect to continue to focus on our niche of the market: quality companies, often trading at out-of-favor prices, which are aggressively returning capital to equity shareholders through dividends and share repurchases.
Parametric Commentary
General Market Overview:
It was a positive year for U.S. stocks, with the major U.S. indexes reaching new highs frequently throughout the year. Despite the turbulent global political situation (North Korea’s nuclear crisis and terrorist attacks globally), the market remains bullish due to economic indicators, with rising earnings and continued low inflation. The passage of tax reform legislation near year-end further boosted the expectation that American corporations will be able to compete globally. We expect that the most highly taxed companies will benefit the most, with expected increases to earnings in 2018.
2017 Performance:
The portion of the Clearwater Core Equity Fund managed by Parametric (the “Portfolio”) outperformed the Russell 1000® Index (the “benchmark”) in 2017, returning 22.89%, gross of fees, while the benchmark returned 21.69%. Most of the outperformance was due to strong stock selection in the Industrial sector. An underweight to General Electric (due to tax loss harvesting) contributed the most to the Portfolio’s outperformance. A slight overweight to Boeing was beneficial, as the stock returned 94.77% in 2017. Several stocks in the Information Technology sector also contributed to the Portfolio’s outperformance, including slight overweights to Amazon and Apple. An underweight to IBM also contributed to the Portfolio’s outperformance, as IBM was one of worst performing technology companies in 2017.
2018 Outlook:
The bull market has been long lasting - more than eight years and running. The market uncertainty for the outlook in 2018 has increased. On one hand, the recent tax reform legislation is expected to boost earnings, which is positive for stocks. On the other hand, continued rate hikes by the Federal Reserve may become a headwind to further advances in the market.
A-3
Clearwater Small Companies Fund
The Clearwater Small Companies Fund seeks long-term growth of capital. Current income is a secondary objective. Under normal market conditions, the Fund invests at least 80% of its net assets, plus the amount of any borrowings for investment purposes, in equity securities of small companies. The Fund defines “small companies” as issuers with market capitalizations no greater than $5 billion at the time of purchase. Equity securities consist primarily of exchange-traded common and preferred stocks and convertible securities. The Fund uses a “multi-style, multi-manager” approach with three subadvisers who employ distinct investment styles: Kennedy Capital Management Inc. (“KCM”), Cooke & Bieler, L.P. (“Cooke & Bieler”), and Pzena Investment Management, LLC (“Pzena”). At the period ending December 31, 2017, KCM managed 60% of the Fund while Cooke & Bieler and Pzena managed 20% each. Cooke & Bieler and Pzena were added to the Fund as subadvisers in September 2017, replacing Keeley-Teton Asset Management (“Keeley-Teton”), which was terminated at that time.
2017 Market Overview:
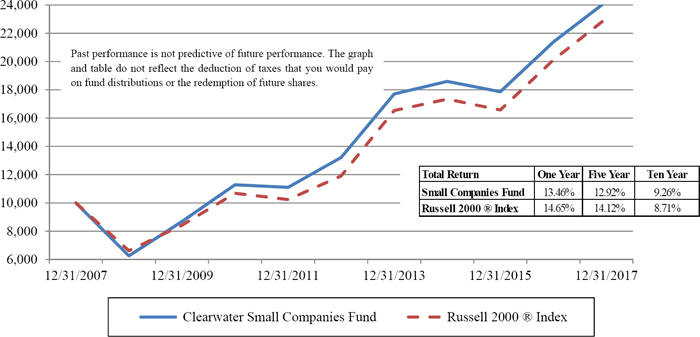
Domestic small capitalization equities performed well in 2017, with the Russell 2000® Index returning 14.6%. The dominant factors influencing share prices were strong employment data, accelerating GDP growth, and the passage of tax reform legislation, which we believe should boost corporate earnings in 2018 and beyond. There was a large gap between small cap growth and small cap value stocks. The Russell 2000® Growth Index gained 22.2%, while the Russell 2000® Value Index lagged with a return of 7.8%.
2017 Performance and 2018 Outlook:
The Clearwater Small Companies Fund rose 13.5%, net of fees, during 2017 compared to a return of 14.6% for the Russell 2000® Index, the Fund’s benchmark. KCM’s small cap core and microcap subportfolios both outperformed, but Keeley-Teton (a small cap value-oriented subadviser which was terminated in September 2017) underperformed the Fund’s benchmark significantly. The underperformance was mostly the result of exposure to small cap value stocks. The Keeley-Teton portfolio returned negative 1.6% for the year-to-date period ending September 30, 2017, slightly underperforming the Russell 2000® Value Index, which returned negative 1.3%, and meaningfully underperforming the Fund’s broad benchmark, the Russell 2000® Index, which gained 4.4% for the same time period.
The subadvisers to the Fund comment on the performance of their specific portfolios and their outlook for the next year in the paragraphs below. For comparison of the subadvisers’ capabilities, performance is shown gross of fees. The Fund pays a single advisory fee to Clearwater Management Company, which in turn pays the subadvisers out of its advisory fee.
Although the overall performance of the Clearwater Small Companies Fund is measured against its benchmark, as stated above, each of the underlying subadvisers may manage their portion of the Fund against a different benchmark that aligns more closely with their strategy. In each section below, the subadvisers discuss their view of the market over the last twelve months, the performance of their portfolios with respect to the benchmark against which their portfolio is managed and their outlook for the next twelve months.
KCM Commentary
General Market Overview:
2017 began with an initial bout of excitement as the President-elect spoke of greatness to come, but it quickly faded once the reality of governing became more apparent. Sectors that had been seen as key
A-4
beneficiaries (e.g., banks and infrastructure plays) began to lose their luster. Outside the U.S., economies showed glimmers of hope. European austerity programs gave way to real economic growth, pulling Asia along with them and Purchasing Managers Index readings strengthened across the world. Then came several serious hurricanes during the period; however, from a market perspective, investors generally chose to defer to intermediate term thinking, rather than near-term. For instance, while the hurricanes disrupted businesses in September and October, potentially impacting revenue generation, the market traded higher. Investors seemed to be looking at potential benefit to companies and the economy from the rebuilding effort. To close out the year, tax reform captured the market’s rapt attention. Counter to the prognostications of many, the prospect of a significantly lower corporate tax rate began to take shape. The importance of this should not be underestimated, and is more fully addressed in the “2018 Outlook” section below.
2017 Performance:
For the year ended December 31, 2017, the portion of the Clearwater Small Cap fund managed by KCM returned 17.1%, gross of fees, outperforming the 14.6% return of its benchmark, the Russell 2000® Index (the “benchmark”). Stock selection had a positive impact on relative performance during the year, particularly in the Consumer Discretionary, Consumer Staples, and Industrial sectors. Stock selection for the year detracted from performance in the Health Care sector. Overall, our sector weightings were not a significant factor driving performance in 2017.
2018 Outlook:
Looking toward the future for small cap stocks, several interconnected issues rise to the top of mind: inflation, mergers and acquisitions, and taxes. Inflation remains stubbornly low despite the Federal Reserve’s policy to target a 2% rate. The typical effect of improving employment driving wage growth, and hence, inflation, has not held. Technology’s impact may be altering this historical relationship. From an investment perspective, there may be opportunities in companies that are enabling this technological productivity enhancement. As to merger activity, the relatively low cost of debt, sizable private equity funds recently raised, and the low corporate tax rates could lead to higher cash returns on investment. Finally, as mentioned earlier, we believe that the lower corporate tax rate will likely drive clear, ongoing cash flow improvement. We believe that this will bolster the fundamental value of our companies, particularly domestically focused ones. We believe that this is not, as some commentators describe, “onetime”. Although the rate changes could be altered again at some point, we expect that these new rates will likely result in a steady stream of higher cash flows.
Cooke & Bieler Commentary
General Market Overview:
Equity returns were robust in 2017 and, despite market volatility that declined to historically low levels, active managers fared better in 2017 than in 2016. Large cap and mid cap equities outperformed small cap equities handily, growth outperformed value and stocks of high quality companies outperformed those of lower quality companies. The Russell 2000® Value Index (the “benchmark”) returned 7.8% for the full year.
2017 Performance:
The strategy performed well on an absolute basis, appreciating by 7.1%, and outperformed the benchmark by 1.36% for the period September 22, 2017 (when Cooke & Bieler began managing the Portfolio) through December 31, 2017. Sector allocation decisions drove the strategy’s excess return. Underweight positions in Utilities and Real Estate along with an overweight position in Consumer Discretionary were particularly additive. The favorable impact of stock selection decisions in Financials, Health Care and
A-5
Materials was offset by poor stock selection results in Consumer Discretionary. Top contributors for the period included Winnebago Industries, PGT Innovations, TCF Financial, PRA Group and Schweitzer-Mauduit International. Meaningful detractors included Syneos Health, Sally Beauty Holdings, Nautilus, World Fuel Services and NOW.
2018 Outlook:
Entering 2018, market expectations and valuations are arguably high. We expect that the recent tax reform legislation should support fundamentals, though, and interest rates could normalize higher if economic growth persists. We expect that this normalization and divergent fundamental performance likely will cause greater dispersion, presenting opportunity for active managers. We believe the strategy should continue performing well in a broad-based rising market and hold up relatively well in a challenging market due to the downside protection inherent in the strategy’s high quality, low risk approach.
Pzena Commentary
General Market Overview:
The 12-month period ended December 31, 2017 saw U.S. equity markets continue an upward trajectory as the U.S. Federal Reserve increased its key interest rate twice this year, in March and June, by 25 basis points each time. The year finished on a high note for equities with the tax reform being passed in the U.S. Senate. While U.S. equity markets saw healthy appreciation supported by the strength of the economy, small cap underperformed large cap, and growth outperformed value.
2017 Performance:
The portion of the Fund managed by Pzena (the “Portfolio”) underperformed the Russell 2000® Value Index (the “benchmark”) by 1.33%, with the strategy returning 4.39% (gross) for the inception-to-date period September 22, 2017 (when Pzena began managing the Portfolio) through December 31, 2017 and the benchmark returning 5.72%. Detracting the most from portfolio performance was stock selection from the Technology, Healthcare, and Consumer Staples sectors. Healthcare services company Owens & Minor was our largest detractor, down 33.1%, as it had negative operating leverage from losing a large contract while also facing competitive pressures, but we believe it has a viable plan to better monetize the services it provides to customers. Essendant Inc., the distributor of office, janitorial, and industrial supplies, was down 26.1%, as a mix shift and poorly executed systems integration has contributed to a margin decline versus expectations and the company’s history. Finally, technology company, Dielbold Nixdorf Incorporated was down 23.5%, as revenue missed consensus expectations and management guided revenue down for the full year; however, operating profit exceeded expectations due to accelerated operating expense reduction as the company’s integration cost savings program appears to be gaining traction.
Financial Services, Materials and Processing, and Utilities contributed the most to the portfolio, with the largest individual contributors being General Cable Corporation, Chart Industries, Inc., and Murphy Oil Corporation. General Cable (BGC), the leading wire and cable manufacturer, was a top contributor with a return of just under 58% for the period. The run-up in the stock was due to the announcement that BGC would be acquired by Italian competitor Prysmian Group for a large premium to the pre-deal trading level. Chart Industries, the maker of liquified natural gas (LNG) tanks and capital equipment, returned 22.4%, as the company had growth and margin expansion across all segments, and encouraging signs of future LNG related orders. Murphy Oil, oil and gas exploration and production, was up 19.3%, driven mostly by macro events, such as strengthening oil prices, continuing strong oil demand and the expectation of production growth in 2018.
A-6
2018 Outlook:
We continue to see opportunities in attractively-valued economically-sensitive cyclical sectors. Our largest overall exposure is in Financials, albeit significantly underweight the index, followed by exposures in Producer Durables and Technology, where we believe valuations are depressed compared to the “safe” sectors such as Consumer Staples. The cyclical stocks that we own are generally benefitting from self-help actions (e.g., restructuring) which we believe will drive earnings improvement over the next few years, as their operations stand to benefit significantly from ongoing improvement in the global macro environment. Given our exposure to restructuring companies and those with more cyclical exposure, we expect to experience short-term price volatility, particularly as market participants react to short-term macro uncertainties. However, as long-term investors, we define risk as the potential for permanent impairment of capital, rather than short-term price gyration. We have focused our exposure generally in businesses with demonstrated high returns on capital, strong franchises, good balance sheets, and an ability to adapt to changing conditions; therefore, we are comfortable with their ability to navigate potential uncertainty in markets on a long-term basis.
A-7
Clearwater Tax-Exempt Bond Fund
The Clearwater Tax-Exempt Bond Fund seeks high current income that is exempt from U.S. federal income tax, consistent with preservation of capital. Under normal market conditions, the Fund invests at least 80% of its net assets, plus the amount of any borrowings for investment purposes, in tax-exempt bonds, which are debt obligations issued by or for the U.S. states, territories, and possessions and the District of Columbia. The interest on these securities is generally exempt from both U.S. regular federal income tax and U.S. federal alternative minimum tax. However, the Fund may invest up to 20% of its assets in securities that generate interest income subject to federal alternative minimum tax for individuals. The Fund invests in both revenue bonds, which are backed by and payable only from the revenues derived from a specific facility or specific revenue source, and in general obligation bonds, which are secured by the full faith, credit and taxation power of the issuing municipality. The Fund’s subadviser, Sit Fixed Income Advisers II, LLC (“Sit”), provides day to day management for the Fund. It should be noted that the Fund is not a money market fund and is not intended to be a money market fund substitute. Under normal market conditions, the Fund’s investments may be more susceptible than a money market fund to interest rate risk and credit risks relevant to the Fund’s investments.
Sit has provided the commentary below regarding the Clearwater Tax-Exempt Bond Fund. The Fund pays a single advisory fee to Clearwater Management Company, which in turn pays the subadviser out of its advisory fee.
Sit Commentary
General Market Overview:
Tax-exempt fixed income markets experienced a strong year in 2017, as long-term rates fell modestly during the year and credit spreads continued to tighten. The U.S. Treasury and tax-exempt yield curves flattened significantly, and funds flows were modestly positive for the year. Supply of municipal bonds followed a record-setting year in 2016 with another strong year in 2017, particularly after the surge of issuance in November and December when it appeared that certain types of tax-exempt bonds (advanced refunding bonds and private activity bonds (“PABs”)) might be eliminated through pending tax legislation. The market absorbed this heavy supply well, and yields fell in December. Credit fundamentals are generally sound, and spreads tightened further during the year, as investors continued to seek yield. State and local government finances remain generally on the upswing, with the notable exceptions of Illinois, Connecticut and New Jersey. Chicago showed modest improvement after tax increases implemented last year began to take effect. Puerto Rico related debt took a negative turn in the spring as the Financial Control Board took some actions regarded as unfriendly to bondholders’ rights. The slide in the value of uninsured Puerto Rico debt was exacerbated by the devastation wrought by Hurricane Maria and its aftermath. More volatility is likely in 2018 as Puerto Rico tries to recover from the aftermath of Hurricane Maria and attempts to restructure some of its debt. The Federal Reserve (the “Fed”) remained quite accommodative, despite its move to raise the federal funds rate by 0.75% and beginning to reduce its balance sheet during 2017. The tax reform legislation passed in December 2017 did not eliminate PABs, but did make other changes to the tax code, such as reducing the maximum corporate tax rate significantly as well as capping state and local tax deductions, that may have significant impacts on demand for and credit fundamentals of tax-exempt bonds going forward.
2017 Performance:
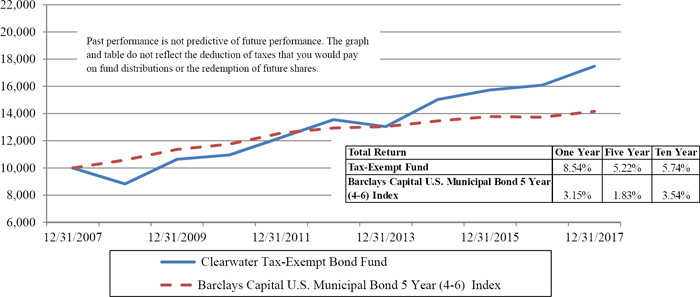
The Clearwater Tax-Exempt Bond Fund returned 8.5%, net of fees, for the year ended December 31, 2017. The Fund’s benchmark, the Barclays Municipal Bond 5 Year (4-6) Index (the “benchmark”), returned 3.1% over the same period. Given the Fed’s increasingly less accommodative policies, the Fund
A-8
shortened its average life duration, a measure of the Fund’s sensitivity to changes in interest rates, from 5.8 years to 3.5 years during 2017 primarily through hedging by shorting U.S. Treasury futures late in the year. For comparison, the benchmark had duration of 3.9 years at December 31, 2016, and it lengthened to 4.0 years at December 31, 2017. The Fund’s longer duration for most of the year, its overweight in revenue bonds (housing bonds in particular) and its superior security selection in non-rated bonds were the primary reasons for its significant outperformance during 2017. Revenue bonds significantly outperformed general obligation bonds during 2017, with revenue bonds returning 6.0% for the year, while general obligation bonds returned 5.2%. Furthermore, lower quality issues (especially lower investment grade and non-rated issues) significantly outperformed those of higher credit quality, as investors sought yield.
2018 Outlook:
The lack of cohesion among elected officials in Washington D.C. and the upcoming mid-term elections could add some political risk to the market in 2018, depending on what policies are put forth and enacted. We expect U.S. growth to accelerate from its pace of 2.2% in 2017 to 2.7% during 2018 and inflation to inch higher. Single-family housing has moderated, and underemployment, despite some improvement, remains elevated, while wage growth is showing signs of improvement. The economy has been accelerating in the second half of 2017, and the recently passed tax legislation is likely to spur some additional growth. We expect that interest rates, while remaining historically low in absolute terms, will likely rise, especially on the short end, as the Fed increased rates in December 2017 and has signaled it intends to continue raising short-term interest rates in 2018, as well as continuing to reduce its balance sheet. We also believe that the Treasury yield curve will continue to flatten, with yields rising more on the short and intermediate portions of the curve, while the tax-exempt curve flattens similarly, with short-term and intermediate rates rising some and long-term tax-exempt yields rising less as supply contracts and most state and local government finances continue to improve, helping tax-exempt bonds outperform. We expect that demand will increase marginally from individuals, especially from high income tax states, and decrease marginally from corporations due to the recently passed tax legislation, but it is too soon to know for certain. We expect revenue bonds to continue their strong relative performance in 2018, as investor focus remains on yield. Puerto Rico related concerns, as well as those from Illinois, Connecticut and New Jersey, are expected to continue to weigh on the market, however, and could produce some volatility. Furthermore, potential problems with budgets and funding retirement pension and healthcare obligations persist in other places, and remain the subject of many of the negative media reports about the municipal market. We believe that the Fund’s shorter duration and its use of revenue and non-rated bonds have positioned it opportunistically for the economic and interest rate environment that we expect in 2018. We expect that investment of new cash flows will be focused on maturities in the 5-25-year range.
A-9
Clearwater International Fund
The Clearwater International Fund seeks long-term growth of capital. The Fund generally invests at least 80% of the value of its net assets, plus the amount of any borrowings for investment purposes, in equity securities of companies organized or located outside the United States and doing a substantial amount of business outside the United States. The Fund diversifies its investments among many different countries throughout the world, and may invest in companies of any size. The Fund does not intend to invest more than 20% of its net assets in the equity securities of developing or emerging market issuers. The Fund uses a “multi-style, multi-manager” approach. The Fund’s adviser allocates portions of the Fund’s assets among subadvisers who employ distinct investment styles. The Fund currently has four subadvisers that provide day-to-day management of Fund assets. Parametric Portfolio Associates LLC (“Parametric”) manages its portion of the portfolio (approximately 40%) to mirror the MSCI World Ex U.S.A Index – Net Dividends as closely as possible without requiring the Fund to realize taxable gains. The Fund’s other three subadvisers, Artisan Partners Limited Partnership (“Artisan”), Templeton Investment Counsel, LLC (“Templeton”) and WCM Investment Management (“WCM”), utilize an active management style and manage the remaining 60% of the Fund.
2017 Market Overview:
As defined by the Fund’s benchmark, the MSCI World Ex U.S.A. Index - Net Dividends (the “benchmark”), large capitalization, international developed market equities returned nearly 25% in 2017, while their small capitalization counterparts returned more than 30%. The dominant factors influencing share prices included continued accommodative central bank policy and improved corporate earnings. Currency adjustments had a significant positive impact on returns for U.S.-based investors in 2017, as the U.S. dollar weakened versus major international currencies by the widest margin since 2007. These currency gains increase the returns earned by shareholders because the Clearwater International Fund reports its results in U.S. dollars, after currency adjustments have taken place.
2017 Performance and 2018 Outlook:
The Clearwater International Fund gained 26.54%, net of fees, in 2017, compared to an increase of 24.21% for the benchmark. Parametric, the subadviser that follows a tax-managed passive strategy, slightly outperformed the benchmark. All three of the Fund’s active subadvisers outperformed the benchmark in 2017.
Each of the four subadvisers comment on the performance of their specific portions of the Fund and provide a market outlook for the next year in the paragraphs below. For comparison of the subadvisers’ capabilities, performance is shown gross of fees. The Fund pays a single advisory fee to Clearwater Management Company, which in turn pays the subadvisers out of its advisory fee.
Although the overall performance of the Clearwater International Fund is measured against its benchmark, as stated above, each of the underlying subadvisers may manage their portion of the Fund against a different benchmark that aligns more closely with their strategy. In each section below, the subadvisers will discuss their view of the market over the last twelve months, the performance of their portfolios with respect to the benchmark against which their particular portfolio is managed and their outlook for the next twelve months.
A-10
Artisan Partners Commentary
General Market Overview:
Measured in U.S. dollar terms, the MSCI EAFE Index (the “benchmark”) was up 25.03% in 2017, aided by generally improving economic conditions and solid corporate profitability. Returns for U.S. investors were bolstered by a weaker U.S. dollar, as the benchmark was up 15.23%. U.S. stocks trailed international stocks in 2017, although U.S. stocks also performed well. From a sector standpoint, Technology, Materials and Industrials led the international markets. Though still nicely positive, Telecom and Healthcare were laggards—sectors with less exposure to strengthening cyclicality.
2017 Performance:
The portion of the Clearwater International Fund managed by Artisan (the “Portfolio”) outperformed the benchmark in 2017, returning 25.23%, gross of fees, while the benchmark returned 25.03%. Performance of the following stocks had a positive impact on the portfolio during the period: Samsung Electronics, a leader in smartphones, semiconductors and other electronic components; Baidu, China’s leading Internet search company; ING, a banking and insurance conglomerate based in the Netherlands; Tokyo Electron, a manufacturer of industrial semiconductors and capital equipment; and ABB, a leading global engineering company. Among the period’s few negative contributors was Imperial Oil, a Canadian integrated oil company.
2018 Outlook:
With stocks broadly looking more fairly valued now, we remain selective in our deployment of portfolio capital, as evidenced by our larger-than-average cash balance.
Templeton Commentary
General Market Overview:
International small capitalization stocks rose strongly and outperformed their larger-capitalization counterparts in 2017. Support came from improving industrial commodity prices, generally upbeat economic data across regions, and investor optimism about pro-growth and pro-business policies in the United States. Emmanuel Macron’s election as France’s president, accommodative monetary policies of various central banks and encouraging corporate earnings reports also boosted investor sentiment. Markets were at times dampened by concerns about the terms of the United Kingdom’s exit from the European Union, though some progress on a deal arose toward the end of the year. Other headwinds included some political uncertainty in the United States and the European Union, and geopolitical tensions from the Korean peninsula and other regions. Global oil oversupply was a concern for much of 2017, but supply constraints enacted by major oil producers continued, and towards the end of 2017 oil prices climbed to levels last seen in 2015.
2017 Performance:
The portion of the Clearwater International Fund managed by Templeton (the “Portfolio”) outperformed the MSCI All-Country World Ex U.S.A. Small Cap Index - Net Dividends (the “benchmark”) in 2017, returning 35.38%, gross of fees, while the benchmark returned 31.65%. Stock selection in the Financials, Industrials, Consumer Discretionary and Consumer Staples sectors drove outperformance for the period. Regionally, holdings in Europe and Asia made the largest contribution to relative performance, with Dewan, Interpump and China Zhengtong the top three contributors. The shares of India-based Dewan Housing Finance continued to benefit from a positive shift in sentiment, a low valuation, and a secular growth opportunity in mortgage finance. At Italy-based Interpump, which manufactures piston pumps and
A-11
hydraulic products, solid free cash flow has been deployed in a wave of value-accretive acquisitions, which we believe have been well integrated into the group with significant synergies. China Zhengtong Auto Service, a luxury car dealer focusing on premium brands, has achieved a competitive advantage by carefully nurturing strong relationships with key luxury automobile suppliers.
2018 Outlook:
Value lagged growth by the most in nearly two decades in 2017, marking the tenth year out of the past 11 that global growth has bested global value. At times like this, it may be tempting for some value investors to relax their discipline and buy the expensive stocks that have been working. Yet, we believe that countering that impulse is decades of market history suggesting that starting-point valuation is virtually all that really matters when it comes to long-term returns. Meanwhile, we believe that financial repression from the world’s central banks appears to have forced investors farther out on the risk spectrum to chase yield and growth in a market offering little of either. We view this as unsustainable for two main reasons. First, many consider zero interest-rate policies and quantitative easing to have favored capital at the expense of labor, deepening inequality and disadvantaging the majority of the electorate, whose opinions matter in a democracy. Second, financial repression could fuel potentially destabilizing asset price bubbles. We believe that overvaluation appears to be largely concentrated in fixed income markets, as well as the growth-oriented and bond proxy stocks that have dominated this cycle. We do not know how the process of policy normalization by central banks will evolve. Nonetheless, we do believe this mature cycle will eventually change, and with it the conditions that have been so hostile to value investing. We would not want to own the leaders of the last cycle during this transition. But we believe that the stocks left behind—the companies whose long-term earnings and cash flow potential we believe have been overlooked and undervalued by a narrowly focused market—might be best positioned for the reversals we view as likely to unfold in the future.
WCM Commentary
General Market Overview:
In 2017, the overall market was up, with broad international benchmarks registering positive returns. Non-U.S. equities outperformed U.S. equities in 2017 - a reversal from recent years when U.S. equities have dominated. The so called “reflationary trade” we saw late in 2016 was not sustained in 2017 as growth outperformed value, and high-quality stocks outperformed low quality stocks - both tailwinds for the portfolio. Another story in 2017 was the resurgence of robust returns in emerging markets. Emerging market equities outperformed non-U.S. developed market equities in all four quarters of 2017.
2017 Performance:
The portion of the Clearwater International Fund managed by WCM (the “Portfolio”) significantly outperformed the MSCI All-Country World Ex U.S.A. Index - Net Dividends (the “benchmark”) in 2017, returning 33.50%, gross of fees, while the benchmark returned 27.19%. The outperformance was attributable to both stock selection and sector allocation. The biggest contributors to the Portfolio’s outperformance was stock selection in Technology and Healthcare. Stock selection in Materials and Financials, an overweight to Technology, and an underweight to Telecom and Energy all contributed positively.
A-12
2018 Outlook:
Looking back a year, the so called “reflationary trade” - and the expected resurgence of value over growth - did not actually materialize in 2017, despite the certainty of many pundits. Such an outcome only fortifies our conviction that our time is not well spent trying to predict macro or political events. Rather, we expect to continue preparing for various scenarios and expect to capitalize on the opportunities that emerge. That is why we welcome turmoil in the world - perhaps the closest to a “new normal” we know. We believe that it refocuses the market on structurally high-quality businesses rather than mediocre businesses benefitting from temporary/cyclical phenomena.
Parametric Commentary
General Market Overview:
2017 was a positive year for global equity markets. All countries had positive returns and all months except August (a flat month) had positive returns. The rally was also widespread across all economic sectors. The Technology sector was the strongest performer, followed by Materials. The Energy sector, a laggard in recent years, stopped its downfall and returned nearly 16% in 2017.
2017 Performance:
The portion of the Clearwater International Fund managed by Parametric (the “Portfolio”) slightly outperformed the MSCI World Ex U.S.A. Index - Net Dividends (the “benchmark”) in 2017, returning 24.29%, gross of fees, while the benchmark returned 24.21%. Nearly all the outperformance was due to stock selection in the Energy sector; in particular, BP’s moderate underweight relative to the benchmark. Cash was also a slight drag on the portfolio’s performance relative to the benchmark.
2018 Outlook:
Globally, uncertainty remains due to the North Korea nuclear crisis. President Trump’s recent speech on national security warned of rising threats from an emboldened Russia and China. The possibility of a trade war and other global confrontations all add to uncertainty in the outlook for 2018.
A-13
Comparison of the Change in Value of a $10,000 Investment in the Clearwater Core Equity Fund and the Russell 1000® Index
Comparison of the Change in Value of a $10,000 Investment in the Clearwater Small Companies Fund and the Russell 2000® Index
A-14
Comparison of the Change in Value of a $10,000 Investment in the Clearwater Tax-Exempt Bond Fund and the Barclays Capital U.S. Municipal Bond 5 Year (4-6) Index
Comparison of the Change in Value of a $10,000 Investment in the Clearwater International Fund and the MSCI World Ex U.S.A. Index - Net Dividends
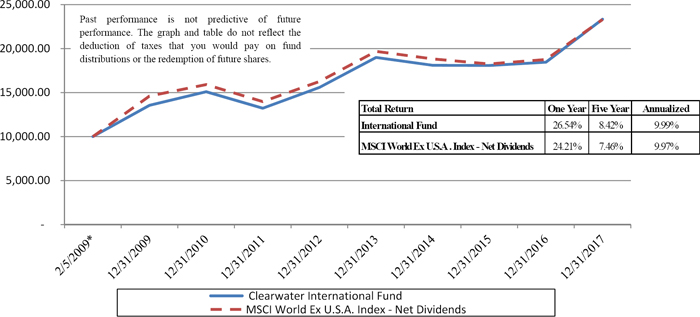
| * | ClearwaterInternational Fund inception date. |
A-15
Fund Expense Example
(unaudited)
As a shareholder of the Clearwater Core Equity Fund (“Core Equity Fund”), Clearwater Small Companies Fund (“Small Companies Fund”), Clearwater Tax-Exempt Bond Fund (“Tax-Exempt Bond Fund”), and Clearwater International Fund (“International Fund” and together with the Core Equity Fund, Small Companies Fund and Tax-Exempt Bond Fund, the “Funds”), you incur costs, including management fees and other Fund expenses. This example is intended to help you understand your ongoing costs (in dollars) of investing in the Funds and to compare these costs with the ongoing costs of investing in other mutual funds. In addition to the ongoing costs which the Funds pay directly, you as a shareholder indirectly bear the expenses of any outside exchange traded funds or mutual funds in which the Funds invest. (These are also referred to as “acquired funds” and those indirect expenses represent the Funds’ pro rata portion of the cumulative expense charged by the acquired funds.)
The example provided is based on an investment of $1,000 invested at the beginning of the period and held for the six-month period ended December 31, 2017.
Actual Expenses
The first section of the table on the following page provides information about actual account values and actual expenses. You may use the information in this section, together with the amount you invested, to estimate the expenses that you incurred over the period. Simply divide your account value by $1,000 (for example, an $8,600 account value divided by $1,000 = 8.6), then multiply the result by the number in the first section under the heading entitled “Expenses Paid During the Period July 1, 2017 through December 31, 2017” to estimate the expenses attributable to your investment during this period.
Hypothetical Example for Comparison Purposes
The second section of the table below provides information about hypothetical account values and hypothetical expenses based on the Fund’s actual expense ratio and an assumed rate of return of 5% per year before expenses, which is not the Fund’s actual return. Thus, you should not use the hypothetical account values and expenses to estimate the actual ending account balance or your expenses for the period. Rather, these figures are provided to enable you to compare the ongoing costs of investing in the Funds and other mutual funds. To do so, compare this 5% hypothetical example with the 5% hypothetical examples that appear in the shareholder reports of the other mutual funds.
Please note that the expenses shown in the second section of the table are meant to highlight your ongoing costs only. Therefore, the second section of the table is useful in comparing ongoing costs only, and will not help you compare the relative total costs of the Funds to other mutual funds that charge transaction costs and/or sales charges or redemption fees.
A-16
| Expenses Paid During the | ||||||||||
| Actual returns | Beginning Account | Ending Account Value | Period July 1, 2017 through | |||||||
| Value July 1, 2017 | December 31, 2017 | December 31, 2017 * | ||||||||
| Core Equity Fund | $1,000.00 | $1,130.20 | $2.04 | |||||||
| Small Companies Fund | $1,000.00 | $1,093.20 | $5.28 | |||||||
| Tax-Exempt Bond Fund | $1,000.00 | $1,039.90 | $1.75 | |||||||
| International Fund | $1,000.00 | $1,102.80 | $3.55 |
Hypothetical 5% return
(before expenses)
| Core Equity Fund | $1,000.00 | $1,023.29 | $1.94 | |||||||
| Small Companies Fund | $1,000.00 | $1,020.16 | $5.09 | |||||||
| Tax-Exempt Bond Fund | $1,000.00 | $1,023.49 | $1.73 | |||||||
| International Fund | $1,000.00 | $1,021.83 | $3.41 |
| * | Expenses are equal to the Fund’s annualized expense ratios, multiplied by the average account value over the period, multiplied by 184/365 (to reflect the one-half year period). Expense ratios for the most recent one-half year period may differ from expense ratios based on one-year data in the Financial Highlights. |
The effective annual expense ratios are as follows:
| Core Equity Fund (a) | 0.39 | % | ||
| Small Companies Fund (b) | 0.99 | % | ||
| Tax-Exempt Bond Fund (c) | 0.34 | % | ||
| International Fund (d) | 0.67 | % |
| (a) | The expense ratio for the Core Equity Fund represents the blended expense ratio during the six-month period. The management fee of the Fund was decreased through a voluntary waiver to 0.37%, until September 22, 2017, when the voluntary waiver was decreased and the expense ratio of the Fund became 0.38%. |
| (b) | The expense ratio for the Small Companies Fund represents the blended expense ratio during the six-month period. The management fee of the Fund was decreased through a voluntary waiver to 0.96%, until September 22, 2017, when the voluntary waiver was decreased and the expense ratio of the Fund became 1.03%. |
| (c) | The management fee of the Tax-Exempt Bond Fund was decreased through a voluntary waiver to 0.34%, which remained in effect in the reporting period. |
| (d) | The expense ratio for the International Fund represents the blended expense ratio during the six-month period. The management fee of the Fund was decreased through a voluntary waiver to 0.65%, until September 22, 2017, when the voluntary waiver was decreased and the expense ratio of the Fund became 0.68%. |
A-17
Approval of Investment Management and Subadvisory Agreements
Clearwater Management Co., Inc. (“CMC”) is responsible for managing the investment programs and strategies for the Core Equity Fund, Small Companies Fund, Tax-Exempt Bond Fund, and International Fund (collectively, “the Funds”). CMC also provides other administrative services to the Funds and these services, as well as its investment management services, are provided to the Funds under an agreement (the “Management Agreement”). CMC conducts due diligence when selecting each subadviser (collectively, the “Subadvisers”) for the Funds and oversees the performance of the Subadvisers. The Subadvisers provide portfolio management and related services for the Funds under individual subadvisory agreements (the “Subadvisory Agreements”).
The Trust’s Board of Trustees (the “Board” or “Trustees”) met periodically throughout the year to address a broad range of agenda items. For example, at each regularly scheduled meeting, the Trustees reviewed information about the investment performance and financial results of the Funds. On an annual basis, the Trustees, including the Trustees who are not “interested persons” of the Trust (the “Independent Trustees”), consider the renewal of the Management Agreement and the Subadvisory Agreements. In addition, the Trustees periodically consider the retention of new subadvisers.
Approval of Subadvisory Agreement – Cooke & Bieler, L.P. (Small Companies Fund)
At an in-person meeting on September 8, 2017, the Trustees considered a new subadvisory agreement with Cooke & Bieler, L.P. (“Cooke & Bieler”) (the “Cooke & Bieler Agreement”) for the Small Companies Fund. At this meeting, the Trustees met with representatives of Cooke & Bieler and received a presentation discussing Cooke & Bieler’s investment philosophy and process, past performance, subadvisory experience, investment team, compensation structure and risk management limits.
Prior to the September 8, 2017 meeting, the Trustees received written information regarding the proposed Cooke & Bieler Agreement, including: information as to the proposed allocation of assets among the Small Companies Fund’s subadvisers, and a summary of information about Cooke & Bieler, including its investment professionals, process, philosophy, portfolio construction, past performance and proposed subadvisory fees. In addition, at the meeting on September 8, 2017, the Trustees received information from the Trust’s Chief Compliance Officer as to his review of Cooke & Bieler’s Code of Ethics, Form ADV, and compliance program.
At the September 8, 2017 meeting, counsel to the Small Companies Fund and Trustees reviewed with the Trustees the various factors relevant to their consideration of the Cooke & Bieler Agreement and the Trustees’ responsibilities related to their review. The Trustees reviewed and analyzed a number of factors that the Trustees deemed relevant with respect to the Cooke & Bieler Agreement. These factors included: the nature, quality, and extent of the services to be provided to the Small Companies Fund by Cooke & Bieler; Cooke & Bieler’s investment process; Cooke & Bieler’s historical performance record for its small cap value strategy; the qualifications and experience of the investment professionals who would be responsible for the management of their allocation of the Small Companies Fund’s assets; and Cooke & Bieler’s overall resources.
No single factor determined whether or not the agreement would be approved but rather the totality of factors considered was determinative. Following an analysis and discussion of the factors described below, the Trustees, including all of the Independent Trustees, approved the Cooke & Bieler Agreement.
Nature, Extent, and Quality of Services Provided
The Trustees considered the specific investment processes Cooke & Bieler would use in managing its allocation of the Small Companies Fund’s assets. The Trustees looked at the qualifications of Cooke & Bieler’s investment team who would be responsible for managing its allocation of the Small Companies Fund’s assets. The Trustees concluded that the nature, extent, and quality of the subadvisory services expected to be provided by Cooke & Bieler were appropriate for the Small Companies Fund.
A-18
Investment Performance
The Trustees discussed the performance record for the strategy Cooke & Bieler would use in managing its allocation of the Fund’s assets as compared to its strategy benchmark and the Fund’s benchmark. The Trustees noted that the strategy’s performance compared favorably to its strategy benchmark for the period since its inception in August 2008. The Trustees concluded that this data supported the decision to approve the Cooke & Bieler Agreement.
Comparative Fees and Cost of Services Provided
The Trustees evaluated the proposed subadvisory fee schedule, which was negotiated at arm’s length by CMC. The Trustees noted that the fee schedule was competitive with the discretionary active manager that currently subadvises the Small Companies Fund and the other proposed subadviser. The Trustees also noted that CMC, not the Small Companies Fund, would pay the subadvisory fee to Cooke & Bieler. The Trustees concluded that the proposed subadvisory fee schedule was reasonable given the nature, extent and quality of the subadvisory services to be performed by Cooke & Bieler.
Benefits to the Subadviser
The Trustees considered the ancillary benefits that could accrue to Cooke & Bieler due to its relationship with the Small Companies Fund and noted that the relationship would be limited to the provision of subadvisory services. The Trustees concluded that no significant ancillary benefits would result from the Cooke & Bieler Agreement.
Profitability
The Trustees considered that Cooke & Bieler is an independent firm and that the subadvisory fee to be charged is the result of arm’s length bargaining between Cooke & Bieler and CMC.
Economies of Scale
The Trustees noted that CMC, not the Small Companies Fund, would pay the subadvisory fee to Cooke & Bieler and that the Trustees consider on an annual basis whether economies of scale might be realized by CMC as the Small Companies Fund’s assets grow and whether there also might be benefits from such growth for the Small Companies Fund’s shareholders.
Other Considerations
The Trustees considered CMC’s judgment and recommendation that adding Cooke & Bieler as a subadviser would add value to the Small Companies Fund’s shareholders and would be complementary to both the existing and proposed subadvisers.
Conclusion
After full consideration of the factors described above along with other information, with no single factor considered determinative, the Trustees, including all of the Independent Trustees, concluded that the approval of the Cooke & Bieler Agreement was in the best interests of the Small Companies Fund and its shareholders and approved the Cooke & Bieler Agreement, with the proposed fee to be paid by CMC out of its management fee.
Approval of Subadvisory Agreement – Pzena Investment Management, LLC (Small Companies Fund)
At an in-person meeting on September 8, 2017, the Trustees considered a new subadvisory agreement with Pzena Investment Management, LLC (“Pzena”) (the “Pzena Agreement”) for the Small Companies Fund. At this meeting, the Trustees met with representatives of Pzena and received a presentation discussing Pzena’s ownership structure, investment philosophy and process, and past performance.
A-19
Prior to the September 8, 2017 meeting, the Trustees received written information regarding the proposed Pzena Agreement, including: information as to the proposed allocation of assets among the Small Companies Fund’s subadvisers, and a summary of information about Pzena, including its investment professionals, process, philosophy, past performance and proposed subadvisory fees. In addition, at the meeting on September 8, 2017, the Trustees received information from the Trust’s Chief Compliance Officer as to his review of Pzena’s Code of Ethics, Form ADV, and compliance program.
At the September 8, 2017 meeting, counsel to the Small Companies Fund and Trustees reviewed with the Trustees the various factors relevant to their consideration of the Pzena Agreement and the Trustees’ responsibilities related to their review. The Trustees reviewed and analyzed a number of factors that the Trustees deemed relevant with respect to the Pzena Agreement. These factors included: the nature, quality, and extent of the services to be provided to the Small Companies Fund by Pzena; Pzena’s investment process; performance data for Pzena’s strategy; the qualifications and experience of the investment professionals who would be responsible for the management of their allocation of the Small Companies Fund’s assets; and Pzena’s overall resources.
No single factor determined whether or not the agreement would be approved but rather the totality of factors considered was determinative. Following an analysis and discussion of the factors described below, the Trustees, including all of the Independent Trustees, approved the Pzena Agreement.
Nature, Extent, and Quality of Services Provided
The Trustees considered the specific investment processes Pzena would use in managing its allocation of the Small Companies Fund’s assets. The Trustees looked at the qualifications of Pzena’s investment team who would be responsible for managing its allocation of the Small Companies Fund’s assets. The Trustees concluded that the nature, extent, and quality of the subadvisory services expected to be provided by Pzena were appropriate for the Small Companies Fund.
Investment Performance
The Trustees discussed Pzena’s performance record for the strategy it would use in managing its allocation of the Small Companies Fund’s assets as compared to its strategy benchmark and the Small Companies Fund’s benchmark. The Trustees noted that the strategy’s performance compared favorably to its strategy benchmark for the period since its inception in January 1996. The Trustees concluded that this data supported the decision to approve the Pzena Agreement.
Comparative Fees and Cost of Services Provided
The Trustees evaluated the proposed subadvisory fee schedule, which was negotiated at arm’s length by CMC. The Trustees noted that CMC, not the Small Companies Fund, would pay the subadvisory fee to Pzena. The Trustees concluded that the proposed subadvisory fee schedule was reasonable given the nature, extent and quality of the subadvisory services to be performed by Pzena.
Benefits to the Subadviser
The Trustees considered the ancillary benefits that could accrue to Pzena due to its relationship with the Small Companies Fund and noted that the relationship would be limited to the provision of subadvisory services. The Trustees concluded that no significant ancillary benefits would result from the Pzena Agreement.
Profitability
The Trustees considered that Pzena is an independent firm and that the subadvisory fee to be charged is the result of arm’s length bargaining between Pzena and CMC.
A-20
Economies of Scale
The Trustees noted that CMC, not the Small Companies Fund, would pay the subadvisory fee to Pzena and that the Trustees consider on an annual basis whether economies of scale might be realized by CMC as the Small Companies Fund’s assets grow and whether there also might be benefits from such growth for the Small Companies Fund’s shareholders.
Other Considerations
The Trustees considered CMC’s judgment and recommendation that adding Pzena as a subadviser would add value to the Small Companies Fund’s shareholders and would be complementary to both the existing and proposed subadvisers.
Conclusion
After full consideration of the factors described above along with other information, with no single factor considered determinative, the Trustees, including all of the Independent Trustees, concluded that the approval of the Pzena Agreement was in the best interests of the Small Companies Fund and its shareholders and approved the Pzena Agreement, with the proposed fee to be paid by CMC out of its management fee.
Approval of Investment Management and Subadvisory Agreements (All Funds)
At their in-person meetings on November 3 and December 7, 2017, the Trustees considered the renewal of the Management Agreement and the Subadvisory Agreements for AQR Capital Management, LLC, Artisan Partners Limited Partnership, Fiduciary Counselling, Inc. (“FCI”), Kennedy Capital Management, Inc., O’Shaughnessy Asset Management, LLC, Parametric Portfolio Associates LLC, Sit Fixed Income Advisors II, LLC, Templeton Investment Counsel, LLC and WCM Investment Management.
Prior to the November 3, 2017 meeting, the Trustees requested, received, and reviewed written responses from CMC and the Subadvisers to questions posed to them on behalf of the Trustees and supporting materials relating to those questions and responses. The information presented at the meeting, including comparative performance and expense data, was designed to assist the Trustees in making their determination as to the renewal of the Management Agreement and Subadvisory Agreements. At this meeting, counsel to the Funds and Trustees reviewed with the Trustees the various factors relevant to their consideration of the Management Agreement and Subadvisory Agreements, and the Trustees’ responsibilities related to their review. In response to requests from the Trustees for certain additional information following review of the materials provided for the November 3, 2017 meeting, CMC and certain of the Subadvisers provided supplemental information in connection with the December 7, 2017 meeting.
At the November 3 and December 7, 2017 meetings, the Trustees considered a number of factors, including those discussed below, that they believed to be relevant. No single factor determined whether or not an agreement would be approved but rather the totality of factors considered was determinative. Following an analysis and discussion of the factors described below, the Trustees, including all of the Independent Trustees, approved the renewal of the Management Agreement and the Subadvisory Agreements.
A-21
Nature, Extent, and Quality of Services Provided
The Trustees considered information presented as to the nature, extent, and quality of services provided by CMC and the Subadvisers, as well as their investment expertise, resources, and capabilities. The Trustees considered the quality of the Subadvisers previously recommended by CMC, as well as the ongoing work performed by CMC to recommend enhancements to individual fund management. The Trustees reviewed information regarding the financial condition of CMC and the Subadvisers related to their ongoing ability to provide services specified under the Management Agreement and Subadvisory Agreements. The Trustees considered that FCI provides, in addition to investment management services, certain services related to due diligence, performance reporting, compliance, and other administrative functions that support the investment management services and Subadviser oversight services provided by CMC. Based on their analysis of the data presented, the Trustees concluded that they were generally satisfied with the nature and quality of the services being provided under the Management Agreement and respective Subadvisory Agreements.
Investment Performance
The Trustees reviewed specific information as to the investment performance of the Funds as compared to the performance of their respective benchmark indices and peer groups over various periods of time. On a quarterly basis, the Trustees reviewed reports summarizing the net assets, redemptions, and purchases of shares of the Funds. The Trustees concluded that they were generally satisfied with CMC’s and the Subadvisers’ investment performance to date.
Comparative Fees and Cost of Services Provided
The Trustees reviewed the fees paid to CMC and the Subadvisers. The Trustees reviewed reports describing both the management fees charged by CMC and the total expense ratios of the Funds in comparison to those of similarly situated funds. In addition, on a quarterly basis, the Trustees reviewed information as to the expense ratios of the Funds compared to the median expense ratio of a peer group of funds with comparable investment strategies. The Trustees also reviewed information provided by each of the Subadvisers as to fees they charge to other clients, as applicable. The Trustees noted the ongoing efforts of CMC to reduce expenses charged to shareholders through oversight of service providers and by voluntarily waiving certain fees payable to CMC as specified in the Funds’ prospectus. In this regard, the Board considered that, effective September 22, 2017, CMC has voluntarily agreed to waive (i) the management fee for the Core Equity Fund from the contractual fee of 0.90% to 0.38%; (ii) the management fee for the Small Companies Fund from the contractual fee of 1.35% to 1.03%; (iii) the management fee for the Tax-Exempt Bond Fund from the contractual fee of 0.60% to 0.34%; and (iv) the management fee for the International Fund from the contractual fee of 1.00% to 0.68%.
Management Profitability
The Trustees reviewed CMC’s level of profitability with respect to the Funds, particularly noting CMC’s payment of fees and expenses typically absorbed by mutual fund shareholders. The Trustees concluded that profitability levels for CMC were reasonable. The Trustees considered that the Subadvisers are each independent firms and the subadvisory fees charged are the result of arm’s length bargaining between them and CMC.
Economies of Scale
The Trustees considered whether economies of scale might be realized by CMC as the Funds’ assets grow and whether there also might be benefits from such growth for the Funds’ shareholders. The Trustees noted that the Funds have been in operation for a number of years and, based on their distribution strategy, the Funds will probably not see significant increases in size. However, the Trustees determined that they would continue to monitor the assets of the Funds and consider whether there were additional opportunities to realize benefits from economies of scale for shareholders in the future.
A-22
Conclusion
Based on the factors described above, the Trustees, including all of the Independent Trustees, concluded that the investment management fees and subadvisory fees were fair and reasonable in view of the investment performance and quality of services provided. In reaching this conclusion, no single factor was considered determinative.
A-23
Quarterly Portfolio Schedule of Investments
The Funds file a complete schedule of their portfolio holdings as of the close of the first and third quarters of their fiscal years with the Securities and Exchange Commission (the “SEC”) on Form N-Q. Shareholders may request copies of Form N-Q free of charge by calling the Transfer Agent toll free at 1-855-684-9144 or by sending a written request to: The Northern Trust Company, P.O. Box 4766, Chicago, IL 60680-4766 Attn: Clearwater Investment Trust Funds. These filings are also available on the SEC’s Internet site at http://www.sec.gov and may be reviewed and copied at the SEC’s Public Reference Room in Washington, DC. Information about the public reference room may be obtained by calling 1-800-SEC-0330.
Voting Proxies on Fund Portfolio Securities
The Funds have established Proxy Voting Policies and Procedures (“Policies”) that the Funds use to determine how to vote proxies relating to portfolio securities. They also report, on Form N-PX, how the Funds voted any such proxies during the most recent 12-month period ended June 30. Shareholders may request copies of the Policies or Form N-PX free of charge by calling Fiduciary Counselling, Inc. toll free at 1-888-228-0935 or by sending a written request to: Fiduciary Counselling, Inc., 30 East 7th Street, Suite 2000, St. Paul, MN 55101 Attn: Clearwater Investment Trust Funds. Form N-PX is also available from the EDGAR database on the SEC’s Internet site at http://www.sec.gov.
A-24
EXECUTIVE OFFICERS AND TRUSTEES
Information About the Independent Trustees
| Name and Age | Positions Held With the Funds | Term of Office | Principal Occupation or Employment During the Last Five Years | Number of Portfolios in the Fund Complex to Be Overseen by the Trustee | Other Directorships Held by the Trustee During the Last 5 Years |
James E. Johnson (75) 30 East 7th Street Saint Paul, Minnesota 55101 | Trustee, Chairman of the Board | As Trustee: Tenure: 7 years Term: Indefinite
As Chairman Tenure: 2013- Present Term: Indefinite | Retired as Executive Vice President, Securian Financial Group, Inc. in 2010, Securian Financial Group, Inc. (1968-2010) | 4 | None |
Charles W. Rasmussen1 (51) 30 East 7th Street Saint Paul, Minnesota 55101 | Trustee, Chairman of the Nominating Committee | As Trustee: Tenure: 18 years Term: Indefinite
As Chairman of the Nominating Committee: Tenure: 7 Years Term: Indefinite | President and Chief Executive Officer, P&G Manufacturing, Inc. (air filtration equipment, 2002-Present) | 4 | Nu Star Inc. (private company, 2014- Present) |
Laura E. Rasmussen1 (54) 30 East 7th Street Saint Paul, Minnesota 55101 | Trustee, Chairman of the Audit Committee | As Trustee: Term: Indefinite Tenure: 18 years
As Chairman of the Audit Committee: Tenure: 2016 – Present Term: Indefinite | Business Owner, 3 Kittens Needle Arts (textile sales, 2006- Present) | 4 | None |
Lindsay R. Schack (40) 30 East 7th Street Saint Paul, Minnesota 55101 | Trustee | Tenure: 2015- Present Term: Indefinite | Owner and Architect, LS Architecture (2013 – Present), Architect, Tuya Studios, Inc. (architectural services, 2011 – 2012), Project Designer, Montana State University (2007 – 2011), Adjunct Faculty, Montana State University School of Architecture (2007 – 2013) | 4 | None |
David M. Weyerhaeuser (59) 30 East 7th Street Saint Paul, Minnesota 55101 | Trustee | Tenure: 2016- Present Term: Indefinite | Vice President, Sales and Marketing, Northwest Hardwoods (lumber manufacturer and distributor, 1991 – 2016) | 4 | R.D. Merrill Company, Inc. (private company, 1992 – Present) |
| 1 | Mr. Rasmussen and Ms. Rasmussen are siblings-in-law. |
A-25
Information about the Funds’ Executive Officers and Interested Trustees
| Name and Age | Positions Held With the Funds | Term of Office | Principal Occupation or Employment During the Last Five Years | Number of Portfolios in the Fund Complex to Be Overseen by the Officer/ Trustee | Other Directorships Held by the Officer/ Trustee During the Last 5 Years |
Sara G. Dent2 (59) 30 East 7th Street Saint Paul, Minnesota 55101 | Trustee | Tenure: 2013 – Present Term: Indefinite | Private Investor | 4 | None |
E. Rodman Titcomb, Jr.3 (69) 30 East 7th Street Saint Paul, Minnesota 55101 | Trustee | Tenure: 2016- Present Term: Indefinite | Chairman and Chief Executive Officer, Rock Island Company (holding company, 1998 – 2013), Managing Director, Elizabeth Ordway Dunn Foundation (1983 – 2013) | 4 | Rock Island Company (private company, 1998- 2013) |
Justin H. Weyerhaeuser4 (44) 30 East 7th Street Saint Paul, Minnesota 55101 | Trustee, President and Treasurer | Tenure: 10 years Term: Indefinite
As President and Treasurer: Tenure: 2013 - Present Term: Reappointed Annually | Private Investor (February 2013 – Present), Attorney, Davis Graham & Stubbs LLP (law firm, November 2011 – February 2013) | 4 | None |
Stephen G. Simon (49) 30 East 7th Street Saint Paul, Minnesota 55101 | Chief Compliance Officer and Secretary | Tenure: 2014 – Present Term: Reappointed Annually As Secretary: Tenure: 2016 – Present Term: Reappointed Annually | Chief Compliance Officer, Fiduciary Counselling, Inc. (February 2014 – Present), Chief Compliance Officer, Clearwater Management Company (March 2014 – Present), Chief Compliance Officer, Allianz Investment Management, LLC (2004 – February 2014). | N/A | N/A |
| 2 | Ms. Sara G. Dent is an interested Trustee due to her mother’s level of ownership of voting securities in one of the Funds in the Trust. From June 2015 through June 2016, Ms. Dent also served as Secretary of the Trust. |
| 3 | Mr. Titcomb is an interested Trustee due to his brother’s position as a director of CMC. |
| 4 | Mr. Justin H. Weyerhaeuser is an interested Trustee due to his position as the Funds’ President and Treasurer. |
A-26
| Name and Age | Positions Held With the Funds | Term of Office | Principal Occupation or Employment During the Last Five Years | Number of the Fund Complex to Be Overseen by the Officer/ Trustee | Other Directorships Held by the Officer/ Trustee During the Last 5 Years |
Shari L. Clifford (49) 30 East 7th Street Saint Paul, Minnesota 55101 | Assistant Treasurer | Tenure: 2014 – Present Term: Reappointed Annually | Chief Financial Officer and Treasurer, Fiduciary Counselling, Inc. (February 2014 – Present), Controller and Finance Director, Woodbury Financial Services, Inc. (November 2007 – February 2014) | N/A | N/A |
Michael D. Jiang (33) The Northern Trust Company 50 South LaSalle Street Chicago, IL 60603 | Assistant Secretary | Tenure: 2016 – Present Term: Reappointed Annually | The Northern Trust Company, Second Vice President (2015-Present) | N/A | N/A |
Additional information about the Funds’ Directors is available in the Funds’ Statement of Additional Information (“SAI”). The SAI is available without charge, upon request, by contacting the transfer agent at 1-855-684-9144 or writing the Funds at The Northern Trust Company, P.O. Box 4766, Chicago, IL 60680-4766. The Funds do not have an internet website.
A-27
Federal Tax Information
(unaudited)
Qualified Dividend Income. Under the Jobs and Growth Tax Relief Reconciliation Act of 2003 (the “Act”), 100.00% of ordinary dividends and 27.87% of qualified short term gains were paid during the fiscal year ended December 31, 2017 for the Core Equity Fund, 100.00% of ordinary dividends paid during the fiscal year ended December 31, 2017 for the Small Companies Fund, and 100.00% of ordinary dividends paid during the fiscal year ended December 31, 2017 for the International Fund are designated as “qualified dividend income”, as defined in the Act, subject to reduced tax rates in 2017.
Corporate Dividends-Received Deduction. 100.00% and 1.71% of the dividends distributed during the fiscal year ended December 31, 2017, for the Core Equity and Small Companies, respectively, qualify for the dividends-received deduction for corporate shareholders.
Capital Gain Distribution. The following Funds made capital gain distributions in December 2017, and hereby designated these long-term capital gain distributions as follows:
| Fund | Long-Term Capital Gain | |||
| Core Equity(1) | $ | 26,497,925 | ||
| Small Companies(2) | 49,069,167 | |||
| Tax-Exempt Bond | 2,113,229 | |||
| International (3) | 7,930,041 | |||
| (1) | During the fiscal year 2017, Core Equity Fund designated long-term capital gain distributions in the amount of $27,867,934. Core Equity Fund utilized equalization accounting for tax purposes, whereby a portion of redemption payments were treated as distributions of long-term capital gain. As a result the Fund paid long-term capital gain distributions in the amount of $26,497,925. |
| (2) | During the fiscal year 2017, Small Companies Fund designated long-term capital gain distributions in the amount of $50,313,637. Small Companies Fund utilized equalization accounting for tax purposes, whereby a portion of redemption payments were treated as distributions of long-term capital gain. As a result the Fund paid long-term capital gain distributions in the amount of $49,069,167. |
| (3) | During the fiscal year 2017, International Fund utilized equalization accounting for tax purposes, whereby a portion of redemption payments were treated as distributions of long-term capital gains in the amount of $8,534,656. As a result the Fund paid long-term capital gain distributions in the amount of $7,930,041. |
A-28
Clearwater Investment Trust
Financial Statements
For the Fiscal Year Ended December 31, 2017
Table of Contents
Financial Statements:
 | |
KPMG LLP 4200 Wells Fargo Center 90 South Seventh Street Minneapolis, MN 55402 |
Report of Independent Registered Public Accounting Firm
To the Shareholders and Board of Trustees
Clearwater Investment Trust:
Opinion on the Financial Statements
We have audited the accompanying statements of assets and liabilities, including the schedules of investments, of Clearwater Core Equity Fund, Clearwater Small Companies Fund, Clearwater Tax-Exempt Bond Fund, and Clearwater International Fund (collectively, the Funds), each a series of Clearwater Investment Trust, as of December 31, 2017, the related statements of operations for the year then ended, the statements of changes in net assets for each of the years in the two-year period then ended, and the related notes (collectively, the “financial statements”) and the financial highlights for each of the years in the five-year period then ended. In our opinion, the financial statements and financial highlights present fairly, in all material respects, the financial position of the Funds as of December 31, 2017, the results of their operations for the year then ended, the changes in their net assets for each of the years in the two-year period then ended, and the financial highlights for each of the years in the five-year period then ended, in conformity with U.S. generally accepted accounting principles.
Basis for Opinion
These financial statements and financial highlights are the responsibility of the Funds’ management. Our responsibility is to express an opinion on these financial statements and financial highlights based on our audits. We are a public accounting firm registered with the Public Company Accounting Oversight Board (United States) (“PCAOB”) and are required to be independent with respect to the Funds in accordance with the U.S. federal securities laws and the applicable rules and regulations of the Securities and Exchange Commission and the PCAOB.
We conducted our audits in accordance with the standards of the PCAOB. Those standards require that we plan and perform the audit to obtain reasonable assurance about whether the financial statements and financial highlights are free of material misstatement, whether due to error or fraud. Our audits included performing procedures to assess the risks of material misstatement of the financial statements and financial highlights, whether due to error or fraud, and performing procedures that respond to those risks. Such procedures included examining, on a test basis, evidence regarding the amounts and disclosures in the financial statements and financial highlights. Such procedures also included confirmation of securities owned as of December 31, 2017, by correspondence with custodians, transfer agents, and brokers, or by other appropriate auditing procedures. Our audits also included evaluating the accounting principles used and significant estimates made by management, as well as evaluating the overall presentation of the financial statements and financial highlights. We believe that our audits provide a reasonable basis for our opinion.
/s/ KPMG LLP
We have served as the auditor of one or more Clearwater Investment Trust investment companies since 1992.
Minneapolis, Minnesota
February 23, 2018
KPMG LLP is a Delaware limited liability partnership and the U.S. member
firm of the KPMG network of independent member firms affiliated with
KPMG International Cooperative (“KPMG International”), a Swiss entity.
1
CLEARWATER INVESTMENT TRUST
Statements of Assets and Liabilities
December 31, 2017
| Core Equity Fund | Small Companies Fund | Tax-Exempt Bond Fund | International Fund | |||||||||||||
| Assets | ||||||||||||||||
| Investments in securities, at fair value (identified cost: $251,668,459, $327,507,517, $490,035,832 and $418,220,351, respectively) | $ | 538,985,975 | 373,299,955 | 515,317,851 | 623,531,280 | |||||||||||
Foreign currencies, at value (cost: $388, $0, $0 and $270,152, respectively) | 410 | - | - | 272,914 | ||||||||||||
Cash (restricted:$0, $0, $1,345,895 and $0, respectively) | - | - | 5,483,102 | - | ||||||||||||
| Receivable for securities sold | 399,337 | 627,947 | - | 90,493 | ||||||||||||
| Receivable for shares of beneficial interest sold | 118,000 | - | - | - | ||||||||||||
| Accrued dividend and interest receivable | 507,340 | 319,131 | 5,269,534 | 641,514 | ||||||||||||
| Foreign tax reclaim receivable | 12,953 | - | - | 1,367,175 | ||||||||||||
| Unrealized appreciation on forward foreign currency exchange contracts | - | - | - | 76,201 | ||||||||||||
| Total assets | 540,024,015 | 374,247,033 | 526,070,487 | 625,979,577 | ||||||||||||
| Liabilities | ||||||||||||||||
| Payables for investment securities purchased | 131,821 | 3,574,687 | - | 55,886 | ||||||||||||
| Accrued investment advisory fee | 506,015 | 952,396 | 444,497 | 1,056,623 | ||||||||||||
| Payable for dividend distribution | - | - | 238,897 | - | ||||||||||||
| Payable for variation margin on futures contracts | - | - | 231,188 | - | ||||||||||||
| Unrealized depreciation on forward foreign currency exchange contracts | - | - | - | 99,851 | ||||||||||||
| Deferred foreign capital gains taxes payable | - | - | - | 125,215 | ||||||||||||
| Short-term Financing | 994,371 | - | - | - | ||||||||||||
| Total liabilities | 1,632,207 | 4,527,083 | 914,582 | 1,337,575 | ||||||||||||
| Net assets | $ | 538,391,808 | 369,719,950 | 525,155,905 | 624,642,002 | |||||||||||
| Capital | ||||||||||||||||
| Capital Stock and additional paid-in capital (authorized unlimited number of shares at no par value for each Fund: 12,459,928, 19,537,740, 51,417,934 and 36,261,774 shares, respectively) | $ | 241,033,506 | 318,424,004 | 494,373,804 | 419,672,764 | |||||||||||
| Undistributed (overdistributed) net investment income | 199,502 | - | 4,066,323 | (2,481,650 | ) | |||||||||||
| Accumulated net realized gain from investments and foreign currency transactions | 9,841,262 | 5,503,508 | 1,037,885 | 2,279,309 | ||||||||||||
| Unrealized appreciation of investments and translation of assets and liabilities in foreign currencies | 287,317,538 | 45,792,438 | 25,677,893 | 205,171,579 | ||||||||||||
| Net assets | $ | 538,391,808 | 369,719,950 | 525,155,905 | 624,642,002 | |||||||||||
| Net asset value per share of outstanding capital stock | $ | 43.21 | 18.92 | 10.21 | 17.23 | |||||||||||
See accompanying notes to financial statements.
2
CLEARWATER INVESTMENT TRUST
Statements of Operations
Year ended December 31, 2017
| Core Equity Fund | Small Companies Fund | Tax-Exempt Bond Fund | International Fund | |||||||||||||
| Investment income: | ||||||||||||||||
| Income: | ||||||||||||||||
Dividends (net of foreign taxes withheld of $53,309, $6,746, $0 and $1,402,734, respectively) | $ | 9,510,825 | 3,832,516 | 1,564,046 | 13,565,687 | |||||||||||
| Interest | - | - | 22,128,192 | - | ||||||||||||
| Total income | 9,510,825 | 3,832,516 | 23,692,238 | 13,565,687 | ||||||||||||
| Expenses: | ||||||||||||||||
| Investment advisory fee | 4,508,545 | 4,722,492 | 3,030,017 | 5,793,357 | ||||||||||||
| Voluntary fee reduction | (2,572,360 | ) | (1,244,414 | ) | (1,313,006 | ) | (1,923,104 | ) | ||||||||
| Other expenses | 170 | 170 | 85 | 170 | ||||||||||||
| Total net expenses | 1,936,355 | 3,478,248 | 1,717,096 | 3,870,423 | ||||||||||||
| Net investment income | 7,574,470 | 354,268 | 21,975,142 | 9,695,264 | ||||||||||||
| Net realized gain (loss) on: | ||||||||||||||||
| Security transactions | 38,688,118 | 62,106,611 | 362,887 | 36,085,164 | ||||||||||||
| Forward foreign currency exchange contracts | - | - | - | (131,701 | ) | |||||||||||
| Foreign currency transactions | - | - | - | 26,483 | ||||||||||||
| Futures contracts | - | - | 3,335,300 | - | ||||||||||||
| Net increase (decrease) in unrealized appreciation/depreciation on: | ||||||||||||||||
| Security transactions (net of increase (decrease) in deferred foreign taxes of $0, $0, $0 and $(125,215), respectively) | 59,003,242 | (17,724,945 | ) | 15,331,617 | 88,716,522 | |||||||||||
| Forward foreign currency exchange contracts | - | - | - | (243,107 | ) | |||||||||||
| Futures contracts | - | - | 395,874 | - | ||||||||||||
| Translation of other assets and liabilities denominated in foreign currencies | 28 | - | - | 130,401 | ||||||||||||
| Net gain (loss) on investments | 97,691,388 | 44,381,666 | 19,425,678 | 124,583,762 | ||||||||||||
| Net increase (decrease) in net assets resulting from operations | $ | 105,265,858 | 44,735,934 | 41,400,820 | 134,279,026 | |||||||||||
See accompanying notes to financial statements.
3
CLEARWATER INVESTMENT TRUST
Statements of Changes in Net Assets
Years ended December 31, 2017 and 2016
| Core Equity Fund | Small Companies Fund | |||||||||||||||
| 12/31/2017 | 12/31/2016 | 12/31/2017 | 12/31/2016 | |||||||||||||
| Operations: | ||||||||||||||||
| Net investment income | $ | 7,574,470 | 7,374,769 | 354,268 | 848,536 | |||||||||||
| Net realized gain | 38,688,118 | 32,005,747 | 62,106,611 | 11,553,619 | ||||||||||||
| Net increase (decrease) in unrealized appreciation/depreciation | 59,003,270 | 5,670,222 | (17,724,945 | ) | 43,242,489 | |||||||||||
| Net increase in net assets resulting from operations | 105,265,858 | 45,050,738 | 44,735,934 | 55,644,644 | ||||||||||||
| Distributions to shareholders from: | ||||||||||||||||
| Net investment income | (7,688,471 | ) | (5,855,358 | ) | (483,397 | ) | (778,724 | ) | ||||||||
| Net realized gain | (26,497,925 | ) | (18,781,174 | ) | (57,259,786 | ) | (12,145,074 | ) | ||||||||
| Total distributions to shareholders | (34,186,396 | ) | (24,636,532 | ) | (57,743,183 | ) | (12,923,798 | ) | ||||||||
| Capital share transactions: | ||||||||||||||||
| Proceeds from shares sold | 17,783,135 | 10,473,387 | 4,295,100 | 34,485,963 | ||||||||||||
Reinvestment of distributions from net investment income and net realized gain | 34,174,713 | 24,636,527 | 57,743,183 | 12,923,794 | ||||||||||||
| Payments for shares redeemed | (51,127,836 | ) | (81,459,509 | ) | (22,704,074 | ) | (46,117,773 | ) | ||||||||
| Net increase (decrease) in net assets from capital share transactions | 830,012 | (46,349,595 | ) | 39,334,209 | 1,291,984 | |||||||||||
| Total increase (decrease) in net assets | 71,909,474 | (25,935,389 | ) | 26,326,960 | 44,012,830 | |||||||||||
| Net assets: | ||||||||||||||||
| At the beginning of the year | 466,482,334 | 492,417,723 | 343,392,990 | 299,380,160 | ||||||||||||
| At the end of the year | $ | 538,391,808 | 466,482,334 | 369,719,950 | 343,392,990 | |||||||||||
| Undistributed net investment income | $ | 199,502 | - | - | - | |||||||||||
| Tax-Exempt Bond Fund | International Fund | |||||||||||||||
| 12/31/2017 | 12/31/2016 | 12/31/2017 | 12/31/2016 | |||||||||||||
| Operations: | ||||||||||||||||
| Net investment income | $ | 21,975,142 | 23,074,963 | 9,695,264 | 9,534,698 | |||||||||||
| Net realized gain (loss) | 3,698,187 | 1,657,062 | 35,979,946 | (21,953,873 | ) | |||||||||||
| Net increase (decrease) in unrealized appreciation/depreciation | 15,727,491 | (12,178,939 | ) | 88,603,816 | 23,655,177 | |||||||||||
| Net increase in net assets resulting from operations | 41,400,820 | 12,553,086 | 134,279,026 | 11,236,002 | ||||||||||||
| Distributions to shareholders from: | ||||||||||||||||
| Net investment income | (24,005,546 | ) | (22,085,107 | ) | (10,724,142 | ) | (9,674,768 | ) | ||||||||
| Net realized gain | (3,125,893 | ) | (1,169,087 | ) | (7,930,041 | ) | (12,673 | ) | ||||||||
| Total distributions to shareholders | (27,131,439 | ) | (23,254,194 | ) | (18,654,183 | ) | (9,687,441 | ) | ||||||||
| Capital share transactions: | ||||||||||||||||
| Proceeds from shares sold | 25,194,500 | 19,338,667 | 13,231,107 | 34,599,021 | ||||||||||||
| Reinvestment of distributions from net investment income and net realized gain | 27,662,365 | 22,594,801 | 18,654,200 | 9,687,457 | ||||||||||||
| Payments for shares redeemed | (26,826,167 | ) | (59,149,478 | ) | (31,866,974 | ) | (28,020,420 | ) | ||||||||
| Net increase (decrease) in net assets from capital share transactions | 26,030,698 | (17,216,010 | ) | 18,333 | 16,266,058 | |||||||||||
| Total increase (decrease) in net assets | 40,300,079 | (27,917,118 | ) | 115,643,176 | 17,814,619 | |||||||||||
| Net assets: | ||||||||||||||||
| At the beginning of the year | 484,855,826 | 512,772,944 | 508,998,826 | 491,184,207 | ||||||||||||
| At the end of the year | $ | 525,155,905 | 484,855,826 | 624,642,002 | 508,998,826 | |||||||||||
| Undistributed (overdistributed) net investment income | $ | 4,066,323 | 1,098,542 | (2,481,650 | ) | (1,591,305 | ) | |||||||||
See accompanying notes to financial statements.
4
CLEARWATER INVESTMENT TRUST
Per share data (rounded to the nearest cent) for a share of capital stock outstanding throughout the years or period ended and selected information for each year or period ended is as follows:
| Year ended December 31, | ||||||||||||||||||||
| Core Equity Fund | 2017 | 2016 | 2015 | 2014 | 2013 | |||||||||||||||
| Net asset value, beginning of year | $ | 37.43 | 35.57 | 39.41 | 37.77 | 28.81 | ||||||||||||||
| Income (loss) from investment operations: | ||||||||||||||||||||
| Net investment income | 0.64 | 0.65 | 0.64 | 0.60 | 0.51 | |||||||||||||||
| Net realized and unrealized gains (losses) | 8.03 | 3.27 | (0.96 | ) | 2.91 | 8.95 | ||||||||||||||
| Total from investment operations | 8.67 | 3.92 | (0.32 | ) | 3.51 | 9.46 | ||||||||||||||
| Less distributions to shareholders from: | ||||||||||||||||||||
| Net investment income | (0.65 | ) | (0.49 | ) | (0.60 | ) | (0.63 | ) | (0.50 | ) | ||||||||||
| Net realized gain | (2.24 | ) | (1.57 | ) | (2.92 | ) | (1.24 | ) | - | |||||||||||
| Total distributions to shareholders: | (2.89 | ) | (2.06 | ) | (3.52 | ) | (1.87 | ) | (0.50 | ) | ||||||||||
| Net asset value, end of year | $ | 43.21 | 37.43 | 35.57 | 39.41 | 37.77 | ||||||||||||||
| Total return (a) | 23.26 | % | 10.98 | % | (0.71 | )% | 9.23 | % | 32.85 | % | ||||||||||
| Net assets, end of year (000s omitted) | $ | 538,392 | 466,482 | 492,418 | 541,017 | 523,042 | ||||||||||||||
| Ratio of expenses, net of waivers, to average net assets (b), (c), (d), (e), (f), (g) | 0.39 | % | 0.43 | % | 0.42 | % | 0.50 | % | 0.50 | % | ||||||||||
| Ratio of expenses, before waivers, to average net assets (b), (c), (d), (e), (f), (g) | 0.90 | % | 0.90 | % | 0.90 | % | 0.90 | % | 0.90 | % | ||||||||||
| Ratio of net investment income (loss), net of waivers, to average net assets (c), (d), (e), (f), (g) | 1.51 | % | 1.63 | % | 1.52 | % | 1.50 | % | 1.51 | % | ||||||||||
| Ratio of net investment income (loss), before waivers, to average net assets (c), (d), (e), (f), (g) | 1.00 | % | 1.16 | % | 1.02 | % | 1.10 | % | 1.11 | % | ||||||||||
| Portfolio turnover rate (excluding short-term securities) | 31.13 | % | 44.11 | % | 94.07 | % | 13.54 | % | 21.07 | % | ||||||||||
| (a) | Total return figures are based on the change in net asset value of a share during the year and assume reinvestment of distributions at net asset value. |
| (b) | In addition to fees and expenses which the Fund bears directly, the Fund indirectly bears a pro rata share of the fees and expenses of any acquired funds in which it invests. Such indirect expenses are not included in the above reported expense ratios. |
| (c) | Effective September 22, 2017, the investment advisory fee, net of voluntary waivers, increased to 0.38%. Also effective September 22, 2017, the Adviser decreased the voluntary waiver to 0.52%. |
| (d) | Effective March 16, 2017, the investment advisory fee, net of voluntary waivers, decreased to 0.37%. Also effective March 16, 2017, the Adviser increased the voluntary waiver to 0.53%. |
| (e) | Effective March 16, 2016, the investment advisory fee, net of voluntary waivers, increased to 0.44%. Also effective March 16, 2016, the Adviser decreased the voluntary waiver to 0.46%. |
| (f) | Effective March 16, 2015, the investment advisory fee, net of voluntary waivers,decreased to 0.40%. Also effective March 16, 2015, the Adviser increased the voluntary waiver to 0.50%. |
| (g) | Effective March 15, 2013, the investment advisory fee, net of voluntary waivers, decreased to 0.50%. Also effective March 15, 2013, the Adviser increased the voluntary waiver to 0.40%. |
See accompanying notes to financial statements.
| 5 |
CLEARWATER INVESTMENT TRUST
Financial Highlights
Per share data (rounded to the nearest cent) for a share of capital stock outstanding throughout the years or period ended and selected information for each year or period ended is as follows:
| Year ended December 31, | ||||||||||||||||||||
| Small Companies Fund | 2017 | 2016 | 2015 | 2014 | 2013 | |||||||||||||||
| Net asset value, beginning of year | $ | 19.79 | 17.18 | 20.30 | 22.35 | 18.70 | ||||||||||||||
| Income (loss) from investment operations: | ||||||||||||||||||||
| Net investment income | 0.02 | 0.07 | 0.07 | 0.05 | 0.05 | |||||||||||||||
| Net realized and unrealized gains (losses) | 2.58 | 3.30 | (0.90 | ) | 1.10 | 6.30 | ||||||||||||||
| Total from investment operations | 2.60 | 3.37 | (0.83 | ) | 1.15 | 6.35 | ||||||||||||||
| Less distributions to shareholders from: | ||||||||||||||||||||
| Net investment income | (0.03 | ) | (0.05 | ) | (0.06 | ) | (0.04 | ) | (0.06 | ) | ||||||||||
| Net realized gain | (3.44 | ) | (0.71 | ) | (2.23 | ) | (3.16 | ) | (2.64 | ) | ||||||||||
| Total distributions to shareholders: | (3.47 | ) | (0.76 | ) | (2.29 | ) | (3.20 | ) | (2.70 | ) | ||||||||||
| Net asset value, end of year | $ | 18.92 | 19.79 | 17.18 | 20.30 | 22.35 | ||||||||||||||
| Total return (a) | 13.46 | % | 19.67 | % | (3.96 | )% | 5.03 | % | 34.01 | % | ||||||||||
| Net assets, end of year (000s omitted) | $ | 369,720 | 343,393 | 299,380 | 333,888 | 343,068 | ||||||||||||||
| Ratio of expenses, net of waivers, to average net assets (b), (c), (d), (e), (f), (g) | 0.99 | % | 1.02 | % | 0.97 | % | 0.94 | % | 0.95 | % | ||||||||||
| Ratio of expenses, before waivers, to average net assets (b), (c), (d), (e), (f), (g) | 1.35 | % | 1.35 | % | 1.35 | % | 1.35 | % | 1.35 | % | ||||||||||
| Ratio of net investment income (loss), net of waivers, to average net assets (c), (d), (e), (f), (g) | 0.11 | % | 0.28 | % | 0.22 | % | 0.24 | % | 0.21 | % | ||||||||||
| Ratio of net investment income (loss), before waivers, to average net assets (c), (d), (e), (f), (g) | (0.25 | )% | (0.05 | )% | (0.16 | )% | (0.17 | )% | (0.19 | )% | ||||||||||
| Portfolio turnover rate (excluding short-term securities) | 113.85 | % | 78.82 | % | 58.71 | % | 55.51 | % | 59.84 | % | ||||||||||
| (a) | Total return figures are based on the change in net asset value of a share during the year and assume reinvestment of distributions at net asset value. |
| (b) | In addition to fees and expenses which the Fund bears directly, the Fund indirectly bears a pro rata share of the fees and expenses of any acquired funds in which it invests. Such indirect expenses are not included in the above reported expense ratios. |
| (c) | Effective September 22, 2017, the investment advisory fee, net of voluntary waivers, increased to 1.03%. Also effective March 16, 2017, the Adviser decreased the voluntary waiver to 0.32%. |
| (d) | Effective March 16, 2017, the investment advisory fee, net of voluntary waivers, decreased to 0.96%. Also effective March 16, 2017, the Adviser increased the voluntary waiver to 0.39%. |
| (e) | Effective March 16, 2016, the investment advisory fee, net of voluntary waivers, increased to 1.03%. Also effective March 16, 2016, the Adviser decreased the voluntary waiver to 0.32%. |
| (f) | Effective March 16, 2015, the investment advisory fee, net of voluntary waivers, increased to 0.98%. Also effective March 16, 2015, the Adviser decreased the voluntary waiver to 0.37%. |
| (g) | Effective March 15, 2013, the investment advisory fee, net of voluntary waivers, decreased to 0.94%. Also effective March 15, 2013, the Adviser increased the voluntary waiver to 0.41%. |
See accompanying notes to financial statements.
| 6 | (Continued) |
CLEARWATER INVESTMENT TRUST
Financial Highlights
Per share data (rounded to the nearest cent) for a share of capital stock outstanding throughout the years or period ended and selected information for each year or period ended is as follows:
| Year ended December 31, | ||||||||||||||||||||
| Tax-Exempt Bond Fund | 2017 | 2016 | 2015 | 2014 | 2013 | |||||||||||||||
| Net asset value, beginning of year | $ | 9.93 | 10.16 | 10.16 | 9.23 | 10.15 | ||||||||||||||
| Income (loss) from investment operations: | ||||||||||||||||||||
| Net investment income | 0.45 | 0.46 | 0.42 | 0.44 | 0.46 | |||||||||||||||
| Net realized and unrealized gains (losses) | 0.38 | (0.23 | ) | 0.04 | 0.95 | (0.84 | ) | |||||||||||||
| Total from investment operations | 0.83 | 0.23 | 0.46 | 1.39 | (0.38 | ) | ||||||||||||||
| Less distributions to shareholders from: | ||||||||||||||||||||
| Net investment income | (0.49 | ) | (0.44 | ) | (0.42 | ) | (0.44 | ) | (0.46 | ) | ||||||||||
| Net realized gain | (0.06 | ) | (0.02 | ) | (0.04 | ) | (0.02 | ) | (0.08 | ) | ||||||||||
| Total distributions to shareholders: | (0.55 | ) | (0.46 | ) | (0.46 | ) | (0.46 | ) | (0.54 | ) | ||||||||||
| Net asset value, end of year | $ | 10.21 | 9.93 | 10.16 | 10.16 | 9.23 | ||||||||||||||
| Total return (a) | 8.54 | % | 2.28 | % | 4.73 | % | 15.29 | % | (3.77 | )% | ||||||||||
| Net assets, end of year (000s omitted) | $ | 525,156 | 484,856 | 512,773 | 507,982 | 465,026 | ||||||||||||||
| Ratio of expenses, net of waivers, to average net assets (b), (c), (d) | 0.34 | % | 0.34 | % | 0.34 | % | 0.33 | % | 0.34 | % | ||||||||||
| Ratio of expenses, before waivers, to average net assets (b), (c), (d) | 0.60 | % | 0.60 | % | 0.60 | % | 0.60 | % | 0.60 | % | ||||||||||
| Ratio of net investment income (loss), net of waivers, to average net assets (c), (d) | 4.35 | % | 4.54 | % | 4.23 | % | 4.48 | % | 4.78 | % | ||||||||||
| Ratio of net investment income (loss), before waivers, to average net assets (c), (d) | 4.09 | % | 4.28 | % | 3.97 | % | 4.21 | % | 4.52 | % | ||||||||||
| Portfolio turnover rate (excluding short-term securities) | 13.28 | % | 13.48 | % | 18.93 | % | 22.25 | % | 31.65 | % | ||||||||||
| (a) | Total return figures are based on the change in net asset value of a share during the year and assume reinvestment of distributions at net asset value. |
| (b) | In addition to fees and expenses which the Fund bears directly, the Fund indirectly bears a pro rata share of the fees and expenses of any acquired funds in which it invests. Such indirect expenses are not included in the above reported expense ratios. |
| (c) | Effective March 16, 2015, the investment advisory fee, net of voluntary waivers, increased to 0.34%. Also effective March 16, 2015, the Adviser decreased the voluntary waiver to 0.26%. |
| (d) | Effective March 15, 2013, the investment advisory fee, net of voluntary waivers, decreased to 0.33%. Also effective March 15, 2013, the Adviser increased the voluntary waiver to 0.27%. |
See accompanying notes to financial statements.
| 7 | (Continued) |
CLEARWATER INVESTMENT TRUST
Financial Highlights
Per share data (rounded to the nearest cent) for a share of capital stock outstanding throughout the years or period ended and selected information for each year or period ended is as follows:
| Year ended December 31, | ||||||||||||||||||||
| International Fund | 2017 | 2016 | 2015 | 2014 | 2013 | |||||||||||||||
| Net asset value, beginning of year | $ | 14.04 | 14.02 | 14.41 | 15.76 | 13.33 | ||||||||||||||
| Income (loss) from investment operations: | ||||||||||||||||||||
| Net investment income | 0.27 | 0.27 | 0.28 | 0.35 | 0.29 | |||||||||||||||
| Net realized and unrealized gains (losses) | 3.44 | 0.02 | (0.31 | ) | (1.08 | ) | 2.62 | |||||||||||||
| Total from investment operations | 3.71 | 0.29 | (0.03 | ) | (0.73 | ) | 2.91 | |||||||||||||
| Less distributions to shareholders from: | ||||||||||||||||||||
| Net investment income | (0.30 | ) | (0.27 | ) | (0.28 | ) | (0.36 | ) | (0.34 | ) | ||||||||||
| Net realized gain | (0.22 | ) | - | (a) | (0.08 | ) | (0.26 | ) | (0.14 | ) | ||||||||||
| Total distributions to shareholders: | (0.52 | ) | (0.27 | ) | (0.36 | ) | (0.62 | ) | (0.48 | ) | ||||||||||
| Net asset value, end of year | $ | 17.23 | 14.04 | 14.02 | 14.41 | 15.76 | ||||||||||||||
| Total return (b) | 26.54 | % | 2.09 | % | (0.15 | )% | (4.70 | )% | 21.85 | % | ||||||||||
| Net assets, end of year (000s omitted) | $ | 624,642 | 508,999 | 491,184 | 481,943 | 511,904 | ||||||||||||||
| Ratio of expenses, net of waivers, to average net assets (c), (d), (e), (f), (g), (h) | 0.67 | % | 0.70 | % | 0.69 | % | 0.67 | % | 0.66 | % | ||||||||||
| Ratio of expenses, before waivers, to average net assets (c), (d), (e), (f), (g), (h) | 1.00 | % | 1.00 | % | 1.00 | % | 1.00 | % | 1.00 | % | ||||||||||
| Ratio of net investment income (loss), net of waivers, to average net assets (d), (e), (f), (g), (h) | 1.67 | % | 1.90 | % | 1.87 | % | 2.22 | % | 1.99 | % | ||||||||||
| Ratio of net investment income (loss), before waivers, to average net assets (d), (e), (f), (g), (h) | 1.34 | % | 1.60 | % | 1.56 | % | 1.89 | % | 1.65 | % | ||||||||||
| Portfolio turnover rate (excluding short-term securities) | 36.17 | % | 37.21 | % | 18.49 | % | 15.33 | % | 22.54 | % | ||||||||||
| (a) | Per share amounts from distributions paid from net realized gain were less than $0.01 per share. |
| (b) | Total return figures are based on the change in net asset value of a share during the year and assume reinvestment of distributions at net asset value. |
| (c) | In addition to fees and expenses which the Fund bears directly, the Fund indirectly bears a pro rata share of the fees and expenses of any acquired funds in which it invests. Such indirect expenses are not included in the above reported expense ratios. |
| (d) | Effective September 22, 2017, the investment advisory fee, net of voluntary waivers, increased to 0.68%. Also effective September 22, 2017, the Advisor decreased the voluntary waiver to 0.32%. |
| (e) | Effective March 16, 2017, the investment advisory fee, net of voluntary waivers, decreased to 0.65%. Also effective March 16, 2017, the Adviser increased the voluntary waiver to 0.35%. |
| (f) | Effective March 16, 2016, the investment advisory fee, net of voluntary waivers, increased to 0.70%. Also effective March 16, 2016, the Adviser decreased the voluntary waiver to 0.30%. |
| (g) | Effective March 16, 2015, the investment advisory fee, net of voluntary waivers, increased to 0.69%. Also effective March 16, 2015, the Advisor decreased the voluntary waiver to 0.31%. |
| (h) | Effective March 15, 2013, the investment advisory fee, net of voluntary waivers, increased to 0.67%. Also effective March 15, 2013, the Adviser decreased the voluntary waiver to 0.33%. |
See accompanying notes to financial statements.
| 8 | (Continued) |
Notes to Financial Statements
December 31, 2017
| (1) | Organization |
Clearwater Investment Trust (the “Trust”) was established on January 12, 1987 as a Massachusetts business trust and is registered under the Investment Company Act of 1940 (as amended) as a diversified open end management investment company and presently includes four series: Clearwater Core Equity Fund (“Core Equity Fund”), Clearwater Small Companies Fund (“Small Companies Fund”), ClearwaterTax-Exempt Bond Fund (“Tax-Exempt Bond Fund”), and Clearwater International Fund (“International Fund” and together with the Core Equity Fund, Small Companies Fund and Tax-Exempt Bond Fund, the “Funds”). Clearwater Management Co., Inc. (the “Adviser”) serves as the investment adviser for each of the Funds and is responsible for the oversight of each of the Fund’s subadvisers. The Trust’s declaration of trust permits the Board of Trustees to create additional funds in the future. The investment objective of the Core Equity, Small Companies, and International Funds is long-term capital growth. The investment objective of the Tax-Exempt Bond Fund is high current income that is exempt from United States (“U.S.”) federal income tax, consistent with preservation of capital.
Fiduciary Counselling, Inc. (“FCI”) acts as subadviser to each of the Funds. FCI does not provide day-to-day management, but provides the Funds with various investment-related services, including investment strategy advice, manager recommendations and related duties as requested by the Adviser. FCI also provides certain services related to due diligence, performance reporting, compliance, and other administrative functions, which support the investment management services and subadviser oversight services provided to the Funds by the Adviser.
The Northern Trust Company serves as the custodian, administrator, accounting services agent and transfer agent for the Trust.
Effective May 18, 2017, the Trust terminated Denver Investments (“Denver”), one of the subadvisers to the Clearwater International Fund.
Effective September 8, 2017, the Trust terminated Keeley-Teton Advisors, LLC (“Keeley-Teton”), one of the subadvisers to the Clearwater Small Companies Fund.
Effective September 22, 2017, the Trust appointed Pzena Investment Management, LLC (“Pzena”) and Cooke & Bieler, L.P. (“Cooke & Bieler”), as two of its subadvisers to the Clearwater Small Companies Fund.
Under normal market conditions, the Core Equity Fund pursues its investment objective by investing at least 80% of its net assets, plus the amount of any borrowings for investment purposes, in equity securities of U.S. companies. The equity securities in which the Fund primarily invests are common and preferred stocks. The Fund employs a multi-style (growth and value) and multi-manager approach whereby portions of the Fund are allocated to different subadvisers who employ distinct investment styles. The Fund’s Adviser allocates portions of the Fund’s assets among subadvisers. The Fund currently allocates assets among the following subadvisers who provide day-to-day management for the Fund: Parametric Portfolio Associates, LLC (“Parametric”), AQR Capital Management (“AQR”), and O’Shaughnessy Asset Management (“OSAM”). The allocation among subadvisers will vary over time, but the current intent of the Fund’s Adviser is that under normal market conditions approximately 60% of the Fund’s total assets will be allocated to Parametric; the remaining assets will be allocated to one or more of the Fund’s two other subadvisers that provide day-to-day management. Parametric manages its portion of the Fund’s assets using a passive management strategy to seek investment results that match, before fees and expenses, the
| 9 | (Continued) |
CLEARWATER INVESTMENT TRUST
Notes to Financial Statements
December 31, 2017
investment results of the Russell 1000® Index as closely as possible without requiring the Fund to realize taxable gains. In addition, as noted above, FCI also acts as a subadviser to the Fund but does not provide day-to-day management.
Under normal market conditions, the Small Companies Fund invests at least 80% of its net assets, plus the amount of any borrowings for investment purposes, in equity securities of small companies. The Fund defines “small companies” as issuers with market capitalizations no greater than $5 billion at the time of purchase. The equity securities the Fund invests in consist primarily of exchange traded common and preferred stocks. The Fund may also invest in a type of equity security called a convertible security to reduce volatility or correlation risk in the portfolio. A convertible security generally entitles the holder to receive interest paid or accrued on debt securities or the dividend paid on preferred stock until the convertible security matures or is redeemed, converted or exchanged. It is intended that the Fund holds a portion of its portfolio for more than two years to allow for the change that prompted the relevant security’s purchase to yield results. The Fund uses a “multi-style, multi-manager” approach. The Fund’s Adviser allocates portions of the Fund’s assets between subadvisers who employ distinct investment styles. The Fund currently allocates assets between the following subadvisers who provide day-to-day management for the Fund: Kennedy Capital Management, Inc. (“KCM”), Pzena and Cooke & Bieler. FCI also acts as a subadviser to the Fund but does not provide day-to-day management.
Under normal market conditions, the Tax-Exempt Bond Fund invests at least 80% of its net assets, plus the amount of any borrowings for investment purposes, in tax-exempt bonds, which are debt obligations issued by or for the U.S. states, territories and possessions and the District of Columbia. The interest on these bonds is generally exempt from both U.S. regular federal income tax and U.S. federal alternative minimum tax. However, the Fund may invest up to 20% of its net assets in bonds that generate interest income subject to federal alternative minimum tax for individuals. All exempt interest income may increase certain corporate shareholders’ alternative minimum tax. The Fund invests in both revenue bonds, which are backed by and payable only from the revenues derived from a specific facility or specific revenue source, and in general obligation bonds, which are secured by the full faith, credit and taxation power of the issuing municipality. The Fund currently has one subadviser that provides day-to-day management for the Fund, Sit Fixed Income Advisers II, LLC (“Sit”). FCI also acts as a subadviser to the Fund but does not provide day-to-day management.
Under normal market conditions, the International Fund intends to invest at least 80% of the value of its net assets, plus the amount of any borrowings for investment purposes, in equity securities of companies organized or located outside the United States and doing a substantial amount of business outside the United States. Equity securities in which the Fund invests include common and preferred stock, sponsored and unsponsored American Depositary Receipts, European Depositary Receipts, Global Depositary Receipts, exchange-traded funds, and other investment companies. The Fund diversifies its investments among a number of different countries throughout the world, and may invest in companies of any size. The Fund does not intend to invest more than 20% of its net assets in the equity securities of developing or emerging market issuers. In order to hedge against adverse movements in currency exchange rates, the Fund may enter into foreign currency exchange contracts. The Fund does not intend to invest in foreign currency exchange contracts, options, futures contracts or options in futures contracts for speculative purposes. The Fund uses a “multi-style, multi-manager” approach. The Fund’s assets are allocated to different subadvisers who employ distinct investment styles. The Fund currently allocates assets among the following subadvisers who provide day-to-day management for the Fund: Parametric, Artisan Partners Limited Partnership (“Artisan Partners”), WCM Investment Management (“WCM”) and Templeton Investment Counsel, LLC (“Templeton”). The allocation among subadvisers will vary over time, but the current intent of the Fund’s Adviser is that under normal market conditions approximately 50% of the Fund’s assets will be allocated to
| 10 | (Continued) |
CLEARWATER INVESTMENT TRUST
Notes to Financial Statements
December 31, 2017
Parametric, and the remaining assets will be allocated to one or more of the Fund’s three other subadvisers that provide day-to-day management of the Fund. Parametric manages its portion of the Fund’s assets using a passive management strategy to seek investment results that match, before fees and expenses, the investment results of the MSCI World Ex U.S.A. Index - Net Dividends as closely as possible without requiring the Fund to realize taxable gains. FCI also acts as a subadviser to the Fund but does not provide day-to-day management.
| (2) | Summary of Significant Accounting Policies |
The Funds are investment companies and follow accounting and reporting guidance under Financial Accounting Standards Board (“FASB”) Accounting Standards Codification (“ASC”) Topic 946, “Financial Services-Investment Companies.”
The significant accounting policies followed by the Funds are as follows:
| (a) | Investments in Securities |
Investments in U.S. and foreign equity securities are valued at the last sales price or the regular trading session closing price on the principal exchange or market where they are traded. Foreign security values are stated in U.S. dollars. Equity securities which have not traded on the date of valuation or securities for which sales prices are not generally reported are valued at the mean between the last bid and asked prices. Debt securities are valued on the basis of evaluated prices provided by independent pricing services when such prices are believed to reflect the fair value of such securities or broker provided prices. Such prices may be determined by taking into account other similar securities’ prices, yields, maturities, call features, ratings, prepayment speeds, credit risks, cash flows, institutional size trading in similar groups of securities and developments related to specific securities. Shares of open end investment companies are valued at their daily net asset value (“NAV”). Shares of closed-end funds and exchange traded funds are valued at the last sales price or the regular trading session closing price on the principal exchange or market where they are traded.
Securities for which no market quotations are readily available (including those for which trading has been suspended), or when the Adviser becomes aware that a significant event impacting the value of a security or group of securities has occurred after the closing of the exchange on which the security or securities principally trade, but before the calculation of the NAV, are valued at fair value as determined in good faith using procedures established by the Board of Trustees. This may occur particularly with respect to certain foreign securities held by the International Fund, whereby the Board of Trustees may use adjustment factors obtained from an independent evaluation service that are intended to reflect more accurately the fair value of these foreign securities as of the time the Fund’s NAV is calculated. The procedures consider, among others, the following factors to determine a security’s fair value: the nature and pricing history (if any) of the security; whether any dealer quotations for the security are available; and possible valuation methodologies that could be used to determine the fair value of the security. These procedures are used by the Valuation Committee, in accordance with the procedures established by the Board of Trustees, to determine the fair value of the security or securities. Such determinations are then submitted for review and ratification by the Board of Trustees. The use of fair valuation involves the risk that the values used by the Funds to price their investments may be higher or lower than the values used by other unaffiliated investment companies and investors to price the same investments.
| 11 | (Continued) |
CLEARWATER INVESTMENT TRUST
Notes to Financial Statements
December 31, 2017
Security transactions are accounted for on the trade date, which is the date the securities are purchased or sold. Realized gains and losses are calculated on an identified cost basis. Dividend income is recognized on the ex-dividend date or, for foreign securities, as soon as the information is available. Interest income, is recognized on an accrual basis and includes amortization of premiums and accretion of discounts using the effective yield method.
| (b) | Foreign Currency Translation |
The International Fund invests in securities which are purchased and sold in foreign currencies as a principal investment strategy. The costs of purchases, proceeds from sales of investments, interest and dividend income are translated into U.S. dollars using the spot market rate of exchange prevailing on the respective dates of such transactions. The value of the International Fund’s net assets, as measured in U.S. dollars, may be affected favorably or unfavorably by changes in foreign currency exchange rates and exchange control regulations. The gains or losses, if any, on investments resulting from changes in foreign exchange rates are recorded within net realized gain (loss) on security transactions and within net increase (decrease) in unrealized appreciation/depreciation on security transactions on the Statements of Operations. The realized gains or losses, if any, on translation of other assets and liabilities denominated in foreign currencies are recorded within net realized gain (loss) on foreign currency transactions on the Statements of Operations. The International Fund also will incur costs in converting U.S. dollars to local currencies, and vice versa. Risks may arise upon investing in foreign securities including, but not limited to, political, social or economic instability in the country of the issuer, the difficulty of predicting international trade patterns, the possibility of the imposition of exchange controls, expropriation, limits on removal of currency or other assets, nationalization of assets, foreign withholding and income tax and possible delays in the settlement of foreign stock exchange transactions. The principal markets on which these securities trade may have less volume and liquidity, and may be more volatile, than securities markets in the U.S.
| (c) | Futures Contracts |
The Tax-Exempt Bond Fund invests in long or short financial futures contracts for hedging purposes or to manage duration or gain additional exposure to bond markets/interest rate risk. When used as a hedge, the Fund will purchase and sell various kinds of futures contracts. The Fund will also enter into closing purchase and sale transactions with respect to any such futures contracts. The futures contracts may be based on various securities and securities indices. The Fund bears the market risk arising from changes in the value of these financial instruments. At the time the Fund enters into a futures contract, it is generally required to make a margin deposit with the custodian or broker of a specified amount of liquid assets. Futures are marked-to-market each day with the change in value reflected in the unrealized appreciation or depreciation. Risk may arise as a result of the potential inability of the counterparties to meet the terms of their contracts. Credit risk is mitigated to the extent that the exchange on which a particular futures contract is traded assumes the risk of a counterparty defaulting on its obligations under the contract. The Statements of Operations include any realized gains or losses on closed futures contracts within net realized gains (losses) on futures contracts, and any unrealized gains or losses on open futures contracts within net increase (decrease) in unrealized appreciation/depreciation on futures contracts. Additional information on derivative instruments and how these positions may impact the financial statements is found in Note 8, Derivative Instruments.
| 12 | (Continued) |
CLEARWATER INVESTMENT TRUST
Notes to Financial Statements
December 31, 2017
| (d) | Forward Foreign Currency Exchange Contracts |
The International Fund enters into forward foreign currency exchange contracts for the purchase or sale of a specific foreign currency at a fixed price on a future date as a hedge against adverse movements in foreign currency exchange rates, specific transactions or the portfolio position. The objective of the International Fund’s foreign currency hedging transactions is to reduce the risk that the U.S. dollar value of the International Fund’s foreign currency denominated securities will decline in value due to changes in foreign currency exchange rates. Forward foreign currency exchange contracts are marked-to-market daily at the applicable exchange rates. Any resulting unrealized gains or losses are recorded on forward foreign currency exchange contracts within net increase (decrease) in unrealized appreciation/depreciation on the Statements of Operations. The International Fund records any realized gains or losses at the time the forward foreign currency exchange contract is offset by entering into a closing transaction with the same counterparty or is extinguished by delivery of the currency. Realized gains or losses, if any, are recorded within net realized gain (loss) on forward foreign currency exchange contracts on the Statements of Operations. Risks may arise upon entering into forward foreign currency exchange contracts from the potential of the issuer to default on its obligations under the contract and from unanticipated movements in the value of a foreign currency relative to the U.S. dollar. The contractual amounts of forward foreign currency exchange contracts do not necessarily represent the amounts potentially subject to risk. The measurement of risks associated with these instruments is meaningful only when all related and offsetting transactions are considered. The International Fund bears the market risk from changes in foreign currency exchange rates and the credit risk if the issuer fails to perform. Additional information on derivative instruments and how these positions may impact the financial statements is found in Note 8, Derivative Instruments.
| (e) | Spot Contracts |
The International Fund routinely enters into spot contracts in order to buy or sell a certain amount of foreign currency at the current market rate. The International Fund may enter into spot contracts in order to make payments, or to receive payments, based on investment trading activity in a foreign currency. A spot contract allows the International Fund to buy or sell foreign currency on the day it chooses to deal. From time to time, the Core Equity Fund may also enter into spot contracts in order to make or receive payments due to investment trading activity in a foreign currency on a non-U.S. exchange. Spot contracts are marked-to-market daily at the applicable exchange rates.Any resulting unrealized gains or losses are recorded in translation of other assets and liabilities denominated in foreign currencies within net increase (decrease) in unrealized appreciation/depreciation on the Statements of Operations. Unrealized gains or losses on outstanding spot contracts are recorded in payables for investment securities purchased or receivable for securities sold, respectively, on the Statements of Assets and Liabilities. The Funds record any realized gains or losses at the time the spot contract settles. Realized gains or losses, if any, are included within net realized gain (loss) on foreign currency transactions on the Statements of Operations. Risks may arise upon entering into spot contracts from unanticipated movements in the value of a foreign currency relative to the U.S. dollar in a short period of time. The Funds bear the market risk from changes in foreign currency exchange rates.
| (f) | Master Limited Partnerships |
The Core Equity and International Funds invest in Master Limited Partnerships (“MLPs”). The benefits derived from the Funds’ investments in MLPs are largely dependent on the MLPs being treated as partnerships for federal income tax purposes. If any of the MLPs held by the Funds were treated as corporations for U.S. federal income tax purposes, the after-tax return to the Funds with respect to their investments in such MLPs would be materially reduced, causing a decline in the value of the common stock. The Funds must include their allocable share of an
| 13 | (Continued) |
CLEARWATER INVESTMENT TRUST
Notes to Financial Statements
December 31, 2017
MLP’s taxable income in their reportable taxable income, whether or not it receives a distribution in cash from the MLP. In such case, the Funds may have to liquidate securities to make required distributions to shareholders.
| (g) | Delayed Delivery Transactions and When-Issued Securities |
Certain Funds may engage in securities transactions on a when-issued or delayed-delivery basis. In these transactions, the securities’ prices and yields are fixed on the date of the commitment, with payment and delivery scheduled for a future date. During this period, the securities are subject to market fluctuations. When delayed-delivery purchases are outstanding, a Fund will segregate liquid assets on its records in amounts sufficient to meet the purchase price. A Fund may dispose of or renegotiate a delayed-delivery transaction, which may result in a capital gain or loss.
| (h) | Short-Term Investments |
The Core Equity, Small Companies, Tax-Exempt Bond, and International Funds currently invest in the U.S. Government Select Portfolio, a money market portfolio of Northern Institutional Funds, an investment company advised by Northern Trust Investments, Inc. The U.S. Government Select Portfolio primarily invests in securities issued by the U.S. government, government agencies, and government-sponsored enterprises.
| (i) | Recoverable Taxes |
The balances disclosed as foreign tax reclaim receivable, if any, represent net amounts withheld by foreign governments on dividend income earned in the respective countries subject to reclamation. All reclaims are paid directly to the applicable Funds.
| (j) | Federal Taxes |
The Trust’s policy is to comply with the requirements of the Internal Revenue Code applicable to regulated investment companies. On a calendar-year basis, the Funds intend to distribute substantially all of their net investment income and net realized gains, if any, to avoid the payment of federal income and excise taxes. Therefore, no income tax provision is required. Each Fund is treated as a separate entity for federal income tax purposes.
Management has analyzed the Funds’ tax positions taken on federal tax returns for all open tax years and has concluded that as of December 31, 2017, no provision for income tax would be required in the Funds’ financial statements. The Funds’ federal and state income and federal excise tax returns for the 2014, 2015, 2016, and 2017 tax years for which the applicable statutes of limitations have not expired remain subject to examination by the Internal Revenue Service and state departments of revenue. Net investment income and net realized gain (loss) for the Funds may differ for financial statement and tax purposes. The character of distributions made during the year from net investment income or net realized gains, if any, may differ from their ultimate characterization for federal income tax purposes. Also, due to the timing of dividend distributions, the fiscal year in which amounts are distributed may differ from the year that the income or realized gain (loss) were recorded by the Funds. The Trust has analyzed the Funds’ tax positions and has concluded that no liability for unrecognized tax benefits should be recorded related to uncertain tax positions. Further, the Trust is not aware of any tax positions for which it is reasonably possible that the total amounts of unrecognized tax benefits will significantly change in the next twelve
| 14 | (Continued) |
CLEARWATER INVESTMENT TRUST
Notes to Financial Statements
December 31, 2017
months. The tax character of distributions by the Funds during the years ended December 31, 2017 and 2016 was as follows:
| Tax-Exempt | Ordinary Income* | ||||||||||||||||
| 2017 | 2016 | 2017 | 2016 | ||||||||||||||
| Core Equity Fund | $ | - | $ | - | $ | 7,688,471 | $ | 5,855,360 | |||||||||
| Small Companies Fund | - | - | 8,674,016 | 848,536 | |||||||||||||
| Tax-Exempt Bond Fund | 24,359,964 | 21,330,974 | 1,189,281 | 97,304 | |||||||||||||
| International Fund | - | - | 10,724,142 | 9,674,768 | |||||||||||||
| Long-Term Capital Gains** | |||||||||||||||||
| 2017 | 2016 | ||||||||||||||||
| Core Equity Fund | $ | 26,497,925 | $ | 18,781,172 | |||||||||||||
| Small Companies Fund | 49,069,167 | 12,075,262 | |||||||||||||||
| Tax-Exempt Bond Fund | 2,113,229 | 1,167,286 | |||||||||||||||
| International Fund | 7,930,041 | 12,673 | |||||||||||||||
* In addition to the ordinary income distributions, during 2017 the following Funds utilized equalization accounting for tax purposes whereby a portion of redemption payments were treated as distributions of ordinary income in the following amounts:
| Core Equity Fund | $ | 43,242 | ||||
| Small Companies Fund | $ | 928,098 | ||||
| International Fund | $ | 60,990 |
** In addition to the long-term capital gain distributions, during 2017 the following Funds utilized equalization accounting for tax purposes whereby a portion of redemption payments were treated as distributions of long-term capital gains in the following amounts:
| Core Equity Fund | $ | 1,370,009 | ||||
| Small Companies Fund | $ | 1,244,470 | ||||
| International Fund | $ | 604,615 |
| 15 | (Continued) |
CLEARWATER INVESTMENT TRUST
Notes to Financial Statements
December 31, 2017
As of December 31, 2017, the components of distributable earnings on a tax basis were as follows:
| Core Equity Fund | Small Companies Fund | Tax-Exempt Bond Fund | International Fund | |||||||||||||
| Undistributed ordinary income | $ | 313,778 | $ | 2,522,390 | $ | 219,745 | $ | 305,918 | ||||||||
| Undistributed tax-exempt income | - | - | 598,085 | - | ||||||||||||
| Undistributed capital gain | 9,941,125 | 3,382,227 | 1,214,014 | 3,032,724 | ||||||||||||
| Accumulated capital losses and other | - | - | (238,897 | ) | (8,557 | ) | ||||||||||
| Unrealized appreciation | 287,103,399 | 45,391,328 | 28,989,154 | 201,639,153 | ||||||||||||
| Total | $ | 297,358,302 | $ | 51,295,945 | $ | 30,782,101 | $ | 204,969,238 | ||||||||
Distributions to shareholders from net investment income and net realized gain are determined in accordance with federal income tax regulations, which may differ from such amounts recorded in accordance with U.S. generally accepted accounting principles (“U.S. GAAP”) for financial reporting purposes. Accordingly, the Funds may make reclassifications among certain of their capital accounts in order to reflect the tax treatment for certain permanent differences that exist between federal income tax regulations and U.S. GAAP. These reclassifications are reported in order to reflect the tax treatment for certain permanent differences that exist between income tax regulations and U.S. GAAP. These reclassifications may relate to net operating losses, Section 988 currency gains and losses, Passive Foreign Investment Companies (“PFICs”) gains and losses, recharacterization of dividends from investments in Real Estate Investment Trusts (“REITs”) and Partnerships gains and losses. At December 31, 2017, the Funds utilized equalization accounting whereby a portion of redemption payments were treated as distributions. These reclassifications have no impact on the total net assets or the NAV per share of the Funds. At December 31, 2017, reclassifications have been recorded among the following capital accounts on the Statements of Assets and Liabilities:
| Core Equity Fund | Small Companies Fund | Tax-Exempt Bond Fund | International Fund | |||||||||||||
| Undistributed (overdistributed) net investment income | $ | 313,503 | $ | 129,129 | $ | 12,994 | $ | 138,533 | ||||||||
| Accumulated net realized gain (loss) | (15,942,377 | ) | (2,301,697 | ) | (12,994 | ) | (804,138 | ) | ||||||||
| Additonal paid-in capital | 15,628,874 | 2,172,568 | - | 665,605 | ||||||||||||
| (k) | Distributions to Shareholders |
Distributions to shareholders from net investment income, if any, are declared annually for the Core Equity, Small Companies, and International Funds and declared daily, payable monthly, for the Tax-Exempt Bond Fund. Distributions to shareholders from net realized gains, if any, are declared annually for all Funds. Distributions are paid in cash or reinvested in additional shares at the direction of the shareholders. During the year ended December 31, 2017, the Core Equity, Small Companies and International Funds utilized equalization accounting with respect to distributions to shareholders, in order to keep remaining shareholders’ interest in undistributed income from being affected.
| 16 | (Continued) |
CLEARWATER INVESTMENT TRUST
Notes to Financial Statements
December 31, 2017
| (l) | Use of Estimates |
The preparation of financial statements in conformity with U.S. GAAP requires management to make estimates and assumptions that affect the reported amounts of assets and liabilities and disclosure of contingent assets and liabilities at the date of the financial statements and the reported amounts of increase and decrease in net assets from operations during the period. Actual results could differ from those estimates.
| (m) | Recent Accounting Pronouncements |
On October 13, 2016, the SEC adopted new rules and forms, and amended existing rules and forms. The new and amended rules and forms are intended to modernize the reporting of information provided by funds and to improve the quality and type of information that funds provide to the SEC and investors. In part, the new and amended rules and forms amend Regulation S-X and require standardized, enhanced disclosure about derivatives in a Fund’s financial statements, as well as other amendments. The compliance date for the amendments of Regulation S-X was August 1, 2017 while the compliance date for the new form types and other rule amendments is on or after June 1, 2018. The financial statements reflect these amendments to Regulation S-X.
| (n) | Indemnification |
Under each Fund’s organizational documents, its officers and directors are indemnified against certain liabilities arising out of the performance of their duties to each Fund. In addition, certain of each Fund’s contracts with its service providers contain general indemnification clauses. Each Fund’s maximum exposure under these arrangements is unknown since the amount of any future claims that may be made against each Fund cannot be determined and each Fund has no historical basis for predicting the likelihood of any such claims. The Funds believe that the likelihood of any such claims is remote.
| (3) | Fair Value Measurements |
Fair value is an estimate of the price the Funds would receive upon selling a security in a timely transaction to an independent buyer in the principal or most advantageous market for the security. This guidance establishes a three-tier hierarchy to maximize the use of observable market data and minimize the use of unobservable inputs and to establish classification of fair value measurements for disclosure purposes. Various inputs are used in determining the value of the Funds’ investments, as described in Note 2(a). These inputs are summarized in the three broad levels listed below.
| ● | Level 1 – Unadjusted quoted market prices in active markets for identical securities on the measurement date. |
| ● | Level 2 – Other significant observable inputs including quoted prices for similar investments, interest rates, prepayment speeds, credit risk, etc. or quoted prices for identical or similar assets in markets that are not active. Inputs that are derived principally from or corroborated by observable market data are also considered Level 2 measurement. An adjustment to any observable input that is significant to the fair value may render the measurement a Level 3 measurement. |
| ● | Level 3 – Valuations based on unobservable inputs, which may include the Adviser’s own assumptions in determining the fair value of an investment. |
| 17 | (Continued) |
CLEARWATER INVESTMENT TRUST
Notes to Financial Statements
December 31, 2017
The inputs or methodology used for valuing securities are not necessarily an indication of the risk associated with investing in those securities and other financial instruments, if any. The following is a summary of the inputs used in valuing each Fund’s investments and other financial instruments, if any, which are carried at fair value, as of December 31, 2017.
In December 2016, FASB released Accounting Standards Update (“ASU”) 2016-19 that makes technical changes to various sections of the ASC, including Topic 820, Fair Value Measurement. The changes to Topic 820 are intended to clarify the difference between a valuation approach and a valuation technique. The changes to ASC 820-10-50-2 require a reporting entity to disclose, for Level 2 and Level 3 fair value measurements, a change in either or both a valuation approach and a valuation technique and the reason(s) for the change. The changes to Topic 820 are effective for fiscal years, and interim periods within those fiscal years, beginning after December 15, 2016. The Funds have adopted ASU 2016-19 for the year ended December 31, 2017.
| Core Equity Fund (a) | ||||||||||||||||
| Level 1 | Level 2 | Level 3 | Total | |||||||||||||
| Common Stocks | $ | 536,258,712 | $ | - | $ | - | $ | 536,258,712 | ||||||||
| Rights | - | - | 1,675 | 1,675 | ||||||||||||
| Short-Term Investments | 2,725,588 | - | - | 2,725,588 | ||||||||||||
| Total | $ | 538,984,300 | $ | - | $ | 1,675 | $ | 538,985,975 | ||||||||
(a) For the Core Equity Fund, the investment value is comprised of equity securities, rights and short-term investments. See the Fund’s Schedule of Investments for industry classification. Investments in equity and short-term securities generally are valued at the last sales price or the regular trading session closing price on the principal exchange or market where they are traded. Investments in rights generally are determined by taking into account the terms of the rights as well as the value of the underlying equity securities, which are determined by the valuation methodology described above. Two rights were deemed Level 3 classifications, as their trading was suspended pending corporate actions and these rights were valued at period end using internally determined prices.
The Core Equity Fund records all transfers between levels based on valuations at the end of each reporting period. At December 31, 2017, there were no transfers between Level 1, Level 2 or Level 3 classifications based on levels assigned to the securities on December 31, 2016.
There were no significant Level 3 valuations at December 31, 2017.
| Small Companies Fund (b) | ||||||||||||||||
| Level 1 | Level 2 | Level 3 | Total | |||||||||||||
| Common Stocks | $ | 354,150,741 | $ | 99,673 | $ | - | $ | 354,250,414 | ||||||||
| Preferred Stocks | 3,048,176 | - | - | 3,048,176 | ||||||||||||
| Rights | - | - | - | * | - | |||||||||||
| Warrant | - | - | - | * | - | |||||||||||
| Short-Term Investments | 16,001,365 | - | - | 16,001,365 | ||||||||||||
| Total | $ | 373,200,282 | $ | 99,673 | $ | - | $ | 373,299,955 | ||||||||
| 18 | (Continued) |
CLEARWATER INVESTMENT TRUST
Notes to Financial Statements
December 31, 2017
* Security has been deemed worthless and is a Level 3 investment.
(b) For the Small Companies Fund, the investment value is comprised of equity securities and short-term investments. See the Fund’s Schedule of Investments for industry classification. Investments in equity and short-term securities generally are valued at the last sales price or the regular trading session closing price on the principal exchange or market where they are traded.
The Small Companies Fund records all transfers between levels based on valuations at the end of each reporting period. At December 31, 2017, there were no transfers between Level 1, Level 2 or Level 3 classifications based on levels assigned to the securities on December 31, 2016.
| Tax-Exempt Bond Fund (c) | ||||||||||||||||
| Level 1 | Level 2 | Level 3 | Total | |||||||||||||
| Closed-End Funds | $ | 24,680,778 | $ | - | $ | - | $ | 24,680,778 | ||||||||
| Municipal Bonds | ||||||||||||||||
| Airports | - | 2,866,940 | - | 2,866,940 | ||||||||||||
| Bond Banks | - | 522,564 | - | 522,564 | ||||||||||||
| Development | - | 33,957,919 | - | 33,957,919 | ||||||||||||
| Education | - | 36,781,843 | - | 36,781,843 | ||||||||||||
| Facilities | - | 3,011,839 | - | 3,011,839 | ||||||||||||
| General | - | 45,063,226 | - | 45,063,226 | ||||||||||||
| General Obligations | - | 22,839,025 | - | 22,839,025 | ||||||||||||
| Higher Education | - | 18,880,648 | - | 18,880,648 | ||||||||||||
| Housing | - | 29,446,745 | - | 29,446,745 | ||||||||||||
| Medical | - | 35,572,500 | - | 35,572,500 | ||||||||||||
| Mello-Roos | - | 1,787,544 | - | 1,787,544 | ||||||||||||
| Multifamily Housing | - | 43,042,161 | - | 43,042,161 | ||||||||||||
| Nursing Home | - | 65,881,987 | - | 65,881,987 | ||||||||||||
| Power | - | 3,873,808 | - | 3,873,808 | ||||||||||||
| School District | - | 32,301,241 | - | 32,301,241 | ||||||||||||
| Single Family Housing | - | 92,991,031 | - | 92,991,031 | ||||||||||||
| Student Loan | - | 1,464,222 | - | 1,464,222 | ||||||||||||
| Transportation | - | 7,352,054 | - | 7,352,054 | ||||||||||||
| Utilities | - | 398,764 | - | 398,764 | ||||||||||||
| Water | - | 6,264,445 | - | 6,264,445 | ||||||||||||
| Short-Term Investments | 6,336,567 | - | - | 6,336,567 | ||||||||||||
| Total | $ | 31,017,345 | $ | 484,300,506 | $ | - | $ | 515,317,851 | ||||||||
(c) For the Tax-Exempt Bond Fund, the investment value is comprised of closed-end funds, municipal bonds, and short-term investments. Investments in closed-end funds and short-term securities generally are valued at the last sales price or the regular trading session closing price on the principal exchange or market where they are traded. Investments in municipal bonds generally are based on valuations using adjusted evaluated prices provided by the primary pricing provider. The Board of Trustees has delegated to the Valuation Committee the responsibility to
| 19 | (Continued) |
CLEARWATER INVESTMENT TRUST
Notes to Financial Statements
December 31, 2017
determine in good faith the fair value of securities for which no price quotation is available from an approved pricing service or broker-dealer at the time the Tax-Exempt Bond Fund’s NAV is calculated, including securities for which the prices do not represent fair value or for which a significant event occurs that materially affects the value of the security after the close of the market on which the security principally trades and before the time the Tax-Exempt Bond Fund’s NAV is calculated.
| Tax-Exempt Bond Fund | ||||||||||||||||
| Other Financial Instruments | Level 1 | Level 2 | Level 3 | Total | ||||||||||||
| Assets | ||||||||||||||||
| Futures contracts | $ | 395,874 | $ | - | $ | - | $ | 395,874 | ||||||||
| Net Other Financial Instruments | $ | 395,874 | $ | - | $ | - | $ | 395,874 | ||||||||
The futures contracts outstanding at December 31, 2017 are considered Level 1 investments due to the contracts being marked-to-market daily at the applicable exchange rates that have been adjusted from the initial quoted rate. Futures contracts are shown on a gross basis in the above table and on the Statements of Operations.
The Tax-Exempt Bond Fund, records all transfers between levels based on valuations at the end of each reporting period. At December 31, 2017, for the Tax-Exempt Bond Fund, there were no transfers between Level 1, Level 2 or Level 3 classifications based on levels assigned to the securities on December 31, 2016.
| International Fund (d) | ||||||||||||||||
| Level 1 | Level 2 | Level 3 | Total | |||||||||||||
| Common Stocks | ||||||||||||||||
| Thailand | $ | - | $ | 689,527 | $ | - | $ | 689,527 | ||||||||
| All other countries | 589,158,815 | - | - | 589,158,815 | ||||||||||||
| Preferred Stocks | 5,261,772 | - | - | 5,261,772 | ||||||||||||
| Rights | 21,276 | - | - | 21,276 | ||||||||||||
| Short-Term Investments | 28,399,890 | - | - | 28,399,890 | ||||||||||||
| Total | $ | 662,841,753 | $ | 689,527 | $ | - | $ | 623,531,280 | ||||||||
(d) For the International Fund, the investment value is comprised of equity securities, rights and short-term investments. See the Fund’s Schedule of Investments for additional information on industry sector and currency concentration information. Investments in equity and short-term securities generally are valued at the last sales price or the regular trading session closing price on the principal exchange or market where they are traded. One
| 20 | (Continued) |
CLEARWATER INVESTMENT TRUST
Notes to Financial Statements
December 31, 2017
inactively traded Thailand based security was valued based on the prices of similar securities resulting in Level 2 classifications.
| International Fund | ||||||||||||||||
| Other Financial Instruments | Level 1 | Level 2 | Level 3 | Total | ||||||||||||
| Assets | ||||||||||||||||
| Forward foreign currency exchange contracts | $ | - | $ | 76,201 | $ | - | $ | 76,201 | ||||||||
| Liabilities | ||||||||||||||||
| Forward foreign currency exchange contracts | - | (99,851 | ) | - | (99,851 | ) | ||||||||||
| Net Other Financial Instruments | $ | - | $ | (23,650 | ) | $ | - | $ | (23,650 | ) | ||||||
The forward foreign currency exchange contracts outstanding at December 31, 2017 are considered Level 2 investments due to the contracts being marked-to-market daily at the applicable exchange rates that have been adjusted from the initial quoted rate. Forward foreign currency exchange contracts are shown on a gross basis in the above table and on the Statements of Assets and Liabilities.
There were no significant Level 3 valuations at December 31, 2017.
The International Fund records all transfers between levels based on valuations at the end of each reporting period. At December 31, 2017, for the International Fund, there were no transfers between Level 1, Level 2 or Level 3 classifications based on levels assigned to the securities on December 31, 2016.
| (4) | Investment Security Transactions |
The cost of purchases and proceeds from sales of securities (excluding short-term securities) for the year ended December 31, 2017, were as follows:
| Purchases | Sales | ||||||||
| Core Equity Fund | $ | 154,981,215 | $ | 179,770,052 | |||||
| Small Companies Fund | 386,020,467 | 401,928,389 | |||||||
| Tax-Exempt Bond Fund | 82,026,248 | 64,627,121 | |||||||
| International Fund | 200,061,976 | 218,207,129 | |||||||
| (5) | Capital Share Transactions |
Transactions in capital shares for the years ended December 31, 2017 and 2016 were as follows:
| Core Equity Fund | Small Companies Fund | |||||||||||||||
| 2017 | 2016 | 2017 | 2016 | |||||||||||||
| Sold | 413,847 | 300,366 | 203,833 | 1,915,674 | ||||||||||||
| Issued for reinvestment of distributions | 800,157 | 652,796 | 3,111,163 | 655,033 | ||||||||||||
| Redeemed | (1,216,957 | ) | (2,334,337 | ) | (1,127,622 | ) | (2,643,251 | ) | ||||||||
| Net Increase (decrease) | (2,953 | ) | (1,381,175 | ) | 2,187,374 | (72,544 | ) | |||||||||
| 21 | (Continued) |
CLEARWATER INVESTMENT TRUST
Notes to Financial Statements
December 31, 2017
| Tax-Exempt Bond Fund | International Fund | |||||||||||||||
| 2017 | 2016 | 2017 | 2016 | |||||||||||||
| Sold | 2,493,171 | 1,899,036 | 805,478 | 2,532,939 | ||||||||||||
| Issued for reinvestment of distributions | 2,737,332 | 2,207,354 | 1,105,107 | 694,441 | ||||||||||||
| Redeemed | (2,655,913 | ) | (5,753,602 | ) | (1,900,836 | ) | (1,998,537 | ) | ||||||||
| Net Increase (decrease) | 2,574,590 | (1,647,212 | ) | 9,749 | 1,228,843 | |||||||||||
| (6) | Capital Loss Carryforward |
For the period subsequent to October 31, 2017 through the fiscal year ended December 31, 2017, the International Fund incurred capital losses and/or late year losses in the amount of $8,557 which the Fund intends to treat as having been incurred in the following fiscal year.
At December 31, 2017, the Funds had no short-term or long-term capital loss carryforwards available to offset future net capital gains. During the fiscal year ended December 31, 2017, the International Fund utilized $23,948,482 in capital losses.
(7) Expenses and Related-Party Transactions
The Trust has a contract for investment advisory services with the Adviser. Under terms of separate agreements, Core Equity Fund, Small Companies Fund, Tax-Exempt Bond Fund and International Fund each pay an investment advisory fee equal to an annual rate of 0.90%, 1.35%, 0.60% and 1.00%, respectively, of each Fund’s average daily net assets. The Adviser is responsible for the payment or reimbursement of all the Funds’ expenses, except brokerage, taxes, interest, and extraordinary expenses. The Adviser has periodically modified its management fee for each of the Funds through voluntary waivers. For the year ended December 31, 2017, voluntary waivers on management fees were as follows:
| Management Fees Voluntary Waivers | |||||||||||||
| Voluntary Waiver % | |||||||||||||
| Voluntary Waiver % | Effective from | Voluntary Waiver % | |||||||||||
| Prior to | March 16, 2017, to | Effective | |||||||||||
| March 16, 2017 | September 21, 2017 | September 22, 2017 | |||||||||||
| Core Equity Fund | (0.46) | (0.53) | (0.52) | ||||||||||
| Small Companies Fund | (0.32) | (0.39) | (0.32) | ||||||||||
| Tax-Exempt Bond Fund | (0.26) | (0.26) | (0.26) | ||||||||||
| International Fund | (0.30) | (0.35) | (0.32) | ||||||||||
The Adviser has periodically modified its management fee for each of the Funds through voluntary waivers. Effective March 16, 2015, the net management fee actually paid for the Tax-Exempt Bond Fund due to the Adviser’s modification of the voluntary waiver for the Fund was 0.34%. Effective September 22, 2017, the net management fees actually paid for the Core Equity Fund, Small Companies Fund and the International Fund due to the Adviser’s modification of the voluntary waivers for those Funds were 0.38%, 1.03% and 0.68%, respectively.
The Adviser currently intends to continue these voluntary waivers indefinitely. However, the Adviser may terminate these voluntary arrangements at any time.
| 22 | (Continued) |
CLEARWATER INVESTMENT TRUST
Notes to Financial Statements
December 31, 2017
In addition to fees and expenses which the Funds bear directly, the Funds indirectly bear a pro rata share of the fees and expenses of any acquired funds in which they invest, such as short-term investments in mutual funds or other investment companies and investments in closed-end funds. Such indirect expenses are not included in any of the reported expense ratios.
The Adviser has entered into subadvisory contracts with independent investment advisory firms for each Fund to provide daily investment management services. The subadvisory fees are based on each subadviser’s proportional net assets it currently manages within each Fund and are paid directly by the Adviser. For each subadviser, the fee schedule is detailed according to the following schedule:
The subadvisory fee for the Core Equity Fund, payable to Parametric, OSAM and AQR is equal to an annual rate of 0.15%, 0.35% and 0.35% of the portions of net assets managed, respectively.
The subadvisory fee for the Small Companies Fund, payable to Keeley-Teton, for its portion of net assets managed was based on the following annual rates:
| Keeley-Teton | ||
| First $2 Million | 1.00% | |
| Next $8 Million | 0.85% | |
| Over $10 Million | 0.70% |
The subadvisory fee for the Small Companies Fund, payable to Pzena for its portion of net assets managed is 1%.
The subadvisory fee for the Small Companies Fund, payable to KCM and Cooke & Bieler for each of their respective portions of net assets managed is based on the following annual rates:
| KCM | ||
| Up to and including $50 Million | 0.85% | |
| Over $50 Million | 0.80% | |
| Cooke & | ||
| Bieler | ||
| First $15 million | 1.00% | |
| Next $20 million | 0.765% | |
| Next $25 million | 0.7225% | |
| All assets in excess of $60 million | 0.68% |
| 23 | (Continued) |
CLEARWATER INVESTMENT TRUST
Notes to Financial Statements
December 31, 2017
The subadvisory fee for the Tax-Exempt Bond Fund, payable to Sit for Sit’s portion of net assets managed is based on the following annual rates:
| Sit | ||
| Up to and including $20 Million | 0.40% | |
| Next $30 Million | 0.30% | |
| Next $25 Million | 0.25% | |
| Next $175 Million | 0.20% | |
| Over $250 Million | 0.18% |
The subadvisory fee for the International Fund, payable to Denver, for its portion of net assets managed was based on the following annual rates:
| Denver | ||
| First $10 Million | 1.25% | |
| All assets in excess of $10 Million | 0.85% |
The subadvisory fee for the International Fund, payable to Parametric and WCM, is equal to an annual rate of 0.15% and 0.80% of the portions of net assets managed, respectively.
The subadvisory fee for the International Fund, payable to Artisan Partners and Templeton for each of their respective portions of net assets managed is based on the following annual rates:
| Artisan | ||
| Partners | ||
| First $50 Million | 0.80% | |
| Next $50 Million | 0.60% | |
| All assets in excess of $100 Million | 0.50% |
| Templeton | ||
| First $25 Million | 0.95% | |
| Next $25 Million | 0.85% | |
| Next $50 Million | 0.75% | |
| Next $150 Million | 0.65% | |
| Next $250 Million | 0.55% | |
| Over $500 Million | 0.50% |
The Adviser has also engaged FCI as a subadviser for each Fund. FCI regularly provides the Funds with various investment-related services, including investment strategy advice, manager recommendations and related duties as requested by the Adviser. FCI also provides certain services related to due diligence, performance reporting, compliance, and other administrative functions, which support the investment management services and
| 24 | (Continued) |
CLEARWATER INVESTMENT TRUST
Notes to Financial Statements
December 31, 2017
subadviser oversight services provided to the Trust by the Adviser. For its services, FCI is compensated with a subadvisory fee payable by the Adviser of 0.20% of each Fund’s average daily net assets, paid on a quarterly basis. FCI is compensated out of the investment advisory fees the Adviser receives from the respective Funds. FCI has agreed to waive the difference between the amount calculated under the subadvisory fee schedule and an amount determined by multiplying the total number of hours worked by FCI in providing services under the subadvisory agreement by an hourly rate that is approved by the Adviser.
On July 3, 2017, the Board of Trustees approved the Funds to engage ReFlow Fund, LLC (“ReFlow”) for their liquidity program. For a fee, ReFlow provides each Fund with a potential source of cash to meet net shareholder redemptions through share purchases. ReFlow then generally redeems those shares when the Fund experiences net sales. ReFlow will periodically redeem its entire share position in a Fund and request that such redemption be met in kind in accordance with the Fund’s redemption in kind policies.
| (8) | Derivative Instruments |
Information concerning the types of derivatives in which the Tax-Exempt Bond Fund and International Fund invest, the objectives for using them and their related risks can be found in Note 2 (c) and (d). Below are the types of derivatives held in the Tax-Exempt Bond Fund and International Fund by location as presented in the Statements of Assets and Liabilities as of December 31, 2017, with additional detail on the net amounts impacting the Statements of Assets and Liabilities. The futures contracts and forward foreign currency exchange contracts presented below are not subject to master netting agreements or other similar agreements.
| ASSETS | LIABILITIES | |||||||||||||||
| Name of Fund | Derivative Type | Statements of Assets and Liabilities Location | Value | Statements of Assets and Liabilities Location | Value | Counterparty | ||||||||||
| Tax-Exempt Bond Fund | Futures contract | Net unrealized appreciation on futures contracts | $ | 395,874 | * | Net unrealized depreciation on futures contracts | $ | - | Northern Trust | |||||||
| International Fund | Forward foreign currency exchange contracts | Unrealized appreciation on forward foreign Currency exchange contracts | $ | 76,201 | Unrealized depreciation on forward foreign currency exchange contracts | $ | 99,851 | Northern Trust | ||||||||
* Represents cumulative appreciation/depreciation on futures contracts as in the Schedules of Investments. Only the variation margin receivable/payable is reported within the Statement of Assets and Liabilities for futures contracts.
| 25 | (Continued) |
CLEARWATER INVESTMENT TRUST
Notes to Financial Statements
December 31, 2017
The following tables set forth by primary risk exposure the Tax-Exempt Bond Fund’s and International Fund’s net realized gain (loss) and net increase (decrease) in appreciation/depreciation on futures contracts and forward foreign currency exchange contracts for the year ended December 31, 2017:
| Name of Fund | Derivative Type | Statements of Operations Location | Amount | Name of Fund | Derivative Type | Statements of Operations Locations | Amount | |||||||||||
| Tax-Exempt Bond Fund | Futures contracts | Net realized gain (loss)on futures contracts | $ | 3,335,300 | Tax-Exempt Bond Fund | Futures contracts | Net increase (decrease) in unrealized appreciation/ depreciation on futures contracts | $ | 395,874 | |||||||||
| International Fund | Forward foreign currency exchange contracts | Net realized gain (loss)on forward foreign currency exchange contracts | $ | (131,701 | ) | International Fund | Forward foreign currency exchange contracts | Net increase (decrease) in unrealized appreciation/depreciation on forward foreign currency exchange contracts | $ | (243,107 | ) | |||||||
Derivative transactions are measured in terms of the notional amount. The following table presents, for the Tax-Exempt Bond Fund and International Fund, the number of transactions and weighted average notional amounts of forward foreign currency exchange contracts, which is indicative of the volume of derivative activity, for the year ended December 31, 2017.
| Tax-Exempt Bond Fund | ||||
| Futures Contracts | ||||
| Number of Transactions | Weighted Average Notional Amount | |||
| 2,650 | $ | 56,835,906 | ||
| International Fund | ||||
| Forward Foreign Currency Exchange Contracts | ||||
| Number of Transactions | Weighted Average Notional Amount | |||
| 15 | $ | 6,082,109 | ||
| (9) | Short-term Financing |
On July 3, 2017, the Board of Trustees approved the Funds to engage ReFlow Fund, LLC (“ReFlow”) for their liquidity program. For a fee, ReFlow provides each Fund with a potential source of cash to meet net shareholder redemptions through share purchases. The Fund then generally redeems those shares when it experiences net sales. The shares may be redeemed in-kind in accordance with the Fund’s redemption in-kind policies. The Fund is
| 26 | (Continued) |
CLEARWATER INVESTMENT TRUST
Notes to Financial Statements
December 31, 2017
generally required to redeem the shares purchased by ReFlow within 30 days (15 days if redeemed in-kind). As such, the proceeds received from ReFlow’s purchase of fund shares is treated as a liability on the statement of assets and liabilities. The fee paid on outstanding shares owned by ReFlow is based on an auction starting at a minimum bid of 0.20% and is paid by the Adviser under the unified advisory fee agreement. During the year ended December 31, 2017, the Fund below utilized the ReFlow arrangement. The average rate paid to ReFlow by the Adviser was 0.20%.
| Average Amount Oustanding For Days in Use | ||||||
| Core Equity Fund | $ | 692,567 | ||||
| 27 | (Continued) |
CLEARWATER INVESTMENT TRUST
Schedule of Investments - Clearwater Core Equity Fund
December 31, 2017
| Shares | Security | Cost | Fair value (a) | Percent of net assets | ||||||||||||
| Common Stocks: | ||||||||||||||||
| Consumer Discretionary: | ||||||||||||||||
| 1,500 | ADVANCE AUTO PARTS, INC. | $ | 53,557 | 149,535 | ||||||||||||
| 5,950 | AMAZON.COM, INC.(b) | 267,559 | 6,958,346 | |||||||||||||
| 1,600 | AMC NETWORKS, INC., CLASS A(b) | 25,785 | 86,528 | |||||||||||||
| 1,100 | AUTOLIV, INC.(c) | 19,410 | 139,788 | |||||||||||||
| 300 | AUTOZONE, INC.(b) | 19,223 | 213,411 | |||||||||||||
| 68,311 | BEST BUY CO., INC. | 2,507,318 | 4,677,254 | |||||||||||||
| 1,400 | BIG LOTS, INC. | 15,477 | 78,610 | |||||||||||||
| 5,067 | BORGWARNER, INC. | 82,026 | 258,873 | |||||||||||||
| 750 | BRINKER INTERNATIONAL, INC. | 10,084 | 29,130 | |||||||||||||
| 958 | BURLINGTON STORES, INC.(b) | 81,036 | 117,863 | |||||||||||||
| 300 | CABLE ONE, INC. | 113,966 | 211,005 | |||||||||||||
| 4,168 | CARMAX, INC.(b) | 50,984 | 267,294 | |||||||||||||
| 18,371 | CARNIVAL CORP. | 1,222,046 | 1,219,283 | |||||||||||||
| 1,377 | CARTER’S, INC. | 119,865 | 161,784 | |||||||||||||
| 4,161 | CBS CORP., CLASS B (NON VOTING) | 27,109 | 245,499 | |||||||||||||
| 3,229 | CHARTER COMMUNICATIONS, INC., CLASS A(b) | 121,025 | 1,084,815 | |||||||||||||
| 4,600 | CLEAR CHANNEL OUTDOOR HOLDINGS, INC., CLASS A | 628 | 21,160 | |||||||||||||
| 80,438 | COMCAST CORP., CLASS A | 1,346,456 | 3,221,542 | |||||||||||||
| 4,600 | D.R. HORTON, INC. | 10,857 | 234,922 | |||||||||||||
| 1,826 | DARDEN RESTAURANTS, INC. | 79,573 | 175,333 | |||||||||||||
| 321 | DELPHI TECHNOLOGIES PLC(b)(c) | 14,260 | 16,843 | |||||||||||||
| 1,500 | DICK’S SPORTING GOODS, INC. | 24,803 | 43,110 | |||||||||||||
| 2,800 | DISH NETWORK CORP., CLASS A(b) | 135,875 | 133,700 | |||||||||||||
| 3,089 | DOLLAR GENERAL CORP. | 207,226 | 287,308 | |||||||||||||
| 7,876 | DOLLAR TREE, INC.(b) | 150,254 | 845,174 | |||||||||||||
| 900 | DOMINO’S PIZZA, INC. | 90,041 | 170,064 | |||||||||||||
| 2,737 | ENTERCOM COMMUNICATIONS CORP., CLASS A | 3,140 | 29,560 | |||||||||||||
| 3,055 | EXPEDIA, INC. | 219,880 | 365,897 | |||||||||||||
| 3,359 | FERRARI N.V.(c) | 255,443 | 352,158 | |||||||||||||
| 700 | FLOOR & DECOR HOLDINGS, INC., CLASS A(b) | 30,751 | 34,076 | |||||||||||||
| 3,000 | FOOT LOCKER, INC. | 40,393 | 140,640 | |||||||||||||
| 38,163 | FORD MOTOR CO. | 164,117 | 476,656 | |||||||||||||
| 3,600 | GAMESTOP CORP., CLASS A | 14,505 | 64,620 | |||||||||||||
| 1,833 | GAP (THE), INC. | 42,086 | 62,432 | |||||||||||||
| 7,229 | GARMIN LTD.(c) | 282,862 | 430,632 | |||||||||||||
| 25,754 | GENERAL MOTORS CO. | 805,390 | 1,055,656 | |||||||||||||
| 22,734 | GENTEX CORP. | 232,271 | 476,277 | |||||||||||||
| 3,450 | GENUINE PARTS CO. | 102,424 | 327,784 | |||||||||||||
| 1,200 | H&R BLOCK, INC. | 32,279 | 31,464 | |||||||||||||
| 4,700 | HANESBRANDS, INC. | 67,353 | 98,277 | |||||||||||||
| 6,750 | HARLEY-DAVIDSON, INC. | 39,547 | 343,440 | |||||||||||||
| 1,218 | HASBRO, INC. | 73,438 | 110,704 | |||||||||||||
| 800 | HILTON GRAND VACATIONS, INC.(b) | 34,176 | 33,560 | |||||||||||||
| 20,367 | HOME DEPOT (THE), INC. | 858,232 | 3,860,157 | |||||||||||||
| 305 | ILG, INC. | 1,053 | 8,686 | |||||||||||||
| 1,700 | INTERNATIONAL GAME TECHNOLOGY PLC | 45,829 | 45,067 | |||||||||||||
| 15,600 | INTERPUBLIC GROUP OF (THE) COS., INC. | 40,950 | 314,496 | |||||||||||||
| 18,907 | KOHL’S CORP. | 556,683 | 1,025,327 | |||||||||||||
| 6,190 | L BRANDS, INC. | 70,745 | 372,762 | |||||||||||||
| 4,983 | LAS VEGAS SANDS CORP. | 158,264 | 346,269 | |||||||||||||
| 12,739 | LEAR CORP. | 1,420,083 | 2,250,472 | |||||||||||||
| 2,900 | LENNAR CORP., CLASS A | 37,613 | 183,396 | |||||||||||||
| 58 | LENNAR CORP., CLASS B | 652 | 2,997 | |||||||||||||
| 1,600 | LIBERTY BROADBAND CORP., CLASS C(b) | 135,837 | 136,256 | |||||||||||||
| 1,389 | LIBERTY EXPEDIA HOLDINGS, INC., CLASS A(b) | 15,147 | 61,574 | |||||||||||||
| 5,832 | LIBERTY GLOBAL PLC, CLASS A(b)(c) | 42,377 | 209,019 | |||||||||||||
| 7,374 | LIBERTY GLOBAL PLC, CLASS C(b)(c) | 51,974 | 249,536 | |||||||||||||
| 51,697 | LIBERTY INTERACTIVE CORP. QVC GROUP, CLASS A(b) | 984,372 | 1,262,441 | |||||||||||||
| 1,000 | LIBERTY MEDIA CORP.-LIBERTY FORMULA ONE, CLASS A(b) | 33,470 | 32,720 | |||||||||||||
| 2,300 | LIBERTY MEDIA CORP.-LIBERTY FORMULA ONE, CLASS C(b) | 80,654 | 78,568 | |||||||||||||
| 980 | LIBERTY TRIPADVISOR HOLDINGS, INC., CLASS A(b) | 1,653 | 9,236 | |||||||||||||
| 1,183 | LIBERTY VENTURES, SERIES A(b) | 7,144 | 64,166 | |||||||||||||
| 1,000 | LIONS GATE ENTERTAINMENT CORP., CLASS A(b) | 32,510 | 33,810 | |||||||||||||
| 1,300 | LIONS GATE ENTERTAINMENT CORP., CLASS B(b) | 39,739 | 41,262 | |||||||||||||
| 1,200 | LKQ CORP.(b) | 14,970 | 48,804 | |||||||||||||
See accompanying notes to financial statements. | 28 | (Continued) |
CLEARWATER INVESTMENT TRUST
Schedule of Investments - Clearwater Core Equity Fund
December 31, 2017
| Shares | Security | Cost | Fair value (a) | Percent of net assets | ||||||||||||
| Consumer Discretionary (Cont’d): | ||||||||||||||||
| 400 | LOWE’S COS., INC. | $ | 34,236 | 37,176 | ||||||||||||
| 1,300 | LULULEMON ATHLETICA, INC.(b)(c) | 99,526 | 102,167 | |||||||||||||
| 3,800 | MACY’S, INC. | 47,080 | 95,722 | |||||||||||||
| 3,998 | MARRIOTT INTERNATIONAL, INC., CLASS A | 185,782 | 542,649 | |||||||||||||
| 244 | MARRIOTT VACATIONS WORLDWIDE CORP. | 3,057 | 32,991 | |||||||||||||
| 5,000 | MATTEL, INC. | 80,253 | 76,900 | |||||||||||||
| 22,161 | MCDONALD’S CORP. | 1,818,098 | 3,814,351 | |||||||||||||
| 15,865 | MELCO RESORTS & ENTERTAINMENT LTD. ADR(c)(d) | 331,523 | 460,720 | |||||||||||||
| 6,600 | MGM RESORTS INTERNATIONAL | 54,921 | 220,374 | |||||||||||||
| 10,005 | MICHAEL KORS HOLDINGS LTD.(b)(c) | 570,464 | 629,815 | |||||||||||||
| 600 | MOHAWK INDUSTRIES, INC.(b) | 26,796 | 165,540 | |||||||||||||
| 600 | MURPHY USA, INC.(b) | 4,392 | 48,216 | |||||||||||||
| 4,600 | NETFLIX, INC.(b) | 38,319 | 883,016 | |||||||||||||
| 6,015 | NEWELL BRANDS, INC. | 85,762 | 185,863 | |||||||||||||
| 2,375 | NEWS CORP., CLASS A | 7,170 | 38,499 | |||||||||||||
| 17,800 | NIKE, INC., CLASS B | 268,854 | 1,113,390 | |||||||||||||
| 4,300 | NORDSTROM, INC. | 45,233 | 203,734 | |||||||||||||
| 600 | NORWEGIAN CRUISE LINE HOLDINGS LTD.(b) | 31,692 | 31,950 | |||||||||||||
| 400 | NVR, INC.(b) | 944,289 | 1,403,288 | |||||||||||||
| 19,659 | OMNICOM GROUP, INC. | 1,360,994 | 1,431,765 | |||||||||||||
| 900 | O’REILLY AUTOMOTIVE, INC.(b) | 27,058 | 216,486 | |||||||||||||
| 700 | POLARIS INDUSTRIES, INC. | 88,295 | 86,793 | |||||||||||||
| 370 | POOL CORP. | 34,226 | 47,970 | |||||||||||||
| 1,048 | PRICELINE GROUP (THE), INC.(b) | 805,444 | 1,821,151 | |||||||||||||
| 25,924 | PULTEGROUP, INC. | 430,758 | 861,973 | |||||||||||||
| 2,464 | PVH CORP. | 205,689 | 338,085 | |||||||||||||
| 1,500 | RALPH LAUREN CORP. | 31,320 | 155,535 | |||||||||||||
| 1,400 | REGAL ENTERTAINMENT GROUP, CLASS A | 31,974 | 32,214 | |||||||||||||
| 13,677 | ROSS STORES, INC. | 249,746 | 1,097,579 | |||||||||||||
| 4,535 | ROYAL CARIBBEAN CRUISES LTD. | 155,610 | 540,935 | |||||||||||||
| 800 | SIGNET JEWELERS LTD. | 43,944 | 45,240 | |||||||||||||
| 33,788 | SIRIUS XM HOLDINGS, INC. | 180,766 | 181,104 | |||||||||||||
| 1,189 | SIX FLAGS ENTERTAINMENT CORP. | 71,941 | 79,152 | |||||||||||||
| 1,600 | SKECHERS U.S.A., INC., CLASS A(b) | 59,085 | 60,544 | |||||||||||||
| 28,500 | STARBUCKS CORP. | 182,045 | 1,636,755 | |||||||||||||
| 8,510 | TAPESTRY, INC. | 144,190 | 376,397 | |||||||||||||
| 21,686 | TARGET CORP. | 1,255,605 | 1,415,011 | |||||||||||||
| 5,700 | TEGNA, INC. | 26,227 | 80,256 | |||||||||||||
| 1,660 | TESLA, INC.(b) | 292,795 | 516,841 | |||||||||||||
| 4,136 | THOR INDUSTRIES, INC. | 148,062 | 623,378 | |||||||||||||
| 1,400 | TIFFANY & CO. | 35,210 | 145,530 | |||||||||||||
| 15,327 | TIME WARNER, INC. | 563,502 | 1,401,961 | |||||||||||||
| 1,829 | TIME, INC. | 12,640 | 33,745 | |||||||||||||
| 10,094 | TJX (THE) COS., INC. | 86,033 | 771,787 | |||||||||||||
| 1,466 | TOPBUILD CORP.(b) | 11,809 | 111,035 | |||||||||||||
| 800 | TRIBUNE MEDIA CO., CLASS A | 33,560 | 33,976 | |||||||||||||
| 810 | TRIPADVISOR, INC.(b) | 13,993 | 27,913 | |||||||||||||
| 9,600 | TWENTY-FIRST CENTURY FOX, INC., CLASS A | 54,697 | 331,488 | |||||||||||||
| 848 | ULTA BEAUTY, INC.(b) | 135,054 | 189,664 | |||||||||||||
| 4,100 | UNDER ARMOUR, INC., CLASS A(b) | 56,370 | 59,163 | |||||||||||||
| 906 | UNDER ARMOUR, INC., CLASS C(b) | 10,146 | 12,068 | |||||||||||||
| 9,578 | VF CORP. | 281,277 | 708,772 | |||||||||||||
| 27,560 | WALT DISNEY (THE) CO. | 532,656 | 2,962,976 | |||||||||||||
| 500 | WAYFAIR, INC., CLASS A(b) | 38,095 | 40,135 | |||||||||||||
| 2,100 | WHIRLPOOL CORP. | 89,510 | 354,144 | |||||||||||||
| 10,224 | WYNDHAM WORLDWIDE CORP. | 427,256 | 1,184,655 | |||||||||||||
| 1,600 | WYNN RESORTS LTD. | 32,322 | 269,744 | |||||||||||||
| 4,416 | YUM CHINA HOLDINGS, INC.(c) | 9,382 | 176,728 | |||||||||||||
| 16,327 | YUM! BRANDS, INC. | 562,211 | 1,332,446 | |||||||||||||
| 27,355,393 | 67,998,483 | 12.61 | % | |||||||||||||
| Consumer Staples: | ||||||||||||||||
| 30,600 | ALTRIA GROUP, INC. | 646,328 | 2,185,146 | |||||||||||||
| 36,088 | ARCHER-DANIELS-MIDLAND CO. | 1,293,792 | 1,446,407 | |||||||||||||
| 5,832 | BROWN-FORMAN CORP., CLASS B | 57,343 | 400,483 | |||||||||||||
| 500 | BUNGE LTD. | 33,065 | 33,540 | |||||||||||||
| 8,000 | CHURCH & DWIGHT CO., INC. | 100,310 | 401,360 | |||||||||||||
| 200 | CLOROX (THE) CO. | 29,254 | 29,748 | |||||||||||||
See accompanying notes to financial statements. | 29 | (Continued) |
CLEARWATER INVESTMENT TRUST
Schedule of Investments - Clearwater Core Equity Fund
December 31, 2017
| Shares | Security | Cost | Fair value (a) | Percent of net assets | ||||||||||||
| Consumer Staples (Cont’d): | ||||||||||||||||
| 57,881 | COCA-COLA (THE) CO. | $ | 869,464 | 2,655,580 | ||||||||||||
| 1,480 | COLGATE-PALMOLIVE CO. | 50,669 | 111,666 | |||||||||||||
| 17,524 | CONAGRA BRANDS, INC. | 543,262 | 660,129 | |||||||||||||
| 4,600 | CONSTELLATION BRANDS, INC., CLASS A | 63,227 | 1,051,422 | |||||||||||||
| 8,172 | COSTCO WHOLESALE CORP. | 290,372 | 1,520,973 | |||||||||||||
| 6,400 | COTY, INC., CLASS A | 125,176 | 127,296 | |||||||||||||
| 23,343 | CVS HEALTH CORP. | 1,477,291 | 1,692,367 | |||||||||||||
| 7,643 | DR. PEPPER SNAPPLE GROUP, INC. | 254,571 | 741,830 | |||||||||||||
| 700 | ENERGIZER HOLDINGS, INC. | 33,278 | 33,586 | |||||||||||||
| 3,734 | ESTEE LAUDER (THE) COS., INC., CLASS A | 70,943 | 475,114 | |||||||||||||
| 29,616 | GENERAL MILLS, INC. | 1,180,988 | 1,755,933 | |||||||||||||
| 3,300 | HERBALIFE LTD.(b) | 45,262 | 223,476 | |||||||||||||
| 1,642 | HERSHEY (THE) CO. | 60,568 | 186,383 | |||||||||||||
| 4,800 | HORMEL FOODS CORP. | 43,206 | 174,672 | |||||||||||||
| 4,372 | INGREDION, INC. | 267,511 | 611,206 | |||||||||||||
| 1,600 | JM SMUCKER (THE) CO. | 64,617 | 198,784 | |||||||||||||
| 1,550 | KIMBERLY-CLARK CORP. | 69,760 | 187,023 | |||||||||||||
| 5,579 | KRAFT HEINZ (THE) CO. | 34,550 | 433,823 | |||||||||||||
| 26,800 | KROGER (THE) CO. | 228,089 | 735,660 | |||||||||||||
| 633 | LAMB WESTON HOLDINGS, INC. | 7,452 | 35,733 | |||||||||||||
| 700 | MCCORMICK & CO., INC. (NON VOTING) | 21,613 | 71,337 | |||||||||||||
| 1,300 | MOLSON COORS BREWING CO., CLASS B | 37,841 | 106,691 | |||||||||||||
| 21,438 | MONDELEZ INTERNATIONAL, INC., CLASS A | 145,386 | 917,546 | |||||||||||||
| 6,654 | MONSTER BEVERAGE CORP.(b) | 172,029 | 421,132 | |||||||||||||
| 4,924 | NU SKIN ENTERPRISES, INC., CLASS A | 174,547 | 335,965 | |||||||||||||
| 18,361 | PEPSICO, INC. | 1,361,495 | 2,201,851 | |||||||||||||
| 25,865 | PHILIP MORRIS INTERNATIONAL, INC. | 886,888 | 2,732,637 | |||||||||||||
| 2,305 | PILGRIM’S PRIDE CORP.(b) | 49,839 | 71,593 | |||||||||||||
| 6,000 | PINNACLE FOODS, INC. | 219,854 | 356,820 | |||||||||||||
| 700 | POST HOLDINGS, INC.(b) | 43,421 | 55,461 | |||||||||||||
| 69,041 | PROCTER & GAMBLE (THE) CO. | 3,560,191 | 6,343,487 | |||||||||||||
| 17,300 | RITE AID CORP.(b) | 31,405 | 34,081 | |||||||||||||
| 26,450 | SYSCO CORP. | 1,120,141 | 1,606,309 | |||||||||||||
| 700 | TREEHOUSE FOODS, INC.(b) | 32,774 | 34,622 | |||||||||||||
| 16,391 | TYSON FOODS, INC., CLASS A | 599,633 | 1,328,818 | |||||||||||||
| 19,650 | WALGREENS BOOTS ALLIANCE, INC. | 224,986 | 1,426,983 | |||||||||||||
| 47,653 | WAL-MART STORES, INC. | 3,815,602 | 4,705,734 | |||||||||||||
| 20,437,993 | 40,860,407 | 7.58 | % | |||||||||||||
| Energy: | ||||||||||||||||
| 3,546 | ANADARKO PETROLEUM CORP. | 67,687 | 190,207 | |||||||||||||
| 2,716 | ANDEAVOR | 145,143 | 310,547 | |||||||||||||
| 1,700 | ANTERO RESOURCES CORP.(b) | 30,478 | 32,300 | |||||||||||||
| 5,700 | BAKER HUGHES A GE CO. | 174,284 | 180,348 | |||||||||||||
| 9,200 | CHESAPEAKE ENERGY CORP.(b) | 33,999 | 36,432 | |||||||||||||
| 32,795 | CHEVRON CORP. | 1,428,027 | 4,105,606 | |||||||||||||
| 500 | CIMAREX ENERGY CO. | 32,151 | 61,005 | |||||||||||||
| 3,600 | CNX RESOURCES CORP.(b) | 25,763 | 52,668 | |||||||||||||
| 1,700 | CONCHO RESOURCES, INC.(b) | 49,631 | 255,374 | |||||||||||||
| 23,044 | CONOCOPHILLIPS | 383,142 | 1,264,885 | |||||||||||||
| 450 | CONSOL ENERGY, INC.(b) | 5,125 | 17,780 | |||||||||||||
| 2,000 | CONTINENTAL RESOURCES, INC.(b) | 20,765 | 105,940 | |||||||||||||
| 6,000 | DIAMONDBACK ENERGY, INC.(b) | 570,297 | 757,500 | |||||||||||||
| 9,794 | ENBRIDGE, INC.(c) | 137,797 | 383,043 | |||||||||||||
| 1,300 | ENERGEN CORP.(b) | 44,343 | 74,841 | |||||||||||||
| 5,700 | EOG RESOURCES, INC. | 44,223 | 615,087 | |||||||||||||
| 4,000 | EQT CORP. | 132,900 | 227,680 | |||||||||||||
| 2,100 | EXTRACTION OIL & GAS, INC.(b) | 31,852 | 30,051 | |||||||||||||
| 43,151 | EXXON MOBIL CORP. | 1,616,092 | 3,609,150 | |||||||||||||
| 10,758 | HALLIBURTON CO. | 164,732 | 525,744 | |||||||||||||
| 3,100 | HELMERICH & PAYNE, INC. | 39,003 | 200,384 | |||||||||||||
| 1,800 | HESS CORP. | 77,007 | 85,446 | |||||||||||||
| 2,400 | HOLLYFRONTIER CORP. | 22,578 | 122,928 | |||||||||||||
| 7,312 | KINDER MORGAN, INC. | 64,699 | 132,128 | |||||||||||||
| 6,100 | MARATHON OIL CORP. | 92,456 | 103,273 | |||||||||||||
| 21,590 | MARATHON PETROLEUM CORP. | 1,289,371 | 1,424,508 | |||||||||||||
| 3,000 | MURPHY OIL CORP. | 39,255 | 93,150 | |||||||||||||
| 5,500 | NABORS INDUSTRIES LTD. | 30,723 | 37,565 | |||||||||||||
See accompanying notes to financial statements. | 30 | (Continued) |
CLEARWATER INVESTMENT TRUST
Schedule of Investments - Clearwater Core Equity Fund
December 31, 2017
| Shares | Security | Cost | Fair value (a) | Percent of net assets | ||||||||||||
| Energy (Cont’d): | ||||||||||||||||
| 4,722 | NATIONAL OILWELL VARCO, INC. | $ | 74,438 | 170,086 | ||||||||||||
| 1,200 | NEWFIELD EXPLORATION CO.(b) | 27,012 | 37,836 | |||||||||||||
| 3,800 | NOBLE ENERGY, INC. | 20,499 | 110,732 | |||||||||||||
| 6,000 | OCCIDENTAL PETROLEUM CORP. | 54,261 | 441,960 | |||||||||||||
| 2,300 | OCEANEERING INTERNATIONAL, INC. | 43,181 | 48,622 | |||||||||||||
| 2,000 | ONEOK, INC. | 27,264 | 106,900 | |||||||||||||
| 2,600 | PATTERSON-UTI ENERGY, INC. | 53,630 | 59,826 | |||||||||||||
| 13,372 | PHILLIPS 66 | 156,993 | 1,352,578 | |||||||||||||
| 3,930 | PIONEER NATURAL RESOURCES CO. | 165,650 | 679,301 | |||||||||||||
| 2,000 | RANGE RESOURCES CORP. | 31,995 | 34,120 | |||||||||||||
| 15,236 | SCHLUMBERGER LTD. | 336,122 | 1,026,754 | |||||||||||||
| 1,600 | SM ENERGY CO. | 31,501 | 35,328 | |||||||||||||
| 5,700 | SOUTHWESTERN ENERGY CO.(b) | 30,187 | 31,806 | |||||||||||||
| 1,300 | TARGA RESOURCES CORP. | 35,333 | 62,946 | |||||||||||||
| 4,900 | TRANSOCEAN LTD.(b)(c) | 46,628 | 52,332 | |||||||||||||
| 85,557 | VALERO ENERGY CORP. | 4,600,122 | 7,863,544 | |||||||||||||
| 14,000 | WEATHERFORD INTERNATIONAL PLC(b)(c) | 47,730 | 58,380 | |||||||||||||
| 1,400 | WHITING PETROLEUM CORP.(b) | 31,358 | 37,072 | |||||||||||||
| 1,400 | WILLIAMS (THE) COS., INC. | 41,704 | 42,686 | |||||||||||||
| 5,200 | WPX ENERGY, INC.(b) | 50,544 | 73,164 | |||||||||||||
| 12,699,675 | 27,361,543 | 5.07 | % | |||||||||||||
| Financials: | ||||||||||||||||
| 82,320 | AEGON N.V. (REGISTERED)(c) | 450,407 | 518,616 | |||||||||||||
| 600 | AFFILIATED MANAGERS GROUP, INC. | 35,024 | 123,150 | |||||||||||||
| 11,241 | AFLAC, INC. | 584,433 | 986,735 | |||||||||||||
| 500 | ALLEGHANY CORP.(b) | 140,685 | 298,045 | |||||||||||||
| 15,284 | ALLSTATE (THE) CORP. | 648,558 | 1,600,388 | |||||||||||||
| 19,826 | ALLY FINANCIAL, INC. | 404,611 | 578,126 | |||||||||||||
| 10,133 | AMERICAN EXPRESS CO. | 257,999 | 1,006,308 | |||||||||||||
| 4,900 | AMERICAN FINANCIAL GROUP, INC. | 220,290 | 531,846 | |||||||||||||
| 6,100 | AMERICAN INTERNATIONAL GROUP, INC. | 143,498 | 363,438 | |||||||||||||
| 27,565 | AMERIPRISE FINANCIAL, INC. | 2,572,033 | 4,671,440 | |||||||||||||
| 10,774 | ANNALY CAPITAL MANAGEMENT, INC. | 120,838 | 128,103 | |||||||||||||
| 3,021 | AON PLC(c) | 77,683 | 404,814 | |||||||||||||
| 9,443 | ARCH CAPITAL GROUP LTD.(b)(c) | 443,802 | 857,141 | |||||||||||||
| 1,600 | ARTHUR J. GALLAGHER & CO. | 34,040 | 101,248 | |||||||||||||
| 800 | ASPEN INSURANCE HOLDINGS LTD.(c) | 32,928 | 32,480 | |||||||||||||
| 4,900 | ASSURANT, INC. | 218,575 | 494,116 | |||||||||||||
| 14,090 | ASSURED GUARANTY LTD.(c) | 367,190 | 477,228 | |||||||||||||
| 1,100 | AXIS CAPITAL HOLDINGS LTD.(c) | 33,351 | 55,286 | |||||||||||||
| 222,337 | BANK OF AMERICA CORP. | 2,916,251 | 6,563,388 | |||||||||||||
| 13,901 | BANK OF NEW YORK MELLON (THE) CORP. | 390,433 | 748,708 | |||||||||||||
| 11,218 | BB&T CORP. | 330,739 | 557,759 | |||||||||||||
| 28,441 | BERKSHIRE HATHAWAY, INC., CLASS B(b) | 3,720,534 | 5,637,575 | |||||||||||||
| 200 | BRIGHTHOUSE FINANCIAL, INC.(b) | 6,471 | 11,728 | |||||||||||||
| 620 | CANNAE HOLDINGS, INC.(b) | 2,893 | 10,559 | |||||||||||||
| 22,679 | CAPITAL ONE FINANCIAL CORP. | 1,365,458 | 2,258,375 | |||||||||||||
| 21,400 | CHARLES SCHWAB (THE) CORP. | 186,608 | 1,099,318 | |||||||||||||
| 6,250 | CHUBB LTD.(c) | 587,621 | 913,312 | |||||||||||||
| 42,279 | CITIGROUP, INC. | 2,246,058 | 3,145,980 | |||||||||||||
| 3,385 | CME GROUP, INC. | 342,594 | 494,379 | |||||||||||||
| 1,928 | COMERICA, INC. | 131,301 | 167,370 | |||||||||||||
| 500 | CREDIT ACCEPTANCE CORP.(b) | 86,421 | 161,740 | |||||||||||||
| 19,861 | DISCOVER FINANCIAL SERVICES | 437,846 | 1,527,708 | |||||||||||||
| 10,182 | E*TRADE FINANCIAL CORP.(b) | 276,402 | 504,722 | |||||||||||||
| 469 | FAIRFAX FINANCIAL HOLDINGS LTD.(c) | 86,576 | 248,729 | |||||||||||||
| 71,243 | FIFTH THIRD BANCORP | 1,430,542 | 2,161,513 | |||||||||||||
| 400 | FIRST CITIZENS BANCSHARES, INC., CLASS A | 57,523 | 161,200 | |||||||||||||
| 30,500 | FIRST HORIZON NATIONAL CORP. | 193,065 | 609,695 | |||||||||||||
| 1,863 | FNF GROUP | 15,560 | 73,104 | |||||||||||||
| 7,500 | FRANKLIN RESOURCES, INC. | 151,437 | 324,975 | |||||||||||||
| 11,064 | GOLDMAN SACHS GROUP (THE), INC. | 1,292,398 | 2,818,665 | |||||||||||||
| 3,000 | HANOVER INSURANCE GROUP (THE), INC. | 215,948 | 324,240 | |||||||||||||
| 12,000 | HARTFORD FINANCIAL SERVICES GROUP (THE), INC. | 401,575 | 675,360 | |||||||||||||
| 43,648 | HUNTINGTON BANCSHARES, INC. | 258,761 | 635,515 | |||||||||||||
| 505 | INTERCONTINENTAL EXCHANGE, INC. | 12,819 | 35,633 | |||||||||||||
| 2,700 | INVESCO LTD. | 32,171 | 98,658 | |||||||||||||
See accompanying notes to financial statements. | 31 | (Continued) |
CLEARWATER INVESTMENT TRUST
Schedule of Investments - Clearwater Core Equity Fund
December 31, 2017
| Shares | Security | Cost | Fair value (a) | Percent of net assets | ||||||||||||
| Financials (Cont’d): | ||||||||||||||||
| 15,903 | JANUS HENDERSON GROUP PLC(c) | $ | 222,792 | 608,449 | ||||||||||||
| 100,529 | JPMORGAN CHASE & CO. | 4,798,832 | 10,750,571 | |||||||||||||
| 7,735 | KEYCORP | 53,455 | 156,015 | |||||||||||||
| 3,752 | LEGG MASON, INC. | 52,584 | 157,509 | |||||||||||||
| 25,805 | LEUCADIA NATIONAL CORP. | 650,645 | 683,574 | |||||||||||||
| 3,417 | LINCOLN NATIONAL CORP. | 177,638 | 262,665 | |||||||||||||
| 1,300 | LOEWS CORP. | 10,310 | 65,039 | |||||||||||||
| 2,482 | M&T BANK CORP. | 387,425 | 424,397 | |||||||||||||
| 200 | MARKEL CORP.(b) | 67,789 | 227,826 | |||||||||||||
| 5,684 | MARSH & MCLENNAN COS., INC. | 240,120 | 462,621 | |||||||||||||
| 1,300 | MERCURY GENERAL CORP. | 38,019 | 69,472 | |||||||||||||
| 2,200 | METLIFE, INC. | 52,967 | 111,232 | |||||||||||||
| 2,200 | MOODY’S CORP. | 77,502 | 324,742 | |||||||||||||
| 41,299 | MORGAN STANLEY | 1,288,328 | 2,166,958 | |||||||||||||
| 3,900 | MSCI, INC. | 124,722 | 493,506 | |||||||||||||
| 5,900 | NASDAQ, INC. | 240,309 | 453,297 | |||||||||||||
| 11,500 | NAVIENT CORP. | 77,545 | 153,180 | |||||||||||||
| 4,539 | PACWEST BANCORP | 65,912 | 228,766 | |||||||||||||
| 15,697 | PNC FINANCIAL SERVICES GROUP (THE), INC. | 1,115,690 | 2,264,920 | |||||||||||||
| 1,600 | POPULAR, INC.(c) | 33,280 | 56,784 | |||||||||||||
| 5,628 | PRINCIPAL FINANCIAL GROUP, INC. | 175,248 | 397,112 | |||||||||||||
| 900 | PROASSURANCE CORP. | 48,946 | 51,435 | |||||||||||||
| 20,386 | PROGRESSIVE (THE) CORP. | 496,849 | 1,148,139 | |||||||||||||
| 24,013 | PRUDENTIAL FINANCIAL, INC. | 1,616,518 | 2,761,015 | |||||||||||||
| 4,745 | RAYMOND JAMES FINANCIAL, INC. | 405,021 | 423,728 | |||||||||||||
| 18,002 | REGIONS FINANCIAL CORP. | 119,439 | 311,075 | |||||||||||||
| 3,371 | REINSURANCE GROUP OF AMERICA, INC. | 296,860 | 525,640 | |||||||||||||
| 800 | RENAISSANCERE HOLDINGS LTD.(c) | 81,779 | 100,472 | |||||||||||||
| 3,151 | ROYAL BANK OF CANADA(c) | 75,538 | 257,279 | |||||||||||||
| 3,600 | S&P GLOBAL, INC. | 84,305 | 609,840 | |||||||||||||
| 7,500 | SEI INVESTMENTS CO. | 108,537 | 538,950 | |||||||||||||
| 10,100 | SLM CORP.(b) | 36,679 | 114,130 | |||||||||||||
| 1,313 | STATE STREET CORP. | 105,277 | 128,162 | |||||||||||||
| 11,022 | SUNTRUST BANKS, INC. | 381,251 | 711,911 | |||||||||||||
| 22,113 | SWISS RE A.G. ADR(c)(d) | 481,138 | 517,002 | |||||||||||||
| 4,737 | SYNCHRONY FINANCIAL | 128,601 | 182,896 | |||||||||||||
| 4,704 | SYNOVUS FINANCIAL CORP. | 83,310 | 225,510 | |||||||||||||
| 3,549 | T. ROWE PRICE GROUP, INC. | 106,978 | 372,397 | |||||||||||||
| 5,800 | TCF FINANCIAL CORP. | 51,852 | 118,900 | |||||||||||||
| 2,600 | TFS FINANCIAL CORP. | 25,038 | 38,844 | |||||||||||||
| 2,468 | TORCHMARK CORP. | 145,321 | 223,872 | |||||||||||||
| 12,969 | TRAVELERS (THE) COS., INC. | 799,096 | 1,759,115 | |||||||||||||
| 4,417 | UNUM GROUP | 156,000 | 242,449 | |||||||||||||
| 29,757 | US BANCORP | 962,524 | 1,594,380 | |||||||||||||
| 1,300 | VALIDUS HOLDINGS LTD.(c) | 32,791 | 60,996 | |||||||||||||
| 1,800 | WASHINGTON FEDERAL, INC. | 23,535 | 61,650 | |||||||||||||
| 77,145 | WELLS FARGO & CO. | 942,151 | 4,680,387 | |||||||||||||
| 56 | WHITE MOUNTAINS INSURANCE GROUP LTD. | 36,131 | 47,672 | |||||||||||||
| 300 | WILLIS TOWERS WATSON PLC(c) | 46,047 | 45,207 | |||||||||||||
| 6,106 | WR BERKLEY CORP. | 273,043 | 437,495 | |||||||||||||
| 35,562 | XL GROUP LTD.(c) | 1,386,993 | 1,250,360 | |||||||||||||
| 9,614 | ZIONS BANCORPORATION | 342,956 | 488,680 | |||||||||||||
| 43,793,566 | 85,746,639 | 15.90 | % | |||||||||||||
| Health Care: | ||||||||||||||||
| 12,487 | ABBOTT LABORATORIES | 246,035 | 712,633 | |||||||||||||
| 12,935 | ABBVIE, INC. | 238,839 | 1,250,944 | |||||||||||||
| 1,500 | ACADIA PHARMACEUTICALS, INC.(b) | 43,249 | 45,165 | |||||||||||||
| 2,363 | AETNA, INC. | 137,549 | 426,262 | |||||||||||||
| 4,120 | AGILENT TECHNOLOGIES, INC. | 181,587 | 275,916 | |||||||||||||
| 1,600 | AKORN, INC.(b) | 52,280 | 51,568 | |||||||||||||
| 3,000 | ALEXION PHARMACEUTICALS, INC.(b) | 58,087 | 358,770 | |||||||||||||
| 937 | ALIGN TECHNOLOGY, INC.(b) | 111,337 | 208,192 | |||||||||||||
| 4,459 | ALLERGAN PLC | 145,720 | 729,403 | |||||||||||||
| 4,700 | ALLSCRIPTS HEALTHCARE SOLUTIONS, INC.(b) | 50,008 | 68,385 | |||||||||||||
| 1,000 | ALNYLAM PHARMACEUTICALS, INC.(b) | 123,670 | 127,050 | |||||||||||||
| 7,200 | AMERISOURCEBERGEN CORP. | 115,968 | 661,104 | |||||||||||||
| 5,620 | AMGEN, INC. | 569,229 | 977,318 | |||||||||||||
See accompanying notes to financial statements. | 32 | (Continued) |
CLEARWATER INVESTMENT TRUST
Schedule of Investments - Clearwater Core Equity Fund
December 31, 2017
| Shares | Security | Cost | Fair value (a) | Percent of net assets | ||||||||||||
| Health Care (Cont’d): | ||||||||||||||||
| 7,850 | ANTHEM, INC. | $ | 411,197 | 1,766,328 | ||||||||||||
| 8,439 | BAXTER INTERNATIONAL, INC. | 397,601 | 545,497 | |||||||||||||
| 3,365 | BECTON DICKINSON AND CO. | 357,166 | 720,363 | |||||||||||||
| 5,988 | BIOGEN, INC.(b) | 247,600 | 1,907,597 | |||||||||||||
| 1,225 | BIOVERATIV, INC.(b) | 2,445 | 66,052 | |||||||||||||
| 32,800 | BOSTON SCIENTIFIC CORP.(b) | 182,160 | 813,112 | |||||||||||||
| 18,500 | BRISTOL-MYERS SQUIBB CO. | 433,437 | 1,133,680 | |||||||||||||
| 3,200 | BROOKDALE SENIOR LIVING, INC.(b) | 31,221 | 31,040 | |||||||||||||
| 2,145 | BRUKER CORP. | 43,219 | 73,616 | |||||||||||||
| 1,000 | CARDINAL HEALTH, INC. | 26,001 | 61,270 | |||||||||||||
| 12,872 | CELGENE CORP.(b) | 146,839 | 1,343,322 | |||||||||||||
| 16,804 | CENTENE CORP.(b) | 1,310,222 | 1,695,188 | |||||||||||||
| 3,600 | CERNER CORP.(b) | 40,604 | 242,604 | |||||||||||||
| 5,700 | CIGNA CORP. | 89,680 | 1,157,613 | |||||||||||||
| 4,513 | COOPER (THE) COS., INC. | 1,098,535 | 983,292 | |||||||||||||
| 12,160 | DANAHER CORP. | 263,810 | 1,128,691 | |||||||||||||
| 2,850 | DAVITA, INC.(b) | 21,812 | 205,913 | |||||||||||||
| 5,332 | DENTSPLY SIRONA, INC. | 141,306 | 351,006 | |||||||||||||
| 1,300 | DEXCOM, INC.(b) | 75,735 | 74,607 | |||||||||||||
| 9,526 | EDWARDS LIFESCIENCES CORP.(b) | 248,804 | 1,073,675 | |||||||||||||
| 8,244 | ELI LILLY & CO. | 337,754 | 696,288 | |||||||||||||
| 5,300 | ENDO INTERNATIONAL PLC(b)(c) | 42,041 | 41,075 | |||||||||||||
| 3,700 | EXELIXIS, INC.(b) | 96,482 | 112,480 | |||||||||||||
| 34,471 | EXPRESS SCRIPTS HOLDING CO.(b) | 1,355,629 | 2,572,915 | |||||||||||||
| 82,870 | GILEAD SCIENCES, INC. | 4,323,023 | 5,936,807 | |||||||||||||
| 193 | HALYARD HEALTH, INC.(b) | 3,014 | 8,913 | |||||||||||||
| 3,800 | HENRY SCHEIN, INC.(b) | 86,166 | 265,544 | |||||||||||||
| 6,608 | HOLOGIC, INC.(b) | 92,603 | 282,492 | |||||||||||||
| 5,850 | HUMANA, INC. | 490,133 | 1,451,210 | |||||||||||||
| 5,202 | IDEXX LABORATORIES, INC.(b) | 413,808 | 813,489 | |||||||||||||
| 2,300 | ILLUMINA, INC.(b) | 98,233 | 502,527 | |||||||||||||
| 1,600 | INCYTE CORP.(b) | 153,324 | 151,536 | |||||||||||||
| 500 | INTERCEPT PHARMACEUTICALS, INC.(b) | 30,810 | 29,210 | |||||||||||||
| 7,011 | INTUITIVE SURGICAL, INC.(b) | 2,281,654 | 2,558,594 | |||||||||||||
| 700 | IONIS PHARMACEUTICALS, INC.(b) | 36,610 | 35,210 | |||||||||||||
| 1,861 | IQVIA HOLDINGS, INC.(b) | 112,204 | 182,192 | |||||||||||||
| 45,717 | JOHNSON & JOHNSON | 4,548,701 | 6,387,579 | |||||||||||||
| 4,800 | JUNO THERAPEUTICS, INC.(b) | 207,341 | 219,408 | |||||||||||||
| 842 | LABORATORY CORP. OF AMERICA HOLDINGS(b) | 53,269 | 134,307 | |||||||||||||
| 1,700 | MALLINCKRODT PLC(b) | 39,539 | 38,352 | |||||||||||||
| 11,997 | MCKESSON CORP. | 1,097,684 | 1,870,932 | |||||||||||||
| 5,700 | MEDTRONIC PLC(c) | 470,629 | 460,275 | |||||||||||||
| 43,278 | MERCK & CO., INC. | 986,667 | 2,435,253 | |||||||||||||
| 1,577 | METTLER-TOLEDO INTERNATIONAL, INC.(b) | 277,694 | 976,983 | |||||||||||||
| 6,700 | MYLAN N.V.(b) | 268,105 | 283,477 | |||||||||||||
| 400 | NEUROCRINE BIOSCIENCES, INC.(b) | 28,172 | 31,036 | |||||||||||||
| 6,200 | OPKO HEALTH, INC.(b) | 30,106 | 30,380 | |||||||||||||
| 1,600 | PATTERSON COS., INC. | 29,864 | 57,808 | |||||||||||||
| 1,700 | PERRIGO CO. PLC(c) | 123,513 | 148,172 | |||||||||||||
| 85,500 | PFIZER, INC. | 680,248 | 3,096,810 | |||||||||||||
| 6,458 | QUEST DIAGNOSTICS, INC. | 528,658 | 636,048 | |||||||||||||
| 100 | REGENERON PHARMACEUTICALS, INC.(b) | 38,340 | 37,596 | |||||||||||||
| 4,791 | RESMED, INC. | 129,046 | 405,750 | |||||||||||||
| 3,800 | STRYKER CORP. | 14,666 | 588,392 | |||||||||||||
| 1,300 | TELEFLEX, INC. | 66,613 | 323,466 | |||||||||||||
| 600 | TESARO, INC.(b) | 49,726 | 49,722 | |||||||||||||
| 7,304 | THERMO FISHER SCIENTIFIC, INC. | 255,451 | 1,386,884 | |||||||||||||
| 1,551 | UNITED THERAPEUTICS CORP.(b) | 186,662 | 229,470 | |||||||||||||
| 26,574 | UNITEDHEALTH GROUP, INC. | 1,855,295 | 5,858,504 | |||||||||||||
| 2,036 | UNIVERSAL HEALTH SERVICES, INC., CLASS B | 38,822 | 230,781 | |||||||||||||
| 1,880 | VAREX IMAGING CORP.(b) | 19,829 | 75,520 | |||||||||||||
| 5,199 | VARIAN MEDICAL SYSTEMS, INC.(b) | 193,000 | 577,869 | |||||||||||||
| 1,445 | VEEVA SYSTEMS, INC., CLASS A(b) | 55,063 | 79,880 | |||||||||||||
| 900 | VERTEX PHARMACEUTICALS, INC.(b) | 22,442 | 134,874 | |||||||||||||
| 2,600 | WATERS CORP.(b) | 60,997 | 502,294 | |||||||||||||
| 4,304 | ZIMMER BIOMET HOLDINGS, INC. | 233,961 | 519,364 | |||||||||||||
See accompanying notes to financial statements. | 33 | (Continued) |
CLEARWATER INVESTMENT TRUST
Schedule of Investments - Clearwater Core Equity Fund
December 31, 2017
| Shares | Security | Cost | Fair value (a) | Percent of net assets | ||||||||||||
| Health Care (Cont’d): | ||||||||||||||||
| 600 | ZOETIS, INC. | $ | 43,236 | 43,224 | ||||||||||||
| 30,229,779 | 64,758,068 | 12.01 | % | |||||||||||||
| Industrials: | ||||||||||||||||
| 8,437 | 3M CO. | 757,691 | 1,985,817 | |||||||||||||
| 4,565 | A.O. SMITH CORP. | 187,414 | 279,743 | |||||||||||||
| 923 | ACCO BRANDS CORP.(b) | 3,137 | 11,261 | |||||||||||||
| 100 | ACUITY BRANDS, INC. | 17,081 | 17,600 | |||||||||||||
| 1,657 | AECOM(b) | 48,445 | 61,558 | |||||||||||||
| 4,642 | AGCO CORP. | 225,963 | 331,578 | |||||||||||||
| 900 | AIR LEASE CORP. | 17,685 | 43,281 | |||||||||||||
| 1,533 | ALLEGION PLC(c) | 40,913 | 121,965 | |||||||||||||
| 400 | AMERCO | 120,202 | 151,164 | |||||||||||||
| 5,175 | AMETEK, INC. | 73,221 | 375,032 | |||||||||||||
| 19,402 | BOEING (THE) CO. | 1,995,318 | 5,721,844 | |||||||||||||
| 5,205 | BWX TECHNOLOGIES, INC. | 145,980 | 314,850 | |||||||||||||
| 2,996 | CARLISLE COS., INC. | 114,358 | 340,495 | |||||||||||||
| 10,504 | CATERPILLAR, INC. | 272,491 | 1,655,220 | |||||||||||||
| 3,200 | CINTAS CORP. | 258,101 | 498,656 | |||||||||||||
| 6,001 | CRANE CO. | 207,659 | 535,409 | |||||||||||||
| 19,924 | CSX CORP. | 193,451 | 1,096,019 | |||||||||||||
| 7,101 | CUMMINS, INC. | 497,031 | 1,254,321 | |||||||||||||
| 7,300 | DEERE & CO. | 199,160 | 1,142,523 | |||||||||||||
| 30,673 | DELTA AIR LINES, INC. | 908,863 | 1,717,688 | |||||||||||||
| 3,195 | DONALDSON CO., INC. | 117,473 | 156,395 | |||||||||||||
| 1,525 | DOVER CORP. | 40,758 | 154,010 | |||||||||||||
| 1,987 | DUN & BRADSTREET (THE) CORP. | 49,383 | 235,281 | |||||||||||||
| 16,254 | EATON CORP. PLC | 561,267 | 1,284,229 | |||||||||||||
| 2,280 | EXPEDITORS INTERNATIONAL OF WASHINGTON, INC. | 112,692 | 147,493 | |||||||||||||
| 8,601 | FEDEX CORP. | 478,914 | 2,146,294 | |||||||||||||
| 1,950 | FLUOR CORP. | 26,013 | 100,718 | |||||||||||||
| 6,209 | FORTIVE CORP. | 90,098 | 449,221 | |||||||||||||
| 4,300 | FORTUNE BRANDS HOME & SECURITY, INC. | 33,889 | 294,292 | |||||||||||||
| 1,400 | GATX CORP. | 24,276 | 87,024 | |||||||||||||
| 6,969 | GENERAL DYNAMICS CORP. | 1,196,686 | 1,417,843 | |||||||||||||
| 93,321 | GENERAL ELECTRIC CO. | 1,526,003 | 1,628,451 | |||||||||||||
| 10,443 | HARRIS CORP. | 904,184 | 1,479,251 | |||||||||||||
| 1,300 | HEICO CORP., CLASS A | 102,158 | 102,765 | |||||||||||||
| 360 | HERC HOLDINGS, INC.(b) | 5,808 | 22,540 | |||||||||||||
| 14,219 | HONEYWELL INTERNATIONAL, INC. | 1,015,856 | 2,180,626 | |||||||||||||
| 2,299 | HUBBELL, INC. | 159,480 | 311,147 | |||||||||||||
| 2,490 | HUNTINGTON INGALLS INDUSTRIES, INC. | 315,772 | 586,893 | |||||||||||||
| 20,636 | IDEX CORP. | 2,293,952 | 2,723,333 | |||||||||||||
| 4,824 | ILLINOIS TOOL WORKS, INC. | 155,812 | 804,884 | |||||||||||||
| 10,505 | INGERSOLL-RAND PLC | 631,190 | 936,941 | |||||||||||||
| 4,671 | JACOBS ENGINEERING GROUP, INC. | 194,274 | 308,099 | |||||||||||||
| 2,100 | JB HUNT TRANSPORT SERVICES, INC. | 40,530 | 241,458 | |||||||||||||
| 13,203 | JETBLUE AIRWAYS CORP.(b) | 81,151 | 294,955 | |||||||||||||
| 859 | JOHNSON CONTROLS INTERNATIONAL PLC | 16,341 | 32,736 | |||||||||||||
| 2,900 | KANSAS CITY SOUTHERN | 46,328 | 305,138 | |||||||||||||
| 850 | KLX, INC.(b) | 13,147 | 58,013 | |||||||||||||
| 1,596 | L3 TECHNOLOGIES, INC. | 122,430 | 315,769 | |||||||||||||
| 600 | LENNOX INTERNATIONAL, INC. | 17,874 | 124,956 | |||||||||||||
| 1,400 | LINCOLN ELECTRIC HOLDINGS, INC. | 28,970 | 128,212 | |||||||||||||
| 2,484 | LOCKHEED MARTIN CORP. | 486,437 | 797,488 | |||||||||||||
| 1,200 | MANITOWOC (THE) CO., INC.(b) | 10,053 | 47,208 | |||||||||||||
| 9,684 | MANPOWERGROUP, INC. | 883,500 | 1,221,249 | |||||||||||||
| 25,346 | MASCO CORP. | 430,620 | 1,113,703 | |||||||||||||
| 1,724 | NORDSON CORP. | 171,931 | 252,394 | |||||||||||||
| 5,702 | NORFOLK SOUTHERN CORP. | 202,245 | 826,220 | |||||||||||||
| 5,973 | NORTHROP GRUMMAN CORP. | 516,333 | 1,833,173 | |||||||||||||
| 2,180 | NOW, INC.(b) | 21,218 | 24,045 | |||||||||||||
| 1,000 | ORBITAL ATK, INC. | 132,210 | 131,500 | |||||||||||||
| 6,476 | OSHKOSH CORP. | 222,024 | 588,604 | |||||||||||||
| 6,784 | OWENS CORNING | 282,404 | 623,721 | |||||||||||||
| 10,867 | PACCAR, INC. | 233,323 | 772,426 | |||||||||||||
| 4,628 | PARKER-HANNIFIN CORP. | 350,966 | 923,656 | |||||||||||||
| 2,519 | PENTAIR PLC(c) | 73,408 | 177,892 | |||||||||||||
See accompanying notes to financial statements. | 34 | (Continued) |
CLEARWATER INVESTMENT TRUST
Schedule of Investments - Clearwater Core Equity Fund
December 31, 2017
| Shares | Security | Cost | Fair value (a) | Percent of net assets | ||||||||||||
| Industrials (Cont’d): | ||||||||||||||||
| 8,836 | QUANTA SERVICES, INC.(b) | $ | 189,853 | 345,576 | ||||||||||||
| 3,398 | RAYTHEON CO. | 201,776 | 638,314 | |||||||||||||
| 5,049 | REPUBLIC SERVICES, INC. | 241,005 | 341,363 | |||||||||||||
| 6,221 | ROCKWELL AUTOMATION, INC. | 179,002 | 1,221,493 | |||||||||||||
| 1,841 | ROCKWELL COLLINS, INC. | 46,427 | 249,676 | |||||||||||||
| 920 | ROLLINS, INC. | 24,890 | 42,808 | |||||||||||||
| 700 | ROPER TECHNOLOGIES, INC. | 94,318 | 181,300 | |||||||||||||
| 2,300 | SNAP-ON, INC. | 230,888 | 400,890 | |||||||||||||
| 17,600 | SOUTHWEST AIRLINES CO. | 129,730 | 1,151,920 | |||||||||||||
| 9,158 | SPIRIT AEROSYSTEMS HOLDINGS, INC., CLASS A | 496,263 | 799,036 | |||||||||||||
| 6,924 | STANLEY BLACK & DECKER, INC. | 533,158 | 1,174,934 | |||||||||||||
| 1,200 | STERICYCLE, INC.(b) | 50,064 | 81,588 | |||||||||||||
| 5,162 | TIMKEN (THE) CO. | 171,352 | 253,712 | |||||||||||||
| 7,788 | TORO (THE) CO. | 457,493 | 508,011 | |||||||||||||
| 100 | TRANSDIGM GROUP, INC. | 27,449 | 27,462 | |||||||||||||
| 13,852 | TRINITY INDUSTRIES, INC. | 380,151 | 518,896 | |||||||||||||
| 15,000 | UNION PACIFIC CORP. | 216,086 | 2,011,500 | |||||||||||||
| 18,153 | UNITED CONTINENTAL HOLDINGS, INC.(b) | 780,145 | 1,223,512 | |||||||||||||
| 3,540 | UNITED PARCEL SERVICE, INC., CLASS B | 166,527 | 421,791 | |||||||||||||
| 3,799 | UNITED RENTALS, INC.(b) | 315,894 | 653,086 | |||||||||||||
| 10,650 | UNITED TECHNOLOGIES CORP. | 359,588 | 1,358,620 | |||||||||||||
| 5,580 | USG CORP.(b) | 109,574 | 215,165 | |||||||||||||
| 1,144 | VALMONT INDUSTRIES, INC. | 146,411 | 189,732 | |||||||||||||
| 180 | VERITIV CORP.(b) | 1,653 | 5,202 | |||||||||||||
| 4,011 | W.W. GRAINGER, INC. | 534,167 | 947,599 | |||||||||||||
| 1,966 | WABCO HOLDINGS, INC.(b) | 30,197 | 282,121 | |||||||||||||
| 1,400 | WABTEC CORP. | 25,603 | 114,002 | |||||||||||||
| 975 | WASTE CONNECTIONS, INC.(c) | 42,575 | 69,167 | |||||||||||||
| 8,650 | WASTE MANAGEMENT, INC. | 135,675 | 746,495 | |||||||||||||
| 4,800 | WELBILT, INC.(b) | 37,515 | 112,848 | |||||||||||||
| 1,415 | XPO LOGISTICS, INC.(b) | 78,936 | 129,600 | |||||||||||||
| 1,600 | XYLEM, INC. | 30,618 | 109,120 | |||||||||||||
| 27,168,528 | 62,574,809 | 11.60 | % | |||||||||||||
| Information Technology: | ||||||||||||||||
| 4,949 | ACCENTURE PLC, CLASS A(c) | 304,426 | 757,642 | |||||||||||||
| 25,710 | ACTIVISION BLIZZARD, INC. | 694,834 | 1,627,957 | |||||||||||||
| 10,827 | ADOBE SYSTEMS, INC.(b) | 697,111 | 1,897,324 | |||||||||||||
| 10,200 | ADVANCED MICRO DEVICES, INC.(b) | 103,382 | 104,856 | |||||||||||||
| 3,300 | AKAMAI TECHNOLOGIES, INC.(b) | 45,920 | 214,632 | |||||||||||||
| 1,600 | ALLIANCE DATA SYSTEMS CORP. | 75,650 | 405,568 | |||||||||||||
| 6,627 | ALPHABET, INC., CLASS A(b) | 2,935,384 | 6,980,882 | |||||||||||||
| 4,778 | ALPHABET, INC., CLASS C(b) | 1,903,715 | 4,999,699 | |||||||||||||
| 4,700 | AMDOCS LTD. | 231,646 | 307,756 | |||||||||||||
| 8,600 | ANALOG DEVICES, INC. | 120,368 | 765,658 | |||||||||||||
| 7,815 | ANSYS, INC.(b) | 840,376 | 1,153,416 | |||||||||||||
| 102,988 | APPLE, INC. | 5,478,338 | 17,428,659 | |||||||||||||
| 31,067 | APPLIED MATERIALS, INC. | 786,343 | 1,588,145 | |||||||||||||
| 409 | ARISTA NETWORKS, INC.(b) | 48,993 | 96,352 | |||||||||||||
| 1,300 | ARRIS INTERNATIONAL PLC(b) | 33,487 | 33,397 | |||||||||||||
| 4,877 | ARROW ELECTRONICS, INC.(b) | 267,343 | 392,160 | |||||||||||||
| 1,686 | AUTODESK, INC.(b) | 32,709 | 176,743 | |||||||||||||
| 6,766 | AUTOMATIC DATA PROCESSING, INC. | 361,211 | 792,908 | |||||||||||||
| 7,371 | BLACK KNIGHT, INC.(b) | 272,636 | 325,429 | |||||||||||||
| 9,100 | BOOZ ALLEN HAMILTON HOLDING CORP. | 273,897 | 346,983 | |||||||||||||
| 4,632 | BROADCOM LTD. | 314,929 | 1,189,961 | |||||||||||||
| 3,413 | BROADRIDGE FINANCIAL SOLUTIONS, INC. | 106,898 | 309,150 | |||||||||||||
| 83,393 | CADENCE DESIGN SYSTEMS, INC.(b) | 2,614,292 | 3,487,495 | |||||||||||||
| 1,900 | CARS.COM, INC.(b) | 14,708 | 54,796 | |||||||||||||
| 400 | CAVIUM, INC.(b) | 34,196 | 33,532 | |||||||||||||
| 5,913 | CDK GLOBAL, INC. | 295,331 | 421,479 | |||||||||||||
| 8,529 | CDW CORP. | 359,082 | 592,680 | |||||||||||||
| 96,542 | CISCO SYSTEMS, INC. | 144,634 | 3,697,559 | |||||||||||||
| 4,234 | CITRIX SYSTEMS, INC.(b) | 38,115 | 372,592 | |||||||||||||
| 1,436 | COGNEX CORP. | 38,165 | 87,826 | |||||||||||||
| 12,600 | COGNIZANT TECHNOLOGY SOLUTIONS CORP., CLASS A | 95,624 | 894,852 | |||||||||||||
| 300 | COHERENT, INC.(b) | 85,683 | 84,666 | |||||||||||||
| 297 | COMMERCEHUB, INC., SERIES A(b) | 505 | 6,531 | |||||||||||||
See accompanying notes to financial statements. | 35 | (Continued) |
CLEARWATER INVESTMENT TRUST
Schedule of Investments - Clearwater Core Equity Fund
December 31, 2017
| Shares | Security | Cost | Fair value (a) | Percent of | |||||||||
| Information Technology (Cont’d): | |||||||||||||
| 594 | COMMERCEHUB, INC., SERIES C(b) | $ | 1,003 | 12,230 | |||||||||
| 3,200 | CONDUENT, INC.(b) | 51,210 | 51,712 | ||||||||||
| 8,308 | CORELOGIC, INC.(b) | 139,352 | 383,913 | ||||||||||
| 64,031 | CORNING, INC. | 1,357,683 | 2,048,352 | ||||||||||
| 2,100 | CSRA, INC. | 60,748 | 62,832 | ||||||||||
| 2,700 | CYPRESS SEMICONDUCTOR CORP. | 3,261 | 41,148 | ||||||||||
| 1,424 | DELL TECHNOLOGIES, INC., CLASS V(b) | 41,143 | 115,743 | ||||||||||
| 2,000 | DOLBY LABORATORIES, INC., CLASS A | 43,420 | 124,000 | ||||||||||
| 6,667 | DXC TECHNOLOGY CO. | 274,617 | 632,698 | ||||||||||
| 23,460 | EBAY, INC.(b) | 457,819 | 885,380 | ||||||||||
| 1,640 | ECHOSTAR CORP., CLASS A(b) | 25,986 | 98,236 | ||||||||||
| 11,266 | ELECTRONIC ARTS, INC.(b) | 280,102 | 1,183,606 | ||||||||||
| 300 | EURONET WORLDWIDE, INC.(b) | 25,458 | 25,281 | ||||||||||
| 1,300 | F5 NETWORKS, INC.(b) | 30,063 | 170,586 | ||||||||||
| 27,424 | FACEBOOK, INC., CLASS A(b) | 1,339,168 | 4,839,239 | ||||||||||
| 15,019 | FIDELITY NATIONAL INFORMATION SERVICES, INC. | 752,823 | 1,413,138 | ||||||||||
| 2,200 | FIREEYE, INC.(b) | 32,268 | 31,240 | ||||||||||
| 500 | FIRST SOLAR, INC.(b) | 33,950 | 33,760 | ||||||||||
| 8,992 | FISERV, INC.(b) | 191,173 | 1,179,121 | ||||||||||
| 1,200 | FLEETCOR TECHNOLOGIES, INC.(b) | 222,127 | 230,916 | ||||||||||
| 1,800 | FLIR SYSTEMS, INC. | 86,072 | 83,916 | ||||||||||
| 1,000 | GENPACT LTD. | 32,650 | 31,740 | ||||||||||
| 3,800 | GLOBAL PAYMENTS, INC. | 113,707 | 380,912 | ||||||||||
| 800 | GODADDY, INC., CLASS A(b) | 39,006 | 40,224 | ||||||||||
| 20,700 | HEWLETT PACKARD ENTERPRISE CO. | 129,133 | 297,252 | ||||||||||
| 13,410 | HP, INC. | 210,885 | 281,744 | ||||||||||
| 1,972 | IAC/INTERACTIVECORP(b) | 156,820 | 241,136 | ||||||||||
| 102,463 | INTEL CORP. | 661,313 | 4,729,692 | ||||||||||
| 21,685 | INTERNATIONAL BUSINESS MACHINES CORP. | 3,132,483 | 3,326,913 | ||||||||||
| 7,490 | INTUIT, INC. | 447,549 | 1,181,772 | ||||||||||
| 2,247 | IPG PHOTONICS CORP.(b) | 183,260 | 481,150 | ||||||||||
| 7,715 | JACK HENRY & ASSOCIATES, INC. | 795,838 | 902,346 | ||||||||||
| 14,075 | JUNIPER NETWORKS, INC. | 394,127 | 401,138 | ||||||||||
| 682 | KLA-TENCOR CORP. | 48,342 | 71,658 | ||||||||||
| 22,401 | LAM RESEARCH CORP. | 3,013,050 | 4,123,352 | ||||||||||
| 1,441 | LEIDOS HOLDINGS, INC. | 46,816 | 93,045 | ||||||||||
| 727 | LOGMEIN, INC. | 9,735 | 83,242 | ||||||||||
| 3,700 | MARVELL TECHNOLOGY GROUP LTD.(c) | 18,704 | 79,439 | ||||||||||
| 17,838 | MASTERCARD, INC., CLASS A | 310,941 | 2,699,960 | ||||||||||
| 1,100 | MATCH GROUP, INC.(b) | 33,561 | 34,441 | ||||||||||
| 2,581 | MICRO FOCUS INTERNATIONAL PLC ADR(b)(c)(d) | 76,191 | 86,696 | ||||||||||
| 4,200 | MICROCHIP TECHNOLOGY, INC. | 38,962 | 369,096 | ||||||||||
| 46,718 | MICRON TECHNOLOGY, INC.(b) | 1,174,705 | 1,921,044 | ||||||||||
| 136,358 | MICROSOFT CORP. | 2,476,412 | 11,664,063 | ||||||||||
| 14,735 | MOTOROLA SOLUTIONS, INC. | 1,341,656 | 1,331,160 | ||||||||||
| 11,141 | NETAPP, INC. | 469,678 | 616,320 | ||||||||||
| 1,700 | NUTANIX, INC., CLASS A(b) | 27,690 | 59,976 | ||||||||||
| 17,637 | NVIDIA CORP. | 1,057,411 | 3,412,760 | ||||||||||
| 19,581 | ON SEMICONDUCTOR CORP.(b) | 294,919 | 410,026 | ||||||||||
| 60,962 | ORACLE CORP. | 31,813 | 2,882,283 | ||||||||||
| 2,800 | PALO ALTO NETWORKS, INC.(b) | 116,508 | 405,832 | ||||||||||
| 3,666 | PAYCHEX, INC. | 10,315 | 249,581 | ||||||||||
| 7,200 | PAYPAL HOLDINGS, INC.(b) | 94,398 | 530,064 | ||||||||||
| 2,400 | PTC, INC.(b) | 82,674 | 145,848 | ||||||||||
| 500 | QORVO, INC.(b) | 33,530 | 33,300 | ||||||||||
| 25,273 | QUALCOMM, INC. | 1,092,636 | 1,617,978 | ||||||||||
| 4,200 | RED HAT, INC.(b) | 61,669 | 504,420 | ||||||||||
| 3,100 | SABRE CORP. | 62,820 | 63,550 | ||||||||||
| 7,600 | SALESFORCE.COM, INC.(b) | 86,710 | 776,948 | ||||||||||
| 37,723 | SEAGATE TECHNOLOGY PLC | 1,213,528 | 1,578,330 | ||||||||||
| 2,100 | SERVICENOW, INC.(b) | 273,110 | 273,819 | ||||||||||
| 500 | SPLUNK, INC.(b) | 40,835 | 41,420 | ||||||||||
| 3,000 | SQUARE, INC., CLASS A(b) | 111,050 | 104,010 | ||||||||||
| 14,419 | SYMANTEC CORP. | 71,242 | 404,597 | ||||||||||
| 18,659 | SYNOPSYS, INC.(b) | 1,131,722 | 1,590,493 | ||||||||||
| 500 | TABLEAU SOFTWARE, INC., CLASS A(b) | 35,535 | 34,600 | ||||||||||
| 200 | TAKE-TWO INTERACTIVE SOFTWARE, INC.(b) | 22,066 | 21,956 | ||||||||||
| See accompanying notes to financial statements. | 36 | (Continued) |
CLEARWATER INVESTMENT TRUST
Schedule of Investments - Clearwater Core Equity Fund
December 31, 2017
| Shares | Security | Cost | Fair value (a) | Percent of net assets | |||||||||
| Information Technology (Cont’d): | |||||||||||||
| 10,192 | TE CONNECTIVITY LTD.(c) | $ | 608,036 | 968,648 | |||||||||
| 1,339 | TERADATA CORP.(b) | 51,257 | 51,498 | ||||||||||
| 13,845 | TERADYNE, INC. | 281,983 | 579,690 | ||||||||||
| 32,225 | TEXAS INSTRUMENTS, INC. | 1,278,236 | 3,365,579 | ||||||||||
| 15,910 | TOTAL SYSTEM SERVICES, INC. | 1,084,652 | 1,258,322 | ||||||||||
| 7,720 | TRIMBLE, INC.(b) | 113,413 | 313,741 | ||||||||||
| 8,700 | TWITTER, INC.(b) | 197,336 | 208,887 | ||||||||||
| 100 | TYLER TECHNOLOGIES, INC.(b) | 18,187 | 17,705 | ||||||||||
| 500 | UNIVERSAL DISPLAY CORP. | 85,255 | 86,325 | ||||||||||
| 2,000 | VANTIV, INC., CLASS A(b) | 149,775 | 147,100 | ||||||||||
| 9,645 | VERISIGN, INC.(b) | 997,324 | 1,103,774 | ||||||||||
| 787 | VERSUM MATERIALS, INC. | 4,722 | 29,788 | ||||||||||
| 23,200 | VISA, INC., CLASS A | 395,709 | 2,645,264 | ||||||||||
| 7,800 | VISHAY INTERTECHNOLOGY, INC. | 48,931 | 161,850 | ||||||||||
| 3,772 | VMWARE, INC., CLASS A(b) | 255,032 | 472,707 | ||||||||||
| 16,415 | WESTERN DIGITAL CORP. | 1,020,299 | 1,305,485 | ||||||||||
| 85,932 | WESTERN UNION (THE) CO. | 1,636,438 | 1,633,567 | ||||||||||
| 300 | WEX, INC.(b) | 41,025 | 42,369 | ||||||||||
| 12,113 | XILINX, INC. | 407,461 | 816,658 | ||||||||||
| 800 | YELP, INC.(b) | 26,800 | 33,568 | ||||||||||
| 300 | ZEBRA TECHNOLOGIES CORP., CLASS A(b) | 31,245 | 31,140 | ||||||||||
| 2,200 | ZILLOW GROUP, INC., CLASS C(b) | 86,638 | 90,024 | ||||||||||
| 55,226,836 | 131,251,347 | 24.33 | % | ||||||||||
| Materials: | |||||||||||||
| 367 | ADVANSIX, INC.(b) | 1,587 | 15,440 | ||||||||||
| 1,575 | AIR PRODUCTS & CHEMICALS, INC. | 57,863 | 258,426 | ||||||||||
| 2,627 | ALBEMARLE CORP. | 138,118 | 335,967 | ||||||||||
| 1,600 | ARDAGH GROUP S.A.(c) | 32,397 | 33,760 | ||||||||||
| 1,600 | ASHLAND GLOBAL HOLDINGS, INC. | 23,171 | 113,920 | ||||||||||
| 3,165 | AVERY DENNISON CORP. | 207,899 | 363,532 | ||||||||||
| 5,128 | BALL CORP. | 10,015 | 194,095 | ||||||||||
| 2,700 | BEMIS CO., INC. | 60,200 | 129,033 | ||||||||||
| 2,279 | BERRY GLOBAL GROUP, INC.(b) | 94,191 | 133,709 | ||||||||||
| 2,064 | CABOT CORP. | 107,403 | 127,122 | ||||||||||
| 10,424 | CELANESE CORP., SERIES A | 886,841 | 1,116,202 | ||||||||||
| 2,900 | CF INDUSTRIES HOLDINGS, INC. | 118,977 | 123,366 | ||||||||||
| 4,267 | CHEMOURS (THE) CO. | 186,210 | 213,606 | ||||||||||
| 1,800 | CROWN HOLDINGS, INC.(b) | 57,831 | 101,250 | ||||||||||
| 36,038 | DOWDUPONT, INC. | 1,184,578 | 2,566,626 | ||||||||||
| 3,000 | EASTMAN CHEMICAL CO. | 58,011 | 277,920 | ||||||||||
| 3,891 | ECOLAB, INC. | 133,579 | 522,094 | ||||||||||
| 15,800 | FREEPORT-MCMORAN, INC.(b) | 103,648 | 299,568 | ||||||||||
| 3,683 | INTERNATIONAL FLAVORS & FRAGRANCES, INC. | 79,231 | 562,063 | ||||||||||
| 14,436 | INTERNATIONAL PAPER CO. | 381,262 | 836,422 | ||||||||||
| 39,707 | LYONDELLBASELL INDUSTRIES N.V., CLASS A | 3,703,425 | 4,380,476 | ||||||||||
| 700 | MARTIN MARIETTA MATERIALS, INC. | 27,965 | 154,728 | ||||||||||
| 9,155 | MONSANTO CO. | 277,563 | 1,069,121 | ||||||||||
| 3,200 | MOSAIC (THE) CO. | 54,200 | 82,112 | ||||||||||
| 7,400 | NEWMONT MINING CORP. | 136,530 | 277,648 | ||||||||||
| 5,844 | NUCOR CORP. | 99,313 | 371,561 | ||||||||||
| 2,100 | OLIN CORP. | 70,785 | 74,718 | ||||||||||
| 9,110 | OWENS-ILLINOIS, INC.(b) | 169,939 | 201,969 | ||||||||||
| 7,343 | PACKAGING CORP. OF AMERICA | 569,796 | 885,199 | ||||||||||
| 4,400 | PLATFORM SPECIALTY PRODUCTS CORP.(b) | 42,294 | 43,648 | ||||||||||
| 7,972 | PPG INDUSTRIES, INC. | 180,558 | 931,289 | ||||||||||
| 4,150 | PRAXAIR, INC. | 119,435 | 641,922 | ||||||||||
| 6,625 | RELIANCE STEEL & ALUMINUM CO. | 325,929 | 568,359 | ||||||||||
| 800 | ROYAL GOLD, INC. | 34,486 | 65,696 | ||||||||||
| 6,500 | RPM INTERNATIONAL, INC. | 72,503 | 340,730 | ||||||||||
| 1,224 | SCOTTS MIRACLE-GRO (THE) CO. | 115,400 | 130,956 | ||||||||||
| 1,400 | SEALED AIR CORP. | 24,528 | 69,020 | ||||||||||
| 1,385 | SHERWIN-WILLIAMS (THE) CO. | 62,296 | 567,905 | ||||||||||
| 3,600 | SONOCO PRODUCTS CO. | 74,519 | 191,304 | ||||||||||
| 3,234 | SOUTHERN COPPER CORP.(c) | 38,445 | 153,453 | ||||||||||
| 62,365 | STEEL DYNAMICS, INC. | 1,840,969 | 2,689,802 | ||||||||||
| 9,400 | TAHOE RESOURCES, INC. | 41,616 | 45,026 | ||||||||||
| 4,392 | VALVOLINE, INC. | 24,184 | 110,063 | ||||||||||
| See accompanying notes to financial statements. | 37 | (Continued) |
CLEARWATER INVESTMENT TRUST
Schedule of Investments - Clearwater Core Equity Fund
December 31, 2017
| Shares | Security | Cost | Fair value (a) | Percent of net assets | |||||||||
| Materials (Cont’d): | |||||||||||||
| 2,100 | VULCAN MATERIALS CO. | $ | 63,441 | 269,577 | |||||||||
| 2,242 | WESTROCK CO. | 24,357 | 141,717 | ||||||||||
| 12,117,488 | 22,782,120 | 4.22 | % | ||||||||||
| Real Estate: | |||||||||||||
| 2,100 | ALEXANDRIA REAL ESTATE EQUITIES, INC. | 104,091 | 274,239 | ||||||||||
| 2,900 | AMERICAN HOMES 4 RENT, CLASS A | 63,758 | 63,336 | ||||||||||
| 4,478 | AMERICAN TOWER CORP. | 405,714 | 638,876 | ||||||||||
| 3,628 | APARTMENT INVESTMENT & MANAGEMENT CO., CLASS A | 39,421 | 158,580 | ||||||||||
| 3,388 | AVALONBAY COMMUNITIES, INC. | 497,879 | 604,453 | ||||||||||
| 4,913 | BOSTON PROPERTIES, INC. | 360,590 | 638,837 | ||||||||||
| 2,600 | BRANDYWINE REALTY TRUST | 28,512 | 47,294 | ||||||||||
| 900 | CAMDEN PROPERTY TRUST | 24,065 | 82,854 | ||||||||||
| 6,668 | COLONY NORTHSTAR, INC., CLASS A | 80,072 | 76,082 | ||||||||||
| 1,545 | CORECIVIC, INC. | 22,038 | 34,763 | ||||||||||
| 200 | CORESITE REALTY CORP. | 23,362 | 22,780 | ||||||||||
| 11,000 | CORPORATE OFFICE PROPERTIES TRUST | 293,312 | 321,200 | ||||||||||
| 6,173 | CROWN CASTLE INTERNATIONAL CORP. | 368,764 | 685,265 | ||||||||||
| 2,300 | CUBESMART | 67,717 | 66,516 | ||||||||||
| 1,100 | CYRUSONE, INC. | 65,537 | 65,483 | ||||||||||
| 4,000 | DDR CORP. | 31,865 | 35,840 | ||||||||||
| 2,201 | DIGITAL REALTY TRUST, INC. | 226,835 | 250,694 | ||||||||||
| 5,200 | DOUGLAS EMMETT, INC. | 49,559 | 213,512 | ||||||||||
| 1,700 | DUKE REALTY CORP. | 28,435 | 46,257 | ||||||||||
| 1,600 | EMPIRE STATE REALTY TRUST, INC., CLASS A | 32,781 | 32,848 | ||||||||||
| 845 | EQUINIX, INC. | 65,492 | 382,971 | ||||||||||
| 800 | EQUITY LIFESTYLE PROPERTIES, INC. | 26,751 | 71,216 | ||||||||||
| 10,351 | EQUITY RESIDENTIAL | 517,129 | 660,083 | ||||||||||
| 1,077 | ESSEX PROPERTY TRUST, INC. | 167,427 | 259,955 | ||||||||||
| 1,500 | EXTRA SPACE STORAGE, INC. | 130,992 | 131,175 | ||||||||||
| 900 | FEDERAL REALTY INVESTMENT TRUST | 48,326 | 119,529 | ||||||||||
| 1,046 | FOUR CORNERS PROPERTY TRUST, INC. | 8,864 | 26,882 | ||||||||||
| 10,635 | GGP, INC. | 233,669 | 248,753 | ||||||||||
| 10,654 | HCP, INC. | 173,807 | 277,856 | ||||||||||
| 2,400 | HEALTHCARE TRUST OF AMERICA, INC., CLASS A | 74,455 | 72,096 | ||||||||||
| 1,800 | HOSPITALITY PROPERTIES TRUST | 21,700 | 53,730 | ||||||||||
| 16,830 | HOST HOTELS & RESORTS, INC. | 184,575 | 334,075 | ||||||||||
| 678 | HOWARD HUGHES (THE) CORP.(b) | 20,502 | 89,001 | ||||||||||
| 2,300 | HUDSON PACIFIC PROPERTIES, INC. | 78,989 | 78,775 | ||||||||||
| 3,600 | INVITATION HOMES, INC. | 85,559 | 84,852 | ||||||||||
| 3,500 | IRON MOUNTAIN, INC. | 132,839 | 132,055 | ||||||||||
| 400 | JBG SMITH PROPERTIES | 6,941 | 13,892 | ||||||||||
| 700 | JONES LANG LASALLE, INC. | 39,951 | 104,251 | ||||||||||
| 8,201 | KIMCO REALTY CORP. | 92,756 | 148,848 | ||||||||||
| 4,200 | LAMAR ADVERTISING CO., CLASS A | 51,133 | 311,808 | ||||||||||
| 1,100 | LIBERTY PROPERTY TRUST | 23,353 | 47,311 | ||||||||||
| 900 | LIFE STORAGE, INC. | 74,857 | 80,163 | ||||||||||
| 5,123 | MACERICH (THE) CO. | 119,436 | 336,479 | ||||||||||
| 2,300 | MEDICAL PROPERTIES TRUST, INC. | 32,585 | 31,694 | ||||||||||
| 1,800 | MID-AMERICA APARTMENT COMMUNITIES, INC. | 132,698 | 181,008 | ||||||||||
| 700 | NATIONAL RETAIL PROPERTIES, INC. | 30,072 | 30,191 | ||||||||||
| 11,400 | PARAMOUNT GROUP, INC. | 180,524 | 180,690 | ||||||||||
| 13,913 | PROLOGIS, INC. | 507,194 | 897,528 | ||||||||||
| 2,828 | PUBLIC STORAGE | 439,429 | 591,052 | ||||||||||
| 6,972 | RAYONIER, INC. | 74,591 | 220,524 | ||||||||||
| 3,860 | REALTY INCOME CORP. | 122,822 | 220,097 | ||||||||||
| 3,900 | REGENCY CENTERS CORP. | 85,344 | 269,802 | ||||||||||
| 9,800 | RETAIL PROPERTIES OF AMERICA, INC., CLASS A | 83,048 | 131,712 | ||||||||||
| 2,100 | SBA COMMUNICATIONS CORP.(b) | 214,169 | 343,056 | ||||||||||
| 3,300 | SENIOR HOUSING PROPERTIES TRUST | 48,067 | 63,195 | ||||||||||
| 6,067 | SIMON PROPERTY GROUP, INC. | 632,818 | 1,041,947 | ||||||||||
| 1,900 | SL GREEN REALTY CORP. | 58,204 | 191,767 | ||||||||||
| 6,000 | SPIRIT REALTY CAPITAL, INC. | 50,795 | 51,480 | ||||||||||
| 2,500 | STORE CAPITAL CORP. | 64,866 | 65,100 | ||||||||||
| 1,000 | SUN COMMUNITIES, INC. | 74,687 | 92,780 | ||||||||||
| 1,700 | TANGER FACTORY OUTLET CENTERS, INC. | 44,010 | 45,067 | ||||||||||
| 2,100 | TAUBMAN CENTERS, INC. | 56,230 | 137,403 | ||||||||||
| 4,100 | UDR, INC. | 65,319 | 157,932 | ||||||||||
| See accompanying notes to financial statements. | 38 | (Continued) |
CLEARWATER INVESTMENT TRUST
Schedule of Investments - Clearwater Core Equity Fund
December 31, 2017
| Shares | Security | Cost | Fair value (a) | Percent of net assets | |||||||||
| Real Estate (Cont’d): | |||||||||||||
| 1,300 | URBAN EDGE PROPERTIES | $ | 18,730 | 33,137 | |||||||||
| 5,380 | VENTAS, INC. | 294,136 | 322,854 | ||||||||||
| 40,900 | VEREIT, INC. | 342,133 | 318,611 | ||||||||||
| 2,209 | VORNADO REALTY TRUST | 133,912 | 172,700 | ||||||||||
| 1,715 | WASHINGTON PRIME GROUP, INC. | 8,005 | 12,211 | ||||||||||
| 2,400 | WEINGARTEN REALTY INVESTORS | 39,999 | 78,888 | ||||||||||
| 7,427 | WELLTOWER, INC. | 465,901 | 473,620 | ||||||||||
| 8,293 | WEYERHAEUSER CO. | 185,937 | 292,411 | ||||||||||
| 9,680,035 | 15,073,922 | 2.79 | % | ||||||||||
| Telecommunication Services: | |||||||||||||
| 65,712 | AT&T, INC. | 1,145,797 | 2,554,883 | ||||||||||
| 7,314 | CENTURYLINK, INC. | 115,551 | 121,997 | ||||||||||
| 29,463 | NIPPON TELEGRAPH & TELEPHONE CORP. ADR(c)(d) | 1,274,359 | 1,391,832 | ||||||||||
| 9,840 | SPRINT CORP.(b) | 21,187 | 57,958 | ||||||||||
| 1,900 | TELEPHONE & DATA SYSTEMS, INC. | 50,350 | 52,820 | ||||||||||
| 11,912 | TELSTRA CORP. LTD. ADR(c)(d) | 190,123 | 168,555 | ||||||||||
| 16,152 | T-MOBILE US, INC.(b) | 681,465 | 1,025,813 | ||||||||||
| 51,083 | VERIZON COMMUNICATIONS, INC. | 2,028,534 | 2,703,823 | ||||||||||
| 900 | ZAYO GROUP HOLDINGS, INC.(b) | 31,068 | 33,120 | ||||||||||
| 5,538,434 | 8,110,801 | 1.50 | % | ||||||||||
| Utilities: | |||||||||||||
| 3,000 | AES CORP. | 32,870 | 32,490 | ||||||||||
| 2,000 | ALLIANT ENERGY CORP. | 24,835 | 85,220 | ||||||||||
| 1,600 | AMEREN CORP. | 40,872 | 94,384 | ||||||||||
| 2,100 | AMERICAN ELECTRIC POWER CO., INC. | 64,051 | 154,497 | ||||||||||
| 2,300 | AMERICAN WATER WORKS CO., INC. | 208,143 | 210,427 | ||||||||||
| 1,735 | AQUA AMERICA, INC. | 22,973 | 68,064 | ||||||||||
| 13,200 | AVANGRID, INC. | 502,113 | 667,656 | ||||||||||
| 2,100 | CALPINE CORP.(b) | 31,705 | 31,773 | ||||||||||
| 5,800 | CENTERPOINT ENERGY, INC. | 66,308 | 164,488 | ||||||||||
| 13,300 | CMS ENERGY CORP. | 259,708 | 629,090 | ||||||||||
| 5,589 | CONSOLIDATED EDISON, INC. | 362,768 | 474,785 | ||||||||||
| 8,862 | DOMINION ENERGY, INC. | 284,452 | 718,354 | ||||||||||
| 2,800 | DTE ENERGY CO. | 132,386 | 306,488 | ||||||||||
| 7,651 | DUKE ENERGY CORP. | 257,468 | 643,526 | ||||||||||
| 8,972 | EDISON INTERNATIONAL | 214,503 | 567,389 | ||||||||||
| 3,164 | ENTERGY CORP. | 68,368 | 257,518 | ||||||||||
| 4,961 | EVERSOURCE ENERGY | 125,492 | 313,436 | ||||||||||
| 6,100 | EXELON CORP. | 248,976 | 240,401 | ||||||||||
| 5,500 | FIRSTENERGY CORP. | 176,693 | 168,410 | ||||||||||
| 2,800 | GREAT PLAINS ENERGY, INC. | 43,498 | 90,272 | ||||||||||
| 900 | NATIONAL FUEL GAS CO. | 20,790 | 49,419 | ||||||||||
| 4,400 | NEXTERA ENERGY, INC. | 204,691 | 687,236 | ||||||||||
| 6,900 | NISOURCE, INC. | 43,973 | 177,123 | ||||||||||
| 1,200 | NRG ENERGY, INC. | 33,227 | 34,176 | ||||||||||
| 4,800 | OGE ENERGY CORP. | 43,344 | 157,968 | ||||||||||
| 500 | ONE GAS, INC. | 3,925 | 36,630 | ||||||||||
| 5,900 | PG&E CORP. | 79,340 | 264,497 | ||||||||||
| 2,400 | PINNACLE WEST CAPITAL CORP. | 71,637 | 204,432 | ||||||||||
| 700 | PPL CORP. | 10,384 | 21,665 | ||||||||||
| 1,400 | PUBLIC SERVICE ENTERPRISE GROUP, INC. | 61,948 | 72,100 | ||||||||||
| 5,100 | SCANA CORP. | 179,373 | 202,878 | ||||||||||
| 3,200 | SEMPRA ENERGY | 174,758 | 342,144 | ||||||||||
| 8,800 | SOUTHERN (THE) CO. | 186,316 | 423,192 | ||||||||||
| 5,426 | UGI CORP. | 80,112 | 254,751 | ||||||||||
| 1,600 | VECTREN CORP. | 77,182 | 104,032 | ||||||||||
| 6,420 | WEC ENERGY GROUP, INC. | 137,909 | 426,481 | ||||||||||
| 1,600 | WESTAR ENERGY, INC. | 36,767 | 84,480 | ||||||||||
| 5,793 | XCEL ENERGY, INC. | 79,584 | 278,701 | ||||||||||
| 4,693,442 | 9,740,573 | 1.81 | % | ||||||||||
| Sub-total Common Stocks: | 248,941,169 | 536,258,712 | 99.42 | % | |||||||||
| Rights: | |||||||||||||
| Consumer Staples: | |||||||||||||
| 1,600 | CASA LEY (CONTINGENT VALUE RIGHTS)(b)(e) | 1,624 | 1,624 | ||||||||||
| See accompanying notes to financial statements. | 39 | (Continued) |
CLEARWATER INVESTMENT TRUST
Schedule of Investments - Clearwater Core Equity Fund
December 31, 2017
| Shares | Security | Cost | Fair value (a) | Percent of net assets | |||||||||
| Consumer Staples (Cont’d): | |||||||||||||
| 1,600 | PROPERTY DEVELOPMENT CENTERS LLC (CONTINGENT VALUE RIGHTS)(b)(e) | $ | 78 | 51 | |||||||||
| 1,702 | 1,675 | 0.00 | % | ||||||||||
| Sub-total Rights: | 1,702 | 1,675 | 0.00 | % | |||||||||
| Short-Term Investments: | |||||||||||||
| 2,725,588 | NORTHERN INSTITUTIONAL FUNDS - U.S. GOVERNMENT SELECT PORTFOLIO, 1.13%(f) | 2,725,588 | 2,725,588 | ||||||||||
| Sub-total Short-Term Investments: | 2,725,588 | 2,725,588 | 0.51 | % | |||||||||
| Grand total(g) | $ | 251,668,459 | 538,985,975 | 99.93 | % | ||||||||
Notes to Schedule of Investments:
| (a) | Investments are valued in accordance with procedures described in note 2 to the financial statements. |
| (b) | Non-income producing assets. |
| (c) | Foreign security values are stated in U.S. dollars. As of December 31, 2017, the value of foreign stocks or depositary receipts of companies based outside of the United States represented 2.66% of net assets. |
| (d) | Securities are American Depositary Receipts of companies based outside of the United States representing 0.49% of net assets as of December 31, 2017. |
| (e) | This is a Level 3 security. |
| (f) | The short-term investment is a money market portfolio of the investment company, Northern Institutional Funds. At December 31, 2016, the value of the Clearwater International Fund’s investment in the U.S. Government Select Portfolio of the Northern Institutional Funds was $2,797,986 with net sales of $72,398 during the fiscal year ended December 31, 2017. |
| (g) | At December 31, 2017, the cost for Federal income tax purposes was $251,882,597. The aggregate gross unrealized appreciation and depreciation of investments in securities based on this cost was as follows: |
| Gross unrealized appreciation | $ | 288,175,106 | ||
| Gross unrealized depreciation | (1,071,728 | ) | ||
| Net unrealized appreciation | $ | 287,103,378 |
| See accompanying notes to financial statements. | 40 | (Continued) |
CLEARWATER INVESTMENT TRUST
Schedule of Investments - Clearwater Core Equity Fund
December 31, 2017
Clearwater Core Equity Fund Portfolio Diversification
(as a percentage of net assets)
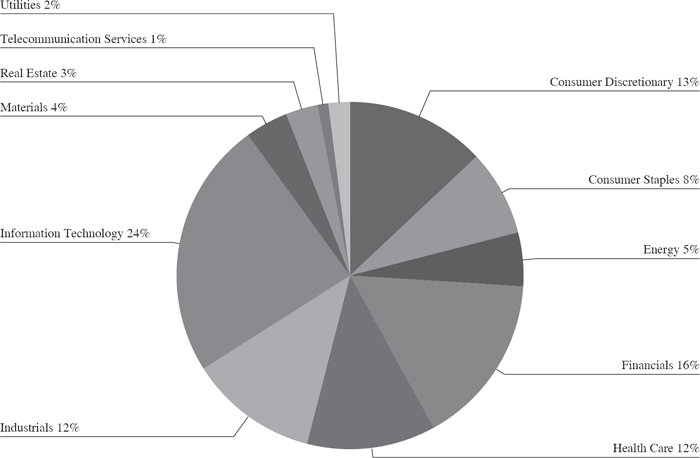
| See accompanying notes to financial statements. | 41 | (Continued) |
CLEARWATER INVESTMENT TRUST
Schedule of Investments - Clearwater Small Companies Fund
December 31, 2017
| Shares | Security | Cost | Fair value (a) | Percent of net assets | |||||||||
| Common Stocks: | |||||||||||||
| Consumer Discretionary: | |||||||||||||
| 94,935 | BBX CAPITAL CORP. | $ | 433,366 | 756,632 | |||||||||
| 27,800 | BRINKER INTERNATIONAL, INC. | 910,735 | 1,079,752 | ||||||||||
| 15,326 | CARRIAGE SERVICES, INC. | 281,361 | 394,031 | ||||||||||
| 8,514 | CENTURY COMMUNITIES, INC.(b) | 254,202 | 264,785 | ||||||||||
| 4,985 | CHILDREN’S PLACE (THE), INC. | 544,955 | 724,570 | ||||||||||
| 234,921 | CLARUS CORP.(b) | 1,384,178 | 1,844,130 | ||||||||||
| 7,788 | COOPER-STANDARD HOLDINGS, INC.(b) | 655,493 | 954,030 | ||||||||||
| 12,295 | CSS INDUSTRIES, INC. | 326,279 | 342,170 | ||||||||||
| 9,249 | DINEEQUITY, INC. | 380,190 | 469,202 | ||||||||||
| 2,905 | EDUCATIONAL DEVELOPMENT CORP.(b) | 36,818 | 55,050 | ||||||||||
| 23,706 | EMMIS COMMUNICATIONS CORP., CLASS A(b) | 77,628 | 83,919 | ||||||||||
| 38,897 | FIESTA RESTAURANT GROUP, INC.(b) | 767,008 | 739,043 | ||||||||||
| 26,900 | FOX FACTORY HOLDING CORP.(b) | 1,054,966 | 1,045,065 | ||||||||||
| 10,817 | FRANCESCA’S HOLDINGS CORP.(b) | 79,424 | 79,072 | ||||||||||
| 151,288 | FULL HOUSE RESORTS, INC.(b) | 340,576 | 591,536 | ||||||||||
| 31,601 | G-III APPAREL GROUP LTD.(b) | 873,855 | 1,165,761 | ||||||||||
| 101,900 | GILDAN ACTIVEWEAR, INC.(c) | 3,136,270 | 3,291,370 | ||||||||||
| 28,300 | HELEN OF TROY LTD.(b) | 2,663,819 | 2,726,705 | ||||||||||
| 11,784 | HORIZON GLOBAL CORP.(b) | 164,324 | 165,212 | ||||||||||
| 23,391 | IROBOT CORP.(b) | 1,592,918 | 1,794,090 | ||||||||||
| 33,804 | JAMBA, INC.(b) | 272,267 | 272,460 | ||||||||||
| 12,917 | LCI INDUSTRIES | 1,136,813 | 1,679,210 | ||||||||||
| 17,588 | LITHIA MOTORS, INC., CLASS A | 1,017,268 | 1,997,821 | ||||||||||
| 18,968 | LUBY’S, INC.(b) | 54,148 | 50,075 | ||||||||||
| 1,925 | M/I HOMES, INC.(b) | 45,593 | 66,220 | ||||||||||
| 53,100 | MALIBU BOATS, INC., CLASS A(b) | 1,497,893 | 1,578,663 | ||||||||||
| 15,076 | MARRIOTT VACATIONS WORLDWIDE CORP. | 930,591 | 2,038,426 | ||||||||||
| 52,705 | MOTORCAR PARTS OF AMERICA, INC.(b) | 1,354,945 | 1,317,098 | ||||||||||
| 149,900 | NAUTILUS, INC.(b) | 2,393,075 | 2,001,165 | ||||||||||
| 110,318 | NEW HOME (THE) CO., INC.(b) | 1,173,640 | 1,382,285 | ||||||||||
| 11,200 | PENSKE AUTOMOTIVE GROUP, INC. | 502,156 | 535,920 | ||||||||||
| 68,255 | PINNACLE ENTERTAINMENT, INC.(b) | 732,424 | 2,233,986 | ||||||||||
| 13,101 | POOL CORP. | 1,358,607 | 1,698,545 | ||||||||||
| 16,803 | RED LION HOTELS CORP.(b) | 111,607 | 165,510 | ||||||||||
| 31,920 | RENT-A-CENTER, INC. | 312,462 | 354,312 | ||||||||||
| 17,706 | SALEM MEDIA GROUP, INC., CLASS A | 100,282 | 79,677 | ||||||||||
| 13,534 | SCHOOL SPECIALTY, INC.(b) | 224,771 | 225,341 | ||||||||||
| 64,561 | SUMMER INFANT, INC.(b) | 102,568 | 96,841 | ||||||||||
| 28,300 | TENNECO, INC. | 1,630,376 | 1,656,682 | ||||||||||
| 74,399 | TILE SHOP HOLDINGS, INC. | 997,164 | 714,230 | ||||||||||
| 15,700 | TOPBUILD CORP.(b) | 409,065 | 1,189,118 | ||||||||||
| 14,861 | TOWN SPORTS INTERNATIONAL HOLDINGS, INC.(b) | 51,439 | 82,479 | ||||||||||
| 22,604 | UNIFI, INC.(b) | 669,242 | 810,805 | ||||||||||
| 14,500 | WILLIAMS-SONOMA, INC. | 669,921 | 749,650 | ||||||||||
| 27,800 | WINNEBAGO INDUSTRIES, INC. | 1,118,230 | 1,545,680 | ||||||||||
| 34,824,912 | 43,088,324 | 11.65 | % | ||||||||||
| Consumer Staples: | |||||||||||||
| 63,149 | AMPLIFY SNACK BRANDS, INC.(b) | 754,788 | 758,419 | ||||||||||
| 23,714 | CALAVO GROWERS, INC. | 1,630,790 | 2,001,462 | ||||||||||
| 15,141 | COFFEE HOLDING CO., INC.(b) | 69,124 | 64,652 | ||||||||||
| 29,643 | FARMER BROTHERS CO.(b) | 947,621 | 953,022 | ||||||||||
| 14,028 | LANDEC CORP.(b) | 171,163 | 176,753 | ||||||||||
| 8,652 | MEDIFAST, INC. | 256,578 | 603,996 | ||||||||||
| 1,059 | OIL-DRI CORP. OF AMERICA | 44,193 | 43,949 | ||||||||||
| 71,212 | S&W SEED CO.(b) | 282,767 | 277,727 | ||||||||||
| 100,098 | SUNOPTA, INC.(b)(c) | 763,774 | 775,759 | ||||||||||
| 20,500 | UNITED NATURAL FOODS, INC.(b) | 824,865 | 1,010,035 | ||||||||||
| 39,522 | UNIVERSAL CORP. | 2,270,439 | 2,074,905 | ||||||||||
| 8,016,102 | 8,740,679 | 2.36 | % | ||||||||||
| Energy: | |||||||||||||
| 15,068 | GREEN PLAINS, INC. | 303,651 | 253,896 | ||||||||||
| 83,731 | MURPHY OIL CORP. | 2,130,986 | 2,599,847 | ||||||||||
| 33,972 | OIL STATES INTERNATIONAL, INC.(b) | 1,063,895 | 961,408 | ||||||||||
| 14,020 | PAR PACIFIC HOLDINGS, INC.(b) | 237,045 | 270,306 | ||||||||||
| 33,069 | SM ENERGY CO. | 1,173,833 | 730,163 | ||||||||||
| 33,951 | SOLARIS OILFIELD INFRASTRUCTURE, INC., CLASS A(b) | 629,900 | 726,891 | ||||||||||
| See accompanying notes to financial statements. | 42 | (Continued) |
CLEARWATER INVESTMENT TRUST
Schedule of Investments - Clearwater Small Companies Fund
December 31, 2017
| Shares | Security | Cost | Fair value (a) | Percent of net assets | |||||||||
| Energy (Cont’d): | |||||||||||||
| 86,791 | SRC ENERGY, INC.(b) | $ | 781,656 | 740,327 | |||||||||
| 71,608 | SUPERIOR ENERGY SERVICES, INC.(b) | 720,870 | 689,585 | ||||||||||
| 36,900 | WORLD FUEL SERVICES CORP. | 1,329,632 | 1,038,366 | ||||||||||
| 8,371,468 | 8,010,789 | 2.17 | % | ||||||||||
| Financials: | |||||||||||||
| 132,494 | AMERICAN EQUITY INVESTMENT LIFE HOLDING CO. | 3,124,400 | 4,071,541 | ||||||||||
| 5,869 | AMERICAN RIVER BANKSHARES | 80,717 | 89,502 | ||||||||||
| 34,219 | AMERIS BANCORP | 1,109,310 | 1,649,356 | ||||||||||
| 1,756 | AMES NATIONAL CORP. | 49,710 | 48,905 | ||||||||||
| 22,063 | ANWORTH MORTGAGE ASSET CORP. | 122,901 | 120,023 | ||||||||||
| 40,627 | ARES COMMERCIAL REAL ESTATE CORP. | 522,987 | 524,088 | ||||||||||
| 29,771 | ARGO GROUP INTERNATIONAL HOLDINGS LTD.(c) | 1,796,079 | 1,835,382 | ||||||||||
| 61,923 | ASPEN INSURANCE HOLDINGS LTD.(c) | 2,595,714 | 2,514,074 | ||||||||||
| 107,251 | ASSOCIATED BANC-CORP | 2,470,813 | 2,724,175 | ||||||||||
| 70,365 | ATLANTIC COAST FINANCIAL CORP.(b) | 570,143 | 663,542 | ||||||||||
| 17,153 | ATLAS FINANCIAL HOLDINGS, INC.(b) | 288,731 | 352,494 | ||||||||||
| 2,677 | AUBURN NATIONAL BANCORPORATION, INC. | 88,228 | 105,313 | ||||||||||
| 22,471 | BANC OF CALIFORNIA, INC. | 413,782 | 464,026 | ||||||||||
| 7,234 | BANCORP 34, INC.(b) | 92,415 | 106,882 | ||||||||||
| 3,984 | BANK OF PRINCETON (THE)(b) | 128,394 | 136,811 | ||||||||||
| 41,077 | BANKFINANCIAL CORP. | 506,950 | 630,121 | ||||||||||
| 1,758 | BAY BANKS OF VIRGINIA, INC. | 16,577 | 18,195 | ||||||||||
| 40,939 | BCB BANCORP, INC. | 501,503 | 593,616 | ||||||||||
| 20,987 | BRIDGE BANCORP, INC. | 608,351 | 734,545 | ||||||||||
| 11,681 | BYLINE BANCORP, INC.(b) | 221,939 | 268,313 | ||||||||||
| 55,055 | CAPITAL SOUTHWEST CORP. | 900,130 | 911,160 | ||||||||||
| 12,731 | CB FINANCIAL SERVICES, INC. | 344,946 | 386,386 | ||||||||||
| 32,333 | CENTRAL VALLEY COMMUNITY BANCORP | 637,066 | 652,480 | ||||||||||
| 15,375 | CHARTER FINANCIAL CORP. | 265,702 | 269,678 | ||||||||||
| 32,540 | CITIZENS COMMUNITY BANCORP, INC. | 438,118 | 438,965 | ||||||||||
| 34,861 | CIVISTA BANCSHARES, INC. | 718,816 | 766,942 | ||||||||||
| 11,141 | CM FINANCE, INC. | 103,463 | 90,799 | ||||||||||
| 19,073 | CNB FINANCIAL CORP. | 386,481 | 500,476 | ||||||||||
| 26,565 | COMMERCE BANCSHARES, INC. | 1,395,420 | 1,483,390 | ||||||||||
| 17,739 | COMMUNITY BANKERS TRUST CORP.(b) | 96,216 | 144,573 | ||||||||||
| 47,422 | DONEGAL GROUP, INC., CLASS A | 764,366 | 820,401 | ||||||||||
| 19,916 | EAGLE BANCORP MONTANA, INC. | 364,156 | 417,240 | ||||||||||
| 17,622 | EMC INSURANCE GROUP, INC. | 280,103 | 505,575 | ||||||||||
| 463 | EMCLAIRE FINANCIAL CORP. | 13,412 | 14,135 | ||||||||||
| 31,116 | ENTERPRISE FINANCIAL SERVICES CORP. | 1,266,505 | 1,404,887 | ||||||||||
| 3,831 | EQUITY BANCSHARES, INC., CLASS A(b) | 124,253 | 135,656 | ||||||||||
| 43,796 | ESSA BANCORP, INC. | 602,796 | 686,283 | ||||||||||
| 12,600 | FARMERS CAPITAL BANK CORP. | 461,072 | 485,100 | ||||||||||
| 19,986 | FARMERS NATIONAL BANC CORP. | 209,675 | 294,794 | ||||||||||
| 33,957 | FIDUS INVESTMENT CORP. | 523,209 | 515,467 | ||||||||||
| 32,647 | FINANCIAL ENGINES, INC. | 1,027,149 | 989,204 | ||||||||||
| 5,056 | FIRST BANCORP | 102,672 | 178,527 | ||||||||||
| 11,310 | FIRST BANCSHARES (THE), INC. | 319,970 | 386,802 | ||||||||||
| 14,159 | FIRST BANK | 171,750 | 196,102 | ||||||||||
| 1,685 | FIRST CAPITAL, INC. | 59,862 | 61,924 | ||||||||||
| 20,195 | FIRST FINANCIAL NORTHWEST, INC. | 323,774 | 313,224 | ||||||||||
| 17,216 | FIRST GUARANTY BANCSHARES, INC. | 370,306 | 430,400 | ||||||||||
| 37,402 | FIRST MERCHANTS CORP. | 1,591,068 | 1,573,128 | ||||||||||
| 7,211 | FIRST MID-ILLINOIS BANCSHARES, INC. | 176,768 | 277,912 | ||||||||||
| 64,032 | FIRST MIDWEST BANCORP, INC. | 1,426,183 | 1,537,408 | ||||||||||
| 42,000 | FIRSTCASH, INC. | 2,530,930 | 2,832,900 | ||||||||||
| 87,088 | FNB CORP. | 1,142,135 | 1,203,556 | ||||||||||
| 47,498 | HANMI FINANCIAL CORP. | 1,069,991 | 1,441,564 | ||||||||||
| 14,839 | HANOVER INSURANCE GROUP (THE), INC. | 1,422,332 | 1,603,799 | ||||||||||
| 48,620 | HERITAGE COMMERCE CORP. | 560,431 | 744,858 | ||||||||||
| 7,073 | HOME BANCORP, INC. | 198,149 | 305,695 | ||||||||||
| 54,768 | HOME BANCSHARES, INC. | 1,319,865 | 1,273,356 | ||||||||||
| 199,190 | HOPE BANCORP, INC. | 3,553,454 | 3,635,218 | ||||||||||
| 20,524 | HOPFED BANCORP, INC. | 283,053 | 291,851 | ||||||||||
| 12,896 | HORIZON BANCORP | 312,999 | 358,509 | ||||||||||
| 2,100 | INFINITY PROPERTY & CASUALTY CORP. | 189,798 | 222,600 | ||||||||||
| 6,230 | INVESTAR HOLDING CORP. | 132,388 | 150,143 | ||||||||||
| See accompanying notes to financial statements. | 43 | (Continued) |
CLEARWATER INVESTMENT TRUST
Schedule of Investments - Clearwater Small Companies Fund
December 31, 2017
| Shares | Security | Cost | Fair value (a) | Percent of net assets | |||||||||
| Financials (Cont’d): | |||||||||||||
| 2,795 | ISABELLA BANK CORP. | $ | 79,854 | 78,959 | |||||||||
| 7,629 | LANDMARK BANCORP, INC. | 215,915 | 221,253 | ||||||||||
| 62,058 | LCNB CORP. | 1,054,903 | 1,269,086 | ||||||||||
| 8,140 | LEGACYTEXAS FINANCIAL GROUP, INC. | 243,945 | 343,589 | ||||||||||
| 12,961 | LUTHER BURBANK CORP.(b) | 139,331 | 156,050 | ||||||||||
| 18,695 | MACKINAC FINANCIAL CORP. | 256,578 | 299,120 | ||||||||||
| 7,222 | MB FINANCIAL, INC. | 300,049 | 321,523 | ||||||||||
| 10,750 | MERIDIAN BANK/MALVERN PA(b) | 183,638 | 214,785 | ||||||||||
| 24,778 | METROPOLITAN BANK HOLDING CORP.(b) | 1,129,374 | 1,043,154 | ||||||||||
| 8,182 | MIDDLEFIELD BANC CORP. | 373,383 | 394,372 | ||||||||||
| 38,898 | MIDWESTONE FINANCIAL GROUP, INC. | 1,293,530 | 1,304,250 | ||||||||||
| 2,385 | MONROE CAPITAL CORP. | 32,799 | 32,794 | ||||||||||
| 3,000 | MSB FINANCIAL CORP. | 48,797 | 53,700 | ||||||||||
| 5,673 | NATIONAL BANK HOLDINGS CORP., CLASS A | 185,055 | 183,975 | ||||||||||
| 1,447 | NATIONAL BANKSHARES, INC. | 52,464 | 65,766 | ||||||||||
| 5,000 | NATIONAL WESTERN LIFE GROUP, INC., CLASS A | 1,664,105 | 1,655,100 | ||||||||||
| 55,619 | NEW MOUNTAIN FINANCE CORP. | 780,609 | 753,637 | ||||||||||
| 5,358 | NORWOOD FINANCIAL CORP. | 123,227 | 176,814 | ||||||||||
| 159,216 | OAKTREE SPECIALTY LENDING CORP. | 738,985 | 778,566 | ||||||||||
| 16,896 | OAKTREE STRATEGIC INCOME CORP. | 131,413 | 141,926 | ||||||||||
| 20,793 | OHA INVESTMENT CORP. | 24,040 | 23,912 | ||||||||||
| 2,925 | ORRSTOWN FINANCIAL SERVICES, INC. | 62,731 | 73,856 | ||||||||||
| 3,425 | PACIFIC FINANCIAL CORP. | 31,413 | 35,278 | ||||||||||
| 3,202 | PENNS WOODS BANCORP, INC. | 133,999 | 149,149 | ||||||||||
| 23,870 | PEOPLES BANCORP OF NORTH CAROLINA, INC. | 577,102 | 732,570 | ||||||||||
| 5,858 | PEOPLES FINANCIAL SERVICES CORP. | 239,185 | 272,866 | ||||||||||
| 69,100 | PRA GROUP, INC.(b) | 1,973,448 | 2,294,120 | ||||||||||
| 17,902 | PREMIER FINANCIAL BANCORP, INC. | 338,162 | 359,472 | ||||||||||
| 17,300 | RENAISSANCERE HOLDINGS LTD.(c) | 2,329,008 | 2,172,707 | ||||||||||
| 131,667 | RESOURCE CAPITAL CORP. | 1,238,436 | 1,233,720 | ||||||||||
| 8,685 | RIVERVIEW FINANCIAL CORP. | 109,667 | 114,208 | ||||||||||
| 3,636 | SALISBURY BANCORP, INC. | 137,808 | 163,256 | ||||||||||
| 26,024 | SELECT BANCORP, INC.(b) | 302,767 | 328,683 | ||||||||||
| 35,325 | SHORE BANCSHARES, INC. | 572,855 | 589,928 | ||||||||||
| 28,688 | SI FINANCIAL GROUP, INC. | 306,081 | 421,714 | ||||||||||
| 6,841 | SIERRA BANCORP | 128,495 | 181,697 | ||||||||||
| 3,880 | SOUND FINANCIAL BANCORP, INC. | 115,735 | 133,084 | ||||||||||
| 14,182 | SOUTHERN MISSOURI BANCORP, INC. | 408,351 | 533,101 | ||||||||||
| 53,414 | SOUTHERN NATIONAL BANCORP OF VIRGINIA, INC. | 870,504 | 856,226 | ||||||||||
| 1,993 | SOUTHWEST GEORGIA FINANCIAL CORP. | 41,224 | 47,832 | ||||||||||
| 66,749 | STERLING BANCORP | 1,443,906 | 1,642,025 | ||||||||||
| 27,655 | STIFEL FINANCIAL CORP. | 1,408,350 | 1,647,132 | ||||||||||
| 15,778 | SUMMIT FINANCIAL GROUP, INC. | 343,722 | 415,277 | ||||||||||
| 31,145 | SUMMIT STATE BANK | 401,411 | 398,656 | ||||||||||
| 28,319 | SUN BANCORP, INC. | 679,571 | 688,152 | ||||||||||
| 2,714 | SUNCREST BANK(b) | 27,318 | 30,044 | ||||||||||
| 22,642 | SUNSHINE BANCORP, INC.(b) | 471,068 | 519,408 | ||||||||||
| 7,193 | SUSSEX BANCORP | 177,212 | 193,492 | ||||||||||
| 12,133 | SUTHERLAND ASSET MANAGEMENT CORP. | 148,722 | 183,815 | ||||||||||
| 32,967 | SYNOVUS FINANCIAL CORP. | 966,978 | 1,580,438 | ||||||||||
| 180,294 | TCF FINANCIAL CORP. | 2,869,601 | 3,696,027 | ||||||||||
| 42,254 | TCP CAPITAL CORP. | 671,100 | 645,641 | ||||||||||
| 7,475 | TGR FINANCIAL, INC.(b) | 62,961 | 81,478 | ||||||||||
| 111,200 | UMPQUA HOLDINGS CORP. | 2,020,524 | 2,312,960 | ||||||||||
| 4,060 | UNITED BANCORP, INC. | 51,691 | 53,795 | ||||||||||
| 4,620 | UNITED BANCSHARES, INC. | 100,066 | 102,102 | ||||||||||
| 14,727 | UNITED COMMUNITY BANCORP | 291,138 | 312,212 | ||||||||||
| 7,712 | UNITED COMMUNITY FINANCIAL CORP. | 71,281 | 70,411 | ||||||||||
| 17,538 | UNITED FINANCIAL BANCORP, INC. | 258,217 | 309,370 | ||||||||||
| 23,102 | UNITY BANCORP, INC. | 333,593 | 456,265 | ||||||||||
| 46,469 | VALIDUS HOLDINGS LTD.(c) | 2,240,189 | 2,180,326 | ||||||||||
| 51,124 | WALKER & DUNLOP, INC.(b) | 1,214,989 | 2,428,390 | ||||||||||
| 56,055 | WEBSTER FINANCIAL CORP. | 2,701,984 | 3,148,049 | ||||||||||
| 21,731 | WEST BANCORPORATION, INC. | 468,693 | 546,535 | ||||||||||
| 81,883,826 | 92,431,769 | 25.00 | % | ||||||||||
| Health Care: | |||||||||||||
| 24,413 | BIOTELEMETRY, INC.(b) | 766,138 | 729,949 | ||||||||||
| See accompanying notes to financial statements. | 44 | (Continued) |
CLEARWATER INVESTMENT TRUST
Schedule of Investments - Clearwater Small Companies Fund
December 31, 2017
| Shares | Security | Cost | Fair value (a) | Percent of net assets | |||||||||
| Health Care (Cont’d): | |||||||||||||
| 30,402 | CAMBREX CORP.(b) | $ | 1,402,101 | 1,459,296 | |||||||||
| 78,268 | CAPITAL SENIOR LIVING CORP.(b) | 1,211,411 | 1,055,835 | ||||||||||
| 18,996 | COMPUTER PROGRAMS & SYSTEMS, INC. | 541,468 | 570,830 | ||||||||||
| 23,860 | CROSS COUNTRY HEALTHCARE, INC.(b) | 299,404 | 304,454 | ||||||||||
| 6,637 | CRYOLIFE, INC.(b) | 128,609 | 127,099 | ||||||||||
| 41,050 | EMERGENT BIOSOLUTIONS, INC.(b) | 1,362,274 | 1,907,594 | ||||||||||
| 45,396 | EXACTECH, INC.(b) | 2,014,170 | 2,244,832 | ||||||||||
| 11,557 | HEALTHSTREAM, INC.(b) | 257,881 | 267,660 | ||||||||||
| 21,800 | HILL-ROM HOLDINGS, INC. | 1,661,686 | 1,837,522 | ||||||||||
| 92,394 | HMS HOLDINGS CORP.(b) | 1,497,740 | 1,566,078 | ||||||||||
| 13,354 | ICON PLC(b)(c) | 595,818 | 1,497,651 | ||||||||||
| 8,529 | ICU MEDICAL, INC.(b) | 1,142,301 | 1,842,264 | ||||||||||
| 67,700 | INC RESEARCH HOLDINGS, INC., CLASS A(b) | 3,379,289 | 2,951,720 | ||||||||||
| 13,784 | LHC GROUP, INC.(b) | 923,506 | 844,270 | ||||||||||
| 13,967 | MAGELLAN HEALTH, INC.(b) | 963,260 | 1,348,514 | ||||||||||
| 29,200 | MEDNAX, INC.(b) | 1,248,938 | 1,560,448 | ||||||||||
| 26,636 | NANOVIBRONIX, INC.(b) | 130,317 | 124,656 | ||||||||||
| 37,076 | OMNICELL, INC.(b) | 1,479,719 | 1,798,186 | ||||||||||
| 73,897 | OWENS & MINOR, INC. | 2,109,235 | 1,395,175 | ||||||||||
| 67,532 | PREMIER, INC., CLASS A(b) | 2,136,030 | 1,971,259 | ||||||||||
| 57,479 | PRESTIGE BRANDS HOLDINGS, INC.(b) | 2,669,414 | 2,552,642 | ||||||||||
| 25,786 | PROVIDENCE SERVICE (THE) CORP.(b) | 1,304,186 | 1,530,141 | ||||||||||
| 91,519 | STREAMLINE HEALTH SOLUTIONS, INC.(b) | 116,935 | 154,667 | ||||||||||
| 37,899 | SUCAMPO PHARMACEUTICALS, INC., CLASS A(b) | 677,634 | 680,287 | ||||||||||
| 64,401 | TIVITY HEALTH, INC.(b) | 2,277,958 | 2,353,857 | ||||||||||
| 81,720 | TRIPLE-S MANAGEMENT CORP., CLASS B(b) | 1,988,370 | 2,030,742 | ||||||||||
| 31,600 | VAREX IMAGING CORP.(b) | 1,050,282 | 1,269,372 | ||||||||||
| 35,336,074 | 37,977,000 | 10.27 | % | ||||||||||
| Industrials: | |||||||||||||
| 160,911 | ACTUANT CORP., CLASS A | 4,191,187 | 4,071,048 | ||||||||||
| 47,200 | AIR LEASE CORP. | 1,883,634 | 2,269,848 | ||||||||||
| 24,246 | ALBANY INTERNATIONAL CORP., CLASS A | 997,486 | 1,489,917 | ||||||||||
| 17,129 | AMERICAN RAILCAR INDUSTRIES, INC. | 628,868 | 713,252 | ||||||||||
| 92,183 | ARC DOCUMENT SOLUTIONS, INC.(b) | 363,444 | 235,067 | ||||||||||
| 40,618 | ARMSTRONG FLOORING, INC.(b) | 700,847 | 687,257 | ||||||||||
| 19,773 | ASTRONICS CORP.(b) | 571,103 | 819,986 | ||||||||||
| 5,164 | ATKORE INTERNATIONAL GROUP, INC.(b) | 86,261 | 110,768 | ||||||||||
| 32,394 | ATLAS AIR WORLDWIDE HOLDINGS, INC.(b) | 1,638,502 | 1,899,908 | ||||||||||
| 37,901 | AVIS BUDGET GROUP, INC.(b) | 1,394,028 | 1,663,096 | ||||||||||
| 28,107 | BLUE BIRD CORP.(b) | 422,697 | 559,329 | ||||||||||
| 29,222 | BRINK’S (THE) CO. | 2,019,023 | 2,299,771 | ||||||||||
| 5,524 | CBIZ, INC.(b) | 82,656 | 85,346 | ||||||||||
| 57,300 | CHART INDUSTRIES, INC.(b) | 2,068,740 | 2,685,078 | ||||||||||
| 4,343 | CIRCOR INTERNATIONAL, INC. | 196,738 | 211,417 | ||||||||||
| 25,896 | COLUMBUS MCKINNON CORP. | 647,822 | 1,035,322 | ||||||||||
| 12,646 | CPI AEROSTRUCTURES, INC.(b) | 110,182 | 113,182 | ||||||||||
| 35,992 | CUBIC CORP. | 1,596,677 | 2,121,728 | ||||||||||
| 10,723 | CURTISS-WRIGHT CORP. | 740,836 | 1,306,598 | ||||||||||
| 22,300 | DONALDSON CO., INC. | 999,628 | 1,091,585 | ||||||||||
| 5,430 | DUCOMMUN, INC.(b) | 145,050 | 154,484 | ||||||||||
| 17,337 | ENERSYS | 1,250,645 | 1,207,175 | ||||||||||
| 232,108 | ESSENDANT, INC. | 2,801,054 | 2,151,641 | ||||||||||
| 54,014 | GENCOR INDUSTRIES, INC.(b) | 820,098 | 893,932 | ||||||||||
| 18,648 | GENERAC HOLDINGS, INC.(b) | 681,580 | 923,449 | ||||||||||
| 6,357 | GENERAL CABLE CORP. | 118,662 | 188,167 | ||||||||||
| 86,203 | GIBRALTAR INDUSTRIES, INC.(b) | 2,499,325 | 2,844,699 | ||||||||||
| 19,684 | GORMAN-RUPP (THE) CO. | 606,594 | 614,338 | ||||||||||
| 58,488 | HARDINGE, INC. | 866,272 | 1,018,861 | ||||||||||
| 21,329 | HARSCO CORP.(b) | 138,019 | 397,786 | ||||||||||
| 6,308 | HUDSON TECHNOLOGIES, INC.(b) | 39,759 | 38,290 | ||||||||||
| 38,111 | INTERFACE, INC. | 616,438 | 958,492 | ||||||||||
| 57,373 | JELD-WEN HOLDING, INC.(b) | 1,922,764 | 2,258,775 | ||||||||||
| 9,718 | KADANT, INC. | 626,866 | 975,687 | ||||||||||
| 57,379 | KBR, INC. | 987,770 | 1,137,826 | ||||||||||
| 36,661 | KENNAMETAL, INC. | 1,364,009 | 1,774,759 | ||||||||||
| 8,008 | KEY TECHNOLOGY, INC.(b) | 145,219 | 147,587 | ||||||||||
| 4,211 | LSC COMMUNICATIONS, INC. | 73,590 | 63,797 | ||||||||||
| See accompanying notes to financial statements. | 45 | (Continued) |
CLEARWATER INVESTMENT TRUST
Schedule of Investments - Clearwater Small Companies Fund
December 31, 2017
| Shares | Security | Cost | Fair value (a) | Percent of net assets | |||||||||
| Industrials (Cont’d): | |||||||||||||
| 104,066 | LSI INDUSTRIES, INC. | $ | 826,647 | 715,974 | |||||||||
| 43,109 | MASONITE INTERNATIONAL CORP.(b) | 2,828,344 | 3,196,532 | ||||||||||
| 16,710 | MCGRATH RENTCORP | 581,361 | 785,036 | ||||||||||
| 74,078 | MILACRON HOLDINGS CORP.(b) | 1,167,413 | 1,417,853 | ||||||||||
| 17,237 | NAVIGANT CONSULTING, INC.(b) | 261,853 | 334,570 | ||||||||||
| 32,210 | NCI BUILDING SYSTEMS, INC.(b) | 447,428 | 621,653 | ||||||||||
| 156,900 | NOW, INC.(b) | 1,929,184 | 1,730,607 | ||||||||||
| 24,843 | ON ASSIGNMENT, INC.(b) | 712,554 | 1,596,660 | ||||||||||
| 10,563 | PARK-OHIO HOLDINGS CORP. | 384,250 | 485,370 | ||||||||||
| 194,330 | PGT INNOVATIONS, INC.(b) | 2,725,660 | 3,274,460 | ||||||||||
| 66,439 | PIONEER POWER SOLUTIONS, INC.(b) | 408,780 | 508,258 | ||||||||||
| 88,545 | PLY GEM HOLDINGS, INC.(b) | 1,428,461 | 1,638,083 | ||||||||||
| 187,671 | QUANEX BUILDING PRODUCTS CORP. | 3,914,341 | 4,391,501 | ||||||||||
| 6,095 | R.R. DONNELLEY & SONS CO. | 70,010 | 56,684 | ||||||||||
| 53,395 | REV GROUP, INC. | 1,335,350 | 1,736,939 | ||||||||||
| 23,625 | SKYWEST, INC. | 766,630 | 1,254,488 | ||||||||||
| 31,754 | SPX CORP.(b) | 743,042 | 996,758 | ||||||||||
| 210,187 | STEELCASE, INC., CLASS A | 2,987,714 | 3,194,842 | ||||||||||
| 9,230 | TELEDYNE TECHNOLOGIES, INC.(b) | 272,162 | 1,672,014 | ||||||||||
| 3,130 | TENNANT CO. | 196,580 | 227,395 | ||||||||||
| 33,101 | TEREX CORP. | 1,419,685 | 1,596,130 | ||||||||||
| 26,120 | TETRA TECH, INC. | 1,120,156 | 1,257,678 | ||||||||||
| 22,995 | TITAN MACHINERY, INC.(b) | 263,264 | 486,804 | ||||||||||
| 118,414 | TRIMAS CORP.(b) | 3,058,028 | 3,167,574 | ||||||||||
| 10,019 | VALMONT INDUSTRIES, INC. | 1,527,033 | 1,661,651 | ||||||||||
| 18,321 | VIAD CORP. | 816,580 | 1,014,983 | ||||||||||
| 69,993 | WESCO AIRCRAFT HOLDINGS, INC.(b) | 666,541 | 517,948 | ||||||||||
| 40,912 | WOODWARD, INC. | 2,269,755 | 3,131,404 | ||||||||||
| 12,145 | XERIUM TECHNOLOGIES, INC.(b) | 50,168 | 51,738 | ||||||||||
| 72,223,047 | 85,940,835 | 23.25 | % | ||||||||||
| Information Technology: | |||||||||||||
| 41,655 | ANIXTER INTERNATIONAL, INC.(b) | 2,967,318 | 3,165,780 | ||||||||||
| 30,042 | ASTRONOVA, INC. | 389,003 | 420,588 | ||||||||||
| 102,810 | BAZAARVOICE, INC.(b) | 527,031 | 560,315 | ||||||||||
| 24,760 | BELDEN, INC. | 1,564,285 | 1,910,729 | ||||||||||
| 26,343 | BLACKHAWK NETWORK HOLDINGS, INC.(b) | 1,082,217 | 939,128 | ||||||||||
| 5,310 | CALAMP CORP.(b) | 101,254 | 113,793 | ||||||||||
| 17,952 | CAMTEK LTD.(c) | 88,840 | 102,685 | ||||||||||
| 81,900 | COHU, INC. | 1,817,011 | 1,797,705 | ||||||||||
| 20,722 | COMMVAULT SYSTEMS, INC.(b) | 1,066,878 | 1,087,905 | ||||||||||
| 4,489 | COMTECH TELECOMMUNICATIONS CORP. | 47,715 | 99,297 | ||||||||||
| 84,805 | CYPRESS SEMICONDUCTOR CORP. | 1,151,493 | 1,292,428 | ||||||||||
| 116,868 | DIEBOLD NIXDORF, INC. | 2,772,243 | 1,910,792 | ||||||||||
| 6,862 | DIGI INTERNATIONAL, INC.(b) | 67,362 | 65,532 | ||||||||||
| 19,176 | DSP GROUP, INC.(b) | 245,609 | 239,700 | ||||||||||
| 25,193 | EURONET WORLDWIDE, INC.(b) | 1,574,093 | 2,123,014 | ||||||||||
| 4,649 | FORMFACTOR, INC.(b) | 56,958 | 72,757 | ||||||||||
| 133,620 | FRANKLIN WIRELESS CORP.(b) | 287,454 | 273,921 | ||||||||||
| 80,704 | FREQUENCY ELECTRONICS, INC.(b) | 784,862 | 755,389 | ||||||||||
| 47,756 | INSIGHT ENTERPRISES, INC.(b) | 1,938,830 | 1,828,577 | ||||||||||
| 16,565 | ITRON, INC.(b) | 952,803 | 1,129,733 | ||||||||||
| 46,804 | JABIL, INC. | 787,107 | 1,228,605 | ||||||||||
| 12,813 | LUMENTUM HOLDINGS, INC.(b) | 801,006 | 626,556 | ||||||||||
| 125,368 | MARCHEX, INC., CLASS B(b) | 355,195 | 404,939 | ||||||||||
| 180,851 | MODUSLINK GLOBAL SOLUTIONS, INC.(b) | 289,661 | 450,319 | ||||||||||
| 12,074 | MONOTYPE IMAGING HOLDINGS, INC. | 274,435 | 290,983 | ||||||||||
| 34,594 | MTS SYSTEMS CORP. | 1,834,008 | 1,857,698 | ||||||||||
| 40,522 | NOVANTA, INC.(b) | 1,197,481 | 2,026,100 | ||||||||||
| 2,271 | PC CONNECTION, INC. | 59,997 | 59,523 | ||||||||||
| 7,652 | PERCEPTRON, INC.(b) | 45,110 | 74,607 | ||||||||||
| 66,716 | PERFICIENT, INC.(b) | 1,039,425 | 1,272,274 | ||||||||||
| 6,040 | PLEXUS CORP.(b) | 340,845 | 366,749 | ||||||||||
| 44,553 | PROS HOLDINGS, INC.(b) | 1,107,324 | 1,178,427 | ||||||||||
| 62,908 | SCANSOURCE, INC.(b) | 2,550,076 | 2,252,106 | ||||||||||
| 107,555 | SILVER SPRING NETWORKS, INC.(b) | 1,739,578 | 1,746,693 | ||||||||||
| 124,348 | SUPPORT.COM, INC.(b) | 369,373 | 300,922 | ||||||||||
| 68,391 | SYNCHRONOSS TECHNOLOGIES, INC.(b) | 1,063,152 | 611,416 | ||||||||||
| See accompanying notes to financial statements. | 46 | (Continued) |
CLEARWATER INVESTMENT TRUST
Schedule of Investments - Clearwater Small Companies Fund
December 31, 2017
| Shares | Security | Cost | Fair value (a) | Percent of net assets | |||||||||
| Information Technology (Cont’d): | |||||||||||||
| 26,941 | SYNNEX CORP. | $ | 1,319,891 | 3,662,629 | |||||||||
| 108,993 | UNISYS CORP.(b) | 1,334,113 | 888,293 | ||||||||||
| 141,393 | VERIFONE SYSTEMS, INC.(b) | 2,831,269 | 2,504,070 | ||||||||||
| 16,767 | VIASAT, INC.(b) | 1,113,102 | 1,255,010 | ||||||||||
| 39,935,407 | 42,947,687 | 11.62 | % | ||||||||||
| Materials: | |||||||||||||
| 21,369 | BERRY GLOBAL GROUP, INC.(b) | 480,633 | 1,253,719 | ||||||||||
| 93,779 | CALGON CARBON CORP. | 1,746,254 | 1,997,493 | ||||||||||
| 33,800 | H.B. FULLER CO. | 1,883,465 | 1,820,806 | ||||||||||
| 17,907 | INGEVITY CORP.(b) | 800,938 | 1,261,906 | ||||||||||
| 2,504 | INNOPHOS HOLDINGS, INC. | 112,147 | 117,012 | ||||||||||
| 27,920 | KOPPERS HOLDINGS, INC.(b) | 538,423 | 1,421,128 | ||||||||||
| 22,500 | RELIANCE STEEL & ALUMINUM CO. | 1,623,398 | 1,930,275 | ||||||||||
| 74,700 | SCHWEITZER-MAUDUIT INTERNATIONAL, INC. | 3,001,402 | 3,388,392 | ||||||||||
| 6,970 | SUNCOKE ENERGY, INC.(b) | 62,497 | 83,570 | ||||||||||
| 415 | SYNALLOY CORP. | 5,293 | 5,561 | ||||||||||
| 24,414 | TRECORA RESOURCES(b) | 270,278 | 329,589 | ||||||||||
| 14,341 | TRINSEO S.A. | 968,771 | 1,041,157 | ||||||||||
| 15,528 | US CONCRETE, INC.(b) | 738,226 | 1,298,917 | ||||||||||
| 12,231,725 | 15,949,525 | 4.31 | % | ||||||||||
| Real Estate: | |||||||||||||
| 23,839 | ASHFORD HOSPITALITY TRUST, INC. | 143,455 | 160,436 | ||||||||||
| 69,296 | BLUEROCK RESIDENTIAL GROWTH REIT, INC. | 751,234 | 700,583 | ||||||||||
| 55,551 | BRANDYWINE REALTY TRUST | 968,187 | 1,010,473 | ||||||||||
| 50,924 | CATCHMARK TIMBER TRUST, INC., CLASS A | 578,922 | 668,632 | ||||||||||
| 107,957 | CEDAR REALTY TRUST, INC. | 606,062 | 656,379 | ||||||||||
| 6,497 | CHATHAM LODGING TRUST | 128,772 | 147,872 | ||||||||||
| 25,928 | CITY OFFICE REIT, INC.(c) | 326,693 | 337,323 | ||||||||||
| 15,949 | CLIPPER REALTY, INC. | 173,841 | 159,331 | ||||||||||
| 12,475 | COMMUNITY HEALTHCARE TRUST, INC. | 288,864 | 350,548 | ||||||||||
| 67,067 | DIAMONDROCK HOSPITALITY CO. | 728,909 | 757,186 | ||||||||||
| 27,246 | EDUCATION REALTY TRUST, INC. | 1,089,976 | 951,430 | ||||||||||
| 23,625 | GRAMERCY PROPERTY TRUST | 489,175 | 629,842 | ||||||||||
| 9,400 | HFF, INC., CLASS A | 348,304 | 457,216 | ||||||||||
| 44,929 | INVESTORS REAL ESTATE TRUST | 258,999 | 255,197 | ||||||||||
| 49,181 | JERNIGAN CAPITAL, INC. | 1,023,395 | 934,931 | ||||||||||
| 31,906 | KITE REALTY GROUP TRUST | 751,015 | 625,358 | ||||||||||
| 24,008 | MARCUS & MILLICHAP, INC.(b) | 563,536 | 782,901 | ||||||||||
| 65,175 | MEDICAL PROPERTIES TRUST, INC. | 562,597 | 898,111 | ||||||||||
| 5,091 | PLYMOUTH INDUSTRIAL REIT, INC. | 89,074 | 94,082 | ||||||||||
| 31,096 | RETAIL OPPORTUNITY INVESTMENTS CORP. | 623,045 | 620,365 | ||||||||||
| 55,430 | STAG INDUSTRIAL, INC. | 921,090 | 1,514,902 | ||||||||||
| 3,762 | STRATUS PROPERTIES, INC. | 108,782 | 111,731 | ||||||||||
| 11,523,927 | 12,824,829 | 3.47 | % | ||||||||||
| Telecommunication Services: | |||||||||||||
| 97,577 | ALASKA COMMUNICATIONS SYSTEMS GROUP, INC.(b) | 179,968 | 261,507 | ||||||||||
| 10,534 | CINCINNATI BELL, INC.(b) | 208,521 | 219,634 | ||||||||||
| 40,271 | HAWAIIAN TELCOM HOLDCO, INC.(b) | 974,158 | 1,242,763 | ||||||||||
| 15,662 | ORBCOMM, INC.(b) | 166,952 | 159,439 | ||||||||||
| 1,529,599 | 1,883,343 | 0.51 | % | ||||||||||
| Utilities: | |||||||||||||
| 8,652 | ALLETE, INC. | 257,881 | 643,363 | ||||||||||
| 32,582 | NEW JERSEY RESOURCES CORP. | 1,257,251 | 1,309,796 | ||||||||||
| 124,147 | PURE CYCLE CORP.(b) | 761,205 | 1,036,627 | ||||||||||
| 18,831 | SPIRE, INC. | 941,910 | 1,415,150 | ||||||||||
| 14,695 | US GEOTHERMAL, INC.(b) | 60,379 | 50,698 | ||||||||||
| 3,278,626 | 4,455,634 | 1.21 | % | ||||||||||
| Sub-total Common Stocks: | 309,154,713 | 354,250,414 | 95.82 | % | |||||||||
| Preferred Stocks: | |||||||||||||
| Financials: | |||||||||||||
| 144,669 | STEEL PARTNERS HOLDINGS L.P., 6.00%(d) | 2,351,239 | 3,048,176 | ||||||||||
| 2,351,239 | 3,048,176 | 0.82 | % | ||||||||||
| Sub-total Preferred Stocks: | 2,351,239 | 3,048,176 | 0.82 | % | |||||||||
| Rights: | |||||||||||||
| See accompanying notes to financial statements. | 47 | (Continued) |
CLEARWATER INVESTMENT TRUST
Schedule of Investments - Clearwater Small Companies Fund
December 31, 2017
| Shares | Security | Cost | Fair value (a) | Percent of net assets | ||||||||
| Consumer Discretionary: | ||||||||||||
| 55,700 | MEDIA GENERAL, INC. (CONTINGENT VALUE RIGHTS)(b)(e) | $ | - | - | ||||||||
| - | - | 0.00 | % | |||||||||
| Sub-total Rights: | - | - | 0.00 | % | ||||||||
| Warrants: | ||||||||||||
| Health Care: | ||||||||||||
| 19,977 | NANOVIBRONIX, INC.(b) | 200 | - | |||||||||
| 200 | - | 0.00 | % | |||||||||
| Sub-total Warrants: | 200 | - | 0.00 | % | ||||||||
| Short-Term Investments: | ||||||||||||
| 16,001,365 | NORTHERN INSTITUTIONAL FUNDS - U.S. GOVERNMENT SELECT PORTFOLIO, 1.13%(f) | 16,001,365 | 16,001,365 | |||||||||
| Sub-total Short-Term Investments: | 16,001,365 | 16,001,365 | 4.33 | % | ||||||||
| Grand total(g) | $ | 327,507,517 | 373,299,955 | 100.97 | % | |||||||
Notes to Schedule of Investments:
| (a) | Investments are valued in accordance with procedures described in note 2 to the financial statements. |
| (b) | Non-income producing assets. |
| (c) | Foreign security values are stated in U.S. dollars. As of December 31, 2017, the value of foreign stocks or depositary receipts of companies based outside of the United States represented 3.98% of net assets. |
| (d) | Current yield is disclosed. Dividends are calculated based on a percentage of the issuer’s net income. |
| (e) | Security has been deemed worthless and is a Level 3 investment. |
| (f) | The short-term investment is a money market portfolio of the investment company, Northern Institutional Funds. At December 31, 2016, the value of the Clearwater International Fund’s investment in the U.S. Government Select Portfolio of the Northern Institutional Funds was $12,813,306 with net purchases of $3,188,059 during the fiscal year ended December 31, 2017. |
| (g) | At December 31, 2017, the cost for Federal income tax purposes was $327,908,626. The aggregate gross unrealized appreciation and depreciation of investments in securities based on this cost was as follows: |
| Gross unrealized appreciation | $ | 54,946,513 | ||
| Gross unrealized depreciation | (9,555,184 | ) | ||
| Net unrealized appreciation | $ | 45,391,329 |
| See accompanying notes to financial statements. | 48 | (Continued) |
CLEARWATER INVESTMENT TRUST
Schedule of Investments - Clearwater Small Companies Fund
December 31, 2017
Clearwater Small Companies Fund Portfolio Diversification
(as a percentage of net assets)
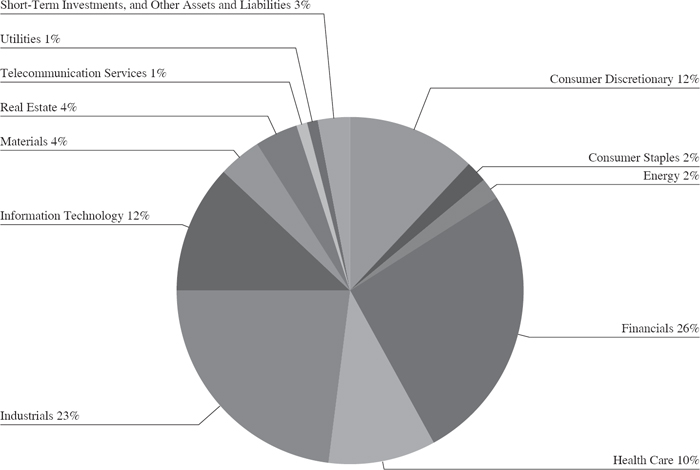
| See accompanying notes to financial statements. | 49 | (Continued) |
Schedule of Investments - Clearwater Tax-Exempt Bond Fund
December 31, 2017
| Par/Shares | Security | Maturity date | Coupon rate | Cost | Fair value (a) | Percent of net assets | ||||||||||||
| Closed-End Funds: | ||||||||||||||||||
| 227,600 | BLACKROCK LONG-TERM MUNICIPAL ADVANTAGE TRUST | $ | 2,360,733 | 2,731,200 | ||||||||||||||
| 10,000 | BLACKROCK MUNIHOLDINGS FUND II INC | 145,052 | 147,800 | |||||||||||||||
| 70,400 | BLACKROCK MUNIHOLDINGS INVESTMENT QUALITY FUND | 734,969 | 1,029,248 | |||||||||||||||
| 57,300 | BLACKROCK MUNIHOLDINGS QUALITY FUND II INC | 729,193 | 797,043 | |||||||||||||||
| 35,700 | BLACKROCK MUNIHOLDINGS QUALITY FUND INC | 474,032 | 477,666 | |||||||||||||||
| 8,302 | BLACKROCK MUNIYIELD FUND INC | 122,288 | 120,545 | |||||||||||||||
| 55,111 | BLACKROCK MUNIYIELD INVESTMENT QUALITY FUND | 701,111 | 768,247 | |||||||||||||||
| 142,461 | BLACKROCK MUNIYIELD MICHIGAN QUALITY FUND INC | 1,846,525 | 1,994,454 | |||||||||||||||
| 51,700 | BLACKROCK MUNIYIELD PENNSYLVANIA QUALITY FUND | 729,423 | 742,412 | |||||||||||||||
| 101,896 | BLACKROCK MUNIYIELD QUALITY FUND II INC | 1,307,244 | 1,334,838 | |||||||||||||||
| 118,472 | BLACKROCK MUNIYIELD QUALITY FUND III INC | 1,572,465 | 1,636,098 | |||||||||||||||
| 4,565 | DEUTSCHE MUNICIPAL INCOME TRUST | 39,441 | 54,324 | |||||||||||||||
| 43,668 | DREYFUS STRATEGIC MUNICIPAL BOND FUND INC | 359,770 | 373,361 | |||||||||||||||
| 18,592 | EATON VANCE CALIFORNIA MUNICIPAL BOND FUND II | 206,025 | 213,808 | |||||||||||||||
| 178,050 | INVESCO ADVANTAGE MUNICIPAL INCOME TRUST II | 1,985,371 | 2,026,209 | |||||||||||||||
| 113,205 | INVESCO MUNICIPAL OPPORTUNITY TRUST | 1,410,252 | 1,403,742 | |||||||||||||||
| 30,000 | INVESCO MUNICIPAL TRUST | 412,242 | 375,000 | |||||||||||||||
| 66,122 | INVESCO QUALITY MUNICIPAL INCOME TRUST | 750,670 | 827,186 | |||||||||||||||
| 60,000 | INVESCO TRUST FOR INVESTMENT GRADE MUNICIPALS | 774,121 | 790,800 | |||||||||||||||
| 50,248 | MANAGED DURATION INVESTMENT GRADE MUNICIPAL FUND | 630,407 | 674,831 | |||||||||||||||
| 53,000 | NUVEEN AMT-FREE MUNICIPAL CREDIT INCOME FUND | 748,312 | 818,320 | |||||||||||||||
| 245,475 | NUVEEN AMT-FREE QUALITY MUNICIPAL INCOME FUND | 3,273,528 | 3,375,275 | |||||||||||||||
| 15,963 | NUVEEN MICHIGAN QUALITY MUNICIPAL INCOME FUND | 214,604 | 211,669 | |||||||||||||||
| 52,779 | NUVEEN PENNSYLVANIA QUALITY MUNICIPAL INCOME FUND | 723,142 | 694,044 | |||||||||||||||
| 29,740 | NUVEEN QUALITY MUNICIPAL INCOME FUND | 409,650 | 418,152 | |||||||||||||||
| 28,000 | PUTNAM MUNICIPAL OPPORTUNITIES TRUST | 371,050 | 345,800 | |||||||||||||||
| 19,613 | WESTERN ASSET MUNICIPAL PARTNERS FUND INC | 246,036 | 298,706 | |||||||||||||||
| Sub-total Closed-End Funds: | 23,277,656 | 24,680,778 | 4.70 | % | ||||||||||||||
| Municipal Bonds: | ||||||||||||||||||
| 2,350,000 | ACALANES CA UNION HIGH SCH DIST(b) | 8/1/2039 | 0.00 | 1,539,940 | 2,255,553 | |||||||||||||
| 510,000 | ALABAMA ST HSG FIN AUTH SF MTGE REVENUE | 10/1/2028 | 5.25 | 510,000 | 512,836 | |||||||||||||
| 1,000,000 | ALACHUA CNTY FL HLTH FACS AUTH CCRC | 10/1/2032 | 8.00 | 1,113,093 | 1,182,530 | |||||||||||||
| 750,000 | ALASKA ST HSG FIN CORP MTGE REVENUE | 12/1/2037 | 4.13 | 737,461 | 771,195 | |||||||||||||
| 500,000 | ALASKA ST HSG FIN CORP MTGE REVENUE | 12/1/2040 | 4.63 | 495,000 | 525,335 | |||||||||||||
| 350,000 | ALASKA ST INDL DEV & EXPORT AUTH CMNTY PROVIDER REVENUE(c) | 12/1/2010 | 5.40 | 350,000 | 23,625 | |||||||||||||
| 670,000 | ALLEGHENY CNTY PA INDL DEV AUTH CHRT SCH REVENUE | 8/15/2026 | 5.90 | 670,000 | 712,887 | |||||||||||||
| 1,000,000 | ALVORD CA UNIF SCH DIST | 8/1/2036 | 5.25 | 1,019,315 | 1,150,190 | |||||||||||||
| 1,000,000 | ALVORD CA UNIF SCH DIST(b) | 8/1/2046 | 0.00 | 540,752 | 1,001,050 | |||||||||||||
| 1,000,000 | APPLE VLY MN SENIOR LIVING REVENUE | 1/1/2047 | 5.00 | 977,527 | 1,038,820 | |||||||||||||
| 1,000,000 | ARIZONA ST INDL DEV AUTH MF HSG REVENUE | 1/1/2038 | 5.38 | 1,000,000 | 1,002,900 | |||||||||||||
| 1,915,000 | ARLINGTON TX HGR EDU FIN CORP EDU REVENUE | 8/15/2028 | 7.00 | 1,880,132 | 2,102,747 | |||||||||||||
| 500,000 | ARLINGTON TX HGR EDU FIN CORP EDU REVENUE | 6/15/2036 | 5.00 | 509,892 | 505,190 | |||||||||||||
| 500,000 | ASTURIA FL CMNTY DEV DIST SPL ASSMNT | 5/1/2034 | 5.75 | 500,000 | 513,780 | |||||||||||||
| 500,000 | ATHENS-CLARKE CNTY GA UNIF GOVT DEV AUTH REVENUE | 6/15/2039 | 5.00 | 515,377 | 566,855 | |||||||||||||
| 500,000 | ATLANTA GA ARPT REVENUE | 1/1/2030 | 6.00 | 507,512 | 560,950 | |||||||||||||
| 500,000 | ATLANTA GA DEV AUTH | 7/1/2035 | 4.00 | 492,245 | 522,395 | |||||||||||||
| 1,000,000 | ATLANTA GA DEV AUTH SENIOR HLTH CARE FACS REVENUE | 1/1/2023 | 6.00 | 989,380 | 1,018,150 | |||||||||||||
| 750,000 | ATLANTA GA DEV AUTH SENIOR HLTH CARE FACS REVENUE | 1/1/2029 | 6.50 | 728,521 | 779,070 | |||||||||||||
| 1,425,000 | BAY CNTY FL EDUCTNL FACS REVENUE | 9/1/2030 | 5.25 | 1,327,142 | 1,498,886 | |||||||||||||
| 1,000,000 | BELLALAGO FL EDUCTNL FACS BENEFIT DIST CAPITAL IMPT REVENUE | 5/1/2030 | 4.38 | 985,446 | 1,078,080 | |||||||||||||
| 1,195,000 | BELLWOOD IL | 12/1/2027 | 5.88 | 1,186,588 | 1,383,272 | |||||||||||||
| 920,000 | BEXAR CNTY TX HSG FIN CORP(d) | 2/1/2035 | 3.75 | 920,000 | 962,817 | |||||||||||||
| 2,000,000 | BEXAR CNTY TX REVENUE | 8/15/2039 | 5.00 | 2,089,612 | 2,196,520 | |||||||||||||
| 500,000 | BLACKBURN CREEK CMNTY DEV DISTFL CAP IMPT REVENUE | 5/1/2035 | 6.25 | 500,000 | 525,035 | |||||||||||||
See accompanying notes to financial statements. | 50 | (Continued) |
CLEARWATER INVESTMENT TRUST
Schedule of Investments - Clearwater Tax-Exempt Bond Fund
December 31, 2017
| Par/Shares | Security | Maturity date | Coupon rate | Cost | Fair value (a) | Percent of net assets | ||||||||||||
| Municipal Bonds (Cont’d): | ||||||||||||||||||
| 420,000 | BLACKBURN CREEK CMNTY DEV DISTFL CAP IMPT REVENUE | 5/1/2045 | 6.25 | $ | 420,000 | 426,775 | ||||||||||||
| 1,150,000 | BURBANK IL EDUCTNL FACS REVENUE(e) | 9/1/2035 | 6.00 | 1,150,000 | 1,174,644 | |||||||||||||
| 1,000,000 | BUREAU CNTY TWP IL HIGH SCH DIST #502 | 10/1/2043 | 6.63 | 1,048,382 | 1,261,710 | |||||||||||||
| 385,000 | BUTLER CNTY PA GEN AUTH REVENUE (FLOATING, ICE LIBOR USD 3M + 0.70%)(f) | 10/1/2034 | 1.84 | 385,000 | 336,783 | |||||||||||||
| 500,000 | CALIFORNIA ST HLTH FACS FING AUTH REVENUE | 8/15/2033 | 5.50 | 504,382 | 562,830 | |||||||||||||
| 620,000 | CALIFORNIA ST HSG FIN AGY REVENUE | 8/1/2033 | 5.45 | 569,083 | 621,978 | |||||||||||||
| 500,000 | CALIFORNIA ST INFRASTRUCTURE & ECON DEV BANK ST SCH FUND APP | 8/15/2029 | 5.75 | 501,468 | 541,915 | |||||||||||||
| 1,500,000 | CALIFORNIA ST SCH FACS FING AUTH REVENUE(b) | 8/1/2029 | 6.00 | 1,494,546 | 1,944,690 | |||||||||||||
| 1,370,000 | CAPITAL TRUST AGY FL CHRT SCHREVENUE | 2/1/2035 | 5.38 | 1,370,000 | 1,376,740 | |||||||||||||
| 750,000 | CAPITAL TRUST AGY FL REVENUE | 4/1/2035 | 7.00 | 750,000 | 769,553 | |||||||||||||
| 1,750,000 | CAPITAL TRUST AGY FL REVENUE(e) | 12/1/2035 | 6.75 | 1,747,582 | 1,777,667 | |||||||||||||
| 750,000 | CAPITAL TRUST AGY FL REVENUE(e) | 7/1/2037 | 6.75 | 750,000 | 755,738 | |||||||||||||
| 750,000 | CAPITAL TRUST AGY FL SENIOR LIVING REVENUE(e) | 8/1/2027 | 5.00 | 750,000 | 762,735 | |||||||||||||
| 750,000 | CAPITAL TRUST AGY FL SENIOR LIVING REVENUE(e) | 8/1/2032 | 5.38 | 750,000 | 768,300 | |||||||||||||
| 1,000,000 | CARLSBAD CA UNIF SCH DIST(b) | 8/1/2031 | 0.00 | 804,738 | 1,127,350 | |||||||||||||
| 860,000 | CARMEL IN REVENUE | 11/15/2022 | 6.00 | 851,034 | 914,223 | |||||||||||||
| 1,000,000 | CARMEL IN REVENUE | 11/15/2027 | 7.00 | 1,015,314 | 1,109,490 | |||||||||||||
| 750,000 | CELEBRATION POINTE CMNTY DEV DIST #1 FL SPL ASSMNT REVENUE(e) | 5/1/2032 | 5.00 | 755,656 | 789,360 | |||||||||||||
| 1,000,000 | CENTRL BRADFORD PROGRESS AUTH PA | 12/1/2031 | 5.50 | 1,017,540 | 1,135,490 | |||||||||||||
| 445,000 | CHANDLER PARK ACADEMY MI PUBLIC SCH ACADEMY REVENUE | 11/1/2022 | 5.00 | 384,296 | 445,445 | |||||||||||||
| 1,000,000 | CHICAGO HEIGHTS IL | 12/1/2029 | 4.50 | 1,066,147 | 1,065,000 | |||||||||||||
| 1,000,000 | CHICAGO IL MIDWAY ARPT REVENUE | 1/1/2035 | 5.25 | 1,001,715 | 1,132,880 | |||||||||||||
| 1,000,000 | CHICAGO IL PARK DIST | 1/1/2028 | 5.00 | 1,125,127 | 1,117,180 | |||||||||||||
| 1,000,000 | CLACKAMAS CNTY OR HOSP FAC AUTH REVENUE | 11/15/2052 | 5.00 | 1,049,182 | 1,054,930 | |||||||||||||
| 165,000 | CLIFTON TX HGR EDU FIN CORP EDU REVENUE | 2/15/2018 | 7.75 | 164,934 | 165,601 | |||||||||||||
| 1,500,000 | CLOVIS CA UNIF SCH DIST(g) | 8/1/2030 | 0.00 | 702,473 | 881,250 | |||||||||||||
| 750,000 | COLLIER CNTY FL INDL DEV AUTH | 10/1/2039 | 6.25 | 736,866 | 845,692 | |||||||||||||
| 375,000 | COLLIER CNTY FLA INDL DEV AUTH CONTINUING CARE CMNTY REV(e) | 5/15/2022 | 5.25 | 375,000 | 375,859 | |||||||||||||
| 750,000 | COLLIER CNTY FLA INDL DEV AUTH CONTINUING CARE CMNTY REV(e) | 5/15/2026 | 7.25 | 750,000 | 827,242 | |||||||||||||
| 1,000,000 | COLLIER CNTY FLA INDL DEV AUTH CONTINUING CARE CMNTY REV(e) | 5/15/2044 | 8.13 | 1,117,407 | 1,118,810 | |||||||||||||
| 1,000,000 | COLORADO ST EDUCTNL & CULTURAL FACS AUTH REVENUE | 6/1/2033 | 5.50 | 977,226 | 1,022,620 | |||||||||||||
| 1,000,000 | COLORADO ST EDUCTNL & CULTURAL FACS AUTH REVENUE | 7/1/2034 | 5.60 | 994,607 | 1,053,170 | |||||||||||||
| 1,000,000 | COLORADO ST EDUCTNL & CULTURAL FACS AUTH REVENUE(e) | 9/1/2046 | 5.00 | 1,009,971 | 1,009,250 | |||||||||||||
| 1,000,000 | COLORADO ST HLTH FACS AUTH REVENUE | 8/1/2033 | 7.63 | 988,706 | 1,149,610 | |||||||||||||
| 500,000 | COLORADO ST HLTH FACS AUTH REVENUE(e) | 12/1/2035 | 5.75 | 492,313 | 521,245 | |||||||||||||
| 115,000 | COLORADO ST HSG & FIN AUTH | 10/1/2029 | 5.40 | 115,000 | 116,205 | |||||||||||||
| 1,000,000 | COLTON CA JT UNIF SCH DIST(b) | 8/1/2035 | 0.00 | 814,739 | 1,003,830 | |||||||||||||
| 1,000,000 | CONNECTICUT ST HSG FIN AUTH HSG FIN PROGRAM | 11/15/2035 | 3.88 | 1,000,000 | 1,063,290 | |||||||||||||
| 1,500,000 | CONNECTICUT ST HSG FIN AUTH HSG MTGE FIN PROGRAM | 11/15/2035 | 3.75 | 1,500,000 | 1,533,405 | |||||||||||||
| 515,000 | CONNECTICUT ST HSG FIN AUTH HSG MTGE FIN PROGRAM | 5/15/2038 | 3.95 | 515,000 | 529,575 | |||||||||||||
| 1,000,000 | CONNECTICUT ST HSG FIN AUTH HSG MTGE FIN PROGRAM | 11/15/2040 | 3.75 | 1,000,000 | 1,035,550 | |||||||||||||
| 5,000,000 | CONNECTICUT ST HSG FIN AUTH HSG MTGE FIN PROGRAM | 11/15/2047 | 3.65 | 5,000,000 | 5,068,050 | |||||||||||||
| 500,000 | COPPERLEAF CO MET DIST #2 | 12/1/2030 | 5.25 | 500,000 | 529,220 | |||||||||||||
See accompanying notes to financial statements. | 51 | (Continued) |
CLEARWATER INVESTMENT TRUST
Schedule of Investments - Clearwater Tax-Exempt Bond Fund
December 31, 2017
| Par/Shares | Security | Maturity date | Coupon rate | Cost | Fair value (a) | Percent of net assets | ||||||||||||
| Municipal Bonds (Cont’d): | ||||||||||||||||||
| 500,000 | COPPERLEAF CO MET DIST #2 | 12/1/2045 | 5.75 | $ | 500,000 | 528,475 | ||||||||||||
| 1,105,000 | CORONA-NORCO CA UNIF SCH DIST(b) | 8/1/2039 | 6.80 | 1,104,845 | 1,519,927 | |||||||||||||
| 637,000 | CORTLAND IL SPL TAX REVENUE(c) | 3/1/2017 | 5.50 | 633,881 | 125,171 | |||||||||||||
| 500,000 | COVENTRY OH LOCAL SCH DIST | 11/1/2037 | 5.25 | 504,302 | 529,410 | |||||||||||||
| 750,000 | CRYSTAL CO CROSSING MET DIST | 12/1/2040 | 5.25 | 750,000 | 763,560 | |||||||||||||
| 474,200 | CUYAHOGA CNTY OH HSG MTGE REVENUE | 3/20/2042 | 5.70 | 479,982 | 484,822 | |||||||||||||
| 1,000,000 | DALLAS-FORT WORTH TX INTERNATIONAL ARPT REVENUE | 11/1/2037 | 5.25 | 1,007,981 | 1,173,110 | |||||||||||||
| 2,000,000 | DAMON RUN IN CONSERVANCY DIST | 7/1/2025 | 6.10 | 2,009,904 | 2,126,860 | |||||||||||||
| 1,000,000 | DAMON RUN IN CONSERVANCY DIST | 1/1/2027 | 6.38 | 1,003,875 | 1,067,160 | |||||||||||||
| 1,000,000 | DAUPHIN CNTY PA GEN AUTH UNIV REVENUE(e) | 10/15/2022 | 4.00 | 997,696 | 998,230 | |||||||||||||
| 1,000,000 | DAVIE FL EDUCTNL FACS REVENUE | 4/1/2042 | 6.00 | 1,019,730 | 1,144,000 | |||||||||||||
| 500,000 | DAVIESS CNTY IN HOSP ASSN LEASE RENTAL REVENUE | 1/15/2029 | 5.25 | 491,754 | 537,425 | |||||||||||||
| 1,000,000 | DAYTON-MONTGOMERY CNTY OH PORT AUTH PROJ REVENUE | 1/15/2040 | 7.00 | 1,000,000 | 1,055,490 | |||||||||||||
| 500,000 | DECATUR IL | 3/1/2034 | 5.00 | 513,309 | 552,595 | |||||||||||||
| 1,000,000 | DEKALB/KANE/LA SALLE CNTYS IL CMNTY CLG DIST #523(g) | 2/1/2029 | 0.00 | 573,807 | 558,470 | |||||||||||||
| 1,000,000 | DEL MAR CA RACE TRACK AUTH | 10/1/2035 | 5.00 | 1,047,582 | 1,103,280 | |||||||||||||
| 245,000 | DELAWARE ST HSG AUTH REVENUE | 7/1/2031 | 5.20 | 245,000 | 252,548 | |||||||||||||
| 500,000 | DIST OF COLUMBIA HSG FIN AGY MF HSG REVENUE | 7/1/2033 | 5.45 | 500,000 | 540,140 | |||||||||||||
| 1,000,000 | DIST OF COLUMBIA HSG FIN AGY MF HSG REVENUE | 6/1/2040 | 4.90 | 1,000,000 | 1,089,570 | |||||||||||||
| 1,000,000 | DIST OF COLUMBIA HSG FIN AGY MF HSG REVENUE | 6/1/2041 | 5.00 | 1,000,000 | 1,111,490 | |||||||||||||
| 750,000 | DIST OF COLUMBIA REVENUE | 7/1/2037 | 5.00 | 750,000 | 791,168 | |||||||||||||
| 1,000,000 | DOUGLAS CNTY CO MF REVENUE | 10/1/2029 | 4.50 | 1,000,000 | 1,052,070 | |||||||||||||
| 3,000,000 | DUBLIN CA UNIF SCH DIST(g) | 8/1/2034 | 0.00 | 1,058,730 | 1,132,620 | |||||||||||||
| 1,000,000 | EAST CHICAGO IN SAN DIST REVENUE | 7/15/2035 | 4.00 | 993,270 | 1,066,180 | |||||||||||||
| 1,500,000 | EAST MORGAN CNTY CO HOSP DIST COPS | 12/1/2038 | 5.88 | 1,500,000 | 1,534,260 | |||||||||||||
| 2,045,000 | EDEN TWP CA HOSP DIST COPS | 6/1/2030 | 6.00 | 2,027,265 | 2,253,876 | |||||||||||||
| 750,000 | EL PASO DE ROBLES CA REDEV AGY TAX ALLOCATION REVENUE | 7/1/2033 | 6.38 | 743,043 | 802,560 | |||||||||||||
| 1,000,000 | EL PASO TX DOWNTOWN DEV CORP SPL REVENUE | 8/15/2038 | 7.25 | 1,061,327 | 1,265,410 | |||||||||||||
| 1,000,000 | ENCINITAS CA UNION SCH DIST(b) | 8/1/2035 | 0.00 | 738,000 | 1,147,840 | |||||||||||||
| 1,155,000 | ENTERPRISE CA ELEM SCH DIST(b) | 8/1/2035 | 0.00 | 928,018 | 1,295,356 | |||||||||||||
| 1,000,000 | ERIE CNTY PA HOSP AUTH | 7/1/2027 | 7.00 | 1,000,000 | 1,069,570 | |||||||||||||
| 600,000 | ESCONDIDO CA SPL TAX | 9/1/2036 | 5.00 | 644,146 | 689,532 | |||||||||||||
| 750,000 | EVANSVILLE IN MF HSG REVENUE | 1/1/2038 | 5.45 | 750,000 | 756,900 | |||||||||||||
| 500,000 | FAIRFAX CNTY VA REDEV & HSG AUTH MF REVENUE | 8/1/2039 | 5.60 | 500,000 | 506,770 | |||||||||||||
| 238,000 | FARMS NEW KENT VA CMNTY DEV AUTH SPL ASSMNT(c) | 3/1/2036 | 5.13 | 238,000 | 83,300 | |||||||||||||
| 1,000,000 | FAYETTE CNTY KY SCH DIST FIN CORP | 8/1/2033 | 4.00 | 990,000 | 1,051,370 | |||||||||||||
| 1,000,000 | FESTIVAL RANCH AZ CMNTY FACS DIST | 7/15/2024 | 6.25 | 1,003,613 | 1,045,730 | |||||||||||||
| 315,000 | FIDDLERS CREEK FL CDD #2 SPL ASSMNT REVENUE(c) | 5/1/2013 | 5.75 | 314,118 | 233,100 | |||||||||||||
| 845,000 | FISHHAWK CCD IV FL SPL ASSMNT REVENUE | 5/1/2033 | 7.00 | 845,000 | 894,382 | |||||||||||||
| 1,000,000 | FLORIDA ST DEV FIN CORP EDUCTNL FACS REVENUE | 6/15/2034 | 6.00 | 990,652 | 1,070,380 | |||||||||||||
| 1,000,000 | FLORIDA ST DEV FIN CORP EDUCTNL FACS REVENUE(e) | 6/15/2035 | 6.00 | 1,001,138 | 1,070,550 | |||||||||||||
| 215,000 | FLORIDA ST HSG FIN CORP REVENUE | 7/1/2026 | 5.00 | 215,254 | 226,978 | |||||||||||||
| 790,000 | FLORIDA ST HSG FIN CORP REVENUE | 7/1/2034 | 5.30 | 790,000 | 802,498 | |||||||||||||
| 985,000 | FLORIDA ST HSG FIN CORP REVENUE | 7/1/2035 | 3.75 | 985,000 | 1,046,080 | |||||||||||||
| 840,000 | FLORIDA ST HSG FIN CORP REVENUE | 7/1/2039 | 4.20 | 840,000 | 881,336 | |||||||||||||
| 1,000,000 | FLORIDA ST HSG FIN CORP REVENUE | 7/1/2047 | 3.80 | 1,000,000 | 1,006,830 | |||||||||||||
| 1,250,000 | FORT SILL APACHE TRIBE OK ECONDEV AUTH GAMING ENTERPRISE REV(e) | 8/25/2026 | 8.50 | 1,250,000 | 1,449,937 | |||||||||||||
| 1,000,000 | FRANKLIN CNTY KS UNIF SCH DIST #290 | 9/1/2039 | 4.75 | 1,045,000 | 1,123,310 | |||||||||||||
| 1,000,000 | FRANKLIN TN HLTH & EDUCTNL FACS BRD REVENUE(e) | 6/1/2027 | 6.50 | 1,000,000 | 1,035,630 | |||||||||||||
| 940,000 | FULTON CNTY GA DEV AUTH | 11/1/2028 | 5.25 | 817,268 | 920,946 | |||||||||||||
See accompanying notes to financial statements. | 52 | (Continued) |
CLEARWATER INVESTMENT TRUST
Schedule of Investments - Clearwater Tax-Exempt Bond Fund
December 31, 2017
| Par/Shares | Security | Maturity date | Coupon rate | Cost | Fair value (a) | Percent of net assets | ||||||||||||
| Municipal Bonds (Cont’d): | ||||||||||||||||||
| 1,000,000 | FYI PROPERTIES WA LEASE REVENUE | 6/1/2034 | 5.50 | $ | 984,010 | 1,053,030 | ||||||||||||
| 1,586,920 | GALVESTON CNTY TX MUN UTIL DIST #52 | 2/21/2018 | 5.87 | 1,586,920 | 1,428,228 | |||||||||||||
| 3,500,000 | GEORGIA ST HSG & FIN AUTH REVENUE | 12/1/2037 | 3.80 | 3,500,000 | 3,581,865 | |||||||||||||
| 2,000,000 | GEORGIA ST HSG & FIN AUTH REVENUE | 12/1/2037 | 4.00 | 2,000,000 | 2,066,320 | |||||||||||||
| 1,000,000 | GEORGIA ST HSG & FIN AUTH REVENUE | 12/1/2039 | 4.00 | 1,000,000 | 1,051,810 | |||||||||||||
| 4,500,000 | GEORGIA ST HSG & FIN AUTH REVENUE | 12/1/2040 | 3.80 | 4,500,000 | 4,619,155 | |||||||||||||
| 1,000,000 | GEORGIA ST HSG & FIN AUTH REVENUE | 12/1/2041 | 3.85 | 1,004,813 | 1,025,640 | |||||||||||||
| 1,740,000 | GEORGIA ST HSG & FIN AUTH REVENUE | 12/1/2042 | 3.55 | 1,740,000 | 1,737,094 | |||||||||||||
| 1,000,000 | GEORGIA ST HSG & FIN AUTH REVENUE | 12/1/2042 | 3.65 | 1,000,000 | 1,006,800 | |||||||||||||
| 1,950,000 | GEORGIA ST HSG & FIN AUTH REVENUE | 12/1/2043 | 3.90 | 1,945,137 | 1,991,944 | |||||||||||||
| 1,000,000 | GEORGIA ST HSG & FIN AUTH REVENUE | 6/1/2044 | 3.60 | 1,000,000 | 1,001,490 | |||||||||||||
| 600,000 | GLENDALE AZ INDL DEV AUTH | 11/15/2036 | 5.00 | 616,946 | 617,868 | |||||||||||||
| 550,000 | GLENDALE AZ INDL DEV AUTH | 11/15/2046 | 5.25 | 559,714 | 547,531 | |||||||||||||
| 1,500,000 | GRAND PARKWAY TRANSPRTN CORP TX SYS TOLL REVENUE(b) | 10/1/2035 | 0.00 | 1,097,597 | 1,442,940 | |||||||||||||
| 1,065,000 | HAMILTON CNTY OH HLTH CARE REVENUE | 1/1/2031 | 6.13 | 1,041,674 | 1,171,255 | |||||||||||||
| 1,250,000 | HARRIS CNTY TX CULTURAL EDU FACS FIN CORP REVENUE | 8/15/2021 | 6.75 | 1,250,000 | 1,351,462 | |||||||||||||
| 1,500,000 | HARTNELL CA CMNTY CLG DIST(b) | 8/1/2034 | 0.00 | 1,094,290 | 1,568,145 | |||||||||||||
| 3,500,000 | HEALDSBURG CA UNIF SCH DIST(b) | 8/1/2037 | 0.00 | 2,840,035 | 3,197,880 | |||||||||||||
| 1,000,000 | HELENDALE CA SCH DIST(b) | 8/1/2034 | 0.00 | 906,842 | 1,195,510 | |||||||||||||
| 750,000 | HEMPSTEAD TOWN NY LOCAL DEV CORP REVENUE | 9/1/2038 | 5.00 | 754,741 | 841,222 | |||||||||||||
| 825,000 | HERITAGE HARBOUR FL N CDD SPLASSMNT | 5/1/2034 | 5.00 | 825,000 | 898,573 | |||||||||||||
| 1,000,000 | HIDALGO CNTY TX REGL MOBILITY AUTH VEHICLE REGISTRATION FEE | 12/1/2038 | 5.25 | 1,023,437 | 1,157,960 | |||||||||||||
| 1,500,000 | HOUSTON TX HGR EDU FIN CORP | 9/1/2038 | 5.50 | 1,530,781 | 1,706,685 | |||||||||||||
| 750,000 | IDAHO ST HLTH FACS AUTH REVENUE | 10/1/2024 | 7.00 | 750,000 | 840,825 | |||||||||||||
| 750,000 | IDAHO ST HLTH FACS AUTH REVENUE | 10/1/2029 | 7.38 | 742,662 | 844,897 | |||||||||||||
| 1,000,000 | IDAHO ST HLTH FACS AUTH REVENUE | 10/1/2044 | 8.00 | 1,064,079 | 1,150,700 | |||||||||||||
| 1,500,000 | ILLINOIS ST | 2/1/2030 | 4.00 | 1,492,815 | 1,559,055 | |||||||||||||
| 500,000 | ILLINOIS ST | 7/1/2033 | 5.50 | 498,790 | 544,120 | |||||||||||||
| 1,000,000 | ILLINOIS ST EDUCTNL FACS AUTH | 11/1/2036 | 4.50 | 1,000,000 | 1,061,470 | |||||||||||||
| 500,000 | ILLINOIS ST FIN AUTH EDU REVENUE | 9/1/2032 | 6.00 | 500,000 | 567,235 | |||||||||||||
| 675,000 | ILLINOIS ST FIN AUTH EDUCTNL FAC REVENUE | 2/1/2034 | 6.00 | 681,793 | 709,614 | |||||||||||||
| 565,000 | ILLINOIS ST FIN AUTH REVENUE | 8/15/2026 | 6.00 | 565,000 | 565,785 | |||||||||||||
| 500,000 | ILLINOIS ST FIN AUTH REVENUE | 5/15/2036 | 5.00 | 501,670 | 532,670 | |||||||||||||
| 750,000 | ILLINOIS ST FIN AUTH REVENUE | 12/1/2037 | 5.00 | 770,677 | 795,173 | |||||||||||||
| 500,000 | ILLINOIS ST FIN AUTH REVENUE | 3/1/2038 | 6.00 | 486,873 | 525,730 | |||||||||||||
| 700,000 | ILLINOIS ST FIN AUTH REVENUE | 5/15/2038 | 5.13 | 684,808 | 688,226 | |||||||||||||
| 1,000,000 | ILLINOIS ST HSG DEV AUTH | 7/1/2034 | 4.95 | 1,000,000 | 1,084,810 | |||||||||||||
| 1,000,000 | ILLINOIS ST HSG DEV AUTH REVENUE | 4/1/2041 | 3.88 | 1,000,000 | 1,004,520 | |||||||||||||
| 1,500,000 | ILLINOIS ST SPORTS FACS AUTH | 6/15/2031 | 5.25 | 1,595,997 | 1,674,195 | |||||||||||||
| 1,000,000 | IMPERIAL CA CMNTY CLG DIST(b) | 8/1/2040 | 6.75 | 1,008,755 | 1,336,590 | |||||||||||||
| 500,000 | INDIANA ST BOND BANK REVENUE | 2/1/2029 | 5.50 | 493,052 | 522,565 | |||||||||||||
| 3,000,000 | INDIANA ST FIN AUTH REVENUE | 9/15/2030 | 6.50 | 3,039,126 | 3,360,480 | |||||||||||||
| 500,000 | INDIANA ST FIN AUTH REVENUE | 11/15/2031 | 5.50 | 493,773 | 544,535 | |||||||||||||
| 1,000,000 | INDIANA ST FIN AUTH REVENUE | 11/15/2033 | 6.50 | 987,754 | 1,128,410 | |||||||||||||
| 1,000,000 | INDIANA ST FIN AUTH REVENUE | 3/1/2041 | 5.00 | 1,037,975 | 1,090,570 | |||||||||||||
| 500,000 | INDIANA ST FIN AUTH REVENUE | 11/15/2041 | 5.88 | 535,115 | 571,290 | |||||||||||||
| 1,000,000 | INDIANA ST FIN AUTH REVENUE | 11/15/2041 | 6.00 | 987,402 | 1,152,110 | |||||||||||||
| 1,000,000 | INDIANA ST FIN AUTH REVENUE | 11/15/2046 | 5.25 | 1,038,006 | 1,114,610 | |||||||||||||
| 1,500,000 | INDIANA ST HSG & CMNTY DEV AUTH MF HSG REVENUE | 1/1/2036 | 5.75 | 1,500,000 | 1,499,910 | |||||||||||||
| 1,500,000 | IOWA ST FIN AUTH REVENUE | 5/15/2036 | 5.00 | 1,657,427 | 1,687,380 | |||||||||||||
| 715,000 | KANSAS CITY MO INDL DEV AUTH | 9/1/2023 | 5.45 | 715,000 | 745,659 | |||||||||||||
| 1,000,000 | KANSAS CITY MO INDL DEV AUTH | 11/20/2039 | 5.10 | 1,000,000 | 1,062,530 | |||||||||||||
| 1,400,000 | KANSAS CITY MO INDL DEV AUTH SENIOR LIVING FACS REVENUE(e) | 11/15/2036 | 5.75 | 1,400,000 | 1,398,292 | |||||||||||||
| 885,000 | KENTUCKY ST HSG CORP HSG REVENUE | 7/1/2028 | 3.75 | 873,640 | 928,462 | |||||||||||||
| 750,000 | KING CNTY WA HSG AUTH | 5/1/2028 | 5.20 | 750,000 | 774,818 | |||||||||||||
| 1,000,000 | KIRKWOOD MO INDL DEV AUTH RETMNT CMNTY REVENUE | 5/15/2037 | 5.25 | 1,023,075 | 1,065,410 | |||||||||||||
| 500,000 | LAKE CNTY IL SCH DIST #33 | 12/1/2040 | 5.00 | 523,247 | 541,005 | |||||||||||||
See accompanying notes to financial statements. | 53 | (Continued) |
CLEARWATER INVESTMENT TRUST
Schedule of Investments - Clearwater Tax-Exempt Bond Fund
December 31, 2017
| Par/Shares | Security | Maturity date | Coupon rate | Cost | Fair value (a) | Percent of net assets | ||||||||||||
| Municipal Bonds (Cont’d): | ||||||||||||||||||
| 750,000 | LAKE CNTY OH PORT & ECON DEV AUTH LEASE REVENUE(e) | 12/1/2037 | 6.50 | $ | 750,000 | 753,915 | ||||||||||||
| 400,000 | LAKEWOOD RANCH FL STEWARDSHIP DIST SPL ASSMNT REVENUE | 5/1/2025 | 4.25 | 399,240 | 407,296 | |||||||||||||
| 1,700,000 | LAKEWOOD RANCH FL STEWARDSHIP DIST SPL ASSMNT REVENUE | 5/1/2030 | 7.40 | 1,686,411 | 1,944,987 | |||||||||||||
| 740,000 | LAKEWOOD RANCH FL STEWARDSHIP DIST SPL ASSMNT REVENUE | 5/1/2033 | 6.70 | 740,000 | 817,041 | |||||||||||||
| 1,000,000 | LAKEWOOD RANCH FL STEWARDSHIP DIST SPL ASSMNT REVENUE | 5/1/2034 | 5.35 | 1,000,000 | 1,088,420 | |||||||||||||
| 1,400,000 | LAKEWOOD RANCH FL STEWARDSHIP DIST SPL ASSMNT REVENUE | 5/1/2036 | 5.00 | 1,400,000 | 1,473,920 | |||||||||||||
| 750,000 | LAKEWOOD RANCH FL STEWARDSHIP DIST SPL ASSMNT REVENUE(e) | 5/1/2037 | 5.00 | 744,367 | 790,538 | |||||||||||||
| 750,000 | LAKEWOOD RANCH FL STEWARDSHIP DIST SPL ASSMNT REVENUE | 5/1/2037 | 5.25 | 745,320 | 804,825 | |||||||||||||
| 1,000,000 | LAMBERTSON FARMS CO MET DIST #1 REVENUE | 12/15/2025 | 5.00 | 991,140 | 1,005,960 | |||||||||||||
| 500,000 | LAMBERTSON FARMS CO MET DIST #1 REVENUE | 12/15/2035 | 5.50 | 500,000 | 506,810 | |||||||||||||
| 2,000,000 | LAS VEGAS NV REDEV AGY TAX INCR REVENUE | 6/15/2023 | 7.50 | 1,988,842 | 2,167,840 | |||||||||||||
| 650,000 | LEE CNTY FL INDL DEV AUTH(e) | 12/1/2032 | 5.38 | 650,000 | 655,187 | |||||||||||||
| 700,000 | LEE CNTY FL INDL DEV AUTH(e) | 12/1/2052 | 5.75 | 684,506 | 694,743 | |||||||||||||
| 750,000 | LEWISVILLE TX COMB CONTRACT REVENUE | 9/1/2024 | 3.00 | 743,279 | 766,718 | |||||||||||||
| 470,000 | LEXINGTON OAKS FL CDD SPL ASSMNT REVENUE | 5/1/2033 | 5.65 | 470,000 | 491,183 | |||||||||||||
| 750,000 | LEYDEN ROCK MET DIST #10 | 12/1/2045 | 5.00 | 767,395 | 764,880 | |||||||||||||
| 1,000,000 | LITTLETON VLG MET DIST #2 COLO SPL REV | 12/1/2045 | 5.38 | 996,379 | 1,010,280 | |||||||||||||
| 180,000 | LOMBARD IL PUBLIC FACS CORP CONFERENCE CENTER & HOTEL REVENUE(c) | 1/1/2015 | 6.38 | 180,000 | 70,200 | |||||||||||||
| 1,000,000 | LOMBARD IL PUBLIC FACS CORP CONFERENCE CENTER & HOTEL REVENUE(c) | 1/1/2036 | 5.25 | 1,005,522 | 280,000 | |||||||||||||
| 385,000 | LONG LAKE RANCH CMNTY DEV DIST FLA CAP IMPT REV | 5/1/2024 | 5.63 | 385,000 | 398,764 | |||||||||||||
| 275,000 | LONG LAKE RANCH CMNTY DEV DIST FLA CAP IMPT REV | 5/1/2026 | 4.00 | 274,568 | 277,404 | |||||||||||||
| 695,000 | LONG LAKE RANCH CMNTY DEV DIST FLA CAP IMPT REV | 5/1/2046 | 4.75 | 685,221 | 701,742 | |||||||||||||
| 1,000,000 | LOUISIANA ST ENERGY & PWR AUTH PWR PROJ REVENUE | 6/1/2038 | 5.25 | 1,014,056 | 1,129,700 | |||||||||||||
| 235,000 | LOUISIANA ST HSG FIN AGY SF MTGE REVENUE | 12/1/2034 | 5.10 | 235,000 | 240,586 | |||||||||||||
| 500,000 | LOUISIANA ST LOCAL GOVT ENVRNMNTL FACS & CMNTY DEV AUTH | 11/15/2025 | 5.25 | 531,402 | 542,505 | |||||||||||||
| 1,000,000 | LOUISIANA ST LOCAL GOVT ENVRNMNTL FACS & CMNTY DEV AUTH | 11/15/2030 | 6.00 | 1,015,574 | 1,132,350 | |||||||||||||
| 500,000 | LOUISIANA ST PUBLIC FACS AUTH HOSP REVENUE | 7/1/2035 | 5.00 | 539,480 | 570,370 | |||||||||||||
| 1,000,000 | LOUISIANA ST PUBLIC FACS AUTH HOSP REVENUE | 7/1/2047 | 5.00 | 1,111,797 | 1,139,350 | |||||||||||||
| 750,000 | LOUISIANA ST PUBLIC FACS AUTH REVENUE | 5/1/2031 | 6.50 | 747,294 | 809,527 | |||||||||||||
| 430,000 | LOUISIANA ST PUBLIC FACS AUTH REVENUE (FLOATING, ICE LIBOR USD 3M + 0.70%)(f) | 2/15/2036 | 1.65 | 430,000 | 391,640 | |||||||||||||
| 500,000 | LUCAS CNTY OH HLTH CARE FACS REVENUE | 8/15/2030 | 5.50 | 493,255 | 550,635 | |||||||||||||
| 1,500,000 | LUCAS MET HSG AUTH OH COPS | 11/1/2036 | 5.00 | 1,569,133 | 1,625,040 | |||||||||||||
| 1,480,000 | LUZERNE CNTY PA | 11/1/2026 | 7.00 | 1,505,564 | 1,610,995 | |||||||||||||
| 1,000,000 | MACON & MOULTRIE CNTYS IL CMNTY SCH DIST #3 MOUNT ZION | 12/1/2041 | 5.50 | 1,023,236 | 1,122,380 | |||||||||||||
| 1,000,000 | MACON CNTY IL SCH DIST #61 | 1/1/2037 | 5.25 | 1,012,960 | 1,074,370 | |||||||||||||
| 250,000 | MAGNOLIA CREEK FL CDD CAPITAL IMPT REVENUE(c) | 5/1/2014 | 5.60 | 250,000 | 52,500 | |||||||||||||
| 1,000,000 | MAINE ST HSG AUTH MTGE PURCHASE | 11/15/2035 | 4.00 | 1,000,000 | 1,047,740 | |||||||||||||
| 1,000,000 | MAINE ST HSG AUTH MTGE PURCHASE | 11/15/2036 | 3.90 | 1,000,000 | 1,050,590 | |||||||||||||
See accompanying notes to financial statements. | 54 | (Continued) |
CLEARWATER INVESTMENT TRUST
Schedule of Investments - Clearwater Tax-Exempt Bond Fund
December 31, 2017
| Par/Shares | Security | Maturity date | Coupon rate | Cost | Fair value (a) | Percent of net assets | ||||||||||||
| Municipal Bonds (Cont’d): | ||||||||||||||||||
| 1,000,000 | MAINE ST HSG AUTH MTGE PURCHASE | 11/15/2040 | 3.55 | $ | 1,000,000 | 1,015,090 | ||||||||||||
| 1,500,000 | MAINE ST HSG AUTH MTGE PURCHASE | 11/15/2040 | 3.85 | 1,500,000 | 1,552,770 | |||||||||||||
| 500,000 | MAINE ST HSG AUTH MTGE PURCHASE | 11/15/2042 | 4.05 | 500,000 | 525,730 | |||||||||||||
| 1,000,000 | MAINE ST HSG AUTH MTGE REVENUE | 11/15/2037 | 4.50 | 1,000,000 | 1,056,160 | |||||||||||||
| 1,000,000 | MALTA IL TAX INCR REVENUE(c) | 12/30/2025 | 5.75 | 1,000,000 | 320,000 | |||||||||||||
| 500,000 | MANATEE CNTY FL SCH BRD COPS | 7/1/2031 | 5.63 | 496,469 | 565,580 | |||||||||||||
| 404,629 | MANHATTAN IL SPL SVC AREA SPL TAX(c) | 3/1/2022 | 5.75 | 404,629 | 72,833 | |||||||||||||
| 800,000 | MARICOPA CNTY AZ INDL DEV AUTH EDU REVENUE | 7/1/2035 | 5.00 | 853,051 | 822,208 | |||||||||||||
| 750,000 | MARICOPA CNTY AZ INDL DEV AUTH SENIOR LIVING FACS REVENUE(e) | 1/1/2036 | 5.75 | 741,656 | 766,365 | |||||||||||||
| 462,000 | MARQUIS VA CMNTY DEV AUTH REVENUE(g) | 9/1/2041 | 0.00 | 133,815 | 60,212 | |||||||||||||
| 349,000 | MARQUIS VA CMNTY DEV AUTH REVENUE | 9/1/2041 | 5.63 | 375,489 | 242,503 | |||||||||||||
| 745,000 | MARSHALL CREEK FL CDD SPL ASSMNT | 5/1/2032 | 5.00 | 761,012 | 749,694 | |||||||||||||
| 750,000 | MARTINEZ CA UNIF SCH DIST(b) | 8/1/2035 | 6.13 | 748,451 | 946,642 | |||||||||||||
| 455,000 | MARYLAND ST CMNTY DEV ADMIN DEPT HSG & CMNTY DEV | 9/1/2030 | 5.13 | 455,000 | 483,924 | |||||||||||||
| 500,000 | MARYLAND ST CMNTY DEV ADMIN DEPT HSG & CMNTY DEV | 7/1/2031 | 4.50 | 500,000 | 535,690 | |||||||||||||
| 530,374 | MASHANTUCKET WSTRN PEQUOT TRIBE CT | 7/1/2031 | 6.05 | 552,822 | 16,574 | |||||||||||||
| 820,000 | MASSACHUSETTS ST DEV FIN AGY REVENUE | 7/1/2030 | 6.38 | 811,271 | 877,671 | |||||||||||||
| 700,000 | MASSACHUSETTS ST DEV FIN AGY REVENUE(e) | 10/1/2047 | 5.00 | 753,205 | 759,521 | |||||||||||||
| 915,000 | MASSACHUSETTS ST EDUCTNL FING AUTH | 1/1/2028 | 5.25 | 915,000 | 958,371 | |||||||||||||
| 700,000 | MASSACHUSETTS ST HSG FIN AGY | 12/1/2033 | 5.00 | 700,000 | 747,509 | |||||||||||||
| 700,000 | MASSACHUSETTS ST HSG FIN AGY | 12/1/2038 | 5.15 | 700,000 | 748,363 | |||||||||||||
| 1,000,000 | MASSACHUSETTS ST HSG FIN AGY | 12/1/2043 | 5.00 | 1,000,000 | 1,080,640 | |||||||||||||
| 765,000 | MASSACHUSETTS ST HSG FIN AGY HSG REVENUE | 6/1/2040 | 5.05 | 765,000 | 784,278 | |||||||||||||
| 2,770,000 | MASSACHUSETTS ST HSG FIN AGY HSG REVENUE | 12/1/2043 | 4.00 | 2,770,000 | 2,834,541 | |||||||||||||
| 2,000,000 | MASSACHUSETTS ST HSG FIN AGY HSG REVENUE | 6/1/2046 | 4.20 | 2,000,000 | 2,119,220 | |||||||||||||
| 160,000 | MEAD NE TAX INCR REVENUE(c) | 7/1/2012 | 5.13 | 160,000 | 14,400 | |||||||||||||
| 1,000,000 | MEDFORD OR HOSP FACS AUTH REVENUE | 10/1/2042 | 5.00 | 1,032,728 | 1,084,980 | |||||||||||||
| 500,000 | MEMPHIS-SHELBY CNTY TN INDL DEV BRD ECON DEV GROWTH ENGINE T | 7/1/2037 | 5.50 | 495,831 | 528,390 | |||||||||||||
| 600,000 | MERRILLVILLE IN ECON DEV REVENUE | 4/1/2036 | 5.75 | 600,000 | 593,928 | |||||||||||||
| 500,000 | MET PIER & EXPOSITION AUTH ILREVENUE | 6/15/2057 | 5.00 | 523,261 | 543,270 | |||||||||||||
| 1,000,000 | MIAMI FL HLTH FACS AUTH | 7/1/2038 | 5.13 | 1,043,134 | 1,114,910 | |||||||||||||
| 135,000 | MIAMI-DADE CNTY FL HLTH FACS AUTH HOSP REVENUE | 8/1/2030 | 6.00 | 131,055 | 148,029 | |||||||||||||
| 750,000 | MICHIGAN ST FIN AUTH REVENUE | 11/15/2035 | 5.25 | 745,312 | 790,433 | |||||||||||||
| 1,500,000 | MICHIGAN ST HOSP FIN AUTH | 6/1/2034 | 6.13 | 1,514,618 | 1,593,870 | |||||||||||||
| 1,000,000 | MICHIGAN ST HSG DEV AUTH | 10/1/2034 | 5.63 | 1,000,000 | 1,018,090 | |||||||||||||
| 1,850,000 | MICHIGAN ST HSG DEV AUTH | 10/1/2035 | 4.10 | 1,850,000 | 1,936,598 | |||||||||||||
| 1,000,000 | MICHIGAN ST HSG DEV AUTH | 12/1/2035 | 3.95 | 1,000,000 | 1,041,740 | |||||||||||||
| 1,000,000 | MICHIGAN ST HSG DEV AUTH | 12/1/2036 | 3.70 | 1,000,000 | 1,026,930 | |||||||||||||
| 940,000 | MICHIGAN ST HSG DEV AUTH | 12/1/2040 | 3.95 | 940,000 | 970,625 | |||||||||||||
| 600,000 | MICHIGAN ST HSG DEV AUTH | 10/1/2042 | 3.75 | 600,000 | 609,336 | |||||||||||||
| 1,500,000 | MICHIGAN ST HSG DEV AUTH | 12/1/2045 | 3.70 | 1,500,000 | 1,518,390 | |||||||||||||
| 1,000,000 | MICHIGAN ST MUNI BOND AUTH | 5/1/2023 | 5.75 | 1,005,700 | 1,054,960 | |||||||||||||
| 500,000 | MICHIGAN ST PUBLIC EDUCTNL FACS AUTH | 11/1/2028 | 6.35 | 500,000 | 500,655 | |||||||||||||
| 235,000 | MINNESOTA ST HSG FIN AGY | 7/1/2034 | 5.05 | 235,000 | 240,776 | |||||||||||||
| 470,000 | MINNESOTA ST HSG FIN AGY | 1/1/2040 | 5.10 | 470,000 | 480,852 | |||||||||||||
| 1,000,000 | MISHAWAKA IN MF HSG REVENUE(e) | 1/1/2038 | 5.38 | 1,000,000 | 1,002,680 | |||||||||||||
| 1,000,000 | MISSISSIPPI ST DEV BANK SPL OBLG | 10/1/2031 | 6.50 | 977,750 | 1,091,880 | |||||||||||||
| 30,000 | MISSISSIPPI ST HOME CORP SF MTGE REVENUE | 6/1/2039 | 6.75 | 31,233 | 31,217 | |||||||||||||
| 1,540,000 | MISSISSIPPI ST HOME CORP SF MTGE REVENUE | 12/1/2045 | 3.63 | 1,540,000 | 1,562,761 | |||||||||||||
See accompanying notes to financial statements. | 55 | (Continued) |
CLEARWATER INVESTMENT TRUST
Schedule of Investments - Clearwater Tax-Exempt Bond Fund
December 31, 2017
| Par/Shares | Security | Maturity date | Coupon rate | Cost | Fair value (a) | Percent of net assets | ||||||||||||
| Municipal Bonds (Cont’d): | ||||||||||||||||||
| 65,000 | MISSOURI ST HSG DEV COMMISSION SF HSG REVENUE | 9/1/2034 | 5.35 | $ | 65,000 | 66,425 | ||||||||||||
| 1,005,000 | MONTANA ST BRD OF HSG | 12/1/2038 | 3.75 | 1,005,000 | 1,039,220 | |||||||||||||
| 645,000 | MONTANA ST BRD OF HSG | 12/1/2038 | 5.20 | 645,000 | 702,695 | |||||||||||||
| 240,000 | MONTANA ST BRD OF HSG | 12/1/2039 | 5.50 | 240,003 | 243,955 | |||||||||||||
| 985,000 | MONTANA ST BRD OF HSG SF MTGE | 12/1/2037 | 3.95 | 985,000 | 1,046,395 | |||||||||||||
| 860,000 | MONTANA ST BRD OF HSG SF MTGE | 12/1/2038 | 4.00 | 862,720 | 900,437 | |||||||||||||
| 1,000,000 | MONTGOMERY CNTY MD HSG OPPNTYS COMMN MFH & RECONSTR DEV REVENUE | 7/1/2039 | 3.88 | 1,000,000 | 1,035,770 | |||||||||||||
| 500,000 | MONTGOMERY CNTY MD HSG OPPORTUNITIES COMMISSION MF REVENUE | 7/1/2037 | 5.13 | 500,000 | 527,945 | |||||||||||||
| 890,000 | MONTGOMERY CNTY MD HSG OPPORTUNITIES COMMISSION SF MTGE REVENUE | 7/1/2038 | 4.00 | 890,000 | 903,154 | |||||||||||||
| 731,973 | MOUNT CARBON CO MET DIST REVENUE(b) | 6/1/2043 | 7.00 | 731,972 | 658,775 | |||||||||||||
| 200,000 | MOUNT CARBON CO MET DIST REVENUE(b)(c) | 6/1/2043 | 8.00 | - | 44,000 | |||||||||||||
| 500,000 | MULTNOMAH CNTY OR HOSP FACS AUTH REVENUE | 12/1/2029 | 5.00 | 522,097 | 546,290 | |||||||||||||
| 615,000 | MUNSTER IN ECON DEV TAX INCR REVENUE | 7/15/2026 | 4.75 | 612,846 | 666,722 | |||||||||||||
| 417,000 | N CENTRL TEXAS ST HLTH FAC DEV CORP | 2/15/2025 | 5.38 | 417,000 | 417,284 | |||||||||||||
| 380,000 | N SPRINGS FL IMPT DIST | 5/1/2027 | 6.00 | 380,000 | 401,869 | |||||||||||||
| 1,000,000 | N TX TOLLWAY AUTH REVENUE | 1/1/2034 | 6.00 | 1,000,000 | 1,124,710 | |||||||||||||
| 1,000,000 | N TX TOLLWAY AUTH REVENUE(b) | 1/1/2042 | 6.20 | 999,514 | 1,251,380 | |||||||||||||
| 1,000,000 | NATRONA CNTY WY HOSP REVENUE | 9/15/2031 | 6.35 | 1,000,000 | 1,143,860 | |||||||||||||
| 500,000 | NAVAJO NATION AZ(e) | 12/1/2030 | 5.50 | 530,582 | 559,035 | |||||||||||||
| 970,000 | NEBRASKA ST INVESTMENT FIN AUTH SF HSG REVENUE | 9/1/2035 | 3.90 | 970,000 | 1,007,161 | |||||||||||||
| 1,390,000 | NEVADA ST HSG DIV SF MTGE REVENUE | 10/1/2039 | 3.85 | 1,390,000 | 1,430,588 | |||||||||||||
| 140,000 | NEVADA ST HSG DIV SF MTGE REVENUE | 10/1/2040 | 5.10 | 140,000 | 142,227 | |||||||||||||
| 1,000,000 | NEW HAMPSHIRE ST HLTH & EDU FACS AUTH REVENUE | 1/1/2034 | 6.00 | 973,855 | 1,124,710 | |||||||||||||
| 500,000 | NEW HAMPSHIRE ST HLTH & EDU FACS AUTH REVENUE | 8/1/2038 | 6.00 | 491,291 | 535,110 | |||||||||||||
| 1,000,000 | NEW HAMPSHIRE ST HSG FIN AUTH MF REVENUE | 7/1/2031 | 5.20 | 1,000,000 | 1,067,860 | |||||||||||||
| 350,000 | NEW HAMPSHIRE ST HSG FIN AUTH SF REVENUE | 7/1/2034 | 5.38 | 350,000 | 356,353 | |||||||||||||
| 75,000 | NEW HAMPSHIRE ST HSG FIN AUTH SF REVENUE | 7/1/2038 | 6.63 | 75,938 | 75,000 | |||||||||||||
| 1,500,000 | NEW HAMPSHIRE ST HSG FIN AUTHMF REVENUE | 7/1/2052 | 4.00 | 1,500,000 | 1,505,625 | |||||||||||||
| 750,000 | NEW HOPE CULTURAL ED FACS FINCORP TX RETIREMENT FAC REVENUE | 1/1/2035 | 5.50 | 763,914 | 814,710 | |||||||||||||
| 750,000 | NEW HOPE CULTURAL EDU FACS FIN CORP TX STUDENT HSG REV | 7/1/2035 | 5.00 | 771,697 | 620,550 | |||||||||||||
| 1,100,000 | NEW HOPE CULTURAL EDU FACS FIN CORP TX STUDENT HSG REV | 4/1/2046 | 5.00 | 1,146,637 | 1,204,038 | |||||||||||||
| 750,000 | NEW HOPE CULTURAL EDU FACS FINCORP TX EDU REVENUE(e) | 8/15/2036 | 5.00 | 758,238 | 761,040 | |||||||||||||
| 1,000,000 | NEW HOPE CULTURAL EDU FACS FINCORP TX EDU REVENUE | 8/15/2036 | 5.50 | 1,006,680 | 1,031,970 | |||||||||||||
| 750,000 | NEW JERSEY ST ECON DEV AUTH REVENUE | 7/15/2047 | 5.00 | 807,085 | 819,525 | |||||||||||||
| 210,000 | NEW JERSEY ST HGR EDU ASSISTANCE AUTH STUDENT LOAN REVENUE | 6/1/2024 | 5.38 | 209,377 | 218,732 | |||||||||||||
| 900,000 | NEW JERSEY ST HSG & MTGE FIN AGY | 10/1/2030 | 4.50 | 900,000 | 953,262 | |||||||||||||
| 375,000 | NEW JERSEY ST HSG & MTGE FIN AGY | 10/1/2034 | 5.00 | 375,000 | 386,756 | |||||||||||||
| 585,000 | NEW JERSEY ST HSG & MTGE FIN AGY | 10/1/2035 | 5.00 | 585,000 | 597,975 | |||||||||||||
| 940,000 | NEW JERSEY ST HSG & MTGE FIN AGY | 10/1/2037 | 5.00 | 934,117 | 954,203 | |||||||||||||
| 1,000,000 | NEW JERSEY ST HSG & MTGE FIN AGY MF CONDUIT REVENUE | 1/1/2030 | 3.60 | 1,000,000 | 1,036,420 | |||||||||||||
| 1,000,000 | NEW JERSEY ST HSG & MTGE FIN AGY MF REVENUE | 5/1/2041 | 4.95 | 968,990 | 1,033,320 | |||||||||||||
See accompanying notes to financial statements. | 56 | (Continued) |
CLEARWATER INVESTMENT TRUST
Schedule of Investments - Clearwater Tax-Exempt Bond Fund
December 31, 2017
| Par/Shares | Security | Maturity date | Coupon rate | Cost | Fair value (a) | Percent of net assets | ||||||||||||
| Municipal Bonds (Cont’d): | ||||||||||||||||||
| 1,000,000 | NEW JERSEY ST TRANSPRTN TRUST FUND AUTH | 6/15/2024 | 5.00 | $ | 1,033,911 | 1,015,350 | ||||||||||||
| 1,000,000 | NEW JERSEY ST TRANSPRTN TRUST FUND AUTH | 6/15/2030 | 5.00 | 1,029,973 | 1,013,990 | |||||||||||||
| 500,000 | NEW JERSEY ST TRANSPRTN TRUST FUND AUTH | 6/15/2041 | 5.25 | 510,181 | 553,825 | |||||||||||||
| 220,000 | NEW MEXICO ST MTGE FIN AUTH | 9/1/2029 | 4.80 | 220,000 | 224,169 | |||||||||||||
| 445,000 | NEW MEXICO ST MTGE FIN AUTH | 9/1/2034 | 5.00 | 445,000 | 457,104 | |||||||||||||
| 435,000 | NEW MEXICO ST MTGE FIN AUTH | 3/1/2036 | 5.45 | 435,000 | 444,074 | |||||||||||||
| 1,000,000 | NEW MEXICO ST MTGE FIN AUTH | 9/1/2042 | 3.70 | 1,000,000 | 1,026,740 | |||||||||||||
| 700,000 | NEW MEXICO ST MTGE FIN AUTH | 9/1/2042 | 3.90 | 700,000 | 716,758 | |||||||||||||
| 1,040,000 | NEW MEXICO ST MTGE FIN AUTH | 9/1/2042 | 4.13 | 1,040,000 | 1,075,599 | |||||||||||||
| 930,000 | NEW MEXICO ST MTGE FIN AUTH | 9/1/2046 | 3.80 | 930,000 | 953,445 | |||||||||||||
| 115,000 | NEW RIVER FL CDD CAPITAL IMPT REVENUE(c) | 5/1/2013 | 5.00 | 114,821 | 1 | |||||||||||||
| 1,000,000 | NEW YORK CITY NY HSG DEV CORP MF HSG REVENUE | 11/1/2037 | 3.80 | 1,000,000 | 1,022,000 | |||||||||||||
| 1,000,000 | NEW YORK CITY NY HSG DEV CORP MF HSG REVENUE | 11/1/2039 | 4.30 | 1,000,000 | 1,045,540 | |||||||||||||
| 1,000,000 | NEW YORK CITY NY HSG DEV CORP MF HSG REVENUE | 11/1/2047 | 3.65 | 1,000,000 | 999,960 | |||||||||||||
| 2,000,000 | NEW YORK CITY NY MUNI WTR FIN AUTH WTR & SWR SYS REVENUE | 6/15/2038 | 5.00 | 2,150,750 | 2,285,000 | |||||||||||||
| 1,000,000 | NEW YORK ST HSG FIN AGY | 11/1/2041 | 4.10 | 1,000,000 | 1,057,050 | |||||||||||||
| 1,000,000 | NEW YORK ST HSG FIN AGY | 11/1/2042 | 4.00 | 1,000,000 | 1,052,810 | |||||||||||||
| 1,500,000 | NEW YORK ST HSG FIN AGY REVENUE | 11/1/2034 | 3.65 | 1,500,000 | 1,545,285 | |||||||||||||
| 500,000 | NEW YORK ST HSG FIN AGY REVENUE | 11/1/2045 | 5.10 | 500,000 | 549,515 | |||||||||||||
| 4,000,000 | NEW YORK ST HSG FIN AGY REVENUE | 5/1/2048 | 4.10 | 4,000,000 | 4,106,800 | |||||||||||||
| 955,000 | NEW YORK ST MTGE AGY HOMEOWNER MTGE REVENUE | 10/1/2036 | 3.90 | 955,000 | 1,000,143 | |||||||||||||
| 750,000 | NEW YORK ST MTGE AGY HOMEOWNER MTGE REVENUE | 10/1/2038 | 3.75 | 750,000 | 768,315 | |||||||||||||
| 1,450,000 | NEW YORK ST MTGE AGY HOMEOWNER MTGE REVENUE | 10/1/2040 | 3.80 | 1,450,000 | 1,490,281 | |||||||||||||
| 500,000 | NEW YORK ST MTGE AGY HOMEOWNER MTGE REVENUE | 10/1/2042 | 3.75 | 500,000 | 508,040 | |||||||||||||
| 500,000 | NORTH CAROLINA ST CAPITAL FACS FIN AGY EDUCTNL FACS REVENUE | 6/1/2023 | 5.00 | 500,000 | 500,880 | |||||||||||||
| 1,000,000 | NORTH CAROLINA ST HSG FIN AGY HOME OWNERSHIP REVENUE | 7/1/2037 | 3.85 | 1,000,000 | 1,051,250 | |||||||||||||
| 1,000,000 | NORTH CAROLINA ST HSG FIN AGY HOME OWNERSHIP REVENUE | 1/1/2041 | 3.95 | 1,015,691 | 1,055,810 | |||||||||||||
| 500,000 | NORTH DAKOTA ST HSG FIN AGY | 7/1/2048 | 4.00 | 536,560 | 537,070 | |||||||||||||
| 600,000 | NORTH LAS VEGAS NV LOCAL IMPT(e) | 12/1/2027 | 4.00 | 584,645 | 585,108 | |||||||||||||
| 600,000 | NORTH LAS VEGAS NV LOCAL IMPT(e) | 12/1/2037 | 5.00 | 601,395 | 603,234 | |||||||||||||
| 500,000 | NORTH SPRINGS FL IMPT DIST | 5/1/2044 | 6.50 | 500,000 | 519,055 | |||||||||||||
| 1,000,000 | NTHRN IL UNIV | 4/1/2026 | 5.50 | 1,005,000 | 1,068,660 | |||||||||||||
| 1,400,000 | NTHRN PALM BEACH CNTY FL IMPT DIST | 8/1/2029 | 5.00 | 1,408,774 | 1,498,602 | |||||||||||||
| 500,000 | NTHRN PALM BEACH CNTY FL IMPT DIST | 8/1/2037 | 5.00 | 511,440 | 534,515 | |||||||||||||
| 2,000,000 | OAK PARK CA UNIF SCH DIST(b) | 8/1/2038 | 0.00 | 1,559,304 | 2,342,980 | |||||||||||||
| 875,000 | OAKLAND CNTY MI ECON DEV CORP LTD OBLG REVENUE | 12/1/2020 | 6.50 | 872,922 | 901,434 | |||||||||||||
| 270,000 | OHIO ST HSG FIN AGY RSDL MTGE REVENUE | 9/1/2033 | 5.40 | 270,000 | 273,505 | |||||||||||||
| 970,000 | OHIO ST HSG FIN AGY RSDL MTGE REVENUE | 9/1/2039 | 3.35 | 866,169 | 982,561 | |||||||||||||
| 105,000 | OKLAHOMA ST HSG FIN AGY SF MTGE REVENUE | 3/1/2032 | 5.15 | 105,000 | 107,024 | |||||||||||||
| 45,000 | OKLAHOMA ST HSG FIN AGY SF MTGE REVENUE | 9/1/2038 | 6.50 | 45,256 | 45,363 | |||||||||||||
| 1,000,000 | ORANGE CNTY FL HLTH FACS AUTH REVENUE | 8/1/2034 | 5.00 | 1,047,323 | 1,099,760 | |||||||||||||
| 750,000 | ORANGE CNTY FL HLTH FACS AUTH REVENUE | 8/1/2035 | 5.00 | 784,619 | 832,725 | |||||||||||||
| 1,000,000 | ORANGE CNTY FL HLTH FACS AUTH REVENUE | 8/1/2047 | 5.00 | 1,085,176 | 1,104,960 | |||||||||||||
| 890,000 | ORANGE CNTY FL HSG FIN AUTH | 9/1/2035 | 3.80 | 890,000 | 917,928 | |||||||||||||
| 1,250,000 | OREGON ST | 12/1/2034 | 3.63 | 1,250,000 | 1,301,387 | |||||||||||||
| 2,000,000 | OREGON ST | 12/1/2039 | 3.90 | 2,000,000 | 2,098,040 | |||||||||||||
See accompanying notes to financial statements. | 57 | (Continued) |
CLEARWATER INVESTMENT TRUST
Schedule of Investments - Clearwater Tax-Exempt Bond Fund
December 31, 2017
| Par/Shares | Security | Maturity date | Coupon rate | Cost | Fair value (a) | Percent of net assets | ||||||||||||
| Municipal Bonds (Cont’d): | ||||||||||||||||||
| 760,000 | OREGON ST HSG & CMNTY SVCS DEPT MTGE REVENUE | 7/1/2035 | 3.75 | $ | 760,000 | 785,749 | ||||||||||||
| 835,000 | OREGON ST HSG & CMNTY SVCS DEPT MTGE REVENUE | 7/1/2038 | 4.00 | 835,000 | 858,647 | |||||||||||||
| 1,400,000 | OREGON ST HSG & CMNTY SVCS DEPT MTGE REVENUE | 7/1/2048 | 3.75 | 1,400,000 | 1,387,428 | |||||||||||||
| 500,000 | PALISADE CO MET DIST #2 LIMITED TAX | 12/1/2046 | 5.00 | 509,087 | 507,860 | |||||||||||||
| 500,000 | PALM BEACH CNTY FL HLTH FACS AUTH REVENUE | 6/1/2034 | 7.25 | 500,000 | 603,345 | |||||||||||||
| 1,200,000 | PALM BEACH CNTY FL HLTH FACS AUTH REVENUE | 5/15/2036 | 5.00 | 1,325,941 | 1,359,288 | |||||||||||||
| 500,000 | PALM BEACH CNTY FL HLTH FACS AUTH REVENUE | 6/1/2049 | 7.50 | 492,566 | 606,640 | |||||||||||||
| 1,000,000 | PELL CITY AL SPL CARE FACS FING AUTH REVENUE | 12/1/2031 | 5.00 | 1,042,134 | 1,099,550 | |||||||||||||
| 500,000 | PENNSYLVANIA ST HGR EDUCTNL FACS AUTH REVENUE (FLOATING, ICE LIBOR USD 3M + 0.65%)(f) | 7/1/2039 | 1.79 | 500,000 | 410,080 | |||||||||||||
| 1,000,000 | PENNSYLVANIA ST HSG FIN AGY SF MTGE REVENUE | 10/1/2037 | 3.65 | 1,003,479 | 1,015,090 | |||||||||||||
| 500,000 | PENNSYLVANIA ST HSG FIN AGY SF MTGE REVENUE | 10/1/2038 | 4.00 | 500,000 | 519,060 | |||||||||||||
| 3,200,000 | PENNSYLVANIA ST HSG FIN AGY SF MTGE REVENUE | 10/1/2040 | 4.05 | 3,200,000 | 3,328,198 | |||||||||||||
| 2,000,000 | PENNSYLVANIA ST HSG FIN AGY SF MTGE REVENUE | 10/1/2042 | 3.65 | 2,000,000 | 2,005,880 | |||||||||||||
| 580,000 | PENNSYLVANIA ST HSG FIN AGY SF MTGE REVENUE | 10/1/2042 | 3.70 | 580,000 | 592,255 | |||||||||||||
| 750,000 | PENNSYLVANIA ST HSG FIN AGY SF MTGE REVENUE | 10/1/2042 | 4.00 | 750,000 | 771,735 | |||||||||||||
| 1,935,000 | PENNSYLVANIA ST TURNPIKE COMMISSION TURNPIKE REVENUE(b) | 12/1/2035 | 5.13 | 1,930,724 | 2,117,219 | |||||||||||||
| 1,500,000 | PENNSYLVANIA ST TURNPIKE COMMISSION TURNPIKE REVENUE(b) | 12/1/2037 | 0.00 | 1,251,468 | 1,415,805 | |||||||||||||
| 1,000,000 | PEORIA AZ INDL DEV AUTH | 11/15/2029 | 5.25 | 1,000,000 | 1,028,360 | |||||||||||||
| 400,000 | PHILADELPHIA PA AUTH FOR INDL DEV REVENUES | 6/15/2023 | 6.13 | 400,000 | 434,516 | |||||||||||||
| 750,000 | PHILADELPHIA PA AUTH FOR INDL DEV REVENUES | 8/1/2036 | 5.63 | 739,328 | 770,753 | |||||||||||||
| 1,000,000 | PHOENIX AZ INDL DEV AUTH EDU REVENUE(e) | 7/1/2036 | 5.13 | 985,241 | 1,008,560 | |||||||||||||
| 750,000 | PHOENIX AZ INDL DEV AUTH EDU REVENUE | 7/1/2042 | 6.30 | 798,204 | 864,082 | |||||||||||||
| 2,500,000 | PHOENIX AZ INDL DEV AUTH LEASE REVENUE | 6/1/2034 | 5.25 | 2,524,456 | 2,786,500 | |||||||||||||
| 1,000,000 | PIKE PLACE MARKET WA PRESERVATION & DEV AUTH SPL OBLG | 12/1/2040 | 5.00 | 1,064,471 | 1,149,000 | |||||||||||||
| 1,000,000 | PIMA CNTY AZ INDL DEV AUTH EDU REVENUE(e) | 12/1/2026 | 5.25 | 1,000,000 | 1,050,770 | |||||||||||||
| 10,000 | PIMA CNTY AZ INDL DEV AUTH EDU REVENUE | 7/1/2031 | 6.75 | 7,724 | 10,074 | |||||||||||||
| 750,000 | PIMA CNTY AZ INDL DEV AUTH EDU REVENUE(e) | 6/15/2037 | 4.75 | 735,981 | 740,603 | |||||||||||||
| 2,625,000 | PITTSBURG CALIF UNI SCH DIST FING AUTH REV(g) | 9/1/2031 | 0.00 | 1,264,142 | 1,194,532 | |||||||||||||
| 900,000 | POINCIANA FL W CDD SPL ASSMNT | 5/1/2030 | 5.38 | 889,936 | 919,323 | |||||||||||||
| 750,000 | POLK CNTY OR HOSP FAC AUTH REVENUE | 7/1/2035 | 5.13 | 750,000 | 789,285 | |||||||||||||
| 2,000,000 | PORT SAINT LUCIE FL RESEARCH FACS REVENUE | 5/1/2033 | 5.00 | 2,036,961 | 2,074,120 | |||||||||||||
| 1,000,000 | PROMENADE CASTLE ROCK CO MET DIST #1 | 12/1/2025 | 5.13 | 1,000,000 | 1,071,690 | |||||||||||||
| 550,000 | PUBLIC FIN AUTH WI CCRC REVENUE | 6/1/2020 | 7.00 | 547,000 | 587,769 | |||||||||||||
| 1,500,000 | PUBLIC FIN AUTH WI CCRC REVENUE | 6/1/2046 | 8.25 | 1,546,750 | 1,761,240 | |||||||||||||
| 750,000 | PUBLIC FIN AUTH WI REVENUE | 4/1/2025 | 5.00 | 754,518 | 806,917 | |||||||||||||
| 1,250,000 | PUBLIC FIN AUTH WI REVENUE(e) | 11/1/2028 | 6.25 | 1,250,000 | 1,305,862 | |||||||||||||
| 600,000 | PUBLIC FIN AUTH WI REVENUE | 4/1/2032 | 5.50 | 600,000 | 655,416 | |||||||||||||
| 406,960 | PUBLIC FIN AUTH WI REVENUE(g) | 10/1/2042 | 0.00 | 452,560 | 98,896 | |||||||||||||
| 515,000 | PUBLIC FIN AUTH WI REVENUE | 10/1/2042 | 7.00 | 548,783 | 518,837 | |||||||||||||
| See accompanying notes to financial statements. | 58 | (Continued) |
CLEARWATER INVESTMENT TRUST
Schedule of Investments - Clearwater Tax-Exempt Bond Fund
December 31, 2017
| Par/Shares | Security | Maturity date | Coupon rate | Cost | Fair value (a) | Percent of net assets | ||||||||||||
| Municipal Bonds (Cont’d): | ||||||||||||||||||
| 1,130,000 | PUBLIC FIN AUTH WI SENIOR LIVING REVENUE | 11/15/2024 | 5.00 | $ | 1,126,703 | 1,232,615 | ||||||||||||
| 1,500,000 | PUERTO RICO CMWLTH | 7/1/2035 | 5.00 | 1,500,000 | 1,531,290 | |||||||||||||
| 1,155,000 | QUECHAN INDIAN TRIBE AZ FORT YUMA INDIAN RESERVATION | 5/1/2025 | 9.75 | 1,155,000 | 1,317,301 | |||||||||||||
| 750,000 | RED RIVER TX HLTH FACS DEV CORP RETIREMENT FAC REVENUE | 11/15/2034 | 7.50 | 746,358 | 871,492 | |||||||||||||
| 1,000,000 | REDONDO BEACH CA UNIF SCH DIST(b) | 8/1/2034 | 6.38 | 998,535 | 1,330,250 | |||||||||||||
| 750,000 | REEF-SUNSET CA UNIF SCH DIST(b) | 8/1/2038 | 0.00 | 631,662 | 714,990 | |||||||||||||
| 500,000 | RHODE ISLAND ST HLTH & EDUCTNL BLDG CORP | 5/15/2030 | 6.25 | 494,880 | 532,000 | |||||||||||||
| 775,000 | RHODE ISLAND ST HSG & MTGE FIN CORP | 10/1/2028 | 4.00 | 771,622 | 803,427 | |||||||||||||
| 750,000 | RHODE ISLAND ST HSG & MTGE FIN CORP | 10/1/2037 | 3.90 | 750,000 | 770,258 | |||||||||||||
| 955,000 | RHODE ISLAND ST HSG & MTGE FIN CORP | 10/1/2046 | 3.40 | 955,000 | 949,757 | |||||||||||||
| 1,000,000 | RIVERSIDE CA CMNTY PPTYS DEV INC LEASE REVENUE | 10/15/2038 | 6.00 | 1,017,546 | 1,227,210 | |||||||||||||
| 1,500,000 | S TAHOE CA JT PWRS FING AUTH LEASE REVENUE | 10/1/2030 | 5.00 | 1,619,158 | 1,724,325 | |||||||||||||
| 450,000 | S WSTRN IL DEV AUTH(c) | 10/1/2022 | 7.00 | 450,000 | 261,000 | |||||||||||||
| 350,000 | SACRAMENTO CNTY CA WTR FING AUTH REVENUE (FLOATING, ICE LIBOR USD 3M + 0.57%)(f) | 6/1/2039 | 1.56 | 350,000 | 299,495 | |||||||||||||
| 750,000 | SAINT LOUIS CNTY MO INDL DEV AUTH SENIOR LIVING FACS | 9/1/2042 | 5.00 | 764,030 | 805,642 | |||||||||||||
| 750,000 | SAINT TAMMANY LA PUBLIC TRUST FING AUTH | 11/15/2037 | 5.25 | 760,747 | 809,040 | |||||||||||||
| 995,000 | SAN CLEMENTE CA SPL TAX | 9/1/2040 | 5.00 | 1,050,646 | 1,098,012 | |||||||||||||
| 500,000 | SAN DIEGO CA HSG AUTH MF HSG REVENUE | 5/1/2029 | 5.00 | 500,000 | 537,585 | |||||||||||||
| 1,500,000 | SAN GABRIEL CA UNIF SCH DIST(b) | 8/1/2039 | 5.35 | 1,497,757 | 1,698,375 | |||||||||||||
| 1,000,000 | SAN JOSE CA FING AUTH | 6/1/2039 | 5.00 | 1,042,301 | 1,124,160 | |||||||||||||
| 500,000 | SANTA MONICA CA REDEV AGY | 7/1/2036 | 5.88 | 508,906 | 570,165 | |||||||||||||
| 1,000,000 | SCHERERVILLE IN ECON DEV REVENUE | 1/15/2030 | 6.00 | 1,012,922 | 1,173,340 | |||||||||||||
| 1,000,000 | SCOTTS BLUFF CNTY NE HOSP AUTH | 2/1/2037 | 5.25 | 1,052,303 | 1,084,830 | |||||||||||||
| 500,000 | SEATTLE WA HSG AUTH | 12/1/2047 | 3.85 | 500,000 | 504,920 | |||||||||||||
| 770,000 | SEATTLE WA HSG AUTH POOLED HSG REVENUE | 9/15/2033 | 5.75 | 781,181 | 884,291 | |||||||||||||
| 500,000 | SEVEN OAKS FL CMNTY DEV DIST SPL ASSMNT REVENUE | 5/1/2033 | 5.50 | 489,856 | 527,585 | |||||||||||||
| 150,000 | SHELBY CNTY TN HLTH EDUCTNL & HSG FACS BRD REVENUE(c) | 1/1/2019 | 5.35 | 134,966 | 375 | |||||||||||||
| 625,000 | SHELBY CNTY TN HLTH EDUCTNL & HSG FACS BRD REVENUE(c) | 1/1/2029 | 5.55 | 556,862 | 1,563 | |||||||||||||
| 130,000 | SHELBY CNTY TN HLTH EDUCTNL & HSG FACS BRD REVENUE(c) | 1/1/2029 | 6.00 | - | 1 | |||||||||||||
| 750,000 | SHELBY CNTY TN HLTH EDUCTNL & HSG FACS BRD REVENUE(e) | 9/1/2037 | 5.00 | 800,963 | 770,648 | |||||||||||||
| 525,000 | SHERIDAN AR SCH DIST #37 | 2/1/2047 | 4.00 | 538,711 | 540,519 | |||||||||||||
| 125,000 | SILVERLEAF FL CDD CAPITAL IMPT REVENUE | 5/1/2023 | 6.50 | 125,000 | 131,704 | |||||||||||||
| 220,000 | SILVERLEAF FL CDD CAPITAL IMPT REVENUE | 5/1/2044 | 6.75 | 215,987 | 236,102 | |||||||||||||
| 275,000 | SOUTH CAROLINA ST EDU ASSISTANCE AUTH | 10/1/2029 | 5.10 | 272,595 | 287,119 | |||||||||||||
| 1,000,000 | SOUTH CAROLINA ST JOBS-ECON DEV AUTH HOSP REVENUE | 2/1/2038 | 5.00 | 1,119,709 | 1,138,080 | |||||||||||||
| 1,000,000 | SOUTH CAROLINA ST PUBLIC SVC AUTH REVENUE | 12/1/2038 | 5.00 | 1,053,159 | 1,121,410 | |||||||||||||
| 1,400,000 | SOUTH CAROLINA ST PUBLIC SVC AUTH REVENUE | 12/1/2043 | 5.75 | 1,460,380 | 1,622,698 | |||||||||||||
| 500,000 | SOUTH DAKOTA ST HLTH & EDUCTNL FACS AUTH | 9/1/2032 | 5.00 | 499,500 | 527,340 | |||||||||||||
| 60,000 | SOUTHSIDE AZ CMNTY FACS DIST #1 SPL ASSMNT REVENUE PRESCOTT | 7/1/2018 | 6.13 | 58,191 | 60,079 | |||||||||||||
| 500,000 | ST VRAIN LAKES MET DIST NO 2 | 12/1/2037 | 5.00 | 500,000 | 502,890 | |||||||||||||
| 1,000,000 | STC MET DIST #2 CO | 12/1/2038 | 6.00 | 970,955 | 1,037,290 | |||||||||||||
| 142,538 | STERLING HILL FL CDD CAPITAL IMPT REVENUE(c) | 11/1/2010 | 5.50 | 142,538 | 99,777 | |||||||||||||
| See accompanying notes to financial statements. | 59 | (Continued) |
CLEARWATER INVESTMENT TRUST
Schedule of Investments - Clearwater Tax-Exempt Bond Fund
December 31, 2017
| Par/Shares | Security | Maturity date | Coupon rate | Cost | Fair value (a) | Percent of net assets | ||||||||||||
| Municipal Bonds (Cont’d): | ||||||||||||||||||
| 1,000,000 | SUGAR LAND TX DEV CORP SALES TAX REVENUE | 2/15/2033 | 5.00 | $ | 1,077,032 | 1,112,740 | ||||||||||||
| 2,385,000 | SULPHUR SPRINGS CA UNION SCH DIST COPS(b) | 12/1/2037 | 6.50 | 2,383,021 | 3,011,159 | |||||||||||||
| 1,500,000 | SUTTER BUTTE CA FLOOD AGY ASSMNT REVENUE | 10/1/2038 | 4.00 | 1,483,242 | 1,573,710 | |||||||||||||
| 1,100,000 | TALLAHASSEE FL HLTH FACS REVENUE | 12/1/2040 | 5.00 | 1,160,568 | 1,215,170 | |||||||||||||
| 1,000,000 | TARRANT CNTY TX CULTURAL EDU FACS FIN CORP HOSP REVENUE | 11/15/2038 | 5.00 | 1,065,278 | 1,115,990 | |||||||||||||
| 1,000,000 | TARRANT CNTY TX CULTURAL EDU FACS FIN CORP RETMNT FAC REVENUE | 11/15/2022 | 5.50 | 1,002,412 | 1,000,750 | |||||||||||||
| 750,000 | TARRANT CNTY TX CULTURAL EDU FACS FIN CORP RETMNT FAC REVENUE | 11/15/2024 | 5.63 | 750,000 | 772,628 | |||||||||||||
| 750,000 | TARRANT CNTY TX CULTURAL EDU FACS FIN CORP RETMNT FAC REVENUE | 11/15/2035 | 5.00 | 777,125 | 792,893 | |||||||||||||
| 700,000 | TARRANT CNTY TX CULTURAL EDU FACS FIN CORP RETMNT FAC REVENUE | 5/15/2037 | 5.00 | 767,633 | 738,626 | |||||||||||||
| 1,485,000 | TARRANT CNTY TX CULTURAL EDU FACS FIN CORP RETMNT FAC REVENUE | 11/15/2037 | 6.63 | 1,510,460 | 1,667,165 | |||||||||||||
| 750,000 | TAYLOR MI BROWNFIELD REDEV AUTH | 5/1/2032 | 5.00 | 787,287 | 833,100 | |||||||||||||
| 500,000 | TEMPE AZ INDL DEV AUTH REVENUE(e) | 10/1/2024 | 4.70 | 498,535 | 501,460 | |||||||||||||
| 500,000 | TEMPE AZ INDL DEV AUTH REVENUE(e) | 10/1/2037 | 6.00 | 503,243 | 514,055 | |||||||||||||
| 1,000,000 | TENNESSEE HSG DEV AGY RSDL FING PROGRAM REVENUE | 7/1/2036 | 3.70 | 1,000,000 | 1,033,490 | |||||||||||||
| 2,000,000 | TENNESSEE HSG DEV AGY RSDL FING PROGRAM REVENUE | 7/1/2040 | 3.45 | 2,000,000 | 1,980,620 | |||||||||||||
| 1,250,000 | TENNESSEE HSG DEV AGY RSDL FING PROGRAM REVENUE | 7/1/2047 | 3.65 | 1,250,000 | 1,275,987 | |||||||||||||
| 630,000 | TENNESSEE ST HSG DEV AGY | 1/1/2035 | 3.85 | 630,000 | 660,599 | |||||||||||||
| 980,000 | TENNESSEE ST HSG DEV AGY | 7/1/2043 | 3.80 | 980,000 | 989,036 | |||||||||||||
| 345,000 | TEXAS ST DEPT OF HSG & CMNTY AFFAIRS | 7/1/2039 | 5.45 | 345,000 | 352,304 | |||||||||||||
| 1,235,000 | TOLEDO-LUCAS CNTY OH PORT AUTHSTUDENT HSG REVENUE | 7/1/2039 | 5.00 | 1,236,977 | 1,292,798 | |||||||||||||
| 35,000 | TOLOMATO FL CDD(b) | 5/1/2039 | 0.00 | 39,806 | 34,997 | |||||||||||||
| 565,000 | TOLOMATO FL CDD(b)(c) | 5/1/2040 | 6.61 | 340,741 | 346,741 | |||||||||||||
| 1,000,000 | TRACY CA JT UNIF SCH DIST(b) | 8/1/2041 | 0.00 | 594,814 | 852,880 | |||||||||||||
| 600,000 | TRAVIS CNTY TX HLTH FACS DEV CORP | 1/1/2046 | 7.13 | 659,621 | 689,700 | |||||||||||||
| 750,000 | TRAVIS CNTY TX HLTH FACS DEV CORP(f)(h) | 1/1/2047 | 5.25 | 750,000 | 809,385 | |||||||||||||
| 500,000 | TSR CDD FL SPL ASSMNT REVENUE | 11/1/2035 | 5.38 | 498,574 | 542,950 | |||||||||||||
| 500,000 | TURLOCK CA PUBLIC FING AUTH WTR REVENUE | 5/1/2032 | 4.75 | 501,630 | 505,545 | |||||||||||||
| 1,250,000 | TUSTIN CA UNIF SCH DIST(b) | 8/1/2028 | 0.00 | 1,133,518 | 1,314,062 | |||||||||||||
| 555,000 | UNIVERSAL ACADEMY MI PUBLIC SCH ACADEMY REVENUE | 12/1/2023 | 6.50 | 548,310 | 574,170 | |||||||||||||
| 750,000 | UPPER IL RIVER VLY DEV AUTH(e) | 12/1/2022 | 4.00 | 743,385 | 743,385 | |||||||||||||
| 750,000 | UPPER IL RIVER VLY DEV AUTH(e) | 12/1/2037 | 5.25 | 767,408 | 773,355 | |||||||||||||
| 1,500,000 | UTAH ST CHRT SCH FIN AUTH CHRT SCH REVENUE | 10/15/2033 | 6.50 | 1,507,071 | 1,528,170 | |||||||||||||
| 750,000 | UTAH ST CHRT SCH FIN AUTH CHRT SCH REVENUE(e) | 4/15/2045 | 6.00 | 766,002 | 786,548 | |||||||||||||
| 185,000 | UTAH ST HSG CORP SF MTGE REVENUE | 1/1/2033 | 5.75 | 185,000 | 192,739 | |||||||||||||
| 490,000 | VANCOUVER WA HSG AUTH | 3/1/2025 | 5.00 | 481,862 | 524,481 | |||||||||||||
| 1,000,000 | VANCOUVER WA HSG AUTH | 8/1/2034 | 3.75 | 981,798 | 1,032,650 | |||||||||||||
| 680,000 | VERMONT ST HSG FIN AGY | 5/1/2032 | 4.88 | 677,150 | 725,716 | |||||||||||||
| 1,000,000 | VIRGINIA ST HSG DEV AUTH | 7/1/2033 | 4.13 | 1,000,000 | 1,055,750 | |||||||||||||
| 1,000,000 | VIRGINIA ST HSG DEV AUTH | 12/1/2039 | 5.00 | 1,000,000 | 1,041,050 | |||||||||||||
| 500,000 | VIRGINIA ST HSG DEV AUTH | 5/1/2041 | 3.55 | 500,000 | 512,000 | |||||||||||||
| 3,500,000 | VIRGINIA ST HSG DEV AUTH CMWLTH MTGE | 1/1/2038 | 3.88 | 3,490,250 | 3,604,650 | |||||||||||||
| 3,000,000 | VIRGINIA ST HSG DEV AUTH CMWLTH MTGE | 7/1/2038 | 4.80 | 3,000,000 | 3,322,380 | |||||||||||||
| 2,000,000 | VIRGINIA ST HSG DEV AUTH CMWLTH MTGE | 10/1/2038 | 4.75 | 2,000,000 | 2,210,460 | |||||||||||||
| 1,205,000 | VLG FL CDD #7 SPL ASSMNT REVENUE | 5/1/2036 | 4.00 | 1,197,253 | 1,242,030 | |||||||||||||
| 530,000 | WASHINGTON ST HSG FIN COMMISSION(e) | 7/1/2025 | 6.00 | 533,145 | 563,809 | |||||||||||||
| 1,000,000 | WASHINGTON ST HSG FIN COMMISSION(e) | 1/1/2031 | 5.00 | 1,001,805 | 1,091,700 | |||||||||||||
| See accompanying notes to financial statements. | 60 | (Continued) |
CLEARWATER INVESTMENT TRUST
Schedule of Investments - Clearwater Tax-Exempt Bond Fund
December 31, 2017
| Par/Shares | Security | Maturity date | Coupon rate | Cost | Fair value (a) | Percent of net assets | ||||||||||||
| Municipal Bonds (Cont’d): | ||||||||||||||||||
| 750,000 | WASHINGTON ST HSG FIN COMMISSION(e) | 7/1/2031 | 5.00 | $ | 803,685 | 793,043 | ||||||||||||
| 675,000 | WASHINGTON ST HSG FIN COMMISSION(e) | 1/1/2035 | 5.75 | 675,000 | 689,000 | |||||||||||||
| 600,000 | WASHINGTON ST HSG FIN COMMISSION(e) | 7/1/2036 | 5.00 | 639,281 | 626,148 | |||||||||||||
| 500,000 | WASHINGTON ST HSG FIN COMMISSION(e) | 1/1/2038 | 5.00 | 549,522 | 551,720 | |||||||||||||
| 750,000 | WASHINGTON ST HSG FIN COMMISSION | 12/1/2045 | 3.80 | 750,000 | 756,908 | |||||||||||||
| 1,000,000 | WASHINGTON ST HSG FIN COMMISSION | 12/1/2047 | 4.00 | 1,066,993 | 1,062,900 | |||||||||||||
| 4,000 | WATERS EDGE FL CDD CAPITAL IMPT REVENUE | 5/1/2039 | 5.35 | 4,000 | 3,980 | |||||||||||||
| 170,000 | WATERS EDGE FL CDD CAPITAL IMPT REVENUE(b) | 5/1/2039 | 6.60 | 168,843 | 170,549 | |||||||||||||
| 1,500,000 | WEST VIRGINIA ST HSG DEV FUND | 11/1/2032 | 3.75 | 1,500,000 | 1,568,100 | |||||||||||||
| 170,000 | WEST VIRGINIA ST HSG DEV FUND | 11/1/2039 | 4.10 | 170,000 | 175,972 | |||||||||||||
| 890,000 | WEST VIRGINIA ST HSG DEV FUND | 11/1/2047 | 4.13 | 890,000 | 939,760 | |||||||||||||
| 1,500,000 | WEST VLY CITY UT MUNI BLDG AUTH LEASE REVENUE | 2/1/2039 | 5.00 | 1,680,587 | 1,760,250 | |||||||||||||
| 550,000 | WESTCHESTER CO NY LOCAL DEV CORP REVENUE | 1/1/2034 | 5.00 | 572,907 | 596,156 | |||||||||||||
| 685,000 | WESTMONT IL PARK DIST(g) | 12/1/2031 | 0.00 | 303,360 | 346,507 | |||||||||||||
| 685,000 | WESTMONT IL PARK DIST(g) | 12/1/2033 | 0.00 | 263,664 | 301,660 | |||||||||||||
| 1,350,000 | WICHITA KS HLTH CARE FACS REVENUE | 5/15/2034 | 6.25 | 1,350,000 | 1,357,600 | |||||||||||||
| 600,000 | WICHITA KS HLTH CARE FACS REVENUE | 12/1/2036 | 5.25 | 605,696 | 644,562 | |||||||||||||
| 1,000,000 | WINDSHIRE PARK CO MET DIST #2 | 12/1/2047 | 6.50 | 1,093,582 | 1,098,320 | |||||||||||||
| 750,000 | WIREGRASS FL CDD CAPITAL IMPT REVENUE | 5/1/2035 | 5.38 | 745,755 | 800,655 | |||||||||||||
| 905,000 | WISCONSIN ST GEN FUND ANNUAL APPROP REVENUE | 5/1/2027 | 6.00 | 909,045 | 957,580 | |||||||||||||
| 630,000 | WISCONSIN ST HLTH & EDUCTNL FACS AUTH REVENUE | 7/1/2030 | 5.75 | 636,115 | 686,442 | |||||||||||||
| 1,300,000 | WISCONSIN ST HLTH & EDUCTNL FACS AUTH REVENUE | 8/15/2032 | 5.00 | 1,413,856 | 1,496,924 | |||||||||||||
| 1,000,000 | WISCONSIN ST HLTH & EDUCTNL FACS AUTH REVENUE | 5/15/2036 | 5.00 | 1,000,000 | 1,001,870 | |||||||||||||
| 700,000 | WISCONSIN ST HLTH & EDUCTNL FACS AUTH REVENUE | 6/1/2037 | 5.00 | 736,536 | 740,152 | |||||||||||||
| 2,000,000 | WISCONSIN ST HLTH & EDUCTNL FACS AUTH REVENUE | 8/15/2043 | 5.00 | 2,084,534 | 2,168,680 | |||||||||||||
| 500,000 | WISCONSIN ST HSG & ECON DEV AUTH | 11/1/2035 | 3.88 | 500,000 | 518,745 | |||||||||||||
| 1,000,000 | WISCONSIN ST HSG & ECON DEV AUTH | 11/1/2040 | 4.00 | 1,000,000 | 1,041,260 | |||||||||||||
| 1,500,000 | WISCONSIN ST HSG & ECON DEV AUTH | 5/1/2055 | 4.15 | 1,500,000 | 1,531,095 | |||||||||||||
| 1,000,000 | WYANDOTTE CNTY KS KANSAS CITY UNIF GOVT SPL OBLG REVENUE | 9/1/2032 | 5.75 | 993,124 | 1,014,750 | |||||||||||||
| 750,000 | WYNNFIELD LAKES FL CDD | 5/1/2036 | 4.50 | 744,930 | 777,968 | |||||||||||||
| 1,645,000 | WYOMING ST CMNTY DEV AUTH HSG REVENUE | 12/1/2038 | 4.05 | 1,645,000 | 1,676,304 | |||||||||||||
| 355,000 | ZEPHYR RIDGE FL CDD CAPITAL IMPT REVENUE(c) | 5/1/2013 | 5.25 | 355,352 | 266,250 | |||||||||||||
| Sub-total Municipal Bonds: | 460,421,609 | 484,300,506 | 92.22 | % | ||||||||||||||
| Short-Term Investments: | ||||||||||||||||||
| 6,336,567 | NORTHERN INSTITUTIONAL FUNDS - U.S. GOVERNMENT SELECT PORTFOLIO, 1.13%(i) | 6,336,567 | 6,336,567 | |||||||||||||||
| Sub-total Short-Term Investments: | 6,336,567 | 6,336,567 | 1.21 | % | ||||||||||||||
| Grand total(j) | $ | 490,035,832 | 515,317,851 | 98.13 | % | |||||||||||||
Notes to Schedule of Investments:
| (a) | Investments are valued in accordance with procedures described in note 2 to the financial statements. |
| (b) | For step bonds, the coupon rate disclosed is the current rate in effect. |
| (c) | Non-income producing assets. For long-term debt securities, item identified is in default as to payment of interest and/or principal. |
| (d) | Security has converted to a fixed rate as of February 1, 2015, and will be going forward. |
| (e) | Securities exempt from registration under Rule 144A of the Securities Act of 1933. These securities may be resold in transactions exempt from registration, normally to qualified institutional buyers. The value of these securities is determined by valuations supplied by a pricing service or brokers, or, if not available, in accordance with procedures established by the Board of Trustees. |
| (f) | Variable rate security. Rate as of December 31, 2017 is disclosed. |
| See accompanying notes to financial statements. | 61 | (Continued) |
CLEARWATER INVESTMENT TRUST
Schedule of Investments - Clearwater Tax-Exempt Bond Fund
December 31, 2017
| (g) | Zero coupon bond. |
| (h) | Rate is determined by a remarketing agent which, in its judgment, on the basis of prevailing financial markets, will be the lowest interest rate necessary to enable the remarketing agent to sell the bonds at a price equal to 100% of the principal amount. |
| (i) | The short-term investment is a money market portfolio of the investment company, Northern Institutional Funds. At December 31, 2016, the value of the Clearwater Tax-Exempt Bond Fund’s investment in the U.S. Government Select Portfolio of the Northern Institutional Funds was $7,667,864 with net sales of $1,331,297 during the fiscal year ended December 31, 2017. |
| (j) | At December 31, 2017, the cost for Federal income tax purposes was $486,328,697. The aggregate gross unrealized appreciation and depreciation of investments in securities based on this cost was as follows: |
| Gross unrealized appreciation | $ | 35,286,006 | ||
| Gross unrealized depreciation | (6,296,852 | ) | ||
| Net unrealized appreciation | $ | 28,989,154 |
Diversification of investments representing geographic diversification, as a percentage of total investments at fair value, is as follows:
| Geographical Diversification | Percent | |||
| Florida | 11.01 | % | ||
| California | 9.78 | |||
| Illinois | 7.77 | |||
| Texas | 6.48 | |||
| Georgia | 4.67 | |||
| New York | 4.58 | |||
| Indiana | 4.27 | |||
| Pennsylvania | 3.73 | |||
| Colorado | 3.39 | |||
| Wisconsin | 3.32 | |||
| Other | 41.00 | |||
| 100.00 | % | |||
At December 31, 2017, the Fund had open futures contracts as follows:
| Type | Number of Contracts | Notional Amount (000s) | Contract Position | Contract Exp. | Value and Unrealized Appreciation (Depreciation) (000s) | |||||||||||
| 10-Year U.S. Treasury Note | 910 | $ | (112,882,656 | ) | Short | 3/18 | $ | 379,575 | ||||||||
| U.S. Treasury Long Bond | 104 | (15,912,000 | ) | Short | 3/18 | (77,688 | ) | |||||||||
| 2-Year U.S. Treasury Note | 119 | (25,479,016 | ) | Short | 3/18 | 47,795 | ||||||||||
| 5-Year U.S. Treasury Note | 103 | (11,964,898 | ) | Short | 3/18 | 46,192 | ||||||||||
| $ | 395,874 | |||||||||||||||
| See accompanying notes to financial statements. | 62 | (Continued) |
CLEARWATER INVESTMENT TRUST
Schedule of Investments - Clearwater Tax-Exempt Bond Fund
December 31, 2017
Clearwater Tax-Exempt Bond Fund Portfolio Diversification
(as a percentage of net assets)
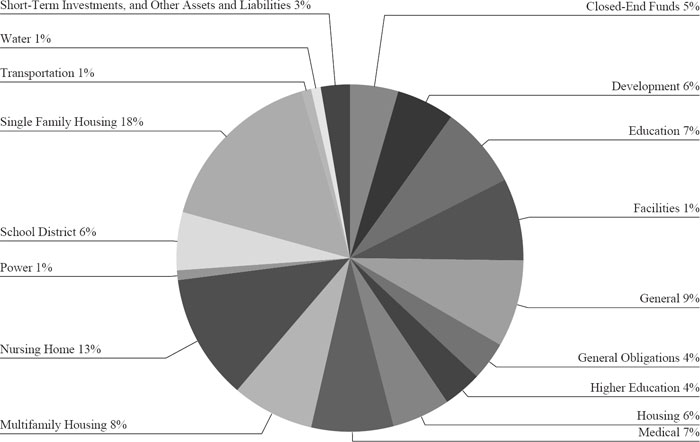
| See accompanying notes to financial statements. | 63 | (Continued) |
CLEARWATER INVESTMENT TRUST
Schedule of Investments - Clearwater International Fund
December 31, 2017
| Percent of | ||||||||||||||||
| Shares | Security | Cost | Fair value (a) | net assets | ||||||||||||
| Common Stocks: | ||||||||||||||||
| Australia: | ||||||||||||||||
| 4,885 | AGL ENERGY LTD. | $ | 66,947 | 92,849 | ||||||||||||
| 32,826 | ALUMINA LTD. | 29,381 | 62,238 | |||||||||||||
| 20,092 | AMP LTD. | 44,790 | 81,362 | |||||||||||||
| 37,762 | APA GROUP | 210,499 | 245,433 | |||||||||||||
| 2,554 | ASX LTD. | 51,631 | 109,323 | |||||||||||||
| 80,380 | AUSTRALIA & NEW ZEALAND BANKING GROUP LTD. | 1,182,375 | 1,802,472 | |||||||||||||
| 68,613 | BANK OF QUEENSLAND LTD. | 536,423 | 680,969 | |||||||||||||
| 70,369 | BENDIGO & ADELAIDE BANK LTD. | 468,821 | 640,746 | |||||||||||||
| 179,910 | BGP HOLDINGS PLC(b) | - | - | |||||||||||||
| 11,553 | BHP BILLITON LTD. | 134,009 | 266,551 | |||||||||||||
| 10,199 | BORAL LTD. | 28,970 | 61,991 | |||||||||||||
| 23,955 | BRAMBLES LTD. | 114,907 | 188,217 | |||||||||||||
| 1,234 | CIMIC GROUP LTD. | 49,785 | 49,537 | |||||||||||||
| 971 | COCHLEAR LTD. | 35,893 | 129,728 | |||||||||||||
| 23,488 | COMMONWEALTH BANK OF AUSTRALIA | 947,318 | 1,472,352 | |||||||||||||
| 53,441 | CSL LTD. | 3,622,185 | 5,891,835 | |||||||||||||
| 14,184 | DEXUS | 62,970 | 107,904 | |||||||||||||
| 97,180 | FORTESCUE METALS GROUP LTD. | 212,026 | 370,024 | |||||||||||||
| 18,737 | GOODMAN GROUP | 48,414 | 123,097 | |||||||||||||
| 18,683 | INCITEC PIVOT LTD. | 30,152 | 56,852 | |||||||||||||
| 47,825 | INSURANCE AUSTRALIA GROUP LTD. | 120,292 | 270,164 | |||||||||||||
| 10,015 | LENDLEASE GROUP | 61,130 | 127,762 | |||||||||||||
| 7,617 | MACQUARIE GROUP LTD. | 165,840 | 592,117 | |||||||||||||
| 27,890 | NATIONAL AUSTRALIA BANK LTD. | 442,099 | 643,478 | |||||||||||||
| 9,045 | NEWCREST MINING LTD. | 89,996 | 161,049 | |||||||||||||
| 24,361 | OIL SEARCH LTD. | 133,952 | 148,070 | |||||||||||||
| 17,965 | ORIGIN ENERGY LTD.(c) | 77,151 | 132,042 | |||||||||||||
| 16,330 | ORORA LTD. | 16,762 | 43,194 | |||||||||||||
| 416 | PERPETUAL LTD. | 7,027 | 15,694 | |||||||||||||
| 5,743 | QBE INSURANCE GROUP LTD. | 48,456 | 47,857 | |||||||||||||
| 2,468 | RAMSAY HEALTH CARE LTD. | 49,765 | 135,027 | |||||||||||||
| 20,500 | SANTOS LTD.(c) | 45,732 | 87,173 | |||||||||||||
| 80,218 | SCENTRE GROUP | 192,775 | 262,252 | |||||||||||||
| 5,884 | SEEK LTD. | 49,598 | 87,275 | |||||||||||||
| 9,824 | SONIC HEALTHCARE LTD. | 79,849 | 175,226 | |||||||||||||
| 101,955 | SOUTH32 LTD. (ATHENS STOCK EXCHANGE) | 70,421 | 277,631 | |||||||||||||
| 11,647 | STAR ENTERTAINMENT GROUP (THE) LTD. | 31,304 | 55,252 | |||||||||||||
| 13,885 | STOCKLAND | 48,681 | 48,535 | |||||||||||||
| 9,837 | SYDNEY AIRPORT | 33,263 | 54,111 | |||||||||||||
| 29,923 | TABCORP HOLDINGS LTD. | 79,432 | 130,279 | |||||||||||||
| 62,716 | TELSTRA CORP. LTD. | 166,825 | 177,631 | |||||||||||||
| 13,099 | TRANSURBAN GROUP | 36,728 | 127,041 | |||||||||||||
| 12,264 | TREASURY WINE ESTATES LTD. | 49,093 | 152,721 | |||||||||||||
| 67,359 | VICINITY CENTRES | 118,058 | 142,955 | |||||||||||||
| 29,744 | WESTFIELD CORP. | 146,662 | 220,242 | |||||||||||||
| 60,491 | WESTPAC BANKING CORP. | 871,309 | 1,479,661 | |||||||||||||
| 3,970 | WOODSIDE PETROLEUM LTD. | 74,324 | 102,468 | |||||||||||||
| 16,846 | WOOLWORTHS GROUP LTD. | 309,168 | 358,834 | |||||||||||||
| 11,493,188 | 18,689,221 | 2.99 | % | |||||||||||||
| Austria: | ||||||||||||||||
| 1,685 | BUWOG A.G.(c) | 30,804 | 58,125 | |||||||||||||
| 3,566 | ERSTE GROUP BANK A.G.(c) | 63,770 | 154,481 | |||||||||||||
| 931 | IMMOFINANZ A.G.(c) | - | 2,399 | |||||||||||||
| 313 | STRABAG S.E. (BEARER) | 5,505 | 12,780 | |||||||||||||
| 100,079 | 227,785 | 0.04 | % | |||||||||||||
| Belgium: | ||||||||||||||||
| 7,120 | AGEAS | 106,907 | 347,825 | |||||||||||||
| 13,822 | ANHEUSER-BUSCH INBEV S.A./N.V. | 502,521 | 1,544,498 | |||||||||||||
| 18,158 | BARCO N.V. | 1,517,130 | 1,944,479 | |||||||||||||
| 24,293 | GROUPE BRUXELLES LAMBERT S.A. | 2,132,635 | 2,623,025 | |||||||||||||
| 4,347 | KBC GROUP N.V. | 101,356 | 370,892 | |||||||||||||
| 40,352 | ONTEX GROUP N.V. | 1,290,748 | 1,335,081 | |||||||||||||
| 2,962 | PROXIMUS SADP | 71,203 | 97,201 | |||||||||||||
| 1,071 | TELENET GROUP HOLDING N.V.(c) | 51,789 | 74,648 | |||||||||||||
See accompanying notes to financial statements. | 64 | (Continued) |
CLEARWATER INVESTMENT TRUST
Schedule of Investments - Clearwater International Fund
December 31, 2017
| Percent of | ||||||||||||||||
| Shares | Security | Cost | Fair value (a) | net assets | ||||||||||||
| Belgium (Cont’d): | ||||||||||||||||
| 1,091 | UCB S.A. | $ | 30,547 | 86,632 | ||||||||||||
| 5,804,836 | 8,424,281 | 1.35 | % | |||||||||||||
| Brazil: | ||||||||||||||||
| 600,900 | CAMIL ALIMENTOS S.A.(c) | 1,528,797 | 1,418,422 | |||||||||||||
| 127,300 | GRENDENE S.A. | 972,481 | 1,091,823 | |||||||||||||
| 84,200 | M DIAS BRANCO S.A.(c) | 957,716 | 1,322,486 | |||||||||||||
| 90,900 | RAIA DROGASIL S.A.(c) | 1,902,688 | 2,515,637 | |||||||||||||
| 5,361,682 | 6,348,368 | 1.02 | % | |||||||||||||
| Canada: | ||||||||||||||||
| 3,480 | AGNICO EAGLE MINES LTD. | 121,170 | 160,684 | |||||||||||||
| 3,620 | AGRIUM, INC. | 154,492 | 416,372 | |||||||||||||
| 170,600 | ALAMOS GOLD, INC., CLASS A | 1,178,151 | 1,110,606 | |||||||||||||
| 4,817 | ALIMENTATION COUCHE-TARD, INC., CLASS B | 138,470 | 251,350 | |||||||||||||
| 2,544 | ALTAGAS LTD. | 58,867 | 57,923 | |||||||||||||
| 5,327 | ARC RESOURCES LTD. | 66,330 | 62,509 | |||||||||||||
| 1,362 | ATCO LTD., CLASS I | 49,205 | 48,759 | |||||||||||||
| 95,100 | BADGER DAYLIGHTING LTD. | 1,696,426 | 2,056,339 | |||||||||||||
| 1,832 | BANK OF MONTREAL | 92,850 | 146,604 | |||||||||||||
| 4,846 | BANK OF NOVA SCOTIA (THE) | 170,376 | 312,735 | |||||||||||||
| 22,326 | BARRICK GOLD CORP. | 176,666 | 322,901 | |||||||||||||
| 49,653 | BOMBARDIER, INC., CLASS B(c) | 48,169 | 119,689 | |||||||||||||
| 17,842 | BROOKFIELD ASSET MANAGEMENT, INC., CLASS A | 164,123 | 776,702 | |||||||||||||
| 11,740 | CAE, INC. | 85,345 | 218,082 | |||||||||||||
| 287,400 | CANACCORD GENUITY GROUP, INC. (TORONTO STOCK EXCHANGE) | 1,072,383 | 1,326,110 | |||||||||||||
| 15,100 | CANADA GOOSE HOLDINGS, INC.(c) | 252,671 | 477,025 | |||||||||||||
| 6,639 | CANADIAN IMPERIAL BANK OF COMMERCE | 268,953 | 647,210 | |||||||||||||
| 15,994 | CANADIAN NATIONAL RAILWAY CO. | 292,557 | 1,318,837 | |||||||||||||
| 26,238 | CANADIAN NATURAL RESOURCES LTD. | 589,011 | 937,638 | |||||||||||||
| 3,606 | CANADIAN PACIFIC RAILWAY LTD. | 112,878 | 658,834 | |||||||||||||
| 22,695 | CANADIAN PACIFIC RAILWAY LTD. | 2,931,368 | 4,147,738 | |||||||||||||
| 744 | CANADIAN TIRE CORP. LTD., CLASS A | 50,047 | 97,010 | |||||||||||||
| 1,912 | CANADIAN UTILITIES LTD., CLASS A | 57,849 | 56,904 | |||||||||||||
| 70,509 | CANADIAN WESTERN BANK | 1,473,408 | 2,201,653 | |||||||||||||
| 1,570 | CCL INDUSTRIES, INC., CLASS B | 45,979 | 72,542 | |||||||||||||
| 8,419 | CENOVUS ENERGY, INC. | 82,774 | 76,889 | |||||||||||||
| 6,978 | CGI GROUP, INC., CLASS A(c) | 55,128 | 379,155 | |||||||||||||
| 167 | CONSTELLATION SOFTWARE, INC. | 49,226 | 101,239 | |||||||||||||
| 19,949 | DOLLARAMA, INC. | 2,299,336 | 2,492,435 | |||||||||||||
| 7,455 | ECN CAPITAL CORP. | 17,223 | 23,308 | |||||||||||||
| 5,947 | EMERA, INC. | 224,403 | 222,267 | |||||||||||||
| 2,478 | EMPIRE CO. LTD., CLASS A | 48,351 | 48,279 | |||||||||||||
| 33,604 | ENCANA CORP. | 212,882 | 448,321 | |||||||||||||
| 211 | FAIRFAX FINANCIAL HOLDINGS LTD. | 52,589 | 112,355 | |||||||||||||
| 8,046 | FIRST QUANTUM MINERALS LTD. | 52,095 | 112,721 | |||||||||||||
| 6,874 | FORTIS, INC. | 259,096 | 252,156 | |||||||||||||
| 2,389 | FRANCO-NEVADA CORP. | 109,265 | 190,930 | |||||||||||||
| 37,800 | GENWORTH MI CANADA, INC. | 851,030 | 1,308,115 | |||||||||||||
| 1,061 | GEORGE WESTON LTD. | 92,079 | 92,139 | |||||||||||||
| 6,104 | GILDAN ACTIVEWEAR, INC. | 33,435 | 197,202 | |||||||||||||
| 13,297 | GOLDCORP, INC. | 152,025 | 169,571 | |||||||||||||
| 391,600 | GRAN TIERRA ENERGY, INC.(c) | 978,737 | 1,062,336 | |||||||||||||
| 69,511 | IMPERIAL OIL LTD. | 2,511,555 | 2,169,385 | |||||||||||||
| 1,100 | INTERNATIONAL PETROLEUM CORP.(c) | 2,833 | 4,801 | |||||||||||||
| 33,281 | KINROSS GOLD CORP.(c) | 62,810 | 143,503 | |||||||||||||
| 3,301 | LOBLAW COS. LTD. | 137,581 | 179,152 | |||||||||||||
| 9,476 | MAGNA INTERNATIONAL, INC. | 61,549 | 537,049 | |||||||||||||
| 31,473 | MANULIFE FINANCIAL CORP. | 380,571 | 656,501 | |||||||||||||
| 1,723 | METHANEX CORP. | 23,658 | 104,394 | |||||||||||||
| 3,000 | METRO, INC. | 54,328 | 96,062 | |||||||||||||
| 98,400 | MULLEN GROUP LTD. | 1,412,125 | 1,232,153 | |||||||||||||
| 2,600 | ONEX CORP. | 105,376 | 190,687 | |||||||||||||
| 6,564 | OPEN TEXT CORP. | 72,477 | 233,474 | |||||||||||||
| 23,139 | PEMBINA PIPELINE CORP. | 537,455 | 837,753 | |||||||||||||
| 13,400 | POTASH CORP. OF SASKATCHEWAN, INC. | 222,258 | 274,823 | |||||||||||||
| 583 | PRAIRIESKY ROYALTY LTD. | 11,473 | 14,869 | |||||||||||||
| 3,681 | RESTAURANT BRANDS INTERNATIONAL, INC. | 137,022 | 226,278 | |||||||||||||
See accompanying notes to financial statements. | 65 | (Continued) |
CLEARWATER INVESTMENT TRUST
Schedule of Investments - Clearwater International Fund
December 31, 2017
| Percent of | ||||||||||||||||
| Shares | Security | Cost | Fair value (a) | net assets | ||||||||||||
| Canada (Cont’d): | ||||||||||||||||
| 2,451 | RIOCAN REAL ESTATE INVESTMENT TRUST | $ | 47,061 | 47,499 | ||||||||||||
| 2,701 | RITCHIE BROS. AUCTIONEERS, INC. | 50,064 | 80,880 | |||||||||||||
| 9,354 | ROGERS COMMUNICATIONS, INC., CLASS B | 221,766 | 476,630 | |||||||||||||
| 27,066 | ROYAL BANK OF CANADA | 909,444 | 2,210,282 | |||||||||||||
| 52,500 | RUSSEL METALS, INC. | 957,245 | 1,218,317 | |||||||||||||
| 4,800 | SAPUTO, INC. | 103,951 | 172,525 | |||||||||||||
| 4,800 | SEVEN GENERATIONS ENERGY LTD., CLASS A(c) | 46,370 | 67,895 | |||||||||||||
| 6,379 | SHAW COMMUNICATIONS, INC., CLASS B | 97,657 | 145,595 | |||||||||||||
| 58,800 | SHAWCOR LTD. | 1,429,412 | 1,282,654 | |||||||||||||
| 2,748 | SMARTCENTRES REAL ESTATE INVESTMENT TRUST | 64,278 | 67,574 | |||||||||||||
| 2,877 | SNC-LAVALIN GROUP, INC. | 119,463 | 130,575 | |||||||||||||
| 11,810 | SUN LIFE FINANCIAL, INC. | 235,812 | 487,433 | |||||||||||||
| 32,366 | SUNCOR ENERGY, INC. | 755,817 | 1,188,298 | |||||||||||||
| 19,201 | TECK RESOURCES LTD., CLASS B | 97,101 | 502,098 | |||||||||||||
| 4,548 | TELUS CORP. | 59,716 | 172,296 | |||||||||||||
| 8,041 | THOMSON REUTERS CORP. | 206,631 | 350,490 | |||||||||||||
| 30,016 | TORONTO-DOMINION BANK (THE) | 557,894 | 1,758,694 | |||||||||||||
| 10,948 | TOURMALINE OIL CORP.(c) | 204,980 | 198,405 | |||||||||||||
| 11,817 | TRANSCANADA CORP. | 511,702 | 575,150 | |||||||||||||
| 104 | TRISURA GROUP LTD. (TORONTO STOCK EXCHANGE)(c) | 490 | 2,131 | |||||||||||||
| 18,713 | TURQUOISE HILL RESOURCES LTD.(c) | 35,694 | 63,865 | |||||||||||||
| 1,366 | VERMILION ENERGY, INC. | 48,551 | 49,641 | |||||||||||||
| 4,726 | WHEATON PRECIOUS METALS CORP. | 58,903 | 104,483 | |||||||||||||
| 25,967 | YAMANA GOLD, INC. | 47,753 | 80,979 | |||||||||||||
| 29,518,244 | 43,627,447 | 6.98 | % | |||||||||||||
| China: | ||||||||||||||||
| 18,630 | BAIDU, INC. ADR(c)(d) | 2,566,346 | 4,363,332 | |||||||||||||
| 1,632,000 | CHINA ZHENGTONG AUTO SERVICES HOLDINGS LTD. | 941,242 | 1,652,293 | |||||||||||||
| 2,221,000 | GOODBABY INTERNATIONAL HOLDINGS LTD. | 1,019,656 | 1,219,541 | |||||||||||||
| 1,977,000 | GREATVIEW ASEPTIC PACKAGING CO. LTD. | 1,052,505 | 1,442,355 | |||||||||||||
| 39,300 | HOLLYSYS AUTOMATION TECHNOLOGIES LTD. | 796,982 | 875,211 | |||||||||||||
| 70,400 | SHANGHAI HAOHAI BIOLOGICAL TECHNOLOGY CO. LTD., CLASS H(e) | 326,859 | 337,905 | |||||||||||||
| 69,255 | TENCENT HOLDINGS LTD. | 464,936 | 3,598,883 | |||||||||||||
| 2,953,000 | XTEP INTERNATIONAL HOLDINGS LTD. | 1,239,096 | 1,152,799 | |||||||||||||
| 8,407,622 | 14,642,319 | 2.34 | % | |||||||||||||
| Denmark: | ||||||||||||||||
| 74 | AP MOLLER - MAERSK A/S, CLASS A | 73,820 | 123,558 | |||||||||||||
| 147 | AP MOLLER - MAERSK A/S, CLASS B | 155,573 | 256,818 | |||||||||||||
| 21,538 | CARLSBERG A/S, CLASS B | 1,865,766 | 2,586,073 | |||||||||||||
| 35,335 | CHR HANSEN HOLDING A/S | 1,625,437 | 3,314,418 | |||||||||||||
| 22,261 | COLOPLAST A/S, CLASS B | 1,453,138 | 1,770,562 | |||||||||||||
| 13,100 | DANSKE BANK A/S | 138,182 | 510,091 | |||||||||||||
| 1,592 | DSV A/S | 48,904 | 125,365 | |||||||||||||
| 200 | FLSMIDTH & CO. A/S | 6,012 | 11,646 | |||||||||||||
| 808 | GENMAB A/S(c) | 101,229 | 134,000 | |||||||||||||
| 62,467 | ISS A/S | 2,054,332 | 2,419,266 | |||||||||||||
| 23,139 | NOVO NORDISK A/S, CLASS B | 335,305 | 1,247,441 | |||||||||||||
| 55,367 | NOVOZYMES A/S, CLASS B | 1,728,098 | 3,163,344 | |||||||||||||
| 2,600 | PANDORA A/S | 18,150 | 283,060 | |||||||||||||
| 10,154 | TDC A/S | 50,412 | 62,400 | |||||||||||||
| 3,250 | TOPDANMARK A/S(c) | 33,362 | 140,430 | |||||||||||||
| 3,244 | VESTAS WIND SYSTEMS A/S | 150,564 | 224,189 | |||||||||||||
| 3,896 | WILLIAM DEMANT HOLDING A/S(c) | 70,444 | 108,942 | |||||||||||||
| 9,908,728 | 16,481,603 | 2.64 | % | |||||||||||||
| Finland: | ||||||||||||||||
| 100,041 | AMER SPORTS OYJ(c) | 1,928,073 | 2,771,589 | |||||||||||||
| 2,770 | ELISA OYJ | 86,574 | 108,748 | |||||||||||||
| 64,770 | HUHTAMAKI OYJ | 1,931,841 | 2,720,000 | |||||||||||||
| 1,396 | KESKO OYJ, CLASS B | 30,705 | 75,793 | |||||||||||||
| 4,902 | KONE OYJ, CLASS B | 86,493 | 263,381 | |||||||||||||
| 7,075 | NESTE OYJ | 67,704 | 452,885 | |||||||||||||
| 61,900 | NOKIA OYJ (HELSINKI EXCHANGE) | 203,584 | 289,210 | |||||||||||||
| 2,240 | NOKIAN RENKAAT OYJ | 31,307 | 101,594 | |||||||||||||
| 1,960 | ORION OYJ, CLASS B | 49,561 | 73,091 | |||||||||||||
| 103,442 | OUTOTEC OYJ(c) | 822,621 | 881,216 | |||||||||||||
See accompanying notes to financial statements. | 66 | (Continued) |
CLEARWATER INVESTMENT TRUST
Schedule of Investments - Clearwater International Fund
December 31, 2017
| Percent of | ||||||||||||||||
| Shares | Security | Cost | Fair value (a) | net assets | ||||||||||||
| Finland (Cont’d): | ||||||||||||||||
| 5,232 | SAMPO OYJ, CLASS A | $ | 211,995 | 287,515 | ||||||||||||
| 15,829 | STORA ENSO OYJ (REGISTERED) | 75,698 | 251,080 | |||||||||||||
| 11,934 | UPM-KYMMENE OYJ | 99,928 | 371,005 | |||||||||||||
| 1,849 | VALMET OYJ | 14,443 | 36,472 | |||||||||||||
| 2,352 | WARTSILA OYJ ABP | 56,960 | 148,440 | |||||||||||||
| 5,697,487 | 8,832,019 | 1.41 | % | |||||||||||||
| France: | ||||||||||||||||
| 1,275 | ACCOR S.A. | 29,826 | 65,782 | |||||||||||||
| 3,443 | AEROPORTS DE PARIS | 334,974 | 654,777 | |||||||||||||
| 10,877 | AIRBUS S.E. | 357,319 | 1,083,214 | |||||||||||||
| 1,093 | ARKEMA S.A. | 77,841 | 133,176 | |||||||||||||
| 435 | ATOS S.E. | 30,494 | 63,337 | |||||||||||||
| 30,343 | AXA S.A. | 403,058 | 900,528 | |||||||||||||
| 16,523 | BNP PARIBAS S.A. | 678,366 | 1,234,114 | |||||||||||||
| 16,698 | BOLLORE S.A. | 52,911 | 90,719 | |||||||||||||
| 2,871 | BOUYGUES S.A. | 90,917 | 149,193 | |||||||||||||
| 3,068 | CAPGEMINI S.E. | 111,959 | 364,028 | |||||||||||||
| 2,834 | CARREFOUR S.A. | 51,599 | 61,343 | |||||||||||||
| 774 | CASINO GUICHARD PERRACHON S.A. | 36,795 | 46,954 | |||||||||||||
| 8,207 | CIE DE SAINT-GOBAIN | 279,263 | 452,773 | |||||||||||||
| 3,404 | CIE GENERALE DES ETABLISSEMENTS MICHELIN | 180,725 | 488,277 | |||||||||||||
| 26,672 | CREDIT AGRICOLE S.A. | 211,038 | 441,633 | |||||||||||||
| 9,359 | DANONE S.A. | 473,663 | 785,496 | |||||||||||||
| 1,781 | EDENRED | 26,435 | 51,671 | |||||||||||||
| 67,951 | ENGIE S.A. | 864,155 | 1,168,747 | |||||||||||||
| 19,018 | ESSILOR INTERNATIONAL CIE GENERALE D’OPTIQUE S.A. | 2,383,453 | 2,623,015 | |||||||||||||
| 2,673 | EURAZEO S.A. | 77,917 | 246,954 | |||||||||||||
| 1,133 | FONCIERE DES REGIONS | 96,781 | 128,439 | |||||||||||||
| 564 | GECINA S.A. | 51,331 | 104,147 | |||||||||||||
| 9,468 | GETLINK S.E. | 72,457 | 121,781 | |||||||||||||
| 4,585 | HERMES INTERNATIONAL | 1,723,178 | 2,454,961 | |||||||||||||
| 514 | ILIAD S.A. | 68,964 | 123,190 | |||||||||||||
| 740 | INGENICO GROUP S.A. | 56,963 | 79,031 | |||||||||||||
| 1,026 | KERING | 174,510 | 483,801 | |||||||||||||
| 2,335 | KLEPIERRE S.A. | 57,367 | 102,723 | |||||||||||||
| 2,119 | LAGARDERE S.C.A. | 50,227 | 67,961 | |||||||||||||
| 4,882 | LEGRAND S.A. | 111,114 | 376,004 | |||||||||||||
| 6,266 | L’OREAL S.A. | 661,338 | 1,390,502 | |||||||||||||
| 16,443 | LVMH MOET HENNESSY LOUIS VUITTON S.E. | 2,408,212 | 4,841,529 | |||||||||||||
| 20,736 | NATIXIS S.A. | 68,871 | 164,109 | |||||||||||||
| 39,439 | ORANGE S.A. | 438,130 | 684,970 | |||||||||||||
| 2,741 | PERNOD RICARD S.A. | 172,088 | 433,956 | |||||||||||||
| 12,969 | PEUGEOT S.A. | 78,174 | 263,834 | |||||||||||||
| 4,895 | RENAULT S.A. | 134,511 | 492,826 | |||||||||||||
| 2,684 | SAFRAN S.A. | 123,278 | 276,664 | |||||||||||||
| 24,263 | SANOFI | 1,499,641 | 2,091,694 | |||||||||||||
| 278 | SCHNEIDER ELECTRIC S.E. | 8,838 | 23,699 | |||||||||||||
| 7,138 | SCHNEIDER ELECTRIC S.E.(c) | 267,356 | 606,883 | |||||||||||||
| 1,813 | SCOR S.E. | 36,441 | 72,971 | |||||||||||||
| 3,283 | SES S.A. | 48,195 | 51,248 | |||||||||||||
| 14,520 | SOCIETE GENERALE S.A. | 503,103 | 750,009 | |||||||||||||
| 8,495 | SODEXO S.A. | 653,272 | 1,142,095 | |||||||||||||
| 9,578 | TELEVISION FRANCAISE 1 | 79,414 | 141,181 | |||||||||||||
| 1,413 | THALES S.A. | 81,763 | 152,382 | |||||||||||||
| 21,913 | TOTAL S.A. | 1,029,479 | 1,210,630 | |||||||||||||
| 1,568 | UNIBAIL-RODAMCO S.E. | 177,708 | 395,087 | |||||||||||||
| 1,878 | VALEO S.A. | 76,759 | 140,314 | |||||||||||||
| 13,671 | VEOLIA ENVIRONNEMENT S.A. | 145,445 | 348,977 | |||||||||||||
| 7,810 | VINCI S.A. | 316,569 | 797,926 | |||||||||||||
| 88,523 | VIVENDI S.A. | 1,711,533 | 2,381,325 | |||||||||||||
| 1,345 | WENDEL S.A. | 91,561 | 233,032 | |||||||||||||
| 1,683 | ZODIAC AEROSPACE | 49,891 | 50,342 | |||||||||||||
| 20,077,170 | 34,285,954 | 5.49 | % | |||||||||||||
| Germany: | ||||||||||||||||
| 15,164 | ADIDAS A.G. | 2,038,114 | 3,041,215 | |||||||||||||
| 8,277 | ALLIANZ S.E. (REGISTERED) | 727,077 | 1,901,817 | |||||||||||||
| 15,026 | BASF S.E. | 542,099 | 1,653,976 | |||||||||||||
See accompanying notes to financial statements. | 67 | (Continued) |
CLEARWATER INVESTMENT TRUST
Schedule of Investments - Clearwater International Fund
December 31, 2017
| Percent of | ||||||||||||||||
| Shares | Security | Cost | Fair value (a) | net assets | ||||||||||||
| Germany (Cont’d): | ||||||||||||||||
| 17,136 | BAYER A.G. (REGISTERED) | $ | 1,013,636 | 2,138,306 | ||||||||||||
| 5,770 | BAYERISCHE MOTOREN WERKE A.G. | 473,448 | 601,136 | |||||||||||||
| 2,206 | BEIERSDORF A.G. | 146,950 | 259,128 | |||||||||||||
| 1,188 | BRENNTAG A.G. | 43,546 | 75,220 | |||||||||||||
| 29,496 | COMMERZBANK A.G.(c) | 190,394 | 442,562 | |||||||||||||
| 916 | CONTINENTAL A.G. | 47,943 | 247,344 | |||||||||||||
| 17,639 | DAIMLER A.G. (REGISTERED) | 589,913 | 1,498,422 | |||||||||||||
| 18,447 | DEUTSCHE BANK A.G. (REGISTERED) | 290,219 | 351,371 | |||||||||||||
| 4,525 | DEUTSCHE BOERSE A.G. | 273,152 | 525,558 | |||||||||||||
| 2,487 | DEUTSCHE LUFTHANSA A.G. (REGISTERED) | 29,539 | 91,669 | |||||||||||||
| 17,828 | DEUTSCHE POST A.G. (REGISTERED) | 210,542 | 850,289 | |||||||||||||
| 72,227 | DEUTSCHE TELEKOM A.G. (REGISTERED) | 948,582 | 1,282,158 | |||||||||||||
| 3,463 | DEUTSCHE WOHNEN S.E. | 80,362 | 151,494 | |||||||||||||
| 13,749 | E.ON S.E. | 110,135 | 149,477 | |||||||||||||
| 594 | FRESENIUS MEDICAL CARE A.G. & CO. KGAA | 21,418 | 62,562 | |||||||||||||
| 6,867 | FRESENIUS S.E. & CO. KGAA | 150,261 | 536,136 | |||||||||||||
| 29,661 | GERRESHEIMER A.G. | 2,046,132 | 2,459,894 | |||||||||||||
| 76,043 | GRAND CITY PROPERTIES S.A. | 1,218,832 | 1,792,870 | |||||||||||||
| 2,246 | HANNOVER RUECK S.E. | 94,321 | 282,691 | |||||||||||||
| 3,952 | HEIDELBERGCEMENT A.G. | 143,515 | 427,948 | |||||||||||||
| 671 | HENKEL A.G. & CO. KGAA | 49,267 | 80,510 | |||||||||||||
| 2,600 | HOCHTIEF A.G. | 108,936 | 460,454 | |||||||||||||
| 1,280 | HUGO BOSS A.G. | 70,065 | 108,950 | |||||||||||||
| 21,437 | INFINEON TECHNOLOGIES A.G. | 117,250 | 587,343 | |||||||||||||
| 69,612 | JENOPTIK A.G. | 1,490,920 | 2,300,667 | |||||||||||||
| 2,661 | K+S A.G. (REGISTERED) | 50,126 | 66,267 | |||||||||||||
| 1,373 | LINDE A.G. | 199,368 | 298,837 | |||||||||||||
| 656 | LINDE A.G.(c) | 153,393 | 153,209 | |||||||||||||
| 542 | MAN S.E. | 59,053 | 62,040 | |||||||||||||
| 2,050 | MERCK KGAA | 86,079 | 220,757 | |||||||||||||
| 3,091 | MUENCHENER RUECKVERSICHERUNGS-GESELLSCHAFT A.G. IN MUENCHEN (REGISTERED) | 382,823 | 670,354 | |||||||||||||
| 1,517 | OSRAM LICHT A.G. | 42,957 | 136,386 | |||||||||||||
| 1,489 | PROSIEBENSAT.1 MEDIA S.E. | 25,180 | 51,284 | |||||||||||||
| 4,124 | RATIONAL A.G. | 1,536,038 | 2,658,163 | |||||||||||||
| 2,803 | RWE A.G.(c) | 57,958 | 57,174 | |||||||||||||
| 17,103 | SAP S.E. | 683,559 | 1,917,691 | |||||||||||||
| 13,106 | SIEMENS A.G. (REGISTERED) | 795,701 | 1,826,486 | |||||||||||||
| 21,310 | STABILUS S.A. | 1,262,498 | 1,916,382 | |||||||||||||
| 33,787 | TELEFONICA DEUTSCHLAND HOLDING A.G. | 130,155 | 169,698 | |||||||||||||
| 2,356 | THYSSENKRUPP A.G. | 44,466 | 68,452 | |||||||||||||
| 7,071 | TUI A.G. - CDI | 57,698 | 145,673 | |||||||||||||
| 9,713 | TUI A.G. - CDI (LONDON EXCHANGE) | 124,901 | 201,956 | |||||||||||||
| 4,249 | UNIPER S.E. | 47,803 | 132,552 | |||||||||||||
| 404 | VOLKSWAGEN A.G. | 40,235 | 81,776 | |||||||||||||
| 2,682 | VONOVIA S.E. | 98,410 | 133,193 | |||||||||||||
| 1,702 | ZALANDO S.E.(c)(e) | 61,430 | 90,089 | |||||||||||||
| 19,206,399 | 35,419,586 | 5.67 | % | |||||||||||||
| Greece: | ||||||||||||||||
| 6,746 | HELLENIC TELECOMMUNICATIONS ORGANIZATION S.A. | 54,075 | 93,083 | |||||||||||||
| 54,075 | 93,083 | 0.02 | % | |||||||||||||
| Hong Kong: | ||||||||||||||||
| 669,800 | AIA GROUP LTD. | 3,771,814 | 5,713,942 | |||||||||||||
| 181,500 | BOC HONG KONG HOLDINGS LTD. | 447,601 | 919,946 | |||||||||||||
| 56,044 | CK ASSET HOLDINGS LTD. | 165,366 | 489,937 | |||||||||||||
| 52,044 | CK HUTCHISON HOLDINGS LTD. | 307,834 | 653,477 | |||||||||||||
| 10,000 | CK INFRASTRUCTURE HOLDINGS LTD. | 46,496 | 85,948 | |||||||||||||
| 34,500 | CLP HOLDINGS LTD. | 236,618 | 353,043 | |||||||||||||
| 18,000 | GALAXY ENTERTAINMENT GROUP LTD. | 39,054 | 144,454 | |||||||||||||
| 15,300 | HANG SENG BANK LTD. | 175,457 | 379,913 | |||||||||||||
| 20,936 | HENDERSON LAND DEVELOPMENT CO. LTD. | 45,544 | 138,004 | |||||||||||||
| 93,690 | HONG KONG & CHINA GAS CO. LTD. | 169,115 | 183,714 | |||||||||||||
| 12,600 | HONG KONG EXCHANGES & CLEARING LTD. | 218,717 | 386,732 | |||||||||||||
| 400 | HOPEWELL HIGHWAY INFRASTRUCTURE LTD. | 229 | 255 | |||||||||||||
| 17,941 | I-CABLE COMMUNICATIONS LTD.(c) | 648 | 526 | |||||||||||||
| 40,500 | LINK REIT | 84,196 | 375,564 | |||||||||||||
| 30,500 | MTR CORP. LTD. | 88,703 | 178,795 | |||||||||||||
See accompanying notes to financial statements. | 68 | (Continued) |
CLEARWATER INVESTMENT TRUST
Schedule of Investments - Clearwater International Fund
December 31, 2017
| Percent of | ||||||||||||||||
| Shares | Security | Cost | Fair value (a) | net assets | ||||||||||||
| Hong Kong (Cont’d): | ||||||||||||||||
| 43,500 | NWS HOLDINGS LTD. | $ | 52,824 | 78,505 | ||||||||||||
| 1,740,000 | PAX GLOBAL TECHNOLOGY LTD. | 895,404 | 779,485 | |||||||||||||
| 190,000 | PCCW LTD. | 77,805 | 110,408 | |||||||||||||
| 24,000 | POWER ASSETS HOLDINGS LTD. | 139,092 | 202,589 | |||||||||||||
| 172,800 | SANDS CHINA LTD. | 551,191 | 892,437 | |||||||||||||
| 27,400 | SINO LAND CO. LTD. | 29,978 | 48,538 | |||||||||||||
| 517,000 | STELLA INTERNATIONAL HOLDINGS LTD. | 1,145,145 | 780,842 | |||||||||||||
| 8,000 | SUN HUNG KAI PROPERTIES LTD. | 65,036 | 133,524 | |||||||||||||
| 19,000 | SWIRE PACIFIC LTD., CLASS A | 127,857 | 175,947 | |||||||||||||
| 500,900 | TECHTRONIC INDUSTRIES CO. LTD. | 1,550,039 | 3,266,523 | |||||||||||||
| 786,000 | VALUE PARTNERS GROUP LTD. | 529,141 | 835,009 | |||||||||||||
| 143,000 | VTECH HOLDINGS LTD. | 1,910,632 | 1,874,246 | |||||||||||||
| 83,500 | WH GROUP LTD.(e) | 45,547 | 94,264 | |||||||||||||
| 6,000 | WHARF HOLDINGS (THE) LTD. | 50,398 | 20,735 | |||||||||||||
| 6,000 | WHARF REAL ESTATE INVESTMENT CO. LTD.(c) | 34,958 | 39,934 | |||||||||||||
| 19,000 | WHEELOCK & CO. LTD. | 30,489 | 135,700 | |||||||||||||
| 15,000 | YUE YUEN INDUSTRIAL HOLDINGS LTD. | 30,233 | 58,941 | |||||||||||||
| 13,063,161 | 19,531,877 | 3.13 | % | |||||||||||||
| India: | ||||||||||||||||
| 314,897 | DEWAN HOUSING FINANCE CORP. LTD. | 1,509,041 | 2,874,787 | |||||||||||||
| 143,344 | HCL TECHNOLOGIES LTD. | 1,723,615 | 1,999,888 | |||||||||||||
| 38,045 | HDFC BANK LTD. ADR(d) | 2,396,990 | 3,868,035 | |||||||||||||
| 5,629,646 | 8,742,710 | 1.40 | % | |||||||||||||
| Ireland: | ||||||||||||||||
| 35,704 | ACCENTURE PLC, CLASS A | 3,731,448 | 5,465,925 | |||||||||||||
| 1,332 | AERCAP HOLDINGS N.V.(c) | 50,212 | 70,077 | |||||||||||||
| 16,075 | CRH PLC (DUBLIN EXCHANGE) | 247,661 | 577,760 | |||||||||||||
| 1,342 | DCC PLC | 129,288 | 135,258 | |||||||||||||
| 22,916 | ICON PLC(c) | 1,672,592 | 2,570,029 | |||||||||||||
| 11,673 | JAMES HARDIE INDUSTRIES PLC - CDI | 105,224 | 206,020 | |||||||||||||
| 3,255 | KERRY GROUP PLC, CLASS A | 214,084 | 365,165 | |||||||||||||
| 33,520 | MEDTRONIC PLC | 2,582,668 | 2,706,740 | |||||||||||||
| 506 | PADDY POWER BETFAIR PLC (DUBLIN EXCHANGE) | 55,156 | 60,227 | |||||||||||||
| 19,340 | RYANAIR HOLDINGS PLC ADR(c)(d) | 2,102,283 | 2,015,035 | |||||||||||||
| 10,890,616 | 14,172,236 | 2.27 | % | |||||||||||||
| Israel: | ||||||||||||||||
| 21,007 | BANK HAPOALIM B.M. | 79,922 | 154,489 | |||||||||||||
| 2,094 | CHECK POINT SOFTWARE TECHNOLOGIES LTD.(c) | 161,340 | 216,980 | |||||||||||||
| 5,900 | MIZRAHI TEFAHOT BANK LTD. | 51,135 | 108,771 | |||||||||||||
| 2,937 | NICE LTD. | 148,741 | 265,454 | |||||||||||||
| 9,647 | TEVA PHARMACEUTICAL INDUSTRIES LTD. ADR(d) | 139,124 | 182,811 | |||||||||||||
| 580,262 | 928,505 | 0.15 | % | |||||||||||||
| Italy: | ||||||||||||||||
| 25,746 | ASSICURAZIONI GENERALI S.P.A. | 314,339 | 469,548 | |||||||||||||
| 18,890 | ATLANTIA S.P.A. | 374,706 | 596,547 | |||||||||||||
| 63,009 | AZIMUT HOLDING S.P.A. | 1,015,728 | 1,207,354 | |||||||||||||
| 25,272 | BANCA MEDIOLANUM S.P.A. | 87,322 | 218,778 | |||||||||||||
| 81,915 | ENEL S.P.A. | 280,368 | 504,206 | |||||||||||||
| 1,022 | FERRARI N.V. | 9,333 | 107,146 | |||||||||||||
| 22,181 | FERRARI N.V. | 2,144,396 | 2,327,383 | |||||||||||||
| 1,181 | GEDI GRUPPO EDITORIALE S.P.A.(c) | 1,053 | 994 | |||||||||||||
| 92,703 | INTERPUMP GROUP S.P.A. | 1,954,865 | 2,916,443 | |||||||||||||
| 190,462 | INTESA SANPAOLO S.P.A. | 334,054 | 633,017 | |||||||||||||
| 10,070 | LEONARDO S.P.A. | 50,331 | 119,858 | |||||||||||||
| 39,101 | LUXOTTICA GROUP S.P.A. | 2,058,977 | 2,399,719 | |||||||||||||
| 10,830 | MEDIOBANCA S.P.A. | 70,955 | 122,927 | |||||||||||||
| 1,669 | PRYSMIAN S.P.A. | 29,837 | 54,449 | |||||||||||||
| 695 | RIZZOLI CORRIERE DELLA SERA MEDIAGROUP S.P.A.(c) | 460 | 1,019 | |||||||||||||
| 76,191 | SNAM S.P.A. | 276,534 | 372,984 | |||||||||||||
| 290,733 | TECHNOGYM S.P.A.(e) | 1,828,782 | 2,816,851 | |||||||||||||
| 30,527 | TENARIS S.A. | 385,417 | 482,022 | |||||||||||||
| 34,652 | TERNA RETE ELETTRICA NAZIONALE S.P.A. | 130,368 | 201,400 | |||||||||||||
| 18,447 | TOD’S S.P.A. | 1,228,297 | 1,347,938 | |||||||||||||
| 23,123 | UNICREDIT S.P.A.(c) | 340,149 | 432,254 | |||||||||||||
See accompanying notes to financial statements. | 69 | (Continued) |
CLEARWATER INVESTMENT TRUST
Schedule of Investments - Clearwater International Fund
December 31, 2017
| Percent of | ||||||||||||||||
| Shares | Security | Cost | Fair value (a) | net assets | ||||||||||||
| Italy (Cont’d): | ||||||||||||||||
| 95,230 | UNIPOLSAI ASSICURAZIONI S.P.A. | $ | 153,826 | 222,468 | ||||||||||||
| 13,070,097 | 17,555,305 | 2.81 | % | |||||||||||||
| Japan: | ||||||||||||||||
| 1,400 | ABC-MART, INC. | 51,583 | 80,390 | |||||||||||||
| 4,700 | AEON CO. LTD. | 52,433 | 79,359 | |||||||||||||
| 4,800 | AEON FINANCIAL SERVICE CO. LTD. | 49,903 | 111,783 | |||||||||||||
| 3,600 | AEON MALL CO. LTD. | 50,736 | 70,418 | |||||||||||||
| 2,300 | AISIN SEIKI CO. LTD. | 37,584 | 129,212 | |||||||||||||
| 15,000 | AJINOMOTO CO., INC. | 116,767 | 282,361 | |||||||||||||
| 2,500 | ALFRESA HOLDINGS CORP. | 24,420 | 58,731 | |||||||||||||
| 2,000 | AMADA HOLDINGS CO. LTD. | 10,582 | 27,229 | |||||||||||||
| 1,400 | ANA HOLDINGS, INC. | 35,110 | 58,473 | |||||||||||||
| 65,400 | ANICOM HOLDINGS, INC. | 1,452,220 | 2,109,865 | |||||||||||||
| 1,800 | AOZORA BANK LTD. | 51,121 | 70,051 | |||||||||||||
| 67,700 | ASAHI CO. LTD. | 935,870 | 788,306 | |||||||||||||
| 5,600 | ASAHI GROUP HOLDINGS LTD. | 85,235 | 277,826 | |||||||||||||
| 31,000 | ASAHI KASEI CORP. | 147,138 | 399,898 | |||||||||||||
| 111,300 | ASICS CORP. | 1,795,253 | 1,774,083 | |||||||||||||
| 37,000 | ASTELLAS PHARMA, INC. | 236,149 | 471,879 | |||||||||||||
| 1,500 | BANDAI NAMCO HOLDINGS, INC. | 14,652 | 49,057 | |||||||||||||
| 6,600 | BANK OF KYOTO (THE) LTD. | 216,700 | 343,838 | |||||||||||||
| 13,800 | BRIDGESTONE CORP. | 205,726 | 641,530 | |||||||||||||
| 5,200 | BROTHER INDUSTRIES LTD. | 38,445 | 128,298 | |||||||||||||
| 156,800 | BUNKA SHUTTER CO. LTD. | 1,279,360 | 1,509,900 | |||||||||||||
| 15,500 | CANON, INC. | 438,724 | 577,768 | |||||||||||||
| 50,200 | CAPCOM CO. LTD. | 1,046,441 | 1,592,767 | |||||||||||||
| 2,800 | CENTRAL JAPAN RAILWAY CO. | 245,792 | 501,478 | |||||||||||||
| 4,500 | CHUGAI PHARMACEUTICAL CO. LTD. | 82,278 | 230,442 | |||||||||||||
| 7,900 | CITIZEN WATCH CO. LTD. | 31,581 | 57,984 | |||||||||||||
| 9,857 | CONCORDIA FINANCIAL GROUP LTD. | 47,717 | 59,488 | |||||||||||||
| 2,500 | DAI NIPPON PRINTING CO. LTD. | 46,806 | 55,758 | |||||||||||||
| 137,500 | DAIBIRU CORP. | 1,376,777 | 1,732,860 | |||||||||||||
| 16,500 | DAI-ICHI LIFE HOLDINGS, INC. | 198,959 | 340,324 | |||||||||||||
| 9,700 | DAIICHI SANKYO CO. LTD. | 150,922 | 252,841 | |||||||||||||
| 4,500 | DAIKIN INDUSTRIES LTD. | 124,473 | 532,572 | |||||||||||||
| 1,200 | DAITO TRUST CONSTRUCTION CO. LTD. | 117,985 | 244,686 | |||||||||||||
| 13,600 | DAIWA HOUSE INDUSTRY CO. LTD. | 194,625 | 522,274 | |||||||||||||
| 25,000 | DAIWA SECURITIES GROUP, INC. | 96,011 | 156,845 | |||||||||||||
| 8,200 | DENSO CORP. | 185,234 | 492,182 | |||||||||||||
| 2,800 | DENTSU, INC. | 46,871 | 118,660 | |||||||||||||
| 84,200 | DESCENTE LTD. | 762,552 | 1,454,958 | |||||||||||||
| 55,000 | DOWA HOLDINGS CO. LTD. | 1,854,964 | 2,245,396 | |||||||||||||
| 7,000 | EAST JAPAN RAILWAY CO. | 392,789 | 683,071 | |||||||||||||
| 3,400 | EISAI CO. LTD. | 112,861 | 193,605 | |||||||||||||
| 7,500 | ELECTRIC POWER DEVELOPMENT CO. LTD. | 169,053 | 202,019 | |||||||||||||
| 1,800 | FAMILYMART UNY HOLDINGS CO. LTD. | 52,590 | 126,204 | |||||||||||||
| 3,100 | FANUC CORP. | 243,447 | 744,495 | |||||||||||||
| 1,400 | FAST RETAILING CO. LTD. | 214,903 | 558,012 | |||||||||||||
| 21,000 | FUJI ELECTRIC CO. LTD. | 51,969 | 158,234 | |||||||||||||
| 65,700 | FUJI OIL HOLDINGS, INC. | 1,298,414 | 1,921,291 | |||||||||||||
| 8,800 | FUJIFILM HOLDINGS CORP. | 165,274 | 359,654 | |||||||||||||
| 18,000 | FUJITSU LTD. | 64,886 | 128,233 | |||||||||||||
| 70,000 | FUKUOKA FINANCIAL GROUP, INC. | 230,551 | 393,255 | |||||||||||||
| 3,200 | FURUKAWA ELECTRIC CO. LTD. | 65,376 | 157,905 | |||||||||||||
| 49,500 | HACHIJUNI BANK (THE) LTD. | 214,554 | 284,238 | |||||||||||||
| 3,000 | HAMAMATSU PHOTONICS K.K. | 52,686 | 100,910 | |||||||||||||
| 2,400 | HANKYU HANSHIN HOLDINGS, INC. | 57,098 | 96,490 | |||||||||||||
| 325 | HIROSE ELECTRIC CO. LTD. | 28,701 | 47,506 | |||||||||||||
| 95,000 | HITACHI LTD. | 295,895 | 740,186 | |||||||||||||
| 6,200 | HITACHI METALS LTD. | 47,471 | 89,031 | |||||||||||||
| 12,400 | HONDA MOTOR CO. LTD. | 301,692 | 425,017 | |||||||||||||
| 5,300 | HOYA CORP. | 112,594 | 264,730 | |||||||||||||
| 34,900 | IDEC CORP. | 849,773 | 831,343 | |||||||||||||
| 193,200 | IDOM, INC. | 1,120,217 | 1,371,733 | |||||||||||||
| 18,200 | ITOCHU CORP. | 192,005 | 339,690 | |||||||||||||
| 4,000 | J FRONT RETAILING CO. LTD. | 31,099 | 75,367 | |||||||||||||
| 7,000 | JAPAN EXCHANGE GROUP, INC. | 56,090 | 121,828 | |||||||||||||
See accompanying notes to financial statements. | 70 | (Continued) |
CLEARWATER INVESTMENT TRUST
Schedule of Investments - Clearwater International Fund
December 31, 2017
| Percent of | ||||||||||||||||
| Shares | Security | Cost | Fair value (a) | net assets | ||||||||||||
| Japan (Cont’d): | ||||||||||||||||
| 10 | JAPAN REAL ESTATE INVESTMENT CORP. | $ | 49,036 | 47,482 | ||||||||||||
| 27 | JAPAN RETAIL FUND INVESTMENT CORP. | 47,846 | 49,507 | |||||||||||||
| 11,600 | JAPAN TOBACCO, INC. | 332,221 | 373,815 | |||||||||||||
| 5,000 | JTEKT CORP. | 36,670 | 85,911 | |||||||||||||
| 84,700 | JXTG HOLDINGS, INC. | 326,972 | 546,500 | |||||||||||||
| 13,000 | KAJIMA CORP. | 44,950 | 125,068 | |||||||||||||
| 2,100 | KANSAI PAINT CO. LTD. | 12,205 | 54,571 | |||||||||||||
| 10,000 | KAO CORP. | 208,279 | 676,193 | |||||||||||||
| 3,500 | KAWASAKI HEAVY INDUSTRIES LTD. | 71,135 | 122,853 | |||||||||||||
| 29,862 | KDDI CORP. | 239,416 | 743,270 | |||||||||||||
| 4,000 | KEIKYU CORP. | 56,995 | 76,858 | |||||||||||||
| 1,200 | KEIO CORP. | 36,571 | 52,771 | |||||||||||||
| 2,500 | KEISEI ELECTRIC RAILWAY CO. LTD. | 23,110 | 80,319 | |||||||||||||
| 10,062 | KEYENCE CORP. | 2,566,618 | 5,636,685 | |||||||||||||
| 6,000 | KIKKOMAN CORP. | 52,867 | 242,822 | |||||||||||||
| 1,200 | KINTETSU GROUP HOLDINGS CO. LTD. | 35,697 | 46,008 | |||||||||||||
| 10,000 | KIRIN HOLDINGS CO. LTD. | 103,112 | 252,097 | |||||||||||||
| 37,300 | KOBAYASHI PHARMACEUTICAL CO. LTD. | 1,436,277 | 2,423,217 | |||||||||||||
| 5,700 | KOMATSU LTD. | 142,116 | 206,298 | |||||||||||||
| 2,300 | KONAMI HOLDINGS CORP. | 50,313 | 126,559 | |||||||||||||
| 21,000 | KUBOTA CORP. | 129,773 | 411,799 | |||||||||||||
| 10,400 | KYB CORP. | 438,565 | 608,263 | |||||||||||||
| 4,100 | KYOCERA CORP. | 137,688 | 268,288 | |||||||||||||
| 5,000 | KYOWA HAKKO KIRIN CO. LTD. | 54,616 | 96,694 | |||||||||||||
| 8,000 | KYUSHU ELECTRIC POWER CO., INC. | 70,471 | 83,852 | |||||||||||||
| 1,400 | LAWSON, INC. | 63,601 | 93,064 | |||||||||||||
| 1,900 | LIXIL GROUP CORP. | 21,742 | 51,431 | |||||||||||||
| 2,400 | M3, INC. | 51,468 | 84,455 | |||||||||||||
| 3,200 | MAKITA CORP. | 82,169 | 134,475 | |||||||||||||
| 32,000 | MARUBENI CORP. | 162,807 | 231,775 | |||||||||||||
| 6,500 | MARUI GROUP CO. LTD. | 32,287 | 119,010 | |||||||||||||
| 11,400 | MAZDA MOTOR CORP. | 95,886 | 152,927 | |||||||||||||
| 2,400 | MEIJI HOLDINGS CO. LTD. | 38,749 | 204,269 | |||||||||||||
| 48,700 | MEITEC CORP. | 1,500,815 | 2,558,722 | |||||||||||||
| 8,700 | MINEBEA MITSUMI, INC. | 84,406 | 182,455 | |||||||||||||
| 36,800 | MITSUBISHI CHEMICAL HOLDINGS CORP. | 149,792 | 403,845 | |||||||||||||
| 18,300 | MITSUBISHI CORP. | 250,540 | 505,595 | |||||||||||||
| 40,000 | MITSUBISHI ELECTRIC CORP. | 322,860 | 664,389 | |||||||||||||
| 24,900 | MITSUBISHI ESTATE CO. LTD. | 334,662 | 433,140 | |||||||||||||
| 8,500 | MITSUBISHI GAS CHEMICAL CO., INC. | 75,149 | 244,043 | |||||||||||||
| 5,700 | MITSUBISHI HEAVY INDUSTRIES LTD. | 185,317 | 212,975 | |||||||||||||
| 13,300 | MITSUBISHI MOTORS CORP. | 60,808 | 96,083 | |||||||||||||
| 3,800 | MITSUBISHI TANABE PHARMA CORP. | 49,996 | 78,647 | |||||||||||||
| 195,000 | MITSUBISHI UFJ FINANCIAL GROUP, INC. | 915,016 | 1,430,202 | |||||||||||||
| 27,000 | MITSUBISHI UFJ LEASE & FINANCE CO. LTD. | 83,878 | 160,790 | |||||||||||||
| 14,000 | MITSUI & CO. LTD. | 128,045 | 227,628 | |||||||||||||
| 7,400 | MITSUI CHEMICALS, INC. | 87,469 | 238,074 | |||||||||||||
| 300 | MITSUI MINING & SMELTING CO. LTD. | 5,391 | 17,546 | |||||||||||||
| 370,200 | MIZUHO FINANCIAL GROUP, INC. | 565,773 | 672,225 | |||||||||||||
| 43,100 | MORITA HOLDINGS CORP. | 736,613 | 811,317 | |||||||||||||
| 8,280 | MS&AD INSURANCE GROUP HOLDINGS, INC. | 177,615 | 280,274 | |||||||||||||
| 3,600 | MURATA MANUFACTURING CO. LTD. | 162,615 | 483,089 | |||||||||||||
| 57,700 | N FIELD CO. LTD. | 997,904 | 786,574 | |||||||||||||
| 198,000 | NACHI-FUJIKOSHI CORP. | 988,917 | 1,328,493 | |||||||||||||
| 5,000 | NGK INSULATORS LTD. | 63,091 | 94,431 | |||||||||||||
| 4,100 | NGK SPARK PLUG CO. LTD. | 48,644 | 99,666 | |||||||||||||
| 6,000 | NH FOODS LTD. | 72,315 | 146,332 | |||||||||||||
| 3,900 | NIDEC CORP. | 129,234 | 547,229 | |||||||||||||
| 109,700 | NIHON PARKERIZING CO. LTD. | 1,508,147 | 1,850,807 | |||||||||||||
| 2,600 | NINTENDO CO. LTD. | 285,625 | 950,468 | |||||||||||||
| 22 | NIPPON BUILDING FUND, INC. | 90,970 | 107,584 | |||||||||||||
| 1,700 | NIPPON EXPRESS CO. LTD. | 60,747 | 113,006 | |||||||||||||
| 22 | NIPPON PROLOGIS REIT, INC. | 45,892 | 46,529 | |||||||||||||
| 15,200 | NIPPON TELEGRAPH & TELEPHONE CORP. | 342,697 | 715,112 | |||||||||||||
| 5,000 | NISSAN CHEMICAL INDUSTRIES LTD. | 50,851 | 199,467 | |||||||||||||
| 30,600 | NISSAN MOTOR CO. LTD. | 279,227 | 305,117 | |||||||||||||
| 3,670 | NISSHIN SEIFUN GROUP, INC. | 31,991 | 74,133 | |||||||||||||
See accompanying notes to financial statements. | 71 | (Continued) |
CLEARWATER INVESTMENT TRUST
Schedule of Investments - Clearwater International Fund
December 31, 2017
| Shares | Security | Cost | Fair value (a) | Percent of net assets | |||||||||
| Japan (Cont’d): | |||||||||||||
| 1,200 | NISSIN FOODS HOLDINGS CO. LTD. | $ | 43,959 | 87,650 | |||||||||
| 2,700 | NITORI HOLDINGS CO. LTD. | 87,310 | 384,961 | ||||||||||
| 4,000 | NITTO DENKO CORP. | 125,248 | 355,358 | ||||||||||
| 97,400 | NOMURA HOLDINGS, INC. | 360,220 | 574,934 | ||||||||||
| 8,400 | NOMURA REAL ESTATE HOLDINGS, INC. | 130,390 | 188,315 | ||||||||||
| 3,267 | NOMURA RESEARCH INSTITUTE LTD. | 43,930 | 151,933 | ||||||||||
| 7,000 | NSK LTD. | 50,459 | 110,211 | ||||||||||
| 7,000 | NTT DATA CORP. | 36,520 | 83,186 | ||||||||||
| 27,600 | NTT DOCOMO, INC. | 449,493 | 651,818 | ||||||||||
| 18,900 | NTT URBAN DEVELOPMENT CORP. | 159,857 | 218,732 | ||||||||||
| 12,000 | OBAYASHI CORP. | 48,665 | 145,267 | ||||||||||
| 5,100 | OLYMPUS CORP. | 71,174 | 195,536 | ||||||||||
| 1,100 | OMRON CORP. | 31,828 | 65,605 | ||||||||||
| 5,000 | ONO PHARMACEUTICAL CO. LTD. | 43,040 | 116,530 | ||||||||||
| 4,800 | ORIENTAL LAND CO. LTD. | 113,097 | 437,506 | ||||||||||
| 12,200 | ORIX CORP. | 138,498 | 206,212 | ||||||||||
| 2,400 | OSAKA GAS CO. LTD. | 36,678 | 46,221 | ||||||||||
| 6,100 | OTSUKA HOLDINGS CO. LTD. | 176,203 | 267,875 | ||||||||||
| 36,000 | PANASONIC CORP. | 242,138 | 527,020 | ||||||||||
| 2,600 | PARK24 CO. LTD. | 51,627 | 62,234 | ||||||||||
| 15,200 | RAKUTEN, INC. | 97,714 | 139,286 | ||||||||||
| 4,300 | RECRUIT HOLDINGS CO. LTD. | 77,690 | 106,856 | ||||||||||
| 19,300 | RESONA HOLDINGS, INC. | 74,265 | 115,295 | ||||||||||
| 1,200 | RINNAI CORP. | 52,047 | 108,631 | ||||||||||
| 4,200 | ROHM CO. LTD. | 166,807 | 465,196 | ||||||||||
| 200 | RYOHIN KEIKAKU CO. LTD. | 45,535 | 62,303 | ||||||||||
| 13,000 | SANTEN PHARMACEUTICAL CO. LTD. | 85,886 | 204,331 | ||||||||||
| 13,720 | SBI HOLDINGS, INC. | 111,165 | 286,881 | ||||||||||
| 3,400 | SECOM CO. LTD. | 133,812 | 256,701 | ||||||||||
| 7,300 | SEGA SAMMY HOLDINGS, INC. | 68,324 | 90,574 | ||||||||||
| 8,400 | SEIBU HOLDINGS, INC. | 139,989 | 158,868 | ||||||||||
| 13,000 | SEKISUI CHEMICAL CO. LTD. | 66,177 | 260,981 | ||||||||||
| 6,000 | SEKISUI HOUSE LTD. | 44,394 | 108,391 | ||||||||||
| 13,300 | SEVEN & I HOLDINGS CO. LTD. | 300,882 | 552,775 | ||||||||||
| 60,500 | SEVEN BANK LTD. | 178,793 | 207,260 | ||||||||||
| 4,000 | SHIMADZU CORP. | 25,419 | 90,952 | ||||||||||
| 1,000 | SHIMAMURA CO. LTD. | 61,206 | 110,051 | ||||||||||
| 1,500 | SHIMANO, INC. | 58,204 | 211,005 | ||||||||||
| 6,000 | SHIMIZU CORP. | 50,949 | 61,984 | ||||||||||
| 9,200 | SHIN-ETSU CHEMICAL CO. LTD. | 461,684 | 934,901 | ||||||||||
| 4,000 | SHIONOGI & CO. LTD. | 67,679 | 216,446 | ||||||||||
| 5,900 | SHISEIDO CO. LTD. | 88,706 | 285,169 | ||||||||||
| 900 | SMC CORP. | 106,941 | 370,464 | ||||||||||
| 18,400 | SOFTBANK GROUP CORP. | 412,233 | 1,456,650 | ||||||||||
| 9,000 | SOMPO HOLDINGS, INC. | 202,248 | 348,578 | ||||||||||
| 18,800 | SONY CORP. | 260,756 | 848,106 | ||||||||||
| 15,700 | SQUARE ENIX HOLDINGS CO. LTD. | 455,288 | 746,856 | ||||||||||
| 30,700 | STANLEY ELECTRIC CO. LTD. | 446,292 | 1,246,528 | ||||||||||
| 5,700 | SUBARU CORP. | 26,572 | 181,257 | ||||||||||
| 10,700 | SUGI HOLDINGS CO. LTD. | 496,504 | 546,039 | ||||||||||
| 25,000 | SUMITOMO CHEMICAL CO. LTD. | 74,256 | 179,720 | ||||||||||
| 7,800 | SUMITOMO CORP. | 67,035 | 132,567 | ||||||||||
| 4,000 | SUMITOMO DAINIPPON PHARMA CO. LTD. | 45,511 | 59,428 | ||||||||||
| 8,800 | SUMITOMO ELECTRIC INDUSTRIES LTD. | 75,679 | 148,782 | ||||||||||
| 2,400 | SUMITOMO HEAVY INDUSTRIES LTD. | 39,379 | 101,602 | ||||||||||
| 6,500 | SUMITOMO MITSUI FINANCIAL GROUP, INC. | 228,819 | 280,825 | ||||||||||
| 1,331 | SUMITOMO MITSUI TRUST HOLDINGS, INC. | 33,400 | 52,838 | ||||||||||
| 4,000 | SUMITOMO REALTY & DEVELOPMENT CO. LTD. | 110,500 | 131,458 | ||||||||||
| 95,000 | SUMITOMO RUBBER INDUSTRIES LTD. | 1,356,344 | 1,767,207 | ||||||||||
| 9,300 | SUZUKI MOTOR CORP. | 199,522 | 539,305 | ||||||||||
| 31,885 | SYSMEX CORP. | 981,487 | 2,510,051 | ||||||||||
| 7,200 | T&D HOLDINGS, INC. | 71,473 | 123,136 | ||||||||||
| 1,400 | TAIHEIYO CEMENT CORP. | 29,931 | 60,448 | ||||||||||
| 3,400 | TAISEI CORP. | 55,809 | 169,283 | ||||||||||
| 5,000 | TAKASHIMAYA CO. LTD. | 31,428 | 52,629 | ||||||||||
| 9,500 | TAKEDA PHARMACEUTICAL CO. LTD. | 383,399 | 539,689 | ||||||||||
| 1,100 | TDK CORP. | 52,815 | 87,766 | ||||||||||
| See accompanying notes to financial statements. | 72 | (Continued) |
CLEARWATER INVESTMENT TRUST
Schedule of Investments - Clearwater International Fund
December 31, 2017
| Shares | Security | Cost | Fair value (a) | Percent of net assets | |||||||||
| Japan (Cont’d): | |||||||||||||
| 32,500 | TECHNOPRO HOLDINGS, INC. | $ | 1,246,154 | 1,765,254 | |||||||||
| 5,800 | TEIJIN LTD. | 67,529 | 129,203 | ||||||||||
| 5,800 | TERUMO CORP. | 117,165 | 274,879 | ||||||||||
| 2,000 | THK CO. LTD. | 29,290 | 75,083 | ||||||||||
| 1,500 | TOHO CO. LTD. | 25,533 | 51,986 | ||||||||||
| 3,400 | TOHO GAS CO. LTD. | 81,221 | 93,242 | ||||||||||
| 10,600 | TOHOKU ELECTRIC POWER CO., INC. | 96,604 | 135,563 | ||||||||||
| 14,400 | TOKIO MARINE HOLDINGS, INC. | 359,676 | 657,026 | ||||||||||
| 28,100 | TOKYO ELECTRIC POWER CO. HOLDINGS, INC.(c) | 104,659 | 111,228 | ||||||||||
| 6,600 | TOKYO ELECTRON LTD. | 306,239 | 1,194,941 | ||||||||||
| 6,000 | TOKYO GAS CO. LTD. | 103,615 | 137,306 | ||||||||||
| 9,800 | TOKYO TATEMONO CO. LTD. | 110,919 | 132,377 | ||||||||||
| 12,500 | TOKYU CORP. | 103,448 | 199,467 | ||||||||||
| 20,000 | TOKYU FUDOSAN HOLDINGS CORP. | 69,576 | 144,664 | ||||||||||
| 17,000 | TORAY INDUSTRIES, INC. | 70,413 | 160,306 | ||||||||||
| 72,000 | TOSHIBA CORP.(c) | 198,615 | 202,565 | ||||||||||
| 3,000 | TOTO LTD. | 30,029 | 177,058 | ||||||||||
| 3,000 | TOYO SUISAN KAISHA LTD. | 74,690 | 128,201 | ||||||||||
| 4,000 | TOYOTA INDUSTRIES CORP. | 101,266 | 257,022 | ||||||||||
| 46,662 | TOYOTA MOTOR CORP. | 1,594,403 | 2,987,113 | ||||||||||
| 1,800 | TOYOTA TSUSHO CORP. | 14,973 | 72,447 | ||||||||||
| 900 | TREND MICRO, INC. | 26,540 | 51,041 | ||||||||||
| 70,700 | TSUMURA & CO. | 2,019,631 | 2,349,869 | ||||||||||
| 7,800 | UNICHARM CORP. | 68,794 | 202,797 | ||||||||||
| 47 | UNITED URBAN INVESTMENT CORP. | 64,693 | 67,617 | ||||||||||
| 56,400 | USHIO, INC. | 669,606 | 806,394 | ||||||||||
| 4,900 | USS CO. LTD. | 56,003 | 103,762 | ||||||||||
| 4,100 | WEST JAPAN RAILWAY CO. | 134,756 | 299,363 | ||||||||||
| 416,900 | YAHOO JAPAN CORP. | 1,803,557 | 1,912,911 | ||||||||||
| 2,500 | YAKULT HONSHA CO. LTD. | 74,984 | 188,596 | ||||||||||
| 16,300 | YAMADA DENKI CO. LTD. | 56,674 | 89,836 | ||||||||||
| 8,300 | YAMAHA MOTOR CO. LTD. | 106,577 | 272,185 | ||||||||||
| 3,000 | YAMATO HOLDINGS CO. LTD. | 46,642 | 60,373 | ||||||||||
| 4,000 | YAMAZAKI BAKING CO. LTD. | 44,679 | 77,994 | ||||||||||
| 5,000 | YASKAWA ELECTRIC CORP. | 48,019 | 220,324 | ||||||||||
| 59,751,381 | 101,004,056 | 16.17 | % | ||||||||||
| Jersey: | |||||||||||||
| 1,418 | RANDGOLD RESOURCES LTD. | 135,766 | 141,865 | ||||||||||
| 135,766 | 141,865 | 0.02 | % | ||||||||||
| Mexico: | |||||||||||||
| 5,161 | FRESNILLO PLC | 72,704 | 99,575 | ||||||||||
| 1,059,134 | WAL-MART DE MEXICO S.A.B. DE C.V. | 2,640,356 | 2,595,787 | ||||||||||
| 2,713,060 | 2,695,362 | 0.43 | % | ||||||||||
| Netherlands: | |||||||||||||
| 27,529 | AALBERTS INDUSTRIES N.V. | 513,949 | 1,400,335 | ||||||||||
| 22,780 | ACCELL GROUP | 377,809 | 640,402 | ||||||||||
| 35,981 | AEGON N.V. | 133,041 | 229,458 | ||||||||||
| 7,007 | AKZO NOBEL N.V. | 406,421 | 613,905 | ||||||||||
| 104,755 | ARCADIS N.V. | 2,101,378 | 2,395,028 | ||||||||||
| 27,560 | ARCELORMITTAL(c) | 380,361 | 896,635 | ||||||||||
| 7,173 | ASML HOLDING N.V. | 106,863 | 1,249,237 | ||||||||||
| 42,847 | BETER BED HOLDING N.V. | 761,408 | 680,668 | ||||||||||
| 23,129 | CORE LABORATORIES N.V. | 2,535,916 | 2,533,782 | ||||||||||
| 3,610 | EXOR N.V. | 90,616 | 221,338 | ||||||||||
| 2,765 | HEINEKEN HOLDING N.V. | 148,540 | 273,668 | ||||||||||
| 3,662 | HEINEKEN N.V. | 128,663 | 381,957 | ||||||||||
| 315,414 | ING GROEP N.V. | 3,244,873 | 5,799,739 | ||||||||||
| 17,656 | KONINKLIJKE AHOLD DELHAIZE N.V. | 203,381 | 388,419 | ||||||||||
| 3,281 | KONINKLIJKE DSM N.V. | 122,903 | 313,638 | ||||||||||
| 51,375 | KONINKLIJKE KPN N.V. | 108,346 | 179,256 | ||||||||||
| 39,765 | KONINKLIJKE PHILIPS N.V. | 996,696 | 1,504,838 | ||||||||||
| 1,264 | NN GROUP N.V. | 37,113 | 54,780 | ||||||||||
| 4,877 | NXP SEMICONDUCTORS N.V.(c) | 393,112 | 571,048 | ||||||||||
| 8,117 | QIAGEN N.V.(c) | 119,394 | 255,069 | ||||||||||
| 3,238 | RANDSTAD HOLDING N.V. | 99,928 | 199,073 | ||||||||||
| 66,566 | REFRESCO GROUP N.V.(e) | 1,274,865 | 1,581,410 | ||||||||||
| See accompanying notes to financial statements. | 73 | (Continued) |
CLEARWATER INVESTMENT TRUST
Schedule of Investments - Clearwater International Fund
December 31, 2017
| Shares | Security | Cost | Fair value (a) | Percent of net assets | |||||||||
| Netherlands (Cont’d): | |||||||||||||
| 60,420 | ROYAL DUTCH SHELL PLC, CLASS A (LONDON EXCHANGE) | $ | 1,485,541 | 2,023,086 | |||||||||
| 81,662 | ROYAL DUTCH SHELL PLC, CLASS B | 1,800,118 | 2,765,771 | ||||||||||
| 6,193 | WOLTERS KLUWER N.V. | 101,075 | 323,086 | ||||||||||
| 17,672,310 | 27,475,626 | 4.40 | % | ||||||||||
| New Zealand: | |||||||||||||
| 16,545 | AUCKLAND INTERNATIONAL AIRPORT LTD. | 50,086 | 75,981 | ||||||||||
| 169,758 | SPARK NEW ZEALAND LTD. | 404,493 | 436,716 | ||||||||||
| 454,579 | 512,697 | 0.08 | % | ||||||||||
| Norway: | |||||||||||||
| 13,773 | DNB ASA | 87,874 | 255,143 | ||||||||||
| 6,824 | NORSK HYDRO ASA | 27,313 | 51,820 | ||||||||||
| 106,292 | ORKLA ASA | 804,680 | 1,126,924 | ||||||||||
| 11,584 | STATOIL ASA | 201,736 | 247,183 | ||||||||||
| 14,536 | TELENOR ASA | 210,513 | 311,412 | ||||||||||
| 3,725 | TGS NOPEC GEOPHYSICAL CO. ASA | 66,557 | 88,105 | ||||||||||
| 105,177 | TOMRA SYSTEMS ASA | 1,153,513 | 1,684,502 | ||||||||||
| 2,500 | YARA INTERNATIONAL ASA | 58,115 | 114,699 | ||||||||||
| 2,610,301 | 3,879,788 | 0.62 | % | ||||||||||
| Philippines: | |||||||||||||
| 444,011 | METROPOLITAN BANK & TRUST CO. | 761,294 | 901,897 | ||||||||||
| 3,065,000 | VISTA LAND & LIFESCAPES, INC. | 315,279 | 367,776 | ||||||||||
| 1,076,573 | 1,269,673 | 0.20 | % | ||||||||||
| Poland: | |||||||||||||
| 23,200 | CCC S.A. | 1,222,714 | 1,899,482 | ||||||||||
| 1,222,714 | 1,899,482 | 0.30 | % | ||||||||||
| Portugal: | |||||||||||||
| 20,567 | EDP - ENERGIAS DE PORTUGAL S.A. | 48,529 | 71,194 | ||||||||||
| 8,119 | GALP ENERGIA SGPS S.A. | 108,273 | 149,290 | ||||||||||
| 10,286 | JERONIMO MARTINS SGPS S.A. | 127,947 | 199,873 | ||||||||||
| 284,749 | 420,357 | 0.07 | % | ||||||||||
| Russia: | |||||||||||||
| 88,580 | YANDEX N.V., CLASS A(c) | 2,098,972 | 2,900,995 | ||||||||||
| 2,098,972 | 2,900,995 | 0.47 | % | ||||||||||
| Singapore: | |||||||||||||
| 124,600 | CAPITALAND LTD. | 247,485 | 328,863 | ||||||||||
| 36,000 | CAPITALAND MALL TRUST | 34,133 | 57,333 | ||||||||||
| 6,300 | CITY DEVELOPMENTS LTD. | 26,574 | 58,834 | ||||||||||
| 28,300 | DBS GROUP HOLDINGS LTD. | 159,243 | 525,818 | ||||||||||
| 26,500 | GLOBAL LOGISTIC PROPERTIES LTD. | 54,433 | 66,772 | ||||||||||
| 21,000 | KEPPEL CORP. LTD. | 53,869 | 115,406 | ||||||||||
| 7,840 | KEPPEL REIT | 3,186 | 7,386 | ||||||||||
| 6,000 | OVERSEA-CHINESE BANKING CORP. LTD. | 33,180 | 55,583 | ||||||||||
| 12,000 | SINGAPORE AIRLINES LTD. | 70,334 | 95,734 | ||||||||||
| 13,000 | SINGAPORE EXCHANGE LTD. | 40,226 | 72,317 | ||||||||||
| 115,500 | SINGAPORE PRESS HOLDINGS LTD. | 223,659 | 228,850 | ||||||||||
| 49,000 | SINGAPORE TECHNOLOGIES ENGINEERING LTD. | 119,584 | 119,436 | ||||||||||
| 112,000 | SINGAPORE TELECOMMUNICATIONS LTD. | 184,276 | 298,957 | ||||||||||
| 4,600 | UNITED OVERSEAS BANK LTD. | 26,071 | 90,972 | ||||||||||
| 15,000 | UOL GROUP LTD. | 49,917 | 99,480 | ||||||||||
| 35,400 | WILMAR INTERNATIONAL LTD. | 68,956 | 81,787 | ||||||||||
| 1,395,126 | 2,303,528 | 0.37 | % | ||||||||||
| South Africa: | |||||||||||||
| 319 | SASOL LTD. | 10,075 | 11,040 | ||||||||||
| 10,075 | 11,040 | 0.00 | % | ||||||||||
| South Korea: | |||||||||||||
| 161,853 | BNK FINANCIAL GROUP, INC. | 1,554,799 | 1,424,179 | ||||||||||
| 221,052 | DGB FINANCIAL GROUP, INC. | 2,290,725 | 2,178,412 | ||||||||||
| 15,230 | HYUNDAI MIPO DOCKYARD CO. LTD.(c) | 1,418,066 | 1,119,612 | ||||||||||
| 2,055 | HYUNDAI MOTOR CO. | 277,569 | 299,454 | ||||||||||
| 14,061 | KIA MOTORS CORP. | 595,796 | 440,001 | ||||||||||
| 14,850 | KOREA INVESTMENT HOLDINGS CO. LTD. | 538,116 | 957,125 | ||||||||||
| 3,152 | KT&G CORP. | 314,672 | 340,065 | ||||||||||
| See accompanying notes to financial statements. | 74 | (Continued) |
CLEARWATER INVESTMENT TRUST
Schedule of Investments - Clearwater International Fund
December 31, 2017
| Shares | Security | Cost | Fair value (a) | Percent of net assets | |||||||||
| South Korea (Cont’d): | |||||||||||||
| 2,286 | SAMSUNG ELECTRONICS CO. LTD. | $ | 3,229,090 | 5,440,874 | |||||||||
| 10,218,833 | 12,199,722 | 1.95 | % | ||||||||||
| Spain: | |||||||||||||
| 13,770 | ABERTIS INFRAESTRUCTURAS S.A. | 177,462 | 306,482 | ||||||||||
| 1,260 | ACCIONA S.A. | 78,312 | 102,864 | ||||||||||
| 1,731 | ACS ACTIVIDADES DE CONSTRUCCION Y SERVICIOS S.A. | 50,359 | 67,750 | ||||||||||
| 583 | AENA S.M.E. S.A.(e) | 50,199 | 118,218 | ||||||||||
| 5,299 | AMADEUS IT GROUP S.A. | 128,322 | 382,180 | ||||||||||
| 127,837 | BANCO BILBAO VIZCAYA ARGENTARIA S.A. | 731,627 | 1,090,876 | ||||||||||
| 162,352 | BANCO SANTANDER S.A. | 719,485 | 1,067,298 | ||||||||||
| 24,978 | BANKIA S.A. | 119,285 | 119,490 | ||||||||||
| 7,551 | BANKINTER S.A. | 51,111 | 71,611 | ||||||||||
| 96,203 | CAIXABANK S.A. | 236,376 | 448,904 | ||||||||||
| 46,016 | CONSTRUCCIONES Y AUXILIAR DE FERROCARRILES S.A. | 1,972,504 | 1,887,156 | ||||||||||
| 10,362 | ENAGAS S.A. | 213,104 | 296,772 | ||||||||||
| 13,198 | FERROVIAL S.A. | 241,691 | 299,689 | ||||||||||
| 16,489 | GAS NATURAL SDG S.A. | 264,629 | 380,848 | ||||||||||
| 15,282 | GRIFOLS S.A. | 273,864 | 447,859 | ||||||||||
| 54,401 | IBERDROLA S.A. | 265,914 | 421,664 | ||||||||||
| 44,685 | INDUSTRIA DE DISENO TEXTIL S.A. | 1,193,746 | 1,557,256 | ||||||||||
| 21,686 | MAPFRE S.A. | 49,735 | 69,681 | ||||||||||
| 26,579 | RED ELECTRICA CORP. S.A. | 390,097 | 596,677 | ||||||||||
| 46,787 | REPSOL S.A. | 567,753 | 827,746 | ||||||||||
| 7,775,575 | 10,561,021 | 1.69 | % | ||||||||||
| Sweden: | |||||||||||||
| 22,200 | ASSA ABLOY AB, CLASS B | 89,466 | 461,153 | ||||||||||
| 85,889 | ATLAS COPCO AB, CLASS A | 2,722,600 | 3,708,584 | ||||||||||
| 4,000 | ATLAS COPCO AB, CLASS B | 30,052 | 153,405 | ||||||||||
| 25,218 | BULTEN AB | 207,108 | 376,590 | ||||||||||
| 224,300 | CLOETTA AB, CLASS B | 877,318 | 812,097 | ||||||||||
| 24,710 | DUNI AB | 217,390 | 365,238 | ||||||||||
| 7,501 | ELECTROLUX AB, CLASS B | 95,788 | 241,679 | ||||||||||
| 8,600 | ESSITY AB, CLASS B(c) | 62,137 | 244,274 | ||||||||||
| 13,600 | HENNES & MAURITZ AB, CLASS B | 274,862 | 280,684 | ||||||||||
| 3,700 | HEXAGON AB, CLASS B | 56,830 | 185,336 | ||||||||||
| 17,500 | HUSQVARNA AB, CLASS B | 64,201 | 166,614 | ||||||||||
| 8,270 | INDUSTRIVARDEN AB, CLASS C | 85,948 | 204,151 | ||||||||||
| 10,953 | INVESTOR AB, CLASS B | 150,033 | 499,508 | ||||||||||
| 3,000 | KINNEVIK AB, CLASS B | 51,225 | 101,413 | ||||||||||
| 3,301 | LUNDIN PETROLEUM AB | 46,596 | 75,572 | ||||||||||
| 41,436 | NORDEA BANK AB | 232,748 | 501,590 | ||||||||||
| 13,973 | SANDVIK AB | 86,678 | 244,776 | ||||||||||
| 13,348 | SECURITAS AB, CLASS B | 106,689 | 233,014 | ||||||||||
| 35,236 | SKANDINAVISKA ENSKILDA BANKEN AB, CLASS A | 139,725 | 413,652 | ||||||||||
| 2,800 | SKANSKA AB, CLASS B | 23,703 | 58,027 | ||||||||||
| 8,600 | SVENSKA CELLULOSA AB S.C.A., CLASS B | 15,915 | 88,641 | ||||||||||
| 26,700 | SVENSKA HANDELSBANKEN AB, CLASS A | 161,721 | 365,196 | ||||||||||
| 2,091 | SWEDBANK AB, CLASS A | 49,088 | 50,445 | ||||||||||
| 36,306 | TELEFONAKTIEBOLAGET LM ERICSSON ADR(d) | 205,462 | 242,524 | ||||||||||
| 168,352 | TELEFONAKTIEBOLAGET LM ERICSSON, CLASS B | 919,558 | 1,105,162 | ||||||||||
| 112,540 | TETHYS OIL AB | 863,807 | 902,038 | ||||||||||
| 139,080 | THULE GROUP AB (THE)(e) | 2,162,706 | 3,134,899 | ||||||||||
| 25,108 | VOLVO AB, CLASS B | 162,740 | 467,383 | ||||||||||
| 10,162,094 | 15,683,645 | 2.51 | % | ||||||||||
| Switzerland: | |||||||||||||
| 198,584 | ABB LTD. (REGISTERED) | 3,908,390 | 5,323,017 | ||||||||||
| 3,728 | ADECCO GROUP A.G. (REGISTERED) | 131,290 | 285,209 | ||||||||||
| 1,308 | ARYZTA A.G.(c) | 32,112 | 51,880 | ||||||||||
| 484 | BALOISE HOLDING A.G. (REGISTERED) | 26,452 | 75,348 | ||||||||||
| 7,585 | BUCHER INDUSTRIES A.G. (REGISTERED) | 2,114,306 | 3,082,416 | ||||||||||
| 35 | CHOCOLADEFABRIKEN LINDT & SPRUENGLI A.G. (PARTICIPATION CERTIFICATE) | 50,308 | 213,710 | ||||||||||
| 3 | CHOCOLADEFABRIKEN LINDT & SPRUENGLI A.G. (REGISTERED) | 75,352 | 216,999 | ||||||||||
| 28,902 | CHUBB LTD. | 2,721,276 | 4,223,449 | ||||||||||
| 28,471 | CIE FINANCIERE RICHEMONT S.A. (REGISTERED) | 1,930,957 | 2,579,906 | ||||||||||
| See accompanying notes to financial statements. | 75 | (Continued) |
CLEARWATER INVESTMENT TRUST
Schedule of Investments - Clearwater International Fund
December 31, 2017
| Shares | Security | Cost | Fair value (a) | Percent of net assets | |||||||||
| Switzerland (Cont’d): | |||||||||||||
| 26,209 | CREDIT SUISSE GROUP A.G. (REGISTERED)(c) | $ | 305,324 | 467,994 | |||||||||
| 4,176 | FERGUSON PLC | 70,461 | 300,517 | ||||||||||
| 990 | GEBERIT A.G. (REGISTERED) | 85,632 | 435,947 | ||||||||||
| 140 | GIVAUDAN S.A. (REGISTERED) | 76,496 | 323,547 | ||||||||||
| 121,887 | GLENCORE PLC(c) | 266,010 | 641,806 | ||||||||||
| 1,807 | IDORSIA LTD.(c) | 18,603 | 47,194 | ||||||||||
| 4,134 | JULIUS BAER GROUP LTD.(c) | 87,890 | 252,847 | ||||||||||
| 4,841 | LAFARGEHOLCIM LTD. (REGISTERED)(c) | 170,733 | 272,988 | ||||||||||
| 42,010 | LOGITECH INTERNATIONAL S.A. (REGISTERED) | 903,788 | 1,413,216 | ||||||||||
| 897 | LONZA GROUP A.G. (REGISTERED)(c) | 50,452 | 242,373 | ||||||||||
| 102,959 | NESTLE S.A. (REGISTERED) | 4,640,580 | 8,854,189 | ||||||||||
| 54,835 | NOVARTIS A.G. (REGISTERED) | 2,528,010 | 4,636,876 | ||||||||||
| 16,917 | PANALPINA WELTTRANSPORT HOLDING A.G. (REGISTERED) | 1,673,979 | 2,623,181 | ||||||||||
| 9,695 | PARGESA HOLDING S.A. (BEARER) | 636,914 | 840,708 | ||||||||||
| 12,406 | ROCHE HOLDING A.G. (GENUSSCHEIN) | 1,614,189 | 3,138,262 | ||||||||||
| 1,381 | SCHINDLER HOLDING A.G. (PARTICIPATION CERTIFICATE) | 108,493 | 317,880 | ||||||||||
| 589 | SCHINDLER HOLDING A.G. (REGISTERED) | 68,597 | 133,280 | ||||||||||
| 121 | SGS S.A. (REGISTERED) | 130,564 | 315,523 | ||||||||||
| 364 | SIKA A.G. (BEARER) | 2,339,326 | 2,891,231 | ||||||||||
| 1,300 | SONOVA HOLDING A.G. (REGISTERED) | 84,464 | 203,048 | ||||||||||
| 7,867 | STMICROELECTRONICS N.V. | 36,286 | 171,841 | ||||||||||
| 635 | SULZER A.G. (REGISTERED) | 30,609 | 77,025 | ||||||||||
| 984 | SWATCH GROUP (THE) A.G. (BEARER) | 257,037 | 401,295 | ||||||||||
| 743 | SWISS LIFE HOLDING A.G. (REGISTERED)(c) | 101,194 | 263,056 | ||||||||||
| 504 | SWISS RE A.G. | 37,466 | 47,196 | ||||||||||
| 529 | SWISSCOM A.G. (REGISTERED) | 191,612 | 281,478 | ||||||||||
| 35,381 | TE CONNECTIVITY LTD. | 1,193,113 | 3,362,610 | ||||||||||
| 4,736 | TECAN GROUP A.G. (REGISTERED) | 870,772 | 985,158 | ||||||||||
| 283,739 | UBS GROUP A.G. (REGISTERED)(c) | 4,795,031 | 5,223,744 | ||||||||||
| 4,668 | ZURICH INSURANCE GROUP A.G. | 912,788 | 1,420,831 | ||||||||||
| 35,276,856 | 56,638,775 | 9.07 | % | ||||||||||
| Taiwan: | |||||||||||||
| 616,846 | CHICONY ELECTRONICS CO. LTD. | 1,588,959 | 1,554,630 | ||||||||||
| 238,000 | GIANT MANUFACTURING CO. LTD. | 1,320,768 | 1,307,626 | ||||||||||
| 1,743,000 | KING YUAN ELECTRONICS CO. LTD. | 1,732,080 | 1,771,788 | ||||||||||
| 323,000 | MERIDA INDUSTRY CO. LTD. | 1,692,528 | 1,356,755 | ||||||||||
| 96,161 | TAIWAN SEMICONDUCTOR MANUFACTURING CO. LTD. ADR(d) | 1,911,494 | 3,812,784 | ||||||||||
| 585,000 | TRIPOD TECHNOLOGY CORP. | 1,569,092 | 1,828,217 | ||||||||||
| 9,814,921 | 11,631,800 | 1.86 | % | ||||||||||
| Thailand: | |||||||||||||
| 1,702,400 | LPN DEVELOPMENT PCL (REGISTERED) | 778,727 | 689,527 | ||||||||||
| 778,727 | 689,527 | 0.11 | % | ||||||||||
| Turkey: | |||||||||||||
| 52,639 | MAVI GIYIM SANAYI VE TICARET A.S., CLASS B(c)(e) | 681,142 | 805,451 | ||||||||||
| 681,142 | 805,451 | 0.13 | % | ||||||||||
| United Kingdom: | |||||||||||||
| 25,248 | 3I GROUP PLC | 88,645 | 311,399 | ||||||||||
| 2,834 | ADMIRAL GROUP PLC | 35,119 | 76,603 | ||||||||||
| 5,026 | AGGREKO PLC | 50,603 | 54,219 | ||||||||||
| 58,936 | ANGLO AMERICAN PLC | 468,356 | 1,232,975 | ||||||||||
| 13,814 | AON PLC | 1,427,338 | 1,851,076 | ||||||||||
| 1,891 | ASHTEAD GROUP PLC | 49,652 | 50,858 | ||||||||||
| 11,482 | ASSOCIATED BRITISH FOODS PLC | 349,112 | 437,168 | ||||||||||
| 26,375 | ASTRAZENECA PLC | 983,695 | 1,823,599 | ||||||||||
| 76,752 | AVIVA PLC | 307,975 | 524,869 | ||||||||||
| 5,239 | BABCOCK INTERNATIONAL GROUP PLC | 41,807 | 49,903 | ||||||||||
| 46,467 | BAE SYSTEMS PLC | 230,164 | 359,485 | ||||||||||
| 392,845 | BARCLAYS PLC | 839,308 | 1,077,242 | ||||||||||
| 16,437 | BELLWAY PLC | 442,531 | 790,716 | ||||||||||
| 2,391 | BERKELEY GROUP HOLDINGS (THE) PLC | 71,739 | 135,488 | ||||||||||
| 40,530 | BOVIS HOMES GROUP PLC | 415,638 | 641,337 | ||||||||||
| 272,121 | BP PLC | 1,596,033 | 1,920,422 | ||||||||||
| 24,485 | BRITISH AMERICAN TOBACCO PLC | 979,511 | 1,658,872 | ||||||||||
| 37,587 | BRITISH LAND (THE) CO. PLC | 252,586 | 350,923 | ||||||||||
| See accompanying notes to financial statements. | 76 | (Continued) |
CLEARWATER INVESTMENT TRUST
Schedule of Investments - Clearwater International Fund
December 31, 2017
| Shares | Security | Cost | Fair value (a) | Percent of net assets | |||||||||
| United Kingdom (Cont’d): | |||||||||||||
| 5,757 | BUNZL PLC | $ | 59,557 | 161,053 | |||||||||
| 8,202 | BURBERRY GROUP PLC | 40,549 | 198,445 | ||||||||||
| 9,570 | CAPITA PLC | 59,127 | 51,800 | ||||||||||
| 13,580 | CNH INDUSTRIAL N.V. | 56,886 | 182,004 | ||||||||||
| 36,024 | COBHAM PLC(c) | 61,838 | 61,430 | ||||||||||
| 1,447 | COCA-COLA EUROPEAN PARTNERS PLC (NEW YORK EXCHANGE) | 55,218 | 57,663 | ||||||||||
| 405,623 | COMPASS GROUP PLC | 5,559,054 | 8,762,431 | ||||||||||
| 2,332 | CRODA INTERNATIONAL PLC | 82,807 | 139,292 | ||||||||||
| 267,400 | DFS FURNITURE PLC | 1,094,905 | 707,619 | ||||||||||
| 75,356 | DIAGEO PLC | 1,092,373 | 2,772,467 | ||||||||||
| 50,421 | DIXONS CARPHONE PLC | 103,690 | 135,471 | ||||||||||
| 3,792 | EASYJET PLC | 49,609 | 74,953 | ||||||||||
| 172,360 | EXPERIAN PLC | 3,039,986 | 3,807,166 | ||||||||||
| 24,413 | FIAT CHRYSLER AUTOMOBILES N.V. | 161,492 | 436,743 | ||||||||||
| 10,222 | FIAT CHRYSLER AUTOMOBILES N.V. (NEW YORK EXCHANGE)(c) | 17,872 | 182,360 | ||||||||||
| 30,218 | G4S PLC | 92,368 | 108,933 | ||||||||||
| 17,333 | GKN PLC | 51,515 | 74,746 | ||||||||||
| 52,286 | GLAXOSMITHKLINE PLC | 768,944 | 933,605 | ||||||||||
| 129,347 | GREGGS PLC | 1,419,609 | 2,443,184 | ||||||||||
| 25,875 | HAMMERSON PLC | 126,745 | 191,095 | ||||||||||
| 264,733 | HSBC HOLDINGS PLC | 1,799,176 | 2,741,125 | ||||||||||
| 52,719 | IMI PLC | 747,385 | 948,810 | ||||||||||
| 18,792 | IMPERIAL BRANDS PLC | 441,174 | 803,278 | ||||||||||
| 12,262 | INDIVIOR PLC(c) | 11,861 | 67,580 | ||||||||||
| 1,338 | INTERCONTINENTAL HOTELS GROUP PLC | 52,044 | 85,249 | ||||||||||
| 32,745 | INTERNATIONAL CONSOLIDATED AIRLINES GROUP S.A. - CDI | 90,834 | 284,296 | ||||||||||
| 63,684 | INTU PROPERTIES PLC | 169,226 | 217,537 | ||||||||||
| 24,324 | ITV PLC | 24,019 | 54,352 | ||||||||||
| 31,939 | J SAINSBURY PLC | 93,794 | 104,098 | ||||||||||
| 101,054 | JOHN WOOD GROUP PLC | 1,362,177 | 886,847 | ||||||||||
| 2,248 | JOHNSON MATTHEY PLC | 35,933 | 93,330 | ||||||||||
| 30,414 | KINGFISHER PLC | 60,107 | 138,671 | ||||||||||
| 579,352 | LAIRD PLC | 1,214,368 | 1,075,542 | ||||||||||
| 26,094 | LAND SECURITIES GROUP PLC | 262,910 | 355,127 | ||||||||||
| 26,807 | LEGAL & GENERAL GROUP PLC | 77,151 | 98,917 | ||||||||||
| 12,407 | LIVANOVA PLC(c) | 713,053 | 991,567 | ||||||||||
| 2,903,240 | LLOYDS BANKING GROUP PLC | 2,333,520 | 2,667,823 | ||||||||||
| 6,030 | LONDON STOCK EXCHANGE GROUP PLC | 69,795 | 308,803 | ||||||||||
| 1,080,970 | MAN GROUP PLC | 1,962,275 | 3,018,188 | ||||||||||
| 9,044 | MARKS & SPENCER GROUP PLC | 34,946 | 38,439 | ||||||||||
| 7,217 | MEGGITT PLC | 16,687 | 46,986 | ||||||||||
| 1,337 | MICRO FOCUS INTERNATIONAL PLC | 48,758 | 45,544 | ||||||||||
| 23,322 | NATIONAL GRID PLC | 148,569 | 275,553 | ||||||||||
| 2,148 | NEXT PLC | 36,823 | 131,231 | ||||||||||
| 73,408 | OLD MUTUAL PLC (LONDON EXCHANGE) | 87,200 | 229,642 | ||||||||||
| 34,908 | OXFORD INSTRUMENTS PLC | 539,512 | 401,085 | ||||||||||
| 7,366 | PEARSON PLC | 69,206 | 73,197 | ||||||||||
| 4,008 | PROVIDENT FINANCIAL PLC | 48,639 | 48,594 | ||||||||||
| 46,063 | PRUDENTIAL PLC | 714,750 | 1,185,068 | ||||||||||
| 54,834 | RECKITT BENCKISER GROUP PLC | 4,332,773 | 5,122,421 | ||||||||||
| 37,896 | RELX N.V. | 361,301 | 871,423 | ||||||||||
| 161,400 | RELX PLC (LONDON EXCHANGE) | 1,753,809 | 3,789,528 | ||||||||||
| 23,247 | RIO TINTO LTD. | 733,396 | 1,375,078 | ||||||||||
| 41,068 | RIO TINTO PLC | 1,083,488 | 2,185,759 | ||||||||||
| 23,557 | ROLLS-ROYCE HOLDINGS PLC(c) | 252,796 | 269,392 | ||||||||||
| 961,961 | ROYAL BANK OF SCOTLAND GROUP PLC(c) | 3,894,588 | 3,610,641 | ||||||||||
| 20,657 | SAGE GROUP (THE) PLC | 74,323 | 222,563 | ||||||||||
| 16,135 | SEGRO PLC | 67,053 | 127,876 | ||||||||||
| 4,954 | SEVERN TRENT PLC | 76,220 | 144,608 | ||||||||||
| 668,995 | SIG PLC | 1,445,084 | 1,591,515 | ||||||||||
| 19,613 | SKY PLC(c) | 145,505 | 267,983 | ||||||||||
| 26,103 | SMITH & NEPHEW PLC | 251,030 | 453,929 | ||||||||||
| 2,453 | SMITHS GROUP PLC | 28,519 | 49,348 | ||||||||||
| 2,906 | SSE PLC | 44,419 | 51,791 | ||||||||||
| 92,045 | STANDARD CHARTERED PLC(c) | 654,783 | 969,466 | ||||||||||
| See accompanying notes to financial statements. | 77 | (Continued) |
CLEARWATER INVESTMENT TRUST
Schedule of Investments - Clearwater International Fund
December 31, 2017
| Shares | Security | Cost | Fair value (a) | Percent of net assets | |||||||||
| United Kingdom (Cont’d): | |||||||||||||
| 141,530 | STANDARD LIFE ABERDEEN PLC | $ | 682,843 | 834,285 | |||||||||
| 1,424 | TECHNIPFMC PLC | 35,975 | 44,167 | ||||||||||
| 15,078 | TECHNIPFMC PLC (NEW YORK EXCHANGE) | 378,582 | 472,092 | ||||||||||
| 1,133,858 | TESCO PLC | 3,932,200 | 3,203,363 | ||||||||||
| 6,022 | TRAVIS PERKINS PLC | 111,057 | 127,407 | ||||||||||
| 2,073 | UBM PLC | 10,703 | 20,907 | ||||||||||
| 13,746 | UNILEVER N.V. - CVA | 465,317 | 774,435 | ||||||||||
| 24,244 | UNILEVER PLC | 545,189 | 1,350,402 | ||||||||||
| 8,137 | UNITED UTILITIES GROUP PLC | 56,989 | 91,130 | ||||||||||
| 433,660 | VECTURA GROUP PLC(c) | 663,693 | 689,141 | ||||||||||
| 4,955 | VESUVIUS PLC | 21,194 | 39,070 | ||||||||||
| 353,981 | VODAFONE GROUP PLC | 1,088,677 | 1,123,130 | ||||||||||
| 3,762 | WEIR GROUP (THE) PLC | 43,887 | 107,833 | ||||||||||
| 5,178 | WHITBREAD PLC | 168,592 | 279,643 | ||||||||||
| 20,383 | WM MORRISON SUPERMARKETS PLC | 52,509 | 60,517 | ||||||||||
| 57,600 | WORLDPAY GROUP PLC(e) | 192,852 | 331,294 | ||||||||||
| 23,432 | WPP PLC | 141,019 | 424,248 | ||||||||||
| 59,680,213 | 83,322,478 | 13.34 | % | ||||||||||
| United States: | |||||||||||||
| 44,193 | ARCH CAPITAL GROUP LTD.(c) | 1,740,143 | 4,011,399 | ||||||||||
| 20,110 | AXIS CAPITAL HOLDINGS LTD. | 1,025,983 | 1,010,728 | ||||||||||
| 4,351 | CARNIVAL PLC | 131,345 | 287,381 | ||||||||||
| 9,299 | SHIRE PLC | 267,371 | 489,647 | ||||||||||
| 3,164,842 | 5,799,155 | 0.93 | % | ||||||||||
| Sub-total Common Stocks: | 385,842,101 | 589,848,342 | 94.43 | % | |||||||||
| Preferred Stocks: | |||||||||||||
| Brazil: | |||||||||||||
| 187,700 | ALPARGATAS S.A.(c) | 600,320 | 987,418 | ||||||||||
| 196,474 | TELEFONICA BRASIL S.A. ADR, 2.33%(d)(f) | 2,522,202 | 2,913,710 | ||||||||||
| 3,122,522 | 3,901,128 | 0.62 | % | ||||||||||
| Germany: | |||||||||||||
| 1,521 | BAYERISCHE MOTOREN WERKE A.G., 4.76%(f) | 49,612 | 136,216 | ||||||||||
| 1,217 | HENKEL A.G. & CO. KGAA, 1.48%(f) | 101,251 | 161,135 | ||||||||||
| 1,443 | PORSCHE AUTOMOBIL HOLDING S.E., 1.45%(f) | 60,635 | 120,816 | ||||||||||
| 770 | VOLKSWAGEN A.G., 1.24%(f) | 99,996 | 153,780 | ||||||||||
| 311,494 | 571,947 | 0.09 | % | ||||||||||
| South Korea: | |||||||||||||
| 1,680 | HYUNDAI MOTOR CO. LTD., 4.10%(f) | 156,649 | 160,067 | ||||||||||
| 322 | SAMSUNG ELECTRONICS CO. LTD., 1.33%(f) | 366,307 | 628,630 | ||||||||||
| 522,956 | 788,697 | 0.13 | % | ||||||||||
| Sub-total Preferred Stocks: | 3,956,972 | 5,261,772 | 0.84 | % | |||||||||
| Rights: | |||||||||||||
| Spain: | |||||||||||||
| 46,787 | REPSOL S.A.(c) | 21,388 | 21,276 | ||||||||||
| 21,388 | 21,276 | 0.00 | % | ||||||||||
| Sub-total Rights: | 21,388 | 21,276 | 0.00 | % | |||||||||
| Short-Term Investments: | |||||||||||||
| 28,399,890 | NORTHERN INSTITUTIONAL FUNDS - U.S. GOVERNMENT SELECT PORTFOLIO, 1.13%(g) | 28,399,890 | 28,399,890 | ||||||||||
| Sub-total Short-Term Investments: | 28,399,890 | 28,399,890 | 4.55 | % | |||||||||
| Grand total(h) | $ | 418,220,351 | 623,531,280 | 99.82 | % | ||||||||
Notes to Schedule of Investments:
| (a) | Investments are valued in accordance with procedures described in note 2 to the financial statements. |
| (b) | Security has been deemed worthless and is a Level 3 investment. |
| (c) | Non-income producing assets. |
| (d) | Securities are American Depositary Receipts of companies based outside of the United States representing 2.79% of net assets as of December 31, 2017. |
| (e) | Securities exempt from registration under Rule 144A of the Securities Act of 1933. These securities may be resold in transactions exempt from registration, normally to qualified institutional buyers. The value of these securities is determined by valuations supplied by a pricing service or brokers, or, if not available, in accordance with procedures established by the Board of Trustees. |
| See accompanying notes to financial statements. | 78 | (Continued) |
CLEARWATER INVESTMENT TRUST
Schedule of Investments - Clearwater International Fund
December 31, 2017
| (f) | Current yield is disclosed. Dividends are calculated based on a percentage of the issuer’s net income. |
| (g) | The short-term investment is a money market portfolio of the investment company, Northern Institutional Funds. At December 31, 2016, the value of the Clearwater International Fund’s investment in the U.S. Government Select Portfolio of the Northern Institutional Funds was $19,594,255 with net purchases of $8,805,635 during the fiscal year ended December 31, 2017. |
| (h) | At December 31, 2017, the cost for Federal income tax purposes was $421,776,480. The aggregate gross unrealized appreciation and depreciation of investments in securities based on this cost was as follows: |
| Gross unrealized appreciation | $ | 207,852,031 | ||
| Gross unrealized depreciation | (6,097,231 | ) | ||
| Net unrealized appreciation | $ | 201,754,800 |
At December 31, 2017, the industry sectors for the Clearwater International Fund were:
| Industry Sector | Percent of Long-Term Investments | |||
| Consumer Discretionary | 16.96 | % | ||
| Consumer Staples | 9.88 | |||
| Energy | 4.54 | |||
| Financials | 19.51 | |||
| Health Care | 8.71 | |||
| Industrials | 16.16 | |||
| Information Technology | 12.21 | |||
| Materials | 6.56 | |||
| Real Estate | 2.12 | |||
| Telecommunication Services | 2.13 | |||
| Utilities | 1.22 | |||
| 100.00 | % | |||
At December 31, 2017, the Clearwater International Fund’s investments were denominated in the following currencies:
| Concentration by Currency | Percent of Long-Term Investments | |||
| Euro | 23.43 | % | ||
| Japanese Yen | 16.97 | |||
| British Pound | 13.93 | |||
| United States Dollar | 9.79 | |||
| Swiss Franc | 7.82 | |||
| Canadian Dollar | 6.45 | |||
| Other currencies | 21.61 | |||
| 100.00 | % | |||
| See accompanying notes to financial statements. | 79 | (Continued) |
CLEARWATER INVESTMENT TRUST
Schedule of Investments - Clearwater International Fund
December 31, 2017
At December 31, 2017, the Clearwater International Fund had outstanding forward foreign currency exchange contracts as follows:
| Contract | Unrealized | |||||||||||||||||||
| Settlement | Contract Amount | Appreciation/ | ||||||||||||||||||
| Counterparty | Date | Deliver | Receive | (Depreciation) | ||||||||||||||||
| Northern Trust | 02/01/2018 | JPY | 343,843,779 | USD | 3,132,745 | $ | 76,201 | |||||||||||||
| $ | 76,201 | |||||||||||||||||||
| Northern Trust | 05/11/2018 | CNH | 24,921,886 | USD | 3,698,542 | $ | (99,851 | ) | ||||||||||||
| $ | (99,851 | ) | ||||||||||||||||||
| $ | (23,650 | ) | ||||||||||||||||||
| See accompanying notes to financial statements. | 80 | (Continued) |
CLEARWATER INVESTMENT TRUST
Schedule of Investments - Clearwater International Fund
December 31, 2017
Clearwater International Fund Portfolio Diversification
(as a percentage of net assets)
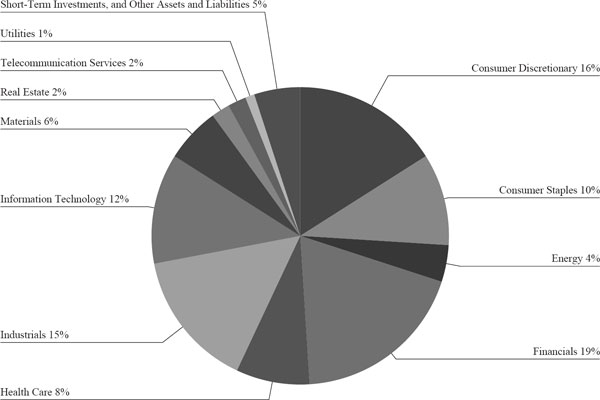
| See accompanying notes to financial statements. | 81 | (Continued) |
Item 2. Code of Ethics
As of December 31, 2017, the Board of Trustees of Clearwater Investment Trust (the “Trust”) has adopted a code of ethics that applies to the Trust’s President/Principal Executive Officer and Treasurer/Principal Financial Officer (“Code of Ethics”). For the fiscal year ended December 31, 2017, there were no amendments to any provision of the Code of Ethics, nor were there any waivers granted from a provision of the Code of Ethics.
Item 3. Audit Committee Financial Expert
The Board of Trustees of the Trust consists of eight members, five of whom are Independent Trustees as defined by the Investment Company Act of 1940, as amended (the “1940 Act”). The Board of Trustees does not include an “audit committee financial expert” (as defined in Item 3 of Form N-CSR). Given the restrictive nature of the definition of an “audit committee financial expert,” the Board of Trustees has determined that no current member of the Board of Trustees of the Trust qualifies as an “audit committee financial expert.” Furthermore, the Board of Trustees has determined that given the nature of investment company financial statements in general and the investment policies of the Trust’s fund offerings in particular that the independent trustees possess the necessary skills and experience to perform the functions of the audit committee.
Item 4. Principal Accountant Fees and Services
| 2017 | 2016 | ||
| (a) | Audit Fees | $105,900 | $103,000 |
| (b) | Audit-Related Fees | $0 | $0 |
| (c) | Tax Fees1 | $23,425 | $29,630 |
| (d) | All Other Fees | $0 | $0 |
1Tax Fees are the aggregate amount billed by the Trust’s principal accountant for tax compliance, tax advice, international tax reclaim filings and tax planning during the fiscal year.
(e)
| 1. | The audit committee has adopted pre-approval policies and procedures regarding the provision of audit or non-audit services to the trust, as described in paragraph (c)(7) of Rule 2-01 of Regulation S-X. |
| The policies and procedures provide that, if pre-approval of non-audit services is requested other than at a regularly scheduled Audit Committee Meeting, Fund management shall present such request to the Audit Committee Chair, or committee member if a Chair is not designated, for review of the proposal and determination if a special session of the Audit Committee is required. If the Chair or member determines the request requires a special session, the Audit Committee Chair will call a session per standard protocols and invite non-members as required. If the request is deemed in adherence to the independence of the auditor and to the benefit of the Fund, the Chair or designee may grant the pre-approval without a special session. |
| The Chair, designee or Audit Committee shall review the purpose, terms and risks of the request in addition to assurances of maintaining auditor independence and adherence to Regulation S-X, paragraph (c)(7) of Rule 2-01. If the pre-approval request is approved, the request will be presented at the next regularly scheduled Audit Committee for ratification. |
| 2. | No services were pre-approved by the audit committee pursuant to paragraph (c)(7)(i)(C) of Rule 2-01 of Regulation S-X. |
| (f) | Not applicable. |
| (g) | Non-Audit Related Fees Provided to the Trust or to the Trust’s Investment Adviser. |
2017= $43,150 2016 = $13,000 |
| (h) | For the most recent fiscal year, the Audit Committee has determined that the provision of non-audit services to Clearwater Management Company and its affiliates was compatible with maintaining the principal accountant’s independence. |
Item 5. Audit Committee of Listed Registrants
Not applicable (the Funds are not listed issuers).
Item 6. Investments
| (a) | Schedule of Investments is included as part of the report to shareholders filed under Item 1 of this report on Form N-CSR. |
| (b) | Not applicable. |
Item 7. Disclosure of Proxy Voting Policies and Procedures for Closed-End Management Investment Companies
Not applicable (the Trust is an open-end management investment company).
Item 8. Portfolio Managers of Closed-End Management Investment Companies
Not applicable (the Trust is an open-end management investment company).
Item 9. Purchases of Equity Securities by Closed-End Management Investment Company and Affiliated Purchasers
Not applicable (the Trust is an open-end management investment company).
Item 10. Submission of Matters to a Vote of Security Holders
There have been no material changes to the procedures by which shareholders may recommend nominees to the Board of Trustees.
Item 11. Controls and Procedures
| (a) | The Trust’s principal executive officer and principal financial officer have concluded that the Trust’s disclosure controls and procedures (as defined in Rule 30a-3(c) under the Investment Company Act of 1940, as amended (the “1940 Act”)) are effective based on the principal executive officer and principal financial officer’s evaluation of these controls and procedures, as required by Rule 30a-3(b) under the 1940 Act, as of a date within 90 days of the filing date of this document.
|
| (b) | There have been no significant changes in the Trust’s internal control over financial reporting (as defined in Rule 30a-3(d) under the 1940 Act) that occurred during the second fiscal quarter of the period covered by this report that have materially affected, or are reasonably likely to materially affect, the Trust’s internal control over financial reporting. |
Item 12. Disclosure of Securities Lending Activities for Closed-End Management Investment Companies
Not applicable (the Trust is an open-end management investment company).
Item 13. Exhibits
| (a)(1) | Code of Ethics pursuant to Item 2 of Form N-CSR is incorporated by reference to Exhibit 12(a)(1) to the report filed on Form N-CSR on March 5, 2015 (Accession Number 0000897101-15-000283). |
| (a)(2) | Certifications pursuant to Section 302 of the Sarbanes-Oxley Act of 2002 and required by Rule 30a-2(a) under the 1940 Act. |
| (a)(3) | No written solicitations to purchase securities were sent or delivered during the period covered by this report by or on behalf of the Trust. |
| (b) | Certifications pursuant to Section 906 of the Sarbanes-Oxley Act of 2002 and required by Rule 30a-2(b) under the 1940 Act. |
SIGNATURES
Pursuant to the requirements of the Securities Exchange Act of 1934 and the Investment Company Act of 1940, the registrant has duly caused this report to be signed on its behalf by the undersigned, thereunto duly authorized.
| Clearwater Investment Trust | ||
| By | /s/ Justin H. Weyerhaeuser | |
| Justin H. Weyerhaeuser | ||
| President (Principal Executive Officer) and | ||
| Treasurer (Principal Financial Officer) | ||
| Date: March 2, 2018 | ||
Pursuant to the requirements of the Securities Exchange Act of 1934 and the Investment Company Act of 1940, this report has been signed below by the following persons on behalf of the registrant and in the capacities and on the dates indicated.
| Clearwater Investment Trust | ||
| By | /s/ Justin H. Weyerhaeuser | |
| Justin H. Weyerhaeuser | ||
| President (Principal Executive Officer) | ||
| Date: March 2, 2018 | ||
| Clearwater Investment Trust | ||
| By | /s/ Justin H. Weyerhaeuser | |
| Justin H. Weyerhaeuser | ||
| Treasurer (Principal Financial Officer) | ||
| Date: March 2, 2018 | ||