UNITED STATES
SECURITIES AND EXCHANGE COMMISSION
Washington, D.C. 20549
FORM N-CSR
CERTIFIED SHAREHOLDER REPORT OF REGISTERED
MANAGEMENT INVESTMENT COMPANIES
| | | | |
| | Investment Company Act file number | 811-05038 | |
Clearwater Investment Trust
(Exact name of registrant as specified in charter)
2000 Wells Fargo Place, 30 East 7th Street, Saint Paul, Minnesota 55101-4930
(Address of principal executive offices) (Zip code)
Karen P. Rau
Fiduciary Counselling, Inc.
2000 Wells Fargo Place, 30 E. 7th Street
Saint Paul, Minnesota 55101-4930
Copy to:
John V. O’Hanlon, Esq.
Dechert LLP
One International Place, 40th Floor
100 Oliver Street
Boston, Massachusetts 02110
(Name and address of agent for service)
Registrant’s telephone number, including area code:651-228-0935
Date of fiscal year end:December 31
Date of reporting period:December 31, 2019
Item 1. Reports to Stockholders
| (a) | The following is a copy of the report transmitted to shareholders pursuant to Rule 30e-1 under the Investment Company Act of 1940 (17 CFR 270.30e-1) |
CLEARWATER INVESTMENT TRUST
Clearwater Core Equity Fund
Clearwater Small Companies Fund
Clearwater Tax-Exempt Bond Fund
Clearwater International Fund
Annual Report
for the year ended
December 31, 2019
Management Discussion of Clearwater Funds’ Performance
Clearwater Core Equity Fund
The Clearwater Core Equity Fund (the “Core Equity Fund” or the “Fund”) seeks long-term growth of capital. Under normal market conditions, the Core Equity Fund pursues its investment objective by investing at least 80% of its net assets, plus the amount of any borrowings for investment purposes, in equity securities of U.S. companies. The Core Equity Fund’s assets are managed in a “multi-manager, multi-style” approach. As of December 31, 2019, the Fund had three subadvisers that provide day-to-day management of Fund assets. Parametric Portfolio Associates LLC (“Parametric”), with approximately 40% to 60% of the Fund’s assets, manages its portion of the Fund’s assets to track the Russell 1000® Index as closely as possible without requiring the Fund to realize taxable gains. The remaining Fund assets are divided between AQR Capital Management, LLC (“AQR”) and O’Shaughnessy Asset Management, LLC (“OSAM”), who both utilize an active management style.
2019 Market Overview:
Domestic large capitalization equities, as defined by the Russell 1000® Index, generated more than 30% returns in 2019, driven by the Federal Reserve’s shift to a more accommodative monetary policy stance and improved investor sentiment that was in part derived from the announcement of a phase one trade deal between the U.S. and China. Value stocks underperformed growth stocks for the third straight year, as measured by the Russell 1000® Value Index and the Russell 1000® Growth Index.
2019 Performance and 2020 Outlook:
The Core Equity Fund gained 29.1%, net of fees, in 2019 compared to an increase of 31.4% for the Russell 1000® Index, the Fund’s benchmark.
Each of the three subadvisers comment on the performance of their specific portions of the Fund and provide a market outlook for the next year in the paragraphs below. For comparison of the subadvisers’ capabilities, performance is shown gross of fees. The Fund pays a single advisory fee to Clearwater Management Co., Inc., which in turn pays the subadvisers out of its advisory fee.
Although the overall performance of the Core Equity Fund is measured against its benchmark, as stated above, each of the underlying subadvisers may manage their portion of the Fund against a different benchmark that aligns more closely with their strategy. In each section below, the subadvisers discuss their view of the market over the last twelve months, the performance of their portfolios with respect to the benchmark against which their particular portfolio is managed and their outlook for the next twelve months. Parametric, the subadviser that follows a tax-managed passive strategy, slightly underperformed its benchmark in 2019. Both active managers, AQR and OSAM, underperformed their respective benchmarks in 2019 by a larger margin.
AQR Commentary
General Market Overview:
We trade a set of strategies based on the value, momentum, and quality signals of individual securities that seek a positive expected return versus the appropriate benchmark, in a variety of economic environments. Because our investment approach employs a systematic set of rules based on economic intuition and testing to seek to ensure they are robust across time, macro environments, and geographies, we typically do not offer general market overviews.
2019 Performance:
The portion of the Core Equity Fund managed by AQR (the “Portfolio”) underperformed the Russell 1000® Index (the “benchmark”) in 2019, returning 28.8%, gross of fees, while the benchmark returned 31.4%. Sector allocation was additive to performance, while stock selection within sectors detracted from performance. The largest detractor was the Health Care sector, where both sector allocation and stock selection within the sector contributed to underperformance versus the benchmark.
2020 Outlook:
In terms of sector positioning, we are currently overweight Financials while being underweight Energy. With respect to long-term attractiveness, we believe that valuations are currently less attractive in the U.S.
OSAM Commentary
General Market Overview:
2019 was a strong year for returns in global equity markets and a few key themes emerged for the year. Growth outperformed value (the Russell 1000® Growth Index outperformed the Russell 1000® Value Index by 9.8% in 2019) and large capitalization stocks outperformed small capitalization stocks (the Russell 1000® Index outperformed the Russell 2000® Index by 5.9%). 2019 was marred by trade wars, Federal Reserve policy, and political tensions. The Federal Reserve cut interest rates for the third time in October and the U.S. came to a verbal agreement with China on signing a phase one trade deal that marked a potential first step to ending the trade war.
2019 Performance:
The portion of the Core Equity Fund managed by OSAM (the “Portfolio”) underperformed the Russell 1000® Index (the “benchmark”) in 2019, returning 26.2%, gross of fees, while the benchmark returned 31.4%. The elimination of lower quality stocks was the largest detractor from the Portfolio’s performance. The Portfolio’s tilts toward factors such as value and momentum and an underweight exposure to large capitalization stocks also detracted from performance.
2020 Outlook:
We believe our Portfolio is positioned well for 2020. Our investment process favors companies that have higher levels of return on capital, lower reliance on external financing, and trade at what we believe are deep discounts across many valuation factors relative to the benchmark. At year- end 2019, the Portfolio’s holdings were returning capital to shareholders at a rate of 6.2% versus the benchmark’s 2.9%. We believe that these combined advantages can only be delivered by a portfolio which is distinct from the benchmark. We also believe that our Portfolio continues to represent a unique take on the U.S. equity market. Entering 2020 we expect to continue to focus on what we believe is our market niche: quality companies, often trading at out-of-favor prices, which are aggressively returning capital to equity shareholders through dividends and share repurchases.
Parametric Commentary
General Market Overview:
The stock market had a strong year in 2019, spanning across large and small capitalization stocks as well as value and growth stocks. The two decisive factors that impacted the market in 2019 were the trade tensions with China and Federal Reserve’s interest rate policy. In May, market sentiment turned negative when the United States increased tariffs on Chinese products and threatened new tariffs with coinciding retaliatory announcements by China. Market sentiment turned positive after trade talks resumed and phase one of the trade deal was announced. In the wake of the trade war and a slowdown in economic activity, the Federal Reserve cut interest rates three times (beginning in July), from 2.50% to 1.75%. This accommodative monetary policy further boosted market confidence.
2019 Performance:
The portion of the Core Equity Fund managed by Parametric (the “Portfolio”) underperformed the Russell 1000® Index (the “benchmark”) in 2019, returning 31.2%, gross of fees, while the benchmark returned 31.4%. Most of the underperformance was attributed to holding a small amount of cash in a strong up market (cash drag). The Technology sector was slightly underweight relative to the benchmark, which also contributed to the underperformance.
2020 Outlook:
The phase one trade deal between the U.S. and China was signed in January 2020. However, there are still many issues between the two largest economic powers. How it unfolds in 2020 remains an uncertainty. The Federal Reserve seems to be committed to low interest rates, ready to accommodate any deteriorating economic conditions.
Clearwater Small Companies Fund
The Clearwater Small Companies Fund (the “Small Companies Fund” or the “Fund”) seeks long-term growth of capital. Under normal market conditions, the Fund invests at least 80% of its net assets, plus the amount of any borrowings for investment purposes, in equity securities of small companies. The Fund defines “small companies” as issuers with market capitalizations no greater than that of the largest market capitalization company included in the Russell 2000® Index at the time of purchase. Equity securities consist primarily of exchange-traded common and preferred stocks and convertible securities. The Fund uses a “multi-style, multi-manager” approach with three subadvisers who employ distinct investment styles: Cooke & Bieler, L.P. (“Cooke & Bieler”), Kennedy Capital Management Inc. (“Kennedy”), and Pzena Investment Management, LLC (“Pzena”). At December 31, 2019, Kennedy managed about 60% of the Fund while Cooke & Bieler and Pzena managed about 20% each.
2019 Market Overview:
Domestic small capitalization equities, as defined by the Russell 2000® Index, generated more than 25% returns in 2019, driven by the Federal Reserve’s shift to a more accommodative monetary policy stance and improved investor sentiment that was in part derived from the announcement of a phase one trade deal between the U.S. and China. Value stocks underperformed growth stocks for the third straight year, as measured by the Russell 2000® Value Index and the Russell 2000® Growth Index.
2019 Performance and 2020 Outlook:
The Small Companies Fund gained 26.4%, net of fees, during 2019 compared to a gain of 25.5% for the Russell 2000® Index, the Fund’s benchmark.
Each of the three subadvisers comment on the performance of their specific portions of the Fund and provide a market outlook for the next year in the paragraphs below. For comparison of the subadvisers’ capabilities, performance is shown gross of fees. The Fund pays a single advisory fee to Clearwater Management Co., Inc., which in turn pays the subadvisers out of its advisory fee.
Although the overall performance of the Small Companies Fund is measured against its benchmark, as stated above, each of the underlying subadvisers may manage their portion of the Fund against a different benchmark that aligns more closely with their strategy. In each section below, the subadvisers discuss their view of the market over the last twelve months, the performance of their portfolios with respect to the benchmark against which their particular portfolio is managed and their outlook for the next twelve months. Both Cooke & Bieler and Pzena outperformed their respective benchmarks in 2019, while Kennedy underperformed its benchmark.
Kennedy Commentary
General Market Overview:
2019 marked a significant turnaround for small capitalization equity markets, with the Russell 2000® Index rising 25.5% following an 11.0% decline in 2018. 2019 was headlined by a few important themes, including tariffs, cyclicality, impeachment, and large cap growth. After driving significant volatility in late 2018, fears of a trade war with China began to subside in 2019 as investors came to realize that verbal sparring is less likely to drive meaningful changes in cash flow for companies. As economic activity continued apace and the yield curve steepened, concerns around a near term economic contraction began to fade. Amidst this steady economic backdrop, uncertainty created by the impeachment hearings seemed to have little effect on equity markets. Gains from large capitalization growth stocks were particularly impressive and were well ahead of the gains from small capitalization value stocks. We find it surprising that the gap between large and small capitalization returns remains this wide, which we believe creates an attractive opportunity for small capitalization investors in the years to come.
2019 Performance:
The portion of the Small Companies Fund managed by Kennedy (the “Portfolio”) underperformed the Russell 2000® Index (the “benchmark”) in 2019, returning 24.5%, gross of fees, while the benchmark returned 25.5%. Positive stock selection in Financials and an underweight to Energy was more than offset by underperformance in the Health Care, Consumer Discretionary, and Industrials sectors. Considering the strength in the equity market, the Portfolio’s cash position also detracted from performance.
2020 Outlook:
As we contemplate the year to come, we are watching a few important themes. As usual, election years come with policy uncertainty, and we believe that heightened political polarity will likely lead to increased market volatility as investors grapple with potential outcomes from the presidential race. From a more fundamental perspective, the health of the U.S. consumer remains foremost in our minds, given our belief that consumers are the engine that drive our economy and hence our companies. Based on employment trends and various income metrics, coupled with continued low inflation, we believe the consumer’s buying power remains strong. Given these factors, we believe the U.S. economy should continue to grow at a modest pace over the near to medium term. From a portfolio perspective, regardless of the economic environment, we remain confident in our ability to find management teams who we believe are adept at utilizing their companies’ cash flows to enable continuing high returns. This is a dynamic that we believe is often overlooked by market participants with shorter time horizons and accrues to our benefit over time.
Cooke & Bieler Commentary
General Market Overview:
U.S. equity markets ended 2019 on a very strong note, with certain indices reaching record highs. Investor optimism was buoyed by easing trade tensions and indications of diminishing recession risks. Growth stocks outperformed value stocks and bond-proxy sectors, such as Utilities, underperformed the broader market. Investors were soothed by the Federal Reserve’s accommodative monetary policy pivot, which boosted U.S. equity indices, with particular strength in the Technology sector. Volatility receded from higher levels in 2018.
2019 Performance:
The portion of the Small Companies Fund managed by Cooke & Bieler (the “Portfolio”) outperformed the Russell 2000® Value Index (the “benchmark”) in 2019, returning 37.6%, gross of fees, while the benchmark returned 22.4%. Stock selection within sectors contributed nearly all the outperformance, although sector allocation also contributed positively. Stock selection in the Industrials, Materials, and Consumer Discretionary sectors was particularly strong. Significant individual contributors to the Portfolio’s return included Winnebago, Colfax, Schweitzer-Mauduit, Reliance Steel, and Syneos Health.
2020 Outlook:
Looking forward, we are cautiously optimistic. The Portfolio’s fundamentals remain strong, but valuations have risen to more demanding levels. The Portfolio’s pro-cyclical tilt benefitted performance in 2019 as recession fears moderated but will likely be less of a tailwind going forward. Nonetheless, we remain confident in the Portfolio’s positioning and our ability to identify what we believe to be reasonably priced stocks of high-quality businesses that should add value over the long term. All things considered, we believe the market likely will be more volatile in 2020, creating opportunities for investors like us. We remain watchful for those openings, with the knowledge that timely eliminations can strengthen the Portfolio as much as initiations.
Pzena Commentary
General Market Overview:
Stocks ended 2019 strongly with large and small capitalization stocks up significantly for the year. Small capitalization stocks lagged large capitalization stocks and growth stocks outperformed value stocks in 2019. Growth’s outperformance shifted between companies viewed as delivering reliable growth with little concern for their valuations and those that provided stability and yield. On the other hand, companies that disappointed in delivering growth were severely punished, even if the underlying businesses remained healthy.
2019 Performance:
The portion of the Small Companies Fund managed by Pzena (the “Portfolio”) outperformed the Russell 2000® Value Index (the “benchmark”) in 2019, returning 26.2%, gross of fees, while the benchmark returned 22.4%. The outperformance was driven by stock selection within the Materials, Consumer Discretionary, and Industrials sectors. Sector allocation within Financials and Health Care detracted from performance.
Specialty technology distributor Anixter was the largest individual contributor to performance, rising as a private equity player and competitor Wesco made competing bids to acquire the company. The initial takeout offer was lower than we felt reasonable, but incremental bidding brought the valuation closer to our estimate of the stock’s fair value, which led us to sell the position. C&J Energy Services was the largest individual detractor on weak crude oil prices. The company operates in the critical oil services industry, which is necessary to find and produce oil and gas. We believe weak oil prices and temporary oversupply are masking the fact that oil and gas capital spending must pick up dramatically to offset a looming shortfall in energy supply coming over the next several years, and the weak prices favor it over suppliers. The company merged with Keane Energy and was renamed NexTier Oilfield Solutions. We believe that the new combined company has incremental scale with two complementary companies brought together.
2020 Outlook:
The large underperformance of value versus growth stocks and small capitalization versus large capitalization stocks has created what we believe to be an abundance of opportunity to build an attractive small cap value portfolio. The wide dispersion between what we believe are the cheapest and most expensive stocks is near unprecedented levels. This is significant, as a wide dispersion has generally led to strong outperformance by value stocks over the long term. We continue to see a broadening of opportunities due to market moves in recent months, but the Portfolio remains heavily invested in what we believe to be attractively valued, economically sensitive market segments. We are still not yet finding opportunities in perceived safe sectors such as REITs and Utilities.
Clearwater Tax-Exempt Bond Fund
The Clearwater Tax-Exempt Bond Fund (the “Tax-Exempt Bond Fund” or the “Fund”) seeks high current income that is exempt from U.S. federal income tax, consistent with preservation of capital. Under normal market conditions, the Fund invests at least 80% of its net assets, plus the amount of any borrowings for investment purposes, in tax-exempt bonds, which are debt obligations issued by or for the U.S. states, territories, and possessions and the District of Columbia. The interest on these securities is generally exempt from both U.S. regular federal income tax and U.S. federal alternative minimum tax. However, the Fund may invest up to 20% of its assets in securities that generate interest income subject to federal alternative minimum tax for individuals. The Fund invests in both revenue bonds, which are backed by and payable only from the revenues derived from a specific facility or specific revenue source, and in general obligation bonds, which are secured by the full faith, credit and taxation power of the issuing municipality. The Fund’s subadviser, Sit Fixed Income Advisors II, LLC (“Sit”), provides day-to-day management for the Fund. It should be noted that the Fund is not a money market fund and is not intended to be a money market fund substitute. Under normal market conditions, the Fund’s investments may be more susceptible than a money market fund to interest rate risk and credit risks relevant to the Fund’s investments.
Sit has provided the commentary below regarding the Tax-Exempt Bond Fund. The Fund pays a single advisory fee to Clearwater Management Co., Inc., which in turn pays the subadviser out of its advisory fee.
Sit Commentary
General Market Overview:
Tax-exempt municipal bonds delivered strong returns in 2019 supported by record inflows into tax-exempt municipal bond funds and net negative supply. The U.S. Treasury yield curve inverted in March and remained inverted until the fourth quarter. Ultra-short yields fell approximately 25-40 basis points in the first half of the year, before falling further to end the year down 90-95 basis points. Meanwhile, short to intermediate yields, which fell 70-75 basis points in the first half of the year, fell slightly in the second half to end the year down about 75-80 basis points. Long U.S. Treasury yields fell by about 50 basis points in the first half of the year and ended the year down 60-65 basis points, so the net result was a slightly steeper U.S. Treasury yield curve. Meanwhile, the municipal yield curve flattened with short and intermediate tax-exempt yields down roughly 75-85 basis points on the year compared to the 30-year maturity which was down 93 basis points.
Credit fundamentals remain generally sound as credit spreads tightened significantly in the first half of the year, then remained stable in the second half. State government general fund revenue collections continue to be strong and state budgets remain largely healthy, despite a few notable exceptions such as Illinois, New Jersey and Connecticut. Puerto Rico bonds rallied significantly in 2019 as the Financial Oversight and Management Board for Puerto Rico reached agreements with various creditor groups and the debt restructuring process proceeded through U.S. District Court. The Federal Reserve kept short-term interest rates unchanged in the first half of 2019, then cut them by 25 basis points in July, September and October. Finally, direct and indirect retail demand remained solid in 2019 in the wake of the tax legislation passed in December 2017 that capped state and local tax deductions.
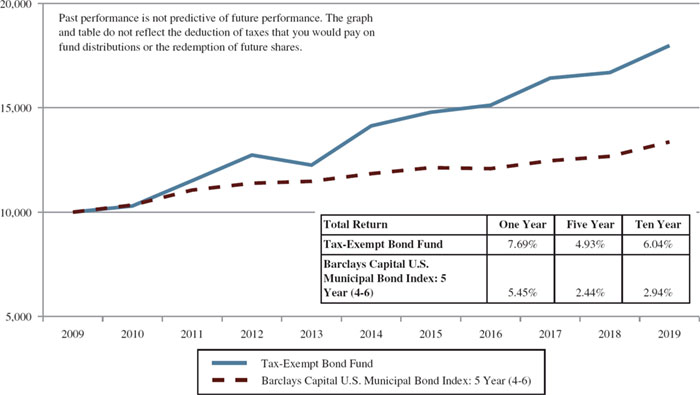
2019 Performance:
The Tax-Exempt Bond Fund returned 7.7%, net of fees, in 2019. The Fund’s benchmark, the Barclays Municipal Bond 5 Year (4-6) Index (the “benchmark”), returned 5.4% over the same period. In 2019 we continued hedging interest rate risk by shorting U.S. Treasury futures. We adjusted the hedge throughout the year as interest rates declined before finally taking off in November. The Fund’s average life duration, a measure of the Fund’s sensitivity to changes in interest rates, increased slightly from 4.6 years at the beginning of the year to 4.9 years at the end of the year. For comparison, the benchmark had a duration of 4.0 years at the beginning and the end of the year.
The Fund’s longer duration as well as an allocation to and superior security selection within non-rated bonds were the primary reasons for the outperformance during 2019. Lower investment grade rated bonds and non-rated bonds outperformed those of higher credit quality as investors sought higher yields. Another contributing factor was the Fund’s position in closed-end municipal bond funds, which performed well in 2019. The Fund’s yield fell during the year, but the Fund continues to maintain a significant yield advantage over its benchmark.
2020 Outlook:
Political discord, ongoing impeachment proceedings and the presidential election add political risk to the financial markets in 2020. In general, we believe the economy enters 2020 with good momentum, aided by precautionary monetary easing, healthy consumer spending and a reduction in trade-related risks with China. We expect U.S. real GDP growth to slow from its estimated pace of 2.5% in 2019 to around 2.0% in 2020, and inflation to inch higher. Uncertainty exists regarding the shape of the yield curve in 2020. The Federal Reserve’s “midcycle adjustment” to interest rates appears to be over for now. The Federal Reserve has indicated a pause after cutting interest rates three times in the second half of 2019 but continues to monitor the implications of incoming information. We expect gross municipal supply to be comparable to 2019, perhaps exceeding maturities and redemptions to generate positive net supply. However, taxable bond issuance continues to become a bigger component of municipal supply with tax-exempt issuance flat. That dynamic provides technical support to the tax-exempt market. We also expect strong retail demand from residents of high-income tax states to continue in the wake of the virtual elimination of the state and local income tax deduction.
Regarding credit, after tightening markedly in 2019, we expect credit spreads to modestly widen which will dampen performance of lower investment grade and non-rated bonds. More progress is expected to be made in Puerto Rico in 2020 with debt swap deals occurring within the next twelve months. We believe that Illinois, New Jersey and Connecticut related concerns will continue to weigh on the market and could produce some volatility. Furthermore, we believe the funding of retirement pensions and healthcare obligations for states and large local municipalities will remain a hot topic and the subject of negative media reports about the municipal market. We believe that the Fund’s income advantage and diversification in terms of yield curve positioning and credit quality have positioned it opportunistically for the economic and interest rate environment that we expect in 2020. We expect our investment of new cash flows to be focused on maturities in the 5-30 year range.
Clearwater International Fund
The Clearwater International Fund (the “International Fund” or the “Fund”) seeks long-term growth of capital. The Fund generally invests at least 80% of the value of its net assets, plus the amount of any borrowings for investment purposes, in equity securities of companies organized or located outside the United States and doing a substantial amount of business outside the United States. The Fund diversifies its investments among many different countries throughout the world and may invest in companies of any size. The Fund does not intend to invest more than 20% of its net assets in the equity securities of developing or emerging market issuers. The Fund uses a “multi-style, multi-manager” approach. The Fund’s adviser allocates portions of the Fund’s assets among subadvisers who employ distinct investment styles. The Fund currently has four subadvisers that provide day-to-day management of Fund assets. Parametric Portfolio Associates LLC (“Parametric”) manages its portion of the portfolio (approximately 35%) to track the MSCI World Ex U.S.A. Index – Net Dividends as closely as possible without requiring the Fund to realize taxable gains. The Fund’s other three subadvisers, Artisan Partners Limited Partnership (“Artisan”), LSV Asset Management (“LSV”) and WCM Investment Management, LLC (“WCM”), utilize an active management style and manage the remaining 65% of the Fund. LSV was added as a subadviser in September 2019 and at the same time WCM, which already managed a large cap strategy, began managing a separate small cap strategy for the Fund. Templeton Investment Counsel, LLC was terminated as a subadviser at that time.
2019 Market Overview:
As defined by the Fund’s benchmark, the MSCI World Ex U.S.A. Index - Net Dividends (the “benchmark”), large and mid-capitalization, international developed market stocks returned more than 22% in 2019. The strong performance was partially attributable to the renewed prospects for, and ultimately a phase one trade deal between the U.S. and China. International small capitalization stocks outperformed large capitalization stocks in 2019, after underperforming in 2018.
2019 Performance and 2020 Outlook:
The International Fund gained 26.5%, net of fees, in 2019 compared to an increase of 22.5% for the benchmark.
Each of the four subadvisers comment on the performance of their specific portions of the Fund and provide a market outlook for the next year in the paragraphs below. For comparison of the subadvisers’ capabilities, performance is shown gross of fees. The Fund pays a single advisory fee to Clearwater Management Co., Inc., which in turn pays the subadvisers out of its advisory fee.
Although the overall performance of the International Fund is measured against its benchmark, as stated above, each of the underlying subadvisers may manage their portion of the Fund against a different benchmark that aligns more closely with their strategy. In each section below, the subadvisers discuss their view of the market over the last twelve months, the performance of their portfolios with respect to the benchmark against which their particular portfolio is managed and their outlook for the next twelve months. Each subadviser allocation outperformed its respective benchmark for the applicable period, with WCM’s Focused Growth International strategy generating significant outperformance.
Artisan Commentary
General Market Overview:
Measured in U.S. dollar terms, the MSCI EAFE Index (the “benchmark”) returned 22.0% in 2019, as a variety of concerns abated, including global trade tensions, global monetary policy’s future direction, Brexit uncertainty and signs of slowing economic growth (particularly as the year concluded). U.S. stocks outperformed developed international stocks. All sectors generated positive returns in 2019, led by Technology, Health Care and Industrials. Conversely, Energy was the worst-performing sector on a relative basis.
2019 Performance:
The portion of the International Fund managed by Artisan (the “Portfolio”) outperformed the benchmark in 2019, returning 25.2%, gross of fees, while the benchmark returned 22.0%. Performance of the following stocks had a positive impact on the Portfolio during the period: Samsung Electronics, a leader in smartphones, semiconductors and other electronic components; Arch Capital, a Bermuda-based company that writes insurance and reinsurance on a worldwide basis; NXP Semiconductors, one of the two dominant suppliers of semiconductors to the automotive industry and one of the top-five suppliers of analog semiconductors for general industrial uses; ABB, a leading global engineering company and the largest global supplier of industrial motors, generators and power grids; and Tesco, the UK’s largest food retailer. Among the period’s negative contributors were Baidu, the dominant Internet search business in China; Bankia, a leading Spanish bank; Fresenius Medical Care, the world’s leading provider of essential kidney dialysis services via its network of owned clinics and in patients’ homes; John Wood Group, a provider of project, engineering and technical services to the oil and gas, industrial, refining, power generation and other sectors worldwide; and Diageo, a world-leading producer and distiller of alcoholic beverages.
2020 Outlook:
As markets rose over the course of 2019, the Portfolio’s discount to intrinsic value accordingly narrowed; however, we still believe the Portfolio holds strong businesses that are trading at attractive valuations.
LSV Commentary
General Market Overview:
International equities rallied in the fourth quarter of 2019, capping off a strong calendar year of performance. Developed international small capitalization stocks outperformed international large capitalization stocks. From a style perspective, international small capitalization value stocks underperformed international small capitalization growth stocks. We define value stocks as stocks that are cheap on multiple measures of value with particular emphasis on stocks that are attractive based on their ability to generate strong cash flow and earnings. While it has been a difficult environment for value stocks over the last several years, our portfolio of value stocks recovered some over the last few months of 2019.
2019 Performance:
The portion of the International Fund managed by LSV (the “Portfolio”) outperformed the MSCI All-Country World Ex U.S.A. Small Cap Value Index - Net Dividends (the “benchmark”) since LSV’s inception in the Fund on September 26, 2019, returning 14.0%, gross of fees, while the benchmark returned 10.8%. Strong stock selection across several sectors accounted for most of the outperformance. Stock selection was particularly strong in the Industrials, Financials and Technology sectors. Within Industrials, our airline and construction companies were positive contributors. In Technology, our holdings in the electronic equipment, electronic components and semiconductor equipment industries added value.
2020 Outlook:
While we do not develop an outlook or use macro forecasts in our investment decision making process, we can comment on the relative attractiveness of the Portfolio from a valuation standpoint. While valuation multiples for the market and the Portfolio expanded in 2019 given the strong market performance, we believe the Portfolio is trading at a significant discount relative to the benchmark. The Portfolio is also yielding nearly 4%, which is in excess of the benchmark’s yield of 3.5%.
While value stocks performed well over the last four months of 2019, we believe that value stocks continue to trade at a significant discount to growth stocks relative to history, after relatively poor performance over the last several years. While it is difficult to time growth/value performance cycles, in the past when we have observed similar spreads between growth and value, value as a style has recovered over the subsequent years.
WCM Commentary
General Market Overview:
Global equity markets enjoyed a strong rally to end 2019, pushing most indices to all-time highs. Investors applauded the more stable U.S.-China trade relationship going into year-end. We did see a resurgence of secular growth stocks toward the end of 2019, although these types of stocks carry a smaller weight in the portfolio as we continue to trim more expensive stocks within this portion of the portfolio.
2019 Performance (Focused Growth International strategy):
The portion of the International Fund managed by WCM pursuant to WCM’s Focused Growth International strategy (the “Portfolio”) significantly outperformed the MSCI All-Country World Ex U.S.A. Growth Index - Net Dividends (the “benchmark”) in 2019, returning 37.4%, gross of fees, while the benchmark returned 27.3%. Stock selection was the primary driver of the outperformance. Sector allocation also contributed to performance, driven by overweights to the Technology, Health Care and Consumer Discretionary sectors. Geographically the story was similar. Country allocation provided a relatively modest contribution to performance, meaning that stock selection drove most of the outperformance.
2019 Performance (International Small Cap Growth strategy):
The portion of the International Fund managed by WCM pursuant to WCM’s International Small Cap Growth strategy (the “Portfolio”) outperformed the MSCI All-Country World Ex U.S.A. Small Cap Growth Index - Net Dividends (the “benchmark”) since WCM’s inception in the Fund on September 27, 2019, returning 15.6%, gross of fees, while the benchmark returned 10.9%. The outperformance was driven about equally by stock selection and sector allocation. An overweight to the Technology sector and an underweight to the Real Estate sector was additive to performance. Stock selection within the Financials, Industrials and Consumer Discretionary sectors contributed positively. Geographically, nearly all the outperformance was attributable to stock selection.
2020 Outlook:
Despite our Focused Growth International strategy realizing its second strongest absolute return in the strategy’s history, we still believe there are plenty of market inefficiencies in global equity markets that can be exploited by our focused, low turnover approach.
Parametric Commentary
General Market Overview:
In 2019, global markets rallied strongly from the December 2018 lows. Global markets rebounded on the renewed prospects of a U.S. trade deal with China. The rally was widespread across all economic sectors and countries. The Technology sector had the highest returns, followed by Health Care.
2019 Performance:
The portion of the International Fund managed by Parametric (the “Portfolio”) outperformed the MSCI World Ex U.S.A. Index - Net Dividends (the “benchmark”) in 2019, returning 23.4%, gross of fees, while the benchmark returned 22.5%. Most of the outperformance was attributable to stock selection in the Materials and Financials sectors. Cash was the largest detractor from performance given the market’s strong returns during the period.
2020 Outlook:
We believe that in 2020, the potential trade war between the U.S. and China could still have a significant impact on the rest of the world. Given China’s large market and imports, a slowdown in its economy due to the trade war directly affects the rest of the world. We believe this risk factor will persist into the foreseeable future.
Comparison of the Change in Value of a $10,000 Investment in the Core Equity Fund and the Russell 1000® Index

Comparison of the Change in Value of a $10,000 Investment in the Small Companies Fund and the Russell 2000® Index

Comparison of the Change in Value of a $10,000 Investment in the Tax-Exempt Bond Fund and the Barclays Capital U.S. Municipal Bond 5 Year (4-6) Index
Comparison of the Change in Value of a $10,000 Investment in the International Fund and the MSCI World Ex U.S.A. Index - Net Dividends

Fund Expense Example
(unaudited)
As a shareholder of the Clearwater Core Equity Fund (“Core Equity Fund”), Clearwater Small Companies Fund (“Small Companies Fund”), Clearwater Tax-Exempt Bond Fund (“Tax-Exempt Bond Fund”), and Clearwater International Fund (“International Fund” and together with the Core Equity Fund, Small Companies Fund and Tax-Exempt Bond Fund, the “Funds”), you incur costs, including management fees and other Fund expenses. This example is intended to help you understand your ongoing costs (in dollars) of investing in the Funds and to compare these costs with the ongoing costs of investing in other mutual funds. In addition to the ongoing costs which the Funds pay directly, you as a shareholder indirectly bear the expenses of any outside exchange traded funds or mutual funds in which the Funds invest. (These are also referred to as “acquired funds” and those indirect expenses represent the Funds’ pro rata portion of the cumulative expense charged by the acquired funds.)
The example provided is based on an investment of $1,000 invested at the beginning of the period and held for the six-month period ended December 31, 2019.
Actual Expenses
The first section of the table on the following page provides information about actual account values and actual expenses. You may use the information in this section, together with the amount you invested, to estimate the expenses that you incurred over the period. Simply divide your account value by $1,000 (for example, an $8,600 account value divided by $1,000 = 8.6), then multiply the result by the number in the first section under the heading entitled “Expenses Paid During the Period July 1, 2019 through December 31, 2019” to estimate the expenses attributable to your investment during this period.
Hypothetical Example for Comparison Purposes
The second section of the table below provides information about hypothetical account values and hypothetical expenses based on the Fund’s actual expense ratio and an assumed rate of return of 5% per year before expenses, which is not the Fund’s actual return. Thus, you should not use the hypothetical account values and expenses to estimate the actual ending account balance or your expenses for the period. Rather, these figures are provided to enable you to compare the ongoing costs of investing in the Funds and other mutual funds. To do so, compare this 5% hypothetical example with the 5% hypothetical examples that appear in the shareholder reports of the other mutual funds.
Please note that the expenses shown in the second section of the table are meant to highlight your ongoing costs only. Therefore, the second section of the table is useful in comparing ongoing costs only, and will not help you compare the relative total costs of the Funds to other mutual funds that charge transaction costs and/or sales charges or redemption fees.
| Actual returns | Beginning Account
Value July 1, 2019 | Ending Account Value
December 31, 2019 | Expenses Paid During the
Period July 1, 2019
through
December 31, 2019* |
| Core Equity Fund | $1,000.00 | $1,103.30 | $1.86 |
| Small Companies Fund | $1,000.00 | $1,086.20 | $5.15 |
| Tax-Exempt Bond Fund | $1,000.00 | $1,024.00 | $1.63 |
| International Fund | $1,000.00 | $1,087.10 | $3.58 |
Hypothetical 5% return (before expenses) | | | |
| Core Equity Fund | $1,000.00 | $1,023.44 | $1.79 |
| Small Companies Fund | $1,000.00 | $1,020.27 | $4.99 |
| Tax-Exempt Bond Fund | $1,000.00 | $1,023.59 | $1.63 |
| International Fund | $1,000.00 | $1,021.78 | $3.47 |
| * | Expenses are equal to the Fund’s annualized expense ratios, multiplied by the average account value over the period, multiplied by 184/365 (to reflect the one-half year period). Expense ratios for the most recent one-half year period may differ from expense ratios based on one-year data in the Financial Highlights. |
The annualized expense ratios (reflecting voluntary fee waivers in effect during the period) are as follows:
| Core Equity Fund | 0.35% |
| Small Companies Fund | 0.98% |
| Tax-Exempt Bond Fund | 0.32% |
| International Fund | 0.68% |
Approval of Investment Management and Subadvisory Agreements
Clearwater Management Co., Inc. (“CMC”) is responsible for managing the investment programs and strategies for the Core Equity Fund, Small Companies Fund, Tax-Exempt Bond Fund, and International Fund (collectively, the “Funds”). CMC also provides other administrative services to the Funds and these services, as well as its investment management services, are provided to the Funds under an agreement (the “Management Agreement”). CMC conducts due diligence when selecting each subadviser (collectively, the “Subadvisers”) for the Funds and oversees the performance of the Subadvisers. The Subadvisers provide portfolio management and related services for the Funds under individual subadvisory agreements (the “Subadvisory Agreements”).
The Trust’s Board of Trustees (the “Board” or “Trustees”) met periodically throughout the year to address a broad range of agenda items. For example, at each regularly scheduled meeting, the Trustees reviewed information about the investment performance and financial results of the Funds. On an annual basis, the Trustees, including the Trustees who are not “interested persons” of the Trust (the “Independent Trustees”), consider the renewal of the Management Agreement and the Subadvisory Agreements. In addition, the Trustees periodically consider the retention of new subadvisers.
Approval of Subadvisory Agreement – LSV Asset Management (International Fund)
At an in-person meeting held on September 12, 2019, the Trustees considered a new subadvisory agreement with LSV Asset Management (“LSV”) (the “LSV Agreement”) for the International Fund. At this meeting, the Trustees met with representatives of LSV and received a presentation discussing LSV’s investment philosophy and process, past performance, subadvisory experience, investment team and organizational structure.
In advance of the meeting on September 12, 2019, the Trustees received written information that included: information as to the proposed allocation of assets among the Fund’s subadvisers, and a summary of information about LSV, including its investment professionals, process, philosophy, portfolio construction, past performance and proposed subadvisory fees. In addition, at the meeting on September 12, 2019, the Trustees received information from the Trust’s Chief Compliance Officer as to his review of LSV’s Code of Ethics, Form ADV and compliance program.
At the September 12, 2019 meeting, counsel to the International Fund and Trustees reviewed with the Trustees the various factors relevant to their consideration of the LSV Agreement and the Trustees’ responsibilities related to their review. The Trustees reviewed and analyzed a number of factors that the Trustees deemed relevant with respect to the LSV Agreement. These factors included: the nature, quality, and extent of the services to be provided to the International Fund by LSV; LSV’s investment process; performance data for LSV’s strategy; the qualifications and experience of the investment professionals who would be responsible for the management of their allocation of the International Fund’s assets; and LSV’s overall resources.
No single factor determined whether or not the agreement would be approved but rather the totality of factors considered was determinative. Following an analysis and discussion of the factors described below, the Trustees, including all of the Independent Trustees, approved the LSV Agreement.
Nature, Extent, and Quality of Services Provided
The Trustees considered the specific investment processes LSV would use in managing its allocation of the Fund’s assets. The Trustees looked at the qualifications of LSV’s investment team who would be responsible for managing its allocation of the Fund’s assets. The Trustees concluded that the nature, extent, and quality of the subadvisory services expected to be provided by LSV were appropriate for the Fund.
Investment Performance
The Trustees discussed the performance record for the strategy LSV would use in managing its allocation of the Fund’s assets as compared to its strategy benchmark. The Trustees noted that the strategy’s performance compared favorably to its strategy benchmark for the period since its inception in 2002. The Trustees concluded that this data supported the decision to approve the LSV Agreement.
Comparative Fees and Cost of Services Provided
The Trustees evaluated the proposed subadvisory fee schedule, which was negotiated at arm’s length by CMC. The Trustees noted that the fee schedule was competitive with the fee schedule for the current subadviser managing a small cap portfolio based on the expected allocation to LSV. The Trustees also noted that CMC, not the Fund, would pay the subadvisory fee to LSV. The Trustees concluded that the proposed subadvisory fee schedule was reasonable given the nature, extent and quality of the subadvisory services to be performed by LSV.
Benefits to the Subadviser
The Trustees considered the ancillary benefits that could accrue to LSV due to its relationship with the Fund and noted that the relationship would be limited to the provision of subadvisory services. The Trustees concluded that no significant ancillary benefits would result from the LSV Agreement.
Profitability
The Trustees considered that LSV is an independent firm and that the subadvisory fee to be charged is the result of arm’s length bargaining between LSV and CMC.
Economies of Scale
The Trustees noted that CMC, not the Fund, would pay the subadvisory fee to LSV and that the Trustees consider on an annual basis whether economies of scale might be realized by CMC as the Fund’s assets grow and whether there also might be benefits from such growth for the Fund’s shareholders
Other Considerations
The Trustees considered CMC’s judgment and recommendation that adding LSV as a subadviser would add value to the Fund’s shareholders and would be complementary to the Fund’s other subadvisers.
Conclusion
After full consideration of the factors described above along with other information, with no single factor identified as being of paramount importance, the Trustees, including all of the Independent Trustees, concluded that the approval of the LSV Agreement was in the best interests of the Fund and its shareholders and approved the LSV Agreement, with the proposed fee to be paid by CMC out of its management fee.
Approval of Subadvisory Agreement – WCM Investment Management, LLC (International Fund)
At an in-person meeting held on September 12, 2019, the Trustees considered an amended and restated subadvisory agreement with WCM Investment Management, LLC (“WCM”) pursuant to which WCM would manage a sleeve of the International Fund using its International Small Cap Growth strategy, in addition to its existing sleeve managed using is Focused Growth International strategy (the “New WCM Agreement”). At this meeting, the Trustees met with representatives of WCM and received a presentation discussing WCM’s investment philosophy and process, past performance, investment team and organizational structure.
In advance of the meeting on September 12, 2019, the Trustees received written information that included: information as to the proposed allocation of assets among the Fund’s subadvisers, and a summary of information about WCM, including its investment professionals, process, philosophy, portfolio construction, past performance and proposed subadvisory fees.
At the September 12, 2019 meeting, counsel to the International Fund and Trustees reviewed with the Trustees the various factors relevant to their consideration of the New WCM Agreement and the Trustees’ responsibilities related to their review. The Trustees reviewed and analyzed a number of factors that the Trustees deemed relevant with respect to the New WCM Agreement. These factors included: the nature, quality, and extent of the services to be provided to the International Fund by WCM; WCM’s investment process; performance data for WCM’s strategy; the qualifications and experience of the investment professionals who would be responsible for the management of their allocation of the International Fund’s assets; and WCM’s overall resources.
No single factor determined whether or not the agreement would be approved but rather the totality of factors considered was determinative. Following an analysis and discussion of the factors described below, the Trustees, including all of the Independent Trustees, approved the New WCM Agreement
Nature, Extent, and Quality of Services Provided
The Trustees considered the specific investment processes WCM would use in managing its new allocation of the Fund’s assets. The Trustees looked at the qualifications of WCM’s investment team who would be responsible for managing its allocation of the Fund’s assets. The Trustees concluded that the nature, extent, and quality of the subadvisory services expected to be provided by WCM were appropriate for the Fund.
Investment Performance
The Trustees discussed the performance record for the strategy WCM would use in managing its allocation of the Fund’s assets as compared to its strategy benchmark. The Trustees noted that the strategy’s performance compared favorably to its strategy benchmark for the period since its inception in 2015. The Trustees concluded that this data supported the decision to approve the New WCM Agreement.
Comparative Fees and Cost of Services Provided
The Trustees evaluated the proposed subadvisory fee schedule, which was negotiated at arm’s length by CMC. The Trustees noted that the WCM fee schedule is competitive when compared to the Templeton fee schedule based on the prior allocation to Templeton. The Trustees also noted that CMC, not the Fund, would pay the subadvisory fee to WCM. The Trustees concluded that the proposed subadvisory fee schedule was reasonable given the nature, extent and quality of the subadvisory services to be performed by WCM.
Benefits to the Subadviser
The Trustees considered the ancillary benefits that could accrue to WCM due to its relationship with the Fund and noted that the relationship would be limited to the provision of subadvisory services. The Trustees concluded that no significant ancillary benefits would result from the New WCM Agreement.
Profitability
The Trustees considered that WCM is an independent firm and that the subadvisory fee to be charged is the result of arm’s length bargaining between WCM and CMC.
Economies of Scale
The Trustees noted that CMC, not the Fund, would pay the subadvisory fee to WCM and that the Trustees consider on an annual basis whether economies of scale might be realized by CMC as the Fund’s assets grow and whether there also might be benefits from such growth for the Fund’s shareholders.
Other Considerations
The Trustees considered CMC’s judgment and recommendation that hiring WCM to manage an additional sleeve of the International Fund would add value to the Fund’s shareholders and would be complementary to the Fund’s other subadvisers.
Conclusion
After full consideration of the factors described above along with other information, with no single factor identified as being of paramount importance, the Trustees, including all of the Independent Trustees, concluded that the approval of the New WCM Agreement was in the best interests of the Fund and its shareholders and approved the New WCM Agreement, with the proposed fee to be paid by CMC out of its management fee.
Approval of Investment Management and Subadvisory Agreements (All Funds)
At their in-person meetings on November 1 and December 12, 2019, the Trustees considered the renewal of the Management Agreement and the Subadvisory Agreements for AQR Capital Management, LLC (“AQR”), Artisan Partners Limited Partnership, Cooke & Bieler, L.P., Fiduciary Counselling, Inc. (“FCI”), Kennedy Capital Management (“KCM”), Inc., O’Shaughnessy Asset Management, LLC, Parametric Portfolio Associates LLC (“Parametric”), Pzena Investment Management, LLC, Sit Fixed Income Advisors II, LLC (“Sit”) and WCM.
Prior to the November 1, 2019 meeting, the Trustees requested, received, and reviewed written responses from CMC and the Subadvisers to questions posed to them on behalf of the Trustees and supporting materials relating to those questions and responses. The information presented at the meeting, including comparative performance and expense data, was designed to assist the Trustees in making their determination as to the renewal of the Management Agreement and Subadvisory Agreements. At this meeting, counsel to the Funds and Trustees reviewed with the Trustees the various factors relevant to their consideration of the Management Agreement and Subadvisory Agreements, and the Trustees’ responsibilities related to their review.
At the November 1 and December 12, 2019 meetings, the Trustees considered a number of factors, including those discussed below, that they believed to be relevant. No single factor determined whether or not an agreement would be approved but rather the totality of factors considered was determinative. Following an analysis and discussion of the factors described below, the Trustees, including all of the Independent Trustees, approved the renewal of the Management Agreement and the Subadvisory Agreements.
Nature, Extent, and Quality of Services Provided
The Trustees considered information presented as to the nature, extent, and quality of services provided by CMC and the Subadvisers, as well as their investment expertise, resources, and capabilities. The Trustees considered the quality of the Subadvisers previously recommended by CMC, as well as the ongoing work performed by CMC to recommend enhancements to individual fund management. The Trustees reviewed information regarding the financial condition of CMC and the Subadvisers related to their ongoing ability to provide services specified under the Management Agreement and Subadvisory Agreements. The Trustees considered that FCI provides, in addition to investment management services, certain services related to due diligence, performance reporting, compliance, and other administrative functions that support the investment management services and Subadviser oversight services provided by CMC. Based on their analysis of the data presented, the Trustees concluded that they were generally satisfied with the nature and quality of the services being provided under the Management Agreement and respective Subadvisory Agreements.
Investment Performance
The Trustees reviewed specific information as to the investment performance of the Funds over various periods of time as compared to the performance of their respective benchmark indices and peer groups. On a quarterly basis, the Trustees reviewed reports summarizing the net assets, redemptions, and purchases of shares of the Funds, as well as information regarding the performance of each Subadviser compared to the benchmark against which its particular portfolio is measured. The Trustees concluded that they were generally satisfied with CMC’s and the Subadvisers’ investment performance to date.
Comparative Fees and Cost of Services Provided
The Trustees reviewed the fees paid to CMC and the Subadvisers. The Trustees reviewed reports describing both the management fees charged by CMC and the total expense ratios of the Funds in comparison to those of similarly situated funds. In addition, on a quarterly basis, the Trustees reviewed information as to the expense ratios of the Funds compared to the median expense ratio of a peer group of funds with comparable investment strategies. The Trustees also reviewed information provided by each of the Subadvisers as to fees they charge to other clients, as applicable.
The Trustees noted the ongoing efforts of CMC to reduce expenses charged to shareholders through oversight of service providers and by voluntarily waiving a portion of the management fee payable to CMC as specified in the Funds’ prospectus. In this regard, the Board considered that, effective January 1, 2020, CMC has voluntarily agreed to waive: (i) the management fee for the Core Equity Fund from the contractual fee of 0.90% to 0.31%; (ii) the management fee for the Small Companies Fund from the contractual fee of 1.35% to 0.95%; (iii) the management fee for the Tax-Exempt Bond Fund from the contractual fee of 0.60% to 0.29%; and the management fee for the International Fund from the contractual fee of 1.00% to 0.65%.
At its November 1, 2019 meeting, the Trustees approved amendments to the subadvisory agreements between the Trust, CMC, and each of: (i) AQR on behalf of the Core Equity Fund; (ii) KCM on behalf of the Small Companies Fund; (iii) Sit on behalf of the Tax-Exempt Bond Fund; (iv) Parametric on behalf of the Core Equity Fund; and (v) Parametric on behalf of the International Fund, in each case to reduce the fee rates payable by CMC thereunder based on current asset levels. The Trustees noted that CMC passes through the benefit of subadvisory fee reductions to the Funds through its voluntary fee waiver arrangements.
Management Profitability
The Trustees reviewed CMC’s level of profitability with respect to the Funds, particularly noting CMC’s payment of fees and expenses typically absorbed by mutual fund shareholders. The Trustees concluded that profitability levels for CMC were reasonable. The Trustees considered that the Subadvisers are each independent firms and the subadvisory fees charged are the result of arm’s length bargaining between them and CMC.
Economies of Scale
The Trustees considered whether economies of scale might be realized by CMC as the Funds’ assets grow and whether there also might be benefits from such growth for the Funds’ shareholders. The Trustees noted that the Funds have been in operation for a number of years and, based on their distribution strategy, the Funds will probably not see significant increases in size. However, the Trustees determined that they would continue to monitor the assets of the Funds and consider whether there were additional opportunities to realize benefits from economies of scale for shareholders in the future.
Conclusion
Based on the factors described above, the Trustees, including all of the Independent Trustees, concluded that the investment management fees and subadvisory fees were fair and reasonable in view of the investment performance and quality of services provided. In reaching this conclusion, no single factor was considered determinative.
Quarterly Portfolio Schedule of Investments
The Funds file a complete schedule of their portfolio holdings as of the close of the first and third quarters of their fiscal years with the Securities and Exchange Commission (the “SEC”) on Form N-PORT. Shareholders may request portfolio holdings information free of charge by calling the Transfer Agent toll free at 1- 855-684-9144 or by sending a written request to: The Northern Trust Company, P.O. Box 4766, Chicago, IL 60680-4766 Attn: Clearwater Investment Trust Funds. These filings are also available on the SEC’s Internet site athttp://www.sec.gov.
Voting Proxies on Fund Portfolio Securities
The Funds have established Proxy Voting Policies and Procedures (“Policies”) that the Funds use to determine how to vote proxies relating to portfolio securities. They also report, on Form N-PX, how the Funds voted any such proxies during the most recent 12-month period ended June 30. Shareholders may request copies of the Policies or Form N-PX free of charge by calling Fiduciary Counselling, Inc. toll free at 1-888-228-0935 or by sending a written request to: Fiduciary Counselling, Inc., 30 East 7th Street, Suite 2000, St. Paul, MN 55101 Attn: Clearwater Investment Trust Funds. Form N-PX is also available from the EDGAR database on the SEC’s Internet site athttp://www.sec.gov.
EXECUTIVE OFFICERS AND TRUSTEES
(As of February 2020)
Information About the Independent Trustees
| Name and Age | Positions Held With the Funds | Term of Office | Principal Occupation or Employment During the Last Five Years and Other Relevant Experience | Number of Portfolios in the Fund Complex to Be Overseen by the Trustee | Other Directorships Held by the Trustee During the Last 5 Years |
Charles W. Rasmussen1(53)
30 East 7th Street Saint Paul,
Minnesota 55101 | Trustee, Chair of the Board | As Trustee: Tenure: 2000 - Present Term: Indefinite As Chair: Tenure: 2020 - Present Term: Indefinite | President and Chief Executive Officer, P&G Manufacturing, Inc. (air filtration equipment, 2002-Present) | 4 | Forest History Society. (non-profit, 2018- Present) Nu Star Inc. (private company 2014- Present) |
Sara G. Dent (61)
30 East 7th Street
Saint Paul,
Minnesota 55101 | Trustee, Chair of the Governance and Nominating Committee | As Trustee: Tenure: 2013- Present Term: Indefinite As Chair of the Governance and Nominating Committee: Tenure: 2019– Present Term: Indefinite | Private Investor | 4 | None |
Laura E. Rasmussen1(56)
30 East 7th Street Saint Paul,
Minnesota 55101 | Trustee, Chair of the Audit Committee | As Trustee: Tenure: 2000- Present Term: Indefinite As Chair of the Audit Committee: Tenure: 2016 – Present Term: Indefinite | Business Owner, 3 Kittens Needle Arts (textile sales, 2006- Present) | 4 | None |
James E. Johnson (77)
30 East 7th Street
Saint Paul, Minnesota 55101 | Trustee | Tenure: 2011- Present Term: Indefinite | Retired as Executive Vice President, Securian Financial Group, Inc. in 2010, Securian Financial Group, Inc. (1968-2010); Chair of the Board of the Trust (2013 – 2019) | 4 | None |
Lindsay R. Schack (42)
30 East 7th Street Saint Paul,
Minnesota 55101 | Trustee | Tenure: 2015- Present Term: Indefinite | Owner and Architect, LS Architecture (2013 – Present), Adjunct Faculty, Montana State University School of Architecture (2007 – 2013) | 4 | None |
| Name and Age | Positions Held With the Funds | Term of Office | Principal Occupation or Employment During the Last Five Years and Other Relevant Experience | Number of Portfolios in the Fund Complex to Be Overseen by the Trustee | Other Directorships Held by the Trustee During the Last 5 Years |
David M. Weyerhaeuser (61)
30 East 7th Street Saint Paul,
Minnesota 55101 | Trustee | Tenure: 2016- Present Term: Indefinite | Vice President, Sales and Marketing, Northwest Hardwoods (lumber manufacturer and distributor, 1991 – 2016) | 4 | Chicago Capital, LLC (investment adviser, 2018 - Present) R.D. Merrill Company, Inc. (private company, 1992 – Present) |
1Mr. Rasmussen and Ms. Rasmussen are siblings-in-law.
Information about the Funds’ Executive Officers and Interested Trustees
| Name and Age | Positions Held With the Funds | Term of Office | Principal Occupation or Employment During the Last Five Years and Other Relevant Experience | Number of Portfolios in the Fund Complex to Be Overseen by the Officer/ Trustee | Other Directorships Held by the Officer/ Trustee During the Last 5 Years |
E. Rodman Titcomb, Jr.2(71)
30 East 7th Street Saint Paul,
Minnesota 55101 | Trustee | Tenure: 2016 – Present Term: Indefinite | Chairman and Chief Executive Officer, Rock Island Company (Communications and event planning, 1998-2013), Managing Director, Elizabeth Ordway Dunn Foundation (1983-2013) | 4 | None |
Justin H. Weyerhaeuser3(46) 30 East 7th Street
Saint Paul,
Minnesota 55101 | Trustee, President and Treasurer | As Trustee: Tenure: 2008 – Present Term: Indefinite As President and Treasurer Tenure: 2013- Present Term: Reappointed Annually | Private Investor (February 2013 - Present), Attorney, Davis Graham & Stubbs LLP (law firm, November 2011- February 2013) | 4 | None |
| Name and Age | Positions Held With the Funds | Term of Office | Principal Occupation or Employment During the Last Five Years and Other Relevant Experience | Number of Portfolios in the Fund Complex to Be Overseen by the Officer/ Trustee | Other Directorships Held by the Officer/ Trustee During the Last 5 Years |
Karen P. Rau (60) 30 East 7th Street Saint Paul,
Minnesota 55101 | Secretary and Interim Chief Compliance Officer | As Secretary: Tenure: 2020 – Present Term: Reappointed Annually As Interim Chief Compliance Officer: Tenure: 2020 – Present Term: Reappointed Annually | Senior Compliance Analyst, Fiduciary Counselling, Inc. (August 2016 – Present), Regional Manager, Fifth Third Bank (October 2013 – July 2016) | N/A | N/A |
Shari L. Clifford (51)
30 East 7th Street
Saint Paul,
Minnesota 55101 | Assistant Treasurer | Tenure: 2014 - Present Term: Reappointed Annually | Chief Financial Officer and Treasurer, Fiduciary Counselling, Inc. (February 2014-Present) Controller and Finance Director, Woodbury Financial Services, Inc. November 2007 - February 2014) | N/A | N/A |
Michael D. Jiang (35)
The Northern Trust Company
50 South LaSalle Street
Chicago, Illinois 60603 | Assistant Secretary | Tenure: 2016- Present Term: Reappointed Annually | Vice President, (2018-Present), Second Vice President, The Northern Trust Company, (2015-2018), Cabrini Green Legal Aid (2014-2015) | N/A | N/A |
2Mr. Titcomb is an interested Trustee due to his brother’s position as a director of CMC.
3Mr. Justin H. Weyerhaeuser is an interested Trustee due to his position as the Funds’ President and Treasurer.
Additional information about the Funds’ Directors is available in the Funds’ Statement of Additional Information (“SAI”). The SAI is available without charge, upon request, by contacting the transfer agent at 1-855-684-9144 or writing the Funds at The Northern Trust Company, P.O. Box 4766, Chicago, IL 60680-4766. The Funds do not have an internet website.
Federal Tax Information
(unaudited)
Qualified Dividend Income.Under the Jobs and Growth Tax Relief Reconciliation Act of 2003 (the “Act”), 100.00% of ordinary dividends paid during the fiscal year ended December 31, 2019 for the Core Equity Fund, 100.00% of ordinary dividends paid during the fiscal year ended December 31, 2019 for the Small Companies Fund, and 100.00% of ordinary dividends paid during the fiscal year ended December 31, 2019 for the International Fund are designated as “qualified dividend income”, as defined in the Act, subject to reduced tax rates in 2019.
Corporate Dividends-Received Deduction. 100.00%, 100.00%, and 0.37% of the dividends distributed during the fiscal year ended December 31, 2019, for the Core Equity, Small Companies, and International Funds, respectively, qualify for the dividends-received deduction for corporate shareholders.
Capital Gain Distribution.The following Funds made capital gain distributions in December 2019, and hereby designated these long-term capital gain distributions as follows:
| Fund | | | | Long-Term Capital Gain | |
| | | | | | |
| Core Equity Fund | | | $ | 2,349,736 | (1) |
| Small Companies Fund | | | | 5,292,066 | (2) |
| Tax-Exempt Bond Fund | | | | — | |
| International Fund | | | | 8,846,708 | (3) |
| (1) | During the fiscal year 2019, Core Equity Fund designated long-term capital gain distributions in the amount of $2,635,960. Core Equity Fund utilized equalization accounting for tax purposes, whereby a portion of redemption payments were treated as distributions of long-term capital gain. As a result the Fund paid long-term capital gain distributions in the amount of $2,349,736. |
| (2) | During the fiscal year 2019, Small Companies Fund designated long-term capital gain distributions in the amount of $5,358,161. Small Companies Fund utilized equalization accounting for tax purposes, whereby a portion of redemption payments were treated as distributions of long-term capital gain. As a result the Fund paid long-term capital gain distributions in the amount of $5,292,066. |
| (3) | During the fiscal year 2019, International Fund utilized equalization accounting for tax purposes, whereby a portion of redemption payments were treated as distributions of long-term capital gains in the amount of $9,080,240. As a result the Fund paid long-term capital gain distributions in the amount of $8,846,708. |
Clearwater Investment Trust
Financial Statements
For the Fiscal Year Ended December 31, 2019
Table of Contents

KPMG LLP
4200 Wells Fargo Center
90 South Seventh Street
Minneapolis, MN 55402
Report of Independent Registered Public Accounting Firm
To the Shareholders and Board of Trustees
Clearwater Investment Trust:
Opinion on the Financial Statements
We have audited the accompanying statements of assets and liabilities of Clearwater Core Equity Fund, Clearwater Small Companies Fund, Clearwater Tax-Exempt Bond Fund, and Clearwater International Fund (collectively, the Funds), including the schedules of investments, as of December 31, 2019, the related statements of operations for the year then ended, the statements of changes in net assets for each of the years in the two-year period then ended, and the related notes (collectively, the financial statements) and the financial highlights for each of the years in the five-year period then ended. In our opinion, the financial statements and financial highlights of each Fund present fairly, in all material respects, the financial position of each Fund as of December 31, 2019, the results of its operations for the year then ended, the changes in its net assets for each of the years in the two-year period then ended, and the financial highlights for each of the years in the five-year period then ended, in conformity with U.S. generally accepted accounting principles.
Basis for Opinion
These financial statements and financial highlights are the responsibility of the Funds’ management. Our responsibility is to express an opinion on these financial statements and financial highlights based on our audits. We are a public accounting firm registered with the Public Company Accounting Oversight Board (United States) (PCAOB) and are required to be independent with respect to the Funds in accordance with the U.S. federal securities laws and the applicable rules and regulations of the Securities and Exchange Commission and the PCAOB.
We conducted our audits in accordance with the standards of the PCAOB. Those standards require that we plan and perform the audit to obtain reasonable assurance about whether the financial statements and financial highlights are free of material misstatement, whether due to error or fraud. Our audits included performing procedures to assess the risks of material misstatement of the financial statements and financial highlights, whether due to error or fraud, and performing procedures that respond to those risks. Such procedures included examining, on a test basis, evidence regarding the amounts and disclosures in the financial statements and financial highlights. Such procedures also included confirmation of securities owned as of December 31, 2019, by correspondence with custodians and brokers. Our audits also included evaluating the accounting principles used and significant estimates made by management, as well as evaluating the overall presentation of the financial statements and financial highlights. We believe that our audits provide a reasonable basis for our opinion.

We have served as the auditor of one or more Clearwater Investment Trust investment companies since 1992.
Minneapolis, Minnesota
February 25, 2020
KPMG LLP is a Delaware limited liability partnership and the U.S. member
firm of the KPMG network of independent member firms affiliated with
KPMG International Cooperative (“KPMG International”), a Swiss entity.
CLEARWATER INVESTMENT TRUST
Statements of Assets and Liabilities
December 31, 2019
| | Core Equity
Fund | | | Small Companies
Fund | | | Tax-Exempt
Bond Fund | | | International
Fund | |
Assets | | | | | | | | | | | | | | | | |
Investments in securities, at fair value (including securities on loan of: $0, $3,424,021, $0 and $7,056,635, respectively); (identified cost: $268,556,334, $331,850,201, $569,172,843 and $502,542,174, respectively) | | $ | 543,176,764 | | | | 378,091,114 | | | | 598,475,122 | | | | 717,689,979 | |
Foreign currencies, at value (cost: $0, $0, $0 and $2,078,240, respectively) | | | - | | | | - | | | | - | | | | 2,113,910 | |
Receivable for securities sold | | | 3,758,107 | | | | 1,655,194 | | | | - | | | | 92,485 | |
Receivable for shares of beneficial interest sold | | | 17,200 | | | | 12,900 | | | | - | | | | 4,400 | |
Accrued dividend and interest receivable | | | 551,422 | | | | 405,676 | | | | 5,653,629 | | | | 726,017 | |
Foreign tax reclaim receivable | | | 3,498 | | | | - | | | | - | | | | 1,137,111 | |
Unrealized appreciation on forward foreign currency exchange contracts | | | - | | | | - | | | | - | | | | 2,800 | |
Total assets | | | 547,506,991 | | | | 380,164,884 | | | | 604,128,751 | | | | 721,766,702 | |
Liabilities | | | | | | | | | | | | | | | | |
Payables for investment securities purchased | | | - | | | | 2,332,788 | | | | - | | | | 458,770 | |
Payable for fund shares redeemed | | | 3,872,231 | | | | 22,224 | | | | 22,900 | | | | - | |
Accrued investment advisory fee | | | 463,458 | | | | 876,203 | | | | 481,085 | | | | 1,140,385 | |
Payable for dividend distribution | | | - | | | | - | | | | 348,180 | | | | - | |
Payable upon return of securities loaned | | | - | | | | 3,509,148 | | | | - | | | | 8,084,387 | |
Unrealized depreciation on forward foreign currency exchange contracts | | | - | | | | - | | | | - | | | | 27,677 | |
Deferred foreign capital gains taxes payable | | | - | | | | - | | | | - | | | | 204,467 | |
Total liabilities | | | 4,335,689 | | | | 6,740,363 | | | | 852,165 | | | | 9,915,686 | |
Net assets | | $ | 543,171,302 | | | | 373,424,521 | | | | 603,276,586 | | | | 711,851,016 | |
Capital | | | | | | | | | | | | | | | | |
Capital Stock and additional paid-in capital (authorized unlimited number of shares at no par value for each Fund: 11,283,799, 20,240,648, 59,528,485 and 41,201,732 shares, respectively) | | $ | 266,019,126 | | | | 326,323,233 | | | | 576,620,212 | | | | 499,212,474 | |
Distributable earnings | | | 277,152,176 | | | | 47,101,288 | | | | 26,656,374 | | | | 212,638,542 | |
Net assets | | $ | 543,171,302 | | | | 373,424,521 | | | | 603,276,586 | | | | 711,851,016 | |
Net asset value per share of outstanding capital stock | | $ | 48.14 | | | | 18.45 | | | | 10.13 | | | | 17.28 | |
See accompanying notes to financial statements.
CLEARWATER INVESTMENT TRUST
Statements of Operations
Year ended December 31, 2019
| | Core Equity
Fund | | | Small Companies
Fund | | | Tax-Exempt
Bond Fund | | | International
Fund | |
Investment income: | | | | | | | | | | | | | | | | |
Income: | | | | | | | | | | | | | | | | |
Dividends (net of foreign taxes withheld of $12,296, $6,411, $0 and $1,343,496, respectively) | | $ | 9,584,310 | | | | 5,507,189 | | | | 1,262,966 | | | | 15,337,805 | |
Interest | | | 2,136 | | | | 22,422 | | | | 23,160,925 | | | | - | |
Net income from securities loaned | | | - | | | | 26,989 | | | | - | | | | 178,883 | |
Total income | | | 9,586,446 | | | | 5,556,600 | | | | 24,423,891 | | | | 15,516,688 | |
Expenses: | | | | | | | | | | | | | | | | |
Investment advisory fee | | | 4,565,655 | | | | 4,621,039 | | | | 3,349,753 | | | | 6,050,114 | |
Voluntary fee reduction | | | (2,790,127 | ) | | | (1,266,509 | ) | | | (1,563,207 | ) | | | (1,936,028 | ) |
Other expenses | | | 185 | | | | 185 | | | | 185 | | | | 185 | |
Total net expenses | | | 1,775,713 | | | | 3,354,715 | | | | 1,786,731 | | | | 4,114,271 | |
Net investment income | | | 7,810,733 | | | | 2,201,885 | | | | 22,637,160 | | | | 11,402,417 | |
Net realized gain (loss) on: | | | | | | | | | | | | | | | | |
Security transactions | | | 39,171,077 | | | | 7,694,544 | | | | 871,784 | | | | 12,232,001 | |
Forward foreign currency exchange contracts | | | - | | | | - | | | | - | | | | 30,802 | |
Foreign currency transactions | | | (5 | ) | | | - | | | | - | | | | (148,486 | ) |
Futures contracts | | | - | | | | - | | | | (3,999,188 | ) | | | - | |
Net increase (decrease) in unrealized appreciation/depreciation on: | | | | | | | | | | | | | | | | |
Security transactions (net of increase (decrease) in deferred foreign taxes of $0, $0, $0 and $204,467, respectively) | | | 81,303,814 | | | | 69,837,002 | | | | 19,255,936 | | | | 118,446,624 | |
Forward foreign currency exchange contracts | | | - | | | | - | | | | - | | | | 19,828 | |
Futures contracts | | | - | | | | - | | | | 1,955,452 | | | | - | |
Translation of other assets and liabilities denominated in foreign currencies | | | 13 | | | | - | | | | - | | | | 39,194 | |
Net gain (loss) on investments | | | 120,474,899 | | | | 77,531,546 | | | | 18,083,984 | | | | 130,619,963 | |
Net increase (decrease) in net assets resulting from operations | | $ | 128,285,632 | | | | 79,733,431 | | | | 40,721,144 | | | | 142,022,380 | |
See accompanying notes to financial statements.
CLEARWATER INVESTMENT TRUST
Statements of Changes in Net Assets
Years ended December 31, 2019 and 2018
| | Core Equity Fund | | | Small Companies Fund | |
| | 12/31/2019 | | | 12/31/2018 | | | 12/31/2019 | | | 12/31/2018 | |
Operations: | | | | | | | | | | | | | | | | |
Net investment income | | $ | 7,810,733 | | | | 7,754,414 | | | | 2,201,885 | | | | 1,227,135 | |
Net realized gain | | | 39,171,072 | | | | 54,663,683 | | | | 7,694,544 | | | | 24,516,139 | |
Net increase (decrease) in unrealized appreciation/depreciation | | | 81,303,827 | | | | (94,000,932 | ) | | | 69,837,002 | | | | (69,388,527 | ) |
Net increase (decrease) in net assets resulting from operations | | | 128,285,632 | | | | (31,582,835 | ) | | | 79,733,431 | | | | (43,645,253 | ) |
Distributions to shareholders | | | (9,748,573 | ) | | | (28,188,556 | ) | | | (7,557,886 | ) | | | (31,837,966 | ) |
Capital share transactions: | | | | | | | | | | | | | | | | |
Proceeds from shares sold | | | 46,023,492 | | | | 52,599,700 | | | | 7,397,888 | | | | 3,357,200 | |
Reinvestment of distributions from net investment income and net realized gain | | | 9,732,390 | | | | 28,187,392 | | | | 7,557,886 | | | | 31,837,966 | |
Payments for shares redeemed | | | (87,995,545 | ) | | | (102,533,603 | ) | | | (19,627,687 | ) | | | (23,511,008 | ) |
Net increase (decrease) in net assets from capital share transactions | | | (32,239,663 | ) | | | (21,746,511 | ) | | | (4,671,913 | ) | | | 11,684,158 | |
Total increase (decrease) in net assets | | | 86,297,396 | | | | (81,517,902 | ) | | | 67,503,632 | | | | (63,799,061 | ) |
Net assets: | | | | | | | | | | | | | | | | |
At the beginning of the year | | | 456,873,906 | | | | 538,391,808 | | | | 305,920,889 | | | | 369,719,950 | |
At the end of the year | | $ | 543,171,302 | | | | 456,873,906 | | | | 373,424,521 | | | | 305,920,889 | |
| | Tax-Exempt Bond Fund | | | International Fund | |
| | 12/31/2019 | | | 12/31/2018 | | | 12/31/2019 | | | 12/31/2018 | |
Operations: | | | | | | | | | | | | | | | | |
Net investment income | | $ | 22,637,160 | | | | 22,454,249 | | | | 11,402,417 | | | | 10,808,402 | |
Net realized gain (loss) | | | (3,127,404 | ) | | | 3,454,386 | | | | 12,114,317 | | | | 12,136,620 | |
Net increase (decrease) in unrealized appreciation/depreciation | | | 21,211,388 | | | | (17,587,001 | ) | | | 118,505,646 | | | | (108,837,773 | ) |
Net increase (decrease) in net assets resulting from operations | | | 40,721,144 | | | | 8,321,634 | | | | 142,022,380 | | | | (85,892,751 | ) |
Distributions to shareholders | | | (24,064,555 | ) | | | (29,103,950 | ) | | | (20,986,457 | ) | | | (26,624,900 | ) |
Capital share transactions: | | | | | | | | | | | | | | | | |
Proceeds from shares sold | | | 65,972,600 | | | | 21,685,452 | | | | 76,508,600 | | | | 7,693,600 | |
Reinvestment of distributions from net investment income and net realized gain | | | 23,964,450 | | | | 29,094,769 | | | | 20,986,457 | | | | 26,624,900 | |
Payments for shares redeemed | | | (32,802,047 | ) | | | (25,668,816 | ) | | | (31,388,422 | ) | | | (21,734,393 | ) |
Net increase in net assets from capital share transactions | | | 57,135,003 | | | | 25,111,405 | | | | 66,106,635 | | | | 12,584,107 | |
Total increase (decrease) in net assets | | | 73,791,592 | | | | 4,329,089 | | | | 187,142,558 | | | | (99,933,544 | ) |
Net assets: | | | | | | | | | | | | | | | | |
At the beginning of the year | | | 529,484,994 | | | | 525,155,905 | | | | 524,708,458 | | | | 624,642,002 | |
At the end of the year | | $ | 603,276,586 | | | | 529,484,994 | | | | 711,851,016 | | | | 524,708,458 | |
See accompanying notes to financial statements.
CLEARWATER INVESTMENT TRUST
Financial Highlights
Per share data (rounded to the nearest cent) for a share of capital stock outstanding throughout the years or period ended and selected information for each year or period ended is as follows:
| | Year ended December 31, | |
Core Equity Fund | | 2019 | | | 2018 | | | 2017 | | | 2016 | | | 2015 | |
Net asset value, beginning of year | | $ | 37.97 | | | | 43.21 | | | | 37.43 | | | | 35.57 | | | | 39.41 | |
Income (loss) from investment operations: | | | | | | | | | | | | | | | | | | | | |
Net investment income | | | 0.72 | | | | 0.68 | | | | 0.64 | | | | 0.65 | | | | 0.64 | |
Net realized and unrealized gains (losses) | | | 10.32 | | | | (3.46 | ) | | | 8.03 | | | | 3.27 | | | | (0.96 | ) |
Total from investment operations | | | 11.04 | | | | (2.78 | ) | | | 8.67 | | | | 3.92 | | | | (0.32 | ) |
Less distributions to shareholders from: | | | | | | | | | | | | | | | | | | | | |
Net investment income | | | (0.66 | ) | | | (0.67 | ) | | | (0.65 | ) | | | (0.49 | ) | | | (0.60 | ) |
Net realized gain | | | (0.21 | ) | | | (1.79 | ) | | | (2.24 | ) | | | (1.57 | ) | | | (2.92 | ) |
Total distributions to shareholders: | | | (0.87 | ) | | | (2.46 | ) | | | (2.89 | ) | | | (2.06 | ) | | | (3.52 | ) |
Net asset value, end of year | | $ | 48.14 | | | | 37.97 | | | | 43.21 | | | | 37.43 | | | | 35.57 | |
Total return (a) | | | 29.11 | % | | | (6.61 | )% | | | 23.26 | % | | | 10.98 | % | | | (0.71 | )% |
Net assets, end of year (000s omitted) | | $ | 543,171 | | | | 456,874 | | | | 538,392 | | | | 466,482 | | | | 492,418 | |
Ratio of expenses, net of waivers, to average net assets (b), (c), (d), (e), (f), (g) | | | 0.35 | % | | | 0.38 | % | | | 0.39 | % | | | 0.43 | % | | | 0.42 | % |
Ratio of expenses, before waivers, to average net assets (b), (c), (d), (e), (f), (g) | | | 0.90 | % | | | 0.90 | % | | | 0.90 | % | | | 0.90 | % | | | 0.90 | % |
Ratio of net investment income (loss), net of waivers, to average net assets (c), (d), (e), (f), (g) | | | 1.54 | % | | | 1.47 | % | | | 1.51 | % | | | 1.63 | % | | | 1.52 | % |
Ratio of net investment income (loss), before waivers, to average net assets (c), (d), (e), (f), (g) | | | 0.99 | % | | | 0.95 | % | | | 1.00 | % | | | 1.16 | % | | | 1.02 | % |
Portfolio turnover rate (excluding short-term securities) | | | 33.73 | % | | | 34.64 | % | | | 31.13 | % | | | 44.11 | % | | | 94.07 | % |
(a) | Total return figures are based on the change in net asset value of a share during the year and assume reinvestment of distributions at net asset value. |
(b) | In addition to fees and expenses which the Fund bears directly, the Fund indirectly bears a pro rata share of the fees and expenses of any acquired funds in which it invests. Such indirect expenses are not included in the above reported expense ratios. |
(c) | Effective December 12, 2018 the investment advisory fee, net of voluntary waivers, decreased to 0.35%. Also effective December 12, 2018, the Adviser increased the voluntary waiver to 0.55%. |
(d) | Effective September 22, 2017, the investment advisory fee, net of voluntary waivers, increased to 0.38%. Also effective September 22, 2017, the Adviser decreased the voluntary waiver to 0.52%. |
(e) | Effective March 16, 2017, the investment advisory fee, net of voluntary waivers, decreased to 0.37%. Also effective March 16, 2017, the Adviser increased the voluntary waiver to 0.53%. |
(f) | Effective March 16, 2016, the investment advisory fee, net of voluntary waivers, increased to 0.44%. Also effective March 16, 2016, the Adviser decreased the voluntary waiver to 0.46%. |
(g) | Effective March 16, 2015, the investment advisory fee, net of voluntary waivers, decreased to 0.40%. Also effective March 16, 2015, the Adviser increased the voluntary waiver to 0.50%. |
See accompanying notes to financial statements.
CLEARWATER INVESTMENT TRUST
Financial Highlights
Per share data (rounded to the nearest cent) for a share of capital stock outstanding throughout the years or period ended and selected information for each year or period ended is as follows:
| | Year ended December 31, | |
Small Companies Fund | | 2019 | | | 2018 | | | 2017 | | | 2016 | | | 2015 | |
Net asset value, beginning of year | | $ | 14.90 | | | | 18.92 | | | | 19.79 | | | | 17.18 | | | | 20.30 | |
Income (loss) from investment operations: | | | | | | | | | | | | | | | | | | | | |
Net investment income | | | 0.14 | | | | 0.07 | | | | 0.02 | | | | 0.07 | | | | 0.07 | |
Net realized and unrealized gains (losses) | | | 3.79 | | | | (2.37 | ) | | | 2.58 | | | | 3.30 | | | | (0.90 | ) |
Total from investment operations | | | 3.93 | | | | (2.30 | ) | | | 2.60 | | | | 3.37 | | | | (0.83 | ) |
Less distributions to shareholders from: | | | | | | | | | | | | | | | | | | | | |
Net investment income | | | (0.11 | ) | | | (0.07 | ) | | | (0.03 | ) | | | (0.05 | ) | | | (0.06 | ) |
Net realized gain | | | (0.27 | ) | | | (1.65 | ) | | | (3.44 | ) | | | (0.71 | ) | | | (2.23 | ) |
Total distributions to shareholders: | | | (0.38 | ) | | | (1.72 | ) | | | (3.47 | ) | | | (0.76 | ) | | | (2.29 | ) |
Net asset value, end of year | | $ | 18.45 | | | | 14.90 | | | | 18.92 | | | | 19.79 | | | | 17.18 | |
Total return (a) | | | 26.40 | % | | | (12.49 | )% | | | 13.46 | % | | | 19.67 | % | | | (3.96 | )% |
Net assets, end of year (000s omitted) | | $ | 373,425 | | | | 305,921 | | | | 369,720 | | | | 343,393 | | | | 299,380 | |
Ratio of expenses, net of waivers, to average net assets (b), (c), (d), (e), (f), (g) | | | 0.98 | % | | | 1.03 | % | | | 0.99 | % | | | 1.02 | % | | | 0.97 | % |
Ratio of expenses, before waivers, to average net assets (b), (c), (d), (e), (f), (g) | | | 1.35 | % | | | 1.35 | % | | | 1.35 | % | | | 1.35 | % | | | 1.35 | % |
Ratio of net investment income (loss), net of waivers, to average net assets (c), (d), (e), (f), (g) | | | 0.64 | % | | | 0.33 | % | | | 0.11 | % | | | 0.28 | % | | | 0.22 | % |
Ratio of net investment income (loss), before waivers, to average net assets (c), (d), (e), (f), (g) | | | 0.27 | % | | | 0.01 | % | | | (0.25 | )% | | | (0.05 | )% | | | (0.16 | )% |
Portfolio turnover rate (excluding short-term securities) | | | 64.32 | % | | | 63.08 | % | | | 113.85 | % | | | 78.82 | % | | | 58.71 | % |
(a) | Total return figures are based on the change in net asset value of a share during the year and assume reinvestment of distributions at net asset value. |
(b) | In addition to fees and expenses which the Fund bears directly, the Fund indirectly bears a pro rata share of the fees and expenses of any acquired funds in which it invests. Such indirect expenses are not included in the above reported expense ratios. |
(c) | Effective December 12, 2018, the investment advisory fee, net of voluntary waivers, decreased to 0.98%. Also effective December 12, 2018, the Adviser increased the voluntary waiver to 0.37%. |
(d) | Effective September 22, 2017, the investment advisory fee, net of voluntary waivers, increased to 1.03%. Also effective March 16, 2017, the Adviser decreased the voluntary waiver to 0.32%. |
(e) | Effective March 16, 2017, the investment advisory fee, net of voluntary waivers, decreased to 0.96%. Also effective March 16, 2017, the Adviser increased the voluntary waiver to 0.39%. |
(f) | Effective March 16, 2016, the investment advisory fee, net of voluntary waivers, increased to 1.03%. Also effective March 16, 2016, the Adviser decreased the voluntary waiver to 0.32%. |
(g) | Effective March 16, 2015, the investment advisory fee, net of voluntary waivers, increased to 0.98%. Also effective March 16, 2015, the Adviser decreased the voluntary waiver to 0.37%. |
See accompanying notes to financial statements.
CLEARWATER INVESTMENT TRUST
Financial Highlights
Per share data (rounded to the nearest cent) for a share of capital stock outstanding throughout the years or period ended and selected information for each year or period ended is as follows:
| | Year ended December 31, | |
Tax-Exempt Bond Fund | | 2019 | | | 2018 | | | 2017 | | | 2016 | | | 2015 | |
Net asset value, beginning of year | | $ | 9.82 | | | | 10.21 | | | | 9.93 | | | | 10.16 | | | | 10.16 | |
Income (loss) from investment operations: | | | | | | | | | | | | | | | | | | | | |
Net investment income | | | 0.40 | | | | 0.42 | | | | 0.45 | | | | 0.46 | | | | 0.42 | |
Net realized and unrealized gains (losses) | | | 0.34 | | | | (0.26 | ) | | | 0.38 | | | | (0.23 | ) | | | 0.04 | |
Total from investment operations | | | 0.74 | | | | 0.16 | | | | 0.83 | | | | 0.23 | | | | 0.46 | |
Less distributions to shareholders from: | | | | | | | | | | | | | | | | | | | | |
Net investment income | | | (0.43 | ) | | | (0.45 | ) | | | (0.49 | ) | | | (0.44 | ) | | | (0.42 | ) |
Net realized gain | | | - | | | | (0.10 | ) | | | (0.06 | ) | | | (0.02 | ) | | | (0.04 | ) |
Total distributions to shareholders: | | | (0.43 | ) | | | (0.55 | ) | | | (0.55 | ) | | | (0.46 | ) | | | (0.46 | ) |
Net asset value, end of year | | $ | 10.13 | | | | 9.82 | | | | 10.21 | | | | 9.93 | | | | 10.16 | |
Total return (a) | | | 7.69 | % | | | 1.59 | % | | | 8.54 | % | | | 2.28 | % | | | 4.73 | % |
Net assets, end of year (000s omitted) | | $ | 603,277 | | | | 529,485 | | | | 525,156 | | | | 484,856 | | | | 512,773 | |
Ratio of expenses, net of waivers, to average net assets (b), (c), (d) | | | 0.32 | % | | | 0.34 | % | | | 0.34 | % | | | 0.34 | % | | | 0.34 | % |
Ratio of expenses, before waivers, to average net assets (b), (c), (d) | | | 0.60 | % | | | 0.60 | % | | | 0.60 | % | | | 0.60 | % | | | 0.60 | % |
Ratio of net investment income (loss), net of waivers, to average net assets (c), (d) | | | 4.05 | % | | | 4.22 | % | | | 4.35 | % | | | 4.54 | % | | | 4.23 | % |
Ratio of net investment income (loss), before waivers, to average net assets (c), (d) | | | 3.77 | % | | | 3.96 | % | | | 4.09 | % | | | 4.28 | % | | | 3.97 | % |
Portfolio turnover rate (excluding short-term securities) | | | 12.53 | % | | | 11.36 | % | | | 13.28 | % | | | 13.48 | % | | | 18.93 | % |
(a) | Total return figures are based on the change in net asset value of a share during the year and assume reinvestment of distributions at net asset value. |
(b) | In addition to fees and expenses which the Fund bears directly, the Fund indirectly bears a pro rata share of the fees and expenses of any acquired funds in which it invests. Such indirect expenses are not included in the above reported expense ratios. |
(c) | Effective December 12, 2018, the investment advisory fee, net of voluntary waivers, decreased to 0.32%. Also effective December 12, 2018, the Adviser increased the voluntary waiver to 0.28%. |
(d) | Effective March 16, 2015, the investment advisory fee, net of voluntary waivers, increased to 0.34%. Also effective March 16, 2015, the Adviser decreased the voluntary waiver to 0.26%. |
See accompanying notes to financial statements.
CLEARWATER INVESTMENT TRUST
Financial Highlights
Per share data (rounded to the nearest cent) for a share of capital stock outstanding throughout the years or period ended and selected information for each year or period ended is as follows:
| | Year ended December 31, | |
International Fund | | 2019 | | | 2018 | | | 2017 | | | 2016 | | | 2015 | |
Net asset value, beginning of year | | $ | 14.08 | | | | 17.23 | | | | 14.04 | | | | 14.02 | | | | 14.41 | |
Income (loss) from investment operations: | | | | | | | | | | | | | | | | | | | | |
Net investment income | | | 0.29 | | | | 0.30 | | | | 0.27 | | | | 0.27 | | | | 0.28 | |
Net realized and unrealized gains (losses) | | | 3.43 | | | | (2.70 | ) | | | 3.44 | | | | 0.02 | | | | (0.31 | ) |
Total from investment operations | | | 3.72 | | | | (2.40 | ) | | | 3.71 | | | | 0.29 | | | | (0.03 | ) |
Less distributions to shareholders from: | | | | | | | | | | | | | | | | | | | | |
Net investment income | | | (0.30 | ) | | | (0.29 | ) | | | (0.30 | ) | | | (0.27 | ) | | | (0.28 | ) |
Net realized gain | | | (0.22 | ) | | | (0.46 | ) | | | (0.22 | ) | | | - | (a) | | | (0.08 | ) |
Total distributions to shareholders: | | | (0.52 | ) | | | (0.75 | ) | | | (0.52 | ) | | | (0.27 | ) | | | (0.36 | ) |
Net asset value, end of year | | $ | 17.28 | | | | 14.08 | | | | 17.23 | | | | 14.04 | | | | 14.02 | |
Total return (b) | | | 26.47 | % | | | (14.01 | )% | | | 26.54 | % | | | 2.09 | % | | | (0.15 | )% |
Net assets, end of year (000s omitted) | | $ | 711,851 | | | | 524,708 | | | | 624,642 | | | | 508,999 | | | | 491,184 | |
Ratio of expenses, net of waivers, to average net assets (c), (d), (e), (f), (g) | | | 0.68 | % | | | 0.68 | % | | | 0.67 | % | | | 0.70 | % | | | 0.69 | % |
Ratio of expenses, before waivers, to average net assets (c), (d), (e), (f), (g) | | | 1.00 | % | | | 1.00 | % | | | 1.00 | % | | | 1.00 | % | | | 1.00 | % |
Ratio of net investment income (loss), net of waivers, to average net assets (d), (e), (f), (g) | | | 1.88 | % | | | 1.79 | % | | | 1.67 | % | | | 1.90 | % | | | 1.87 | % |
Ratio of net investment income (loss), before waivers, to average net assets (d), (e), (f), (g) | | | 1.56 | % | | | 1.47 | % | | | 1.34 | % | | | 1.60 | % | | | 1.56 | % |
Portfolio turnover rate (excluding short-term securities) | | | 49.69 | % | | | 19.57 | % | | | 36.17 | % | | | 37.21 | % | | | 18.49 | % |
(a) | Per share amounts from distributions paid from net realized gain were less than $0.01 per share. |
(b) | Total return figures are based on the change in net asset value of a share during the year and assume reinvestment of distributions at net asset value. |
(c) | In addition to fees and expenses which the Fund bears directly, the Fund indirectly bears a pro rata share of the fees and expenses of any acquired funds in which it invests. Such indirect expenses are not included in the above reported expense ratios. |
(d) | Effective September 22, 2017, the investment advisory fee, net of voluntary waivers, increased to 0.68%. Also effective September 22, 2017, the Advisor decreased the voluntary waiver to 0.32%. |
(e) | Effective March 16, 2017, the investment advisory fee, net of voluntary waivers, decreased to 0.65%. Also effective March 16, 2017, the Adviser increased the voluntary waiver to 0.35%. |
(f) | Effective March 16, 2016, the investment advisory fee, net of voluntary waivers, increased to 0.70%. Also effective March 16, 2016, the Adviser decreased the voluntary waiver to 0.30%. |
(g) | Effective March 16, 2015, the investment advisory fee, net of voluntary waivers, increased to 0.69%. Also effective March 16, 2015, the Advisor decreased the voluntary waiver to 0.31%. |
See accompanying notes to financial statements.
CLEARWATER INVESTMENT TRUST
Notes to Financial Statements
December 31, 2019
Clearwater Investment Trust (the “Trust”) was established on January 12, 1987 as a Massachusetts business trust and is registered under the Investment Company Act of 1940 (as amended) as a diversified open end management investment company and presently includes four series: Clearwater Core Equity Fund (“Core Equity Fund”), Clearwater Small Companies Fund (“Small Companies Fund”), ClearwaterTax-Exempt Bond Fund (“Tax-Exempt Bond Fund”), and Clearwater International Fund (“International Fund” and together with the Core Equity Fund, Small Companies Fund and Tax-Exempt Bond Fund, the “Funds”). Clearwater Management Co., Inc. (the “Adviser”) serves as the investment adviser for each of the Funds and is responsible for the oversight of each of the Fund’s subadvisers. The Trust’s declaration of trust permits the Board of Trustees to create additional funds in the future. The investment objective of the Core Equity, Small Companies, and International Funds is long-term capital growth. The investment objective of the Tax-Exempt Bond Fund is high current income that is exempt from United States (“U.S.”) federal income tax, consistent with preservation of capital.
Fiduciary Counselling, Inc. (“FCI”) acts as subadviser to each of the Funds. FCI does not provide day-to-day management, but provides the Funds with various investment-related services, including investment strategy advice, manager recommendations and related duties as requested by the Adviser. FCI also provides certain services related to due diligence, performance reporting, compliance, and other administrative functions, which support the investment management services and subadviser oversight services provided to the Funds by the Adviser.
The Northern Trust Company serves as the custodian, administrator, accounting services agent and transfer agent for the Trust.
Effective September 12, 2019, the Trust terminated the subadvisory agreement with Templeton Investment Counsel, LLC (“Templeton”), one of the subadvisers to the International Fund. At the same time, the Trust appointed LSV Asset Management (“LSV”) as a subadviser to the International Fund. LSV began managing assets for the Fund on September 26, 2019.
Under normal market conditions, the Core Equity Fund pursues its investment objective by investing at least 80% of its net assets, plus the amount of any borrowings for investment purposes, in equity securities of U.S. companies. The equity securities in which the Fund primarily invests are common and preferred stocks. The Fund employs a multi-style (growth and value) and multi-manager approach whereby portions of the Fund are allocated to different subadvisers who employ distinct investment styles. The Fund’s Adviser allocates portions of the Fund’s assets among subadvisers. The Fund currently allocates assets among the following subadvisers who provide day-to-day management for the Fund: Parametric Portfolio Associates, LLC (“Parametric”), AQR Capital Management (“AQR”), and O’Shaughnessy Asset Management (“OSAM”). The allocation among subadvisers will vary over time, but the current intent of the Fund’s Adviser is that under normal market conditions approximately 60% of the Fund’s total assets will be allocated to Parametric; the remaining assets will be allocated to one or more of the Fund’s two other subadvisers that provide day-to-day management. Parametric manages its portion of the Fund’s assets using a passive management strategy to seek investment results that track, before fees and expenses, the investment results of the Russell 1000® Index as closely as possible without requiring the Fund to realize taxable gains. In addition, as noted above, FCI also acts as a subadviser to the Fund but does not provide day-to-day management.
CLEARWATER INVESTMENT TRUST
Notes to Financial Statements
December 31, 2019
Under normal market conditions, the Small Companies Fund invests at least 80% of its net assets, plus the amount of any borrowings for investment purposes, in equity securities of small companies. The Fund defines “small companies” as issuers with market capitalizations no greater than that of the largest capitalization company included in the Russell 2000® Index at the time of purchase. The equity securities the Fund invests in consist primarily of exchange-traded common and preferred stocks. The Fund may also invest in a type of equity security called a convertible security to reduce volatility or correlation risk in the portfolio. A convertible security generally entitles the holder to receive interest paid or accrued on debt securities or the dividend paid on preferred stock until the convertible security matures or is redeemed, converted or exchanged. It is intended that the Fund holds a portion of its portfolio for more than two years to allow for the change that prompted the relevant security’s purchase to yield results. The Fund uses a “multi-style, multi-manager” approach. The Fund’s Adviser allocates portions of the Fund’s assets between subadvisers who employ distinct investment styles. The Fund currently allocates assets between the following subadvisers who provide day-to-day management for the Fund: Kennedy Capital Management, Inc. (“KCM”), Cooke & Bieler, L.P. (“Cooke & Bieler”), and Pzena Investment Management, LLC (“Pzena”). FCI also acts as a subadviser to the Fund but does not provide day-to-day management.
Under normal market conditions, the Tax-Exempt Bond Fund invests at least 80% of its net assets, plus the amount of any borrowings for investment purposes, in tax-exempt bonds, which are debt obligations issued by or for the U.S. states, territories and possessions and the District of Columbia. The interest on these bonds is generally exempt from both U.S. regular federal income tax and U.S. federal alternative minimum tax. However, the Fund may invest up to 20% of its net assets in bonds that generate interest income subject to federal alternative minimum tax for individuals. The Fund invests in both revenue bonds, which are backed by and payable only from the revenues derived from a specific facility or specific revenue source, and in general obligation bonds, which are secured by the full faith, credit and taxation power of the issuing municipality. The Fund currently has one subadviser that provides day-to-day management for the Fund, Sit Fixed Income Advisors II, LLC (“Sit”). FCI also acts as a subadviser to the Fund but does not provide day-to-day management.
Under normal market conditions, the International Fund intends to invest at least 80% of the value of its net assets, plus the amount of any borrowings for investment purposes, in equity securities of companies organized or located outside the United States and doing a substantial amount of business outside the United States. Equity securities in which the Fund invests include common and preferred stock, sponsored and unsponsored American Depositary Receipts, European Depositary Receipts, Global Depositary Receipts, exchange-traded funds, and other investment companies. The Fund diversifies its investments among a number of different countries throughout the world, and may invest in companies of any size. The Fund does not intend to invest more than 20% of its net assets in the equity securities of developing or emerging market issuers. In order to hedge against adverse movements in currency exchange rates, the Fund may enter into foreign currency exchange contracts. The Fund may invest in foreign currency exchange contracts, options, futures contracts or options in futures contracts for speculative purposes. The Fund uses a “multi-style, multi-manager” approach. The Fund’s assets are allocated to different subadvisers who employ distinct investment styles. The Fund currently allocates assets among the following subadvisers who provide day-to-day management for the Fund: Parametric, Artisan Partners Limited Partnership (“Artisan Partners”), WCM Investment Management, LLC (“WCM”) and LSV. The allocation among subadvisers will vary over time, but the current intent of the Fund’s Adviser is that under normal market conditions approximately 35% of the Fund’s assets will be allocated to Parametric, and the remaining assets will be allocated to one or more of the Fund’s three other subadvisers that provide day-to-day management of the Fund. Parametric manages its portion of the Fund’s assets using a passive management strategy to seek investment results that track, before fees and expenses, the investment results of the MSCI World Ex U.S.A. Index - Net Dividends as closely as
CLEARWATER INVESTMENT TRUST
Notes to Financial Statements
December 31, 2019
possible without requiring the Fund to realize taxable gains. FCI also acts as a subadviser to the Fund but does not provide day-to-day management.
(2) | Summary of Significant Accounting Policies |
The Funds are investment companies and follow accounting and reporting guidance under Financial Accounting Standards Board (“FASB”) Accounting Standards Codification (“ASC”) Topic 946, “Financial Services-Investment Companies.”
The significant accounting policies followed by the Funds are as follows:
| | (a) | Investments in Securities |
Investments in U.S. and foreign equity securities are valued at the last sales price or the regular trading session closing price on the principal exchange or market where they are traded. Foreign security values are stated in U.S. dollars. Equity securities which have not traded on the date of valuation or securities for which sales prices are not generally reported are valued at the mean between the last bid and asked prices. Debt securities are valued on the basis of evaluated prices provided by independent pricing services when such prices are believed to reflect the fair value of such securities or broker provided prices. Such prices may be determined by taking into account other similar securities’ prices, yields, maturities, call features, ratings, prepayment speeds, credit risks, cash flows, institutional size trading in similar groups of securities and developments related to specific securities. Shares of open end investment companies are valued at their daily net asset value (“NAV”). Shares of closed-end funds and exchange traded funds are valued at the last sales price or the regular trading session closing price on the principal exchange or market where they are traded.
Securities for which no market quotations are readily available (including those for which trading has been suspended), or when the Adviser becomes aware that a significant event impacting the value of a security or group of securities has occurred after the closing of the exchange on which the security or securities principally trade, but before the calculation of the NAV, are valued at fair value as determined in good faith using procedures established by the Board of Trustees. This may occur particularly with respect to certain foreign securities held by the International Fund, whereby the Board of Trustees may use adjustment factors obtained from an independent evaluation service that are intended to reflect more accurately the fair value of these foreign securities as of the time the Fund’s NAV is calculated. The procedures consider, among others, the following factors to determine a security’s fair value: the nature and pricing history (if any) of the security; whether any dealer quotations for the security are available; and possible valuation methodologies that could be used to determine the fair value of the security. These procedures are used by the Valuation Committee, in accordance with the procedures established by the Board of Trustees, to determine the fair value of the security or securities. Such determinations are then submitted for review and ratification by the Board of Trustees. The use of fair valuation involves the risk that the values used by the Funds to price their investments may be higher or lower than the values used by other unaffiliated investment companies and investors to price the same investments.
Security transactions are accounted for on the trade date, which is the date the securities are purchased or sold. Realized gains and losses are calculated on an identified cost basis. Dividend income is recognized on the ex-dividend date or, for foreign securities, as soon as the information is available. Interest income, is recognized on an accrual basis and includes amortization of premiums and accretion of discounts using the effective yield method.
CLEARWATER INVESTMENT TRUST
Notes to Financial Statements
December 31, 2019
| (b) | Foreign Currency Translation |
The International Fund invests in securities which are purchased and sold in foreign currencies as a principal investment strategy. The costs of purchases, proceeds from sales of investments, interest and dividend income are translated into U.S. dollars using the spot market rate of exchange prevailing on the respective dates of such transactions. The value of the International Fund’s net assets, as measured in U.S. dollars, may be affected favorably or unfavorably by changes in foreign currency exchange rates and exchange control regulations. The gains or losses, if any, on investments resulting from changes in foreign exchange rates are recorded within net realized gain (loss) on security transactions and within net increase (decrease) in unrealized appreciation/depreciation on security transactions on the Statements of Operations. The realized gains or losses, if any, on translation of other assets and liabilities denominated in foreign currencies are recorded within net realized gain (loss) on foreign currency transactions on the Statements of Operations. The International Fund also will incur costs in converting U.S. dollars to local currencies, and vice versa. Risks may arise upon investing in foreign securities including, but not limited to, political, social or economic instability in the country of the issuer, the difficulty of predicting international trade patterns, the possibility of the imposition of exchange controls, expropriation, limits on removal of currency or other assets, nationalization of assets, foreign withholding and income tax and possible delays in the settlement of foreign stock exchange transactions. The principal markets on which these securities trade may have less volume and liquidity, and may be more volatile, than securities markets in the U.S.
The Tax-Exempt Bond Fund invests in long or short financial futures contracts for hedging purposes or to gain exposure to interest rate risk. When used as a hedge, the Fund will purchase and sell various kinds of futures contracts. The Fund will also enter into closing purchase and sale transactions with respect to any such futures contracts. The futures contracts may be based on various interest rates or indices. The Fund bears the market risk arising from changes in the value of these financial instruments. At the time the Fund enters into a futures contract, it is generally required to make a margin deposit with the custodian or broker of a specified amount of liquid assets. Futures are marked to market each day with the change in value reflected in the unrealized appreciation or depreciation. Risk may arise as a result of the potential inability of the counterparties to meet the terms of their contracts. Credit risk is mitigated to the extent that the exchange on which a particular futures contract is traded assumes the risk of a counterparty defaulting on its obligations under the contract. The Statements of Operations include any realized gains or losses on closed futures contracts within Net realized gain (loss) on futures contracts, and any unrealized gains or losses on open futures contracts within Net increase (decrease) in unrealized appreciation/depreciation on futures contracts. Additional information on derivative instruments and how these positions may impact the financial statements is found in Note 8, Derivative Instruments.
| (d) | Forward Foreign Currency Exchange Contracts |
The International Fund enters into forward foreign currency exchange contracts for the purchase or sale of a specific foreign currency at a fixed price on a future date as a hedge against adverse movements in foreign currency exchange rates, specific transactions or the portfolio position. The objective of the International Fund’s foreign currency hedging transactions is to reduce the risk that the U.S. dollar value of the International Fund’s foreign currency denominated securities will decline in value due to changes in foreign currency exchange rates. Forward foreign currency exchange contracts are marked-to-market daily at the applicable exchange rates. Any resulting unrealized gains or losses are recorded on forward foreign currency exchange contracts within net increase (decrease) in unrealized appreciation/depreciation on the Statements of Operations. The International Fund records any realized gains or losses at the time the forward foreign currency exchange contract is offset by entering into a
CLEARWATER INVESTMENT TRUST
Notes to Financial Statements
December 31, 2019
closing transaction with the same counterparty or is extinguished by delivery of the currency. Realized gains or losses, if any, are recorded within Net realized gain (loss) on forward foreign currency exchange contracts on the Statements of Operations. Risks may arise upon entering into forward foreign currency exchange contracts from the potential of the counterparty to default on its obligations under the contract and from unanticipated movements in the value of a foreign currency relative to the U.S. dollar. The contractual amounts of forward foreign currency exchange contracts do not necessarily represent the amounts potentially subject to risk. The measurement of risks associated with these instruments is meaningful only when all related and offsetting transactions are considered. The International Fund bears the market risk from changes in foreign currency exchange rates and the credit risk if the issuer fails to perform. Additional information on derivative instruments and how these positions may impact the financial statements is found in Note 8, Derivative Instruments.
The International Fund routinely enters into spot contracts in order to buy or sell a certain amount of foreign currency at the current market rate. The International Fund may enter into spot contracts in order to make payments, or to receive payments, based on investment trading activity in a foreign currency. A spot contract allows the International Fund to buy or sell foreign currency on the day it chooses to deal. From time to time, the Core Equity Fund may also enter into spot contracts in order to make or receive payments due to investment trading activity in a foreign currency on a non-U.S. exchange. Spot contracts are marked-to-market daily at the applicable exchange rates. Any resulting unrealized gains or losses are recorded in translation of other assets and liabilities denominated in foreign currencies within net increase (decrease) in unrealized appreciation/depreciation on the Statements of Operations. Unrealized gains or losses on outstanding spot contracts are recorded in payables for investment securities purchased or receivable for securities sold, respectively, on the Statements of Assets and Liabilities. The Funds record any realized gains or losses at the time the spot contract settles. Realized gains or losses, if any, are included within Net realized gain (loss) on foreign currency transactions on the Statements of Operations. Risks may arise upon entering into spot contracts from unanticipated movements in the value of a foreign currency relative to the U.S. dollar in a short period of time. The Funds bear the market risk from changes in foreign currency exchange rates.
| (f) | Master Limited Partnerships |
The International Fund invests in Master Limited Partnerships (“MLPs”). The benefits derived from the Fund’s investments in MLPs are largely dependent on the MLPs being treated as partnerships for federal income tax purposes. If any of the MLPs held by the Fund were treated as corporations for U.S. federal income tax purposes, the after-tax return to the Fund with respect to its investments in such MLPs would be materially reduced, causing a decline in the value of the common stock. The Fund must include its allocable share of an MLP’s taxable income in its reportable taxable income, whether or not it receives a distribution in cash from the MLP. In such case, the Fund may have to liquidate securities to make required distributions to shareholders.
| (g) | Delayed Delivery Transactions and When-Issued Securities |
Certain Funds may engage in securities transactions on a when-issued or delayed-delivery basis. In these transactions, the securities’ prices and yields are fixed on the date of the commitment, with payment and delivery scheduled for a future date. During this period, the securities are subject to market fluctuations. When delayed-delivery purchases are outstanding, a Fund will segregate liquid assets on its records in amounts sufficient to meet the purchase price. A Fund may dispose of or renegotiate a delayed-delivery transaction, which may result in a capital gain or loss.
CLEARWATER INVESTMENT TRUST
Notes to Financial Statements
December 31, 2019
| (h) | Short-Term Investments |
The Core Equity, Small Companies, Tax-Exempt Bond, and International Funds currently invest in the U.S. Government Select Portfolio, a money market portfolio of Northern Institutional Funds, an investment company advised by Northern Trust Investments, Inc. The U.S. Government Select Portfolio primarily invests in securities issued by the U.S. government, government agencies, and government-sponsored enterprises.
The balances disclosed as foreign tax reclaim receivable, if any, represent net amounts withheld by foreign governments on dividend income earned in the respective countries subject to reclaims. All reclaims are paid directly to the applicable Funds.
The Trust’s policy is to comply with the requirements of the Internal Revenue Code applicable to regulated investment companies. On a calendar-year basis, the Funds intend to distribute substantially all of their net investment income and net realized gains, if any, to avoid the payment of federal income and excise taxes. Therefore, no income tax provision is required. Each Fund is treated as a separate entity for federal income tax purposes.
Management has analyzed the Funds’ tax positions taken on federal tax returns for all open tax years and has concluded that as of December 31, 2019, no provision for income tax is required in the Funds’ financial statements. The Funds’ federal and state income and federal excise tax returns for the 2016, 2017, 2018, and 2019 tax years for which the applicable statutes of limitations have not expired remain subject to examination by the Internal Revenue Service and state departments of revenue. Net investment income and net realized gain (loss) for the Funds may differ for financial statement and tax purposes. The character of distributions made during the year from net investment income or net realized gains, if any, may differ from their ultimate characterization for federal income tax purposes. Also, due to the timing of dividend distributions, the fiscal year in which amounts are distributed may differ from the year that the income or realized gain (loss) were recorded by the Funds. The Trust has analyzed the Funds’ tax positions and has concluded that no liability for unrecognized tax benefits should be recorded related to uncertain tax positions. Further, the Trust is not aware of any tax positions for which it is reasonably possible that the total amounts of unrecognized tax benefits will significantly change in the next twelve months. The tax character of distributions by the Funds during the years ended December 31, 2019 and 2018 was as follows:
| | Tax-Exempt | | | Ordinary Income* | |
| | 2019 | | | 2018 | | | 2019 | | | 2018 | |
Core Equity Fund | | $ | — | | | $ | — | | | $ | 7,398,837 | | | $ | 7,833,537 | |
Small Companies Fund | | | — | | | | — | | | | 2,265,820 | | | | 13,643,176 | |
Tax-Exempt Bond Fund | | | 23,538,099 | | | | 23,513,734 | | | | 426,352 | | | | 2,426,996 | |
International Fund | | | — | | | | — | | | | 12,139,749 | | | | 10,507,300 | |
CLEARWATER INVESTMENT TRUST
Notes to Financial Statements
December 31, 2019
| | Long-Term Capital Gains** | |
| | 2019 | | | 2018 | |
Core Equity Fund | | $ | 2,349,736 | | | $ | 20,355,019 | |
Small Companies Fund | | | 5,292,066 | | | | 18,194,790 | |
Tax-Exempt Bond Fund | | | — | | | | 3,154,039 | |
International Fund | | | 8,846,708 | | | | 16,117,600 | |
* In addition to the ordinary income distributions, during 2019 the following Funds utilized equalization accounting for tax purposes whereby a portion of redemption payments were treated as distributions of ordinary income in the following amounts:
Core Equity Fund | | $ | 350,142 | |
Small Companies Fund | | $ | 4,263 | |
International Fund | | $ | 21,020 | |
** In addition to the long-term capital gain distributions, during 2019 the following Funds utilized equalization accounting for tax purposes whereby a portion of redemption payments were treated as distributions of long-term capital gains in the following amounts:
Core Equity Fund | | $ | 286,224 | |
Small Companies Fund | | $ | 66,095 | |
International Fund | | $ | 233,532 | |
As of December 31, 2019, the components of distributable earnings on a tax basis were as follows:
| | Core
Equity Fund | | | Small
Companies
Fund | | | Tax-Exempt
Bond Fund | | | International
Fund | |
Undistributed ordinary income | | $ | 94,083 | | | $ | — | | | $ | — | | | $ | 163,546 | |
Undistributed tax-exempt income | | | — | | | | — | | | | 500,735 | | | | — | |
Undistributed capital gain | | | 2,727,592 | | | | 1,876,119 | | | | — | | | | 1,816,947 | |
Accumulated capital losses and other | | | — | | | | — | | | | (4,306,006 | ) | | | — | |
Unrealized appreciation/depreciation | | | 274,330,501 | | | | 45,225,169 | | | | 30,461,645 | | | | 210,658,049 | |
Total | | $ | 277,152,176 | | | $ | 47,101,288 | | | $ | 26,656,374 | | | $ | 212,638,542 | |
Distributions to shareholders are determined in accordance with federal income tax regulations, which may differ from such amounts recorded in accordance with U.S. generally accepted accounting principles (“U.S. GAAP”) for financial reporting purposes. Accordingly, the Funds may make reclassifications among certain of their capital
CLEARWATER INVESTMENT TRUST
Notes to Financial Statements
December 31, 2019
accounts in order to reflect the tax treatment for certain permanent differences that exist between federal income tax regulations and U.S. GAAP. These reclassifications are reported in order to reflect the tax treatment for certain permanent differences that exist between income tax regulations and U.S. GAAP. The primary reasons for permanent differences are the Funds use of equalization accounting whereby a portion of redemption payments were treated as distributions and realized gains on in-kind redemptions that are not recognized for tax purposes. These reclassifications have no impact on the total net assets or the NAV per share of the Funds. At December 31, 2019, reclassifications have been recorded among the following capital accounts on the Statements of Assets and Liabilities:
| | Core
Equity Fund | | | Small Companies
Fund | | | Tax-Exempt
Bond Fund | | | International
Fund | |
Distributable earnings | | $ | (34,505,313 | ) | | $ | (70,358 | ) | | $ | — | | | $ | (254,552 | ) |
Additional paid-in capital | | | 34,505,313 | | | | 70,358 | | | | — | | | | 254,522 | |
| (k) | Distributions to Shareholders |
Distributions to shareholders from net investment income, if any, are declared annually for the Core Equity, Small Companies, and International Funds and declared daily, payable monthly, for the Tax-Exempt Bond Fund. Distributions to shareholders from net realized gains, if any, are declared annually for all Funds. Distributions are paid in cash or reinvested in additional shares at the direction of the shareholders. During the year ended December 31, 2019, the Core Equity, Small Companies and International Funds utilized equalization accounting with respect to distributions to shareholders, in order to keep remaining shareholders’ interest in undistributed income from being affected.
The preparation of financial statements in conformity with U.S. GAAP requires management to make estimates and assumptions that affect the reported amounts of assets and liabilities and disclosure of contingent assets and liabilities at the date of the financial statements and the reported amounts of increase and decrease in net assets from operations during the period. Actual results could differ from those estimates.
Under each Fund’s organizational documents, its officers and directors are indemnified against certain liabilities arising out of the performance of their duties to each Fund. In addition, certain of each Fund’s contracts with its service providers contain general indemnification clauses. Each Fund’s maximum exposure under these arrangements is unknown since the amount of any future claims that may be made against each Fund cannot be determined and each Fund has no historical basis for predicting the likelihood of any such claims. The Funds believe that the likelihood of any such claims is remote.
(3) | Fair Value Measurements |
Fair value is an estimate of the price the Funds would receive upon selling a security in a timely transaction to an independent buyer in the principal or most advantageous market for the security. This guidance establishes a three-tier hierarchy to maximize the use of observable market data and minimize the use of unobservable inputs and to establish classification of fair value measurements for disclosure purposes. Various inputs are used in
CLEARWATER INVESTMENT TRUST
Notes to Financial Statements
December 31, 2019
determining the value of the Funds’ investments, as described in Note 2(a). These inputs are summarized in the three broad levels listed below.
● | Level 1 – Unadjusted quoted market prices in active markets for identical securities on the measurement date. |
● | Level 2 – Other significant observable inputs including quoted prices for similar investments, interest rates, prepayment speeds, credit risk, etc. or quoted prices for identical or similar assets in markets that are not active. Inputs that are derived principally from or corroborated by observable market data are also considered Level 2 measurement. An adjustment to any observable input that is significant to the fair value may render the measurement a Level 3 measurement. |
● | Level 3 – Valuations based on unobservable inputs, which may include the Adviser’s own assumptions in determining the fair value of an investment. |
The inputs or methodology used for valuing securities are not necessarily an indication of the risk associated with investing in those securities and other financial instruments, if any. The following is a summary of the inputs used in valuing each Fund’s investments and other financial instruments, if any, which are carried at fair value, as of December 31, 2019.
| | Core Equity Fund (a) | |
| | Level 1 | | | Level 2 | | | Level 3 | | | Total | |
Common Stocks | | $ | 540,259,888 | | | $ | — | | | $ | — | | | $ | 540,259,888 | |
Short-Term Investments | | | 2,916,876 | | | | — | | | | — | | | | 2,916,876 | |
Total | | $ | 543,176,764 | | | $ | — | | | $ | — | | | $ | 543,176,764 | |
(a) For the Core Equity Fund, the investment value is comprised of equity securities and short-term investments. See the Fund’s Schedule of Investments for industry classification. Investments in equity and short-term securities generally are valued at the last sales price or the regular trading session closing price on the principal exchange or market where they are traded. Investments in rights generally are determined by taking into account the terms of the rights as well as the value of the underlying equity securities, which are determined by the valuation methodology described above.
CLEARWATER INVESTMENT TRUST
Notes to Financial Statements
December 31, 2019
| | Small Companies Fund (b) | |
| | Level 1 | | | Level 2 | | | Level 3 | | | Total | |
Common Stocks | | $ | 356,673,356 | | | $ | — | | | $ | — | | | $ | 356,673,356 | |
Convertible Bonds | | | — | | | | 316,794 | | | | — | | | | 316,794 | |
Convertible Preferred Stocks | | | 145,722 | | | | — | | | | — | | | | 145,722 | |
Investment Companies | | | 3,036,400 | | | | — | | | | — | | | | 3,036,400 | |
Master Limited Partnerships | | | 423,183 | | | | — | | | | — | | | | 423,183 | |
Preferred Stocks | | | 4,294,586 | | | | — | | | | — | | | | 4,294,586 | |
Rights | | | — | | | | — | | | | — | * | | | — | * |
Warrants | | | — | | | | — | | | | — | * | | | — | * |
Short-Term Investments | | | 13,201,073 | | | | — | | | | — | | | | 13,201,073 | |
Total | | $ | 377,774,320 | | | $ | 316,794 | | | $ | — | * | | $ | 378,091,114 | |
* Security has been deemed worthless and is a Level 3 investment.
(b) For the Small Companies Fund, the investment value is comprised of equity securities, convertible bonds, investment companies, master limited partnerships and short-term investments. See the Fund’s Schedule of Investments for industry classification. Investments in equity and short-term securities generally are valued at the last sales price or the regular trading session closing price on the principal exchange or market where they are traded.
There were no significant Level 3 valuations at December 31, 2019.
CLEARWATER INVESTMENT TRUST
Notes to Financial Statements
December 31, 2019
| | Tax-Exempt Bond Fund (c) | |
| | Level 1 | | | Level 2 | | | Level 3 | | | Total | |
Closed-End Funds | | $ | 32,249,979 | | | $ | — | | | $ | — | | | $ | 32,249,979 | |
Municipal Bonds | | | | | | | | | | | | | | | | |
Airports | | | — | | | | 2,766,505 | | | | — | | | | 2,766,505 | |
Development | | | — | | | | 53,952,124 | | | | — | | | | 53,952,124 | |
Education | | | — | | | | 40,725,664 | | | | — | | | | 40,725,664 | |
Facilities | | | — | | | | 3,289,437 | | | | — | | | | 3,289,437 | |
General | | | — | | | | 50,927,615 | | | | — | | | | 50,927,615 | |
General Obligations | | | — | | | | 18,456,909 | | | | — | | | | 18,456,909 | |
Higher Education | | | — | | | | 20,885,592 | | | | — | | | | 20,885,592 | |
Housing | | | — | | | | 22,830,386 | | | | — | | | | 22,830,386 | |
Medical | | | — | | | | 21,781,496 | | | | — | | | | 21,781,496 | |
Mello-Roos | | | — | | | | 698,964 | | | | — | | | | 698,964 | |
Multifamily Housing | | | — | | | | 52,135,091 | | | | — | | | | 52,135,091 | |
Nursing Home | | | — | | | | 82,037,425 | | | | — | | | | 82,037,425 | |
Power | | | — | | | | 3,879,200 | | | | — | | | | 3,879,200 | |
School District | | | — | | | | 34,993,188 | | | | — | | | | 34,993,188 | |
Single Family Housing | | | — | | | | 116,947,577 | | | | — | | | | 116,947,577 | |
Student Loan | | | — | | | | 545,416 | | | | — | | | | 545,416 | |
Tobacco Settlement | | | — | | | | 1,497,015 | | | | — | | | | 1,497,015 | |
Transportation | | | — | | | | 7,472,805 | | | | — | | | | 7,472,805 | |
Utilities | | | — | | | | 556,913 | | | | — | | | | 556,913 | |
Water | | | — | | | | 7,264,301 | | | | — | | | | 7,264,301 | |
Short-Term Investments | | | 22,581,520 | | | | — | | | | — | | | | 22,581,520 | |
Total | | $ | 54,831,499 | | | $ | 543,643,623 | | | $ | — | | | $ | 598,475,122 | |
(c) For the Tax-Exempt Bond Fund, the investment value is comprised of closed-end funds, municipal bonds, and short-term investments. Investments in closed-end funds and short-term securities generally are valued at the last sales price or the regular trading session closing price on the principal exchange or market where they are traded. Investments in municipal bonds generally are based on valuations using adjusted evaluated prices provided by the primary pricing provider. The Board of Trustees has delegated to the Valuation Committee the responsibility to determine in good faith the fair value of securities for which no price quotation is available from an approved pricing service or broker-dealer at the time the Tax-Exempt Bond Fund’s NAV is calculated, including securities for which the prices do not represent fair value or for which a significant event occurs that materially affects the value of the security after the close of the market on which the security principally trades and before the time the Tax-Exempt Bond Fund’s NAV is calculated.
CLEARWATER INVESTMENT TRUST
Notes to Financial Statements
December 31, 2019
| | International Fund (d) | |
| | Level 1 | | | Level 2 | | | Level 3 | | | Total | |
Common Stocks | | | | | | | | | | | | | | | | |
Singapore | | $ | 2,613,414 | | | $ | — | | | $ | 524,010 | | | $ | 3,137,424 | |
Thailand | | | — | | | | 213,498 | | | | — | | | | 213,498 | |
All other countries | | | 664,932,902 | | | | — | | | | — | | | | 664,932,902 | |
Preferred Stocks | | | 8,646,629 | | | | — | | | | — | | | | 8,646,629 | |
Rights | | | 22,199 | | | | — | | | | — | | | | 22,199 | |
Short-Term Investments | | | 40,737,327 | | | | — | | | | — | | | | 40,737,327 | |
Total | | $ | 716,952,471 | | | $ | 213,498 | | | $ | 524,010 | | | $ | 717,689,979 | |
(d) For the International Fund, the investment value is comprised of equity securities, rights, investment companies and short-term investments. See the Fund’s Schedule of Investments for additional information on industry sector and currency concentration information. Investments in equity and short-term securities generally are valued at the last sales price or the regular trading session closing price on the principal exchange or market where they are traded. Shares of open end investment companies are valued at their daily net asset value. Two equity securities were deemed Level 3 classifications, as their trading was suspended pending custody agents, these equities were valued at period end using internally determined prices.
There were no significant Level 3 valuations for which significant in unobservable inputs were used at December 31, 2019.
International Fund | | | | | | | | | | | | |
Other Financial Instruments | | Level 1 | | | Level 2 | | | Level 3 | | | Total | |
Assets | | | | | | | | | | | | | | | | |
Forward foreign currency exchange contracts | | $ | — | | | $ | 2,800 | | | $ | — | | | $ | 2,800 | |
Liabilities | | | | | | | | | | | | | | | | |
Forward foreign currency exchange contracts | | | — | | | | (27,677 | ) | | | — | | | | (27,677 | ) |
Net Other Financial Instruments | | $ | — | | | $ | (24,877 | ) | | $ | — | | | $ | (24,877 | ) |
The forward foreign currency exchange contracts outstanding at December 31, 2019 are considered Level 2 investments due to the contracts being marked-to-market daily at the applicable exchange rates that have been adjusted from the initial quoted rate. Forward foreign currency exchange contracts are shown on a gross basis in the above table and on the Statements of Assets and Liabilities.
CLEARWATER INVESTMENT TRUST
Notes to Financial Statements
December 31, 2019
(4) | Investment Security Transactions |
The cost of purchases and proceeds from sales of securities (excluding short-term securities) for the year ended December 31, 2019, were as follows:
| | Purchases | | | Sales | |
Core Equity Fund | | $ | 169,584,084 | | | $ | 202,748,868 | |
Small Companies Fund | | | 212,010,381 | | | | 218,803,580 | |
Tax-Exempt Bond Fund | | | 104,445,448 | | | | 67,229,341 | |
International Fund | | | 325,806,521 | | | | 288,060,945 | |
The difference between book basis and tax basis net unrealized appreciation (depreciation) is attributable primarily to the tax deferral of losses on wash sales, deferral of post-October currency and capital losses for tax purposes, and the recharacterization of income recognition on investments in PFICs.
At December 31, 2019, for federal income tax purposes, gross unrealized appreciation, gross unrealized depreciation, net unrealized appreciation (depreciation) on investments (including the effects of foreign currency translation and derivative instruments, if any) and the cost basis of investments (including derivative instruments, if any) were as follows:
Funds | | Unrealized
Appreciation | | | Unrealized
Depreciation | | | Net
Appreciation
(Depreciation) | | | Cost Basis of
Investments | |
Core Equity Fund | | $ | 275,206,545 | | | $ | (876,044 | ) | | $ | 274,330,501 | | | $ | 268,846,262 | |
Small Companies Fund | | | 58,188,362 | | | | (12,963,193 | ) | | | 45,225,169 | | | | 332,865,945 | |
Tax-Exempt Bond Fund | | | 36,780,370 | | | | (6,318,726 | ) | | | 30,461,644 | | | | 568,013,478 | |
International Fund | | | 217,605,907 | | | | (6,789,150 | ) | | | 210,816,757 | | | | 506,873,222 | |
(5) | Capital Share Transactions |
Transactions in capital shares for the years ended December 31, 2019 and 2018 were as follows:
| | Core Equity Fund | | | Small Companies Fund | |
| | 2019 | | | 2018 | | | 2019 | | | 2018 | |
Sold | | | 1,044,814 | | | | 1,199,527 | | | | 428,526 | | | | 187,783 | |
Issued for reinvestment of distributions | | | 204,376 | | | | 718,516 | | | | 412,774 | | | | 2,068,744 | |
Redeemed | | | (1,997,685 | ) | | | (2,345,677 | ) | | | (1,137,168 | ) | | | (1,257,751 | ) |
Net Increase (decrease) | | | (748,495 | ) | | | (427,634 | ) | | | (295,868 | ) | | | 998,776 | |
CLEARWATER INVESTMENT TRUST
Notes to Financial Statements
December 31, 2019
| | Tax-Exempt Bond Fund | | | International Fund | |
| | 2019 | | | 2018 | | | 2019 | | | 2018 | |
Sold | | | 6,498,951 | | | | 2,150,381 | | | | 4,699,885 | | | | 487,916 | |
Issued for reinvestment of distributions | | | 2,381,364 | | | | 2,915,620 | | | | 1,224,414 | | | | 1,865,795 | |
Redeemed | | | (3,270,230 | ) | | | (2,565,535 | ) | | | (1,983,567 | ) | | | (1,354,485 | ) |
Net Increase (decrease) | | | 5,610,085 | | | | 2,500,466 | | | | 3,940,732 | | | | 999,226 | |
(6) | Capital Loss Carryforward |
At December 31, 2019, one Fund had the following short term capital loss carry-forwards and long term capital loss carry forwards available to offset future net capital gains which do not expire. Future utilization of the capital loss carry-forward, may be limited.
| | Short-Term | | | Long-Term | | | Late-year
Gain/Loss | | | Total | |
Tax-Exempt Bond Fund | | $ | 1,786,605 | | | $ | 2,171,221 | | | $ | — | | | $ | 3,957,826 | |
(7) | Expenses and Related-Party Transactions |
The Trust has a contract for investment advisory services with the Adviser. Under terms of separate agreements, Core Equity Fund, Small Companies Fund, Tax-Exempt Bond Fund and International Fund each pay an investment advisory fee equal to an annual rate of 0.90%, 1.35%, 0.60% and 1.00%, respectively, of each Fund’s average daily net assets. The Adviser is responsible for the payment or reimbursement of all the Funds’ expenses, except brokerage, taxes, interest, and extraordinary expenses. The Adviser has periodically modified its management fee for each of the Funds through voluntary waivers. For the year ended December 31, 2019, voluntary waivers on management fees were as follows:
| | Management Fees Voluntary Waivers % |
Core Equity Fund | | (0.55) |
Small Companies Fund | | (0.37) |
Tax-Exempt Bond Fund | | (0.28) |
International Fund | | (0.32) |
The Adviser has periodically modified its management fee for each of the Funds through voluntary waivers. Effective September 22, 2017, the net management fee actually paid for the International Fund due to the Adviser’s modification of the voluntary waiver for the Fund was 0.68%. Effective December 12, 2018, the net management fees actually paid for the Core Equity Fund, the Small Companies Fund, and the Tax-Exempt Bond Fund were 0.35%, 0.98%, and 0.32%, respectively.
The Adviser currently intends to continue these voluntary waivers indefinitely. However, the Adviser may terminate these voluntary arrangements at any time.
CLEARWATER INVESTMENT TRUST
Notes to Financial Statements
December 31, 2019
In addition to fees and expenses which the Funds bear directly, the Funds indirectly bear a pro rata share of the fees and expenses of any acquired funds in which they invest, such as short-term investments in mutual funds or other investment companies and investments in closed-end funds. Such indirect expenses are not included in any of the reported expense ratios.
The Adviser has entered into subadvisory contracts with independent investment advisory firms for each Fund to provide daily investment management services. The subadvisory fees are based on each subadviser’s proportional net assets it currently manages within each Fund and are paid directly by the Adviser. For each subadviser, the fee schedule is detailed according to the following schedule:
The subadvisory fee for the Core Equity Fund, payable to Parametric and OSAM is equal to an annual rate of 0.15% and 0.35% of the portions of net assets managed, respectively.
The subadvisory fee for the Core Equity Fund, payable to AQR for its portion of net assets managed is based on the following annual rates:
For the period: January 1, 2019 to September 30, 2019
| | AQR |
First $100 million | | 0.25% |
Next $100 million | | 0.23% |
Next $100 million | | 0.21% |
All assets in excess of $300 million | | 0.20% |
For the period: October 1, 2019 to December 31, 2019
The subadvisory fee for the Small Companies Fund, payable to KCM is determined by the net assets managed in two different strategies/accounts for its portion of net assets managed is based on the following annual rates:
For the period: January 1, 2019 to September 30, 2019
Clearwater Small Cap Core Net Assets | | Percent |
Up to and including $50 million | | 0.75% |
Next $50 million | | 0.70% |
Over $100 million | | 0.60% |
CLEARWATER INVESTMENT TRUST
Notes to Financial Statements December 31, 2019
For the period: October 1, 2019 to December 31, 2019
Clearwater Small Cap Core Net Assets | | Percent |
Up to and including $50 million | | 0.75% |
Next $50 million | | 0.70% |
Over $100 million | | 0.50% |
For the period: January 1, 2019 to December 31, 2019
Clearwater Micro Cap Core Net Assets | | Percent |
All Assets | | 0.80% |
The subadvisory fee for the Small Companies Fund, payable to Cooke & Bieler for its portion of net assets managed is based on the following annual rates:
| | Cooke &
Bieler |
First $15 million | | 1.00% |
Next $20 million | | 0.765% |
Next $25 million | | 0.7225% |
All assets in excess of $60 million | | 0.68% |
The subadvisory fee for the Small Companies Fund, payable to Pzena for its portion of net assets managed is 1.00%.
The subadvisory fee for the Tax-Exempt Bond Fund, payable to Sit for Sit’s portion of net assets managed is based on the following annual rates:
| | Sit |
Up to and including $20 million | | 0.40% |
Next $30 million | | 0.30% |
Next $25 million | | 0.25% |
Next $175 million | | 0.20% |
Over $250 million | | 0.18% |
Effective October 1, 2019, the subadvisory fee for the Tax-Exempt Bond Fund payable to Sit is equal to 0.185% of the portion of net assets managed by Sit if such assets exceed $500 million.
CLEARWATER INVESTMENT TRUST
Notes to Financial Statements
December 31, 2019
The subadvisory fee for the International Fund payable to Parametric is equal to an annual rate of 0.15% of the portions of net assets managed. The subadvisory fee for the International Fund payable to WCM is equal to an annual rate of 0.80% and 0.70% of the portions of net assets managed for the WCM Focused Growth International strategy and WCM International Small Cap Growth strategy (September 27, 2019 to December 31, 2019), respectively.
The subadvisory fee for the International Fund, payable to Artisan Partners, Templeton (for the period January 1, 2019 to September 12, 2019) and LSV (from September 26, 2019 to December 31, 2019) for each of their respective portions of net assets managed is based on the following annual rates:
| | Artisan |
| | Partners |
First $50 million | | 0.80% |
Next $50 million | | 0.60% |
All assets in excess of $100 million | | 0.50% |
| | Templeton |
First $25 million | | 0.95% |
Next $25 million | | 0.85% |
Next $50 million | | 0.75% |
Next $150 million | | 0.65% |
Next $250 million | | 0.55% |
Over $500 million | | 0.50% |
| | LSV |
First $25 million | | 0.95% |
Next $25 million | | 0.85% |
Over $50 million | | 0.75% |
The Adviser has also engaged FCI as a subadviser for each Fund. FCI regularly provides the Funds with various investment-related services, including investment strategy advice, manager recommendations and related duties as requested by the Adviser. FCI also provides certain services related to due diligence, performance reporting, compliance, and other administrative functions, which support the investment management services and subadviser oversight services provided to the Trust by the Adviser. For its services, FCI is compensated with a subadvisory fee payable by the Adviser of 0.20% of each Fund’s average daily net assets, paid on a quarterly basis. FCI is compensated out of the investment advisory fees the Adviser receives from the respective Funds. FCI has agreed to waive the difference between the amount calculated under the subadvisory fee schedule and an amount determined by multiplying the total number of hours worked by FCI in providing services under the subadvisory agreement by an hourly rate that is approved by the Adviser.
CLEARWATER INVESTMENT TRUST
Notes to Financial Statements
December 31, 2019
(8) | Derivative Instruments |
Information concerning the types of derivatives in which the Tax-Exempt Bond Fund and International Fund invest, the objectives for using them and their related risks can be found in Note 2 (c) and (d). Below are the types of derivatives held in the International Fund by location as presented in the Statements of Assets and Liabilities as of December 31, 2019, with additional detail on the net amounts impacting the Statements of Assets and Liabilities. The forward foreign currency exchange contracts presented below are not subject to master netting agreements or other similar agreements.
ASSETS | | LIABILITIES |
Name of Fund | | Derivative Type | | Statements of Assets and
Liabilities Location | | Value | | Statements of Assets and Liabilities Location | | Value | | Counterparty |
International Fund | | Forward foreign currency exchange contracts | | Unrealized appreciation on forward foreign currency exchange contracts | | $ | 2,800 | | Unrealized depreciation on forward foreign currency exchange contracts | | $ | 27,677 | | Barclays/Brown Brothers Harriman/Northern Trust |
The following tables set forth by primary risk exposure the Tax-Exempt Bond Fund’s and International Fund’s net realized gain (loss) and net increase (decrease) in appreciation/depreciation on futures contracts and forward foreign currency exchange contracts for the year ended December 31, 2019:
Name of Fund | | Derivative Type | | Statements of
Operations Location | | Value | | Name of Fund | | Derivative Type | | Statements of
Operations Locations | | Value |
Tax-Exempt Bond Fund | | Futures contracts | | Net realized gain (loss) on futures contracts | | $ | (3,999,188) | | Tax-Exempt Bond Fund | | Futures Contracts | | Net increase (decrease) in unrealized appreciation/depreciation on futures contracts | | $ | 1,955,452 |
International Fund | | Forward foreign currency exchange contracts | | Net realized gain (loss) on forward foreign currency exchange contracts | | $ | 30,802 | | International Fund | | Forward foreign currency exchange contracts | | Net increase (decrease) in unrealized appreciation/depreciation on forward foreign currency exchange contracts | | $ | 19,828 |
Derivative transactions are measured in terms of the notional amount. The following table presents, for the Tax-Exempt Bond Fund and International Fund, the number of transactions and weighted average notional amounts of futures contracts and forward foreign currency exchange contracts, which is indicative of the volume of derivative activity, for the year ended December 31, 2019.
Tax-Exempt Bond Fund |
Future Contracts |
Number of
Transactions | | Weighted
Average Notional
Amount |
1,695 | | $ | 40,333,963 |
CLEARWATER INVESTMENT TRUST
Notes to Financial Statements
December 31, 2019
International Fund |
Forward Foreign Currency Exchange
Contracts |
Number of
Transactions | | Weighted
Average Notional
Amount |
28 | | $ | 4,372,757 |
ReFlow Fund, LLC (“ReFlow”) provides each Fund with a potential source of cash to meet net shareholder redemptions through share purchases for a fee. The Fund then generally redeems those shares when it experiences net sales. The shares may be redeemed in-kind in accordance with the Fund’s redemption in-kind policies. The Fund is generally required to redeem the shares purchased by ReFlow within 30 days (15 days if redeemed in-kind). As such, the proceeds received from ReFlow’s purchase of fund shares is treated as a liability on the statement of assets and liabilities. The fee paid on outstanding shares owned by ReFlow is based on an auction starting at a minimum bid of 0.20% and is paid by the Adviser under the unified advisory fee agreement. For the year ended December 31, 2019, the Core Equity Fund had total sales in kind of $38,607,496, resulting in realized gains of $33,868,947. These realized gains are not recognized for tax purposes as discussed in note 2. As of December 31, 2019, the Fund’s ReFlow account had a zero balance. During the year ended December 31, 2019, the Fund had the following activity:
| | Average Amount
Oustanding for
Days in Use | | Days Used |
Core Equity Fund | | $ | 481,471 | | 168 |
(10) | Portfolio Securities Loaned |
The Small Companies Fund and the International Fund participate in a securities lending program and have loaned portions of their investment portfolios at December 31, 2019. Under the program, the Funds loan securities to borrowers who post collateral for those loaned securities. The Securities Finance Trust Company serves as the Funds’ securities lending agent (the lending agent) who operates and maintains the securities lending program. The loans are governed by a securities lending agreement between the lending agent, acting on behalf of the Funds, and each borrowing counterparty. The fair value of securities on loan as of December 31, 2019 is recognized within investments in securities, at fair value, on the Funds’ Statements of Assets and Liabilities.
Each borrower receives a negotiated interest rate, which is generally referred to as the rebate rate, on the cash that it delivers to the Funds as collateral for the securities loaned and agrees to pay a negotiated rate with respect to the loaned securities. The amount of these rates for each securities lending transaction may differ depending on several factors, including the demand for the security, tax considerations and the credit quality of the borrower. A net payment is generally made by the borrower with respect to these rates upon termination of the loan (the Net Rate). The value of the securities loan will be marked-to-market daily, and the borrower will be required to provide
CLEARWATER INVESTMENT TRUST
Notes to Financial Statements
December 31, 2019
additional collateral if the posted amount falls below certain negotiated levels, and the lending agent (on behalf of the Funds) will be required to return collateral to the borrower if the amount of collateral posted is greater than such negotiated levels.
During the reporting period, the cash collateral received from borrowers related to the Funds’ securities lending activities was invested in the Fidelity Investments Money Market Government Portfolio and the daily residual was swept into the Northern Institutional Fund-U.S Government Select Portfolio. The short-term investments purchased with the cash collateral in the amount of $3,509,148 and $8,084,387 are included in Investment in Securities on the Statement of Assets and Liabilities of the Small Companies Fund and the International Fund, respectively.
The Funds provide compensation to the lending agent in connection with operating and maintaining the securities lending program. The lending agent is compensated in an amount of 15% of gross revenues for the 12 month period commencing as of implementation date. The fee will then be increased to 20% for the first $1 million of gross revenues and 15% of any gross revenues in excess of $ 1 million. The revenues derived from the securities lending activities of the Funds depend on many factors, including the value of the securities available to be loaned, the demand for the securities available to be loaned, the actual percentage of the Fund’s securities that are on loan (the utilization rate), the amount earned from the investment of any collateral and the amount of the fees or profit retained by the lending agent. All compensation, costs and expenses associated with the securities lending program are considered transaction charges that are borne by the Funds and are not an obligation of the Manager under the securities lending agency agreement. These transaction charges are netted with the income from securities lending and included in net income from securities loaned on the accompanying Statement of Operations.
The Funds’ securities lending program involves certain risks, including counterparty or borrower risk, collateral investment risk, replacement risk, operational, legal, tax and accounting risks. In the event the borrower does not meet its contractual obligation to return the securities, the Funds may be exposed to the risk of loss of reacquiring the loaned securities at prevailing market prices using the proceeds of the sale of the collateral.
CLEARWATER INVESTMENT TRUST
Notes to Financial Statements
December 31, 2019
The following is information on the securities lending activities by the lending agent for the Funds as of December 31, 2019:
| | Gross Amounts of
Securities Loaned in
Statement of Assets
and
Liabilities | | | % of Net Assets | | | Collateral
Received | |
Small Companies Fund | | $ | 3,424,021 | | | | 0.92% | | | $ | 3,509,148 | |
International Fund | | | 7,056,635 | | | | 0.99% | | | | 8,084,387 | |
At December 31, 2019, there were no offsetting of securities and they are presented on a gross basis.
Certain of the Funds’ investments, payment obligations and financing terms may be based on floating rates, such as London Interbank Offered Rate (“LIBOR”), Euro Interbank Offered Rate and other similar types of reference rates (each, a “Reference Rate”). On July 27, 2017, the Chief Executive of the UK Financial Conduct Authority (FCA), which regulates LIBOR, announced that the FCA will no longer persuade nor compel banks to submit rates for the calculation of LIBOR and certain other Reference Rates after 2021. Such announcement indicates that the continuation of LIBOR and other Reference Rates on the current basis cannot and will not be guaranteed after 2021. The transition away from Reference Rates may lead to increased volatility and illiquidity in markets that are tied to such Reference Rates and reduced values of Reference Rate-related instruments. This announcement and any additional regulatory or market changes that occur as a result of the transition away from Reference Rates may have an adverse impact on a Fund’s investments, performance or financial condition.
Effective January 1, 2020, CMC has voluntarily agreed to waive a portion of the management fee for the Core Equity Fund, the Small Companies Fund, the Tax-Exempt Bond Fund and the International Fund to achieve an effective management fee rate equal to 0.31%, 0.95%, 0.29% and 0.65%, respectively, of each Fund’s average daily net assets. It is CMC’s current intent to continue these fee reductions indefinitely. Nonetheless, the investment manager may terminate any voluntary fee reduction at any time.
Additionally, effective January 1, 2020, for each of the Core Equity Fund and the International Fund, the subadvisory fee payable to Parametric is equal to an annual rate of 0.10% of the portion of net assets managed.
Management has evaluated subsequent events for the Funds through the date the financial statements were issued and has concluded there no additional events that require financial statement disclosure and/or adjustments to the financial statements.
CLEARWATER INVESTMENT TRUST
Schedule of Investments - Clearwater Core Equity Fund
December 31, 2019
Shares | | | Security | | | Cost | | | Fair value (a) | | | Percent of
net assets | |
Common Stocks: | | | | | | | | | | | | | |
Communication Services: | | | | | | | | | | | | | |
18,873 | | | ACTIVISION BLIZZARD, INC. | | | $ | 289,107 | | | | 1,121,434 | | | | | |
5,805 | | | ALPHABET, INC., CLASS A(b) | | | | 2,494,100 | | | | 7,775,159 | | | | | |
4,279 | | | ALPHABET, INC., CLASS C(b) | | | | 1,763,252 | | | | 5,721,109 | | | | | |
5,717 | | | ALTICE U.S.A, INC., CLASS A(b) | | | | 167,165 | | | | 156,303 | | | | | |
26,992 | | | AMC NETWORKS, INC., CLASS A(b) | | | | 1,021,304 | | | | 1,066,184 | | | | | |
127,220 | | | AT&T, INC. | | | | 3,334,070 | | | | 4,971,758 | | | | | |
300 | | | CABLE ONE, INC. | | | | 113,966 | | | | 446,541 | | | | | |
1,900 | | | CARS.COM, INC.(b) | | | | 14,708 | | | | 23,218 | | | | | |
1,929 | | | CHARTER COMMUNICATIONS, INC., CLASS A(b) | | | | 79,053 | | | | 935,719 | | | | | |
57,795 | | | COMCAST CORP., CLASS A | | | | 632,884 | | | | 2,599,041 | | | | | |
41,063 | | | DISCOVERY, INC., CLASS A(b) | | | | 1,190,733 | | | | 1,344,403 | | | | | |
3,880 | | | DISH NETWORK CORP., CLASS A(b) | | | | 128,509 | | | | 137,624 | | | | | |
11,266 | | | ELECTRONIC ARTS, INC.(b) | | | | 280,102 | | | | 1,211,208 | | | | | |
31,804 | | | FACEBOOK, INC., CLASS A(b) | | | | 1,885,863 | | | | 6,527,771 | | | | | |
1,360 | | | GCI LIBERTY, INC., CLASS A(b) | | | | 51,149 | | | | 96,356 | | | | | |
1,972 | | | IAC/INTERACTIVECORP(b) | | | | 156,820 | | | | 491,245 | | | | | |
15,600 | | | INTERPUBLIC GROUP OF (THE) COS., INC. | | | | 40,950 | | | | 360,360 | | | | | |
5,832 | | | LIBERTY GLOBAL PLC, CLASS A(b)(c) | | | | 42,377 | | | | 132,620 | | | | | |
7,374 | | | LIBERTY GLOBAL PLC, CLASS C(b)(c) | | | | 51,974 | | | | 160,716 | | | | | |
1,600 | | | LIVE NATION ENTERTAINMENT, INC.(b) | | | | 88,717 | | | | 114,352 | | | | | |
1,100 | | | MATCH GROUP, INC.(b) | | | | 31,366 | | | | 90,321 | | | | | |
2,211 | | | NETFLIX, INC.(b) | | | | 713,130 | | | | 715,413 | | | | | |
2,375 | | | NEWS CORP., CLASS A | | | | 7,170 | | | | 33,583 | | | | | |
19,418 | | | OMNICOM GROUP, INC. | | | | 1,331,957 | | | | 1,573,246 | | | | | |
625 | | | ROKU, INC.(b) | | | | 93,606 | | | | 83,687 | | | | | |
14,300 | | | SIRIUS XM HOLDINGS, INC. | | | | 90,452 | | | | 102,245 | | | | | |
9,840 | | | SPRINT CORP.(b) | | | | 21,187 | | | | 51,266 | | | | | |
724 | | | TAKE-TWO INTERACTIVE SOFTWARE, INC.(b) | | | | 88,784 | | | | 88,639 | | | | | |
1,544 | | | TEGNA, INC. | | | | 7,743 | | | | 25,769 | | | | | |
1,900 | | | TELEPHONE & DATA SYSTEMS, INC. | | | | 50,350 | | | | 48,317 | | | | | |
9,228 | | | T-MOBILE U.S., INC.(b) | | | | 422,845 | | | | 723,660 | | | | | |
4,559 | | | TRIPADVISOR, INC. | | | | 130,522 | | | | 138,502 | | | | | |
8,700 | | | TWITTER, INC.(b) | | | | 197,336 | | | | 278,835 | | | | | |
63,543 | | | VERIZON COMMUNICATIONS, INC. | | | | 2,754,029 | | | | 3,901,540 | | | | | |
25,548 | | | VIACOMCBS, INC., CLASS B | | | | 1,165,626 | | | | 1,072,230 | | | | | |
27,007 | | | WALT DISNEY (THE) CO. | | | | 679,844 | | | | 3,906,022 | | | | | |
1,000 | | | ZAYO GROUP HOLDINGS, INC.(b) | | | | 26,680 | | | | 34,650 | | | | | |
| | | | | | | 21,639,430 | | | | 48,261,046 | | | | 8.88 | % |
Consumer Discretionary: | | | | | | | | | | | | | |
1,800 | | | ADIENT PLC(b) | | | | 38,861 | | | | 38,250 | | | | | |
1,500 | | | ADVANCE AUTO PARTS, INC. | | | | 53,557 | | | | 240,240 | | | | | |
4,444 | | | AMAZON.COM, INC.(b) | | | | 1,734,004 | | | | 8,211,801 | | | | | |
500 | | | APTIV PLC(c) | | | | 30,790 | | | | 47,485 | | | | | |
10,387 | | | ARAMARK | | | | 451,940 | | | | 450,796 | | | | | |
1,100 | | | AUTOLIV, INC.(c) | | | | 13,982 | | | | 92,851 | | | | | |
2,406 | | | AUTOZONE, INC.(b) | | | | 2,034,736 | | | | 2,866,292 | | | | | |
24,507 | | | BEST BUY CO., INC. | | | | 914,218 | | | | 2,151,715 | | | | | |
1,400 | | | BIG LOTS, INC. | | | | 15,477 | | | | 40,208 | | | | | |
447 | | | BOOKING HOLDINGS, INC.(b) | | | | 527,689 | | | | 918,017 | | | | | |
47,974 | | | BORGWARNER, INC. | | | | 1,785,739 | | | | 2,081,112 | | | | | |
831 | | | BURLINGTON STORES, INC.(b) | | | | 85,265 | | | | 189,493 | | | | | |
8,300 | | | CAESARS ENTERTAINMENT CORP.(b) | | | | 66,994 | | | | 112,880 | | | | | |
3,068 | | | CARMAX, INC.(b) | | | | 33,093 | | | | 268,972 | | | | | |
3,796 | | | CARNIVAL CORP. | | | | 164,606 | | | | 192,951 | | | | | |
2,100 | | | CARVANA CO.(b) | | | | 130,236 | | | | 193,305 | | | | | |
126 | | | CHIPOTLE MEXICAN GRILL, INC.(b) | | | | 100,702 | | | | 105,476 | | | | | |
4,600 | | | D.R. HORTON, INC. | | | | 22,057 | | | | 242,650 | | | | | |
2,195 | | | DARDEN RESTAURANTS, INC. | | | | 120,499 | | | | 239,277 | | | | | |
5,977 | | | DICK’S SPORTING GOODS, INC. | | | | 173,600 | | | | 295,802 | | | | | |
3,089 | | | DOLLAR GENERAL CORP. | | | | 207,226 | | | | 481,822 | | | | | |
5,224 | | | DOLLAR TREE, INC.(b) | | | | 52,773 | | | | 491,317 | | | | | |
900 | | | DOMINO’S PIZZA, INC. | | | | 90,041 | | | | 264,402 | | | | | |
45,945 | | | EBAY, INC. | | | | 1,419,210 | | | | 1,659,074 | | | | | |
1,022 | | | EXPEDIA GROUP, INC. | | | | 35,459 | | | | 110,519 | | | | | |
791 | | | FLOOR & DECOR HOLDINGS, INC., CLASS A(b) | | | | 22,319 | | | | 40,191 | | | | | |
25,008 | | | FOOT LOCKER, INC. | | | | 916,636 | | | | 975,062 | | | | | |
| See accompanying notes to financial statements. | 30 | (Continued) |
CLEARWATER INVESTMENT TRUST
Schedule of Investments - Clearwater Core Equity Fund
December 31, 2019
Shares | | | Security | | | Cost | | | Fair value (a) | | | Percent of
net assets | |
Consumer Discretionary (Cont’d): | | | | | | | | | | | | | |
38,163 | | | FORD MOTOR CO. | | | $ | 164,117 | | | | 354,916 | | | | | |
1,300 | | | FRONTDOOR, INC.(b) | | | | 30,171 | | | | 61,646 | | | | | |
1,336 | | | GAMESTOP CORP., CLASS A | | | | 5,383 | | | | 8,123 | | | | | |
26,342 | | | GAP (THE), INC. | | | | 443,927 | | | | 465,727 | | | | | |
5,579 | | | GARMIN LTD.(c) | | | | 202,757 | | | | 544,287 | | | | | |
2,018 | | | GARRETT MOTION, INC.(b)(c) | | | | 16,668 | | | | 20,160 | | | | | |
6,433 | | | GENERAL MOTORS CO. | | | | 211,146 | | | | 235,448 | | | | | |
15,000 | | | GENTEX CORP. | | | | 106,860 | | | | 434,700 | | | | | |
3,450 | | | GENUINE PARTS CO. | | | | 102,424 | | | | 366,493 | | | | | |
2,000 | | | HANESBRANDS, INC. | | | | 10,096 | | | | 29,700 | | | | | |
400 | | | HASBRO, INC. | | | | 10,206 | | | | 42,244 | | | | | |
900 | | | HILTON GRAND VACATIONS, INC.(b) | | | | 23,760 | | | | 30,951 | | | | | |
17,037 | | | HOME DEPOT (THE), INC. | | | | 2,754,688 | | | | 3,720,540 | | | | | |
20,337 | | | KOHL’S CORP. | | | | 642,230 | | | | 1,036,170 | | | | | |
971 | | | KONTOOR BRANDS, INC. | | | | 5,113 | | | | 40,772 | | | | | |
7,467 | | | L BRANDS, INC. | | | | 110,693 | | | | 135,302 | | | | | |
2,538 | | | LAS VEGAS SANDS CORP. | | | | 25,066 | | | | 175,224 | | | | | |
6,763 | | | LENNAR CORP., CLASS A | | | | 275,494 | | | | 377,308 | | | | | |
58 | | | LENNAR CORP., CLASS B | | | | 652 | | | | 2,593 | | | | | |
1,200 | | | LKQ CORP.(b) | | | | 14,970 | | | | 42,840 | | | | | |
400 | | | LOWE’S COS., INC. | | | | 34,236 | | | | 47,904 | | | | | |
5,034 | | | LULULEMON ATHLETICA, INC.(b)(c) | | | | 644,872 | | | | 1,166,227 | | | | | |
15,878 | | | MACY’S, INC. | | | | 228,901 | | | | 269,926 | | | | | |
3,038 | | | MARRIOTT INTERNATIONAL, INC., CLASS A | | | | 63,603 | | | | 460,044 | | | | | |
294 | | | MARRIOTT VACATIONS WORLDWIDE CORP. | | | | 4,103 | | | | 37,855 | | | | | |
10,620 | | | MCDONALD’S CORP. | | | | 433,348 | | | | 2,098,618 | | | | | |
7,000 | | | MGM RESORTS INTERNATIONAL | | | | 64,629 | | | | 232,890 | | | | | |
600 | | | MOHAWK INDUSTRIES, INC.(b) | | | | 26,796 | | | | 81,828 | | | | | |
600 | | | MURPHY USA, INC.(b) | | | | 4,392 | | | | 70,200 | | | | | |
5,415 | | | NEWELL BRANDS, INC. | | | | 61,523 | | | | 104,076 | | | | | |
17,800 | | | NIKE, INC., CLASS B | | | | 268,854 | | | | 1,803,318 | | | | | |
4,300 | | | NORDSTROM, INC. | | | | 45,233 | | | | 175,999 | | | | | |
13,113 | | | NORWEGIAN CRUISE LINE HOLDINGS LTD.(b) | | | | 651,339 | | | | 765,930 | | | | | |
503 | | | NVR, INC.(b) | | | | 1,170,386 | | | | 1,915,630 | | | | | |
2,300 | | | O’REILLY AUTOMOTIVE, INC.(b) | | | | 511,946 | | | | 1,007,998 | | | | | |
800 | | | PENSKE AUTOMOTIVE GROUP, INC. | | | | 32,264 | | | | 40,176 | | | | | |
300 | | | POLARIS, INC. | | | | 23,007 | | | | 30,510 | | | | | |
370 | | | POOL CORP. | | | | 34,226 | | | | 78,581 | | | | | |
35,744 | | | PULTEGROUP, INC. | | | | 815,511 | | | | 1,386,867 | | | | | |
600 | | | PVH CORP. | | | | 22,503 | | | | 63,090 | | | | | |
5,300 | | | QURATE RETAIL, INC.(b) | | | | 12,356 | | | | 44,679 | | | | | |
1,500 | | | RALPH LAUREN CORP. | | | | 31,320 | | | | 175,830 | | | | | |
4,743 | | | ROSS STORES, INC. | | | | 176,855 | | | | 552,180 | | | | | |
3,870 | | | ROYAL CARIBBEAN CRUISES LTD. | | | | 82,045 | | | | 516,684 | | | | | |
24,469 | | | SKECHERS U.S.A., INC., CLASS A(b) | | | | 854,529 | | | | 1,056,816 | | | | | |
48,492 | | | STARBUCKS CORP. | | | | 2,313,956 | | | | 4,263,417 | | | | | |
5,000 | | | TAPESTRY, INC. | | | | 19,161 | | | | 134,850 | | | | | |
13,226 | | | TARGET CORP. | | | | 1,424,767 | | | | 1,695,705 | | | | | |
860 | | | TESLA, INC.(b) | | | | 22,377 | | | | 359,764 | | | | | |
1,900 | | | THOR INDUSTRIES, INC. | | | | 22,315 | | | | 141,151 | | | | | |
1,400 | | | TIFFANY & CO. | | | | 35,210 | | | | 187,110 | | | | | |
20,188 | | | TJX (THE) COS., INC. | | | | 86,033 | | | | 1,232,679 | | | | | |
1,466 | | | TOPBUILD CORP.(b) | | | | 11,809 | | | | 151,115 | | | | | |
753 | | | ULTA BEAUTY, INC.(b) | | | | 117,541 | | | | 190,614 | | | | | |
8,340 | | | URBAN OUTFITTERS, INC.(b) | | | | 174,368 | | | | 231,602 | | | | | |
200 | | | VAIL RESORTS, INC. | | | | 42,166 | | | | 47,966 | | | | | |
1,100 | | | VEONEER, INC.(b)(c) | | | | 5,428 | | | | 17,182 | | | | | |
6,800 | | | VF CORP. | | | | 81,950 | | | | 677,688 | | | | | |
400 | | | VISTEON CORP.(b) | | | | 24,116 | | | | 34,636 | | | | | |
600 | | | WAYFAIR, INC., CLASS A(b) | | | | 49,325 | | | | 54,222 | | | | | |
7,474 | | | WHIRLPOOL CORP. | | | | 893,635 | | | | 1,102,639 | | | | | |
637 | | | WILLIAMS-SONOMA, INC. | | | | 36,201 | | | | 46,781 | | | | | |
1,800 | | | WYNN RESORTS LTD. | | | | 52,106 | | | | 249,966 | | | | | |
2,716 | | | YUM CHINA HOLDINGS, INC.(c) | | | | 5,770 | | | | 130,395 | | | | | |
| | | | | | | 28,115,141 | | | | 56,260,442 | | | | 10.36 | % |
Consumer Staples: | | | | | | | | | | | | | |
8,800 | | | ALTRIA GROUP, INC. | | | | 564,326 | | | | 439,208 | | | | | |
| See accompanying notes to financial statements. | 31 | (Continued) |
CLEARWATER INVESTMENT TRUST
Schedule of Investments - Clearwater Core Equity Fund
December 31, 2019
Shares | | | Security | | | Cost | | | Fair value (a) | | | Percent of
net assets | |
Consumer Staples (Cont’d): | | | | | | | | | | | | | |
10,300 | | | ARCHER-DANIELS-MIDLAND CO. | | | $ | 188,618 | | | | 477,405 | | | | | |
7,290 | | | BROWN-FORMAN CORP., CLASS B | | | | 57,343 | | | | 492,804 | | | | | |
19,848 | | | CHURCH & DWIGHT CO., INC. | | | | 886,114 | | | | 1,396,108 | | | | | |
2,848 | | | CLOROX (THE) CO. | | | | 426,516 | | | | 437,282 | | | | | |
57,881 | | | COCA-COLA (THE) CO. | | | | 869,464 | | | | 3,203,713 | | | | | |
1,280 | | | COLGATE-PALMOLIVE CO. | | | | 36,019 | | | | 88,115 | | | | | |
1,900 | | | CONAGRA BRANDS, INC. | | | | 26,152 | | | | 65,056 | | | | | |
7,649 | | | COSTCO WHOLESALE CORP. | | | | 612,726 | | | | 2,248,194 | | | | | |
7,270 | | | ESTEE LAUDER (THE) COS., INC., CLASS A | | | | 694,476 | | | | 1,501,546 | | | | | |
12,400 | | | GENERAL MILLS, INC. | | | | 277,056 | | | | 664,144 | | | | | |
5,300 | | | HERBALIFE NUTRITION LTD.(b) | | | | 36,401 | | | | 252,651 | | | | | |
9,115 | | | HERSHEY (THE) CO. | | | | 1,207,882 | | | | 1,339,723 | | | | | |
4,800 | | | HORMEL FOODS CORP. | | | | 43,206 | | | | 216,528 | | | | | |
16,650 | | | INGREDION, INC. | | | | 1,224,758 | | | | 1,547,618 | | | | | |
8,444 | | | JM SMUCKER (THE) CO. | | | | 819,934 | | | | 879,274 | | | | | |
1,643 | | | KEURIG DR. PEPPER, INC. | | | | - | | | | 47,565 | | | | | |
3,336 | | | KIMBERLY-CLARK CORP. | | | | 278,758 | | | | 458,867 | | | | | |
3,714 | | | KRAFT HEINZ (THE) CO. | | | | 26,692 | | | | 119,331 | | | | | |
56,921 | | | KROGER (THE) CO. | | | | 955,468 | | | | 1,650,140 | | | | | |
2,112 | | | LAMB WESTON HOLDINGS, INC. | | | | 134,817 | | | | 181,695 | | | | | |
700 | | | MCCORMICK & CO., INC. (NON VOTING) | | | | 21,613 | | | | 118,811 | | | | | |
4,160 | | | MOLSON COORS BREWING CO., CLASS B | | | | 192,976 | | | | 224,224 | | | | | |
6,969 | | | MONDELEZ INTERNATIONAL, INC., CLASS A | | | | 94,887 | | | | 383,853 | | | | | |
7,364 | | | MONSTER BEVERAGE CORP.(b) | | | | 206,981 | | | | 467,982 | | | | | |
232 | | | NU SKIN ENTERPRISES, INC., CLASS A | | | | 8,194 | | | | 9,507 | | | | | |
30,860 | | | PEPSICO, INC. | | | | 2,651,046 | | | | 4,217,636 | | | | | |
13,329 | | | PHILIP MORRIS INTERNATIONAL, INC. | | | | 886,823 | | | | 1,134,165 | | | | | |
15,562 | | | PILGRIM’S PRIDE CORP.(b) | | | | 498,841 | | | | 509,111 | | | | | |
700 | | | POST HOLDINGS, INC.(b) | | | | 43,421 | | | | 76,370 | | | | | |
39,496 | | | PROCTER & GAMBLE (THE) CO. | | | | 1,223,858 | | | | 4,933,050 | | | | | |
500 | | | SPECTRUM BRANDS HOLDINGS, INC. | | | | 24,845 | | | | 32,145 | | | | | |
21,075 | | | SYSCO CORP. | | | | 1,178,483 | | | | 1,802,756 | | | | | |
18,262 | | | TYSON FOODS, INC., CLASS A | | | | 762,351 | | | | 1,662,572 | | | | | |
46,065 | | | WALGREENS BOOTS ALLIANCE, INC. | | | | 1,894,994 | | | | 2,715,992 | | | | | |
13,104 | | | WALMART, INC. | | | | 1,023,284 | | | | 1,557,279 | | | | | |
| | | | | | | 20,079,323 | | | | 37,552,420 | | | | 6.91 | % |
Energy: | | | | | | | | | | | | | |
1,162 | | | APERGY CORP.(b) | | | | 18,689 | | | | 39,252 | | | | | |
20,075 | | | CABOT OIL & GAS CORP. | | | | 334,981 | | | | 349,506 | | | | | |
48,290 | | | CHEVRON CORP. | | | | 3,637,504 | | | | 5,819,428 | | | | | |
3,600 | | | CNX RESOURCES CORP.(b) | | | | 25,763 | | | | 31,860 | | | | | |
1,700 | | | CONCHO RESOURCES, INC. | | | | 49,632 | | | | 148,869 | | | | | |
58,769 | | | CONOCOPHILLIPS | | | | 2,553,972 | | | | 3,821,748 | | | | | |
450 | | | CONSOL ENERGY, INC.(b) | | | | 5,125 | | | | 6,530 | | | | | |
2,000 | | | CONTINENTAL RESOURCES, INC. | | | | 20,765 | | | | 68,600 | | | | | |
1,337 | | | DIAMONDBACK ENERGY, INC. | | | | 80,335 | | | | 124,154 | | | | | |
9,794 | | | ENBRIDGE, INC.(c) | | | | 137,797 | | | | 389,507 | | | | | |
600 | | | EOG RESOURCES, INC. | | | | 19,976 | | | | 50,256 | | | | | |
40,751 | | | EXXON MOBIL CORP. | | | | 1,583,108 | | | | 2,843,605 | | | | | |
7,200 | | | HALLIBURTON CO. | | | | 75,727 | | | | 176,184 | | | | | |
3,100 | | | HELMERICH & PAYNE, INC. | | | | 39,003 | | | | 140,833 | | | | | |
21,996 | | | HOLLYFRONTIER CORP. | | | | 1,278,395 | | | | 1,115,417 | | | | | |
6,912 | | | KINDER MORGAN, INC. | | | | 56,110 | | | | 146,327 | | | | | |
3,652 | | | MARATHON PETROLEUM CORP. | | | | 134,026 | | | | 220,033 | | | | | |
3,000 | | | MURPHY OIL CORP. | | | | 39,255 | | | | 80,400 | | | | | |
4,022 | | | NATIONAL OILWELL VARCO, INC. | | | | 51,730 | | | | 100,751 | | | | | |
6,101 | | | OCCIDENTAL PETROLEUM CORP. | | | | 58,993 | | | | 251,422 | | | | | |
2,000 | | | ONEOK, INC. | | | | 15,766 | | | | 151,340 | | | | | |
31,900 | | | PARSLEY ENERGY, INC., CLASS A | | | | 509,926 | | | | 603,229 | | | | | |
5,203 | | | PHILLIPS 66 | | | | 53,571 | | | | 579,666 | | | | | |
730 | | | PIONEER NATURAL RESOURCES CO. | | | | 117,143 | | | | 110,500 | | | | | |
11,233 | | | SCHLUMBERGER LTD. | | | | 148,574 | | | | 451,567 | | | | | |
1,000 | | | TARGA RESOURCES CORP. | | | | 20,287 | | | | 40,830 | | | | | |
13,103 | | | VALERO ENERGY CORP. | | | | 529,604 | | | | 1,227,096 | | | | | |
5,200 | | | WPX ENERGY, INC.(b) | | | | 50,544 | | | | 71,448 | | | | | |
| | | | | | | 11,646,301 | | | | 19,160,358 | | | | 3.53 | % |
| See accompanying notes to financial statements. | 32 | (Continued) |
CLEARWATER INVESTMENT TRUST
Schedule of Investments - Clearwater Core Equity Fund
December 31, 2019
Shares | | | Security | | | Cost | | | Fair value (a) | | | Percent of
net assets | |
Financials: | | | | | | | | | | | | | |
15,982 | | | AFLAC, INC. | | | $ | 520,002 | | | | 845,448 | | | | | |
500 | | | ALLEGHANY CORP.(b) | | | | 140,685 | | | | 399,785 | | | | | |
9,753 | | | ALLSTATE (THE) CORP. | | | | 296,804 | | | | 1,096,725 | | | | | |
19,826 | | | ALLY FINANCIAL, INC. | | | | 404,611 | | | | 605,883 | | | | | |
3,633 | | | AMERICAN EXPRESS CO. | | | | 111,938 | | | | 452,272 | | | | | |
3,400 | | | AMERICAN FINANCIAL GROUP, INC. | | | | 210,306 | | | | 372,810 | | | | | |
5,500 | | | AMERICAN INTERNATIONAL GROUP, INC. | | | | 129,086 | | | | 282,315 | | | | | |
18,154 | | | AMERIPRISE FINANCIAL, INC. | | | | 1,671,730 | | | | 3,024,093 | | | | | |
848 | | | AON PLC(c) | | | | 32,575 | | | | 176,630 | | | | | |
35,638 | | | ARCH CAPITAL GROUP LTD.(b)(c) | | | | 916,635 | | | | 1,528,514 | | | | | |
2,300 | | | ARTHUR J. GALLAGHER & CO. | | | | 80,002 | | | | 219,029 | | | | | |
4,900 | | | ASSURANT, INC. | | | | 218,575 | | | | 642,292 | | | | | |
30,441 | | | ASSURED GUARANTY LTD.(c) | | | | 1,106,313 | | | | 1,492,218 | | | | | |
4,149 | | | ATHENE HOLDING LTD., CLASS A(b)(c) | | | | 181,572 | | | | 195,127 | | | | | |
18,209 | | | AXA EQUITABLE HOLDINGS, INC. | | | | 449,112 | | | | 451,219 | | | | | |
1,300 | | | AXIS CAPITAL HOLDINGS LTD.(c) | | | | 43,361 | | | | 77,272 | | | | | |
205,320 | | | BANK OF AMERICA CORP. | | | | 3,485,544 | | | | 7,231,370 | | | | | |
10,000 | | | BANK OF NEW YORK MELLON (THE) CORP. | | | | 206,454 | | | | 503,300 | | | | | |
27,906 | | | BERKSHIRE HATHAWAY, INC., CLASS B(b) | | | | 3,620,611 | | | | 6,320,709 | | | | | |
11,926 | | | BRIGHTHOUSE FINANCIAL, INC.(b) | | | | 443,135 | | | | 467,857 | | | | | |
620 | | | CANNAE HOLDINGS, INC.(b) | | | | 2,893 | | | | 23,058 | | | | | |
15,798 | | | CAPITAL ONE FINANCIAL CORP. | | | | 913,383 | | | | 1,625,772 | | | | | |
17,900 | | | CHARLES SCHWAB (THE) CORP. | | | | 156,088 | | | | 851,324 | | | | | |
6,250 | | | CHUBB LTD.(c) | | | | 587,621 | | | | 972,875 | | | | | |
66,282 | | | CITIGROUP, INC. | | | | 4,019,221 | | | | 5,295,269 | | | | | |
865 | | | CME GROUP, INC. | | | | 31,878 | | | | 173,623 | | | | | |
500 | | | CREDIT ACCEPTANCE CORP.(b) | | | | 86,421 | | | | 221,165 | | | | | |
11,776 | | | DISCOVER FINANCIAL SERVICES | | | | 330,143 | | | | 998,840 | | | | | |
10,182 | | | E*TRADE FINANCIAL CORP. | | | | 276,402 | | | | 461,957 | | | | | |
4,686 | | | EVERCORE, INC., CLASS A | | | | 356,466 | | | | 350,325 | | | | | |
469 | | | FAIRFAX FINANCIAL HOLDINGS LTD.(c) | | | | 86,576 | | | | 220,013 | | | | | |
1,863 | | | FIDELITY NATIONAL FINANCIAL, INC. | | | | 15,560 | | | | 84,487 | | | | | |
37,220 | | | FIFTH THIRD BANCORP | | | | 831,816 | | | | 1,144,143 | | | | | |
400 | | | FIRST CITIZENS BANCSHARES, INC., CLASS A | | | | 57,523 | | | | 212,884 | | | | | |
30,500 | | | FIRST HORIZON NATIONAL CORP. | | | | 193,065 | | | | 505,080 | | | | | |
10,867 | | | FRANKLIN RESOURCES, INC. | | | | 282,498 | | | | 282,325 | | | | | |
2,468 | | | GLOBE LIFE, INC. | | | | 145,321 | | | | 259,757 | | | | | |
8,351 | | | GOLDMAN SACHS GROUP (THE), INC. | | | | 750,557 | | | | 1,920,145 | | | | | |
3,000 | | | HANOVER INSURANCE GROUP (THE), INC. | | | | 215,948 | | | | 410,010 | | | | | |
36,986 | | | HARTFORD FINANCIAL SERVICES GROUP (THE), INC. | | | | 1,781,491 | | | | 2,247,639 | | | | | |
35,000 | | | HUNTINGTON BANCSHARES, INC. | | | | 169,770 | | | | 527,800 | | | | | |
505 | | | INTERCONTINENTAL EXCHANGE, INC. | | | | 12,819 | | | | 46,738 | | | | | |
2,700 | | | INVESCO LTD. | | | | 32,170 | | | | 48,546 | | | | | |
15,903 | | | JANUS HENDERSON GROUP PLC(c) | | | | 222,792 | | | | 388,828 | | | | | |
59,862 | | | JPMORGAN CHASE & CO. | | | | 2,584,346 | | | | 8,344,763 | | | | | |
5,904 | | | KEYCORP | | | | 30,107 | | | | 119,497 | | | | | |
1,852 | | | LEGG MASON, INC. | | | | 25,956 | | | | 66,505 | | | | | |
200 | | | MARKEL CORP.(b) | | | | 67,789 | | | | 228,634 | | | | | |
5,684 | | | MARSH & MCLENNAN COS., INC. | | | | 240,120 | | | | 633,254 | | | | | |
1,300 | | | MERCURY GENERAL CORP. | | | | 38,018 | | | | 63,349 | | | | | |
11,412 | | | METLIFE, INC. | | | | 482,154 | | | | 581,670 | | | | | |
40,278 | | | MGIC INVESTMENT CORP. | | | | 530,550 | | | | 570,739 | | | | | |
2,000 | | | MOODY’S CORP. | | | | 70,550 | | | | 474,820 | | | | | |
16,800 | | | MORGAN STANLEY | | | | 240,305 | | | | 858,816 | | | | | |
3,100 | | | MSCI, INC. | | | | 99,138 | | | | 800,358 | | | | | |
5,900 | | | NASDAQ, INC. | | | | 240,309 | | | | 631,890 | | | | | |
1,700 | | | NEW RESIDENTIAL INVESTMENT CORP. | | | | 24,001 | | | | 27,387 | | | | | |
3,585 | | | PACWEST BANCORP | | | | 48,720 | | | | 137,198 | | | | | |
8,825 | | | PNC FINANCIAL SERVICES GROUP (THE), INC. | | | | 325,194 | | | | 1,408,735 | | | | | |
11,354 | | | POPULAR, INC. | | | | 566,301 | | | | 667,048 | | | | | |
5,628 | | | PRINCIPAL FINANCIAL GROUP, INC. | | | | 175,248 | | | | 309,540 | | | | | |
9,491 | | | PROGRESSIVE (THE) CORP. | | | | 285,859 | | | | 687,053 | | | | | |
5,900 | | | PRUDENTIAL FINANCIAL, INC. | | | | 182,565 | | | | 553,066 | | | | | |
17,302 | | | REGIONS FINANCIAL CORP. | | | | 116,601 | | | | 296,902 | | | | | |
3,371 | | | REINSURANCE GROUP OF AMERICA, INC. | | | | 296,860 | | | | 549,675 | | | | | |
800 | | | RENAISSANCERE HOLDINGS LTD.(c) | | | | 81,779 | | | | 156,816 | | | | | |
3,151 | | | ROYAL BANK OF CANADA(c) | | | | 75,538 | | | | 249,559 | | | | | |
| See accompanying notes to financial statements. | 33 | (Continued) |
CLEARWATER INVESTMENT TRUST
Schedule of Investments - Clearwater Core Equity Fund
December 31, 2019
Shares | | | Security | | | Cost | | | Fair value (a) | | | Percent of
net assets | |
Financials (Cont’d): | | | | | | | | | | | | | |
735 | | | S&P GLOBAL, INC. | | | $ | 24,183 | | | | 200,692 | | | | | |
7,500 | | | SEI INVESTMENTS CO. | | | | 108,537 | | | | 491,100 | | | | | |
10,100 | | | SLM CORP. | | | | 36,679 | | | | 89,991 | | | | | |
47,700 | | | SYNCHRONY FINANCIAL | | | | 1,643,127 | | | | 1,717,677 | | | | | |
3,657 | | | SYNOVUS FINANCIAL CORP. | | | | 49,372 | | | | 143,354 | | | | | |
3,549 | | | T. ROWE PRICE GROUP, INC. | | | | 106,978 | | | | 432,410 | | | | | |
2,946 | | | TCF FINANCIAL CORP. | | | | 51,834 | | | | 137,873 | | | | | |
6,268 | | | TRAVELERS (THE) COS., INC. | | | | 482,609 | | | | 858,403 | | | | | |
15,443 | | | TRUIST FINANCIAL CORP. | | | | 315,878 | | | | 869,771 | | | | | |
17,585 | | | US BANCORP | | | | 318,503 | | | | 1,042,615 | | | | | |
41,867 | | | VOYA FINANCIAL, INC. | | | | 2,257,048 | | | | 2,553,050 | | | | | |
9,159 | | | W.R. BERKLEY CORP. | | | | 273,043 | | | | 632,887 | | | | | |
1,800 | | | WASHINGTON FEDERAL, INC. | | | | 23,535 | | | | 65,970 | | | | | |
79,201 | | | WELLS FARGO & CO. | | | | 2,175,324 | | | | 4,261,014 | | | | | |
2,604 | | | WILLIS TOWERS WATSON PLC(c) | | | | 454,330 | | | | 525,852 | | | | | |
2,600 | | | ZIONS BANCORP N.A. | | | | 49,361 | | | | 134,992 | | | | | |
| | | | | | | 41,025,822 | | | | 78,232,396 | | | | 14.40 | % |
Health Care: | | | | | | | | | | | | | |
16,122 | | | ABBOTT LABORATORIES | | | | 509,440 | | | | 1,400,357 | | | | | |
24,196 | | | ABBVIE, INC. | | | | 1,135,983 | | | | 2,142,314 | | | | | |
1,310 | | | ABIOMED, INC.(b) | | | | 251,899 | | | | 223,473 | | | | | |
1,000 | | | ACADIA HEALTHCARE CO., INC.(b) | | | | 25,720 | | | | 33,220 | | | | | |
4,120 | | | AGILENT TECHNOLOGIES, INC. | | | | 181,587 | | | | 351,477 | | | | | |
5,183 | | | ALEXION PHARMACEUTICALS, INC.(b) | | | | 493,459 | | | | 560,541 | | | | | |
1,391 | | | ALIGN TECHNOLOGY, INC.(b) | | | | 181,009 | | | | 388,145 | | | | | |
2,233 | | | ALLERGAN PLC | | | | 259,023 | | | | 426,883 | | | | | |
38,947 | | | AMERISOURCEBERGEN CORP. | | | | 2,826,704 | | | | 3,311,274 | | | | | |
20,287 | | | AMGEN, INC. | | | | 3,736,904 | | | | 4,890,587 | | | | | |
7,050 | | | ANTHEM, INC. | | | | 381,518 | | | | 2,129,311 | | | | | |
193 | | | AVANOS MEDICAL, INC.(b) | | | | 3,014 | | | | 6,504 | | | | | |
8,439 | | | BAXTER INTERNATIONAL, INC. | | | | 397,601 | | | | 705,669 | | | | | |
3,965 | | | BECTON DICKINSON AND CO. | | | | 492,312 | | | | 1,078,361 | | | | | |
6,962 | | | BIOGEN, INC.(b) | | | | 1,759,743 | | | | 2,065,834 | | | | | |
400 | | | BIOMARIN PHARMACEUTICAL, INC.(b) | | | | 34,064 | | | | 33,820 | | | | | |
3,200 | | | BLUEBIRD BIO, INC.(b) | | | | 414,307 | | | | 280,800 | | | | | |
32,800 | | | BOSTON SCIENTIFIC CORP.(b) | | | | 182,160 | | | | 1,483,216 | | | | | |
36,442 | | | BRISTOL-MYERS SQUIBB CO. | | | | 1,389,563 | | | | 2,339,212 | | | | | |
2,145 | | | BRUKER CORP. | | | | 43,219 | | | | 109,331 | | | | | |
500 | | | CANTEL MEDICAL CORP. | | | | 37,230 | | | | 35,450 | | | | | |
44,665 | | | CARDINAL HEALTH, INC. | | | | 2,084,688 | | | | 2,259,156 | | | | | |
3,704 | | | CENTENE CORP.(b) | | | | 106,465 | | | | 232,870 | | | | | |
3,600 | | | CERNER CORP. | | | | 40,604 | | | | 264,204 | | | | | |
7,042 | | | CIGNA CORP. | | | | 236,060 | | | | 1,440,019 | | | | | |
200 | | | COOPER (THE) COS., INC. | | | | 50,902 | | | | 64,258 | | | | | |
1,520 | | | COVETRUS, INC.(b) | | | | 18,619 | | | | 20,064 | | | | | |
7,625 | | | CVS HEALTH CORP. | | | | 236,748 | | | | 566,461 | | | | | |
10,529 | | | DANAHER CORP. | | | | 287,475 | | | | 1,615,991 | | | | | |
14,902 | | | DAVITA, INC.(b) | | | | 1,098,123 | | | | 1,118,097 | | | | | |
5,632 | | | DENTSPLY SIRONA, INC. | | | | 152,472 | | | | 318,715 | | | | | |
1,500 | | | DEXCOM, INC.(b) | | | | 87,312 | | | | 328,110 | | | | | |
8,226 | | | EDWARDS LIFESCIENCES CORP.(b) | | | | 228,593 | | | | 1,919,044 | | | | | |
16,877 | | | ELI LILLY & CO. | | | | 1,295,172 | | | | 2,218,144 | | | | | |
1,400 | | | EXACT SCIENCES CORP.(b) | | | | 111,825 | | | | 129,472 | | | | | |
42,906 | | | EXELIXIS, INC.(b) | | | | 757,356 | | | | 756,004 | | | | | |
22,127 | | | GILEAD SCIENCES, INC. | | | | 455,146 | | | | 1,437,812 | | | | | |
1,227 | | | HCA HEALTHCARE, INC. | | | | 132,097 | | | | 181,363 | | | | | |
3,800 | | | HENRY SCHEIN, INC.(b) | | | | 67,547 | | | | 253,536 | | | | | |
6,608 | | | HOLOGIC, INC.(b) | | | | 92,603 | | | | 345,004 | | | | | |
5,942 | | | HORIZON THERAPEUTICS PLC(b) | | | | 137,546 | | | | 215,100 | | | | | |
845 | | | HUMANA, INC. | | | | 291,040 | | | | 309,709 | | | | | |
200 | | | ICU MEDICAL, INC.(b) | | | | 45,928 | | | | 37,424 | | | | | |
2,299 | | | IDEXX LABORATORIES, INC.(b) | | | | 98,745 | | | | 600,338 | | | | | |
2,300 | | | ILLUMINA, INC.(b) | | | | 98,233 | | | | 763,002 | | | | | |
1,900 | | | INCYTE CORP.(b) | | | | 120,836 | | | | 165,908 | | | | | |
9 | | | INSULET CORP.(b) | | | | 714 | | | | 1,541 | | | | | |
6,500 | | | INTERCEPT PHARMACEUTICALS, INC.(b) | | | | 416,369 | | | | 805,480 | | | | | |
462 | | | INTUITIVE SURGICAL, INC.(b) | | | | 100,629 | | | | 273,111 | | | | | |
| See accompanying notes to financial statements. | 34 | (Continued) |
CLEARWATER INVESTMENT TRUST
Schedule of Investments - Clearwater Core Equity Fund
December 31, 2019
Shares | | | Security | | | Cost | | | Fair value (a) | | | Percent of
net assets | |
Health Care (Cont’d): | | | | | | | | | | | | | |
268 | | | IONIS PHARMACEUTICALS, INC.(b) | | | $ | 12,689 | | | | 16,190 | | | | | |
4,358 | | | IQVIA HOLDINGS, INC.(b) | | | | 434,765 | | | | 673,355 | | | | | |
5,338 | | | JAZZ PHARMACEUTICALS PLC(b)(c) | | | | 677,689 | | | | 796,857 | | | | | |
22,636 | | | JOHNSON & JOHNSON | | | | 1,317,640 | | | | 3,301,913 | | | | | |
842 | | | LABORATORY CORP. OF AMERICA HOLDINGS(b) | | | | 53,269 | | | | 142,441 | | | | | |
10,915 | | | MCKESSON CORP. | | | | 934,126 | | | | 1,509,763 | | | | | |
9,400 | | | MEDTRONIC PLC(c) | | | | 790,465 | | | | 1,066,430 | | | | | |
53,996 | | | MERCK & CO., INC. | | | | 2,071,000 | | | | 4,910,936 | | | | | |
1,317 | | | METTLER-TOLEDO INTERNATIONAL, INC.(b) | | | | 123,051 | | | | 1,044,750 | | | | | |
939 | | | MOLINA HEALTHCARE, INC.(b) | | | | 122,169 | | | | 127,413 | | | | | |
41,980 | | | MYLAN N.V.(b) | | | | 801,414 | | | | 843,798 | | | | | |
300 | | | PENUMBRA, INC.(b) | | | | 36,663 | | | | 49,281 | | | | | |
68,946 | | | PFIZER, INC. | | | | 1,467,427 | | | | 2,701,304 | | | | | |
4,791 | | | RESMED, INC. | | | | 129,046 | | | | 742,461 | | | | | |
200 | | | SAGE THERAPEUTICS, INC.(b) | | | | 19,160 | | | | 14,438 | | | | | |
8,751 | | | STERIS PLC | | | | 993,359 | | | | 1,333,827 | | | | | |
1,800 | | | TELEFLEX, INC. | | | | 195,858 | | | | 677,592 | | | | | |
10,647 | | | THERMO FISHER SCIENTIFIC, INC. | | | | 1,185,659 | | | | 3,458,891 | | | | | |
13,105 | | | UNITEDHEALTH GROUP, INC. | | | | 1,543,425 | | | | 3,852,608 | | | | | |
3,772 | | | UNIVERSAL HEALTH SERVICES, INC., CLASS B | | | | 251,140 | | | | 541,131 | | | | | |
1,880 | | | VAREX IMAGING CORP.(b) | | | | 19,829 | | | | 56,043 | | | | | |
5,199 | | | VARIAN MEDICAL SYSTEMS, INC.(b) | | | | 193,000 | | | | 738,310 | | | | | |
499 | | | VEEVA SYSTEMS, INC., CLASS A(b) | | | | 19,015 | | | | 70,189 | | | | | |
900 | | | VERTEX PHARMACEUTICALS, INC.(b) | | | | 22,442 | | | | 197,055 | | | | | |
3,483 | | | WATERS CORP.(b) | | | | 266,897 | | | | 813,803 | | | | | |
294 | | | WELLCARE HEALTH PLANS, INC.(b) | | | | 80,065 | | | | 97,082 | | | | | |
4,304 | | | ZIMMER BIOMET HOLDINGS, INC. | | | | 233,961 | | | | 644,223 | | | | | |
1,159 | | | ZOETIS, INC. | | | | 110,713 | | | | 153,394 | | | | | |
| | | | | | | 37,692,242 | | | | 73,211,194 | | | | 13.48 | % |
Industrials: | | | | | | | | | | | | | |
6,987 | | | 3M CO. | | | | 417,187 | | | | 1,232,647 | | | | | |
923 | | | ACCO BRANDS CORP. | | | | 3,137 | | | | 8,639 | | | | | |
300 | | | ACUITY BRANDS, INC. | | | | 34,488 | | | | 41,400 | | | | | |
4,642 | | | AGCO CORP. | | | | 225,963 | | | | 358,594 | | | | | |
900 | | | AIR LEASE CORP. | | | | 17,685 | | | | 42,768 | | | | | |
1,533 | | | ALLEGION PLC(c) | | | | 40,913 | | | | 190,920 | | | | | |
400 | | | AMERCO | | | | 120,202 | | | | 150,328 | | | | | |
5,175 | | | AMETEK, INC. | | | | 73,220 | | | | 516,154 | | | | | |
5,136 | | | BOEING (THE) CO. | | | | 263,331 | | | | 1,673,103 | | | | | |
1,200 | | | BWX TECHNOLOGIES, INC. | | | | 54,215 | | | | 74,496 | | | | | |
5,604 | | | CARLISLE COS., INC. | | | | 470,886 | | | | 906,951 | | | | | |
10,504 | | | CATERPILLAR, INC. | | | | 272,491 | | | | 1,551,231 | | | | | |
4,440 | | | CINTAS CORP. | | | | 592,910 | | | | 1,194,715 | | | | | |
5,739 | | | CRANE CO. | | | | 189,222 | | | | 495,735 | | | | | |
3,724 | | | CSX CORP. | | | | 136,592 | | | | 269,469 | | | | | |
21,760 | | | CUMMINS, INC. | | | | 3,551,689 | | | | 3,894,170 | | | | | |
7,300 | | | DEERE & CO. | | | | 199,160 | | | | 1,264,798 | | | | | |
10,100 | | | DELTA AIR LINES, INC. | | | | 100,965 | | | | 590,648 | | | | | |
3,663 | | | DOVER CORP. | | | | 273,061 | | | | 422,197 | | | | | |
16,254 | | | EATON CORP. PLC | | | | 472,195 | | | | 1,539,579 | | | | | |
2,280 | | | EXPEDITORS INTERNATIONAL OF WASHINGTON, INC. | | | | 112,692 | | | | 177,886 | | | | | |
5,753 | | | FEDEX CORP. | | | | 113,466 | | | | 869,911 | | | | | |
782 | | | FLUOR CORP. | | | | 10,432 | | | | 14,764 | | | | | |
3,953 | | | FORTIVE CORP. | | | | 71,279 | | | | 301,970 | | | | | |
7,927 | | | FORTUNE BRANDS HOME & SECURITY, INC. | | | | 271,063 | | | | 517,950 | | | | | |
1,400 | | | GATX CORP. | | | | 24,276 | | | | 115,990 | | | | | |
2,828 | | | GENERAL DYNAMICS CORP. | | | | 423,356 | | | | 498,718 | | | | | |
94,400 | | | GENERAL ELECTRIC CO. | | | | 715,085 | | | | 1,053,504 | | | | | |
2,150 | | | HEICO CORP. | | | | 225,635 | | | | 245,423 | | | | | |
2,156 | | | HEICO CORP., CLASS A | | | | 109,365 | | | | 193,027 | | | | | |
360 | | | HERC HOLDINGS, INC.(b) | | | | 5,808 | | | | 17,618 | | | | | |
9,188 | | | HONEYWELL INTERNATIONAL, INC. | | | | 265,803 | | | | 1,626,276 | | | | | |
1,200 | | | HUBBELL, INC. | | | | 43,310 | | | | 177,384 | | | | | |
1,423 | | | HUNTINGTON INGALLS INDUSTRIES, INC. | | | | 192,370 | | | | 357,002 | | | | | |
2,271 | | | IDEX CORP. | | | | 140,770 | | | | 390,612 | | | | | |
4,865 | | | IHS MARKIT LTD.(b)(c) | | | | 341,988 | | | | 366,578 | | | | | |
4,824 | | | ILLINOIS TOOL WORKS, INC. | | | | 155,812 | | | | 866,535 | | | | | |
| See accompanying notes to financial statements. | 35 | (Continued) |
CLEARWATER INVESTMENT TRUST
Schedule of Investments - Clearwater Core Equity Fund
December 31, 2019
Shares | | | Security | | | Cost | | | Fair value (a) | | | Percent of
net assets | |
Industrials (Cont’d): | | | | | | | | | | | | | |
10,505 | | | INGERSOLL-RAND PLC | | | $ | 631,190 | | | | 1,396,325 | | | | | |
1,468 | | | JACOBS ENGINEERING GROUP, INC. | | | | 29,713 | | | | 131,870 | | | | | |
2,100 | | | JB HUNT TRANSPORT SERVICES, INC. | | | | 40,530 | | | | 245,238 | | | | | |
13,203 | | | JETBLUE AIRWAYS CORP.(b) | | | | 81,151 | | | | 247,160 | | | | | |
859 | | | JOHNSON CONTROLS INTERNATIONAL PLC | | | | 16,341 | | | | 34,970 | | | | | |
4,274 | | | L3HARRIS TECHNOLOGIES, INC. | | | | 274,846 | | | | 845,696 | | | | | |
4,205 | | | LENNOX INTERNATIONAL, INC. | | | | 858,156 | | | | 1,025,894 | | | | | |
1,400 | | | LINCOLN ELECTRIC HOLDINGS, INC. | | | | 28,970 | | | | 135,422 | | | | | |
1,438 | | | LOCKHEED MARTIN CORP. | | | | 338,308 | | | | 559,928 | | | | | |
1,200 | | | MANITOWOC (THE) CO., INC.(b) | | | | 10,053 | | | | 21,000 | | | | | |
3,158 | | | MANPOWERGROUP, INC. | | | | 145,298 | | | | 306,642 | | | | | |
15,263 | | | MASCO CORP. | | | | 139,724 | | | | 732,471 | | | | | |
200 | | | MIDDLEBY (THE) CORP.(b) | | | | 20,548 | | | | 21,904 | | | | | |
577 | | | NORDSON CORP. | | | | 57,299 | | | | 93,959 | | | | | |
1,702 | | | NORFOLK SOUTHERN CORP. | | | | 117,419 | | | | 330,409 | | | | | |
5,973 | | | NORTHROP GRUMMAN CORP. | | | | 516,333 | | | | 2,054,533 | | | | | |
2,519 | | | NVENT ELECTRIC PLC(c) | | | | 24,113 | | | | 64,436 | | | | | |
7,480 | | | OSHKOSH CORP. | | | | 303,782 | | | | 707,982 | | | | | |
1,100 | | | OWENS CORNING | | | | 22,578 | | | | 71,632 | | | | | |
1,067 | | | PACCAR, INC. | | | | 47,468 | | | | 84,400 | | | | | |
4,628 | | | PARKER-HANNIFIN CORP. | | | | 350,966 | | | | 952,535 | | | | | |
2,519 | | | PENTAIR PLC(c) | | | | 49,295 | | | | 115,547 | | | | | |
4,100 | | | QUANTA SERVICES, INC. | | | | 52,131 | | | | 166,911 | | | | | |
1,157 | | | RAYTHEON CO. | | | | 32,516 | | | | 254,239 | | | | | |
14,185 | | | REPUBLIC SERVICES, INC. | | | | 880,819 | | | | 1,271,402 | | | | | |
1,531 | | | RESIDEO TECHNOLOGIES, INC.(b) | | | | 8,723 | | | | 18,265 | | | | | |
9,210 | | | ROCKWELL AUTOMATION, INC. | | | | 692,444 | | | | 1,866,591 | | | | | |
2,580 | | | ROLLINS, INC. | | | | 67,194 | | | | 85,553 | | | | | |
804 | | | ROPER TECHNOLOGIES, INC. | | | | 130,715 | | | | 284,801 | | | | | |
2,015 | | | SNAP-ON, INC. | | | | 191,097 | | | | 341,341 | | | | | |
36,059 | | | SOUTHWEST AIRLINES CO. | | | | 1,509,573 | | | | 1,946,465 | | | | | |
5,900 | | | SPIRIT AEROSYSTEMS HOLDINGS, INC., CLASS A | | | | 238,478 | | | | 429,992 | | | | | |
2,557 | | | STANLEY BLACK & DECKER, INC. | | | | 72,048 | | | | 423,797 | | | | | |
600 | | | STERICYCLE, INC.(b) | | | | 18,858 | | | | 38,286 | | | | | |
29,426 | | | TEXTRON, INC. | | | | 1,501,033 | | | | 1,312,400 | | | | | |
5,162 | | | TIMKEN (THE) CO. | | | | 171,352 | | | | 290,672 | | | | | |
1,596 | | | TORO (THE) CO. | | | | 76,510 | | | | 127,153 | | | | | |
500 | | | TRANSDIGM GROUP, INC. | | | | 172,159 | | | | 280,000 | | | | | |
8,643 | | | UNION PACIFIC CORP. | | | | 137,416 | | | | 1,562,568 | | | | | |
3,503 | | | UNITED AIRLINES HOLDINGS, INC.(b) | | | | 165,098 | | | | 308,579 | | | | | |
3,540 | | | UNITED PARCEL SERVICE, INC., CLASS B | | | | 166,527 | | | | 414,392 | | | | | |
2,565 | | | UNITED RENTALS, INC.(b) | | | | 196,251 | | | | 427,765 | | | | | |
11,340 | | | UNITED TECHNOLOGIES CORP. | | | | 444,920 | | | | 1,698,278 | | | | | |
4,716 | | | VERISK ANALYTICS, INC. | | | | 626,524 | | | | 704,287 | | | | | |
180 | | | VERITIV CORP.(b) | | | | 1,653 | | | | 3,541 | | | | | |
700 | | | W.W. GRAINGER, INC. | | | | 30,601 | | | | 236,964 | | | | | |
1,200 | | | WABTEC CORP. | | | | 21,945 | | | | 93,360 | | | | | |
975 | | | WASTE CONNECTIONS, INC. | | | | 42,575 | | | | 88,520 | | | | | |
26,746 | | | WASTE MANAGEMENT, INC. | | | | 1,728,843 | | | | 3,047,974 | | | | | |
4,800 | | | WELBILT, INC.(b) | | | | 37,515 | | | | 74,928 | | | | | |
1,600 | | | XYLEM, INC. | | | | 30,618 | | | | 126,064 | | | | | |
| | | | | | | 24,282,239 | | | | 52,314,731 | | | | 9.63 | % |
Information Technology: | | | | | | | | | | | | | |
6,512 | | | 2U, INC.(b) | | | | 99,017 | | | | 156,223 | | | | | |
4,949 | | | ACCENTURE PLC, CLASS A(c) | | | | 304,426 | | | | 1,042,111 | | | | | |
7,574 | | | ADOBE, INC.(b) | | | | 638,010 | | | | 2,497,981 | | | | | |
10,700 | | | ADVANCED MICRO DEVICES, INC.(b) | | | | 115,242 | | | | 490,702 | | | | | |
14,739 | | | AKAMAI TECHNOLOGIES, INC.(b) | | | | 844,826 | | | | 1,273,155 | | | | | |
2,269 | | | ALLIANCE DATA SYSTEMS CORP. | | | | 145,172 | | | | 254,582 | | | | | |
836 | | | ALTERYX, INC., CLASS A(b) | | | | 96,023 | | | | 83,659 | | | | | |
4,065 | | | AMDOCS LTD. | | | | 200,086 | | | | 293,452 | | | | | |
400 | | | AMPHENOL CORP., CLASS A | | | | 35,916 | | | | 43,292 | | | | | |
8,600 | | | ANALOG DEVICES, INC. | | | | 120,368 | | | | 1,022,024 | | | | | |
1,200 | | | ANSYS, INC.(b) | | | | 30,630 | | | | 308,892 | | | | | |
67,506 | | | APPLE, INC. | | | | 4,709,320 | | | | 19,823,137 | | | | | |
7,400 | | | APPLIED MATERIALS, INC. | | | | 134,145 | | | | 451,696 | | | | | |
1,109 | | | ARISTA NETWORKS, INC.(b) | | | | 215,910 | | | | 225,571 | | | | | |
| See accompanying notes to financial statements. | 36 | (Continued) |
CLEARWATER INVESTMENT TRUST
Schedule of Investments - Clearwater Core Equity Fund
December 31, 2019
Shares | | | Security | | | Cost | | | Fair value (a) | | | Percent of
net assets | |
Information Technology (Cont’d): | | | | | | | | | | | | | |
4,877 | | | ARROW ELECTRONICS, INC.(b) | | | $ | 267,343 | | | | 413,277 | | | | | |
1,300 | | | ATLASSIAN CORP. PLC, CLASS A(b)(c) | | | | 116,368 | | | | 156,442 | | | | | |
2,586 | | | AUTODESK, INC.(b) | | | | 163,995 | | | | 474,428 | | | | | |
7,679 | | | AUTOMATIC DATA PROCESSING, INC. | | | | 511,336 | | | | 1,309,269 | | | | | |
7,371 | | | BLACK KNIGHT, INC.(b) | | | | 272,636 | | | | 475,282 | | | | | |
9,493 | | | BOOZ ALLEN HAMILTON HOLDING CORP. | | | | 296,190 | | | | 675,237 | | | | | |
5,291 | | | BROADCOM, INC. | | | | 497,844 | | | | 1,672,062 | | | | | |
3,413 | | | BROADRIDGE FINANCIAL SOLUTIONS, INC. | | | | 106,898 | | | | 421,642 | | | | | |
1,062 | | | CACI INTERNATIONAL, INC., CLASS A(b) | | | | 224,187 | | | | 265,489 | | | | | |
36,993 | | | CADENCE DESIGN SYSTEMS, INC.(b) | | | | 1,811,009 | | | | 2,565,834 | | | | | |
1,522 | | | CDK GLOBAL, INC. | | | | 19,712 | | | | 83,223 | | | | | |
8,276 | | | CDW CORP. | | | | 476,119 | | | | 1,182,144 | | | | | |
109,611 | | | CISCO SYSTEMS, INC. | | | | 2,735,457 | | | | 5,256,944 | | | | | |
14,390 | | | CITRIX SYSTEMS, INC. | | | | 1,371,291 | | | | 1,595,851 | | | | | |
10,090 | | | COGNEX CORP. | | | | 458,212 | | | | 565,444 | | | | | |
2,700 | | | COGNIZANT TECHNOLOGY SOLUTIONS CORP., CLASS A | | | | 25,751 | | | | 167,454 | | | | | |
400 | | | COHERENT, INC.(b) | | | | 51,825 | | | | 66,540 | | | | | |
6,700 | | | CORELOGIC, INC.(b) | | | | 76,313 | | | | 292,857 | | | | | |
21,889 | | | CORNING, INC. | | | | 229,346 | | | | 637,189 | | | | | |
1,635 | | | DELL TECHNOLOGIES, INC., CLASS C(b) | | | | 75,203 | | | | 84,023 | | | | | |
700 | | | DOCUSIGN, INC.(b) | | | | 29,771 | | | | 51,877 | | | | | |
2,000 | | | DOLBY LABORATORIES, INC., CLASS A | | | | 43,420 | | | | 137,600 | | | | | |
1,615 | | | DXC TECHNOLOGY CO. | | | | 38,103 | | | | 60,708 | | | | | |
1,640 | | | ECHOSTAR CORP., CLASS A(b) | | | | 21,050 | | | | 71,028 | | | | | |
400 | | | ELASTIC N.V.(b) | | | | 28,596 | | | | 25,720 | | | | | |
454 | | | EPAM SYSTEMS, INC.(b) | | | | 75,613 | | | | 96,321 | | | | | |
300 | | | EURONET WORLDWIDE, INC.(b) | | | | 25,458 | | | | 47,268 | | | | | |
1,300 | | | F5 NETWORKS, INC.(b) | | | | 30,063 | | | | 181,545 | | | | | |
12,959 | | | FIDELITY NATIONAL INFORMATION SERVICES, INC. | | | | 538,426 | | | | 1,802,467 | | | | | |
1,000 | | | FIRST SOLAR, INC.(b) | | | | 46,410 | | | | 55,960 | | | | | |
9,784 | | | FISERV, INC.(b) | | | | 172,685 | | | | 1,131,324 | | | | | |
2,135 | | | FLEETCOR TECHNOLOGIES, INC.(b) | | | | 508,464 | | | | 614,282 | | | | | |
5,523 | | | FORTINET, INC.(b) | | | | 393,491 | | | | 589,635 | | | | | |
200 | | | GARTNER, INC.(b) | | | | 25,570 | | | | 30,820 | | | | | |
5,708 | | | GLOBAL PAYMENTS, INC. | | | | 297,530 | | | | 1,042,052 | | | | | |
1,700 | | | GODADDY, INC., CLASS A(b) | | | | 98,073 | | | | 115,464 | | | | | |
64,690 | | | HEWLETT PACKARD ENTERPRISE CO. | | | | 836,454 | | | | 1,025,983 | | | | | |
13,529 | | | HP, INC. | | | | 213,661 | | | | 278,021 | | | | | |
68,231 | | | INTEL CORP. | | | | 1,023,945 | | | | 4,083,625 | | | | | |
4,778 | | | INTERNATIONAL BUSINESS MACHINES CORP. | | | | 482,990 | | | | 640,443 | | | | | |
8,501 | | | INTUIT, INC. | | | | 657,198 | | | | 2,226,667 | | | | | |
500 | | | IPG PHOTONICS CORP.(b) | | | | 74,090 | | | | 72,460 | | | | | |
8,881 | | | JABIL, INC. | | | | 346,906 | | | | 367,052 | | | | | |
6,798 | | | KEYSIGHT TECHNOLOGIES, INC.(b) | | | | 414,422 | | | | 697,679 | | | | | |
9,185 | | | LAM RESEARCH CORP. | | | | 803,602 | | | | 2,685,694 | | | | | |
27,189 | | | LEIDOS HOLDINGS, INC. | | | | 2,191,927 | | | | 2,661,531 | | | | | |
827 | | | LOGMEIN, INC. | | | | 17,893 | | | | 70,907 | | | | | |
2,240 | | | MANHATTAN ASSOCIATES, INC.(b) | | | | 148,410 | | | | 178,640 | | | | | |
3,770 | | | MARVELL TECHNOLOGY GROUP LTD. | | | | 20,234 | | | | 100,131 | | | | | |
7,876 | | | MASTERCARD, INC., CLASS A | | | | 1,645,814 | | | | 2,351,695 | | | | | |
4,200 | | | MICROCHIP TECHNOLOGY, INC. | | | | 38,962 | | | | 439,824 | | | | | |
48,652 | | | MICRON TECHNOLOGY, INC.(b) | | | | 1,137,474 | | | | 2,616,505 | | | | | |
109,446 | | | MICROSOFT CORP. | | | | 3,555,593 | | | | 17,259,634 | | | | | |
500 | | | MKS INSTRUMENTS, INC. | | | | 32,310 | | | | 55,005 | | | | | |
1,217 | | | NETAPP, INC. | | | | 85,113 | | | | 75,758 | | | | | |
14,419 | | | NORTONLIFELOCK, INC. | | | | 71,242 | | | | 367,973 | | | | | |
1,100 | | | NUTANIX, INC., CLASS A(b) | | | | 46,529 | | | | 34,386 | | | | | |
4,991 | | | NVIDIA CORP. | | | | 383,944 | | | | 1,174,382 | | | | | |
38,526 | | | NXP SEMICONDUCTORS N.V.(c) | | | | 3,533,140 | | | | 4,902,819 | | | | | |
597 | | | OKTA, INC.(b) | | | | 55,185 | | | | 68,876 | | | | | |
36,436 | | | ON SEMICONDUCTOR CORP.(b) | | | | 796,653 | | | | 888,310 | | | | | |
60,981 | | | ORACLE CORP. | | | | 3,255,991 | | | | 3,230,773 | | | | | |
2,800 | | | PALO ALTO NETWORKS, INC.(b) | | | | 116,508 | | | | 647,500 | | �� | | | |
1,952 | | | PAYCHEX, INC. | | | | 139,107 | | | | 166,037 | | | | | |
1,553 | | | PAYCOM SOFTWARE, INC.(b) | | | | 217,948 | | | | 411,172 | | | | | |
7,600 | | | PAYPAL HOLDINGS, INC.(b) | | | | 595,521 | | | | 822,092 | | | | | |
907 | | | PERSPECTA, INC. | | | | 8,504 | | | | 23,981 | | | | | |
| See accompanying notes to financial statements. | 37 | (Continued) |
CLEARWATER INVESTMENT TRUST
Schedule of Investments - Clearwater Core Equity Fund
December 31, 2019
Shares | | | Security | | Cost | | | Fair value (a) | | | Percent of
net assets | |
Information Technology (Cont’d): | | | | | | | | | | | | |
| 600 | | | PROOFPOINT, INC.(b) | | $ | 56,232 | | | | 68,868 | | | | | |
| 2,700 | | | PTC, INC.(b) | | | 107,547 | | | | 202,203 | | | | | |
| 2,400 | | | PURE STORAGE, INC., CLASS A(b) | | | 43,850 | | | | 41,064 | | | | | |
| 2,403 | | | QORVO, INC.(b) | | | 185,625 | | | | 279,301 | | | | | |
| 9,907 | | | QUALCOMM, INC. | | | 775,864 | | | | 874,095 | | | | | |
| 3,800 | | | RINGCENTRAL, INC., CLASS A(b) | | | 432,566 | | | | 640,946 | | | | | |
| 3,100 | | | SABRE CORP. | | | 62,820 | | | | 69,564 | | | | | |
| 8,372 | | | SALESFORCE.COM, INC.(b) | | | 147,727 | | | | 1,361,622 | | | | | |
| 62,815 | | | SEAGATE TECHNOLOGY PLC | | | 2,445,378 | | | | 3,737,492 | | | | | |
| 2,100 | | | SERVICENOW, INC.(b) | | | 273,110 | | | | 592,872 | | | | | |
| 2,258 | | | SKYWORKS SOLUTIONS, INC. | | | 182,369 | | | | 272,947 | | | | | |
| 500 | | | SPLUNK, INC.(b) | | | 40,835 | | | | 74,885 | | | | | |
| 3,579 | | | SQUARE, INC., CLASS A(b) | | | 153,539 | | | | 223,902 | | | | | |
| 1,938 | | | SS&C TECHNOLOGIES HOLDINGS, INC. | | | 86,602 | | | | 118,993 | | | | | |
| 2,234 | | | SYNNEX CORP. | | | 277,157 | | | | 287,739 | | | | | |
| 8,981 | | | SYNOPSYS, INC.(b) | | | 778,444 | | | | 1,250,155 | | | | | |
| 4,600 | | | TERADYNE, INC. | | | 82,730 | | | | 313,674 | | | | | |
| 28,440 | | | TEXAS INSTRUMENTS, INC. | | | 952,040 | | | | 3,648,568 | | | | | |
| 7,720 | | | TRIMBLE, INC.(b) | | | 113,413 | | | | 321,847 | | | | | |
| 200 | | | VERISIGN, INC.(b) | | | 23,200 | | | | 38,536 | | | | | |
| 23,278 | | | VISA, INC., CLASS A | | | 632,927 | | | | 4,373,936 | | | | | |
| 7,800 | | | VISHAY INTERTECHNOLOGY, INC. | | | 48,931 | | | | 166,062 | | | | | |
| 3,772 | | | VMWARE, INC., CLASS A | | | 190,784 | | | | 572,552 | | | | | |
| 6,045 | | | WESTERN DIGITAL CORP. | | | 99,733 | | | | 383,676 | | | | | |
| 154,053 | | | WESTERN UNION (THE) CO. | | | 3,216,594 | | | | 4,125,539 | | | | | |
| 300 | | | WEX, INC.(b) | | | 41,025 | | | | 62,838 | | | | | |
| 1,700 | | | WORKDAY, INC., CLASS A(b) | | | 254,727 | | | | 279,565 | | | | | |
| 1,184 | | | XEROX HOLDINGS CORP. | | | 33,188 | | | | 43,654 | | | | | |
| 6,750 | | | XILINX, INC. | | | 47,180 | | | | 659,948 | | | | | |
| 2,795 | | | ZEBRA TECHNOLOGIES CORP., CLASS A(b) | | | 414,835 | | | | 713,955 | | | | | |
| 1,300 | | | ZENDESK, INC.(b) | | | 79,216 | | | | 99,619 | | | | | |
| | | | | | | 55,076,307 | | | | 128,907,351 | | | | 23.73 | % |
Materials: | | | | | | | | | | | | |
| 1,075 | | | AIR PRODUCTS & CHEMICALS, INC. | | | 43,205 | | | | 252,614 | | | | | |
| 1,300 | | | ALBEMARLE CORP. | | | 29,152 | | | | 94,952 | | | | | |
| 13,770 | | | AMCOR PLC(c) | | | 60,200 | | | | 149,267 | | | | | |
| 700 | | | ASHLAND GLOBAL HOLDINGS, INC. | | | 12,006 | | | | 53,571 | | | | | |
| 3,165 | | | AVERY DENNISON CORP. | | | 207,899 | | | | 414,045 | | | | | |
| 2,592 | | | BALL CORP. | | | 140,020 | | | | 167,625 | | | | | |
| 12,171 | | | CELANESE CORP. | | | 1,230,154 | | | | 1,498,494 | | | | | |
| 29,430 | | | CF INDUSTRIES HOLDINGS, INC. | | | 1,377,588 | | | | 1,404,988 | | | | | |
| 7,262 | | | CORTEVA, INC. | | | 88,857 | | | | 214,665 | | | | | |
| 1,800 | | | CROWN HOLDINGS, INC.(b) | | | 57,831 | | | | 130,572 | | | | | |
| 7,262 | | | DOW, INC. | | | 147,036 | | | | 397,449 | | | | | |
| 7,262 | | | DUPONT DE NEMOURS, INC. | | | 212,802 | | | | 466,220 | | | | | |
| 3,000 | | | EASTMAN CHEMICAL CO. | | | 58,011 | | | | 237,780 | | | | | |
| 3,891 | | | ECOLAB, INC. | | | 133,579 | | | | 750,924 | | | | | |
| 15,800 | | | FREEPORT-MCMORAN, INC. | | | 103,648 | | | | 207,296 | | | | | |
| 238 | | | INTERNATIONAL FLAVORS & FRAGRANCES, INC. | | | 5,120 | | | | 30,707 | | | | | |
| 46,669 | | | INTERNATIONAL PAPER CO. | | | 1,775,517 | | | | 2,149,108 | | | | | |
| 4,450 | | | LINDE PLC(c) | | | 723,931 | | | | 947,405 | | | | | |
| 2,596 | | | LYONDELLBASELL INDUSTRIES N.V., CLASS A | | | 240,311 | | | | 245,270 | | | | | |
| 700 | | | MARTIN MARIETTA MATERIALS, INC. | | | 27,965 | | | | 195,748 | | | | | |
| 2,400 | | | MOSAIC (THE) CO. | | | 34,272 | | | | 51,936 | | | | | |
| 7,400 | | | NEWMONT GOLDCORP CORP. | | | 136,530 | | | | 321,530 | | | | | |
| 5,844 | | | NUCOR CORP. | | | 99,312 | | | | 328,900 | | | | | |
| 3,245 | | | PACKAGING CORP. OF AMERICA | | | 133,051 | | | | 363,408 | | | | | |
| 5,172 | | | PPG INDUSTRIES, INC. | | | 123,888 | | | | 690,410 | | | | | |
| 6,625 | | | RELIANCE STEEL & ALUMINUM CO. | | | 325,929 | | | | 793,410 | | | | | |
| 600 | | | ROYAL GOLD, INC. | | | 22,314 | | | | 73,350 | | | | | |
| 2,400 | | | RPM INTERNATIONAL, INC. | | | 24,657 | | | | 184,224 | | | | | |
| 500 | | | SCOTTS MIRACLE-GRO (THE) CO. | | | 37,765 | | | | 53,090 | | | | | |
| 1,400 | | | SEALED AIR CORP. | | | 24,528 | | | | 55,762 | | | | | |
| 457 | | | SHERWIN-WILLIAMS (THE) CO. | | | 22,208 | | | | 266,678 | | | | | |
| 3,600 | | | SONOCO PRODUCTS CO. | | | 74,519 | | | | 222,192 | | | | | |
| 3,234 | | | SOUTHERN COPPER CORP.(c) | | | 38,445 | | | | 137,380 | | | | | |
| 8,200 | | | STEEL DYNAMICS, INC. | | | 89,708 | | | | 279,128 | | | | | |
| See accompanying notes to financial statements. | 38 | (Continued) |
CLEARWATER INVESTMENT TRUST
Schedule of Investments - Clearwater Core Equity Fund
December 31, 2019
Shares | | | Security | | Cost | | | Fair value (a) | | | Percent of
net assets | |
Materials (Cont’d): | | | | | | | | | | | | |
| 4,392 | | | VALVOLINE, INC. | | $ | 24,184 | | | | 94,033 | | | | | |
| 2,100 | | | VULCAN MATERIALS CO. | | | 63,441 | | | | 302,379 | | | | | |
| 2,242 | | | WESTROCK CO. | | | 24,357 | | | | 96,204 | | | | | |
| | | | | | | 7,973,940 | | | | 14,322,714 | | | | 2.64 | % |
Real Estate: | | | | | | | | | | | | |
| 2,100 | | | ALEXANDRIA REAL ESTATE EQUITIES, INC. | | | 106,066 | | | | 339,318 | | | | | |
| 9,673 | | | AMERICAN TOWER CORP. | | | 1,556,483 | | | | 2,223,049 | | | | | |
| 3,629 | | | APARTMENT INVESTMENT & MANAGEMENT CO., CLASS A | | | 44,956 | | | | 187,438 | | | | | |
| 1,734 | | | AVALONBAY COMMUNITIES, INC. | | | 193,548 | | | | 363,620 | | | | | |
| 3,388 | | | BOSTON PROPERTIES, INC. | | | 171,468 | | | | 467,070 | | | | | |
| 2,600 | | | BRANDYWINE REALTY TRUST | | | 27,691 | | | | 40,950 | | | | | |
| 900 | | | CAMDEN PROPERTY TRUST | | | 24,065 | | | | 95,490 | | | | | |
| 500 | | | CORESITE REALTY CORP. | | | 43,021 | | | | 56,060 | | | | | |
| 4,700 | | | CROWN CASTLE INTERNATIONAL CORP. | | | 190,955 | | | | 668,105 | | | | | |
| 500 | | | DIGITAL REALTY TRUST, INC. | | | 26,905 | | | | 59,870 | | | | | |
| 5,200 | | | DOUGLAS EMMETT, INC. | | | 44,883 | | | | 228,280 | | | | | |
| 1,700 | | | DUKE REALTY CORP. | | | 28,435 | | | | 58,939 | | | | | |
| 2,140 | | | EQUINIX, INC. | | | 817,154 | | | | 1,249,118 | | | | | |
| 10,892 | | | EQUITY LIFESTYLE PROPERTIES, INC. | | | 574,160 | | | | 766,688 | | | | | |
| 5,416 | | | EQUITY RESIDENTIAL | | | 174,162 | | | | 438,263 | | | | | |
| 875 | | | ESSEX PROPERTY TRUST, INC. | | | 116,032 | | | | 263,252 | | | | | |
| 1,500 | | | EXTRA SPACE STORAGE, INC. | | | 130,992 | | | | 158,430 | | | | | |
| 900 | | | FEDERAL REALTY INVESTMENT TRUST | | | 48,326 | | | | 115,857 | | | | | |
| 1,046 | | | FOUR CORNERS PROPERTY TRUST, INC. | | | 8,684 | | | | 29,487 | | | | | |
| 7,000 | | | HEALTHPEAK PROPERTIES, INC. | | | 72,217 | | | | 241,290 | | | | | |
| 27,674 | | | HOST HOTELS & RESORTS, INC. | | | 359,517 | | | | 513,353 | | | | | |
| 678 | | | HOWARD HUGHES (THE) CORP.(b) | | | 20,502 | | | | 85,970 | | | | | |
| 22,016 | | | INVITATION HOMES, INC. | | | 683,161 | | | | 659,819 | | | | | |
| 700 | | | JBG SMITH PROPERTIES | | | 17,888 | | | | 27,923 | | | | | |
| 700 | | | JONES LANG LASALLE, INC. | | | 39,951 | | | | 121,863 | | | | | |
| 6,601 | | | KIMCO REALTY CORP. | | | 66,653 | | | | 136,707 | | | | | |
| 3,900 | | | LAMAR ADVERTISING CO., CLASS A | | | 43,876 | | | | 348,114 | | | | | |
| 1,100 | | | LIBERTY PROPERTY TRUST | | | 22,954 | | | | 66,055 | | | | | |
| 600 | | | LIFE STORAGE, INC. | | | 48,542 | | | | 64,968 | | | | | |
| 5,123 | | | MACERICH (THE) CO. | | | 108,936 | | | | 137,911 | | | | | |
| 1,800 | | | MID-AMERICA APARTMENT COMMUNITIES, INC. | | | 132,698 | | | | 237,348 | | | | | |
| 800 | | | OMEGA HEALTHCARE INVESTORS, INC. | | | 25,845 | | | | 33,880 | | | | | |
| 10,169 | | | PROLOGIS, INC. | | | 257,893 | | | | 906,465 | | | | | |
| 1,424 | | | PUBLIC STORAGE | | | 135,843 | | | | 303,255 | | | | | |
| 6,972 | | | RAYONIER, INC. | | | 74,591 | | | | 228,403 | | | | | |
| 2,700 | | | REALTY INCOME CORP. | | | 54,729 | | | | 198,801 | | | | | |
| 3,900 | | | REGENCY CENTERS CORP. | | | 85,344 | | | | 246,051 | | | | | |
| 9,800 | | | RETAIL PROPERTIES OF AMERICA, INC., CLASS A | | | 80,834 | | | | 131,320 | | | | | |
| 1,224 | | | RETAIL VALUE, INC. | | | 31,509 | | | | 45,043 | | | | | |
| 6,422 | | | SBA COMMUNICATIONS CORP. | | | 1,163,408 | | | | 1,547,638 | | | | | |
| 1,800 | | | SERVICE PROPERTIES TRUST | | | 22,490 | | | | 43,794 | | | | | |
| 3,140 | | | SIMON PROPERTY GROUP, INC. | | | 254,353 | | | | 467,734 | | | | | |
| 589 | | | SL GREEN REALTY CORP. | | | 29,460 | | | | 54,117 | | | | | |
| 2,800 | | | STORE CAPITAL CORP. | | | 73,372 | | | | 104,272 | | | | | |
| 1,100 | | | SUN COMMUNITIES, INC. | | | 83,011 | | | | 165,110 | | | | | |
| 2,100 | | | TAUBMAN CENTERS, INC. | | | 53,754 | | | | 65,289 | | | | | |
| 4,100 | | | UDR, INC. | | | 63,318 | | | | 191,470 | | | | | |
| 1,300 | | | URBAN EDGE PROPERTIES | | | 18,730 | | | | 24,934 | | | | | |
| 3,527 | | | VENTAS, INC. | | | 147,330 | | | | 203,649 | | | | | |
| 10,902 | | | VORNADO REALTY TRUST | | | 686,942 | | | | 724,983 | | | | | |
| 2,100 | | | WEINGARTEN REALTY INVESTORS | | | 29,916 | | | | 65,604 | | | | | |
| 4,600 | | | WELLTOWER, INC. | | | 273,411 | | | | 376,188 | | | | | |
| 5,416 | | | WEYERHAEUSER CO. | | | 75,648 | | | | 163,563 | | | | | |
| | | | | | | 9,666,612 | | | | 16,742,168 | | | | 3.08 | % |
Utilities: | | | | | | | | | | | | |
| 3,000 | | | AES CORP. | | | 32,870 | | | | 59,700 | | | | | |
| 2,000 | | | ALLIANT ENERGY CORP. | | | 24,835 | | | | 109,440 | | | | | |
| 1,600 | | | AMEREN CORP. | | | 40,872 | | | | 122,880 | | | | | |
| 8,554 | | | AMERICAN ELECTRIC POWER CO., INC. | | | 477,380 | | | | 808,438 | | | | | |
| 1,735 | | | AQUA AMERICA, INC. | | | 22,973 | | | | 81,441 | | | | | |
| 13,200 | | | AVANGRID, INC. | | | 502,113 | | | | 675,312 | | | | | |
| 5,800 | | | CENTERPOINT ENERGY, INC. | | | 66,308 | | | | 158,166 | | | | | |
| See accompanying notes to financial statements. | 39 | (Continued) |
CLEARWATER INVESTMENT TRUST
Schedule of Investments - Clearwater Core Equity
Fund December 31, 2019
Shares | | | Security | | Cost | | | Fair value (a) | | | Percent of
net assets | |
Utilities (Cont’d): | | | | | | | | | | | | |
| 13,300 | | | CMS ENERGY CORP. | | $ | 259,708 | | | | 835,772 | | | | | |
| 18,263 | | | CONSOLIDATED EDISON, INC. | | | 1,535,633 | | | | 1,652,254 | | | | | |
| 12,073 | | | DOMINION ENERGY, INC. | | | 450,978 | | | | 999,886 | | | | | |
| 6,243 | | | DTE ENERGY CO. | | | 510,391 | | | | 810,778 | | | | | |
| 12,617 | | | DUKE ENERGY CORP. | | | 620,162 | | | | 1,150,797 | | | | | |
| 8,325 | | | EDISON INTERNATIONAL | | | 179,967 | | | | 627,788 | | | | | |
| 3,164 | | | ENTERGY CORP. | | | 68,368 | | | | 379,047 | | | | | |
| 2,974 | | | EVERGY, INC. | | | 67,407 | | | | 193,578 | | | | | |
| 4,961 | | | EVERSOURCE ENERGY | | | 125,492 | | | | 422,032 | | | | | |
| 38,066 | | | EXELON CORP. | | | 1,437,136 | | | | 1,735,429 | | | | | |
| 5,500 | | | FIRSTENERGY CORP. | | | 176,692 | | | | 267,300 | | | | | |
| 3,067 | | | HAWAIIAN ELECTRIC INDUSTRIES, INC. | | | 138,198 | | | | 143,720 | | | | | |
| 900 | | | NATIONAL FUEL GAS CO. | | | 20,790 | | | | 41,886 | | | | | |
| 4,400 | | | NEXTERA ENERGY, INC. | | | 204,691 | | | | 1,065,504 | | | | | |
| 6,900 | | | NISOURCE, INC. | | | 43,973 | | | | 192,096 | | | | | |
| 1,200 | | | NRG ENERGY, INC. | | | 33,083 | | | | 47,700 | | | | | |
| 10,933 | | | OGE ENERGY CORP. | | | 282,750 | | | | 486,190 | | | | | |
| 7,176 | | | PINNACLE WEST CAPITAL CORP. | | | 498,834 | | | | 645,338 | | | | | |
| 700 | | | PPL CORP. | | | 10,384 | | | | 25,116 | | | | | |
| 1,200 | | | PUBLIC SERVICE ENTERPRISE GROUP, INC. | | | 51,552 | | | | 70,860 | | | | | |
| 3,200 | | | SEMPRA ENERGY | | | 174,758 | | | | 484,736 | | | | | |
| 8,600 | | | SOUTHERN (THE) CO. | | | 176,010 | | | | 547,820 | | | | | |
| 5,426 | | | UGI CORP. | | | 80,112 | | | | 245,038 | | | | | |
| 1,600 | | | WEC ENERGY GROUP, INC. | | | 91,440 | | | | 147,568 | | | | | |
| 968 | | | XCEL ENERGY, INC. | | | 36,241 | | | | 61,458 | | | | | |
| | | | | | | 8,442,101 | | | | 15,295,068 | | | | 2.82 | % |
| | Sub-total Common Stocks: | | | 265,639,458 | | | | 540,259,888 | | | | 99.46 | % |
Short-Term Investments: | | | | | | | | | | | | |
| 2,916,876 | | | NORTHERN INSTITUTIONAL FUNDS - U.S. GOVERNMENT SELECT PORTFOLIO, 1.53%(d) | | | 2,916,876 | | | | 2,916,876 | | | | | |
| | Sub-total Short-Term Investments: | | | 2,916,876 | | | | 2,916,876 | | | | 0.54 | % |
| | | | Grand total | | $ | 268,556,334 | | | | 543,176,764 | | | | 100.00 | % |
Notes to Schedule of Investments:
| (a) | Investments are valued in accordance with procedures described in note 2 to the financial statements. |
| (b) | Non-income producing assets. |
| (c) | Foreign security values are stated in U.S. dollars. As of December 31, 2019, the value of foreign stocks or depositary receipts of companies based outside of the United States represented 3.43% of net assets. |
| (d) | The short-term investment is a money market portfolio of the investment company, Northern Institutional Funds. At December 31, 2018, the value of the Clearwater Core Equity Fund’s investment in the U.S. Government Select Portfolio of the Northern Institutional Funds was $4,473,835 with net sales of $1,556,959 during the fiscal year ended December 31, 2019. |
| See accompanying notes to financial statements. | 40 | (Continued) |
CLEARWATER INVESTMENT TRUST
Schedule of Investments - Clearwater Core Equity Fund
December 31, 2019
Clearwater Core Equity Fund Portfolio Diversification
(as a percentage of net assets)
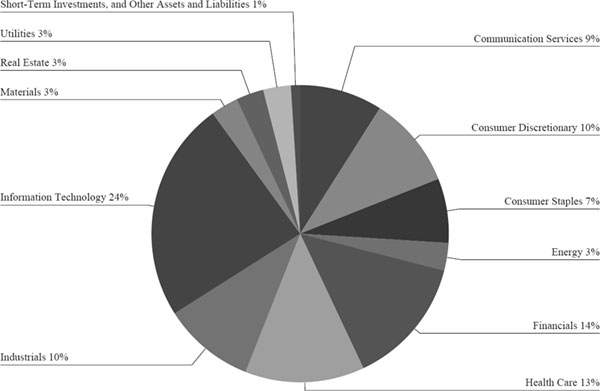
| See accompanying notes to financial statements. | 41 | (Continued) |
CLEARWATER INVESTMENT TRUST
Schedule of Investments - Clearwater Small Companies Fund
December 31, 2019
Shares | | | Security | | Cost | | | Fair value (a) | | | Percent of net assets | |
Common Stocks: | | | | | | | | | | | | | | | |
| Communication Services: | | | | | | | | | | | | |
| 149,248 | | | ALASKA COMMUNICATIONS SYSTEMS GROUP, INC.(b) | | $ | 269,931 | | | | 264,169 | | | | | |
| 38,997 | | | AMC ENTERTAINMENT HOLDINGS, INC., CLASS A(c) | | | 364,704 | | | | 282,338 | | | | | |
| 34,629 | | | BEASLEY BROADCAST GROUP, INC., CLASS A | | | 110,712 | | | | 107,004 | | | | | |
| 39,992 | | | CONSOLIDATED COMMUNICATIONS HOLDINGS, INC. | | | 154,162 | | | | 155,169 | | | | | |
| 94,646 | | | ENTERCOM COMMUNICATIONS CORP., CLASS A | | | 456,585 | | | | 439,157 | | | | | |
| 68,327 | | | ENTRAVISION COMMUNICATIONS CORP., CLASS A | | | 203,102 | | | | 179,017 | | | | | |
| 23,030 | | | EW SCRIPPS (THE) CO., CLASS A | | | 304,269 | | | | 361,801 | | | | | |
| 10,066 | | | HEMISPHERE MEDIA GROUP, INC.(b) | | | 119,184 | | | | 149,480 | | | | | |
| 33,600 | | | IMAX CORP.(b)(d) | | | 669,117 | | | | 686,448 | | | | | |
| 106,464 | | | MARCHEX, INC., CLASS B(b) | | | 270,241 | | | | 402,434 | | | | | |
| 60,095 | | | MEET GROUP (THE), INC.(b) | | | 251,025 | | | | 301,076 | | | | | |
| 69,691 | | | READING INTERNATIONAL, INC., CLASS A(b) | | | 962,179 | | | | 779,842 | | | | | |
| 32,942 | | | SAGA COMMUNICATIONS, INC., CLASS A | | | 1,008,312 | | | | 1,001,437 | | | | | |
| 25,579 | | | TOWNSQUARE MEDIA, INC., CLASS A | | | 202,974 | | | | 255,023 | | | | | |
| | | | | | | 5,346,497 | | | | 5,364,395 | | | | 1.44 | % |
| Consumer Discretionary: | | | | | | | | | | | | |
| 181,800 | | | AMERICAN EAGLE OUTFITTERS, INC. | | | 3,316,224 | | | | 2,672,460 | | | | | |
| 281,528 | | | BBX CAPITAL CORP. | | | 1,478,854 | | | | 1,342,889 | | | | | |
| 102,790 | | | BLUEGREEN VACATIONS CORP. | | | 996,334 | | | | 1,062,849 | | | | | |
| 104,726 | | | CALLAWAY GOLF CO. | | | 1,780,579 | | | | 2,220,191 | | | | | |
| 48,474 | | | CARRIAGE SERVICES, INC. | | | 944,280 | | | | 1,240,934 | | | | | |
| 14,593 | | | CENTURY CASINOS, INC.(b) | | | 116,977 | | | | 115,577 | | | | | |
| 213,435 | | | CLARUS CORP. | | | 1,204,054 | | | | 2,894,179 | | | | | |
| 6,137 | | | COOPER-STANDARD HOLDINGS, INC.(b) | | | 196,880 | | | | 203,503 | | | | | |
| 11,846 | | | CROWN CRAFTS, INC. | | | 56,505 | | | | 72,853 | | | | | |
| 120,353 | | | CSS INDUSTRIES, INC. | | | 1,044,954 | | | | 530,757 | | | | | |
| 57,427 | | | DANA, INC. | | | 984,805 | | | | 1,045,171 | | | | | |
| 92,821 | | | DRIVE SHACK, INC.(b) | | | 373,395 | | | | 339,725 | | | | | |
| 71,600 | | | EXTENDED STAY AMERICA, INC. | | | 1,391,461 | | | | 1,063,976 | | | | | |
| 106,227 | | | FIESTA RESTAURANT GROUP, INC.(b) | | | 1,475,488 | | | | 1,050,585 | | | | | |
| 267,572 | | | FULL HOUSE RESORTS, INC.(b) | | | 625,764 | | | | 896,366 | | | | | |
| 87,800 | | | GILDAN ACTIVEWEAR, INC.(d) | | | 2,591,066 | | | | 2,592,734 | | | | | |
| 20,631 | | | GOPRO, INC., CLASS A(b)(c) | | | 82,494 | | | | 89,539 | | | | | |
| 8,333 | | | HAMILTON BEACH BRANDS HOLDING CO., CLASS A | | | 141,445 | | | | 159,160 | | | | | |
| 67,200 | | | HANESBRANDS, INC. | | | 921,601 | | | | 997,920 | | | | | |
| 15,100 | | | HELEN OF TROY LTD.(b) | | | 1,571,758 | | | | 2,714,829 | | | | | |
| 57,738 | | | HOOKER FURNITURE CORP. | | | 1,324,417 | | | | 1,483,289 | | | | | |
| 46,899 | | | J ALEXANDER’S HOLDINGS, INC.(b) | | | 524,538 | | | | 448,354 | | | | | |
| 35,333 | | | LAKELAND INDUSTRIES, INC.(b) | | | 397,004 | | | | 381,596 | | | | | |
| 230,067 | | | LIFETIME BRANDS, INC. | | | 2,211,304 | | | | 1,598,966 | | | | | |
| 40,490 | | | MALIBU BOATS, INC., CLASS A(b) | | | 1,312,739 | | | | 1,658,065 | | | | | |
| 19,006 | | | MARINEMAX, INC.(b) | | | 308,848 | | | | 317,210 | | | | | |
| 51,402 | | | MASTERCRAFT BOAT HOLDINGS, INC.(b) | | | 1,213,461 | | | | 809,582 | | | | | |
| 68,618 | | | MOTORCAR PARTS OF AMERICA, INC.(b) | | | 1,293,852 | | | | 1,511,655 | | | | | |
| 407,682 | | | OFFICE DEPOT, INC. | | | 773,117 | | | | 1,117,049 | | | | | |
| 114,891 | | | PENN NATIONAL GAMING, INC.(b) | | | 2,442,231 | | | | 2,936,614 | | | | | |
| 177,932 | | | POTBELLY CORP.(b) | | | 1,447,478 | | | | 750,873 | | | | | |
| 64,519 | | | SKYLINE CHAMPION CORP.(b) | | | 1,497,704 | | | | 2,045,252 | | | | | |
| 5,890 | | | STONERIDGE, INC.(b) | | | 176,096 | | | | 172,695 | | | | | |
| 62,822 | | | TWIN RIVER WORLDWIDE HOLDINGS, INC. | | | 1,864,875 | | | | 1,611,384 | | | | | |
| 13,794 | | | UNIFI, INC.(b) | | | 317,257 | | | | 348,436 | | | | | |
| 11,800 | | | WILLIAMS-SONOMA, INC. | | | 599,653 | | | | 866,592 | | | | | |
| 76,400 | | | WINNEBAGO INDUSTRIES, INC. | | | 2,332,073 | | | | 4,047,672 | | | | | |
| 36,281 | | | WYNDHAM DESTINATIONS, INC. | | | 1,828,997 | | | | 1,875,365 | | | | | |
| | | | | | | 43,160,562 | | | | 47,286,846 | | | | 12.66 | % |
| Consumer Staples: | | | | | | | | | | | | |
| 70,132 | | | BJ’S WHOLESALE CLUB HOLDINGS, INC.(b) | | | 1,749,269 | | | | 1,594,802 | | | | | |
| 29,718 | | | CENTRAL GARDEN & PET CO., CLASS A(b) | | | 770,801 | | | | 872,520 | | | | | |
| 46,722 | | | PERFORMANCE FOOD GROUP CO.(b) | | | 1,661,403 | | | | 2,405,249 | | | | | |
| 105,435 | | | PRIMO WATER CORP.(b) | | | 1,161,614 | | | | 1,183,508 | | | | | |
| 39,763 | | | SPECTRUM BRANDS HOLDINGS, INC. | | | 2,119,401 | | | | 2,556,363 | | | | | |
| 542,798 | | | SUNOPTA, INC.(b)(c)(d) | | | 2,254,729 | | | | 1,356,995 | | | | | |
| 39,757 | | | UNIVERSAL CORP. | | | 2,167,649 | | | | 2,268,534 | | | | | |
| | | | | | | 11,884,866 | | | | 12,237,971 | | | | 3.28 | % |
| See accompanying notes to financial statements. | 42 | (Continued) |
CLEARWATER INVESTMENT TRUST
Schedule of Investments - Clearwater Small Companies Fund
December 31, 2019
Shares | | | Security | | Cost | | | Fair value (a) | | | Percent of net assets | |
| Energy: | | | | | | | | | | | | | | | |
| 81,486 | | | MURPHY OIL CORP. | | $ | 1,942,122 | | | | 2,183,825 | | | | | |
| 322,456 | | | NEXTIER OILFIELD SOLUTIONS, INC.(b) | | | 1,728,828 | | | | 2,160,455 | | | | | |
| 39,457 | | | PROFIRE ENERGY, INC.(b) | | | 60,294 | | | | 57,213 | | | | | |
| 31,187 | | | SOLARIS OILFIELD INFRASTRUCTURE, INC., CLASS A | | | 554,616 | | | | 436,618 | | | | | |
| | | | | | | 4,285,860 | | | | 4,838,111 | | | | 1.29 | % |
| Financials: | | | | | | | | | | | | | | | |
| 9,628 | | | 1ST CONSTITUTION BANCORP | | | 183,798 | | | | 213,068 | | | | | |
| 20,328 | | | AMALGAMATED BANK, CLASS A | | | 348,082 | | | | 395,380 | | | | | |
| 24,065 | | | AMBAC FINANCIAL GROUP, INC.(b) | | | 463,781 | | | | 519,082 | | | | | |
| 108,687 | | | AMERICAN EQUITY INVESTMENT LIFE HOLDING CO. | | | 2,810,755 | | | | 3,253,002 | | | | | |
| 10,167 | | | AMERICAN NATIONAL BANKSHARES, INC. | | | 367,944 | | | | 402,308 | | | | | |
| 32,222 | | | AMERIS BANCORP | | | 1,028,050 | | | | 1,370,724 | | | | | |
| 13,813 | | | ARGO GROUP INTERNATIONAL HOLDINGS LTD.(d) | | | 723,465 | | | | 908,205 | | | | | |
| 107,251 | | | ASSOCIATED BANC-CORP | | | 2,470,813 | | | | 2,363,812 | | | | | |
| 46,550 | | | AXIS CAPITAL HOLDINGS LTD.(d) | | | 2,492,373 | | | | 2,766,932 | | | | | |
| 47,860 | | | BANCORP (THE), INC.(b) | | | 434,951 | | | | 620,744 | | | | | |
| 13,321 | | | BANKWELL FINANCIAL GROUP, INC. | | | 368,487 | | | | 384,178 | | | | | |
| 24,775 | | | BCB BANCORP, INC. | | | 303,494 | | | | 341,647 | | | | | |
| 59,957 | | | BLACKROCK TCP CAPITAL CORP. | | | 827,704 | | | | 842,396 | | | | | |
| 7,869 | | | BRIDGE BANCORP, INC. | | | 259,718 | | | | 263,848 | | | | | |
| 3,597 | | | BRYN MAWR BANK CORP. | | | 136,468 | | | | 148,340 | | | | | |
| 54,366 | | | CANNAE HOLDINGS, INC.(b) | | | 1,117,259 | | | | 2,021,872 | | | | | |
| 30,449 | | | CAROLINA FINANCIAL CORP. | | | 1,086,402 | | | | 1,316,310 | | | | | |
| 9,471 | | | CB FINANCIAL SERVICES, INC. | | | 255,287 | | | | 285,456 | | | | | |
| 1,879 | | | CENTRAL VALLEY COMMUNITY BANCORP | | | 37,299 | | | | 40,718 | | | | | |
| 8,950 | | | CITIZENS HOLDING CO. | | | 184,838 | | | | 195,826 | | | | | |
| 218,602 | | | CNO FINANCIAL GROUP, INC. | | | 3,912,846 | | | | 3,963,254 | | | | | |
| 32,753 | | | COMMERCE BANCSHARES, INC. | | | 1,610,229 | | | | 2,225,215 | | | | | |
| 64,236 | | | CRAWFORD & CO., CLASS A | | | 575,568 | | | | 736,787 | | | | | |
| 6,782 | | | CRAWFORD & CO., CLASS B | | | 52,628 | | | | 68,837 | | | | | |
| 101,211 | | | DONEGAL GROUP, INC., CLASS A | | | 1,520,565 | | | | 1,499,947 | | | | | |
| 20,009 | | | DONNELLEY FINANCIAL SOLUTIONS, INC.(b) | | | 193,699 | | | | 209,494 | | | | | |
| 14,965 | | | EAGLE BANCORP MONTANA, INC. | | | 263,774 | | | | 320,101 | | | | | |
| 33,111 | | | EMPIRE BANCORP, INC.(b) | | | 447,702 | | | | 459,912 | | | | | |
| 18,844 | | | ENTERPRISE FINANCIAL SERVICES CORP. | | | 764,625 | | | | 908,469 | | | | | |
| 47,798 | | | ESSENT GROUP LTD.(b) | | | 2,112,665 | | | | 2,485,018 | | | | | |
| 137,437 | | | EXANTAS CAPITAL CORP. | | | 1,236,870 | | | | 1,623,131 | | | | | |
| 6,964 | | | FARMERS NATIONAL BANC CORP. | | | 73,057 | | | | 113,652 | | | | | |
| 68,287 | | | FIDUS INVESTMENT CORP. | | | 957,431 | | | | 1,013,379 | | | | | |
| 3,755 | | | FIRST BANCSHARES (THE), INC. | | | 125,075 | | | | 133,378 | | | | | |
| 20,599 | | | FIRST HAWAIIAN, INC. | | | 528,327 | | | | 594,281 | | | | | |
| 36,229 | | | FIRST MERCHANTS CORP. | | | 1,471,298 | | | | 1,506,764 | | | | | |
| 8,878 | | | FIRST MID BANCSHARES, INC. | | | 310,388 | | | | 312,950 | | | | | |
| 77,252 | | | FIRST MIDWEST BANCORP, INC. | | | 1,720,204 | | | | 1,781,431 | | | | | |
| 2,758 | | | FIRST NORTHWEST BANCORP | | | 44,522 | | | | 50,003 | | | | | |
| 31,800 | | | FIRSTCASH, INC. | | | 2,371,961 | | | | 2,564,034 | | | | | |
| 39,419 | | | FLUSHING FINANCIAL CORP. | | | 840,969 | | | | 851,648 | | | | | |
| 47,700 | | | GLACIER BANCORP, INC. | | | 2,018,446 | | | | 2,193,723 | | | | | |
| 26,846 | | | HANCOCK WHITNEY CORP. | | | 1,296,703 | | | | 1,178,002 | | | | | |
| 16,511 | | | HARBORONE BANCORP, INC.(b) | | | 176,523 | | | | 181,456 | | | | | |
| 33,023 | | | HERITAGE COMMERCE CORP. | | | 367,840 | | | | 423,685 | | | | | |
| 147,427 | | | HOPE BANCORP, INC. | | | 2,439,921 | | | | 2,190,765 | | | | | |
| 41,921 | | | HUNT COS. FINANCE TRUST, INC. | | | 144,020 | | | | 135,405 | | | | | |
| 89,145 | | | INVESTCORP CREDIT MANAGEMENT BDC, INC. | | | 643,119 | | | | 597,272 | | | | | |
| 26,251 | | | LAKELAND BANCORP, INC. | | | 437,906 | | | | 456,242 | | | | | |
| 30,705 | | | LANDMARK BANCORP, INC. | | | 719,534 | | | | 769,160 | | | | | |
| 9,356 | | | LCNB CORP. | | | 164,215 | | | | 180,571 | | | | | |
| 5,864 | | | LENDINGTREE, INC.(b)(c) | | | 1,574,874 | | | | 1,779,372 | | | | | |
| 30,359 | | | LUTHER BURBANK CORP. | | | 326,271 | | | | 350,039 | | | | | |
| 52,869 | | | MACKINAC FINANCIAL CORP. | | | 792,728 | | | | 923,093 | | | | | |
| 8,240 | | | MAINSTREET BANCSHARES, INC.(b) | | | 174,029 | | | | 189,520 | | | | | |
| 57,794 | | | MVC CAPITAL, INC. | | | 524,641 | | | | 529,971 | | | | | |
| 3,801 | | | NATIONAL WESTERN LIFE GROUP, INC., CLASS A | | | 1,240,185 | | | | 1,105,635 | | | | | |
| 68,545 | | | NEW MOUNTAIN FINANCE CORP. | | | 921,167 | | | | 941,808 | | | | | |
| 270,910 | | | OAKTREE SPECIALTY LENDING CORP. | | | 1,223,535 | | | | 1,479,169 | | | | | |
| 163,263 | | | OAKTREE STRATEGIC INCOME CORP. | | | 1,385,687 | | | | 1,337,124 | | | | | |
| 6,913 | | | OCEANFIRST FINANCIAL CORP. | | | 147,731 | | | | 176,558 | | | | | |
| See accompanying notes to financial statements. | 43 | (Continued) |
CLEARWATER INVESTMENT TRUST
Schedule of Investments - Clearwater Small Companies Fund
December 31, 2019
Shares | | | Security | | Cost | | | Fair value (a) | | | Percent of net assets | |
| Financials (Cont’d): | | | | | | | | | | | | |
| 1,581 | | | OCONEE FEDERAL FINANCIAL CORP. | | $ | 36,347 | | | | 41,280 | | | | | |
| 2,015 | | | ORRSTOWN FINANCIAL SERVICES, INC. | | | 45,509 | | | | 45,579 | | | | | |
| 20,619 | | | PENNANTPARK FLOATING RATE CAPITAL LTD. | | | 239,812 | | | | 251,139 | | | | | |
| 154,100 | | | PENNANTPARK INVESTMENT CORP. | | | 1,014,166 | | | | 1,006,273 | | | | | |
| 6,478 | | | PENNS WOODS BANCORP, INC. | | | 181,444 | | | | 230,358 | | | | | |
| 14,779 | | | PEOPLES BANCORP OF NORTH CAROLINA, INC. | | | 339,412 | | | | 485,490 | | | | | |
| 34,724 | | | PIONEER BANCORP, INC.(b) | | | 469,703 | | | | 531,624 | | | | | |
| 41,900 | | | PRA GROUP, INC.(b) | | | 1,175,644 | | | | 1,520,970 | | | | | |
| 1,087 | | | PROVIDENT BANCORP, INC.(b) | | | 13,076 | | | | 13,533 | | | | | |
| 4,110 | | | RENAISSANCERE HOLDINGS LTD.(d) | | | 516,890 | | | | 805,642 | | | | | |
| 3,881 | | | SALISBURY BANCORP, INC. | | | 147,544 | | | | 177,245 | | | | | |
| 920 | | | SB FINANCIAL GROUP, INC. | | | 15,179 | | | | 18,115 | | | | | |
| 28,956 | | | SHORE BANCSHARES, INC. | | | 437,007 | | | | 502,676 | | | | | |
| 2,336 | | | SIERRA BANCORP | | | 40,971 | | | | 68,024 | | | | | |
| 32,519 | | | SIMMONS FIRST NATIONAL CORP., CLASS A | | | 954,252 | | | | 871,184 | | | | | |
| 73,125 | | | SOLAR CAPITAL LTD. | | | 1,498,741 | | | | 1,507,837 | | | | | |
| 59,770 | | | SOUTHERN NATIONAL BANCORP OF VIRGINIA, INC. | | | 942,707 | | | | 977,240 | | | | | |
| 3,671 | | | SOUTHWEST GEORGIA FINANCIAL CORP. | | | 75,193 | | | | 128,840 | | | | | |
| 23,920 | | | STIFEL FINANCIAL CORP. | | | 1,177,039 | | | | 1,450,748 | | | | | |
| 28,558 | | | SUMMIT STATE BANK | | | 363,303 | | | | 370,254 | | | | | |
| 48,613 | | | SYNOVUS FINANCIAL CORP. | | | 1,568,049 | | | | 1,905,630 | | | | | |
| 99,660 | | | TCF FINANCIAL CORP. | | | 3,379,328 | | | | 4,664,088 | | | | | |
| 153,500 | | | UMPQUA HOLDINGS CORP. | | | 2,682,897 | | | | 2,716,950 | | | | | |
| 16,486 | | | UNITED BANCORP, INC. | | | 204,353 | | | | 235,750 | | | | | |
| 5,970 | | | UNITED BANCSHARES, INC. | | | 129,860 | | | | 135,579 | | | | | |
| 25,582 | | | UNITED SECURITY BANCSHARES | | | 263,272 | | | | 274,495 | | | | | |
| 50,520 | | | UNITY BANCORP, INC. | | | 989,819 | | | | 1,140,236 | | | | | |
| 26,645 | | | WALKER & DUNLOP, INC. | | | 409,864 | | | | 1,723,399 | | | | | |
| 41,496 | | | WEBSTER FINANCIAL CORP. | | | 2,008,379 | | | | 2,214,227 | | | | | |
| 18,716 | | | WEST BANCORPORATION, INC. | | | 392,649 | | | | 479,691 | | | | | |
| 32,236 | | | WSFS FINANCIAL CORP. | | | 1,348,832 | | | | 1,418,062 | | | | | |
| | | | | | | 76,815,687 | | | | 87,106,261 | | | | 23.33 | % |
| Health Care: | | | | | | | | | | | | |
| 35,615 | | | AMN HEALTHCARE SERVICES, INC.(b) | | | 1,834,243 | | | | 2,219,171 | | | | | |
| 123,912 | | | AVID BIOSERVICES, INC.(b) | | | 647,353 | | | | 950,405 | | | | | |
| 38,383 | | | BIOTELEMETRY, INC.(b) | | | 1,539,095 | | | | 1,777,133 | | | | | |
| 18,169 | | | BRUKER CORP. | | | 492,084 | | | | 926,074 | | | | | |
| 33,674 | | | CUTERA, INC.(b) | | | 712,555 | | | | 1,205,866 | | | | | |
| 21,056 | | | EMERGENT BIOSOLUTIONS, INC.(b) | | | 665,082 | | | | 1,135,971 | | | | | |
| 27,696 | | | GLOBUS MEDICAL, INC., CLASS A(b) | | | 1,332,836 | | | | 1,630,740 | | | | | |
| 6,586 | | | HARROW HEALTH, INC.(b) | | | 31,441 | | | | 51,239 | | | | | |
| 206,911 | | | HARVARD BIOSCIENCE, INC.(b) | | | 424,925 | | | | 631,079 | | | | | |
| 16,780 | | | HILL-ROM HOLDINGS, INC. | | | 1,309,948 | | | | 1,905,033 | | | | | |
| 56,996 | | | INFUSYSTEM HOLDINGS, INC.(b) | | | 248,414 | | | | 486,176 | | | | | |
| 53,108 | | | INTEGRA LIFESCIENCES HOLDINGS CORP.(b) | | | 3,113,946 | | | | 3,095,134 | | | | | |
| 21,757 | | | INVACARE CORP. | | | 215,655 | | | | 196,248 | | | | | |
| 14,838 | | | LHC GROUP, INC.(b) | | | 967,214 | | | | 2,044,083 | | | | | |
| 2,830 | | | LIGAND PHARMACEUTICALS, INC.(b) | | | 308,575 | | | | 295,141 | | | | | |
| 19,324 | | | LIVANOVA PLC(b)(d) | | | 1,827,529 | | | | 1,457,609 | | | | | |
| 9,317 | | | MAGELLAN HEALTH, INC.(b) | | | 572,931 | | | | 729,055 | | | | | |
| 27,231 | | | NANOVIBRONIX, INC.(b) | | | 132,728 | | | | 77,608 | | | | | |
| 37,841 | | | OMNICELL, INC.(b) | | | 2,043,004 | | | | 3,092,367 | | | | | |
| 12,297 | | | ORTHOFIX MEDICAL, INC.(b) | | | 624,890 | | | | 567,875 | | | | | |
| 40,419 | | | PREMIER, INC., CLASS A(b) | | | 1,217,182 | | | | 1,531,072 | | | | | |
| 38,542 | | | PROVIDENCE SERVICE (THE) CORP.(b) | | | 2,435,958 | | | | 2,280,916 | | | | | |
| 46,660 | | | PSYCHEMEDICS CORP. | | | 624,933 | | | | 426,939 | | | | | |
| 76,419 | | | STREAMLINE HEALTH SOLUTIONS, INC.(b) | | | 88,635 | | | | 106,222 | | | | | |
| 52,100 | | | SYNEOS HEALTH, INC.(b) | | | 2,450,918 | | | | 3,098,648 | | | | | |
| 93,545 | | | TRIPLE-S MANAGEMENT CORP., CLASS B(b)(d) | | | 2,136,298 | | | | 1,729,647 | | | | | |
| 119,109 | | | VAREX IMAGING CORP.(b) | | | 3,382,287 | | | | 3,550,639 | | | | | |
| | | | | | | 31,380,659 | | | | 37,198,090 | | | | 9.96 | % |
| Industrials: | | | | | | | | | | | | |
| 131,705 | | | ACTUANT CORP., CLASS A | | | 3,286,955 | | | | 3,428,281 | | | | | |
| 13,700 | | | ACUITY BRANDS, INC. | | | 1,555,656 | | | | 1,890,600 | | | | | |
| 6,784 | | | AEROVIRONMENT, INC.(b) | | | 362,471 | | | | 418,844 | | | | | |
| 27,900 | | | AIR LEASE CORP. | | | 965,683 | | | | 1,325,808 | | | | | |
| 4,547 | | | AIR TRANSPORT SERVICES GROUP, INC.(b) | | | 86,878 | | | | 106,673 | | | | | |
| See accompanying notes to financial statements. | 44 | (Continued) |
CLEARWATER INVESTMENT TRUST
Schedule of Investments - Clearwater Small Companies Fund
December 31, 2019
Shares | | | Security | | Cost | | | Fair value (a) | | | Percent of net assets | |
| Industrials (Cont’d): | | | | | | | | | | | | |
| 17,240 | | | ALBANY INTERNATIONAL CORP., CLASS A | | $ | 775,121 | | | | 1,308,861 | | | | | |
| 14,200 | | | AMERICAN WOODMARK CORP.(b) | | | 1,158,011 | | | | 1,484,042 | | | | | |
| 23,583 | | | APOGEE ENTERPRISES, INC. | | | 871,456 | | | | 766,447 | | | | | |
| 37,225 | | | ASGN, INC.(b) | | | 1,690,059 | | | | 2,641,858 | | | | | |
| 83,571 | | | AVIS BUDGET GROUP, INC.(b) | | | 2,864,798 | | | | 2,694,329 | | | | | |
| 24,319 | | | BRINK’S (THE) CO. | | | 1,621,214 | | | | 2,205,247 | | | | | |
| 31,200 | | | BWX TECHNOLOGIES, INC. | | | 1,680,772 | | | | 1,936,896 | | | | | |
| 18,842 | | | CECO ENVIRONMENTAL CORP.(b) | | | 140,183 | | | | 144,330 | | | | | |
| 34,190 | | | CIRCOR INTERNATIONAL, INC.(b) | | | 1,234,082 | | | | 1,580,946 | | | | | |
| 73,700 | | | COLFAX CORP.(b) | | | 2,101,049 | | | | 2,681,206 | | | | | |
| 26,279 | | | COLUMBUS MCKINNON CORP. | | | 686,170 | | | | 1,051,948 | | | | | |
| 25,200 | | | DONALDSON CO., INC. | | | 1,139,000 | | | | 1,452,024 | | | | | |
| 109,800 | | | GATES INDUSTRIAL CORP. PLC(b) | | | 1,573,211 | | | | 1,510,848 | | | | | |
| 7,603 | | | GIBRALTAR INDUSTRIES, INC.(b) | | | 218,297 | | | | 383,495 | | | | | |
| 11,900 | | | GORMAN-RUPP (THE) CO. | | | 360,214 | | | | 446,250 | | | | | |
| 7,650 | | | GP STRATEGIES CORP.(b) | | | 94,397 | | | | 101,209 | | | | | |
| 98,848 | | | GRAFTECH INTERNATIONAL LTD. | | | 1,227,471 | | | | 1,148,614 | | | | | |
| 17,647 | | | GRAHAM CORP. | | | 342,564 | | | | 386,116 | | | | | |
| 73,258 | | | HARSCO CORP.(b) | | | 1,398,611 | | | | 1,685,667 | | | | | |
| 23,933 | | | HERC HOLDINGS, INC.(b) | | | 1,135,302 | | | | 1,171,281 | | | | | |
| 28,700 | | | HEXCEL CORP. | | | 1,854,128 | | | | 2,103,997 | | | | | |
| 82,966 | | | INTERFACE, INC. | | | 1,523,674 | | | | 1,376,406 | | | | | |
| 134,071 | | | JELD-WEN HOLDING, INC.(b) | | | 3,653,103 | | | | 3,138,602 | | | | | |
| 19,050 | | | KADANT, INC. | | | 1,650,190 | | | | 2,006,727 | | | | | |
| 1,302 | | | KELLY SERVICES, INC., CLASS A | | | 27,920 | | | | 29,399 | | | | | |
| 21,072 | | | KENNAMETAL, INC. | | | 739,914 | | | | 777,346 | | | | | |
| 219,598 | | | LSI INDUSTRIES, INC. | | | 1,176,894 | | | | 1,328,568 | | | | | |
| 40,453 | | | MASONITE INTERNATIONAL CORP.(b) | | | 2,648,935 | | | | 2,921,111 | | | | | |
| 30,987 | | | MERCURY SYSTEMS, INC.(b) | | | 1,424,464 | | | | 2,141,512 | | | | | |
| 6,240 | | | MSA SAFETY, INC. | | | 577,740 | | | | 788,486 | | | | | |
| 140,400 | | | NOW, INC.(b) | | | 1,583,047 | | | | 1,578,096 | | | | | |
| 183,000 | | | PGT INNOVATIONS, INC.(b) | | | 2,861,691 | | | | 2,728,530 | | | | | |
| 110,865 | | | PIONEER POWER SOLUTIONS, INC.(b) | | | 640,160 | | | | 251,664 | | | | | |
| 154,047 | | | REV GROUP, INC. | | | 1,757,550 | | | | 1,883,995 | | | | | |
| 23,500 | | | RUSH ENTERPRISES, INC., CLASS A | | | 961,055 | | | | 1,092,750 | | | | | |
| 46,101 | | | RYDER SYSTEM, INC. | | | 2,779,246 | | | | 2,503,745 | | | | | |
| 23,870 | | | SKYWEST, INC. | | | 1,015,599 | | | | 1,542,718 | | | | | |
| 143,744 | | | STEELCASE, INC., CLASS A | | | 2,071,806 | | | | 2,941,002 | | | | | |
| 87,936 | | | TEREX CORP. | | | 3,115,428 | | | | 2,618,734 | | | | | |
| 22,677 | | | THERMON GROUP HOLDINGS, INC.(b) | | | 503,220 | | | | 607,744 | | | | | |
| 64,293 | | | TITAN MACHINERY, INC.(b) | | | 936,524 | | | | 950,251 | | | | | |
| 68,793 | | | TRIMAS CORP.(b) | | | 1,808,640 | | | | 2,160,788 | | | | | |
| 8,106 | | | VALMONT INDUSTRIES, INC. | | | 1,141,610 | | | | 1,214,117 | | | | | |
| 32,741 | | | VIAD CORP. | | | 1,672,890 | | | | 2,210,017 | | | | | |
| 28,259 | | | WOODWARD, INC. | | | 1,729,799 | | | | 3,346,996 | | | | | |
| | | | | | | 68,424,852 | | | | 78,195,121 | | | | 20.94 | % |
| Information Technology: | | | | | | | | | | | | |
| 6,863 | | | ADESTO TECHNOLOGIES CORP.(b) | | | 50,420 | | | | 58,336 | | | | | |
| 3,071 | | | ANIXTER INTERNATIONAL, INC.(b) | | | 186,779 | | | | 282,839 | | | | | |
| 24,286 | | | ASURE SOFTWARE, INC.(b) | | | 200,315 | | | | 198,659 | | | | | |
| 69,627 | | | AVIAT NETWORKS, INC.(b) | | | 1,229,827 | | | | 978,259 | | | | | |
| 34,488 | | | AVNET, INC. | | | 1,429,758 | | | | 1,463,671 | | | | | |
| 11,693 | | | AXT, INC.(b) | | | 50,256 | | | | 50,865 | | | | | |
| 14,121 | | | CALAMP CORP.(b) | | | 138,043 | | | | 135,279 | | | | | |
| 243,464 | | | CELESTICA, INC.(b)(d) | | | 2,556,238 | | | | 2,013,447 | | | | | |
| 94,200 | | | COHU, INC. | | | 1,510,462 | | | | 2,152,470 | | | | | |
| 98,463 | | | DSP GROUP, INC.(b) | | | 1,254,137 | | | | 1,549,808 | | | | | |
| 12,500 | | | ENTEGRIS, INC. | | | 325,159 | | | | 626,125 | | | | | |
| 8,187 | | | EURONET WORLDWIDE, INC.(b) | | | 370,523 | | | | 1,289,944 | | | | | |
| 10,465 | | | EVERBRIDGE, INC.(b) | | | 937,687 | | | | 817,107 | | | | | |
| 40,197 | | | EVO PAYMENTS, INC., CLASS A(b) | | | 981,490 | | | | 1,061,603 | | | | | |
| 22,573 | | | FARO TECHNOLOGIES, INC.(b) | | | 1,097,560 | | | | 1,136,551 | | | | | |
| 69,172 | | | FIREEYE, INC.(b) | | | 1,100,746 | | | | 1,143,413 | | | | | |
| 133,620 | | | FRANKLIN WIRELESS CORP.(b) | | | 287,454 | | | | 319,352 | | | | | |
| 114,452 | | | FREQUENCY ELECTRONICS, INC.(b) | | | 1,051,440 | | | | 1,168,555 | | | | | |
| 15,855 | | | HARMONIC, INC.(b) | | | 123,933 | | | | 123,669 | | | | | |
| 49,349 | | | IDENTIV, INC.(b) | | | 246,885 | | | | 278,328 | | | | | |
| See accompanying notes to financial statements. | 45 | (Continued) |
CLEARWATER INVESTMENT TRUST
Schedule of Investments - Clearwater Small Companies Fund
December 31, 2019
Shares | | | Security | | Cost | | | Fair value (a) | | | Percent of net assets | |
| Information Technology (Cont’d): | | | | | | | | | | | | |
| 93,795 | | | IMMERSION CORP.(b) | | $ | 710,627 | | | | 696,897 | | | | | |
| 171,422 | | | INFINERA CORP.(b) | | | 932,404 | | | | 1,361,091 | | | | | |
| 12,362 | | | INSIGHT ENTERPRISES, INC.(b) | | | 496,249 | | | | 868,925 | | | | | |
| 38,590 | | | JABIL, INC. | | | 714,871 | | | | 1,594,925 | | | | | |
| 14,682 | | | KBR, INC. | | | 250,070 | | | | 447,801 | | | | | |
| 35,070 | | | LIMELIGHT NETWORKS, INC.(b) | | | 142,091 | | | | 143,086 | | | | | |
| 25,854 | | | LUMENTUM HOLDINGS, INC.(b) | | | 1,404,441 | | | | 2,050,222 | | | | | |
| 6,890 | | | MKS INSTRUMENTS, INC. | | | 522,844 | | | | 757,969 | | | | | |
| 18,184 | | | NOVANTA, INC.(b) | | | 583,046 | | | | 1,608,193 | | | | | |
| 39,981 | | | PERFICIENT, INC.(b) | | | 730,774 | | | | 1,841,925 | | | | | |
| 13,564 | | | PFSWEB, INC.(b) | | | 29,217 | | | | 51,814 | | | | | |
| 27,600 | | | PLEXUS CORP.(b) | | | 1,515,111 | | | | 2,123,544 | | | | | |
| 15,298 | | | PROS HOLDINGS, INC.(b) | | | 532,357 | | | | 916,656 | | | | | |
| 3,802 | | | ROGERS CORP.(b) | | | 451,806 | | | | 474,223 | | | | | |
| 65,846 | | | SCANSOURCE, INC.(b) | | | 2,514,326 | | | | 2,433,010 | | | | | |
| 376,702 | | | SERVICESOURCE INTERNATIONAL, INC.(b) | | | 367,800 | | | | 629,092 | | | | | |
| 325,211 | | | STEEL CONNECT, INC.(b) | | | 527,819 | | | | 474,808 | | | | | |
| 85,335 | | | SUPER MICRO COMPUTER, INC.(b) | | | 1,796,261 | | | | 2,049,747 | | | | | |
| 41,313 | | | SYKES ENTERPRISES, INC.(b) | | | 1,216,536 | | | | 1,528,168 | | | | | |
| 13,680 | | | SYNNEX CORP. | | | 1,041,979 | | | | 1,761,984 | | | | | |
| 218,803 | | | TIVO CORP. | | | 1,835,784 | | | | 1,855,449 | | | | | |
| 76,963 | | | UNISYS CORP.(b) | | | 643,341 | | | | 912,781 | | | | | |
| 136,170 | | | VERRA MOBILITY CORP.(b) | | | 1,867,511 | | | | 1,905,018 | | | | | |
| 28,192 | | | VIRTUSA CORP.(b) | | | 1,279,974 | | | | 1,277,943 | | | | | |
| 29,797 | | | XPERI CORP. | | | 560,195 | | | | 551,244 | | | | | |
| | | | | | | 37,796,546 | | | | 47,164,795 | | | | 12.63 | % |
| Materials: | | | | | | | | | | | | |
| 12,052 | | | AMERICAN VANGUARD CORP. | | | 212,463 | | | | 234,652 | | | | | |
| 40,100 | | | H.B. FULLER CO. | | | 2,195,774 | | | | 2,067,957 | | | | | |
| 31,475 | | | INGEVITY CORP.(b) | | | 1,933,623 | | | | 2,750,286 | | | | | |
| 28,314 | | | KOPPERS HOLDINGS, INC.(b) | | | 543,966 | | | | 1,082,161 | | | | | |
| 3,564 | | | MERCER INTERNATIONAL, INC.(d) | | | 48,243 | | | | 43,837 | | | | | |
| 8,768 | | | NORTHERN TECHNOLOGIES INTERNATIONAL CORP. | | | 104,258 | | | | 123,278 | | | | | |
| 67,231 | | | OLIN CORP. | | | 1,173,329 | | | | 1,159,735 | | | | | |
| 21,400 | | | RELIANCE STEEL & ALUMINUM CO. | | | 1,596,343 | | | | 2,562,864 | | | | | |
| 70,900 | | | SCHWEITZER-MAUDUIT INTERNATIONAL, INC. | | | 2,808,249 | | | | 2,977,091 | | | | | |
| | | | | | | 10,616,248 | | | | 13,001,861 | | | | 3.48 | % |
| Real Estate: | | | | | | | | | | | | |
| 35,179 | | | ALPINE INCOME PROPERTY TRUST, INC. | | | 665,288 | | | | 669,456 | | | | | |
| 54,922 | | | BLUEROCK RESIDENTIAL GROWTH REIT, INC. | | | 461,663 | | | | 661,810 | | | | | |
| 77,807 | | | CITY OFFICE REIT, INC.(d) | | | 1,019,236 | | | | 1,051,951 | | | | | |
| 3,296 | | | CLIPPER REALTY, INC. | | | 28,036 | | | | 34,938 | | | | | |
| 130,852 | | | CONDOR HOSPITALITY TRUST, INC. | | | 1,421,930 | | | | 1,444,606 | | | | | |
| 67,067 | | | DIAMONDROCK HOSPITALITY CO. | | | 728,909 | | | | 743,102 | | | | | |
| 78,539 | | | EMPIRE STATE REALTY TRUST, INC., CLASS A | | | 1,190,226 | | | | 1,096,404 | | | | | |
| 45,086 | | | ESSENTIAL PROPERTIES REALTY TRUST, INC. | | | 938,504 | | | | 1,118,584 | | | | | |
| 69,962 | | | INDEPENDENCE REALTY TRUST, INC. | | | 1,029,131 | | | | 985,065 | | | | | |
| 10,800 | | | INNOVATIVE INDUSTRIAL PROPERTIES, INC.(c) | | | 992,487 | | | | 819,396 | | | | | |
| 34,575 | | | MARCUS & MILLICHAP, INC.(b) | | | 941,579 | | | | 1,287,919 | | | | | |
| 30,733 | | | MONMOUTH REAL ESTATE INVESTMENT CORP. | | | 385,053 | | | | 445,014 | | | | | |
| 14,525 | | | ONE LIBERTY PROPERTIES, INC. | | | 404,332 | | | | 394,935 | | | | | |
| 69,072 | | | PHYSICIANS REALTY TRUST | | | 1,149,562 | | | | 1,308,224 | | | | | |
| 4,005 | | | POWER REIT(b) | | | 37,858 | | | | 36,045 | | | | | |
| 23,259 | | | QTS REALTY TRUST, INC., CLASS A | | | 1,075,104 | | | | 1,262,266 | | | | | |
| 69,283 | | | REALOGY HOLDINGS CORP.(c) | | | 1,827,617 | | | | 670,659 | | | | | |
| 35,540 | | | STAG INDUSTRIAL, INC. | | | 506,714 | | | | 1,121,998 | | | | | |
| 60,746 | | | STRATUS PROPERTIES, INC.(b) | | | 1,686,228 | | | | 1,881,911 | | | | | |
| 41,180 | | | UMH PROPERTIES, INC. | | | 507,529 | | | | 647,761 | | | | | |
| 65,898 | | | XENIA HOTELS & RESORTS, INC. | | | 1,460,643 | | | | 1,424,056 | | | | | |
| | | | | | | 18,457,629 | | | | 19,106,100 | | | | 5.12 | % |
| Utilities: | | | | | | | | | | | | |
| 8,375 | | | ALLETE, INC. | | | 308,022 | | | | 679,799 | | | | | |
| 153,899 | | | PURE CYCLE CORP.(b) | | | 1,075,000 | | | | 1,937,589 | | | | | |
| 20,922 | | | SJW GROUP | | | 1,314,162 | | | | 1,486,717 | | | | | |
| See accompanying notes to financial statements. | 46 | (Continued) |
CLEARWATER INVESTMENT TRUST
Schedule of Investments - Clearwater Small Companies Fund
December 31, 2019
| | | | | | | | | | | |
Shares | | Security | | Cost | | | Fair value (a) | | | Percent of net assets | |
| Utilities (Cont’d): | | | | | | | | | | | | |
| 12,840 | | SPIRE, INC. | | $ | 697,520 | | | | 1,069,700 | | | | | |
| | | | | | 3,394,704 | | | | 5,173,805 | | | | 1.38 | % |
| | Sub-total Common Stocks: | | | 311,564,110 | | | | 356,673,356 | | | | 95.51 | % |
Convertible Bonds: | | | | | | | | | | | | |
| Health Care: | | | | | | | | | | | | |
| 340,000 | | INVACARE CORP., 4.50%, 6/1/22 | | | 291,706 | | | | 316,794 | | | | | |
| | | | | | 291,706 | | | | 316,794 | | | | 0.09 | % |
| | Sub-total Convertible Bonds: | | | 291,706 | | | | 316,794 | | | | 0.09 | % |
Convertible Preferred Stocks: | | | | | | | | | | | | |
| Real Estate: | | | | | | | | | | | | |
| 4,224 | | WHEELER REAL ESTATE INVESTMENT TRUST, INC.(b) | | | 47,126 | | | | 46,422 | | | | | |
| 6,660 | | WHEELER REAL ESTATE INVESTMENT TRUST, INC. (Step to 10.75% on 9/21/2023), 8.75%(b)(e) | | | 64,211 | | | | 99,300 | | | | | |
| | | | | | 111,337 | | | | 145,722 | | | | 0.04 | % |
| | Sub-total Convertible Preferred Stocks: | | | 111,337 | | | | 145,722 | | | | 0.04 | % |
Investment Companies: | | | | | | | | | | | | |
| Financials: | | | | | | | | | | | | |
| 18,328 | | ISHARES RUSSELL 2000 ETF | | | 3,011,261 | | | | 3,036,400 | | | | | |
| | | | | | 3,011,261 | | | | 3,036,400 | | | | 0.81 | % |
| | Sub-total Investment Companies: | | | 3,011,261 | | | | 3,036,400 | | | | 0.81 | % |
Master Limited Partnerships: | | | | | | | | | | | | |
| Industrials: | | | | | | | | | | | | |
| 34,968 | | STEEL PARTNERS HOLDINGS L.P.(b) | | | 471,461 | | | | 423,183 | | | | | |
| | | | | | 471,461 | | | | 423,183 | | | | 0.11 | % |
| | Sub-total Master Limited Partnerships: | | | 471,461 | | | | 423,183 | | | | 0.11 | % |
Preferred Stocks: | | | | | | | | | | | | |
| Industrials: | | | | | | | | | | | | |
| 184,080 | | STEEL PARTNERS HOLDINGS L.P. | | | 3,199,053 | | | | 4,294,586 | | | | | |
| | | | | | 3,199,053 | | | | 4,294,586 | | | | 1.15 | % |
| | Sub-total Preferred Stocks: | | | 3,199,053 | | | | 4,294,586 | | | | 1.15 | % |
Rights: | | | | | | | | | | | | | | |
| Consumer Discretionary: | | | | | | | | | | | | |
| 55,700 | | MEDIA GENERAL, INC. (CONTINGENT VALUE RIGHTS)(b)(f) | | | - | | | | - | | | | | |
| | | | | | - | | | | - | | | | 0.00 | % |
| | Sub-total Rights: | | | - | | | | - | | | | 0.00 | % |
Warrants: | | | | | | | | | | | | |
| Health Care: | | | | | | | | | | | | |
| 19,977 | | NANOVIBRONIX, INC.(b)(f) | | | 200 | | | | - | | | | | |
| | | | | | 200 | | | | - | | | | 0.00 | % |
| | Sub-total Warrants: | | | 200 | | | | - | | | | 0.00 | % |
Short-Term Investments: | | | | | | | | | | | | |
| | | FIDELITY INVESTMENTS MONEY MARKET | | | | | | | | | | | | |
| 3,509,148 | | GOVERNMENT PORTFOLIO(g) | | | 3,509,148 | | | | 3,509,148 | | | | | |
| | | NORTHERN INSTITUTIONAL FUNDS - U.S. GOVERNMENT | | | | | | | | | | | | |
| 9,691,925 | | SELECT PORTFOLIO, 1.53%(h) | | | 9,691,925 | | | | 9,691,925 | | | | | |
| | Sub-total Short-Term Investments: | | | 13,201,073 | | | | 13,201,073 | | | | 3.54 | % |
| | | Grand total | | $ | 331,850,201 | | | | 378,091,114 | | | | 101.25 | % |
Notes to Schedule of Investments:
| (a) | Investments are valued in accordance with procedures described in note 2 to the financial statements. |
| (b) | Non-income producing assets. |
| (c) | Security is either wholly or partially on loan. |
| (d) | Foreign security values are stated in U.S. dollars. As of December 31, 2019, the value of foreign stocks or depositary receipts of companies based outside of the United States represented 4.13% of net assets. |
| (e) | For step bonds, the coupon rate disclosed is the current rate in effect. |
| (f) | Security has been deemed worthless and is a Level 3 investment. |
| (g) | Investment relates to cash collateral received from portfolio securities loaned. |
| See accompanying notes to financial statements. | 47 | (Continued) |
CLEARWATER INVESTMENT TRUST
Schedule of Investments - Clearwater Small Companies Fund
December 31, 2019
| (h) | The short-term investment is a money market portfolio of the investment company, Northern Institutional Funds. At December 31, 2018, the value of the Clearwater Small Companies Fund’s investment in the U.S. Government Select Portfolio of the Northern Institutional Funds was $12,345,333 with net sales of $2,653,408 during the fiscal year ended December 31, 2019. |
| See accompanying notes to financial statements. | 48 | (Continued) |
CLEARWATER INVESTMENT TRUST
Schedule of Investments - Clearwater Small Companies Fund
December 31, 2019
Clearwater Small Companies Fund Portfolio Diversification
(as a percentage of net assets)

| See accompanying notes to financial statements. | 49 | (Continued) |
CLEARWATER INVESTMENT TRUST
Schedule of Investments - Clearwater Tax-Exempt Bond Fund
December 31, 2019
| | | | | | | | | | | | | | | | | | |
Par/Shares | | | Security | | Maturity
date | | | Coupon
rate | | | Cost | | | Fair value (a) | | | Percent of
net assets | |
Closed-End Funds: | | | | | | | | | | | | | | | | | | | | |
| 197,600 | | | BLACKROCK LONG-TERM MUNICIPAL ADVANTAGE TRUST | | | $ | 2,002,821 | | | | 2,523,352 | | | | | |
| 54,180 | | | BLACKROCK MUNICIPAL INCOME QUALITY TRUST | | | | 739,165 | | | | 761,229 | | | | | |
| 19,200 | | | BLACKROCK MUNIENHANCED FUND INC | | | | 201,815 | | | | 214,272 | | | | | |
| 58,171 | | | BLACKROCK MUNIHOLDINGS FUND II INC | | | | 822,154 | | | | 885,944 | | | | | |
| 91,327 | | | BLACKROCK MUNIHOLDINGS INVESTMENT QUALITY FUND | | | | 1,010,095 | | | | 1,213,736 | | | | | |
| 32,117 | | | BLACKROCK MUNIHOLDINGS NEW JERSEY QUALITY FUND INC | | | | 455,993 | | | | 460,879 | | | | | |
| 83,977 | | | BLACKROCK MUNIHOLDINGS QUALITY FUND II INC | | | | 1,060,120 | | | | 1,058,950 | | | | | |
| 66,500 | | | BLACKROCK MUNIHOLDINGS QUALITY FUND INC | | | | 860,392 | | | | 835,905 | | | | | |
| 55,111 | | | BLACKROCK MUNIYIELD INVESTMENT QUALITY FUND | | | | 701,111 | | | | 747,305 | | | | | |
| 157,958 | | | BLACKROCK MUNIYIELD MICHIGAN QUALITY FUND INC | | | | 2,064,776 | | | | 2,242,214 | | | | | |
| 51,700 | | | BLACKROCK MUNIYIELD PENNSYLVANIA QUALITY FUND | | | | 729,423 | | | | 738,793 | | | | | |
| 102,096 | | | BLACKROCK MUNIYIELD QUALITY FUND II INC | | | | 1,309,732 | | | | 1,327,248 | | | | | |
| 118,472 | | | BLACKROCK MUNIYIELD QUALITY FUND III INC | | | | 1,572,465 | | | | 1,599,372 | | | | | |
| 141,249 | | | DWS MUNICIPAL INCOME TRUST | | | | 1,615,481 | | | | 1,600,351 | | | | | |
| 178,050 | | | INVESCO ADVANTAGE MUNICIPAL INCOME TRUST II | | | | 1,981,830 | | | | 1,988,819 | | | | | |
| 113,205 | | | INVESCO MUNICIPAL OPPORTUNITY TRUST | | | | 1,406,896 | | | | 1,399,214 | | | | | |
| 80,614 | | | INVESCO MUNICIPAL TRUST | | | | 1,025,311 | | | | 996,389 | | | | | |
| 134,886 | | | INVESCO QUALITY MUNICIPAL INCOME TRUST | | | | 1,622,828 | | | | 1,696,866 | | | | | |
| 60,000 | | | INVESCO TRUST FOR INVESTMENT GRADE MUNICIPALS | | | | 772,688 | | | | 771,000 | | | | | |
| 65,834 | | | NUVEEN AMT-FREE MUNICIPAL CREDIT INCOME FUND | | | | | | | | | | | 969,329 | | | | 1,097,453 | | | | | |
| 300,875 | | | NUVEEN AMT-FREE QUALITY MUNICIPAL INCOME FUND | | | | 4,065,667 | | | | 4,326,582 | | | | | |
| 15,963 | | | NUVEEN MICHIGAN QUALITY MUNICIPAL INCOME FUND | | | | 214,604 | | | | 225,717 | | | | | |
| 52,779 | | | NUVEEN PENNSYLVANIA QUALITY MUNICIPAL INCOME FUND | | | | 723,142 | | | | 746,823 | | | | | |
| 165,984 | | | NUVEEN QUALITY MUNICIPAL INCOME FUND | | | | 2,355,520 | | | | 2,423,366 | | | | | |
| 28,000 | | | PUTNAM MUNICIPAL OPPORTUNITIES TRUST | | | | 371,050 | | | | 368,200 | | | | | |
| | | | Sub-total Closed-End Funds: | | | | | | | | | | | 30,654,408 | | | | 32,249,979 | | | | 5.35 | % |
Municipal Bonds: | | | | | | | | | | | | | | | | | | | | |
| 500,000 | | | 9TH AVENUE MET DIST #2 CO | | | 12/1/2048 | | | | 5.00 | | | | 500,000 | | | | 526,825 | | | | | |
| 2,350,000 | | | ACALANES CA UNION HIGH SCH DIST (Step to 6.55% on 8/1/2024)(b) | | | 8/1/2039 | | | | 0.00 | | | | 1,751,368 | | | | 2,524,370 | | | | | |
| 1,000,000 | | | AEROTROPOLIS REGL TRANPRTN AUTH CO SPL REVENUE | | | 12/1/2051 | | | | 5.00 | | | | 1,015,081 | | | | 1,044,450 | | | | | |
| 1,000,000 | | | ALACHUA CNTY FL HLTH FACS AUTH CCRC | | | 10/1/2032 | | | | 8.00 | | | | 1,076,864 | | | | 1,126,990 | | | | | |
| 385,000 | | | ALASKA ST HSG FIN CORP MTGE REVENUE | | | 12/1/2037 | | | | 4.13 | | | | 378,994 | | | | 394,017 | | | | | |
| 350,000 | | | ALASKA ST INDL DEV & EXPORT AUTH CMNTY PROVIDER REVENUE(c) | | | 12/1/2010 | | | | 5.40 | | | | 350,000 | | | | 17,500 | | | | | |
| 545,000 | | | ALLEGHENY CNTY PA INDL DEV AUTH CHRT SCH REVENUE | | | 8/15/2026 | | | | 5.90 | | | | 545,000 | | | | 557,415 | | | | | |
| 500,000 | | | ALTA LAKES CMNTY DEV DIST FL SPL ASSMNT | | | 5/1/2039 | | | | 4.40 | | | | 497,401 | | | | 511,115 | | | | | |
| 1,000,000 | | | ALVORD CA UNIF SCH DIST | | | 8/1/2036 | | | | 5.25 | | | | 1,012,983 | | | | 1,134,310 | | | | | |
| 1,000,000 | | | ALVORD CA UNIF SCH DIST (Step to 7.35% on 8/1/2026)(b) | | | 8/1/2046 | | | | 0.00 | | | | 624,710 | | | | 1,154,710 | | | | | |
| 1,000,000 | | | APPLE VLY MN SENIOR LIVING REVENUE | | | 1/1/2047 | | | | 5.00 | | | | 978,241 | | | | 814,610 | | | | | |
| 500,000 | | | ARIZONA ST INDL DEV AUTH EDU REVENUE(d) | | | 7/15/2038 | | | | 5.75 | | | | 522,086 | | | | 568,000 | | | | | |
| 1,000,000 | | | ARIZONA ST INDL DEV AUTH MF HSG REVENUE | | | 1/1/2038 | | | | 5.38 | | | | 1,000,000 | | | | 1,035,700 | | | | | |
| 1,750,000 | | | ARLINGTON TX HGR EDU FIN CORP EDU REVENUE | | | 8/15/2028 | | | | 7.00 | | | | 1,719,763 | | | | 1,811,145 | | | | | |
| 500,000 | | | ARLINGTON TX HGR EDU FIN CORP EDU REVENUE | | | 6/15/2036 | | | | 5.00 | | | | 504,344 | | | | 510,150 | | | | | |
| 650,000 | | | ARLINGTON TX SPL TAX REVENUE | | | 2/15/2041 | | | | 5.00 | | | | 695,306 | | | | 731,179 | | | | | |
| 400,000 | | | ASTURIA FL CMNTY DEV DIST SPL ASSMNT | | | 5/1/2034 | | | | 5.75 | | | | 400,000 | | | | 417,648 | | | | | |
| 500,000 | | | ATHENS-CLARKE CNTY GA UNIF GOVT DEV AUTH REVENUE | | | 6/15/2039 | | | | 5.00 | | | | 510,153 | | | | 553,910 | | | | | |
| 500,000 | | | ATLANTA GA ARPT REVENUE | | | 1/1/2030 | | | | 6.00 | | | | 502,640 | | | | 523,705 | | | | | |
| 1,265,000 | | | BAY CNTY FL EDUCTNL FACS REVENUE | | | 9/1/2030 | | | | 5.25 | | | | 1,179,505 | | | | 1,289,288 | | | | | |
| 1,000,000 | | | BELLALAGO FL EDUCTNL FACS BENEFIT DIST CAPITAL IMPT REVENUE | | | 5/1/2030 | | | | 4.38 | | | | 987,295 | | | | 1,094,610 | | | | | |
| 1,195,000 | | | BELLWOOD IL | | | 12/1/2027 | | | | 5.88 | | | | 1,187,912 | | | | 1,332,676 | | | | | |
| 650,000 | | | BERKELEY CNTY SC ASSMNT REVENUE | | | 11/1/2040 | | | | 4.25 | | | | 647,310 | | | | 651,001 | | | | | |
| 850,000 | | | BEXAR CNTY TX HSG FIN CORP(e)(f) | | | 2/1/2035 | | | | 3.75 | | | | 850,000 | | | | 888,590 | | | | | |
| 2,000,000 | | | BEXAR CNTY TX REVENUE | | | 8/15/2039 | | | | 5.00 | | | | 2,052,808 | | | | 2,160,360 | | | | | |
| See accompanying notes to financial statements. | 50 | (Continued) |
CLEARWATER INVESTMENT TRUST
Schedule of Investments - Clearwater Tax-Exempt Bond Fund
December 31, 2019
| | | | | | | | | | | | | | | | | |
Par/Shares | | | Security | | Maturity
date | | Coupon
rate | | | Cost | | | Fair value (a) | | | Percent of
net assets | |
Municipal Bonds (Cont’d): | | | | | | | | | | | | | | | | | | |
| 500,000 | | | BLACKBURN CREEK CMNTY DEV DIST FL CAP IMPT REVENUE | | 5/1/2035 | | | 6.25 | | | $ | 500,000 | | | | 548,510 | | | | | |
| 225,000 | | | BLACKBURN CREEK CMNTY DEV DIST FL CAP IMPT REVENUE | | 5/1/2045 | | | 6.25 | | | | 225,000 | | | | 244,647 | | | | | |
| 1,495,000 | | | BOLINGBROOK IL SPL SVC AREA SPL TAX | | 3/1/2030 | | | 4.00 | | | | 1,546,746 | | | | 1,676,059 | | | | | |
| 750,000 | | | BROADWAY STATION MET DIST #2 CO | | 12/1/2048 | | | 5.13 | | | | 750,000 | | | | 802,357 | | | | | |
| 1,000,000 | | | BROADWAY STATION MET DIST #3 CO | | 12/1/2049 | | | 5.00 | | | | 1,023,467 | | | | 1,045,920 | | | | | |
| 600,000 | | | BRYAN OH CITY SCH DIST | | 12/15/2034 | | | 4.00 | | | | 613,584 | | | | 612,462 | | | | | |
| 650,000 | | | BUFFALO HIGHLANDS MET DIST | | 12/1/2038 | | | 5.25 | | | | 651,830 | | | | 679,913 | | | | | |
| 1,250,000 | | | BURBANK IL EDUCTNL FACS REVENUE(d) | | 9/1/2035 | | | 6.00 | | | | 1,261,111 | | | | 1,386,137 | | | | | |
| 1,000,000 | | | BUREAU CNTY TWP IL HIGH SCH DIST #502 | | 10/1/2043 | | | 6.63 | | | | 1,033,775 | | | | 1,209,220 | | | | | |
| 380,000 | | | BUTLER CNTY PA GEN AUTH REVENUE (Floating, ICE LIBOR USD 3M + 0.70%)(e) | | 10/1/2034 | | | 1.98 | | | | 380,000 | | | | 366,658 | | | | | |
| 500,000 | | | CALIFORNIA ST HLTH FACS FING AUTH REVENUE | | 8/15/2033 | | | 5.50 | | | | 502,064 | | | | 534,390 | | | | | |
| 1,500,000 | | | CALIFORNIA ST SCH FACS FING AUTH REVENUE | | 8/1/2029 | | | 6.00 | | | | 1,491,929 | | | | 1,929,705 | | | | | |
| 1,370,000 | | | CAPITAL TRUST AGY FL CHRT SCH REVENUE | | 2/1/2035 | | | 5.38 | | | | 1,370,000 | | | | 1,420,676 | | | | | |
| 750,000 | | | CAPITAL TRUST AGY FL REVENUE | | 4/1/2035 | | | 7.00 | | | | 750,000 | | | | 755,760 | | | | | |
| 1,750,000 | | | CAPITAL TRUST AGY FL REVENUE(d) | | 12/1/2035 | | | 6.75 | | | | 1,746,021 | | | | 1,659,437 | | | | | |
| 750,000 | | | CAPITAL TRUST AGY FL REVENUE(d) | | 7/1/2037 | | | 6.75 | | | | 750,000 | | | | 752,175 | | | | | |
| 750,000 | | | CAPITAL TRUST AGY FL SENIOR LIVING REVENUE(d) | | 8/1/2027 | | | 5.00 | | | | 750,000 | | | | 770,888 | | | | | |
| 750,000 | | | CAPITAL TRUST AGY FL SENIOR LIVING REVENUE(d) | | 8/1/2032 | | | 5.38 | | | | 750,000 | | | | 781,935 | | | | | |
| 500,000 | | | CAPITAL TRUST AGY FL STUDENT HSG REVENUE(d) | | 12/1/2043 | | | 5.25 | | | | 515,031 | | | | 526,885 | | | | | |
| 1,000,000 | | | CARLSBAD CA UNIF SCH DIST (Step to 6.13% on 8/1/2021)(b) | | 8/1/2031 | | | 0.00 | | | | 907,175 | | | | 1,267,310 | | | | | |
| 252,893 | | | CARMEL IN REVENUE(c) | | 11/15/2022 | | | 6.00 | | | | 255,937 | | | | 6,702 | | | | | |
| 358,714 | | | CARMEL IN REVENUE(c) | | 11/15/2027 | | | 7.00 | | | | 352,542 | | | | 9,506 | | | | | |
| 750,000 | | | CELEBRATION POINTE CMNTY DEV DIST #1 FL SPL ASSMNT REVENUE(d) | | 5/1/2032 | | | 5.00 | | | | 754,553 | | | | 816,840 | | | | | |
| 1,000,000 | | | CENTRL BRADFORD PROGRESS AUTH PA | | 12/1/2031 | | | 5.50 | | | | 1,009,005 | | | | 1,080,990 | | | | | |
| 275,000 | | | CHANDLER PARK ACADEMY MI PUBLIC SCH ACADEMY REVENUE | | 11/1/2022 | | | 5.00 | | | | 251,205 | | | | 275,468 | | | | | |
| 1,000,000 | | | CHICAGO HEIGHTS IL | | 12/1/2029 | | | 4.50 | | | | 1,050,236 | | | | 1,091,630 | | | | | |
| 1,000,000 | | | CHICAGO IL MIDWAY ARPT REVENUE | | 1/1/2035 | | | 5.25 | | | | 1,001,081 | | | | 1,108,420 | | | | | |
| 1,000,000 | | | CHICAGO IL PARK DIST | | 1/1/2028 | | | 5.00 | | | | 1,083,476 | | | | 1,112,030 | | | | | |
| 1,000,000 | | | CLACKAMAS CNTY OR HOSP FAC AUTH REVENUE | | 11/15/2052 | | | 5.00 | | | | 1,042,719 | | | | 1,127,040 | | | | | |
| 1,500,000 | | | CLOVIS CA UNIF SCH DIST(g) | | 8/1/2030 | | | 0.00 | | | | 792,481 | | | | 945,435 | | | | | |
| 650,000 | | | CMWLTH FING AUTH PA TOBACCO MASTER SETTLEMENT PAYMENT REVENUE | | 6/1/2039 | | | 4.00 | | | | 646,937 | | | | 717,867 | | | | | |
| 1,350,000 | | | COBB CNTY GA DEV AUTH(d) | | 12/1/2039 | | | 5.00 | | | | 1,420,334 | | | | 1,423,332 | | | | | |
| 750,000 | | | COLLIER CNTY FL INDL DEV AUTH | | 10/1/2039 | | | 6.25 | | | | 737,466 | | | | 793,350 | | | | | |
| 750,000 | | | COLLIER CNTY FLA INDL DEV AUTH CONTINUING CARE CMNTY REVENUE(c)(d)(h) | | 5/15/2026 | | | 7.25 | | | | 750,000 | | | | 704,265 | | | | | |
| 1,750,000 | | | COLLIER CNTY FLA INDL DEV AUTH CONTINUING CARE CMNTY REVENUE(c)(d)(h) | | 5/15/2044 | | | 8.13 | | | | 1,913,765 | | | | 1,639,960 | | | | | |
| 500,000 | | | COLORADO SCIENCE AND TECH PARK MET DIST #1 | | 12/1/2033 | | | 5.00 | | | | 506,032 | | | | 533,555 | | | | | |
| 1,000,000 | | | COLORADO ST EDUCTNL & CULTURAL FACS AUTH REVENUE | | 7/1/2034 | | | 5.60 | | | | 995,029 | | | | 1,014,150 | | | | | |
| 1,000,000 | | | COLORADO ST EDUCTNL & CULTURAL FACS AUTH REVENUE(d) | | 9/1/2046 | | | 5.00 | | | | 1,004,743 | | | | 1,012,490 | | | | | |
| 1,250,000 | | | COLORADO ST HLTH FACS AUTH HOSP REVENUE | | 12/1/2048 | | | 5.00 | | | | 1,310,665 | | | | 1,445,862 | | | | | |
| 1,000,000 | | | COLORADO ST HLTH FACS AUTH REVENUE | | 8/1/2033 | | | 7.63 | | | | 989,523 | | | | 1,125,090 | | | | | |
| 1,000,000 | | | COLTON CA JT UNIF SCH DIST (Step to 5.80% on 8/1/2021)(b) | | 8/1/2035 | | | 0.00 | | | | 913,442 | | | | 1,150,370 | | | | | |
| See accompanying notes to financial statements. | 51 | (Continued) |
CLEARWATER INVESTMENT TRUST
Schedule of Investments - Clearwater Tax-Exempt Bond Fund
December 31, 2019
Par/Shares | | | Security | | Maturity
date | | Coupon
rate | | | Cost | | | Fair value (a) | | | Percent of
net assets | |
Municipal Bonds (Cont’d): | | | | | | | | | | | | | | | | | | |
| 1,500,000 | | | COLUMBUS-FRANKLIN CNTY OH FIN AUTH DEV REVENUE | | 5/15/2049 | | | 4.00 | | | $ | 1,602,716 | | | | 1,602,135 | | | | | |
| 1,000,000 | | | CONNECTICUT ST HSG FIN AUTH HSG FIN MTGE PROGRAM | | 11/15/2035 | | | 3.88 | | | | 1,000,000 | | | | 1,073,720 | | | | | |
| 515,000 | | | CONNECTICUT ST HSG FIN AUTH HSG MTGE FIN PROGRAM | | 5/15/2038 | | | 3.95 | | | | 515,000 | | | | 537,645 | | | | | |
| 2,000,000 | | | CONNECTICUT ST HSG FIN AUTH HSG MTGE FIN PROGRAM | | 5/15/2045 | | | 3.85 | | | | 2,066,612 | | | | 2,067,980 | | | | | |
| 5,000,000 | | | CONNECTICUT ST HSG FIN AUTH HSG MTGE FIN PROGRAM | | 11/15/2047 | | | 3.65 | | | | 5,000,000 | | | | 5,053,450 | | | | | |
| 650,000 | | | COPPER RIDGE MET DIST CO TAX INCR & SALES TAX SUPPORTED REVENUE | | 12/1/2043 | | | 5.00 | | | | 669,373 | | | | 675,792 | | | | | |
| 500,000 | | | COPPERLEAF CO MET DIST #2 | | 12/1/2030 | | | 5.25 | | | | 500,000 | | | | 522,345 | | | | | |
| 500,000 | | | COPPERLEAF CO MET DIST #2 | | 12/1/2045 | | | 5.75 | | | | 500,000 | | | | 522,245 | | | | | |
| 1,105,000 | | | CORONA-NORCO CA UNIF SCH DIST | | 8/1/2039 | | | 6.80 | | | | 1,104,115 | | | | 1,549,983 | | | | | |
| 637,000 | | | CORTLAND IL SPL TAX REVENUE(c) | | 3/1/2017 | | | 5.50 | | | | 633,881 | | | | 127,400 | | | | | |
| 500,000 | | | COVENTRY OH LOCAL SCH DIST | | 11/1/2037 | | | 5.25 | | | | 502,159 | | | | 529,550 | | | | | |
| 1,000,000 | | | CREEKWALK MARKETPLACE BUSINESS IMPT DIST CO(d) | | 12/1/2039 | | | 5.50 | | | | 1,000,000 | | | | 1,019,080 | | | | | |
| 750,000 | | | CRYSTAL CO CROSSING MET DIST | | 12/1/2040 | | | 5.25 | | | | 750,000 | | | | 786,443 | | | | | |
| 1,000,000 | | | DALLAS-FORT WORTH TX INTERNATIONAL ARPT REVENUE | | 11/1/2037 | | | 5.25 | | | | 1,005,504 | | | | 1,134,380 | | | | | |
| 2,000,000 | | | DAMON RUN IN CONSERVANCY DIST | | 7/1/2025 | | | 6.10 | | | | 2,000,000 | | | | 2,001,640 | | | | | |
| 1,000,000 | | | DAMON RUN IN CONSERVANCY DIST | | 1/1/2027 | | | 6.38 | | | | 1,000,000 | | | | 1,000,870 | | | | | |
| 1,350,000 | | | DANBURY TX HGR EDU AUTH INC EDU REVENUE | | 8/15/2049 | | | 5.13 | | | | 1,420,722 | | | | 1,419,984 | | | | | |
| 600,000 | | | DAUPHIN CNTY PA GEN AUTH UNIV REVENUE(d) | | 10/15/2022 | | | 4.00 | | | | 599,163 | | | | 615,390 | | | | | |
| 1,000,000 | | | DAVIE FL EDUCTNL FACS REVENUE | | 4/1/2042 | | | 6.00 | | | | 1,012,876 | | | | 1,120,030 | | | | | |
| 500,000 | | | DAVIESS CNTY IN HOSP ASSN LEASE RENTAL REVENUE | | 1/15/2029 | | | 5.25 | | | | 492,910 | | | | 515,650 | | | | | |
| 1,000,000 | | | DAYTON-MONTGOMERY CNTY OH PORT AUTH PROJ REVENUE | | 1/15/2040 | | | 7.00 | | | | 1,000,000 | | | | 1,020,710 | | | | | |
| 500,000 | | | DECATUR IL | | 3/1/2034 | | | 5.00 | | | | 509,387 | | | | 552,485 | | | | | |
| 1,000,000 | | | DEKALB/KANE/LA SALLE CNTYS IL CMNTY CLG DIST #523(g) | | 2/1/2029 | | | 0.00 | | | | 602,697 | | | | 589,770 | | | | | |
| 1,000,000 | | | DENVER CO URBAN RENEWAL AUTH TAX INCR REVENUE(d) | | 12/1/2039 | | | 5.25 | | | | 985,363 | | | | 1,068,230 | | | | | |
| 1,000,000 | | | DIATC MET DIST CO(d) | | 12/1/2049 | | | 5.00 | | | | 1,065,560 | | | | 1,060,630 | | | | | |
| 500,000 | | | DIST OF COLUMBIA HSG FIN AGY MF HSG REVENUE | | 7/1/2033 | | | 5.45 | | | | 500,000 | | | | 523,035 | | | | | |
| 1,000,000 | | | DIST OF COLUMBIA HSG FIN AGY MF HSG REVENUE | | 6/1/2040 | | | 4.90 | | | | 1,000,000 | | | | 1,057,310 | | | | | |
| 1,000,000 | | | DIST OF COLUMBIA HSG FIN AGY MF HSG REVENUE | | 6/1/2041 | | | 5.00 | | | | 1,000,000 | | | | 1,066,290 | | | | | |
| 1,200,000 | | | DIST OF COLUMBIA REVENUE | | 7/1/2037 | | | 5.00 | | | | 1,200,000 | | | | 1,294,056 | | | | | |
| 1,000,000 | | | DISTRICT OF COLUMBIA HSG FIN AGY | | 9/1/2043 | | | 4.05 | | | | 1,000,000 | | | | 1,082,240 | | | | | |
| 1,000,000 | | | DOUGLAS CNTY CO MF REVENUE | | 10/1/2029 | | | 4.50 | | | | 1,000,000 | | | | 1,038,170 | | | | | |
| 500,000 | | | DOWDEN WEST CMNTY DEV DIST FL SPL ASSMNT REVENUE(d) | | 5/1/2039 | | | 5.40 | | | | 500,000 | | | | 536,300 | | | | | |
| 1,000,000 | | | EAST CHICAGO IN SAN DIST REVENUE | | 7/15/2035 | | | 4.00 | | | | 993,270 | | | | 1,071,580 | | | | | |
| 2,045,000 | | | EDEN TWP CA HOSP DIST COPS | | 6/1/2030 | | | 6.00 | | | | 2,029,307 | | | | 2,086,984 | | | | | |
| 1,500,000 | | | EL PASO CNTY TX HOSP DIST | | 8/15/2043 | | | 5.00 | | | | 1,602,235 | | | | 1,594,410 | | | | | |
| 750,000 | | | EL PASO DE ROBLES CA REDEV AGY TAX ALLOCATION REVENUE | | 7/1/2033 | | | 6.38 | | | | 743,605 | | | | 753,053 | | | | | |
| 1,000,000 | | | EL PASO TX DOWNTOWN DEV CORP SPL REVENUE | | 8/15/2038 | | | 7.25 | | | | 1,041,787 | | | | 1,203,160 | | | | | |
| 1,000,000 | | | ENCINITAS CA UNION SCH DIST (Step to 6.75% on 8/1/2022)(b) | | 8/1/2035 | | | 0.00 | | | | 842,465 | | | | 1,308,890 | | | | | |
| 1,155,000 | | | ENTERPRISE CA ELEM SCH DIST (Step to 6.20% on 8/1/2021)(b) | | 8/1/2035 | | | 0.00 | | | | 1,048,557 | | | | 1,472,244 | | | | | |
| 1,000,000 | | | ESCAMBIA CNTY FL HSG FIN AUTH SF MTGE REVENUE | | 10/1/2049 | | | 3.75 | | | | 1,000,000 | | | | 1,045,600 | | | | | |
| 600,000 | | | ESCONDIDO CA SPL TAX | | 9/1/2036 | | | 5.00 | | | | 633,857 | | | | 698,964 | | | | | |
| 750,000 | | | EVANSVILLE IN MF HSG REVENUE | | 1/1/2038 | | | 5.45 | | | | 750,000 | | | | 789,675 | | | | | |
| 500,000 | | | FAIRFAX CNTY VA REDEV & HSG AUTH MF REVENUE | | 8/1/2039 | | | 5.60 | | | | 500,000 | | | | 501,235 | | | | | |
| 550,000 | | | FALLBROOK TX UTILITY DIST | | 9/1/2024 | | | 4.00 | | | | 557,257 | | | | 556,914 | | | | | |
| 715,000 | | | FISHHAWK CCD IV FL SPL ASSMNT REVENUE | | 5/1/2033 | | | 7.00 | | | | 715,000 | | | | 802,587 | | | | | |
| See accompanying notes to financial statements. | 52 | (Continued) |
CLEARWATER INVESTMENT TRUST
Schedule of Investments - Clearwater Tax-Exempt Bond Fund
December 31, 2019
Par/Shares | | | Security | | Maturity
date | | Coupon
rate | | | Cost | | | Fair value (a) | | | Percent of
net assets | |
Municipal Bonds (Cont’d): | | | | | | | | | | | | | | | | | | |
| 1,000,000 | | | FLORIDA ST DEV FIN CORP EDUCTNL FACS REVENUE(d) | | 6/15/2035 | | | 6.00 | | | $ | 1,000,880 | | | | 1,103,740 | | | | | |
| 125,000 | | | FLORIDA ST HSG FIN CORP REVENUE | | 7/1/2026 | | | 5.00 | | | | 125,031 | | | | 125,610 | | | | | |
| 805,000 | | | FLORIDA ST HSG FIN CORP REVENUE | | 7/1/2035 | | | 3.75 | | | | 805,000 | | | | 849,782 | | | | | |
| 565,000 | | | FLORIDA ST HSG FIN CORP REVENUE | | 7/1/2039 | | | 4.20 | | | | 565,000 | | | | 588,928 | | | | | |
| 2,000,000 | | | FLORIDA ST HSG FIN CORP REVENUE | | 1/1/2045 | | | 4.20 | | | | 2,000,000 | | | | 2,158,460 | | | | | |
| 1,000,000 | | | FLORIDA ST HSG FIN CORP REVENUE | | 7/1/2049 | | | 3.30 | | | | 1,000,000 | | | | 1,026,440 | | | | | |
| 1,090,000 | | | FORT SILL APACHE TRIBE OK ECON DEV AUTH GAMING ENTERPRISE REVENUE(d) | | 8/25/2026 | | | 8.50 | | | | 1,090,000 | | | | 1,194,106 | | | | | |
| 1,000,000 | | | FRANKLIN CNTY KS UNIF SCH DIST #290 | | 9/1/2039 | | | 4.75 | | | | 1,034,567 | | | | 1,133,990 | | | | | |
| 1,000,000 | | | FRANKLIN TN HLTH & EDUCTNL FACS BRD REVENUE(d) | | 6/1/2027 | | | 6.50 | | | | 1,000,000 | | | | 1,055,890 | | | | | |
| 845,000 | | | FULTON CNTY GA DEV AUTH | | 11/1/2028 | | | 5.25 | | | | 739,249 | | | | 845,228 | | | | | |
| 3,500,000 | | | GEORGIA ST HSG & FIN AUTH REVENUE | | 12/1/2037 | | | 3.80 | | | | 3,500,000 | | | | 3,616,410 | | | | | |
| 2,000,000 | | | GEORGIA ST HSG & FIN AUTH REVENUE | | 12/1/2037 | | | 4.00 | | | | 2,000,000 | | | | 2,049,760 | | | | | |
| 925,000 | | | GEORGIA ST HSG & FIN AUTH REVENUE | | 12/1/2038 | | | 3.85 | | | | 925,000 | | | | 999,749 | | | | | |
| 675,000 | | | GEORGIA ST HSG & FIN AUTH REVENUE | | 12/1/2039 | | | 4.00 | | | | 675,000 | | | | 725,234 | | | | | |
| 2,500,000 | | | GEORGIA ST HSG & FIN AUTH REVENUE | | 12/1/2040 | | | 3.80 | | | | 2,500,000 | | | | 2,625,775 | | | | | |
| 1,000,000 | | | GEORGIA ST HSG & FIN AUTH REVENUE | | 12/1/2041 | | | 3.85 | | | | 1,002,960 | | | | 1,030,640 | | | | | |
| 1,950,000 | | | GEORGIA ST HSG & FIN AUTH REVENUE | | 12/1/2043 | | | 3.90 | | | | 1,941,616 | | | | 2,003,898 | | | | | |
| 1,100,000 | | | GEORGIA ST HSG & FIN AUTH REVENUE | | 12/1/2048 | | | 4.00 | | | | 1,100,000 | | | | 1,175,713 | | | | | |
| 2,000,000 | | | GEORGIA ST HSG & FIN AUTH REVENUE | | 12/1/2048 | | | 4.20 | | | | 2,013,437 | | | | 2,173,960 | | | | | |
| 1,750,000 | | | GEORGIA ST HSG & FIN AUTH REVENUE | | 12/1/2049 | | | 3.25 | | | | 1,750,000 | | | | 1,782,445 | | | | | |
| 700,000 | | | GLENDALE AZ INDL DEV AUTH | | 11/15/2036 | | | 5.00 | | | | 723,685 | | | | 755,762 | | | | | |
| 550,000 | | | GLENDALE AZ INDL DEV AUTH | | 11/15/2046 | | | 5.25 | | | | 557,880 | | | | 592,268 | | | | | |
| 1,500,000 | | | GRAND PARKWAY TRANSPRTN CORP TX SYS TOLL REVENUE (Step to 5.50%on 10/1/2023)(b) | | 10/1/2035 | | | 0.00 | | | | 1,222,878 | | | | 1,635,480 | | | | | |
| 950,000 | | | HAMILTON CNTY OH HLTH CARE REVENUE | | 1/1/2031 | | | 6.13 | | | | 931,397 | | | | 992,379 | | | | | |
| 650,000 | | | HARBOR BAY FL CDD CAPITAL IMPT REVENUE | | 5/1/2048 | | | 4.10 | | | | 645,653 | | | | 642,447 | | | | | |
| 1,500,000 | | | HARTNELL CA CMNTY CLG DIST (Step to 7.00% on 8/1/2022)(b) | | 8/1/2034 | | | 0.00 | | | | 1,255,725 | | | | 1,756,140 | | | | | |
| 500,000 | | | HASKINS STATION CO MET DIST | | 12/1/2039 | | | 5.00 | | | | 516,689 | | | | 516,465 | | | | | |
| 3,500,000 | | | HEALDSBURG CA UNIF SCH DIST (Step to 4.60% on 8/1/2022)(b) | | 8/1/2037 | | | 0.00 | | | | 3,109,418 | | | | 3,545,465 | | | | | |
| 1,000,000 | | | HELENDALE CA SCH DIST | | 8/1/2034 | | | 6.25 | | | | 999,065 | | | | 1,366,490 | | | | | |
| 750,000 | | | HEMPSTEAD TOWN NY LOCAL DEV CORP REVENUE | | 9/1/2038 | | | 5.00 | | | | 753,213 | | | | 831,742 | | | | | |
| 800,000 | | | HERITAGE HARBOUR FL N CDD SPL ASSMNT | | 5/1/2034 | | | 5.00 | | | | 800,000 | | | | 883,496 | | | | | |
| 1,000,000 | | | HIDALGO CNTY TX REGL MOBILITY AUTH VEHICLE REGISTRATION FEE | | 12/1/2038 | | | 5.25 | | | | 1,016,236 | | | | 1,140,610 | | | | | |
| 1,500,000 | | | HOUSTON TX HGR EDU FIN CORP | | 9/1/2038 | | | 5.50 | | | | 1,518,453 | | | | 1,655,370 | | | | | |
| 500,000 | | | HUNTERS OVERLOOK METRO DIST #5 CO | | 12/1/2049 | | | 5.00 | | | | 528,673 | | | | 529,305 | | | | | |
| 655,000 | | | IDAHO ST HLTH FACS AUTH REVENUE | | 10/1/2024 | | | 7.00 | | | | 655,000 | | | | 723,317 | | | | | |
| 750,000 | | | IDAHO ST HLTH FACS AUTH REVENUE | | 10/1/2029 | | | 7.38 | | | | 743,508 | | | | 825,660 | | | | | |
| 1,000,000 | | | IDAHO ST HLTH FACS AUTH REVENUE | | 10/1/2044 | | | 8.00 | | | | 1,043,800 | | | | 1,114,940 | | | | | |
| 1,500,000 | | | ILLINOIS ST | | 2/1/2030 | | | 4.00 | | | | 1,493,777 | | | | 1,649,340 | | | | | |
| 500,000 | | | ILLINOIS ST | | 7/1/2033 | | | 5.50 | | | | 498,790 | | | | 547,850 | | | | | |
| 1,000,000 | | | ILLINOIS ST EDUCTNL FACS AUTH | | 11/1/2036 | | | 4.50 | | | | 1,000,000 | | | | 1,075,860 | | | | | |
| 675,000 | | | ILLINOIS ST FIN AUTH EDUCTNL FAC REVENUE | | 2/1/2034 | | | 6.00 | | | | 679,815 | | | | 738,052 | | | | | |
| 500,000 | | | ILLINOIS ST FIN AUTH REVENUE | | 5/15/2036 | | | 5.00 | | | | 501,331 | | | | 537,430 | | | | | |
| 750,000 | | | ILLINOIS ST FIN AUTH REVENUE | | 12/1/2037 | | | 5.00 | | | | 766,131 | | | | 822,780 | | | | | |
| 500,000 | | | ILLINOIS ST FIN AUTH REVENUE | | 5/1/2038 | | | 5.25 | | | | 508,790 | | | | 543,865 | | | | | |
| 1,450,000 | | | ILLINOIS ST FIN AUTH REVENUE | | 5/15/2038 | | | 5.13 | | | | 1,410,030 | | | | 1,522,906 | | | | | |
| See accompanying notes to financial statements. | 53 | (Continued) |
CLEARWATER INVESTMENT TRUST
Schedule of Investments - Clearwater Tax-Exempt Bond Fund
December 31, 2019
Par/Shares | | | Security | | Maturity
date | | Coupon
rate | | | Cost | | | Fair value (a) | | | Percent of
net assets | |
Municipal Bonds (Cont’d): | | | | | | | | | | | | | | | | | | |
| 1,000,000 | | | ILLINOIS ST FIN AUTH REVENUE | | 5/15/2045 | | | 5.00 | | | $ | 1,057,701 | | | | 1,093,090 | | | | | |
| 2,000,000 | | | ILLINOIS ST HSG DEV AUTH MF REVENUE | | 7/1/2044 | | | 3.15 | | | | 2,000,000 | | | | 2,013,320 | | | | | |
| 980,000 | | | ILLINOIS ST HSG DEV AUTH REVENUE | | 4/1/2041 | | | 3.88 | | | | 980,000 | | | | 1,043,769 | | | | | |
| 1,000,000 | | | ILLINOIS ST SALES TAX REVENUE | | 6/15/2033 | | | 5.00 | | | | 1,071,097 | | | | 1,146,410 | | | | | |
| 1,500,000 | | | ILLINOIS ST SPORTS FACS AUTH | | 6/15/2031 | | | 5.25 | | | | 1,568,897 | | | | 1,686,525 | | | | | |
| 1,000,000 | | | IMPERIAL CA CMNTY CLG DIST | | 8/1/2040 | | | 6.75 | | | | 1,007,376 | | | | 1,299,810 | | | | | |
| 3,000,000 | | | INDIANA ST FIN AUTH REVENUE | | 9/15/2030 | | | 6.50 | | | | 3,019,087 | | | | 3,265,620 | | | | | |
| 500,000 | | | INDIANA ST FIN AUTH REVENUE | | 11/15/2031 | | | 5.50 | | | | 494,404 | | | | 529,710 | | | | | |
| 1,000,000 | | | INDIANA ST FIN AUTH REVENUE | | 11/15/2033 | | | 6.50 | | | | 988,694 | | | | 1,128,010 | | | | | |
| 1,000,000 | | | INDIANA ST FIN AUTH REVENUE | | 3/1/2041 | | | 5.00 | | | | 1,020,528 | | | | 1,081,930 | | | | | |
| 500,000 | | | INDIANA ST FIN AUTH REVENUE | | 11/15/2041 | | | 5.88 | | | | 524,170 | | | | 560,725 | | | | | |
| 1,000,000 | | | INDIANA ST FIN AUTH REVENUE | | 11/15/2041 | | | 6.00 | | | | 987,905 | | | | 1,127,990 | | | | | |
| 1,000,000 | | | INDIANA ST FIN AUTH REVENUE | | 11/15/2046 | | | 5.25 | | | | 1,030,757 | | | | 1,132,150 | | | | | |
| 1,500,000 | | | INDIANA ST HSG & CMNTY DEV AUTH MF HSG REVENUE | | 1/1/2036 | | | 5.75 | | | | 1,500,000 | | | | 1,531,905 | | | | | |
| 1,500,000 | | | IOWA ST FIN AUTH REVENUE | | 5/15/2036 | | | 5.00 | | | | 1,623,915 | | | | 1,682,745 | | | | | |
| 710,000 | | | IRON MOUNTAIN MET DIST #2 CO | | 12/1/2049 | | | 5.00 | | | | 723,959 | | | | 723,440 | | | | | |
| 700,000 | | | KALISPEL TRIBE OF INDIANS PRIORITY DIST WA REVENUE(d) | | 1/1/2038 | | | 5.25 | | | | 686,391 | | | | 804,776 | | | | | |
| 485,000 | | | KANSAS CITY MO INDL DEV AUTH | | 9/1/2023 | | | 5.45 | | | | 485,000 | | | | 491,548 | | | | | |
| 1,000,000 | | | KANSAS CITY MO INDL DEV AUTH | | 11/20/2039 | | | 5.10 | | | | 1,000,000 | | | | 1,002,890 | | | | | |
| 1,300,000 | | | KANSAS CITY MO INDL DEV AUTH SENIOR LIVING FACS REVENUE(c)(d)(h) | | 11/15/2036 | | | 5.75 | | | | 1,300,000 | | | | 1,039,480 | | | | | |
| 885,000 | | | KENTUCKY ST HSG CORP HSG REVENUE | | 7/1/2028 | | | 3.75 | | | | 875,464 | | | | 925,453 | | | | | |
| 550,000 | | | KING CNTY WA HSG AUTH | | 5/1/2028 | | | 5.20 | | | | 550,000 | | | | 551,639 | | | | | |
| 1,500,000 | | | KING CNTY WA HSG AUTH | | 11/1/2039 | | | 3.00 | | | | 1,466,989 | | | | 1,514,805 | | | | | |
| 1,000,000 | | | KIRKWOOD MO INDL DEV AUTH RETMNT CMNTY REVENUE | | 5/15/2037 | | | 5.25 | | | | 1,018,287 | | | | 1,134,250 | | | | | |
| 500,000 | | | LAKE CNTY IL SCH DIST #33 | | 12/1/2040 | | | 5.00 | | | | 518,091 | | | | 547,790 | | | | | |
| 750,000 | | | LAKE CNTY OH PORT & ECON DEV AUTH LEASE REVENUE(d) | | 12/1/2037 | | | 6.50 | | | | 750,000 | | | | 758,250 | | | | | |
| 240,000 | | | LAKEWOOD RANCH FL STEWARDSHIP DIST SPL ASSMNT REVENUE | | 5/1/2025 | | | 4.25 | | | | 239,655 | | | | 247,728 | | | | | |
| 1,600,000 | | | LAKEWOOD RANCH FL STEWARDSHIP DIST SPL ASSMNT REVENUE | | 5/1/2030 | | | 7.40 | | | | 1,588,580 | | | | 1,706,032 | | | | | |
| 730,000 | | | LAKEWOOD RANCH FL STEWARDSHIP DIST SPL ASSMNT REVENUE | | 5/1/2033 | | | 6.70 | | | | 730,000 | | | | 793,160 | | | | | |
| 1,000,000 | | | LAKEWOOD RANCH FL STEWARDSHIP DIST SPL ASSMNT REVENUE | | 5/1/2034 | | | 5.35 | | | | 1,000,000 | | | | 1,109,580 | | | | | |
| 1,300,000 | | | LAKEWOOD RANCH FL STEWARDSHIP DIST SPL ASSMNT REVENUE | | 5/1/2036 | | | 5.00 | | | | 1,300,000 | | | | 1,380,847 | | | | | |
| 750,000 | | | LAKEWOOD RANCH FL STEWARDSHIP DIST SPL ASSMNT REVENUE(d) | | 5/1/2037 | | | 5.00 | | | | 744,832 | | | | 805,567 | | | | | |
| 750,000 | | | LAKEWOOD RANCH FL STEWARDSHIP DIST SPL ASSMNT REVENUE | | 5/1/2037 | | | 5.25 | | | | 745,722 | | | | 822,465 | | | | | |
| 700,000 | | | LAKEWOOD RANCH FL STEWARDSHIP DIST SPL ASSMNT REVENUE | | 5/1/2038 | | | 5.00 | | | | 700,000 | | | | 743,988 | | | | | |
| 1,000,000 | | | LAKEWOOD RANCH FL STEWARDSHIP DIST SPL ASSMNT REVENUE | | 5/1/2039 | | | 5.30 | | | | 1,000,000 | | | | 1,092,180 | | | | | |
| 630,000 | | | LAKEWOOD RANCH FL STEWARDSHIP DIST SPL ASSMNT REVENUE | | 5/1/2049 | | | 4.00 | | | | 626,749 | | | | 630,945 | | | | | |
| 500,000 | | | LAKEWOOD RANCH FL STEWARDSHIP DIST SPL ASSMNT REVENUE | | 5/1/2049 | | | 4.50 | | | | 492,772 | | | | 517,190 | | | | | |
| 940,000 | | | LAKEWOOD RANCH FL STEWARDSHIP DIST SPL ASSMNT REVENUE | | 5/1/2050 | | | 4.00 | | | | 925,317 | | | | 930,168 | | | | | |
| 1,000,000 | | | LAMBERTSON FARMS CO MET DIST #1 REVENUE | | 12/15/2025 | | | 5.00 | | | | 991,140 | | | | 1,019,390 | | | | | |
| 500,000 | | | LAMBERTSON FARMS CO MET DIST #1 REVENUE | | 12/15/2035 | | | 5.50 | | | | 500,000 | | | | 515,160 | | | | | |
| 750,000 | | | LEWISVILLE TX COMB CONTRACT REVENUE | | 9/1/2024 | | | 3.00 | | | | 745,150 | | | | 774,743 | | | | | |
| 465,000 | | | LEXINGTON OAKS FL CDD SPL ASSMNT REVENUE | | 5/1/2033 | | | 5.65 | | | | 465,000 | | | | 482,517 | | | | | |
| 750,000 | | | LEYDEN ROCK MET DIST #10 | | 12/1/2045 | | | 5.00 | | | | 766,488 | | | | 786,083 | | | | | |
| 1,000,000 | | | LITTLETON VLG MET DIST #2 COLO SPL REVENUE | | 12/1/2045 | | | 5.38 | | | | 996,498 | | | | 1,038,700 | | | | | |
| 315,000 | | | LONG LAKE RANCH CMNTY DEV DIST FLA CAP IMPT REVENUE | | 5/1/2024 | | | 5.63 | | | | 315,000 | | | | 325,773 | | | | | |
| See accompanying notes to financial statements. | 54 | (Continued) |
CLEARWATER INVESTMENT TRUST
Schedule of Investments - Clearwater Tax-Exempt Bond Fund
December 31, 2019
| | | | | | | | | | | | | | | | | | | | | | |
Par/Shares | | | Security | | Maturity
date | | Coupon
rate | | | Cost | | | Fair value (a) | | | Percent of
net assets | |
Municipal Bonds (Cont’d): | | | | | | | | | | | | | | | | | | |
| 225,000 | | | LONG LAKE RANCH CMNTY DEV DIST FLA CAP IMPT REVENUE | | 5/1/2026 | | | 4.00 | | | $ | 224,750 | | | | 229,691 | | | | | |
| 500,000 | | | LONG LAKE RESERVE CMNTY DEV DIST SPL ASSMNT | | 5/1/2038 | | | 5.00 | | | | 498,785 | | | | 528,915 | | | | | |
| 1,000,000 | | | LOUISIANA ST ENERGY & PWR AUTH PWR PROJ REVENUE | | 6/1/2038 | | | 5.25 | | | | 1,009,294 | | | | 1,114,530 | | | | | |
| 650,000 | | | LOUISIANA ST LOCAL GOVT ENVRNMNTL FACS & CMNTY DEV AUTH | | 11/15/2025 | | | 5.25 | | | | 686,029 | | | | 706,927 | | | | | |
| 1,000,000 | | | LOUISIANA ST LOCAL GOVT ENVRNMNTL FACS & CMNTY DEV AUTH | | 11/15/2030 | | | 6.00 | | | | 1,012,250 | | | | 1,136,610 | | | | | |
| 700,000 | | | LOUISIANA ST LOCAL GOVT ENVRNMNTL FACS & CMNTY DEV AUTH REVENUE(d) | | 11/1/2037 | | | 5.65 | | | | 700,000 | | | | 785,708 | | | | | |
| 1,000,000 | | | LOUISIANA ST LOCAL GOVT ENVRNMNTL FACS & CMNTY DEV AUTH REVENUE(d) | | 7/1/2039 | | | 5.00 | | | | 1,066,934 | | | | 1,095,730 | | | | | |
| 700,000 | | | LOUISIANA ST LOCAL GOVT ENVRNMNTL FACS & CMNTY DEV AUTH REVENUE(d) | | 11/1/2039 | | | 5.50 | | | | 700,000 | | | | 753,907 | | | | | |
| 1,100,000 | | | LOUISIANA ST LOCAL GOVT ENVRNMNTL FACS & CMNTY DEV AUTH REVENUE(d) | | 11/1/2044 | | | 4.00 | | | | 1,100,000 | | | | 1,113,343 | | | | | |
| 750,000 | | | LOUISIANA ST LOCAL GOVT ENVRNMNTL FACS & CMNTY DEV AUTH REVENUE(d) | | 11/1/2044 | | | 4.40 | | | | 750,000 | | | | 786,315 | | | | | |
| 500,000 | | | LOUISIANA ST PUBLIC FACS AUTH HOSP REVENUE | | 7/1/2035 | | | 5.00 | | | | 530,011 | | | | 570,528 | | | | | |
| 750,000 | | | LOUISIANA ST PUBLIC FACS AUTH REVENUE | | 5/1/2031 | | | 6.50 | | | | 747,567 | | | | 801,983 | | | | | |
| 400,000 | | | LOUISIANA ST PUBLIC FACS AUTH REVENUE (Floating, ICE LIBOR USD 3M + 0.70%)(e) | | 2/15/2036 | | | 1.98 | | | | 400,000 | | | | 395,076 | | | | | |
| 500,000 | | | LT RANCH CDD FL CAPITAL IMPT REVENUE | | 5/1/2040 | | | 4.00 | | | | 506,324 | | | | 505,895 | | | | | |
| 500,000 | | | LUCAS CNTY OH HLTH CARE FACS REVENUE | | 8/15/2030 | | | 5.50 | | | | 494,034 | | | | 527,210 | | | | | |
| 1,500,000 | | | LUCAS MET HSG AUTH OH COPS | | 11/1/2036 | | | 5.00 | | | | 1,553,613 | | | | 1,653,525 | | | | | |
| 1,000,000 | | | MACON & MOULTRIE CNTYS IL CMNTY SCH DIST #3 MOUNT ZION | | 12/1/2041 | | | 5.50 | | | | 1,016,133 | | | | 1,118,330 | | | | | |
| 1,000,000 | | | MACON CNTY IL SCH DIST #61 | | 1/1/2037 | | | 5.25 | | | | 1,004,526 | | | | 1,034,110 | | | | | |
| 1,080,000 | | | MACOUPIN SANGAMON & MONTGOMERY CNTYS IL CMNTY SCH DIST #34 | | 12/1/2037 | | | 4.25 | | | | 1,104,587 | | | | 1,153,915 | | | | | |
| 250,000 | | | MAGNOLIA CREEK FL CDD CAPITAL IMPT REVENUE(c) | | 5/1/2014 | | | 5.60 | | | | 250,000 | | | | 45,000 | | | | | |
| 1,000,000 | | | MAINE ST HSG AUTH MTGE PURCHASE | | 11/15/2035 | | | 4.00 | | | | 1,000,000 | | | | 1,061,630 | | | | | |
| 1,000,000 | | | MAINE ST HSG AUTH MTGE PURCHASE | | 11/15/2036 | | | 3.90 | | | | 1,000,000 | | | | 1,070,370 | | | | | |
| 1,500,000 | | | MAINE ST HSG AUTH MTGE PURCHASE | | 11/15/2040 | | | 3.85 | | | | 1,500,000 | | | | 1,573,365 | | | | | |
| 500,000 | | | MAINE ST HSG AUTH MTGE PURCHASE | | 11/15/2042 | | | 4.05 | | | | 500,000 | | | | 531,900 | | | | | |
| 900,000 | | | MAINE ST HSG AUTH MTGE PURCHASE | | 11/15/2044 | | | 3.10 | | | | 900,000 | | | | 911,115 | | | | | |
| 430,000 | | | MAINE ST HSG AUTH MTGE REVENUE | | 11/15/2037 | | | 4.50 | | | | 430,000 | | | | 450,679 | | | | | |
| 1,000,000 | | | MALTA IL TAX INCR REVENUE(c) | | 12/30/2025 | | | 5.75 | | | | 1,000,000 | | | | 320,000 | | | | | |
| 500,000 | | | MANATEE CNTY FL SCH BRD COPS | | 7/1/2031 | | | 5.63 | | | | 496,839 | | | | 533,445 | | | | | |
| 800,000 | | | MARICOPA CNTY AZ INDL DEV AUTH EDU REVENUE | | 7/1/2035 | | | 5.00 | | | | 842,142 | | | | 871,576 | | | | | |
| 750,000 | | | MARICOPA CNTY AZ INDL DEV AUTH SENIOR LIVING FACS REVENUE(d) | | 1/1/2036 | | | 5.75 | | | | 742,216 | | | | 786,915 | | | | | |
| 462,000 | | | MARQUIS VA CMNTY DEV AUTH REVENUE(g) | | 9/1/2041 | | | 0.00 | | | | 153,152 | | | | 27,826 | | | | | |
| 349,000 | | | MARQUIS VA CMNTY DEV AUTH REVENUE | | 9/1/2041 | | | 5.63 | | | | 374,261 | | | | 223,266 | | | | | |
| 740,000 | | | MARSHALL CREEK FL CDD SPL ASSMNT | | 5/1/2032 | | | 5.00 | | | | 752,085 | | | | 767,239 | | | | | |
| 750,000 | | | MARTINEZ CA UNIF SCH DIST | | 8/1/2035 | | | 6.13 | | | | 747,758 | | | | 923,835 | | | | | |
| 500,000 | | | MARYLAND ST CMNTY DEV ADMIN DEPT HSG & CMNTY DEV | | 7/1/2031 | | | 4.50 | | | | 500,000 | | | | 521,055 | | | | | |
| 574,545 | | | MASHANTUCKET WSTRN PEQUOT TRIBE CT | | 7/1/2031 | | | 6.05 | | | | 590,486 | | | | 17,236 | | | | | |
| 730,000 | | | MASSACHUSETTS ST DEV FIN AGY REVENUE | | 7/1/2030 | | | 6.38 | | | | 723,095 | | | | 748,644 | | | | | |
| See accompanying notes to financial statements. | 55 | (Continued) |
CLEARWATER INVESTMENT TRUST
Schedule of Investments - Clearwater Tax-Exempt Bond Fund
December 31, 2019
| | | | | | | | | | | | | | | | | | | | | | |
Par/Shares | | | Security | | Maturity
date | | Coupon
rate | | | Cost | | | Fair value (a) | | | Percent of
net assets | |
Municipal Bonds (Cont’d): | | | | | | | | | | | | | | | | | | |
| 700,000 | | | MASSACHUSETTS ST DEV FIN AGY REVENUE(d) | | 10/1/2047 | | | 5.00 | | | $ | 745,918 | | | | 768,642 | | | | | |
| 1,500,000 | | | MASSACHUSETTS ST DEV FIN AGY REVENUE | | 6/1/2049 | | | 4.00 | | | | 1,517,610 | | | | 1,591,200 | | | | | |
| 375,000 | | | MASSACHUSETTS ST EDUCTNL FING AUTH | | 1/1/2028 | | | 5.25 | | | | 375,000 | | | | 375,338 | | | | | |
| 700,000 | | | MASSACHUSETTS ST HSG FIN AGY | | 12/1/2033 | | | 5.00 | | | | 700,000 | | | | 748,601 | | | | | |
| 700,000 | | | MASSACHUSETTS ST HSG FIN AGY | | 12/1/2038 | | | 5.15 | | | | 700,000 | | | | 748,391 | | | | | |
| 1,000,000 | | | MASSACHUSETTS ST HSG FIN AGY | | 12/1/2043 | | | 5.00 | | | | 1,000,000 | | | | 1,073,690 | | | | | |
| 2,770,000 | | | MASSACHUSETTS ST HSG FIN AGY HSG REVENUE | | 12/1/2043 | | | 4.00 | | | | 2,770,000 | | | | 2,847,975 | | | | | |
| 1,975,000 | | | MASSACHUSETTS ST HSG FIN AGY HSG REVENUE | | 6/1/2046 | | | 4.20 | | | | 1,975,000 | | | | 2,119,787 | | | | | |
| 160,000 | | | MEAD NE TAX INCR REVENUE(c) | | 7/1/2012 | | | 5.13 | | | | 160,000 | | | | 6,640 | | | | | |
| 1,750,000 | | | MECKLENBURG CNTY NC MF HSG REVENUE | | 1/1/2036 | | | 5.38 | | | | 1,750,000 | | | | 1,778,455 | | | | | |
| 1,000,000 | | | MEDFORD OR HOSP FACS AUTH REVENUE | | 10/1/2042 | | | 5.00 | | | | 1,022,252 | | | | 1,082,840 | | | | | |
| 600,000 | | | MERRILLVILLE IN ECON DEV REVENUE | | 4/1/2036 | | | 5.75 | | | | 600,000 | | | | 600,876 | | | | | |
| 500,000 | | | MET PIER & EXPOSITION AUTH IL REVENUE | | 6/15/2057 | | | 5.00 | | | | 519,265 | | | | 556,860 | | | | | |
| 135,000 | | | MIAMI-DADE CNTY FL HLTH FACS AUTH HOSP REVENUE | | 8/1/2030 | | | 6.00 | | | | 131,055 | | | | 138,393 | | | | | |
| 750,000 | | | MICHIGAN ST FIN AUTH REVENUE | | 11/15/2035 | | | 5.25 | | | | 745,967 | | | | 804,570 | | | | | |
| 1,850,000 | | | MICHIGAN ST HSG DEV AUTH | | 10/1/2035 | | | 4.10 | | | | 1,850,000 | | | | 1,969,954 | | | | | |
| 1,000,000 | | | MICHIGAN ST HSG DEV AUTH | | 12/1/2036 | | | 3.70 | | | | 1,000,000 | | | | 1,057,590 | | | | | |
| 600,000 | | | MICHIGAN ST HSG DEV AUTH | | 10/1/2042 | | | 3.75 | | | | 600,000 | | | | 631,026 | | | | | |
| 1,650,000 | | | MICHIGAN ST HSG DEV AUTH | | 10/1/2043 | | | 4.00 | | | | 1,650,000 | | | | 1,771,753 | | | | | |
| 1,000,000 | | | MICHIGAN ST HSG DEV AUTH | | 10/1/2054 | | | 3.50 | | | | 1,000,000 | | | | 1,018,900 | | | | | |
| 2,500,000 | | | MICHIGAN ST HSG DEV AUTH SF MTGE REVENUE | | 12/1/2038 | | | 4.13 | | | | 2,500,000 | | | | 2,738,775 | | | | | |
| 1,000,000 | | | MICHIGAN ST HSG DEV AUTH SF MTGE REVENUE | | 6/1/2049 | | | 4.00 | | | | 1,003,508 | | | | 1,069,620 | | | | | |
| 3,000,000 | | | MICHIGAN ST HSG DEV AUTH SF MTGE REVENUE | | 6/1/2050 | | | 3.15 | | | | 3,000,000 | | | | 3,021,750 | | | | | |
| 460,000 | | | MICHIGAN ST PUBLIC EDUCTNL FACS AUTH | | 11/1/2028 | | | 6.35 | | | | 460,000 | | | | 460,938 | | | | | |
| 1,000,000 | | | MISHAWAKA IN MF HSG REVENUE(d) | | 1/1/2038 | | | 5.38 | | | | 1,000,000 | | | | 1,035,120 | | | | | |
| 1,000,000 | | | MISSISSIPPI ST DEV BANK SPL OBLG | | 10/1/2031 | | | 6.50 | | | | 979,868 | | | | 1,047,920 | | | | | |
| 1,000,000 | | | MISSISSIPPI ST DEV BANK SPL OBLG(d) | | 11/1/2039 | | | 4.55 | | | | 1,000,000 | | | | 1,038,260 | | | | | |
| 2,000,000 | | | MISSOURI ST HLTH & EDUCTNL FACS AUTH | | 2/1/2048 | | | 4.00 | | | | 2,083,470 | | | | 2,085,560 | | | | | |
| 945,000 | | | MISSOURI ST HSG DEV COMMISSION SF MTGE REVENUE | | 11/1/2048 | | | 3.80 | | | | 945,000 | | | | 1,005,007 | | | | | |
| 500,000 | | | MISSOURI ST HSG DEV COMMISSION SF MTGE REVENUE | | 11/1/2049 | | | 3.35 | | | | 500,000 | | | | 512,690 | | | | | |
| 1,250,000 | | | MONROE CNTY NY INDL DEV CORP REVENUE | | 1/1/2050 | | | 5.00 | | | | 1,341,719 | | | | 1,350,512 | | | | | |
| 885,000 | | | MONTANA ST BRD OF HSG | | 12/1/2038 | | | 3.75 | | | | 885,000 | | | | 911,329 | | | | | |
| 560,000 | | | MONTANA ST BRD OF HSG | | 12/1/2038 | | | 5.20 | | | | 560,000 | | | | 605,662 | | | | | |
| 995,000 | | | MONTANA ST BRD OF HSG | | 6/1/2045 | | | 4.00 | | | | 995,000 | | | | 1,073,555 | | | | | |
| 895,000 | | | MONTANA ST BRD OF HSG SF MTGE | | 12/1/2037 | | | 3.95 | | | | 895,000 | | | | 962,429 | | | | | |
| 800,000 | | | MONTANA ST BRD OF HSG SF MTGE | | 12/1/2038 | | | 4.00 | | | | 801,919 | | | | 854,432 | | | | | |
| 500,000 | | | MONTGOMERY CNTY MD HSG OPPORTUNITIES COMMISSION MF REVENUE | | 7/1/2037 | | | 5.13 | | | | 500,000 | | | | 507,495 | | | | | |
| 890,000 | | | MONTGOMERY CNTY MD HSG OPPORTUNITIES COMMISSION SF MTGE REVENUE | | 7/1/2038 | | | 4.00 | | | | 890,000 | | | | 903,386 | | | | | |
| 700,000 | | | MORONGO BAND OF MISSION INDIANS CA REVENUE(d) | | 10/1/2042 | | | 5.00 | | | | 700,000 | | | | 803,467 | | | | | |
| 611,972 | | | MOUNT CARBON CO MET DIST REVENUE | | 6/1/2043 | | | 7.00 | | | | 611,972 | | | | 611,972 | | | | | |
| 200,000 | | | MOUNT CARBON CO MET DIST REVENUE(c) | | 6/1/2043 | | | 8.00 | | | | - | | | | 44,000 | | | | | |
| 500,000 | | | MULTNOMAH CNTY OR HOSP FACS AUTH REVENUE | | 12/1/2029 | | | 5.00 | | | | 513,622 | | | | 539,310 | | | | | |
| 615,000 | | | MUNSTER IN ECON DEV TAX INCR REVENUE | | 7/15/2026 | | | 4.75 | | | | 613,275 | | | | 671,531 | | | | | |
| 323,000 | | | N CENTRL TEXAS ST HLTH FAC DEV CORP | | 2/15/2025 | | | 5.38 | | | | 323,000 | | | | 323,446 | | | | | |
| See accompanying notes to financial statements. | 56 | (Continued) |
CLEARWATER INVESTMENT TRUST
Schedule of Investments - Clearwater Tax-Exempt Bond Fund
December 31, 2019
Par/Shares | | | Security | | Maturity
date | | Coupon
rate | | | Cost | | | Fair value (a) | | | Percent of
net assets | |
Municipal Bonds (Cont’d): | | | | | | | | | | | | | | | | | | |
| 350,000 | | | N SPRINGS FL IMPT DIST | | 5/1/2027 | | | 6.00 | | | $ | 350,000 | | | | 372,495 | | | | | |
| 1,000,000 | | | N TX TOLLWAY AUTH REVENUE | | 1/1/2034 | | | 6.00 | | | | 1,000,000 | | | | 1,048,230 | | | | | |
| 1,000,000 | | | N TX TOLLWAY AUTH REVENUE | | 1/1/2042 | | | 6.20 | | | | 999,157 | | | | 1,213,540 | | | | | |
| 600,000 | | | NASHVILLE MET DEV & HSG AGY TN TAX INCR REVENUE(d) | | 6/1/2036 | | | 5.13 | | | | 600,000 | | | | 670,488 | | | | | |
| 1,000,000 | | | NATRONA CNTY WY HOSP REVENUE | | 9/15/2031 | | | 6.35 | | | | 1,000,000 | | | | 1,061,650 | | | | | |
| 500,000 | | | NAVAJO NATION AZ(d) | | 12/1/2030 | | | 5.50 | | | | 523,857 | | | | 567,815 | | | | | |
| 570,000 | | | NEBRASKA ST INVESTMENT FIN AUTH SF HSG REVENUE | | 9/1/2035 | | | 3.75 | | | | 570,000 | | | | 612,448 | | | | | |
| 1,000,000 | | | NEBRASKA ST INVESTMENT FIN AUTH SF HSG REVENUE | | 9/1/2042 | | | 3.05 | | | | 1,000,000 | | | | 1,000,160 | | | | | |
| 900,000 | | | NEVADA ST HSG DIV SF MTGE REVENUE | | 10/1/2039 | | | 3.85 | | | | 900,000 | | | | 933,966 | | | | | |
| 1,000,000 | | | NEVADA ST HSG DIV SF MTGE REVENUE | | 10/1/2049 | | | 3.35 | | | | 1,000,000 | | | | 1,026,800 | | | | | |
| 1,000,000 | | | NEW HAMPSHIRE ST HLTH & EDU FACS AUTH REVENUE | | 1/1/2034 | | | 6.00 | | | | 975,895 | | | | 1,047,720 | | | | | |
| 1,000,000 | | | NEW HAMPSHIRE ST HSG FIN AUTH MF REVENUE | | 7/1/2031 | | | 5.20 | | | | 1,000,000 | | | | 1,040,770 | | | | | |
| 1,500,000 | | | NEW HAMPSHIRE ST HSG FIN AUTH MF REVENUE | | 7/1/2052 | | | 4.00 | | | | 1,500,000 | | | | 1,586,520 | | | | | |
| 230,000 | | | NEW HAMPSHIRE ST HSG FIN AUTH SF REVENUE | | 7/1/2034 | | | 5.38 | | | | 230,000 | | | | 233,445 | | | | | |
| 1,000,000 | | | NEW HOPE CULTURAL ED FACS FIN CORP TX RETIREMENT FAC REVENUE | | 10/1/2034 | | | 5.00 | | | | 1,006,312 | | | | 1,107,520 | | | | | |
| 750,000 | | | NEW HOPE CULTURAL ED FACS FIN CORP TX RETIREMENT FAC REVENUE | | 1/1/2035 | | | 5.50 | | | | 760,433 | | | | 812,115 | | | | | |
| 1,100,000 | | | NEW HOPE CULTURAL ED FACS FIN CORP TX RETIREMENT FAC REVENUE | | 1/1/2055 | | | 5.00 | | | | 1,148,733 | | | | 1,151,920 | | | | | |
| 750,000 | | | NEW HOPE CULTURAL EDU FACS FIN CORP TX EDU REVENUE(d) | | 8/15/2036 | | | 5.00 | | | | 753,106 | | | | 767,625 | | | | | |
| 1,000,000 | | | NEW HOPE CULTURAL EDU FACS FIN CORP TX EDU REVENUE | | 8/15/2036 | | | 5.50 | | | | 1,002,572 | | | | 1,038,810 | | | | | |
| 1,000,000 | | | NEW HOPE CULTURAL EDU FACS FIN CORP TX EDU REVENUE(d) | | 8/15/2037 | | | 6.00 | | | | 1,016,039 | | | | 1,066,710 | | | | | |
| 670,000 | | | NEW HOPE CULTURAL EDU FACS FIN CORP TX EDU REVENUE(d) | | 8/15/2049 | | | 5.00 | | | | 698,014 | | | | 703,721 | | | | | |
| 1,100,000 | | | NEW HOPE CULTURAL EDU FACS FIN CORP TX STUDENT HSG REVENUE | | 4/1/2046 | | | 5.00 | | | | 1,133,018 | | | | 1,212,255 | | | | | |
| 750,000 | | | NEW JERSEY ST ECON DEV AUTH | | 6/15/2037 | | | 5.00 | | | | 778,464 | | | | 869,527 | | | | | |
| 500,000 | | | NEW JERSEY ST ECON DEV AUTH | | 6/15/2042 | | | 5.00 | | | | 536,586 | | | | 566,775 | | | | | |
| 750,000 | | | NEW JERSEY ST ECON DEV AUTH REVENUE | | 7/15/2047 | | | 5.00 | | | | 796,845 | | | | 845,422 | | | | | |
| 1,000,000 | | | NEW JERSEY ST HSG & MTGE FIN AGY MF CONDUIT REVENUE | | 1/1/2030 | | | 3.60 | | | | 1,000,000 | | | | 1,044,350 | | | | | |
| 820,000 | | | NEW JERSEY ST HSG & MTGE FIN AGY REVENUE | | 10/1/2030 | | | 4.50 | | | | 820,000 | | | | 852,825 | | | | | |
| 3,350,000 | | | NEW JERSEY ST HSG & MTGE FIN AGY REVENUE | | 10/1/2035 | | | 3.75 | | | | 3,350,000 | | | | 3,590,262 | | | | | |
| 955,000 | | | NEW JERSEY ST HSG & MTGE FIN AGY REVENUE | | 4/1/2049 | | | 4.00 | | | | 957,655 | | | | 1,022,624 | | | | | |
| 500,000 | | | NEW JERSEY ST TRANSPRTN TRUST FUND AUTH | | 12/15/2039 | | | 4.00 | | | | 529,051 | | | | 529,565 | | | | | |
| 500,000 | | | NEW JERSEY ST TRANSPRTN TRUST FUND AUTH | | 6/15/2041 | | | 5.25 | | | | 507,800 | | | | 562,035 | | | | | |
| 645,000 | | | NEW MEXICO ST MTGE FIN AUTH | | 9/1/2042 | | | 3.90 | | | | 645,000 | | | | 659,925 | | | | | |
| 960,000 | | | NEW MEXICO ST MTGE FIN AUTH | | 9/1/2042 | | | 4.13 | | | | 960,000 | | | | 989,366 | | | | | |
| 1,530,000 | | | NEW MEXICO ST MTGE FIN AUTH | | 7/1/2043 | | | 3.85 | | | | 1,530,000 | | | | 1,617,684 | | | | | |
| 870,000 | | | NEW MEXICO ST MTGE FIN AUTH | | 9/1/2046 | | | 3.80 | | | | 870,000 | | | | 900,372 | | | | | |
| 770,000 | | | NEW MEXICO ST MTGE FIN AUTH | | 7/1/2048 | | | 3.90 | | | | 770,000 | | | | 819,788 | | | | | |
| 1,000,000 | | | NEW MEXICO ST MTGE FIN AUTH | | 7/1/2048 | | | 4.00 | | | | 1,001,994 | | | | 1,069,680 | | | | | |
| 1,000,000 | | | NEW MEXICO ST MTGE FIN AUTH | | 7/1/2049 | | | 3.10 | | | | 1,000,000 | | | | 1,008,160 | | | | | |
| 1,000,000 | | | NEW MEXICO ST MTGE FIN AUTH | | 7/1/2049 | | | 3.35 | | | | 1,000,000 | | | | 1,030,930 | | | | | |
| 995,000 | | | NEW MEXICO ST MTGE FIN AUTH | | 7/1/2049 | | | 4.00 | | | | 995,000 | | | | 1,078,769 | | | | | |
| 115,000 | | | NEW RIVER FL CDD CAPITAL IMPT REVENUE(c) | | 5/1/2013 | | | 5.00 | | | | 114,821 | | | | 1 | | | | | |
| 1,000,000 | | | NEW YORK CITY NY HSG DEV CORP MF HSG REVENUE | | 11/1/2037 | | | 3.80 | | | | 1,000,000 | | | | 1,026,430 | | | | | |
| 1,000,000 | | | NEW YORK CITY NY HSG DEV CORP MF HSG REVENUE | | 11/1/2039 | | | 4.30 | | | | 1,000,000 | | | | 1,052,080 | | | | | |
| See accompanying notes to financial statements. | 57 | (Continued) |
CLEARWATER INVESTMENT TRUST
Schedule of Investments - Clearwater Tax-Exempt Bond Fund
December 31, 2019
Par/Shares | | | Security | | Maturity
date | | Coupon
rate | | | Cost | | | Fair value (a) | | | Percent of
net assets | |
Municipal Bonds (Cont’d): | | | | | | | | | | | | | | | | | | |
| 600,000 | | | NEW YORK CITY NY HSG DEV CORP MF HSG REVENUE | | 11/1/2042 | | | 3.85 | | | $ | 601,593 | | | | 634,212 | | | | | |
| 1,000,000 | | | NEW YORK CITY NY HSG DEV CORP MF HSG REVENUE | | 11/1/2047 | | | 3.65 | | | | 1,000,000 | | | | 1,035,500 | | | | | |
| 1,000,000 | | | NEW YORK CITY NY HSG DEV CORP MF HSG REVENUE | | 11/1/2049 | | | 3.95 | | | | 1,000,000 | | | | 1,060,160 | | | | | |
| 2,000,000 | | | NEW YORK CITY NY MUNI WTR FIN AUTH WTR & SWR SYS REVENUE | | 6/15/2038 | | | 5.00 | | | | 2,098,725 | | | | 2,230,480 | | | | | |
| 1,000,000 | | | NEW YORK ST HSG FIN AGY | | 11/1/2041 | | | 4.10 | | | | 1,000,000 | | | | 1,081,270 | | | | | |
| 1,000,000 | | | NEW YORK ST HSG FIN AGY | | 11/1/2042 | | | 4.00 | | | | 1,000,000 | | | | 1,061,830 | | | | | |
| 1,000,000 | | | NEW YORK ST HSG FIN AGY | | 11/1/2048 | | | 3.95 | | | | 1,000,000 | | | | 1,059,520 | | | | | |
| 1,500,000 | | | NEW YORK ST HSG FIN AGY REVENUE | | 11/1/2034 | | | 3.65 | | | | 1,500,000 | | | | 1,563,390 | | | | | |
| 500,000 | | | NEW YORK ST HSG FIN AGY REVENUE | | 11/1/2045 | | | 5.10 | | | | 500,000 | | | | 541,030 | | | | | |
| 4,000,000 | | | NEW YORK ST HSG FIN AGY REVENUE | | 5/1/2048 | | | 4.10 | | | | 4,000,000 | | | | 4,108,040 | | | | | |
| 930,000 | | | NEW YORK ST MTGE AGY HOMEOWNER MTGE REVENUE | | 10/1/2036 | | | 3.90 | | | | 930,000 | | | | 992,319 | | | | | |
| 435,000 | | | NEW YORK ST MTGE AGY HOMEOWNER MTGE REVENUE | | 10/1/2042 | | | 3.75 | | | | 435,000 | | | | 442,773 | | | | | |
| 1,000,000 | | | NEW YORK ST MTGE AGY HOMEOWNER MTGE REVENUE | | 10/1/2043 | | | 4.20 | | | | 1,000,000 | | | | 1,090,450 | | | | | |
| 1,490,000 | | | NEW YORK ST MTGE AGY HOMEOWNER MTGE REVENUE | | 10/1/2048 | | | 3.80 | | | | 1,490,000 | | | | 1,563,457 | | | | | |
| 2,000,000 | | | NEW YORK ST MTGE AGY HOMEOWNER MTGE REVENUE | | 10/1/2049 | | | 2.95 | | | | 2,000,000 | | | | 1,965,280 | | | | | |
| 1,000,000 | | | NORTH CAROLINA ST HSG FIN AGY HOME OWNERSHIP REVENUE | | 7/1/2037 | | | 3.85 | | | | 1,000,000 | | | | 1,073,370 | | | | | |
| 995,000 | | | NORTH CAROLINA ST HSG FIN AGY HOME OWNERSHIP REVENUE | | 1/1/2041 | | | 3.95 | | | | 1,007,135 | | | | 1,057,197 | | | | | |
| 965,000 | | | NORTH CAROLINA ST HSG FIN AGY HOME OWNERSHIP REVENUE | | 1/1/2048 | | | 4.00 | | | | 965,000 | | | | 1,030,958 | | | | | |
| 600,000 | | | NORTH CAROLINA ST MED CARE COMMISSION RETMNT FACS REVENUE | | 10/1/2038 | | | 5.00 | | | | 596,357 | | | | 659,526 | | | | | |
| 440,000 | | | NORTH DAKOTA ST HSG FIN AGY | | 7/1/2048 | | | 4.00 | | | | 465,705 | | | | 473,766 | | | | | |
| 515,000 | | | NORTH LAS VEGAS NV LOCAL IMPT(d) | | 12/1/2027 | | | 4.00 | | | | 504,048 | | | | 537,696 | | | | | |
| 515,000 | | | NORTH LAS VEGAS NV LOCAL IMPT(d) | | 12/1/2037 | | | 5.00 | | | | 515,997 | | | | 564,208 | | | | | |
| 500,000 | | | NORTH SPRINGS FL IMPT DIST | | 5/1/2044 | | | 6.50 | | | | 500,000 | | | | 531,730 | | | | | |
| 1,000,000 | | | NTHRN IL UNIV | | 4/1/2026 | | | 5.50 | | | | 1,000,582 | | | | 1,009,020 | | | | | |
| 1,400,000 | | | NTHRN PALM BEACH CNTY FL IMPT DIST | | 8/1/2029 | | | 5.00 | | | | 1,406,381 | | | | 1,504,020 | | | | | |
| 500,000 | | | NTHRN PALM BEACH CNTY FL IMPT DIST | | 8/1/2037 | | | 5.00 | | | | 509,454 | | | | 541,565 | | | | | |
| 2,000,000 | | | OAK PARK CA UNIF SCH DIST (Step to 7.10% on 8/1/2021)(b) | | 8/1/2038 | | | 0.00 | | | | 1,792,000 | | | | 2,674,140 | | | | | |
| 280,000 | | | OAKLAND CNTY MI ECON DEV CORP LTD OBLG REVENUE | | 12/1/2020 | | | 6.50 | | | | 279,777 | | | | 285,104 | | | | | |
| 2,000,000 | | | OHIO ST HGR EDUCTNL FAC COMMISSION | | 11/1/2049 | | | 4.00 | | | | 2,042,416 | | | | 1,982,700 | | | | | |
| 910,000 | | | OHIO ST HSG FIN AGY RSDL MTGE REVENUE | | 9/1/2039 | | | 3.35 | | | | 818,431 | | | | 939,975 | | | | | |
| 1,470,000 | | | OHIO ST HSG FIN AGY RSDL MTGE REVENUE | | 9/1/2048 | | | 4.00 | | | | 1,470,000 | | | | 1,572,503 | | | | | |
| 1,500,000 | | | OHIO ST HSG FIN AGY RSDL MTGE REVENUE | | 3/1/2049 | | | 4.00 | | | | 1,500,000 | | | | 1,609,875 | | | | | |
| 1,000,000 | | | OHIO ST HSG FIN AGY RSDL MTGE REVENUE | | 9/1/2049 | | | 3.35 | | | | 1,000,000 | | | | 1,030,510 | | | | | |
| 2,000,000 | | | OKLAHOMA ST DEV FIN AUTH | | 8/1/2049 | | | 5.00 | | | | 2,235,438 | | | | 2,235,920 | | | | | |
| 1,000,000 | | | ORANGE CNTY FL HLTH FACS AUTH REVENUE | | 8/1/2034 | | | 5.00 | | | | 1,034,283 | | | | 1,114,290 | | | | | |
| 750,000 | | | ORANGE CNTY FL HLTH FACS AUTH REVENUE | | 8/1/2035 | | | 5.00 | | | | 776,541 | | | | 851,655 | | | | | |
| 1,000,000 | | | ORANGE CNTY FL HLTH FACS AUTH REVENUE | | 8/1/2047 | | | 5.00 | | | | 1,066,727 | | | | 1,103,940 | | | | | |
| 640,000 | | | ORANGE CNTY FL HSG FIN AUTH | | 9/1/2035 | | | 3.80 | | | | 640,000 | | | | 673,402 | | | | | |
| 2,000,000 | | | OREGON ST | | 12/1/2039 | | | 3.90 | | | | 2,000,000 | | | | 2,082,700 | | | | | |
| 585,000 | | | OREGON ST HSG & CMNTY SVCS DEPT MTGE REVENUE | | 7/1/2035 | | | 3.75 | | | | 585,000 | | | | 621,498 | | | | | |
| 760,000 | | | OREGON ST HSG & CMNTY SVCS DEPT MTGE REVENUE | | 7/1/2038 | | | 4.00 | | | | 760,000 | | | | 778,977 | | | | | |
| 1,280,000 | | | OREGON ST HSG & CMNTY SVCS DEPT MTGE REVENUE | | 7/1/2048 | | | 3.75 | | | | 1,280,000 | | | | 1,333,376 | | | | | |
| See accompanying notes to financial statements. | 58 | (Continued) |
CLEARWATER INVESTMENT TRUST
Schedule of Investments - Clearwater Tax-Exempt Bond Fund
December 31, 2019
| | | | | | | | | | | | | | | | | | | | | | |
Par/Shares | | | Security | | Maturity
date | | Coupon
rate | | | Cost | | | Fair value (a) | | | Percent of
net assets | |
Municipal Bonds (Cont’d): | | | | | | | | | | | | | | | | | | |
| 1,000,000 | | | PAINTED PRAIRIE PUB IMPT AUTH CO | | 12/1/2039 | | | 5.00 | | | $ | 1,032,983 | | | | 1,032,930 | | | | | |
| 500,000 | | | PALISADE CO MET DIST #2 LIMITED TAX | | 12/1/2046 | | | 5.00 | | | | 510,927 | | | | 517,625 | | | | | |
| 500,000 | | | PALM BEACH CNTY FL HLTH FACS AUTH REVENUE | | 6/1/2034 | | | 7.25 | | | | 500,000 | | | | 560,360 | | | | | |
| 1,200,000 | | | PALM BEACH CNTY FL HLTH FACS AUTH REVENUE | | 5/15/2036 | | | 5.00 | | | | 1,299,132 | | | | 1,346,196 | | | | | |
| 500,000 | | | PALM BEACH CNTY FL HLTH FACS AUTH REVENUE | | 6/1/2049 | | | 7.50 | | | | 492,692 | | | | 561,245 | | | | | |
| 1,185,000 | | | PALM BEACH CNTY FL HLTH FACS AUTH REVENUE | | 5/15/2053 | | | 4.00 | | | | 1,180,658 | | | | 1,200,820 | | | | | |
| 1,000,000 | | | PELL CITY AL SPL CARE FACS FING AUTH REVENUE | | 12/1/2031 | | | 5.00 | | | | 1,021,396 | | | | 1,063,100 | | | | | |
| 500,000 | | | PENNSYLVANIA ST HGR EDUCTNL FACS AUTH REVENUE (Floating, ICE LIBOR USD 3M + 0.65%)(e) | | 7/1/2039 | | | 1.93 | | | | 500,000 | | | | 476,340 | | | | | |
| 1,000,000 | | | PENNSYLVANIA ST HSG FIN AGY SF MTGE REVENUE | | 10/1/2038 | | | 3.95 | | | | 1,000,000 | | | | 1,072,450 | | | | | |
| 440,000 | | | PENNSYLVANIA ST HSG FIN AGY SF MTGE REVENUE | | 10/1/2038 | | | 4.00 | | | | 440,000 | | | | 453,886 | | | | | |
| 1,125,000 | | | PENNSYLVANIA ST HSG FIN AGY SF MTGE REVENUE | | 10/1/2040 | | | 4.05 | | | | 1,125,000 | | | | 1,175,113 | | | | | |
| 1,835,000 | | | PENNSYLVANIA ST HSG FIN AGY SF MTGE REVENUE | | 10/1/2042 | | | 3.65 | | | | 1,835,000 | | | | 1,901,610 | | | | | |
| 535,000 | | | PENNSYLVANIA ST HSG FIN AGY SF MTGE REVENUE | | 10/1/2042 | | | 3.70 | | | | 535,000 | | | | 541,484 | | | | | |
| 1,400,000 | | | PENNSYLVANIA ST HSG FIN AGY SF MTGE REVENUE | | 10/1/2046 | | | 3.00 | | | | 1,400,000 | | | | 1,400,504 | | | | | |
| 995,000 | | | PENNSYLVANIA ST HSG FIN AGY SF MTGE REVENUE | | 10/1/2047 | | | 4.00 | | | | 995,000 | | | | 1,054,471 | | | | | |
| 1,000,000 | | | PENNSYLVANIA ST HSG FIN AGY SF MTGE REVENUE | | 10/1/2049 | | | 3.40 | | | | 1,000,000 | | | | 1,025,960 | | | | | |
| 1,935,000 | | | PENNSYLVANIA ST TURNPIKE COMMISSION TURNPIKE REVENUE | | 12/1/2035 | | | 5.13 | | | | 1,928,804 | | | | 2,006,285 | | | | | |
| 1,500,000 | | | PENNSYLVANIA ST TURNPIKE COMMISSION TURNPIKE REVENUE (Step to 4.60% on 12/1/2021)(b) | | 12/1/2037 | | | 0.00 | | | | 1,371,174 | | | | 1,569,270 | | | | | |
| 1,000,000 | | | PEORIA AZ INDL DEV AUTH | | 11/15/2029 | | | 5.25 | | | | 1,000,000 | | | | 1,039,480 | | | | | |
| 300,000 | | | PHILADELPHIA PA AUTH FOR INDL DEV REVENUES | | 6/15/2023 | | | 6.13 | | | | 300,000 | | | | 317,796 | | | | | |
| 750,000 | | | PHILADELPHIA PA AUTH FOR INDL DEV REVENUES | | 8/1/2036 | | | 5.63 | | | | 740,014 | | | | 802,395 | | | | | |
| 750,000 | | | PHILADELPHIA PA AUTH FOR INDL DEV REVENUES | | 6/15/2049 | | | 5.00 | | | | 781,411 | | | | 791,805 | | | | | |
| 1,000,000 | | | PHOENIX AZ INDL DEV AUTH EDU REVENUE(d) | | 7/1/2036 | | | 5.13 | | | | 986,243 | | | | 1,097,930 | | | | | |
| 750,000 | | | PHOENIX AZ INDL DEV AUTH EDU REVENUE | | 7/1/2042 | | | 6.30 | | | | 771,541 | | | | 806,947 | | | | | |
| 2,500,000 | | | PHOENIX AZ INDL DEV AUTH LEASE REVENUE | | 6/1/2034 | | | 5.25 | | | | 2,514,038 | | | | 2,698,150 | | | | | |
| 1,000,000 | | | PIKE PLACE MARKET WA PRESERVATION & DEV AUTH SPL OBLG | | 12/1/2040 | | | 5.00 | | | | 1,050,057 | | | | 1,156,710 | | | | | |
| 800,000 | | | PIMA CNTY AZ INDL DEV AUTH EDU REVENUE(d) | | 12/1/2026 | | | 5.25 | | | | 800,000 | | | | 833,832 | | | | | |
| 10,000 | | | PIMA CNTY AZ INDL DEV AUTH EDU REVENUE | | 7/1/2031 | | | 6.75 | | | | 7,909 | | | | 10,092 | | | | | |
| 1,370,000 | | | PIMA CNTY AZ INDL DEV AUTH EDU REVENUE(d) | | 6/15/2035 | | | 5.38 | | | | 1,457,861 | | | | 1,502,835 | | | | | |
| 750,000 | | | PIMA CNTY AZ INDL DEV AUTH EDU REVENUE(d) | | 6/15/2037 | | | 4.75 | | | | 736,891 | | | | 771,278 | | | | | |
| 500,000 | | | PINELLAS CNTY FL INDL DEV AUTH INDL DEV REVENUE | | 7/1/2039 | | | 5.00 | | | | 554,815 | | | | 580,745 | | | | | |
| 2,625,000 | | | PITTSBURG CALIF UNI SCH DIST FING AUTH REVENUE(g) | | 9/1/2031 | | | 0.00 | | | | 1,319,470 | | | | 1,256,745 | | | | | |
| 725,000 | | | POINCIANA FL W CDD SPL ASSMNT | | 5/1/2030 | | | 5.38 | | | | 717,868 | | | | 772,691 | | | | | |
| 1,500,000 | | | POLK CNTY OR HOSP FAC AUTH REVENUE | | 7/1/2035 | | | 5.13 | | | | 1,529,973 | | | | 1,546,665 | | | | | |
| 2,000,000 | | | PORT SAINT LUCIE FL RESEARCH FACS REVENUE | | 5/1/2033 | | | 5.00 | | | | 2,005,489 | | | | 2,025,280 | | | | | |
| 1,000,000 | | | PROMENADE CASTLE ROCK CO MET DIST #1 | | 12/1/2025 | | | 5.13 | | | | 1,000,000 | | | | 1,050,510 | | | | | |
| 200,000 | | | PUBLIC FIN AUTH WI CCRC REVENUE(d) | | 6/1/2020 | | | 7.00 | | | | 199,799 | | | | 203,466 | | | | | |
| See accompanying notes to financial statements. | 59 | (Continued) |
CLEARWATER INVESTMENT TRUST
Schedule of Investments - Clearwater Tax-Exempt Bond Fund
December 31, 2019
| | | | | | | | | | | | | | | | | | | | | | |
Par/Shares | | | Security | | Maturity
date | | Coupon
rate | | | Cost | | | Fair value (a) | | | Percent of
net assets | |
Municipal Bonds (Cont’d): | | | | | | | | | | | | | | | | | | |
| 1,500,000 | | | PUBLIC FIN AUTH WI CCRC REVENUE(d) | | 6/1/2046 | | | 8.25 | | | $ | 1,537,471 | | | | 1,637,370 | | | | | |
| 16,520 | | | PUBLIC FIN AUTH WI CONFERENCE CENTER & HOTEL REVENUE(d)(g) | | 1/1/2046 | | | 0.00 | | | | 976 | | | | 564 | | | | | |
| 18,299 | | | PUBLIC FIN AUTH WI CONFERENCE CENTER & HOTEL REVENUE(d)(g) | | 1/1/2047 | | | 0.00 | | | | 1,055 | | | | 612 | | | | | |
| 17,930 | | | PUBLIC FIN AUTH WI CONFERENCE CENTER & HOTEL REVENUE(d)(g) | | 1/1/2048 | | | 0.00 | | | | 1,012 | | | | 602 | | | | | |
| 17,786 | | | PUBLIC FIN AUTH WI CONFERENCE CENTER & HOTEL REVENUE(d)(g) | | 1/1/2049 | | | 0.00 | | | | 985 | | | | 596 | | | | | |
| 17,496 | | | PUBLIC FIN AUTH WI CONFERENCE CENTER & HOTEL REVENUE(d)(g) | | 1/1/2050 | | | 0.00 | | | | 951 | | | | 573 | | | | | |
| 18,980 | | | PUBLIC FIN AUTH WI CONFERENCE CENTER & HOTEL REVENUE(d)(g) | | 1/1/2051 | | | 0.00 | | | | 1,012 | | | | 622 | | | | | |
| 451,406 | | | PUBLIC FIN AUTH WI CONFERENCE CENTER & HOTEL REVENUE(d)(e)(f) | | 7/1/2051 | | | 3.75 | | | | 449,050 | | | | 396,104 | | | | | |
| 19,357 | | | PUBLIC FIN AUTH WI CONFERENCE CENTER & HOTEL REVENUE(d)(g) | | 1/1/2052 | | | 0.00 | | | | 1,012 | | | | 620 | | | | | |
| 19,095 | | | PUBLIC FIN AUTH WI CONFERENCE CENTER & HOTEL REVENUE(d)(g) | | 1/1/2053 | | | 0.00 | | | | 980 | | | | 612 | | | | | |
| 18,909 | | | PUBLIC FIN AUTH WI CONFERENCE CENTER & HOTEL REVENUE(d)(g) | | 1/1/2054 | | | 0.00 | | | | 954 | | | | 599 | | | | | |
| 18,634 | | | PUBLIC FIN AUTH WI CONFERENCE CENTER & HOTEL REVENUE(d)(g) | | 1/1/2055 | | | 0.00 | | | | 924 | | | | 587 | | | | | |
| 18,360 | | | PUBLIC FIN AUTH WI CONFERENCE CENTER & HOTEL REVENUE(d)(g) | | 1/1/2056 | | | 0.00 | | | | 895 | | | | 579 | | | | | |
| 97,028 | | | PUBLIC FIN AUTH WI CONFERENCE CENTER & HOTEL REVENUE(d) | | 7/1/2056 | | | 5.50 | | | | 96,856 | | | | 92,456 | | | | | |
| 18,454 | | | PUBLIC FIN AUTH WI CONFERENCE CENTER & HOTEL REVENUE(d)(g) | | 1/1/2057 | | | 0.00 | | | | 1,670 | | | | 576 | | | | | |
| 18,165 | | | PUBLIC FIN AUTH WI CONFERENCE CENTER & HOTEL REVENUE(d)(g) | | 1/1/2058 | | | 0.00 | | | | 854 | | | | 562 | | | | | |
| 17,992 | | | PUBLIC FIN AUTH WI CONFERENCE CENTER & HOTEL REVENUE(d)(g) | | 1/1/2059 | | | 0.00 | | | | 833 | | | | 555 | | | | | |
| 17,834 | | | PUBLIC FIN AUTH WI CONFERENCE CENTER & HOTEL REVENUE(d)(g) | | 1/1/2060 | | | 0.00 | | | | 814 | | | | 542 | | | | | |
| 17,573 | | | PUBLIC FIN AUTH WI CONFERENCE CENTER & HOTEL REVENUE(d)(g) | | 1/1/2061 | | | 0.00 | | | | 791 | | | | 528 | | | | | |
| 17,400 | | | PUBLIC FIN AUTH WI CONFERENCE CENTER & HOTEL REVENUE(d)(g) | | 1/1/2062 | | | 0.00 | | | | 773 | | | | 517 | | | | | |
| 17,125 | | | PUBLIC FIN AUTH WI CONFERENCE CENTER & HOTEL REVENUE(d)(g) | | 1/1/2063 | | | 0.00 | | | | 750 | | | | 507 | | | | | |
| 16,967 | | | PUBLIC FIN AUTH WI CONFERENCE CENTER & HOTEL REVENUE(d)(g) | | 1/1/2064 | | | 0.00 | | | | 734 | | | | 500 | | | | | |
| 16,823 | | | PUBLIC FIN AUTH WI CONFERENCE CENTER & HOTEL REVENUE(d)(g) | | 1/1/2065 | | | 0.00 | | | | 719 | | | | 488 | | | | | |
| 16,731 | | | PUBLIC FIN AUTH WI CONFERENCE CENTER & HOTEL REVENUE(d)(g) | | 1/1/2066 | | | 0.00 | | | | 705 | | | | 469 | | | | | |
| 215,987 | | | PUBLIC FIN AUTH WI CONFERENCE CENTER & HOTEL REVENUE(d)(g) | | 1/1/2067 | | | 0.00 | | | | 8,662 | | | | 5,700 | | | | | |
| 535,000 | | | PUBLIC FIN AUTH WI REVENUE | | 4/1/2025 | | | 5.00 | | | | 537,444 | | | | 572,621 | | | | | |
| 1,250,000 | | | PUBLIC FIN AUTH WI REVENUE(d) | | 11/1/2028 | | | 6.25 | | | | 1,250,000 | | | | 1,411,050 | | | | | |
| 600,000 | | | PUBLIC FIN AUTH WI REVENUE | | 4/1/2032 | | | 5.50 | | | | 600,000 | | | | 635,700 | | | | | |
| 1,000,000 | | | PUBLIC FIN AUTH WI REVENUE(d) | | 1/1/2033 | | | 6.13 | | | | 988,886 | | | | 1,039,250 | | | | | |
| 341,645 | | | PUBLIC FIN AUTH WI REVENUE(g) | | 10/1/2042 | | | 0.00 | | | | 376,682 | | | | 65,727 | | | | | |
| 515,000 | | | PUBLIC FIN AUTH WI REVENUE | | 10/1/2042 | | | 7.00 | | | | 532,024 | | | | 519,676 | | | | | |
| 13,694 | | | PUBLIC FIN AUTH WI REVENUE(d) | | 12/1/2048 | | | 5.50 | | | | 13,694 | | | | 13,694 | | | | | |
| 1,195,000 | | | PUBLIC FIN AUTH WI SENIOR LIVING REVENUE(d) | | 11/15/2024 | | | 5.00 | | | | 1,193,006 | | | | 1,266,461 | | | | | |
| 520,000 | | | PUBLIC FIN AUTH WIS ED REVENUE(d) | | 6/15/2049 | | | 5.00 | | | | 527,126 | | | | 551,725 | | | | | |
| 1,500,000 | | | PUERTO RICO CMWLTH | | 7/1/2035 | | | 5.00 | | | | 1,500,000 | | | | 1,594,260 | | | | | |
| 930,000 | | | QUECHAN INDIAN TRIBE AZ FORT YUMA INDIAN RESERVATION | | 5/1/2025 | | | 9.75 | | | | 930,000 | | | | 1,011,942 | | | | | |
| 750,000 | | | RED RIVER TX HLTH FACS DEV CORP RETIREMENT FAC REVENUE | | 11/15/2034 | | | 7.50 | | | | 746,592 | | | | 885,705 | | | | | |
| 1,000,000 | | | REDONDO BEACH CA UNIF SCH DIST | | 8/1/2034 | | | 6.38 | | | | 997,614 | | | | 1,305,600 | | | | | |
| 750,000 | | | REEF-SUNSET CA UNIF SCH DIST (Step to 4.85% on 8/1/2021)(b) | | 8/1/2038 | | | 0.00 | | | | 695,198 | | | | 792,660 | | | | | |
| 665,000 | | | RHODE ISLAND ST HSG & MTGE FIN CORP | | 10/1/2028 | | | 4.00 | | | | 662,550 | | | | 680,727 | | | | | |
| 750,000 | | | RHODE ISLAND ST HSG & MTGE FIN CORP | | 10/1/2037 | | | 3.90 | | | | 750,000 | | | | 779,363 | | | | | |
| See accompanying notes to financial statements. | 60 | (Continued) |
CLEARWATER INVESTMENT TRUST
Schedule of Investments - Clearwater Tax-Exempt Bond Fund
December 31, 2019
| | | | | | | | | | | | | | | | | | | | | | |
Par/Shares | | | Security | | Maturity
date | | Coupon
rate | | | Cost | | | Fair value (a) | | | Percent of
net assets | |
Municipal Bonds (Cont’d): | | | | | | | | | | | | | | | | | | |
| 500,000 | | | RICHTON PARK IL PUBLIC LIBRARY DIST | | 12/15/2032 | | | 4.50 | | | $ | 528,305 | | | | 529,150 | | | | | |
| 1,000,000 | | | RIVERSIDE CA CMNTY PPTYS DEV INC LEASE REVENUE | | 10/15/2038 | | | 6.00 | | | | 1,012,111 | | | | 1,189,270 | | | | | |
| 1,000,000 | | | ROCHESTER MN | | 9/1/2038 | | | 5.13 | | | | 1,000,000 | | | | 1,044,730 | | | | | |
| 500,000 | | | ROWLEY MA | | 5/1/2027 | | | 4.00 | | | | 500,000 | | | | 501,050 | | | | | |
| 1,500,000 | | | S TAHOE CA JT PWRS FING AUTH LEASE REVENUE | | 10/1/2030 | | | 5.00 | | | | 1,586,848 | | | | 1,723,335 | | | | | |
| 395,000 | | | S WSTRN IL DEV AUTH(c) | | 10/1/2022 | | | 7.00 | | | | 395,000 | | | | 229,100 | | | | | |
| 350,000 | | | SACRAMENTO CNTY CA WTR FING AUTH REVENUE (Floating, ICE LIBOR USD 3M + 0.57%)(e) | | 6/1/2039 | | | 1.85 | | | | 350,000 | | | | 332,686 | | | | | |
| 750,000 | | | SAINT LOUIS CNTY MO INDL DEV AUTH SENIOR LIVING FACS | | 9/1/2042 | | | 5.00 | | | | 758,376 | | | | 787,470 | | | | | |
| 750,000 | | | SAINT TAMMANY LA PUBLIC TRUST FING AUTH | | 11/15/2037 | | | 5.25 | | | | 757,986 | | | | 819,105 | | | | | |
| 500,000 | | | SAN DIEGO CA HSG AUTH MF HSG REVENUE | | 5/1/2029 | | | 5.00 | | | | 500,000 | | | | 520,455 | | | | | |
| 1,500,000 | | | SAN GABRIEL CA UNIF SCH DIST | | 8/1/2039 | | | 5.35 | | | | 1,496,411 | | | | 1,648,080 | | | | | |
| 1,000,000 | | | SAN JOSE CA FING AUTH | | 6/1/2039 | | | 5.00 | | | | 1,027,757 | | | | 1,122,930 | | | | | |
| 500,000 | | | SANTA MONICA CA REDEV AGY | | 7/1/2036 | | | 5.88 | | | | 504,018 | | | | 534,975 | | | | | |
| 1,000,000 | | | SCHERERVILLE IN ECON DEV REVENUE | | 1/15/2030 | | | 6.00 | | | | 1,008,225 | | | | 1,129,590 | | | | | |
| 1,000,000 | | | SCOTTS BLUFF CNTY NE HOSP AUTH | | 2/1/2037 | | | 5.25 | | | | 1,042,546 | | | | 1,099,050 | | | | | |
| 770,000 | | | SEATTLE WA HSG AUTH POOLED HSG REVENUE | | 9/15/2033 | | | 5.75 | | | | 777,646 | | | | 867,397 | | | | | |
| 500,000 | | | SEVEN OAKS FL CMNTY DEV DIST SPL ASSMNT REVENUE | | 5/1/2033 | | | 5.50 | | | | 490,739 | | | | 522,465 | | | | | |
| 1,350,000 | | | SHELBY CNTY TN HLTH EDUCTNL & HSG FACS BRD RETMNT FACS REVENUE | | 10/1/2039 | | | 5.50 | | | | 1,341,854 | | | | 1,351,876 | | | | | |
| 150,000 | | | SHELBY CNTY TN HLTH EDUCTNL & HSG FACS BRD REVENUE(c) | | 1/1/2019 | | | 5.35 | | | | 134,965 | | | | 375 | | | | | |
| 625,000 | | | SHELBY CNTY TN HLTH EDUCTNL & HSG FACS BRD REVENUE(c) | | 1/1/2029 | | | 5.55 | | | | 556,862 | | | | 1,563 | | | | | |
| 130,000 | | | SHELBY CNTY TN HLTH EDUCTNL & HSG FACS BRD REVENUE(c) | | 1/1/2029 | | | 6.00 | | | | - | | | | 1 | | | | | |
| 525,000 | | | SHERIDAN AR SCH DIST #37 | | 2/1/2047 | | | 4.00 | | | | 532,226 | | | | 538,571 | | | | | |
| 175,000 | | | SILVERLEAF FL CDD CAPITAL IMPT REVENUE | | 5/1/2044 | | | 6.75 | | | | 171,901 | | | | 190,514 | | | | | |
| 500,000 | | | SNOHOMISH CNTY WA HSG AUTH | | 4/1/2044 | | | 4.00 | | | | 508,513 | | | | 536,340 | | | | | |
| 170,000 | | | SOUTH CAROLINA ST EDU ASSISTANCE AUTH | | 10/1/2029 | | | 5.10 | | | | 168,707 | | | | 170,078 | | | | | |
| 665,000 | | | SOUTH CAROLINA ST JOBS-ECON DEV AUTH ECON DEV REVENUE | | 4/1/2054 | | | 4.00 | | | | 688,968 | | | | 691,573 | | | | | |
| 1,000,000 | | | SOUTH CAROLINA ST PUBLIC SVC AUTH REVENUE | | 12/1/2038 | | | 5.00 | | | | 1,038,031 | | | | 1,119,670 | | | | | |
| 1,400,000 | | | SOUTH CAROLINA ST PUBLIC SVC AUTH REVENUE | | 12/1/2043 | | | 5.75 | | | | 1,441,871 | | | | 1,645,000 | | | | | |
| 500,000 | | | SOUTH DAKOTA ST HLTH & EDUCTNL FACS AUTH | | 9/1/2032 | | | 5.00 | | | | 499,500 | | | | 509,470 | | | | | |
| 1,000,000 | | | SPRINGDALE AR SALES & USE REVENUE | | 4/1/2041 | | | 3.60 | | | | 972,408 | | | | 1,032,460 | | | | | |
| 500,000 | | | ST VRAIN LAKES MET DIST #2 | | 12/1/2037 | | | 5.00 | | | | 500,000 | | | | 525,265 | | | | | |
| 1,000,000 | | | STC MET DIST #2 CO | | 12/1/2049 | | | 5.00 | | | | 1,058,584 | | | | 1,071,330 | | | | | |
| 142,538 | | | STERLING HILL FL CDD CAPITAL IMPT REVENUE(c) | | 11/1/2010 | | | 5.50 | | | | 142,538 | | | | 89,799 | | | | | |
| 1,000,000 | | | SUGAR LAND TX DEV CORP SALES TAX REVENUE | | 2/15/2033 | | | 5.00 | | | | 1,048,505 | | | | 1,099,250 | | | | | |
| 2,250,000 | | | SULPHUR SPRINGS CA UNION SCH DIST COPS | | 12/1/2037 | | | 6.50 | | | | 2,248,360 | | | | 2,783,623 | | | | | |
| 1,500,000 | | | SUTTER BUTTE CA FLOOD AGY ASSMNT REVENUE | | 10/1/2038 | | | 4.00 | | | | 1,484,316 | | | | 1,583,970 | | | | | |
| 1,100,000 | | | TALLAHASSEE FL HLTH FACS REVENUE | | 12/1/2040 | | | 5.00 | | | | 1,145,998 | | | | 1,245,409 | | | | | |
| 500,000 | | | TALLMAN GULCH MET DIST CO | | 12/1/2047 | | | 5.25 | | | | 500,000 | | | | 514,550 | | | | | |
| 1,000,000 | | | TARRANT CNTY TX CULTURAL EDU FACS FIN CORP HOSP REVENUE | | 11/15/2038 | | | 5.00 | | | | 1,042,444 | | | | 1,101,570 | | | | | |
| 1,000,000 | | | TARRANT CNTY TX CULTURAL EDU FACS FIN CORP RETMNT FAC REVENUE(c) | | 11/15/2022 | | | 5.50 | | | | 1,000,000 | | | | 700,000 | | | | | |
| 750,000 | | | TARRANT CNTY TX CULTURAL EDU FACS FIN CORP RETMNT FAC REVENUE | | 11/15/2024 | | | 5.63 | | | | 750,000 | | | | 751,358 | | | | | |
| See accompanying notes to financial statements. | 61 | (Continued) |
CLEARWATER INVESTMENT TRUST
Schedule of Investments - Clearwater Tax-Exempt Bond Fund
December 31, 2019
| | | | | | | | | | | | | | | | | | | | | | |
Par/Shares | | | Security | | Maturity
date | | Coupon
rate | | | Cost | | | Fair value (a) | | | Percent of
net assets | |
Municipal Bonds (Cont’d): | | | | | | | | | | | | | | | | | | |
| 750,000 | | | TARRANT CNTY TX CULTURAL EDU FACS FIN CORP RETMNT FAC REVENUE | | 11/15/2035 | | | 5.00 | | | $ | 771,098 | | | | 788,835 | | | | | |
| 1,485,000 | | | TARRANT CNTY TX CULTURAL EDU FACS FIN CORP RETMNT FAC REVENUE | | 11/15/2037 | | | 6.63 | | | | 1,506,139 | | | | 1,724,323 | | | | | |
| 750,000 | | | TAYLOR MI BROWNFIELD REDEV AUTH | | 5/1/2032 | | | 5.00 | | | | 776,532 | | | | 833,572 | | | | | |
| 500,000 | | | TEMPE AZ INDL DEV AUTH REVENUE(d) | | 10/1/2024 | | | 4.70 | | | | 498,922 | | | | 510,470 | | | | | |
| 500,000 | | | TEMPE AZ INDL DEV AUTH REVENUE(d) | | 10/1/2037 | | | 6.00 | | | | 502,719 | | | | 574,250 | | | | | |
| 740,000 | | | TENNESSEE HSG DEV AGY RSDL FING PROGRAM REVENUE | | 1/1/2031 | | | 3.60 | | | | 745,434 | | | | 768,631 | | | | | |
| 980,000 | | | TENNESSEE HSG DEV AGY RSDL FING PROGRAM REVENUE | | 7/1/2042 | | | 3.85 | | | | 980,000 | | | | 1,041,407 | | | | | |
| 980,000 | | | TENNESSEE HSG DEV AGY RSDL FING PROGRAM REVENUE | | 7/1/2042 | | | 3.90 | | | | 980,000 | | | | 1,044,690 | | | | | |
| 2,000,000 | | | TENNESSEE HSG DEV AGY RSDL FING PROGRAM REVENUE | | 7/1/2044 | | | 4.00 | | | | 2,014,249 | | | | 2,163,860 | | | | | |
| 990,000 | | | TENNESSEE HSG DEV AGY RSDL FING PROGRAM REVENUE | | 1/1/2049 | | | 3.95 | | | | 990,000 | | | | 1,049,994 | | | | | |
| 1,970,000 | | | TENNESSEE HSG DEV AGY RSDL FING PROGRAM REVENUE | | 1/1/2049 | | | 4.05 | | | | 1,970,000 | | | | 2,095,922 | | | | | |
| 2,250,000 | | | TENNESSEE HSG DEV AGY RSDL FING PROGRAM REVENUE | | 7/1/2049 | | | 2.95 | | | | 2,250,000 | | | | 2,212,537 | | | | | |
| 500,000 | | | TENNESSEE ST HSG DEV AGY | | 1/1/2035 | | | 3.85 | | | | 500,000 | | | | 528,740 | | | | | |
| 1,000,000 | | | TEXAS ST AFFORDABLE HSG CORP SF MTGE REVENUE | | 3/1/2050 | | | 4.00 | | | | 1,024,660 | | | | 1,075,090 | | | | | |
| 2,000,000 | | | TEXAS ST DEPT OF HSG & CMNTY AFFAIRS | | 9/1/2044 | | | 3.63 | | | | 2,047,091 | | | | 2,118,480 | | | | | |
| 1,000,000 | | | TEXAS ST DEPT OF HSG & CMNTY AFFAIRS | | 9/1/2048 | | | 4.25 | | | | 1,018,333 | | | | 1,082,460 | | | | | |
| 1,000,000 | | | THOMPSON CROSSING MET DIST #4 CO | | 12/1/2049 | | | 5.00 | | | | 1,055,695 | | | | 1,064,020 | | | | | |
| 700,000 | | | TOBACCO SETTLEMENT FING CORP NJ | | 6/1/2046 | | | 5.00 | | | | 704,740 | | | | 779,149 | | | | | |
| 500,000 | | | TOLOMATO FL CDD | | 5/1/2037 | | | 4.25 | | | | 500,000 | | | | 511,215 | | | | | |
| 50,000 | | | TOLOMATO FL CDD (Step to 6.61% on 5/1/2022)(b) | | 5/1/2040 | | | 0.00 | | | | 47,777 | | | | 43,523 | | | | | |
| 115,000 | | | TOLOMATO FL CDD (Step to 6.61% on 11/1/2024)(b) | | 5/1/2040 | | | 0.00 | | | | 82,297 | | | | 81,702 | | | | | |
| 185,000 | | | TOLOMATO FL CDD (Step to 6.61% on 11/1/2021)(b) | | 5/1/2040 | | | 0.00 | | | | 165,262 | | | | 160,536 | | | | | |
| 1,490,000 | | | TOLOMATO FL CDD | | 5/1/2040 | | | 3.75 | | | | 1,432,431 | | | | 1,585,211 | | | | | |
| 125,000 | | | TOLOMATO FL CDD(c) | | 5/1/2040 | | | 6.61 | | | | - | | | | 1 | | | | | |
| 1,000,000 | | | TRACY CA JT UNIF SCH DIST (Step to 7.30% on 8/1/2027)(b) | | 8/1/2041 | | | 0.00 | | | | 674,322 | | | | 1,001,720 | | | | | |
| 600,000 | | | TRAVIS CNTY TX HLTH FACS DEV CORP | | 1/1/2046 | | | 7.13 | | | | 620,587 | | | | 635,286 | | | | | |
| 700,000 | | | TROUT CREEK CDD FL CAPITAL IMPT REVENUE | | 5/1/2038 | | | 5.38 | | | | 700,000 | | | | 752,178 | | | | | |
| 500,000 | | | TSR CDD FL SPL ASSMNT REVENUE | | 11/1/2035 | | | 5.38 | | | | 498,675 | | | | 554,605 | | | | | |
| 1,250,000 | | | TUSTIN CA UNIF SCH DIST | | 8/1/2028 | | | 6.00 | | | | 1,245,777 | | | | 1,349,637 | | | | | |
| 410,000 | | | UNIVERSAL ACADEMY MI PUBLIC SCH ACADEMY REVENUE | | 12/1/2023 | | | 6.50 | | | | 406,516 | | | | 425,346 | | | | | |
| 1,500,000 | | | UNIVERSITY PARK RECREATION DIST FL ON-AD VALOREM ASSMNT | | 5/1/2050 | | | 3.50 | | | | 1,500,000 | | | | 1,545,120 | | | | | |
| 620,000 | | | UPPER IL RIVER VLY DEV AUTH(d) | | 12/1/2022 | | | 4.00 | | | | 616,622 | | | | 625,289 | | | | | |
| 750,000 | | | UPPER IL RIVER VLY DEV AUTH(d) | | 12/1/2037 | | | 5.25 | | | | 766,959 | | | | 807,472 | | | | | |
| 1,000,000 | | | UTAH ST CHRT SCH FIN AUTH CHRT SCH REVENUE(d) | | 7/15/2033 | | | 4.65 | | | | 990,053 | | | | 1,017,330 | | | | | |
| 1,000,000 | | | UTAH ST CHRT SCH FIN AUTH CHRT SCH REVENUE | | 10/15/2033 | | | 6.50 | | | | 1,000,000 | | | | 1,002,790 | | | | | |
| 1,000,000 | | | UTAH ST CHRT SCH FIN AUTH CHRT SCH REVENUE(d) | | 4/15/2045 | | | 6.00 | | | | 1,002,600 | | | | 1,005,600 | | | | | |
| 110,000 | | | UTAH ST HSG CORP SF MTGE REVENUE | | 1/1/2033 | | | 5.75 | | | | 110,000 | | | | 112,165 | | | | | |
| 490,000 | | | VANCOUVER WA HSG AUTH | | 3/1/2025 | | | 5.00 | | | | 481,862 | | | | 493,082 | | | | | |
| 1,000,000 | | | VANCOUVER WA HSG AUTH | | 8/1/2034 | | | 3.75 | | | | 983,427 | | | | 1,072,450 | | | | | |
| 1,500,000 | | | VANCOUVER WA HSG AUTH | | 12/1/2051 | | | 3.30 | | | | 1,500,000 | | | | 1,487,895 | | | | | |
| 700,000 | | | VAUXMONT MET DIST CO | | 12/15/2050 | | | 3.25 | | | | 700,000 | | | | 721,581 | | | | | |
| 500,000 | | | VELOCITY MET DIST #3 CO | | 12/1/2039 | | | 5.38 | | | | 500,000 | | | | 532,770 | | | | | |
| 680,000 | | | VERMONT ST HSG FIN AGY | | 5/1/2032 | | | 4.88 | | | | 677,439 | | | | 725,390 | | | | | |
| 1,000,000 | | | VIRGINIA ST HSG DEV AUTH | | 7/1/2033 | | | 4.13 | | | | 1,000,000 | | | | 1,055,600 | | | | | |
| 3,500,000 | | | VIRGINIA ST HSG DEV AUTH CMWLTH MTGE | | 1/1/2038 | | | 3.88 | | | | 3,490,250 | | | | 3,611,720 | | | | | |
| See accompanying notes to financial statements. | 62 | (Continued) |
CLEARWATER INVESTMENT TRUST
Schedule of Investments - Clearwater Tax-Exempt Bond Fund
December 31, 2019
| | | | | | | | | | | | | | | | | | | | | | |
Par/Shares | | | Security | | Maturity
date | | Coupon
rate | | | Cost | | | Fair value (a) | | | Percent of
net assets | |
Municipal Bonds (Cont’d): | | | | | | | | | | | | | | | | | | |
| 1,160,000 | | | VLG FL CDD #7 SPL ASSMNT REVENUE | | 5/1/2036 | | | 4.00 | | | $ | 1,153,116 | | | | 1,234,379 | | | | | |
| 530,000 | | | WASHINGTON ST HSG FIN COMMISSION(d) | | 7/1/2025 | | | 6.00 | | | | 532,436 | | | | 580,456 | | | | | |
| 1,000,000 | | | WASHINGTON ST HSG FIN COMMISSION(d) | | 1/1/2031 | | | 5.00 | | | | 1,001,422 | | | | 1,127,800 | | | | | |
| 750,000 | | | WASHINGTON ST HSG FIN COMMISSION(d) | | 7/1/2031 | | | 5.00 | | | | 792,827 | | | | 824,085 | | | | | |
| 675,000 | | | WASHINGTON ST HSG FIN COMMISSION(d) | | 1/1/2035 | | | 5.75 | | | | 675,000 | | | | 725,470 | | | | | |
| 600,000 | | | WASHINGTON ST HSG FIN COMMISSION(d) | | 7/1/2036 | | | 5.00 | | | | 631,213 | | | | 649,344 | | | | | |
| 500,000 | | | WASHINGTON ST HSG FIN COMMISSION(d) | | 1/1/2038 | | | 5.00 | | | | 540,729 | | | | 568,480 | | | | | |
| 1,000,000 | | | WASHINGTON ST HSG FIN COMMISSION(d) | | 1/1/2044 | | | 5.00 | | | | 1,089,531 | | | | 1,099,310 | | | | | |
| 905,000 | | | WASHINGTON ST HSG FIN COMMISSION | | 12/1/2047 | | | 4.00 | | | | 954,210 | | | | 952,730 | | | | | |
| 4,000 | | | WATERS EDGE FL CDD CAPITAL IMPT REVENUE | | 5/1/2039 | | | 5.35 | | | | 4,000 | | | | 4,001 | | | | | |
| 105,000 | | | WATERS EDGE FL CDD CAPITAL IMPT REVENUE | | 5/1/2039 | | | 6.60 | | | | 104,235 | | | | 105,444 | | | | | |
| 1,500,000 | | | WEST VIRGINIA ST HSG DEV FUND | | 11/1/2032 | | | 3.75 | | | | 1,500,000 | | | | 1,591,500 | | | | | |
| 180,000 | | | WEST VIRGINIA ST HSG DEV FUND | | 11/1/2047 | | | 4.13 | | | | 180,000 | | | | 180,432 | | | | | |
| 1,500,000 | | | WEST VLY CITY UT MUNI BLDG AUTH LEASE REVENUE | | 2/1/2039 | | | 5.00 | | | | 1,639,973 | | | | 1,768,725 | | | | | |
| 550,000 | | | WESTCHESTER CO NY LOCAL DEV CORP REVENUE | | 1/1/2034 | | | 5.00 | | | | 564,294 | | | | 592,213 | | | | | |
| 685,000 | | | WESTMONT IL PARK DIST(g) | | 12/1/2031 | | | 0.00 | | | | 341,027 | | | | 391,149 | | | | | |
| 685,000 | | | WESTMONT IL PARK DIST(g) | | 12/1/2033 | | | 0.00 | | | | 297,266 | | | | 342,116 | | | | | |
| 700,000 | | | WICHITA KS HLTH CARE FACS REVENUE | | 12/1/2036 | | | 5.25 | | | | 711,773 | | | | 758,947 | | | | | |
| 1,000,000 | | | WINDSHIRE PARK CO MET DIST #2 | | 12/1/2047 | | | 6.50 | | | | 1,081,757 | | | | 1,125,700 | | | | | |
| 740,000 | | | WIREGRASS FL CDD CAPITAL IMPT REVENUE | | 5/1/2035 | | | 5.38 | | | | 736,120 | | | | 796,107 | | | | | |
| 630,000 | | | WISCONSIN ST HLTH & EDUCTNL FACS AUTH REVENUE | | 7/1/2030 | | | 5.75 | | | | 631,163 | | | | 644,339 | | | | | |
| 1,300,000 | | | WISCONSIN ST HLTH & EDUCTNL FACS AUTH REVENUE | | 8/15/2032 | | | 5.00 | | | | 1,384,745 | | | | 1,485,757 | | | | | |
| 700,000 | | | WISCONSIN ST HLTH & EDUCTNL FACS AUTH REVENUE | | 6/1/2037 | | | 5.00 | | | | 732,859 | | | | 756,406 | | | | | |
| 500,000 | | | WISCONSIN ST HLTH & EDUCTNL FACS AUTH REVENUE | | 9/15/2040 | | | 5.00 | | | | 514,614 | | | | 525,435 | | | | | |
| 2,000,000 | | | WISCONSIN ST HLTH & EDUCTNL FACS AUTH REVENUE | | 8/15/2043 | | | 5.00 | | | | 2,056,648 | | | | 2,162,160 | | | | | |
| 1,400,000 | | | WISCONSIN ST HLTH & EDUCTNL FACS AUTH REVENUE | | 9/15/2045 | | | 5.00 | | | | 1,438,494 | | | | 1,466,262 | | | | | |
| 650,000 | | | WISCONSIN ST HLTH & EDUCTNL FACS AUTH REVENUE | | 11/1/2046 | | | 5.00 | | | | 673,611 | | | | 702,358 | | | | | |
| 2,000,000 | | | WISCONSIN ST HLTH & EDUCTNL FACS AUTH REVENUE | | 10/1/2048 | | | 5.13 | | | | 1,963,100 | | | | 2,140,840 | | | | | |
| 500,000 | | | WISCONSIN ST HSG & ECON DEV AUTH | | 11/1/2035 | | | 3.88 | | | | 500,000 | | | | 529,980 | | | | | |
| 1,000,000 | | | WISCONSIN ST HSG & ECON DEV AUTH | | 11/1/2040 | | | 4.00 | | | | 1,000,000 | | | | 1,056,010 | | | | | |
| 1,000,000 | | | WISCONSIN ST HSG & ECON DEV AUTH | | 11/1/2042 | | | 3.90 | | | | 1,004,056 | | | | 1,060,100 | | | | | |
| 2,000,000 | | | WISCONSIN ST HSG & ECON DEV AUTH | | 11/1/2049 | | | 3.20 | | | | 2,000,000 | | | | 2,023,020 | | | | | |
| 1,500,000 | | | WISCONSIN ST HSG & ECON DEV AUTH | | 5/1/2055 | | | 4.15 | | | | 1,500,000 | | | | 1,595,685 | | | | | |
| 935,000 | | | WYANDOTTE CNTY KS KANSAS CITY UNIF GOVT SPL OBLG REVENUE | | 9/1/2032 | | | 5.75 | | | | 929,163 | | | | 1,025,040 | | | | | |
| 750,000 | | | WYNNFIELD LAKES FL CDD | | 5/1/2036 | | | 4.50 | | | | 745,300 | | | | 801,630 | | | | | |
| 630,000 | | | WYOMING ST CMNTY DEV AUTH HSG REVENUE | | 12/1/2038 | | | 3.90 | | | | 630,000 | | | | 669,917 | | | | | |
| 1,645,000 | | | WYOMING ST CMNTY DEV AUTH HSG REVENUE | | 12/1/2038 | | | 4.05 | | | | 1,645,000 | | | | 1,697,870 | | | | | |
| | | | | | | | | | | | | | | | | | | | | | |
| 350,934 | | | ZEPHYR RIDGE FL CDD CAPITAL IMPT REVENUE(c) | | 5/1/2013 | | | 5.25 | | | | 351,276 | | | | 294,784 | | | | | |
| | | Sub-total Municipal Bonds: | | | | | | | | | 515,936,915 | | | | 543,643,623 | | | | 90.11 | % |
Short-Term Investments: | | | | | | | | | | | | | | | | | | |
| 22,581,520 | | | NORTHERN INSTITUTIONAL FUNDS - U.S. GOVERNMENT | | | | | | | | | | | | | | | | | | |
| | | | SELECT PORTFOLIO, 1.53%(i) | | | | | | | | | 22,581,520 | | | | 22,581,520 | | | | | |
| | | Sub-total Short-Term Investments: | | | | | | | | | 22,581,520 | | | | 22,581,520 | | | | 3.74 | % |
| | | | Grand total | | | | | | | | $ | 569,172,843 | | | | 598,475,122 | | | | 99.20 | % |
| See accompanying notes to financial statements. | 63 | (Continued) |
CLEARWATER INVESTMENT TRUST
Schedule of Investments - Clearwater Tax-Exempt Bond Fund
December 31, 2019
Notes to Schedule of Investments:
| (a) | Investments are valued in accordance with procedures described in note 2 to the financial statements. |
| (b) | For step bonds, the coupon rate disclosed is the current rate in effect. |
| (c) | Non-income producing assets. For long-term debt securities, item identified is in default as to payment of interest and/or principal. |
| (d) | Securities exempt from registration under Rule 144A of the Securities Act of 1933. These securities may be resold in transactions exempt from registration, normally to qualified institutional buyers. The value of these securities is determined by valuations supplied by a pricing service or brokers, or, if not available, in accordance with procedures established by the Board of Trustees. |
| (e) | Variable rate security. Rate as of December 31, 2019 is disclosed. |
| (f) | These securities are remarketed by an agent, and the rate at which these securities are set are determined by general market conditions and supply and demand. |
| (g) | Zero coupon bond. |
| (h) | Restricted security that has been deemed illiquid. At December 31, 2019, the value of these restricted illiquid securities amounted to $3,383,705 or 0.56% of net assets. Additional information on these restricted illiquid securities is as follows: |
| SECURITY | | AQUISITION
DATE | | ACQUISITION
COST | |
| COLLIER CNTY FLA INDL DEV | | | | | |
| AUTH CONTINUING CARE CMNTY | | | | | |
| REVENUE, 7.25%, 5/15/26 | | 12/16/13 | | $750,000 | |
| COLLIER CNTY FLA INDL DEV | | | | | |
| AUTH CONTINUING CARE CMNTY | | | | | |
| REVENUE, 8.13%, 5/15/44 | | 6/27/17-4/12/18 | | 1,961,290 | |
| KANSAS CITY MO INDL DEV AUTH | | | | | |
| SENIOR LIVING FACS REVENUE, | | | | | |
| 5.75%, 11/15/36 | | 12/18/15 | | 1,300,000 | |
| (i) | The short-term investment is a money market portfolio of the investment company, Northern Institutional Funds. At December 31, 2018, the value of the Clearwater Tax-Exempt Bond Fund’s investment in the U.S. Government Select Portfolio of the Northern Institutional Funds was $4,274,380 with net purchases of $18,307,140 during the fiscal year ended December 31, 2019. |
Diversification of investments representing geographic diversification, as a percentage of total investments at fair value, is as follows:
| Geographical Diversification | | | Percent | |
| Illinois | | | 11.02 | % |
| Florida | | | 10.92 | |
| California | | | 8.02 | |
| Texas | | | 6.62 | |
| New York | | | 5.21 | |
| Colorado | | | 4.99 | |
| Wisconsin | | | 4.11 | |
| Georgia | | | 4.01 | |
| Indiana | | | 3.21 | |
| Pennsylvania | | | 3.00 | |
| Other | | | 38.89 | |
| | | | 100.00 | % |
| See accompanying notes to financial statements. | 64 | (Continued) |
CLEARWATER INVESTMENT TRUST
Schedule of Investments - Clearwater Tax-Exempt Bond Fund
December 31, 2019
Clearwater Tax-Exempt Bond Fund Portfolio Diversification
(as a percentage of net assets)
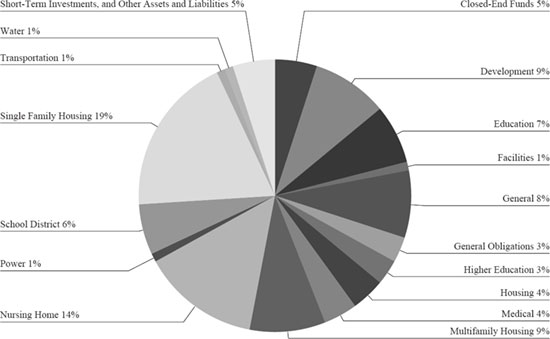
| See accompanying notes to financial statements. | 65 | (Continued) |
CLEARWATER INVESTMENT TRUST
Schedule of Investments - Clearwater International Fund
December 31, 2019
| | | | | | | | | | | | Percent of | |
| Shares | | | Security | | Cost | | | Fair value (a) | | | net assets | |
| Common Stocks: | | | | | | | | | | | | |
| | Australia: | | | | | | | | | | | | |
| | 275,180 | | | ADAIRS LTD.(b) | | $ | 331,893 | | | | 442,216 | | | | | |
| | 53,401 | | | AFTERPAY LTD.(c) | | | 1,173,884 | | | | 1,097,243 | | | | | |
| | 10,655 | | | AGL ENERGY LTD. | | | 140,756 | | | | 153,506 | | | | | |
| | 102,780 | | | ALLIANCE AVIATION SERVICES LTD. | | | 167,434 | | | | 186,085 | | | | | |
| | 23,329 | | | ALUMINA LTD. | | | 18,929 | | | | 37,654 | | | | | |
| | 41,047 | | | APA GROUP | | | 230,317 | | | | 319,732 | | | | | |
| | 74,125 | | | APPEN LTD. | | | 1,097,710 | | | | 1,168,307 | | | | | |
| | 7,674 | | | ARISTOCRAT LEISURE LTD. | | | 149,326 | | | | 181,321 | | | | | |
| | 2,554 | | | ASX LTD. | | | 51,631 | | | | 140,532 | | | | | |
| | 33,277 | | | AUSTRALIA & NEW ZEALAND BANKING GROUP LTD. | | | 351,123 | | | | 575,163 | | | | | |
| | 155,819 | | | AVENTUS GROUP | | | 289,289 | | | | 311,636 | | | | | |
| | 250,708 | | | BEACH ENERGY LTD. | | | 466,720 | | | | 441,595 | | | | | |
| | 179,910 | | | BGP HOLDINGS PLC(c)(d) | | | - | | | | - | | | | | |
| | 11,117 | | | BHP GROUP LTD. | | | 128,168 | | | | 303,629 | | | | | |
| | 29,300 | | | BLUESCOPE STEEL LTD. | | | 232,964 | | | | 309,653 | | | | | |
| | 17,400 | | | BRAMBLES LTD. | | | 64,294 | | | | 143,106 | | | | | |
| | 49,542 | | | CEDAR WOODS PROPERTIES LTD. | | | 234,956 | | | | 272,914 | | | | | |
| | 7,457 | | | COCA-COLA AMATIL LTD. | | | 47,691 | | | | 57,876 | | | | | |
| | 971 | | | COCHLEAR LTD. | | | 35,893 | | | | 153,131 | | | | | |
| | 19,339 | | | COLES GROUP LTD. | | | 154,507 | | | | 201,396 | | | | | |
| | 24,616 | | | COMMONWEALTH BANK OF AUSTRALIA | | | 927,865 | | | | 1,380,215 | | | | | |
| | 44,677 | | | CSL LTD. | | | 3,226,709 | | | | 8,645,651 | | | | | |
| | 15,806 | | | DEXUS | | | 76,116 | | | | 129,775 | | | | | |
| | 97,180 | | | FORTESCUE METALS GROUP LTD. | | | 212,026 | | | | 729,016 | | | | | |
| | 18,737 | | | GOODMAN GROUP | | | 48,414 | | | | 175,798 | | | | | |
| | 17,655 | | | HARVEY NORMAN HOLDINGS LTD. | | | 46,984 | | | | 50,425 | | | | | |
| | 191,776 | | | HT&E LTD. | | | 241,003 | | | | 228,111 | | | | | |
| | 21,415 | | | INCITEC PIVOT LTD. | | | 36,638 | | | | 47,789 | | | | | |
| | 46,677 | | | INSURANCE AUSTRALIA GROUP LTD. | | | 120,292 | | | | 250,908 | | | | | |
| | 12,403 | | | LENDLEASE GROUP | | | 80,469 | | | | 153,187 | | | | | |
| | 7,617 | | | MACQUARIE GROUP LTD. | | | 165,840 | | | | 736,840 | | | | | |
| | 25,670 | | | MINERAL RESOURCES LTD. | | | 246,214 | | | | 297,230 | | | | | |
| | 287,808 | | | NANOSONICS LTD.(c) | | | 1,244,379 | | | | 1,282,505 | | | | | |
| | 21,604 | | | NATIONAL AUSTRALIA BANK LTD. | | | 287,411 | | | | 373,406 | | | | | |
| | 185,584 | | | NEW HOPE CORP. LTD. | | | 317,284 | | | | 268,281 | | | | | |
| | 6,653 | | | NEWCREST MINING LTD. | | | 50,401 | | | | 141,229 | | | | | |
| | 23,006 | | | OIL SEARCH LTD. | | | 112,331 | | | | 117,047 | | | | | |
| | 15,650 | | | ORIGIN ENERGY LTD. | | | 70,539 | | | | 92,801 | | | | | |
| | 16,330 | | | ORORA LTD. | | | 16,762 | | | | 36,441 | | | | | |
| | 416 | | | PERPETUAL LTD. | | | 7,027 | | | | 12,004 | | | | | |
| | 92,392 | | | QANTAS AIRWAYS LTD. | | | 401,745 | | | | 460,985 | | | | | |
| | 2,468 | | | RAMSAY HEALTH CARE LTD. | | | 49,765 | | | | 125,616 | | | | | |
| | 169,500 | | | REGIS RESOURCES LTD. | | | 501,445 | | | | 516,228 | | | | | |
| | 20,500 | | | SANTOS LTD. | | | 45,732 | | | | 117,676 | | | | | |
| | 51,054 | | | SCENTRE GROUP | | | 98,594 | | | | 137,218 | | | | | |
| | 5,884 | | | SEEK LTD. | | | 49,598 | | | | 93,111 | | | | | |
| | 9,824 | | | SONIC HEALTHCARE LTD. | | | 79,849 | | | | 198,202 | | | | | |
| | 101,955 | | | SOUTH32 LTD. | | | 70,421 | | | | 193,177 | | | | | |
| | 43,370 | | | STOCKLAND | | | 115,690 | | | | 140,609 | | | | | |
| | 75,800 | | | SUPER RETAIL GROUP LTD. | | | 517,213 | | | | 538,310 | | | | | |
| | 9,837 | | | SYDNEY AIRPORT | | | 33,263 | | | | 59,781 | | | | | |
| | 15,554 | | | TABCORP HOLDINGS LTD. | | | 30,149 | | | | 49,445 | | | | | |
| | 35,097 | | | TELSTRA CORP. LTD. | | | 75,707 | | | | 87,188 | | | | | |
| | 38,553 | | | TRANSURBAN GROUP | | | 292,995 | | | | 403,384 | | | | | |
| | 12,264 | | | TREASURY WINE ESTATES LTD. | | | 49,093 | | | | 139,766 | | | | | |
| | 33,315 | | | VICINITY CENTRES | | | 46,791 | | | | 58,213 | | | | | |
| | 3,329 | | | WASHINGTON H. SOUL PATTINSON & CO. LTD. | | | 45,851 | | | | 50,227 | | | | | |
| | 9,847 | | | WESFARMERS LTD. | | | 239,524 | | | | 286,079 | | | | | |
| | 52,115 | | | WESTPAC BANKING CORP. | | | 691,073 | | | | 886,132 | | | | | |
| | 16,160 | | | WOODSIDE PETROLEUM LTD. | | | 348,115 | | | | 389,879 | | | | | |
| | 2,163 | | | WOOLWORTHS GROUP LTD. | | | 47,654 | | | | 54,887 | | | | | |
| | 5,244 | | | WORLEY LTD. | | | 40,526 | | | | 56,340 | | | | | |
| | 374,133 | | | ZIP CO. LTD.(b)(c) | | | 924,155 | | | | 929,419 | | | | | |
| | | | | | | | 17,697,137 | | | | 27,617,226 | | | | 3.88 | % |
| | Austria: | | | | | | | | | | | | | | | |
| | 1,388 | | | ANDRITZ A.G. | | | 48,521 | | | | 59,786 | | | | | |
| See accompanying notes to financial statements. | 66 | (Continued) |
CLEARWATER INVESTMENT TRUST
Schedule of Investments - Clearwater International Fund
December 31, 2019
| | | | | | | | | | | | Percent of | |
| Shares | | | Security | | Cost | | | Fair value (a) | | | net assets | |
| | Austria (Cont’d): | | | | | | | | | | | | | |
| | 8,998 | | | BAWAG GROUP A.G.(c)(e) | | $ | 357,978 | | | | 409,778 | | | | | |
| | 3,566 | | | ERSTE GROUP BANK A.G.(c) | | | 63,769 | | | | 134,239 | | | | | |
| | 93 | | | IMMOFINANZ A.G.(c) | | | - | | | | 2,493 | | | | | |
| | 313 | | | STRABAG S.E. (BEARER) | | | 5,505 | | | | 10,884 | | | | | |
| | 34,691 | | | TELEKOM AUSTRIA A.G.(c) | | | 259,973 | | | | 283,286 | | | | | |
| | 631 | | | UBM DEVELOPMENT A.G. | | | 28,972 | | | | 33,408 | | | | | |
| | 21,794 | | | VIENNA INSURANCE GROUP A.G. WIENER VERSICHERUNG GRUPPE | | | 595,919 | | | | 620,937 | | | | | |
| | 2,012 | | | VOESTALPINE A.G. | | | 45,304 | | | | 56,106 | | | | | |
| | 13,496 | | | WIENERBERGER A.G. | | | 337,601 | | | | 399,958 | | | | | |
| | | | | | | | 1,743,542 | | | | 2,010,875 | | | | 0.28 | % |
| | Belgium: | | | | | | | | | | | | | | | |
| | 7,120 | | | AGEAS | | | 106,908 | | | | 420,729 | | | | | |
| | 13,180 | | | ANHEUSER-BUSCH INBEV S.A./N.V. | | | 452,184 | | | | 1,074,945 | | | | | |
| | 19,000 | | | BPOST S.A. | | | 195,697 | | | | 219,517 | | | | | |
| | 25,946 | | | GROUPE BRUXELLES LAMBERT S.A. | | | 2,315,088 | | | | 2,734,577 | | | | | |
| | 10,697 | | | KBC GROUP N.V. | | | 464,860 | | | | 804,641 | | | | | |
| | 21,394 | | | ONTEX GROUP N.V. | | | 501,601 | | | | 449,956 | | | | | |
| | 2,190 | | | PROXIMUS SADP | | | 49,577 | | | | 62,690 | | | | | |
| | 1,091 | | | UCB S.A. | | | 30,547 | | | | 86,766 | | | | | |
| | 1,545 | | | UMICORE S.A. | | | 45,694 | | | | 75,144 | | | | | |
| | | | | | | | 4,162,156 | | | | 5,928,965 | | | | 0.83 | % |
| | Brazil: | | | | | | | | | | | | | | | |
| | 74,700 | | | CIA SIDERURGICA NACIONAL S.A. | | | 235,831 | | | | 262,017 | | | | | |
| | 126,800 | | | GRUPO SBF S.A.(c) | | | 652,921 | | | | 1,108,913 | | | | | |
| | 51,200 | | | IOCHPE-MAXION S.A.(c) | | | 228,388 | | | | 297,575 | | | | | |
| | 73,600 | | | NOTRE DAME INTERMEDICA PARTICIPACOES S.A. | | | 1,013,651 | | | | 1,248,714 | | | | | |
| | 88,100 | | | WIZ SOLUCOES E CORRETAGEM DE SEGUROS S.A. | | | 235,725 | | | | 309,238 | | | | | |
| | | | | | | | 2,366,516 | | | | 3,226,457 | | | | 0.45 | % |
| | Canada: | | | | | | | | | | | | | | | |
| | 2,489 | | | AGNICO EAGLE MINES LTD. | | | 77,836 | | | | 153,302 | | | | | |
| | 12,428 | | | ALIMENTATION COUCHE-TARD, INC., CLASS B | | | 223,779 | | | | 394,408 | | | | | |
| | 31,523 | | | ALTAGAS LTD.(b) | | | 346,931 | | | | 480,170 | | | | | |
| | 5,073 | | | BANK OF MONTREAL | | | 336,776 | | | | 393,167 | | | | | |
| | 9,533 | | | BANK OF NOVA SCOTIA (THE) | | | 415,068 | | | | 538,482 | | | | | |
| | 40,918 | | | BARRICK GOLD CORP. | | | 384,639 | | | | 760,034 | | | | | |
| | 49,653 | | | BOMBARDIER, INC., CLASS B(c) | | | 48,169 | | | | 73,798 | | | | | |
| | 17,842 | | | BROOKFIELD ASSET MANAGEMENT, INC., CLASS A | | | 164,184 | | | | 1,030,908 | | | | | |
| | 11,000 | | | BRP, INC. (SUB VOTING) | | | 430,510 | | | | 501,144 | | | | | |
| | 88,850 | | | CAE, INC. | | | 2,056,167 | | | | 2,352,365 | | | | | |
| | 6,639 | | | CANADIAN IMPERIAL BANK OF COMMERCE | | | 268,953 | | | | 552,470 | | | | | |
| | 15,994 | | | CANADIAN NATIONAL RAILWAY CO. | | | 292,557 | | | | 1,446,856 | | | | | |
| | 14,181 | | | CANADIAN NATURAL RESOURCES LTD. | | | 282,344 | | | | 458,667 | | | | | |
| | 3,606 | | | CANADIAN PACIFIC RAILWAY LTD. | | | 112,878 | | | | 919,252 | | | | | |
| | 22,574 | | | CANADIAN PACIFIC RAILWAY LTD. (NEW YORK EXCHANGE) | | | 3,102,265 | | | | 5,755,241 | | | | | |
| | 6,144 | | | CANADIAN TIRE CORP. LTD., CLASS A | | | 632,301 | | | | 661,218 | | | | | |
| | 1,449 | | | CANADIAN UTILITIES LTD., CLASS A | | | 35,079 | | | | 43,708 | | | | | |
| | 14,700 | | | CARGOJET, INC. | | | 1,104,040 | | | | 1,169,729 | | | | | |
| | 35,300 | | | CASCADES, INC. | | | 347,472 | | | | 304,735 | | | | | |
| | 1,570 | | | CCL INDUSTRIES, INC., CLASS B | | | 45,979 | | | | 66,884 | | | | | |
| | 23,087 | | | CENOVUS ENERGY, INC. | | | 200,780 | | | | 234,684 | | | | | |
| | 45,100 | | | CENTERRA GOLD, INC.(c) | | | 366,388 | | | | 358,772 | | | | | |
| | 6,978 | | | CGI, INC.(c) | | | 55,128 | | | | 583,958 | | | | | |
| | 25,800 | | | COMINAR REAL ESTATE INVESTMENT TRUST | | | 273,247 | | | | 281,335 | | | | | |
| | 167 | | | CONSTELLATION SOFTWARE, INC. | | | 49,226 | | | | 162,191 | | | | | |
| | 52,400 | | | CORUS ENTERTAINMENT, INC., CLASS B | | | 212,483 | | | | 214,676 | | | | | |
| | 31,800 | | | DESCARTES SYSTEMS GROUP (THE), INC.(c) | | | 1,259,887 | | | | 1,359,131 | | | | | |
| | 59,577 | | | DOLLARAMA, INC. | | | 2,246,991 | | | | 2,047,608 | | | | | |
| | 25,600 | | | DOREL INDUSTRIES, INC., CLASS B | | | 175,448 | | | | 117,891 | | | | | |
| | 67,455 | | | ECN CAPITAL CORP. | | | 232,360 | | | | 248,823 | | | | | |
| | 25,636 | | | ENBRIDGE, INC. | | | 926,643 | | | | 1,019,280 | | | | | |
| | 63,982 | | | ENCANA CORP. | | | 300,066 | | | | 299,573 | | | | | |
| | 39,600 | | | ENERPLUS CORP. | | | 318,702 | | | | 282,084 | | | | | |
| | 207,540 | | | EUROPEAN RESIDENTIAL REAL ESTATE INVESTMENT TRUST | | | 732,188 | | | | 743,184 | | | | | |
| | 421 | | | FAIRFAX FINANCIAL HOLDINGS LTD. | | | 142,076 | | | | 197,682 | | | | | |
| See accompanying notes to financial statements. | 67 | (Continued) |
CLEARWATER INVESTMENT TRUST
Schedule of Investments - Clearwater International Fund
December 31, 2019
| | | | | | | | | | | | Percent of | |
| Shares | | | Security | | Cost | | | Fair value (a) | | | net assets | |
| | Canada (Cont’d): | | | | | | | | | | | | | |
| | 18,805 | | | FIRSTSERVICE CORP. | | $ | 1,915,364 | | | | 1,750,673 | | | | | |
| | 6,289 | | | FORTIS, INC. | | | 195,157 | | | | 260,946 | | | | | |
| | 2,389 | | | FRANCO-NEVADA CORP. | | | 109,265 | | | | 246,691 | | | | | |
| | 6,104 | | | GILDAN ACTIVEWEAR, INC. | | | 33,435 | | | | 180,457 | | | | | |
| | 33,825 | | | HUSKY ENERGY, INC. | | | 230,453 | | | | 271,423 | | | | | |
| | 19,500 | | | IA FINANCIAL CORP., INC. | | | 882,358 | | | | 1,071,145 | | | | | |
| | 109,296 | | | IMPERIAL OIL LTD. | | | 3,584,356 | | | | 2,891,161 | | | | | |
| | 3,057 | | | INTER PIPELINE LTD. | | | 44,071 | | | | 53,063 | | | | | |
| | 1,100 | | | INTERNATIONAL PETROLEUM CORP.(c) | | | 2,833 | | | | 4,895 | | | | | |
| | 1,988 | | | KEYERA CORP. | | | 40,155 | | | | 52,083 | | | | | |
| | 14,205 | | | KINAXIS, INC.(c) | | | 907,384 | | | | 1,094,131 | | | | | |
| | 33,281 | | | KINROSS GOLD CORP.(c) | | | 62,810 | | | | 157,877 | | | | | |
| | 85,700 | | | LEAGOLD MINING CORP.(c) | | | 177,524 | | | | 213,169 | | | | | |
| | 2,077 | | | LOBLAW COS. LTD. | | | 71,240 | | | | 107,165 | | | | | |
| | 13,709 | | | LULULEMON ATHLETICA, INC.(c) | | | 2,888,178 | | | | 3,175,964 | | | | | |
| | 9,476 | | | MAGNA INTERNATIONAL, INC. | | | 61,549 | | | | 519,573 | | | | | |
| | 31,473 | | | MANULIFE FINANCIAL CORP. | | | 380,571 | | | | 638,888 | | | | | |
| | 2,029 | | | METHANEX CORP. | | | 33,006 | | | | 78,360 | | | | | |
| | 3,000 | | | METRO, INC. | | | 54,328 | | | | 123,807 | | | | | |
| | 18,700 | | | NFI GROUP, INC. | | | 423,076 | | | | 383,778 | | | | | |
| | 8,072 | | | NUTRIEN LTD. | | | 154,455 | | | | 386,459 | | | | | |
| | 2,600 | | | ONEX CORP. | | | 105,376 | | | | 164,524 | | | | | |
| | 6,564 | | | OPEN TEXT CORP. | | | 72,477 | | | | 289,240 | | | | | |
| | 26,607 | | | PEMBINA PIPELINE CORP.(b) | | | 660,003 | | | | 986,173 | | | | | |
| | 23,400 | | | PIZZA PIZZA ROYALTY CORP. | | | 181,786 | | | | 176,056 | | | | | |
| | 3,681 | | | RESTAURANT BRANDS INTERNATIONAL, INC. | | | 137,022 | | | | 234,656 | | | | | |
| | 2,701 | | | RITCHIE BROS. AUCTIONEERS, INC. | | | 50,064 | | | | 115,898 | | | | | |
| | 9,354 | | | ROGERS COMMUNICATIONS, INC., CLASS B | | | 221,766 | | | | 464,476 | | | | | |
| | 27,066 | | | ROYAL BANK OF CANADA | | | 909,444 | | | | 2,141,644 | | | | | |
| | 4,800 | | | SAPUTO, INC. | | | 103,951 | | | | 148,597 | | | | | |
| | 40,500 | | | SEVEN GENERATIONS ENERGY LTD., CLASS A(c) | | | 277,351 | | | | 264,168 | | | | | |
| | 6,379 | | | SHAW COMMUNICATIONS, INC., CLASS B | | | 97,657 | | | | 129,442 | | | | | |
| | 1,352 | | | SHOPIFY, INC., CLASS A(c) | | | 360,074 | | | | 537,552 | | | | | |
| | 16,279 | | | SHOPIFY, INC., CLASS A (NEW YORK EXCHANGE)(c) | | | 2,320,156 | | | | 6,472,205 | | | | | |
| | 11,810 | | | SUN LIFE FINANCIAL, INC. | | | 235,812 | | | | 538,501 | | | | | |
| | 18,690 | | | SUNCOR ENERGY, INC. | | | 389,695 | | | | 612,565 | | | | | |
| | 6,418 | | | TC ENERGY CORP. | | | 216,982 | | | | 341,819 | | | | | |
| | 19,201 | | | TECK RESOURCES LTD., CLASS B | | | 97,101 | | | | 332,992 | | | | | |
| | 4,548 | | | TELUS CORP. | | | 59,716 | | | | 176,099 | | | | | |
| | 10,700 | | | TFI INTERNATIONAL, INC. | | | 328,109 | | | | 360,663 | | | | | |
| | 8,041 | | | THOMSON REUTERS CORP. | | | 206,631 | | | | 575,202 | | | | | |
| | 30,016 | | | TORONTO-DOMINION BANK (THE) | | | 557,894 | | | | 1,683,466 | | | | | |
| | 104 | | | TRISURA GROUP LTD.(c) | | | 490 | | | | 3,225 | | | | | |
| | 16,898 | | | VERMILION ENERGY, INC. | | | 254,206 | | | | 276,265 | | | | | |
| | 16,800 | | | WAJAX CORP. | | | 206,860 | | | | 191,475 | | | | | |
| | 20,600 | | | WESTSHORE TERMINALS INVESTMENT CORP.(b) | | | 319,282 | | | | 300,620 | | | | | |
| | 6,930 | | | WHEATON PRECIOUS METALS CORP. | | | 108,261 | | | | 206,211 | | | | | |
| | 25,967 | | | YAMANA GOLD, INC. | | | 47,753 | | | | 102,784 | | | | | |
| | | | | | | | 38,977,027 | | | | 57,695,636 | | | | 8.10 | % |
| | Chile: | | | | | | | | | | | | | | | |
| | 5,893,187 | | | ENEL CHILE S.A. | | | 532,931 | | | | 552,523 | | | | | |
| | | | | | | | 532,931 | | | | 552,523 | | | | 0.08 | % |
| | China: | | | | | | | | | | | | | | | |
| | 290,000 | | | AGILE GROUP HOLDINGS LTD. | | | 352,847 | | | | 436,174 | | | | | |
| | 225,500 | | | ASIA CEMENT CHINA HOLDINGS CORP. | | | 293,280 | | | | 336,848 | | | | | |
| | 27,806 | | | BAIDU, INC. ADR(c)(f) | | | 3,808,381 | | | | 3,514,678 | | | | | |
| | 656,000 | | | CHINA BLUECHEMICAL LTD., CLASS H | | | 177,444 | | | | 161,637 | | | | | |
| | 408,000 | | | CHINA MEDICAL SYSTEM HOLDINGS LTD. | | | 472,941 | | | | 587,472 | | | | | |
| | 1,191,000 | | | CHINA SUNTIEN GREEN ENERGY CORP. LTD., CLASS H | | | 329,834 | | | | 343,897 | | | | | |
| | 122,557 | | | HANGZHOU TIGERMED CONSULTING CO. LTD., CLASS A | | | 1,065,738 | | | | 1,111,137 | | | | | |
| | 97,555 | | | TENCENT HOLDINGS LTD. | | | 1,604,694 | | | | 4,702,291 | | | | | |
| | 302,000 | | | ZHEJIANG EXPRESSWAY CO. LTD., CLASS H | | | 271,689 | | | | 275,169 | | | | | |
| | | | | | | | 8,376,848 | | | | 11,469,303 | | | | 1.61 | % |
| | Czech Republic: | | | | | | | | | | | | | |
| | 88,400 | | | MONETA MONEY BANK A.S.(e) | | | 268,732 | | | | 331,450 | | | | | |
| See accompanying notes to financial statements. | 68 | (Continued) |
CLEARWATER INVESTMENT TRUST
Schedule of Investments - Clearwater International Fund
December 31, 2019
| | | | | | | | | | | | Percent of | |
| Shares | | | Security | | Cost | | | Fair value (a) | | | net assets | |
| | Czech Republic (Cont’d): | | | | | | | | | | | | |
| | 701 | | | PHILIP MORRIS CR A.S. | | $ | 402,294 | | | | 472,486 | | | | | |
| | | | | | | | 671,026 | | | | 803,936 | | | | 0.11 | % |
| | Denmark: | | | | | | | | | | | | | | | |
| | 46 | | | AP MOLLER - MAERSK A/S, CLASS A | | | 37,177 | | | | 62,352 | | | | | |
| | 65 | | | AP MOLLER - MAERSK A/S, CLASS B | | | 52,319 | | | | 93,746 | | | | | |
| | 1,695 | | | CARLSBERG A/S, CLASS B | | | 90,296 | | | | 252,856 | | | | | |
| | 905 | | | CHR HANSEN HOLDING A/S | | | 50,981 | | | | 71,918 | | | | | |
| | 1,500 | | | COLOPLAST A/S, CLASS B | | | 27,666 | | | | 186,074 | | | | | |
| | 47,414 | | | DANSKE BANK A/S | | | 607,330 | | | | 767,239 | | | | | |
| | 3,896 | | | DEMANT A/S(c) | | | 70,444 | | | | 122,696 | | | | | |
| | 70,782 | | | DSV PANALPINA A/S | | | 6,427,483 | | | | 8,157,857 | | | | | |
| | 200 | | | FLSMIDTH & CO. A/S | | | 6,013 | | | | 7,968 | | | | | |
| | 808 | | | GENMAB A/S(c) | | | 101,229 | | | | 179,687 | | | | | |
| | 21,785 | | | NOVO NORDISK A/S, CLASS B | | | 271,361 | | | | 1,264,389 | | | | | |
| | 2,500 | | | NOVOZYMES A/S, CLASS B | | | 39,158 | | | | 122,338 | | | | | |
| | 864 | | | ORSTED A/S(e) | | | 68,168 | | | | 89,359 | | | | | |
| | 9,926 | | | PANDORA A/S | | | 330,868 | | | | 431,795 | | | | | |
| | 11,420 | | | SIMCORP A/S | | | 1,064,882 | | | | 1,298,536 | | | | | |
| | 2,699 | | | SOLAR A/S, CLASS B | | | 116,641 | | | | 121,138 | | | | | |
| | 3,250 | | | TOPDANMARK A/S | | | 33,362 | | | | 160,211 | | | | | |
| | 3,244 | | | VESTAS WIND SYSTEMS A/S | | | 150,564 | | | | 327,816 | | | | | |
| | | | | | | | 9,545,942 | | | | 13,717,975 | | | | 1.93 | % |
| | Finland: | | | | | | | | | | | | | | | |
| | 23,294 | | | CRAMO OYJ | | | 240,704 | | | | 345,946 | | | | | |
| | 2,770 | | | ELISA OYJ | | | 86,574 | | | | 153,025 | | | | | |
| | 1,396 | | | KESKO OYJ, CLASS B | | | 30,705 | | | | 98,777 | | | | | |
| | 4,902 | | | KONE OYJ, CLASS B | | | 86,493 | | | | 320,457 | | | | | |
| | 21,225 | | | NESTE OYJ | | | 67,704 | | | | 738,527 | | | | | |
| | 2,240 | | | NOKIAN RENKAAT OYJ | | | 31,307 | | | | 64,398 | | | | | |
| | 169 | | | NORDEA BANK ABP | | | 1,068 | | | | 1,373 | | | | | |
| | 102,296 | | | NORDEA BANK ABP (STOCKHOLM EXCHANGE) | | | 713,529 | | | | 826,114 | | | | | |
| | 1,960 | | | ORION OYJ, CLASS B | | | 49,561 | | | | 90,733 | | | | | |
| | 1,554 | | | SAMPO OYJ, CLASS A | | | 51,255 | | | | 67,825 | | | | | |
| | 24,493 | | | SANOMA OYJ | | | 271,642 | | | | 259,490 | | | | | |
| | 17,680 | | | STORA ENSO OYJ, CLASS R | | | 95,532 | | | | 257,117 | | | | | |
| | 11,934 | | | UPM-KYMMENE OYJ | | | 99,928 | | | | 413,773 | | | | | |
| | 1,849 | | | VALMET OYJ | | | 14,443 | | | | 44,301 | | | | | |
| | 7,056 | | | WARTSILA OYJ ABP | | | 56,960 | | | | 77,960 | | | | | |
| | | | | | | | 1,897,405 | | | | 3,759,816 | | | | 0.53 | % |
| | France: | | | | | | | | | | | | | | | |
| | 1,275 | | | ACCOR S.A. | | | 29,826 | | | | 59,709 | | | | | |
| | 3,443 | | | AEROPORTS DE PARIS | | | 334,974 | | | | 680,101 | | | | | |
| | 22,200 | | | AIR FRANCE-KLM(c) | | | 263,182 | | | | 247,125 | | | | | |
| | 10,877 | | | AIRBUS S.E. | | | 357,319 | | | | 1,591,951 | | | | | |
| | 2,833 | | | ALSTOM S.A. | | | 117,549 | | | | 134,197 | | | | | |
| | 5,292 | | | ARKEMA S.A. | | | 464,611 | | | | 562,143 | | | | | |
| | 30,343 | | | AXA S.A. | | | 403,058 | | | | 854,638 | | | | | |
| | 11,555 | | | BNP PARIBAS S.A. | | | 499,314 | | | | 684,743 | | | | | |
| | 16,698 | | | BOLLORE S.A. | | | 52,911 | | | | 72,860 | | | | | |
| | 1,643 | | | BOUYGUES S.A. | | | 51,359 | | | | 69,811 | | | | | |
| | 3,068 | | | CAPGEMINI S.E. | | | 111,959 | | | | 374,766 | | | | | |
| | 1,844 | | | CASINO GUICHARD PERRACHON S.A. | | | 69,882 | | | | 86,253 | | | | | |
| | 2,383 | | | CIE DE SAINT-GOBAIN | | | 64,767 | | | | 97,565 | | | | | |
| | 5,399 | | | CIE DES ALPES | | | 143,643 | | | | 180,773 | | | | | |
| | 3,404 | | | CIE GENERALE DES ETABLISSEMENTS MICHELIN S.C.A. | | | 180,725 | | | | 416,573 | | | | | |
| | 12,397 | | | CIE PLASTIC OMNIUM S.A. | | | 365,091 | | | | 346,252 | | | | | |
| | 37,390 | | | COFACE S.A. | | | 449,179 | | | | 460,086 | | | | | |
| | 435 | | | COVIVIO | | | 36,723 | | | | 49,379 | | | | | |
| | 60,517 | | | CREDIT AGRICOLE S.A. | | | 605,297 | | | | 877,374 | | | | | |
| | 9,359 | | | DANONE S.A. | | | 473,663 | | | | 775,802 | | | | | |
| | 1,591 | | | DASSAULT SYSTEMES S.E. | | | 236,177 | | | | 261,537 | | | | | |
| | 1,781 | | | EDENRED | | | 26,435 | | | | 92,096 | | | | | |
| | 18,140 | | | ELECTRICITE DE FRANCE S.A. | | | 191,029 | | | | 202,011 | | | | | |
| | 40,882 | | | ENGIE S.A. | | | 496,973 | | | | 660,346 | | | | | |
| | 15,893 | | | ESSILORLUXOTTICA S.A. | | | 1,815,129 | | | | 2,412,017 | | | | | |
| | 22,826 | | | ESSILORLUXOTTICA S.A. (EURONEXT PARIS EXCHANGE) | | | 2,889,782 | | | | 3,477,013 | | | | | |
| See accompanying notes to financial statements. | 69 | (Continued) |
CLEARWATER INVESTMENT TRUST
Schedule of Investments - Clearwater International Fund
December 31, 2019
| | | | | | | | | | | | Percent of | |
| Shares | | | Security | | Cost | | | Fair value (a) | | | net assets | |
| | France (Cont’d): | | | | | | | | | | | | |
| | 2,946 | | | EURAZEO S.E. | | $ | 77,882 | | | | 201,576 | | | | | |
| | 162 | | | EUROFINS SCIENTIFIC S.E. | | | 71,527 | | | | 89,804 | | | | | |
| | 1,185 | | | FAURECIA S.E. | | | 48,875 | | | | 63,842 | | | | | |
| | 711 | | | GECINA S.A. | | | 70,962 | | | | 127,286 | | | | | |
| | 9,468 | | | GETLINK S.E. | | | 72,457 | | | | 164,720 | | | | | |
| | 1,348 | | | ICADE | | | 118,190 | | | | 146,745 | | | | | |
| | 3,399 | | | INFOTEL S.A. | | | 145,404 | | | | 152,316 | | | | | |
| | 1,865 | | | JCDECAUX S.A. | | | 51,106 | | | | 57,487 | | | | | |
| | 7,198 | | | KAUFMAN & BROAD S.A. | | | 285,637 | | | | 298,738 | | | | | |
| | 1,090 | | | KERING S.A. | | | 209,802 | | | | 715,497 | | | | | |
| | 2,335 | | | KLEPIERRE S.A. | | | 57,367 | | | | 88,659 | | | | | |
| | 4,882 | | | LEGRAND S.A. | | | 111,114 | | | | 397,787 | | | | | |
| | 6,266 | | | L’OREAL S.A. | | | 661,338 | | | | 1,855,543 | | | | | |
| | 16,378 | | | LVMH MOET HENNESSY LOUIS VUITTON S.E. | | | 2,672,763 | | | | 7,609,353 | | | | | |
| | 14,296 | | | MERSEN S.A. | | | 465,081 | | | | 547,623 | | | | | |
| | 15,891 | | | NATIXIS S.A. | | | 49,085 | | | | 70,551 | | | | | |
| | 8,798 | | | NEXITY S.A. | | | 431,993 | | | | 441,921 | | | | | |
| | 34,547 | | | ORANGE S.A. | | | 364,835 | | | | 508,418 | | | | | |
| | 23,086 | | | PERNOD RICARD S.A. | | | 3,591,404 | | | | 4,127,754 | | | | | |
| | 12,969 | | | PEUGEOT S.A. | | | 78,174 | | | | 309,858 | | | | | |
| | 4,895 | | | RENAULT S.A. | | | 134,511 | | | | 231,599 | | | | | |
| | 2,982 | | | SAFRAN S.A. | | | 163,488 | | | | 460,427 | | | | | |
| | 18,127 | | | SANOFI | | | 1,018,143 | | | | 1,822,249 | | | | | |
| | 278 | | | SCHNEIDER ELECTRIC S.E. | | | 8,838 | | | | 28,567 | | | | | |
| | 7,138 | | | SCHNEIDER ELECTRIC S.E. (EURONEXT PARIS EXCHANGE) | | | 267,356 | | | | 732,613 | | | | | |
| | 1,813 | | | SCOR S.E. | | | 36,441 | | | | 76,099 | | | | | |
| | 30,595 | | | SOCIETE GENERALE S.A. | | | 786,406 | | | | 1,064,386 | | | | | |
| | 3,699 | | | SOCIETE POUR L’INFORMATIQUE INDUSTRIELLE | | | 108,264 | | | | 119,081 | | | | | |
| | 28,373 | | | SODEXO S.A. | | | 2,639,950 | | | | 3,362,416 | | | | | |
| | 3,361 | | | SUEZ | | | 45,101 | | | | 50,839 | | | | | |
| | 51,800 | | | TELEVISION FRANCAISE 1 | | | 458,222 | | | | 429,970 | | | | | |
| | 1,413 | | | THALES S.A. | | | 81,763 | | | | 146,641 | | | | | |
| | 25,497 | | | TOTAL S.A. | | | 1,298,154 | | | | 1,407,119 | | | | | |
| | 3,830 | | | UNIBAIL-RODAMCO-WESTFIELD | | | 515,211 | | | | 604,248 | | | | | |
| | 13,671 | | | VEOLIA ENVIRONNEMENT S.A. | | | 145,445 | | | | 363,587 | | | | | |
| | 5,698 | | | VICAT S.A. | | | 265,667 | | | | 257,895 | | | | | |
| | 7,810 | | | VINCI S.A. | | | 316,569 | | | | 867,287 | | | | | |
| | 90,726 | | | VIVENDI S.A. | | | 1,867,125 | | | | 2,627,633 | | | | | |
| | 1,345 | | | WENDEL S.A. | | | 91,561 | | | | 178,779 | | | | | |
| | | | | | | | 30,613,768 | | | | 48,534,034 | | | | 6.82 | % |
| | Georgia: | | | | | | | | | | | | | | | |
| | 21,875 | | | BANK OF GEORGIA GROUP PLC | | | 355,261 | | | | 470,854 | | | | | |
| | | | | | | | 355,261 | | | | 470,854 | | | | 0.07 | % |
| | Germany: | | | | | | | | | | | | | | | |
| | 15,301 | | | ADIDAS A.G. | | | 2,163,802 | | | | 4,973,876 | | | | | |
| | 8,277 | | | ALLIANZ S.E. (REGISTERED) | | | 727,077 | | | | 2,027,694 | | | | | |
| | 19,421 | | | AROUNDTOWN S.A. | | | 161,212 | | | | 173,928 | | | | | |
| | 6,098 | | | AURUBIS A.G. | | | 286,000 | | | | 374,292 | | | | | |
| | 13,539 | | | BASF S.E. | | | 453,717 | | | | 1,022,824 | | | | | |
| | 12,571 | | | BAYER A.G. (REGISTERED) | | | 632,383 | | | | 1,026,686 | | | | | |
| | 2,206 | | | BEIERSDORF A.G. | | | 146,950 | | | | 263,902 | | | | | |
| | 3,249 | | | BRENNTAG A.G. | | | 147,674 | | | | 176,681 | | | | | |
| | 1,082 | | | CONTINENTAL A.G. | | | 67,835 | | | | 139,889 | | | | | |
| | 13,593 | | | DAIMLER A.G. (REGISTERED) | | | 413,912 | | | | 752,758 | | | | | |
| | 1,576 | | | DELIVERY HERO S.E.(c)(e) | | | 67,447 | | | | 124,736 | | | | | |
| | 4,525 | | | DEUTSCHE BOERSE A.G. | | | 273,151 | | | | 711,358 | | | | | |
| | 15,996 | | | DEUTSCHE EUROSHOP A.G. | | | 435,440 | | | | 474,047 | | | | | |
| | 7,818 | | | DEUTSCHE LUFTHANSA A.G. (REGISTERED) | | | 119,908 | | | | 143,907 | | | | | |
| | 37,890 | | | DEUTSCHE PFANDBRIEFBANK A.G.(e) | | | 469,871 | | | | 618,818 | | | | | |
| | 17,828 | | | DEUTSCHE POST A.G. (REGISTERED) | | | 210,542 | | | | 680,121 | | | | | |
| | 42,716 | | | DEUTSCHE TELEKOM A.G. (REGISTERED) | | | 491,621 | | | | 698,115 | | | | | |
| | 5,360 | | | DEUTSCHE WOHNEN S.E. | | | 152,620 | | | | 218,968 | | | | | |
| | 9,361 | | | E.ON S.E. | | | 69,356 | | | | 100,004 | | | | | |
| | 55,556 | | | EVOTEC S.E.(b)(c) | | | 1,275,861 | | | | 1,436,411 | | | | | |
| | 23,600 | | | FREENET A.G. | | | 557,311 | | | | 541,090 | | | | | |
| | 53,753 | | | FRESENIUS MEDICAL CARE A.G. & CO. KGAA | | | 4,127,756 | | | | 3,977,041 | | | | | |
| See accompanying notes to financial statements. | 70 | (Continued) |
CLEARWATER INVESTMENT TRUST
Schedule of Investments - Clearwater International Fund
December 31, 2019
| | | | | | | | | | | | Percent of | |
| Shares | | | Security | | Cost | | | Fair value (a) | | | net assets | |
| | Germany (Cont’d): | | | | | | | | | | | | |
| | 6,867 | | | FRESENIUS S.E. & CO. KGAA | | $ | 150,261 | | | | 386,522 | | | | | |
| | 2,425 | | | GEA GROUP A.G. | | | 66,776 | | | | 80,189 | | | | | |
| | 17,795 | | | HAMBURGER HAFEN UND LOGISTIK A.G. | | | 443,620 | | | | 489,834 | | | | | |
| | 2,246 | | | HANNOVER RUECK S.E. | | | 94,321 | | | | 434,082 | | | | | |
| | 3,952 | | | HEIDELBERGCEMENT A.G. | | | 143,515 | | | | 287,965 | | | | | |
| | 19,996 | | | HELLA GMBH & CO. KGAA | | | 929,193 | | | | 1,106,672 | | | | | |
| | 671 | | | HENKEL A.G. & CO. KGAA | | | 49,267 | | | | 63,223 | | | | | |
| | 2,600 | | | HOCHTIEF A.G. | | | 108,936 | | | | 331,597 | | | | | |
| | 21,437 | | | INFINEON TECHNOLOGIES A.G. | | | 117,250 | | | | 488,372 | | | | | |
| | 22,496 | | | ISRA VISION A.G. | | | 980,949 | | | | 980,584 | | | | | |
| | 6,898 | | | JOST WERKE A.G.(e) | | | 220,852 | | | | 288,608 | | | | | |
| | 877 | | | LANXESS A.G. | | | 48,124 | | | | 58,847 | | | | | |
| | 2,050 | | | MERCK KGAA | | | 86,079 | | | | 242,251 | | | | | |
| | 646 | | | MTU AERO ENGINES A.G. | | | 160,592 | | | | 184,488 | | | | | |
| | 3,091 | | | MUENCHENER RUECKVERSICHERUNGS-GESELLSCHAFT A.G. IN MUENCHEN (REGISTERED) | | | 382,823 | | | | 911,867 | | | | | |
| | 15,705 | | | NEMETSCHEK S.E. | | | 837,589 | | | | 1,035,838 | | | | | |
| | 2,170 | | | OSRAM LICHT A.G.(b)(c) | | | 64,123 | | | | 98,702 | | | | | |
| | 19,095 | | | PROSIEBENSAT.1 MEDIA S.E. | | | 286,490 | | | | 297,936 | | | | | |
| | 5,998 | | | PUBLITY A.G.(b) | | | 216,076 | | | | 244,225 | | | | | |
| | 3,999 | | | RHEINMETALL A.G. | | | 520,402 | | | | 459,333 | | | | | |
| | 35,765 | | | RIB SOFTWARE S.E. | | | 846,621 | | | | 906,658 | | | | | |
| | 3,608 | | | RWE A.G. | | | 78,041 | | | | 110,688 | | | | | |
| | 17,103 | | | SAP S.E. | | | 683,559 | | | | 2,308,271 | | | | | |
| | 13,106 | | | SIEMENS A.G. (REGISTERED) | | | 795,701 | | | | 1,713,255 | | | | | |
| | 3,600 | | | SILTRONIC A.G. | | | 264,192 | | | | 362,300 | | | | | |
| | 3,953 | | | TUI A.G. - CDI | | | 26,466 | | | | 50,549 | | | | | |
| | 4,249 | | | UNIPER S.E. | | | 47,803 | | | | 140,648 | | | | | |
| | 404 | | | VOLKSWAGEN A.G. | | | 40,235 | | | | 78,511 | | | | | |
| | 2,682 | | | VONOVIA S.E. | | | 98,410 | | | | 144,403 | | | | | |
| | 1,182 | | | ZALANDO S.E.(c)(e) | | | 46,492 | | | | 59,902 | | | | | |
| | | | | | | | 22,286,204 | | | | 35,003,466 | | | | 4.92 | % |
| | Greece: | | | | | | | | | | | | | | | |
| | 6,746 | | | HELLENIC TELECOMMUNICATIONS ORGANIZATION S.A. | | | 54,075 | | | | 107,905 | | | | | |
| | | | | | | | 54,075 | | | | 107,905 | | | | 0.01 | % |
| | Hong Kong: | | | | | | | | | | | | | | | |
| | 667,400 | | | AIA GROUP LTD. | | | 3,816,314 | | | | 7,006,060 | | | | | |
| | 631,000 | | | AUSNUTRIA DAIRY CORP. LTD.(c) | | | 864,946 | | | | 908,566 | | | | | |
| | 181,500 | | | BOC HONG KONG HOLDINGS LTD. | | | 447,601 | | | | 630,055 | | | | | |
| | 1,462,000 | | | CITIC TELECOM INTERNATIONAL HOLDINGS LTD. | | | 547,331 | | | | 532,844 | | | | | |
| | 56,044 | | | CK ASSET HOLDINGS LTD. | | | 165,366 | | | | 404,563 | | | | | |
| | 44,544 | | | CK HUTCHISON HOLDINGS LTD. | | | 243,474 | | | | 424,729 | | | | | |
| | 10,000 | | | CK INFRASTRUCTURE HOLDINGS LTD. | | | 46,496 | | | | 71,160 | | | | | |
| | 34,500 | | | CLP HOLDINGS LTD. | | | 236,618 | | | | 362,608 | | | | | |
| | 722,000 | | | FIRST PACIFIC CO. LTD. | | | 288,855 | | | | 245,537 | | | | | |
| | 18,000 | | | GALAXY ENTERTAINMENT GROUP LTD. | | | 39,054 | | | | 132,592 | | | | | |
| | 15,300 | | | HANG SENG BANK LTD. | | | 175,457 | | | | 316,120 | | | | | |
| | 25,331 | | | HENDERSON LAND DEVELOPMENT CO. LTD. | | | 45,544 | | | | 124,342 | | | | | |
| | 113,364 | | | HONG KONG & CHINA GAS CO. LTD. | | | 169,115 | | | | 221,424 | | | | | |
| | 11,800 | | | HONG KONG EXCHANGES & CLEARING LTD. | | | 203,281 | | | | 383,122 | | | | | |
| | 40,500 | | | LINK REIT | | | 84,196 | | | | 428,789 | | | | | |
| | 30,500 | | | MTR CORP. LTD. | | | 88,703 | | | | 180,245 | | | | | |
| | 43,500 | | | NWS HOLDINGS LTD. | | | 52,825 | | | | 60,960 | | | | | |
| | 190,000 | | | PCCW LTD. | | | 77,805 | | | | 112,406 | | | | | |
| | 392,000 | | | PERFECT SHAPE MEDICAL LTD. | | | 140,251 | | | | 154,440 | | | | | |
| | 9,000 | | | POWER ASSETS HOLDINGS LTD. | | | 49,197 | | | | 65,834 | | | | | |
| | 133,000 | | | SHENZHEN INTERNATIONAL HOLDINGS LTD. | | | 256,636 | | | | 292,206 | | | | | |
| | 25,400 | | | SINO LAND CO. LTD. | | | 27,321 | | | | 36,899 | | | | | |
| | 185,000 | | | SITC INTERNATIONAL HOLDINGS CO. LTD. | | | 196,112 | | | | 225,543 | | | | | |
| | 8,000 | | | SUN HUNG KAI PROPERTIES LTD. | | | 65,036 | | | | 122,480 | | | | | |
| | 19,000 | | | SWIRE PACIFIC LTD., CLASS A | | | 127,857 | | | | 176,533 | | | | | |
| | 7,000 | | | TECHTRONIC INDUSTRIES CO. LTD. | | | 44,938 | | | | 57,088 | | | | | |
| | 600,000 | | | UNITED LABORATORIES INTERNATIONAL HOLDINGS (THE) LTD.(b) | | | 352,686 | | | | 437,355 | | | | | |
| | 469,800 | | | VALUETRONICS HOLDINGS LTD. | | | 216,550 | | | | 286,432 | | | | | |
| | 214,000 | | | VITASOY INTERNATIONAL HOLDINGS LTD. | | | 972,479 | | | | 775,830 | | | | | |
| | 83,500 | | | WH GROUP LTD.(e) | | | 45,547 | | | | 86,261 | | | | | |
| See accompanying notes to financial statements. | 71 | (Continued) |
CLEARWATER INVESTMENT TRUST
Schedule of Investments - Clearwater International Fund
December 31, 2019
| Shares | | | Security | | Cost | | | Fair value (a) | | | Percent of
net assets | |
| | Hong Kong (Cont’d): | | | | | | | | | | | | |
| | 19,000 | | | WHEELOCK & CO. LTD. | | $ | 30,489 | | | | 126,670 | | | | | |
| | 232,000 | | | XINYI GLASS HOLDINGS LTD. | | | 260,215 | | | | 307,257 | | | | | |
| | 16,500 | | | YUE YUEN INDUSTRIAL HOLDINGS LTD. | | | 34,352 | | | | 48,702 | | | | | |
| | 358,000 | | | YUEXIU TRANSPORT INFRASTRUCTURE LTD. | | | 311,883 | | | | 318,384 | | | | | |
| | | | | | | | 10,724,530 | | | | 16,064,036 | | | | 2.26 | % |
| | India: | | | | | | | | | | | | |
| | 468,615 | | | BHARTI INFRATEL LTD. | | | 2,045,623 | | | | 1,657,724 | | | | | |
| | 370,531 | | | HCL TECHNOLOGIES LTD. | | | 2,363,415 | | | | 2,949,063 | | | | | |
| | 75,694 | | | HDFC BANK LTD. ADR(f) | | | 2,505,428 | | | | 4,796,729 | | | | | |
| | 114,700 | | | HINDUSTAN PETROLEUM CORP. LTD. | | | 431,628 | | | | 425,034 | | | | | |
| | 16,851 | | | JUBILANT LIFE SCIENCES LTD. | | | 126,724 | | | | 126,775 | | | | | |
| | 322,000 | | | NMDC LTD. | | | 521,633 | | | | 581,492 | | | | | |
| | 268,000 | | | SJVN LTD. | | | 94,210 | | | | 95,556 | | | | | |
| | 226,732 | | | SYNGENE INTERNATIONAL LTD.(e) | | | 1,006,907 | | | | 1,016,953 | | | | | |
| | 28,590 | | | WNS HOLDINGS LTD. ADR(c)(f) | | | 1,707,928 | | | | 1,891,229 | | | | | |
| | | | | | | | 10,803,496 | | | | 13,540,555 | | | | 1.90 | % |
| | Indonesia: | | | | | | | | | | | | |
| | 4,097,000 | | | ADARO ENERGY TBK PT | | | 470,816 | | | | 458,911 | | | | | |
| | 3,712,500 | | | BANK TABUNGAN PENSIUNAN NASIONAL SYARIAH TBK PT(c) | | | 1,039,545 | | | | 1,136,548 | | | | | |
| | | | | | | | 1,510,361 | | | | 1,595,459 | | | | 0.22 | % |
| | Ireland: | | | | | | | | | | | | |
| | 28,272 | | | ACCENTURE PLC, CLASS A | | | 3,522,256 | | | | 5,953,235 | | | | | |
| | 6,116 | | | AERCAP HOLDINGS N.V.(c) | | | 330,924 | | | | 375,950 | | | | | |
| | 56,468 | | | BANK OF IRELAND GROUP PLC | | | 272,464 | | | | 309,227 | | | | | |
| | 93,239 | | | CRH PLC | | | 2,837,761 | | | | 3,730,590 | | | | | |
| | 65,382 | | | DALATA HOTEL GROUP PLC | | | 368,686 | | | | 377,696 | | | | | |
| | 180,318 | | | EXPERIAN PLC | | | 3,456,357 | | | | 6,095,433 | | | | | |
| | 804 | | | FLUTTER ENTERTAINMENT PLC | | | 66,541 | | | | 97,715 | | | | | |
| | 14,505 | | | ICON PLC(c) | | | 1,088,213 | | | | 2,498,196 | | | | | |
| | 11,673 | | | JAMES HARDIE INDUSTRIES PLC - CDI | | | 105,225 | | | | 228,298 | | | | | |
| | 3,255 | | | KERRY GROUP PLC, CLASS A | | | 214,084 | | | | 405,641 | | | | | |
| | 68,446 | | | KEYWORDS STUDIOS PLC | | | 1,166,779 | | | | 1,358,140 | | | | | |
| | | | | | | | 13,429,290 | | | | 21,430,121 | | | | 3.01 | % |
| | Isle of Man: | | | | | | | | | | | | |
| | 8,622 | | | GVC HOLDINGS PLC | | | 66,376 | | | | 100,982 | | | | | |
| | | | | | | | 66,376 | | | | 100,982 | | | | 0.01 | % |
| | Israel: | | | | | | | | | | | | |
| | 1,123 | | | AZRIELI GROUP LTD. | | | 65,459 | | | | 82,112 | | | | | |
| | 21,007 | | | BANK HAPOALIM B.M. | | | 79,922 | | | | 174,283 | | | | | |
| | 2,094 | | | CHECK POINT SOFTWARE TECHNOLOGIES LTD.(c) | | | 161,340 | | | | 232,350 | | | | | |
| | 13,114 | | | CYBERARK SOFTWARE LTD.(c) | | | 1,359,352 | | | | 1,528,830 | | | | | |
| | 338 | | | ELBIT SYSTEMS LTD. | | | 43,582 | | | | 52,619 | | | | | |
| | 5,900 | | | MIZRAHI TEFAHOT BANK LTD. | | | 51,135 | | | | 157,183 | | | | | |
| | 2,937 | | | NICE LTD.(c) | | | 148,741 | | | | 455,523 | | | | | |
| | 6,106 | | | TEVA PHARMACEUTICAL INDUSTRIES LTD. ADR(c)(f) | | | 49,510 | | | | 59,839 | | | | | |
| | 9,899 | | | WIX.COM LTD.(c) | | | 1,239,888 | | | | 1,211,439 | | | | | |
| | | | | | | | 3,198,929 | | | | 3,954,178 | | | | 0.55 | % |
| | Italy: | | | | | | | | | | | | |
| | 16,000 | | | A2A S.P.A. | | | 30,042 | | | | 30,008 | | | | | |
| | 57,916 | | | AMPLIFON S.P.A. | | | 1,457,778 | | | | 1,665,687 | | | | | |
| | 25,746 | | | ASSICURAZIONI GENERALI S.P.A. | | | 314,339 | | | | 531,235 | | | | | |
| | 2,238 | | | ATLANTIA S.P.A. | | | 25,873 | | | | 52,190 | | | | | |
| | 10,697 | | | AVIO S.P.A. | | | 142,834 | | | | 166,304 | | | | | |
| | 25,272 | | | BANCA MEDIOLANUM S.P.A. | | | 87,322 | | | | 251,018 | | | | | |
| | 11,397 | | | EL.EN. S.P.A. | | | 291,927 | | | | 422,384 | | | | | |
| | 85,116 | | | ENEL S.P.A. | | | 300,516 | | | | 675,196 | | | | | |
| | 1,955 | | | FERRARI N.V. | | | 161,821 | | | | 324,333 | | | | | |
| | 1,022 | | | FERRARI N.V. (NEW YORK EXCHANGE) | | | 7,571 | | | | 169,182 | | | | | |
| | 10,263 | | | FINECOBANK BANCA FINECO S.P.A. | | | 116,718 | | | | 123,063 | | | | | |
| | 41,869 | | | INTERPUMP GROUP S.P.A. | | | 650,316 | | | | 1,326,276 | | | | | |
| | 177,988 | | | INTESA SANPAOLO S.P.A. | | | 307,053 | | | | 468,876 | | | | | |
| | 173,553 | | | IREN S.P.A. | | | 474,559 | | | | 537,691 | | | | | |
| | 10,070 | | | LEONARDO S.P.A. | | | 50,331 | | | | 118,038 | | | | | |
| | 10,830 | | | MEDIOBANCA BANCA DI CREDITO FINANZIARIO S.P.A. | | | 70,955 | | | | 119,221 | | | | | |
| See accompanying notes to financial statements. | 72 | (Continued) |
CLEARWATER INVESTMENT TRUST
Schedule of Investments - Clearwater International Fund
December 31, 2019
| Shares | | | Security | | Cost | | | Fair value (a) | | | Percent of
net assets | |
| | Italy (Cont’d): | | | | | | | | | | | | |
| | 4,231 | | | MONCLER S.P.A. | | $ | 151,854 | | | | 190,169 | | | | | |
| | 8,642 | | | PIRELLI & C S.P.A.(e) | | | 45,916 | | | | 49,826 | | | | | |
| | 3,764 | | | PRYSMIAN S.P.A. | | | 70,326 | | | | 90,732 | | | | | |
| | 695 | | | RIZZOLI CORRIERE DELLA SERA MEDIAGROUP S.P.A. | | | 460 | | | | 786 | | | | | |
| | 76,191 | | | SNAM S.P.A. | | | 276,534 | | | | 400,482 | | | | | |
| | 49,687 | | | SOCIETA CATTOLICA DI ASSICURAZIONI S.C. | | | 431,868 | | | | 405,186 | | | | | |
| | 99,406 | | | TELECOM ITALIA S.P.A. (RSP) | | | 46,425 | | | | 60,859 | | | | | |
| | 34,652 | | | TERNA RETE ELETTRICA NAZIONALE S.P.A. | | | 130,368 | | | | 231,427 | | | | | |
| | 23,582 | | | UNICREDIT S.P.A. | | | 305,920 | | | | 344,404 | | | | | |
| | 71,681 | | | UNIPOL GRUPPO S.P.A. | | | 376,844 | �� | | | 411,028 | | | | | |
| | 95,230 | | | UNIPOLSAI ASSICURAZIONI S.P.A. | | | 153,826 | | | | 276,662 | | | | | |
| | | | | | | | 6,480,296 | | | | 9,442,263 | | | | 1.33 | % |
| | Japan: | | | | | | | | | | | | |
| | 1,400 | | | ABC-MART, INC. | | | 51,583 | | | | 95,863 | | | | | |
| | 30,600 | | | ADEKA CORP. | | | 390,224 | | | | 466,372 | | | | | |
| | 4,700 | | | AEON CO. LTD. | | | 52,433 | | | | 97,564 | | | | | |
| | 4,800 | | | AEON FINANCIAL SERVICE CO. LTD. | | | 49,903 | | | | 76,293 | | | | | |
| | 400 | | | AEON REIT INVESTMENT CORP. | | | 511,339 | | | | 547,421 | | | | | |
| | 2,400 | | | AGC, INC. | | | 71,041 | | | | 86,807 | | | | | |
| | 3,000 | | | AISIN SEIKI CO. LTD. | | | 57,864 | | | | 112,374 | | | | | |
| | 15,000 | | | AJINOMOTO CO., INC. | | | 116,767 | | | | 250,564 | | | | | |
| | 2,500 | | | ALFRESA HOLDINGS CORP. | | | 24,420 | | | | 51,263 | | | | | |
| | 4,000 | | | AMADA HOLDINGS CO. LTD. | | | 32,994 | | | | 46,017 | | | | | |
| | 1,400 | | | ANA HOLDINGS, INC. | | | 35,110 | | | | 46,927 | | | | | |
| | 5,300 | | | AOZORA BANK LTD. | | | 134,170 | | | | 141,018 | | | | | |
| | 15,600 | | | ARCS CO. LTD. | | | 325,913 | | | | 331,225 | | | | | |
| | 5,600 | | | ASAHI GROUP HOLDINGS LTD. | | | 85,235 | | | | 256,820 | | | | | |
| | 38,700 | | | ASAHI INTECC CO. LTD. | | | 962,101 | | | | 1,139,754 | | | | | |
| | 31,000 | | | ASAHI KASEI CORP. | | | 147,138 | | | | 352,068 | | | | | |
| | 22,100 | | | ASAHI YUKIZAI CORP. | | | 276,792 | | | | 363,469 | | | | | |
| | 9,300 | | | ASANUMA CORP. | | | 324,412 | | | | 406,134 | | | | | |
| | 37,000 | | | ASTELLAS PHARMA, INC. | | | 236,149 | | | | 636,786 | | | | | |
| | 1,900 | | | BANDAI NAMCO HOLDINGS, INC. | | | 33,289 | | | | 115,953 | | | | | |
| | 7,400 | | | BANK OF KYOTO (THE) LTD. | | | 257,271 | | | | 320,096 | | | | | |
| | 13,800 | | | BRIDGESTONE CORP. | | | 205,726 | | | | 516,921 | | | | | |
| | 18,700 | | | BROTHER INDUSTRIES LTD. | | | 287,805 | | | | 390,849 | | | | | |
| | 48,400 | | | BUNKA SHUTTER CO. LTD. | | | 363,296 | | | | 429,411 | | | | | |
| | 2,700 | | | CENTRAL JAPAN RAILWAY CO. | | | 229,516 | | | | 546,684 | | | | | |
| | 4,500 | | | CHUGAI PHARMACEUTICAL CO. LTD. | | | 82,278 | | | | 417,468 | | | | | |
| | 7,900 | | | CITIZEN WATCH CO. LTD. | | | 31,581 | | | | 43,406 | | | | | |
| | 4,200 | | | CREDIT SAISON CO. LTD. | | | 45,547 | | | | 73,482 | | | | | |
| | 3,800 | | | DAI NIPPON PRINTING CO. LTD. | | | 75,182 | | | | 103,520 | | | | | |
| | 13,700 | | | DAI-ICHI LIFE HOLDINGS, INC. | | | 159,920 | | | | 229,037 | | | | | |
| | 9,700 | | | DAIICHI SANKYO CO. LTD. | | | 150,922 | | | | 645,268 | | | | | |
| | 4,500 | | | DAIKIN INDUSTRIES LTD. | | | 124,473 | | | | 639,869 | | | | | |
| | 1,200 | | | DAITO TRUST CONSTRUCTION CO. LTD. | | | 117,985 | | | | 148,875 | | | | | |
| | 11,500 | | | DAITRON CO. LTD. | | | 200,103 | | | | 201,730 | | | | | |
| | 13,600 | | | DAIWA HOUSE INDUSTRY CO. LTD. | | | 194,625 | | | | 424,316 | | | | | |
| | 38 | | | DAIWA HOUSE REIT INVESTMENT CORP. | | | 83,440 | | | | 99,184 | | | | | |
| | 15,000 | | | DAIWA SECURITIES GROUP, INC. | | | 50,985 | | | | 76,343 | | | | | |
| | 5,600 | | | DAIWABO HOLDINGS CO. LTD. | | | 223,879 | | | | 346,859 | | | | | |
| | 8,200 | | | DENSO CORP. | | | 185,234 | | | | 374,775 | | | | | |
| | 2,800 | | | DENTSU, INC. | | | 46,871 | | | | 97,280 | | | | | |
| | 7,000 | | | EAST JAPAN RAILWAY CO. | | | 392,789 | | | | 635,093 | | | | | |
| | 13,700 | | | ECO’S CO. LTD. | | | 210,388 | | | | 216,366 | | | | | |
| | 3,400 | | | EISAI CO. LTD. | | | 112,861 | | | | 256,717 | | | | | |
| | 17,900 | | | ELEMATEC CORP. | | | 175,861 | | | | 190,277 | | | | | |
| | 7,200 | | | FAMILYMART CO. LTD. | | | 52,590 | | | | 173,945 | | | | | |
| | 3,100 | | | FANUC CORP. | | | 243,447 | | | | 580,029 | | | | | |
| | 1,300 | | | FAST RETAILING CO. LTD. | | | 188,734 | | | | 777,691 | | | | | |
| | 97,300 | | | FEED ONE CO. LTD. | | | 148,765 | | | | 167,458 | | | | | |
| | 37,700 | | | FERROTEC HOLDINGS CORP. | | | 322,172 | | | | 320,600 | | | | | |
| | 34,200 | | | FJ NEXT CO. LTD. | | | 337,056 | | | | 361,027 | | | | | |
| | 27,800 | | | FREEE K.K.(b)(c) | | | 544,059 | | | | 825,135 | | | | | |
| | 4,200 | | | FUJI ELECTRIC CO. LTD. | | | 51,969 | | | | 129,299 | | | | | |
| | 10,400 | | | FUJIBO HOLDINGS, INC. | | | 287,084 | | | | 338,834 | | | | | |
| | 8,800 | | | FUJIFILM HOLDINGS CORP. | | | 165,274 | | | | 423,579 | | | | | |
| See accompanying notes to financial statements. | 73 | (Continued) |
CLEARWATER INVESTMENT TRUST
Schedule of Investments - Clearwater International Fund
December 31, 2019
| Shares | | | Security | | Cost | | | Fair value (a) | | | Percent of
net assets | |
| | Japan (Cont’d): | | | | | | | | | | | | |
| | 2,300 | | | FUJITSU LTD. | | $ | 106,202 | | | | 217,395 | | | | | |
| | 2,200 | | | FUKUOKA FINANCIAL GROUP, INC. | | | 36,398 | | | | 42,621 | | | | | |
| | 35,800 | | | FURUNO ELECTRIC CO. LTD. | | | 322,070 | | | | 445,461 | | | | | |
| | 13,500 | | | GMO PAYMENT GATEWAY, INC. | | | 891,303 | | | | 929,364 | | | | | |
| | 31,400 | | | HAKUHODO DY HOLDINGS, INC. | | | 484,808 | | | | 510,931 | | | | | |
| | 19,400 | | | HAKUTO CO. LTD. | | | 213,407 | | | | 243,181 | | | | | |
| | 3,000 | | | HAMAMATSU PHOTONICS K.K. | | | 52,686 | | | | 124,108 | | | | | |
| | 2,400 | | | HANKYU HANSHIN HOLDINGS, INC. | | | 57,098 | | | | 103,373 | | | | | |
| | 16,800 | | | HARMONIC DRIVE SYSTEMS, INC. | | | 719,516 | | | | 814,836 | | | | | |
| | 341 | | | HIROSE ELECTRIC CO. LTD. | | | 28,677 | | | | 44,031 | | | | | |
| | 19,000 | | | HITACHI LTD. | | | 295,895 | | | | 808,927 | | | | | |
| | 6,000 | | | HITACHI METALS LTD. | | | 45,405 | | | | 89,071 | | | | | |
| | 5,300 | | | HOYA CORP. | | | 112,594 | | | | 509,733 | | | | | |
| | 5,700 | | | HULIC CO. LTD. | | | 48,487 | | | | 69,037 | | | | | |
| | 3,000 | | | IDEMITSU KOSAN CO. LTD. | | | 76,345 | | | | 83,659 | | | | | |
| | 14,500 | | | INNOTECH CORP. | | | 120,909 | | | | 150,265 | | | | | |
| | 13,800 | | | INTAGE HOLDINGS, INC. | | | 121,039 | | | | 118,625 | | | | | |
| | 1,300 | | | INVINCIBLE INVESTMENT CORP. | | | 761,926 | | | | 740,601 | | | | | |
| | 14,600 | | | ISETAN MITSUKOSHI HOLDINGS LTD. | | | 119,482 | | | | 132,220 | | | | | |
| | 21,600 | | | ITOCHU CORP. | | | 263,926 | | | | 503,844 | | | | | |
| | 47,800 | | | IWAKI & CO. LTD. | | | 220,919 | | | | 202,365 | | | | | |
| | 4,000 | | | J FRONT RETAILING CO. LTD. | | | 31,099 | | | | 56,325 | | | | | |
| | 21,900 | | | JACCS CO. LTD. | | | 467,646 | | | | 564,355 | | | | | |
| | 30,400 | | | JAPAN AVIATION ELECTRONICS INDUSTRY LTD. | | | 458,316 | | | | 620,562 | | | | | |
| | 43,200 | | | JAPAN ELEVATOR SERVICE HOLDINGS CO. LTD. | | | 1,063,768 | | | | 1,090,586 | | | | | |
| | 7,000 | | | JAPAN EXCHANGE GROUP, INC. | | | 56,090 | | | | 124,339 | | | | | |
| | 87,200 | | | JAPAN MATERIAL CO. LTD. | | | 1,081,649 | | | | 1,466,241 | | | | | |
| | 42,600 | | | JAPAN POST BANK CO. LTD. | | | 383,307 | | | | 411,670 | | | | | |
| | 10 | | | JAPAN REAL ESTATE INVESTMENT CORP. | | | 49,036 | | | | 66,265 | | | | | |
| | 33,900 | | | JFE HOLDINGS, INC. | | | 410,386 | | | | 440,227 | | | | | |
| | 5,000 | | | JTEKT CORP. | | | 36,670 | | | | 59,868 | | | | | |
| | 160,800 | | | JXTG HOLDINGS, INC. | | | 670,500 | | | | 736,849 | | | | | |
| | 6,500 | | | KAJIMA CORP. | | | 44,950 | | | | 87,221 | | | | | |
| | 35,374 | | | KANDENKO CO. LTD. | | | 351,855 | | | | 341,515 | | | | | |
| | 12,300 | | | KANEKA CORP. | | | 387,968 | | | | 398,472 | | | | | |
| | 2,100 | | | KANSAI PAINT CO. LTD. | | | 12,205 | | | | 51,739 | | | | | |
| | 10,000 | | | KAO CORP. | | | 208,279 | | | | 830,611 | | | | | |
| | 21,500 | | | KAWASAKI HEAVY INDUSTRIES LTD. | | | 463,080 | | | | 476,481 | | | | | |
| | 29,862 | | | KDDI CORP. | | | 239,416 | | | | 894,032 | | | | | |
| | 1,200 | | | KEIO CORP. | | | 36,571 | | | | 73,002 | | | | | |
| | 2,500 | | | KEISEI ELECTRIC RAILWAY CO. LTD. | | | 23,110 | | | | 97,557 | | | | | |
| | 15,724 | | | KEYENCE CORP. | | | 1,873,825 | | | | 5,570,077 | | | | | |
| | 6,000 | | | KIKKOMAN CORP. | | | 52,867 | | | | 296,535 | | | | | |
| | 1,200 | | | KINTETSU GROUP HOLDINGS CO. LTD. | | | 35,697 | | | | 65,381 | | | | | |
| | 10,000 | | | KIRIN HOLDINGS CO. LTD. | | | 103,112 | | | | 219,962 | | | | | |
| | 10,000 | | | KIRINDO HOLDINGS CO. LTD. | | | 194,672 | | | | 197,966 | | | | �� | |
| | 67,600 | | | KITZ CORP. | | | 466,295 | | | | 481,546 | | | | | |
| | 2,300 | | | KONAMI HOLDINGS CORP. | | | 50,313 | | | | 94,938 | | | | | |
| | 21,000 | | | KUBOTA CORP. | | | 129,773 | | | | 333,588 | | | | | |
| | 4,100 | | | KYOCERA CORP. | | | 137,688 | | | | 282,251 | | | | | |
| | 49,000 | | | KYOSAN ELECTRIC MANUFACTURING CO. LTD. | | | 177,172 | | | | 282,306 | | | | | |
| | 5,000 | | | KYOWA KIRIN CO. LTD. | | | 54,616 | | | | 118,402 | | | | | |
| | 52,200 | | | LASERTEC CORP. | | | 1,613,876 | | | | 2,671,133 | | | | | |
| | 800 | | | LAWSON, INC. | | | 37,075 | | | | 45,575 | | | | | |
| | 13,100 | | | LINTEC CORP. | | | 259,789 | | | | 294,661 | | | | | |
| | 9,600 | | | LIXIL GROUP CORP. | | | 116,603 | | | | 166,899 | | | | | |
| | 4,800 | | | M3, INC. | | | 51,468 | | | | 146,003 | | | | | |
| | 2,000 | | | MAKITA CORP. | | | 48,587 | | | | 70,130 | | | | | |
| | 39,400 | | | MARUBENI CORP. | | | 214,969 | | | | 293,936 | | | | | |
| | 6,500 | | | MARUI GROUP CO. LTD. | | | 32,287 | | | | 159,606 | | | | | |
| | 14,600 | | | MATSUMOTOKIYOSHI HOLDINGS CO. LTD. | | | 542,531 | | | | 569,058 | | | | | |
| | 6,200 | | | MAZDA MOTOR CORP. | | | 47,297 | | | | 53,524 | | | | | |
| | 2,400 | | | MEIJI HOLDINGS CO. LTD. | | | 38,749 | | | | 163,011 | | | | | |
| | 8,700 | | | MINEBEA MITSUMI, INC. | | | 84,406 | | | | 182,319 | | | | | |
| | 597 | | | MIRAI CORP. | | | 328,940 | | | | 335,162 | | | | | |
| | 800 | | | MIRAIAL CO. LTD. | | | 9,998 | | | | 10,234 | | | | | |
| | 36,800 | | | MITSUBISHI CHEMICAL HOLDINGS CORP. | | | 149,792 | | | | 276,876 | | | | | |
| See accompanying notes to financial statements. | 74 | (Continued) |
CLEARWATER INVESTMENT TRUST
Schedule of Investments - Clearwater International Fund
December 31, 2019
| Shares | | | Security | | Cost | | | Fair value (a) | | | Percent of
net assets | |
| | Japan (Cont’d): | | | | | | | | | | | | |
| | 17,500 | | | MITSUBISHI CORP. | | $ | 230,376 | | | | 467,075 | | | | | |
| | 40,000 | | | MITSUBISHI ELECTRIC CORP. | | | 322,860 | | | | 551,654 | | | | | |
| | 17,000 | | | MITSUBISHI ESTATE CO. LTD. | | | 199,703 | | | | 326,920 | | | | | |
| | 8,500 | | | MITSUBISHI GAS CHEMICAL CO., INC. | | | 75,149 | | | | 130,956 | | | | | |
| | 2,500 | | | MITSUBISHI HEAVY INDUSTRIES LTD. | | | 76,146 | | | | 97,741 | | | | | |
| | 126,400 | | | MITSUBISHI UFJ FINANCIAL GROUP, INC. | | | 597,760 | | | | 690,079 | | | | | |
| | 27,000 | | | MITSUBISHI UFJ LEASE & FINANCE CO. LTD. | | | 83,878 | | | | 175,436 | | | | | |
| | 15,300 | | | MITSUI & CO. LTD. | | | 147,837 | | | | 274,021 | | | | | |
| | 7,400 | | | MITSUI CHEMICALS, INC. | | | 87,469 | | | | 182,523 | | | | | |
| | 219,200 | | | MIZUHO FINANCIAL GROUP, INC. | | | 334,687 | | | | 339,528 | | | | | |
| | 38,900 | | | MONOTARO CO. LTD. | | | 1,033,078 | | | | 1,046,475 | | | | | |
| | 8,280 | | | MS&AD INSURANCE GROUP HOLDINGS, INC. | | | 177,615 | | | | 275,174 | | | | | |
| | 37,400 | | | MUGEN ESTATE CO. LTD. | | | 216,786 | | | | 273,302 | | | | | |
| | 10,800 | | | MURATA MANUFACTURING CO. LTD. | | | 162,615 | | | | 670,533 | | | | | |
| | 1,700 | | | NABTESCO CORP. | | | 45,449 | | | | 51,084 | | | | | |
| | 20,200 | | | NANTO BANK (THE) LTD. | | | 470,557 | | | | 517,386 | | | | | |
| | 3,000 | | | NGK SPARK PLUG CO. LTD. | | | 28,359 | | | | 58,920 | | | | | |
| | 3,000 | | | NH FOODS LTD. | | | 72,315 | | | | 124,523 | | | | | |
| | 16,700 | | | NICHIAS CORP. | | | 297,341 | | | | 428,048 | | | | | |
| | 3,900 | | | NIDEC CORP. | | | 129,234 | | | | 538,581 | | | | | |
| | 55,100 | | | NIHON M&A CENTER, INC. | | | 1,586,088 | | | | 1,909,268 | | | | | |
| | 2,600 | | | NINTENDO CO. LTD. | | | 285,625 | | | | 1,052,156 | | | | | |
| | 22 | | | NIPPON BUILDING FUND, INC. | | | 90,970 | | | | 160,968 | | | | | |
| | 2,200 | | | NIPPON ELECTRIC GLASS CO. LTD. | | | 44,793 | | | | 49,424 | | | | | |
| | 1,700 | | | NIPPON EXPRESS CO. LTD. | | | 60,747 | | | | 100,446 | | | | | |
| | 26 | | | NIPPON PROLOGIS REIT, INC. | | | 54,492 | | | | 66,140 | | | | | |
| | 30,400 | | | NIPPON TELEGRAPH & TELEPHONE CORP. | | | 342,697 | | | | 771,366 | | | | | |
| | 5,000 | | | NISSAN CHEMICAL CORP. | | | 50,851 | | | | 211,449 | | | | | |
| | 3,670 | | | NISSHIN SEIFUN GROUP, INC. | | | 31,991 | | | | 64,378 | | | | | |
| | 1,200 | | | NISSIN FOODS HOLDINGS CO. LTD. | | | 43,959 | | | | 89,678 | | | | | |
| | 2,700 | | | NITORI HOLDINGS CO. LTD. | | | 87,310 | | | | 428,029 | | | | | |
| | 3,200 | | | NITTO DENKO CORP. | | | 77,639 | | | | 182,007 | | | | | |
| | 3,500 | | | NITTO FUJI FLOUR MILLING CO. LTD. | | | 211,323 | | | | 203,580 | | | | | |
| | 67,300 | | | NOMURA HOLDINGS, INC. | | | 225,895 | | | | 348,965 | | | | | |
| | 33,200 | | | NOMURA REAL ESTATE HOLDINGS, INC. | | | 679,160 | | | | 800,552 | | | | | |
| | 46 | | | NOMURA REAL ESTATE MASTER FUND, INC. | | | 64,976 | | | | 78,575 | | | | | |
| | 9,801 | | | NOMURA RESEARCH INSTITUTE LTD. | | | 43,930 | | | | 210,894 | | | | | |
| | 7,000 | | | NSK LTD. | | | 50,459 | | | | 67,066 | | | | | |
| | 7,000 | | | NTT DATA CORP. | | | 36,520 | | | | 94,510 | | | | | |
| | 23,800 | | | NTT DOCOMO, INC. | | | 362,981 | | | | 665,449 | | | | | |
| | 12,000 | | | OBAYASHI CORP. | | | 48,665 | | | | 134,407 | | | | | |
| | 33,200 | | | OLYMPUS CORP. | | | 211,415 | | | | 516,081 | | | | | |
| | 1,100 | | | OMRON CORP. | | | 31,828 | | | | 64,995 | | | | | |
| | 5,000 | | | ONO PHARMACEUTICAL CO. LTD. | | | 43,040 | | | | 115,135 | | | | | |
| | 4,800 | | | ORIENTAL LAND CO. LTD. | | | 113,097 | | | | 657,347 | | | | | |
| | 12,600 | | | ORIX CORP. | | | 144,981 | | | | 210,010 | | | | | |
| | 7,300 | | | OTSUKA HOLDINGS CO. LTD. | | | 217,894 | | | | 328,065 | | | | | |
| | 23,900 | | | PANASONIC CORP. | | | 152,339 | | | | 226,451 | | | | | |
| | 15,900 | | | PKSHA TECHNOLOGY, INC.(c) | | | 662,203 | | | | 580,949 | | | | | |
| | 20,600 | | | RAKSUL, INC.(c) | | | 693,328 | | | | 711,914 | | | | | |
| | 74,200 | | | RAKUS CO. LTD. | | | 1,100,951 | | | | 1,366,474 | | | | | |
| | 8,400 | | | RAKUTEN, INC. | | | 40,327 | | | | 72,284 | | | | | |
| | 18,800 | | | RECRUIT HOLDINGS CO. LTD. | | | 561,557 | | | | 709,228 | | | | | |
| | 10,300 | | | RENESAS ELECTRONICS CORP.(c) | | | 48,441 | | | | 71,097 | | | | | |
| | 1,200 | | | RINNAI CORP. | | | 52,047 | | | | 94,427 | | | | | |
| | 4,200 | | | ROHM CO. LTD. | | | 166,807 | | | | 339,386 | | | | | |
| | 34,600 | | | SANKI ENGINEERING CO. LTD. | | | 423,298 | | | | 491,352 | | | | | |
| | 13,000 | | | SANTEN PHARMACEUTICAL CO. LTD. | | | 85,886 | | | | 249,579 | | | | | |
| | 13,720 | | | SBI HOLDINGS, INC. | | | 111,165 | | | | 292,318 | | | | | |
| | 3,400 | | | SECOM CO. LTD. | | | 133,812 | | | | 305,939 | | | | | |
| | 7,300 | | | SEGA SAMMY HOLDINGS, INC. | | | 68,324 | | | | 106,354 | | | | | |
| | 49,400 | | | SEIKITOKYU KOGYO CO. LTD. | | | 333,527 | | | | 413,732 | | | | | |
| | 5,300 | | | SEIKO EPSON CORP. | | | 75,811 | | | | 80,728 | | | | | |
| | 13,000 | | | SEKISUI CHEMICAL CO. LTD. | | | 66,177 | | | | 227,804 | | | | | |
| | 6,000 | | | SEKISUI HOUSE LTD. | | | 44,394 | | | | 128,857 | | | | | |
| | 47,800 | | | SEVEN & I HOLDINGS CO. LTD. | | | 1,539,536 | | | | 1,761,018 | | | | | |
| | 6,400 | | | SHARP CORP. | | | 61,105 | | | | 99,250 | | | | | |
| See accompanying notes to financial statements. | 75 | (Continued) |
CLEARWATER INVESTMENT TRUST
Schedule of Investments - Clearwater International Fund
December 31, 2019
| Shares | | | Security | | Cost | | | Fair value (a) | | | Percent of
net assets | |
| | Japan (Cont’d): | | | | | | | | | | | | |
| | 4,000 | | | SHIMADZU CORP. | | $ | 25,419 | | | | 126,639 | | | | | |
| | 1,000 | | | SHIMAMURA CO. LTD. | | | 61,206 | | | | 76,573 | | | | | |
| | 1,500 | | | SHIMANO, INC. | | | 58,204 | | | | 245,318 | | | | | |
| | 9,200 | | | SHIN-ETSU CHEMICAL CO. LTD. | | | 461,684 | | | | 1,021,140 | | | | | |
| | 4,000 | | | SHIONOGI & CO. LTD. | | | 67,679 | | | | 249,119 | | | | | |
| | 5,900 | | | SHISEIDO CO. LTD. | | | 88,706 | | | | 422,565 | | | | | |
| | 28,700 | | | SHOWA CORP. | | | 405,945 | | | | 600,123 | | | | | |
| | 20,200 | | | SK-ELECTRONICS CO. LTD. | | | 355,639 | | | | 370,704 | | | | | |
| | 900 | | | SMC CORP. | | | 106,941 | | | | 416,557 | | | | | |
| | 7,000 | | | SOFTBANK CORP. | | | 83,164 | | | | 94,027 | | | | | |
| | 36,800 | | | SOFTBANK GROUP CORP. | | | 412,233 | | | | 1,610,794 | | | | | |
| | 9,000 | | | SOMPO HOLDINGS, INC. | | | 202,248 | | | | 356,173 | | | | | |
| | 23,200 | | | SONY CORP. | | | 522,909 | | | | 1,580,260 | | | | | |
| | 2,700 | | | STANLEY ELECTRIC CO. LTD. | | | 30,745 | | | | 79,021 | | | | | |
| | 4,600 | | | STARZEN CO. LTD. | | | 186,228 | | | | 187,124 | | | | | |
| | 5,700 | | | SUBARU CORP. | | | 26,572 | | | | 142,349 | | | | | |
| | 9,300 | | | SUMCO CORP. | | | 108,434 | | | | 156,291 | | | | | |
| | 25,000 | | | SUMITOMO CHEMICAL CO. LTD. | | | 74,256 | | | | 114,583 | | | | | |
| | 17,500 | | | SUMITOMO CORP. | | | 207,148 | | | | 261,562 | | | | | |
| | 4,000 | | | SUMITOMO DAINIPPON PHARMA CO. LTD. | | | 45,511 | | | | 78,413 | | | | | |
| | 8,800 | | | SUMITOMO ELECTRIC INDUSTRIES LTD. | | | 75,679 | | | | 133,796 | | | | | |
| | 17,100 | | | SUMITOMO HEAVY INDUSTRIES LTD. | | | 494,606 | | | | 492,596 | | | | | |
| | 4,631 | | | SUMITOMO MITSUI TRUST HOLDINGS, INC. | | | 156,733 | | | | 184,848 | | | | | |
| | 4,000 | | | SUMITOMO REALTY & DEVELOPMENT CO. LTD. | | | 110,500 | | | | 140,334 | | | | | |
| | 9,300 | | | SUZUKI MOTOR CORP. | | | 199,522 | | | | 390,899 | | | | | |
| | 2,600 | | | SYSMEX CORP. | | | 51,707 | | | | 178,247 | | | | | |
| | 13,700 | | | T RAD CO. LTD. | | | 264,171 | | | | 258,983 | | | | | |
| | 36,400 | | | T&D HOLDINGS, INC. | | | 381,317 | | | | 467,332 | | | | | |
| | 1,400 | | | TAIHEIYO CEMENT CORP. | | | 29,931 | | | | 41,425 | | | | | |
| | 3,400 | | | TAISEI CORP. | | | 55,809 | | | | 142,221 | | | | | |
| | 109,800 | | | TAKARA LEBEN CO. LTD. | | | 430,207 | | | | 512,343 | | | | | |
| | 22,897 | | | TAKEDA PHARMACEUTICAL CO. LTD. | | | 779,583 | | | | 912,888 | | | | | |
| | 74,100 | | | TATSUTA ELECTRIC WIRE AND CABLE CO. LTD. | | | 327,189 | | | | 413,277 | | | | | |
| | 1,900 | | | TDK CORP. | | | 133,104 | | | | 216,658 | | | | | |
| | 5,800 | | | TEIJIN LTD. | | | 67,529 | | | | 109,162 | | | | | |
| | 11,600 | | | TERUMO CORP. | | | 117,165 | | | | 414,762 | | | | | |
| | 2,800 | | | THK CO. LTD. | | | 48,191 | | | | 76,484 | | | | | |
| | 1,500 | | | TOHO CO. LTD. | | | 25,533 | | | | 62,744 | | | | | |
| | 3,400 | | | TOHO GAS CO. LTD. | | | 81,221 | | | | 139,561 | | | | | |
| | 7,200 | | | TOHOKU ELECTRIC POWER CO., INC. | | | 56,650 | | | | 71,699 | | | | | |
| | 14,400 | | | TOKIO MARINE HOLDINGS, INC. | | | 359,676 | | | | 810,948 | | | | | |
| | 28,100 | | | TOKYO ELECTRIC POWER CO. HOLDINGS, INC.(c) | | | 104,659 | | | | 120,774 | | | | | |
| | 3,300 | | | TOKYO ELECTRON LTD. | | | 135,391 | | | | 726,635 | | | | | |
| | 6,000 | | | TOKYO GAS CO. LTD. | | | 103,615 | | | | 146,418 | | | | | |
| | 7,100 | | | TOKYO SEIMITSU CO. LTD. | | | 212,364 | | | | 278,367 | | | | | |
| | 12,500 | | | TOKYU CORP. | | | 103,448 | | | | 232,272 | | | | | |
| | 20,000 | | | TOKYU FUDOSAN HOLDINGS CORP. | | | 69,576 | | | | 138,972 | | | | | |
| | 3,000 | | | TOPPAN PRINTING CO. LTD. | | | 46,386 | | | | 62,427 | | | | | |
| | 17,000 | | | TORAY INDUSTRIES, INC. | | | 70,413 | | | | 115,951 | | | | | |
| | 3,000 | | | TOTO LTD. | | | 30,029 | | | | 128,112 | | | | | |
| | 75,200 | | | TOYO CONSTRUCTION CO. LTD. | | | 312,593 | | | | 361,968 | | | | | |
| | 3,000 | | | TOYO SUISAN KAISHA LTD. | | | 74,690 | | | | 127,836 | | | | | |
| | 4,000 | | | TOYOTA INDUSTRIES CORP. | | | 101,266 | | | | 233,031 | | | | | |
| | 46,662 | | | TOYOTA MOTOR CORP. | | | 1,594,403 | | | | 3,312,785 | | | | | |
| | 1,800 | | | TOYOTA TSUSHO CORP. | | | 14,973 | | | | 63,946 | | | | | |
| | 900 | | | TREND MICRO, INC. | | | 26,540 | | | | 46,385 | | | | | |
| | 19,200 | | | UBE INDUSTRIES LTD. | | | 387,205 | | | | 420,384 | | | | | |
| | 7,800 | | | UNICHARM CORP. | | | 68,794 | | | | 265,611 | | | | | |
| | 60 | | | UNITED URBAN INVESTMENT CORP. | | | 85,311 | | | | 112,429 | | | | | |
| | 4,900 | | | USS CO. LTD. | | | 56,003 | | | | 93,170 | | | | | |
| | 1,400 | | | WELCIA HOLDINGS CO. LTD. | | | 48,069 | | | | 89,550 | | | | | |
| | 4,100 | | | WEST JAPAN RAILWAY CO. | | | 134,756 | | | | 356,248 | | | | | |
| | 2,500 | | | YAKULT HONSHA CO. LTD. | | | 74,984 | | | | 138,742 | | | | | |
| | 18,500 | | | YAMADA DENKI CO. LTD. | | | 67,043 | | | | 98,412 | | | | | |
| | 46,400 | | | YAMAGUCHI FINANCIAL GROUP, INC. | | | 326,523 | | | | 317,718 | | | | | |
| | 4,800 | | | YAMAHA MOTOR CO. LTD. | | | 48,849 | | | | 97,321 | | | | | |
| | 4,000 | | | YAMAZAKI BAKING CO. LTD. | | | 44,679 | | | | 71,750 | | | | | |
| See accompanying notes to financial statements. | 76 | (Continued) |
CLEARWATER INVESTMENT TRUST
Schedule of Investments - Clearwater International Fund
December 31, 2019
| | | | | | | | | | | | | |
| Shares | | | Security | | Cost | | | Fair value (a) | | | Percent of
net assets | |
| | Japan (Cont’d): | | | | | | | | | | | | | | | |
| | 5,000 | | | YASKAWA ELECTRIC CORP. | | $ | 48,019 | | | | 191,892 | | | | | |
| | 10,100 | | | YUASA TRADING CO. LTD. | | | 293,394 | | | | 342,538 | | | | | |
| | 25,900 | | | Z HOLDINGS CORP. | | | 65,455 | | | | 109,888 | | | | | |
| | | | | | | | 57,675,854 | | | | 94,586,873 | | | | 13.29 | % |
| | Jersey: | | | | | | | | | | | | | | | |
| | 116,287 | | | SANNE GROUP PLC | | | 812,583 | | | | 1,042,809 | | | | | |
| | 197,400 | | | XLMEDIA PLC | | | 161,763 | | | | 117,010 | | | | | |
| | | | | | | | 974,346 | | | | 1,159,819 | | | | 0.16 | % |
| | Macau: | | | | | | | | | | | | | | | |
| | 172,800 | | | SANDS CHINA LTD. | | | 551,191 | | | | 923,619 | | | | | |
| | | | | | | | 551,191 | | | | 923,619 | | | | 0.13 | % |
| | Mexico: | | | | | | | | | | | | | | | |
| | 201,200 | | | BANCO DEL BAJIO S.A.(e) | | | 360,811 | | | | 337,009 | | | | | |
| | 64,700 | | | QUALITAS CONTROLADORA S.A.B. DE C.V. | | | 232,834 | | | | 271,701 | | | | | |
| | 213,700 | | | REGIONAL S.A.B. DE C.V. | | | 1,029,203 | | | | 1,199,749 | | | | | |
| | 1,053,734 | | | WAL-MART DE MEXICO S.A.B. DE C.V. | | | 2,681,393 | | | | 3,017,834 | | | | | |
| | | | | | | | 4,304,241 | | | | 4,826,293 | | | | 0.68 | % |
| | Netherlands: | | | | | | | | | | | | | | | |
| | 3,857 | | | AKZO NOBEL N.V. | | | 184,366 | | | | 392,145 | | | | | |
| | 9,632 | | | ARCELORMITTAL S.A. | | | 97,048 | | | | 169,000 | | | | | |
| | 7,173 | | | ASML HOLDING N.V. | | | 106,863 | | | | 2,121,718 | | | | | |
| | 14,743 | | | ASML HOLDING N.V. (REGISTERED) | | | 2,939,685 | | | | 4,363,043 | | | | | |
| | 3,610 | | | EXOR N.V. | | | 90,616 | | | | 279,728 | | | | | |
| | 22,294 | | | FORFARMERS N.V. | | | 142,814 | | | | 143,541 | | | | | |
| | 2,765 | | | HEINEKEN HOLDING N.V. | | | 148,540 | | | | 267,970 | | | | | |
| | 3,662 | | | HEINEKEN N.V. | | | 128,663 | | | | 389,900 | | | | | |
| | 17,328 | | | IMCD N.V. | | | 1,330,919 | | | | 1,512,184 | | | | | |
| | 448,838 | | | ING GROEP N.V. | | | 4,727,760 | | | | 5,380,998 | | | | | |
| | 19,595 | | | INTERTRUST N.V.(e) | | | 321,331 | | | | 380,469 | | | | | |
| | 16,750 | | | INTERXION HOLDING N.V.(c) | | | 1,438,986 | | | | 1,403,817 | | | | | |
| | 17,656 | | | KONINKLIJKE AHOLD DELHAIZE N.V. | | | 203,381 | | | | 441,547 | | | | | |
| | 3,281 | | | KONINKLIJKE DSM N.V. | | | 122,903 | | | | 427,283 | | | | | |
| | 51,375 | | | KONINKLIJKE KPN N.V. | | | 108,346 | | | | 151,618 | | | | | |
| | 20,095 | | | KONINKLIJKE PHILIPS N.V. | | | 343,642 | | | | 980,965 | | | | | |
| | 25,793 | | | KONINKLIJKE VOLKERWESSELS N.V. | | | 445,731 | | | | 635,058 | | | | | |
| | 29,817 | | | NXP SEMICONDUCTORS N.V. | | | 2,680,727 | | | | 3,794,511 | | | | | |
| | 8,117 | | | QIAGEN N.V.(c) | | | 119,394 | | | | 277,333 | | | | | |
| | 3,238 | | | RANDSTAD N.V. | | | 99,928 | | | | 197,730 | | | | | |
| | 30,151 | | | ROYAL DUTCH SHELL PLC, CLASS A | | | 668,681 | | | | 892,615 | | | | | |
| | 78,928 | | | ROYAL DUTCH SHELL PLC, CLASS B | | | 1,736,914 | | | | 2,341,353 | | | | | |
| | 12,197 | | | SIGNIFY N.V.(e) | | | 353,260 | | | | 381,163 | | | | | |
| | 19,620 | | | TAKEAWAY.COM N.V.(b)(c)(e) | | | 1,617,085 | | | | 1,809,037 | | | | | |
| | 6,193 | | | WOLTERS KLUWER N.V. | | | 101,075 | | | | 451,674 | | | | | |
| | | | | | | | 20,258,658 | | | | 29,586,400 | | | | 4.16 | % |
| | New Zealand: | | | | | | | | | | | | | | | |
| | 16,545 | | | AUCKLAND INTERNATIONAL AIRPORT LTD. | | | 50,086 | | | | 97,458 | | | | | |
| | 31,147 | | | HALLENSTEIN GLASSON HOLDINGS LTD. | | | 115,879 | | | | 126,648 | | | | | |
| | | | | | | | 165,965 | | | | 224,106 | | | | 0.03 | % |
| | Norway: | | | | | | | | | | | | | | | |
| | 1,208 | | | ADEVINTA ASA(c) | | | 11,661 | | | | 14,310 | | | | | |
| | 17,485 | | | BAKKAFROST P/F | | | 1,232,983 | | | | 1,294,551 | | | | | |
| | 15,038 | | | DNB ASA | | | 107,736 | | | | 280,914 | | | | | |
| | 31,602 | | | EQUINOR ASA | | | 538,961 | | | | 631,731 | | | | | |
| | 74,772 | | | KITRON ASA | | | 79,048 | | | | 93,685 | | | | | |
| | 8,921 | | | ORKLA ASA | | | 59,155 | | | | 90,396 | | | | | |
| | 57,040 | | | STOREBRAND ASA | | | 364,067 | | | | 448,430 | | | | | |
| | 14,536 | | | TELENOR ASA | | | 210,513 | | | | 260,692 | | | | | |
| | 9,490 | | | TGS NOPEC GEOPHYSICAL CO. ASA | | | 257,799 | | | | 288,722 | | | | | |
| | 2,500 | | | YARA INTERNATIONAL ASA | | | 58,115 | | | | 103,995 | | | | | |
| | | | | | | | 2,920,038 | | | | 3,507,426 | | | | 0.49 | % |
| | Philippines: | | | | | | | | | | | | | | | |
| | 573,800 | | | FIRST GEN CORP. | | | 286,157 | | | | 273,616 | | | | | |
| See accompanying notes to financial statements. | 77 | (Continued) |
CLEARWATER INVESTMENT TRUST
Schedule of Investments - Clearwater International Fund
December 31, 2019
| | | | | | | | | | | | | |
| Shares | | | Security | | Cost | | | Fair value (a) | | | Percent of
net assets | |
| | Philippines (Cont’d): | | | | | | | | | | | | |
| | 9,000 | | | GLOBE TELECOM, INC. | | $ | 319,161 | | | | 358,969 | | | | | |
| | | | | | | | 605,318 | | | | 632,585 | | | | 0.09 | % |
| | Portugal: | | | | | | | | | | | | | | | |
| | 85,477 | | | ALTRI SGPS S.A. | | | 583,770 | | | | 544,596 | | | | | |
| | 20,567 | | | EDP - ENERGIAS DE PORTUGAL S.A. | | | 48,529 | | | | 89,143 | | | | | |
| | 9,417 | | | JERONIMO MARTINS SGPS S.A. | | | 105,676 | | | | 154,907 | | | | | |
| | | | | | | | 737,975 | | | | 788,646 | | | | 0.11 | % |
| | Russia: | | | | | | | | | | | | | | | |
| | 52,700 | | | HEADHUNTER GROUP PLC ADR(b)(f) | | | 1,086,642 | | | | 1,130,415 | | | | | |
| | 257,400 | | | RUSHYDRO PJSC ADR(f) | | | 218,665 | | | | 216,988 | | | | | |
| | | | | | | | 1,305,307 | | | | 1,347,403 | | | | 0.19 | % |
| | Singapore: | | | | | | | | | | | | | | | |
| | 302,700 | | | AEM HOLDINGS LTD. | | | 265,969 | | | | 454,630 | | | | | |
| | 529,900 | | | ASCOTT RESIDENCE TRUST(c)(g) | | | 504,028 | | | | 524,010 | | | | | |
| | 124,600 | | | CAPITALAND LTD. | | | 247,485 | | | | 347,411 | | | | | |
| | 36,000 | | | CAPITALAND MALL TRUST | | | 34,133 | | | | 65,846 | | | | | |
| | 8,400 | | | CITY DEVELOPMENTS LTD. | | | 34,076 | | | | 68,389 | | | | | |
| | 28,300 | | | DBS GROUP HOLDINGS LTD. | | | 159,243 | | | | 544,558 | | | | | |
| | 374,800 | | | FRENCKEN GROUP LTD. | | | 253,379 | | | | 257,772 | | | | | |
| | 21,000 | | | KEPPEL CORP. LTD. | | | 53,869 | | | | 105,707 | | | | | |
| | 7,840 | | | KEPPEL REIT | | | 3,183 | | | | 7,228 | | | | | |
| | 6,000 | | | OVERSEA-CHINESE BANKING CORP. LTD. | | | 33,180 | | | | 48,983 | | | | | |
| | 13,000 | | | SINGAPORE EXCHANGE LTD. | | | 40,226 | | | | 85,639 | | | | | |
| | 112,000 | | | SINGAPORE TELECOMMUNICATIONS LTD. | | | 184,276 | | | | 280,635 | | | | | |
| | 4,600 | | | UNITED OVERSEAS BANK LTD. | | | 26,071 | | | | 90,327 | | | | | |
| | 23,900 | | | UOL GROUP LTD. | | | 89,591 | | | | 147,848 | | | | | |
| | 35,400 | | | WILMAR INTERNATIONAL LTD. | | | 68,955 | | | | 108,441 | | | | | |
| | | | | | | | 1,997,664 | | | | 3,137,424 | | | | 0.44 | % |
| | South Africa: | | | | | | | | | | | | | | | |
| | 33,591 | | | AFRICAN RAINBOW MINERALS LTD. | | | 339,096 | | | | 392,511 | | | | | |
| | 26,593 | | | BARLOWORLD LTD. | | | 218,512 | | | | 214,039 | | | | | |
| | 79,610 | | | INVESTEC PLC | | | 490,976 | | | | 467,255 | | | | | |
| | 117,469 | | | METAIR INVESTMENTS LTD. | | | 184,301 | | | | 193,741 | | | | | |
| | 83,378 | | | TELKOM S.A. SOC LTD. | | | 425,342 | | | | 207,284 | | | | | |
| | | | | | | | 1,658,227 | | | | 1,474,830 | | | | 0.21 | % |
| | South Korea: | | | | | | | | | | | | | | | |
| | 3,487 | | | DAELIM INDUSTRIAL CO. LTD. | | | 294,468 | | | | 272,881 | | | | | |
| | 16,911 | | | DAEWON PHARMACEUTICAL CO. LTD.(c) | | | 218,169 | | | | 252,981 | | | | | |
| | 20,489 | | | DB HITEK CO. LTD. | | | 270,468 | | | | 488,993 | | | | | |
| | 19,034 | | | DOUZONE BIZON CO. LTD. | | | 1,078,859 | | | | 1,333,178 | | | | | |
| | 5,830 | | | GS HOLDINGS CORP. | | | 245,188 | | | | 260,131 | | | | | |
| | 2,154 | | | HYUNDAI GLOVIS CO. LTD. | | | 274,512 | | | | 266,351 | | | | | |
| | 46,124 | | | HYUNDAI GREENFOOD CO. LTD. | | | 465,431 | | | | 472,627 | | | | | |
| | 12,025 | | | HYUNDAI MOTOR CO. | | | 1,475,791 | | | | 1,252,983 | | | | | |
| | 13,688 | | | KC TECH CO. LTD. | | | 209,922 | | | | 276,376 | | | | | |
| | 30,770 | | | LG UPLUS CORP. | | | 348,896 | | | | 377,824 | | | | | |
| | 10,183 | | | LOTTE FINE CHEMICAL CO. LTD. | | | 404,389 | | | | 397,564 | | | | | |
| | 4,775 | | | MAEIL DAIRIES CO. LTD. | | | 380,764 | | | | 355,508 | | | | | |
| | 24,242 | | | NAVER CORP. | | | 3,044,908 | | | | 3,909,493 | | | | | |
| | 166,348 | | | SAMSUNG ELECTRONICS CO. LTD. | | | 5,437,201 | | | | 8,026,476 | | | | | |
| | 14,251 | | | SAMSUNG SECURITIES CO. LTD. | | | 434,059 | | | | 475,670 | | | | | |
| | 28,697 | | | SETTLE BANK, INC. | | | 899,288 | | | | 717,146 | | | | | |
| | 21,239 | | | UNITEST, INC. | | | 237,890 | | | | 263,548 | | | | | |
| | 8,433 | | | VIEWORKS CO. LTD. | | | 182,467 | | | | 229,703 | | | | | |
| | | | | | | | 15,902,670 | | | | 19,629,433 | | | | 2.76 | % |
| | Spain: | | | | | | | | | | | | | | | |
| | 1,260 | | | ACCIONA S.A. | | | 78,312 | | | | 132,571 | | | | | |
| | 1,729 | | | ACS ACTIVIDADES DE CONSTRUCCION Y SERVICIOS S.A. | | | 50,301 | | | | 69,140 | | | | | |
| | 583 | | | AENA S.M.E. S.A.(e) | | | 50,199 | | | | 111,499 | | | | | |
| | 50,208 | | | AMADEUS IT GROUP S.A. | | | 3,724,950 | | | | 4,099,974 | | | | | |
| | 21,276 | | | BANCO BILBAO VIZCAYA ARGENTARIA S.A. | | | 115,458 | | | | 118,921 | | | | | |
| | 284,591 | | | BANCO DE SABADELL S.A. | | | 262,572 | | | | 331,995 | | | | | |
| | 813,038 | | | BANKIA S.A. | | | 2,507,535 | | | | 1,735,051 | | | | | |
| | 294,605 | | | CAIXABANK S.A. | | | 694,881 | | | | 924,623 | | | | | |
| | 7,431 | | | ENAGAS S.A. | | | 139,323 | | | | 189,546 | | | | | |
| See accompanying notes to financial statements. | 78 | (Continued) |
CLEARWATER INVESTMENT TRUST
Schedule of Investments - Clearwater International Fund
December 31, 2019
| | | | | | | | | | | | | |
| Shares | | | Security | | Cost | | | Fair value (a) | | | Percent of
net assets | |
| | Spain (Cont’d): | | | | | | | | | | | | |
| | 5,742 | | | FERROVIAL S.A. | | $ | 97,569 | | | | 173,708 | | | | | |
| | 15,282 | | | GRIFOLS S.A. | | | 273,864 | | | | 538,767 | | | | | |
| | 54,451 | | | IBERDROLA S.A. | | | 266,323 | | | | 560,693 | | | | | |
| | 2,187 | | | INDUSTRIA DE DISENO TEXTIL S.A. | | | 15,763 | | | | 77,152 | | | | | |
| | 53,086 | | | MEDIASET ESPANA COMUNICACION S.A. | | | 352,561 | | | | 337,034 | | | | | |
| | 13,196 | | | MIQUEL Y COSTAS & MIQUEL S.A. | | | 241,236 | | | | 242,752 | | | | | |
| | 16,489 | | | NATURGY ENERGY GROUP S.A. | | | 264,629 | | | | 414,304 | | | | | |
| | 11,356 | | | RED ELECTRICA CORP. S.A. | | | 121,909 | | | | 228,329 | | | | | |
| | 46,787 | | | REPSOL S.A. | | | 567,753 | | | | 731,060 | | | | | |
| | | | | | | | 9,825,138 | | | | 11,017,119 | | | | 1.55 | % |
| | Sweden: | | | | | | | | | | | | | | | |
| | 22,200 | | | ASSA ABLOY AB, CLASS B | | | 89,466 | | | | 519,071 | | | | | |
| | 102,779 | | | ATLAS COPCO AB, CLASS A | | | 2,853,245 | | | | 4,099,594 | | | | | |
| | 4,000 | | | ATLAS COPCO AB, CLASS B | | | 22,805 | | | | 138,880 | | | | | |
| | 154,830 | | | AVANZA BANK HOLDING AB | | | 1,337,232 | | | | 1,616,678 | | | | | |
| | 56,101 | | | BEIJER REF AB | | | 1,357,684 | | | | 1,645,951 | | | | | |
| | 75,639 | | | BIOTAGE AB | | | 837,243 | | | | 1,001,376 | | | | | |
| | 18,403 | | | BOLIDEN AB | | | 471,821 | | | | 488,253 | | | | | |
| | 22,316 | | | CELLAVISION AB | | | 829,856 | | | | 761,232 | | | | | |
| | 7,501 | | | ELECTROLUX AB, CLASS B | | | 95,788 | | | | 184,114 | | | | | |
| | 9,604 | | | EPIROC AB, CLASS A | | | 18,146 | | | | 117,251 | | | | | |
| | 4,000 | | | EPIROC AB, CLASS B | | | 7,248 | | | | 47,425 | | | | | |
| | 8,600 | | | ESSITY AB, CLASS B | | | 62,137 | | | | 277,107 | | | | | |
| | 14,726 | | | HENNES & MAURITZ AB, CLASS B | | | 222,503 | | | | 299,477 | | | | | |
| | 3,700 | | | HEXAGON AB, CLASS B | | | 56,830 | | | | 207,391 | | | | | |
| | 41,907 | | | HUMANA AB | | | 223,180 | | | | 272,479 | | | | | |
| | 17,500 | | | HUSQVARNA AB, CLASS B | | | 64,201 | | | | 140,167 | | | | | |
| | 8,270 | | | INDUSTRIVARDEN AB, CLASS C | | | 85,948 | | | | 199,458 | | | | | |
| | 41,319 | | | INDUTRADE AB | | | 1,259,933 | | | | 1,478,711 | | | | | |
| | 10,953 | | | INVESTOR AB, CLASS B | | | 150,033 | | | | 597,797 | | | | | |
| | 56,909 | | | INWIDO AB | | | 320,042 | | | | 438,072 | | | | | |
| | 3,000 | | | KINNEVIK AB, CLASS B | | | 51,225 | | | | 73,348 | | | | | |
| | 7,801 | | | KNOW IT AB | | | 144,665 | | | | 173,655 | | | | | |
| | 3,301 | | | LUNDIN PETROLEUM AB | | | 46,596 | | | | 112,179 | | | | | |
| | 77,305 | | | MEDICOVER AB, CLASS B(c) | | | 670,793 | | | | 896,328 | | | | | |
| | 77,913 | | | NOBIA AB | | | 452,973 | | | | 580,624 | | | | | |
| | 46,408 | | | NOBINA AB(e) | | | 300,038 | | | | 319,334 | | | | | |
| | 65,911 | | | RESURS HOLDING AB(e) | | | 404,333 | | | | 423,276 | | | | | |
| | 17,617 | | | SANDVIK AB | | | 137,705 | | | | 343,543 | | | | | |
| | 13,348 | | | SECURITAS AB, CLASS B | | | 106,689 | | | | 230,083 | | | | | |
| | 35,236 | | | SKANDINAVISKA ENSKILDA BANKEN AB, CLASS A | | | 139,725 | | | | 331,355 | | | | | |
| | 2,800 | | | SKANSKA AB, CLASS B | | | 23,703 | | | | 63,286 | | | | | |
| | 5,929 | | | SKF AB, CLASS B | | | 90,829 | | | | 119,892 | | | | | |
| | 8,600 | | | SVENSKA CELLULOSA AB S.C.A., CLASS B | | | 15,915 | | | | 87,227 | | | | | |
| | 26,700 | | | SVENSKA HANDELSBANKEN AB, CLASS A | | | 161,721 | | | | 287,629 | | | | | |
| | 59,340 | | | TELEFONAKTIEBOLAGET LM ERICSSON, CLASS B | | | 304,553 | | | | 516,719 | | | | | |
| | 35,506 | | | TETHYS OIL AB | | | 259,465 | | | | 319,944 | | | | | |
| | 70,205 | | | VITEC SOFTWARE GROUP AB, CLASS B | | | 1,210,148 | | | | 1,386,658 | | | | | |
| | 25,108 | | | VOLVO AB, CLASS B | | | 162,740 | | | | 420,596 | | | | | |
| | | | | | | | 15,049,157 | | | | 21,216,160 | | | | 2.98 | % |
| | Switzerland: | | | | | | | | | | | | | | | |
| | 321,938 | | | ABB LTD. (REGISTERED) | | | 6,426,815 | | | | 7,774,014 | | | | | |
| | 2,686 | | | ADECCO GROUP A.G. (REGISTERED) | | | 80,814 | | | | 169,908 | | | | | |
| | 71,035 | | | ALCON, INC.(c) | | | 3,896,964 | | | | 4,022,234 | | | | | |
| | 484 | | | BALOISE HOLDING A.G. (REGISTERED) | | | 26,452 | | | | 87,518 | | | | | |
| | 1,098 | | | BUCHER INDUSTRIES A.G. (REGISTERED) | | | 236,188 | | | | 385,514 | | | | | |
| | 35 | | | CHOCOLADEFABRIKEN LINDT & SPRUENGLI A.G. (PARTICIPATION CERTIFICATE) | | | 50,308 | | | | 271,776 | | | | | |
| | 3 | | | CHOCOLADEFABRIKEN LINDT & SPRUENGLI A.G. (REGISTERED) | | | 75,352 | | | | 265,034 | | | | | |
| | 28,752 | | | CHUBB LTD. | | | 2,743,388 | | | | 4,475,536 | | | | | |
| | 55,933 | | | CIE FINANCIERE RICHEMONT S.A. (REGISTERED) | | | 3,914,442 | | | | 4,395,809 | | | | | |
| | 6,592 | | | GEBERIT A.G. (REGISTERED) | | | 2,318,982 | | | | 3,699,912 | | | | | |
| | 140 | | | GIVAUDAN S.A. (REGISTERED) | | | 76,496 | | | | 438,458 | | | | | |
| | 90,298 | | | GLENCORE PLC(c) | | | 188,311 | | | | 281,499 | | | | | |
| | 1,807 | | | IDORSIA LTD.(c) | | | 18,603 | | | | 55,902 | | | | | |
| | 3,937 | | | JULIUS BAER GROUP LTD.(c) | | | 81,664 | | | | 203,115 | | | | | |
| See accompanying notes to financial statements. | 79 | (Continued) |
CLEARWATER INVESTMENT TRUST
Schedule of Investments - Clearwater International Fund
December 31, 2019
| | | | | | | | | | | | | |
| Shares | | | Security | | Cost | | | Fair value (a) | | | Percent of
net assets | |
| | Switzerland (Cont’d): | | | | | | | | | | | | |
| | 71,597 | | | LAFARGEHOLCIM LTD. (REGISTERED)(c) | | $ | 3,552,062 | | | | 3,972,679 | | | | | |
| | 8,089 | | | LANDIS+GYR GROUP A.G.(c) | | | 568,369 | | | | 841,664 | | | | | |
| | 897 | | | LONZA GROUP A.G. (REGISTERED)(c) | | | 50,452 | | | | 327,361 | | | | | |
| | 130,046 | | | NESTLE S.A. (REGISTERED) | | | 7,138,358 | | | | 14,079,582 | | | | | |
| | 61,857 | | | NOVARTIS A.G. (REGISTERED) | | | 3,114,420 | | | | 5,873,795 | | | | | |
| | 19,355 | | | PARGESA HOLDING S.A. (BEARER) | | | 1,371,838 | | | | 1,608,917 | | | | | |
| | 12,406 | | | ROCHE HOLDING A.G. (GENUSSCHEIN) | | | 1,614,189 | | | | 4,025,092 | | | | | |
| | 1,381 | | | SCHINDLER HOLDING A.G. (PARTICIPATION CERTIFICATE) | | | 108,493 | | | | 351,315 | | | | | |
| | 589 | | | SCHINDLER HOLDING A.G. (REGISTERED) | | | 68,597 | | | | 144,359 | | | | | |
| | 121 | | | SGS S.A. (REGISTERED) | | | 130,564 | | | | 331,443 | | | | | |
| | 26,209 | | | SIKA A.G. (REGISTERED) | | | 3,213,477 | | | | 4,924,681 | | | | | |
| | 1,300 | | | SONOVA HOLDING A.G. (REGISTERED) | | | 84,464 | | | | 297,530 | | | | | |
| | 7,867 | | | STMICROELECTRONICS N.V. | | | 36,286 | | | | 211,521 | | | | | |
| | 635 | | | SULZER A.G. (REGISTERED) | | | 30,609 | | | | 70,862 | | | | | |
| | 743 | | | SWISS LIFE HOLDING A.G. (REGISTERED) | | | 101,194 | | | | 372,959 | | | | | |
| | 777 | | | SWISS PRIME SITE A.G. (REGISTERED)(c) | | | 65,303 | | | | 89,839 | | | | | |
| | 436 | | | SWISS RE A.G. | | | 32,156 | | | | 48,970 | | | | | |
| | 196 | | | SWISSCOM A.G. (REGISTERED) | | | 49,924 | | | | 103,812 | | | | | |
| | 20,268 | | | TE CONNECTIVITY LTD. | | | 570,413 | | | | 1,942,485 | | | | | |
| | 4,749 | | | TECAN GROUP A.G. (REGISTERED) | | | 974,125 | | | | 1,334,706 | | | | | |
| | 467,437 | | | UBS GROUP A.G. (REGISTERED)(c) | | | 6,714,198 | | | | 5,904,544 | | | | | |
| | 9,681 | | | VAT GROUP A.G.(c)(e) | | | 1,322,294 | | | | 1,636,007 | | | | | |
| | 100 | | | VETROPACK HOLDING A.G. (BEARER) | | | 256,087 | | | | 314,115 | | | | | |
| | 31,055 | | | WIZZ AIR HOLDINGS PLC(c)(e) | | | 1,370,968 | | | | 1,602,226 | | | | | |
| | 4,693 | | | ZEHNDER GROUP A.G. (REGISTERED) | | | 178,951 | | | | 221,121 | | | | | |
| | 4,668 | | | ZURICH INSURANCE GROUP A.G. | | | 912,788 | | | | 1,915,337 | | | | | |
| | | | | | | | 53,765,358 | | | | 79,073,151 | | | | 11.11 | % |
| | Taiwan: | | | | | | | | | | | | | | | |
| | 67,000 | | | AIRTAC INTERNATIONAL GROUP | | | 813,902 | | | | 1,042,649 | | | | | |
| | 305,000 | | | ASIA CEMENT CORP. | | | 434,632 | | | | 487,866 | | | | | |
| | 46,000 | | | BIOTEQUE CORP. | | | 199,088 | | | | 200,254 | | | | | |
| | 125,000 | | | CHC HEALTHCARE GROUP | | | 178,135 | | | | 167,837 | | | | | |
| | 124,000 | | | CHIPBOND TECHNOLOGY CORP. | | | 239,179 | | | | 277,973 | | | | | |
| | 419,000 | | | CHIPMOS TECHNOLOGIES, INC. | | | 449,603 | | | | 478,725 | | | | | |
| | 179,000 | | | ESON PRECISION IND CO. LTD. | | | 236,267 | | | | 220,936 | | | | | |
| | 38,000 | | | GLOBALWAFERS CO. LTD. | | | 372,583 | | | | 484,872 | | | | | |
| | 145,000 | | | JARLLYTEC CO. LTD. | | | 327,630 | | | | 460,970 | | | | | |
| | 241,000 | | | MIRLE AUTOMATION CORP. | | | 311,936 | | | | 319,168 | | | | | |
| | 90,000 | | | RADIANT OPTO-ELECTRONICS CORP. | | | 361,908 | | | | 360,276 | | | | | |
| | 1,260,000 | | | SINOPAC FINANCIAL HOLDINGS CO. LTD. | | | 492,562 | | | | 546,419 | | | | | |
| | 95,662 | | | TAIWAN SEMICONDUCTOR MANUFACTURING CO. LTD. ADR(f) | | | 2,063,335 | | | | 5,557,962 | | | | | |
| | 82,000 | | | TOPCO SCIENTIFIC CO. LTD. | | | 252,353 | | | | 288,588 | | | | | |
| | 644,000 | | | WISTRON CORP. | | | 522,109 | | | | 609,047 | | | | | |
| | 90,000 | | | ZHEN DING TECHNOLOGY HOLDING LTD. | | | 335,681 | | | | 429,329 | | | | | |
| | | | | | | | 7,590,903 | | | | 11,932,871 | | | | 1.68 | % |
| | Thailand: | | | | | | | | | | | | | | | |
| | 432,100 | | | PRUKSA HOLDING PCL (REGISTERED) | | | 233,658 | | | | 213,498 | | | | | |
| | | | | | | | 233,658 | | | | 213,498 | | | | 0.03 | % |
| | Turkey: | | | | | | | | | | | | | | | |
| | 53,800 | | | COCA-COLA ICECEK A.S. | | | 315,265 | | | | 349,985 | | | | | |
| | | | | | | | 315,265 | | | | 349,985 | | | | 0.05 | % |
| | United Arab Emirates: | | | | | | | | | | | | |
| | 187,397 | | | NETWORK INTERNATIONAL HOLDINGS PLC(c)(e) | | | 1,324,742 | | | | 1,591,129 | | | | | |
| | | | | | | | 1,324,742 | | | | 1,591,129 | | | | 0.22 | % |
| | United Kingdom: | | | | | | | | | | | | |
| | 25,248 | | | 3I GROUP PLC | | | 88,645 | | | | 367,210 | | | | | |
| | 55,800 | | | ABCAM PLC | | | 810,583 | | | | 999,300 | | | | | |
| | 80,250 | | | ACCESSO TECHNOLOGY GROUP PLC(c) | | | 653,680 | | | | 515,551 | | | | | |
| | 15,173 | | | ADMIRAL GROUP PLC | | | 364,853 | | | | 464,066 | | | | | |
| | 38,656 | | | AGGREKO PLC | | | 408,897 | | | | 426,322 | | | | | |
| | 53,800 | | | ANGLO AMERICAN PLC | | | 419,970 | | | | 1,548,556 | | | | | |
| | 1,885 | | | ASHTEAD GROUP PLC | | | 47,343 | | | | 60,274 | | | | | |
| | 26,375 | | | ASTRAZENECA PLC | | | 983,695 | | | | 2,657,607 | | | | | |
| | 14,221 | | | AUTO TRADER GROUP PLC(e) | | | 68,171 | | | | 112,006 | | | | | |
| | 44,043 | | | AVIVA PLC | | | 142,300 | | | | 244,267 | | | | | |
| See accompanying notes to financial statements. | 80 | (Continued) |
CLEARWATER INVESTMENT TRUST
Schedule of Investments - Clearwater International Fund
December 31, 2019
Shares | | | Security | | Cost | | | Fair value (a) | | | Percent of
net assets | |
United Kingdom (Cont’d): | | | | | | | | | | | | |
| 43,051 | | | BABCOCK INTERNATIONAL GROUP PLC | | $ | 300,400 | | | | 358,918 | | | | | |
| 49,840 | | | BAE SYSTEMS PLC | | | 250,267 | | | | 372,870 | | | | | |
| 113,471 | | | BAKKAVOR GROUP PLC(e) | | | 166,389 | | | | 209,824 | | | | | |
| 240,132 | | | BARCLAYS PLC | | | 425,446 | | | | 571,397 | | | | | |
| 2,391 | | | BERKELEY GROUP HOLDINGS (THE) PLC | | | 71,739 | | | | 153,890 | | | | | |
| 147,057 | | | BP PLC | | | 864,272 | | | | 918,638 | | | | | |
| 34,586 | | | BRITISH AMERICAN TOBACCO PLC | | | 1,035,056 | | | | 1,480,435 | | | | | |
| 10,909 | | | BRITISH LAND (THE) CO. PLC | | | 56,767 | | | | 92,307 | | | | | |
| 47,145 | | | BT GROUP PLC | | | 119,733 | | | | 120,175 | | | | | |
| 6,194 | | | BUNZL PLC | | | 68,422 | | | | 169,424 | | | | | |
| 8,202 | | | BURBERRY GROUP PLC | | | 40,549 | | | | 239,559 | | | | | |
| 17,991 | | | CNH INDUSTRIAL N.V. | | | 97,871 | | | | 197,567 | | | | | |
| 1,447 | | | COCA-COLA EUROPEAN PARTNERS PLC | | | 55,218 | | | | 73,623 | | | | | |
| 437,581 | | | COMPASS GROUP PLC | | | 6,450,879 | | | | 10,954,815 | | | | | |
| 36,515 | | | CRANEWARE PLC | | | 959,637 | | | | 1,141,480 | | | | | |
| 2,276 | | | CRODA INTERNATIONAL PLC | | | 82,785 | | | | 154,357 | | | | | |
| 43,200 | | | DART GROUP PLC | | | 431,313 | | | | 969,353 | | | | | |
| 35,641 | | | DECHRA PHARMACEUTICALS PLC | | | 1,319,890 | | | | 1,369,092 | | | | | |
| 41,623 | | | DIAGEO PLC | | | 507,983 | | | | 1,764,558 | | | | | |
| 40,654 | | | EASYJET PLC | | | 523,562 | | | | 767,097 | | | | | |
| 3,956 | | | FERGUSON PLC | | | 70,457 | | | | 358,948 | | | | | |
| 58,240 | | | FEVERTREE DRINKS PLC | | | 1,475,370 | | | | 1,614,639 | | | | | |
| 10,222 | | | FIAT CHRYSLER AUTOMOBILES N.V. | | | 17,872 | | | | 150,161 | | | | | |
| 24,413 | | | FIAT CHRYSLER AUTOMOBILES N.V. | | | 161,492 | | | | 361,305 | | | | | |
| 53,256 | | | G4S PLC | | | 123,878 | | | | 153,784 | | | | | |
| 141,025 | | | GB GROUP PLC | | | 1,013,266 | | | | 1,457,054 | | | | | |
| 60,868 | | | GLAXOSMITHKLINE PLC | | | 943,970 | | | | 1,434,332 | | | | | |
| 144,168 | | | HSBC HOLDINGS PLC | | | 916,254 | | | | 1,130,322 | | | | | |
| 97,482 | | | IMI PLC | | | 1,301,896 | | | | 1,522,380 | | | | | |
| 2,072 | | | IMPERIAL BRANDS PLC | | | 44,967 | | | | 51,296 | | | | | |
| 1,474 | | | INTERCONTINENTAL HOTELS GROUP PLC | | | 64,215 | | | | 101,684 | | | | | |
| 32,745 | | | INTERNATIONAL CONSOLIDATED AIRLINES GROUP S.A. -CDI | | | 90,834 | | | | 265,191 | | | | | |
| 46,380 | | | ITV PLC | | | 59,143 | | | | 92,767 | | | | | |
| 251,437 | | | J SAINSBURY PLC | | | 662,344 | | | | 765,690 | | | | | |
| 132,767 | | | JOHN WOOD GROUP PLC | | | 1,142,076 | | | | 700,815 | | | | | |
| 2,248 | | | JOHNSON MATTHEY PLC | | | 35,933 | | | | 89,212 | | | | | |
| 219,599 | | | KINGFISHER PLC | | | 531,850 | | | | 631,212 | | | | | |
| 11,063 | | | LAND SECURITIES GROUP PLC | | | 77,637 | | | | 145,075 | | | | | |
| 4,601,377 | | | LLOYDS BANKING GROUP PLC | | | 3,437,928 | | | | 3,809,365 | | | | | |
| 6,030 | | | LONDON STOCK EXCHANGE GROUP PLC | | | 69,795 | | | | 619,019 | | | | | |
| 40,464 | | | M&G PLC(c) | | | 84,073 | | | | 127,136 | | | | | |
| 157,221 | | | MAN GROUP PLC | | | 205,784 | | | | 329,043 | | | | | |
| 300,659 | | | MARSTON’S PLC | | | 477,602 | | | | 506,578 | | | | | |
| 10,115 | | | MEGGITT PLC | | | 39,653 | | | | 88,000 | | | | | |
| 35,540 | | | MELROSE INDUSTRIES PLC | | | 51,515 | | | | 113,030 | | | | | |
| 145,235 | | | MORGAN ADVANCED MATERIALS PLC | | | 467,561 | | | | 609,839 | | | | | |
| 40,225 | | | NATIONAL GRID PLC | | | 346,588 | | | | 503,142 | | | | | |
| 2,148 | | | NEXT PLC | | | 36,823 | | | | 199,679 | | | | | |
| 103,083 | | | ONESAVINGS BANK PLC | | | 483,067 | | | | 591,781 | | | | | |
| 40,464 | | | PRUDENTIAL PLC | | | 505,774 | | | | 776,644 | | | | | |
| 32,250 | | | RECKITT BENCKISER GROUP PLC | | | 2,079,013 | | | | 2,618,208 | | | | | |
| 170,506 | | | REDDE PLC | | | 266,694 | | | | 239,403 | | | | | |
| 57,235 | | | REDROW PLC | | | 447,916 | | | | 564,811 | | | | | |
| 47,054 | | | RELX PLC | | | 574,910 | | | | 1,185,450 | | | | | |
| 197,232 | | | RELX PLC (LONDON EXCHANGE) | | | 2,613,839 | | | | 4,978,186 | | | | | |
| 19,426 | | | RIO TINTO LTD. | | | 611,119 | | | | 1,368,672 | | | | | |
| 34,005 | | | RIO TINTO PLC | | | 893,598 | | | | 2,028,288 | | | | | |
| 611,306 | | | ROYAL BANK OF SCOTLAND GROUP PLC | | | 1,838,692 | | | | 1,945,796 | | | | | |
| 77,712 | | | ROYAL MAIL PLC | | | 220,280 | | | | 232,947 | | | | | |
| 20,657 | | | SAGE GROUP (THE) PLC | | | 74,323 | | | | 204,943 | | | | | |
| 1,412 | | | SCHRODERS PLC | | | 46,641 | | | | 62,357 | | | | | |
| 16,135 | | | SEGRO PLC | | | 67,053 | | | | 191,753 | | | | | |
| 114,270 | | | SENIOR PLC | | | 287,158 | | | | 261,705 | | | | | |
| 4,954 | | | SEVERN TRENT PLC | | | 76,220 | | | | 165,036 | | | | | |
| 166,460 | | | SMITH & NEPHEW PLC | | | 3,574,023 | | | | 4,040,533 | | | | | |
| 2,453 | | | SMITHS GROUP PLC | | | 28,519 | | | | 54,815 | | | | | |
| 9,489 | | | SPECTRIS PLC | | | 300,454 | | | | 365,259 | | | | | |
| See accompanying notes to financial statements. | 81 | (Continued) |
CLEARWATER INVESTMENT TRUST
Schedule of Investments - Clearwater International Fund
December 31, 2019
Shares | | | Security | | Cost | | | Fair value (a) | | | Percent of
net assets | |
| United Kingdom (Cont’d): | | | | | | | | | | | | |
| 297,861 | | | SPEEDY HIRE PLC | | $ | 207,072 | | | | 303,801 | | | | | |
| 13,083 | | | SPIRAX-SARCO ENGINEERING PLC | | | 1,341,634 | | | | 1,540,614 | | | | | |
| 11,840 | | | SSE PLC | | | 202,889 | | | | 225,604 | | | | | |
| 114,497 | | | STANDARD CHARTERED PLC | | | 832,701 | | | | 1,080,445 | | | | | |
| 82,413 | | | STHREE PLC | | | 315,585 | | | | 413,733 | | | | | |
| 62,229 | | | TATE & LYLE PLC | | | 582,881 | | | | 626,622 | | | | | |
| 72,176 | | | TAYLOR WIMPEY PLC | | | 122,883 | | | | 184,899 | | | | | |
| 1,445,201 | | | TESCO PLC | | | 4,656,968 | | | | 4,885,328 | | | | | |
| 97,889 | | | TP ICAP PLC | | | 415,366 | | | | 529,936 | | | | | |
| 3,749 | | | TRAVIS PERKINS PLC | | | 51,659 | | | | 79,554 | | | | | |
| 66,425 | | | TYMAN PLC | | | 194,645 | | | | 238,884 | | | | | |
| 9,489 | | | UNILEVER N.V. | | | 233,474 | | | | 545,283 | | | | | |
| 24,244 | | | UNILEVER PLC | | | 545,189 | | | | 1,397,102 | | | | | |
| 34,174 | | | UNITED UTILITIES GROUP PLC | | | 335,278 | | | | 427,048 | | | | | |
| 418,658 | | | VODAFONE GROUP PLC | | | 697,213 | | | | 813,864 | | | | | |
| 31,614 | | | WEIR GROUP (THE) PLC | | | 518,070 | | | | 632,117 | | | | | |
| 4,755 | | | WHITBREAD PLC | | | 148,786 | | | | 305,224 | | | | | |
| 10,770 | | | WILLIS TOWERS WATSON PLC | | | 1,703,837 | | | | 2,174,894 | | | | | |
| 25,243 | | | WPP PLC | | | 161,294 | | | | 356,604 | | | | | |
| | | | | | | 60,023,808 | | | | 86,043,379 | | | | 12.09 | % |
| United States: | | | | | | | | | | | | | | | |
| 164,503 | | | ARCH CAPITAL GROUP LTD.(c) | | | 3,036,859 | | | | 7,055,534 | | | | | |
| 6,947 | | | CARNIVAL PLC | | | 239,494 | | | | 335,321 | | | | | |
| 183,492 | | | DIVERSIFIED GAS & OIL PLC | | | 265,564 | | | | 258,852 | | | | | |
| 19,837 | | | ELASTIC N.V.(c) | | | 1,752,954 | | | | 1,275,519 | | | | | |
| 3,424 | | | FIDELITY NATIONAL INFORMATION SERVICES, INC. | | | 289,873 | | | | 476,244 | | | | | |
| 4,277 | | | METTLER-TOLEDO INTERNATIONAL, INC.(c) | | | 2,543,268 | | | | 3,392,858 | | | | | |
| 1,600 | | | MILLICOM INTERNATIONAL CELLULAR S.A. SDR | | | 72,490 | | | | 76,632 | | | | | |
| 3,157 | | | NEWMONT GOLDCORP CORP. | | | 101,845 | | | | 137,215 | | | | | |
| 32,180 | | | RESMED, INC. | | | 3,548,292 | | | | 4,986,935 | | | | | |
| | | | | | | 11,850,639 | | | | 17,995,110 | | | | 2.53 | % |
| | | Sub-total Common Stocks: | | 454,529,238 | | | | 668,283,824 | | | | 93.88 | % |
Preferred Stocks: | | | | | | | | | | |
| Brazil: | | | | | | | | | | | |
| 26,203 | | | AZUL S.A. ADR(c)(f) | | | 941,400 | | | | 1,121,488 | | | | | |
| 87,800 | | | CIA DE SANEAMENTO DO PARANA, 0.98%(h) | | | 350,151 | | | | 460,095 | | | | | |
| 274,581 | | | TELEFONICA BRASIL S.A. ADR, 1.06%(f)(h) | | | 3,464,906 | | | | 3,932,000 | | | | | |
| | | | | | | 4,756,457 | | | | 5,513,583 | | | | 0.78 | % |
| Germany: | | | | | | | | | | | | |
| 1,521 | | | BAYERISCHE MOTOREN WERKE A.G., 6.37%(h) | | | 49,612 | | | | 93,921 | | | | | |
| 1,217 | | | HENKEL A.G. & CO. KGAA, 2.03%(h) | | | 101,251 | | | | 125,863 | | | | | |
| 10,197 | | | JUNGHEINRICH A.G., 2.28%(h) | | | 253,285 | | | | 245,917 | | | | | |
| 1,443 | | | PORSCHE AUTOMOBIL HOLDING S.E., 3.30%(h) | | | 60,635 | | | | 107,864 | | | | | |
| 272 | | | SARTORIUS A.G., 0.33%(h) | | | 45,992 | | | | 58,214 | | | | | |
| 2,299 | | | STO S.E. & CO. KGAA, 0.27%(h) | | | 248,295 | | | | 293,982 | | | | | |
| 770 | | | VOLKSWAGEN A.G., 2.75%(h) | | | 99,996 | | | | 152,220 | | | | | |
| | | | | | | 859,066 | | | | 1,077,981 | | | | 0.15 | % |
| South Korea: | | | | | | | | | | | | | | | |
| 2,204 | | | HYUNDAI MOTOR CO. LTD. (2ND PREFERRED), 5.22%(h) | | | 198,515 | | | | 151,323 | | | | | |
| 48,493 | | | SAMSUNG ELECTRONICS CO. LTD., 3.10%(h) | | | 1,439,460 | | | | 1,903,742 | | | | | |
| | | | | | | 1,637,975 | | | | 2,055,065 | | | | 0.29 | % |
| | | Sub-total Preferred Stocks: | 7,253,498 | | | | 8,646,629 | | | | 1.22 | % |
| Rights: | | | | | | | | | | | | |
| Spain: | | | | | | | | | | | | |
| 46,787 | | | REPSOL S.A.(c) | | | 22,111 | | | | 22,199 | | | | | |
| | | | | | | 22,111 | | | | 22,199 | | | | 0.00 | % |
| | | Sub-total Rights: | 22,111 | | | | 22,199 | | | | 0.00 | % |
| Short-Term Investments: | | | | | | | | | | | | |
| 8,084,387 | | | FIDELITY INVESTMENTS MONEY MARKET GOVERNMENT PORTFOLIO(i) | | | 8,084,387 | | | | 8,084,387 | | | | | |
| See accompanying notes to financial statements. | 82 | (Continued) |
CLEARWATER INVESTMENT TRUST
Schedule of Investments - Clearwater International Fund
December 31, 2019
Shares | | | Security | | Cost | | | Fair value (a) | | | Percent of
net assets | |
Short-Term Investments: | | | | | | | | | | | | |
| 32,652,940 | | | NORTHERN INSTITUTIONAL FUNDS - U.S. GOVERNMENT SELECT PORTFOLIO, 1.53%(j) | | $ | 32,652,940 | | | | 32,652,940 | | | | | |
| | | Sub-total Short-Term Investments: | | 40,737,327 | | | | 40,737,327 | | | | 5.72 | % |
| | | | Grand total | | $ | 502,542,174 | | | | 717,689,979 | | | | 100.82 | % |
Notes to Schedule of Investments:
| (a) | Investments are valued in accordance with procedures described in note 2 to the financial statements. |
| (b) | Security is either wholly or partially on loan. |
| (c) | Non-income producing assets. |
| (d) | Security has been deemed worthless and is a Level 3 investment. |
| (e) | Securities exempt from registration under Rule 144A of the Securities Act of 1933. These securities may be resold in transactions exempt from registration, normally to qualified institutional buyers. The value of these securities is determined by valuations supplied by a pricing service or brokers, or, if not available, in accordance with procedures established by the Board of Trustees. |
| (f) | Securities are American Depositary Receipts of companies based outside of the United States representing 3.12% of net assets as of December 31, 2019. |
| (g) | This is a Level 3 security. |
| (h) | Current yield is disclosed. Dividends are calculated based on a percentage of the issuer’s net income. |
| (i) | Investment relates to cash collateral received from portfolio securities loaned. |
| (j) | The short-term investment is a money market portfolio of the investment company, Northern Institutional Funds. At December 31, 2018, the value of the Clearwater International Fund’s investment in the U.S. Government Select Portfolio of the Northern Institutional Funds was $15,216,595 with net purchases of $17,436,345 during the fiscal year ended December 31, 2019. |
At December 31, 2019, the industry sectors for the Clearwater International Fund were:
| | | | |
Industry Sector | | Percent of
Long-Term
Investments | |
Communication Services | | | 5.27 | % |
Consumer Discretionary | | | 11.41 | |
Consumer Staples | | | 8.63 | |
Energy | | | 3.14 | |
Financials | | | 16.47 | |
Health Care | | | 11.71 | |
Industrials | | | 17.55 | |
Information Technology | | | 16.05 | |
Materials | | | 5.88 | |
Real Estate | | | 2.33 | |
Utilities | | | 1.56 | |
| | | 100.00 | % |
At December 31, 2019, the Clearwater International Fund’s investments were denominated in the following currencies:
| | | | |
Concentration by Currency | | Percent of
Long-Term
Investments | |
Euro | | | 20.86 | % |
British Pound | | | 14.28 | |
Japanese Yen | | | 13.97 | |
United States Dollar | | | 12.58 | |
Swiss Franc | | | 10.42 | |
Canadian Dollar | | | 6.27 | |
Other currencies | | | 21.62 | |
| | | 100.00 | % |
| See accompanying notes to financial statements. | 83 | (Continued) |
CLEARWATER INVESTMENT TRUST
Schedule of Investments - Clearwater International Fund
December 31, 2019
At December 31, 2019, the Clearwater International Fund had outstanding forward foreign currency exchange contracts as follows:
| | Contract | | | | | | | | | | | | | | Unrealized | |
| | Settlement | | Contract Amount | | Appreciation | |
Counterparty | | Date | | Deliver | | Receive | | (Depreciation) | |
Northern Trust | | | 01/23/2020 | | | JPY | | | 60,174,599 | | | USD | | | 557,335 | | $ | 2,800 | |
Northern Trust | | | 01/23/2020 | | | JPY | | | 57,464,230 | | | USD | | | 527,592 | | $ | (1,966 | ) |
Northern Trust | | | 05/14/2020 | | | CNY | | | 20,573,291 | | | USD | | | 2,920,425 | | | (25,711 | ) |
| | | | | | | | | | | | | | | | | $ | (27,677 | ) |
| | | | | | | | | | | | | | | | | $ | (24,877 | ) |
| See accompanying notes to financial statements. | 84 | (Continued) |
CLEARWATER INVESTMENT TRUST
Schedule of Investments - Clearwater International Fund
December 31, 2019
Clearwater International Fund Portfolio Diversification
(as a percentage of net assets)
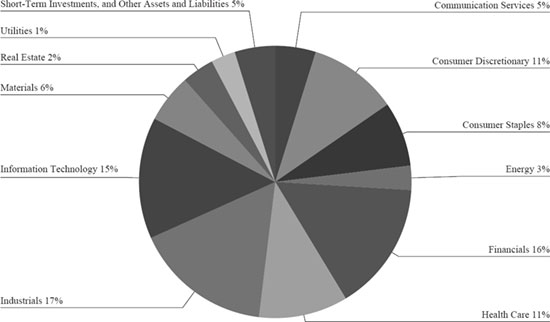
| See accompanying notes to financial statements. | 85 | (Continued) |
Item 1. Reports to Stockholders (cont.).
Item 2. Code of Ethics
As of December 31, 2019, the Board of Trustees of Clearwater Investment Trust (the “Trust”) has adopted a code of ethics that applies to the Trust’s President/Principal Executive Officer and Treasurer/Principal Financial Officer (“Code of Ethics”). For the fiscal year ended December 31, 2019, there were no amendments to any provision of the Code of Ethics, nor were there any waivers granted from a provision of the Code of Ethics.
Item 3. Audit Committee Financial Expert
The Board of Trustees of the Trust consists of eight members, six of whom are Independent Trustees as defined by the Investment Company Act of 1940, as amended (the “1940 Act”). The Board of Trustees does not include an “audit committee financial expert” (as defined in Item 3 of Form N-CSR). Given the restrictive nature of the definition of an “audit committee financial expert,” the Board of Trustees has determined that no current member of the Board of Trustees of the Trust qualifies as an “audit committee financial expert.” Furthermore, the Board of Trustees has determined that given the nature of investment company financial statements in general and the investment policies of the Trust’s fund offerings in particular that the independent trustees possess the necessary skills and experience to perform the functions of the audit committee.
Item 4. Principal Accountant Fees and Services
| | | |
| | 2019 | 2018 |
| (a) | Audit Fees | $111,600 | $108,700 |
| (b) | Audit-Related Fees | $0 | $0 |
| (c) | Tax Fees1 | $32,204 | $38,220 |
| (d) | All Other Fees | $0 | $0 |
1Tax Fees are the aggregate amount billed by the Trust’s principal accountant for tax compliance, tax advice, international tax reclaim filings and tax planning during the fiscal year.
(e)
| 1. | The audit committee has adopted pre-approval policies and procedures regarding the provision of audit or non-audit services to the trust, as described in paragraph (c)(7) of Rule 2-01 of Regulation S-X. |
The policies and procedures provide that, if pre-approval of non-audit services is requested other than at a regularly scheduled Audit Committee Meeting, Fund management shall present such request to the Audit Committee Chair, or committee member if a Chair is not designated, for review of the proposal and determination if a special session of the Audit Committee is required. If the Chair or member determines the request requires a special session, the Audit Committee Chair will call a session per standard protocols and invite non-members as required. If the request is deemed in adherence to the independence of the auditor and to the benefit of the Fund, the Chair or designee may grant the pre-approval without a special session.
The Chair, designee or Audit Committee shall review the purpose, terms and risks of the
request in addition to assurances of maintaining auditor independence and adherence to Regulation S-X, paragraph (c)(7) of Rule 2-01. If the pre-approval request is approved, the request will be presented at the next regularly scheduled Audit Committee for ratification.
| 2. | No services were pre-approved by the audit committee pursuant to paragraph (c)(7)(i)(C) of Rule 2-01 of Regulation S-X. |
| (g) | Non-Audit Related Fees Provided to the Trust or to the Trust’s Investment Adviser. |
2019= $17,000 2018= $15,600
| (h) | For the most recent fiscal year, the Audit Committee has determined that the provision of non-audit services to Clearwater Management Company and its affiliates was compatible with maintaining the principal accountant’s independence. |
Item 5. Audit Committee of Listed Registrants
Not applicable (the Funds are not listed issuers).
Item 6. Investments
| (a) | Schedule of Investments is included as part of the report to shareholders filed under Item 1 of this report on Form N-CSR. |
Item 7. Disclosure of Proxy Voting Policies and Procedures for Closed-End Management Investment Companies
Not applicable (the Trust is an open-end management investment company).
Item 8. Portfolio Managers of Closed-End Management Investment Companies
Not applicable (the Trust is an open-end management investment company).
Item 9. Purchases of Equity Securities by Closed-End Management Investment Company and Affiliated Purchasers
Not applicable (the Trust is an open-end management investment company).
Item 10. Submission of Matters to a Vote of Security Holders
There have been no material changes to the procedures by which shareholders may recommend nominees to the Board of Trustees.
Item 11. Controls and Procedures
| (a) | The Trust’s principal executive officer and principal financial officer have concluded that the Trust’s disclosure controls and procedures (as defined in Rule 30a-3(c) under the Investment Company Act of 1940, as amended (the “1940 Act”)) are effective based on the principal executive officer and principal financial officer’s evaluation of these controls and procedures, as required by Rule 30a-3(b) under the 1940 Act, as of a date within 90 days of the filing date of this document. |
| (b) | There have been no significant changes in the Trust’s internal control over financial reporting (as defined in Rule 30a-3(d) under the 1940 Act) that occurred during the period covered by this report that have materially affected, or are reasonably likely to materially affect, the Trust’s internal control over financial reporting. |
Item 12. Disclosure of Securities Lending Activities for Closed-End Management Investment Companies
Not applicable (the Trust is an open-end management investment company).
Item 13. Exhibits
| (a)(1) | Code of Ethics pursuant to Item 2 of Form N-CSR is incorporated by reference to Exhibit 12(a)(1) to the report filed on Form N-CSR on March 5, 2015 (Accession Number 0000897101-15-000283). |
| (a)(2) | Certifications pursuant to Section 302 of the Sarbanes-Oxley Act of 2002 and required by Rule 30a-2(a) under the 1940 Act. |
| (a)(3) | No written solicitations to purchase securities were sent or delivered during the period covered by this report by or on behalf of the Trust. |
| (b) | Certifications pursuant to Section 906 of the Sarbanes-Oxley Act of 2002 and required by Rule 30a-2(b) under the 1940 Act. |
SIGNATURES
Pursuant to the requirements of the Securities Exchange Act of 1934 and the Investment Company Act of 1940, the registrant has duly caused this report to be signed on its behalf by the undersigned, thereunto duly authorized.
| | Clearwater Investment Trust |
| | |
| | By | /s/ Justin H. Weyerhaeuser |
| | | Justin H. Weyerhaeuser |
| | | President (Principal Executive Officer) and |
| | | Treasurer (Principal Financial Officer) |
| | | |
| | Date: | March 5, 2020 |
| | |
Pursuant to the requirements of the Securities Exchange Act of 1934 and the Investment Company Act of 1940, this report has been signed below by the following persons on behalf of the registrant and in the capacities and on the dates indicated.
| | Clearwater Investment Trust |
| | |
| | By | /s/ Justin H. Weyerhaeuser |
| | | Justin H. Weyerhaeuser |
| | | President (Principal Executive Officer) |
| | | |
| | Date: | March 5, 2020 |
| | Clearwater Investment Trust |
| | |
| | By | /s/ Justin H. Weyerhaeuser |
| | | Justin H. Weyerhaeuser |
| | | Treasurer (Principal Financial Officer) |
| | | |
| | Date: | March 5, 2020 |