UNITED STATES
SECURITIES AND EXCHANGE COMMISSION
Washington, D.C. 20549
FORM N-CSR
CERTIFIED SHAREHOLDER REPORT OF REGISTERED
MANAGEMENT INVESTMENT COMPANIES
| Investment Company Act file number | 811-05038 |
Clearwater Investment Trust
(Exact name of registrant as specified in charter)
2000 Wells Fargo Place, 30 East 7th Street, Saint Paul, Minnesota 55101-4930
(Address of principal executive offices) (Zip code)
Stephen G. Simon
Fiduciary Counselling, Inc.
2000 Wells Fargo Place, 30 E. 7th Street
Saint Paul, Minnesota 55101-4930
Copy to:
John V. O’Hanlon, Esq.
Dechert LLP
One International Place, 40th Floor
100 Oliver Street
Boston, Massachusetts 02110
(Name and address of agent for service)
| Registrant’s telephone number, including area code: | 651-228-0935 |
| Date of fiscal year end: | December 31 |
| Date of reporting period: | June 30, 2017 |
| Item 1. | Reports to Stockholders |
CLEARWATER INVESTMENT TRUST
Clearwater Core Equity Fund
Clearwater Small Companies Fund
Clearwater Tax-Exempt Bond Fund
Clearwater International Fund
Semi-annual Report
for the period ended
June 30, 2017
Management Discussion of Clearwater Funds’ Performance
Clearwater Core Equity Fund
The Clearwater Core Equity Fund seeks long-term growth of capital. Current income, to the extent income is produced by the stocks held by the Fund, is a secondary objective. Under normal market conditions, the Clearwater Core Equity Fund pursues its investment objective by investing at least 80% of its net assets, plus the amount of any borrowings for investment purposes, in equity securities of U.S. companies. The Clearwater Core Equity Fund’s assets are managed in a “multi-manager, multi-style” approach. As of June 30, 2017, the Core Equity Fund had three subadvisers that provided day-to-day management of Fund assets. Parametric Portfolio Associates LLC, (“Parametric”), with approximately 60% of the Fund’s assets, manages its portion of the Fund’s assets to seek investment results that track, before fees and expenses, the investment results of the Russell 1000® Index as closely as possible without requiring the Fund to realize taxable gains. The remaining 40% of the Fund’s assets are divided between AQR Capital Management, LLC (“AQR”) and O’Shaughnessy Asset Management, LLC (“OSAM”), who both utilize an active management style.
2017 Year-To-Date Market Overview:
Domestic large capitalization equities achieved strong single digit returns in the first half of 2017. The dominant factors influencing share prices were slow, yet persistent, growth of the U.S. economy, low (albeit rising) interest rates, and the continued expectation for pro-growth policies under the Trump administration.
2017 Year-To-Date Performance and 2017 Outlook:
The Clearwater Core Equity Fund gained 9.1%, net of fees, in the first half of 2017, compared to an increase of 9.3% for the Russell 1000® Index, the Fund’s benchmark. Parametric, the subadviser that follows a tax-managed passive strategy, slightly outperformed the Fund’s benchmark. Both of the active managers, AQR and OSAM, underperformed the Fund’s benchmark. This was mostly driven by their preference for value stocks, which underperformed in the first half of 2017.
Each of the three subadvisers comment on the performance of their respective portfolios and their outlook for the next six months in the paragraphs below. For comparison of the subadvisers’ capabilities, performance is shown gross of fees. The Fund pays a single advisory fee to Clearwater Management Co., Inc., which in turn pays the subadvisers out of its advisory fee.
Although the overall performance of the Clearwater Core Equity Fund is measured against its benchmark, as stated above, each of the underlying subadvisers may manage their portfolio of the Fund against a different benchmark that aligns more closely with their particular strategy. In each section below, the subadvisers discuss the performance of their portfolios with respect to the benchmark against which their particular portfolio is managed.
AQR Commentary
General Market Overview:
We trade a set of strategies based on the value, momentum, and profitability signals of individual securities that seek a positive expected return versus the appropriate benchmark, in a variety of economic environments. Because our investment approach employs a systematic set of rules based on economic
intuition and rigorous testing to ensure they are robust across time, macro environments, and geographies, we typically do not offer general market overviews.
2017 Performance for the 6-month period ending June 30, 2017:
The portion of the Clearwater Core Equity Fund managed by AQR (the “Portfolio”) underperformed the Russell 1000® Index (the “benchmark”) in the first six months of 2017, returning 8.6%, gross of fees, while the benchmark returned 9.3%. Stock selection within sectors detracted from performance while sector selection contributed positively to performance. Poor stock selection in the Consumer Discretionary sector was the primary driver of the underperformance.
2017 Remaining Year Outlook:
In terms of sector positioning we are currently overweight Industrials while being underweight Energy. With respect to long-term attractiveness, we see value as more attractive in the U.S.
OSAM Commentary
General Market Overview:
In focus for the year were two interest rate hikes by the U.S. Federal Reserve, a weakening U.S. dollar, and the anticipated path of the Federal Reserve’s monetary policy. The Russell 1000® Growth Index dominated the Russell 1000® Value Index during the six months ended June 30, 2017. Oil settled 14.3% lower during the period, a continued headwind for the Energy sector (which is also considered a value sector). Because we build portfolios from the bottom up using screening “factors,” we think about performance through the lens of factors first, and through the lens of stocks and industries second. Our industry over and underweights relative to the benchmark result from the factors themselves and are not based on views of the market from a macroeconomic perspective.
2017 Performance for the 6-month period ending June 30, 2017:
The portion of the Clearwater Core Equity Fund managed by OSAM (the “Portfolio”) underperformed the Russell 1000® Index (the “benchmark”) in the first six months of 2017, returning 8.8%, gross of fees, while the benchmark returned 9.3%. The value factor struggled during the period and was the largest detractor from returns. In addition, sector allocation detracted from returns, mainly because of underweight allocations to Information Technology and Health Care and an overweight allocation to Financials. An overweight allocation to the momentum and earnings growth factors contributed to returns. Similarly, an underweight allocation to the yield factor and an allocation to stocks with smaller market capitalizations aided performance. The quality factors had mixed performance overall, yet contributed positively to performance in aggregate. Security selection contributed, driven by strong stock picks within Energy, Telecommunication Services, and Financials.
2017 Remaining Year Outlook:
Based on our key themes, we believe the Portfolio is well positioned versus its benchmark and relative to the overall market. The Portfolio’s companies have higher levels of return on capital, lower reliance on external financing, and trade at deep discounts across a number of valuation factors. The Portfolio’s companies are, in aggregate, returning capital to shareholders (via share repurchases and dividends, which we refer to as the shareholder yield factor) at more than two times the rate of the benchmark (6.2% for the portfolio versus 1.9% for the benchmark). These combined advantages are delivered through a Portfolio which is distinct from the benchmark, and we believe that it represents a unique take on the U.S. equity market.
Parametric Commentary
General Market Overview:
In the first half of 2017, the market continued the rally since Donald Trump’s election. The belief is that his election promises, including tax cuts, mega infrastructure spending and bank deregulation, and the repeal of the Affordable Care Act, will pass through Congress and stimulate the economy in a positive direction (although the rally has had a few bumps). March was particularly volatile, as the Dow Jones Index dropped 238 points on Tuesday, March 21, 2017, when the health care reform stalled in Congress, with the implication that if it fails, then tax reform will also be in danger. This fear evaporated when Medicare reform finally cleared through the House of Representatives on May 4, 2017.
2017 Performance for the 6-month period ending June 30, 2017:
The portion of the Clearwater Core Equity Fund managed by Parametric (the “Portfolio”) outperformed the Russell 1000® Index (the “benchmark”) in the first six months of 2017, returning 9.7%, gross of fees, while the benchmark returned 9.3%. Although Parametric does not actively select stocks, the Portfolio tends to have slight overweights or underweights to certain stocks (relative to the benchmark), driven by the desire to avoid the realization of capital gains. Therefore, the Portfolio may slightly outperform or underperform the benchmark in any given period. For this time period, the Portfolio’s outperformance was attributable to the slight overweight to stocks within the Industrial sector.
2017 Remaining Year Outlook:
In the second half of 2017, uncertainty surrounds the timing and scale of the Federal Reserve’s policy shift to unwind its $4.5 trillion balance sheet. The pace and scale of the tightening of monetary policy will have a great impact on the market. Additionally, a host of market-moving events are on the horizon, such as ongoing geopolitical turmoil, investigations into President Trump, and rising interest rates.
Clearwater Small Companies Fund
The Clearwater Small Companies Fund (the “Fund”) seeks long-term growth of capital. Current income is a secondary objective. Under normal market conditions, the Fund invests at least 80% of its net assets, plus the amount of any borrowings for investment purposes, in equity securities of small companies. The Fund defines “small companies” as issuers with market capitalizations no greater than $5 billion at the time of purchase. Equity securities consist primarily of exchange-traded common and preferred stocks and convertible securities. The Fund uses a “multi-style, multi-manager” approach with two subadvisers who provide day-to-day management of the Fund and employ distinct investment styles: Kennedy Capital Management Inc. (“Kennedy”) and Keeley-Teton Advisors, LLC. (“Keeley”). At the period ending June 30, 2017, Kennedy and Keeley respectively managed approximately 80% and 20% of the Fund balances.
2017 Year-To-Date Market Overview:
Following very strong returns in 2016, domestic small capitalization equities delivered solid performance during the first half of 2017 but trailed returns from most other major equity segments. While economic conditions in the U.S. and abroad continue to improve, investors in small cap stocks showed slightly less exuberance given the delays in anticipated pro-growth policies proposed by the Trump administration. There was a large gap between small cap growth and small cap value stocks. The Russell 2000® Growth Index gained 10.0%, while the Russell 2000® Value Index managed a slightly positive return of 0.5%.
2017 Performance for the 6-month period ending June 30, 2017:
For the six-month period ending June 30, 2017, the Clearwater Small Companies Fund rose 3.8%, net of fees, compared to a return of 5.0% for the Russell 2000® Index, the Fund’s benchmark. Kennedy’s microcap sub portfolio and small cap sub portfolio both outperformed, but Keeley slightly
underperformed the index against which its portfolio is compared. Keeley’s underperformance was mostly the result of poor security selection in the Industrials and Consumer Discretionary sectors. Given the value orientation for Keeley’s portfolio, this was a meaningful drag on the performance of the Fund for the first half of the year.
The two subadvisers to the Fund comment on the performance of their specific portfolios and their outlook for the next six months in the paragraphs below. For comparison of the subadvisers’ capabilities, performance is shown gross of fees. The Fund pays a single advisory fee to Clearwater Management Co., Inc., which in turn pays the subadvisers out of its advisory fee.
Although the overall performance of the Clearwater Small Companies Fund is measured against its benchmark, as stated above, each of the underlying subadvisers may manage their portfolio of the Fund against a different benchmark that aligns more closely with their particular strategy. In each section below, the subadvisers discuss the performance of their portfolios with respect to the benchmark against which their particular portfolio is managed.
Keeley Commentary
General Market Overview:
Improving economic data and core inflation still below the Federal Reserve’s 2% long term goal have helped drive markets into record territory. However, investors seemed to be growing slightly less comfortable with the growth prospects for the US. We are in the eighth year of the economic expansion, and there has been little traction to any of President Trump’s tax, healthcare, regulatory and infrastructure spend reforms that could give a boost to the economy. For the first six months of the year, investors favored the safety of larger-cap stocks and growth. This was demonstrated by the increases of 9.34% in the S&P 500 Index and 9.97% in the Russell 2000® Growth Index. The Russell 2000® Value Index, our primary benchmark was up 0.54%.
2017 Performance for the 6-month period ending June 30, 2017:
The portion of the Clearwater Small Companies Fund managed by Keeley (the “Portfolio”) underperformed the Russell 2000® Value Index (the “benchmark”) in the first six months of 2017, returning negative 0.2%, gross of fees, while the benchmark returned 0.5%. Over this period, the bulk of the underperformance came from stock selection, primarily among Industrials and Consumer Discretionary sectors. However, given the wide dispersion among sector performance within the benchmark (e.g., Energy decreased nearly 30% while Health Care increased nearly 15%), we were able to mitigate some of this underperformance from sector weights, as avoiding Consumer Staples and underweighting the Financials and Energy sectors delivered positive results. The portfolio also benefited from positive stock selection in Utilities, Technology and Materials.
2017 Remaining Year Outlook:
We view this economic environment as generally healthy for small capitalization company fundamentals. Though the new administration is still finding its footing, the likelihood of faster gross domestic product (GDP) growth seems to remain high given President Trump’s focus to drive change. We are not alone in this viewpoint of optimism as current small cap stock valuations are at 19 times earnings, above the upper end of historic norms. In recognition, we have become more selective about new investments, but are content to retain existing positions that demonstrate improving fundamentals and confirm our initial investment theses. We expect that merger and acquisition activity will continue to be centered upon small caps that by nature of their size and narrower business focus, provide less disruptive business integration while offering avenues of growth for constrained mid and large-cap peers. For investors, we believe that such activity can be better captured through active management, as opposed to passive. Our strategy of
seeking companies undergoing restructuring, including spin-offs, often leaves these portfolio companies more susceptible to being acquired.
Kennedy Commentary
General Market Overview:
This was a period that seemed to be driven more by actual corporate performance than by political machinations, a rarity of late. Healthcare reform expectations have gyrated, as have tax change proposals. During the latter half of 2016, stocks moved more on loosely supported extrapolations of policy expectations than on fundamentals. As market participants have progressed back towards fundamentals, stock movements have become more rooted in reality. Key items of interest to the market were rising short-term rates (but lower long-term rates), flattening auto sales, and a surprisingly healthy mortgage/housing market. While rising rates likely did not come as a shock to most market observers, this did lead many of us to sharpen our pencils as we thought through impacts to our portfolios.
2017 Performance for the 6-month period ending June 30, 2017:
The portion of the Clearwater Small Companies Fund managed by Kennedy (the “Portfolio”) outperformed the Russell 2000® Index (the “benchmark”) in the first six months of 2017, returning 5.4%, gross of fees, while the benchmark returned 5.0%. Stock selection was a positive contributor during the period, adding 66 basis points of relative performance. Sector allocation weighed on performance during the first half of the year, as we were under-represented in the Health Care sector, which rose sharply during the period. Energy stocks have been under significant pressure, and our underweight has helped relative performance.
2017 Remaining Year Outlook:
The small cap market has had a remarkable run since bottoming in March 2009, but it is important to note that we compete in a relative world. Absolute valuations for small cap stocks have moved higher, but investors are on a continual quest for returns. As small cap investors, we are working to assemble a portfolio of stocks that we believe will generate the best risk-adjusted returns for our investors. There are many ways that we believe companies can create value, including:
1) generating outsized cash flow and reinvesting; or
2) exploiting under-appreciated opportunities to outgrow revenue expectations or improve margins; or
3) using technological or managerial advantage to expand addressable markets or gain share.
We assess all of this within a return on invested capital framework. Of course, these factors are only valuable if they are not properly recognized by others in the market. The stock price is the point on a curve where the supply of shares meets the demand for shares. If a company is able to improve its attractiveness to investors, that equilibrium point tends to move higher (i.e., demand for shares grows).
Clearwater Tax-Exempt Bond Fund
The Clearwater Tax-Exempt Bond Fund (the “Fund”) seeks high current income that is exempt from U.S. federal income tax, consistent with preservation of capital. Under normal market conditions, the Fund invests at least 80% of its net assets, plus the amount of any borrowings for investment purposes, in tax-exempt bonds, which are debt obligations issued by or for the U.S. states, territories, and possessions and the District of Columbia. The interest on these securities is generally exempt from both U.S. regular federal income tax and U.S. federal alternative minimum tax. However, the Fund may invest up to 20% of its assets in securities that generate interest income subject to federal alternative minimum tax for individuals. The Fund invests in both revenue bonds, which are backed by and payable only from the revenues derived from a specific facility or specific revenue source, and in general obligation bonds, which are secured by the full faith, credit and taxation power of the issuing municipality. A subadviser, Sit Fixed Income Advisors II, LLC (“Sit”), provides day to day management for the Fund. It should be noted that the Fund is not a money market fund and is not intended to be a money market fund substitute. Under normal market conditions, the Fund’s investments may be more susceptible than a money market fund to interest rate risk and credit risks relevant to the Fund’s investments.
Sit has provided the commentary below regarding the Clearwater Tax-Exempt Bond Fund. The Fund pays a single advisory fee to Clearwater Management Co., Inc., which in turn pays the subadviser out of its advisory fee.
Sit Commentary
General Market Overview:
Coming off a very difficult post-election period at the end of 2016, tax-exempt fixed income markets rebounded sharply in first half of 2017, as flows into tax-exempt municipal bond funds turned modestly positive, supply moderated (down 16% from first half of 2016) and the yield curve steepened. Specifically, levels of interest rates, especially in the intermediate part of the curve, have fallen in the first half of 2017, with intermediate U.S. Treasury yields down 5-10 basis points, and intermediate tax-exempt yields down 30-45 basis points. Credit fundamentals are generally sound. State and local government tax collections remain generally on the upswing, despite a few notable exceptions such as New Jersey, Connecticut, and Illinois. Chicago showed modest improvement after tax increases implemented last year began taking effect. Puerto Rico related debt took a negative turn in the spring, as the Financial Control Board appointed by President Obama and Congress last autumn took some actions regarded as unfriendly to bondholders’ rights. The situation remains very fluid, and could lead to further volatility in the tax-exempt bond market. The Federal Reserve (the “Fed”) made two 25 basis point hikes in short-term interest rates during the first half of 2017, and a further increase remains a possibility in the second half of 2017. Furthermore, the Fed is preparing to announce its plan to commence reducing its balance sheet in second half of 2017. Given how well these potential moves have been telegraphed, their implementation should not, in our view, have much negative impact on the bond market. Concerns about tax reform, and a potential reduction of the value of the municipal bond tax exemption remain, given that the Trump administration is expected to release its plan this autumn. Thus far, they have had little overall effect on the market.
2017 Performance for the 6-month period ending June 30, 2017:
The Clearwater Tax-Exempt Bond Fund outperformed the Bloomberg Barclays U.S. Municipal Bond Index: 5-Year (4-6) Index (the “benchmark”) in the first six months of 2017, returning 4.4%, net of fees, while the benchmark returned 3.2%. We modestly decreased the Fund’s average life duration, a measure of the Fund’s sensitivity to changes in interest rates, from 5.8 years at the beginning of the year to 5.4 years at the end of the period. For comparison, the benchmark had a duration of 3.9 years at June 30,
2017. The Fund’s yield fell during the period, more than the yield of the index. Revenue bonds and general obligation bonds both delivered strong performance during the first half of 2017, with revenue bonds in the index returning 3.9% for the period, while general obligation bonds in the benchmark returned 3.5%. Furthermore, duration dictated much of the relative performance, as longer duration outperformed intermediate and short duration. Sector allocations had little effect on performance, but credit quality played a role, as lower investment grade rated bonds and non-rated bonds outperformed those of higher credit quality as investors sought yield. The Fund’s performance, due to its longer duration and meaningful exposure to lower investment grade and non-rated bonds, came in well ahead that of its benchmark in the first half of 2017.
2017 Remaining Year Outlook:
We expect growth to accelerate modestly during the second half of 2017, after the slow first quarter. Housing is providing some strength, and employment appears to be steady, although underemployment remains elevated and wage growth is stagnating. The economy has been able to muddle through volatility in oil prices and surprising political developments over the past couple of years, but doesn’t seem able to accelerate to a consistently higher level of growth as is typical after most recessions. We believe that interest rates, while likely to remain low in absolute terms, may rise a bit in second half of 2017, as the Fed ponders when to hike short-term interest rates again and how to begin to unwind its balance sheet. The Treasury yield curve should, in our view, remain relatively steep, with yields rising a bit on the short and intermediate portions of the curve, while the tax-exempt curve flattens similarly. We believe that supply should continue at a manageable level, demand should remain modestly positive and most state and local government finances should remain stable. We expect revenue bonds to continue to be strong performers in the second half of 2017. Puerto Rico related concerns, as well as Connecticut and Illinois, will continue to weigh on the market, however, and could lead to some increase in volatility. Furthermore, potential problems funding retirement pension and healthcare obligations still persist in many places, and remain the subject of many of the negative media reports about the municipal market. Despite the strong performance in the first half of 2017, the Fund’s longer duration and its use of revenue and non-rated bonds have positioned it opportunistically for the economic and interest rate environment that we expect in the second half of 2017.
Clearwater International Fund
The Clearwater International Fund seeks long-term growth of capital. The Fund generally invests at least 80% of the value of its net assets, plus the amount of any borrowings for investment purposes, in equity securities of companies organized or located outside the United States and doing a substantial amount of business outside the United States. The Fund diversifies its investments among a number of different countries throughout the world, and may invest in companies of any size. The Fund does not intend to invest more than 20% of its net assets in the equity securities of developing or emerging market issuers. The Fund uses a “multi-style, multi-manager” approach. The Fund’s adviser allocates portions of the Fund’s assets among subadvisers who employ distinct investment styles. The Fund currently has four subadvisers that provide day-to-day management of Fund assets. Parametric Portfolio Associates LLC (“Parametric”) manages its portion of the portfolio (approximately 40%) to mirror the MSCI World Ex U.S.A. Index (net dividends) as closely as possible without requiring the Fund to realize taxable gains. The Fund’s other three subadvisers, Artisan Partners Limited Partnership (“Artisan”), Templeton Investment Counsel, LLC (“Templeton”) and WCM Investment Management (“WCM”), utilize an active management style and manage the remaining 60% of the Fund. Denver Investments (“Denver”), another active subadviser, was terminated in May 2017.
2017 Year-To-Date Market Overview:
International developed market equities recorded very strong low double digit to mid double digit returns in the first six months of 2017. The dominant factors influencing share prices included stronger economic growth in Europe, stimulative monetary policies from the European Central Bank and the Bank of Japan, the impact of slowing growth in China and a continued rise in nationalist populism. Currency adjustments had a significant positive impact on returns for U.S based investors, as major international currencies strengthened against the U.S. dollar. These currency gains increase the returns earned by shareholders because the Clearwater International Fund reports its results in U.S. dollars, after currency adjustments have taken place.
2017 Year-To-Date Performance and 2017 Outlook:
The Clearwater International Fund gained 14.7%, net of fees, during the first six months of 2017, compared to an increase of 12.8% for the MSCI World ex U.S.A. Index (net dividends), the Fund’s benchmark. Parametric, the subadviser that follows a tax-managed passive strategy, matched the performance of the Fund’s benchmark. Three of the Fund’s four active subadvisers outperformed the Fund’s benchmark in the first six months of 2017, while Denver, the other active subadviser, underperformed. The subadvisory contract with Denver was terminated in May; its portion of the Fund’s assets were re-allocated in varying degrees to the remaining three active subadvisers.
Each of the four subadvisers comment on the performance of their specific portions of the portfolio and provide market outlook for the next six months in the paragraphs below. For comparison of the subadvisers’ capabilities, performance is shown gross of fees. The Fund pays a single advisory fee to Clearwater Management Co., Inc., which in turn pays the subadvisers out of its advisory fee.
Although the overall performance of the Clearwater International Fund is measured against its benchmark, as stated above, each of the underlying subadvisers may manage their portfolio of the Fund against a different benchmark that aligns more closely with their particular strategy. In each section below, the subadvisers will discuss the performance of their portfolios with respect to the benchmark against which their particular portfolio is managed.
Artisan Partners Commentary
General Market Overview:
Measured in U.S. dollar terms, the MSCI EAFE Index (net dividends) returned 13.8% during the first six months of 2017. Stocks globally were strong, aided by solid corporate earnings. European markets led the U.S. in the second quarter of 2017, as several noteworthy elections, including France’s presidential and parliamentary elections and the United Kingdom’s snap parliamentary election, seemed to calm investor nerves about the likelihood for near-term dramatic political change. Overall, a weaker U.S. dollar was a boon to U.S. based investors. In local currency terms (before the currency adjustment to U.S. dollar returns), the MSCI EAFE Index returned 7.5% during the period.
2017 Performance for the 6-month period ending June 30, 2017:
The portion of the Clearwater International Fund managed by Artisan (the “Portfolio”) outperformed the MSCI EAFE Index (net dividends) (the “benchmark”), in the first six months of 2017, returning 14.3%, gross of fees, while the benchmark returned 13.8%. Performance of the following stocks had a positive impact on the portfolio during the period: Samsung Electronics, ING Groep, ABB, Tokyo Electron and Medtronic. Notable detractors in the period included: Tesco, Imperial Oil, TGS NOPEC Geophysical, Yahoo Japan and Netmarble Games.
2017 Remaining Year Outlook:
With stocks looking increasingly fairly valued now, we remain selective in our deployment of portfolio capital, as evidenced by our higher-than-average cash balance.
Parametric Commentary
General Market Overview:
In the first half of 2017, the international market had a strong rally, driven both by signs of economic recovery in the Eurozone and France’s election of the pro-European Union centrist Emmanuel Macron over the Far-Right wing leader Marine Le Pen. Macron’s election dispels the concern of dissolution of the European Union, which has been present since the Brexit victory in the United Kingdom. Countries in the Eurozone had particularly strong performance (Austria up 32.8% and Spain up 23.8%). On the other hand, countries depending heavily on resources did not perform very well, dragged down by the weak performance of the energy sector (-4.8%). Canada had a positive 3.2% return while Norway had a positive 5.6% return.
2017 Performance for the 6-month period ending June 30, 2017:
The portion of the Clearwater International Fund managed by Parametric (the “Portfolio”) matched the performance of the MSCI World Ex U.S.A. Index (net dividends), the “benchmark”, in the first six months of 2017, returning 12.8%, gross of fees, while the benchmark also returned 12.8%. Although Parametric does not actively select stocks, the Portfolio tends to have slight overweights or underweights to certain stocks (relative to the benchmark), driven by the desire to avoid the realization of capital gains. Therefore, the Portfolio may slightly outperform or underperform the benchmark in any given period. For this time period, the Portfolio’s slight underperformance in the Materials and Consumer Discretionary sectors was offset by slight outperformance in the Energy sector and in Canadian stocks.
2017 Remaining Year Outlook:
In the second half of 2017, potential market-moving events in the coming months include the Brexit negotiations and the Italian elections. Also, we expect that the pace and scale of the reduction in the U.S. Federal Reserve’s large balance sheet will affect not only the U.S. market, but the rest of the world given that U.S. consumption continues to be a growth driver for the world economy.
Templeton Commentary
General Market Overview:
The global economy generally expanded during the first six months of 2017. In this environment, global developed and emerging market stocks rose, and international small-cap stocks outperformed their larger-cap counterparts. Global markets were aided by improved industrial commodity prices at certain points during the period, generally upbeat economic data across regions, investor optimism about anticipated pro-growth and pro-business policies in the U.S., hopes of tax reforms under the Trump administration, Emmanuel Macron’s election as France’s president and encouraging corporate earnings reports. However, investors expressed concerns about the timing and economic effects of the United Kingdom’s exit from the European Union (also known as “Brexit”) and the U.S. executive order banning entry by people from some Muslim-majority countries. Other headwinds included the health of European banks, concerns about U.S. political turmoil, political uncertainty in the European Union, geopolitical tensions in certain regions, worries about global oversupply in oil production despite a pact to extend cuts, and hawkish comments from key central bankers around the world toward period-end.
2017 Performance for the 6-month period ending June 30, 2017:
The portion of the Clearwater International Fund managed by Templeton (the “Portfolio”) outperformed the MSCI ACWI ex U.S.A. Small Cap Index (net dividends) (the “benchmark”), in the first six months of 2017, returning 20.4%, gross of fees, while the benchmark returned 15.6%. Stock selection in the financials, consumer discretionary, and industrials sectors contributed positively to relative performance for the period. India-based Dewan Housing Finance was a significant contributor, benefiting from a positive shift in sentiment, its low valuation and secular growth opportunity in mortgage finance. Stock selection in the energy and materials sectors detracted from relative performance for the period. Japan-based Dowa Holdings was a significant detractor. The stock doubled in 2016 on the back of recovering zinc prices. We sold shares, and the stock fell as the market prepared for further recovery in the company’s cyclical end markets. Regionally, holdings in Asia and Europe contributed positively to relative performance. Europe has seen an encouraging combination of genuine economic momentum and a political climate now conducive to structural reform. Unemployment recently hit an eight-year low, GDP growth outpaced that of the United States for the first time since the global financial crisis, and corporate profits have solidly accelerated. On the political front, Emmanuel Macron’s victory in the French presidential election (and subsequent success in parliamentary voting) creates a historic opportunity for genuine reform and closer European integration. Stock selection in Canada detracted, with Badger Daylighting and Mullen Group falling in value during the period.
2017 Remaining Year Outlook:
We continue to stress the value of a focus on fundamentals, active stock picking and risk management in the current environment. Overall, we believe global equities offer selectively attractive opportunities and should continue to generate investor interest in a generally lower-yield, lower-return world in which many asset owners are under pressure to meet challenging performance targets. However, we do not think this is the point in the cycle to buy equities indiscriminately. Monetary policy has rarely been so loose and experimental, artificially depressing the price of money and skewing other asset prices, in our analysis. Global debt levels are extremely high, generating what we see as a flood of liquidity that has saturated many financial assets. Stocks appear to have become commoditized into “factor buckets,” and today are often thought of not as ownership stakes in long-term, cash-generating businesses, but instead as high-or-low-beta, high-or-low-quality, defensive-or-aggressive, risk-on-or-off, etc. These are unusual conditions that have created additional challenges for fundamentally-oriented securities analysts. Yet it is our belief that all of these trends are temporary, as price typically converges with value over time and a healthy market needs investors with the ability to facilitate price discovery. After a long fallow period for active value investors, we anticipate a more supportive environment for our investment style in the future. We saw what may have been the initial stages of this market transition last year, when a number of historically under-owned and unloved value stocks re-rated sharply. In the intermediate term, the prevailing tensions between inflationary and deflationary forces, and how central bankers attempt to resolve such tensions, will likely continue to drive markets. We also think investors should be prepared for a potential rise in volatility at some point following an unusually quiet period for global financial markets. However, we believe value should ultimately benefit as policy tensions are eventually resolved and investors refocus on fundamentals.
WCM Commentary
General Market Overview:
So far in 2017, non-U.S. equity indices have outperformed their counterparts in the U.S. Notably, emerging market equities led the way, via double-digit returns in the first quarter of 2017 and the best second quarter performance of the major global equity indices. The traditional growth sectors have made a comeback so far in 2017 following the extreme reflationary trade that occurred in the fourth quarter of 2016.
2017 Performance for the 6-month period ending June 30, 2017:
The portion of the Clearwater International Fund managed by WCM (the “Portfolio”) outperformed the MSCI ACWI ex U.S.A. Index (net dividends), the “benchmark, in the first six months of 2017, returning 20.6%, gross of fees, while the benchmark returned 14.1%. After a positive first quarter of 2017, the traditional growth sectors, such as Technology and Health Care, continued to climb higher in the second quarter of 2017. Consequently, our bottom-up driven sector biases provided a modest tailwind. More significantly, solid, broad-based stock selection was the primary driver of outperformance, once again spotlighting the benefit of positive moat-trajectory businesses (a moat is defined as a company’s competitive advantage) during uncertain markets.
2017 Remaining Year Outlook:
We continue to expect market volatility to be the norm. Rather than trying to predict macro or political events (interest rate moves, regulatory changes, geopolitics, etc.), we think our time is best served preparing for the various outcome scenarios and teeing up our watch list to capitalize on the opportunities that emerge. Most important, we believe our quality growth approach, which we define as growing moats backed by superior cultures and secular tailwinds, is most conducive to volatile environments such as these. Because we are laser-focused on what we believe to be large, high-quality (meaning growing moats even more than clean financials) multinational businesses that have demonstrated their ability to navigate country-specific uncertainty, we are optimistic about our portfolio businesses with respect to turmoil around the world and, as just noted, will take advantage of any short-term market mispricing’s. Our expectation of continued volatility should keep the opportunity set interesting.
Fund Expense Example
(unaudited)
As a shareholder of the Clearwater Core Equity Fund (“Core Equity Fund”), Clearwater Small Companies Fund (“Small Companies Fund”), Clearwater Tax-Exempt Bond Fund (“Tax-Exempt Bond Fund”), and Clearwater International Fund (“International Fund” and together with the Core Equity Fund, Small Companies Fund and Tax-Exempt Bond Fund, the “Funds”), you incur costs, including management fees and other Fund expenses. This Example is intended to help you to understand your ongoing costs (in dollars) of investing in the Funds and to compare these costs with the ongoing costs of investing in other mutual funds. In addition to the ongoing costs which the Funds pay directly, you as a shareholder indirectly bear the expenses of any outside exchange traded funds or mutual funds in which the Funds invest. (These are also referred to as “acquired funds” and those indirect expenses represent the Funds’ pro rata portion of the cumulative expense charged by the acquired funds.)
The Example provided is based on an investment of $1,000 invested at the beginning of the period and held for the six-month period ended June 30, 2017.
Actual Expenses
The first section of the table below provides information about actual account values and actual expenses. You may use the information in this section, together with the amount you invested, to estimate the expenses that you incurred over the period. Simply divide your account value by $1,000 (for example, an $8,600 account value divided by $1,000 = 8.6), then multiply the result by the number in the first section under the heading entitled “Expenses Paid During the Period January 1, 2017 through June 30, 2017” to estimate the expenses attributable to your investment during this period.
Hypothetical Example for Comparison Purposes
The second section of the table below provides information about hypothetical account values and hypothetical expenses based on the Fund’s actual expense ratio and an assumed rate of return of 5% per year before expenses, which is not the Fund’s actual return. Thus, you should not use the hypothetical account values and expenses to estimate the actual ending account balance or your expenses for the period. Rather, these figures are provided to enable you to compare the ongoing costs of investing in the Funds and other mutual funds. To do so, compare this 5% hypothetical example with the 5% hypothetical examples that appear in the shareholder reports of the other mutual funds.
Please note that the expenses shown in the second section of the table are meant to highlight your ongoing costs only. Therefore, the second section of the table is useful in comparing ongoing costs only, and will not help you compare the relative total costs of the Funds to other mutual funds that charge transaction costs and/or sales charges or redemption fees.
| Actual returns | Beginning Account
Value January 1, 2017 | Ending Account
Value June 30, 2017 | Expenses Paid During the
Period January 1, 2017
through June 30, 2017 * |
| Core Equity Fund | $1,000.00 | $1,090.60 | $2.07 |
| Small Companies Fund | $1,000.00 | $1,037.90 | $5.00 |
| Tax-Exempt Bond Fund | $1,000.00 | $1,043.70 | $1.72 |
| International Fund | $1,000.00 | $1,147.40 | $3.57 |
Hypothetical 5% return
(before expenses)
| Core Equity Fund | $1,000.00 | $1,022.81 | $2.01 |
| Small Companies Fund | $1,000.00 | $1,019.89 | $4.96 |
| Tax-Exempt Bond Fund | $1,000.00 | $1,023.11 | $1.71 |
| International Fund | $1,000.00 | $1,021.47 | $3.36 |
| * | Expenses are equal to the Fund’s annualized expense ratios, multiplied by the average account value over the period, multiplied by 181/365 (to reflect the one-half year period). Expense ratios for the most recent one-half year period may differ from expense ratios based on one-year data in the Financial Highlights. |
The annualized expense ratios are as follows:
| Core Equity Fund (a) | 0.40% |
| Small Companies Fund (b) | 0.99% |
| Tax-Exempt Bond Fund (c) | 0.34% |
| International Fund (d) | 0.67% |
| (a) | The expense ratio for the Core Equity Fund represents the blended expense ratio during the six-month period. The management fee of the Fund was decreased through a voluntary waiver to 0.44%, until March 16, 2017, when the voluntary waiver was increased and the expense ratio of the fund became 0.37%. |
| (b) | The expense ratio for the Small Companies Fund represents the blended expense ratio during the six-month period. The management fee of the Fund was decreased through a voluntary waiver to 1.03%, until March 16, 2017, when the voluntary waiver was increased and the expense ratio of the fund became 0.96%. |
| (c) | The management fee of the Tax-Exempt Bond Fund was decreased through a voluntary waiver to 0.34%, which remained in effect in the reporting period. |
| (d) | The expense ratio for the International Fund represents the blended expense ratio during the six-month period. The management fee of the Fund was decreased through a voluntary waiver to 0.70%, until March 16, 2017, when the voluntary waiver was increased and the expense ratio of the fund became 0.65%. |
Quarterly Portfolio Schedule of Investments
The Funds file a complete schedule of their portfolio holdings as of the close of the first and third quarters of their fiscal years with the Securities and Exchange Commission (the “SEC”) on Form N-Q. Shareholders may request copies of Form N-Q free of charge by calling the Transfer Agent toll free at 1-855-684-9144 or by sending a written request to: The Northern Trust Company, P.O. Box 4766, Chicago, IL 60680-4766 Attn: Clearwater Investment Trust Funds. These filings are also available on the SEC’s Internet site at http://www.sec.gov and may be reviewed and copied at the SEC’s Public Reference Room in Washington, DC. Information about the public reference room may be obtained by calling 1-800-SEC-0330.
Voting Proxies on Fund Portfolio Securities
The Funds have established Proxy Voting Policies and Procedures (“Policies”) that the Funds use to determine how to vote proxies relating to portfolio securities. They also report, on Form N-PX, how the Funds voted any such proxies during the most recent 12-month period ended June 30. Shareholders may request copies of the Policies or Form N-PX free of charge by calling Fiduciary Counselling, Inc. toll free at 1-888-228-0935 or by sending a written request to: Fiduciary Counselling, Inc., 30 East 7th Street, Suite 2000, St. Paul, MN 55101 Attn: Clearwater Investment Trust Funds. Form N-PX is also available from the EDGAR database on the SEC’s Internet site at http://www.sec.gov.
Clearwater Investment Trust
Financial Statements
For the Six Months Ended June 30, 2017 (unaudited)
Table of Contents
Financial Statements:
CLEARWATER INVESTMENT TRUST
Statements of Assets and Liabilities
June 30, 2017 (unaudited)
| | | | | | | | | | | | | |
| | | Core Equity
Fund | | | Small Companies
Fund | | | Tax-Exempt
Bond Fund | | | International
Fund | |
| Assets | | | | | | | | | | | | | | | | |
| Investments in securities, at fair value (identified cost: $237,370,891, $294,019,590, $484,539,982 and $423,437,681, respectively) | | $ | 494,267,958 | | | | 347,951,258 | | | | 505,467,620 | | | | 578,478,441 | |
| Foreign currencies, at value (cost: $390, $0, $0 and $736,255, respectively) | | | 397 | | | | - | | | | - | | | | 744,748 | |
| Cash | | | - | | | | - | | | | - | | | | - | |
| Receivable for securities sold | | | 8,003,096 | | | | 2,929,533 | | | | 1,083,778 | | | | 122,680 | |
| Receivable for shares of beneficial interest sold | | | - | | | | - | | | | 309,200 | | | | - | |
| Accrued dividend and interest receivable | | | 531,083 | | | | 345,682 | | | | 5,089,120 | | | | 1,302,679 | |
| Foreign tax reclaim receivable | | | 18,326 | | | | - | | | | - | | | | 1,469,150 | |
| Unrealized appreciation on forward foreign currency exchange contracts | | | - | | | | - | | | | - | | | | 9,377 | |
| Total assets | | | 502,820,860 | | | | 351,226,473 | | | | 511,949,718 | | | | 582,127,075 | |
| Liabilities | | | | | | | | | | | | | | | | |
| Cash Overdraft | | | 4,968,727 | | | | - | | | | - | | | | - | |
| Payables for investment securities purchased | | | 2,232,681 | | | | 5,205,045 | | | | 4,485,126 | | | | 137,239 | |
| Payable for fund shares redeemed | | | 30,200 | | | | 16,200 | | | | - | | | | 31,000 | |
| Accrued investment advisory fee | | | 452,768 | | | | 815,780 | | | | 424,196 | | | | 925,095 | |
| Payable for dividend distribution | | | - | | | | - | | | | 110,386 | | | | - | |
| Unrealized depreciation on forward foreign currency exchange contracts | | | - | | | | - | | | | - | | | | 69,789 | |
| Total liabilities | | | 7,684,376 | | | | 6,037,025 | | | | 5,019,708 | | | | 1,163,123 | |
| Net assets | | $ | 495,136,484 | | | | 345,189,448 | | | | 506,930,010 | | | | 580,963,952 | |
| Capital | | | | | | | | | | | | | | | | |
| Capital Stock and additional paid-in capital (authorized unlimited number of shares at no par value for each Fund: 12,130,020, 16,805,183, 50,116,913 and 36,056,571 shares, respectively) | | $ | 211,384,203 | | | | 266,020,618 | | | | 481,126,831 | | | | 415,737,967 | |
| Undistributed (overdistributed) net investment income | | | 4,578,990 | | | | - | | | | 5,121,514 | | | | 5,895,623 | |
| Accumulated net realized gain (loss) from investments and foreign currency transactions | | | 22,276,217 | | | | 25,237,162 | | | | (245,973 | ) | | | 4,343,767 | |
| Unrealized appreciation of investments and translation of assets and liabilities in foreign currencies | | | 256,897,074 | | | | 53,931,668 | | | | 20,927,638 | | | | 154,986,595 | |
| Net assets | | $ | 495,136,484 | | | | 345,189,448 | | | | 506,930,010 | | | | 580,963,952 | |
| Net asset value per share of outstanding capital stock | | $ | 40.82 | | | | 20.54 | | | | 10.11 | | | | 16.11 | |
See accompanying notes to financial statements. | 1 | |
CLEARWATER INVESTMENT TRUST
Statements of Operations
for the six months ended June 30, 2017 (unaudited)
| | | | | | | | | | | | | |
| | | Core Equity
Fund | | | Small Companies
Fund | | | Tax-Exempt
Bond Fund | | | International
Fund | |
| Investment income: | | | | | | | �� | | | | | | | | | |
| Income: | | | | | | | | | | | | | | | | |
| Dividends (net of foreign taxes withheld of $39,504, $2,491, $0 and $975,216, respectively) | | $ | 4,739,864 | | | | 1,662,438 | | | | 787,312 | | | | 8,935,025 | |
| Interest | | | - | | | | - | | | | 16,067,615 | | | | - | |
| Total income | | | 4,739,864 | | | | 1,662,438 | | | | 16,854,927 | | | | 8,935,025 | |
| Expenses: | | | | | | | | | | | | | | | | |
| Investment advisory fee | | | 2,168,265 | | | | 2,291,449 | | | | 1,470,565 | | | | 2,731,532 | |
| Voluntary fee reduction | | | (1,208,774 | ) | | | (613,038 | ) | | | (637,244 | ) | | | (902,604 | ) |
| Other Expenses | | | 85 | | | | 85 | | | | - | | | | 85 | |
| Total net expenses | | | 959,576 | | | | 1,678,496 | | | | 833,321 | | | | 1,829,013 | |
| Net investment income | | | 3,780,288 | | | | (16,058 | ) | | | 16,021,606 | | | | 7,106,012 | |
| Net realized gain (loss) on: | | | | | | | | | | | | | | | | |
| Security transactions | | | 9,494,938 | | | | 22,294,840 | | | | (713,003 | ) | | | 29,609,168 | |
| Forward foreign currency exchange contracts | | | - | | | | - | | | | - | | | | 67,575 | |
| Foreign currency transactions | | | - | | | | - | | | | - | | | | 14,398 | |
| Net increase (decrease) in unrealized appreciation/depreciation on: | | | | | | | | | | | | | | | | |
| Security transactions | | | 28,582,793 | | | | (9,585,715 | ) | | | 5,992,045 | | | | 38,571,568 | |
| Forward foreign currency exchange contracts | | | - | | | | - | | | | - | | | | (279,959 | ) |
| Translation of other assets and liabilities denominated in foreign currencies | | | 13 | | | | - | | | | - | | | | 127,223 | |
| Net gain (loss) on investments | | | 38,077,744 | | | | 12,709,125 | | | | 5,279,042 | | | | 68,109,973 | |
| Net increase (decrease) in net assets resulting from operations | | $ | 41,858,032 | | | | 12,693,067 | | | | 21,300,648 | | | | 75,215,985 | |
See accompanying notes to financial statements. | 2 | |
CLEARWATER INVESTMENT TRUST
Statements of Changes in Net Assets
for the six months ended June 30, 2017 (unaudited) and the year ended December 31, 2016
| | | Core Equity Fund | | | Small Companies Fund | |
| | | 06/30/2017 | | | 12/31/2016 | | | 06/30/2017 | | | 12/31/2016 | |
| Operations: | | | | | | | | | | | | | | | | |
| Net investment income (loss) | | $ | 3,780,288 | | | | 7,374,769 | | | | (16,058 | ) | | | 848,536 | |
| Net realized gain | | | 9,494,938 | | | | 32,005,747 | | | | 22,294,840 | | | | 11,553,619 | |
| Net increase (decrease) in unrealized appreciation/depreciation | | | 28,582,806 | | | | 5,670,222 | | | | (9,585,715 | ) | | | 43,242,489 | |
| Net increase in net assets resulting from operations | | | 41,858,032 | | | | 45,050,738 | | | | 12,693,067 | | | | 55,644,644 | |
| Distributions to shareholders from: | | | | | | | | | | | | | | | | |
| Net investment income | | | - | | | | (7,221,912 | ) | | | - | | | | (903,897 | ) |
| Net realized gain | | | - | | | | (19,436,500 | ) | | | - | | | | (12,145,074 | ) |
| Total distributions to shareholders | | | - | | | | (26,658,412 | ) | | | - | | | | (13,048,971 | ) |
| Equalization: | | | | | | | | | | | | | | | | |
| Net equalization | | | - | | | | 2,021,880 | | | | - | | | | 125,173 | |
| Capital share transactions: | | | | | | | | | | | | | | | | |
| Proceeds from shares sold | | | 1,983,800 | | | | 10,473,387 | | | | 1,168,700 | | | | 34,485,963 | |
| Reinvestment of distributions from net investment income and net realized gain | | | - | | | | 24,636,527 | | | | - | | | | 12,923,794 | |
| Payments for shares redeemed | | | (15,187,682 | ) | | | (81,459,509 | ) | | | (12,065,309 | ) | | | (46,117,773 | ) |
| Net increase (decrease) in net assets from capital share transactions | | | (13,203,882 | ) | | | (46,349,595 | ) | | | (10,896,609 | ) | | | 1,291,984 | |
| Total increase (decrease) in net assets | | | 28,654,150 | | | | (25,935,389 | ) | | | 1,796,458 | | | | 44,012,830 | |
| Net assets: | | | | | | | | | | | | | | | | |
| At the beginning of the year | | | 466,482,334 | | | | 492,417,723 | | | | 343,392,990 | | | | 299,380,160 | |
| At the end of the year | | $ | 495,136,484 | | | | 466,482,334 | | | | 345,189,448 | | | | 343,392,990 | |
| Undistributed net investment income | | $ | 4,578,990 | | | | - | | | | - | | | | - | |
| | | | | | | | | | | | | | | | | |
| | | Tax-Exempt Bond Fund | | | International Fund | |
| | | 06/30/2017 | | | 12/31/2016 | | | 06/30/2017 | | | 12/31/2016 | |
| Operations: | | | | | | | | | | | | | | | | |
| Net investment income | | $ | 16,021,606 | | | | 23,074,963 | | | | 7,106,012 | | | | 9,534,698 | |
| Net realized gain (loss) | | | (713,003 | ) | | | 1,657,062 | | | | 29,691,141 | | | | (21,953,873 | ) |
| Net increase (decrease) in unrealized appreciation/depreciation | | | 5,992,045 | | | | (12,178,939 | ) | | | 38,418,832 | | | | 23,655,177 | |
| Net increase in net assets resulting from operations | | | 21,300,648 | | | | 12,553,086 | | | | 75,215,985 | | | | 11,236,002 | |
| Distributions to shareholders from: | | | | | | | | | | | | | | | | |
| Net investment income | | | (12,010,189 | ) | | | (22,085,107 | ) | | | - | | | | (9,674,768 | ) |
| Net realized gain | | | - | | | | (1,169,087 | ) | | | - | | | | (12,673 | ) |
| Total distributions to shareholders | | | (12,010,189 | ) | | | (23,254,194 | ) | | | - | | | | (9,687,441 | ) |
| Equalization: | | | | | | | | | | | | | | | | |
| Net equalization | | | - | | | | - | | | | - | | | | - | |
| Capital share transactions: | | | | | | | | | | | | | | | | |
| Proceeds from shares sold | | | 13,163,600 | | | | 19,338,667 | | | | 3,514,000 | | | | 34,599,021 | |
| Reinvestment of distributions from net investment income and net realized gain | | | 12,669,281 | | | | 22,594,801 | | | | - | | | | 9,687,457 | |
| Payments for shares redeemed | | | (13,049,156 | ) | | | (59,149,478 | ) | | | (6,764,859 | ) | | | (28,020,420 | ) |
| Net increase (decrease) in net assets from capital share transactions | | | 12,783,725 | | | | (17,216,010 | ) | | | (3,250,859 | ) | | | 16,266,058 | |
| Total increase (decrease) in net assets | | | 22,074,184 | | | | (27,917,118 | ) | | | 71,965,126 | | | | 17,814,619 | |
| Net assets: | | | | | | | | | | | | | | | | |
| At the beginning of the year | | | 484,855,826 | | | | 512,772,944 | | | | 508,998,826 | | | | 491,184,207 | |
| At the end of the year | | $ | 506,930,010 | | | | 484,855,826 | | | | 580,963,952 | | | | 508,998,826 | |
| Undistributed (overdistributed) net investment income | | $ | 5,121,514 | | | | 1,098,542 | | | | 5,895,623 | | | | (1,591,305 | ) |
See accompanying notes to financial statements. | 3 | |
CLEARWATER INVESTMENT TRUST
Financial Highlights
Per share data (rounded to the nearest cent) for a share of capital stock outstanding throughout the years or period ended and selected information for each year or period ended is as follows:
| | | | | | | |
| | | June 30, | | | Year ended December 31, | |
| | | 2017 | | | | | | | | | | | | | | | | |
| Core Equity Fund | | (Unaudited) | | | 2016 | | | 2015 | | | 2014 | | | 2013 | | | 2012 | |
| Net asset value, beginning of period | | $ | 37.43 | | | | 35.57 | | | | 39.41 | | | | 37.77 | | | | 28.81 | | | | 25.26 | |
| Income (loss) from investment operations: | | | | | | | | | | | | | | | | | | | | | | | | |
| Net investment income | | | 0.32 | | | | 0.65 | | | | 0.64 | | | | 0.60 | | | | 0.51 | | | | 0.40 | |
| Net realized and unrealized gains (losses) | | | 3.07 | | | | 3.27 | | | | (0.96 | ) | | | 2.91 | | | | 8.95 | | | | 3.54 | |
| Total from investment operations | | | 3.39 | | | | 3.92 | | | | (0.32 | ) | | | 3.51 | | | | 9.46 | | | | 3.94 | |
| Less distributions to shareholders from: | | | | | | | | | | | | | | | | | | | | | | | | |
| Net investment income | | | - | | | | (0.49 | ) | | | (0.60 | ) | | | (0.63 | ) | | | (0.50 | ) | | | (0.39 | ) |
| Net realized gain | | | - | | | | (1.57 | ) | | | (2.92 | ) | | | (1.24 | ) | | | - | | | | - | |
| Total distributions to shareholders: | | | - | | | | (2.06 | ) | | | (3.52 | ) | | | (1.87 | ) | | | (0.50 | ) | | | (0.39 | ) |
| Net asset value, end of period | | $ | 40.82 | | | | 37.43 | | | | 35.57 | | | | 39.41 | | | | 37.77 | | | | 28.81 | |
| Total return (a) | | | 9.06 | % | | | 10.98 | % | | | (0.71 | )% | | | 9.23 | % | | | 32.85 | % | | | 15.64 | % |
| Net assets, end of period (000s omitted) | | $ | 495,136 | | | | 466,482 | | | | 492,418 | | | | 541,017 | | | | 523,042 | | | | 395,242 | |
| Ratio of expenses, net of waivers, to average net assets (b), (c), (d), (e), (f), (g), (h) | | | 0.40 | % | | | 0.43 | % | | | 0.42 | % | | | 0.50 | % | | | 0.50 | % | | | 0.54 | % |
| Ratio of expenses, before waivers, to average net assets (b), (c), (d), (e), (f), (g), (h) | | | 0.90 | % | | | 0.90 | % | | | 0.90 | % | | | 0.90 | % | | | 0.90 | % | | | 0.90 | % |
| Ratio of net investment income (loss), net of waivers, to average net assets (c), (d), (e), (f), (g), (h) | | | 1.57 | % | | | 1.63 | % | | | 1.52 | % | | | 1.50 | % | | | 1.51 | % | | | 1.49 | % |
| Ratio of net investment income (loss), before waivers, to average net assets (c), (d), (e), (f), (g), (h) | | | 1.07 | % | | | 1.16 | % | | | 1.02 | % | | | 1.10 | % | | | 1.11 | % | | | 1.13 | % |
| Portfolio turnover rate (excluding short-term securities) | | | 12.69 | % | | | 44.11 | % | | | 94.07 | % | | | 13.54 | % | | | 21.07 | % | | | 22.31 | % |
| (a) | Total return figures are based on the change in net asset value of a share during the period and assume reinvestment of distributions at net asset value. Total return is not annualized for periods of less than one year. |
| (b) | In addition to fees and expenses which the Fund bears directly, the Fund indirectly bears a pro rata share of the fees and expenses of any acquired funds in which it invests. Such indirect expenses are not included in the above reported expense ratios. |
| (c) | Annualized for periods less than one year. |
| (d) | Effective March 16, 2017, the investment advisory fee, net of voluntary waivers, decreased to 0.37%. Also effective March 16, 2017, the Adviser increased the voluntary waiver to 0.53%. |
| (e) | Effective March 16, 2016, the investment advisory fee, net of voluntary waivers, increased to 0.44%. Also effective March 16, 2016, the Advisor decreased the voluntary waiver to 0.46% |
| (f) | Effective March 16, 2015, the investment advisory fee, net of voluntary waivers, decreased to 0.40%. Also effective March 15, 2015, the Advisor increased the voluntary waiver to 0.50%. |
| (g) | Effective March 15, 2013, the investment advisory fee, net of voluntary waivers, decreased to 0.50%. Also effective March 15, 2013, the Advisor increased the voluntary waiver to 0.40%. |
| (h) | Effective March 15, 2012, the investment advisory fee, net of voluntary waivers, decreased to 0.52%. Also effective March 15, 2012, the Advisor increased the voluntary waiver to 0.38%. |
See accompanying notes to financial statements. | 4 | |
CLEARWATER INVESTMENT TRUST
Financial Highlights
Per share data (rounded to the nearest cent) for a share of capital stock outstanding throughout the years or period ended and selected information for each year or period ended is as follows:
| | | | | | | | | | | | | | | | | | | |
| | | June 30, | | | Year ended December 31, | |
| | | 2017 | | | | |
| Small Companies Fund | | (Unaudited) | | | 2016 | | | 2015 | | | 2014 | | | 2013 | | | 2012 | |
| Net asset value, beginning of period | | $ | 19.79 | | | | 17.18 | | | | 20.30 | | | | 22.35 | | | | 18.70 | | | | 16.91 | |
| Income (loss) from investment operations: | | | | | | | | | | | | | | | | | | | | | | | | |
| Net investment income | | | 0.01 | | | | 0.07 | | | | 0.07 | | | | 0.05 | | | | 0.05 | | | | 0.09 | |
| Net realized and unrealized gains (losses) | | | 0.74 | | | | 3.30 | | | | (0.90 | ) | | | 1.10 | | | | 6.30 | | | | 3.10 | |
| Total from investment operations | | | 0.75 | | | | 3.37 | | | | (0.83 | ) | | | 1.15 | | | | 6.35 | | | | 3.19 | |
| Less distributions to shareholders from: | | | | | | | | | | | | | | | | | | | | | | | | |
| Net investment income | | | - | | | | (0.05 | ) | | | (0.06 | ) | | | (0.04 | ) | | | (0.06 | ) | | | (0.10 | ) |
| Net realized gain | | | - | | | | (0.71 | ) | | | (2.23 | ) | | | (3.16 | ) | | | (2.64 | ) | | | (1.30 | ) |
| Total distributions to shareholders: | | | - | | | | (0.76 | ) | | | (2.29 | ) | | | (3.20 | ) | | | (2.70 | ) | | | (1.40 | ) |
| Net asset value, end of period | | $ | 20.54 | | | | 19.79 | | | | 17.18 | | | | 20.30 | | | | 22.35 | | | | 18.70 | |
| Total return (a) | | | 3.79 | % | | | 19.67 | % | | | (3.96 | )% | | | 5.03 | % | | | 34.01 | % | | | 19.02 | % |
| Net assets, end of period (000s omitted) | | $ | 345,189 | | | | 343,393 | | | | 299,380 | | | | 333,888 | | | | 343,068 | | | | 281,936 | |
| Ratio of expenses, net of waivers, to average net assets (b), (c), (d), (e), (f), (g) | | | 0.99 | % | | | 1.02 | % | | | 0.97 | % | | | 0.94 | % | | | 0.95 | % | | | 1.00 | % |
| Ratio of expenses, before waivers, to average net assets (b), (c), (d), (e), (f), (g) | | | 1.35 | % | | | 1.35 | % | | | 1.35 | % | | | 1.35 | % | | | 1.35 | % | | | 1.35 | % |
| Ratio of net investment income (loss), net of waivers, to average net assets (c), (d), (e), (f), (g) | | | (0.01 | )% | | | 0.28 | % | | | 0.22 | % | | | 0.24 | % | | | 0.21 | % | | | 0.51 | % |
| Ratio of net investment income (loss), before waivers, to average net assets (c), (d), (e), (f), (g) | | | (0.37 | )% | | | (0.05 | )% | | | (0.16 | )% | | | (0.17 | )% | | | (0.19 | )% | | | 0.16 | % |
| Portfolio turnover rate (excluding short-term securities) | | | 38.75 | % | | | 78.82 | % | | | 58.71 | % | | | 55.51 | % | | | 59.84 | % | | | 59.48 | % |
| (a) | Total return figures are based on the change in net asset value of a share during the period and assume reinvestment of distributions at net asset value. Total return is not annualized for periods of less than one year. |
| (b) | In addition to fees and expenses which the Fund bears directly, the Fund indirectly bears a pro rata share of the fees and expenses of any acquired funds in which it invests. Such indirect expenses are not included in the above reported expense ratios. |
| (c) | Annualized for periods less than one year. |
| (d) | Effective March 16, 2017, the investment advisory fee, net of voluntary waivers, decreased to 0.96%. Also effective March 16, 2017, the Adviser increased the voluntary waiver to 0.39%. |
| (e) | Effective March 16, 2016, the investment advisory fee, net of voluntary waivers, increased to 1.03%. Also effective March 16, 2016, the Adviser decreased the voluntary waiver to 0.32%. |
| (f) | Effective March 16, 2015, the investment advisory fee, net of voluntary waivers, increased to 0.98%. Also effective March 16, 2015, the Adviser decreased the voluntary waiver to 0.37%. |
| (g) | Effective March 15, 2013, the investment advisory fee, net of voluntary waivers, decreased to 0.94%. Also effective March 15, 2013, the Adviser increased the voluntary waiver to 0.41%. |
See accompanying notes to financial statements. | 5 | (Continued) |
CLEARWATER INVESTMENT TRUST
Financial Highlights
Per share data (rounded to the nearest cent) for a share of capital stock outstanding throughout the years or period ended and selected information for each year or period ended is as follows:
| | | | | | | | | | | | | | | | | | | |
| | | June 30, | | | Year ended December 31, | |
| | | 2017 | | | | | | | | | | | | | | | | |
| Tax-Exempt Bond Fund | | (Unaudited) | | | 2016 | | | 2015 | | | 2014 | | | 2013 | | | 2012 | |
| Net asset value, beginning of period | | $ | 9.93 | | | | 10.16 | | | | 10.16 | | | | 9.23 | | | | 10.15 | | | | 9.62 | |
| Income (loss) from investment operations: | | | | | | | | | | | | | | | | | | | | | | | | |
| Net investment income | | | 0.34 | | | | 0.46 | | | | 0.42 | | | | 0.44 | | | | 0.46 | | | | 0.48 | |
| Net realized and unrealized gains (losses) | | | 0.10 | | | | (0.23 | ) | | | 0.04 | | | | 0.95 | | | | (0.84 | ) | | | 0.53 | |
| Total from investment operations | | | 0.44 | | | | 0.23 | | | | 0.46 | | | | 1.39 | | | | (0.38 | ) | | | 1.01 | |
| Less distributions to shareholders from: | | | | | | | | | | | | | | | | | | | | | | | | |
| Net investment income | | | (0.26 | ) | | | (0.44 | ) | | | (0.42 | ) | | | (0.44 | ) | | | (0.46 | ) | | | (0.48 | ) |
| Net realized gain | | | - | | | | (0.02 | ) | | | (0.04 | ) | | | (0.02 | ) | | | (0.08 | ) | | | - | |
| Total distributions to shareholders: | | | (0.26 | ) | | | (0.46 | ) | | | (0.46 | ) | | | (0.46 | ) | | | (0.54 | ) | | | (0.48 | ) |
| Net asset value, end of period | | $ | 10.11 | | | | 9.93 | | | | 10.16 | | | | 10.16 | | | | 9.23 | | | | 10.15 | |
| Total return (a) | | | 4.37 | % | | | 2.28 | % | | | 4.73 | % | | | 15.29 | % | | | (3.77 | )% | | | 10.66 | % |
| Net assets, end of period (000s omitted) | | $ | 506,930 | | | | 484,856 | | | | 512,773 | | | | 507,982 | | | | 465,026 | | | | 527,118 | |
| Ratio of expenses, net of waivers, to average net assets (b), (c), (d), (e) | | | 0.34 | % | | | 0.34 | % | | | 0.34 | % | | | 0.33 | % | | | 0.34 | % | | | 0.36 | % |
| Ratio of expenses, before waivers, to average net assets (b), (c), (d), (e) | | | 0.60 | % | | | 0.60 | % | | | 0.60 | % | | | 0.60 | % | | | 0.60 | % | | | 0.60 | % |
| Ratio of net investment income (loss), net of waivers, to average net assets (c), (d), (e) | | | 6.54 | % | | | 4.54 | % | | | 4.23 | % | | | 4.48 | % | | | 4.78 | % | | | 4.79 | % |
| Ratio of net investment income (loss), before waivers, to average net assets (c), (d), (e) | | | 6.28 | % | | | 4.28 | % | | | 3.97 | % | | | 4.21 | % | | | 4.52 | % | | | 4.55 | % |
| Portfolio turnover rate (excluding short-term securities) | | | 6.85 | % | | | 13.48 | % | | | 18.93 | % | | | 22.25 | % | | | 31.65 | % | | | 28.06 | % |
| (a) | Total return figures are based on the change in net asset value of a share during the period and assume reinvestment of distributions at net asset value. Total return is not annualized for periods of less than one year. |
| (b) | In addition to fees and expenses which the Fund bears directly, the Fund indirectly bears a pro rata share of the fees and expenses of any acquired funds in which it invests. Such indirect expenses are not included in the above reported expense ratios. |
| (c) | Annualized for periods less than one year. |
| (d) | Effective March 16, 2015, the investment advisory fee, net of voluntary waivers, increased to 0.34%. Also effective March 16, 2015, the Adviser decreased the voluntary waiver to 0.26%. |
| (e) | Effective March 15, 2013, the investment advisory fee, net of voluntary waivers, decreased to 0.33%. Also effective March 15, 2013, the Adviser increased the voluntary waiver to 0.27%. |
See accompanying notes to financial statements. | 6 | (Continued) |
CLEARWATER INVESTMENT TRUST
Financial Highlights
Per share data (rounded to the nearest cent) for a share of capital stock outstanding throughout the years or period ended and selected information for each year or period ended is as follows:
| | | June 30, | | | Year ended December 31, | |
| | | 2017 | | | | | | | | | | | | | | | | |
| International Fund | | (Unaudited) | | | 2016 | | | 2015 | | | 2014 | | | 2013 | | | 2012 | |
| Net asset value, beginning of period | | $ | 14.04 | | | | 14.02 | | | | 14.41 | | | | 15.76 | | | | 13.33 | | | | 12.23 | |
| Income (loss) from investment operations: | | | | | | | | | | | | | | | | | | | | | | | | |
| Net investment income | | | 0.20 | | | | 0.27 | | | | 0.28 | | | | 0.35 | | | | 0.29 | | | | 0.30 | |
| Net realized and unrealized gains (losses) | | | 1.87 | | | | 0.02 | | | | (0.31 | ) | | | (1.08 | ) | | | 2.62 | | | | 1.88 | |
| Total from investment operations | | | 2.07 | | | | 0.29 | | | | (0.03 | ) | | | (0.73 | ) | | | 2.91 | | | | 2.18 | |
| Less distributions to shareholders from: | | | | | | | | | | | | | | | | | | | | | | | | |
| Net investment income | | | - | | | | (0.27 | ) | | | (0.28 | ) | | | (0.36 | ) | | | (0.34 | ) | | | (0.31 | ) |
| Net realized gain | | | - | | | | - | (a) | | | (0.08 | ) | | | (0.26 | ) | | | (0.14 | ) | | | (0.77 | ) |
| Total distributions to shareholders: | | | - | | | | (0.27 | ) | | | (0.36 | ) | | | (0.62 | ) | | | (0.48 | ) | | | (1.08 | ) |
| Net asset value, end of period | | $ | 16.11 | | | | 14.04 | | | | 14.02 | | | | 14.41 | | | | 15.76 | | | | 13.33 | |
| Total return (b) | | | 14.74 | % | | | 2.09 | % | | | (0.15 | )% | | | (4.70 | )% | | | 21.85 | % | | | 17.91 | % |
| Net assets, end of period (000s omitted) | | $ | 580,964 | | | | 508,999 | | | | 491,184 | | | | 481,943 | | | | 511,904 | | | | 408,059 | |
| Ratio of expenses, net of waivers, to average net assets (c), (d), (e), (f), (g), (h), (i) | | | 0.67 | % | | | 0.70 | % | | | 0.69 | % | | | 0.67 | % | | | 0.66 | % | | | 0.62 | % |
| Ratio of expenses, before waivers, to average net assets (c), (d), (e), (f), (g), (h), (i) | | | 1.00 | % | | | 1.00 | % | | | 1.00 | % | | | 1.00 | % | | | 1.00 | % | | | 1.00 | % |
| Ratio of net investment income (loss), net of waivers, to average net assets (d), (e), (f), (g), (h), (i) | | | 2.60 | % | | | 1.90 | % | | | 1.87 | % | | | 2.22 | % | | | 1.99 | % | | | 2.39 | % |
| Ratio of net investment income (loss), before waivers, to average net assets (d), (e), (f), (g), (h), (i) | | | 2.27 | % | | | 1.60 | % | | | 1.56 | % | | | 1.89 | % | | | 1.65 | % | | | 2.01 | % |
| Portfolio turnover rate (excluding short-term securities) | | | 29.30 | % | | | 37.21 | % | | | 18.49 | % | | | 15.33 | % | | | 22.54 | % | | | 72.32 | % |
| (a) | Per share amounts from distributions paid from net realized gain were less than $0.01 per share. |
| (b) | Total return figures are based on the change in net asset value of a share during the period and assume reinvestment of distributions at net asset value. Total return is not annualized for periods of less than one year. |
| (c) | In addition to fees and expenses which the Fund bears directly, the Fund indirectly bears a pro rata share of the fees and expenses of any acquired funds in which it invests. Such indirect expenses are not included in the above reported expense ratios. |
| (d) | Annualized for periods less than one year. |
| (e) | Effective March 16, 2017, the investment advisory fee, net of voluntary waivers, decreased to 0.65%. Also effective March 16, 2017, the Advisor increased the voluntary waiver to 0.35%. |
| (f) | Effective March 16, 2016, the investment advisory fee, net of voluntary waivers, increased to 0.70%. Also effective March 16, 2016, the Adviser decreased the voluntary waiver to 0.30%. |
| (g) | Effective March 16, 2015, the investment advisory fee, net of voluntary waivers, increased to 0.69%. Also effective March 16, 2015, the Advisor decreased the voluntary waiver to 0.31%. |
| (h) | Effective March 15, 2013, the investment advisory fee, net of voluntary waivers, increased to 0.67%. Also effective March 15, 2013, the Adviser decreased the voluntary waiver to 0.33%. |
| (i) | Effective March 15, 2012, the investment advisory fee, net of voluntary waivers, decreased to 0.60%. Also effective March 15, 2012, the Adviser increased the voluntary waiver to 0.40%. |
See accompanying notes to financial statements. | 7 | (Continued) |
CLEARWATER INVESTMENT TRUST
Notes to Financial Statements (unaudited)
June 30, 2017
Clearwater Investment Trust (the “Trust”) was established on January 12, 1987 as a Massachusetts business trust and is registered under the Investment Company Act of 1940 (as amended) as a diversified open end management investment company and presently includes four series: Clearwater Core Equity Fund (“Core Equity Fund”), Clearwater Small Companies Fund (“Small Companies Fund”), ClearwaterTax-Exempt Bond Fund (“Tax-Exempt Bond Fund”), and Clearwater International Fund (“International Fund” and together with the Core Equity Fund, Small Companies Fund and Tax-Exempt Bond Fund, the “Funds”). Clearwater Management Co., Inc. (the “Adviser”) serves as the investment adviser for each of the Funds and is responsible for the oversight of each of the Fund’s subadvisers. The Trust’s declaration of trust permits the Board of Trustees to create additional funds in the future.The investment objective of the Core Equity, Small Companies, and International Funds is long-term capital growth. The investment objective of the Tax-Exempt Bond Fund is high current income that is exempt from United States (“U.S.”) federal income tax, consistent with preservation of capital.
Fiduciary Counselling, Inc. (“FCI”) acts as subadviser to each of the Funds. FCI does not provide day-to-day management, but provides the Funds with various investment-related services, including investment strategy advice, manager recommendations and related duties as requested by the Adviser. FCI also provides certain services related to due diligence, performance reporting, compliance, and other administrative functions, which support the investment management services and subadviser oversight services provided to the Funds by the Adviser.
The Northern Trust Company serves as the custodian, administrator, accounting services agent and transfer agent for the Trust.
Effective May 18, 2017, the Trust terminated Denver Investments (“Denver”), one of the subadvisers to the Clearwater International Fund.
Under normal market conditions, the Core Equity Fund pursues its investment objective by investing at least 80% of its net assets, plus the amount of any borrowings for investment purposes, in equity securities of U.S. companies. The equity securities in which the Fund primarily invests are common and preferred stocks. The Fund employs a multi-style (growth and value) and multi-manager approach whereby portions of the Fund are allocated to different subadvisers who employ distinct investment styles. The Fund’s Adviser allocates portions of the Fund’s assets among subadvisers. The Fund currently allocates assets among the following subadvisers who provide day-to-day management for the Fund: Parametric Portfolio Associates, LLC (“Parametric”), AQR Capital Management (“AQR”), and O’Shaughnessy Asset Management (“OSAM”). The allocation among subadvisers will vary over time, but the current intent of the Fund’s Adviser is that under normal market conditions approximately 60% of the Fund’s total assets will be allocated to Parametric; the remaining assets will be allocated to one or more of the Fund’s two other subadvisers that provide day-to-day management. Parametric manages its portion of the Fund’s assets using a passive management strategy to seek investment results that match, before fees and expenses, the investment results of the Russell 1000® Index as closely as possible without requiring the Fund to realize taxable gains. In addition, as noted above, FCI also acts as a subadviser to the Fund but does not provide day-to-day management.
Under normal market conditions, the Small Companies Fund invests at least 80% of its net assets, plus the amount of any borrowings for investment purposes, in equity securities of small companies. The Fund defines “small companies” as issuers with market capitalizations no greater than $5 billion at the time of purchase. The equity
CLEARWATER INVESTMENT TRUST
Notes to Financial Statements (unaudited)
June 30, 2017
securities the Fund invests in consist primarily of exchange traded common and preferred stocks. The Fund may also invest in a type of equity security called a convertible security to reduce volatility or correlation risk in the portfolio. A convertible security generally entitles the holder to receive interest paid or accrued on debt securities or the dividend paid on preferred stock until the convertible security matures or is redeemed, converted or exchanged. It is intended that the Fund holds a portion of its portfolio for more than two years to allow for the change that prompted the relevant security’s purchase to yield results. The Fund uses a “multi-style, multi-manager” approach. The Fund’s Adviser allocates portions of the Fund’s assets between subadvisers who employ distinct investment styles. The Fund currently allocates assets between the following subadvisers who provide day-to-day management for the Fund: Kennedy Capital Management, Inc. (“Kennedy”) and Keeley-Teton Advisors, LLC (“Keeley-Teton”). FCI also acts as a subadviser to the Fund but does not provide day-to-day management.
Under normal market conditions, the Tax-Exempt Bond Fund invests at least 80% of its net assets, plus the amount of any borrowings for investment purposes, in tax-exempt bonds, which are debt obligations issued by or for the U.S. states, territories and possessions and the District of Columbia.The interest on these bonds is generally exempt from both U.S. regular federal income tax and U.S. federal alternative minimum tax. However, the Fund may invest up to 20% of its net assets in bonds that generate interest income subject to federal alternative minimum tax for individuals. All exempt interest income may increase certain corporate shareholders’ alternative minimum tax. The Fund invests in both revenue bonds, which are backed by and payable only from the revenues derived from a specific facility or specific revenue source, and in general obligation bonds, which are secured by the full faith, credit and taxation power of the issuing municipality. The Fund currently has one subadviser that provides day-to-day management for the Fund, Sit Fixed Income Advisers II, LLC (“Sit”). FCI also acts as a subadviser to the Fund but does not provide day-to-day management.
Under normal market conditions, the International Fund intends to invest at least 80% of the value of its net assets, plus the amount of any borrowings for investment purposes, in equity securities of companies organized or located outside the United States and doing a substantial amount of business outside the United States. Equity securities in which the Fund invests include common and preferred stock, sponsored and unsponsored American Depositary Receipts, European Depositary Receipts, Global Depositary Receipts, exchange-traded funds, and other investment companies. The Fund diversifies its investments among a number of different countries throughout the world, and may invest in companies of any size. The Fund does not intend to invest more than 20% of its net assets in the equity securities of developing or emerging market issuers. In order to hedge against adverse movements in currency exchange rates, the Fund may enter into foreign currency exchange contracts. The Fund does not intend to invest in foreign currency exchange contracts, options, futures contracts or options in futures contracts for speculative purposes. The Fund uses a “multi-style, multi-manager” approach. The Fund’s assets are allocated to different subadvisers who employ distinct investment styles. The Fund currently allocates assets among the following subadvisers who provide day-to-day management for the Fund: Parametric, Artisan Partners Limited Partnership (“Artisan Partners”), WCM Investment Management (“WCM”) and Templeton Investment Counsel, LLC (“Templeton”). The allocation among subadvisers will vary over time, but the current intent of the Fund’s Adviser is that under normal market conditions approximately 50% of the Fund’s assets will be allocated to Parametric, and the remaining assets will be allocated to one or more of the Fund’s three other subadvisers that provide day-to-day management of the Fund. Parametric manages its portion of the Fund’s assets using a passive management strategy to seek investment results that match, before fees and expenses, the investment results of the MSCI World Ex U.S.A. Index - Net as closely as possible without requiring the Fund to realize taxable gains. FCI also acts as a subadviser to the Fund but does not provide day-to-day management.
CLEARWATER INVESTMENT TRUST
Notes to Financial Statements (unaudited)
June 30, 2017
| (2) | Summary of Significant Accounting Policies |
The Funds are investment companies and follow accounting and reporting guidance under Financial Accounting Standards Board (“FASB”) Accounting Standards Codification (“ASC”) Topic 946, “Financial Services-Investment Companies.”
The significant accounting policies followed by the Funds are as follows:
| (a) | Investments in Securities |
Investments in U.S. and foreign equity securities are valued at the last sales price or the regular trading session closing price on the principal exchange or market where they are traded. Foreign security values are stated in U.S. dollars. Equity securities which have not traded on the date of valuation or securities for which sales prices are not generally reported are valued at the mean between the last bid and asked prices. Debt securities are valued on the basis of evaluated prices provided by independent pricing services when such prices are believed to reflect the fair value of such securities or broker provided prices. Such prices may be determined by taking into account other similar securities’ prices, yields, maturities, call features, ratings, prepayment speeds, credit risks, cash flows, institutional size trading in similar groups of securities and developments related to specific securities. Shares of open end investment companies are valued at their daily net asset value (“NAV”). Shares of closed-end funds and exchange traded funds are valued at the last sales price or the regular trading session closing price on the principal exchange or market where they are traded.
Securities for which no market quotations are readily available (including those for which trading has been suspended), or when the Adviser becomes aware that a significant event impacting the value of a security or group of securities has occurred after the closing of the exchange on which the security or securities principally trade, but before the calculation of the NAV, are valued at fair value as determined in good faith using procedures established by the Board of Trustees. This may occur particularly with respect to certain foreign securities held by the International Fund, whereby the Board of Trustees may use adjustment factors obtained from an independent evaluation service that are intended to reflect more accurately the fair value of these foreign securities as of the time the Fund’s NAV is calculated. The procedures consider, among others, the following factors to determine a security’s fair value: the nature and pricing history (if any) of the security; whether any dealer quotations for the security are available; and possible valuation methodologies that could be used to determine the fair value of the security. These procedures are used by the Valuation Committee, in accordance with the procedures established by the Board of Trustees, to determine the fair value of the security or securities. Such determinations are then submitted for review and ratification by the Board of Trustees. The use of fair valuation involves the risk that the values used by the Funds to price their investments may be higher or lower than the values used by other unaffiliated investment companies and investors to price the same investments.
Security transactions are accounted for on the trade date, which is the date the securities are purchased or sold. Realized gains and losses are calculated on an identified cost basis. Dividend income is recognized on the ex-dividend date or, for foreign securities, as soon as the information is available. Interest income, is recognized on an accrual basis and includes amortization of premiums and accretion of discounts using the effective yield method.
CLEARWATER INVESTMENT TRUST
Notes to Financial Statements (unaudited)
June 30, 2017
| (b) | Foreign Currency Translation |
The International Fund invests in securities which are purchased and sold in foreign currencies as a principal investment strategy. The costs of purchases, proceeds from sales of investments, interest and dividend income are translated into U.S. dollars using the spot market rate of exchange prevailing on the respective dates of such transactions.The value of the International Fund’s net assets, as measured in U.S. dollars, may be affected favorably or unfavorably by changes in foreign currency exchange rates and exchange control regulations. The gains or losses, if any, on investments resulting from changes in foreign exchange rates are recorded within net realized gain (loss) on security transactions and within net increase (decrease) in unrealized appreciation/depreciation on security transactions on the Statements of Operations. The realized gains or losses, if any, on translation of other assets and liabilities denominated in foreign currencies are recorded within net realized gain (loss) on foreign currency transactions on the Statements of Operations. The International Fund also will incur costs in converting U.S. dollars to local currencies, and vice versa. Risks may arise upon investing in foreign securities including, but not limited to, political, social or economic instability in the country of the issuer, the difficulty of predicting international trade patterns, the possibility of the imposition of exchange controls, expropriation, limits on removal of currency or other assets, nationalization of assets, foreign withholding and income tax and possible delays in the settlement of foreign stock exchange transactions. The principal markets on which these securities trade may have less volume and liquidity, and may be more volatile, than securities markets in the U.S.
| (c) | Forward Foreign Currency Exchange Contracts |
The International Fund enters into forward foreign currency exchange contracts for the purchase or sale of a specific foreign currency at a fixed price on a future date as a hedge against adverse movements in foreign currency exchange rates, specific transactions or the portfolio position. The objective of the International Fund’s foreign currency hedging transactions is to reduce the risk that the U.S. dollar value of the International Fund’s foreign currency denominated securities will decline in value due to changes in foreign currency exchange rates. Forward foreign currency exchange contracts are marked-to-market daily at the applicable exchange rates. Any resulting unrealized gains or losses are recorded on forward foreign currency exchange contracts within net increase (decrease) in unrealized appreciation/depreciation on the Statements of Operations.The International Fund records any realized gains or losses at the time the forward foreign currency exchange contract is offset by entering into a closing transaction with the same counterparty or is extinguished by delivery of the currency. Realized gains or losses, if any, are recorded within net realized gain (loss) on forward foreign currency exchange contracts on the Statements of Operations. Risks may arise upon entering into forward foreign currency exchange contracts from the potential of the issuer to default on its obligations under the contract and from unanticipated movements in the value of a foreign currency relative to the U.S. dollar. The contractual amounts of forward foreign currency exchange contracts do not necessarily represent the amounts potentially subject to risk. The measurement of risks associated with these instruments is meaningful only when all related and offsetting transactions are considered. The International Fund bears the market risk from changes in foreign currency exchange rates and the credit risk if the issuer fails to perform. Additional information on derivative instruments and how these positions may impact the financial statements is found in Note 8, Derivative Instruments.
The International Fund routinely enters into spot contracts in order to buy or sell a certain amount of foreign currency at the current market rate.The International Fund may enter into spot contracts in order to make payments, or to receive payments, based on investment trading activity in a foreign currency. A spot contract allows the International Fund to buy or sell foreign currency on the day it chooses to deal. From time to time, the Core Equity
CLEARWATER INVESTMENT TRUST
Notes to Financial Statements (unaudited)
June 30, 2017
Fund may also enter into spot contracts in order to make or receive payments due to investment trading activity in a foreign currency on a non-U.S. exchange. Spot contracts are marked-to-market daily at the applicable exchange rates.Any resulting unrealized gains or losses are recorded in translation of other assets and liabilities denominated in foreign currencies within net increase (decrease) in unrealized appreciation/depreciation on the Statements of Operations. Unrealized gains or losses on outstanding spot contracts are recorded in payables for investment securities purchased or receivable for securities sold, respectively, on the Statements of Assets and Liabilities. The Funds record any realized gains or losses at the time the spot contract settles. Realized gains or losses, if any, are included within net realized gain (loss) on foreign currency transactions on the Statements of Operations. Risks may arise upon entering into spot contracts from unanticipated movements in the value of a foreign currency relative to the U.S. dollar in a short period of time. The Funds bear the market risk from changes in foreign currency exchange rates.
| (e) | Master Limited Partnerships |
The Core Equity and International Funds invest in Master Limited Partnerships (“MLPs”). The benefits derived from the Funds’ investments in MLPs are largely dependent on the MLPs being treated as partnerships for federal income tax purposes. If any of the MLPs held by the Funds were treated as corporations for U.S. federal income tax purposes, the after-tax return to the Funds with respect to their investments in such MLPs would be materially reduced, causing a decline in the value of the common stock. The Funds must include their allocable share of an MLP’s taxable income in their reportable taxable income, whether or not it receives a distribution in cash from the MLP. In such case, the Funds may have to liquidate securities to make required distributions to shareholders.
| (f) | Delayed Delivery Transactions and When-Issued Securities |
Certain Funds may engage in securities transactions on a when-issued or delayed-delivery basis. In these transactions, the securities’ prices and yields are fixed on the date of the commitment, with payment and delivery scheduled for a future date. During this period, the securities are subject to market fluctuations. When delayed-delivery purchases are outstanding, a Fund will segregate liquid assets on its records in amounts sufficient to meet the purchase price. A Fund may dispose of or renegotiate a delayed-delivery transaction, which may result in a capital gain or loss.
| (g) | Short-Term Investments |
The Core Equity, Small Companies, Tax-Exempt Bond, and International Funds currently invest in the U.S. Government Select Portfolio, a money market portfolio of Northern Institutional Funds, an investment company advised by Northern Trust Investments, Inc. The U.S. Government Select Portfolio primarily invests in securities issued by the U.S. government, government agencies, and government-sponsored enterprises.
The balances disclosed as foreign tax reclaim receivable, if any, represent net amounts withheld by foreign governments on dividend income earned in the respective countries subject to reclamation. All reclaims are paid directly to the applicable Funds.
CLEARWATER INVESTMENT TRUST
Notes to Financial Statements (unaudited)
June 30, 2017
The Trust’s policy is to comply with the requirements of the Internal Revenue Code applicable to regulated investment companies. On a calendar-year basis, the Funds intend to distribute substantially all of their net investment income and net realized gains, if any, to avoid the payment of federal income and excise taxes. Therefore, no income tax provision is required. Each Fund is treated as a separate entity for federal income tax purposes.
Management has analyzed the Funds’ tax positions taken on federal tax returns for all open tax years and has concluded that as of December 31, 2016, no provision for income tax would be required in the Funds’ financial statements. The Funds’ federal and state income and federal excise tax returns for the 2013, 2014, 2015 and 2016 tax years for which the applicable statutes of limitations have not expired remain subject to examination by the Internal Revenue Service and state departments of revenue. Net investment income and net realized gain (loss) for the Funds may differ for financial statement and tax purposes. The character of distributions made during the year from net investment income or net realized gains, if any, may differ from their ultimate characterization for federal income tax purposes. Also, due to the timing of dividend distributions, the fiscal year in which amounts are distributed may differ from the year that the income or realized gain (loss) were recorded by the Funds. The Trust has analyzed the Funds’ tax positions and has concluded that no liability for unrecognized tax benefits should be recorded related to uncertain tax positions. Further, the Trust is not aware of any tax positions for which it is reasonably possible that the total amounts of unrecognized tax benefits will significantly change in the next twelve months. The tax character of distributions paid by the Funds during the years ended December 31, 2016 and 2015 was as follows:
| | | | Tax-Exempt | | | Ordinary Income | |
| | | | 2016 | | | 2015 | | | 2016 | | | 2015 | |
| Core Equity Fund | | | $ | - | | | $ | - | | | $ | 5,855,360 | | | $ | 7,656,214 | |
| Small Companies Fund | | | | - | | | | - | | | | 848,536 | | | | 2,251,204 | |
| Tax-Exempt Bond Fund | | | | 21,330,974 | | | | 21,378,310 | | | | 97,304 | | | | 449,770 | |
| International Bond | | | | - | | | | - | | | | 9,674,768 | | | | 9,665,584 | |
| | | | Long-Term Capital Gains | |
| | | | 2016 | | | 2015 | |
| Core Equity Fund | | | $ | 18,781,172 | | | $ | 37,447,878 | |
| Small Companies Fund | | | | 12,075,262 | | | | 32,947,975 | |
| Tax-Exempt Bond Fund | | | | 1,167,286 | | | | 1,682,556 | |
| International Bond | | | | 12,673 | | | | 2,640,682 | |
CLEARWATER INVESTMENT TRUST
Notes to Financial Statements (unaudited)
June 30, 2017
As of June 30, 2017, the components of distributable earnings on a tax basis were as follows:
| | | Core Equity Fund | | | Small Companies Fund | | | Tax-Exempt Bond Fund | | | International Fund | |
| Undistributed ordinary income | | $ | 4,578,991 | | | $ | 2,746,100 | | | $ | - | | | $ | 7,695,566 | |
| Undistributed tax-exempt income | | | - | | | | - | | | | 5,263,658 | | | | - | |
| Undistributed capital gain | | | 22,555,912 | | | | 23,038,975 | | | | 591,290 | | | | 5,304,695 | |
| Accumulated capital losses and other | | | - | | | | - | | | | (947,648 | ) | | | - | |
| Unrealized appreciation | | | 256,617,378 | | | | 53,383,755 | | | | 20,895,879 | | | | 152,225,724 | |
| Total | | $ | 283,752,281 | | | $ | 79,168,830 | | | $ | 25,803,179 | | | $ | 165,225,985 | |
Distributions to shareholders from net investment income and net realized gain are determined in accordance with federal income tax regulations, which may differ from such amounts recorded in accordance with U.S. generally accepted accounting principles (“U.S. GAAP”) for financial reporting purposes. Accordingly, the Funds may make reclassifications among certain of their capital accounts in order to reflect the tax treatment for certain permanent differences that exist between federal income tax regulations and U.S. GAAP. These reclassifications are reported in order to reflect the tax treatment for certain permanent differences that exist between income tax regulations and U.S. GAAP. These reclassifications may relate to net operating losses, Section 988 currency gains and losses, Passive Foreign Investment Companies (“PFICs”) gains and losses, recharacterization of dividends from investments in Real Estate Investment Trusts (“REITs”) and Partnerships gains and losses. At December 31, 2016, the reclassifications utilized equalization accounting whereby a portion of redemption payments were treated as distributions. These reclassifications have no impact on the total net assets or the NAV per share of the Funds. At June 30, 2017, reclassifications have been recorded among the following capital accounts on the Statements of Assets and Liabilities:
| | | Core Equity Fund | | | Small Companies Fund | | | Tax-Exempt Bond Fund | | | International Fund | |
| Undistributed (overdistributed) net investment income | | $ | 798,702 | | | $ | 16,058 | | | $ | 11,555 | | | $ | 380,916 | |
| Accumulated net realized gain (loss) | | | (812,167 | ) | | | (16,058 | ) | | | (11,555 | ) | | | (380,916 | ) |
| Additonal paid-in capital | | | 13,465 | | | | - | | | | - | | | | - | |
| (j) | Distributions to Shareholders |
Distributions to shareholders from net investment income, if any, are declared annually for the Core Equity, Small Companies, and International Funds and declared daily, payable monthly, for the Tax-Exempt Bond Fund. Distributions to shareholders from net realized gains, if any, are declared annually for all Funds. Distributions are paid in cash or reinvested in additional shares at the direction of the shareholders. During the year ended December 31, 2016, the Core Equity and Small Companies Funds utilized equalization accounting with respect to distributions to shareholders, in order to keep remaining shareholders’ interest in undistributed income from being affected. Such equalization is recorded on the Statements of Changes in Net Assets.
CLEARWATER INVESTMENT TRUST
Notes to Financial Statements (unaudited)
June 30, 2017
The preparation of financial statements in conformity with U.S. GAAP requires management to make estimates and assumptions that affect the reported amounts of assets and liabilities and disclosure of contingent assets and liabilities at the date of the financial statements and the reported amounts of increase and decrease in net assets from operations during the period. Actual results could differ from those estimates.
| (l) | Recent Accounting Pronouncements |
On October 13, 2016, the SEC adopted new rules and forms, and amended existing rules and forms. The new and amended rules and forms are intended to modernize the reporting of information provided by funds and to improve the quality and type of information that funds provide to the SEC and investors. In part, the new and amended rules and forms amend Regulation S-X and require standardized, enhanced disclosure about derivatives in a Fund’s financial statements, as well as other amendments. The compliance date for the amendments of Regulation S-X is August 1, 2017 while the compliance date for the new form types and other rule amendments is on or after June 1, 2018. Management is evaluating the new and amended rules and forms to determine the impact to the Funds.
Under each Fund’s organizational documents, its officers and directors are indemnified against certain liabilities arising out of the performance of their duties to each Fund. In addition, certain of each Fund’s contracts with its service providers contain general indemnification clauses. Each Fund’s maximum exposure under these arrangements is unknown since the amount of any future claims that may be made against each Fund cannot be determined and each Fund has no historical basis for predicting the likelihood of any such claims. The Funds believe that the likelihood of any such claims is remote.
| (3) | Fair Value Measurements |
Fair value is an estimate of the price the Funds would receive upon selling a security in a timely transaction to an independent buyer in the principal or most advantageous market for the security. This guidance establishes a three-tier hierarchy to maximize the use of observable market data and minimize the use of unobservable inputs and to establish classification of fair value measurements for disclosure purposes. Various inputs are used in determining the value of the Funds’ investments, as described in Note 2(a). These inputs are summarized in the three broad levels listed below.
| ● | Level 1 – Unadjusted quoted market prices in active markets for identical securities on the measurement date. |
| ● | Level 2 – Other significant observable inputs including quoted prices for similar investments, interest rates, prepayment speeds, credit risk, etc. or quoted prices for identical or similar assets in markets that are not active. Inputs that are derived principally from or corroborated by observable market data are also considered Level 2 measurement. An adjustment to any observable input that is significant to the fair value may render the measurement a Level 3 measurement. |
| ● | Level 3 – Valuations based on unobservable inputs, which may include the Adviser’s own assumptions in determining the fair value of an investment. |
CLEARWATER INVESTMENT TRUST
Notes to Financial Statements (unaudited)
June 30, 2017
The inputs or methodology used for valuing securities are not necessarily an indication of the risk associated with investing in those securities and other financial instruments, if any. The following is a summary of the inputs used in valuing each Fund’s investments and other financial instruments, if any, which are carried at fair value, as of June 30, 2017.
In December 2016, FASB released Accounting Standards Update (“ASU”) 2016-19 that makes technical changes to various sections of the ASC, including Topic 820, Fair Value Measurement. The changes to Topic 820 are intended to clarify the difference between a valuation approach and a valuation technique. The changes to ASC 820-10-50-2 require a reporting entity to disclose, for Level 2 and Level 3 fair value measurements, a change in either or both a valuation approach and a valuation technique and the reason(s) for the change.The changes toTopic 820 are effective for fiscal years, and interim periods within those fiscal years, beginning after December 15, 2016. The Funds have adopted ASU 2016-19 for the period ended June 30, 2017.
| | | Core Equity Fund (a) | |
| | | Level 1 | | | Level 2 | | | Level 3 | | | Total | |
| Common Stocks | | $ | 491,734,414 | | | $ | - | | | $ | - | | | $ | 491,734,414 | |
| Rights | | | - | | | | - | | | | 1,675 | | | | 1,675 | |
| Short-Term Investments | | | 2,531,869 | | | | - | | | | - | | | | 2,531,869 | |
| Total | | $ | 494,266,283 | | | $ | - | | | $ | 1,675 | | | $ | 494,267,958 | |
| (a) | For the Core Equity Fund, the investment value is comprised of common stocks, rights and short-term investments. See the Fund’s Schedule of Investments for industry classification. Investments in equity and short-term securities generally are valued at the last sales price or the regular trading session closing price on the principal exchange or market where they are traded. Investments in rights generally are determined by taking into account the terms of the rights as well as the value of the underlying equity securities, which are determined by the valuation methodology described above. Two rights were deemed Level 3 classifications, as their trading was suspended pending corporate actions and these rights were valued at period end using internally determined prices. |
The Core Equity Fund records all transfers between levels based on valuations at the end of each reporting period. At June 30, 2017, there were no transfers between Level 1, Level 2 or Level 3 classifications based on levels assigned to the securities on December 31, 2016.
There were no significant Level 3 valuations for which significant unobservable inputs were used at June 30, 2017.
| | | Small Companies Fund (b) | |
| | | Level 1 | | | Level 2 | | | Level 3 | | | Total | |
| Common Stocks | | | | | | | | | | | | | | | | |
| Financials | | $ | 69,787,219 | | | $ | 73,684 | | | $ | - | | | $ | 69,860,903 | |
| All Other Industries | | | 268,692,781 | | | | - | | | | - | | | | 268,692,781 | |
| Short-Term Investments | | | 9,397,574 | | | | - | | | | - | | | | 9,397,574 | |
| Total | | $ | 347,877,574 | | | $ | 73,684 | | | $ | - | | | $ | 347,951,258 | |
CLEARWATER INVESTMENT TRUST
Notes to Financial Statements (unaudited)
June 30, 2017
| (b) | For the Small Companies Fund, the investment value is comprised of equity securities and short-term investments. See the Fund’s Schedule of Investments for industry classification. Investments in equity and short-term securities generally are valued at the last sales price or the regular trading session closing price on the principal exchange or market where they are traded.At June 30, 2017, two securities were valued at their bid prices, resulting in Level 2 classification. |
The Small Companies Fund records all transfers between levels based on valuations at the end of each reporting period.At June 30, 2017, there were no transfers between Level 1, Level 2 or Level 3 classifications based on levels assigned to the securities on December 31, 2016.
| | | Tax-Exempt Bond Fund (c) | |
| | | Level 1 | | | Level 2 | | | Level 3 | | | Total | |
| Closed-End Funds | | $ | 26,452,279 | | | $ | - | | | $ | - | | | $ | 26,452,279 | |
| Municipal Bonds | | | | | | | | | | | | | | | | |
| Airports | | | - | | | | 2,854,090 | | | | - | | | | 2,854,090 | |
| Bond Banks | | | - | | | | 532,295 | | | | - | | | | 532,295 | |
| Development | | | - | | | | 36,162,573 | | | | - | | | | 36,162,573 | |
| Education | | | - | | | | 39,837,013 | | | | - | | | | 39,837,013 | |
| Facilities | | | - | | | | 1,937,012 | | | | - | | | | 1,937,012 | |
| General | | | - | | | | 42,671,914 | | | | - | | | | 42,671,914 | |
| General Obligations | | | - | | | | 22,170,039 | | | | - | | | | 22,170,039 | |
| Higher Education | | | - | | | | 18,691,490 | | | | - | | | | 18,691,490 | |
| Housing | | | - | | | | 31,537,380 | | | | - | | | | 31,537,380 | |
| Medical | | | - | | | | 38,875,358 | | | | - | | | | 38,875,358 | |
| Mello-Roos | | | - | | | | 1,881,898 | | | | - | | | | 1,881,898 | |
| Multifamily Housing | | | - | | | | 37,959,669 | | | | - | | | | 37,959,669 | |
| Nursing Home | | | - | | | | 57,071,613 | | | | - | | | | 57,071,613 | |
| Power | | | - | | | | 3,810,356 | | | | - | | | | 3,810,356 | |
| School District | | | - | | | | 31,365,615 | | | | - | | | | 31,365,615 | |
| Single Family Housing | | | - | | | | 79,740,009 | | | | - | | | | 79,740,009 | |
| Student Loan | | | - | | | | 1,576,153 | | | | - | | | | 1,576,153 | |
| Transportation | | | - | | | | 7,254,771 | | | | - | | | | 7,254,771 | |
| Utilities | | | - | | | | 425,228 | | | | - | | | | 425,228 | |
| Water | | | - | | | | 6,189,942 | | | | - | | | | 6,189,942 | |
| Short-Term Investments | | | 16,470,923 | | | | - | | | | - | | | | 16,470,923 | |
| Total | | $ | 42,923,202 | | | $ | 462,544,418 | | | $ | - | | | $ | 505,467,620 | |
| (c) | For the Tax-Exempt Bond Fund, the investment value is comprised of closed-end funds, municipal bonds, and short-term investments. Investments in closed-end funds and short-term securities generally are valued at the last sales price or the regular trading session closing price on the principal exchange or market where they are traded. Investments in municipal bonds generally are based on valuations using adjusted evaluated prices provided by the primary pricing provider. The Board of Trustees has delegated to the Valuation Committee the responsibility to determine in good faith the fair value of securities for which no price quotation is available from an approved pricing service or broker-dealer at the time theTax-Exempt Bond Fund’s NAV is calculated, including securities for |
CLEARWATER INVESTMENT TRUST
Notes to Financial Statements (unaudited)
June 30, 2017
which the prices do not represent fair value or for which a significant event occurs that materially affects the value of the security after the close of the market on which the security principally trades and before the time the Tax-Exempt Bond Fund’s NAV is calculated.
The Tax-Exempt Bond Fund, records all transfers between levels based on valuations at the end of each reporting period. At June 30, 2017, for the Tax-Exempt Bond Fund, there were no transfers between Level 1, Level 2 or Level 3 classifications based on levels assigned to the securities on December 31, 2016.
There were no significant Level 3 valuations for which significant unobservable inputs were used at June 30, 2017.
| | | International Fund (d) | |
| | | Level 1 | | | Level 2 | | | Level 3 | | | Total | |
| Common Stocks | | | | | | | | | | | | | | | | |
| Thailand | | $ | 662,903 | | | $ | 1,069,101 | | | $ | - | | | $ | 1,732,004 | |
| All other countries | | | 545,915,835 | | | | - | | | | - | | | | 545,915,835 | |
| Convertible Preferred Stocks | | | 93,632 | | | | - | | | | - | | | | 93,632 | |
| Investment Companies | | | 2,169,000 | | | | - | | | | - | | | | 2,169,000 | |
| Master Limited Partnerships | | | 17 | | | | - | | | | - | | | | 17 | |
| Preferred Stocks | | | 4,420,517 | | | | - | | | | - | | | | 4,420,517 | |
| Rights | | | 1,384 | | | | - | | | | - | | | | 1,384 | |
| Short-Term Investments | | | 24,146,052 | | | | - | | | | - | | | | 24,146,052 | |
| Total | | $ | 577,409,340 | | | $ | 1,069,101 | | | $ | - | | | $ | 578,478,441 | |
| (d) | For the International Fund, the investment value is comprised of equity securities, MLPs, investment companies, rights and short-term investments. See the Fund’s Schedule of Investments for additional information on industry sector and currency concentration information. Investments in equity, MLPs and short-term securities generally are valued at the last sales price or the regular trading session closing price on the principal exchange or market where they are traded. Shares of open end investment companies are valued at their daily net asset value. Two inactively traded Thailand based securities were valued based on the prices of similar securities resulting in Level 2 classifications. At June 30, 2017, one security was deemed worthless, resulting in Level 3 classification. |
| International Fund | | | | | | | | | | | | |
| Other Financial Instruments | | Level 1 | | | Level 2 | | | Level 3 | | | Total | |
| Assets | | | | | | | | | | | | |
| Forward foreign currency exchange contracts | | $ | - | | | $ | 9,377 | | | $ | - | | | $ | - | |
| Liabilities | | | | | | | | | | | | | | | | |
| Forward foreign currency exchange contracts | | | - | | | | (69,789 | ) | | | - | | | | - | |
| Net Other Financial Instruments | | $ | - | | | $ | (60,412 | ) | | $ | - | | | $ | - | |
The forward foreign currency exchange contracts outstanding at June 30, 2017 are considered Level 2 investments due to the contracts being marked-to-market daily at the applicable exchange rates that have been adjusted from the initial quoted rate. Forward foreign currency exchange contracts are shown on a gross basis in the above table and on the Statements of Assets and Liabilities.
CLEARWATER INVESTMENT TRUST
Notes to Financial Statements (unaudited)
June 30, 2017
The International Fund records all transfers between levels based on valuations at the end of each reporting period. At June 30, 2017, there was one transfer from Level 3 to Level 1 classification based on the last traded price of the securities on December 31, 2016.
There were no significant Level 3 valuations for which significant unobservable inputs were used at June 30, 2017.
| (4) | Investment Security Transactions |
The cost of purchases and proceeds from sales of securities (excluding short-term securities) for the period ended June 30, 2017, were as follows:
| | | Purchases | | | Sales | |
| Core Equity Fund | | $ | 61,071,043 | | | $ | 70,863,034 | |
| Small Companies Fund | | | 128,139,799 | | | | 131,392,914 | |
| Tax-Exempt Bond Fund | | | 36,021,292 | | | | 32,771,005 | |
| International Fund | | | 156,557,002 | | | | 156,897,365 | |
| (5) | Capital Share Transactions |
Transactions in capital shares for the six months ended June 30, 2017 and the fiscal year ended December 31, 2016 were as follows:
| | | Core Equity Fund | | | Small Companies Fund | |
| | | 2017 | | | 2016 | | | 2017 | | | 2016 | |
| Sold | | | 50,349 | | | | 300,366 | | | | 58,369 | | | | 1,915,674 | |
| Issued for reinvestment of distributions | | | - | | | | 652,796 | | | | - | | | | 655,033 | |
| Redeemed | | | (383,210 | ) | | | (2,334,337 | ) | | | (603,552 | ) | | | (2,643,251 | ) |
| Net Increase (decrease) | | | (332,861 | ) | | | (1,381,175 | ) | | | (545,183 | ) | | | (72,544 | ) |
| | | Tax-Exempt Bond Fund | | | International Fund | |
| | | 2017 | | | 2016 | | | 2017 | | | 2016 | |
| Sold | | | 1,313,315 | | | | 1,899,036 | | | | 233,784 | | | | 2,532,939 | |
| Issued for reinvestment of distributions | | | 1,267,483 | | | | 2,207,354 | | | | - | | | | 694,441 | |
| Redeemed | | | (1,307,229 | ) | | | (5,753,602 | ) | | | (429,238 | ) | | | (1,998,537 | ) |
| Net Increase (decrease) | | | 1,273,569 | | | | (1,647,212 | ) | | | (195,454 | ) | | | 1,228,843 | |
CLEARWATER INVESTMENT TRUST
Notes to Financial Statements (unaudited)
June 30, 2017
| (6) | Capital Loss Carryforward |
For the period subsequent to October 31, 2016 through the fiscal year ended December 31, 2016, the following Funds incurred capital losses and/or Section 988 currency (gains) and losses yielding a net capital loss which each Fund intends to treat as having been incurred in the following fiscal year:
| | | Short-Term | | Long-Term | | Total | |
| Core Equity Fund | | $ | - | | | $ | - | | | $ | - | |
| Small Companies Fund | | | - | | | | - | | | | - | |
| Tax-Exempt Bond Fund | | | 112,705 | | | | - | | | | 112,705 | |
| International Fund | | | - | | | | - | | | | - | |
At June 30, 2017, the Funds had the following short-term and long-term capital loss carryforwards available to offset future net capital gains which do not expire. Future utilization of the capital loss carryforwards may be limited.
| | | Short-Term | | Long-Term | | Total | |
| Core Equity Fund | | $ | - | | | $ | - | | | $ | - | |
| Small Companies Fund | | | - | | | | - | | | | - | |
| Tax-Exempt Bond Fund | | | 289,002 | | | | 548,260 | | | | 837,262 | |
| International Fund | | | - | | | | - | | | | - | |
| (7) | Expenses and Related-Party Transactions |
The Trust has a contract for investment advisory services with the Adviser. Under terms of separate agreements, Core Equity Fund, Small Companies Fund, Tax-Exempt Bond Fund and International Fund each pay an investment advisory fee equal to an annual rate of 0.90%, 1.35%, 0.60% and 1.00%, respectively, of each Fund’s average daily net assets. The Adviser is responsible for the payment or reimbursement of all the Funds’ expenses, except brokerage, taxes, interest, and extraordinary expenses. From the beginning of the reporting period until March 15, 2017, the management fees and the corresponding voluntary waivers for the Funds were as follows:
| | | Management Fees Prior to March 16, 2017 |
| | | Management
Fee % | | Voluntary
Waiver % | | Net Fee
Actually
Paid % |
| Core Equity Fund | | 0.90 | | (0.46) | | 0.44 |
| Small Companies Fund | | 1.35 | | (0.32) | | 1.03 |
| Tax-Exempt Bond Fund | | 0.60 | | (0.26) | | 0.34 |
| International Fund | | 1.00 | | (0.30) | | 0.70 |
CLEARWATER INVESTMENT TRUST
Notes to Financial Statements (unaudited)
June 30, 2017
The Adviser has periodically modified its management fee for each of the Funds through voluntary waivers. Effective March 16, 2017, the net management fees actually paid for the Core Equity Fund, Small Companies Fund and the International Fund changed due to the Adviser’s modification of the voluntary waivers for those Funds as shown below:
| | | Management Fees Effective March 16, 2017 |
| | |
Management
Fee% | | Voluntary
Waiver % | | Net Fee
Actually
Paid % |
| Core Equity Fund | | 0.90 | | (0.53) | | 0.37 |
| Small Companies Fund | | 1.35 | | (0.39) | | 0.96 |
| Tax-Exempt Bond Fund | | 0.60 | | (0.26) | | 0.34 |
| International Fund | | 1.00 | | (0.35) | | 0.65 |
The Adviser currently intends to continue these voluntary waivers indefinitely. However, the Adviser may terminate these voluntary arrangements at any time.
In addition to fees and expenses which the Funds bear directly, the Funds indirectly bear a pro rata share of the fees and expenses of any acquired funds in which they invest, such as short-term investments in mutual funds or other investment companies and investments in closed-end funds. Such indirect expenses are not included in any of the reported expense ratios.
The Adviser has entered into subadvisory contracts with independent investment advisory firms for each Fund to provide daily investment management services. The subadvisory fees are based on each subadviser’s proportional net assets it currently manages within each Fund and are paid directly by the Adviser. For each subadviser, the fee schedule is detailed according to the following schedule:
The subadvisory fee for the Core Equity Fund, payable to Parametric, OSAM and AQR is equal to an annual rate of 0.15%, 0.35% and 0.35% of the portions of net assets managed, respectively.
The subadvisory fee for the Small Companies Fund, payable to Kennedy and Keeley-Teton for each of their respective portions of net assets managed is based on the following annual rates:
| | | Kennedy |
| Up to and including $50 Million | | 0.85% |
| Over $50 Million | | 0.80% |
| | | Keeley-Teton |
| First $2 Million | | 1.00% |
| Next $8 Million | | 0.85% |
| Over $10 Million | | 0.70% |
CLEARWATER INVESTMENT TRUST
Notes to Financial Statements (unaudited)
June 30, 2017
The subadvisory fee for the Tax-Exempt Bond Fund, payable to Sit for Sit’s portion of net assets managed is based on the following annual rates:
| | | Sit |
| Up to and including $20 Million | | 0.40% |
| Next $30 Million | | 0.30% |
| Next $25 Million | | 0.25% |
| Next $175 Million | | 0.20% |
| Over $250 Million | | 0.18% |
The subadvisory fee for the International Fund, payable to Parametric and WCM, is equal to an annual rate of 0.15% and 0.80% of the portions of net assets managed, respectively.
The subadvisory fee for the International Fund, payable to Denver, for its portion of net assets managed was based on the following annual rates:
| | | Denver |
| First $10 Million | | 1.25% |
| All assets in excess of $10 Million | | 0.85% |
The subadvisory fee for the International Fund, payable to Artisan Partners and Templeton for each of their respective portions of net assets managed is based on the following annual rates:
| | | Artisan
Partners |
| First $50 Million | | 0.80% |
| Next $50 Million | | 0.60% |
| All assets in excess of $100 Million | | 0.50% |
| | | Templeton |
| First $25 Million | | 0.95% |
| Next $25 Million | | 0.85% |
| Next $50 Million | | 0.75% |
| Next $150 Million | | 0.65% |
| Next $250 Million | | 0.55% |
| Over $500 Million | | 0.50% |
The Adviser has also engaged FCI as a subadviser for each Fund. FCI regularly provides the Funds with various investment-related services, including investment strategy advice, manager recommendations and related duties as requested by the Adviser. FCI also provides certain services related to due diligence, performance reporting, compliance, and other administrative functions, which support the investment management services and
CLEARWATER INVESTMENT TRUST
Notes to Financial Statements (unaudited)
June 30, 2017
subadviser oversight services provided to the Trust by the Adviser. For its services, FCI is compensated with a subadvisory fee payable by the Adviser of 0.20% of each Fund’s average daily net assets, paid on a quarterly basis. FCI is compensated out of the investment advisory fees the Adviser receives from the respective Funds. FCI has agreed to waive the difference between the amount calculated under the subadvisory fee schedule and an amount determined by multiplying the total number of hours worked by FCI in providing services under the subadvisory agreement by an hourly rate that is approved by the Adviser.
| (8) | Derivative Instruments |
Information concerning the types of derivatives in which the International Fund invests, the objectives for using them and their related risks can be found in Note 2 (c) and (d). Below are the types of derivatives held in the International Fund by location as presented in the Statements of Assets and Liabilities as of June 30, 2017, with additional detail on the net amounts impacting the Statements of Assets and Liabilities. The forward foreign currency exchange contracts presented below are not subject to master netting agreements or other similar agreements.
| ASSETS | | LIABILITIES |
| Name of Fund | | Derivative Type | | Statements of Assets
and Liabilities
Location | | Value | | | Statements of Assets
and Liabilities
Location | | Value | | Counterparty |
| International Fund | | Forward foreign currency exchange contracts | | Unrealized appreciation on forward foreign currency exchange contracts | | $ | 9,377 | | | Unrealized depreciation on forward foreign currency exchange contracts | | $ | 69,789 | | Northern Trust |
The following tables set forth by primary risk exposure the International Fund’s net realized gain (loss) and net increase (decrease) in appreciation/depreciation on forward foreign currency exchange contracts for the six months ended June 30, 2017:
| Name of Fund | | Derivative Type | | Statements of
Operations Location | | Value | | | Name of Fund | | Derivative Type | | Statements of
Operations Locations | | Value |
| International Fund | | Forward foreign currency exchange contracts | | Net realized gain (loss) on forward foreign currency exchange contracts | | $ | 67,575 | | | International Fund | | Forward foreign currency exchange contracts | | Net increase (decrease) in unrealized appreciation/depreciation on forward foreign currency exchange contracts | | $ | (279,959) |
CLEARWATER INVESTMENT TRUST
Notes to Financial Statements (unaudited)
June 30, 2017
Derivative transactions are measured in terms of the notional amount. The following table presents, for the International Fund, the number of transactions and weighted average notional amounts of forward foreign currency exchange contracts, which is indicative of the volume of derivative activity, for the six months ended June 30, 2017.
| International Fund |
Forward Foreign Currency
Exchange Contracts |
| | Number of
Transactions | | | | Weighted
Average Notional
Amount | |
| | 10 | | | $ | 5,385,154 | |
Management has evaluated subsequent events relating to the Funds through the date the financial statements were available to be issued and has concluded there are no such events or transactions requiring financial statement disclosure and/or adjustments to the financial statements except for the item noted below:
On July 3, 2017, the Board of Trustees approved the Funds to engage ReFlow Fund, LLC (“ReFlow”) for their liquidity program. For a fee, ReFlow provides each Fund with a potential source of cash to meet net shareholder redemptions through share purchases. ReFlow then generally redeems those shares when the Fund experiences net sales. ReFlow will periodically redeem its entire share position in a Fund and request that such redemption be met in kind in accordance with the Fund’s redemption in kind policies. As of the date of this report issuance, the Funds have not commenced any transactions with ReFlow.
CLEARWATER INVESTMENT TRUST
Schedule of Investments - Clearwater Core Equity Fund
June 30, 2017 (unaudited)
| Shares | | | Security | | Cost | | | Fair value (a) | | | Percent of
net assets | |
| Common Stocks: | | | | | | | | | | | | |
| Consumer Discretionary: | | | | | | | | | | | |
| | 1,500 | | | ADVANCE AUTO PARTS, INC. | | $ | 53,557 | | | | 174,885 | | | | | |
| | 6,150 | | | AMAZON.COM, INC.(b) | | | 274,721 | | | | 5,953,200 | | | | | |
| | 1,600 | | | AMC NETWORKS, INC., CLASS A(b) | | | 25,785 | | | | 85,456 | | | | | |
| | 1,100 | | | AUTOLIV, INC.(c) | | | 19,410 | | | | 120,780 | | | | | |
| | 498 | | | AUTOZONE, INC.(b) | | | 137,990 | | | | 284,089 | | | | | |
| | 87,423 | | | BEST BUY CO., INC. | | | 3,244,648 | | | | 5,011,961 | | | | | |
| | 1,400 | | | BIG LOTS, INC. | | | 15,477 | | | | 67,620 | | | | | |
| | 4,400 | | | BORGWARNER, INC. | | | 51,799 | | | | 186,384 | | | | | |
| | 750 | | | BRINKER INTERNATIONAL, INC. | | | 10,084 | | | | 28,575 | | | | | |
| | 561 | | | BURLINGTON STORES, INC.(b) | | | 47,657 | | | | 51,606 | | | | | |
| | 300 | | | CABLE ONE, INC. | | | 113,966 | | | | 213,270 | | | | | |
| | 4,168 | | | CARMAX, INC.(b) | | | 50,984 | | | | 262,834 | | | | | |
| | 1,377 | | | CARTER’S, INC. | | | 119,865 | | | | 122,484 | | | | | |
| | 18,017 | | | CBS CORP., CLASS B (NON VOTING) | | | 852,593 | | | | 1,149,124 | | | | | |
| | 3,229 | | | CHARTER COMMUNICATIONS, INC., CLASS A(b) | | | 121,025 | | | | 1,087,689 | | | | | |
| | 4,600 | | | CLEAR CHANNEL OUTDOOR HOLDINGS, INC., CLASS A | | | - | | | | 22,310 | | | | | |
| | 14,667 | | | COACH, INC. | | | 365,135 | | | | 694,336 | | | | | |
| | 83,388 | | | COMCAST CORP., CLASS A | | | 1,440,063 | | | | 3,245,461 | | | | | |
| | 4,600 | | | D.R. HORTON, INC. | | | 22,057 | | | | 159,022 | | | | | |
| | 3,015 | | | DARDEN RESTAURANTS, INC. | | | 180,904 | | | | 272,677 | | | | | |
| | 4,105 | | | DICK’S SPORTING GOODS, INC. | | | 138,642 | | | | 163,502 | | | | | |
| | 3,975 | | | DILLARD’S, INC., CLASS A | | | 222,098 | | | | 229,318 | | | | | |
| | 3,089 | | | DOLLAR GENERAL CORP. | | | 207,226 | | | | 222,686 | | | | | |
| | 8,584 | | | DOLLAR TREE, INC.(b) | | | 203,669 | | | | 600,193 | | | | | |
| | 900 | | | DOMINO’S PIZZA, INC. | | | 90,041 | | | | 190,377 | | | | | |
| | 2,955 | | | EXPEDIA, INC. | | | 207,889 | | | | 440,147 | | | | | |
| | 3,359 | | | FERRARI N.V.(c) | | | 255,443 | | | | 288,941 | | | | | |
| | 7,700 | | | FOOT LOCKER, INC. | | | 294,530 | | | | 379,456 | | | | | |
| | 38,163 | | | FORD MOTOR CO. | | | 164,117 | | | | 427,044 | | | | | |
| | 3,600 | | | GAMESTOP CORP., CLASS A | | | 14,505 | | | | 77,796 | | | | | |
| | 7,977 | | | GAP (THE), INC. | | | 211,934 | | | | 175,414 | | | | | |
| | 7,229 | | | GARMIN LTD.(c) | | | 282,862 | | | | 368,896 | | | | | |
| | 25,054 | | | GENERAL MOTORS CO. | | | 776,816 | | | | 875,136 | | | | | |
| | 25,361 | | | GENTEX CORP. | | | 276,468 | | | | 481,098 | | | | | |
| | 3,450 | | | GENUINE PARTS CO. | | | 102,424 | | | | 320,022 | | | | | |
| | 1,599 | | | GOODYEAR TIRE & RUBBER (THE) CO. | | | 46,171 | | | | 55,901 | | | | | |
| | 19,219 | | | GROUPON, INC.(b) | | | 70,098 | | | | 73,801 | | | | | |
| | 2,000 | | | HANESBRANDS, INC. | | | 9,893 | | | | 46,320 | | | | | |
| | 7,570 | | | HARLEY-DAVIDSON, INC. | | | 86,370 | | | | 408,931 | | | | | |
| | 3,884 | | | HASBRO, INC. | | | 281,693 | | | | 433,105 | | | | | |
| | 30,991 | | | HOME DEPOT (THE), INC. | | | 865,161 | | | | 4,754,019 | | | | | |
| | 305 | | | ILG, INC. | | | 1,053 | | | | 8,384 | | | | | |
| | 15,600 | | | INTERPUBLIC GROUP OF (THE) COS., INC. | | | 40,950 | | | | 383,760 | | | | | |
| | 19,726 | | | J.C. PENNEY CO., INC.(b) | | | 129,470 | | | | 91,726 | | | | | |
| | 940 | | | JOHN WILEY & SONS, INC., CLASS A | | | 48,495 | | | | 49,585 | | | | | |
| | 43,418 | | | KOHL’S CORP. | | | 1,631,361 | | | | 1,678,974 | | | | | |
| | 6,190 | | | L BRANDS, INC. | | | 70,745 | | | | 333,579 | | | | | |
| | 4,983 | | | LAS VEGAS SANDS CORP. | | | 158,264 | | | | 318,364 | | | | | |
| | 23,720 | | | LEAR CORP. | | | 2,727,443 | | | | 3,370,138 | | | | | |
| | 3,631 | | | LEGGETT & PLATT, INC. | | | 163,555 | | | | 190,736 | | | | | |
| | 2,900 | | | LENNAR CORP., CLASS A | | | 38,266 | | | | 154,628 | | | | | |
| | 783 | | | LIBERTY BROADBAND CORP., CLASS A(b) | | | 1,186 | | | | 67,174 | | | | | |
| | 1,566 | | | LIBERTY BROADBAND CORP., CLASS C(b) | | | 2,222 | | | | 135,851 | | | | | |
| | 1,189 | | | LIBERTY EXPEDIA HOLDINGS, INC., CLASS A(b) | | | 6,215 | | | | 64,230 | | | | | |
| | 5,832 | | | LIBERTY GLOBAL PLC, CLASS A(b)(c) | | | 42,377 | | | | 187,324 | | | | | |
| | 7,374 | | | LIBERTY GLOBAL PLC, CLASS C(b)(c) | | | 51,974 | | | | 229,921 | | | | | |
| | 9,800 | | | LIBERTY INTERACTIVE CORP. QVC GROUP, CLASS A(b) | | | 22,847 | | | | 240,492 | | | | | |
| | 3,132 | | | LIBERTY MEDIA CORP.-LIBERTY SIRIUSXM, CLASS A(b) | | | 2,687 | | | | 131,481 | | | | | |
| | 6,264 | | | LIBERTY MEDIA CORP.-LIBERTY SIRIUSXM, CLASS C(b) | | | 5,109 | | | | 261,209 | | | | | |
| | 1,080 | | | LIBERTY TRIPADVISOR HOLDINGS, INC., CLASS A(b) | | | 3,377 | | | | 12,528 | | | | | |
| | 1,783 | | | LIBERTY VENTURES, SERIES A(b) | | | 7,986 | | | | 93,233 | | | | | |
| | 1,200 | | | LKQ CORP.(b) | | | 14,970 | | | | 39,540 | | | | | |
| | 27,097 | | | MACY’S, INC. | | | 918,170 | | | | 629,734 | | | | | |
| | 5,537 | | | MARRIOTT INTERNATIONAL, INC., CLASS A | | | 73,149 | | | | 555,416 | | | | | |
| | 496 | | | MARRIOTT VACATIONS WORLDWIDE CORP. | | | 3,643 | | | | 58,404 | | | | | |
| | 30,437 | | | MCDONALD’S CORP. | | | 2,795,066 | | | | 4,661,731 | | | | | |
| | 15,865 | | | MELCO RESORTS & ENTERTAINMENT LTD. ADR(c)(d) | | | 331,523 | | | | 356,169 | | | | | |
| | 6,600 | | | MGM RESORTS INTERNATIONAL | | | 54,921 | | | | 206,514 | | | | | |
See accompanying notes to financial statements. | 25 | (Continued) |
CLEARWATER INVESTMENT TRUST
Schedule of Investments - Clearwater Core Equity Fund
June 30, 2017 (unaudited)
| Shares | | | Security | | Cost | | | Fair value (a) | | | Percent of
net assets | |
| | Consumer Discretionary (Cont’d): | | | | | | | | | | | | |
| | 2,099 | | | MICHAELS (THE) COS., INC.(b) | | $ | 45,372 | | | | 38,874 | | | | | |
| | 600 | | | MOHAWK INDUSTRIES, INC.(b) | | | 26,796 | | | | 145,014 | | | | | |
| | 2,049 | | | MURPHY USA, INC.(b) | | | 104,617 | | | | 151,851 | | | | | |
| | 4,600 | | | NETFLIX, INC.(b) | | | 38,319 | | | | 687,286 | | | | | |
| | 4,915 | | | NEWELL BRANDS, INC. | | | 52,223 | | | | 263,542 | | | | | |
| | 2,375 | | | NEWS CORP., CLASS A | | | 7,170 | | | | 32,538 | | | | | |
| | 17,600 | | | NIKE, INC., CLASS B | | | 255,946 | | | | 1,038,400 | | | | | |
| | 4,300 | | | NORDSTROM, INC. | | | 45,233 | | | | 205,669 | | | | | |
| | 117 | | | NVR, INC.(b) | | | 154,454 | | | | 282,041 | | | | | |
| | 2,195 | | | OMNICOM GROUP, INC. | | | 52,802 | | | | 181,966 | | | | | |
| | 2,251 | | | O’REILLY AUTOMOTIVE, INC.(b) | | | 290,427 | | | | 492,384 | | | | | |
| | 1,300 | | | PANERA BREAD CO., CLASS A(b) | | | 60,378 | | | | 409,032 | | | | | |
| | 370 | | | POOL CORP. | | | 34,226 | | | | 43,501 | | | | | |
| | 600 | | | PRICELINE GROUP (THE), INC.(b) | | | 55,053 | | | | 1,122,312 | | | | | |
| | 14,100 | | | PULTEGROUP, INC. | | | 58,797 | | | | 345,873 | | | | | |
| | 2,464 | | | PVH CORP. | | | 205,689 | | | | 282,128 | | | | | |
| | 1,500 | | | RALPH LAUREN CORP. | | | 31,320 | | | | 110,700 | | | | | |
| | 13,677 | | | ROSS STORES, INC. | | | 249,746 | | | | 789,573 | | | | | |
| | 3,903 | | | ROYAL CARIBBEAN CRUISES LTD. | | | 83,046 | | | | 426,325 | | | | | |
| | 3,846 | | | SCRIPPS NETWORKS INTERACTIVE, INC., CLASS A | | | 245,756 | | | | 262,720 | | | | | |
| | 33,788 | | | SIRIUS XM HOLDINGS, INC. | | | 180,766 | | | | 184,820 | | | | | |
| | 689 | | | SIX FLAGS ENTERTAINMENT CORP. | | | 38,181 | | | | 41,071 | | | | | |
| | 28,500 | | | STARBUCKS CORP. | | | 182,045 | | | | 1,661,835 | | | | | |
| | 28,480 | | | TARGET CORP. | | | 1,788,159 | | | | 1,489,219 | | | | | |
| | 5,700 | | | TEGNA, INC. | | | 26,227 | | | | 82,137 | | | | | |
| | 860 | | | TESLA, INC.(b) | | | 22,377 | | | | 310,985 | | | | | |
| | 4,136 | | | THOR INDUSTRIES, INC. | | | 148,062 | | | | 432,295 | | | | | |
| | 1,400 | | | TIFFANY & CO. | | | 35,210 | | | | 131,418 | | | | | |
| | 11,833 | | | TIME WARNER, INC. | | | 232,643 | | | | 1,188,152 | | | | | |
| | 1,829 | | | TIME, INC. | | | 12,640 | | | | 26,246 | | | | | |
| | 11,440 | | | TJX (THE) COS., INC. | | | 176,444 | | | | 825,625 | | | | | |
| | 1,466 | | | TOPBUILD CORP.(b) | | | 11,809 | | | | 77,801 | | | | | |
| | 810 | | | TRIPADVISOR, INC.(b) | | | 13,993 | | | | 30,942 | | | | | |
| | 2,387 | | | TUPPERWARE BRANDS CORP. | | | 142,995 | | | | 167,639 | | | | | |
| | 9,600 | | | TWENTY-FIRST CENTURY FOX, INC., CLASS A | | | 54,697 | | | | 272,064 | | | | | |
| | 730 | | | ULTA BEAUTY, INC.(b) | | | 109,768 | | | | 209,758 | | | | | |
| | 800 | | | UNDER ARMOUR, INC., CLASS A(b) | | | 9,641 | | | | 17,408 | | | | | |
| | 906 | | | UNDER ARMOUR, INC., CLASS C(b) | | | 10,146 | | | | 18,265 | | | | | |
| | 6,800 | | | VF CORP. | | | 87,065 | | | | 391,680 | | | | | |
| | 27,560 | | | WALT DISNEY (THE) CO. | | | 532,656 | | | | 2,928,250 | | | | | |
| | 2,100 | | | WHIRLPOOL CORP. | | | 89,510 | | | | 402,402 | | | | | |
| | 10,325 | | | WYNDHAM WORLDWIDE CORP. | | | 435,839 | | | | 1,036,733 | | | | | |
| | 1,600 | | | WYNN RESORTS LTD. | | | 32,322 | | | | 214,592 | | | | | |
| | 4,416 | | | YUM CHINA HOLDINGS, INC.(b) | | | 9,382 | | | | 174,123 | | | | | |
| | 23,727 | | | YUM! BRANDS, INC. | | | 1,022,518 | | | | 1,750,104 | | | | | |
| | | | | | | | 28,805,259 | | | | 66,093,984 | | | | 13.35 | % |
| | Consumer Staples: | | | | | | | | | | | | |
| | 25,100 | | | ALTRIA GROUP, INC. | | | 94,284 | | | | 1,869,197 | | | | | |
| | 10,300 | | | ARCHER-DANIELS-MIDLAND CO. | | | 188,618 | | | | 426,214 | | | | | |
| | 5,832 | | | BROWN-FORMAN CORP., CLASS B | | | 57,343 | | | | 283,435 | | | | | |
| | 8,000 | | | CHURCH & DWIGHT CO., INC. | | | 100,310 | | | | 415,040 | | | | | |
| | 57,881 | | | COCA-COLA (THE) CO. | | | 869,464 | | | | 2,595,963 | | | | | |
| | 1,280 | | | COLGATE-PALMOLIVE CO. | | | 36,019 | | | | 94,886 | | | | | |
| | 1,900 | | | CONAGRA BRANDS, INC. | | | 26,152 | | | | 67,944 | | | | | |
| | 4,600 | | | CONSTELLATION BRANDS, INC., CLASS A | | | 63,227 | | | | 891,158 | | | | | |
| | 8,172 | | | COSTCO WHOLESALE CORP. | | | 290,372 | | | | 1,306,948 | | | | | |
| | 7,625 | | | CVS HEALTH CORP. | | | 236,748 | | | | 613,507 | | | | | |
| | 8,318 | | | DR. PEPPER SNAPPLE GROUP, INC. | | | 307,779 | | | | 757,853 | | | | | |
| | 2,391 | | | ENERGIZER HOLDINGS, INC. | | | 112,183 | | | | 114,816 | | | | | |
| | 3,734 | | | ESTEE LAUDER (THE) COS., INC., CLASS A | | | 70,943 | | | | 358,389 | | | | | |
| | 12,400 | | | GENERAL MILLS, INC. | | | 277,056 | | | | 686,960 | | | | | |
| | 3,300 | | | HERBALIFE LTD.(b) | | | 45,262 | | | | 235,389 | | | | | |
| | 1,642 | | | HERSHEY (THE) CO. | | | 60,568 | | | | 176,302 | | | | | |
| | 4,800 | | | HORMEL FOODS CORP. | | | 43,206 | | | | 163,728 | | | | | |
| | 12,980 | | | INGREDION, INC. | | | 1,315,492 | | | | 1,547,346 | | | | | |
| | 4,298 | | | JM SMUCKER (THE) CO. | | | 418,518 | | | | 508,582 | | | | | |
| | 1,550 | | | KIMBERLY-CLARK CORP. | | | 69,760 | | | | 200,121 | | | | | |
| | 5,579 | | | KRAFT HEINZ (THE) CO. | | | 29,025 | | | | 477,786 | | | | | |
See accompanying notes to financial statements. | 26 | (Continued) |
CLEARWATER INVESTMENT TRUST
Schedule of Investments - Clearwater Core Equity Fund
June 30, 2017 (unaudited)
| Shares | | | Security | | Cost | | | Fair value (a) | | | Percent of
net assets | |
| | Consumer Staples (Cont’d): | | | | | | | | | | | |
| | 26,800 | | | KROGER (THE) CO. | | $ | 228,089 | | | | 624,976 | | | | | |
| | 633 | | | LAMB WESTON HOLDINGS, INC. | | | 7,452 | | | | 27,877 | | | | | |
| | 700 | | | MCCORMICK & CO., INC. (NON VOTING) | | | 21,613 | | | | 68,257 | | | | | |
| | 4,114 | | | MOLSON COORS BREWING CO., CLASS B | | | 258,129 | | | | 355,203 | | | | | |
| | 21,438 | | | MONDELEZ INTERNATIONAL, INC., CLASS A | | | 139,524 | | | | 925,907 | | | | | |
| | 6,654 | | | MONSTER BEVERAGE CORP.(b) | | | 172,029 | | | | 330,571 | | | | | |
| | 4,924 | | | NU SKIN ENTERPRISES, INC., CLASS A | | | 174,547 | | | | 309,424 | | | | | |
| | 8,991 | | | PEPSICO, INC. | | | 320,746 | | | | 1,038,371 | | | | | |
| | 28,832 | | | PHILIP MORRIS INTERNATIONAL, INC. | | | 248,821 | | | | 3,386,318 | | | | | |
| | 2,305 | | | PILGRIM’S PRIDE CORP.(b) | | | 49,839 | | | | 50,526 | | | | | |
| | 6,000 | | | PINNACLE FOODS, INC. | | | 219,854 | | | | 356,400 | | | | | |
| | 200 | | | POST HOLDINGS, INC.(b) | | | 4,616 | | | | 15,530 | | | | | |
| | 44,473 | | | PROCTER & GAMBLE (THE) CO. | | | 1,325,131 | | | | 3,875,822 | | | | | |
| | 5,596 | | | REYNOLDS AMERICAN, INC. | | | 27,316 | | | | 363,964 | | | | | |
| | 1,900 | | | SPECTRUM BRANDS HOLDINGS, INC. | | | 176,648 | | | | 237,576 | | | | | |
| | 1,963 | | | SPROUTS FARMERS MARKET, INC.(b) | | | 43,420 | | | | 44,501 | | | | | |
| | 15,381 | | | SYSCO CORP. | | | 485,645 | | | | 774,126 | | | | | |
| | 16,391 | | | TYSON FOODS, INC., CLASS A | | | 599,633 | | | | 1,026,568 | | | | | |
| | 19,650 | | | WALGREENS BOOTS ALLIANCE, INC. | | | 224,986 | | | | 1,538,791 | | | | | |
| | 21,057 | | | WAL-MART STORES, INC. | | | 1,521,316 | | | | 1,593,594 | | | | | |
| | 6,000 | | | WHOLE FOODS MARKET, INC. | | | 64,425 | | | | 252,660 | | | | | |
| | | | | | | | 11,026,108 | | | | 30,988,526 | | | | 6.26 | % |
| | Energy: | | | | | | | | | | | | | | | |
| | 3,346 | | | ANADARKO PETROLEUM CORP. | | | 58,107 | | | | 151,708 | | | | | |
| | 500 | | | APACHE CORP. | | | 18,831 | | | | 23,965 | | | | | |
| | 800 | | | BAKER HUGHES, INC. | | | 24,230 | | | | 43,608 | | | | | |
| | 56 | | | CALIFORNIA RESOURCES CORP.(b) | | | 22 | | | | 479 | | | | | |
| | 9,400 | | | CHESAPEAKE ENERGY CORP.(b) | | | 48,316 | | | | 46,718 | | | | | |
| | 32,795 | | | CHEVRON CORP. | | | 1,428,027 | | | | 3,421,502 | | | | | |
| | 10,831 | | | CHINA PETROLEUM & CHEMICAL CORP. ADR(c)(d) | | | 871,472 | | | | 851,317 | | | | | |
| | 500 | | | CIMAREX ENERGY CO. | | | 32,151 | | | | 47,005 | | | | | |
| | 1,700 | | | CONCHO RESOURCES, INC.(b) | | | 49,632 | | | | 206,601 | | | | | |
| | 23,044 | | | CONOCOPHILLIPS | | | 383,142 | | | | 1,013,014 | | | | | |
| | 3,600 | | | CONSOL ENERGY, INC.(b) | | | 30,888 | | | | 53,784 | | | | | |
| | 2,000 | | | CONTINENTAL RESOURCES, INC.(b) | | | 20,765 | | | | 64,660 | | | | | |
| | 1,900 | | | DIAMOND OFFSHORE DRILLING, INC.(b) | | | 28,211 | | | | 20,577 | | | | | |
| | 6,000 | | | DIAMONDBACK ENERGY, INC.(b) | | | 570,297 | | | | 532,860 | | | | | |
| | 9,794 | | | ENBRIDGE, INC.(c) | | | 137,797 | | | | 389,899 | | | | | |
| | 1,300 | | | ENERGEN CORP.(b) | | | 44,343 | | | | 64,181 | | | | | |
| | 3,700 | | | ENSCO PLC, CLASS A(c) | | | 30,808 | | | | 19,092 | | | | | |
| | 9,600 | | | EOG RESOURCES, INC. | | | 62,765 | | | | 868,992 | | | | | |
| | 4,000 | | | EQT CORP. | | | 132,900 | | | | 234,360 | | | | | |
| | 43,051 | | | EXXON MOBIL CORP. | | | 1,607,797 | | | | 3,475,507 | | | | | |
| | 10,158 | | | HALLIBURTON CO. | | | 138,080 | | | | 433,848 | | | | | |
| | 3,100 | | | HELMERICH & PAYNE, INC. | | | 39,003 | | | | 168,454 | | | | | |
| | 2,400 | | | HOLLYFRONTIER CORP. | | | 22,578 | | | | 65,928 | | | | | |
| | 7,312 | | | KINDER MORGAN, INC. | | | 64,699 | | | | 140,098 | | | | | |
| | 2,900 | | | LAREDO PETROLEUM, INC.(b) | | | 31,813 | | | | 30,508 | | | | | |
| | 647 | | | MARATHON PETROLEUM CORP. | | | 34,278 | | | | 33,858 | | | | | |
| | 3,000 | | | MURPHY OIL CORP. | | | 39,255 | | | | 76,890 | | | | | |
| | 2,400 | | | NABORS INDUSTRIES LTD. | | | 28,313 | | | | 19,536 | | | | | |
| | 4,022 | | | NATIONAL OILWELL VARCO, INC. | | | 51,730 | | | | 132,485 | | | | | |
| | 5,095 | | | NEWFIELD EXPLORATION CO.(b) | | | 147,584 | | | | 145,004 | | | | | |
| | 3,800 | | | NOBLE ENERGY, INC. | | | 20,499 | | | | 107,540 | | | | | |
| | 6,000 | | | OCCIDENTAL PETROLEUM CORP. | | | 54,261 | | | | 359,220 | | | | | |
| | 2,000 | | | ONEOK, INC. | | | 27,592 | | | | 104,320 | | | | | |
| | 15,390 | | | PATTERSON-UTI ENERGY, INC. | | | 207,935 | | | | 310,724 | | | | | |
| | 13,372 | | | PHILLIPS 66 | | | 156,993 | | | | 1,105,731 | | | | | |
| | 3,200 | | | PIONEER NATURAL RESOURCES CO. | | | 48,507 | | | | 510,656 | | | | | |
| | 2,100 | | | QEP RESOURCES, INC.(b) | | | 28,224 | | | | 21,210 | | | | | |
| | 11,647 | | | RICE ENERGY, INC.(b) | | | 225,553 | | | | 310,160 | | | | | |
| | 2,000 | | | ROWAN COS. PLC, CLASS A(b) | | | 28,555 | | | | 20,480 | | | | | |
| | 13,636 | | | SCHLUMBERGER LTD. | | | 234,840 | | | | 897,794 | | | | | |
| | 1,900 | | | SM ENERGY CO. | | | 38,102 | | | | 31,407 | | | | | |
| | 5,800 | | | SOUTHWESTERN ENERGY CO.(b) | | | 44,631 | | | | 35,264 | | | | | |
| | 1,100 | | | TARGA RESOURCES CORP. | | | 27,709 | | | | 49,720 | | | | | |
| | 11,874 | | | TESORO CORP. | | | 850,649 | | | | 1,111,406 | | | | | |
| | 6,680 | | | TRANSOCEAN LTD.(b)(c) | | | 78,926 | | | | 54,976 | | | | | |
See accompanying notes to financial statements. | 27 | (Continued) |
CLEARWATER INVESTMENT TRUST
Schedule of Investments - Clearwater Core Equity Fund
June 30, 2017 (unaudited)
| Shares | | | Security | | Cost | | | Fair value (a) | | | Percent of
net assets | |
| | Energy (Cont’d): | | | | | | | | | | | | |
| | 67,868 | | | VALERO ENERGY CORP. | | $ | 3,217,924 | | | | 4,578,375 | | | | | |
| | 4,600 | | | WHITING PETROLEUM CORP.(b) | | | 37,134 | | | | 25,346 | | | | | |
| | 5,200 | | | WPX ENERGY, INC.(b) | | | 50,544 | | | | 50,232 | | | | | |
| | | | | | | | 11,556,412 | | | | 22,460,999 | | | | 4.54 | % |
| | Financials: | | | | | | | | | | | | |
| | 82,320 | | | AEGON N.V. (REGISTERED)(c) | | | 450,407 | | | | 420,655 | | | | | |
| | 600 | | | AFFILIATED MANAGERS GROUP, INC. | | | 35,024 | | | | 99,516 | | | | | |
| | 11,757 | | | AFLAC, INC. | | | 621,464 | | | | 913,284 | | | | | |
| | 500 | | | ALLEGHANY CORP.(b) | | | 140,685 | | | | 297,400 | | | | | |
| | 20,390 | | | ALLIANZ S.E. ADR(c)(d) | | | 310,533 | | | | 403,212 | | | | | |
| | 8,100 | | | ALLIED WORLD ASSURANCE CO. HOLDINGS A.G.(c) | | | 86,630 | | | | 428,490 | | | | | |
| | 15,823 | | | ALLSTATE (THE) CORP. | | | 682,836 | | | | 1,399,386 | | | | | |
| | 19,826 | | | ALLY FINANCIAL, INC. | | | 404,611 | | | | 414,363 | | | | | |
| | 10,133 | | | AMERICAN EXPRESS CO. | | | 257,999 | | | | 853,604 | | | | | |
| | 4,900 | | | AMERICAN FINANCIAL GROUP, INC. | | | 220,290 | | | | 486,913 | | | | | |
| | 6,100 | | | AMERICAN INTERNATIONAL GROUP, INC. | | | 143,498 | | | | 381,372 | | | | | |
| | 28,009 | | | AMERIPRISE FINANCIAL, INC. | | | 2,590,894 | | | | 3,565,266 | | | | | |
| | 5,829 | | | AON PLC(c) | | | 230,910 | | | | 774,966 | | | | | |
| | 9,443 | | | ARCH CAPITAL GROUP LTD.(b)(c) | | | 443,802 | | | | 880,937 | | | | | |
| | 1,600 | | | ARTHUR J. GALLAGHER & CO. | | | 34,040 | | | | 91,600 | | | | | |
| | 3,116 | | | ASSOCIATED BANC-CORP | | | 61,095 | | | | 78,523 | | | | | |
| | 4,900 | | | ASSURANT, INC. | | | 218,575 | | | | 508,081 | | | | | |
| | 14,090 | | | ASSURED GUARANTY LTD.(c) | | | 367,190 | | | | 588,117 | | | | | |
| | 24,328 | | | AXA S.A. ADR(c)(d) | | | 491,239 | | | | 670,480 | | | | | |
| | 4,327 | | | AXIS CAPITAL HOLDINGS LTD.(c) | | | 209,054 | | | | 279,784 | | | | | |
| | 255,260 | | | BANK OF AMERICA CORP. | | | 3,718,923 | | | | 6,192,608 | | | | | |
| | 15,858 | | | BANK OF NEW YORK MELLON (THE) CORP. | | | 483,356 | | | | 809,075 | | | | | |
| | 11,218 | | | BB&T CORP. | | | 330,739 | | | | 509,409 | | | | | |
| | 19,197 | | | BERKSHIRE HATHAWAY, INC., CLASS B(b) | | | 1,870,829 | | | | 3,251,396 | | | | | |
| | 14,590 | | | CAPITAL ONE FINANCIAL CORP. | | | 689,445 | | | | 1,205,426 | | | | | |
| | 21,400 | | | CHARLES SCHWAB (THE) CORP. | | | 186,608 | | | | 919,344 | | | | | |
| | 6,250 | | | CHUBB LTD.(c) | | | 587,621 | | | | 908,625 | | | | | |
| | 17,643 | | | CINCINNATI FINANCIAL CORP. | | | 1,115,506 | | | | 1,278,235 | | | | | |
| | 131 | | | CIT GROUP, INC. | | | 5,356 | | | | 6,380 | | | | | |
| | 45,846 | | | CITIGROUP, INC. | | | 2,267,734 | | | | 3,066,181 | | | | | |
| | 28,921 | | | CITIZENS FINANCIAL GROUP, INC. | | | 1,038,076 | | | | 1,031,901 | | | | | |
| | 3,385 | | | CME GROUP, INC. | | | 342,594 | | | | 423,937 | | | | | |
| | 2,667 | | | COMERICA, INC. | | | 184,080 | | | | 195,331 | | | | | |
| | 500 | | | CREDIT ACCEPTANCE CORP.(b) | | | 86,421 | | | | 128,570 | | | | | |
| | 31,980 | | | DISCOVER FINANCIAL SERVICES | | | 1,283,558 | | | | 1,988,836 | | | | | |
| | 13,477 | | | E*TRADE FINANCIAL CORP.(b) | | | 300,741 | | | | 512,530 | | | | | |
| | 1,527 | | | EAST WEST BANCORP, INC. | | | 85,687 | | | | 89,452 | | | | | |
| | 1,649 | | | EVEREST RE GROUP LTD.(c) | | | 296,126 | | | | 419,819 | | | | | |
| | 71,941 | | | FIFTH THIRD BANCORP | | | 1,381,999 | | | | 1,867,588 | | | | | |
| | 400 | | | FIRST CITIZENS BANCSHARES, INC., CLASS A | | | 57,523 | | | | 149,080 | | | | | |
| | 36,400 | | | FIRST HORIZON NATIONAL CORP. | | | 273,237 | | | | 634,088 | | | | | |
| | 1,863 | | | FNF GROUP | | | 21,555 | | | | 83,518 | | | | | |
| | 620 | | | FNFV GROUP(b) | | | 2,893 | | | | 9,796 | | | | | |
| | 8,577 | | | FRANKLIN RESOURCES, INC. | | | 158,011 | | | | 384,164 | | | | | |
| | 12,925 | | | GOLDMAN SACHS GROUP (THE), INC. | | | 1,744,285 | | | | 2,868,058 | | | | | |
| | 3,000 | | | HANOVER INSURANCE GROUP (THE), INC. | | | 215,948 | | | | 265,890 | | | | | |
| | 38,841 | | | HARTFORD FINANCIAL SERVICES GROUP (THE), INC. | | | 1,555,786 | | | | 2,041,871 | | | | | |
| | 102,753 | | | HUNTINGTON BANCSHARES, INC. | | | 1,039,961 | | | | 1,389,221 | | | | | |
| | 505 | | | INTERCONTINENTAL EXCHANGE, INC. | | | 12,819 | | | | 33,290 | | | | | |
| | 2,700 | | | INVESCO LTD. | | | 32,171 | | | | 95,013 | | | | | |
| | 15,903 | | | JANUS HENDERSON GROUP PLC(b)(c) | | | 222,792 | | | | 526,548 | | | | | |
| | 95,202 | | | JPMORGAN CHASE & CO. | | | 4,292,847 | | | | 8,701,463 | | | | | |
| | 50,700 | | | KEYCORP | | | 831,172 | | | | 950,118 | | | | | |
| | 3,752 | | | LEGG MASON, INC. | | | 52,584 | | | | 143,176 | | | | | |
| | 23,233 | | | LINCOLN NATIONAL CORP. | | | 1,184,990 | | | | 1,570,086 | | | | | |
| | 1,300 | | | LOEWS CORP. | | | 10,310 | | | | 60,853 | | | | | |
| | 2,482 | | | M&T BANK CORP. | | | 387,425 | | | | 401,960 | | | | | |
| | 200 | | | MARKEL CORP.(b) | | | 67,789 | | | | 195,172 | | | | | |
| | 7,137 | | | MARSH & MCLENNAN COS., INC. | | | 336,988 | | | | 556,401 | | | | | |
| | 1,300 | | | MERCURY GENERAL CORP. | | | 38,019 | | | | 70,200 | | | | | |
| | 12,161 | | | METLIFE, INC. | | | 444,606 | | | | 668,125 | | | | | |
| | 2,200 | | | MOODY’S CORP. | | | 77,502 | | | | 267,696 | | | | | |
| | 49,528 | | | MORGAN STANLEY | | | 1,664,976 | | | | 2,206,968 | | | | | |
See accompanying notes to financial statements. | 28 | (Continued) |
CLEARWATER INVESTMENT TRUST
Schedule of Investments - Clearwater Core Equity Fund
June 30, 2017 (unaudited)
| Shares | | | Security | | Cost | | | Fair value (a) | | | Percent of
net assets | |
| | Financials (Cont’d): | | | | | | | | | | | | |
| | 16,662 | | | MSCI, INC. | | $ | 1,181,714 | | | | 1,716,019 | | | | | |
| | 5,900 | | | NASDAQ, INC. | | | 240,309 | | | | 421,791 | | | | | |
| | 34,355 | | | NAVIENT CORP. | | | 402,517 | | | | 572,011 | | | | | |
| | 5,552 | | | PACWEST BANCORP | | | 115,642 | | | | 259,278 | | | | | |
| | 15,807 | | | PNC FINANCIAL SERVICES GROUP (THE), INC. | | | 1,128,585 | | | | 1,973,820 | | | | | |
| | 8,040 | | | POPULAR, INC.(c) | | | 229,520 | | | | 335,348 | | | | | |
| | 9,008 | | | PRINCIPAL FINANCIAL GROUP, INC. | | | 378,450 | | | | 577,143 | | | | | |
| | 700 | | | PROASSURANCE CORP. | | | 36,774 | | | | 42,560 | | | | | |
| | 20,637 | | | PROGRESSIVE (THE) CORP. | | | 504,643 | | | | 909,885 | | | | | |
| | 27,632 | | | PRUDENTIAL FINANCIAL, INC. | | | 1,988,535 | | | | 2,988,124 | | | | | |
| | 89,415 | | | REGIONS FINANCIAL CORP. | | | 1,160,173 | | | | 1,309,036 | | | | | |
| | 3,371 | | | REINSURANCE GROUP OF AMERICA, INC. | | | 296,860 | | | | 432,803 | | | | | |
| | 1,379 | | | RENAISSANCERE HOLDINGS LTD.(c) | | | 146,120 | | | | 191,750 | | | | | |
| | 3,151 | | | ROYAL BANK OF CANADA(c) | | | 75,539 | | | | 228,511 | | | | | |
| | 3,600 | | | S&P GLOBAL, INC. | | | 84,305 | | | | 525,564 | | | | | |
| | 7,500 | | | SEI INVESTMENTS CO. | | | 108,537 | | | | 403,350 | | | | | |
| | 10,100 | | | SLM CORP.(b) | | | 36,679 | | | | 116,150 | | | | | |
| | 43,633 | | | SOCIETE GENERALE S.A. ADR(c)(d) | | | 290,839 | | | | 477,127 | | | | | |
| | 1,313 | | | STATE STREET CORP. | | | 105,277 | | | | 117,816 | | | | | |
| | 13,722 | | | SUNTRUST BANKS, INC. | | | 405,753 | | | | 778,312 | | | | | |
| | 26,145 | | | SWISS RE A.G. ADR(c)(d) | | | 573,164 | | | | 596,890 | | | | | |
| | 6,025 | | | SYNCHRONY FINANCIAL | | | 175,642 | | | | 179,666 | | | | | |
| | 4,704 | | | SYNOVUS FINANCIAL CORP. | | | 83,310 | | | | 208,105 | | | | | |
| | 6,349 | | | T. ROWE PRICE GROUP, INC. | | | 125,884 | | | | 471,159 | | | | | |
| | 44,711 | | | TCF FINANCIAL CORP. | | | 725,856 | | | | 712,693 | | | | | |
| | 2,600 | | | TFS FINANCIAL CORP. | | | 25,038 | | | | 40,222 | | | | | |
| | 2,468 | | | TORCHMARK CORP. | | | 145,321 | | | | 188,802 | | | | | |
| | 23,807 | | | TRAVELERS (THE) COS., INC. | | | 1,850,935 | | | | 3,012,300 | | | | | |
| | 30,894 | | | UNUM GROUP | | | 1,064,293 | | | | 1,440,587 | | | | | |
| | 36,223 | | | US BANCORP | | | 1,268,185 | | | | 1,880,698 | | | | | |
| | 6,518 | | | VALIDUS HOLDINGS LTD.(c) | | | 251,458 | | | | 338,740 | | | | | |
| | 1,800 | | | WASHINGTON FEDERAL, INC. | | | 23,535 | | | | 59,760 | | | | | |
| | 85,998 | | | WELLS FARGO & CO. | | | 1,399,550 | | | | 4,765,149 | | | | | |
| | 1,705 | | | WESTERN ALLIANCE BANCORP(b) | | | 83,079 | | | | 83,886 | | | | | |
| | 300 | | | WHITE MOUNTAINS INSURANCE GROUP LTD. | | | 194,754 | | | | 260,589 | | | | | |
| | 6,106 | | | WR BERKLEY CORP. | | | 273,043 | | | | 422,352 | | | | | |
| | 31,613 | | | XL GROUP LTD.(c) | | | 1,267,410 | | | | 1,384,649 | | | | | |
| | 21,862 | | | ZIONS BANCORPORATION | | | 872,605 | | | | 959,960 | | | | | |
| | | | | | | | 58,302,197 | | | | 93,995,952 | | | | 18.98 | % |
| | Health Care: | | | | | | | | | | | | | | | |
| | 12,487 | | | ABBOTT LABORATORIES | | | 246,035 | | | | 606,993 | | | | | |
| | 12,835 | | | ABBVIE, INC. | | | 229,019 | | | | 930,666 | | | | | |
| | 8,291 | | | AETNA, INC. | | | 427,221 | | | | 1,258,822 | | | | | |
| | 4,120 | | | AGILENT TECHNOLOGIES, INC. | | | 181,587 | | | | 244,357 | | | | | |
| | 1,000 | | | AKORN, INC.(b) | | | 32,920 | | | | 33,540 | | | | | |
| | 3,000 | | | ALEXION PHARMACEUTICALS, INC.(b) | | | 58,087 | | | | 365,010 | | | | | |
| | 737 | | | ALIGN TECHNOLOGY, INC.(b) | | | 64,241 | | | | 110,638 | | | | | |
| | 4,359 | | | ALLERGAN PLC | | | 128,625 | | | | 1,059,629 | | | | | |
| | 4,700 | | | ALLSCRIPTS HEALTHCARE SOLUTIONS, INC.(b) | | | 50,008 | | | | 59,972 | | | | | |
| | 7,200 | | | AMERISOURCEBERGEN CORP. | | | 115,968 | | | | 680,616 | | | | | |
| | 18,131 | | | AMGEN, INC. | | | 418,978 | | | | 3,122,702 | | | | | |
| | 7,113 | | | ANTHEM, INC. | | | 270,687 | | | | 1,338,169 | | | | | |
| | 8,439 | | | BAXTER INTERNATIONAL, INC. | | | 397,601 | | | | 510,897 | | | | | |
| | 2,756 | | | BECTON DICKINSON AND CO. | | | 225,345 | | | | 537,723 | | | | | |
| | 6,061 | | | BIOGEN, INC.(b) | | | 267,889 | | | | 1,644,713 | | | | | |
| | 1,225 | | | BIOVERATIV, INC.(b) | | | 2,445 | | | | 73,708 | | | | | |
| | 32,800 | | | BOSTON SCIENTIFIC CORP.(b) | | | 182,160 | | | | 909,216 | | | | | |
| | 18,300 | | | BRISTOL-MYERS SQUIBB CO. | | | 420,955 | | | | 1,019,676 | | | | | |
| | 2,145 | | | BRUKER CORP. | | | 43,219 | | | | 61,862 | | | | | |
| | 1,200 | | | C.R. BARD, INC. | | | 72,420 | | | | 379,332 | | | | | |
| | 1,000 | | | CARDINAL HEALTH, INC. | | | 26,001 | | | | 77,920 | | | | | |
| | 12,872 | | | CELGENE CORP.(b) | | | 146,839 | | | | 1,671,687 | | | | | |
| | 9,064 | | | CENTENE CORP.(b) | | | 643,323 | | | | 724,032 | | | | | |
| | 3,600 | | | CERNER CORP.(b) | | | 40,603 | | | | 239,292 | | | | | |
| | 5,700 | | | CIGNA CORP. | | | 89,680 | | | | 954,123 | | | | | |
| | 1,991 | | | COOPER (THE) COS., INC. | | | 489,092 | | | | 476,685 | | | | | |
| | 12,418 | | | DANAHER CORP. | | | 281,939 | | | | 1,047,955 | | | | | |
| | 2,850 | | | DAVITA, INC.(b) | | | 21,812 | | | | 184,566 | | | | | |
See accompanying notes to financial statements. | 29 | (Continued) |
CLEARWATER INVESTMENT TRUST
Schedule of Investments - Clearwater Core Equity Fund
June 30, 2017 (unaudited)
| Shares | | | Security | | Cost | | | Fair value (a) | | | Percent of
net assets | |
| | Health Care (Cont’d): | | | | | | | | | | | | |
| | 5,332 | | | DENTSPLY SIRONA, INC. | | $ | 141,306 | | | | 345,727 | | | | | |
| | 9,526 | | | EDWARDS LIFESCIENCES CORP.(b) | | | 248,804 | | | | 1,126,354 | | | | | |
| | 7,544 | | | ELI LILLY & CO. | | | 277,449 | | | | 620,871 | | | | | |
| | 2,700 | | | ENDO INTERNATIONAL PLC(b)(c) | | | 27,801 | | | | 30,159 | | | | | |
| | 36,277 | | | EXPRESS SCRIPTS HOLDING CO.(b) | | | 1,618,176 | | | | 2,315,924 | | | | | |
| | 57,688 | | | GILEAD SCIENCES, INC. | | | 2,464,210 | | | | 4,083,157 | | | | | |
| | 193 | | | HALYARD HEALTH, INC.(b) | | | 3,014 | | | | 7,581 | | | | | |
| | 2,341 | | | HENRY SCHEIN, INC.(b) | | | 154,657 | | | | 428,450 | | | | | |
| | 6,608 | | | HOLOGIC, INC.(b) | | | 92,603 | | | | 299,871 | | | | | |
| | 5,719 | | | HUMANA, INC. | | | 458,731 | | | | 1,376,106 | | | | | |
| | 12,809 | | | IDEXX LABORATORIES, INC.(b) | | | 1,264,911 | | | | 2,067,629 | | | | | |
| | 2,300 | | | ILLUMINA, INC.(b) | | | 98,233 | | | | 399,096 | | | | | |
| | 935 | | | INTUITIVE SURGICAL, INC.(b) | | | 826,672 | | | | 874,571 | | | | | |
| | 23,764 | | | JOHNSON & JOHNSON | | | 1,450,860 | | | | 3,143,740 | | | | | |
| | 1,360 | | | LABORATORY CORP. OF AMERICA HOLDINGS(b) | | | 117,456 | | | | 209,630 | | | | | |
| | 1,400 | | | MALLINCKRODT PLC(b) | | | 60,940 | | | | 62,734 | | | | | |
| | 13,453 | | | MCKESSON CORP. | | | 1,329,699 | | | | 2,213,557 | | | | | |
| | 540 | | | MEDTRONIC PLC(c) | | | 39,216 | | | | 47,925 | | | | | |
| | 43,278 | | | MERCK & CO., INC. | | | 986,667 | | | | 2,773,687 | | | | | |
| | 1,577 | | | METTLER-TOLEDO INTERNATIONAL, INC.(b) | | | 277,694 | | | | 928,128 | | | | | |
| | 700 | | | MYLAN N.V.(b) | | | 25,788 | | | | 27,174 | | | | | |
| | 1,600 | | | PATTERSON COS., INC. | | | 29,864 | | | | 75,120 | | | | | |
| | 1,700 | | | PERRIGO CO. PLC(c) | | | 122,655 | | | | 128,384 | | | | | |
| | 85,500 | | | PFIZER, INC. | | | 680,248 | | | | 2,871,945 | | | | | |
| | 7,644 | | | QUEST DIAGNOSTICS, INC. | | | 651,811 | | | | 849,707 | | | | | |
| | 1,861 | | | QUINTILES IMS HOLDINGS, INC.(b) | | | 112,204 | | | | 166,559 | | | | | |
| | 4,791 | | | RESMED, INC. | | | 129,046 | | | | 373,075 | | | | | |
| | 4,700 | | | STRYKER CORP. | | | 18,139 | | | | 652,266 | | | | | |
| | 1,300 | | | TELEFLEX, INC. | | | 66,613 | | | | 270,088 | | | | | |
| | 6,700 | | | THERMO FISHER SCIENTIFIC, INC. | | | 138,727 | | | | 1,168,949 | | | | | |
| | 1,734 | | | UNITED THERAPEUTICS CORP.(b) | | | 209,805 | | | | 224,952 | | | | | |
| | 26,633 | | | UNITEDHEALTH GROUP, INC. | | | 1,864,799 | | | | 4,938,291 | | | | | |
| | 3,936 | | | UNIVERSAL HEALTH SERVICES, INC., CLASS B | | | 239,148 | | | | 480,507 | | | | | |
| | 1,880 | | | VAREX IMAGING CORP.(b) | | | 19,829 | | | | 63,544 | | | | | |
| | 5,199 | | | VARIAN MEDICAL SYSTEMS, INC.(b) | | | 193,000 | | | | 536,485 | | | | | |
| | 1,445 | | | VEEVA SYSTEMS, INC., CLASS A(b) | | | 55,063 | | | | 88,593 | | | | | |
| | 900 | | | VERTEX PHARMACEUTICALS, INC.(b) | | | 22,441 | | | | 115,983 | | | | | |
| | 4,379 | | | WATERS CORP.(b) | | | 321,839 | | | | 805,035 | | | | | |
| | 4,304 | | | ZIMMER BIOMET HOLDINGS, INC. | | | 233,961 | | | | 552,634 | | | | | |
| | | | | | | | 22,648,778 | | | | 58,068,689 | | | | 11.73 | % |
| | Industrials: | | | | | | | | | | | | |
| | 6,987 | | | 3M CO. | | | 417,187 | | | | 1,454,624 | | | | | |
| | 4,565 | | | A.O. SMITH CORP. | | | 187,413 | | | | 257,146 | | | | | |
| | 38,320 | | | ABB LTD. ADR(c)(d) | | | 838,528 | | | | 954,168 | | | | | |
| | 923 | | | ACCO BRANDS CORP.(b) | | | 3,137 | | | | 10,753 | | | | | |
| | 1,657 | | | AECOM(b) | | | 48,445 | | | | 53,571 | | | | | |
| | 4,642 | | | AGCO CORP. | | | 225,963 | | | | 312,824 | | | | | |
| | 900 | | | AIR LEASE CORP. | | | 17,685 | | | | 33,624 | | | | | |
| | 4,088 | | | ALASKA AIR GROUP, INC. | | | 273,119 | | | | 366,939 | | | | | |
| | 1,533 | | | ALLEGION PLC(c) | | | 40,913 | | | | 124,357 | | | | | |
| | 400 | | | AMERCO | | | 120,202 | | | | 146,424 | | | | | |
| | 11,473 | | | AMERICAN AIRLINES GROUP, INC. | | | 432,429 | | | | 577,321 | | | | | |
| | 5,175 | | | AMETEK, INC. | | | 73,221 | | | | 313,450 | | | | | |
| | 9,405 | | | AVIS BUDGET GROUP, INC.(b) | | | 287,066 | | | | 256,474 | | | | | |
| | 23,177 | | | BOEING (THE) CO. | | | 1,553,765 | | | | 4,583,252 | | | | | |
| | 5,205 | | | BWX TECHNOLOGIES, INC. | | | 145,980 | | | | 253,744 | | | | | |
| | 3,208 | | | CARLISLE COS., INC. | | | 135,239 | | | | 306,043 | | | | | |
| | 10,504 | | | CATERPILLAR, INC. | | | 272,491 | | | | 1,128,760 | | | | | |
| | 10,845 | | | CINTAS CORP. | | | 972,969 | | | | 1,366,904 | | | | | |
| | 6,001 | | | CRANE CO. | | | 207,659 | | | | 476,359 | | | | | |
| | 30,324 | | | CSX CORP. | | | 229,953 | | | | 1,654,477 | | | | | |
| | 7,101 | | | CUMMINS, INC. | | | 497,031 | | | | 1,151,924 | | | | | |
| | 7,300 | | | DEERE & CO. | | | 199,160 | | | | 902,207 | | | | | |
| | 80,009 | | | DELTA AIR LINES, INC. | | | 3,081,824 | | | | 4,299,684 | | | | | |
| | 3,195 | | | DONALDSON CO., INC. | | | 117,473 | | | | 145,500 | | | | | |
| | 1,525 | | | DOVER CORP. | | | 40,758 | | | | 122,336 | | | | | |
| | 1,987 | | | DUN & BRADSTREET (THE) CORP. | | | 49,383 | | | | 214,894 | | | | | |
| | 16,537 | | | EATON CORP. PLC | | | 599,246 | | | | 1,287,075 | | | | | |
See accompanying notes to financial statements. | 30 | (Continued) |
CLEARWATER INVESTMENT TRUST
Schedule of Investments - Clearwater Core Equity Fund
June 30, 2017 (unaudited)
| Shares | | | Security | | Cost | | | Fair value (a) | | | Percent of
net assets | |
| | Industrials (Cont’d): | | | | | | | | | | | | |
| | 711 | | | EQUIFAX, INC. | | $ | 75,755 | | | | 97,706 | | | | | |
| | 2,280 | | | EXPEDITORS INTERNATIONAL OF WASHINGTON, INC. | | | 112,692 | | | | 128,774 | | | | | |
| | 8,601 | | | FEDEX CORP. | | | 478,914 | | | | 1,869,255 | | | | | |
| | 4,170 | | | FLUOR CORP. | | | 138,027 | | | | 190,903 | | | | | |
| | 6,209 | | | FORTIVE CORP. | | | 90,098 | | | | 393,340 | | | | | |
| | 4,300 | | | FORTUNE BRANDS HOME & SECURITY, INC. | | | 33,889 | | | | 280,532 | | | | | |
| | 1,400 | | | GATX CORP. | | | 24,276 | | | | 89,978 | | | | | |
| | 7,072 | | | GENERAL DYNAMICS CORP. | | | 1,216,492 | | | | 1,400,963 | | | | | |
| | 90,221 | | | GENERAL ELECTRIC CO. | | | 1,438,842 | | | | 2,436,869 | | | | | |
| | 3,752 | | | HD SUPPLY HOLDINGS, INC.(b) | | | 114,664 | | | | 114,924 | | | | | |
| | 360 | | | HERC HOLDINGS, INC.(b) | | | 5,808 | | | | 14,155 | | | | | |
| | 9,188 | | | HONEYWELL INTERNATIONAL, INC. | | | 277,615 | | | | 1,224,669 | | | | | |
| | 2,299 | | | HUBBELL, INC. | | | 159,480 | | | | 260,178 | | | | | |
| | 4,276 | | | HUNTINGTON INGALLS INDUSTRIES, INC. | | | 608,298 | | | | 796,020 | | | | | |
| | 3,871 | | | IDEX CORP. | | | 178,042 | | | | 437,462 | | | | | |
| | 18,672 | | | ILLINOIS TOOL WORKS, INC. | | | 1,389,233 | | | | 2,674,764 | | | | | |
| | 10,505 | | | INGERSOLL-RAND PLC | | | 631,190 | | | | 960,052 | | | | | |
| | 5,384 | | | JACOBS ENGINEERING GROUP, INC. | | | 233,589 | | | | 292,836 | | | | | |
| | 2,100 | | | JB HUNT TRANSPORT SERVICES, INC. | | | 40,530 | | | | 191,898 | | | | | |
| | 13,203 | | | JETBLUE AIRWAYS CORP.(b) | | | 81,151 | | | | 301,424 | | | | | |
| | 859 | | | JOHNSON CONTROLS INTERNATIONAL PLC | | | 16,341 | | | | 37,246 | | | | | |
| | 2,900 | | | KANSAS CITY SOUTHERN | | | 46,328 | | | | 303,485 | | | | | |
| | 850 | | | KLX, INC.(b) | | | 13,147 | | | | 42,500 | | | | | |
| | 30,023 | | | KOMATSU LTD. ADR(c)(d) | | | 676,360 | | | | 770,090 | | | | | |
| | 3,689 | | | L3 TECHNOLOGIES, INC. | | | 431,514 | | | | 616,358 | | | | | |
| | 600 | | | LENNOX INTERNATIONAL, INC. | | | 17,874 | | | | 110,184 | | | | | |
| | 1,400 | | | LINCOLN ELECTRIC HOLDINGS, INC. | | | 28,970 | | | | 128,926 | | | | | |
| | 1,684 | | | LOCKHEED MARTIN CORP. | | | 232,821 | | | | 467,495 | | | | | |
| | 4,800 | | | MANITOWOC (THE) CO., INC.(b) | | | 10,053 | | | | 28,848 | | | | | |
| | 2,475 | | | MANPOWERGROUP, INC. | | | 81,958 | | | | 276,334 | | | | | |
| | 25,346 | | | MASCO CORP. | | | 430,620 | | | | 968,471 | | | | | |
| | 2,181 | | | MSC INDUSTRIAL DIRECT CO., INC., CLASS A | | | 157,499 | | | | 187,479 | | | | | |
| | 1,724 | | | NORDSON CORP. | | | 171,931 | | | | 209,156 | | | | | |
| | 5,702 | | | NORFOLK SOUTHERN CORP. | | | 202,245 | | | | 693,933 | | | | | |
| | 7,965 | | | NORTHROP GRUMMAN CORP. | | | 839,307 | | | | 2,044,695 | | | | | |
| | 2,180 | | | NOW, INC.(b) | | | 21,218 | | | | 35,054 | | | | | |
| | 6,476 | | | OSHKOSH CORP. | | | 222,024 | | | | 446,067 | | | | | |
| | 6,784 | | | OWENS CORNING | | | 282,404 | | | | 453,985 | | | | | |
| | 10,867 | | | PACCAR, INC. | | | 233,323 | | | | 717,657 | | | | | |
| | 6,720 | | | PARKER-HANNIFIN CORP. | | | 597,595 | | | | 1,073,990 | | | | | |
| | 2,519 | | | PENTAIR PLC(c) | | | 73,408 | | | | 167,614 | | | | | |
| | 8,836 | | | QUANTA SERVICES, INC.(b) | | | 189,853 | | | | 290,881 | | | | | |
| | 3,198 | | | RAYTHEON CO. | | | 164,018 | | | | 516,413 | | | | | |
| | 5,049 | | | REPUBLIC SERVICES, INC. | | | 241,005 | | | | 321,773 | | | | | |
| | 6,221 | | | ROCKWELL AUTOMATION, INC. | | | 179,002 | | | | 1,007,553 | | | | | |
| | 1,841 | | | ROCKWELL COLLINS, INC. | | | 46,427 | | | | 193,452 | | | | | |
| | 920 | | | ROLLINS, INC. | | | 24,890 | | | | 37,453 | | | | | |
| | 700 | | | ROPER TECHNOLOGIES, INC. | | | 94,318 | | | | 162,071 | | | | | |
| | 2,300 | | | SNAP-ON, INC. | | | 230,888 | | | | 363,400 | | | | | |
| | 22,401 | | | SOUTHWEST AIRLINES CO. | | | 411,388 | | | | 1,391,998 | | | | | |
| | 5,900 | | | SPIRIT AEROSYSTEMS HOLDINGS, INC., CLASS A | | | 238,478 | | | | 341,846 | | | | | |
| | 6,924 | | | STANLEY BLACK & DECKER, INC. | | | 533,158 | | | | 974,415 | | | | | |
| | 1,200 | | | STERICYCLE, INC.(b) | | | 50,064 | | | | 91,584 | | | | | |
| | 5,162 | | | TIMKEN (THE) CO. | | | 171,352 | | | | 238,742 | | | | | |
| | 1,596 | | | TORO (THE) CO. | | | 76,510 | | | | 110,587 | | | | | |
| | 13,852 | | | TRINITY INDUSTRIES, INC. | | | 380,151 | | | | 388,272 | | | | | |
| | 15,000 | | | UNION PACIFIC CORP. | | | 216,086 | | | | 1,633,650 | | | | | |
| | 58,340 | | | UNITED CONTINENTAL HOLDINGS, INC.(b) | | | 3,359,993 | | | | 4,390,085 | | | | | |
| | 3,540 | | | UNITED PARCEL SERVICE, INC., CLASS B | | | 166,527 | | | | 391,489 | | | | | |
| | 3,799 | | | UNITED RENTALS, INC.(b) | | | 315,894 | | | | 428,185 | | | | | |
| | 10,650 | | | UNITED TECHNOLOGIES CORP. | | | 359,588 | | | | 1,300,471 | | | | | |
| | 8,113 | | | USG CORP.(b) | | | 186,246 | | | | 235,439 | | | | | |
| | 1,144 | | | VALMONT INDUSTRIES, INC. | | | 146,411 | | | | 171,142 | | | | | |
| | 180 | | | VERITIV CORP.(b) | | | 1,653 | | | | 8,100 | | | | | |
| | 1,700 | | | W.W. GRAINGER, INC. | | | 74,317 | | | | 306,901 | | | | | |
| | 1,966 | | | WABCO HOLDINGS, INC.(b) | | | 30,197 | | | | 250,685 | | | | | |
| | 1,400 | | | WABTEC CORP. | | | 25,603 | | | | 128,100 | | | | | |
| | 975 | | | WASTE CONNECTIONS, INC.(c) | | | 42,575 | | | | 62,810 | | | | | |
| | 14,368 | | | WASTE MANAGEMENT, INC. | | | 510,838 | | | | 1,053,893 | | | | | |
See accompanying notes to financial statements. | 31 | (Continued) |
CLEARWATER INVESTMENT TRUST
Schedule of Investments - Clearwater Core Equity Fund
June 30, 2017 (unaudited)
| Shares | | | Security | | Cost | | | Fair value (a) | | | Percent of
net assets | |
| | Industrials (Cont’d): | | | | | | | | | | | | |
| | 4,800 | | | WELBILT, INC.(b) | | $ | 37,515 | | | | 90,480 | | | | | |
| | 3,065 | | | WESCO INTERNATIONAL, INC.(b) | | | 174,935 | | | | 175,625 | | | | | |
| | 1,600 | | | XYLEM, INC. | | | 30,618 | | | | 88,688 | | | | | |
| | | | | | | | 31,894,262 | | | | 63,837,286 | | | | 12.89 | % |
| | Information Technology: | | | | | | | | | | | | |
| | 5,113 | | | ACCENTURE PLC, CLASS A(c) | | | 322,118 | | | | 632,376 | | | | | |
| | 25,710 | | | ACTIVISION BLIZZARD, INC. | | | 694,834 | | | | 1,480,125 | | | | | |
| | 10,925 | | | ADOBE SYSTEMS, INC.(b) | | | 711,226 | | | | 1,545,232 | | | | | |
| | 3,300 | | | AKAMAI TECHNOLOGIES, INC.(b) | | | 45,919 | | | | 164,373 | | | | | |
| | 1,600 | | | ALLIANCE DATA SYSTEMS CORP. | | | 75,650 | | | | 410,704 | | | | | |
| | 4,989 | | | ALPHABET, INC., CLASS A(b) | | | 1,396,880 | | | | 4,638,174 | | | | | |
| | 3,406 | | | ALPHABET, INC., CLASS C(b) | | | 490,985 | | | | 3,095,134 | | | | | |
| | 4,700 | | | AMDOCS LTD. | | | 231,646 | | | | 302,962 | | | | | |
| | 13,014 | | | ANALOG DEVICES, INC. | | | 385,778 | | | | 1,012,489 | | | | | |
| | 6,752 | | | ANSYS, INC.(b) | | | 711,970 | | | | 821,583 | | | | | |
| | 125,752 | | | APPLE, INC. | | | 6,782,023 | | | | 18,110,803 | | | | | |
| | 72,897 | | | APPLIED MATERIALS, INC. | | | 1,965,882 | | | | 3,011,375 | | | | | |
| | 309 | | | ARISTA NETWORKS, INC.(b) | | | 26,320 | | | | 46,285 | | | | | |
| | 2,007 | | | ARRIS INTERNATIONAL PLC(b) | | | 53,668 | | | | 56,236 | | | | | |
| | 4,877 | | | ARROW ELECTRONICS, INC.(b) | | | 267,343 | | | | 382,454 | | | | | |
| | 1,686 | | | AUTODESK, INC.(b) | | | 32,709 | | | | 169,983 | | | | | |
| | 6,866 | | | AUTOMATIC DATA PROCESSING, INC. | | | 370,293 | | | | 703,490 | | | | | |
| | 6,800 | | | BLACK KNIGHT FINANCIAL SERVICES, INC., CLASS A(b) | | | 266,651 | | | | 278,460 | | | | | |
| | 8,300 | | | BOOZ ALLEN HAMILTON HOLDING CORP. | | | 242,633 | | | | 270,082 | | | | | |
| | 4,414 | | | BROADCOM LTD. | | | 248,889 | | | | 1,028,683 | | | | | |
| | 3,413 | | | BROADRIDGE FINANCIAL SOLUTIONS, INC. | | | 106,898 | | | | 257,886 | | | | | |
| | 4,166 | | | CA, INC. | | | 117,232 | | | | 143,602 | | | | | |
| | 65,985 | | | CADENCE DESIGN SYSTEMS, INC.(b) | | | 1,953,244 | | | | 2,209,838 | | | | | |
| | 1,900 | | | CARS.COM, INC.(b) | | | 14,708 | | | | 50,597 | | | | | |
| | 5,913 | | | CDK GLOBAL, INC. | | | 295,331 | | | | 366,961 | | | | | |
| | 8,529 | | | CDW CORP. | | | 359,082 | | | | 533,318 | | | | | |
| | 112,891 | | | CISCO SYSTEMS, INC. | | | 655,817 | | | | 3,533,488 | | | | | |
| | 5,974 | | | CITRIX SYSTEMS, INC.(b) | | | 156,224 | | | | 475,411 | | | | | |
| | 718 | | | COGNEX CORP. | | | 38,165 | | | | 60,958 | | | | | |
| | 12,600 | | | COGNIZANT TECHNOLOGY SOLUTIONS CORP., CLASS A | | | 95,624 | | | | 836,640 | | | | | |
| | 297 | | | COMMERCEHUB, INC., SERIES A(b) | | | 505 | | | | 5,174 | | | | | |
| | 594 | | | COMMERCEHUB, INC., SERIES C(b) | | | 1,003 | | | | 10,359 | | | | | |
| | 7,708 | | | COMMSCOPE HOLDING CO., INC.(b) | | | 227,630 | | | | 293,135 | | | | | |
| | 2,600 | | | CONDUENT, INC.(b) | | | 41,748 | | | | 41,444 | | | | | |
| | 8,308 | | | CORELOGIC, INC.(b) | | | 139,352 | | | | 360,401 | | | | | |
| | 60,478 | | | CORNING, INC. | | | 1,243,236 | | | | 1,817,364 | | | | | |
| | 2,100 | | | CSRA, INC. | | | 60,747 | | | | 66,675 | | | | | |
| | 2,700 | | | CYPRESS SEMICONDUCTOR CORP. | | | 3,261 | | | | 36,855 | | | | | |
| | 1,424 | | | DELL TECHNOLOGIES, INC., CLASS V(b) | | | 41,143 | | | | 87,021 | | | | | |
| | 3,901 | | | DOLBY LABORATORIES, INC., CLASS A | | | 134,600 | | | | 190,993 | | | | | |
| | 6,467 | | | DXC TECHNOLOGY CO. | | | 255,604 | | | | 496,148 | | | | | |
| | 23,460 | | | EBAY, INC.(b) | | | 454,136 | | | | 819,223 | | | | | |
| | 1,640 | | | ECHOSTAR CORP., CLASS A(b) | | | 25,986 | | | | 99,548 | | | | | |
| | 11,266 | | | ELECTRONIC ARTS, INC.(b) | | | 280,102 | | | | 1,191,042 | | | | | |
| | 2,667 | | | F5 NETWORKS, INC.(b) | | | 181,488 | | | | 338,869 | | | | | |
| | 23,600 | | | FACEBOOK, INC., CLASS A(b) | | | 654,660 | | | | 3,563,128 | | | | | |
| | 11,102 | | | FIDELITY NATIONAL INFORMATION SERVICES, INC. | | | 388,684 | | | | 948,111 | | | | | |
| | 8,992 | | | FISERV, INC.(b) | | | 191,173 | | | | 1,100,081 | | | | | |
| | 100 | | | FLEETCOR TECHNOLOGIES, INC.(b) | | | 14,767 | | | | 14,421 | | | | | |
| | 3,800 | | | GLOBAL PAYMENTS, INC. | | | 113,707 | | | | 343,216 | | | | | |
| | 5,000 | | | HARRIS CORP. | | | 189,845 | | | | 545,400 | | | | | |
| | 46,565 | | | HEWLETT PACKARD ENTERPRISE CO. | | | 626,736 | | | | 772,513 | | | | | |
| | 23,508 | | | HP, INC. | | | 388,370 | | | | 410,920 | | | | | |
| | 1,300 | | | IAC/INTERACTIVECORP(b) | | | 78,263 | | | | 134,212 | | | | | |
| | 116,874 | | | INTEL CORP. | | | 1,089,585 | | | | 3,943,329 | | | | | |
| | 2,646 | | | INTERNATIONAL BUSINESS MACHINES CORP. | | | 250,051 | | | | 407,034 | | | | | |
| | 7,490 | | | INTUIT, INC. | | | 447,549 | | | | 994,747 | | | | | |
| | 2,247 | | | IPG PHOTONICS CORP.(b) | | | 183,260 | | | | 326,040 | | | | | |
| | 4,848 | | | JABIL, INC. | | | 98,476 | | | | 141,513 | | | | | |
| | 3,324 | | | JACK HENRY & ASSOCIATES, INC. | | | 349,429 | | | | 345,264 | | | | | |
| | 4,180 | | | JUNIPER NETWORKS, INC. | | | 101,249 | | | | 116,538 | | | | | |
| | 1,425 | | | KEYSIGHT TECHNOLOGIES, INC.(b) | | | 47,146 | | | | 55,475 | | | | | |
| | 952 | | | KLA-TENCOR CORP. | | | 68,542 | | | | 87,118 | | | | | |
See accompanying notes to financial statements. | 32 | (Continued) |
CLEARWATER INVESTMENT TRUST
Schedule of Investments - Clearwater Core Equity Fund
June 30, 2017 (unaudited)
| Shares | | | Security | | Cost | | | Fair value (a) | | | Percent of
net assets | |
| | Information Technology (Cont’d): | | | | | | | | | | | | |
| | 12,691 | | | LAM RESEARCH CORP. | | $ | 1,207,701 | | | | 1,794,888 | | | | | |
| | 1,441 | | | LEIDOS HOLDINGS, INC. | | | 46,816 | | | | 74,485 | | | | | |
| | 727 | | | LOGMEIN, INC. | | | 9,735 | | | | 75,972 | | | | | |
| | 3,700 | | | MARVELL TECHNOLOGY GROUP LTD.(c) | | | 18,704 | | | | 61,124 | | | | | |
| | 17,000 | | | MASTERCARD, INC. | | | 182,282 | | | | 2,064,650 | | | | | |
| | 4,200 | | | MICROCHIP TECHNOLOGY, INC. | | | 37,797 | | | | 324,156 | | | | | |
| | 33,643 | | | MICRON TECHNOLOGY, INC.(b) | | | 591,055 | | | | 1,004,580 | | | | | |
| | 132,368 | | | MICROSOFT CORP. | | | 1,544,105 | | | | 9,124,126 | | | | | |
| | 9,106 | | | MOTOROLA SOLUTIONS, INC. | | | 806,058 | | | | 789,854 | | | | | |
| | 7,094 | | | NCR CORP.(b) | | | 274,757 | | | | 289,719 | | | | | |
| | 7,726 | | | NETAPP, INC. | | | 286,908 | | | | 309,426 | | | | | |
| | 1,700 | | | NUTANIX, INC., CLASS A(b) | | | 27,690 | | | | 34,255 | | | | | |
| | 26,558 | | | NVIDIA CORP. | | | 1,070,856 | | | | 3,839,224 | | | | | |
| | 18,320 | | | ON SEMICONDUCTOR CORP.(b) | | | 274,983 | | | | 257,213 | | | | | |
| | 60,962 | | | ORACLE CORP. | | | 31,813 | | | | 3,056,635 | | | | | |
| | 2,800 | | | PALO ALTO NETWORKS, INC.(b) | | | 116,508 | | | | 374,668 | | | | | |
| | 2,700 | | | PANDORA MEDIA, INC.(b) | | | 29,529 | | | | 24,084 | | | | | |
| | 4,170 | | | PAYCHEX, INC. | | | 37,984 | | | | 237,440 | | | | | |
| | 7,100 | | | PAYPAL HOLDINGS, INC.(b) | | | 86,971 | | | | 381,057 | | | | | |
| | 2,400 | | | PTC, INC.(b) | | | 82,674 | | | | 132,288 | | | | | |
| | 2,490 | | | QORVO, INC.(b) | | | 111,933 | | | | 157,667 | | | | | |
| | 14,373 | | | QUALCOMM, INC. | | | 378,179 | | | | 793,677 | | | | | |
| | 4,200 | | | RED HAT, INC.(b) | | | 61,669 | | | | 402,150 | | | | | |
| | 2,600 | | | SABRE CORP. | | | 60,052 | | | | 56,602 | | | | | |
| | 7,600 | | | SALESFORCE.COM, INC.(b) | | | 86,710 | | | | 658,160 | | | | | |
| | 40,278 | | | SEAGATE TECHNOLOGY PLC | | | 1,311,480 | | | | 1,560,773 | | | | | |
| | 14,419 | | | SYMANTEC CORP. | | | 71,242 | | | | 407,337 | | | | | |
| | 25,772 | | | SYNOPSYS, INC.(b) | | | 1,555,314 | | | | 1,879,552 | | | | | |
| | 43,500 | | | TAIWAN SEMICONDUCTOR MANUFACTURING CO. LTD. ADR(c)(d) | | | 1,319,326 | | | | 1,520,760 | | | | | |
| | 27,303 | | | TE CONNECTIVITY LTD.(c) | | | 1,680,799 | | | | 2,148,200 | | | | | |
| | 13,045 | | | TERADYNE, INC. | | | 248,079 | | | | 391,741 | | | | | |
| | 30,977 | | | TEXAS INSTRUMENTS, INC. | | | 1,129,769 | | | | 2,383,061 | | | | | |
| | 8,792 | | | TRIMBLE, INC.(b) | | | 143,101 | | | | 313,611 | | | | | |
| | 900 | | | TWILIO, INC., CLASS A(b) | | | 27,747 | | | | 26,199 | | | | | |
| | 787 | | | VERSUM MATERIALS, INC. | | | 4,722 | | | | 25,578 | | | | | |
| | 23,200 | | | VISA, INC., CLASS A | | | 395,709 | | | | 2,175,696 | | | | | |
| | 7,800 | | | VISHAY INTERTECHNOLOGY, INC. | | | 48,931 | | | | 129,480 | | | | | |
| | 2,800 | | | VMWARE, INC., CLASS A(b) | | | 167,024 | | | | 244,804 | | | | | |
| | 10,700 | | | WESTERN DIGITAL CORP. | | | 491,518 | | | | 948,020 | | | | | |
| | 47,788 | | | WESTERN UNION (THE) CO. | | | 909,994 | | | | 910,361 | | | | | |
| | 15,217 | | | XILINX, INC. | | | 498,562 | | | | 978,757 | | | | | |
| | 3,426 | | | YELP, INC.(b) | | | 113,454 | | | | 102,849 | | | | | |
| | 800 | | | ZILLOW GROUP, INC., CLASS C(b) | | | 29,296 | | | | 39,208 | | | | | |
| | | | | | | | 45,097,311 | | | | 109,237,100 | | | | 22.06 | % |
| | Materials: | | | | | | | | | | | | |
| | 367 | | | ADVANSIX, INC.(b) | | | 1,587 | | | | 11,465 | | | | | |
| | 1,575 | | | AIR PRODUCTS & CHEMICALS, INC. | | | 57,863 | | | | 225,319 | | | | | |
| | 2,627 | | | ALBEMARLE CORP. | | | 138,118 | | | | 277,254 | | | | | |
| | 1,600 | | | ASHLAND GLOBAL HOLDINGS, INC. | | | 23,171 | | | | 105,456 | | | | | |
| | 3,165 | | | AVERY DENNISON CORP. | | | 207,899 | | | | 279,691 | | | | | |
| | 5,128 | | | BALL CORP. | | | 10,015 | | | | 216,453 | | | | | |
| | 4,077 | | | BEMIS CO., INC. | | | 127,121 | | | | 188,561 | | | | | |
| | 2,279 | | | BERRY GLOBAL GROUP, INC.(b) | | | 94,191 | | | | 129,926 | | | | | |
| | 2,464 | | | CABOT CORP. | | | 128,235 | | | | 131,652 | | | | | |
| | 10,588 | | | CELANESE CORP., SERIES A | | | 902,353 | | | | 1,005,225 | | | | | |
| | 3,225 | | | CROWN HOLDINGS, INC.(b) | | | 133,175 | | | | 192,403 | | | | | |
| | 23,253 | | | DOW CHEMICAL (THE) CO. | | | 977,958 | | | | 1,466,567 | | | | | |
| | 11,925 | | | E.I. DU PONT DE NEMOURS & CO. | | | 332,718 | | | | 962,467 | | | | | |
| | 438 | | | EAGLE MATERIALS, INC. | | | 1,727 | | | | 40,480 | | | | | |
| | 3,000 | | | EASTMAN CHEMICAL CO. | | | 58,011 | | | | 251,970 | | | | | |
| | 3,891 | | | ECOLAB, INC. | | | 133,579 | | | | 516,530 | | | | | |
| | 31,354 | | | FREEPORT-MCMORAN, INC.(b) | | | 311,676 | | | | 376,562 | | | | | |
| | 3,683 | | | INTERNATIONAL FLAVORS & FRAGRANCES, INC. | | | 79,231 | | | | 497,205 | | | | | |
| | 14,436 | | | INTERNATIONAL PAPER CO. | | | 381,262 | | | | 817,222 | | | | | |
| | 34,344 | | | LYONDELLBASELL INDUSTRIES N.V., CLASS A | | | 2,921,620 | | | | 2,898,290 | | | | | |
| | 700 | | | MARTIN MARIETTA MATERIALS, INC. | | | 27,965 | | | | 155,806 | | | | | |
| | 10,115 | | | MONSANTO CO. | | | 47,604 | | | | 1,197,211 | | | | | |
See accompanying notes to financial statements. | 33 | (Continued) |
CLEARWATER INVESTMENT TRUST
Schedule of Investments - Clearwater Core Equity Fund
June 30, 2017 (unaudited)
| Shares | | | Security | | Cost | | | Fair value (a) | | | Percent of net assets | |
| | Materials (Cont’d): | | | | | | | | | | | | |
| | 2,400 | | | MOSAIC (THE) CO. | | $ | 34,272 | | | | 54,792 | | | | | |
| | 7,400 | | | NEWMONT MINING CORP. | | | 136,530 | | | | 239,686 | | | | | |
| | 6,734 | | | NUCOR CORP. | | | 153,847 | | | | 389,697 | | | | | |
| | 9,110 | | | OWENS-ILLINOIS, INC.(b) | | | 169,939 | | | | 217,911 | | | | | |
| | 3,368 | | | PACKAGING CORP. OF AMERICA | | | 134,861 | | | | 375,161 | | | | | |
| | 17,231 | | | PLATFORM SPECIALTY PRODUCTS CORP.(b) | | | 237,206 | | | | 218,489 | | | | | |
| | 7,972 | | | PPG INDUSTRIES, INC. | | | 180,558 | | | | 876,601 | | | | | |
| | 4,150 | | | PRAXAIR, INC. | | | 119,435 | | | | 550,082 | | | | | |
| | 6,903 | | | RELIANCE STEEL & ALUMINUM CO. | | | 345,937 | | | | 502,607 | | | | | |
| | 700 | | | ROYAL GOLD, INC. | | | 26,033 | | | | 54,719 | | | | | |
| | 9,745 | | | RPM INTERNATIONAL, INC. | | | 228,799 | | | | 531,590 | | | | | |
| | 724 | | | SCOTTS MIRACLE-GRO (THE) CO. | | | 63,975 | | | | 64,769 | | | | | |
| | 1,400 | | | SEALED AIR CORP. | | | 24,528 | | | | 62,664 | | | | | |
| | 1,385 | | | SHERWIN-WILLIAMS (THE) CO. | | | 62,296 | | | | 486,080 | | | | | |
| | 5,997 | | | SONOCO PRODUCTS CO. | | | 194,930 | | | | 308,366 | | | | | |
| | 3,234 | | | SOUTHERN COPPER CORP.(c) | | | 38,445 | | | | 111,993 | | | | | |
| | 46,075 | | | STEEL DYNAMICS, INC. | | | 1,289,023 | | | | 1,649,946 | | | | | |
| | 5,300 | | | TAHOE RESOURCES, INC. | | | 46,375 | | | | 45,686 | | | | | |
| | 8,791 | | | UNITED STATES STEEL CORP. | | | 187,275 | | | | 194,633 | | | | | |
| | 4,392 | | | VALVOLINE, INC. | | | 24,184 | | | | 104,178 | | | | | |
| | 2,100 | | | VULCAN MATERIALS CO. | | | 63,441 | | | | 266,028 | | | | | |
| | 2,242 | | | WESTROCK CO. | | | 24,357 | | | | 127,032 | | | | | |
| | | | | | | | 10,883,325 | | | | 19,376,425 | | | | 3.91 | % |
| | Real Estate: | | | | | | | | | | | | |
| | 2,100 | | | ALEXANDRIA REAL ESTATE EQUITIES, INC. | | | 106,711 | | | | 252,987 | | | | | |
| | 3,350 | | | AMERICAN TOWER CORP. | | | 153,516 | | | | 443,272 | | | | | |
| | 3,628 | | | APARTMENT INVESTMENT & MANAGEMENT CO., CLASS A | | | 39,421 | | | | 155,895 | | | | | |
| | 1,734 | | | AVALONBAY COMMUNITIES, INC. | | | 193,548 | | | | 333,223 | | | | | |
| | 3,388 | | | BOSTON PROPERTIES, INC. | | | 171,468 | | | | 416,792 | | | | | |
| | 2,600 | | | BRANDYWINE REALTY TRUST | | | 28,512 | | | | 45,578 | | | | | |
| | 900 | | | CAMDEN PROPERTY TRUST | | | 24,065 | | | | 76,959 | | | | | |
| | 2,168 | | | COLONY NORTHSTAR, INC., CLASS A | | | 25,620 | | | | 30,547 | | | | | |
| | 1,545 | | | CORECIVIC, INC. | | | 22,663 | | | | 42,611 | | | | | |
| | 11,000 | | | CORPORATE OFFICE PROPERTIES TRUST | | | 286,815 | | | | 385,330 | | | | | |
| | 4,600 | | | CROWN CASTLE INTERNATIONAL CORP. | | | 191,990 | | | | 460,828 | | | | | |
| | 400 | | | DIGITAL REALTY TRUST, INC. | | | 15,555 | | | | 45,180 | | | | | |
| | 5,200 | | | DOUGLAS EMMETT, INC. | | | 50,620 | | | | 198,692 | | | | | |
| | 1,700 | | | DUKE REALTY CORP. | | | 28,419 | | | | 47,515 | | | | | |
| | 845 | | | EQUINIX, INC. | | | 65,492 | | | | 362,640 | | | | | |
| | 800 | | | EQUITY LIFESTYLE PROPERTIES, INC. | | | 26,684 | | | | 69,072 | | | | | |
| | 5,416 | | | EQUITY RESIDENTIAL | | | 174,162 | | | | 356,535 | | | | | |
| | 875 | | | ESSEX PROPERTY TRUST, INC. | | | 116,032 | | | | 225,111 | | | | | |
| | 900 | | | FEDERAL REALTY INVESTMENT TRUST | | | 48,326 | | | | 113,751 | | | | | |
| | 1,046 | | | FOUR CORNERS PROPERTY TRUST, INC. | | | 9,190 | | | | 26,265 | | | | | |
| | 1,200 | | | GGP, INC. | | | 20,388 | | | | 28,272 | | | | | |
| | 7,000 | | | HCP, INC. | | | 71,129 | | | | 223,720 | | | | | |
| | 1,800 | | | HOSPITALITY PROPERTIES TRUST | | | 23,220 | | | | 52,470 | | | | | |
| | 12,222 | | | HOST HOTELS & RESORTS, INC. | | | 93,479 | | | | 223,296 | | | | | |
| | 678 | | | HOWARD HUGHES (THE) CORP.(b) | | | 20,502 | | | | 83,286 | | | | | |
| | 700 | | | JONES LANG LASALLE, INC. | | | 39,951 | | | | 87,500 | | | | | |
| | 8,201 | | | KIMCO REALTY CORP. | | | 98,033 | | | | 150,488 | | | | | |
| | 4,200 | | | LAMAR ADVERTISING CO., CLASS A | | | 51,171 | | | | 308,994 | | | | | |
| | 1,100 | | | LIBERTY PROPERTY TRUST | | | 23,237 | | | | 44,781 | | | | | |
| | 600 | | | LIFE STORAGE, INC. | | | 49,363 | | | | 44,460 | | | | | |
| | 5,123 | | | MACERICH (THE) CO. | | | 119,645 | | | | 297,441 | | | | | |
| | 1,800 | | | MID-AMERICA APARTMENT COMMUNITIES, INC. | | | 132,698 | | | | 189,684 | | | | | |
| | 4,744 | | | PIEDMONT OFFICE REALTY TRUST, INC., CLASS A | | | 95,694 | | | | 100,004 | | | | | |
| | 10,169 | | | PROLOGIS, INC. | | | 257,893 | | | | 596,310 | | | | | |
| | 1,061 | | | PUBLIC STORAGE | | | 65,830 | | | | 221,250 | | | | | |
| | 6,972 | | | RAYONIER, INC. | | | 74,591 | | | | 200,585 | | | | | |
| | 2,600 | | | REALTY INCOME CORP. | | | 54,846 | | | | 143,468 | | | | | |
| | 3,900 | | | REGENCY CENTERS CORP. | | | 84,090 | | | | 244,296 | | | | | |
| | 9,800 | | | RETAIL PROPERTIES OF AMERICA, INC., CLASS A | | | 82,213 | | | | 119,658 | | | | | |
| | 2,100 | | | SBA COMMUNICATIONS CORP.(b) | | | 214,169 | | | | 283,290 | | | | | |
| | 3,300 | | | SENIOR HOUSING PROPERTIES TRUST | | | 47,020 | | | | 67,452 | | | | | |
| | 3,595 | | | SIMON PROPERTY GROUP, INC. | | | 148,165 | | | | 581,527 | | | | | |
| | 1,900 | | | SL GREEN REALTY CORP. | | | 58,203 | | | | 201,020 | | | | | |
| | 800 | | | SUN COMMUNITIES, INC. | | | 56,769 | | | | 70,152 | | | | | |
| See accompanying notes to financial statements. | 34 | (Continued) |
CLEARWATER INVESTMENT TRUST
Schedule of Investments - Clearwater Core Equity Fund
June 30, 2017 (unaudited)
| Shares | | | Security | | Cost | | | Fair value (a) | | | Percent of
net assets | |
| | Real Estate (Cont’d): | | | | | | | | | | | | |
| | 2,100 | | | TAUBMAN CENTERS, INC. | | $ | 57,233 | | | | 125,055 | | | | | |
| | 4,100 | | | UDR, INC. | | | 65,319 | | | | 159,777 | | | | | |
| | 1,300 | | | URBAN EDGE PROPERTIES | | | 18,730 | | | | 30,849 | | | | | |
| | 1,800 | | | VENTAS, INC. | | | 63,969 | | | | 125,064 | | | | | |
| | 800 | | | VORNADO REALTY TRUST | | | 36,178 | | | | 75,120 | | | | | |
| | 2,497 | | | WASHINGTON PRIME GROUP, INC. | | | 14,504 | | | | 20,900 | | | | | |
| | 2,100 | | | WEINGARTEN REALTY INVESTORS | | | 29,916 | | | | 63,210 | | | | | |
| | 4,600 | | | WELLTOWER, INC. | | | 274,468 | | | | 344,310 | | | | | |
| | 4,916 | | | WEYERHAEUSER CO. | | | 64,713 | | | | 164,686 | | | | | |
| | | | | | | | 4,386,138 | | | | 9,761,158 | | | | 1.97 | % |
| | Telecommunication Services: | | | | | | | | | | | | |
| | 69,502 | | | AT&T, INC. | | | 1,284,948 | | | | 2,622,310 | | | | | |
| | 13,691 | | | CENTURYLINK, INC. | | | 335,750 | | | | 326,941 | | | | | |
| | 34,600 | | | FRONTIER COMMUNICATIONS CORP. | | | 59,945 | | | | 40,136 | | | | | |
| | 17,421 | | | KT CORP. ADR(c)(d) | | | 265,449 | | | | 289,885 | | | | | |
| | 6,710 | | | LEVEL 3 COMMUNICATIONS, INC.(b) | | | 159,907 | | | | 397,903 | | | | | |
| | 35,430 | | | NIPPON TELEGRAPH & TELEPHONE CORP. ADR(c)(d) | | | 1,530,847 | | | | 1,669,462 | | | | | |
| | 50,003 | | | SPRINT CORP.(b) | | | 361,355 | | | | 410,525 | | | | | |
| | 14,763 | | | TELEFONICA S.A. ADR(c)(d) | | | 144,224 | | | | 153,388 | | | | | |
| | 1,900 | | | TELEPHONE & DATA SYSTEMS, INC. | | | 50,350 | | | | 52,725 | | | | | |
| | 11,912 | | | TELSTRA CORP. LTD. ADR(c)(d) | | | 190,123 | | | | 196,786 | | | | | |
| | 17,545 | | | T-MOBILE US, INC.(b) | | | 753,602 | | | | 1,063,578 | | | | | |
| | 700 | | | UNITED STATES CELLULAR CORP.(b) | | | 26,446 | | | | 26,824 | | | | | |
| | 27,083 | | | VERIZON COMMUNICATIONS, INC. | | | 772,249 | | | | 1,209,527 | | | | | |
| | 900 | | | ZAYO GROUP HOLDINGS, INC.(b) | | | 31,068 | | | | 27,810 | | | | | |
| | | | | | | | 5,966,263 | | | | 8,487,800 | | | | 1.72 | % |
| | Utilities: | | | | | | | | | | | | |
| | 2,000 | | | ALLIANT ENERGY CORP. | | | 24,835 | | | | 80,340 | | | | | |
| | 1,600 | | | AMEREN CORP. | | | 40,872 | | | | 87,472 | | | | | |
| | 2,100 | | | AMERICAN ELECTRIC POWER CO., INC. | | | 64,051 | | | | 145,887 | | | | | |
| | 1,735 | | | AQUA AMERICA, INC. | | | 22,973 | | | | 57,775 | | | | | |
| | 13,200 | | | AVANGRID, INC. | | | 502,113 | | | | 582,780 | | | | | |
| | 5,800 | | | CENTERPOINT ENERGY, INC. | | | 66,308 | | | | 158,804 | | | | | |
| | 13,300 | | | CMS ENERGY CORP. | | | 259,708 | | | | 615,125 | | | | | |
| | 5,589 | | | CONSOLIDATED EDISON, INC. | | | 362,768 | | | | 451,703 | | | | | |
| | 8,862 | | | DOMINION ENERGY, INC. | | | 284,452 | | | | 679,095 | | | | | |
| | 2,800 | | | DTE ENERGY CO. | | | 132,386 | | | | 296,212 | | | | | |
| | 7,651 | | | DUKE ENERGY CORP. | | | 257,468 | | | | 639,547 | | | | | |
| | 8,525 | | | EDISON INTERNATIONAL | | | 182,117 | | | | 666,570 | | | | | |
| | 3,064 | | | ENTERGY CORP. | | | 60,101 | | | | 235,223 | | | | | |
| | 4,961 | | | EVERSOURCE ENERGY | | | 125,492 | | | | 301,182 | | | | | |
| | 2,800 | | | GREAT PLAINS ENERGY, INC. | | | 43,498 | | | | 81,984 | | | | | |
| | 6,778 | | | MDU RESOURCES GROUP, INC. | | | 175,744 | | | | 177,584 | | | | | |
| | 900 | | | NATIONAL FUEL GAS CO. | | | 20,790 | | | | 50,256 | | | | | |
| | 4,400 | | | NEXTERA ENERGY, INC. | | | 204,691 | | | | 616,572 | | | | | |
| | 6,900 | | | NISOURCE, INC. | | | 43,973 | | | | 174,984 | | | | | |
| | 4,800 | | | OGE ENERGY CORP. | | | 43,344 | | | | 166,992 | | | | | |
| | 500 | | | ONE GAS, INC. | | | 3,925 | | | | 34,905 | | | | | |
| | 5,900 | | | PG&E CORP. | | | 79,340 | | | | 391,583 | | | | | |
| | 2,400 | | | PINNACLE WEST CAPITAL CORP. | | | 71,637 | | | | 204,384 | | | | | |
| | 700 | | | PPL CORP. | | | 10,384 | | | | 27,062 | | | | | |
| | 1,200 | | | PUBLIC SERVICE ENTERPRISE GROUP, INC. | | | 51,552 | | | | 51,612 | | | | | |
| | 4,800 | | | SCANA CORP. | | | 166,536 | | | | 321,648 | | | | | |
| | 3,200 | | | SEMPRA ENERGY | | | 174,757 | | | | 360,800 | | | | | |
| | 9,700 | | | SOUTHERN (THE) CO. | | | 228,467 | | | | 464,436 | | | | | |
| | 9,841 | | | UGI CORP. | | | 246,543 | | | | 476,403 | | | | | |
| | 1,600 | | | VECTREN CORP. | | | 77,182 | | | | 93,504 | | | | | |
| | 6,420 | | | WEC ENERGY GROUP, INC. | | | 137,909 | | | | 394,060 | | | | | |
| | 1,400 | | | WESTAR ENERGY, INC. | | | 25,767 | | | | 74,228 | | | | | |
| | 5,793 | | | XCEL ENERGY, INC. | | | 79,584 | | | | 265,783 | | | | | |
| | | | | | | | 4,271,267 | | | | 9,426,495 | | | | 1.90 | % |
| | | | Sub-total Common Stocks: | | | 234,837,320 | | | | 491,734,414 | | | | 99.31 | % |
| Rights: | | | | | | | | | | | | | | | |
| | Consumer Staples: | | | | | | | | | | | | |
| | 1,600 | | | CASA LEY (CONTINGENT VALUE RIGHTS)(b)(e) | | | 1,624 | | | | 1,624 | | | | | |
| See accompanying notes to financial statements. | 35 | (Continued) |
CLEARWATER INVESTMENT TRUST
Schedule of Investments - Clearwater Core Equity Fund
June 30, 2017 (unaudited)
| Shares | | Security | | | Cost | | | Fair value (a) | | | Percent of
net assets | |
| | Consumer Staples (Cont’d): | | | | | | | | | | | | | |
| | 1,600 | | | PROPERTY DEVELOPMENT CENTERS LLC (CONTINGENT VALUE RIGHTS)(b)(e) | | | $ | 78 | | | | 51 | | | | | |
| | | | | | | | | 1,702 | | | | 1,675 | | | | 0.00 | % |
| | | | Sub-total Rights: | | | | 1,702 | | | | 1,675 | | | | 0.00 | % |
Short-Term Investments: | | | | | | | | | | | | | |
| | | | | | | | | | | | | | | | | | |
| | 2,531,869 | | | NORTHERN INSTITUTIONAL FUNDS -U.S. GOVERNMENT SELECT PORTFOLIO, 0.82%(f) | | | | 2,531,869 | | | | 2,531,869 | | | | | |
| | | | Sub-total Short-Term Investments: | | | | 2,531,869 | | | | 2,531,869 | | | | 0.51 | % |
| | | | | Grand total(g) | | | $ | 237,370,891 | | | | 494,267,958 | | | | 99.82 | % |
Notes to Schedule of Investments:
| (a) | Investments are valued in accordance with procedures described in note 2 to the financial statements. |
| (b) | Non-income producing assets. |
| (c) | Foreign security values are stated in U.S. dollars. As of June 30, 2017, the value of foreign stocks or depositary receipts of companies based outside of the United States represented 4.40% of net assets. |
| (d) | Securities are American Depositary Receipts of companies based outside of the United States representing 1.80% of net assets as of June 30, 2017. |
| (e) | This is a Level 3 security. |
| (f) | The short-term investment is a money market portfolio of the investment company, Northern Institutional Funds. At December 31, 2016, the value of the Clearwater Core Equity Fund’s investment in the U.S. Government Select Portfolio of the Northern Institutional Funds was $2,797,986 with net sales of $266,117 during the six months ended June 30, 2017. |
| (g) | At June 30, 2017, the cost for Federal income tax purposes was $237,650,586. The aggregate gross unrealized appreciation and depreciation of investments in securities based on this cost was as follows: |
| Gross unrealized appreciation | | $ | 258,710,684 | |
| Gross unrealized depreciation | | | (2,093,312 | ) |
| Net unrealized appreciation | | $ | 256,617,372 | |
| See accompanying notes to financial statements. | 36 | (Continued) |
CLEARWATER INVESTMENT TRUST
Schedule of Investments - Clearwater Core Equity Fund
June 30, 2017 (unaudited)
Clearwater Core Equity Fund Portfolio Diversification
(as a percentage of net assets)
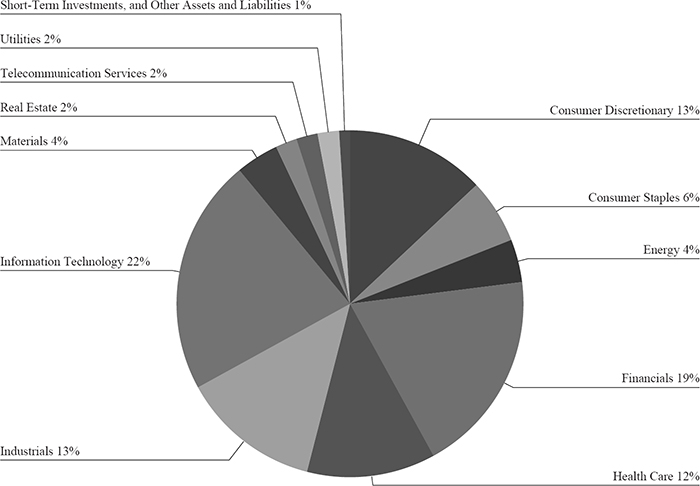
| See accompanying notes to financial statements. | 37 | (Continued) |
CLEARWATER INVESTMENT TRUST
Schedule of Investments - Clearwater Small Companies Fund
June 30, 2017 (unaudited)
| Shares | | | Security | | Cost | | | Fair value (a) | | | Percent of
net assets | |
| Common Stocks: | | | | | | | | | | | | |
| | Consumer Discretionary: | | | | | | | | | | | | |
| | 83,196 | | | 1-800-FLOWERS.COM, INC., CLASS A(b) | | $ | 806,337 | | | | 811,161 | | | | | |
| | 116,468 | | | BBX CAPITAL CORP. | | | 537,147 | | | | 766,359 | | | | | |
| | 221,420 | | | BLACK DIAMOND, INC.(b) | | | 1,287,441 | | | | 1,472,443 | | | | | |
| | 40,200 | | | BLOOMIN’ BRANDS, INC. | | | 859,418 | | | | 853,446 | | | | | |
| | 109,481 | | | BRAVO BRIO RESTAURANT GROUP, INC.(b) | | | 918,390 | | | | 503,613 | | | | | |
| | 76,884 | | | CALLAWAY GOLF CO. | | | 811,163 | | | | 982,577 | | | | | |
| | 15,326 | | | CARRIAGE SERVICES, INC. | | | 281,361 | | | | 413,189 | | | | | |
| | 12,400 | | | CITI TRENDS, INC. | | | 228,922 | | | | 263,128 | | | | | |
| | 110,405 | | | CLUBCORP HOLDINGS, INC. | | | 1,711,896 | | | | 1,446,305 | | | | | |
| | 11,975 | | | COOPER-STANDARD HOLDINGS, INC.(b) | | | 1,117,698 | | | | 1,207,918 | | | | | |
| | 9,067 | | | CROCS, INC.(b) | | | 66,118 | | | | 69,907 | | | | | |
| | 8,642 | | | CSS INDUSTRIES, INC. | | | 225,877 | | | | 226,075 | | | | | |
| | 121,600 | | | DENNY’S CORP.(b) | | | 616,940 | | | | 1,431,232 | | | | | |
| | 1,813 | | | DINEEQUITY, INC. | | | 78,436 | | | | 79,863 | | | | | |
| | 21,824 | | | EMMIS COMMUNICATIONS CORP., CLASS A(b) | | | 72,136 | | | | 62,853 | | | | | |
| | 66,407 | | | FIESTA RESTAURANT GROUP, INC.(b) | | | 1,565,885 | | | | 1,371,305 | | | | | |
| | 151,288 | | | FULL HOUSE RESORTS, INC.(b) | | | 340,576 | | | | 369,143 | | | | | |
| | 25,563 | | | HELEN OF TROY LTD.(b) | | | 2,175,025 | | | | 2,405,478 | | | | | |
| | 12,143 | | | HORIZON GLOBAL CORP.(b) | | | 172,917 | | | | 174,373 | | | | | |
| | 13,496 | | | IROBOT CORP.(b) | | | 386,654 | | | | 1,135,553 | | | | | |
| | 19,064 | | | JAMBA, INC.(b) | | | 173,168 | | | | 148,509 | | | | | |
| | 28,282 | | | LCI INDUSTRIES | | | 2,638,635 | | | | 2,896,077 | | | | | |
| | 21,365 | | | LIBERTY TAX, INC. | | | 264,938 | | | | 276,677 | | | | | |
| | 38,267 | | | LITHIA MOTORS, INC., CLASS A | | | 2,728,187 | | | | 3,605,899 | | | | | |
| | 2,640 | | | LUBY’S, INC.(b) | | | 7,709 | | | | 7,418 | | | | | |
| | 17,532 | | | M/I HOMES, INC.(b) | | | 425,027 | | | | 500,539 | | | | | |
| | 49,998 | | | MARINEMAX, INC.(b) | | | 957,156 | | | | 977,461 | | | | | |
| | 23,226 | | | MARRIOTT VACATIONS WORLDWIDE CORP. | | | 1,442,133 | | | | 2,734,861 | | | | | |
| | 100,444 | | | MOTORCAR PARTS OF AMERICA, INC.(b) | | | 2,720,872 | | | | 2,836,539 | | | | | |
| | 111,763 | | | NEW HOME (THE) CO., INC.(b) | | | 1,185,520 | | | | 1,281,922 | | | | | |
| | 30,956 | | | NEXSTAR MEDIA GROUP, INC., CLASS A | | | 1,599,553 | | | | 1,851,169 | | | | | |
| | 19,500 | | | PENSKE AUTOMOTIVE GROUP, INC. | | | 444,310 | | | | 856,245 | | | | | |
| | 147,725 | | | PINNACLE ENTERTAINMENT, INC.(b) | | | 1,721,168 | | | | 2,919,046 | | | | | |
| | 16,803 | | | RED LION HOTELS CORP.(b) | | | 111,607 | | | | 123,502 | | | | | |
| | 20,987 | | | SALEM MEDIA GROUP, INC., CLASS A | | | 121,799 | | | | 149,008 | | | | | |
| | 21,889 | | | SUMMER INFANT, INC.(b) | | | 37,428 | | | | 38,962 | | | | | |
| | 65,128 | | | TILE SHOP HOLDINGS, INC. | | | 1,107,063 | | | | 1,344,893 | | | | | |
| | 40,500 | | | TIME, INC. | | | 948,120 | | | | 581,175 | | | | | |
| | 41,111 | | | TOPBUILD CORP.(b) | | | 1,077,306 | | | | 2,181,761 | | | | | |
| | 32,863 | | | TOWN SPORTS INTERNATIONAL HOLDINGS, INC.(b) | | | 83,515 | | | | 154,456 | | | | | |
| | 80,100 | | | TRI POINTE GROUP, INC.(b) | | | 1,247,792 | | | | 1,056,519 | | | | | |
| | 49,408 | | | UNIFI, INC.(b) | | | 1,337,064 | | | | 1,521,766 | | | | | |
| | 39,677 | | | US AUTO PARTS NETWORK, INC.(b) | | | 123,417 | | | | 128,157 | | | | | |
| | 6,177 | | | VAIL RESORTS, INC. | | | 217,265 | | | | 1,252,881 | | | | | |
| | 33,700 | | | VISTA OUTDOOR, INC.(b) | | | 1,395,641 | | | | 758,587 | | | | | |
| | 8,700 | | | VISTEON CORP.(b) | | | 799,368 | | | | 887,922 | | | | | |
| | 23,556 | | | WINNEBAGO INDUSTRIES, INC. | | | 618,132 | | | | 824,460 | | | | | |
| | | | | | | | 39,794,230 | | | | 47,942,332 | | | | 13.89 | % |
| | Consumer Staples: | | | | | | | | | | | | |
| | 18,867 | | | CALAVO GROWERS, INC. | | | 1,300,753 | | | | 1,302,766 | | | | | |
| | 12,287 | | | CHEFS’ WAREHOUSE (THE), INC.(b) | | | 173,383 | | | | 159,731 | | | | | |
| | 15,141 | | | COFFEE HOLDING CO., INC.(b) | | | 69,125 | | | | 67,529 | | | | | |
| | 30,531 | | | FARMER BROTHERS CO.(b) | | | 979,027 | | | | 923,563 | | | | | |
| | 59,758 | | | MEDIFAST, INC. | | | 1,897,848 | | | | 2,478,164 | | | | | |
| | 8,699 | | | MGP INGREDIENTS, INC. | | | 442,465 | | | | 445,128 | | | | | |
| | 29,358 | | | NATURAL GROCERS BY VITAMIN COTTAGE, INC.(b) | | | 299,273 | | | | 242,791 | | | | | |
| | 130,555 | | | S&W SEED CO.(b) | | | 588,802 | | | | 541,803 | | | | | |
| | 84,214 | | | SUNOPTA, INC.(b)(c) | | | 550,154 | | | | 858,983 | | | | | |
| | 18,487 | | | TREEHOUSE FOODS, INC.(b) | | | 1,287,061 | | | | 1,510,203 | | | | | |
| | | | | | | | 7,587,891 | | | | 8,530,661 | | | | 2.47 | % |
| | Energy: | | | | | | | | | | | | |
| | 19,900 | | | BASIC ENERGY SERVICES, INC.(b) | | | 754,616 | | | | 495,510 | | | | | |
| | 47,936 | | | CARRIZO OIL & GAS, INC.(b) | | | 1,312,318 | | | | 835,045 | | | | | |
| | 25,600 | | | DELEK US HOLDINGS, INC. | | | 656,633 | | | | 676,864 | | | | | |
| | 38,311 | | | GREEN PLAINS, INC. | | | 880,879 | | | | 787,291 | | | | | |
| | 52,521 | | | OIL STATES INTERNATIONAL, INC.(b) | | | 1,667,890 | | | | 1,425,945 | | | | | |
| | 41,998 | | | PACIFIC ETHANOL, INC.(b) | | | 283,615 | | | | 262,488 | | | | | |
| See accompanying notes to financial statements. | 38 | (Continued) |
CLEARWATER INVESTMENT TRUST
Schedule of Investments - Clearwater Small Companies Fund
June 30, 2017 (unaudited)
| | | | | | | | | | | | | |
| Shares | | | Security | | Cost | | | Fair value (a) | | | Percent of
net assets | |
| | Energy (Cont’d): | | | | | | | | | | | | |
| | 18,953 | | | PAR PACIFIC HOLDINGS, INC.(b) | | $ | 310,022 | | | | 341,912 | | | | | |
| | 32,600 | | | PARSLEY ENERGY, INC., CLASS A(b) | | | 603,699 | | | | 904,650 | | | | | |
| | 48,191 | | | PBF ENERGY, INC., CLASS A | | | 1,337,194 | | | | 1,072,732 | | | | | |
| | 50,970 | | | SM ENERGY CO. | | | 1,812,388 | | | | 842,534 | | | | | |
| | 115,000 | | | SRC ENERGY, INC.(b) | | | 1,162,601 | | | | 773,950 | | | | | |
| | | | | | | | 10,781,855 | | | | 8,418,921 | | | | 2.44 | % |
| | Financials: | | | | | | | | | | | | |
| | 82,695 | | | AMERICAN EQUITY INVESTMENT LIFE HOLDING CO. | | | 1,529,167 | | | | 2,173,225 | | | | | |
| | 10,000 | | | AMERICAN NATIONAL BANKSHARES, INC. | | | 278,633 | | | | 369,500 | | | | | |
| | 47,873 | | | AMERIS BANCORP | | | 1,573,386 | | | | 2,307,479 | | | | | |
| | 45,813 | | | ANWORTH MORTGAGE ASSET CORP. | | | 236,653 | | | | 275,336 | | | | | |
| | 25,823 | | | ARES COMMERCIAL REAL ESTATE CORP. | | | 332,335 | | | | 338,023 | | | | | |
| | 18,335 | | | ATLAS FINANCIAL HOLDINGS, INC.(b) | | | 239,765 | | | | 273,191 | | | | | |
| | 2,379 | | | AUBURN NATIONAL BANCORPORATION, INC. | | | 78,025 | | | | 88,951 | | | | | |
| | 7,234 | | | BANCORP 34, INC.(b) | | | 92,415 | | | | 101,276 | | | | | |
| | 33,800 | | | BANCORPSOUTH, INC. | | | 987,567 | | | | 1,030,900 | | | | | |
| | 19,555 | | | BANK MUTUAL CORP. | | | 150,209 | | | | 178,928 | | | | | |
| | 57,784 | | | BANKFINANCIAL CORP. | | | 701,689 | | | | 862,137 | | | | | |
| | 35,802 | | | BANKUNITED, INC. | | | 1,063,822 | | | | 1,206,885 | | | | | |
| | 80,991 | | | BOFI HOLDING, INC.(b) | | | 1,582,584 | | | | 1,921,107 | | | | | |
| | 20,800 | | | BOK FINANCIAL CORP. | | | 1,018,062 | | | | 1,749,904 | | | | | |
| | 25,115 | | | BRIDGE BANCORP, INC. | | | 729,849 | | | | 836,329 | | | | | |
| | 4,117 | | | BSB BANCORP, INC.(b) | | | 86,034 | | | | 120,422 | | | | | |
| | 11,779 | | | BYLINE BANCORP, INC.(b) | | | 223,801 | | | | 236,168 | | | | | |
| | 6,659 | | | CAPITAL SOUTHWEST CORP. | | | 105,347 | | | | 107,077 | | | | | |
| | 9,700 | | | CB FINANCIAL SERVICES, INC. | | | 256,088 | | | | 253,170 | | | | | |
| | 1,352 | | | CBT FINANCIAL CORP. | | | 47,374 | | | | 50,024 | | | | | |
| | 11,491 | | | CENTRAL VALLEY COMMUNITY BANCORP | | | 221,257 | | | | 254,641 | | | | | |
| | 24,901 | | | CITIZENS COMMUNITY BANCORP, INC. | | | 331,121 | | | | 348,116 | | | | | |
| | 17,810 | | | CIVISTA BANCSHARES, INC. | | | 369,000 | | | | 371,873 | | | | | |
| | 24,906 | | | CNB FINANCIAL CORP. | | | 479,061 | | | | 596,997 | | | | | |
| | 21,000 | | | COLUMBIA BANKING SYSTEM, INC. | | | 818,311 | | | | 836,850 | | | | | |
| | 17,739 | | | COMMUNITY BANKERS TRUST CORP.(b) | | | 96,216 | | | | 146,347 | | | | | |
| | 53,622 | | | DONEGAL GROUP, INC., CLASS A | | | 869,936 | | | | 852,590 | | | | | |
| | 56,248 | | | DONNELLEY FINANCIAL SOLUTIONS, INC.(b) | | | 1,237,295 | | | | 1,291,454 | | | | | |
| | 4,656 | | | EAGLE BANCORP MONTANA, INC. | | | 85,607 | | | | 84,274 | | | | | |
| | 23,314 | | | EMC INSURANCE GROUP, INC. | | | 437,681 | | | | 647,663 | | | | | |
| | 31,948 | | | ENTERPRISE FINANCIAL SERVICES CORP. | | | 1,345,935 | | | | 1,303,478 | | | | | |
| | 3,022 | | | EQUITY BANCSHARES, INC., CLASS A(b) | | | 96,310 | | | | 92,594 | | | | | |
| | 36,915 | | | ESSA BANCORP, INC. | | | 502,020 | | | | 543,389 | | | | | |
| | 9,436 | | | FARMERS CAPITAL BANK CORP. | | | 341,826 | | | | 363,758 | | | | | |
| | 19,986 | | | FARMERS NATIONAL BANC CORP. | | | 209,675 | | | | 289,797 | | | | | |
| | 195,298 | | | FIFTH STREET FINANCE CORP. | | | 819,980 | | | | 949,148 | | | | | |
| | 50,893 | | | FIFTH STREET SENIOR FLOATING RATE CORP. | | | 407,661 | | | | 414,778 | | | | | |
| | 7,584 | | | FIRST BANCORP | | | 158,271 | | | | 237,076 | | | | | |
| | 7,886 | | | FIRST BANK | | | 89,900 | | | | 91,872 | | | | | |
| | 1,110 | | | FIRST FINANCIAL NORTHWEST, INC. | | | 17,032 | | | | 17,904 | | | | | |
| | 10,335 | | | FIRST GUARANTY BANCSHARES, INC. | | | 227,440 | | | | 281,525 | | | | | |
| | 13,187 | | | FIRST MID-ILLINOIS BANCSHARES, INC. | | | 332,404 | | | | 451,523 | | | | | |
| | 86,772 | | | FNB CORP. | | | 1,147,304 | | | | 1,228,692 | | | | | |
| | 3,173 | | | FOUR OAKS FINCORP, INC. | | | 52,279 | | | | 59,018 | | | | | |
| | 100,386 | | | HANMI FINANCIAL CORP. | | | 2,424,168 | | | | 2,855,982 | | | | | |
| | 48,620 | | | HERITAGE COMMERCE CORP. | | | 560,431 | | | | 669,984 | | | | | |
| | 23,206 | | | HERITAGE FINANCIAL CORP. | | | 319,950 | | | | 614,959 | | | | | |
| | 70,100 | | | HILLTOP HOLDINGS, INC. | | | 1,352,287 | | | | 1,837,321 | | | | | |
| | 7,073 | | | HOME BANCORP, INC. | | | 198,149 | | | | 300,744 | | | | | |
| | 105,542 | | | HOPE BANCORP, INC. | | | 2,277,182 | | | | 1,968,358 | | | | | |
| | 12,657 | | | HOPFED BANCORP, INC. | | | 170,383 | | | | 186,184 | | | | | |
| | 8,611 | | | HORIZON BANCORP | | | 200,855 | | | | 226,900 | | | | | |
| | 17,100 | | | IBERIABANK CORP. | | | 918,723 | | | | 1,393,650 | | | | | |
| | 6,230 | | | INVESTAR HOLDING CORP. | | | 132,388 | | | | 142,667 | | | | | |
| | 94,800 | | | KEARNY FINANCIAL CORP. | | | 1,130,182 | | | | 1,407,780 | | | | | |
| | 61,792 | | | LCNB CORP. | | | 1,048,398 | | | | 1,235,840 | | | | | |
| | 37,415 | | | LEGACYTEXAS FINANCIAL GROUP, INC. | | | 1,195,691 | | | | 1,426,634 | | | | | |
| | 15,898 | | | MACKINAC FINANCIAL CORP. | | | 217,467 | | | | 222,572 | | | | | |
| | 21,142 | | | MB FINANCIAL, INC. | | | 893,445 | | | | 931,094 | | | | | |
| | 4,929 | | | MIDLAND STATES BANCORP, INC. | | | 113,417 | | | | 165,220 | | | | | |
| | 30,518 | | | MIDWESTONE FINANCIAL GROUP, INC. | | | 1,010,766 | | | | 1,034,255 | | | | | |
| See accompanying notes to financial statements. | 39 | (Continued) |
CLEARWATER INVESTMENT TRUST
Schedule of Investments - Clearwater Small Companies Fund
June 30, 2017 (unaudited)
| Shares | | | Security | | Cost | | | Fair value (a) | | | Percent of
net assets | |
| | Financials (Cont’d): | | | | | | | | | | | | |
| | 3,000 | | | MSB FINANCIAL CORP.(b) | | $ | 48,797 | | | | 52,650 | | | | | |
| | 37,487 | | | MTGE INVESTMENT CORP. | | | 651,215 | | | | 704,756 | | | | | |
| | 3,394 | | | NATIONAL BANKSHARES, INC. | | | 124,286 | | | | 138,475 | | | | | |
| | 85,636 | | | NEW MOUNTAIN FINANCE CORP. | | | 1,239,661 | | | | 1,246,004 | | | | | |
| | 3,572 | | | NORWOOD FINANCIAL CORP. | | | 123,227 | | | | 150,917 | | | | | |
| | 34,214 | | | OCEANFIRST FINANCIAL CORP. | | | 963,843 | | | | 927,884 | | | | | |
| | 71,500 | | | OPUS BANK | | | 1,647,908 | | | | 1,730,300 | | | | | |
| | 2,925 | | | ORRSTOWN FINANCIAL SERVICES, INC. | | | 62,731 | | | | 66,836 | | | | | |
| | 21,777 | | | PEOPLES BANCORP OF NORTH CAROLINA, INC. | | | 569,138 | | | | 688,153 | | | | | |
| | 2,786 | | | PEOPLES FINANCIAL SERVICES CORP. | | | 113,733 | | | | 121,832 | | | | | |
| | 5,032 | | | PEOPLE’S UTAH BANCORP | | | 94,093 | | | | 134,858 | | | | | |
| | 14,123 | | | PREMIER FINANCIAL BANCORP, INC. | | | 264,322 | | | | 291,075 | | | | | |
| | 51,800 | | | PROVIDENT FINANCIAL SERVICES, INC. | | | 921,469 | | | | 1,314,684 | | | | | |
| | 86,852 | | | RESOURCE CAPITAL CORP. | | | 786,708 | | | | 883,285 | | | | | |
| | 3,636 | | | SALISBURY BANCORP, INC. | | | 137,808 | | | | 150,712 | | | | | |
| | 6,126 | | | SELECT BANCORP, INC.(b) | | | 72,779 | | | | 74,860 | | | | | |
| | 8,494 | | | SHORE BANCSHARES, INC. | | | 121,529 | | | | 139,726 | | | | | |
| | 27,030 | | | SI FINANCIAL GROUP, INC. | | | 281,989 | | | | 435,183 | | | | | |
| | 6,841 | | | SIERRA BANCORP | | | 128,495 | | | | 167,947 | | | | | |
| | 3,654 | | | SOUND FINANCIAL BANCORP, INC. | | | 108,989 | | | | 111,264 | | | | | |
| | 27,411 | | | SOUTHERN MISSOURI BANCORP, INC. | | | 716,495 | | | | 884,279 | | | | | |
| | 21,949 | | | SOUTHERN NATIONAL BANCORP OF VIRGINIA, INC. | | | 351,599 | | | | 386,302 | | | | | |
| | 31,560 | | | STATE BANK FINANCIAL CORP. | | | 837,168 | | | | 855,907 | | | | | |
| | 92,050 | | | STERLING BANCORP | | | 2,076,537 | | | | 2,140,162 | | | | | |
| | 43,197 | | | STIFEL FINANCIAL CORP.(b) | | | 2,204,156 | | | | 1,986,198 | | | | | |
| | 18,250 | | | SUMMIT STATE BANK | | | 237,124 | | | | 237,250 | | | | | |
| | 791 | | | SUN BANCORP, INC. | | | 18,608 | | | | 19,498 | | | | | |
| | 2,366 | | | SUNCREST BANK(b) | | | 23,755 | | | | 23,660 | | | | | |
| | 6,751 | | | SUNSHINE BANCORP, INC.(b) | | | 128,151 | | | | 143,864 | | | | | |
| | 33,379 | | | SUTHERLAND ASSET MANAGEMENT CORP. | | | 426,196 | | | | 495,678 | | | | | |
| | 24,500 | | | SYNOVUS FINANCIAL CORP. | | | 599,104 | | | | 1,083,880 | | | | | |
| | 7,475 | | | TGR FINANCIAL, INC.(b) | | | 62,961 | | | | 71,012 | | | | | |
| | 18,694 | | | TRICO BANCSHARES | | | 489,736 | | | | 657,094 | | | | | |
| | 13,125 | | | UMB FINANCIAL CORP. | | | 653,778 | | | | 982,537 | | | | | |
| | 1,612 | | | UNITED BANCSHARES, INC. | | | 34,382 | | | | 37,479 | | | | | |
| | 15,843 | | | UNITED FINANCIAL BANCORP, INC. | | | 208,917 | | | | 264,420 | | | | | |
| | 23,102 | | | UNITY BANCORP, INC. | | | 333,593 | | | | 397,354 | | | | | |
| | 9,751 | | | UNIVEST CORP. OF PENNSYLVANIA | | | 224,017 | | | | 292,042 | | | | | |
| | 23,069 | | | VALIDUS HOLDINGS LTD.(c) | | | 1,185,683 | | | | 1,198,896 | | | | | |
| | 60,924 | | | WALKER & DUNLOP, INC.(b) | | | 1,176,846 | | | | 2,974,919 | | | | | |
| | 34,350 | | | WEBSTER FINANCIAL CORP. | | | 1,631,714 | | | | 1,793,757 | | | | | |
| | 23,162 | | | WEST BANCORPORATION, INC. | | | 489,054 | | | | 547,781 | | | | | |
| | | | | | | | 58,742,503 | | | | 69,860,903 | | | | 20.24 | % |
| | Health Care: | | | | | | | | | | | | |
| | 30,819 | | | ALBANY MOLECULAR RESEARCH, INC.(b) | | | 662,950 | | | | 668,772 | | | | | |
| | 2,845 | | | ANI PHARMACEUTICALS, INC.(b) | | | 143,139 | | | | 133,146 | | | | | |
| | 4,398 | | | ANIKA THERAPEUTICS, INC.(b) | | | 199,807 | | | | 216,997 | | | | | |
| | 1,294 | | | BIOTELEMETRY, INC.(b) | | | 38,534 | | | | 43,284 | | | | | |
| | 59,439 | | | CAMBREX CORP.(b) | | | 2,923,738 | | | | 3,551,480 | | | | | |
| | 54,584 | | | CAPITAL SENIOR LIVING CORP.(b) | | | 893,289 | | | | 830,223 | | | | | |
| | 17,067 | | | COMPUTER PROGRAMS & SYSTEMS, INC. | | | 509,688 | | | | 559,798 | | | | | |
| | 32,782 | | | CUTERA, INC.(b) | | | 654,345 | | | | 849,054 | | | | | |
| | 34,145 | | | DIGIRAD CORP. | | | 160,020 | | | | 138,287 | | | | | |
| | 18,266 | | | EMERGENT BIOSOLUTIONS, INC.(b) | | | 547,393 | | | | 619,400 | | | | | |
| | 64,800 | | | ENSIGN GROUP (THE), INC. | | | 1,307,171 | | | | 1,410,696 | | | | | |
| | 7,354 | | | HEALTHSTREAM, INC.(b) | | | 161,198 | | | | 193,557 | | | | | |
| | 142,388 | | | HMS HOLDINGS CORP.(b) | | | 2,283,201 | | | | 2,634,178 | | | | | |
| | 25,058 | | | ICON PLC(b)(c) | | | 1,233,098 | | | | 2,450,422 | | | | | |
| | 13,146 | | | ICU MEDICAL, INC.(b) | | | 1,779,314 | | | | 2,267,685 | | | | | |
| | 31,473 | | | MAGELLAN HEALTH, INC.(b) | | | 2,112,521 | | | | 2,294,382 | | | | | |
| | 57,860 | | | OMNICELL, INC.(b) | | | 2,038,623 | | | | 2,493,766 | | | | | |
| | 158,204 | | | PEREGRINE PHARMACEUTICALS, INC.(b) | | | 64,818 | | | | 96,188 | | | | | |
| | 93,980 | | | PREMIER, INC., CLASS A(b) | | | 3,086,770 | | | | 3,383,280 | | | | | |
| | 36,509 | | | PRESTIGE BRANDS HOLDINGS, INC.(b) | | | 1,879,838 | | | | 1,928,040 | | | | | |
| | 80,877 | | | STREAMLINE HEALTH SOLUTIONS, INC.(b) | | | 100,379 | | | | 86,539 | | | | | |
| | 45,371 | | | TIVITY HEALTH, INC.(b) | | | 1,448,545 | | | | 1,808,034 | | | | | |
| | 34,846 | | | WRIGHT MEDICAL GROUP N.V.(b)(c) | | | 886,587 | | | | 957,917 | | | | | |
| | | | | | | | 25,114,966 | | | | 29,615,125 | | | | 8.58 | % |
| See accompanying notes to financial statements. | 40 | (Continued) |
CLEARWATER INVESTMENT TRUST
Schedule of Investments - Clearwater Small Companies Fund
June 30, 2017 (unaudited)
| Shares | | | Security | | Cost | | | Fair value (a) | | | Percent of
net assets | |
| | Industrials: | | | | | | | | | | | | | | | |
| | 31,700 | | | ABM INDUSTRIES, INC. | | $ | 919,303 | | | | 1,316,184 | | | | | |
| | 12,356 | | | AEROJET ROCKETDYNE HOLDINGS, INC.(b) | | | 219,131 | | | | 257,005 | | | | | |
| | 55,300 | | | AIR LEASE CORP. | | | 1,432,594 | | | | 2,066,008 | | | | | |
| | 54,348 | | | AIR TRANSPORT SERVICES GROUP, INC.(b) | | | 821,390 | | | | 1,183,699 | | | | | |
| | 32,643 | | | ALBANY INTERNATIONAL CORP., CLASS A | | | 1,316,605 | | | | 1,743,136 | | | | | |
| | 9,676 | | | AMERICAN RAILCAR INDUSTRIES, INC. | | | 343,812 | | | | 370,591 | | | | | |
| | 33,022 | | | APOGEE ENTERPRISES, INC. | | | 1,727,776 | | | | 1,876,970 | | | | | |
| | 59,663 | | | ARMSTRONG FLOORING, INC.(b) | | | 1,048,669 | | | | 1,072,144 | | | | | |
| | 45,274 | | | ATLAS AIR WORLDWIDE HOLDINGS, INC.(b) | | | 1,989,109 | | | | 2,361,039 | | | | | |
| | 21,443 | | | BLUE BIRD CORP.(b) | | | 304,439 | | | | 364,531 | | | | | |
| | 21,191 | | | BRINK’S (THE) CO. | | | 1,387,405 | | | | 1,419,797 | | | | | |
| | 34,182 | | | COLUMBUS MCKINNON CORP. | | | 821,807 | | | | 868,906 | | | | | |
| | 75,998 | | | COVENANT TRANSPORTATION GROUP, INC., CLASS A(b) | | | 1,455,179 | | | | 1,332,245 | | | | | |
| | 10,650 | | | CURTISS-WRIGHT CORP. | | | 733,697 | | | | 977,457 | | | | | |
| | 12,399 | | | ENERSYS | | | 916,265 | | | | 898,308 | | | | | |
| | 26,224 | | | ENNIS, INC. | | | 430,851 | | | | 500,878 | | | | | |
| | 23,600 | | | ESCO TECHNOLOGIES, INC. | | | 835,079 | | | | 1,407,740 | | | | | |
| | 41,514 | | | GENCOR INDUSTRIES, INC.(b) | | | 621,322 | | | | 672,527 | | | | | |
| | 93,235 | | | GENERAC HOLDINGS, INC.(b) | | | 3,383,773 | | | | 3,368,581 | | | | | |
| | 755 | | | GP STRATEGIES CORP.(b) | | | 18,902 | | | | 19,932 | | | | | |
| | 3,557 | | | HARDINGE, INC. | | | 40,916 | | | | 44,178 | | | | | |
| | 51,401 | | | HARSCO CORP.(b) | | | 358,166 | | | | 827,556 | | | | | |
| | 3,052 | | | HERC HOLDINGS, INC.(b) | | | 111,921 | | | | 120,005 | | | | | |
| | 70,973 | | | INTERFACE, INC. | | | 1,172,132 | | | | 1,394,619 | | | | | |
| | 31,800 | | | ITT, INC. | | | 974,718 | | | | 1,277,724 | | | | | |
| | 45,088 | | | JASON INDUSTRIES, INC.(b) | | | 97,704 | | | | 58,164 | | | | | |
| | 18,300 | | | JOHN BEAN TECHNOLOGIES CORP. | | | 236,381 | | | | 1,793,400 | | | | | |
| | 6,849 | | | KADANT, INC. | | | 338,324 | | | | 515,045 | | | | | |
| | 58,800 | | | KBR, INC. | | | 1,012,556 | | | | 894,936 | | | | | |
| | 29,563 | | | LSC COMMUNICATIONS, INC. | | | 594,280 | | | | 632,648 | | | | | |
| | 82,732 | | | LSI INDUSTRIES, INC. | | | 794,779 | | | | 748,725 | | | | | |
| | 20,613 | | | MCGRATH RENTCORP | | | 718,273 | | | | 713,828 | | | | | |
| | 52,590 | | | NCI BUILDING SYSTEMS, INC.(b) | | | 754,513 | | | | 878,253 | | | | | |
| | 11,596 | | | NORDSON CORP. | | | 1,049,091 | | | | 1,406,827 | | | | | |
| | 44,398 | | | ON ASSIGNMENT, INC.(b) | | | 1,358,277 | | | | 2,404,152 | | | | | |
| | 10,563 | | | PARK-OHIO HOLDINGS CORP. | | | 384,250 | | | | 402,450 | | | | | |
| | 60,058 | | | PIONEER POWER SOLUTIONS, INC.(b) | | | 369,681 | | | | 402,389 | | | | | |
| | 57,435 | | | QUANEX BUILDING PRODUCTS CORP. | | | 1,084,728 | | | | 1,214,750 | | | | | |
| | 92,575 | | | R.R. DONNELLEY & SONS CO. | | | 1,227,931 | | | | 1,160,890 | | | | | |
| | 19,403 | | | REGAL BELOIT CORP. | | | 1,530,990 | | | | 1,582,315 | | | | | |
| | 29,300 | | | RITCHIE BROS. AUCTIONEERS, INC.(c) | | | 638,721 | | | | 842,082 | | | | | |
| | 63,649 | | | SKYWEST, INC. | | | 2,193,397 | | | | 2,234,080 | | | | | |
| | 72,973 | | | SPARTON CORP.(b) | | | 1,477,776 | | | | 1,604,676 | | | | | |
| | 29,575 | | | SPX CORP.(b) | | | 694,031 | | | | 744,107 | | | | | |
| | 14,262 | | | TELEDYNE TECHNOLOGIES, INC.(b) | | | 792,143 | | | | 1,820,544 | | | | | |
| | 24,904 | | | TITAN MACHINERY, INC.(b) | | | 265,817 | | | | 447,774 | | | | | |
| | 15,508 | | | TRIMAS CORP.(b) | | | 268,303 | | | | 323,342 | | | | | |
| | 11,914 | | | VALMONT INDUSTRIES, INC. | | | 1,861,738 | | | | 1,782,334 | | | | | |
| | 25,147 | | | VIAD CORP. | | | 1,002,513 | | | | 1,188,196 | | | | | |
| | 50,800 | | | WELBILT, INC.(b) | | | 930,323 | | | | 957,580 | | | | | |
| | 35,246 | | | WOODWARD, INC. | | | 1,265,507 | | | | 2,381,925 | | | | | |
| | 6,045 | | | YRC WORLDWIDE, INC.(b) | | | 60,441 | | | | 67,220 | | | | | |
| | | | | | | | 46,387,429 | | | | 56,944,392 | | | | 16.50 | % |
| | Information Technology: | | | | | | | | | | | |
| | 13,133 | | | AMBER ROAD, INC.(b) | | | 120,478 | | | | 112,550 | | | | | |
| | 9,498 | | | AUTOBYTEL, INC.(b) | | | 122,037 | | | | 119,770 | | | | | |
| | 47,424 | | | BAZAARVOICE, INC.(b) | | | 225,502 | | | | 234,749 | | | | | |
| | 44,839 | | | BELDEN, INC. | | | 2,885,794 | | | | 3,382,206 | | | | | |
| | 76,516 | | | CALLIDUS SOFTWARE, INC.(b) | | | 811,118 | | | | 1,851,687 | | | | | |
| | 32,157 | | | COMMVAULT SYSTEMS, INC.(b) | | | 1,686,792 | | | | 1,815,263 | | | | | |
| | 17,630 | | | COMTECH TELECOMMUNICATIONS CORP. | | | 198,932 | | | | 334,441 | | | | | |
| | 39,100 | | | DIEBOLD NIXDORF, INC. | | | 1,135,846 | | | | 1,094,800 | | | | | |
| | 16,745 | | | DIGI INTERNATIONAL, INC.(b) | | | 224,179 | | | | 169,962 | | | | | |
| | 2,255 | | | DSP GROUP, INC.(b) | | | 27,012 | | | | 26,158 | | | | | |
| | 47,746 | | | ELECTRONICS FOR IMAGING, INC.(b) | | | 1,960,367 | | | | 2,262,205 | | | | | |
| | 43,104 | | | EURONET WORLDWIDE, INC.(b) | | | 2,192,186 | | | | 3,765,997 | | | | | |
| | 6,911 | | | FORMFACTOR, INC.(b) | | | 86,383 | | | | 85,696 | | | | | |
| | 131,693 | | | FRANKLIN WIRELESS CORP.(b) | | | 283,239 | | | | 296,309 | | | | | |
| See accompanying notes to financial statements. | 41 | (Continued) |
CLEARWATER INVESTMENT TRUST
Schedule of Investments - Clearwater Small Companies Fund
June 30, 2017 (unaudited)
| Shares | | | Security | | Cost | | | Fair value (a) | | | Percent of
net assets | |
| | Information Technology (Cont’d): | | | | | | | | | | | | |
| | 72,285 | | | FREQUENCY ELECTRONICS, INC.(b) | | $ | 713,098 | | | | 689,599 | | | | | |
| | 3,774 | | | GTT COMMUNICATIONS, INC.(b) | | | 89,311 | | | | 119,447 | | | | | |
| | 98,683 | | | INTERNAP CORP.(b) | | | 148,426 | | | | 362,167 | | | | | |
| | 13,820 | | | INTEST CORP.(b) | | | 49,681 | | | | 92,594 | | | | | |
| | 21,772 | | | IPG PHOTONICS CORP.(b) | | | 1,120,020 | | | | 3,159,117 | | | | | |
| | 51,097 | | | ITRON, INC.(b) | | | 2,792,290 | | | | 3,461,822 | | | | | |
| | 71,953 | | | JABIL, INC. | | | 1,215,513 | | | | 2,100,308 | | | | | |
| | 52,200 | | | KNOWLES CORP.(b) | | | 1,055,595 | | | | 883,224 | | | | | |
| | 29,569 | | | LUMENTUM HOLDINGS, INC.(b) | | | 1,852,177 | | | | 1,686,911 | | | | | |
| | 24,228 | | | MACOM TECHNOLOGY SOLUTIONS HOLDINGS, INC.(b) | | | 816,163 | | | | 1,351,196 | | | | | |
| | 85,976 | | | MARCHEX, INC., CLASS B(b) | | | 235,373 | | | | 256,208 | | | | | |
| | 160,400 | | | MITEL NETWORKS CORP.(b)(c) | | | 1,265,836 | | | | 1,178,940 | | | | | |
| | 176,042 | | | MODUSLINK GLOBAL SOLUTIONS, INC.(b) | | | 282,774 | | | | 301,032 | | | | | |
| | 30,241 | | | MTS SYSTEMS CORP. | | | 1,628,366 | | | | 1,566,484 | | | | | |
| | 12,829 | | | NCI, INC., CLASS A(b) | | | 199,472 | | | | 270,692 | | | | | |
| | 63,824 | | | NOVANTA, INC.(b) | | | 1,954,436 | | | | 2,297,664 | | | | | |
| | 2,224 | | | PC CONNECTION, INC. | | | 59,249 | | | | 60,181 | | | | | |
| | 3,411 | | | PERCEPTRON, INC.(b) | | | 14,651 | | | | 24,832 | | | | | |
| | 102,543 | | | PERFICIENT, INC.(b) | | | 1,622,855 | | | | 1,911,402 | | | | | |
| | 10,670 | | | PFSWEB, INC.(b) | | | 82,311 | | | | 88,134 | | | | | |
| | 20,383 | | | SHORETEL, INC.(b) | | | 150,227 | | | | 118,221 | | | | | |
| | 70,593 | | | SUPER MICRO COMPUTER, INC.(b) | | | 1,641,673 | | | | 1,740,117 | | | | | |
| | 132,439 | | | SUPPORT.COM, INC.(b) | | | 399,865 | | | | 309,907 | | | | | |
| | 158,955 | | | SYNCHRONOSS TECHNOLOGIES, INC.(b) | | | 4,225,130 | | | | 2,614,810 | | | | | |
| | 43,451 | | | SYNNEX CORP. | | | 3,190,482 | | | | 5,212,382 | | | | | |
| | 72,890 | | | TANGOE, INC.(b) | | | 470,789 | | | | 474,514 | | | | | |
| | 96,194 | | | UNISYS CORP.(b) | | | 1,289,527 | | | | 1,231,283 | | | | | |
| | 26,400 | | | VERINT SYSTEMS, INC.(b) | | | 921,972 | | | | 1,074,480 | | | | | |
| | 40,200 | | | VERSUM MATERIALS, INC. | | | 942,641 | | | | 1,306,500 | | | | | |
| | 17,863 | | | VIASAT, INC.(b) | | | 1,237,472 | | | | 1,182,531 | | | | | |
| | 68,098 | | | VIRTUSA CORP.(b) | | | 1,711,975 | | | | 2,002,081 | | | | | |
| | 3,869 | | | VISHAY PRECISION GROUP, INC.(b) | | | 60,426 | | | | 66,934 | | | | | |
| | 7,800 | | | WEX, INC.(b) | | | 203,342 | | | | 813,306 | | | | | |
| | | | | | | | 45,602,983 | | | | 55,560,813 | | | | 16.09 | % |
| | Materials: | | | | | | | | | | | | | | | |
| | 72,617 | | | BERRY GLOBAL GROUP, INC.(b) | | | 1,962,160 | | | | 4,139,895 | | | | | |
| | 37,817 | | | CALGON CARBON CORP. | | | 524,454 | | | | 571,037 | | | | | |
| | 57,800 | | | COMMERCIAL METALS CO. | | | 952,473 | | | | 1,123,054 | | | | | |
| | 69,073 | | | HANDY & HARMAN LTD.(b) | | | 1,465,192 | | | | 2,168,892 | | | | | |
| | 46,516 | | | INGEVITY CORP.(b) | | | 2,197,404 | | | | 2,670,018 | | | | | |
| | 13,700 | | | KAISER ALUMINUM CORP. | | | 1,071,135 | | | | 1,212,724 | | | | | |
| | 33,500 | | | KAPSTONE PAPER AND PACKAGING CORP. | | | 910,424 | | | | 691,105 | | | | | |
| | 36,593 | | | KOPPERS HOLDINGS, INC.(b) | | | 761,909 | | | | 1,322,837 | | | | | |
| | 10,503 | | | KRATON CORP.(b) | | | 284,283 | | | | 361,723 | | | | | |
| | 34,981 | | | OLIN CORP. | | | 720,765 | | | | 1,059,225 | | | | | |
| | 6,985 | | | P.H. GLATFELTER CO. | | | 129,009 | | | | 136,487 | | | | | |
| | 18,000 | | | SENSIENT TECHNOLOGIES CORP. | | | 1,019,457 | | | | 1,449,540 | | | | | |
| | 16,830 | | | TRECORA RESOURCES(b) | | | 180,170 | | | | 189,338 | | | | | |
| | 38,097 | | | US CONCRETE, INC.(b) | | | 2,007,441 | | | | 2,992,519 | | | | | |
| | | | | | | | 14,186,276 | | | | 20,088,394 | | | | 5.82 | % |
| | Real Estate: | | | | | | | | | | | | | | | |
| | 49,884 | | | ARMADA HOFFLER PROPERTIES, INC. | | | 671,072 | | | | 645,998 | | | | | |
| | 14,942 | | | ASHFORD HOSPITALITY PRIME, INC. | | | 146,234 | | | | 153,753 | | | | | |
| | 32,483 | | | ASHFORD HOSPITALITY TRUST, INC. | | | 201,851 | | | | 197,497 | | | | | |
| | 37,418 | | | BLUEROCK RESIDENTIAL GROWTH REIT, INC. | | | 462,905 | | | | 482,318 | | | | | |
| | 65,200 | | | CARETRUST REIT, INC. | | | 851,843 | | | | 1,208,808 | | | | | |
| | 16,396 | | | CATCHMARK TIMBER TRUST, INC., CLASS A | | | 173,532 | | | | 186,423 | | | | | |
| | 110,091 | | | CBL & ASSOCIATES PROPERTIES, INC. | | | 1,182,430 | | | | 928,067 | | | | | |
| | 137,739 | | | CEDAR REALTY TRUST, INC. | | | 794,654 | | | | 668,034 | | | | | |
| | 3,848 | | | COMMUNITY HEALTHCARE TRUST, INC. | | | 93,699 | | | | 98,470 | | | | | |
| | 41,900 | | | EDUCATION REALTY TRUST, INC. | | | 1,756,638 | | | | 1,623,625 | | | | | |
| | 77,018 | | | FELCOR LODGING TRUST, INC. | | | 557,784 | | | | 555,300 | | | | | |
| | 58,429 | | | FIRST POTOMAC REALTY TRUST | | | 648,902 | | | | 649,146 | | | | | |
| | 160,499 | | | FORESTAR GROUP, INC.(b) | | | 2,149,037 | | | | 2,752,558 | | | | | |
| | 36,341 | | | GRAMERCY PROPERTY TRUST | | | 775,935 | | | | 1,079,691 | | | | | |
| | 18,430 | | | JERNIGAN CAPITAL, INC. | | | 393,617 | | | | 405,460 | | | | | |
| | 79,300 | | | KENNEDY-WILSON HOLDINGS, INC. | | | 1,589,710 | | | | 1,510,665 | | | | | |
| | 72,237 | | | KITE REALTY GROUP TRUST | | | 1,771,723 | | | | 1,367,446 | | | | | |
| See accompanying notes to financial statements. | 42 | (Continued) |
CLEARWATER INVESTMENT TRUST
Schedule of Investments - Clearwater Small Companies Fund
June 30, 2017 (unaudited)
| Shares | | | Security | | Cost | | | Fair value (a) | | | Percent of
net assets | |
| | Real Estate (Cont’d): | | | | | | | | | | | | |
| | 50,087 | | | MARCUS & MILLICHAP, INC.(b) | | $ | 1,393,243 | | | | 1,320,293 | | | | | |
| | 99,950 | | | MEDICAL PROPERTIES TRUST, INC. | | | 948,124 | | | | 1,286,357 | | | | | |
| | 85,200 | | | OUTFRONT MEDIA, INC. | | | 2,005,879 | | | | 1,969,824 | | | | | |
| | 78,101 | | | PARKWAY, INC. | | | 1,443,108 | | | | 1,787,732 | | | | | |
| | 48,003 | | | RETAIL OPPORTUNITY INVESTMENTS CORP. | | | 968,996 | | | | 921,178 | | | | | |
| | 21,890 | | | RYMAN HOSPITALITY PROPERTIES, INC. | | | 592,181 | | | | 1,401,179 | | | | | |
| | 49,700 | | | SABRA HEALTH CARE REIT, INC. | | | 806,801 | | | | 1,197,770 | | | | | |
| | 14,800 | | | SERITAGE GROWTH PROPERTIES, CLASS A | | | 640,831 | | | | 620,860 | | | | | |
| | 85,320 | | | STAG INDUSTRIAL, INC. | | | 1,527,881 | | | | 2,354,832 | | | | | |
| | 26,800 | | | URBAN EDGE PROPERTIES | | | 601,422 | | | | 635,964 | | | | | |
| | 27,164 | | | URSTADT BIDDLE PROPERTIES, INC., CLASS A | | | 549,125 | | | | 537,847 | | | | | |
| | 10,589 | | | WHITESTONE REIT | | | 129,021 | | | | 129,715 | | | | | |
| | | | | | | | 25,828,178 | | | | 28,676,810 | | | | 8.31 | % |
| | Telecommunication Services: | | | | | | | | | | | | |
| | 97,577 | | | ALASKA COMMUNICATIONS SYSTEMS GROUP, INC.(b) | | | 179,968 | | | | 214,669 | | | | | |
| | 35,124 | | | HAWAIIAN TELCOM HOLDCO, INC.(b) | | | 818,959 | | | | 877,749 | | | | | |
| | 22,265 | | | IDT CORP., CLASS B | | | 314,831 | | | | 319,948 | | | | | |
| | 145,604 | | | LUMOS NETWORKS CORP.(b) | | | 2,569,606 | | | | 2,601,944 | | | | | |
| | | | | | | | 3,883,364 | | | | 4,014,310 | | | | 1.16 | % |
| | Utilities: | | | | | | | | | | | | | | | |
| | 46,201 | | | ALLETE, INC. | | | 2,147,649 | | | | 3,311,688 | | | | | |
| | 22,900 | | | BLACK HILLS CORP. | | | 1,351,759 | | | | 1,545,063 | | | | | |
| | 19,372 | | | NEW JERSEY RESOURCES CORP. | | | 714,435 | | | | 769,068 | | | | | |
| | 68,375 | | | PURE CYCLE CORP.(b) | | | 358,775 | | | | 529,906 | | | | | |
| | 21,260 | | | SOUTH JERSEY INDUSTRIES, INC. | | | 562,289 | | | | 726,454 | | | | | |
| | 28,944 | | | SPIRE, INC. | | | 1,577,434 | | | | 2,018,844 | | | | | |
| | | | | | | | 6,712,341 | | | | 8,901,023 | | | | 2.58 | % |
| | | Sub-total Common Stocks: | | | 284,622,016 | | | | 338,553,684 | | | | 98.08 | % |
| Rights: | | | | | | | | | | | | | | | |
| | Consumer Discretionary: | | | | | | | | | | | | |
| | 55,700 | | | MEDIA GENERAL INC. (CONTINGENT VALUE RIGHTS)(b) | | | - | | | | - | | | | | |
| | | | | | | | - | | | | - | | | | 0.00 | % |
| | | | Sub-total Rights: | | | - | | | | - | | | | 0.00 | % |
| Short-Term Investments: | | | | | | | | | | | | |
| | 9,397,574 | | | NORTHERN INSTITUTIONAL FUNDS -U.S. GOVERNMENT SELECT PORTFOLIO, 0.82%(d) | | | 9,397,574 | | | | 9,397,574 | | | | | |
| | | | Sub-total Short-Term Investments: | | | 9,397,574 | | | | 9,397,574 | | | | 2.72 | % |
| | | | | Grand total(e) | | $ | 294,019,590 | | | | 347,951,258 | | | | 100.80 | % |
Notes to Schedule of Investments:
| (a) | Investments are valued in accordance with procedures described in note 2 to the financial statements. |
| (b) | Non-income producing assets. |
| (c) | Foreign security values are stated in U.S. dollars. As of June 30, 2017, the value of foreign stocks or depositary receipts of companies based outside of the United States represented 2.17% of net assets. |
| (d) | The short-term investment is a money market portfolio of the investment company, Northern Institutional Funds. At December 31, 2016, the value of the Clearwater Small Companies Fund’s investment in the U.S. Government Select Portfolio of the Northern Institutional Funds was $12,813,306 with net sales of $3,415,732 during the six months ended June 30, 2017. |
| (e) | At June 30, 2017, the cost for Federal income tax purposes was $294,567,505. The aggregate gross unrealized appreciation and depreciation of investments in securities based on this cost was as follows: |
| Gross unrealized appreciation | | $ | 64,019,774 | |
| Gross unrealized depreciation | | | (10,636,021 | ) |
| Net unrealized appreciation | | $ | 53,383,753 | |
| See accompanying notes to financial statements. | 43 | (Continued) |
CLEARWATER INVESTMENT TRUST
Schedule of Investments - Clearwater Small Companies Fund
June 30, 2017 (unaudited)
Clearwater Small Companies Fund Portfolio Diversification
(as a percentage of net assets)
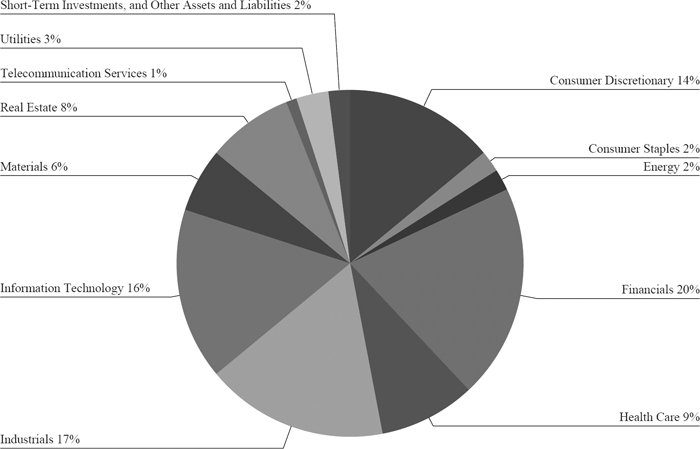
| See accompanying notes to financial statements. | 44 | (Continued) |
CLEARWATER INVESTMENT TRUST
Schedule of Investments - Clearwater Tax-Exempt Bond Fund
June 30, 2017 (unaudited)
Par/Shares |
|
Security |
| Maturity
date |
|
| Coupon
rate |
|
|
Cost |
|
|
Fair value (a) |
|
| Percent of
net assets |
|
| Closed-End Funds: | | | | | | | | | | | | | | | | | | | | |
| | 227,600 | | BLACKROCK LONG-TERM MUNICIPAL ADVANTAGE TRUST | | | | | | | | | | $ | 2,360,733 | | | | 2,685,680 | | | | | |
| | 12,000 | | BLACKROCK MUNIHOLDINGS FUND II INC | | | | | | | | | | | 174,062 | | | | 189,480 | | | | | |
| | 148,800 | | BLACKROCK MUNIHOLDINGS INVESTMENT QUALITY FUND | | | | | | | | | | | 1,705,296 | | | | 2,188,848 | | | | | |
| | 57,300 | | BLACKROCK MUNIHOLDINGS QUALITY FUND II INC | | | | | | | | | | | 729,193 | | | | 780,999 | | | | | |
| | 35,700 | | BLACKROCK MUNIHOLDINGS QUALITY FUND INC | | | | | | | | | | | 474,032 | | | | 479,808 | | | | | |
| | 8,302 | | BLACKROCK MUNIYIELD FUND INC | | | | | | | | | | | 122,288 | | | | 124,447 | | | | | |
| | 55,111 | | BLACKROCK MUNIYIELD INVESTMENT QUALITY FUND | | | | | | | | | | | 701,111 | | | | 775,412 | | | | | |
| | 142,461 | | BLACKROCK MUNIYIELD MICHIGAN QUALITY FUND INC | | | | | | | | | | | 1,846,525 | | | | 1,998,728 | | | | | |
| | 51,700 | | BLACKROCK MUNIYIELD PENNSYLVANIA QUALITY FUND | | | | | | | | | | | 729,423 | | | | 740,861 | | | | | |
| | 101,896 | | BLACKROCK MUNIYIELD QUALITY FUND II INC | | | | | | | | | | | 1,307,244 | | | | 1,336,876 | | | | | |
| | 118,472 | | BLACKROCK MUNIYIELD QUALITY FUND III INC | | | | | | | | | | | 1,572,465 | | | | 1,692,965 | | | | | |
| | 19,965 | | DEUTSCHE MUNICIPAL INCOME TRUST | | | | | | | | | | | 192,103 | | | | 269,527 | | | | | |
| | 43,668 | | DREYFUS STRATEGIC MUNICIPAL BOND FUND INC | | | | | | | | | | | 359,770 | | | | 371,615 | | | | | |
| | 19,200 | | DREYFUS STRATEGIC MUNICIPALS INC | | | | | | | | | | | 175,346 | | | | 171,072 | | | | | |
| | 18,592 | | EATON VANCE CALIFORNIA MUNICIPAL BOND FUND II | | | | | | | | | | | 206,025 | | | | 221,059 | | | | | |
| | 178,050 | | INVESCO ADVANTAGE MUNICIPAL INCOME TRUST II | | | | | | | | | | | 1,985,371 | | | | 2,056,477 | | | | | |
| | 113,205 | | INVESCO MUNICIPAL OPPORTUNITY TRUST | | | | | | | | | | | 1,410,252 | | | | 1,481,853 | | | | | |
| | 30,000 | | INVESCO MUNICIPAL TRUST | | | | | | | | | | | 412,242 | | | | 384,900 | | | | | |
| | 66,122 | | INVESCO QUALITY MUNICIPAL INCOME TRUST | | | | | | | | | | | 750,670 | | | | 842,394 | | | | | |
| | 60,000 | | INVESCO TRUST FOR INVESTMENT GRADE MUNICIPALS | | | | | | | | | | | 774,122 | | | | 805,200 | | | | | |
| | 50,248 | | MANAGED DURATION INVESTMENT GRADE MUNICIPAL FUND | | | | | | | | | | | 632,960 | | | | 692,970 | | | | | |
| | 53,000 | | NUVEEN AMT-FREE MUNICIPAL CREDIT INCOME FUND | | | | | | | | | | | 748,312 | | | | 802,950 | | | | | |
| | 245,475 | | NUVEEN AMT-FREE QUALITY MUNICIPAL INCOME FUND | | | | | | | | | | | 3,273,528 | | | | 3,360,547 | | | | | |
| | 15,963 | | NUVEEN MICHIGAN QUALITY MUNICIPAL INCOME FUND | | | | | | | | | | | 214,604 | | | | 218,693 | | | | | |
| | 52,779 | | NUVEEN PENNSYLVANIA QUALITY MUNICIPAL INCOME FUND | | | | | | | | | | | 723,141 | | | | 706,183 | | | | | |
| | 29,740 | | NUVEEN QUALITY MUNICIPAL INCOME FUND | | | | | | | | | | | 409,650 | | | | 417,557 | | | | | |
| | 28,000 | | PUTNAM MUNICIPAL OPPORTUNITIES TRUST | | | | | | | | | | | 371,050 | | | | 350,000 | | | | | |
| | 19,613 | | WESTERN ASSET MUNICIPAL PARTNERS FUND INC | | | | | | | | | | | 246,036 | | | | 305,178 | | | | | |
| | | | Sub-total Closed-End Funds: | | | | | | | | | | | 24,607,554 | | | | 26,452,279 | | | | 5.22 | % |
| Municipal Bonds: | | | | | | | | | | | | | | | | | | | |
| | 2,350,000 | | ACALANES CA UNION HIGH SCH DIST(b) | | | 8/1/2039 | | | | 0.00 | | | | 1,491,126 | | | | 2,165,290 | | | | | |
| | 540,000 | | ALABAMA ST HSG FIN AUTH SF MTGE REVENUE | | | 10/1/2028 | | | | 5.25 | | | | 540,000 | | | | 549,509 | | | | | |
| | 1,000,000 | | ALACHUA CNTY FL HLTH FACS AUTH CCRC | | | 10/1/2032 | | | | 8.00 | | | | 1,121,615 | | | | 1,189,250 | | | | | |
| | 750,000 | | ALASKA ST HSG FIN CORP MTGE REVENUE | | | 12/1/2037 | | | | 4.13 | | | | 737,261 | | | | 766,462 | | | | | |
| | 500,000 | | ALASKA ST HSG FIN CORP MTGE REVENUE | | | 12/1/2040 | | | | 4.63 | | | | 495,000 | | | | 520,795 | | | | | |
| | 350,000 | | ALASKA ST INDL DEV & EXPORT AUTH CMNTY PROVIDER REVENUE(c) | | | 12/1/2010 | | | | 5.40 | | | | 350,000 | | | | 34,139 | | | | | |
| | 725,000 | | ALLEGHENY CNTY PA INDL DEV AUTH CHRT SCH REVENUE | | | 8/15/2026 | | | | 5.90 | | | | 725,000 | | | | 769,123 | | | | | |
| | 1,000,000 | | ALVORD CA UNIF SCH DIST | | | 8/1/2036 | | | | 5.25 | | | | 1,020,809 | | | | 1,159,240 | | | | | |
| | 1,000,000 | | ALVORD CA UNIF SCH DIST(b) | | | 8/1/2046 | | | | 0.00 | | | | 521,564 | | | | 938,070 | | | | | |
| | 1,000,000 | | APPLE VLY MN SENIOR LIVING REVENUE | | | 1/1/2047 | | | | 5.00 | | | | 977,360 | | | | 1,019,360 | | | | | |
| | 785,000 | | ARIZONA ST HLTH FACS AUTH HLTH CARE FACS REVENUE | | | 10/1/2022 | | | | 5.10 | | | | 774,426 | | | | 785,989 | | | | | |
| | 1,990,000 | | ARLINGTON TX HGR EDU FIN CORP EDU REVENUE | | | 8/15/2028 | | | | 7.00 | | | | 1,958,201 | | | | 2,158,752 | | | | | |
| | 500,000 | | ARLINGTON TX HGR EDU FIN CORP EDU REVENUE | | | 6/15/2036 | | | | 5.00 | | | | 511,213 | | | | 502,125 | | | | | |
| | 500,000 | | ASTURIA FL CMNTY DEV DIST SPL ASSMNT | | | 5/1/2034 | | | | 5.75 | | | | 500,000 | | | | 494,855 | | | | | |
| | 500,000 | | ATHENS-CLARKE CNTY GA UNIF GOVT DEV AUTH REVENUE | | | 6/15/2039 | | | | 5.00 | | | | 516,621 | | | | 553,895 | | | | | |
| | 500,000 | | ATLANTA GA ARPT REVENUE | | | 1/1/2030 | | | | 6.00 | | | | 508,650 | | | | 581,150 | | | | | |
| | 500,000 | | ATLANTA GA DEV AUTH | | | 7/1/2035 | | | | 4.00 | | | | 492,094 | | | | 514,850 | | | | | |
| | 1,000,000 | | ATLANTA GA DEV AUTH SENIOR HLTH CARE FACS REVENUE(d) | | | 1/1/2023 | | | | 6.00 | | | | 988,530 | | | | 997,220 | | | | | |
| | 750,000 | | ATLANTA GA DEV AUTH SENIOR HLTH CARE FACS REVENUE(d) | | | 1/1/2029 | | | | 6.50 | | | | 727,905 | | | | 739,867 | | | | | |
| | 1,500,000 | | BAY CNTY FL EDUCTNL FACS REVENUE | | | 9/1/2030 | | | | 5.25 | | | | 1,398,667 | | | | 1,543,050 | | | | | |
| | 1,000,000 | | BELLALAGO FL EDUCTNL FACS BENEFIT DIST CAPITAL IMPT REVENUE | | | 5/1/2030 | | | | 4.38 | | | | 985,006 | | | | 1,071,290 | | | | | |
| | 1,195,000 | | BELLWOOD IL | | | 12/1/2027 | | | | 5.88 | | | | 1,186,278 | | | | 1,357,185 | | | | | |
| | 935,000 | | BEXAR CNTY TX HSG FIN CORP | | | 2/1/2035 | | | | 3.75 | | | | 935,000 | | | | 965,864 | | | | | |
| | 2,000,000 | | BEXAR CNTY TX REVENUE | | | 8/15/2039 | | | | 5.00 | | | | 2,098,410 | | | | 2,189,640 | | | | | |
| | 500,000 | | BLACKBURN CREEK CMNTY DEV DISTFL CAP IMPT REVENUE | | | 5/1/2035 | | | | 6.25 | | | | 500,000 | | | | 499,310 | | | | | |
| See accompanying notes to financial statements. | 45 | (Continued) |
CLEARWATER INVESTMENT TRUST
Schedule of Investments - Clearwater Tax-Exempt Bond Fund
June 30, 2017 (unaudited)
| Par/Shares | | Security | | | Maturity
date | | | Coupon
rate | | | Cost | | | Fair value (a) | | | Percent of
net assets | |
| | Municipal Bonds (Cont’d): | | | | | | | | | | | | | | | | | | | | |
| | 560,000 | | BLACKBURN CREEK CMNTY DEV DISTFL CAP IMPT REVENUE | | | 5/1/2045 | | | | 6.25 | | | $ | 560,000 | | | | 560,269 | | | | | |
| | 750,000 | | BOWLING GREEN OH STUDENT HSG REVENUE | | | 6/1/2031 | | | | 5.75 | | | | 724,283 | | | | 795,780 | | | | | |
| | 1,150,000 | | BURBANK IL EDUCTNL FACS REVENUE(d) | | | 9/1/2035 | | | | 6.00 | | | | 1,150,000 | | | | 1,179,728 | | | | | |
| | 1,000,000 | | BUREAU CNTY TWP IL HIGH SCH DIST #502 | | | 10/1/2043 | | | | 6.63 | | | | 1,051,809 | | | | 1,237,200 | | | | | |
| | 390,000 | | BUTLER CNTY PA GEN AUTH REVENUE | | | 10/1/2034 | | | | 1.47 | | | | 390,000 | | | | 316,391 | | | | | |
| | 500,000 | | CALIFORNIA ST HLTH FACS FING AUTH REVENUE | | | 8/15/2033 | | | | 5.50 | | | | 504,927 | | | | 566,190 | | | | | |
| | 740,000 | | CALIFORNIA ST HSG FIN AGY REVENUE | | | 8/1/2033 | | | | 5.45 | | | | 683,483 | | | | 753,357 | | | | | |
| | 500,000 | | CALIFORNIA ST INFRASTRUCTURE & ECON DEV BANK ST SCH FUND APP | | | 8/15/2029 | | | | 5.75 | | | | 501,791 | | | | 557,110 | | | | | |
| | 1,500,000 | | CALIFORNIA ST SCH FACS FING AUTH REVENUE(b) | | | 8/1/2029 | | | | 6.00 | | | | 1,495,154 | | | | 1,917,195 | | | | | |
| | 500,000 | | CALIFORNIA ST STWD CMNTYS DEV AUTH REVENUE | | | 11/1/2021 | | | | 6.50 | | | | 500,000 | | | | 551,995 | | | | | |
| | 1,370,000 | | CAPITAL TRUST AGY FL CHRT SCHREVENUE | | | 2/1/2035 | | | | 5.38 | | | | 1,370,000 | | | | 1,359,163 | | | | | |
| | 750,000 | | CAPITAL TRUST AGY FL REVENUE | | | 4/1/2035 | | | | 7.00 | | | | 750,000 | | | | 766,957 | | | | | |
| | 1,750,000 | | CAPITAL TRUST AGY FL REVENUE(d) | | | 12/1/2035 | | | | 6.75 | | | | 1,747,946 | | | | 1,757,543 | | | | | |
| | 750,000 | | CAPITAL TRUST AGY FL REVENUE(d) | | | 7/1/2037 | | | | 6.75 | | | | 750,000 | | | | 745,927 | | | | | |
| | 1,000,000 | | CARLSBAD CA UNIF SCH DIST(b) | | | 8/1/2031 | | | | 0.00 | | | | 780,963 | | | | 1,087,280 | | | | | |
| | 1,000,000 | | CARMEL IN REVENUE | | | 11/15/2022 | | | | 6.00 | | | | 988,666 | | | | 1,075,390 | | | | | |
| | 1,000,000 | | CARMEL IN REVENUE | | | 11/15/2027 | | | | 7.00 | | | | 1,016,634 | | | | 1,098,900 | | | | | |
| | 500,000 | | CEDAR FALLS IA CMNTY SCH DIST SCH INFRASTRUCTURE SALES SVCS | | | 6/1/2027 | | | | 5.38 | | | | 498,650 | | | | 540,580 | | | | | |
| | 750,000 | | CELEBRATION POINTE CMNTY DEV DIST #1 FL SPL ASSMNT REVENUE(d) | | | 5/1/2032 | | | | 5.00 | | | | 755,792 | | | | 762,187 | | | | | |
| | 1,000,000 | | CENTRL BRADFORD PROGRESS AUTH PA | | | 12/1/2031 | | | | 5.50 | | | | 1,019,558 | | | | 1,143,670 | | | | | |
| | 520,000 | | CHANDLER PARK ACADEMY MI PUBLIC SCH ACADEMY REVENUE | | | 11/1/2022 | | | | 5.00 | | | | 443,193 | | | | 520,556 | | | | | |
| | 1,000,000 | | CHICAGO IL MIDWAY ARPT REVENUE | | | 1/1/2035 | | | | 5.25 | | | | 1,001,863 | | | | 1,120,350 | | | | | |
| | 165,000 | | CLIFTON TX HGR EDU FIN CORP EDU REVENUE | | | 2/15/2018 | | | | 7.75 | | | | 164,737 | | | | 167,458 | | | | | |
| | 1,500,000 | | CLOVIS CA UNIF SCH DIST(e) | | | 8/1/2030 | | | | 0.00 | | | | 681,603 | | | | 854,910 | | | | | |
| | 750,000 | | COLLIER CNTY FL INDL DEV AUTH | | | 10/1/2039 | | | | 6.25 | | | | 736,726 | | | | 852,998 | | | | | |
| | 490,000 | | COLLIER CNTY FLA INDL DEV AUTH CONTINUING CARE CMNTY REV(d) | | | 5/15/2022 | | | | 5.25 | | | | 490,000 | | | | 489,975 | | | | | |
| | 750,000 | | COLLIER CNTY FLA INDL DEV AUTH CONTINUING CARE CMNTY REV(d) | | | 5/15/2026 | | | | 7.25 | | | | 750,000 | | | | 817,515 | | | | | |
| | 1,000,000 | | COLLIER CNTY FLA INDL DEV AUTH CONTINUING CARE CMNTY REV(d) | | | 5/15/2044 | | | | 8.13 | | | | 1,118,166 | | | | 1,112,170 | | | | | |
| | 1,500,000 | | COLORADO ST EDUCTNL & CULTURAL FACS AUTH INDEP SCH REVENUE | | | 5/1/2030 | | | | 6.00 | | | | 1,467,106 | | | | 1,701,795 | | | | | |
| | 1,000,000 | | COLORADO ST EDUCTNL & CULTURAL FACS AUTH REVENUE | | | 6/1/2033 | | | | 5.50 | | | | 976,974 | | | | 1,038,140 | | | | | |
| | 1,000,000 | | COLORADO ST EDUCTNL & CULTURAL FACS AUTH REVENUE | | | 7/1/2034 | | | | 5.60 | | | | 994,509 | | | | 1,055,280 | | | | | |
| | 1,000,000 | | COLORADO ST EDUCTNL & CULTURAL FACS AUTH REVENUE(d) | | | 9/1/2046 | | | | 5.00 | | | | 1,011,218 | | | | 982,350 | | | | | |
| | 1,000,000 | | COLORADO ST HLTH FACS AUTH REVENUE | | | 8/1/2033 | | | | 7.63 | | | | 988,520 | | | | 1,124,820 | | | | | |
| | 500,000 | | COLORADO ST HLTH FACS AUTH REVENUE(d) | | | 12/1/2035 | | | | 5.75 | | | | 492,192 | | | | 514,245 | | | | | |
| | 115,000 | | COLORADO ST HSG & FIN AUTH | | | 10/1/2029 | | | | 5.40 | | | | 115,000 | | | | 117,245 | | | | | |
| | 1,000,000 | | COLTON CA JT UNIF SCH DIST(b) | | | 8/1/2035 | | | | 0.00 | | | | 791,777 | | | | 971,460 | | | | | |
| | 1,000,000 | | CONNECTICUT ST HSG FIN AUTH HSG FIN PROGRAM | | | 11/15/2035 | | | | 3.88 | | | | 1,000,000 | | | | 1,043,960 | | | | | |
| | 1,500,000 | | CONNECTICUT ST HSG FIN AUTH HSG MTGE FIN PROGRAM | | | 11/15/2035 | | | | 3.75 | | | | 1,500,000 | | | | 1,523,235 | | | | | |
| | 515,000 | | CONNECTICUT ST HSG FIN AUTH HSG MTGE FIN PROGRAM | | | 5/15/2038 | | | | 3.95 | | | | 515,000 | | | | 531,815 | | | | | |
| | 1,000,000 | | CONNECTICUT ST HSG FIN AUTH HSG MTGE FIN PROGRAM | | | 11/15/2040 | | | | 3.75 | | | | 1,000,000 | | | | 1,020,040 | | | | | |
| | 5,000,000 | | CONNECTICUT ST HSG FIN AUTH HSG MTGE FIN PROGRAM | | | 11/15/2047 | | | | 3.65 | | | | 5,000,000 | | | | 5,014,300 | | | | | |
| | 500,000 | | COPPERLEAF CO MET DIST #2 | | | 12/1/2030 | | | | 5.25 | | | | 500,000 | | | | 522,670 | | | | | |
| | 500,000 | | COPPERLEAF CO MET DIST #2 | | | 12/1/2045 | | | | 5.75 | | | | 500,000 | | | | 521,830 | | | | | |
| | 1,105,000 | | CORONA-NORCO CA UNIF SCH DIST(b) | | | 8/1/2039 | | | | 0.00 | | | | 1,098,956 | | | | 1,486,446 | | | | | |
| | 637,000 | | CORTLAND IL SPL TAX REVENUE(c) | | | 3/1/2017 | | | | 5.50 | | | | 633,881 | | | | 127,107 | | | | | |
| See accompanying notes to financial statements. | 46 | (Continued) |
CLEARWATER INVESTMENT TRUST
Schedule of Investments - Clearwater Tax-Exempt Bond Fund
June 30, 2017 (unaudited)
| Par/Shares | | Security | | | Maturity
date | | | Coupon
rate | | | Cost | | | Fair value (a) | | | Percent of
net assets | |
| | Municipal Bonds (Cont’d): | | | | | | | | | | | | | | | | | |
| | 500,000 | | COVENTRY OH LOCAL SCH DIST | | | 11/1/2037 | | | | 5.25 | | | $ | 504,808 | | | | 536,560 | | | | | |
| | 145,000 | | CROW FIN AUTH MT TRIBAL PURPOSE REVENUE(d) | | | 10/1/2017 | | | | 5.65 | | | | 144,758 | | | | 145,548 | | | | | |
| | 750,000 | | CRYSTAL CO CROSSING MET DIST | | | 12/1/2040 | | | | 5.25 | | | | 750,000 | | | | 759,892 | | | | | |
| | 474,200 | | CUYAHOGA CNTY OH HSG MTGE REVENUE | | | 3/20/2042 | | | | 5.70 | | | | 482,379 | | | | 485,443 | | | | | |
| | 1,000,000 | | DALLAS-FORT WORTH TX INTERNATIONAL ARPT REVENUE | | | 11/1/2037 | | | | 5.25 | | | | 1,008,566 | | | | 1,152,590 | | | | | |
| | 2,000,000 | | DAMON RUN IN CONSERVANCY DIST | | | 7/1/2025 | | | | 6.10 | | | | 2,013,022 | | | | 2,144,080 | | | | | |
| | 1,000,000 | | DAMON RUN IN CONSERVANCY DIST | | | 1/1/2027 | | | | 6.38 | | | | 1,005,091 | | | | 1,073,610 | | | | | |
| | 1,000,000 | | DAVIE FL EDUCTNL FACS REVENUE | | | 4/1/2042 | | | | 6.00 | | | | 1,021,343 | | | | 1,166,000 | | | | | |
| | 500,000 | | DAVIESS CNTY IN HOSP ASSN LEASE RENTAL REVENUE | | | 1/15/2029 | | | | 5.25 | | | | 491,484 | | | | 537,285 | | | | | |
| | 1,000,000 | | DAYTON-MONTGOMERY CNTY OH PORT AUTH PROJ REVENUE | | | 1/15/2040 | | | | 7.00 | | | | 1,000,000 | | | | 1,019,620 | | | | | |
| | 500,000 | | DECATUR IL | | | 3/1/2034 | | | | 5.00 | | | | 514,247 | | | | 548,920 | | | | | |
| | 1,000,000 | | DEKALB/KANE/LA SALLE CNTYS IL CMNTY CLG DIST #523(e) | | | 2/1/2029 | | | | 0.00 | | | | 554,439 | | | | 558,230 | | | | | |
| | 1,000,000 | | DEL MAR CA RACE TRACK AUTH | | | 10/1/2035 | | | | 5.00 | | | | 1,050,385 | | | | 1,076,740 | | | | | |
| | 245,000 | | DELAWARE ST HSG AUTH REVENUE | | | 7/1/2031 | | | | 5.20 | | | | 245,000 | | | | 253,729 | | | | | |
| | 500,000 | | DINUBA CA FING AUTH LEASE REVENUE | | | 9/1/2038 | | | | 5.38 | | | | 495,304 | | | | 503,825 | | | | | |
| | 500,000 | | DIST OF COLUMBIA HSG FIN AGY MF HSG REVENUE | | | 7/1/2033 | | | | 5.45 | | | | 500,000 | | | | 540,585 | | | | | |
| | 1,000,000 | | DIST OF COLUMBIA HSG FIN AGY MF HSG REVENUE | | | 6/1/2040 | | | | 4.90 | | | | 1,000,000 | | | | 1,087,930 | | | | | |
| | 1,000,000 | | DIST OF COLUMBIA HSG FIN AGY MF HSG REVENUE | | | 6/1/2041 | | | | 5.00 | | | | 1,000,000 | | | | 1,111,860 | | | | | |
| | 1,000,000 | | DOUGLAS CNTY CO MF REVENUE | | | 10/1/2029 | | | | 4.50 | | | | 1,000,000 | | | | 1,051,160 | | | | | |
| | 3,000,000 | | DUBLIN CA UNIF SCH DIST(e) | | | 8/1/2034 | | | | 0.00 | | | | 1,025,919 | | | | 1,124,190 | | | | | |
| | 1,000,000 | | EAST CHICAGO IN SAN DIST REVENUE | | | 7/15/2035 | | | | 4.00 | | | | 993,270 | | | | 1,037,890 | | | | | |
| | 1,500,000 | | EAST MORGAN CNTY CO HOSP DIST COPS | | | 12/1/2038 | | | | 5.88 | | | | 1,500,000 | | | | 1,515,540 | | | | | |
| | 2,045,000 | | EDEN TWP CA HOSP DIST COPS | | | 6/1/2030 | | | | 6.00 | | | | 2,026,788 | | | | 2,331,034 | | | | | |
| | 750,000 | | EL PASO DE ROBLES CA REDEV AGY TAX ALLOCATION REVENUE | | | 7/1/2033 | | | | 6.38 | | | | 742,914 | | | | 820,470 | | | | | |
| | 1,000,000 | | EL PASO TX DOWNTOWN DEV CORP SPL REVENUE | | | 8/15/2038 | | | | 7.25 | | | | 1,065,883 | | | | 1,216,150 | | | | | |
| | 1,000,000 | | ENCINITAS CA UNION SCH DIST(b) | | | 8/1/2035 | | | | 0.00 | | | | 713,951 | | | | 1,094,660 | | | | | |
| | 1,155,000 | | ENTERPRISE CA ELEM SCH DIST(b) | | | 8/1/2035 | | | | 0.00 | | | | 900,114 | | | | 1,174,277 | | | | | |
| | 1,000,000 | | ERIE CNTY PA HOSP AUTH | | | 7/1/2027 | | | | 7.00 | | | | 1,000,000 | | | | 1,030,780 | | | | | |
| | 600,000 | | ESCONDIDO CA SPL TAX | | | 9/1/2036 | | | | 5.00 | | | | 646,627 | | | | 679,842 | | | | | |
| | 500,000 | | FAIRFAX CNTY VA REDEV & HSG AUTH MF REVENUE | | | 8/1/2039 | | | | 5.60 | | | | 500,000 | | | | 510,875 | | | | | |
| | 238,000 | | FARMS NEW KENT VA CMNTY DEV AUTH SPL ASSMNT(c) | | | 3/1/2036 | | | | 5.13 | | | | 238,000 | | | | 59,490 | | | | | |
| | 1,000,000 | | FAYETTE CNTY KY SCH DIST FIN CORP | | | 8/1/2033 | | | | 4.00 | | | | 990,000 | | | | 1,037,070 | | | | | |
| | 1,000,000 | | FESTIVAL RANCH AZ CMNTY FACS DIST | | | 7/15/2024 | | | | 6.25 | | | | 1,004,719 | | | | 1,067,800 | | | | | |
| | 315,000 | | FIDDLERS CREEK FL CDD #2 SPL ASSMNT REVENUE(c) | | | 5/1/2013 | | | | 5.75 | | | | 314,118 | | | | 233,100 | | | | | |
| | 845,000 | | FISHHAWK CCD IV FL SPL ASSMNT REVENUE | | | 5/1/2033 | | | | 7.00 | | | | 845,000 | | | | 898,243 | | | | | |
| | 1,000,000 | | FLORIDA ST DEV FIN CORP EDUCTNL FACS REVENUE | | | 6/15/2034 | | | | 6.00 | | | | 990,487 | | | | 1,022,180 | | | | | |
| | 1,000,000 | | FLORIDA ST DEV FIN CORP EDUCTNL FACS REVENUE(d) | | | 6/15/2035 | | | | 6.00 | | | | 1,001,198 | | | | 1,026,660 | | | | | |
| | 245,000 | | FLORIDA ST HSG FIN CORP REVENUE | | | 7/1/2026 | | | | 5.00 | | | | 245,343 | | | | 263,968 | | | | | |
| | 820,000 | | FLORIDA ST HSG FIN CORP REVENUE | | | 7/1/2034 | | | | 5.30 | | | | 820,000 | | | | 835,801 | | | | | |
| | 990,000 | | FLORIDA ST HSG FIN CORP REVENUE | | | 7/1/2035 | | | | 3.75 | | | | 990,000 | | | | 1,036,164 | | | | | |
| | 885,000 | | FLORIDA ST HSG FIN CORP REVENUE | | | 7/1/2039 | | | | 4.20 | | | | 885,000 | | | | 916,577 | | | | | |
| | 1,250,000 | | FORT SILL APACHE TRIBE OK ECONDEV AUTH GAMING ENTERPRISE REV(d) | | | 8/25/2026 | | | | 8.50 | | | | 1,250,000 | | | | 1,460,038 | | | | | |
| | 1,000,000 | | FRANKLIN CNTY KS UNIF SCH DIST #290 | | | 9/1/2039 | | | | 4.75 | | | | 1,047,509 | | | | 1,101,540 | | | | | |
| | 1,000,000 | | FRANKLIN TN HLTH & EDUCTNL FACS BRD REVENUE(d) | | | 6/1/2027 | | | | 6.50 | | | | 1,000,000 | | | | 1,002,100 | | | | | |
| | 1,040,000 | | FULTON CNTY GA DEV AUTH | | | 11/1/2028 | | | | 5.25 | | | | 912,498 | | | | 990,964 | | | | | |
| | 1,000,000 | | FYI PROPERTIES WA LEASE REVENUE | | | 6/1/2034 | | | | 5.50 | | | | 983,714 | | | | 1,073,850 | | | | | |
| | 1,586,920 | | GALVESTON CNTY TX MUN UTIL DIST #52 | | | 2/21/2018 | | | | 5.87 | | | | 1,586,920 | | | | 1,190,158 | | | | | |
| | 3,500,000 | | GEORGIA ST HSG & FIN AUTH REVENUE | | | 12/1/2037 | | | | 3.80 | | | | 3,500,000 | | | | 3,549,280 | | | | | |
| | 2,000,000 | | GEORGIA ST HSG & FIN AUTH REVENUE | | | 12/1/2037 | | | | 4.00 | | | | 2,000,000 | | | | 2,051,300 | | | | | |
| | 1,000,000 | | GEORGIA ST HSG & FIN AUTH REVENUE | | | 12/1/2039 | | | | 4.00 | | | | 1,000,000 | | | | 1,031,800 | | | | | |
| | 4,500,000 | | GEORGIA ST HSG & FIN AUTH REVENUE | | | 12/1/2040 | | | | 3.80 | | | | 4,500,000 | | | | 4,577,355 | | | | | |
| See accompanying notes to financial statements. | 47 | (Continued) |
CLEARWATER INVESTMENT TRUST
Schedule of Investments - Clearwater Tax-Exempt Bond Fund
June 30, 2017 (unaudited)
| Par/Shares | | Security | | | Maturity
date | | | Coupon
rate | | | Cost | | | Fair value (a) | | | Percent of
net assets | |
| | Municipal Bonds (Cont’d): | | | | | | | | | | | | | | | | | |
| | 1,000,000 | | GEORGIA ST HSG & FIN AUTH REVENUE | | | 12/1/2041 | | | | 3.85 | | | $ | 1,005,258 | | | | 1,019,200 | | | | | |
| | 1,950,000 | | GEORGIA ST HSG & FIN AUTH REVENUE | | | 12/1/2043 | | | | 3.90 | | | | 1,945,983 | | | | 1,973,147 | | | | | |
| | 550,000 | | GLENDALE AZ INDL DEV AUTH | | | 11/15/2046 | | | | 5.25 | | | | 560,147 | | | | 534,726 | | | | | |
| | 1,500,000 | | GRAND PARKWAY TRANSPRTN CORP TX SYS TOLL REVENUE(b) | | | 10/1/2035 | | | | 0.00 | | | | 1,068,310 | | | | 1,354,830 | | | | | |
| | 1,065,000 | | HAMILTON CNTY OH HLTH CARE REVENUE | | | 1/1/2031 | | | | 6.13 | | | | 1,041,103 | | | | 1,217,061 | | | | | |
| | 1,250,000 | | HARRIS CNTY TX CULTURAL EDU FACS FIN CORP REVENUE | | | 8/15/2021 | | | | 6.75 | | | | 1,250,000 | | | | 1,341,938 | | | | | |
| | 1,500,000 | | HARTNELL CA CMNTY CLG DIST(b) | | | 8/1/2034 | | | | 0.00 | | | | 1,057,284 | | | | 1,519,305 | | | | | |
| | 3,500,000 | | HEALDSBURG CA UNIF SCH DIST(b) | | | 8/1/2037 | | | | 0.00 | | | | 2,776,385 | | | | 2,956,695 | | | | | |
| | 1,000,000 | | HELENDALE CA SCH DIST(b) | | | 8/1/2034 | | | | 0.00 | | | | 879,454 | | | | 1,152,700 | | | | | |
| | 750,000 | | HEMPSTEAD TOWN NY LOCAL DEV CORP REVENUE | | | 9/1/2038 | | | | 5.00 | | | | 755,105 | | | | 852,878 | | | | | |
| | 2,000,000 | | HENDERSON NV HLTHCARE FAC REVENUE | | | 7/1/2031 | | | | 5.25 | | | | 2,000,000 | | | | 2,000,240 | | | | | |
| | 825,000 | | HERITAGE HARBOUR FL N CDD SPLASSMNT | | | 5/1/2034 | | | | 5.00 | | | | 825,000 | | | | 850,773 | | | | | |
| | 1,000,000 | | HIDALGO CNTY TX REGL MOBILITY AUTH VEHICLE REGISTRATION FEE | | | 12/1/2038 | | | | 5.25 | | | | 1,025,144 | | | | 1,135,470 | | | | | |
| | 1,500,000 | | HOUSTON TX HGR EDU FIN CORP | | | 9/1/2038 | | | | 5.50 | | | | 1,533,712 | | | | 1,675,215 | | | | | |
| | 750,000 | | IDAHO ST HLTH FACS AUTH REVENUE | | | 10/1/2024 | | | | 7.00 | | | | 750,000 | | | | 809,483 | | | | | |
| | 750,000 | | IDAHO ST HLTH FACS AUTH REVENUE | | | 10/1/2029 | | | | 7.38 | | | | 742,468 | | | | 791,355 | | | | | |
| | 1,000,000 | | IDAHO ST HLTH FACS AUTH REVENUE | | | 10/1/2044 | | | | 8.00 | | | | 1,064,461 | | | | 1,074,750 | | | | | |
| | 1,500,000 | | ILLINOIS ST | | | 2/1/2030 | | | | 4.00 | | | | 1,492,586 | | | | 1,487,985 | | | | | |
| | 500,000 | | ILLINOIS ST | | | 7/1/2033 | | | | 5.50 | | | | 498,790 | | | | 524,705 | | | | | |
| | 250,000 | | ILLINOIS ST COPS | | | 7/1/2017 | | | | 5.80 | | | | 250,000 | | | | 250,022 | | | | | |
| | 1,000,000 | | ILLINOIS ST EDUCTNL FACS AUTH | | | 11/1/2036 | | | | 4.50 | | | | 1,000,000 | | | | 1,049,630 | | | | | |
| | 500,000 | | ILLINOIS ST FIN AUTH EDU REVENUE | | | 9/1/2032 | | | | 6.00 | | | | 500,000 | | | | 552,725 | | | | | |
| | 675,000 | | ILLINOIS ST FIN AUTH EDUCTNL FAC REVENUE | | | 2/1/2034 | | | | 6.00 | | | | 682,254 | | | | 710,127 | | | | | |
| | 610,000 | | ILLINOIS ST FIN AUTH REVENUE | | | 8/15/2026 | | | | 6.00 | | | | 610,000 | | | | 610,769 | | | | | |
| | 435,000 | | ILLINOIS ST FIN AUTH REVENUE | | | 5/15/2029 | | | | 5.25 | | | | 435,733 | | | | 451,373 | | | | | |
| | 500,000 | | ILLINOIS ST FIN AUTH REVENUE | | | 5/15/2036 | | | | 5.00 | | | | 501,750 | | | | 517,360 | | | | | |
| | 750,000 | | ILLINOIS ST FIN AUTH REVENUE | | | 11/15/2036 | | | | 5.25 | | | | 750,000 | | | | 751,642 | | | | | |
| | 750,000 | | ILLINOIS ST FIN AUTH REVENUE | | | 12/1/2037 | | | | 5.00 | | | | 771,758 | | | | 792,158 | | | | | |
| | 500,000 | | ILLINOIS ST FIN AUTH REVENUE | | | 3/1/2038 | | | | 6.00 | | | | 486,710 | | | | 540,850 | | | | | |
| | 1,000,000 | | ILLINOIS ST HSG DEV AUTH | | | 7/1/2034 | | | | 4.95 | | | | 1,000,000 | | | | 1,096,600 | | | | | |
| | 500,000 | | ILLINOIS ST HSG DEV AUTH | | | 7/1/2047 | | | | 4.50 | | | | 465,720 | | | | 500,150 | | | | | |
| | 1,500,000 | | ILLINOIS ST SPORTS FACS AUTH | | | 6/15/2031 | | | | 5.25 | | | | 1,602,474 | | | | 1,662,810 | | | | | |
| | 1,000,000 | | IMPERIAL CA CMNTY CLG DIST(b) | | | 8/1/2040 | | | | 6.75 | | | | 1,009,073 | | | | 1,278,610 | | | | | |
| | 500,000 | | INDIANA ST BOND BANK REVENUE | | | 2/1/2029 | | | | 5.50 | | | | 492,829 | | | | 532,295 | | | | | |
| | 3,000,000 | | INDIANA ST FIN AUTH REVENUE | | | 9/15/2030 | | | | 6.50 | | | | 3,043,820 | | | | 3,391,590 | | | | | |
| | 500,000 | | INDIANA ST FIN AUTH REVENUE | | | 11/15/2031 | | | | 5.50 | | | | 493,626 | | | | 542,965 | | | | | |
| | 1,000,000 | | INDIANA ST FIN AUTH REVENUE | | | 11/15/2033 | | | | 6.50 | | | | 987,537 | | | | 1,108,540 | | | | | |
| | 1,000,000 | | INDIANA ST FIN AUTH REVENUE | | | 3/1/2041 | | | | 5.00 | | | | 1,042,175 | | | | 1,076,550 | | | | | |
| | 500,000 | | INDIANA ST FIN AUTH REVENUE | | | 11/15/2041 | | | | 5.88 | | | | 537,714 | | | | 557,325 | | | | | |
| | 1,000,000 | | INDIANA ST FIN AUTH REVENUE | | | 11/15/2041 | | | | 6.00 | | | | 987,285 | | | | 1,122,270 | | | | | |
| | 1,000,000 | | INDIANA ST FIN AUTH REVENUE | | | 11/15/2046 | | | | 5.25 | | | | 1,039,722 | | | | 1,077,410 | | | | | |
| | 1,500,000 | | INDIANA ST HSG & CMNTY DEV AUTH MF HSG REVENUE | | | 1/1/2036 | | | | 5.75 | | | | 1,500,000 | | | | 1,453,545 | | | | | |
| | 1,500,000 | | IOWA ST FIN AUTH REVENUE | | | 5/15/2036 | | | | 5.00 | | | | 1,665,480 | | | | 1,676,385 | | | | | |
| | 70,000 | | JEFFERSON PARISH LA FIN AUTH | | | 12/1/2048 | | | | 5.70 | | | | 73,444 | | | | 73,510 | | | | | |
| | 790,000 | | KANSAS CITY MO INDL DEV AUTH | | | 9/1/2023 | | | | 5.45 | | | | 790,000 | | | | 826,933 | | | | | |
| | 1,000,000 | | KANSAS CITY MO INDL DEV AUTH | | | 11/20/2039 | | | | 5.10 | | | | 1,000,000 | | | | 1,071,090 | | | | | |
| | 1,500,000 | | KANSAS CITY MO INDL DEV AUTH SENIOR LIVING FACS REVENUE(d) | | | 11/15/2036 | | | | 5.75 | | | | 1,500,000 | | | | 1,476,825 | | | | | |
| | 975,000 | | KENTUCKY ST HSG CORP HSG REVENUE | | | 7/1/2028 | | | | 3.75 | | | | 962,006 | | | | 1,019,655 | | | | | |
| | 750,000 | | KING CNTY WA HSG AUTH | | | 5/1/2028 | | | | 5.20 | | | | 750,000 | | | | 786,548 | | | | | |
| | 1,000,000 | | KIRKWOOD MO INDL DEV AUTH RETMNT CMNTY REVENUE | | | 5/15/2037 | | | | 5.25 | | | | 1,023,426 | | | | 1,053,500 | | | | | |
| | 141,000 | | LAFAYETTE LA PUBLIC TRUST FING AUTH SF MTGE | | | 1/1/2041 | | | | 5.35 | | | | 144,173 | | | | 143,074 | | | | | |
| | 500,000 | | LAKE CNTY IL SCH DIST #33 | | | 12/1/2040 | | | | 5.00 | | | | 524,476 | | | | 533,585 | | | | | |
| | 400,000 | | LAKEWOOD RANCH FL STEWARDSHIP DIST SPL ASSMNT REVENUE | | | 5/1/2025 | | | | 4.25 | | | | 399,197 | | | | 407,732 | | | | | |
| | 1,700,000 | | LAKEWOOD RANCH FL STEWARDSHIP DIST SPL ASSMNT REVENUE | | | 5/1/2030 | | | | 7.40 | | | | 1,686,078 | | | | 1,965,030 | | | | | |
| | 750,000 | | LAKEWOOD RANCH FL STEWARDSHIP DIST SPL ASSMNT REVENUE | | | 5/1/2033 | | | | 6.70 | | | | 750,000 | | | | 835,755 | | | | | |
| See accompanying notes to financial statements. | 48 | (Continued) |
CLEARWATER INVESTMENT TRUST
Schedule of Investments - Clearwater Tax-Exempt Bond Fund
June 30, 2017 (unaudited)
| Par/Shares | | Security | | | Maturity
date | | | Coupon
rate | | | Cost | | | Fair value (a) | | | Percent of
net assets | |
| | Municipal Bonds (Cont’d): | | | | | | | | | | | | | | | | | |
| | 1,000,000 | | LAKEWOOD RANCH FL STEWARDSHIP DIST SPL ASSMNT REVENUE | | | 5/1/2034 | | | | 5.35 | | | $ | 1,000,000 | | | | 1,036,340 | | | | | |
| | 1,400,000 | | LAKEWOOD RANCH FL STEWARDSHIP DIST SPL ASSMNT REVENUE | | | 5/1/2036 | | | | 5.00 | | | | 1,400,000 | | | | 1,425,942 | | | | | |
| | 750,000 | | LAKEWOOD RANCH FL STEWARDSHIP DIST SPL ASSMNT REVENUE | | | 5/1/2037 | | | | 5.25 | | | | 745,320 | | | | 767,887 | | | | | |
| | 750,000 | | LAKEWOOD RANCH FL STEWARDSHIPDIST SPL ASSMNT REVENUE(d) | | | 5/1/2037 | | | | 5.00 | | | | 744,368 | | | | 756,330 | | | | | |
| | 1,000,000 | | LAMBERTSON FARMS CO MET DIST #1 REVENUE | | | 12/15/2025 | | | | 5.00 | | | | 991,140 | | | | 1,003,260 | | | | | |
| | 500,000 | | LAMBERTSON FARMS CO MET DIST #1 REVENUE | | | 12/15/2035 | | | | 5.50 | | | | 500,000 | | | | 501,600 | | | | | |
| | 2,000,000 | | LAS VEGAS NV REDEV AGY TAX INCR REVENUE | | | 6/15/2023 | | | | 7.50 | | | | 1,988,024 | | | | 2,244,600 | | | | | |
| | 235,000 | | LEHIGH CNTY PA GEN PURPOSE AUTH | | | 8/15/2042 | | | | 1.81 | | | | 235,000 | | | | 192,533 | | | | | |
| | 750,000 | | LEWISVILLE TX COMB CONTRACT REVENUE | | | 9/1/2024 | | | | 3.00 | | | | 742,824 | | | | 771,488 | | | | | |
| | 470,000 | | LEXINGTON OAKS FL CDD SPL ASSMNT REVENUE | | | 5/1/2033 | | | | 5.65 | | | | 470,000 | | | | 494,647 | | | | | |
| | 750,000 | | LEYDEN ROCK MET DIST #10 | | | 12/1/2045 | | | | 5.00 | | | | 767,610 | | | | 754,590 | | | | | |
| | 1,000,000 | | LITTLETON VLG MET DIST #2 COLO SPL REV | | | 12/1/2045 | | | | 5.38 | | | | 996,351 | | | | 1,005,070 | | | | | |
| | 180,000 | | LOMBARD IL PUBLIC FACS CORP CONFERENCE CENTER & HOTEL REVENU(c) | | | 1/1/2015 | | | | 6.38 | | | | 180,000 | | | | 78,815 | | | | | |
| | 1,000,000 | | LOMBARD IL PUBLIC FACS CORP CONFERENCE CENTER & HOTEL REVENU(c) | | | 1/1/2036 | | | | 5.25 | | | | 1,005,522 | | | | 291,360 | | | | | |
| | 385,000 | | LONG LAKE RANCH CMNTY DEV DIST FLA CAP IMPT REV | | | 5/1/2024 | | | | 5.63 | | | | 385,000 | | | | 389,997 | | | | | |
| | 275,000 | | LONG LAKE RANCH CMNTY DEV DIST FLA CAP IMPT REV | | | 5/1/2026 | | | | 4.00 | | | | 274,568 | | | | 276,210 | | | | | |
| | 35,000 | | LONG LAKE RANCH CMNTY DEV DIST FLA CAP IMPT REV | | | 5/1/2044 | | | | 5.75 | | | | 34,295 | | | | 35,231 | | | | | |
| | 700,000 | | LONG LAKE RANCH CMNTY DEV DIST FLA CAP IMPT REV | | | 5/1/2046 | | | | 4.75 | | | | 690,151 | | | | 696,689 | | | | | |
| | 1,000,000 | | LOUISIANA ST ENERGY & PWR AUTH PWR PROJ REVENUE | | | 6/1/2038 | | | | 5.25 | | | | 1,015,184 | | | | 1,136,860 | | | | | |
| | 260,000 | | LOUISIANA ST HSG FIN AGY SF MTGE REVENUE | | | 12/1/2034 | | | | 5.10 | | | | 260,000 | | | | 268,726 | | | | | |
| | 500,000 | | LOUISIANA ST LOCAL GOVT ENVRNMNTL FACS & CMNTY DEV AUTH | | | 11/15/2025 | | | | 5.25 | | | | 533,071 | | | | 516,910 | | | | | |
| | 1,000,000 | | LOUISIANA ST LOCAL GOVT ENVRNMNTL FACS & CMNTY DEV AUTH | | | 11/15/2030 | | | | 6.00 | | | | 1,016,351 | | | | 1,045,490 | | | | | |
| | 500,000 | | LOUISIANA ST PUBLIC FACS AUTH HOSP REVENUE | | | 7/1/2035 | | | | 5.00 | | | | 541,738 | | | | 564,230 | | | | | |
| | 1,000,000 | | LOUISIANA ST PUBLIC FACS AUTH HOSP REVENUE | | | 7/1/2047 | | | | 5.00 | | | | 1,116,696 | | | | 1,111,270 | | | | | |
| | 750,000 | | LOUISIANA ST PUBLIC FACS AUTH REVENUE | | | 5/1/2031 | | | | 6.50 | | | | 747,230 | | | | 828,938 | | | | | |
| | 430,000 | | LOUISIANA ST PUBLIC FACS AUTH REVENUE | | | 2/15/2036 | | | | 1.49 | | | | 430,000 | | | | 387,456 | | | | | |
| | 500,000 | | LUCAS CNTY OH HLTH CARE FACS REVENUE | | | 8/15/2030 | | | | 5.50 | | | | 493,073 | | | | 551,845 | | | | | |
| | 1,500,000 | | LUCAS MET HSG AUTH OH COPS | | | 11/1/2036 | | | | 5.00 | | | | 1,572,833 | | | | 1,606,455 | | | | | |
| | 1,480,000 | | LUZERNE CNTY PA | | | 11/1/2026 | | | | 7.00 | | | | 1,512,111 | | | | 1,638,094 | | | | | |
| | 1,000,000 | | MACON & MOULTRIE CNTYS IL CMNTY SCH DIST #3 MOUNT ZION | | | 12/1/2041 | | | | 5.50 | | | | 1,024,914 | | | | 1,124,460 | | | | | |
| | 1,000,000 | | MACON CNTY IL SCH DIST #61 | | | 1/1/2037 | | | | 5.25 | | | | 1,014,947 | | | | 1,083,990 | | | | | |
| | 250,000 | | MAGNOLIA CREEK FL CDD CAPITAL IMPT REVENUE(c) | | | 5/1/2014 | | | | 5.60 | | | | 250,000 | | | | 52,402 | | | | | |
| | 1,000,000 | | MAINE ST HSG AUTH MTGE PURCHASE | | | 11/15/2035 | | | | 4.00 | | | | 1,000,000 | | | | 1,032,220 | | | | | |
| | 1,000,000 | | MAINE ST HSG AUTH MTGE PURCHASE | | | 11/15/2036 | | | | 3.90 | | | | 1,000,000 | | | | 1,031,340 | | | | | |
| | 1,000,000 | | MAINE ST HSG AUTH MTGE PURCHASE | | | 11/15/2040 | | | | 3.55 | | | | 1,000,000 | | | | 994,930 | | | | | |
| | 1,500,000 | | MAINE ST HSG AUTH MTGE PURCHASE | | | 11/15/2040 | | | | 3.85 | | | | 1,500,000 | | | | 1,525,680 | | | | | |
| | 500,000 | | MAINE ST HSG AUTH MTGE PURCHASE | | | 11/15/2042 | | | | 4.05 | | | | 500,000 | | | | 515,795 | | | | | |
| | 1,000,000 | | MAINE ST HSG AUTH MTGE REVENUE | | | 11/15/2037 | | | | 4.50 | | | | 1,000,000 | | | | 1,047,580 | | | | | |
| | 1,000,000 | | MALTA IL TAX INCR REVENUE(c) | | | 12/30/2025 | | | | 5.75 | | | | 1,000,000 | | | | 379,930 | | | | | |
| | 500,000 | | MANATEE CNTY FL SCH BRD COPS | | | 7/1/2031 | | | | 5.63 | | | | 496,382 | | | | 559,270 | | | | | |
| | 404,629 | | MANHATTAN IL SPL SVC AREA SPL TAX(c) | | | 3/1/2022 | | | | 5.75 | | | | 404,629 | | | | 72,700 | | | | | |
| See accompanying notes to financial statements. | 49 | (Continued) |
CLEARWATER INVESTMENT TRUST
Schedule of Investments - Clearwater Tax-Exempt Bond Fund
June 30, 2017 (unaudited)
| Par/Shares | | Security | | Maturity
date | | | Coupon
rate | | | Cost | | | Fair value (a) | | | Percent of
net assets | |
| | Municipal Bonds (Cont’d): | | | | | | | | | | | | | | | | | | | | |
| | 800,000 | | MAPLE-STEELE ND JT WTR RESOURCE DIST | | | 5/1/2030 | | | | 4.00 | | | $ | 800,000 | | | | 800,976 | | | | | |
| | 800,000 | | MARICOPA CNTY AZ INDL DEV AUTH EDU REVENUE | | | 7/1/2035 | | | | 5.00 | | | | 855,644 | | | | 824,560 | | | | | |
| | 750,000 | | MARICOPA CNTY AZ INDL DEV AUTH SENIOR LIVING FACS REVENUE(d) | | | 1/1/2036 | | | | 5.75 | | | | 741,526 | | | | 734,955 | | | | | |
| | 462,000 | | MARQUIS VA CMNTY DEV AUTH REVENUE(e) | | | 9/1/2041 | | | | 0.00 | | | | 127,462 | | | | 61,996 | | | | | |
| | 349,000 | | MARQUIS VA CMNTY DEV AUTH REVENUE | | | 9/1/2041 | | | | 5.63 | | | | 375,781 | | | | 268,465 | | | | | |
| | 750,000 | | MARSHALL CREEK FL CDD SPL ASSMNT | | | 5/1/2032 | | | | 5.00 | | | | 767,038 | | | | 760,875 | | | | | |
| | 750,000 | | MARTINEZ CA UNIF SCH DIST(b) | | | 8/1/2035 | | | | 6.13 | | | | 748,612 | | | | 980,535 | | | | | |
| | 455,000 | | MARYLAND ST CMNTY DEV ADMIN DEPT HSG & CMNTY DEV | | | 9/1/2030 | | | | 5.13 | | | | 455,000 | | | | 484,834 | | | | | |
| | 500,000 | | MARYLAND ST CMNTY DEV ADMIN DEPT HSG & CMNTY DEV | | | 7/1/2031 | | | | 4.50 | | | | 500,000 | | | | 525,005 | | | | | |
| | 750,000 | | MARYLAND ST INDL DEV FING AUTH ECON DEV REVENUE | | | 11/1/2042 | | | | 4.00 | | | | 780,180 | | | | 780,818 | | | | | |
| | 514,802 | | MASHANTUCKET WSTRN PEQUOT TRIBE CT | | | 7/1/2031 | | | | 6.05 | | | | 539,065 | | | | 19,871 | | | | | |
| | 855,000 | | MASSACHUSETTS ST DEV FIN AGY REVENUE | | | 7/1/2030 | | | | 6.38 | | | | 845,664 | | | | 926,264 | | | | | |
| | 915,000 | | MASSACHUSETTS ST EDUCTNL FING AUTH | | | 1/1/2028 | | | | 5.25 | | | | 915,000 | | | | 965,865 | | | | | |
| | 700,000 | | MASSACHUSETTS ST HSG FIN AGY | | | 12/1/2033 | | | | 5.00 | | | | 700,000 | | | | 741,846 | | | | | |
| | 700,000 | | MASSACHUSETTS ST HSG FIN AGY | | | 12/1/2038 | | | | 5.15 | | | | 700,000 | | | | 741,657 | | | | | |
| | 1,000,000 | | MASSACHUSETTS ST HSG FIN AGY | | | 12/1/2043 | | | | 5.00 | | | | 1,000,000 | | | | 1,070,710 | | | | | |
| | 765,000 | | MASSACHUSETTS ST HSG FIN AGY HSG REVENUE | | | 6/1/2040 | | | | 5.05 | | | | 765,000 | | | | 786,665 | | | | | |
| | 2,770,000 | | MASSACHUSETTS ST HSG FIN AGY HSG REVENUE | | | 12/1/2043 | | | | 4.00 | | | | 2,770,000 | | | | 2,799,528 | | | | | |
| | 2,000,000 | | MASSACHUSETTS ST HSG FIN AGY HSG REVENUE | | | 6/1/2046 | | | | 4.20 | | | | 2,000,000 | | | | 2,078,420 | | | | | |
| | 160,000 | | MEAD NE TAX INCR REVENUE(c) | | | 7/1/2012 | | | | 5.13 | | | | 160,000 | | | | 3,701 | | | | | |
| | 1,000,000 | | MEDFORD OR HOSP FACS AUTH REVENUE | | | 10/1/2042 | | | | 5.00 | | | | 1,035,231 | | | | 1,062,170 | | | | | |
| | 600,000 | | MERRILLVILLE IN ECON DEV REVENUE | | | 4/1/2036 | | | | 5.75 | | | | 600,000 | | | | 575,694 | | | | | |
| | 1,000,000 | | MIAMI FL HLTH FACS AUTH | | | 7/1/2038 | | | | 5.13 | | | | 1,044,933 | | | | 1,080,860 | | | | | |
| | 500,000 | | MIAMI-DADE CNTY FL HLTH FACS AUTH HOSP REVENUE | | | 8/1/2030 | | | | 6.00 | | | | 485,390 | | | | 567,784 | | | | | |
| | 750,000 | | MICHIGAN ST FIN AUTH REVENUE | | | 11/15/2035 | | | | 5.25 | | | | 745,313 | | | | 780,878 | | | | | |
| | 1,500,000 | | MICHIGAN ST HOSP FIN AUTH | | | 6/1/2034 | | | | 6.13 | | | | 1,519,557 | | | | 1,643,715 | | | | | |
| | 1,000,000 | | MICHIGAN ST HSG DEV AUTH | | | 10/1/2034 | | | | 5.63 | | | | 1,000,000 | | | | 1,026,400 | | | | | |
| | 1,850,000 | | MICHIGAN ST HSG DEV AUTH | | | 10/1/2035 | | | | 4.10 | | | | 1,850,000 | | | | 1,908,497 | | | | | |
| | 1,000,000 | | MICHIGAN ST HSG DEV AUTH | | | 12/1/2035 | | | | 3.95 | | | | 1,000,000 | | | | 1,025,340 | | | | | |
| | 1,000,000 | | MICHIGAN ST HSG DEV AUTH | | | 12/1/2036 | | | | 3.70 | | | | 1,000,000 | | | | 1,016,060 | | | | | |
| | 940,000 | | MICHIGAN ST HSG DEV AUTH | | | 12/1/2040 | | | | 3.95 | | | | 940,000 | | | | 952,718 | | | | | |
| | 600,000 | | MICHIGAN ST HSG DEV AUTH | | | 10/1/2042 | | | | 3.75 | | | | 600,000 | | | | 593,214 | | | | | |
| | 1,500,000 | | MICHIGAN ST HSG DEV AUTH | | | 12/1/2045 | | | | 3.70 | | | | 1,500,000 | | | | 1,504,050 | | | | | |
| | 1,000,000 | | MICHIGAN ST MUNI BOND AUTH | | | 5/1/2023 | | | | 5.75 | | | | 1,007,750 | | | | 1,084,150 | | | | | |
| | 500,000 | | MICHIGAN ST PUBLIC EDUCTNL FACS AUTH | | | 11/1/2028 | | | | 6.35 | | | | 500,000 | | | | 500,895 | | | | | |
| | 260,000 | | MINNESOTA ST HSG FIN AGY | | | 7/1/2034 | | | | 5.05 | | | | 260,000 | | | | 269,248 | | | | | |
| | 530,000 | | MINNESOTA ST HSG FIN AGY | | | 1/1/2040 | | | | 5.10 | | | | 530,000 | | | | 547,781 | | | | | |
| | 1,000,000 | | MISSISSIPPI ST DEV BANK SPL OBLG | | | 10/1/2031 | | | | 6.50 | | | | 977,259 | | | | 1,125,520 | | | | | |
| | 30,000 | | MISSISSIPPI ST HOME CORP SF MTGE REVENUE | | | 6/1/2039 | | | | 6.75 | | | | 31,273 | | | | 31,287 | | | | | |
| | 1,600,000 | | MISSISSIPPI ST HOME CORP SF MTGE REVENUE | | | 12/1/2045 | | | | 3.63 | | | | 1,600,000 | | | | 1,617,360 | | | | | |
| | 70,000 | | MISSOURI ST HSG DEV COMMISSION SF HSG REVENUE | | | 9/1/2034 | | | | 5.35 | | | | 70,000 | | | | 72,274 | | | | | |
| | 1,050,000 | | MONTANA ST BRD OF HSG | | | 12/1/2038 | | | | 3.75 | | | | 1,050,000 | | | | 1,074,297 | | | | | |
| | 710,000 | | MONTANA ST BRD OF HSG | | | 12/1/2038 | | | | 5.20 | | | | 710,000 | | | | 767,695 | | | | | |
| | 280,000 | | MONTANA ST BRD OF HSG | | | 12/1/2039 | | | | 5.50 | | | | 280,007 | | | | 290,405 | | | | | |
| | 1,000,000 | | MONTANA ST BRD OF HSG SF MTGE | | | 12/1/2037 | | | | 3.95 | | | | 1,000,000 | | | | 1,042,520 | | | | | |
| | 900,000 | | MONTANA ST BRD OF HSG SF MTGE | | | 12/1/2038 | | | | 4.00 | | | | 903,012 | | | | 953,811 | | | | | |
| | 1,250,000 | | MONTERRA FL CDD SPL ASSMNT | | | 5/1/2036 | | | | 3.50 | | | | 1,222,903 | | | | 1,242,988 | | | | | |
| | 1,000,000 | | MONTGOMERY CNTY MD HSG OPPNTYS COMMN MFH & RECONSTR DEV REV | | | 7/1/2039 | | | | 3.88 | | | | 1,000,000 | | | | 1,019,990 | | | | | |
| | 500,000 | | MONTGOMERY CNTY MD HSG OPPORTUNITIES COMMISSION MF REVENUE | | | 7/1/2037 | | | | 5.13 | | | | 500,000 | | | | 526,760 | | | | | |
See accompanying notes to financial statements. | 50 | (Continued) |
CLEARWATER INVESTMENT TRUST
Schedule of Investments - Clearwater Tax-Exempt Bond Fund
June 30, 2017 (unaudited)
| Par/Shares | | Security | | | Maturity
date | | | Coupon
rate | | | Cost | | | Fair value (a) | | | Percent of
net assets | |
| | Municipal Bonds (Cont’d): | | | | | | | | | | | | | | | | | | | | |
| | 890,000 | | MONTGOMERY CNTY MD HSG OPPORTUNITIES COMMISSION SF MTGE REVE | | | 7/1/2038 | | | | 4.00 | | | $ | 890,000 | | | | 905,851 | | | | | |
| | 750,000 | | MOON INDL DEV AUTH PA REVENUE | | | 7/1/2030 | | | | 5.63 | | | | 741,485 | | | | 791,865 | | | | | |
| | 731,972 | | MOUNT CARBON CO MET DIST REVENUE(b) | | | 6/1/2043 | | | | 7.00 | | | | 731,972 | | | | 435,319 | | | | | |
| | 200,000 | | MOUNT CARBON CO MET DIST REVENUE(c) | | | 6/1/2043 | | | | 8.00 | | | | - | | | | 6,000 | | | | | |
| | 500,000 | | MULTNOMAH CNTY OR HOSP FACS AUTH REVENUE | | | 12/1/2029 | | | | 5.00 | | | | 524,126 | | | | 553,770 | | | | | |
| | 615,000 | | MUNSTER IN ECON DEV TAX INCR REVENUE | | | 7/15/2026 | | | | 4.75 | | | | 612,745 | | | | 668,640 | | | | | |
| | 417,000 | | N CENTRL TEXAS ST HLTH FAC DEV CORP | | | 2/15/2025 | | | | 5.38 | | | | 417,000 | | | | 413,072 | | | | | |
| | 20,000 | | N SLOPE BORO AK SVC AREA 10 WTR & WSTWTR FACS | | | 6/30/2034 | | | | 5.25 | | | | 20,718 | | | | 21,575 | | | | | |
| | 380,000 | | N SPRINGS FL IMPT DIST | | | 5/1/2027 | | | | 6.00 | | | | 380,000 | | | | 392,126 | | | | | |
| | 1,000,000 | | N TX TOLLWAY AUTH REVENUE | | | 1/1/2034 | | | | 6.00 | | | | 1,000,000 | | | | 1,150,410 | | | | | |
| | 1,000,000 | | N TX TOLLWAY AUTH REVENUE(b) | | | 1/1/2042 | | | | 6.20 | | | | 999,597 | | | | 1,254,340 | | | | | |
| | 1,000,000 | | NATRONA CNTY WY HOSP REVENUE | | | 9/15/2031 | | | | 6.35 | | | | 1,000,000 | | | | 1,114,080 | | | | | |
| | 500,000 | | NAVAJO NATION AZ(d) | | | 12/1/2030 | | | | 5.50 | | | | 532,182 | | | | 546,270 | | | | | |
| | 975,000 | | NEBRASKA ST INVESTMENT FIN AUTH SF HSG REVENUE | | | 9/1/2035 | | | | 3.90 | | | | 975,000 | | | | 997,269 | | | | | |
| | 1,440,000 | | NEVADA ST HSG DIV SF MTGE REVENUE | | | 10/1/2039 | | | | 3.85 | | | | 1,440,000 | | | | 1,461,715 | | | | | |
| | 185,000 | | NEVADA ST HSG DIV SF MTGE REVENUE | | | 10/1/2040 | | | | 5.10 | | | | 185,000 | | | | 189,790 | | | | | |
| | 1,000,000 | | NEW HAMPSHIRE ST HLTH & EDU FACS AUTH REVENUE | | | 1/1/2034 | | | | 6.00 | | | | 973,383 | | | | 1,115,620 | | | | | |
| | 500,000 | | NEW HAMPSHIRE ST HLTH & EDU FACS AUTH REVENUE | | | 8/1/2038 | | | | 6.00 | | | | 491,186 | | | | 548,640 | | | | | |
| | 1,000,000 | | NEW HAMPSHIRE ST HSG FIN AUTH MF REVENUE | | | 7/1/2031 | | | | 5.20 | | | | 1,000,000 | | | | 1,066,990 | | | | | |
| | 355,000 | | NEW HAMPSHIRE ST HSG FIN AUTH SF REVENUE | | | 7/1/2034 | | | | 5.38 | | | | 355,000 | | | | 365,029 | | | | | |
| | 125,000 | | NEW HAMPSHIRE ST HSG FIN AUTH SF REVENUE | | | 7/1/2038 | | | | 6.63 | | | | 126,971 | | | | 131,881 | | | | | |
| | 750,000 | | NEW HOPE CULTURAL ED FACS FINCORP TX RETIREMENT FAC REVENUE | | | 1/1/2035 | | | | 5.50 | | | | 764,730 | | | | 777,495 | | | | | |
| | 750,000 | | NEW HOPE CULTURAL EDU FACS FIN CORP TX STUDENT HSG REV | | | 7/1/2035 | | | | 5.00 | | | | 772,900 | | | | 803,055 | | | | | |
| | 1,100,000 | | NEW HOPE CULTURAL EDU FACS FIN CORP TX STUDENT HSG REV | | | 4/1/2046 | | | | 5.00 | | | | 1,149,896 | | | | 1,192,213 | | | | | |
| | 750,000 | | NEW HOPE CULTURAL EDU FACS FINCORP TX EDU REVENUE(d) | | | 8/15/2036 | | | | 5.00 | | | | 758,373 | | | | 752,730 | | | | | |
| | 1,000,000 | | NEW HOPE CULTURAL EDU FACS FINCORP TX EDU REVENUE | | | 8/15/2036 | | | | 5.50 | | | | 1,006,783 | | | | 1,013,910 | | | | | |
| | 280,000 | | NEW JERSEY ST HGR EDU ASSISTANCE AUTH STUDENT LOAN REVENUE | | | 6/1/2024 | | | | 5.38 | | | | 279,115 | | | | 295,204 | | | | | |
| | 925,000 | | NEW JERSEY ST HSG & MTGE FIN AGY | | | 10/1/2030 | | | | 4.50 | | | | 925,000 | | | | 978,743 | | | | | |
| | 375,000 | | NEW JERSEY ST HSG & MTGE FIN AGY | | | 10/1/2034 | | | | 5.00 | | | | 375,000 | | | | 384,911 | | | | | |
| | 600,000 | | NEW JERSEY ST HSG & MTGE FIN AGY | | | 10/1/2035 | | | | 5.00 | | | | 600,000 | | | | 615,552 | | | | | |
| | 940,000 | | NEW JERSEY ST HSG & MTGE FIN AGY | | | 10/1/2037 | | | | 5.00 | | | | 934,030 | | | | 961,789 | | | | | |
| | 1,000,000 | | NEW JERSEY ST HSG & MTGE FIN AGY MF CONDUIT REVENUE | | | 1/1/2030 | | | | 3.60 | | | | 1,000,000 | | | | 1,027,190 | | | | | |
| | 1,000,000 | | NEW JERSEY ST HSG & MTGE FIN AGY MF REVENUE | | | 5/1/2041 | | | | 4.95 | | | | 968,990 | | | | 1,035,390 | | | | | |
| | 1,000,000 | | NEW JERSEY ST TRANSPRTN TRUST FUND AUTH | | | 6/15/2024 | | | | 5.00 | | | | 1,036,177 | | | | 1,029,870 | | | | | |
| | 1,000,000 | | NEW JERSEY ST TRANSPRTN TRUST FUND AUTH | | | 6/15/2030 | | | | 5.00 | | | | 1,030,858 | | | | 1,020,170 | | | | | |
| | 500,000 | | NEW JERSEY ST TRANSPRTN TRUST FUND AUTH | | | 6/15/2041 | | | | 5.25 | | | | 510,744 | | | | 519,045 | | | | | |
| | 230,000 | | NEW MEXICO ST MTGE FIN AUTH | | | 9/1/2029 | | | | 4.80 | | | | 230,000 | | | | 236,359 | | | | | |
| | 465,000 | | NEW MEXICO ST MTGE FIN AUTH | | | 9/1/2034 | | | | 5.00 | | | | 465,000 | | | | 482,191 | | | | | |
| | 455,000 | | NEW MEXICO ST MTGE FIN AUTH | | | 3/1/2036 | | | | 5.45 | | | | 455,000 | | | | 469,319 | | | | | |
| | 745,000 | | NEW MEXICO ST MTGE FIN AUTH | | | 9/1/2042 | | | | 3.90 | | | | 745,000 | | | | 755,460 | | | | | |
| | 1,095,000 | | NEW MEXICO ST MTGE FIN AUTH | | | 9/1/2042 | | | | 4.13 | | | | 1,095,000 | | | | 1,122,780 | | | | | |
| | 940,000 | | NEW MEXICO ST MTGE FIN AUTH | | | 9/1/2046 | | | | 3.80 | | | | 940,000 | | | | 946,693 | | | | | |
| | 115,000 | | NEW RIVER FL CDD CAPITAL IMPT REVENUE(c) | | | 5/1/2013 | | | | 5.00 | | | | 114,821 | | | | 1 | | | | | |
| | 1,000,000 | | NEW YORK CITY NY HSG DEV CORPMF HSG REVENUE | | | 11/1/2037 | | | | 3.80 | | | | 1,000,000 | | | | 1,018,470 | | | | | |
See accompanying notes to financial statements. | 51 | (Continued) |
CLEARWATER INVESTMENT TRUST
Schedule of Investments - Clearwater Tax-Exempt Bond Fund
June 30, 2017 (unaudited)
| Par/Shares | | Security | | Maturity
date | | | Coupon
rate | | | Cost | | | Fair value (a) | | | Percent of
net assets | |
| | Municipal Bonds (Cont’d): | | | | | | | | | | | | | | | | | | | | |
| | 1,000,000 | | NEW YORK CITY NY HSG DEV CORPMF HSG REVENUE | | | 11/1/2039 | | | | 4.30 | | | $ | 1,000,000 | | | | 1,033,850 | | | | | |
| | 1,000,000 | | NEW YORK CITY NY HSG DEV CORPMF HSG REVENUE | | | 11/1/2047 | | | | 3.65 | | | | 1,000,000 | | | | 989,450 | | | | | |
| | 2,000,000 | | NEW YORK CITY NY MUNI WTR FIN AUTH WTR & SWR SYS REVENUE | | | 6/15/2038 | | | | 5.00 | | | | 2,163,282 | | | | 2,282,300 | | | | | |
| | 1,000,000 | | NEW YORK ST HSG FIN AGY | | | 11/1/2041 | | | | 4.10 | | | | 1,000,000 | | | | 1,043,680 | | | | | |
| | 1,000,000 | | NEW YORK ST HSG FIN AGY | | | 11/1/2042 | | | | 4.00 | | | | 1,000,000 | | | | 1,035,370 | | | | | |
| | 1,500,000 | | NEW YORK ST HSG FIN AGY REVENUE | | | 11/1/2034 | | | | 3.65 | | | | 1,500,000 | | | | 1,530,375 | | | | | |
| | 500,000 | | NEW YORK ST HSG FIN AGY REVENUE | | | 11/1/2045 | | | | 5.10 | | | | 500,000 | | | | 535,605 | | | | | |
| | 4,000,000 | | NEW YORK ST HSG FIN AGY REVENUE | | | 5/1/2048 | | | | 4.10 | | | | 4,000,000 | | | | 4,062,720 | | | | | |
| | 955,000 | | NEW YORK ST MTGE AGY HOMEOWNER MTGE REVENUE | | | 10/1/2036 | | | | 3.90 | | | | 955,000 | | | | 983,106 | | | | | |
| | 750,000 | | NEW YORK ST MTGE AGY HOMEOWNER MTGE REVENUE | | | 10/1/2038 | | | | 3.75 | | | | 750,000 | | | | 757,897 | | | | | |
| | 1,450,000 | | NEW YORK ST MTGE AGY HOMEOWNER MTGE REVENUE | | | 10/1/2040 | | | | 3.80 | | | | 1,450,000 | | | | 1,467,705 | | | | | |
| | 1,465,000 | | NEW YORK ST MTGE AGY HOMEOWNER MTGE REVENUE | | | 10/1/2040 | | | | 4.13 | | | | 1,465,000 | | | | 1,503,163 | | | | | |
| | 500,000 | | NEW YORK ST MTGE AGY HOMEOWNER MTGE REVENUE | | | 10/1/2042 | | | | 3.75 | | | | 500,000 | | | | 502,575 | | | | | |
| | 500,000 | | NORTH CAROLINA ST CAPITAL FACS FIN AGY EDUCTNL FACS REVENUE | | | 6/1/2023 | | | | 5.00 | | | | 500,000 | | | | 500,800 | | | | | |
| | 1,000,000 | | NORTH CAROLINA ST HSG FIN AGYHOMEOWNERSHIP REVENUE | | | 7/1/2037 | | | | 3.85 | | | | 1,000,000 | | | | 1,014,010 | | | | | |
| | 1,000,000 | | NORTH CAROLINA ST HSG FIN AGYHOMEOWNERSHIP REVENUE | | | 1/1/2041 | | | | 3.95 | | | | 1,015,902 | | | | 1,021,810 | | | | | |
| | 500,000 | | NORTH SPRINGS FL IMPT DIST | | | 5/1/2044 | | | | 6.50 | | | | 500,000 | | | | 512,310 | | | | | |
| | 1,000,000 | | NTHRN IL UNIV | | | 4/1/2026 | | | | 5.50 | | | | 1,006,044 | | | | 1,077,070 | | | | | |
| | 1,400,000 | | NTHRN PALM BEACH CNTY FL IMPT DIST | | | 8/1/2029 | | | | 5.00 | | | | 1,409,340 | | | | 1,456,658 | | | | | |
| | 500,000 | | NTHRN PALM BEACH CNTY FL IMPTDIST | | | 8/1/2037 | | | | 5.00 | | | | 511,909 | | | �� | 514,350 | | | | | |
| | 2,000,000 | | OAK PARK CA UNIF SCH DIST(b) | | | 8/1/2038 | | | | 0.00 | | | | 1,505,939 | | | | 2,231,080 | | | | | |
| | 970,000 | | OAKLAND CNTY MI ECON DEV CORP LTD OBLG REVENUE | | | 12/1/2020 | | | | 6.50 | | | | 967,341 | | | | 1,005,298 | | | | | |
| | 280,000 | | OHIO ST HSG FIN AGY RSDL MTGE REVENUE | | | 9/1/2033 | | | | 5.40 | | | | 280,000 | | | | 286,614 | | | | | |
| | 985,000 | | OHIO ST HSG FIN AGY RSDL MTGE REVENUE | | | 9/1/2039 | | | | 3.35 | | | | 878,044 | | | | 970,698 | | | | | |
| | 3,658,926 | | OKLAHOMA CNTY OK HOME FIN AUTH SF REVENUE(e) | | | 9/1/2034 | | | | 0.00 | | | | 1,291,458 | | | | 1,330,934 | | | | | |
| | 125,000 | | OKLAHOMA ST HSG FIN AGY SF MTGE REVENUE | | | 3/1/2032 | | | | 5.15 | | | | 125,000 | | | | 128,552 | | | | | |
| | 95,000 | | OKLAHOMA ST HSG FIN AGY SF MTGE REVENUE | | | 9/1/2038 | | | | 6.50 | | | | 95,939 | | | | 98,808 | | | | | |
| | 1,000,000 | | ORANGE CNTY FL HLTH FACS AUTH REVENUE | | | 8/1/2034 | | | | 5.00 | | | | 1,050,427 | | | | 1,082,940 | | | | | |
| | 750,000 | | ORANGE CNTY FL HLTH FACS AUTH REVENUE | | | 8/1/2035 | | | | 5.00 | | | | 786,539 | | | | 821,970 | | | | | |
| | 1,000,000 | | ORANGE CNTY FL HLTH FACS AUTH REVENUE | | | 8/1/2047 | | | | 5.00 | | | | 1,089,589 | | | | 1,081,630 | | | | | |
| | 925,000 | | ORANGE CNTY FL HSG FIN AUTH | | | 9/1/2035 | | | | 3.80 | | | | 925,000 | | | | 939,375 | | | | | |
| | 1,250,000 | | OREGON ST | | | 12/1/2034 | | | | 3.63 | | | | 1,250,000 | | | | 1,281,675 | | | | | |
| | 2,000,000 | | OREGON ST | | | 12/1/2039 | | | | 3.90 | | | | 2,000,000 | | | | 2,046,280 | | | | | |
| | 800,000 | | OREGON ST HSG & CMNTY SVCS DEPT MTGE REVENUE | | | 7/1/2035 | | | | 3.75 | | | | 800,000 | | | | 811,000 | | | | | |
| | 850,000 | | OREGON ST HSG & CMNTY SVCS DEPT MTGE REVENUE | | | 7/1/2038 | | | | 4.00 | | | | 850,000 | | | | 864,289 | | | | | |
| | 500,000 | | PALISADE CO MET DIST #2 LIMITED TAX | | | 12/1/2046 | | | | 5.00 | | | | 510,145 | | | | 477,320 | | | | | |
| | 500,000 | | PALM BEACH CNTY FL HLTH FACS AUTH REVENUE | | | 6/1/2034 | | | | 7.25 | | | | 500,000 | | | | 589,480 | | | | | |
| | 1,200,000 | | PALM BEACH CNTY FL HLTH FACS AUTH REVENUE | | | 5/15/2036 | | | | 5.00 | | | | 1,332,384 | | | | 1,341,108 | | | | | |
| | 500,000 | | PALM BEACH CNTY FL HLTH FACS AUTH REVENUE | | | 6/1/2049 | | | | 7.50 | | | | 492,537 | | | | 594,315 | | | | | |
| | 1,000,000 | | PELL CITY AL SPL CARE FACS FING AUTH REVENUE | | | 12/1/2031 | | | | 5.00 | | | | 1,047,110 | | | | 1,098,690 | | | | | |
| | 500,000 | | PENNSYLVANIA ST HGR EDUCTNL FACS AUTH REVENUE | | | 7/1/2039 | | | | 1.52 | | | | 500,000 | | | | 392,160 | | | | | |
| | 1,000,000 | | PENNSYLVANIA ST HSG FIN AGY SF MTGE REVENUE | | | 10/1/2037 | | | | 3.65 | | | | 1,003,913 | | | | 1,006,230 | | | | | |
| | 500,000 | | PENNSYLVANIA ST HSG FIN AGY SF MTGE REVENUE | | | 10/1/2038 | | | | 4.00 | | | | 500,000 | | | | 514,055 | | | | | |
See accompanying notes to financial statements. | 52 | (Continued) |
CLEARWATER INVESTMENT TRUST
Schedule of Investments - Clearwater Tax-Exempt Bond Fund
June 30, 2017 (unaudited)
| Par/Shares | | Security | | Maturity
date | | | Coupon
rate | | | Cost | | | Fair value (a) | | | Percent of
net assets | |
| | Municipal Bonds (Cont’d): | | | | | | | | | | | | | | | | | | | | |
| | 3,200,000 | | PENNSYLVANIA ST HSG FIN AGY SF MTGE REVENUE | | | 10/1/2040 | | | | 4.05 | | | $ | 3,200,000 | | | | 3,282,776 | | | | | |
| | 615,000 | | PENNSYLVANIA ST HSG FIN AGY SF MTGE REVENUE | | | 10/1/2042 | | | | 3.70 | | | | 615,000 | | | | 631,457 | | | | | |
| | 750,000 | | PENNSYLVANIA ST HSG FIN AGY SF MTGE REVENUE | | | 10/1/2042 | | | | 4.00 | | | | 750,000 | | | | 765,690 | | | | | |
| | 1,935,000 | | PENNSYLVANIA ST TURNPIKE COMMISSION TURNPIKE REVENUE(b) | | | 12/1/2035 | | | | 5.13 | | | | 1,931,175 | | | | 2,117,006 | | | | | |
| | 1,500,000 | | PENNSYLVANIA ST TURNPIKE COMMISSION TURNPIKE REVENUE(b) | | | 12/1/2037 | | | | 0.00 | | | | 1,223,211 | | | | 1,378,185 | | | | | |
| | 1,000,000 | | PEORIA AZ INDL DEV AUTH | | | 11/15/2029 | | | | 5.25 | | | | 1,000,000 | | | | 1,010,750 | | | | | |
| | 5,000,000 | | PEORIA IL PUBLIC BLDG COMMISSION SCH DIST FACS REVENUE(e) | | | 12/1/2026 | | | | 0.00 | | | | 2,804,891 | | | | 2,945,250 | | | | | |
| | 400,000 | | PHILADELPHIA PA AUTH FOR INDL DEV REVENUES | | | 6/15/2023 | | | | 6.13 | | | | 400,000 | | | | 432,764 | | | | | |
| | 750,000 | | PHILADELPHIA PA AUTH FOR INDL DEV REVENUES | | | 8/1/2036 | | | | 5.63 | | | | 739,168 | | | | 765,735 | | | | | |
| | 1,000,000 | | PHOENIX AZ INDL DEV AUTH EDU REVENUE(d) | | | 7/1/2036 | | | | 5.13 | | | | 985,006 | | | | 973,940 | | | | | |
| | 750,000 | | PHOENIX AZ INDL DEV AUTH EDU REVENUE | | | 7/1/2042 | | | | 6.30 | | | | 804,522 | | | | 812,700 | | | | | |
| | 2,500,000 | | PHOENIX AZ INDL DEV AUTH LEASE REVENUE | | | 6/1/2034 | | | | 5.25 | | | | 2,526,920 | | | | 2,767,475 | | | | | |
| | 1,000,000 | | PIKE PLACE MARKET WA PRESERVATION & DEV AUTH SPL OBLG | | | 12/1/2040 | | | | 5.00 | | | | 1,067,920 | | | | 1,110,080 | | | | | |
| | 110,000 | | PIMA CNTY AZ INDL DEV AUTH EDU REVENUE | | | 12/1/2018 | | | | 6.38 | | | | 110,000 | | | | 112,678 | | | | | |
| | 1,000,000 | | PIMA CNTY AZ INDL DEV AUTH EDU REVENUE(d) | | | 12/1/2026 | | | | 5.25 | | | | 1,000,000 | | | | 1,039,890 | | | | | |
| | 10,000 | | PIMA CNTY AZ INDL DEV AUTH EDU REVENUE | | | 7/1/2031 | | | | 6.75 | | | | 7,683 | | | | 10,069 | | | | | |
| | 2,625,000 | | PITTSBURG CALIF UNI SCH DIST FING AUTH REV(e) | | | 9/1/2031 | | | | 0.00 | | | | 1,213,972 | | | | 1,206,109 | | | | | |
| | 900,000 | | POINCIANA FL W CDD SPL ASSMNT | | | 5/1/2030 | | | | 5.38 | | | | 889,652 | | | | 915,408 | | | | | |
| | 750,000 | | POLK CNTY OR HOSP FAC AUTH REVENUE | | | 7/1/2035 | | | | 5.13 | | | | 750,000 | | | | 752,685 | | | | | |
| | 2,000,000 | | PORT SAINT LUCIE FL RESEARCH FACS REVENUE | | | 5/1/2033 | | | | 5.00 | | | | 2,044,476 | | | | 2,034,220 | | | | | |
| | 1,000,000 | | PROMENADE CASTLE ROCK CO MET DIST #1 | | | 12/1/2025 | | | | 5.13 | | | | 1,000,000 | | | | 1,071,140 | | | | | |
| | 550,000 | | PUBLIC FIN AUTH WI CCRC REVENUE | | | 6/1/2020 | | | | 7.00 | | | | 546,437 | | | | 595,677 | | | | | |
| | 1,500,000 | | PUBLIC FIN AUTH WI CCRC REVENUE | | | 6/1/2046 | | | | 8.25 | | | | 1,548,872 | | | | 1,778,085 | | | | | |
| | 750,000 | | PUBLIC FIN AUTH WI REVENUE | | | 4/1/2025 | | | | 5.00 | | | | 754,777 | | | | 786,270 | | | | | |
| | 1,250,000 | | PUBLIC FIN AUTH WI REVENUE(d) | | | 11/1/2028 | | | | 6.25 | | | | 1,250,000 | | | | 1,265,725 | | | | | |
| | 600,000 | | PUBLIC FIN AUTH WI REVENUE | | | 4/1/2032 | | | | 5.50 | | | | 600,000 | | | | 617,352 | | | | | |
| | 406,960 | | PUBLIC FIN AUTH WI REVENUE(e) | | | 10/1/2042 | | | | 0.00 | | | | 453,541 | | | | 83,907 | | | | | |
| | 515,000 | | PUBLIC FIN AUTH WI REVENUE | | | 10/1/2042 | | | | 7.00 | | | | 552,750 | | | | 515,371 | | | | | |
| | 1,250,000 | | PUBLIC FIN AUTH WI SENIOR LIVING REVENUE | | | 11/15/2024 | | | | 5.00 | | | | 1,246,132 | | | | 1,322,038 | | | | | |
| | 1,500,000 | | PUERTO RICO CMWLTH | | | 7/1/2035 | | | | 5.00 | | | | 1,500,000 | | | | 1,563,945 | | | | | |
| | 1,155,000 | | QUECHAN INDIAN TRIBE AZ FORT YUMA INDIAN RESERVATION | | | 5/1/2025 | | | | 9.75 | | | | 1,155,000 | | | | 1,242,630 | | | | | |
| | 750,000 | | RED RIVER TX HLTH FACS DEV CORP RETIREMENT FAC REVENUE | | | 11/15/2034 | | | | 7.50 | | | | 746,305 | | | | 849,143 | | | | | |
| | 1,000,000 | | REDONDO BEACH CA UNIF SCH DIST(b) | | | 8/1/2034 | | | | 6.38 | | | | 998,748 | | | | 1,306,550 | | | | | |
| | 750,000 | | REEF-SUNSET CA UNIF SCH DIST(b) | | | 8/1/2038 | | | | 0.00 | | | | 616,707 | | | | 689,280 | | | | | |
| | 500,000 | | RHODE ISLAND ST HLTH & EDUCTNL BLDG CORP | | | 5/15/2030 | | | | 6.25 | | | | 494,745 | | | | 547,975 | | | | | |
| | 1,000,000 | | RHODE ISLAND ST HSG & MTGE FIN CORP | | | 10/1/2028 | | | | 4.00 | | | | 995,479 | | | | 1,036,550 | | | | | |
| | 750,000 | | RHODE ISLAND ST HSG & MTGE FIN CORP | | | 10/1/2037 | | | | 3.90 | | | | 750,000 | | | | 762,232 | | | | | |
| | 1,000,000 | | RHODE ISLAND ST HSG & MTGE FIN CORP | | | 10/1/2046 | | | | 3.40 | | | | 1,000,000 | | | | 967,490 | | | | | |
| | 1,000,000 | | RIVERSIDE CA CMNTY PPTYS DEV INC LEASE REVENUE | | | 10/15/2038 | | | | 6.00 | | | | 1,018,823 | | | | 1,181,480 | | | | | |
| | 1,500,000 | | S TAHOE CA JT PWRS FING AUTH LEASE REVENUE | | | 10/1/2030 | | | | 5.00 | | | | 1,626,944 | | | | 1,694,955 | | | | | |
| | 470,000 | | S WSTRN IL DEV AUTH(c) | | | 10/1/2022 | | | | 7.00 | | | | 470,000 | | | | 234,972 | | | | | |
| | 350,000 | | SACRAMENTO CNTY CA WTR FING AUTH REVENUE | | | 6/1/2039 | | | | 1.38 | | | | 350,000 | | | | 286,352 | | | | | |
See accompanying notes to financial statements. | 53 | (Continued) |
CLEARWATER INVESTMENT TRUST
Schedule of Investments - Clearwater Tax-Exempt Bond Fund
June 30, 2017 (unaudited)
| Par/Shares | | Security | | | Maturity date | | | Coupon
rate | | | Cost | | | Fair value (a) | | | Percent of
net assets | |
| | Municipal Bonds (Cont’d): | | | | | | | | | | | | | | | | | | | | |
| | 110,000 | | SADDLEBACK VLY CA UNIF SCH DIST PUBLIC FING AUTH | | | 9/1/2017 | | | | 5.65 | | | $ | 110,000 | | | | 110,436 | | | | | |
| | 49,000 | | SAINT BERNARD PARISH LA HOME MTGE AUTH SF MTGE | | | 3/1/2039 | | | | 5.80 | | | | 48,020 | | | | 51,860 | | | | | |
| | 750,000 | | SAINT LOUIS CNTY MO INDL DEV AUTH SENIOR LIVING FACS | | | 9/1/2042 | | | | 5.00 | | | | 765,382 | | | | 797,633 | | | | | |
| | 750,000 | | SAINT TAMMANY LA PUBLIC TRUST FING AUTH | | | 11/15/2037 | | | | 5.25 | | | | 761,398 | | | | 774,473 | | | | | |
| | 1,000,000 | | SAN CLEMENTE CA SPL TAX | | | 9/1/2040 | | | | 5.00 | | | | 1,059,034 | | | | 1,091,620 | | | | | |
| | 500,000 | | SAN DIEGO CA HSG AUTH MF HSG REVENUE | | | 5/1/2029 | | | | 5.00 | | | | 500,000 | | | | 539,480 | | | | | |
| | 1,500,000 | | SAN GABRIEL CA UNIF SCH DIST(b) | | | 8/1/2039 | | | | 5.35 | | | | 1,498,072 | | | | 1,729,860 | | | | | |
| | 1,000,000 | | SAN JOSE CA FING AUTH | | | 6/1/2039 | | | | 5.00 | | | | 1,045,778 | | | | 1,137,330 | | | | | |
| | 500,000 | | SANTA MONICA CA REDEV AGY | | | 7/1/2036 | | | | 5.88 | | | | 510,050 | | | | 582,245 | | | | | |
| | 1,000,000 | | SARASOTA CNTY FL HLTH FACS AUTH RETMNT FAC REVENUE | | | 1/1/2032 | | | | 5.50 | | | | 1,001,700 | | | | 1,022,720 | | | | | |
| | 1,000,000 | | SCHERERVILLE IN ECON DEV REVENUE | | | 1/15/2030 | | | | 6.00 | | | | 1,014,017 | | | | 1,164,800 | | | | | |
| | 1,000,000 | | SCOTTS BLUFF CNTY NE HOSP AUTH | | | 2/1/2037 | | | | 5.25 | | | | 1,054,615 | | | | 1,078,030 | | | | | |
| | 770,000 | | SEATTLE WA HSG AUTH POOLED HSG REVENUE | | | 9/15/2033 | | | | 5.75 | | | | 782,016 | | | | 881,588 | | | | | |
| | 500,000 | | SEMINOLE TRIBE FL SPL OBLG REVENUE(d) | | | 10/1/2024 | | | | 5.50 | | | | 500,222 | | | | 503,800 | | | | | |
| | 500,000 | | SEVEN OAKS FL CMNTY DEV DIST SPL ASSMNT REVENUE | | | 5/1/2033 | | | | 5.50 | | | | 489,650 | | | | 521,260 | | | | | |
| | 150,000 | | SHELBY CNTY TN HLTH EDUCTNL & HSG FACS BRD REVENUE(c) | | | 1/1/2019 | | | | 5.35 | | | | 134,966 | | | | 378 | | | | | |
| | 625,000 | | SHELBY CNTY TN HLTH EDUCTNL & HSG FACS BRD REVENUE(c) | | | 1/1/2029 | | | | 5.55 | | | | 556,863 | | | | 1,575 | | | | | |
| | 130,000 | | SHELBY CNTY TN HLTH EDUCTNL & HSG FACS BRD REVENUE(c) | | | 1/1/2029 | | | | 6.00 | | | | - | | | | 1 | | | | | |
| | 750,000 | | SHELBY CNTY TN HLTH EDUCTNL & HSG FACS BRD REVENUE | | | 9/1/2037 | | | | 5.00 | | | | 801,775 | | | | 783,608 | | | | | |
| | 525,000 | | SHERIDAN AR SCH DIST #37 | | | 2/1/2047 | | | | 4.00 | | | | 540,271 | | | | 534,235 | | | | | |
| | 195,000 | | SILVERLEAF FL CDD CAPITAL IMPT REVENUE | | | 5/1/2023 | | | | 6.50 | | | | 195,000 | | | | 203,576 | | | | | |
| | 230,000 | | SILVERLEAF FL CDD CAPITAL IMPT REVENUE | | | 5/1/2044 | | | | 6.75 | | | | 225,776 | | | | 240,693 | | | | | |
| | 300,000 | | SOUTH CAROLINA ST EDU ASSISTANCE AUTH | | | 10/1/2029 | | | | 5.10 | | | | 297,295 | | | | 315,084 | | | | | |
| | 1,000,000 | | SOUTH CAROLINA ST JOBS-ECON DEV AUTH HOSP REVENUE | | | 2/1/2038 | | | | 5.00 | | | | 1,126,142 | | | | 1,098,710 | | | | | |
| | 356,475 | | SOUTH CAROLINA ST JOBS-ECON DEV AUTH REVENUE | | | 11/15/2032 | | | | 6.00 | | | | 356,475 | | | | 357,594 | | | | | |
| | 1,000,000 | | SOUTH CAROLINA ST PUBLIC SVC AUTH REVENUE | | | 12/1/2038 | | | | 5.00 | | | | 1,056,779 | | | | 1,086,960 | | | | | |
| | 1,400,000 | | SOUTH CAROLINA ST PUBLIC SVC AUTH REVENUE | | | 12/1/2043 | | | | 5.75 | | | | 1,464,763 | | | | 1,586,536 | | | | | |
| | 500,000 | | SOUTH DAKOTA ST HLTH & EDUCTNL FACS AUTH | | | 9/1/2032 | | | | 5.00 | | | | 499,500 | | | | 538,160 | | | | | |
| | 117,000 | | SOUTHSIDE AZ CMNTY FACS DIST #1 SPL ASSMNT REVENUE PRESCOTT | | | 7/1/2018 | | | | 6.13 | | | | 110,150 | | | | 109,796 | | | | | |
| | 1,000,000 | | STC MET DIST #2 CO | | | 12/1/2038 | | | | 6.00 | | | | 970,618 | | | | 998,510 | | | | | |
| | 150,000 | | STERLING HILL FL CDD CAPITAL IMPT REVENUE(c) | | | 11/1/2010 | | | | 5.50 | | | | 150,000 | | | | 105,000 | | | | | |
| | 1,000,000 | | SUGAR LAND TX DEV CORP SALES TAX REVENUE | | | 2/15/2033 | | | | 5.00 | | | | 1,083,900 | | | | 1,110,430 | | | | | |
| | 2,445,000 | | SULPHUR SPRINGS CA UNION SCH DIST COPS(b) | | | 12/1/2037 | | | | 6.50 | | | | 2,442,885 | | | | 3,054,688 | | | | | |
| | 1,500,000 | | SUTTER BUTTE CA FLOOD AGY ASSMNT REVENUE | | | 10/1/2038 | | | | 4.00 | | | | 1,482,984 | | | | 1,552,815 | | | | | |
| | 1,100,000 | | TALLAHASSEE FL HLTH FACS REVENUE | | | 12/1/2040 | | | | 5.00 | | | | 1,164,051 | | | | 1,191,080 | | | | | |
| | 1,000,000 | | TARRANT CNTY TX CULTURAL EDU FACS FIN CORP HOSP REVENU | | | 11/15/2038 | | | | 5.00 | | | | 1,070,758 | | | | 1,110,370 | | | | | |
| | 750,000 | | TARRANT CNTY TX CULTURAL EDU FACS FIN CORP RETMNT FAC REVENU | | | 11/15/2024 | | | | 5.63 | | | | 750,000 | | | | 760,665 | | | | | |
| | 1,485,000 | | TARRANT CNTY TX CULTURAL EDU FACS FIN CORP RETMNT FAC REVENU | | | 11/15/2037 | | | | 6.63 | | | | 1,511,462 | | | | 1,563,438 | | | | | |
| | 750,000 | | TARRANT CNTY TX CULTURAL EDU FACS FIN CORP RETMNT FAC REVENUE | | | 11/15/2035 | | | | 5.00 | | | | 778,558 | | | | 763,830 | | | | | |
| | 700,000 | | TARRANT CNTY TX CULTURAL EDU FACS FIN CORP RETMNT FAC REVENUE | | | 5/15/2037 | | | | 5.00 | | | | 768,754 | | | | 713,531 | | | | | |
| | 750,000 | | TAYLOR MI BROWNFIELD REDEV AUTH | | | 5/1/2032 | | | | 5.00 | | | | 789,857 | | | | 828,390 | | | | | |
See accompanying notes to financial statements. | 54 | (Continued) |
CLEARWATER INVESTMENT TRUST
Schedule of Investments - Clearwater Tax-Exempt Bond Fund
June 30, 2017 (unaudited)
| Par/Shares | | Security | | | Maturity date | | | Coupon
rate | | | Cost | | | Fair value (a) | | | Percent of
net assets | |
| | Municipal Bonds (Cont’d): | | | | | | | | | | | | | | | | | | | | |
| | 1,000,000 | | TENNESSEE HSG DEV AGY RSDL FING PROGRAM REVENUE | | | 7/1/2036 | | | | 3.70 | | | $ | 1,000,000 | | | | 1,013,170 | | | | | |
| | 700,000 | | TENNESSEE ST HSG DEV AGY | | | 1/1/2035 | | | | 3.85 | | | | 700,000 | | | | 722,862 | | | | | |
| | 1,070,000 | | TENNESSEE ST HSG DEV AGY | | | 7/1/2043 | | | | 3.80 | | | | 1,070,000 | | | | 1,068,063 | | | | | |
| | 370,000 | | TEXAS ST DEPT OF HSG & CMNTY AFFAIRS | | | 7/1/2039 | | | | 5.45 | | | | 370,000 | | | | 380,034 | | | | | |
| | 1,235,000 | | TOLEDO-LUCAS CNTY OH PORT AUTHSTUDENT HSG REVENUE | | | 7/1/2039 | | | | 5.00 | | | | 1,237,104 | | | | 1,298,232 | | | | | |
| | 35,000 | | TOLOMATO FL CDD(b) | | | 5/1/2039 | | | | 6.61 | | | | 39,853 | | | | 34,998 | | | | | |
| | 440,000 | | TOLOMATO FL CDD(b) | | | 5/1/2040 | | | | 0.00 | | | | 329,944 | | | | 249,092 | | | | | |
| | 125,000 | | TOLOMATO FL CDD(c) | | | 5/1/2040 | | | | 6.61 | | | | - | | | | 1 | | | | | |
| | 1,000,000 | | TRACY CA JT UNIF SCH DIST(b) | | | 8/1/2041 | | | | 0.00 | | | | 576,447 | | | | 805,110 | | | | | |
| | 600,000 | | TRAVIS CNTY TX HLTH FACS DEV CORP | | | 1/1/2046 | | | | 7.13 | | | | 668,952 | | | | 653,046 | | | | | |
| | 750,000 | | TRAVIS CNTY TX HLTH FACS DEV CORP | | | 1/1/2047 | | | | 5.25 | | | | 750,000 | | | | 753,450 | | | | | |
| | 500,000 | | TSR CDD FL SPL ASSMNT REVENUE | | | 11/1/2035 | | | | 5.38 | | | | 498,550 | | | | 509,230 | | | | | |
| | 500,000 | | TURLOCK CA PUBLIC FING AUTH WTR REVENUE | | | 5/1/2032 | | | | 4.75 | | | | 504,064 | | | | 516,235 | | | | | |
| | 1,250,000 | | TUSTIN CA UNIF SCH DIST(b) | | | 8/1/2028 | | | | 0.00 | | | | 1,100,236 | | | | 1,306,413 | | | | | |
| | 625,000 | | UNIVERSAL ACADEMY MI PUBLIC SCH ACADEMY REVENUE | | | 12/1/2023 | | | | 6.50 | | | | 616,951 | | | | 645,094 | | | | | |
| | 1,500,000 | | UTAH ST CHRT SCH FIN AUTH CHRT SCH REVENUE | | | 10/15/2033 | | | | 6.50 | | | | 1,511,439 | | | | 1,541,475 | | | | | |
| | 750,000 | | UTAH ST CHRT SCH FIN AUTH CHRT SCH REVENUE(d) | | | 4/15/2045 | | | | 6.00 | | | | 769,294 | | | | 777,555 | | | | | |
| | 210,000 | | UTAH ST HSG CORP SF MTGE REVENUE | | | 1/1/2033 | | | | 5.75 | | | | 210,000 | | | | 220,429 | | | | | |
| | 490,000 | | VANCOUVER WA HSG AUTH | | | 3/1/2025 | | | | 5.00 | | | | 481,862 | | | | 539,495 | | | | | |
| | 1,000,000 | | VANCOUVER WA HSG AUTH | | | 8/1/2034 | | | | 3.75 | | | | 981,409 | | | | 1,017,250 | | | | | |
| | 770,000 | | VERMONT ST HSG FIN AGY | | | 5/1/2032 | | | | 4.88 | | | | 766,695 | | | | 818,033 | | | | | |
| | 1,000,000 | | VIRGINIA ST HSG DEV AUTH | | | 7/1/2033 | | | | 4.13 | | | | 1,000,000 | | | | 1,040,180 | | | | | |
| | 1,000,000 | | VIRGINIA ST HSG DEV AUTH | | | 12/1/2039 | | | | 5.00 | | | | 1,000,000 | | | | 1,049,590 | | | | | |
| | 500,000 | | VIRGINIA ST HSG DEV AUTH | | | 5/1/2041 | | | | 3.55 | | | | 500,000 | | | | 502,980 | | | | | |
| | 3,500,000 | | VIRGINIA ST HSG DEV AUTH CMWLTH MTGE | | | 1/1/2038 | | | | 3.88 | | | | 3,490,250 | | | | 3,562,335 | | | | | |
| | 3,000,000 | | VIRGINIA ST HSG DEV AUTH CMWLTH MTGE | | | 7/1/2038 | | | | 4.80 | | | | 3,000,000 | | | | 3,314,220 | | | | | |
| | 2,000,000 | | VIRGINIA ST HSG DEV AUTH CMWLTH MTGE | | | 10/1/2038 | | | | 4.75 | | | | 2,000,000 | | | | 2,204,620 | | | | | |
| | 1,215,000 | | VLG FL CDD #7 SPL ASSMNT REVENUE | | | 5/1/2036 | | | | 4.00 | | | | 1,207,045 | | | | 1,219,982 | | | | | |
| | 530,000 | | WASHINGTON ST HSG FIN COMMISSION(d) | | | 7/1/2025 | | | | 6.00 | | | | 533,310 | | | | 529,666 | | | | | |
| | 1,000,000 | | WASHINGTON ST HSG FIN COMMISSION(d) | | | 1/1/2031 | | | | 5.00 | | | | 1,001,854 | | | | 1,056,530 | | | | | |
| | 750,000 | | WASHINGTON ST HSG FIN COMMISSION(d) | | | 7/1/2031 | | | | 5.00 | | | | 806,268 | | | | 783,720 | | | | | |
| | 675,000 | | WASHINGTON ST HSG FIN COMMISSION(d) | | | 1/1/2035 | | | | 5.75 | | | | 675,000 | | | | 672,421 | | | | | |
| | 600,000 | | WASHINGTON ST HSG FIN COMMISSION(d) | | | 7/1/2036 | | | | 5.00 | | | | 641,198 | | | | 610,884 | | | | | |
| | 4,000 | | WATERS EDGE FL CDD CAPITAL IMPT REVENUE | | | 5/1/2039 | | | | 5.35 | | | | 4,000 | | | | 3,814 | | | | | |
| | 185,000 | | WATERS EDGE FL CDD CAPITAL IMPT REVENUE(b) | | | 5/1/2039 | | | | 6.60 | | | | 183,727 | | | | 179,330 | | | | | |
| | 1,500,000 | | WEST VIRGINIA ST HSG DEV FUND | | | 11/1/2032 | | | | 3.75 | | | | 1,500,000 | | | | 1,545,585 | | | | | |
| | 310,000 | | WEST VIRGINIA ST HSG DEV FUND | | | 11/1/2039 | | | | 4.10 | | | | 310,000 | | | | 316,581 | | | | | |
| | 1,000,000 | | WEST VIRGINIA ST HSG DEV FUND | | | 11/1/2047 | | | | 4.13 | | | | 1,000,000 | | | | 1,034,030 | | | | | |
| | 1,500,000 | | WEST VLY CITY UT MUNI BLDG AUTH LEASE REVENUE | | | 2/1/2039 | | | | 5.00 | | | | 1,683,263 | | | | 1,734,750 | | | | | |
| | 550,000 | | WESTCHESTER CO NY LOCAL DEV CORP REVENUE | | | 1/1/2034 | | | | 5.00 | | | | 574,954 | | | | 597,278 | | | | | |
| | 685,000 | | WESTMONT IL PARK DIST(e) | | | 12/1/2031 | | | | 0.00 | | | | 294,582 | | | | 342,144 | | | | | |
| | 685,000 | | WESTMONT IL PARK DIST(e) | | | 12/1/2033 | | | | 0.00 | | | | 255,848 | | | | 298,057 | | | | | |
| | 1,350,000 | | WICHITA KS HLTH CARE FACS REVENUE | | | 5/15/2034 | | | | 6.25 | | | | 1,350,000 | | | | 1,367,523 | | | | | |
| | 600,000 | | WICHITA KS HLTH CARE FACS REVENUE | | | 12/1/2036 | | | | 5.25 | | | | 605,785 | | | | 627,648 | | | | | |
| | 1,000,000 | | WINDSHIRE PARK CO MET DIST #2 | | | 12/1/2047 | | | | 6.50 | | | | 1,094,164 | | | | 1,089,000 | | | | | |
| | 750,000 | | WIREGRASS FL CDD CAPITAL IMPTREVENUE | | | 5/1/2035 | | | | 5.38 | | | | 745,682 | | | | 767,752 | | | | | |
| | 1,000,000 | | WISCONSIN ST GEN FUND ANNUAL APPROP REVENUE | | | 5/1/2027 | | | | 6.00 | | | | 1,005,988 | | | | 1,087,453 | | | | | |
| | 1,000,000 | | WISCONSIN ST HLTH & EDUCTNL FACS AUTH REVENUE | | | 7/1/2030 | | | | 5.75 | | | | 1,010,379 | | | | 1,101,840 | | | | | |
| | 1,300,000 | | WISCONSIN ST HLTH & EDUCTNL FACS AUTH REVENUE | | | 8/15/2032 | | | | 5.00 | | | | 1,420,844 | | | | 1,467,492 | | | | | |
See accompanying notes to financial statements. | 55 | (Continued) |
CLEARWATER INVESTMENT TRUST
Schedule of Investments - Clearwater Tax-Exempt Bond Fund
June 30, 2017 (unaudited)
| Par/Shares | | | Security | | Maturity date | | Coupon rate | | | Cost | | | Fair value (a) | | | Percent of
net assets | |
| Municipal Bonds (Cont’d): | | | | | | | | | | | | | | | | | | |
| | 1,000,000 | | | WISCONSIN ST HLTH & EDUCTNL FACS AUTH REVENUE | | 5/15/2036 | | | 5.00 | | | $ | 1,000,000 | | | | 1,001,410 | | | | | |
| | 2,000,000 | | | WISCONSIN ST HLTH & EDUCTNL FACS AUTH REVENUE | | 8/15/2043 | | | 5.00 | | | | 2,091,186 | | | | 2,131,080 | | | | | |
| | 500,000 | | | WISCONSIN ST HSG & ECON DEV AUTH | | 11/1/2035 | | | 3.88 | | | | 500,000 | | | | 510,155 | | | | | |
| | 1,000,000 | | | WISCONSIN ST HSG & ECON DEV AUTH | | 11/1/2040 | | | 4.00 | | | | 1,000,000 | | | | 1,023,630 | | | | | |
| | 1,000,000 | | | WYANDOTTE CNTY KS KANSAS CITY UNIF GOVT SPL OBLG REVENUE | | 9/1/2032 | | | 5.75 | | | | 992,975 | | | | 1,003,790 | | | | | |
| | 750,000 | | | WYNNFIELD LAKES FL CDD | | 5/1/2036 | | | 4.50 | | | | 744,842 | | | | 770,392 | | | | | |
| | 1,840,000 | | | WYOMING ST CMNTY DEV AUTH HSG REVENUE | | 12/1/2038 | | | 4.05 | | | | 1,840,000 | | | | 1,884,031 | | | | | |
| | 355,000 | | | ZEPHYR RIDGE FL CDD CAPITAL IMPT REVENUE(c) | | 5/1/2013 | | | 5.25 | | | | 355,352 | | | | 177,411 | | | | | |
| | | | Sub-total Municipal Bonds: | | | | | | | | | 443,461,505 | | | | 462,544,418 | | | | 91.24 | % |
| Short-Term Investments: | | | | | | | | | | | | | | | | | | |
| | 16,470,923 | | | NORTHERN INSTITUTIONAL FUNDS -U.S. GOVERNMENT SELECT PORTFOLIO, 0.82%(f) | | | | | | | | | 16,470,923 | | | | 16,470,923 | | | | | |
| | | | Sub-total Short-Term Investments: | | | | | | | | | 16,470,923 | | | | 16,470,923 | | | | 3.25 | % |
| | | | | Grand total(g) | | | | | | | | $ | 484,539,982 | | | | 505,467,620 | | | | 99.71 | % |
Notes to Schedule of Investments:
| (a) | Investments are valued in accordance with procedures described in note 2 to the financial statements. |
| (b) | For step bonds, the coupon rate disclosed is the current rate in effect. |
| (c) | Non-income producing assets. For long-term debt securities, item identified is in default as to payment of interest and/or principal. |
| (d) | Securities exempt from registration under Rule 144A of the Securities Act of 1933. These securities may be resold in transactions exempt from registration, normally to qualified institutional buyers. The value of these securities is determined by valuations supplied by a pricing service or brokers, or, if not available, in accordance with procedures established by the Board of Trustees. |
| (f) | The short-term investment is a money market portfolio of the investment company, Northern Institutional Funds. At December 31, 2016, the value of the Clearwater Tax-Exempt Bond Fund’s investment in the U.S. Government Select Portfolio of the Northern Institutional Funds was $7,677,864 with net purchases of $8,793,059 for the six months ended June 30, 2017. |
| (g) | At June 30, 2017, the cost for Federal income tax purposes was $484,571,740. The aggregate gross unrealized appreciation and depreciation of investments in securities based on this cost was as follows: |
| Gross unrealized appreciation | | $ | 28,299,820 | |
| Gross unrealized depreciation | | | (7,403,940 | ) |
| Net unrealized appreciation | | $ | 20,895,880 | |
| See accompanying notes to financial statements. | 56 | (Continued) |
CLEARWATER INVESTMENT TRUST
Schedule of Investments - Clearwater Tax-Exempt Bond Fund
June 30, 2017 (unaudited)
Diversification of investments representing geographic diversification, as a percentage of total investments at fair value, is as follows:
| Geographical Diversification | | Percent | |
| Florida | | | 11.03 | % |
| California | | | 10.06 | |
| Illinois | | | 9.51 | |
| Texas | | | 6.31 | |
| New York | | | 5.04 | |
| Indiana | | | 4.01 | |
| Georgia | | | 4.01 | |
| Colorado | | | 3.62 | |
| Pennsylvania | | | 3.41 | |
| Wisconsin | | | 3.03 | |
| Other | | | 39.97 | |
| | | | 100.00 | % |
| See accompanying notes to financial statements. | 57 | (Continued) |
CLEARWATER INVESTMENT TRUST
Schedule of Investments - Clearwater Tax-Exempt Bond Fund
June 30, 2017 (unaudited)
Clearwater Tax-Exempt Bond Fund Portfolio Diversification
(as a percentage of net assets)
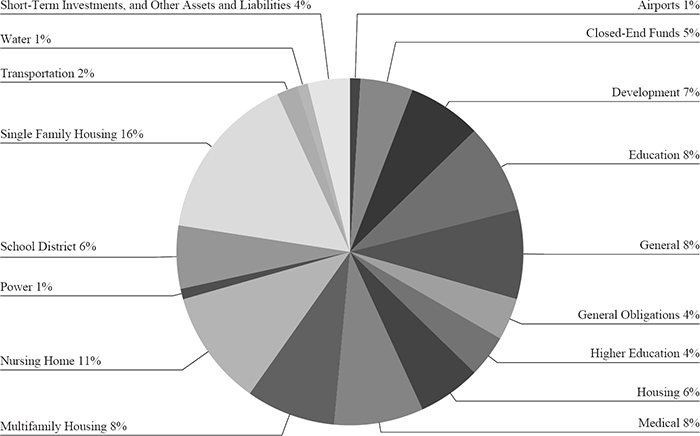
| See accompanying notes to financial statements. | 58 | (Continued) |
CLEARWATER INVESTMENT TRUST
Schedule of Investments - Clearwater International Fund
June 30, 2017 (unaudited)
| | | | | | | | | | | | Percent of | |
| Shares | | | Security | | Cost | | | Fair value (a) | | | net assets | |
| Common Stocks: | | | | | | | | | | | | |
| | Australia: | | | | | | | | | | | | | | | |
| | 2,729 | | | AGL ENERGY LTD. | | $ | 27,218 | | | | 53,486 | | | | | |
| | 32,826 | | | ALUMINA LTD. | | | 29,381 | | | | 48,442 | | | | | |
| | 20,092 | | | AMP LTD. | | | 44,790 | | | | 80,148 | | | | | |
| | 37,762 | | | APA GROUP | | | 210,499 | | | | 266,149 | | | | | |
| | 2,554 | | | ASX LTD. | | | 51,631 | | | | 105,237 | | | | | |
| | 80,380 | | | AUSTRALIA & NEW ZEALAND BANKING GROUP LTD. | | | 1,182,375 | | | | 1,774,323 | | | | | |
| | 68,613 | | | BANK OF QUEENSLAND LTD. | | | 536,423 | | | | 603,827 | | | | | |
| | 70,369 | | | BENDIGO & ADELAIDE BANK LTD. | | | 468,821 | | | | 599,269 | | | | | |
| | 179,910 | | | BGP HOLDINGS PLC(b) | | | - | | | | - | | | | | |
| | 11,553 | | | BHP BILLITON LTD. | | | 134,009 | | | | 206,718 | | | | | |
| | 10,782 | | | BHP BILLITON PLC | | | 147,458 | | | | 165,146 | | | | | |
| | 10,199 | | | BORAL LTD. | | | 28,970 | | | | 54,481 | | | | | |
| | 17,400 | | | BRAMBLES LTD. | | | 64,294 | | | | 130,125 | | | | | |
| | 971 | | | COCHLEAR LTD. | | | 35,893 | | | | 116,014 | | | | | |
| | 22,548 | | | COMMONWEALTH BANK OF AUSTRALIA | | | 889,466 | | | | 1,435,130 | | | | | |
| | 55,946 | | | CSL LTD. | | | 3,869,689 | | | | 5,935,303 | | | | | |
| | 14,184 | | | DEXUS | | | 62,970 | | | | 103,349 | | | | | |
| | 97,180 | | | FORTESCUE METALS GROUP LTD. | | | 212,026 | | | | 389,895 | | | | | |
| | 18,737 | | | GOODMAN GROUP | | | 48,414 | | | | 113,338 | | | | | |
| | 18,683 | | | INCITEC PIVOT LTD. | | | 30,152 | | | | 48,967 | | | | | |
| | 47,825 | | | INSURANCE AUSTRALIA GROUP LTD. | | | 120,292 | | | | 249,221 | | | | | |
| | 10,015 | | | LENDLEASE GROUP | | | 61,130 | | | | 128,164 | | | | | |
| | 7,617 | | | MACQUARIE GROUP LTD. | | | 165,843 | | | | 518,128 | | | | | |
| | 30,477 | | | NATIONAL AUSTRALIA BANK LTD. | | | 499,771 | | | | 693,135 | | | | | |
| | 6,653 | | | NEWCREST MINING LTD. | | | 50,401 | | | | 103,088 | | | | | |
| | 17,965 | | | ORIGIN ENERGY LTD.(c) | | | 77,152 | | | | 94,722 | | | | | |
| | 16,330 | | | ORORA LTD. | | | 16,762 | | | | 35,896 | | | | | |
| | 416 | | | PERPETUAL LTD. | | | 7,027 | | | | 17,864 | | | | | |
| | 2,468 | | | RAMSAY HEALTH CARE LTD. | | | 49,765 | | | | 139,612 | | | | | |
| | 20,500 | | | SANTOS LTD.(c) | | | 45,732 | | | | 47,742 | | | | | |
| | 53,666 | | | SCENTRE GROUP | | | 107,604 | | | | 167,053 | | | | | |
| | 5,884 | | | SEEK LTD. | | | 49,598 | | | | 76,474 | | | | | |
| | 9,824 | | | SONIC HEALTHCARE LTD. | | | 79,849 | | | | 182,879 | | | | | |
| | 101,955 | | | SOUTH32 LTD. | | | 70,421 | | | | 210,012 | | | | | |
| | 11,647 | | | STAR ENTERTAINMENT GROUP (THE) LTD. | | | 31,304 | | | | 45,207 | | | | | |
| | 9,837 | | | SYDNEY AIRPORT | | | 33,263 | | | | 53,605 | | | | | |
| | 16,067 | | | TABCORP HOLDINGS LTD. | | | 39,321 | | | | 53,965 | | | | | |
| | 17,320 | | | TATTS GROUP LTD. | | | 40,111 | | | | 55,645 | | | | | |
| | 13,099 | | | TRANSURBAN GROUP | | | 36,728 | | | | 119,304 | | | | | |
| | 12,264 | | | TREASURY WINE ESTATES LTD. | | | 49,093 | | | | 124,048 | | | | | |
| | 33,315 | | | VICINITY CENTRES | | | 46,791 | | | | 65,807 | | | | | |
| | 12,773 | | | WESFARMERS LTD. | | | 431,440 | | | | 393,853 | | | | | |
| | 14,744 | | | WESTFIELD CORP. | | | 51,213 | | | | 90,998 | | | | | |
| | 60,491 | | | WESTPAC BANKING CORP. | | | 871,309 | | | | 1,418,513 | | | | | |
| | 3,970 | | | WOODSIDE PETROLEUM LTD. | | | 74,324 | | | | 91,144 | | | | | |
| | 16,846 | | | WOOLWORTHS LTD. | | | 309,168 | | | | 330,688 | | | | | |
| | | | | | | | 11,489,891 | | | | 17,736,114 | | | | 3.05 | % |
| | Austria: | | | | | | | | | | | | | | | |
| | 1,685 | | | BUWOG A.G.(c) | | | 30,804 | | | | 48,411 | | | | | |
| | 3,566 | | | ERSTE GROUP BANK A.G.(c) | | | 63,770 | | | | 136,544 | | | | | |
| | 931 | | | IMMOFINANZ A.G.(c) | | | - | | | | 2,128 | | | | | |
| | 313 | | | STRABAG S.E. (BEARER) | | | 5,505 | | | | 13,535 | | | | | |
| | | | | | | | 100,079 | | | | 200,618 | | | | 0.04 | % |
| | Belgium: | | | | | | | | | | | | | | | |
| | 7,120 | | | AGEAS | | | 106,907 | | | | 286,738 | | | | | |
| | 13,822 | | | ANHEUSER-BUSCH INBEV S.A./N.V. | | | 502,521 | | | | 1,526,741 | | | | | |
| | 10,910 | | | BARCO N.V. | | | 740,520 | | | | 1,120,355 | | | | | |
| | 25,161 | | | GROUPE BRUXELLES LAMBERT S.A. | | | 2,214,864 | | | | 2,422,295 | | | | | |
| | 4,347 | | | KBC GROUP N.V. | | | 101,356 | | | | 329,721 | | | | | |
| | 34,690 | | | ONTEX GROUP N.V. | | | 1,095,109 | | | | 1,232,615 | | | | | |
| | 2,962 | | | PROXIMUS SADP | | | 71,203 | | | | 103,623 | | | | | |
| | 1,071 | | | TELENET GROUP HOLDING N.V.(c) | | | 51,789 | | | | 67,462 | | | | | |
| | 1,091 | | | UCB S.A. | | | 30,547 | | | | 75,052 | | | | | |
| | | | | | | | 4,914,816 | | | | 7,164,602 | | | | 1.23 | % |
| | Brazil: | | | | | | | | | | | | | | | |
| | 130,255 | | | AMBEV S.A. ADR(d) | | | 751,032 | | | | 715,100 | | | | | |
| | 109,100 | | | GRENDENE S.A. | | | 823,014 | | | | 844,044 | | | | | |
| See accompanying notes to financial statements. | 59 | (Continued) |
CLEARWATER INVESTMENT TRUST
Schedule of Investments - Clearwater International Fund
June 30, 2017 (unaudited)
| | | | | | | | | | | | Percent of | |
| Shares | | | Security | | Cost | | | Fair value (a) | | | net assets | |
| | Brazil (Cont’d): | | | | | | | | | | | | |
| | 84,200 | | | M DIAS BRANCO S.A.(c) | | $ | 957,716 | | | | 1,252,999 | | | | | |
| | 96,400 | | | RAIA DROGASIL S.A.(c) | | | 2,024,927 | | | | 2,040,087 | | | | | |
| | | | | | | | 4,556,689 | | | | 4,852,230 | | | | 0.84 | % |
| | Canada: | | | | | | | | | | | | | | | |
| | 2,200 | | | AGNICO EAGLE MINES LTD. | | | 63,567 | | | | 99,210 | | | | | |
| | 3,620 | | | AGRIUM, INC. | | | 154,492 | | | | 328,083 | | | | | |
| | 55,700 | | | ALAMOS GOLD, INC., CLASS A | | | 392,898 | | | | 399,926 | | | | | |
| | 4,817 | | | ALIMENTATION COUCHE-TARD, INC., CLASS B | | | 138,408 | | | | 230,895 | | | | | |
| | 95,100 | | | BADGER DAYLIGHTING LTD. | | | 1,696,426 | | | | 1,952,161 | | | | | |
| | 1,832 | | | BANK OF MONTREAL | | | 92,850 | | | | 134,518 | | | | | |
| | 5,119 | | | BANK OF NOVA SCOTIA (THE) | | | 186,720 | | | | 307,937 | | | | | |
| | 22,326 | | | BARRICK GOLD CORP. | | | 176,666 | | | | 355,171 | | | | | |
| | 49,653 | | | BOMBARDIER, INC., CLASS B(c) | | | 48,169 | | | | 90,362 | | | | | |
| | 17,842 | | | BROOKFIELD ASSET MANAGEMENT, INC., CLASS A | | | 164,194 | | | | 700,189 | | | | | |
| | 11,740 | | | CAE, INC. | | | 85,345 | | | | 202,426 | | | | | |
| | 287,400 | | | CANACCORD GENUITY GROUP, INC. | | | 1,072,383 | | | | 1,181,248 | | | | | |
| | 11,700 | | | CANADA GOOSE HOLDINGS, INC.(c) | | | 181,785 | | | | 231,149 | | | | | |
| | 6,639 | | | CANADIAN IMPERIAL BANK OF COMMERCE | | | 268,953 | | | | 539,547 | | | | | |
| | 15,994 | | | CANADIAN NATIONAL RAILWAY CO. | | | 292,557 | | | | 1,297,724 | | | | | |
| | 26,238 | | | CANADIAN NATURAL RESOURCES LTD. | | | 589,011 | | | | 757,114 | | | | | |
| | 3,606 | | | CANADIAN PACIFIC RAILWAY LTD. | | | 112,878 | | | | 580,191 | | | | | |
| | 24,040 | | | CANADIAN PACIFIC RAILWAY LTD. | | | 3,113,569 | | | | 3,865,872 | | | | | |
| | 744 | | | CANADIAN TIRE CORP. LTD., CLASS A | | | 50,047 | | | | 84,658 | | | | | |
| | 56,097 | | | CANADIAN WESTERN BANK | | | 1,143,221 | | | | 1,184,390 | | | | | |
| | 1,570 | | | CCL INDUSTRIES, INC., CLASS B | | | 45,979 | | | | 79,432 | | | | | |
| | 6,978 | | | CGI GROUP, INC., CLASS A(c) | | | 55,128 | | | | 356,541 | | | | | |
| | 167 | | | CONSTELLATION SOFTWARE, INC. | | | 49,226 | | | | 87,365 | | | | | |
| | 27,449 | | | CRESCENT POINT ENERGY CORP. | | | 215,381 | | | | 209,974 | | | | | |
| | 2,064 | | | DOLLARAMA, INC. | | | 75,934 | | | | 197,216 | | | | | |
| | 7,455 | | | ECN CAPITAL CORP. | | | 17,223 | | | | 22,995 | | | | | |
| | 113,139 | | | ELDORADO GOLD CORP. | | | 319,802 | | | | 300,122 | | | | | |
| | 15,245 | | | ENBRIDGE, INC. | | | 644,385 | | | | 607,308 | | | | | |
| | 33,604 | | | ENCANA CORP. | | | 212,882 | | | | 295,668 | | | | | |
| | 52,700 | | | ENERFLEX LTD. | | | 656,712 | | | | 764,817 | | | | | |
| | 211 | | | FAIRFAX FINANCIAL HOLDINGS LTD. | | | 52,589 | | | | 91,444 | | | | | |
| | 8,046 | | | FIRST QUANTUM MINERALS LTD. | | | 52,095 | | | | 68,063 | | | | | |
| | 2,389 | | | FRANCO-NEVADA CORP. | | | 109,265 | | | | 172,377 | | | | | |
| | 37,800 | | | GENWORTH MI CANADA, INC. | | | 851,031 | | | | 1,040,025 | | | | | |
| | 6,104 | | | GILDAN ACTIVEWEAR, INC. | | | 33,435 | | | | 187,573 | | | | | |
| | 7,233 | | | GOLDCORP, INC. | | | 71,545 | | | | 93,257 | | | | | |
| | 391,600 | | | GRAN TIERRA ENERGY, INC.(c) | | | 978,737 | | | | 869,685 | | | | | |
| | 59,072 | | | IMPERIAL OIL LTD. | | | 2,222,503 | | | | 1,721,870 | | | | | |
| | 1,100 | | | INTERNATIONAL PETROLEUM CORP.(c) | | | 2,833 | | | | 3,264 | | | | | |
| | 33,281 | | | KINROSS GOLD CORP.(c) | | | 62,810 | | | | 135,249 | | | | | |
| | 15,300 | | | LAURENTIAN BANK OF CANADA | | | 600,033 | | | | 639,112 | | | | | |
| | 2,077 | | | LOBLAW COS. LTD. | | | 71,240 | | | | 115,542 | | | | | |
| | 9,476 | | | MAGNA INTERNATIONAL, INC. | | | 61,549 | | | | 438,945 | | | | | |
| | 31,473 | | | MANULIFE FINANCIAL CORP. | | | 380,571 | | | | 589,997 | | | | | |
| | 1,723 | | | METHANEX CORP. | | | 23,658 | | | | 76,066 | | | | | |
| | 3,000 | | | METRO, INC. | | | 54,328 | | | | 98,735 | | | | | |
| | 98,400 | | | MULLEN GROUP LTD. | | | 1,412,125 | | | | 1,214,065 | | | | | |
| | 2,600 | | | ONEX CORP. | | | 105,376 | | | | 208,132 | | | | | |
| | 6,564 | | | OPEN TEXT CORP. | | | 72,477 | | | | 207,175 | | | | | |
| | 4,522 | | | PEMBINA PIPELINE CORP. | | | 33,296 | | | | 149,769 | | | | | |
| | 5,100 | | | PEYTO EXPLORATION & DEVELOPMENT CORP. | | | 91,071 | | | | 92,498 | | | | | |
| | 13,400 | | | POTASH CORP. OF SASKATCHEWAN, INC. | | | 222,258 | | | | 218,546 | | | | | |
| | 583 | | | PRAIRIESKY ROYALTY LTD. | | | 11,473 | | | | 13,276 | | | | | |
| | 3,681 | | | RESTAURANT BRANDS INTERNATIONAL, INC. | | | 137,022 | | | | 230,318 | | | | | |
| | 2,701 | | | RITCHIE BROS. AUCTIONEERS, INC. | | | 50,064 | | | | 77,606 | | | | | |
| | 9,354 | | | ROGERS COMMUNICATIONS, INC., CLASS B | | | 221,766 | | | | 441,805 | | | | | |
| | 27,066 | | | ROYAL BANK OF CANADA | | | 909,444 | | | | 1,965,249 | | | | | |
| | 62,000 | | | RUSSEL METALS, INC. | | | 1,130,357 | | | | 1,241,147 | | | | | |
| | 4,800 | | | SAPUTO, INC. | | | 103,951 | | | | 152,684 | | | | | |
| | 4,800 | | | SEVEN GENERATIONS ENERGY LTD., CLASS A(c) | | | 46,370 | | | | 82,209 | | | | | |
| | 6,379 | | | SHAW COMMUNICATIONS, INC., CLASS B | | | 97,657 | | | | 139,159 | | | | | |
| | 45,400 | | | SHAWCOR LTD. | | | 1,126,458 | | | | 927,045 | | | | | |
| | 2,877 | | | SNC-LAVALIN GROUP, INC. | | | 119,463 | | | | 124,393 | | | | | |
| | 11,810 | | | SUN LIFE FINANCIAL, INC. | | | 235,812 | | | | 422,202 | | | | | |
| See accompanying notes to financial statements. | 60 | (Continued) |
CLEARWATER INVESTMENT TRUST
Schedule of Investments - Clearwater International Fund
June 30, 2017 (unaudited)
| | | | | | | | | | | | Percent of | |
| Shares | | | Security | | Cost | | | Fair value (a) | | | net assets | |
| | Canada (Cont’d): | | | | | | | | | | | | |
| | 32,366 | | | SUNCOR ENERGY, INC. | | $ | 755,817 | | | | 945,672 | | | | | |
| | 19,201 | | | TECK RESOURCES LTD., CLASS B | | | 97,101 | | | | 332,849 | | | | | |
| | 4,548 | | | TELUS CORP. | | | 59,716 | | | | 157,013 | | | | | |
| | 8,041 | | | THOMSON REUTERS CORP. | | | 206,631 | | | | 372,287 | | | | | |
| | 30,016 | | | TORONTO-DOMINION BANK (THE) | | | 557,894 | | | | 1,512,605 | | | | | |
| | 6,593 | | | TRANSCANADA CORP. | | | 247,302 | | | | 314,296 | | | | | |
| | 105 | | | TRISURA GROUP LTD.(c) | | | 499 | | | | 1,756 | | | | | |
| | 18,713 | | | TURQUOISE HILL RESOURCES LTD.(c) | | | 35,694 | | | | 49,784 | | | | | |
| | 66,286 | | | VERESEN, INC. | | | 504,158 | | | | 937,450 | | | | | |
| | 1 | | | WASTE CONNECTIONS, INC. | | | 40 | | | | 60 | | | | | |
| | 4,726 | | | WHEATON PRECIOUS METALS CORP. | | | 58,903 | | | | 93,879 | | | | | |
| | 25,967 | | | YAMANA GOLD, INC. | | | 47,753 | | | | 62,675 | | | | | |
| | | | | | | | 26,642,961 | | | | 36,473,017 | | | | 6.28 | % |
| | China: | | | | | | | | | | | | | | | |
| | 22,959 | | | BAIDU, INC. ADR(c)(d) | | | 3,383,987 | | | | 4,106,447 | | | | | |
| | 1,790,500 | | | CHINA ZHENGTONG AUTO SERVICES HOLDINGS LTD. | | | 1,038,086 | | | | 1,433,326 | | | | | |
| | 60,195 | | | CTRIP.COM INTERNATIONAL LTD. ADR(c) | | | 3,012,891 | | | | 3,242,102 | | | | | |
| | 1,963,000 | | | GOODBABY INTERNATIONAL HOLDINGS LTD. | | | 891,796 | | | | 814,622 | | | | | |
| | 1,491,000 | | | GREATVIEW ASEPTIC PACKAGING CO. LTD. | | | 734,086 | | | | 930,031 | | | | | |
| | 70,400 | | | SHANGHAI HAOHAI BIOLOGICAL TECHNOLOGY CO. LTD., CLASS H(e) | | | 326,858 | | | | 382,322 | | | | | |
| | 116,155 | | | TENCENT HOLDINGS LTD. | | | 1,676,846 | | | | 4,153,786 | | | | | |
| | 2,286,000 | | | XTEP INTERNATIONAL HOLDINGS LTD. | | | 988,585 | | | | 881,320 | | | | | |
| | | | | | | | 12,053,135 | | | | 15,943,956 | | | | 2.74 | % |
| | Denmark: | | | | | | | | | | | | | | | |
| | 74 | | | AP MOLLER - MAERSK A/S, CLASS A | | | 73,820 | | | | 141,286 | | | | | |
| | 147 | | | AP MOLLER - MAERSK A/S, CLASS B | | | 155,573 | | | | 295,565 | | | | | |
| | 22,003 | | | CARLSBERG A/S, CLASS B | | | 1,915,720 | | | | 2,350,578 | | | | | |
| | 37,395 | | | CHR HANSEN HOLDING A/S | | | 1,770,448 | | | | 2,719,751 | | | | | |
| | 37,645 | | | COLOPLAST A/S, CLASS B | | | 2,684,460 | | | | 3,145,588 | | | | | |
| | 13,100 | | | DANSKE BANK A/S | | | 138,182 | | | | 503,850 | | | | | |
| | 1,592 | | | DSV A/S | | | 48,905 | | | | 97,813 | | | | | |
| | 200 | | | FLSMIDTH & CO. A/S | | | 6,013 | | | | 12,638 | | | | | |
| | 808 | | | GENMAB A/S(c) | | | 101,229 | | | | 172,389 | | | | | |
| | 62,441 | | | ISS A/S | | | 2,058,220 | | | | 2,452,428 | | | | | |
| | 21,430 | | | NOVO NORDISK A/S, CLASS B | | | 244,460 | | | | 917,721 | | | | | |
| | 58,427 | | | NOVOZYMES A/S, CLASS B | | | 1,864,891 | | | | 2,556,829 | | | | | |
| | 2,600 | | | PANDORA A/S | | | 18,150 | | | | 242,614 | | | | | |
| | 10,154 | | | TDC A/S | | | 50,412 | | | | 59,049 | | | | | |
| | 3,250 | | | TOPDANMARK A/S(c) | | | 33,362 | | | | 103,785 | | | | | |
| | 3,244 | | | VESTAS WIND SYSTEMS A/S | | | 150,564 | | | | 299,468 | | | | | |
| | 3,896 | | | WILLIAM DEMANT HOLDING A/S(c) | | | 70,444 | | | | 100,836 | | | | | |
| | | | | | | | 11,384,853 | | | | 16,172,188 | | | | 2.78 | % |
| | Finland: | | | | | | | | | | | | | | | |
| | 97,500 | | | AMER SPORTS OYJ(c) | | | 1,857,586 | | | | 2,438,776 | | | | | |
| | 2,770 | | | ELISA OYJ | | | 86,574 | | | | 107,346 | | | | | |
| | 64,770 | | | HUHTAMAKI OYJ | | | 1,931,841 | | | | 2,552,208 | | | | | |
| | 1,396 | | | KESKO OYJ, CLASS B | | | 30,705 | | | | 71,016 | | | | | |
| | 4,902 | | | KONE OYJ, CLASS B | | | 86,493 | | | | 249,371 | | | | | |
| | 7,075 | | | NESTE OYJ | | | 67,704 | | | | 278,704 | | | | | |
| | 74,334 | | | NOKIA OYJ | | | 270,327 | | | | 454,643 | | | | | |
| | 2,240 | | | NOKIAN RENKAAT OYJ | | | 31,307 | | | | 92,717 | | | | | |
| | 1,960 | | | ORION OYJ, CLASS B | | | 49,561 | | | | 125,139 | | | | | |
| | 5,232 | | | SAMPO OYJ, CLASS A | | | 211,995 | | | | 268,131 | | | | | |
| | 15,829 | | | STORA ENSO OYJ (REGISTERED) | | | 75,698 | | | | 204,475 | | | | | |
| | 11,934 | | | UPM-KYMMENE OYJ | | | 99,928 | | | | 340,215 | | | | | |
| | 1,849 | | | VALMET OYJ | | | 14,443 | | | | 35,922 | | | | | |
| | 2,352 | | | WARTSILA OYJ ABP | | | 56,960 | | | | 139,018 | | | | | |
| | | | | | | | 4,871,122 | | | | 7,357,681 | | | | 1.27 | % |
| | France: | | | | | | | | | | | | | | | |
| | 1,275 | | | ACCOR S.A. | | | 29,826 | | | | 59,771 | | | | | |
| | 3,443 | | | AEROPORTS DE PARIS | | | 334,974 | | | | 555,651 | | | | | |
| | 10,877 | | | AIRBUS S.E. | | | 357,319 | | | | 894,468 | | | | | |
| | 1,093 | | | ARKEMA S.A. | | | 77,841 | | | | 116,635 | | | | | |
| | 435 | | | ATOS S.E. | | | 30,494 | | | | 61,061 | | | | | |
| | 30,343 | | | AXA S.A. | | | 403,058 | | | | 830,017 | | | | | |
| | 48,988 | | | BENETEAU S.A. | | | 656,247 | | | | 847,388 | | | | | |
| See accompanying notes to financial statements. | 61 | (Continued) |
CLEARWATER INVESTMENT TRUST
Schedule of Investments - Clearwater International Fund
June 30, 2017 (unaudited)
| | | | | | | | | | | | Percent of | |
| Shares | | | Security | | Cost | | | Fair value (a) | | | net assets | |
| | France (Cont’d): | | | | | | | | | | | | |
| | 16,523 | | | BNP PARIBAS S.A. | | $ | 678,366 | | | | 1,190,052 | | | | | |
| | 16,698 | | | BOLLORE S.A. | | | 52,911 | | | | 75,924 | | | | | |
| | 2,871 | | | BOUYGUES S.A. | | | 90,917 | | | | 121,065 | | | | | |
| | 3,068 | | | CAPGEMINI S.E. | | | 111,959 | | | | 317,052 | | | | | |
| | 2,834 | | | CARREFOUR S.A. | | | 51,599 | | | | 71,696 | | | | | |
| | 774 | | | CASINO GUICHARD PERRACHON S.A. | | | 36,795 | | | | 45,846 | | | | | |
| | 994 | | | CHRISTIAN DIOR S.E.(c) | | | 70,757 | | | | 284,222 | | | | | |
| | 8,207 | | | CIE DE SAINT-GOBAIN | | | 279,263 | | | | 438,498 | | | | | |
| | 3,404 | | | CIE GENERALE DES ETABLISSEMENTS MICHELIN | | | 180,725 | | | | 452,549 | | | | | |
| | 26,672 | | | CREDIT AGRICOLE S.A. | | | 211,038 | | | | 429,077 | | | | | |
| | 9,359 | | | DANONE S.A. | | | 473,663 | | | | 703,468 | | | | | |
| | 1,781 | | | EDENRED | | | 26,435 | | | | 46,440 | | | | | |
| | 67,951 | | | ENGIE S.A. | | | 864,155 | | | | 1,025,619 | | | | | |
| | 20,063 | | | ESSILOR INTERNATIONAL S.A. | | | 2,523,803 | | | | 2,552,726 | | | | | |
| | 2,673 | | | EURAZEO S.A. | | | 77,917 | | | | 200,549 | | | | | |
| | 1,133 | | | FONCIERE DES REGIONS | | | 96,781 | | | | 105,103 | | | | | |
| | 564 | | | GECINA S.A. | | | 51,331 | | | | 88,477 | | | | | |
| | 9,468 | | | GROUPE EUROTUNNEL S.E. (REGISTERED) | | | 72,457 | | | | 100,980 | | | | | |
| | 4,845 | | | HERMES INTERNATIONAL | | | 1,851,297 | | | | 2,394,163 | | | | | |
| | 514 | | | ILIAD S.A. | | | 68,964 | | | | 121,581 | | | | | |
| | 740 | | | INGENICO GROUP S.A. | | | 56,963 | | | | 67,184 | | | | | |
| | 1,026 | | | KERING | | | 174,510 | | | | 349,445 | | | | | |
| | 2,335 | | | KLEPIERRE | | | 57,367 | | | | 95,703 | | | | | |
| | 2,119 | | | LAGARDERE S.C.A. | | | 50,227 | | | | 66,919 | | | | | |
| | 4,882 | | | LEGRAND S.A. | | | 111,114 | | | | 341,529 | | | | | |
| | 6,266 | | | L’OREAL S.A. | | | 661,338 | | | | 1,305,384 | | | | | |
| | 17,153 | | | LVMH MOET HENNESSY LOUIS VUITTON S.E. | | | 2,589,862 | | | | 4,276,781 | | | | | |
| | 20,736 | | | NATIXIS S.A. | | | 68,871 | | | | 139,189 | | | | | |
| | 39,439 | | | ORANGE S.A. | | | 438,130 | | | | 625,679 | | | | | |
| | 2,741 | | | PERNOD RICARD S.A. | | | 172,088 | | | | 367,067 | | | | | |
| | 12,969 | | | PEUGEOT S.A. | | | 78,174 | | | | 258,701 | | | | | |
| | 1,182 | | | PUBLICIS GROUPE S.A. | | | 75,683 | | | | 88,170 | | | | | |
| | 4,895 | | | RENAULT S.A. | | | 134,511 | | | | 443,073 | | | | | |
| | 2,684 | | | SAFRAN S.A. | | | 123,278 | | | | 245,978 | | | | | |
| | 24,263 | | | SANOFI | | | 1,499,641 | | | | 2,321,156 | | | | | |
| | 278 | | | SCHNEIDER ELECTRIC S.E. | | | 8,838 | | | | 21,348 | | | | | |
| | 7,138 | | | SCHNEIDER ELECTRIC S.E.(c) | | | 267,356 | | | | 548,430 | | | | | |
| | 1,813 | | | SCOR S.E. | | | 36,441 | | | | 71,875 | | | | | |
| | 2,134 | | | SFR GROUP S.A.(c) | | | 51,973 | | | | 72,267 | | | | | |
| | 14,520 | | | SOCIETE GENERALE S.A. | | | 503,103 | | | | 781,273 | | | | | |
| | 8,614 | | | SODEXO S.A. | | | 669,264 | | | | 1,113,716 | | | | | |
| | 9,578 | | | TELEVISION FRANCAISE 1 | | | 79,414 | | | | 134,118 | | | | | |
| | 1,413 | | | THALES S.A. | | | 81,763 | | | | 152,090 | | | | | |
| | 21,913 | | | TOTAL S.A. | | | 1,029,479 | | | | 1,083,334 | | | | | |
| | 1,568 | | | UNIBAIL-RODAMCO S.E. | | | 177,708 | | | | 395,160 | | | | | |
| | 1,878 | | | VALEO S.A. | | | 76,759 | | | | 126,531 | | | | | |
| | 13,671 | | | VEOLIA ENVIRONNEMENT S.A. | | | 145,445 | | | | 288,865 | | | | | |
| | 7,810 | | | VINCI S.A. | | | 316,569 | | | | 666,606 | | | | | |
| | 90,151 | | | VIVENDI S.A. | | | 1,747,844 | | | | 2,006,807 | | | | | |
| | 1,345 | | | WENDEL S.A. | | | 91,561 | | | | 199,091 | | | | | |
| | | | | | | | 21,336,166 | | | | 32,783,547 | | | | 5.64 | % |
| | Germany: | | | | | | | | | | | | | | | |
| | 15,764 | | | ADIDAS A.G. | | | 2,148,557 | | | | 3,020,314 | | | | | |
| | 8,277 | | | ALLIANZ S.E. (REGISTERED) | | | 727,077 | | | | 1,629,796 | | | | | |
| | 15,026 | | | BASF S.E. | | | 542,099 | | | | 1,391,662 | | | | | |
| | 17,136 | | | BAYER A.G. (REGISTERED) | | | 1,013,636 | | | | 2,215,537 | | | | | |
| | 5,770 | | | BAYERISCHE MOTOREN WERKE A.G. | | | 473,448 | | | | 535,652 | | | | | |
| | 2,206 | | | BEIERSDORF A.G. | | | 146,950 | | | | 231,902 | | | | | |
| | 1,188 | | | BRENNTAG A.G. | | | 43,546 | | | | 68,766 | | | | | |
| | 29,496 | | | COMMERZBANK A.G.(c) | | | 190,394 | | | | 351,375 | | | | | |
| | 916 | | | CONTINENTAL A.G. | | | 47,943 | | | | 197,681 | | | | | |
| | 17,639 | | | DAIMLER A.G. (REGISTERED) | | | 589,913 | | | | 1,276,676 | | | | | |
| | 24,062 | | | DEUTSCHE BANK A.G. (REGISTERED) | | | 382,946 | | | | 426,665 | | | | | |
| | 4,525 | | | DEUTSCHE BOERSE A.G. | | | 273,151 | | | | 477,648 | | | | | |
| | 2,487 | | | DEUTSCHE LUFTHANSA A.G. (REGISTERED) | | | 29,539 | | | | 56,598 | | | | | |
| | 17,828 | | | DEUTSCHE POST A.G. (REGISTERED) | | | 210,542 | | | | 668,289 | | | | | |
| | 72,227 | | | DEUTSCHE TELEKOM A.G. (REGISTERED) | | | 948,582 | | | | 1,296,807 | | | | | |
| | 3,463 | | | DEUTSCHE WOHNEN A.G. (BEARER) | | | 80,362 | | | | 132,462 | | | | | |
| See accompanying notes to financial statements. | 62 | (Continued) |
CLEARWATER INVESTMENT TRUST
Schedule of Investments - Clearwater International Fund
June 30, 2017 (unaudited)
| Shares | | | Security | | Cost | | | Fair value (a) | | | Percent of
net assets | |
| | Germany (Cont’d): | | | | | | | | | | | | |
| | 12,873 | | | E.ON S.E. | | $ | 98,819 | | | | 121,270 | | | | | |
| | 594 | | | FRESENIUS MEDICAL CARE A.G. & CO. KGAA | | | 21,418 | | | | 57,104 | | | | | |
| | 6,867 | | | FRESENIUS S.E. & CO. KGAA | | | 150,261 | | | | 588,706 | | | | | |
| | 30,470 | | | GERRESHEIMER A.G. | | | 2,115,200 | | | | 2,451,056 | | | | | |
| | 87,220 | | | GRAND CITY PROPERTIES S.A. | | | 1,446,148 | | | | 1,747,804 | | | | | |
| | 2,246 | | | HANNOVER RUECK S.E. | | | 94,321 | | | | 269,225 | | | | | |
| | 3,952 | | | HEIDELBERGCEMENT A.G. | | | 143,515 | | | | 382,091 | | | | | |
| | 671 | | | HENKEL A.G. & CO. KGAA | | | 49,267 | | | | 81,160 | | | | | |
| | 2,600 | | | HOCHTIEF A.G. | | | 108,936 | | | | 476,322 | | | | | |
| | 1,280 | | | HUGO BOSS A.G. | | | 70,065 | | | | 89,618 | | | | | |
| | 21,437 | | | INFINEON TECHNOLOGIES A.G. | | | 117,250 | | | | 452,592 | | | | | |
| | 71,670 | | | JENOPTIK A.G. | | | 1,548,935 | | | | 1,879,867 | | | | | |
| | 2,661 | | | K+S A.G. (REGISTERED) | | | 50,126 | | | | 68,140 | | | | | |
| | 1,373 | | | LINDE A.G. | | | 199,368 | | | | 260,003 | | | | | |
| | 2,050 | | | MERCK KGAA | | | 86,079 | | | | 247,604 | | | | | |
| | 1,868 | | | METRO A.G. | | | 58,041 | | | | 63,057 | | | | | |
| | 3,091 | | | MUENCHENER RUECKVERSICHERUNGS-GESELLSCHAFT A.G. IN MUENCHEN (REGISTERED) | | | 382,823 | | | | 623,290 | | | | | |
| | 1,517 | | | OSRAM LICHT A.G. | | | 42,957 | | | | 120,852 | | | | | |
| | 1,489 | | | PROSIEBENSAT.1 MEDIA S.E. | | | 25,180 | | | | 62,312 | | | | | |
| | 5,070 | | | RATIONAL A.G. | | | 2,043,688 | | | | 2,698,466 | | | | | |
| | 17,103 | | | SAP S.E. | | | 683,559 | | | | 1,786,402 | | | | | |
| | 13,106 | | | SIEMENS A.G. (REGISTERED) | | | 795,701 | | | | 1,801,521 | | | | | |
| | 21,310 | | | STABILUS S.A. | | | 1,262,498 | | | | 1,654,823 | | | | | |
| | 33,787 | | | TELEFONICA DEUTSCHLAND HOLDING A.G. | | | 130,155 | | | | 168,753 | | | | | |
| | 2,356 | | | THYSSENKRUPP A.G. | | | 44,466 | | | | 66,936 | | | | | |
| | 9,713 | | | TUI A.G. - CDI | | | 124,901 | | | | 141,561 | | | | | |
| | 7,071 | | | TUI A.G. - CDI | | | 57,698 | | | | 102,688 | | | | | |
| | 4,249 | | | UNIPER S.E. | | | 47,803 | | | | 79,759 | | | | | |
| | 404 | | | VOLKSWAGEN A.G. | | | 40,235 | | | | 62,639 | | | | | |
| | 2,682 | | | VONOVIA S.E. | | | 98,410 | | | | 106,494 | | | | | |
| | 1,702 | | | ZALANDO S.E.(c)(e) | | | 61,430 | | | | 77,777 | | | | | |
| | | | | | | | 20,047,938 | | | | 32,767,722 | | | | 5.64 | % |
| | Greece: | | | | | | | | | | | | | | | |
| | 6,746 | | | HELLENIC TELECOMMUNICATIONS ORGANIZATION S.A. | | | 54,075 | | | | 81,210 | | | | | |
| | | | | | | | 54,075 | | | | 81,210 | | | | 0.01 | % |
| | Hong Kong: | | | | | | | | | | | | | | | |
| | 563,000 | | | AIA GROUP LTD. | | | 2,831,427 | | | | 4,113,910 | | | | | |
| | 181,500 | | | BOC HONG KONG HOLDINGS LTD. | | | 447,601 | | | | 868,277 | | | | | |
| | 56,044 | | | CHEUNG KONG PROPERTY HOLDINGS LTD. | | | 165,366 | | | | 438,951 | | | | | |
| | 52,044 | | | CK HUTCHISON HOLDINGS LTD. | | | 307,834 | | | | 653,262 | | | | | |
| | 10,000 | | | CK INFRASTRUCTURE HOLDINGS LTD. | | | 46,496 | | | | 84,022 | | | | | |
| | 34,500 | | | CLP HOLDINGS LTD. | | | 236,618 | | | | 364,998 | | | | | |
| | 18,000 | | | GALAXY ENTERTAINMENT GROUP LTD. | | | 39,054 | | | | 109,280 | | | | | |
| | 15,300 | | | HANG SENG BANK LTD. | | | 175,457 | | | | 320,014 | | | | | |
| | 20,936 | | | HENDERSON LAND DEVELOPMENT CO. LTD. | | | 45,544 | | | | 116,781 | | | | | |
| | 93,690 | | | HONG KONG & CHINA GAS CO. LTD. | | | 169,115 | | | | 176,161 | | | | | |
| | 14,900 | | | HONG KONG EXCHANGES & CLEARING LTD. | | | 275,274 | | | | 385,122 | | | | | |
| | 400 | | | HOPEWELL HIGHWAY INFRASTRUCTURE LTD. | | | 229 | | | | 230 | | | | | |
| | 3,200 | | | JARDINE MATHESON HOLDINGS LTD. | | | 212,627 | | | | 205,440 | | | | | |
| | 40,500 | | | LINK REIT | | | 84,196 | | | | 308,129 | | | | | |
| | 272,800 | | | LUK FOOK HOLDINGS INTERNATIONAL LTD. | | | 872,448 | | | | 932,924 | | | | | |
| | 30,500 | | | MTR CORP. LTD. | | | 88,703 | | | | 171,692 | | | | | |
| | 43,500 | | | NWS HOLDINGS LTD. | | | 52,824 | | | | 85,580 | | | | | |
| | 190,000 | | | PCCW LTD. | | | 77,805 | | | | 108,051 | | | | | |
| | 24,000 | | | POWER ASSETS HOLDINGS LTD. | | | 139,092 | | | | 211,951 | | | | | |
| | 172,800 | | | SANDS CHINA LTD. | | | 551,191 | | | | 791,244 | | | | | |
| | 27,400 | | | SINO LAND CO. LTD. | | | 29,978 | | | | 44,921 | | | | | |
| | 517,000 | | | STELLA INTERNATIONAL HOLDINGS LTD. | | | 1,145,145 | | | | 927,063 | | | | | |
| | 8,000 | | | SUN HUNG KAI PROPERTIES LTD. | | | 65,036 | | | | 117,529 | | | | | |
| | 19,000 | | | SWIRE PACIFIC LTD., CLASS A | | | 127,857 | | | | 185,560 | | | | | |
| | 628,900 | | | TECHTRONIC INDUSTRIES CO. LTD. | | | 2,044,519 | | | | 2,891,791 | | | | | |
| | 786,000 | | | VALUE PARTNERS GROUP LTD. | | | 529,141 | | | | 715,786 | | | | | |
| | 357,000 | | | VINDA INTERNATIONAL HOLDINGS LTD. | | | 681,287 | | | | 722,464 | | | | | |
| | 150,500 | | | VTECH HOLDINGS LTD. | | | 2,024,699 | | | | 2,384,498 | | | | | |
| | 83,500 | | | WH GROUP LTD.(e) | | | 45,547 | | | | 84,276 | | | | | |
| | 6,000 | | | WHARF HOLDINGS (THE) LTD. | | | 50,398 | | | | 49,722 | | | | | |
| | 19,000 | | | WHEELOCK & CO. LTD. | | | 30,489 | | | | 143,337 | | | | | |
| See accompanying notes to financial statements. | 63 | (Continued) |
CLEARWATER INVESTMENT TRUST
Schedule of Investments - Clearwater International Fund
June 30, 2017 (unaudited)
| Shares | | | Security | | Cost | | | Fair value (a) | | | Percent of
net assets | |
| | Hong Kong (Cont’d): | | | | | | | | | | | | |
| | 15,000 | | | YUE YUEN INDUSTRIAL HOLDINGS LTD. | | $ | 30,233 | | | | 62,248 | | | | | |
| | | | | | | | 13,623,230 | | | | 18,775,214 | | | | 3.23 | % |
| | India: | | | | | | | | | | | | | | | |
| | 411,676 | | | DEWAN HOUSING FINANCE CORP. LTD. | | | 1,966,450 | | | | 2,784,525 | | | | | |
| | 119,551 | | | HCL TECHNOLOGIES LTD. | | | 1,403,527 | | | | 1,573,791 | | | | | |
| | 40,080 | | | HDFC BANK LTD. ADR(d) | | | 2,555,048 | | | | 3,485,758 | | | | | |
| | 535,545 | | | JAIN IRRIGATION SYSTEMS LTD. | | | 706,024 | | | | 851,321 | | | | | |
| | | | | | | | 6,631,049 | | | | 8,695,395 | | | | 1.50 | % |
| | Ireland: | | | | | | | | | | | | | | | |
| | 37,446 | | | ACCENTURE PLC, CLASS A | | | 3,937,063 | | | | 4,631,321 | | | | | |
| | 1,332 | | | AERCAP HOLDINGS N.V.(c) | | | 50,212 | | | | 61,845 | | | | | |
| | 16,075 | | | CRH PLC | | | 247,661 | | | | 568,703 | | | | | |
| | 24,321 | | | ICON PLC(c) | | | 1,766,422 | | | | 2,378,351 | | | | | |
| | 11,673 | | | JAMES HARDIE INDUSTRIES PLC - CDI | | | 105,224 | | | | 183,923 | | | | | |
| | 3,255 | | | KERRY GROUP PLC, CLASS A | | | 214,084 | | | | 280,054 | | | | | |
| | 34,275 | | | MEDTRONIC PLC | | | 2,642,435 | | | | 3,041,906 | | | | | |
| | 506 | | | PADDY POWER BETFAIR PLC | | | 55,156 | | | | 54,019 | | | | | |
| | | | | | | | 9,018,257 | | | | 11,200,122 | | | | 1.93 | % |
| | Israel: | | | | | | | | | | | | | | | |
| | 1,031 | | | AZRIELI GROUP LTD. | | | 54,739 | | | | 57,338 | | | | | |
| | 21,007 | | | BANK HAPOALIM B.M. | | | 79,922 | | | | 141,759 | | | | | |
| | 2,481 | | | CHECK POINT SOFTWARE TECHNOLOGIES LTD.(c) | | | 201,425 | | | | 270,627 | | | | | |
| | 30,030 | | | ISRAEL CHEMICALS LTD. | | | 136,101 | | | | 141,785 | | | | | |
| | 5,900 | | | MIZRAHI TEFAHOT BANK LTD. | | | 51,135 | | | | 107,400 | | | | | |
| | 2,937 | | | NICE LTD. | | | 148,741 | | | | 235,576 | | | | | |
| | 494 | | | TARO PHARMACEUTICAL INDUSTRIES LTD.(c) | | | 53,058 | | | | 55,358 | | | | | |
| | | | | | | | 725,121 | | | | 1,009,843 | | | | 0.17 | % |
| | Italy: | | | | | | | | | | | | | | | |
| | 25,746 | | | ASSICURAZIONI GENERALI S.P.A. | | | 314,339 | | | | 423,738 | | | | | |
| | 18,890 | | | ATLANTIA S.P.A. | | | 374,706 | | | | 531,613 | | | | | |
| | 40,765 | | | AZIMUT HOLDING S.P.A. | | | 589,227 | | | | 817,124 | | | | | |
| | 25,272 | | | BANCA MEDIOLANUM S.P.A. | | | 87,322 | | | | 209,700 | | | | | |
| | 81,915 | | | ENEL S.P.A. | | | 280,368 | | | | 439,167 | | | | | |
| | 1,022 | | | FERRARI N.V. | | | 9,333 | | | | 87,913 | | | | | |
| | 1,211 | | | FERRARI N.V. | | | 46,128 | | | | 103,943 | | | | | |
| | 101,275 | | | INTERPUMP GROUP S.P.A. | | | 2,207,229 | | | | 2,769,170 | | | | | |
| | 190,462 | | | INTESA SANPAOLO S.P.A. | | | 334,054 | | | | 603,880 | | | | | |
| | 10,070 | | | LEONARDO S.P.A. | | | 50,331 | | | | 167,346 | | | | | |
| | 40,876 | | | LUXOTTICA GROUP S.P.A. | | | 2,166,391 | | | | 2,364,672 | | | | | |
| | 10,830 | | | MEDIOBANCA S.P.A. | | | 70,955 | | | | 106,872 | | | | | |
| | 1,669 | | | PRYSMIAN S.P.A. | | | 29,837 | | | | 49,086 | | | | | |
| | 695 | | | RIZZOLI CORRIERE DELLA SERA MEDIAGROUP S.P.A.(c) | | | 460 | | | | 972 | | | | | |
| | 76,191 | | | SNAM S.P.A. | | | 276,534 | | | | 332,074 | | | | | |
| | 290,733 | | | TECHNOGYM S.P.A.(e) | | | 1,828,782 | | | | 2,239,749 | | | | | |
| | 30,527 | | | TENARIS S.A. | | | 385,417 | | | | 475,927 | | | | | |
| | 34,652 | | | TERNA RETE ELETTRICA NAZIONALE S.P.A. | | | 130,368 | | | | 187,045 | | | | | |
| | 14,256 | | | TOD’S S.P.A. | | | 957,725 | | | | 889,024 | | | | | |
| | 23,123 | | | UNICREDIT S.P.A.(c) | | | 340,149 | | | | 431,802 | | | | | |
| | 95,230 | | | UNIPOLSAI ASSICURAZIONI S.P.A. | | | 153,826 | | | | 207,854 | | | | | |
| | | | | | | | 10,633,481 | | | | 13,438,671 | | | | 2.31 | % |
| | Japan: | | | | | | | | | | | | | | | |
| | 1,400 | | | ABC-MART, INC. | | | 51,583 | | | | 82,276 | | | | | |
| | 4,700 | | | AEON CO. LTD. | | | 52,433 | | | | 71,331 | | | | | |
| | 4,800 | | | AEON FINANCIAL SERVICE CO. LTD. | | | 49,903 | | | | 101,484 | | | | | |
| | 3,600 | | | AEON MALL CO. LTD. | | | 50,736 | | | | 70,800 | | | | | |
| | 2,300 | | | AISIN SEIKI CO. LTD. | | | 37,584 | | | | 117,582 | | | | | |
| | 15,000 | | | AJINOMOTO CO., INC. | | | 116,767 | | | | 323,605 | | | | | |
| | 2,500 | | | ALFRESA HOLDINGS CORP. | | | 24,420 | | | | 48,166 | | | | | |
| | 2,000 | | | ALPS ELECTRIC CO. LTD. | | | 49,738 | | | | 57,613 | | | | | |
| | 2,000 | | | AMADA HOLDINGS CO. LTD. | | | 10,582 | | | | 23,081 | | | | | |
| | 14,000 | | | ANA HOLDINGS, INC. | | | 35,110 | | | | 48,594 | | | | | |
| | 40,600 | | | ANICOM HOLDINGS, INC. | | | 848,710 | | | | 889,067 | | | | | |
| | 18,000 | | | AOZORA BANK LTD. | | | 51,121 | | | | 68,495 | | | | | |
| | 67,700 | | | ASAHI CO. LTD. | | | 935,870 | | | | 789,708 | | | | | |
| | 5,600 | | | ASAHI GROUP HOLDINGS LTD. | | | 85,235 | | | | 210,507 | | | | | |
| | 31,000 | | | ASAHI KASEI CORP. | | | 147,138 | | | | 332,807 | | | | | |
| | 109,800 | | | ASICS CORP. | | | 1,766,783 | | | | 2,032,484 | | | | | |
| See accompanying notes to financial statements. | 64 | (Continued) |
CLEARWATER INVESTMENT TRUST
Schedule of Investments - Clearwater International Fund
June 30, 2017 (unaudited)
| Shares | | | Security | | Cost | | | Fair value (a) | | | Percent of net assets | |
| | Japan (Cont’d): | | | | | | | | | | | | |
| | 37,000 | | | ASTELLAS PHARMA, INC. | | $ | 236,149 | | | | 452,158 | | | | | |
| | 1,500 | | | BANDAI NAMCO HOLDINGS, INC. | | | 14,652 | | | | 51,078 | | | | | |
| | 33,000 | | | BANK OF KYOTO (THE) LTD. | | | 216,700 | | | | 311,002 | | | | | |
| | 13,800 | | | BRIDGESTONE CORP. | | | 205,726 | | | | 593,839 | | | | | |
| | 5,200 | | | BROTHER INDUSTRIES LTD. | | | 38,445 | | | | 119,881 | | | | | |
| | 127,200 | | | BUNKA SHUTTER CO. LTD. | | | 985,958 | | | | 973,720 | | | | | |
| | 15,500 | | | CANON, INC. | | | 438,724 | | | | 525,877 | | | | | |
| | 57,800 | | | CAPCOM CO. LTD. | | | 1,206,755 | | | | 1,368,494 | | | | | |
| | 3,300 | | | CENTRAL JAPAN RAILWAY CO. | | | 327,176 | | | | 537,213 | | | | | |
| | 4,500 | | | CHUGAI PHARMACEUTICAL CO. LTD. | | | 82,278 | | | | 168,237 | | | | | |
| | 7,900 | | | CITIZEN WATCH CO. LTD. | | | 31,581 | | | | 55,347 | | | | | |
| | 9,857 | | | CONCORDIA FINANCIAL GROUP LTD. | | | 47,717 | | | | 49,655 | | | | | |
| | 14,701 | | | CREDIT SAISON CO. LTD. | | | 162,054 | | | | 286,766 | | | | | |
| | 5,000 | | | DAI NIPPON PRINTING CO. LTD. | | | 46,806 | | | | 55,479 | | | | | |
| | 137,500 | | | DAIBIRU CORP. | | | 1,376,777 | | | | 1,427,873 | | | | | |
| | 16,500 | | | DAI-ICHI LIFE HOLDINGS, INC. | | | 198,959 | | | | 297,286 | | | | | |
| | 9,700 | | | DAIICHI SANKYO CO. LTD. | | | 150,922 | | | | 228,281 | | | | | |
| | 4,500 | | | DAIKIN INDUSTRIES LTD. | | | 124,473 | | | | 458,902 | | | | | |
| | 1,200 | | | DAITO TRUST CONSTRUCTION CO. LTD. | | | 117,985 | | | | 186,655 | | | | | |
| | 13,600 | | | DAIWA HOUSE INDUSTRY CO. LTD. | | | 194,625 | | | | 464,075 | | | | | |
| | 25,000 | | | DAIWA SECURITIES GROUP, INC. | | | 96,011 | | | | 147,988 | | | | | |
| | 8,200 | | | DENSO CORP. | | | 185,234 | | | | 345,716 | | | | | |
| | 2,800 | | | DENTSU, INC. | | | 46,871 | | | | 133,683 | | | | | |
| | 84,200 | | | DESCENTE LTD. | | | 762,552 | | | | 1,137,888 | | | | | |
| | 223,000 | | | DOWA HOLDINGS CO. LTD. | | | 1,453,661 | | | | 1,687,246 | | | | | |
| | 7,000 | | | EAST JAPAN RAILWAY CO. | | | 392,789 | | | | 668,726 | | | | | |
| | 3,800 | | | EISAI CO. LTD. | | | 133,730 | | | | 209,638 | | | | | |
| | 7,500 | | | ELECTRIC POWER DEVELOPMENT CO. LTD. | | | 169,053 | | | | 185,241 | | | | | |
| | 1,800 | | | FAMILYMART UNY HOLDINGS CO. LTD. | | | 52,590 | | | | 102,903 | | | | | |
| | 3,100 | | | FANUC CORP. | | | 243,447 | | | | 596,848 | | | | | |
| | 1,400 | | | FAST RETAILING CO. LTD. | | | 214,903 | | | | 465,775 | | | | | |
| | 21,000 | | | FUJI ELECTRIC CO. LTD. | | | 51,969 | | | | 110,531 | | | | | |
| | 60,200 | | | FUJI OIL HOLDINGS, INC. | | | 1,168,244 | | | | 1,390,528 | | | | | |
| | 8,800 | | | FUJIFILM HOLDINGS CORP. | | | 165,274 | | | | 316,088 | | | | | |
| | 18,000 | | | FUJITSU LTD. | | | 64,886 | | | | 132,477 | | | | | |
| | 70,000 | | | FUKUOKA FINANCIAL GROUP, INC. | | | 230,551 | | | | 332,341 | | | | | |
| | 3,200 | | | FURUKAWA ELECTRIC CO. LTD. | | | 65,376 | | | | 142,254 | | | | | |
| | 49,500 | | | HACHIJUNI BANK (THE) LTD. | | | 214,554 | | | | 313,790 | | | | | |
| | 3,000 | | | HAMAMATSU PHOTONICS K.K. | | | 52,686 | | | | 92,020 | | | | | |
| | 2,400 | | | HANKYU HANSHIN HOLDINGS, INC. | | | 57,098 | | | | 86,206 | | | | | |
| | 325 | | | HIROSE ELECTRIC CO. LTD. | | | 28,701 | | | | 46,290 | | | | | |
| | 95,000 | | | HITACHI LTD. | | | 295,895 | | | | 582,289 | | | | | |
| | 6,200 | | | HITACHI METALS LTD. | | | 47,471 | | | | 86,103 | | | | | |
| | 12,400 | | | HONDA MOTOR CO. LTD. | | | 301,692 | | | | 337,796 | | | | | |
| | 5,300 | | | HOYA CORP. | | | 112,594 | | | | 274,860 | | | | | |
| | 147,600 | | | IDOM, INC. | | | 840,744 | | | | 1,017,026 | | | | | |
| | 18,200 | | | ITOCHU CORP. | | | 192,005 | | | | 270,067 | | | | | |
| | 4,000 | | | J FRONT RETAILING CO. LTD. | | | 31,099 | | | | 61,311 | | | | | |
| | 7,000 | | | JAPAN EXCHANGE GROUP, INC. | | | 56,090 | | | | 126,650 | | | | | |
| | 8,600 | | | JAPAN POST HOLDINGS CO. LTD. | | | 102,805 | | | | 106,587 | | | | | |
| | 43 | | | JAPAN RETAIL FUND INVESTMENT CORP. | | | 80,049 | | | | 79,329 | | | | | |
| | 11,600 | | | JAPAN TOBACCO, INC. | | | 332,221 | | | | 407,070 | | | | | |
| | 5,000 | | | JTEKT CORP. | | | 36,670 | | | | 72,994 | | | | | |
| | 84,700 | | | JXTG HOLDINGS, INC. | | | 326,972 | | | | 369,525 | | | | | |
| | 13,000 | | | KAJIMA CORP. | | | 44,950 | | | | 109,571 | | | | | |
| | 2,100 | | | KANSAI PAINT CO. LTD. | | | 12,205 | | | | 48,264 | | | | | |
| | 10,000 | | | KAO CORP. | | | 208,279 | | | | 593,198 | | | | | |
| | 35,000 | | | KAWASAKI HEAVY INDUSTRIES LTD. | | | 71,135 | | | | 103,312 | | | | | |
| | 29,862 | | | KDDI CORP. | | | 239,416 | | | | 789,860 | | | | | |
| | 8,000 | | | KEIKYU CORP. | | | 56,995 | | | | 96,235 | | | | | |
| | 6,000 | | | KEIO CORP. | | | 36,571 | | | | 50,144 | | | | | |
| | 2,500 | | | KEISEI ELECTRIC RAILWAY CO. LTD. | | | 23,110 | | | | 66,681 | | | | | |
| | 10,362 | | | KEYENCE CORP. | | | 2,640,940 | | | | 4,545,553 | | | | | |
| | 6,000 | | | KIKKOMAN CORP. | | | 52,867 | | | | 191,509 | | | | | |
| | 12,000 | | | KINTETSU GROUP HOLDINGS CO. LTD. | | | 35,697 | | | | 46,197 | | | | | |
| | 10,000 | | | KIRIN HOLDINGS CO. LTD. | | | 103,112 | | | | 203,512 | | | | | |
| | 47,000 | | | KOBAYASHI PHARMACEUTICAL CO. LTD. | | | 2,007,787 | | | | 2,787,197 | | | | | |
| | 5,700 | | | KOMATSU LTD. | | | 142,116 | | | | 144,660 | | | | | |
| | 2,300 | | | KONAMI HOLDINGS CORP. | | | 50,313 | | | | 127,602 | | | | | |
| See accompanying notes to financial statements. | 65 | (Continued) |
CLEARWATER INVESTMENT TRUST
Schedule of Investments - Clearwater International Fund
June 30, 2017 (unaudited)
| | | | | | | | | | | | Percent of | |
| Shares | | | Security | | Cost | | | Fair value (a) | | | net assets | |
| | Japan (Cont’d): | | | | | | | | | | | | | |
| | 21,000 | | | KUBOTA CORP. | | $ | 129,773 | | | | 352,412 | | | | | |
| | 153,000 | | | KYB CORP. | | | 643,454 | | | | 782,174 | | | | | |
| | 4,100 | | | KYOCERA CORP. | | | 137,688 | | | | 237,160 | | | | | |
| | 5,000 | | | KYOWA HAKKO KIRIN CO. LTD. | | | 54,616 | | | | 92,776 | | | | | |
| | 8,000 | | | KYUSHU ELECTRIC POWER CO., INC. | | | 70,471 | | | | 97,017 | | | | | |
| | 1,400 | | | LAWSON, INC. | | | 63,601 | | | | 97,835 | | | | | |
| | 1,900 | | | LIXIL GROUP CORP. | | | 21,742 | | | | 47,451 | | | | | |
| | 2,400 | | | M3, INC. | | | 51,468 | | | | 66,041 | | | | | |
| | 3,200 | | | MAKITA CORP. | | | 82,169 | | | | 118,213 | | | | | |
| | 32,000 | | | MARUBENI CORP. | | | 162,807 | | | | 206,496 | | | | | |
| | 6,500 | | | MARUI GROUP CO. LTD. | | | 32,287 | | | | 95,701 | | | | | |
| | 11,400 | | | MAZDA MOTOR CORP. | | | 95,886 | | | | 158,926 | | | | | |
| | 2,400 | | | MEIJI HOLDINGS CO. LTD. | | | 38,749 | | | | 194,390 | | | | | |
| | 58,800 | | | MEITEC CORP. | | | 1,918,838 | | | | 2,501,516 | | | | | |
| | 8,700 | | | MINEBEA MITSUMI, INC. | | | 84,406 | | | | 139,618 | | | | | |
| | 36,800 | | | MITSUBISHI CHEMICAL HOLDINGS CORP. | | | 149,792 | | | | 304,314 | | | | | |
| | 17,500 | | | MITSUBISHI CORP. | | | 230,376 | | | | 366,570 | | | | | |
| | 40,000 | | | MITSUBISHI ELECTRIC CORP. | | | 322,860 | | | | 574,528 | | | | | |
| | 31,000 | | | MITSUBISHI ESTATE CO. LTD. | | | 444,880 | | | | 577,004 | | | | | |
| | 8,500 | | | MITSUBISHI GAS CHEMICAL CO., INC. | | | 75,149 | | | | 179,484 | | | | | |
| | 57,000 | | | MITSUBISHI HEAVY INDUSTRIES LTD. | | | 185,317 | | | | 233,017 | | | | | |
| | 13,300 | | | MITSUBISHI MOTORS CORP. | | | 60,808 | | | | 87,504 | | | | | |
| | 3,800 | | | MITSUBISHI TANABE PHARMA CORP. | | | 49,996 | | | | 87,707 | | | | | |
| | 195,000 | | | MITSUBISHI UFJ FINANCIAL GROUP, INC. | | | 915,016 | | | | 1,308,611 | | | | | |
| | 27,000 | | | MITSUBISHI UFJ LEASE & FINANCE CO. LTD. | | | 83,878 | | | | 147,393 | | | | | |
| | 14,000 | | | MITSUI & CO. LTD. | | | 128,045 | | | | 199,840 | | | | | |
| | 37,000 | | | MITSUI CHEMICALS, INC. | | | 87,469 | | | | 195,732 | | | | | |
| | 3,000 | | | MITSUI MINING & SMELTING CO. LTD. | | | 5,391 | | | | 11,709 | | | | | |
| | 370,200 | | | MIZUHO FINANCIAL GROUP, INC. | | | 565,773 | | | | 676,053 | | | | | |
| | 8,280 | | | MS&AD INSURANCE GROUP HOLDINGS, INC. | | | 177,615 | | | | 277,828 | | | | | |
| | 3,600 | | | MURATA MANUFACTURING CO. LTD. | | | 162,615 | | | | 546,361 | | | | | |
| | 198,000 | | | NACHI-FUJIKOSHI CORP. | | | 988,917 | | | | 1,121,369 | | | | | |
| | 5,000 | | | NGK INSULATORS LTD. | | | 63,091 | | | | 99,533 | | | | | |
| | 4,100 | | | NGK SPARK PLUG CO. LTD. | | | 48,644 | | | | 87,085 | | | | | |
| | 6,000 | | | NH FOODS LTD. | | | 72,315 | | | | 182,174 | | | | | |
| | 3,900 | | | NIDEC CORP. | | | 129,234 | | | | 399,102 | | | | | |
| | 109,700 | | | NIHON PARKERIZING CO. LTD. | | | 1,508,147 | | | | 1,631,723 | | | | | |
| | 2,600 | | | NINTENDO CO. LTD. | | | 285,625 | | | | 871,020 | | | | | |
| | 22 | | | NIPPON BUILDING FUND, INC. | | | 90,970 | | | | 112,274 | | | | | |
| | 17,000 | | | NIPPON EXPRESS CO. LTD. | | | 60,747 | | | | 106,255 | | | | | |
| | 15,200 | | | NIPPON TELEGRAPH & TELEPHONE CORP. | | | 342,697 | | | | 717,599 | | | | | |
| | 5,000 | | | NISSAN CHEMICAL INDUSTRIES LTD. | | | 50,851 | | | | 164,926 | | | | | |
| | 30,600 | | | NISSAN MOTOR CO. LTD. | | | 279,227 | | | | 304,164 | | | | | |
| | 3,670 | | | NISSHIN SEIFUN GROUP, INC. | | | 31,991 | | | | 60,201 | | | | | |
| | 1,200 | | | NISSIN FOODS HOLDINGS CO. LTD. | | | 43,959 | | | | 74,897 | | | | | |
| | 2,700 | | | NITORI HOLDINGS CO. LTD. | | | 87,310 | | | | 361,040 | | | | | |
| | 4,000 | | | NITTO DENKO CORP. | | | 125,248 | | | | 328,606 | | | | | |
| | 97,400 | | | NOMURA HOLDINGS, INC. | | | 360,220 | | | | 583,144 | | | | | |
| | 8,400 | | | NOMURA REAL ESTATE HOLDINGS, INC. | | | 130,390 | | | | 164,602 | | | | | |
| | 3,267 | | | NOMURA RESEARCH INSTITUTE LTD. | | | 43,930 | | | | 128,531 | | | | | |
| | 7,000 | | | NSK LTD. | | | 50,459 | | | | 87,317 | | | | | |
| | 7,000 | | | NTT DATA CORP. | | | 36,520 | | | | 77,795 | | | | | |
| | 27,600 | | | NTT DOCOMO, INC. | | | 449,493 | | | | 650,769 | | | | | |
| | 18,900 | | | NTT URBAN DEVELOPMENT CORP. | | | 159,857 | | | | 182,152 | | | | | |
| | 12,000 | | | OBAYASHI CORP. | | | 48,665 | | | | 140,938 | | | | | |
| | 7,400 | | | OLYMPUS CORP. | | | 153,138 | | | | 269,749 | | | | | |
| | 1,100 | | | OMRON CORP. | | | 31,828 | | | | 47,677 | | | | | |
| | 5,000 | | | ONO PHARMACEUTICAL CO. LTD. | | | 43,040 | | | | 108,958 | | | | | |
| | 4,800 | | | ORIENTAL LAND CO. LTD. | | | 113,097 | | | | 324,680 | | | | | |
| | 12,200 | | | ORIX CORP. | | | 138,498 | | | | 188,735 | | | | | |
| | 12,000 | | | OSAKA GAS CO. LTD. | | | 36,678 | | | | 49,024 | | | | | |
| | 6,100 | | | OTSUKA HOLDINGS CO. LTD. | | | 176,203 | | | | 259,782 | | | | | |
| | 36,000 | | | PANASONIC CORP. | | | 242,138 | | | | 487,788 | | | | | |
| | 2,600 | | | PARK24 CO. LTD. | | | 51,627 | | | | 66,020 | | | | | |
| | 15,200 | | | RAKUTEN, INC. | | | 97,714 | | | | 178,657 | | | | | |
| | 2,400 | | | RECRUIT HOLDINGS CO. LTD. | | | 31,274 | | | | 41,204 | | | | | |
| | 19,300 | | | RESONA HOLDINGS, INC. | | | 74,265 | | | | 106,131 | | | | | |
| | 1,200 | | | RINNAI CORP. | | | 52,047 | | | | 111,705 | | | | | |
| | 4,200 | | | ROHM CO. LTD. | | | 166,807 | | | | 322,258 | | | | | |
| See accompanying notes to financial statements. | 66 | (Continued) |
CLEARWATER INVESTMENT TRUST
Schedule of Investments - Clearwater International Fund
June 30, 2017 (unaudited)
| | | | | | | | | | | | Percent of | |
| Shares | | | Security | | Cost | | | Fair value (a) | | | net assets | |
| | Japan (Cont’d): | | | | | | | | | | | | |
| | 200 | | | RYOHIN KEIKAKU CO. LTD. | | $ | 45,535 | | | | 49,913 | | | | | |
| | 2,300 | | | SANKYO CO. LTD. | | | 77,278 | | | | 77,911 | | | | | |
| | 13,000 | | | SANTEN PHARMACEUTICAL CO. LTD. | | | 85,886 | | | | 176,146 | | | | | |
| | 13,720 | | | SBI HOLDINGS, INC. | | | 111,165 | | | | 185,658 | | | | | |
| | 3,400 | | | SECOM CO. LTD. | | | 133,812 | | | | 257,702 | | | | | |
| | 7,300 | | | SEGA SAMMY HOLDINGS, INC. | | | 68,324 | | | | 98,134 | | | | | |
| | 8,400 | | | SEIBU HOLDINGS, INC. | | | 139,989 | | | | 155,117 | | | | | |
| | 13,000 | | | SEKISUI CHEMICAL CO. LTD. | | | 66,177 | | | | 232,434 | | | | | |
| | 6,000 | | | SEKISUI HOUSE LTD. | | | 44,394 | | | | 105,597 | | | | | |
| | 13,300 | | | SEVEN & I HOLDINGS CO. LTD. | | | 300,882 | | | | 547,254 | | | | | |
| | 77,400 | | | SEVEN BANK LTD. | | | 227,795 | | | | 276,637 | | | | | |
| | 4,000 | | | SHIMADZU CORP. | | | 25,419 | | | | 76,035 | | | | | |
| | 1,000 | | | SHIMAMURA CO. LTD. | | | 61,206 | | | | 122,338 | | | | | |
| | 1,500 | | | SHIMANO, INC. | | | 58,204 | | | | 237,119 | | | | | |
| | 6,000 | | | SHIMIZU CORP. | | | 50,949 | | | | 63,534 | | | | | |
| | 9,200 | | | SHIN-ETSU CHEMICAL CO. LTD. | | | 461,684 | | | | 833,092 | | | | | |
| | 4,300 | | | SHIONOGI & CO. LTD. | | | 83,066 | | | | 239,286 | | | | | |
| | 5,900 | | | SHISEIDO CO. LTD. | | | 88,706 | | | | 209,510 | | | | | |
| | 900 | | | SMC CORP. | | | 106,941 | | | | 273,261 | | | | | |
| | 18,400 | | | SOFTBANK GROUP CORP. | | | 412,233 | | | | 1,488,196 | | | | | |
| | 9,000 | | | SOMPO HOLDINGS, INC. | | | 202,248 | | | | 347,197 | | | | | |
| | 19,400 | | | SONY CORP. | | | 280,843 | | | | 739,261 | | | | | |
| | 27,300 | | | SQUARE ENIX HOLDINGS CO. LTD. | | | 605,737 | | | | 893,212 | | | | | |
| | 43,300 | | | STANLEY ELECTRIC CO. LTD. | | | 786,864 | | | | 1,305,063 | | | | | |
| | 5,700 | | | SUBARU CORP. | | | 26,572 | | | | 191,867 | | | | | |
| | 15,500 | | | SUGI HOLDINGS CO. LTD. | | | 744,570 | | | | 829,607 | | | | | |
| | 25,000 | | | SUMITOMO CHEMICAL CO. LTD. | | | 74,256 | | | | 143,587 | | | | | |
| | 7,800 | | | SUMITOMO CORP. | | | 67,035 | | | | 101,388 | | | | | |
| | 4,000 | | | SUMITOMO DAINIPPON PHARMA CO. LTD. | | | 45,511 | | | | 54,519 | | | | | |
| | 8,800 | | | SUMITOMO ELECTRIC INDUSTRIES LTD. | | | 75,679 | | | | 135,355 | | | | | |
| | 12,000 | | | SUMITOMO HEAVY INDUSTRIES LTD. | | | 39,379 | | | | 79,058 | | | | | |
| | 3,300 | | | SUMITOMO MITSUI FINANCIAL GROUP, INC. | | | 100,127 | | | | 128,479 | | | | | |
| | 1,331 | | | SUMITOMO MITSUI TRUST HOLDINGS, INC. | | | 33,400 | | | | 47,560 | | | | | |
| | 4,000 | | | SUMITOMO REALTY & DEVELOPMENT CO. LTD. | | | 110,500 | | | | 123,227 | | | | | |
| | 106,200 | | | SUMITOMO RUBBER INDUSTRIES LTD. | | | 1,553,593 | | | | 1,790,222 | | | | | |
| | 9,300 | | | SUZUKI MOTOR CORP. | | | 199,522 | | | | 440,711 | | | | | |
| | 33,285 | | | SYSMEX CORP. | | | 1,020,380 | | | | 1,985,707 | | | | | |
| | 7,200 | | | T&D HOLDINGS, INC. | | | 71,473 | | | | 109,432 | | | | | |
| | 14,000 | | | TAIHEIYO CEMENT CORP. | | | 29,931 | | | | 50,909 | | | | | |
| | 17,000 | | | TAISEI CORP. | | | 55,809 | | | | 155,074 | | | | | |
| | 5,000 | | | TAKASHIMAYA CO. LTD. | | | 31,428 | | | | 47,522 | | | | | |
| | 10,100 | | | TAKEDA PHARMACEUTICAL CO. LTD. | | | 409,592 | | | | 512,655 | | | | | |
| | 1,100 | | | TDK CORP. | | | 52,815 | | | | 72,274 | | | | | |
| | 28,700 | | | TECHNOPRO HOLDINGS, INC. | | | 1,082,554 | | | | 1,153,359 | | | | | |
| | 5,800 | | | TEIJIN LTD. | | | 67,529 | | | | 111,436 | | | | | |
| | 5,800 | | | TERUMO CORP. | | | 117,165 | | | | 228,184 | | | | | |
| | 2,000 | | | THK CO. LTD. | | | 29,290 | | | | 56,546 | | | | | |
| | 9,000 | | | TOBU RAILWAY CO. LTD. | | | 46,244 | | | | 49,051 | | | | | |
| | 1,500 | | | TOHO CO. LTD. | | | 25,533 | | | | 46,144 | | | | | |
| | 17,000 | | | TOHO GAS CO. LTD. | | | 81,221 | | | | 123,636 | | | | | |
| | 10,600 | | | TOHOKU ELECTRIC POWER CO., INC. | | | 96,604 | | | | 146,548 | | | | | |
| | 14,400 | | | TOKIO MARINE HOLDINGS, INC. | | | 359,676 | | | | 595,460 | | | | | |
| | 28,100 | | | TOKYO ELECTRIC POWER CO. HOLDINGS, INC.(c) | | | 104,659 | | | | 115,673 | | | | | |
| | 13,400 | | | TOKYO ELECTRON LTD. | | | 864,381 | | | | 1,806,126 | | | | | |
| | 30,000 | | | TOKYO GAS CO. LTD. | | | 103,615 | | | | 155,848 | | | | | |
| | 9,800 | | | TOKYO TATEMONO CO. LTD. | | | 110,919 | | | | 128,256 | | | | | |
| | 25,000 | | | TOKYU CORP. | | | 103,448 | | | | 190,487 | | | | | |
| | 20,000 | | | TOKYU FUDOSAN HOLDINGS CORP. | | | 69,576 | | | | 118,071 | | | | | |
| | 17,000 | | | TORAY INDUSTRIES, INC. | | | 70,413 | | | | 142,121 | | | | | |
| | 3,000 | | | TOTO LTD. | | | 30,029 | | | | 114,425 | | | | | |
| | 3,000 | | | TOYO SUISAN KAISHA LTD. | | | 74,690 | | | | 114,826 | | | | | |
| | 4,000 | | | TOYOTA INDUSTRIES CORP. | | | 101,266 | | | | 210,180 | | | | | |
| | 46,662 | | | TOYOTA MOTOR CORP. | | | 1,594,403 | | | | 2,444,803 | | | | | |
| | 1,800 | | | TOYOTA TSUSHO CORP. | | | 14,973 | | | | 53,852 | | | | | |
| | 900 | | | TREND MICRO, INC. | | | 26,540 | | | | 46,330 | | | | | |
| | 70,700 | | | TSUMURA & CO. | | | 2,019,631 | | | | 2,866,344 | | | | | |
| | 7,800 | | | UNICHARM CORP. | | | 68,794 | | | | 195,702 | | | | | |
| | 59,800 | | | USHIO, INC. | | | 714,020 | | | | 750,723 | | | | | |
| | 4,900 | | | USS CO. LTD. | | | 56,003 | | | | 97,281 | | | | | |
| See accompanying notes to financial statements. | 67 | (Continued) |
CLEARWATER INVESTMENT TRUST
Schedule of Investments - Clearwater International Fund
June 30, 2017 (unaudited)
| | | | | | | | | | | | Percent of | |
| Shares | | | Security | | Cost | | | Fair value (a) | | | net assets | |
| | Japan (Cont’d): | | | | | | | | | | | | |
| | 4,100 | | | WEST JAPAN RAILWAY CO. | | $ | 134,756 | | | | 289,287 | | | | | |
| | 82,100 | | | YAHOO JAPAN CORP. | | | 310,884 | | | | 356,941 | | | | | |
| | 2,500 | | | YAKULT HONSHA CO. LTD. | | | 74,984 | | | | 170,038 | | | | | |
| | 16,300 | | | YAMADA DENKI CO. LTD. | | | 56,674 | | | | 80,866 | | | | | |
| | 8,300 | | | YAMAHA MOTOR CO. LTD. | | | 106,577 | | | | 213,856 | | | | | |
| | 3,000 | | | YAMATO HOLDINGS CO. LTD. | | | 46,642 | | | | 60,774 | | | | | |
| | 4,000 | | | YAMAZAKI BAKING CO. LTD. | | | 44,679 | | | | 79,627 | | | | | |
| | 5,000 | | | YASKAWA ELECTRIC CORP. | | | 48,019 | | | | 105,846 | | | | | |
| | | | | | | | 57,103,251 | | | | 87,787,069 | | | | 15.11 | % |
| | Jordan: | | | | | | | | | | | | | | | |
| | 2,797 | | | HIKMA PHARMACEUTICALS PLC | | | 58,456 | | | | 53,551 | | | | | |
| | | | | | | | 58,456 | | | | 53,551 | | | | 0.01 | % |
| | Mexico: | | | | | | | | | | | | | | | |
| | 3,986 | | | FRESNILLO PLC | | | 52,236 | | | | 77,146 | | | | | |
| | 1,118,034 | | | WAL-MART DE MEXICO S.A.B. DE C.V. | | | 2,779,171 | | | | 2,595,373 | | | | | |
| | | | | | | | 2,831,407 | | | | 2,672,519 | | | | 0.46 | % |
| | Netherlands: | | | | | | | | | | | | | | | |
| | 54,400 | | | AALBERTS INDUSTRIES N.V. | | | 1,571,174 | | | | 2,165,955 | | | | | |
| | 22,780 | | | ACCELL GROUP | | | 377,809 | | | | 746,331 | | | | | |
| | 35,981 | | | AEGON N.V. | | | 133,041 | | | | 183,739 | | | | | |
| | 6,271 | | | AKZO NOBEL N.V. | | | 339,845 | | | | 544,989 | | | | | |
| | 10,414 | | | ALTICE N.V., CLASS A(c) | | | 150,435 | | | | 240,266 | | | | | |
| | 3,262 | | | ALTICE N.V., CLASS B(c) | | | 50,824 | | | | 75,278 | | | | | |
| | 104,755 | | | ARCADIS N.V. | | | 2,101,378 | | | | 1,893,397 | | | | | |
| | 27,560 | | | ARCELORMITTAL(c) | | | 380,361 | | | | 625,146 | | | | | |
| | 7,173 | | | ASML HOLDING N.V. | | | 106,863 | | | | 934,780 | | | | | |
| | 38,630 | | | BETER BED HOLDING N.V. | | | 674,709 | | | | 696,013 | | | | | |
| | 24,564 | | | CORE LABORATORIES N.V. | | | 2,747,527 | | | | 2,487,596 | | | | | |
| | 3,610 | | | EXOR N.V. | | | 90,616 | | | | 195,397 | | | | | |
| | 2,765 | | | HEINEKEN HOLDING N.V. | | | 148,540 | | | | 253,433 | | | | | |
| | 3,662 | | | HEINEKEN N.V. | | | 128,663 | | | | 356,061 | | | | | |
| | 321,305 | | | ING GROEP N.V. | | | 3,345,079 | | | | 5,541,375 | | | | | |
| | 20,441 | | | KONINKLIJKE AHOLD DELHAIZE N.V. | | | 260,253 | | | | 390,824 | | | | | |
| | 3,281 | | | KONINKLIJKE DSM N.V. | | | 122,903 | | | | 238,484 | | | | | |
| | 51,375 | | | KONINKLIJKE KPN N.V. | | | 108,346 | | | | 164,357 | | | | | |
| | 32,307 | | | KONINKLIJKE PHILIPS N.V. | | | 722,838 | | | | 1,147,388 | | | | | |
| | 1,264 | | | NN GROUP N.V. | | | 37,113 | | | | 44,927 | | | | | |
| | 4,877 | | | NXP SEMICONDUCTORS N.V.(c) | | | 393,113 | | | | 533,788 | | | | | |
| | 8,116 | | | QIAGEN N.V.(c) | | | 119,394 | | | | 269,987 | | | | | |
| | 3,238 | | | RANDSTAD HOLDING N.V. | | | 99,928 | | | | 189,056 | | | | | |
| | 115,048 | | | REFRESCO GROUP N.V.(e) | | | 2,074,547 | | | | 2,348,155 | | | | | |
| | 52,511 | | | ROYAL DUTCH SHELL PLC, CLASS A | | | 1,238,437 | | | | 1,391,797 | | | | | |
| | 81,662 | | | ROYAL DUTCH SHELL PLC, CLASS B | | | 1,800,118 | | | | 2,193,689 | | | | | |
| | 6,193 | | | WOLTERS KLUWER N.V. | | | 101,075 | | | | 262,173 | | | | | |
| | | | | | | | 19,424,929 | | | | 26,114,381 | | | | 4.50 | % |
| | New Zealand: | | | | | | | | | | | | | | | |
| | 16,545 | | | AUCKLAND INTERNATIONAL AIRPORT LTD. | | | 50,086 | | | | 86,445 | | | | | |
| | 169,758 | | | SPARK NEW ZEALAND LTD. | | | 404,493 | | | | 470,227 | | | | | |
| | | | | | | | 454,579 | | | | 556,672 | | | | 0.10 | % |
| | Norway: | | | | | | | | | | | | | | | |
| | 13,773 | | | DNB ASA | | | 87,874 | | | | 234,259 | | | | | |
| | 8,251 | | | NORSK HYDRO ASA | | | 33,839 | | | | 45,738 | | | | | |
| | 106,292 | | | ORKLA ASA | | | 804,681 | | | | 1,080,267 | | | | | |
| | 11,584 | | | STATOIL ASA | | | 201,736 | | | | 192,032 | | | | | |
| | 14,536 | | | TELENOR ASA | | | 210,513 | | | | 241,142 | | | | | |
| | 4,101 | | | TGS NOPEC GEOPHYSICAL CO. ASA | | | 74,796 | | | | 84,046 | | | | | |
| | 60,850 | | | TOMRA SYSTEMS ASA | | | 503,097 | | | | 743,429 | | | | | |
| | 2,500 | | | YARA INTERNATIONAL ASA | | | 58,115 | | | | 93,906 | | | | | |
| | | | | | | | 1,974,651 | | | | 2,714,819 | | | | 0.47 | % |
| | Philippines: | | | | | | | | | | | | | | | |
| | 780,461 | | | METROPOLITAN BANK & TRUST CO. | | | 1,363,480 | | | | 1,353,356 | | | | | |
| See accompanying notes to financial statements. | 68 | (Continued) |
CLEARWATER INVESTMENT TRUST
Schedule of Investments - Clearwater International Fund
June 30, 2017 (unaudited)
| Shares | | | Security | | Cost | | | Fair value (a) | | | Percent of
net assets | |
| | Philippines (Cont’d): | | | | | | | | | | | | |
| | 3,065,000 | | | VISTA LAND & LIFESCAPES, INC. | | $ | 315,279 | | | | 352,906 | | | | | |
| | | | | | | | 1,678,759 | | | | 1,706,262 | | | | 0.29 | % |
| | Poland: | | | | | | | | | | | | | | | |
| | 23,200 | | | CCC S.A. | | | 1,222,714 | | | | 1,408,660 | | | | | |
| | | | | | | | 1,222,714 | | | | 1,408,660 | | | | 0.24 | % |
| | Portugal: | | | | | | | | | | | | | | | |
| | 20,567 | | | EDP - ENERGIAS DE PORTUGAL S.A. | | | 48,529 | | | | 67,254 | | | | | |
| | 8,119 | | | GALP ENERGIA SGPS S.A. | | | 108,273 | | | | 122,915 | | | | | |
| | 10,286 | | | JERONIMO MARTINS SGPS S.A. | | | 127,947 | | | | 200,776 | | | | | |
| | | | | | | | 284,749 | | | | 390,945 | | | | 0.07 | % |
| | Russia: | | | | | | | | | | | | | | | |
| | 93,940 | | | YANDEX N.V., CLASS A(c) | | | 2,242,995 | | | | 2,464,986 | | | | | |
| | | | | | | | 2,242,995 | | | | 2,464,986 | | | | 0.42 | % |
| | Singapore: | | | | | | | | | | | | | | | |
| | 124,600 | | | CAPITALAND LTD. | | | 247,485 | | | | 316,761 | | | | | |
| | 36,000 | | | CAPITALAND MALL TRUST | | | 34,133 | | | | 51,643 | | | | | |
| | 6,300 | | | CITY DEVELOPMENTS LTD. | | | 26,574 | | | | 49,100 | | | | | |
| | 28,300 | | | DBS GROUP HOLDINGS LTD. | | | 159,243 | | | | 426,324 | | | | | |
| | 26,500 | | | GLOBAL LOGISTIC PROPERTIES LTD. | | | 54,433 | | | | 55,050 | | | | | |
| | 21,000 | | | KEPPEL CORP. LTD. | | | 53,869 | | | | 95,943 | | | | | |
| | 7,840 | | | KEPPEL REIT | | | 3,194 | | | | 6,520 | | | | | |
| | 6,000 | | | OVERSEA-CHINESE BANKING CORP. LTD. | | | 33,180 | | | | 47,024 | | | | | |
| | 12,000 | | | SINGAPORE AIRLINES LTD. | | | 70,334 | | | | 88,208 | | | | | |
| | 13,000 | | | SINGAPORE EXCHANGE LTD. | | | 40,226 | | | | 69,308 | | | | | |
| | 22,000 | | | SINGAPORE PRESS HOLDINGS LTD. | | | 36,067 | | | | 51,614 | | | | | |
| | 112,000 | | | SINGAPORE TELECOMMUNICATIONS LTD. | | | 184,276 | | | | 316,455 | | | | | |
| | 4,600 | | | UNITED OVERSEAS BANK LTD. | | | 26,071 | | | | 77,249 | | | | | |
| | 15,000 | | | UOL GROUP LTD. | | | 49,917 | | | | 83,240 | | | | | |
| | 35,400 | | | WILMAR INTERNATIONAL LTD. | | | 68,955 | | | | 86,138 | | | | | |
| | | | | | | | 1,087,957 | | | | 1,820,577 | | | | 0.31 | % |
| | South Africa: | | | | | | | | | | | | | | | |
| | 7,274 | | | MEDICLINIC INTERNATIONAL PLC | | | 66,641 | | | | 70,250 | | | | | |
| | | | | | | | 66,641 | | | | 70,250 | | | | 0.01 | % |
| | South Korea: | | | | | | | | | | | | | | | |
| | 10,780 | | | AMOREPACIFIC CORP. | | | 3,043,990 | | | | 2,864,240 | | | | | |
| | 138,142 | | | BNK FINANCIAL GROUP, INC. | | | 1,351,597 | | | | 1,322,077 | | | | | |
| | 221,052 | | | DGB FINANCIAL GROUP, INC. | | | 2,290,725 | | | | 2,279,783 | | | | | |
| | 10,323 | | | HYUNDAI MIPO DOCKYARD CO. LTD.(c) | | | 988,402 | | | | 983,444 | | | | | |
| | 164 | | | HYUNDAI MOTOR CO. | | | 22,385 | | | | 22,862 | | | | | |
| | 11,198 | | | KIA MOTORS CORP. | | | 512,977 | | | | 373,870 | | | | | |
| | 37,754 | | | KOREA INVESTMENT HOLDINGS CO. LTD. | | | 1,698,641 | | | | 2,313,119 | | | | | |
| | 2,444 | | | SAMSUNG ELECTRONICS CO. LTD. | | | 3,425,779 | | | | 5,077,471 | | | | | |
| | | | | | | | 13,334,496 | | | | 15,236,866 | | | | 2.62 | % |
| | Spain: | | | | | | | | | | | | | | | |
| | 13,770 | | | ABERTIS INFRAESTRUCTURAS S.A. | | | 177,462 | | | | 255,099 | | | | | |
| | 1,260 | | | ACCIONA S.A. | | | 78,312 | | | | 110,898 | | | | | |
| | 1,731 | | | ACS ACTIVIDADES DE CONSTRUCCION Y SERVICIOS S.A. | | | 50,359 | | | | 66,874 | | | | | |
| | 583 | | | AENA S.A.(e) | | | 50,199 | | | | 113,764 | | | | | |
| | 5,299 | | | AMADEUS IT GROUP S.A. | | | 128,321 | | | | 316,835 | | | | | |
| | 127,837 | | | BANCO BILBAO VIZCAYA ARGENTARIA S.A. | | | 731,627 | | | | 1,060,756 | | | | | |
| | 161,217 | | | BANCO SANTANDER S.A. | | | 711,881 | | | | 1,066,504 | | | | | |
| | 7,551 | | | BANKINTER S.A. | | | 51,111 | | | | 69,556 | | | | | |
| | 96,203 | | | CAIXABANK S.A. | | | 236,376 | | | | 459,291 | | | | | |
| | 28,030 | | | CONSTRUCCIONES Y AUXILIAR DE FERROCARRILES S.A. | | | 1,220,539 | | | | 1,151,240 | | | | | |
| | 10,362 | | | ENAGAS S.A. | | | 213,104 | | | | 290,548 | | | | | |
| | 12,912 | | | FERROVIAL S.A. | | | 235,630 | | | | 286,617 | | | | | |
| | 16,489 | | | GAS NATURAL SDG S.A. | | | 264,629 | | | | 385,886 | | | | | |
| | 15,282 | | | GRIFOLS S.A. | | | 273,864 | | | | 425,624 | | | | | |
| | 53,268 | | | IBERDROLA S.A. | | | 257,035 | | | | 421,804 | | | | | |
| | 48,504 | | | INDUSTRIA DE DISENO TEXTIL S.A. | | | 1,344,086 | | | | 1,861,955 | | | | | |
| | 21,686 | | | MAPFRE S.A. | | | 49,735 | | | | 75,743 | | | | | |
| | 26,579 | | | RED ELECTRICA CORP. S.A. | | | 390,097 | | | | 555,385 | | | | | |
| | 46,787 | | | REPSOL S.A. | | | 567,753 | | | | 716,066 | | | | | |
See accompanying notes to financial statements. | 69 | (Continued) |
CLEARWATER INVESTMENT TRUST
Schedule of Investments - Clearwater International Fund
June 30, 2017 (unaudited)
| Shares | | | Security | | Cost | | | Fair value (a) | | | Percent of
net assets | |
| | Spain (Cont’d): | | | | | | | | | | | | |
| | 7,381 | | | TELEFONICA S.A. | | $ | 72,274 | | | | 76,192 | | | | | |
| | | | | | | | 7,104,394 | | | | 9,766,637 | | | | 1.68 | % |
| | Sweden: | | | | | | | | | | | | | | | |
| | 22,200 | | | ASSA ABLOY AB, CLASS B | | | 89,466 | | | | 487,759 | | | | | |
| | 64,464 | | | ATLAS COPCO AB, CLASS A | | | 1,913,052 | | | | 2,471,527 | | | | | |
| | 4,000 | | | ATLAS COPCO AB, CLASS B | | | 30,052 | | | | 138,213 | | | | | |
| | 25,218 | | | BULTEN AB | | | 207,109 | | | | 359,201 | | | | | |
| | 224,300 | | | CLOETTA AB, CLASS B | | | 877,318 | | | | 923,856 | | | | | |
| | 24,710 | | | DUNI AB | | | 217,390 | | | | 361,497 | | | | | |
| | 7,501 | | | ELECTROLUX AB, CLASS B | | | 95,788 | | | | 245,828 | | | | | |
| | 8,600 | | | ESSITY AB, CLASS B(c) | | | 62,137 | | | | 235,296 | | | | | |
| | 13,600 | | | HENNES & MAURITZ AB, CLASS B | | | 274,862 | | | | 338,842 | | | | | |
| | 3,700 | | | HEXAGON AB, CLASS B | | | 56,830 | | | | 175,893 | | | | | |
| | 17,500 | | | HUSQVARNA AB, CLASS B | | | 64,201 | | | | 173,864 | | | | | |
| | 8,270 | | | INDUSTRIVARDEN AB, CLASS C | | | 85,948 | | | | 198,291 | | | | | |
| | 10,953 | | | INVESTOR AB, CLASS B | | | 150,033 | | | | 527,843 | | | | | |
| | 3,000 | | | KINNEVIK AB, CLASS B | | | 51,225 | | | | 91,837 | | | | | |
| | 3,301 | | | LUNDIN PETROLEUM AB | | | 46,596 | | | | 63,515 | | | | | |
| | 41,436 | | | NORDEA BANK AB | | | 232,748 | | | | 527,252 | | | | | |
| | 13,973 | | | SANDVIK AB | | | 86,678 | | | | 219,761 | | | | | |
| | 13,348 | | | SECURITAS AB, CLASS B | | | 106,689 | | | | 224,983 | | | | | |
| | 35,236 | | | SKANDINAVISKA ENSKILDA BANKEN AB, CLASS A | | | 139,725 | | | | 426,193 | | | | | |
| | 2,800 | | | SKANSKA AB, CLASS B | | | 23,703 | | | | 66,438 | | | | | |
| | 8,600 | | | SVENSKA CELLULOSA AB S.C.A., CLASS B | | | 15,915 | | | | 65,076 | | | | | |
| | 26,700 | | | SVENSKA HANDELSBANKEN AB, CLASS A | | | 161,721 | | | | 382,212 | | | | | |
| | 59,340 | | | TELEFONAKTIEBOLAGET LM ERICSSON, CLASS B | | | 304,553 | | | | 424,375 | | | | | |
| | 112,540 | | | TETHYS OIL AB | | | 863,807 | | | | 781,463 | | | | | |
| | 141,810 | | | THULE GROUP AB (THE)(e) | | | 2,214,346 | | | | 2,661,241 | | | | | |
| | 25,108 | | | VOLVO AB, CLASS B | | | 162,740 | | | | 427,969 | | | | | |
| | | | | | | | 8,534,632 | | | | 13,000,225 | | | | 2.24 | % |
| | Switzerland: | | | | | | | | | | | | | | | |
| | 202,526 | | | ABB LTD. (REGISTERED) | | | 4,006,781 | | | | 5,001,372 | | | | | |
| | 18,845 | | | ADECCO GROUP A.G. (REGISTERED) | | | 864,568 | | | | 1,432,684 | | | | | |
| | 1,308 | | | ARYZTA A.G.(c) | | | 32,112 | | | | 43,009 | | | | | |
| | 484 | | | BALOISE HOLDING A.G. (REGISTERED) | | | 26,452 | | | | 74,803 | | | | | |
| | 9,670 | | | BASILEA PHARMACEUTICA A.G. (REGISTERED)(c) | | | 757,259 | | | | 814,825 | | | | | |
| | 9,050 | | | BUCHER INDUSTRIES A.G. (REGISTERED) | | | 2,534,668 | | | | 2,847,886 | | | | | |
| | 35 | | | CHOCOLADEFABRIKEN LINDT & SPRUENGLI A.G. (PARTICIPATION CERTIFICATE) | | | 50,308 | | | | 202,941 | | | | | |
| | 3 | | | CHOCOLADEFABRIKEN LINDT & SPRUENGLI A.G. (REGISTERED) | | | 75,352 | | | | 209,146 | | | | | |
| | 30,452 | | | CHUBB LTD. | | | 2,939,505 | | | | 4,427,112 | | | | | |
| | 33,684 | | | CIE FINANCIERE RICHEMONT S.A. (REGISTERED) | | | 2,339,573 | | | | 2,775,092 | | | | | |
| | 26,209 | | | CREDIT SUISSE GROUP A.G. (REGISTERED)(c) | | | 305,324 | | | | 378,826 | | | | | |
| | 990 | | | GEBERIT A.G. (REGISTERED) | | | 85,632 | | | | 461,704 | | | | | |
| | 140 | | | GIVAUDAN S.A. (REGISTERED) | | | 76,496 | | | | 280,029 | | | | | |
| | 124,017 | | | GLENCORE PLC(c) | | | 271,249 | | | | 463,902 | | | | | |
| | 1,807 | | | IDORSIA LTD.(c) | | | 18,603 | | | | 34,109 | | | | | |
| | 4,134 | | | JULIUS BAER GROUP LTD.(c) | | | 87,890 | | | | 217,499 | | | | | |
| | 4,841 | | | LAFARGEHOLCIM LTD. (REGISTERED)(c) | | | 170,733 | | | | 277,162 | | | | | |
| | 44,610 | | | LOGITECH INTERNATIONAL S.A. (REGISTERED) | | | 1,000,120 | | | | 1,635,403 | | | | | |
| | 897 | | | LONZA GROUP A.G. (REGISTERED)(c) | | | 50,452 | | | | 193,918 | | | | | |
| | 105,654 | | | NESTLE S.A. (REGISTERED) | | | 4,868,356 | | | | 9,194,730 | | | | | |
| | 55,478 | | | NOVARTIS A.G. (REGISTERED) | | | 2,580,874 | | | | 4,616,899 | | | | | |
| | 17,316 | | | PANALPINA WELTTRANSPORT HOLDING A.G. (REGISTERED) | | | 1,728,496 | | | | 2,436,050 | | | | | |
| | 9,695 | | | PARGESA HOLDING S.A. (BEARER) | | | 636,914 | | | | 737,564 | | | | | |
| | 12,677 | | | ROCHE HOLDING A.G. (GENUSSCHEIN) | | | 1,678,439 | | | | 3,228,411 | | | | | |
| | 1,381 | | | SCHINDLER HOLDING A.G. (PARTICIPATION CERTIFICATE) | | | 108,493 | | | | 292,215 | | | | | |
| | 589 | | | SCHINDLER HOLDING A.G. (REGISTERED) | | | 68,597 | | | | 122,112 | | | | | |
| | 1,304 | | | SGS S.A. (REGISTERED) | | | 2,779,948 | | | | 3,157,668 | | | | | |
| | 77 | | | SIKA A.G. (BEARER) | | | 152,753 | | | | 494,650 | | | | | |
| | 1,300 | | | SONOVA HOLDING A.G. (REGISTERED) | | | 84,464 | | | | 211,086 | | | | | |
| | 7,867 | | | STMICROELECTRONICS N.V. | | | 36,286 | | | | 112,945 | | | | | |
| | 635 | | | SULZER A.G. (REGISTERED) | | | 30,609 | | | | 71,983 | | | | | |
| | 984 | | | SWATCH GROUP (THE) A.G. (BEARER) | | | 257,037 | | | | 363,369 | | | | | |
| | 743 | | | SWISS LIFE HOLDING A.G. (REGISTERED)(c) | | | 101,194 | | | | 250,740 | | | | | |
| | 504 | | | SWISS RE A.G. | | | 37,466 | | | | 46,069 | | | | | |
See accompanying notes to financial statements. | 70 | (Continued) |
CLEARWATER INVESTMENT TRUST
Schedule of Investments - Clearwater International Fund
June 30, 2017 (unaudited)
| Shares | | | Security | | Cost | | | Fair value (a) | | | Percent of
net assets | |
| | Switzerland (Cont’d): | | | | | | | | | | | | |
| | 529 | | | SWISSCOM A.G. (REGISTERED) | | $ | 191,612 | | | | 255,259 | | | | | |
| | 36,148 | | | TE CONNECTIVITY LTD. | | | 1,251,855 | | | | 2,844,125 | | | | | |
| | 4,520 | | | TECAN GROUP A.G. (REGISTERED) | | | 827,025 | | | | 849,886 | | | | | |
| | 276,520 | | | UBS GROUP A.G. (REGISTERED)(c) | | | 4,692,680 | | | | 4,683,163 | | | | | |
| | 4,176 | | | WOLSELEY PLC | | | 70,461 | | | | 256,342 | | | | | |
| | 4,668 | | | ZURICH INSURANCE GROUP A.G. | | | 912,788 | | | | 1,358,681 | | | | | |
| | | | | | | | 38,789,424 | | | | 57,355,369 | | | | 9.87 | % |
| | Taiwan: | | | | | | | | | | | | | | | |
| | 613,778 | | | CHICONY ELECTRONICS CO. LTD. | | | 1,588,959 | | | | 1,555,631 | | | | | |
| | 206,000 | | | GIANT MANUFACTURING CO. LTD. | | | 1,153,615 | | | | 1,178,304 | | | | | |
| | 1,091,000 | | | KING YUAN ELECTRONICS CO. LTD. | | | 1,073,928 | | | | 1,117,181 | | | | | |
| | 323,000 | | | MERIDA INDUSTRY CO. LTD. | | | 1,692,528 | | | | 1,730,736 | | | | | |
| | 101,496 | | | TAIWAN SEMICONDUCTOR MANUFACTURING CO. LTD. ADR(d) | | | 2,100,608 | | | | 3,548,300 | | | | | |
| | 717,000 | | | TRIPOD TECHNOLOGY CORP. | | | 1,916,005 | | | | 2,283,935 | | | | | |
| | | | | | | | 9,525,643 | | | | 11,414,087 | | | | 1.97 | % |
| | Thailand: | | | | | | | | | | | | | | | |
| | 1,702,400 | | | LPN DEVELOPMENT PCL (REGISTERED) | | | 778,727 | | | | 596,366 | | | | | |
| | 211,300 | | | TISCO FINANCIAL GROUP PCL (REGISTERED) | | | 413,651 | | | | 472,735 | | | | | |
| | 296,300 | | | TISCO FINANCIAL GROUP PCL NVDR | | | 562,479 | | | | 662,903 | | | | | |
| | | | | | | | 1,754,857 | | | | 1,732,004 | | | | 0.30 | % |
| | Turkey: | | | | | | | | | | | | | | | |
| | 34,200 | | | MAVI GIYIM SANAYI VE TICARET A.S., CLASS B(c)(e) | | | 418,242 | | | | 417,774 | | | | | |
| | | | | | | | 418,242 | | | | 417,774 | | | | 0.07 | % |
| | United Kingdom: | | | | | | | | | | | | |
| | 25,248 | | | 3I GROUP PLC | | | 88,645 | | | | 296,780 | | | | | |
| | 134,971 | | | ABERDEEN ASSET MANAGEMENT PLC | | | 477,788 | | | | 530,895 | | | | | |
| | 2,834 | | | ADMIRAL GROUP PLC | | | 35,119 | | | | 73,934 | | | | | |
| | 5,026 | | | AGGREKO PLC | | | 50,603 | | | | 60,257 | | | | | |
| | 130,834 | | | AMEC FOSTER WHEELER PLC | | | 1,368,758 | | | | 796,131 | | | | | |
| | 58,936 | | | ANGLO AMERICAN PLC(c) | | | 468,356 | | | | 786,035 | | | | | |
| | 14,133 | | | AON PLC | | | 1,457,169 | | | | 1,878,982 | | | | | |
| | 11,482 | | | ASSOCIATED BRITISH FOODS PLC | | | 349,112 | | | | 439,071 | | | | | |
| | 26,375 | | | ASTRAZENECA PLC | | | 983,695 | | | | 1,763,981 | | | | | |
| | 10,313 | | | AUTO TRADER GROUP PLC(e) | | | 51,982 | | | | 51,042 | | | | | |
| | 76,752 | | | AVIVA PLC | | | 307,975 | | | | 525,819 | | | | | |
| | 5,239 | | | BABCOCK INTERNATIONAL GROUP PLC | | | 41,807 | | | | 60,081 | | | | | |
| | 52,785 | | | BAE SYSTEMS PLC | | | 280,055 | | | | 435,530 | | | | | |
| | 318,603 | | | BARCLAYS PLC | | | 647,028 | | | | 841,340 | | | | | |
| | 17,830 | | | BELLWAY PLC | | | 494,455 | | | | 690,875 | | | | | |
| | 2,391 | | | BERKELEY GROUP HOLDINGS PLC | | | 71,739 | | | | 100,494 | | | | | |
| | 40,530 | | | BOVIS HOMES GROUP PLC | | | 415,638 | | | | 504,392 | | | | | |
| | 279,607 | | | BP PLC | | | 1,638,916 | | | | 1,612,563 | | | | | |
| | 15,241 | | | BRITISH AMERICAN TOBACCO PLC | | | 352,060 | | | | 1,038,982 | | | | | |
| | 37,587 | | | BRITISH LAND (THE) CO. PLC | | | 252,586 | | | | 296,424 | | | | | |
| | 5,069 | | | BUNZL PLC | | | 39,524 | | | | 151,056 | | | | | |
| | 8,202 | | | BURBERRY GROUP PLC | | | 40,549 | | | | 177,440 | | | | | |
| | 30,021 | | | CAPITA PLC | | | 206,329 | | | | 270,382 | | | | | |
| | 136,536 | | | CENTRICA PLC | | | 346,482 | | | | 356,018 | | | | | |
| | 13,580 | | | CNH INDUSTRIAL N.V. | | | 56,886 | | | | 153,786 | | | | | |
| | 1,447 | | | COCA-COLA EUROPEAN PARTNERS PLC | | | 55,218 | | | | 58,849 | | | | | |
| | 419,666 | | | COMPASS GROUP PLC | | | 5,865,934 | | | | 8,854,830 | | | | | |
| | 2,332 | | | CRODA INTERNATIONAL PLC | | | 82,807 | | | | 118,000 | | | | | |
| | 267,400 | | | DFS FURNITURE PLC | | | 1,094,905 | | | | 715,705 | | | | | |
| | 76,045 | | | DIAGEO PLC | | | 1,113,213 | | | | 2,246,831 | | | | | |
| | 18,947 | | | DIXONS CARPHONE PLC | | | 76,376 | | | | 69,985 | | | | | |
| | 3,792 | | | EASYJET PLC | | | 49,609 | | | | 67,119 | | | | | |
| | 180,970 | | | EXPERIAN PLC | | | 3,225,426 | | | | 3,712,344 | | | | | |
| | 10,222 | | | FIAT CHRYSLER AUTOMOBILES N.V.(c) | | | 17,872 | | | | 108,660 | | | | | |
| | 24,413 | | | FIAT CHRYSLER AUTOMOBILES N.V.(c) | | | 161,492 | | | | 257,363 | | | | | |
| | 395,304 | | | FOXTONS GROUP PLC | | | 997,621 | | | | 487,833 | | | | | |
| | 30,218 | | | G4S PLC | | | 92,368 | | | | 128,463 | | | | | |
| | 17,333 | | | GKN PLC | | | 51,515 | | | | 73,596 | | | | | |
| | 57,423 | | | GLAXOSMITHKLINE PLC | | | 873,406 | | | | 1,223,200 | | | | | |
| | 136,580 | | | GREGGS PLC | | | 1,521,318 | | | | 1,921,197 | | | | | |
| | 25,875 | | | HAMMERSON PLC | | | 126,745 | | | | 193,612 | | | | | |
| | 226,183 | | | HSBC HOLDINGS PLC | | | 1,416,410 | | | | 2,096,612 | | | | | |
See accompanying notes to financial statements. | 71 | (Continued) |
CLEARWATER INVESTMENT TRUST
Schedule of Investments - Clearwater International Fund
June 30, 2017 (unaudited)
| | | | | | | | | | | | | |
| Shares | | | Security | | Cost | | | Fair value (a) | | | Percent of
net assets | |
| | United Kingdom (Cont’d): | | | | | | | | | | | | |
| | 54,150 | | | IMI PLC | | $ | 770,522 | | | | 842,806 | | | | | |
| | 24,043 | | | IMPERIAL BRANDS PLC | | | 671,493 | | | | 1,079,891 | | | | | |
| | 12,262 | | | INDIVIOR PLC(c) | | | 11,861 | | | | 49,940 | | | | | |
| | 4,334 | | | INMARSAT PLC | | | 35,770 | | | | 43,437 | | | | | |
| | 1,338 | | | INTERCONTINENTAL HOTELS GROUP PLC | | | 52,044 | | | | 74,360 | | | | | |
| | 32,745 | | | INTERNATIONAL CONSOLIDATED AIRLINES GROUP S.A. - CDI | | | 90,834 | | | | 259,890 | | | | | |
| | 103,895 | | | ITV PLC | | | 191,956 | | | | 245,467 | | | | | |
| | 31,939 | | | J SAINSBURY PLC | | | 93,794 | | | | 104,705 | | | | | |
| | 2,248 | | | JOHNSON MATTHEY PLC | | | 35,933 | | | | 84,060 | | | | | |
| | 30,414 | | | KINGFISHER PLC | | | 60,107 | | | | 119,115 | | | | | |
| | 579,352 | | | LAIRD PLC | | | 1,214,368 | | | | 1,045,089 | | | | | |
| | 27,834 | | | LAND SECURITIES GROUP PLC | | | 262,915 | | | | 367,237 | | | | | |
| | 26,807 | | | LEGAL & GENERAL GROUP PLC | | | 77,151 | | | | 90,185 | | | | | |
| | 19,607 | | | LIVANOVA PLC(c) | | | 1,163,975 | | | | 1,200,144 | | | | | |
| | 2,964,410 | | | LLOYDS BANKING GROUP PLC | | | 2,391,268 | | | | 2,554,049 | | | | | |
| | 6,030 | | | LONDON STOCK EXCHANGE GROUP PLC | | | 69,795 | | | | 286,349 | | | | | |
| | 939,167 | | | MAN GROUP PLC | | | 1,670,043 | | | | 1,893,542 | | | | | |
| | 9,044 | | | MARKS & SPENCER GROUP PLC | | | 34,946 | | | | 39,261 | | | | | |
| | 7,217 | | | MEGGITT PLC | | | 16,687 | | | | 44,828 | | | | | |
| | 9,380 | | | MERLIN ENTERTAINMENTS PLC(e) | | | 50,482 | | | | 58,703 | | | | | |
| | 41,259 | | | NATIONAL GRID PLC | | | 403,679 | | | | 511,476 | | | | | |
| | 2,148 | | | NEXT PLC | | | 36,823 | | | | 107,878 | | | | | |
| | 73,408 | | | OLD MUTUAL PLC | | | 87,200 | | | | 184,910 | | | | | |
| | 34,575 | | | OXFORD INSTRUMENTS PLC | | | 535,282 | | | | 471,938 | | | | | |
| | 47,168 | | | PRUDENTIAL PLC | | | 735,049 | | | | 1,081,852 | | | | | |
| | 59,669 | | | RECKITT BENCKISER GROUP PLC | | | 4,778,130 | | | | 6,049,405 | | | | | |
| | 38,559 | | | RELX N.V. | | | 371,904 | | | | 792,723 | | | | | |
| | 164,494 | | | RELX PLC | | | 1,819,961 | | | | 3,556,470 | | | | | |
| | 23,247 | | | RIO TINTO LTD. | | | 733,396 | | | | 1,130,486 | | | | | |
| | 41,280 | | | RIO TINTO PLC | | | 1,089,188 | | | | 1,743,066 | | | | | |
| | 11,633 | | | ROLLS-ROYCE HOLDINGS PLC(c) | | | 110,936 | | | | 134,999 | | | | | |
| | 474,138 | | | ROLLS-ROYCE HOLDINGS PLC(c) | | | 612 | | | | 626 | | | | | |
| | 1,085,844 | | | ROYAL BANK OF SCOTLAND GROUP PLC(c) | | | 4,622,764 | | | | 3,496,045 | | | | | |
| | 20,657 | | | SAGE GROUP (THE) PLC | | | 74,323 | | | | 185,104 | | | | | |
| | 16,135 | | | SEGRO PLC | | | 67,053 | | | | 102,806 | | | | | |
| | 8,093 | | | SEVERN TRENT PLC | | | 163,887 | | | | 229,999 | | | | | |
| | 603,370 | | | SIG PLC | | | 1,352,484 | | | | 1,167,787 | | | | | |
| | 19,613 | | | SKY PLC | | | 145,505 | | | | 253,917 | | | | | |
| | 26,103 | | | SMITH & NEPHEW PLC | | | 251,030 | | | | 450,472 | | | | | |
| | 2,453 | | | SMITHS GROUP PLC | | | 28,519 | | | | 51,023 | | | | | |
| | 14,561 | | | SSE PLC | | | 257,387 | | | | 275,561 | | | | | |
| | 13,349 | | | ST. JAMES’S PLACE PLC | | | 180,692 | | | | 205,507 | | | | | |
| | 92,045 | | | STANDARD CHARTERED PLC(c) | | | 654,783 | | | | 931,738 | | | | | |
| | 39,357 | | | STANDARD LIFE PLC | | | 131,737 | | | | 204,581 | | | | | |
| | 1,424 | | | TECHNIPFMC PLC(c) | | | 35,975 | | | | 38,619 | | | | | |
| | 1,075,526 | | | TESCO PLC(c) | | | 3,786,294 | | | | 2,364,582 | | | | | |
| | 3,970 | | | TRAVIS PERKINS PLC | | | 69,979 | | | | 75,234 | | | | | |
| | 2,073 | | | UBM PLC | | | 10,703 | | | | 18,630 | | | | | |
| | 12,426 | | | UNILEVER N.V. - CVA | | | 385,591 | | | | 685,775 | | | | | |
| | 24,244 | | | UNILEVER PLC | | | 545,189 | | | | 1,312,008 | | | | | |
| | 14,205 | | | UNILEVER PLC ADR(d) | | | 478,204 | | | | 768,775 | | | | | |
| | 26,193 | | | UNITED UTILITIES GROUP PLC | | | 260,684 | | | | 295,948 | | | | | |
| | 781,910 | | | VECTURA GROUP PLC(c) | | | 1,221,304 | | | | 1,139,588 | | | | | |
| | 83,528 | | | VESUVIUS PLC | | | 436,755 | | | | 577,136 | | | | | |
| | 188,309 | | | VODAFONE GROUP PLC | | | 556,015 | | | | 534,059 | | | | | |
| | 3,762 | | | WEIR GROUP (THE) PLC | | | 43,887 | | | | 84,816 | | | | | |
| | 5,178 | | | WHITBREAD PLC | | | 168,592 | | | | 267,538 | | | | | |
| | 20,383 | | | WM MORRISON SUPERMARKETS PLC | | | 52,509 | | | | 64,033 | | | | | |
| | 57,600 | | | WORLDPAY GROUP PLC(e) | | | 192,852 | | | | 236,166 | | | | | |
| | 23,432 | | | WPP PLC | | | 141,019 | | | | 492,577 | | | | | |
| | | | | | | | 63,329,311 | | | | 78,985,400 | | | | 13.60 | % |
| | United States: | | | | | | | | | | | | |
| | 45,189 | | | ARCH CAPITAL GROUP LTD.(c) | | | 1,834,879 | | | | 4,215,682 | | | | | |
| | 20,110 | | | AXIS CAPITAL HOLDINGS LTD. | | | 1,025,983 | | | | 1,300,313 | | | | | |
| | 4,351 | | | CARNIVAL PLC | | | 131,345 | | | | 287,881 | | | | | |
| | 46,780 | | | FLEX LTD.(c) | | | 538,998 | | | | 762,982 | | | | | |
| See accompanying notes to financial statements. | 72 | (Continued) |
CLEARWATER INVESTMENT TRUST
Schedule of Investments - Clearwater International Fund
June 30, 2017 (unaudited)
| | | | | | | | | | | | | | |
| Shares | | | Security | | Cost | | | Fair value (a) | | | Percent of
net assets | |
| | United States (Cont’d): | | | | | | | | | | | | |
| | 13,765 | | | SHIRE PLC | | $ | 520,154 | | | | 759,798 | | | | | |
| | | | | | | | 4,051,359 | | | | 7,326,656 | | | | 1.26 | % |
| | | | | Sub-total Common Stocks: | | | 393,356,309 | | | | 547,647,839 | | | | 94.26 | % |
| Master Limited Partnerships: | | | | | | | | | | | | |
| | Canada: | | | | | | | | | | | | | | | |
| | 1 | | | BROOKFIELD BUSINESS PARTNERS L.P. | | | 17 | | | | 17 | | | | | |
| | | | | | | | 17 | | | | 17 | | | | 0.00 | % |
| | | | | Sub-total Master Limited Partnerships: | | | 17 | | | | 17 | | | | 0.00 | % |
| Preferred Stocks: | | | | | | | | | | | | |
| | Brazil: | | | | | | | | | | | | | | | |
| | 187,700 | | | ALPARGATAS S.A.(c) | | | 600,320 | | | | 776,772 | | | | | |
| | 195,359 | | | TELEFONICA BRASIL S.A. ADR(d) | | | 2,501,815 | | | | 2,635,393 | | | | | |
| | | | | | | | 3,102,135 | | | | 3,412,165 | | | | 0.59 | % |
| | Germany: | | | | | | | | | | | | | | | |
| | 1,521 | | | BAYERISCHE MOTOREN WERKE A.G. | | | 49,612 | | | | 125,392 | | | | | |
| | 1,217 | | | HENKEL A.G. & CO. KGAA | | | 101,251 | | | | 167,495 | | | | | |
| | 1,443 | | | PORSCHE AUTOMOBIL HOLDING S.E. | | | 60,635 | | | | 81,071 | | | | | |
| | 770 | | | VOLKSWAGEN A.G. | | | 99,996 | | | | 117,275 | | | | | |
| | | | | | | | 311,494 | | | | 491,233 | | | | 0.08 | % |
| | South Korea: | | | | | | | | | | | | | | | |
| | 92 | | | HYUNDAI MOTOR CO. LTD. | | | 8,465 | | | | 9,368 | | | | | |
| | 312 | | | SAMSUNG ELECTRONICS CO. LTD. | | | 347,651 | | | | 507,751 | | | | | |
| | | | | | | | 356,116 | | | | 517,119 | | | | 0.09 | % |
| | | | | Sub-total Preferred Stocks: | | | 3,769,745 | | | | 4,420,517 | | | | 0.76 | % |
| Convertible Preferred Stocks: | | | | | | | | | | | | |
| | Canada: | | | | | | | | | | | | | | | |
| | 41,800 | | | GRAN TIERRA ENERGY, INC.(c) | | | 125,400 | | | | 93,632 | | | | | |
| | | | | | | | 125,400 | | | | 93,632 | | | | 0.02 | % |
| | | | | Sub-total Convertible Preferred Stocks: | | | 125,400 | | | | 93,632 | | | | 0.02 | % |
| Rights: | | | | | | | | | | | | | | | |
| | Spain: | | | | | | | | | | | | | | | |
| | 1,731 | | | ACS ACTIVIDADES DE CONSTRUCCION Y SERVICIOS S.A.(c) | | | 1,476 | | | | 1,384 | | | | | |
| | | | | | | | 1,476 | | | | 1,384 | | | | 0.00 | % |
| | | | | Sub-total Rights: | | | 1,476 | | | | 1,384 | | | | 0.00 | % |
| Investment Companies: | | | | | | | | | | | | |
| | United States: | | | | | | | | | | | | | | |
| | 37,500 | | | ISHARES MSCI EAFE SMALL-CAP ETF | | | 2,038,682 | | | | 2,169,000 | | | | | |
| | | | | | | | 2,038,682 | | | | 2,169,000 | | | | 0.37 | % |
| | | | | Sub-total Investment Companies: | | | 2,038,682 | | | | 2,169,000 | | | | 0.37 | % |
| Short-Term Investments: | | | | | | | | | | | | |
| | 24,146,052 | | | NORTHERN INSTITUTIONAL FUNDS -U.S. GOVERNMENT SELECT PORTFOLIO, 0.82%(f) | | | 24,146,052 | | | | 24,146,052 | | | | | |
| | | | | Sub-total Short-Term Investments: | | | 24,146,052 | | | | 24,146,052 | | | | 4.16 | % |
| | | | | Grand total(g) | | $ | 423,437,681 | | | | 578,478,441 | | | | 99.57 | % |
Notes to Schedule of Investments:
| (a) | Investments are valued in accordance with procedures described in note 2 to the financial statements. |
| (b) | Security has been deemed worthless and is a Level 3 investment. |
| (c) | Non-income producing assets. |
| (d) | Securities are American Depositary Receipts of companies based outside of the United States representing 3.18% of net assets as of June 30, 2017. |
| (e) | Securities exempt from registration under Rule 144A of the Securities Act of 1933. These securities may be resold in transactions exempt from registration, normally to qualified institutional buyers. The value of these securities is determined by valuations supplied by a pricing service or brokers, or, if not available, in accordance with procedures established by the Board of Trustees. |
| (f) | The short-term investment is a money market portfolio of the investment company, Northern Institutional Funds. At December 31,2016, the value of the Clearwater International Fund’s investment in the U.S. Government Select Portfolio of the Northern Institutional Funds was $19,594,255 with net purchases of $4,551,797 during the six months ended June 30, 2017. |
| See accompanying notes to financial statements. | 73 | (Continued) |
CLEARWATER INVESTMENT TRUST
Schedule of Investments - Clearwater International Fund
June 30, 2017 (unaudited)
| (g) | At June 30, 2017, the cost for Federal income tax purposes was $426,258,965. The aggregate gross unrealized appreciation and depreciation of investments in securities based on this cost was as follows: |
| Gross unrealized appreciation | | $ | 160,519,188 | |
| Gross unrealized depreciation | | | (8,299,712 | ) |
| Net unrealized appreciation | | $ | 152,219,476 | |
At June 30, 2017, the industry sectors for the Clearwater International Fund were:
| Industry Sector | | | Percent of
Long-Term
Investments | |
| Consumer Discretionary | | | 16.79 | % |
| Consumer Staples | | | 11.00 | |
| Energy | | | 4.25 | |
| Financials | | | 20.02 | |
| Health Care | | | 9.54 | |
| Industrials | | | 15.95 | |
| Information Technology | | | 11.54 | |
| Materials | | | 5.40 | |
| Real Estate | | | 2.06 | |
| Telecommunication Services | | | 2.12 | |
| Utilities | | | 1.33 | |
| | | | 100.00 | % |
At June 30, 2017, the Clearwater International Fund’s investments were denominated in the following currencies:
| Concentration by Currency | | Percent of
Long-Term
Investments | |
| Euro | | | 22.90 | % |
| Japanese Yen | | | 15.84 | |
| British Pound | | | 13.98 | |
| United States Dollar | | | 10.76 | |
| Swiss Franc | | | 8.59 | |
| Canadian Dollar | | | 5.81 | |
| All other currencies less than 5% | | | 22.12 | |
| | | | 100.00 | % |
At June 30, 2017, the Clearwater International Fund had outstanding forward foreign currency exchange contracts as follows:
| Contracts To Deliver Currency | | Amount (Local Currency) | | In Exchange For Currency | | Amount (Local Currency) | | Settlement Date | | | Unrealized Gains (Losses) | | | Counterparty |
| Japanese Yen | | 71,913,904 | | United States Dollar | | 649,687 | | 08/01/2017 | | | $ | 9,377 | | | Northern Trust |
| Japanese Yen | | 149,340,960 | | United States Dollar | | 1,322,415 | | 08/01/2017 | | | | (7,293 | ) | | Northern Trust |
| Chinese Offshore Yuan | | 5,861,881 | | United States Dollar | | 850,472 | | 11/15/2017 | | | | (5,499 | ) | | Northern Trust |
| Chinese Offshore Yuan | | 17,738,821 | | United States Dollar | | 2,533,285 | | 11/15/2017 | | | | (56,997 | ) | | Northern Trust |
| | | | | | | | | | | | $ | (60,412 | ) | | |
| See accompanying notes to financial statements. | 74 | (Continued) |
CLEARWATER INVESTMENT TRUST
Schedule of Investments - Clearwater International Fund
June 30, 2017 (unaudited)
Clearwater International Fund Portfolio Diversification
(as a percentage of net assets)
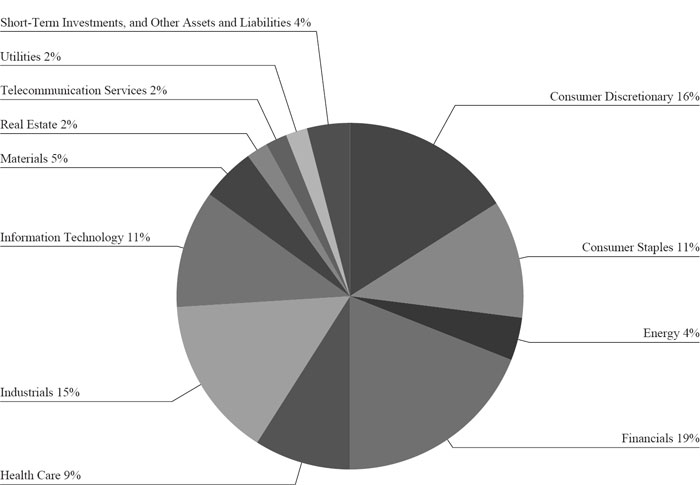
| See accompanying notes to financial statements. | 75 | (Continued) |
Not applicable to this filing.
| Item 3. | Audit Committee Financial Expert |
Not applicable to this filing.
| Item 4. | Principal Accountant Fees and Services |
Not applicable to this filing.
| Item 5. | Audit Committee of Listed Registrants |
Not applicable to this filing.
| (a) | Schedule of Investments is included as part of the report to shareholders filed under Item 1 of this report on Form N-CSR. |
| Item 7. | Disclosure of Proxy Voting Policies and Procedures for Closed-End Management Investment Companies |
Not applicable (the Trust is an open-end management investment company).
| Item 8. | Portfolio Managers of Closed-End Management Investment Companies |
Not applicable (the Trust is an open-end management investment company).
| Item 9. | Purchases of Equity Securities by Closed-End Management Investment Company and Affiliated Purchasers |
Not applicable (the Trust is an open-end management investment company).
| Item 10. | Submission of Matters to a Vote of Security Holders |
There have been no material changes to the procedures by which shareholders may recommend nominees to the Board of Trustees.
| Item 11. | Controls and Procedures |
| (a) | The Trust’s principal executive officer and principal financial officer have concluded that the Trust’s disclosure controls and procedures (as defined in Rule 30a-3(c) under the Investment Company Act of 1940, as amended (the “1940 Act”)) are effective based on the principal executive officer and principal financial officer’s evaluation of these controls and procedures, as required by Rule 30a-3(b) under the 1940 Act, as of a date within 90 days of the filing date of this document. |
| (b) | There have been no significant changes in the Trust’s internal control over financial reporting (as defined in Rule 30a-3(d) under the 1940 Act) that occurred during the second fiscal quarter of the period covered by this |
| | report that have materially affected, or are reasonably likely to materially affect, the Trust’s internal control over financial reporting. |
| (a)(1) | Not applicable to this filing. |
| (a)(2) | Certifications pursuant to Section 302 of the Sarbanes-Oxley Act of 2002 and required by Rule 30a-2(a) under the 1940 Act. |
| (a)(3) | No written solicitations to purchase securities were sent or delivered during the period covered by this report by or on behalf of the Trust. |
| (b) | Certifications pursuant to Section 906 of the Sarbanes-Oxley Act of 2002 and required by Rule 30a-2(b) under the 1940 Act. |
SIGNATURES
Pursuant to the requirements of the Securities Exchange Act of 1934 and the Investment Company Act of 1940, the registrant has duly caused this report to be signed on its behalf by the undersigned, thereunto duly authorized.
| | Clearwater Investment Trust |
| | | |
| | By | /s/ Justin H. Weyerhaeuser |
| | | Justin H. Weyerhaeuser |
| | | President (Principal Executive Officer) and |
| | | Treasurer (Principal Financial Officer) |
| | | |
| | Date: August 30, 2017 |
Pursuant to the requirements of the Securities Exchange Act of 1934 and the Investment Company Act of 1940, this report has been signed below by the following persons on behalf of the registrant and in the capacities and on the dates indicated.
| | Clearwater Investment Trust |
| | | |
| | By | /s/ Justin H. Weyerhaeuser |
| | | Justin H. Weyerhaeuser |
| | | President (Principal Executive Officer) |
| | | |
| | Date: August 30, 2017 |
| | | |
| | Clearwater Investment Trust |
| | | |
| | By | /s/ Justin H. Weyerhaeuser |
| | | Justin H. Weyerhaeuser |
| | | Treasurer (Principal Financial Officer) |
| | | |
| | Date: August 30, 2017 |