UNITED STATES
SECURITIES AND EXCHANGE COMMISSION
Washington, D.C. 20549
FORM N-CSR
CERTIFIED SHAREHOLDER REPORT OF REGISTERED
MANAGEMENT INVESTMENT COMPANIES
| Investment Company Act file number | 811-05038 | ||
| Clearwater Investment Trust | |||
| (Exact name of registrant as specified in charter) | |||
| 2000 Wells Fargo Place, 30 East 7th Street, Saint Paul, Minnesota 55101-4930 | |||
| (Address of principal executive offices) (Zip code) | |||
Stephen G. Simon
Fiduciary Counselling, Inc.
2000 Wells Fargo Place, 30 E. 7th Street
Saint Paul, Minnesota 55101-4930
Copy to:
John O’Hanlon, Esq.
Dechert LLP
One International Place, 40th Floor
100 Oliver Street
| Boston, Massachusetts 02110 | ||
| (Name and address of agent for service) |
Registrant’s telephone number, including area code: | 651-228-0935 |
| Date of fiscal year end: | December 31 | |||
| Date of reporting period: | December 31, 2014 |
Item 1. Reports to Stockholders
| CLEARWATER INVESTMENT TRUST |
| Clearwater Core Equity Fund |
| Clearwater Small Companies Fund |
| Clearwater Tax-Exempt Bond Fund |
| Clearwater International Fund |
Annual Report for the year ended December 31, 2014 |
| Letter to Shareholders |
| (unaudited) |
| February 26, 2015 |
This annual report provides information regarding the performance and holdings of your Clearwater Funds for the year ended December 31, 2014. During 2014, the Clearwater Tax-Exempt Bond Fund and the Clearwater Small Companies Fund outperformed their respective benchmarks while the Clearwater Core Equity Fund and the Clearwater International Fund underperformed their respective benchmarks.
We encourage you to read this annual report as it contains important information about the Clearwater Funds, including commentary from the Funds’ investment manager, Clearwater Management Company, and the managers who act as subadvisers to the Funds provided in the section of the report that follows this letter titled: Management Discussion of Clearwater Funds’ Performance. Additionally, this report includes information describing the contract renewal process in December 2014, during which the Board of Trustees reviewed the services provided and fees charged by, as well as performance of, Clearwater Management Company and that of each Clearwater subadviser. Effective January 29, 2015, the Trust terminated Heartland Advisers, Inc. and Knightsbridge Asset Management, LLC as subadvisers to the Clearwater Core Equity Fund. Effective as of February 3, 2015 and February 4, 2015, respectively, the Trust engaged AQR Capital Management, LLC and O’Shaughnessy Asset Management, LLC as subadvisers to the Clearwater Core Equity Fund.
The updated annual Prospectus of the Clearwater Funds will be mailed to you by the end of April 2015. This annual update of the Prospectus and the related Statement of Additional Information, which is available from your Financial Consultant at Fiduciary Counselling, Inc. upon request, includes a detailed discussion of the investment objectives and risks of investing in each Fund. We believe this will help you better understand how your shareholder assets are invested and managed. For additional information that is available at this time, please see the Clearwater Funds’ current prospectus and statement of additional information.
We hope the information disclosed within this annual report is helpful in understanding the 2014 results of each of the Clearwater Funds. We appreciate your continued confidence and your choice to invest with us.
| Justin H. Weyerhaeuser | James E. Johnson |
| President | Chairman of the Board of Trustees |
| Clearwater Investment Trust | Clearwater Investment Trust |
| A-1 |
Management Discussion of Clearwater Funds’ Performance
Clearwater Core Equity Fund
The Clearwater Core Equity Fund seeks long-term growth of capital. Current income, to the extent income is produced by the stocks held by the Fund, is a secondary objective. Under normal market conditions, the Clearwater Core Equity Fund pursues its investment objective by investing at least 80% of its net assets, plus the amount of any borrowings for investment purposes, in equity securities of U.S. companies. The Clearwater Core Equity Fund’s assets are managed in a “multi-manager, multi-style” approach. During the period ending December 31, 2014, the Core Equity Fund had four subadvisers. Parametric Portfolio Associates (“Parametric”), with approximately 60% of the Fund’s assets, manages its portion of the Fund’s assets to mirror the Russell 1000® Index as closely as possible without requiring the Fund to realize taxable gains. The remaining 40% of the Fund’s assets were divided evenly between Heartland Advisers, Inc. (“Heartland”), Knightsbridge Asset Management, LLC (“Knightsbridge”), and Osterweis Capital Management, LLC (“Osterweis”) who all utilized an active management style.
| 2014 Market Overview: |
| U.S. equity prices were supported in 2014 by strong corporate earnings, an accelerating economic recovery, low inflation, improving investor sentiment, and an accommodative Federal Reserve Bank. Domestic equity prices were pressured by weak economic conditions outside the U.S., particularly in Japan and Europe and slowing growth in China. On the geo-political front, tension between Russia and the West over the Ukraine also weighed on equities. |
| 2014 Performance and 2015 Outlook: |
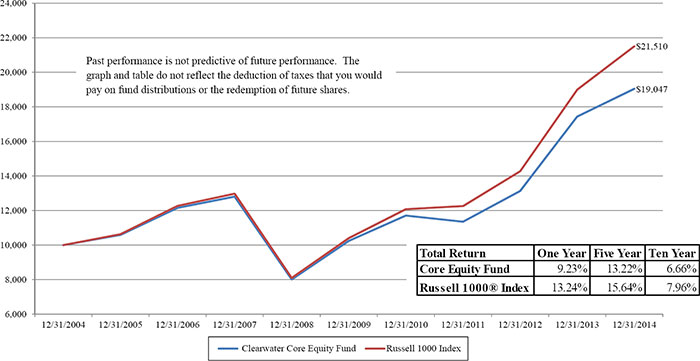
| The Clearwater Core Equity Fund advanced 9.2%, net of fees, in 2014. We believe that absolute returns were excellent considering the uncertain economic and geo-political conditions, but relative returns were disappointing in comparison to the Fund’s benchmark, the Russell 1000® Index, which returned 13.2% for the year. The underperformance was generated by Fund’s three active sub-advisers - Heartland, Knightsbridge, and Osterweis. |
| Each of the three active managers in the Clearwater Core Equity Fund comment on the performance of their respective portfolios for 2014, and their outlook for 2015, in the paragraphs that follow. For comparison of the subadvisers’ capabilities, performance is shown gross of fees. The Fund pays a single advisory fee to Clearwater Management Company, which in turn pays the subadvisers out of its advisory fee. |
| A-2 |
Heartland Commentary
2014 Performance: For the year ended December 31, 2014, the portion of the Clearwater Core Equity Fund managed by Heartland returned 4.5%, gross of fees, underperforming the Russell 1000® Index (the “benchmark”), which returned 13.2%. Stock selection in Information Technology and Consumer Discretionary, particularly Royal Caribbean Cruises Ltd. (RCL), was strong, but unable to offset the underperformance of our holdings in and allocation to Energy. An overweight to and selection in the Energy Equipment and Services industry accounted for the majority of the shortfall. Our stocks in this area were hit harder than those in the benchmark, on average, primarily because the Russell 1000® Index includes a pair of behemoths in the energy space: Exxon Mobil Corporation (XOM) and Chevron Corporation (CVX). These highly diversified companies are arguably more immune to downside volatility than the smaller names we hold, but may not represent the upside potential we seek. Stock selection in Financials also held back relative performance.
2015 Outlook: Our outlook is squarely centered on improving Consumer and Industrial fundamentals as part of a broad, if slow moving, economic expansion. As such, catalysts dependent upon a reviving U.S. economy are prevalent in the portfolio. We also believe the much discussed “tax break” associated with cheap energy may benefit moderate income households disproportionately and we are positioned accordingly. While uncertainty remains for the year ahead, we are uncovering companies that appear to have reasonable valuations, strong balance sheets and earnings, and—even in the face of investor skepticism—management team confidence expressed in the form of personal investing.
Knightsbridge Commentary
2014 Performance: For 2014, the Knightsbridge managed portion of the Clearwater Fund returned 1.8%, gross of fees, compared to 13.2% for the Russell 1000® Index (the “benchmark”). Lack of exposure to the best performing sectors (Healthcare and Utilities) detracted from relative performance, as did underperformance in the worst performing sector (Energy). A modest cash allocation throughout the year also hindered performance.
2015 Outlook: Although there are some positive tailwinds for stocks in 2015, we see more reasons for concern. First, the good news: we believe that low interest rates, low inflation and an improving economy should provide some support for U.S. stocks. Yet, as contrarian value investors, we worry about things such as record profit margins, the most IPOs since the tech bubble and U.S. households holding high levels of stock. Domestic equity valuations are rising, pushing the market’s cash flow multiple to previous market peak levels. The cyclically adjusted “Shiller” P/E has risen to levels that may indicate low stock returns going forward. Measures of sentiment also appear elevated. Due to our evaluation of these factors, we have raised cash, and when looking at new stocks, we are prioritizing resilient business models employing manageable financial leverage. Fortunately, our internal research on what we believe are investment anomalies provides us with a universe of prospective stocks that have company-specific valuation drivers that do not appear to rely on overall market strength.
Osterweis Commentary
2014 Performance: Against a backdrop of improving U.S. growth and weak growth abroad, the U.S. stock market chalked up another solid year. The Russell 1000 Index® (the “benchmark”) was up 13.2% while our portion of the Clearwater Core Equity Fund was up 7.8% (gross of fees). The strong aggregate return of the benchmark masked some rather stark divergences. In the first half of the year, our portion of the Clearwater Core Equity Fund had no trouble keeping pace with a strong benchmark and in fact modestly outperformed the benchmark. For the second half of the year, however, the top 100 stocks (in
| A-3 |
performance impact) of the benchmark accounted for a whopping 115% of the benchmark’s return. Furthermore, performance was clearly bifurcated with large-cap stocks in the benchmark rising over 6% in aggregate while those in the small- and mid-cap segments plunged, returning (41)% and (9)%, respectively. In other words, it was a very narrow market, which according to S&P Capital IQ Fund Research, caused about 80% of all active managers – ourselves included – to underperform the benchmark. Essentially, if you did not own the top stocks and the large cap names, you could not keep up. This was very reminiscent of the mid- to late-1990’s when a small group of high-tech stocks accounted for an outsized share of the market’s gain. We believe such a concentration of performance will reverse, collapsing under its own weight. In part this is because the benchmark is capitalization weighted, so those buying into the benchmark have to buy more of the largest cap stocks, which could push the largest stocks further and further along the path towards overvaluation. This process may feed on itself until the overvaluation of the “winners” simply becomes too great. Eventually they can crack, dragging the benchmark down sharply and allowing active managers who did not buy these stocks to outperform the benchmark. We may be entering such a phase now.
2015 Outlook: We expect moderate, low-inflation growth to continue in the U.S. in 2015 alongside continued weak results in Europe, Japan, China and much of the emerging markets. Strong relative and absolute economic growth in the U.S., coupled with a likelihood that the Federal Reserve will begin to tighten in 2015, suggest that the dollar may continue to rally versus most other currencies and as a result, U.S.-focused companies may be at an advantage this year. While we believe that the U.S. stock market is not currently cheap, we think valuations are not unreasonable given the current low level of interest rates. The key risk is the potential for deflationary contagion, a period of weak prices and declining spending, particularly capital spending. The primary investment risk in such a scenario would be persistent earnings disappointments, which in turn would lead to declining stock prices. While we regard this scenario as unlikely, the probability of its occurrence may have increased and we are, therefore, monitoring the development of what we view to be key components. In this environment, we believe companies that can deliver growth will be rewarded. We believe that consistent growers tend to be well identified by the market and hence fully valued. Instead we are focused on what we view to be attractively valued companies that can demonstrate accelerated growth that is unanticipated by the market. We particularly like companies with strong and growing free cash flow, especially those that return this cash flow to shareholders through dividends and stock repurchases.
| A-4 |
Clearwater Small Companies Fund
The Clearwater Small Companies Fund seeks long-term growth of capital. Current income is a secondary objective. Under normal market conditions, the Fund normally invests at least 80% of its net assets, plus the amount of any borrowings for investment purposes, in equity securities of small companies. The Fund defines “small companies” as issuers with market capitalizations no greater than $5 billion at the time of purchase. Equity securities consist primarily of exchange-traded common and preferred stocks and convertible securities. The Fund uses a “multi-style, multi-manager” approach with two subadvisers who employ distinct investment styles: Kennedy Capital Management (“Kennedy”) and Keeley Asset Management (“Keeley”). At the period ending December 31, 2014, Kennedy and Keeley respectively managed approximately 75% and 25% of the Fund balances.
2014 Market Overview: |
| U.S. equity prices were supported in 2014 by strong corporate earnings, an accelerating economic recovery, low inflation, improving investor sentiment, and an accommodative Federal Reserve Bank. Domestic equity prices were pressured by weak economic conditions outside the U.S., particularly in Japan and Europe and slowing growth in China. On the geo-political front, tension between Russia and the West over the Ukraine also weighed on equities. |
| 2014 Performance and 2015 Outlook: |
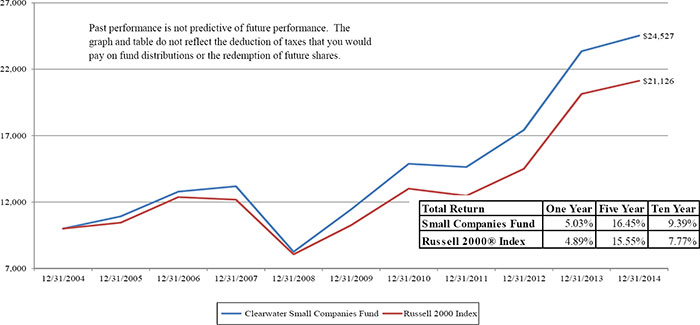
| The Clearwater Small Companies Fund advanced 5.0%, net of fees, in 2014, slightly beating its benchmark, the Russell 2000® Index, which returned 4.9% for the year. The Fund’s performance was helped by its underweighting of unprofitable smaller companies and it was hurt by its stock selection in the Energy sector. |
| Each of the two subadvisers for the Clearwater Small Companies Fund comments on the performance of their specific portfolio for 2014 and their outlook for 2015, in the paragraphs below. For comparison of the subadvisers’ capabilities, performance is shown gross of fees. The Fund pays a single advisory fee to Clearwater Management Company, which in turn pays the subadvisers out of its advisory fee. |
Kennedy Commentary
2014 Performance: For the year ended December 31, 2014, the portion of the Clearwater Small Companies Fund managed by Kennedy Capital Management returned 7.4%, gross of fees, outperforming the 4.9% return of the Fund’s benchmark, the Russell 2000® Index (the “benchmark”). Stock selection had a positive impact on relative performance during the year, particularly in the Financial, Industrial and Health Care sectors.
2015 Outlook: As we see it, the U.S. economy is generally trundling along fairly well. New car sales are still solid. Housing starts are adequate (not great yet, but not lapsing back to 2010/11 levels). Employment growth seems to be real (not just offsetting monthly positives and negatives as we progress throughout the year). Consumer sentiment is moving back into the ranges we saw in the ‘80s and ‘90s. The Energy sector, however, is going through a difficult period. Of course, the cost of energy (e.g., for consumers and industry) is clearly a windfall – which could be a nice shot in the arm for our economy in 2015. Unfortunately, lower oil prices may set the stage for more geopolitical tensions. When we think of economic malaise outside the U.S., we do have some level of unease but not grave concern. Weaker currencies are a double-edged sword. While they hurt a consumer’s ability to buy foreign goods, they
| A-5 |
help a company’s ability to sell its goods abroad. This may not “rescue” the European Union and Japan, but it will likely boost competitiveness of companies exporting from those countries. As the Yen weakens, for instance, Japanese companies may gain a competitive edge over their U.S. counterparts. While we are not buying stocks to explicitly capitalize on these factors, we are mindful of them as we consider initiating or maintaining positions.
Keeley Commentary
2014 Performance: For the year ending December 31, 2014, Keeley’s portion of the Clearwater Small Companies Fund produced a return of 2.1%, gross of fees, compared to 4.9% for the Russell 2000® Index (the “benchmark”). In terms of sector attribution, our exposure to the Energy and Health Care sectors served as the two primary detractors in 2014. Our significant underweight to Health Care, relative to the benchmark, combined with poor stock selection within the Health Care sector, resulted in the largest drag on performance relative to the benchmark. While our stock selection was positive within Energy, our overweight stance relative to the benchmark amidst falling oil prices resulted in the second largest drag on relative performance. For the year, the primary positive contribution came from strong stock selection in Consumer Discretionary. Our overweight to Financials and our underweight to Utilities also provided small positive contributions.
2015 Outlook: Today, we are cautiously optimistic that much of the declines in the Energy sector have been realized and that prices in this sector have stabilized, but we do believe that markets tend to overshoot on the downside while searching for equilibrium. While we do not feel it would be prudent to add at this point, we are not against adding to our holdings in the future if we become more comfortable with the stability in the price of oil. In general, we are optimistic that the environment for restructuring activity remains attractive over the near-to-long term. Spin-off activity has accelerated, and we believe shareholder activism is poised to remain high in 2015. In addition, we believe that a healthy environment exists for companies emerging from bankruptcy, which are often shunned by investors.
| A-6 |
Clearwater Tax-Exempt Bond Fund
The Clearwater Tax-Exempt Bond Fund seeks high current income that is exempt from U.S. federal income tax, consistent with preservation of capital. Under normal market conditions, the Fund invests at least 80% of its net assets, plus the amount of any borrowings for investment purposes, in tax-exempt bonds, which are debt obligations issued by or for the U.S. states, territories and possessions and the District of Columbia. The interest on these securities is generally exempt from both U.S. regular federal income tax and U.S. federal alternative minimum tax. However, the Fund may invest up to 20% of its assets in securities that generate interest income subject to federal alternative minimum tax for individuals. The Fund invests in both revenue bonds, which are backed by and payable only from the revenues derived from a specific facility or specific revenue source, and in general obligation bonds, which are secured by the full faith, credit and taxation power of the issuing municipality. The Fund’s subadviser, Sit Fixed Income Advisers II, LLC (“Sit”), provides day to day management for the Fund. It should be noted that the Fund is not a money market fund and is not intended to be a money market fund substitute. Under normal market conditions, the Fund’s investments may be more susceptible than a money market fund to interest rate risk and credit risks relevant to the Fund’s investments.
| Sit has provided all of the commentary below regarding the Clearwater Tax-Exempt Bond Fund. The Fund pays an advisory fee to Clearwater Management Company, which in turn pays the subadviser out of its advisory fee. |
Sit Commentary
2014 Market Overview: Tax-exempt fixed income markets experienced a remarkably strong year in 2014, as the U.S. Treasury and tax-exempt yield curves flattened considerably (long rates fell over 100 basis points), and funds flows that had been significantly negative in 2013 turned modestly positive. Supply, while increasing slightly from 2013, was very manageable to absorb, particularly as fund inflows were concentrated in long-term and high yield tax-exempt funds. Credit fundamentals were generally sound, and spreads tightened substantially during the year. State and local government tax collections continued to improve from the low recession-driven levels of 2008 and 2009, and have now exceeded pre-recession levels, such that even though assistance from the federal government’s stimulus programs is no longer helping, state and local government finances remain generally on the upswing, with the notable exceptions of Detroit (although it now has emerged from bankruptcy), Chicago, and the states of Illinois and New Jersey. Puerto Rico related debt was volatile throughout the year, absorbing significant downgrades in the early and middle parts of the year that sparked selloffs but also rallying significantly in late summer. We believe more volatility is likely in 2015 as Puerto Rico continues to suffer a recession and it attempts to restructure some of its debt. The Fed ended its quantitative easing program in 2014 but remained quite accommodative. Concerns about tax reform and a potential reduction of the value of the municipal bond tax exemption remain, but appear to have had little overall effect on the market.
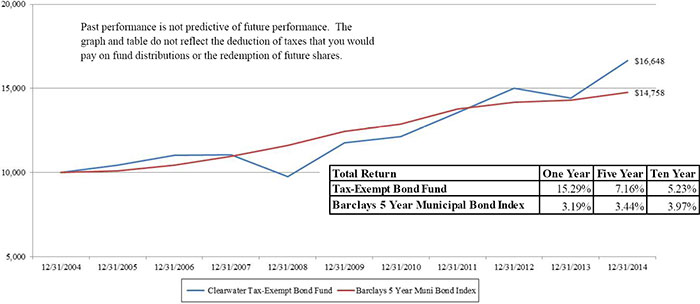
2014 Performance: The Clearwater Tax-Exempt Bond Fund returned 15.3%, net of fees, for the year ended December 31, 2014. The Fund’s benchmark, the Barclays 5 Year Municipal Bond Index (the “benchmark”), gained 3.2% over the same period. Given the Fed’s accommodative policies and the steep tax-exempt yield curve, the Fund’s average life duration, a measure of the Fund’s sensitivity to changes in interest rates, began the year at 6.7 years. However, it shortened to 5.6 years by year-end primarily due to the rally in the tax-exempt bond market. For comparison, the Fund’s benchmark had duration of 3.9 years at December 31, 2013, and it remained there throughout the year. The Fund’s longer duration was the primary reason for its outperformance during 2014. The Fund’s yield fell significantly, much more than
| A-7 |
the yield of the benchmark. Revenue bonds significantly outperformed general obligation bonds during 2014, with revenue bonds returning 10.1% for the year, while general obligation bonds returned 7.8%. Furthermore, lower quality issues (especially lower investment grade and non-rated issues) significantly outperformed those of higher credit quality, as investors sought yield. The Fund’s performance, due to its heavy emphasis on revenue bonds, its considerably longer duration and its meaningful exposure to lower quality issues, outperformed that of its benchmark in 2014.
2015 Outlook: We expect U.S. growth to moderate from its rapid pace in late 2014 to lower levels during 2015, and inflation to remain subdued. Single-family housing has moderated, but unemployment, despite some improvement, remains elevated, and wage growth remains slow. We believe that Republicans gaining control of the U.S. Senate is not likely to have a significant impact on fiscal or economic policy. Although Republican policy goals differ greatly from those of President Obama, it appears that both sides want to avoid the drama and volatility caused by budget and debt ceiling negotiations in recent years. Therefore, we expect agreements to be reached timely that will avoid unsettling the markets. Interest rates, which we believe are likely to remain low in absolute terms, may start to rise during 2015, as the economy continues to grow. The Fed has signaled it intends to begin raising short-term interest rates in 2015. We believe that the Treasury yield curve should remain relatively steep, with yields rising more on the short and intermediate portions of the curve, while the tax-exempt curve flattens similarly, with short-term and intermediate rates rising some and long-term tax-exempt yields rising less as supply continues at a still manageable level and state and local government finances continue to improve, helping tax-exempt bonds outperform. One potential concern for the market will be the performance of the equity markets. If they weaken, it could be a positive for bonds, but if they rally strongly, more money could move out of fixed income into equities, again creating negative pressure on the bond market. We expect revenue bonds to continue their strong relative performance in 2015, as investor focus remains on yield. Puerto Rico related concerns may weigh on the market, however, and could produce some volatility. Furthermore, potential problems funding retirement pension and healthcare obligations still persist in other places, especially Chicago and Illinois, and remain the subject of many of the negative media reports about the municipal market. The Fund’s longer duration and its use of revenue and non-rated bonds have positioned it opportunistically for the economic and interest rate environment that we expect in 2015, although we do expect to continue to shorten duration during the year. We expect investment of new cash flows to be focused on maturities in the 5-25 year range.
| A-8 |
Clearwater International Fund
The Clearwater International Fund seeks long-term growth of capital. The Fund generally invests at least 80% of the value of its net assets, plus the amount of any borrowings for investment purposes, in equity securities of companies organized or located outside the United States and doing a substantial amount of business outside the United States. The Fund diversifies its investments among a number of different countries throughout the world, and may invest in companies of any size. The Fund does not intend to invest more than 20% of its net assets in the equity securities of developing or emerging market issuers. The Fund uses a “multi-style, multi-manager” approach. The Fund’s adviser allocates portions of the Fund’s assets among subadvisers who employ distinct investment styles. The Fund currently has five subadvisers. Parametric Portfolio Associates (“Parametric”) manages its portion of the portfolio (approximately 50%) to mirror the MSCI World Ex USA Index (net). The Fund also has four “active” managers who each manage approximately 12.5% of the Fund: Artisan Partners Limited Partnership (“Artisan Partners”), Denver Investments (“Denver”), Templeton Investment Counsel, LLC (“Templeton”) and WCM Investment Management (“WCM”).
2014 Market Overview: |
| Sub-par economic conditions, weakening currencies, and the threat of deflation pressured stock prices in the developed market countries in 2014. In Japan, a big increase in the national consumption tax tempered consumer demand. When the economy headed toward recession, the Bank of Japan responded by adopting an ultra-easy monetary policy. On the geo-political front, tension between Russia and the West over the Ukraine also weighed on equities. In Europe, economic growth was sub-par, interest rates fell, and policymakers voiced concern that deflation was a possibility. These conditions paled against the stronger economic conditions in the U.S. and as a result, the currencies in Japan and Europe were pressured. In 2014, Japanese Yen dropped 13.7% against the U.S. Dollar while the Euro fell 13.6%. The Clearwater International Fund reports its results in U.S. dollars, after these currencies adjustments have taken place. |
2014 Performance and 2015 Outlook: |
| The Clearwater International Fund lost 4.7% for the year and underperformed its benchmark, the MSCI World Ex USA. Index (net), which fell 4.3%. Performance was hurt by poor stock selection in smaller international companies but was helped by the Fund’s underweighting of Energy and Industrial companies. |
| Each of the four active managers in the Clearwater International Fund comments on the performance of their portfolio in 2014 and their outlook for 2015, in the paragraphs below. For comparison of the sub-adviser’s capabilities, performance is shown gross of fees. The Fund pays a single advisory fee to Clearwater Management Company, which in turn pays the subadvisers out of its advisory fee. |
Artisan Partners Commentary
2014 Performance: During the year ended December 31, 2014, Artisan’s portion of the Clearwater International Fund returned 1.1%, gross of fees, outperforming the MSCI World Ex USA Index (net) (the “benchmark”), which declined 4.3% over the same period. Performance of the following stocks had a positive impact on the portfolio during the period: U.S. health care products developer Covidien plc; U.S. semiconductor equipment provider Applied Materials, Inc.; Chinese internet search provider Baidu, Inc.;
| A-9 |
U.K. publisher Reed Elsevier plc1; and Japanese household products company Kao Corp. Notable detractors included: U.K. food retailer TESCO plc; Norwegian oil and gas services and equipment company Aker Solutions ASA; Denmark-based brewing company Carlsberg AS; U.K. outsourcing services provider Serco Group plc; and Japanese consumer credit company Credit Saison Co., Ltd.
2015 Outlook: Given the performance of the international equities markets on a local currency basis, we are still finding that, with few exceptions, stocks appear mostly fairly priced. Broadly speaking, valuations appear to be more attractive in Financials. Banks are still trading at big discounts to book value and are not priced for the same kind of optimism as other industries. Additionally, the recent rout in oil prices has created dislocations in the share prices of many Energy companies. We are busy prospecting for investment opportunities that we believe are both undervalued and that have the balance sheet strength to sustain an extended period of low oil prices.
Denver Commentary
2014 Performance: The portion of the Clearwater International Fund managed by Denver returned (12.4)%, gross of fees, compared to the MSCI World Ex USA Index (net) (the “benchmark”) which returned (4.3)%. Our portfolio’s largest detractor for the year was Ports Design Limited. Ports Design, based in Hong Kong, designs, manufactures and sells high-end branded apparel in mainland China. The company sells its products under the Ports International and Ports 1961 brand names. Throughout the year, Ports’ stock price was negatively impacted by investor concerns relating to China’s crackdown on government officials’ luxury spending and China’s slowing growth. Additionally during the year, Ports pursued a store refurbishment campaign resulting in company costs exceeding revenues. Since December 31, 2014, the company announced that it will be acquired at approximately a 27% premium. Our portfolio’s largest contributor for the year was PAX Global. PAX is based in Hong Kong and is a leading electronic funds transfer (EFT) point of sales (POS) terminal solutions provider. The company develops and sells countertop and mobile EFT-POS terminals, which are able to process a range of electronic payment types, including signature and PIN-based debit cards, credit cards, contactless/radio frequency (RF) identification cards, RF-enabled mobile phones, integrated circuit cards, pre-paid gift and other stored-value cards. PAX has seen strong overseas growth as it expands into emerging markets including Latin America, Africa and the Middle East. Throughout the year investors reacted positively as PAX continued to execute on its growth plan as demonstrated by strong earnings growth.
2015 Outlook: Although it is disappointing to underperform in any timeframe, we remain encouraged by our portfolio’s holdings. Our portfolio’s underperformance relative to its benchmark has mostly been driven by performance of holdings that have exposure to China and related markets such as Australia. We feel these holdings have suffered mostly as a result of fear of China’s economy slowing, rather than because of operational disappointments. As of December 31, our portion of the fund held a diversified portfolio of roughly 40 stocks of companies that we believe are fast-growing, high-return, cash-generative businesses with sound balance sheets.
Templeton Commentary
2014 Performance: Templeton’s portion of the Clearwater International Fund returned (1.7)%, gross of fees, for the year ending 12/31/14. The Fund’s benchmark, the MSCI World Ex USA Index (net) (the “benchmark”), returned (4.3)%. Our portfolio outperformed the Fund’s benchmark for the period. The largest sector contributors were stock selection in Consumer Discretionary and Information Technology
1 *The portfolio owns Reed Elsevier plc and Reed Elsevier N.V., which are separate legal entities with jointly owned operating companies. Holdings of Reed Elsevier plc and Reed Elsevier N.V. are aggregated to determine Reed Elsevier’s contribution to return.
| A-10 |
and an underweight to Utilities. In our view, Utilities are broadly expensive considering the potential impacts of weaker economic growth and increasing regulatory interference on power demand and industry pricing. Stock selection in Industrials and Health Care were the largest detractors. Since mid-June, the performance of our Cyclical Industrials holdings have been negatively impacted by rising geopolitical tension in the Middle East and Ukraine, slowing GDP growth and heightened risk aversion. Regionally, stock selection in Asia was the largest regional contributor for the year, further boosted by an overweight to the region. Our focus in Asia is on finding companies that we believe have balance sheet strength, capital discipline and the ability to sustainably generate strong free cash flow. Stock selection in Canada was the largest regional detractor.
2015 Outlook: At the core of Templeton’s investment philosophy is an acceptance that any given investor has imperfect knowledge of market and economic variables. Throughout this challenging period, we have tried to use the market’s distraction to our advantage by focusing on what we determine to be overlooked value. In doing so, we have continued to build differentiated portfolios that embed long-term assumptions about company-level business fundamentals. Reassuringly, academic studies attesting to the potential benefits of the type of truly active, long-term value investing long practiced by Templeton have begun to emerge in recent years. Overall, we believe performance comes from value recognition, and, in our experience, price and value eventually do intersect over time. Going into 2015, we remain confident that our portfolio contains far more long-term value potential than its prices reflected at year-end.
WCM Commentary
2014 Performance: The portfolio managed by WCM returned 1.5% for the period, gross of fees. This compares to the MSCI World Ex USA Index (net) (the “benchmark”), which returned (4.3)% for the same period. Stock selection overall was positive and broad based. The standouts were Industrials and Health Care; the weak spots were Discretionary and Staples, isolated to just a few specific names. Allocation was actually the dominant contributor this year, led by the strategy’s underweights to Energy and Materials and overweights to Technology and Health Care. Even so, we still strive to deliver outperformance due to selection.
2015 Outlook: Looking ahead to 2015, we expect the recent bouts of volatility to persist as the market digests the various global macro cross-currents (prospect of Fed tightening, European Central Bank Qualitative Easing, oil price and currency volatility, etc.). We believe these are the periods during which stock selection matters most, and we seek to exploit this with our focused portfolio approach. We believe that companies with improving competitive advantages—our primary focus—are able to gain ground during volatile macro periods, since we believe they can fully capitalize on growth opportunities while their peers are playing defense and/or dealing with internal issues.
| A-11 |
Comparison of the Change in Value of a $10,000 Investment in the Clearwater Core
Equity Fund and the Russell 1000® Index
Comparison of the Change in Value of a $10,000 Investment in the Clearwater Small
Companies Fund and the Russell 2000® Index
| A-12 |
Comparison of the Change in Value of a $10,000 Investment in the Clearwater Tax-
Exempt Bond Fund and the Barclays 5-Year Municipal Bond Index
Comparison of the Change in Value of a $10,000 Investment in the Clearwater
International Fund and the MSCI World Ex USA Index (net)
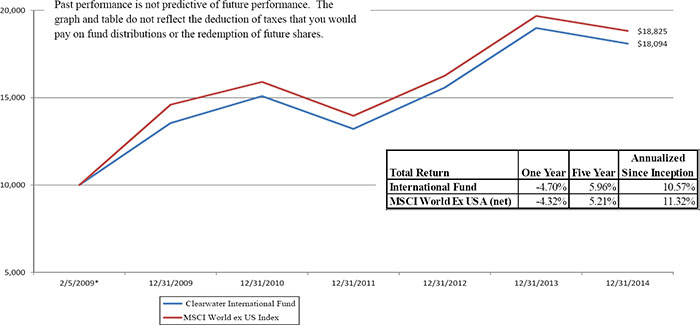
* Clearwater International Fund inception date.
| A-13 |
Fund Expense Example
(unaudited)
As a shareholder of the Clearwater Core Equity Fund, Clearwater Small Companies Fund, Clearwater Tax-Exempt Bond Fund, and Clearwater International Fund (the “Funds”), you incur costs, including management fees and other Fund expenses. This Example is intended to help you to understand your ongoing costs (in dollars) of investing in the Funds and to compare these costs with the ongoing costs of investing in other mutual funds. In addition to the ongoing costs which the Funds pay directly, you as a shareholder indirectly bear the expenses of any outside exchange traded funds or mutual funds in which the Funds invest. (These are also referred to as “acquired funds” and those indirect expenses represent the Funds’ pro rata portion of the cumulative expense charged by the acquired funds.)
The Example provided is based on an investment of $1,000 invested at the beginning of the period and held for the six-month period ended December 31, 2014.
Actual Expenses
The first section of the table below provides information about actual account values and actual expenses. You may use the information in this section, together with the amount you invested, to estimate the expenses that you incurred over the period. Simply divide your account value by $1,000 (for example, an $8,600 account value divided by $1,000 = 8.6), then multiply the result by the number in the first section under the heading entitled “Expenses Paid During the Period July 1, 2014 through December 31, 2014” to estimate the expenses attributable to your investment during this period.
Hypothetical Example for Comparison Purposes
The second section of the table below provides information about hypothetical account values and hypothetical expenses based on the Fund’s actual expense ratio and an assumed rate of return of 5% per year before expenses, which is not the Fund’s actual return. Thus, you should not use the hypothetical account values and expenses to estimate the actual ending account balance or your expenses for the period. Rather, these figures are provided to enable you to compare the ongoing costs of investing in the Funds and other mutual funds. To do so, compare this 5% hypothetical example with the 5% hypothetical examples that appear in the shareholder reports of the other mutual funds.
Please note that the expenses shown in the second section of the table are meant to highlight your ongoing costs only. Therefore, the second section of the table is useful in comparing ongoing costs only, and will not help you compare the relative total costs of the Funds to other mutual funds that charge transaction costs and/or sales charges or redemption fees.
| A-14 |
| Actual returns | Beginning Account Value July 1, 2014 | Ending Account Value December 31, 2014 | Expenses Paid During the Period July 1, 2014 through December 31, 2014 * |
| Core Equity Fund | $1,000.00 | $1,026.20 | $2.55 |
| Small Companies Fund | $1,000.00 | $1,019.30 | $4.78 |
| Tax-Exempt Bond Fund | $1,000.00 | $1,048.80 | $1.70 |
| International Fund | $1,000.00 | $912.50 | $3.23 |
| Hypothetical 5% return | |||
| (before expenses) | |||
| Core Equity Fund | $1,000.00 | $1,022.68 | $2.55 |
| Small Companies Fund | $1,000.00 | $1,020.47 | $4.79 |
| Tax-Exempt Bond Fund | $1,000.00 | $1,023.54 | $1.68 |
| International Fund | $1,000.00 | $1,021.83 | $3.41 |
| * | Expenses are equal to the Fund’s annualized expense ratios, multiplied by the average account value over the period, multiplied by 184/365 (to reflect the one-half year period). Expense ratios for the most recent one-half year period may differ from expense ratios based on one-year data in the Financial Highlights. |
The annualized expense ratios are as follows:
| Core Equity Fund | 0.50% | |
| Small Companies Fund | 0.94% | |
| Tax-Exempt Bond Fund | 0.33% | |
| International Fund | 0.67% |
Quarterly Portfolio Schedule of Investments
The Funds file a complete schedule of their portfolio holdings as of the close of the first and third quarters of their fiscal years with the Securities and Exchange Commission (the “SEC”) on Form N-Q. Shareholders may request copies of Form N-Q free of charge by calling the Transfer Agent toll free at 1-855-684-9144 or by sending a written request to: The Northern Trust Company, P.O. Box 4766, Chicago, IL 60680-4766 Attn: Clearwater Investment Trust Funds. These filings are also available on the SEC’s Internet site at http://www.sec.gov and may be reviewed and copied at the SEC’s Public Reference Room in Washington, DC. Information about the public reference room may be obtained by calling 1-800-SEC-0330.
Voting Proxies on Fund Portfolio Securities
The Funds have established Proxy Voting Policies and Procedures (“Policies”) that the Funds use to determine how to vote proxies relating to portfolio securities. They also report, on Form N-PX, how the Funds voted any such proxies during the most recent 12-month period ended June 30. Shareholders may request copies of the Policies or Form N-PX free of charge by calling Fiduciary Counselling, Inc. toll free at 1-888-228-0935 or by sending a written request to: Fiduciary Counselling, Inc., 30 East 7th Street, Suite 2000, St. Paul, MN 55101 Attn: Clearwater Investment Trust Funds. Form N-PX is also available from the EDGAR database on the SEC’s Internet site at http://www.sec.gov.
| A-15 |
EXECUTIVE OFFICERS AND TRUSTEES
Information About the Independent Trustees
| Name and Age | Positions Held With the Funds | Term of Office | Principal Occupation or Employment During the Last Five Years | Number of Portfolios in the Fund Complex to Be Overseen by the Trustee | Other Directorships Held by the Trustee During the Last 5 Years | ||||||
James E. Johnson (72) 30 East 7th Street Saint Paul, Minnesota 55101 | Trustee, Chairman of the Board | As Trustee: Tenure: 4 years Term: Indefinite As Chairman: Tenure: May 2013 – Present Term: Reappointed Annually | Retired as Executive Vice President, Securian Financial Group, Inc. in 2010, Securian Financial Group, Inc. (1968- 2010) | 4 | None | ||||||
Charles W. Rasmussen (48)1 30 East 7th Street Saint Paul, Minnesota 55101 | Trustee, Chairman of the Nominating Committee | As Trustee: Tenure: 15 years Term: Indefinite As Chairman of the Nominating Committee: Tenure: 2 Years Term: Reappointed Annually | President and Chief Executive Officer, P&G Manufacturing, Inc. (air filtration equipment, 2002-Present) | 4 | None | ||||||
Laura E. Rasmussen (51)1 30 East 7th Street Saint Paul, Minnesota 55101 | Trustee | Tenure: 15 years Term: Indefinite | Business Owner, 3 Kittens Needle Arts (textile sales, 2006-Present) | 4 | None | ||||||
Edward R. Titcomb III (40) 30 East 7th Street Saint Paul, Minnesota 55101 | Trustee, Chairman of the Audit Committee | As Trustee: Tenure: 4 years Term: Indefinite As Chairman of the Audit Committee: Tenure: May 2013 – Present Term: Reappointed Annually | Vice President, Wells Fargo Institutional Trust (August 2013-Present), Vice President, Trust Point Inc. (2010-2013), Key Account Manager, GWG Life (2008- 2010) | 4 | None |
| 1 | Mr. Rasmussen and Ms. Rasmussen are spouses-in-law, and are the niece or nephew of Mr. Frederick T. Weyerhaeuser (see below). |
| A-16 |
Information about the Funds’ Executive Officers and Interested Trustees
| Name and Age | Positions Held With the Funds | Term of Office | Principal Occupation or Employment During the Last Five Years | Number of Portfolios in the Fund Complex to Be Overseen by the Officer/ Trustee | Other Directorships Held by the Officer/ Trustee During the Last 5 Years | ||||||
Sara G. Dent (56) 1 30 East 7th Street Saint Paul, Minnesota 55101 | Trustee | Tenure: December 2013 – Present Term: Indefinite | Private Investor | 4 | None | ||||||
Frederick T. Weyerhaeuser (83) 2 30 East 7th Street Saint Paul, Minnesota 55101 | Trustee, Secretary | Tenure: 27 years Term: Indefinite As Secretary: Tenure: December 2013 - Present Term: Reappointed Annually | Private Investor | 4 | None | ||||||
Justin H. Weyerhaeuser (41) 3 30 East 7th Street Saint Paul, Minnesota 55101 | Trustee, President and Treasurer | Tenure: 7 years Term: Indefinite As President and Treasurer: Tenure: May 2013 - Present Term: Reappointed Annually | Private Investor (February 2013 – Present), Attorney, Davis Graham &Stubbs LLP (law firm, November 2011 – February 2013), Husch Blackwell (law firm, July 2011 – November 2011), Jacobs Chase Attorneys (2009-July 2011), Volunteer Attorney, ACLU of Colorado (2007- 2009) | 4 | None | ||||||
Stephen G. Simon (46) 30 East 7th Street Saint Paul, Minnesota 55101 | Chief Compliance Officer | Tenure: March 2014 – Present Term: Reappointed Annually | Chief Compliance Officer, Fiduciary Counselling, Inc. (February 2014 – Present), Chief Compliance Officer, Allianz Investment Management, LLC (2004 – February 2014). | N/A | N/A |
| 1 | Ms. Sara G. Dent is an interested Trustee due to her mother’s level of ownership of voting securities in two of the Funds in the Trust. |
| 2 | Mr. Frederick T. Weyerhaeuser is an interested Trustee due to his daughter’s position as a director of Clearwater Management Company, the Funds’ investment manager. |
| 3 | Mr. Justin H. Weyerhaeuser is an interested Trustee due to his position as the Funds’ President and Treasurer. |
| A-17 |
| Name and Age | Positions Held With the Funds | Term of Office | Principal Occupation or Employment During the Last Five Years | Number of Portfolios in the Fund Complex to Be Overseen by the Officer/ Trustee | Other Directorships Held by the Officer/ Trustee During the Last 5 Years | ||||||
Joe Chavosky (34) The Northern Trust Company 50 South LaSalle Street Chicago, IL 60603 | Assistant Treasurer | Tenure: December 2014 – Present Term: Reappointed Annually | The Northern Trust Company, Vice President and Client Service Delivery Manager (2014-Present), The Northern Trust Company, Vice President and Fund Administration Manager (2011-2014), Invesco, Fund Administration Assistant Manager (2011-2010), Van Kampen Investments, Senior Associate (2008- 2010) | N/A | N/A | ||||||
Shari L. Clifford (46) 30 East 7th Street Saint Paul, Minnesota 55101 | Assistant Treasurer | Tenure: March 2014 – Present Term: Reappointed Annually | Chief Financial Officer and Treasurer, Fiduciary Counselling, Inc. (February 2014 – Present), Controller and Finance Director, Woodbury Financial Services, Inc. (November 2007 – February 2014) | N/A | N/A | ||||||
Brianne Mitchell (32) 30 East 7th Street Saint Paul, Minnesota 55101 | Assistant Secretary | Tenure: December 2014 – Present Term: Reappointed Annually | Senior Compliance Analyst, Fiduciary Counselling, Inc. (July 2014-Present), Legal & Compliance Analyst, Highbridge Capital Management (June 2013- June 2014), Assoc. General Counsel & Asst. Director of Compliance, Catterton Management Company (January 2011-June 2013), Candidate for J.D., St. John’s University School of Law (August 2008-May 2011) | N/A | N/A | ||||||
Marcia Lucas (47) The Northern Trust Company 50 South LaSalle Street Chicago, IL 60603 | Assistant Secretary | Tenure: March 2011 – Present Term: Reappointed Annually | The Northern Trust Company, Vice President (2011-Present), Second Vice President (2010-2011) | N/A | N/A |
Additional information about the Fund Directors is available in the Funds’ Statement of Additional Information (“SAI”). The SAI is available, without charge, upon request, by contacting the transfer agent at 1-855-684-9144 or writing the Funds at The Northern Trust Company, P.O. Box 4766, Chicago, IL 60680-4766. The Funds do not have an internet website.
| A-18 |
Approval of the Investment Management and Subadviser Service Agreements
Clearwater Management Company, Inc. (“CMC”) is responsible for managing the investment programs and strategies for the Core Equity Fund, Small Companies Fund, Tax-Exempt Bond Fund, and International Fund (collectively, “the Funds”). CMC also provides other administrative services to the Funds and these services, as well as its investment management services, are provided to the Funds under an agreement (the “Management Agreement”). CMC conducts due diligence when selecting each subadviser (collectively, the “Subadvisers”) for the Funds and oversees the performance of the Subadvisers. The Subadvisers provide portfolio management and related services for the Funds under individual subadvisory agreements (the “Subadvisory Agreements”).
The Funds’ Board of Trustees (the “Trustees”) met periodically throughout the year to address a broad range of agenda items. For example, at each regularly scheduled meeting, the Trustees reviewed information about the investment performance and financial results of the Funds. On an annual basis, the Trustees, including the independent trustees, consider the renewal of the Management Agreement and the Subadvisory Agreements. In addition, the Trustees may periodically consider the retention of new subadvisers.
At their in-person meeting on December 5-6, 2014, the Trustees considered the renewal of the Management Agreement and the Subadvisory Agreements for Artisan Partners Limited Partnership, Denver Investments, Fiduciary Counselling, Inc. (“FCI”), Heartland Advisors, Inc., Keeley Asset Management Corp., Kennedy Capital Management, Inc., Knightsbridge Asset Management, LLC, Osterweis Capital Management, LLC, Parametric Portfolio Associates LLC, Sit Fixed Income Advisors II, LLC, Templeton Investment Counsel, LLC, and WCM Investment Management.
Prior to the December 5-6, 2014 meeting, the Trustees requested, received, and reviewed written responses from CMC and the Subadvisers to questions posed to them on behalf of the Trustees and supporting materials relating to those questions and responses. The information presented at the meeting, including performance and expense data obtained from independent sources, was designed to assist the Trustees in making their determination as to the renewal of the Management Agreement and Subadvisory Agreements. At this meeting, counsel to the Funds reviewed with the Trustees the various factors relevant to their consideration of the Management Agreement and Subadvisory Agreements, and the Trustees’ responsibilities related to their review. The Trustees considered a number of factors, including those discussed below, that they believed to be relevant. No single factor determined whether or not an agreement would be approved but rather the totality of factors considered was determinative. Following an analysis and discussion of the factors described below, the Trustees, including all independent trustees, approved the renewal of the Management Agreement and the Subadvisory Agreements for an additional one-year period.
Nature, Extent, and Quality of Services Provided
The Trustees considered information presented as to the nature, extent, and quality of services provided by CMC and the Subadvisers, as well as their investment expertise, resources, and capabilities. The Trustees considered the quality of the Subadvisers previously recommended by
| A-19 |
CMC, as well as the ongoing work performed by CMC to recommend enhancements to individual fund management or creation of new funds. The Trustees reviewed information regarding the financial condition of CMC and the Subadvisers related to their ongoing ability to provide services specified under the Management Agreement and Subadvisory Agreements. The Trustees considered that FCI provides, in addition to investment management services, certain services related to due diligence, performance reporting, compliance, and other administrative functions which support the investment management services and Subadviser oversight services provided by CMC. Based on their analysis of the data presented, the Trustees concluded that they were generally satisfied with the nature and quality of the services being provided under the Management Agreement and respective Subadvisory Agreements.
Investment Performance
The Trustees reviewed specific information as to the investment performance of the Funds as compared to the performance of their respective benchmark indices and peer groups over various periods of time. The Trustees also reviewed reports summarizing the net assets, redemptions, and purchases of shares of the Funds during 2014. The Trustees concluded that they were generally satisfied with CMC’s and the Subadvisers’ investment performance to date. The Trustees noted that, notwithstanding the satisfactory performance of the Core Equity Fund, CMC reported that it was likely to recommend certain changes to the Subadvisers for the Fund in the near term in an effort to enhance the Fund’s performance.
Comparative Fees and Cost of Services Provided
The Trustees reviewed the fees paid to CMC and the Subadvisers. The Trustees reviewed reports describing both the management fees charged by CMC and the total expense ratios of the Funds in comparison to those of similarly situated funds. In addition, on a quarterly basis, the Trustees reviewed information as to the expense ratios of the Funds compared to the median expense ratio of a peer group of funds with comparable investment strategies. The Trustees also reviewed information provided by each of the Subadvisers as to fees they charge to other clients. The Trustees noted the ongoing efforts of CMC to reduce expenses charged to shareholders through oversight of service providers and by voluntarily waiving certain fees payable to CMC as specified in the prospectuses of the Core Equity Fund, International Fund, Small Companies Fund and Tax-Exempt Fund.
The Board considered that between June 1, 2011 and March 14, 2012, CMC voluntarily waived the management fee for the Core Equity Fund from the contractual fee of 0.90% to 0.60%. Between March 15, 2012 and March 14, 2013, CMC voluntarily waived the management fee for the Core Equity Fund to 0.52%. Effective March 15, 2013, CMC voluntarily waived the management fee for the Core Equity Fund to 0.50%. Between June 1, 2011 and March 14, 2013, CMC voluntarily waived the management fee for the Small Companies Fund from the contractual fee of 1.35% to 1.00%. Effective March 15, 2013, CMC voluntarily waived the management fee for the Small Companies Fund to 0.94%. Between July 1, 2008 and March 14, 2013, CMC voluntarily waived the management fee for the Tax-Exempt Bond Fund from the contractual fee of 0.60% to 0.36%. Effective March 15, 2013, CMC voluntarily waived the management fee for the Tax-Exempt Bond Fund to 0.33%. Between June 1, 2011 and December 4, 2011, CMC voluntarily waived the management fee for the International Fund from the
| A-20 |
contractual fee of 1.00% to 0.75%. Between December 5, 2011 and March 14, 2012, CMC voluntarily waived the management fee for the International Fund to 0.70%. Between March 15, 2012 and March 14, 2013, CMC voluntarily waived the management fee for the International Fund to 0.60%. Effective March 15, 2013, CMC reduced its voluntary waiver of the management fee for the International Fund such that its management fee would be 0.67%. The reduction in the voluntary waiver for the International Fund was a result of the replacement of two Subadvisers to the International Fund with three new Subadvisers. CMC had undertaken to subsidize any additional cost to the International Fund, if applicable, between the initiation of the new Subadvisers’ services to the International Fund through March 2013.
Management Profitability
The Trustees reviewed CMC’s level of profitability with respect to the Funds, particularly noting CMC’s payment of fees and expenses typically absorbed by mutual fund shareholders. The Trustees concluded that profitability levels for CMC were reasonable. The Trustees considered that the Subadvisers are each independent firms and the subadvisory fees charged are the result of arm’s length bargaining between them and CMC under the supervision of the Trustees.
Economies of Scale
The Trustees considered whether economies of scale might be realized by CMC as the Funds’ assets grow and whether there also might be benefits from such growth for the Funds’ shareholders. The Trustees noted that the Funds have been in operation for a number of years and, based on their distribution strategy, the Funds will probably not see significant increases in size. However, the Trustees determined that they would continue to monitor the assets of the Funds and consider whether there were additional opportunities to realize benefits from economies of scale for shareholders in the future.
Based on the factors described above, the Trustees, including all of the independent trustees, concluded that the investment management fees and subadvisory fees were fair and reasonable in view of the investment performance and quality of services provided. In reaching this conclusion, no single factor was considered determinative.
| A-21 |
Federal Tax Information
(unaudited)
Qualified Dividend Income. Under the Jobs and Growth Tax Relief Reconciliation Act of 2003 (the “Act”), 100.00% of ordinary dividends paid during the fiscal year ended December 31, 2014 for the Core Equity Fund, 12.45% of ordinary dividends paid during the fiscal year ended December 31, 2014 for the Small Companies Fund, and 74.91% of ordinary dividends paid during the fiscal year ended December 31, 2014 for the International Fund are designated as “qualified dividend income”, as defined in the Act, subject to reduced tax rates in 2014.
Corporate Dividends-Received Deduction. 85.54%, 11.69% and 0.97% of the dividends distributed during the fiscal year ended December 31, 2014, for the Core Equity, Small Companies and International Funds, respectively, qualify for the dividends-received deduction for corporate shareholders.
Capital Gain Distribution. The following Fund’s made capital gain distributions in December 2014, and hereby designated these long-term capital gain distributions as follows:
| Fund | Long-Term Capital Gain | |||
| Core Equity | $ | 17,853,920 | ||
| Small Companies | 43,827,345 | |||
| Tax-Exempt Bond | 350,149 | |||
| International | 6,673,460 | |||
| A-22 |
Clearwater Investment Trust
Financial Statements
For the Fiscal Year Ended December 31, 2014
Table of Contents
Financial Statements:
| 1 | ||
| 2 | ||
| 3 | ||
| 4 | ||
| 5 | ||
| 9 | ||
| 29 | ||
| 29 | ||
| 43 | ||
| 50 | ||
| 69 |
 | |
| KPMG LLP | |
4200 Wells Fargo Center 90 South Seventh Street Minneapolis, MN 55402 |
The Board of Trustees and Shareholders
Clearwater Investment Trust:
We have audited the accompanying statements of assets and liabilities, including the schedules of investments, of Clearwater Core Equity Fund, Clearwater Small Companies Fund, Clearwater Tax-Exempt Bond Fund and the Clearwater International Fund (collectively, the “Funds”), as of December 31, 2014, and the related statements of operations for the year then ended, the statements of changes in net assets for each of the years in the two-year period then ended, and the financial highlights for each of the years or periods in the five-year period then ended. These financial statements and financial highlights are the responsibility of the Funds’ management. Our responsibility is to express an opinion on these financial statements and financial highlights based on our audits.
We conducted our audits in accordance with the standards of the Public Company Accounting Oversight Board (United States). Those standards require that we plan and perform the audit to obtain reasonable assurance about whether the financial statements and financial highlights are free of material misstatement. An audit includes examining, on a test basis, evidence supporting the amounts and disclosures in the financial statements. Our procedures included confirmation of securities owned as of December 31, 2014, by correspondence with the custodian, transfer agent (of underlying funds) and brokers, or by other appropriate auditing procedures. An audit also includes assessing the accounting principles used and significant estimates made by management, as well as evaluating the overall financial statement presentation. We believe that our audits provide a reasonable basis for our opinion.
In our opinion, the financial statements and financial highlights referred to above present fairly, in all material respects, the financial position of the Clearwater Core Equity Fund, Clearwater Small Companies Fund, Clearwater Tax-Exempt Bond Fund and the Clearwater International Fund as of December 31, 2014, the results of their operations for the year then ended, the changes in their net assets for each of the years in the two-year period then ended, and the financial highlights for each of the years or periods in the five-year period then ended, in conformity with U.S. generally accepted accounting principles.

Minneapolis, Minnesota
February 26, 2015
KPMG LLP is a Delaware limited liability partnership, the U.S. member firm of KPMG International Cooperative (“KPMG International”), a Swiss entity. |
| 1 |
CLEARWATER INVESTMENT TRUST
December 31, 2014
| Core Equity | Small Companies | Tax-Exempt | International | |||||||||||||
| Fund | Fund | Bond Fund | Fund | |||||||||||||
Assets | ||||||||||||||||
| Investments in securities, at fair value (identified cost: $266,262,701 Core Equity Fund; $262,995,710 Small Companies Fund; $475,071,657 Tax-Exempt Bond Fund; $376,143,985 International Fund) | $ | 540,908,430 | 336,328,501 | 502,661,129 | 481,075,841 | |||||||||||
| Foreign currencies, at value (cost: $13,962 and $487,990, respectively) | 12,571 | - | - | 489,775 | ||||||||||||
| Cash | - | - | 1,933,491 | - | ||||||||||||
| Receivable for securities sold | 297 | 232,509 | - | 78,711 | ||||||||||||
| Receivable for shares of beneficial interest sold | 168,700 | 144,300 | - | 1,071,100 | ||||||||||||
| Accrued dividend and interest receivable | 721,767 | 366,167 | 5,280,309 | 486,024 | ||||||||||||
| Foreign tax reclaim receivable | 30,875 | - | - | 1,047,277 | ||||||||||||
| Unrealized appreciation on forward foreign currency exchange contracts | - | - | - | 567,896 | ||||||||||||
| Total assets | 541,842,640 | 337,071,477 | 509,874,929 | 484,816,624 | ||||||||||||
| Liabilities | ||||||||||||||||
| Payables for investment securities purchased | 143,558 | 2,383,742 | 1,364,348 | 1,985,622 | ||||||||||||
| Accrued investment advisory fee | 681,900 | 799,872 | 419,272 | 834,565 | ||||||||||||
| Payable for dividend distribution | - | - | 109,297 | - | ||||||||||||
| Unrealized depreciation on forward foreign currency exchange contracts | - | - | - | 53,793 | ||||||||||||
| Total liabilities | 825,458 | 3,183,614 | 1,892,917 | 2,873,980 | ||||||||||||
| Net assets | $ | 541,017,182 | 333,887,863 | 507,982,012 | 481,942,644 | |||||||||||
| Capital | ||||||||||||||||
| Capital stock and additional paid-in capital (authorized unlimited number of shares at no par value for each Fund: 13,728,301, 16,451,292, 49,985,800 and 33,439,287 shares, respectively) | $ | 266,393,163 | 260,663,430 | 480,401,556 | 379,433,936 | |||||||||||
| Undistributed (overdistributed) net investment income | 445,248 | 130,675 | 49,910 | (1,759,655 | ) | |||||||||||
| Accumulated net realized loss from investments and foreign currency transactions | (465,518 | ) | (239,033 | ) | (58,926 | ) | (1,074,852 | ) | ||||||||
| Unrealized appreciation of investments and translation of assets and liabilities in foreign currencies | 274,644,289 | 73,332,791 | 27,589,472 | 105,343,215 | ||||||||||||
| Net assets | $ | 541,017,182 | 333,887,863 | 507,982,012 | 481,942,644 | |||||||||||
| Net asset value per share of outstanding capital stock | $ | 39.41 | 20.30 | 10.16 | 14.41 | |||||||||||
See accompanying notes to financial statements.
| 2 |
CLEARWATER INVESTMENT TRUST
Year ended December 31, 2014
| Core Equity | Small Companies | Tax-Exempt | International | |||||||||||||
| Fund | Fund | Bond Fund | Fund | |||||||||||||
| Investment income: | ||||||||||||||||
| Income: | ||||||||||||||||
| Dividends (net of foreign taxes withheld of $98,590, $9,071, $0 and $1,302,802, respectively) | $ | 10,652,953 | 3,988,944 | 1,898,991 | 14,755,712 | |||||||||||
| Interest | - | - | 21,649,946 | - | ||||||||||||
| Total income | 10,652,953 | 3,988,944 | 23,548,937 | 14,755,712 | ||||||||||||
| Expenses: | ||||||||||||||||
| Investment advisory fee | 4,793,491 | 4,557,342 | 2,937,555 | 5,100,494 | ||||||||||||
| Voluntary fee reduction | (2,130,443 | ) | (1,384,084 | ) | (1,321,903 | ) | (1,683,162 | ) | ||||||||
| Total net expenses | 2,663,048 | 3,173,258 | 1,615,652 | 3,417,332 | ||||||||||||
| Net investment income | 7,989,905 | 815,686 | 21,933,285 | 11,338,380 | ||||||||||||
| Net realized gain (loss) on: | ||||||||||||||||
| Security transactions | 17,023,383 | 36,427,294 | 1,154,381 | 7,178,352 | ||||||||||||
| Forward foreign currency exchange contracts | - | - | - | (2,309 | ) | |||||||||||
| Foreign currency transactions | - | - | - | 58,326 | ||||||||||||
| Net increase (decrease) in unrealized appreciation/depreciation on: | ||||||||||||||||
| Security transactions | 22,276,853 | (20,342,867 | ) | 46,365,974 | (42,892,478 | ) | ||||||||||
| Forward foreign currency exchange contracts | - | - | - | 258,569 | ||||||||||||
| Translation of other assets and liabilities denominated in foreign currencies | (1,219 | ) | - | - | (161,973 | ) | ||||||||||
| Net gain (loss) on investments | 39,299,017 | 16,084,427 | 47,520,355 | (35,561,513 | ) | |||||||||||
| Net increase (decrease) in net assets resulting from operations | $ | 47,288,922 | 16,900,113 | 69,453,640 | (24,223,133 | ) | ||||||||||
See accompanying notes to financial statements.
| 3 |
CLEARWATER INVESTMENT TRUST
Years ended December 31, 2014 and 2013
| Core Equity Fund | Small Companies Fund | |||||||||||||||
| 12/31/2014 | 12/31/2013 | 12/31/2014 | 12/31/2013 | |||||||||||||
| Operations: | ||||||||||||||||
| Net investment income | $ | 7,989,905 | 7,086,228 | 815,686 | 691,640 | |||||||||||
| Net realized gain | 17,023,383 | 13,465,166 | 36,427,294 | 44,785,569 | ||||||||||||
| Net increase (decrease) in unrealized appreciation/depreciation | 22,275,634 | 111,306,273 | (20,342,867 | ) | 49,036,212 | |||||||||||
| Net increase in net assets resulting from operations | 47,288,922 | 131,857,667 | 16,900,113 | 94,513,421 | ||||||||||||
| Distributions to shareholders from: | ||||||||||||||||
| Net investment income | (8,347,216 | ) | (6,883,274 | ) | (637,608 | ) | (891,425 | ) | ||||||||
| Net realized gain | (16,626,561 | ) | - | (47,231,708 | ) | (37,952,618 | ) | |||||||||
| Total distributions to shareholders | (24,973,777 | ) | (6,883,274 | ) | (47,869,316 | ) | (38,844,043 | ) | ||||||||
| Capital share transactions: | ||||||||||||||||
| Proceeds from shares sold | 3,000,890 | 15,629,091 | 8,274,472 | 4,225,025 | ||||||||||||
| Reinvestment of distributions from net investment income and net realized gain | 24,973,774 | 6,883,274 | 47,869,316 | 38,844,043 | ||||||||||||
| Payments for shares redeemed | (32,315,020 | ) | (19,686,851 | ) | (34,354,438 | ) | (37,606,332 | ) | ||||||||
| Net increase (decrease) in net assets from capital share transactions | (4,340,356 | ) | 2,825,514 | 21,789,350 | 5,462,736 | |||||||||||
| Total increase (decrease) in net assets | 17,974,789 | 127,799,907 | (9,179,853 | ) | 61,132,114 | |||||||||||
| Net assets: | ||||||||||||||||
| At the beginning of the year | 523,042,393 | 395,242,486 | 343,067,716 | 281,935,602 | ||||||||||||
| At the end of the year | $ | 541,017,182 | 523,042,393 | 333,887,863 | 343,067,716 | |||||||||||
| Undistributed net investment income | $ | 445,248 | 330,514 | 130,675 | - | |||||||||||
| Tax-Exempt Bond Fund | International Fund | |||||||||||||||
| 12/31/2014 | 12/31/2013 | 12/31/2014 | 12/31/2013 | |||||||||||||
| Operations: | ||||||||||||||||
| Net investment income | $ | 21,933,285 | 23,141,104 | 11,338,380 | 9,215,783 | |||||||||||
| Net realized gain | 1,154,381 | 3,650,141 | 7,234,369 | 10,320,161 | ||||||||||||
| Net increase (decrease) in unrealized appreciation/depreciation | 46,365,974 | (45,551,290 | ) | (42,795,882 | ) | 72,443,614 | ||||||||||
| Net increase (decrease) in net assets resulting from operations | 69,453,640 | (18,760,045 | ) | (24,223,133 | ) | 91,979,558 | ||||||||||
| Distributions to shareholders from: | ||||||||||||||||
| Net investment income | (21,919,530 | ) | (23,112,535 | ) | (11,567,920 | ) | (10,730,659 | ) | ||||||||
| Net realized gain | (894,126 | ) | (4,029,044 | ) | (8,447,272 | ) | (4,515,432 | ) | ||||||||
| Total distributions to shareholders | (22,813,656 | ) | (27,141,579 | ) | (20,015,192 | ) | (15,246,091 | ) | ||||||||
| Capital share transactions: | ||||||||||||||||
| Proceeds from shares sold | 18,525,800 | 28,246,973 | 14,290,245 | 27,992,633 | ||||||||||||
| Reinvestment of distributions from net investment income and net realized gain | 22,773,030 | 27,132,457 | 20,015,199 | 15,246,091 | ||||||||||||
| Payments for shares redeemed | (44,983,038 | ) | (71,569,136 | ) | (20,028,659 | ) | (16,126,924 | ) | ||||||||
| Net increase (decrease) in net assets from capital share transactions | (3,684,208 | ) | (16,189,706 | ) | 14,276,785 | 27,111,800 | ||||||||||
| Total increase (decrease) in net assets | 42,955,776 | (62,091,330 | ) | (29,961,540 | ) | 103,845,267 | ||||||||||
| Net assets: | ||||||||||||||||
| At the beginning of the year | 465,026,236 | 527,117,566 | 511,904,184 | 408,058,917 | ||||||||||||
| At the end of the year | $ | 507,982,012 | 465,026,236 | 481,942,644 | 511,904,184 | |||||||||||
| Undistributed (overdistributed) net investment income | $ | 49,910 | 39,244 | (1,759,655 | ) | (1,676,102 | ) | |||||||||
See accompanying notes to financial statements.
| 4 |
CLEARWATER INVESTMENT TRUST
Per share data (rounded to the nearest cent) for a share of capital stock outstanding throughout the years ended and selected information for each year ended is as follows:
| Year ended December 31, | |||||||||||||||||||||
| Core Equity Fund | 2014 | 2013 | 2012 | 2011 | 2010 | ||||||||||||||||
| Net asset value, beginning of year | $ | 37.77 | 28.81 | 25.26 | 26.38 | 23.40 | |||||||||||||||
| Income (loss) from investment operations: | |||||||||||||||||||||
| Net investment income | 0.60 | 0.51 | 0.40 | 0.33 | 0.38 | ||||||||||||||||
| Net realized and unrealized gains (losses) | 2.91 | 8.95 | 3.54 | (1.13 | ) | 2.99 | |||||||||||||||
| Total from investment operations | 3.51 | 9.46 | 3.94 | (0.80 | ) | 3.37 | |||||||||||||||
| Less distributions to shareholders from: | |||||||||||||||||||||
| Net investment income | (0.63 | ) | (0.50 | ) | (0.39 | ) | (0.32 | ) | (0.39 | ) | |||||||||||
| Distributions from net realized gains | (1.24 | ) | - | - | - | - | |||||||||||||||
| Total distributions to shareholders | (1.87 | ) | (0.50 | ) | (0.39 | ) | (0.32 | ) | (0.39 | ) | |||||||||||
| Net asset value, end of year | $ | 39.41 | 37.77 | 28.81 | 25.26 | 26.38 | |||||||||||||||
| Total return (a) | 9.23 | % | 32.85 | % | 15.64 | % | (3.04 | )% | 14.42 | % | |||||||||||
| Net assets, end of year (000s omitted) | $ | 541,017 | 523,042 | 395,242 | 332,320 | 344,270 | |||||||||||||||
| Ratio of expenses, net of waivers, to average net assets (b)(c)(d)(e)(f) | 0.50 | % | 0.50 | % | 0.54 | % | 0.53 | % | 0.30 | % | |||||||||||
| Ratio of expenses, before waivers, to average net assets (b)(c)(d)(e)(f) | 0.90 | % | 0.90 | % | 0.90 | % | 0.69 | % | 0.45 | % | |||||||||||
| Ratio of net investment income, net of waivers, to average net assets (c)(d)(e)(f) | 1.50 | % | 1.51 | % | 1.49 | % | 1.25 | % | 1.60 | % | |||||||||||
| Ratio of net investment income, before waivers, to average net assets (c)(d)(e)(f) | 1.10 | % | 1.11 | % | 1.13 | % | 1.09 | % | 1.45 | % | |||||||||||
| Portfolio turnover rate (excluding short-term securities) | 13.54 | % | 21.07 | % | 22.31 | % | 27.01 | % | 43.65 | % | |||||||||||
| (a) | Total return figures are based on the change in net asset value of a share during the year and assume reinvestment of distributions at net asset value. | |
| (b) | In addition to fees and expenses which the Fund bears directly, the Fund indirectly bears a pro rata share of the fees and expenses of any acquired funds in which it invests. Such indirect expenses are not included in the above reported expense ratios. | |
| (c) | Effective March 15, 2013, the investment advisory fee, net of voluntary waivers, decreased to 0.50%. Also effective March 15, 2013, the Advisor increased the voluntary waiver to 0.40%. | |
| (d) | Effective March 15, 2012, the investment advisory fee, net of voluntary waivers, decreased to 0.52%. Also effective March 15, 2012, the Adviser increased the voluntary waiver to 0.38%. | |
| (e) | Effective June 1, 2011, the investment advisory fee, net of voluntary waivers, increased to 0.60%. Also effective June 1, 2011, the Adviser increased the voluntary waiver to 0.30%. | |
| (f) | Effective December 1, 2010, the Adviser discontinued the voluntary waiver previously in effect. |
See accompanying notes to financial statements.
| 5 |
CLEARWATER INVESTMENT TRUST
Financial Highlights
Per share data (rounded to the nearest cent) for a share of capital stock outstanding throughout the years ended and selected information for each year ended is as follows:
| Year ended December 31, | |||||||||||||||||||||
| Small Companies Fund | 2014 | 2013 | 2012 | 2011 | 2010 | ||||||||||||||||
| Net asset value, beginning of year | $ | 22.35 | 18.70 | 16.91 | 18.70 | 14.41 | |||||||||||||||
| Income (loss) from investment operations: | |||||||||||||||||||||
| Net investment income | 0.05 | 0.05 | 0.09 | 0.01 | - | ||||||||||||||||
| Net realized and unrealized gains (losses) | 1.10 | 6.30 | 3.10 | (0.28 | ) | 4.31 | |||||||||||||||
| Total from investment operations | 1.15 | 6.35 | 3.19 | (0.27 | ) | 4.31 | |||||||||||||||
| Less distributions to shareholders from: | |||||||||||||||||||||
| Net investment income | (0.04 | ) | (0.06 | ) | (0.10 | ) | (0.01 | ) | (0.02 | ) | |||||||||||
| Net realized gain | (3.16 | ) | (2.64 | ) | (1.30 | ) | (1.51 | ) | - | ||||||||||||
| Total distributions to shareholders | (3.20 | ) | (2.70 | ) | (1.40 | ) | (1.52 | ) | (0.02 | ) | |||||||||||
| Net asset value, end of year | $ | 20.30 | 22.35 | 18.70 | 16.91 | 18.70 | |||||||||||||||
| Total return (a) | 5.03 | % | 34.01 | % | 19.02 | % | (1.62 | )% | 29.99 | % | |||||||||||
| Net assets, end of year (000s omitted) | $ | 333,888 | 343,068 | 281,936 | 239,508 | 256,237 | |||||||||||||||
| Ratio of expenses, net of waivers, to average net assets (b)(c)(d) | 0.94 | % | 0.95 | % | 1.00 | % | 0.98 | % | 0.95 | % | |||||||||||
| Ratio of expenses, before waivers, to average net assets (b)(c)(d) | 1.35 | % | 1.35 | % | 1.35 | % | 1.35 | % | 1.35 | % | |||||||||||
| Ratio of net investment income (loss), net of waivers, to average net assets(c)(d) | 0.24 | % | 0.21 | % | 0.51 | % | 0.05 | % | (0.02 | )% | |||||||||||
| Ratio of net investment income (loss), before waivers, to average net assets(c)(d) | (0.17 | )% | (0.19 | )% | 0.16 | % | (0.32 | )% | (0.42 | )% | |||||||||||
| Portfolio turnover rate (excluding short-term securities) | 55.51 | % | 59.84 | % | 59.48 | % | 64.54 | % | 71.05 | % | |||||||||||
| (a) | Total return figures are based on the change in net asset value of a share during the year and assume reinvestment of distributions at net asset value. | |
| (b) | In addition to fees and expenses which the Fund bears directly, the Fund indirectly bears a pro rata share of the fees and expenses of any acquired funds in which it invests. Such indirect expenses are not included in the above reported expense ratios. | |
| (c) | Effective March 15, 2013, the investment advisory fee, net of voluntary waivers, decreased to 0.94%. Also effective March 15, 2013, the Adviser increased the voluntary waiver to 0.41%. | |
| (d) | Effective June 1, 2011, the investment advisory fee, net of voluntary waivers, increased to 1.00%. Also effective June 1, 2011, the Adviser reduced the voluntary waiver to 0.35%. |
See accompanying notes to financial statements.
| 6 | (Continued) |
CLEARWATER INVESTMENT TRUST
Financial Highlights
Per share data (rounded to the nearest cent) for a share of capital stock outstanding throughout the years ended and selected information for each year ended is as follows:
| Year ended December 31, | |||||||||||||||||||||
| Tax-Exempt Bond Fund | 2014 | 2013 | 2012 | 2011 | 2010 | ||||||||||||||||
| Net asset value, beginning of year | $ | 9.23 | 10.15 | 9.62 | 9.06 | 9.25 | |||||||||||||||
| Income (loss) from investment operations: | |||||||||||||||||||||
| Net investment income | 0.44 | 0.46 | 0.48 | 0.48 | 0.47 | ||||||||||||||||
| Net realized and unrealized gains (losses) | 0.95 | (0.84 | ) | 0.53 | 0.56 | (0.19 | ) | ||||||||||||||
| Total from investment operations | 1.39 | (0.38 | ) | 1.01 | 1.04 | 0.28 | |||||||||||||||
| Less distributions to shareholders from: | |||||||||||||||||||||
| Net investment income | (0.44 | ) | (0.46 | ) | (0.48 | ) | (0.48 | ) | (0.47 | ) | |||||||||||
| Net realized gain | (0.02 | ) | (0.08 | ) | - | - | - | ||||||||||||||
| Total distributions to shareholders | (0.46 | ) | (0.54 | ) | (0.48 | ) | (0.48 | ) | (0.47 | ) | |||||||||||
| Net asset value, end of year | $ | 10.16 | 9.23 | 10.15 | 9.62 | 9.06 | |||||||||||||||
| Total return (a) | 15.29 | % | (3.77 | )% | 10.66 | % | 11.81 | % | 2.99 | % | |||||||||||
| Net assets, end of year (000s omitted) | $ | 507,982 | 465,026 | 527,118 | 518,834 | 516,202 | |||||||||||||||
| Ratio of expenses, net of waivers, to average net assets (b)(c) | 0.33 | % | 0.34 | % | 0.36 | % | 0.36 | % | 0.36 | % | |||||||||||
| Ratio of expenses, before waivers, to average net assets (b)(c) | 0.60 | % | 0.60 | % | 0.60 | % | 0.60 | % | 0.60 | % | |||||||||||
| Ratio of net investment income, net of waivers, to average net assets(c) | 4.48 | % | 4.78 | % | 4.79 | % | 5.08 | % | 5.00 | % | |||||||||||
| Ratio of net investment income, before waivers, to average net assets(c) | 4.21 | % | 4.52 | % | 4.55 | % | 4.84 | % | 4.76 | % | |||||||||||
| Portfolio turnover rate (excluding short-term securities) | 22.25 | % | 31.65 | % | 28.06 | % | 24.83 | % | 28.95 | % | |||||||||||
| (a) | Total return figures are based on the change in net asset value of a share during the year and assume reinvestment of distributions at net asset value. | |
| (b) | In addition to fees and expenses which the Fund bears directly, the Fund indirectly bears a pro rata share of the fees and expenses of any acquired funds in which it invests. Such indirect expenses are not included in the above reported expense ratios. | |
| (c) | Effective March 15, 2013, the investment advisory fee, net of voluntary waivers, decreased to 0.33%. Also effective March 15, 2013, the Adviser increased the voluntary waiver to 0.27%. |
See accompanying notes to financial statements.
| 7 | (Continued) |
CLEARWATER INVESTMENT TRUST
Financial Highlights
Per share data (rounded to the nearest cent) for a share of capital stock outstanding throughout the years ended and selected information for each year ended is as follows:
| Year ended December 31, | |||||||||||||||||||||
| International Fund | 2014 | 2013 | 2012 | 2011 | 2010 | ||||||||||||||||
| Net asset value, beginning of year | $ | 15.76 | 13.33 | 12.23 | 14.33 | 13.16 | |||||||||||||||
| Income (loss) from investment operations: | |||||||||||||||||||||
| Net investment income | 0.35 | 0.29 | 0.30 | 0.30 | 0.23 | ||||||||||||||||
| Net realized and unrealized gains (losses) | (1.08 | ) | 2.62 | 1.88 | (2.08 | ) | 1.27 | ||||||||||||||
| Total from investment operations | (0.73 | ) | 2.91 | 2.18 | (1.78 | ) | 1.50 | ||||||||||||||
| Less distributions to shareholders from: | |||||||||||||||||||||
| Net investment income | (0.36 | ) | (0.34 | ) | (0.31 | ) | (0.29 | ) | (0.23 | ) | |||||||||||
| Net realized gain | (0.26 | ) | (0.14 | ) | (0.77 | ) | (0.03 | ) | (0.10 | ) | |||||||||||
| Total distributions to shareholders | (0.62 | ) | (0.48 | ) | (1.08 | ) | (0.32 | ) | (0.33 | ) | |||||||||||
| Net asset value, end of year | $ | 14.41 | 15.76 | 13.33 | 12.23 | 14.33 | |||||||||||||||
| Total return (a) | (4.70 | )% | 21.85 | % | 17.91 | % | (12.44 | )% | 11.39 | % | |||||||||||
| Net assets, end of year (000s omitted) | $ | 481,943 | 511,904 | 408,059 | 305,071 | 346,415 | |||||||||||||||
| Ratio of expenses, net of waivers, to average net assets (b)(c)(d)(e) | 0.67 | % | 0.66 | % | 0.62 | % | 0.77 | % | 0.80 | % | |||||||||||
| Ratio of expenses, before waivers, to average net assets (b)(c)(d)(e) | 1.00 | % | 1.00 | % | 1.00 | % | 1.00 | % | 1.00 | % | |||||||||||
| Ratio of net investment income, net of waivers, to average net assets (c)(d)(e) | 2.22 | % | 1.99 | % | 2.39 | % | 2.15 | % | 1.77 | % | |||||||||||
| Ratio of net investment income, before waivers, to average net assets (c)(d)(e) | 1.89 | % | 1.65 | % | 2.01 | % | 1.92 | % | 1.57 | % | |||||||||||
| Portfolio turnover rate (excluding short-term securities) | 15.33 | % | 22.54 | % | 72.32 | % | 36.93 | % | 30.82 | % | |||||||||||
| (a) | Total return figures are based on the change in net asset value of a share during the year and assume reinvestment of distributions at net asset value. | |
| (b) | In addition to fees and expenses which the Fund bears directly, the Fund indirectly bears a pro rata share of the fees and expenses of any acquired funds in which it invests. Such indirect expenses are not included in the above reported expense ratios. | |
| (c) | Effective March 15, 2013, the investment advisory fee, net of voluntary waivers, increased to 0.67%. Also effective March 15, 2013, the Adviser reduced the voluntary waiver to 0.33%. | |
| (d) | Effective March 15, 2012, the investment advisory fee, net of voluntary waivers, decreased to 0.60%. Also effective March 15, 2012, the Adviser increased the voluntary waiver to 0.40%. | |
| (e) | Effective June 1, 2011, the investment advisory fee, net of voluntary waivers, decreased to 0.75%. Also effective June 1, 2011, the Adviser increased the voluntary waiver to 0.25%. Effective December 5, 2011, the investment advisory fee, net of voluntary waivers, decreased to 0.70%. Also effective December 5, 2011, the Adviser increased the voluntary waiver to 0.30%. |
See accompanying notes to financial statements.
| 8 | (Continued) |
CLEARWATER INVESTMENT TRUST
December 31, 2014
| (1) | Organization |
Clearwater Investment Trust (the “Trust”) was established on January 12, 1987 as a Massachusetts business trust and is registered under the Investment Company Act of 1940 (as amended) as a diversified open end management investment company and presently includes four series: Clearwater Core Equity Fund, Clearwater Small Companies Fund, Clearwater Tax-Exempt Bond Fund, and Clearwater International Fund (the “Funds”). Clearwater Management Company (the “Adviser”) serves as the investment adviser for each of the Funds and is responsible for the oversight of each of the Fund’s subadvisers. The Trust’s declaration of trust permits the Board of Trustees to create additional funds in the future. The investment objective of the Clearwater Core Equity, Small Companies, and International Funds is long-term capital growth. The investment objective of the Clearwater Tax-Exempt Bond Fund is high current income that is exempt from United States (“U.S.”) federal income tax, consistent with preservation of capital.
Fiduciary Counselling, Inc. (“FCI”) acts as subadviser to each of the Funds. FCI does not provide day-to-day management, but provides the Funds with various investment-related services, including investment strategy advice, manager recommendations and related duties as requested by the Adviser. FCI also provides certain services related to due diligence, performance reporting, compliance, and other administrative functions, which support the investment management services and subadviser oversight services provided to the Funds by the Adviser.
The Northern Trust Company serves as the custodian, administrator, accounting services agent and transfer agent for the Trust.
Under normal market conditions, the Clearwater Core Equity Fund pursues its investment objective by investing at least 80% of its net assets, plus the amount of any borrowings for investment purposes, in equity securities of U.S. companies. The equity securities in which the Fund primarily invests are common and preferred stocks. The Fund employs a multi-style (growth and value) and multi-manager approach whereby portions of the Fund are allocated to different subadvisers who employ distinct investment styles. The Fund’s Adviser allocates portions of the Fund’s net assets among subadvisers. The Fund currently allocates net assets among the following subadvisers who provide day-to-day management for the Fund: Parametric Portfolio Associates (“Parametric”), Heartland Advisors, Inc. (“Heartland”), Knightsbridge Asset Management, LLC (“Knightsbridge”), and Osterweis Capital Management, LLC (“Osterweis”). The allocation among subadvisers will vary over time, but the current intent of the Fund’s Adviser is that under normal market conditions approximately 60% of the Fund’s net assets will be allocated to Parametric; the remaining net assets will be allocated to one or more of the Fund’s three other subadvisers. To the extent feasible, Parametric manages its portion of the Fund’s net assets in a passive management strategy so that its portion of the Fund’s holdings generally matches the holdings of the Russell 1000® Index as closely as possible without requiring the Fund to realize gains. In addition, as noted above, FCI also acts as a subadviser to the Fund.
Under normal market conditions, the Clearwater Small Companies Fund invests at least 80% of its net assets, plus the amount of any borrowings for investment purposes, in equity securities of small companies. The Fund defines “small companies” as issuers with market capitalizations no greater than $5 billion at the time of purchase. The equity securities the Fund invests in consist primarily of exchange traded common and preferred stocks. The Fund may also invest in a type of equity security called a convertible security to reduce volatility or correlation risk associated with individual securities or sectors. A convertible security generally entitles the holder to receive interest paid or accrued on debt securities or the dividend paid on preferred stock until the
9
CLEARWATER INVESTMENT TRUST
Notes to Financial Statements
December 31, 2014
convertible security matures or is redeemed, converted or exchanged. The Fund uses a “multi-style, multi-manager” approach, whereby portions of the Fund’s net assets are allocated between subadvisers who employ distinct investment styles. The Fund currently has two subadvisers that provide day-to-day management for the Fund, Kennedy Capital Management, Inc. (“Kennedy”) and Keeley Asset Management (“Keeley”). In addition, as noted above, FCI also acts as a subadviser to the Fund.
Under normal market conditions, the Clearwater Tax-Exempt Bond Fund invests at least 80% of its net assets, plus the amount of any borrowings for investment purposes, in tax-exempt bonds, which are debt obligations issued by or for the U.S. states, territories and possessions, and the District of Columbia. The interest on these bonds is generally exempt from both U.S. regular federal income tax and U.S. federal alternative minimum tax. However, the Fund may invest up to 20% of its net assets in bonds that generate interest income subject to federal alternative minimum tax. The Fund invests in both revenue bonds, which are backed by and payable only from the revenues derived from a specific facility or specific revenue source, and in general obligation bonds, which are secured by the full faith, credit and taxation power of the issuing municipality. The Fund currently has one subadviser that provides day-to-day management for the Fund, Sit Fixed Income Advisers II, LLC (“Sit”). In addition, as noted above, FCI also acts as a subadviser to the Fund.
Under normal market conditions, the Clearwater International Fund intends to invest at least 80% of the value of its net assets, plus the amount of any borrowings for investment purposes, in equity securities of companies organized or located outside the U.S. and doing a substantial amount of business outside the U.S. Equity securities in which the Fund invests include common and preferred stock, sponsored and unsponsored American Depositary Receipts, European Depositary Receipts, and Global Depositary Receipts as well as exchange-traded funds and other investment companies. The Fund diversifies its investments among a number of different countries throughout the world, and may invest in companies of any size. The Fund currently does not intend to invest more than 20% of its net assets in the equity securities of developing or emerging market issuers. In order to hedge against adverse movements in currency exchange rates, the Fund may enter into foreign currency exchange contracts. The Fund does not intend to invest in foreign currency exchange contracts for speculative purposes. The Fund uses a “multi-style, multi-manager” approach, whereby portions of the Fund’s net assets are allocated to different subadvisers who employ distinct investment styles. The Fund currently allocates net assets among the following subadvisers who provide day-to-day management for the Fund: Parametric, Artisan Partners Limited Partnership (“Artisan Partners”), Denver Investments (“Denver”), WCM Investment Management (“WCM”) and Templeton Investment Counsel, LLC (“Templeton”). The allocation among subadvisers will vary over time, but the current intent of the Fund’s Adviser is that under normal market conditions approximately 50% of the Fund’s net assets will be allocated to Parametric; the remaining net assets will be allocated to one or more of the Fund’s four other subadvisers. To the extent feasible, Parametric manages its portion of the Fund’s net assets in a passive management strategy so that its portion of the Fund’s holdings generally matches the holdings of the MSCI World Ex USA Index (net) on a net basis as closely as possible. In addition, as noted above, FCI also acts as a subadviser to the Fund.
| 10 | (Continued) |
CLEARWATER INVESTMENT TRUST
Notes to Financial Statements
December 31, 2014
| (2) | Summary of Significant Accounting Policies |
The Funds are investment companies and follow accounting and reporting guidance under Financial Accounting Standards Board (“FASB”) Accounting Standards Codification (“ASC”) Topic 946, “Financial Services-Investment Companies.”
The significant accounting policies followed by the Funds are as follows:
| (a) | Investments in Securities | |
| Investments in U.S. and foreign equity securities are valued at the last sales price or the regular trading session closing price on the principal exchange or market where they are traded. Foreign security values are stated in U.S. dollars. Equity securities which have not traded on the date of valuation or securities for which sales prices are not generally reported are valued at the mean between the last bid and asked prices. Debt securities maturing more than 60 days from the valuation date are valued at the market price supplied by an independent pricing vendor; those securities of sufficient credit quality with maturities of less than 60 days when acquired, or which subsequently are within 60 days of maturity, are valued at amortized cost, which approximates fair value. Securities for which no market quotations are readily available (including those for which trading has been suspended), or when the Adviser becomes aware that a significant event impacting the value of a security or group of securities has occurred after the closing of the exchange on which the security or securities principally trade, but before the calculation of the daily net asset value (“NAV”), are valued at fair value as determined in good faith using procedures established by the Board of Trustees. This may occur particularly with respect to certain foreign securities held by the International Fund, whereby the Board of Trustees may use adjustment factors obtained from an independent evaluation service that are intended to reflect more accurately the fair value of these foreign securities as of the time the Fund’s NAV is calculated. The procedures consider, among others, the following factors to determine a security’s fair value: the nature and pricing history (if any) of the security; whether any dealer quotations for the security are available; and possible valuation methodologies that could be used to determine the fair value of the security. These procedures are used by the Valuation Committee, in accordance with the procedures established by the Board of Trustees, to determine the fair value of the security or securities. Such determinations are then submitted for review and ratification by the Board of Trustees. The use of fair valuation involves the risk that the values used by the Funds to price their investments may be higher or lower than the values used by other unaffiliated investment companies and investors to price the same investments. Security transactions are accounted for on the trade date, which is the date the securities are purchased or sold. Realized gains and losses are calculated on an identified cost basis. Dividend income is recognized on the ex-dividend date or, for foreign securities, as soon as the information is available. Interest income, including accretion of original issue discount and amortization of original issue premium, is accrued daily. | ||
| (b) | Foreign Currency Translation | |
| The International Fund invests in securities which are purchased and sold in foreign currencies as a principal investment strategy. The costs of purchases, proceeds from sales of investments, interest and dividend income are translated into U.S. dollars using the spot market rate of exchange prevailing on the respective dates of such transactions. The value of the International Fund’s net assets, as measured in U.S. dollars, may be affected favorably or unfavorably by changes in foreign currency exchange rates and exchange control regulations. The gains or losses, if any, on investments resulting from changes in foreign exchange rates are recorded within net realized gain on security transactions and within net increase (decrease) in unrealized appreciation/depreciation on security transactions on the Statements of Operations. The realized gains or | ||
| 11 | (Continued) |
CLEARWATER INVESTMENT TRUST
Notes to Financial Statements
December 31, 2014
| losses, if any, on translation of other assets and liabilities denominated in foreign currencies are recorded within net realized gain on foreign currency transactions on the Statements of Operations. The International Fund also will incur costs in converting U.S. dollars to local currencies, and vice versa. The International Fund therefore may enter into foreign currency transactions as a principal investment strategy. Risks may arise upon investing in foreign securities including, but not limited to, political, social or economic instability in the country of the issuer, the difficulty of predicting international trade patterns, the possibility of the imposition of exchange controls, expropriation, limits on removal of currency or other assets, nationalization of assets, foreign withholding and income tax and possible delays in the settlement of foreign stock exchange transactions. The principal markets on which these securities trade may have less volume and liquidity, and may be more volatile, than securities markets in the U.S. | ||
| (c) | Forward Foreign Currency Exchange Contracts | |
| The International Fund enters into forward foreign currency exchange contracts for the purchase or sale of a specific foreign currency at a fixed price on a future date as a hedge against adverse movements in foreign currency exchange rates, specific transactions or the portfolio position. The objective of the International Fund’s foreign currency hedging transactions is to reduce the risk that the U.S. dollar value of the International Fund’s foreign currency denominated securities will decline in value due to changes in foreign currency exchange rates. Forward foreign currency exchange contracts are marked-to-market daily at the applicable exchange rates. Any resulting unrealized gains or losses are recorded in forward foreign currency exchange contracts within net increase (decrease) in unrealized appreciation/depreciation on the Statements of Operations. The International Fund records any realized gains or losses at the time the forward foreign currency exchange contract is offset by entering into a closing transaction with the same counterparty or is extinguished by delivery of the currency. Realized gains or losses, if any, are recorded within net realized gain (loss) on forward foreign currency exchange contracts on the Statements of Operations. | ||
| Risks may arise upon entering into forward foreign currency exchange contracts from the potential of the issuer to default on its obligations under the contract and from unanticipated movements in the value of a foreign currency relative to the U.S. dollar. The contractual amounts of forward foreign currency exchange contracts do not necessarily represent the amounts potentially subject to risk. The measurement of risks associated with these instruments is meaningful only when all related and offsetting transactions are considered. The International Fund bears the market risk from changes in foreign currency exchange rates and the credit risk if the issuer fails to perform. Additional information on derivative instruments and how these positions may impact the financial statements is found in Note 8, Derivative Instruments. | ||
| (d) | Spot Contracts | |
| The International Fund routinely enters into spot contracts in order to buy or sell a certain amount of foreign currency at the current market rate. The International Fund may enter into spot contracts in order to make payments, or to receive payments, based on investment trading activity in a foreign currency. A spot contract allows the International Fund to buy or sell foreign currency on the day it chooses to deal. From time to time, the Core Equity Fund may also enter into spot contracts in order to make or receive payments due to investment trading activity in a foreign currency on a non-U.S. exchange. Spot contracts are marked-to-market daily at the applicable exchange rates. Any resulting unrealized gains or losses are recorded in foreign currency transactions within net increase (decrease) in unrealized appreciation/depreciation on the Statements of Operations. Foreign currency amounts payable to or receivable from counterparties related to outstanding spot contracts, if any, are recorded in payables for investment securities purchased or receivable for securities | ||
| 12 | (Continued) |
CLEARWATER INVESTMENT TRUST
Notes to Financial Statements
December 31, 2014
| sold, respectively, on the Statements of Assets and Liabilities. The Funds record any realized gains or losses at the time the spot contract settles. Realized gains or losses, if any, are included within net realized gain (loss) on foreign currency transactions on the Statements of Operations. Risks may arise upon entering into spot contracts from unanticipated movements in the value of a foreign currency relative to the U.S. dollar in a short period of time. The Funds bear the market risk from changes in foreign currency exchange rates. | ||
| (e) | Master Limited Partnerships | |
| The Core Equity and International Funds invest in Master Limited Partnerships (“MLPs”). The benefits derived from the Funds’ investments in MLPs is largely dependent on the MLPs being treated as partnerships for federal income tax purposes. If any of the MLPs held by the Funds were treated as corporations for U.S. federal income tax purposes, the after-tax return to the Funds with respect to their investments in such MLPs would be materially reduced, causing a decline in the value of the common stock. The Funds must include their allocable share of an MLP’s taxable income in their reportable taxable income, whether or not it receives a distribution in cash from the MLP. In such case, the Funds may have to liquidate securities to make required distributions to shareholders. | ||
| (f) | Delayed Delivery Transactions and When-Issued Securities | |
| Certain Funds may engage in securities transactions on a when-issued or delayed-delivery basis. In these transactions, the securities’ prices and yields are fixed on the date of the commitment, with payment and delivery scheduled for a future date. During this period, the securities are subject to market fluctuations. When delayed-delivery purchases are outstanding, a Fund will segregate liquid assets on its records in amounts sufficient to meet the purchase price. A Fund may dispose of or renegotiate a delayed-delivery transaction, which may result in a capital gain or loss. | ||
| (g) | Short-Term Investments | |
| Each Fund currently invests uninvested cash in money market portfolios of Northern Institutional Funds, an investment company advised by Northern Trust Investments, Inc. (“NTI”), a subsidiary of Northern Trust. The Core Equity, Small Companies and International Funds currently invest in the U.S. Government Select Portfolio and the Tax-Exempt Bond Fund currently invests in the Tax-Exempt Portfolio. The U.S. Government Select Portfolio primarily invests in securities issued by the U.S. government, government agencies, and government-sponsored enterprises. The Tax-Exempt Portfolio primarily invests in high-quality short-term municipal instruments. | ||
| (h) | Recoverable Taxes | |
| The balances disclosed as foreign tax reclaim receivable, if any, represent net amounts withheld by foreign governments on dividend income earned in the respective countries subject to reclamation. All reclaims are paid directly to the applicable Funds. | ||
| (i) | Federal Taxes | |
| The Trust’s policy is to comply with the requirements of the Internal Revenue Code applicable to regulated investment companies. On a calendar-year basis, the Funds intend to distribute substantially all of their net investment income and net realized gains, if any, to avoid the payment of federal income and excise taxes. Therefore, no income tax provision is required. Each Fund is treated as a separate entity for federal income tax purposes. | ||
| 13 | (Continued) |
CLEARWATER INVESTMENT TRUST
Notes to Financial Statements
December 31, 2014
| Management has analyzed the Funds’ tax positions taken on federal tax returns for all open tax years and has concluded that as of December 31, 2014, no provision for income tax would be required in the Funds’ financial statements. The Funds’ federal and state income and federal excise tax returns for the 2011, 2012, 2013 and 2014 tax years for which the applicable statutes of limitations have not expired remain subject to examination by the Internal Revenue Service and state departments of revenue. Net investment income and net realized gain (loss) for the Funds may differ for financial statement and tax purposes. The character of distributions made during the year from net investment income or net realized gains, if any, may differ from their ultimate characterization for federal income tax purposes. Also, due to the timing of dividend distributions, the fiscal year in which amounts are distributed may differ from the year that the income or realized gain (loss) were recorded by the Funds. The tax character of distributions paid by the Funds during the years ended December 31, 2014 and 2013 was as follows: | ||
| Tax-Exempt | Ordinary Income | |||||||||||||||
| 2014 | 2013 | 2014 | 2013 | |||||||||||||
| Core Equity Fund | $ | - | $ | - | $ | 7,119,857 | $ | 6,741,356 | ||||||||
| Small Companies Fund | - | - | 4,041,973 | 7,282,854 | ||||||||||||
| Tax-Exempt Bond Fund | 21,739,172 | 22,903,417 | 683,862 | 199,996 | ||||||||||||
| International Fund | - | - | 13,341,732 | 12,704,376 | ||||||||||||
| Long-Term Capital Gains | ||||||||||||||||
| 2014 | 2013 | |||||||||||||||
| Core Equity Fund | $ | 17,853,920 | $ | 141,918 | ||||||||||||
| Small Companies Fund | 43,827,345 | 31,561,189 | ||||||||||||||
| Tax-Exempt Bond Fund | 350,149 | 4,029,044 | ||||||||||||||
| International Fund | 6,673,460 | 2,541,715 | ||||||||||||||
As of December 31, 2014, the components of distributable earnings on a tax basis were as follows:
| Core | Small Companies | Tax-Exempt | International | |||||||||||||
| Equity Fund | Fund | Bond Fund | Fund | |||||||||||||
| Undistributed ordinary income | $ | - | $ | 159,906 | $ | 154,583 | $ | 299,490 | ||||||||
| Undistributed capital gain | 861,434 | 1,191,873 | 3,131 | 1,377,850 | ||||||||||||
| Accumulated capital losses | (1,129,556 | ) | (1,262,085 | ) | (216,640 | ) | (1,823,469 | ) | ||||||||
| Unrealized appreciation | 274,892,141 | 73,134,739 | 27,589,472 | 102,654,837 | ||||||||||||
| Total | $ | 274,624,019 | $ | 73,224,433 | $ | 27,530,546 | $ | 102,508,708 | ||||||||
| Distributions to shareholders from net investment income and net realized gain are determined in accordance with federal income tax regulations, which may differ from such amounts recorded in accordance with U.S. generally accepted accounting principles (“U.S. GAAP”) for financial reporting purposes. Accordingly, the Funds may make reclassifications among certain of their capital accounts in order to reflect the tax treatment for certain permanent differences that exist between federal income tax regulations and U.S. GAAP. These reclassifications are reported in order to reflect the tax treatment for certain permanent differences that exist | ||
| 14 | (Continued) |
CLEARWATER INVESTMENT TRUST
Notes to Financial Statements
December 31, 2014
| between income tax regulations and U.S. GAAP. These reclassifications may relate to net operating losses, Section 998 currency gains and losses, Passive Foreign Investment Companies (“PFICs”) gains and losses, recharacterization of dividends from investments in REITs, and Partnerships. These reclassifications have no impact on the total net assets or the NAV per share of the Funds. At December 31, 2014, reclassifications have been recorded among the following capital accounts on the Statements of Assets and Liabilities: | ||
| Core | Small Companies | Tax-Exempt | International | |||||||||||||
| Equity Fund | Fund | Bond Fund | Fund | |||||||||||||
Undistributed (overdistributed) net investment income | $ | 472,045 | $ | (47,403 | ) | $ | (3,089 | ) | $ | 145,987 | ||||||
| Accumulated net realized | ||||||||||||||||
| gain (loss) | (472,045 | ) | 47,403 | 3,089 | (145,987 | ) | ||||||||||
| (j) | Distributions to Shareholders | |
| Distributions to shareholders from net investment income, if any, are declared annually for the Core Equity, Small Companies, and International Funds and declared daily, payable monthly, for the Tax-Exempt Bond Fund. Distributions to shareholders from net realized gains, if any, are declared annually for all Funds. Distributions are paid in cash or reinvested in additional shares at the direction of the shareholders. | ||
| (k) | Use of Estimates | |
| The preparation of financial statements in conformity with U.S. GAAP requires management to make estimates and assumptions that affect the reported amounts of assets and liabilities and disclosure of contingent assets and liabilities at the date of the financial statements and the reported amounts of increase and decrease in net assets from operations during the period. Actual results could differ from those estimates. | ||
| (l) | Indemnification | |
| Under each Fund’s organizational documents, its officers and directors are indemnified against certain liabilities arising out of the performance of their duties to each Fund. In addition, certain of each Fund’s contracts with its service providers contain general indemnification clauses. Each Fund’s maximum exposure under these arrangements is unknown since the amount of any future claims that may be made against each Fund cannot be determined and each Fund has no historical basis for predicting the likelihood of any such claims. |
| (3) | Fair Value Measurements |
Fair value is an estimate of the price the Funds would receive upon selling a security in a timely transaction to an independent buyer in the principal or most advantageous market of the security. This guidance establishes a three-tier hierarchy to maximize the use of observable market data and minimize the use of unobservable inputs and to establish classification of fair value measurements for disclosure purposes. Various inputs are used in determining the value of the Funds’ investments, as described in Note 2(a) above. These inputs are summarized in the three broad levels listed below.
| ● | Level 1 – Unadjusted quoted market prices in active markets for identical securities on the measurement date. |
| 15 | (Continued) |
CLEARWATER INVESTMENT TRUST
Notes to Financial Statements
December 31, 2014
| ● | Level 2 – Other significant observable inputs including quoted prices for similar investments, interest rates, prepayment speeds, credit risk, etc. or quoted prices for identical or similar assets in markets that are not active. Inputs that are derived principally from or corroborated by observable market data are also considered a Level 2 measurement. An adjustment to any observable input that is significant to the fair value may render the measurement a Level 3 measurement. |
| ● | Level 3 – Valuations based on unobservable inputs, which may include the Adviser’s own assumptions in determining the fair value of an investment. |
The inputs or methodology used for valuing securities are not necessarily an indication of the risk associated with investing in those securities and other financial instruments, if any. The following is a summary of the inputs used in valuing each Fund’s investments and other financial instruments, if any, which are carried at fair value, as of December 31, 2014.
| Core Equity Fund (a) | ||||||||||||||||
| Level 1 | Level 2 | Level 3 | Total | |||||||||||||
| Common Stocks | $ | 520,274,803 | $ | - | $ | - | $ | 520,274,803 | ||||||||
| Master Limited Partnerships | 9,950,098 | - | - | 9,950,098 | ||||||||||||
| Rights | 4,475 | - | - | 4,475 | ||||||||||||
| Warrants | 321,624 | - | - | 321,624 | ||||||||||||
| Short-Term Investments | 10,357,430 | - | - | 10,357,430 | ||||||||||||
| Total | $ | 540,908,430 | $ | - | $ | - | $ | 540,908,430 | ||||||||
| (a) | For the Core Equity Fund, the investment value is comprised of equity securities, master limited partnerships, rights, warrants and short-term investments. See the Fund’s Schedule of Investments for industry classification. Investments in equity, master limited partnerships and short-term securities generally are valued at the last sales price or the regular trading session closing price on the principal exchange or market where they are traded. Investments in rights and warrants generally are determined by taking into account the terms of the rights and warrants as well as the value of the underlying equity securities, which are determined by the valuation methodology described above. | |
| The Core Equity Fund records all transfers between levels based on valuations at the end of each reporting period. At December 31, 2014, there were no transfers between Level 1, Level 2 or Level 3 classifications based on levels assigned to the securities on December 31, 2013. | ||
| 16 | (Continued) |
CLEARWATER INVESTMENT TRUST
Notes to Financial Statements
December 31, 2014
| Small Companies Fund (b) | ||||||||||||||||
| Level 1 | Level 2 | Level 3 | Total | |||||||||||||
| Common Stocks | $ | 325,278,777 | $ | - | $ | - | $ | 325,278,777 | ||||||||
| Short-Term Investments | 11,049,724 | - | - | 11,049,724 | ||||||||||||
| Total | $ | 336,328,501 | $ | - | $ | - | $ | 336,328,501 | ||||||||
| (b) | For the Small Companies Fund, the investment value is comprised of equity securities and short-term investments. See the Fund’s Schedule of Investments for industry classification. Investments in equity and short-term securities generally are valued at the last sales price or the regular trading session closing price on the principal exchange or market where they are traded. | |
| The Small Companies Fund records all transfers between levels based on valuations at the end of each reporting period. At December 31, 2014, there were no transfers between Level 1, Level 2 or Level 3 classifications based on levels assigned to the securities on December 31, 2013. | ||
| 17 | (Continued) |
CLEARWATER INVESTMENT TRUST
Notes to Financial Statements
December 31, 2014
| Tax-Exempt Bond Fund (c) | ||||||||||||||||
| Level 1 | Level 2 | Level 3 | Total | |||||||||||||
| Closed-End Funds | $ | 28,448,179 | $ | - | $ | - | $ | 28,448,179 | ||||||||
| Municipal Bonds | ||||||||||||||||
| Airport | - | 3,955,890 | - | 3,955,890 | ||||||||||||
| Bond Bank | - | 2,546,461 | - | 2,546,461 | ||||||||||||
| Development | - | 24,267,564 | 267,629 | 24,535,193 | ||||||||||||
| Education | - | 40,546,020 | - | 40,546,020 | ||||||||||||
| Facilities | - | 2,038,535 | - | 2,038,535 | ||||||||||||
| General | - | 45,907,386 | 3,515 | 45,910,901 | ||||||||||||
| General Obligation | - | 19,198,526 | - | 19,198,526 | ||||||||||||
| Higher Education | - | 20,664,231 | - | 20,664,231 | ||||||||||||
| Housing | - | 43,740,289 | - | 43,740,289 | ||||||||||||
| Medical | - | 52,967,507 | 157,500 | 53,125,007 | ||||||||||||
| Mello-Roos | - | 431,905 | - | 431,905 | ||||||||||||
| Multifamily Housing | - | 27,559,434 | - | 27,559,434 | ||||||||||||
| Nursing Home | - | 48,336,392 | - | 48,336,392 | ||||||||||||
| Pollution | - | 586,980 | - | 586,980 | ||||||||||||
| Power | - | 6,234,800 | - | 6,234,800 | ||||||||||||
| School District | - | 29,244,325 | - | 29,244,325 | ||||||||||||
| Single Family Housing | - | 69,587,218 | - | 69,587,218 | ||||||||||||
| Student Loan | - | 2,811,461 | - | 2,811,461 | ||||||||||||
| Tobacco Settlement | - | 720,213 | - | 720,213 | ||||||||||||
| Transportation | - | 13,242,121 | - | 13,242,121 | ||||||||||||
| Utilities | - | 2,714,438 | - | 2,714,438 | ||||||||||||
| Water | - | 9,464,613 | - | 9,464,613 | ||||||||||||
| Short-Term Investments | 7,017,997 | - | - | 7,017,997 | ||||||||||||
| Total | $ | 35,466,176 | $ | 466,766,309 | $ | 428,644 | $ | 502,661,129 | ||||||||
| (c) | For the Tax-Exempt Bond Fund, the investment value is comprised of closed-end funds, municipal bonds, and short-term investments. Investments in closed-end funds and short-term securities generally are valued at the last sales price or the regular trading session closing price on the principal exchange or market where they are traded. Investments in municipal bonds generally are based on valuations using adjusted evaluated prices provided by the primary pricing provider. The Board of Trustees has delegated to the Valuation Committee the responsibility to determine in good faith the fair value of securities for which no price quotation is available from an approved pricing service or broker-dealer at the time the Tax-Exempt Bond Fund’s NAV is calculated, including securities for which the prices do not represent fair value or for which a significant event occurs that materially affects the value of the security after the close of the market on which the security principally trades and before the time the Tax-Exempt Bond Fund’s NAV is calculated. |
| 18 | (Continued) |
CLEARWATER INVESTMENT TRUST
Notes to Financial Statements
December 31, 2014
As of December 31, 2014, the Valuation Committee determined the fair valuation of municipal bonds based on inputs such as the last traded price at the time of significant events or the default of a municipal bond in addition to the consideration of observations and the nature of similar securities which are not currently openly traded in the active market. Such investments have been classified as Level 3 instruments.
The Tax-Exempt Bond Fund records all transfers between levels based on valuations at the end of each reporting period. At December 31, 2014, there were no transfers between Level 1 or Level 2 classifications based on levels assigned to the securities on December 31, 2013.
The following is a reconciliation of investments for the Tax-Exempt Bond Fund in which significant unobservable inputs (Level 3) were used in determining fair value:
| Municipal Bonds | ||||||||||||||||
| Development | General | Medical | Total | |||||||||||||
| Balance as of 12/31/13 | $ | 180,129 | $ | 3,515 | $ | 157,500 | $ | 341,144 | ||||||||
| Accrued Discounts | - | - | - | - | ||||||||||||
| Realized Gains (Losses) | - | - | - | - | ||||||||||||
| Change in Unrealized Appreciation (Depreciation) | - | - | - | - | ||||||||||||
| Purchases | - | - | - | - | ||||||||||||
| Sales | - | - | - | - | ||||||||||||
Transfers into Level 3 (1) | 87,500 | (2) | - | - | 87,500 | |||||||||||
| Transfers out of Level 3 | - | - | - | - | ||||||||||||
| Balance as of 12/31/14 | $ | 267,629 | $ | 3,515 | $ | 157,500 | $ | 428,644 | ||||||||
Net increase (decrease) in unrealized appreciation (depreciation) (3) | $ | 1,418 | $ | - | $ | - | $ | 1,418 | ||||||||
| (1) | The value of Transfers into Level 3 is measured using the fair value as of the year ended December 31, 2014. |
| (2) | Transferred from Level 2 to Level 3 due to the security being measured at fair value at the time of default using procedures adopted by the Board of Trustees. |
| (3) | The net increase (decrease) in unrealized appreciation (depreciation) on Level 3 securities still held at December 31, 2014 is included in the Statements of Operations. |
There were no significant Level 3 valuations for which significant unobservable valuations inputs were developed at December 31, 2014.
| 19 | (Continued) |
CLEARWATER INVESTMENT TRUST
Notes to Financial Statements
December 31, 2014
| International Fund (d) | ||||||||||||||||
| Level 1 | Level 2 | Level 3 | Total | |||||||||||||
| Common Stocks | ||||||||||||||||
| Canada | $ | 5,483,238 | $ | 31,347,506 | $ | - | $ | 36,830,744 | ||||||||
| China | 1,767,679 | 9,477,493 | - | 11,245,172 | ||||||||||||
| Denmark | 2,224,127 | 10,197,082 | - | 12,421,209 | ||||||||||||
| Ireland | 5,738,985 | 3,422,158 | - | 9,161,143 | ||||||||||||
| Israel | 2,707,264 | 409,433 | - | 3,116,697 | ||||||||||||
| Netherlands | 7,852,025 | 14,190,905 | - | 22,042,930 | ||||||||||||
| Russia | 122 | 56,753 | - | 56,875 | ||||||||||||
| Switzerland | 5,492,208 | 32,900,323 | - | 38,392,531 | ||||||||||||
| Taiwan | 3,502,157 | 2,706,777 | - | 6,208,934 | ||||||||||||
| United Kingdom | 3,325,920 | 77,216,202 | - | 80,542,122 | ||||||||||||
| United States | 9,818,593 | 649,028 | - | 10,467,621 | ||||||||||||
| All other countries | - | 228,504,223 | - | 228,504,223 | ||||||||||||
| Master Limited Partnerships | 2,568,490 | - | - | 2,568,490 | ||||||||||||
| Preferred Stock | - | 1,782,442 | - | 1,782,442 | ||||||||||||
| Rights | ||||||||||||||||
| South Korea | 16,549 | - | - | 16,549 | ||||||||||||
| All other countries | - | 2,350 | - | 2,350 | ||||||||||||
| Warrants | 22,112 | - | - | 22,112 | ||||||||||||
| Investment Companies | 906,174 | - | - | 906,174 | ||||||||||||
| Short-Term Investments | 16,787,523 | - | - | 16,787,523 | ||||||||||||
| Total | $ | 68,213,166 | $ | 412,862,675 | $ | - | $ | 481,075,841 | ||||||||
| (d) | For the International Fund, the investment value is comprised of equity securities, master limited partnerships, rights, warrants, investment companies and short-term investments. See the Fund’s Schedule of Investments for additional information on industry sector and currency concentration information. Investments in equity, master limited partnerships, investment companies and short-term securities generally are valued at the last sales price or the regular trading session closing price on the principal exchange or market where they are traded. Investments in rights and warrants generally are determined by taking into account the terms of the rights and warrants as well as the value of the underlying equity securities, which are determined by the valuation methodology described above. At December 31, 2014, an equity security, based in the United Kingdom, with a fair value of $4,682, was valued nominally using observable inputs other than the last traded price from the primary pricing provider. |
| 20 | (Continued) |
CLEARWATER INVESTMENT TRUST
Notes to Financial Statements
December 31, 2014
| At December 31, 2014, the International Fund adjusted the price of certain foreign equity securities held in its portfolio on December 31, 2014 using adjustment factors designed to reflect more accurately the fair value of the securities. The fair valuation of these securities resulted in their classification as Level 2 investments. Additionally, a Hong Kong security’s trading was suspended pending a potential corporate action and was valued using the last traded price from the primary pricing provider. The security was classified as Level 2 because the security was not actively trading at year end. | |
| The International Fund records all transfers between levels based on valuations at the end of each reporting period. | |
| At December 31, 2014, the International Fund had transfers from Level 1 to Level 2 classifications from December 31, 2013 to December 31, 2014 as disclosed below: |
| Transfers from Level 1 to Level 2 | |||||
| Country | Value | Reason | |||
| Common Stocks | |||||
| Australia | $ | 25,526,209 | Valuations at last trade with foreign fair value adjustments | ||
| Austria | 1,439,060 | Valuations at last trade with foreign fair value adjustments | |||
| Belgium | 4,670,602 | Valuations at last trade with foreign fair value adjustments | |||
| Brazil | 1,129,683 | Valuations at last trade with foreign fair value adjustments | |||
| Canada | 30,118,470 | Valuations at last trade with foreign fair value adjustments | |||
| China | 6,591,946 | Valuations at last trade with foreign fair value adjustments | |||
| Denmark | 4,462,612 | Valuations at last trade with foreign fair value adjustments | |||
| Finland | 4,327,176 | Valuations at last trade with foreign fair value adjustments | |||
| France | 23,706,067 | Valuations at last trade with foreign fair value adjustments | |||
| Germany | 22,817,779 | Valuations at last trade with foreign fair value adjustments | |||
| Greece | 322,809 | Valuations at last trade with foreign fair value adjustments | |||
| Hong Kong | 18,499,944 | Valuations at last trade with foreign fair value adjustments | |||
| 729,641 | Valuation other than last traded price based on active trading | ||||
| Ireland | 2,025,820 | Valuations at last trade with foreign fair value adjustments | |||
| Israel | 365,852 | Valuations at last trade with foreign fair value adjustments | |||
| Italy | 7,588,951 | Valuations at last trade with foreign fair value adjustments | |||
| Japan | 62,526,418 | Valuations at last trade with foreign fair value adjustments | |||
| Mexico | 1,067,927 | Valuations at last trade with foreign fair value adjustments | |||
| Netherlands | 13,862,058 | Valuations at last trade with foreign fair value adjustments | |||
| New Zealand | 252,215 | Valuations at last trade with foreign fair value adjustments | |||
| 21 | (Continued) |
CLEARWATER INVESTMENT TRUST
Notes to Financial Statements
December 31, 2014
| Country | Value | Reason | ||||
| Norway | $ | 3,572,353 | Valuations at last trade with foreign fair value adjustments | |||
| Philippines | 614,957 | Valuations at last trade with foreign fair value adjustments | ||||
| Portugal | 224,820 | Valuations at last trade with foreign fair value adjustments | ||||
| Russia | 56,753 | Valuations at last trade with foreign fair value adjustments | ||||
| Singapore | 3,267,146 | Valuations at last trade with foreign fair value adjustments | ||||
| South Africa | 1,167,171 | Valuations at last trade with foreign fair value adjustments | ||||
| South Korea | 9,134,601 | Valuations at last trade with foreign fair value adjustments | ||||
| Spain | 7,654,920 | Valuations at last trade with foreign fair value adjustments | ||||
| Sweden | 8,908,856 | Valuations at last trade with foreign fair value adjustments | ||||
| Switzerland | 29,809,149 | Valuations at last trade with foreign fair value adjustments | ||||
| Taiwan | 2,706,778 | Valuations at last trade with foreign fair value adjustments | ||||
| Thailand | 563,708 | Valuations at last trade with foreign fair value adjustments | ||||
| United Kingdom | 63,021,082 | Valuations at last trade with foreign fair value adjustments | ||||
| United States | 520,850 | Valuations at last trade with foreign fair value adjustments | ||||
| Preferred Stock | ||||||
| Germany | 1,601,852 | Valuations at last trade with foreign fair value adjustments | ||||
| South Korea | 180,590 | Valuations at last trade with foreign fair value adjustments | ||||
| Rights | ||||||
| France | 11 | Valuations at last trade with foreign fair value adjustments | ||||
| Total | $ | 365,036,836 | ||||
| 22 | (Continued) | |
CLEARWATER INVESTMENT TRUST
Notes to Financial Statements
December 31, 2014
| Other Financial Instruments | Level 1 | Level 2 | Level 3 | Total | ||||||||||||
| Assets | ||||||||||||||||
| Forward foreign currency exchange contracts | $ | - | $ | 567,896 | $ | - | $ | 567,896 | ||||||||
| Liabilities | ||||||||||||||||
| Forward foreign currency exchange contracts | - | (53,793 | ) | - | (53,793 | ) | ||||||||||
| Net Other Financial Instruments | $ | - | $ | 514,103 | $ | - | $ | 514,103 | ||||||||
The forward foreign currency exchange contracts outstanding at December 31, 2014 are considered Level 2 investments due to the contracts being marked-to-market daily at the applicable exchange rates that have been adjusted from the initial quoted rate. Forward foreign currency exchange contracts are shown on a gross basis in the above table and on the Statements of Assets and Liabilities.
| (4) | Investment Security Transactions |
The cost of purchases and proceeds from sales of securities (excluding short-term securities) for the year ended December 31, 2014, were as follows:
| Purchases | Sales | |||||||
| Core Equity Fund | $ | 70,142,080 | $ | 88,250,989 | ||||
| Small Companies Fund | 183,124,537 | 210,559,783 | ||||||
| Tax-Exempt Bond Fund | 105,524,620 | 112,988,629 | ||||||
| International Fund | 82,642,774 | 75,404,274 | ||||||
| 23 | (Continued) |
CLEARWATER INVESTMENT TRUST
Notes to Financial Statements
December 31, 2014
| (5) | Capital Share Transactions |
Transactions in capital shares for fiscal years ended December 31, 2014 and December 31, 2013, were as follows:
| Core Equity Fund | Small Companies Fund | |||||||||||||||
| 2014 | 2013 | 2014 | 2013 | |||||||||||||
| Sold | 76,703 | 507,556 | 375,718 | 201,528 | ||||||||||||
| Issued for reinvestment of distributions | 625,596 | 183,114 | 2,336,228 | 1,743,449 | ||||||||||||
| Redeemed | (823,611 | ) | (560,122 | ) | (1,611,217 | ) | (1,670,646 | ) | ||||||||
| Net Increase (decrease) | (121,312 | ) | 130,548 | 1,100,729 | 274,331 | |||||||||||
| Tax-Exempt Bond Fund | International Fund | |||||||||||||||
| 2014 | 2013 | 2014 | 2013 | |||||||||||||
| Sold | 1,888,829 | 2,901,091 | 897,252 | 1,958,551 | ||||||||||||
| Issued for reinvestment of distributions | 2,303,187 | 2,834,108 | 1,374,670 | 973,569 | ||||||||||||
| Redeemed | (4,609,524 | ) | (7,249,870 | ) | (1,309,596 | ) | (1,067,258 | ) | ||||||||
| Net Increase (decrease) | (417,508 | ) | (1,514,671 | ) | 962,326 | 1,864,862 | ||||||||||
| (6) | Capital Loss Carryforward |
For the period subsequent to October 31, 2014 through the fiscal year ended December 31, 2014, the following Funds incurred net capital losses, and/or Section 988 currency losses which each Fund intends to treat as having been incurred in the following fiscal year:
| Short-Term | Long-Term | Total | ||||||||||
| Core Equity Fund | $ | 1,129,556 | $ | - | $ | 1,129,556 | ||||||
| Small Companies Fund | 1,262,085 | - | 1,262,085 | |||||||||
| Tax-Exempt Bond Fund | - | 216,640 | 216,640 | |||||||||
| International Fund | 1,823,469 | - | 1,823,469 | |||||||||
| 24 | (Continued) |
CLEARWATER INVESTMENT TRUST
Notes to Financial Statements
December 31, 2014
| (7) | Expenses and Related-Party Transactions |
The Trust has a contract for investment advisory services with the Adviser. Under terms of separate agreements, Clearwater Core Equity Fund, Clearwater Small Companies Fund, Clearwater Tax-Exempt Bond Fund and Clearwater International Fund each pay an investment advisory fee equal to an annual rate of 0.90%, 1.35%, 0.60% and 1.00%, respectively, of each Fund’s average daily net assets. The Adviser is responsible for the payment or reimbursement of all the Funds’ expenses, except brokerage, taxes, interest, and extraordinary expenses. The Adviser has periodically modified its management fee for each of the Funds through voluntary waivers. As of December 31, 2014, the management fees in place, net of voluntary waivers, for the Core Equity, Small Companies, Tax-Exempt Bond, and International Funds are 0.50%, 0.94%, 0.33%, and 0.67%, respectively. The Adviser currently intends to continue these voluntary waivers indefinitely. However, the Adviser may terminate these voluntary arrangements at any time.
In addition to fees and expenses which the Funds bear directly, the Funds indirectly bear a pro rata share of the fees and expenses of any acquired funds in which they invest, such as short-term investments in mutual funds or other investment companies and investments in closed-end funds. Such indirect expenses are not included in any of the reported expense ratios.
The Adviser has entered into subadvisory contracts with independent investment advisory firms for each Fund to provide daily investment management services. The subadvisory fees are based on each subadviser’s proportional net assets it currently manages within each Fund and are paid directly by the Adviser. For each subadviser, the fee schedule is detailed according to the following schedule:
The subadvisory fee for the Clearwater Core Equity Fund, payable to Parametric, Heartland and Osterweis, is equal to an annual rate of 0.15% of the portion of net assets managed, an annual rate of 0.65% of the portion of net assets managed and an annual rate of 0.75% of the portion of net assets managed, respectively.
The subadvisory fee for the Clearwater Core Equity Fund, payable to Knightsbridge for Knightsbridge’s portion of net assets managed is based on the following annual rates:
| Knightsbridge | |
| First $20 Million | 0.75% |
| Over $20 Million | 0.50% |
| 25 | (Continued) |
CLEARWATER INVESTMENT TRUST
Notes to Financial Statements
December 31, 2014
The subadvisory fee for the Clearwater Small Companies Fund, payable to Kennedy and Kelley for each of their respective portions of net assets managed is based on the following annual rates:
| Kennedy | |
| First $50 Million | 0.85% |
| Over $50 Million | 0.80% |
| Keeley | |
| First $2 Million | 1.00% |
| Next $8 Million | 0.85% |
| Over $10 Million | 0.70% |
The subadvisory fee for the Clearwater Tax-Exempt Bond Fund, payable to Sit for Sit’s portion of net assets managed is based on the following annual rates:
| Sit | |
| First $20 Million | 0.40% |
| Next $30 Million | 0.30% |
| Next $25 Million | 0.25% |
| Next $175 Million | 0.20% |
| Over $250 Million | 0.18% |
The subadvisory fee for the Clearwater International Fund, payable to Parametric and WCM, is equal to an annual rate of 0.15% and 0.80% of the portion of net assets managed, respectively.
The subadvisory fee for the Clearwater International Fund, payable to Artisan Partners, Denver, and Templeton for each of their respective portions of net assets managed is based on the following annual rates:
| Artisan Partners | |
| First $50 Million | 0.80% |
| Next $50 Million | 0.60% |
| Over $100 Million | 0.50% |
| Denver | |
| First $10 Million | 1.25% |
| Over $10 Million | 0.85% |
| Templeton | |
| First $25 Million | 0.95% |
| Next $25 Million | 0.85% |
| Next $50 Million | 0.75% |
| Next $150 Million | 0.65% |
| Next $250 Million | 0.55% |
| Over $500 Million | 0.50% |
| 26 | (Continued) |
CLEARWATER INVESTMENT TRUST
Notes to Financial Statements
December 31, 2014
The Adviser has also engaged FCI as a subadviser for each Fund. FCI regularly provides the Funds with various investment-related services, including investment strategy advice, manager recommendations and related duties as requested by the Adviser. FCI also provides certain services related to due diligence, performance reporting, compliance, and other administrative functions, which support the investment management services and subadviser oversight services provided to the Trust by the Adviser. For its services, FCI is compensated with a subadvisory fee payable by the Adviser of 0.20% of each Fund’s average daily net assets, paid on a quarterly basis. FCI is compensated out of the investment advisory fees the Adviser receives from the respective Funds. FCI has agreed to waive the difference between the amount calculated under the subadvisory fee schedule and an amount determined by multiplying the total number of hours worked by FCI in providing services under the subadvisory agreement by an hourly rate that is approved by the Adviser.
| (8) | Derivative Instruments |
Information concerning the types of derivatives in which the International Fund invests, the objectives for using them and their related risks can be found in Note 2 (c). Below are the types of derivatives held in the International Fund by location as presented in the Statements of Assets and Liabilities as of December 31, 2014, with additional detail on the net amounts impacting the Statements of Assets and Liabilities. The forward foreign currency exchange contracts presented below are not subject to master netting agreements or other similar agreements.
| ASSETS | LIABILITIES | |||||||||||||||
| Derivative Type | Statements of Assets and Liabilities Location | Value | Statements of Assets and Liabilities Location | Value | Net Amounts of Assets Presented in the Statements of Assets and Liabilities | Counterparty | ||||||||||
| Forward foreign currency exchange contracts | Unrealized appreciation on forward foreign currency exchange contracts | $ | 567,896 | Unrealized depreciation on forward foreign currency exchange contracts | $ | 53,793 | $ | 514,103 | Northern Trust | |||||||
The following tables set forth by primary risk exposure the International Fund’s net realized gain (loss) and net increase (decrease) in appreciation/depreciation on forward foreign currency exchange contracts for the fiscal year ended December 31, 2014:
| Derivative Type | Statements of Operations Location | Value | Derivative Type | Statements of Operations Location | Value | ||||||||
| Forward foreign currency exchange contracts | Net realized gain (loss) loss on forward foreign currency exchange contracts | $ | (2,309) | Forward foreign currency exchange contracts | Net increase (decrease) in unrealized appreciation/depreciation on forward foreign currency exchange contracts | $ | 258,569 | ||||||
| 27 | (Continued) |
CLEARWATER INVESTMENT TRUST
Notes to Financial Statements
December 31, 2014
Derivative transactions are measured in terms of the notional amount. The following table presents, for the International Fund, the number of transactions and weighted average notional amounts, which is indicative of the volume of derivative activity, for the fiscal year ended December 31, 2014.
Forward Foreign Currency Exchange Contracts | ||||
Number of Transactions | Weighted Average Notional Amount | |||
| 12 | $ | 121,364,742 | ||
| (9) | Subsequent Events |
The Trust terminated Knightbridge and Heartland as subadvisers to Clearwater Core Equity Fund, effective January 29, 2015. Effective February 3, 2015 and February 4, 2015, respectively, the Trust engaged AQR Capital Management, LLC and O’Shaughnessy Asset Management, LLC as subadvisers to the Clearwater Core Equity Fund.
The subadvisory fee for the Clearwater Core Equity Fund payable to AQR Capital Management LLC for their portion of the net assets managed (“Allocated Assets”), is 0.375% on all Allocated Assets while Allocated Assets are under $100 million and 0.35% on all Allocated Assets while Allocated Assets are at or above $100 million. The subadvisory fee for the Clearwater Core Equity Fund payable to O’Shaughnessy Asset Management, LLC for their portion of the net assets managed is 0.35% of the Allocated Assets.
Effective January 29, 2015, the Trust also approved a change to the fee schedule for the Clearwater Core Equity Fund payable to Osterweis Capital Management. The new subadvisory fee for the Clearwater Core Equity Fund payable to Osterweis Capital Management for their portion of the net assets managed is 0.75% on all Allocated Assets up to $25 million, 0.65% for Allocated Assets from $25 million to $100 million, and 0.55% on all Allocated Assets in excess of $100 million.
Management has evaluated subsequent events relating to the Funds through the date the financial statements were available to be issued, and has concluded, other than the item noted above, there are no such events or transactions requiring financial statement disclosure and/or adjustments to the financial statements.
| 28 | (Continued) |
CLEARWATER INVESTMENT TRUST
December 31, 2014
| Shares | Security | Cost | Fair value (a) | Percent of net assets | |||||||||
| Common Stocks: | |||||||||||||
| Consumer Discretionary: | |||||||||||||
| 2,300 | ABERCROMBIE & FITCH CO., CLASS A | $ | 50,218 | 65,872 | |||||||||
| 1,500 | ADVANCE AUTO PARTS, INC. | 53,558 | 238,920 | ||||||||||
| 6,150 | AMAZON.COM, INC.(b) | 274,721 | 1,908,652 | ||||||||||
| 1,600 | AMC NETWORKS, INC., CLASS A(b) | 25,785 | 102,032 | ||||||||||
| 3,300 | AMERICAN EAGLE OUTFITTERS, INC. | 33,099 | 45,804 | ||||||||||
| 1,300 | AUTOLIV, INC.(c) | 29,596 | 137,956 | ||||||||||
| 500 | AUTOZONE, INC.(b) | 32,038 | 309,555 | ||||||||||
| 4,575 | BED BATH & BEYOND, INC.(b) | 120,780 | 348,478 | ||||||||||
| 709,000 | BFC FINANCIAL CORP., CLASS A(b) | 2,859,268 | 2,268,800 | ||||||||||
| 1,400 | BIG LOTS, INC. | 15,477 | 56,028 | ||||||||||
| 4,400 | BORGWARNER, INC. | 51,799 | 241,780 | ||||||||||
| 750 | BRINKER INTERNATIONAL, INC. | 10,084 | 44,017 | ||||||||||
| 4,168 | CARMAX, INC.(b) | 50,984 | 277,505 | ||||||||||
| 2,700 | CARNIVAL CORP. | 80,824 | 122,391 | ||||||||||
| 6,043 | CBS CORP., CLASS B (NON VOTING) | 52,350 | 334,420 | ||||||||||
| 14,430 | CHARTER COMMUNICATIONS, INC., CLASS A(b) | 1,866,908 | 2,404,327 | ||||||||||
| 600 | CHICO’S FAS, INC. | 5,619 | 9,726 | ||||||||||
| 300 | CHIPOTLE MEXICAN GRILL, INC.(b) | 89,324 | 205,353 | ||||||||||
| 68,820 | CINEMARK HOLDINGS, INC. | 1,340,355 | 2,448,616 | ||||||||||
| 18,500 | CLEAR CHANNEL OUTDOOR HOLDINGS, INC., CLASS A | 53,472 | 195,915 | ||||||||||
| 5,000 | COACH, INC. | 19,161 | 187,800 | ||||||||||
| 36,800 | COMCAST CORP., CLASS A | 586,118 | 2,134,768 | ||||||||||
| 1,345 | CST BRANDS, INC. | 11,311 | 58,655 | ||||||||||
| 2,300 | DARDEN RESTAURANTS, INC. | 47,909 | 134,849 | ||||||||||
| 2,400 | DEVRY EDUCATION GROUP, INC. | 44,808 | 113,928 | ||||||||||
| 1,500 | DICK’S SPORTING GOODS, INC. | 24,803 | 74,475 | ||||||||||
| 28,216 | DIRECTV(b) | 934,923 | 2,446,327 | ||||||||||
| 1,000 | DOLLAR GENERAL CORP.(b) | 46,180 | 70,700 | ||||||||||
| 6,700 | DOLLAR TREE, INC.(b) | 61,517 | 471,546 | ||||||||||
| 4,600 | DR HORTON, INC. | 22,057 | 116,334 | ||||||||||
| 710 | EXPEDIA, INC. | 10,883 | 60,606 | ||||||||||
| 500 | FAMILY DOLLAR STORES, INC. | 12,653 | 39,605 | ||||||||||
| 3,000 | FOOT LOCKER, INC. | 40,394 | 168,540 | ||||||||||
| 77,808 | FORD MOTOR CO. | 639,323 | 1,206,024 | ||||||||||
| 3,600 | GAMESTOP CORP., CLASS A | 14,505 | 121,680 | ||||||||||
| 5,700 | GANNETT CO., INC. | 51,200 | 182,001 | ||||||||||
| 4,100 | GAP (THE), INC. | 58,946 | 172,651 | ||||||||||
| 2,200 | GARMIN LTD.(c) | 40,557 | 116,226 | ||||||||||
| 4,100 | GENERAL MOTORS CO. | 88,015 | 143,131 | ||||||||||
| 7,500 | GENTEX CORP. | 106,860 | 270,975 | ||||||||||
| 3,450 | GENUINE PARTS CO. | 102,424 | 367,666 | ||||||||||
| 1,900 | GOODYEAR TIRE & RUBBER (THE) CO. | 26,258 | 54,283 | ||||||||||
| 22,100 | GROUPON, INC.(b) | 169,823 | 182,546 | ||||||||||
| 57,900 | H&R BLOCK, INC. | 799,932 | 1,950,072 | ||||||||||
| 500 | HANESBRANDS, INC. | 10,750 | 55,810 | ||||||||||
| 6,750 | HARLEY-DAVIDSON, INC. | 39,547 | 444,892 | ||||||||||
| 4,300 | HARMAN INTERNATIONAL INDUSTRIES, INC. | 74,798 | 458,853 | ||||||||||
| 400 | HASBRO, INC. | 10,206 | 21,996 | ||||||||||
| 29,525 | HOME DEPOT (THE), INC. | 19,256 | 3,099,239 | ||||||||||
| 15,600 | INTERPUBLIC GROUP OF (THE) COS., INC. | 40,950 | 324,012 | ||||||||||
| 3,150 | JARDEN CORP.(b) | 25,277 | 150,822 | ||||||||||
| 9,500 | JOHNSON CONTROLS, INC. | 262,575 | 459,230 | ||||||||||
| 7,750 | KOHL’S CORP. | 86,000 | 473,060 | ||||||||||
| 6,190 | L BRANDS, INC. | 70,745 | 535,744 | ||||||||||
| 180 | LANDS’ END, INC.(b) | 4,697 | 9,713 | ||||||||||
| 5,738 | LAS VEGAS SANDS CORP. | 159,855 | 333,722 | ||||||||||
| 3,000 | LEAR CORP. | 128,814 | 294,240 | ||||||||||
| 2,900 | LENNAR CORP., CLASS A | 38,266 | 129,949 | ||||||||||
| 783 | LIBERTY BROADBAND CORP., CLASS A(b) | 1,186 | 39,220 | ||||||||||
| 1,566 | LIBERTY BROADBAND CORP., CLASS C(b) | 2,222 | 78,018 | ||||||||||
| 5,832 | LIBERTY GLOBAL PLC, SERIES A(b)(c) | 51,410 | 292,796 | ||||||||||
| 7,374 | LIBERTY GLOBAL PLC, SERIES C(b)(c) | 64,301 | 356,238 | ||||||||||
| 88,880 | LIBERTY INTERACTIVE CORP., CLASS A(b) | 1,313,283 | 2,614,850 | ||||||||||
| 3,132 | LIBERTY MEDIA CORP., CLASS A(b) | 3,690 | 110,466 | ||||||||||
| 6,264 | LIBERTY MEDIA CORP., CLASS C(b) | 6,877 | 219,428 | ||||||||||
| 1,580 | LIBERTY TRIPADVISOR HOLDINGS, INC., CLASS A(b) | 11,997 | 42,502 | ||||||||||
| 16,645 | LIBERTY VENTURES, SERIES A(b) | 341,955 | 627,849 | ||||||||||
| See accompanying notes to the financial statements. | 29 | (Continued) |
CLEARWATER INVESTMENT TRUST
Schedule of Investments - Clearwater Core Equity Fund
December 31, 2014
| Shares | Security | Cost | Fair value (a) | Percent of net assets | |||||||||
| Consumer Discretionary (Cont’d): | |||||||||||||
| 1,200 | LKQ CORP.(b) | $ | 14,970 | 33,744 | |||||||||
| 13,100 | LOWE’S COS., INC. | 335,332 | 901,280 | ||||||||||
| 5,000 | MACY’S, INC. | 81,374 | 328,750 | ||||||||||
| 4,969 | MARRIOTT INTERNATIONAL, INC., CLASS A | 60,013 | 387,731 | ||||||||||
| 496 | MARRIOTT VACATIONS WORLDWIDE CORP. | 3,643 | 36,972 | ||||||||||
| 4,200 | MATTEL, INC. | 64,058 | 129,969 | ||||||||||
| 16,002 | MCDONALD’S CORP. | 358,888 | 1,499,387 | ||||||||||
| 6,600 | MGM RESORTS INTERNATIONAL(b) | 54,921 | 141,108 | ||||||||||
| 1,900 | MICHAEL KORS HOLDINGS LTD.(b)(c) | 112,956 | 142,690 | ||||||||||
| 600 | MOHAWK INDUSTRIES, INC.(b) | 26,796 | 93,216 | ||||||||||
| 1,400 | MORNINGSTAR, INC. | 57,577 | 90,594 | ||||||||||
| 35,323 | MURPHY USA, INC.(b) | 1,388,911 | 2,432,342 | ||||||||||
| 700 | NETFLIX, INC.(b) | 41,142 | 239,127 | ||||||||||
| 2,200 | NEWELL RUBBERMAID, INC. | 26,950 | 83,798 | ||||||||||
| 7,175 | NEWS CORP., CLASS A(b) | 36,051 | 112,576 | ||||||||||
| 11,100 | NIKE, INC., CLASS B | 238,633 | 1,067,265 | ||||||||||
| 4,300 | NORDSTROM, INC. | 45,233 | 341,377 | ||||||||||
| 100 | NVR, INC.(b) | 51,543 | 127,533 | ||||||||||
| 2,695 | OMNICOM GROUP, INC. | 78,532 | 208,782 | ||||||||||
| 2,300 | O’REILLY AUTOMOTIVE, INC.(b) | 69,869 | 443,026 | ||||||||||
| 1,500 | PANERA BREAD CO., CLASS A(b) | 69,668 | 262,200 | ||||||||||
| 2,600 | PETSMART, INC. | 55,966 | 211,367 | ||||||||||
| 800 | PRICELINE GROUP (THE), INC.(b) | 194,799 | 912,168 | ||||||||||
| 14,100 | PULTEGROUP, INC. | 58,797 | 302,586 | ||||||||||
| 600 | PVH CORP. | 22,503 | 76,902 | ||||||||||
| 1,500 | RALPH LAUREN CORP. | 31,320 | 277,740 | ||||||||||
| 3,000 | REGAL ENTERTAINMENT GROUP, CLASS A | 26,428 | 64,080 | ||||||||||
| 4,600 | ROSS STORES, INC. | 36,395 | 433,596 | ||||||||||
| 30,020 | ROYAL CARIBBEAN CRUISES LTD. | 906,417 | 2,474,549 | ||||||||||
| 600 | SCRIPPS NETWORKS INTERACTIVE, INC., CLASS A | 21,337 | 45,162 | ||||||||||
| 47,600 | SEARS HOLDINGS CORP.(b) | 1,759,568 | 1,569,848 | ||||||||||
| 10,400 | SERVICE CORP. INTERNATIONAL | 74,152 | 236,080 | ||||||||||
| 11,000 | SIRIUS XM HOLDINGS, INC.(b) | 29,370 | 38,500 | ||||||||||
| 14,250 | STARBUCKS CORP. | 182,045 | 1,169,212 | ||||||||||
| 710 | STARWOOD HOTELS & RESORTS WORLDWIDE, INC. | 14,193 | 57,560 | ||||||||||
| 12,200 | TARGET CORP. | 353,659 | 926,102 | ||||||||||
| 1,000 | TEMPUR SEALY INTERNATIONAL, INC.(b) | 31,500 | 54,910 | ||||||||||
| 2,100 | TESLA MOTORS, INC.(b) | 147,498 | 467,061 | ||||||||||
| 6,200 | THOMSON REUTERS CORP. | 178,087 | 250,108 | ||||||||||
| 1,900 | THOR INDUSTRIES, INC. | 22,316 | 106,153 | ||||||||||
| 4,200 | TIFFANY & CO. | 122,192 | 448,812 | ||||||||||
| 5,979 | TIME WARNER CABLE, INC. | 194,383 | 909,167 | ||||||||||
| 21,033 | TIME WARNER, INC. | 457,012 | 1,796,639 | ||||||||||
| 2,629 | TIME, INC. | 19,683 | 64,700 | ||||||||||
| 10,094 | TJX (THE) COS., INC. | 86,033 | 692,247 | ||||||||||
| 400 | TRACTOR SUPPLY CO. | 20,180 | 31,528 | ||||||||||
| 12,585 | TRI POINTE HOMES, INC.(b) | 186,102 | 191,921 | ||||||||||
| 2,210 | TRIPADVISOR, INC.(b) | 42,908 | 164,999 | ||||||||||
| 900 | TRW AUTOMOTIVE HOLDINGS CORP.(b) | 21,698 | 92,565 | ||||||||||
| 21,400 | TWENTY-FIRST CENTURY FOX, INC., CLASS A | 165,966 | 821,867 | ||||||||||
| 1,000 | UNDER ARMOUR, INC., CLASS A(b) | 23,330 | 67,900 | ||||||||||
| 2,127 | URBAN OUTFITTERS, INC.(b) | 37,857 | 74,721 | ||||||||||
| 6,800 | VF CORP. | 87,065 | 509,320 | ||||||||||
| 39,452 | VIACOM, INC., CLASS B | 1,860,938 | 2,968,763 | ||||||||||
| 800 | VISTEON CORP.(b) | 33,968 | 85,488 | ||||||||||
| 29,560 | WALT DISNEY (THE) CO. | 578,637 | 2,784,256 | ||||||||||
| 2,100 | WHIRLPOOL CORP. | 89,510 | 406,854 | ||||||||||
| 5,475 | WYNDHAM WORLDWIDE CORP. | 24,501 | 469,536 | ||||||||||
| 1,600 | WYNN RESORTS LTD. | 32,322 | 238,016 | ||||||||||
| 9,016 | YUM! BRANDS, INC. | 78,831 | 656,816 | ||||||||||
| 25,352,002 | 66,037,450 | 12.21 | % | ||||||||||
| Consumer Staples: | |||||||||||||
| 29,200 | ALTRIA GROUP, INC. | 128,021 | 1,438,684 | ||||||||||
| 11,500 | ARCHER-DANIELS-MIDLAND CO. | 219,815 | 598,000 | ||||||||||
| 2,916 | BROWN-FORMAN CORP., CLASS B | 57,343 | 256,141 | ||||||||||
| 21,567 | BUNGE LTD. | 1,406,979 | 1,960,656 | ||||||||||
| 4,000 | CHURCH & DWIGHT CO., INC. | 100,310 | 315,240 | ||||||||||
| See accompanying notes to the financial statements. | 30 | (Continued) |
CLEARWATER INVESTMENT TRUST
Schedule of Investments - Clearwater Core Equity Fund
December 31, 2014
| Shares | Security | Cost | Fair value (a) | Percent of net assets | |||||||||
| Consumer Staples (Cont’d): | |||||||||||||
| 3,000 | CLOROX (THE) CO. | $ | 154,515 | 312,630 | |||||||||
| 64,481 | COCA-COLA (THE) CO. | 991,395 | 2,722,388 | ||||||||||
| 15,880 | COLGATE-PALMOLIVE CO. | 480,871 | 1,098,737 | ||||||||||
| 2,700 | CONAGRA FOODS, INC. | 55,905 | 97,956 | ||||||||||
| 4,600 | CONSTELLATION BRANDS, INC., CLASS A(b) | 63,227 | 451,582 | ||||||||||
| 7,800 | COSTCO WHOLESALE CORP. | 237,671 | 1,105,650 | ||||||||||
| 470 | CRIMSON WINE GROUP LTD.(b) | 2,671 | 4,465 | ||||||||||
| 16,225 | CVS CAREMARK CORP. | 642,050 | 1,562,630 | ||||||||||
| 19,120 | DIAGEO PLC ADR(c)(d) | 1,551,209 | 2,181,401 | ||||||||||
| 6,000 | DR. PEPPER SNAPPLE GROUP, INC. | 125,060 | 430,080 | ||||||||||
| 397 | ENERGIZER HOLDINGS, INC. | 20,533 | 51,038 | ||||||||||
| 3,734 | ESTEE LAUDER (THE) COS., INC., CLASS A | 70,943 | 284,531 | ||||||||||
| 2,700 | FLOWERS FOODS, INC. | 25,434 | 51,813 | ||||||||||
| 12,400 | GENERAL MILLS, INC. | 277,055 | 661,292 | ||||||||||
| 3,300 | HERBALIFE LTD. | 45,262 | 124,410 | ||||||||||
| 2,042 | HERSHEY (THE) CO. | 88,044 | 212,225 | ||||||||||
| 2,400 | HORMEL FOODS CORP. | 43,206 | 125,040 | ||||||||||
| 1,700 | INGREDION, INC. | 48,104 | 144,228 | ||||||||||
| 1,600 | JM SMUCKER (THE) CO. | 64,617 | 161,568 | ||||||||||
| 5,800 | KEURIG GREEN MOUNTAIN, INC. | 122,296 | 767,891 | ||||||||||
| 1,550 | KIMBERLY-CLARK CORP. | 69,760 | 179,087 | ||||||||||
| 7,279 | KRAFT FOODS GROUP, INC. | 89,966 | 456,102 | ||||||||||
| 13,400 | KROGER (THE) CO. | 228,089 | 860,414 | ||||||||||
| 5,322 | LORILLARD, INC. | 80,950 | 334,967 | ||||||||||
| 700 | MCCORMICK & CO., INC. (NON VOTING) | 21,613 | 52,010 | ||||||||||
| 2,200 | MEAD JOHNSON NUTRITION CO. | 103,422 | 221,188 | ||||||||||
| 1,300 | MOLSON COORS BREWING CO., CLASS B | 37,841 | 96,876 | ||||||||||
| 26,338 | MONDELEZ INTERNATIONAL, INC., CLASS A | 285,157 | 956,728 | ||||||||||
| 1,400 | MONSTER BEVERAGE CORP.(b) | 44,343 | 151,690 | ||||||||||
| 27,391 | PEPSICO, INC. | 1,025,750 | 2,590,093 | ||||||||||
| 30,132 | PHILIP MORRIS INTERNATIONAL, INC. | 261,758 | 2,454,251 | ||||||||||
| 200 | POST HOLDINGS, INC.(b) | 4,616 | 8,378 | ||||||||||
| 45,360 | PROCTER & GAMBLE (THE) CO. | 772,158 | 4,131,842 | ||||||||||
| 3,500 | REYNOLDS AMERICAN, INC. | 50,449 | 224,945 | ||||||||||
| 1,600 | SAFEWAY, INC. | 28,960 | 56,192 | ||||||||||
| 8,000 | SYSCO CORP. | 124,113 | 317,520 | ||||||||||
| 6,010 | TYSON FOODS, INC., CLASS A | 53,610 | 240,941 | ||||||||||
| 48,000 | UNILEVER N.V. (REGISTERED)(c) | 1,454,959 | 1,873,920 | ||||||||||
| 20,150 | WALGREENS BOOTS ALLIANCE, INC. | 231,445 | 1,535,430 | ||||||||||
| 19,723 | WAL-MART STORES, INC. | 776,452 | 1,693,811 | ||||||||||
| 8,800 | WHOLE FOODS MARKET, INC. | 116,393 | 443,696 | ||||||||||
| 12,884,340 | 36,000,357 | 6.65 | % | ||||||||||
| Energy: | |||||||||||||
| 9,446 | ANADARKO PETROLEUM CORP. | 319,802 | 779,295 | ||||||||||
| 600 | ATWOOD OCEANICS, INC.(b) | 18,078 | 17,022 | ||||||||||
| 15,248 | BAKER HUGHES, INC. | 725,397 | 854,955 | ||||||||||
| 62,000 | BP PLC ADR(c)(d) | 2,753,380 | 2,363,440 | ||||||||||
| 3,400 | CABOT OIL & GAS CORP. | 76,023 | 100,674 | ||||||||||
| 11,962 | CALIFORNIA RESOURCES CORP.(b) | 50,304 | 65,911 | ||||||||||
| 4,800 | CAMERON INTERNATIONAL CORP.(b) | 124,988 | 239,760 | ||||||||||
| 146,100 | CHESAPEAKE ENERGY CORP. | 2,540,798 | 2,859,177 | ||||||||||
| 33,195 | CHEVRON CORP. | 1,449,959 | 3,723,815 | ||||||||||
| 400 | CIMAREX ENERGY CO. | 24,076 | 42,400 | ||||||||||
| 7,200 | COBALT INTERNATIONAL ENERGY, INC.(b) | 63,000 | 64,008 | ||||||||||
| 1,700 | CONCHO RESOURCES, INC.(b) | 49,632 | 169,575 | ||||||||||
| 25,444 | CONOCOPHILLIPS | 460,670 | 1,757,163 | ||||||||||
| 4,531 | CONSOL ENERGY, INC. | 118,221 | 153,193 | ||||||||||
| 2,000 | CONTINENTAL RESOURCES, INC.(b) | 20,765 | 76,720 | ||||||||||
| 32,358 | DEVON ENERGY CORP. | 2,007,357 | 1,980,633 | ||||||||||
| 3,000 | DRESSER-RAND GROUP, INC.(b) | 98,595 | 245,400 | ||||||||||
| 9,600 | EOG RESOURCES, INC. | 62,765 | 883,872 | ||||||||||
| 4,000 | EQT CORP. | 132,900 | 302,800 | ||||||||||
| 73,551 | EXXON MOBIL CORP. | 2,863,497 | 6,799,790 | ||||||||||
| 3,900 | FMC TECHNOLOGIES, INC.(b) | 97,950 | 182,676 | ||||||||||
| 14,958 | HALLIBURTON CO. | 295,103 | 588,298 | ||||||||||
| 3,100 | HELMERICH & PAYNE, INC. | 39,003 | 209,002 | ||||||||||
| 10,195 | HESS CORP. | 491,296 | 752,595 | ||||||||||
| 4,000 | HOLLYFRONTIER CORP. | 52,098 | 149,920 | ||||||||||
| See accompanying notes to the financial statements. | 31 | (Continued) |
CLEARWATER INVESTMENT TRUST
Schedule of Investments - Clearwater Core Equity Fund
December 31, 2014
| Shares | Security | Cost | Fair value (a) | Percent of net assets | |||||||||
| Energy (Cont’d): | |||||||||||||
| 7,412 | KINDER MORGAN, INC. | $ | 67,014 | 313,602 | |||||||||
| 3,600 | MARATHON PETROLEUM CORP. | 199,978 | 324,936 | ||||||||||
| 2,400 | MURPHY OIL CORP. | 27,663 | 121,248 | ||||||||||
| 2,600 | NABORS INDUSTRIES LTD.(c) | 39,026 | 33,748 | ||||||||||
| 8,722 | NATIONAL OILWELL VARCO, INC. | 193,630 | 571,553 | ||||||||||
| 1,200 | NEWFIELD EXPLORATION CO.(b) | 27,012 | 32,544 | ||||||||||
| 8,400 | NOBLE ENERGY, INC. | 158,332 | 398,412 | ||||||||||
| 33,825 | OCCIDENTAL PETROLEUM CORP. | 1,487,582 | 2,726,633 | ||||||||||
| 2,500 | OCEANEERING INTERNATIONAL, INC. | 66,222 | 147,025 | ||||||||||
| 400 | OIL STATES INTERNATIONAL, INC.(b) | 17,546 | 19,560 | ||||||||||
| 2,000 | ONEOK, INC. | 27,592 | 99,580 | ||||||||||
| 2,500 | PATTERSON-UTI ENERGY, INC. | 46,600 | 41,475 | ||||||||||
| 503,000 | PENGROWTH ENERGY CORP.(c) | 2,317,791 | 1,564,330 | ||||||||||
| 13,372 | PHILLIPS 66 | 156,993 | 958,772 | ||||||||||
| 3,200 | PIONEER NATURAL RESOURCES CO. | 48,507 | 476,320 | ||||||||||
| 1,200 | RANGE RESOURCES CORP. | 39,654 | 64,140 | ||||||||||
| 19,800 | SCHLUMBERGER LTD. | 540,329 | 1,691,118 | ||||||||||
| 157,495 | SCORPIO TANKERS, INC.(c) | 1,566,285 | 1,368,632 | ||||||||||
| 9,857 | SEVENTY SEVEN ENERGY, INC.(b) | 139,799 | 53,326 | ||||||||||
| 7,200 | SOUTHWESTERN ENERGY CO.(b) | 107,060 | 196,488 | ||||||||||
| 10,954 | SPECTRA ENERGY CORP. | 155,906 | 397,630 | ||||||||||
| 1,200 | TESORO CORP. | 24,660 | 89,220 | ||||||||||
| 43,871 | TIDEWATER, INC. | 2,058,361 | 1,421,859 | ||||||||||
| 26,886 | UNIT CORP.(b) | 1,390,345 | 916,813 | ||||||||||
| 12,110 | VALERO ENERGY CORP. | 119,502 | 599,445 | ||||||||||
| 2,600 | WHITING PETROLEUM CORP.(b) | 73,760 | 85,800 | ||||||||||
| 6,600 | WILLIAMS (THE) COS., INC. | 139,909 | 296,604 | ||||||||||
| 26,172,715 | 40,372,907 | 7.46 | % | ||||||||||
| Financials: | |||||||||||||
| 5,300 | ACE LTD.(c) | 280,788 | 608,864 | ||||||||||
| 1,100 | AFFILIATED MANAGERS GROUP, INC.(b) | 73,654 | 233,464 | ||||||||||
| 9,850 | AFLAC, INC. | 262,100 | 601,737 | ||||||||||
| 2,100 | ALEXANDRIA REAL ESTATE EQUITIES, INC. | 110,574 | 186,354 | ||||||||||
| 4,346 | ALLEGHANY CORP.(b) | 1,209,887 | 2,014,371 | ||||||||||
| 8,100 | ALLIED WORLD ASSURANCE CO. HOLDINGS A.G.(c) | 86,629 | 307,152 | ||||||||||
| 8,300 | ALLSTATE (THE) CORP. | 197,623 | 583,075 | ||||||||||
| 800 | AMERICAN CAMPUS COMMUNITIES, INC. | 28,915 | 33,088 | ||||||||||
| 18,333 | AMERICAN EXPRESS CO. | 546,904 | 1,705,702 | ||||||||||
| 1,800 | AMERICAN FINANCIAL GROUP, INC. | 29,745 | 109,296 | ||||||||||
| 101,000 | AMERICAN INTERNATIONAL GROUP, INC. | 2,881,346 | 5,657,010 | ||||||||||
| 3,450 | AMERICAN TOWER CORP. | 159,151 | 341,033 | ||||||||||
| 5,191 | AMERIPRISE FINANCIAL, INC. | 160,907 | 686,510 | ||||||||||
| 4,748 | AON PLC(c) | 110,582 | 450,253 | ||||||||||
| 3,628 | APARTMENT INVESTMENT & MANAGEMENT CO., CLASS A | 39,421 | 134,780 | ||||||||||
| 4,800 | ARCH CAPITAL GROUP LTD.(b)(c) | 101,982 | 283,680 | ||||||||||
| 1,600 | ARTHUR J GALLAGHER & CO. | 34,040 | 75,328 | ||||||||||
| 2,500 | ASSURANT, INC. | 60,538 | 171,075 | ||||||||||
| 734 | AVALONBAY COMMUNITIES, INC. | 31,138 | 119,928 | ||||||||||
| 900 | AXIS CAPITAL HOLDINGS LTD.(c) | 23,391 | 45,981 | ||||||||||
| 432,000 | BANK OF AMERICA CORP. | 4,490,969 | 7,728,480 | ||||||||||
| 56,783 | BANK OF NEW YORK MELLON (THE) CORP. | 1,287,045 | 2,303,686 | ||||||||||
| 52,608 | BB&T CORP. | 1,445,131 | 2,045,925 | ||||||||||
| 28,000 | BERKSHIRE HATHAWAY, INC., CLASS B(b) | 2,296,518 | 4,204,200 | ||||||||||
| 2,500 | BIOMED REALTY TRUST, INC. | 44,395 | 53,850 | ||||||||||
| 1,600 | BLACKROCK, INC. | 300,619 | 572,096 | ||||||||||
| 110,309 | BOSTON PRIVATE FINANCIAL HOLDINGS, INC. | 1,201,677 | 1,485,862 | ||||||||||
| 3,388 | BOSTON PROPERTIES, INC. | 171,468 | 436,002 | ||||||||||
| 2,800 | BRANDYWINE REALTY TRUST | 31,119 | 44,744 | ||||||||||
| 900 | CAMDEN PROPERTY TRUST | 24,065 | 66,456 | ||||||||||
| 35,999 | CAPITAL ONE FINANCIAL CORP. | 1,772,221 | 2,971,717 | ||||||||||
| 5,300 | CBL & ASSOCIATES PROPERTIES, INC. | 96,937 | 102,926 | ||||||||||
| 2,500 | CBRE GROUP, INC., CLASS A(b) | 50,579 | 85,625 | ||||||||||
| 21,400 | CHARLES SCHWAB (THE) CORP. | 186,608 | 646,066 | ||||||||||
| 36,400 | CHIMERA INVESTMENT CORP. | 85,297 | 115,752 | ||||||||||
| 2,700 | CHUBB (THE) CORP. | 86,607 | 279,369 | ||||||||||
| 2,800 | CIT GROUP, INC. | 100,145 | 133,924 | ||||||||||
| 43,581 | CITIGROUP, INC. | 1,510,680 | 2,358,168 | ||||||||||
| 2,000 | CITY NATIONAL CORP. | 75,538 | 161,620 | ||||||||||
| See accompanying notes to the financial statements. | 32 | (Continued) |
CLEARWATER INVESTMENT TRUST
Schedule of Investments - Clearwater Core Equity Fund
December 31, 2014
| Shares | Security | Cost | Fair value (a) | Percent of net assets | |||||||||
| Financials (Cont’d): | |||||||||||||
| 1,365 | CME GROUP, INC. | $ | 50,304 | 121,007 | |||||||||
| 1,100 | CNA FINANCIAL CORP. | 25,102 | 42,581 | ||||||||||
| 800 | COMERICA, INC. | 25,288 | 37,472 | ||||||||||
| 771 | COMMERCE BANCSHARES, INC. | 25,553 | 33,531 | ||||||||||
| 4,800 | CORPORATE OFFICE PROPERTIES TRUST | 106,129 | 136,176 | ||||||||||
| 3,045 | CORRECTIONS CORP. OF AMERICA | 64,833 | 110,655 | ||||||||||
| 4,600 | CROWN CASTLE INTERNATIONAL CORP. | 194,396 | 362,020 | ||||||||||
| 816 | CULLEN/FROST BANKERS, INC. | 45,125 | 57,642 | ||||||||||
| 8,500 | DDR CORP. | 111,401 | 156,060 | ||||||||||
| 59,225 | DIGITAL REALTY TRUST, INC. | 3,046,470 | 3,926,618 | ||||||||||
| 16,287 | DISCOVER FINANCIAL SERVICES | 233,079 | 1,066,636 | ||||||||||
| 5,200 | DOUGLAS EMMETT, INC. | 57,331 | 147,680 | ||||||||||
| 1,700 | DUKE REALTY CORP. | 28,468 | 34,340 | ||||||||||
| 6,000 | E*TRADE FINANCIAL CORP.(b) | 48,576 | 145,530 | ||||||||||
| 1,100 | EAST WEST BANCORP, INC. | 25,190 | 42,581 | ||||||||||
| 900 | ENDURANCE SPECIALTY HOLDINGS LTD.(c) | 25,106 | 53,856 | ||||||||||
| 800 | EQUITY LIFESTYLE PROPERTIES, INC. | 26,920 | 41,240 | ||||||||||
| 8,216 | EQUITY RESIDENTIAL | 331,618 | 590,237 | ||||||||||
| 875 | ESSEX PROPERTY TRUST, INC. | 105,181 | 180,775 | ||||||||||
| 900 | FEDERAL REALTY INVESTMENT TRUST | 48,326 | 120,114 | ||||||||||
| 25,300 | FIFTH THIRD BANCORP | 220,963 | 515,488 | ||||||||||
| 400 | FIRST CITIZENS BANCSHARES, INC., CLASS A | 57,523 | 101,116 | ||||||||||
| 30,500 | FIRST HORIZON NATIONAL CORP. | 193,065 | 414,190 | ||||||||||
| 55,327 | FIRST INTERSTATE BANCSYSTEM, INC., CLASS A | 1,149,813 | 1,539,197 | ||||||||||
| 15,200 | FIRST NIAGARA FINANCIAL GROUP, INC. | 120,688 | 128,136 | ||||||||||
| 1,863 | FNF GROUP | 21,555 | 64,180 | ||||||||||
| 620 | FNFV GROUP(b) | 4,427 | 9,759 | ||||||||||
| 10,077 | FRANKLIN RESOURCES, INC. | 189,834 | 557,963 | ||||||||||
| 54,700 | FRANKLIN STREET PROPERTIES CORP. | 651,794 | 671,169 | ||||||||||
| 6,400 | GENERAL GROWTH PROPERTIES, INC. | 122,757 | 180,032 | ||||||||||
| 10,800 | GENWORTH FINANCIAL, INC., CLASS A(b) | 57,035 | 91,800 | ||||||||||
| 108,000 | GETTY REALTY CORP. | 1,769,035 | 1,966,680 | ||||||||||
| 8,500 | GOLDMAN SACHS GROUP (THE), INC. | 723,237 | 1,647,555 | ||||||||||
| 3,500 | GREENHILL & CO., INC. | 106,120 | 152,600 | ||||||||||
| 3,700 | HARTFORD FINANCIAL SERVICES GROUP (THE), INC. | 62,228 | 154,253 | ||||||||||
| 1,000 | HCC INSURANCE HOLDINGS, INC. | 24,155 | 53,520 | ||||||||||
| 7,000 | HCP, INC. | 101,851 | 308,210 | ||||||||||
| 4,300 | HEALTH CARE REIT, INC. | 221,375 | 325,381 | ||||||||||
| 4,250 | HEALTHCARE TRUST OF AMERICA, INC., CLASS A | 96,571 | 114,495 | ||||||||||
| 500 | HOME PROPERTIES, INC. | 30,360 | 32,800 | ||||||||||
| 2,900 | HOSPITALITY PROPERTIES TRUST | 49,578 | 89,900 | ||||||||||
| 16,122 | HOST HOTELS & RESORTS, INC. | 138,445 | 383,220 | ||||||||||
| 678 | HOWARD HUGHES (THE) CORP.(b) | 20,502 | 88,425 | ||||||||||
| 10,500 | HUDSON CITY BANCORP, INC. | 65,625 | 106,260 | ||||||||||
| 35,000 | HUNTINGTON BANCSHARES, INC. | 169,771 | 368,200 | ||||||||||
| 701 | INTERCONTINENTAL EXCHANGE, INC. | 89,127 | 153,722 | ||||||||||
| 11,400 | INVESCO LTD. | 176,068 | 450,528 | ||||||||||
| 1,634 | IRON MOUNTAIN, INC. | 38,000 | 63,170 | ||||||||||
| 33,700 | JANUS CAPITAL GROUP, INC. | 222,792 | 543,581 | ||||||||||
| 700 | JONES LANG LASALLE, INC. | 39,951 | 104,951 | ||||||||||
| 60,546 | JPMORGAN CHASE & CO. | 1,549,200 | 3,788,969 | ||||||||||
| 11,700 | KEYCORP | 80,298 | 162,630 | ||||||||||
| 600 | KILROY REALTY CORP. | 31,529 | 41,442 | ||||||||||
| 8,201 | KIMCO REALTY CORP. | 94,870 | 206,173 | ||||||||||
| 4,200 | LAMAR ADVERTISING CO., CLASS A | 55,317 | 225,288 | ||||||||||
| 3,752 | LEGG MASON, INC. | 52,584 | 200,244 | ||||||||||
| 4,700 | LEUCADIA NATIONAL CORP. | 95,768 | 105,374 | ||||||||||
| 1,100 | LIBERTY PROPERTY TRUST | 23,645 | 41,393 | ||||||||||
| 1,100 | LINCOLN NATIONAL CORP. | 22,715 | 63,437 | ||||||||||
| 6,000 | LOEWS CORP. | 131,444 | 252,120 | ||||||||||
| 2,000 | M&T BANK CORP. | 145,114 | 251,240 | ||||||||||
| 5,123 | MACERICH (THE) CO. | 119,436 | 427,309 | ||||||||||
| 200 | MARKEL CORP.(b) | 67,789 | 136,568 | ||||||||||
| 5,478 | MARSH & MCLENNAN COS., INC. | 153,199 | 313,561 | ||||||||||
| 3,100 | MBIA, INC.(b) | 25,265 | 29,574 | ||||||||||
| 3,600 | MCGRAW HILL FINANCIAL, INC. | 84,305 | 320,328 | ||||||||||
| 1,300 | MERCURY GENERAL CORP. | 38,019 | 73,671 | ||||||||||
| 12,400 | METLIFE, INC. | 380,550 | 670,716 | ||||||||||
| See accompanying notes to the financial statements. | 33 | (Continued) |
CLEARWATER INVESTMENT TRUST
Schedule of Investments - Clearwater Core Equity Fund
December 31, 2014
| Shares | Security | Cost | Fair value (a) | Percent of net assets | |||||||||
| Financials (Cont’d): | |||||||||||||
| 1,200 | MID-AMERICA APARTMENT COMMUNITIES, INC. | $ | 78,164 | 89,616 | |||||||||
| 2,200 | MOODY’S CORP. | 77,502 | 210,782 | ||||||||||
| 21,600 | MORGAN STANLEY | 332,129 | 838,080 | ||||||||||
| 3,900 | MSCI, INC. | 124,722 | 185,016 | ||||||||||
| 1,800 | NASDAQ OMX GROUP (THE), INC. | 45,036 | 86,328 | ||||||||||
| 188,600 | NAVIENT CORP. | 2,896,870 | 4,075,646 | ||||||||||
| 112,257 | NEW RESIDENTIAL INVESTMENT CORP. | 1,320,470 | 1,433,522 | ||||||||||
| 86,104 | NEW SENIOR INVESTMENT GROUP, INC. | 1,647,904 | 1,416,411 | ||||||||||
| 7,649 | NEW YORK COMMUNITY BANCORP, INC. | 86,776 | 122,384 | ||||||||||
| 1,402 | NORTHERN TRUST CORP. | 66,115 | 94,495 | ||||||||||
| 247,100 | OLD REPUBLIC INTERNATIONAL CORP. | 2,450,161 | 3,615,073 | ||||||||||
| 4,539 | PACWEST BANCORP | 65,912 | 206,343 | ||||||||||
| 2,200 | PARTNERRE LTD.(c) | 119,028 | 251,086 | ||||||||||
| 5,200 | PEOPLE’S UNITED FINANCIAL, INC. | 68,068 | 78,936 | ||||||||||
| 62,460 | PHH CORP.(b) | 1,402,341 | 1,496,542 | ||||||||||
| 4,385 | PLUM CREEK TIMBER CO., INC. | 105,969 | 187,634 | ||||||||||
| 27,915 | PNC FINANCIAL SERVICES GROUP (THE), INC. | 1,530,042 | 2,546,685 | ||||||||||
| 1,600 | POPULAR, INC.(b)(c) | 33,280 | 54,480 | ||||||||||
| 41,665 | PRINCIPAL FINANCIAL GROUP, INC. | 1,719,196 | 2,164,080 | ||||||||||
| 6,048 | PROGRESSIVE (THE) CORP. | 80,691 | 163,236 | ||||||||||
| 10,169 | PROLOGIS, INC. | 257,893 | 437,572 | ||||||||||
| 2,200 | PROTECTIVE LIFE CORP. | 24,849 | 153,230 | ||||||||||
| 8,500 | PRUDENTIAL FINANCIAL, INC. | 257,378 | 768,910 | ||||||||||
| 2,261 | PUBLIC STORAGE | 235,264 | 417,946 | ||||||||||
| 6,972 | RAYONIER, INC. | 75,256 | 194,798 | ||||||||||
| 2,700 | REALTY INCOME CORP. | 58,594 | 128,817 | ||||||||||
| 3,900 | REGENCY CENTERS CORP. | 90,152 | 248,742 | ||||||||||
| 15,799 | REGIONS FINANCIAL CORP. | 86,452 | 166,837 | ||||||||||
| 9,800 | RETAIL PROPERTIES OF AMERICA, INC., CLASS A | 85,814 | 163,562 | ||||||||||
| 7,500 | SEI INVESTMENTS CO. | 108,537 | 300,300 | ||||||||||
| 1,500 | SENIOR HOUSING PROPERTIES TRUST | 23,231 | 33,165 | ||||||||||
| 400 | SIGNATURE BANK(b) | 29,712 | 50,384 | ||||||||||
| 132,000 | SILVER BAY REALTY TRUST CORP. | 2,399,767 | 2,185,920 | ||||||||||
| 3,595 | SIMON PROPERTY GROUP, INC. | 148,165 | 654,685 | ||||||||||
| 1,900 | SL GREEN REALTY CORP. | 58,204 | 226,138 | ||||||||||
| 12,600 | SLM CORP. | 48,157 | 128,394 | ||||||||||
| 3,000 | SPIRIT REALTY CAPITAL, INC. | 27,083 | 35,670 | ||||||||||
| 2,700 | ST. JOE (THE) CO.(b) | 42,426 | 49,653 | ||||||||||
| 240 | STARWOOD WAYPOINT RESIDENTIAL TRUST | 6,926 | 6,329 | ||||||||||
| 6,000 | STATE STREET CORP. | 262,103 | 471,000 | ||||||||||
| 36,220 | STONEGATE MORTGAGE CORP.(b) | 615,094 | 433,191 | ||||||||||
| 6,634 | SUNTRUST BANKS, INC. | 92,816 | 277,965 | ||||||||||
| 3,657 | SYNOVUS FINANCIAL CORP. | 49,372 | 99,068 | ||||||||||
| 6,349 | T ROWE PRICE GROUP, INC. | 125,884 | 545,125 | ||||||||||
| 2,100 | TAUBMAN CENTERS, INC. | 57,437 | 160,482 | ||||||||||
| 12,000 | TCF FINANCIAL CORP. | 111,496 | 190,680 | ||||||||||
| 2,600 | TFS FINANCIAL CORP. | 25,038 | 38,701 | ||||||||||
| 5,400 | TORCHMARK CORP. | 95,047 | 292,518 | ||||||||||
| 9,588 | TRAVELERS (THE) COS., INC. | 334,488 | 1,014,890 | ||||||||||
| 7,600 | TWO HARBORS INVESTMENT CORP. | 78,052 | 76,152 | ||||||||||
| 4,100 | UDR, INC. | 65,319 | 126,362 | ||||||||||
| 1,600 | UNUM GROUP | 33,328 | 55,808 | ||||||||||
| 17,885 | US BANCORP | 325,796 | 803,931 | ||||||||||
| 1,100 | VALIDUS HOLDINGS LTD.(c) | 23,557 | 45,716 | ||||||||||
| 3,200 | VALLEY NATIONAL BANCORP | 29,792 | 31,072 | ||||||||||
| 3,800 | VENTAS, INC. | 201,381 | 272,460 | ||||||||||
| 2,600 | VORNADO REALTY TRUST | 198,652 | 306,046 | ||||||||||
| 2,400 | VOYA FINANCIAL, INC. | 64,032 | 101,712 | ||||||||||
| 2,900 | WADDELL & REED FINANCIAL, INC., CLASS A | 75,337 | 144,478 | ||||||||||
| 47,575 | WASHINGTON FEDERAL, INC. | 851,441 | 1,053,786 | ||||||||||
| 1,797 | WASHINGTON PRIME GROUP, INC. | 9,413 | 30,944 | ||||||||||
| 2,100 | WEINGARTEN REALTY INVESTORS | 30,002 | 73,332 | ||||||||||
| 85,445 | WELLS FARGO & CO. | 1,229,493 | 4,684,095 | ||||||||||
| 5,300 | WEYERHAEUSER CO. | 159,708 | 190,217 | ||||||||||
| 1,106 | WR BERKLEY CORP. | 29,276 | 56,694 | ||||||||||
| 4,900 | XL GROUP PLC(c) | 95,648 | 168,413 | ||||||||||
| 27,284 | ZIONS BANCORPORATION | 770,920 | 777,867 | ||||||||||
| 60,750,779 | 104,432,550 | 19.30 | % | ||||||||||
| See accompanying notes to the financial statements. | 34 | (Continued) |
CLEARWATER INVESTMENT TRUST
Schedule of Investments - Clearwater Core Equity Fund
December 31, 2014
| Shares | Security | Cost | Fair value (a) | Percent of net assets | |||||||||
| Health Care: | |||||||||||||
| 13,035 | ABBOTT LABORATORIES | $ | 216,782 | 586,836 | |||||||||
| 23,735 | ABBVIE, INC. | 606,253 | 1,553,218 | ||||||||||
| 10,090 | ACTAVIS PLC(b) | 1,664,589 | 2,597,267 | ||||||||||
| 4,503 | AETNA, INC. | 34,521 | 400,001 | ||||||||||
| 5,600 | AGILENT TECHNOLOGIES, INC. | 158,209 | 229,264 | ||||||||||
| 4,200 | ALERE, INC.(b) | 77,812 | 159,600 | ||||||||||
| 3,000 | ALEXION PHARMACEUTICALS, INC.(b) | 58,088 | 555,090 | ||||||||||
| 5,507 | ALLERGAN, INC. | 201,259 | 1,170,733 | ||||||||||
| 7,200 | AMERISOURCEBERGEN CORP. | 115,968 | 649,152 | ||||||||||
| 16,000 | AMGEN, INC. | 64,848 | 2,548,640 | ||||||||||
| 9,249 | ANTHEM, INC. | 325,438 | 1,162,322 | ||||||||||
| 3,800 | BAXTER INTERNATIONAL, INC. | 196,258 | 278,502 | ||||||||||
| 17,970 | BAYER A.G. ADR(c)(d) | 1,257,826 | 2,459,015 | ||||||||||
| 2,500 | BECTON DICKINSON AND CO. | 143,665 | 347,900 | ||||||||||
| 5,250 | BIOGEN IDEC, INC.(b) | 66,400 | 1,782,113 | ||||||||||
| 900 | BIOMARIN PHARMACEUTICAL, INC.(b) | 45,432 | 81,360 | ||||||||||
| 32,800 | BOSTON SCIENTIFIC CORP.(b) | 182,160 | 434,600 | ||||||||||
| 27,500 | BRISTOL-MYERS SQUIBB CO. | 730,394 | 1,623,325 | ||||||||||
| 3,400 | CARDINAL HEALTH, INC. | 128,461 | 274,482 | ||||||||||
| 1,800 | CATAMARAN CORP.(b) | 60,287 | 93,150 | ||||||||||
| 14,072 | CELGENE CORP.(b) | 198,565 | 1,574,094 | ||||||||||
| 3,600 | CERNER CORP.(b) | 40,604 | 232,776 | ||||||||||
| 5,700 | CIGNA CORP. | 89,680 | 586,587 | ||||||||||
| 3,879 | COMMUNITY HEALTH SYSTEMS, INC.(b) | 68,097 | 209,156 | ||||||||||
| 4,100 | COVIDIEN PLC(c) | 186,882 | 419,348 | ||||||||||
| 1,200 | CR BARD, INC. | 72,420 | 199,944 | ||||||||||
| 2,850 | DAVITA HEALTHCARE PARTNERS, INC.(b) | 21,812 | 215,859 | ||||||||||
| 3,700 | DENTSPLY INTERNATIONAL, INC. | 102,582 | 197,099 | ||||||||||
| 3,800 | EDWARDS LIFESCIENCES CORP.(b) | 118,151 | 484,044 | ||||||||||
| 7,100 | ELI LILLY & CO. | 239,059 | 489,829 | ||||||||||
| 4,200 | ENDO INTERNATIONAL PLC(b)(c) | 110,376 | 302,904 | ||||||||||
| 16,502 | EXPRESS SCRIPTS HOLDING CO.(b) | 241,921 | 1,397,224 | ||||||||||
| 27,920 | GILEAD SCIENCES, INC.(b) | 226,342 | 2,631,739 | ||||||||||
| 193 | HALYARD HEALTH, INC.(b) | 3,014 | 8,776 | ||||||||||
| 1,300 | HEALTH NET, INC.(b) | 31,603 | 69,589 | ||||||||||
| 29,070 | HEALTHSOUTH CORP. | 522,001 | 1,118,032 | ||||||||||
| 1,900 | HENRY SCHEIN, INC.(b) | 86,167 | 258,685 | ||||||||||
| 7,208 | HOLOGIC, INC.(b) | 102,880 | 192,742 | ||||||||||
| 1,805 | HOSPIRA, INC.(b) | 47,736 | 110,556 | ||||||||||
| 3,900 | HUMANA, INC. | 39,107 | 560,157 | ||||||||||
| 1,400 | IDEXX LABORATORIES, INC.(b) | 60,410 | 207,578 | ||||||||||
| 2,300 | ILLUMINA, INC.(b) | 98,233 | 424,534 | ||||||||||
| 300 | INTUITIVE SURGICAL, INC.(b) | 112,800 | 158,682 | ||||||||||
| 66,693 | JOHNSON & JOHNSON | 3,074,466 | 6,974,087 | ||||||||||
| 800 | LABORATORY CORP. OF AMERICA HOLDINGS(b) | 18,788 | 86,320 | ||||||||||
| 5,700 | MCKESSON CORP. | 202,596 | 1,183,206 | ||||||||||
| 16,900 | MEDTRONIC, INC. | 617,995 | 1,220,180 | ||||||||||
| 49,178 | MERCK & CO., INC. | 1,169,227 | 2,792,819 | ||||||||||
| 1,321 | METTLER-TOLEDO INTERNATIONAL, INC.(b) | 91,350 | 399,550 | ||||||||||
| 4,600 | MYLAN, INC.(b) | 85,192 | 259,302 | ||||||||||
| 21,945 | NOVARTIS A.G. ADR(c)(d) | 1,287,171 | 2,033,424 | ||||||||||
| 1,600 | PATTERSON COS., INC. | 29,864 | 76,960 | ||||||||||
| 3,400 | PERKINELMER, INC. | 53,706 | 148,682 | ||||||||||
| 187,411 | PFIZER, INC. | 2,362,232 | 5,837,853 | ||||||||||
| 2,400 | QIAGEN N.V.(b)(c) | 43,584 | 56,304 | ||||||||||
| 36,385 | QUEST DIAGNOSTICS, INC. | 2,015,966 | 2,439,978 | ||||||||||
| 1,200 | REGENERON PHARMACEUTICALS, INC.(b) | 187,859 | 492,300 | ||||||||||
| 4,000 | RESMED, INC. | 81,990 | 224,240 | ||||||||||
| 600 | SALIX PHARMACEUTICALS LTD.(b) | 24,294 | 68,964 | ||||||||||
| 900 | SIRONA DENTAL SYSTEMS, INC.(b) | 38,745 | 78,633 | ||||||||||
| 4,539 | ST. JUDE MEDICAL, INC. | 114,088 | 295,171 | ||||||||||
| 4,700 | STRYKER CORP. | 18,139 | 443,351 | ||||||||||
| 20,625 | TELEFLEX, INC. | 1,094,711 | 2,368,163 | ||||||||||
| 35,670 | TEVA PHARMACEUTICAL INDUSTRIES LTD. ADR(c)(d) | 1,376,046 | 2,051,382 | ||||||||||
| 6,700 | THERMO FISHER SCIENTIFIC, INC. | 138,727 | 839,443 | ||||||||||
| 96,426 | TRIPLE-S MANAGEMENT CORP., CLASS B(b)(c) | 1,794,751 | 2,305,546 | ||||||||||
| 16,802 | UNITEDHEALTH GROUP, INC. | 263,626 | 1,698,514 | ||||||||||
| See accompanying notes to the financial statements. | 35 | (Continued) |
CLEARWATER INVESTMENT TRUST
Schedule of Investments - Clearwater Core Equity Fund
December 31, 2014
Schedule of Investments - Clearwater Core Equity Fund
December 31, 2014
| Shares | Security | Cost | Fair value (a) | Percent of net assets | |||||||||
| Health Care (Cont’d): | |||||||||||||
| 2,036 | UNIVERSAL HEALTH SERVICES, INC., CLASS B | $ | 38,822 | 226,525 | |||||||||
| 20,130 | VALEANT PHARMACEUTICALS INTERNATIONAL, INC.(b) | 566,080 | 2,880,804 | ||||||||||
| 4,700 | VARIAN MEDICAL SYSTEMS, INC.(b) | 173,242 | 406,597 | ||||||||||
| 3,000 | VERTEX PHARMACEUTICALS, INC.(b) | 74,805 | 356,400 | ||||||||||
| 2,600 | WATERS CORP.(b) | 60,997 | 293,072 | ||||||||||
| 3,374 | ZIMMER HOLDINGS, INC. | 140,047 | 382,679 | ||||||||||
| 26,394,198 | 69,956,953 | 12.93 | % | ||||||||||
| Industrials: | |||||||||||||
| 7,987 | 3M CO. | 480,442 | 1,312,424 | ||||||||||
| 923 | ACCO BRANDS CORP.(b) | 3,137 | 8,316 | ||||||||||
| 49,340 | ADT (THE) CORP. | 1,539,537 | 1,787,588 | ||||||||||
| 1,410 | AGCO CORP. | 54,377 | 63,732 | ||||||||||
| 75,330 | AIR LEASE CORP. | 1,868,329 | 2,584,572 | ||||||||||
| 1,533 | ALLEGION PLC(c) | 40,913 | 85,020 | ||||||||||
| 5,175 | AMETEK, INC. | 73,220 | 272,360 | ||||||||||
| 1,700 | B/E AEROSPACE, INC.(b) | 34,478 | 98,634 | ||||||||||
| 29,760 | BOEING (THE) CO. | 1,404,260 | 3,868,205 | ||||||||||
| 2,200 | CARLISLE COS., INC. | 45,116 | 198,528 | ||||||||||
| 11,004 | CATERPILLAR, INC. | 295,368 | 1,007,196 | ||||||||||
| 2,500 | CHICAGO BRIDGE & IRON CO. N.V.(c) | 50,995 | 104,950 | ||||||||||
| 2,027 | CON-WAY, INC. | 44,529 | 99,688 | ||||||||||
| 800 | COPA HOLDINGS S.A., CLASS A(c) | 32,618 | 82,912 | ||||||||||
| 3,948 | CRANE CO. | 66,572 | 231,748 | ||||||||||
| 27,900 | CSX CORP. | 97,923 | 1,010,817 | ||||||||||
| 3,700 | CUMMINS, INC. | 50,756 | 533,429 | ||||||||||
| 11,163 | DANAHER CORP. | 255,642 | 956,781 | ||||||||||
| 7,300 | DEERE & CO. | 199,160 | 645,831 | ||||||||||
| 10,100 | DELTA AIR LINES, INC. | 100,965 | 496,819 | ||||||||||
| 1,460 | DONALDSON CO., INC. | 38,557 | 56,400 | ||||||||||
| 2,125 | DOVER CORP. | 61,065 | 152,405 | ||||||||||
| 1,987 | DUN & BRADSTREET (THE) CORP. | 49,383 | 240,347 | ||||||||||
| 8,384 | EATON CORP. PLC | 136,018 | 569,777 | ||||||||||
| 15,500 | EMERSON ELECTRIC CO. | 422,332 | 956,815 | ||||||||||
| 194,000 | EXELIS, INC. | 2,063,687 | 3,400,820 | ||||||||||
| 900 | EXPEDITORS INTERNATIONAL OF WASHINGTON, INC. | 26,150 | 40,149 | ||||||||||
| 1,600 | FASTENAL CO. | 34,863 | 76,096 | ||||||||||
| 6,653 | FEDEX CORP. | 130,734 | 1,155,360 | ||||||||||
| 300 | FLOWSERVE CORP. | 14,470 | 17,949 | ||||||||||
| 1,950 | FLUOR CORP. | 26,013 | 118,228 | ||||||||||
| 4,300 | FORTUNE BRANDS HOME & SECURITY, INC. | 33,889 | 194,661 | ||||||||||
| 1,400 | GATX CORP. | 24,276 | 80,556 | ||||||||||
| 3,100 | GENERAL DYNAMICS CORP. | 204,878 | 426,622 | ||||||||||
| 133,200 | GENERAL ELECTRIC CO. | 2,090,503 | 3,365,964 | ||||||||||
| 1,200 | HARSCO CORP. | 17,510 | 22,668 | ||||||||||
| 6,600 | HERTZ GLOBAL HOLDINGS, INC.(b) | 37,676 | 164,604 | ||||||||||
| 9,288 | HONEYWELL INTERNATIONAL, INC. | 285,338 | 928,057 | ||||||||||
| 1,200 | HUBBELL, INC., CLASS B | 43,309 | 128,196 | ||||||||||
| 610 | HUNTINGTON INGALLS INDUSTRIES, INC. | 14,978 | 68,601 | ||||||||||
| 2,500 | IDEX CORP. | 58,238 | 194,600 | ||||||||||
| 700 | IHS, INC., CLASS A(b) | 30,839 | 79,716 | ||||||||||
| 5,624 | ILLINOIS TOOL WORKS, INC. | 205,252 | 532,593 | ||||||||||
| 4,600 | INGERSOLL-RAND PLC | 160,916 | 291,594 | ||||||||||
| 800 | ITT CORP. | 8,681 | 32,368 | ||||||||||
| 1,468 | JACOBS ENGINEERING GROUP, INC.(b) | 29,713 | 65,605 | ||||||||||
| 2,100 | JB HUNT TRANSPORT SERVICES, INC. | 40,530 | 176,925 | ||||||||||
| 167,030 | JETBLUE AIRWAYS CORP.(b) | 1,042,688 | 2,649,096 | ||||||||||
| 1,138 | JOY GLOBAL, INC. | 49,509 | 52,940 | ||||||||||
| 2,900 | KANSAS CITY SOUTHERN | 46,327 | 353,887 | ||||||||||
| 66,719 | KBR, INC. | 1,791,892 | 1,130,887 | ||||||||||
| 400 | KIRBY CORP.(b) | 24,760 | 32,296 | ||||||||||
| 850 | KLX, INC.(b) | 13,147 | 35,062 | ||||||||||
| 1,100 | L-3 COMMUNICATIONS HOLDINGS, INC. | 49,763 | 138,831 | ||||||||||
| 1,200 | LANDSTAR SYSTEM, INC. | 38,351 | 87,036 | ||||||||||
| 900 | LENNOX INTERNATIONAL, INC. | 26,811 | 85,563 | ||||||||||
| 1,400 | LINCOLN ELECTRIC HOLDINGS, INC. | 28,970 | 96,726 | ||||||||||
| 2,900 | LOCKHEED MARTIN CORP. | 102,203 | 558,453 | ||||||||||
| 4,800 | MANITOWOC (THE) CO., INC. | 47,568 | 106,080 | ||||||||||
| See accompanying notes to the financial statements. | 36 | (Continued) |
CLEARWATER INVESTMENT TRUST
Schedule of Investments - Clearwater Core Equity Fund
December 31, 2014
| Shares | Security | Cost | Fair value (a) | Percent of net assets | |||||||||
| Industrials (Cont’d): | |||||||||||||
| 2,475 | MANPOWERGROUP, INC. | $ | 81,958 | 168,721 | |||||||||
| 13,200 | MASCO CORP. | 97,548 | 332,640 | ||||||||||
| 2,200 | NAVISTAR INTERNATIONAL CORP.(b) | 47,586 | 73,656 | ||||||||||
| 2,000 | NIELSEN N.V. | 61,200 | 89,460 | ||||||||||
| 700 | NORDSON CORP. | 29,470 | 54,572 | ||||||||||
| 4,760 | NORFOLK SOUTHERN CORP. | 99,373 | 521,744 | ||||||||||
| 3,660 | NORTHROP GRUMMAN CORP. | 139,878 | 539,447 | ||||||||||
| 2,180 | NOW, INC.(b) | 21,218 | 56,091 | ||||||||||
| 13,985 | OSHKOSH CORP. | 468,929 | 680,370 | ||||||||||
| 1,100 | OWENS CORNING | 22,578 | 39,391 | ||||||||||
| 8,389 | PACCAR, INC. | 91,278 | 570,536 | ||||||||||
| 2,200 | PALL CORP. | 55,214 | 222,662 | ||||||||||
| 2,850 | PARKER-HANNIFIN CORP. | 123,853 | 367,507 | ||||||||||
| 2,519 | PENTAIR PLC(c) | 73,408 | 167,312 | ||||||||||
| 2,000 | PRECISION CASTPARTS CORP. | 118,921 | 481,760 | ||||||||||
| 4,100 | QUANTA SERVICES, INC.(b) | 52,131 | 116,399 | ||||||||||
| 5,300 | RAYTHEON CO. | 148,950 | 573,301 | ||||||||||
| 3,100 | REPUBLIC SERVICES, INC. | 92,639 | 124,775 | ||||||||||
| 5,250 | ROCKWELL AUTOMATION, INC. | 73,987 | 583,800 | ||||||||||
| 5,214 | ROCKWELL COLLINS, INC. | 154,727 | 440,479 | ||||||||||
| 300 | ROPER INDUSTRIES, INC. | 19,526 | 46,905 | ||||||||||
| 2,800 | RR DONNELLEY & SONS CO. | 25,228 | 47,054 | ||||||||||
| 15,095 | RYDER SYSTEM, INC. | 825,392 | 1,401,571 | ||||||||||
| 700 | SNAP-ON, INC. | 17,991 | 95,718 | ||||||||||
| 2,700 | SOLARCITY CORP.(b) | 98,496 | 144,396 | ||||||||||
| 17,600 | SOUTHWEST AIRLINES CO. | 129,729 | 744,832 | ||||||||||
| 1,500 | SPIRIT AEROSYSTEMS HOLDINGS, INC., CLASS A(b) | 25,470 | 64,560 | ||||||||||
| 300 | SPX CORP. | 11,766 | 25,776 | ||||||||||
| 2,557 | STANLEY BLACK & DECKER, INC. | 72,048 | 245,677 | ||||||||||
| 2,000 | STERICYCLE, INC.(b) | 95,283 | 262,160 | ||||||||||
| 1,700 | TEREX CORP. | 31,637 | 47,396 | ||||||||||
| 1,100 | TEXTRON, INC. | 27,165 | 46,321 | ||||||||||
| 1,000 | TOWERS WATSON & CO., CLASS A | 56,220 | 113,170 | ||||||||||
| 22,240 | TRIUMPH GROUP, INC. | 1,567,233 | 1,494,973 | ||||||||||
| 10,500 | TYCO INTERNATIONAL PLC | 190,755 | 460,530 | ||||||||||
| 15,000 | UNION PACIFIC CORP. | 216,086 | 1,786,950 | ||||||||||
| 4,828 | UNITED CONTINENTAL HOLDINGS, INC.(b) | 104,937 | 322,945 | ||||||||||
| 10,640 | UNITED PARCEL SERVICE, INC., CLASS B | 635,863 | 1,182,849 | ||||||||||
| 59,925 | UNITED STATIONERS, INC. | 2,330,640 | 2,526,438 | ||||||||||
| 16,850 | UNITED TECHNOLOGIES CORP. | 637,288 | 1,937,750 | ||||||||||
| 33,640 | UNIVERSAL FOREST PRODUCTS, INC. | 1,326,043 | 1,789,648 | ||||||||||
| 2,000 | USG CORP.(b) | 12,350 | 55,980 | ||||||||||
| 62,000 | VECTRUS, INC.(b) | 1,153,716 | 1,698,800 | ||||||||||
| 500 | VERISK ANALYTICS, INC., CLASS A(b) | 25,120 | 32,025 | ||||||||||
| 180 | VERITIV CORP.(b) | 1,653 | 9,337 | ||||||||||
| 1,966 | WABCO HOLDINGS, INC.(b) | 30,197 | 205,997 | ||||||||||
| 1,400 | WABTEC CORP. | 25,603 | 121,646 | ||||||||||
| 1,650 | WASTE CONNECTIONS, INC. | 29,915 | 72,583 | ||||||||||
| 8,650 | WASTE MANAGEMENT, INC. | 135,675 | 443,918 | ||||||||||
| 1,700 | WW GRAINGER, INC. | 74,317 | 433,313 | ||||||||||
| 1,600 | XYLEM, INC. | 30,618 | 60,912 | ||||||||||
| 28,308,930 | 58,440,836 | 10.80 | % | ||||||||||
| Information Technology: | |||||||||||||
| 5,600 | ACCENTURE PLC, CLASS A(c) | 230,959 | 500,136 | ||||||||||
| 7,800 | ACTIVISION BLIZZARD, INC. | 34,584 | 157,170 | ||||||||||
| 7,524 | ADOBE SYSTEMS, INC.(b) | 128,931 | 546,995 | ||||||||||
| 63,924 | ADTRAN, INC. | 1,475,958 | 1,393,543 | ||||||||||
| 3,300 | AKAMAI TECHNOLOGIES, INC.(b) | 45,920 | 207,768 | ||||||||||
| 1,600 | ALLIANCE DATA SYSTEMS CORP.(b) | 75,650 | 457,680 | ||||||||||
| 5,000 | ALTERA CORP. | 94,155 | 184,700 | ||||||||||
| 8,600 | ANALOG DEVICES, INC. | 120,368 | 477,472 | ||||||||||
| 1,300 | ANSYS, INC.(b) | 34,888 | 106,600 | ||||||||||
| 6,900 | AOL, INC.(b) | 91,149 | 318,573 | ||||||||||
| 102,300 | APPLE, INC. | 382,779 | 11,291,874 | ||||||||||
| 12,100 | APPLIED MATERIALS, INC. | 130,014 | 301,532 | ||||||||||
| 700 | ARROW ELECTRONICS, INC.(b) | 18,814 | 40,523 | ||||||||||
| 2,386 | AUTODESK, INC.(b) | 55,907 | 143,303 | ||||||||||
| 6,066 | AUTOMATIC DATA PROCESSING, INC. | 218,033 | 505,722 | ||||||||||
| See accompanying notes to the financial statements. | 37 | (Continued) |
CLEARWATER INVESTMENT TRUST
Schedule of Investments - Clearwater Core Equity Fund
December 31, 2014
| Shares | Security | Cost | Fair value (a) | Percent of net assets | |||||||||
| Information Technology (Cont’d): | |||||||||||||
| 800 | AVAGO TECHNOLOGIES LTD.(c) | $ | 26,256 | 80,472 | |||||||||
| 2,300 | AVX CORP. | 24,817 | 32,200 | ||||||||||
| 262 | BLACKHAWK NETWORK HOLDINGS, INC., CLASS B(b) | 6,196 | 9,875 | ||||||||||
| 9,791 | BROADCOM CORP., CLASS A | 146,420 | 424,244 | ||||||||||
| 2,180 | BROADRIDGE FINANCIAL SOLUTIONS, INC. | 33,318 | 100,672 | ||||||||||
| 3,000 | CA, INC. | 66,523 | 91,350 | ||||||||||
| 4,200 | CADENCE DESIGN SYSTEMS, INC.(b) | 24,003 | 79,674 | ||||||||||
| 2,022 | CDK GLOBAL, INC. | 30,504 | 82,416 | ||||||||||
| 173,924 | CISCO SYSTEMS, INC. | 1,554,709 | 4,837,696 | ||||||||||
| 4,234 | CITRIX SYSTEMS, INC.(b) | 47,866 | 270,129 | ||||||||||
| 12,600 | COGNIZANT TECHNOLOGY SOLUTIONS CORP., CLASS A(b) | 95,625 | 663,516 | ||||||||||
| 1,500 | COMPUTER SCIENCES CORP. | 62,082 | 94,575 | ||||||||||
| 6,700 | CORELOGIC, INC.(b) | 76,313 | 211,653 | ||||||||||
| 23,200 | CORNING, INC. | 181,284 | 531,976 | ||||||||||
| 2,700 | CYPRESS SEMICONDUCTOR CORP.(b) | 4,449 | 38,556 | ||||||||||
| 2,000 | DOLBY LABORATORIES, INC., CLASS A | 43,420 | 86,240 | ||||||||||
| 44,220 | EBAY, INC.(b) | 1,884,324 | 2,481,626 | ||||||||||
| 187,000 | EBIX, INC. | 2,065,748 | 3,177,130 | ||||||||||
| 2,140 | ECHOSTAR CORP., CLASS A(b) | 36,471 | 112,350 | ||||||||||
| 8,900 | ELECTRONIC ARTS, INC.(b) | 125,795 | 418,434 | ||||||||||
| 34,310 | EMC CORP. | 233,560 | 1,020,379 | ||||||||||
| 921 | EQUINIX, INC. | 74,468 | 208,818 | ||||||||||
| 1,300 | F5 NETWORKS, INC.(b) | 30,063 | 169,605 | ||||||||||
| 85,105 | FABRINET(b)(c) | 1,488,524 | 1,509,763 | ||||||||||
| 26,400 | FACEBOOK, INC., CLASS A(b) | 806,504 | 2,059,728 | ||||||||||
| 7,802 | FIDELITY NATIONAL INFORMATION SERVICES, INC. | 135,427 | 485,284 | ||||||||||
| 7,900 | FISERV, INC.(b) | 108,063 | 560,663 | ||||||||||
| 2,100 | FLIR SYSTEMS, INC. | 49,313 | 67,851 | ||||||||||
| 1,300 | FORTINET, INC.(b) | 24,791 | 39,858 | ||||||||||
| 1,300 | FREESCALE SEMICONDUCTOR LTD.(b) | 14,326 | 32,799 | ||||||||||
| 1,000 | GLOBAL PAYMENTS, INC. | 33,115 | 80,730 | ||||||||||
| 6,021 | GOOGLE, INC., CLASS A(b) | 1,239,018 | 3,195,104 | ||||||||||
| 6,021 | GOOGLE, INC., CLASS C(b) | 1,236,617 | 3,169,454 | ||||||||||
| 2,800 | HARRIS CORP. | 37,337 | 201,096 | ||||||||||
| 31,300 | HEWLETT-PACKARD CO. | 555,703 | 1,256,069 | ||||||||||
| 500 | IAC/INTERACTIVECORP | 22,745 | 30,395 | ||||||||||
| 1,800 | INFORMATICA CORP.(b) | 54,045 | 68,643 | ||||||||||
| 5,200 | INGRAM MICRO, INC., CLASS A(b) | 68,614 | 143,728 | ||||||||||
| 90,500 | INTEL CORP. | 181,195 | 3,284,245 | ||||||||||
| 15,246 | INTERNATIONAL BUSINESS MACHINES CORP. | 1,200,820 | 2,446,068 | ||||||||||
| 5,000 | INTUIT, INC. | 103,285 | 460,950 | ||||||||||
| 1,900 | ITRON, INC.(b) | 65,968 | 80,351 | ||||||||||
| 900 | JABIL CIRCUIT, INC. | 14,140 | 19,647 | ||||||||||
| 2,567 | JUNIPER NETWORKS, INC. | 35,912 | 57,295 | ||||||||||
| 2,800 | KEYSIGHT TECHNOLOGIES, INC.(b) | 63,035 | 94,556 | ||||||||||
| 2,600 | KLA-TENCOR CORP. | 75,369 | 182,832 | ||||||||||
| 1,062 | KNOWLES CORP.(b) | 12,542 | 25,010 | ||||||||||
| 4,800 | LAM RESEARCH CORP. | 123,706 | 380,832 | ||||||||||
| 53,500 | LEIDOS HOLDINGS, INC. | 1,634,312 | 2,328,320 | ||||||||||
| 5,400 | LINEAR TECHNOLOGY CORP. | 119,475 | 246,240 | ||||||||||
| 1,100 | LINKEDIN CORP., CLASS A(b) | 136,813 | 252,681 | ||||||||||
| 14,800 | MARVELL TECHNOLOGY GROUP LTD.(c) | 94,528 | 214,600 | ||||||||||
| 17,000 | MASTERCARD, INC., CLASS A | 182,282 | 1,464,720 | ||||||||||
| 4,400 | MAXIM INTEGRATED PRODUCTS, INC. | 76,114 | 140,228 | ||||||||||
| 4,200 | MICROCHIP TECHNOLOGY, INC. | 49,116 | 189,462 | ||||||||||
| 11,900 | MICRON TECHNOLOGY, INC.(b) | 53,372 | 416,619 | ||||||||||
| 118,450 | MICROSOFT CORP. | 435,643 | 5,502,003 | ||||||||||
| 62,428 | MOTOROLA SOLUTIONS, INC. | 2,597,865 | 4,187,670 | ||||||||||
| 5,700 | NETAPP, INC. | 144,148 | 236,265 | ||||||||||
| 4,800 | NEUSTAR, INC., CLASS A(b) | 79,848 | 133,440 | ||||||||||
| 4,800 | NUANCE COMMUNICATIONS, INC.(b) | 63,624 | 68,496 | ||||||||||
| 8,900 | NVIDIA CORP. | 58,789 | 178,445 | ||||||||||
| 68,262 | ORACLE CORP. | 82,431 | 3,069,742 | ||||||||||
| 2,800 | PALO ALTO NETWORKS, INC.(b) | 116,508 | 343,196 | ||||||||||
| 3,666 | PAYCHEX, INC. | 10,315 | 169,259 | ||||||||||
| 189,780 | PHOTRONICS, INC.(b) | 1,592,558 | 1,577,072 | ||||||||||
| 20,700 | QUALCOMM, INC. | 502,530 | 1,538,631 | ||||||||||
| 4,200 | RED HAT, INC.(b) | 61,669 | 290,388 | ||||||||||
| See accompanying notes to the financial statements. | 38 | (Continued) |
CLEARWATER INVESTMENT TRUST
Schedule of Investments - Clearwater Core Equity Fund
December 31, 2014
| Shares | Security | Cost | Fair value (a) | Percent of net assets | |||||||||
| Information Technology (Cont’d): | |||||||||||||
| 8,100 | SALESFORCE.COM, INC.(b) | $ | 113,766 | 480,411 | |||||||||
| 5,300 | SANDISK CORP. | 51,149 | 519,294 | ||||||||||
| 30,571 | SCIENCE APPLICATIONS INTERNATIONAL CORP. | 739,224 | 1,514,182 | ||||||||||
| 5,500 | SEAGATE TECHNOLOGY PLC | 51,728 | 365,750 | ||||||||||
| 3,700 | SERVICENOW, INC.(b) | 139,416 | 251,045 | ||||||||||
| 13,000 | SUNEDISON, INC.(b) | 285,740 | 253,630 | ||||||||||
| 15,519 | SYMANTEC CORP. | 88,098 | 398,140 | ||||||||||
| 800 | SYNOPSYS, INC.(b) | 13,284 | 34,776 | ||||||||||
| 36,958 | TERADATA CORP.(b) | 1,535,042 | 1,614,326 | ||||||||||
| 82,388 | TERADYNE, INC. | 1,475,933 | 1,630,459 | ||||||||||
| 17,400 | TEXAS INSTRUMENTS, INC. | 280,527 | 930,291 | ||||||||||
| 2,700 | TOTAL SYSTEM SERVICES, INC. | 60,453 | 91,692 | ||||||||||
| 5,000 | TRIMBLE NAVIGATION LTD.(b) | 38,163 | 132,700 | ||||||||||
| 900 | VERISIGN, INC.(b) | 40,779 | 51,300 | ||||||||||
| 7,000 | VISA, INC., CLASS A | 498,468 | 1,835,400 | ||||||||||
| 7,800 | VISHAY INTERTECHNOLOGY, INC. | 48,931 | 110,370 | ||||||||||
| 557 | VISHAY PRECISION GROUP, INC.(b) | 5,692 | 9,558 | ||||||||||
| 1,500 | VMWARE, INC., CLASS A(b) | 47,285 | 123,780 | ||||||||||
| 5,900 | WESTERN DIGITAL CORP. | 91,433 | 653,130 | ||||||||||
| 6,000 | WESTERN UNION (THE) CO. | 76,080 | 107,460 | ||||||||||
| 3,000 | WORKDAY, INC., CLASS A(b) | 180,280 | 244,830 | ||||||||||
| 5,307 | XEROX CORP. | 32,248 | 73,555 | ||||||||||
| 6,750 | XILINX, INC. | 47,180 | 292,208 | ||||||||||
| 20,640 | YAHOO!, INC.(b) | 228,331 | 1,042,526 | ||||||||||
| 60,000 | ZYNGA, INC., CLASS A(b) | 160,272 | 159,600 | ||||||||||
| 32,183,879 | 87,258,018 | 16.13 | % | ||||||||||
| Materials: | |||||||||||||
| 2,775 | AIR PRODUCTS & CHEMICALS, INC. | 126,374 | 400,238 | ||||||||||
| 400 | AIRGAS, INC. | 16,882 | 46,072 | ||||||||||
| 1,300 | ALBEMARLE CORP. | 29,153 | 78,169 | ||||||||||
| 1,600 | ALLEGHENY TECHNOLOGIES, INC. | 39,592 | 55,632 | ||||||||||
| 800 | APTARGROUP, INC. | 27,324 | 53,472 | ||||||||||
| 1,600 | ASHLAND, INC. | 47,358 | 191,616 | ||||||||||
| 700 | AVERY DENNISON CORP. | 25,347 | 36,316 | ||||||||||
| 2,564 | BALL CORP. | 10,015 | 174,788 | ||||||||||
| 3,000 | BEMIS CO., INC. | 66,889 | 135,630 | ||||||||||
| 87,980 | BOISE CASCADE CO.(b) | 2,436,127 | 3,268,457 | ||||||||||
| 600 | CELANESE CORP., SERIES A | 24,630 | 35,976 | ||||||||||
| 1,100 | CF INDUSTRIES HOLDINGS, INC. | 97,135 | 299,794 | ||||||||||
| 500 | COMPASS MINERALS INTERNATIONAL, INC. | 27,452 | 43,415 | ||||||||||
| 42,780 | CROWN HOLDINGS, INC.(b) | 1,312,976 | 2,177,502 | ||||||||||
| 1,400 | CYTEC INDUSTRIES, INC. | 25,564 | 64,638 | ||||||||||
| 2,000 | DOMTAR CORP.(c) | 52,480 | 80,440 | ||||||||||
| 17,700 | DOW CHEMICAL (THE) CO. | 441,871 | 807,297 | ||||||||||
| 15,225 | E.I. DU PONT DE NEMOURS & CO. | 485,530 | 1,125,737 | ||||||||||
| 438 | EAGLE MATERIALS, INC. | 1,727 | 33,301 | ||||||||||
| 3,000 | EASTMAN CHEMICAL CO. | 58,011 | 227,580 | ||||||||||
| 3,991 | ECOLAB, INC. | 137,417 | 417,139 | ||||||||||
| 6,196 | FREEPORT-MCMORAN, INC. | 100,778 | 144,739 | ||||||||||
| 900 | GREIF, INC., CLASS A | 27,103 | 42,507 | ||||||||||
| 27,421 | HAYNES INTERNATIONAL, INC. | 1,405,606 | 1,329,919 | ||||||||||
| 3,683 | INTERNATIONAL FLAVORS & FRAGRANCES, INC. | 79,231 | 373,309 | ||||||||||
| 9,431 | INTERNATIONAL PAPER CO. | 115,495 | 505,313 | ||||||||||
| 22,726 | LSB INDUSTRIES, INC.(b) | 739,156 | 714,506 | ||||||||||
| 1,900 | LYONDELLBASELL INDUSTRIES N.V., CLASS A | 54,143 | 150,841 | ||||||||||
| 700 | MARTIN MARIETTA MATERIALS, INC. | 27,965 | 77,224 | ||||||||||
| 2,875 | MEADWESTVACO CORP. | 27,016 | 127,621 | ||||||||||
| 10,115 | MONSANTO CO. | 47,604 | 1,208,439 | ||||||||||
| 34,299 | MOSAIC (THE) CO. | 1,612,376 | 1,565,749 | ||||||||||
| 96,000 | NEWMONT MINING CORP. | 2,343,871 | 1,814,400 | ||||||||||
| 5,844 | NUCOR CORP. | 99,313 | 286,648 | ||||||||||
| 95,070 | OWENS-ILLINOIS, INC.(b) | 2,455,571 | 2,565,939 | ||||||||||
| 2,100 | PACKAGING CORP. OF AMERICA | 30,902 | 163,905 | ||||||||||
| 3,986 | PPG INDUSTRIES, INC. | 180,558 | 921,364 | ||||||||||
| 6,450 | PRAXAIR, INC. | 258,706 | 835,662 | ||||||||||
| 2,324 | RAYONIER ADVANCED MATERIALS, INC. | 26,574 | 51,825 | ||||||||||
| 2,200 | RELIANCE STEEL & ALUMINUM CO. | 61,215 | 134,794 | ||||||||||
| 800 | ROCK-TENN CO., CLASS A | 29,220 | 48,784 | ||||||||||
| See accompanying notes to the financial statements. | 39 | (Continued) |
CLEARWATER INVESTMENT TRUST
Schedule of Investments - Clearwater Core Equity Fund
December 31, 2014
| Shares | Security | Cost | Fair value (a) | Percent of net assets | |||||||||
| Materials (Cont’d): | |||||||||||||
| 2,300 | ROYAL GOLD, INC. | $ | 111,969 | 144,210 | |||||||||
| 6,500 | RPM INTERNATIONAL, INC. | 72,503 | 329,615 | ||||||||||
| 53,255 | RTI INTERNATIONAL METALS, INC.(b) | 1,345,818 | 1,345,221 | ||||||||||
| 86,400 | SEALED AIR CORP. | 1,696,699 | 3,665,952 | ||||||||||
| 1,585 | SHERWIN-WILLIAMS (THE) CO. | 72,398 | 416,918 | ||||||||||
| 3,600 | SONOCO PRODUCTS CO. | 74,519 | 157,320 | ||||||||||
| 3,234 | SOUTHERN COPPER CORP. | 38,445 | 91,199 | ||||||||||
| 8,700 | STEEL DYNAMICS, INC. | 95,178 | 171,738 | ||||||||||
| 1,273 | SUNCOKE ENERGY, INC. | 8,474 | 24,620 | ||||||||||
| 1,600 | UNITED STATES STEEL CORP. | 30,208 | 42,784 | ||||||||||
| 3,200 | VALSPAR (THE) CORP. | 68,240 | 276,736 | ||||||||||
| 2,100 | VULCAN MATERIALS CO. | 63,441 | 138,033 | ||||||||||
| 18,890,149 | 29,621,043 | 5.48 | % | ||||||||||
| Telecommunication Services: | |||||||||||||
| 139,032 | AT&T, INC. | 3,882,085 | 4,670,085 | ||||||||||
| 900 | CENTURYLINK, INC. | 31,014 | 35,622 | ||||||||||
| 16,300 | FRONTIER COMMUNICATIONS CORP. | 65,330 | 108,721 | ||||||||||
| 6,710 | LEVEL 3 COMMUNICATIONS, INC.(b) | 159,907 | 331,340 | ||||||||||
| 700 | SBA COMMUNICATIONS CORP., CLASS A(b) | 53,338 | 77,532 | ||||||||||
| 10,940 | SPRINT CORP.(b) | 26,340 | 45,401 | ||||||||||
| 5,435 | TELEPHONE & DATA SYSTEMS, INC. | 109,150 | 137,234 | ||||||||||
| 1,500 | T-MOBILE US, INC.(b) | 13,875 | 40,410 | ||||||||||
| 284,000 | TURKCELL ILETISIM HIZMETLERI A/S ADR(b)(c)(d) | 3,474,067 | 4,294,080 | ||||||||||
| 47,583 | VERIZON COMMUNICATIONS, INC. | 1,687,855 | 2,225,932 | ||||||||||
| 18,218 | WINDSTREAM HOLDINGS, INC. | 129,582 | 150,116 | ||||||||||
| 9,632,543 | 12,116,473 | 2.24 | % | ||||||||||
| Utilities: | |||||||||||||
| 9,100 | AES CORP. | 97,825 | 125,307 | ||||||||||
| 4,500 | AGL RESOURCES, INC. | 135,198 | 245,295 | ||||||||||
| 1,000 | ALLIANT ENERGY CORP. | 24,835 | 66,420 | ||||||||||
| 4,000 | AMEREN CORP. | 114,624 | 184,520 | ||||||||||
| 9,200 | AMERICAN ELECTRIC POWER CO., INC. | 289,948 | 558,624 | ||||||||||
| 45,310 | AMERICAN WATER WORKS CO., INC. | 1,186,470 | 2,415,023 | ||||||||||
| 1,735 | AQUA AMERICA, INC. | 22,973 | 46,324 | ||||||||||
| 8,500 | CALPINE CORP.(b) | 56,653 | 188,105 | ||||||||||
| 5,800 | CENTERPOINT ENERGY, INC. | 66,308 | 135,894 | ||||||||||
| 10,200 | CMS ENERGY CORP. | 144,342 | 354,450 | ||||||||||
| 4,589 | CONSOLIDATED EDISON, INC. | 184,849 | 302,920 | ||||||||||
| 9,762 | DOMINION RESOURCES, INC. | 334,591 | 750,698 | ||||||||||
| 2,300 | DTE ENERGY CO. | 84,036 | 198,651 | ||||||||||
| 10,851 | DUKE ENERGY CORP. | 395,594 | 906,492 | ||||||||||
| 8,525 | EDISON INTERNATIONAL | 182,117 | 558,217 | ||||||||||
| 3,064 | ENTERGY CORP. | 60,101 | 268,039 | ||||||||||
| 8,124 | EXELON CORP. | 239,927 | 301,238 | ||||||||||
| 2,800 | GREAT PLAINS ENERGY, INC. | 43,498 | 79,548 | ||||||||||
| 10,500 | ITC HOLDINGS CORP. | 154,843 | 424,515 | ||||||||||
| 1,500 | NATIONAL FUEL GAS CO. | 38,322 | 104,295 | ||||||||||
| 5,100 | NEXTERA ENERGY, INC. | 234,503 | 542,079 | ||||||||||
| 6,900 | NISOURCE, INC. | 111,901 | 292,698 | ||||||||||
| 4,961 | NORTHEAST UTILITIES | 125,492 | 265,513 | ||||||||||
| 10,883 | NRG ENERGY, INC. | 189,415 | 293,297 | ||||||||||
| 33,360 | NRG YIELD, INC., CLASS A | 1,425,959 | 1,572,590 | ||||||||||
| 4,800 | OGE ENERGY CORP. | 43,344 | 170,304 | ||||||||||
| 500 | ONE GAS, INC. | 3,925 | 20,610 | ||||||||||
| 1,500 | PEPCO HOLDINGS, INC. | 28,485 | 40,395 | ||||||||||
| 5,900 | PG&E CORP. | 79,340 | 314,116 | ||||||||||
| 2,400 | PINNACLE WEST CAPITAL CORP. | 71,637 | 163,944 | ||||||||||
| 9,000 | PPL CORP. | 245,589 | 326,970 | ||||||||||
| 7,800 | PUBLIC SERVICE ENTERPRISE GROUP, INC. | 236,574 | 322,998 | ||||||||||
| 57,300 | QUESTAR CORP. | 959,089 | 1,448,544 | ||||||||||
| 4,800 | SCANA CORP. | 166,536 | 289,920 | ||||||||||
| 3,300 | SEMPRA ENERGY | 170,451 | 367,488 | ||||||||||
| 11,700 | SOUTHERN (THE) CO. | 275,353 | 574,587 | ||||||||||
| 7,600 | TECO ENERGY, INC. | 90,842 | 155,724 | ||||||||||
| 4,650 | UGI CORP. | 51,203 | 176,607 | ||||||||||
| 1,400 | WESTAR ENERGY, INC. | 25,767 | 57,736 | ||||||||||
| See accompanying notes to the financial statements. | 40 | (Continued) |
CLEARWATER INVESTMENT TRUST
Schedule of Investments - Clearwater Core Equity Fund
December 31, 2014
| Shares | Security | Cost | Fair value (a) | Percent of net assets | |||||||||
| Utilities (Cont’d): | |||||||||||||
| 4,820 | WISCONSIN ENERGY CORP. | $ | 46,469 | 254,207 | |||||||||
| 4,825 | XCEL ENERGY, INC. | 43,342 | 173,314 | ||||||||||
| 8,482,270 | 16,038,216 | 2.97 | % | ||||||||||
| Sub-total Common Stocks: | 249,051,805 | 520,274,803 | 96.17 | % | |||||||||
| Master Limited Partnerships: | |||||||||||||
| Energy: | |||||||||||||
| 58,615 | CONE MIDSTREAM PARTNERS L.P.(b) | 1,564,739 | 1,413,794 | ||||||||||
| 60,340 | ENTERPRISE PRODUCTS PARTNERS L.P. | 1,358,885 | 2,179,481 | ||||||||||
| 42,825 | MAGELLAN MIDSTREAM PARTNERS L.P. | 1,197,471 | 3,539,914 | ||||||||||
| 79,965 | PLAINS GP HOLDINGS LP, CLASS A | 1,994,391 | 2,053,501 | ||||||||||
| 30,795 | VTTI ENERGY PARTNERS L.P.(c) | 661,649 | 763,408 | ||||||||||
| 6,777,135 | 9,950,098 | 1.84 | % | ||||||||||
| Sub-total Master Limited Partnerships: | 6,777,135 | 9,950,098 | 1.84 | % | |||||||||
| Rights: | |||||||||||||
| Consumer Discretionary: | |||||||||||||
| 471 | LIBERTY BROADBAND CORP.(b) | - | 4,475 | ||||||||||
| Sub-total Rights: | - | 4,475 | 0.00 | % | |||||||||
| Warrants: | |||||||||||||
| Consumer Discretionary: | |||||||||||||
| 15,575 | SEARS HOLDINGS CORP. EXP. 12/15/2019, STRIKE $28.41(b) | 76,331 | 321,624 | ||||||||||
| Sub-total Warrants: | 76,331 | 321,624 | 0.06 | % | |||||||||
| Short-Term Investments: | |||||||||||||
| 10,357,430 | NORTHERN INSTITUTIONAL FUNDS - U.S. GOVERNMENT SELECT PORTFOLIO, 0.01%(e) | 10,357,430 | 10,357,430 | ||||||||||
| Sub-total Short-Term Investments: | 10,357,430 | 10,357,430 | 1.91 | % | |||||||||
| Grand total(f) | $ | 266,262,701 | 540,908,430 | 99.98 | % | ||||||||
Notes to Schedule of Investments:
| (a) | Investments are valued in accordance with procedures described in note 2 to the financial statements. | |
| (b) | Non-income producing assets. | |
| (c) | Foreign security values are stated in U.S. dollars. As of December 31, 2014, the value of foreign stocks or depositary receipts of companies based outside of the United States represented 5.58% of net assets. | |
| (d) | Securities are American Depositary Receipts of companies based outside of the United States representing 2.84% of net assets as of December 31, 2014. | |
| (e) | The short-term investment is a money market portfolio of the investment company, Northern Institutional Funds. At December 31, 2013, the value of the Clearwater Core Equity Fund’s investment in the U.S. Government Select Portfolio of the Northern Institutional Funds was approximately $15,630,648 with net sales of approximately $5,273,218 during the fiscal year ended December 31, 2014. | |
| (f) | At December 31, 2014, the cost for Federal income tax purposes was $266,014,849. The aggregate gross unrealized appreciation and depreciation of investments in securities based on this cost was as follows: |
| Gross unrealized appreciation | $ | 280,907,508 | ||
| Gross unrealized depreciation | (6,013,927 | ) | ||
| Net unrealized appreciation | $ | 274,893,581 |
| See accompanying notes to the financial statements. | 41 | (Continued) |
CLEARWATER INVESTMENT TRUST
Schedule of Investments – Clearwater Core Equity Fund
December 31, 2014
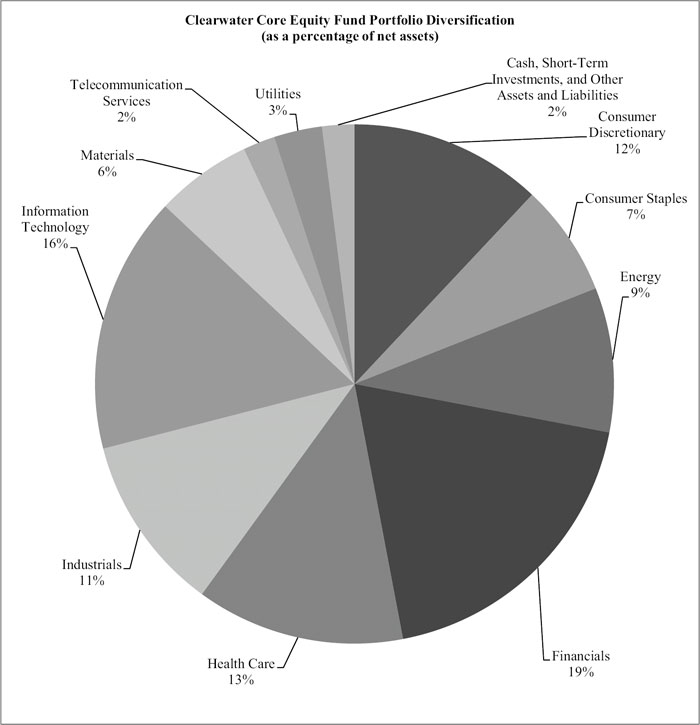
| See accompanying notes to the financial statements | 42 | (Continued) |
CLEARWATER INVESTMENT TRUST
December 31, 2014
| Shares | Security | Cost | Fair value (a) | Percent of net assets | |||||||||
| Common Stocks: | |||||||||||||
| Consumer Discretionary: | |||||||||||||
| 16,373 | 1-800-FLOWERS.COM, INC., CLASS A(b) | $ | 127,450 | 134,914 | |||||||||
| 4,438 | ARCTIC CAT, INC. | 143,447 | 157,549 | ||||||||||
| 142,563 | BLACK DIAMOND, INC.(b) | 1,209,025 | 1,247,426 | ||||||||||
| 32,900 | BLOOMIN’ BRANDS, INC.(b) | 757,789 | 814,604 | ||||||||||
| 38,381 | BRAVO BRIO RESTAURANT GROUP, INC.(b) | 541,841 | 533,880 | ||||||||||
| 22,988 | CARRIAGE SERVICES, INC. | 417,803 | 481,599 | ||||||||||
| 35,700 | CST BRANDS, INC. | 1,075,899 | 1,556,877 | ||||||||||
| 162,000 | DENNY’S CORP.(b) | 628,669 | 1,670,220 | ||||||||||
| 46,077 | DGSE COS., INC.(b) | 106,456 | 57,596 | ||||||||||
| 21,814 | DIVERSIFIED RESTAURANT HOLDINGS, INC.(b) | 108,586 | 112,560 | ||||||||||
| 42,600 | EW SCRIPPS (THE) CO., CLASS A(b) | 841,353 | 952,110 | ||||||||||
| 170,015 | EXPRESS, INC.(b) | 2,915,571 | 2,497,520 | ||||||||||
| 68,600 | FEDERAL-MOGUL HOLDINGS CORP.(b) | 1,232,520 | 1,103,774 | ||||||||||
| 34,386 | FTD COS., INC.(b) | 1,130,207 | 1,197,320 | ||||||||||
| 2,987 | GOOD TIMES RESTAURANTS, INC.(b) | 17,633 | 20,789 | ||||||||||
| 81,656 | IROBOT CORP.(b) | 2,715,537 | 2,835,096 | ||||||||||
| 52,687 | JAMBA, INC.(b) | 739,767 | 795,047 | ||||||||||
| 22,256 | JASON INDUSTRIES, INC.(b) | 229,682 | 219,222 | ||||||||||
| 168,264 | LIFELOCK, INC.(b) | 2,148,463 | 3,114,567 | ||||||||||
| 47,278 | LITHIA MOTORS, INC., CLASS A | 3,039,932 | 4,098,530 | ||||||||||
| 20,000 | MARRIOTT VACATIONS WORLDWIDE CORP. | 457,786 | 1,490,800 | ||||||||||
| 4,249 | NATHAN’S FAMOUS, INC.(b) | 209,747 | 339,920 | ||||||||||
| 159,461 | OFFICE DEPOT, INC.(b) | 786,908 | 1,367,378 | ||||||||||
| 25,264 | OUTERWALL, INC.(b) | 1,794,220 | 1,900,358 | ||||||||||
| 31,500 | PENSKE AUTOMOTIVE GROUP, INC. | 609,816 | 1,545,705 | ||||||||||
| 104,180 | PIER 1 IMPORTS, INC. | 1,658,240 | 1,604,372 | ||||||||||
| 80,755 | PINNACLE ENTERTAINMENT, INC.(b) | 1,778,778 | 1,796,799 | ||||||||||
| 39,424 | ROCKY BRANDS, INC. | 420,464 | 522,762 | ||||||||||
| 43,000 | SALLY BEAUTY HOLDINGS, INC.(b) | 366,257 | 1,321,820 | ||||||||||
| 16,923 | SHILOH INDUSTRIES, INC.(b) | 293,941 | 266,199 | ||||||||||
| 10,010 | SHOE CARNIVAL, INC. | 232,242 | 257,157 | ||||||||||
| 59,803 | SHUTTERFLY, INC.(b) | 2,827,805 | 2,493,486 | ||||||||||
| 41,700 | STARZ, CLASS A(b) | 778,590 | 1,238,490 | ||||||||||
| 27,774 | SUPERIOR INDUSTRIES INTERNATIONAL, INC. | 545,306 | 549,647 | ||||||||||
| 33,000 | TIME, INC. | 789,414 | 812,130 | ||||||||||
| 13,474 | TOWER INTERNATIONAL, INC.(b) | 293,542 | 344,261 | ||||||||||
| 23,922 | TRAVELCENTERS OF AMERICA LLC(b) | 218,132 | 301,896 | ||||||||||
| 75,100 | TRI POINTE HOMES, INC.(b) | 1,269,144 | 1,145,275 | ||||||||||
| 11,933 | UNIFI, INC.(b) | 325,299 | 354,768 | ||||||||||
| 38,214 | US AUTO PARTS NETWORK, INC.(b) | 105,586 | 89,421 | ||||||||||
| 15,500 | VAIL RESORTS, INC. | 580,317 | 1,412,515 | ||||||||||
| 18,758 | WINNEBAGO INDUSTRIES, INC. | 471,610 | 408,174 | ||||||||||
| 36,940,774 | 45,164,533 | 13.52 | % | ||||||||||
| Consumer Staples: | |||||||||||||
| 32,701 | CASEY’S GENERAL STORES, INC. | 2,279,786 | 2,953,554 | ||||||||||
| 26,857 | DIAMOND FOODS, INC.(b) | 722,620 | 758,173 | ||||||||||
| 56,350 | FLOWERS FOODS, INC. | 466,377 | 1,081,356 | ||||||||||
| 58,144 | FRESH MARKET (THE), INC.(b) | 2,141,988 | 2,395,533 | ||||||||||
| 35,073 | INTER PARFUMS, INC. | 699,283 | 962,754 | ||||||||||
| 49,457 | MEDIFAST, INC.(b) | 1,544,449 | 1,659,282 | ||||||||||
| 30,718 | PANTRY (THE), INC.(b) | 404,403 | 1,138,409 | ||||||||||
| 26,214 | PRIMO WATER CORP.(b) | 81,667 | 112,982 | ||||||||||
| 42,303 | S&W SEED CO.(b) | 188,827 | 169,212 | ||||||||||
| 7,087 | SENECA FOODS CORP., CLASS A(b) | 154,404 | 191,562 | ||||||||||
| 25,169 | SPARTANNASH CO. | 568,431 | 657,918 | ||||||||||
| 45,739 | SPECTRUM BRANDS HOLDINGS, INC. | 1,522,965 | 4,376,308 | ||||||||||
| 10,775,200 | 16,457,043 | 4.93 | % | ||||||||||
| Energy: | |||||||||||||
| 18,578 | ALON USA ENERGY, INC. | 229,060 | 235,383 | ||||||||||
| 60,938 | CALLON PETROLEUM CO.(b) | 357,877 | 332,112 | ||||||||||
| 43,311 | CARRIZO OIL & GAS, INC.(b) | 1,122,172 | 1,801,738 | ||||||||||
| 38,579 | FORBES ENERGY SERVICES LTD.(b) | 115,919 | 46,681 | ||||||||||
| 60,200 | HELIX ENERGY SOLUTIONS GROUP, INC.(b) | 1,294,927 | 1,306,340 | ||||||||||
| 41,683 | ROSETTA RESOURCES, INC.(b) | 1,757,252 | 929,948 | ||||||||||
| 28,202 | STEEL EXCEL, INC.(b) | 816,240 | 717,741 | ||||||||||
| See accompanying notes to the financial statements. | 43 | (Continued) |
CLEARWATER INVESTMENT TRUST
Schedule of Investments - Clearwater Small Companies Fund
December 31, 2014
| Shares | Security | Cost | Fair value (a) | Percent of net assets | |||||||||
| Energy (Cont’d): | |||||||||||||
| 98,377 | SYNERGY RESOURCES CORP.(b) | $ | 1,090,784 | 1,233,647 | |||||||||
| 6,784,231 | 6,603,590 | 1.98 | % | ||||||||||
| Financials: | |||||||||||||
| 56,100 | AMERICAN EQUITY INVESTMENT LIFE HOLDING CO. | 1,154,324 | 1,637,559 | ||||||||||
| 36,814 | AMERICAN NATIONAL BANKSHARES, INC. | 800,768 | 913,355 | ||||||||||
| 52,239 | AMREIT, INC. | 1,032,011 | 1,386,423 | ||||||||||
| 47,783 | AMTRUST FINANCIAL SERVICES, INC. | 1,318,170 | 2,687,794 | ||||||||||
| 18,211 | ASHFORD HOSPITALITY PRIME, INC. | 287,363 | 312,501 | ||||||||||
| 29,788 | ASHFORD HOSPITALITY TRUST, INC. | 307,100 | 312,178 | ||||||||||
| 16,537 | ATLAS FINANCIAL HOLDINGS, INC.(b) | 206,712 | 269,884 | ||||||||||
| 38,900 | BANCORPSOUTH, INC. | 753,702 | 875,639 | ||||||||||
| 4,251 | BBX CAPITAL CORP., CLASS A(b) | 73,417 | 69,929 | ||||||||||
| 25,220 | BERKSHIRE HILLS BANCORP, INC. | 581,467 | 672,365 | ||||||||||
| 20,198 | BNC BANCORP | 340,540 | 347,608 | ||||||||||
| 88,429 | BROOKLINE BANCORP, INC. | 762,579 | 886,943 | ||||||||||
| 15,893 | BSB BANCORP, INC.(b) | 247,593 | 296,086 | ||||||||||
| 10,639 | CAMPUS CREST COMMUNITIES, INC. | 82,909 | 77,771 | ||||||||||
| 33,338 | CAPE BANCORP, INC. | 311,944 | 313,710 | ||||||||||
| 3,146 | CAPITAL SOUTHWEST CORP. | 115,478 | 119,265 | ||||||||||
| 62,600 | CAPITOL FEDERAL FINANCIAL, INC. | 784,610 | 800,028 | ||||||||||
| 21,300 | CBOE HOLDINGS, INC. | 501,811 | 1,350,846 | ||||||||||
| 11,706 | CHARTER FINANCIAL CORP. | 117,280 | 134,034 | ||||||||||
| 71,630 | CHESAPEAKE LODGING TRUST | 1,200,457 | 2,665,352 | ||||||||||
| 33,294 | CHEVIOT FINANCIAL CORP. | 369,046 | 473,108 | ||||||||||
| 8,363 | CHICOPEE BANCORP, INC. | 134,125 | 140,080 | ||||||||||
| 10,819 | CITIZENS & NORTHERN CORP. | 213,286 | 223,629 | ||||||||||
| 7,264 | CNB FINANCIAL CORP. | 120,321 | 134,384 | ||||||||||
| 8,821 | COMMUNITY TRUST BANCORP, INC. | 288,471 | 322,937 | ||||||||||
| 16,505 | CONNECTONE BANCORP, INC. | 295,909 | 313,595 | ||||||||||
| 23,868 | CORRECTIONS CORP. OF AMERICA | 726,241 | 867,363 | ||||||||||
| 124,925 | COUSINS PROPERTIES, INC. | 1,264,353 | 1,426,643 | ||||||||||
| 19,911 | DONEGAL GROUP, INC., CLASS A | 316,178 | 318,178 | ||||||||||
| 19,305 | EMC INSURANCE GROUP, INC. | 461,114 | 684,555 | ||||||||||
| 5,599 | EVANS BANCORP, INC. | 115,674 | 138,015 | ||||||||||
| 28,869 | FARMERS NATIONAL BANC CORP. | 184,999 | 241,056 | ||||||||||
| 23,621 | FINANCIAL INSTITUTIONS, INC. | 410,802 | 594,068 | ||||||||||
| 49,000 | FIRST AMERICAN FINANCIAL CORP. | 686,144 | 1,661,100 | ||||||||||
| 17,014 | FIRST COMMUNITY BANCSHARES, INC. | 258,149 | 280,221 | ||||||||||
| 18,548 | FIRST FINANCIAL CORP. | 559,232 | 660,680 | ||||||||||
| 107,674 | FIRSTMERIT CORP. | 1,605,447 | 2,033,962 | ||||||||||
| 20,535 | FLUSHING FINANCIAL CORP. | 326,021 | 416,245 | ||||||||||
| 46,300 | FORESTAR GROUP, INC.(b) | 769,985 | 713,020 | ||||||||||
| 15,573 | FRANKLIN FINANCIAL CORP.(b) | 217,750 | 329,836 | ||||||||||
| 22,700 | GAMING AND LEISURE PROPERTIES, INC. | 828,957 | 666,018 | ||||||||||
| 9,356 | GERMAN AMERICAN BANCORP, INC. | 258,265 | 285,545 | ||||||||||
| 50,449 | GETTY REALTY CORP. | 905,458 | 918,676 | ||||||||||
| 63,822 | GLIMCHER REALTY TRUST | 601,565 | 876,914 | ||||||||||
| 44,403 | GRAMERCY PROPERTY TRUST, INC. | 272,057 | 306,381 | ||||||||||
| 13,058 | HAMPDEN BANCORP, INC. | 210,199 | 279,441 | ||||||||||
| 93,075 | HANMI FINANCIAL CORP. | 2,015,035 | 2,029,966 | ||||||||||
| 24,100 | HANOVER INSURANCE GROUP (THE), INC. | 1,337,061 | 1,718,812 | ||||||||||
| 56,225 | HERITAGE FINANCIAL CORP. | 764,333 | 986,749 | ||||||||||
| 15,912 | HERITAGE FINANCIAL GROUP, INC. | 221,781 | 412,121 | ||||||||||
| 14,178 | HORACE MANN EDUCATORS CORP. | 178,549 | 470,426 | ||||||||||
| 18,100 | IBERIABANK CORP. | 853,747 | 1,173,785 | ||||||||||
| 150,733 | INVESTORS BANCORP, INC. | 822,731 | 1,691,978 | ||||||||||
| 7,838 | KANSAS CITY LIFE INSURANCE CO. | 307,791 | 376,459 | ||||||||||
| 105,628 | KITE REALTY GROUP TRUST | 2,662,372 | 3,035,749 | ||||||||||
| 48,700 | LEGACYTEXAS FINANCIAL GROUP, INC. | 618,187 | 1,161,495 | ||||||||||
| 5,054 | MANNING & NAPIER, INC. | 73,417 | 69,846 | ||||||||||
| 24,629 | MARCUS & MILLICHAP, INC.(b) | 767,101 | 818,914 | ||||||||||
| 47,832 | MEADOWBROOK INSURANCE GROUP, INC. | 306,764 | 404,659 | ||||||||||
| 103,330 | MEDICAL PROPERTIES TRUST, INC. | 958,999 | 1,423,887 | ||||||||||
| 98,363 | NATIONAL BANK HOLDINGS CORP., CLASS A | 1,875,172 | 1,909,226 | ||||||||||
| 109,181 | NEW MOUNTAIN FINANCE CORP. | 1,649,725 | 1,631,164 | ||||||||||
| 115,359 | ORITANI FINANCIAL CORP. | 1,580,024 | 1,776,529 | ||||||||||
| 24,520 | PACIFIC CONTINENTAL CORP. | 236,385 | 347,694 | ||||||||||
| 24,649 | PACIFIC MERCANTILE BANCORP(b) | 146,951 | 173,529 | ||||||||||
| See accompanying notes to the financial statements. | 44 | (Continued) |
CLEARWATER INVESTMENT TRUST
Schedule of Investments - Clearwater Small Companies Fund
December 31, 2014
| Shares | Security | Cost | Fair value (a) | Percent of net assets | |||||||||
| Financials (Cont’d): | |||||||||||||
| 65,413 | PACWEST BANCORP | $ | 1,894,985 | 2,973,675 | |||||||||
| 20,445 | PARK STERLING CORP. | 128,157 | 150,271 | ||||||||||
| 8,961 | PEOPLES BANCORP, INC. | 184,760 | 232,359 | ||||||||||
| 11,381 | PHOENIX (THE) COS., INC.(b) | 600,793 | 783,809 | ||||||||||
| 24,679 | PLATINUM UNDERWRITERS HOLDINGS LTD.(c) | 726,674 | 1,811,932 | ||||||||||
| 148,117 | PREFERRED APARTMENT COMMUNITIES, INC., CLASS A | 1,110,166 | 1,347,865 | ||||||||||
| 72,700 | PROVIDENT FINANCIAL SERVICES, INC. | 1,313,447 | 1,312,962 | ||||||||||
| 4,637 | RENASANT CORP. | 74,444 | 134,148 | ||||||||||
| 29,690 | RYMAN HOSPITALITY PROPERTIES, INC. | 701,230 | 1,565,851 | ||||||||||
| 35,200 | SABRA HEALTH CARE REIT, INC. | 560,494 | 1,069,024 | ||||||||||
| 22,224 | SANDY SPRING BANCORP, INC. | 450,236 | 579,602 | ||||||||||
| 29,297 | SI FINANCIAL GROUP, INC. | 292,666 | 326,369 | ||||||||||
| 6,178 | SIMPLICITY BANCORP, INC. | 61,780 | 105,953 | ||||||||||
| 91,700 | SLM CORP. | 808,164 | 934,423 | ||||||||||
| 88,240 | SPIRIT REALTY CAPITAL, INC. | 669,749 | 1,049,174 | ||||||||||
| 23,641 | STATE BANK FINANCIAL CORP. | 379,459 | 472,347 | ||||||||||
| 49,303 | STERLING BANCORP | 530,252 | 708,977 | ||||||||||
| 4,885 | STOCK YARDS BANCORP, INC. | 134,954 | 162,866 | ||||||||||
| 21,365 | STONEGATE BANK | 585,464 | 632,831 | ||||||||||
| 88,584 | SYNOVUS FINANCIAL CORP. | 1,657,200 | 2,399,741 | ||||||||||
| 23,400 | UMB FINANCIAL CORP. | 1,237,898 | 1,331,226 | ||||||||||
| 144,141 | UMPQUA HOLDINGS CORP. | 1,866,838 | 2,451,838 | ||||||||||
| 34,400 | UNION BANKSHARES CORP. | 802,320 | 828,352 | ||||||||||
| 63,058 | UNITED FINANCIAL BANCORP, INC. | 658,521 | 905,513 | ||||||||||
| 11,659 | UNITED FIRE GROUP, INC. | 308,798 | 346,622 | ||||||||||
| 19,896 | UNIVEST CORP. OF PENNSYLVANIA | 334,146 | 402,695 | ||||||||||
| 9,113 | URSTADT BIDDLE PROPERTIES, INC., CLASS A | 149,210 | 199,392 | ||||||||||
| 83,820 | WALKER & DUNLOP, INC.(b) | 1,139,220 | 1,470,203 | ||||||||||
| 27,800 | WINTRUST FINANCIAL CORP. | 1,006,799 | 1,299,928 | ||||||||||
| 61,124,932 | 81,037,856 | 24.27 | % | ||||||||||
| Health Care: | |||||||||||||
| 62,381 | ACCURAY, INC.(b) | 481,678 | 470,977 | ||||||||||
| 49,345 | AIR METHODS CORP.(b) | 2,086,510 | 2,172,660 | ||||||||||
| 109,120 | ALERE, INC.(b) | 3,641,719 | 4,146,560 | ||||||||||
| 12,405 | AMN HEALTHCARE SERVICES, INC.(b) | 158,995 | 243,138 | ||||||||||
| 24,936 | ANALOGIC CORP. | 1,846,323 | 2,109,835 | ||||||||||
| 12,374 | ANGIODYNAMICS, INC.(b) | 170,498 | 235,230 | ||||||||||
| 1,485 | ANIKA THERAPEUTICS, INC.(b) | 52,276 | 60,499 | ||||||||||
| 18,215 | ATRICURE, INC.(b) | 287,184 | 363,571 | ||||||||||
| 16,294 | BIO-REFERENCE LABORATORIES, INC.(b) | 454,304 | 523,526 | ||||||||||
| 5,854 | CAMBREX CORP.(b) | 136,502 | 126,564 | ||||||||||
| 16,928 | CRYOLIFE, INC. | 161,766 | 191,794 | ||||||||||
| 21,229 | CYNOSURE, INC., CLASS A(b) | 524,482 | 582,099 | ||||||||||
| 32,819 | CYTRX CORP.(b) | 133,199 | 89,924 | ||||||||||
| 79,002 | EMERGENT BIOSOLUTIONS, INC.(b) | 1,775,489 | 2,151,224 | ||||||||||
| 7,439 | ENZO BIOCHEM, INC.(b) | 35,811 | 33,029 | ||||||||||
| 114,391 | EXAMWORKS GROUP, INC.(b) | 3,587,617 | 4,757,522 | ||||||||||
| 125,705 | FLAMEL TECHNOLOGIES S.A. ADR(b)(c)(d) | 1,756,389 | 2,153,327 | ||||||||||
| 77,073 | GLOBUS MEDICAL, INC., CLASS A(b) | 1,233,427 | 1,832,025 | ||||||||||
| 55,795 | HEALTHSOUTH CORP. | 1,079,844 | 2,145,876 | ||||||||||
| 778 | HEALTHSTREAM, INC.(b) | 18,898 | 22,935 | ||||||||||
| 121,905 | HEALTHWAYS, INC.(b) | 1,597,057 | 2,423,471 | ||||||||||
| 44,689 | ICON PLC(b)(c) | 2,033,826 | 2,278,692 | ||||||||||
| 11,060 | ICU MEDICAL, INC.(b) | 692,604 | 905,814 | ||||||||||
| 26,756 | LEMAITRE VASCULAR, INC. | 195,585 | 204,683 | ||||||||||
| 13,603 | LHC GROUP, INC.(b) | 298,407 | 424,142 | ||||||||||
| 47,428 | MEDASSETS, INC.(b) | 929,124 | 937,177 | ||||||||||
| 64,412 | MERGE HEALTHCARE, INC.(b) | 167,988 | 229,307 | ||||||||||
| 17,866 | NATUS MEDICAL, INC.(b) | 273,860 | 643,891 | ||||||||||
| 18,866 | OHR PHARMACEUTICAL, INC.(b) | 149,688 | 157,342 | ||||||||||
| 25,500 | PAREXEL INTERNATIONAL CORP.(b) | 1,378,777 | 1,416,780 | ||||||||||
| 34,639 | PHARMERICA CORP.(b) | 665,176 | 717,374 | ||||||||||
| 44,873 | PSYCHEMEDICS CORP. | 551,048 | 676,236 | ||||||||||
| 15,048 | SANGAMO BIOSCIENCES, INC.(b) | 203,494 | 228,880 | ||||||||||
| 10,670 | SCICLONE PHARMACEUTICALS, INC.(b) | 51,727 | 93,469 | ||||||||||
| 10,368 | SYMMETRY SURGICAL, INC.(b) | 67,322 | 80,767 | ||||||||||
| 14,432 | U.S. PHYSICAL THERAPY, INC. | 508,157 | 605,567 | ||||||||||
| 36,462 | VOLCANO CORP.(b) | 610,135 | 651,941 | ||||||||||
| See accompanying notes to the financial statements. | 45 | (Continued) |
CLEARWATER INVESTMENT TRUST
Schedule of Investments - Clearwater Small Companies Fund
December 31, 2014
| Shares | Security | Cost | Fair value (a) | Percent of net assets | |||||||||
| Health Care (Cont’d): | |||||||||||||
| 36,797 | WEST PHARMACEUTICAL SERVICES, INC. | $ | 685,403 | 1,959,072 | |||||||||
| 28,500 | WRIGHT MEDICAL GROUP, INC.(b) | 821,617 | 765,795 | ||||||||||
| 31,503,906 | 39,812,715 | 11.92 | % | ||||||||||
| Industrials: | |||||||||||||
| 75,064 | A.O. SMITH CORP. | 1,719,008 | 4,234,360 | ||||||||||
| 31,693 | ACETO CORP. | 617,249 | 687,738 | ||||||||||
| 76,035 | ACTUANT CORP., CLASS A | 2,043,876 | 2,071,193 | ||||||||||
| 35,200 | AIR LEASE CORP. | 776,980 | 1,207,712 | ||||||||||
| 11,250 | ALLEGIANT TRAVEL CO. | 1,146,936 | 1,691,212 | ||||||||||
| 92,416 | API TECHNOLOGIES CORP.(b) | 246,558 | 196,846 | ||||||||||
| 38,141 | ASTRONICS CORP.(b) | 1,748,426 | 2,109,579 | ||||||||||
| 36,492 | CASELLA WASTE SYSTEMS, INC., CLASS A(b) | 173,936 | 147,428 | ||||||||||
| 22,355 | CDI CORP. | 357,745 | 395,907 | ||||||||||
| 10,919 | CELADON GROUP, INC. | 217,378 | 247,752 | ||||||||||
| 40,225 | CLARCOR, INC. | 2,355,849 | 2,680,594 | ||||||||||
| 19,540 | COMFORT SYSTEMS USA, INC. | 257,153 | 334,525 | ||||||||||
| 10,471 | COMMERCIAL VEHICLE GROUP, INC.(b) | 79,218 | 69,737 | ||||||||||
| 68,902 | ECHO GLOBAL LOGISTICS, INC.(b) | 1,382,919 | 2,011,938 | ||||||||||
| 25,738 | ENNIS, INC. | 360,412 | 346,691 | ||||||||||
| 20,000 | ENPRO INDUSTRIES, INC.(b) | 569,233 | 1,255,200 | ||||||||||
| 29,397 | ESCO TECHNOLOGIES, INC. | 1,008,385 | 1,084,749 | ||||||||||
| 47,000 | EXELIS, INC. | 806,079 | 823,910 | ||||||||||
| 29,700 | FORTUNE BRANDS HOME & SECURITY, INC. | 588,009 | 1,344,519 | ||||||||||
| 57,866 | GENCORP, INC.(b) | 919,310 | 1,058,948 | ||||||||||
| 82,771 | GENERAC HOLDINGS, INC.(b) | 3,053,088 | 3,870,372 | ||||||||||
| 13,000 | GENESEE & WYOMING, INC., CLASS A(b) | 321,298 | 1,168,960 | ||||||||||
| 10,212 | GIBRALTAR INDUSTRIES, INC.(b) | 167,670 | 166,047 | ||||||||||
| 27,306 | GRAHAM CORP. | 694,756 | 785,594 | ||||||||||
| 40,300 | HARSCO CORP. | 1,056,914 | 761,267 | ||||||||||
| 41,700 | HILLENBRAND, INC. | 1,231,301 | 1,438,650 | ||||||||||
| 13,624 | HOUSTON WIRE & CABLE CO. | 183,562 | 162,807 | ||||||||||
| 32,400 | ITT CORP. | 644,275 | 1,310,904 | ||||||||||
| 45,000 | JOHN BEAN TECHNOLOGIES CORP. | 604,564 | 1,478,700 | ||||||||||
| 19,000 | LB FOSTER CO., CLASS A | 424,937 | 922,830 | ||||||||||
| 34,029 | LSI INDUSTRIES, INC. | 270,924 | 231,057 | ||||||||||
| 15,948 | MIDDLEBY (THE) CORP.(b) | 236,583 | 1,580,447 | ||||||||||
| 10,065 | NN, INC. | 238,210 | 206,936 | ||||||||||
| 83,372 | ON ASSIGNMENT, INC.(b) | 2,475,153 | 2,767,117 | ||||||||||
| 284 | ORBITAL SCIENCES CORP.(b) | 6,962 | 7,637 | ||||||||||
| 11,879 | QUANEX BUILDING PRODUCTS CORP. | 215,834 | 223,088 | ||||||||||
| 11,591 | REGAL-BELOIT CORP. | 575,852 | 871,643 | ||||||||||
| 98,002 | REXNORD CORP.(b) | 2,364,080 | 2,764,636 | ||||||||||
| 52,800 | RITCHIE BROS. AUCTIONEERS, INC.(c) | 1,177,399 | 1,419,792 | ||||||||||
| 4,430 | SPARTON CORP.(b) | 109,934 | 125,546 | ||||||||||
| 6,353 | SUPREME INDUSTRIES, INC., CLASS A | 36,284 | 44,852 | ||||||||||
| 13,117 | TELEDYNE TECHNOLOGIES, INC.(b) | 411,875 | 1,347,641 | ||||||||||
| 52,380 | TRIMAS CORP.(b) | 1,613,572 | 1,638,970 | ||||||||||
| 27,963 | TRIUMPH GROUP, INC. | 1,779,494 | 1,879,673 | ||||||||||
| 48,022 | VERSAR, INC.(b) | 167,260 | 151,750 | ||||||||||
| 16,190 | VIAD CORP. | 338,030 | 431,625 | ||||||||||
| 35,769 | WOODWARD, INC. | 1,257,246 | 1,760,908 | ||||||||||
| 39,031,716 | 53,519,987 | 16.03 | % | ||||||||||
| Information Technology: | |||||||||||||
| 39,800 | ADVENT SOFTWARE, INC. | 1,170,977 | 1,219,472 | ||||||||||
| 13,778 | ASURE SOFTWARE, INC.(b) | 81,915 | 75,779 | ||||||||||
| 16,700 | BROADRIDGE FINANCIAL SOLUTIONS, INC. | 270,669 | 771,206 | ||||||||||
| 3,627 | CALAMP CORP.(b) | 63,243 | 66,374 | ||||||||||
| 131,126 | CALLIDUS SOFTWARE, INC.(b) | 1,385,979 | 2,141,288 | ||||||||||
| 51,232 | COGNEX CORP.(b) | 1,029,288 | 2,117,419 | ||||||||||
| 5,393 | COMTECH TELECOMMUNICATIONS CORP. | 187,064 | 169,987 | ||||||||||
| 21,972 | DEALERTRACK TECHNOLOGIES, INC.(b) | 936,314 | 973,579 | ||||||||||
| 23,200 | DIEBOLD, INC. | 786,024 | 803,648 | ||||||||||
| 39,003 | DIGITAL RIVER, INC.(b) | 877,345 | 964,544 | ||||||||||
| 21,334 | DSP GROUP, INC.(b) | 212,618 | 231,901 | ||||||||||
| 87,261 | ELECTRONICS FOR IMAGING, INC.(b) | 3,644,052 | 3,737,389 | ||||||||||
| 34,244 | EPIQ SYSTEMS, INC. | 568,241 | 584,888 | ||||||||||
| See accompanying notes to the financial statements. | 46 | (Continued) |
CLEARWATER INVESTMENT TRUST
Schedule of Investments - Clearwater Small Companies Fund
December 31, 2014
| Shares | Security | Cost | Fair value (a) | Percent of net assets | |||||||||
| Information Technology (Cont’d): | |||||||||||||
| 55,403 | EURONET WORLDWIDE, INC.(b) | $ | 2,312,123 | 3,041,625 | |||||||||
| 15,412 | EVOLVING SYSTEMS, INC. | 124,907 | 144,410 | ||||||||||
| 30,980 | EXAR CORP.(b) | 203,637 | 315,996 | ||||||||||
| 80,600 | FAIRCHILD SEMICONDUCTOR INTERNATIONAL, INC.(b) | 1,020,949 | 1,360,528 | ||||||||||
| 15,375 | FEI CO. | 1,240,069 | 1,389,131 | ||||||||||
| 68,934 | FRANKLIN WIRELESS CORP.(b) | 125,914 | 99,954 | ||||||||||
| 36,809 | FREQUENCY ELECTRONICS, INC.(b) | 361,015 | 420,727 | ||||||||||
| 58,452 | GLOBALSCAPE, INC. | 141,114 | 129,763 | ||||||||||
| 26,184 | HACKETT GROUP (THE), INC. | 96,826 | 230,157 | ||||||||||
| 36,035 | HARMONIC, INC.(b) | 201,700 | 252,605 | ||||||||||
| 69,774 | IGATE CORP.(b) | 2,324,971 | 2,754,678 | ||||||||||
| 44,162 | INFORMATICA CORP.(b) | 1,343,194 | 1,684,118 | ||||||||||
| 12,752 | INTEGRATED SILICON SOLUTION, INC. | 147,055 | 211,301 | ||||||||||
| 38,335 | INTERNAP CORP.(b) | 280,001 | 305,147 | ||||||||||
| 31,878 | INTEST CORP.(b) | 120,089 | 135,800 | ||||||||||
| 106,980 | INVENSENSE, INC.(b) | 1,748,538 | 1,739,495 | ||||||||||
| 63,285 | IPG PHOTONICS CORP.(b) | 3,755,394 | 4,741,312 | ||||||||||
| 30,550 | ITERIS, INC.(b) | 59,851 | 52,852 | ||||||||||
| 39,000 | KNOWLES CORP.(b) | 1,186,746 | 918,450 | ||||||||||
| 11,981 | KVH INDUSTRIES, INC.(b) | 112,398 | 151,560 | ||||||||||
| 44,627 | LIONBRIDGE TECHNOLOGIES, INC.(b) | 197,813 | 256,605 | ||||||||||
| 43,651 | MARCHEX, INC., CLASS B | 211,446 | 200,358 | ||||||||||
| 20,378 | MATTSON TECHNOLOGY, INC.(b) | 49,446 | 69,285 | ||||||||||
| 25,944 | MAXLINEAR, INC., CLASS A(b) | 191,073 | 192,245 | ||||||||||
| 44,920 | MERCURY SYSTEMS, INC.(b) | 520,965 | 625,286 | ||||||||||
| 8,052 | METHODE ELECTRONICS, INC. | 212,278 | 293,978 | ||||||||||
| 73,800 | MITEL NETWORKS CORP.(b)(c) | 747,984 | 788,922 | ||||||||||
| 74,066 | MODUSLINK GLOBAL SOLUTIONS, INC.(b) | 256,811 | 277,747 | ||||||||||
| 100,829 | ORBOTECH LTD.(b)(c) | 1,461,856 | 1,492,269 | ||||||||||
| 43,214 | PC-TEL, INC. | 332,086 | 374,233 | ||||||||||
| 26,867 | PLANET PAYMENT, INC.(b) | 62,891 | 55,883 | ||||||||||
| 53,612 | PLEXUS CORP.(b) | 1,625,330 | 2,209,351 | ||||||||||
| 29,613 | QUANTUM CORP.(b) | 34,742 | 52,119 | ||||||||||
| 74,598 | RMG NETWORKS HOLDING CORP.(b) | 109,416 | 93,247 | ||||||||||
| 40,677 | ROGERS CORP.(b) | 2,569,143 | 3,312,735 | ||||||||||
| 8,737 | SABA SOFTWARE, INC.(b) | 79,847 | 71,294 | ||||||||||
| 13,060 | SCIQUEST, INC.(b) | 199,956 | 188,717 | ||||||||||
| 18,059 | SELECTICA, INC.(b) | 82,422 | 93,546 | ||||||||||
| 32,416 | SERVICESOURCE INTERNATIONAL, INC.(b) | 155,397 | 151,707 | ||||||||||
| 51,416 | SHORETEL, INC.(b) | 366,139 | 377,908 | ||||||||||
| 186,135 | SUPPORT.COM, INC.(b) | 693,672 | 392,745 | ||||||||||
| 30,998 | SYKES ENTERPRISES, INC.(b) | 526,780 | 727,523 | ||||||||||
| 63,255 | SYNCHRONOSS TECHNOLOGIES, INC.(b) | 2,292,947 | 2,647,854 | ||||||||||
| 49,551 | SYNNEX CORP. | 2,399,385 | 3,872,906 | ||||||||||
| 30,075 | ULTRA CLEAN HOLDINGS, INC.(b) | 222,423 | 279,096 | ||||||||||
| 20,400 | VERINT SYSTEMS, INC.(b) | 720,670 | 1,188,912 | ||||||||||
| 12,000 | WEX, INC.(b) | 318,887 | 1,187,040 | ||||||||||
| 131,386 | ZIX CORP.(b) | 372,554 | 472,990 | ||||||||||
| 45,134,579 | 55,883,584 | 16.74 | % | ||||||||||
| Materials: | |||||||||||||
| 57,315 | BERRY PLASTICS GROUP, INC.(b) | 1,323,507 | 1,808,288 | ||||||||||
| 49,600 | CHEMTURA CORP.(b) | 863,595 | 1,226,608 | ||||||||||
| 22,937 | CORE MOLDING TECHNOLOGIES, INC.(b) | 203,503 | 316,531 | ||||||||||
| 10,700 | DELTIC TIMBER CORP. | 504,016 | 731,880 | ||||||||||
| 106,118 | FERRO CORP.(b) | 671,631 | 1,375,289 | ||||||||||
| 32,139 | HANDY & HARMAN LTD.(b) | 411,576 | 1,479,358 | ||||||||||
| 5,591 | INNOSPEC, INC. | 186,934 | 238,736 | ||||||||||
| 11,600 | KAISER ALUMINUM CORP. | 883,670 | 828,588 | ||||||||||
| 46,800 | KAPSTONE PAPER AND PACKAGING CORP. | 1,313,978 | 1,371,708 | ||||||||||
| 11,672 | NEENAH PAPER, INC. | 333,498 | 703,471 | ||||||||||
| 22,756 | OMNOVA SOLUTIONS, INC.(b) | 197,081 | 185,234 | ||||||||||
| 51,146 | POLYONE CORP. | 1,788,098 | 1,938,945 | ||||||||||
| 18,500 | SENSIENT TECHNOLOGIES CORP. | 1,007,928 | 1,116,290 | ||||||||||
| 3,929 | SYNALLOY CORP. | 53,596 | 69,190 | ||||||||||
| 13,650 | TRECORA RESOURCES(b) | 172,947 | 200,655 | ||||||||||
| See accompanying notes to the financial statements. | 47 | (Continued) |
CLEARWATER INVESTMENT TRUST
Schedule of Investments - Clearwater Small Companies Fund
December 31, 2014
| Shares | Security | Cost | Fair value (a) | Percent of net assets | |||||||||
| Materials (Cont’d): | |||||||||||||
| 76,358 | TRONOX LTD., CLASS A | $ | 1,825,949 | 1,823,429 | |||||||||
| 53,673 | US ANTIMONY CORP.(b) | 73,643 | 37,571 | ||||||||||
| 11,815,150 | 15,451,771 | 4.63 | % | ||||||||||
| Utilities: | |||||||||||||
| 33,990 | ALLETE, INC. | 1,203,836 | 1,874,209 | ||||||||||
| 23,566 | DELTA NATURAL GAS CO., INC. | 484,167 | 500,777 | ||||||||||
| 18,962 | LACLEDE GROUP (THE), INC. | 912,486 | 1,008,778 | ||||||||||
| 22,192 | MIDDLESEX WATER CO. | 421,640 | 511,748 | ||||||||||
| 24,600 | ONE GAS, INC. | 880,972 | 1,014,012 | ||||||||||
| 32,400 | PNM RESOURCES, INC. | 677,634 | 960,012 | ||||||||||
| 14,955 | PURE CYCLE CORP.(b) | 86,528 | 59,820 | ||||||||||
| 36,100 | QUESTAR CORP. | 611,290 | 912,608 | ||||||||||
| 26,435 | SJW CORP. | 712,865 | 849,092 | ||||||||||
| 48,866 | UIL HOLDINGS CORP. | 1,638,863 | 2,127,626 | ||||||||||
| 4,872 | UNITIL CORP. | 103,553 | 178,656 | ||||||||||
| 19,900 | VECTREN CORP. | 733,717 | 919,977 | ||||||||||
| 18,543 | YORK WATER (THE) CO. | 367,947 | 430,383 | ||||||||||
| 8,835,498 | 11,347,698 | 3.40 | % | ||||||||||
| Sub-total Common Stocks: | 251,945,986 | 325,278,777 | 97.42 | % | |||||||||
| Short-Term Investments: | |||||||||||||
| 11,049,724 | NORTHERN INSTITUTIONAL FUNDS - | ||||||||||||
| U.S. GOVERNMENT SELECT PORTFOLIO, 0.01%(e) | 11,049,724 | 11,049,724 | |||||||||||
| Sub-total Short-Term Investments: | 11,049,724 | 11,049,724 | 3.31 | % | |||||||||
| Grand total(f) | $ | 262,995,710 | 336,328,501 | 100.73 | % | ||||||||
Notes to Schedule of Investments:
| (a) | Investments are valued in accordance with procedures described in note 2 to the financial statements. | |
| (b) | Non-income producing assets. | |
| (c) | Foreign security values are stated in U.S. dollars. As of December 31, 2014, the value of foreign stocks or depositary receipts of companies based outside of the United States represented 2.98% of net assets. | |
| (d) | Securities are American Depositary Receipts of companies based outside of the United States representing 0.64% of net assets as of December 31, 2014. | |
| (e) | The short-term investment is a money market portfolio of the investment company, Northern Institutional Funds. At December 31, 2013, the value of the Clearwater Small Companies Fund’s investment in the U.S. Government Select Portfolio of the Northern Institutional Funds was approximately $7,122,336 with net purchases of approximately $3,927,388 during the fiscal year ended December 31, 2014. | |
| (f) | At December 31, 2014, the cost for Federal income tax purposes was $263,193,761. The aggregate gross unrealized appreciation and depreciation of investments in securities based on this cost was as follows: |
| Gross unrealized appreciation | $ | 77,487,843 | ||
| Gross unrealized depreciation | (4,353,103 | ) | ||
| Net unrealized appreciation | $ | 73,134,740 |
| See accompanying notes to the financial statements. | 48 | (Continued) |
CLEARWATER INVESTMENT TRUST
Schedule of Investments – Clearwater Small Companies Fund
December 31, 2014
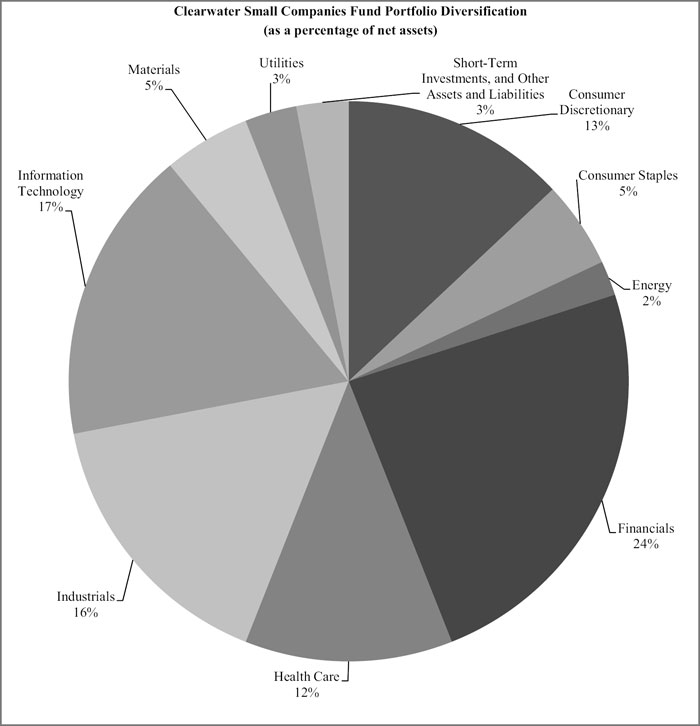
| See accompanying notes to the financial statements. | 49 | (Continued) |
CLEARWATER INVESTMENT TRUST
December 31, 2014
| Par/Shares | Security | Maturity date | Coupon rate | Cost | Fair value (a) | Percent of net assets | ||||||||||||
| Closed-End Funds: | ||||||||||||||||||
| 225,100 | BLACKROCK LNG-TM MUN ADV | $ | 2,332,461 | 2,543,630 | ||||||||||||||
| 22,000 | BLACKROCK MUN INCOMSCI BR | 300,539 | 311,960 | |||||||||||||||
| 148,800 | BLACKROCK MUNIHOLDINGS INVESTMENT QUALITY FUND | 1,705,296 | 2,124,864 | |||||||||||||||
| 57,300 | BLACKROCK MUNIHOLDINGS QUALITY FUND II INC | 729,193 | 772,404 | |||||||||||||||
| 15,000 | BLACKROCK MUNIHOLDINGS QUALITY FUND INC | 199,057 | 199,800 | |||||||||||||||
| 8,302 | BLACKROCK MUNIYIELD FUND INC | 122,288 | 122,372 | |||||||||||||||
| 67,229 | BLACKROCK MUNIYIELD INVES | 854,076 | 1,040,705 | |||||||||||||||
| 55,111 | BLACKROCK MUNIYIELD INVESTMENT QUALITY FUND | 701,111 | 758,327 | |||||||||||||||
| 86,800 | BLACKROCK MUNIYIELD MICHIGAN QUALITY FUND II INC | 1,045,017 | 1,116,248 | |||||||||||||||
| 76,179 | BLACKROCK MUNIYIELD MICHIGAN QUALITY FUND INC | 1,014,103 | 1,056,603 | |||||||||||||||
| 54,700 | BLACKROCK MUNIYIELD PENNS | 774,527 | 784,398 | |||||||||||||||
| 101,896 | BLACKROCK MUNIYIELD QUAL | 1,307,244 | 1,344,008 | |||||||||||||||
| 118,472 | BLACKROCK MUNIYIELD QUALITY FUND III INC | 1,572,465 | 1,666,901 | |||||||||||||||
| 24,027 | BLACKROCK MUNIYIELD QUALITY FUND INC | 331,620 | 368,574 | |||||||||||||||
| 193,098 | DEUTSCHE MUNICIPAL INCOME | 2,097,006 | 2,581,720 | |||||||||||||||
| 33,000 | DREYFUS STRAT MUN COM USD | 301,450 | 270,270 | |||||||||||||||
| 28,668 | DREYFUS STRATEGIC MUNI BD | 239,110 | 228,197 | |||||||||||||||
| 43,662 | EATON VANCE CALI MUN BOND | 486,047 | 549,705 | |||||||||||||||
| 178,050 | INVESCO ADV MUN INC TR II | 1,985,371 | 2,065,380 | |||||||||||||||
| 108,205 | INVESCO MUNICIPAL OPP TR | 1,345,902 | 1,391,516 | |||||||||||||||
| 66,122 | INVESCO QUALITY MUNI INC | 750,670 | 825,864 | |||||||||||||||
| 50,248 | MANAGED DURATION INVESTME | 635,196 | 678,850 | |||||||||||||||
| 39,100 | MFC NUVEEN INSD MUN | 588,519 | 573,597 | |||||||||||||||
| 15,963 | NUVEEN MI QUALITY INCOME | 214,604 | 218,214 | |||||||||||||||
| 52,779 | NUVEEN PENN INV QUAL MUNI | 723,142 | 724,656 | |||||||||||||||
| 30,200 | NUVEEN PREMIER MUNI INC F | 409,657 | 421,894 | |||||||||||||||
| 238,709 | NUVEEN PREMIUM INC MUNI F | 3,273,534 | 3,380,120 | |||||||||||||||
| 22,077 | WESTERN ASSET MUNICIPAL P | 276,995 | 327,402 | |||||||||||||||
| Sub-total Closed-End Funds | 26,316,200 | 28,448,179 | 5.60 | % | ||||||||||||||
| Municipal Bonds: | ||||||||||||||||||
| 2,350,000 | ACALANES CA UNION HIGH SCH DIST(b) | 8/1/2039 | 2.02 | 1,179,136 | 1,796,857 | |||||||||||||
| 1,200,000 | AGUA CALIENTE CA BAND OF CAHUILLA INDIANS REVENUE(c) | 7/1/2018 | 6.00 | 1,186,946 | 1,187,736 | |||||||||||||
| 790,000 | ALABAMA ST HSG FIN AUTH SF MTGE REVENUE | 10/1/2028 | 5.25 | 790,000 | 839,573 | |||||||||||||
| 450,000 | ALABAMA ST HSG FIN AUTH SF MTGE REVENUE | 4/1/2038 | 4.50 | 342,808 | 453,447 | |||||||||||||
| 1,000,000 | ALACHUA CNTY FL HLTH FACS AUTH CCRC | 10/1/2032 | 8.00 | 1,160,464 | 1,265,080 | |||||||||||||
| 750,000 | ALASKA ST HSG FIN CORP MTGE REVENUE | 12/1/2037 | 4.13 | 736,329 | 773,663 | |||||||||||||
| 500,000 | ALASKA ST HSG FIN CORP MTGE REVENUE | 12/1/2040 | 4.63 | 495,358 | 521,745 | |||||||||||||
| 350,000 | ALASKA ST INDL DEV & EXPORT AUTH CMNTY PROVIDER REVENUE(d)(e) | 12/1/2010 | 5.40 | 350,000 | 157,500 | |||||||||||||
| 240,000 | ALBANY NY INDL DEV AGY(e) | 5/1/2016 | 6.50 | 207,593 | 2,995 | |||||||||||||
| 830,000 | ALLEGHENY CNTY PA INDL DEV AUTH CHRT SCH REVENUE | 8/15/2026 | 5.90 | 830,000 | 893,337 | |||||||||||||
| 1,000,000 | ALVORD CA UNIF SCH DIST | 8/1/2036 | 5.25 | 1,027,744 | 1,148,730 | |||||||||||||
| 1,000,000 | ALVORD CA UNIF SCH DIST(b) | 8/1/2046 | 1.89 | 374,989 | 791,240 | |||||||||||||
| 855,401 | ARIZONA ST HLTH FACS AUTH | 7/1/2027 | 5.25 | 833,275 | 968,596 | |||||||||||||
| 1,000,000 | ARIZONA ST HLTH FACS AUTH HLTH CARE FACS REVENUE | 10/1/2022 | 5.10 | 987,373 | 1,008,880 | |||||||||||||
| 1,940,000 | ARLINGTON TX HGR EDU FIN CORP EDU REVENUE | 8/15/2028 | 7.00 | 1,896,125 | 2,160,093 | |||||||||||||
| 500,000 | ARLINGTON TX HGR EDU FIN CORPEDU REVENUE | 3/1/2024 | 5.88 | 500,000 | 529,365 | |||||||||||||
| 500,000 | ASTURIA FL CMNTY DEV DIST SPL ASSMNT | 5/1/2034 | 5.75 | 500,000 | 498,855 | |||||||||||||
| 500,000 | ASTURIA FL CMNTY DEV DIST SPL ASSMNT | 5/1/2045 | 5.75 | 495,002 | 493,595 | |||||||||||||
| 500,000 | ATHENS-CLARKE CNTY GA UNIF GOVT DEV AUTH REVENUE | 6/15/2039 | 5.00 | �� | 522,415 | 551,015 | ||||||||||||
| See accompanying notes to the financial statements. | 50 | (Continued) |
CLEARWATER INVESTMENT TRUST
Schedule of Investments - Clearwater Tax-Exempt Bond Fund
December 31, 2014
| Par/Shares | Security | Maturity date | Coupon rate | Cost | Fair value (a) | Percent of net assets | ||||||||||||
| Municipal Bonds (Cont’d): | ||||||||||||||||||
| 500,000 | ATLANTA GA ARPT REVENUE | 1/1/2030 | 6.00 | $ | 515,608 | 602,510 | ||||||||||||
| 1,325,000 | ATLANTA GA WTR & WSTWTR REVENUE | 11/1/2039 | 5.00 | 1,323,755 | 1,329,426 | |||||||||||||
| 1,500,000 | BAY CNTY FL EDUCTNL FACS REVENUE | 9/1/2030 | 5.25 | 1,387,719 | 1,557,900 | |||||||||||||
| 1,000,000 | BELLALAGO FL EDUCTNL FACS BENEFIT DIST CAPITAL IMPT REVENUE | 5/1/2030 | 4.38 | 982,964 | 1,041,190 | |||||||||||||
| 1,195,000 | BELLWOOD IL | 12/1/2027 | 5.88 | 1,184,870 | 1,366,184 | |||||||||||||
| 2,000,000 | BEXAR CNTY TX REVENUE | 8/15/2039 | 5.00 | 2,150,341 | 2,183,720 | |||||||||||||
| 1,000,000 | BIRMINGHAM AL BAPTIST MED CTRS SPL CARE FACS FING AUTH REVEN | 11/15/2030 | 5.00 | 1,006,995 | 1,007,160 | |||||||||||||
| 500,000 | BOONE CNTY MO HOSP REVENUE | 8/1/2028 | 5.75 | 508,056 | 555,900 | |||||||||||||
| 750,000 | BOWLING GREEN OH STUDENT HSG REVENUE | 6/1/2031 | 5.75 | 721,591 | 813,323 | |||||||||||||
| 500,000 | BOYNTON BEACH FLA REV | 6/1/2022 | 5.75 | 500,000 | 299,995 | |||||||||||||
| 500,000 | BOYNTON BEACH FLA REV | 6/1/2027 | 6.25 | 500,000 | 299,995 | |||||||||||||
| 500,000 | BRAZOS CNTY TX HLTH FACS DEV CORP | 1/1/2033 | 5.50 | 502,518 | 547,510 | |||||||||||||
| 1,000,000 | BUREAU CNTY TWP IL HIGH SCH DIST #502 | 10/1/2043 | 6.63 | 1,067,460 | 1,257,640 | |||||||||||||
| 600,000 | BURLINGTON CNTY NJ BRIDGE COMMISSION ECON DEV REVENUE | 1/1/2038 | 5.63 | 604,507 | 617,562 | |||||||||||||
| 390,000 | BUTLER CNTY PA GEN AUTH REVENUE | 10/1/2034 | 0.87 | 390,000 | 318,763 | |||||||||||||
| 124,028 | CALIFORNIA ST CMNTY HSG FIN AGY LEASE REVENUE(e) | 8/1/2012 | 4.65 | 124,028 | 15 | |||||||||||||
| 351,527 | CALIFORNIA ST CMNTY HSG FIN AGY LEASE REVENUE(d)(e) | 11/1/2012 | 4.85 | 347,373 | 3,515 | |||||||||||||
| 500,000 | CALIFORNIA ST HLTH FACS FING AUTH REVENUE | 8/15/2033 | 5.50 | 507,439 | 595,380 | |||||||||||||
| 1,000,000 | CALIFORNIA ST HSG FIN AGY REVENUE | 8/1/2033 | 5.45 | 932,023 | 1,050,820 | |||||||||||||
| 500,000 | CALIFORNIA ST INFRASTRUCTURE & ECON DEV BANK ST SCH FUND APP | 8/15/2029 | 5.75 | 503,271 | 586,760 | |||||||||||||
| 750,000 | CALIFORNIA ST MUNI FIN AUTH MOBILE HOME PARK REVENUE | 8/15/2039 | 5.25 | 782,166 | 828,653 | |||||||||||||
| 1,500,000 | CALIFORNIA ST SCH FACS FING AUTH REVENUE(b) | 8/1/2029 | 1.64 | 1,123,104 | 1,739,730 | |||||||||||||
| 1,000,000 | CALIFORNIA ST STWD CMNTYS DEV AUTH EDUCTNL FACS REVENUE | 7/1/2030 | 5.15 | 834,893 | 1,009,940 | |||||||||||||
| 700,000 | CALIFORNIA ST STWD CMNTYS DEV AUTH REVENUE | 11/1/2021 | 6.50 | 700,000 | 796,957 | |||||||||||||
| 1,400,000 | CALIFORNIA ST STWD CMNTYS DEVAUTH STUDENT HSG REVENUE | 1/15/2036 | 5.60 | 1,400,000 | 1,458,772 | |||||||||||||
| 400,000 | CALIFORNIA STWD CMNTYS DEV AUTH REVENUE | 11/1/2023 | 5.13 | 400,000 | 431,796 | |||||||||||||
| 255,000 | CAPITAL TRUST AGY FL MF REVENUE(e) | 6/1/2013 | 4.75 | 255,000 | 229,503 | |||||||||||||
| 750,000 | CAPITAL TRUST AGY FL MF REVENUE(e) | 6/1/2038 | 5.88 | 762,053 | 675,008 | |||||||||||||
| 1,000,000 | CARLSBAD CA UNIF SCH DIST(b) | 8/1/2031 | 2.26 | 604,721 | 930,250 | |||||||||||||
| 809,472 | CARLSBAD NM INDL DEV REVENUE | 4/15/2021 | 5.75 | 823,415 | 866,953 | |||||||||||||
| 1,000,000 | CARMEL IN REVENUE | 11/15/2022 | 6.00 | 984,545 | 1,115,280 | |||||||||||||
| 1,000,000 | CARMEL IN REVENUE | 11/15/2027 | 7.00 | 1,022,594 | 1,135,030 | |||||||||||||
| 500,000 | CEDAR FALLS IA CMNTY SCH DIST SCH INFRASTRUCTURE SALES SVCS | 6/1/2027 | 5.38 | 498,864 | 554,720 | |||||||||||||
| 1,000,000 | CENTRL BRADFORD PROGRESS AUTH PA | 12/1/2031 | 5.50 | 1,028,863 | 1,183,170 | |||||||||||||
| See accompanying notes to the financial statements. | 51 | (Continued) |
CLEARWATER INVESTMENT TRUST
Schedule of Investments - Clearwater Tax-Exempt Bond Fund
December 31, 2014
| Par/Shares | Security | Maturity date | Coupon rate | Cost | Fair value (a) | Percent of net assets | ||||||||||||
| Municipal Bonds (Cont’d): | ||||||||||||||||||
| 595,000 | CHANDLER PARK ACADEMY MI PUBLIC SCH ACADEMY REVENUE | 11/1/2022 | 5.00 | $ | 477,612 | 600,432 | ||||||||||||
| 275,000 | CHESTERFIELD CNTY VA INDL DEV AUTH MF REVENUE | 7/1/2019 | 5.20 | 264,130 | 275,484 | |||||||||||||
| 500,000 | CHICAGO IL BRD OF EDU | 12/1/2017 | 5.00 | 503,088 | 501,935 | |||||||||||||
| 1,000,000 | CHICAGO IL MIDWAY ARPT REVENUE | 1/1/2035 | 5.25 | 1,002,551 | 1,133,870 | |||||||||||||
| 200,000 | CITIZEN POTAWATOMI NATION OK SENIOR OBLG TAX REVENUE | 9/1/2016 | 6.50 | 200,000 | 197,206 | |||||||||||||
| 590,000 | CLIFTON TX HGR EDU FIN CORP EDU REVENUE | 2/15/2018 | 7.75 | 585,963 | 626,857 | |||||||||||||
| 1,500,000 | CLOVIS CA UNIF SCH DIST(b) | 8/1/2030 | 3.76 | 586,260 | 784,005 | |||||||||||||
| 85,000 | COLLIER CNTY FL HSG FIN AUTH MF HSG REVENUE | 8/15/2015 | 5.25 | 84,967 | 85,288 | |||||||||||||
| 750,000 | COLLIER CNTY FL INDL DEV AUTH | 10/1/2039 | 6.25 | 736,096 | 860,303 | |||||||||||||
| 1,000,000 | COLLIER CNTY FLA INDL DEV AUTHCONTINUING CARE CMNTY REV(c) | 5/15/2020 | 6.50 | 1,000,000 | 1,006,530 | |||||||||||||
| 750,000 | COLLIER CNTY FLA INDL DEV AUTHCONTINUING CARE CMNTY REV(c) | 5/15/2026 | 7.25 | 750,000 | 868,290 | |||||||||||||
| 1,500,000 | COLORADO ST EDUCTNL & CULTURAL FACS AUTH INDEP SCH REVENUE | 5/1/2030 | 6.00 | 1,463,214 | 1,604,790 | |||||||||||||
| 835,000 | COLORADO ST EDUCTNL & CULTURAL FACS AUTH REVENUE | 11/15/2028 | 6.75 | 835,000 | 1,005,507 | |||||||||||||
| 1,000,000 | COLORADO ST EDUCTNL & CULTURAL FACS AUTH REVENUE | 6/1/2033 | 5.50 | 977,306 | 1,105,700 | |||||||||||||
| 1,000,000 | COLORADO ST EDUCTNL & CULTURAL FACS AUTH REVENUE | 7/1/2034 | 5.60 | 994,057 | 1,092,730 | |||||||||||||
| 1,000,000 | COLORADO ST HLTH FACS AUTH REVENUE | 12/1/2028 | 5.50 | 1,013,984 | 1,121,090 | |||||||||||||
| 1,000,000 | COLORADO ST HLTH FACS AUTH REVENUE | 8/1/2033 | 7.63 | 987,691 | 1,184,880 | |||||||||||||
| 430,000 | COLORADO ST HSG & FIN AUTH | 10/1/2029 | 5.40 | 430,000 | 460,229 | |||||||||||||
| 515,000 | COLORADO ST HSG & FIN AUTH | 11/1/2029 | 5.50 | 515,000 | 532,989 | |||||||||||||
| 620,000 | COLORADO ST HSG FIN AUTH SF MTGE REVENUE | 11/1/2034 | 5.00 | 620,024 | 645,290 | |||||||||||||
| 1,000,000 | COLTON CA JT UNIF SCH DIST(b) | 8/1/2035 | 1.86 | 597,662 | 842,730 | |||||||||||||
| 1,000,000 | CONNECTICUT ST HSG FIN AUTH | 11/15/2035 | 4.75 | 1,000,000 | 1,059,650 | |||||||||||||
| 870,000 | CONNECTICUT ST HSG FIN AUTH | 11/15/2041 | 4.63 | 865,870 | 922,061 | |||||||||||||
| 85,000 | CONNECTICUT ST HSG FIN AUTH | 11/15/2041 | 5.00 | 85,000 | 91,688 | |||||||||||||
| 1,500,000 | CONNECTICUT ST HSG FIN AUTH HSG MTGE FIN PROGRAM | 11/15/2035 | 3.75 | 1,500,000 | 1,528,950 | |||||||||||||
| 1,000,000 | CONNECTICUT ST HSG FIN AUTH HSG MTGE FIN PROGRAM | 5/15/2038 | 3.95 | 1,000,000 | 1,032,490 | |||||||||||||
| 2,485,000 | CONNECTICUT ST HSG FIN AUTH HSG MTGE FIN PROGRAM | 5/15/2042 | 4.15 | 2,485,000 | 2,576,448 | |||||||||||||
| 5,000,000 | CONNECTICUT ST HSG FIN AUTH HSG MTGE FIN PROGRAM | 11/15/2047 | 3.65 | 5,000,000 | 4,921,250 | |||||||||||||
| 1,105,000 | CORONA-NORCO CA UNIF SCH DIST(b) | 8/1/2039 | 1.35 | 723,855 | 1,334,951 | |||||||||||||
| 637,000 | CORTLAND IL SPL TAX REVENUE(e) | 3/1/2017 | 5.50 | 633,881 | 127,324 | |||||||||||||
| See accompanying notes to the financial statements. | 52 | (Continued) |
CLEARWATER INVESTMENT TRUST
Schedule of Investments - Clearwater Tax-Exempt Bond Fund
December 31, 2014
December 31, 2014
| Par/Shares | Security | Maturity date | Coupon rate | Cost | Fair value (a) | Percent of net assets | ||||||||||||
| Municipal Bonds (Cont’d): | ||||||||||||||||||
| 500,000 | COVENTRY OH LOCAL SCH DIST | 11/1/2037 | 5.25 | $ | 507,145 | 556,280 | ||||||||||||
| 515,000 | CROW FIN AUTH MT TRIBAL PURPOSE REVENUE | 10/1/2017 | 5.65 | 506,305 | 516,808 | |||||||||||||
| 500,000 | CUYAHOGA CNTY OH HSG MTGE REVENUE | 3/20/2042 | 5.70 | 511,515 | 532,880 | |||||||||||||
| 1,000,000 | DALLAS-FORT WORTH TX INTERNATIONAL ARPT REVENUE | 11/1/2037 | 5.25 | 1,011,261 | 1,150,800 | |||||||||||||
| 2,000,000 | DAMON RUN IN CONSERVANCY DIST | 7/1/2025 | 6.10 | 2,027,354 | 2,285,420 | |||||||||||||
| 1,000,000 | DAMON RUN IN CONSERVANCY DIST | 1/1/2027 | 6.38 | 1,010,652 | 1,156,580 | |||||||||||||
| 1,000,000 | DAVIE FL EDUCTNL FACS REVENUE | 4/1/2042 | 6.00 | 1,028,706 | 1,166,820 | |||||||||||||
| 500,000 | DAVIESS CNTY IN HOSP ASSN LEASE RENTAL REVENUE | 1/15/2029 | 5.25 | 490,239 | 551,830 | |||||||||||||
| 500,000 | DECATUR IL | 3/1/2034 | 5.00 | 518,579 | 556,695 | |||||||||||||
| 1,000,000 | DEKALB/KANE/LA SALLE CNTYS IL CMNTY CLG DIST #523(b) | 2/1/2029 | 3.83 | 458,443 | 497,530 | |||||||||||||
| 310,000 | DELAWARE ST HSG AUTH REVENUE | 7/1/2031 | 5.20 | 310,000 | 331,821 | |||||||||||||
| 500,000 | DINUBA CA FING AUTH LEASE REVENUE | 9/1/2038 | 5.38 | 495,026 | 516,260 | |||||||||||||
| 500,000 | DIST OF COLUMBIA HSG FIN AGY MF HSG REVENUE | 7/1/2033 | 5.45 | 500,000 | 562,430 | |||||||||||||
| 1,000,000 | DIST OF COLUMBIA HSG FIN AGY MF HSG REVENUE | 6/1/2040 | 4.90 | 1,000,000 | 1,063,200 | |||||||||||||
| 1,000,000 | DIST OF COLUMBIA HSG FIN AGY MF HSG REVENUE | 6/1/2041 | 5.00 | 1,000,000 | 1,073,610 | |||||||||||||
| 1,000,000 | DOUGLAS CNTY CO MF REVENUE | 10/1/2029 | 4.50 | 1,000,000 | 1,065,800 | |||||||||||||
| 3,000,000 | DUBLIN CA UNIF SCH DIST(b) | 8/1/2034 | 3.18 | 876,989 | 1,005,630 | |||||||||||||
| 1,500,000 | EAST MORGAN CNTY CO HOSP DIST COPS | 12/1/2038 | 5.88 | 1,500,000 | 1,532,280 | |||||||||||||
| 825,000 | EAST POINT GA | 2/1/2026 | 8.00 | 825,000 | 827,261 | |||||||||||||
| 2,045,000 | EDEN TWP CA HOSP DIST COPS | 6/1/2030 | 6.00 | 2,024,626 | 2,218,498 | |||||||||||||
| 750,000 | EL PASO DE ROBLES CA REDEV AGY TAX ALLOCATION REVENUE | 7/1/2033 | 6.38 | 742,325 | 875,242 | |||||||||||||
| 1,000,000 | EL PASO TX DOWNTOWN DEV CORP SPL REVENUE | 8/15/2038 | 7.25 | 1,086,660 | 1,273,550 | |||||||||||||
| 1,000,000 | ENCINITAS CA UNION SCH DIST(b) | 8/1/2035 | 2.16 | 553,894 | 944,610 | |||||||||||||
| 1,155,000 | ENTERPRISE CA ELEM SCH DIST(b) | 8/1/2035 | 1.94 | 669,559 | 1,058,916 | |||||||||||||
| 1,000,000 | ERIE CNTY PA HOSP AUTH | 7/1/2027 | 7.00 | 1,000,000 | 1,068,410 | |||||||||||||
| 500,000 | FAIRFAX CNTY VA REDEV & HSG AUTH MF REVENUE | 8/1/2039 | 5.60 | 500,000 | 534,395 | |||||||||||||
| 238,000 | FARMS NEW KENT VA CMNTY DEV AUTH SPL ASSMNT(e) | 3/1/2036 | 5.13 | 238,000 | 128,289 | |||||||||||||
| 1,000,000 | FESTIVAL RANCH AZ CMNTY FACS DIST | 7/15/2024 | 6.25 | 1,009,780 | 1,103,510 | |||||||||||||
| 315,000 | FIDDLERS CREEK FL CDD #2 SPL ASSMNT REVENUE(e) | 5/1/2013 | 5.75 | 314,118 | 236,880 | |||||||||||||
| 1,000,000 | FISHHAWK CCD IV FL SPL ASSMNT REVENUE | 5/1/2033 | 7.00 | 1,000,000 | 1,090,030 | |||||||||||||
| 700,000 | FLAGSTAFF AZ INDL DEV AUTH | 7/1/2022 | 5.50 | 658,940 | 704,179 | |||||||||||||
| 1,000,000 | FLORIDA ST DEV FIN CORP EDUCTNL FACS REVENUE | 12/15/2025 | 6.38 | 1,000,000 | 1,065,460 | |||||||||||||
| 1,000,000 | FLORIDA ST DEV FIN CORP EDUCTNL FACS REVENUE | 6/15/2034 | 6.00 | 989,738 | 1,006,410 | |||||||||||||
| 370,000 | FLORIDA ST HSG FIN CORP REVENUE | 7/1/2026 | 5.00 | 370,894 | 388,086 | |||||||||||||
| 80,000 | FLORIDA ST HSG FIN CORP REVENUE | 7/1/2033 | 5.45 | 80,000 | 84,371 | |||||||||||||
| 1,205,000 | FLORIDA ST HSG FIN CORP REVENUE | 7/1/2034 | 5.30 | 1,208,828 | 1,281,746 | |||||||||||||
| See accompanying notes to the financial statements. | 53 | (Continued) |
CLEARWATER INVESTMENT TRUST
Schedule of Investments - Clearwater Tax-Exempt Bond Fund
December 31, 2014
| Par/Shares | Security | Maturity date | Coupon rate | Cost | Fair value (a) | Percent of net assets | ||||||||||||
| Municipal Bonds (Cont’d): | ||||||||||||||||||
| 995,000 | FLORIDA ST HSG FIN CORP REVENUE | 7/1/2039 | 4.20 | $ | 995,000 | 1,037,437 | ||||||||||||
| 1,250,000 | FORT SILL APACHE TRIBE OK ECONDEV AUTH GAMING ENTERPRISE REV(c) | 8/25/2026 | 8.50 | 1,250,000 | 1,468,613 | |||||||||||||
| 750,000 | FOSSIL RIDGE CO MET DIST #3 | 12/1/2044 | 5.00 | 789,276 | 790,358 | |||||||||||||
| 1,145,000 | FULTON CNTY GA DEV AUTH | 11/1/2028 | 5.25 | 999,150 | 1,095,204 | |||||||||||||
| 1,000,000 | FYI PROPERTIES WA LEASE REVENUE | 6/1/2034 | 5.50 | 982,364 | 1,138,500 | |||||||||||||
| 500,000 | GAINESVILLE & HALL CNTY GA DEV AUTH RETMNT CMNTY REVENUE | 11/15/2029 | 6.38 | 509,898 | 579,630 | |||||||||||||
| 1,490,316 | GALVESTON COUNTY MUNICIPAL UTILITY DISTRICT | 2/25/2015 | 6.50 | 1,490,316 | 1,189,138 | |||||||||||||
| 500,000 | GEORGIA ST ENVRNMNTL LOAN ACQUISITION CORP LOC GOVT LOAN SEC | 2/15/2031 | 5.13 | 495,938 | 566,175 | |||||||||||||
| 355,000 | GEORGIA ST ENVRNMNTL LOAN ACQUISITION CORP LOC GOVT LOAN SEC | 2/15/2036 | 5.25 | 349,433 | 407,387 | |||||||||||||
| 3,500,000 | GEORGIA ST HSG & FIN AUTH REVENUE | 12/1/2037 | 3.80 | 3,500,000 | 3,555,020 | |||||||||||||
| 2,000,000 | GEORGIA ST HSG & FIN AUTH REVENUE | 12/1/2037 | 4.00 | 2,000,000 | 2,059,680 | |||||||||||||
| 1,000,000 | GEORGIA ST HSG & FIN AUTH REVENUE | 12/1/2039 | 3.55 | 1,000,000 | 1,001,570 | |||||||||||||
| 1,000,000 | GEORGIA ST HSG & FIN AUTH REVENUE | 12/1/2041 | 3.85 | 1,007,347 | 1,000,650 | |||||||||||||
| 1,950,000 | GEORGIA ST HSG & FIN AUTH REVENUE | 12/1/2043 | 3.90 | 1,950,103 | 1,965,834 | |||||||||||||
| 2,000,000 | GLENDALE CA UNIF SCH DIST(b) | 9/1/2028 | 3.82 | 855,769 | 1,027,980 | |||||||||||||
| 1,500,000 | GRAND PARKWAY TRANSPRTN CORP TX SYS TOLL REVENUE(b) | 10/1/2035 | 1.91 | 895,000 | 1,148,400 | |||||||||||||
| 1,210,000 | HAMILTON CNTY OH HLTH CARE REVENUE | 1/1/2031 | 6.13 | 1,179,899 | 1,359,471 | |||||||||||||
| 940,000 | HAMMOND IN LOCAL PUBLIC IMPT BOND BANK SPL REVENUE | 8/15/2025 | 6.50 | 943,380 | 960,351 | |||||||||||||
| 1,000,000 | HAMMOND IN LOCAL PUBLIC IMPT BOND BANK SPL REVENUE | 8/15/2030 | 6.50 | 1,001,800 | 1,020,370 | |||||||||||||
| 1,250,000 | HARRIS CNTY TX CULTURAL EDU FACS FIN CORP REVENUE(c) | 8/15/2021 | 6.75 | 1,250,000 | 1,380,600 | |||||||||||||
| 1,500,000 | HARTNELL CA CMNTY CLG DIST(b) | 8/1/2034 | 2.36 | 746,764 | 1,247,325 | |||||||||||||
| 3,500,000 | HEALDSBURG CA UNIF SCH DIST(b) | 8/1/2037 | 1.44 | 2,336,451 | 2,502,640 | |||||||||||||
| 1,000,000 | HELENDALE CA SCH DIST(b) | 8/1/2034 | 1.82 | 622,194 | 963,740 | |||||||||||||
| 750,000 | HEMPSTEAD TOWN NY LOCAL DEV CORP REVENUE | 9/1/2038 | 5.00 | �� | 756,775 | 842,985 | ||||||||||||
| 2,000,000 | HENDERSON NV HLTHCARE FAC REVENUE | 7/1/2031 | 5.25 | 2,000,000 | 2,123,500 | |||||||||||||
| 850,000 | HERITAGE HARBOUR FL N CDD SPLASSMNT | 5/1/2034 | 5.00 | 850,000 | 859,036 | |||||||||||||
| 1,000,000 | HIDALGO CNTY TX REGL MOBILITY AUTH VEHICLE REGISTRATION FEE | 12/1/2038 | 5.25 | 1,033,039 | 1,153,720 | |||||||||||||
| 500,000 | HIGHLANDS CNTY FL HLTH FACS AUTH | 11/15/2032 | 5.13 | 500,575 | 530,745 | |||||||||||||
| 1,000,000 | HILLSBORO OR HOSP FAC AUTH | 10/1/2031 | 5.38 | 1,000,000 | 1,012,540 | |||||||||||||
| 63,000 | HOUMA-TERREBONNE LA PUBLIC TRUST FING AUTH SF MTGE | 12/1/2040 | 5.15 | 65,171 | 63,209 | |||||||||||||
| See accompanying notes to the financial statements. | 54 | (Continued) |
CLEARWATER INVESTMENT TRUST
Schedule of Investments - Clearwater Tax-Exempt Bond Fund
December 31, 2014
| Par/Shares | Security | Maturity date | Coupon rate | Cost | Fair value (a) | Percent of net assets | ||||||||||||
| Municipal Bonds (Cont’d): | ||||||||||||||||||
| 1,500,000 | HOUSTON TX HGR EDU FIN CORP | 9/1/2038 | 5.50 | $ | 1,547,148 | 1,700,130 | ||||||||||||
| 500,000 | IDAHO ST HLTH FACS AUTH REVENUE | 10/1/2021 | 6.00 | 500,000 | 505,210 | |||||||||||||
| 750,000 | IDAHO ST HLTH FACS AUTH REVENUE | 10/1/2024 | 7.00 | 750,000 | 807,532 | |||||||||||||
| 750,000 | IDAHO ST HLTH FACS AUTH REVENUE | 10/1/2029 | 7.38 | 741,604 | 799,530 | |||||||||||||
| 120,000 | IDAHO ST HSG & FIN ASSN SF MTGE REVENUE | 7/1/2026 | 5.65 | 121,739 | 126,047 | |||||||||||||
| 75,000 | IDAHO ST HSG & FIN ASSN SF MTGE REVENUE | 1/1/2040 | 5.50 | 75,000 | 78,116 | |||||||||||||
| 1,000,000 | ILLINOIS ST | 2/1/2031 | 5.25 | 1,040,269 | 1,105,620 | |||||||||||||
| 500,000 | ILLINOIS ST | 7/1/2033 | 5.50 | 498,842 | 562,025 | |||||||||||||
| 700,000 | ILLINOIS ST COPS | 7/1/2017 | 5.80 | 700,000 | 701,393 | |||||||||||||
| 1,000,000 | ILLINOIS ST EDUCTNL FACS AUTH | 11/1/2036 | 4.50 | 1,000,000 | 1,009,450 | |||||||||||||
| 1,500,000 | ILLINOIS ST FIN AUTH EDU REVENUE | 9/1/2027 | 5.00 | 1,455,871 | 1,530,270 | |||||||||||||
| 500,000 | ILLINOIS ST FIN AUTH EDU REVENUE | 9/1/2032 | 6.00 | 500,000 | 565,170 | |||||||||||||
| 675,000 | ILLINOIS ST FIN AUTH EDUCTNL FAC REVENUE | 2/1/2034 | 6.00 | 684,366 | 701,770 | |||||||||||||
| 935,000 | ILLINOIS ST FIN AUTH REVENUE | 8/15/2023 | 5.25 | 911,226 | 982,563 | |||||||||||||
| 750,000 | ILLINOIS ST FIN AUTH REVENUE | 5/15/2025 | 6.00 | 758,538 | 755,092 | |||||||||||||
| 610,000 | ILLINOIS ST FIN AUTH REVENUE | 8/15/2026 | 6.00 | 614,498 | 623,932 | |||||||||||||
| 500,000 | ILLINOIS ST FIN AUTH REVENUE | 3/15/2027 | 5.00 | 508,174 | 536,140 | |||||||||||||
| 1,000,000 | ILLINOIS ST FIN AUTH REVENUE | 5/15/2027 | 5.50 | 1,027,379 | 1,072,460 | |||||||||||||
| 500,000 | ILLINOIS ST FIN AUTH REVENUE | 5/15/2029 | 5.25 | 503,067 | 541,825 | |||||||||||||
| 1,045,000 | ILLINOIS ST FIN AUTH REVENUE | 5/15/2030 | 5.50 | 1,067,164 | 1,108,546 | |||||||||||||
| 750,000 | ILLINOIS ST FIN AUTH REVENUE | 11/15/2036 | 5.25 | 757,279 | 769,988 | |||||||||||||
| 570,000 | ILLINOIS ST FIN AUTH REVENUE | 2/1/2037 | 5.25 | 570,961 | 588,348 | |||||||||||||
| 500,000 | ILLINOIS ST FIN AUTH REVENUE | 3/1/2038 | 6.00 | 485,971 | 563,660 | |||||||||||||
| 750,000 | ILLINOIS ST FIN AUTH SPORTS FAC REVENUE(c)(e)(f) | 10/1/2027 | 6.13 | 730,795 | 54,022 | |||||||||||||
| 500,000 | ILLINOIS ST FIN AUTH SPORTS FAC REVENUE(c)(e)(f) | 10/1/2037 | 6.25 | 484,210 | 36,015 | |||||||||||||
| 1,000,000 | ILLINOIS ST FIN AUTH STUDENT HSG REVENUE | 10/1/2024 | 6.00 | 990,889 | 1,133,650 | |||||||||||||
| 600,000 | ILLINOIS ST HSG DEV AUTH | 7/1/2029 | 3.40 | 600,000 | 600,486 | |||||||||||||
| 1,000,000 | ILLINOIS ST HSG DEV AUTH | 7/1/2034 | 4.95 | 1,000,000 | 1,086,650 | |||||||||||||
| 500,000 | ILLINOIS ST HSG DEV AUTH | 7/1/2047 | 4.50 | 466,854 | 503,905 | |||||||||||||
| 1,500,000 | ILLINOIS ST SPORTS FACS AUTH | 6/15/2031 | 5.25 | 1,632,733 | 1,722,765 | |||||||||||||
| 1,000,000 | IMPERIAL CA CMNTY CLG DIST(b) | 8/1/2040 | 0.84 | 963,778 | 1,224,490 | |||||||||||||
| 500,000 | INDIANA ST BOND BANK REVENUE | 2/1/2029 | 5.50 | 491,803 | 565,740 | |||||||||||||
| 3,000,000 | INDIANA ST FIN AUTH REVENUE | 9/15/2030 | 6.50 | 3,065,034 | 3,430,620 | |||||||||||||
| 500,000 | INDIANA ST FIN AUTH REVENUE | 2/1/2031 | 4.00 | 492,969 | 519,945 | |||||||||||||
| 500,000 | INDIANA ST FIN AUTH REVENUE | 11/15/2031 | 5.50 | 492,950 | 549,060 | |||||||||||||
| 1,000,000 | INDIANA ST FIN AUTH REVENUE | 11/15/2033 | 6.50 | 986,555 | 1,142,550 | |||||||||||||
| 1,000,000 | INDIANA ST FIN AUTH REVENUE | 3/1/2041 | 5.00 | 1,061,709 | 1,083,750 | |||||||||||||
| 500,000 | INDIANA ST FIN AUTH REVENUE | 11/15/2041 | 5.88 | 549,815 | 563,840 | |||||||||||||
| 1,000,000 | INDIANA ST FIN AUTH REVENUE | 11/15/2041 | 6.00 | 986,752 | 1,137,680 | |||||||||||||
| 575,000 | INDIANA ST HLTH & EDUCTNL FACFING AUTH HOSP REVENUE | 2/15/2030 | 5.25 | 441,827 | 595,361 | |||||||||||||
| 6,118,187 | INTERMEDIATE SCH DIST #287 MN LEASE REVENUE | 11/1/2032 | 5.30 | 5,901,327 | 6,275,730 | |||||||||||||
| 1,000,000 | IOWA ST FIN AUTH HLTH CARE FACS REVENUE | 7/1/2033 | 5.50 | 1,039,137 | 1,171,610 | |||||||||||||
| 90,000 | IOWA ST STUDENT LOAN LIQUIDITY CORP | 12/1/2027 | 5.50 | 88,288 | 97,009 | |||||||||||||
| 2,000,000 | JEFFERSON CA UNION HIGH SCH DIST SAN MATEO CNTY(b) | 8/1/2031 | 4.10 | 635,693 | 790,880 | |||||||||||||
| See accompanying notes to the financial statements. | 55 | (Continued) |
CLEARWATER INVESTMENT TRUST
Schedule of Investments - Clearwater Tax-Exempt Bond Fund
December 31, 2014
| Par/Shares | Security | Maturity date | Coupon rate | Cost | Fair value (a) | Percent of net assets | ||||||||||||
| Municipal Bonds (Cont’d): | ||||||||||||||||||
| 330,000 | JEFFERSON PARISH LA FIN AUTH | 6/1/2038 | 5.00 | $ | 343,616 | 343,533 | ||||||||||||
| 110,000 | JEFFERSON PARISH LA FIN AUTH | 12/1/2048 | 5.70 | 115,372 | 115,466 | |||||||||||||
| 780,000 | KALISPEL TRIBE OF INDIANS PRIORITY DIST WA REVENUE | 1/1/2016 | 6.20 | 770,599 | 777,582 | |||||||||||||
| 1,090,000 | KANSAS CITY MO INDL DEV AUTH | 9/1/2023 | 5.45 | 1,090,000 | 1,161,210 | |||||||||||||
| 1,000,000 | KANSAS CITY MO INDL DEV AUTH | 11/20/2039 | 5.10 | 1,000,000 | 1,065,240 | |||||||||||||
| 500,000 | KENTUCKY ST ECON DEV FIN AUTH MF HSG REVENUE | 11/20/2035 | 5.38 | 500,000 | 523,970 | |||||||||||||
| 1,000,000 | KENTUCKY ST HSG CORP HSG REVENUE | 7/1/2028 | 3.75 | 984,356 | 1,047,910 | |||||||||||||
| 185,000 | KENTUCKY ST HSG CORP HSG REVENUE | 7/1/2039 | 5.15 | 185,000 | 185,128 | |||||||||||||
| 1,850,000 | KERRVILLE TX HLTH FACS DEV CORP HOSP REVENUE | 8/15/2035 | 5.45 | 1,825,544 | 1,855,458 | |||||||||||||
| 750,000 | KING CNTY WA HSG AUTH | 5/1/2028 | 5.20 | 750,000 | 833,602 | |||||||||||||
| 500,000 | KIRKWOOD MO INDL DEV AUTH RETMNT CMNTY REVENUE | 5/15/2021 | 8.00 | 500,000 | 591,545 | |||||||||||||
| 2,325,000 | KOYUKUK AK REVENUE | 10/1/2023 | 7.00 | 2,269,230 | 2,589,794 | |||||||||||||
| 1,175,000 | KREMMLING CO MEMORIAL HOSP DIST COPS | 12/1/2022 | 6.00 | 1,165,889 | 1,078,333 | |||||||||||||
| 396,000 | LAFAYETTE LA PUBLIC TRUST FING AUTH SF MTGE | 1/1/2041 | 5.35 | 404,630 | 405,124 | |||||||||||||
| 1,900,000 | LAKEWOOD RANCH FL STEWARDSHIP DIST SPL ASSMNT REVENUE | 5/1/2030 | 7.40 | 1,882,781 | 2,362,707 | |||||||||||||
| 750,000 | LAKEWOOD RANCH FL STEWARDSHIP DIST SPL ASSMNT REVENUE | 5/1/2033 | 6.70 | 750,000 | 838,125 | |||||||||||||
| 1,000,000 | LAKEWOOD RANCH FL STEWARDSHIPDIST SPL ASSMNT REVENUE | 5/1/2034 | 5.35 | 1,000,000 | 1,011,920 | |||||||||||||
| 2,000,000 | LAS VEGAS NV REDEV AGY TAX INCR REVENUE | 6/15/2023 | 7.50 | 1,984,390 | 2,287,420 | |||||||||||||
| 245,000 | LEHIGH CNTY PA GEN PURPOSE AUTH | 8/15/2042 | 1.18 | 245,000 | 195,405 | |||||||||||||
| 750,000 | LEWISVILLE TX COMB CONTRACT REVENUE | 9/1/2024 | 3.00 | 740,681 | 753,045 | |||||||||||||
| 480,000 | LEXINGTON OAKS FL CDD SPL ASSMNT REVENUE | 5/1/2033 | 5.65 | 480,000 | 516,466 | |||||||||||||
| 500,000 | LEXINGTON VA INDL DEV AUTH RSDL CARE FAC REVENUE | 1/1/2028 | 5.38 | 504,527 | 514,155 | |||||||||||||
| 180,000 | LOMBARD IL PUBLIC FACS CORP CONFERENCE CENTER & HOTEL REVENU | 1/1/2015 | 6.38 | 180,000 | 107,633 | |||||||||||||
| 550,000 | LOMBARD IL PUBLIC FACS CORP CONFERENCE CENTER & HOTEL REVENU | 1/1/2030 | 5.50 | 556,063 | 387,722 | |||||||||||||
| 1,000,000 | LOMBARD IL PUBLIC FACS CORP CONFERENCE CENTER & HOTEL REVENU(e) | 1/1/2036 | 5.25 | 1,005,522 | 310,000 | |||||||||||||
| 500,000 | LONG LAKE RANCH CMNTY DEV DISTFLA CAP IMPT REV | 5/1/2024 | 5.63 | 500,000 | 511,250 | |||||||||||||
| 1,000,000 | LONG LAKE RANCH CMNTY DEV DISTFLA CAP IMPT REV | 5/1/2044 | 5.75 | 979,121 | 1,014,050 | |||||||||||||
| 1,000,000 | LOUISIANA ST ENERGY & PWR AUTH PWR PROJ REVENUE | 6/1/2038 | 5.25 | 1,020,383 | 1,143,050 | |||||||||||||
| 430,000 | LOUISIANA ST HSG FIN AGY SF MTGE REVENUE | 12/1/2034 | 5.10 | 430,000 | 461,373 | |||||||||||||
| 90,000 | LOUISIANA ST HSG FIN AGY SF MTGE REVENUE | 6/1/2038 | 5.85 | 92,592 | 95,308 | |||||||||||||
| 490,000 | LOUISIANA ST HSG FIN AGY SF MTGE REVENUE | 12/1/2038 | 5.70 | 499,254 | 506,930 | |||||||||||||
| 185,000 | LOUISIANA ST HSG FIN AGY SF MTGE REVENUE | 6/1/2039 | 5.60 | 190,782 | 201,341 | |||||||||||||
| See accompanying notes to the financial statements. | 56 | (Continued) |
CLEARWATER INVESTMENT TRUST
Schedule of Investments - Clearwater Tax-Exempt Bond Fund
December 31, 2014
| Par/Shares | Security | Maturity date | Coupon rate | Cost | Fair value (a) | Percent of net assets | ||||||||||||
| Municipal Bonds (Cont’d): | ||||||||||||||||||
| 365,000 | LOUISIANA ST LOCAL GOVT ENVRNMNTL FACS & CMNTY DEV AUTH | 6/20/2028 | 8.00 | $ | 365,000 | 328,504 | ||||||||||||
| 750,000 | LOUISIANA ST PUBLIC FACS AUTH REVENUE | 5/1/2031 | 6.50 | 746,944 | 840,135 | |||||||||||||
| 475,000 | LOUISIANA ST PUBLIC FACS AUTH REVENUE | 2/15/2036 | 0.86 | 475,000 | 419,306 | |||||||||||||
| 500,000 | LUCAS CNTY OH HLTH CARE FACS REVENUE | 8/15/2030 | 5.50 | 492,238 | 551,485 | |||||||||||||
| 1,485,000 | LUZERNE CNTY PA | 11/1/2026 | 7.00 | 1,547,112 | 1,790,168 | |||||||||||||
| 1,000,000 | MACON & MOULTRIE CNTYS IL CMNTY SCH DIST #3 MOUNT ZION | 12/1/2041 | 5.50 | 1,032,650 | 1,183,130 | |||||||||||||
| 1,000,000 | MACON CNTY IL SCH DIST #61 | 1/1/2037 | 5.25 | 1,024,208 | 1,104,790 | |||||||||||||
| 250,000 | MAGNOLIA CREEK FL CDD CAPITAL IMPT REVENUE(d)(e) | 5/1/2014 | 5.60 | 250,000 | 87,500 | |||||||||||||
| 1,000,000 | MAINE ST HLTH & HGR EDUCTNL FACS AUTH REVENUE | 7/1/2032 | 7.50 | 1,043,126 | 1,213,490 | |||||||||||||
| 1,000,000 | MAINE ST HSG AUTH MTGE REVENUE | 11/15/2036 | 3.60 | 1,000,000 | 1,002,700 | |||||||||||||
| 1,000,000 | MAINE ST HSG AUTH MTGE REVENUE | 11/15/2037 | 4.50 | 1,000,000 | 1,065,420 | |||||||||||||
| 1,000,000 | MAINE ST TECH CLG SYS COPS | 1/1/2017 | 5.80 | 1,000,000 | 1,004,550 | |||||||||||||
| 1,000,000 | MALTA IL TAX INCR REVENUE(e) | 12/30/2025 | 5.75 | 1,000,000 | 535,550 | |||||||||||||
| 500,000 | MANATEE CNTY FL SCH BRD COPS | 7/1/2031 | 5.63 | 495,986 | 568,920 | |||||||||||||
| 500,000 | MANCHESTER NH HSG & REDEV AUTH REVENUE | 1/1/2015 | 6.75 | 500,000 | 500,000 | |||||||||||||
| 500,000 | MANCHESTER NH HSG & REDEV AUTH REVENUE(b) | 1/1/2020 | 3.58 | 380,465 | 377,325 | |||||||||||||
| 452,000 | MANHATTAN IL SPL SVC AREA SPL TAX(e) | 3/1/2022 | 5.75 | 452,000 | 81,365 | |||||||||||||
| 500,000 | MANSFIELD OH | 12/1/2024 | 6.00 | 516,035 | 568,260 | |||||||||||||
| 462,000 | MARQUIS VA CMNTY DEV AUTH REVENUE(b) | 9/1/2041 | 2.95 | 98,801 | 65,456 | |||||||||||||
| 349,000 | MARQUIS VA CMNTY DEV AUTH REVENUE | 9/1/2041 | 5.63 | 377,116 | 330,953 | |||||||||||||
| 750,000 | MARTINEZ CA UNIF SCH DIST | 8/1/2035 | 6.13 | 626,675 | 976,672 | |||||||||||||
| 500,000 | MARYLAND ST CMNTY DEV ADMIN DEPT HSG & CMNTY DEV | 9/1/2030 | 5.13 | 500,000 | 547,740 | |||||||||||||
| 500,000 | MARYLAND ST CMNTY DEV ADMIN DEPT HSG & CMNTY DEV | 7/1/2031 | 4.50 | 500,000 | 537,115 | |||||||||||||
| 452,318 | MASHANTUCKET WSTRN PEQUOT TRIBE CT | 7/1/2031 | 6.05 | 513,038 | 61,628 | |||||||||||||
| 930,000 | MASSACHUSETTS ST DEV FIN AGY REVENUE | 7/1/2030 | 6.38 | 918,689 | 1,031,788 | |||||||||||||
| 1,580,000 | MASSACHUSETTS ST EDUCTNL FING AUTH | 1/1/2028 | 5.25 | 1,580,380 | 1,721,710 | |||||||||||||
| 1,000,000 | MASSACHUSETTS ST HSG FIN AGY | 12/1/2033 | 5.00 | 1,000,000 | 1,095,530 | |||||||||||||
| 1,000,000 | MASSACHUSETTS ST HSG FIN AGY | 12/1/2038 | 5.15 | 1,000,000 | 1,077,760 | |||||||||||||
| 1,000,000 | MASSACHUSETTS ST HSG FIN AGY | 12/1/2043 | 5.00 | 1,000,000 | 1,091,740 | |||||||||||||
| 885,000 | MASSACHUSETTS ST HSG FIN AGY HSG REVENUE | 6/1/2040 | 5.05 | 885,000 | 938,799 | |||||||||||||
| 500,000 | MASSACHUSETTS ST HSG FIN AGY HSG REVENUE | 12/1/2042 | 3.50 | 499,400 | 474,315 | |||||||||||||
| 3,295,000 | MASSACHUSETTS ST HSG FIN AGY HSG REVENUE | 12/1/2043 | 4.00 | 3,295,000 | 3,330,619 | |||||||||||||
| 160,000 | MEAD NE TAX INCR REVENUE(e) | 7/1/2012 | 5.13 | 160,000 | 16,000 | |||||||||||||
| 750,000 | MEADOW PINES FL CDD | 5/1/2030 | 4.45 | 750,000 | 783,172 | |||||||||||||
| See accompanying notes to the financial statements. | 57 | (Continued) |
CLEARWATER INVESTMENT TRUST
Schedule of Investments - Clearwater Tax-Exempt Bond Fund
December 31, 2014
| Par/Shares | Security | Maturity date | Coupon rate | Cost | Fair value (a) | Percent of net assets | ||||||||||||
| Municipal Bonds (Cont’d): | ||||||||||||||||||
| 1,000,000 | MEDFORD OR HOSP FACS AUTH REVENUE | 10/1/2042 | 5.00 $ | 1,046,854 | 1,076,980 | |||||||||||||
| 1,070,000 | MET GOVT NASHVILLE & DAVIDSON CNTY TN HLTH & EDUCTNL FAC BRD(e) | 12/20/2020 | 8.00 | 1,070,000 | 320,989 | |||||||||||||
| 855,000 | MET GOVT NASHVILLE & DAVIDSON CNTY TN HLTH & EDUCTNL FAC BRD(e) | 6/20/2036 | 10.00 | 855,000 | 25,650 | |||||||||||||
| 1,830,000 | MET GOVT NASHVILLE & DAVIDSON CNTY TN HLTH & EDUCTNL FAC BRD(e) | 12/20/2040 | 7.50 | 1,830,000 | 1,097,927 | |||||||||||||
| 2,000,000 | MET WASHINGTON DC ARPTS AUTH DULLES TOLL ROAD REVENUE(b) | 10/1/2041 | 1.14 | 1,367,788 | 2,355,160 | |||||||||||||
| 1,000,000 | MET WASHINGTON DC ARPTS AUTH DULLES TOLL ROAD REVENUE | 10/1/2053 | 5.00 | 1,036,824 | 1,068,710 | |||||||||||||
| 500,000 | MIAMI-DADE CNTY FL HLTH FACS AUTH HOSP REVENUE | 8/1/2030 | 6.00 | 487,142 | 579,355 | |||||||||||||
| 1,000,000 | MIAMI-DADE CNTY FL SPL OBLIG(b) | 10/1/2038 | 2.96 | 294,760 | 293,580 | |||||||||||||
| 2,500,000 | MICHIGAN ST HOSP FIN AUTH | 11/15/2025 | 5.25 | 2,314,404 | 2,503,625 | |||||||||||||
| 1,500,000 | MICHIGAN ST HOSP FIN AUTH | 6/1/2034 | 6.13 | 1,542,197 | 1,812,405 | |||||||||||||
| 1,000,000 | MICHIGAN ST HSG DEV AUTH | 10/1/2034 | 5.63 | 1,000,000 | 1,071,700 | |||||||||||||
| 1,000,000 | MICHIGAN ST HSG DEV AUTH | 12/1/2040 | 3.95 | 1,000,000 | 1,008,600 | |||||||||||||
| 1,000,000 | MICHIGAN ST MUNI BOND AUTH | 5/1/2023 | 5.75 | 1,017,175 | 1,161,610 | |||||||||||||
| 610,000 | MICHIGAN ST PUBLIC EDUCTNL FACS AUTH(c)(f) | 9/1/2016 | 6.00 | 608,812 | 396,506 | |||||||||||||
| 360,000 | MICHIGAN ST PUBLIC EDUCTNL FACS AUTH | 10/1/2023 | 6.25 | 360,000 | 179,993 | |||||||||||||
| 500,000 | MICHIGAN ST PUBLIC EDUCTNL FACS AUTH | 11/1/2028 | 6.35 | 500,000 | 508,275 | |||||||||||||
| 166,395 | MINNESOTA ST HGR EDU FACS AUTH REVENUE | 10/1/2016 | 4.49 | 166,736 | 168,485 | |||||||||||||
| 350,000 | MINNESOTA ST HSG FIN AGY | 7/1/2034 | 5.05 | 350,000 | 369,092 | |||||||||||||
| 705,000 | MINNESOTA ST HSG FIN AGY | 1/1/2040 | 5.10 | 705,000 | 750,684 | |||||||||||||
| 1,000,000 | MISSISSIPPI ST DEV BANK SPL OBLG | 10/1/2031 | 6.50 | 975,055 | 1,156,770 | |||||||||||||
| 90,000 | MISSISSIPPI ST HOME CORP SF MTGE REVENUE | 6/1/2039 | 6.75 | 94,351 | 94,881 | |||||||||||||
| 200,000 | MISSOURI ST HSG DEV COMMISSION SF HSG REVENUE | 9/1/2034 | 5.35 | 200,000 | 215,328 | |||||||||||||
| 947,585 | MOBERLY MO INDL DEV AUTH(e) | 9/1/2024 | 6.00 | 963,425 | 60,361 | |||||||||||||
| 1,305,000 | MONTANA ST BRD OF HSG | 12/1/2038 | 3.75 | 1,305,000 | 1,341,005 | |||||||||||||
| 915,000 | MONTANA ST BRD OF HSG | 12/1/2038 | 5.20 | 915,000 | 1,013,454 | |||||||||||||
| 630,000 | MONTANA ST BRD OF HSG | 12/1/2039 | 5.50 | 630,052 | 667,516 | |||||||||||||
| 1,000,000 | MONTGOMERY CNTY MD HSG OPPNTYSCOMMN MFH & RECONSTR DEV REV | 7/1/2039 | 3.88 | 1,000,000 | 1,017,120 | |||||||||||||
| 500,000 | MONTGOMERY CNTY MD HSG OPPORTUNITIES COMMISSION MF REVENUE | 7/1/2037 | 5.13 | 500,000 | 543,980 | |||||||||||||
| 2,000,000 | MONTGOMERY CNTY MD HSG OPPORTUNITIES COMMISSION SF MTGE REVE | 7/1/2038 | 4.00 | 2,000,000 | 2,045,400 | |||||||||||||
| 1,500,000 | MONTGOMERY CNTY PA INDL DEV AUTH | 2/1/2021 | 6.00 | 1,506,247 | 1,504,680 | |||||||||||||
| 800,000 | MOUNT CARBON CO MET DIST REVENUE | 6/1/2043 | 7.00 | 800,000 | 480,344 | |||||||||||||
| 200,000 | MOUNT CARBON CO MET DIST REVENUE(e) | 6/1/2043 | 8.00 | - | 20,000 | |||||||||||||
| 500,000 | MULTNOMAH CNTY OR HOSP FACS AUTH REVENUE | 12/1/2029 | 5.00 | 533,616 | 542,455 | |||||||||||||
| 615,000 | MUNSTER IN ECON DEV TAX INCR REVENUE | 7/15/2026 | 4.75 | 612,274 | 667,318 | |||||||||||||
| See accompanying notes to the financial statements. | 58 | (Continued) |
CLEARWATER INVESTMENT TRUST
Schedule of Investments - Clearwater Tax-Exempt Bond Fund
December 31, 2014
| Par/Shares | Security | Maturity date | Coupon rate | Cost | Fair value (a) | Percent of net assets | ||||||||||||
| Municipal Bonds (Cont’d): | ||||||||||||||||||
| 1,000,000 | N ESTRN IL UNIV | 7/1/2030 | 4.00 | $ | 997,503 | 1,018,180 | ||||||||||||
| 1,000,000 | N SLOPE BORO AK SVC AREA 10 WTR & WSTWTR FACS | 6/30/2034 | 5.25 | 1,050,967 | 1,114,970 | |||||||||||||
| 500,000 | N SPRINGS FL IMPT DIST | 5/1/2027 | 6.00 | 500,000 | 521,995 | |||||||||||||
| 1,000,000 | N TX TOLLWAY AUTH REVENUE | 1/1/2034 | 6.00 | 1,000,000 | 1,173,800 | |||||||||||||
| 1,000,000 | N TX TOLLWAY AUTH REVENUE | 1/1/2042 | 6.20 | 732,933 | 1,248,200 | |||||||||||||
| 1,000,000 | NATRONA CNTY WY HOSP REVENUE | 9/15/2031 | 6.35 | 1,000,000 | 1,156,460 | |||||||||||||
| 2,000,000 | NEVADA ST HSG DIV SF MTGE REVENUE | 10/1/2039 | 3.85 | 2,000,000 | 2,007,300 | |||||||||||||
| 400,000 | NEVADA ST HSG DIV SF MTGE REVENUE | 10/1/2040 | 5.10 | 400,000 | 423,264 | |||||||||||||
| 1,000,000 | NEW HAMPSHIRE ST HLTH & EDU FACS AUTH REVENUE | 1/1/2034 | 6.00 | 971,230 | 1,125,610 | |||||||||||||
| 500,000 | NEW HAMPSHIRE ST HLTH & EDU FACS AUTH REVENUE | 8/1/2038 | 6.00 | 490,708 | 578,380 | |||||||||||||
| 1,000,000 | NEW HAMPSHIRE ST HSG FIN AUTH MF REVENUE | 7/1/2031 | 5.20 | 1,000,000 | 1,095,270 | |||||||||||||
| 575,000 | NEW HAMPSHIRE ST HSG FIN AUTH SF REVENUE | 7/1/2034 | 5.38 | 575,000 | 615,693 | |||||||||||||
| 350,000 | NEW HAMPSHIRE ST HSG FIN AUTH SF REVENUE | 7/1/2038 | 6.63 | 360,766 | 378,626 | |||||||||||||
| 750,000 | NEW HOPE CULTURAL ED FACS FINCORP TX RETIREMENT FAC REVENUE | 1/1/2035 | 5.50 | 768,511 | 778,035 | |||||||||||||
| 1,500,000 | NEW HOPE CULTURAL EDU FACS FIN CORP TX STUDENT HSG REV | 4/1/2034 | 5.00 | 1,522,082 | 1,575,840 | |||||||||||||
| 1,100,000 | NEW HOPE CULTURAL EDU FACS FIN CORP TX STUDENT HSG REV | 4/1/2046 | 5.00 | 1,165,059 | 1,204,720 | |||||||||||||
| 325,000 | NEW JERSEY ST ECON DEV AUTH | 12/1/2016 | 5.75 | 325,000 | 325,474 | |||||||||||||
| 500,000 | NEW JERSEY ST HGR EDU ASSISTANCE AUTH | 6/1/2024 | 5.38 | 497,979 | 548,425 | |||||||||||||
| 940,000 | NEW JERSEY ST HSG & MTGE FIN AGY | 10/1/2030 | 4.50 | 940,000 | 1,010,660 | |||||||||||||
| 205,000 | NEW JERSEY ST HSG & MTGE FIN AGY | 10/1/2030 | 6.45 | 213,275 | 222,388 | |||||||||||||
| 500,000 | NEW JERSEY ST HSG & MTGE FIN AGY | 10/1/2034 | 5.00 | 500,000 | 530,365 | |||||||||||||
| 680,000 | NEW JERSEY ST HSG & MTGE FIN AGY | 10/1/2035 | 5.00 | 680,000 | 720,195 | |||||||||||||
| 1,260,000 | NEW JERSEY ST HSG & MTGE FIN AGY | 10/1/2037 | 5.00 | 1,251,462 | 1,325,318 | |||||||||||||
| 1,000,000 | NEW JERSEY ST HSG & MTGE FIN AGY MF CONDUIT REVENUE | 1/1/2030 | 3.60 | 1,000,000 | 1,021,330 | |||||||||||||
| 1,000,000 | NEW JERSEY ST HSG & MTGE FIN AGY MF REVENUE | 5/1/2041 | 4.95 | 971,273 | 1,028,920 | |||||||||||||
| 295,000 | NEW MEXICO ST MTGE FIN AUTH | 9/1/2029 | 4.80 | 295,000 | 314,691 | |||||||||||||
| 600,000 | NEW MEXICO ST MTGE FIN AUTH | 9/1/2029 | 5.00 | 600,000 | 639,378 | |||||||||||||
| 590,000 | NEW MEXICO ST MTGE FIN AUTH | 9/1/2034 | 5.00 | 590,000 | 634,350 | |||||||||||||
| 560,000 | NEW MEXICO ST MTGE FIN AUTH | 3/1/2036 | 5.45 | 560,000 | 600,992 | |||||||||||||
| 880,000 | NEW MEXICO ST MTGE FIN AUTH | 9/1/2042 | 3.90 | 880,000 | 890,956 | |||||||||||||
| 1,270,000 | NEW MEXICO ST MTGE FIN AUTH | 9/1/2042 | 4.13 | 1,270,000 | 1,306,881 | |||||||||||||
| 115,000 | NEW RIVER FL CDD CAPITAL IMPT REVENUE(e) | 5/1/2013 | 5.00 | 114,821 | 1 | |||||||||||||
| 60,000 | NEW RIVER FL CDD CAPITAL IMPT REVENUE | 5/1/2015 | 5.00 | 59,523 | 59,780 | |||||||||||||
| 175,000 | NEW RIVER FL CDD CAPITAL IMPT REVENUE | 5/1/2038 | 5.75 | 144,613 | 158,088 | |||||||||||||
| See accompanying notes to the financial statements. | 59 | (Continued) |
CLEARWATER INVESTMENT TRUST
Schedule of Investments - Clearwater Tax-Exempt Bond Fund
December 31, 2014
| Par/Shares | Security | Maturity date | Coupon rate | Cost | Fair value (a) | Percent of net assets | |||||||||||||
| Municipal Bonds (Cont’d): | |||||||||||||||||||
| 70,000 | NEW RIVER FL CDD CAPITAL IMPT REVENUE | 5/1/2038 | 5.75 | $ | 63,108 | 70,174 | |||||||||||||
| 1,000,000 | NEW YORK CITY NY HSG DEV CORPMF HSG REVENUE | 11/1/2037 | 3.80 | 1,000,000 | 1,014,690 | ||||||||||||||
| 1,000,000 | NEW YORK CITY NY HSG DEV CORPMF HSG REVENUE | 11/1/2039 | 4.30 | 1,000,000 | 1,040,460 | ||||||||||||||
| 2,000,000 | NEW YORK CITY NY MUNI WTR FINAUTH WTR & SWR SYS REVENUE | 6/15/2038 | 5.00 | 2,222,382 | 2,303,200 | ||||||||||||||
| 1,500,000 | NEW YORK ST HSG FIN AGY REVENUE | 11/1/2034 | 3.65 | 1,500,000 | 1,502,295 | ||||||||||||||
| 500,000 | NEW YORK ST HSG FIN AGY REVENUE | 11/1/2045 | 5.10 | 500,000 | 547,150 | ||||||||||||||
| 5,000,000 | NEW YORK ST HSG FIN AGY REVENUE | 5/1/2048 | 4.10 | 5,000,000 | 5,109,500 | ||||||||||||||
| 750,000 | NEW YORK ST MTGE AGY HOMEOWNER MTGE REVENUE | 10/1/2038 | 3.75 | 750,000 | 759,472 | ||||||||||||||
| 2,000,000 | NEW YORK ST MTGE AGY HOMEOWNER MTGE REVENUE | 10/1/2038 | 4.85 | 2,000,000 | 2,179,960 | ||||||||||||||
| 1,465,000 | NEW YORK ST MTGE AGY HOMEOWNER MTGE REVENUE | 10/1/2040 | 4.13 | 1,465,000 | 1,521,344 | ||||||||||||||
| 500,000 | NEW YORK ST MTGE AGY HOMEOWNER MTGE REVENUE | 10/1/2042 | 3.75 | 500,000 | 502,190 | ||||||||||||||
| 500,000 | NORTH CAROLINA ST CAPITAL FACS FIN AGY EDUCTNL FACS REVENUE | 6/1/2023 | 5.00 | 502,538 | 500,555 | ||||||||||||||
| 1,000,000 | NORTH CAROLINA ST MED CARE COMMISSION HLTH CARE FACS REVENUE | 10/1/2029 | 6.38 | 1,000,000 | 1,001,040 | ||||||||||||||
| 1,000,000 | NORTH CAROLINA ST MED CARE COMMISSION RETMNT FACS REVENUE | 7/1/2035 | 6.25 | 977,316 | 1,090,040 | ||||||||||||||
| 1,075,000 | NORTH DAKOTA ST HSG FIN AGY | 7/1/2032 | 3.60 | 1,075,000 | 1,087,997 | ||||||||||||||
| 750,000 | NORTH DAKOTA ST HSG FIN AGY | 7/1/2033 | 5.00 | 750,000 | 830,670 | ||||||||||||||
| 1,290,000 | NORTH DAKOTA ST HSG FIN AGY | 1/1/2038 | 5.15 | 1,290,000 | 1,427,914 | ||||||||||||||
| 230,000 | NORTH DAKOTA ST HSG FIN AGY | 7/1/2040 | 5.05 | 230,000 | 230,000 | ||||||||||||||
| 500,000 | NORTH SPRINGS FL IMPT DIST | 5/1/2044 | 6.50 | 500,000 | 517,545 | ||||||||||||||
| 1,000,000 | NTHRN IL UNIV | 4/1/2026 | 5.50 | 1,010,827 | 1,146,440 | ||||||||||||||
| 1,000,000 | NTHRN PALM BEACH CNTY FL IMPTDIST | 8/1/2029 | 5.00 | 1,000,000 | 1,022,120 | ||||||||||||||
| 2,000,000 | OAK PARK CA UNIF SCH DIST(b) | 8/1/2038 | 1.86 | 1,082,848 | 1,852,480 | ||||||||||||||
| 1,160,000 | OAKLAND CNTY MI ECON DEV CORP LTD OBLG REVENUE | 12/1/2020 | 6.50 | 1,154,904 | 1,243,207 | ||||||||||||||
| 410,000 | OHIO ST HSG FIN AGY RSDL MTGE REVENUE | 9/1/2033 | 5.40 | 410,000 | 438,753 | ||||||||||||||
| 6,253,432 | OKLAHOMA CNTY OK HOME FIN AUTH SF REVENUE(b) | 9/1/2034 | 3.42 | 1,920,648 | 1,966,954 | ||||||||||||||
| 265,000 | OKLAHOMA ST HSG FIN AGY SF MTGE REVENUE | 3/1/2032 | 5.15 | 265,000 | 281,782 | ||||||||||||||
| 350,000 | OKLAHOMA ST HSG FIN AGY SF MTGE REVENUE | 9/1/2038 | 6.50 | 360,138 | 372,505 | ||||||||||||||
| 1,000,000 | ORANGE CNTY FL HLTH FACS AUTHREVENUE | 8/1/2034 | 5.00 | 1,064,973 | 1,104,060 | ||||||||||||||
| 1,000,000 | ORANGE CNTY FL HSG FIN AUTH | 9/1/2035 | 3.80 | 1,000,000 | 1,012,090 | ||||||||||||||
| 1,250,000 | OREGON ST | 12/1/2034 | 3.62 | 1,250,000 | 1,271,450 | ||||||||||||||
| 2,000,000 | OREGON ST | 12/1/2039 | 3.90 | 2,000,000 | 2,035,280 | ||||||||||||||
| 970,000 | OREGON ST HSG & CMNTY SVCS DEPT MTGE REVENUE | 7/1/2038 | 4.00 | 970,000 | 996,762 | ||||||||||||||
| 500,000 | PALM BEACH CNTY FL HLTH FACS AUTH REVENUE | 6/1/2021 | 6.00 | 500,000 | 546,325 | ||||||||||||||
| 1,000,000 | PALM BEACH CNTY FL HLTH FACS AUTH REVENUE | 11/15/2022 | 5.38 | 936,532 | 1,090,210 | ||||||||||||||
| See accompanying notes to the financial statements. | 60 | (Continued) |
CLEARWATER INVESTMENT TRUST
Schedule of Investments - Clearwater Tax-Exempt Bond Fund
December 31, 2014
| Percent | |||||||||||||||||||
| Maturity | Coupon | Fair | of | ||||||||||||||||
| Par/Shares | Security | date | rate | Cost | value (a) | net assets | |||||||||||||
| Municipal Bonds (Cont’d): | |||||||||||||||||||
| 500,000 | PALM BEACH CNTY FL HLTH FACS AUTH REVENUE | 6/1/2023 | 6.25 | $ | 500,000 | 551,510 | |||||||||||||
| 500,000 | PALM BEACH CNTY FL HLTH FACS AUTH REVENUE | 6/1/2034 | 7.25 | 500,000 | 570,280 | ||||||||||||||
| 500,000 | PALM BEACH CNTY FL HLTH FACS AUTH REVENUE | 6/1/2049 | 7.50 | 492,408 | 571,500 | ||||||||||||||
| 500,000 | PENNSYLVANIA ST HGR EDUCTNL FACS AUTH REVENUE | 7/1/2039 | 0.81 | 500,000 | 396,185 | ||||||||||||||
| 1,000,000 | PENNSYLVANIA ST HSG FIN AGY SF MTGE REVENUE | 10/1/2029 | 4.63 | 926,517 | 1,055,140 | ||||||||||||||
| 1,000,000 | PENNSYLVANIA ST HSG FIN AGY SF MTGE REVENUE | 10/1/2037 | 3.65 | 1,005,953 | 1,013,720 | ||||||||||||||
| 500,000 | PENNSYLVANIA ST HSG FIN AGY SF MTGE REVENUE | 10/1/2038 | 4.00 | 500,000 | 515,450 | ||||||||||||||
| 815,000 | PENNSYLVANIA ST HSG FIN AGY SF MTGE REVENUE | 10/1/2042 | 3.70 | 815,000 | 818,839 | ||||||||||||||
| 1,935,000 | PENNSYLVANIA ST TURNPIKE COMMISSION TURNPIKE REVENUE(b) | 12/1/2035 | 0.90 | 1,560,987 | 2,016,251 | ||||||||||||||
| 1,500,000 | PENNSYLVANIA ST TURNPIKE COMMISSION TURNPIKE REVENUE(b) | 12/1/2037 | 1.25 | 1,068,850 | 1,185,855 | ||||||||||||||
| 1,500,000 | PENNSYLVANIA ST TURNPIKE COMMISSION TURNPIKE REVENUE(b) | 12/1/2038 | 1.02 | 1,123,565 | 1,629,735 | ||||||||||||||
| 1,000,000 | PEORIA AZ INDL DEV AUTH | 11/15/2029 | 5.25 | 1,000,000 | 1,011,850 | ||||||||||||||
| 5,000,000 | PEORIA IL PUBLIC BLDG COMMISSION SCH DIST FACS REVENUE(b) | 12/1/2026 | 3.73 | 2,385,232 | 2,717,250 | ||||||||||||||
| 500,000 | PHILADELPHIA PA AUTH FOR INDLDEV REVENUES | 6/15/2023 | 6.13 | 500,000 | 540,175 | ||||||||||||||
| 1,250,000 | PHOENIX AZ INDL DEV AUTH EDU REVENUE(c) | 7/1/2024 | 5.75 | 1,240,873 | 1,369,712 | ||||||||||||||
| 2,500,000 | PHOENIX AZ INDL DEV AUTH LEASE REVENUE | 6/1/2034 | 5.25 | 2,544,054 | 2,813,075 | ||||||||||||||
| 315,000 | PIMA CNTY AZ INDL DEV AUTH EDU REVENUE | 6/1/2016 | 6.00 | 315,703 | 319,671 | ||||||||||||||
| 575,000 | PIMA CNTY AZ INDL DEV AUTH EDU REVENUE | 12/1/2017 | 5.35 | 540,634 | 580,744 | ||||||||||||||
| 185,000 | PIMA CNTY AZ INDL DEV AUTH EDU REVENUE | 12/1/2018 | 6.38 | 185,000 | 194,540 | ||||||||||||||
| 45,000 | PIMA CNTY AZ INDL DEV AUTH EDU REVENUE | 7/1/2021 | 6.70 | 45,000 | 45,347 | ||||||||||||||
| 785,000 | PIMA CNTY AZ INDL DEV AUTH EDU REVENUE | 6/1/2022 | 5.00 | 733,184 | 783,045 | ||||||||||||||
| 10,000 | PIMA CNTY AZ INDL DEV AUTH EDU REVENUE | 7/1/2031 | 6.75 | 7,498 | 10,061 | ||||||||||||||
| 2,625,000 | PITTSBURG CALIF UNI SCH DIST FING AUTH REV(b) | 9/1/2031 | 3.78 | 965,304 | 1,033,699 | ||||||||||||||
| 2,000,000 | PORT SAINT LUCIE FL RESEARCH FACS REVENUE | 5/1/2033 | 5.00 | 2,079,586 | 2,203,040 | ||||||||||||||
| 1,000,000 | PUBLIC FIN AUTH WI CCRC REVENUE | 6/1/2020 | 7.00 | 988,954 | 1,133,830 | ||||||||||||||
| 1,500,000 | PUBLIC FIN AUTH WI CCRC REVENUE | 6/1/2046 | 8.25 | 1,558,285 | 1,768,290 | ||||||||||||||
| 450,000 | PUBLIC FIN AUTH WI EDUCTNL FAC REVENUE | 9/1/2022 | 5.25 | 450,000 | 458,780 | ||||||||||||||
| 600,000 | PUBLIC FIN AUTH WI REVENUE | 4/1/2032 | 5.50 | 600,000 | 649,056 | ||||||||||||||
| 221,000 | PUBLIC FIN AUTH WI REVENUE(b) | 10/1/2042 | (0.46 | ) | 248,949 | 69,281 | |||||||||||||
| 221,000 | PUBLIC FIN AUTH WI REVENUE(b) | 10/1/2042 | (0.46 | ) | 248,947 | 2 | |||||||||||||
| 515,000 | PUBLIC FIN AUTH WI REVENUE | 10/1/2042 | 7.00 | 570,975 | 516,447 | ||||||||||||||
| 1,250,000 | PUBLIC FIN AUTH WI SENIOR LIVING REVENUE | 11/15/2024 | 5.00 | 1,245,113 | 1,310,488 | ||||||||||||||
| 1,000,000 | PUERTO RICO CMWLTH | 7/1/2028 | 6.00 | 990,814 | 756,080 | ||||||||||||||
| 1,500,000 | PUERTO RICO CMWLTH | 7/1/2035 | 5.00 | 1,500,000 | 1,495,800 | ||||||||||||||
| See accompanying notes to the financial statements. | 61 | (Continued) |
CLEARWATER INVESTMENT TRUST
Schedule of Investments - Clearwater Tax-Exempt Bond Fund
December 31, 2014
| Percent | |||||||||||||||||||
| Maturity | Coupon | Fair | of | ||||||||||||||||
| Par/Shares | Security | date | rate | Cost | value (a) | net assets | |||||||||||||
| Municipal Bonds (Cont’d): | |||||||||||||||||||
| 1,000,000 | PUERTO RICO ELEC PWR AUTH PWRREVENUE | 7/1/2030 | 7.25 | $ | 1,033,130 | 500,240 | |||||||||||||
| 1,000,000 | PUERTO RICO INDL TOURIST EDUCTNL MED & ENVRNMNTL CONTROL FAC | 11/15/2025 | 6.13 | 1,000,000 | 1,024,560 | ||||||||||||||
| 1,260,000 | QUECHAN INDIAN TRIBE AZ FORT YUMA INDIAN RESERVATION | 5/1/2025 | 9.75 | 1,260,000 | 1,428,475 | ||||||||||||||
| 750,000 | RED RIVER TX HLTH FACS DEV CORP RETIREMENT FAC REVENUE | 11/15/2020 | 6.13 | 750,000 | 759,368 | ||||||||||||||
| 750,000 | RED RIVER TX HLTH FACS DEV CORP RETIREMENT FAC REVENUE | 11/15/2034 | 7.50 | 746,067 | 853,215 | ||||||||||||||
| 1,000,000 | REDONDO BEACH CA UNIF SCH DIST(b) | 8/1/2034 | 1.38 | 717,514 | 1,121,590 | ||||||||||||||
| 750,000 | REEF-SUNSET CA UNIF SCH DIST(b) | 8/1/2038 | 1.30 | 515,681 | 590,220 | ||||||||||||||
| 500,000 | RHODE ISLAND ST HLTH & EDUCTNL BLDG CORP | 5/15/2030 | 6.25 | 494,131 | 578,080 | ||||||||||||||
| 1,000,000 | RHODE ISLAND ST HSG & MTGE FIN CORP | 10/1/2028 | 4.00 | 994,724 | 1,040,920 | ||||||||||||||
| 750,000 | RHODE ISLAND ST HSG & MTGE FIN CORP | 10/1/2037 | 3.90 | 750,000 | 756,465 | ||||||||||||||
| 325,000 | RICHMOND IN HOSP AUTH REVENUE | 1/1/2029 | 6.50 | 316,246 | 374,325 | ||||||||||||||
| 1,000,000 | RIVERSIDE CA CMNTY PPTYS DEV INC LEASE REVENUE | 10/15/2038 | 6.00 | 1,024,649 | 1,201,940 | ||||||||||||||
| 500,000 | S BAYSIDE CA WST MGMT AUTH SOL WST ENTERPRISE REVENUE | 9/1/2029 | 6.25 | 510,302 | 586,980 | ||||||||||||||
| 1,500,000 | S TAHOE CA JT PWRS FING AUTH LEASE REVENUE | 10/1/2030 | 5.00 | 1,663,464 | 1,696,350 | ||||||||||||||
| 540,000 | S WSTRN IL DEV AUTH | 10/1/2022 | 7.00 | 540,000 | 450,355 | ||||||||||||||
| 350,000 | SACRAMENTO CNTY CA WTR FING AUTH REVENUE | 6/1/2039 | 0.73 | 350,000 | 309,956 | ||||||||||||||
| 430,000 | SADDLEBACK VLY CA UNIF SCH DIST PUBLIC FING AUTH | 9/1/2017 | 5.65 | 430,000 | 431,905 | ||||||||||||||
| 92,000 | SAINT BERNARD PARISH LA HOME MTGE AUTH SF MTGE | 3/1/2039 | 5.80 | 90,323 | 95,496 | ||||||||||||||
| 500,000 | SAINT JOHNS CNTY FL INDL DEV AUTH REVENUE | 8/1/2040 | 5.88 | 493,160 | 561,625 | ||||||||||||||
| 460,000 | SAINT JOSEPH CNTY IN ECON DEV REVENUE | 5/15/2026 | 6.00 | 353,418 | 470,778 | ||||||||||||||
| 500,000 | SAINT JOSEPH CNTY IN ECON DEV REVENUE | 5/15/2038 | 6.00 | 373,931 | 508,310 | ||||||||||||||
| 1,000,000 | SAINT JOSEPH CNTY IN ECON DEV REVENUE | 5/15/2039 | 6.25 | 1,009,749 | 1,032,980 | ||||||||||||||
| 425,694 | SAINT JOSEPH CNTY IN HOSP AUTH HLTH FACS REVENUE(e) | 2/15/2028 | 5.25 | 431,280 | 35,073 | ||||||||||||||
| 750,000 | SAINT LOUIS CNTY MO INDL DEV AUTH SENIOR LIVING FACS | 9/1/2042 | 5.00 | 771,619 | 797,025 | ||||||||||||||
| 750,000 | SAINT TAMMANY LA PUBLIC TRUST FING AUTH | 11/15/2037 | 5.25 | 764,348 | 767,655 | ||||||||||||||
| 500,000 | SAN DIEGO CA HSG AUTH MF HSG REVENUE | 5/1/2029 | 5.00 | 500,000 | 533,465 | ||||||||||||||
| 1,500,000 | SAN GABRIEL CA UNIF SCH DIST(b) | 8/1/2039 | 0.32 | 1,382,029 | 1,596,780 | ||||||||||||||
| 1,000,000 | SAN JOSE CA FING AUTH | 6/1/2039 | 5.00 | 1,062,013 | 1,140,580 | ||||||||||||||
| 500,000 | SANTA MONICA CA REDEV AGY | 7/1/2036 | 5.88 | 515,341 | 601,990 | ||||||||||||||
| 1,450,000 | SARASOTA CNTY FL HLTH FACS AUTH RETMNT FAC REVENUE | 1/1/2027 | 5.50 | 1,228,706 | 1,548,107 | ||||||||||||||
| 1,000,000 | SARASOTA CNTY FL HLTH FACS AUTH RETMNT FAC REVENUE | 1/1/2032 | 5.50 | 1,009,580 | 1,061,170 | ||||||||||||||
| 1,000,000 | SCHERERVILLE IN ECON DEV REVENUE | 1/15/2030 | 6.00 | 1,019,047 | 1,178,440 | ||||||||||||||
| See accompanying notes to the financial statements. | 62 | (Continued) |
CLEARWATER INVESTMENT TRUST
Schedule of Investments - Clearwater Tax-Exempt Bond Fund
December 31, 2014
| Percent | |||||||||||||||||||
| Maturity | Coupon | Fair | of | ||||||||||||||||
| Par/Shares | Security | date | rate | Cost | value (a) | net assets | |||||||||||||
| Municipal Bonds (Cont’d): | |||||||||||||||||||
| 770,000 | SEATTLE WA HSG AUTH POOLED HSG REVENUE | 9/15/2033 | 5.75 | $ | 785,824 | 914,899 | |||||||||||||
| 500,000 | SEMINOLE TRIBE FL SPL OBLG REVENUE(c) | 10/1/2024 | 5.50 | 502,271 | 542,800 | ||||||||||||||
| 500,000 | SEVEN OAKS FL CMNTY DEV DIST SPL ASSMNT REVENUE | 5/1/2033 | 5.50 | 488,705 | 530,265 | ||||||||||||||
| 150,000 | SHELBY CNTY TN HLTH EDUCTNL & HSG FACS BRD REVENUE(e) | 1/1/2019 | 5.35 | 134,966 | 7,494 | ||||||||||||||
| 625,000 | SHELBY CNTY TN HLTH EDUCTNL & HSG FACS BRD REVENUE(e) | 1/1/2029 | 5.55 | 556,863 | 31,225 | ||||||||||||||
| 130,000 | SHELBY CNTY TN HLTH EDUCTNL & HSG FACS BRD REVENUE(e) | 1/1/2029 | 6.00 | - | 1 | ||||||||||||||
| 530,000 | SILVERLEAF FL CDD CAPITAL IMPT REVENUE | 5/1/2023 | 6.50 | 530,000 | 564,270 | ||||||||||||||
| 250,000 | SILVERLEAF FL CDD CAPITAL IMPT REVENUE | 5/1/2044 | 6.75 | 245,271 | 265,842 | ||||||||||||||
| 410,000 | SOUTH CAROLINA ST EDU ASSISTANCE AUTH | 10/1/2029 | 5.10 | 405,796 | 444,317 | ||||||||||||||
| 155,000 | SOUTH CAROLINA ST HSG FIN & DEV AUTH MTGE REVENUE | 7/1/2032 | 5.50 | 155,000 | 162,854 | ||||||||||||||
| 356,475 | SOUTH CAROLINA ST JOBS-ECON DEV AUTH REVENUE | 11/15/2032 | 6.00 | 356,475 | 335,254 | ||||||||||||||
| 228,572 | SOUTH CAROLINA ST JOBS-ECON DEV AUTH REVENUE(b) | 11/15/2047 | 0.04 | 225,031 | 13,488 | ||||||||||||||
| 152,775 | SOUTH CAROLINA ST JOBS-ECON DEV AUTH REVENUE(b) | 11/15/2047 | 0.14 | 145,322 | 9,015 | ||||||||||||||
| 1,000,000 | SOUTH CAROLINA ST PUBLIC SVC AUTH REVENUE | 12/1/2038 | 5.00 | 1,073,699 | 1,135,670 | ||||||||||||||
| 1,400,000 | SOUTH CAROLINA ST PUBLIC SVC AUTH REVENUE | 12/1/2043 | 5.75 | 1,484,998 | 1,670,200 | ||||||||||||||
| 500,000 | SOUTH DAKOTA ST HLTH & EDUCTNL FACS AUTH | 9/1/2032 | 5.00 | 499,524 | 537,695 | ||||||||||||||
| 238,000 | SOUTHSIDE AZ CMNTY FACS DIST #1 SPL ASSMNT REVENUE PRESCOTT | 7/1/2018 | 6.13 | 195,733 | 196,681 | ||||||||||||||
| 1,000,000 | SPARKS NV REDEV AGY TAX INCR REVENUE | 6/1/2020 | 7.25 | 993,394 | 1,048,690 | ||||||||||||||
| 1,000,000 | SPRINGFIELD IL ELEC REVENUE | 3/1/2035 | 5.00 | 1,014,878 | 1,039,230 | ||||||||||||||
| 155,000 | STERLING HILL FL CDD CAPITAL IMPT REVENUE(e) | 11/1/2010 | 5.50 | 155,000 | 97,650 | ||||||||||||||
| 1,000,000 | SUGAR LAND TX DEV CORP SALES TAX REVENUE | 2/15/2033 | 5.00 | 1,116,421 | 1,128,580 | ||||||||||||||
| 2,500,000 | SULPHUR SPRINGS CA UNION SCH DIST COPS(b) | 12/1/2037 | 1.00 | 1,925,254 | 2,973,775 | ||||||||||||||
| 1,500,000 | SUTTER BUTTE CA FLOOD AGY ASSMNT REVENUE | 10/1/2038 | 4.00 | 1,481,784 | 1,552,425 | ||||||||||||||
| 500,000 | TALLAHASSEE FL HLTH FACS REVENUE | 12/1/2030 | 6.38 | 492,016 | 501,875 | ||||||||||||||
| 1,000,000 | TARRANT CNTY TX CULTURAL EDU FACS FIN CORP HOSP REVENUE | 11/15/2038 | 5.00 | 1,096,588 | 1,116,460 | ||||||||||||||
| 15,000 | TARRANT CNTY TX CULTURAL EDU FACS FIN CORP RETMNT FAC REVENU | 2/15/2016 | 7.25 | 15,000 | 15,049 | ||||||||||||||
| 1,000,000 | TARRANT CNTY TX CULTURAL EDU FACS FIN CORP RETMNT FAC REVENU | 11/15/2026 | 6.00 | 1,011,927 | 1,060,360 | ||||||||||||||
| 1,000,000 | TENNESSEE HSG DEV AGY RSDL FING PROGRAM REVENUE | 7/1/2039 | 3.55 | 1,000,000 | 987,090 | ||||||||||||||
| See accompanying notes to the financial statements. | 63 | (Continued) |
CLEARWATER INVESTMENT TRUST
Schedule of Investments - Clearwater Tax-Exempt Bond Fund
December 31, 2014
| Percent | |||||||||||||||||||
| Maturity | Coupon | Fair | of | ||||||||||||||||
| Par/Shares | Security | date | rate | Cost | value (a) | net assets | |||||||||||||
| Municipal Bonds (Cont’d): | |||||||||||||||||||
| 1,475,000 | TENNESSEE ST HSG DEV AGY | 7/1/2043 | 3.80 | $ | 1,475,000 | 1,482,213 | |||||||||||||
| 465,000 | TEXAS ST DEPT OF HSG & CMNTY AFFAIRS | 7/1/2039 | 5.45 | 465,000 | 496,248 | ||||||||||||||
| 2,000,000 | TEXAS ST PRIV ACTIVITY BOND SURFACE TRANSPRTN CORP REVENUE | 6/30/2033 | 7.50 | 2,040,395 | 2,484,720 | ||||||||||||||
| 1,000,000 | TOBACCO SETTLEMENT AUTH WA TOBACCO SETTLEMENT REVENUE | 6/1/2029 | 5.25 | 1,033,680 | 1,089,990 | ||||||||||||||
| 650,000 | TOBACCO SETTLEMENT FING CORP LA REVENUE | 5/15/2030 | 5.50 | 679,092 | 720,213 | ||||||||||||||
| 360,257 | TODD CREEK FARMS CO MET DIST #1 WTR & WSTWTR REVENUE(d)(e) | 12/1/2009 | 4.75 | 356,355 | 180,129 | ||||||||||||||
| 1,235,000 | TOLEDO-LUCAS CNTY OH PORT AUTHSTUDENT HSG REVENUE | 7/1/2039 | 5.00 | 1,237,697 | 1,304,802 | ||||||||||||||
| 300,000 | TOLOMATO FL CDD(e) | 5/1/2017 | 6.38 | 300,000 | 199,002 | ||||||||||||||
| 100,000 | TOLOMATO FL CDD(e) | 5/1/2017 | 6.38 | 100,000 | 1 | ||||||||||||||
| 75,000 | TOLOMATO FL CDD | 5/1/2017 | 6.38 | 75,000 | 74,586 | ||||||||||||||
| 10,000 | TOLOMATO FL CDD(e) | 5/1/2017 | 6.38 | 10,000 | 10,115 | ||||||||||||||
| 35,000 | TOLOMATO FL CDD(b) | 5/1/2039 | 1.39 | 22,917 | 25,630 | ||||||||||||||
| 90,000 | TOLOMATO FL CDD(b) | 5/1/2040 | 1.34 | 58,841 | 53,698 | ||||||||||||||
| 50,000 | TOLOMATO FL CDD(b) | 5/1/2040 | 1.34 | 32,690 | 22,082 | ||||||||||||||
| 1,000,000 | TRACY CA JT UNIF SCH DIST(b) | 8/1/2041 | 2.00 | 467,461 | 671,470 | ||||||||||||||
| 500,000 | TURLOCK CA PUBLIC FING AUTH WTR REVENUE | 5/1/2032 | 4.75 | 515,503 | 534,920 | ||||||||||||||
| 1,250,000 | TUSTIN CA UNIF SCH DIST(b) | 8/1/2028 | 2.33 | 824,686 | 1,119,412 | ||||||||||||||
| 750,000 | UNIVERSAL ACADEMY MI PUBLIC SCH ACADEMY REVENUE | 12/1/2023 | 6.50 | 737,564 | 788,768 | ||||||||||||||
| 500,000 | UTAH ST CHRT SCH FIN AUTH CHRT SCH REVENUE | 7/15/2025 | 6.50 | 500,000 | 552,400 | ||||||||||||||
| 1,500,000 | UTAH ST CHRT SCH FIN AUTH CHRT SCH REVENUE | 10/15/2033 | 6.50 | 1,531,292 | 1,608,705 | ||||||||||||||
| 340,000 | UTAH ST HSG CORP SF MTGE REVENUE | 1/1/2032 | 4.95 | 340,000 | 358,000 | ||||||||||||||
| 585,000 | UTAH ST HSG CORP SF MTGE REVENUE | 1/1/2033 | 5.75 | 585,000 | 647,343 | ||||||||||||||
| 490,000 | VANCOUVER WA HSG AUTH | 3/1/2025 | 5.00 | 483,417 | 552,990 | ||||||||||||||
| 945,000 | VERMONT ST HSG FIN AGY | 5/1/2032 | 4.88 | 940,505 | 1,013,446 | ||||||||||||||
| 420,000 | VIRGIN ISLANDS WTR & PWR AUTH WTR SYS REVENUE | 7/1/2017 | 5.50 | 420,000 | 421,474 | ||||||||||||||
| 1,000,000 | VIRGINIA ST HSG DEV AUTH | 7/1/2033 | 4.13 | 1,000,000 | 1,057,590 | ||||||||||||||
| 1,500,000 | VIRGINIA ST HSG DEV AUTH | 10/1/2038 | 5.10 | 1,500,000 | 1,672,380 | ||||||||||||||
| 1,000,000 | VIRGINIA ST HSG DEV AUTH | 12/1/2039 | 5.00 | 1,000,000 | 1,060,440 | ||||||||||||||
| 3,500,000 | VIRGINIA ST HSG DEV AUTH CMWLTH MTGE | 1/1/2038 | 3.88 | 3,490,509 | 3,588,270 | ||||||||||||||
| 3,000,000 | VIRGINIA ST HSG DEV AUTH CMWLTH MTGE | 7/1/2038 | 4.80 | 3,000,000 | 3,283,890 | ||||||||||||||
| 2,000,000 | VIRGINIA ST HSG DEV AUTH CMWLTH MTGE | 10/1/2038 | 4.75 | 2,000,000 | 2,182,500 | ||||||||||||||
| 1,000,000 | W CAMPUS HSG LLC AZ STUDENT HSG REVENUE | 7/1/2025 | 5.00 | 901,213 | 1,003,620 | ||||||||||||||
| 1,000,000 | WASHINGTON ST HLTH CARE FACS AUTH | 3/1/2029 | 7.12 | 978,176 | 1,239,810 | ||||||||||||||
| 1,400,000 | WASHINGTON ST HSG FIN COMMISSION | 10/1/2022 | 6.00 | 1,400,000 | 1,547,574 | ||||||||||||||
| 1,500,000 | WASHINGTON ST HSG FIN COMMISSION | 7/1/2030 | 3.50 | 1,500,000 | 1,524,780 | ||||||||||||||
| 500,000 | WASHINGTON ST HSG FIN COMMISSION | 12/1/2033 | 3.50 | 500,000 | 508,655 | ||||||||||||||
| 1,475,000 | WASHINGTON ST HSG FIN COMMISSION NONPROFIT REVENUE | 1/1/2017 | 5.25 | 1,463,514 | 1,500,164 | ||||||||||||||
| 2,000,000 | WASHINGTON ST HSG FIN COMMISSION NONPROFIT REVENUE | 1/1/2027 | 5.63 | 1,871,688 | 2,014,060 | ||||||||||||||
| See accompanying notes to the financial statements. | 64 | (Continued) |
CLEARWATER INVESTMENT TRUST
Schedule of Investments - Clearwater Tax-Exempt Bond Fund
December 31, 2014
| Percent | |||||||||||||||||||
| Maturity | Coupon | Fair | of | ||||||||||||||||
| Par/Shares | Security | date | rate | Cost | value (a) | net assets | |||||||||||||
| Municipal Bonds (Cont’d): | |||||||||||||||||||
| 330,000 | WATERS EDGE FL CDD CAPITAL IMPT REVENUE(b) | 5/1/2039 | 0.87 | $ | 295,799 | 275,302 | |||||||||||||
| 6,000 | WATERS EDGE FL CDD CAPITAL IMPT REVENUE | 5/1/2039 | 5.35 | 7,077 | 6,028 | ||||||||||||||
| 700,000 | WEST VIRGINIA ST HSG DEV FUND | 11/1/2039 | 4.10 | 700,000 | 726,789 | ||||||||||||||
| 550,000 | WESTCHESTER CO NY LOCAL DEV CORP REVENUE | 1/1/2034 | 5.00 | 584,593 | 595,952 | ||||||||||||||
| 750,000 | WESTMINSTER MD PROJ REVENUE | 7/1/2034 | 6.00 | 750,000 | 800,325 | ||||||||||||||
| 685,000 | WESTMONT IL PARK DIST(b) | 12/1/2031 | 3.61 | 254,504 | 309,545 | ||||||||||||||
| 685,000 | WESTMONT IL PARK DIST(b) | 12/1/2033 | 3.48 | 220,236 | 269,232 | ||||||||||||||
| 1,350,000 | WICHITA KS HLTH CARE FACS REVENUE | 5/15/2034 | 6.25 | 1,350,000 | 1,414,030 | ||||||||||||||
| 750,000 | WICHITA KS HLTH CARE FACS REVENUE | 12/15/2036 | 7.12 | 739,764 | 855,472 | ||||||||||||||
| 750,000 | WIREGRASS FL CDD CAPITAL IMPTREVENUE | 5/1/2035 | 5.38 | 745,346 | 755,265 | ||||||||||||||
| 1,000,000 | WISCONSIN ST GEN FUND ANNUAL APPROP REVENUE | 5/1/2027 | 6.00 | 1,013,261 | 1,193,180 | ||||||||||||||
| 1,000,000 | WISCONSIN ST HLTH & EDUCTNL FACS AUTH REVENUE | 10/1/2029 | 5.00 | 1,000,000 | 1,019,260 | ||||||||||||||
| 1,000,000 | WISCONSIN ST HLTH & EDUCTNL FACS AUTH REVENUE | 7/1/2030 | 5.75 | 1,017,852 | 1,127,130 | ||||||||||||||
| 1,000,000 | WISCONSIN ST HLTH & EDUCTNL FACS AUTH REVENUE | 12/1/2034 | 6.80 | 1,000,000 | 1,000,000 | ||||||||||||||
| 1,000,000 | WISCONSIN ST HLTH & EDUCTNL FACS AUTH REVENUE | 5/15/2036 | 5.00 | 1,009,846 | 1,019,750 | ||||||||||||||
| 1,000,000 | WISCONSIN ST HLTH & EDUCTNL FACS AUTH REVENUE | 8/15/2043 | 5.00 | 1,046,251 | 1,062,530 | ||||||||||||||
| 720,000 | WSTRN GENERATION AGY OR COGENERATION PROJ REVENUE | 1/1/2021 | 5.00 | 720,104 | 746,410 | ||||||||||||||
| 750,000 | WYNNFIELD LAKES FL CDD | 5/1/2036 | 4.50 | 744,434 | 773,625 | ||||||||||||||
| 1,000,000 | WYOMING MI SWR DIST SYS REVENUE | 6/1/2027 | 5.00 | 1,016,507 | 1,017,530 | ||||||||||||||
| 2,350,000 | WYOMING ST CMNTY DEV AUTH HSG REVENUE | 12/1/2038 | 4.05 | 2,350,000 | 2,405,930 | ||||||||||||||
| 1,000,000 | WYOMING ST CMNTY DEV AUTH HSGREVENUE | 12/1/2039 | 4.05 | 1,000,000 | 1,027,880 | ||||||||||||||
| 355,000 | ZEPHYR RIDGE FL CDD CAPITAL IMPT REVENUE(e) | 5/1/2013 | 5.25 | 355,352 | 139,742 | ||||||||||||||
| Sub-total Municipal Bonds: | 441,737,460 | 467,194,953 | 91.97 | % | |||||||||||||||
| See accompanying notes to the financial statements. | 65 | (Continued) |
CLEARWATER INVESTMENT TRUST
Schedule of Investments - Clearwater Tax-Exempt Bond Fund
December 31, 2014
| Percent | |||||||||||||||||||
| Maturity | Coupon | Fair | of | ||||||||||||||||
| Par/Shares | Security | date | rate | Cost | value (a) | net assets | |||||||||||||
| Short-Term Investments: | |||||||||||||||||||
| 7,017,997 | NORTHERN INSTITUTIONAL FUNDS -TAX-EXEMPT PORTFOLIO, 0.01%(g) | $ | 7,017,997 | 7,017,997 | |||||||||||||||
| Sub-total Short-Term Investments: | 7,017,997 | 7,017,997 | 1.38 | % | |||||||||||||||
| Grand total(h) | $ | 475,071,657 | 502,661,129 | 98.95 | % | ||||||||||||||
Notes to Schedule of Investments:
| (a) | Investments are valued in accordance with procedures described in note 2 to the financial statements. | |
| (b) | For zero coupon bonds, the interest rate disclosed represents the annualized effective yield on the date of acquisition. | |
| (c) | Securities exempt from registration under Rule 144A of the Securities Act of 1933. These securities may be resold in transactions exempt from registration, normally to qualified institutional buyers. The value of these securities is determined by valuations supplied by a pricing service or brokers, or, if not available, in accordance with procedures established by the Board of Trustees. | |
| (d) | This security is being measured at fair value according to procedures adopted by the Board of Trustees. | |
| (e) | Non-income producing assets. For long-term debt securities, item identified is in default as to payment of interest and/or principal. | |
| (f) | Restricted security that has been deemed illiquid. At December 31, 2014, the value of these restricted illiquid securities amounted to approximately $486,543 or 0.10% of net assets. Additional information on each restricted illiquid security is as follows: |
| ACQUISITION | ACQUISITION | ||||||
| SECURITY | DATE | COST | |||||
| ILLINOIS ST FIN AUTH SPORTS FAC REVENUE, 6.13%, 10/1/27 | 9/28/07 | $ | 728,963 | ||||
| ILLINOIS ST FIN AUTH SPORTS FAC REVENUE, 6.25%, 10/1/37 | 9/28/07 | 483,580 | |||||
| MICHIGAN ST PUBLIC EDUCTNL FACS AUTH, 6.00%, 9/1/16 | 9/24/07 - 4/12/11 | 606,563 | |||||
| (g) | The short-term investment is a money market portfolio of the investment company, Northern Institutional Funds. At December 31, 2013, the value of the Clearwater Tax-Exempt Bond Fund’s investment in the Tax-Exempt Portfolio of the Northern Institutional Funds was approximately $10,777,197 with net sales of approximately $3,759,200 during the fiscal year ended December 31, 2014. | |
| (h) | At December 31, 2014, the cost for Federal income tax purposes was $475,160,073. The aggregate gross unrealized appreciation and depreciation of investments in securities based on this cost was as follows: |
| Gross unrealized appreciation | $ | 41,831,312 | ||
| Gross unrealized depreciation | (14,330,256 | ) | ||
| Net unrealized appreciation | $ | 27,501,056 |
| See accompanying notes to the financial statements. | 66 | (Continued) |
CLEARWATER INVESTMENT TRUST
Schedule of Investments - Clearwater Tax-Exempt Bond Fund
December 31, 2014
Diversification of investments representing geographic diversification, as a percentage of total investments at fair value, is as follows:
| Geographical Diversification | Percent | |||
| California | 10.39 | % | ||
| Illinois | 9.68 | |||
| Florida | 8.85 | |||
| Texas | 6.28 | |||
| New York | 5.21 | |||
| Indiana | 4.39 | |||
| Georgia | 3.26 | |||
| Pennyslvania | 3.21 | |||
| Virginia | 3.01 | |||
| Colorado | 2.76 | |||
| Other | 42.96 | |||
| 100.00 | % | |||
| See accompanying notes to the financial statements. | 67 | (Continued) |
CLEARWATER INVESTMENT TRUST
Schedule of Investments – Clearwater Tax-Exempt Bond Fund
December 31, 2014
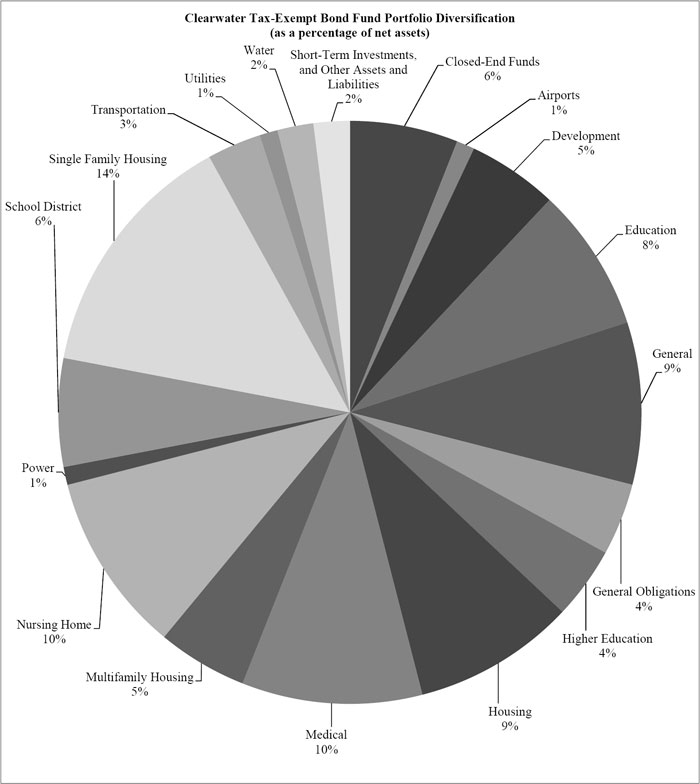
| See accompanying notes to the financial statements. | 68 | (Continued) |
CLEARWATER INVESTMENT TRUST
December 31, 2014
| Shares | Security | Cost | Fair value (a) | Percent of net assets | |||||||||
| Common Stocks: | |||||||||||||
| Australia: | |||||||||||||
| 9,284 | AGL ENERGY LTD. | $ | 105,943 | 100,927 | |||||||||
| 51,722 | ALUMINA LTD.(b) | 50,177 | 74,952 | ||||||||||
| 16,330 | AMCOR LTD. | 148,761 | 179,703 | ||||||||||
| 60,339 | AMP LTD. | 196,569 | 268,508 | ||||||||||
| 10,115 | APA GROUP | 50,066 | 61,588 | ||||||||||
| 21,346 | ASCIANO LTD. | 100,771 | 104,511 | ||||||||||
| 4,593 | ASX LTD. | 114,203 | 137,099 | ||||||||||
| 25,843 | AURIZON HOLDINGS LTD. | 91,220 | 96,825 | ||||||||||
| 50,341 | AUSTRALIA & NEW ZEALAND BANKING GROUP LTD. | 712,399 | 1,309,510 | ||||||||||
| 6,281 | BENDIGO AND ADELAIDE BANK LTD. | 52,780 | 65,278 | ||||||||||
| 179,910 | BGP HOLDINGS PLC(b)(c) | - | - | ||||||||||
| 58,607 | BHP BILLITON LTD. | 1,389,859 | 1,390,660 | ||||||||||
| 39,133 | BHP BILLITON PLC | 853,977 | 837,047 | ||||||||||
| 10,199 | BORAL LTD. | 28,970 | 43,748 | ||||||||||
| 32,841 | BRAMBLES LTD. | 174,637 | 282,822 | ||||||||||
| 403,770 | CARDNO LTD. | 2,516,763 | 1,117,743 | ||||||||||
| 10,469 | COCA-COLA AMATIL LTD. | 85,706 | 79,224 | ||||||||||
| 971 | COCHLEAR LTD. | 35,893 | 61,283 | ||||||||||
| 27,759 | COMMONWEALTH BANK OF AUSTRALIA | 1,283,262 | 1,927,871 | ||||||||||
| 6,418 | COMPUTERSHARE LTD. | 56,556 | 61,380 | ||||||||||
| 422,858 | CREDIT CORP. GROUP LTD. | 3,491,348 | 3,363,827 | ||||||||||
| 9,576 | CSL LTD. | 226,091 | 674,257 | ||||||||||
| 1,648,101 | DECMIL GROUP LTD. | 3,353,500 | 1,967,257 | ||||||||||
| 14,184 | DEXUS PROPERTY GROUP | 62,970 | 80,207 | ||||||||||
| 22,356 | ECHO ENTERTAINMENT GROUP LTD. | 70,002 | 68,473 | ||||||||||
| 25,256 | FEDERATION CENTRES | 52,870 | 58,780 | ||||||||||
| 21,110 | FORTESCUE METALS GROUP LTD. | 37,574 | 46,520 | ||||||||||
| 18,737 | GOODMAN GROUP | 48,414 | 86,377 | ||||||||||
| 30,080 | GPT GROUP (THE) | 100,097 | 106,272 | ||||||||||
| 17,989 | HARVEY NORMAN HOLDINGS LTD. | 52,604 | 49,052 | ||||||||||
| 44,610 | ILUKA RESOURCES LTD. | 451,020 | 214,448 | ||||||||||
| 36,603 | INCITEC PIVOT LTD. | 83,901 | 94,651 | ||||||||||
| 47,825 | INSURANCE AUSTRALIA GROUP LTD. | 120,292 | 242,468 | ||||||||||
| 10,015 | LEND LEASE GROUP | 61,130 | 133,347 | ||||||||||
| 7,617 | MACQUARIE GROUP LTD. | 165,843 | 359,520 | ||||||||||
| 37,974 | MIRVAC GROUP | 50,570 | 54,842 | ||||||||||
| 40,383 | NATIONAL AUSTRALIA BANK LTD. | 694,465 | 1,100,327 | ||||||||||
| 17,346 | NEWCREST MINING LTD.(b) | 173,211 | 154,460 | ||||||||||
| 40,505 | NOVION PROPERTY GROUP | 46,791 | 69,733 | ||||||||||
| 2,947 | ORICA LTD. | 51,960 | 45,165 | ||||||||||
| 20,046 | ORIGIN ENERGY LTD. | 226,734 | 189,175 | ||||||||||
| 16,330 | ORORA LTD. | 16,762 | 25,770 | ||||||||||
| 416 | PERPETUAL LTD. | 7,027 | 15,582 | ||||||||||
| 15,297 | QBE INSURANCE GROUP LTD. | 162,994 | 138,750 | ||||||||||
| 2,468 | RAMSAY HEALTH CARE LTD. | 49,765 | 114,444 | ||||||||||
| 1,268 | REA GROUP LTD. | 52,915 | 46,586 | ||||||||||
| 6,568 | RECALL HOLDINGS LTD. | 24,961 | 38,353 | ||||||||||
| 22,469 | SANTOS LTD. | 244,511 | 151,807 | ||||||||||
| 99,326 | SCENTRE GROUP(b) | 185,324 | 282,438 | ||||||||||
| 5,884 | SEEK LTD. | 49,598 | 82,117 | ||||||||||
| 4,898 | SHOPPING CENTRES AUSTRALASIA PROPERTY GROUP | 7,202 | 7,392 | ||||||||||
| 424,938 | SLATER & GORDON LTD. | 937,638 | 2,201,900 | ||||||||||
| 9,824 | SONIC HEALTHCARE LTD. | 79,849 | 147,533 | ||||||||||
| 34,990 | STOCKLAND | 132,304 | 116,886 | ||||||||||
| 22,978 | SUNCORP GROUP LTD. | 258,173 | 261,838 | ||||||||||
| 9,837 | SYDNEY AIRPORT | 33,263 | 37,598 | ||||||||||
| 8,477 | TABCORP HOLDINGS LTD. | 15,377 | 28,598 | ||||||||||
| 35,105 | TATTS GROUP LTD. | 95,309 | 98,760 | ||||||||||
| 70,571 | TELSTRA CORP. LTD. | 308,487 | 342,707 | ||||||||||
| 22,161 | TOLL HOLDINGS LTD. | 98,848 | 105,478 | ||||||||||
| 26,039 | TRANSURBAN GROUP | 118,706 | 182,027 | ||||||||||
| 747,139 | WEBJET LTD. | 2,736,537 | 1,754,044 | ||||||||||
| 16,278 | WESFARMERS LTD. | 619,257 | 551,074 | ||||||||||
| 42,659 | WESTFIELD CORP.(b) | 159,704 | 311,890 | ||||||||||
| 58,094 | WESTPAC BANKING CORP. | 811,435 | 1,561,783 | ||||||||||
| See accompanying notes to the financial statements. | 69 | (Continued) |
CLEARWATER INVESTMENT TRUST
Schedule of Investments - Clearwater International Fund
December 31, 2014
| Shares | Security | Cost | Fair value (a) | Percent of net assets | |||||||||
| Australia (Cont’d): | |||||||||||||
| 11,700 | WOODSIDE PETROLEUM LTD. | $ | 381,919 | 363,731 | |||||||||
| 22,832 | WOOLWORTHS LTD. | 435,292 | 568,867 | ||||||||||
| 25,693,056 | 26,897,790 | 5.58 | % | ||||||||||
| Austria: | |||||||||||||
| 13,326 | ANDRITZ A.G. | 718,254 | 732,348 | ||||||||||
| 1,685 | BUWOG A.G.(b) | 30,804 | 33,394 | ||||||||||
| 5,146 | ERSTE GROUP BANK A.G. | 114,055 | 117,979 | ||||||||||
| 33,719 | IMMOFINANZ A.G. | 87,282 | 85,350 | ||||||||||
| 1,383 | OMV A.G. | 50,806 | 36,596 | ||||||||||
| 313 | STRABAG S.E. (BEARER) | 5,505 | 6,884 | ||||||||||
| 1,368 | VOESTALPINE A.G. | 51,509 | 53,928 | ||||||||||
| 29,470 | WIENERBERGER A.G. | 241,514 | 405,975 | ||||||||||
| 1,299,729 | 1,472,454 | 0.31 | % | ||||||||||
| Belgium: | |||||||||||||
| 7,120 | AGEAS | 106,907 | 252,502 | ||||||||||
| 13,822 | ANHEUSER-BUSCH INBEV N.V. | 502,521 | 1,555,441 | ||||||||||
| 10,910 | BARCO N.V. | 740,520 | 768,913 | ||||||||||
| 2,190 | BELGACOM S.A. | 49,577 | 79,299 | ||||||||||
| 1,645 | COLRUYT S.A. | 74,892 | 76,277 | ||||||||||
| 1,238 | DELHAIZE GROUP S.A. | 51,243 | 89,930 | ||||||||||
| 15,841 | GROUPE BRUXELLES LAMBERT S.A. | 1,332,249 | 1,348,344 | ||||||||||
| 4,347 | KBC GROEP N.V.(b) | 101,356 | 241,261 | ||||||||||
| 12,430 | ONTEX GROUP N.V.(b) | 322,500 | 356,433 | ||||||||||
| 415 | SOLVAY S.A., CLASS A | 57,004 | 56,063 | ||||||||||
| 1,896 | UCB S.A. | 81,069 | 143,888 | ||||||||||
| 1,457 | UMICORE S.A. | 72,577 | 58,684 | ||||||||||
| 3,492,415 | 5,027,035 | 1.04 | % | ||||||||||
| Brazil: | |||||||||||||
| 113,403 | CETIP S.A. - MERCADOS ORGANIZADOS | 1,402,793 | 1,373,434 | ||||||||||
| 13,600 | CIA DE SANEAMENTO DE MINAS GERAIS-COPASA(b) | 328,620 | 129,662 | ||||||||||
| 55,400 | GRENDENE S.A. | 372,958 | 318,639 | ||||||||||
| 76,003 | TOTVS S.A. | 1,167,487 | 1,000,021 | ||||||||||
| 3,271,858 | 2,821,756 | 0.59 | % | ||||||||||
| Canada: | |||||||||||||
| 45,400 | AGF MANAGEMENT LTD., CLASS B | 488,633 | 331,766 | ||||||||||
| 2,346 | AGNICO EAGLE MINES LTD. | 80,561 | 58,398 | ||||||||||
| 3,620 | AGRIUM, INC. | 154,492 | 342,744 | ||||||||||
| 4,817 | ALIMENTATION COUCHE TARD, INC., CLASS B | 138,408 | 201,876 | ||||||||||
| 1,130 | ALTAGAS LTD. | 52,858 | 42,154 | ||||||||||
| 4,900 | ARC RESOURCES LTD. | 108,943 | 106,115 | ||||||||||
| 10,982 | BANK OF MONTREAL | 673,721 | 776,812 | ||||||||||
| 21,213 | BANK OF NOVA SCOTIA | 1,118,013 | 1,210,737 | ||||||||||
| 6,662 | BARRICK GOLD CORP. | 122,880 | 71,792 | ||||||||||
| 3,479 | BAYTEX ENERGY CORP. | 151,408 | 57,854 | ||||||||||
| 3,581 | BCE, INC. | 153,196 | 164,224 | ||||||||||
| 8,500 | BLACKBERRY LTD.(b) | 90,213 | 93,209 | ||||||||||
| 12,732 | BOMBARDIER, INC., CLASS B | 50,302 | 45,479 | ||||||||||
| 11,895 | BROOKFIELD ASSET MANAGEMENT, INC., CLASS A | 164,693 | 596,081 | ||||||||||
| 11,740 | CAE, INC. | 85,345 | 152,384 | ||||||||||
| 11,081 | CAMECO CORP. | 198,977 | 181,695 | ||||||||||
| 49,900 | CANACCORD GENUITY GROUP, INC. | 261,393 | 335,444 | ||||||||||
| 7,334 | CANADIAN IMPERIAL BANK OF COMMERCE | 342,248 | 630,252 | ||||||||||
| 34,284 | CANADIAN NATIONAL RAILWAY CO. | 1,509,588 | 2,362,510 | ||||||||||
| 15,994 | CANADIAN NATIONAL RAILWAY CO. | 292,557 | 1,101,601 | ||||||||||
| 19,866 | CANADIAN NATURAL RESOURCES LTD. | 433,114 | 614,208 | ||||||||||
| 4,722 | CANADIAN OIL SANDS LTD. | 97,388 | 42,351 | ||||||||||
| 14,240 | CANADIAN PACIFIC RAILWAY LTD. | 1,686,012 | 2,743,906 | ||||||||||
| 3,606 | CANADIAN PACIFIC RAILWAY LTD. | 112,878 | 694,476 | ||||||||||
| 1,060 | CANADIAN TIRE CORP. LTD., CLASS A | 80,129 | 111,985 | ||||||||||
| 8,988 | CENOVUS ENERGY, INC. | 253,226 | 185,438 | ||||||||||
| 6,978 | CGI GROUP, INC., CLASS A(b) | 55,128 | 266,014 | ||||||||||
| 1,964 | CI FINANCIAL CORP. | 49,854 | 54,586 | ||||||||||
| 1,256 | CONSTELLATION SOFTWARE, INC. | 363,301 | 373,449 | ||||||||||
| 5,882 | CRESCENT POINT ENERGY CORP. | 190,849 | 136,241 | ||||||||||
| 2,064 | DOLLARAMA, INC. | 75,934 | 105,527 | ||||||||||
| See accompanying notes to the financial statements. | 70 | (Continued) |
CLEARWATER INVESTMENT TRUST
Schedule of Investments - Clearwater International Fund
December 31, 2014
| Shares | Security | Cost | Fair value (a) | Percent of net assets | |||||||||
| Canada (Cont’d): | |||||||||||||
| 22,400 | DOREL INDUSTRIES, INC., CLASS B | $ | 805,238 | 771,603 | |||||||||
| 12,292 | ELDORADO GOLD CORP. | 92,575 | 74,907 | ||||||||||
| 14,138 | ENBRIDGE, INC. | 623,673 | 726,979 | ||||||||||
| 11,992 | ENCANA CORP. | 240,407 | 166,905 | ||||||||||
| 17,900 | ENERFLEX LTD. | 204,385 | 252,523 | ||||||||||
| 3,995 | ENERPLUS CORP. | 57,117 | 38,478 | ||||||||||
| 32,600 | ENSIGN ENERGY SERVICES, INC. | 509,675 | 286,211 | ||||||||||
| 211 | FAIRFAX FINANCIAL HOLDINGS LTD. | 52,589 | 110,563 | ||||||||||
| 2,200 | FINNING INTERNATIONAL, INC. | 51,485 | 47,776 | ||||||||||
| 3,000 | FIRST CAPITAL REALTY, INC. | 51,131 | 48,184 | ||||||||||
| 6,854 | FIRST QUANTUM MINERALS LTD. | 123,021 | 97,400 | ||||||||||
| 3,100 | FORTIS, INC. | 105,357 | 103,956 | ||||||||||
| 1,695 | FRANCO-NEVADA CORP. | 78,995 | 83,466 | ||||||||||
| 18,700 | GENWORTH MI CANADA, INC. | 382,689 | 595,219 | ||||||||||
| 3,052 | GILDAN ACTIVEWEAR, INC. | 33,435 | 172,591 | ||||||||||
| 15,817 | GOLDCORP, INC. | 468,301 | 292,842 | ||||||||||
| 3,958 | GREAT-WEST LIFECO, INC. | 99,709 | 114,434 | ||||||||||
| 2,408 | H&R REAL ESTATE INVESTMENT TRUST | 51,440 | 45,039 | ||||||||||
| 38,192 | HOME CAPITAL GROUP, INC. | 992,558 | 1,577,581 | ||||||||||
| 124,600 | HUDBAY MINERALS, INC. | 1,106,269 | 1,085,343 | ||||||||||
| 5,697 | HUSKY ENERGY, INC. | 144,766 | 134,849 | ||||||||||
| 14,262 | IAMGOLD CORP.(b) | 78,431 | 38,546 | ||||||||||
| 2,500 | IGM FINANCIAL, INC. | 100,363 | 99,651 | ||||||||||
| 38,499 | IMPERIAL OIL LTD. | 1,625,703 | 1,658,526 | ||||||||||
| 2,780 | INDUSTRIAL ALLIANCE INSURANCE & FINANCIAL SERVICES, INC. | 97,885 | 106,314 | ||||||||||
| 2,672 | INTACT FINANCIAL CORP. | 170,651 | 192,845 | ||||||||||
| 2,582 | INTER PIPELINE LTD. | 82,335 | 79,874 | ||||||||||
| 700 | KEYERA CORP. | 51,327 | 48,846 | ||||||||||
| 3,199 | LOBLAW COS. LTD. | 121,245 | 171,184 | ||||||||||
| 4,738 | MAGNA INTERNATIONAL, INC. | 61,549 | 513,399 | ||||||||||
| 28,359 | MANULIFE FINANCIAL CORP. | 338,337 | 541,404 | ||||||||||
| 1,369 | METHANEX CORP. | 12,561 | 62,888 | ||||||||||
| 1,000 | METRO, INC. | 54,328 | 80,306 | ||||||||||
| 71,556 | MTY FOOD GROUP, INC. | 2,148,508 | 2,076,220 | ||||||||||
| 20,000 | MULLEN GROUP LTD. | 450,618 | 366,845 | ||||||||||
| 6,295 | NATIONAL BANK OF CANADA | 247,929 | 267,882 | ||||||||||
| 11,280 | NEW GOLD, INC.(b) | 90,970 | 48,351 | ||||||||||
| 2,600 | ONEX CORP. | 105,376 | 150,969 | ||||||||||
| 3,282 | OPEN TEXT CORP. | 72,477 | 190,993 | ||||||||||
| 4,328 | PAN AMERICAN SILVER CORP. | 53,923 | 39,935 | ||||||||||
| 4,772 | PEMBINA PIPELINE CORP. | 40,530 | 173,908 | ||||||||||
| 19,434 | PENGROWTH ENERGY CORP. | 99,676 | 61,223 | ||||||||||
| 2,500 | PEYTO EXPLORATION & DEVELOPMENT CORP. | 95,328 | 72,022 | ||||||||||
| 13,239 | POTASH CORP. OF SASKATCHEWAN, INC. | 356,548 | 468,003 | ||||||||||
| 4,200 | POWER CORP. OF CANADA | 105,623 | 114,815 | ||||||||||
| 1,672 | POWER FINANCIAL CORP. | 52,980 | 52,068 | ||||||||||
| 3,681 | RESTAURANT BRANDS INTERNATIONAL, INC.(b) | 137,022 | 144,160 | ||||||||||
| 2,546 | RIOCAN REAL ESTATE INVESTMENT TRUST | 64,797 | 57,919 | ||||||||||
| 2,701 | RITCHIE BROS. AUCTIONEERS, INC. | 50,064 | 72,582 | ||||||||||
| 9,354 | ROGERS COMMUNICATIONS, INC., CLASS B | 221,766 | 363,677 | ||||||||||
| 26,066 | ROYAL BANK OF CANADA | 866,758 | 1,800,255 | ||||||||||
| 4,800 | SAPUTO, INC. | 103,951 | 144,273 | ||||||||||
| 9,661 | SHAW COMMUNICATIONS, INC., CLASS B | 153,543 | 260,692 | ||||||||||
| 6,133 | SILVER WHEATON CORP. | 155,292 | 124,740 | ||||||||||
| 2,700 | SNC-LAVALIN GROUP, INC. | 100,003 | 102,976 | ||||||||||
| 11,810 | SUN LIFE FINANCIAL, INC. | 235,812 | 426,128 | ||||||||||
| 24,565 | SUNCOR ENERGY, INC. | 576,706 | 780,210 | ||||||||||
| 24,791 | TALISMAN ENERGY, INC. | 289,882 | 194,180 | ||||||||||
| 10,451 | TELUS CORP. | 261,680 | 376,822 | ||||||||||
| 33,126 | TORONTO-DOMINION BANK (THE) | 671,143 | 1,582,737 | ||||||||||
| 2,738 | TOURMALINE OIL CORP.(b) | 103,345 | 91,204 | ||||||||||
| 3,818 | TRANSALTA CORP. | 60,803 | 34,572 | ||||||||||
| 10,568 | TRANSCANADA CORP. | 451,538 | 519,395 | ||||||||||
| 32,500 | TRICAN WELL SERVICE LTD. | 422,140 | 155,814 | ||||||||||
| 15,331 | TURQUOISE HILL RESOURCES LTD.(b) | 53,846 | 47,373 | ||||||||||
| 5,205 | VALEANT PHARMACEUTICALS INTERNATIONAL, INC.(b) | 458,741 | 745,178 | ||||||||||
| See accompanying notes to the financial statements. | 71 | (Continued) |
CLEARWATER INVESTMENT TRUST
Schedule of Investments - Clearwater International Fund
December 31, 2014
| Shares | Security | Cost | Fair value (a) | Percent of net assets | |||||||||
| Canada (Cont’d): | |||||||||||||
| 2,256 | VERMILION ENERGY, INC. | $ | 83,841 | 110,683 | |||||||||
| 28,148,931 | 36,830,744 | 7.64 | % | ||||||||||
| China: | |||||||||||||
| 103,500 | AAC TECHNOLOGIES HOLDINGS, INC. | 357,673 | 550,024 | ||||||||||
| 7,754 | BAIDU, INC. ADR(b)(d) | 718,666 | 1,767,679 | ||||||||||
| 1,247,898 | CHINA MEDICAL SYSTEM HOLDINGS LTD. | 911,776 | 2,048,786 | ||||||||||
| 908,500 | CHINA ZHENGTONG AUTO SERVICES HOLDINGS LTD. | 519,426 | 401,972 | ||||||||||
| 2,382,000 | KINGDEE INTERNATIONAL SOFTWARE GROUP CO. LTD.(b) | 469,113 | 703,550 | ||||||||||
| 1,102,000 | SHENGUAN HOLDINGS GROUP LTD. | 462,633 | 366,749 | ||||||||||
| 589,000 | SINOMEDIA HOLDING LTD. | 492,982 | 329,242 | ||||||||||
| 865,500 | SUN ART RETAIL GROUP LTD. | 1,379,016 | 858,272 | ||||||||||
| 152,600 | TENCENT HOLDINGS LTD. | 1,050,626 | 2,189,556 | ||||||||||
| 5,054,228 | XTEP INTERNATIONAL HOLDINGS LTD. | 2,217,935 | 2,029,342 | ||||||||||
| 8,579,846 | 11,245,172 | 2.33 | % | ||||||||||
| Denmark: | |||||||||||||
| 50 | AP MOELLER - MAERSK A/S, CLASS A | 46,408 | 95,667 | ||||||||||
| 120 | AP MOELLER - MAERSK A/S, CLASS B | 125,436 | 238,525 | ||||||||||
| 14,193 | CARLSBERG A/S, CLASS B | 1,170,298 | 1,102,166 | ||||||||||
| 62,920 | CHR HANSEN HOLDING A/S | 2,449,257 | 2,799,616 | ||||||||||
| 1,500 | COLOPLAST A/S, CLASS B | 27,666 | 126,251 | ||||||||||
| 13,100 | DANSKE BANK A/S | 138,182 | 352,581 | ||||||||||
| 200 | FLSMIDTH & CO. A/S | 6,012 | 8,773 | ||||||||||
| 46,955 | ISS A/S(b) | 1,405,048 | 1,351,777 | ||||||||||
| 52,555 | NOVO NORDISK A/S ADR(d) | 1,778,838 | 2,224,128 | ||||||||||
| 35,825 | NOVO NORDISK A/S, CLASS B | 714,442 | 1,515,813 | ||||||||||
| 49,087 | NOVOZYMES A/S, CLASS B | 1,367,636 | 2,059,487 | ||||||||||
| 2,600 | PANDORA A/S | 18,150 | 210,893 | ||||||||||
| 15,973 | TDC A/S | 107,272 | 121,725 | ||||||||||
| 3,250 | TOPDANMARK A/S(b) | 33,362 | 105,708 | ||||||||||
| 1,862 | VESTAS WIND SYSTEMS A/S(b) | 92,473 | 67,264 | ||||||||||
| 538 | WILLIAM DEMANT HOLDING A/S(b) | 50,896 | 40,835 | ||||||||||
| 9,531,376 | 12,421,209 | 2.58 | % | ||||||||||
| Finland: | |||||||||||||
| 59,010 | AMER SPORTS OYJ | 756,234 | 1,146,601 | ||||||||||
| 4,509 | FORTUM OYJ | 87,100 | 97,437 | ||||||||||
| 45,730 | HUHTAMAKI OYJ | 754,175 | 1,205,329 | ||||||||||
| 1,396 | KESKO OYJ, CLASS B | 30,705 | 50,867 | ||||||||||
| 5,600 | KONE OYJ, CLASS B | 116,154 | 254,343 | ||||||||||
| 1,849 | METSO OYJ | 47,784 | 55,148 | ||||||||||
| 7,075 | NESTE OIL OYJ | 67,704 | 171,433 | ||||||||||
| 61,900 | NOKIA OYJ | 203,584 | 487,186 | ||||||||||
| 2,240 | NOKIAN RENKAAT OYJ | 31,307 | 54,866 | ||||||||||
| 1,960 | ORION OYJ, CLASS B | 49,561 | 60,847 | ||||||||||
| 5,328 | SAMPO OYJ, CLASS A | 242,279 | 249,828 | ||||||||||
| 15,829 | STORA ENSO OYJ (REGISTERED) | 75,698 | 140,896 | ||||||||||
| 11,934 | UPM-KYMMENE OYJ | 99,928 | 195,964 | ||||||||||
| 1,849 | VALMET OYJ | 14,443 | 22,771 | ||||||||||
| 3,486 | WARTSILA OYJ ABP | 107,429 | 156,431 | ||||||||||
| 2,684,085 | 4,349,947 | 0.90 | % | ||||||||||
| France: | |||||||||||||
| 2,714 | ACCOR S.A. | 79,810 | 121,604 | ||||||||||
| 695 | AEROPORTS DE PARIS | 87,114 | 84,239 | ||||||||||
| 3,200 | AIR FRANCE-KLM(b) | 22,485 | 30,619 | ||||||||||
| 5,971 | AIR LIQUIDE S.A. | 664,778 | 736,753 | ||||||||||
| 8,186 | AIRBUS GROUP N.V. | 198,085 | 406,576 | ||||||||||
| 40,600 | ALCATEL-LUCENT(b) | 165,772 | 144,137 | ||||||||||
| 3,171 | ALSTOM S.A.(b) | 111,651 | 102,292 | ||||||||||
| 15,974 | ARCELORMITTAL | 233,322 | 173,018 | ||||||||||
| 1,165 | ARKEMA S.A. | 98,307 | 77,257 | ||||||||||
| 661 | ATOS | 51,394 | 52,307 | ||||||||||
| 30,426 | AXA S.A. | 405,215 | 702,735 | ||||||||||
| 26,840 | BENETEAU S.A.(b) | 272,439 | 375,860 | ||||||||||
| 17,630 | BNP PARIBAS S.A. | 762,443 | 1,036,014 | ||||||||||
| 1,253 | BOUYGUES S.A. | 50,411 | 45,215 | ||||||||||
| 1,977 | BUREAU VERITAS S.A. | 52,037 | 43,656 | ||||||||||
| See accompanying notes to the financial statements. | 72 | (Continued) |
CLEARWATER INVESTMENT TRUST
Schedule of Investments - Clearwater International Fund
December 31, 2014
| Shares | Security | Cost | Fair value (a) | Percent of net assets | |||||||||
| France (Cont’d): | |||||||||||||
| 3,068 | CAP GEMINI S.A. | $ | 111,960 | 218,527 | |||||||||
| 10,544 | CARREFOUR S.A. | 248,258 | 320,348 | ||||||||||
| 2,177 | CASINO GUICHARD PERRACHON S.A. | 172,738 | 200,337 | ||||||||||
| 994 | CHRISTIAN DIOR S.A. | 70,757 | 169,832 | ||||||||||
| 7,447 | CIE DE SAINT-GOBAIN | 248,952 | 313,513 | ||||||||||
| 3,404 | CIE GENERALE DES ETABLISSEMENTS MICHELIN | 180,725 | 308,615 | ||||||||||
| 16,517 | CREDIT AGRICOLE S.A. | 122,492 | 212,337 | ||||||||||
| 9,584 | DANONE S.A. | 479,394 | 630,498 | ||||||||||
| 1,296 | DASSAULT SYSTEMES S.A. | 86,663 | 78,872 | ||||||||||
| 3,633 | EDENRED | 65,572 | 100,878 | ||||||||||
| 8,317 | ELECTRICITE DE FRANCE S.A. | 153,984 | 228,375 | ||||||||||
| 3,084 | ESSILOR INTERNATIONAL S.A. | 309,421 | 343,301 | ||||||||||
| 2,310 | EURAZEO S.A. | 77,962 | 161,357 | ||||||||||
| 3,160 | EUTELSAT COMMUNICATIONS S.A. | 100,179 | 102,155 | ||||||||||
| 20,350 | GDF SUEZ | 433,306 | 475,280 | ||||||||||
| 564 | GECINA S.A. | 51,331 | 70,589 | ||||||||||
| 13,307 | GROUPE EUROTUNNEL S.A. (REGISTERED) | 102,800 | 171,775 | ||||||||||
| 275 | HERMES INTERNATIONAL | 95,103 | 98,093 | ||||||||||
| 304 | ILIAD S.A. | 29,549 | 73,026 | ||||||||||
| 19,090 | IPSOS | 630,769 | 547,472 | ||||||||||
| 2,121 | JCDECAUX S.A. | 50,974 | 72,834 | ||||||||||
| 1,442 | KERING | 274,344 | 277,235 | ||||||||||
| 2,335 | KLEPIERRE | 57,367 | 100,576 | ||||||||||
| 4,713 | LAFARGE S.A. | 166,939 | 330,779 | ||||||||||
| 4,882 | LEGRAND S.A. | 111,114 | 255,567 | ||||||||||
| 4,633 | L’OREAL S.A. | 385,425 | 777,821 | ||||||||||
| 11,477 | LVMH MOET HENNESSY LOUIS VUITTON S.A. | 1,514,395 | 1,814,904 | ||||||||||
| 15,891 | NATIXIS S.A. | 49,085 | 104,497 | ||||||||||
| 34,547 | ORANGE S.A. | 364,835 | 587,516 | ||||||||||
| 3,500 | PERNOD RICARD S.A. | 239,500 | 388,069 | ||||||||||
| 12,969 | PEUGEOT S.A.(b) | 78,174 | 158,207 | ||||||||||
| 3,471 | PUBLICIS GROUPE S.A. | 251,099 | 248,604 | ||||||||||
| 4,895 | RENAULT S.A. | 134,511 | 357,705 | ||||||||||
| 2,444 | REXEL S.A. | 51,580 | 43,642 | ||||||||||
| 3,651 | SAFRAN S.A. | 184,115 | 224,715 | ||||||||||
| 19,270 | SANOFI | 1,135,907 | 1,756,189 | ||||||||||
| 10,522 | SCHNEIDER ELECTRIC S.E. | 454,997 | 764,548 | ||||||||||
| 278 | SCHNEIDER ELECTRIC S.E. | 8,838 | 20,167 | ||||||||||
| 1,813 | SCOR S.E. | 36,441 | 54,866 | ||||||||||
| 5,515 | SES S.A. | 114,220 | 197,829 | ||||||||||
| 457 | SOCIETE BIC S.A. | 49,235 | 60,650 | ||||||||||
| 11,367 | SOCIETE GENERALE S.A. | 395,442 | 477,656 | ||||||||||
| 66,982 | SOCIETE TELEVISION FRANCAISE 1 | 834,791 | 1,024,626 | ||||||||||
| 5,160 | SODEXO S.A. | 267,994 | 505,935 | ||||||||||
| 1,581 | TECHNIP S.A. | 161,403 | 94,407 | ||||||||||
| 36,579 | TOTAL S.A. | 1,846,777 | 1,885,985 | ||||||||||
| 1,808 | UNIBAIL-RODAMCO S.E. | 228,178 | 462,102 | ||||||||||
| 674 | VALEO S.A. | 91,950 | 83,952 | ||||||||||
| 2,466 | VALLOUREC S.A. | 112,671 | 67,338 | ||||||||||
| 13,671 | VEOLIA ENVIRONNEMENT S.A. | 145,445 | 242,777 | ||||||||||
| 7,810 | VINCI S.A. | 316,569 | 427,369 | ||||||||||
| 47,725 | VIVENDI S.A. | 933,054 | 1,190,508 | ||||||||||
| 1,345 | WENDEL S.A. | 91,561 | 150,316 | ||||||||||
| 1,601 | ZODIAC AEROSPACE | 51,780 | 54,030 | ||||||||||
| 18,217,888 | 24,221,383 | 5.03 | % | ||||||||||
| Germany: | |||||||||||||
| 3,492 | ADIDAS A.G. | 145,098 | 243,386 | ||||||||||
| 8,540 | ALLIANZ S.E. (REGISTERED) | 758,733 | 1,418,952 | ||||||||||
| 16,707 | BASF S.E. | 672,193 | 1,412,304 | ||||||||||
| 14,908 | BAYER A.G. (REGISTERED) | 793,310 | 2,038,064 | ||||||||||
| 5,125 | BAYERISCHE MOTOREN WERKE A.G. | 483,372 | 556,595 | ||||||||||
| 1,591 | BEIERSDORF A.G. | 86,858 | 129,766 | ||||||||||
| 1,305 | BRENNTAG A.G. | 47,835 | 73,432 | ||||||||||
| 54,100 | CANCOM S.E. | 2,500,765 | 2,322,536 | ||||||||||
| 4,528 | CELESIO A.G. | 63,758 | 146,410 | ||||||||||
| 20,348 | COMMERZBANK A.G.(b) | 248,184 | 270,317 | ||||||||||
| 1,564 | CONTINENTAL A.G. | 187,604 | 332,119 | ||||||||||
| See accompanying notes to the financial statements. | 73 | (Continued) |
CLEARWATER INVESTMENT TRUST
Schedule of Investments - Clearwater International Fund
December 31, 2014
| Shares | Security | Cost | Fair value (a) | Percent of net assets | |||||||||
| Germany (Cont’d): | |||||||||||||
| 26,370 | CTS EVENTIM A.G. & CO. KGAA | $ | 390,118 | 783,755 | |||||||||
| 17,639 | DAIMLER A.G. (REGISTERED) | 589,913 | 1,471,633 | ||||||||||
| 21,220 | DEUTSCHE BANK A.G. (REGISTERED) | 743,686 | 641,390 | ||||||||||
| 13,804 | DEUTSCHE BOERSE A.G. | 734,170 | 989,250 | ||||||||||
| 3,261 | DEUTSCHE LUFTHANSA A.G. (REGISTERED) | 35,709 | 54,611 | ||||||||||
| 17,828 | DEUTSCHE POST A.G. (REGISTERED) | 210,542 | 583,308 | ||||||||||
| 50,136 | DEUTSCHE TELEKOM A.G. (REGISTERED) | 607,871 | 803,593 | ||||||||||
| 2,229 | DEUTSCHE WOHNEN A.G. (BEARER) | 49,350 | 52,962 | ||||||||||
| 18,495 | DMG MORI SEIKI A.G. (BEARER) | 399,162 | 525,857 | ||||||||||
| 27,124 | E.ON S.E. | 500,011 | 465,773 | ||||||||||
| 3,041 | FRESENIUS MEDICAL CARE A.G. & CO. KGAA | 190,582 | 227,591 | ||||||||||
| 6,867 | FRESENIUS S.E. & CO. KGAA | 150,261 | 358,596 | ||||||||||
| 1,527 | GEA GROUP A.G. | 49,653 | 67,611 | ||||||||||
| 18,980 | GERRESHEIMER A.G. | 1,060,450 | 1,026,468 | ||||||||||
| 40,600 | GRAND CITY PROPERTIES S.A.(b) | 502,298 | 596,848 | ||||||||||
| 2,246 | HANNOVER RUECK S.E. | 94,321 | 203,728 | ||||||||||
| 3,952 | HEIDELBERGCEMENT A.G. | 143,515 | 281,138 | ||||||||||
| 1,460 | HENKEL A.G. & CO. KGAA | 129,118 | 142,168 | ||||||||||
| 2,600 | HOCHTIEF A.G. | 108,936 | 183,714 | ||||||||||
| 387 | HUGO BOSS A.G. | 50,390 | 47,513 | ||||||||||
| 21,437 | INFINEON TECHNOLOGIES A.G. | 117,250 | 229,827 | ||||||||||
| 1,800 | K+S A.G. (REGISTERED) | 50,566 | 49,984 | ||||||||||
| 54,120 | KLOECKNER & CO. S.E.(b) | 611,006 | 583,246 | ||||||||||
| 1,013 | LANXESS A.G. | 69,793 | 47,128 | ||||||||||
| 4,200 | LEONI A.G. | 233,895 | 250,929 | ||||||||||
| 2,743 | LINDE A.G. | 475,408 | 511,624 | ||||||||||
| 728 | MAN S.E. | 80,772 | 81,192 | ||||||||||
| 2,050 | MERCK KGAA | 86,079 | 194,474 | ||||||||||
| 1,559 | METRO A.G.(b) | 48,976 | 47,731 | ||||||||||
| 3,549 | MUENCHENER RUECKVERSICHERUNGS-GESELLSCHAFT AG IN MUENCHEN (REGISTERED) | 444,935 | 711,013 | ||||||||||
| 2,502 | OSRAM LICHT A.G.(b) | 92,424 | 98,585 | ||||||||||
| 1,489 | PROSIEBENSAT.1 MEDIA A.G. (REGISTERED) | 25,180 | 62,730 | ||||||||||
| 2,970 | RATIONAL A.G. | 770,182 | 933,455 | ||||||||||
| 6,701 | RWE A.G. | 216,363 | 209,794 | ||||||||||
| 1,130 | SALZGITTER A.G. | 50,070 | 31,839 | ||||||||||
| 17,263 | SAP S.E. | 695,155 | 1,220,589 | ||||||||||
| 14,594 | SIEMENS A.G. (REGISTERED) | 934,614 | 1,655,108 | ||||||||||
| 7,661 | THYSSENKRUPP A.G.(b) | 152,398 | 197,045 | ||||||||||
| 7,071 | TUI A.G. | 57,698 | 117,201 | ||||||||||
| 3,007 | TUI A.G.(b) | 50,440 | 48,324 | ||||||||||
| 483 | VOLKSWAGEN A.G. | 48,103 | 105,243 | ||||||||||
| 18,039,073 | 25,838,449 | 5.36 | % | ||||||||||
| Greece: | |||||||||||||
| 6,746 | HELLENIC TELECOMMUNICATIONS ORGANIZATION S.A.(b) | 54,075 | 73,618 | ||||||||||
| 20,281 | JUMBO S.A. | 123,759 | 206,789 | ||||||||||
| 3,968 | OPAP S.A. | 51,161 | 42,401 | ||||||||||
| 228,995 | 322,808 | 0.07 | % | ||||||||||
| Hong Kong: | |||||||||||||
| 220,400 | AIA GROUP LTD. | 733,244 | 1,213,624 | ||||||||||
| 16,600 | BANK OF EAST ASIA LTD. | 71,196 | 66,581 | ||||||||||
| 82,500 | BOC HONG KONG HOLDINGS LTD. | 169,112 | 274,676 | ||||||||||
| 9,140,684 | BONJOUR HOLDINGS LTD. | 1,077,855 | 1,000,208 | ||||||||||
| 28,000 | CHEUNG KONG HOLDINGS LTD. | 277,057 | 467,214 | ||||||||||
| 10,000 | CHEUNG KONG INFRASTRUCTURE HOLDINGS LTD. | 46,496 | 73,696 | ||||||||||
| 36,500 | CLP HOLDINGS LTD. | 253,113 | 316,026 | ||||||||||
| 27,800 | ESPRIT HOLDINGS LTD. | 35,637 | 33,227 | ||||||||||
| 26,000 | GALAXY ENTERTAINMENT GROUP LTD. | 67,404 | 144,733 | ||||||||||
| 84,000 | GLOBAL BRANDS GROUP HOLDING LTD.(b) | 14,386 | 16,419 | ||||||||||
| 456,822 | HAIER ELECTRONICS GROUP CO. LTD. | 876,894 | 1,079,619 | ||||||||||
| 44,000 | HANG LUNG PROPERTIES LTD. | 116,126 | 122,623 | ||||||||||
| 18,600 | HANG SENG BANK LTD. | 228,767 | 309,270 | ||||||||||
| 15,730 | HENDERSON LAND DEVELOPMENT CO. LTD. | 45,544 | 109,188 | ||||||||||
| 48,300 | HONG KONG & CHINA GAS CO. LTD. | 103,438 | 109,982 | ||||||||||
| 15,300 | HONG KONG EXCHANGES AND CLEARING LTD. | 281,244 | 336,580 | ||||||||||
| 400 | HOPEWELL HIGHWAY INFRASTRUCTURE LTD. | 229 | 201 | ||||||||||
| See accompanying notes to the financial statements. | 74 | (Continued) |
CLEARWATER INVESTMENT TRUST
Schedule of Investments - Clearwater International Fund
December 31, 2014
| Shares | Security | Cost | Fair value (a) | Percent of net assets | |||||||||
| Hong Kong (Cont’d): | |||||||||||||
| 41,000 | HUTCHISON WHAMPOA LTD. | $ | 238,015 | 469,393 | |||||||||
| 12,000 | HYSAN DEVELOPMENT CO. LTD. | 49,052 | 53,321 | ||||||||||
| 13,500 | KERRY LOGISTICS NETWORK LTD. | 28,209 | 21,366 | ||||||||||
| 27,000 | KERRY PROPERTIES LTD. | 90,767 | 97,547 | ||||||||||
| 84,000 | LI & FUNG LTD. | 86,666 | 78,557 | ||||||||||
| 40,500 | LINK REIT (THE) | 84,196 | 252,813 | ||||||||||
| 164,000 | LUK FOOK HOLDINGS INTERNATIONAL LTD. | 538,949 | 614,154 | ||||||||||
| 26,800 | MGM CHINA HOLDINGS LTD. | 51,645 | 67,561 | ||||||||||
| 30,500 | MTR CORP. LTD. | 88,703 | 124,569 | ||||||||||
| 54,000 | NEW WORLD DEVELOPMENT CO. LTD. | 59,135 | 61,767 | ||||||||||
| 43,500 | NWS HOLDINGS LTD. | 52,824 | 79,775 | ||||||||||
| 1,663,100 | PAX GLOBAL TECHNOLOGY LTD.(b) | 618,904 | 1,707,580 | ||||||||||
| 190,000 | PCCW LTD. | 77,805 | 129,435 | ||||||||||
| 8,130,757 | PICO FAR EAST HOLDINGS LTD. | 2,165,357 | 1,863,149 | ||||||||||
| 2,397,506 | PORTS DESIGN LTD.(b) | 1,773,831 | 729,641 | ||||||||||
| 24,000 | POWER ASSETS HOLDINGS LTD. | 139,091 | 231,854 | ||||||||||
| 25,937,742 | REXLOT HOLDINGS LTD. | 2,497,354 | 2,094,115 | ||||||||||
| 48,000 | SANDS CHINA LTD. | 128,061 | 233,462 | ||||||||||
| 22,000 | SHANGRI-LA ASIA LTD. | 29,501 | 30,273 | ||||||||||
| 1,055,400 | SINO BIOPHARMACEUTICAL LTD. | 922,369 | 954,651 | ||||||||||
| 59,400 | SINO LAND CO. LTD. | 80,601 | 95,346 | ||||||||||
| 566,000 | SITOY GROUP HOLDINGS LTD. | 361,652 | 458,061 | ||||||||||
| 25,000 | SJM HOLDINGS LTD. | 52,349 | 39,536 | ||||||||||
| 256,000 | STELLA INTERNATIONAL HOLDINGS LTD. | 679,964 | 675,038 | ||||||||||
| 26,000 | SUN HUNG KAI PROPERTIES LTD. | 310,693 | 393,157 | ||||||||||
| 19,000 | SWIRE PACIFIC LTD., CLASS A | 127,857 | 246,130 | ||||||||||
| 17,800 | SWIRE PROPERTIES LTD. | 50,632 | 52,531 | ||||||||||
| 415,000 | TECHTRONIC INDUSTRIES CO. LTD. | 776,722 | 1,329,946 | ||||||||||
| 3,000 | TELEVISION BROADCASTS LTD. | 9,222 | 17,433 | ||||||||||
| 708,000 | VALUE PARTNERS GROUP LTD. | 442,082 | 591,305 | ||||||||||
| 84,300 | VTECH HOLDINGS LTD. | 996,749 | 1,206,221 | ||||||||||
| 18,000 | WHARF HOLDINGS (THE) LTD. | 142,156 | 129,262 | ||||||||||
| 19,000 | WHEELOCK & CO. LTD. | 30,489 | 88,219 | ||||||||||
| 30,000 | WYNN MACAU LTD. | 50,423 | 83,636 | ||||||||||
| 582,000 | YINGDE GASES GROUP CO. LTD. | 583,171 | 407,054 | ||||||||||
| 15,000 | YUE YUEN INDUSTRIAL HOLDINGS LTD. | 30,233 | 54,005 | ||||||||||
| 18,843,171 | 21,435,730 | 4.45 | % | ||||||||||
| Ireland: | |||||||||||||
| 6,412 | ACCENTURE PLC, CLASS A | 203,726 | 572,656 | ||||||||||
| 329,197 | BANK OF IRELAND(b) | 119,783 | 122,742 | ||||||||||
| 26,160 | COVIDIEN PLC | 851,052 | 2,675,645 | ||||||||||
| 14,894 | CRH PLC | 217,633 | 358,339 | ||||||||||
| 87,393 | EXPERIAN PLC | 1,408,425 | 1,474,120 | ||||||||||
| 11,673 | JAMES HARDIE INDUSTRIES PLC - CDI | 105,224 | 124,292 | ||||||||||
| 2,463 | KERRY GROUP PLC, CLASS A | 160,052 | 169,937 | ||||||||||
| 14,900 | PERRIGO CO. PLC | 1,908,034 | 2,490,684 | ||||||||||
| 9,423 | SHIRE PLC | 277,551 | 666,707 | ||||||||||
| 67,799 | UBM PLC | 542,163 | 506,021 | ||||||||||
| 5,793,643 | 9,161,143 | 1.90 | % | ||||||||||
| Israel: | |||||||||||||
| 21,030 | BANK HAPOALIM B.M. | 80,002 | 99,182 | ||||||||||
| 21,775 | BANK LEUMI LE-ISRAEL B.M.(b) | 77,241 | 74,703 | ||||||||||
| 217 | DELEK GROUP LTD. | 52,364 | 54,452 | ||||||||||
| 6,042 | ISRAEL CHEMICALS LTD. | 49,265 | 43,581 | ||||||||||
| 314,214 | MAGIC SOFTWARE ENTERPRISES LTD. | 2,294,243 | 1,869,573 | ||||||||||
| 5,900 | MIZRAHI TEFAHOT BANK LTD.(b) | 51,135 | 61,887 | ||||||||||
| 1,494 | NICE SYSTEMS LTD. | 50,675 | 75,628 | ||||||||||
| 14,566 | TEVA PHARMACEUTICAL INDUSTRIES LTD. ADR(d) | 585,135 | 837,691 | ||||||||||
| 3,240,060 | 3,116,697 | 0.65 | % | ||||||||||
| Italy: | |||||||||||||
| 56,711 | AMPLIFON S.P.A. | 248,331 | 335,776 | ||||||||||
| 18,467 | ASSICURAZIONI GENERALI S.P.A. | 269,600 | 377,381 | ||||||||||
| 5,758 | ATLANTIA S.P.A. | 117,756 | 133,739 | ||||||||||
| 93,475 | AZIMUT HOLDING S.P.A. | 1,279,167 | 2,016,559 | ||||||||||
| 57,599 | ENEL GREEN POWER S.P.A. | 98,098 | 119,672 | ||||||||||
| 95,489 | ENEL S.P.A. | 357,926 | 426,955 | ||||||||||
| 49,857 | ENI S.P.A. | 958,264 | 870,763 | ||||||||||
| See accompanying notes to the financial statements. | 75 | (Continued) |
CLEARWATER INVESTMENT TRUST
Schedule of Investments - Clearwater International Fund
December 31, 2014
| Shares | Security | Cost | Fair value (a) | Percent of net assets | |||||||||
| Italy (Cont’d): | |||||||||||||
| 3,610 | EXOR S.P.A. | $ | 90,616 | 147,278 | |||||||||
| 10,070 | FINMECCANICA S.P.A.(b) | 50,331 | 93,500 | ||||||||||
| 221,737 | INTESA SANPAOLO S.P.A. | 432,354 | 641,450 | ||||||||||
| 18,185 | INTESA SANPAOLO S.P.A. (RSP) | 53,136 | 44,762 | ||||||||||
| 2,826 | LUXOTTICA GROUP S.P.A. | 118,626 | 154,717 | ||||||||||
| 19,749 | MARR S.P.A. | 315,231 | 349,859 | ||||||||||
| 5,176 | MEDIOBANCA S.P.A. | 52,251 | 41,908 | ||||||||||
| 25,272 | MEDIOLANUM S.P.A. | 87,322 | 160,321 | ||||||||||
| 2,801 | PRYSMIAN S.P.A. | 56,504 | 50,981 | ||||||||||
| 57,530 | SNAM S.P.A. | 249,716 | 283,803 | ||||||||||
| 214,771 | SORIN S.P.A.(b) | 634,461 | 500,460 | ||||||||||
| 111,427 | TELECOM ITALIA S.P.A.(b) | 150,893 | 118,171 | ||||||||||
| 7,497 | TENARIS S.A. | 100,710 | 113,239 | ||||||||||
| 34,652 | TERNA RETE ELETTRICA NAZIONALE S.P.A. | 130,368 | 156,977 | ||||||||||
| 74,546 | UNICREDIT S.P.A. | 407,835 | 475,120 | ||||||||||
| 25,343 | UNIONE DI BANCHE ITALIANE S.C.P.A. | 103,374 | 180,401 | ||||||||||
| 6,362,870 | 7,793,792 | 1.62 | % | ||||||||||
| Japan: | |||||||||||||
| 1,400 | ABC-MART, INC. | 51,583 | 67,840 | ||||||||||
| 30,200 | ADERANS CO. LTD. | 398,005 | 284,937 | ||||||||||
| 14,200 | AEON CO. LTD. | 162,360 | 142,929 | ||||||||||
| 6,300 | AEON FINANCIAL SERVICE CO. LTD. | 81,451 | 123,159 | ||||||||||
| 1,210 | AEON MALL CO. LTD. | 23,091 | 21,397 | ||||||||||
| 2,300 | AISIN SEIKI CO. LTD. | 37,584 | 82,668 | ||||||||||
| 15,000 | AJINOMOTO CO., INC. | 116,767 | 277,946 | ||||||||||
| 5,200 | ALFRESA HOLDINGS CORP. | 50,794 | 62,844 | ||||||||||
| 2,000 | AMADA CO. LTD. | 10,582 | 17,148 | ||||||||||
| 21,000 | ANA HOLDINGS, INC. | 52,231 | 51,689 | ||||||||||
| 18,000 | AOZORA BANK LTD. | 51,121 | 55,864 | ||||||||||
| 36,100 | ASAHI CO. LTD. | 561,894 | 332,401 | ||||||||||
| 16,000 | ASAHI GLASS CO. LTD. | 97,913 | 78,130 | ||||||||||
| 5,600 | ASAHI GROUP HOLDINGS LTD. | 85,235 | 172,851 | ||||||||||
| 31,000 | ASAHI KASEI CORP. | 147,138 | 284,096 | ||||||||||
| 57,900 | ASICS CORP. | 802,820 | 1,383,682 | ||||||||||
| 37,000 | ASTELLAS PHARMA, INC. | 236,149 | 514,952 | ||||||||||
| 1,500 | BANDAI NAMCO HOLDINGS, INC. | 14,652 | 31,838 | ||||||||||
| 37,000 | BANK OF YOKOHAMA (THE) LTD. | 164,514 | 200,817 | ||||||||||
| 3,000 | BENESSE HOLDINGS, INC. | 114,910 | 89,117 | ||||||||||
| 13,800 | BRIDGESTONE CORP. | 205,726 | 479,562 | ||||||||||
| 5,200 | BROTHER INDUSTRIES LTD. | 38,445 | 94,342 | ||||||||||
| 20,100 | CANON, INC. | 672,638 | 638,414 | ||||||||||
| 16,600 | CAPCOM CO. LTD. | 276,543 | 250,201 | ||||||||||
| 3,800 | CASIO COMPUTER CO. LTD. | 51,908 | 58,357 | ||||||||||
| 2,700 | CENTRAL JAPAN RAILWAY CO. | 229,516 | 405,059 | ||||||||||
| 15,000 | CHIBA BANK (THE) LTD. | 81,968 | 98,449 | ||||||||||
| 7,800 | CHUBU ELECTRIC POWER CO., INC.(b) | 102,883 | 91,763 | ||||||||||
| 4,500 | CHUGAI PHARMACEUTICAL CO. LTD. | 82,278 | 110,618 | ||||||||||
| 4,000 | CHUGOKU BANK (THE) LTD. | 53,626 | 54,617 | ||||||||||
| 5,200 | CHUGOKU ELECTRIC POWER (THE) CO., INC. | 81,720 | 68,098 | ||||||||||
| 7,900 | CITIZEN HOLDINGS CO. LTD. | 31,581 | 60,777 | ||||||||||
| 43,036 | CREDIT SAISON CO. LTD. | 561,719 | 800,717 | ||||||||||
| 6,000 | DAI NIPPON PRINTING CO. LTD. | 55,038 | 54,151 | ||||||||||
| 33,400 | DAIBIRU CORP. | 353,886 | 313,923 | ||||||||||
| 11,000 | DAIDO STEEL CO. LTD. | 45,649 | 41,643 | ||||||||||
| 17,500 | DAI-ICHI LIFE INSURANCE (THE) CO. LTD. | 222,759 | 265,557 | ||||||||||
| 6,000 | DAIICHI SANKYO CO. LTD. | 96,542 | 83,883 | ||||||||||
| 4,500 | DAIKIN INDUSTRIES LTD. | 124,473 | 290,238 | ||||||||||
| 1,200 | DAITO TRUST CONSTRUCTION CO. LTD. | 117,985 | 135,871 | ||||||||||
| 10,000 | DAIWA HOUSE INDUSTRY CO. LTD. | 103,706 | 189,357 | ||||||||||
| 25,000 | DAIWA SECURITIES GROUP, INC. | 96,011 | 194,690 | ||||||||||
| 8,200 | DENSO CORP. | 185,234 | 382,166 | ||||||||||
| 2,800 | DENTSU, INC. | 46,871 | 117,834 | ||||||||||
| 48,000 | DESCENTE LTD. | 278,723 | 465,736 | ||||||||||
| 13,000 | DOWA HOLDINGS CO. LTD. | 55,385 | 103,755 | ||||||||||
| 7,000 | EAST JAPAN RAILWAY CO. | 392,789 | 524,444 | ||||||||||
| 3,400 | EISAI CO. LTD. | 112,861 | 131,743 | ||||||||||
| 2,400 | ELECTRIC POWER DEVELOPMENT CO. LTD. | 71,894 | 81,235 | ||||||||||
| See accompanying notes to the financial statements. | 76 | (Continued) |
CLEARWATER INVESTMENT TRUST
Schedule of Investments - Clearwater International Fund
December 31, 2014
| Shares | Security | Cost | Fair value (a) | Percent of net assets | |||||||||
| Japan (Cont’d): | |||||||||||||
| 1,800 | FAMILYMART CO. LTD. | $ | 52,590 | 67,197 | |||||||||
| 13,700 | FANUC CORP. | 1,968,162 | 2,261,029 | ||||||||||
| 1,100 | FAST RETAILING CO. LTD. | 136,395 | 400,765 | ||||||||||
| 21,000 | FUJI ELECTRIC CO. LTD. | 51,969 | 83,773 | ||||||||||
| 10,000 | FUJI HEAVY INDUSTRIES LTD. | 146,485 | 352,151 | ||||||||||
| 8,800 | FUJIFILM HOLDINGS CORP. | 165,274 | 265,573 | ||||||||||
| 44,000 | FUJITSU LTD. | 171,664 | 234,382 | ||||||||||
| 11,000 | FUKUOKA FINANCIAL GROUP, INC. | 36,036 | 56,793 | ||||||||||
| 32,000 | FURUKAWA ELECTRIC CO. LTD. | 65,376 | 52,884 | ||||||||||
| 12,000 | GS YUASA CORP. | 47,814 | 51,044 | ||||||||||
| 6,000 | GUNMA BANK (THE) LTD. | 31,571 | 38,920 | ||||||||||
| 1,500 | HAMAMATSU PHOTONICS K.K. | 52,686 | 71,677 | ||||||||||
| 11,000 | HANKYU HANSHIN HOLDINGS, INC. | 51,221 | 59,180 | ||||||||||
| 3,000 | HINO MOTORS LTD. | 42,968 | 39,246 | ||||||||||
| 500 | HIROSE ELECTRIC CO. LTD. | 48,402 | 58,208 | ||||||||||
| 7,000 | HIROSHIMA BANK (THE) LTD. | 26,154 | 33,273 | ||||||||||
| 95,000 | HITACHI LTD. | 295,895 | 695,140 | ||||||||||
| 6,000 | HITACHI METALS LTD. | 45,405 | 102,178 | ||||||||||
| 9,500 | HOKKAIDO ELECTRIC POWER CO., INC.(b) | 84,575 | 75,995 | ||||||||||
| 7,300 | HOKURIKU ELECTRIC POWER CO. | 76,486 | 93,224 | ||||||||||
| 28,800 | HONDA MOTOR CO. LTD. | 780,069 | 837,495 | ||||||||||
| 6,300 | HOYA CORP. | 145,196 | 210,930 | ||||||||||
| 3,800 | IBIDEN CO. LTD. | 71,559 | 55,845 | ||||||||||
| 1,200 | IDEMITSU KOSAN CO. LTD. | 23,804 | 19,884 | ||||||||||
| 20,000 | IHI CORP. | 52,673 | 101,547 | ||||||||||
| 15,600 | INPEX CORP. | 192,488 | 173,087 | ||||||||||
| 9,800 | ISETAN MITSUKOSHI HOLDINGS LTD. | 85,535 | 120,141 | ||||||||||
| 8,500 | ISUZU MOTORS LTD. | 108,047 | 103,705 | ||||||||||
| 27,200 | ITOCHU CORP. | 291,860 | 290,813 | ||||||||||
| 5,000 | IYO BANK (THE) LTD. | 43,448 | 54,196 | ||||||||||
| 4,000 | J FRONT RETAILING CO. LTD. | 31,099 | 46,581 | ||||||||||
| 1,600 | JAPAN AIRLINES CO. LTD. | 47,656 | 46,737 | ||||||||||
| 3,500 | JAPAN EXCHANGE GROUP, INC. | 56,090 | 81,544 | ||||||||||
| 1,500 | JAPAN PETROLEUM EXPLORATION CO. LTD. | 54,111 | 47,001 | ||||||||||
| 10 | JAPAN REAL ESTATE INVESTMENT CORP. | 52,344 | 48,126 | ||||||||||
| 33 | JAPAN RETAIL FUND INVESTMENT CORP. | 60,174 | 69,592 | ||||||||||
| 13,500 | JAPAN TOBACCO, INC. | 389,868 | 370,684 | ||||||||||
| 6,000 | JFE HOLDINGS, INC. | 94,802 | 133,551 | ||||||||||
| 4,000 | JGC CORP. | 53,048 | 82,436 | ||||||||||
| 12,000 | JOYO BANK (THE) LTD. | 54,056 | 59,549 | ||||||||||
| 3,100 | JSR CORP. | 39,530 | 53,233 | ||||||||||
| 5,000 | JTEKT CORP. | 36,670 | 84,685 | ||||||||||
| 29,200 | JX HOLDINGS, INC. | 150,765 | 113,760 | ||||||||||
| 7,000 | KAJIMA CORP. | 15,004 | 28,930 | ||||||||||
| 18,000 | KANSAI ELECTRIC POWER (THE) CO., INC.(b) | 164,557 | 171,247 | ||||||||||
| 2,000 | KANSAI PAINT CO. LTD. | 10,449 | 30,909 | ||||||||||
| 40,913 | KAO CORP. | 1,003,886 | 1,614,001 | ||||||||||
| 35,000 | KAWASAKI HEAVY INDUSTRIES LTD. | 71,135 | 159,835 | ||||||||||
| 9,954 | KDDI CORP. | 239,416 | 622,824 | ||||||||||
| 24,800 | KEIHIN CORP. | 308,810 | 368,190 | ||||||||||
| 13,000 | KEIKYU CORP. | 95,310 | 96,283 | ||||||||||
| 5,000 | KEIO CORP. | 28,322 | 35,884 | ||||||||||
| 5,000 | KEISEI ELECTRIC RAILWAY CO. LTD. | 23,110 | 60,971 | ||||||||||
| 981 | KEYENCE CORP. | 180,512 | 434,522 | ||||||||||
| 6,000 | KIKKOMAN CORP. | 52,867 | 147,203 | ||||||||||
| 35,000 | KINTETSU CORP. | 106,062 | 115,439 | ||||||||||
| 10,000 | KIRIN HOLDINGS CO. LTD. | 103,112 | 123,871 | ||||||||||
| 19,300 | KOBAYASHI PHARMACEUTICAL CO. LTD. | 1,039,320 | 1,126,178 | ||||||||||
| 15,400 | KOMATSU LTD. | 339,281 | 341,411 | ||||||||||
| 2,300 | KONAMI CORP. | 50,313 | 42,408 | ||||||||||
| 7,000 | KONICA MINOLTA, INC. | 53,139 | 75,506 | ||||||||||
| 21,000 | KUBOTA CORP. | 129,773 | 304,946 | ||||||||||
| 4,300 | KURITA WATER INDUSTRIES LTD. | 96,931 | 89,833 | ||||||||||
| 5,400 | KYOCERA CORP. | 198,000 | 247,502 | ||||||||||
| 5,000 | KYOWA HAKKO KIRIN CO. LTD. | 54,616 | 47,066 | ||||||||||
| 6,500 | KYUSHU ELECTRIC POWER CO., INC.(b) | 59,661 | 65,098 | ||||||||||
| 2,800 | LAWSON, INC. | 120,035 | 169,311 | ||||||||||
| 4,200 | LIXIL GROUP CORP. | 71,097 | 88,822 | ||||||||||
| See accompanying notes to the financial statements. | 77 | (Continued) |
CLEARWATER INVESTMENT TRUST
Schedule of Investments - Clearwater International Fund
December 31, 2014
| Shares | Security | Cost | Fair value (a) | Percent of net assets | |||||||||
| Japan (Cont’d): | |||||||||||||
| 1,000 | MAKITA CORP. | $ | 48,587 | 45,244 | |||||||||
| 24,000 | MARUBENI CORP. | 173,505 | 143,863 | ||||||||||
| 6,500 | MARUI GROUP CO. LTD. | 32,287 | 58,785 | ||||||||||
| 11,400 | MAZDA MOTOR CORP. | 95,886 | 273,647 | ||||||||||
| 2,700 | MCDONALD’S HOLDINGS CO. JAPAN LTD. | 73,436 | 59,068 | ||||||||||
| 1,700 | MEIJI HOLDINGS CO. LTD. | 54,895 | 154,828 | ||||||||||
| 32,100 | MEITEC CORP. | 736,840 | 947,496 | ||||||||||
| 1,800 | MIRACA HOLDINGS, INC. | 71,311 | 77,570 | ||||||||||
| 40,000 | MITSUBISHI CHEMICAL HOLDINGS CORP. | 161,621 | 194,788 | ||||||||||
| 25,200 | MITSUBISHI CORP. | 378,464 | 462,165 | ||||||||||
| 32,000 | MITSUBISHI ELECTRIC CORP. | 244,114 | 380,993 | ||||||||||
| 27,000 | MITSUBISHI ESTATE CO. LTD. | 353,310 | 571,438 | ||||||||||
| 17,000 | MITSUBISHI GAS CHEMICAL CO., INC. | 75,149 | 85,399 | ||||||||||
| 57,000 | MITSUBISHI HEAVY INDUSTRIES LTD. | 185,317 | 315,163 | ||||||||||
| 4,000 | MITSUBISHI LOGISTICS CORP. | 45,017 | 57,830 | ||||||||||
| 18,000 | MITSUBISHI MATERIALS CORP. | 47,129 | 59,836 | ||||||||||
| 6,400 | MITSUBISHI MOTORS CORP. | 62,338 | 58,631 | ||||||||||
| 3,800 | MITSUBISHI TANABE PHARMA CORP. | 49,996 | 55,685 | ||||||||||
| 240,600 | MITSUBISHI UFJ FINANCIAL GROUP, INC. | 1,162,680 | 1,318,763 | ||||||||||
| 27,000 | MITSUBISHI UFJ LEASE & FINANCE CO. LTD. | 83,878 | 127,589 | ||||||||||
| 29,600 | MITSUI & CO. LTD. | 306,203 | 395,698 | ||||||||||
| 37,000 | MITSUI CHEMICALS, INC. | 87,469 | 105,098 | ||||||||||
| 14,000 | MITSUI FUDOSAN CO. LTD. | 364,288 | 376,537 | ||||||||||
| 3,000 | MITSUI MINING & SMELTING CO. LTD. | 5,391 | 7,227 | ||||||||||
| 12,000 | MITSUI OSK LINES LTD. | 47,398 | 35,645 | ||||||||||
| 387,420 | MIZUHO FINANCIAL GROUP, INC. | 672,532 | 650,981 | ||||||||||
| 8,280 | MS&AD INSURANCE GROUP HOLDINGS, INC. | 177,615 | 196,665 | ||||||||||
| 3,600 | MURATA MANUFACTURING CO. LTD. | 162,615 | 393,241 | ||||||||||
| 27,000 | NEC CORP. | 70,167 | 78,713 | ||||||||||
| 5,000 | NGK INSULATORS LTD. | 63,090 | 102,977 | ||||||||||
| 3,000 | NGK SPARK PLUG CO. LTD. | 28,359 | 90,592 | ||||||||||
| 6,000 | NH FOODS LTD. | 72,315 | 131,239 | ||||||||||
| 3,500 | NIDEC CORP. | 102,546 | 227,019 | ||||||||||
| 9,369 | NIFCO, INC. | 209,429 | 303,823 | ||||||||||
| 6,000 | NIKON CORP. | 75,728 | 79,668 | ||||||||||
| 1,800 | NINTENDO CO. LTD. | 172,120 | 187,598 | ||||||||||
| 22 | NIPPON BUILDING FUND, INC. | 90,970 | 110,224 | ||||||||||
| 17,000 | NIPPON EXPRESS CO. LTD. | 60,747 | 86,459 | ||||||||||
| 2,000 | NIPPON PAINT HOLDINGS CO. LTD. | 44,426 | 58,051 | ||||||||||
| 123,535 | NIPPON STEEL & SUMITOMO METAL CORP. | 307,243 | 306,579 | ||||||||||
| 7,600 | NIPPON TELEGRAPH & TELEPHONE CORP. | 342,697 | 391,081 | ||||||||||
| 17,000 | NISHI-NIPPON CITY BANK (THE) LTD. | 40,901 | 49,093 | ||||||||||
| 5,000 | NISSAN CHEMICAL INDUSTRIES LTD. | 50,851 | 90,167 | ||||||||||
| 39,400 | NISSAN MOTOR CO. LTD. | 365,539 | 343,184 | ||||||||||
| 8,470 | NISSHIN SEIFUN GROUP, INC. | 78,577 | 82,068 | ||||||||||
| 1,200 | NISSIN FOODS HOLDINGS CO. LTD. | 43,959 | 57,426 | ||||||||||
| 13,900 | NISSIN KOGYO CO. LTD. | 186,052 | 193,523 | ||||||||||
| 2,700 | NITORI HOLDINGS CO. LTD. | 87,310 | 145,094 | ||||||||||
| 3,200 | NITTO DENKO CORP. | 77,639 | 178,955 | ||||||||||
| 72,300 | NOMURA HOLDINGS, INC. | 256,136 | 411,429 | ||||||||||
| 2,700 | NOMURA RESEARCH INSTITUTE LTD. | 43,930 | 82,906 | ||||||||||
| 17,800 | NORTH PACIFIC BANK LTD. | 49,457 | 68,886 | ||||||||||
| 7,000 | NSK LTD. | 50,459 | 82,904 | ||||||||||
| 1,400 | NTT DATA CORP. | 36,520 | 52,335 | ||||||||||
| 23,800 | NTT DOCOMO, INC. | 362,981 | 348,388 | ||||||||||
| 6,500 | NTT URBAN DEVELOPMENT CORP. | 52,710 | 65,204 | ||||||||||
| 12,000 | OBAYASHI CORP. | 48,665 | 77,124 | ||||||||||
| 4,000 | ODAKYU ELECTRIC RAILWAY CO. LTD. | 30,548 | 35,495 | ||||||||||
| 5,100 | OLYMPUS CORP.(b) | 71,174 | 179,703 | ||||||||||
| 2,700 | OMRON CORP. | 80,696 | 121,015 | ||||||||||
| 1,300 | ONO PHARMACEUTICAL CO. LTD. | 55,952 | 115,196 | ||||||||||
| 8,000 | ONWARD HOLDINGS CO. LTD. | 54,094 | 48,136 | ||||||||||
| 1,200 | ORIENTAL LAND CO. LTD. | 113,097 | 275,184 | ||||||||||
| 10,700 | ORIX CORP. | 118,187 | 133,760 | ||||||||||
| 37,000 | OSAKA GAS CO. LTD. | 121,878 | 138,291 | ||||||||||
| 5,100 | OTSUKA HOLDINGS CO. LTD. | 146,161 | 152,959 | ||||||||||
| 35,800 | PANASONIC CORP. | 247,727 | 420,602 | ||||||||||
| 2,600 | PARK24 CO. LTD. | 51,627 | 38,288 | ||||||||||
| See accompanying notes to the financial statements. | 78 | (Continued) |
CLEARWATER INVESTMENT TRUST
Schedule of Investments - Clearwater International Fund
December 31, 2014
| Shares | Security | Cost | Fair value (a) | Percent of net assets | |||||||||
| Japan (Cont’d): | |||||||||||||
| 190,400 | PRESTIGE INTERNATIONAL, INC. | $ | 1,329,082 | 1,500,571 | |||||||||
| 15,200 | RAKUTEN, INC. | 97,714 | 211,624 | ||||||||||
| 28,900 | RESONA HOLDINGS, INC. | 128,453 | 145,862 | ||||||||||
| 10,000 | RICOH CO. LTD. | 94,506 | 101,586 | ||||||||||
| 1,200 | RINNAI CORP. | 52,047 | 80,805 | ||||||||||
| 1,500 | ROHM CO. LTD. | 51,836 | 91,003 | ||||||||||
| 4,000 | SANKYO CO. LTD. | 195,165 | 137,857 | ||||||||||
| 2,600 | SANTEN PHARMACEUTICAL CO. LTD. | 85,886 | 139,141 | ||||||||||
| 13,720 | SBI HOLDINGS, INC. | 111,165 | 148,979 | ||||||||||
| 3,400 | SECOM CO. LTD. | 133,812 | 195,337 | ||||||||||
| 4,100 | SEGA SAMMY HOLDINGS, INC. | 38,822 | 52,601 | ||||||||||
| 3,400 | SEIBU HOLDINGS, INC. | 65,652 | 69,367 | ||||||||||
| 1,800 | SEIKO EPSON CORP. | 55,145 | 75,606 | ||||||||||
| 13,000 | SEKISUI CHEMICAL CO. LTD. | 66,177 | 156,501 | ||||||||||
| 6,000 | SEKISUI HOUSE LTD. | 44,394 | 78,587 | ||||||||||
| 8,100 | SERIA CO. LTD. | 125,942 | 268,829 | ||||||||||
| 12,800 | SEVEN & I HOLDINGS CO. LTD. | 281,200 | 461,705 | ||||||||||
| 25,000 | SHARP CORP.(b) | 50,043 | 55,403 | ||||||||||
| 4,900 | SHIKOKU ELECTRIC POWER CO., INC.(b) | 52,495 | 59,400 | ||||||||||
| 4,000 | SHIMADZU CORP. | 25,419 | 40,708 | ||||||||||
| 1,000 | SHIMAMURA CO. LTD. | 61,206 | 86,158 | ||||||||||
| 1,500 | SHIMANO, INC. | 58,204 | 194,025 | ||||||||||
| 6,000 | SHIMIZU CORP. | 50,924 | 40,855 | ||||||||||
| 8,300 | SHIN-ETSU CHEMICAL CO. LTD. | 411,842 | 539,975 | ||||||||||
| 41,600 | SHINKO PLANTECH CO. LTD. | 342,251 | 291,896 | ||||||||||
| 25,000 | SHINSEI BANK LTD. | 51,465 | 43,645 | ||||||||||
| 4,000 | SHIONOGI & CO. LTD. | 67,679 | 103,622 | ||||||||||
| 5,900 | SHISEIDO CO. LTD. | 88,706 | 82,620 | ||||||||||
| 7,000 | SHIZUOKA BANK (THE) LTD. | 65,240 | 64,029 | ||||||||||
| 900 | SMC CORP. | 106,941 | 234,366 | ||||||||||
| 16,500 | SOFTBANK CORP. | 351,077 | 981,952 | ||||||||||
| 5,700 | SOMPO JAPAN NIPPONKOA HOLDINGS, INC. | 114,918 | 143,241 | ||||||||||
| 16,000 | SONY CORP. | 201,655 | 325,741 | ||||||||||
| 4,400 | SONY FINANCIAL HOLDINGS, INC. | 56,074 | 64,882 | ||||||||||
| 22,200 | SQUARE ENIX HOLDINGS CO. LTD. | 278,007 | 461,450 | ||||||||||
| 54,900 | STANLEY ELECTRIC CO. LTD. | 805,200 | 1,186,666 | ||||||||||
| 7,000 | SUMCO CORP. | 47,761 | 100,659 | ||||||||||
| 25,000 | SUMITOMO CHEMICAL CO. LTD. | 74,256 | 98,981 | ||||||||||
| 21,300 | SUMITOMO CORP. | 207,214 | 218,772 | ||||||||||
| 13,100 | SUMITOMO ELECTRIC INDUSTRIES LTD. | 127,803 | 163,446 | ||||||||||
| 12,000 | SUMITOMO HEAVY INDUSTRIES LTD. | 39,379 | 64,489 | ||||||||||
| 9,000 | SUMITOMO METAL MINING CO. LTD. | 88,484 | 134,296 | ||||||||||
| 25,500 | SUMITOMO MITSUI FINANCIAL GROUP, INC. | 795,433 | 921,379 | ||||||||||
| 71,310 | SUMITOMO MITSUI TRUST HOLDINGS, INC. | 214,202 | 272,146 | ||||||||||
| 6,000 | SUMITOMO REALTY & DEVELOPMENT CO. LTD. | 163,837 | 204,393 | ||||||||||
| 67,200 | SUMITOMO RUBBER INDUSTRIES LTD. | 817,767 | 1,000,533 | ||||||||||
| 1,500 | SUNTORY BEVERAGE & FOOD LTD. | 54,566 | 51,792 | ||||||||||
| 5,800 | SUZUKI MOTOR CORP. | 104,611 | 174,354 | ||||||||||
| 47,000 | SYSMEX CORP. | 1,081,349 | 2,085,072 | ||||||||||
| 7,700 | T&D HOLDINGS, INC. | 97,474 | 92,634 | ||||||||||
| 13,000 | TAIHEIYO CEMENT CORP. | 27,372 | 40,907 | ||||||||||
| 11,000 | TAISEI CORP. | 19,822 | 62,615 | ||||||||||
| 600 | TAISHO PHARMACEUTICAL HOLDINGS CO. LTD. | 40,190 | 36,602 | ||||||||||
| 10,000 | TAKASHIMAYA CO. LTD. | 63,872 | 80,199 | ||||||||||
| 12,800 | TAKEDA PHARMACEUTICAL CO. LTD. | 505,987 | 531,145 | ||||||||||
| 1,100 | TDK CORP. | 52,815 | 64,812 | ||||||||||
| 29,000 | TEIJIN LTD. | 67,529 | 77,230 | ||||||||||
| 5,200 | TERUMO CORP. | 95,419 | 118,428 | ||||||||||
| 2,000 | THK CO. LTD. | 29,290 | 48,287 | ||||||||||
| 14,000 | TOBU RAILWAY CO. LTD. | 67,422 | 59,828 | ||||||||||
| 2,200 | TOHO CO. LTD. | 42,502 | 49,919 | ||||||||||
| 17,000 | TOHO GAS CO. LTD. | 81,221 | 83,311 | ||||||||||
| 7,200 | TOHOKU ELECTRIC POWER CO., INC. | 56,650 | 83,638 | ||||||||||
| 19,100 | TOKAI RIKA CO. LTD. | 279,165 | 401,226 | ||||||||||
| 14,400 | TOKIO MARINE HOLDINGS, INC. | 359,676 | 467,636 | ||||||||||
| 21,600 | TOKYO ELECTRIC POWER CO., INC.(b) | 102,702 | 88,017 | ||||||||||
| 4,300 | TOKYO ELECTRON LTD. | 191,374 | 326,314 | ||||||||||
| 40,000 | TOKYO GAS CO. LTD. | 151,969 | 215,847 | ||||||||||
| See accompanying notes to the financial statements. | 79 | (Continued) |
CLEARWATER INVESTMENT TRUST
Schedule of Investments - Clearwater International Fund
December 31, 2014
| Shares | Security | Cost | Fair value (a) | Percent of net assets | |||||||||
| Japan (Cont’d): | |||||||||||||
| 6,000 | TOKYO TATEMONO CO. LTD. | $ | 56,308 | 43,696 | |||||||||
| 25,000 | TOKYU CORP. | 103,448 | 155,094 | ||||||||||
| 23,000 | TOKYU FUDOSAN HOLDINGS CORP. | 86,617 | 158,478 | ||||||||||
| 4,000 | TONENGENERAL SEKIYU K.K. | 37,796 | 34,194 | ||||||||||
| 17,000 | TORAY INDUSTRIES, INC. | 70,413 | 136,153 | ||||||||||
| 80,000 | TOSHIBA CORP. | 245,424 | 338,752 | ||||||||||
| 6,000 | TOTO LTD. | 30,029 | 69,787 | ||||||||||
| 3,000 | TOYO SUISAN KAISHA LTD. | 74,690 | 96,868 | ||||||||||
| 4,000 | TOYOTA INDUSTRIES CORP. | 101,266 | 204,389 | ||||||||||
| 48,000 | TOYOTA MOTOR CORP. | 1,673,413 | 2,993,307 | ||||||||||
| 1,900 | TOYOTA TSUSHO CORP. | 17,167 | 43,914 | ||||||||||
| 2,500 | TREND MICRO, INC. | 74,501 | 68,400 | ||||||||||
| 61,000 | TSUGAMI CORP. | 318,601 | 326,233 | ||||||||||
| 34,800 | TSUMURA & CO. | 799,027 | 769,362 | ||||||||||
| 24,596 | TSURUHA HOLDINGS, INC. | 904,437 | 1,425,875 | ||||||||||
| 8,000 | UBE INDUSTRIES LTD. | 13,963 | 11,953 | ||||||||||
| 7,800 | UNICHARM CORP. | 68,794 | 187,704 | ||||||||||
| 17,500 | UNIPRES CORP. | 363,607 | 287,037 | ||||||||||
| 34 | UNITED URBAN INVESTMENT CORP. | 52,061 | 53,405 | ||||||||||
| 6,500 | USHIO, INC. | 68,874 | 67,993 | ||||||||||
| 4,900 | USS CO. LTD. | 56,003 | 75,406 | ||||||||||
| 4,100 | WEST JAPAN RAILWAY CO. | 134,756 | 194,282 | ||||||||||
| 23,600 | YAHOO JAPAN CORP. | 62,283 | 85,158 | ||||||||||
| 1,300 | YAKULT HONSHA CO. LTD. | 22,252 | 68,605 | ||||||||||
| 16,300 | YAMADA DENKI CO. LTD. | 56,674 | 54,404 | ||||||||||
| 4,800 | YAMAHA MOTOR CO. LTD. | 48,849 | 96,535 | ||||||||||
| 4,500 | YAMATO HOLDINGS CO. LTD. | 77,981 | 88,607 | ||||||||||
| 1,600 | YAMATO KOGYO CO. LTD. | 50,862 | 44,984 | ||||||||||
| 4,000 | YAMAZAKI BAKING CO. LTD. | 44,679 | 49,354 | ||||||||||
| 5,000 | YASKAWA ELECTRIC CORP. | 48,019 | 63,956 | ||||||||||
| 47,848,075 | 65,150,047 | 13.52 | % | ||||||||||
| Mexico: | |||||||||||||
| 7,695 | FRESNILLO PLC | 109,038 | 91,315 | ||||||||||
| 496,719 | WAL-MART DE MEXICO S.A.B. DE C.V., SERIES V | 1,512,171 | 1,067,927 | ||||||||||
| 1,621,209 | 1,159,242 | 0.24 | % | ||||||||||
| Netherlands: | |||||||||||||
| 35,080 | AALBERTS INDUSTRIES N.V. | 676,899 | 1,036,408 | ||||||||||
| 26,780 | ACCELL GROUP | 446,234 | 440,405 | ||||||||||
| 34,297 | AEGON N.V. | 128,398 | 257,330 | ||||||||||
| 4,340 | AKZO NOBEL N.V. | 184,408 | 300,956 | ||||||||||
| 1,349 | ALTICE S.A.(b) | 91,892 | 106,452 | ||||||||||
| 30,290 | ARCADIS N.V. | 736,105 | 905,795 | ||||||||||
| 7,173 | ASML HOLDING N.V. | 106,863 | 768,491 | ||||||||||
| 25,939 | ASML HOLDING N.V. (REGISTERED) | 1,571,559 | 2,797,002 | ||||||||||
| 14,274 | CORE LABORATORIES N.V. | 1,662,464 | 1,717,733 | ||||||||||
| 1,094 | CORIO N.V. | 43,642 | 53,390 | ||||||||||
| 3,045 | DELTA LLOYD N.V. | 50,617 | 66,922 | ||||||||||
| 768 | GEMALTO N.V. | 50,382 | 63,129 | ||||||||||
| 965 | HEINEKEN HOLDING N.V. | 23,862 | 60,489 | ||||||||||
| 3,662 | HEINEKEN N.V. | 128,663 | 260,146 | ||||||||||
| 240,268 | ING GROEP N.V. - CVA(b) | 2,123,546 | 3,110,896 | ||||||||||
| 12,511 | KONINKLIJKE AHOLD N.V. | 152,129 | 222,396 | ||||||||||
| 2,539 | KONINKLIJKE DSM N.V. | 86,313 | 154,387 | ||||||||||
| 51,375 | KONINKLIJKE KPN N.V. | 108,346 | 161,974 | ||||||||||
| 20,095 | KONINKLIJKE PHILIPS N.V. | 343,642 | 583,462 | ||||||||||
| 1,765 | KONINKLIJKE VOPAK N.V. | 97,890 | 91,434 | ||||||||||
| 1,395 | OCI N.V.(b) | 50,711 | 48,414 | ||||||||||
| 8,430 | QIAGEN N.V.(b) | 119,420 | 197,415 | ||||||||||
| 3,238 | RANDSTAD HOLDING N.V. | 99,928 | 155,721 | ||||||||||
| 69,437 | ROYAL DUTCH SHELL PLC, CLASS A | 1,986,780 | 2,301,592 | ||||||||||
| 45,720 | ROYAL DUTCH SHELL PLC, CLASS B | 1,093,318 | 1,570,661 | ||||||||||
| 46,270 | SENSATA TECHNOLOGIES HOLDING N.V.(b) | 1,607,892 | 2,425,011 | ||||||||||
| 121,345 | TNT EXPRESS N.V. | 825,513 | 806,198 | ||||||||||
| 24,590 | USG PEOPLE N.V. | 199,072 | 277,336 | ||||||||||
| 6,193 | WOLTERS KLUWER N.V. | 101,075 | 189,107 | ||||||||||
| 50,795 | YANDEX N.V., CLASS A(b) | 1,341,566 | 912,278 | ||||||||||
| 16,239,129 | 22,042,930 | 4.57 | % | ||||||||||
| See accompanying notes to the financial statements. | 80 | (Continued) |
CLEARWATER INVESTMENT TRUST
Schedule of Investments - Clearwater International Fund
December 31, 2014
| Shares | Security | Cost | Fair value (a) | Percent of net assets | |||||||||
| New Zealand: | |||||||||||||
| 25,444 | AUCKLAND INTERNATIONAL AIRPORT LTD. | $ | 78,319 | 83,739 | |||||||||
| 11,811 | CONTACT ENERGY LTD. | 51,688 | 58,780 | ||||||||||
| 7,321 | FLETCHER BUILDING LTD. | 51,323 | 47,220 | ||||||||||
| 18,050 | SKYCITY ENTERTAINMENT GROUP LTD. | 49,428 | 54,525 | ||||||||||
| 37,843 | SPARK NEW ZEALAND LTD. | 73,138 | 91,690 | ||||||||||
| 303,896 | 335,954 | 0.07 | % | ||||||||||
| Norway: | |||||||||||||
| 76,926 | AKASTOR ASA | 262,774 | 222,960 | ||||||||||
| 94,877 | AKER SOLUTIONS ASA(b) | 1,065,672 | 522,791 | ||||||||||
| 15,353 | DNB ASA | 117,829 | 226,370 | ||||||||||
| 3,900 | KVAERNER ASA | 6,507 | 4,580 | ||||||||||
| 21,490 | NORSK HYDRO ASA | 82,180 | 120,868 | ||||||||||
| 104,344 | ORKLA ASA | 711,925 | 711,134 | ||||||||||
| 12,350 | SCHIBSTED ASA | 474,812 | 784,995 | ||||||||||
| 5,278 | SEADRILL LTD. | 104,057 | 60,757 | ||||||||||
| 21,587 | STATOIL ASA | 418,607 | 378,300 | ||||||||||
| 11,360 | TELENOR ASA | 229,860 | 229,056 | ||||||||||
| 53,300 | TGS NOPEC GEOPHYSICAL CO. ASA | 1,394,842 | 1,153,217 | ||||||||||
| 85,000 | TOMRA SYSTEMS ASA | 703,315 | 654,446 | ||||||||||
| 4,000 | YARA INTERNATIONAL ASA | 109,527 | 178,887 | ||||||||||
| 5,681,907 | 5,248,361 | 1.09 | % | ||||||||||
| Philippines: | |||||||||||||
| 333,554 | METROPOLITAN BANK & TRUST CO. | 570,875 | 614,957 | ||||||||||
| 570,875 | 614,957 | 0.13 | % | ||||||||||
| Portugal: | |||||||||||||
| 20,567 | EDP - ENERGIAS DE PORTUGAL S.A. | 48,529 | 79,541 | ||||||||||
| 10,080 | GALP ENERGIA SGPS S.A. | 157,855 | 101,979 | ||||||||||
| 4,320 | JERONIMO MARTINS SGPS S.A. | 51,516 | 43,300 | ||||||||||
| 257,900 | 224,820 | 0.05 | % | ||||||||||
| Russia: | |||||||||||||
| 10 | X5 RETAIL GROUP N.V.(b) | 172 | 122 | ||||||||||
| 4,670 | X5 RETAIL GROUP N.V. GDR (REGISTERED)(b) | 69,764 | 56,753 | ||||||||||
| 69,936 | 56,875 | 0.01 | % | ||||||||||
| Singapore: | |||||||||||||
| 31,000 | ASCENDAS REAL ESTATE INVESTMENT TRUST | 51,629 | 55,646 | ||||||||||
| 39,500 | CAPITALAND LTD. | 75,674 | 98,141 | ||||||||||
| 36,000 | CAPITAMALL TRUST | 34,133 | 55,394 | ||||||||||
| 11,000 | CITY DEVELOPMENTS LTD. | 71,096 | 84,928 | ||||||||||
| 32,000 | COMFORTDELGRO CORP. LTD. | 49,631 | 62,648 | ||||||||||
| 34,000 | DBS GROUP HOLDINGS LTD. | 221,626 | 525,043 | ||||||||||
| 22,000 | FRASER AND NEAVE LTD. | 7,411 | 45,184 | ||||||||||
| 44,000 | FRASERS CENTREPOINT LTD. | 52,608 | 56,074 | ||||||||||
| 113,000 | GLOBAL LOGISTIC PROPERTIES LTD. | 177,046 | 211,334 | ||||||||||
| 2,000 | JARDINE CYCLE & CARRIAGE LTD. | 60,253 | 64,220 | ||||||||||
| 28,000 | KEPPEL CORP. LTD. | 105,334 | 186,835 | ||||||||||
| 7,840 | KEPPEL REIT | 3,250 | 7,218 | ||||||||||
| 40,000 | OVERSEA-CHINESE BANKING CORP. LTD. | 316,737 | 314,375 | ||||||||||
| 17,000 | SEMBCORP INDUSTRIES LTD. | 31,827 | 57,009 | ||||||||||
| 22,000 | SEMBCORP MARINE LTD. | 32,803 | 54,193 | ||||||||||
| 12,000 | SINGAPORE AIRLINES LTD. | 70,334 | 104,917 | ||||||||||
| 31,000 | SINGAPORE EXCHANGE LTD. | 139,131 | 182,270 | ||||||||||
| 26,000 | SINGAPORE PRESS HOLDINGS LTD. | 44,166 | 82,588 | ||||||||||
| 21,000 | SINGAPORE TECHNOLOGIES ENGINEERING LTD. | 48,624 | 53,764 | ||||||||||
| 170,000 | SINGAPORE TELECOMMUNICATIONS LTD. | 324,551 | 499,013 | ||||||||||
| 16,000 | STARHUB LTD. | 54,214 | 50,104 | ||||||||||
| 24,000 | UNITED OVERSEAS BANK LTD. | 333,181 | 443,709 | ||||||||||
| 15,000 | UOL GROUP LTD. | 49,917 | 78,717 | ||||||||||
| 2,355,176 | 3,373,324 | 0.70 | % | ||||||||||
| South Africa: | |||||||||||||
| 11,111 | INVESTEC PLC | 66,959 | 92,819 | ||||||||||
| 74,221 | SHOPRITE HOLDINGS LTD. | 1,521,660 | 1,074,352 | ||||||||||
| 271,007 | WOOLWORTHS HOLDINGS LTD. | 1,736,434 | 1,791,525 | ||||||||||
| 3,325,053 | 2,958,696 | 0.61 | % | ||||||||||
| South Korea: | |||||||||||||
| 6,492 | BINGGRAE CO. LTD. | 586,045 | 445,151 | ||||||||||
| See accompanying notes to the financial statements. | 81 | (Continued) |
CLEARWATER INVESTMENT TRUST
Schedule of Investments - Clearwater International Fund
December 31, 2014
| Shares | Security | Cost | Fair value (a) | Percent of net assets | |||||||||
| South Korea (Cont’d): | |||||||||||||
| 61,397 | BS FINANCIAL GROUP, INC. | $ | 682,218 | 808,011 | |||||||||
| 2,493 | DAUM KAKAO CORP. | 183,545 | 278,395 | ||||||||||
| 57,052 | DGB FINANCIAL GROUP, INC. | 701,742 | 587,017 | ||||||||||
| 22,930 | HALLA VISTEON CLIMATE CONTROL CORP. | 481,495 | 1,003,559 | ||||||||||
| 5,243 | HYUNDAI MIPO DOCKYARD | 581,800 | 330,723 | ||||||||||
| 68,521 | KGINICIS CO. LTD. | 1,234,753 | 1,109,712 | ||||||||||
| 18,148 | KIA MOTORS CORP. | 860,470 | 857,440 | ||||||||||
| 6,353 | KIWOOM SECURITIES CO. LTD. | 349,706 | 264,115 | ||||||||||
| 8,630 | KOREA INVESTMENT HOLDINGS CO. LTD. | 309,155 | 379,207 | ||||||||||
| 1,948 | SAMSUNG ELECTRONICS CO. LTD. | 2,418,879 | 2,341,597 | ||||||||||
| 9,049 | YOUNGONE HOLDINGS CO. LTD. | 515,320 | 729,674 | ||||||||||
| 8,905,128 | 9,134,601 | 1.89 | % | ||||||||||
| Spain: | |||||||||||||
| 7,845 | ABERTIS INFRAESTRUCTURAS S.A. | 102,995 | 154,986 | ||||||||||
| 1,260 | ACCIONA S.A.(b) | 78,312 | 84,594 | ||||||||||
| 7,760 | ACERINOX S.A. | 95,129 | 116,006 | ||||||||||
| 5,299 | AMADEUS IT HOLDING S.A., CLASS A | 128,322 | 210,567 | ||||||||||
| 103,161 | BANCO BILBAO VIZCAYA ARGENTARIA S.A. | 787,415 | 970,902 | ||||||||||
| 52,763 | BANCO DE SABADELL S.A. | 136,577 | 138,226 | ||||||||||
| 19,444 | BANCO POPULAR ESPANOL S.A. | 75,512 | 96,273 | ||||||||||
| 202,261 | BANCO SANTANDER S.A. | 1,458,460 | 1,691,271 | ||||||||||
| 98,076 | BANKIA S.A.(b) | 167,891 | 145,399 | ||||||||||
| 33,767 | CAIXABANK S.A. | 125,921 | 175,392 | ||||||||||
| 1,388 | CONSTRUCCIONES Y AUXILIAR DE FERROCARRILES S.A. | 645,501 | 506,303 | ||||||||||
| 9,700 | DISTRIBUIDORA INTERNACIONAL DE ALIMENTACION S.A. | 47,567 | 65,222 | ||||||||||
| 6,512 | ENAGAS S.A. | 118,772 | 206,123 | ||||||||||
| 3,362 | FERROVIAL S.A. | 50,676 | 66,244 | ||||||||||
| 10,622 | GAS NATURAL SDG S.A. | 164,427 | 267,216 | ||||||||||
| 1,818 | GRIFOLS S.A. | 52,706 | 72,370 | ||||||||||
| 72,700 | IBERDROLA S.A. | 385,685 | 489,138 | ||||||||||
| 84,315 | INDITEX S.A. | 2,292,219 | 2,415,873 | ||||||||||
| 41,424 | MAPFRE S.A. | 112,854 | 139,498 | ||||||||||
| 21,941 | MELIA HOTELS INTERNATIONAL S.A. | 146,843 | 233,955 | ||||||||||
| 2,839 | RED ELECTRICA CORP. S.A. | 121,909 | 249,227 | ||||||||||
| 19,639 | REPSOL S.A. | 379,635 | 365,053 | ||||||||||
| 6,246 | TECNICAS REUNIDAS S.A. | 299,368 | 273,977 | ||||||||||
| 62,394 | TELEFONICA S.A. | 864,770 | 892,481 | ||||||||||
| 4,021 | ZARDOYA OTIS S.A. | 45,057 | 44,497 | ||||||||||
| 8,884,523 | 10,070,793 | 2.09 | % | ||||||||||
| Sweden: | |||||||||||||
| 7,400 | ASSA ABLOY AB, CLASS B | 89,466 | 391,067 | ||||||||||
| 11,337 | ATLAS COPCO AB, CLASS A | 121,648 | 315,590 | ||||||||||
| 6,368 | ATLAS COPCO AB, CLASS B | 78,834 | 163,173 | ||||||||||
| 31,182 | BULTEN AB | 262,010 | 266,793 | ||||||||||
| 34,110 | DUNI AB | 300,088 | 504,997 | ||||||||||
| 7,501 | ELECTROLUX AB, CLASS B | 95,788 | 220,089 | ||||||||||
| 8,575 | ELEKTA AB, CLASS B | 104,728 | 87,518 | ||||||||||
| 15,793 | HENNES & MAURITZ AB, CLASS B | 349,564 | 655,122 | ||||||||||
| 3,700 | HEXAGON AB, CLASS B | 56,830 | 114,422 | ||||||||||
| 17,500 | HUSQVARNA AB, CLASS B | 64,201 | 128,701 | ||||||||||
| 8,270 | INDUSTRIVARDEN AB, CLASS C | 85,948 | 143,639 | ||||||||||
| 3,000 | INVESTMENT AB KINNEVIK, CLASS B | 51,225 | 97,294 | ||||||||||
| 10,953 | INVESTOR AB, CLASS B | 150,033 | 396,929 | ||||||||||
| 1,045 | MILLICOM INTERNATIONAL CELLULAR S.A. SDR | 88,132 | 77,718 | ||||||||||
| 43,747 | NORDEA BANK AB | 262,992 | 505,256 | ||||||||||
| 13,730 | ORIFLAME COSMETICS S.A. SDR | 453,020 | 189,822 | ||||||||||
| 23,773 | SANDVIK AB | 201,678 | 231,470 | ||||||||||
| 13,348 | SECURITAS AB, CLASS B | 106,689 | 161,728 | ||||||||||
| 35,236 | SKANDINAVISKA ENSKILDA BANKEN AB, CLASS A | 139,725 | 445,718 | ||||||||||
| 2,800 | SKANSKA AB, CLASS B | 23,703 | 59,860 | ||||||||||
| 5,793 | SKF AB, CLASS B | 143,420 | 121,867 | ||||||||||
| 5,400 | SSAB AB, CLASS A(b) | 48,129 | 31,188 | ||||||||||
| 78,705 | SVENSKA CELLULOSA AB S.C.A., CLASS B | 1,587,366 | 1,699,714 | ||||||||||
| 11,056 | SVENSKA HANDELSBANKEN AB, CLASS A | 235,903 | 516,235 | ||||||||||
| 10,728 | SWEDBANK AB, CLASS A | 252,261 | 266,944 | ||||||||||
| 3,023 | SWEDISH MATCH AB | 101,559 | 94,290 | ||||||||||
| 9,481 | TELE2 AB, CLASS B | 115,918 | 114,779 | ||||||||||
| See accompanying notes to the financial statements. | 82 | (Continued) |
CLEARWATER INVESTMENT TRUST
Schedule of Investments - Clearwater International Fund
December 31, 2014
| Shares | Security | Cost | Fair value (a) | Percent of net assets | |||||||||
| Sweden (Cont’d): | |||||||||||||
| 58,718 | TELEFONAKTIEBOLAGET LM ERICSSON, CLASS B | $ | 533,417 | 711,130 | |||||||||
| 36,666 | TELIASONERA AB | 193,138 | 235,797 | ||||||||||
| 21,000 | VOLVO AB, CLASS B | 127,847 | 226,797 | ||||||||||
| 6,425,260 | 9,175,647 | 1.90 | % | ||||||||||
| Switzerland: | |||||||||||||
| 91,143 | ABB LTD. (REGISTERED) | 1,653,847 | 1,927,829 | ||||||||||
| 24,737 | ACE LTD. | 1,993,580 | 2,841,786 | ||||||||||
| 1,367 | ACTELION LTD. (REGISTERED) | 52,159 | 157,269 | ||||||||||
| 19,843 | ADECCO S.A. (REGISTERED) | 869,461 | 1,359,324 | ||||||||||
| 2,059 | ARYZTA A.G. | 50,704 | 158,208 | ||||||||||
| 484 | BALOISE HOLDING A.G. (REGISTERED) | 26,452 | 61,814 | ||||||||||
| 93 | BANQUE CANTONALE VAUDOISE (REGISTERED) | 50,737 | 50,173 | ||||||||||
| 88 | BARRY CALLEBAUT A.G. (REGISTERED) | 88,741 | 90,127 | ||||||||||
| 35 | CHOCOLADEFABRIKEN LINDT & SPRUNGLI A.G. (PARTICIPATION CERTIFICATE) | 50,308 | 172,788 | ||||||||||
| 3 | CHOCOLADEFABRIKEN LINDT & SPRUNGLI A.G. (REGISTERED) | 75,352 | 172,190 | ||||||||||
| 8,167 | CIE FINANCIERE RICHEMONT S.A. (REGISTERED) | 550,611 | 723,411 | ||||||||||
| 21,908 | CREDIT SUISSE GROUP A.G. (REGISTERED) | 555,076 | 549,208 | ||||||||||
| 990 | GEBERIT A.G. (REGISTERED) | 85,632 | 336,435 | ||||||||||
| 140 | GIVAUDAN S.A. (REGISTERED) | 76,496 | 250,328 | ||||||||||
| 189,200 | GLENCORE PLC | 736,586 | 870,839 | ||||||||||
| 4,025 | HOLCIM LTD. (REGISTERED) | 183,971 | 285,816 | ||||||||||
| 4,134 | JULIUS BAER GROUP LTD. | 87,890 | 188,655 | ||||||||||
| 45,240 | LOGITECH INTERNATIONAL S.A. (REGISTERED) | 392,534 | 607,573 | ||||||||||
| 897 | LONZA GROUP A.G. (REGISTERED) | 50,452 | 101,090 | ||||||||||
| 87,529 | NESTLE S.A. (REGISTERED) | 3,375,183 | 6,416,011 | ||||||||||
| 61,842 | NOVARTIS A.G. (REGISTERED) | 2,791,270 | 5,687,453 | ||||||||||
| 12,477 | PANALPINA WELTTRANSPORT HOLDING A.G. (REGISTERED) | 996,903 | 1,675,134 | ||||||||||
| 8,225 | PARGESA HOLDING S.A. (BEARER) | 522,376 | 633,599 | ||||||||||
| 12,406 | ROCHE HOLDING A.G. (GENUSSCHEIN) | 1,614,189 | 3,362,528 | ||||||||||
| 1,381 | SCHINDLER HOLDING A.G. (PARTICIPATION CERTIFICATE) | 108,493 | 199,269 | ||||||||||
| 589 | SCHINDLER HOLDING A.G. (REGISTERED) | 68,597 | 84,478 | ||||||||||
| 1,079 | SGS S.A. (REGISTERED) | 2,223,657 | 2,200,019 | ||||||||||
| 77 | SIKA A.G. (BEARER) | 152,753 | 225,842 | ||||||||||
| 1,300 | SONOVA HOLDING A.G. (REGISTERED) | 84,464 | 190,571 | ||||||||||
| 10,640 | STMICROELECTRONICS N.V. | 55,625 | 79,349 | ||||||||||
| 635 | SULZER A.G. (REGISTERED) | 30,609 | 67,461 | ||||||||||
| 2,995 | SWATCH GROUP (THE) A.G. (BEARER) | 1,446,159 | 1,329,892 | ||||||||||
| 743 | SWISS LIFE HOLDING A.G. (REGISTERED) | 101,194 | 175,582 | ||||||||||
| 1,660 | SWISS PRIME SITE A.G. (REGISTERED) | 125,957 | 121,631 | ||||||||||
| 4,658 | SWISS RE A.G. | 362,000 | 389,750 | ||||||||||
| 459 | SWISSCOM A.G. (REGISTERED) | 157,641 | 241,021 | ||||||||||
| 1,427 | SYNGENTA A.G. (REGISTERED) | 339,691 | 458,210 | ||||||||||
| 32,298 | TE CONNECTIVITY LTD. | 587,755 | 2,042,848 | ||||||||||
| 56,395 | UBS GROUP A.G.(b) | 905,252 | 969,413 | ||||||||||
| 4,176 | WOLSELEY PLC | 70,461 | 237,733 | ||||||||||
| 2,235 | ZURICH INSURANCE GROUP A.G. | 358,327 | 699,874 | ||||||||||
| 24,109,145 | 38,392,531 | 7.97 | % | ||||||||||
| Taiwan: | |||||||||||||
| 671,160 | D-LINK CORP. | 372,053 | 391,783 | ||||||||||
| 121,000 | GIANT MANUFACTURING CO. LTD. | 642,691 | 1,070,950 | ||||||||||
| 176,000 | SIMPLO TECHNOLOGY CO. LTD. | 932,483 | 873,250 | ||||||||||
| 156,486 | TAIWAN SEMICONDUCTOR MANUFACTURING CO. LTD. ADR(d) | 2,401,935 | 3,502,157 | ||||||||||
| 190,000 | TRIPOD TECHNOLOGY CORP. | 428,387 | 370,794 | ||||||||||
| 4,777,549 | 6,208,934 | 1.29 | % | ||||||||||
| Thailand: | |||||||||||||
| 843,000 | LPN DEVELOPMENT PCL (REGISTERED) | 503,455 | 563,708 | ||||||||||
| 358,100 | PRUKSA REAL ESTATE PCL (REGISTERED) | 244,466 | 312,929 | ||||||||||
| 747,921 | 876,637 | 0.18 | % | ||||||||||
| United Kingdom: | |||||||||||||
| 25,248 | 3I GROUP PLC | 88,645 | 175,469 | ||||||||||
| 13,185 | ABERDEEN ASSET MANAGEMENT PLC | 49,918 | 88,064 | ||||||||||
| 89,889 | ADMIRAL GROUP PLC | 1,676,101 | 1,840,804 | ||||||||||
| See accompanying notes to the financial statements. | 83 | (Continued) |
CLEARWATER INVESTMENT TRUST
Schedule of Investments - Clearwater International Fund
December 31, 2014
| Shares | Security | Cost | Fair value (a) | Percent of net assets | |||||||||
| United Kingdom (Cont’d): | |||||||||||||
| 1,020,354 | ADVANCED COMPUTER SOFTWARE GROUP PLC | $ | 1,875,273 | 2,206,417 | |||||||||
| 5,755 | AGGREKO PLC | 166,030 | 134,082 | ||||||||||
| 100,516 | ALENT PLC | 496,170 | 501,497 | ||||||||||
| 50,155 | AMEC FOSTER WHEELER PLC | 774,558 | 656,427 | ||||||||||
| 24,964 | ANGLO AMERICAN PLC | 493,529 | 461,882 | ||||||||||
| 9,080 | ANTOFAGASTA PLC | 92,822 | 105,421 | ||||||||||
| 20,590 | ARM HOLDINGS PLC | 287,778 | 317,050 | ||||||||||
| 45,240 | ARM HOLDINGS PLC ADR(d) | 1,472,829 | 2,094,612 | ||||||||||
| 64,586 | ASHMORE GROUP PLC | 355,710 | 280,012 | ||||||||||
| 4,622 | ASHTEAD GROUP PLC | 77,679 | 81,713 | ||||||||||
| 5,043 | ASSOCIATED BRITISH FOODS PLC | 166,737 | 245,017 | ||||||||||
| 22,825 | ASTRAZENECA PLC | 798,636 | 1,605,639 | ||||||||||
| 59,299 | AVIVA PLC | 212,664 | 444,337 | ||||||||||
| 5,239 | BABCOCK INTERNATIONAL GROUP PLC | 41,807 | 85,715 | ||||||||||
| 46,467 | BAE SYSTEMS PLC | 230,164 | 339,210 | ||||||||||
| 13,290 | BALFOUR BEATTY PLC | 50,926 | 43,516 | ||||||||||
| 269,400 | BARCLAYS PLC | 1,019,431 | 1,012,809 | ||||||||||
| 13,160 | BELLWAY PLC | 213,724 | 395,324 | ||||||||||
| 30,110 | BERENDSEN PLC | 273,326 | 513,388 | ||||||||||
| 61,258 | BG GROUP PLC | 967,887 | 815,388 | ||||||||||
| 23,170 | BOVIS HOMES GROUP PLC | 193,551 | 319,098 | ||||||||||
| 336,758 | BP PLC | 2,260,533 | 2,138,325 | ||||||||||
| 30,795 | BRITISH AMERICAN TOBACCO PLC | 1,148,773 | 1,673,210 | ||||||||||
| 11,630 | BRITISH LAND (THE) CO. PLC | 61,579 | 139,712 | ||||||||||
| 143,369 | BT GROUP PLC | 523,985 | 889,972 | ||||||||||
| 5,069 | BUNZL PLC | 39,524 | 138,180 | ||||||||||
| 68,102 | BURBERRY GROUP PLC | 1,468,017 | 1,725,610 | ||||||||||
| 16,980 | CAPITA PLC | 162,367 | 284,571 | ||||||||||
| 13,691 | CARPHONE WAREHOUSE GROUP PLC | 84,128 | 98,611 | ||||||||||
| 92,189 | CENTRICA PLC | 340,421 | 396,777 | ||||||||||
| 24,375 | CNH INDUSTRIAL N.V. | 141,398 | 196,497 | ||||||||||
| 28,496 | COBHAM PLC | 93,701 | 142,890 | ||||||||||
| 210,376 | COMPASS GROUP PLC | 1,296,438 | 3,585,716 | ||||||||||
| 2,950 | CRODA INTERNATIONAL PLC | 101,220 | 121,552 | ||||||||||
| 268,760 | DEBENHAMS PLC | 325,200 | 312,706 | ||||||||||
| 82,520 | DEVRO PLC | 362,296 | 390,345 | ||||||||||
| 73,493 | DIAGEO PLC | 1,001,558 | 2,107,862 | ||||||||||
| 14,844 | DIGNITY PLC | 263,151 | 442,812 | ||||||||||
| 142,245 | DIPLOMA PLC | 1,049,766 | 1,570,278 | ||||||||||
| 32,144 | DIRECT LINE INSURANCE GROUP PLC | 123,935 | 144,980 | ||||||||||
| 95 | DRAX GROUP PLC | 544 | 675 | ||||||||||
| 2,272 | EASYJET PLC | 52,680 | 58,643 | ||||||||||
| 10,222 | FIAT CHRYSLER AUTOMOBILES N.V.(b) | 27,207 | 118,371 | ||||||||||
| 34,018 | FRIENDS LIFE GROUP LTD. | 144,933 | 192,326 | ||||||||||
| 21,685 | G4S PLC | 77,070 | 93,323 | ||||||||||
| 32,712 | GKN PLC | 101,683 | 173,510 | ||||||||||
| 88,301 | GLAXOSMITHKLINE PLC | 1,353,348 | 1,889,203 | ||||||||||
| 101,170 | GREGGS PLC | 781,008 | 1,148,446 | ||||||||||
| 17,505 | HAMMERSON PLC | 69,535 | 163,610 | ||||||||||
| 104,290 | HOMESERVE PLC | 364,770 | 545,295 | ||||||||||
| 335,233 | HSBC HOLDINGS PLC | 2,323,658 | 3,168,111 | ||||||||||
| 81,929 | IG GROUP HOLDINGS PLC | 612,506 | 913,182 | ||||||||||
| 2,476 | IMI PLC | 52,347 | 48,471 | ||||||||||
| 18,792 | IMPERIAL TOBACCO GROUP PLC | 441,174 | 822,960 | ||||||||||
| 41,477 | INDIVIOR PLC(b) | 69,421 | 96,581 | ||||||||||
| 11,958 | INMARSAT PLC | 92,794 | 148,189 | ||||||||||
| 1,678 | INTERCONTINENTAL HOTELS GROUP PLC | 52,076 | 67,241 | ||||||||||
| 32,745 | INTERNATIONAL CONSOLIDATED AIRLINES GROUP S.A.(b) | 90,834 | 242,377 | ||||||||||
| 2,722 | INTERTEK GROUP PLC | 108,909 | 98,669 | ||||||||||
| 6,025 | INTU PROPERTIES PLC | 21,274 | 31,157 | ||||||||||
| 687,159 | ITE GROUP PLC | 2,554,971 | 1,713,346 | ||||||||||
| 40,973 | ITV PLC | 90,693 | 136,496 | ||||||||||
| 29,306 | J SAINSBURY PLC | 141,007 | 111,414 | ||||||||||
| 3,841 | JOHNSON MATTHEY PLC | 85,088 | 201,361 | ||||||||||
| 42,914 | KINGFISHER PLC | 109,517 | 226,140 | ||||||||||
| 133,080 | LAIRD PLC | 465,719 | 638,545 | ||||||||||
| See accompanying notes to the financial statements. | 84 | (Continued) |
CLEARWATER INVESTMENT TRUST
Schedule of Investments - Clearwater International Fund
December 31, 2014
| Shares | Security | Cost | Fair value (a) | Percent of net assets | |||||||||
| United Kingdom (Cont’d): | |||||||||||||
| 15,511 | LAND SECURITIES GROUP PLC | $ | 113,585 | 277,552 | |||||||||
| 76,900 | LEGAL & GENERAL GROUP PLC | 203,240 | 295,359 | ||||||||||
| 271 | LIBERTY GLOBAL PLC, CLASS A(b) | 12,461 | 13,606 | ||||||||||
| 669 | LIBERTY GLOBAL PLC, SERIES C(b) | 29,576 | 32,319 | ||||||||||
| 2,013,775 | LLOYDS BANKING GROUP PLC(b) | 1,667,432 | 2,378,001 | ||||||||||
| 6,030 | LONDON STOCK EXCHANGE GROUP PLC | 69,795 | 207,169 | ||||||||||
| 449,800 | MAN GROUP PLC | 638,904 | 1,112,938 | ||||||||||
| 25,083 | MARKS & SPENCER GROUP PLC | 101,882 | 185,194 | ||||||||||
| 309,051 | MEARS GROUP PLC | 1,592,404 | 1,801,939 | ||||||||||
| 13,587 | MEGGITT PLC | 60,745 | 108,606 | ||||||||||
| 13,437 | MELROSE INDUSTRIES PLC | 52,258 | 55,289 | ||||||||||
| 58,002 | NATIONAL GRID PLC | 577,740 | 826,866 | ||||||||||
| 3,200 | NEXT PLC | 86,367 | 337,523 | ||||||||||
| 96,618 | OLD MUTUAL PLC | 133,905 | 284,145 | ||||||||||
| 17,030 | PEARSON PLC | 231,527 | 313,270 | ||||||||||
| 2,408 | PERSIMMON PLC(b) | 52,915 | 58,904 | ||||||||||
| 6,290 | PETROFAC LTD. | 120,064 | 68,219 | ||||||||||
| 40,642 | PRUDENTIAL PLC | 617,594 | 935,259 | ||||||||||
| 126,222 | QINETIQ GROUP PLC | 220,779 | 367,350 | ||||||||||
| 2,341 | RANDGOLD RESOURCES LTD. | 150,411 | 158,394 | ||||||||||
| 41,477 | RECKITT BENCKISER GROUP PLC | 3,002,452 | 3,346,005 | ||||||||||
| 21,004 | REED ELSEVIER N.V. | 272,359 | 501,969 | ||||||||||
| 163,258 | REED ELSEVIER PLC | 1,280,530 | 2,777,572 | ||||||||||
| 10,746 | REXAM PLC | 57,562 | 75,548 | ||||||||||
| 44,200 | RIGHTMOVE PLC | 1,610,114 | 1,538,824 | ||||||||||
| 7,202 | RIO TINTO LTD. | 402,208 | 337,826 | ||||||||||
| 20,340 | RIO TINTO PLC | 890,650 | 937,115 | ||||||||||
| 33,377 | ROLLS-ROYCE HOLDINGS PLC | 497,076 | 449,623 | ||||||||||
| 20,800 | ROTORK PLC | 903,523 | 748,493 | ||||||||||
| 417,869 | ROYAL BANK OF SCOTLAND GROUP PLC(b) | 2,373,403 | 2,536,682 | ||||||||||
| 7,055 | ROYAL MAIL PLC | 51,348 | 46,979 | ||||||||||
| 12,917 | RSA INSURANCE GROUP PLC(b) | 94,770 | 86,931 | ||||||||||
| 15,612 | SABMILLER PLC | 708,109 | 807,956 | ||||||||||
| 20,657 | SAGE GROUP (THE) PLC | 74,323 | 148,966 | ||||||||||
| 8,660 | SAVILLS PLC | 53,120 | 91,304 | ||||||||||
| 10,277 | SEGRO PLC | 36,889 | 58,910 | ||||||||||
| 139,395 | SERCO GROUP PLC | 651,134 | 346,650 | ||||||||||
| 4,954 | SEVERN TRENT PLC | 76,220 | 153,598 | ||||||||||
| 18,980 | SKY PLC | 142,985 | 264,168 | ||||||||||
| 18,823 | SMITH & NEPHEW PLC | 151,602 | 345,579 | ||||||||||
| 5,478 | SMITHS GROUP PLC | 80,025 | 92,716 | ||||||||||
| 4,369 | SPORTS DIRECT INTERNATIONAL PLC(b) | 53,128 | 47,916 | ||||||||||
| 16,949 | SSE PLC | 293,983 | 425,499 | ||||||||||
| 31,024 | STANDARD CHARTERED PLC | 418,962 | 465,267 | ||||||||||
| 48,103 | STANDARD LIFE PLC | 131,737 | 296,335 | ||||||||||
| 689,878 | TESCO PLC | 3,300,612 | 2,007,491 | ||||||||||
| 1,868 | TRAVIS PERKINS PLC | 52,605 | 53,780 | ||||||||||
| 22,129 | TSB BANKING GROUP PLC(b)(e) | 101,184 | 95,663 | ||||||||||
| 8,792 | TULLOW OIL PLC | 101,958 | 55,629 | ||||||||||
| 26,076 | UNILEVER N.V. - CVA | 863,492 | 1,024,337 | ||||||||||
| 24,244 | UNILEVER PLC | 545,190 | 984,809 | ||||||||||
| 26,359 | UNILEVER PLC ADR(d) | 631,457 | 1,067,012 | ||||||||||
| 10,541 | UNITED UTILITIES GROUP PLC | 80,109 | 149,376 | ||||||||||
| 256,900 | VECTURA GROUP PLC(b) | 364,176 | 510,146 | ||||||||||
| 2,343 | VEDANTA RESOURCES PLC | 35,450 | 20,690 | ||||||||||
| 118,639 | VESUVIUS PLC | 588,138 | 824,277 | ||||||||||
| 484,417 | VODAFONE GROUP PLC | 1,593,934 | 1,659,835 | ||||||||||
| 3,239 | WEIR GROUP (THE) PLC | 94,600 | 92,707 | ||||||||||
| 2,849 | WHITBREAD PLC | 65,613 | 210,248 | ||||||||||
| 8,611 | WILLIAM HILL PLC | 52,153 | 48,425 | ||||||||||
| 51,312 | WM MORRISON SUPERMARKETS PLC | 206,637 | 146,032 | ||||||||||
| 25,749 | WPP PLC | 191,382 | 534,193 | ||||||||||
| 63,119,137 | 80,542,122 | 16.71 | % | ||||||||||
| United States: | |||||||||||||
| 75,947 | APPLIED MATERIALS, INC. | 1,325,523 | 1,892,599 | ||||||||||
| 33,092 | ARCH CAPITAL GROUP LTD.(b) | 650,221 | 1,955,737 | ||||||||||
| 24,880 | AXIS CAPITAL HOLDINGS LTD. | 938,631 | 1,271,119 | ||||||||||
| See accompanying notes to the financial statements. | 85 | (Continued) |
CLEARWATER INVESTMENT TRUST
Schedule of Investments - Clearwater International Fund
December 31, 2014
| Shares | Security | Cost | Fair value (a) | Percent of net assets | |||||||||
| United States (Cont’d): | |||||||||||||
| 4,351 | CARNIVAL PLC | $ | 131,345 | 196,455 | |||||||||
| 2,477 | CATAMARAN CORP.(b) | 112,176 | 128,178 | ||||||||||
| 49,124 | COCA-COLA ENTERPRISES, INC. | 1,541,074 | 2,172,264 | ||||||||||
| 157,653 | FLEXTRONICS INTERNATIONAL LTD.(b) | 1,057,465 | 1,762,560 | ||||||||||
| 16,540 | STEINER LEISURE LTD.(b) | 783,275 | 764,314 | ||||||||||
| 8,041 | THOMSON REUTERS CORP. | 206,631 | 324,395 | ||||||||||
| 6,746,341 | 10,467,621 | 2.17 | % | ||||||||||
| Sub-total Common Stocks: | 355,415,156 | 458,990,201 | 95.24 | % | |||||||||
| Master Limited Partnerships: | |||||||||||||
| United States: | |||||||||||||
| 51,339 | LAZARD LTD., CLASS A | 1,479,020 | 2,568,490 | ||||||||||
| 1,479,020 | 2,568,490 | 0.53 | % | ||||||||||
| Sub-total Master Limited Partnerships: | 1,479,020 | 2,568,490 | 0.53 | % | |||||||||
| Preferred Stocks: | |||||||||||||
| Germany: | |||||||||||||
| 1,521 | BAYERISCHE MOTOREN WERKE A.G. | 49,612 | 124,830 | ||||||||||
| 3,500 | DRAEGERWERK A.G. & CO. KGAA | 397,095 | 355,142 | ||||||||||
| 2,072 | HENKEL A.G. & CO. KGAA | 181,473 | 224,138 | ||||||||||
| 3,478 | PORSCHE AUTOMOBIL HOLDING S.E. | 159,145 | 282,591 | ||||||||||
| 2,770 | RWE A.G. (NON VOTING) | 76,994 | 62,976 | ||||||||||
| 2,472 | VOLKSWAGEN A.G. | 552,028 | 552,175 | ||||||||||
| 1,416,347 | 1,601,852 | 0.33 | % | ||||||||||
| South Korea: | |||||||||||||
| 193 | SAMSUNG ELECTRONICS CO. LTD. | 167,351 | 180,590 | ||||||||||
| 167,351 | 180,590 | 0.04 | % | ||||||||||
| Sub-total Preferred Stocks | 1,583,698 | 1,782,442 | 0.37 | % | |||||||||
| Rights: | |||||||||||||
| Austria: | |||||||||||||
| 10,586 | IMMOEAST A.G.(b)(c) | - | - | ||||||||||
| - | - | 0.00 | % | ||||||||||
| France: | |||||||||||||
| 2 | GROUPE FNAC(b) | - | 11 | ||||||||||
| - | 11 | 0.00 | % | ||||||||||
| South Korea: | |||||||||||||
| 10,454 | DGB FINANCIAL GROUP, INC.(b) | - | 16,549 | ||||||||||
| - | 16,549 | 0.00 | % | ||||||||||
| United Kingdom: | |||||||||||||
| 3,371 | APA GROUP(b) | - | 2,339 | ||||||||||
| - | 2,339 | 0.00 | % | ||||||||||
| Sub-total Rights | - | 18,899 | 0.00 | % | |||||||||
| Warrants: | |||||||||||||
| France: | �� | ||||||||||||
| 12,969 | PEUGEOT S.A. | ||||||||||||
| EXP. 4/29/17, STRIKE $6.43(b) | - | 22,112 | |||||||||||
| - | 22,112 | 0.01 | % | ||||||||||
| Sub-total Warrants | - | 22,112 | 0.01 | % | |||||||||
| See accompanying notes to the financial statements. | 86 | (Continued) |
CLEARWATER INVESTMENT TRUST
Schedule of Investments - Clearwater International Fund
December 31, 2014
| Shares | Security | Cost | Fair value (a) | Percent of net assets | |||||||||
| Investment Companies: | |||||||||||||
| United States: | |||||||||||||
| 19,400 | ISHARES MSCI EAFE SMALL-CAP ETF | $ | 878,588 | 906,174 | |||||||||
| 878,588 | 906,174 | 0.19 | % | ||||||||||
| Sub-total Investment Companies | 878,588 | 906,174 | 0.19 | % | |||||||||
| Short-Term Investments: | |||||||||||||
| 16,787,523 | NORTHERN INSTITUTIONAL FUNDS - U.S. GOVERNMENT SELECT PORTFOLIO, 0.01%(f) | 16,787,523 | 16,787,523 | ||||||||||
| Sub-total Short-Term Investments: | 16,787,523 | 16,787,523 | 3.48 | % | |||||||||
| Grand total(g) | $ | 376,143,985 | 481,075,841 | 99.82 | % | ||||||||
| (a) | Investments are valued in accordance with procedures described in note 2 to the financial statements. | |
| (b) | Non-income producing assets. | |
| (c) | Security has been deemed worthless and is a Level 3 investment. | |
| (d) | Securities are American Depositary Receipts of companies based outside of the United States representing 2.38% of net assets as of December 31, 2014. | |
| (e) | Securities exempt from registration under Rule 144A of the Securities Act of 1933. These securities may be resold in transactions exempt from registration, normally to qualified institutional buyers. The value of these securities is determined by valuations supplied by a pricing service or brokers, or, if not available, in accordance with procedures established by the Board of Trustees. | |
| (f) | The short-term investment is a money market portfolio of the investment company, Northern Institutional Funds. At December 31, 2013, the value of the Clearwater International Fund’s investment in the U.S. Government Select Portfolio of the Northern Institutional Funds was approximately $17,465,003 with net sales of approximately $677,480 during the fiscal year ended December 31, 2014. | |
| (g) | At December 31, 2014, the cost for Federal income tax purposes was $378,319,708. The aggregate gross unrealized appreciation and depreciation of investments in securities based on this cost was as follows: |
| Gross unrealized appreciation | $ | 124,149,675 | ||
| Gross unrealized depreciation | (21,393,542 | ) | ||
| Net unrealized appreciation | $ | 102,756,133 |
At December 31, 2014, the industry sectors for the Clearwater International Fund were:
| Industry Sector | Percent of Long-Term Investments | ||||
| Consumer Discretionary | 17.99 | % | |||
| Consumer Staples | 10.35 | ||||
| Energy | 5.25 | ||||
| Financials | 21.24 | ||||
| Health Care | 9.64 | ||||
| Industrials | 15.01 | ||||
| Information Technology | 10.38 | ||||
| Materials | 5.68 | ||||
| Telecommunication Services | 2.60 | ||||
| Utilities | 1.86 | ||||
| 100.00 | % | ||||
| See accompanying notes to the financial statements. | 87 | (Continued) |
CLEARWATER INVESTMENT TRUST
Schedule of Investments - Clearwater International Fund
December 31, 2014
At December 31, 2014, the Clearwater International Fund’s investments were denominated in the following currencies:
| Concentration by Currency | Percent of Long-Term Investments | ||||
| Euro | 20.23 | % | |||
| British Pound | 18.05 | ||||
| Japanese Yen | 14.03 | ||||
| United States Dollar | 11.00 | ||||
| Canadian Dollar | 6.93 | ||||
| Swiss Franc | 6.83 | ||||
| Hong Kong Dollar | 6.66 | ||||
| Australian Dollar | 5.71 | ||||
| All other currencies less than 5% | 10.56 | ||||
| 100.00 | % | ||||
At December 31, 2014, the Clearwater International Fund had outstanding forward foreign currency exchange contracts as follows:
Contracts To Deliver Currency | Amount (Local Currency) | In Exchange For Currency | Amount (Local Currency) | Settlement Date | Unrealized Gains (Losses) | Counterparty | ||||||||
| Japanese Yen | 376,474,272 | United States Dollar | 3,688,393 | 2/13/15 | $ | 544,169 | Northern Trust | |||||||
| Japanese Yen | 15,098,441 | United States Dollar | 139,765 | 2/13/15 | 13,666 | Northern Trust | ||||||||
| Japanese Yen | 21,258,338 | United States Dollar | 187,606 | 2/13/15 | 10,061 | Northern Trust | ||||||||
| Japanese Yen | 18,808,240 | United States Dollar | 155,040 | 2/13/15 | (2,042 | ) | Northern Trust | |||||||
| United States Dollar | 246,446 | Japanese Yen | 26,899,872 | 2/13/15 | (21,785 | ) | Northern Trust | |||||||
| United States Dollar | 280,061 | Japanese Yen | 29,945,249 | 2/13/15 | (29,966 | ) | Northern Trust | |||||||
| $ | 514,103 | |||||||||||||
| See accompanying notes to the financial statements. | 88 | (Continued) |
CLEARWATER INVESTMENT TRUST
Schedule of Investments – Clearwater International Fund
December 31, 2014
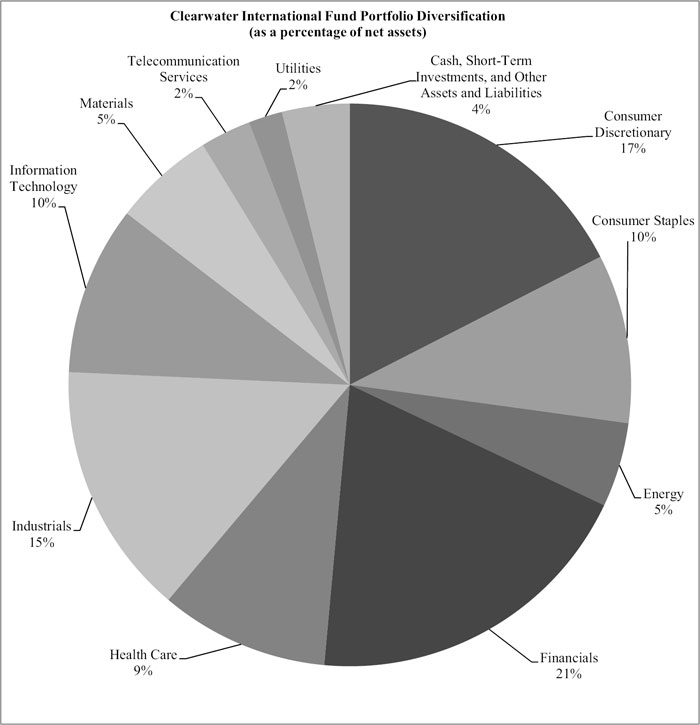
| See accompanying notes to the financial statements | 89 | (Continued) |
Item 2. Code of Ethics
As of December 31, 2014, the Board of Trustees of Clearwater Investment Trust (the “Trust”) has adopted a code of ethics that applies to the Trust’s President/Chief Executive Officer and Treasurer/Chief Financial Officer (“Code of Ethics”). For the fiscal year ended December 31, 2014, there were no amendments to any provision of the Code of Ethics, nor were there any waivers granted from a provision of the Code of Ethics. A copy of the Code of Ethics has been filed with this Form N-CSR pursuant to Item 12(a)(1).
Item 3. Audit Committee Financial Expert
The Board of Trustees of the Trust consists of seven members, four of whom are Independent Trustees as defined by the Investment Company Act of 1940, as amended (the “1940 Act”). The Board of Trustees does not include an “audit committee financial expert” (as defined in Item 3 of Form N-CSR). Given the restrictive nature of the definition of an “audit committee financial expert,” the Board of Trustees has determined that no current member of the Board of Trustees of the Trust qualifies as an “audit committee financial expert.” Furthermore, the Board of Trustees has determined that given the nature of investment company financial statements in general and the investment policies of the Trust’s fund offerings in particular that the independent trustees possess the necessary skills and experience to perform the functions of the audit committee.
Item 4. Principal Accountant Fees and Services
| 2014 | 2013 | ||||
| (a) | Audit Fees | $100,635 | $92,354 | ||
| (b) | Audit-Related Fees | $0 | $0 | ||
| (c) | Tax Fees1 | $54,400 | $29,700 | ||
| (d) | All Other Fees | $0 | $0 |
| 1 | Tax Fees are the aggregate amount billed by the Trust's principal accountant for tax compliance, tax advice, international tax reclaim filings and tax planning during the fiscal year. | ||
| (e) | |||
| 1. | The audit committee has not adopted pre-approval policies and procedures regarding the provision of audit or non-audit services to the trust, as described in paragraph (c)(7) of Rule 2-01 of Regulation S-X, as the audit committee requires that all such services be approved by them in advance. | ||
| 2. | No services were pre-approved by the audit committee pursuant to paragraph (c)(7)(i)(C) of Rule 2-01 of Regulation S-X. | ||
| (f) | Not applicable. | ||
| (g) | Non-Audit Related Fees Provided to the Trust or to the Trust’s Investment Adviser. | ||
| 2014 = $16,150 2013 = $11,100 | |||
| (h) | For the most recent fiscal year, the Audit Committee has determined that the provision of non-audit services to Clearwater Management Company and its affiliates was compatible with maintaining the principal accountant’s independence. | ||
Item 5. Audit Committee of Listed Registrants
Not applicable (the Funds are not listed issuers).
Item 6. Investments
| (a) | Schedule of Investments is included as part of the report to shareholders filed under Item 1 of this report on Form N-CSR. |
| (b) | Not applicable. |
Item 7. Disclosure of Proxy Voting Policies and Procedures for Closed-End Management Investment Companies
Not applicable (the Trust is an open-end management investment company)
Item 8. Portfolio Managers of Closed-End Management Investment Companies
Not applicable (the Trust is an open-end management investment company)
Item 9. Purchases of Equity Securities by Closed-End Management Investment Company and Affiliated Purchasers
Not applicable (the Trust is an open-end management investment company)
Item 10. Submission of Matters to a Vote of Security Holders
There have been no material changes to the procedures by which shareholders may recommend nominees to the Board of Trustees.
Item 11. Controls and Procedures
| (a) | The Trust’s principal executive officer and principal financial officer has concluded that the Trust’s disclosure controls and procedures (as defined in Rule 30a-3(c) under the 1940 Act) are effective based on the principal executive officer and principal financial officer’s evaluation of these controls and procedures (as required by Rule 30a-3(b) under the 1940 Act and Rules 13a-15(b) or 15d-15(b) under the Securities Exchange Act of 1934, as amended) as of a date within 90 days of the filing date of this document. | |
| (b) | There were no changes in the Trust’s internal controls over financial reporting (as defined in Rule 30a-3(d) under the 1940 Act) that occurred during the Trust’s second fiscal quarter of the period covered by this report that have materially affected, or are reasonably likely to materially affect, the Trust’s internal control over financial reporting. |
Item 12. Exhibits
| (a)(1) | Code of Ethics pursuant to Item 2 of Form N-CSR. | |
| (a)(2) | Certifications pursuant to Section 302 of the Sarbanes-Oxley Act of 2002 and required by Rule 30a-2(a) under the 1940 Act. | |
| (b) | Certifications pursuant to Section 906 of the Sarbanes-Oxley Act of 2002 and required by Rule 30a-2(b) under the 1940 Act. |
SIGNATURES
Pursuant to the requirements of the Securities Exchange Act of 1934 and the Investment Company Act of 1940, the registrant has duly caused this report to be signed on its behalf by the undersigned, thereunto duly authorized.
Clearwater Investment Trust | |||
| By | /s/ Justin H. Weyerhaeuser | ||
| Justin H. Weyerhaeuser | |||
| President (Principal Executive Officer) and | |||
Treasurer (Principal Financial Officer) | |||
| Date: March 5, 2015 | |||
Pursuant to the requirements of the Securities Exchange Act of 1934 and the Investment Company Act of 1940, this report has been signed below by the following persons on behalf of the registrant and in the capacities and on the dates indicated.
Clearwater Investment Trust | |||
| By | /s/ Justin H. Weyerhaeuser | ||
| Justin H. Weyerhaeuser | |||
President (Principal Executive Officer) | |||
Date: March 5, 2015 | |||
Clearwater Investment Trust | |||
| By | /s/ Justin H. Weyerhaeuser | ||
Justin H. Weyerhaeuser | |||
Treasurer (Principal Financial Officer) | |||
Date: March 5, 2015 | |||