For the period subsequent to October 31, 2012 through the fiscal year ended December 31, 2012, the following Funds incurred net capital losses, and/or Section 988 currency losses which each Fund intends to treat as having been incurred in the following fiscal year:
On December 22, 2010, the Regulated Investment Company Modernization Act of 2010 (the “Act”) was enacted, which changed various technical rules governing the tax treatment of regulated investment companies. The changes were made effective for the Funds for the fiscal year ended December 31, 2011. One of the more prominent changes addresses capital loss carryforwards. Under the Act, each Fund will be permitted to carry forward capital losses incurred in taxable years beginning after the date of enactment for an unlimited period. However, any losses incurred during those future taxable years will be required to be utilized prior to the losses incurred in pre-enactment taxable years, which carry an expiration date. As a result of this ordering rule, pre-enactment capital loss carryforwards may be more likely to expire unused. Additionally, post-enactment capital loss carryforwards will retain their character as either short-term or long-term capital losses rather than being considered all short-term as permitted under previous regulation. As of December 31, 2012, pre-enactment capital loss carryforwards for U.S. Federal income tax purposes for the Core Equity Fund are $10,839,789, which will expire as follows:
CLEARWATER INVESTMENT TRUST
Notes to Financial Statements
December 31, 2012
The following Fund’s capital loss carryforwards do not expire.
| | | | |
| | Core
Equity Fund | |
Short-Term Capital Loss Carryforward | | $ | 2,623,181 | |
The Fund in the above table may offset future capital gains with these capital loss carryforwards.
The following capital loss carryforwards were utilized at December 31, 2012, for U.S. Federal income tax purposes:
| | | | |
| | Amount | |
Core Equity Fund | | $ | 3,110,304 | |
Tax-Exempt Bond Fund | | | 8,301,181 | |
International Fund | | | 1,559,480 | |
| |
(7) | Expenses and Related-Party Transactions |
The Trust has a contract for investment advisory services with the Adviser. Under terms of separate agreements, Clearwater Core Equity Fund, Clearwater Small Companies Fund, Clearwater Tax-Exempt Bond Fund and Clearwater International Fund pay a fee equal to an annual rate of 0.90%, 1.35%, 0.60% and 1.00%, respectively, of each Fund’s average daily net assets. The Adviser is responsible for the payment or reimbursement of all the Funds’ expenses, except brokerage, taxes, interest, and extraordinary expenses. The Adviser has periodically reduced its management fee for each of the Funds through voluntary waivers. Effective March 15, 2012, the voluntary waivers for the Core Equity Fund and the International Fund were increased to 0.38% and 0.40%, respectively. As of December 31, 2012, the management fees paid by the Core Equity, Small Companies, Tax-Exempt Bond and International Funds net of voluntary waivers are 0.54%, 1.00%, 0.36%, and 0.62%, respectively. As of December 31, 2012, the management fees in place, net of voluntary waivers, for the Core Equity, Small Companies, Tax-Exempt Bond, and International Funds are 0.52%, 1.00%, 0.36%, and 0.60%, respectively.
In addition to fees and expenses which the Funds bear directly, the Funds indirectly bear a pro rata share of the fees and expenses of any acquired funds in which they invest, such as short-term investments in mutual funds and investments in closed-end funds. Such indirect expenses are not included in any of the reported expense ratios.
The Adviser has entered into subadvisory contracts with independent investment advisory firms for each Fund to provide daily investment management services. Effective October 16, 2012, the Adviser has engaged and entered into subadvisory contracts with Denver, WCM and Templeton as three new subadvisers to provide daily investment management services and investment selection decisions for allocated portions of the International Fund. The subadvisory fees are based on each subadviser’s proportional net assets it currently manages within each Fund and are paid directly by the Adviser.
The subadvisory fee for the Clearwater Core Equity Fund, payable to Parametric, Heartland and Osterweis, is equal to an annual rate of 0.15% of the portion of net assets managed, an annual rate of 0.65% of the portion of net assets managed and an annual rate of 0.75% of the portion of net assets managed, respectively. The subadvisory fee payable to Knightsbridge is equal to a fee schedule based on an annual rate of 0.75% on the first
CLEARWATER INVESTMENT TRUST
Notes to Financial Statements
December 31, 2012
$20 million of the portion of net assets managed, decreasing to 0.50% of the portion of net assets managed in excess of $20 million. The subadvisory fee for the Clearwater Small Companies Fund, payable to Kennedy, is equal to a fee schedule based on an annual rate of 0.85% on the first $50 million of the portion of net assets managed, decreasing to 0.80% of the portion of net assets managed in excess of $50 million. The subadvisory fee payable to Keeley is equal to a fee schedule based on an annual rate of 1.00% on the first $2 million of the portion of net assets managed, decreasing to 0.85% on the next $8 million of the portion of net assets managed, and further decreasing to 0.70% of the portion of net assets managed in excess of $10 million.
The subadvisory fee for the Clearwater Tax-Exempt Bond Fund, payable to Sit, is equal to a fee schedule based on an annual rate of 0.40% on the first $20 million in net assets managed, decreasing to 0.30% on the next $30 million of the portion of net assets managed, decreasing to 0.25% on the next $25 million of the portion of net assets managed, and further decreasing to 0.20% of net assets managed in excess of $75 million.
The subadvisory fee for the Clearwater International Fund, payable to Parametric, is equal to an annual rate of 0.15% of the portion of net assets managed. The subadvisory fee payable to Artisan Partners is equal to a fee schedule based on an annual rate of 0.80% on the first $50 million of the portion of net assets managed, decreasing to 0.60% on the next $50 million of the portion of net assets managed, and further decreasing to 0.50% of the portion of net assets managed in excess of $100 million. The subadvisory fee payable to Denver is equal to a fee schedule based on an annual rate of 1.25% on the first $10 million of the portion of net assets managed, decreasing to 0.85% of the portion of net assets managed in excess of $10 million. The subadvisory fee payable to WCM is equal to an annual rate of 0.80% of the portion of net assets managed. The subadvisory fee payable to Templeton is equal to a fee schedule based on an annual rate of 0.95% on the first $25 million of the portion of net assets managed, decreasing to 0.85% on the next $25 million of the portion of net assets managed, decreasing to 0.75% on the next $50 million of the portion of net assets managed, decreasing to 0.65% on the next $150 million of the portion of net assets managed, decreasing to 0.55% on the next $250 million of the net assets managed and further decreasing to 0.50% of the portion of net assets managed in excess of $500 million.
In addition to the above, under the investment advisory agreements with AXA Rosenberg and Eagle, which the Board of Trustees of the Trust voted to terminate on October 16, 2012, the Adviser paid AXA Rosenberg and Eagle based on the proportional net assets that each subadviser managed for the Clearwater International Fund. The subadvisory fee payable to AXA Rosenberg was equal to a fee schedule based on an annual rate of 0.85% on the first $50 million of the portion of net assets managed, decreasing to 0.75% on the next $50 million of the portion of net assets managed and further decreasing to 0.65% of the portion of net assets managed in excess of $100 million. The subadvisory fee payable to Eagle was equal to a fee schedule based on an annual rate of 0.60% on the first $100 million of the portion of net assets managed, decreasing to 0.50% of the portion of net assets managed in excess of $100 million.
The Adviser has also engaged FCI as a subadviser for each Fund. FCI regularly provides the Funds with various investment-related services, including investment strategy advice, manager recommendations and related duties as requested by the Adviser. FCI also provides certain services related to due diligence, performance reporting, compliance, and other administrative functions, which support the investment management services and subadviser oversight services provided to the Trust by the Adviser. For its services, FCI is compensated with a subadvisory fee payable by the Adviser of 0.20% of each Fund’s net assets, paid on a quarterly basis. FCI is compensated out of the investment advisory fees the Adviser receives from the respective Funds. FCI has agreed to waive the difference between the amount calculated under the subadvisory fee schedule and an amount determined by multiplying the total number of hours worked by FCI in providing services under the subadvisory agreement by an hourly rate that is approved by the Adviser. The effect of this waiver agreement is that fees paid
CLEARWATER INVESTMENT TRUST
Notes to Financial Statements
December 31, 2012
to FCI under the subadvisory agreement would approximate the fees previously paid to FCI under a consulting agreement previously in effect between the Adviser and FCI.
| |
(8) | Derivative Instruments |
Information concerning the types of derivatives in which the International Fund invests, the objectives for using them and their related risks can be found in Note 2 (c).
Below are the types of derivatives in the International Fund by location as presented in the Statements of Assets and Liabilities as of December 31, 2012:
| | | | | | | | | | |
| | ASSETS | | | | LIABILITIES | | |
Derivative Type | | Statements of Assets and
Liabilities Location | | Value | | Statements of Assets and
Liabilities Location | | Value |
|
Forward foreign currency exchange contracts | | Unrealized appreciation on forward foreign
currency exchange contracts | | $ | 403,237 | | Unrealized depreciation on forward foreign
currency exchange contracts | | $ | 64,746 |
The following tables set forth by primary risk exposure the International Fund’s net realized gain (loss) and net increase (decrease) in appreciation/depreciation on forward foreign currency exchange contracts for the year ended December 31, 2012:
| | | | | | | | | | | | |
Derivative Type | | Statements of
Operations Location | | Value | | Derivative Type | | Statements of Operations
Location | | Value |
Forward foreign currency exchange contracts | | Net realized gain on forward foreign currency exchange contracts | | $ | 101,063 | | Forward foreign currency exchange contracts | | Net increase in appreciation on forward foreign currency exchange contracts | | $ | 336,676 |
Derivative transactions are measured in terms of the notional amount. The following table presents, for the International Fund, the number of transactions and weighted average notional amounts, which is indicative of the volume of derivative activity, for the year ended December 31, 2012.
| | | | | |
Foreign Exchange Contracts | |
Number of
Transactions | | Weighted
Average Notional
Amount | |
| 1,804 | | $ | 1,366,319 | |
Management has evaluated subsequent events relating to the Funds through the date the financial statements were available to be issued, and has concluded there are no such events or transactions requiring financial statement disclosure and/or adjustments to the financial statements.
CLEARWATER INVESTMENT TRUST
Schedule of Investments - Clearwater Core Equity Fund(A)
December 31, 2012
| | | | | | | | | | | | | |
Shares | | Security | | Cost | | Fair
value (a) | | Percent
of
net assets | |
Common Stocks: | | | | | | | | | | |
| Consumer Discretionary: | | | | | | | | | | |
| 2,300 | | ABERCROMBIE & FITCH CO., CLASS A | | $ | 50,218 | | | 110,331 | | | | |
| 1,500 | | ADVANCE AUTO PARTS, INC. | | | 53,558 | | | 108,525 | | | | |
| 6,150 | | AMAZON.COM, INC.(b) | | | 274,722 | | | 1,544,511 | | | | |
| 1,600 | | AMC NETWORKS, INC., CLASS A(b) | | | 25,785 | | | 79,200 | | | | |
| 3,300 | | AMERICAN EAGLE OUTFITTERS, INC. | | | 33,099 | | | 67,683 | | | | |
| 1,600 | | AUTOLIV, INC.(c) | | | 44,874 | | | 107,824 | | | | |
| 500 | | AUTOZONE, INC.(b) | | | 32,038 | | | 177,215 | | | | |
| 23,295 | | BED BATH & BEYOND, INC.(b) | | | 1,200,112 | | | 1,302,424 | | | | |
| 1,400 | | BIG LOTS, INC.(b) | | | 15,477 | | | 39,844 | | | | |
| 2,200 | | BORGWARNER, INC.(b) | | | 51,799 | | | 157,564 | | | | |
| 750 | | BRINKER INTERNATIONAL, INC. | | | 10,084 | | | 23,243 | | | | |
| 1,700 | | CABLEVISION SYSTEMS CORP. (NEW | | | | | | | | | | |
| | | YORK GROUP), CLASS A | | | 15,956 | | | 25,398 | | | | |
| 4,168 | | CARMAX, INC.(b) | | | 50,984 | | | 156,467 | | | | |
| 5,100 | | CARNIVAL CORP. | | | 173,794 | | | 187,527 | | | | |
| 6,743 | | CBS CORP., CLASS B (NON VOTING) | | | 77,837 | | | 256,571 | | | | |
| 600 | | CHARTER COMMUNICATIONS, INC., CLASS A(b) | | | 30,036 | | | 45,744 | | | | |
| 600 | | CHICO’S FAS, INC. | | | 5,619 | | | 11,076 | | | | |
| 68,820 | | CINEMARK HOLDINGS, INC. | | | 1,340,356 | | | 1,787,944 | | | | |
| 18,500 | | CLEAR CHANNEL OUTDOOR HOLDINGS, INC., CLASS A | | | 72,792 | | | 129,870 | | | | |
| 5,000 | | COACH, INC. | | | 19,161 | | | 277,550 | | | | |
| 41,100 | | COMCAST CORP., CLASS A | | | 748,537 | | | 1,536,318 | | | | |
| 4,600 | | D.R. HORTON, INC. | | | 22,057 | | | 90,988 | | | | |
| 2,300 | | DARDEN RESTAURANTS, INC. | | | 47,909 | | | 103,661 | | | | |
| 2,400 | | DEVRY, INC. | | | 44,808 | | | 56,952 | | | | |
| 1,500 | | DICK’S SPORTING GOODS, INC. | | | 24,802 | | | 68,235 | | | | |
| 14,821 | | DIRECTV(b) | | | 174,284 | | | 743,421 | | | | |
| 3,200 | | DISCOVERY COMMUNICATIONS, INC., CLASS A(b) | | | 193,638 | | | 203,136 | | | | |
| 500 | | DOLLAR GENERAL CORP.(b) | | | 25,005 | | | 22,045 | | | | |
| 6,700 | | DOLLAR TREE, INC.(b) | | | 61,517 | | | 271,752 | | | | |
| 710 | | EXPEDIA, INC. | | | 10,883 | | | 43,630 | | | | |
| 500 | | FAMILY DOLLAR STORES, INC. | | | 12,652 | | | 31,705 | | | | |
| 3,000 | | FOOT LOCKER, INC. | | | 40,394 | | | 96,360 | | | | |
| 53,863 | | FORD MOTOR CO. | | | 275,953 | | | 697,526 | | | | |
| 4,600 | | GAMESTOP CORP., CLASS A | | | 34,643 | | | 115,414 | | | | |
| 5,700 | | GANNETT CO., INC. | | | 51,200 | | | 102,657 | | | | |
| 4,100 | | GAP (THE), INC. | | | 58,946 | | | 127,264 | | | | |
| 2,200 | | GARMIN LTD.(c) | | | 40,557 | | | 89,804 | | | | |
| 4,000 | | GENERAL MOTORS CO.(b) | | | 85,048 | | | 115,320 | | | | |
| 7,500 | | GENTEX CORP. | | | 106,860 | | | 141,150 | | | | |
| 3,450 | | GENUINE PARTS CO. | | | 102,424 | | | 219,351 | | | | |
| 1,900 | | GOODYEAR TIRE & RUBBER (THE) CO.(b) | | | 26,258 | | | 26,239 | | | | |
| 166,500 | | H&R BLOCK, INC. | | | 2,380,408 | | | 3,091,905 | | | | |
| 500 | | HANESBRANDS, INC.(b) | | | 10,750 | | | 17,910 | | | | |
| 6,750 | | HARLEY-DAVIDSON, INC. | | | 39,547 | | | 329,670 | | | | |
| 4,300 | | HARMAN INTERNATIONAL INDUSTRIES, INC. | | | 74,798 | | | 191,952 | | | | |
| 400 | | HASBRO, INC. | | | 10,206 | | | 14,360 | | | | |
| 29,825 | | HOME DEPOT (THE), INC. | | | 19,452 | | | 1,844,676 | | | | |
| 2,200 | | INTERNATIONAL GAME TECHNOLOGY | | | 31,196 | | | 31,174 | | | | |
| 15,600 | | INTERPUBLIC GROUP OF (THE) COS., INC. | | | 40,950 | | | 171,912 | | | | |
| 2,700 | | J.C. PENNEY CO., INC. | | | 53,244 | | | 53,217 | | | | |
| 1,400 | | JARDEN CORP. | | | 25,277 | | | 72,380 | | | | |
| 56,458 | | JOHNSON CONTROLS, INC. | | | 1,545,253 | | | 1,733,261 | | | | |
| 16,469 | | KOHL’S CORP. | | | 479,722 | | | 707,838 | | | | |
| 4,200 | | LAMAR ADVERTISING CO., CLASS A(b) | | | 55,664 | | | 162,750 | | | | |
| 5,738 | | LAS VEGAS SANDS CORP. | | | 163,627 | | | 264,866 | | | | |
| 3,000 | | LEAR CORP. | | | 128,814 | | | 140,520 | | | | |
| 2,900 | | LENNAR CORP., CLASS A | | | 38,266 | | | 112,143 | | | | |
| 5,800 | | LIBERTY GLOBAL, INC., CLASS A(b) | | | 103,484 | | | 365,342 | | | | |
| 88,880 | | LIBERTY INTERACTIVE CORP., CLASS A(b) | | | 1,551,796 | | | 1,749,158 | | | | |
| 5,032 | | LIBERTY MEDIA CORP. - LIBERTY CAPITAL, CLASS A(b) | | | 30,073 | | | 583,762 | | | | |
| 790 | | LIBERTY VENTURES, CLASS A(b) | | | 23,580 | | | 53,530 | | | | |
| 6,190 | | LIMITED BRANDS, INC. | | | 70,745 | | | 291,301 | | | | |
| 2,000 | | LKQ CORP.(b) | | | 24,950 | | | 42,200 | | | | |
| 17,400 | | LOWE’S COS., INC. | | | 483,438 | | | 618,048 | | | | |
| 5,000 | | MACY’S, INC. | | | 81,374 | | | 195,100 | | | | |
| | |
(A)Name change effective April 30, 2012. Formerly known as the Clearwater Growth Fund. |
|
See accompanying notes to the financial statements. | 28 | (Continued) |
CLEARWATER INVESTMENT TRUST
Schedule of Investments - Clearwater Core Equity Fund
December 31, 2012
| | | | | | | | | | | | | |
Shares | | Security | | Cost | | Fair
value (a) | | Percent
of
net assets | |
Consumer Discretionary (Cont’d): | | | | | | | | | | |
| 66,130 | | MARKS & SPENCER GROUP PLC ADR(c)(d) | | $ | 772,476 | | | 823,980 | | | | |
| 4,969 | | MARRIOTT INTERNATIONAL, INC., CLASS A | | | 60,013 | | | 185,195 | | | | |
| 75,496 | | MARRIOTT VACATIONS WORLDWIDE CORP.(b) | | | 1,321,371 | | | 3,145,918 | | | | |
| 4,200 | | MATTEL, INC. | | | 75,213 | | | 153,804 | | | | |
| 17,302 | | MCDONALD’S CORP. | | | 470,052 | | | 1,526,209 | | | | |
| 3,600 | | MCGRAW-HILL (THE) COS., INC. | | | 84,305 | | | 196,812 | | | | |
| 6,600 | | MGM RESORTS INTERNATIONAL(b) | | | 54,921 | | | 76,824 | | | | |
| 600 | | MOHAWK INDUSTRIES, INC.(b) | | | 26,796 | | | 54,282 | | | | |
| 1,400 | | MORNINGSTAR, INC. | | | 57,577 | | | 87,962 | | | | |
| 800 | | NETFLIX, INC.(b) | | | 47,728 | | | 74,224 | | | | |
| 2,200 | | NEWELL RUBBERMAID, INC. | | | 26,950 | | | 48,994 | | | | |
| 28,700 | | NEWS CORP., CLASS A | | | 308,077 | | | 732,998 | | | | |
| 12,000 | | NIKE, INC., CLASS B | | | 283,152 | | | 619,200 | | | | |
| 4,300 | | NORDSTROM, INC. | | | 45,232 | | | 230,050 | | | | |
| 100 | | NVR, INC.(b) | | | 51,542 | | | 92,000 | | | | |
| 2,195 | | OMNICOM GROUP, INC. | | | 52,802 | | | 109,662 | | | | |
| 2,300 | | O’REILLY AUTOMOTIVE, INC.(b) | | | 69,868 | | | 205,666 | | | | |
| 1,500 | | PANERA BREAD CO., CLASS A(b) | | | 69,668 | | | 238,245 | | | | |
| 2,600 | | PETSMART, INC. | | | 55,966 | | | 177,684 | | | | |
| 600 | | PRICELINE.COM, INC.(b) | | | 55,053 | | | 372,720 | | | | |
| 14,100 | | PULTEGROUP, INC.(b) | | | 58,797 | | | 256,056 | | | | |
| 700 | | PVH CORP. | | | 26,253 | | | 77,707 | | | | |
| 1,500 | | RALPH LAUREN CORP. | | | 31,320 | | | 224,880 | | | | |
| 3,000 | | REGAL ENTERTAINMENT GROUP, CLASS A | | | 29,065 | | | 41,850 | | | | |
| 4,600 | | ROSS STORES, INC. | | | 36,395 | | | 249,090 | | | | |
| 21,031 | | ROYAL CARIBBEAN CRUISES LTD. | | | 610,836 | | | 715,054 | | | | |
| 600 | | SCRIPPS NETWORKS INTERACTIVE, INC., CLASS A | | | 21,337 | | | 34,752 | | | | |
| 600 | | SEARS HOLDINGS CORP.(b) | | | 24,822 | | | 24,816 | | | | |
| 10,400 | | SERVICE CORP. INTERNATIONAL | | | 74,152 | | | 143,624 | | | | |
| 2,600 | | SIGNET JEWELERS LTD.(c) | | | 52,469 | | | 138,840 | | | | |
| 38,500 | | SIRIUS XM RADIO, INC. | | | 106,710 | | | 111,265 | | | | |
| 14,250 | | STARBUCKS CORP. | | | 182,045 | | | 764,085 | | | | |
| 710 | | STARWOOD HOTELS & RESORTS | | | | | | | | | | |
| | | WORLDWIDE, INC. | | | 14,193 | | | 40,726 | | | | |
| 12,200 | | TARGET CORP. | | | 353,659 | | | 721,874 | | | | |
| 1,000 | | TEMPUR-PEDIC INTERNATIONAL, INC.(b) | | | 31,500 | | | 31,490 | | | | |
| 900 | | TESLA MOTORS, INC.(b) | | | 23,418 | | | 30,483 | | | | |
| 4,500 | | THOMSON REUTERS CORP. | | | 128,277 | | | 130,770 | | | | |
| 1,900 | | THOR INDUSTRIES, INC. | | | 22,316 | | | 71,117 | | | | |
| 4,200 | | TIFFANY & CO. | | | 122,192 | | | 240,828 | | | | |
| 5,979 | | TIME WARNER CABLE, INC. | | | 194,383 | | | 581,099 | | | | |
| 21,033 | | TIME WARNER, INC. | | | 476,695 | | | 1,006,008 | | | | |
| 10,094 | | TJX COS., INC. | | | 86,033 | | | 428,490 | | | | |
| 2,210 | | TRIPADVISOR, INC.(b) | | | 42,908 | | | 92,732 | | | | |
| 2,800 | | TRW AUTOMOTIVE HOLDINGS CORP.(b) | | | 87,856 | | | 150,108 | | | | |
| 300 | | ULTA SALON COSMETICS & FRAGRANCE, INC. | | | 29,379 | | | 29,478 | | | | |
| 2,127 | | URBAN OUTFITTERS, INC.(b) | | | 37,857 | | | 83,719 | | | | |
| 1,700 | | VF CORP. | | | 87,065 | | | 256,649 | | | | |
| 43,792 | | VIACOM, INC., CLASS B | | | 1,892,513 | | | 2,309,590 | | | | |
| 4,000 | | VIRGIN MEDIA, INC. | | | 55,548 | | | 147,000 | | | | |
| 800 | | VISTEON CORP.(b) | | | 33,968 | | | 43,056 | | | | |
| 29,960 | | WALT DISNEY (THE) CO. | | | 587,935 | | | 1,491,708 | | | | |
| 2,300 | | WHIRLPOOL CORP. | | | 98,184 | | | 234,025 | | | | |
| 66,031 | | WMS INDUSTRIES, INC.(b) | | | 1,237,799 | | | 1,155,543 | | | | |
| 5,475 | | WYNDHAM WORLDWIDE CORP. | | | 24,500 | | | 291,325 | | | | |
| 1,600 | | WYNN RESORTS LTD. | | | 32,322 | | | 179,984 | | | | |
| 9,016 | | YUM! BRANDS, INC. | | | 78,831 | | | 598,662 | | | | |
| | | | | | 24,255,584 | | | 46,619,326 | | | 11.80% | |
Consumer Staples: | | | | | | | | | | |
| 30,800 | | ALTRIA GROUP, INC. | | | 160,507 | | | 967,736 | | | | |
| 52,016 | | ARCHER-DANIELS-MIDLAND CO. | | | 1,434,097 | | | 1,424,718 | | | | |
| 4,300 | | BEAM, INC. | | | 115,443 | | | 262,687 | | | | |
| 2,916 | | BROWN-FORMAN CORP., CLASS B | | | 57,343 | | | 184,437 | | | | |
| 23,505 | | BUNGE LTD. | | | 1,518,601 | | | 1,708,578 | | | | |
| 4,000 | | CHURCH & DWIGHT CO., INC. | | | 100,310 | | | 214,280 | | | | |
| 3,000 | | CLOROX (THE) CO. | | | 154,515 | | | 219,660 | | | | |
| 67,781 | | COCA-COLA (THE) CO. | | | 1,113,200 | | | 2,457,061 | | | | |
| 2,300 | | COCA-COLA ENTERPRISES, INC. | | | 39,664 | | | 72,979 | | | | |
| | |
See accompanying notes to the financial statements. | 29 | (Continued) |
CLEARWATER INVESTMENT TRUST
Schedule of Investments - Clearwater Core Equity Fund
December 31, 2012
| | | | | | | | | | | | | |
Shares | | Security | | Cost | | Fair
value (a) | | Percent
of
net assets | |
Consumer Staples (Cont’d): | | | | | | | | | | |
| 8,490 | | COLGATE-PALMOLIVE CO. | | $ | 539,355 | | | 887,545 | | | | |
| 3,700 | | CONAGRA FOODS, INC. | | | 85,654 | | | 109,150 | | | | |
| 4,600 | | CONSTELLATION BRANDS, INC., CLASS A(b) | | | 63,227 | | | 162,794 | | | | |
| 7,800 | | COSTCO WHOLESALE CORP. | | | 237,671 | | | 770,406 | | | | |
| 29,656 | | CVS CAREMARK CORP. | | | 840,220 | | | 1,433,868 | | | | |
| 16,185 | | DIAGEO PLC ADR(c)(d) | | | 1,214,077 | | | 1,886,847 | | | | |
| 6,000 | | DR PEPPER SNAPPLE GROUP, INC. | | | 125,060 | | | 265,080 | | | | |
| 397 | | ENERGIZER HOLDINGS, INC. | | | 20,533 | | | 31,752 | | | | |
| 3,734 | | ESTEE LAUDER (THE) COS., INC., CLASS A | | | 70,943 | | | 223,517 | | | | |
| 1,800 | | FLOWERS FOODS, INC. | | | 25,434 | | | 41,886 | | | | |
| 12,400 | | GENERAL MILLS, INC. | | | 277,056 | | | 501,084 | | | | |
| 5,800 | | GREEN MOUNTAIN COFFEE ROASTERS, INC.(b) | | | 122,296 | | | 239,888 | | | | |
| 3,900 | | H.J. HEINZ CO. | | | 146,623 | | | 224,952 | | | | |
| 3,800 | | HERBALIFE LTD.(c) | | | 52,204 | | | 125,172 | | | | |
| 2,042 | | HERSHEY (THE) CO. | | | 88,044 | | | 147,473 | | | | |
| 2,400 | | HORMEL FOODS CORP. | | | 43,206 | | | 74,904 | | | | |
| 1,700 | | INGREDION, INC. | | | 48,104 | | | 109,531 | | | | |
| 1,600 | | J.M. SMUCKER (THE) CO. | | | 64,617 | | | 137,984 | | | | |
| 5,250 | | KIMBERLY-CLARK CORP. | | | 385,435 | | | 443,258 | | | | |
| 19,209 | | KRAFT FOODS GROUP, INC. | | | 499,883 | | | 873,433 | | | | |
| 13,400 | | KROGER (THE) CO. | | | 228,089 | | | 348,668 | | | | |
| 1,574 | | LORILLARD, INC. | | | 57,946 | | | 183,639 | | | | |
| 1,200 | | MCCORMICK & CO., INC. (NON VOTING) | | | 50,951 | | | 76,236 | | | | |
| 2,200 | | MEAD JOHNSON NUTRITION CO. | | | 103,422 | | | 144,958 | | | | |
| 1,800 | | MOLSON COORS BREWING CO., CLASS B | | | 54,437 | | | 77,022 | | | | |
| 29,538 | | MONDELEZ INTERNATIONAL, INC., CLASS A | | | 371,129 | | | 752,333 | | | | |
| 900 | | MONSTER BEVERAGE CORP.(b) | | | 15,478 | | | 47,592 | | | | |
| 27,891 | | PEPSICO, INC. | | | 1,058,802 | | | 1,908,581 | | | | |
| 30,132 | | PHILIP MORRIS INTERNATIONAL, INC. | | | 261,758 | | | 2,520,241 | | | | |
| 200 | | POST HOLDINGS, INC.(b) | | | 4,616 | | | 6,850 | | | | |
| 47,360 | | PROCTER & GAMBLE (THE) CO. | | | 823,796 | | | 3,215,270 | | | | |
| 400 | | RALCORP HOLDINGS, INC.(b) | | | 25,772 | | | 35,860 | | | | |
| 4,200 | | REYNOLDS AMERICAN, INC. | | | 79,844 | | | 174,006 | | | | |
| 1,600 | | SAFEWAY, INC. | | | 28,960 | | | 28,944 | | | | |
| 5,700 | | SMITHFIELD FOODS, INC.(b) | | | 106,346 | | | 122,949 | | | | |
| 7,900 | | SYSCO CORP. | | | 121,024 | | | 250,114 | | | | |
| 6,010 | | TYSON FOODS, INC., CLASS A | | | 53,610 | | | 116,594 | | | | |
| 48,000 | | UNILEVER N.V. (REGISTERED)(c) | | | 1,454,959 | | | 1,838,400 | | | | |
| 20,150 | | WALGREEN CO. | | | 231,445 | | | 745,752 | | | | |
| 28,723 | | WAL-MART STORES, INC. | | | 1,387,001 | | | 1,959,770 | | | | |
| 4,400 | | WHOLE FOODS MARKET, INC. | | | 116,393 | | | 401,852 | | | | |
| | | | | | 16,279,100 | | | 31,158,291 | | | 7.88% | |
Energy: | | | | | | | | | | |
| 7,542 | | ALPHA NATURAL RESOURCES, INC.(b) | | | 58,865 | | | 73,459 | | | | |
| 9,446 | | ANADARKO PETROLEUM CORP. | | | 319,802 | | | 701,932 | | | | |
| 5,300 | | APACHE CORP. | | | 487,670 | | | 416,050 | | | | |
| 1,700 | | ATWOOD OCEANICS, INC.(b) | | | 51,221 | | | 77,843 | | | | |
| 800 | | BAKER HUGHES, INC. | | | 24,230 | | | 32,672 | | | | |
| 69,000 | | BP PLC ADR(c)(d) | | | 3,074,860 | | | 2,873,160 | | | | |
| 1,600 | | CABOT OIL & GAS CORP. | | | 69,825 | | | 79,584 | | | | |
| 4,800 | | CAMERON INTERNATIONAL CORP.(b) | | | 124,988 | | | 271,008 | | | | |
| 128,100 | | CHESAPEAKE ENERGY CORP. | | | 2,300,610 | | | 2,129,022 | | | | |
| 33,595 | | CHEVRON CORP. | | | 1,471,891 | | | 3,632,963 | | | | |
| 7,200 | | COBALT INTERNATIONAL ENERGY, INC.(b) | | | 63,000 | | | 176,832 | | | | |
| 1,700 | | CONCHO RESOURCES, INC.(b) | | | 49,632 | | | 136,952 | | | | |
| 25,444 | | CONOCOPHILLIPS | | | 460,670 | | | 1,475,498 | | | | |
| 4,531 | | CONSOL ENERGY, INC. | | | 118,221 | | | 145,445 | | | | |
| 1,000 | | CONTINENTAL RESOURCES, INC.(b) | | | 20,765 | | | 73,490 | | | | |
| 37,455 | | COSAN LTD., CLASS A(c) | | | 519,427 | | | 648,346 | | | | |
| 9,300 | | DENBURY RESOURCES, INC.(b) | | | 88,950 | | | 150,660 | | | | |
| 59,403 | | DEVON ENERGY CORP. | | | 3,803,353 | | | 3,091,332 | | | | |
| 3,000 | | DRESSER-RAND GROUP, INC.(b) | | | 98,595 | | | 168,420 | | | | |
| 23,548 | | ENSCO PLC, CLASS A(c) | | | 1,163,852 | | | 1,395,925 | | | | |
| 27,570 | | ENTERPRISE PRODUCTS PARTNERS L.P. | | | 1,184,195 | | | 1,380,706 | | | | |
| 4,800 | | EOG RESOURCES, INC. | | | 62,765 | | | 579,792 | | | | |
| 4,000 | | EQT CORP. | | | 132,900 | | | 235,920 | | | | |
| 15,800 | | EXCO RESOURCES, INC.(b) | | | 115,036 | | | 106,966 | | | | |
| 77,051 | | EXXON MOBIL CORP. | | | 3,049,270 | | | 6,668,764 | | | | |
| | |
See accompanying notes to the financial statements. | 30 | (Continued) |
CLEARWATER INVESTMENT TRUST
Schedule of Investments - Clearwater Core Equity Fund
December 31, 2012
| | | | | | | | | | | | | |
Shares | | Security | | Cost | | Fair
value (a) | | Percent
of
net assets | |
Energy (Cont’d): | | | | | | | | | | |
| 3,900 | | FMC TECHNOLOGIES, INC.(b) | | $ | 97,950 | | | 167,037 | | | | |
| 11,458 | | HALLIBURTON CO. | | | 167,048 | | | 397,478 | | | | |
| 3,100 | | HELMERICH & PAYNE, INC. | | | 39,003 | | | 173,631 | | | | |
| 23,395 | | HESS CORP. | | | 1,249,072 | | | 1,238,999 | | | | |
| 4,000 | | HOLLYFRONTIER CORP. | | | 52,098 | | | 186,200 | | | | |
| 53,282 | | KINDER MORGAN, INC. | | | 1,503,289 | | | 1,882,453 | | | | |
| 9,000 | | KOSMOS ENERGY LTD.(b)(c) | | | 89,726 | | | 111,150 | | | | |
| 51,390 | | MAGELLAN MIDSTREAM PARTNERS L.P. | | | 1,489,018 | | | 2,219,534 | | | | |
| 44,232 | | MARATHON OIL CORP. | | | 1,056,702 | | | 1,356,153 | | | | |
| 3,800 | | MARATHON PETROLEUM CORP. | | | 209,484 | | | 239,400 | | | | |
| 265,363 | | MCDERMOTT INTERNATIONAL, INC.(b) | | | 3,084,257 | | | 2,924,300 | | | | |
| 2,400 | | MURPHY OIL CORP. | | | 32,055 | | | 142,920 | | | | |
| 8,722 | | NATIONAL OILWELL VARCO, INC. | | | 214,854 | | | 596,149 | | | | |
| 4,200 | | NOBLE ENERGY, INC. | | | 158,332 | | | 427,308 | | | | |
| 32,840 | | OCCIDENTAL PETROLEUM CORP. | | | 1,471,855 | | | 2,515,873 | | | | |
| 2,500 | | OCEANEERING INTERNATIONAL, INC. | | | 66,222 | | | 134,475 | | | | |
| 2,500 | | PATTERSON-UTI ENERGY, INC. | | | 46,600 | | | 46,575 | | | | |
| 4,500 | | PEABODY ENERGY CORP. | | | 96,557 | | | 119,745 | | | | |
| 13,372 | | PHILLIPS 66 | | | 156,993 | | | 710,053 | | | | |
| 3,200 | | PIONEER NATURAL RESOURCES CO. | | | 48,507 | | | 341,088 | | | | |
| 5,100 | | PLAINS EXPLORATION & PRODUCTION CO.(b) | | | 137,712 | | | 239,394 | | | | |
| 58,900 | | QEP RESOURCES, INC. | | | 2,054,577 | | | 1,782,903 | | | | |
| 1,200 | | RANGE RESOURCES CORP. | | | 39,654 | | | 75,396 | | | | |
| 12,200 | | SANDRIDGE ENERGY, INC.(b) | | | 69,540 | | | 77,470 | | | | |
| 21,000 | | SCHLUMBERGER LTD. | | | 625,961 | | | 1,455,090 | | | | |
| 1,100 | | SM ENERGY CO. | | | 57,442 | | | 57,431 | | | | |
| 7,200 | | SOUTHWESTERN ENERGY CO.(b) | | | 107,060 | | | 240,552 | | | | |
| 10,954 | | SPECTRA ENERGY CORP. | | | 155,906 | | | 299,921 | | | | |
| 1,200 | | TESORO CORP. | | | 24,660 | | | 52,860 | | | | |
| 29,517 | | TIDEWATER, INC. | | | 1,446,858 | | | 1,318,820 | | | | |
| 12,110 | | VALERO ENERGY CORP. | | | 130,822 | | | 413,193 | | | | |
| 2,600 | | WHITING PETROLEUM CORP.(b) | | | 73,761 | | | 112,762 | | | | |
| 7,200 | | WILLIAMS (THE) COS., INC. | | | 152,628 | | | 235,728 | | | | |
| 2,400 | | WPX ENERGY, INC.(b) | | | 34,284 | | | 35,712 | | | | |
| | | | | | 35,355,080 | | | 49,050,494 | | | 12.41% | |
Financials: | | | | | | | | | | |
| 6,000 | | ACE LTD.(c) | | | 317,873 | | | 478,800 | | | | |
| 1,100 | | AFFILIATED MANAGERS GROUP, INC.(b) | | | 73,654 | | | 143,165 | | | | |
| 9,850 | | AFLAC, INC. | | | 262,100 | | | 523,232 | | | | |
| 2,100 | | ALEXANDRIA REAL ESTATE EQUITIES, INC. | | | 111,442 | | | 145,572 | | | | |
| 4,916 | | ALLEGHANY CORP.(b) | | | 1,400,737 | | | 1,648,925 | | | | |
| 2,700 | | ALLIED WORLD ASSURANCE CO. HOLDINGS A.G.(c) | | | 86,630 | | | 212,760 | | | | |
| 8,300 | | ALLSTATE (THE) CORP. | | | 197,623 | | | 333,411 | | | | |
| 500 | | AMERICAN CAMPUS COMMUNITIES, INC. | | | 23,070 | | | 23,065 | | | | |
| 18,333 | | AMERICAN EXPRESS CO. | | | 546,904 | | | 1,053,781 | | | | |
| 1,800 | | AMERICAN FINANCIAL GROUP, INC. | | | 29,745 | | | 71,136 | | | | |
| 94,500 | | AMERICAN INTERNATIONAL GROUP, INC.(b) | | | 2,587,871 | | | 3,335,850 | | | | |
| 22,580 | | AMERICAN INTERNATIONAL GROUP, INC. | | | | | | | | | | |
| | | - (FRACTIONAL SHARES)(b) | | | - | | | - | | | | |
| 4,850 | | AMERICAN TOWER CORP. | | | 264,465 | | | 374,760 | | | | |
| 5,191 | | AMERIPRISE FINANCIAL, INC. | | | 160,907 | | | 325,112 | | | | |
| 17,300 | | ANNALY CAPITAL MANAGEMENT, INC. | | | 254,587 | | | 242,892 | | | | |
| 4,748 | | AON PLC(c) | | | 110,582 | | | 263,989 | | | | |
| 3,628 | | APARTMENT INVESTMENT & MANAGEMENT CO., CLASS A | | | 39,421 | | | 98,174 | | | | |
| 4,800 | | ARCH CAPITAL GROUP LTD.(b)(c) | | | 101,982 | | | 211,296 | | | | |
| 1,600 | | ARTHUR J. GALLAGHER & CO. | | | 34,040 | | | 55,440 | | | | |
| 2,500 | | ASSURANT, INC. | | | 60,538 | | | 86,750 | | | | |
| 2,000 | | ASSURED GUARANTY LTD.(c) | | | 24,580 | | | 28,460 | | | | |
| 1,834 | | AVALONBAY COMMUNITIES, INC. | | | 180,298 | | | 248,672 | | | | |
| 900 | | AXIS CAPITAL HOLDINGS LTD.(c) | | | 23,391 | | | 31,176 | | | | |
| 396,800 | | BANK OF AMERICA CORP. | | | 4,020,451 | | | 4,602,880 | | | | |
| 67,129 | | BANK OF NEW YORK MELLON (THE) CORP. | | | 1,543,076 | | | 1,725,215 | | | | |
| 40,258 | | BB&T CORP. | | | 965,162 | | | 1,171,910 | | | | |
| 28,300 | | BERKSHIRE HATHAWAY, INC., CLASS B(b) | | | 2,323,632 | | | 2,538,510 | | | | |
| 2,500 | | BIOMED REALTY TRUST, INC. | | | 44,395 | | | 48,325 | | | | |
| 1,400 | | BLACKROCK, INC. | | | 257,653 | | | 289,394 | | | | |
| 3,388 | | BOSTON PROPERTIES, INC. | | | 171,468 | | | 358,484 | | | | |
| 2,800 | | BRANDYWINE REALTY TRUST | | | 31,804 | | | 34,132 | | | | |
| | |
See accompanying notes to the financial statements. | 31 | (Continued) |
CLEARWATER INVESTMENT TRUST
Schedule of Investments - Clearwater Core Equity Fund
December 31, 2012
| | | | | | | | | | | | | |
Shares | | Security | | Cost | | Fair
value (a) | | Percent
of
net assets | |
Financials (Cont’d): | | | | | | | | | | |
| 1,600 | | BRE PROPERTIES, INC. | | $ | 50,588 | | | 81,328 | | | | |
| 900 | | CAMDEN PROPERTY TRUST | | | 24,065 | | | 61,389 | | | | |
| 39,881 | | CAPITAL ONE FINANCIAL CORP. | | | 1,810,019 | | | 2,310,306 | | | | |
| 16,000 | | CAPITALSOURCE, INC. | | | 78,410 | | | 121,280 | | | | |
| 5,300 | | CBL & ASSOCIATES PROPERTIES, INC. | | | 96,937 | | | 112,413 | | | | |
| 1,300 | | CBRE GROUP, INC., CLASS A(b) | | | 25,883 | | | 25,870 | | | | |
| 21,400 | | CHARLES SCHWAB (THE) CORP. | | | 186,608 | | | 307,304 | | | | |
| 17,700 | | CHIMERA INVESTMENT CORP. | | | 37,226 | | | 46,197 | | | | |
| 2,700 | | CHUBB (THE) CORP. | | | 86,607 | | | 203,364 | | | | |
| 2,800 | | CIT GROUP, INC.(b) | | | 100,145 | | | 108,192 | | | | |
| 47,081 | | CITIGROUP, INC. | | | 1,682,425 | | | 1,862,524 | | | | |
| 2,000 | | CITY NATIONAL CORP. | | | 75,538 | | | 99,040 | | | | |
| 2,565 | | CME GROUP, INC. | | | 94,814 | | | 130,071 | | | | |
| 1,100 | | CNA FINANCIAL CORP. | | | 25,102 | | | 30,811 | | | | |
| 4,800 | | CORPORATE OFFICE PROPERTIES TRUST | | | 107,522 | | | 119,904 | | | | |
| 2,216 | | CULLEN/FROST BANKERS, INC. | | | 122,545 | | | 120,262 | | | | |
| 8,500 | | DDR CORP. | | | 117,951 | | | 133,110 | | | | |
| 1,900 | | DIGITAL REALTY TRUST, INC. | | | 117,405 | | | 128,991 | | | | |
| 16,287 | | DISCOVER FINANCIAL SERVICES | | | 233,079 | | | 627,864 | | | | |
| 5,200 | | DOUGLAS EMMETT, INC. | | | 61,495 | | | 121,160 | | | | |
| 6,000 | | E*TRADE FINANCIAL CORP.(b) | | | 48,576 | | | 53,700 | | | | |
| 31,128 | | ENDURANCE SPECIALTY HOLDINGS LTD.(c) | | | 1,204,451 | | | 1,235,470 | | | | |
| 400 | | EQUITY LIFESTYLE PROPERTIES, INC. | | | 26,920 | | | 26,916 | | | | |
| 5,416 | | EQUITY RESIDENTIAL | | | 174,162 | | | 306,925 | | | | |
| 100 | | ESSEX PROPERTY TRUST, INC. | | | 14,666 | | | 14,665 | | | | |
| 900 | | FEDERAL REALTY INVESTMENT TRUST | | | 48,326 | | | 93,618 | | | | |
| 1,600 | | FIDELITY NATIONAL FINANCIAL, INC., CLASS A | | | 24,512 | | | 37,680 | | | | |
| 25,300 | | FIFTH THIRD BANCORP | | | 220,963 | | | 384,307 | | | | |
| 400 | | FIRST CITIZENS BANCSHARES, INC., CLASS A | | | 57,523 | | | 65,400 | | | | |
| 30,500 | | FIRST HORIZON NATIONAL CORP. | | | 193,065 | | | 302,255 | | | | |
| 95,534 | | FIRST HORIZON NATIONAL CORP. | | | | | | | | | | |
| | | - (FRACTIONAL SHARES)(b) | | | - | | | - | | | | |
| 67,197 | | FIRST INTERSTATE BANCSYSTEM, INC. | | | 977,732 | | | 1,036,850 | | | | |
| 15,200 | | FIRST NIAGARA FINANCIAL GROUP, INC. | | | 120,688 | | | 120,536 | | | | |
| 35,690 | | FIRST REPUBLIC BANK | | | 1,032,094 | | | 1,169,918 | | | | |
| 3,359 | | FRANKLIN RESOURCES, INC. | | | 189,834 | | | 422,226 | | | | |
| 1,800 | | GENERAL GROWTH PROPERTIES, INC. | | | 30,582 | | | 35,730 | | | | |
| 7,700 | | GENWORTH FINANCIAL, INC., CLASS A(b) | | | 31,801 | | | 57,827 | | | | |
| 83,600 | | GETTY REALTY CORP. | | | 1,283,016 | | | 1,509,816 | | | | |
| 8,700 | | GOLDMAN SACHS GROUP (THE), INC. | | | 742,546 | | | 1,109,772 | | | | |
| 3,500 | | GREENHILL & CO., INC. | | | 106,120 | | | 181,965 | | | | |
| 3,700 | | HARTFORD FINANCIAL SERVICES GROUP, INC. | | | 62,228 | | | 83,028 | | | | |
| 1,600 | | HATTERAS FINANCIAL CORP. | | | 39,712 | | | 39,696 | | | | |
| 1,000 | | HCC INSURANCE HOLDINGS, INC. | | | 24,155 | | | 37,210 | | | | |
| 7,100 | | HCP, INC. | | | 104,919 | | | 320,778 | | | | |
| 1,900 | | HEALTH CARE REIT, INC. | | | 83,301 | | | 116,451 | | | | |
| 2,900 | | HOSPITALITY PROPERTIES TRUST | | | 49,740 | | | 67,918 | | | | |
| 16,122 | | HOST HOTELS & RESORTS, INC. | | | 138,445 | | | 252,632 | | | | |
| 678 | | HOWARD HUGHES (THE) CORP.(b) | | | 20,502 | | | 49,508 | | | | |
| 10,500 | | HUDSON CITY BANCORP, INC. | | | 65,625 | | | 85,365 | | | | |
| 35,000 | | HUNTINGTON BANCSHARES, INC. | | | 169,770 | | | 223,650 | | | | |
| 11,400 | | INVESCO LTD. | | | 176,068 | | | 297,426 | | | | |
| 33,700 | | JANUS CAPITAL GROUP, INC. | | | 222,792 | | | 287,124 | | | | |
| 700 | | JONES LANG LASALLE, INC. | | | 39,950 | | | 58,758 | | | | |
| 60,946 | | JPMORGAN CHASE & CO. | | | 1,566,752 | | | 2,679,796 | | | | |
| 8,900 | | KEYCORP | | | 55,350 | | | 74,938 | | | | |
| 8,201 | | KIMCO REALTY CORP. | | | 100,158 | | | 158,443 | | | | |
| 3,752 | | LEGG MASON, INC. | | | 52,584 | | | 96,501 | | | | |
| 4,700 | | LEUCADIA NATIONAL CORP. | | | 98,439 | | | 111,813 | | | | |
| 1,100 | | LIBERTY PROPERTY TRUST | | | 23,946 | | | 39,347 | | | | |
| 1,100 | | LINCOLN NATIONAL CORP. | | | 22,715 | | | 28,490 | | | | |
| 6,000 | | LOEWS CORP. | | | 131,444 | | | 244,500 | | | | |
| 2,000 | | M&T BANK CORP. | | | 145,114 | | | 196,940 | | | | |
| 5,123 | | MACERICH (THE) CO. | | | 121,389 | | | 298,671 | | | | |
| 200 | | MARKEL CORP.(b) | | | 67,789 | | | 86,684 | | | | |
| 2,978 | | MARSH & MCLENNAN COS., INC. | | | 66,024 | | | 102,652 | | | | |
| 1,300 | | MERCURY GENERAL CORP. | | | 38,018 | | | 51,597 | | | | |
| | |
See accompanying notes to the financial statements. | 32 | (Continued) |
CLEARWATER INVESTMENT TRUST
Schedule of Investments - Clearwater Core Equity Fund
December 31, 2012
| | | | | | | | | | | | | |
Shares | | Security | | Cost | | Fair
value (a) | | Percent
of
net assets | |
| Financials (Cont’d): | | | | | | | | | | |
| 10,900 | | METLIFE, INC. | | $ | 327,220 | | | 359,046 | | | | |
| 3,200 | | MFA FINANCIAL, INC. | | | 24,800 | | | 25,952 | | | | |
| 2,200 | | MOODY’S CORP. | | | 77,502 | | | 110,704 | | | | |
| 21,600 | | MORGAN STANLEY | | | 332,129 | | | 412,992 | | | | |
| 1,800 | | NASDAQ OMX GROUP (THE), INC. | | | 45,036 | | | 45,018 | | | | |
| 30,810 | | NATIONSTAR MORTGAGE HOLDINGS, INC.(b) | | | 429,098 | | | 954,494 | | | | |
| 7,649 | | NEW YORK COMMUNITY BANCORP, INC. | | | 86,776 | | | 100,202 | | | | |
| 2,502 | | NORTHERN TRUST CORP. | | | 120,110 | | | 125,500 | | | | |
| 4,100 | | NYSE EURONEXT | | | 129,355 | | | 129,314 | | | | |
| 245,000 | | OLD REPUBLIC INTERNATIONAL CORP. | | | 2,422,210 | | | 2,609,250 | | | | |
| 2,200 | | PARTNERRE LTD.(c) | | | 119,028 | | | 177,078 | | | | |
| 4,385 | | PLUM CREEK TIMBER CO., INC. | | | 105,969 | | | 194,562 | | | | |
| 23,002 | | PNC FINANCIAL SERVICES GROUP, INC. | | | 1,129,077 | | | 1,341,247 | | | | |
| 1,600 | | POPULAR, INC.(b)(c) | | | 33,280 | | | 33,264 | | | | |
| 6,100 | | PRINCIPAL FINANCIAL GROUP, INC. | | | 140,614 | | | 173,972 | | | | |
| 6,048 | | PROGRESSIVE (THE) CORP. | | | 80,691 | | | 127,613 | | | | |
| 10,169 | | PROLOGIS, INC. | | | 257,893 | | | 371,067 | | | | |
| 2,200 | | PROTECTIVE LIFE CORP. | | | 24,849 | | | 62,876 | | | | |
| 8,500 | | PRUDENTIAL FINANCIAL, INC. | | | 257,378 | | | 453,305 | | | | |
| 2,261 | | PUBLIC STORAGE | | | 235,329 | | | 327,755 | | | | |
| 20,062 | | RAYMOND JAMES FINANCIAL, INC. | | | 621,448 | | | 772,989 | | | | |
| 6,972 | | RAYONIER, INC. | | | 104,763 | | | 361,359 | | | | |
| 2,700 | | REALTY INCOME CORP. | | | 62,340 | | | 108,567 | | | | |
| 3,900 | | REGENCY CENTERS CORP. | | | 91,178 | | | 183,768 | | | | |
| 9,099 | | REGIONS FINANCIAL CORP. | | | 36,947 | | | 64,785 | | | | |
| 2,900 | | RENAISSANCERE HOLDINGS LTD.(c) | | | 136,230 | | | 235,654 | | | | |
| 9,800 | | RETAIL PROPERTIES OF AMERICA, INC., CLASS A | | | 90,439 | | | 117,306 | | | | |
| 7,500 | | SEI INVESTMENTS CO. | | | 108,537 | | | 175,050 | | | | |
| 2,900 | | SENIOR HOUSING PROPERTIES TRUST | | | 57,884 | | | 68,556 | | | | |
| 4,195 | | SIMON PROPERTY GROUP, INC. | | | 250,319 | | | 663,187 | | | | |
| 1,900 | | SL GREEN REALTY CORP. | | | 58,204 | | | 145,635 | | | | |
| 12,600 | | SLM CORP. | | | 134,787 | | | 215,838 | | | | |
| 4,400 | | ST. JOE (THE) CO.(b) | | | 69,320 | | | 101,552 | | | | |
| 6,000 | | STATE STREET CORP. | | | 262,103 | | | 282,060 | | | | |
| 6,634 | | SUNTRUST BANKS, INC. | | | 92,816 | | | 188,074 | | | | |
| 79,260 | | SYMETRA FINANCIAL CORP. | | | 929,924 | | | 1,028,795 | | | | |
| 25,600 | | SYNOVUS FINANCIAL CORP.(b) | | | 48,740 | | | 62,720 | | | | |
| 6,349 | | T. ROWE PRICE GROUP, INC. | | | 125,884 | | | 413,510 | | | | |
| 2,100 | | TAUBMAN CENTERS, INC. | | | 60,146 | | | 165,312 | | | | |
| 12,000 | | TCF FINANCIAL CORP. | | | 111,496 | | | 145,800 | | | | |
| 2,600 | | TFS FINANCIAL CORP.(b) | | | 25,038 | | | 25,012 | | | | |
| 5,100 | | TORCHMARK CORP. | | | 138,962 | | | 263,517 | | | | |
| 10,688 | | TRAVELERS (THE) COS., INC. | | | 378,568 | | | 767,612 | | | | |
| 17,785 | | U.S. BANCORP | | | 322,544 | | | 568,053 | | | | |
| 4,100 | | UDR, INC. | | | 65,319 | | | 97,498 | | | | |
| 1,600 | | UNUM GROUP | | | 33,328 | | | 33,312 | | | | |
| 1,100 | | VALIDUS HOLDINGS LTD.(c) | | | 23,557 | | | 38,038 | | | | |
| 3,200 | | VALLEY NATIONAL BANCORP | | | 29,792 | | | 29,760 | | | | |
| 3,200 | | VENTAS, INC. | | | 162,519 | | | 207,104 | | | | |
| 800 | | VORNADO REALTY TRUST | | | 39,944 | | | 64,064 | | | | |
| 1,106 | | W.R. BERKLEY CORP. | | | 29,276 | | | 41,740 | | | | |
| 2,900 | | WADDELL & REED FINANCIAL, INC., CLASS A | | | 75,337 | | | 100,978 | | | | |
| 1,800 | | WASHINGTON FEDERAL, INC. | | | 23,535 | | | 30,366 | | | | |
| 2,100 | | WEINGARTEN REALTY INVESTORS | | | 30,002 | | | 56,217 | | | | |
| 81,645 | | WELLS FARGO & CO. | | | 1,092,068 | | | 2,790,626 | | | | |
| 262 | | WHITE MOUNTAINS INSURANCE GROUP LTD. | | | 136,992 | | | 134,930 | | | | |
| 15,441 | | WILLIS GROUP HOLDINGS PLC(c) | | | 563,070 | | | 517,737 | | | | |
| 4,900 | | XL GROUP PLC(c) | | | 95,648 | | | 122,794 | | | | |
| 3,000 | | ZIONS BANCORPORATION | | | 56,955 | | | 64,200 | | | | |
| | | | | | 44,753,254 | | | 61,301,426 | | | 15.51% | |
| Health Care: | | | | | | | | | | |
| 12,835 | | ABBOTT LABORATORIES | | | 439,131 | | | 840,692 | | | | |
| 8,103 | | AETNA, INC. | | | 108,542 | | | 375,169 | | | | |
| 5,600 | | AGILENT TECHNOLOGIES, INC. | | | 221,244 | | | 229,264 | | | | |
| 4,200 | | ALERE, INC.(b) | | | 77,812 | | | 77,700 | | | | |
| 3,000 | | ALEXION PHARMACEUTICALS, INC.(b) | | | 58,088 | | | 281,430 | | | | |
| 5,507 | | ALLERGAN, INC. | | | 201,259 | | | 505,157 | | | | |
| 7,200 | | AMERISOURCEBERGEN CORP. | | | 115,968 | | | 310,896 | | | | |
| | |
See accompanying notes to the financial statements. | 33 | (Continued) |
CLEARWATER INVESTMENT TRUST
Schedule of Investments - Clearwater Core Equity Fund
December 31, 2012
| | | | | | | | | | | | | |
Shares | | Security | | Cost | | Fair
value (a) | | Percent
of
net assets | |
| Health Care (Cont’d): | | | | | | | | | | |
| 16,000 | | AMGEN, INC. | | $ | 64,848 | | | 1,381,120 | | | | |
| 7,500 | | BAXTER INTERNATIONAL, INC. | | | 433,958 | | | 499,950 | | | | |
| 18,945 | | BAYER A.G. ADR(c)(d) | | | 1,332,790 | | | 1,817,204 | | | | |
| 1,700 | | BECTON, DICKINSON AND CO. | | | 76,290 | | | 132,923 | | | | |
| 5,750 | | BIOGEN IDEC, INC.(b) | | | 72,723 | | | 843,353 | | | | |
| 500 | | BIOMARIN PHARMACEUTICAL, INC.(b) | | | 24,660 | | | 24,625 | | | | |
| 264,291 | | BOSTON SCIENTIFIC CORP.(b) | | | 1,661,326 | | | 1,514,387 | | | | |
| 26,100 | | BRISTOL-MYERS SQUIBB CO. | | | 680,925 | | | 850,599 | | | | |
| 1,200 | | C.R. BARD, INC. | | | 72,420 | | | 117,288 | | | | |
| 1,000 | | CARDINAL HEALTH, INC. | | | 26,001 | | | 41,180 | | | | |
| 78,000 | | CAREFUSION CORP.(b) | | | 1,937,401 | | | 2,229,240 | | | | |
| 1,900 | | CATAMARAN CORP.(b) | | | 73,474 | | | 89,509 | | | | |
| 6,736 | | CELGENE CORP.(b) | | | 170,860 | | | 530,258 | | | | |
| 1,800 | | CERNER CORP.(b) | | | 40,604 | | | 139,752 | | | | |
| 5,700 | | CIGNA CORP. | | | 89,680 | | | 304,722 | | | | |
| 3,400 | | COMMUNITY HEALTH SYSTEMS, INC. | | | 58,650 | | | 104,516 | | | | |
| 19,151 | | COVIDIEN PLC(c) | | | 877,071 | | | 1,105,779 | | | | |
| 1,425 | | DAVITA HEALTHCARE PARTNERS, INC.(b) | | | 21,812 | | | 157,505 | | | | |
| 3,700 | | DENTSPLY INTERNATIONAL, INC. | | | 102,582 | | | 146,557 | | | | |
| 3,800 | | EDWARDS LIFESCIENCES CORP.(b) | | | 118,152 | | | 342,646 | | | | |
| 14,900 | | ELI LILLY & CO. | | | 587,030 | | | 734,868 | | | | |
| 4,200 | | ENDO HEALTH SOLUTIONS, INC.(b) | | | 110,376 | | | 110,334 | | | | |
| 17,002 | | EXPRESS SCRIPTS HOLDING CO.(b) | | | 255,105 | | | 918,108 | | | | |
| 4,300 | | FOREST LABORATORIES, INC.(b) | | | 149,131 | | | 151,876 | | | | |
| 14,260 | | GILEAD SCIENCES, INC.(b) | | | 231,726 | | | 1,047,397 | | | | |
| 6,900 | | HEALTH MANAGEMENT ASSOCIATES, INC., CLASS A(b) | | | 44,746 | | | 64,308 | | | | |
| 1,300 | | HEALTH NET, INC.(b) | | | 31,603 | | | 31,590 | | | | |
| 68,310 | | HEALTHSOUTH CORP.(b) | | | 1,240,167 | | | 1,442,024 | | | | |
| 1,900 | | HENRY SCHEIN, INC.(b) | | | 86,166 | | | 152,874 | | | | |
| 85,193 | | HOLOGIC, INC.(b) | | | 1,517,449 | | | 1,706,416 | | | | |
| 33,321 | | HOSPIRA, INC.(b) | | | 1,134,557 | | | 1,040,948 | | | | |
| 3,900 | | HUMANA, INC. | | | 39,107 | | | 267,657 | | | | |
| 1,400 | | IDEXX LABORATORIES, INC.(b) | | | 60,410 | | | 129,920 | | | | |
| 2,300 | | ILLUMINA, INC.(b) | | | 98,233 | | | 127,857 | | | | |
| 600 | | INTUITIVE SURGICAL, INC.(b) | | | 312,638 | | | 294,222 | | | | |
| 70,808 | | JOHNSON & JOHNSON | | | 3,357,911 | | | 4,963,641 | | | | |
| 800 | | LABORATORY CORP. OF AMERICA HOLDINGS(b) | | | 18,788 | | | 69,296 | | | | |
| 1,873 | | LIFE TECHNOLOGIES CORP.(b) | | | 59,724 | | | 91,927 | | | | |
| 5,700 | | MCKESSON CORP. | | | 202,596 | | | 552,672 | | | | |
| 16,900 | | MEDTRONIC, INC. | | | 617,995 | | | 693,238 | | | | |
| 49,378 | | MERCK & CO., INC. | | | 1,179,137 | | | 2,021,535 | | | | |
| 1,321 | | METTLER-TOLEDO INTERNATIONAL, INC.(b) | | | 91,350 | | | 255,349 | | | | |
| 4,600 | | MYLAN, INC.(b) | | | 85,192 | | | 126,408 | | | | |
| 21,945 | | NOVARTIS A.G. ADR(c)(d) | | | 1,287,171 | | | 1,389,118 | | | | |
| 300 | | ONYX PHARMACEUTICALS, INC.(b) | | | 22,644 | | | 22,659 | | | | |
| 1,600 | | PATTERSON COS., INC. | | | 29,864 | | | 54,768 | | | | |
| 3,400 | | PERKINELMER, INC. | | | 53,706 | | | 107,916 | | | | |
| 2,900 | | PERRIGO CO. | | | 109,545 | | | 301,687 | | | | |
| 166,918 | | PFIZER, INC. | | | 1,535,470 | | | 4,186,303 | | | | |
| 3,900 | | QIAGEN N.V.(b)(c) | | | 70,824 | | | 70,785 | | | | |
| 22,139 | | QUEST DIAGNOSTICS, INC. | | | 1,178,739 | | | 1,290,040 | | | | |
| 1,000 | | REGENERON PHARMACEUTICALS, INC.(b) | | | 155,108 | | | 171,070 | | | | |
| 4,000 | | RESMED, INC. | | | 81,990 | | | 166,280 | | | | |
| 600 | | SALIX PHARMACEUTICALS LTD.(b) | | | 24,294 | | | 24,288 | | | | |
| 900 | | SIRONA DENTAL SYSTEMS, INC.(b) | | | 38,745 | | | 58,014 | | | | |
| 4,539 | | ST. JUDE MEDICAL, INC. | | | 114,088 | | | 164,040 | | | | |
| 4,700 | | STRYKER CORP. | | | 18,139 | | | 257,654 | | | | |
| 22,645 | | TELEFLEX, INC. | | | 1,222,836 | | | 1,614,815 | | | | |
| 7,500 | | THERMO FISHER SCIENTIFIC, INC. | | | 162,174 | | | 478,350 | | | | |
| 400 | | UNITED THERAPEUTICS CORP.(b) | | | 21,372 | | | 21,368 | | | | |
| 17,202 | | UNITEDHEALTH GROUP, INC. | | | 273,316 | | | 933,037 | | | | |
| 2,036 | | UNIVERSAL HEALTH SERVICES, INC., CLASS B | | | 38,822 | | | 98,441 | | | | |
| 29,760 | | VALEANT PHARMACEUTICALS INTERNATIONAL, INC.(b)(c) | | | 878,700 | | | 1,778,755 | | | | |
| 5,000 | | VARIAN MEDICAL SYSTEMS, INC.(b) | | | 184,300 | | | 351,200 | | | | |
| 3,000 | | VERTEX PHARMACEUTICALS, INC.(b) | | | 74,805 | | | 125,820 | | | | |
| 2,600 | | WATERS CORP.(b) | | | 60,997 | | | 226,512 | | | | |
| 3,175 | | WATSON PHARMACEUTICALS, INC.(b) | | | 79,361 | | | 273,050 | | | | |
| 9,249 | | WELLPOINT, INC. | | | 325,438 | | | 563,449 | | | | |
| | | | | | | | | | | | | |
| | |
See accompanying notes to the financial statements. | 34 | (Continued) |
CLEARWATER INVESTMENT TRUST
Schedule of Investments - Clearwater Core Equity Fund
December 31, 2012
| | | | | | | | | | | | | |
Shares | | Security | | Cost | | Fair
value (a) | | Percent
of
net assets | |
| Health Care (Cont’d): | | | | | | | | | | |
| 22,238 | | ZIMMER HOLDINGS, INC. | | $ | 1,270,712 | | | 1,482,385 | | | | |
| | | | | | 29,982,568 | | | 48,199,690 | | | 12.19% | |
| Industrials: | | | | | | | | | | | | |
| 10,187 | | 3M CO. | | | 683,400 | | | 945,863 | | | | |
| 948 | | ACCO BRANDS CORP.(b) | | | 3,315 | | | 6,958 | | | | |
| 5,250 | | ADT (THE) CORP. | | | 124,100 | | | 244,072 | | | | |
| 17,672 | | AGCO CORP.(b) | | | 679,766 | | | 868,049 | | | | |
| 75,330 | | AIR LEASE CORP.(b) | | | 1,868,329 | | | 1,619,595 | | | | |
| 500 | | ALLIANT TECHSYSTEMS, INC. | | | 24,985 | | | 30,980 | | | | |
| 5,175 | | AMETEK, INC. | | | 73,220 | | | 194,425 | | | | |
| 1,700 | | B/E AEROSPACE, INC.(b) | | | 47,626 | | | 83,980 | | | | |
| 2,700 | | BABCOCK & WILCOX (THE) CO. | | | 35,478 | | | 70,740 | | | | |
| 29,760 | | BOEING (THE) CO. | | | 1,404,260 | | | 2,242,714 | | | | |
| 2,200 | | CARLISLE COS., INC. | | | 45,116 | | | 129,272 | | | | |
| 11,004 | | CATERPILLAR, INC. | | | 295,368 | | | 985,738 | | | | |
| 2,500 | | CHICAGO BRIDGE & IRON CO. N.V.(c) | | | 50,995 | | | 115,875 | | | | |
| 400 | | CLEAN HARBORS, INC.(b) | | | 22,008 | | | 22,004 | | | | |
| 2,027 | | CON-WAY, INC. | | | 44,529 | | | 56,391 | | | | |
| 800 | | COPA HOLDINGS S.A., CLASS A(c) | | | 32,618 | | | 79,560 | | | | |
| 2,600 | | CORRECTIONS CORP. OF AMERICA | | | 49,022 | | | 92,222 | | | | |
| 3,948 | | CRANE CO. | | | 66,572 | | | 182,713 | | | | |
| 27,900 | | CSX CORP. | | | 97,923 | | | 550,467 | | | | |
| 3,700 | | CUMMINS, INC. | | | 50,756 | | | 400,895 | | | | |
| 11,163 | | DANAHER CORP. | | | 255,642 | | | 624,012 | | | | |
| 7,300 | | DEERE & CO. | | | 199,160 | | | 630,866 | | | | |
| 8,200 | | DELTA AIR LINES, INC.(b) | | | 75,182 | | | 97,334 | | | | |
| 2,160 | | DONALDSON CO., INC. | | | 61,867 | | | 70,934 | | | | |
| 3,325 | | DOVER CORP. | | | 122,574 | | | 218,486 | | | | |
| 5,469 | | DUN & BRADSTREET (THE) CORP. | | | 301,952 | | | 430,137 | | | | |
| 8,384 | | EATON CORP. PLC(c) | | | 157,701 | | | 454,413 | | | | |
| 31,183 | | EMCOR GROUP, INC. | | | 892,612 | | | 1,079,244 | | | | |
| 15,500 | | EMERSON ELECTRIC CO. | | | 422,332 | | | 820,880 | | | | |
| 200 | | ENGILITY HOLDINGS, INC.(b) | | | 2,327 | | | 3,852 | | | | |
| 195,600 | | EXELIS, INC. | | | 2,224,286 | | | 2,204,412 | | | | |
| 1,700 | | EXPEDITORS INTERNATIONAL OF WASHINGTON, INC. | | | 56,747 | | | 67,235 | | | | |
| 3,200 | | FASTENAL CO. | | | 105,341 | | | 149,408 | | | | |
| 6,653 | | FEDEX CORP. | | | 130,734 | | | 610,213 | | | | |
| 100 | | FLOWSERVE CORP. | | | 14,470 | | | 14,680 | | | | |
| 1,950 | | FLUOR CORP. | | | 26,013 | | | 114,543 | | | | |
| 4,300 | | FORTUNE BRANDS HOME & SECURITY, INC.(b) | | | 33,889 | | | 125,646 | | | | |
| 1,400 | | GATX CORP. | | | 24,276 | | | 60,620 | | | | |
| 2,500 | | GENERAL CABLE CORP.(b) | | | 60,825 | | | 76,025 | | | | |
| 3,600 | | GENERAL DYNAMICS CORP. | | | 239,388 | | | 249,372 | | | | |
| 322,900 | | GENERAL ELECTRIC CO. | | | 5,108,160 | | | 6,777,671 | | | | |
| 2,800 | | GRAFTECH INTERNATIONAL LTD.(b) | | | 26,320 | | | 26,292 | | | | |
| 1,600 | | HARSCO CORP. | | | 28,236 | | | 37,600 | | | | |
| 6,600 | | HERTZ GLOBAL HOLDINGS, INC.(b) | | | 37,676 | | | 107,382 | | | | |
| 11,088 | | HONEYWELL INTERNATIONAL, INC. | | | 399,163 | | | 703,755 | | | | |
| 1,200 | | HUBBELL, INC., CLASS B | | | 43,310 | | | 101,556 | | | | |
| 610 | | HUNTINGTON INGALLS INDUSTRIES, INC. | | | 14,978 | | | 26,437 | | | | |
| 2,500 | | IDEX CORP. | | | 58,238 | | | 116,325 | | | | |
| 700 | | IHS, INC., CLASS A(b) | | | 30,838 | | | 67,200 | | | | |
| 5,624 | | ILLINOIS TOOL WORKS, INC. | | | 205,252 | | | 341,995 | | | | |
| 3,700 | | INGERSOLL-RAND PLC(b)(c) | | | 153,006 | | | 177,452 | | | | |
| 1,524 | | IRON MOUNTAIN, INC. | | | 35,583 | | | 47,320 | | | | |
| 28,800 | | ITT CORP. | | | 517,715 | | | 675,648 | | | | |
| 2,100 | | J.B. HUNT TRANSPORT SERVICES, INC. | | | 40,530 | | | 125,391 | | | | |
| 2,068 | | JACOBS ENGINEERING GROUP, INC.(b) | | | 46,598 | | | 88,035 | | | | |
| 2,438 | | JOY GLOBAL, INC. | | | 118,055 | | | 155,496 | | | | |
| 2,900 | | KANSAS CITY SOUTHERN | | | 46,328 | | | 242,092 | | | | |
| 2,800 | | KBR, INC. | | | 55,655 | | | 83,776 | | | | |
| 400 | | KIRBY CORP.(b) | | | 24,760 | | | 24,756 | | | | |
| 1,100 | | L-3 COMMUNICATIONS HOLDINGS, INC. | | | 49,763 | | | 84,282 | | | | |
| 1,200 | | LANDSTAR SYSTEM, INC. | | | 38,351 | | | 62,952 | | | | |
| 900 | | LENNOX INTERNATIONAL, INC. | | | 26,811 | | | 47,268 | | | | |
| 1,400 | | LINCOLN ELECTRIC HOLDINGS, INC. | | | 28,970 | | | 68,152 | | | | |
| 3,900 | | LOCKHEED MARTIN CORP. | | | 194,786 | | | 359,931 | | | | |
| 4,800 | | MANITOWOC (THE) CO., INC. | | | 47,568 | | | 75,264 | | | | |
| | | | | | | | | | | | | |
| | |
See accompanying notes to the financial statements. | 35 | (Continued) |
CLEARWATER INVESTMENT TRUST
Schedule of Investments - Clearwater Core Equity Fund
December 31, 2012
| | | | | | | | | | | | | |
Shares | | Security | | Cost | | Fair
value (a) | | Percent
of
net assets | |
| Industrials (Cont’d): | | | | | | | | | | |
| 32,238 | | MANPOWER, INC. | | $ | 1,224,672 | | | 1,368,181 | | | | |
| 13,200 | | MASCO CORP. | | | 97,548 | | | 219,912 | | | | |
| 50,407 | | MASTEC, INC.(b) | | | 815,426 | | | 1,256,647 | | | | |
| 2,200 | | NAVISTAR INTERNATIONAL CORP.(b) | | | 47,586 | | | 47,894 | | | | |
| 2,000 | | NIELSEN HOLDINGS N.V.(b) | | | 61,200 | | | 61,180 | | | | |
| 700 | | NORDSON CORP. | | | 29,470 | | | 44,184 | | | | |
| 4,760 | | NORFOLK SOUTHERN CORP. | | | 99,373 | | | 294,358 | | | | |
| 3,660 | | NORTHROP GRUMMAN CORP. | | | 139,878 | | | 247,343 | | | | |
| 6,300 | | OSHKOSH CORP.(b) | | | 109,053 | | | 186,795 | | | | |
| 1,100 | | OWENS CORNING(b) | | | 22,578 | | | 40,689 | | | | |
| 8,389 | | PACCAR, INC. | | | 91,278 | | | 379,267 | | | | |
| 2,200 | | PALL CORP. | | | 55,214 | | | 132,572 | | | | |
| 2,850 | | PARKER HANNIFIN CORP. | | | 123,853 | | | 242,421 | | | | |
| 2,519 | | PENTAIR LTD. (REGISTERED)(c) | | | 73,408 | | | 123,809 | | | | |
| 2,200 | | PRECISION CASTPARTS CORP. | | | 145,807 | | | 416,724 | | | | |
| 4,100 | | QUANTA SERVICES, INC.(b) | | | 52,131 | | | 111,889 | | | | |
| 2,800 | | R.R. DONNELLEY & SONS CO. | | | 25,228 | | | 25,200 | | | | |
| 5,700 | | RAYTHEON CO. | | | 160,192 | | | 328,092 | | | | |
| 5,250 | | ROCKWELL AUTOMATION, INC. | | | 73,987 | | | 440,948 | | | | |
| 5,214 | | ROCKWELL COLLINS, INC. | | | 154,727 | | | 303,298 | | | | |
| 600 | | ROPER INDUSTRIES, INC. | | | 52,897 | | | 66,888 | | | | |
| 23,795 | | RYDER SYSTEM, INC. | | | 903,248 | | | 1,188,084 | | | | |
| 700 | | SNAP-ON, INC. | | | 17,991 | | | 55,293 | | | | |
| 161,420 | | SOUTHWEST AIRLINES CO. | | | 1,371,355 | | | 1,652,941 | | | | |
| 66,640 | | SPIRIT AEROSYSTEMS HOLDINGS, INC., CLASS A(b) | | | 1,527,185 | | | 1,130,881 | | | | |
| 300 | | SPX CORP. | | | 11,766 | | | 21,045 | | | | |
| 2,557 | | STANLEY BLACK & DECKER, INC. | | | 72,047 | | | 189,141 | | | | |
| 2,000 | | STERICYCLE, INC.(b) | | | 95,284 | | | 186,540 | | | | |
| 1,700 | | TEREX CORP.(b) | | | 31,637 | | | 47,787 | | | | |
| 2,000 | | TEXTRON, INC. | | | 49,440 | | | 49,580 | | | | |
| 1,000 | | TOWERS WATSON & CO., CLASS A | | | 56,220 | | | 56,210 | | | | |
| 200 | | TRANSDIGM GROUP, INC. | | | 26,368 | | | 27,272 | | | | |
| 10,500 | | TYCO INTERNATIONAL LTD.(c) | | | 190,755 | | | 307,125 | | | | |
| 7,600 | | UNION PACIFIC CORP. | | | 219,426 | | | 955,472 | | | | |
| 4,828 | | UNITED CONTINENTAL HOLDINGS, INC.(b) | | | 104,937 | | | 112,879 | | | | |
| 10,340 | | UNITED PARCEL SERVICE, INC., CLASS B | | | 612,760 | | | 762,368 | | | | |
| 16,850 | | UNITED TECHNOLOGIES CORP. | | | 637,288 | | | 1,381,868 | | | | |
| 31,907 | | UNIVERSAL FOREST PRODUCTS, INC. | | | 1,135,287 | | | 1,213,742 | | | | |
| 36,163 | | URS CORP. | | | 1,491,181 | | | 1,419,759 | | | | |
| 2,000 | | USG CORP.(b) | | | 12,350 | | | 56,140 | | | | |
| 2,200 | | UTI WORLDWIDE, INC. | | | 25,509 | | | 29,480 | | | | |
| 500 | | VERISK ANALYTICS, INC., CLASS A(b) | | | 25,120 | | | 25,500 | | | | |
| 1,700 | | W.W. GRAINGER, INC. | | | 74,317 | | | 344,029 | | | | |
| 1,966 | | WABCO HOLDINGS, INC.(b) | | | 30,197 | | | 128,164 | | | | |
| 700 | | WABTEC CORP. | | | 25,602 | | | 61,278 | | | | |
| 1,650 | | WASTE CONNECTIONS, INC. | | | 29,914 | | | 55,754 | | | | |
| 8,650 | | WASTE MANAGEMENT, INC. | | | 135,675 | | | 291,851 | | | | |
| 57,600 | | XYLEM, INC. | | | 1,826,023 | | | 1,560,960 | | | | |
| | | | | | 32,877,742 | | | 47,298,287 | | | 11.97% | |
| Information Technology: | | | | | | | | | | |
| 9,300 | | ACCENTURE PLC, CLASS A(c) | | | 455,515 | | | 618,450 | | | | |
| 5,600 | | ACTIVISION BLIZZARD, INC. | | | 9,966 | | | 59,472 | | | | |
| 6,824 | | ADOBE SYSTEMS, INC.(b) | | | 101,869 | | | 257,128 | | | | |
| 3,300 | | AKAMAI TECHNOLOGIES, INC.(b) | | | 45,920 | | | 135,003 | | | | |
| 1,600 | | ALLIANCE DATA SYSTEMS CORP.(b) | | | 75,650 | | | 231,616 | | | | |
| 5,000 | | ALTERA CORP. | | | 94,155 | | | 172,200 | | | | |
| 800 | | AMDOCS LTD. | | | 27,960 | | | 27,192 | | | | |
| 1,200 | | AMPHENOL CORP., CLASS A | | | 76,532 | | | 77,640 | | | | |
| 8,600 | | ANALOG DEVICES, INC. | | | 120,368 | | | 361,716 | | | | |
| 1,300 | | ANSYS, INC.(b) | | | 34,888 | | | 87,542 | | | | |
| 7,800 | | AOL, INC. | | | 103,038 | | | 230,958 | | | | |
| 15,400 | | APPLE, INC. | | | 725,558 | | | 8,208,662 | | | | |
| 12,100 | | APPLIED MATERIALS, INC. | | | 130,014 | | | 138,424 | | | | |
| 700 | | ARROW ELECTRONICS, INC.(b) | | | 18,814 | | | 26,656 | | | | |
| 139,250 | | ATMEL CORP.(b) | | | 1,236,223 | | | 912,088 | | | | |
| 62,211 | | ATMI, INC.(b) | | | 1,210,179 | | | 1,298,966 | | | | |
| 3,186 | | AUTODESK, INC.(b) | | | 84,239 | | | 112,625 | | | | |
| | |
See accompanying notes to the financial statements. | 36 | (Continued) |
CLEARWATER INVESTMENT TRUST
Schedule of Investments - Clearwater Core Equity Fund
December 31, 2012
| | | | | | | | | | | | | |
Shares | | Security | | Cost | | Fair
value (a) | | Percent
of
net assets | |
| Information Technology (Cont’d): | | | | | | | | | | |
| 6,366 | | AUTOMATIC DATA PROCESSING, INC. | | $ | 266,423 | | | 362,926 | | | | |
| 700 | | AVAGO TECHNOLOGIES LTD.(c) | | | 24,577 | | | 22,162 | | | | |
| 53,807 | | AVNET, INC.(b) | | | 1,738,897 | | | 1,647,032 | | | | |
| 2,300 | | AVX CORP. | | | 24,817 | | | 24,794 | | | | |
| 66,726 | | BENCHMARK ELECTRONICS, INC.(b) | | | 1,111,756 | | | 1,108,986 | | | | |
| 4,550 | | BMC SOFTWARE, INC.(b) | | | 89,322 | | | 180,453 | | | | |
| 9,791 | | BROADCOM CORP., CLASS A | | | 155,428 | | | 325,159 | | | | |
| 2,180 | | BROADRIDGE FINANCIAL SOLUTIONS, INC. | | | 33,318 | | | 49,878 | | | | |
| 5,300 | | CA, INC. | | | 122,856 | | | 116,494 | | | | |
| 4,200 | | CADENCE DESIGN SYSTEMS, INC.(b) | | | 24,003 | | | 56,742 | | | | |
| 168,828 | | CISCO SYSTEMS, INC. | | | 1,400,676 | | | 3,317,470 | | | | |
| 4,234 | | CITRIX SYSTEMS, INC.(b) | | | 47,866 | | | 278,386 | | | | |
| 6,300 | | COGNIZANT TECHNOLOGY SOLUTIONS CORP., CLASS A(b) | | | 95,624 | | | 466,515 | | | | |
| 132,230 | | COMPUWARE CORP.(b) | | | 1,249,466 | | | 1,437,340 | | | | |
| 400 | | CONCUR TECHNOLOGIES, INC.(b) | | | 27,272 | | | 27,008 | | | | |
| 6,700 | | CORELOGIC, INC.(b) | | | 76,313 | | | 180,364 | | | | |
| 15,600 | | CORNING, INC. | | | 85,176 | | | 196,872 | | | | |
| 2,700 | | CYPRESS SEMICONDUCTOR CORP. | | | 6,825 | | | 29,268 | | | | |
| 2,000 | | DOLBY LABORATORIES, INC., CLASS A | | | 43,420 | | | 58,660 | | | | |
| 17,900 | | EBAY, INC.(b) | | | 490,391 | | | 913,258 | | | | |
| 2,140 | | ECHOSTAR CORP., CLASS A(b) | | | 36,471 | | | 73,231 | | | | |
| 2,000 | | ELECTRONIC ARTS, INC.(b) | | | 24,020 | | | 29,060 | | | | |
| 34,310 | | EMC CORP.(b) | | | 233,560 | | | 868,043 | | | | |
| 900 | | EQUINIX, INC.(b) | | | 69,754 | | | 185,580 | | | | |
| 1,300 | | F5 NETWORKS, INC.(b) | | | 30,062 | | | 126,295 | | | | |
| 6,600 | | FACEBOOK, INC., CLASS A(b) | | | 149,724 | | | 175,758 | | | | |
| 7,802 | | FIDELITY NATIONAL INFORMATION SERVICES, INC. | | | 135,427 | | | 271,588 | | | | |
| 3,950 | | FISERV, INC.(b) | | | 108,063 | | | 312,168 | | | | |
| 3,100 | | FREESCALE SEMICONDUCTOR LTD.(b) | | | 34,162 | | | 34,131 | | | | |
| 2,800 | | FUSION-IO, INC.(b) | | | 64,232 | | | 64,204 | | | | |
| 1,000 | | GLOBAL PAYMENTS, INC. | | | 33,115 | | | 45,300 | | | | |
| 6,676 | | GOOGLE, INC., CLASS A(b) | | | 2,845,214 | | | 4,735,754 | | | | |
| 2,800 | | HARRIS CORP. | | | 37,337 | | | 137,088 | | | | |
| 5,200 | | INGRAM MICRO, INC., CLASS A(b) | | | 68,614 | | | 87,984 | | | | |
| 143,381 | | INTEL CORP. | | | 1,271,976 | | | 2,957,950 | | | | |
| 500 | | INTERACTIVECORP | | | 23,355 | | | 23,650 | | | | |
| 18,146 | | INTERNATIONAL BUSINESS MACHINES CORP. | | | 1,486,075 | | | 3,475,866 | | | | |
| 5,000 | | INTUIT, INC. | | | 103,285 | | | 297,500 | | | | |
| 1,900 | | ITRON, INC.(b) | | | 65,968 | | | 84,645 | | | | |
| 900 | | JABIL CIRCUIT, INC.(b) | | | 14,428 | | | 17,361 | | | | |
| 8,567 | | JUNIPER NETWORKS, INC.(b) | | | 147,336 | | | 168,513 | | | | |
| 2,600 | | KLA-TENCOR CORP. | | | 86,094 | | | 124,176 | | | | |
| 4,800 | | LAM RESEARCH CORP.(b) | | | 123,706 | | | 173,424 | | | | |
| 3,700 | | LENDER PROCESSING SERVICES, INC. | | | 55,722 | | | 91,094 | | | | |
| 2,000 | | LEXMARK INTERNATIONAL, INC., CLASS A | | | 30,530 | | | 46,380 | | | | |
| 5,400 | | LINEAR TECHNOLOGY CORP. | | | 119,475 | | | 185,220 | | | | |
| 400 | | LINKEDIN CORP., CLASS A(b) | | | 25,488 | | | 45,928 | | | | |
| 23,700 | | LSI CORP.(b) | | | 99,658 | | | 167,796 | | | | |
| 14,800 | | MARVELL TECHNOLOGY GROUP LTD.(c) | | | 94,528 | | | 107,448 | | | | |
| 1,700 | | MASTERCARD, INC., CLASS A | | | 182,282 | | | 835,176 | | | | |
| 4,400 | | MAXIM INTEGRATED PRODUCTS, INC. | | | 76,114 | | | 129,360 | | | | |
| 4,200 | | MICROCHIP TECHNOLOGY, INC.(b) | | | 61,036 | | | 136,878 | | | | |
| 15,300 | | MICRON TECHNOLOGY, INC.(b) | | | 68,620 | | | 97,155 | | | | |
| 1,000 | | MICROS SYSTEMS, INC.(b) | | | 26,215 | | | 42,440 | | | | |
| 125,550 | | MICROSOFT CORP. | | | 579,569 | | | 3,355,952 | | | | |
| 56,428 | | MOTOROLA SOLUTIONS, INC. | | | 2,240,348 | | | 3,141,911 | | | | |
| 4,200 | | NETAPP, INC.(b) | | | 94,994 | | | 140,910 | | | | |
| 4,800 | | NEUSTAR, INC., CLASS A(b) | | | 79,848 | | | 201,264 | | | | |
| 4,800 | | NUANCE COMMUNICATIONS, INC.(b) | | | 63,624 | | | 107,136 | | | | |
| 8,900 | | NVIDIA CORP. | | | 60,716 | | | 109,381 | | | | |
| 116,392 | | ORACLE CORP. | | | 1,579,274 | | | 3,878,181 | | | | |
| 3,666 | | PAYCHEX, INC. | | | 10,315 | | | 114,159 | | | | |
| 27,000 | | QUALCOMM, INC. | | | 863,196 | | | 1,674,540 | | | | |
| 1,200 | | RACKSPACE HOSTING, INC.(b) | | | 70,120 | | | 89,124 | | | | |
| 4,200 | | RED HAT, INC.(b) | | | 61,669 | | | 222,432 | | | | |
| 194,283 | | RF MICRO DEVICES, INC.(b) | | | 1,057,216 | | | 870,388 | | | | |
| 2,700 | | RIVERBED TECHNOLOGY, INC.(b) | | | 53,271 | | | 53,244 | | | | |
| 214,000 | | SAIC, INC. | | | 2,373,546 | | | 2,422,480 | | | | |
| | |
See accompanying notes to the financial statements. | 37 | (Continued) |
CLEARWATER INVESTMENT TRUST
Schedule of Investments - Clearwater Core Equity Fund
December 31, 2012
| | | | | | | | | | | | | |
Shares | | Security | | Cost | | Fair
value (a) | | Percent
of
net assets | |
| Information Technology (Cont’d): | | | | | | | | | | |
| 2,100 | | SALESFORCE.COM, INC.(b) | | $ | 120,892 | | | 353,010 | | | | |
| 5,300 | | SANDISK CORP.(b) | | | 51,149 | | | 230,868 | | | | |
| 5,500 | | SEAGATE TECHNOLOGY PLC(c) | | | 51,728 | | | 167,640 | | | | |
| 400 | | SOLERA HOLDINGS, INC. | | | 21,484 | | | 21,388 | | | | |
| 15,519 | | SYMANTEC CORP.(b) | | | 88,098 | | | 291,912 | | | | |
| 1,500 | | SYNOPSYS, INC.(b) | | | 24,907 | | | 47,760 | | | | |
| 37,645 | | TE CONNECTIVITY LTD.(c) | | | 1,278,486 | | | 1,397,382 | | | | |
| 4,500 | | TERADATA CORP.(b) | | | 73,317 | | | 278,505 | | | | |
| 4,400 | | TERADYNE, INC.(b) | | | 40,150 | | | 74,316 | | | | |
| 17,400 | | TEXAS INSTRUMENTS, INC. | | | 280,527 | | | 538,356 | | | | |
| 2,500 | | TRIMBLE NAVIGATION LTD.(b) | | | 38,163 | | | 149,450 | | | | |
| 1,700 | | VERIFONE SYSTEMS, INC.(b) | | | 49,888 | | | 50,456 | | | | |
| 7,900 | | VISA, INC., CLASS A | | | 603,303 | | | 1,197,482 | | | | |
| 7,800 | | VISHAY INTERTECHNOLOGY, INC.(b) | | | 48,931 | | | 82,914 | | | | |
| 557 | | VISHAY PRECISION GROUP, INC.(b) | | | 5,692 | | | 7,364 | | | | |
| 1,500 | | VMWARE, INC., CLASS A(b) | | | 47,285 | | | 141,210 | | | | |
| 5,900 | | WESTERN DIGITAL CORP. | | | 91,433 | | | 250,691 | | | | |
| 10,000 | | WESTERN UNION (THE) CO. | | | 130,105 | | | 136,100 | | | | |
| 500 | | WORKDAY, INC., CLASS A(b) | | | 27,255 | | | 27,250 | | | | |
| 92,802 | | XEROX CORP. | | | 630,591 | | | 632,910 | | | | |
| 6,750 | | XILINX, INC. | | | 47,180 | | | 242,325 | | | | |
| 15,840 | | YAHOO!, INC.(b) | | | 135,325 | | | 315,216 | | | | |
| 26,400 | | ZYNGA, INC., CLASS A(b) | | | 62,832 | | | 62,568 | | | | |
| | | | | | 32,833,387 | | | 63,188,424 | | | 15.99% | |
| Materials: | | | | | | | | | | |
| 2,875 | | AIR PRODUCTS & CHEMICALS, INC. | | | 132,510 | | | 241,558 | | | | |
| 400 | | AIRGAS, INC. | | | 16,882 | | | 36,516 | | | | |
| 1,300 | | ALBEMARLE CORP. | | | 29,152 | | | 80,756 | | | | |
| 3,600 | | ALLEGHENY TECHNOLOGIES, INC. | | | 100,332 | | | 109,296 | | | | |
| 800 | | APTARGROUP, INC. | | | 27,324 | | | 38,176 | | | | |
| 1,600 | | ASHLAND, INC. | | | 47,358 | | | 128,656 | | | | |
| 197,049 | | AURICO GOLD, INC.(b)(c) | | | 1,388,397 | | | 1,622,430 | | | | |
| 3,064 | | BALL CORP. | | | 11,968 | | | 137,114 | | | | |
| 3,000 | | BEMIS CO., INC. | | | 66,889 | | | 100,380 | | | | |
| 1,100 | | CELANESE CORP., CLASS A | | | 46,900 | | | 48,983 | | | | |
| 1,100 | | CF INDUSTRIES HOLDINGS, INC. | | | 97,135 | | | 223,476 | | | | |
| 3,400 | | CLIFFS NATURAL RESOURCES, INC. | | | 108,332 | | | 131,104 | | | | |
| 500 | | COMPASS MINERALS INTERNATIONAL, INC. | | | 27,452 | | | 37,355 | | | | |
| 42,780 | | CROWN HOLDINGS, INC.(b) | | | 1,312,976 | | | 1,574,732 | | | | |
| 700 | | CYTEC INDUSTRIES, INC. | | | 25,564 | | | 48,181 | | | | |
| 1,000 | | DOMTAR CORP.(c) | | | 52,480 | | | 83,520 | | | | |
| 17,500 | | DOW CHEMICAL (THE) CO. | | | 435,169 | | | 565,600 | | | | |
| 14,225 | | E.I. DU PONT DE NEMOURS & CO. | | | 439,400 | | | 639,698 | | | | |
| 438 | | EAGLE MATERIALS, INC. | | | 1,727 | | | 25,623 | | | | |
| 3,000 | | EASTMAN CHEMICAL CO. | | | 58,012 | | | 204,150 | | | | |
| 3,991 | | ECOLAB, INC. | | | 137,417 | | | 286,953 | | | | |
| 82,496 | | FREEPORT-MCMORAN COPPER & GOLD, INC. | | | 2,415,523 | | | 2,821,363 | | | | |
| 900 | | GREIF, INC., CLASS A | | | 27,104 | | | 40,050 | | | | |
| 3,683 | | INTERNATIONAL FLAVORS & FRAGRANCES, INC. | | | 79,231 | | | 245,067 | | | | |
| 9,431 | | INTERNATIONAL PAPER CO. | | | 117,152 | | | 375,731 | | | | |
| 1,200 | | INTREPID POTASH, INC. | | | 25,560 | | | 25,548 | | | | |
| 3,600 | | LYONDELLBASELL INDUSTRIES N.V., CLASS A(c) | | | 102,587 | | | 205,524 | | | | |
| 700 | | MARTIN MARIETTA MATERIALS, INC. | | | 27,965 | | | 65,996 | | | | |
| 2,875 | | MEADWESTVACO CORP. | | | 27,016 | | | 91,626 | | | | |
| 10,115 | | MONSANTO CO. | | | 47,604 | | | 957,385 | | | | |
| 18,911 | | MOSAIC (THE) CO. | | | 921,308 | | | 1,070,930 | | | | |
| 82,000 | | NEWMONT MINING CORP. | | | 3,953,727 | | | 3,808,080 | | | | |
| 5,844 | | NUCOR CORP. | | | 99,313 | | | 252,344 | | | | |
| 4,750 | | OWENS-ILLINOIS, INC.(b) | | | 68,062 | | | 101,032 | | | | |
| 2,100 | | PACKAGING CORP. OF AMERICA | | | 30,902 | | | 80,787 | | | | |
| 3,986 | | PPG INDUSTRIES, INC. | | | 180,558 | | | 539,505 | | | | |
| 6,450 | | PRAXAIR, INC. | | | 258,706 | | | 705,952 | | | | |
| 2,200 | | RELIANCE STEEL & ALUMINUM CO. | | | 61,215 | | | 136,620 | | | | |
| 1,100 | | ROYAL GOLD, INC. | | | 53,182 | | | 89,441 | | | | |
| 6,500 | | RPM INTERNATIONAL, INC. | | | 72,503 | | | 190,840 | | | | |
| 53,094 | | RTI INTERNATIONAL METALS, INC.(b) | | | 1,267,436 | | | 1,463,271 | | | | |
| 118,400 | | SEALED AIR CORP. | | | 2,332,433 | | | 2,073,184 | | | | |
| 1,585 | | SHERWIN-WILLIAMS (THE) CO. | | | 72,398 | | | 243,805 | | | | |
| | |
See accompanying notes to the financial statements. | 38 | (Continued) |
CLEARWATER INVESTMENT TRUST
Schedule of Investments - Clearwater Core Equity Fund
December 31, 2012
| | | | | | | | | | | | | |
Shares | | Security | | Cost | | Fair
value (a) | | Percent
of
net assets | |
| Materials (Cont’d): | | | | | | | | | | |
| 3,600 | | SONOCO PRODUCTS CO. | | $ | 74,519 | | | 107,028 | | | | |
| 3,234 | | SOUTHERN COPPER CORP. | | | 38,445 | | | 122,439 | | | | |
| 8,700 | | STEEL DYNAMICS, INC. | | | 95,178 | | | 119,451 | | | | |
| 1,273 | | SUNCOKE ENERGY, INC.(b) | | | 8,474 | | | 19,846 | | | | |
| 1,600 | | UNITED STATES STEEL CORP. | | | 30,208 | | | 38,192 | | | | |
| 3,200 | | VALSPAR CORP. | | | 68,240 | | | 199,680 | | | | |
| 2,100 | | VULCAN MATERIALS CO. | | | 63,441 | | | 109,305 | | | | |
| 1,800 | | WALTER ENERGY, INC. | | | 42,609 | | | 64,584 | | | | |
| | | | | | 17,225,975 | | | 22,728,863 | | | 5.75% | |
| Telecommunication Services: | | | | | | | | | | |
| 96,590 | | AT&T, INC. | | | 2,385,728 | | | 3,256,049 | | | | |
| 13,013 | | CENTURYLINK, INC. | | | 507,915 | | | 509,069 | | | | |
| 8,600 | | CLEARWIRE CORP., CLASS A(b) | | | 24,940 | | | 24,854 | | | | |
| 4,600 | | CROWN CASTLE INTERNATIONAL CORP.(b) | | | 194,396 | | | 331,936 | | | | |
| 5,100 | | LEVEL 3 COMMUNICATIONS, INC.(b) | | | 115,002 | | | 117,861 | | | | |
| 5,400 | | METROPCS COMMUNICATIONS, INC.(b) | | | 49,902 | | | 53,676 | | | | |
| 11,400 | | NII HOLDINGS, INC.(b) | | | 83,027 | | | 81,282 | | | | |
| 500 | | SBA COMMUNICATIONS CORP., CLASS A(b) | | | 34,910 | | | 35,510 | | | | |
| 41,800 | | SPRINT NEXTEL CORP.(b) | | | 123,442 | | | 237,006 | | | | |
| 5,435 | | TELEPHONE & DATA SYSTEMS, INC. | | | 109,150 | | | 120,331 | | | | |
| 2,300 | | TW TELECOM, INC.(b) | | | 58,604 | | | 58,581 | | | | |
| 3,600 | | UNITED STATES CELLULAR CORP.(b) | | | 126,895 | | | 126,864 | | | | |
| 27,083 | | VERIZON COMMUNICATIONS, INC. | | | 772,249 | | | 1,171,881 | | | | |
| 23,618 | | WINDSTREAM CORP. | | | 200,624 | | | 195,557 | | | | |
| | | | | | 4,786,784 | | | 6,320,457 | | | 1.60% | |
| Utilities: | | | | | | | | | | |
| 4,500 | | AGL RESOURCES, INC. | | | 135,198 | | | 179,865 | | | | |
| 1,000 | | ALLIANT ENERGY CORP. | | | 24,835 | | | 43,910 | | | | |
| 4,000 | | AMEREN CORP. | | | 114,624 | | | 122,880 | | | | |
| 9,200 | | AMERICAN ELECTRIC POWER CO., INC. | | | 289,948 | | | 392,656 | | | | |
| 44,610 | | AMERICAN WATER WORKS CO., INC. | | | 1,158,848 | | | 1,656,369 | | | | |
| 1,388 | | AQUA AMERICA, INC. | | | 22,973 | | | 35,283 | | | | |
| 8,600 | | CALPINE CORP.(b) | | | 57,319 | | | 155,918 | | | | |
| 5,800 | | CENTERPOINT ENERGY, INC. | | | 66,308 | | | 111,650 | | | | |
| 10,200 | | CMS ENERGY CORP. | | | 144,342 | | | 248,676 | | | | |
| 4,589 | | CONSOLIDATED EDISON, INC. | | | 184,849 | | | 254,873 | | | | |
| 8,862 | | DOMINION RESOURCES, INC. | | | 284,452 | | | 459,051 | | | | |
| 2,300 | | DTE ENERGY CO. | | | 84,036 | | | 138,115 | | | | |
| 10,851 | | DUKE ENERGY CORP. | | | 395,594 | | | 692,294 | | | | |
| 8,525 | | EDISON INTERNATIONAL | | | 182,117 | | | 385,245 | | | | |
| 3,064 | | ENTERGY CORP. | | | 60,101 | | | 195,330 | | | | |
| 17,924 | | EXELON CORP. | | | 587,983 | | | 533,060 | | | | |
| 4,700 | | FIRSTENERGY CORP. | | | 189,521 | | | 196,272 | | | | |
| 2,800 | | GREAT PLAINS ENERGY, INC. | | | 43,498 | | | 56,868 | | | | |
| 3,500 | | ITC HOLDINGS CORP. | | | 154,844 | | | 269,185 | | | | |
| 1,500 | | NATIONAL FUEL GAS CO. | | | 38,322 | | | 76,035 | | | | |
| 6,700 | | NEXTERA ENERGY, INC. | | | 347,944 | | | 463,573 | | | | |
| 6,900 | | NISOURCE, INC. | | | 111,901 | | | 171,741 | | | | |
| 4,961 | | NORTHEAST UTILITIES | | | 125,492 | | | 193,876 | | | | |
| 9,384 | | NRG ENERGY, INC. | | | 149,229 | | | 215,731 | | | | |
| 6,200 | | NV ENERGY, INC. | | | 76,954 | | | 112,468 | | | | |
| 2,400 | | OGE ENERGY CORP. | | | 43,344 | | | 135,144 | | | | |
| 2,000 | | ONEOK, INC. | | | 31,518 | | | 85,500 | | | | |
| 5,900 | | PG&E CORP. | | | 79,340 | | | 237,062 | | | | |
| 2,400 | | PINNACLE WEST CAPITAL CORP. | | | 71,637 | | | 122,352 | | | | |
| 9,000 | | PPL CORP. | | | 245,589 | | | 257,670 | | | | |
| 73,285 | | QUESTAR CORP. | | | 1,256,836 | | | 1,448,111 | | | | |
| 4,800 | | SCANA CORP. | | | 166,536 | | | 219,072 | | | | |
| 2,700 | | SEMPRA ENERGY | | | 124,368 | | | 191,538 | | | | |
| 13,100 | | SOUTHERN (THE) CO. | | | 339,687 | | | 560,811 | | | | |
| 7,600 | | TECO ENERGY, INC. | | | 90,842 | | | 127,376 | | | | |
| 3,100 | | UGI CORP. | | | 51,202 | | | 101,401 | | | | |
| 1,400 | | WESTAR ENERGY, INC. | | | 25,767 | | | 40,068 | | | | |
| | |
See accompanying notes to the financial statements. | 39 | (Continued) |
CLEARWATER INVESTMENT TRUST
Schedule of Investments - Clearwater Core Equity Fund
December 31, 2012
| | | | | | | | | | | | | |
Shares | | Security | | Cost | | Fair
value (a) | | Percent
of
net assets | |
| Utilities (Cont’d): | | | | | | | | | | |
| 4,820 | | WISCONSIN ENERGY CORP. | | $ | 46,469 | | | 177,617 | | | | |
| 4,825 | | XCEL ENERGY, INC. | | | 43,343 | | | 128,876 | | | | |
| | | | | | 7,647,710 | | | 11,193,522 | | | 2.83% | |
| | Sub-total Common Stocks: | | | 245,997,184 | | | 387,058,780 | | | 97.93% | |
Rights: | | | | | | | | | | | | |
| Health Care: | | | | | | | | | | |
| 700 | | SANOFI - CVR(b)(c) | | | - | | | 1,193 | | | | |
| | Sub-total Rights: | | | - | | | 1,193 | | | 0.00% | |
Short-Term Investments: | | | | | | | | | | |
| 26,364,287 | | NORTHERN INSTITUTIONAL FUNDS - | | | | | | | | | | |
| | | U.S. GOVERNMENT SELECT PORTFOLIO, 0.01%(e) | | | 26,364,287 | | | 26,364,287 | | | | |
| | Sub-total Short-Term Investments: | | | 26,364,287 | | | 26,364,287 | | | 6.67% | |
| | | Grand total(f) | | $ | 272,361,471 | | | 413,424,260 | | | 104.60% | |
Notes to Schedule of Investments:
| | |
| (a) | Securities are valued in accordance with procedures described in note 2 to the financial statements. |
| (b) | Currently non-income producing assets. |
| (c) | Foreign security values are stated in U.S. dollars. As of December 31, 2012, the value of foreign stocks or depositary receipts of companies based outside of the United States represented 6.39% of net assets. |
| (d) | Securities are American Depositary Receipts of companies based outside of the United States representing 2.22% of net assets. |
| (e) | The short-term investment is a money market portfolio of the investment company, Northern Institutional Funds. At December 31, 2011, the value of the Clearwater Core Equity Fund’s investment in the U.S. Government Select Portfolio of the Northern Institutional Funds was approximately $12,242,109 with net purchases of approximately $14,122,178 during the fiscal year ended December 31, 2012. |
| (f) | At December 31, 2012, the cost for Federal income tax purposes was $272,612,003. The aggregate gross unrealized appreciation and depreciation of investments in securities based on this cost were as follows: |
| | | | |
Gross unrealized appreciation | | $ | 145,619,425 | |
Gross unrealized depreciation | | | (4,807,168 | ) |
Net unrealized appreciation | | $ | 140,812,257 | |
At December 31, 2012, the Clearwater Core Equity Fund had one outstanding spot foreign currency transaction as follows:
| | | | | | | | | | | | | | | | | | | |
Contracts To
Deliver Currency | | Amount
(Local
Currency) | | In
Exchange
For Currency | | Amount
(Local
Currency) | | Settlement
Date | | Unrealized
Gains (Losses) | | Counterparty | |
United States Dollar | | | 115,390 | | | Canadian Dollar | | | 114,582 | | | 1/3/13 | | $ | (205 | ) | | Northern Trust | |
| | |
See accompanying notes to the financial statements. | 40 | (Continued) |
CLEARWATER INVESTMENT TRUST
Schedule of Investments – Clearwater Core Equity Fund (A)
December 31, 2012
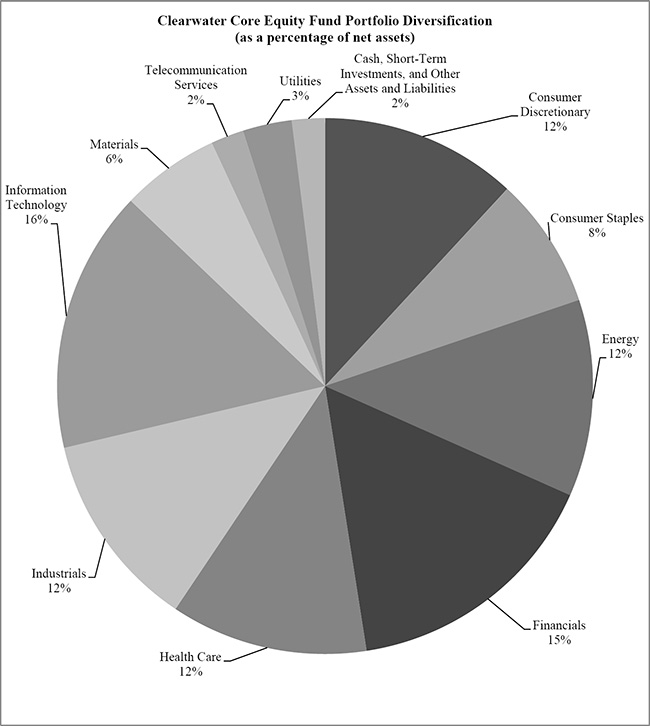
(A)Name change effective April 30, 2012. Formerly known as the Clearwater Growth Fund.
| | |
See accompanying notes to the financial statements. | 41 | (Continued) |
CLEARWATER INVESTMENT TRUST
Schedule of Investments - Clearwater Small Companies Fund(A)
December 31, 2012
| | | | | | | | | | | | | |
Shares | | Security | | Cost | | Fair
value (a) | | Percent
of
net assets | |
Common Stocks: | | | | | | | | | | | |
| Consumer Discretionary: | | | | | | | | | | |
| 4,301 | | 1-800-FLOWERS.COM, INC., CLASS A(b) | | $ | 13,484 | | | 15,785 | | | | |
| 17,000 | | AMC NETWORKS, INC., CLASS A(b) | | | 755,419 | | | 841,500 | | | | |
| 1,285 | | AMERICA’S CAR-MART, INC.(b) | | | 53,253 | | | 52,068 | | | | |
| 44,695 | | ARCTIC CAT, INC.(b) | | | 1,834,916 | | | 1,492,366 | | | | |
| 43,176 | | BELO CORP., CLASS A | | | 275,334 | | | 331,160 | | | | |
| 46,473 | | BLACK DIAMOND, INC.(b) | | | 326,223 | | | 381,079 | | | | |
| 15,791 | | BRAVO BRIO RESTAURANT GROUP, INC.(b) | | | 252,542 | | | 212,073 | | | | |
| 3,871 | | CARRIAGE SERVICES, INC. | | | 39,758 | | | 45,949 | | | | |
| 5,578 | | CEC ENTERTAINMENT, INC. | | | 193,171 | | | 185,134 | | | | |
| 35,144 | | CENTURY CASINOS, INC.(b) | | | 67,511 | | | 99,809 | | | | |
| 36,465 | | COOPER TIRE & RUBBER CO. | | | 427,168 | | | 924,752 | | | | |
| 5,355 | | CORE-MARK HOLDING CO., INC. | | | 214,078 | | | 253,559 | | | | |
| 162,000 | | DENNY’S CORP.(b) | | | 628,669 | | | 790,560 | | | | |
| 25,039 | | DGSE COS., INC.(b) | | | 64,315 | | | 134,710 | | | | |
| 8,571 | | E.W. SCRIPPS (THE) CO., CLASS A(b) | | | 81,564 | | | 92,653 | | | | |
| 105,725 | | EXPRESS, INC.(b) | | | 1,785,666 | | | 1,595,390 | | | | |
| 17,955 | | GAIAM, INC., CLASS A(b) | | | 63,279 | | | 56,738 | | | | |
| 38,246 | | GENESCO, INC.(b) | | | 1,882,208 | | | 2,103,530 | | | | |
| 73,458 | | GENTHERM, INC.(b) | | | 1,057,002 | | | 976,991 | | | | |
| 264,575 | | HANCOCK FABRICS, INC.(b) | | | 357,610 | | | 126,996 | | | | |
| 28,500 | | HANESBRANDS, INC.(b) | | | 652,515 | | | 1,020,870 | | | | |
| 96,605 | | ICONIX BRAND GROUP, INC.(b) | | | 1,153,286 | | | 2,156,224 | | | | |
| 28,354 | | JAMBA, INC.(b) | | | 66,399 | | | 63,513 | | | | |
| 21,979 | | JOE’S JEANS, INC.(b) | | | 25,241 | | | 21,979 | | | | |
| 24,381 | | KRISPY KREME DOUGHNUTS, INC.(b) | | | 172,692 | | | 228,694 | | | | |
| 21,500 | | LAMAR ADVERTISING CO., CLASS A(b) | | | 818,073 | | | 833,125 | | | | |
| 22,171 | | LEAPFROG ENTERPRISES, INC.(b) | | | 178,294 | | | 191,336 | | | | |
| 22,000 | | MADISON SQUARE GARDEN (THE) CO., CLASS A(b) | | | 408,574 | | | 975,700 | | | | |
| 113,757 | | MAIDENFORM BRANDS, INC.(b) | | | 2,670,631 | | | 2,217,124 | | | | |
| 30,000 | | MARRIOTT VACATIONS WORLDWIDE CORP.(b) | | | 688,452 | | | 1,250,100 | | | | |
| 105,550 | | OUTDOOR CHANNEL HOLDINGS, INC. | | | 669,564 | | | 802,180 | | | | |
| 37,000 | | PENSKE AUTOMOTIVE GROUP, INC. | | | 723,337 | | | 1,113,330 | | | | |
| 90,667 | | PIER 1 IMPORTS, INC. | | | 1,071,949 | | | 1,813,340 | | | | |
| 34,674 | | PINNACLE ENTERTAINMENT, INC.(b) | | | 354,005 | | | 548,889 | | | | |
| 26,375 | | PREMIER EXHIBITIONS, INC.(b) | | | 74,277 | | | 71,476 | | | | |
| 49,766 | | QUIKSILVER, INC.(b) | | | 173,647 | | | 211,506 | | | | |
| 9,869 | | RED ROBIN GOURMET BURGERS, INC.(b) | | | 298,412 | | | 348,277 | | | | |
| 44,394 | | RENT-A-CENTER, INC. | | | 1,478,133 | | | 1,525,378 | | | | |
| 31,364 | | ROCKY BRANDS, INC.(b) | | | 263,458 | | | 408,359 | | | | |
| 22,562 | | RUBY TUESDAY, INC.(b) | | | 155,803 | | | 177,337 | | | | |
| 51,255 | | RUE21, INC.(b) | | | 1,448,915 | | | 1,455,129 | | | | |
| 25,000 | | RYLAND GROUP (THE), INC. | | | 712,145 | | | 912,500 | | | | |
| 43,000 | | SALLY BEAUTY HOLDINGS, INC.(b) | | | 366,257 | | | 1,013,510 | | | | |
| 89,890 | | SELECT COMFORT CORP.(b) | | | 2,594,577 | | | 2,352,421 | | | | |
| 9,212 | | SHILOH INDUSTRIES, INC. | | | 97,434 | | | 94,884 | | | | |
| 8,773 | | STANDARD MOTOR PRODUCTS, INC. | | | 112,643 | | | 194,936 | | | | |
| 41,859 | | STEINWAY MUSICAL INSTRUMENTS, INC.(b) | | | 998,395 | | | 885,318 | | | | |
| 6,557 | | SUMMER INFANT, INC.(b) | | | 12,084 | | | 11,409 | | | | |
| 24,162 | | TANDY LEATHER FACTORY, INC. | | | 115,506 | | | 133,374 | | | | |
| 38,514 | | TEMPUR-PEDIC INTERNATIONAL, INC.(b) | | | 1,130,686 | | | 1,212,806 | | | | |
| 24,330 | | TRUE RELIGION APPAREL, INC. | | | 584,002 | | | 618,469 | | | | |
| 15,500 | | VAIL RESORTS, INC. | | | 580,317 | | | 838,395 | | | | |
| 117,442 | | WMS INDUSTRIES, INC.(b) | | | 2,267,433 | | | 2,055,235 | | | | |
| 66,326 | | WOLVERINE WORLD WIDE, INC. | | | 1,994,876 | | | 2,718,039 | | | | |
| 19,000 | | WYNDHAM WORLDWIDE CORP. | | | 425,309 | | | 1,010,990 | | | | |
| 15,404 | | ZAGG, INC.(b) | | | 118,439 | | | 113,373 | | | | |
| | | | | | 36,028,930 | | | 42,312,327 | | | 15.01% | |
| Consumer Staples: | | | | | | | | | | |
| 10,926 | | CENTRAL GARDEN AND PET CO.(b) | | | 108,391 | | | 109,478 | | | | |
| 168,210 | | COTT CORP.(c) | | | 1,371,963 | | | 1,350,726 | | | | |
| 44,819 | | DARLING INTERNATIONAL, INC.(b) | | | 631,087 | | | 718,897 | | | | |
| 5,325 | | DIAMOND FOODS, INC. | | | 76,603 | | | 72,793 | | | | |
| 40,500 | | FLOWERS FOODS, INC. | | | 511,723 | | | 942,435 | | | | |
| 28,000 | | HILLSHIRE BRANDS CO. | | | 758,043 | | | 787,920 | | | | |
| 67,847 | | INTER PARFUMS, INC. | | | 1,101,078 | | | 1,320,303 | | | | |
| 55,117 | | MEDIFAST, INC.(b) | | | 865,881 | | | 1,454,538 | | | | |
| 41,531 | | OMEGA PROTEIN CORP.(b) | | | 305,229 | | | 254,170 | | | | |
(A)Name change effective April 30, 2012. Formerly known as the Clearwater Small Cap Fund.
| | |
See accompanying notes to the financial statements. | 42 | (Continued) |
CLEARWATER INVESTMENT TRUST
Schedule of Investments - Clearwater Small Companies Fund
December 31, 2012
| | | | | | | | | | | | | |
Shares | | Security | | Cost | | Fair
value (a) | | Percent
of
net assets | |
| Consumer Staples (Cont’d): | | | | | | | | | | |
| 24,304 | | PANTRY (THE), INC.(b) | | $ | 337,131 | | | 294,807 | | | | |
| 54,863 | | S&W SEED CO.(b) | | | 326,739 | | | 423,542 | | | | |
| 9,830 | | SENECA FOODS CORP., CLASS A(b) | | | 220,734 | | | 298,832 | | | | |
| 40,000 | | SNYDERS-LANCE, INC. | | | 898,946 | | | 964,400 | | | | |
| 62,841 | | SPECTRUM BRANDS HOLDINGS, INC. | | | 1,720,974 | | | 2,823,446 | | | | |
| 2,447 | | USANA HEALTH SCIENCES, INC.(b) | | | 76,311 | | | 80,580 | | | | |
| | | | | | 9,310,833 | | | 11,896,867 | | | 4.22% | |
| Energy: | | | | | | | | | | | | |
| 60,959 | | BILL BARRETT CORP.(b) | | | 1,613,862 | | | 1,084,461 | | | | |
| 100,683 | | CARRIZO OIL & GAS, INC.(b) | | | 2,985,799 | | | 2,106,288 | | | | |
| 11,000 | | DRIL-QUIP, INC.(b) | | | 534,766 | | | 803,550 | | | | |
| 95,916 | | ENDEAVOUR INTERNATIONAL CORP.(b) | | | 914,963 | | | 496,845 | | | | |
| 46,582 | | FORBES ENERGY SERVICES LTD.(b) | | | 201,644 | | | 117,853 | | | | |
| 28,000 | | GULFPORT ENERGY CORP.(b) | | | 816,373 | | | 1,070,160 | | | | |
| 37,500 | | HELIX ENERGY SOLUTIONS GROUP, INC.(b) | | | 749,112 | | | 774,000 | | | | |
| 290,530 | | HERCULES OFFSHORE, INC.(b) | | | 1,505,140 | | | 1,795,475 | | | | |
| 31,466 | | HORNBECK OFFSHORE SERVICES, INC.(b) | | | 1,135,141 | | | 1,080,542 | | | | |
| 129,577 | | KEY ENERGY SERVICES, INC.(b) | | | 1,771,634 | | | 900,560 | | | | |
| 32,000 | | OASIS PETROLEUM, INC.(b) | | | 564,228 | | | 1,017,600 | | | | |
| 38,500 | | SANCHEZ ENERGY CORP.(b) | | | 878,506 | | | 693,000 | | | | |
| 52,404 | | STEEL EXCEL, INC.(b) | | | 1,515,227 | | | 1,307,480 | | | | |
| 62,003 | | SUPERIOR ENERGY SERVICES, INC.(b) | | | 1,467,374 | | | 1,284,702 | | | | |
| | | | | | 16,653,769 | | | 14,532,516 | | | 5.15% | |
| Financials: | | | | | | | | | | | | |
| 27,806 | | AGREE REALTY CORP. | | | 646,070 | | | 744,923 | | | | |
| 8,622 | | AMERICAN NATIONAL BANKSHARES, INC. | | | 173,025 | | | 174,078 | | | | |
| 3,151 | | AMERICAN SAFETY INSURANCE HOLDINGS LTD.(b)(c) | | | 67,701 | | | 59,617 | | | | |
| 43,313 | | AMTRUST FINANCIAL SERVICES, INC. | | | 653,859 | | | 1,242,650 | | | | |
| 27,000 | | ARTHUR J. GALLAGHER & CO. | | | 562,570 | | | 935,550 | | | | |
| 46,289 | | ASHFORD HOSPITALITY TRUST, INC. | | | 367,993 | | | 486,497 | | | | |
| 28,085 | | ASPEN INSURANCE HOLDINGS LTD.(c) | | | 660,670 | | | 900,967 | | | | |
| 50,000 | | ASSOCIATED BANC-CORP | | | 666,059 | | | 656,000 | | | | |
| 44,186 | | ASSOCIATED ESTATES REALTY CORP. | | | 666,251 | | | 712,278 | | | | |
| 26,916 | | BERKSHIRE HILLS BANCORP, INC. | | | 604,733 | | | 642,216 | | | | |
| 10,316 | | BNC BANCORP | | | 85,554 | | | 82,631 | | | | |
| 34,559 | | BROOKLINE BANCORP, INC. | | | 291,739 | | | 293,752 | | | | |
| 178,686 | | CAMPUS CREST COMMUNITIES, INC. | | | 1,928,455 | | | 2,190,690 | | | | |
| 14,964 | | CAPE BANCORP, INC. | | | 138,595 | | | 130,037 | | | | |
| 65,000 | | CAPITOL FEDERAL FINANCIAL, INC. | | | 768,473 | | | 759,850 | | | | |
| 70,476 | | CAPLEASE, INC.(b) | | | 131,850 | | | 392,551 | | | | |
| 35,000 | | CBOE HOLDINGS, INC. | | | 848,346 | | | 1,031,100 | | | | |
| 937 | | CENTURY BANCORP, INC., CLASS A | | | 29,070 | | | 30,874 | | | | |
| 63,371 | | CHESAPEAKE LODGING TRUST | | | 1,001,316 | | | 1,323,187 | | | | |
| 12,836 | | CLIFTON SAVINGS BANCORP, INC. | | | 142,143 | | | 144,662 | | | | |
| 27,024 | | COLONY FINANCIAL, INC. | | | 499,505 | | | 526,968 | | | | |
| 11,889 | | COMMUNITY TRUST BANCORP, INC. | | | 391,600 | | | 389,721 | | | | |
| 47,525 | | CORPORATE OFFICE PROPERTIES TRUST | | | 1,041,239 | | | 1,187,174 | | | | |
| 11,465 | | EMC INSURANCE GROUP, INC. | | | 246,331 | | | 273,784 | | | | |
| 16,668 | | EXCEL TRUST, INC. | | | 195,480 | | | 211,184 | | | | |
| 22,669 | | FINANCIAL INSTITUTIONS, INC. | | | 389,399 | | | 422,324 | | | | |
| 49,000 | | FIRST AMERICAN FINANCIAL CORP. | | | 686,144 | | | 1,180,410 | | | | |
| 17,488 | | FIRST FINANCIAL CORP. | | | 522,556 | | | 528,837 | | | | |
| 31,681 | | FIRST MERCHANTS CORP. | | | 187,769 | | | 470,146 | | | | |
| 23,979 | | FIRST PACTRUST BANCORP, INC. | | | 297,524 | | | 294,222 | | | | |
| 133,876 | | FIRSTMERIT CORP. | | | 1,970,595 | | | 1,899,701 | | | | |
| 50,000 | | FORESTAR GROUP, INC.(b) | | | 940,728 | | | 866,500 | | | | |
| 15,573 | | FRANKLIN FINANCIAL CORP. | | | 217,750 | | | 258,200 | | | | |
| 34,264 | | GETTY REALTY CORP. | | | 556,254 | | | 618,808 | | | | |
| 34,617 | | GLADSTONE CAPITAL CORP. | | | 265,157 | | | 282,475 | | | | |
| 15,147 | | GOLUB CAPITAL BDC, INC. | | | 228,484 | | | 242,049 | | | | |
| 9,929 | | HENNESSY ADVISORS, INC. | | | 29,849 | | | 43,588 | | | | |
| 16,070 | | HERITAGE FINANCIAL CORP. | | | 201,226 | | | 236,068 | | | | |
| 48,080 | | HOME FEDERAL BANCORP, INC. | | | 611,641 | | | 597,634 | | | | |
| 16,385 | | HOME PROPERTIES, INC. | | | 895,936 | | | 1,004,564 | | | | |
| 34,358 | | HORACE MANN EDUCATORS CORP. | | | 444,663 | | | 685,786 | | | | |
| 5,707 | | HORIZON BANCORP | | | 68,965 | | | 112,143 | | | | |
| 19,500 | | IBERIABANK CORP. | | | 928,547 | | | 957,840 | | | | |
| | |
See accompanying notes to the financial statements. | 43 | (Continued) |
CLEARWATER INVESTMENT TRUST
Schedule of Investments - Clearwater Small Companies Fund
December 31, 2012
| | | | | | | | | | | | | |
Shares | | Security | | Cost | | Fair
value (a) | | Percent
of
net assets | |
| Financials (Cont’d): | | | | | | | | | | |
| 120,837 | | INVESTORS BANCORP, INC. | | $ | 1,722,929 | | | 2,148,482 | | | | |
| 35,719 | | INVESTORS CAPITAL HOLDINGS LTD.(b) | | | 151,806 | | | 128,588 | | | | |
| 48,699 | | KITE REALTY GROUP TRUST | | | 208,256 | | | 272,227 | | | | |
| 17,620 | | LAPORTE BANCORP, INC. | | | 154,704 | | | 152,061 | | | | |
| 60,000 | | MANNING & NAPIER, INC. | | | 754,331 | | | 756,000 | | | | |
| 119,458 | | MEDICAL PROPERTIES TRUST, INC. | | | 1,177,342 | | | 1,428,718 | | | | |
| 20,536 | | MEDLEY CAPITAL CORP. | | | 280,561 | | | 299,004 | | | | |
| 10,688 | | MERIDIAN INTERSTATE BANCORP, INC.(b) | | | 157,730 | | | 179,345 | | | | |
| 6,600 | | MIDSOUTH BANCORP, INC. | | | 97,614 | | | 107,910 | | | | |
| 37,880 | | NATIONAL FINANCIAL PARTNERS CORP.(b) | | | 506,854 | | | 649,263 | | | | |
| 46,937 | | NATIONAL RETAIL PROPERTIES, INC. | | | 761,193 | | | 1,464,434 | | | | |
| 106,755 | | NGP CAPITAL RESOURCES CO. | | | 829,912 | | | 770,771 | | | | |
| 187,615 | | NORTHWEST BANCSHARES, INC. | | | 2,023,320 | | | 2,277,646 | | | | |
| 80,162 | | ORITANI FINANCIAL CORP. | | | 1,019,287 | | | 1,228,082 | | | | |
| 18,917 | | PACIFIC CONTINENTAL CORP. | | | 173,771 | | | 184,062 | | | | |
| 47,803 | | PACWEST BANCORP | | | 1,107,968 | | | 1,184,558 | | | | |
| 13,111 | | PARK STERLING CORP.(b) | | | 80,326 | | | 68,571 | | | | |
| 33,319 | | PENNANTPARK INVESTMENT CORP. | | | 352,463 | | | 366,342 | | | | |
| 1,075 | | PEOPLES BANCORP, INC. | | | 21,372 | | | 21,962 | | | | |
| 35,000 | | PHH CORP.(b) | | | 719,485 | | | 796,250 | | | | |
| 27,246 | | PLATINUM UNDERWRITERS HOLDINGS LTD.(c) | | | 808,813 | | | 1,253,316 | | | | |
| 30,143 | | PREFERRED APARTMENT COMMUNITIES, INC., CLASS A | | | 189,537 | | | 234,814 | | | | |
| 74,318 | | PRIVATEBANCORP, INC. | | | 980,425 | | | 1,138,552 | | | | |
| 24,899 | | RENASANT CORP. | | | 403,755 | | | 476,567 | | | | |
| 36,717 | | RETAIL OPPORTUNITY INVESTMENTS CORP. | | | 457,079 | | | 472,181 | | | | |
| 111,663 | | ROCKVILLE FINANCIAL, INC. | | | 1,176,110 | | | 1,440,453 | | | | |
| 31,990 | | RYMAN HOSPITALITY PROPERTIES | | | 791,509 | | | 1,230,351 | | | | |
| 38,000 | | SABRA HEALTH CARE REIT, INC. | | | 674,953 | | | 825,360 | | | | |
| 14,195 | | SANDY SPRING BANCORP, INC. | | | 254,929 | | | 275,667 | | | | |
| 7,053 | | SCBT FINANCIAL CORP. | | | 227,109 | | | 283,390 | | | | |
| 26,664 | | SI FINANCIAL GROUP, INC. | | | 261,875 | | | 306,636 | | | | |
| 26,907 | | SIMMONS FIRST NATIONAL CORP., CLASS A | | | 673,089 | | | 682,362 | | | | |
| 12,142 | | SIMPLICITY BANCORP, INC. | | | 133,682 | | | 181,523 | | | | |
| 26,053 | | SOUTHSIDE BANCSHARES, INC. | | | 528,223 | | | 548,676 | | | | |
| 50,000 | | SPIRIT REALTY CAPITAL, INC. | | | 803,435 | | | 889,000 | | | | |
| 32,408 | | STANCORP FINANCIAL GROUP, INC. | | | 1,000,017 | | | 1,188,401 | | | | |
| 21,942 | | STATE BANK FINANCIAL CORP. | | | 342,312 | | | 348,439 | | | | |
| 25,800 | | STELLARONE CORP. | | | 341,581 | | | 364,812 | | | | |
| 153,898 | | SUSQUEHANNA BANCSHARES, INC. | | | 1,126,613 | | | 1,612,851 | | | | |
| 524,797 | | SYNOVUS FINANCIAL CORP.(b) | | | 1,121,754 | | | 1,285,753 | | | | |
| 2,792 | | TCP CAPITAL CORP. | | | 40,882 | | | 41,154 | | | | |
| 36,500 | | TERRITORIAL BANCORP, INC. | | | 585,519 | | | 834,025 | | | | |
| 16,845 | | THL CREDIT, INC. | | | 230,068 | | | 249,138 | | | | |
| 97,996 | | UMPQUA HOLDINGS CORP. | | | 1,076,352 | | | 1,155,373 | | | | |
| 17,544 | | UNIVEST CORP. OF PENNSYLVANIA | | | 290,698 | | | 300,002 | | | | |
| 28,877 | | URSTADT BIDDLE PROPERTIES, INC., CLASS A | | | 498,068 | | | 568,299 | | | | |
| 52,500 | | VIEWPOINT FINANCIAL GROUP, INC. | | | 669,191 | | | 1,099,350 | | | | |
| 65,309 | | WALKER & DUNLOP, INC.(b) | | | 770,605 | | | 1,088,048 | | | | |
| 23,000 | | WALTER INVESTMENT MANAGEMENT CORP.(b) | | | 305,985 | | | 989,460 | | | | |
| 23,143 | | WASHINGTON BANKING CO. | | | 319,825 | | | 315,208 | | | | |
| 55,778 | | WESTFIELD FINANCIAL, INC. | | | 444,906 | | | 403,275 | | | | |
| 25,000 | | WINTRUST FINANCIAL CORP. | | | 855,525 | | | 917,500 | | | | |
| | | | | | 52,937,462 | | | 63,708,448 | | | 22.60% | |
| Health Care: | | | | | | | | | | |
| 95,875 | | ACCRETIVE HEALTH, INC.(b) | | | 1,146,680 | | | 1,108,315 | | | | |
| 18,346 | | ADDUS HOMECARE CORP.(b) | | | 111,149 | | | 130,624 | | | | |
| 29,569 | | ANALOGIC CORP. | | | 2,151,786 | | | 2,196,977 | | | | |
| 14,179 | | ANGIODYNAMICS, INC.(b) | | | 171,444 | | | 155,827 | | | | |
| 7,856 | | ARTHROCARE CORP.(b) | | | 210,964 | | | 271,739 | | | | |
| 14,933 | | BIOCLINICA, INC.(b) | | | 70,834 | | | 85,417 | | | | |
| 71,031 | | BIODELIVERY SCIENCES INTERNATIONAL, INC.(b) | | | 351,577 | | | 306,144 | | | | |
| 1,783 | | BIO-REFERENCE LABS, INC.(b) | | | 46,008 | | | 51,154 | | | | |
| 73,542 | | CAMBREX CORP.(b) | | | 724,389 | | | 836,908 | | | | |
| 31,997 | | CENTENE CORP.(b) | | | 1,290,016 | | | 1,311,877 | | | | |
| 20,102 | | CONCEPTUS, INC.(b) | | | 350,233 | | | 422,343 | | | | |
| 26,383 | | CRYOLIFE, INC. | | | 148,060 | | | 164,366 | | | | |
| 37,000 | | HANGER, INC.(b) | | | 718,063 | | | 1,012,320 | | | | |
| | |
See accompanying notes to the financial statements. | 44 | (Continued) |
CLEARWATER INVESTMENT TRUST
Schedule of Investments - Clearwater Small Companies Fund
December 31, 2012
| | | | | | | | | | | | | |
Shares | | Security | | Cost | | Fair
value (a) | | Percent
of
net assets | |
| Health Care (Cont’d): | | | | | | | | | | |
| 9,444 | | HARVARD BIOSCIENCE, INC.(b) | | $ | 38,371 | | | 41,365 | | | | |
| 144,009 | | HEALTHSOUTH CORP.(b) | | | 2,300,403 | | | 3,040,030 | | | | |
| 152,301 | | HEALTHWAYS, INC.(b) | | | 1,506,802 | | | 1,629,621 | | | | |
| 18,622 | | HESKA CORP. | | | 150,935 | | | 150,838 | | | | |
| 61,173 | | HILL-ROM HOLDINGS, INC. | | | 1,636,405 | | | 1,743,430 | | | | |
| 79,154 | | ICON PLC ADR(b)(c)(d) | | | 1,886,709 | | | 2,197,315 | | | | |
| 58,566 | | MERGE HEALTHCARE, INC.(b) | | | 207,020 | | | 144,658 | | | | |
| 89,443 | | MERIT MEDICAL SYSTEMS, INC.(b) | | | 1,246,842 | | | 1,243,258 | | | | |
| 1,314 | | NATIONAL RESEARCH CORP. | | | 66,735 | | | 71,219 | | | | |
| 12,379 | | NATUS MEDICAL, INC.(b) | | | 144,641 | | | 138,397 | | | | |
| 13,346 | | NUVASIVE, INC.(b) | | | 190,116 | | | 206,329 | | | | |
| 12,531 | | OMNICELL, INC.(b) | | | 193,370 | | | 186,336 | | | | |
| 54,399 | | ORTHOFIX INTERNATIONAL N.V.(b)(c) | | | 1,551,563 | | | 2,139,513 | | | | |
| 22,000 | | PATTERSON COS., INC. | | | 514,141 | | | 753,060 | | | | |
| 22,810 | | PDI, INC.(b) | | | 152,202 | | | 173,356 | | | | |
| 23,125 | | PHARMERICA CORP.(b) | | | 291,212 | | | 329,300 | | | | |
| 17,453 | | PSYCHEMEDICS CORP. | | | 201,042 | | | 187,620 | | | | |
| 27,690 | | SALIX PHARMACEUTICALS LTD.(b) | | | 1,172,234 | | | 1,120,891 | | | | |
| 4,009 | | SURMODICS, INC.(b) | | | 74,205 | | | 89,641 | | | | |
| 12,951 | | VASCULAR SOLUTIONS, INC.(b) | | | 141,527 | | | 204,626 | | | | |
| 20,794 | | WEST PHARMACEUTICAL SERVICES, INC. | | | 775,312 | | | 1,138,471 | | | | |
| | | | | | 21,932,990 | | | 24,983,285 | | | 8.86% | |
| Industrials: | | | | | | | | | | | | |
| 44,203 | | A.O. SMITH CORP. | | | 1,988,253 | | | 2,787,883 | | | | |
| 39,756 | | ACCO BRANDS CORP.(b) | | | 269,984 | | | 291,809 | | | | |
| 17,170 | | ACETO CORP. | | | 161,988 | | | 172,387 | | | | |
| 58,573 | | ACTUANT CORP., CLASS A | | | 1,188,610 | | | 1,634,772 | | | | |
| 15,000 | | ACUITY BRANDS, INC. | | | 533,328 | | | 1,015,950 | | | | |
| 38,000 | | AIR LEASE CORP.(b) | | | 840,658 | | | 817,000 | | | | |
| 5,000 | | AMERCO, INC. | | | 538,938 | | | 634,050 | | | | |
| 9,562 | | AMERICAN RAILCAR INDUSTRIES, INC. | | | 280,660 | | | 303,402 | | | | |
| 12,135 | | ASTRONICS CORP.(b) | | | 235,485 | | | 277,649 | | | | |
| 942 | | ASTRONICS CORP., CLASS B(b) | | | 19,609 | | | 20,441 | | | | |
| 55,000 | | AVIS BUDGET GROUP, INC.(b) | | | 738,891 | | | 1,090,100 | | | | |
| 86,651 | | AZZ, INC. | | | 2,061,609 | | | 3,329,998 | | | | |
| 32,000 | | BABCOCK & WILCOX (THE) CO. | | | 726,567 | | | 838,400 | | | | |
| 7,590 | | BREEZE-EASTERN CORP.(b) | | | 54,253 | | | 56,925 | | | | |
| 31,860 | | CASELLA WASTE SYSTEMS, INC., CLASS A(b) | | | 191,279 | | | 139,547 | | | | |
| 17,079 | | CECO ENVIRONMENTAL CORP. | | | 94,807 | | | 169,936 | | | | |
| 13,926 | | CELADON GROUP, INC. | | | 208,703 | | | 251,643 | | | | |
| 24,000 | | CHICAGO BRIDGE & IRON CO. N.V.(c) | | | 408,333 | | | 1,112,400 | | | | |
| 4,386 | | CIRCOR INTERNATIONAL, INC. | | | 141,041 | | | 173,642 | | | | |
| 25,000 | | COLFAX CORP.(b) | | | 197,420 | | | 1,008,750 | | | | |
| 15,561 | | COMFORT SYSTEMS USA, INC. | | | 166,096 | | | 189,222 | | | | |
| 22,000 | | CORRECTIONS CORP. OF AMERICA | | | 666,092 | | | 780,340 | | | | |
| 17,032 | | DUCOMMUN, INC.(b) | | | 245,764 | | | 275,407 | | | | |
| 2,388 | | DXP ENTERPRISES, INC.(b) | | | 36,554 | | | 117,179 | | | | |
| 11,858 | | ENNIS, INC. | | | 156,390 | | | 183,443 | | | | |
| 20,000 | | ENPRO INDUSTRIES, INC.(b) | | | 569,233 | | | 818,000 | | | | |
| 40,631 | | ESCO TECHNOLOGIES, INC. | | | 1,403,171 | | | 1,520,006 | | | | |
| 35,108 | | FEDERAL SIGNAL CORP.(b) | | | 138,188 | | | 267,172 | | | | |
| 32,000 | | FORTUNE BRANDS HOME & SECURITY, INC.(b) | | | 637,834 | | | 935,040 | | | | |
| 56,231 | | GENCORP, INC.(b) | | | 291,058 | | | 514,514 | | | | |
| 13,000 | | GENESEE & WYOMING, INC., CLASS A(b) | | | 321,298 | | | 989,040 | | | | |
| 9,177 | | GP STRATEGIES CORP.(b) | | | 62,336 | | | 189,505 | | | | |
| 20,576 | | GRAHAM CORP. | | | 451,669 | | | 401,232 | | | | |
| 5,286 | | GREENBRIER COS., INC.(b) | | | 84,003 | | | 85,475 | | | | |
| 17,417 | | HAWAIIAN HOLDINGS, INC.(b) | | | 93,239 | | | 114,430 | | | | |
| 82,482 | | ICF INTERNATIONAL, INC.(b) | | | 1,852,733 | | | 1,933,378 | | | | |
| 35,000 | | ITT CORP. | | | 698,010 | | | 821,100 | | | | |
| 45,000 | | JOHN BEAN TECHNOLOGIES CORP. | | | 604,564 | | | 799,650 | | | | |
| 11,000 | | KANSAS CITY SOUTHERN | | | 210,643 | | | 918,280 | | | | |
| 20,500 | | L.B. FOSTER CO., CLASS A | | | 462,717 | | | 890,520 | | | | |
| 7,858 | | LYDALL, INC.(b) | | | 62,301 | | | 112,684 | | | | |
| 25,500 | | MACQUARIE INFRASTRUCTURE CO. LLC | | | 695,627 | | | 1,161,780 | | | | |
| 12,999 | | MIDDLEBY CORP.(b) | | | 604,541 | | | 1,666,602 | | | | |
| 53,606 | | POLYPORE INTERNATIONAL, INC.(b) | | | 2,153,002 | | | 2,492,679 | | | | |
| 34,283 | | REGAL-BELOIT CORP. | | | 1,884,244 | | | 2,415,923 | | | | |
| | |
See accompanying notes to the financial statements. | 45 | (Continued) |
CLEARWATER INVESTMENT TRUST
Schedule of Investments - Clearwater Small Companies Fund
December 31, 2012
| | | | | | | | | | | | | |
Shares | | Security | | Cost | | Fair
value (a) | | Percent
of
net assets | |
| Industrials (Cont’d): | | | | | | | | | | |
| 36,000 | | REXNORD CORP.(b) | | $ | 759,725 | | | 766,800 | | | | |
| 10,800 | | RUSH ENTERPRISES, INC., CLASS A(b) | | | 180,522 | | | 223,236 | | | | |
| 5,025 | | SAIA, INC.(b) | | | 67,935 | | | 116,178 | | | | |
| 12,607 | | SL INDUSTRIES, INC. | | | 166,647 | | | 226,926 | | | | |
| 13,547 | | SPARTON CORP.(b) | | | 112,820 | | | 187,897 | | | | |
| 8,629 | | STANDEX INTERNATIONAL CORP. | | | 205,540 | | | 442,581 | | | | |
| 30,239 | | TELEDYNE TECHNOLOGIES, INC.(b) | | | 1,215,646 | | | 1,967,652 | | | | |
| 55,352 | | TENNANT CO. | | | 2,062,274 | | | 2,432,720 | | | | |
| 36,500 | | TEREX CORP.(b) | | | 831,385 | | | 1,026,015 | | | | |
| 5,263 | | TREX CO., INC.(b) | | | 141,715 | | | 195,941 | | | | |
| 72,679 | | TRINITY INDUSTRIES, INC. | | | 2,196,577 | | | 2,603,362 | | | | |
| 35,032 | | TRIUMPH GROUP, INC. | | | 1,463,202 | | | 2,287,590 | | | | |
| 12,407 | | US ECOLOGY, INC. | | | 213,326 | | | 292,061 | | | | |
| 17,742 | | WABASH NATIONAL CORP.(b) | | | 123,875 | | | 159,146 | | | | |
| 19,112 | | WABTEC CORP. | | | 974,230 | | | 1,673,064 | | | | |
| 21,954 | | WOODWARD, INC. | | | 605,792 | | | 837,106 | | | | |
| | | | | | 36,752,934 | | | 52,157,560 | | | 18.50% | |
| Information Technology: | | | | | | | | | | |
| 17,723 | | ACTUATE CORP.(b) | | | 90,532 | | | 99,249 | | | | |
| 56,015 | | ADTRAN, INC. | | | 1,903,896 | | | 1,094,533 | | | | |
| 16,554 | | ALLIANCE FIBER OPTIC PRODUCTS, INC. | | | 150,663 | | | 198,979 | | | | |
| 87,801 | | ANAREN, INC.(b) | | | 1,077,593 | | | 1,707,729 | | | | |
| 11,857 | | BADGER METER, INC. | | | 388,152 | | | 562,140 | | | | |
| 96,367 | | BRIDGELINE DIGITAL, INC.(b) | | | 130,323 | | | 139,732 | | | | |
| 32,000 | | BROADRIDGE FINANCIAL SOLUTIONS, INC. | | | 543,517 | | | 732,160 | | | | |
| 24,619 | | CALAMP CORP.(b) | | | 169,800 | | | 204,830 | | | | |
| 29,438 | | CALLIDUS SOFTWARE, INC.(b) | | | 124,556 | | | 133,649 | | | | |
| 37,875 | | CAMTEK LTD.(b)(c) | | | 82,558 | | | 52,268 | | | | |
| 59,138 | | COGNEX CORP. | | | 1,756,558 | | | 2,177,461 | | | | |
| 256,063 | | ENTROPIC COMMUNICATIONS, INC.(b) | | | 1,957,776 | | | 1,354,573 | | | | |
| 19,091 | | EVOLVING SYSTEMS, INC. | | | 65,338 | | | 113,782 | | | | |
| 40,189 | | EXAR CORP.(b) | | | 273,828 | | | 357,682 | | | | |
| 36,111 | | FRANKLIN WIRELESS CORP.(b) | | | 92,351 | | | 72,222 | | | | |
| 27,200 | | FREQUENCY ELECTRONICS, INC. | | | 199,884 | | | 223,312 | | | | |
| 31,036 | | GLOBAL CASH ACCESS HOLDINGS, INC.(b) | | | 242,175 | | | 243,322 | | | | |
| 142,630 | | GSI GROUP, INC.(b) | | | 1,669,761 | | | 1,235,176 | | | | |
| 47,972 | | HACKETT GROUP (THE), INC. | | | 192,541 | | | 205,320 | | | | |
| 18,893 | | HARMONIC, INC.(b) | | | 84,186 | | | 95,788 | | | | |
| 5,786 | | IEC ELECTRONICS CORP.(b) | | | 39,467 | | | 39,113 | | | | |
| 3,567 | | INPHI CORP.(b) | | | 33,130 | | | 34,172 | | | | |
| 12,596 | | INTEST CORP. | | | 40,621 | | | 35,269 | | | | |
| 35,767 | | IPG PHOTONICS CORP. | | | 1,549,951 | | | 2,383,871 | | | | |
| 28,592 | | KVH INDUSTRIES, INC.(b) | | | 307,121 | | | 399,716 | | | | |
| 22,913 | | LIONBRIDGE TECHNOLOGIES, INC.(b) | | | 76,092 | | | 92,110 | | | | |
| 28,663 | | LIQUIDITY SERVICES, INC.(b) | | | 1,132,336 | | | 1,171,170 | | | | |
| 51,923 | | LOGMEIN, INC.(b) | | | 1,132,812 | | | 1,163,594 | | | | |
| 19,635 | | LTX-CREDENCE CORP.(b) | | | 126,595 | | | 128,806 | | | | |
| 8,502 | | METHODE ELECTRONICS, INC. | | | 91,863 | | | 85,275 | | | | |
| 28,068 | | MIPS TECHNOLOGIES, INC.(b) | | | 160,360 | | | 219,492 | | | | |
| 27,950 | | MKS INSTRUMENTS, INC. | | | 730,125 | | | 720,551 | | | | |
| 41,800 | | NAPCO SECURITY TECHNOLOGIES, INC.(b) | | | 68,377 | | | 152,152 | | | | |
| 37,000 | | NCR CORP.(b) | | | 878,564 | | | 942,760 | | | | |
| 82,094 | | NETGEAR, INC.(b) | | | 2,781,561 | | | 3,236,146 | | | | |
| 64,371 | | NEWPORT CORP.(b) | | | 1,056,833 | | | 865,790 | | | | |
| 18,621 | | NOVA MEASURING INSTRUMENTS LTD.(b)(c) | | | 134,096 | | | 148,596 | | | | |
| 89,822 | | OFFICIAL PAYMENTS HOLDINGS, INC.(b) | | | 563,404 | | | 506,596 | | | | |
| 5,747 | | OPLINK COMMUNICATIONS, INC.(b) | | | 108,720 | | | 89,538 | | | | |
| 54,646 | | PARAMETRIC TECHNOLOGY CORP.(b) | | | 1,150,178 | | | 1,230,081 | | | | |
| 37,206 | | PERCEPTRON, INC. | | | 216,757 | | | 219,515 | | | | |
| 163,621 | | SANMINA CORP.(b) | | | 1,654,340 | | | 1,811,284 | | | | |
| 25,697 | | SELECTICA, INC.(b) | | | 127,961 | | | 162,148 | | | | |
| 19,001 | | SILICON IMAGE, INC.(b) | | | 100,933 | | | 94,245 | | | | |
| 55,937 | | SUPPORT.COM, INC.(b) | | | 147,589 | | | 233,817 | | | | |
| 95,412 | | SYNNEX CORP.(b) | | | 2,824,707 | | | 3,280,265 | | | | |
| 43,194 | | UNISYS CORP.(b) | | | 688,124 | | | 747,256 | | | | |
| 174,919 | | VALUECLICK, INC.(b) | | | 2,761,951 | | | 3,395,178 | | | | |
| 56,162 | | WESTELL TECHNOLOGIES, INC., CLASS A(b) | | | 118,745 | | | 103,900 | | | | |
| | |
See accompanying notes to the financial statements. | 46 | (Continued) |
CLEARWATER INVESTMENT TRUST
Schedule of Investments - Clearwater Small Companies Fund
December 31, 2012
| | | | | | | | | | | | | |
Shares | | Security | | Cost | | Fair
value (a) | | Percent
of
net assets | |
| Information Technology (Cont’d): | | | | | | | | | | |
| 14,000 | | WEX, INC.(b) | | $ | 375,767 | | | 1,055,180 | | | | |
| 140,270 | | ZIX CORP.(b) | | | 397,473 | | | 392,756 | | | | |
| | | | | | 32,772,541 | | | 36,144,249 | | | 12.82% | |
| Materials: | | | | | | | | | | |
| 15,000 | | ASHLAND, INC. | | | 551,175 | | | 1,206,150 | | | | |
| 4,400 | | CHASE CORP. | | | 67,610 | | | 81,840 | | | | |
| 133,368 | | CHEMTURA CORP.(b) | | | 2,232,937 | | | 2,835,404 | | | | |
| 19,933 | | CORE MOLDING TECHNOLOGIES, INC.(b) | | | 182,873 | | | 131,558 | | | | |
| 11,500 | | DELTIC TIMBER CORP. | | | 546,288 | | | 812,130 | | | | |
| 8,703 | | FLOTEK INDUSTRIES, INC.(b) | | | 85,453 | | | 106,177 | | | | |
| 45,930 | | HANDY & HARMAN LTD.(b) | | | 346,633 | | | 692,165 | | | | |
| 15,172 | | INNOPHOS HOLDINGS, INC. | | | 650,573 | | | 705,498 | | | | |
| 94,561 | | INNOSPEC, INC. | | | 2,712,877 | | | 3,261,409 | | | | |
| 13,195 | | KAPSTONE PAPER AND PACKAGING CORP. | | | 249,869 | | | 292,797 | | | | |
| 63,504 | | KOPPERS HOLDINGS, INC. | | | 1,894,971 | | | 2,422,677 | | | | |
| 13,584 | | LANDEC CORP.(b) | | | 92,156 | | | 128,912 | | | | |
| 12,747 | | NEENAH PAPER, INC. | | | 363,626 | | | 362,907 | | | | |
| 22,302 | | STEPAN CO. | | | 854,666 | | | 1,238,653 | | | | |
| 9,466 | | SYNALLOY CORP. | | | 114,118 | | | 124,194 | | | | |
| 15,000 | | W.R. GRACE & CO.(b) | | | 362,905 | | | 1,008,450 | | | | |
| 25,099 | | WAUSAU PAPER CORP. | | | 223,229 | | | 217,357 | | | | |
| | | | | | 11,531,959 | | | 15,628,278 | | | 5.54% | |
| Utilities: | | | | | | | | | | | | |
| 37,421 | | ALLETE, INC. | | | 1,338,109 | | | 1,533,513 | | | | |
| 20,796 | | MIDDLESEX WATER CO. | | | 385,266 | | | 406,770 | | | | |
| 35,000 | | PNM RESOURCES, INC. | | | 733,499 | | | 717,850 | | | | |
| 74,153 | | PORTLAND GENERAL ELECTRIC CO. | | | 1,674,829 | | | 2,028,826 | | | | |
| 55,499 | | PURE CYCLE CORP.(b) | | | 122,638 | | | 157,062 | | | | |
| 39,000 | | QUESTAR CORP. | | | 663,326 | | | 770,640 | | | | |
| 26,652 | | SOUTHWEST GAS CORP. | | | 802,844 | | | 1,130,311 | | | | |
| 36,766 | | UIL HOLDINGS CORP. | | | 1,179,357 | | | 1,316,590 | | | | |
| 18,155 | | UNITIL CORP. | | | 434,938 | | | 470,578 | | | | |
| | | | | | 7,334,806 | | | 8,532,140 | | | 3.03% | |
| | Sub-total Common Stocks: | | | 225,256,224 | | | 269,895,670 | | | 95.73% | |
Escrow: | | | | | | | | | | | | |
| Energy: | | | | | | | | | | | | |
| 38,070 | | CVR ENERGY, INC.(b) | | | - | | | - | | | | |
| | Sub-total Escrow: | | | - | | | - | | | 0.00% | |
Short-Term Investments: | | | | | | | | | | |
| 22,370,992 | | NORTHERN INSTITUTIONAL FUNDS - U.S. GOVERNMENT SELECT PORTFOLIO, 0.01%(e) | | | 22,370,992 | | | 22,370,992 | | | | |
| | Sub-total Short-Term Investments: | | | 22,370,992 | | | 22,370,992 | | | 7.93% | |
| | | Grand total(f) | | $ | 247,627,216 | | | 292,266,662 | | | 103.66% | |
| | | |
Notes to Schedule of Investments: |
| | | |
| (a) | Securities are valued in accordance with procedures described in note 2 to the financial statements. |
| (b) | Currently non-income producing assets. |
| (c) | Foreign security values are stated in U.S. dollars. As of December 31, 2012, the value of foreign stocks or depositary receipts of companies based outside of the United States represented 3.27% of net assets. |
| (d) | Securities are American Depositary Receipts of companies based outside of the United States representing 0.78% of net assets. |
| (e) | The short-term investment is a money market portfolio of the investment company, Northern Institutional Funds. At December 31, 2011, the value of the Clearwater Small Companies Fund’s investment in the U.S. Government Select Portfolio of the Northern Institutional Funds was approximately $1,896,952 with net purchases of approximately $20,474,040 during the fiscal year ended December 31, 2012. |
| | |
See accompanying notes to the financial statements. | 47 | (Continued) |
CLEARWATER INVESTMENT TRUST
Schedule of Investments - Clearwater Small Companies Fund
December 31, 2012
| | | |
| (f) | At December 31, 2012, the cost for Federal income tax purposes was $247,635,244. The aggregate gross unrealized appreciation and depreciation of investments in securities based on this cost were as follows: |
| | | | |
Gross unrealized appreciation | | $ | 53,273,928 | |
Gross unrealized depreciation | | | (8,642,510) | |
Net unrealized appreciation | | $ | 44,631,418 | |
| | |
See accompanying notes to the financial statements. | 48 | (Continued) |
CLEARWATER INVESTMENT TRUST
Schedule of Investments – Clearwater Small Companies Fund(A)
December 31, 2012
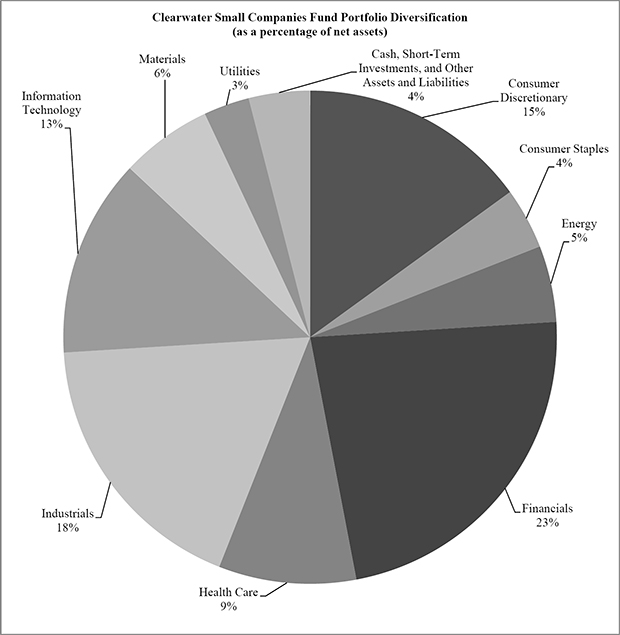
(A)Name change effective April 30, 2012. Formerly known as the Clearwater Small Cap Fund.
| | |
See accompanying notes to the financial statements. | 49 | (Continued) |
CLEARWATER INVESTMENT TRUST
Schedule of Investments - Clearwater Tax-Exempt Bond Fund
December 31, 2012
| | | | | | | | | | | | | | | | | |
Par/Shares | | Security | | Maturity
date | | Coupon
rate | | Cost | | Fair
value(a) | | Percent
of
net assets | |
Closed-End funds: | | | | | | | | | | | | | | |
| 208,600 | | BLACKROCK LNG-TM MUN ADV | | | | | | $ | 2,133,992 | | | 2,626,274 | | | | |
| 11,100 | | BLACKROCK MUN INC TRUST | | | | | | | 94,733 | | | 179,931 | | | | |
| 7,471 | | BLACKROCK MUNI BOND TRUST | | | | | | | 62,993 | | | 127,007 | | | | |
| 137,900 | | BLACKROCK MUNIHOLDINGS INVESTMENT QUALITY FUND | | | | | | | 1,547,557 | | | 2,220,190 | | | | |
| 59,600 | | BLACKROCK MUNIHOLDINGS QUALITY FUND II INC | | | | | | | 787,170 | | | 898,768 | | | | |
| 60,700 | | BLACKROCK MUNIYIELD INVES | | | | | | | 759,694 | | | 1,024,009 | | | | |
| 21,837 | | BLACKROCK MUNIYIELD INVESTMENT QUALITY FUND | | | | | | | 275,931 | | | 342,841 | | | | |
| 81,800 | | BLACKROCK MUNIYIELD MICHIGAN QUALITY FUND II INC | | | | | | | 981,525 | | | 1,173,830 | | | | |
| 76,179 | | BLACKROCK MUNIYIELD MICHIGAN QUALITY FUND INC | | | | | | | 1,014,103 | | | 1,192,201 | | | | |
| 54,700 | | BLACKROCK MUNIYIELD PENNS | | | | | | | 774,527 | | | 894,345 | | | | |
| 51,500 | | BLACKROCK MUNIYIELD QUAL | | | | | | | 677,589 | | | 743,660 | | | | |
| 73,500 | | BLACKROCK MUNIYIELD QUALITY FUND III INC | | | | | | | 963,910 | | | 1,124,550 | | | | |
| 209,000 | | DWS MUNICIPAL INCOME TRUS | | | | | | | 2,278,136 | | | 3,007,510 | | | | |
| 66,800 | | EATON VANCE CALI MUN BOND | | | | | | | 744,489 | | | 953,236 | | | | |
| 110,150 | | INVESCO ADV MUN INC TR II | | | | | | | 1,261,284 | | | 1,448,473 | | | | |
| 76,505 | | INVESCO MUNICIPAL OPP TR | | | | | | | 913,964 | | | 1,116,208 | | | | |
| 94,239 | | INVESCO PENN VAL MUNI | | | | | | | 1,240,054 | | | 1,441,857 | | | | |
| 100,142 | | INVESCO QUALITY MUNI INC | | | | | | | 1,173,329 | | | 1,371,945 | | | | |
| 94,277 | | INVESCO TRUST INV GRD MUN | | | | | | | 1,342,033 | | | 1,434,896 | | | | |
| 56,248 | | MANAGED DURATION INVESTME | | | | | | | 714,557 | | | 860,594 | | | | |
| 31,103 | | NUVEEN CAL INV QUAL MUNI | | | | | | | 373,215 | | | 487,695 | | | | |
| 42,560 | | NUVEEN DIVIDEND ADV MUNI | | | | | | | 523,323 | | | 642,230 | | | | |
| 13,500 | | NUVEEN DIVIDEND ADVANTAGE | | | | | | | 181,771 | | | 207,225 | | | | |
| 41,700 | | NUVEEN DVD ADVANTAGE MUNI | | | | | | | 475,800 | | | 645,516 | | | | |
| 30,600 | | NUVEEN MI PREMIUM INC MUN | | | | | | | 404,605 | | | 457,776 | | | | |
| 44,600 | | NUVEEN MUNI ADVANTAGE FUN | | | | | | | 522,316 | | | 678,366 | | | | |
| 6,453 | | NUVEEN NJ INV QUAL MUNI F | | | | | | | 87,518 | | | 98,731 | | | | |
| 10,100 | | NUVEEN PA DVD ADV MUNI FD | | | | | | | 127,550 | | | 151,702 | | | | |
| 48,500 | | NUVEEN PENN INV QUAL MUNI | | | | | | | 673,352 | | | 758,540 | | | | |
| 27,100 | | NUVEEN PREMIER MUNI INC F | | | | | | | 367,653 | | | 404,332 | | | | |
| 238,709 | | NUVEEN PREMIUM INC MUNI F | | | | | | | 3,273,534 | | | 3,628,377 | | | | |
| 22,000 | | WESTERN ASSET MANAGED MUN | | | | | | | 240,488 | | | 316,140 | | | | |
| 38,366 | | WESTERN ASSET MUNICIPAL P | | | | | | | 486,666 | | | 660,279 | | | | |
| | Sub-total Closed-End Funds | | | | | | | 27,479,361 | | | 33,319,234 | | | 6.32% | |
Municipal Bonds: | | | | | | | | | | | | | | |
| 750,000 | | ABAG CA FIN AUTH FOR | | | | | | | | | | | | | | |
| | | NONPROFIT CORPS | | 9/1/2037 | | 6.00 | | | 745,175 | | | 866,895 | | | | |
| 650,000 | | ABAG CA FIN AUTH FOR | | | | | | | | | | | | | | |
| | | NONPROFIT CORPS COPS | | 11/1/2029 | | 6.20 | | | 634,355 | | | 650,559 | | | | |
| 2,500,000 | | ACALANES CA UNION HIGH SCH | | | | | | | | | | | | | | |
| | | DIST(b) | | 8/1/2039 | | 4.68 | | | 1,153,120 | | | 1,709,550 | | | | |
| 1,500,000 | | AGUA CALIENTE CA BAND OF | | | | | | | | | | | | | | |
| | | CAHUILLA INDIANS | | | | | | | | | | | | | | |
| | | REVENUE(c) | | 7/1/2018 | | 6.00 | | | 1,475,843 | | | 1,469,970 | | | | |
| 1,095,000 | | ALABAMA ST HSG FIN AUTH SF | | | | | | | | | | | | | | |
| | | MTGE REVENUE | | 10/1/2028 | | 5.25 | | | 1,095,000 | | | 1,205,420 | | | | |
| 530,000 | | ALABAMA ST HSG FIN AUTH SF | | | | | | | | | | | | | | |
| | | MTGE REVENUE | | 4/1/2038 | | 4.50 | | | 399,325 | | | 542,778 | | | | |
| 1,250,000 | | ALACHUA CNTY FL HLTH FACS | | | | | | | | | | | | | | |
| | | AUTH | | 11/15/2016 | | 7.13 | | | 1,250,000 | | | 1,265,350 | | | | |
| 1,000,000 | | ALACHUA CNTY FL HLTH FACS | | | | | | | | | | | | | | |
| | | AUTH CCRC | | 10/1/2032 | | 8.00 | | | 1,181,583 | | | 1,223,170 | | | | |
| 500,000 | | ALAMEDA CA CORRIDOR | | | | | | | | | | | | | | |
| | | TRANSPRTN AUTH | | 10/1/2021 | | 5.25 | | | 496,211 | | | 506,480 | | | | |
| 500,000 | | ALAMEDA CA CORRIDOR | | | | | | | | | | | | | | |
| | | TRANSPRTN AUTH | | 10/1/2024 | | 5.40 | | | 421,998 | | | 560,495 | | | | |
| 2,000,000 | | ALASKA ST HSG FIN CORP | | 12/1/2034 | | 5.25 | | | 2,003,390 | | | 2,130,340 | | | | |
| 750,000 | | ALASKA ST HSG FIN CORP | | | | | | | | | | | | | | |
| | | MTGE REVENUE | | 12/1/2037 | | 4.13 | | | 735,649 | | | 772,305 | | | | |
| 500,000 | | ALASKA ST HSG FIN CORP | | | | | | | | | | | | | | |
| | | MTGE REVENUE | | 12/1/2040 | | 4.63 | | | 495,181 | | | 530,020 | | | | |
| 350,000 | | ALASKA ST INDL DEV & EXPORT | | | | | | | | | | | | | | |
| | | AUTH CMNTY PROVIDER | | | | | | | | | | | | | | |
| | | REVENUE(d)(e) | | 12/1/2010 | | 5.40 | | | 350,000 | | | 237,380 | | | | |
| 240,000 | | ALBANY NY INDL DEV AGY(e) | | 5/1/2016 | | 6.50 | | | 240,000 | | | 35,993 | | | | |
| 1,025,000 | | ALISAL CA UNION SCH DIST(b) | | 8/1/2025 | | 10.55 | | | 500,435 | | | 617,675 | | | | |
| 925,000 | | ALLEGHENY CNTY PA INDL DEV | | | | | | | | | | | | | | |
| | | AUTH CHRT SCH REVENUE | | 8/15/2026 | | 5.90 | | | 925,000 | | | 986,216 | | | | |
| | |
See accompanying notes to the financial statements. | 50 | (Continued) |
CLEARWATER INVESTMENT TRUST
Schedule of Investments - Clearwater Tax-Exempt Bond Fund
December 31, 2012
| | | | | | | | | | | | | | | | | |
Par/Shares | | Security | | Maturity
date | | Coupon
rate | | Cost | | Fair
value(a) | | Percent
of
net assets | |
Municipal Bonds (Cont’d): | | | | | | | | | | | | | | |
| 528,050 | | ALPHARETTA GA DEV AUTH | | | | | | | | | | | | | | |
| | | EDLFACS REV | | 7/1/2031 | | 6.25 | | $ | 513,901 | | | 300,988 | | | | |
| 1,000,000 | | ALVORD CA UNIF SCH DIST(b) | | 8/1/2046 | | 5.63 | | | 352,407 | | | 631,300 | | | | |
| 946,576 | | ARIZONA ST HLTH FACS AUTH(d) | | 7/1/2027 | | 5.25 | | | 919,824 | | | 1,014,758 | | | | |
| 1,000,000 | | ARIZONA ST HLTH FACS AUTH | | | | | | | | | | | | | | |
| | | HLTH CARE FACS REVENUE | | 10/1/2022 | | 5.10 | | | 864,089 | | | 1,016,900 | | | | |
| 2,000,000 | | ARLINGTON TX HGR EDU FIN | | | | | | | | | | | | | | |
| | | CORP EDU REVENUE | | 8/15/2028 | | 7.00 | | | 1,951,173 | | | 2,170,320 | | | | |
| 785,000 | | ARLINGTON TX SPL OBLIG | | 8/15/2034 | | 5.00 | | | 815,840 | | | 821,079 | | | | |
| 500,000 | | ATLANTA GA ARPT REVENUE | | 1/1/2030 | | 6.00 | | | 518,441 | | | 618,005 | | | | |
| 1,500,000 | | ATLANTA GA WTR & WSTWTR | | | | | | | | | | | | | | |
| | | REVENUE | | 11/1/2039 | | 5.00 | | | 1,498,535 | | | 1,504,110 | | | | |
| 1,500,000 | | BAY CNTY FL EDUCTNL FACS | | | | | | | | | | | | | | |
| | | REVENUE | | 9/1/2030 | | 5.25 | | | 1,380,177 | | | 1,579,125 | | | | |
| 1,195,000 | | BELLWOOD IL | | 12/1/2027 | | 5.88 | | | 1,183,881 | | | 1,167,694 | | | | |
| 1,000,000 | | BEXAR CNTY TX HLTH FACS DEV | | | | | | | | | | | | | | |
| | | CORP | | 7/1/2030 | | 5.88 | | | 985,041 | | | 1,122,530 | | | | |
| 500,000 | | BEXAR CNTY TX HSG FIN CORP | | 1/1/2021 | | 5.70 | | | 453,457 | | | 500,045 | | | | |
| 445,000 | | BEXAR CNTY TX HSG FIN | | | | | | | | | | | | | | |
| | | CORP(e) | | 9/15/2021 | | 8.75 | | | 445,000 | | | 314,277 | | | | |
| 235,000 | | BEXAR CNTY TX HSG FIN CORP | | 12/1/2021 | | 6.50 | | | 237,155 | | | 234,984 | | | | |
| 805,000 | | BEXAR CNTY TX HSG FIN | | | | | | | | | | | | | | |
| | | CORP(e) | | 4/1/2030 | | 9.00 | | | 802,520 | | | 158,963 | | | | |
| 600,000 | | BEXAR CNTY TX HSG FIN CORP | | 8/1/2030 | | 6.10 | | | 520,881 | | | 605,982 | | | | |
| 365,000 | | BEXAR CNTY TX HSG FIN CORP | | 8/1/2030 | | 8.13 | | | 353,009 | | | 319,098 | | | | |
| 1,005,000 | | BEXAR CNTY TX HSG FIN | | | | | | | | | | | | | | |
| | | CORP(e) | | 6/1/2031 | | 10.50 | | | 1,005,000 | | | 200,839 | | | | |
| 885,000 | | BEXAR CNTY TX HSG FIN | | | | | | | | | | | | | | |
| | | CORP(e) | | 12/1/2036 | | 9.25 | | | 864,131 | | | 441,473 | | | | |
| 2,000,000 | | BEXAR CNTY TX REVENUE | | 8/15/2039 | | 5.00 | | | 2,169,140 | | | 2,181,720 | | | | |
| 500,000 | | BOONE CNTY MO HOSP | | | | | | | | | | | | | | |
| | | REVENUE | | 8/1/2028 | | 5.75 | | | 511,942 | | | 580,785 | | | | |
| 700,000 | | BOSTON MA REVENUE | | 10/1/2031 | | 6.13 | | | 700,357 | | | 708,589 | | | | |
| 750,000 | | BOWLING GREEN OH STUDENT | | | | | | | | | | | | | | |
| | | HSG REVENUE | | 6/1/2031 | | 5.75 | | | 719,715 | | | 840,638 | | | | |
| 500,000 | | BOYNTON BEACH FLA REV | | 6/1/2022 | | 5.75 | | | 500,000 | | | 513,875 | | | | |
| 500,000 | | BOYNTON BEACH FLA REV | | 6/1/2027 | | 6.25 | | | 500,000 | | | 516,850 | | | | |
| 500,000 | | BRAZOS CNTY TX HLTH FACS | | | | | | | | | | | | | | |
| | | DEV CORP | | 1/1/2033 | | 5.50 | | | 503,762 | | | 548,590 | | | | |
| 81,000 | | BRIDGEVILLE DE SPL OBLIG | | 7/1/2035 | | 5.13 | | | 81,000 | | | 66,241 | | | | |
| 890,000 | | BUCKEYE OH TOBACCO | | | | | | | | | | | | | | |
| | | SETTLEMENT FING AUTH | | 6/1/2024 | | 5.13 | | | 859,820 | | | 809,775 | | | | |
| 395,000 | | BUTLER CNTY PA GEN AUTH | | | | | | | | | | | | | | |
| | | REVENUE | | 10/1/2034 | | 0.94 | | | 395,000 | | | 317,118 | | | | |
| 500,000 | | CALIFORNIA CNTY CA TOBACCO | | | | | | | | | | | | | | |
| | | SECURITIZATION AGY | | | | | | | | | | | | | | |
| | | TOBACCO SETTLE | | 6/1/2036 | | 5.00 | | | 495,224 | | | 443,250 | | | | |
| 139,263 | | CALIFORNIA ST CMNTY HSG FIN | | | | | | | | | | | | | | |
| | | AGY LEASE REVENUE(e) | | 8/1/2012 | | 4.65 | | | 139,216 | | | 6,037 | | | | |
| 373,490 | | CALIFORNIA ST CMNTY HSG FIN | | | | | | | | | | | | | | |
| | | AGY LEASE REVENUE(d)(e) | | 11/1/2012 | | 4.85 | | | 369,075 | | | 11,765 | | | | |
| 750,000 | | CALIFORNIA ST HLTH FACS FING | | | | | | | | | | | | | | |
| | | AUTH REVENUE | | 8/15/2033 | | 5.50 | | | 763,844 | | | 853,598 | | | | |
| 1,000,000 | | CALIFORNIA ST HSG FIN AGY | | | | | | | | | | | | | | |
| | | REVENUE | | 8/1/2033 | | 5.45 | | | 928,333 | | | 1,030,330 | | | | |
| 605,000 | | CALIFORNIA ST HSG FIN AGY | | | | | | | | | | | | | | |
| | | REVENUE | | 8/1/2038 | | 5.50 | | | 607,686 | | | 619,708 | | | | |
| 1,000,000 | | CALIFORNIA ST | | | | | | | | | | | | | | |
| | | INFRASTRUCTURE & ECON | | | | | | | | | | | | | | |
| | | DEV BANK REVENUE | | 2/1/2030 | | 6.00 | | | 1,006,389 | | | 1,079,279 | | | | |
| 500,000 | | CALIFORNIA ST | | | | | | | | | | | | | | |
| | | INFRASTRUCTURE & ECON | | | | | | | | | | | | | | |
| | | DEV BANK ST SCH FUND APP | | 8/15/2029 | | 5.75 | | | 504,317 | | | 561,640 | | | | |
| 570,000 | | CALIFORNIA ST MUNI FIN AUTH | | | | | | | | | | | | | | |
| | | CHRT SCH LEASE REVENUE | | 9/1/2022 | | 5.50 | | | 574,409 | | | 600,905 | | | | |
| | |
See accompanying notes to the financial statements. | 51 | (Continued) |
CLEARWATER INVESTMENT TRUST
Schedule of Investments - Clearwater Tax-Exempt Bond Fund
December 31, 2012
| | | | | | | | | | | | | | | | | |
Par/Shares | | Security | | Maturity date | | Coupon rate | | Cost | | Fair
value(a) | | Percent
of
net assets | |
Municipal Bonds (Cont’d): | | | | | | | | | | | | | | |
| 500,000 | | CALIFORNIA ST MUNI FIN AUTH | | | | | | | | | | | | | | |
| | | REVENUE | | 5/1/2025 | | 6.88 | | $ | 498,954 | | | 598,645 | | | | |
| 1,500,000 | | CALIFORNIA ST SCH FACS FING | | | | | | | | | | | | | | |
| | | AUTH REVENUE(b) | | 8/1/2029 | | 2.42 | | | 1,079,410 | | | 1,512,660 | | | | |
| 970,000 | | CALIFORNIA ST STWD CMNTYS | | | | | | | | | | | | | | |
| | | DEV AUTH REVENUE | | 1/1/2016 | | 5.25 | | | 966,640 | | | 982,600 | | | | |
| 1,400,000 | | CALIFORNIA ST STWD CMNTYS | | | | | | | | | | | | | | |
| | | DEV AUTH REVENUE | | 1/1/2021 | | 6.00 | | | 1,400,000 | | | 1,513,218 | | | | |
| 900,000 | | CALIFORNIA ST STWD CMNTYS | | | | | | | | | | | | | | |
| | | DEV AUTH REVENUE | | 11/1/2021 | | 6.50 | | | 900,000 | | | 1,029,240 | | | | |
| 750,000 | | CALIFORNIA ST STWD CMNTYS | | | | | | | | | | | | | | |
| | | DEV AUTH SCH FAC REVENUE | | 7/1/2020 | | 5.00 | | | 713,637 | | | 754,635 | | | | |
| 750,000 | | CALIFORNIA ST STWD CMNTYS | | | | | | | | | | | | | | |
| | | DEVAUTH MFH REVENUE | | 7/15/2032 | | 4.70 | | | 750,000 | | | 830,790 | | | | |
| 255,000 | | CAPITAL TRUST AGY FL MF | | | | | | | | | | | | | | |
| | | REVENUE(e) | | 6/1/2013 | | 4.75 | | | 255,000 | | | 145,337 | | | | |
| 750,000 | | CAPITAL TRUST AGY FL MF | | | | | | | | | | | | | | |
| | | REVENUE(e) | | 6/1/2038 | | 5.88 | | | 762,053 | | | 427,462 | | | | |
| 1,000,000 | | CARLSBAD CA UNIF SCH DIST(b) | | 8/1/2031 | | 4.17 | | | 569,130 | | | 803,530 | | | | |
| 1,003,870 | | CARLSBAD NM INDL DEV | | | | | | | | | | | | | | |
| | | REVENUE(d) | | 4/15/2021 | | 5.75 | | | 1,025,542 | | | 909,527 | | | | |
| 1,000,000 | | CARMEL IN REVENUE | | 11/15/2022 | | 6.00 | | | 981,667 | | | 1,063,480 | | | | |
| 1,000,000 | | CARMEL IN REVENUE | | 11/15/2027 | | 7.00 | | | 1,027,002 | | | 1,109,390 | | | | |
| 500,000 | | CEDAR FALLS IA CMNTY SCH | | | | | | | | | | | | | | |
| | | DIST SCH INFRASTRUCTURE | | | | | | | | | | | | | | |
| | | SALES SVCS | | 6/1/2027 | | 5.38 | | | 498,741 | | | 560,460 | | | | |
| 1,000,000 | | CENTER CA UNIF SCH DIST(b) | | 8/1/2031 | | 12.90 | | | 337,618 | | | 376,470 | | | | |
| 1,000,000 | | CENTRL BRADFORD PROGRESS | | | | | | | | | | | | | | |
| | | AUTH PA | | 12/1/2031 | | 5.50 | | | 1,035,532 | | | 1,175,470 | | | | |
| 500,000 | | CENTRL TX REGL MOBILITY | | | | | | | | | | | | | | |
| | | AUTH REVENUE | | 1/1/2031 | | 5.75 | | | 495,572 | | | 591,300 | | | | |
| 595,000 | | CHANDLER PARK ACADEMY MI | | | | | | | | | | | | | | |
| | | PUBLIC SCH ACADEMY | | | | | | | | | | | | | | |
| | | REVENUE | | 11/1/2022 | | 5.00 | | | 458,028 | | | 597,451 | | | | |
| 910,000 | | CHAUTAUQUA CNTY NY CAPITAL | | | | | | | | | | | | | | |
| | | RESOURCE CORP REVENUE | | 11/15/2016 | | 6.75 | | | 894,774 | | | 989,871 | | | | |
| 275,000 | | CHESTERFIELD CNTY VA INDL | | | | | | | | | | | | | | |
| | | DEV AUTH MF REVENUE | | 7/1/2019 | | 5.20 | | | 260,182 | | | 275,693 | | | | |
| 500,000 | | CHICAGO IL | | 1/1/2035 | | 5.25 | | | 513,422 | | | 557,275 | | | | |
| 10,000 | | CHICAGO IL MET HSG DEV | | | | | | | | | | | | | | |
| | | CORP | | 7/1/2022 | | 6.85 | | | 10,000 | | | 10,032 | | | | |
| 400,000 | | CITIZEN POTAWATOMI NATION | | | | | | | | | | | | | | |
| | | OK SENIOR OBLG TAX | | | | | | | | | | | | | | |
| | | REVENUE | | 9/1/2016 | | 6.50 | | | 400,000 | | | 395,884 | | | | |
| 250,000 | | CLARK CNTY NV ECON DEV | | | | | | | | | | | | | | |
| | | REVENUE | | 5/15/2033 | | 5.38 | | | 250,665 | | | 253,372 | | | | |
| 355,000 | | CLEARWATER FL HSG AUTH | | 5/1/2024 | | 5.35 | | | 268,756 | | | 354,968 | | | | |
| 685,000 | | CLIFTON TX HGR EDU FIN CORP | | | | | | | | | | | | | | |
| | | EDU REVENUE | | 2/15/2018 | | 7.75 | | | 677,860 | | | 756,946 | | | | |
| 500,000 | | CLIFTON TX HGR EDU FIN CORP | | | | | | | | | | | | | | |
| | | EDU REVENUE | | 8/15/2031 | | 5.50 | | | 483,010 | | | 548,480 | | | | |
| 1,000,000 | | CMNTY MEMORIAL HOSP DIST | | | | | | | | | | | | | | |
| | | MO HOSP REVENUE | | 12/1/2034 | | 6.68 | | | 887,892 | | | 950,400 | | | | |
| 225,000 | | COLLIER CNTY FL HSG FIN | | | | | | | | | | | | | | |
| | | AUTH MF HSG REVENUE | | 8/15/2015 | | 5.25 | | | 224,646 | | | 225,668 | | | | |
| 750,000 | | COLLIER CNTY FL INDL DEV | | | | | | | | | | | | | | |
| | | AUTH | | 10/1/2039 | | 6.25 | | | 735,657 | | | 877,875 | | | | |
| 1,500,000 | | COLORADO ST EDUCTNL & | | | | | | | | | | | | | | |
| | | CULTURAL FACS AUTH INDEP | | | | | | | | | | | | | | |
| | | SCH REVENUE | | 5/1/2030 | | 6.00 | | | 1,460,499 | | | 1,626,435 | | | | |
| 835,000 | | COLORADO ST EDUCTNL & | | | | | | | | | | | | | | |
| | | CULTURAL FACS AUTH | | | | | | | | | | | | | | |
| | | REVENUE | | 11/15/2028 | | 6.75 | | | 835,000 | | | 967,314 | | | | |
| | | | | | | | | | | | | | | | | | | | | | | | | | | | | | | | | |
| | |
See accompanying notes to the financial statements. | 52 | (Continued) |
CLEARWATER INVESTMENT TRUST
Schedule of Investments - Clearwater Tax-Exempt Bond Fund
December 31, 2012
| | | | | | | | | | | | | | | | | |
Par/Shares | | Security | | Maturity
date | | Coupon
rate | | Cost | | Fair
value(a) | | Percent
of
net assets | |
Municipal Bonds (Cont’d): | | | | | | | | | | | | | | |
| 1,000,000 | | COLORADO ST EDUCTNL & | | | | | | | | | | | | | | |
| | | CULTURAL FACS AUTH | | | | | | | | | | | | | | |
| | | REVENUE | | 6/1/2033 | | 5.50 | | $ | 975,977 | | | 1,105,410 | | | | |
| 1,000,000 | | COLORADO ST EDUCTNL & | | | | | | | | | | | | | | |
| | | CULTURAL FACS AUTH | | | | | | | | | | | | | | |
| | | REVENUE | | 7/1/2034 | | 5.60 | | | 993,738 | | | 1,062,510 | | | | |
| 350,000 | | COLORADO ST EDUCTNL & | | | | | | | | | | | | | | |
| | | CULTURAL FACS AUTH | | | | | | | | | | | | | | |
| | | REVENUE | | 12/1/2039 | | 5.13 | | | 331,184 | | | 370,755 | | | | |
| 800,000 | | COLORADO ST HLTH FACS AUTH | | | | | | | | | | | | | | |
| | | REVENUE | | 12/1/2042 | | 5.00 | | | 821,137 | | | 855,752 | | | | |
| 635,000 | | COLORADO ST HSG & FIN AUTH | | 10/1/2029 | | 5.40 | | | 635,000 | | | 683,355 | | | | |
| 720,000 | | COLORADO ST HSG & FIN AUTH | | 11/1/2029 | | 5.50 | | | 720,000 | | | 746,244 | | | | |
| 625,000 | | COLORADO ST HSG FIN AUTH | | | | | | | | | | | | | | |
| | | SF MTGE REVENUE | | 11/1/2034 | | 5.00 | | | 625,037 | | | 652,888 | | | | |
| 1,000,000 | | COLTON CA JT UNIF SCH DIST(b) | | 8/1/2035 | | 3.46 | | | 568,507 | | | 718,180 | | | | |
| 500,000 | | COMANCHE CNTY OK HOSP | | | | | | | | | | | | | | |
| | | AUTH REVENUE | | 7/1/2032 | | 5.00 | | | 536,331 | | | 534,710 | | | | |
| 1,000,000 | | CONNECTICUT ST HSG FIN | | | | | | | | | | | | | | |
| | | AUTH | | 11/15/2035 | | 4.75 | | | 1,000,000 | | | 1,078,900 | | | | |
| 980,000 | | CONNECTICUT ST HSG FIN | | | | | | | | | | | | | | |
| | | AUTH | | 11/15/2041 | | 4.63 | | | 975,180 | | | 1,054,500 | | | | |
| 385,000 | | CONNECTICUT ST HSG FIN | | | | | | | | | | | | | | |
| | | AUTH | | 11/15/2041 | | 5.00 | | | 385,000 | | | 423,758 | | | | |
| 1,500,000 | | CONNECTICUT ST HSG FIN | | | | | | | | | | | | | | |
| | | AUTH HSG MTGE FIN | | | | | | | | | | | | | | |
| | | PROGRAM | | 11/15/2035 | | 3.75 | | | 1,500,000 | | | 1,524,780 | | | | |
| 5,000,000 | | CONNECTICUT ST HSG FIN | | | | | | | | | | | | | | |
| | | AUTH HSG MTGE FIN | | | | | | | | | | | | | | |
| | | PROGRAM | | 5/15/2042 | | 4.15 | | | 5,000,000 | | | 5,226,550 | | | | |
| 1,000,000 | | CONNECTICUT ST HSG FIN | | | | | | | | | | | | | | |
| | | AUTH HSG MTGE FIN | | | | | | | | | | | | | | |
| | | PROGRAM | | 11/15/2042 | | 3.40 | | | 996,004 | | | 956,040 | | | | |
| 5,000,000 | | CONNECTICUT ST HSG FIN | | | | | | | | | | | | | | |
| | | AUTH HSG MTGE FIN | | | | | | | | | | | | | | |
| | | PROGRAM | | 11/15/2047 | | 3.65 | | | 5,000,000 | | | 4,885,200 | | | | |
| 500,000 | | COOK CNTY IL SCH DIST #83 | | 6/1/2031 | | 5.38 | | | 489,973 | | | 577,685 | | | | |
| 1,105,000 | | CORONA-NORCO CA UNIF SCH | | | | | | | | | | | | | | |
| | | DIST(b) | | 8/1/2039 | | 2.24 | | | 699,369 | | | 1,100,812 | | | | |
| 637,000 | | CORTLAND IL SPL TAX | | | | | | | | | | | | | | |
| | | REVENUE(e) | | 3/1/2017 | | 5.50 | | | 633,881 | | | 429,809 | | | | |
| 680,000 | | CROW FIN AUTH MT TRIBAL | | | | | | | | | | | | | | |
| | | PURPOSE REVENUE | | 10/1/2017 | | 5.65 | | | 661,315 | | | 682,217 | | | | |
| 750,000 | | CULLMAN CNTY AL HLTH CARE | | | | | | | | | | | | | | |
| | | AUTH | | 2/1/2023 | | 6.25 | | | 736,219 | | | 820,808 | | | | |
| 500,000 | | CUYAHOGA CNTY OH HSG MTGE | | | | | | | | | | | | | | |
| | | REVENUE | | 3/20/2042 | | 5.70 | | | 512,737 | | | 549,130 | | | | |
| 3,214,000 | | DALLAS TX HSG FIN CORP | | 10/20/2032 | | 6.75 | | | 3,187,090 | | | 3,245,240 | | | | |
| 2,000,000 | | DAMON RUN IN CONSERVANCY | | | | | | | | | | | | | | |
| | | DIST | | 7/1/2025 | | 6.10 | | | 2,037,444 | | | 2,226,820 | | | | |
| 1,000,000 | | DAMON RUN IN CONSERVANCY | | | | | | | | | | | | | | |
| | | DIST | | 1/1/2027 | | 6.38 | | | 1,014,536 | | | 1,123,810 | | | | |
| 500,000 | | DAVIESS CNTY IN HOSP ASSN | | | | | | | | | | | | | | |
| | | LEASE RENTAL REVENUE | | 1/15/2029 | | 5.25 | | | 489,356 | | | 561,215 | | | | |
| 1,000,000 | | DEKALB/KANE/LA SALLE CNTYS | | | | | | | | | | | | | | |
| | | IL CMNTY CLG DIST #523(b) | | 2/1/2029 | | 11.72 | | | 381,604 | | | 450,680 | | | | |
| 440,000 | | DELAWARE ST HSG AUTH | | | | | | | | | | | | | | |
| | | REVENUE | | 7/1/2031 | | 5.20 | | | 440,000 | | | 485,839 | | | | |
| 108,717 | | DENHAM SPRINGS-LIVINGSTON | | | | | | | | | | | | | | |
| | | LA HSG & MTGE FIN AUTH | | 11/1/2040 | | 5.00 | | | 112,335 | | | 109,680 | | | | |
| 500,000 | | DINUBA CA FING AUTH LEASE | | | | | | | | | | | | | | |
| | | REVENUE | | 9/1/2038 | | 5.38 | | | 494,829 | | | 507,680 | | | | |
| 500,000 | | DIST OF COLUMBIA HSG FIN | | | | | | | | | | | | | | |
| | | AGY MF HSG REVENUE | | 7/1/2033 | | 5.45 | | | 500,000 | | | 582,740 | | | | |
| 1,000,000 | | DIST OF COLUMBIA HSG FIN | | | | | | | | | | | | | | |
| | | AGY MF HSG REVENUE | | 6/1/2040 | | 4.90 | | | 1,000,000 | | | 1,075,450 | | | | |
| | |
See accompanying notes to the financial statements. | 53 | (Continued) |
CLEARWATER INVESTMENT TRUST
Schedule of Investments - Clearwater Tax-Exempt Bond Fund
December 31, 2012
| | | | | | | | | | | | | | | | | |
Par/Shares | | Security | | Maturity
date | | Coupon
rate | | Cost | | Fair
value(a) | | Percent
of
net assets | |
Municipal Bonds (Cont’d): | | | | | | | | | | | | | | |
| 1,000,000 | | DIST OF COLUMBIA HSG FIN AGY MF HSG REVENUE | | 6/1/2041 | | 5.00 | | $ | 1,000,000 | | | 1,090,800 | | | | |
| 3,000,000 | | DUBLIN CA UNIF SCH DIST(b) | | 8/1/2034 | | 15.06 | | | 773,505 | | | 839,460 | | | | |
| 550,000 | | E CHICAGO IN REDEV COMMISSION LAKE FRONT REDEV AREA TAX | | 7/15/2014 | | 5.00 | | | 550,000 | | | 554,196 | | | | |
| 565,000 | | E CHICAGO IN REDEV COMMISSION LAKE FRONT REDEV AREA TAX | | 1/15/2015 | | 5.25 | | | 565,000 | | | 568,842 | | | | |
| 1,000,000 | | EARLIMART CA ELEM SCH DIST | | 8/1/2037 | | 5.00 | | | 1,121,068 | | | 1,108,320 | | | | |
| 910,000 | | EAST POINT GA | | 2/1/2026 | | 8.00 | | | 910,000 | | | 911,492 | | | | |
| 2,045,000 | | EDEN TWP CA HOSP DIST COPS | | 6/1/2030 | | 6.00 | | | 2,023,113 | | | 2,263,692 | | | | |
| 750,000 | | EL PASO DE ROBLES CA REDEV AGY TAX ALLOCATION REVENUE | | 7/1/2033 | | 6.38 | | | 741,916 | | | 860,310 | | | | |
| 500,000 | | ELKHART CNTY IN HOSP AUTH | | 8/15/2020 | | 5.25 | | | 500,000 | | | 500,960 | | | | |
| 1,000,000 | | ENCINITAS CA UNION SCH DIST(b) | | 8/1/2035 | | 4.54 | | | 510,571 | | | 777,880 | | | | |
| 1,155,000 | | ENTERPRISE CA ELEM SCH DIST(b) | | 8/1/2035 | | 3.73 | | | 635,011 | | | 893,011 | | | | |
| 1,000,000 | | ERIE CNTY PA HOSP AUTH | | 7/1/2027 | | 7.00 | | | 1,000,000 | | | 1,103,440 | | | | |
| 500,000 | | FAIRFAX CNTY VA REDEV & HSG AUTH MF REVENUE | | 8/1/2039 | | 5.60 | | | 500,000 | | | 550,685 | | | | |
| 239,000 | | FARMS NEW KENT VA CMNTY DEV AUTH SPL ASSMNT | | 3/1/2036 | | 5.13 | | | 239,000 | | | 141,130 | | | | |
| 1,000,000 | | FESTIVAL RANCH AZ CMNTY FACS DIST | | 7/15/2024 | | 6.25 | | | 1,013,325 | | | 1,097,120 | | | | |
| 315,000 | | FIDDLERS CREEK FL CDD #2 SPL ASSMNT REVENUE(e) | | 5/1/2013 | | 5.75 | | | 314,118 | | | 165,482 | | | | |
| 800,000 | | FLAGSTAFF AZ INDL DEV AUTH | | 7/1/2022 | | 5.50 | | | 743,921 | | | 809,480 | | | | |
| 1,000,000 | | FLORIDA ST GOVTL UTILITY AUTH UTILITY REVENUE | | 10/1/2037 | | 5.00 | | | 1,052,400 | | | 1,094,390 | | | | |
| 470,000 | | FLORIDA ST HSG FIN CORP REVENUE | | 7/1/2026 | | 5.00 | | | 471,479 | | | 504,512 | | | | |
| 375,000 | | FLORIDA ST HSG FIN CORP REVENUE | | 7/1/2033 | | 5.45 | | | 375,000 | | | 408,724 | | | | |
| 1,565,000 | | FLORIDA ST HSG FIN CORP REVENUE | | 7/1/2034 | | 5.30 | | | 1,576,907 | | | 1,693,440 | | | | |
| 500,000 | | FLORIDA ST MID-BAY BRIDGE AUTH(b) | | 10/1/2021 | | 9.78 | | | 283,475 | | | 288,535 | | | | |
| 330,000 | | FOREST CREEK FL CDD CAPITAL IMPT REVENUE | | 11/1/2013 | | 7.00 | | | 354,834 | | | 327,004 | | | | |
| 1,250,000 | | FORT SILL APACHE TRIBE OK ECONDEV AUTH GAMING ENTERPRISE REV(c) | | 8/25/2026 | | 8.50 | | | 1,250,000 | | | 1,379,325 | | | | |
| 750,000 | | FRANKLIN PARK IL | | 7/1/2030 | | 4.00 | | | 727,003 | | | 699,308 | | | | |
| 1,145,000 | | FULTON CNTY GA DEV AUTH | | 11/1/2028 | | 5.25 | | | 987,738 | | | 1,115,734 | | | | |
| 1,000,000 | | FYI PROPERTIES WA LEASE REVENUE | | 6/1/2034 | | 5.50 | | | 981,410 | | | 1,135,540 | | | | |
| 500,000 | | GAINESVILLE & HALL CNTY GA DEV AUTH RETMNT CMNTY REVENUE | | 11/15/2029 | | 6.38 | | | 513,217 | | | 578,100 | | | | |
| 1,332,225 | | GALVESTON TX MUNI UTILITY DIST #52 | | 2/27/2013 | | 6.01 | | | 1,297,572 | | | 1,066,046 | | | | |
| 400,000 | | GEISINGER PA AUTH | | 5/1/2037 | | 1.07 | | | 400,000 | | | 312,272 | | | | |
| 500,000 | | GEORGIA ST ENVRNMNTL LOAN ACQUISITION CORP LOC GOVT LOAN SEC | | 2/15/2031 | | 5.13 | | | 495,631 | | | 580,760 | | | | |
| 3,000,000 | | GEORGIA ST ENVRNMNTL LOAN ACQUISITION CORP LOC GOVT LOAN SEC | | 3/15/2031 | | 5.13 | | | 3,000,000 | | | 3,479,760 | | | | |
| 500,000 | | GEORGIA ST ENVRNMNTL LOAN ACQUISITION CORP LOC GOVT LOAN SEC | | 2/15/2036 | | 5.25 | | | 491,778 | | | 575,875 | | | | |
| 2,000,000 | | GEORGIA ST HSG & FIN AUTH REVENUE | | 12/1/2037 | | 4.00 | | | 2,000,000 | | | 2,074,420 | | | | |
| | |
See accompanying notes to the financial statements. | 54 | (Continued) |
CLEARWATER INVESTMENT TRUST
Schedule of Investments - Clearwater Tax-Exempt Bond Fund
December 31, 2012
| | | | | | | | | | | | | | | | | |
Par/Shares | | Security | | Maturity
date | | Coupon
rate | | Cost | | Fair
value(a) | | Percent
of
net assets | |
Municipal Bonds (Cont’d): | | | | | | | | | | | | | | |
| 500,000 | | GILA CNTY AZ UNIF SCH DIST #10 PAYSON | | 7/1/2028 | | 5.75 | | $ | 478,347 | | | 587,230 | | | | |
| 2,000,000 | | GLENDALE CA UNIF SCH DIST(b) | | 9/1/2028 | | 11.02 | | | 755,801 | | | 886,360 | | | | |
| 750,000 | | GTR WENATCHEE WA REGL EVENTS CENTER PUBLIC FACS DIST REVENUE | | 9/1/2032 | | 5.25 | | | 738,670 | | | 749,940 | | | | |
| 330,000 | | HAMDEN CT FAC REVENUE | | 1/1/2014 | | 6.13 | | | 328,502 | | | 330,512 | | | | |
| 1,250,000 | | HAMILTON CNTY OH HLTH CARE REVENUE | | 1/1/2031 | | 6.13 | | | 1,216,783 | | | 1,332,825 | | | | |
| 1,000,000 | | HAMMOND IN LOCAL PUBLIC IMPT BOND BANK SPL REVENUE | | 8/15/2025 | | 6.50 | | | 1,014,311 | | | 1,047,220 | | | | |
| 1,000,000 | | HAMMOND IN LOCAL PUBLIC IMPT BOND BANK SPL REVENUE | | 8/15/2030 | | 6.50 | | | 1,007,143 | | | 1,043,850 | | | | |
| 500,000 | | HAMMOND IN REDEV DIST REVENUE | | 1/15/2017 | | 6.00 | | | 500,000 | | | 519,495 | | | | |
| 1,250,000 | | HARRIS CNTY TX CULTURAL EDU FACS FIN CORP REVENUE(c) | | 8/15/2021 | | 6.75 | | | 1,250,000 | | | 1,395,050 | | | | |
| 1,500,000 | | HARTNELL CA CMNTY CLG DIST(b) | | 8/1/2034 | | 5.71 | | | 695,423 | | | 1,130,070 | | | | |
| 250,000 | | HARVEY IL | | 12/1/2027 | | 5.50 | | | 197,539 | | | 245,748 | | | | |
| 590,000 | | HAWAII ST DEPT OF BUDGET & FIN SPL PURPOSE SENIOR LIVING REV | | 11/15/2029 | | 8.75 | | | 582,230 | | | 710,950 | | | | |
| 500,000 | | HAWAII ST DEPT OF BUDGET & FIN SPL PURPOSE SENIOR LIVING REV | | 11/15/2037 | | 5.25 | | | 507,654 | | | 523,910 | | | | |
| 1,000,000 | | HAWTHORNE CA SCH DIST(b) | | 11/1/2026 | | 11.90 | | | 404,230 | | | 532,340 | | | | |
| 3,500,000 | | HEALDSBURG CA UNIF SCH DIST(b) | | 8/1/2037 | | 2.25 | | | 2,250,863 | | | 2,202,935 | | | | |
| 1,000,000 | | HELENDALE CA SCH DIST(b) | | 8/1/2034 | | 3.31 | | | 592,763 | | | 841,950 | | | | |
| 255,000 | | HIGHLANDS CNTY FL HLTH FACS AUTH | | 11/15/2027 | | 5.00 | | | 256,590 | | | 278,486 | | | | |
| | | | | | | | | | | | | | | | | |
| 500,000 | | HIGHLANDS CNTY FL HLTH FACS AUTH | | 11/15/2032 | | 5.13 | | | 501,134 | | | 549,620 | | | | |
| 167,000 | | HOUMA-TERREBONNE LA PUBLIC TRUST FING AUTH SF MTGE | | 12/1/2040 | | 5.15 | | | 173,330 | | | 169,847 | | | | |
| 1,000,000 | | HOUSTON TX HOTEL OCCUPANCY TAX & SPL REVENUE | | 9/1/2030 | | 5.00 | | | 1,029,177 | | | 1,022,160 | | | | |
| 245,000 | | IDAHO ST HSG & FIN ASSN NONPROFIT FACS REVENUE | | 8/1/2017 | | 6.25 | | | 245,000 | | | 244,973 | | | | |
| 750,000 | | IDAHO ST HSG & FIN ASSN NONPROFIT FACS REVENUE | | 7/1/2030 | | 5.50 | | | 750,000 | | | 770,858 | | | | |
| 600,000 | | IDAHO ST HSG & FIN ASSN SF MTGE REVENUE | | 7/1/2026 | | 5.65 | | | 611,950 | | | 665,952 | | | | |
| 5,000 | | IDAHO ST HSG & FIN ASSN SF MTGE REVENUE | | 7/1/2038 | | 5.50 | | | 5,000 | | | 5,000 | | | | |
| 175,000 | | IDAHO ST HSG & FIN ASSN SF MTGE REVENUE | | 1/1/2040 | | 5.50 | | | 175,000 | | | 182,693 | | | | |
| 900,000 | | ILLINOIS ST COPS | | 7/1/2017 | | 5.80 | | | 900,000 | | | 901,341 | | | | |
| 250,000 | | ILLINOIS ST DEV FIN AUTH | | 5/15/2021 | | 5.50 | | | 250,000 | | | 251,078 | | | | |
| 1,000,000 | | ILLINOIS ST FIN AUTH CHRT SCH REVENUE | | 10/1/2031 | | 6.88 | | | 1,000,000 | | | 1,149,630 | | | | |
| 1,500,000 | | ILLINOIS ST FIN AUTH EDU REVENUE | | 9/1/2027 | | 5.00 | | | 1,453,959 | | | 1,503,615 | | | | |
| 900,000 | | ILLINOIS ST FIN AUTH REVENUE | | 5/15/2017 | | 6.00 | | | 900,000 | | | 900,972 | | | | |
| 610,000 | | ILLINOIS ST FIN AUTH REVENUE | | 8/15/2026 | | 6.00 | | | 619,523 | | | 628,922 | | | | |
| 1,000,000 | | ILLINOIS ST FIN AUTH REVENUE | | 11/15/2026 | | 5.25 | | | 969,860 | | | 1,037,110 | | | | |
| 500,000 | | ILLINOIS ST FIN AUTH REVENUE | | 3/15/2027 | | 5.00 | | | 514,975 | | | 554,650 | | | | |
| 1,000,000 | | ILLINOIS ST FIN AUTH REVENUE | | 5/15/2027 | | 5.50 | | | 1,033,438 | | | 1,040,780 | | | | |
| 500,000 | | ILLINOIS ST FIN AUTH REVENUE | | 5/15/2029 | | 5.25 | | | 504,658 | | | 533,340 | | | | |
| 1,045,000 | | ILLINOIS ST FIN AUTH REVENUE | | 5/15/2030 | | 5.50 | | | 1,072,098 | | | 1,072,630 | | | | |
| 1,500,000 | | ILLINOIS ST FIN AUTH REVENUE | | 8/15/2036 | | 5.25 | | | 1,474,956 | | | 1,626,450 | | | | |
| 805,000 | | ILLINOIS ST FIN AUTH REVENUE | | 2/1/2037 | | 5.25 | | | 799,808 | | | 817,655 | | | | |
| | |
See accompanying notes to the financial statements. | 55 | (Continued) |
CLEARWATER INVESTMENT TRUST
Schedule of Investments - Clearwater Tax-Exempt Bond Fund
December 31, 2012
| | | | | | | | | | | | | | | | | |
Par/Shares | | Security | | Maturity
date | | Coupon
rate | | Cost | | Fair
value(a) | | Percent
of
net assets | |
Municipal Bonds (Cont’d): | | | | | | | | | | | | | | |
| 500,000 | | ILLINOIS ST FIN AUTH REVENUE | | 3/1/2038 | | 6.00 | | $ | 485,455 | | | 570,550 | | | | |
| 750,000 | | ILLINOIS ST FIN AUTH SPORTS FAC REVENUE(c)(e)(f) | | 10/1/2027 | | 6.13 | | | 730,795 | | | 44,655 | | | | |
| 500,000 | | ILLINOIS ST FIN AUTH SPORTS FAC REVENUE(c)(e)(f) | | 10/1/2037 | | 6.25 | | | 484,210 | | | 29,770 | | | | |
| 1,000,000 | | ILLINOIS ST FIN AUTH STUDENT HSG REVENUE | | 10/1/2024 | | 6.00 | | | 989,595 | | | 1,150,350 | | | | |
| 335,000 | | ILLINOIS ST HLTH FACS AUTH | | 5/15/2014 | | 6.25 | | | 335,000 | | | 336,256 | | | | |
| 750,000 | | ILLINOIS ST HLTH FACS AUTH | | 8/15/2028 | | 5.38 | | | 738,332 | | | 750,870 | | | | |
| 500,000 | | ILLINOIS ST HLTH FACS AUTH REVENUE | | 7/1/2033 | | 6.00 | | | 502,748 | | | 510,850 | | | | |
| 2,100,000 | | ILLINOIS ST HLTH FACS AUTH REVENUE | | 8/15/2033 | | 5.10 | | | 2,107,992 | | | 2,119,131 | | | | |
| 500,000 | | ILLINOIS ST HSG DEV AUTH | | 7/1/2047 | | 4.50 | | | 466,055 | | | 504,635 | | | | |
| 1,000,000 | | ILLINOIS ST SPORTS FACS AUTH | | 6/15/2032 | | 5.00 | | | 1,014,343 | | | 1,006,510 | | | | |
| 1,000,000 | | IMPERIAL CA CMNTY CLG DIST(b) | | 8/1/2040 | | 1.12 | | | 858,151 | | | 1,027,570 | | | | |
| 250,000 | | INDEPENDENCE MO THIRTY-NINTH STREET TRANSPRTN DIST REVENUE | | 9/1/2032 | | 6.88 | | | 250,000 | | | 259,742 | | | | |
| 500,000 | | INDIANA ST BOND BANK REVENUE | | 2/1/2029 | | 5.50 | | | 491,079 | | | 566,345 | | | | |
| 750,000 | | INDIANA ST FIN AUTH HOSP REVENUE | | 5/1/2031 | | 5.75 | | | 771,951 | | | 867,188 | | | | |
| 3,000,000 | | INDIANA ST FIN AUTH REVENUE | | 9/15/2030 | | 6.50 | | | 3,078,661 | | | 3,386,190 | | | | |
| 500,000 | | INDIANA ST FIN AUTH REVENUE | | 11/15/2031 | | 5.50 | | | 492,472 | | | 549,650 | | | | |
| 500,000 | | INDIANA ST FIN AUTH REVENUE | | 3/1/2034 | | 4.00 | | | 503,812 | | | 488,105 | | | | |
| 1,000,000 | | INDIANA ST FIN AUTH REVENUE | | 3/1/2041 | | 5.00 | | | 1,076,853 | | | 1,080,840 | | | | |
| 1,000,000 | | INDIANA ST HLTH & EDUCTNL FAC FING AUTH HOSP REVENUE | | 2/15/2030 | | 5.25 | | | 753,469 | | | 1,039,580 | | | | |
| 6,506,976 | | INTERMEDIATE SCH DIST #287 MN LEASE REVENUE | | 11/1/2032 | | 5.30 | | | 6,279,667 | | | 6,830,438 | | | | |
| 144,631 | | IOWA ST FIN AUTH SENIOR HSG REVENUE(e) | | 12/1/2014 | | 5.00 | | | 144,288 | | | 5,340 | | | | |
| 410,000 | | IOWA ST STUDENT LOAN LIQUIDITY CORP | | 12/1/2027 | | 5.50 | | | 401,426 | | | 442,456 | | | | |
| 2,000,000 | | JEFFERSON CA UNION HIGH SCH DIST SAN MATEO CNTY(b) | | 8/1/2031 | | 26.18 | | | 471,237 | | | 500,540 | | | | |
| 439,000 | | JEFFERSON CNTY KY MTGE REVENUE | | 11/15/2013 | | 6.13 | | | 439,000 | | | 440,291 | | | | |
| 745,000 | | JEFFERSON PARISH LA FIN AUTH | | 6/1/2038 | | 5.00 | | | 776,634 | | | 789,164 | | | | |
| 175,000 | | JEFFERSON PARISH LA FIN AUTH | | 12/1/2048 | | 5.70 | | | 183,396 | | | 185,612 | | | | |
| 1,410,000 | | KALISPEL TRIBE OF INDIANS PRIORITY DIST WA REVENUE | | 1/1/2016 | | 6.20 | | | 1,376,340 | | | 1,403,895 | | | | |
| 1,250,000 | | KANSAS CITY MO INDL DEV AUTH | | 9/1/2023 | | 5.45 | | | 1,250,000 | | | 1,344,650 | | | | |
| 1,000,000 | | KANSAS CITY MO INDL DEV AUTH | | 11/20/2039 | | 5.10 | | | 1,000,000 | | | 1,086,410 | | | | |
| 500,000 | | KENTUCKY ST ECON DEV FIN AUTH MF HSG REVENUE | | 11/20/2035 | | 5.38 | | | 500,000 | | | 540,230 | | | | |
| 450,000 | | KENTUCKY ST HSG CORP HSG REVENUE | | 7/1/2039 | | 5.15 | | | 450,000 | | | 489,312 | | | | |
| 1,940,000 | | KERRVILLE TX HLTH FACS DEV CORP HOSP REVENUE | | 8/15/2035 | | 5.45 | | | 1,914,358 | | | 1,942,735 | | | | |
| 750,000 | | KING CNTY WA HSG AUTH | | 5/1/2028 | | 5.20 | | | 750,000 | | | 838,095 | | | | |
| 500,000 | | KIRKWOOD MO INDL DEV AUTH RETMNT CMNTY REVENUE | | 5/15/2021 | | 8.00 | | | 500,000 | | | 567,420 | | | | |
| 900,000 | | KLICKITAT CNTY WA PUBLIC HOSP DIST #2 HOSP REVENUE | | 12/1/2020 | | 6.00 | | | 843,389 | | | 933,597 | | | | |
| 2,500,000 | | KOYUKUK AK REVENUE | | 10/1/2023 | | 7.00 | | | 2,430,888 | | | 2,762,125 | | | | |
| 1,390,000 | | KREMMLING CO MEMORIAL HOSP DIST COPS | | 12/1/2022 | | 6.00 | | | 1,377,220 | | | 1,528,458 | | | | |
| 1,500,000 | | LA MIRADA CA REDEV AGY(b) | | 8/15/2027 | | 14.17 | | | 558,042 | | | 660,390 | | | | |
| | |
See accompanying notes to the financial statements. | 56 | (Continued) |
CLEARWATER INVESTMENT TRUST
Schedule of Investments - Clearwater Tax-Exempt Bond Fund
December 31, 2012
| | | | | | | | | | | | | | | | | |
Par/Shares | | Security | | Maturity
date | | Coupon
rate | | Cost | | Fair
value(a) | | Percent
of
net assets | |
Municipal Bonds (Cont’d): | | | | | | | | | | | | | | |
| 744,000 | | LAFAYETTE LA PUBLIC TRUST FING AUTH SF MTGE | | 1/1/2041 | | 5.35 | | $ | 759,842 | | | 777,361 | | | | |
| 2,000,000 | | LAKEWOOD RANCH FL STEWARDSHIP DIST SPL ASSMNT REVENUE | | 5/1/2030 | | 7.40 | | | 1,980,688 | | | 2,201,240 | | | | |
| 2,000,000 | | LAS VEGAS NV REDEV AGY TAX INCR REVENUE | | 6/15/2023 | | 7.50 | | | 1,981,931 | | | 2,272,920 | | | | |
| 1,000,000 | | LEE CNTY FL INDL DEV AUTH | | 11/15/2029 | | 5.00 | | | 835,067 | | | 1,010,100 | | | | |
| 940,000 | | LEHIGH CNTY PA GEN PURPOSE AUTH | | 12/15/2023 | | 6.00 | | | 861,233 | | | 941,260 | | | | |
| 250,000 | | LEHIGH CNTY PA GEN PURPOSE AUTH | | 8/15/2042 | | 1.31 | | | 250,000 | | | 186,180 | | | | |
| 495,000 | | LEXINGTON OAKS FL CDD SPL ASSMNT REVENUE | | 5/1/2033 | | 5.65 | | | 495,000 | | | 540,827 | | | | |
| 500,000 | | LOMBARD IL PUBLIC FACS CORP CONFERENCE CENTER & HOTEL REVENU | | 1/1/2015 | | 6.38 | | | 500,000 | | | 404,635 | | | | |
| 550,000 | | LOMBARD IL PUBLIC FACS CORP CONFERENCE CENTER & HOTEL REVENU | | 1/1/2030 | | 5.50 | | | 567,433 | | | 349,679 | | | | |
| 1,000,000 | | LOMBARD IL PUBLIC FACS CORP CONFERENCE CENTER & HOTEL REVENU | | 1/1/2036 | | 5.25 | | | 1,008,455 | | | 465,870 | | | | |
| 2,000,000 | | LOS ANGELES CA HSG AUTH | | 6/1/2029 | | 5.00 | | | 1,712,162 | | | 2,008,560 | | | | |
| 1,250,000 | | LOUDOUN CNTY VA INDL DEV AUTH RSDL CARE FAC REVENUE | | 8/1/2028 | | 6.00 | | | 1,251,639 | | | 1,340,775 | | | | |
| 500,000 | | LOUISIANA ST HSG FIN AGY SF MTGE REVENUE | | 12/1/2034 | | 5.10 | | | 500,000 | | | 549,160 | | | | |
| 185,000 | | LOUISIANA ST HSG FIN AGY SF MTGE REVENUE | | 6/1/2038 | | 5.85 | | | 193,642 | | | 197,475 | | | | |
| 895,000 | | LOUISIANA ST HSG FIN AGY SF MTGE REVENUE | | 12/1/2038 | | 5.70 | | | 924,492 | | | 953,094 | | | | |
| 235,000 | | LOUISIANA ST HSG FIN AGY SF | | | | | | | | | | | | | | |
| | | MTGE REVENUE | | 6/1/2039 | | 5.60 | | | 242,434 | | | 262,199 | | | | |
| 400,000 | | LOUISIANA ST LOCAL GOVT | | | | | | | | | | | | | | |
| | | ENVRNMNTL FACS & CMNTY | | | | | | | | | | | | | | |
| | | DEV AUTH | | 6/20/2028 | | 8.00 | | | 400,000 | | | 392,696 | | | | |
| 750,000 | | LOUISIANA ST PUBLIC FACS | | | | | | | | | | | | | | |
| | | AUTH REVENUE | | 5/1/2031 | | 6.50 | | | 746,745 | | | 874,200 | | | | |
| 500,000 | | LOUISIANA ST PUBLIC FACS | | | | | | | | | | | | | | |
| | | AUTH REVENUE | | 2/15/2036 | | 0.99 | | | 500,000 | | | 446,930 | | | | |
| 1,000,000 | | LOUISIANA ST TRANSPRTN | | | | | | | | | | | | | | |
| | | AUTH TOLL REVENUE(b) | | 12/1/2027 | | 9.18 | | | 451,081 | | | 457,900 | | | | |
| 500,000 | | LUCAS CNTY OH HLTH CARE | | | | | | | | | | | | | | |
| | | FACS REVENUE | | 8/15/2030 | | 5.50 | | | 491,656 | | | 551,150 | | | | |
| 1,490,000 | | LUZERNE CNTY PA | | 11/1/2026 | | 7.00 | | | 1,573,350 | | | 1,797,208 | | | | |
| 342,229 | | LYONS CO | | 11/30/2016 | | 4.75 | | | 344,099 | | | 345,576 | | | | |
| 1,000,000 | | MACON CNTY IL SCH DIST #61 | | 1/1/2037 | | 5.25 | | | 1,030,868 | | | 1,130,870 | | | | |
| 430,000 | | MADISON CNTY FL | | 7/1/2025 | | 6.00 | | | 424,418 | | | 418,485 | | | | |
| 250,000 | | MAGNOLIA CREEK FL CDD | | | | | | | | | | | | | | |
| | | CAPITAL IMPT REVENUE(e) | | 5/1/2014 | | 5.60 | | | 250,000 | | | 87,508 | | | | |
| 1,000,000 | | MAINE ST HLTH & HGR EDUCTNL | | | | | | | | | | | | | | |
| | | FACS AUTH REVENUE | | 7/1/2026 | | 6.00 | | | 999,530 | | | 1,183,650 | | | | |
| 1,000,000 | | MAINE ST HLTH & HGR EDUCTNL | | | | | | | | | | | | | | |
| | | FACS AUTH REVENUE | | 7/1/2032 | | 7.50 | | | 1,053,098 | | | 1,279,790 | | | | |
| 1,000,000 | | MAINE ST TECH CLG SYS COPS | | 1/1/2017 | | 5.80 | | | 1,000,000 | | | 1,004,170 | | | | |
| 1,000,000 | | MALTA IL TAX INCR REVENUE | | 12/30/2025 | | 5.75 | | | 1,000,000 | | | 644,950 | | | | |
| 500,000 | | MANATEE CNTY FL SCH BRD | | 7/1/2031 | | 5.63 | | | 495,707 | | | 581,130 | | | | |
| 500,000 | | MANCHESTER NH HSG & REDEV AUTH REVENUE | | 1/1/2015 | | 6.75 | | | 496,899 | | | 487,855 | | | | |
| 500,000 | | MANCHESTER NH HSG & REDEV AUTH REVENUE(b) | | 1/1/2020 | | 7.87 | | | 341,078 | | | 245,355 | | | | |
| 452,000 | | MANHATTAN IL SPL SVC AREA SPL TAX(e) | | 3/1/2022 | | 5.75 | | | 452,000 | | | 113,023 | | | | |
| 500,000 | | MANSFIELD OH | | 12/1/2024 | | 6.00 | | | 521,478 | | | 587,445 | | | | |
| 600,000 | | MANTECA CA FING AUTH SWR REVENUE | | 12/1/2033 | | 5.00 | | | 556,893 | | | 625,488 | | | | |
| | |
See accompanying notes to the financial statements. | 57 | (Continued) |
CLEARWATER INVESTMENT TRUST
Schedule of Investments - Clearwater Tax-Exempt Bond Fund
December 31, 2012
| | | | | | | | | | | | | | | | | |
Par/Shares | | Security | | Maturity
date | | Coupon
rate | | Cost | | Fair
value(a) | | Percent
of
net assets | |
Municipal Bonds (Cont’d): | | | | | | | | | | | | | | |
| 349,000 | | MARQUIS VA CMNTY DEV AUTH REVENUE | | 9/1/2041 | | 5.63 | | $ | 378,073 | | | 311,144 | | | | |
| 462,000 | | MARQUIS VA CMNTY DEV AUTH REVENUE(b) | | 9/1/2041 | | 22.45 | | | 71,580 | | | 49,951 | | | | |
| 1,175,000 | | MARTIN CNTY FL HLTH FACS AUTH | | 11/15/2032 | | 5.50 | | | 1,206,423 | | | 1,309,208 | | | | |
| 750,000 | | MARTINEZ CA UNIF SCH DIST(b) | | 8/1/2035 | | 0.87 | | | 627,569 | | | 827,558 | | | | |
| 500,000 | | MARYLAND ST CMNTY DEV ADMIN DEPT HSG & CMNTY DEV | | 9/1/2030 | | 5.13 | | | 500,000 | | | 564,455 | | | | |
| 500,000 | | MARYLAND ST CMNTY DEV ADMIN DEPT HSG & CMNTY DEV | | 7/1/2031 | | 4.50 | | | 500,000 | | | 545,900 | | | | |
| 1,000,000 | | MARYLAND ST HLTH & HGR EDUCTNL FACS AUTH REVENUE | | 1/1/2026 | | 6.00 | | | 1,024,347 | | | 1,196,710 | | | | |
| 1,000,000 | | MARYLAND ST HLTH & HGR EDUCTNL FACS AUTH REVENUE | | 1/1/2031 | | 6.25 | | | 1,017,098 | | | 1,189,320 | | | | |
| 500,000 | | MASHANTUCKET WSTRN PEQUOT TRIBE CT(c)(e)(f) | | 9/1/2036 | | 5.50 | | | 509,035 | | | 215,045 | | | | |
| 1,000,000 | | MASSACHUSETTS ST DEV FIN AGY REVENUE | | 7/1/2030 | | 6.38 | | | 986,976 | | | 1,142,150 | | | | |
| 290,000 | | MASSACHUSETTS ST DEV FIN AGY SENIOR LIVING FAC REVENUE | | 6/1/2014 | | 6.25 | | | 290,000 | | | 145,012 | | | | |
| 410,000 | | MASSACHUSETTS ST EDUCTNL FING AUTH | | 1/1/2027 | | 5.20 | | | 410,000 | | | 465,461 | | | | |
| 2,065,000 | | MASSACHUSETTS ST EDUCTNL FING AUTH | | 1/1/2028 | | 5.25 | | | 2,068,581 | | | 2,316,228 | | | | |
| 685,000 | | MASSACHUSETTS ST HLTH & EDUCTNL FACS AUTH | | 7/1/2013 | | 7.30 | | | 685,000 | | | 688,254 | | | | |
| 750,000 | | MASSACHUSETTS ST HSG FIN AGY | | 12/1/2031 | | 3.50 | | | 750,000 | | | 769,620 | | | | |
| 1,000,000 | | MASSACHUSETTS ST HSG FIN AGY | | 12/1/2032 | | 4.05 | | | 1,000,000 | | | 1,044,910 | | | | |
| 830,000 | | MASSACHUSETTS ST HSG FIN AGY | | 12/1/2033 | | 5.35 | | | 830,000 | | | 876,331 | | | | |
| 2,000,000 | | MASSACHUSETTS ST HSG FIN AGY | | 12/1/2037 | | 3.45 | | | 2,000,000 | | | 1,960,560 | | | | |
| 885,000 | | MASSACHUSETTS ST HSG FIN AGY | | 6/1/2040 | | 5.05 | | | 885,000 | | | 958,234 | | | | |
| 500,000 | | MASSACHUSETTS ST HSG FIN AGY | | 12/1/2042 | | 3.50 | | | 499,376 | | | 491,630 | | | | |
| 1,750,000 | | MCALESTER OK PUBLIC WKS AUTH UTILITY SYS REVENUE(b) | | 2/1/2030 | | 11.04 | | | 669,805 | | | 671,422 | | | | |
| 160,000 | | MEAD NE TAX INCR REVENUE(e) | | 7/1/2012 | | 5.13 | | | 160,000 | | | 72,000 | | | | |
| 400,000 | | MEDITERRA FL S CDD CAPITAL IMPT REVENUE | | 5/1/2031 | | 5.10 | | | 400,000 | | | 410,884 | | | | |
| 1,000,000 | | MESQUITE TX HLTH FAC DEV CORP | | 2/15/2025 | | 5.50 | | | 998,167 | | | 1,032,000 | | | | |
| 1,070,000 | | MET GOVT NASHVILLE & DAVIDSON CNTY TN HLTH & EDUCTNL FAC BRD(e) | | 12/20/2020 | | 8.00 | | | 1,070,000 | | | 502,836 | | | | |
| 855,000 | | MET GOVT NASHVILLE & DAVIDSON CNTY TN HLTH & EDUCTNL FAC BRD(e) | | 6/20/2036 | | 10.00 | | | 855,000 | | | 401,799 | | | | |
| 1,830,000 | | MET GOVT NASHVILLE & DAVIDSON CNTY TN HLTH & EDUCTNL FAC BRD(e) | | 12/20/2040 | | 7.50 | | | 1,830,000 | | | 1,006,390 | | | | |
| 2,000,000 | | MET WASHINGTON DC ARPTS AUTH DULLES TOLL ROAD REVENUE(b) | | 10/1/2041 | | 1.80 | | | 1,329,475 | | | 1,984,940 | | | | |
| 500,000 | | MIAMI-DADE CNTY FL HLTH FACS AUTH HOSP REVENUE | | 8/1/2030 | | 6.00 | | | 486,218 | | | 598,055 | | | | |
| 1,000,000 | | MIAMI-DADE CNTY FL SPL OBLG | | 10/1/2035 | | 5.00 | | | 1,114,334 | | | 1,121,200 | | | | |
| | |
See accompanying notes to the financial statements. | 58 | (Continued) |
CLEARWATER INVESTMENT TRUST
Schedule of Investments - Clearwater Tax-Exempt Bond Fund
December 31, 2012
| | | | | | | | | | | | | | | | | |
Par/Shares | | Security | | Maturity
date | | Coupon
rate | | Cost | | Fair
value(a) | | Percent
of
net assets | |
Municipal Bonds (Cont’d): | | | | | | | | | | | | | | |
| 465,000 | | MICHIGAN ST FIN AUTH LTD OBLGREVENUE | | 10/1/2021 | | 6.00 | | $ | 461,835 | | | 506,873 | | | | |
| 1,000,000 | | MICHIGAN ST HOSP FIN AUTH | | 12/1/2023 | | 6.13 | | | 990,174 | | | 1,226,570 | | | | |
| 2,500,000 | | MICHIGAN ST HOSP FIN AUTH | | 11/15/2025 | | 5.25 | | | 2,291,321 | | | 2,530,950 | | | | |
| 1,500,000 | | MICHIGAN ST HOSP FIN AUTH | | 6/1/2034 | | 6.13 | | | 1,558,280 | | | 1,752,645 | | | | |
| 625,000 | | MICHIGAN ST HSG DEV AUTH | | 10/1/2020 | | 5.38 | | | 602,835 | | | 702,038 | | | | |
| 1,000,000 | | MICHIGAN ST HSG DEV AUTH | | 10/1/2034 | | 5.63 | | | 1,000,000 | | | 1,096,450 | | | | |
| 1,000,000 | | MICHIGAN ST MUNI BOND AUTH | | 5/1/2023 | | 5.75 | | | 1,023,884 | | | 1,191,190 | | | | |
| 695,000 | | MICHIGAN ST PUBLIC EDUCTNL FACS AUTH(c) | | 9/1/2016 | | 6.00 | | | 692,537 | | | 638,886 | | | | |
| 750,000 | | MICHIGAN ST PUBLIC EDUCTNL FACS AUTH | | 6/1/2020 | | 6.00 | | | 744,423 | | | 795,488 | | | | |
| 440,000 | | MICHIGAN ST PUBLIC EDUCTNL FACS AUTH | | 9/1/2021 | | 8.00 | | | 440,000 | | | 402,723 | | | | |
| 450,000 | | MICHIGAN ST PUBLIC EDUCTNL FACS AUTH | | 10/1/2023 | | 6.25 | | | 450,000 | | | 453,614 | | | | |
| 500,000 | | MICHIGAN ST PUBLIC EDUCTNL FACS AUTH | | 11/1/2028 | | 6.35 | | | 500,000 | | | 515,350 | | | | |
| 305,000 | | MICHIGAN ST TOBACCO SETTLEMENT FIN AUTH | | 6/1/2022 | | 5.13 | | | 287,544 | | | 282,888 | | | | |
| 1,000,000 | | MIDDLEBURG HEIGHTS OH HOSP REVENUE | | 8/1/2047 | | 5.00 | | | 1,079,414 | | | 1,076,450 | | | | |
| 496,000 | | MILLSBORO DE SPL OBLG | | 7/1/2036 | | 5.45 | | | 496,000 | | | 386,716 | | | | |
| 318,641 | | MINNESOTA ST HGR EDU FACS AUTH REVENUE | | 10/1/2016 | | 4.49 | | | 319,984 | | | 325,670 | | | | |
| 425,000 | | MINNESOTA ST HSG FIN AGY | | 7/1/2034 | | 5.05 | | | 425,000 | | | 458,108 | | | | |
| 840,000 | | MINNESOTA ST HSG FIN AGY | | 1/1/2040 | | 5.10 | | | 840,000 | | | 904,982 | | | | |
| 1,000,000 | | MINNESOTA ST OFFICE OF HGR EDU REVENUE | | 11/1/2029 | | 5.00 | | | 1,000,000 | | | 1,126,760 | | | | |
| 1,000,000 | | MISSISSIPPI ST DEV BANK SPL OBLG | | 10/1/2031 | | 6.50 | | | 973,535 | | | 1,220,150 | | | | |
| 185,000 | | MISSISSIPPI ST HOME CORP SF MTGE REVENUE | | 6/1/2039 | | 6.75 | | | 194,710 | | | 192,866 | | | | |
| 500,000 | | MISSOURI ST DEV FIN BRD | | 11/1/2025 | | 5.50 | | | 492,739 | | | 533,310 | | | | |
| 980,000 | | MISSOURI ST HLTH & EDUCTNL FACS AUTH | | 2/1/2022 | | 5.13 | | | 997,942 | | | 1,046,905 | | | | |
| 500,000 | | MISSOURI ST HLTH & EDUCTNL FACS AUTH | | 2/1/2035 | | 5.38 | | | 498,356 | | | 532,505 | | | | |
| 185,000 | | MISSOURI ST HSG DEV COMMISSION SF HSG REVENUE | | 9/1/2034 | | 5.25 | | | 183,816 | | | 192,574 | | | | |
| 305,000 | | MISSOURI ST HSG DEV COMMISSION SF HSG REVENUE | | 9/1/2034 | | 5.35 | | | 305,000 | | | 337,107 | | | | |
| 1,000,000 | | MOBERLY MO INDL DEV AUTH(e) | | 9/1/2024 | | 6.00 | | | 1,016,984 | | | 60,010 | | | | |
| 1,105,000 | | MONTANA ST BRD OF HSG | | 12/1/2039 | | 5.50 | | | 1,105,137 | | | 1,202,914 | | | | |
| 500,000 | | MONTGOMERY CNTY MD HSG OPPORTUNITIES COMMISSION MF REVENUE | | 7/1/2037 | | 5.13 | | | 500,000 | | | 544,160 | | | | |
| 2,000,000 | | MONTGOMERY CNTY MD HSG OPPORTUNITIES COMMISSION SF MTGE REVE(b) | | 7/1/2028 | | 9.14 | | | 881,485 | | | 844,600 | | | | |
| 1,500,000 | | MONTGOMERY CNTY OH HLTH CARE FACS REVENUE | | 9/20/2032 | | 6.55 | | | 1,459,491 | | | 1,506,180 | | | | |
| 650,000 | | MONTGOMERY CNTY PA INDL DEV AUTH | | 2/1/2014 | | 5.38 | | | 649,155 | | | 657,774 | | | | |
| 800,000 | | MOUNT CARBON CO MET DIST REVENUE | | 6/1/2043 | | 7.00 | | | 800,000 | | | 488,552 | | | | |
| 200,000 | | MOUNT CARBON CO MET DIST REVENUE(e) | | 6/1/2043 | | 8.00 | | | - | | | 20,000 | | | | |
| 1,500,000 | | MOUNT VERNON IN SCH BLDG CORP | | 1/15/2037 | | 5.00 | | | 1,532,785 | | | 1,589,460 | | | | |
| 500,000 | | MULTNOMAH CNTY OR HOSP FACS AUTH REVENUE | | 12/1/2029 | | 5.00 | | | 540,856 | | | 545,645 | | | | |
| | |
See accompanying notes to the financial statements. | 59 | (Continued) |
CLEARWATER INVESTMENT TRUST
Schedule of Investments - Clearwater Tax-Exempt Bond Fund
December 31, 2012
| | | | | | | | | | | | | | | | | |
Par/Shares | | Security | | Maturity
date | | Coupon
rate | | Cost | | Fair
value(a) | | Percent
of
net assets | |
Municipal Bonds (Cont’d): | | | | | | | | | | | | | | |
| 1,500,000 | | N SUMTER CNTY UTILITY DEPENDENT DIST FL SOLID WASTE REVENUE | | 10/1/2032 | | 5.00 | | $ | 1,528,893 | | | 1,542,930 | | | | |
| 500,000 | | N TX TOLLWAY AUTH DALLAS N TOLLWAY SYS REVENUE | | 1/1/2025 | | 6.00 | | | 500,000 | | | 590,225 | | | | |
| 1,000,000 | | N TX TOLLWAY AUTH REVENUE(b) | | 1/1/2028 | | 10.85 | | | 418,027 | | | 540,030 | | | | |
| 1,000,000 | | N TX TOLLWAY AUTH REVENUE | | 1/1/2034 | | 6.00 | | | 1,000,000 | | | 1,182,310 | | | | |
| 1,000,000 | | N TX TOLLWAY AUTH REVENUE(b) | | 1/1/2042 | | 1.40 | | | 716,257 | | | 1,092,110 | | | | |
| 1,000,000 | | NATRONA CNTY WY HOSP REVENUE | | 9/15/2031 | | 6.35 | | | 1,000,000 | | | 1,179,020 | | | | |
| 235,000 | | NEVADA ST HSG DIV SF MTGE REVENUE | | 10/1/2039 | | 5.38 | | | 235,000 | | | 243,733 | | | | |
| 1,025,000 | | NEVADA ST HSG DIV SF MTGE REVENUE | | 10/1/2040 | | 5.10 | | | 1,025,000 | | | 1,106,856 | | | | |
| 1,000,000 | | NEW HAMPSHIRE ST HLTH & ED FACS AUTH HLTHCARE SYS REVENUE | | 7/1/2042 | | 5.00 | | | 1,022,767 | | | 1,070,230 | | | | |
| 1,000,000 | | NEW HAMPSHIRE ST HLTH & EDU FACS AUTH HOSP REVENUE | | 10/1/2024 | | 5.00 | | | 987,174 | | | 1,023,180 | | | | |
| 1,000,000 | | NEW HAMPSHIRE ST HLTH & EDU FACS AUTH REVENUE | | 1/1/2034 | | 6.00 | | | 969,730 | | | 1,148,310 | | | | |
| 500,000 | | NEW HAMPSHIRE ST HLTH & EDU FACS AUTH REVENUE | | 8/1/2038 | | 6.00 | | | 490,374 | | | 585,410 | | | | |
| 1,000,000 | | NEW HAMPSHIRE ST HSG FIN AUTH MF REVENUE | | 7/1/2031 | | 5.20 | | | 1,000,000 | | | 1,127,980 | | | | |
| 745,000 | | NEW HAMPSHIRE ST HSG FIN AUTH SF REVENUE | | 7/1/2034 | | 5.38 | | | 745,000 | | | 818,315 | | | | |
| 570,000 | | NEW HAMPSHIRE ST HSG FIN AUTH SF REVENUE | | 7/1/2038 | | 6.63 | | | 593,533 | | | 632,261 | | | | |
| 615,000 | | NEW JERSEY ST ECON DEV AUTH | | 12/1/2016 | | 5.75 | | | 615,000 | | | 615,775 | | | | |
| 500,000 | | NEW JERSEY ST HGR EDU ASSISTANCE AUTH | | 6/1/2024 | | 5.38 | | | 497,666 | | | 563,445 | | | | |
| 555,000 | | NEW JERSEY ST HGR EDU ASSISTANCE AUTH | | 6/1/2027 | | 5.00 | | | 553,196 | | | 585,963 | | | | |
| 995,000 | | NEW JERSEY ST HSG & MTGE FIN AGY | | 10/1/2030 | | 4.50 | | | 995,000 | | | 1,085,057 | | | | |
| 390,000 | | NEW JERSEY ST HSG & MTGE FIN AGY | | 10/1/2030 | | 6.45 | | | 412,976 | | | 440,969 | | | | |
| 755,000 | | NEW JERSEY ST HSG & MTGE FIN AGY | | 10/1/2034 | | 5.00 | | | 755,000 | | | 817,597 | | | | |
| 775,000 | | NEW JERSEY ST HSG & MTGE FIN AGY | | 10/1/2035 | | 5.00 | | | 775,000 | | | 835,652 | | | | |
| 1,905,000 | | NEW JERSEY ST HSG & MTGE FIN AGY | | 10/1/2037 | | 5.00 | | | 1,891,510 | | | 2,039,493 | | | | |
| 1,000,000 | | NEW JERSEY ST HSG & MTGE FIN AGY MF REVENUE | | 5/1/2041 | | 4.95 | | | 970,286 | | | 1,075,440 | | | | |
| 395,000 | | NEW MEXICO ST MTGE FIN AUTH | | 9/1/2029 | | 4.80 | | | 395,000 | | | 433,153 | | | | |
| 775,000 | | NEW MEXICO ST MTGE FIN AUTH | | 9/1/2029 | | 5.00 | | | 775,000 | | | 852,477 | | | | |
| 790,000 | | NEW MEXICO ST MTGE FIN AUTH | | 9/1/2034 | | 5.00 | | | 790,000 | | | 869,253 | | | | |
| 755,000 | | NEW MEXICO ST MTGE FIN AUTH | | 3/1/2036 | | 5.45 | | | 755,000 | | | 829,398 | | | | |
| 1,000,000 | | NEW MEXICO ST MTGE FIN AUTH | | 9/1/2042 | | 3.90 | | | 1,000,000 | | | 1,023,990 | | | | |
| 1,500,000 | | NEW MEXICO ST MTGE FIN AUTH | | 9/1/2042 | | 4.13 | | | 1,500,000 | | | 1,568,115 | | | | |
| 750,000 | | NEW ORLEANS LA SEWAGE SVC REVENUE | | 6/1/2024 | | 6.00 | | | 740,818 | | | 874,072 | | | | |
| 115,000 | | NEW RIVER FL CDD CAPITAL IMPT REVENUE(e) | | 5/1/2013 | | 5.00 | | | 114,821 | | | 1 | | | | |
| | |
See accompanying notes to the financial statements. | 60 | (Continued) |
CLEARWATER INVESTMENT TRUST
Schedule of Investments - Clearwater Tax-Exempt Bond Fund
December 31, 2012
| | | | | | | | | | | | | | | | | |
Par/Shares | | Security | | Maturity
date | | Coupon
rate | | Cost | | Fair
value(a) | | Percent
of
net assets | |
Municipal Bonds (Cont’d): | | | | | | | | | | | | | |
| 70,000 | | NEW RIVER FL CDD CAPITAL IMPT REVENUE | | 5/1/2015 | | 5.00 | | $ | 66,542 | | | 62,569 | | | | |
| 135,000 | | NEW RIVER FL CDD CAPITAL IMPT REVENUE(b) | | 5/1/2018 | | 1.37 | | | 121,599 | | | 62,784 | | | | |
| 175,000 | | NEW RIVER FL CDD CAPITAL IMPT REVENUE(b) | | 5/1/2038 | | 0.80 | | | 142,268 | | | 75,651 | | | | |
| 70,000 | | NEW RIVER FL CDD CAPITAL IMPT REVENUE | | 5/1/2038 | | 5.75 | | | 63,184 | | | 55,131 | | | | |
| 1,000,000 | | NEW YORK CITY NY HSG DEV CORPMF HSG REVENUE | | 11/1/2037 | | 3.80 | | | 1,000,000 | | | 1,000,270 | | | | |
| 2,500,000 | | NEW YORK ST HSG FIN AGY REVENUE | | 11/1/2042 | | 3.80 | | | 2,500,000 | | | 2,523,425 | | | | |
| 5,000,000 | | NEW YORK ST HSG FIN AGY REVENUE | | 5/1/2048 | | 4.10 | | | 5,000,000 | | | 4,972,950 | | | | |
| 1,750,000 | | NEW YORK ST MTGE AGY HOMEOWNER MTGE REVENUE | | 10/1/2040 | | 4.13 | | | 1,750,000 | | | 1,832,758 | | | | |
| 500,000 | | NEW YORK ST MTGE AGY HOMEOWNER MTGE REVENUE | | 10/1/2042 | | 3.75 | | | 500,000 | | | 506,230 | | | | |
| 450,000 | | NOBLESVILLE IN REDEV AUTH ECON DEV REVENUE | | 2/1/2031 | | 5.13 | | | 446,052 | | | 506,696 | | | | |
| 1,000,000 | | NORTH CAROLINA ST MED CARE COMMISSION HLTH CARE FACS REVENUE | | 10/1/2029 | | 6.38 | | | 1,000,000 | | | 1,003,970 | | | | |
| 1,300,000 | | NORTH CAROLINA ST MED CARE COMMISSION HLTH CARE FACS REVENUE | | 10/1/2035 | | 6.63 | | | 1,300,000 | | | 1,170,117 | | | | |
| 2,000,000 | | NORTH DAKOTA ST HSG FIN AGY | | 7/1/2032 | | 3.60 | | | 2,000,000 | | | 2,032,240 | | | | |
| 380,000 | | NORTH DAKOTA ST HSG FIN AGY | | 7/1/2034 | | 5.35 | | | 380,000 | | | 398,954 | | | | |
| 145,000 | | NORTH DAKOTA ST HSG FIN AGY | | 7/1/2039 | | 5.45 | | | 145,000 | | | 155,478 | | | | |
| 1,510,000 | | NORTH DAKOTA ST HSG FIN AGY | | 7/1/2040 | | 5.05 | | | 1,510,000 | | | 1,632,793 | | | | |
| 500,000 | | NTHRN CA GAS AUTH #1 GAS PROJ REVENUE | | 7/1/2027 | | 0.96 | | | 500,000 | | | 406,320 | | | | |
| 1,000,000 | | NTHRN IL UNIV | | 4/1/2026 | | 5.50 | | | 1,014,237 | | | 1,139,230 | | | | |
| 2,000,000 | | OAK PARK CA UNIF SCH DIST(b) | | 8/1/2038 | | 3.77 | | | 1,027,945 | | | 1,520,860 | | | | |
| 1,250,000 | | OAKLAND CNTY MI ECON DEV CORP LTD OBLG REVENUE | | 12/1/2020 | | 6.50 | | | 1,243,079 | | | 1,270,750 | | | | |
| 520,000 | | OHIO ST HSG FIN AGY RSDL MTGE REVENUE | | 9/1/2033 | | 5.40 | | | 520,000 | | | 572,889 | | | | |
| 160,000 | | OHIO ST HSG FIN AGY RSDL MTGE REVENUE | | 9/1/2033 | | 5.45 | | | 160,000 | | | 165,536 | | | | |
| 500,000 | | OKLAHOMA CNTY OK FIN AUTH REVENUE | | 4/1/2033 | | 5.00 | | | 505,509 | | | 493,695 | | | | |
| 500,000 | | OKLAHOMA CNTY OK FIN AUTH REVENUE | | 4/1/2042 | | 5.13 | | | 500,000 | | | 482,525 | | | | |
| 390,000 | | OKLAHOMA ST HSG FIN AGY SF MTGE REVENUE | | 3/1/2032 | | 5.15 | | | 390,000 | | | 428,119 | | | | |
| 605,000 | | OKLAHOMA ST HSG FIN AGY SF MTGE REVENUE | | 9/1/2038 | | 6.50 | | | 630,694 | | | 625,903 | | | | |
| 435,000 | | ONEIDA TRIBE OF INDIANS WI RETAIL SALES REVENUE(c) | | 2/1/2021 | | 5.50 | | | 435,000 | | | 496,474 | | | | |
| 1,000,000 | | OVERLAND PARK KS TRANSPRTN DEV DIST SALES TAX REVENUE | | 4/1/2032 | | 5.90 | | | 1,000,000 | | | 1,121,160 | | | | |
| 2,280,000 | | PACHECO CA UNION SCH DIST COPS(b) | | 2/1/2037 | | 15.27 | | | 526,420 | | | 670,046 | | | | |
| 1,000,000 | | PALM BAY FL UTILITY REVENUE(b) | | 10/1/2031 | | 11.87 | | | 335,799 | | | 407,860 | | | | |
| 1,000,000 | | PALM BEACH CNTY FL HLTH FACS AUTH REVENUE | | 11/15/2022 | | 5.38 | | | 925,227 | | | 1,050,340 | | | | |
| 1,665,000 | | PATTERSON CA JT UNIF SCH DIST(b) | | 8/1/2027 | | 12.31 | | | 650,640 | | | 883,865 | | | | |
| 750,000 | | PELL CITY AL SPL CARE FACS FING AUTH REVENUE | | 12/1/2027 | | 5.25 | | | 651,813 | | | 907,290 | | | | |
| 1,000,000 | | PELL CITY AL SPL CARE FACS FING AUTH REVENUE | | 12/1/2039 | | 5.00 | | | 1,067,439 | | | 1,064,310 | | | | |
| | |
See accompanying notes to the financial statements. | 61 | (Continued) |
CLEARWATER INVESTMENT TRUST
Schedule of Investments - Clearwater Tax-Exempt Bond Fund
December 31, 2012
| | | | | | | | | | | | | | | | | |
Par/Shares | | Security | | Maturity
date | | Coupon
rate | | Cost | | Fair
value(a) | | Percent
of
net assets | |
Municipal Bonds (Cont’d): | | | | | | | | | | | | | | |
| 500,000 | | PENNSYLVANIA ST HGR EDUCTNL FACS AUTH REVENUE | | 7/1/2039 | | 0.89 | | $ | 500,000 | | | 336,730 | | | | |
| 1,000,000 | | PENNSYLVANIA ST HGR EDUCTNL FACS AUTH REVENUE | | 5/1/2042 | | 5.38 | | | 1,007,635 | | | 1,051,230 | | | | |
| 500,000 | | PENNSYLVANIA ST HSG FIN AGY SF MTGE REVENUE | | 10/1/2025 | | 5.00 | | | 501,584 | | | 547,655 | | | | |
| 1,000,000 | | PENNSYLVANIA ST HSG FIN AGY SF MTGE REVENUE | | 10/1/2029 | | 4.63 | | | 920,269 | | | 1,063,770 | | | | |
| 1,000,000 | | PENNSYLVANIA ST HSG FIN AGY SF MTGE REVENUE | | 10/1/2034 | | 4.88 | | | 1,002,970 | | | 1,068,430 | | | | |
| 1,000,000 | | PENNSYLVANIA ST HSG FIN AGY SF MTGE REVENUE | | 10/1/2037 | | 3.65 | | | 1,007,465 | | | 988,700 | | | | |
| 1,000,000 | | PENNSYLVANIA ST HSG FIN AGY SF MTGE REVENUE | | 10/1/2042 | | 3.70 | | | 1,000,000 | | | 991,570 | | | | |
| 1,000,000 | | PENNSYLVANIA ST TURNPIKE COMMISSION TURNPIKE REVENUE(b) | | 6/1/2033 | | 2.19 | | | 697,300 | | | 1,057,150 | | | | |
| 1,935,000 | | PENNSYLVANIA ST TURNPIKE COMMISSION TURNPIKE REVENUE(b) | | 12/1/2035 | | 1.17 | | | 1,529,252 | | | 1,818,919 | | | | |
| 750,000 | | PENNSYLVANIA ST TURNPIKE COMMISSION TURNPIKE REVENUE(b) | | 12/1/2035 | | 2.01 | | | 601,819 | | | 711,698 | | | | |
| 1,500,000 | | PENNSYLVANIA ST TURNPIKE COMMISSION TURNPIKE REVENUE(b) | | 12/1/2038 | | 1.44 | | | 1,096,739 | | | 1,439,880 | | | | |
| 2,000,000 | | PEORIA IL PUBLIC BLDG COMMISSION SCH DIST FACS REVENUE(b) | | 12/1/2021 | | 8.01 | | | 1,222,116 | | | 1,431,660 | | | | |
| 5,000,000 | | PEORIA IL PUBLIC BLDG COMMISSION SCH DIST FACS REVENUE(b) | | 12/1/2026 | | 11.11 | | | 2,116,666 | | | 2,393,700 | | | | |
| 500,000 | | PHOENIX AZ INDL DEV AUTH EDU REVENUE | | 7/1/2022 | | 5.00 | | | 500,000 | | | 497,385 | | | | |
| 3,000,000 | | PHOENIX AZ INDL DEV AUTH LEASE REVENUE | | 6/1/2034 | | 5.25 | | | 3,057,019 | | | 3,376,980 | | | | |
| 975,000 | | PIMA CNTY AZ INDL DEV AUTH CHRT SCH REVENUE | | 4/1/2022 | | 5.88 | | | 975,000 | | | 1,022,034 | | | | |
| 650,000 | | PIMA CNTY AZ INDL DEV AUTH EDU REVENUE | | 6/1/2016 | | 6.00 | | | 652,755 | | | 657,748 | | | | |
| 825,000 | | PIMA CNTY AZ INDL DEV AUTH EDU REVENUE | | 12/1/2017 | | 5.35 | | | 747,608 | | | 827,269 | | | | |
| 330,000 | | PIMA CNTY AZ INDL DEV AUTH EDU REVENUE | | 12/1/2018 | | 6.38 | | | 330,000 | | | 343,216 | | | | |
| 1,985,000 | | PIMA CNTY AZ INDL DEV AUTH EDU REVENUE | | 7/1/2021 | | 6.70 | | | 1,985,000 | | | 1,996,831 | | | | |
| 865,000 | | PIMA CNTY AZ INDL DEV AUTH EDU REVENUE | | 6/1/2022 | | 5.00 | | | 804,228 | | | 873,148 | | | | |
| 995,000 | | PIMA CNTY AZ INDL DEV AUTH EDU REVENUE | | 7/1/2026 | | 5.00 | | | 870,255 | | | 911,579 | | | | |
| 490,000 | | PIMA CNTY AZ INDL DEV AUTH EDU REVENUE | | 7/1/2031 | | 6.75 | | | 361,857 | | | 492,132 | | | | |
| 2,625,000 | | PITTSBURG CALIF UNI SCH DIST FING AUTH REV(b) | | 9/1/2031 | | 16.03 | | | 766,261 | | | 809,812 | | | | |
| 1,000,000 | | PUBLIC FIN AUTH WI CCRC REVENUE | | 6/1/2020 | | 7.00 | | | 985,838 | | | 1,150,000 | | | | |
| 1,500,000 | | PUBLIC FIN AUTH WI CCRC REVENUE | | 6/1/2046 | | 8.25 | | | 1,564,641 | | | 1,805,145 | | | | |
| 500,000 | | PUBLIC FIN AUTH WI EDUCTNL FAC REVENUE | | 9/1/2022 | | 5.25 | | | 500,000 | | | 502,975 | | | | |
| 1,000,000 | | PUBLIC FIN AUTH WI REVENUE | | 4/1/2022 | | 5.00 | | | 1,000,000 | | | 1,006,550 | | | | |
| 600,000 | | PUBLIC FIN AUTH WI REVENUE | | 4/1/2032 | | 5.50 | | | 600,000 | | | 606,012 | | | | |
| 221,000 | | PUBLIC FIN AUTH WI REVENUE(b) | | 10/1/2042 | | (0.40) | | | 251,095 | | | 109,399 | | | | |
| | |
See accompanying notes to the financial statements. | 62 | (Continued) |
CLEARWATER INVESTMENT TRUST
Schedule of Investments - Clearwater Tax-Exempt Bond Fund
December 31, 2012
| | | | | | | | | | | | | | | | | |
Par/Shares | | Security | | Maturity
date | | Coupon
rate | | Cost | | Fair
value(a) | | Percent
of
net assets | |
Municipal Bonds (Cont’d): | | | | | | | | | | | | | | |
| 221,000 | | PUBLIC FIN AUTH WI REVENUE(b) | | 10/1/2042 | | (0.40 | ) | $ | 251,093 | | | 2 | | | | |
| 515,000 | | PUBLIC FIN AUTH WI REVENUE | | 10/1/2042 | | 7.00 | | | 585,639 | | | 493,859 | | | | |
| 1,000,000 | | PUERTO RICO CMWLTH | | 7/1/2028 | | 6.00 | | | 989,982 | | | 1,057,920 | | | | |
| 1,500,000 | | PUERTO RICO CMWLTH | | 7/1/2035 | | 5.00 | | | 1,500,000 | | | 1,497,990 | | | | |
| 1,500,000 | | PUERTO RICO CMWLTH | | 7/1/2039 | | 5.50 | | | 1,527,636 | | | 1,487,595 | | | | |
| 1,500,000 | | PUERTO RICO CMWLTH | | 7/1/2040 | | 6.50 | | | 1,524,271 | | | 1,597,620 | | | | |
| 1,000,000 | | PUERTO RICO CMWLTH AQUEDUCT & SWR AUTH REVENUE | | 7/1/2038 | | 6.00 | | | 1,047,552 | | | 1,002,320 | | | | |
| 500,000 | | PUERTO RICO ELEC PWR AUTH PWR REVENUE | | 7/1/2025 | | 0.92 | | | 500,000 | | | 396,130 | | | | |
| 1,000,000 | | PUERTO RICO SALES TAX FING CORP SALES TAX REVENUE(b) | | 8/1/2033 | | 3.37 | | | 599,620 | | | 837,690 | | | | |
| 500,000 | | PUERTO RICO SALES TAX FING CORP SALES TAX REVENUE | | 8/1/2057 | | 1.14 | | | 500,000 | | | 298,600 | | | | |
| 750,000 | | QUAIL CREEK AZ CMNTY FACS DIST | | 7/15/2016 | | 5.15 | | | 750,000 | | | 773,340 | | | | |
| 1,260,000 | | QUECHAN INDIAN TRIBE AZ FORT YUMA INDIAN RESERVATION | | 5/1/2025 | | 9.75 | | | 1,260,000 | | | 1,358,293 | | | | |
| 2,000,000 | | RAILSPLITTER IL TOBACCO SETTLEMENT AUTH | | 6/1/2024 | | 6.25 | | | 2,030,578 | | | 2,233,200 | | | | |
| 500,000 | | RED RIVER TX HLTH FACS DEV CORP FIRST MTGE REVENUE | | 1/1/2032 | | 5.50 | | | 515,199 | | | 522,365 | | | | |
| 1,000,000 | | REDONDO BEACH CA UNIF SCH DIST(b) | | 8/1/2034 | | 2.10 | | | 693,597 | | | 1,005,520 | | | | |
| 750,000 | | RENO NV SPARKS INDIAN COLONY | | 6/1/2021 | | 5.00 | | | 765,006 | | | 785,482 | | | | |
| 500,000 | | RHODE ISLAND ST HLTH & EDUCTNL BLDG CORP | | 5/15/2030 | | 6.25 | | | 493,705 | | | 589,465 | | | | |
| 1,000,000 | | RHODE ISLAND ST HSG & MTGE FIN CORP | | 10/1/2028 | | 4.00 | | | 994,160 | | | 1,031,900 | | | | |
| 500,000 | | RICHMOND CA JT PWRS FING AUTH | | 7/1/2024 | | 6.25 | | | 500,000 | | | 588,700 | | | | |
| 325,000 | | RICHMOND IN HOSP AUTH REVENUE | | 1/1/2029 | | 6.50 | | | 315,539 | | | 380,422 | | | | |
| 3,000,000 | | ROBLA CA SCH DIST(b) | | 8/1/2036 | | 15.56 | | | 718,591 | | | 933,930 | | | | |
| 500,000 | | S BAYSIDE CA WST MGMT AUTH SOL WST ENTERPRISE REVENUE | | 9/1/2029 | | 6.25 | | | 513,953 | | | 578,845 | | | | |
| 1,000,000 | | S COAST IN CONSERVANCY DIST | | 1/1/2028 | | 5.25 | | | 994,805 | | | 1,000,000 | | | | |
| 610,000 | | S WSTRN IL DEV AUTH | | 10/1/2022 | | 7.00 | | | 610,000 | | | 634,821 | | | | |
| 195,000 | | S WSTRN IL DEV AUTH | | 11/1/2026 | | 5.63 | | | 193,828 | | | 165,502 | | | | |
| 1,000,000 | | SACRAMENTO CA CITY FING AUTH(b) | | 12/1/2021 | | 7.46 | | | 634,354 | | | 697,570 | | | | |
| 350,000 | | SACRAMENTO CNTY CA WTR FING AUTH REVENUE | | 6/1/2039 | | 0.78 | | | 350,000 | | | 272,506 | | | | |
| 845,000 | | SADDLEBACK VLY CA UNIF SCH DIST PUBLIC FING AUTH | | 9/1/2017 | | 5.65 | | | 845,000 | | | 848,456 | | | | |
| 1,000,000 | | SAGINAW MI HOSP FIN AUTH | | 7/1/2030 | | 5.00 | | | 923,109 | | | 1,063,580 | | | | |
| 172,000 | | SAINT BERNARD PARISH LA HOME MTGE AUTH SF MTGE | | 3/1/2039 | | 5.80 | | | 168,754 | | | 186,830 | | | | |
| 500,000 | | SAINT JOHNS CNTY FL INDL DEV AUTH REVENUE | | 8/1/2040 | | 5.88 | | | 492,944 | | | 558,015 | | | | |
| 460,000 | | SAINT JOSEPH CNTY IN ECON DEV REVENUE | | 5/15/2026 | | 6.00 | | | 343,673 | | | 477,112 | | | | |
| 500,000 | | SAINT JOSEPH CNTY IN ECON DEV REVENUE | | 5/15/2038 | | 6.00 | | | 370,707 | | | 512,190 | | | | |
| 1,000,000 | | SAINT JOSEPH CNTY IN ECON DEV REVENUE | | 5/15/2039 | | 6.25 | | | 1,017,007 | | | 1,039,930 | | | | |
| 425,694 | | SAINT JOSEPH CNTY IN HOSP AUTH HLTH FACS REVENUE(e) | | 2/15/2028 | | 5.25 | | | 431,280 | | | 51,139 | | | | |
| 500,000 | | SAINT LOUIS CNTY MO INDL DEV AUTH | | 8/15/2032 | | 5.88 | | | 500,000 | | | 511,390 | | | | |
| | |
See accompanying notes to the financial statements. | 63 | (Continued) |
CLEARWATER INVESTMENT TRUST
Schedule of Investments - Clearwater Tax-Exempt Bond Fund
December 31, 2012
| | | | | | | | | | | | | | | | | |
Par/Shares | | Security | | Maturity
date | | Coupon
rate | | Cost | | Fair
value(a) | | Percent
of
net assets | |
Municipal Bonds (Cont’d): | | | | | | | | | | | | | | |
| 750,000 | | SAINT LOUIS CNTY MO INDL DEV AUTH SENIOR LIVING FACS | | 9/1/2042 | | 5.00 | | $ | 772,764 | | | 787,492 | | | | |
| 1,000,000 | | SAINT PETERSBURG FL PUBLIC UTILITIES REVENUE | | 10/1/2042 | | 4.00 | | | 1,000,000 | | | 1,001,550 | | | | |
| 117,309 | | SAINT TAMMANY PARISH LA FIN AUTH SF MTGE REVENUE | | 12/1/2039 | | 5.25 | | | 119,913 | | | 120,341 | | | | |
| 1,000,000 | | SALEM OR HOSP FAC AUTH REVENUE | | 5/15/2027 | | 5.75 | | | 1,027,270 | | | 1,095,870 | | | | |
| 2,000,000 | | SALINE CNTY MO INDL DEV AUTH HLTH FACS REVENUE | | 12/1/2020 | | 5.00 | | | 1,983,881 | | | 2,090,220 | | | | |
| 500,000 | | SALINE CNTY MO INDL DEV AUTH HLTH FACS REVENUE | | 12/1/2028 | | 5.60 | | | 489,692 | | | 535,580 | | | | |
| 500,000 | | SAN DIEGO CA HSG AUTH MF HSG REVENUE | | 5/1/2029 | | 5.00 | | | 500,000 | | | 546,345 | | | | |
| 500,000 | | SAN DIEGO CA REDEV AGY | | 9/1/2023 | | 5.00 | | | 456,396 | | | 525,155 | | | | |
| 250,000 | | SAN JOAQUIN HILLS CA TRANSPRTN CORRIDOR AGY | | 1/15/2030 | | 5.25 | | | 250,000 | | | 243,678 | | | | |
| 500,000 | | SANTA ANA CA CMNTY REDEV AGY | | 9/1/2022 | | 6.00 | | | 495,463 | | | 584,865 | | | | |
| 1,000,000 | | SANTA BARBARA CA UNIF SCH DISTT(b) | | 8/1/2037 | | 2.57 | | | 615,161 | | | 656,350 | | | | |
| 500,000 | | SANTA MONICA CA REDEV AGY | | 7/1/2036 | | 5.88 | | | 519,103 | | | 593,530 | | | | |
| 1,450,000 | | SARASOTA CNTY FL HLTH FACS AUTH RETMNT FAC REVENUE | | 1/1/2027 | | 5.50 | | | 1,211,225 | | | 1,553,791 | | | | |
| 500,000 | | SEMINOLE TRIBE FL SPL OBLG REVENUE(c) | | 10/1/2024 | | 5.50 | | | 503,730 | | | 543,610 | | | | |
| 500,000 | | SEVEN OAKS FL CMNTY DEV DIST SPL ASSMNT REVENUE | | 5/1/2033 | | 5.50 | | | 488,039 | | | 536,550 | | | | |
| 150,000 | | SHELBY CNTY TN HLTH EDUCTNL & HSG FACS BRD REVENUE(e) | | 1/1/2019 | | 5.35 | | | 134,966 | | | 15,000 | | | | |
| 625,000 | | SHELBY CNTY TN HLTH EDUCTNL & HSG FACS BRD REVENUE(e) | | 1/1/2029 | | 5.55 | | | 556,862 | | | 62,500 | | | | |
| 515,000 | | SOUTH CAROLINA ST EDU ASSISTANCE AUTH | | 10/1/2029 | | 5.10 | | | 509,264 | | | 570,656 | | | | |
| 220,000 | | SOUTH CAROLINA ST HSG FIN & DEV AUTH MTGE REVENUE | | 7/1/2032 | | 5.50 | | | 220,000 | | | 241,078 | | | | |
| 1,500,000 | | SOUTH CAROLINA ST JOBS-ECON DEV AUTH ECON DEV REVENUE | | 11/15/2030 | | 5.63 | | | 1,434,764 | | | 1,505,250 | | | | |
| 356,475 | | SOUTH CAROLINA ST JOBS-ECON DEV AUTH REVENUE | | 11/15/2032 | | 6.00 | | | 359,390 | | | 268,607 | | | | |
| 228,572 | | SOUTH CAROLINA ST JOBS-ECON DEV AUTH REVENUE(b) | | 11/15/2047 | | 0.04 | | | 225,000 | | | 8,608 | | | | |
| 152,775 | | SOUTH CAROLINA ST JOBS-ECON DEV AUTH REVENUE(b) | | 11/15/2047 | | 0.15 | | | 145,042 | | | 773 | | | | |
| 533,336 | | SOUTH CAROLINA ST JOBS-ECON DEV AUTH REVENUE | | 11/15/2047 | | 6.00 | | | 525,169 | | | 373,687 | | | | |
| 338,000 | | SOUTHSIDE AZ CMNTY FACS DIST #1 SPL ASSMNT REVENUE PRESCOTT | | 7/1/2018 | | 6.13 | | | 253,417 | | | 258,036 | | | | |
| 1,000,000 | | SPARKS NV REDEV AGY TAX INCR REVENUE | | 6/1/2020 | | 7.25 | | | 991,541 | | | 1,060,430 | | | | |
| 1,000,000 | | SPARKS NV REDEV AGY TAX INCR REVENUE | | 1/15/2022 | | 5.00 | | | 980,723 | | | 1,056,770 | | | | |
| 1,000,000 | | SPRINGFIELD IL ELEC REVENUE | | 3/1/2035 | | 5.00 | | | 1,041,446 | | | 1,039,370 | | | | |
| 2,500,000 | | SULPHUR SPRINGS CA UNION SCH DIST COPS(b) | | 12/1/2037 | | 1.37 | | | 1,875,127 | | | 2,607,900 | | | | |
| 500,000 | | TALLAHASSEE FL HLTH FACS REVENUE | | 12/1/2030 | | 6.38 | | | 491,474 | | | 508,455 | | | | |
| | |
See accompanying notes to the financial statements. | 64 | (Continued) |
|
CLEARWATER INVESTMENT TRUST |
Schedule of Investments - Clearwater Tax-Exempt Bond Fund |
December 31, 2012 |
| | | | | | | | | | | | | | | | | |
Par/Shares | | Security | | Maturity
date | | Coupon
rate | | Cost | | Fair
value(a) | | Percent
of
net assets | |
Municipal Bonds (Cont’d): | | | | | | | | | | | | | | |
| 915,000 | | TARRANT CNTY TX CULTURAL EDU FACS FIN CORP RETMNT FAC REVENU | | 2/15/2016 | | 7.25 | | $ | 915,000 | | | 917,443 | | | | |
| 750,000 | | TARRANT CNTY TX CULTURAL EDU FACS FIN CORP RETMNT FAC REVENU | | 11/15/2019 | | 7.75 | | | 750,000 | | | 865,582 | | | | |
| 1,000,000 | | TARRANT CNTY TX CULTURAL EDU FACS FIN CORP RETMNT FAC REVENU | | 11/15/2026 | | 6.00 | | | 1,023,449 | | | 1,068,810 | | | | |
| 1,000,000 | | TARRANT CNTY TX CULTURAL EDU FACS FIN CORP RETMNT FAC REVENU | | 5/15/2027 | | 5.13 | | | 732,856 | | | 1,023,310 | | | | |
| 750,000 | | TARRANT CNTY TX CULTURAL EDU FACS FIN CORP RETMNT FAC REVENU | | 11/15/2036 | | 6.00 | | | 765,183 | | | 797,468 | | | | |
| 1,150,000 | | TENNESSEE ST HSG DEV AGY | | 1/1/2031 | | 3.30 | | | 1,150,000 | | | 1,167,940 | | | | |
| 710,000 | | TENNESSEE ST HSG DEV AGY | | 7/1/2038 | | 5.45 | | | 710,000 | | | 749,277 | | | | |
| 2,000,000 | | TENNESSEE ST HSG DEV AGY | | 7/1/2043 | | 3.80 | | | 2,000,000 | | | 2,013,660 | | | | |
| 155,000 | | TENNESSEE ST HSG DEV AGY MTGE FIN | | 7/1/2023 | | 5.20 | | | 155,197 | | | 156,757 | | | | |
| 580,000 | | TEXAS ST DEPT OF HSG & CMNTY AFFAIRS | | 7/1/2039 | | 5.45 | | | 580,000 | | | 634,821 | | | | |
| 250,000 | | TEXAS ST MUNI GAS ACQUISITION & SPLY CORP I GAS SPLY REVENUE | | 12/15/2026 | | 1.71 | | | 250,000 | | | 203,505 | | | | |
| 2,000,000 | | TEXAS ST PRIV ACTIVITY BOND SURFACE TRANSPRTN CORP REVENUE | | 6/30/2033 | | 7.50 | | | 2,051,671 | | | 2,526,740 | | | | |
| 800,000 | | TEXAS ST STUDENT HSG AUTH REVENUE(e) | | 1/1/2033 | | 11.00 | | | 800,000 | | | 8 | | | | |
| 360,257 | | TODD CREEK FARMS CO MET DIST #1 WTR & WSTWTR REVENUE(d)(e) | | 12/1/2009 | | 4.75 | | | 356,355 | | | 180,129 | | | | |
| 300,000 | | TOLOMATO FL CDD | | 5/1/2017 | | 6.38 | | | 300,000 | | | 141,381 | | | | |
| 115,000 | | TOLOMATO FL CDD | | 5/1/2017 | | 6.38 | | | 115,000 | | | 111,918 | | | | |
| 100,000 | | TOLOMATO FL CDD | | 5/1/2017 | | 6.38 | | | 100,000 | | | 1 | | | | |
| 10,000 | | TOLOMATO FL CDD | | 5/1/2017 | | 6.38 | | | 10,000 | | | 5,507 | | | | |
| 35,000 | | TOLOMATO FL CDD(b) | | 5/1/2039 | | 2.21 | | | 22,030 | | | 25,118 | | | | |
| 90,000 | | TOLOMATO FL CDD(b) | | 5/1/2040 | | 2.13 | | | 56,642 | | | 51,854 | | | | |
| 50,000 | | TOLOMATO FL CDD(b) | | 5/1/2040 | | 2.13 | | | 31,468 | | | 21,192 | | | | |
| 2,000,000 | | TORRANCE CA UNIF SCH DIST(b) | | 8/1/2023 | | 9.54 | | | 1,048,155 | | | 1,369,220 | | | | |
| 1,000,000 | | TRACY CA JT UNIF SCH DIST(b) | | 8/1/2041 | | 4.95 | | | 427,421 | | | 504,040 | | | | |
| 1,000,000 | | TRAVIS CNTY TX HLTH FACS DEV CORP | | 11/1/2016 | | 6.25 | | | 1,000,000 | | | 1,026,920 | | | | |
| 1,000,000 | | TRAVIS CNTY TX HLTH FACS DEV CORP | | 1/1/2017 | | 5.50 | | | 982,393 | | | 1,000,590 | | | | |
| 1,000,000 | | TRAVIS CNTY TX HLTH FACS DEV CORP | | 1/1/2022 | | 6.00 | | | 990,584 | | | 1,042,520 | | | | |
| 840,000 | | TRAVIS CNTY TX HSG FIN CORP(e) | | 6/1/2035 | | 9.25 | | | 840,000 | | | 41,966 | | | | |
| 500,000 | | TURLOCK CA PUBLIC FING AUTH WTR REVENUE | | 5/1/2032 | | 4.75 | | | 523,974 | | | 537,955 | | | | |
| 1,250,000 | | TUSTIN CA UNIF SCH DIST(b) | | 8/1/2028 | | 4.10 | | | 775,704 | | | 975,925 | | | | |
| 1,250,000 | | UPLAND CA COPS | | 1/1/2032 | | 6.38 | | | 1,216,419 | | | 1,477,825 | | | | |
| 671,000 | | UTAH ASSOC MUNI POWER(d) | | 5/1/2022 | | 4.75 | | | 671,000 | | | 619,400 | | | | |
| 600,000 | | UTAH ST CHRT SCH FIN AUTH CHRT SCH REVENUE | | 7/15/2018 | | 6.38 | | | 600,000 | | | 634,110 | | | | |
| 500,000 | | UTAH ST CHRT SCH FIN AUTH CHRT SCH REVENUE | | 7/15/2020 | | 5.75 | | | 469,587 | | | 537,260 | | | | |
| 500,000 | | UTAH ST CHRT SCH FIN AUTH CHRT SCH REVENUE | | 7/15/2025 | | 6.50 | | | 500,000 | | | 554,895 | | | | |
| 1,000,000 | | UTAH ST HSG CORP MTGE REVENUE | | 7/1/2030 | | 4.10 | | | 1,000,000 | | | 1,069,000 | | | | |
| 480,000 | | UTAH ST HSG CORP SF MTGE REVENUE | | 1/1/2032 | | 4.95 | | | 480,000 | | | 523,502 | | | | |
| 730,000 | | UTAH ST HSG CORP SF MTGE REVENUE | | 1/1/2033 | | 5.75 | | | 730,000 | | | 832,273 | | | | |
| 500,000 | | VANCOUVER WA HSG AUTH | | 3/1/2025 | | 5.00 | | | 493,258 | | | 541,060 | | | | |
| | |
See accompanying notes to the financial statements. | 65 | (Continued) |
|
CLEARWATER INVESTMENT TRUST |
Schedule of Investments - Clearwater Tax-Exempt Bond Fund |
December 31, 2012 |
| | | | | | | | | | | | | | | | | |
Par/Shares | | Security | | Maturity
date | | Coupon
rate | | Cost | | Fair
value(a) | | Percent
of
net assets | |
Municipal Bonds (Cont’d): | | | | | | | | | | | | | |
| 1,240,000 | | VERMONT ST EDUCTNL & HLTH BLDGS FING AGY | | 12/1/2027 | | 6.13 | | | $1,223,721 | | | 1,244,451 | | | | |
| 1,000,000 | | VERMONT ST HSG FIN AGY MULTI FAMILY | | 8/15/2041 | | 3.80 | | | 982,801 | | | 977,750 | | | | |
| 1,000,000 | | VIRGIN ISLANDS PUBLIC FIN AUTH REVENUE | | 10/1/2042 | | 5.00 | | | 1,042,962 | | | 1,046,280 | | | | |
| 750,000 | | VIRGINIA ST HSG DEV AUTH | | 12/1/2038 | | 4.60 | | | 746,327 | | | 804,233 | | | | |
| 1,000,000 | | VIRGINIA ST HSG DEV AUTH | | 12/1/2039 | | 5.00 | | | 1,000,000 | | | 1,083,120 | | | | |
| 695,000 | | VIRGINIA ST HSG DEV AUTH CMWLTH MTGE | | 7/1/2025 | | 6.00 | | | 695,000 | | | 793,933 | | | | |
| 945,000 | | VIRGINIA ST HSG DEV AUTH CMWLTH MTGE | | 7/1/2031 | | 6.25 | | | 962,465 | | | 1,086,731 | | | | |
| 1,000,000 | | W CAMPUS HSG LLC AZ STUDENT HSG REVENUE | | 7/1/2025 | | 5.00 | | | 888,658 | | | 1,013,350 | | | | |
| 230,000 | | W VLGS FL IMPT DIST(e) | | 5/1/2037 | | 5.50 | | | 230,000 | | | 102,916 | | | | |
| 1,000,000 | | WASHINGTON ST HLTH CARE FACS AUTH | | 3/1/2029 | | 7.13 | | | 976,532 | | | 1,224,500 | | | | |
| 500,000 | | WASHINGTON ST HSG FIN COMMISSION | | 10/1/2017 | | 5.00 | | | 500,000 | | | 500,800 | | | | |
| 1,500,000 | | WASHINGTON ST HSG FIN COMMISSION | | 10/1/2022 | | 6.00 | | | 1,500,000 | | | 1,506,420 | | | | |
| 1,000,000 | | WASHINGTON ST HSG FIN COMMISSION | | 7/15/2029 | | 4.75 | | | 1,000,000 | | | 1,108,690 | | | | |
| 1,500,000 | | WASHINGTON ST HSG FIN COMMISSION | | 7/1/2030 | | 3.50 | | | 1,500,000 | | | 1,530,435 | | | | |
| 1,150,000 | | WASHINGTON ST HSG FIN COMMISSION NONPROFIT REVENUE | | 1/1/2017 | | 5.25 | | | 1,147,906 | | | 1,177,450 | | | | |
| 500,000 | | WATERLOO IA CMNTY SCH DIST SCH INFRASTRUCTURE SALES & SVCS T | | 7/1/2029 | | 5.00 | | | 500,000 | | | 545,390 | | | | |
| 70,000 | | WATERS EDGE FL CDD CAPITAL IMPT REVENUE(d)(e) | | 11/1/2012 | | 5.00 | | | 70,000 | | | 1 | | | | |
| 445,000 | | WATERS EDGE FL CDD CAPITAL IMPT REVENUE(b) | | 5/1/2039 | | 1.14 | | | 353,805 | | | 209,270 | | | | |
| 6,000 | | WATERS EDGE FL CDD CAPITAL IMPT REVENUE | | 5/1/2039 | | 5.35 | | | 9,500 | | | 6,041 | | | | |
| 750,000 | | WAYZATA MN SENIOR HSG REVENUE | | 11/1/2025 | | 5.20 | | | 738,269 | | | 783,135 | | | | |
| 1,000,000 | | WEST TRAVIS CNTY TX PUBLIC UTILITY AGY REVENUE | | 8/15/2024 | | 5.00 | | | 1,020,934 | | | 1,023,090 | | | | |
| 1,000,000 | | WISCONSIN ST GEN FUND ANNUAL APPROP REVENUE | | 5/1/2027 | | 6.00 | | | 1,018,384 | | | 1,229,450 | | | | |
| 400,000 | | WISCONSIN ST HLTH & EDUCTNL FACS AUTH REVENUE | | 8/15/2023 | | 5.60 | | | 400,327 | | | 405,056 | | | | |
| 1,000,000 | | WISCONSIN ST HLTH & EDUCTNL FACS AUTH REVENUE | | 7/1/2030 | | 5.75 | | | 1,023,158 | | | 1,136,700 | | | | |
| 750,000 | | WISCONSIN ST HLTH & EDUCTNL FACS AUTH REVENUE | | 4/15/2033 | | 6.40 | | | 751,862 | | | 756,382 | | | | |
| 500,000 | | WISCONSIN ST HLTH & EDUCTNL FACS AUTH REVENUE | | 8/15/2034 | | 6.75 | | | 503,364 | | | 513,670 | | | | |
| 1,000,000 | | WISCONSIN ST HLTH & | | | | | | | | | | | | | | |
| | | EDUCTNL FACS AUTH | | | | | | | | | | | | | | |
| | | REVENUE | | 12/1/2034 | | 6.31 | | | 1,000,000 | | | 550,110 | | | | |
| 500,000 | | WISCONSIN ST HLTH & EDUCTNL FACS AUTH REVENUE | | 2/15/2040 | | 5.00 | | | 513,792 | | | 539,465 | | | | |
| 295,000 | | WSTRN GENERATION AGY OR COGENERATION PROJ REVENUE | | 1/1/2021 | | 5.00 | | | 295,836 | | | 296,080 | | | | |
| 500,000 | | WYOMING CMNTY DEV AUTH STUDENTHSG REV | | 7/1/2031 | | 6.25 | | | 500,000 | | | 564,250 | | | | |
| | |
See accompanying notes to the financial statements. | 66 | (Continued) |
|
CLEARWATER INVESTMENT TRUST |
Schedule of Investments - Clearwater Tax-Exempt Bond Fund |
December 31, 2012 |
| | | | | | | | | | | | | | | | | |
Par/Shares | | Security | | Maturity
date | | Coupon
rate | | Cost | | Fair
value(a) | | Percent
of
net assets | |
Municipal Bonds (Cont’d): | | | | | | | | | | | | |
| 355,000 | | ZEPHYR RIDGE FL CDD CAPITAL IMPT REVENUE(e) | | 5/1/2013 | | 5.25 | | $ | 355,352 | | | 141,400 | | | | |
| | Sub-total Municipal Bonds: | | | | | | | 453,457,942 | | | 474,392,857 | | | 90.00 | % |
Short-Term Investments: | | | | | | | | | | | | | | |
| 18,121,788 | | NORTHERN INSTITUTIONAL FUNDS - TAX-EXEMPT PORTFOLIO, 0.01%(g) | | | | | | | 18,121,788 | | | 18,121,788 | | | | |
| | Sub-total Short-Term Investments: | | | | | | | 18,121,788 | | | 18,121,788 | | | 3.44 | % |
| | | Grand total(h) | | | | | | $ | 499,059,091 | | | 525,833,879 | | | 99.76 | % |
Notes to Schedule of Investments:
| | |
| (a) | Securities are valued in accordance with procedures described in note 2 to the financial statements. |
| | |
| (b) | For zero coupon bonds, the interest rate disclosed represents the annualized effective yield on the date of acquisition. |
| | |
| (c) | Securities exempt from registration under Rule 144A of the Securities Act of 1933. These securities may not be publicly traded without registration under the Securities Act of 1933. The value of these securities is determined by valuations supplied by a pricing service or brokers, or, if not available, in accordance with procedures established by the Board of Trustees of the Funds. |
| | |
| (d) | This security is being fair valued according to procedures adopted by the Board of Trustees. |
| | |
| (e) | Currently non-income producing assets. For long-term debt securities, item identified is in default as to payment of interest and/or principal. |
| | |
| (f) | Restricted security that has been deemed illiquid. At December 31, 2012, the value of these restricted illiquid securities amounted to approximately $289,470 or 0.05% of net assets. Additional information on each restricted illiquid security is as follows: |
| | | | | | | | |
| SECURITY | | ACQUISITION AND
ENFORCEABLE DATE | | ACQUISITION
COST | |
| ILLINOIS ST FIN AUTH SPORTS FAC REVENUE,
6.13%, 10/1/27 | | | 9/28/07 | | $ | 728,963 | |
| ILLINOIS ST FIN AUTH SPORTS FAC REVENUE,
6.25%, 10/1/37 | | | 9/28/07 | | | 483,580 | |
| MASHANTUCKET WSTRN PEQUOT TRIBE CT,
5.50%, 9/1/36 | | | 7/19/06 | | | 509,675 | |
| | |
| (g) | The short-term investment is a money market portfolio of the investment company, Northern Institutional Funds. |
At December 31, 2011, the value of the Clearwater Tax-Exempt Bond Fund’s investment in the Tax-Exempt Portfolio of the Northern Institutional Funds was approximately $11,769,850 with net purchases of approximately $6,351,938 during the fiscal year ended December 31, 2012.
| | |
| (h) | At December 31, 2012, the cost for Federal income tax purposes was $499,059,091. The aggregate gross unrealized appreciation and depreciation of investments in securities based on this cost were as follows: |
| | | | |
Gross unrealized appreciation | | $ | 45,430,055 | |
Gross unrealized depreciation | | | (18,655,267 | ) |
Net unrealized appreciation | | $ | 26,774,788 | |
| | |
See accompanying notes to the financial statements. | 67 | (Continued) |
CLEARWATER INVESTMENT TRUST
Schedule of Investments - Clearwater Tax-Exempt Bond Fund
December 31, 2012
Diversification of investments representing geographic diversification, as a percentage of total invesments at fair value, is as follows:
| | | | |
Geographical Diversification | | Percent | |
California | | | 11.44 | % |
Illinois | | | 8.65 | |
Texas | | | 7.10 | |
Ohio | | | 6.59 | |
Florida | | | 5.61 | |
Indiana | | | 4.53 | |
Arizona | | | 3.60 | |
Pennsylvania | | | 3.53 | |
New Jersey | | | 3.30 | |
New York | | | 3.12 | |
Other | | | 42.53 | |
| | | 100.00 | % |
| | |
See accompanying notes to the financial statements. | 68 | (Continued) |
CLEARWATER INVESTMENT TRUST
Schedule of Investments – Clearwater Tax-Exempt Bond Fund
December 31, 2012

| | |
See accompanying notes to the financial statements. | 69 | (Continued) |
CLEARWATER INVESTMENT TRUST
Schedule of Investments - Clearwater International Fund
December 31, 2012
| | | | | | | | | | | | | |
Shares | | Security | | Cost | | Fair
value (a) | | Percent
of
net assets | |
Common Stocks: | | | | | | | | | | |
Argentina: | | | | | | | | | | | |
| 144,099 | | ARCOS DORADOS HOLDINGS, INC., CLASS A | | $ | 2,073,729 | | | 1,723,424 | | | | |
| | | | | | 2,073,729 | | | 1,723,424 | | | 0.42 | % |
Australia: | | | | | | | | | | | | |
| 9,284 | | AGL ENERGY LTD. | | | 105,943 | | | 149,089 | | | | |
| 51,722 | | ALUMINA LTD. | | | 50,177 | | | 50,014 | | | | |
| 36,255 | | AMP LTD. | | | 95,058 | | | 184,281 | | | | |
| 10,115 | | APA GROUP | | | 50,066 | | | 58,387 | | | | |
| 11,099 | | ASCIANO LTD. | | | 49,426 | | | 54,242 | | | | |
| 4,593 | | ASX LTD. | | | 114,203 | | | 149,845 | | | | |
| 25,843 | | AURIZON HOLDINGS LTD. | | | 91,220 | | | 101,496 | | | | |
| 50,341 | | AUSTRALIA & NEW ZEALAND BANKING GROUP LTD. | | | 712,399 | | | 1,317,973 | | | | |
| 6,281 | | BENDIGO AND ADELAIDE BANK LTD. | | | 52,780 | | | 56,005 | | | | |
| 179,910 | | BGP HOLDINGS PLC - (FRACTIONAL SHARES)(b) | | | - | | | - | | | | |
| 60,332 | | BHP BILLITON LTD. | | | 1,453,162 | | | 2,356,152 | | | | |
| 10,199 | | BORAL LTD. | | | 28,970 | | | 46,913 | | | | |
| 38,613 | | BRAMBLES LTD. | | | 218,269 | | | 307,287 | | | | |
| 373,378 | | CARDNO LTD. | | | 2,900,058 | | | 2,732,485 | | | | |
| 25,256 | | CENTRO RETAIL AUSTRALIA | | | 52,870 | | | 59,796 | | | | |
| 40,505 | | CFS RETAIL PROPERTY TRUST GROUP | | | 46,791 | | | 81,160 | | | | |
| 10,606 | | COCA-COLA AMATIL LTD. | | | 91,642 | | | 149,114 | | | | |
| 971 | | COCHLEAR LTD. | | | 35,893 | | | 80,330 | | | | |
| 23,113 | | COMMONWEALTH BANK OF AUSTRALIA | | | 959,865 | | | 1,501,361 | | | | |
| 1,113 | | COMPUTERSHARE LTD. | | | 5,565 | | | 10,481 | | | | |
| 263,286 | | CREDIT CORP. GROUP LTD. | | | 2,069,632 | | | 2,222,980 | | | | |
| 9,576 | | CSL LTD. | | | 226,091 | | | 540,968 | | | | |
| 389,188 | | DECMIL GROUP LTD. | | | 1,106,503 | | | 1,043,577 | | | | |
| 85,105 | | DEXUS PROPERTY GROUP | | | 62,970 | | | 90,237 | | | | |
| 8,477 | | ECHO ENTERTAINMENT GROUP LTD. | | | 19,848 | | | 30,566 | | | | |
| 373,064 | | EMECO HOLDINGS LTD. | | | 283,607 | | | 236,974 | | | | |
| 21,110 | | FORTESCUE METALS GROUP LTD. | | | 37,574 | | | 104,734 | | | | |
| 18,737 | | GOODMAN GROUP | | | 48,414 | | | 85,242 | | | | |
| 29,308 | | ILUKA RESOURCES LTD. | | | 316,664 | | | 284,017 | | | | |
| 36,603 | | INCITEC PIVOT LTD. | | | 83,901 | | | 124,385 | | | | |
| 47,825 | | INSURANCE AUSTRALIA GROUP LTD. | | | 120,292 | | | 235,200 | | | | |
| 2,773 | | LEIGHTON HOLDINGS LTD. | | | 49,627 | | | 52,172 | | | | |
| 10,015 | | LEND LEASE GROUP | | | 61,130 | | | 97,571 | | | | |
| 9,837 | | MACQUARIE GROUP LTD. | | | 195,127 | | | 365,843 | | | | |
| 13,956 | | METCASH LTD. | | | 38,758 | | | 48,601 | | | | |
| 37,974 | | MIRVAC GROUP | | | 50,570 | | | 59,176 | | | | |
| 54,636 | | MONADELPHOUS GROUP LTD. | | | 1,186,679 | | | 1,401,345 | | | | |
| 39,852 | | NATIONAL AUSTRALIA BANK LTD. | | | 675,928 | | | 1,042,241 | | | | |
| 9,984 | | NEWCREST MINING LTD. | | | 240,151 | | | 233,096 | | | | |
| 3,475 | | ORICA LTD. | | | 85,253 | | | 91,380 | | | | |
| 12,164 | | ORIGIN ENERGY LTD. | | | 125,371 | | | 148,859 | | | | |
| 6,634 | | OZ MINERALS LTD. | | | 49,799 | | | 47,237 | | | | |
| 453,290 | | PACIFIC BRANDS LTD. | | | 263,126 | | | 295,741 | | | | |
| 416 | | PERPETUAL LTD. | | | 7,027 | | | 15,149 | | | | |
| 36,732 | | QANTAS AIRWAYS LTD.(b) | | | 46,697 | | | 57,754 | | | | |
| 3,611 | | QBE INSURANCE GROUP LTD. | | | 49,104 | | | 41,330 | | | | |
| 2,468 | | RAMSAY HEALTH CARE LTD. | | | 49,765 | | | 70,117 | | | | |
| 7,202 | | RIO TINTO LTD. | | | 402,208 | | | 501,288 | | | | |
| 118,297 | | SAI GLOBAL LTD. | | | 492,324 | | | 527,002 | | | | |
| 22,469 | | SANTOS LTD. | | | 244,511 | | | 263,146 | | | | |
| 4,898 | | SHOPPING CENTRES AUSTRALASIA
PROPERTY GROUP(b) | | | 7,202 | | | 7,629 | | | | |
| 1,033,482 | | SLATER & GORDON LTD. | | | 2,130,929 | | | 2,274,782 | | | | |
| 9,824 | | SONIC HEALTHCARE LTD. | | | 79,849 | | | 137,182 | | | | |
| 11,895 | | SUNCORP GROUP LTD. | | | 126,410 | | | 126,467 | | | | |
| 8,477 | | TABCORP HOLDINGS LTD. | | | 15,377 | | | 27,091 | | �� | | |
| 8,846 | | TATTS GROUP LTD. | | | 14,773 | | | 27,852 | | | | |
| 54,293 | | TELSTRA CORP. LTD. | | | 225,744 | | | 247,332 | | | | |
| 22,161 | | TOLL HOLDINGS LTD. | | | 98,848 | | | 106,090 | | | | |
| 21,881 | | TRANSURBAN GROUP | | | 88,365 | | | 138,969 | | | | |
| 219,954 | | WEBJET LTD. | | | 932,875 | | | 996,603 | | | | |
| 11,197 | | WESFARMERS LTD. | | | 408,869 | | | 432,074 | | | | |
| 42,659 | | WESTFIELD GROUP | | | 253,085 | | | 470,716 | | | | |
| 35,413 | | WESTFIELD RETAIL TRUST | | | 53,180 | | | 111,455 | | | | |
| | |
See accompanying notes to the financial statements. | 70 | (Continued) |
CLEARWATER INVESTMENT TRUST
Schedule of Investments - Clearwater International Fund
December 31, 2012
| | | | | | | | | | | | | |
Shares | | Security | | Cost | | Fair
value (a) | | Percent
of
net assets | |
Australia (Cont’d): | | | | | | | | | | |
| 60,789 | | WESTPAC BANKING CORP. | | $ | 872,864 | | | 1,661,875 | | | | |
| 32,555 | | WHITEHAVEN COAL LTD. | | | 99,446 | | | 120,381 | | | | |
| 13,603 | | WOODSIDE PETROLEUM LTD. | | | 455,825 | | | 484,803 | | | | |
| 22,832 | | WOOLWORTHS LTD. | | | 435,292 | | | 697,840 | | | | |
| 3,542 | | WORLEYPARSONS LTD. | | | 57,010 | | | 87,378 | | | | |
| | | | | | 22,158,951 | | | 27,960,858 | | | 6.85 | % |
Austria: | | | | | | | | | | |
| 26,945 | | ANDRITZ A.G. | | | 1,622,111 | | | 1,731,167 | | | | |
| 3,566 | | ERSTE GROUP BANK A.G.(b) | | | 63,770 | | | 114,025 | | | | |
| 33,719 | | IMMOFINANZ A.G. | | | 94,190 | | | 142,154 | | | | |
| 3,309 | | RAIFFEISEN BANK INTERNATIONAL A.G. | | | 106,621 | | | 138,319 | | | | |
| 313 | | STRABAG S.E. (BEARER) | | | 5,505 | | | 8,442 | | | | |
| 19,070 | | TELEKOM AUSTRIA A.G. | | | 124,529 | | | 144,308 | | | | |
| 27,600 | | WIENERBERGER A.G. | | | 213,061 | | | 254,263 | | | | |
| | | | | | 2,229,787 | | | 2,532,678 | | | 0.62 | % |
Bahamas: | | | | | | | | | | | |
| 16,410 | | STEINER LEISURE LTD.(b) | | | 777,562 | | | 790,798 | | | | |
| | | | | | 777,562 | | | 790,798 | | | 0.19 | % |
Belgium: | | | | | | | | | | |
| 9,207 | | AGEAS | | | 155,603 | | | 274,697 | | | | |
| 13,822 | | ANHEUSER-BUSCH INBEV N.V. | | | 502,521 | | | 1,207,885 | | | | |
| 10,910 | | BARCO N.V. | | | 740,520 | | | 785,581 | | | | |
| 1,645 | | COLRUYT S.A. | | | 74,892 | | | 81,676 | | | | |
| 13,233 | | GROUPE BRUXELLES LAMBERT S.A. | | | 1,093,923 | | | 1,043,213 | | | | |
| 4,347 | | KBC GROEP N.V. | | | 101,356 | | | 151,309 | | | | |
| 415 | | SOLVAY S.A. | | | 57,004 | | | 59,740 | | | | |
| 1,066 | | TELENET GROUP HOLDING N.V. | | | 50,357 | | | 49,531 | | | | |
| 1,091 | | UCB S.A. | | | 30,548 | | | 62,764 | | | | |
| 1,457 | | UMICORE S.A. | | | 72,577 | | | 80,340 | | | | |
| | | | | | 2,879,301 | | | 3,796,736 | | | 0.93 | % |
Bermuda: | | | | | | | | | | |
| 52,194 | | LAZARD LTD., CLASS A | | | 1,503,652 | | | 1,557,469 | | | | |
| | | | | | 1,503,652 | | | 1,557,469 | | | 0.38 | % |
Brazil: | | | | | | | | | | |
| 77,661 | | BRASIL FOODS S.A. ADR(c) | | | 1,438,817 | | | 1,639,424 | | | | |
| 13,600 | | CIA DE SANEAMENTO DE MINAS GERAIS-COPASA | | | 328,620 | | | 290,598 | | | | |
| 5,900 | | LOJAS RENNER S.A. | | | 217,003 | | | 229,805 | | | | |
| | | | | | 1,984,440 | | | 2,159,827 | | | 0.53 | % |
Canada: | | | | | | | | | | |
| 29,100 | | AGF MANAGEMENT LTD., CLASS B | | | 309,797 | | | 290,210 | | | | |
| 1,935 | | AGNICO-EAGLE MINES LTD. | | | 87,643 | | | 101,409 | | | | |
| 3,934 | | AGRIUM, INC. | | | 176,472 | | | 392,095 | | | | |
| 4,900 | | ARC RESOURCES LTD. | | | 108,943 | | | 120,394 | | | | |
| 44,600 | | ATS AUTOMATION TOOLING SYSTEMS, INC.(b) | | | 401,190 | | | 394,123 | | | | |
| 4,909 | | BANK OF MONTREAL | | | 286,742 | | | 300,354 | | | | |
| 12,806 | | BANK OF NOVA SCOTIA | | | 606,324 | | | 739,753 | | | | |
| 14,377 | | BARRICK GOLD CORP. | | | 469,761 | | | 503,274 | | | | |
| 3,479 | | BAYTEX ENERGY CORP. | | | 151,408 | | | 149,939 | | | | |
| 3,700 | | BCE, INC. | | | 156,653 | | | 158,571 | | | | |
| 1,900 | | BELL ALIANT, INC. | | | 51,733 | | | 50,274 | | | | |
| 3,100 | | BONAVISTA ENERGY CORP. | | | 50,156 | | | 46,187 | | | | |
| 13,183 | | BROOKFIELD ASSET MANAGEMENT, INC.,
CLASS A | | | 220,688 | | | 482,948 | | | | |
| 11,740 | | CAE, INC. | | | 85,345 | | | 118,852 | | | | |
| 11,081 | | CAMECO CORP. | | | 198,977 | | | 218,233 | | | | |
| 46,300 | | CANACCORD FINANCIAL, INC. | | | 237,982 | | | 311,863 | | | | |
| 6,440 | | CANADIAN IMPERIAL BANK OF COMMERCE | | | 260,643 | | | 517,751 | | | | |
| 21,692 | | CANADIAN NATIONAL RAILWAY CO. | | | 1,910,278 | | | 1,974,189 | | | | |
| 9,614 | | CANADIAN NATIONAL RAILWAY CO. | | | 389,611 | | | 873,060 | | | | |
| 19,866 | | CANADIAN NATURAL RESOURCES LTD. | | | 433,114 | | | 571,994 | | | | |
| 4,722 | | CANADIAN OIL SANDS LTD. | | | 97,388 | | | 95,750 | | | | |
| 4,295 | | CANADIAN PACIFIC RAILWAY LTD. | | | 154,434 | | | 435,675 | | | | |
| 9,003 | | CENOVUS ENERGY, INC. | | | 271,843 | | | 301,307 | | | | |
| 5,200 | | CENTERRA GOLD, INC. | | | 48,907 | | | 48,670 | | | | |
| 10,919 | | CGI GROUP, INC., CLASS A(b) | | | 90,696 | | | 251,816 | | | | |
| | |
See accompanying notes to the financial statements. | 71 | (Continued) |
|
CLEARWATER INVESTMENT TRUST |
Schedule of Investments - Clearwater International Fund |
December 31, 2012 |
| | | | | | | | | | | | | |
Shares | | Security | | Cost | | Fair
value (a) | | Percent
of
net assets | |
| Canada (Cont’d): | | | | | | | | | | |
| 3,131 | | CRESCENT POINT ENERGY CORP. | | $ | 89,474 | | | 118,416 | | | | |
| 21,200 | | DOREL INDUSTRIES, INC., CLASS B | | | 765,777 | | | 766,201 | | | | |
| 15,478 | | ELDORADO GOLD CORP. | | | 198,459 | | | 199,174 | | | | |
| 3,700 | | ENBRIDGE, INC. | | | 145,943 | | | 160,022 | | | | |
| 9,252 | | ENCANA CORP. | | | 190,539 | | | 182,864 | | | | |
| 29,700 | | ENERFLEX LTD. | | | 343,284 | | | 357,702 | | | | |
| 32,600 | | ENSIGN ENERGY SERVICES, INC. | | | 509,675 | | | 503,732 | | | | |
| 211 | | FAIRFAX FINANCIAL HOLDINGS LTD. | | | 52,589 | | | 76,057 | | | | |
| 2,200 | | FINNING INTERNATIONAL, INC. | | | 51,485 | | | 54,342 | | | | |
| 5,096 | | FIRST QUANTUM MINERALS LTD. | | | 98,955 | | | 112,248 | | | | |
| 3,100 | | FORTIS, INC. | | | 105,357 | | | 106,647 | | | | |
| 1,983 | | FRANCO-NEVADA CORP. | | | 94,697 | | | 113,195 | | | | |
| 22,700 | | GENWORTH MI CANADA, INC. | | | 467,217 | | | 515,525 | | | | |
| 3,052 | | GILDAN ACTIVEWEAR, INC. | | | 33,435 | | | 111,470 | | | | |
| 12,908 | | GOLDCORP, INC. | | | 410,214 | | | 474,561 | | | | |
| 2,200 | | GREAT-WEST LIFECO, INC. | | | 49,273 | | | 53,855 | | | | |
| 32,751 | | HOME CAPITAL GROUP, INC. | | | 1,650,550 | | | 1,944,910 | | | | |
| 62,500 | | HUDBAY MINERALS, INC. | | | 596,862 | | | 629,587 | | | | |
| 8,953 | | HUSKY ENERGY, INC. | | | 227,518 | | | 264,621 | | | | |
| 4,003 | | IAMGOLD CORP. | | | 28,201 | | | 45,837 | | | | |
| 2,500 | | IGM FINANCIAL, INC. | | | 100,363 | | | 104,554 | | | | |
| 304 | | IMPERIAL OIL LTD. | | | 9,319 | | | 13,059 | | | | |
| 1,100 | | INMET MINING CORP. | | | 53,339 | | | 81,845 | | | | |
| 800 | | INTACT FINANCIAL CORP. | | | 49,979 | | | 52,092 | | | | |
| 11,900 | | KINROSS GOLD CORP. | | | 98,714 | | | 115,566 | | | | |
| 1,500 | | LOBLAW COS. LTD. | | | 53,150 | | | 63,230 | | | | |
| 4,738 | | MAGNA INTERNATIONAL, INC. | | | 61,549 | | | 236,638 | | | | |
| 34,374 | | MANULIFE FINANCIAL CORP. | | | 420,235 | | | 466,867 | | | | |
| 3,469 | | METHANEX CORP. | | | 31,828 | | | 110,483 | | | | |
| 1,000 | | METRO, INC. | | | 54,328 | | | 63,667 | | | | |
| 26,100 | | MULLEN GROUP LTD. | | | 594,865 | | | 548,396 | | | | |
| 2,810 | | NATIONAL BANK OF CANADA | | | 214,109 | | | 218,201 | | | | |
| 4,300 | | NEW GOLD, INC.(b) | | | 41,682 | | | 47,595 | | | | |
| 10,281 | | NEXEN, INC. | | | 165,994 | | | 274,622 | | | | |
| 2,600 | | ONEX CORP. | | | 105,376 | | | 109,442 | | | | |
| 1,641 | | OPEN TEXT CORP.(b) | | | 72,477 | | | 91,775 | | | | |
| 10,000 | | OSISKO MINING CORP.(b) | | | 81,325 | | | 80,426 | | | | |
| 4,753 | | PAN AMERICAN SILVER CORP. | | | 88,411 | | | 89,068 | | | | |
| 6,322 | | PEMBINA PIPELINE CORP. | | | 85,382 | | | 180,883 | | | | |
| 19,434 | | PENGROWTH ENERGY CORP. | | | 99,676 | | | 96,711 | | | | |
| 7,900 | | PENN WEST PETROLEUM LTD. | | | 85,291 | | | 85,775 | | | | |
| 50,391 | | POTASH CORP. OF SASKATCHEWAN, INC. | | | 2,044,957 | | | 2,050,410 | | | | |
| 14,521 | | POTASH CORP. OF SASKATCHEWAN, INC. | | | 406,729 | | | 590,942 | | | | |
| 4,200 | | POWER CORP. OF CANADA | | | 105,623 | | | 107,164 | | | | |
| 1,900 | | POWER FINANCIAL CORP. | | | 52,279 | | | 52,032 | | | | |
| 7,700 | | RESEARCH IN MOTION LTD.(b) | | | 85,461 | | | 91,344 | | | | |
| 2,701 | | RITCHIE BROS AUCTIONEERS, INC. | | | 50,064 | | | 56,344 | | | | |
| 11,804 | | ROGERS COMMUNICATIONS, INC., CLASS B | | | 297,723 | | | 535,909 | | | | |
| 28,202 | | ROYAL BANK OF CANADA | | | 984,939 | | | 1,697,734 | | | | |
| 2,400 | | SAPUTO, INC. | | | 103,951 | | | 121,387 | | | | |
| 9,661 | | SHAW COMMUNICATIONS, INC., CLASS B | | | 153,543 | | | 221,833 | | | | |
| 3,394 | | SHOPPERS DRUG MART CORP. | | | 145,104 | | | 146,037 | | | | |
| 2,600 | | SILVER WHEATON CORP. | | | 100,384 | | | 93,733 | | | | |
| 2,700 | | SNC-LAVALIN GROUP, INC. | | | 100,003 | | | 109,444 | | | | |
| 13,665 | | SUN LIFE FINANCIAL, INC. | | | 280,304 | | | 362,266 | | | | |
| 30,795 | | SUNCOR ENERGY, INC. | | | 760,915 | | | 1,012,672 | | | | |
| 24,791 | | TALISMAN ENERGY, INC. | | | 289,882 | | | 280,385 | | | | |
| 7,378 | | TECK RESOURCES LTD., CLASS B | | | 246,013 | | | 268,136 | | | | |
| 800 | | TELUS CORP. | | | 49,597 | | | 52,357 | | | | |
| 2,274 | | TELUS CORP. (NON VOTING) | | | 59,716 | | | 147,866 | | | | |
| 4,489 | | TIM HORTONS, INC. | | | 137,057 | | | 220,366 | | | | |
| 18,042 | | TORONTO-DOMINION BANK (THE) | | | 792,660 | | | 1,519,069 | | | | |
| 1,800 | | TOURMALINE OIL CORP.(b) | | | 51,783 | | | 56,514 | | | | |
| 8,260 | | TRANSALTA CORP. | | | 129,937 | | | 125,557 | | | | |
| 3,885 | | TRANSCANADA CORP. | | | 129,654 | | | 183,646 | | | | |
| 32,500 | | TRICAN WELL SERVICE LTD. | | | 422,140 | | | 428,672 | | | | |
| 3,842 | | VALEANT PHARMACEUTICALS INTERNATIONAL, INC.(b) | | | 223,633 | | | 229,199 | | | | |
| 2,256 | | VERMILION ENERGY, INC. | | | 83,841 | | | 117,869 | | | | |
| | |
See accompanying notes to the financial statements. | 72 | (Continued) |
|
CLEARWATER INVESTMENT TRUST |
Schedule of Investments - Clearwater International Fund |
December 31, 2012 |
| | | | | | | | | | | | | |
Shares | | Security | | Cost | | Fair
value (a) | | Percent
of
net assets | |
| Canada (Cont’d): | | | | | | | | | | |
| 19,653 | | YAMANA GOLD, INC. | | $ | 186,540 | | | 338,055 | | | | |
| | | | | | 24,408,056 | | | 30,587,494 | | | 7.50 | % |
| China: | | | | | | | | | | | | |
| 178,500 | | AAC TECHNOLOGIES HOLDINGS, INC. | | | 619,927 | | | 631,161 | | | | |
| 636,000 | | ANHUI EXPRESSWAY CO. LTD., CLASS H | | | 320,679 | | | 362,221 | | | | |
| 4,064 | | BAIDU, INC. ADR(b)(c) | | | 384,505 | | | 407,579 | | | | |
| 1,038,000 | | CHINA MEDICAL SYSTEM HOLDINGS LTD. | | | 593,937 | | | 805,464 | | | | |
| 1,532,000 | | KINGDEE INTERNATIONAL SOFTWARE GROUP CO. LTD.(b) | | | 310,518 | | | 290,912 | | | | |
| 884,000 | | SHANDONG WEIGAO GROUP MEDICAL POLYMER CO. LTD., CLASS H | | | 1,220,778 | | | 883,237 | | | | |
| 33,000 | | TENCENT HOLDINGS LTD. | | | 1,177,595 | | | 1,073,982 | | | | |
| 728,000 | | WANT WANT CHINA HOLDINGS LTD. | | | 1,075,498 | | | 1,014,232 | | | | |
| | | | | | 5,703,437 | | | 5,468,788 | | | 1.34 | % |
| Denmark: | | | | | | | | | | | | |
| 10 | | A.P. MOELLER - MAERSK A/S, CLASS A | | | 46,408 | | | 71,213 | | | | |
| 24 | | A.P. MOELLER - MAERSK A/S, CLASS B | | | 125,436 | | | 183,707 | | | | |
| 11,397 | | CARLSBERG A/S, CLASS B | | | 896,574 | | | 1,120,491 | | | | |
| 1,500 | | COLOPLAST A/S, CLASS B | | | 27,666 | | | 73,516 | | | | |
| 13,100 | | DANSKE BANK A/S(b) | | | 138,182 | | | 222,706 | | | | |
| 200 | | FLSMIDTH & CO. A/S | | | 6,013 | | | 11,684 | | | | |
| 13,065 | | NOVO NORDISK A/S ADR(c) | | | 2,212,191 | | | 2,132,339 | | | | |
| 5,916 | | NOVO NORDISK A/S, CLASS B | | | 502,317 | | | 966,200 | | | | |
| 81,797 | | NOVOZYMES A/S, CLASS B | | | 2,278,298 | | | 2,314,900 | | | | |
| 10,488 | | PANDORA A/S | | | 73,214 | | | 231,101 | | | | |
| 15,973 | | TDC A/S | | | 107,272 | | | 113,196 | | | | |
| 325 | | TOPDANMARK A/S(b) | | | 33,362 | | | 69,727 | | | | |
| | | | | | 6,446,933 | | | 7,510,780 | | | 1.84 | % |
| Finland: | | | | | | | | | | | | |
| 64,170 | | AMER SPORTS OYJ | | | 823,361 | | | 958,581 | | | | |
| 2,638 | | ELISA OYJ | | | 55,816 | | | 58,949 | | | | |
| 4,509 | | FORTUM OYJ | | | 87,100 | | | 84,794 | | | | |
| 57,270 | | HUHTAMAKI OYJ | | | 944,354 | | | 929,249 | | | | |
| 1,396 | | KESKO OYJ, CLASS B | | | 30,705 | | | 45,758 | | | | |
| 2,451 | | KONE OYJ, CLASS B | | | 86,493 | | | 181,490 | | | | |
| 1,849 | | METSO OYJ | | | 62,227 | | | 80,548 | | | | |
| 11,359 | | NESTE OIL OYJ | | | 110,935 | | | 148,102 | | | | |
| 61,900 | | NOKIA OYJ | | | 203,584 | | | 243,428 | | | | |
| 2,240 | | NOKIAN RENKAAT OYJ | | | 31,307 | | | 90,135 | | | | |
| 10,565 | | POHJOLA BANK PLC, CLASS A | | | 85,425 | | | 157,767 | | | | |
| 15,829 | | STORA ENSO OYJ, CLASS R | | | 75,698 | | | 111,956 | | | | |
| 11,934 | | UPM-KYMMENE OYJ | | | 99,928 | | | 141,818 | | | | |
| 2,352 | | WARTSILA OYJ ABP | | | 56,960 | | | 104,028 | | | | |
| | | | | | 2,753,893 | | | 3,336,603 | | | 0.82 | % |
| France: | | | | | | | | | | | | |
| 2,714 | | ACCOR S.A. | | | 79,810 | | | 97,353 | | | | |
| 3,200 | | AIR FRANCE-KLM(b) | | | 22,485 | | | 30,446 | | | | |
| 3,721 | | AIR LIQUIDE S.A. | | | 453,907 | | | 466,303 | | | | |
| 4,036 | | ALSTOM S.A. | | | 142,736 | | | 165,383 | | | | |
| 1,165 | | ARKEMA S.A. | | | 98,308 | | | 122,493 | | | | |
| 30,343 | | AXA S.A. | | | 403,058 | | | 548,843 | | | | |
| 16,306 | | BNP PARIBAS S.A. | | | 672,088 | | | 919,122 | | | | |
| 3,068 | | CAP GEMINI S.A. | | | 111,960 | | | 133,703 | | | | |
| 12,351 | | CARREFOUR S.A. | | | 296,772 | | | 319,835 | | | | |
| 2,177 | | CASINO GUICHARD PERRACHON S.A. | | | 172,738 | | | 209,415 | | | | |
| 994 | | CHRISTIAN DIOR S.A. | | | 84,311 | | | 171,848 | | | | |
| 8,977 | | CIE DE ST-GOBAIN | | | 309,749 | | | 384,113 | | | | |
| 2,998 | | CIE GENERALE DE GEOPHYSIQUE - VERITAS(b) | | | 87,186 | | | 90,356 | | | | |
| 3,404 | | CIE GENERALE DES ETABLISSEMENTS MICHELIN | | | 180,725 | | | 322,709 | | | | |
| 1,900 | | CIE GENERALE D’OPTIQUE ESSILOR INTERNATIONAL S.A. | | | 189,479 | | | 192,642 | | | | |
| 16,517 | | CREDIT AGRICOLE S.A.(b) | | | 122,492 | | | 134,103 | | | | |
| 11,712 | | DANONE S.A. | | | 612,831 | | | 773,807 | | | | |
| 3,633 | | EDENRED | | | 65,572 | | | 112,976 | | | | |
| 14,107 | | ELECTRICITE DE FRANCE S.A. | | | 261,183 | | | 264,397 | | | | |
| | |
See accompanying notes to the financial statements. | 73 | (Continued) |
|
CLEARWATER INVESTMENT TRUST |
Schedule of Investments - Clearwater International Fund |
December 31, 2012 |
| | | | | | | | | | | | | |
Shares | | Security | | Cost | | Fair
value (a) | | Percent
of
net assets | |
| France (Cont’d): | | | | | | | | | | |
| 1,612 | | EURAZEO | | $ | 53,525 | | | 78,203 | | | | |
| 6,181 | | EUROPEAN AERONAUTIC DEFENCE AND SPACE | | | | | | | | | | |
| | | CO. N.V. | | | 78,384 | | | 242,254 | | | | |
| 1,636 | | EUTELSAT COMMUNICATIONS S.A. | | | 49,913 | | | 54,321 | | | | |
| 564 | | GECINA S.A. | | | 51,331 | | | 62,948 | | | | |
| 6,795 | | GROUPE EUROTUNNEL S.A. (REGISTERED) | | | 51,329 | | | 52,466 | | | | |
| 304 | | ILIAD S.A. | | | 29,549 | | | 52,329 | | | | |
| 14,770 | | IPSOS | | | 469,780 | | | 550,543 | | | | |
| 2,335 | | KLEPIERRE | | | 57,367 | | | 94,114 | | | | |
| 4,713 | | LAFARGE S.A. | | | 166,939 | | | 302,000 | | | | |
| 1,212 | | LAGARDERE S.C.A. | | | 30,640 | | | 41,153 | | | | |
| 4,882 | | LEGRAND S.A. | | | 111,114 | | | 206,054 | | | | |
| 23,981 | | L’OREAL S.A. | | | 2,935,661 | | | 3,349,908 | | | | |
| 11,662 | | LVMH MOET HENNESSY LOUIS VUITTON S.A. | | | 1,567,288 | | | 2,173,179 | | | | |
| 15,891 | | NATIXIS | | | 55,209 | | | 54,977 | | | | |
| 3,500 | | PERNOD-RICARD S.A. | | | 239,500 | | | 411,554 | | | | |
| 948 | | PPR | | | 172,811 | | | 176,691 | | | | |
| 14,352 | | PUBLICIS GROUPE S.A. | | | 450,675 | | | 859,910 | | | | |
| 5,954 | | RENAULT S.A. | | | 173,471 | | | 328,493 | | | | |
| 2,397 | | SAFRAN S.A. | | | 103,557 | | | 104,594 | | | | |
| 18,127 | | SANOFI | | | 1,018,143 | | | 1,719,077 | | | | |
| 11,344 | | SCHNEIDER ELECTRIC S.A. | | | 504,223 | | | 846,075 | | | | |
| 1,813 | | SCOR S.E. | | | 36,441 | | | 48,886 | | | | |
| 5,515 | | SES S.A. | | | 114,220 | | | 159,542 | | | | |
| 468 | | SOCIETE BIC S.A. | | | 50,420 | | | 55,868 | | | | |
| 12,879 | | SOCIETE GENERALE S.A.(b) | | | 453,713 | | | 484,433 | | | | |
| 41,523 | | SOCIETE TELEVISION FRANCAISE 1 | | | 390,640 | | | 492,896 | | | | |
| 4,172 | | SODEXO | | | 221,116 | | | 349,595 | | | | |
| 13,444 | | SODEXO PRIME FIDELITE | | | 721,006 | | | 1,130,737 | | | | |
| 673 | | TECHNIP S.A. | | | 59,257 | | | 77,482 | | | | |
| 6,700 | | TELEPERFORMANCE S.A. | | | 205,373 | | | 242,819 | | | | |
| 59,569 | | TOTAL S.A. | | | 3,085,810 | | | 3,083,143 | | | | |
| 1,808 | | UNIBAIL-RODAMCO S.E. | | | 228,178 | | | 442,610 | | | | |
| 2,466 | | VALLOUREC S.A. | | | 112,671 | | | 128,692 | | | | |
| 24,299 | | VEOLIA ENVIRONNEMENT S.A. | | | 258,576 | | | 296,201 | | | | |
| 7,810 | | VINCI S.A. | | | 316,569 | | | 371,696 | | | | |
| 20,807 | | VIVENDI S.A. | | | 406,810 | | | 468,566 | | | | |
| 1,345 | | WENDEL S.A. | | | 91,561 | | | 139,244 | | | | |
| 480 | | ZODIAC AEROSPACE | | | 50,096 | | | 53,608 | | | | |
| | | | | | 19,540,256 | | | 25,246,708 | | | 6.19 | % |
| Germany: | | | | | | | | | | | | |
| 3,492 | | ADIDAS A.G. | | | 145,098 | | | 311,201 | | | | |
| 8,718 | | ALLIANZ S.E. (REGISTERED) | | | 780,413 | | | 1,207,762 | | | | |
| 17,269 | | BASF S.E. | | | 720,825 | | | 1,623,135 | | | | |
| 15,596 | | BAYER A.G. (REGISTERED) | | | 850,530 | | | 1,481,035 | | | | |
| 3,195 | | BAYERISCHE MOTOREN WERKE A.G. | | | 287,107 | | | 308,132 | | | | |
| 1,591 | | BEIERSDORF A.G. | | | 86,858 | | | 130,000 | | | | |
| 435 | | BRENNTAG A.G. | | | 47,835 | | | 57,149 | | | | |
| 7,652 | | CELESIO A.G. | | | 109,250 | | | 131,780 | | | | |
| 102,069 | | COMMERZBANK A.G.(b) | | | 178,818 | | | 194,243 | | | | |
| 916 | | CONTINENTAL A.G. | | | 47,943 | | | 105,986 | | | | |
| 31,948 | | CTS EVENTIM A.G. | | | 947,860 | | | 1,124,253 | | | | |
| 17,639 | | DAIMLER A.G. (REGISTERED) | | | 589,913 | | | 963,878 | | | | |
| 13,070 | | DEUTSCHE BANK A.G. (REGISTERED) | | | 478,830 | | | 569,427 | | | | |
| 13,908 | | DEUTSCHE BOERSE A.G. | | | 739,792 | | | 848,888 | | | | |
| 3,261 | | DEUTSCHE LUFTHANSA A.G. (REGISTERED) | | | 35,709 | | | 61,295 | | | | |
| 19,219 | | DEUTSCHE POST A.G. (REGISTERED) | | | 228,974 | | | 421,421 | | | | |
| 23,764 | | DEUTSCHE TELEKOM A.G. (REGISTERED) | | | 271,365 | | | 269,988 | | | | |
| 1,565 | | FRESENIUS MEDICAL CARE A.G. & CO. KGAA | | | 88,330 | | | 108,129 | | | | |
| 2,289 | | FRESENIUS S.E. & CO. KGAA | | | 150,261 | | | 263,448 | | | | |
| 1,527 | | GEA GROUP A.G. | | | 49,653 | | | 49,320 | | | | |
| 9,320 | | GERRESHEIMER A.G. | | | 469,617 | | | 493,419 | | | | |
| 2,580 | | HANNOVER RUECKVERSICHERUNG A.G. (REGISTERED) | | | 110,106 | | | 200,813 | | | | |
| 23,070 | | HEIDELBERGCEMENT A.G. | | | 1,037,374 | | | 1,397,643 | | | | |
| 2,600 | | HOCHTIEF A.G.(b) | | | 108,936 | | | 151,074 | | | | |
| 21,437 | | INFINEON TECHNOLOGIES A.G. | | | 120,692 | | | 173,956 | | | | |
| 37,820 | | JENOPTIK A.G. | | | 336,539 | | | 368,616 | | | | |
| 1,045 | | K+S A.G. (REGISTERED) | | | 44,974 | | | 48,314 | | | | |
| | |
See accompanying notes to the financial statements. | 74 | (Continued) |
CLEARWATER INVESTMENT TRUST
Schedule of Investments - Clearwater International Fund
December 31, 2012
| | | | | | | | | | | | | |
Shares | | Security | | Cost | | Fair
value (a) | | Percent
of
net assets | |
Germany (Cont’d): | | | | | | | | | | |
| 1,680 | | KABEL DEUTSCHLAND HOLDING A.G. | | $ | 100,991 | | | 125,628 | | | | |
| 29,520 | | KLOECKNER & CO. S.E.(b) | | | 297,635 | | | 349,492 | | | | |
| 1,013 | | LANXESS A.G. | | | 69,793 | | | 88,594 | | | | |
| 1,803 | | LINDE A.G. | | | 307,869 | | | 314,424 | | | | |
| 465 | | MAN S.E. | | | 50,636 | | | 49,722 | | | | |
| 1,025 | | MERCK KGAA | | | 86,079 | | | 135,236 | | | | |
| 4,041 | | MUENCHENER RUECKVERSICHERUNGS
A.G. (REGISTERED) | | | 512,591 | | | 725,535 | | | | |
| 2,570 | | RATIONAL A.G. | | | 642,664 | | | 740,156 | | | | |
| 8,089 | | RWE A.G. | | | 329,670 | | | 333,936 | | | | |
| 2,588 | | SALZGITTER A.G. | | | 129,200 | | | 134,862 | | | | |
| 18,062 | | SAP A.G. | | | 753,061 | | | 1,446,883 | | | | |
| 15,642 | | SIEMENS A.G. (REGISTERED) | | | 1,039,593 | | | 1,700,122 | | | | |
| 7,661 | | THYSSENKRUPP A.G. | | | 152,398 | | | 180,005 | | | | |
| 7,071 | | TUI A.G.(b) | | | 57,698 | | | 73,346 | | | | |
| 483 | | VOLKSWAGEN A.G. | | | 48,103 | | | 103,764 | | | | |
| 8,488 | | WINCOR NIXDORF A.G. | | | 317,452 | | | 397,563 | | | | |
| 61,274 | | WIRECARD A.G. | | | 1,405,672 | | | 1,502,672 | | | | |
| | | | | | 15,364,707 | | | 21,466,245 | | | 5.26 | % |
Greece: | | | | | | | | | | | |
| 3,332 | | COCA COLA HELLENIC BOTTLING CO. S.A. | | | 76,471 | | | 78,827 | | | | |
| 63,630 | | JUMBO S.A. | | | 409,127 | | | 503,281 | | | | |
| 27,055 | | METKA S.A. | | | 248,841 | | | 352,753 | | | | |
| | | | | | 734,439 | | | 934,861 | | | 0.23 | % |
Hong Kong: | | | | | | | | | | |
| 208,600 | | AIA GROUP LTD. | | | 682,342 | | | 831,363 | | | | |
| 82,500 | | BOC HONG KONG HOLDINGS LTD. | | | 169,112 | | | 258,826 | | | | |
| 6,588,600 | | BONJOUR HOLDINGS LTD. | | | 848,940 | | | 832,670 | | | | |
| 28,000 | | CHEUNG KONG HOLDINGS LTD. | | | 277,057 | | | 433,408 | | | | |
| 10,000 | | CHEUNG KONG INFRASTRUCTURE HOLDINGS LTD. | | | 46,496 | | | 61,430 | | | | |
| 36,500 | | CLP HOLDINGS LTD. | | | 253,113 | | | 306,501 | | | | |
| 27,800 | | ESPRIT HOLDINGS LTD. | | | 35,637 | | | 38,870 | | | | |
| 26,000 | | GALAXY ENTERTAINMENT GROUP LTD.(b) | | | 67,404 | | | 103,710 | | | | |
| 50,014 | | GUOCO GROUP LTD. | | | 417,780 | | | 603,261 | | | | |
| 44,000 | | HANG LUNG PROPERTIES LTD. | | | 116,126 | | | 176,418 | | | | |
| 15,400 | | HANG SENG BANK LTD. | | | 176,972 | | | 237,905 | | | | |
| 13,000 | | HENDERSON LAND DEVELOPMENT CO. LTD. | | | 45,544 | | | 92,605 | | | | |
| 19,000 | | HONG KONG & CHINA GAS CO. LTD. | | | 51,319 | | | 52,357 | | | | |
| 10,300 | | HONG KONG EXCHANGES AND CLEARING LTD. | | | 175,585 | | | 177,443 | | | | |
| 400 | | HOPEWELL HIGHWAY INFRASTRUCTURE LTD. | | | 229 | | | 223 | | | | |
| 88,500 | | HOPEWELL HOLDINGS LTD. | | | 337,564 | | | 382,666 | | | | |
| 41,000 | | HUTCHISON WHAMPOA LTD. | | | 238,015 | | | 434,941 | | | | |
| 12,000 | | HYSAN DEVELOPMENT CO. LTD. | | | 49,052 | | | 58,033 | | | | |
| 27,000 | | KERRY PROPERTIES LTD. | | | 90,767 | | | 141,024 | | | | |
| 120,000 | | LI & FUNG LTD. | | | 153,985 | | | 215,580 | | | | |
| 40,500 | | LINK REIT (THE) | | | 84,196 | | | 202,558 | | | | |
| 30,500 | | MTR CORP. LTD. | | | 88,703 | | | 120,734 | | | | |
| 54,000 | | NEW WORLD DEVELOPMENT CO. LTD. | | | 62,818 | | | 84,747 | | | | |
| 43,500 | | NWS HOLDINGS LTD. | | | 52,824 | | | 74,247 | | | | |
| 190,000 | | PCCW LTD. | | | 77,805 | | | 83,688 | | | | |
| 6,668,300 | | PICO FAR EAST HOLDINGS LTD. | | | 1,761,686 | | | 1,992,665 | | | | |
| 1,942,500 | | PORTS DESIGN LTD. | | | 1,477,795 | | | 1,553,885 | | | | |
| 24,000 | | POWER ASSETS HOLDINGS LTD. | | | 139,092 | | | 205,682 | | | | |
| 48,000 | | SANDS CHINA LTD. | | | 128,061 | | | 215,009 | | | | |
| 22,000 | | SHANGRI-LA ASIA LTD. | | | 29,501 | | | 44,330 | | | | |
| 59,400 | | SINO LAND CO. LTD. | | | 80,601 | | | 107,577 | | | | |
| 2,800 | | SINO-FOREST CORP.(b)(d) | | | 50,555 | | | - | | | | |
| 25,000 | | SJM HOLDINGS LTD. | | | 52,349 | | | 58,831 | | | | |
| 241,500 | | STELLA INTERNATIONAL HOLDINGS LTD. | | | 635,651 | | | 654,660 | | | | |
| 11,000 | | SUN HUNG KAI PROPERTIES LTD. | | | 109,933 | | | 166,025 | | | | |
| 19,000 | | SWIRE PACIFIC LTD., CLASS A | | | 127,857 | | | 236,111 | | | | |
| 633,000 | | TECHTRONIC INDUSTRIES CO. | | | 1,152,933 | | | 1,199,911 | | | | |
| 3,000 | | TELEVISION BROADCASTS LTD. | | | 9,222 | | | 22,499 | | | | |
| 298,000 | | TEXWINCA HOLDINGS LTD. | | | 236,882 | | | 284,614 | | | | |
| 65,500 | | VTECH HOLDINGS LTD. | | | 774,123 | | | 735,946 | | | | |
| 19,000 | | WHEELOCK & CO. LTD. | | | 30,489 | | | 96,691 | | | | |
| | |
See accompanying notes to the financial statements. | 75 | (Continued) |
CLEARWATER INVESTMENT TRUST
Schedule of Investments - Clearwater International Fund
December 31, 2012
| | | | | | | | | | | | | |
Shares | | Security | | Cost | | Fair
value (a) | | Percent
of
net assets | |
Hong Kong (Cont’d): | | | | | | | | | | |
| 30,000 | | WYNN MACAU LTD.(b) | | $ | 50,423 | | | 82,678 | | | | |
| 4,785,400 | | XTEP INTERNATIONAL HOLDINGS | | | 2,053,919 | | | 2,070,850 | | | | |
| 360,500 | | YINGDE GASES GROUP CO. | | | 355,161 | | | 370,930 | | | | |
| 80,000 | | YUE YUEN INDUSTRIAL HOLDINGS LTD. | | | 214,234 | | | 270,072 | | | | |
| | | | | | 14,069,852 | | | 16,374,174 | | | 4.01 | % |
Ireland: | | | | | | | | | | |
| 10,242 | | ACCENTURE PLC, CLASS A | | | 329,345 | | | 681,093 | | | | |
| 43,898 | | COVIDIEN PLC | | | 1,933,418 | | | 2,534,671 | | | | |
| 14,588 | | CRH PLC | | | 212,444 | | | 304,942 | | | | |
| 306 | | CRH PLC (DUBLIN EXCHANGE) | | | 5,188 | | | 6,350 | | | | |
| 5,080 | | ELAN CORP. PLC(b) | | | 29,005 | | | 52,463 | | | | |
| 6,217 | | EXPERIAN PLC | | | 73,481 | | | 100,450 | | | | |
| 124,830 | | HENDERSON GROUP PLC | | | 245,162 | | | 276,969 | | | | |
| 26,828 | | ICON PLC ADR(b)(c) | | | 508,477 | | | 744,745 | | | | |
| 6,478 | | JAMES HARDIE INDUSTRIES PLC | | | 53,712 | | | 62,670 | | | | |
| 929 | | KERRY GROUP PLC, CLASS A | | | 50,775 | | | 49,312 | | | | |
| 124 | | PROTHENA CORP. PLC(b) | | | 556 | | | 908 | | | | |
| 9,299 | | SHIRE PLC | | | 267,371 | | | 285,600 | | | | |
| 48,323 | | UBM PLC | | | 516,779 | | | 558,234 | | | | |
| | | | | | 4,225,713 | | | 5,658,407 | | | 1.39 | % |
Israel: | | | | | | | | | | |
| 13,950 | | BANK HAPOALIM B.M.(b) | | | 48,718 | | | 60,014 | | | | |
| 53 | | ISRAEL (THE) CORP. LTD. | | | 37,899 | | | 34,805 | | | | |
| 1,820 | | ISRAEL CHEMICALS LTD. | | | 21,615 | | | 21,941 | | | | |
| 659 | | MELLANOX TECHNOLOGIES LTD.(b) | | | 55,022 | | | 39,668 | | | | |
| 5,900 | | MIZRAHI TEFAHOT BANK LTD.(b) | | | 51,135 | | | 60,955 | | | | |
| 1,494 | | NICE SYSTEMS LTD.(b) | | | 50,675 | | | 50,054 | | | | |
| 5,692 | | TEVA PHARMACEUTICAL INDUSTRIES LTD. ADR(c) | | | 229,651 | | | 212,539 | | | | |
| | | | | | 494,715 | | | 479,976 | | | 0.12 | % |
Italy: | | | | | | | | | | |
| 45,194 | | AMPLIFON S.P.A. | | | 191,093 | | | 224,519 | | | | |
| 18,467 | | ASSICURAZIONI GENERALI S.P.A. | | | 269,601 | | | 336,851 | | | | |
| 2,238 | | ATLANTIA S.P.A. | | | 25,873 | | | 40,591 | | | | |
| 166,331 | | AZIMUT HOLDING S.P.A. | | | 2,087,018 | | | 2,399,971 | | | | |
| 37,200 | | BANCO POPOLARE SCARL(b) | | | 61,868 | | | 62,267 | | | | |
| 57,599 | | ENEL GREEN POWER S.P.A. | | | 98,098 | | | 107,724 | | | | |
| 84,176 | | ENEL S.P.A. | | | 307,528 | | | 350,204 | | | | |
| 49,857 | | ENI S.P.A. | | | 958,264 | | | 1,229,949 | | | | |
| 3,610 | | EXOR S.P.A. | | | 90,616 | | | 90,959 | | | | |
| 24,375 | | FIAT INDUSTRIAL S.P.A. | | | 141,398 | | | 267,259 | | | | |
| 10,222 | | FIAT S.P.A.(b) | | | 27,207 | | | 51,633 | | | | |
| 10,070 | | FINMECCANICA S.P.A.(b) | | | 50,331 | | | 58,360 | | | | |
| 65,001 | | INTESA SANPAOLO S.P.A. | | | 105,892 | | | 112,452 | | | | |
| 2,826 | | LUXOTTICA GROUP S.P.A. | | | 118,626 | | | 117,423 | | | | |
| 34,777 | | MEDIOLANUM S.P.A. | | | 120,164 | | | 177,048 | | | | |
| 32 | | PRYSMIAN S.P.A. | | | 318 | | | 647 | | | | |
| 4,376 | | SAIPEM S.P.A. | | | 190,726 | | | 169,777 | | | | |
| 57,530 | | SNAM S.P.A. | | | 249,716 | | | 267,518 | | | | |
| 7,497 | | TENARIS S.A. | | | 100,711 | | | 156,282 | | | | |
| 34,652 | | TERNA RETE ELETTRICA NAZIONALE S.P.A. | | | 130,368 | | | 138,774 | | | | |
| 10,464 | | UNICREDIT S.P.A.(b) | | | 52,057 | | | 51,672 | | | | |
| 25,343 | | UNIONE DI BANCHE ITALIANE S.C.P.A. | | | 103,374 | | | 118,209 | | | | |
| | | | | | 5,480,847 | | | 6,530,089 | | | 1.60 | % |
Japan: | | | | | | | | | | |
| 19,794 | | ADERANS CO. LTD.(b) | | | 230,091 | | | 261,527 | | | | |
| 4,700 | | AEON CO. LTD. | | | 52,433 | | | 53,724 | | | | |
| 10,400 | | AEON CREDIT SERVICE CO. LTD. | | | 165,828 | | | 209,978 | | | | |
| 76,200 | | AEON DELIGHT CO. LTD. | | | 1,553,600 | | | 1,489,854 | | | | |
| 1,100 | | AEON MALL CO. LTD. | | | 23,091 | | | 26,887 | | | | |
| 2,300 | | AISIN SEIKI CO. LTD. | | | 37,584 | | | 71,731 | | | | |
| 17,000 | | AJINOMOTO CO., INC. | | | 136,093 | | | 224,929 | | | | |
| 2,000 | | AMADA CO. LTD. | | | 10,582 | | | 13,014 | | | | |
| 17,000 | | AOZORA BANK LTD. | | | 53,794 | | | 52,235 | | | | |
| 36,100 | | ASAHI CO. LTD. | | | 561,894 | | | 516,732 | | | | |
| 16,000 | | ASAHI GLASS CO. LTD. | | | 120,885 | | | 116,246 | | | | |
| | |
See accompanying notes to the financial statements. | 76 | (Continued) |
CLEARWATER INVESTMENT TRUST
Schedule of Investments - Clearwater International Fund
December 31, 2012
| | | | | | | | | | | | | |
Shares | | Security | | Cost | | Fair
value (a) | | Percent
of
net assets | |
Japan (Cont’d): | | | | | | | | | | |
| 5,600 | | ASAHI GROUP HOLDINGS LTD. | | $ | 85,235 | | | 118,704 | | | | |
| 31,000 | | ASAHI KASEI CORP. | | | 147,138 | | | 183,065 | | | | |
| 77,800 | | ASICS CORP. | | | 1,063,884 | | | 1,185,271 | | | | |
| 7,400 | | ASTELLAS PHARMA, INC. | | | 236,149 | | | 332,418 | | | | |
| 5,000 | | BANK OF KYOTO (THE) LTD. | | | 43,972 | | | 42,068 | | | | |
| 37,000 | | BANK OF YOKOHAMA (THE) LTD. | | | 164,514 | | | 171,748 | | | | |
| 1,300 | | BENESSE HOLDINGS, INC. | | | 48,395 | | | 53,883 | | | | |
| 13,800 | | BRIDGESTONE CORP. | | | 205,726 | | | 357,711 | | | | |
| 5,200 | | BROTHER INDUSTRIES LTD. | | | 38,445 | | | 56,104 | | | | |
| 20,100 | | CANON, INC. | | | 672,638 | | | 788,366 | | | | |
| 1,000 | | CASIO COMPUTER CO. LTD. | | | 7,474 | | | 8,769 | | | | |
| 15,000 | | CHIBA BANK (THE) LTD. | | | 81,968 | | | 87,760 | | | | |
| 4,500 | | CHUGAI PHARMACEUTICAL CO. LTD. | | | 82,278 | | | 86,243 | | | | |
| 11,800 | | CHUGOKU ELECTRIC POWER (THE) CO., INC. | | | 185,442 | | | 185,046 | | | | |
| 7,900 | | CITIZEN HOLDINGS CO. LTD. | | | 31,581 | | | 41,761 | | | | |
| 49,436 | | CREDIT SAISON CO. LTD. | | | 605,262 | | | 1,236,230 | | | | |
| 11,000 | | DAIDO STEEL CO. LTD. | | | 45,649 | | | 55,214 | | | | |
| 103 | | DAI-ICHI LIFE INSURANCE (THE) CO. LTD. | | | 120,497 | | | 144,926 | | | | |
| 9,800 | | DAIICHI SANKYO CO. LTD. | | | 166,638 | | | 150,327 | | | | |
| 4,500 | | DAIKIN INDUSTRIES LTD. | | | 124,473 | | | 154,622 | | | | |
| 10,000 | | DAIWA HOUSE INDUSTRY CO. LTD. | | | 103,706 | | | 172,067 | | | | |
| 31,000 | | DAIWA SECURITIES GROUP, INC. | | | 119,396 | | | 172,660 | | | | |
| 64,800 | | DENA CO. LTD. | | | 2,028,069 | | | 2,130,680 | | | | |
| 8,200 | | DENSO CORP. | | | 185,234 | | | 285,318 | | | | |
| 2,800 | | DENTSU, INC. | | | 46,871 | | | 75,213 | | | | |
| 48,000 | | DESCENTE LTD. | | | 278,723 | | | 294,565 | | | | |
| 13,000 | | DOWA HOLDINGS CO. LTD. | | | 55,385 | | | 84,218 | | | | |
| 7,000 | | EAST JAPAN RAILWAY CO. | | | 392,789 | | | 452,594 | | | | |
| 2,200 | | EISAI CO. LTD. | | | 67,604 | | | 91,859 | | | | |
| 179 | | EPS CORP. | | | 514,491 | | | 458,630 | | | | |
| 1,800 | | FAMILYMART CO. LTD. | | | 52,590 | | | 74,096 | | | | |
| 14,100 | | FANUC CORP. | | | 2,036,196 | | | 2,622,090 | | | | |
| 1,100 | | FAST RETAILING CO. LTD. | | | 136,395 | | | 279,371 | | | | |
| 11,000 | | FUJI HEAVY INDUSTRIES LTD. | | | 57,631 | | | 138,504 | | | | |
| 6,300 | | FUJIFILM HOLDINGS CORP. | | | 113,804 | | | 126,892 | | | | |
| 44,000 | | FUJITSU LTD. | | | 171,664 | | | 184,742 | | | | |
| 11,000 | | FUKUOKA FINANCIAL GROUP, INC. | | | 36,036 | | | 44,027 | | | | |
| 32,000 | | FURUKAWA ELECTRIC CO. LTD.(b) | | | 65,376 | | | 71,900 | | | | |
| 64,300 | | GREE, INC. | | | 1,118,923 | | | 996,942 | | | | |
| 6,000 | | GUNMA BANK (THE) LTD. | | | 31,571 | | | 29,192 | | | | |
| 1,500 | | HAMAMATSU PHOTONICS K.K. | | | 52,686 | | | 54,116 | | | | |
| 11,000 | | HANKYU HANSHIN HOLDINGS, INC. | | | 51,221 | | | 56,788 | | | | |
| 500 | | HIROSE ELECTRIC CO. LTD. | | | 48,402 | | | 59,862 | | | | |
| 7,000 | | HIROSHIMA BANK (THE) LTD. | | | 26,154 | | | 29,330 | | | | |
| 95,000 | | HITACHI LTD. | | | 295,895 | | | 559,087 | | | | |
| 6,000 | | HITACHI METALS LTD. | | | 45,405 | | | 50,739 | | | | |
| 9,500 | | HOKKAIDO ELECTRIC POWER CO., INC. | | | 84,575 | | | 115,360 | | | | |
| 11,400 | | HOKURIKU ELECTRIC POWER CO. | | | 124,923 | | | 134,781 | | | | |
| 28,800 | | HONDA MOTOR CO. LTD. | | | 780,069 | | | 1,061,522 | | | | |
| 2,800 | | HOYA CORP. | | | 62,075 | | | 55,129 | | | | |
| 300 | | IDEMITSU KOSAN CO. LTD. | | | 23,804 | | | 26,129 | | | | |
| 28 | | INPEX CORP. | | | 153,822 | | | 149,432 | | | | |
| 9,800 | | ISETAN MITSUKOSHI HOLDINGS LTD. | | | 85,535 | | | 95,384 | | | | |
| 18,200 | | ITOCHU CORP. | | | 192,005 | | | 192,117 | | | | |
| 8,000 | | J. FRONT RETAILING CO. LTD. | | | 31,099 | | | 44,107 | | | | |
| 5 | | JAPAN REAL ESTATE INVESTMENT CORP. | | | 38,770 | | | 49,044 | | | | |
| 8 | | JAPAN RETAIL FUND INVESTMENT CORP. | | | 8,807 | | | 14,674 | | | | |
| 22,000 | | JAPAN STEEL WORKS (THE) LTD. | | | 126,429 | | | 142,520 | | | | |
| 11,600 | | JAPAN TOBACCO, INC. | | | 332,600 | | | 327,024 | | | | |
| 3,300 | | JFE HOLDINGS, INC. | | | 45,376 | | | 62,214 | | | | |
| 4,000 | | JGC CORP. | | | 53,048 | | | 124,609 | | | | |
| 12,000 | | JOYO BANK (THE) LTD. | | | 54,056 | | | 56,708 | | | | |
| 3,100 | | JSR CORP. | | | 39,530 | | | 58,565 | | | | |
| 5,000 | | JTEKT CORP. | | | 36,670 | | | 47,683 | | | | |
| 29,100 | | JX HOLDINGS, INC. | | | 159,013 | | | 163,898 | | | | |
| 7,000 | | KAJIMA CORP. | | | 15,004 | | | 23,120 | | | | |
| 33,400 | | KANSAI ELECTRIC POWER (THE) CO., INC. | | | 305,345 | | | 350,926 | | | | |
| 2,000 | | KANSAI PAINT CO. LTD. | | | 10,449 | | | 21,541 | | | | |
| | |
See accompanying notes to the financial statements. | 77 | (Continued) |
CLEARWATER INVESTMENT TRUST
Schedule of Investments - Clearwater International Fund
December 31, 2012
| | | | | | | | | | | | | |
Shares | | Security | | | Cost | | Fair
value (a) | | Percent
of
net assets | |
Japan (Cont’d): | | | | | | | | | | |
| 63,013 | | KAO CORP. | | $ | 1,591,030 | | | 1,641,767 | | | | |
| 35,000 | | KAWASAKI HEAVY INDUSTRIES LTD. | | | 71,135 | | | 95,115 | | | | |
| 4,977 | | KDDI CORP. | | | 239,416 | | | 351,550 | | | | |
| 21,500 | | KEIHIN CORP. | | | 261,255 | | | 307,502 | | | | |
| 13,000 | | KEIKYU CORP. | | | 95,310 | | | 115,055 | | | | |
| 5,000 | | KEIO CORP. | | | 28,322 | | | 37,281 | | | | |
| 5,000 | | KEISEI ELECTRIC RAILWAY CO. LTD. | | | 23,110 | | | 42,206 | | | | |
| 981 | | KEYENCE CORP. | | | 180,512 | | | 270,747 | | | | |
| 6,000 | | KIKKOMAN CORP. | | | 52,867 | | | 85,710 | | | | |
| 49,000 | | KINTETSU CORP. | | | 153,011 | | | 200,454 | | | | |
| 10,000 | | KIRIN HOLDINGS CO. LTD. | | | 103,112 | | | 117,504 | | | | |
| 18,300 | | KOBAYASHI PHARMACEUTICAL CO. LTD. | | | 982,900 | | | 869,006 | | | | |
| 15,400 | | KOMATSU LTD. | | | 339,281 | | | 394,078 | | | | |
| 21,000 | | KUBOTA CORP. | | | 129,773 | | | 241,194 | | | | |
| 4,300 | | KURITA WATER INDUSTRIES LTD. | | | 96,931 | | | 94,475 | | | | |
| 2,700 | | KYOCERA CORP. | | | 198,000 | | | 244,839 | | | | |
| 7,000 | | KYUSHU ELECTRIC POWER CO., INC. | | | 64,251 | | | 79,908 | | | | |
| 2,800 | | LAWSON, INC. | | | 120,035 | | | 190,325 | | | | |
| 1,900 | | LIXIL GROUP CORP. | | | 21,742 | | | 42,311 | | | | |
| 24,000 | | MARUBENI CORP. | | | 173,505 | | | 171,986 | | | | |
| 6,500 | | MARUI GROUP CO. LTD. | | | 32,287 | | | 52,011 | | | | |
| 57,000 | | MAZDA MOTOR CORP.(b) | | | 95,886 | | | 116,395 | | | | |
| 1,600 | | MCDONALD’S HOLDINGS CO. JAPAN LTD. | | | 43,060 | | | 42,205 | | | | |
| 47,500 | | MEGANE TOP CO. LTD. | | | 538,247 | | | 558,507 | | | | |
| 1,700 | | MEIJI HOLDINGS CO. LTD. | | | 54,895 | | | 73,683 | | | | |
| 32,700 | | MEITEC CORP. | | | 728,137 | | | 719,303 | | | | |
| 1,800 | | MIRACA HOLDINGS, INC. | | | 71,311 | | | 72,476 | | | | |
| 40,000 | | MITSUBISHI CHEMICAL HOLDINGS CORP. | | | 161,621 | | | 199,528 | | | | |
| 25,200 | | MITSUBISHI CORP. | | | 378,464 | | | 484,387 | | | | |
| 32,000 | | MITSUBISHI ELECTRIC CORP. | | | 244,114 | | | 272,366 | | | | |
| 27,000 | | MITSUBISHI ESTATE CO. LTD. | | | 353,310 | | | 645,470 | | | | |
| 17,000 | | MITSUBISHI GAS CHEMICAL CO., INC. | | | 75,149 | | | 104,161 | | | | |
| 57,000 | | MITSUBISHI HEAVY INDUSTRIES LTD. | | | 185,317 | | | 275,641 | | | | |
| 4,000 | | MITSUBISHI LOGISTICS CORP. | | | 45,017 | | | 57,377 | | | | |
| 18,000 | | MITSUBISHI MATERIALS CORP. | | | 47,129 | | | 61,354 | | | | |
| 54,000 | | MITSUBISHI MOTORS CORP.(b) | | | 51,556 | | | 55,819 | | | | |
| 240,600 | | MITSUBISHI UFJ FINANCIAL GROUP, INC. | | | 1,162,680 | | | 1,294,702 | | | | |
| 2,700 | | MITSUBISHI UFJ LEASE & FINANCE CO. LTD. | | | 83,878 | | | 116,124 | | | | |
| 33,400 | | MITSUI & CO. LTD. | | | 357,690 | | | 499,673 | | | | |
| 37,000 | | MITSUI CHEMICALS, INC. | | | 87,469 | | | 96,644 | | | | |
| 8,000 | | MITSUI FUDOSAN CO. LTD. | | | 184,883 | | | 195,449 | | | | |
| 3,000 | | MITSUI MINING & SMELTING CO. LTD. | | | 5,391 | | | 7,404 | | | | |
| 266,120 | | MIZUHO FINANCIAL GROUP, INC. | | | 440,505 | | | 486,905 | | | | |
| 3,580 | | MS&AD INSURANCE GROUP HOLDINGS | | | 75,251 | | | 71,523 | | | | |
| 3,600 | | MURATA MANUFACTURING CO. LTD. | | | 162,615 | | | 212,324 | | | | |
| 1,500 | | NAMCO BANDAI HOLDINGS, INC. | | | 14,652 | | | 19,454 | | | | |
| 27,000 | | NEC CORP.(b) | | | 70,167 | | | 56,853 | | | | |
| 3,000 | | NGK SPARK PLUG CO. LTD. | | | 28,359 | | | 39,868 | | | | |
| 1,500 | | NIDEC CORP. | | | 70,097 | | | 87,712 | | | | |
| 10,069 | | NIFCO, INC. | | | 227,783 | | | 223,184 | | | | |
| 6,000 | | NIKON CORP. | | | 75,728 | | | 177,141 | | | | |
| 11 | | NIPPON BUILDING FUND, INC. | | | 90,970 | | | 113,414 | | | | |
| 17,000 | | NIPPON EXPRESS CO. LTD. | | | 60,747 | | | 70,217 | | | | |
| 6,000 | | NIPPON MEAT PACKERS, INC. | | | 72,315 | | | 82,603 | | | | |
| 4,200 | | NIPPON PAPER GROUP, INC. | | | 49,572 | | | 58,385 | | | | |
| 78,535 | | NIPPON STEEL CORP. | | | 186,705 | | | 193,179 | | | | |
| 7,300 | | NIPPON TELEGRAPH & TELEPHONE CORP. | | | 335,022 | | | 306,645 | | | | |
| 17,000 | | NISHI-NIPPON CITY BANK (THE) LTD. | | | 40,901 | | | 41,879 | | | | |
| 5,000 | | NISSAN CHEMICAL INDUSTRIES LTD. | | | 50,851 | | | 59,208 | | | | |
| 23,500 | | NISSAN MOTOR CO. LTD. | | | 211,413 | | | 223,049 | | | | |
| 2,500 | | NISSHIN SEIFUN GROUP, INC. | | | 25,731 | | | 31,282 | | | | |
| 3,000 | | NISSHINBO HOLDINGS, INC. | | | 23,700 | | | 25,386 | | | | |
| 1,200 | | NISSIN FOODS HOLDINGS CO. LTD. | | | 43,959 | | | 45,502 | | | | |
| 17,400 | | NISSIN KOGYO CO. LTD. | | | 232,900 | | | 269,333 | | | | |
| 600 | | NITORI HOLDINGS CO. LTD. | | | 33,819 | | | 43,925 | | | | |
| 3,200 | | NITTO DENKO CORP. | | | 77,639 | | | 157,442 | | | | |
| 5,700 | | NKSJ HOLDINGS, INC. | | | 114,918 | | | 121,392 | | | | |
| 72,300 | | NOMURA HOLDINGS, INC. | | | 256,136 | | | 426,879 | | | | |
| | |
See accompanying notes to the financial statements. | 78 | (Continued) |
CLEARWATER INVESTMENT TRUST
Schedule of Investments - Clearwater International Fund
December 31, 2012
| | | | | | | | | | | | | |
Shares | | Security | | Cost | | Fair
value (a) | | Percent
of
net assets | |
Japan (Cont’d): | | | | | | | | | | |
| 2,700 | | NOMURA RESEARCH INSTITUTE LTD. | | $ | 43,930 | | | 55,891 | | | | |
| 17,800 | | NORTH PACIFIC BANK LTD.(b) | | | 49,457 | | | 49,911 | | | | |
| 14 | | NTT DATA CORP. | | | 36,520 | | | 43,772 | | | | |
| 260 | | NTT DOCOMO, INC. | | | 381,437 | | | 373,399 | | | | |
| 65 | | NTT URBAN DEVELOPMENT CORP. | | | 52,710 | | | 62,778 | | | | |
| 12,000 | | OBAYASHI CORP. | | | 48,665 | | | 67,546 | | | | |
| 4,000 | | ODAKYU ELECTRIC RAILWAY CO. LTD. | | | 30,548 | | | 41,613 | | | | |
| 8,100 | | OLYMPUS CORP.(b) | | | 119,871 | | | 157,214 | | | | |
| 1,300 | | ONO PHARMACEUTICAL CO. LTD. | | | 55,952 | | | 66,340 | | | | |
| 8,000 | | ONWARD HOLDINGS CO. LTD. | | | 54,094 | | | 60,366 | | | | |
| 800 | | ORIENTAL LAND CO. LTD. | | | 50,479 | | | 96,671 | | | | |
| 1,090 | | ORIX CORP. | | | 120,397 | | | 122,994 | | | | |
| 37,000 | | OSAKA GAS CO. LTD. | | | 121,878 | | | 134,393 | | | | |
| 3,500 | | OTSUKA HOLDINGS CO. LTD. | | | 97,073 | | | 98,262 | | | | |
| 1,900 | | PRESTIGE INTERNATIONAL, INC. | | | 20,966 | | | 16,591 | | | | |
| 9,500 | | RAKUTEN, INC. | | | 47,421 | | | 74,088 | | | | |
| 23,400 | | RESONA HOLDINGS, INC. | | | 97,985 | | | 106,091 | | | | |
| 15,000 | | RICOH CO. LTD. | | | 148,229 | | | 159,359 | | | | |
| 1,200 | | RINNAI CORP. | | | 52,047 | | | 81,528 | | | | |
| 11,946 | | SANKYO CO. LTD. | | | 626,465 | | | 472,704 | | | | |
| 2,600 | | SANTEN PHARMACEUTICAL CO. LTD. | | | 85,886 | | | 99,545 | | | | |
| 21,520 | | SBI HOLDINGS, INC. | | | 173,535 | | | 192,086 | | | | |
| 3,400 | | SECOM CO. LTD. | | | 133,812 | | | 171,358 | | | | |
| 4,100 | | SEGA SAMMY HOLDINGS, INC. | | | 38,822 | | | 69,248 | | | | |
| 13,000 | | SEKISUI CHEMICAL CO. LTD. | | | 66,177 | | | 112,582 | | | | |
| 6,000 | | SEKISUI HOUSE LTD. | | | 44,394 | | | 65,676 | | | | |
| 12,800 | | SEVEN & I HOLDINGS CO. LTD. | | | 281,200 | | | 360,255 | | | | |
| 25,000 | | SHARP CORP. | | | 50,043 | | | 87,672 | | | | |
| 11,100 | | SHIKOKU ELECTRIC POWER CO., INC. | | | 118,917 | | | 177,025 | | | | |
| 4,000 | | SHIMADZU CORP. | | | 25,419 | | | 26,984 | | | | |
| 1,000 | | SHIMAMURA CO. LTD. | | | 61,206 | | | 96,843 | | | | |
| 1,500 | | SHIMANO, INC. | | | 58,204 | | | 95,644 | | | | |
| 8,300 | | SHIN-ETSU CHEMICAL CO. LTD. | | | 411,842 | | | 506,960 | | | | |
| 41,600 | | SHINKO PLANTECH CO. LTD. | | | 342,251 | | | 328,387 | | | | |
| 4,000 | | SHIONOGI & CO. LTD. | | | 67,679 | | | 66,631 | | | | |
| 6,000 | | SHISEIDO CO. LTD. | | | 92,764 | | | 84,375 | | | | |
| 8,000 | | SHIZUOKA BANK (THE) LTD. | | | 74,794 | | | 78,132 | | | | |
| 21,000 | | SHOWA DENKO K.K. | | | 33,824 | | | 32,110 | | | | |
| 900 | | SMC CORP. | | | 106,941 | | | 163,272 | | | | |
| 652 | | SMS CO. LTD. | | | 1,377,794 | | | 1,292,342 | | | | |
| 17,900 | | SOFTBANK CORP. | | | 355,350 | | | 654,992 | | | | |
| 4,400 | | SONY FINANCIAL HOLDINGS, INC. | | | 56,074 | | | 79,148 | | | | |
| 62,802 | | STANLEY ELECTRIC CO. LTD. | | | 927,218 | | | 893,972 | | | | |
| 7,000 | | SUMCO CORP.(b) | | | 47,761 | | | 68,103 | | | | |
| 43,000 | | SUMITOMO CHEMICAL CO. LTD. | | | 145,530 | | | 135,667 | | | | |
| 21,300 | | SUMITOMO CORP. | | | 207,214 | | | 273,019 | | | | |
| 13,100 | | SUMITOMO ELECTRIC INDUSTRIES LTD. | | | 127,803 | | | 151,596 | | | | |
| 12,000 | | SUMITOMO HEAVY INDUSTRIES LTD. | | | 39,379 | | | 57,314 | | | | |
| 9,000 | | SUMITOMO METAL MINING CO. LTD. | | | 88,484 | | | 127,003 | | | | |
| 26,400 | | SUMITOMO MITSUI FINANCIAL GROUP, INC. | | | 824,716 | | | 959,086 | | | | |
| 71,310 | | SUMITOMO MITSUI TRUST HOLDINGS, INC. | | | 214,202 | | | 250,544 | | | | |
| 6,000 | | SUMITOMO REALTY & DEVELOPMENT CO. LTD. | | | 163,837 | | | 199,364 | | | | |
| 54,400 | | SUMITOMO RUBBER INDUSTRIES LTD. | | | 632,819 | | | 657,275 | | | | |
| 5,800 | | SUZUKI MOTOR CORP. | | | 104,611 | | | 151,622 | | | | |
| 39,500 | | SYSMEX CORP. | | | 1,825,892 | | | 1,809,740 | | | | |
| 4,200 | | T&D HOLDINGS, INC. | | | 47,440 | | | 51,190 | | | | |
| 31,000 | | TAIHEIYO CEMENT CORP. | | | 68,814 | | | 85,304 | | | | |
| 11,000 | | TAISEI CORP. | | | 19,822 | | | 36,364 | | | | |
| 600 | | TAISHO PHARMACEUTICAL HOLDINGS CO. LTD. | | | 40,190 | | | 40,979 | | | | |
| 10,000 | | TAKASHIMAYA CO. LTD. | | | 63,872 | | | 71,273 | | | | |
| 7,100 | | TAKEDA PHARMACEUTICAL CO. LTD. | | | 246,901 | | | 317,296 | | | | |
| 1,500 | | TDK CORP. | | | 58,582 | | | 54,546 | | | | |
| 29,000 | | TEIJIN LTD. | | | 67,529 | | | 71,525 | | | | |
| 2,600 | | TERUMO CORP. | | | 95,419 | | | 103,306 | | | | |
| 2,000 | | THK CO. LTD. | | | 29,290 | | | 35,939 | | | | |
| 5,000 | | TOBU RAILWAY CO. LTD. | | | 19,140 | | | 26,460 | | | | |
| 1,000 | | TOHO CO. LTD. | | | 13,412 | | | 17,612 | | | | |
| 17,000 | | TOHO GAS CO. LTD. | | | 81,221 | | | 91,255 | | | | |
| | |
See accompanying notes to the financial statements. | 79 | (Continued) |
CLEARWATER INVESTMENT TRUST
Schedule of Investments - Clearwater International Fund
December 31, 2012
| | | | | | | | | | | | | |
Shares | | Security | | Cost | | Fair
value (a) | | Percent
of
net assets | |
Japan (Cont’d): | | | | | | | | | | |
| 7,200 | | TOHOKU ELECTRIC POWER CO., INC.(b) | | $ | 56,650 | | | 67,003 | | | | |
| 13,100 | | TOKAI RIKA CO. LTD. | | | 168,635 | | | 182,342 | | | | |
| 14,400 | | TOKIO MARINE HOLDINGS, INC. | | | 359,676 | | | 401,501 | | | | |
| 3,200 | | TOKYO ELECTRON LTD. | | | 128,746 | | | 147,242 | | | | |
| 40,000 | | TOKYO GAS CO. LTD. | | | 151,969 | | | 182,878 | | | | |
| 25,000 | | TOKYU CORP. | | | 103,448 | | | 140,395 | | | | |
| 23,000 | | TOKYU LAND CORP. | | | 86,617 | | | 168,134 | | | | |
| 4,000 | | TONENGENERAL SEKIYU K.K. | | | 37,796 | | | 34,468 | | | | |
| 17,000 | | TORAY INDUSTRIES, INC. | | | 70,413 | | | 103,662 | | | | |
| 80,000 | | TOSHIBA CORP. | | | 245,424 | | | 316,336 | | | | |
| 6,000 | | TOTO LTD. | | | 30,029 | | | 45,070 | | | | |
| 1,800 | | TOYO SEIKAN KAISHA LTD. | | | 24,940 | | | 24,248 | | | | |
| 3,000 | | TOYO SUISAN KAISHA LTD. | | | 74,690 | | | 79,951 | | | | |
| 4,000 | | TOYOTA INDUSTRIES CORP. | | | 101,266 | | | 127,682 | | | | |
| 55,000 | | TOYOTA MOTOR CORP. | | | 1,917,045 | | | 2,567,211 | | | | |
| 4,000 | | TOYOTA TSUSHO CORP. | | | 63,233 | | | 98,760 | | | | |
| 2,500 | | TREND MICRO, INC. | | | 74,501 | | | 75,447 | | | | |
| 1,700 | | TSUMURA & CO. | | | 50,505 | | | 51,234 | | | | |
| 13,400 | | TSURUHA HOLDINGS, INC. | | | 986,250 | | | 1,051,103 | | | | |
| 8,000 | | UBE INDUSTRIES LTD. | | | 13,963 | | | 19,239 | | | | |
| 4,000 | | UNICHARM CORP. | | | 141,844 | | | 208,226 | | | | |
| 80 | | USS CO. LTD. | | | 3,505 | | | 8,292 | | | | |
| 4,100 | | WEST JAPAN RAILWAY CO. | | | 134,756 | | | 161,468 | | | | |
| 236 | | YAHOO JAPAN CORP. | | | 62,283 | | | 76,386 | | | | |
| 1,300 | | YAKULT HONSHA CO. LTD. | | | 22,252 | | | 56,964 | | | | |
| 2,720 | | YAMADA DENKI CO. LTD. | | | 102,434 | | | 104,891 | | | | |
| 1,000 | | YAMAGUCHI FINANCIAL GROUP, INC. | | | 8,604 | | | 8,835 | | | | |
| 4,700 | | YAMAHA MOTOR CO. LTD. | | | 47,385 | | | 52,098 | | | | |
| | | | | | 48,766,907 | | | 57,108,636 | | | 14.00 | % |
Mexico: | | | | | | | | | | | | |
| 4,183 | | FRESNILLO PLC | | | 101,968 | | | 129,793 | | | | |
| 500,419 | | WAL-MART DE MEXICO S.A.B. DE C.V., SERIES V | | | 1,523,435 | | | 1,638,732 | | | | |
| | | | | | 1,625,403 | | | 1,768,525 | | | 0.43 | % |
Netherlands: | | | | | | | | | | | | |
| 36,750 | | AALBERTS INDUSTRIES N.V. | | | 686,893 | | | 776,899 | | | | |
| 25,740 | | ACCELL GROUP | | | 426,901 | | | 452,872 | | | | |
| 34,297 | | AEGON N.V. | | | 128,398 | | | 218,568 | | | | |
| 4,340 | | AKZO NOBEL N.V. | | | 184,408 | | | 286,383 | | | | |
| 21,730 | | ARCADIS N.V. | | | 459,143 | | | 509,176 | | | | |
| 10,521 | | ARCELORMITTAL | | | 163,439 | | | 182,130 | | | | |
| 8,054 | | ASML HOLDING N.V. | | | 131,659 | | | 521,413 | | | | |
| 17,454 | | ASML HOLDING N.V. (REGISTERED) | | | 952,704 | | | 1,124,212 | | | | |
| 17,379 | | CORE LABORATORIES N.V. | | | 1,832,751 | | | 1,899,698 | | | | |
| 1,094 | | CORIO N.V. | | | 43,642 | | | 49,770 | | | | |
| 25,239 | | DE MASTER BLENDERS 1753 N.V.(b) | | | 272,152 | | | 293,581 | | | | |
| 1,259 | | FUGRO N.V. - CVA | | | 70,525 | | | 73,753 | | | | |
| 768 | | GEMALTO N.V. | | | 50,382 | | | 69,532 | | | | |
| 965 | | HEINEKEN HOLDING N.V. | | | 23,862 | | | 52,860 | | | | |
| 3,662 | | HEINEKEN N.V. | | | 128,663 | | | 244,266 | | | | |
| 221,418 | | ING GROEP N.V. - CVA(b) | | | 2,055,673 | | | 2,117,351 | | | | |
| 71,860 | | KONINKLIJKE AHOLD N.V. | | | 905,670 | | | 954,495 | | | | |
| 2,539 | | KONINKLIJKE DSM N.V. | | | 86,313 | | | 152,935 | | | | |
| 59,484 | | KONINKLIJKE PHILIPS ELECTRONICS N.V. | | | 1,231,488 | | | 1,595,854 | | | | |
| 9,990 | | ORIFLAME COSMETICS S.A. SDR | | | 328,762 | | | 318,999 | | | | |
| 9,716 | | QIAGEN N.V.(b) | | | 139,904 | | | 176,215 | | | | |
| 3,238 | | RANDSTAD HOLDING N.V. | | | 99,928 | | | 119,528 | | | | |
| 22,774 | | REED ELSEVIER N.V. | | | 264,057 | | | 337,419 | | | | |
| 54,559 | | ROYAL DUTCH SHELL PLC, CLASS A | | | 1,445,241 | | | 1,927,817 | | | | |
| 50,447 | | ROYAL DUTCH SHELL PLC, CLASS B | | | 1,266,061 | | | 1,785,438 | | | | |
| 21,030 | | ROYAL IMTECH N.V. | | | 572,376 | | | 491,765 | | | | |
| 17,078 | | TNT EXPRESS N.V. | | | 152,515 | | | 193,186 | | | | |
| 21,023 | | UNILEVER N.V. - CVA | | | 662,501 | | | 793,276 | | | | |
| 25,180 | | USG PEOPLE N.V. | | | 195,853 | | | 201,833 | | | | |
| 6,193 | | WOLTERS KLUWER N.V. | | | 101,075 | | | 128,058 | | | | |
| | | | | | 15,062,939 | | | 18,049,282 | | | 4.42 | % |
New Zealand: | | | | | | | | | | | |
| 11,811 | | CONTACT ENERGY LTD. | | | 51,688 | | | 50,979 | | | | |
| | |
See accompanying notes to the financial statements. | 80 | (Continued) |
CLEARWATER INVESTMENT TRUST
Schedule of Investments - Clearwater International Fund
December 31, 2012
| | | | | | | | | | | | | |
Shares | | Security | | Cost | | Fair
value (a) | | Percent
of
net assets | |
New Zealand (Cont’d): | | | | | | | | | | |
| 7,321 | | FLETCHER BUILDING LTD. | | $ | 51,323 | | | 51,228 | | | | |
| 18,050 | | SKYCITY ENTERTAINMENT GROUP LTD. | | | 49,428 | | | 56,676 | | | | |
| 37,843 | | TELECOM CORP. OF NEW ZEALAND LTD. | | | 73,138 | | | 71,566 | | | | |
| | | | | | 225,577 | | | 230,449 | | | 0.06 | % |
Norway: | | | | | | | | | | | | |
| 8,104 | | AKER SOLUTIONS ASA | | | 124,751 | | | 166,765 | | | | |
| 13,773 | | DNB ASA | | | 87,874 | | | 175,563 | | | | |
| 3,900 | | KVAERNER ASA | | | 6,506 | | | 11,423 | | | | |
| 21,490 | | NORSK HYDRO ASA | | | 82,180 | | | 109,477 | | | | |
| 97,189 | | ORKLA ASA | | | 661,656 | | | 850,870 | | | | |
| 11,450 | | SCHIBSTED ASA | | | 434,923 | | | 488,283 | | | | |
| 3,754 | | SEADRILL LTD. | | | 39,723 | | | 138,351 | | | | |
| 16,318 | | STATOIL ASA | | | 293,362 | | | 409,485 | | | | |
| 11,360 | | TELENOR ASA | | | 229,860 | | | 230,798 | | | | |
| 85,000 | | TOMRA SYSTEMS ASA | | | 703,315 | | | 768,394 | | | | |
| 4,000 | | YARA INTERNATIONAL ASA | | | 109,527 | | | 198,545 | | | | |
| | | | | | 2,773,677 | | | 3,547,954 | | | 0.87 | % |
Philippines: | | | | | | | | | | | | |
| 328,710 | | METROPOLITAN BANK & TRUST | | | 731,360 | | | 819,261 | | | | |
| | | | | | 731,360 | | | 819,261 | | | 0.20 | % |
Poland: | | | | | | | | | | | | |
| 29,290 | | EUROCASH S.A. | | | 353,713 | | | 412,430 | | | | |
| | | | | | 353,713 | | | 412,430 | | | 0.10 | % |
Portugal: | | | | | | | | | | | | |
| 35,520 | | ENERGIAS DE PORTUGAL S.A. | | | 97,580 | | | 106,769 | | | | |
| 3,330 | | GALP ENERGIA SGPS S.A. | | | 51,795 | | | 51,732 | | | | |
| 58,647 | | JERONIMO MARTINS SGPS S.A. | | | 982,426 | | | 1,131,689 | | | | |
| 42,710 | | PORTUGAL TELECOM SGPS S.A. (REGISTERED) | | | 200,104 | | | 213,647 | | | | |
| | | | | | 1,331,905 | | | 1,503,837 | | | 0.37 | % |
Russia: | | | | | | | | | | | | |
| 6,460 | | X5 RETAIL GROUP N.V. GDR (REGISTERED)(b) | | | 122,935 | | | 115,915 | | | | |
| | | | | | 122,935 | | | 115,915 | | | 0.03 | % |
Singapore: | | | | | | | | | | | | |
| 31,000 | | ASCENDAS REAL ESTATE INVESTMENT TRUST | | | 51,644 | | | 60,732 | | | | |
| 39,500 | | CAPITALAND LTD. | | | 75,674 | | | 121,178 | | | | |
| 36,000 | | CAPITAMALL TRUST | | | 34,133 | | | 63,080 | | | | |
| 11,000 | | CITY DEVELOPMENTS LTD. | | | 71,096 | | | 117,331 | | | | |
| 34,000 | | DBS GROUP HOLDINGS LTD. | | | 221,626 | | | 416,205 | | | | |
| 68,650 | | FLEXTRONICS INTERNATIONAL LTD.(b) | | | 411,378 | | | 426,316 | | | | |
| 22,000 | | FRASER AND NEAVE LTD. | | | 58,463 | | | 175,103 | | | | |
| 130,000 | | GLOBAL LOGISTIC PROPERTIES LTD. | | | 203,681 | | | 298,917 | | | | |
| 2,000 | | JARDINE CYCLE & CARRIAGE LTD. | | | 79,849 | | | 79,573 | | | | |
| 28,000 | | KEPPEL CORP. LTD. | | | 105,334 | | | 254,422 | | | | |
| 18,000 | | OVERSEA-CHINESE BANKING CORP. LTD. | | | 141,450 | | | 144,822 | | | | |
| 17,000 | | SEMBCORP INDUSTRIES LTD. | | | 31,827 | | | 74,073 | | | | |
| 22,000 | | SEMBCORP MARINE LTD. | | | 32,803 | | | 83,755 | | | | |
| 18,000 | | SINGAPORE AIRLINES LTD. | | | 121,795 | | | 159,191 | | | | |
| 31,000 | | SINGAPORE EXCHANGE LTD. | | | 139,131 | | | 179,719 | | | | |
| 41,000 | | SINGAPORE PRESS HOLDINGS LTD. | | | 91,268 | | | 135,649 | | | | |
| 38,000 | | SINGAPORE TECHNOLOGIES ENGINEERING LTD. | | | 91,421 | | | 119,950 | | | | |
| 188,000 | | SINGAPORE TELECOMMUNICATIONS LTD. | | | 370,916 | | | 511,277 | | | | |
| 9,000 | | UNITED OVERSEAS BANK LTD. | | | 92,783 | | | 147,406 | | | | |
| 15,000 | | UOL GROUP LTD. | | | 49,917 | | | 74,043 | | | | |
| | | | | | 2,476,189 | | | 3,642,742 | | | 0.89 | % |
SouthAfrica: | | | | | | | | | | | | |
| 49,316 | | SHOPRITE HOLDINGS LTD. | | | 1,033,343 | | | 1,198,598 | | | | |
| | | | | | 1,033,343 | | | 1,198,598 | | | 0.29 | % |
South Korea: | | | | | | | | | | | | |
| 7,439 | | BINGGRAE CO. LTD. | | | 692,763 | | | 781,305 | | | | |
| 52,710 | | BS FINANCIAL GROUP, INC. | | | 588,471 | | | 654,914 | | | | |
| 46,420 | | DGB FINANCIAL GROUP, INC. | | | 573,075 | | | 633,371 | | | | |
| 21,400 | | HALLA CLIMATE CONTROL CORP. | | | 447,476 | | | 475,463 | | | | |
| 4,234 | | HYUNDAI MIPO DOCKYARD | | | 495,687 | | | 508,353 | | | | |
| 4,425 | | KIWOOM SECURITIES CO. LTD. | | | 239,844 | | | 245,040 | | | | |
| 6,820 | | KOREA INVESTMENT HOLDINGS CO. LTD. | | | 241,658 | | | 273,489 | | | | |
| | |
See accompanying notes to the financial statements. | 81 | (Continued) |
CLEARWATER INVESTMENT TRUST
Schedule of Investments - Clearwater International Fund
December 31, 2012
| | | | | | | | | | | | | |
Shares | | Security | | Cost | | Fair
value (a) | | Percent
of
net assets | |
South Korea (Cont’d): | | | | | | | | | | |
| 7,454 | | MEGASTUDY CO. LTD. | | $ | 484,709 | | | 549,411 | | | | |
| 9,049 | | YOUNGONE HOLDINGS CO. LTD. | | | 515,320 | | | 505,312 | | | | |
| | | | | | 4,279,003 | | | 4,626,658 | | | 1.13 | % |
Spain: | | | | | | | | | | | | |
| 10,866 | | ABERTIS INFRAESTRUCTURAS S.A. | | | 160,296 | | | 181,089 | | | | |
| 1,260 | | ACCIONA S.A. | | | 78,312 | | | 95,548 | | | | |
| 7,760 | | ACERINOX S.A. | | | 95,129 | | | 85,610 | | | | |
| 2,148 | | AMADEUS IT HOLDING S.A., CLASS A | | | 49,855 | | | 53,902 | | | | |
| 26,395 | | ANTENA 3 DE TELEVISION S.A. | | | 104,337 | | | 136,333 | | | | |
| 97,279 | | BANCO BILBAO VIZCAYA ARGENTARIA S.A. | | | 737,382 | | | 893,054 | | | | |
| 65,630 | | BANCO DE SABADELL S.A.(b) | | | 181,306 | | | 173,902 | | | | |
| 153,939 | | BANCO SANTANDER S.A. | | | 1,041,028 | | | 1,241,222 | | | | |
| 27,341 | | CAIXABANK | | | 92,783 | | | 95,583 | | | | |
| 1,388 | | CONSTRUCCIONES Y AUXILIAR DE FERROCARRILES S.A. | | | 645,501 | | | 639,599 | | | | |
| 9,700 | | DISTRIBUIDORA INTERNACIONAL DE ALIMENTACION S.A. | | | 47,567 | | | 62,329 | | | | |
| 73,594 | | DURO FELGUERA S.A. | | | 466,774 | | | 471,198 | | | | |
| 5,084 | | ENAGAS S.A. | | | 87,894 | | | 108,793 | | | | |
| 18,004 | | GAS NATURAL SDG S.A. | | | 278,700 | | | 329,219 | | | | |
| 1,818 | | GRIFOLS S.A.(b) | | | 52,706 | | | 63,963 | | | | |
| 17,125 | | IBERDROLA S.A. | | | 71,908 | | | 95,496 | | | | |
| 3,101 | | INDITEX S.A. | | | 374,413 | | | 434,443 | | | | |
| 80,017 | | MAPFRE S.A. | | | 217,995 | | | 246,970 | | | | |
| 20,350 | | MELIA HOTELS INTERNATIONAL S.A. | | | 135,424 | | | 156,384 | | | | |
| 3,172 | | RED ELECTRICA CORP. S.A. | | | 137,295 | | | 156,721 | | | | |
| 22,452 | | REPSOL S.A. | | | 446,870 | | | 461,089 | | | | |
| 10,996 | | TECNICAS REUNIDAS S.A. | | | 547,514 | | | 511,339 | | | | |
| 23,962 | | TELEFONICA S.A. | | | 368,956 | | | 325,374 | | | | |
| 4,021 | | ZARDOYA OTIS S.A. | | | 49,157 | | | 57,956 | | | | |
| | | | | | 6,469,102 | | | 7,077,116 | | | 1.74 | % |
Sweden: | | | | | | | | | | | | |
| 7,400 | | ASSA ABLOY AB, CLASS B | | | 89,466 | | | 278,650 | | | | |
| 11,337 | | ATLAS COPCO AB, CLASS A | | | 121,649 | | | 313,843 | | | | |
| 6,368 | | ATLAS COPCO AB, CLASS B | | | 78,834 | | | 156,233 | | | | |
| 39,960 | | DUNI AB | | | 351,554 | | | 364,717 | | | | |
| 8,524 | | ELECTROLUX AB, CLASS B | | | 113,200 | | | 223,871 | | | | |
| 8,575 | | ELEKTA AB, CLASS B | | | 104,728 | | | 135,225 | | | | |
| 77 | | GETINGE AB, CLASS B | | | 905 | | | 2,608 | | | | |
| 13,660 | | HENNES & MAURITZ AB, CLASS B | | | 276,813 | | | 474,676 | | | | |
| 3,700 | | HEXAGON AB, CLASS B | | | 56,830 | | | 93,009 | | | | |
| 17,500 | | HUSQVARNA AB, CLASS B | | | 64,201 | | | 106,080 | | | | |
| 10,000 | | INDUSTRIVARDEN AB, CLASS C | | | 103,927 | | | 166,307 | | | | |
| 46,254 | | INDUTRADE AB | | | 1,300,495 | | | 1,400,003 | | | | |
| 3,000 | | INVESTMENT AB KINNEVIK, CLASS B | | | 51,225 | | | 62,686 | | | | |
| 11,800 | | INVESTOR AB, CLASS B | | | 161,782 | | | 309,493 | | | | |
| 2,344 | | LUNDIN PETROLEUM AB(b) | | | 54,274 | | | 54,086 | | | | |
| 1,045 | | MILLICOM INTERNATIONAL CELLULAR S.A. SDR | | | 88,132 | | | 90,827 | | | | |
| 41,436 | | NORDEA BANK AB | | | 232,747 | | | 396,841 | | | | |
| 23,773 | | SANDVIK AB | | | 201,678 | | | 382,092 | | | | |
| 2,429 | | SCANIA AB, CLASS B | | | 50,725 | | | 50,519 | | | | |
| 15,868 | | SECURITAS AB, CLASS B | | | 125,722 | | | 139,388 | | | | |
| 41,800 | | SKANDINAVISKA ENSKILDA BANKEN AB, CLASS A | | | 171,318 | | | 356,453 | | | | |
| 2,800 | | SKANSKA AB, CLASS B | | | 23,703 | | | 46,068 | | | | |
| 5,400 | | SSAB AB, CLASS A | | | 48,129 | | | 47,618 | | | | |
| 56,755 | | SVENSKA CELLULOSA AB, CLASS B | | | 1,036,621 | | | 1,242,405 | | | | |
| 11,896 | | SVENSKA HANDELSBANKEN AB, CLASS A | | | 264,805 | | | 426,233 | | | | |
| 4,856 | | SWEDBANK AB, CLASS A | | | 93,496 | | | 95,558 | | | | |
| 5,254 | | TELE2 AB, CLASS B | | | 90,044 | | | 95,288 | | | | |
| 58,718 | | TELEFONAKTIEBOLAGET LM ERICSSON, CLASS B | | | 533,417 | | | 590,601 | | | | |
| 43,674 | | TELIASONERA AB | | | 244,086 | | | 297,486 | | | | |
| 21,000 | | VOLVO AB, CLASS B | | | 127,847 | | | 289,584 | | | | |
| | | | | | 6,262,353 | | | 8,688,448 | | | 2.13 | % |
Switzerland: | | | | | | | | | | | | |
| 44,424 | | ABB LTD. (REGISTERED) | | | 619,065 | | | 922,416 | | | | |
| 25,102 | | ACE LTD. | | | 2,022,995 | | | 2,003,140 | | | | |
| 2,362 | | ACTELION LTD. (REGISTERED) | | | 90,246 | | | 113,456 | | | | |
| 18,895 | | ADECCO S.A. (REGISTERED) | | | 790,950 | | | 1,001,543 | | | | |
| 2,059 | | ARYZTA A.G. | | | 50,704 | | | 105,643 | | | | |
| | |
See accompanying notes to the financial statements. | 82 | (Continued) |
|
CLEARWATER INVESTMENT TRUST |
Schedule of Investments - Clearwater International Fund |
December 31, 2012 |
| | | | | | | | | | | | | |
Shares | | Security | | Cost | | Fair
value (a) | | Percent
of
net assets | |
Switzerland (Cont’d): | | | | | | | | | | |
| 484 | | BALOISE HOLDING A.G. (REGISTERED) | | $ | 26,452 | | | 42,238 | | | | |
| 8,167 | | CIE FINANCIERE RICHEMONT S.A., CLASS A (BEARER) | | | 550,612 | | | 653,062 | | | | |
| 8,634 | | CREDIT SUISSE GROUP A.G. (REGISTERED) | | | 188,288 | | | 216,639 | | | | |
| 440 | | FORBO HOLDING A.G. (REGISTERED) | | | 288,223 | | | 281,918 | | | | |
| 1,115 | | GEBERIT A.G. (REGISTERED) | | | 110,661 | | | 246,837 | | | | |
| 174 | | GIVAUDAN S.A. (REGISTERED) | | | 105,989 | | | 184,471 | | | | |
| 52,102 | | GLENCORE INTERNATIONAL PLC | | | 293,569 | | | 303,635 | | | | |
| 4,025 | | HOLCIM LTD. (REGISTERED) | | | 183,971 | | | 296,453 | | | | |
| 6,304 | | JULIUS BAER GROUP LTD. | | | 156,474 | | | 226,809 | | | | |
| 8,784 | | KUEHNE + NAGEL INTERNATIONAL A.G. (REGISTERED) | | | 975,525 | | | 1,069,020 | | | | |
| 41 | | LINDT & SPRUENGLI A.G. (PARTICIPATION CERTIFICATE) | | | 59,775 | | | 133,720 | | | | |
| 3 | | LINDT & SPRUENGLI A.G. (REGISTERED) | | | 75,352 | | | 113,213 | | | | |
| 41,960 | | LOGITECH INTERNATIONAL S.A. (REGISTERED) | | | 369,319 | | | 316,378 | | | | |
| 91,854 | | NESTLE S.A. (REGISTERED) | | | 3,591,121 | | | 5,986,503 | | | | |
| 31,669 | | NOBEL BIOCARE HOLDING A.G. (REGISTERED) | | | 289,021 | | | 269,543 | | | | |
| 58,378 | | NOVARTIS A.G. (REGISTERED) | | | 2,520,675 | | | 3,696,000 | | | | |
| 15,256 | | PANALPINA WELTTRANSPORT HOLDING A.G. (REGISTERED) | | | 1,198,279 | | | 1,551,001 | | | | |
| 10,711 | | PARGESA HOLDING S.A. (BEARER) | | | 685,433 | | | 741,217 | | | | |
| 14,218 | | ROCHE HOLDING A.G. (GENUSSCHEIN) | | | 1,931,605 | | | 2,896,561 | | | | |
| 1,381 | | SCHINDLER HOLDING A.G. (PARTICIPATION CERTIFICATE) | | | 108,493 | | | 199,473 | | | | |
| 589 | | SCHINDLER HOLDING A.G. (REGISTERED) | | | 68,597 | | | 83,480 | | | | |
| 1,089 | | SGS S.A. (REGISTERED) | | | 2,245,506 | | | 2,419,154 | | | | |
| 77 | | SIKA A.G. (BEARER) | | | 152,753 | | | 178,457 | | | | |
| 1,300 | | SONOVA HOLDING A.G. (REGISTERED) | | | 84,464 | | | 144,023 | | | | |
| 10,640 | | STMICROELECTRONICS N.V. | | | 55,625 | | | 77,576 | | | | |
| 635 | | SULZER A.G. (REGISTERED) | | | 30,609 | | | 100,634 | | | | |
| 510 | | SWATCH GROUP (THE) A.G. (BEARER) | | | 241,014 | | | 262,464 | | | | |
| 620 | | SWISS PRIME SITE A.G. (REGISTERED) | | | 50,243 | | | 51,877 | | | | |
| 3,258 | | SWISS RE A.G. | | | 237,318 | | | 237,783 | | | | |
| 850 | | SWISSCOM A.G. (REGISTERED) | | | 312,654 | | | 366,598 | | | | |
| 1,170 | | SYNGENTA A.G. (REGISTERED) | | | 237,102 | | | 471,958 | | | | |
| 56,261 | | TE CONNECTIVITY LTD. | | | 1,102,960 | | | 2,088,408 | | | | |
| 4,316 | | WOLSELEY PLC | | | 70,476 | | | 205,144 | | | | |
| 42,081 | | XSTRATA PLC | | | 389,442 | | | 748,456 | | | | |
| 2,962 | | ZURICH FINANCIAL SERVICES A.G. | | | 537,249 | | | 792,014 | | | | |
| | | | | | 23,098,809 | | | 31,798,915 | | | 7.79 | % |
Taiwan: | | | | | | | | | | |
| 803,000 | | D-LINK CORP. | | | 454,041 | | | 508,550 | | | | |
| 112,000 | | GIANT MANUFACTURING CO. LTD. | | | 593,113 | | | 644,256 | | | | |
| 142,000 | | SIMPLO TECHNOLOGY CO. LTD. | | | 830,775 | | | 717,246 | | | | |
| 159,151 | | TAIWAN SEMICONDUCTOR MANUFACTURING CO. LTD. ADR(c) | | | 2,442,840 | | | 2,731,031 | | | | |
| | | | | | 4,320,769 | | | 4,601,083 | | | 1.13 | % |
Thailand: | | | | | | | | | | |
| 1,024,700 | | LPN DEVELOPMENT PCL (REGISTERED) | | | 612,245 | | | 616,361 | | | | |
| | | | | | 612,245 | | | 616,361 | | | 0.15 | % |
Turkey: | | | | | | | | | | |
| 35,552 | | AYGAZ A/S | | | 160,534 | | | 188,258 | | | | |
| | | | | | 160,534 | | | 188,258 | | | 0.05 | % |
| | | | | | | | | | | | | |
United Kingdom: | | | | | | | | | | |
| 11,608 | | 3I GROUP PLC | | | 38,159 | | | 40,579 | | | | |
| 13,185 | | ABERDEEN ASSET MANAGEMENT PLC | | | 49,918 | | | 78,185 | | | | |
| 56,727 | | ADMIRAL GROUP PLC | | | 1,011,863 | | | 1,086,259 | | | | |
| 2,169 | | AGGREKO PLC | | | 65,013 | | | 62,203 | | | | |
| 91,638 | | ALENT PLC(b) | | | 424,694 | | | 459,684 | | | | |
| 6,487 | | AMEC PLC | | | 66,053 | | | 106,133 | | | | |
| 21,098 | | ANGLO AMERICAN PLC | | | 402,109 | | | 673,480 | | | | |
| 4,811 | | ANTOFAGASTA PLC | | | 33,978 | | | 106,904 | | | | |
| 33,451 | | AON PLC | | | 1,617,255 | | | 1,859,876 | | | | |
| 12,569 | | ARM HOLDINGS PLC | | | 157,039 | | | 160,719 | | | | |
| 55,785 | | ARM HOLDINGS PLC ADR(c) | | | 1,591,976 | | | 2,110,347 | | | | |
| 119,301 | | ASHMORE GROUP PLC | | | 722,417 | | | 689,836 | | | | |
| 23,825 | | ASTRAZENECA PLC | | | 844,023 | | | 1,126,336 | | | | |
| 59,299 | | AVIVA PLC | | | 212,664 | | | 357,976 | | | | |
| 5,239 | | BABCOCK INTERNATIONAL GROUP PLC | | | 47,416 | | | 81,303 | | | | |
| | |
See accompanying notes to the financial statements. | 83 | (Continued) |
|
CLEARWATER INVESTMENT TRUST |
Schedule of Investments - Clearwater International Fund |
December 31, 2012 |
| | | | | | | | | | | | | |
Shares | | Security | | Cost | | Fair
value (a) | | Percent
of
net assets | |
United Kingdom (Cont’d): | | | | | | | | | |
| 45,083 | | BAE SYSTEMS PLC | | $ | 222,741 | | | 247,685 | | | | |
| 192,166 | | BARCLAYS PLC | | | 735,199 | | | 829,847 | | | | |
| 28,750 | | BELLWAY PLC | | | 466,911 | | | 488,699 | | | | |
| 78,740 | | BERENDSEN PLC | | | 717,414 | | | 750,034 | | | | |
| 58,418 | | BG GROUP PLC | | | 917,965 | | | 979,569 | | | | |
| 40,871 | | BHP BILLITON PLC | | | 904,905 | | | 1,436,187 | | | | |
| 84,450 | | BODYCOTE PLC | | | 502,843 | | | 626,333 | | | | |
| 40,090 | | BOVIS HOMES GROUP PLC | | | 334,837 | | | 375,320 | | | | |
| 335,818 | | BP PLC | | | 2,248,089 | | | 2,326,803 | | | | |
| 26,734 | | BRITISH AMERICAN TOBACCO PLC | | | 942,646 | | | 1,354,613 | | | | |
| 11,630 | | BRITISH LAND CO. PLC | | | 61,579 | | | 108,122 | | | | |
| 17,468 | | BRITISH SKY BROADCASTING GROUP PLC | | | 116,486 | | | 218,209 | | | | |
| 130,142 | | BT GROUP PLC | | | 472,713 | | | 490,570 | | | | |
| 5,069 | | BUNZL PLC | | | 39,524 | | | 82,766 | | | | |
| 8,202 | | BURBERRY GROUP PLC | | | 40,549 | | | 167,932 | | | | |
| 16,980 | | CAPITA PLC | | | 162,367 | | | 210,257 | | | | |
| 6,025 | | CAPITAL SHOPPING CENTRES GROUP PLC | | | 23,472 | | | 33,900 | | | | |
| 3,001 | | CARNIVAL PLC | | | 81,398 | | | 116,008 | | | | |
| 21,278 | | CARPETRIGHT PLC(b) | | | 208,442 | | | 236,350 | | | | |
| 92,189 | | CENTRICA PLC | | | 340,421 | | | 500,807 | | | | |
| 11,669 | | COBHAM PLC | | | 30,337 | | | 42,437 | | | | |
| 278,351 | | COMPASS GROUP PLC | | | 1,770,331 | | | 3,291,991 | | | | |
| 2,950 | | CRODA INTERNATIONAL PLC | | | 101,220 | | | 114,290 | | | | |
| 178,700 | | DEBENHAMS PLC | | | 183,635 | | | 331,743 | | | | |
| 86,957 | | DIAGEO PLC | | | 1,189,739 | | | 2,531,538 | | | | |
| 17,440 | | DIGNITY PLC | | | 263,164 | | | 301,543 | | | | |
| 148,835 | | DIPLOMA PLC | | | 1,084,198 | | | 1,338,370 | | | | |
| 78,731 | | DIRECT LINE INSURANCE GROUP PLC(b) | | | 243,123 | | | 275,326 | | | | |
| 24,646 | | DOMINO’S PIZZA GROUP PLC | | | 198,335 | | | 201,760 | | | | |
| 95 | | DRAX GROUP PLC | | | 544 | | | 840 | | | | |
| 15,800 | | EVRAZ PLC | | | 58,891 | | | 69,739 | | | | |
| 92,109 | | FIBERWEB PLC | | | 101,889 | | | 104,626 | | | | |
| 9,888 | | G4S PLC | | | 27,001 | | | 41,289 | | | | |
| 32,712 | | GKN PLC | | | 101,683 | | | 122,057 | | | | |
| 91,912 | | GLAXOSMITHKLINE PLC | | | 1,410,189 | | | 1,995,555 | | | | |
| 101,170 | | GREGGS PLC | | | 781,008 | | | 751,604 | | | | |
| 17,505 | | HAMMERSON PLC | | | 69,535 | | | 141,040 | | | | |
| 62,510 | | HOMESERVE PLC | | | 239,482 | | | 235,995 | | | | |
| 356,152 | | HSBC HOLDINGS PLC | | | 2,511,669 | | | 3,766,960 | | | | |
| 109,069 | | ICAP PLC | | | 566,994 | | | 557,998 | | | | |
| 323,672 | | IG GROUP HOLDINGS PLC | | | 2,355,619 | | | 2,369,815 | | | | |
| 18,792 | | IMPERIAL TOBACCO GROUP PLC | | | 441,174 | | | 725,650 | | | | |
| 11,958 | | INMARSAT PLC | | | 92,794 | | | 115,432 | | | | |
| 15,937 | | INTERNATIONAL CONSOLIDATED AIRLINES GROUP S.A.(b) | | | 37,969 | | | 47,100 | | | | |
| 2,722 | | INTERTEK GROUP PLC | | | 108,909 | | | 137,368 | | | | |
| 12,127 | | INVENSYS PLC | | | 29,802 | | | 65,887 | | | | |
| 11,111 | | INVESTEC PLC | | | 66,959 | | | 75,677 | | | | |
| 303,659 | | ITE GROUP PLC | | | 975,638 | | | 1,218,648 | | | | |
| 17,144 | | ITV PLC | | | 9,112 | | | 29,411 | | | | |
| 29,306 | | J. SAINSBURY PLC | | | 141,007 | | | 164,888 | | | | |
| 3,841 | | JOHNSON MATTHEY PLC | | | 85,088 | | | 147,515 | | | | |
| 4,109 | | KAZAKHMYS PLC | | | 31,447 | | | 54,032 | | | | |
| 42,914 | | KINGFISHER PLC | | | 109,517 | | | 198,215 | | | | |
| 195,230 | | LAIRD PLC | | | 683,216 | | | 647,720 | | | | |
| 15,511 | | LAND SECURITIES GROUP PLC | | | 113,585 | | | 209,706 | | | | |
| 24,932 | | LEGAL & GENERAL GROUP PLC | | | 59,462 | | | 60,191 | | | | |
| 1,573,050 | | LLOYDS BANKING GROUP PLC(b) | | | 1,240,403 | | | 1,260,453 | | | | |
| 6,030 | | LONDON STOCK EXCHANGE GROUP PLC | | | 69,795 | | | 105,328 | | | | |
| 198,580 | | MAN GROUP PLC | | | 259,918 | | | 266,274 | | | | |
| 25,083 | | MARKS & SPENCER GROUP PLC | | | 101,882 | | | 156,385 | | | | |
| 223,728 | | MEARS GROUP PLC | | | 1,067,408 | | | 1,195,825 | | | | |
| 13,587 | | MEGGITT PLC | | | 60,745 | | | 84,699 | | | | |
| 15,880 | | MELROSE INDUSTRIES PLC | | | 52,258 | | | 59,161 | | | | |
| 92,482 | | MICHAEL PAGE INTERNATIONAL PLC | | | 519,290 | | | 597,311 | | | | |
| 348,938 | | MITIE GROUP PLC | | | 1,649,110 | | | 1,493,172 | | | | |
| 28,932 | | NATIONAL GRID PLC | | | 186,288 | | | 331,400 | | | | |
| | |
See accompanying notes to the financial statements. | 84 | (Continued) |
|
CLEARWATER INVESTMENT TRUST |
Schedule of Investments - Clearwater International Fund |
December 31, 2012 |
| | | | | | | | | | | | | |
Shares | | Security | | Cost | | Fair
value (a) | | Percent
of
net assets | |
United Kingdom (Cont’d): | | | | | | | | | | |
| 3,200 | | NEXT PLC | | $ | 86,367 | | | 197,506 | | | | |
| 96,618 | | OLD MUTUAL PLC | | | 133,905 | | | 286,984 | | | | |
| 12,536 | | PEARSON PLC | | | 148,820 | | | 245,071 | | | | |
| 3,761 | | PETROFAC LTD. | | | 71,320 | | | 101,896 | | | | |
| 26,634 | | PRUDENTIAL PLC | | | 375,820 | | | 371,632 | | | | |
| 442,700 | | QINETIQ GROUP PLC | | | 825,790 | | | 1,300,163 | | | | |
| 950 | | RANDGOLD RESOURCES LTD. | | | 104,460 | | | 93,628 | | | | |
| 13,321 | | RECKITT BENCKISER GROUP PLC | | | 585,115 | | | 834,477 | | | | |
| 185,888 | | REED ELSEVIER PLC | | | 1,450,716 | | | 1,951,805 | | | | |
| 24,403 | | RESOLUTION LTD. | | | 95,067 | | | 97,414 | | | | |
| 20,541 | | REXAM PLC | | | 87,985 | | | 144,344 | | | | |
| 9,588 | | RIGHTMOVE PLC | | | 246,958 | | | 220,857 | | | | |
| 19,369 | | RIO TINTO PLC | | | 853,296 | | | 1,128,679 | | | | |
| 17,193 | | ROLLS-ROYCE HOLDINGS PLC | | | 248,249 | | | 247,721 | | | | |
| 21,561 | | ROYAL BANK OF SCOTLAND GROUP PLC(b) | | | 103,058 | | | 116,125 | | | | |
| 65,996 | | RSA INSURANCE GROUP PLC | | | 124,109 | | | 133,200 | | | | |
| 11,375 | | SABMILLER PLC | | | 504,213 | | | 535,399 | | | | |
| 21,731 | | SAGE GROUP (THE) PLC | | | 74,327 | | | 104,105 | | | | |
| 76,707 | | SAVILLS PLC | | | 358,714 | | | 595,706 | | | | |
| 10,277 | | SEGRO PLC | | | 36,889 | | | 42,139 | | | | |
| 77,648 | | SERCO GROUP PLC | | | 686,588 | | | 668,480 | | | | |
| 4,954 | | SEVERN TRENT PLC | | | 76,220 | | | 126,923 | | | | |
| 14,030 | | SMITH & NEPHEW PLC | | | 98,533 | | | 155,265 | | | | |
| 5,478 | | SMITHS GROUP PLC | | | 80,025 | | | 107,824 | | | | |
| 16,949 | | SSE PLC | | | 293,983 | | | 391,710 | | | | |
| 46,350 | | STANDARD CHARTERED PLC | | | 772,953 | | | 1,174,911 | | | | |
| 48,103 | | STANDARD LIFE PLC | | | 131,737 | | | 256,934 | | | | |
| 6,872 | | SUBSEA 7 S.A. | | | 162,265 | | | 164,358 | | | | |
| 46,509 | | SYNERGY HEALTH PLC | | | 706,531 | | | 824,695 | | | | |
| 8,607 | | TATE & LYLE PLC | | | 92,385 | | | 106,729 | | | | |
| 347,453 | | TESCO PLC | | | 1,758,861 | | | 1,908,670 | | | | |
| 18,836 | | TULLOW OIL PLC | | | 298,063 | | | 383,583 | | | | |
| 24,244 | | UNILEVER PLC | | | 545,190 | | | 920,249 | | | | |
| 38,512 | | UNILEVER PLC ADR(c) | | | 941,533 | | | 1,491,185 | | | | |
| 10,541 | | UNITED UTILITIES GROUP PLC | | | 80,109 | | | 115,669 | | | | |
| 307,500 | | VECTURA GROUP PLC(b) | | | 435,905 | | | 427,643 | | | | |
| 2,343 | | VEDANTA RESOURCES PLC | | | 35,450 | | | 45,793 | | | | |
| 78,964 | | VESUVIUS PLC | | | 355,588 | | | 446,603 | | | | |
| 928,295 | | VODAFONE GROUP PLC | | | 1,671,709 | | | 2,334,538 | | | | |
| 1,806 | | WEIR GROUP (THE) PLC | | | 44,508 | | | 56,057 | | | | |
| 2,849 | | WHITBREAD PLC | | | 65,613 | | | 113,580 | | | | |
| 14,810 | | WM MORRISON SUPERMARKETS PLC | | | 54,378 | | | 63,345 | | | | |
| 23,432 | | WPP PLC | | | 141,019 | | | 340,637 | | | | |
| | | | | | 54,350,764 | | | 69,988,027 | | | 17.15 | % |
United States: | | | | | | | | | | |
| 43,295 | | ARCH CAPITAL GROUP LTD.(b) | | | 830,535 | | | 1,905,846 | | | | |
| 23,080 | | AXIS CAPITAL HOLDINGS LTD. | | | 861,791 | | | 799,491 | | | | |
| 9,091 | | BROOKFIELD OFFICE PROPERTIES, INC.(b) | | | 79,818 | | | 155,005 | | | | |
| 1,379 | | CATAMARAN CORP.(b) | | | 63,335 | | | 64,853 | | | | |
| 64,714 | | COCA-COLA ENTERPRISES, INC. | | | 2,030,149 | | | 2,053,375 | | | | |
| 21,389 | | SIGNET JEWELERS LTD. | | | 414,556 | | | 1,142,173 | | | | |
| 8,041 | | THOMSON REUTERS CORP. | | | 206,631 | | | 232,653 | | | | |
| | | | | | 4,486,815 | | | 6,353,396 | | | 1.56 | % |
| | Sub-total Common Stocks: | | | 311,374,612 | | | 386,451,806 | | | 94.71 | % |
Preferred Stocks: | | | | | | | | | | |
Germany: | | | | | | | | | | |
| 1,521 | | BAYERISCHE MOTOREN WERKE A.G. | | | 49,612 | | | 98,290 | | | | |
| 604 | | HENKEL A.G. & CO. KGAA | | | 50,309 | | | 49,602 | | | | |
| 3,478 | | PORSCHE AUTOMOBIL HOLDING S.E. | | | 159,145 | | | 283,410 | | | | |
| 3,577 | | PROSIEBENSAT.1 MEDIA A.G. | | | 60,489 | | | 100,653 | | | | |
| 2,770 | | RWE A.G. (NON VOTING) | | | 76,994 | | | 104,474 | | | | |
| | |
See accompanying notes to the financial statements. | 85 | (Continued) |
|
CLEARWATER INVESTMENT TRUST |
Schedule of Investments - Clearwater International Fund |
December 31, 2012 |
| | | | | | | | | | | | | |
Shares | | Security | | Cost | | Fair
value (a) | | Percent
of
net assets | |
Germany (Cont’d): | | | | | | | | | | |
| 1,742 | | VOLKSWAGEN A.G. | | $ | 376,312 | | | 396,315 | | | | |
| | | | | | 772,861 | | | 1,032,744 | | | 0.25 | % |
| | Sub-total Preferred Stocks | | | 772,861 | | | 1,032,744 | | | 0.25 | % |
Rights: | | | | | | | | | | |
Austria: | | | | | | | | | | |
| 10,586 | | IMMOEAST A.G.(b) | | | - | | | - | | | | |
| | | | | | - | | | - | | | 0.00 | % |
Spain: | | | | | | | | | | | |
| 22,452 | | REPSOL S.A.(b) | | | 14,061 | | | 13,692 | | | | |
| | | | | | 14,061 | | | 13,692 | | | 0.00 | % |
| | Sub-total Rights | | | 14,061 | | | 13,692 | | | 0.00 | % |
Short-Term Investments: | | | | | | | | | | |
| 33,524,860 | | NORTHERN INSTITUTIONAL FUNDS - | | | | | | | | | | |
| | | U.S. GOVERNMENT SELECT PORTFOLIO, 0.01%(e) | | | 33,524,860 | | | 33,524,860 | | | | |
| | Sub-total Short-Term Investments: | | | 33,524,860 | | | 33,524,860 | | | 8.22 | % |
| | | Grand total(f) | | $ | 345,686,394 | | | 421,023,102 | | | 103.18 | % |
Notes to Schedule of Investments:
| | |
| (a) | Securities are valued in accordance with procedures described in note 2 to the financial statements. |
| | |
| (b) | Currently non-income producing assets. |
| | |
| (c) | Securities are American Depositary Receipts of companies based outside of the United States representing 2.81% of net assets. |
| | |
| (d) | This security is being fair valued according to procedures adopted by the Board of Trustees. |
| | |
| (e) | The short-term investment is a money market portfolio of the investment company, Northern Institutional Funds. |
At December 31, 2011, the value of the Clearwater International Fund’s investment in the U.S. Government Select Portfolio of the Northern Institutional Funds was approximately $2,073,315 with net purchases of approximately $31,451,545 during the fiscal year ended December 31, 2012.
| | |
| (f) | At December 31, 2012, the cost for Federal income tax purposes was $347,101,180. The aggregate gross unrealized appreciation and depreciation of investments in securities based on this cost were as follows: |
| | | | |
Gross unrealized appreciation | | $ | 77,688,816 | |
Gross unrealized depreciation | | | (3,766,894 | ) |
Net unrealized appreciation | | $ | 73,921,922 | |
| | |
See accompanying notes to the financial statements. | 86 | (Continued) |
|
CLEARWATER INVESTMENT TRUST |
Schedule of Investments - Clearwater International Fund |
December 31, 2012 |
|
At December 31, 2012, the industry sectors for the Clearwater International Fund were: |
| | | | |
Industry Sector | | Percent of
Long-Term
Investments | |
Consumer Discretionary | | | 15.87 | % |
Consumer Staples | | | 12.20 | |
Energy | | | 6.37 | |
Financials | | | 20.92 | |
Health Care | | | 7.91 | |
Industrials | | | 16.65 | |
Information Technology | | | 8.06 | |
Materials | | | 7.72 | |
Telecommunication Services | | | 2.39 | |
Utilities | | | 1.91 | |
| | | 100.00 | % |
At December 31, 2012, the Clearwater International Fund’s investments were denominated in the following currencies:
| | | | |
Concentration by Currency | | Percent of
Long-Term
Investments | |
Euro | | | 21.86 | % |
British Pound | | | 18.31 | |
Japanese Yen | | | 14.74 | |
United States Dollar | | | 9.94 | |
Australian Dollar | | | 7.23 | |
Canadian Dollar | | | 6.97 | |
Swiss Franc | | | 6.72 | |
Hong Kong Dollar | | | 5.53 | |
All other currencies less than 5% | | | 8.70 | |
| | | 100.00 | % |
At December 31, 2012, the Clearwater International Fund had outstanding forward foreign currency exchange contracts as follows:
| | | | | | | | | | | | | | | | | | | |
Contracts To
Deliver Currency | | Amount
(Local
Currency) | | In
Exchange
For Currency | | Amount
(Local
Currency) | | Settlement
Date | | Unrealized
Gains (Losses) | | Counterparty | |
Euro | | | 4,698 | | | United States Dollar | | | 6,204 | | | 1/2/13 | | $ | 3 | | | Northern Trust | |
Hong Kong Dollar | | | 105,115 | | | United States Dollar | | | 13,560 | | | 1/2/13 | | | (2 | ) | | Northern Trust | |
United States Dollar | | | 5,019 | | | British Pound | | | 3,123 | | | 1/2/13 | | | 54 | | | Morgan Stanley | |
United States Dollar | | | 15,630 | | | British Pound | | | 9,701 | | | 1/2/13 | | | 128 | | | Northern Trust | |
United States Dollar | | | 21,574 | | | Hong Kong Dollar | | | 167,238 | | | 1/2/13 | | | 3 | | | Northern Trust | |
British Pound | | | 889 | | | United States Dollar | | | 1,437 | | | 1/3/13 | | | (7 | ) | | Northern Trust | |
British Pound | | | 935 | | | United States Dollar | | | 1,512 | | | 1/3/13 | | | (7 | ) | | Northern Trust | |
Canadian Dollar | | | 664 | | | United States Dollar | | | 666 | | | 1/3/13 | | | (1 | ) | | Northern Trust | |
Hong Kong Dollar | | | 161,750 | | | United States Dollar | | | 20,869 | | | 1/3/13 | | | - | * | | Northern Trust | |
Hong Kong Dollar | | | 10,875 | | | United States Dollar | | | 1,403 | | | 1/3/13 | | | - | * | | Northern Trust | |
Hong Kong Dollar | | | 89,937 | | | United States Dollar | | | 11,602 | | | 1/3/13 | | | (2 | ) | | Northern Trust | |
United States Dollar | | | 27,639 | | | Australian Dollar | | | 26,656 | | | 1/3/13 | | | 35 | | | Northern Trust | |
United States Dollar | | | 12,138 | | | British Pound | | | 7,513 | | | 1/3/13 | | | 66 | | | Northern Trust | |
United States Dollar | | | 5,049 | | | British Pound | | | 3,123 | | | 1/3/13 | | | 25 | | | State Street | |
United States Dollar | | | 12,725 | | | Hong Kong Dollar | | | 98,646 | | | 1/3/13 | | | 2 | | | Northern Trust | |
United States Dollar | | | 566 | | | Hong Kong Dollar | | | 4,384 | | | 1/3/13 | | | - | * | | Northern Trust | |
United States Dollar | | | 61,039 | | | Australian Dollar | | | 58,776 | | | 1/4/13 | | | (22 | ) | | Northern Trust | |
United States Dollar | | | 5,527 | | | Japanese Yen | | | 471,674 | | | 1/4/13 | | | (83 | ) | | Morgan Stanley | |
United States Dollar | | | 5,114 | | | Swiss Franc | | | 4,671 | | | 1/4/13 | | | (7 | ) | | Bank of America | |
United States Dollar | | | 5,583 | | | Japanese Yen | | | 478,763 | | | 1/7/13 | | | (56 | ) | | Bank of America | |
| | |
See accompanying notes to the financial statements. | 87 | (Continued) |
|
CLEARWATER INVESTMENT TRUST |
Schedule of Investments - Clearwater International Fund |
December 31, 2012 |
| | | | | | | | | | | | | | | | | | | |
Contracts To
Deliver Currency | | Amount
(Local
Currency) | | In
Exchange
For Currency | | Amount
(Local
Currency) | | Settlement
Date | | Unrealized
Gains (Losses) | | Counterparty | |
Japanese Yen | | | 858,678 | | | United States Dollar | | | 9,985 | | | 1/8/13 | | $ | 73 | | | Morgan Stanley | |
Japanese Yen | | | 342,039,600 | | | United States Dollar | | | 4,350,542 | | | 2/15/13 | | | 401,014 | | | Northern Trust | |
Japanese Yen | | | 16,623,952 | | | United States Dollar | | | 193,791 | | | 2/15/13 | | | 1,834 | | | Northern Trust | |
United States Dollar | | | 746,999 | | | Japanese Yen | | | 59,101,067 | | | 2/15/13 | | | (64,559 | ) | | Northern Trust | |
| | | | | | | | | | | | | | $ | 338,491 | | | | |
| | |
| * | Amount rounds to less than $1. |
The Clearwater International Fund did not have any spot foreign currency transactions outstanding as of December 31, 2012.
| | |
See accompanying notes to the financial statements. | 88 | (Continued) |
|
CLEARWATER INVESTMENT TRUST |
Schedule of Investments – Clearwater International Fund |
December 31, 2012 |
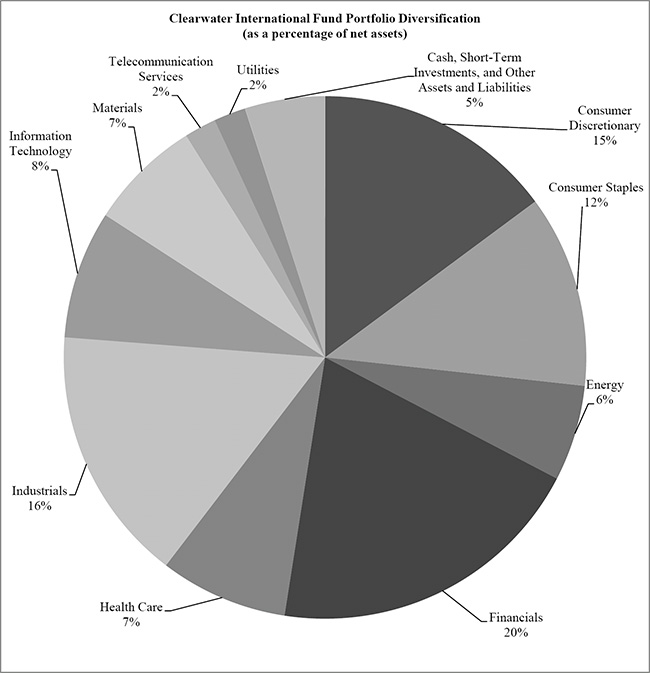
| | |
See accompanying notes to the financial statements. | 89 | (Continued) |
Item 2. Code of Ethics
As of December 31, 2012, the Board of Trustees of Clearwater Investment Trust (the “Trust”) has adopted a code of ethics that applies to the Registrant’s President/Chief Executive Officer and Treasurer/Chief Financial Officer. For the fiscal year ended December 31, 2012, there were no amendments to a provision of its code of ethics, nor were there any waivers granted from a provision of the code of ethics. A copy of its code of ethics is filed with this Form N-CSR under Item 12(a)(1).
Item 3. Audit Committee Financial Expert
The Board of Trustees of the Trust consists of six members, four of whom are Independent Trustees as defined by the Investment Company Act of 1940. The Board of Trustees does not include an “audit committee financial expert” as defined by Section 407 of the Sarbanes-Oxley Act of 2002 and the rules promulgated thereunder. Given the restrictive nature of the definition of an “audit committee financial expert”, the Board of Trustees have determined that no current member of the Board of Trustees of the Trust qualifies as an “audit committee financial expert”. Furthermore, the Board of Trustees have determined that given the nature of investment company financial statements in general and the investment policies of the Trust’s fund offerings in particular that the independent trustees possess the necessary skills and experience to perform the functions of the audit committee.
Item 4. Principal Accountant Fees and Services
| | | | |
| (a) | Audit Fees | 2012 = $80,300 | 2011 = $83,600 |
|
| (b) | Audit-Related Fees | 2012= $0 | 2011= $0 |
|
| (c) | Tax Fees | 2012= $20,700 | 2011= $21,500 |
|
| (d) | All Other Fees | 2012 = $79,500* | 2011 = $73,700* |
| * Amounts relate to audit services for Clearwater Management Company and its affiliates. |
| (e) | | | |
| | | |
| | 1. | The Independent Trustees have not adopted pre-approval policies and procedures regarding the provision of audit or non-audit services to the trust, as described in paragraph (c)(7) of Rule 2-01 of Regulation S-X, as they require that all such proposed services be approved by them in advance. |
| | | |
| | 2. | No services were pre-approved by the Independent Trustees pursuant to paragraph (c)(7) of Rule 2-01 of Regulation S-X. |
| | | |
| (f) | Not applicable. |
| | |
| (g) | Non-Audit Related Fees Provided to the Trust or to the Trust’s Investment Adviser. |
| | | | |
| | 2012 = $0 | | 2011 = $0 |
| | | | |
| (h) | Not applicable. |
Item 5. Audit Committee of Listed Registrants
The Audit Committee includes the four members of the Board of Trustees who have been deemed independent. The Audit Committee has adopted a charter.
| |
Item 6. Investments |
| |
See Item 1. |
|
Item 7. Disclosure of Proxy Voting Policies and Procedures for Closed-End Management Investment Companies |
| |
Not applicable (the Trust is an open-end management investment company) |
|
Item 8. Portfolio Managers of Closed-End Management Investment Companies |
| |
Not applicable (the Trust is an open-end management investment company) |
|
Item 9. Purchases of Equity Securities by Closed-End Management Investment Company and Affiliated Purchasers |
| |
Not applicable (the Trust is an open-end management investment company) |
|
Item 10. Submission of Matters to a Vote of Security Holders |
| |
There have been no material changes to the procedures by which shareholders may recommend nominees to the Board of Trustees. |
|
Item 11. Controls and Procedures |
| |
(a) | The Trust’s principal executive officer and principal financial officer have concluded that the Trust’s disclosure controls and procedures (as defined in Rule 30a-3(c) under the Investment company Act of 1940, as amended) are effective based on their evaluation of these controls and procedures as of a date within 90 days of the filing date of this document. |
| |
(b) | There have been no significant changes in the Trust’s internal controls over financial reporting since the filing of the last report that have materially affected, or are reasonably likely to materially affect, the Trust’s internal control over financial reporting. |
| |
Item 12. Exhibits |
| |
(a) | The Clearwater Investment Trust Code of Ethics for the President, Chief Financial Officer and Treasurer is attached. |
| |
(b) | The certifications for each principal executive and principal financial officer of the Trust as required by Rule 30a-2(a) of the Investment Company Act of 1940 are attached. |
| |
(c) | No written solicitations to purchase securities were sent or delivered during the period covered by this report by or on behalf of the Trust. |
SIGNATURES
Pursuant to the requirements of the Securities Exchange Act of 1934 and the Investment Company Act of 1940, the registrant has duly caused this report to be signed on its behalf by the undersigned, thereunto duly authorized.
| | | |
| Clearwater Investment Trust |
| | |
| By | /s/ George H. Weyerhaeuser, Jr. | |
| | George H. Weyerhaeuser, Jr., Chief Executive Officer |
| | |
| Date: March 11, 2013 |
Pursuant to the requirements of the Securities Exchange Act of 1934 and the Investment Company Act of 1940, this report has been signed below by the following persons on behalf of the registrant and in the capacities and on the dates indicated.
| | | |
| Clearwater Investment Trust |
| |
| By | /s/ George H. Weyerhaeuser, Jr. | |
| | George H. Weyerhaeuser, Jr., Chief Executive Officer |
| | |
| Date: March 11, 2013 |
| | |
| Clearwater Investment Trust |
| |
| By | /s/ George H. Weyerhaeuser, Jr. | |
| | George H. Weyerhaeuser, Jr., Treasurer |
| | |
| Date: March 11, 2013 |