As of December 31, 2011, pre-enactment capital loss carryforwards for U.S. Federal income tax purposes for the Growth Fund, Small Cap Fund, Tax-Exempt Bond Fund and International Fund are $10,839,789, $0, $7,429,939, and $0, respectively, which will expire as follows:
The following Funds’ capital loss carryforwards do not expire.
The Funds in the above table may offset future capital gains with these capital loss carryforwards.
The following capital loss carryforwards were utilized at December 31, 2011, for U.S. Federal income tax purposes:
CLEARWATER INVESTMENT TRUST
Notes to Financial Statements
December 31, 2011
| |
(7) | Expenses and Related-Party Transactions |
The Trust has a contract for investment advisory services with the Adviser. Under terms of separate agreements, Clearwater Growth Fund, Clearwater Small Cap Fund, Clearwater Tax-Exempt Bond Fund and Clearwater International Fund pay a fee equal to an annual rate of 0.90%, 1.35%, 0.60% and 1.00% of average net assets, respectively. Effective June 1, 2011, Clearwater Growth Fund’s investment advisory fee increased from 0.45% to 0.90% of average net assets. The Adviser is responsible for the payment or reimbursement of all the Funds’ expenses, except brokerage, taxes, interest, and extraordinary expenses. The Adviser has periodically reduced its management fee for each of the Funds through voluntary waivers. Effective June 1, 2011, the voluntary waivers for the Growth Fund and International Fund were increased to 0.30% and 0.25%, respectively. The voluntary waiver for the Small Cap Fund was decreased to 0.35%, effective June 1, 2011. Effective December 5, 2011, the voluntary waiver for the International Fund was increased to 0.30%. As of December 31, 2011, the management fees paid by the Growth, Small Cap, Tax-Exempt Bond and International Funds net of voluntary waiver are 0.53%, 0.98%, 0.36%, and 0.77%, respectively. Effective December 31, 2011, the management fees in place, net of voluntary waivers, for the Growth, Small Cap, Tax-Exempt Bond, and International Funds are 0.60%, 1.00%, 0.36%, and 0.70%, respectively.
In addition to fees and expenses which the Funds bear directly, the Funds indirectly bear a pro rata share of the fees and expenses of any acquired funds in which they invest, such as short-term investments in mutual funds and investments in closed-end funds. Such indirect expenses are not included in any of the reported expense ratios.
The Adviser has entered into sub advisory contracts with independent investment advisory firms for each Fund to provide daily investment management services. The sub advisory fees are based on each subadviser’s proportional net assets it currently manages within each Fund and are paid directly by the Adviser.
The sub advisory fee for the Clearwater Growth Fund, payable to Parametric, Heartland, Osterweis and Knightsbridge, is equal to an annual rate of 0.14% of the portion of net assets managed, an annual rate of 0.65% of the portion of net assets managed, an annual rate of 0.75% of the portion of net assets managed, and an annual rate of 0.75% on the first $20 million of the portion of net assets managed, decreasing to 0.50% of the portion of net assets managed in excess of $20 million, respectively.
The sub advisory fee for the Clearwater Small Cap Fund, payable to Kennedy, is equal to an annual rate of 0.85% on the first $50 million of the portion of net assets managed, decreasing to 0.80% of the portion of net assets managed in excess of $50 million. The sub advisory fee payable to Keeley is equal to an annual rate of 1.00% on the first $2 million of the portion of net assets managed, decreasing to 0.85% on the next $8 million of the portion of net assets managed, and further decreasing to 0.70% of the portion of net assets managed in excess of $10 million.
The sub advisory fee for the Clearwater Tax-Exempt Bond Fund, payable to Sit, is equal to an annual rate of 0.40% on the first $20 million in net assets, decreasing to 0.20% of net assets in excess of $75 million.
CLEARWATER INVESTMENT TRUST
Notes to Financial Statements
December 31, 2011
The sub advisory fee for the Clearwater International Fund, payable to Parametric, is equal to an annual rate of 0.15% of the portion of net assets managed. The sub advisory fee payable to AXA Rosenberg is equal to an annual rate of 0.85% on the first $50 million of the portion of net assets managed, decreasing to 0.75% on the next $50 million of the portion of net assets managed, and further decreasing to 0.65% of the portion of net assets managed in excess of $100 million. The sub advisory fee payable to Artisan Partners is equal to an annual rate of 0.80% on the first $50 million of the portion of net assets managed, decreasing to 0.60% on the next $50 million of the portion of net assets managed, and further decreasing to 0.50% of the portion of net assets managed in excess of $100 million. The sub advisory fee payable to Eagle is equal to an annual rate of 0.60% on the first $100 million of the portion of net assets managed, decreasing to 0.50% of the portion of net assets managed in excess of $100 million.
The Adviser has also engaged FCI as a sub-adviser for each Fund. FCI regularly provides the Funds with various investment-related services, including investment strategy advice, manager recommendations and related duties as requested by the Adviser. FCI also provides certain services related to due diligence, performance reporting, compliance, and other administrative functions, which support the investment management services and subadviser oversight services provided to the Trust by the Adviser. For its services, FCI is compensated with a subadvisory fee payable by the Adviser of 0.20% of each Fund’s net assets, paid on a quarterly basis. FCI is compensated out of the fees the Adviser receives from the respective Funds. FCI has agreed to waive the difference between the amount calculated under the subadvisory fee schedule and an amount determined by multiplying the total number of hours worked by FCI in providing services under the subadvisory agreement by an hourly rate that is approved by the Adviser. The effect of this waiver agreement is that fees paid to FCI under the subadvisory agreement would approximate the fees previously paid to FCI under a consulting agreement previously in effect between the Adviser and FCI.
| |
(8) | Derivative Instruments |
Information concerning the types of derivatives in which the International Fund invests, the objectives for using them and their related risks can be found in Note 2.
Below are the types of derivatives in the International Fund by location as presented in the Statements of Assets and Liabilities as of December 31, 2011:
| | | | | | | | | | | | |
| | ASSETS | | | | LIABILITIES | | | | |
Derivative Type | | Statements of Assets and
Liabilities Location | | Value | | Statements of Assets and
Liabilities Location | | Value | | Counterparty |
Forward foreign currency exchange contracts | | Unrealized appreciation on forward foreign
currency exchange contracts | | $ | 10,247 | | Unrealized depreciation on forward foreign
currency exchange contracts | | $ | 8,432 | | CSFB Global Deutsche Bank Northern Trust |
CLEARWATER INVESTMENT TRUST
Notes to Financial Statements
December 31, 2011
The following tables set forth by primary risk exposure the International Fund’s realized gain (loss) on investments and foreign currencies and net increase (decrease) in appreciation/depreciation by type of derivative contract for the year ended December 31, 2011:
| | | | | | | | | | | | |
Derivative Type | | Statements of
Operations Location | | Value | | Derivative Type | | Statements of Operations
Location | | Value |
Forward foreign currency exchange contracts | | Net realized loss on forward foreign currency exchange contracts | | $ | (247,124 | ) | Forward foreign currency exchange contracts | | Net decrease in appreciation on forward foreign currency exchange contracts | | $ | (3,232) |
Derivative transactions are measured in terms of the notional amount. The following table presents, for the International Fund, the number of transactions and average notional amounts, which is indicative of the volume of derivative activity for the year ended December 31, 2011.
| | | | | |
Foreign Exchange Contracts | |
Number of
Transactions | | Average Notional
Amount | |
| 1,573 | | $ | 1,139,153 | |
Management has evaluated subsequent events relating to the Funds through the date the financial statements were available to be issued, and has concluded there are no such events or transactions requiring financial statement disclosure and/or adjustments to the financial statements.
CLEARWATER INVESTMENT TRUST
Schedule of Investments - Clearwater Growth Fund
December 31, 2011
| | | | | | | | | | | | | |
Shares | | Security | | Cost | | Fair
value (a) | | Percent
of
net assets | |
Common Stocks: | | | | | | | | | | |
Consumer Discretionary: | | | | | | | | | | |
| 2,300 | | ABERCROMBIE & FITCH CO., CLASS A | | $ | 50,218 | | | 112,332 | | | | |
| 1,500 | | ADVANCE AUTO PARTS, INC. | | | 53,558 | | | 104,444 | | | | |
| 6,150 | | AMAZON.COM, INC.(b) | | | 274,722 | | | 1,064,565 | | | | |
| 1,600 | | AMC NETWORKS, INC., CLASS A(b) | | | 25,785 | | | 60,128 | | | | |
| 3,300 | | AMERICAN EAGLE OUTFITTERS, INC. | | | 33,099 | | | 50,457 | | | | |
| 20,800 | | AMERICAN GREETINGS CORP., CLASS A | | | 458,365 | | | 260,208 | | | | |
| 1,900 | | APOLLO GROUP, INC., CLASS A(b) | | | 80,303 | | | 102,353 | | | | |
| 1,600 | | AUTOLIV, INC.(c) | | | 44,874 | | | 85,584 | | | | |
| 500 | | AUTOZONE, INC.(b) | | | 32,038 | | | 162,485 | | | | |
| 4,575 | | BED BATH & BEYOND, INC.(b) | | | 120,780 | | | 265,213 | | | | |
| 4,800 | | BEST BUY CO., INC. | | | 84,882 | | | 112,176 | | | | |
| 1,400 | | BIG LOTS, INC.(b) | | | 15,477 | | | 52,864 | | | | |
| 2,200 | | BORGWARNER, INC.(b) | | | 51,799 | | | 140,228 | | | | |
| 750 | | BRINKER INTERNATIONAL, INC. | | | 10,084 | | | 20,070 | | | | |
| 6,400 | | CABLEVISION SYSTEMS CORP. (NEW YORK GROUP), CLASS A | | | 60,070 | | | 91,008 | | | | |
| 4,168 | | CARMAX, INC.(b) | | | 50,984 | | | 127,041 | | | | |
| 7,000 | | CARNIVAL CORP. | | | 209,545 | | | 228,480 | | | | |
| 6,043 | | CBS CORP., CLASS B (NON VOTING) | | | 52,350 | | | 164,007 | | | | |
| 600 | | CHARTER COMMUNICATIONS, INC., CLASS A(b) | | | 30,036 | | | 34,164 | | | | |
| 600 | | CHICO’S FAS, INC. | | | 5,619 | | | 6,684 | | | | |
| 62,535 | | CINEMARK HOLDINGS, INC. | | | 1,207,504 | | | 1,156,272 | | | | |
| 9,400 | | CLEAR CHANNEL OUTDOOR HOLDINGS, INC., CLASS A(b) | | | 75,051 | | | 117,970 | | | | |
| 5,000 | | COACH, INC. | | | 19,161 | | | 305,200 | | | | |
| 38,500 | | COMCAST CORP., CLASS A | | | 607,791 | | | 912,835 | | | | |
| 4,600 | | D.R. HORTON, INC. | | | 22,057 | | | 58,006 | | | | |
| 2,300 | | DARDEN RESTAURANTS, INC. | | | 47,909 | | | 104,834 | | | | |
| 1,500 | | DICK’S SPORTING GOODS, INC. | | | 24,802 | | | 55,320 | | | | |
| 14,821 | | DIRECTV, CLASS A(b) | | | 174,284 | | | 633,746 | | | | |
| 900 | | DISCOVERY COMMUNICATIONS, INC., CLASS A(b) | | | 37,611 | | | 36,873 | | | | |
| 1,600 | | DISH NETWORK CORP., CLASS A | | | 44,672 | | | 45,568 | | | | |
| 3,350 | | DOLLAR TREE, INC.(b) | | | 61,517 | | | 278,418 | | | | |
| 1,300 | | DREAMWORKS ANIMATION SKG, INC., CLASS A(b) | | | 25,298 | | | 21,574 | | | | |
| 2,210 | | EXPEDIA, INC. | | | 38,086 | | | 64,134 | | | | |
| 500 | | FAMILY DOLLAR STORES, INC. | | | 12,652 | | | 28,830 | | | | |
| 3,000 | | FOOT LOCKER, INC. | | | 40,394 | | | 71,520 | | | | |
| 58,863 | | FORD MOTOR CO.(b) | | | 323,193 | | | 633,366 | | | | |
| 300 | | FOSSIL, INC.(b) | | | 29,187 | | | 23,808 | | | | |
| 4,600 | | GAMESTOP CORP., CLASS A(b) | | | 34,643 | | | 110,998 | | | | |
| 5,700 | | GANNETT CO., INC. | | | 51,200 | | | 76,209 | | | | |
| 4,100 | | GAP (THE), INC. | | | 58,946 | | | 76,055 | | | | |
| 3,700 | | GARMIN LTD.(c) | | | 82,077 | | | 147,297 | | | | |
| 1,100 | | GENERAL MOTORS CO.(b) | | | 25,300 | | | 22,297 | | | | |
| 7,500 | | GENTEX CORP. | | | 106,860 | | | 221,925 | | | | |
| 3,450 | | GENUINE PARTS CO. | | | 102,424 | | | 211,140 | | | | |
| 11,500 | | H&R BLOCK, INC. | | | 120,130 | | | 187,795 | | | | |
| 500 | | HANESBRANDS, INC.(b) | | | 10,750 | | | 10,930 | | | | |
| 6,750 | | HARLEY-DAVIDSON, INC. | | | 39,547 | | | 262,372 | | | | |
| 4,300 | | HARMAN INTERNATIONAL INDUSTRIES, INC. | | | 74,798 | | | 163,572 | | | | |
| 400 | | HASBRO, INC. | | | 10,206 | | | 12,756 | | | | |
| 33,825 | | HOME DEPOT (THE), INC. | | | 22,060 | | | 1,422,003 | | | | |
| 4,700 | | INTERNATIONAL GAME TECHNOLOGY | | | 62,322 | | | 80,840 | | | | |
| 15,600 | | INTERPUBLIC GROUP OF COS., INC. | | | 40,950 | | | 151,788 | | | | |
| 1,300 | | ITT EDUCATIONAL SERVICES, INC.(b) | | | 52,038 | | | 73,957 | | | | |
| 800 | | J.C. PENNEY CO., INC. | | | 20,608 | | | 28,120 | | | | |
| 1,400 | | JARDEN CORP. | | | 25,277 | | | 41,832 | | | | |
| 40,800 | | JOHNSON CONTROLS, INC. | | | 1,149,341 | | | 1,275,408 | | | | |
| 7,750 | | KOHL’S CORP. | | | 86,000 | | | 382,462 | | | | |
| 4,200 | | LAMAR ADVERTISING CO., CLASS A(b) | | | 55,664 | | | 115,500 | | | | |
| 6,338 | | LAS VEGAS SANDS CORP.(b) | | | 66,556 | | | 270,823 | | | | |
| 3,500 | | LEAR CORP. | | | 148,257 | | | 139,300 | | | | |
| 1,300 | | LEGGETT & PLATT, INC. | | | 25,422 | | | 29,952 | | | | |
| 2,900 | | LENNAR CORP., CLASS A | | | 38,266 | | | 56,985 | | | | |
| 5,800 | | LIBERTY GLOBAL, INC., CLASS A(b) | | | 103,484 | | | 237,974 | | | | |
| 9,800 | | LIBERTY INTERACTIVE CORP., CLASS A(b) | | | 30,625 | | | 158,907 | | | | |
| 5,032 | | LIBERTY MEDIA CORP. - LIBERTY CAPITAL, CLASS A(b) | | | 30,073 | | | 392,748 | | | | |
| | |
See accompanying notes to the financial statements. | 28 | (Continued) |
CLEARWATER INVESTMENT TRUST
Schedule of Investments - Clearwater Growth Fund
December 31, 2011
| | | | | | | | | | | | | |
Shares | | Security | | Cost | | Fair
value (a) | | Percent
of
net assets | |
Consumer Discretionary (Cont’d): | | | | | | | | | |
| 6,190 | | LIMITED BRANDS, INC. | | $ | 70,745 | | | 249,766 | | | | |
| 1,000 | | LKQ CORP.(b) | | | 24,950 | | | 30,080 | | | | |
| 9,100 | | LOWE’S COS., INC. | | | 212,741 | | | 230,958 | | | | |
| 5,000 | | MACY’S, INC. | | | 81,374 | | | 160,900 | | | | |
| 69,000 | | MADISON SQUARE GARDEN (THE) CO., CLASS A(b) | | | 1,572,579 | | | 1,976,160 | | | | |
| 62,715 | | MARKS & SPENCER GROUP PLC ADR(c)(d) | | | 731,006 | | | 597,047 | | | | |
| 4,969 | | MARRIOTT INTERNATIONAL, INC., CLASS A | | | 60,013 | | | 144,946 | | | | |
| 75,496 | | MARRIOTT VACATIONS WORLDWIDE CORP.(b) | | | 1,321,371 | | | 1,295,511 | | | | |
| 4,200 | | MATTEL, INC. | | | 75,213 | | | 116,592 | | | | |
| 16,400 | | MCDONALD’S CORP. | | | 370,761 | | | 1,645,412 | | | | |
| 4,700 | | MCGRAW-HILL (THE) COS., INC. | | | 121,958 | | | 211,359 | | | | |
| 10,000 | | MGM RESORTS INTERNATIONAL(b) | | | 94,040 | | | 104,300 | | | | |
| 600 | | MOHAWK INDUSTRIES, INC.(b) | | | 26,796 | | | 35,910 | | | | |
| 1,400 | | MORNINGSTAR, INC. | | | 57,577 | | | 83,230 | | | | |
| 2,200 | | NEWELL RUBBERMAID, INC. | | | 26,950 | | | 35,530 | | | | |
| 34,000 | | NEWS CORP., CLASS A | | | 354,723 | | | 606,560 | | | | |
| 4,400 | | NIKE, INC., CLASS B | | | 126,358 | | | 424,028 | | | | |
| 4,300 | | NORDSTROM, INC. | | | 45,232 | | | 213,753 | | | | |
| 100 | | NVR, INC.(b) | | | 51,542 | | | 68,600 | | | | |
| 3,095 | | OMNICOM GROUP, INC. | | | 87,717 | | | 137,975 | | | | |
| 2,300 | | O’REILLY AUTOMOTIVE, INC.(b) | | | 69,868 | | | 183,885 | | | | |
| 1,500 | | PANERA BREAD CO., CLASS A(b) | | | 69,668 | | | 212,175 | | | | |
| 2,600 | | PETSMART, INC. | | | 55,966 | | | 133,354 | | | | |
| 600 | | PRICELINE.COM, INC.(b) | | | 55,053 | | | 280,626 | | | | |
| 22,900 | | PULTE GROUP, INC.(b) | | | 95,493 | | | 144,499 | | | | |
| 700 | | PVH CORP. | | | 26,254 | | | 49,343 | | | | |
| 1,700 | | RADIOSHACK CORP. | | | 20,714 | | | 16,507 | | | | |
| 1,500 | | RALPH LAUREN CORP. | | | 31,320 | | | 207,120 | | | | |
| 3,000 | | REGAL ENTERTAINMENT GROUP, CLASS A | | | 30,735 | | | 35,820 | | | | |
| 4,600 | | ROSS STORES, INC. | | | 36,395 | | | 218,638 | | | | |
| 1,800 | | ROYAL CARIBBEAN CRUISES LTD. | | | 22,599 | | | 44,586 | | | | |
| 600 | | SCRIPPS NETWORKS INTERACTIVE, INC., CLASS A | | | 21,337 | | | 25,452 | | | | |
| 12,600 | | SERVICE CORP. INTERNATIONAL | | | 90,438 | | | 134,190 | | | | |
| 2,600 | | SIGNET JEWELERS LTD.(c) | | | 52,469 | | | 114,296 | | | | |
| 9,450 | | STAPLES, INC. | | | 119,696 | | | 131,260 | | | | |
| 15,750 | | STARBUCKS CORP. | | | 204,658 | | | 724,658 | | | | |
| 1,810 | | STARWOOD HOTELS & RESORTS WORLDWIDE, INC. | | | 59,620 | | | 86,826 | | | | |
| 12,200 | | TARGET CORP. | | | 353,659 | | | 624,884 | | | | |
| 900 | | TESLA MOTORS, INC.(b) | | | 23,418 | | | 25,704 | | | | |
| 3,600 | | THOMSON REUTERS CORP. | | | 102,096 | | | 96,012 | | | | |
| 1,900 | | THOR INDUSTRIES, INC. | | | 22,316 | | | 52,117 | | | | |
| 4,200 | | TIFFANY & CO. | | | 122,192 | | | 278,292 | | | | |
| 6,279 | | TIME WARNER CABLE, INC. | | | 208,890 | | | 399,156 | | | | |
| 21,033 | | TIME WARNER, INC. | | | 476,695 | | | 760,133 | | | | |
| 5,047 | | TJX COS., INC. | | | 86,033 | | | 325,784 | | | | |
| 2,210 | | TRIPADVISOR, INC.(b) | | | 42,908 | | | 55,714 | | | | |
| 2,800 | | TRW AUTOMOTIVE HOLDINGS CORP.(b) | | | 87,856 | | | 91,280 | | | | |
| 700 | | TUPPERWARE BRANDS CORP. | | | 39,473 | | | 39,179 | | | | |
| 2,127 | | URBAN OUTFITTERS, INC.(b) | | | 37,857 | | | 58,620 | | | | |
| 1,700 | | VF CORP. | | | 87,065 | | | 215,883 | | | | |
| 8,457 | | VIACOM, INC., CLASS B | | | 218,419 | | | 384,033 | | | | |
| 5,300 | | VIRGIN MEDIA, INC. | | | 78,460 | | | 113,314 | | | | |
| 29,960 | | WALT DISNEY (THE) CO. | | | 587,935 | | | 1,123,500 | | | | |
| 2,300 | | WHIRLPOOL CORP. | | | 98,184 | | | 109,135 | | | | |
| 1,100 | | WILLIAMS-SONOMA, INC. | | | 41,492 | | | 42,350 | | | | |
| 51,400 | | WMS INDUSTRIES, INC.(b) | | | 985,422 | | | 1,054,728 | | | | |
| 5,475 | | WYNDHAM WORLDWIDE CORP. | | | 24,500 | | | 207,119 | | | | |
| 1,600 | | WYNN RESORTS LTD. | | | 42,372 | | | 176,784 | | | | |
| 9,016 | | YUM! BRANDS, INC. | | | 78,831 | | | 532,034 | | | | |
| | | | | | 17,631,583 | | | 32,032,317 | | | 9.64% | |
Consumer Staples: | | | | | | | | | | |
| 30,100 | | ALTRIA GROUP, INC. | | | 137,687 | | | 892,465 | | | | |
| 41,550 | | ARCHER-DANIELS-MIDLAND CO. | | | 1,175,362 | | | 1,188,330 | | | | |
| 5,062 | | AVON PRODUCTS, INC. | | | 99,766 | | | 88,433 | | | | |
| 4,300 | | BEAM, INC. | | | 115,443 | | | 220,289 | | | | |
| 1,944 | | BROWN-FORMAN CORP., CLASS B | | | 57,343 | | | 156,511 | | | | |
| | |
See accompanying notes to the financial statements. | 29 | (Continued) |
CLEARWATER INVESTMENT TRUST
Schedule of Investments - Clearwater Growth Fund
December 31, 2011
| | | | | | | | | | | | | |
Shares | | Security | | Cost | | Fair
value (a) | | Percent
of
net assets | |
Consumer Staples (Cont’d): | | | | | | | | | |
| 15,500 | | BUNGE LTD. | | $ | 953,676 | | | 886,600 | | | | |
| 600 | | CAMPBELL SOUP CO. | | | 16,020 | | | 19,944 | | | | |
| 4,000 | | CHURCH & DWIGHT CO., INC. | | | 100,310 | | | 183,040 | | | | |
| 3,000 | | CLOROX (THE) CO. | | | 154,515 | | | 199,680 | | | | |
| 32,261 | | COCA-COLA (THE) CO. | | | 992,260 | | | 2,257,302 | | | | |
| 2,300 | | COCA-COLA ENTERPRISES, INC. | | | 39,664 | | | 59,294 | | | | |
| 7,390 | | COLGATE-PALMOLIVE CO. | | | 422,681 | | | 682,762 | | | | |
| 6,000 | | CONAGRA FOODS, INC. | | | 123,690 | | | 158,400 | | | | |
| 4,600 | | CONSTELLATION BRANDS, INC., CLASS A(b) | | | 63,227 | | | 95,082 | | | | |
| 1,800 | | CORN PRODUCTS INTERNATIONAL, INC. | | | 52,636 | | | 94,662 | | | | |
| 35,535 | | COSAN LTD., CLASS A(c) | | | 490,821 | | | 389,464 | | | | |
| 7,800 | | COSTCO WHOLESALE CORP. | | | 237,671 | | | 649,896 | | | | |
| 36,622 | | CVS CAREMARK CORP. | | | 787,259 | | | 1,493,445 | | | | |
| 14,590 | | DIAGEO PLC ADR(c)(d) | | | 1,054,739 | | | 1,275,458 | | | | |
| 6,000 | | DR PEPPER SNAPPLE GROUP, INC. | | | 125,060 | | | 236,880 | | | | |
| 397 | | ENERGIZER HOLDINGS, INC.(b) | | | 20,533 | | | 30,760 | | | | |
| 1,867 | | ESTEE LAUDER (THE) COS., INC., CLASS A | | | 70,943 | | | 209,702 | | | | |
| 1,800 | | FLOWERS FOODS, INC. | | | 25,434 | | | 34,164 | | | | |
| 12,400 | | GENERAL MILLS, INC. | | | 277,056 | | | 501,084 | | | | |
| 2,400 | | GREEN MOUNTAIN COFFEE ROASTERS, INC.(b) | | | 44,948 | | | 107,640 | | | | |
| 3,000 | | H.J. HEINZ CO. | | | 93,909 | | | 162,120 | | | | |
| 900 | | HANSEN NATURAL CORP.(b) | | | 30,956 | | | 82,926 | | | | |
| 3,800 | | HERBALIFE LTD.(c) | | | 52,204 | | | 196,346 | | | | |
| 1,700 | | HERSHEY (THE) CO. | | | 62,742 | | | 105,026 | | | | |
| 2,400 | | HORMEL FOODS CORP. | | | 43,206 | | | 70,296 | | | | |
| 1,600 | | J.M. SMUCKER (THE) CO. | | | 64,617 | | | 125,072 | | | | |
| 2,300 | | KELLOGG CO. | | | 99,285 | | | 116,311 | | | | |
| 4,050 | | KIMBERLY-CLARK CORP. | | | 202,324 | | | 297,918 | | | | |
| 50,838 | | KRAFT FOODS, INC., CLASS A | | | 1,178,532 | | | 1,899,308 | | | | |
| 13,400 | | KROGER (THE) CO. | | | 228,089 | | | 324,548 | | | | |
| 1,374 | | LORILLARD, INC. | | | 34,727 | | | 156,636 | | | | |
| 800 | | MCCORMICK & CO., INC. (NON VOTING) | | | 24,815 | | | 40,336 | | | | |
| 2,200 | | MEAD JOHNSON NUTRITION CO. | | | 103,422 | | | 151,206 | | | | |
| 1,800 | | MOLSON COORS BREWING CO., CLASS B | | | 54,437 | | | 78,372 | | | | |
| 27,500 | | PEPSICO, INC. | | | 1,031,385 | | | 1,824,625 | | | | |
| 33,532 | | PHILIP MORRIS INTERNATIONAL, INC. | | | 336,856 | | | 2,631,591 | | | | |
| 49,560 | | PROCTER & GAMBLE (THE) CO. | | | 882,493 | | | 3,306,148 | | | | |
| 400 | | RALCORP HOLDINGS, INC.(b) | | | 30,388 | | | 34,200 | | | | |
| 3,000 | | REYNOLDS AMERICAN, INC. | | | 29,474 | | | 124,260 | | | | |
| 96,194 | | SAFEWAY, INC. | | | 2,026,334 | | | 2,023,922 | | | | |
| 13,350 | | SARA LEE CORP. | | | 110,338 | | | 252,582 | | | | |
| 5,700 | | SMITHFIELD FOODS, INC.(b) | | | 106,346 | | | 138,396 | | | | |
| 7,900 | | SYSCO CORP. | | | 121,024 | | | 231,707 | | | | |
| 7,427 | | TYSON FOODS, INC., CLASS A | | | 78,124 | | | 153,293 | | | | |
| 45,420 | | UNILEVER N.V. (REGISTERED)(c) | | | 1,366,228 | | | 1,561,085 | | | | |
| 20,150 | | WALGREEN CO. | | | 231,445 | | | 666,159 | | | | |
| 24,596 | | WAL-MART STORES, INC. | | | 1,046,575 | | | 1,469,857 | | | | |
| 4,400 | | WHOLE FOODS MARKET, INC. | | | 116,393 | | | 306,152 | | | | |
| | | | | | 17,425,412 | | | 30,641,685 | | | 9.22% | |
Energy: | | | | | | | | | | |
| 1,142 | | ALPHA NATURAL RESOURCES, INC.(b) | | | 26,874 | | | 23,331 | | | | |
| 9,446 | | ANADARKO PETROLEUM CORP. | | | 319,802 | | | 721,013 | | | | |
| 11,386 | | APACHE CORP. | | | 711,832 | | | 1,031,344 | | | | |
| 6,400 | | ARCH COAL, INC. | | | 68,943 | | | 92,864 | | | | |
| 1,700 | | ATWOOD OCEANICS, INC.(b) | | | 51,221 | | | 67,643 | | | | |
| 5,000 | | BAKER HUGHES, INC. | | | 219,568 | | | 243,200 | | | | |
| 58,000 | | BP PLC ADR(c)(d) | | | 2,621,492 | | | 2,478,920 | | | | |
| 1,504 | | CABOT OIL & GAS CORP. | | | 38,739 | | | 114,154 | | | | |
| 4,800 | | CAMERON INTERNATIONAL CORP.(b) | | | 124,988 | | | 236,112 | | | | |
| 10,400 | | CHESAPEAKE ENERGY CORP. | | | 207,021 | | | 231,816 | | | | |
| 34,095 | | CHEVRON CORP. | | | 1,499,394 | | | 3,627,708 | | | | |
| 400 | | CIMAREX ENERGY CO. | | | 24,008 | | | 24,760 | | | | |
| 42,400 | | CLOUD PEAK ENERGY, INC.(b) | | | 950,791 | | | 819,168 | | | | |
| 7,200 | | COBALT INTERNATIONAL ENERGY, INC.(b) | | | 63,000 | | | 111,744 | | | | |
| 1,700 | | CONCHO RESOURCES, INC.(b) | | | 49,632 | | | 159,375 | | | | |
| 27,744 | | CONOCOPHILLIPS | | | 706,207 | | | 2,021,705 | | | | |
| 5,431 | | CONSOL ENERGY, INC. | | | 148,332 | | | 199,318 | | | | |
| | |
See accompanying notes to the financial statements. | 30 | (Continued) |
CLEARWATER INVESTMENT TRUST
Schedule of Investments - Clearwater Growth Fund
December 31, 2011
| | | | | | | | | | | | | |
Shares | | Security | | Cost | | Fair
value (a) | | Percent
of
net assets | |
Energy (Cont’d): | | | | | | | | | | |
| 1,000 | | CONTINENTAL RESOURCES, INC.(b) | | $ | 20,765 | | | 66,710 | | | | |
| 9,300 | | DENBURY RESOURCES, INC.(b) | | | 88,950 | | | 140,430 | | | | |
| 47,775 | | DEVON ENERGY CORP. | | | 3,196,708 | | | 2,962,050 | | | | |
| 3,000 | | DRESSER-RAND GROUP, INC.(b) | | | 98,595 | | | 149,730 | | | | |
| 17,400 | | EL PASO CORP. | | | 139,789 | | | 462,318 | | | | |
| 21,072 | | ENSCO PLC ADR(c)(d) | | | 1,021,092 | | | 988,698 | | | | |
| 24,005 | | ENTERPRISE PRODUCTS PARTNERS L.P. | | | 998,596 | | | 1,113,352 | | | | |
| 4,800 | | EOG RESOURCES, INC. | | | 62,765 | | | 472,848 | | | | |
| 4,000 | | EQT CORP. | | | 132,900 | | | 219,160 | | | | |
| 82,251 | | EXXON MOBIL CORP. | | | 3,236,727 | | | 6,971,595 | | | | |
| 2,400 | | FMC TECHNOLOGIES, INC.(b) | | | 33,690 | | | 125,352 | | | | |
| 4,800 | | FOREST OIL CORP.(b) | | | 54,895 | | | 65,040 | | | | |
| 15,158 | | HALLIBURTON CO. | | | 274,762 | | | 523,103 | | | | |
| 3,100 | | HELMERICH & PAYNE, INC. | | | 39,003 | | | 180,916 | | | | |
| 1,000 | | HESS CORP. | | | 57,839 | | | 56,800 | | | | |
| 4,000 | | HOLLYFRONTIER CORP. | | | 52,098 | | | 93,600 | | | | |
| 43,395 | | KINDER MORGAN, INC. | | | 1,344,193 | | | 1,396,017 | | | | |
| 2,939 | | LONE PINE RESOURCES, INC.(b)(c) | | | 21,418 | | | 20,602 | | | | |
| 21,250 | | MAGELLAN MIDSTREAM PARTNERS L.P. | | | 1,186,723 | | | 1,463,700 | | | | |
| 36,861 | | MARATHON OIL CORP. | | | 838,219 | | | 1,078,921 | | | | |
| 23,845 | | MARATHON PETROLEUM CORP. | | | 825,453 | | | 793,800 | | | | |
| 164,500 | | MCDERMOTT INTERNATIONAL, INC.(b) | | | 1,874,601 | | | 1,893,395 | | | | |
| 2,400 | | MURPHY OIL CORP. | | | 32,055 | | | 133,776 | | | | |
| 4,600 | | NABORS INDUSTRIES LTD.(b)(c) | | | 65,274 | | | 79,764 | | | | |
| 8,722 | | NATIONAL OILWELL VARCO, INC. | | | 214,854 | | | 593,009 | | | | |
| 1,542 | | NEWFIELD EXPLORATION CO.(b) | | | 62,333 | | | 58,180 | | | | |
| 4,200 | | NOBLE ENERGY, INC. | | | 158,332 | | | 396,438 | | | | |
| 21,940 | | OCCIDENTAL PETROLEUM CORP. | | | 576,239 | | | 2,055,778 | | | | |
| 3,400 | | OCEANEERING INTERNATIONAL, INC. | | | 87,014 | | | 156,842 | | | | |
| 1,300 | | PATTERSON-UTI ENERGY, INC. | | | 24,310 | | | 25,974 | | | | |
| 3,500 | | PEABODY ENERGY CORP. | | | 69,937 | | | 115,885 | | | | |
| 3,200 | | PIONEER NATURAL RESOURCES CO. | | | 48,507 | | | 286,336 | | | | |
| 76,100 | | PLAINS EXPLORATION & PRODUCTION CO.(b) | | | 2,668,000 | | | 2,794,392 | | | | |
| 56,000 | | QEP RESOURCES, INC. | | | 1,966,765 | | | 1,640,800 | | | | |
| 10,700 | | QUICKSILVER RESOURCES, INC.(b) | | | 91,699 | | | 71,797 | | | | |
| 3,700 | | RANGE RESOURCES CORP. | | | 128,866 | | | 229,178 | | | | |
| 700 | | ROWAN COS., INC.(b) | | | 19,887 | | | 21,231 | | | | |
| 12,200 | | SANDRIDGE ENERGY, INC.(b) | | | 69,540 | | | 99,552 | | | | |
| 19,100 | | SCHLUMBERGER LTD. | | | 491,562 | | | 1,304,721 | | | | |
| 9,300 | | SOUTHWESTERN ENERGY CO.(b) | | | 163,644 | | | 297,042 | | | | |
| 10,954 | | SPECTRA ENERGY CORP. | | | 155,906 | | | 336,836 | | | | |
| 2,400 | | SUNOCO, INC. | | | 50,440 | | | 98,448 | | | | |
| 900 | | SUPERIOR ENERGY SERVICES, INC.(b) | | | 27,135 | | | 25,596 | | | | |
| 1,200 | | TESORO CORP.(b) | | | 24,660 | | | 28,032 | | | | |
| 23,075 | | TIDEWATER, INC. | | | 1,150,431 | | | 1,137,597 | | | | |
| 2,400 | | ULTRA PETROLEUM CORP.(b) | | | 74,376 | | | 71,112 | | | | |
| 12,110 | | VALERO ENERGY CORP. | | | 130,822 | | | 254,915 | | | | |
| 2,600 | | WHITING PETROLEUM CORP.(b) | | | 73,760 | | | 121,394 | | | | |
| 7,200 | | WILLIAMS (THE) COS., INC. | | | 186,912 | | | 237,744 | | | | |
| | | | | | 32,244,885 | | | 46,114,681 | | | 13.88% | |
Financials: | | | | | | | | | | |
| 6,000 | | ACE LTD.(c) | | | 317,873 | | | 420,720 | | | | |
| 1,100 | | AFFILIATED MANAGERS GROUP, INC.(b) | | | 73,654 | | | 105,545 | | | | |
| 9,850 | | AFLAC, INC. | | | 262,100 | | | 426,111 | | | | |
| 2,100 | | ALEXANDRIA REAL ESTATE EQUITIES, INC. | | | 111,601 | | | 144,837 | | | | |
| 2,700 | | ALLIED WORLD ASSURANCE CO. HOLDINGS A.G.(c) | | | 86,630 | | | 169,911 | | | | |
| 8,300 | | ALLSTATE (THE) CORP. | | | 197,623 | | | 227,503 | | | | |
| 18,333 | | AMERICAN EXPRESS CO. | | | 546,904 | | | 864,767 | | | | |
| 1,800 | | AMERICAN FINANCIAL GROUP, INC. | | | 29,745 | | | 66,402 | | | | |
| 9,500 | | AMERICAN INTERNATIONAL GROUP, INC.(b) | | | 233,988 | | | 220,400 | | | | |
| 22,580 | | AMERICAN INTERNATIONAL GROUP, INC., (FRACTIONAL SHARES)(b) | | | - | | | - | | | | |
| 5,191 | | AMERIPRISE FINANCIAL, INC. | | | 160,907 | | | 257,681 | | | | |
| 4,900 | | ANNALY CAPITAL MANAGEMENT, INC. | | | 78,180 | | | 78,204 | | | | |
| 4,748 | | AON CORP. | | | 110,582 | | | 222,206 | | | | |
| 3,628 | | APARTMENT INVESTMENT & MANAGEMENT CO., CLASS A | | | 39,421 | | | 83,117 | | | | |
| 4,800 | | ARCH CAPITAL GROUP LTD.(b)(c) | | | 101,982 | | | 178,704 | | | | |
| | |
See accompanying notes to the financial statements. | 31 | (Continued) |
CLEARWATER INVESTMENT TRUST
Schedule of Investments - Clearwater Growth Fund
December 31, 2011
| | | | | | | | | | | | | |
Shares | | Security | | Cost | | Fair
value (a) | | Percent
of
net assets | |
Financials (Cont’d): | | | | | | | | | | |
| 1,600 | | ARTHUR J. GALLAGHER & CO. | | $ | 34,040 | | | 53,504 | | | | |
| 2,500 | | ASSURANT, INC. | | | 60,538 | | | 102,650 | | | | |
| 734 | | AVALONBAY COMMUNITIES, INC. | | | 31,138 | | | 95,860 | | | | |
| 900 | | AXIS CAPITAL HOLDINGS LTD.(c) | | | 23,391 | | | 28,764 | | | | |
| 440,300 | | BANK OF AMERICA CORP. | | | 6,039,129 | | | 2,448,068 | | | | |
| 456 | | BANK OF MONTREAL(c) | | | 23,826 | | | 24,993 | | | | |
| 7,300 | | BANK OF NEW YORK MELLON (THE) CORP. | | | 150,088 | | | 145,343 | | | | |
| 53,622 | | BB&T CORP. | | | 1,299,931 | | | 1,349,666 | | | | |
| 24,500 | | BERKSHIRE HATHAWAY, INC., CLASS B(b) | | | 1,982,130 | | | 1,869,350 | | | | |
| 3,388 | | BOSTON PROPERTIES, INC. | | | 171,468 | | | 337,445 | | | | |
| 1,100 | | BRE PROPERTIES, INC. | | | 25,168 | | | 55,528 | | | | |
| 900 | | CAMDEN PROPERTY TRUST | | | 24,065 | | | 56,016 | | | | |
| 32,547 | | CAPITAL ONE FINANCIAL CORP. | | | 1,390,841 | | | 1,376,413 | | | | |
| 16,000 | | CAPITALSOURCE, INC.(b) | | | 78,410 | | | 107,200 | | | | |
| 1,000 | | CBOE HOLDINGS, INC. | | | 23,780 | | | 25,860 | | | | |
| 21,400 | | CHARLES SCHWAB (THE) CORP. | | | 186,608 | | | 240,964 | | | | |
| 79,100 | | CHIMERA INVESTMENT CORP. | | | 239,978 | | | 198,541 | | | | |
| 2,700 | | CHUBB (THE) CORP. | | | 86,607 | | | 186,894 | | | | |
| 1,400 | | CIT GROUP, INC.(b) | | | 49,108 | | | 48,818 | | | | |
| 119,381 | | CITIGROUP, INC. | | | 4,642,288 | | | 3,140,914 | | | | |
| 2,000 | | CITY NATIONAL CORP. | | | 75,538 | | | 88,360 | | | | |
| 1,373 | | CME GROUP, INC. | | | 311,424 | | | 334,559 | | | | |
| 1,100 | | CNA FINANCIAL CORP. | | | 25,102 | | | 29,425 | | | | |
| 6,700 | | COMMONWEALTH REIT | | | 127,516 | | | 111,488 | | | | |
| 400 | | DIGITAL REALTY TRUST, INC. | | | 15,650 | | | 26,668 | | | | |
| 16,287 | | DISCOVER FINANCIAL SERVICES | | | 233,079 | | | 390,888 | | | | |
| 5,200 | | DOUGLAS EMMETT, INC.(b) | | | 63,182 | | | 94,848 | | | | |
| 900 | | ENDURANCE SPECIALTY HOLDINGS LTD.(c) | | | 25,106 | | | 34,425 | | | | |
| 5,416 | | EQUITY RESIDENTIAL | | | 174,162 | | | 308,874 | | | | |
| 400 | | ERIE INDEMNITY CO., CLASS A | | | 26,912 | | | 31,264 | | | | |
| 900 | | FEDERAL REALTY INVESTMENT TRUST | | | 48,326 | | | 81,675 | | | | |
| 5,100 | | FEDERATED INVESTORS, INC., CLASS B | | | 97,600 | | | 77,265 | | | | |
| 1,600 | | FIDELITY NATIONAL FINANCIAL, INC., CLASS A | | | 24,512 | | | 25,488 | | | | |
| 25,300 | | FIFTH THIRD BANCORP | | | 220,963 | | | 321,816 | | | | |
| 400 | | FIRST CITIZENS BANCSHARES, INC., CLASS A | | | 57,523 | | | 69,996 | | | | |
| 30,500 | | FIRST HORIZON NATIONAL CORP. | | | 193,065 | | | 244,000 | | | | |
| 95,534 | | FIRST HORIZON NATIONAL CORP. (FRACTIONAL SHARES)(b) | | | - | | | - | | | | |
| 47,200 | | FIRST INTERSTATE BANCSYSTEM, INC. | | | 680,988 | | | 615,016 | | | | |
| 28,205 | | FIRST REPUBLIC BANK(b) | | | 790,953 | | | 863,355 | | | | |
| 3,359 | | FRANKLIN RESOURCES, INC. | | | 189,834 | | | 322,666 | | | | |
| 9,000 | | GOLDMAN SACHS GROUP (THE), INC. | | | 771,906 | | | 813,870 | | | | |
| 1,400 | | GREEN DOT CORP., CLASS A(b) | | | 44,569 | | | 43,708 | | | | |
| 3,500 | | GREENHILL & CO., INC. | | | 106,120 | | | 127,295 | | | | |
| 700 | | HANOVER INSURANCE GROUP (THE), INC. | | | 24,899 | | | 24,465 | | | | |
| 2,500 | | HARTFORD FINANCIAL SERVICES GROUP, INC. | | | 35,288 | | | 40,625 | | | | |
| 1,000 | | HCC INSURANCE HOLDINGS, INC. | | | 24,155 | | | 27,500 | | | | |
| 7,100 | | HCP, INC. | | | 108,388 | | | 294,153 | | | | |
| 2,000 | | HEALTH CARE REIT, INC. | | | 90,641 | | | 109,060 | | | | |
| 1,800 | | HOSPITALITY PROPERTIES TRUST | | | 23,967 | | | 41,364 | | | | |
| 16,122 | | HOST HOTELS & RESORTS, INC. | | | 138,445 | | | 238,122 | | | | |
| 678 | | HOWARD HUGHES (THE) CORP.(b) | | | 20,502 | | | 29,947 | | | | |
| 35,000 | | HUNTINGTON BANCSHARES, INC. | | | 169,770 | | | 192,150 | | | | |
| 112,550 | | INLAND REAL ESTATE CORP. | | | 951,420 | | | 856,506 | | | | |
| 1,300 | | INTERCONTINENTALEXCHANGE, INC.(b) | | | 157,514 | | | 156,715 | | | | |
| 12,700 | | INVESCO LTD. | | | 205,676 | | | 255,143 | | | | |
| 33,700 | | JANUS CAPITAL GROUP, INC. | | | 222,792 | | | 212,647 | | | | |
| 700 | | JONES LANG LASALLE, INC. | | | 39,950 | | | 42,882 | | | | |
| 56,346 | | JPMORGAN CHASE & CO. | | | 1,370,888 | | | 1,873,504 | | | | |
| 5,900 | | KEYCORP | | | 30,060 | | | 45,371 | | | | |
| 8,201 | | KIMCO REALTY CORP. | | | 101,601 | | | 133,184 | | | | |
| 4,852 | | LEGG MASON, INC. | | | 82,631 | | | 116,691 | | | | |
| 1,100 | | LIBERTY PROPERTY TRUST | | | 24,364 | | | 33,968 | | | | |
| 6,000 | | LOEWS CORP. | | | 131,444 | | | 225,900 | | | | |
| 2,600 | | LPL INVESTMENT HOLDINGS, INC.(b) | | | 67,938 | | | 79,404 | | | | |
| 2,000 | | M&T BANK CORP. | | | 145,114 | | | 152,680 | | | | |
| 5,123 | | MACERICH (THE) CO. | | | 121,389 | | | 259,224 | | | | |
| | |
See accompanying notes to the financial statements. | 32 | (Continued) |
CLEARWATER INVESTMENT TRUST
Schedule of Investments - Clearwater Growth Fund
December 31, 2011
| | | | | | | | | | | | | |
Shares | | Security | | Cost | | Fair
value (a) | | Percent
of
net assets | |
Financials (Cont’d): | | | | | | | | | | |
| 300 | | MARKEL CORP.(b) | | $ | 101,683 | | | 124,401 | | | | |
| 5,678 | | MARSH & MCLENNAN COS., INC. | | | 135,775 | | | 179,538 | | | | |
| 7,800 | | MBIA, INC.(b) | | | 38,883 | | | 90,402 | | | | |
| 1,300 | | MERCURY GENERAL CORP. | | | 38,018 | | | 59,306 | | | | |
| 7,900 | | METLIFE, INC. | | | 230,694 | | | 246,322 | | | | |
| 8,200 | | MORGAN STANLEY | | | 130,626 | | | 124,066 | | | | |
| 2,400 | | MSCI, INC., CLASS A(b) | | | 68,930 | | | 79,032 | | | | |
| 4,500 | | NASDAQ OMX GROUP (THE), INC.(b) | | | 107,280 | | | 110,295 | | | | |
| 11,049 | | NEW YORK COMMUNITY BANCORP, INC. | | | 128,782 | | | 136,676 | | | | |
| 102 | | NORTHERN TRUST CORP. | | | 3,787 | | | 4,045 | | | | |
| 2,200 | | PARTNERRE LTD.(c) | | | 119,028 | | | 141,262 | | | | |
| 4,385 | | PLUM CREEK TIMBER CO., INC. | | | 105,969 | | | 160,316 | | | | |
| 24,200 | | PNC FINANCIAL SERVICES GROUP, INC. | | | 1,208,454 | | | 1,395,614 | | | | |
| 7,100 | | PRINCIPAL FINANCIAL GROUP, INC. | | | 166,208 | | | 174,660 | | | | |
| 6,048 | | PROGRESSIVE (THE) CORP. | | | 80,691 | | | 117,996 | | | | |
| 10,169 | | PROLOGIS, INC. | | | 257,434 | | | 290,732 | | | | |
| 2,200 | | PROTECTIVE LIFE CORP. | | | 24,849 | | | 49,632 | | | | |
| 8,500 | | PRUDENTIAL FINANCIAL, INC. | | | 257,378 | | | 426,020 | | | | |
| 1,091 | | PUBLIC STORAGE | | | 67,691 | | | 146,696 | | | | |
| 25,275 | | RAYMOND JAMES FINANCIAL, INC. | | | 780,707 | | | 782,514 | | | | |
| 6,972 | | RAYONIER, INC. | | | 104,763 | | | 311,161 | | | | |
| 2,700 | | REALTY INCOME CORP. | | | 63,518 | | | 94,392 | | | | |
| 3,900 | | REGENCY CENTERS CORP. | | | 93,198 | | | 146,718 | | | | |
| 9,099 | | REGIONS FINANCIAL CORP. | | | 36,947 | | | 39,126 | | | | |
| 2,200 | | REINSURANCE GROUP OF AMERICA, INC. | | | 105,732 | | | 114,950 | | | | |
| 2,900 | | RENAISSANCERE HOLDINGS LTD.(c) | | | 136,230 | | | 215,673 | | | | |
| 7,500 | | SEI INVESTMENTS CO. | | | 108,537 | | | 130,125 | | | | |
| 1,300 | | SENIOR HOUSING PROPERTIES TRUST | | | 20,787 | | | 29,172 | | | | |
| 3,595 | | SIMON PROPERTY GROUP, INC. | | | 157,583 | | | 463,540 | | | | |
| 1,900 | | SL GREEN REALTY CORP. | | | 58,204 | | | 126,616 | | | | |
| 12,600 | | SLM CORP. | | | 134,787 | | | 168,840 | | | | |
| 1,600 | | ST. JOE (THE) CO.(b) | | | 25,024 | | | 23,456 | | | | |
| 1,400 | | STATE STREET CORP. | | | 57,274 | | | 56,434 | | | | |
| 6,634 | | SUNTRUST BANKS, INC. | | | 92,816 | | | 117,422 | | | | |
| 52,395 | | SYMETRA FINANCIAL CORP. | | | 647,597 | | | 475,223 | | | | |
| 6,349 | | T. ROWE PRICE GROUP, INC. | | | 125,884 | | | 361,576 | | | | |
| 2,100 | | TAUBMAN CENTERS, INC. | | | 61,286 | | | 130,410 | | | | |
| 12,000 | | TCF FINANCIAL CORP. | | | 111,496 | | | 123,840 | | | | |
| 3,266 | | TD AMERITRADE HOLDING CORP. | | | 45,984 | | | 51,113 | | | | |
| 5,100 | | TORCHMARK CORP. | | | 138,962 | | | 221,289 | | | | |
| 23,640 | | TRANSATLANTIC HOLDINGS, INC. | | | 1,243,761 | | | 1,293,817 | | | | |
| 10,688 | | TRAVELERS (THE) COS., INC. | | | 378,568 | | | 632,409 | | | | |
| 30,785 | | U.S. BANCORP | | | 618,521 | | | 832,734 | | | | |
| 2,400 | | UDR, INC. | | | 24,876 | | | 60,240 | | | | |
| 37,200 | | UNUM GROUP | | | 795,048 | | | 783,804 | | | | |
| 1,100 | | VALIDUS HOLDINGS LTD.(c) | | | 23,556 | | | 34,650 | | | | |
| 1,800 | | VENTAS, INC. | | | 73,053 | | | 99,234 | | | | |
| 1,300 | | VORNADO REALTY TRUST | | | 76,003 | | | 99,918 | | | | |
| 1,106 | | W.R. BERKLEY CORP. | | | 29,276 | | | 38,035 | | | | |
| 2,900 | | WADDELL & REED FINANCIAL, INC., CLASS A | | | 75,336 | | | 71,833 | | | | |
| 1,800 | | WASHINGTON FEDERAL, INC. | | | 23,535 | | | 25,182 | | | | |
| 1,900 | | WEINGARTEN REALTY INVESTORS | | | 25,128 | | | 41,458 | | | | |
| 77,800 | | WELLS FARGO & CO. | | | 957,533 | | | 2,144,168 | | | | |
| 4,900 | | XL GROUP PLC(c) | | | 95,648 | | | 96,873 | | | | |
| | | | | | 38,325,906 | | | 40,352,009 | | | 12.14% | |
Health Care: | | | | | | | | | | |
| 47,335 | | ABBOTT LABORATORIES | | | 1,974,208 | | | 2,661,647 | | | | |
| 8,703 | | AETNA, INC. | | | 122,419 | | | 367,180 | | | | |
| 3,000 | | ALEXION PHARMACEUTICALS, INC.(b) | | | 58,088 | | | 214,500 | | | | |
| 5,507 | | ALLERGAN, INC. | | | 201,259 | | | 483,184 | | | | |
| 7,200 | | AMERISOURCEBERGEN CORP. | | | 115,968 | | | 267,768 | | | | |
| 21,000 | | AMGEN, INC. | | | 85,551 | | | 1,348,410 | | | | |
| 4,100 | | BAXTER INTERNATIONAL, INC. | | | 218,728 | | | 202,868 | | | | |
| 20,315 | | BAYER A.G. ADR(c)(d) | | | 1,463,805 | | | 1,296,097 | | | | |
| 2,500 | | BECTON, DICKINSON AND CO. | | | 123,650 | | | 186,800 | | | | |
| 6,550 | | BIOGEN IDEC, INC.(b) | | | 82,841 | | | 720,828 | | | | |
| 187,900 | | BOSTON SCIENTIFIC CORP.(b) | | | 1,272,645 | | | 1,003,386 | | | | |
| | |
See accompanying notes to the financial statements. | 33 | (Continued) |
CLEARWATER INVESTMENT TRUST
Schedule of Investments - Clearwater Growth Fund
December 31, 2011
| | | | | | | | | | | | | |
Shares | | Security | | Cost | | Fair
value (a) | | Percent
of
net assets | |
Health Care (Cont’d): | | | | | | | | | | |
| 18,700 | | BRISTOL-MYERS SQUIBB CO. | | $ | 432,823 | | | 658,988 | | | | |
| 2,000 | | BRUKER CORP.(b) | | | 28,160 | | | 24,840 | | | | |
| 1,700 | | C.R. BARD, INC. | | | 111,570 | | | 145,350 | | | | |
| 3,400 | | CARDINAL HEALTH, INC. | | | 102,635 | | | 138,074 | | | | |
| 84,100 | | CAREFUSION CORP.(b) | | | 2,085,997 | | | 2,136,981 | | | | |
| 6,436 | | CELGENE CORP.(b) | | | 146,839 | | | 435,074 | | | | |
| 1,800 | | CERNER CORP.(b) | | | 40,604 | | | 110,250 | | | | |
| 5,700 | | CIGNA CORP. | | | 89,680 | | | 239,400 | | | | |
| 3,400 | | COMMUNITY HEALTH SYSTEMS, INC.(b) | | | 58,650 | | | 59,330 | | | | |
| 23,300 | | COVIDIEN PLC(c) | | | 998,647 | | | 1,048,733 | | | | |
| 1,425 | | DAVITA, INC.(b) | | | 21,812 | | | 108,029 | | | | |
| 2,500 | | DENDREON CORP.(b) | | | 24,700 | | | 19,000 | | | | |
| 3,700 | | DENTSPLY INTERNATIONAL, INC. | | | 102,582 | | | 129,463 | | | | |
| 3,800 | | EDWARDS LIFESCIENCES CORP.(b) | | | 118,152 | | | 268,660 | | | | |
| 17,000 | | ELI LILLY & CO. | | | 582,850 | | | 706,520 | | | | |
| 9,100 | | EXPRESS SCRIPTS, INC.(b) | | | 173,782 | | | 406,679 | | | | |
| 800 | | FOREST LABORATORIES, INC.(b) | | | 25,000 | | | 24,208 | | | | |
| 20,260 | | GEN-PROBE, INC.(b) | | | 1,079,249 | | | 1,197,771 | | | | |
| 14,260 | | GILEAD SCIENCES, INC.(b) | | | 231,726 | | | 583,662 | | | | |
| 6,900 | | HEALTH MANAGEMENT ASSOCIATES, INC., CLASS A(b) | | | 44,746 | | | 50,853 | | | | |
| 57,235 | | HEALTHSOUTH CORP.(b) | | | 1,027,752 | | | 1,011,342 | | | | |
| 1,900 | | HENRY SCHEIN, INC.(b) | | | 86,166 | | | 122,417 | | | | |
| 1,300 | | HILL-ROM HOLDINGS, INC. | | | 38,228 | | | 43,797 | | | | |
| 7,208 | | HOLOGIC, INC.(b) | | | 102,880 | | | 126,212 | | | | |
| 2,005 | | HOSPIRA, INC.(b) | | | 50,661 | | | 60,892 | | | | |
| 1,800 | | HUMAN GENOME SCIENCES, INC.(b) | | | 25,704 | | | 13,302 | | | | |
| 3,900 | | HUMANA, INC. | | | 39,107 | | | 341,679 | | | | |
| 1,400 | | IDEXX LABORATORIES, INC.(b) | | | 60,410 | | | 107,744 | | | | |
| 3,700 | | ILLUMINA, INC.(b) | | | 158,027 | | | 112,776 | | | | |
| 700 | | INTUITIVE SURGICAL, INC.(b) | | | 165,982 | | | 324,107 | | | | |
| 63,701 | | JOHNSON & JOHNSON | | | 2,862,186 | | | 4,177,512 | | | | |
| 800 | | LABORATORY CORP. OF AMERICA HOLDINGS(b) | | | 18,788 | | | 68,776 | | | | |
| 1,373 | | LIFE TECHNOLOGIES CORP.(b) | | | 35,179 | | | 53,423 | | | | |
| 825 | | LINCARE HOLDINGS, INC. | | | 16,059 | | | 21,211 | | | | |
| 5,700 | | MCKESSON CORP. | | | 202,596 | | | 444,087 | | | | |
| 9,756 | | MEDCO HEALTH SOLUTIONS, INC.(b) | | | 137,776 | | | 545,360 | | | | |
| 9,400 | | MEDTRONIC, INC. | | | 318,841 | | | 359,550 | | | | |
| 48,078 | | MERCK & CO., INC. | | | 1,123,592 | | | 1,812,540 | | | | |
| 1,300 | | METTLER-TOLEDO INTERNATIONAL, INC.(b) | | | 87,484 | | | 192,023 | | | | |
| 119,600 | | MYLAN, INC.(b) | | | 2,314,946 | | | 2,566,616 | | | | |
| 15,335 | | NOVARTIS A.G. ADR(c)(d) | | | 923,592 | | | 876,702 | | | | |
| 1,600 | | PATTERSON COS., INC. | | | 29,864 | | | 47,232 | | | | |
| 3,400 | | PERKINELMER, INC. | | | 53,706 | | | 68,000 | | | | |
| 2,900 | | PERRIGO CO. | | | 109,545 | | | 282,170 | | | | |
| 165,325 | | PFIZER, INC. | | | 1,355,390 | | | 3,577,633 | | | | |
| 400 | | PHARMASSET, INC.(b) | | | 32,036 | | | 51,280 | | | | |
| 20,965 | | QUEST DIAGNOSTICS, INC. | | | 1,109,957 | | | 1,217,228 | | | | |
| 4,000 | | RESMED, INC.(b) | | | 81,990 | | | 101,600 | | | | |
| 900 | | SIRONA DENTAL SYSTEMS, INC.(b) | | | 38,745 | | | 39,636 | | | | |
| 7,839 | | ST. JUDE MEDICAL, INC. | | | 226,619 | | | 268,878 | | | | |
| 7,200 | | STRYKER CORP. | | | 119,192 | | | 357,912 | | | | |
| 500 | | SXC HEALTH SOLUTIONS CORP.(b) | | | 27,765 | | | 28,240 | | | | |
| 16,775 | | TELEFLEX, INC. | | | 856,456 | | | 1,028,140 | | | | |
| 7,100 | | TENET HEALTHCARE CORP.(b) | | | 31,133 | | | 36,423 | | | | |
| 7,400 | | THERMO FISHER SCIENTIFIC, INC.(b) | | | 156,535 | | | 332,778 | | | | |
| 17,202 | | UNITEDHEALTH GROUP, INC. | | | 273,316 | | | 871,797 | | | | |
| 2,036 | | UNIVERSAL HEALTH SERVICES, INC., CLASS B | | | 38,822 | | | 79,119 | | | | |
| 28,140 | | VALEANT PHARMACEUTICALS INTERNATIONAL, INC.(b)(c) | | | 791,331 | | | 1,313,856 | | | | |
| 5,000 | | VARIAN MEDICAL SYSTEMS, INC.(b) | | | 184,300 | | | 335,650 | | | | |
| 3,000 | | VERTEX PHARMACEUTICALS, INC.(b) | | | 74,805 | | | 99,630 | | | | |
| 1,900 | | WARNER CHILCOTT PLC, CLASS A(b)(c) | | | 29,963 | | | 28,747 | | | | |
| 2,600 | | WATERS CORP.(b) | | | 60,997 | | | 192,530 | | | | |
| 3,175 | | WATSON PHARMACEUTICALS, INC.(b) | | | 79,361 | | | 191,580 | | | | |
| 9,249 | | WELLPOINT, INC. | | | 325,438 | | | 612,746 | | | | |
| 20,374 | | ZIMMER HOLDINGS, INC.(b) | | | 1,153,219 | | | 1,088,379 | | | | |
| | | | | | 29,255,807 | | | 42,877,785 | | | 12.90% | |
Industrials: | | | | | | | | | | |
| 8,287 | | 3M CO. | | | 505,006 | | | 677,297 | | | | |
| | |
See accompanying notes to the financial statements. | 34 | (Continued) |
CLEARWATER INVESTMENT TRUST
Schedule of Investments - Clearwater Growth Fund
December 31, 2011
| | | | | | | | | | | | | |
Shares | | Security | | Cost | | Fair
value (a) | | Percent
of
net assets | |
Industrials (Cont’d): | | | | | | | | | | |
| 36,100 | | ABB LTD. ADR(b)(c)(d) | | $ | 718,842 | | | 679,763 | | | | |
| 3,500 | | AECOM TECHNOLOGY CORP.(b) | | | 64,365 | | | 71,995 | | | | |
| 21,210 | | AGCO CORP.(b) | | | 815,335 | | | 911,394 | | | | |
| 43,820 | | AIR LEASE CORP.(b) | | | 1,151,677 | | | 1,038,972 | | | | |
| 3,450 | | AMETEK, INC. | | | 73,220 | | | 145,245 | | | | |
| 13,900 | | AMR CORP.(b) | | | 48,593 | | | 4,865 | | | | |
| 2,700 | | BABCOCK & WILCOX (THE) CO.(b) | | | 35,478 | | | 65,178 | | | | |
| 1,700 | | BE AEROSPACE, INC.(b) | | | 47,626 | | | 65,807 | | | | |
| 17,000 | | BOEING (THE) CO. | | | 402,135 | | | 1,246,950 | | | | |
| 3,400 | | C.H. ROBINSON WORLDWIDE, INC. | | | 164,205 | | | 237,252 | | | | |
| 2,200 | | CARLISLE COS., INC. | | | 45,116 | | | 97,460 | | | | |
| 11,004 | | CATERPILLAR, INC. | | | 295,368 | | | 996,962 | | | | |
| 2,500 | | CHICAGO BRIDGE & IRON CO. N.V. (REGISTERED)(c) | | | 50,995 | | | 94,500 | | | | |
| 2,500 | | CINTAS CORP. | | | 70,284 | | | 87,025 | | | | |
| 2,027 | | CON-WAY, INC. | | | 44,529 | | | 59,107 | | | | |
| 1,400 | | COOPER INDUSTRIES PLC | | | 60,725 | | | 75,810 | | | | |
| 800 | | COPA HOLDINGS S.A., CLASS A(c) | | | 32,618 | | | 46,936 | | | | |
| 2,600 | | CORRECTIONS CORP. OF AMERICA(b) | | | 49,022 | | | 52,962 | | | | |
| 3,948 | | CRANE CO. | | | 66,572 | | | 184,411 | | | | |
| 27,900 | | CSX CORP. | | | 97,923 | | | 587,574 | | | | |
| 3,800 | | CUMMINS, INC. | | | 53,831 | | | 334,476 | | | | |
| 11,163 | | DANAHER CORP. | | | 255,642 | | | 525,108 | | | | |
| 7,300 | | DEERE & CO. | | | 199,160 | | | 564,655 | | | | |
| 38,405 | | DIGITALGLOBE, INC.(b) | | | 1,152,062 | | | 657,110 | | | | |
| 1,600 | | DONALDSON CO., INC. | | | 63,714 | | | 108,928 | | | | |
| 3,325 | | DOVER CORP. | | | 122,574 | | | 193,016 | | | | |
| 1,987 | | DUN & BRADSTREET (THE) CORP. | | | 49,383 | | | 148,687 | | | | |
| 8,400 | | EATON CORP. | | | 158,064 | | | 365,652 | | | | |
| 34,425 | | EMCOR GROUP, INC. | | | 972,737 | | | 922,934 | | | | |
| 15,500 | | EMERSON ELECTRIC CO. | | | 422,332 | | | 722,145 | | | | |
| 195,600 | | EXELIS, INC. | | | 2,224,286 | | | 1,770,180 | | | | |
| 1,800 | | EXPEDITORS INTERNATIONAL OF WASHINGTON, INC. | | | 57,067 | | | 73,728 | | | | |
| 3,800 | | FASTENAL CO. | | | 62,224 | | | 165,718 | | | | |
| 6,653 | | FEDEX CORP. | | | 130,734 | | | 555,592 | | | | |
| 2,550 | | FLUOR CORP. | | | 52,518 | | | 128,138 | | | | |
| 4,300 | | FORTUNE BRANDS HOME & SECURITY, INC.(b) | | | 33,889 | | | 73,229 | | | | |
| 300 | | GARDNER DENVER, INC. | | | 16,684 | | | 23,118 | | | | |
| 1,400 | | GATX CORP. | | | 24,276 | | | 61,124 | | | | |
| 2,500 | | GENERAL CABLE CORP.(b) | | | 60,825 | | | 62,525 | | | | |
| 1,200 | | GENERAL DYNAMICS CORP. | | | 78,384 | | | 79,692 | | | | |
| 323,800 | | GENERAL ELECTRIC CO. | | | 5,470,770 | | | 5,799,258 | | | | |
| 3,200 | | GOODRICH CORP. | | | 95,088 | | | 395,840 | | | | |
| 4,800 | | GRAFTECH INTERNATIONAL LTD.(b) | | | 68,496 | | | 65,520 | | | | |
| 1,600 | | HARSCO CORP. | | | 28,236 | | | 32,928 | | | | |
| 6,600 | | HERTZ GLOBAL HOLDINGS, INC.(b) | | | 37,676 | | | 77,352 | | | | |
| 9,188 | | HONEYWELL INTERNATIONAL, INC. | | | 279,204 | | | 499,368 | | | | |
| 1,200 | | HUBBELL, INC., CLASS B | | | 43,310 | | | 80,232 | | | | |
| 610 | | HUNTINGTON INGALLS INDUSTRIES, INC.(b) | | | 14,978 | | | 19,081 | �� | | | |
| 2,500 | | IDEX CORP. | | | 58,238 | | | 92,775 | | | | |
| 700 | | IHS, INC., CLASS A(b) | | | 30,838 | | | 60,312 | | | | |
| 4,824 | | ILLINOIS TOOL WORKS, INC. | | | 155,812 | | | 225,329 | | | | |
| 5,400 | | IRON MOUNTAIN, INC. | | | 121,527 | | | 166,320 | | | | |
| 28,800 | | ITT CORP. | | | 517,715 | | | 556,704 | | | | |
| 2,100 | | J.B. HUNT TRANSPORT SERVICES, INC. | | | 40,530 | | | 94,647 | | | | |
| 2,068 | | JACOBS ENGINEERING GROUP, INC.(b) | | | 46,598 | | | 83,919 | | | | |
| 2,038 | | JOY GLOBAL, INC. | | | 92,539 | | | 152,789 | | | | |
| 2,900 | | KANSAS CITY SOUTHERN(b) | | | 46,328 | | | 197,229 | | | | |
| 2,800 | | KBR, INC. | | | 55,655 | | | 78,036 | | | | |
| 1,200 | | L-3 COMMUNICATIONS HOLDINGS, INC. | | | 56,882 | | | 80,016 | | | | |
| 1,200 | | LANDSTAR SYSTEM, INC. | | | 38,351 | | | 57,504 | | | | |
| 900 | | LENNOX INTERNATIONAL, INC. | | | 26,811 | | | 30,375 | | | | |
| 1,400 | | LINCOLN ELECTRIC HOLDINGS, INC. | | | 28,970 | | | 54,768 | | | | |
| 2,600 | | LOCKHEED MARTIN CORP. | | | 74,846 | | | 210,340 | | | | |
| 14,475 | | MANPOWER, INC. | | | 505,719 | | | 517,481 | | | | |
| 13,200 | | MASCO CORP. | | | 97,548 | | | 138,336 | | | | |
| 42,625 | | MASTEC, INC.(b) | | | 640,618 | | | 740,396 | | | | |
| 700 | | NORDSON CORP. | | | 29,470 | | | 28,826 | | | | |
| 5,360 | | NORFOLK SOUTHERN CORP. | | | 121,639 | | | 390,530 | | | | |
| | |
See accompanying notes to the financial statements. | 35 | (Continued) |
CLEARWATER INVESTMENT TRUST
Schedule of Investments - Clearwater Growth Fund
December 31, 2011
| | | | | | | | | | | | | |
Shares | | Security | | Cost | | Fair
value (a) | | Percent
of
net assets | |
Industrials (Cont’d): | | | | | | | | | | |
| 3,660 | | NORTHROP GRUMMAN CORP. | | $ | 139,878 | | | 214,037 | | | | |
| 6,300 | | OSHKOSH CORP.(b) | | | 109,053 | | | 134,694 | | | | |
| 1,100 | | OWENS CORNING(b) | | | 22,578 | | | 31,592 | | | | |
| 8,389 | | PACCAR, INC. | | | 91,278 | | | 314,336 | | | | |
| 2,200 | | PALL CORP. | | | 55,214 | | | 125,730 | | | | |
| 2,850 | | PARKER HANNIFIN CORP. | | | 123,853 | | | 217,312 | | | | |
| 600 | | PENTAIR, INC. | | | 17,889 | | | 19,974 | | | | |
| 2,100 | | PRECISION CASTPARTS CORP. | | | 126,967 | | | 346,059 | | | | |
| 44,000 | | QUANTA SERVICES, INC.(b) | | | 862,333 | | | 947,760 | | | | |
| 3,000 | | R.R. DONNELLEY & SONS CO. | | | 43,590 | | | 43,290 | | | | |
| 5,700 | | RAYTHEON CO. | | | 160,192 | | | 275,766 | | | | |
| 49,718 | | REPUBLIC SERVICES, INC. | | | 1,348,686 | | | 1,369,731 | | | | |
| 5,250 | | ROCKWELL AUTOMATION, INC. | | | 73,987 | | | 385,192 | | | | |
| 5,214 | | ROCKWELL COLLINS, INC. | | | 154,728 | | | 288,699 | | | | |
| 300 | | ROPER INDUSTRIES, INC. | | | 19,526 | | | 26,061 | | | | |
| 600 | | RYDER SYSTEM, INC. | | | 24,336 | | | 31,884 | | | | |
| 700 | | SNAP-ON, INC. | | | 17,991 | | | 35,434 | | | | |
| 20,400 | | SOUTHWEST AIRLINES CO. | | | 154,768 | | | 174,624 | | | | |
| 54,045 | | SPIRIT AEROSYSTEMS HOLDINGS, INC., CLASS A(b) | | | 1,246,466 | | | 1,123,055 | | | | |
| 300 | | SPX CORP. | | | 11,766 | | | 18,081 | | | | |
| 2,557 | | STANLEY BLACK & DECKER, INC. | | | 72,048 | | | 172,853 | | | | |
| 2,000 | | STERICYCLE, INC.(b) | | | 95,284 | | | 155,840 | | | | |
| 97,000 | | TEXTRON, INC. | | | 2,350,672 | | | 1,793,530 | | | | |
| 10,500 | | TYCO INTERNATIONAL LTD.(c) | | | 388,274 | | | 490,455 | | | | |
| 7,600 | | UNION PACIFIC CORP. | | | 219,426 | | | 805,144 | | | | |
| 7,840 | | UNITED PARCEL SERVICE, INC., CLASS B | | | 424,293 | | | 573,810 | | | | |
| 16,850 | | UNITED TECHNOLOGIES CORP. | | | 637,288 | | | 1,231,567 | | | | |
| 33,025 | | UNIVERSAL FOREST PRODUCTS, INC. | | | 1,164,401 | | | 1,019,482 | | | | |
| 21,735 | | URS CORP.(b) | | | 957,699 | | | 763,333 | | | | |
| 2,000 | | USG CORP.(b) | | | 12,350 | | | 20,320 | | | | |
| 4,100 | | UTI WORLDWIDE, INC.(c) | | | 50,356 | | | 54,489 | | | | |
| 1,700 | | W.W. GRAINGER, INC. | | | 74,317 | | | 318,223 | | | | |
| 1,966 | | WABCO HOLDINGS, INC.(b) | | | 30,197 | | | 85,324 | | | | |
| 700 | | WABTEC CORP. | | | 25,602 | | | 48,965 | | | | |
| 1,650 | | WASTE CONNECTIONS, INC. | | | 29,914 | | | 54,681 | | | | |
| 8,650 | | WASTE MANAGEMENT, INC. | | | 135,675 | | | 282,942 | | | | |
| 57,600 | | XYLEM, INC. | | | 1,826,023 | | | 1,479,744 | | | | |
| | | | | | 33,153,310 | | | 41,363,444 | | | 12.45% | |
Information Technology: | | | | | | | | | | |
| 8,100 | | ACCENTURE PLC, CLASS A(c) | | | 365,109 | | | 431,163 | | | | |
| 5,600 | | ACTIVISION BLIZZARD, INC. | | | 9,966 | | | 68,992 | | | | |
| 6,224 | | ADOBE SYSTEMS, INC.(b) | | | 79,363 | | | 175,953 | | | | |
| 14,300 | | ADVANCED MICRO DEVICES, INC.(b) | | | 64,278 | | | 77,220 | | | | |
| 3,300 | | AKAMAI TECHNOLOGIES, INC.(b) | | | 45,920 | | | 106,524 | | | | |
| 1,600 | | ALLIANCE DATA SYSTEMS CORP.(b) | | | 75,650 | | | 166,144 | | | | |
| 5,000 | | ALTERA CORP. | | | 94,155 | | | 185,500 | | | | |
| 200 | | AMPHENOL CORP., CLASS A | | | 8,409 | | | 9,078 | | | | |
| 8,600 | | ANALOG DEVICES, INC. | | | 120,368 | | | 307,708 | | | | |
| 2,400 | | ANSYS, INC.(b) | | | 81,726 | | | 137,472 | | | | |
| 15,000 | | APPLE, INC.(b) | | | 411,858 | | | 6,075,000 | | | | |
| 700 | | ARROW ELECTRONICS, INC.(b) | | | 18,814 | | | 26,187 | | | | |
| 52,325 | | ATMEL CORP.(b) | | | 456,466 | | | 423,832 | | | | |
| 58,000 | | ATMI, INC.(b) | | | 1,134,063 | | | 1,161,740 | | | | |
| 1,686 | | AUTODESK, INC.(b) | | | 32,709 | | | 51,136 | | | | |
| 4,066 | | AUTOMATIC DATA PROCESSING, INC. | | | 132,231 | | | 219,605 | | | | |
| 59,130 | | AVNET, INC.(b) | | | 1,932,175 | | | 1,838,352 | | | | |
| 70,325 | | BENCHMARK ELECTRONICS, INC.(b) | | | 1,211,936 | | | 947,278 | | | | |
| 4,550 | | BMC SOFTWARE, INC.(b) | | | 89,322 | | | 149,149 | | | | |
| 9,791 | | BROADCOM CORP., CLASS A(b) | | | 159,344 | | | 287,464 | | | | |
| 2,180 | | BROADRIDGE FINANCIAL SOLUTIONS, INC. | | | 33,319 | | | 49,159 | | | | |
| 4,200 | | CADENCE DESIGN SYSTEMS, INC.(b) | | | 24,003 | | | 43,680 | | | | |
| 105,450 | | CISCO SYSTEMS, INC. | | | 160,814 | | | 1,906,536 | | | | |
| 4,234 | | CITRIX SYSTEMS, INC.(b) | | | 47,867 | | | 257,088 | | | | |
| 6,300 | | COGNIZANT TECHNOLOGY SOLUTIONS CORP., CLASS A(b) | | | 95,624 | | | 405,153 | | | | |
| 148,365 | | COMPUWARE CORP.(b) | | | 1,506,265 | | | 1,234,397 | | | | |
| 6,700 | | CORELOGIC, INC.(b) | | | 76,313 | | | 86,631 | | | | |
| 21,700 | | CORNING, INC. | | | 154,491 | | | 281,666 | | | | |
| 1,300 | | CREE, INC.(b) | | | 33,512 | | | 28,652 | | | | |
| | |
See accompanying notes to the financial statements. | 36 | (Continued) |
CLEARWATER INVESTMENT TRUST
Schedule of Investments - Clearwater Growth Fund
December 31, 2011
| | | | | | | | | | | | | |
Shares | | Security | | Cost | | Fair
value (a) | | Percent
of
net assets | |
Information Technology (Cont’d): | | | | | | | | | | |
| 2,700 | | CYPRESS SEMICONDUCTOR CORP.(b) | | $ | 8,256 | | | 45,603 | | | | |
| 17,650 | | DELL, INC.(b) | | | 255,615 | | | 258,220 | | | | |
| 2,000 | | DOLBY LABORATORIES, INC., CLASS A(b) | | | 43,420 | | | 61,020 | | | | |
| 14,300 | | EBAY, INC.(b) | | | 312,035 | | | 433,719 | | | | |
| 2,140 | | ECHOSTAR CORP., CLASS A(b) | | | 36,471 | | | 44,812 | | | | |
| 34,310 | | EMC CORP.(b) | | | 233,560 | | | 739,038 | | | | |
| 900 | | EQUINIX, INC.(b) | | | 69,754 | | | 91,260 | | | | |
| 1,300 | | F5 NETWORKS, INC.(b) | | | 30,062 | | | 137,956 | | | | |
| 7,802 | | FIDELITY NATIONAL INFORMATION SERVICES, INC. | | | 135,427 | | | 207,455 | | | | |
| 3,950 | | FISERV, INC.(b) | | | 108,064 | | | 232,023 | | | | |
| 1,400 | | FLIR SYSTEMS, INC. | | | 30,177 | | | 35,098 | | | | |
| 1,400 | | FORTINET, INC.(b) | | | 24,304 | | | 30,534 | | | | |
| 1,000 | | GLOBAL PAYMENTS, INC. | | | 33,115 | | | 47,380 | | | | |
| 4,067 | | GOOGLE, INC., CLASS A(b) | | | 1,221,503 | | | 2,626,875 | | | | |
| 2,800 | | HARRIS CORP. | | | 37,337 | | | 100,912 | | | | |
| 54,557 | | HEWLETT-PACKARD CO. | | | 1,224,983 | | | 1,405,388 | | | | |
| 5,200 | | INGRAM MICRO, INC., CLASS A(b) | | | 68,614 | | | 94,588 | | | | |
| 138,725 | | INTEL CORP. | | | 1,017,830 | | | 3,364,081 | | | | |
| 17,941 | | INTERNATIONAL BUSINESS MACHINES CORP. | | | 1,445,165 | | | 3,298,991 | | | | |
| 5,000 | | INTUIT, INC. | | | 103,285 | | | 262,950 | | | | |
| 1,900 | | ITRON, INC.(b) | | | 65,968 | | | 67,963 | | | | |
| 900 | | JABIL CIRCUIT, INC.(b) | | | 14,715 | | | 17,694 | | | | |
| 4,667 | | JUNIPER NETWORKS, INC.(b) | | | 75,460 | | | 95,254 | | | | |
| 2,600 | | KLA-TENCOR CORP. | | | 86,094 | | | 125,450 | | | | |
| 3,000 | | LAM RESEARCH CORP.(b) | | | 83,706 | | | 111,060 | | | | |
| 3,700 | | LENDER PROCESSING SERVICES, INC. | | | 55,722 | | | 55,759 | | | | |
| 2,000 | | LEXMARK INTERNATIONAL, INC., CLASS A | | | 30,530 | | | 66,140 | | | | |
| 5,400 | | LINEAR TECHNOLOGY CORP. | | | 119,475 | | | 162,162 | | | | |
| 400 | | LINKEDIN CORP., CLASS A(b) | | | 25,488 | | | 25,204 | | | | |
| 23,700 | | LSI CORP.(b) | | | 99,658 | | | 141,015 | | | | |
| 5,900 | | MARVELL TECHNOLOGY GROUP LTD.(b)(c) | | | 29,824 | | | 81,715 | | | | |
| 1,700 | | MASTERCARD, INC., CLASS A | | | 182,282 | | | 633,794 | | | | |
| 7,000 | | MAXIM INTEGRATED PRODUCTS, INC. | | | 125,147 | | | 182,280 | | | | |
| 4,200 | | MICROCHIP TECHNOLOGY, INC. | | | 66,925 | | | 153,846 | | | | |
| 15,300 | | MICRON TECHNOLOGY, INC.(b) | | | 68,620 | | | 96,237 | | | | |
| 1,000 | | MICROS SYSTEMS, INC.(b) | | | 26,215 | | | 46,580 | | | | |
| 123,950 | | MICROSOFT CORP. | | | 535,441 | | | 3,217,742 | | | | |
| 3,700 | | MOTOROLA MOBILITY HOLDINGS, INC.(b) | | | 57,454 | | | 143,560 | | | | |
| 56,428 | | MOTOROLA SOLUTIONS, INC. | | | 2,240,348 | | | 2,612,052 | | | | |
| 4,200 | | NETAPP, INC.(b) | | | 94,994 | | | 152,334 | | | | |
| 4,800 | | NEUSTAR, INC., CLASS A(b) | | | 79,848 | | | 164,016 | | | | |
| 1,600 | | NOVELLUS SYSTEMS, INC.(b) | | | 40,000 | | | 66,064 | | | | |
| 4,800 | | NUANCE COMMUNICATIONS, INC.(b) | | | 63,624 | | | 120,768 | | | | |
| 8,900 | | NVIDIA CORP.(b) | | | 60,716 | | | 123,354 | | | | |
| 4,000 | | ON SEMICONDUCTOR CORP.(b) | | | 30,100 | | | 30,880 | | | | |
| 70,462 | | ORACLE CORP. | | | 105,191 | | | 1,807,350 | | | | |
| 6,266 | | PAYCHEX, INC. | | | 76,160 | | | 188,669 | | | | |
| 22,200 | | QUALCOMM, INC. | | | 562,630 | | | 1,214,340 | | | | |
| 4,200 | | RED HAT, INC.(b) | | | 61,669 | | | 173,418 | | | | |
| 136,275 | | RF MICRO DEVICES, INC.(b) | | | 849,403 | | | 735,885 | | | | |
| 1,100 | | RIVERBED TECHNOLOGY, INC.(b) | | | 23,815 | | | 25,850 | | | | |
| 2,300 | | ROVI CORP.(b) | | | 55,714 | | | 56,534 | | | | |
| 2,000 | | SAIC, INC.(b) | | | 24,560 | | | 24,580 | | | | |
| 1,900 | | SALESFORCE.COM, INC.(b) | | | 86,710 | | | 192,774 | | | | |
| 5,300 | | SANDISK CORP.(b) | | | 51,148 | | | 260,813 | | | | |
| 6,500 | | SEAGATE TECHNOLOGY PLC(c) | | | 61,132 | | | 106,600 | | | | |
| 13,177 | | SUNPOWER CORP.(b) | | | 117,625 | | | 82,093 | | | | |
| 15,519 | | SYMANTEC CORP.(b) | | | 88,098 | | | 242,872 | | | | |
| 1,500 | | SYNOPSYS, INC.(b) | | | 24,907 | | | 40,800 | | | | |
| 26,450 | | TE CONNECTIVITY LTD.(c) | | | 876,308 | | | 814,924 | | | | |
| 14,300 | | TELLABS, INC. | | | 64,350 | | | 57,772 | | | | |
| 4,500 | | TERADATA CORP.(b) | | | 73,317 | | | 218,295 | | | | |
| 4,400 | | TERADYNE, INC.(b) | | | 40,150 | | | 59,972 | | | | |
| 17,400 | | TEXAS INSTRUMENTS, INC. | | | 280,527 | | | 506,514 | | | | |
| 2,500 | | TRIMBLE NAVIGATION LTD.(b) | | | 38,162 | | | 108,500 | | | | |
| 7,500 | | VISA, INC., CLASS A | | | 543,213 | | | 761,475 | | | | |
| 7,800 | | VISHAY INTERTECHNOLOGY, INC.(b) | | | 48,931 | | | 70,122 | | | | |
| 557 | | VISHAY PRECISION GROUP, INC.(b) | | | 5,692 | | | 8,901 | | | | |
| | |
See accompanying notes to the financial statements. | 37 | (Continued) |
CLEARWATER INVESTMENT TRUST
Schedule of Investments - Clearwater Growth Fund
December 31, 2011
| | | | | | | | | | | | | |
Shares | | Security | | Cost | | Fair
value (a) | | Percent
of
net assets | |
Information Technology (Cont’d): | | | | | | | | | | |
| 1,500 | | VMWARE, INC., CLASS A(b) | | $ | 47,284 | | | 124,785 | | | | |
| 2,666 | | WEBMD HEALTH CORP.(b) | | | 58,227 | | | 100,108 | | | | |
| 49,525 | | WEBSENSE, INC.(b) | | | 1,048,348 | | | 927,603 | | | | |
| 5,900 | | WESTERN DIGITAL CORP.(b) | | | 91,433 | | | 182,605 | | | | |
| 14,207 | | XEROX CORP. | | | 94,177 | | | 113,088 | | | | |
| 6,750 | | XILINX, INC. | | | 47,180 | | | 216,405 | | | | |
| 15,940 | | YAHOO!, INC.(b) | | | 136,630 | | | 257,112 | | | | |
| | | | | | 25,136,092 | | | 49,030,044 | | | 14.75% | |
Materials: | | | | | | | | | | |
| 9,600 | | AGNICO-EAGLE MINES LTD.(c) | | | 444,382 | | | 348,672 | | | | |
| 3,375 | | AIR PRODUCTS & CHEMICALS, INC. | | | 165,820 | | | 287,516 | | | | |
| 400 | | AIRGAS, INC. | | | 16,882 | | | 31,232 | | | | |
| 1,300 | | ALBEMARLE CORP. | | | 29,152 | | | 66,963 | | | | |
| 16,800 | | ALCOA, INC. | | | 175,346 | | | 145,320 | | | | |
| 1,600 | | ALLEGHENY TECHNOLOGIES, INC. | | | 39,592 | | | 76,480 | | | | |
| 3,500 | | ALLIED NEVADA GOLD CORP.(b) | | | 105,490 | | | 105,980 | | | | |
| 55,000 | | ANGLOGOLD ASHANTI LTD. ADR(c)(d) | | | 2,570,646 | | | 2,334,750 | | | | |
| 800 | | APTARGROUP, INC. | | | 27,324 | | | 41,736 | | | | |
| 1,600 | | ASHLAND, INC. | | | 47,358 | | | 91,456 | | | | |
| 124,725 | | AURICO GOLD, INC.(b)(c) | | | 966,685 | | | 1,002,564 | | | | |
| 3,064 | | BALL CORP. | | | 11,968 | | | 109,415 | | | | |
| 3,000 | | BEMIS CO., INC. | | | 66,889 | | | 90,240 | | | | |
| 1,300 | | CF INDUSTRIES HOLDINGS, INC. | | | 124,851 | | | 188,474 | | | | |
| 1,700 | | CLIFFS NATURAL RESOURCES, INC. | | | 42,764 | | | 105,995 | | | | |
| 500 | | COMPASS MINERALS INTERNATIONAL, INC. | | | 27,452 | | | 34,425 | | | | |
| 40,505 | | CROWN HOLDINGS, INC.(b) | | | 1,226,421 | | | 1,360,158 | | | | |
| 700 | | CYTEC INDUSTRIES, INC. | | | 25,564 | | | 31,255 | | | | |
| 1,000 | | DOMTAR CORP.(c) | | | 52,480 | | | 79,960 | | | | |
| 11,000 | | DOW CHEMICAL (THE) CO. | | | 238,011 | | | 316,360 | | | | |
| 13,025 | | E.I. DU PONT DE NEMOURS & CO. | | | 385,472 | | | 596,285 | | | | |
| 438 | | EAGLE MATERIALS, INC. | | | 1,727 | | | 11,239 | | | | |
| 3,000 | | EASTMAN CHEMICAL CO. | | | 58,012 | | | 117,180 | | | | |
| 4,491 | | ECOLAB, INC. | | | 162,542 | | | 259,625 | | | | |
| 20,496 | | FREEPORT-MCMORAN COPPER & GOLD, INC. | | | 517,188 | | | 754,048 | | | | |
| 900 | | GREIF, INC., CLASS A | | | 27,104 | | | 40,995 | | | | |
| 3,683 | | INTERNATIONAL FLAVORS & FRAGRANCES, INC. | | | 79,230 | | | 193,063 | | | | |
| 9,431 | | INTERNATIONAL PAPER CO. | | | 117,152 | | | 279,158 | | | | |
| 2,300 | | KRONOS WORLDWIDE, INC. | | | 42,780 | | | 41,492 | | | | |
| 3,600 | | LYONDELLBASELL INDUSTRIES N.V., CLASS A(c) | | | 106,560 | | | 116,964 | | | | |
| 700 | | MARTIN MARIETTA MATERIALS, INC. | | | 27,965 | | | 52,787 | | | | |
| 2,875 | | MEADWESTVACO CORP. | | | 30,334 | | | 86,106 | | | | |
| 10,115 | | MONSANTO CO. | | | 47,604 | | | 708,758 | | | | |
| 4,400 | | MOSAIC (THE) CO. | | | 150,149 | | | 221,892 | | | | |
| 54,100 | | NEWMONT MINING CORP. | | | 2,751,951 | | | 3,246,541 | | | | |
| 5,844 | | NUCOR CORP. | | | 99,313 | | | 231,247 | | | | |
| 5,950 | | OWENS-ILLINOIS, INC.(b) | | | 91,875 | | | 115,311 | | | | |
| 2,100 | | PACKAGING CORP. OF AMERICA | | | 30,901 | | | 53,004 | | | | |
| 3,986 | | PPG INDUSTRIES, INC. | | | 180,558 | | | 332,791 | | | | |
| 6,450 | | PRAXAIR, INC. | | | 258,706 | | | 689,505 | | | | |
| 2,200 | | RELIANCE STEEL & ALUMINUM CO. | | | 61,215 | | | 107,118 | | | | |
| 1,100 | | ROYAL GOLD, INC. | | | 53,182 | | | 74,173 | | | | |
| 6,500 | | RPM INTERNATIONAL, INC. | | | 72,503 | | | 159,575 | | | | |
| 42,325 | | RTI INTERNATIONAL METALS, INC.(b) | | | 995,824 | | | 982,363 | | | | |
| 200 | | SCOTTS MIRACLE-GRO (THE) CO., CLASS A | | | 7,195 | | | 9,338 | | | | |
| 2,500 | | SEALED AIR CORP. | | | 45,225 | | | 43,025 | | | | |
| 1,585 | | SHERWIN-WILLIAMS (THE) CO. | | | 72,398 | | | 141,493 | | | | |
| 3,600 | | SONOCO PRODUCTS CO. | | | 74,519 | | | 118,656 | | | | |
| 3,200 | | SOUTHERN COPPER CORP. | | | 38,448 | | | 96,576 | | | | |
| 8,700 | | STEEL DYNAMICS, INC. | | | 95,178 | | | 114,405 | | | | |
| 2,000 | | TEMPLE-INLAND, INC. | | | 22,890 | | | 63,420 | | | | |
| 3,200 | | VALSPAR CORP. | | | 68,240 | | | 124,704 | | | | |
| 2,100 | | VULCAN MATERIALS CO. | | | 63,441 | | | 82,635 | | | | |
| 1,800 | | WALTER ENERGY, INC. | | | 42,609 | | | 109,008 | | | | |
| | | | | | 13,285,067 | | | 17,223,431 | | | 5.18% | |
Telecommunication Services: | | | | | | | | | | |
| 3,550 | | AMERICAN TOWER CORP., CLASS A(b) | | | 164,786 | | | 213,036 | | | | |
| | |
See accompanying notes to the financial statements. | 38 | (Continued) |
CLEARWATER INVESTMENT TRUST
Schedule of Investments - Clearwater Growth Fund
December 31, 2011
| | | | | | | | | | | | | |
Shares | | Security | | Cost | | Fair
value (a) | | Percent
of
net assets | |
Telecommunication Services (Cont’d): | | | | | | | | | | |
| 128,715 | | AT&T, INC. | | $ | 3,085,810 | | | 3,892,341 | | | | |
| 2,600 | | CENTURYLINK, INC. | | | 97,708 | | | 96,720 | | | | |
| 31,600 | | CLEARWIRE CORP., CLASS A(b) | | | 78,368 | | | 61,304 | | | | |
| 4,600 | | CROWN CASTLE INTERNATIONAL CORP.(b) | | | 194,396 | | | 206,080 | | | | |
| 40,100 | | FRONTIER COMMUNICATIONS CORP. | | | 242,421 | | | 206,515 | | | | |
| 4,400 | | NII HOLDINGS, INC.(b) | | | 133,628 | | | 93,720 | | | | |
| 5,000 | | TELEPHONE & DATA SYSTEMS, INC. | | | 109,150 | | | 129,450 | | | | |
| 51,483 | | VERIZON COMMUNICATIONS, INC. | | | 1,529,395 | | | 2,065,498 | | | | |
| | | | | | 5,635,662 | | | 6,964,664 | | | 2.10% | |
Utilities: | | | | | | | | | | |
| 10,400 | | AES (THE) CORP.(b) | | | 105,450 | | | 123,136 | | | | |
| 4,500 | | AGL RESOURCES, INC. | | | 135,198 | | | 190,170 | | | | |
| 1,000 | | ALLIANT ENERGY CORP. | | | 24,835 | | | 44,110 | | | | |
| 1,600 | | AMEREN CORP. | | | 40,872 | | | 53,008 | | | | |
| 9,200 | | AMERICAN ELECTRIC POWER CO., INC. | | | 289,948 | | | 380,052 | | | | |
| 36,935 | | AMERICAN WATER WORKS CO., INC. | | | 905,525 | | | 1,176,749 | | | | |
| 1,888 | | AQUA AMERICA, INC. | | | 32,248 | | | 41,630 | | | | |
| 33,100 | | BLACK HILLS CORP. | | | 999,432 | | | 1,111,498 | | | | |
| 8,600 | | CALPINE CORP.(b) | | | 57,319 | | | 140,438 | | | | |
| 5,800 | | CENTERPOINT ENERGY, INC. | | | 66,308 | | | 116,522 | | | | |
| 10,200 | | CMS ENERGY CORP. | | | 144,342 | | | 225,216 | | | | |
| 4,589 | | CONSOLIDATED EDISON, INC. | | | 184,849 | | | 284,656 | | | | |
| 2,715 | | CONSTELLATION ENERGY GROUP, INC. | | | 79,463 | | | 107,704 | | | | |
| 8,862 | | DOMINION RESOURCES, INC. | | | 284,452 | | | 470,395 | | | | |
| 2,800 | | DTE ENERGY CO. | | | 105,289 | | | 152,460 | | | | |
| 22,213 | | DUKE ENERGY CORP. | | | 248,268 | | | 488,686 | | | | |
| 8,525 | | EDISON INTERNATIONAL | | | 182,117 | | | 352,935 | | | | |
| 3,064 | | ENTERGY CORP. | | | 60,101 | | | 223,825 | | | | |
| 6,500 | | EXELON CORP. | | | 245,607 | | | 281,905 | | | | |
| 3,500 | | FIRSTENERGY CORP. | | | 135,258 | | | 155,050 | | | | |
| 8,700 | | GREAT PLAINS ENERGY, INC. | | | 157,250 | | | 189,486 | | | | |
| 37,200 | | HAWAIIAN ELECTRIC INDUSTRIES, INC. | | | 827,997 | | | 985,056 | | | | |
| 800 | | INTEGRYS ENERGY GROUP, INC. | | | 41,296 | | | 43,344 | | | | |
| 3,500 | | ITC HOLDINGS CORP. | | | 154,844 | | | 265,580 | | | | |
| 1,500 | | NATIONAL FUEL GAS CO. | | | 38,322 | | | 83,370 | | | | |
| 4,000 | | NEXTERA ENERGY, INC. | | | 157,876 | | | 243,520 | | | | |
| 6,900 | | NISOURCE, INC. | | | 111,901 | | | 164,289 | | | | |
| 2,600 | | NORTHEAST UTILITIES | | | 64,649 | | | 93,782 | | | | |
| 5,500 | | NRG ENERGY, INC.(b) | | | 108,207 | | | 99,660 | | | | |
| 1,800 | | NSTAR | | | 60,859 | | | 84,528 | | | | |
| 6,200 | | NV ENERGY, INC. | | | 76,954 | | | 101,370 | | | | |
| 2,400 | | OGE ENERGY CORP. | | | 43,344 | | | 136,104 | | | | |
| 1,000 | | ONEOK, INC. | | | 31,518 | | | 86,690 | | | | |
| 4,028 | | PEPCO HOLDINGS, INC. | | | 71,539 | | | 81,768 | | | | |
| 7,700 | | PG&E CORP. | | | 145,781 | | | 317,394 | | | | |
| 2,400 | | PINNACLE WEST CAPITAL CORP. | | | 71,637 | | | 115,632 | | | | |
| 63,425 | | PNM RESOURCES, INC. | | | 779,548 | | | 1,156,238 | | | | |
| 700 | | PPL CORP. | | | 11,190 | | | 20,594 | | | | |
| 4,600 | | PROGRESS ENERGY, INC. | | | 166,393 | | | 257,692 | | | | |
| 5,984 | | PUBLIC SERVICE ENTERPRISE GROUP, INC. | | | 171,531 | | | 197,532 | | | | |
| 67,975 | | QUESTAR CORP. | | | 1,151,883 | | | 1,349,984 | | | | |
| 4,800 | | SCANA CORP. | | | 166,536 | | | 216,288 | | | | |
| 2,700 | | SEMPRA ENERGY | | | 124,368 | | | 148,500 | | | | |
| 11,300 | | SOUTHERN (THE) CO. | | | 258,573 | | | 523,077 | | | | |
| 7,600 | | TECO ENERGY, INC. | | | 90,842 | | | 145,464 | | | | |
| 3,100 | | UGI CORP. | | | 51,202 | | | 91,140 | | | | |
| 1,400 | | WESTAR ENERGY, INC. | | | 25,767 | | | 40,292 | | | | |
| 4,820 | | WISCONSIN ENERGY CORP. | | | 46,469 | | | 168,507 | | | | |
| 4,825 | | XCEL ENERGY, INC. | | | 43,342 | | | 133,363 | | | | |
| | | | | | 9,578,499 | | | 13,660,389 | | | 4.11% | |
| | Sub-total Common Stocks: | | | 221,672,223 | | | 320,260,449 | | | 96.37% | |
Rights: | | | | | | | | | | |
Health Care: | | | | | | | | | | |
| 700 | | SANOFI(b)(c) | | | - | | | 840 | | | | |
| | Sub-total Rights: | | | - | | | 840 | | | 0.00% | |
| | |
See accompanying notes to the financial statements. | 39 | (Continued) |
CLEARWATER INVESTMENT TRUST
Schedule of Investments - Clearwater Growth Fund
December 31, 2011
| | | | | | | | | | | | | |
Shares | | Security | | Cost | | Fair
value (a) | | Percent
of
net assets | |
Short-Term Investments: |
| 12,242,109 | | NORTHERN INSTITUTIONAL GOVERNMENT SELECT PORTFOLIO, 0.01%(e) | | $ | 12,242,109 | | | 12,242,109 | | | | |
| | Sub-total Short-Term Investments: | | | 12,242,109 | | | 12,242,109 | | | 3.69 | % |
| | | Grand total(f) | | $ | 233,914,332 | | | 332,503,398 | | | 100.06 | % |
Notes to Schedule of Investments:
| | |
| (a) | Securities are valued in accordance with procedures described in note 2 to the financial statements. |
| (b) | Currently non-income producing assets. |
| (c) | Foreign security values are stated in U.S. dollars. As of December 31, 2011, the value of foreign stocks or depositary receipts of companies based outside of the United States represented 6.17% of net assets. |
| (d) | Securities are American Depositary Receipts of companies based outside of the United States representing 3.17% of net assets. |
| (e) | The short-term investment is a money market portfolio of the investment company, Northern Institutional Funds. At December 31, 2010, the value of the Fund’s investment in the Government Select Portfolio of the Northern Institutional Funds was approximately $24,212,191 with net sales of approximately $11,970,082 during the fiscal year ended December 31, 2011. |
| (f) | At December 31, 2011, the cost for Federal income tax purposes was $234,089,127. The aggregate gross unrealized appreciation and depreciation of investments in securities based on this cost were as follows: |
| | | | |
Gross unrealized appreciation | | $ | 111,286,409 | |
Gross unrealized depreciation | | | (12,872,138 | ) |
Net unrealized appreciation | | $ | 98,414,271 | |
| | |
See accompanying notes to the financial statements. | 40 | (Continued) |
CLEARWATER INVESTMENT TRUST
Schedule of Investments – Clearwater Growth Fund
December 31, 2011
| | |
See accompanying notes to the financial statements. | 41 | (Continued) |
CLEARWATER INVESTMENT TRUST
Schedule of Investments - Clearwater Small Cap Fund
December 31, 2011
| | | | | | | | | | | | | |
Shares | | Security | | Cost | | Fair
value (a) | | Percent
of
net assets | |
Common Stocks: |
Consumer Discretionary: |
| 19,000 | | ARBITRON, INC. | | $ | 777,999 | | | 653,790 | | | | |
| 19,287 | | BELO CORP., CLASS A | | | 103,761 | | | 121,508 | | | | |
| 71,222 | | BLACK DIAMOND, INC.(b) | | | 479,975 | | | 532,028 | | | | |
| 5,072 | | BRAVO BRIO RESTAURANT GROUP, INC.(b) | | | 79,887 | | | 86,985 | | | | |
| 2,733 | | CARIBOU COFFEE CO., INC.(b) | | | 36,997 | | | 38,125 | | | | |
| 4,023 | | CEC ENTERTAINMENT, INC. | | | 126,143 | | | 138,592 | | | | |
| 37,472 | | CENTURY CASINOS, INC.(b) | | | 73,098 | | | 97,052 | | | | |
| 23,435 | | CHILDREN’S PLACE RETAIL STORES (THE), INC.(b) | | | 963,477 | | | 1,244,867 | | | | |
| 47,955 | | COLLECTIVE BRANDS, INC.(b) | | | 594,648 | | | 689,113 | | | | |
| 115,235 | | COOPER TIRE & RUBBER CO. | | | 2,053,723 | | | 1,614,442 | | | | |
| 14,517 | | COST PLUS, INC.(b) | | | 137,114 | | | 141,541 | | | | |
| 157,000 | | DENNY’S CORP.(b) | | | 608,569 | | | 590,320 | | | | |
| 25,535 | | DGSE COS., INC.(b) | | | 65,426 | | | 185,384 | | | | |
| 4,016 | | DIGITAL GENERATION, INC.(b) | | | 47,951 | | | 47,871 | | | | |
| 167,415 | | ENTERCOM COMMUNICATIONS CORP., CLASS A(b) | | | 1,264,024 | | | 1,029,602 | | | | |
| 307,810 | | EXIDE TECHNOLOGIES(b) | | | 1,920,755 | | | 809,540 | | | | |
| 28,500 | | GAYLORD ENTERTAINMENT CO.(b) | | | 666,790 | | | 687,990 | | | | |
| 12,474 | | GENESCO, INC.(b) | | | 321,290 | | | 770,145 | | | | |
| 264,575 | | HANCOCK FABRICS, INC.(b) | | | 357,610 | | | 236,795 | | | | |
| 28,500 | | HANESBRANDS, INC.(b) | | | 652,515 | | | 623,010 | | | | |
| 192,181 | | ICONIX BRAND GROUP, INC.(b) | | | 2,498,961 | | | 3,130,629 | | | | |
| 3,778 | | JOHNSON OUTDOORS, INC., CLASS A(b) | | | 55,154 | | | 57,992 | | | | |
| 6,990 | | KRISPY KREME DOUGHNUTS, INC.(b) | | | 46,120 | | | 45,715 | | | | |
| 31,000 | | MADISON SQUARE GARDEN (THE) CO., CLASS A(b) | | | 599,247 | | | 887,840 | | | | |
| 152,405 | | MAIDENFORM BRANDS, INC.(b) | | | 3,847,892 | | | 2,789,012 | | | | |
| 37,000 | | MARCUS CORP. | | | 421,681 | | | 466,570 | | | | |
| 80,143 | | MCCORMICK & SCHMICK’S SEAFOOD RESTAURANTS, INC.(b) | | | 696,050 | | | 700,450 | | | | |
| 20,500 | | O’CHARLEYS, INC.(b) | | | 130,841 | | | 112,545 | | | | |
| 98,944 | | OUTDOOR CHANNEL HOLDINGS, INC. | | | 617,641 | | | 738,122 | | | | |
| 37,000 | | PENSKE AUTOMOTIVE GROUP, INC. | | | 723,337 | | | 712,250 | | | | |
| 6,885 | | PEP BOYS-MANNY, MOE & JACK | | | 99,187 | | | 75,735 | | | | |
| 20,000 | | PETSMART, INC. | | | 428,805 | | | 1,025,800 | | | | |
| 111,349 | | PIER 1 IMPORTS, INC.(b) | | | 1,214,965 | | | 1,551,092 | | | | |
| 26,550 | | RED ROBIN GOURMET BURGERS, INC.(b) | | | 930,372 | | | 735,435 | | | | |
| 38,659 | | ROCKY BRANDS, INC.(b) | | | 324,736 | | | 348,704 | | | | |
| 8,835 | | RUBY TUESDAY, INC.(b) | | | 58,393 | | | 60,962 | | | | |
| 52,000 | | SALLY BEAUTY HOLDINGS, INC.(b) | | | 443,733 | | | 1,098,760 | | | | |
| 7,690 | | SHILOH INDUSTRIES, INC.(b) | | | 88,974 | | | 64,442 | | | | |
| 12,047 | | SMITH & WESSON HOLDING CORP.(b) | | | 34,577 | | | 52,525 | | | | |
| 28,404 | | STEINWAY MUSICAL INSTRUMENTS, INC.(b) | | | 666,405 | | | 711,236 | | | | |
| 178,965 | | STONERIDGE, INC.(b) | | | 1,693,295 | | | 1,508,675 | | | | |
| 10,888 | | SUMMER INFANT, INC.(b) | | | 73,936 | | | 76,652 | | | | |
| 17,793 | | TANDY LEATHER FACTORY, INC.(b) | | | 81,842 | | | 86,830 | | | | |
| 16,034 | | TUESDAY MORNING CORP.(b) | | | 63,498 | | | 55,317 | | | | |
| 62,694 | | UNIVERSAL ELECTRONICS, INC.(b) | | | 1,618,250 | | | 1,057,648 | | | | |
| 14,000 | | VAIL RESORTS, INC. | | | 517,107 | | | 593,040 | | | | |
| 96,674 | | WMS INDUSTRIES, INC.(b) | | | 1,856,085 | | | 1,983,750 | | | | |
| 89,057 | | WOLVERINE WORLD WIDE, INC. | | | 2,652,213 | | | 3,173,992 | | | | |
| 28,000 | | WYNDHAM WORLDWIDE CORP. | | | 695,522 | | | 1,059,240 | | | | |
| | | | | | 34,510,571 | | | 35,299,660 | | | 14.74 | % |
Consumer Staples: |
| 7,090 | | CENTRAL GARDEN AND PET CO.(b) | | | 69,113 | | | 57,854 | | | | |
| 243,992 | | COTT CORP.(b)(c) | | | 2,016,705 | | | 1,527,390 | | | | |
| 40,500 | | FLOWERS FOODS, INC. | | | 511,723 | | | 768,690 | | | | |
| 6,521 | | INVENTURE FOODS, INC.(b) | | | 25,546 | | | 24,389 | | | | |
| 21,958 | | OMEGA PROTEIN CORP.(b) | | | 137,497 | | | 156,561 | | | | |
| 12,057 | | PANTRY (THE), INC.(b) | | | 174,975 | | | 144,322 | | | | |
| 11,563 | | SENECA FOODS CORP., CLASS A(b) | | | 264,128 | | | 298,557 | | | | |
| 30,000 | | SNYDERS-LANCE, INC. | | | 663,181 | | | 675,000 | | | | |
| 96,212 | | SPECTRUM BRANDS HOLDINGS, INC.(b) | | | 2,637,112 | | | 2,636,209 | | | | |
| 4,399 | | SUSSER HOLDINGS CORP.(b) | | | 101,048 | | | 99,505 | | | | |
| 25,138 | | TREEHOUSE FOODS, INC.(b) | | | 1,179,215 | | | 1,643,522 | | | | |
| 38,559 | | WINN-DIXIE STORES, INC.(b) | | | 359,297 | | | 361,683 | | | | |
| | | | | | 8,139,540 | | | 8,393,682 | | | 3.50 | % |
| | |
See accompanying notes to the financial statements. | 42 | (Continued) |
CLEARWATER INVESTMENT TRUST
Schedule of Investments - Clearwater Small Cap Fund
December 31, 2011
| | | | | | | | | | | | | |
Shares | | Security | | Cost | | Fair
value (a) | | Percent
of
net assets | |
Energy: | | | | | | | | | | |
| 30,850 | | BILL BARRETT CORP.(b) | | $ | 1,163,267 | | | 1,051,059 | | | | |
| 85,577 | | CARRIZO OIL & GAS, INC.(b) | | | 2,595,319 | | | 2,254,954 | | | | |
| 48,975 | | COMPLETE PRODUCTION SERVICES, INC.(b) | | | 1,437,051 | | | 1,643,601 | | | | |
| 11,000 | | CONTANGO OIL & GAS CO.(b) | | | 487,508 | | | 639,980 | | | | |
| 43,442 | | CVR ENERGY, INC.(b) | | | 992,930 | | | 813,669 | | | | |
| 11,000 | | DRIL-QUIP, INC.(b) | | | 534,766 | | | 724,020 | | | | |
| 28,000 | | GULFPORT ENERGY CORP.(b) | | | 896,991 | | | 824,600 | | | | |
| 37,038 | | MAGELLAN PETROLEUM CORP.(b) | | | 58,406 | | | 35,853 | | | | |
| 46,000 | | MCDERMOTT INTERNATIONAL, INC.(b) | | | 559,629 | | | 529,460 | | | | |
| 32,000 | | OASIS PETROLEUM, INC.(b) | | | 564,228 | | | 930,880 | | | | |
| 187,435 | | PIONEER DRILLING CO.(b) | | | 1,600,441 | | | 1,814,371 | | | | |
| 20,000 | | QEP RESOURCES, INC. | | | 740,019 | | | 586,000 | | | | |
| 31,972 | | SUPERIOR ENERGY SERVICES, INC.(b) | | | 621,168 | | | 909,284 | | | | |
| 65,689 | | TESCO CORP.(b) | | | 636,398 | | | 830,309 | | | | |
| 20,063 | | VENOCO, INC.(b) | | | 164,101 | | | 135,826 | | | | |
| | | | | | 13,052,222 | | | 13,723,866 | | | 5.73 | % |
Financials: | | | | | | | | | | |
| 4,398 | | AMERICAN SAFETY INSURANCE HOLDINGS LTD.(b) | | | 89,930 | | | 95,656 | | | | |
| 45,410 | | AMTRUST FINANCIAL SERVICES, INC. | | | 746,371 | | | 1,078,488 | | | | |
| 27,000 | | ARTHUR J. GALLAGHER & CO. | | | 562,570 | | | 902,880 | | | | |
| 32,434 | | ASPEN INSURANCE HOLDINGS LTD.(c) | | | 785,167 | | | 859,501 | | | | |
| 29,519 | | ASSOCIATED ESTATES REALTY CORP. | | | 434,540 | | | 470,828 | | | | |
| 136,199 | | BANCORP (THE), INC.(b) | | | 1,285,289 | | | 984,719 | | | | |
| 7,419 | | BERKSHIRE HILLS BANCORP, INC. | | | 163,389 | | | 164,628 | | | | |
| 127,968 | | BRANDYWINE REALTY TRUST | | | 1,471,142 | | | 1,215,696 | | | | |
| 33,818 | | BROOKLINE BANCORP, INC. | | | 285,383 | | | 285,424 | | | | |
| 65,000 | | CAPITOL FEDERAL FINANCIAL, INC. | | | 768,473 | | | 750,100 | | | | |
| 61,522 | | CAPLEASE, INC.(b) | | | 112,062 | | | 248,549 | | | | |
| 35,000 | | CBOE HOLDINGS, INC. | | | 848,346 | | | 905,100 | | | | |
| 73,325 | | CHESAPEAKE LODGING TRUST | | | 1,170,375 | | | 1,133,604 | | | | |
| 32,680 | | COMMUNITY TRUST BANCORP, INC. | | | 907,688 | | | 961,446 | | | | |
| 8,037 | | CREXUS INVESTMENT CORP. | | | 83,357 | | | 83,424 | | | | |
| 50,540 | | DELPHI FINANCIAL GROUP, INC., CLASS A | | | 1,147,339 | | | 2,238,922 | | | | |
| 43,905 | | EDUCATION REALTY TRUST, INC.(b) | | | 325,730 | | | 449,148 | | | | |
| 3,940 | | EMC INSURANCE GROUP, INC. | | | 88,020 | | | 81,046 | | | | |
| 48,000 | | EPOCH HOLDING CORP. | | | 635,774 | | | 1,067,040 | | | | |
| 49,000 | | FIRST AMERICAN FINANCIAL CORP. | | | 686,144 | | | 620,830 | | | | |
| 99,971 | | FIRST MERCHANTS CORP. | | | 651,779 | | | 846,754 | | | | |
| 10,657 | | FIRST PACTRUST BANCORP, INC. | | | 135,371 | | | 109,234 | | | | |
| 14,155 | | FIRST POTOMAC REALTY TRUST | | | 135,590 | | | 184,723 | | | | |
| 54,718 | | FIRSTMERIT CORP. | | | 732,885 | | | 827,883 | | | | |
| 50,000 | | FORESTAR GROUP, INC.(b) | | | 940,728 | | | 756,500 | | | | |
| 2,899 | | GAIN CAPITAL HOLDINGS, INC. | | | 19,202 | | | 19,423 | | | | |
| 34,617 | | GLADSTONE CAPITAL CORP. | | | 267,566 | | | 264,128 | | | | |
| 19,289 | | HALLMARK FINANCIAL SERVICES, INC.(b) | | | 134,431 | | | 134,830 | | | | |
| 13,499 | | HERITAGE FINANCIAL CORP. | | | 167,280 | | | 169,547 | | | | |
| 48,080 | | HOME FEDERAL BANCORP, INC. | | | 611,641 | | | 500,032 | | | | |
| 18,322 | | HOME PROPERTIES, INC. | | | 1,011,860 | | | 1,054,798 | | | | |
| 40,566 | | HORACE MANN EDUCATORS CORP. | | | 535,876 | | | 556,160 | | | | |
| 11,205 | | HORIZON BANCORP | | | 100,149 | | | 195,191 | | | | |
| 14,934 | | HUDSON PACIFIC PROPERTIES, INC. | | | 201,322 | | | 211,465 | | | | |
| 39,397 | | IBERIABANK CORP. | | | 1,971,208 | | | 1,942,272 | | | | |
| 87,954 | | INVESTORS BANCORP, INC.(b) | | | 1,204,493 | | | 1,185,620 | | | | |
| 35,719 | | INVESTORS CAPITAL HOLDINGS LTD.(b) | | | 151,806 | | | 146,448 | | | | |
| 8,999 | | KAISER FEDERAL FINANCIAL GROUP, INC. | | | 89,990 | | | 115,367 | | | | |
| 25,350 | | KITE REALTY GROUP TRUST | | | 93,223 | | | 114,328 | | | | |
| 27,000 | | LEGG MASON, INC. | | | 672,286 | | | 649,350 | | | | |
| 47,000 | | MANNING & NAPIER, INC.(b) | | | 581,252 | | | 587,030 | | | | |
| 69,723 | | MEDICAL PROPERTIES TRUST, INC. | | | 669,526 | | | 688,166 | | | | |
| 6,600 | | MIDSOUTH BANCORP, INC. | | | 97,614 | | | 85,866 | | | | |
| 82,104 | | MISSION WEST PROPERTIES, INC. | | | 596,609 | | | 740,578 | | | | |
| 20,897 | | NATIONAL FINANCIAL PARTNERS CORP.(b) | | | 245,242 | | | 282,528 | | | | |
| 53,301 | | NATIONAL RETAIL PROPERTIES, INC. | | | 889,297 | | | 1,406,080 | | | | |
| 154,793 | | NGP CAPITAL RESOURCES CO. | | | 1,547,378 | | | 1,112,962 | | | | |
| 132,855 | | NORTHWEST BANCSHARES, INC. | | | 1,365,649 | | | 1,652,716 | | | | |
| 55,000 | | ORITANI FINANCIAL CORP. | | | 694,042 | | | 702,350 | | | | |
| 10,928 | | PACIFIC CONTINENTAL CORP. | | | 101,008 | | | 96,713 | | | | |
| 41,657 | | PACWEST BANCORP | | | 857,628 | | | 789,400 | | | | |
| | |
See accompanying notes to the financial statements. | 43 | (Continued) |
CLEARWATER INVESTMENT TRUST
Schedule of Investments - Clearwater Small Cap Fund
December 31, 2011
| | | | | | | | | | | | | |
Shares | | Security | | Cost | | Fair
value (a) | | Percent
of
net assets | |
Financials (Cont’d): | | | | | | | | | | |
| 13,111 | | PARK STERLING CORP.(b) | | $ | 80,326 | | | 53,493 | | | | |
| 90,553 | | PHOENIX (THE) COS., INC.(b) | | | 231,406 | | | 152,129 | | | | |
| 44,982 | | PLATINUM UNDERWRITERS HOLDINGS LTD.(c) | | | 1,423,961 | | | 1,534,336 | | | | |
| 42,757 | | PRESIDENTIAL LIFE CORP. | | | 424,376 | | | 427,143 | | | | |
| 9,471 | | RENASANT CORP. | | | 151,594 | | | 142,065 | | | | |
| 89,555 | | ROCKVILLE FINANCIAL, INC. | | | 918,303 | | | 927,790 | | | | |
| 5,634 | | SCBT FINANCIAL CORP. | | | 171,266 | | | 163,442 | | | | |
| 16,131 | | SI FINANCIAL GROUP, INC. | | | 153,421 | | | 158,890 | | | | |
| 7,026 | | SOUTHSIDE BANCSHARES, INC. | | | 140,417 | | | 152,183 | | | | |
| 3,860 | | STATE BANK FINANCIAL CORP.(b) | | | 58,804 | | | 58,325 | | | | |
| 12,198 | | STELLARONE CORP. | | | 175,812 | | | 138,813 | | | | |
| 19,037 | | SUNSTONE HOTEL INVESTORS, INC.(b) | | | 117,092 | | | 155,152 | | | | |
| 35,000 | | TERRITORIAL BANCORP, INC. | | | 553,273 | | | 691,250 | | | | |
| 49,590 | | TOWER BANCORP, INC. | | | 1,152,178 | | | 1,415,299 | | | | |
| 91,990 | | UMPQUA HOLDINGS CORP. | | | 1,001,674 | | | 1,139,756 | | | | |
| 13,331 | | UNITED FINANCIAL BANCORP, INC. | | | 172,645 | | | 214,496 | | | | |
| 15,362 | | UNIVEST CORP. OF PENNSYLVANIA | | | 256,796 | | | 224,900 | | | | |
| 20,364 | | URSTADT BIDDLE PROPERTIES, INC., CLASS A | | | 349,126 | | | 368,181 | | | | |
| 52,500 | | VIEWPOINT FINANCIAL GROUP | | | 669,191 | | | 683,025 | | | | |
| 108,637 | | WALKER & DUNLOP, INC.(b) | | | 1,283,279 | | | 1,364,481 | | | | |
| 35,240 | | WALTER INVESTMENT MANAGEMENT CORP. | | | 472,218 | | | 722,772 | | | | |
| 10,087 | | WASHINGTON BANKING CO. | | | 140,436 | | | 120,136 | | | | |
| 114,520 | | WESTFIELD FINANCIAL, INC. | | | 1,094,187 | | | 842,867 | | | | |
| 21,000 | | WINTRUST FINANCIAL CORP. | | | 721,450 | | | 589,050 | | | | |
| | | | | | 41,984,251 | | | 45,165,445 | | | 18.86 | % |
Health Care: | | | | | | | | | | |
| 16,600 | | ACCESS PLANS, INC.(b) | | | 43,346 | | | 44,156 | | | | |
| 16,391 | | ALPHATEC HOLDINGS, INC.(b) | | | 43,036 | | | 28,193 | | | | |
| 42,515 | | AMERICAN DENTAL PARTNERS, INC.(b) | | | 662,190 | | | 800,557 | | | | |
| 21,000 | | AMERISOURCEBERGEN CORP. | | | 346,010 | | | 780,990 | | | | |
| 9,203 | | BIOCLINICA, INC.(b) | | | 45,794 | | | 39,113 | | | | |
| 14,390 | | BIOCRYST PHARMACEUTICALS, INC.(b) | | | 49,843 | | | 35,543 | | | | |
| 21,285 | | BIOSCRIP, INC.(b) | | | 94,580 | | | 116,216 | | | | |
| 35,231 | | CATALYST HEALTH SOLUTIONS, INC.(b) | | | 1,079,278 | | | 1,832,012 | | | | |
| 3,930 | | CRYOLIFE, INC.(b) | | | 18,517 | | | 18,864 | | | | |
| 22,475 | | DGT HOLDINGS CORP.(b) | | | 203,045 | | | 246,776 | | | | |
| 37,000 | | HANGER ORTHOPEDIC GROUP, INC.(b) | | | 718,063 | | | 691,530 | | | | |
| 184,625 | | HEALTHSOUTH CORP.(b) | | | 3,022,435 | | | 3,262,324 | | | | |
| 70,543 | | HEALTHSPRING, INC.(b) | | | 1,160,830 | | | 3,847,415 | | | | |
| 20,886 | | HESKA CORP.(b) | | | 180,903 | | | 152,468 | | | | |
| 75,915 | | HILL-ROM HOLDINGS, INC. | | | 2,211,588 | | | 2,557,576 | | | | |
| 11,346 | | INTEGRAMED AMERICA, INC.(b) | | | 87,872 | | | 89,066 | | | | |
| 7,890 | | MEDIWARE INFORMATION SYSTEMS(b) | | | 95,279 | | | 101,150 | | | | |
| 20,377 | | MEDTOX SCIENTIFIC, INC.(b) | | | 245,261 | | | 286,297 | | | | |
| 58,803 | | MOLINA HEALTHCARE, INC.(b) | | | 1,103,973 | | | 1,313,071 | | | | |
| 14,476 | | OMNICELL, INC.(b) | | | 208,148 | | | 239,144 | | | | |
| 52,023 | | ORTHOFIX INTERNATIONAL N.V.(b)(c) | | | 1,375,561 | | | 1,832,770 | | | | |
| 41,276 | | PAR PHARMACEUTICAL COS., INC.(b) | | | 1,148,885 | | | 1,350,963 | | | | |
| 22,000 | | PATTERSON COS., INC. | | | 514,141 | | | 649,440 | | | | |
| 20,797 | | PDI, INC.(b) | | | 139,001 | | | 134,141 | | | | |
| 10,000 | | PERRIGO CO. | | | 198,386 | | | 973,000 | | | | |
| 15,203 | | REPLIGEN CORP.(b) | | | 54,664 | | | 52,754 | | | | |
| 8,570 | | SPECTRANETICS CORP.(b) | | | 42,102 | | | 61,875 | | | | |
| 19,530 | | SYNOVIS LIFE TECHNOLOGIES, INC.(b) | | | 544,161 | | | 543,520 | | | | |
| 23,440 | | WEST PHARMACEUTICAL SERVICES, INC. | | | 874,755 | | | 889,548 | | | | |
| 39,701 | | ZOLL MEDICAL CORP.(b) | | | 1,058,664 | | | 2,508,309 | | | | |
| | | | | | 17,570,311 | | | 25,478,781 | | | 10.64 | % |
Industrials: |
| 19,000 | | A.O. SMITH CORP. | | | 767,665 | | | 762,280 | | | | |
| 50,600 | | ACTUANT CORP., CLASS A | | | 949,396 | | | 1,148,114 | | | | |
| 15,000 | | ACUITY BRANDS, INC. | | | 533,328 | | | 795,000 | | | | |
| 326,822 | | AIR TRANSPORT SERVICES GROUP, INC.(b) | | | 1,748,300 | | | 1,542,600 | | | | |
| 5,392 | | ASTRONICS CORP.(b) | | | 100,603 | | | 193,087 | | | | |
| 645 | | ASTRONICS CORP., CLASS B(b) | | | 13,290 | | | 23,381 | | | | |
| 55,000 | | AVIS BUDGET GROUP, INC.(b) | | | 738,891 | | | 589,600 | | | | |
| 23,528 | | AZZ, INC. | | | 711,539 | | | 1,069,112 | | | | |
| 32,000 | | BABCOCK & WILCOX (THE) CO.(b) | | | 726,566 | | | 772,480 | | | | |
| | |
See accompanying notes to the financial statements. | 44 | (Continued) |
CLEARWATER INVESTMENT TRUST
Schedule of Investments - Clearwater Small Cap Fund
December 31, 2011
| | | | | | | | | | | | | |
Shares | | Security | | Cost | | Fair
value (a) | | Percent
of
net assets | |
Industrials (Cont’d): |
| 40,390 | | BELDEN, INC. | | $ | 1,367,193 | | | 1,344,179 | | | | |
| 11,565 | | BREEZE-EASTERN CORP.(b) | | | 82,719 | | | 92,520 | | | | |
| 3,695 | | CASCADE CORP. | | | 91,752 | | | 174,293 | | | | |
| 23,542 | | CASELLA WASTE SYSTEMS, INC., CLASS A(b) | | | 136,225 | | | 150,669 | | | | |
| 17,079 | | CECO ENVIRONMENTAL CORP. | | | 94,807 | | | 96,496 | | | | |
| 27,000 | | CHICAGO BRIDGE & IRON CO. N.V. (REGISTERED)(c) | | | 486,367 | | | 1,020,600 | | | | |
| 1,894 | | CIRCOR INTERNATIONAL, INC. | | | 57,607 | | | 66,877 | | | | |
| 37,000 | | COLFAX CORP.(b) | | | 307,010 | | | 1,053,760 | | | | |
| 138,530 | | COMMERCIAL VEHICLE GROUP, INC.(b) | | | 1,118,060 | | | 1,252,311 | | | | |
| 5,977 | | DUCOMMUN, INC. | | | 96,481 | | | 76,207 | | | | |
| 2,388 | | DXP ENTERPRISES, INC.(b) | | | 36,554 | | | 76,894 | | | | |
| 10,400 | | ENNIS, INC. | | | 135,022 | | | 138,632 | | | | |
| 20,000 | | ENPRO INDUSTRIES, INC.(b) | | | 569,233 | | | 659,600 | | | | |
| 46,750 | | ESCO TECHNOLOGIES, INC. | | | 1,621,769 | | | 1,345,465 | | | | |
| 29,000 | | FOSTER WHEELER A.G.(b)(c) | | | 640,562 | | | 555,060 | | | | |
| 4,709 | | FREIGHTCAR AMERICA, INC.(b) | | | 73,440 | | | 98,654 | | | | |
| 11,929 | | GARDNER DENVER, INC. | | | 280,338 | | | 919,249 | | | | |
| 149,529 | | GENCORP, INC.(b) | | | 693,010 | | | 795,494 | | | | |
| 17,000 | | GENESEE & WYOMING, INC., CLASS A(b) | | | 425,830 | | | 1,029,860 | | | | |
| 9,177 | | GP STRATEGIES CORP.(b) | | | 62,336 | | | 123,706 | | | | |
| 3,779 | | GRAHAM CORP. | | | 79,742 | | | 84,801 | | | | |
| 40,000 | | GREENBRIER COS., INC.(b) | | | 575,947 | | | 971,200 | | | | |
| 17,417 | | HAWAIIAN HOLDINGS, INC.(b) | | | 93,239 | | | 101,019 | | | | |
| 106,820 | | ICF INTERNATIONAL, INC.(b) | | | 2,465,249 | | | 2,647,000 | | | | |
| 949 | | ITEX CORP. | | | 2,866 | | | 3,749 | | | | |
| 35,000 | | ITT CORP. | | | 698,010 | | | 676,550 | | | | |
| 42,000 | | JOHN BEAN TECHNOLOGIES CORP. | | | 552,164 | | | 645,540 | | | | |
| 11,000 | | JOY GLOBAL, INC. | | | 420,752 | | | 824,670 | | | | |
| 16,000 | | KANSAS CITY SOUTHERN(b) | | | 341,149 | | | 1,088,160 | | | | |
| 24,500 | | L.B. FOSTER CO., CLASS A | | | 563,464 | | | 693,105 | | | | |
| 15,259 | | LYDALL, INC.(b) | | | 115,269 | | | 144,808 | | | | |
| 24,000 | | MACQUARIE INFRASTRUCTURE CO. LLC | | | 652,272 | | | 670,800 | | | | |
| 61,000 | | MANITOWOC (THE) CO., INC. | | | 590,803 | | | 560,590 | | | | |
| 73,247 | | METALICO, INC.(b) | | | 434,718 | | | 240,983 | | | | |
| 19,536 | | MIDDLEBY CORP.(b) | | | 901,946 | | | 1,837,165 | | | | |
| 7,000 | | NATIONAL PRESTO INDUSTRIES, INC. | | | 771,050 | | | 655,200 | | | | |
| 29,388 | | REGAL-BELOIT CORP. | | | 1,474,802 | | | 1,497,906 | | | | |
| 7,083 | | SAIA, INC.(b) | | | 96,623 | | | 88,396 | | | | |
| 8,109 | | SL INDUSTRIES, INC.(b) | | | 92,589 | | | 131,366 | | | | |
| 14,000 | | SNAP-ON, INC. | | | 638,880 | | | 708,680 | | | | |
| 32,478 | | SPARTON CORP.(b) | | | 189,051 | | | 282,559 | | | | |
| 10,254 | | STANDEX INTERNATIONAL CORP. | | | 244,335 | | | 350,379 | | | | |
| 33,552 | | TELEDYNE TECHNOLOGIES, INC.(b) | | | 1,390,730 | | | 1,840,327 | | | | |
| 35,569 | | TENNANT CO. | | | 1,320,740 | | | 1,382,567 | | | | |
| 13,500 | | THOMAS & BETTS CORP.(b) | | | 602,790 | | | 737,100 | | | | |
| 70,640 | | TRIUMPH GROUP, INC. | | | 3,063,462 | | | 4,128,908 | | | | |
| 7,658 | | TWIN DISC, INC. | | | 248,307 | | | 278,138 | | | | |
| 13,071 | | US ECOLOGY, INC. | | | 221,482 | | | 245,473 | | | | |
| 7,283 | | VSE CORP. | | | 199,049 | | | 176,831 | | | | |
| 22,662 | | WABTEC CORP. | | | 708,688 | | | 1,585,207 | | | | |
| 56,650 | | WCA WASTE CORP.(b) | | | 363,693 | | | 368,791 | | | | |
| 36,949 | | WOODWARD, INC. | | | 1,047,233 | | | 1,512,323 | | | | |
| | | | | | 35,826,987 | | | 45,126,471 | | | 18.84 | % |
Information Technology: |
| 30,560 | | ACTUATE CORP.(b) | | | 156,154 | | | 179,082 | | | | |
| 35,243 | | ADTRAN, INC. | | | 1,241,668 | | | 1,062,929 | | | | |
| 99,523 | | ANAREN, INC.(b) | | | 1,194,828 | | | 1,654,072 | | | | |
| 69,077 | | ANCESTRY.COM, INC.(b) | | | 1,560,973 | | | 1,586,008 | | | | |
| 47,856 | | ATS CORP.(b) | | | 204,101 | | | 149,311 | | | | |
| 126,517 | | BRIDGELINE DIGITAL, INC.(b) | | | 177,249 | | | 75,910 | | | | |
| 32,000 | | BROADRIDGE FINANCIAL SOLUTIONS, INC. | | | 543,517 | | | 721,600 | | | | |
| 31,284 | | CALAMP CORP.(b) | | | 99,494 | | | 132,957 | | | | |
| 5,018 | | CALIX, INC.(b) | | | 42,580 | | | 32,466 | | | | |
| 38,436 | | CAMTEK LTD.(b)(c) | | | 97,346 | | | 67,263 | | | | |
| 1,946 | | CHECKPOINT SYSTEMS, INC.(b) | | | 23,078 | | | 21,289 | | | | |
| 66,440 | | COGNEX CORP. | | | 2,009,628 | | | 2,377,888 | | | | |
| 13,879 | | COMMTOUCH SOFTWARE LTD.(b)(c) | | | 50,171 | | | 45,107 | | | | |
| | |
See accompanying notes to the financial statements. | 45 | (Continued) |
CLEARWATER INVESTMENT TRUST
Schedule of Investments - Clearwater Small Cap Fund
December 31, 2011
| | | | | | | | | | | | | |
Shares | | Security | | Cost | | Fair
value (a) | | Percent
of
net assets | |
Information Technology (Cont’d): |
| 56,734 | | COMTECH TELECOMMUNICATIONS CORP. | | $ | 1,370,017 | | | 1,623,727 | | | | |
| 6,336 | | CRAY, INC.(b) | | | 35,888 | | | 40,994 | | | | |
| 8,128 | | CRYPTOLOGIC LTD.(b)(c) | | | 19,152 | | | 19,263 | | | | |
| 125,961 | | DDI CORP. | | | 1,140,044 | | | 1,175,216 | | | | |
| 50,572 | | DYNAMICS RESEARCH CORP.(b) | | | 374,862 | | | 573,486 | | | | |
| 6,807 | | DYNASIL CORP. OF AMERICA(b) | | | 11,077 | | | 11,844 | | | | |
| 9,557 | | EASYLINK SERVICES INTERNATIONAL CORP., CLASS A(b) | | | 31,498 | | | 38,037 | | | | |
| 353,778 | | ENTROPIC COMMUNICATIONS, INC.(b) | | | 3,066,734 | | | 1,807,806 | | | | |
| 33,058 | | EVOLVING SYSTEMS, INC. | | | 239,600 | | | 247,604 | | | | |
| 17,411 | | EXAR CORP.(b) | | | 109,732 | | | 113,172 | | | | |
| 37,417 | | FRANKLIN WIRELESS CORP.(b) | | | 96,203 | | | 56,126 | | | | |
| 8,280 | | FREQUENCY ELECTRONICS, INC.(b) | | | 46,669 | | | 63,425 | | | | |
| 35,629 | | GILAT SATELLITE NETWORKS LTD.(b)(c) | | | 137,783 | | | 140,735 | | | | |
| 71,869 | | GLOBAL CASH ACCESS HOLDINGS, INC.(b) | | | 206,558 | | | 319,817 | | | | |
| 20,987 | | GLOBECOMM SYSTEMS, INC.(b) | | | 271,810 | | | 287,102 | | | | |
| 197,287 | | GSI GROUP, INC.(b) | | | 2,325,099 | | | 2,018,246 | | | | |
| 32,277 | | HACKETT GROUP (THE), INC.(b) | | | 124,944 | | | 120,716 | | | | |
| 50,728 | | INX, INC.(b) | | | 441,842 | | | 443,870 | | | | |
| 168,559 | | LOOKSMART LTD.(b) | | | 195,677 | | | 217,441 | | | | |
| 7,306 | | LTX-CREDENCE CORP.(b) | | | 51,713 | | | 39,087 | | | | |
| 50,295 | | MAGMA DESIGN AUTOMATION, INC.(b) | | | 362,627 | | | 361,118 | | | | |
| 33,341 | | MERCURY COMPUTER SYSTEMS, INC.(b) | | | 337,086 | | | 443,102 | | | | |
| 8,502 | | METHODE ELECTRONICS, INC. | | | 91,863 | | | 70,482 | | | | |
| 28,145 | | MICRONETICS, INC.(b) | | | 144,631 | | | 221,783 | | | | |
| 30,665 | | MKS INSTRUMENTS, INC. | | | 784,846 | | | 853,100 | | | | |
| 30,433 | | MODUSLINK GLOBAL SOLUTIONS, INC. | | | 124,478 | | | 164,338 | | | | |
| 41,800 | | NAPCO SECURITY TECHNOLOGIES, INC.(b) | | | 68,377 | | | 104,082 | | | | |
| 47,791 | | NETGEAR, INC.(b) | | | 1,507,745 | | | 1,604,344 | | | | |
| 116,854 | | NEWPORT CORP.(b) | | | 2,042,626 | | | 1,590,383 | | | | |
| 7,871 | | NOVA MEASURING INSTRUMENTS LTD.(b)(c) | | | 45,313 | | | 58,009 | | | | |
| 64,836 | | ONLINE RESOURCES CORP.(b) | | | 404,222 | | | 156,903 | | | | |
| 5,112 | | OPLINK COMMUNICATIONS, INC.(b) | | | 94,868 | | | 84,195 | | | | |
| 13,869 | | OSI SYSTEMS, INC.(b) | | | 423,506 | | | 676,530 | | | | |
| 96,576 | | QUEST SOFTWARE, INC.(b) | | | 1,896,793 | | | 1,796,314 | | | | |
| 6,310 | | REIS, INC.(b) | | | 56,260 | | | 57,547 | | | | |
| 184,563 | | RF MICRO DEVICES, INC.(b) | | | 989,679 | | | 996,640 | | | | |
| 166,156 | | SANMINA-SCI CORP.(b) | | | 1,766,562 | | | 1,546,912 | | | | |
| 33,870 | | SELECTICA, INC.(b) | | | 195,859 | | | 103,981 | | | | |
| 31,879 | | STEEL EXCEL, INC.(b) | | | 954,155 | | | 765,096 | | | | |
| 3,551 | | SUPER MICRO COMPUTER, INC.(b) | | | 56,321 | | | 55,680 | | | | |
| 27,294 | | SUPPORT.COM, INC.(b) | | | 57,411 | | | 61,411 | | | | |
| 48,814 | | SWK HOLDINGS CORP.(b) | | | 35,146 | | | 40,027 | | | | |
| 94,271 | | SYNNEX CORP.(b) | | | 2,664,833 | | | 2,871,495 | | | | |
| 20,569 | | THESTREET, INC. | | | 43,058 | | | 34,556 | | | | |
| 107,274 | | TIER TECHNOLOGIES, INC.(b) | | | 702,933 | | | 467,715 | | | | |
| 48,154 | | TNS, INC.(b) | | | 1,042,760 | | | 853,289 | | | | |
| 75,145 | | VALUECLICK, INC.(b) | | | 1,136,300 | | | 1,224,112 | | | | |
| 6,208 | | VISHAY PRECISION GROUP, INC.(b) | | | 104,800 | | | 99,204 | | | | |
| 8,681 | | WEB.COM GROUP, INC.(b) | | | 60,802 | | | 99,397 | | | | |
| 16,064 | | WESTELL TECHNOLOGIES, INC., CLASS A(b) | | | 36,465 | | | 35,662 | | | | |
| 17,000 | | WRIGHT EXPRESS CORP.(b) | | | 463,372 | | | 922,760 | | | | |
| 9,414 | | ZIX CORP.(b) | | | 23,225 | | | 26,547 | | | | |
| 3,740 | | ZYGO CORP.(b) | | | 44,630 | | | 66,011 | | | | |
| | | | | | 36,461,241 | | | 35,976,321 | | | 15.02 | % |
| Materials: | | | | | | | | | | | | |
| 1,360 | | A. SCHULMAN, INC. | | | 28,428 | | | 28,805 | | | | |
| 17,000 | | APTARGROUP, INC. | | | 711,338 | | | 886,890 | | | | |
| 15,000 | | ASHLAND, INC. | | | 551,175 | | | 857,400 | | | | |
| 11,584 | | CORE MOLDING TECHNOLOGIES, INC.(b) | | | 104,158 | | | 93,367 | | | | |
| 11,500 | | DELTIC TIMBER CORP. | | | 546,288 | | | 694,485 | | | | |
| 30,831 | | HANDY & HARMAN LTD.(b) | | | 154,151 | | | 305,227 | | | | |
| 35,138 | | INNOPHOS HOLDINGS, INC. | | | 1,433,464 | | | 1,706,301 | | | | |
| 77,588 | | INNOSPEC, INC.(b) | | | 2,039,897 | | | 2,177,895 | | | | |
| 20,000 | | KAPSTONE PAPER AND PACKAGING CORP.(b) | | | 145,550 | | | 314,800 | | | | |
| 35,468 | | KOPPERS HOLDINGS, INC. | | | 948,784 | | | 1,218,680 | | | | |
| 25,504 | | LANDEC CORP.(b) | | | 159,001 | | | 140,782 | | | | |
| 33,291 | | LSB INDUSTRIES, INC.(b) | | | 1,154,470 | | | 933,147 | | | | |
| 41,458 | | QUAKER CHEMICAL CORP. | | | 1,257,063 | | | 1,612,302 | | | | |
| | |
See accompanying notes to the financial statements. | 46 | (Continued) |
CLEARWATER INVESTMENT TRUST
Schedule of Investments - Clearwater Small Cap Fund
December 31, 2011
| | | | | | | | | | | | | |
Shares | | Security | | Cost | | Fair
value (a) | | Percent
of
net assets | |
Materials (Cont’d): |
| 38,947 | | ROCK-TENN CO., CLASS A | | $ | 1,257,230 | | | 2,247,242 | | | | |
| 22,138 | | STEPAN CO. | | | 1,614,755 | | | 1,774,582 | | | | |
| 9,466 | | SYNALLOY CORP. | | | 114,118 | | | 97,216 | | | | |
| 38,819 | | US ANTIMONY CORP.(b) | | | 37,871 | | | 93,166 | | | | |
| 19,000 | | W.R. GRACE & CO.(b) | | | 465,151 | | | 872,480 | | | | |
| 7,000 | | WALTER ENERGY, INC. | | | 622,023 | | | 423,920 | | | | |
| 42,000 | | ZEP, INC. | | | 601,828 | | | 587,160 | | | | |
| | | | | | 13,946,743 | | | 17,065,847 | | | 7.13 | % |
Utilities: | | | | | | | | | | |
| 39,680 | | ALLETE, INC. | | | 1,376,905 | | | 1,665,766 | | | | |
| 20,138 | | CENTRAL VERMONT PUBLIC SERVICE CORP. | | | 705,711 | | | 706,844 | | | | |
| 4,161 | | CHESAPEAKE UTILITIES CORP. | | | 167,910 | | | 180,379 | | | | |
| 19,000 | | CLECO CORP. | | | 470,134 | | | 723,900 | | | | |
| 15,569 | | CONSOLIDATED WATER CO. LTD.(c) | | | 127,024 | | | 133,582 | | | | |
| 13,500 | | ITC HOLDINGS CORP. | | | 616,005 | | | 1,024,380 | | | | |
| 7,844 | | MIDDLESEX WATER CO. | | | 140,859 | | | 146,369 | | | | |
| 28,746 | | PENNICHUCK CORP. | | | 823,310 | | | 828,747 | | | | |
| 68,062 | | PORTLAND GENERAL ELECTRIC CO. | | | 1,471,447 | | | 1,721,288 | | | | |
| 39,000 | | QUESTAR CORP. | | | 663,326 | | | 774,540 | | | | |
| 21,675 | | SOUTHWEST GAS CORP. | | | 539,056 | | | 920,971 | | | | |
| 32,492 | | UIL HOLDINGS CORP. | | | 973,417 | | | 1,149,242 | | | | |
| 12,795 | | UNITIL CORP. | | | 278,132 | | | 363,122 | | | | |
| 20,600 | | WESTAR ENERGY, INC. | | | 562,203 | | | 592,868 | | | | |
| | | | | | 8,915,439 | | | 10,931,998 | | | 4.56 | % |
| | Sub-total Common Stocks: | | | 210,407,305 | | | 237,162,071 | | | 99.02 | % |
Short-Term Investments: |
| 1,896,952 | | NORTHERN INSTITUTIONAL GOVERNMENT
SELECT PORTFOLIO, 0.01%(d) | | | 1,896,952 | | | 1,896,952 | | | | |
| | Sub-total Short-Term Investments: | | | 1,896,952 | | | 1,896,952 | | | 0.79 | % |
| | | Grand total(e) | | $ | 212,304,257 | | | 239,059,023 | | | 99.81 | % |
Notes to Schedule of Investments:
| | |
| (a) | Securities are valued in accordance with procedures described in note 2 to the financial statements. |
| (b) | Currently non-income producing assets. |
| (c) | Foreign security values are stated in U.S. dollars. As of December 31, 2011, the value of foreign stocks or depositary receipts of companies based outside of the United States represented 3.25% of net assets. |
| (d) | The short-term investment is a money market portfolio of the investment company, Northern Institutional Funds. At December 31, 2010, the value of the Fund’s investment in the Government Select Portfolio of the Northern Institutional Funds was approximately $5,133,720 with net sales of approximately $3,236,768 during the fiscal year ended December 31, 2011. |
| (e) | At December 31, 2011, the cost for Federal income tax purposes was $212,334,630. The aggregate gross unrealized appreciation and depreciation of investments in securities based on this cost were as follows: |
| | | | |
Gross unrealized appreciation | | $ | 40,164,908 | |
Gross unrealized depreciation | | | (13,440,515 | ) |
Net unrealized appreciation | | $ | 26,724,393 | |
| | |
See accompanying notes to the financial statements. | 47 | (Continued) |
CLEARWATER INVESTMENT TRUST
Schedule of Investments – Clearwater Small Cap Fund
December 31, 2011
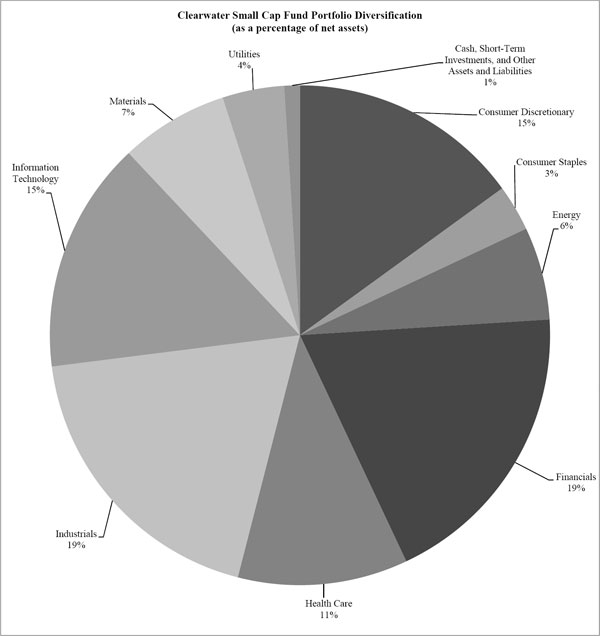
| | |
See accompanying notes to the financial statements. | 48 | (Continued) |
CLEARWATER INVESTMENT TRUST
Schedule of Investments - Clearwater Tax-Exempt Bond Fund
December 31, 2011
| | | | | | | | | | | | | | | | | |
Par/Shares | | Security | | Maturity
date | | Coupon
rate | | Cost | | Fair
value(a) | | Percent
of
net assets | |
Closed-End Funds: | | | | | | | | | | | | | | |
| 47,200 | | AMERICAN MUNI INCOME PT | | | | | | $ | 554,976 | | | 686,760 | | | | |
| 208,600 | | BLACKROCK LNG-TM MUN ADV | | | | | | | 2,133,992 | | | 2,434,362 | | | | |
| 35,600 | | BLACKROCK MUN INC TRUST | | | | | | | 373,567 | | | 541,476 | | | | |
| 18,200 | | BLACKROCK MUNI BOND TRUST | | | | | | | 169,379 | | | 286,104 | | | | |
| 186,000 | | BLACKROCK MUNIHOLDINGS QU | | | | | | | 2,175,942 | | | 2,717,460 | | | | |
| 59,500 | | BLACKROCK MUNIHOLDINGS QU | | | | | | | 749,861 | | | 850,850 | | | | |
| 71,200 | | BLACKROCK MUNIYIELD INVES | | | | | | | 905,807 | | | 1,045,928 | | | | |
| 81,800 | | BLACKROCK MUNIYIELD MI QU | | | | | | | 981,525 | | | 1,213,094 | | | | |
| 76,179 | | BLACKROCK MUNIYIELD MI QU | | | | | | | 1,014,103 | | | 1,179,251 | | | | |
| 54,700 | | BLACKROCK MUNIYIELD PENNS | | | | | | | 774,527 | | | 863,713 | | | | |
| 28,100 | | BLACKROCK MUNIYIELD QUAL | | | | | | | 333,747 | | | 384,970 | | | | |
| 78,300 | | BLACKROCK MUNIYIELD QUALI | | | | | | | 1,032,557 | | | 1,107,162 | | | | |
| 21,837 | | BLACKROCK MUNIYIELD QUALI | | | | | | | 275,930 | | | 314,671 | | | | |
| 12,500 | | DREYFUS STRATEGIC MUNI BD | | | | | | | 68,613 | | | 108,500 | | | | |
| 209,000 | | DWS MUNICIPAL INCOME TRUS | | | | | | | 2,278,136 | | | 2,884,200 | | | | |
| 1,000 | | EATON VANCE CAL MUNI BOND | | | | | | | 8,280 | | | 12,820 | | | | |
| 66,800 | | EATON VANCE CALI MUN BOND | | | | | | | 744,489 | | | 865,060 | | | | |
| 1,100 | | EATON VANCE MICHI MUNI BN | | | | | | | 15,510 | | | 16,005 | | | | |
| 26,905 | | EATON VANCE MUNICIPAL INC | | | | | | | 286,929 | | | 343,039 | | | | |
| 68,200 | | INVESCO MUNICIPAL PREMIUM | | | | | | | 515,130 | | | 607,662 | | | | |
| 101,881 | | INVESCO QUALITY MUNI INC | | | | | | | 1,164,128 | | | 1,369,281 | | | | |
| 95,900 | | INVESCO QUALITY MUNI INV | | | | | | | 1,173,337 | | | 1,361,780 | | | | |
| 124,300 | | INVESCO VAN KAMPEN AD MIT | | | | | | | 1,443,464 | | | 1,548,778 | | | | |
| 94,239 | | INVESCO VAN KAMPEN PENN V | | | | | | | 1,240,054 | | | 1,338,194 | | | | |
| 37,800 | | INVESCO VAN KAMPEN S S MN | | | | | | | 398,849 | | | 480,438 | | | | |
| 74,277 | | INVESCO VAN KAMPEN TRUST | | | | | | | 1,042,890 | | | 1,112,670 | | | | |
| 83,800 | | INVESCO VAN KAMPEN TRUST | | | | | | | 954,508 | | | 1,277,950 | | | | |
| 56,248 | | MANAGED DURATION INVESTME | | | | | | | 714,557 | | | 838,095 | | | | |
| 6,500 | | MFS HIGH INCOME MUNICIPAL | | | | | | | 23,108 | | | 34,710 | | | | |
| 10,299 | | NEUBERGER BERMAN INTMD MU | | | | | | | 126,917 | | | 163,651 | | | | |
| 31,103 | | NUVEEN CAL INV QUAL MUNI | | | | | | | 373,215 | | | 457,214 | | | | |
| 13,700 | | NUVEEN CAL MUNI MKT OPPOR | | | | | | | 157,825 | | | 200,568 | | | | |
| 42,560 | | NUVEEN DIVIDEND ADV MUNI | | | | | | | 523,323 | | | 626,058 | | | | |
| 13,500 | | NUVEEN DIVIDEND ADVANTAGE | | | | | | | 181,771 | | | 203,175 | | | | |
| 41,700 | | NUVEEN DVD ADVANTAGE MUNI | | | | | | | 475,800 | | | 607,152 | | | | |
| 4,800 | | NUVEEN MA PREMIUM INC MUN | | | | | | | 65,734 | | | 70,128 | | | | |
| 30,600 | | NUVEEN MI PREMIUM INC MUN | | | | | | | 404,605 | | | 431,766 | | | | |
| 44,600 | | NUVEEN MUNI ADVANTAGE FUN | | | | | | | 522,316 | | | 654,728 | | | | |
| 15,500 | | NUVEEN NJ INV QUAL MUNI F | | | | | | | 211,528 | | | 221,185 | | | | |
| 10,100 | | NUVEEN PA DVD ADV MUNI FD | | | | | | | 127,549 | | | 141,703 | | | | |
| 48,500 | | NUVEEN PENN INV QUAL MUNI | | | | | | | 673,352 | | | 734,290 | | | | |
| 27,100 | | NUVEEN PREMIER MUNI INC F | | | | | | | 367,653 | | | 401,351 | | | | |
| 238,709 | | NUVEEN PREMIUM INC MUNI F | | | | | | | 3,273,534 | | | 3,561,538 | | | | |
| 216,190 | | PUTNAM MUNI OPPORTUNITIES | | | | | | | 2,450,699 | | | 2,652,651 | | | | |
| 12,700 | | WESTERN ASSET INTERMEDIAT | | | | | | | 111,045 | | | 124,460 | | | | |
| 22,000 | | WESTERN ASSET MANAGED MUN | | | | | | | 240,488 | | | 295,020 | | | | |
| 48,606 | | WESTERN ASSET MUNICIPAL P | | | | | | | 620,291 | | | 746,588 | | | | |
| | Sub-total Closed-End Funds: | | | | | | | 34,455,540 | | | 40,118,209 | | | 7.73 | % |
Municipal Bonds: | | | | | | | | | | | | | | |
| 1,500,000 | | ABAG CA FIN AUTH FOR NONPROFIT CORPS | | 7/1/2037 | | 5.75 | | | 1,441,935 | | | 1,541,925 | | | | |
| 750,000 | | ABAG CA FIN AUTH FOR NONPROFIT CORPS | | 9/1/2037 | | 6.00 | | | 745,092 | | | 787,110 | | | | |
| 650,000 | | ABAG CA FIN AUTH FOR NONPROFIT CORPS COPS | | 11/1/2029 | | 6.20 | | | 633,848 | | | 645,775 | | | | |
| 2,500,000 | | ACALANES CA UNION HIGH SCH DIST(b) | | 8/1/2039 | | 4.68 | | | 1,102,342 | | | 1,305,125 | | | | |
| 1,500,000 | | AGUA CALIENTE CA BAND OF CAHUILLA INDIANS REVENUE (c) | | 7/1/2018 | | 6.00 | | | 1,472,275 | | | 1,430,355 | | | | |
| 1,240,000 | | ALABAMA ST HSG FIN AUTH SF MTGE REVENUE | | 10/1/2028 | | 5.25 | | | 1,240,000 | | | 1,305,150 | | | | |
| 580,000 | | ALABAMA ST HSG FIN AUTH SF MTGE REVENUE | | 4/1/2038 | | 4.50 | | | 434,794 | | | 575,546 | | | | |
| 1,250,000 | | ALACHUA CNTY FL HLTH FACS AUTH | | 11/15/2016 | | 7.12 | | | 1,250,000 | | | 1,254,300 | | | | |
| 500,000 | | ALAMEDA CA CORRIDOR TRANSPRTN AUTH | | 10/1/2021 | | 5.25 | | | 495,878 | | | 500,455 | | | | |
| | |
See accompanying notes to the financial statements. | 49 | (Continued) |
CLEARWATER INVESTMENT TRUST
Schedule of Investments - Clearwater Tax-Exempt Bond Fund
December 31, 2011
| | | | | | | | | | | | | | | | | |
Par/Shares | | Security | | Maturity
date | | Coupon
rate | | Cost | | Fair
value(a) | | Percent
of
net assets | |
Municipal Bonds (Cont’d): | | | | | | | | | | | | | | |
| 500,000 | | ALAMEDA CA CORRIDOR TRANSPRTN AUTH(b) | | 10/1/2024 | | 1.60 | | $ | 415,941 | | | 472,685 | | | | |
| 1,500,000 | | ALASKA ST HSG FIN CORP | | 6/1/2032 | | 5.25 | | | 1,289,534 | | | 1,511,175 | | | | |
| 2,000,000 | | ALASKA ST HSG FIN CORP | | 12/1/2034 | | 5.25 | | | 2,005,035 | | | 2,063,220 | | | | |
| 370,000 | | ALASKA ST HSG FIN CORP HOME MTGE REVENUE | | 12/1/2033 | | 5.45 | | | 370,000 | | | 387,290 | | | | |
| 895,000 | | ALASKA ST HSG FIN CORP HOME MTGE REVENUE | | 12/1/2034 | | 5.25 | | | 892,554 | | | 931,256 | | | | |
| 500,000 | | ALASKA ST HSG FIN CORP MTGE REVENUE | | 12/1/2040 | | 4.63 | | | 495,098 | | | 500,310 | | | | |
| 350,000 | | ALASKA ST INDL DEV & EXPORT AUTH CMNTY PROVIDER REVENUE (d)(e) | | 12/1/2010 | | 5.40 | | | 350,000 | | | 237,380 | | | | |
| 240,000 | | ALBANY NY INDL DEV AGY (d) | | 5/1/2016 | | 6.50 | | | 240,000 | | | 55,205 | | | | |
| 1,025,000 | | ALISAL CA UNION SCH DIST(b) | | 8/1/2025 | | 10.55 | | | 472,721 | | | 526,788 | | | | |
| 965,000 | | ALLEGHENY CNTY PA INDL DEV AUTH CHRT SCH REVENUE | | 8/15/2026 | | 5.90 | | | 965,000 | | | 939,148 | | | | |
| 480,000 | | ALLEGHENY CNTY PA INDL DEV AUTH CHRT SCH REVENUE | | 8/15/2026 | | 5.90 | | | 404,145 | | | 476,251 | | | | |
| 1,000,000 | | ALPHARETTA GA DEV AUTH EDLFACS REV | | 7/1/2031 | | 6.25 | | | 972,473 | | | 949,330 | | | | |
| 1,000,000 | | ALVORD CA UNIF SCH DIST(b) | | 8/1/2046 | | 5.63 | | | 341,631 | | | 451,880 | | | | |
| 988,705 | | ARIZONA ST HLTH FACS AUTH (e) | | 7/1/2027 | | 5.25 | | | 959,699 | | | 907,374 | | | | |
| 2,000,000 | | ARLINGTON TX HGR EDU FIN CORP EDU REVENUE | | 8/15/2028 | | 7.00 | | | 1,949,530 | | | 1,984,280 | | | | |
| 995,000 | | ARLINGTON TX SPL OBLIG | | 8/15/2034 | | 5.00 | | | 1,048,974 | | | 1,035,646 | | | | |
| 500,000 | | ATLANTA GA ARPT REVENUE | | 1/1/2030 | | 6.00 | | | 519,745 | | | 589,890 | | | | |
| 1,000,000 | | ATLANTA GA TAX ALLOCATION | | 1/1/2030 | | 5.60 | | | 926,289 | | | 1,006,940 | | | | |
| 1,500,000 | | ATLANTA GA WTR & WSTWTR REVENUE | | 11/1/2039 | | 5.00 | | | 1,498,510 | | | 1,502,295 | | | | |
| 630,000 | | AUSTIN CONVENTION ENTERPRISES INC TX CONVENTION CENTER (c) | | 1/1/2012 | | 6.00 | | | 630,000 | | | 630,006 | | | | |
| 1,500,000 | | AUSTIN CONVENTION ENTERPRISES INC TX CONVENTION CENTER | | 1/1/2016 | | 5.25 | | | 1,481,334 | | | 1,484,895 | | | | |
| 1,500,000 | | BAY CNTY FL EDUCTNL FACS REVENUE | | 9/1/2030 | | 5.25 | | | 1,376,764 | | | 1,355,835 | | | | |
| 750,000 | | BERKS CNTY PA MUNI AUTH | | 3/1/2028 | | 5.00 | | | 751,903 | | | 750,480 | | | | |
| 1,000,000 | | BEXAR CNTY TX HLTH FACS DEV CORP | | 7/1/2030 | | 5.88 | | | 984,569 | | | 1,025,200 | | | | |
| 500,000 | | BEXAR CNTY TX HSG FIN CORP | | 1/1/2021 | | 5.70 | | | 449,291 | | | 490,020 | | | | |
| 445,000 | | BEXAR CNTY TX HSG FIN CORP (d) | | 9/15/2021 | | 8.75 | | | 445,000 | | | 313,240 | | | | |
| 250,000 | | BEXAR CNTY TX HSG FIN CORP | | 12/1/2021 | | 6.50 | | | 254,793 | | | 225,265 | | | | |
| 805,000 | | BEXAR CNTY TX HSG FIN CORP (d) | | 4/1/2030 | | 9.00 | | | 802,520 | | | 159,036 | | | | |
| 600,000 | | BEXAR CNTY TX HSG FIN CORP | | 8/1/2030 | | 6.10 | | | 520,479 | | | 569,142 | | | | |
| 365,000 | | BEXAR CNTY TX HSG FIN CORP | | 8/1/2030 | | 8.13 | | | 352,720 | | | 331,095 | | | | |
| 1,005,000 | | BEXAR CNTY TX HSG FIN CORP (d) | | 6/1/2031 | | 10.50 | | | 1,005,000 | | | 200,930 | | | | |
| 885,000 | | BEXAR CNTY TX HSG FIN CORP | | 12/1/2036 | | 9.25 | | | 863,905 | | | 585,295 | | | | |
| 500,000 | | BOONE CNTY MO HOSP REVENUE | | 8/1/2028 | | 5.75 | | | 513,739 | | | 529,420 | | | | |
| 700,000 | | BOSTON MA REVENUE | | 10/1/2031 | | 6.13 | | | 700,810 | | | 714,896 | | | | |
| 750,000 | | BOWLING GREEN OH STUDENT HSG REVENUE | | 6/1/2031 | | 5.75 | | | 718,861 | | | 751,942 | | | | |
| 500,000 | | BRAZOS CNTY TX HLTH FACS DEV CORP | | 1/1/2033 | | 5.50 | | | 504,337 | | | 507,085 | | | | |
| 1,000,000 | | BREA CA REDEV AGY(b) | | 8/1/2029 | | 13.50 | | | 298,102 | | | 298,820 | | | | |
| 135,000 | | BRIDGEVILLE DE SPL OBLIG | | 7/1/2035 | | 5.13 | | | 135,000 | | | 97,671 | | | | |
| 890,000 | | BUCKEYE OH TOBACCO SETTLEMENT FING AUTH | | 6/1/2024 | | 5.13 | | | 857,967 | | | 677,486 | | | | |
| 1,000,000 | | BUTLER CNTY OH HOSP FACS | | 4/1/2036 | | 6.38 | | | 1,040,596 | | | 1,098,440 | | | | |
| | |
See accompanying notes to the financial statements. | 50 | (Continued) |
CLEARWATER INVESTMENT TRUST
Schedule of Investments - Clearwater Tax-Exempt Bond Fund
December 31, 2011
| | | | | | | | | | | | | | | | | |
Par/Shares | | Security | | Maturity
date | | Coupon
rate | | Cost | | Fair
value(a) | | Percent
of
net assets | |
Municipal Bonds (Cont’d): | | | | | | | | | | | | | | |
| 395,000 | | BUTLER CNTY PA GEN AUTH REVENUE | | 10/1/2034 | | 1.09 | | $ | 395,000 | | | 240,172 | | | | |
| 125,000 | | CALIFORNIA CNTY CA TOBACCO SECURITIZATION AGY TOBACCO SETTLE | | 6/1/2021 | | 4.50 | | | 123,769 | | | 110,495 | | | | |
| 500,000 | | CALIFORNIA CNTY CA TOBACCO SECURITIZATION AGY TOBACCO SETTLE | | 6/1/2036 | | 5.00 | | | 495,120 | | | 334,965 | | | | |
| 145,000 | | CALIFORNIA ST CMNTY HSG FIN AGY LEASE REVENUE (d) | | 8/1/2012 | | 4.65 | | | 144,935 | | | 72,499 | | | | |
| 385,000 | | CALIFORNIA ST CMNTY HSG FIN AGY LEASE REVENUE (d) | | 11/1/2012 | | 4.85 | | | 383,286 | | | 192,496 | | | | |
| 750,000 | | CALIFORNIA ST HLTH FACS FING AUTH REVENUE | | 8/15/2033 | | 5.50 | | | 765,086 | | | 785,918 | | | | |
| 1,000,000 | | CALIFORNIA ST HSG FIN AGY REVENUE | | 8/1/2033 | | 5.45 | | | 926,651 | | | 977,620 | | | | |
| 750,000 | | CALIFORNIA ST HSG FIN AGY REVENUE | | 8/1/2038 | | 5.50 | | | 753,886 | | | 708,030 | | | | |
| 1,000,000 | | CALIFORNIA ST INFRASTRUCTURE & ECON DEV BANK REVENUE | | 2/1/2030 | | 6.00 | | | 1,009,201 | | | 1,074,010 | | | | |
| 500,000 | | CALIFORNIA ST INFRASTRUCTURE & ECON DEV BANK ST SCH FUND APP | | 8/15/2029 | | 5.75 | | | 504,798 | | | 534,045 | | | | |
| 570,000 | | CALIFORNIA ST MUNI FIN AUTH CHRT SCH LEASE REVENUE | | 9/1/2022 | | 5.50 | | | 574,864 | | | 556,485 | | | | |
| 750,000 | | CALIFORNIA ST MUNI FIN AUTH EDUCTNL REVENUE | | 6/1/2026 | | 5.25 | | | 743,891 | | | 669,525 | | | | |
| 500,000 | | CALIFORNIA ST MUNI FIN AUTH REVENUE | | 5/1/2025 | | 6.88 | | | 498,902 | | | 549,120 | | | | |
| 500,000 | | CALIFORNIA ST MUNI FIN AUTH REVENUE | | 1/1/2033 | | 5.75 | | | 514,140 | | | 523,620 | | | | |
| 1,500,000 | | CALIFORNIA ST SCH FACS FING AUTH REVENUE (b) | | 8/1/2029 | | 2.42 | | | 1,058,204 | | | 1,275,330 | | | | |
| 1,000,000 | | CALIFORNIA ST STWD CMNTYS DEV AUTH | | 8/15/2028 | | 5.50 | | | 1,002,094 | | | 1,008,560 | | | | |
| 1,000,000 | | CALIFORNIA ST STWD CMNTYS DEV AUTH | | 11/1/2032 | | 5.50 | | | 1,002,398 | | | 1,006,410 | | | | |
| 200,000 | | CALIFORNIA ST STWD CMNTYS DEV AUTH | | 4/20/2036 | | 7.00 | | | 200,000 | | | 210,326 | | | | |
| 400,000 | | CALIFORNIA ST STWD CMNTYS DEV AUTH COPS | | 8/15/2031 | | 5.50 | | | 372,766 | | | 400,272 | | | | |
| 590,000 | | CALIFORNIA ST STWD CMNTYS DEV AUTH MF | | 11/20/2036 | | 6.15 | | | 615,903 | | | 613,063 | | | | |
| 1,335,000 | | CALIFORNIA ST STWD CMNTYS DEV AUTH REVENUE | | 1/1/2016 | | 5.25 | | | 1,328,990 | | | 1,345,533 | | | | |
| 700,000 | | CALIFORNIA ST STWD CMNTYS DEV AUTH REVENUE | | 6/1/2017 | | 5.40 | | | 698,352 | | | 708,155 | | | | |
| 1,500,000 | | CALIFORNIA ST STWD CMNTYS DEV AUTH REVENUE | | 1/1/2021 | | 6.00 | | | 1,500,000 | | | 1,540,155 | | | | |
| 1,000,000 | | CALIFORNIA ST STWD CMNTYS DEV AUTH REVENUE | | 11/1/2021 | | 6.50 | | | 1,000,000 | | | 1,083,790 | | | | |
| 750,000 | | CALIFORNIA ST STWD CMNTYS DEV AUTH SCH FAC REVENUE | | 7/1/2020 | | 5.00 | | | 709,864 | | | 751,312 | | | | |
| 850,000 | | CALIFORNIA ST STWD CMNTYS DEV AUTH SCH FAC REVENUE | | 7/1/2031 | | 6.75 | | | 850,000 | | | 863,982 | | | | |
| 750,000 | | CALIFORNIA ST STWD CMNTYS DEVAUTH MFH REVENUE | | 7/15/2032 | | 4.70 | | | 750,000 | | | 764,790 | | | | |
| 210,000 | | CAMERON TX EDU CORP REVENUE | | 8/15/2021 | | 5.00 | | | 168,462 | | | 191,354 | | | | |
| 255,000 | | CAPITAL TRUST AGY FL MF REVENUE (d) | | 6/1/2013 | | 4.75 | | | 255,000 | | | 145,360 | | | | |
| 750,000 | | CAPITAL TRUST AGY FL MF REVENUE (d) | | 6/1/2038 | | 5.88 | | | 762,053 | | | 427,530 | | | | |
| 1,000,000 | | CARLSBAD CA UNIF SCH DIST(b) | | 8/1/2031 | | 4.17 | | | 552,128 | | | 651,700 | | | | |
| 1,093,055 | | CARLSBAD NM INDL DEV REVENUE (e) | | 4/15/2021 | | 5.75 | | | 1,118,851 | | | 990,330 | | | | |
| | |
See accompanying notes to the financial statements. | 51 | (Continued) |
CLEARWATER INVESTMENT TRUST
Schedule of Investments - Clearwater Tax-Exempt Bond Fund
December 31, 2011
| | | | | | | | | | | | | | | | | |
Par/Shares | | Security | | Maturity
date | | Coupon
rate | | Cost | | Fair
value(a) | | Percent
of
net assets | |
Municipal Bonds (Cont’d): | | | | | | | | | | | | | | |
| 500,000 | | CEDAR FALLS IA CMNTY SCH DIST SCH INFRASTRUCTURE SALES SVCS | | 6/1/2027 | | 5.38 | | $ | 498,685 | | | 541,740 | | | | |
| 1,000,000 | | CENTER CA UNIF SCH DIST (b) | | 8/1/2031 | | 12.90 | | | 318,457 | | | 295,170 | | | | |
| 1,000,000 | | CENTRL BRADFORD PROGRESS AUTH PA | | 12/1/2031 | | 5.50 | | | 1,038,629 | | | 1,073,470 | | | | |
| 500,000 | | CENTRL TX REGL MOBILITY AUTH REVENUE | | 1/1/2031 | | 5.75 | | | 495,436 | | | 507,790 | | | | |
| 595,000 | | CHANDLER PARK ACADEMY MI PUBLIC SCH ACADEMY REVENUE | | 11/1/2022 | | 5.00 | | | 449,385 | | | 562,085 | | | | |
| 1,000,000 | | CHAUTAUQUA CNTY NY CAPITAL RESOURCE CORP REVENUE | | 11/15/2016 | | 6.75 | | | 979,641 | | | 1,044,060 | | | | |
| 275,000 | | CHESTERFIELD CNTY VA INDL DEV AUTH MF REVENUE | | 7/1/2019 | | 5.20 | | | 258,381 | | | 275,468 | | | | |
| 500,000 | | CHICAGO IL | | 1/1/2035 | | 5.25 | | | 513,761 | | | 523,735 | | | | |
| 10,000 | | CHICAGO IL MET HSG DEV CORP | | 7/1/2022 | | 6.85 | | | 10,000 | | | 10,023 | | | | |
| 500,000 | | CITIZEN POTAWATOMI NATION OK SENIOR OBLG TAX REVENUE | | 9/1/2016 | | 6.50 | | | 500,000 | | | 481,220 | | | | |
| 250,000 | | CLARK CNTY NV ECON DEV REVENUE | | 5/15/2033 | | 5.38 | | | 252,406 | | | 252,638 | | | | |
| 455,000 | | CLARK CNTY NV IMPT DIST | | 2/1/2019 | | 5.00 | | | 456,254 | | | 427,272 | | | | |
| 355,000 | | CLEARWATER FL HSG AUTH | | 5/1/2024 | | 5.35 | | | 264,442 | | | 322,652 | | | | |
| 720,000 | | CLIFTON TX HGR EDU FIN CORP EDU REVENUE | | 2/15/2018 | | 7.75 | | | 711,351 | | | 782,374 | | | | |
| 500,000 | | CLIFTON TX HGR EDU FIN CORP EDU REVENUE | | 8/15/2031 | | 5.50 | | | 482,512 | | | 505,175 | | | | |
| 1,000,000 | | CMNTY MEMORIAL HOSP DIST MO HOSP REVENUE | | 12/1/2034 | | 6.68 | | | 885,979 | | | 1,074,070 | | | | |
| 295,000 | | COLLIER CNTY FL HSG FIN AUTH MF HSG REVENUE | | 8/15/2015 | | 5.25 | | | 294,374 | | | 296,012 | | | | |
| 750,000 | | COLLIER CNTY FL INDL DEV AUTH | | 10/1/2039 | | 6.25 | | | 735,458 | | | 790,845 | | | | |
| 1,500,000 | | COLORADO ST EDUCTNL & CULTURAL FACS AUTH INDEP SCH REVENUE | | 5/1/2030 | | 6.00 | | | 1,459,260 | | | 1,512,570 | | | | |
| 835,000 | | COLORADO ST EDUCTNL & CULTURAL FACS AUTH REVENUE | | 11/15/2028 | | 6.75 | | | 835,000 | | | 936,594 | | | | |
| 2,810,670 | | COLORADO ST EDUCTNL & CULTURAL FACS AUTH REVENUE | | 11/15/2028 | | 6.75 | | | 2,810,670 | | | 2,973,633 | | | | |
| 1,000,000 | | COLORADO ST EDUCTNL & CULTURAL FACS AUTH REVENUE | | 6/1/2033 | | 5.50 | | | 975,366 | | | 1,028,280 | | | | |
| 1,000,000 | | COLORADO ST EDUCTNL & CULTURAL FACS AUTH REVENUE | | 7/1/2034 | | 5.60 | | | 993,591 | | | 1,000,000 | | | | |
| 350,000 | | COLORADO ST EDUCTNL & CULTURAL FACS AUTH REVENUE | | 12/1/2039 | | 5.13 | | | 330,884 | | | 349,727 | | | | |
| 865,000 | | COLORADO ST HSG & FIN AUTH | | 10/1/2029 | | 5.40 | | | 865,000 | | | 912,333 | | | | |
| 790,000 | | COLORADO ST HSG & FIN AUTH | | 11/1/2029 | | 5.50 | | | 790,000 | | | 808,257 | | | | |
| 625,000 | | COLORADO ST HSG FIN AUTH SF MTGE REVENUE | | 11/1/2034 | | 5.00 | | | 625,043 | | | 640,988 | | | | |
| 1,000,000 | | COLTON CA JT UNIF SCH DIST (b) | | 8/1/2035 | | 3.46 | | | 554,467 | | | 597,250 | | | | |
| 1,250,000 | | CONNECTICUT ST DEV AUTH POLL CONTROL REVENUE | | 9/1/2028 | | 5.85 | | | 1,254,702 | | | 1,254,900 | | | | |
| 1,000,000 | | CONNECTICUT ST HSG FIN AUTH | | 11/15/2035 | | 4.75 | | | 1,000,000 | | | 1,021,700 | | | | |
| | |
See accompanying notes to the financial statements. | 52 | (Continued) |
CLEARWATER INVESTMENT TRUST
Schedule of Investments - Clearwater Tax-Exempt Bond Fund
December 31, 2011
| | | | | | | | | | | | | | | | | |
Par/Shares | | Security | | Maturity
date | | Coupon
rate | | Cost | | Fair
value(a) | | Percent
of
net assets | |
Municipal Bonds (Cont’d): | | | | | | | | | | | | | | |
| 1,000,000 | | CONNECTICUT ST HSG FIN AUTH | | 11/15/2041 | | 4.63 | | $ | 995,002 | | | 1,004,710 | | | | |
| 500,000 | | CONNECTICUT ST HSG FIN AUTH | | 11/15/2041 | | 5.00 | | | 500,000 | | | 515,950 | | | | |
| 375,000 | | CONNERTON W FL CDD CAPITAL IMPT REVENUE (d) | | 5/1/2016 | | 5.13 | | | 374,540 | | | 150,506 | | | | |
| 500,000 | | COOK CNTY IL SCH DIST #83 | | 6/1/2031 | | 5.38 | | | 489,666 | | | 543,435 | | | | |
| 1,105,000 | | CORONA-NORCO CA UNIF SCH DIST (b) | | 8/1/2039 | | 2.24 | | | 687,438 | | | 932,344 | | | | |
| 637,000 | | CORTLAND IL SPL TAX REVENUE | | 3/1/2017 | | 5.50 | | | 633,485 | | | 392,456 | | | | |
| 790,000 | | CROW FIN AUTH MT TRIBAL PURPOSE REVENUE | | 10/1/2017 | | 5.65 | | | 764,478 | | | 792,425 | | | | |
| 1,000,000 | | CULLMAN CNTY AL HLTH CARE AUTH | | 2/1/2023 | | 6.25 | | | 980,369 | | | 986,200 | | | | |
| 500,000 | | CUYAHOGA CNTY OH HSG MTGE REVENUE | | 3/20/2042 | | 5.70 | | | 513,301 | | | 532,640 | | | | |
| 3,287,000 | | DALLAS TX HSG FIN CORP | | 10/20/2032 | | 6.75 | | | 3,262,541 | | | 3,357,769 | | | | |
| 2,000,000 | | DAMON RUN IN CONSERVANCY DIST | | 7/1/2025 | | 6.10 | | | 2,042,076 | | | 2,160,880 | | | | |
| 1,000,000 | | DAMON RUN IN CONSERVANCY DIST | | 1/1/2027 | | 6.38 | | | 1,016,310 | | | 1,084,500 | | | | |
| 500,000 | | DAVIESS CNTY IN HOSP ASSN LEASE RENTAL REVENUE | | 1/15/2029 | | 5.25 | | | 488,949 | | | 530,645 | | | | |
| 1,000,000 | | DE KALB CNTY GA HOSP AUTH | | 9/1/2030 | | 6.00 | | | 970,993 | | | 1,053,040 | | | | |
| 1,000,000 | | DEKALB/KANE/LA SALLE CNTYS IL CMNTY CLG DIST #523(b) | | 2/1/2029 | | 11.72 | | | 343,079 | | | 384,040 | | | | |
| 500,000 | | DELAWARE RIVER NJ PORT AUTH | | 1/1/2022 | | 5.70 | | | 500,000 | | | 501,180 | | | | |
| 440,000 | | DELAWARE ST HSG AUTH REVENUE | | 7/1/2031 | | 5.20 | | | 440,000 | | | 460,112 | | | | |
| 147,417 | | DENHAM SPRINGS-LIVINGSTON LA HSG & MTGE FIN AUTH | | 11/1/2040 | | 5.00 | | | 152,576 | | | 152,585 | | | | |
| 500,000 | | DETROIT LAKES MN HSG & HLTH FACS REVENUE | | 8/1/2034 | | 2.39 | | | 500,000 | | | 482,385 | | | | |
| 500,000 | | DINUBA CA FING AUTH LEASE REVENUE | | 9/1/2038 | | 5.38 | | | 494,738 | | | 454,325 | | | | |
| 1,105,000 | | DIRECTOR OF THE ST OF NEVADA DEPT OF BUSINESS & INDUSTRY (d) | | 11/15/2014 | | 6.00 | | | 1,097,305 | | | 595,264 | | | | |
| 500,000 | | DIST OF COLUMBIA HSG FIN AGY MF HSG REVENUE | | 7/1/2033 | | 5.45 | | | 500,000 | | | 523,015 | | | | |
| 1,000,000 | | DIST OF COLUMBIA HSG FIN AGY MF HSG REVENUE | | 6/1/2040 | | 4.90 | | | 1,000,000 | | | 1,004,800 | | | | |
| 1,000,000 | | DIST OF COLUMBIA HSG FIN AGY MF HSG REVENUE | | 6/1/2041 | | 5.00 | | | 1,000,000 | | | 1,010,880 | | | | |
| 500,000 | | DISTRICT OF COLUMBIA REVENUE | | 6/1/2026 | | 5.00 | | | 506,843 | | | 443,760 | | | | |
| 3,000,000 | | DUBLIN CA UNIF SCH DIST (b) | | 8/1/2034 | | 15.06 | | | 726,437 | | | 732,660 | | | | |
| 225,000 | | E BATON ROUGE LA MTGE FIN AUTH SF REVENUE | | 10/1/2034 | | 5.00 | | | 225,000 | | | 232,162 | | | | |
| 550,000 | | E CHICAGO IN REDEV COMMISSION LAKE FRONT REDEV AREA TAX | | 7/15/2014 | | 5.00 | | | 550,000 | | | 548,559 | | | | |
| 565,000 | | E CHICAGO IN REDEV COMMISSION LAKE FRONT REDEV AREA TAX | | 1/15/2015 | | 5.25 | | | 565,000 | | | 562,011 | | | | |
| 500,000 | | E-470 CO PUBLIC HIGHWAY AUTH | | 9/1/2024 | | 5.50 | | | 504,267 | | | 512,795 | | | | |
| 945,000 | | EAST POINT GA | | 2/1/2026 | | 8.00 | | | 987,073 | | | 951,483 | | | | |
| 800,000 | | EDEN PRAIRIE MN MF HSG REVENUE | | 2/20/2043 | | 6.20 | | | 837,132 | | | 840,792 | | | | |
| 2,045,000 | | EDEN TWP CA HOSP DIST COPS | | 6/1/2030 | | 6.00 | | | 2,022,422 | | | 2,084,100 | | | | |
| 750,000 | | EL PASO DE ROBLES CA REDEV AGY TAX ALLOCATION REVENUE | | 7/1/2033 | | 6.38 | | | 741,731 | | | 825,675 | | | | |
| 705,268 | | EL PASO TX HSG FIN CORP | | 4/1/2033 | | 6.18 | | | 730,093 | | | 736,131 | | | | |
| 500,000 | | ELKHART CNTY IN HOSP AUTH | | 8/15/2020 | | 5.25 | | | 500,000 | | | 500,670 | | | | |
| | |
See accompanying notes to the financial statements. | 53 | (Continued) |
CLEARWATER INVESTMENT TRUST
Schedule of Investments - Clearwater Tax-Exempt Bond Fund
December 31, 2011
| | | | | | | | | | | | | | | | | |
Par/Shares | | Security | | Maturity
date | | Coupon
rate | | Cost | | Fair
value(a) | | Percent
of
net assets | |
Municipal Bonds (Cont’d): | | | | | | | | | | | | | | |
| 2,000,000 | | EMERY CNTY UT POLL CONTROL REVENUE | | 11/1/2023 | | 5.65 | | $ | 2,000,000 | | | 2,001,580 | | | | |
| 1,000,000 | | ENCINITAS CA UNION SCH DIST(b) | | 8/1/2035 | | 4.54 | | | 488,850 | | | 621,020 | | | | |
| 1,155,000 | | ENTERPRISE CA ELEM SCH DIST (b) | | 8/1/2035 | | 3.73 | | | 618,412 | | | 695,206 | | | | |
| 1,000,000 | | ERIE CNTY PA HOSP AUTH | | 7/1/2027 | | 7.00 | | | 1,000,000 | | | 1,023,580 | | | | |
| 500,000 | | ESTHERVILLE IA HOSP REVENUE | | 7/1/2020 | | 6.30 | | | 501,268 | | | 503,370 | | | | |
| 500,000 | | FAIRFAX CNTY VA REDEV & HSG AUTH MF REVENUE | | 8/1/2039 | | 5.60 | | | 500,000 | | | 529,390 | | | | |
| 239,000 | | FARMS NEW KENT VA CMNTY DEV AUTH SPL ASSMNT | | 3/1/2036 | | 5.13 | | | 239,000 | | | 144,585 | | | | |
| 1,000,000 | | FESTIVAL RANCH AZ CMNTY FACS DIST | | 7/15/2024 | | 6.25 | | | 1,014,946 | | | 1,075,040 | | | | |
| 315,000 | | FIDDLERS CREEK FL CDD #2 SPL ASSMNT REVENUE (d) | | 5/1/2013 | | 5.75 | | | 314,118 | | | 165,186 | | | | |
| 850,000 | | FLAGSTAFF AZ INDL DEV AUTH | | 7/1/2022 | | 5.50 | | | 786,001 | | | 791,528 | | | | |
| 250,000 | | FLORIDA ST HGR EDUCTNL FACS FINANCIAL AUTH REVENUE | | 7/1/2032 | | 5.38 | | | 252,960 | | | 265,132 | | | | |
| 500,000 | | FLORIDA ST HSG FIN CORP REVENUE | | 7/1/2026 | | 5.00 | | | 501,743 | | | 531,295 | | | | |
| 390,000 | | FLORIDA ST HSG FIN CORP REVENUE | | 1/1/2027 | | 5.05 | | | 390,000 | | | 414,184 | | | | |
| 375,000 | | FLORIDA ST HSG FIN CORP REVENUE | | 7/1/2033 | | 5.45 | | | 375,000 | | | 391,455 | | | | |
| 1,710,000 | | FLORIDA ST HSG FIN CORP REVENUE | | 7/1/2034 | | 5.30 | | | 1,726,618 | | | 1,770,790 | | | | |
| 500,000 | | FLORIDA ST MID-BAY BRIDGE AUTH(b) | | 10/1/2021 | | 9.78 | | | 258,672 | | | 251,535 | | | | |
| 490,000 | | FOREST CREEK FL CDD CAPITAL IMPT REVENUE | | 11/1/2013 | | 7.00 | | | 579,929 | | | 478,157 | | | | |
| 1,250,000 | | FORT SILL APACHE TRIBE OK ECONDEV AUTH GAMING ENTERPRISE REV | | 8/25/2026 | | 8.50 | | | 1,250,000 | | | 1,250,988 | | | | |
| 1,145,000 | | FULTON CNTY GA DEV AUTH | | 11/1/2028 | | 5.25 | | | 982,618 | | | 925,297 | | | | |
| 1,000,000 | | FYI PROPERTIES WA LEASE REVENUE | | 6/1/2034 | | 5.50 | | | 980,972 | | | 1,084,750 | | | | |
| 500,000 | | GAINESVILLE & HALL CNTY GA DEV AUTH RETMNT CMNTY REVENUE | | 11/15/2029 | | 6.38 | | | 514,738 | | | 538,535 | | | | |
| 1,206,508 | | GALVESTON TX MUNI UTILITY DIST #52(e) | | 3/1/2011 | | 6.16 | | | 1,206,508 | | | 964,241 | | | | |
| 400,000 | | GEISINGER PA AUTH | | 5/1/2037 | | 1.06 | | | 400,000 | | | 259,656 | | | | |
| 500,000 | | GEORGIA ST ENVRNMNTL LOAN ACQUISITION CORP LOC GOVT LOAN SEC | | 2/15/2031 | | 5.13 | | | 495,488 | | | 541,040 | | | | |
| 3,000,000 | | GEORGIA ST ENVRNMNTL LOAN ACQUISITION CORP LOC GOVT LOAN SEC | | 3/15/2031 | | 5.13 | | | 3,000,000 | | | 3,283,920 | | | | |
| 500,000 | | GEORGIA ST ENVRNMNTL LOAN ACQUISITION CORP LOC GOVT LOAN SEC | | 2/15/2036 | | 5.25 | | | 491,601 | | | 543,380 | | | | |
| 500,000 | | GILA CNTY AZ UNIF SCH DIST #10 PAYSON | | 7/1/2028 | | 5.75 | | | 477,532 | | | 557,235 | | | | |
| 2,000,000 | | GLENDALE CA UNIF SCH DIST(b) | | 9/1/2028 | | 11.02 | | | 710,240 | | | 742,040 | | | | |
| 1,000,000 | | GREENWOOD CNTY SC HOSP REVENUE | | 10/1/2031 | | 5.50 | | | 1,003,500 | | | 1,001,130 | | | | |
| 1,000,000 | | HAMDEN CT FAC REVENUE | | 1/1/2014 | | 6.13 | | | 991,209 | | | 1,000,750 | | | | |
| 1,250,000 | | HAMILTON CNTY OH HLTH CARE REVENUE | | 1/1/2031 | | 6.13 | | | 1,215,818 | | | 1,274,275 | | | | |
| 1,000,000 | | HAMMOND IN LOCAL PUBLIC IMPT BOND BANK SPL REVENUE | | 8/15/2025 | | 6.50 | | | 1,019,219 | | | 1,039,360 | | | | |
| | |
See accompanying notes to the financial statements. | 54 | (Continued) |
CLEARWATER INVESTMENT TRUST
Schedule of Investments - Clearwater Tax-Exempt Bond Fund
December 31, 2011
| | | | | | | | | | | | | | | | | |
Par/Shares | | Security | | Maturity
date | | Coupon
rate | | Cost | | Fair
value(a) | | Percent
of
net assets | |
Municipal Bonds (Cont’d): | | | | | | | | | | | | | | |
| 1,000,000 | | HAMMOND IN LOCAL PUBLIC IMPT BOND BANK SPL REVENUE | | 8/15/2030 | | 6.50 | | $ | 1,009,579 | | | 1,025,460 | | | | |
| 500,000 | | HAMMOND IN REDEV DIST REVENUE | | 1/15/2017 | | 6.00 | | | 500,000 | | | 505,650 | | | | |
| 1,250,000 | | HARRIS CNTY TX CULTURAL EDU FACS FIN CORP REVENUE (c) | | 8/15/2021 | | 6.75 | | | 1,250,000 | | | 1,332,525 | | | | |
| 1,500,000 | | HARTNELL CA CMNTY CLG DIST (b) | | 8/1/2034 | | 5.71 | | | 671,093 | | | 943,485 | | | | |
| 500,000 | | HARVEY IL | | 12/1/2027 | | 5.50 | | | 450,845 | | | 435,590 | | | | |
| 1,000,000 | | HAWAII ST DEPT OF BUDGET & FIN SPL PURPOSE REVENUE | | 11/15/2023 | | 7.88 | | | 969,749 | | | 1,040,990 | | | | |
| 1,500,000 | | HAWAII ST DEPT OF BUDGET & FIN SPL PURPOSE REVENUE | | 11/15/2033 | | 8.00 | | | 1,566,624 | | | 1,555,320 | | | | |
| 200,000 | | HAWAII ST DEPT OF BUDGET & FIN SPL PURPOSE SENIOR LIVING REV | | 11/15/2014 | | 6.40 | | | 200,000 | | | 200,994 | | | | |
| 590,000 | | HAWAII ST DEPT OF BUDGET & FIN SPL PURPOSE SENIOR LIVING REV | | 11/15/2029 | | 8.75 | | | 582,036 | | | 674,028 | | | | |
| 1,000,000 | | HAWTHORNE CA SCH DIST (b) | | 11/1/2026 | | 11.90 | | | 378,584 | | | 422,640 | | | | |
| 2,000,000 | | HAWTHORNE CA SCH DIST COPS (b) | | 12/1/2029 | | 1.69 | | | 1,539,644 | | | 1,829,880 | | | | |
| 1,000,000 | | HEALDSBURG CA REDEV AGY TAX ALLOCATION | | 8/1/2034 | | 5.38 | | | 990,255 | | | 1,083,930 | | | | |
| 1,000,000 | | HELENDALE CA SCH DIST (b) | | 8/1/2034 | | 3.31 | | | 578,573 | | | 714,080 | | | | |
| 255,000 | | HIGHLANDS CNTY FL HLTH FACS AUTH | | 11/15/2027 | | 5.00 | | | 257,095 | | | 265,266 | | | | |
| 500,000 | | HIGHLANDS CNTY FL HLTH FACS AUTH | | 11/15/2032 | | 5.13 | | | 501,393 | | | 509,790 | | | | |
| 219,000 | | HOUMA-TERREBONNE LA PUBLIC TRUST FING AUTH SF MTGE | | 12/1/2040 | | 5.15 | | | 227,652 | | | 227,239 | | | | |
| 1,000,000 | | IDAHO ST HSG & FIN ASSN ECON DEV REVENUE | | 2/1/2026 | | 6.50 | | | 1,000,000 | | | 1,054,610 | | | | |
| 245,000 | | IDAHO ST HSG & FIN ASSN NONPROFIT FACS REVENUE | | 8/1/2017 | | 6.25 | | | 245,000 | | | 241,141 | | | | |
| 750,000 | | IDAHO ST HSG & FIN ASSN NONPROFIT FACS REVENUE | | 7/1/2030 | | 5.50 | | | 750,000 | | | 668,468 | | | | |
| 655,000 | | IDAHO ST HSG & FIN ASSN SF MTGE REVENUE | | 7/1/2026 | | 5.65 | | | 669,689 | | | 688,890 | | | | |
| 295,000 | | IDAHO ST HSG & FIN ASSN SF MTGE REVENUE | | 7/1/2038 | | 5.50 | | | 295,000 | | | 311,302 | | | | |
| 195,000 | | IDAHO ST HSG & FIN ASSN SF MTGE REVENUE | | 1/1/2040 | | 5.50 | | | 195,000 | | | 203,118 | | | | |
| 900,000 | | ILLINOIS ST COPS | | 7/1/2017 | | 5.80 | | | 900,000 | | | 900,567 | | | | |
| 250,000 | | ILLINOIS ST DEV FIN AUTH | | 5/15/2021 | | 5.50 | | | 250,000 | | | 250,192 | | | | |
| 1,000,000 | | ILLINOIS ST FIN AUTH CHRT SCH REVENUE | | 10/1/2031 | | 6.88 | | | 1,000,000 | | | 1,017,040 | | | | |
| 600,000 | | ILLINOIS ST FIN AUTH EDU REVENUE | | 9/1/2027 | | 5.00 | | | 567,890 | | | 494,802 | | | | |
| 500,000 | | ILLINOIS ST FIN AUTH REVENUE | | 5/15/2012 | | 5.10 | | | 499,817 | | | 499,350 | | | | |
| 1,000,000 | | ILLINOIS ST FIN AUTH REVENUE | | 5/15/2017 | | 6.00 | | | 1,000,000 | | | 999,950 | | | | |
| 350,000 | | ILLINOIS ST FIN AUTH REVENUE | | 8/15/2023 | | 6.00 | | | 361,539 | | | 366,296 | | | | |
| 610,000 | | ILLINOIS ST FIN AUTH REVENUE | | 8/15/2026 | | 6.00 | | | 621,838 | | | 530,968 | | | | |
| 1,000,000 | | ILLINOIS ST FIN AUTH REVENUE | | 11/15/2026 | | 5.25 | | | 970,233 | | | 909,390 | | | | |
| 250,000 | | ILLINOIS ST FIN AUTH REVENUE | | 11/15/2026 | | 5.75 | | | 251,846 | | | 261,888 | | | | |
| 500,000 | | ILLINOIS ST FIN AUTH REVENUE | | 3/15/2027 | | 5.00 | | | 518,174 | | | 510,760 | | | | |
| 500,000 | | ILLINOIS ST FIN AUTH REVENUE | | 5/15/2029 | | 5.25 | | | 505,397 | | | 509,730 | | | | |
| | |
See accompanying notes to the financial statements. | 55 | (Continued) |
CLEARWATER INVESTMENT TRUST
Schedule of Investments - Clearwater Tax-Exempt Bond Fund
December 31, 2011
| | | | | | | | | | | | | | | | | |
Par/Shares | | Security | | Maturity
date | | Coupon
rate | | Cost | | Fair
value(a) | | Percent
of
net assets | |
Municipal Bonds (Cont’d): | | | | | | | | | | | | | | |
| 1,500,000 | | ILLINOIS ST FIN AUTH REVENUE | | 8/15/2036 | | 5.25 | | $ | 1,474,439 | | | 1,465,455 | | | | |
| 150,000 | | ILLINOIS ST FIN AUTH REVENUE | | 12/1/2036 | | 5.00 | | | 151,229 | | | 132,132 | | | | |
| 805,000 | | ILLINOIS ST FIN AUTH REVENUE | | 2/1/2037 | | 5.25 | | | 800,597 | | | 736,897 | | | | |
| 500,000 | | ILLINOIS ST FIN AUTH REVENUE | | 3/1/2038 | | 6.00 | | | 485,220 | | | 547,090 | | | | |
| 750,000 | | ILLINOIS ST FIN AUTH SPORTS FAC REVENUE (c)(d) | | 10/1/2027 | | 6.13 | | | 730,795 | | | 75,000 | | | | |
| 500,000 | | ILLINOIS ST FIN AUTH SPORTS FAC REVENUE (c)(d) | | 10/1/2037 | | 6.25 | | | 484,210 | | | 50,000 | | | | |
| 1,500,000 | | ILLINOIS ST FIN AUTH STUDENT HSG REVENUE | | 10/1/2024 | | 6.00 | | | 1,483,506 | | | 1,580,190 | | | | |
| 490,000 | | ILLINOIS ST HLTH FACS AUTH | | 5/15/2014 | | 6.25 | | | 490,000 | | | 491,475 | | | | |
| 750,000 | | ILLINOIS ST HLTH FACS AUTH | | 8/15/2028 | | 5.38 | | | 737,871 | | | 750,188 | | | | |
| 500,000 | | ILLINOIS ST HLTH FACS AUTH REVENUE | | 7/1/2033 | | 6.00 | | | 508,050 | | | 510,270 | | | | |
| 2,100,000 | | ILLINOIS ST HLTH FACS AUTH REVENUE | | 8/15/2033 | | 5.10 | | | 2,120,669 | | | 2,114,847 | | | | |
| 1,000,000 | | IMPERIAL CA CMNTY CLG DIST (b) | | 8/1/2040 | | 1.12 | | | 803,038 | | | 914,340 | | | | |
| 250,000 | | INDEPENDENCE MO THIRTY-NINTH STREET TRANSPRTN DIST REVENUE | | 9/1/2032 | | 6.88 | | | 250,000 | | | 244,445 | | | | |
| 500,000 | | INDIANA ST BOND BANK REVENUE | | 2/1/2029 | | 5.50 | | | 490,746 | | | 539,145 | | | | |
| 1,750,000 | | INDIANA ST FIN AUTH HOSP REVENUE | | 5/1/2031 | | 5.75 | | | 1,807,890 | | | 1,867,250 | | | | |
| 1,000,000 | | INDIANA ST FIN AUTH REVENUE | | 10/1/2021 | | 6.00 | | | 1,000,000 | | | 1,026,040 | | | | |
| 3,000,000 | | INDIANA ST FIN AUTH REVENUE | | 9/15/2030 | | 6.50 | | | 3,086,480 | | | 3,090,930 | | | | |
| 500,000 | | INDIANA ST FIN AUTH REVENUE | | 11/15/2031 | | 5.50 | | | 492,253 | | | 506,425 | | | | |
| 1,000,000 | | INDIANA ST HLTH & EDUCTNL FAC FING AUTH HOSP REVENUE | | 2/15/2030 | | 5.25 | | | 746,831 | | | 1,013,240 | | | | |
| 1,315,000 | | INDIANA ST HLTH FAC FING AUTH | | 8/15/2018 | | 5.00 | | | 1,203,686 | | | 1,316,315 | | | | |
| 6,686,652 | | INTERMEDIATE SCH DIST #287 MN LEASE REVENUE | | 11/1/2032 | | 5.30 | | | 6,454,766 | | | 6,798,720 | | | | |
| 400,000 | | IOWA ST FIN AUTH SENIOR HSG REVENUE | | 12/1/2014 | | 5.00 | | | 398,592 | | | 347,440 | | | | |
| 1,000,000 | | IOWA ST STUDENT LOAN LIQUIDITY CORP | | 12/1/2027 | | 5.50 | | | 978,216 | | | 1,044,280 | | | | |
| 395,000 | | JACKSONVILLE FL ECON DEV COMMISSION HLTH CARE FACS REVENUE | | 9/1/2017 | | 6.00 | | | 395,000 | | | 422,437 | | | | |
| 2,000,000 | | JEFFERSON CA UNION HIGH SCH DIST SAN MATEO CNTY (b) | | 8/1/2031 | | 26.18 | | | 388,784 | | | 419,100 | | | | |
| 859,000 | | JEFFERSON CNTY KY MTGE REVENUE | | 11/15/2013 | | 6.13 | | | 859,000 | | | 861,242 | | | | |
| 120,000 | | JEFFERSON PARISH LA FIN AUTH | | 6/1/2033 | | 5.00 | | | 125,754 | | | 123,768 | | | | |
| 990,000 | | JEFFERSON PARISH LA FIN AUTH | | 6/1/2038 | | 5.00 | | | 1,032,591 | | | 1,032,649 | | | | |
| 215,000 | | JEFFERSON PARISH LA FIN AUTH | | 12/1/2048 | | 5.70 | | | 225,230 | | | 230,751 | | | | |
| 1,690,000 | | KALISPEL TRIBE OF INDIANS PRIORITY DIST WA REVENUE | | 1/1/2016 | | 6.20 | | | 1,646,669 | | | 1,607,274 | | | | |
| 1,250,000 | | KANSAS CITY MO INDL DEV AUTH | | 9/1/2023 | | 5.45 | | | 1,250,000 | | | 1,308,150 | | | | |
| 1,000,000 | | KANSAS CITY MO INDL DEV AUTH | | 11/20/2039 | | 5.10 | | | 1,000,000 | | | 1,031,520 | | | | |
| 1,000,000 | | KANSAS ST DEV FIN AUTH HOSP REVENUE | | 11/15/2029 | | 5.50 | | | 977,688 | | | 1,107,550 | | | | |
| 500,000 | | KENTUCKY ST ECON DEV FIN AUTH MF HSG REVENUE | | 11/20/2035 | | 5.38 | | | 500,000 | | | 529,285 | | | | |
| | |
See accompanying notes to the financial statements. | 56 | (Continued) |
CLEARWATER INVESTMENT TRUST
Schedule of Investments - Clearwater Tax-Exempt Bond Fund
December 31, 2011
| | | | | | | | | | | | | | | | | |
Par/Shares | | Security | | Maturity
date | | Coupon
rate | | Cost | | Fair
value(a) | | Percent
of
net assets | |
Municipal Bonds (Cont’d): | | | | | | | | | | | | | | |
| 470,000 | | KENTUCKY ST HSG CORP HSG REVENUE | | 7/1/2039 | | 5.15 | | $ | 470,000 | | | 488,979 | | | | |
| 1,980,000 | | KERRVILLE TX HLTH FACS DEV CORP HOSP REVENUE | | 8/15/2035 | | 5.45 | | | 1,953,813 | | | 1,918,521 | | | | |
| 750,000 | | KING CNTY WA HSG AUTH | | 5/1/2028 | | 5.20 | | | 750,000 | | | 797,558 | | | | |
| 500,000 | | KIRKWOOD MO INDL DEV AUTH RETMNT CMNTY REVENUE | | 11/15/2015 | | 7.00 | | | 500,000 | | | 501,050 | | | | |
| 500,000 | | KIRKWOOD MO INDL DEV AUTH RETMNT CMNTY REVENUE | | 5/15/2021 | | 8.00 | | | 500,000 | | | 533,830 | | | | |
| 900,000 | | KLICKITAT CNTY WA PUBLIC HOSP DIST #2 HOSP REVENUE | | 12/1/2020 | | 6.00 | | | 838,369 | | | 856,413 | | | | |
| 2,500,000 | | KOYUKUK AK REVENUE | | 10/1/2023 | | 7.00 | | | 2,426,784 | | | 2,542,925 | | | | |
| 1,390,000 | | KREMMLING CO MEMORIAL HOSP DIST COPS | | 12/1/2022 | | 6.00 | | | 1,376,306 | | | 1,393,225 | | | | |
| 1,500,000 | | LA MIRADA CA REDEV AGY(b) | | 8/15/2027 | | 14.17 | | | 493,469 | | | 526,830 | | | | |
| 410,000 | | LA VERNIA TX HGR EDU FIN CORP EDU REVENUE | | 2/15/2018 | | 6.00 | | | 410,000 | | | 411,747 | | | | |
| 1,007,000 | | LAFAYETTE LA PUBLIC TRUST FING AUTH SF MTGE | | 1/1/2041 | | 5.35 | | | 1,028,292 | | | 1,031,339 | | | | |
| 750,000 | | LAKESIDE 370 MO LEVEE DIST | | 4/1/2028 | | 7.00 | | | 750,000 | | | 729,368 | | | | |
| 2,000,000 | | LAKEWOOD RANCH FL STEWARDSHIP DIST SPL ASSMNT REVENUE | | 5/1/2030 | | 7.40 | | | 1,980,157 | | | 2,048,380 | | | | |
| 2,000,000 | | LAS VEGAS NV REDEV AGY TAX INCR REVENUE | | 6/15/2023 | | 7.50 | | | 1,980,833 | | | 2,344,720 | | | | |
| 750,000 | | LEE CNTY FL INDL DEV AUTH | | 6/15/2027 | | 5.25 | | | 753,134 | | | 683,978 | | | | |
| 1,000,000 | | LEE CNTY FL INDL DEV AUTH | | 11/15/2029 | | 5.00 | | | 830,787 | | | 846,460 | | | | |
| 1,000,000 | | LEHIGH CNTY PA GEN PURPOSE AUTH | | 12/15/2023 | | 6.00 | | | 911,221 | | | 939,080 | | | | |
| 250,000 | | LEHIGH CNTY PA GEN PURPOSE AUTH | | 8/15/2042 | | 1.32 | | | 250,000 | | | 141,415 | | | | |
| 500,000 | | LEXINGTON OAKS FL CDD SPL ASSMNT REVENUE | | 5/1/2033 | | 5.65 | | | 500,000 | | | 508,175 | | | | |
| 500,000 | | LOMBARD IL PUBLIC FACS CORP CONFERENCE CENTER & HOTEL REVENU | | 1/1/2015 | | 6.38 | | | 500,000 | | | 362,010 | | | | |
| 550,000 | | LOMBARD IL PUBLIC FACS CORP CONFERENCE CENTER & HOTEL REVENU | | 1/1/2030 | | 5.50 | | | 572,760 | | | 327,486 | | | | |
| 1,750,000 | | LOMBARD IL PUBLIC FACS CORP CONFERENCE CENTER & HOTEL REVENU | | 1/1/2036 | | 5.25 | | | 1,771,784 | | | 1,239,402 | | | | |
| 250,000 | | LOMPOC CA HLTHCARE DIST | | 8/1/2034 | | 5.00 | | | 251,804 | | | 251,072 | | | | |
| 1,000,000 | | LOS ANGELES CA COPS | | 2/1/2027 | | 5.00 | | | 1,000,039 | | | 1,000,900 | | | | |
| 2,000,000 | | LOS ANGELES CA HSG AUTH | | 6/1/2029 | | 5.00 | | | 1,704,769 | | | 1,771,760 | | | | |
| 500,000 | | LOUDOUN CNTY VA INDL DEV AUTH RSDL CARE FAC REVENUE | | 8/1/2028 | | 7.00 | | | 500,000 | | | 499,935 | | | | |
| 500,000 | | LOUISIANA ST HSG FIN AGY SF MTGE REVENUE | | 12/1/2034 | | 5.10 | | | 500,000 | | | 521,870 | | | | |
| 240,000 | | LOUISIANA ST HSG FIN AGY SF MTGE REVENUE | | 6/1/2038 | | 5.85 | | | 253,214 | | | 250,195 | | | | |
| 1,105,000 | | LOUISIANA ST HSG FIN AGY SF MTGE REVENUE | | 12/1/2038 | | 5.70 | | | 1,148,644 | | | 1,161,024 | | | | |
| 235,000 | | LOUISIANA ST HSG FIN AGY SF MTGE REVENUE | | 6/1/2039 | | 5.60 | | | 242,475 | | | 256,171 | | | | |
| 420,000 | | LOUISIANA ST LOCAL GOVT ENVRNMNTL FACS & CMNTY DEV AUTH | | 6/20/2028 | | 8.00 | | | 420,000 | | | 360,612 | | | | |
| 500,000 | | LOUISIANA ST PUBLIC FACS AUTH HOSP REVENUE | | 7/1/2024 | | 6.75 | | | 511,475 | | | 530,295 | | | | |
| 750,000 | | LOUISIANA ST PUBLIC FACS AUTH REVENUE | | 5/1/2031 | | 6.50 | | | 746,655 | | | 796,808 | | | | |
| 500,000 | | LOUISIANA ST PUBLIC FACS AUTH REVENUE | | 2/15/2036 | | 1.00 | | | 500,000 | | | 358,585 | | | | |
| | |
See accompanying notes to the financial statements. | 57 | (Continued) |
CLEARWATER INVESTMENT TRUST
Schedule of Investments - Clearwater Tax-Exempt Bond Fund
December 31, 2011
| | | | | | | | | | | | | | | | | |
Par/Shares | | Security | | Maturity
date | | Coupon
rate | | Cost | | Fair
value(a) | | Percent
of
net assets | |
Municipal Bonds (Cont’d): | | | | | | | | | | | | | | |
| 1,000,000 | | LOUISIANA ST TRANSPRTN AUTH TOLL REVENUE(b) | | 12/1/2027 | | 9.18 | | $ | 414,198 | | | 425,520 | | | | |
| 500,000 | | LUCAS CNTY OH HLTH CARE FACS REVENUE | | 8/15/2030 | | 5.50 | | | 491,378 | | | 508,185 | | | | |
| 1,495,000 | | LUZERNE CNTY PA | | 11/1/2026 | | 7.00 | | | 1,588,290 | | | 1,752,319 | | | | |
| 418,312 | | LYONS CO | | 11/30/2016 | | 4.75 | | | 421,120 | | | 408,277 | | | | |
| 1,000,000 | | MACON CNTY IL SCH DIST #61 | | 1/1/2037 | | 5.25 | | | 1,033,969 | | | 1,063,390 | | | | |
| 1,000,000 | | MADERA CA IRR FING AUTH REVENUE | | 1/1/2031 | | 6.25 | | | 978,156 | | | 1,066,000 | | | | |
| 440,000 | | MADISON CNTY FL | | 7/1/2025 | | 6.00 | | | 433,992 | | | 404,197 | | | | |
| 250,000 | | MAGNOLIA CREEK FL CDD CAPITAL IMPT REVENUE (d) | | 5/1/2014 | | 5.60 | | | 250,000 | | | 100,012 | | | | |
| 725,000 | | MAINE ST EDUCTNL AUTH STUDENT LOAN REVENUE | | 12/1/2027 | | 5.63 | | | 725,000 | | | 793,150 | | | | |
| 1,000,000 | | MAINE ST HLTH & HGR EDUCTNL FACS AUTH REVENUE | | 7/1/2026 | | 6.00 | | | 999,508 | | | 1,024,720 | | | | |
| 1,000,000 | | MAINE ST HLTH & HGR EDUCTNL FACS AUTH REVENUE | | 7/1/2032 | | 7.50 | | | 1,057,614 | | | 1,104,280 | | | | |
| 1,000,000 | | MAINE ST TECH CLG SYS COPS | | 1/1/2017 | | 5.80 | | | 1,000,000 | | | 1,003,910 | | | | |
| 1,000,000 | | MALTA IL TAX INCR REVENUE | | 12/30/2025 | | 5.75 | | | 1,000,000 | | | 667,630 | | | | |
| 500,000 | | MANATEE CNTY FL SCH BRD | | 7/1/2031 | | 5.63 | | | 495,579 | | | 546,340 | | | | |
| 500,000 | | MANCHESTER NH HSG & REDEV AUTH REVENUE | | 1/1/2015 | | 6.75 | | | 495,510 | | | 480,915 | | | | |
| 500,000 | | MANCHESTER NH HSG & REDEV AUTH REVENUE (b) | | 1/1/2020 | | 7.87 | | | 322,940 | | | 235,010 | | | | |
| 452,000 | | MANHATTAN IL SPL SVC AREA SPL TAX(d) | | 3/1/2022 | | 5.75 | | | 452,000 | | | 135,758 | | | | |
| 500,000 | | MANSFIELD OH | | 12/1/2024 | | 6.00 | | | 523,996 | | | 581,100 | | | | |
| 750,000 | | MANTECA CA FING AUTH SWR REVENUE | | 12/1/2033 | | 5.00 | | | 694,783 | | | 755,640 | | | | |
| 300,000 | | MARICOPA CNTY AZ ELEM SCH DIST #21 MURPHY | | 7/1/2024 | | 8.00 | | | 307,537 | | | 341,256 | | | | |
| 439,000 | | MARQUIS VA CMNTY DEV AUTH REVENUE | | 9/1/2013 | | 5.10 | | | 439,000 | | | 361,345 | | | | |
| 750,000 | | MARTINEZ CA UNIF SCH DIST(b) | | 8/1/2035 | | 0.87 | | | 622,136 | | | 713,640 | | | | |
| 500,000 | | MARYLAND ST CMNTY DEV ADMIN DEPT HSG & CMNTY DEV | | 9/1/2030 | | 5.13 | | | 500,000 | | | 527,465 | | | | |
| 500,000 | | MARYLAND ST CMNTY DEV ADMIN DEPT HSG & CMNTY DEV | | 7/1/2031 | | 4.50 | | | 500,000 | | | 504,815 | | | | |
| 1,000,000 | | MARYLAND ST HLTH & HGR EDUCTNL FACS AUTH REVENUE | | 1/1/2026 | | 6.00 | | | 1,026,373 | | | 1,049,850 | | | | |
| 1,000,000 | | MARYLAND ST HLTH & HGR EDUCTNL FACS AUTH REVENUE | | 1/1/2031 | | 6.25 | | | 1,018,490 | | | 1,043,760 | | | | |
| 500,000 | | MASHANTUCKET WSTRN PEQUOT TRIBE CT (c)(d) | | 9/1/2036 | | 5.50 | | | 509,035 | | | 182,935 | | | | |
| 1,000,000 | | MASSACHUSETTS ST DEV FIN AGY REVENUE | | 7/1/2030 | | 6.38 | | | 986,585 | | | 1,060,530 | | | | |
| 290,000 | | MASSACHUSETTS ST DEV FIN AGY SENIOR LIVING FAC REVENUE | | 6/1/2014 | | 6.25 | | | 290,000 | | | 289,986 | | | | |
| 455,000 | | MASSACHUSETTS ST EDUCTNL FING AUTH | | 1/1/2027 | | 5.20 | | | 455,000 | | | 494,348 | | | | |
| 2,280,000 | | MASSACHUSETTS ST EDUCTNL FING AUTH | | 1/1/2028 | | 5.25 | | | 2,285,517 | | | 2,441,287 | | | | |
| 1,330,000 | | MASSACHUSETTS ST HLTH & EDUCTNL FACS AUTH | | 7/1/2013 | | 7.30 | | | 1,330,000 | | | 1,335,586 | | | | |
| 500,000 | | MASSACHUSETTS ST HLTH & EDUCTNL FACS AUTH REVENUE | | 7/1/2022 | | 6.00 | | | 505,000 | | | 505,690 | | | | |
| 1,000,000 | | MASSACHUSETTS ST HSG FIN AGY | | 12/1/2033 | | 5.35 | | | 1,000,000 | | | 1,044,630 | | | | |
| | |
See accompanying notes to the financial statements. | 58 | (Continued) |
CLEARWATER INVESTMENT TRUST
Schedule of Investments - Clearwater Tax-Exempt Bond Fund
December 31, 2011
| | | | | | | | | | | | | | | | | |
Par/Shares | | Security | | Maturity
date | | Coupon
rate | | Cost | | Fair
value(a) | | Percent
of
net assets | |
Municipal Bonds (Cont’d): | | | | | | | | | | | | | | |
| 750,000 | | MASSACHUSETTS ST HSG FIN AGY | | 12/1/2037 | | 5.40 | | $ | 763,276 | | | 782,572 | | | | |
| 960,000 | | MASSACHUSETTS ST HSG FIN AGY | | 6/1/2040 | | 5.05 | | | 960,000 | | | 990,998 | | | | |
| 1,750,000 | | MCALESTER OK PUBLIC WKS AUTH UTILITY SYS REVENUE (b) | | 2/1/2030 | | 11.04 | | | 633,260 | | | 633,745 | | | | |
| 160,000 | | MEAD NE TAX INCR REVENUE(d) | | 7/1/2012 | | 5.13 | | | 160,000 | | | 138,709 | | | | |
| 1,000,000 | | MESQUITE TX HLTH FAC DEV CORP | | 2/15/2025 | | 5.50 | | | 998,063 | | | 1,000,290 | | | | |
| 1,070,000 | | MET GOVT NASHVILLE & DAVIDSON CNTY TN HLTH & EDUCTNL FAC BRD (d) | | 12/20/2020 | | 8.00 | | | 1,070,000 | | | 534,968 | | | | |
| 855,000 | | MET GOVT NASHVILLE & DAVIDSON CNTY TN HLTH & EDUCTNL FAC BRD (d) | | 6/20/2036 | | 10.00 | | | 855,000 | | | 420,720 | | | | |
| 1,830,000 | | MET GOVT NASHVILLE & DAVIDSON CNTY TN HLTH & EDUCTNL FAC BRD (d) | | 12/20/2040 | | 7.50 | | | 1,830,000 | | | 1,063,285 | | | | |
| 2,000,000 | | MET WASHINGTON DC ARPTS AUTH DULES TOLL ROAD REVENUE (b) | | 10/1/2041 | | 1.80 | | | 1,310,697 | | | 1,728,460 | | | | |
| 500,000 | | MIAMI-DADE CNTY FL HLTH FACS AUTH HOSP REVENUE | | 8/1/2030 | | 6.00 | | | 485,796 | | | 542,525 | | | | |
| 1,500,000 | | MIAMI-DADE CNTY FL SPL OBLG (b) | | 10/1/2026 | | 10.87 | | | 608,848 | | | 619,935 | | | | |
| 500,000 | | MICHIGAN ST FIN AUTH LTD OBLGREVENUE | | 10/1/2021 | | 6.00 | | | 496,309 | | | 502,875 | | | | |
| 1,000,000 | | MICHIGAN ST HOSP FIN AUTH | | 12/1/2023 | | 6.13 | | | 989,561 | | | 1,172,110 | | | | |
| 1,000,000 | | MICHIGAN ST HOSP FIN AUTH | | 4/1/2032 | | 5.75 | | | 1,008,891 | | | 1,014,130 | | | | |
| 1,500,000 | | MICHIGAN ST HOSP FIN AUTH | | 6/1/2034 | | 6.13 | | | 1,565,705 | | | 1,607,295 | | | | |
| 625,000 | | MICHIGAN ST HSG DEV AUTH | | 10/1/2020 | | 5.38 | | | 600,638 | | | 681,050 | | | | |
| 1,000,000 | | MICHIGAN ST HSG DEV AUTH | | 10/1/2034 | | 5.63 | | | 1,000,000 | | | 1,049,370 | | | | |
| 1,000,000 | | MICHIGAN ST MUNI BOND AUTH | | 5/1/2023 | | 5.75 | | | 1,026,987 | | | 1,188,310 | | | | |
| 850,000 | | MICHIGAN ST PUBLIC EDUCTNL FACS AUTH (c) | | 9/1/2016 | | 6.00 | | | 846,955 | | | 771,494 | | | | |
| 750,000 | | MICHIGAN ST PUBLIC EDUCTNL FACS AUTH | | 6/1/2020 | | 6.00 | | | 743,844 | | | 747,022 | | | | |
| 475,000 | | MICHIGAN ST PUBLIC EDUCTNL FACS AUTH | | 9/1/2021 | | 8.00 | | | 475,000 | | | 433,262 | | | | |
| 300,000 | | MICHIGAN ST PUBLIC EDUCTNL FACS AUTH | | 9/1/2022 | | 5.00 | | | 300,000 | | | 272,178 | | | | |
| 450,000 | | MICHIGAN ST PUBLIC EDUCTNL FACS AUTH | | 10/1/2023 | | 6.25 | | | 450,000 | | | 409,774 | | | | |
| 500,000 | | MICHIGAN ST PUBLIC EDUCTNL FACS AUTH | | 11/1/2028 | | 6.35 | | | 500,000 | | | 494,955 | | | | |
| 310,000 | | MICHIGAN ST TOBACCO SETTLEMENT FIN AUTH | | 6/1/2022 | | 5.13 | | | 291,132 | | | 263,596 | | | | |
| 496,000 | | MILLSBORO DE SPL OBLG | | 7/1/2036 | | 5.45 | | | 496,000 | | | 370,343 | | | | |
| 2,500,000 | | MINNEAPOLIS MN MF REVENUE | | 11/1/2013 | | 6.00 | | | 2,489,148 | | | 2,479,350 | | | | |
| 389,838 | | MINNESOTA ST HGR EDU FACS AUTH REVENUE | | 10/1/2016 | | 4.49 | | | 391,878 | | | 396,777 | | | | |
| 190,000 | | MINNESOTA ST HSG FIN AGY | | 1/1/2020 | | 5.00 | | | 183,311 | | | 190,262 | | | | |
| 475,000 | | MINNESOTA ST HSG FIN AGY | | 7/1/2034 | | 5.05 | | | 475,000 | | | 491,905 | | | | |
| 945,000 | | MINNESOTA ST HSG FIN AGY | | 1/1/2040 | | 5.10 | | | 945,000 | | | 975,665 | | | | |
| 1,000,000 | | MINNESOTA ST OFFICE OF HGR EDU REVENUE | | 11/1/2029 | | 5.00 | | | 1,000,000 | | | 1,071,460 | | | | |
| 1,000,000 | | MISSISSIPPI ST DEV BANK SPL OBLG | | 10/1/2031 | | 6.50 | | | 972,846 | | | 1,077,730 | | | | |
| 245,000 | | MISSISSIPPI ST HOME CORP SF MTGE REVENUE | | 6/1/2039 | | 6.75 | | | 258,321 | | | 263,936 | | | | |
| 500,000 | | MISSOURI ST DEV FIN BRD | | 11/1/2025 | | 5.50 | | | 492,362 | | | 521,935 | | | | |
| 500,000 | | MISSOURI ST DEV FIN BRD | | 4/1/2027 | | 6.00 | | | 502,663 | | | 513,855 | | | | |
| | |
See accompanying notes to the financial statements. | 59 | (Continued) |
CLEARWATER INVESTMENT TRUST
Schedule of Investments - Clearwater Tax-Exempt Bond Fund
December 31, 2011
| | | | | | | | | | | | | | | | | |
Par/Shares | | Security | | Maturity
date | | Coupon
rate | | Cost | | Fair
value(a) | | Percent
of
net assets | |
Municipal Bonds (Cont’d): | | | | | | | | | | | | | | |
| 500,000 | | MISSOURI ST DEV FIN BRD | | 10/1/2027 | | 6.13 | | $ | 484,990 | | | 520,335 | | | | |
| 500,000 | | MISSOURI ST DEV FIN BRD INFRASTRUCTURE FACS LEASEHOLD | | 6/1/2029 | | 5.63 | | | 487,236 | | | 515,630 | | | | |
| 980,000 | | MISSOURI ST HLTH & EDUCTNL FACS AUTH | | 2/1/2022 | | 5.13 | | | 1,003,252 | | | 1,017,877 | | | | |
| 500,000 | | MISSOURI ST HLTH & EDUCTNL FACS AUTH | | 2/1/2035 | | 5.38 | | | 498,318 | | | 481,115 | | | | |
| 265,000 | | MISSOURI ST HSG DEV COMMISSION SF HSG REVENUE | | 9/1/2034 | | 5.25 | | | 263,262 | | | 277,330 | | | | |
| 360,000 | | MISSOURI ST HSG DEV COMMISSION SF HSG REVENUE | | 9/1/2034 | | 5.35 | | | 360,000 | | | 379,454 | | | | |
| 1,000,000 | | MOBERLY MO INDL DEV AUTH | | 9/1/2024 | | 6.00 | | | 1,016,984 | | | 400,170 | | | | |
| 1,000,000 | | MOHAVE CNTY AZ INDL DEV AUTH CORRNL FACS | | 5/1/2015 | | 7.25 | | | 994,741 | | | 1,049,630 | | | | |
| 1,320,000 | | MONTANA ST BRD OF HSG | | 12/1/2039 | | 5.50 | | | 1,320,189 | | | 1,383,096 | | | | |
| 500,000 | | MONTGOMERY CNTY MD HSG OPPORTUNITIES COMMISSION MF REVENUE | | 7/1/2037 | | 5.13 | | | 500,000 | | | 513,940 | | | | |
| 2,000,000 | | MONTGOMERY CNTY MD HSG OPPORTUNITIES COMMISSION SF MTGE REVE(b) | | 7/1/2028 | | 9.13 | | | 809,157 | | | 798,000 | | | | |
| 1,500,000 | | MONTGOMERY CNTY OH HLTH CARE FACS REVENUE | | 9/20/2032 | | 6.55 | | | 1,458,532 | | | 1,517,130 | | | | |
| 650,000 | | MONTGOMERY CNTY PA INDL DEV AUTH | | 2/1/2014 | | 5.38 | | | 648,418 | | | 635,290 | | | | |
| 375,000 | | MONTGOMERY CNTY PA INDL DEV AUTH | | 2/1/2028 | | 6.13 | | | 370,280 | | | 332,040 | | | | |
| 800,000 | | MOUNT CARBON CO MET DIST REVENUE | | 6/1/2043 | | 7.00 | | | 800,000 | | | 230,360 | | | | |
| 200,000 | | MOUNT CARBON CO MET DIST REVENUE | | 6/1/2043 | | 8.00 | | | - | | | 20,000 | | | | |
| 1,000,000 | | MOUNT LEBANON PA HOSP AUTH | | 7/1/2032 | | 5.63 | | | 1,002,022 | | | 1,003,560 | | | | |
| 350,000 | | N RANGE CO MET DIST #1 | | 12/15/2024 | | 5.00 | | | 358,152 | | | 284,456 | | | | |
| 500,000 | | N TX TOLLWAY AUTH DALLAS N TOLLWAY SYS REVENUE | | 1/1/2025 | | 6.00 | | | 500,000 | | | 577,375 | | | | |
| 1,000,000 | | N TX TOLLWAY AUTH REVENUE (b) | | 1/1/2028 | | 10.85 | | | 394,413 | | | 446,680 | | | | |
| 1,000,000 | | N TX TOLLWAY AUTH REVENUE | | 1/1/2034 | | 6.00 | | | 1,000,000 | | | 1,119,460 | | | | |
| 1,000,000 | | N TX TOLLWAY AUTH REVENUE (b) | | 1/1/2042 | | 1.40 | | | 708,062 | | | 954,740 | | | | |
| 1,000,000 | | NATRONA CNTY WY HOSP REVENUE | | 9/15/2031 | | 6.35 | | | 1,000,000 | | | 1,084,730 | | | | |
| 500,000 | | NEBRASKA ST INVESTMENT FIN AUTH SF HSG REVENUE | | 9/1/2036 | | 5.90 | | | 500,000 | | | 544,885 | | | | |
| 300,000 | | NEVADA ST HSG DIV SF MTGE REVENUE | | 10/1/2039 | | 5.38 | | | 300,000 | | | 310,545 | | | | |
| 1,150,000 | | NEVADA ST HSG DIV SF MTGE REVENUE | | 10/1/2040 | | 5.10 | | | 1,150,000 | | | 1,185,466 | | | | |
| 1,000,000 | | NEW HAMPSHIRE ST HLTH & EDU FACS AUTH HOSP REVENUE | | 10/1/2024 | | 5.00 | | | 986,395 | | | 1,016,680 | | | | |
| 1,250,000 | | NEW HAMPSHIRE ST HLTH & EDU FACS AUTH REVENUE | | 1/1/2034 | | 6.00 | | | 1,211,309 | | | 1,325,775 | | | | |
| 500,000 | | NEW HAMPSHIRE ST HLTH & EDU FACS AUTH REVENUE | | 8/1/2038 | | 6.00 | | | 490,221 | | | 548,065 | | | | |
| 1,000,000 | | NEW HAMPSHIRE ST HSG FIN AUTH MF REVENUE | | 7/1/2031 | | 5.20 | | | 1,000,000 | | | 1,051,590 | | | | |
| 745,000 | | NEW HAMPSHIRE ST HSG FIN AUTH SF REVENUE | | 7/1/2034 | | 5.38 | | | 745,000 | | | 781,051 | | | | |
| 690,000 | | NEW HAMPSHIRE ST HSG FIN AUTH SF REVENUE | | 7/1/2038 | | 6.63 | | | 721,815 | | | 760,276 | | | | |
| | |
See accompanying notes to the financial statements. | 60 | (Continued) |
CLEARWATER INVESTMENT TRUST
Schedule of Investments - Clearwater Tax-Exempt Bond Fund
December 31, 2011
| | | | | | | | | | | | | | | | | |
Par/Shares | | Security | | Maturity
date | | Coupon
rate | | Cost | | Fair
value(a) | | Percent
of
net assets | |
Municipal Bonds (Cont’d): | | | | | | | | | | | | | | |
| 500,000 | | NEW JERSEY ST HGR EDU ASSISTANCE AUTH | | 6/1/2024 | | 5.38 | | $ | 497,522 | | | 547,200 | | | | |
| 2,500,000 | | NEW JERSEY ST HGR EDU ASSISTANCE AUTH | | 6/1/2027 | | 5.00 | | | 2,496,598 | | | 2,572,425 | | | | |
| 2,500,000 | | NEW JERSEY ST HLTH CARE FACS FING AUTH | | 7/1/2016 | | 6.25 | | | 2,500,000 | | | 2,506,575 | | | | |
| 1,000,000 | | NEW JERSEY ST HSG & MTGE FIN AGY | | 10/1/2030 | | 4.50 | | | 1,000,000 | | | 1,006,220 | | | | |
| 500,000 | | NEW JERSEY ST HSG & MTGE FIN AGY | | 10/1/2030 | | 6.45 | | | 533,750 | | | 538,990 | | | | |
| 925,000 | | NEW JERSEY ST HSG & MTGE FIN AGY | | 10/1/2034 | | 5.00 | | | 925,000 | | | 951,557 | | | | |
| 800,000 | | NEW JERSEY ST HSG & MTGE FIN AGY | | 10/1/2035 | | 5.00 | | | 800,000 | | | 821,576 | | | | |
| 2,335,000 | | NEW JERSEY ST HSG & MTGE FIN AGY | | 10/1/2037 | | 5.00 | | | 2,318,134 | | | 2,400,146 | | | | |
| 1,000,000 | | NEW JERSEY ST HSG & MTGE FIN AGY MF REVENUE | | 5/1/2041 | | 4.95 | | | 969,829 | | | 1,017,480 | | | | |
| 2,250,000 | | NEW JERSEY ST TRANSPRTN TRUST FUND AUTH (b) | | 12/15/2025 | | 9.43 | | | 1,006,191 | | | 1,132,538 | | | | |
| 500,000 | | NEW JERSEY ST TRANSPRTN TRUST FUND AUTH | | 6/15/2036 | | 5.25 | | | 511,201 | | | 538,600 | | | | |
| 465,000 | | NEW MEXICO ST MTGE FIN AUTH | | 9/1/2029 | | 4.80 | | | 465,000 | | | 478,894 | | | | |
| 940,000 | | NEW MEXICO ST MTGE FIN AUTH | | 9/1/2029 | | 5.00 | | | 940,000 | | | 978,408 | | | | |
| 925,000 | | NEW MEXICO ST MTGE FIN AUTH | | 9/1/2034 | | 5.00 | | | 925,000 | | | 965,025 | | | | |
| 945,000 | | NEW MEXICO ST MTGE FIN AUTH | | 3/1/2036 | | 5.45 | | | 945,000 | | | 993,516 | | | | |
| 750,000 | | NEW ORLEANS LA SEWAGE SVC REVENUE | | 6/1/2024 | | 6.00 | | | 740,277 | | | 847,860 | | | | |
| 115,000 | | NEW RIVER FL CDD CAPITAL IMPT REVENUE (d) | | 5/1/2013 | | 5.00 | | | 114,821 | | | 1 | | | | |
| 70,000 | | NEW RIVER FL CDD CAPITAL IMPT REVENUE (b) | | 5/1/2015 | | 1.20 | | | 65,110 | | | 59,024 | | | | |
| 135,000 | | NEW RIVER FL CDD CAPITAL IMPT REVENUE (b) | | 5/1/2018 | | 1.37 | | | 119,235 | | | 59,175 | | | | |
| 70,000 | | NEW RIVER FL CDD CAPITAL IMPT REVENUE (b) | | 5/1/2038 | | 0.37 | | | 62,928 | | | 42,685 | | | | |
| 175,000 | | NEW RIVER FL CDD CAPITAL IMPT REVENUE (b) | | 5/1/2038 | | 0.80 | | | 141,109 | | | 67,540 | | | | |
| 250,000 | | NEW YORK CITY NY INDL DEV AGY REVENUE | | 1/1/2029 | | 6.13 | | | 246,739 | | | 274,015 | | | | |
| 320,000 | | NEW YORK ST DORM AUTH REVENUES | | 7/1/2019 | | 6.88 | | | 321,623 | | | 324,128 | | | | |
| 1,000,000 | | NEW YORK ST DORM AUTH REVENUES | | 8/15/2024 | | 6.45 | | | 998,478 | | | 1,018,630 | | | | |
| 1,820,000 | | NEW YORK ST MED CARE FACS FIN AGY | | 2/15/2035 | | 6.38 | | | 1,802,751 | | | 1,826,607 | | | | |
| 450,000 | | NOBLESVILLE IN REDEV AUTH ECON DEV REVENUE | | 2/1/2031 | | 5.13 | | | 445,923 | | | 479,043 | | | | |
| 500,000 | | NORCO CA REDEV AGY | | 3/1/2032 | | 5.88 | | | 492,695 | | | 520,505 | | | | |
| 1,000,000 | | NORTH CAROLINA ST MED CARE COMMISSION HLTH CARE FACS REVENUE | | 10/1/2029 | | 6.38 | | | 1,000,000 | | | 1,027,170 | | | | |
| 1,300,000 | | NORTH CAROLINA ST MED CARE COMMISSION HLTH CARE FACS REVENUE | | 10/1/2035 | | 6.63 | | | 1,300,000 | | | 1,011,660 | | | | |
| 865,000 | | NORTH DAKOTA ST HSG FIN AGY | | 7/1/2034 | | 5.35 | | | 865,000 | | | 905,568 | | | | |
| 965,000 | | NORTH DAKOTA ST HSG FIN AGY | | 7/1/2039 | | 5.45 | | | 965,000 | | | 1,011,870 | | | | |
| 1,885,000 | | NORTH DAKOTA ST HSG FIN AGY | | 7/1/2040 | | 5.05 | | | 1,885,000 | | | 1,926,564 | | | | |
| 500,000 | | NTHRN CA GAS AUTH #1 GAS PROJ REVENUE | | 7/1/2027 | | 1.11 | | | 500,000 | | | 355,440 | | | | |
| 1,000,000 | | NTHRN IL UNIV | | 4/1/2026 | | 5.50 | | | 1,015,815 | | | 1,093,460 | | | | |
| | |
See accompanying notes to the financial statements. | 61 | (Continued) |
CLEARWATER INVESTMENT TRUST
Schedule of Investments - Clearwater Tax-Exempt Bond Fund
December 31, 2011
| | | | | | | | | | | | | | | | | |
Par/Shares | | Security | | Maturity
date | | Coupon
rate | | Cost | | Fair
value(a) | | Percent
of
net assets | |
Municipal Bonds (Cont’d): | | | | | | | | | | | | | | |
| 395,000 | | NTHRN MARIANA ISLANDS CMWLTH | | 10/1/2022 | | 5.00 | | $ | 397,551 | | | 330,046 | | | | |
| 2,000,000 | | OAK PARK CA UNIF SCH DIST(b) | | 8/1/2038 | | 3.77 | | | 1,001,547 | | | 1,268,960 | | | | |
| 1,250,000 | | OAKLAND CNTY MI ECON DEV CORP LTD OBLG REVENUE | | 12/1/2020 | | 6.50 | | | 1,242,431 | | | 1,243,250 | | | | |
| 615,000 | | OHIO ST HSG FIN AGY RSDL MTGE REVENUE | | 9/1/2033 | | 5.40 | | | 615,000 | | | 645,098 | | | | |
| 275,000 | | OHIO ST HSG FIN AGY RSDL MTGE REVENUE | | 9/1/2033 | | 5.45 | | | 275,000 | | | 288,538 | | | | |
| 440,000 | | OKLAHOMA ST HSG FIN AGY SF MTGE REVENUE | | 3/1/2032 | | 5.15 | | | 440,000 | | | 458,097 | | | | |
| 745,000 | | OKLAHOMA ST HSG FIN AGY SF MTGE REVENUE | | 9/1/2038 | | 6.50 | | | 781,275 | | | 796,688 | | | | |
| 500,000 | | ONEIDA TRIBE OF INDIANS WI RETAIL SALES REVENUE (c) | | 2/1/2021 | | 5.50 | | | 500,000 | | | 562,910 | | | | |
| 500,000 | | ONONDAGA NY CIVIC DEV CORP | | 12/1/2041 | | 5.25 | | | 509,636 | | | 519,575 | | | | |
| 1,000,000 | | ONTARIO CA REDEV FING AUTH LEASE REVENUE | | 8/1/2032 | | 5.00 | | | 939,360 | | | 1,014,060 | | | | |
| 1,000,000 | | OVERLAND PARK KS TRANSPRTN DEV DIST SALES TAX REVENUE | | 4/1/2032 | | 5.90 | | | 1,000,000 | | | 1,079,800 | | | | |
| 2,280,000 | | PACHECO CA UNION SCH DIST COPS (b) | | 2/1/2037 | | 15.27 | | | 485,024 | | | 482,174 | | | | |
| 1,000,000 | | PALM BAY FL UTILITY REVENUE (b) | | 10/1/2031 | | 11.87 | | | 316,785 | | | 345,450 | | | | |
| 250,000 | | PALM BEACH CNTY FL HLTH FACS AUTH | | 11/15/2029 | | 5.13 | | | 249,946 | | | 244,125 | | | | |
| 1,000,000 | | PALM BEACH CNTY FL HLTH FACS AUTH REVENUE | | 11/15/2022 | | 5.38 | | | 920,134 | | | 1,011,720 | | | | |
| 1,665,000 | | PATTERSON CA JT UNIF SCH DIST(b) | | 8/1/2027 | | 12.31 | | | 610,043 | | | 730,086 | | | | |
| 750,000 | | PELL CITY AL SPL CARE FACS FING AUTH REVENUE | | 12/1/2027 | | 5.25 | | | 625,786 | | | 762,158 | | | | |
| 1,500,000 | | PENNSYLVANIA ST ECON DEV FING AUTH HLTH SYS REVENUE | | 10/15/2023 | | 6.25 | | | 1,469,290 | | | 1,615,935 | | | | |
| 500,000 | | PENNSYLVANIA ST HGR EDUCTNL FACS AUTH REVENUE | | 7/1/2039 | | 1.04 | | | 500,000 | | | 266,730 | | | | |
| 500,000 | | PENNSYLVANIA ST HSG FIN AGY SF MTGE REVENUE | | 10/1/2025 | | 5.00 | | | 501,748 | | | 530,895 | | | | |
| 1,000,000 | | PENNSYLVANIA ST HSG FIN AGY SF MTGE REVENUE | | 10/1/2029 | | 4.63 | | | 917,380 | | | 1,018,010 | | | | |
| 1,000,000 | | PENNSYLVANIA ST HSG FIN AGY SF MTGE REVENUE | | 10/1/2034 | | 4.88 | | | 1,003,369 | | | 1,015,490 | | | | |
| 1,000,000 | | PENNSYLVANIA ST TURNPIKE COMMISSION(b) | | 6/1/2033 | | 2.19 | | | 685,088 | | | 886,440 | | | | |
| 1,935,000 | | PENNSYLVANIA ST TURNPIKE COMMISSION(b) | | 12/1/2035 | | 1.17 | | | 1,513,621 | | | 1,621,685 | | | | |
| 750,000 | | PENNSYLVANIA ST TURNPIKE COMMISSION(b) | | 12/1/2035 | | 2.01 | | | 550,847 | | | 622,005 | | | | |
| 1,500,000 | | PENNSYLVANIA ST TURNPIKE COMMISSION(b) | | 12/1/2038 | | 1.44 | | | 1,083,561 | | | 1,248,045 | | | | |
| 2,000,000 | | PEORIA IL PUBLIC BLDG COMMISSION SCH DIST FACS REVENUE(b) | | 12/1/2021 | | 8.01 | | | 1,156,393 | | | 1,306,900 | | | | |
| 500,000 | | PEORIA IL PUBLIC BLDG COMMISSION SCH DIST FACS REVENUE(b) | | 12/1/2022 | | 9.39 | | | 258,113 | | | 305,785 | | | | |
| 5,000,000 | | PEORIA IL PUBLIC BLDG COMMISSION SCH DIST FACS REVENUE(b) | | 12/1/2026 | | 11.11 | | | 1,993,889 | | | 2,167,450 | | | | |
| 950,000 | | PHILADELPHIA PA HOSPS & HGR EDU FACS AUTH | | 11/15/2023 | | 6.63 | | | 950,000 | | | 950,190 | | | | |
| 1,000,000 | | PIMA CNTY AZ INDL DEV AUTH CHRT SCH REVENUE | | 4/1/2022 | | 5.88 | | | 1,000,000 | | | 974,760 | | | | |
| 25,000 | | PIMA CNTY AZ INDL DEV AUTH EDU REVENUE | | 8/1/2012 | | 6.25 | | | 25,000 | | | 25,180 | | | | |
| | |
See accompanying notes to the financial statements. | 62 | (Continued) |
CLEARWATER INVESTMENT TRUST
Schedule of Investments - Clearwater Tax-Exempt Bond Fund
December 31, 2011
| | | | | | | | | | | | | | | | | |
Par/Shares | | Security | | Maturity
date | | Coupon
rate | | Cost | | Fair
value(a) | | Percent
of
net assets | |
Municipal Bonds (Cont’d): | | | | | | | | | | | | | | |
| 280,000 | | PIMA CNTY AZ INDL DEV AUTH EDU REVENUE | | 6/1/2016 | | 6.00 | | $ | 280,000 | | | 278,272 | | | | |
| 980,000 | | PIMA CNTY AZ INDL DEV AUTH EDU REVENUE | | 12/1/2017 | | 5.35 | | | 881,894 | | | 944,357 | | | | |
| 440,000 | | PIMA CNTY AZ INDL DEV AUTH EDU REVENUE | | 12/1/2018 | | 6.38 | | | 440,000 | | | 439,850 | | | | �� |
| 865,000 | | PIMA CNTY AZ INDL DEV AUTH EDU REVENUE | | 6/1/2022 | | 5.00 | | | 799,966 | | | 797,392 | | | | |
| 995,000 | | PIMA CNTY AZ INDL DEV AUTH EDU REVENUE | | 7/1/2026 | | 5.00 | | | 864,574 | | | 839,611 | | | | |
| 490,000 | | PIMA CNTY AZ INDL DEV AUTH EDU REVENUE | | 7/1/2031 | | 6.75 | | | 359,470 | | | 481,410 | | | | |
| 1,000,000 | | PITTSBURG CA REDEV AGY TAX ALLOCATION | | 9/1/2028 | | 6.50 | | | 978,018 | | | 1,010,100 | | | | |
| 2,625,000 | | PITTSBURG CALIF UNI SCH DIST FING AUTH REV(b) | | 9/1/2031 | | 16.03 | | | 666,467 | | | 695,625 | | | | |
| 250,000 | | PROVIDENCE RI HSG AUTH HSG REVENUE | | 9/1/2026 | | 5.00 | | | 255,174 | | | 270,498 | | | | |
| 500,000 | | PROVIDENCE RI HSG AUTH HSG REVENUE | | 9/1/2027 | | 5.00 | | | 507,988 | | | 536,835 | | | | |
| 745,000 | | PROVO UT CHRT SCH REVENUE | | 6/15/2037 | | 5.50 | | | 605,746 | | | 583,767 | | | | |
| 1,000,000 | | PUBLIC FIN AUTH WI CCRC REVENUE | | 6/1/2020 | | 7.00 | | | 984,438 | | | 1,010,030 | | | | |
| 1,000,000 | | PUERTO RICO CMWLTH | | 7/1/2028 | | 6.00 | | | 989,602 | | | 1,103,560 | | | | |
| 1,500,000 | | PUERTO RICO CMWLTH | | 7/1/2040 | | 6.50 | | | 1,526,379 | | | 1,687,890 | | | | |
| 500,000 | | PUERTO RICO ELEC PWR AUTH PWR REVENUE | | 7/1/2025 | | 1.07 | | | 500,000 | | | 355,045 | | | | |
| 750,000 | | PUERTO RICO PUBLIC FIN CORP | | 8/1/2031 | | 5.50 | | | 750,000 | | | 767,918 | | | | |
| 1,000,000 | | PUERTO RICO SALES TAX FING CORP SALES TAX REVENUE(b) | | 8/1/2033 | | 3.37 | | | 584,905 | | | 759,040 | | | | |
| 500,000 | | PUERTO RICO SALES TAX FING CORP SALES TAX REVENUE | | 8/1/2057 | | 1.22 | | | 500,000 | | | 249,585 | | | | |
| 750,000 | | QUAIL CREEK AZ CMNTY FACS DIST | | 7/15/2016 | | 5.15 | | | 750,000 | | | 750,165 | | | | |
| 2,000,000 | | RAILSPLITTER IL TOBACCO SETTLEMENT AUTH | | 6/1/2024 | | 6.25 | | | 2,038,472 | | | 2,187,340 | | | | |
| 975,000 | | RAMONA CA UNIF SCH DIST COPS(b) | | 5/1/2032 | | 1.11 | | | 797,285 | | | 959,371 | | | | |
| 1,000,000 | | REDONDO BEACH CA UNIF SCH DIST(b) | | 8/1/2034 | | 2.10 | | | 681,939 | | | 875,420 | | | | |
| 1,500,000 | | REGL CO TRANSPRTN DIST PRIV ACTIVITY REVENUE | | 1/15/2034 | | 6.00 | | | 1,485,438 | | | 1,555,695 | | | | |
| 400,000 | | RENO NV HOSP REVENUE | | 6/1/2032 | | 5.25 | | | 409,630 | | | 402,040 | | | | |
| 750,000 | | RENO NV SPARKS INDIAN COLONY | | 6/1/2021 | | 5.00 | | | 765,011 | | | 780,945 | | | | |
| 500,000 | | RHODE ISLAND ST HLTH & EDUCTNL BLDG CORP | | 5/15/2030 | | 6.25 | | | 493,511 | | | 556,360 | | | | |
| 500,000 | | RHODE ISLAND ST STUDENT LOAN AUTH STUDENT LOAN REVENUE | | 12/1/2027 | | 5.75 | | | 500,000 | | | 537,785 | | | | |
| 1,000,000 | | RICHMOND CA CMNTY REDEV AGY TAX ALLOCATION | | 9/1/2030 | | 6.00 | | | 972,590 | | | 1,063,070 | | | | |
| 500,000 | | RICHMOND CA JT PWRS FING AUTH | | 7/1/2024 | | 6.25 | | | 500,000 | | | 553,550 | | | | |
| 325,000 | | RICHMOND IN HOSP AUTH REVENUE | | 1/1/2029 | | 6.50 | | | 315,220 | | | 363,054 | | | | |
| 1,000,000 | | RIVERSIDE CNTY CA REDEV AGY | | 10/1/2030 | | 6.00 | | | 1,013,471 | | | 1,034,270 | | | | |
| 3,000,000 | | ROBLA CA SCH DIST(b) | | 8/1/2036 | | 15.56 | | | 621,645 | | | 631,440 | | | | |
| 500,000 | | S BAYSIDE CA WST MGMT AUTH SOL WST ENTERPRISE REVENUE | | 9/1/2029 | | 6.25 | | | 515,632 | | | 546,020 | | | | |
| 1,000,000 | | S COAST IN CONSERVANCY DIST | | 1/1/2028 | | 5.25 | | | 994,583 | | | 1,010,940 | | | | |
| 173,000 | | S WSTRN IL DEV AUTH | | 8/15/2015 | | 5.38 | | | 173,000 | | | 173,279 | | | | |
| 635,000 | | S WSTRN IL DEV AUTH | | 10/1/2022 | | 7.00 | | | 635,000 | | | 635,857 | | | | |
| | |
See accompanying notes to the financial statements. | 63 | (Continued) |
CLEARWATER INVESTMENT TRUST
Schedule of Investments - Clearwater Tax-Exempt Bond Fund
December 31, 2011
| | | | | | | | | | | | | | | | | |
Par/Shares | | Security | | Maturity
date | | Coupon
rate | | Cost | | Fair
value(a) | | Percent
of
net assets | |
Municipal Bonds (Cont’d): | | | | | | | | | | | | | | |
| 210,000 | | S WSTRN IL DEV AUTH | | 11/1/2026 | | 5.63 | | $ | 208,679 | | | 155,994 | | | | |
| 1,500,000 | | S WSTRN IL DEV AUTH | | 8/15/2029 | | 5.63 | | | 1,500,000 | | | 1,500,090 | | | | |
| 1,000,000 | | SACRAMENTO CA CITY FING AUTH(b) | | 12/1/2021 | | 7.46 | | | 602,765 | | | 604,460 | | | | |
| 250,000 | | SACRAMENTO CNTY CA SANTN DISTS FING AUTH REVENUE | | 12/1/2035 | | 0.88 | | | 250,000 | | | 157,160 | | | | |
| 350,000 | | SACRAMENTO CNTY CA WTR FING AUTH REVENUE | | 6/1/2039 | | 0.92 | | | 350,000 | | | 191,300 | | | | |
| 1,030,000 | | SADDLEBACK VLY CA UNIF SCH DIST PUBLIC FING AUTH | | 9/1/2017 | | 5.65 | | | 1,030,000 | | | 1,033,677 | | | | |
| 1,000,000 | | SAGINAW MI HOSP FIN AUTH | | 7/1/2030 | | 5.00 | | | 920,574 | | | 984,580 | | | | |
| 191,000 | | SAINT BERNARD PARISH LA HOME MTGE AUTH SF MTGE | | 3/1/2039 | | 5.80 | | | 187,339 | | | 202,852 | | | | |
| 500,000 | | SAINT JOHNS CNTY FL INDL DEV AUTH REVENUE | | 8/1/2040 | | 5.88 | | | 492,845 | | | 508,900 | | | | |
| 460,000 | | SAINT JOSEPH CNTY IN ECON DEV REVENUE | | 5/15/2026 | | 6.00 | | | 339,426 | | | 442,833 | | | | |
| 500,000 | | SAINT JOSEPH CNTY IN ECON DEV REVENUE | | 5/15/2038 | | 6.00 | | | 369,285 | | | 452,910 | | | | |
| 460,443 | | SAINT JOSEPH CNTY IN HOSP AUTH HLTH FACS REVENUE(d) | | 2/15/2028 | | 5.25 | | | 466,925 | | | 78,874 | | | | |
| 500,000 | | SAINT JOSEPH MO INDL DEV AUTH | | 11/1/2023 | | 5.38 | | | 496,724 | | | 476,595 | | | | |
| 1,000,000 | | SAINT PAUL MN PORT AUTH | | 12/1/2036 | | 5.00 | | | 974,965 | | | 1,049,860 | | | | |
| 143,791 | | SAINT TAMMANY PARISH LA FIN AUTH SF MTGE REVENUE | | 12/1/2039 | | 5.25 | | | 146,927 | | | 149,596 | | | | |
| 2,000,000 | | SALINE CNTY MO INDL DEV AUTH HLTH FACS REVENUE | | 12/1/2020 | | 5.00 | | | 1,982,266 | | | 2,027,820 | | | | |
| 500,000 | | SALINE CNTY MO INDL DEV AUTH HLTH FACS REVENUE | | 12/1/2028 | | 5.60 | | | 489,305 | | | 496,200 | | | | |
| 500,000 | | SAN DIEGO CA HSG AUTH MF HSG REVENUE | | 5/1/2029 | | 5.00 | | | 500,000 | | | 514,745 | | | | |
| 500,000 | | SAN DIEGO CA REDEV AGY | | 9/1/2023 | | 5.00 | | | 453,563 | | | 508,925 | | | | |
| 1,000,000 | | SAN FRANCISCO CITY & CNTY CA ARPTS COMMISSION | | 5/1/2039 | | 6.00 | | | 1,029,813 | | | 1,117,730 | | | | |
| 250,000 | | SAN JOAQUIN HILLS CA TRANSPRTN CORRIDOR AGY | | 1/15/2030 | | 5.25 | | | 250,000 | | | 208,355 | | | | |
| 1,000,000 | | SAN JOSE CA FING AUTH | | 5/1/2031 | | 5.50 | | | 987,084 | | | 1,091,410 | | | | |
| 500,000 | | SANTA ANA CA CMNTY REDEV AGY | | 9/1/2022 | | 6.00 | | | 495,127 | | | 558,475 | | | | |
| 500,000 | | SANTA MONICA CA REDEV AGY | | 7/1/2036 | | 5.88 | | | 520,841 | | | 558,010 | | | | |
| 1,450,000 | | SARASOTA CNTY FL HLTH FACS AUTH RETMNT FAC REVENUE | | 1/1/2027 | | 5.50 | | | 1,203,611 | | | 1,461,774 | | | | |
| 500,000 | | SEMINOLE TRIBE FL SPL OBLG REVENUE(c) | | 10/1/2024 | | 5.50 | | | 504,405 | | | 476,815 | | | | |
| 500,000 | | SEVEN OAKS FL CMNTY DEV DIST SPL ASSMNT REVENUE | | 5/1/2033 | | 5.50 | | | 487,732 | | | 497,475 | | | | |
| 150,000 | | SHELBY CNTY TN HLTH EDUCTNL & HSG FACS BRD REVENUE(d) | | 1/1/2019 | | 5.35 | | | 134,966 | | | 17,804 | | | | |
| 625,000 | | SHELBY CNTY TN HLTH EDUCTNL & HSG FACS BRD REVENUE(d) | | 1/1/2029 | | 5.55 | | | 556,862 | | | 62,756 | | | | |
| 550,000 | | SNOHOMISH CNTY WA HSG AUTH | | 4/1/2026 | | 6.40 | | | 550,000 | | | 552,766 | | | | |
| 555,000 | | SOUTH CAROLINA ST EDU ASSISTANCE AUTH | | 10/1/2029 | | 5.10 | | | 548,591 | | | 593,789 | | | | |
| 230,000 | | SOUTH CAROLINA ST HSG FIN & DEV AUTH MTGE REVENUE | | 7/1/2032 | | 5.50 | | | 230,000 | | | 241,735 | | | | |
| 1,500,000 | | SOUTH CAROLINA ST JOBS-ECON DEV AUTH ECON DEV REVENUE | | 11/15/2030 | | 5.63 | | | 1,432,766 | | | 1,503,765 | | | | |
| 500,000 | | SOUTH CAROLINA ST JOBS-ECON DEV AUTH REVENUE | | 11/15/2027 | | 6.00 | | | 503,376 | | | 197,435 | | | | |
| | |
See accompanying notes to the financial statements. | 64 | (Continued) |
CLEARWATER INVESTMENT TRUST
Schedule of Investments - Clearwater Tax-Exempt Bond Fund
December 31, 2011
| | | | | | | | | | | | | | | | | |
Par/Shares | | Security | | Maturity
date | | Coupon
rate | | Cost | | Fair
value(a) | | Percent
of
net assets | |
Municipal Bonds (Cont’d): | | | | | | | | | | | | | | |
| 750,000 | | SOUTH CAROLINA ST JOBS-ECON DEV AUTH REVENUE | | 11/15/2042 | | 5.15 | | $ | 750,000 | | | 296,152 | | | | |
| 453,000 | | SOUTHSIDE AZ CMNTY FACS DIST #1 SPL ASSMNT REVENUE PRESCOTT | | 7/1/2018 | | 6.13 | | | 325,909 | | | 327,673 | | | | |
| 1,000,000 | | SPARKS NV REDEV AGY TAX INCR REVENUE | | 6/1/2020 | | 7.25 | | | 990,710 | | | 1,043,210 | | | | |
| 1,000,000 | | SPARKS NV REDEV AGY TAX INCR REVENUE | | 1/15/2022 | | 5.00 | | | 979,095 | | | 1,027,760 | | | | |
| 435,000 | | SPARKS NV TOURISM IMPT DIST #1 REVENUE (c) | | 6/15/2020 | | 6.50 | | | 422,623 | | | 401,496 | | | | |
| 300,000 | | STHRN MINNESOTA ST MUNI PWR AGY PWR SPLY SYS REVENUE | | 1/1/2013 | | 2.79 | | | 300,000 | | | 300,579 | | | | |
| 2,500,000 | | SULPHUR SPRINGS CA UNION SCH DIST(b) | | 12/1/2037 | | 1.37 | | | 1,849,995 | | | 2,262,600 | | | | |
| 500,000 | | TALLAHASSEE FL HLTH FACS REVENUE | | 12/1/2030 | | 6.38 | | | 491,227 | | | 500,345 | | | | |
| 170,000 | | TARRANT CNTY TX CULTURAL EDU FACS FIN CORP RETMNT FAC REVENU | | 2/15/2013 | | 5.00 | | | 169,944 | | | 168,310 | | | | |
| 500,000 | | TARRANT CNTY TX CULTURAL EDU FACS FIN CORP RETMNT FAC REVENU | | 2/15/2014 | | 6.50 | | | 500,000 | | | 500,090 | | | | |
| 210,000 | | TARRANT CNTY TX CULTURAL EDU FACS FIN CORP RETMNT FAC REVENU | | 11/15/2014 | | 6.25 | | | 210,000 | | | 207,304 | | | | |
| 1,000,000 | | TARRANT CNTY TX CULTURAL EDU FACS FIN CORP RETMNT FAC REVENU | | 11/15/2014 | | 6.50 | | | 1,000,000 | | | 999,970 | | | | |
| 1,000,000 | | TARRANT CNTY TX CULTURAL EDU FACS FIN CORP RETMNT FAC REVENU | | 2/15/2016 | | 7.25 | | | 1,000,000 | | | 1,002,380 | | | | |
| 750,000 | | TARRANT CNTY TX CULTURAL EDU FACS FIN CORP RETMNT FAC REVENU | | 11/15/2019 | | 7.75 | | | 750,000 | | | 760,455 | | | | |
| 1,000,000 | | TARRANT CNTY TX CULTURAL EDU FACS FIN CORP RETMNT FAC REVENU | | 11/15/2026 | | 6.00 | | | 1,028,776 | | | 1,008,310 | | | | |
| 1,000,000 | | TARRANT CNTY TX CULTURAL EDU FACS FIN CORP RETMNT FAC REVENU | | 5/15/2027 | | 5.13 | | | 723,483 | | | 961,360 | | | | |
| 750,000 | | TARRANT CNTY TX CULTURAL EDU FACS FIN CORP RETMNT FAC REVENU | | 11/15/2036 | | 6.00 | | | 768,624 | | | 734,760 | | | | |
| 810,000 | | TENNESSEE ST HSG DEV AGY | | 7/1/2038 | | 5.45 | | | 810,000 | | | 847,390 | | | | |
| 175,000 | | TENNESSEE ST HSG DEV AGY MTGE FIN | | 7/1/2023 | | 5.20 | | | 175,652 | | | 178,328 | | | | |
| 700,000 | | TEXAS ST DEPT OF HSG & CMNTY AFFAIRS | | 7/1/2039 | | 5.45 | | | 700,000 | | | 733,999 | | | | |
| 250,000 | | TEXAS ST MUNI GAS ACQUISITION & SPLY CORP I GAS SPLY REVENUE | | 12/15/2026 | | 1.82 | | | 250,000 | | | 172,528 | | | | |
| 2,000,000 | | TEXAS ST PRIV ACTIVITY BOND SURFACE TRANSPRTN CORP REVENUE | | 6/30/2033 | | 7.50 | | | 2,056,749 | | | 2,262,900 | | | | |
| 500,000 | | TEXAS ST PUBLIC FIN AUTH CHRT SCH FIN CORP REVENUE | | 2/15/2030 | | 6.00 | | | 500,000 | | | 520,485 | | | | |
| 1,000,000 | | TEXAS ST PUBLIC FIN AUTH CHRT SCH FIN CORP REVENUE | | 8/15/2030 | | 5.00 | | | 880,508 | | | 978,600 | | | | |
| 800,000 | | TEXAS ST STUDENT HSG AUTH REVENUE(d) | | 1/1/2033 | | 11.00 | | | 800,000 | | | 8 | | | | |
| 1,000,000 | | TOBACCO SECURITIZATION AUTH MNTOBACCO SETTLEMENT REVENUE | | 3/1/2031 | | 5.25 | | | 995,014 | | | 1,028,510 | | | | |
| | |
See accompanying notes to the financial statements. | 65 | (Continued) |
CLEARWATER INVESTMENT TRUST
Schedule of Investments - Clearwater Tax-Exempt Bond Fund
December 31, 2011
| | | | | | | | | | | | | | | | | |
Par/Shares | | Security | | Maturity
date | | Coupon
rate | | Cost | | Fair
value(a) | | Percent
of
net assets | |
Municipal Bonds (Cont’d): | | | | | | | | | | | | | | |
| 403,949 | | TODD CREEK FARMS CO MET DIST #1 WTR & WSTWTR REVENUE(d)(e) | | 12/1/2009 | | 4.75 | | $ | 399,574 | | | 181,777 | | | | |
| 655,000 | | TOLOMATO FL CDD | | 5/1/2017 | | 6.38 | | | 655,000 | | | 280,471 | | | | |
| 2,000,000 | | TORRANCE CA UNIF SCH DIST(b) | | 8/1/2023 | | 9.54 | | | 986,084 | | | 1,143,880 | | | | |
| 1,000,000 | | TRACY CA JT UNIF SCH DIST(b) | | 8/1/2041 | | 4.95 | | | 407,346 | | | 421,650 | | | | |
| 1,000,000 | | TRAVIS CNTY TX HLTH FACS DEV CORP | | 11/1/2016 | | 6.25 | | | 1,000,000 | | | 1,019,650 | | | | |
| 840,000 | | TRAVIS CNTY TX HSG FIN CORP(d) | | 6/1/2035 | | 9.25 | | | 840,000 | | | 83,916 | | | | |
| 1,250,000 | | TUSTIN CA UNIF SCH DIST(b) | | 8/1/2028 | | 4.10 | | | 752,314 | | | 876,400 | | | | |
| 85,000 | | ULSTER CNTY NY INDL DEV AGY | | 9/15/2013 | | 5.10 | | | 84,793 | | | 75,153 | | | | |
| 500,000 | | ULSTER CNTY NY INDL DEV AGY | | 9/15/2016 | | 5.25 | | | 495,880 | | | 351,710 | | | | |
| 1,250,000 | | UPLAND CA COPS | | 1/1/2032 | | 6.38 | | | 1,215,554 | | | 1,366,738 | | | | |
| 671,000 | | UTAH ASSOC MUNI POWER(e) | | 5/1/2022 | | 4.75 | | | 671,000 | | | 619,400 | | | | |
| 600,000 | | UTAH ST CHRT SCH FIN AUTH CHRT SCH REVENUE | | 7/15/2018 | | 6.38 | | | 600,000 | | | 614,280 | | | | |
| 500,000 | | UTAH ST CHRT SCH FIN AUTH CHRT SCH REVENUE | | 7/15/2020 | | 5.75 | | | 466,544 | | | 497,325 | | | | |
| 500,000 | | UTAH ST CHRT SCH FIN AUTH CHRT SCH REVENUE | | 7/15/2025 | | 6.50 | | | 500,000 | | | 511,810 | | | | |
| 495,000 | | UTAH ST HSG CORP SF MTGE REVENUE | | 1/1/2032 | | 4.95 | | | 495,000 | | | 507,890 | | | | |
| 750,000 | | UTAH ST HSG CORP SF MTGE REVENUE | | 1/1/2033 | | 5.75 | | | 750,000 | | | 799,328 | | | | |
| 360,000 | | UTAH ST HSG CORP SF MTGE REVENUE | | 1/1/2040 | | 5.55 | | | 360,000 | | | 374,152 | | | | |
| 500,000 | | VANCOUVER WA HSG AUTH | | 3/1/2025 | | 5.00 | | | 492,866 | | | 534,525 | | | | |
| 260,000 | | VERANO CENTER FL CDD | | 11/1/2012 | | 5.00 | | | 260,000 | | | 238,885 | | | | |
| 1,240,000 | | VERMONT ST EDUCTNL & HLTH BLDGS FING AGY | | 12/1/2027 | | 6.13 | | | 1,223,087 | | | 1,240,000 | | | | |
| 750,000 | | VIRGINIA ST HSG DEV AUTH | | 12/1/2038 | | 4.60 | | | 746,254 | | | 754,448 | | | | |
| 1,000,000 | | VIRGINIA ST HSG DEV AUTH | | 12/1/2039 | | 5.00 | | | 1,000,000 | | | 1,030,000 | | | | |
| 735,000 | | VIRGINIA ST HSG DEV AUTH CMWLTH MTGE | | 7/1/2025 | | 6.00 | | | 735,000 | | | 810,484 | | | | |
| 1,000,000 | | VIRGINIA ST HSG DEV AUTH CMWLTH MTGE | | 7/1/2031 | | 6.25 | | | 1,021,257 | | | 1,098,900 | | | | |
| 1,000,000 | | W CAMPUS HSG LLC AZ STUDENT HSG REVENUE | | 7/1/2025 | | 5.00 | | | 882,941 | | | 928,460 | | | | |
| 230,000 | | W VLGS FL IMPT DIST | | 5/1/2037 | | 5.50 | | | 230,000 | | | 102,752 | | | | |
| 500,000 | | WASHINGTON ST HLTH CARE FACS AUTH | | 3/1/2024 | | 6.50 | | | 479,714 | | | 559,425 | | | | |
| 1,000,000 | | WASHINGTON ST HLTH CARE FACS AUTH | | 3/1/2029 | | 7.12 | | | 975,793 | | | 1,129,840 | | | | |
| 750,000 | | WASHINGTON ST HLTH CARE FACS AUTH | | 11/15/2031 | | 6.13 | | | 743,536 | | | 825,458 | | | | |
| 1,000,000 | | WASHINGTON ST HSG FIN COMMISSION | | 7/15/2029 | | 4.75 | | | 1,000,000 | | | 1,023,960 | | | | |
| 250,000 | | WASHINGTON ST HSG FIN COMMISSION NONPROFIT REVENUE | | 1/1/2013 | | 5.10 | | | 250,000 | | | 237,700 | | | | |
| 1,150,000 | | WASHINGTON ST HSG FIN COMMISSION NONPROFIT REVENUE | | 1/1/2017 | | 5.25 | | | 1,147,447 | | | 988,782 | | | | |
| 500,000 | | WATERLOO IA CMNTY SCH DIST SCH INFRASTRUCTURE SALES & SVCS T | | 7/1/2029 | | 5.00 | | | 500,000 | | | 519,965 | | | | |
| 420,000 | | WATERS EDGE FL CDD CAPITAL IMPT REVENUE(d) | | 11/1/2012 | | 5.00 | | | 420,018 | | | 185,199 | | | | |
| 1,000,000 | | WISCONSIN ST GEN FUND ANNUAL APPROP REVENUE | | 5/1/2027 | | 6.00 | | | 1,020,741 | | | 1,183,180 | | | | |
| 525,000 | | WISCONSIN ST HLTH & EDUCTNL FACS AUTH | | 2/15/2018 | | 6.25 | | | 510,215 | | | 526,087 | | | | |
| 605,000 | | WISCONSIN ST HLTH & EDUCTNL FACS AUTH | | 11/15/2025 | | 5.75 | | | 599,546 | | | 606,053 | | | | |
| 960,000 | | WISCONSIN ST HLTH & EDUCTNL FACS AUTH | | 2/15/2029 | | 5.60 | | | 952,934 | | | 960,470 | | | | |
| | |
See accompanying notes to the financial statements. | 66 | (Continued) |
CLEARWATER INVESTMENT TRUST
Schedule of Investments - Clearwater Tax-Exempt Bond Fund
December 31, 2011
| | | | | | | | | | | | | | | | | |
Par/Shares | | Security | | Maturity
date | | Coupon
rate | | Cost | | Fair
value(a) | | Percent
of
net assets | |
Municipal Bonds (Cont’d): | | | | | | | | | | | | | | |
| 400,000 | | WISCONSIN ST HLTH & EDUCTNL FACS AUTH REVENUE | | 8/15/2023 | | 5.60 | | $ | 400,830 | | | 408,012 | | | | |
| 185,000 | | WISCONSIN ST HLTH & EDUCTNL FACS AUTH REVENUE | | 11/15/2023 | | 6.00 | | | 191,725 | | | 192,039 | | | | |
| 500,000 | | WISCONSIN ST HLTH & EDUCTNL FACS AUTH REVENUE | | 8/15/2024 | | 6.50 | | | 357,677 | | | 500,140 | | | | |
| 500,000 | | WISCONSIN ST HLTH & EDUCTNL FACS AUTH REVENUE | | 1/15/2025 | | 5.65 | | | 501,698 | | | 510,280 | | | | |
| 500,000 | | WISCONSIN ST HLTH & EDUCTNL FACS AUTH REVENUE | | 7/1/2026 | | 5.00 | | | 503,628 | | | 502,600 | | | | |
| 1,000,000 | | WISCONSIN ST HLTH & EDUCTNL FACS AUTH REVENUE | | 7/1/2030 | | 5.75 | | | 1,025,607 | | | 1,057,820 | | | | |
| 500,000 | | WISCONSIN ST HLTH & EDUCTNL FACS AUTH REVENUE | | 2/15/2032 | | 5.25 | | | 489,030 | | | 501,375 | | | | |
| 250,000 | | WISCONSIN ST HLTH & EDUCTNL FACS AUTH REVENUE | | 11/15/2032 | | 6.00 | | | 260,780 | | | 255,360 | | | | |
| 750,000 | | WISCONSIN ST HLTH & EDUCTNL FACS AUTH REVENUE | | 4/15/2033 | | 6.40 | | | 758,162 | | | 765,922 | | | | |
| 500,000 | | WISCONSIN ST HLTH & EDUCTNL FACS AUTH REVENUE | | 8/15/2034 | | 6.75 | | | 505,274 | | | 503,700 | | | | |
| 1,000,000 | | WISCONSIN ST HLTH & EDUCTNL FACS AUTH REVENUE | | 12/1/2034 | | 7.07 | | | 1,000,000 | | | 299,880 | | | | |
| 570,000 | | WOODHILL TX PUBLIC FAC CORP MF REVENUE | | 12/1/2015 | | 7.25 | | | 566,156 | | | 570,274 | | | | |
| 405,000 | | WSTRN GENERATION AGY OR COGENERATION PROJ REVENUE | | 1/1/2021 | | 5.00 | | | 406,984 | | | 371,328 | | | | |
| 500,000 | | WYOMING CMNTY DEV AUTH STUDENTHSG REV | | 7/1/2031 | | 6.25 | | | 500,000 | | | 520,705 | | | | |
| 750,000 | | WYOMING ST CMNTY DEV AUTH HSG REVENUE | | 12/1/2023 | | 5.25 | | | 758,090 | | | 806,498 | | | | |
| 355,000 | | ZEPHYR RIDGE FL CDD CAPITAL IMPT REVENUE(d) | | 5/1/2013 | | 5.25 | | | 355,352 | | | 141,272 | | | | |
| | Sub-total Municipal Bonds: | | | | | | | 457,208,435 | | | 458,492,111 | | | 88.37 | % |
Short-Term Investments: | | | | | | | | | | | | | | |
| 11,769,850 | | NORTHERN INSTITUTIONAL TAX-EXEMPT PORTFOLIO, 0.03% (f) | | | | | | | 11,769,850 | | | 11,769,850 | | | | |
| | Sub-total Short-Term Investments: | | | | | | | 11,769,850 | | | 11,769,850 | | | 2.27 | % |
| | | Grand total(g) | | | | | | $ | 503,433,825 | | | 510,380,170 | | | 98.37 | % |
| | |
See accompanying notes to the financial statements. | 67 | (Continued) |
CLEARWATER INVESTMENT TRUST
Schedule of Investments - Clearwater Tax-Exempt Bond Fund
December 31, 2011
Notes to Schedule of Investments:
| | |
| (a) | Securities are valued in accordance with procedures described in note 2 to the financial statements. |
| (b) | For zero coupon bonds, the interest rate disclosed represents the annualized effective yield on the date of acquisition. |
| (c) | Securities exempt from registration under Rule 144A of the Securities Act of 1933. These securities may not be publicly sold without registration under the Securities Act of 1933. The value of these securities is determined by valuations supplied by a pricing service or brokers, or, if not available, in accordance with procedures established by the Board of Trustees of the Funds. |
| (d) | Currently non-income producing assets. For long-term debt securities, item identified is in default as to payment of interest and/or principal. |
| (e) | This security is being fair valued according to procedures adopted by the Board of Trustees. |
| (f) | The short-term investment is a money market portfolio of the investment company, Northern Institutional Funds. At December 31, 2010, the value of the Fund’s investment in the Tax-Exempt Portfolio of the Northern Institutional Funds was approximately $8,475,514 with net purchases of approximately $3,294,336 during the fiscal year ended December 31, 2011. |
| (g) | At December 31, 2011, the cost for Federal income tax purposes was $503,433,825. The aggregate gross unrealized appreciation and depreciation of investments in securities based on this cost were as follows: |
| | | | |
Gross unrealized appreciation | | $ | 28,314,173 | |
Gross unrealized depreciation | | | (21,367,828 | ) |
Net unrealized appreciation | | $ | 6,946,345 | |
Diversification of investments representing geographic diversification, as a percentage of total invesments at fair value, is as follows:
| | | | |
Geographical Diversification | | Percent | |
California | | | 14.11 | % |
Illinois | | | 10.62 | |
Texas | | | 7.26 | |
Florida | | | 4.45 | |
New Jersey | | | 3.99 | |
Indiana | | | 3.95 | |
Pennsylvania | | | 3.89 | |
Minnesota | | | 3.29 | |
Colorado | | | 2.89 | |
Massachusetts | | | 2.66 | |
Other | | | 42.89 | |
| | | 100.00 | % |
| | |
See accompanying notes to the financial statements. | 68 | (Continued) |
|
CLEARWATER INVESTMENT TRUST |
Schedule of Investments – Clearwater Tax-Exempt Bond Fund |
December 31, 2011 |
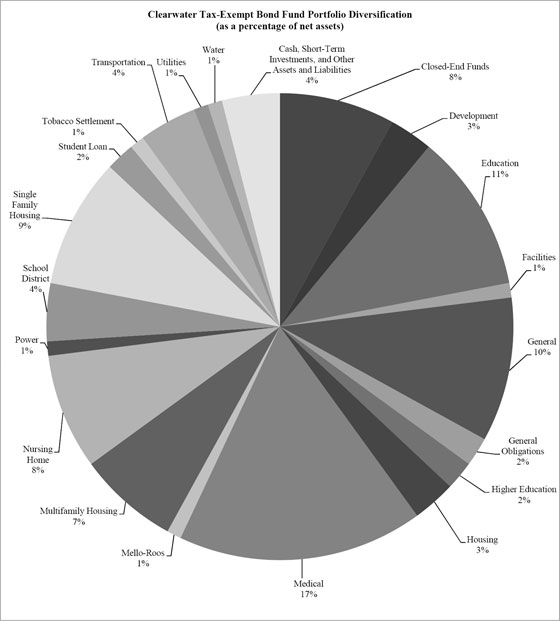
| | |
See accompanying notes to the financial statements. | 69 | (Continued) |
|
CLEARWATER INVESTMENT TRUST |
Schedule of Investments - Clearwater International Fund |
December 31, 2011 |
| | | | | | | | | | | | | |
Shares | | Security | | Cost | | Fair
value (a) | | Percent
of
net assets | |
Common Stocks: | |
Australia: | | | | | | | | | | | | |
| 26,184 | | AGL ENERGY LTD. | | $ | 342,599 | | | 383,601 | | | | |
| 51,722 | | ALUMINA LTD. | | | 50,177 | | | 58,959 | | | | |
| 28,415 | | AMCOR LTD. | | | 114,487 | | | 209,450 | | | | |
| 46,294 | | AMP LTD. | | | 141,805 | | | 192,627 | | | | |
| 29,665 | | ASCIANO LTD. | | | 129,579 | | | 136,475 | | | | |
| 4,112 | | ASX LTD. | | | 84,309 | | | 128,555 | | | | |
| 46,617 | | AUSTRALIA & NEW ZEALAND BANKING GROUP LTD. | | | 638,253 | | | 978,431 | | | | |
| 6,281 | | BENDIGO AND ADELAIDE BANK LTD. | | | 52,780 | | | 51,563 | | | | |
| 179,910 | | BGP HOLDINGS PLC - (FRACTIONAL SHARES)(b) | | | - | | | - | | | | |
| 58,575 | | BHP BILLITON LTD. | | | 1,409,751 | | | 2,061,200 | | | | |
| 13,040 | | BORAL LTD. | | | 38,661 | | | 47,993 | | | | |
| 17,400 | | BRAMBLES LTD. | | | 64,294 | | | 127,368 | | | | |
| 8,400 | | CALTEX AUSTRALIA LTD. | | | 105,590 | | | 101,077 | | | | |
| 2,393 | | CAMPBELL BROTHERS LTD. | | | 117,246 | | | 119,853 | | | | |
| 121,633 | | CFS RETAIL PROPERTY TRUST | | | 194,250 | | | 209,531 | | | | |
| 27,898 | | COCA-COLA AMATIL LTD. | | | 299,576 | | | 328,281 | | | | |
| 971 | | COCHLEAR LTD. | | | 35,893 | | | 61,547 | | | | |
| 28,762 | | COMMONWEALTH BANK OF AUSTRALIA | | | 837,550 | | | 1,447,297 | | | | |
| 79,200 | | COMMONWEALTH PROPERTY OFFICE FUND | | | 76,992 | | | 77,326 | | | | |
| 8,520 | | COMPUTERSHARE LTD. | | | 47,795 | | | 69,770 | | | | |
| 18,353 | | CROWN LTD. | | | 99,514 | | | 151,793 | | | | |
| 9,576 | | CSL LTD. | | | 226,091 | | | 313,279 | | | | |
| 13,946 | | CSR LTD. | | | 34,433 | | | 27,945 | | | | |
| 85,105 | | DEXUS PROPERTY GROUP | | | 62,970 | | | 72,215 | | | | |
| 5,726 | | DULUXGROUP LTD. | | | 5,840 | | | 16,918 | | | | |
| 12,777 | | ECHO ENTERTAINMENT GROUP LTD.(b) | | | 35,384 | | | 46,894 | | | | |
| 24,200 | | EMECO HOLDINGS LTD. | | | 30,149 | | | 23,875 | | | | |
| 38,735 | | FAIRFAX MEDIA LTD. | | | 31,235 | | | 28,512 | | | | |
| 5,300 | | FLIGHT CENTRE LTD. | | | 104,602 | | | 87,345 | | | | |
| 21,110 | | FORTESCUE METALS GROUP LTD. | | | 37,574 | | | 92,154 | | | | |
| 93,686 | | GOODMAN GROUP | | | 48,414 | | | 54,594 | | | | |
| 104,982 | | GPT GROUP | | | 265,936 | | | 329,496 | | | | |
| 34,615 | | HARVEY NORMAN HOLDINGS LTD. | | | 79,261 | | | 64,938 | | | | |
| 44,965 | | INCITEC PIVOT LTD. | | | 117,225 | | | 142,966 | | | | |
| 47,825 | | INSURANCE AUSTRALIA GROUP LTD. | | | 120,292 | | | 145,703 | | | | |
| 2,244 | | LEIGHTON HOLDINGS LTD. | | | 29,819 | | | 43,680 | | | | |
| 10,015 | | LEND LEASE GROUP | | | 61,130 | | | 73,310 | | | | |
| 9,837 | | MACQUARIE GROUP LTD. | | | 195,127 | | | 239,251 | | | | |
| 55,748 | | METCASH LTD. | | | 200,733 | | | 230,254 | | | | |
| 3,900 | | MINERAL RESOURCES LTD. | | | 37,407 | | | 43,859 | | | | |
| 37,974 | | MIRVAC GROUP | | | 50,570 | | | 45,810 | | | | |
| 41,258 | | NATIONAL AUSTRALIA BANK LTD. | | | 706,058 | | | 985,322 | | | | |
| 10,628 | | NEWCREST MINING LTD. | | | 289,672 | | | 321,618 | | | | |
| 165,887 | | ONESTEEL LTD. | | | 355,418 | | | 118,716 | | | | |
| 10,126 | | ORICA LTD. | | | 164,369 | | | 250,939 | | | | |
| 15,652 | | ORIGIN ENERGY LTD. | | | 164,158 | | | 213,463 | | | | |
| 6,819 | | OZ MINERALS LTD. | | | 25,768 | | | 69,783 | | | | |
| 60,703 | | PALADIN ENERGY LTD.(b) | | | 104,577 | | | 85,021 | | | | |
| 416 | | PERPETUAL LTD. | | | 7,027 | | | 8,689 | | | | |
| 130,032 | | QANTAS AIRWAYS LTD.(b) | | | 239,257 | | | 194,089 | | | | |
| 15,800 | | QBE INSURANCE GROUP LTD. | | | 218,199 | | | 209,182 | | | | |
| 20,800 | | RAMELIUS RESOURCES LTD.(b) | | | 31,764 | | | 22,647 | | | | |
| 8,245 | | RIO TINTO LTD. | | | 321,508 | | | 508,282 | | | | |
| 23,269 | | SANTOS LTD. | | | 255,999 | | | 291,176 | | | | |
| 9,824 | | SONIC HEALTHCARE LTD. | | | 79,849 | | | 113,291 | | | | |
| 10,500 | | SP AUSNET | | | 9,788 | | | 10,091 | | | | |
| 10,100 | | SPOTLESS GROUP LTD. | | | 18,131 | | | 24,575 | | | | |
| 132,929 | | STOCKLAND | | | 390,281 | | | 433,518 | | | | |
| 49,573 | | SUNCORP GROUP LTD. | | | 273,388 | | | 424,704 | | | | |
| 72,377 | | TABCORP HOLDINGS LTD. | | | 177,152 | | | 202,004 | | | | |
| 100,846 | | TATTS GROUP LTD. | | | 225,972 | | | 251,562 | | | | |
| 69,046 | | TELSTRA CORP. LTD. | | | 158,437 | | | 235,061 | | | | |
| 55,889 | | TOLL HOLDINGS LTD. | | | 302,168 | | | 241,121 | | | | |
| 13,099 | | TRANSURBAN GROUP | | | 36,728 | | | 75,261 | | | | |
| 53,700 | | TREASURY WINE ESTATES LTD. | | | 205,527 | | | 202,032 | | | | |
| 16,997 | | WESFARMERS LTD. | | | 225,362 | | | 512,615 | | | | |
| 2,560 | | WESFARMERS LTD. - PPS | | | 32,507 | | | 77,862 | | | | |
| | |
See accompanying notes to the financial statements. | 70 | (Continued) |
|
CLEARWATER INVESTMENT TRUST |
Schedule of Investments - Clearwater International Fund |
December 31, 2011 |
| | | | | | | | | | | | | |
Shares | | Security | | Cost | | Fair
value (a) | | Percent
of
net assets | |
Australia (Cont’d): | |
| 42,659 | | WESTFIELD GROUP | | $ | 253,085 | | | 340,611 | | | | |
| 35,413 | | WESTFIELD RETAIL TRUST | | | 53,180 | | | 90,149 | | | | |
| 56,332 | | WESTPAC BANKING CORP. | | | 771,371 | | | 1,151,814 | | | | |
| 7,677 | | WOODSIDE PETROLEUM LTD. | | | 245,484 | | | 240,322 | | | | |
| 19,482 | | WOOLWORTHS LTD. | | | 346,571 | | | 499,924 | | | | |
| 6,807 | | WORLEYPARSONS LTD. | | | 151,071 | | | 178,640 | | | | |
| | | | | | 13,495,119 | | | 17,649,779 | | | 5.79% | |
Austria: | | | | | | | | | | | | |
| 3,566 | | ERSTE GROUP BANK A.G. | | | 63,769 | | | 62,700 | | | | |
| 33,719 | | IMMOFINANZ A.G.(b) | | | 101,096 | | | 101,249 | | | | |
| 900 | | OESTERREICHISCHE POST A.G. | | | 27,958 | | | 27,141 | | | | |
| 4,858 | | OMV A.G. | | | 162,153 | | | 147,382 | | | | |
| 3,309 | | RAIFFEISEN BANK INTERNATIONAL A.G. | | | 106,621 | | | 85,934 | | | | |
| 3,016 | | STRABAG S.E. (BEARER) | | | 88,668 | | | 86,307 | | | | |
| 915 | | VERBUND A.G. | | | 30,953 | | | 24,556 | | | | |
| 1,003 | | VIENNA INSURANCE GROUP A.G. WIENER VERSICHERUNG GRUPPE | | | 49,973 | | | 39,750 | | | | |
| 11,446 | | VOESTALPINE A.G. | | | 448,554 | | | 321,026 | | | | |
| | | | | | 1,079,745 | | | 896,045 | | | 0.29% | |
Belgium: | | | | | | | | | | | | |
| 92,075 | | AGEAS | | | 155,612 | | | 143,005 | | | | |
| 13,088 | | ANHEUSER-BUSCH INBEV N.V. | | | 445,645 | | | 801,324 | | | | |
| 5,100 | | ANHEUSER-BUSCH INBEV N.V. ADR(c) | | | 318,185 | | | 311,049 | | | | |
| 15,383 | | BELGACOM S.A. | | | 496,582 | | | 482,616 | | | | |
| 1,645 | | COLRUYT S.A. | | | 74,892 | | | 62,276 | | | | |
| 8,404 | | DELHAIZE GROUP S.A. | �� | | 582,741 | | | 472,121 | | | | |
| 14,562 | | GROUPE BRUXELLES LAMBERT S.A. | | | 1,232,472 | | | 970,824 | | | | |
| 2,869 | | KBC GROEP N.V. | | | 50,323 | | | 36,134 | | | | |
| 400 | | MOBISTAR S.A. | | | 25,537 | | | 20,962 | | | | |
| 625 | | SOLVAY S.A., CLASS A | | | 36,847 | | | 51,496 | | | | |
| 7,091 | | UCB S.A. | | | 261,400 | | | 298,368 | | | | |
| 2,966 | | UMICORE S.A. | | | 53,114 | | | 122,344 | | | | |
| | | | | | 3,733,350 | | | 3,772,519 | | | 1.24% | |
Canada: | | | | | | | | | | | | |
| 4,700 | | ADVANTAGE OIL & GAS LTD.(b) | | | 36,288 | | | 19,559 | | | | |
| 4,044 | | AGNICO-EAGLE MINES LTD. | | | 244,292 | | | 146,878 | | | | |
| 1,900 | | AGRIUM, INC. | | | 106,809 | | | 127,514 | | | | |
| 12,134 | | AGRIUM, INC. (NEW YORK EXCHANGE) | | | 599,550 | | | 814,313 | | | | |
| 7,100 | | ALIMENTATION COUCHE TARD, INC., CLASS B | | | 176,962 | | | 220,898 | | | | |
| 400 | | ARC RESOURCES LTD. | | | 8,963 | | | 9,854 | | | | |
| 3,000 | | ATCO LTD., CLASS I | | | 102,722 | | | 177,370 | | | | |
| 9,300 | | AURICO GOLD, INC.(b) | | | 84,169 | | | 74,755 | | | | |
| 12,593 | | BANK OF MONTREAL | | | 453,760 | | | 690,222 | | | | |
| 20,946 | | BANK OF NOVA SCOTIA | | | 628,249 | | | 1,043,320 | | | | |
| 18,364 | | BARRICK GOLD CORP. | | | 620,486 | | | 830,971 | | | | |
| 3,479 | | BAYTEX ENERGY CORP. | | | 151,408 | | | 194,441 | | | | |
| 7,800 | | BCE, INC. | | | 164,418 | | | 325,026 | | | | |
| 11,627 | | BROOKFIELD ASSET MANAGEMENT, INC., CLASS A | | | 172,468 | | | 319,510 | | | | |
| 11,740 | | CAE, INC. | | | 85,345 | | | 113,878 | | | | |
| 2,700 | | CALFRAC WELL SERVICES LTD. | | | 69,284 | | | 75,524 | | | | |
| 500 | | CAMECO CORP. | | | 10,257 | | | 9,034 | | | | |
| 11,081 | | CAMECO CORP. (NEW YORK EXCHANGE) | | | 198,977 | | | 200,012 | | | | |
| 8,340 | | CANADIAN IMPERIAL BANK OF COMMERCE | | | 394,681 | | | 603,566 | | | | |
| 9,614 | | CANADIAN NATIONAL RAILWAY CO. | | | 389,611 | | | 755,276 | | | | |
| 22,671 | | CANADIAN NATURAL RESOURCES LTD. | | | 540,039 | | | 847,215 | | | | |
| 1,100 | | CANADIAN PACIFIC RAILWAY LTD. | | | 50,079 | | | 74,504 | | | | |
| 3,842 | | CANADIAN PACIFIC RAILWAY LTD. (NEW YORK EXCHANGE) | | | 120,622 | | | 259,988 | | | | |
| 2,200 | | CANADIAN TIRE CORP. LTD., CLASS A | | | 131,124 | | | 142,293 | | | | |
| 3,400 | | CANADIAN UTILITIES LTD., CLASS A | | | 173,027 | | | 205,358 | | | | |
| 15,213 | | CENOVUS ENERGY, INC. | | | 314,780 | | | 505,072 | | | | |
| 2,300 | | CENTERRA GOLD, INC. | | | 45,093 | | | 40,633 | | | | |
| 12,200 | | CGI GROUP, INC., CLASS A(b) | | | 225,117 | | | 229,898 | | | | |
| 10,919 | | CGI GROUP, INC., CLASS A (NEW YORK EXCHANGE)(b) | | | 90,696 | | | 205,823 | | | | |
| 3,100 | | COGECO CABLE, INC. | | | 140,724 | | | 156,235 | | | | |
| 1,861 | | CRESCENT POINT ENERGY CORP. | | | 38,774 | | | 82,107 | | | | |
| | |
See accompanying notes to the financial statements. | 71 | (Continued) |
|
CLEARWATER INVESTMENT TRUST |
Schedule of Investments - Clearwater International Fund |
December 31, 2011 |
| | | | | | | | | | | | | |
Shares | | Security | | Cost | | Fair
value (a) | | Percent
of
net assets | |
Canada (Cont’d): | |
| 4,200 | | DUNDEE CORP., CLASS A(b) | | $ | 97,479 | | | 97,242 | | | | |
| 12,278 | | ELDORADO GOLD CORP. | | | 151,008 | | | 168,331 | | | | |
| 1,200 | | EMPIRE CO. LTD., CLASS A | | | 71,754 | | | 69,617 | | | | |
| 15,872 | | ENBRIDGE, INC. | | | 263,158 | | | 593,772 | | | | |
| 16,387 | | ENCANA CORP. | | | 375,934 | | | 303,651 | | | | |
| 6,047 | | ENERPLUS CORP. | | | 113,667 | | | 153,110 | | | | |
| 10,700 | | ENSIGN ENERGY SERVICES, INC. | | | 171,153 | | | 170,652 | | | | |
| 660 | | FAIRFAX FINANCIAL HOLDINGS LTD. | | | 270,775 | | | 283,081 | | | | |
| 349 | | FAIRFAX FINANCIAL HOLDINGS LTD. (OTC EXCHANGE) | | | 107,219 | | | 150,489 | | | | |
| 2,800 | | GEORGE WESTON LTD. | | | 200,720 | | | 187,118 | | | | |
| 3,052 | | GILDAN ACTIVEWEAR, INC. | | | 33,435 | | | 57,347 | | | | |
| 14,604 | | GOLDCORP, INC. | | | 479,947 | | | 646,227 | | | | |
| 11,200 | | HUDBAY MINERALS, INC. | | | 110,573 | | | 111,463 | | | | |
| 8,203 | | IAMGOLD CORP. | | | 91,103 | | | 130,018 | | | | |
| 7,165 | | IMPERIAL OIL LTD. | | | 255,881 | | | 318,699 | | | | |
| 2,400 | | INMET MINING CORP. | | | 149,124 | | | 154,286 | | | | |
| 200 | | INTACT FINANCIAL CORP. | | | 11,023 | | | 11,489 | | | | |
| 6,600 | | IVANHOE MINES LTD.(b) | | | 74,692 | | | 116,952 | | | | |
| 24,936 | | KINROSS GOLD CORP. | | | 416,761 | | | 284,270 | | | | |
| 1,500 | | LAURENTIAN BANK OF CANADA | | | 65,319 | | | 70,415 | | | | |
| 2,900 | | MACDONALD DETTWILER & ASSOCIATES LTD. | | | 125,974 | | | 134,030 | | | | |
| 600 | | MAGNA INTERNATIONAL, INC. | | | 15,163 | | | 20,022 | | | | |
| 6,538 | | MAGNA INTERNATIONAL, INC. (NEW YORK EXCHANGE) | | | 86,809 | | | 217,781 | | | | |
| 900 | | MANITOBA TELECOM SERVICES, INC. | | | 27,675 | | | 26,208 | | | | |
| 26,435 | | MANULIFE FINANCIAL CORP. | | | 325,227 | | | 280,740 | | | | |
| 8,200 | | MAPLE LEAF FOODS, INC. | | | 99,478 | | | 87,160 | | | | |
| 3,469 | | METHANEX CORP. | | | 31,828 | | | 79,163 | | | | |
| 1,900 | | METHANEX CORP. (TORONTO EXCHANGE) | | | 43,920 | | | 43,487 | | | | |
| 4,700 | | METRO, INC., CLASS A | | | 227,622 | | | 249,096 | | | | |
| 100 | | NATIONAL BANK OF CANADA | | | 6,671 | | | 7,080 | | | | |
| 7,600 | | NEO MATERIAL TECHNOLOGIES, INC.(b) | | | 69,912 | | | 54,676 | | | | |
| 12,300 | | NEVSUN RESOURCES LTD. | | | 74,157 | | | 68,328 | | | | |
| 8,650 | | NEW GOLD, INC.(b) | | | 86,240 | | | 87,192 | | | | |
| 7,300 | | NEW GOLD, INC. (TORONTO EXCHANGE)(b) | | | 82,539 | | | 73,653 | | | | |
| 10,200 | | NEXEN, INC. | | | 204,786 | | | 162,277 | | | | |
| 11,881 | | NEXEN, INC. (NEW YORK EXCHANGE) | | | 199,398 | | | 189,027 | | | | |
| 4,500 | | NUVISTA ENERGY LTD.(b) | | | 47,576 | | | 23,143 | | | | |
| 1,641 | | OPEN TEXT CORP.(b) | | | 72,477 | | | 83,921 | | | | |
| 1,300 | | PACE OIL AND GAS LTD.(b) | | | 5,385 | | | 5,460 | | | | |
| 2,253 | | PAN AMERICAN SILVER CORP. | | | 41,183 | | | 49,138 | | | | |
| 12,861 | | PENGROWTH ENERGY CORP. | | | 127,732 | | | 132,916 | | | | |
| 15,200 | | PENN WEST PETROLEUM LTD. | | | 378,105 | | | 301,200 | | | | |
| 12,367 | | PENN WEST PETROLEUM LTD. (NEW YORK EXCHANGE) | | | 146,337 | | | 244,867 | | | | |
| 6,700 | | PETROBANK ENERGY & RESOURCES LTD.(b) | | | 106,114 | | | 69,572 | | | | |
| 1,400 | | PETROMINERALES LTD. | | | 35,257 | | | 22,754 | | | | |
| 16,494 | | POTASH CORP. OF SASKATCHEWAN, INC. | | | 487,584 | | | 680,872 | | | | |
| 25,500 | | PRECISION DRILLING CORP.(b) | | | 265,192 | | | 261,630 | | | | |
| 10,641 | | PROVIDENT ENERGY LTD. | | | 33,300 | | | 103,111 | | | | |
| 4,500 | | QUEBECOR, INC., CLASS B | | | 150,339 | | | 154,095 | | | | |
| 6,365 | | RESEARCH IN MOTION LTD.(b) | | | 171,604 | | | 92,292 | | | | |
| 2,101 | | RITCHIE BROS. AUCTIONEERS, INC. | | | 37,504 | | | 46,390 | | | | |
| 11,804 | | ROGERS COMMUNICATIONS, INC., CLASS B | | | 297,724 | | | 454,572 | | | | |
| 27,302 | | ROYAL BANK OF CANADA | | | 933,280 | | | 1,391,310 | | | | |
| 3,700 | | SAPUTO, INC. | | | 151,722 | | | 141,734 | | | | |
| 600 | | SHAW COMMUNICATIONS, INC., CLASS B | | | 12,390 | | | 11,925 | | | | |
| 9,661 | | SHAW COMMUNICATIONS, INC., CLASS B (NEW YORK EXCHANGE) | | | 153,543 | | | 191,964 | | | | |
| 17,300 | | SHERRITT INTERNATIONAL CORP. | | | 124,690 | | | 92,707 | | | | |
| 1,000 | | SHOPPERS DRUG MART CORP. | | | 39,932 | | | 40,377 | | | | |
| 6,863 | | SILVER WHEATON CORP. | | | 71,004 | | | 198,752 | | | | |
| 200 | | SNC-LAVALIN GROUP, INC. | | | 5,085 | | | 10,027 | | | | |
| 13,665 | | SUN LIFE FINANCIAL, INC. | | | 280,304 | | | 253,076 | | | | |
| 28,437 | | SUNCOR ENERGY, INC. | | | 680,912 | | | 819,839 | | | | |
| 21,947 | | TALISMAN ENERGY, INC. | | | 254,929 | | | 279,824 | | | | |
| 12,276 | | TECK RESOURCES LTD., CLASS B | | | 103,421 | | | 431,992 | | | | |
| 4,274 | | TELUS CORP. (NON VOTING) | | | 113,886 | | | 228,873 | | | | |
| 400 | | TIM HORTONS, INC. | | | 18,783 | | | 19,378 | | | | |
| | |
See accompanying notes to the financial statements. | 72 | (Continued) |
CLEARWATER INVESTMENT TRUST
Schedule of Investments - Clearwater International Fund
December 31, 2011
| | | | | | | | | | | | | |
Shares | | Security | | Cost | | Fair
value (a) | | Percent
of
net assets | |
Canada (Cont’d): | | | | | | | | | | |
| 4,489 | | TIM HORTONS, INC. (NEW YORK EXCHANGE) | | $ | 137,057 | | | 217,357 | | | | |
| 16,563 | | TORONTO-DOMINION BANK (THE) | | | 671,143 | | | 1,239,078 | | | | |
| 13,170 | | TRANSALTA CORP. | | | 255,566 | | | 271,565 | | | | |
| 14,285 | | TRANSCANADA CORP. | | | 389,230 | | | 623,826 | | | | |
| 5,900 | | TRANSFORCE, INC. | | | 72,666 | | | 74,989 | | | | |
| 6,000 | | TRICAN WELL SERVICE LTD. | | | 109,274 | | | 103,348 | | | | |
| 5,968 | | VALEANT PHARMACEUTICALS INTERNATIONAL, INC.(b) | | | 117,465 | | | 278,646 | | | | |
| 2,256 | | VERMILION ENERGY, INC. | | | 83,841 | | | 100,458 | | | | |
| 1,700 | | WEST FRASER TIMBER CO. LTD. | | | 67,344 | | | 69,076 | | | | |
| 9,900 | | YAMANA GOLD, INC. | | | 97,087 | | | 145,942 | | | | |
| 19,653 | | YAMANA GOLD, INC. (NEW YORK EXCHANGE) | | | 186,540 | | | 288,703 | | | | |
| | | | | | 19,321,405 | | | 25,609,895 | | | 8.39 | % |
China: | | | | | | | | | | | | |
| 210,000 | | ANHUI EXPRESSWAY CO. LTD., CLASS H | | | 172,455 | | | 123,287 | | | | |
| 10,000 | | CHINA MINZHONG FOOD CORP. LTD.(b) | | | 10,321 | | | 6,284 | | | | |
| 39,000 | | HAIER ELECTRONICS GROUP CO. LTD.(b) | | | 33,373 | | | 34,897 | | | | |
| 269,930 | | INDUSTRIAL & COMMERCIAL BANK OF CHINA, CLASS H | | | 213,123 | | | 160,208 | | | | |
| | | | | | 429,272 | | | 324,676 | | | 0.11 | % |
Denmark: | | | | | | | | | | | | |
| 10 | | A.P. MOLLER - MAERSK A/S, CLASS A | | | 46,408 | | | 62,403 | | | | |
| 30 | | A.P. MOLLER - MAERSK A/S, CLASS B | | | 161,539 | | | 198,075 | | | | |
| 18,066 | | CARLSBERG A/S, CLASS B | | | 1,367,629 | | | 1,273,964 | | | | |
| 300 | | COLOPLAST A/S, CLASS B | | | 27,666 | | | 43,146 | | | | |
| 13,100 | | DANSKE BANK A/S(b) | | | 138,182 | | | 166,394 | | | | |
| 4,000 | | DSV A/S | | | 31,768 | | | 71,736 | | | | |
| 200 | | FLSMIDTH & CO. A/S | | | 6,013 | | | 11,753 | | | | |
| 11,700 | | H. LUNDBECK A/S | | | 226,537 | | | 220,014 | | | | |
| 9,900 | | NOVO-NORDISK A/S, CLASS B | | | 554,060 | | | 1,137,678 | | | | |
| 2,500 | | NOVOZYMES A/S, CLASS B | | | 39,158 | | | 77,177 | | | | |
| 12,746 | | PANDORA A/S | | | 88,977 | | | 119,842 | | | | |
| 325 | | TOPDANMARK A/S(b) | | | 33,362 | | | 50,645 | | | | |
| | | | | | 2,721,299 | | | 3,432,827 | | | 1.12 | % |
Finland: | | | | | | | | | | | | |
| 1,907 | | CARGOTEC OYJ, CLASS B | | | 84,966 | | | 56,719 | | | | |
| 1,805 | | ELISA OYJ | | | 21,851 | | | 37,682 | | | | |
| 7,306 | | FORTUM OYJ | | | 150,746 | | | 155,929 | | | | |
| 18,000 | | KEMIRA OYJ | | | 247,726 | | | 213,867 | | | | |
| 1,396 | | KESKO OYJ, CLASS B | | | 30,705 | | | 46,905 | | | | |
| 1,628 | | KONE OYJ, CLASS B | | | 35,674 | | | 84,494 | | | | |
| 5,078 | | METSO OYJ | | | 59,357 | | | 188,298 | | | | |
| 13,359 | | NESTE OIL OYJ | | | 131,411 | | | 134,951 | | | | |
| 59,752 | | NOKIA OYJ | | | 345,692 | | | 291,710 | | | | |
| 2,240 | | NOKIAN RENKAAT OYJ | | | 31,307 | | | 72,132 | | | | |
| 12,778 | | OUTOKUMPU OYJ | | | 101,492 | | | 84,015 | | | | |
| 10,565 | | POHJOLA BANK PLC, CLASS A | | | 85,425 | | | 102,692 | | | | |
| 5,573 | | SAMPO OYJ, CLASS A | | | 77,600 | | | 138,274 | | | | |
| 559 | | SANOMA OYJ | | | 6,931 | | | 6,414 | | | | |
| 15,829 | | STORA ENSO OYJ, CLASS R | | | 75,698 | | | 94,814 | | | | |
| 9,000 | | TIETO OYJ | | | 122,401 | | | 128,134 | | | | |
| 11,934 | | UPM-KYMMENE OYJ | | | 99,928 | | | 131,445 | | | | |
| 634 | | WARTSILA OYJ | | | 7,249 | | | 18,315 | | | | |
| | | | | | 1,716,159 | | | 1,986,790 | | | 0.65 | % |
France: | | | | | | | | | | | | |
| 15,275 | | ACCOR S.A. | | | 595,716 | | | 387,198 | | | | |
| 551 | | AEROPORTS DE PARIS | | | 28,858 | | | 37,797 | | | | |
| 5,432 | | AIR FRANCE-KLM(b) | | | 38,168 | | | 27,932 | | | | |
| 5,518 | | AIR LIQUIDE S.A. | | | 508,863 | | | 682,688 | | | | |
| 89,279 | | ALCATEL-LUCENT(b) | | | 261,835 | | | 139,471 | | | | |
| 2,297 | | ALSTOM S.A. | | | 87,870 | | | 69,656 | | | | |
| 10,833 | | ARCELORMITTAL | | | 204,661 | | | 198,116 | | | | |
| 2,808 | | ARKEMA S.A. | | | 73,140 | | | 198,798 | | | | |
| 608 | | ATOS | | | 15,429 | | | 26,685 | | | | |
| 27,416 | | AXA S.A. | | | 373,813 | | | 356,436 | | | | |
| 819 | | BIOMERIEUX | | | 79,843 | | | 58,555 | | | | |
| 18,641 | | BNP PARIBAS S.A. | | | 813,238 | | | 732,244 | | | | |
| 7,036 | | BOUYGUES S.A. | | | 250,920 | | | 221,699 | | | | |
| | |
See accompanying notes to the financial statements. | 73 | (Continued) |
CLEARWATER INVESTMENT TRUST
Schedule of Investments - Clearwater International Fund
December 31, 2011
| | | | | | | | | | | | | |
Shares | | Security | | Cost | | Fair
value (a) | | Percent
of
net assets | |
France (Cont’d): | | | | | | | | | | | |
| 735 | | BUREAU VERITAS S.A. | | $ | 29,322 | | | 53,558 | | | | |
| 1,862 | | CAP GEMINI S.A. | | | 62,328 | | | 58,188 | | | | |
| 5,422 | | CARREFOUR S.A. | | | 147,570 | | | 123,615 | | | | |
| 2,177 | | CASINO GUICHARD PERRACHON S.A. | | | 172,738 | | | 183,372 | | | | |
| 648 | | CHRISTIAN DIOR S.A. | | | 36,000 | | | 76,833 | | | | |
| 8,977 | | CIE DE SAINT-GOBAIN | | | 309,749 | | | 344,670 | | | | |
| 7,231 | | CIE GENERALE DES ESTABLISSEMENTS MICHELIN, CLASS B | | | 443,942 | | | 427,469 | | | | |
| 3,462 | | CIE GENERALE D’OPTIQUE ESSILOR INTERNATIONAL S.A. | | | 134,447 | | | 244,427 | | | | |
| 20,236 | | CNP ASSURANCES | | | 315,458 | | | 250,858 | | | | |
| 9,764 | | DANONE | | | 490,226 | | | 613,796 | | | | |
| 812 | | DASSAULT SYSTEMES S.A. | | | 31,122 | | | 65,086 | | | | |
| 3,633 | | EDENRED | | | 65,572 | | | 89,434 | | | | |
| 1,536 | | EURAZEO | | | 53,525 | | | 54,660 | | | | |
| 3,941 | | EUTELSAT COMMUNICATIONS S.A. | | | 92,604 | | | 153,788 | | | | |
| 32,283 | | FRANCE TELECOM S.A. | | | 572,425 | | | 507,039 | | | | |
| 24,659 | | GDF SUEZ | | | 721,519 | | | 674,058 | | | | |
| 564 | | GECINA S.A. | | | 51,331 | | | 47,448 | | | | |
| 648 | | HERMES INTERNATIONAL | | | 64,252 | | | 193,193 | | | | |
| 304 | | ILIAD S.A. | | | 29,549 | | | 37,516 | | | | |
| 2,335 | | KLEPIERRE | | | 57,367 | | | 66,608 | | | | |
| 4,713 | | LAFARGE S.A. | | | 166,939 | | | 165,674 | | | | |
| 5,451 | | LAGARDERE S.C.A. | | | 132,733 | | | 143,924 | | | | |
| 3,554 | | LEGRAND S.A. | | | 61,802 | | | 114,307 | | | | |
| 3,491 | | L’OREAL S.A. | | | 255,535 | | | 364,629 | | | | |
| 3,812 | | LVMH MOET HENNESSY LOUIS VUITTON S.A. | | | 284,586 | | | 539,757 | | | | |
| 41,178 | | NATIXIS | | | 92,351 | | | 103,607 | | | | |
| 991 | | NEOPOST S.A. | | | 83,847 | | | 66,774 | | | | |
| 2,898 | | PERNOD-RICARD S.A. | | | 177,566 | | | 268,784 | | | | |
| 10,344 | | PEUGEOT S.A. | | | 168,977 | | | 162,129 | | | | |
| 1,531 | | PPR | | | 112,344 | | | 219,258 | | | | |
| 40,596 | | PUBLICIS GROUPE S.A. | | | 1,432,100 | | | 1,867,625 | | | | |
| 5,954 | | RENAULT S.A. | | | 173,471 | | | 206,524 | | | | |
| 4,202 | | SAFRAN S.A. | | | 40,399 | | | 126,202 | | | | |
| 30,836 | | SANOFI | | | 1,902,383 | | | 2,264,915 | | | | |
| 9,202 | | SCHNEIDER ELECTRIC S.A. | | | 387,172 | | | 484,497 | | | | |
| 1,813 | | SCOR S.E. | | | 36,441 | | | 42,378 | | | | |
| 3,311 | | SES S.A. | | | 62,443 | | | 79,472 | | | | |
| 5,823 | | SOCIETE GENERALE S.A. | | | 158,425 | | | 129,667 | | | | |
| 36,045 | | SOCIETE TELEVISION FRANCAISE 1 | | | 365,148 | | | 351,852 | | | | |
| 7,071 | | SODEXO | | | 363,938 | | | 507,653 | | | | |
| 13,444 | | SODEXO PRIME FIDELITE(b) | | | 721,006 | | | 965,194 | | | | |
| 30,250 | | SUEZ ENVIRONNEMENT CO. | | | 464,566 | | | 348,491 | | | | |
| 2,589 | | TECHNIP S.A. | | | 116,011 | | | 243,342 | | | | |
| 2,172 | | THALES S.A. | | | 86,735 | | | 68,593 | | | | |
| 77,940 | | TOTAL S.A. | | | 4,118,434 | | | 3,984,606 | | | | |
| 1,568 | | UNIBAIL-RODAMCO S.E. | | | 177,708 | | | 281,888 | | | | |
| 3,072 | | VALLOUREC S.A. | | | 191,446 | | | 199,437 | | | | |
| 5,000 | | VEOLIA ENVIRONNEMENT S.A. | | | 70,640 | | | 54,806 | | | | |
| 8,329 | | VINCI S.A. | | | 346,780 | | | 363,934 | | | | |
| 25,193 | | VIVENDI S.A. | | | 569,279 | | | 551,707 | | | | |
| | | | | | 20,534,605 | | | 22,674,517 | | | 7.43 | % |
Germany: | | | | | | | | | | | | |
| 2,785 | | ADIDAS A.G. | | | 94,549 | | | 181,166 | | | | |
| 9,809 | | ALLIANZ S.E. (REGISTERED) | | | 984,216 | | | 938,331 | | | | |
| 2,459 | | AURUBIS A.G. | | | 142,179 | | | 131,124 | | | | |
| 24,026 | | BASF S.E. | | | 1,152,067 | | | 1,675,782 | | | | |
| 12,500 | | BAYER A.G. (REGISTERED) | | | 629,487 | | | 799,217 | | | | |
| 14,464 | | BAYERISCHE MOTOREN WERKE A.G. | | | 786,641 | | | 968,971 | | | | |
| 828 | | BEIERSDORF A.G. | | | 35,556 | | | 46,960 | | | | |
| 4,000 | | BILFINGER BERGER S.E. | | | 273,213 | | | 341,068 | | | | |
| 7,652 | | CELESIO A.G. | | | 109,250 | | | 121,223 | | | | |
| 916 | | CONTINENTAL A.G.(b) | | | 47,943 | | | 57,019 | | | | |
| 17,639 | | DAIMLER A.G. (REGISTERED) | | | 589,913 | | | 774,386 | | | | |
| 10,725 | | DEUTSCHE BANK A.G. (REGISTERED) | | | 416,479 | | | 408,591 | | | | |
| 2,057 | | DEUTSCHE BOERSE A.G.(b) | | | 105,574 | | | 107,851 | | | | |
| | |
See accompanying notes to the financial statements. | 74 | (Continued) |
CLEARWATER INVESTMENT TRUST
Schedule of Investments - Clearwater International Fund
December 31, 2011
| | | | | | | | | | | | | |
Shares | | Security | | Cost | | Fair
value (a) | | Percent
of
net assets | |
Germany (Cont’d): | | | | | | | | | | |
| 3,261 | | DEUTSCHE LUFTHANSA A.G. (REGISTERED) | | $ | 35,709 | | | 38,767 | | | | |
| 19,219 | | DEUTSCHE POST A.G. (REGISTERED) | | | 228,974 | | | 295,512 | | | | |
| 41,318 | | DEUTSCHE TELEKOM A.G. (REGISTERED) | | | 511,289 | | | 474,074 | | | | |
| 23,204 | | E.ON A.G. | | | 589,190 | | | 500,641 | | | | |
| 4,168 | | FRESENIUS MEDICAL CARE A.G. & CO. KGAA | | | 184,299 | | | 283,214 | | | | |
| 1,848 | | FRESENIUS S.E. & CO. KGAA | | | 99,809 | | | 170,968 | | | | |
| 2,738 | | GEA GROUP A.G. | | | 27,680 | | | 77,431 | | | | |
| 13,631 | | HANNOVER RUECKVERSICHERUNG A.G. (REGISTERED) | | | 689,309 | | | 676,142 | | | | |
| 34,628 | | HEIDELBERGCEMENT A.G. | | | 1,710,609 | | | 1,469,592 | | | | |
| 10,464 | | HENKEL A.G. & CO. KGAA | | | 419,473 | | | 506,521 | | | | |
| 1,550 | | HOCHTIEF A.G. | | | 59,506 | | | 89,664 | | | | |
| 21,437 | | INFINEON TECHNOLOGIES A.G. | | | 120,692 | | | 161,368 | | | | |
| 2,921 | | K+S A.G. (REGISTERED) | | | 149,718 | | | 132,018 | | | | |
| 5,523 | | LANXESS A.G. | | | 299,998 | | | 285,932 | | | | |
| 2,642 | | LINDE A.G. | | | 210,857 | | | 393,070 | | | | |
| 2,275 | | MAN S.E. | | | 122,285 | | | 202,286 | | | | |
| 1,310 | | MERCK KGAA | | | 110,683 | | | 130,605 | | | | |
| 4,523 | | METRO A.G. | | | 157,225 | | | 165,083 | | | | |
| 4,041 | | MUENCHENER RUECKVERSICHERUNGS A.G. (REGISTERED) | | | 512,591 | | | 495,717 | | | | |
| 10,061 | | RWE A.G. | | | 298,363 | | | 353,540 | | | | |
| 1,458 | | SALZGITTER A.G. | | | 79,130 | | | 72,897 | | | | |
| 17,103 | | SAP A.G. | | | 683,559 | | | 904,258 | | | | |
| 13,593 | | SIEMENS A.G. (REGISTERED) | | | 846,647 | | | 1,300,837 | | | | |
| 4,300 | | SIEMENS A.G. ADR(c) | | | 450,971 | | | 411,123 | | | | |
| 4,500 | | SUEDZUCKER A.G. | | | 150,087 | | | 143,568 | | | | |
| 6,245 | | THYSSENKRUPP A.G. | | | 125,145 | | | 143,267 | | | | |
| 7,071 | | TUI A.G.(b) | | | 57,698 | | | 43,901 | | | | |
| 493 | | VOLKSWAGEN A.G. | | | 49,099 | | | 66,137 | | | | |
| 517 | | WACKER CHEMIE A.G. | | | 55,413 | | | 41,587 | | | | |
| | | | | | 14,403,075 | | | 16,581,409 | | | 5.44 | % |
Greece: | | | | | | | | | | | | |
| 6,991 | | COCA COLA HELLENIC BOTTLING CO. S.A.(b) | | | 108,814 | | | 119,890 | | | | |
| 38,799 | | NATIONAL BANK OF GREECE S.A.(b) | | | 320,607 | | | 81,351 | | | | |
| | | | | | 429,421 | | | 201,241 | | | 0.07 | % |
Hong Kong: | | | | | | | | | | | | |
| 94,800 | | AIA GROUP LTD. | | | 287,504 | | | 295,974 | | | | |
| 23,100 | | BANK OF EAST ASIA LTD. | | | 41,005 | | | 87,436 | | | | |
| 46,000 | | BOC HONG KONG HOLDINGS LTD. | | | 63,016 | | | 108,970 | | | | |
| 26,000 | | CATHAY PACIFIC AIRWAYS LTD. | | | 31,809 | | | 44,587 | | | | |
| 252,000 | | CHAMPION REIT | | | 99,702 | | | 94,736 | | | | |
| 20,000 | | CHEUNG KONG HOLDINGS LTD. | | | 172,258 | | | 237,922 | | | | |
| 11,000 | | CHEUNG KONG INFRASTRUCTURE HOLDINGS LTD. | | | 51,146 | | | 64,437 | | | | |
| 33,000 | | CHOW SANG SANG HOLDINGS INTERNATIONAL LTD. | | | 90,252 | | | 74,351 | | | | |
| 36,500 | | CLP HOLDINGS LTD. | | | 253,113 | | | 310,384 | | | | |
| 27,800 | | ESPRIT HOLDINGS LTD. | | | 38,689 | | | 35,863 | | | | |
| 18,000 | | GALAXY ENTERTAINMENT GROUP LTD.(b) | | | 39,054 | | | 33,000 | | | | |
| 83,123 | | GUOCO GROUP LTD. | | | 703,310 | | | 773,200 | | | | |
| 17,000 | | HANG LUNG GROUP LTD. | | | 50,690 | | | 93,128 | | | | |
| 30,000 | | HANG LUNG PROPERTIES LTD. | | | 64,007 | | | 85,358 | | | | |
| 11,500 | | HANG SENG BANK LTD. | | | 124,740 | | | 136,435 | | | | |
| 13,000 | | HENDERSON LAND DEVELOPMENT CO. LTD. | | | 45,544 | | | 64,605 | | | | |
| 110,110 | | HONG KONG & CHINA GAS CO. LTD. | | | 149,918 | | | 255,172 | | | | |
| 18,900 | | HONG KONG EXCHANGES AND CLEARING LTD. | | | 202,799 | | | 301,972 | | | | |
| 400 | | HOPEWELL HIGHWAY INFRASTRUCTURE LTD. | | | 229 | | | 200 | | | | |
| 4,000 | | HOPEWELL HOLDINGS LTD. | | | 10,853 | | | 10,228 | | | | |
| 48,000 | | HOPSON DEVELOPMENT HOLDINGS LTD. | | | 75,765 | | | 24,905 | | | | |
| 36,000 | | HUTCHISON WHAMPOA LTD. | | | 189,637 | | | 301,497 | | | | |
| 116,000 | | JOHNSON ELECTRIC HOLDINGS LTD. | | | 64,368 | | | 64,069 | | | | |
| 27,000 | | KERRY PROPERTIES LTD. | | | 90,767 | | | 89,337 | | | | |
| 50,000 | | KINGBOARD CHEMICAL HOLDINGS LTD. | | | 180,015 | | | 148,058 | | | | |
| 150,000 | | LI & FUNG LTD. | | | 208,513 | | | 277,705 | | | | |
| 104,500 | | LINK REIT (THE) | | | 296,460 | | | 384,782 | | | | |
| 16,500 | | MTR CORP. | | | 38,268 | | | 53,426 | | | | |
| 190,000 | | NEW WORLD DEVELOPMENT LTD. | | | 230,135 | | | 153,130 | | | | |
| 216,000 | | NOBLE GROUP LTD. | | | 331,689 | | | 188,179 | | | | |
| 154,500 | | NWS HOLDINGS LTD. | | | 215,741 | | | 227,556 | | | | |
| | |
See accompanying notes to the financial statements. | 75 | (Continued) |
CLEARWATER INVESTMENT TRUST
Schedule of Investments - Clearwater International Fund
December 31, 2011
| | | | | | | | | | | | | |
Shares | | Security | | Cost | | Fair
value (a) | | Percent
of
net assets | |
Hong Kong (Cont’d): | | | | | | | | | | |
| 37,000 | | PACIFIC ANDES RESOURCES DEVELOPMENT LTD. | | $ | 5,907 | | | 5,534 | | | | |
| 284,000 | | PCCW LTD. | | | 110,273 | | | 97,625 | | | | |
| 81,000 | | POWER ASSETS HOLDINGS LTD. | | | 509,060 | | | 599,112 | | | | |
| 31,200 | | SANDS CHINA LTD.(b) | | | 71,562 | | | 88,170 | | | | |
| 22,000 | | SHANGRI-LA ASIA LTD. | | | 29,501 | | | 37,954 | | | | |
| 59,400 | | SINO LAND CO. LTD. | | | 80,601 | | | 84,581 | | | | |
| 2,800 | | SINO-FOREST CORP.(b) | | | 50,555 | | | 13,218 | | | | |
| 105,000 | | SJM HOLDINGS LTD. | | | 192,849 | | | 171,412 | | | | |
| 23,000 | | SUN HUNG KAI PROPERTIES LTD. | | | 222,078 | | | 288,268 | | | | |
| 19,000 | | SWIRE PACIFIC LTD., CLASS A | | | 143,178 | | | 229,328 | | | | |
| 13,000 | | TELEVISION BROADCASTS LTD. | | | 71,193 | | | 78,831 | | | | |
| 37,000 | | WHARF HOLDINGS LTD. | | | 91,952 | | | 167,202 | | | | |
| 22,000 | | WHEELOCK & CO. LTD. | | | 39,213 | | | 54,496 | | | | |
| 30,000 | | WYNN MACAU LTD. | | | 50,423 | | | 75,316 | | | | |
| 53,500 | | YUE YUEN INDUSTRIAL HOLDINGS LTD. | | | 123,576 | | | 169,098 | | | | |
| | | | | | 6,232,917 | | | 7,180,747 | | | 2.35 | % |
Ireland: | | | | | | | | | | | |
| 16,590 | | ACCENTURE PLC, CLASS A | | | 573,657 | | | 883,086 | | | | |
| 31,362 | | COVIDIEN PLC | | | 1,134,423 | | | 1,411,604 | | | | |
| 14,588 | | CRH PLC | | | 212,444 | | | 289,978 | | | | |
| 3,489 | | CRH PLC (DUBLIN EXCHANGE) | | | 62,091 | | | 69,362 | | | | |
| 9,600 | | DCC PLC | | | 234,006 | | | 227,130 | | | | |
| 6,124 | | ELAN CORP. PLC(b) | | | 36,901 | | | 84,968 | | | | |
| 93,651 | | EXPERIAN PLC | | | 710,182 | | | 1,273,290 | | | | |
| 33,826 | | ICON PLC ADR(b)(c) | | | 672,709 | | | 578,763 | | | | |
| 1,776 | | KERRY GROUP PLC, CLASS A | | | 35,054 | | | 65,017 | | | | |
| 11,192 | | SHIRE PLC | | | 130,296 | | | 389,848 | | | | |
| 1,700 | | SHIRE PLC ADR(c) | | | 160,981 | | | 176,630 | | | | |
| 17,323 | | SMURFIT KAPPA GROUP PLC(b) | | | 101,972 | | | 104,705 | | | | |
| 58,632 | | WPP PLC | | | 556,646 | | | 615,062 | | | | |
| | | | | | 4,621,362 | | | 6,169,443 | | | 2.02 | % |
Israel: | | | | | | | | | | | |
| 85,992 | | BANK HAPOALIM BM | | | 356,731 | | | 280,247 | | | | |
| 18,000 | | BANK LEUMI LE-ISRAEL BM | | | 61,393 | | | 51,530 | | | | |
| 25,562 | | BEZEQ THE ISRAELI TELECOMMUNICATION CORP. LTD. | | | 53,201 | | | 46,831 | | | | |
| 2,000 | | ELBIT SYSTEMS LTD. | | | 89,922 | | | 82,131 | | | | |
| 53 | | ISRAEL (THE) CORP. LTD. | | | 37,899 | | | 33,099 | | | | |
| 8,857 | | ISRAEL CHEMICALS LTD. | | | 105,188 | | | 91,801 | | | | |
| 96,000 | | ISRAEL DISCOUNT BANK LTD., CLASS A(b) | | | 159,546 | | | 128,470 | | | | |
| 33,339 | | MIZRAHI TEFAHOT BANK LTD. | | | 308,269 | | | 263,580 | | | | |
| 6,816 | | PARTNER COMMUNICATIONS CO. LTD. | | | 65,918 | | | 60,201 | | | | |
| 11,598 | | TEVA PHARMACEUTICAL INDUSTRIES LTD. ADR(c) | | | 504,674 | | | 468,095 | | | | |
| | | | | | 1,742,741 | | | 1,505,985 | | | 0.49 | % |
Italy: | | | | | | | | | | | |
| 12,000 | | ACEA S.P.A. | | | 120,512 | | | 75,917 | | | | |
| 26,031 | | ASSICURAZIONI GENERALI S.P.A. | | | 405,603 | | | 391,831 | | | | |
| 4,848 | | ATLANTIA S.P.A. | | | 76,988 | | | 77,618 | | | | |
| 12,162 | | AUTOGRILL S.P.A. | | | 72,812 | | | 118,687 | | | | |
| 91,413 | | BANCO POPOLARE SCARL | | | 152,031 | | | 118,314 | | | | |
| 6,300 | | DANIELI & C OFFICINE MECCANICHE S.P.A. | | | 146,810 | | | 132,991 | | | | |
| 171,832 | | ENEL S.P.A. | | | 891,273 | | | 699,221 | | | | |
| 40,243 | | ENI S.P.A. | | | 752,356 | | | 833,892 | | | | |
| 5,619 | | EXOR S.P.A. | | | 100,186 | | | 113,088 | | | | |
| 24,375 | | FIAT INDUSTRIAL S.P.A.(b) | | | 141,398 | | | 209,006 | | | | |
| 10,667 | | FIAT S.P.A. | | | 28,452 | | | 49,012 | | | | |
| 36,000 | | FINMECCANICA S.P.A. | | | 441,396 | | | 133,166 | | | | |
| 90,049 | | INTESA SANPAOLO S.P.A. | | | 161,397 | | | 150,814 | | | | |
| 1,095 | | LUXOTTICA GROUP S.P.A. | | | 14,342 | | | 30,754 | | | | |
| 72,000 | | MEDIASET S.P.A. | | | 191,613 | | | 199,236 | | | | |
| 19,771 | | MEDIOBANCA S.P.A. | | | 152,640 | | | 113,769 | | | | |
| 34,777 | | MEDIOLANUM S.P.A. | | | 120,164 | | | 135,393 | | | | |
| 2,966 | | PRYSMIAN S.P.A. | | | 29,515 | | | 36,834 | | | | |
| 3,842 | | SAIPEM S.P.A. | | | 66,811 | | | 163,350 | | | | |
| 40,318 | | SNAM RETE GAS S.P.A. | | | 174,297 | | | 177,734 | | | | |
| 15,445 | | SOCIETA INIZIATIVE AUTOSTRADALI E SERVIZI S.P.A. | | | 128,115 | | | 116,343 | | | | |
| 5,059 | | TENARIS S.A. | | | 50,651 | | | 93,502 | | | | |
| 22,370 | | TERNA RETE ELETTRICA NAZIONALE S.P.A. | | | 71,955 | | | 75,394 | | | | |
| | |
See accompanying notes to the financial statements. | 76 | (Continued) |
CLEARWATER INVESTMENT TRUST
Schedule of Investments - Clearwater International Fund
December 31, 2011
| | | | | | | | | | | | | |
Shares | | Security | | Cost | | Fair
value (a) | | Percent
of
net assets | |
Italy (Cont’d): |
| 9,971 | | UNICREDIT S.P.A. | | $ | 116,338 | | | 82,848 | | | | |
| 49,543 | | UNIONE DI BANCHE ITALIANE S.C.P.A. | | | 270,288 | | | 203,012 | | | | |
| | | | | | 4,877,943 | | | 4,531,726 | | | 1.49 | % |
Japan: |
| 24,300 | | ADERANS CO. LTD.(b) | | | 283,683 | | | 312,555 | | | | |
| 44,000 | | AEON CO. LTD. | | | 321,555 | | | 604,245 | | | | |
| 4,800 | | AEON CREDIT SERVICE CO. LTD. | | | 49,903 | | | 75,833 | | | | |
| 1,100 | | AEON MALL CO. LTD. | | | 23,091 | | | 23,352 | | | | |
| 2,300 | | AISIN SEIKI CO. LTD. | | | 37,584 | | | 65,562 | | | | |
| 17,000 | | AJINOMOTO CO., INC. | | | 136,093 | | | 204,083 | | | | |
| 88,000 | | ALL NIPPON AIRWAYS CO. LTD. | | | 271,021 | | | 245,814 | | | | |
| 2,000 | | AMADA CO. LTD. | | | 10,582 | | | 12,681 | | | | |
| 15,000 | | ASAHI GLASS CO. LTD. | | | 80,697 | | | 125,895 | | | | |
| 11,100 | | ASAHI GROUP HOLDINGS LTD. | | | 182,090 | | | 243,722 | | | | |
| 74,000 | | ASAHI KASEI CORP. | | | 409,280 | | | 446,103 | | | | |
| 7,600 | | ASTELLAS PHARMA, INC. | | | 243,758 | | | 309,060 | | | | |
| 11,000 | | BANK OF KYOTO (THE) LTD. | | | 98,298 | | | 94,753 | | | | |
| 37,000 | | BANK OF YOKOHAMA (THE) LTD. | | | 164,514 | | | 174,980 | | | | |
| 1,300 | | BENESSE HOLDINGS, INC. | | | 48,395 | | | 62,915 | | | | |
| 13,800 | | BRIDGESTONE CORP. | | | 205,726 | | | 312,867 | | | | |
| 22,500 | | BROTHER INDUSTRIES LTD. | | | 255,948 | | | 276,249 | | | | |
| 29,100 | | CANON, INC. | | | 925,802 | | | 1,289,238 | | | | |
| 29 | | CENTRAL JAPAN RAILWAY CO. | | | 162,730 | | | 244,905 | | | | |
| 5,200 | | CENTURY TOKYO LEASING CORP. | | | 101,825 | | | 98,300 | | | | |
| 15,000 | | CHIBA BANK (THE) LTD. | | | 81,968 | | | 96,663 | | | | |
| 18,000 | | CHUBU ELECTRIC POWER CO., INC. | | | 308,559 | | | 336,059 | | | | |
| 1,900 | | CHUGAI PHARMACEUTICAL CO. LTD. | | | 30,706 | | | 31,326 | | | | |
| 11,800 | | CHUGOKU ELECTRIC POWER (THE) CO., INC. | | | 185,442 | | | 206,814 | | | | |
| 7,900 | | CITIZEN HOLDINGS CO. LTD. | | | 31,581 | | | 45,880 | | | | |
| 4,500 | | COCA-COLA WEST CO. LTD. | | | 76,049 | | | 78,051 | | | | |
| 73,219 | | CREDIT SAISON CO. LTD. | | | 908,590 | | | 1,467,828 | | | | |
| 42,000 | | DAI NIPPON PRINTING CO. LTD. | | | 418,468 | | | 403,800 | | | | |
| 5,000 | | DAIHATSU MOTOR CO. LTD. | | | 40,684 | | | 89,257 | | | | |
| 38 | | DAI-ICHI LIFE INSURANCE CO. (THE) LTD. | | | 42,668 | | | 37,374 | | | | |
| 13,100 | | DAIICHI SANKYO CO. LTD. | | | 225,226 | | | 259,724 | | | | |
| 4,200 | | DAIKIN INDUSTRIES LTD. | | | 122,580 | | | 115,029 | | | | |
| 14,500 | | DAINIPPON SUMITOMO PHARMA CO. LTD. | | | 131,146 | | | 165,216 | | | | |
| 1,200 | | DAITO TRUST CONSTRUCTION CO. LTD. | | | 42,344 | | | 102,899 | | | | |
| 10,000 | | DAIWA HOUSE INDUSTRY CO. LTD. | | | 93,050 | | | 119,269 | | | | |
| 16,000 | | DAIWA SECURITIES GROUP, INC. | | | 68,411 | | | 49,890 | | | | |
| 1,300 | | DENA CO. LTD. | | | 40,158 | | | 38,999 | | | | |
| 4,000 | | DENKI KAGAKU KOGYO K.K. | | | 7,188 | | | 14,811 | | | | |
| 8,200 | | DENSO CORP. | | | 185,234 | | | 226,497 | | | | |
| 2,900 | | DENTSU, INC. | | | 48,680 | | | 88,505 | | | | |
| 13,000 | | DOWA HOLDINGS CO. LTD. | | | 55,385 | | | 82,254 | | | | |
| 7,000 | | EAST JAPAN RAILWAY CO. | | | 392,789 | | | 445,635 | | | | |
| 6,000 | | EBARA CORP. | | | 23,162 | | | 20,658 | | | | |
| 7,000 | | EDION CORP. | | | 63,084 | | | 57,114 | | | | |
| 3,800 | | EISAI CO. LTD. | | | 120,732 | | | 157,246 | | | | |
| 9,500 | | ELECTRIC POWER DEVELOPMENT CO. LTD. | | | 237,649 | | | 252,655 | | | | |
| 1,800 | | FAMILYMART CO. LTD. | | | 52,590 | | | 72,731 | | | | |
| 3,300 | | FANUC CORP. | | | 276,592 | | | 505,062 | | | | |
| 1,100 | | FAST RETAILING CO. LTD. | | | 136,395 | | | 200,081 | | | | |
| 47,000 | | FUJI ELECTRIC CO. LTD. | | | 121,832 | | | 128,844 | | | | |
| 41,000 | | FUJI HEAVY INDUSTRIES LTD. | | | 229,647 | | | 247,698 | | | | |
| 20,300 | | FUJIFILM HOLDINGS CORP. | | | 551,524 | | | 480,804 | | | | |
| 31,000 | | FUJITSU LTD. | | | 124,538 | | | 161,104 | | | | |
| 72,000 | | FUKUOKA FINANCIAL GROUP, INC. | | | 279,237 | | | 302,149 | | | | |
| 15,000 | | FURUKAWA ELECTRIC CO. LTD. | | | 48,082 | | | 34,495 | | | | |
| 1 | | GEO CORP. | | | 1,033 | | | 1,038 | | | | |
| 1,600 | | GREE, INC. | | | 53,031 | | | 55,129 | | | | |
| 6,000 | | GUNMA BANK (THE) LTD. | | | 31,571 | | | 32,975 | | | | |
| 12,000 | | HACHIJUNI BANK (THE) LTD. | | | 67,350 | | | 68,442 | | | | |
| 400 | | HAJIME CONSTRUCTION CO. LTD. | | | 7,780 | | | 8,222 | | | | |
| 2,720 | | HAKUHODO DY HOLDINGS, INC. | | | 146,468 | | | 156,199 | | | | |
| 73,000 | | HANKYU HANSHIN HOLDINGS, INC. | | | 308,754 | | | 307,294 | | | | |
| 500 | | HIROSE ELECTRIC CO. LTD. | | | 48,402 | | | 43,849 | | | | |
| | |
See accompanying notes to the financial statements. | 77 | (Continued) |
CLEARWATER INVESTMENT TRUST
Schedule of Investments - Clearwater International Fund
December 31, 2011
| | | | | | | | | | | | | |
Shares | | Security | | Cost | | Fair
value (a) | | Percent
of
net assets | |
Japan (Cont’d): | | | | | | | | | | | |
| 7,000 | | HIROSHIMA BANK (THE) LTD. | | $ | 26,154 | | | 32,559 | | | | |
| 600 | | HISAMITSU PHARMACEUTICAL CO., INC. | | | 17,668 | | | 25,413 | | | | |
| 3,400 | | HITACHI CAPITAL CORP. | | | 42,103 | | | 47,133 | | | | |
| 3,000 | | HITACHI CHEMICAL CO. LTD. | | | 54,135 | | | 52,853 | | | | |
| 102,000 | | HITACHI LTD. | | | 318,968 | | | 535,386 | | | | |
| 13,500 | | HITACHI LTD. ADR(c) | | | 717,502 | | | 703,890 | | | | |
| 25,000 | | HOKUHOKU FINANCIAL GROUP, INC. | | | 45,996 | | | 48,721 | | | | |
| 38,400 | | HONDA MOTOR CO. LTD. | | | 1,057,440 | | | 1,171,426 | | | | |
| 1,100 | | HOSHIZAKI ELECTRIC CO. LTD. | | | 24,052 | | | 25,839 | | | | |
| 4,800 | | HOYA CORP. | | | 101,897 | | | 103,398 | | | | |
| 1,600 | | IBIDEN CO. LTD. | | | 37,951 | | | 31,639 | | | | |
| 2,700 | | IDEMITSU KOSAN CO. LTD. | | | 271,144 | | | 278,529 | | | | |
| 24,000 | | IHI CORP. | | | 31,334 | | | 58,309 | | | | |
| 52 | | INPEX CORP. | | | 293,098 | | | 327,665 | | | | |
| 9,800 | | ISETAN MITSUKOSHI HOLDINGS LTD. | | | 85,535 | | | 102,751 | | | | |
| 31,000 | | ISUZU MOTORS LTD. | | | 66,138 | | | 143,383 | | | | |
| 28,000 | | ITOCHU CORP. | | | 163,531 | | | 284,479 | | | | |
| 7,700 | | ITOCHU ENEX CO. LTD. | | | 42,905 | | | 43,218 | | | | |
| 8,000 | | J. FRONT RETAILING CO. LTD. | | | 31,099 | | | 38,665 | | | | |
| 2,000 | | JACCS CO. LTD. | | | 5,850 | | | 5,977 | | | | |
| 2,200 | | JAPAN PETROLEUM EXPLORATION CO. | | | 89,226 | | | 86,035 | | | | |
| 6 | | JAPAN REAL ESTATE INVESTMENT CORP. | | | 46,693 | | | 46,772 | | | | |
| 51 | | JAPAN RETAIL FUND INVESTMENT CORP. | | | 70,217 | | | 75,537 | | | | |
| 6,000 | | JAPAN SECURITIES FINANCE CO. LTD. | | | 34,653 | | | 27,128 | | | | |
| 22,000 | | JAPAN STEEL WORKS (THE) LTD. | | | 126,429 | | | 152,919 | | | | |
| 77 | | JAPAN TOBACCO, INC. | | | 200,326 | | | 362,147 | | | | |
| 3,400 | | JFE HOLDINGS, INC. | | | 76,281 | | | 61,578 | | | | |
| 4,000 | | JGC CORP. | | | 53,048 | | | 96,039 | | | | |
| 5,100 | | JS GROUP CORP. | | | 59,682 | | | 97,735 | | | | |
| 3,100 | | JSR CORP. | | | 39,530 | | | 57,192 | | | | |
| 5,000 | | JTEKT CORP. | | | 36,670 | | | 49,176 | | | | |
| 45 | | JUPITER TELECOMMUNICATIONS CO. LTD. | | | 27,159 | | | 45,603 | | | | |
| 45,180 | | JX HOLDINGS, INC. | | | 203,020 | | | 272,951 | | | | |
| 7,000 | | KAJIMA CORP. | | | 15,004 | | | 21,463 | | | | |
| 11,000 | | KAMIGUMI CO. LTD. | | | 72,240 | | | 94,896 | | | | |
| 30,000 | | KANEKA CORP. | | | 168,655 | | | 159,805 | | | | |
| 7,600 | | KANSAI ELECTRIC POWER (THE) CO., INC. | | | 113,716 | | | 116,614 | | | | |
| 2,000 | | KANSAI PAINT CO. LTD. | | | 10,449 | | | 17,851 | | | | |
| 61,700 | | KAO CORP. | | | 1,548,698 | | | 1,685,815 | | | | |
| 35,000 | | KAWASAKI HEAVY INDUSTRIES LTD. | | | 71,135 | | | 87,308 | | | | |
| 50 | | KDDI CORP. | | | 240,697 | | | 321,559 | | | | |
| 13,000 | | KEIKYU CORP. | | | 95,310 | | | 116,710 | | | | |
| 5,000 | | KEIO CORP. | | | 28,322 | | | 35,274 | | | | |
| 30,000 | | KEISEI ELECTRIC RAILWAY CO. LTD. | | | 170,073 | | | 220,609 | | | | |
| 10,200 | | KEWPIE CORP. | | | 129,359 | | | 145,111 | | | | |
| 710 | | KEYENCE CORP. | | | 131,805 | | | 171,207 | | | | |
| 6,000 | | KIKKOMAN CORP. | | | 52,867 | | | 68,911 | | | | |
| 7,000 | | KINDEN CORP. | | | 60,585 | | | 59,115 | | | | |
| 49,000 | | KINTETSU CORP. | | | 153,011 | | | 191,623 | | | | |
| 15,000 | | KIRIN HOLDINGS CO. LTD. | | | 169,540 | | | 182,412 | | | | |
| 57,000 | | KOBE STEEL LTD. | | | 90,912 | | | 88,127 | | | | |
| 1,500 | | KOHNAN SHOJI CO. LTD. | | | 23,819 | | | 24,653 | | | | |
| 15,100 | | KOMATSU LTD. | | | 187,238 | | | 352,934 | | | | |
| 2,300 | | KONAMI CORP. | | | 36,513 | | | 68,879 | | | | |
| 3,800 | | KOSE CORP. | | | 96,604 | | | 95,236 | | | | |
| 3,100 | | K’S HOLDINGS CORP. | | | 132,959 | | | 122,842 | | | | |
| 21,000 | | KUBOTA CORP. | | | 129,773 | | | 175,981 | | | | |
| 5,500 | | KURARAY CO. LTD. | | | 46,234 | | | 78,246 | | | | |
| 4,300 | | KURITA WATER INDUSTRIES LTD. | | | 96,931 | | | 111,734 | | | | |
| 2,700 | | KYOCERA CORP. | | | 198,000 | | | 217,140 | | | | |
| 3,000 | | KYOWA HAKKO KIRIN CO. LTD. | | | 23,089 | | | 36,716 | | | | |
| 13,300 | | KYUSHU ELECTRIC POWER CO., INC. | | | 205,903 | | | 190,423 | | | | |
| 2,800 | | LAWSON, INC. | | | 120,035 | | | 174,798 | | | | |
| 17,000 | | LION CORP. | | | 100,035 | | | 100,495 | | | | |
| 2,000 | | MAKITA CORP. | | | 45,574 | | | 64,728 | | | | |
| 27,000 | | MARUBENI CORP. | | | 91,249 | | | 164,521 | | | | |
| 6,500 | | MARUI GROUP CO. LTD. | | | 32,287 | | | 50,670 | | | | |
| 53,000 | | MAZDA MOTOR CORP.(b) | | | 117,012 | | | 93,648 | | | | |
| | |
See accompanying notes to the financial statements. | 78 | (Continued) |
CLEARWATER INVESTMENT TRUST
Schedule of Investments - Clearwater International Fund
December 31, 2011
| | | | | | | | | | | | | |
Shares | | Security | | Cost | | Fair
value (a) | | Percent
of
net assets | |
Japan (Cont’d): | | | | | | | | | | |
| 5,200 | | MEIJI HOLDINGS CO. LTD. | | $ | 201,937 | | | 215,854 | | | | |
| 49,500 | | MITSUBISHI CHEMICAL HOLDINGS CORP. | | | 206,621 | | | 272,682 | | | | |
| 28,300 | | MITSUBISHI CORP. | | | 464,235 | | | 571,745 | | | | |
| 32,000 | | MITSUBISHI ELECTRIC CORP. | | | 148,393 | | | 306,826 | | | | |
| 27,000 | | MITSUBISHI ESTATE CO. LTD. | | | 353,310 | | | 403,410 | | | | |
| 17,000 | | MITSUBISHI GAS CHEMICAL CO., INC. | | | 75,149 | | | 94,311 | | | | |
| 57,000 | | MITSUBISHI HEAVY INDUSTRIES LTD. | | | 185,317 | | | 242,904 | | | | |
| 4,000 | | MITSUBISHI LOGISTICS CORP. | | | 45,017 | | | 44,434 | | | | |
| 122,000 | | MITSUBISHI MATERIALS CORP. | | | 329,608 | | | 331,277 | | | | |
| 5,000 | | MITSUBISHI TANABE PHARMA CORP. | | | 54,031 | | | 79,123 | | | | |
| 353,269 | | MITSUBISHI UFJ FINANCIAL GROUP, INC. | | | 1,706,666 | | | 1,500,855 | | | | |
| 2,700 | | MITSUBISHI UFJ LEASE & FINANCE CO. LTD. | | | 83,878 | | | 106,991 | | | | |
| 71,000 | | MITSUI & CO. LTD. | | | 824,847 | | | 1,104,175 | | | | |
| 16,000 | | MITSUI CHEMICALS, INC. | | | 40,819 | | | 48,851 | | | | |
| 20,000 | | MITSUI FUDOSAN CO. LTD. | | | 254,116 | | | 291,547 | | | | |
| 3,000 | | MITSUI MINING & SMELTING CO. LTD. | | | 5,391 | | | 7,756 | | | | |
| 34,000 | | MITSUI O.S.K. LINES LTD. | | | 137,301 | | | 131,638 | | | | |
| 437,020 | | MIZUHO FINANCIAL GROUP, INC. | | | 723,730 | | | 590,500 | | | | |
| 17,000 | | MORINAGA MILK INDUSTRY CO. LTD. | | | 68,235 | | | 65,819 | | | | |
| 14,180 | | MS&AD INSURANCE GROUP HOLDINGS | | | 303,657 | | | 262,713 | | | | |
| 3,600 | | MURATA MANUFACTURING CO. LTD. | | | 162,615 | | | 184,984 | | | | |
| 900 | | NAGASE & CO. LTD. | | | 9,638 | | | 9,810 | | | | |
| 65,000 | | NAGOYA RAILROAD CO. LTD. | | | 171,000 | | | 174,811 | | | | |
| 1,500 | | NAMCO BANDAI HOLDINGS, INC. | | | 14,652 | | | 21,359 | | | | |
| 41,000 | | NEC CORP.(b) | | | 114,733 | | | 83,099 | | | | |
| 3,000 | | NGK INSULATORS LTD. | | | 44,485 | | | 35,625 | | | | |
| 3,000 | | NGK SPARK PLUG CO. LTD. | | | 28,359 | | | 37,223 | | | | |
| 1,600 | | NIDEC CORP. | | | 75,128 | | | 139,069 | | | | |
| 11,100 | | NIFCO, INC. | | | 255,342 | | | 310,205 | | | | |
| 7,800 | | NIKON CORP. | | | 115,961 | | | 173,696 | | | | |
| 2,200 | | NINTENDO CO. LTD. | | | 369,606 | | | 302,980 | | | | |
| 11 | | NIPPON BUILDING FUND, INC. | | | 90,970 | | | 90,037 | | | | |
| 21,000 | | NIPPON ELECTRIC GLASS CO. LTD. | | | 218,680 | | | 207,903 | | | | |
| 72,000 | | NIPPON EXPRESS CO. LTD. | | | 269,535 | | | 280,633 | | | | |
| 6,000 | | NIPPON MEAT PACKERS, INC. | | | 72,315 | | | 74,524 | | | | |
| 11,000 | | NIPPON SHEET GLASS CO. LTD. | | | 30,764 | | | 20,580 | | | | |
| 48,000 | | NIPPON STEEL CORP. | | | 129,984 | | | 119,737 | | | | |
| 21,300 | | NIPPON TELEGRAPH & TELEPHONE CORP. | | | 944,460 | | | 1,088,955 | | | | |
| 90,000 | | NIPPON YUSEN K.K. | | | 331,990 | | | 230,353 | | | | |
| 91,000 | | NISHI-NIPPON CITY BANK (THE) LTD. | | | 250,065 | | | 261,288 | | | | |
| 5,000 | | NISSAN CHEMICAL INDUSTRIES LTD. | | | 50,851 | | | 48,396 | | | | |
| 97,600 | | NISSAN MOTOR CO. LTD. | | | 667,688 | | | 877,489 | | | | |
| 2,500 | | NISSHIN SEIFUN GROUP, INC. | | | 25,731 | | | 30,305 | | | | |
| 3,000 | | NISSHINBO HOLDINGS, INC. | | | 23,700 | | | 27,050 | | | | |
| 1,300 | | NISSIN FOODS HOLDINGS CO. LTD. | | | 47,622 | | | 50,923 | | | | |
| 600 | | NITORI HOLDINGS CO. LTD. | | | 33,819 | | | 56,283 | | | | |
| 12,100 | | NITTO DENKO CORP. | | | 399,272 | | | 432,947 | | | | |
| 3,800 | | NKSJ HOLDINGS, INC. | | | 92,673 | | | 74,550 | | | | |
| 43,100 | | NOMURA HOLDINGS, INC. | | | 145,794 | | | 130,472 | | | | |
| 12 | | NOMURA REAL ESTATE OFFICE FUND, INC. | | | 60,411 | | | 61,661 | | | | |
| 2,700 | | NOMURA RESEARCH INSTITUTE LTD. | | | 43,930 | | | 61,038 | | | | |
| 6,000 | | NSK LTD. | | | 24,006 | | | 38,977 | | | | |
| 2,000 | | NTN CORP. | | | 5,258 | | | 8,055 | | | | |
| 81 | | NTT DATA CORP. | | | 248,643 | | | 258,674 | | | | |
| 284 | | NTT DOCOMO, INC. | | | 404,857 | | | 522,108 | | | | |
| 12,000 | | OBAYASHI CORP. | | | 48,665 | | | 53,320 | | | | |
| 8,000 | | ODAKYU ELECTRIC RAILWAY CO. LTD. | | | 62,234 | | | 77,330 | | | | |
| 13,000 | | OJI PAPER CO. LTD. | | | 49,994 | | | 66,715 | | | | |
| 4,000 | | OLYMPUS CORP. | | | 61,766 | | | 52,593 | | | | |
| 7,300 | | OMRON CORP. | | | 99,962 | | | 146,723 | | | | |
| 1,400 | | ONO PHARMACEUTICAL CO. LTD. | | | 60,256 | | | 78,577 | | | | |
| 8,000 | | ONWARD HOLDINGS CO. LTD. | | | 54,094 | | | 58,725 | | | | |
| 800 | | ORIENTAL LAND CO. LTD. | | | 50,479 | | | 84,502 | | | | |
| 5,630 | | ORIX CORP. | | | 333,643 | | | 465,212 | | | | |
| 120,000 | | OSAKA GAS CO. LTD. | | | 446,292 | | | 473,959 | | | | |
| 1,700 | | OTSUKA HOLDINGS CO. LTD. | | | 46,385 | | | 47,796 | | | | |
| 20,100 | | PANASONIC CORP. | | | 218,199 | | | 170,789 | | | | |
| 108 | | RAKUTEN, INC.(b) | | | 55,805 | | | 116,182 | | | | |
| | |
See accompanying notes to the financial statements. | 79 | (Continued) |
CLEARWATER INVESTMENT TRUST
Schedule of Investments - Clearwater International Fund
December 31, 2011
| | | | | | | | | | | | | |
Shares | | Security | | Cost | | Fair
value (a) | | Percent
of
net assets | |
Japan (Cont’d): | | | | | | | | | | |
| 17,000 | | RENGO CO. LTD. | | $ | 111,253 | | | 118,607 | | | | |
| 39,000 | | RICOH CO. LTD. | | | 454,497 | | | 339,995 | | | | |
| 2,100 | | RICOH LEASING CO. LTD. | | | 46,154 | | | 46,955 | | | | |
| 1,200 | | RINNAI CORP. | | | 52,047 | | | 85,905 | | | | |
| 1,800 | | ROHM CO. LTD. | | | 99,465 | | | 83,956 | | | | |
| 15,481 | | SANKYO CO. LTD. | | | 810,847 | | | 783,415 | | | | |
| 800 | | SANRIO CO. LTD. | | | 41,411 | | | 41,108 | | | | |
| 2,600 | | SANTEN PHARMACEUTICAL CO. LTD. | | | 85,886 | | | 107,082 | | | | |
| 35,000 | | SAPPORO HOKUYO HOLDINGS, INC. | | | 109,166 | | | 125,505 | | | | |
| 1,532 | | SBI HOLDINGS, INC. | | | 124,129 | | | 112,260 | | | | |
| 3,400 | | SECOM CO. LTD. | | | 133,812 | | | 156,817 | | | | |
| 4,100 | | SEGA SAMMY HOLDINGS, INC. | | | 38,822 | | | 88,585 | | | | |
| 7,700 | | SEIKO EPSON CORP. | | | 110,865 | | | 102,342 | | | | |
| 31,930 | | SEINO HOLDINGS CORP. | | | 241,043 | | | 247,662 | | | | |
| 13,000 | | SEKISUI CHEMICAL CO. LTD. | | | 66,177 | | | 107,251 | | | | |
| 41,000 | | SEKISUI HOUSE LTD. | | | 389,976 | | | 363,823 | | | | |
| 13,000 | | SEVEN & I HOLDINGS CO. LTD. | | | 286,258 | | | 362,290 | | | | |
| 20,000 | | SHARP CORP. | | | 174,731 | | | 174,876 | | | | |
| 4,000 | | SHIMADZU CORP. | | | 25,419 | | | 33,884 | | | | |
| 1,000 | | SHIMAMURA CO. LTD. | | | 61,206 | | | 102,249 | | | | |
| 1,500 | | SHIMANO, INC. | | | 58,204 | | | 72,887 | | | | |
| 2,000 | | SHIMIZU CORP. | | | 7,530 | | | 8,393 | | | | |
| 7,500 | | SHIN-ETSU CHEMICAL CO. LTD. | | | 365,373 | | | 369,306 | | | | |
| 26,000 | | SHIONOGI & CO. LTD. | | | 324,230 | | | 334,084 | | | | |
| 7,400 | | SHISEIDO CO. LTD. | | | 115,809 | | | 136,042 | | | | |
| 8,000 | | SHIZUOKA BANK (THE) LTD. | | | 74,794 | | | 84,294 | | | | |
| 21,000 | | SHOWA DENKO K.K. | | | 33,824 | | | 42,563 | | | | |
| 173 | | SKY PERFECT JSAT HOLDINGS, INC. | | | 82,814 | | | 86,648 | | | | |
| 600 | | SMC CORP. | | | 57,789 | | | 96,819 | | | | |
| 13,700 | | SOFTBANK CORP. | | | 217,333 | | | 403,513 | | | | |
| 21,900 | | SOJITZ CORP. | | | 34,134 | | | 33,859 | | | | |
| 11,700 | | SONY CORP. | | | 242,357 | | | 210,077 | | | | |
| 6,600 | | SONY FINANCIAL HOLDINGS, INC. | | | 85,415 | | | 97,239 | | | | |
| 6,400 | | SQUARE ENIX HOLDINGS CO. LTD. | | | 120,160 | | | 125,641 | | | | |
| 61,200 | | STANLEY ELECTRIC CO. LTD. | | | 912,616 | | | 899,290 | | | | |
| 115,000 | | SUMITOMO CHEMICAL CO. LTD. | | | 510,738 | | | 419,846 | | | | |
| 21,300 | | SUMITOMO CORP. | | | 207,214 | | | 288,359 | | | | |
| 13,100 | | SUMITOMO ELECTRIC INDUSTRIES LTD. | | | 127,803 | | | 142,627 | | | | |
| 12,000 | | SUMITOMO HEAVY INDUSTRIES LTD. | | | 39,379 | | | 70,002 | | | | |
| 38,000 | | SUMITOMO METAL INDUSTRIES LTD. | | | 78,322 | | | 69,119 | | | | |
| 18,000 | | SUMITOMO METAL MINING CO. LTD. | | | 242,021 | | | 231,289 | | | | |
| 23,200 | | SUMITOMO MITSUI FINANCIAL GROUP, INC. | | | 724,753 | | | 646,247 | | | | |
| 85,310 | | SUMITOMO MITSUI TRUST HOLDINGS, INC. | | | 265,182 | | | 250,492 | | | | |
| 7,000 | | SUMITOMO REALTY & DEVELOPMENT CO. LTD. | | | 81,291 | | | 122,595 | | | | |
| 5,700 | | SUZUKI MOTOR CORP. | | | 102,733 | | | 117,897 | | | | |
| 17,400 | | T&D HOLDINGS, INC. | | | 186,307 | | | 162,089 | | | | |
| 11,000 | | TAISEI CORP. | | | 19,821 | | | 27,868 | | | | |
| 600 | | TAISHO PHARMACEUTICAL HOLDINGS CO. LTD.(b) | | | 40,190 | | | 46,305 | | | | |
| 34,000 | | TAKASHIMAYA CO. LTD. | | | 222,236 | | | 246,048 | | | | |
| 15,500 | | TAKEDA PHARMACEUTICAL CO. LTD. | | | 596,985 | | | 680,666 | | | | |
| 4,500 | | TDK CORP. | | | 186,697 | | | 199,367 | | | | |
| 7,000 | | TEIJIN LTD. | | | 14,861 | | | 21,554 | | | | |
| 2,600 | | TERUMO CORP. | | | 95,419 | | | 122,452 | | | | |
| 2,000 | | THK CO. LTD. | | | 29,290 | | | 39,419 | | | | |
| 13,000 | | TOBU RAILWAY CO. LTD. | | | 49,764 | | | 66,378 | | | | |
| 1,000 | | TOHO CO. LTD. | | | 13,412 | | | 17,825 | | | | |
| 17,000 | | TOHO GAS CO. LTD. | | | 81,221 | | | 108,226 | | | | |
| 5,100 | | TOHOKU ELECTRIC POWER CO., INC. | | | 64,437 | | | 48,967 | | | | |
| 16,300 | | TOKIO MARINE HOLDINGS, INC. | | | 411,422 | | | 361,075 | | | | |
| 19,000 | | TOKUYAMA CORP. | | | 93,604 | | | 60,479 | | | | |
| 10,000 | | TOKYO BROADCASTING SYSTEM HOLDINGS, INC. | | | 133,941 | | | 128,624 | | | | |
| 18,200 | | TOKYO ELECTRIC POWER (THE) CO., INC.(b) | | | 81,026 | | | 43,272 | | | | |
| 3,200 | | TOKYO ELECTRON LTD. | | | 128,746 | | | 162,767 | | | | |
| 64,000 | | TOKYO GAS CO. LTD. | | | 238,072 | | | 294,353 | | | | |
| 75,000 | | TOKYU CORP. | | | 303,931 | | | 369,306 | | | | |
| 62,000 | | TOKYU LAND CORP. | | | 256,270 | | | 234,407 | | | | |
| 4,000 | | TONENGENERAL SEKIYU K.K. | | | 37,796 | | | 43,706 | | | | |
| 53,000 | | TOPPAN PRINTING CO. LTD. | | | 422,474 | | | 389,742 | | | | |
| | |
See accompanying notes to the financial statements. | 80 | (Continued) |
CLEARWATER INVESTMENT TRUST
Schedule of Investments - Clearwater International Fund
December 31, 2011
| | | | | | | | | | | | | |
Shares | | Security | | Cost | | Fair
value (a) | | Percent
of
net assets | |
Japan (Cont’d): | | | | | | | | | | |
| 17,000 | | TORAY INDUSTRIES, INC. | | $ | 70,413 | | | 121,699 | | | | |
| 66,000 | | TOSHIBA CORP. | | | 197,553 | | | 270,109 | | | | |
| 18,000 | | TOSOH CORP. | | | 48,357 | | | 48,175 | | | | |
| 6,000 | | TOTO LTD. | | | 30,029 | | | 46,305 | | | | |
| 11,200 | | TOYO SEIKAN KAISHA LTD. | | | 169,286 | | | 152,789 | | | | |
| 1,000 | | TOYO SUISAN KAISHA LTD. | | | 23,261 | | | 24,230 | | | | |
| 2,300 | | TOYOTA INDUSTRIES CORP. | | | 51,959 | | | 62,603 | | | | |
| 48,800 | | TOYOTA MOTOR CORP. | | | 1,664,486 | | | 1,626,270 | | | | |
| 1,800 | | TOYOTA TSUSHO CORP. | | | 14,973 | | | 31,828 | | | | |
| 2,500 | | TREND MICRO, INC.(b) | | | 74,501 | | | 74,738 | | | | |
| 1,700 | | TSUMURA & CO. | | | 50,505 | | | 50,137 | | | | |
| 8,000 | | UBE INDUSTRIES LTD. | | | 13,963 | | | 21,931 | | | | |
| 2,100 | | UNICHARM CORP. | | | 42,705 | | | 103,542 | | | | |
| 133 | | UNITED URBAN INVESTMENT CORP. | | | 145,147 | | | 150,852 | | | | |
| 12,600 | | UNY CO. LTD. | | | 121,599 | | | 113,446 | | | | |
| 1,000 | | USHIO, INC. | | | 14,106 | | | 14,447 | | | | |
| 130 | | USS CO. LTD. | | | 5,696 | | | 11,755 | | | | |
| 11,400 | | WEST JAPAN RAILWAY CO. | | | 382,763 | | | 495,435 | | | | |
| 236 | | YAHOO JAPAN CORP. | | | 62,283 | | | 76,010 | | | | |
| 2,500 | | YAKULT HONSHA CO. LTD. | | | 42,793 | | | 78,766 | | | | |
| 5,930 | | YAMADA DENKI CO. LTD. | | | 403,169 | | | 403,712 | | | | |
| 25,000 | | YAMAGUCHI FINANCIAL GROUP, INC. | | | 220,002 | | | 238,733 | | | | |
| 7,400 | | YAMAHA MOTOR CO. LTD. | | | 82,524 | | | 93,643 | | | | |
| 9,000 | | YAMATO HOLDINGS CO. LTD. | | | 96,669 | | | 151,659 | | | | |
| 21,000 | | YOKOHAMA RUBBER (THE) CO. LTD. | | | 123,081 | | | 117,866 | | | | |
| | | | | | 50,191,297 | | | 56,909,683 | | | 18.65 | % |
Mexico: | | | | | | | | | | |
| 6,700 | | FOMENTO ECONOMICO MEXICANO S.A.B. DE C.V. ADR(c) | | | 204,664 | | | 467,057 | | | | |
| 2,225 | | FRESNILLO PLC | | | 49,821 | | | 52,763 | | | | |
| | | | | | 254,485 | | | 519,820 | | | 0.17 | % |
Netherlands: | | | | | | | | | | |
| 49,297 | | AEGON N.V.(b) | | | 185,505 | | | 197,856 | | | | |
| 3,274 | | AKZO NOBEL N.V. | | | 134,323 | | | 158,312 | | | | |
| 10,461 | | ASML HOLDING N.V. | | | 263,592 | | | 439,694 | | | | |
| 1,079 | | CORIO N.V. | | | 43,024 | | | 46,930 | | | | |
| 6,423 | | EUROPEAN AERONAUTIC DEFENCE AND SPACE CO. N.V. | | | 81,439 | | | 200,763 | | | | |
| 520 | | FUGRO N.V. - CVA | | | 19,413 | | | 30,215 | | | | |
| 1,747 | | HEINEKEN HOLDING N.V. | | | 53,733 | | | 71,496 | | | | |
| 2,822 | | HEINEKEN N.V. | | | 79,167 | | | 130,648 | | | | |
| 3,500 | | IMTECH N.V. | | | 93,726 | | | 90,667 | | | | |
| 221,383 | | ING GROEP N.V. - CVA(b) | | | 2,247,191 | | | 1,593,114 | | | | |
| 88,033 | | KONINKLIJKE AHOLD N.V. | | | 1,112,569 | | | 1,185,538 | | | | |
| 7,039 | | KONINKLIJKE DSM N.V. | | | 355,849 | | | 326,609 | | | | |
| 74,162 | | KONINKLIJKE KPN N.V. | | | 985,657 | | | 887,394 | | | | |
| 72,908 | | KONINKLIJKE PHILIPS ELECTRONICS N.V. | | | 1,662,361 | | | 1,536,234 | | | | |
| 3,698 | | MEDIQ N.V.(b) | | | 58,977 | | | 56,310 | | | | |
| 2,500 | | NUTRECO N.V. | | | 194,892 | | | 164,503 | | | | |
| 42,000 | | POSTNL N.V.(b) | | | 134,127 | | | 133,725 | | | | |
| 9,716 | | QIAGEN N.V.(b) | | | 139,904 | | | 133,926 | | | | |
| 3,773 | | RANDSTAD HOLDING N.V. | | | 73,225 | | | 111,633 | | | | |
| 7,918 | | REED ELSEVIER N.V. | | | 85,578 | | | 92,305 | | | | |
| 8,800 | | ROYAL DUTCH SHELL PLC ADR(c) | | | 605,153 | | | 643,192 | | | | |
| 63,335 | | ROYAL DUTCH SHELL PLC, CLASS A | | | 1,523,734 | | | 2,332,030 | | | | |
| 44,225 | | ROYAL DUTCH SHELL PLC, CLASS B | | | 1,039,766 | | | 1,685,393 | | | | |
| 6,056 | | SBM OFFSHORE N.V. | | | 85,999 | | | 124,783 | | | | |
| 2,181 | | SNS REAAL N.V.(b) | | | 6,124 | | | 4,771 | | | | |
| 17,078 | | TNT EXPRESS N.V. | | | 152,515 | | | 127,627 | | | | |
| 28,402 | | UNILEVER N.V. - CVA | | | 579,364 | | | 976,716 | | | | |
| 6,193 | | WOLTERS KLUWER N.V. | | | 101,075 | | | 107,047 | | | | |
| | | | | | 12,097,982 | | | 13,589,431 | | | 4.45 | % |
New Zealand: | | | | | | | | | | |
| 5,083 | | CHORUS LTD.(b) | | | 8,483 | | | 12,342 | | | | |
| 7,267 | | CONTACT ENERGY LTD.(b) | | | 20,979 | | | 29,803 | | | | |
| 14,246 | | FLETCHER BUILDING LTD. | | | 48,135 | | | 68,070 | | | | |
| | |
See accompanying notes to the financial statements. | 81 | (Continued) |
CLEARWATER INVESTMENT TRUST
Schedule of Investments - Clearwater International Fund
December 31, 2011
| | | | | | | | | | | | | |
Shares | | Security | | Cost | | Fair
value (a) | | Percent
of
net assets | |
New Zealand (Cont’d): |
| 25,416 | | TELECOM CORP. OF NEW ZEALAND LTD. | | $ | 27,958 | | | 40,942 | | | | |
| 9,200 | | VECTOR LTD. | | | 17,307 | | | 17,684 | | | | |
| | | | | | 122,862 | | | 168,841 | | | 0.06 | % |
Norway: |
| 3,900 | | AKER SOLUTIONS ASA | | | 45,406 | | | 41,054 | | | | |
| 13,800 | | DNB ASA | | | 88,172 | | | 135,114 | | | | |
| 6,000 | | FRED OLSEN ENERGY ASA | | | 181,296 | | | 201,670 | | | | |
| 3,900 | | KVAERNER ASA(b) | | | 6,506 | | | 6,359 | | | | |
| 31,521 | | NORSK HYDRO ASA | | | 131,018 | | | 146,218 | | | | |
| 12,000 | | ORKLA ASA | | | 80,407 | | | 89,598 | | | | |
| 6,600 | | SEADRILL LTD. | | | 70,381 | | | 220,734 | | | | |
| 17,748 | | STATOIL ASA | | | 328,001 | | | 455,567 | | | | |
| 10,900 | | TELENOR ASA | | | 62,904 | | | 178,809 | | | | |
| 4,500 | | TGS NOPEC GEOPHYSICAL CO. ASA | | | 115,129 | | | 99,707 | | | | |
| 4,000 | | YARA INTERNATIONAL ASA | | | 109,527 | | | 160,534 | | | | |
| | | | | | 1,218,747 | | | 1,735,364 | | | 0.57 | % |
Philippines: |
| 8,500 | | GLOBE TELECOM, INC. | | | 172,736 | | | 219,599 | | | | |
| | | | | | 172,736 | | | 219,599 | | | 0.07 | % |
| Portugal: |
| 8,464 | | CIMPOR CIMENTOS DE PORTUGAL SGPS S.A. | | | 39,214 | | | 58,247 | | | | |
| 13,166 | | ENERGIAS DE PORTUGAL S.A. | | | 44,835 | | | 40,744 | | | | |
| 2,881 | | GALP ENERGIA SGPS S.A., CLASS B | | | 35,487 | | | 42,434 | | | | |
| 6,408 | | JERONIMO MARTINS SGPS S.A.(b) | | | 30,015 | | | 106,077 | | | | |
| 14,258 | | PORTUGAL TELECOM SGPS S.A. (REGISTERED) | | | 114,811 | | | 82,119 | | | | |
| | | | | | 264,362 | | | 329,621 | | | 0.11 | % |
Russia: |
| 9,100 | | LUKOIL OAO ADR(c) | | | 645,112 | | | 481,845 | | | | |
| 12,600 | | SBERBANK OF RUSSIA ADR(b)(c) | | | 185,664 | | | 124,992 | | | | |
| 12,100 | | SBERBANK OF RUSSIA ADR (OTC EXCHANGE)(b)(c) | | | 171,650 | | | 120,165 | | | | |
| | | | | | 1,002,426 | | | 727,002 | | | 0.24 | % |
Singapore: |
| 19,500 | | CAPITALAND LTD. | | | 25,646 | | | 33,225 | | | | |
| 36,000 | | CAPITAMALL TRUST | | | 34,148 | | | 47,183 | | | | |
| 5,000 | | CITY DEVELOPMENTS LTD. | | | 14,259 | | | 34,308 | | | | |
| 51,000 | | COSCO CORP. SINGAPORE LTD. | | | 48,134 | | | 34,405 | | | | |
| 106,500 | | DBS GROUP HOLDINGS LTD. | | | 846,917 | | | 945,889 | | | | |
| 51,000 | | FRASER AND NEAVE LTD. | | | 118,135 | | | 243,781 | | | | |
| 96,800 | | GENTING SINGAPORE PLC(b) | | | 48,634 | | | 112,691 | | | | |
| 130,000 | | GLOBAL LOGISTIC PROPERTIES LTD.(b) | | | 203,681 | | | 175,897 | | | | |
| 8,000 | | JARDINE CYCLE & CARRIAGE LTD. | | | 63,087 | | | 296,793 | | | | |
| 177,120 | | KEPPEL CORP. LTD. | | | 877,967 | | | 1,269,956 | | | | |
| 4,000 | | K-GREEN TRUST | | | 1,432 | | | 2,806 | | | | |
| 53,000 | | OLAM INTERNATIONAL LTD. | | | 79,953 | | | 87,035 | | | | |
| 44,000 | | OVERSEA-CHINESE BANKING CORP. LTD. | | | 141,236 | | | 265,615 | | | | |
| 84,000 | | SEMBCORP INDUSTRIES LTD. | | | 203,163 | | | 262,284 | | | | |
| 22,000 | | SEMBCORP MARINE LTD. | | | 32,803 | | | 64,792 | | | | |
| 12,000 | | SINGAPORE AIRLINES LTD. | | | 70,334 | | | 93,997 | | | | |
| 22,000 | | SINGAPORE EXCHANGE LTD. | | | 89,462 | | | 103,973 | | | | |
| 25,000 | | SINGAPORE PRESS HOLDINGS LTD. | | | 41,026 | | | 71,122 | | | | |
| 137,000 | | SINGAPORE TELECOMMUNICATIONS LTD. | | | 242,937 | | | 326,375 | | | | |
| 305,000 | | STARHILL GLOBAL REIT | | | 153,931 | | | 132,858 | | | | |
| 25,000 | | UNITED OVERSEAS BANK LTD. | | | 160,579 | | | 294,318 | | | | |
| 59,000 | | UOL GROUP LTD. | | | 192,887 | | | 181,949 | | | | |
| 35,000 | | WILMAR INTERNATIONAL LTD. | | | 146,616 | | | 134,920 | | | | |
| | | | | | 3,836,967 | | | 5,216,172 | | | 1.71% | |
South Korea: |
| 265 | | AMOREPACIFIC GROUP(b) | | | 53,245 | | | 58,659 | | | | |
| 1,578 | | CJ CORP.(b) | | | 123,301 | | | 105,474 | | | | |
| 4,340 | | DONGBU INSURANCE CO. LTD. | | | 153,355 | | | 201,177 | | | | |
| 1,270 | | DOOSAN CORP. | | | 149,957 | | | 157,648 | | | | |
| 3,640 | | DOOSAN HEAVY INDUSTRIES AND CONSTRUCTION CO. LTD.(b) | | | 190,670 | | | 205,698 | | | | |
| 970 | | GREEN CROSS HOLDINGS CORP.(b) | | | 15,638 | | | 12,462 | | | | |
| 3,180 | | GS HOLDINGS(b) | | | 249,031 | | | 139,953 | | | | |
| | |
See accompanying notes to the financial statements. | 82 | (Continued) |
CLEARWATER INVESTMENT TRUST
Schedule of Investments - Clearwater International Fund
December 31, 2011
| | | | | | | | | | | | | |
Shares | | Security | | Cost | | Fair
value (a) | | Percent
of
net assets | |
South Korea (Cont’d): |
| 180 | | GS HOME SHOPPING, INC.(b) | | $ | 11,109 | | | 18,125 | | | | |
| 3,030 | | HALLA CLIMATE CONTROL CORP.(b) | | | 65,581 | | | 57,339 | | | | |
| 230 | | HYUNDAI DEPARTMENT STORE CO. LTD.(b) | | | 29,872 | | | 32,543 | | | | |
| 2,320 | | HYUNDAI MARINE & FIRE INSURANCE CO. LTD. | | | 61,833 | | | 69,479 | | | | |
| 9,920 | | INDUSTRIAL BANK OF KOREA(b) | | | 114,156 | | | 107,639 | | | | |
| 560 | | KCC CORP. | | | 128,235 | | | 138,785 | | | | |
| 173 | | KISWIRE LTD.(b) | | | 5,374 | | | 6,355 | | | | |
| 22,870 | | KOREA EXCHANGE BANK | | | 178,115 | | | 145,915 | | | | |
| 460 | | KOREA ZINC CO. LTD.(b) | | | 50,116 | | | 121,389 | | | | |
| 3,640 | | KT CORP.(b) | | | 145,775 | | | 112,644 | | | | |
| 3,170 | | KT&G CORP.(b) | | | 193,276 | | | 223,991 | | | | |
| 2,060 | | LS CORP.(b) | | | 141,821 | | | 135,903 | | | | |
| 710 | | OCI CO. LTD.(b) | | | 303,342 | | | 135,282 | | | | |
| 90 | | SAMSUNG FIRE & MARINE INSURANCE CO. LTD. | | | 13,128 | | | 16,484 | | | | |
| 1,770 | | SAMSUNG HEAVY INDUSTRIES CO. LTD.(b) | | | 43,569 | | | 42,867 | | | | |
| 1,750 | | SK C&C CO. LTD.(b) | | | 212,914 | | | 177,734 | | | | |
| 1,920 | | SK HOLDINGS CO. LTD.(b) | | | 170,549 | | | 201,667 | | | | |
| 1,160 | | SK INNOVATION CO. LTD.(b) | | | 208,609 | | | 142,986 | | | | |
| 8,180 | | SK NETWORKS CO. LTD.(b) | | | 80,647 | | | 71,717 | | | | |
| 20 | | TAEKWANG INDUSTRIAL CO. LTD.(b) | | | 22,217 | | | 21,528 | | | | |
| 24,870 | | WOORI FINANCE HOLDINGS CO. LTD.(b) | | | 233,155 | | | 203,580 | | | | |
| | | | | | 3,348,590 | | | 3,065,023 | | | 1.00 | % |
Spain: |
| 9,600 | | ABENGOA S.A. | | | 247,008 | | | 203,771 | | | | |
| 4,082 | | ABERTIS INFRAESTRUCTURAS S.A. | | | 59,419 | | | 65,195 | | | | |
| 7,760 | | ACERINOX S.A. | | | 96,174 | | | 99,532 | | | | |
| 1,133 | | ACS ACTIVIDADES DE CONSTRUCCION Y SERVICIOS S.A. | | | 43,928 | | | 33,581 | | | | |
| 86,231 | | BANCO BILBAO VIZCAYA ARGENTARIA S.A. | | | 665,808 | | | 745,535 | | | | |
| 15,600 | | BANCO BILBAO VIZCAYA ARGENTARIA S.A. ADR(c) | | | 133,319 | | | 133,692 | | | | |
| 44,766 | | BANCO DE SABADELL S.A. | | | 151,160 | | | 169,995 | | | | |
| 11,881 | | BANCO POPULAR ESPANOL S.A. | | | 65,227 | | | 54,128 | | | | |
| 122,411 | | BANCO SANTANDER S.A. | | | 902,277 | | | 930,007 | | | | |
| 17,452 | | BANKINTER S.A. | | | 82,955 | | | 107,292 | | | | |
| 13,443 | | CAIXABANK | | | 41,927 | | | 66,029 | | | | |
| 390 | | CONSTRUCCIONES Y AUXILIAR DE FERROCARRILES S.A. | | | 187,283 | | | 194,336 | | | | |
| 9,700 | | DISTRIBUIDORA INTERNACIONAL DE ALIMENTACION S.A.(b) | | | 46,997 | | | 43,878 | | | | |
| 2,531 | | ENAGAS S.A. | | | 38,143 | | | 46,811 | | | | |
| 16,085 | | FERROVIAL S.A. | | | 79,147 | | | 194,132 | | | | |
| 3,797 | | FOMENTO DE CONSTRUCCIONES Y CONTRATAS S.A. | | | 150,651 | | | 98,484 | | | | |
| 4,262 | | GAS NATURAL SDG S.A. | | | 52,029 | | | 73,173 | | | | |
| 2,222 | | GRIFOLS S.A.(b) | | | 31,676 | | | 37,387 | | | | |
| 56,060 | | IBERDROLA S.A. | | | 391,650 | | | 351,105 | | | | |
| 4,941 | | INDITEX S.A. | | | 202,632 | | | 404,678 | | | | |
| 13,809 | | INDRA SISTEMAS S.A. | | | 253,493 | | | 175,814 | | | | |
| 32,296 | | MAPFRE S.A. | | | 99,474 | | | 102,619 | | | | |
| 2,111 | | RED ELECTRICA CORP. S.A. | | | 88,270 | | | 90,341 | | | | |
| 13,070 | | REPSOL YPF S.A. | | | 249,017 | | | 401,507 | | | | |
| 69,508 | | TELEFONICA S.A. | | | 1,388,562 | | | 1,204,151 | | | | |
| | | | | | 5,748,226 | | | 6,027,173 | | | 1.98 | % |
Sweden: |
| 4,550 | | ALFA LAVAL AB | | | 35,782 | | | 86,208 | | | | |
| 7,400 | | ASSA ABLOY AB, CLASS B | | | 89,466 | | | 185,580 | | | | |
| 9,200 | | ATLAS COPCO AB, CLASS A | | | 70,694 | | | 197,838 | | | | |
| 19,000 | | ATLAS COPCO AB, CLASS B | | | 320,555 | | | 361,095 | | | | |
| 3,544 | | AXFOOD AB | | | 128,166 | | | 130,588 | | | | |
| 12,000 | | BOLIDEN AB | | | 159,060 | | | 175,229 | | | | |
| 10,200 | | ELECTROLUX AB, CLASS B | | | 151,888 | | | 162,580 | | | | |
| 18,671 | | GETINGE AB, CLASS B | | | 390,810 | | | 473,123 | | | | |
| 13,600 | | HENNES & MAURITZ AB, CLASS B | | | 274,862 | | | 437,301 | | | | |
| 3,700 | | HEXAGON AB, CLASS B | | | 56,830 | | | 55,319 | | | | |
| 400 | | HOLMEN AB, CLASS B | | | 8,156 | | | 11,490 | | | | |
| 17,500 | | HUSQVARNA AB, CLASS B | | | 64,201 | | | 80,630 | | | | |
| 10,000 | | INDUSTRIVARDEN AB, CLASS C(b) | | | 103,927 | | | 119,290 | | | | |
| 11,800 | | INVESTOR AB, CLASS B | | | 161,782 | | | 220,144 | | | | |
| 3,000 | | KINNEVIK INVESTMENT AB, CLASS B | | | 51,225 | | | 58,453 | | | | |
| | |
See accompanying notes to the financial statements. | 83 | (Continued) |
CLEARWATER INVESTMENT TRUST
Schedule of Investments - Clearwater International Fund
December 31, 2011
| | | | | | | | | | | | | |
Shares | | Security | | Cost | | Fair
value (a) | | Percent
of
net assets | |
Sweden (Cont’d): |
| 26,000 | | MEDA AB, CLASS A | | $ | 211,471 | | | 270,487 | | | | |
| 1,600 | | MILLICOM INTERNATIONAL CELLULAR S.A. SDR | | | 87,461 | | | 160,293 | | | | |
| 1,100 | | MODERN TIMES GROUP AB, CLASS B | | | 50,174 | | | 52,551 | | | | |
| 43,400 | | NORDEA BANK AB | | | 253,480 | | | 335,791 | | | | |
| 3,200 | | RATOS AB, CLASS B | | | 51,338 | | | 37,545 | | | | |
| 12,563 | | SAAB AB, CLASS B | | | 253,264 | | | 259,934 | | | | |
| 23,773 | | SANDVIK AB | | | 201,678 | | | 291,705 | | | | |
| 7,800 | | SCANIA AB, CLASS B | | | 65,585 | | | 115,599 | | | | |
| 34,200 | | SECURITAS AB, CLASS B | | | 381,213 | | | 295,170 | | | | |
| 41,800 | | SKANDINAVISKA ENSKILDA BANKEN AB, CLASS A | | | 171,318 | | | 243,485 | | | | |
| 2,800 | | SKANSKA AB, CLASS B | | | 23,703 | | | 46,379 | | | | |
| 13,800 | | SKF AB, CLASS B | | | 141,836 | | | 291,944 | | | | |
| 5,400 | | SSAB AB, CLASS A | | | 48,129 | | | 47,587 | | | | |
| 8,600 | | SVENSKA CELLULOSA AB, CLASS B | | | 78,052 | | | 127,455 | | | | |
| 8,900 | | SVENSKA HANDELSBANKEN AB, CLASS A | | | 161,721 | | | 234,061 | | | | |
| 18,300 | | SWEDBANK AB, CLASS A | | | 58,744 | | | 237,046 | | | | |
| 6,600 | | SWEDISH MATCH AB | | | 95,099 | | | 234,276 | | | | |
| 8,685 | | TELE2 AB, CLASS B | | | 128,531 | | | 168,970 | | | | |
| 45,000 | | TELEFONAKTIEBOLAGET LM ERICSSON, CLASS B | | | 406,347 | | | 460,304 | | | | |
| 29,500 | | TELIASONERA AB | | | 145,684 | | | 200,470 | | | | |
| 27,000 | | TRELLEBORG AB, CLASS B | | | 206,592 | | | 234,402 | | | | |
| 46,800 | | VOLVO AB, CLASS B | | | 453,534 | | | 512,036 | | | | |
| | | | | | 5,742,358 | | | 7,612,358 | | | 2.50 | % |
| Switzerland: |
| 41,343 | | ABB LTD. (REGISTERED)(b) | | | 560,773 | | | 778,155 | | | | |
| 25,497 | | ADECCO S.A. (REGISTERED)(b) | | | 1,207,204 | | | 1,068,109 | | | | |
| 2,727 | | ARYZTA A.G. | | | 68,593 | | | 131,802 | | | | |
| 5,889 | | BALOISE HOLDING A.G. (REGISTERED) | | | 537,708 | | | 403,747 | | | | |
| 1,970 | | BKW S.A.(b) | | | 94,121 | | | 76,444 | | | | |
| 8,185 | | CIE FINANCIERE RICHEMONT S.A., CLASS A (BEARER) | | | 130,638 | | | 413,986 | | | | |
| 22,000 | | CLARIANT A.G. (REGISTERED)(b) | | | 351,715 | | | 217,112 | | | | |
| 11,893 | | CREDIT SUISSE GROUP A.G. (REGISTERED)(b) | | | 331,251 | | | 279,432 | | | | |
| 28,000 | | FERREXPO PLC | | | 170,879 | | | 116,882 | | | | |
| 680 | | FLUGHAFEN ZUERICH A.G. (REGISTERED) | | | 252,783 | | | 235,998 | | | | |
| 3,339 | | GAM HOLDING A.G.(b) | | | 20,061 | | | 36,258 | | | | |
| 1,115 | | GEBERIT A.G. (REGISTERED)(b) | | | 117,053 | | | 214,850 | | | | |
| 174 | | GIVAUDAN S.A. (REGISTERED)(b) | | | 109,479 | | | 165,788 | | | | |
| 6,556 | | GLENCORE INTERNATIONAL PLC(b) | | | 40,864 | | | 39,910 | | | | |
| 650 | | HELVETIA HOLDING A.G. (REGISTERED) | | | 204,462 | | | 204,135 | | | | |
| 3,916 | | HOLCIM LTD. (REGISTERED)(b) | | | 168,212 | | | 209,489 | | | | |
| 6,304 | | JULIUS BAER GROUP LTD.(b) | | | 160,169 | | | 246,568 | | | | |
| 967 | | KUEHNE & NAGEL INTERNATIONAL A.G. (REGISTERED) | | | 57,750 | | | 108,608 | | | | |
| 55 | | LINDT & SPRUENGLI A.G. (PARTICIPATION CERTIFICATE) | | | 90,640 | | | 163,595 | | | | |
| 3 | | LINDT & SPRUENGLI A.G. (REGISTERED) | | | 75,352 | | | 100,252 | | | | |
| 6,301 | | LOGITECH INTERNATIONAL S.A. (REGISTERED)(b) | | | 70,452 | | | 49,203 | | | | |
| 1,693 | | LONZA GROUP A.G. (REGISTERED)(b) | | | 105,411 | | | 100,030 | | | | |
| 89,048 | | NESTLE S.A. (REGISTERED) | | | 3,181,057 | | | 5,119,172 | | | | |
| 87,829 | | NOVARTIS A.G. (REGISTERED) | | | 3,692,210 | | | 5,021,044 | | | | |
| 36,000 | | OC OERLIKON CORP. A.G. (REGISTERED)(b) | | | 253,647 | | | 192,776 | | | | |
| 11,411 | | PANALPINA WELTTRANSPORT HOLDING A.G. (REGISTERED)(b) | | | 877,772 | | | 1,168,640 | | | | |
| 14,410 | | PARGESA HOLDING S.A. (BEARER) | | | 931,106 | | | 943,454 | | | | |
| 12,394 | | ROCHE HOLDING A.G. (GENUSSCHEIN) | | | 1,602,744 | | | 2,100,566 | | | | |
| 7,550 | | ROCHE HOLDING A.G. ADR(c) | | | 303,461 | | | 321,252 | | | | |
| 755 | | SCHINDLER HOLDING A.G. (PARTICIPATION CERTIFICATE) | | | 34,888 | | | 87,932 | | | | |
| 329 | | SCHINDLER HOLDING A.G. (REGISTERED) | | | 38,313 | | | 38,212 | | | | |
| 121 | | SGS S.A. (REGISTERED) | | | 130,564 | | | 200,308 | | | | |
| 27 | | SIKA A.G. (BEARER) | | | 52,140 | | | 50,877 | | | | |
| 1,300 | | SONOVA HOLDING A.G. (REGISTERED)(b) | | | 84,464 | | | 135,975 | | | | |
| 17,678 | | STMICROELECTRONICS N.V. | | | 104,709 | | | 105,043 | | | | |
| 635 | | SULZER A.G. (REGISTERED) | | | 30,609 | | | 67,872 | | | | |
| 475 | | SWATCH GROUP (THE) A.G. (BEARER) | | | 59,791 | | | 177,746 | | | | |
| 2,391 | | SWATCH GROUP (THE) A.G. (REGISTERED) | | | 61,462 | | | 159,344 | | | | |
| 4,325 | | SWISS LIFE HOLDING A.G. (REGISTERED)(b) | | | 360,148 | | | 397,816 | | | | |
| 11,031 | | SWISS RE A.G.(b) | | | 326,129 | | | 562,160 | | | | |
| 451 | | SWISSCOM A.G. (REGISTERED) | | | 148,509 | | | 170,878 | | | | |
| 1,734 | | SYNGENTA A.G. (REGISTERED)(b) | | | 377,174 | | | 507,649 | | | | |
| 65,057 | | TE CONNECTIVITY LTD. | | | 1,346,324 | | | 2,004,406 | | | | |
| | |
See accompanying notes to the financial statements. | 84 | (Continued) |
CLEARWATER INVESTMENT TRUST
Schedule of Investments - Clearwater International Fund
December 31, 2011
| | | | | | | | | | | | | |
Shares | | Security | | Cost | | Fair
value (a) | | Percent
of
net assets | |
Switzerland (Cont’d): |
| 3,564 | | TRANSOCEAN LTD. | | $ | 195,878 | | | 136,822 | | | | |
| 4,513 | | WOLSELEY PLC | | | 70,476 | | | 149,421 | | | | |
| 35,679 | | XSTRATA PLC | | | 288,752 | | | 541,889 | | | | |
| 3,315 | | ZURICH FINANCIAL SERVICES A.G.(b) | | | 573,168 | | | 749,936 | | | | |
| | | | | | 20,051,065 | | | 26,471,543 | | | 8.68 | % |
Thailand: |
| 1,196,566 | | THAI BEVERAGE PCL | | | 268,860 | | | 226,017 | | | | |
| | | | | | 268,860 | | | 226,017 | | | 0.07 | % |
| United Kingdom: |
| 11,608 | | 3I GROUP PLC | | | 38,159 | | | 32,628 | | | | |
| 2,834 | | ADMIRAL GROUP PLC | | | 35,119 | | | 37,497 | | | | |
| 125,000 | | AFREN PLC(b) | | | 290,716 | | | 166,360 | | | | |
| 2,907 | | AGGREKO PLC | | | 87,133 | | | 91,056 | | | | |
| 4,578 | | AMEC PLC | | | 34,931 | | | 64,518 | | | | |
| 21,888 | | ANGLO AMERICAN PLC | | | 453,848 | | | 808,647 | | | | |
| 21,100 | | ANGLO AMERICAN PLC ADR(c) | | | 372,692 | | | 382,965 | | | | |
| 4,811 | | ANTOFAGASTA PLC | | | 33,978 | | | 90,776 | | | | |
| 22,199 | | ARM HOLDINGS PLC | | | 101,371 | | | 204,086 | | | | |
| 3,799 | | ASSOCIATED BRITISH FOODS PLC | | | 35,240 | | | 65,309 | | | | |
| 25,536 | | ASTRAZENECA PLC | | | 927,228 | | | 1,179,773 | | | | |
| 10,000 | | ASTRAZENECA PLC ADR(c) | | | 461,598 | | | 462,900 | | | | |
| 67,839 | | AVIVA PLC | | | 252,388 | | | 316,895 | | | | |
| 5,239 | | BABCOCK INTERNATIONAL GROUP PLC | | | 47,416 | | | 59,840 | | | | |
| 103,246 | | BAE SYSTEMS PLC | | | 475,321 | | | 457,119 | | | | |
| 68,000 | | BALFOUR BEATTY PLC | | | 287,866 | | | 279,631 | | | | |
| 251,625 | | BARCLAYS PLC | | | 873,845 | | | 687,937 | | | | |
| 58,418 | | BG GROUP PLC | | | 917,965 | | | 1,248,768 | | | | |
| 36,463 | | BHP BILLITON PLC | | | 769,878 | | | 1,063,141 | | | | |
| 5,400 | | BHP BILLITON PLC ADR(c) | | | 424,475 | | | 315,306 | | | | |
| 317,112 | | BP PLC | | | 2,120,649 | | | 2,267,781 | | | | |
| 63,994 | | BRITISH AMERICAN TOBACCO PLC | | | 1,725,235 | | | 3,036,549 | | | | |
| 11,630 | | BRITISH LAND CO. PLC | | | 61,579 | | | 83,531 | | | | |
| 17,468 | | BRITISH SKY BROADCASTING GROUP PLC | | | 116,486 | | | 198,705 | | | | |
| 486,009 | | BT GROUP PLC | | | 1,158,344 | | | 1,440,817 | | | | |
| 5,069 | | BUNZL PLC | | | 39,524 | | | 69,588 | | | | |
| 8,202 | | BURBERRY GROUP PLC | | | 40,549 | | | 150,937 | | | | |
| 40,577 | | CAIRN ENERGY PLC(b) | | | 155,293 | | | 167,177 | | | | |
| 16,980 | | CAPITA GROUP PLC | | | 162,367 | | | 165,730 | | | | |
| 6,025 | | CAPITAL & COUNTIES PROPERTIES PLC | | | 6,933 | | | 17,272 | | | | |
| 6,025 | | CAPITAL SHOPPING CENTRES GROUP PLC | | | 23,472 | | | 29,221 | | | | |
| 10,534 | | CARNIVAL PLC | | | 366,702 | | | 347,789 | | | | |
| 31,729 | | CARPETRIGHT PLC | | | 338,549 | | | 236,514 | | | | |
| 82,257 | | CENTRICA PLC | | | 290,637 | | | 369,556 | | | | |
| 11,669 | | COBHAM PLC | | | 30,337 | | | 33,235 | | | | |
| 315,090 | | COMPASS GROUP PLC | | | 2,095,337 | | | 2,989,748 | | | | |
| 8,154 | | COMPUTACENTER PLC | | | 60,118 | | | 42,370 | | | | |
| 33,598 | | COOKSON GROUP PLC | | | 275,788 | | | 265,577 | | | | |
| 108,000 | | DEBENHAMS PLC | | | 95,208 | | | 98,200 | | | | |
| 106,313 | | DIAGEO PLC | | | 1,431,414 | | | 2,322,121 | | | | |
| 46,724 | | DRAX GROUP PLC | | | 346,422 | | | 395,453 | | | | |
| 2,968 | | ENQUEST PLC(b) | | | 3,713 | | | 4,261 | | | | |
| 24,458 | | ESSAR ENERGY PLC.(b) | | | 94,201 | | | 65,101 | | | | |
| 11,872 | | EURASIAN NATURAL RESOURCES CORP. PLC | | | 106,253 | | | 117,165 | | | | |
| 64,094 | | FIRSTGROUP PLC | | | 328,053 | | | 336,429 | | | | |
| 37,699 | | G4S PLC | | | 134,529 | | | 159,125 | | | | |
| 91,912 | | GLAXOSMITHKLINE PLC | | | 1,410,189 | | | 2,100,348 | | | | |
| 3,000 | | GREENE KING PLC | | | 24,323 | | | 22,698 | | | | |
| 17,505 | | HAMMERSON PLC | | | 69,535 | | | 97,864 | | | | |
| 36,031 | | HAYS PLC | | | 49,874 | | | 35,867 | | | | |
| 354,483 | | HSBC HOLDINGS PLC | | | 2,564,079 | | | 2,703,210 | | | | |
| 21,813 | | ICAP PLC | | | 124,343 | | | 117,511 | | | | |
| 11,465 | | IMI PLC | | | 43,254 | | | 135,315 | | | | |
| 18,809 | | IMPERIAL TOBACCO GROUP PLC | | | 441,612 | | | 711,252 | | | | |
| 50,000 | | INCHCAPE PLC | | | 227,275 | | | 227,818 | | | | |
| 11,958 | | INMARSAT PLC | | | 92,794 | | | 75,154 | | | | |
| 17,590 | | INTERCONTINENTAL HOTELS GROUP PLC | | | 253,023 | | | 316,052 | | | | |
| | |
See accompanying notes to the financial statements. | 85 | (Continued) |
CLEARWATER INVESTMENT TRUST
Schedule of Investments - Clearwater International Fund
December 31, 2011
| | | | | | | | | | | | | |
Shares | | Security | | Cost | | Fair
value (a) | | Percent
of
net assets | |
United Kingdom (Cont’d): |
| 15,937 | | INTERNATIONAL CONSOLIDATED AIRLINES GROUP S.A.(b) | | $ | 37,969 | | | 35,891 | | | | |
| 29,641 | | INTERNATIONAL POWER PLC | | | 84,802 | | | 155,217 | | | | |
| 12,127 | | INVENSYS PLC | | | 29,802 | | | 39,737 | | | | |
| 24,275 | | INVESTEC PLC | | | 158,102 | | | 127,796 | | | | |
| 98,470 | | ITV PLC | | | 52,339 | | | 104,215 | | | | |
| 111,306 | | J. SAINSBURY PLC | | | 593,334 | | | 523,572 | | | | |
| 2,494 | | JOHNSON MATTHEY PLC | | | 35,938 | | | 71,110 | | | | |
| 8,909 | | KAZAKHMYS PLC | | | 96,358 | | | 128,253 | | | | |
| 152,914 | | KINGFISHER PLC | | | 547,309 | | | 595,333 | | | | |
| 41,068 | | LANCASHIRE HOLDINGS LTD. | | | 319,566 | | | 462,062 | | | | |
| 15,511 | | LAND SECURITIES GROUP PLC | | | 113,585 | | | 153,078 | | | | |
| 174,802 | | LEGAL & GENERAL GROUP PLC | | | 205,778 | | | 279,060 | | | | |
| 1,943,018 | | LLOYDS BANKING GROUP PLC(b) | | | 1,575,947 | | | 781,662 | | | | |
| 182,000 | | LOGICA PLC | | | 343,639 | | | 174,387 | | | | |
| 7,230 | | LONDON STOCK EXCHANGE GROUP PLC | | | 86,287 | | | 89,262 | | | | |
| 2,131 | | LONMIN PLC | | | 42,554 | | | 32,432 | | | | |
| 37,725 | | MAN GROUP PLC | | | 120,515 | | | 73,642 | | | | |
| 51,083 | | MARKS & SPENCER GROUP PLC | | | 233,606 | | | 246,715 | | | | |
| 5,840 | | MEGGITT PLC | | | 9,420 | | | 31,996 | | | | |
| 101,812 | | MICHAEL PAGE INTERNATIONAL PLC | | | 577,156 | | | 551,486 | | | | |
| 21,029 | | N BROWN GROUP PLC | | | 87,311 | | | 76,058 | | | | |
| 83,737 | | NATIONAL GRID PLC | | | 682,819 | | | 812,748 | | | | |
| 2,148 | | NEXT PLC | | | 36,823 | | | 91,299 | | | | |
| 110,421 | | OLD MUTUAL PLC | | | 133,905 | | | 232,354 | | | | |
| 12,536 | | PEARSON PLC | | | 148,820 | | | 235,561 | | | | |
| 3,761 | | PETROFAC LTD. | | | 71,320 | | | 84,164 | | | | |
| 1,900 | | PROVIDENT FINANCIAL PLC | | | 32,564 | | | 27,765 | | | | |
| 53,918 | | PRUDENTIAL PLC | | | 337,248 | | | 534,630 | | | | |
| 720,674 | | QINETIQ GROUP PLC | | | 1,388,956 | | | 1,484,025 | | | | |
| 2,185 | | RANDGOLD RESOURCES LTD. | | | 159,057 | | | 223,443 | | | | |
| 213,034 | | RAVEN RUSSIA LTD. | | | 169,113 | | | 172,033 | | | | |
| 9,834 | | RECKITT BENCKISER GROUP PLC | | | 388,763 | | | 485,642 | | | | |
| 208,801 | | REED ELSEVIER PLC | | | 1,643,561 | | | 1,682,901 | | | | |
| 36,637 | | RESOLUTION LTD. | | | 143,696 | | | 143,036 | | | | |
| 98,541 | | REXAM PLC | | | 500,825 | | | 539,889 | | | | |
| 24,886 | | RIO TINTO PLC | | | 777,698 | | | 1,207,713 | | | | |
| 30,518 | | ROLLS-ROYCE HOLDINGS PLC(b) | | | 139,944 | | | 353,789 | | | | |
| 106,898 | | ROYAL BANK OF SCOTLAND GROUP PLC(b) | | | 39,096 | | | 33,500 | | | | |
| 136,259 | | RSA INSURANCE GROUP PLC | | | 244,217 | | | 222,607 | | | | |
| 15,817 | | SABMILLER PLC | | | 272,321 | | | 556,722 | | | | |
| 21,731 | | SAGE GROUP (THE) PLC | | | 74,327 | | | 99,284 | | | | |
| 101,441 | | SAVILLS PLC | | | 477,242 | | | 516,079 | | | | |
| 5,566 | | SCHRODERS PLC | | | 79,235 | | | 113,579 | | | | |
| 10,277 | | SEGRO PLC | | | 36,889 | | | 33,276 | | | | |
| 7,999 | | SERCO GROUP PLC | | | 42,799 | | | 58,881 | | | | |
| 4,954 | | SEVERN TRENT PLC | | | 76,220 | | | 115,092 | | | | |
| 21,324 | | SMITH & NEPHEW PLC | | | 162,110 | | | 207,136 | | | | |
| 5,313 | | SMITHS GROUP PLC | | | 80,666 | | | 75,495 | | | | |
| 13,000 | | SPECTRIS PLC | | | 268,445 | | | 260,229 | | | | |
| 18,671 | | SSE PLC | | | 331,442 | | | 374,328 | | | | |
| 34,993 | | STANDARD CHARTERED PLC | | | 515,595 | | | 765,686 | | | | |
| 141,103 | | STANDARD LIFE PLC | | | 386,496 | | | 452,058 | | | | |
| 3,900 | | SUBSEA 7 S.A.(b) | | | 96,867 | | | 72,391 | | | | |
| 3,419 | | TATE & LYLE PLC | | | 36,262 | | | 37,406 | | | | |
| 126,000 | | TAYLOR WOODROW PLC(b) | | | 73,622 | | | 73,377 | | | | |
| 133,626 | | TESCO PLC | | | 668,051 | | | 837,220 | | | | |
| 20,173 | | TULLOW OIL PLC | | | 327,851 | | | 439,215 | | | | |
| 2,333 | | UBM PLC | | | 13,794 | | | 17,296 | | | | |
| 21,707 | | UNILEVER PLC | | | 463,177 | | | 729,147 | | | | |
| 57,958 | | UNILEVER PLC ADR(c) | | | 1,546,068 | | | 1,942,752 | | | | |
| 13,660 | | UNITED UTILITIES GROUP PLC | | | 111,980 | | | 128,553 | | | | |
| 6,150 | | VEDANTA RESOURCES PLC | | | 116,202 | | | 96,939 | | | | |
| 928,295 | | VODAFONE GROUP PLC | | | 1,671,709 | | | 2,579,022 | | | | |
| 25,000 | | VODAFONE GROUP PLC ADR(c) | | | 642,332 | | | 700,750 | | | | |
| 3,202 | | WEIR GROUP (THE) PLC | | | 100,740 | | | 101,043 | | | | |
| 3,994 | | WHITBREAD PLC | | | 87,292 | | | 97,007 | | | | |
| | |
See accompanying notes to the financial statements. | 86 | (Continued) |
CLEARWATER INVESTMENT TRUST
Schedule of Investments - Clearwater International Fund
December 31, 2011
| | | | | | | | | | | | | |
Shares | | Security | | Cost | | Fair
value (a) | | Percent
of
net assets | |
United Kingdom (Cont’d): |
| 76,000 | | WILLIAM HILL PLC | | $ | 274,578 | | | 239,354 | | | | |
| 42,339 | | WM MORRISON SUPERMARKETS PLC | | | 156,009 | | | 214,478 | | | | |
| | | | | | 45,409,223 | | | 55,202,051 | | | 18.09 | % |
United States: |
| 56,600 | | ARCH CAPITAL GROUP LTD.(b) | | | 1,103,898 | | | 2,107,218 | | | | |
| 6,600 | | BROOKFIELD OFFICE PROPERTIES, INC. | | | 94,023 | | | 103,449 | | | | |
| 9,091 | | BROOKFIELD OFFICE PROPERTIES, INC. (NEW YORK
EXCHANGE)(b) | | | 84,537 | | | 142,183 | | | | |
| 3,384 | | KRAFT FOODS, INC., CLASS A | | | 10,684 | | | 126,426 | | | | |
| 38,751 | | SIGNET JEWELERS LTD. | | | 752,909 | | | 1,703,494 | | | | |
| 6,500 | | SIMS METAL MANAGEMENT LTD. | | | 91,939 | | | 84,062 | | | | |
| 1,159 | | SYNTHES, INC. (REGISTERED)(d)(e) | | | 141,367 | | | 194,333 | | | | |
| 9,775 | | THOMSON REUTERS CORP. | | | 254,637 | | | 260,699 | | | | |
| | | | | | 2,533,994 | | | 4,721,864 | | | 1.55 | % |
| | | Sub-total Common Stocks: | | | 247,602,593 | | | 295,259,161 | | | 96.78 | % |
Preferred Stocks: |
Brazil: |
| 14,200 | | PETROLEO BRASILEIRO S.A. ADR(c) | | | 448,224 | | | 333,558 | | | | |
| 11,000 | | VALE S.A. ADR(c) | | | 172,836 | | | 226,600 | | | | |
| | | | | | 621,060 | | | 560,158 | | | 0.19 | % |
Germany: |
| 1,521 | | BAYERISCHE MOTOREN WERKE A.G. | | | 49,612 | | | 71,952 | | | | |
| 2,360 | | HENKEL A.G. & CO. KGAA | | | 60,940 | | | 136,200 | | | | |
| 1,943 | | JUNGHEINRICH A.G.(b) | | | 63,561 | | | 47,630 | | | | |
| 4,187 | | PORSCHE AUTOMOBIL HOLDING S.E. | | | 207,723 | | | 224,082 | | | | |
| 22,479 | | PROSIEBENSAT.1 MEDIA A.G. | | | 408,889 | | �� | 410,663 | | | | |
| 3,746 | | RWE A.G. (NON VOTING) | | | 104,122 | | | 123,319 | | | | |
| 2,665 | | VOLKSWAGEN A.G. | | | 183,670 | | | 399,251 | | | | |
| | | | | | 1,078,517 | | | 1,413,097 | | | 0.46 | % |
| | | Sub-total Preferred Stocks: | | | 1,699,577 | | | 1,973,255 | | | 0.65 | % |
Corporate Bonds: |
United Kingdom: |
| 253,289 | | HSBC BANK PLC, EXP. 9/12/14(b) | | | 1,047,983 | | | 1,221,777 | | | | |
| | | Sub-total Corporate Bonds: | | | 1,047,983 | | | 1,221,777 | | | 0.40 | % |
Rights: |
Austria: |
| 10,586 | | IMMOEAST A.G.(b) | | | — | | | — | | | | |
| | | Sub-total Rights: | | | — | | | — | | | 0.00 | % |
Short-Term Investments: |
| 2,073,315 | | NORTHERN INSTITUTIONAL GOVERNMENT SELECT PORTFOLIO, 0.01%(f) | | | 2,073,315 | | | 2,073,315 | | | | |
| | | Sub-total Short-Term Investments: | | | 2,073,315 | | | 2,073,315 | | | 0.68 | % |
| | | Grand total(g) | | $ | 252,423,468 | | | 300,527,508 | | | 98.51 | % |
| | |
See accompanying notes to the financial statements. | 87 | (Continued) |
|
CLEARWATER INVESTMENT TRUST |
Schedule of Investments - Clearwater International Fund |
December 31, 2011 |
Notes to Schedule of Investments:
| | |
| (a) | Securities are valued in accordance with procedures described in note 2 to the financial statements. |
| | |
| (b) | Currently non-income producing assets. |
| | |
| (c) | Securities are American Depositary Receipts of companies based outside of the United States representing 3.05% of net assets. |
| | |
| (d) | Security exempt from registration under Rule 144A of the Securities Act of 1933. This security may not be publicly sold without registration under the Securities Act of 1933. The value of this security is determined by valuations supplied by a pricing service or brokers, or if not available in accordance with procedures established by the Board of Trustees of the Fund. |
| | |
| (e) | Restricted security that has been deemed illiquid. At December 31, 2011 the value of this restricted illiquid security amounted to approximately $194,333 or 0.06% of net assets. Additional information on this restricted illiquid security is as follows: |
| | | | | | | | | | |
| | SECURITY | | ACQUISITION AND
ENFORCEABLE DATE | | ACQUISITION
COST | |
| | | | | | | | | | |
| | | SYNTHES,INC.(REGISTERED) | | | 3/8/10 - 11/10/10 | | $ | 141,367 | |
| | |
| (f) | The short-term investment is a money market portfolio of the investment company, Northern Institutional Funds. At December 31, 2010, the value of the Fund’s investment in the Government Select Portfolio of the Northern Institutional Funds was approximately $7,747,967 with net sales of approximately $5,674,652 during the fiscal year ended December 31, 2011. |
| |
| (g) | At December 31, 2011, the cost for Federal income tax purposes was $253,834,655. The aggregate gross unrealized appreciation and depreciation of investments in securities based on this cost were as follows: |
| | | | |
Gross unrealized appreciation | | $ | 61,330,358 | |
Gross unrealized depreciation | | | (14,637,505 | ) |
Net unrealized appreciation | | $ | 46,692,853 | |
At December 31, 2011, the industry sectors for the Clearwater International Fund were:
| | | | |
Industry Sector | | Percent of
Long-Term
Investments | |
Consumer Discretionary | | | 12.58 | % |
Consumer Staples | | | 11.89 | |
Energy | | | 8.98 | |
Financials | | | 20.90 | |
Health Care | | | 8.39 | |
Industrials | | | 13.69 | |
Information Technology | | | 4.98 | |
Materials | | | 10.16 | |
Telecommunication Services | | | 4.85 | |
Utilities | | | 3.58 | |
| | | 100.00 | % |
At December 31, 2011, the Clearwater International Fund’s investments were denominated in the following currencies:
| | | | |
Concentration by Currency | | Percent of
Long-Term
Investments | |
Euro | | | 22.41 | % |
British Pound | | | 19.58 | |
Japanese Yen | | | 18.82 | |
United States Dollar | | | 13.78 | |
Swiss Franc | | | 7.77 | |
Australian Dollar | | | 5.93 | |
All other currencies less than 5% | | | 11.71 | |
| | | 100.00 | % |
| | |
See accompanying notes to the financial statements. | 88 | (Continued) |
CLEARWATER INVESTMENT TRUST
Schedule of Investments - Clearwater International Fund
December 31, 2011
At December 31, 2011, the Clearwater International Fund had outstanding forward foreign currency exchange contracts as follows:
| | | | | | | | | | | | | | | | | | | |
Contracts To
Deliver Currency | | Amount
(Local
Currency) | | In
Exchange
For Currency | | Amount
(Local
Currency) | | Settlement
Date | | Unrealized
Gain (Loss) | | Counterparty | |
Danish Krone | | | 862,763 | | | United States Dollar | | | 150,229 | | | 1/3/12 | | $ | 5 | | | Northern Trust | |
Euro | | | 13,216 | | | United States Dollar | | | 17,108 | | | 1/3/12 | | | 3 | | | Northern Trust | |
Euro | | | 22,823 | | | United States Dollar | | | 29,544 | | | 1/3/12 | | | 4 | | | Northern Trust | |
Euro | | | 430,386 | | | United States Dollar | | | 557,135 | | | 1/3/12 | | | 85 | | | Northern Trust | |
Euro | | | 44,739 | | | United States Dollar | | | 58,004 | | | 1/3/12 | | | 98 | | | Northern Trust | |
Hong Kong Dollar | | | 460,346 | | | United States Dollar | | | 59,232 | | | 1/3/12 | | | (36 | ) | | Deutsche Bank | |
Swiss Franc | | | 79,755 | | | United States Dollar | | | 84,702 | | | 1/3/12 | | | (209 | ) | | Deutsche Bank | |
United States Dollar | | | 134,141 | | | Euro | | | 103,464 | | | 1/3/12 | | | (227 | ) | | CSFB Global | |
British Pound | | | 18,753 | | | United States Dollar | | | 28,857 | | | 1/4/12 | | | (264 | ) | | Northern Trust | |
Danish Krone | | | 236,285 | | | United States Dollar | | | 41,211 | | | 1/4/12 | | | 69 | | | Northern Trust | |
Euro | | | 57,680 | | | United States Dollar | | | 74,666 | | | 1/4/12 | | | 11 | | | Northern Trust | |
Euro | | | 303,402 | | | United States Dollar | | | 393,361 | | | 1/4/12 | | | 664 | | | Northern Trust | |
Hong Kong Dollar | | | 14,355 | | | United States Dollar | | | 1,848 | | | 1/4/12 | | | -* | | | Northern Trust | |
Singapore Dollar | | | 39,964 | | | United States Dollar | | | 30,678 | | | 1/4/12 | | | (133 | ) | | Northern Trust | |
United States Dollar | | | 267,253 | | | Euro | | | 206,133 | | | 1/4/12 | | | (453 | ) | | CSFB Global | |
British Pound | | | 310,245 | | | United States Dollar | | | 481,500 | | | 1/5/12 | | | (275 | ) | | Northern Trust | |
Japanese Yen | | | 15,160,217 | | | United States Dollar | | | 194,912 | | | 1/5/12 | | | (2,070 | ) | | Northern Trust | |
Japanese Yen | | | 16,948,634 | | | United States Dollar | | | 218,158 | | | 1/5/12 | | | (2,061 | ) | | Deutsche Bank | |
Japanese Yen | | | 391,868 | | | United States Dollar | | | 5,037 | | | 1/5/12 | | | (55 | ) | | Northern Trust | |
Swiss Franc | | | 254,336 | | | United States Dollar | | | 271,002 | | | 1/5/12 | | | 214 | | | Northern Trust | |
Japanese Yen | | | 15,784,600 | | | United States Dollar | | | 203,909 | | | 1/6/12 | | | (1,188 | ) | | Northern Trust | |
Japanese Yen | | | 397,185,878 | | | United States Dollar | | | 5,173,510 | | | 2/16/12 | | | 9,094 | | | Northern Trust | |
United States Dollar | | | 733,281 | | | Japanese Yen | | | 56,283,016 | | | 2/16/12 | | | (1,461 | ) | | Northern Trust | |
| | | | | | | | | | | | | | $ | 1,815 | | | | |
| | |
| * | Amount rounds to less than $1. |
The Clearwater International Fund did not have any spot foreign currency transactions outstanding as of December 31, 2011.
| | |
See accompanying notes to the financial statements. | 89 | (Continued) |
CLEARWATER INVESTMENT TRUST
Schedule of Investments – Clearwater International Fund
December 31, 2011
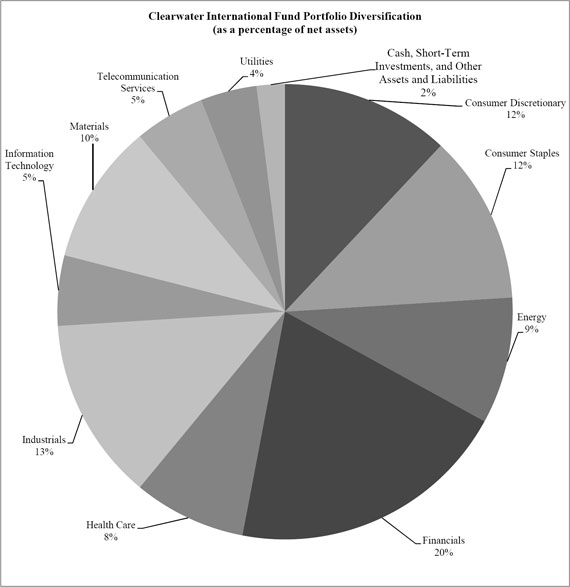
| | |
See accompanying notes to the financial statements. | 90 | |
Item 2. Code of Ethics
As of December 31, 2011, the Board of Trustees of Clearwater Investment Trust (the “Trust”) has adopted a code of ethics that applies to the Registrant’s President/Chief Executive Officer and Treasurer/Chief Financial Officer. For the fiscal year ended December 31, 2011, there were no amendments to a provision of its code of ethics, nor were there any waivers granted from a provision of the code of ethics. A copy of its code of ethics is filed with this Form N-CSR under Item 12(a)(1).
Item 3. Audit Committee Financial Expert
The Board of Trustees of the Trust consists of six members, four of whom are Independent Trustees as defined by the Investment Company Act of 1940. The Board of Trustees does not include an “audit committee financial expert” as defined by Section 407 of the Sarbanes-Oxley Act of 2002 and the rules promulgated thereunder. Given the restrictive nature of the definition of an “audit committee financial expert”, the Board of Trustees have determined that no current member of the Board of Trustees of the Trust qualifies as an “audit committee financial expert”. Furthermore, the Board of Trustees have determined that given the nature of investment company financial statements in general and the investment policies of the Trust’s fund offerings in particular that the independent trustees possess the necessary skills and experience to perform the functions of the audit committee.
Item 4. Principal Accountant Fees and Services
| | (a) | Audit Fees | 2011 = $83,600 | 2010 = $80,350 |
| | | | | |
| | (b) | Audit-Related Fees | 2011 = $0 | 2010 = $0 |
| | | | | |
| | (c) | Tax Fees | 2011 = $21,500 | 2010 = $20,000 |
| | | | | |
| | (d) | All Other Fees | 2011 = $0 | 2010 = $0 |
| | | | | |
| | (e) | | | |
| | | | | |
| | | 1. | The Independent Trustees have not adopted pre-approval policies and procedures regarding the provision of audit or non-audit services to the trust, as described in paragraph (c)(7) of Rule 2-01 of Regulation S-X, as they require that all such proposed services be approved by them in advance. |
| | | | | | |
| | | 2. | No services were pre-approved by the Independent Trustees pursuant to paragraph (c)(7) of Rule 2-01 of Regulation S-X. |
| | | | | | |
| | (f) | Not applicable. |
| | | | | | |
| | (g) | Non-Audit Related Fees Provided to the Trust or to the Trust’s Investment Adviser. |
| | | | | |
| | | 2011 = $0 | 2010 = $0 | |
| | | | | |
| | (h) | Not applicable. | | |
Item 5. Audit Committee of Listed Registrants
The Audit Committee includes the four members of the Board of Trustees who have been deemed independent. The Audit Committee has adopted a charter.
Item 6. Investments
See Item 1.
Item 7. Disclosure of Proxy Voting Policies and Procedures for Closed-End Management Investment Companies
Not applicable (the Trust is an open-end management investment company)
Item 8. Portfolio Managers of Closed-End Management Investment Companies
Not applicable (the Trust is an open-end management investment company)
Item 9. Purchases of Equity Securities by Closed-End Management Investment Company and Affiliated Purchasers
Not applicable (the Trust is an open-end management investment company)
Item 10. Submission of Matters to a Vote of Security Holders
There have been no material changes to the procedures by which shareholders may recommend nominees to the Board of Trustees.
Item 11. Controls and Procedures
| (a) | The Trust’s principal executive officer and principal financial officer have concluded that the Trust’s disclosure controls and procedures (as defined in Rule 30a-3(c) under the Investment company Act of 1940, as amended) are effective based on their evaluation of these controls and procedures as of a date within 90 days of the filing date of this document. |
| | |
| (b) | There have been no significant changes in the Trust’s internal controls over financial reporting since the filing of the last report that have materially affected, or are reasonably likely to materially affect, the Trust’s internal control over financial reporting. |
Item 12. Exhibits
| (a) | The Clearwater Investment Trust Code of Ethics for the President, Chief Financial Officer and Treasurer is attached. |
| | |
| (b) | The certifications for each principal executive and principal financial officer of the Trust as required by Rule 30a-2(a) of the Investment Company Act of 1940 are attached. |
| | |
| (c) | No written solicitations to purchase securities were sent or delivered during the period covered by this report by or on behalf of the Trust. |
SIGNATURES
Pursuant to the requirements of the Securities Exchange Act of 1934 and the Investment Company Act of 1940, the registrant has duly caused this report to be signed on its behalf by the undersigned, thereunto duly authorized.
| | Clearwater Investment Trust |
| | | |
| | By | /s/ George H. Weyerhaeuser, Jr. |
| | | George H. Weyerhaeuser, Jr., Chairman |
| | | |
| | Date: March 9, 2012 |
Pursuant to the requirements of the Securities Exchange Act of 1934 and the Investment Company Act of 1940, this report has been signed below by the following persons on behalf of the registrant and in the capacities and on the dates indicated.
| | Clearwater Investment Trust |
| | | |
| | By | /s/ George H. Weyerhaeuser, Jr. |
| | | George H. Weyerhaeuser, Jr., Chairman |
| | | |
| | Date: March 9, 2012 |
| | Clearwater Investment Trust |
| | | |
| | By | /s/ George H. Weyerhaeuser, Jr. |
| | | George H. Weyerhaeuser, Jr., Treasurer |
| | | |
| | Date: March 9, 2012 |