rates and spread tightening, which is what the market and the Fund experienced in 2009. The Tax-Exempt Bond Funds’ duration of 5.9 years, longer than the 4.1 years of its benchmark, contributed significantly to its outperformance. Furthermore, every sector in which the Fund invested outperformed the benchmark. The Fund’s largest sector, hospital/healthcare, with 17.7% of the Fund’s assets, returned 23.8%, gross of fees in 2009. The Fund’s second largest sector, multi-family housing, with 17.6% of the Fund’s assets, returned 18.3%, gross of fees, for the year. Of particular note, the Fund’s 6.9% weighting in tax-exempt closed-end mutual funds returned 51.4%, gross of fess, for the year.
Sit Investment Associates 2010 Market Outlook: While modest growth has returned to the economy, with the unemployment rate still above 10%, the Fed is likely to continue to remain accommodative in 2010. Furthermore, fiscal stimulus from the Obama administration will continue to have a significant impact on fixed income markets in 2010. Returns in fixed income markets, except for U.S. Treasuries, are likely to be bumpy but positive as the Fed’s accommodative policies and the federal government’s fiscal stimulus continue to help the fixed income markets stabilize. We expect revenue bonds to again be strong performers in 2010, as the Fed’s accommodative policies and the Obama administration’s fiscal stimulus should continue to allay liquidity concerns in the market, and investor focus remains on yield. General obligation bond performance should remain weak on a relative basis, however, as many cities, counties and states continue to experience revenue shortfalls despite the economy pulling out of recession due to the persistent unemployment problem. In addition, potential problems funding retirement pension and healthcare obligations still persist. We expect U.S. economic growth to remain positive throughout 2010, although it may slow somewhat in the second half of the year, as the Fed looks to wean the economy off its accommodative policies of the past few years and the federal government’s stimulus run out of steam. With the housing and sub prime mortgage mess still unwinding and unemployment reaching levels not seen in decades, interest rates may continue to be volatile during the year. The Treasury yield curve should remain relatively steep, with yields rising across the curve, while the tax-exempt curve grows somewhat flatter, with short-term rates rising and long-term municipal yields falling. Build America Bonds, which were authorized under the fiscal stimulus bill, will remove over $100 billion of tax-exempt supply in 2010, helping tax-exempt bonds to outperform.
Clearwater International Fund
The Clearwater International Fund commenced operations on February 5, 2009, with two subadvisers, Parametric Portfolio Associates and Axa Rosenberg. Eagle Global Advisors and Artisan Partners were added as subadvisers of the International Fund in May and June 2009, respectively.
2009 Market Overview: Worldwide equity markets staged a dramatic recovery off their March, 2009 lows following unprecedented stimulative action by governments and central banks around the world. Globally, small cap stocks outperformed large cap, while in terms of style, growth handily outperformed value due to the strength of cyclical sectors like Technology, Consumer Discretionary and Materials. Regionally, Europe outperformed the U.S. and Japan, largely due to currency effect, while Japan failed to reach double-digit gains for the year. Emerging markets continued to lead developed markets for the year with China being the main engine of global economic growth.
A-5
As the year closed, corporate earnings came in modestly better than expected as companies improved their margins with aggressive cost cutting and productivity gains. Although the global economy has begun to show signs of improvement, top-line corporate revenue still remains under pressure. The link between earnings and stock returns has been challenged over the past 18 months as investors lacked confidence in the long-term earnings power of companies, while macroeconomic themes dominated the market environment.
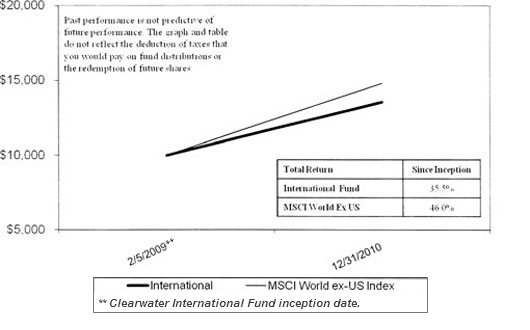
2009 Performance: For the period since inception on February 5, 2009, through December 31, 2009, the Clearwater International Fund had a total return, net of fees and expenses of 35.5%. This compared to a 46.0% return for the International Fund’s benchmark the MSCI World Index over the same period. The International Fund’s performance was negatively impacted partially due to the time required to invest in securities as part of the commencement of operations. This meant that the International Fund was not fully invested in the equities market during the period and therefore did not fully participate in the increase. Each subadviser to the International Fund has provided 2009 performance commentary for the period during which they were investing the assets of the International Fund and 2010 market outlook for their respective portion of the Fund below.
Parametric Portfolio Associates Performance Commentary: The portion of the International Fund (approximately 60%) we manage is designed to mirror the MSCI World Index. Our portion of the International Fund returned 43.12, versus 45.09% for MSCI World Index. Once the portfolio was fully invested it is generally aligned with the MSCI World as to specific securities and sector weightings. However, the time required to get the portfolio fully invested during the commencement of the International Fun negatively impacted overall performance.
AXA Rosenberg Performance Commentary: Our portion of the Clearwater International Fund (approximately 15%) posted impressive absolute returns of 44.55%, gross of fees and expenses, but underperformed the MSCI World, which returned 53.9% during the period between March 31, 2009 (when the portfolio funded) and December 31, 2009. Relative returns suffered as our proprietary valuation approach and emphasis on earnings remained out of favor. Instead, the market was focused on distressed opportunities, creating a sharp disconnect between the long term corporate earnings power and its short term trajectory. Overall, country and industry attribution was modestly negative for 2009, and stock selection was the primary detractor of relative performance. We maintain fairly neutral regional weights, and country and Industry weights are a result of bottom-up fundamentals. While stock selection was negative across most sectors, several industries reflected a rationalization of prices and valuation. Security selection within Banks, Paper and Forest Products, Metal, Aircraft and Telephone were positive. We remain overweight software stocks within Information Technology. As the global economy recovers, particularly in Asia, technology companies are likely to benefit from a revival in corporate capital expenditures and the software and hardware industry groups continue to present attractive earning profiles, both on valuation and earnings outlook. Towards the end of the year, we increased our overweight in Materials and significantly reduced our underweight to Consumer Staples.
A-6
Axa Rosenberg 2010 Market Outlook: As the economies around the world recover, and earnings visibility improves, we believe that investors will be more discerning in their focus on the relationship between earnings and price. This is a welcome development for fundamental stock pickers like ourselves as we seek to build portfolios that will capture more future earnings per dollar invested than the benchmark. As the recovery continues, the market will shift away from distress and rationalization will broaden to other more stable companies that exhibit large mispricings.
Artisan Partners Performance Commentary: Our portion of the Clearwater International Fund represents approximately 15% of the total Fund. For period June 15, 2009 through December 31, 2009 our portfolio returned 21.87%, gross of fees, versus 21.80% for the benchmark. Our largest contributor to the portfolio’s return during the year was, Signet Jewelers. The stock increased by more than 200% from its level at the end of 2008 and was the largest contributor to the portfolio’s investment returns for the year. Significant returns during the year also came across many industries and geographies with notable impacts from Experian, Publicis Groupe, Samsung Electronics, Guoco Group and Adecco. There were, though, several equities that declined during the year. Meitec declined as fundamentals deteriorated in its Japanese engineering outsourcing business and we also incurred losses on our shares of Nokia and Julius Baer. Both of these latter companies, in our view, were facing significant secular challenges. We sold them close to the bottom of the market in favor of other undervalued equities. In the fourth quarter, the portfolio’s consumer staples businesses generated very good returns as Unilever, Diageo, Nestle and Grupo Modelo all increased more than 10%. These global franchises simply became too cheap as more cyclical companies were favored by the market earlier in the year. Our significant investments in the health care sector also gained considerably as the current version of U.S. health reform looks less threatening to the near term economics of the industry.
Artisan Partners 2010 Market Outlook: Providing an outlook is, of course, a fool’s errand. In the short-term, markets are unpredictable. Over the long-term, we believe, our businesses will grow business value and undervaluation gaps will unwind. Our only insight into today’s market resides in the aggregate discount of our portfolio. Today, the aggregate portfolio discount is in the range of normal relative to our own history, though valuations are based on estimates that assume a rather muted economic environment. Macro trends are tough to discern (as usual) with obvious imbalances offset by the fact that we have had a significant rebasing of the global economy from which we could grow. Though the outcome could vary widely, we remain invested in what we believe are superior businesses with strong balance sheets, at cheap prices — factors that enhance the odds of generating wealth over time.
Eagle Global Advisors Performance Commentary: Initial funding of our portfolio (approximately 10% of the Clearwater International Fund) commenced in mid-June, continued through the third and fourth quarters, and was completed in early December. In total there were 39 inflows of varied amounts over that period. Concurrently, global equity markets were in the midst of a significant yet volatile rally (the MSCI World Index rose 19.7% from July through September), extending a sharp rebound from the depths of the lows seen in mid-March. For the period June 30, 2009 through December 31, 2009, our portion of the International Fund posted a return, gross of fees and expenses of 20.3%, versus 22.3% for the MSCI World Index. From a
A-7
portfolio management perspective, such circumstances provide additional challenge when investing new monies, particularly when there is a high frequency of large inflows. As a result, the portfolio contained, on average, a larger allocation to cash than expected under normal circumstances. This allocation hindered portfolio performance with fund results trailing the MSCI World Index by approximately 400 basis points from June 30 through year-end (+20.15% vs. +24.16%). With a cash balance of only 2.3% the account was fully invested as of 12/31 and performing as expected.
During the last half of 2009, our investment process was guiding the team to adopt a cautious optimism and, accordingly, we began to transition the portfolio away from the defensive posture that was a legacy of our 2008 strategy. The resulting actions increased allocations to the more cyclically oriented sectors, with relative overweights in Energy and Technology and increased, although still underweight, exposures in Industrials and Materials. Allocations to the traditionally defensive Staples and Telecom sectors remained overweight with a combination of both developed and emerging markets names. Although confidence in Financials is increasing, a long-standing underweight to this sector remains. This combination of both cyclical and defensive holdings provides a balanced exposure that will benefit from improving global economic conditions.
Eagle Global Advisors 2010 Market Outlook: Global growth is back and poised to accelerate in 2010 as developed economies recover from one of the worst recessions in recent history and as emerging markets resume strong economic growth. The strength of the recovery in many developed countries is uncertain as analysts worry about potential deleveraging from households and financial institutions. In addition, government fiscal stimulus measures will begin to decelerate into the latter half of the year. Moreover, recent meetings of major economic powers at the G-20 Summit and the Bank of International Settlements (BIS) meetings resulted in concerns about the timing of and the tools necessary to unwind the highly accommodative and sometimes unconventional monetary policies around the world. Most agree a gradual approach is needed, although we have already seen commodity-centric countries like Australia and Norway be the first to begin increasing interest rates. The Eurozone economy grew for the first time in a year and a half in the third quarter of 2009 and is likely to accelerate further into 2010. Yet, there is stress in the Eurozone in some of its smaller economies like Spain, Greece, and Ireland. The OECD projects Eurozone GDP to grow about 1% in 2010 from a projected -4% decline in 2009, although some economists expect a better recovery. The U.K. economy showed mixed signals in the fourth quarter of 2009, with an unexpected plunge in industrial activity in November leading the monetary authorities to increase their quantitative easing measures in the same month. The significant stimulative fiscal and monetary measures in the U.K. are likely to lift growth in that country to almost 2% for 2010, according to Bloomberg consensus estimates. The emerging markets have again taken their place as the growth engines of the world with some expecting a strong bounce of greater than 6% real GDP growth in 2010 for the emerging economies. This will be led by the likes of China, India, and Brazil.
A-8
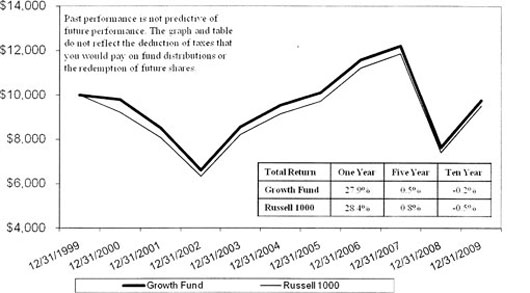
Comparison of the Change in Value of a $10,000 Investment in the Clearwater
Growth Fund and the Russell 1000 Index
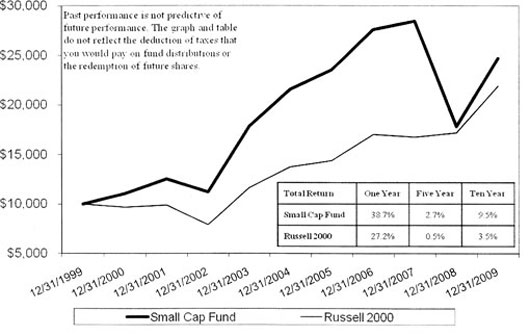
Comparison of the Change in Value of a $10,000 Investment in the Clearwater
Small Cap Fund and the Russell 2000 Index
A-9
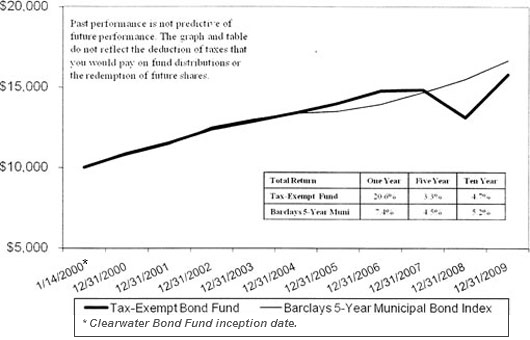
Comparison of the Change in Value of a $10,000 Investment in the Clearwater
Tax-Exempt Bond Fund and the Barclays 5-Year Municipal Bond Fund Index
Comparison of the Change in Value of a $10,000 Investment in the Clearwater
International Fund and the MSCI World ex-US Index
A-10
Fund Expense Example
(unaudited)
As a shareholder of the Funds, you incur costs, including management fees and other Fund expenses. This Example is intended to help you to understand your ongoing costs (in dollars) of investing in the Funds and to compare these costs with the ongoing costs of investing in other mutual funds. In addition to the ongoing costs which the Funds pay directly, you as a shareholder indirectly bear the expenses of any outside mutual funds in which the Funds invest. (These are also referred to as “acquired funds” and those indirect expenses represent the Funds’ pro rata portion of the cumulative expenses charged by the acquired funds.)
The example provided is based on an investment of $1,000 invested at the beginning of the period and held for the six month ended December 31, 2009.
Actual Expenses
The first section of the table below provides information about actual account values and actual expenses. You may use the information in this section, together with the amount you invested, to estimate the expenses that you incurred over the period. Simply divide your account value by $1,000 (for example, an $8,600 account value divided by $1,000 = 8.6), then multiply the result by the number in the first section under the heading entitled “Expenses Paid During the Period” to estimate the expenses attributable to your investment during this period.
Hypothetical Example for Comparison Purposes
The second section of the table below provides information about hypothetical account values and hypothetical expenses based on the Fund’s actual expense ratio and an assumed rate of return of 5% per year before expenses, which is not the Fund’s actual return. Thus, you should not use the hypothetical account values and expenses to estimate the actual ending account balance or your expenses for the period. Rather, these figures are provided to enable you to compare the ongoing costs of investing in the Clearwater Funds and other mutual funds. To do so, compare this 5% hypothetical example with the 5% hypothetical examples that appear in the shareholder reports of the other funds.
Please note that the expenses shown in the second section of the table are meant to highlight your ongoing costs only. Therefore, the second section of the table will not help you compare the relative total costs of the Clearwater Funds to funds that charge transaction costs and/or sales charges or redemption fees.
A-11
| | | | | | | | | |
Actual
| | | Beginning Account
Value
July 1, 2009 | | | Ending Account
Value
December 31,
2009 | | | Expenses Paid
During the Period*
July 1, 2009 thru
December 31,
2009 |
Growth Fund | | | $1,000.00 | | | $1,227.10 | | | $1.57 |
Small Cap Fund | | | $1,000.00 | | | $1,266.30 | | | $5.43 |
Tax-Exempt Bond Fund | | | $1,000.00 | | | $1,081.90 | | | $1.89 |
International Fund | | | $1,000.00 | | | $1,208.50 | | | $5.01 |
| | | | | | | | | |
Hypothetical (5% return
before expenses) | | | | | | | | | |
Growth Fund | | | $1,000.00 | | | $1,025.21 | | | $1.43 |
Small Cap Fund | | | $1,000.00 | | | $1,025.21 | | | $4.85 |
Tax-Exempt Bond Fund | | | $1,000.00 | | | $1,025.21 | | | $1.84 |
International Fund | | | $1,000.00 | | | $1,025.21 | | | $4.59 |
* Expenses are equal to the Fund’s annualized expense ratios, multiplied by the average account value over the period, multiplied by 184/365 (to reflect the one-half year period). The annualized expense ratios are as follows:
| | |
| Growth Fund | 0.28% |
| Small Cap Fund | 0.95% |
| Tax-Exempt Bond Fund | 0.36% |
| International Fund (a) | 0.90% |
| |
| (a) The expense ratio for the International Fund represents the blended expense ratio during the period. The management fee at inception of the Fund was 1.00%, but was reduced through voluntary waivers to 0.80% during the period ended December 31, 2009. |
Quarterly Portfolio Schedule of Investments
The Funds file a complete schedule of their portfolio holdings as of the close of the first and third quarters of their fiscal years with the SEC on Form N-Q. Shareholders may request copies of Form N-Q free of charge by calling the Transfer Agent toll free at 1-888-228-0935 or by sending a written request to: Fiduciary Counselling, Inc, 30 East 7th Street, Suite 2000, St. Paul, MN 55101 Attn: Clearwater Investment Trust Transfer Agent. These filings are also available on the SEC’s Internet site at http://www.sec.gov and may be reviewed and copied at the SEC’s Public Reference Room in Washington, DC. Information about the public reference room may be obtained by calling 1-800-SEC-0330.
A-12
Voting Proxies on Fund Portfolio Securities
The funds have established Proxy Voting Policies and Procedure (“Policies”) that the funds use to determine how to vote proxies relating to portfolio securities. They also report, on Form N-PX, how the Funds voted any such proxies during the most recent 12-month period ended June 30. Shareholders may request copies of the Policies or Form N-PX free of charge by calling the Transfer Agent toll free at 1-888-228-0935 or by sending a written request to: Fiduciary Counselling, Inc, 30 East 7th Street, Suite 2000, St. Paul, MN 55101 Attn: Clearwater Investment Trust Transfer Agent. Form N-PX is also available from the EDGAR database on the SEC’s Internet site at http://www.sec.gov.
A-13
EXECUTIVE OFFICERS AND TRUSTEES
Information About the Funds’ Independent Trustees
| | | | | | | | | | |
Name, Address,
and Age | | Positions Held
with the Funds | | Term of Office
and Length of
Time Served | | Principal
Occupation(s)
During the Last 5
Years | | Number of
Portfolios in the
Fund Complex
Overseen by the
Trustee | | Other
Directorships Held
by the Trustee |
Lucy R. Jones
(68)
30 East 7th Street,
Saint. Paul,
Minnesota 55101 | | Trustee | | Tenure: 10 yrs
Term:
Indefinite | | Private Investor | | 4 | | None |
| | | | | | | | | | |
Charles W.
Rasmussen (43)1
30 East 7th Street,
Saint. Paul,
Minnesota 55101 | | Trustee | | Tenure: 10 yrs
Term:
Indefinite | | President and Chief Executive Officer, P&G Manufacturing, Inc. (air filtration
equipment, 2002- Present); | | 4 | | None |
| | | | | | | | | | |
Laura E.
Rasmussen (46)1
30 East 7th Street,
Saint. Paul,
Minnesota 55101 | | Trustee | | Tenure: 10 yrs
Term:
Indefinite | | Business Owner | | 4 | | None |
| | | | | | | | | | |
Justin H. Weyerhaeuser (36)
30 East 7th Street,
Saint. Paul,
Minnesota 55101 | | Trustee | | Tenure: 2 yrs Term:
Indefinite | | Attorney | | 4 | | None |
| | | | | | | | | | |
1 Mr. Rasmussen and Ms. Rasmussen are spouses-in-law, and are nieces or nephews of Mr. F. T.
Weyerhaeuser (see below).
A-14
EXECUTIVE OFFICERS AND TRUSTEES
Information About the Funds’ Officers and Interested Trustee
| | | | | | | | | | |
Name, Address,
and Age | | Positions Held
with the Funds | | Term of Office
and Length of
Time Served | | Principal
Occupation(s)
During the Last 5
Years | | Number of
Portfolios in the
Fund Complex
Overseen by the
Trustee | | Other
Directorships Held
by the Trustee |
George H.
Weyerhaeuser, Jr.
(56)
30 East 7th Street,
Saint. Paul,
Minnesota 55101 | | Trustee, Chairman, Chief Executive Officer and Treasurer | | As Trustee; Tenure: 3 yrs Term: Indefinite
As Officer; Tenure: 3 yr Term: Reappointed annually | | Senior Vice President, Technology, Weyerhaeuser Company (1998 - 2006)
Director, Clearwater Management Company (1987- 2006)
Member, Advisory Board, Pictet Advisory Overseas Services Ltd (2009 - Present) | | 4 | | Foss Waterway Development Authority |
| | | | | | | | | | |
Frederick T.
Weyerhaeuser
(78)1
30 East 7th Street,
Saint. Paul,
Minnesota 55101 | | Trustee, Vice President and Secretary | | As Trustee; Tenure: 22 yrs Term: Indefinite
As Officer; Tenure: 22 yrs Term: Reappointed Annually | | Private Investor | | 4 | | Potlach Corporation (1960 - 2003) |
| | | | | | | | | | |
1 Mr. F. T. Weyerhaeuser is an interested trustee due to his daughter's position as a director of Clearwater Management Company, the Funds’ adviser.
A-15
EXECUTIVE OFFICERS AND TRUSTEES
Information About the Funds’ Officers and Interested Trustee
| | | | | | | | | | |
Name, Address,
and Age | | Positions Held
with the Funds | | Term of Office
and Length of
Time Served | | Principal
Occupation(s)
During the Last 5
Years | | Number of
Portfolios in the
Fund Complex
Overseen by the
Trustee | | Other
Directorships Held
by the Trustee |
Jennifer D.
Lammers (49) | | Chief Compliance Officer | | Tenure: September 2009- Present Term: Reappointed Annually | | Clearwater Management Company, Inc: Chief Compliance Officer, 9/09 - Present; Fiduciary Counselling, Chief Financial Officer and Chief Compliance Officer, 9/09 - Present; RiverSource Investments and RiverSource Funds, Chief Compliance Officer, 2006 - 2009; President, Tamarack Funds, 2003 - 2006 | | N/A | | N/A |
30 East 7th Street,
Saint. Paul,
Minnesota 55101
| | | | | | | | | | |
| | | | | | | | | | |
Additional information about the Fund Directors is available in the Funds’ Statement of Additional Information (SAI). The SAI is available, without charge, upon request, by contacting the transfer agent at (888) 228-0935 or writing the Funds at 2000 Wells Fargo Place, 30 East 7th Street, St. Paul, Minnesota 55101-4930. The Funds do not have an Internet Web site.
A-16
Approval of the Investment Management and Subadviser Service Agreements
Clearwater Management Company (“CMC”) is responsible for managing the investment programs and strategies for the Growth Fund, Small Cap Fund, Tax-Exempt Bond Fund, and International Fund (collectively, “the Funds”.) CMC also provides other administrative services to the Funds, and these services, as well as its investment management services, are provided to the Funds under an agreement (the “Management Agreement”.) CMC conducts due diligence when selecting each subadviser (collectively, the “Subadvisers”) for the Funds and oversees the performance of the Subadvisers. The Subadvisers provide portfolio management and related services for the Funds under individual subadvisory agreements (the “Subadvisory Agreements”.)
On an annual basis, the Funds’ Board of Trustees (the “Trustees”) including the independent trustees, considers renewal of the Management Agreement and the Subadvisory Agreements. The Trustees considered the renewal of the Agreements at their in-person meeting on December 10-11, 2009. Prior to the meeting, the Trustees requested, received, and reviewed written responses from CMC and the Subadvisers to questions posed to them on behalf of the Trustees and supporting materials relating to those questions and responses. The information presented at the meeting, including performance and expense data obtained from independent sources were designed to assist the Trustees in making their determination as to the renewal of the Management Agreement and Subadvisory Agreements. Also during this meeting, counsel to the Funds reviewed with the Trustees the various factors relevant to their consideration of the Management Agreement and Subadvisory Agreements, and the Trustees’ responsibilities related to their review. In addition to the information presented on December 10-11, 2009, at each regularly scheduled meeting throughout the year, the Trustees reviewed information on the investment performance and financial results of the Funds. Following an analysis and discussion of the factors described below, the Trustees, including all independent trustees present, approved renewal of the Management Agreement and the Subadvisory Agreements, with the exception of the Subadvisory Agreement described in the paragraph titled “Keeley Asset Management Subadvisory Agreement” below, for an additional one year period.
Nature, Extent and Quality of Services Provided
The Trustees considered information presented as to the services provided by CMC and the Subadvisers, as well as their investment expertise, resources and capabilities. The Trustees considered the quality of the Subadvisers previously recommended by CMC, as well as the ongoing work performed by CMC to recommend enhancements as to individual fund management or creation of new funds. The Board of Trustees specifically noted the work performed by CMC to create the new International Fund during 2009. The Trustees also noted the efforts of CMC to enhance its compliance program and oversight of Subadvisers. The Trustees reviewed information regarding the financial condition of CMC and the Subadvisers as related to their ongoing ability to provide services as specified under the Investment Management Agreement and Subadvisory Agreements. The Trustees reviewed specific information as to the investment performance of the Funds for various periods, as well as the performance of their respective benchmark indices and peer groups. The Trustees also reviewed reports summarizing the net assets, redemptions and purchases of shares of the Funds during 2009. Based on their analysis of the data presented, the Trustees concluded that they were generally satisfied with the nature and quality of the services being provided under the Investment Management Agreement and Subadvisory Agreements.
A-17
Comparative Fees and Cost of Services Provided
The Trustees reviewed the fees paid to CMC and the Subadvisers. The Trustees reviewed reports describing both the management fees charged by CMC and the total expense ratios of the Funds in comparison to those of similarly situated funds. In addition, throughout the year, the Trustees reviewed information as to the expense ratios of the Funds compared to the median expense ratio of a peer group of funds with a comparable investment strategy. The Trustees also reviewed information provided by the Subadvisers as to fees charged to other subadvisory clients. The Trustees noted the ongoing efforts of CMC to reduce fees paid by shareholders via voluntary waivers. The Trustees also reviewed CMC’s profitability, particularly noting CMC’s payment of fees and expenses normally absorbed by mutual fund shareholders, and profitability information provided by the Subadvisers. The Trustees concluded that profitability levels for CMC and the Subadvisers were reasonable.
Economies of Scale
The Trustees considered whether economies of scale might be realized by CMC as the Funds’ assets grow, and whether there also might be benefits from such growth for the Funds’ shareholders. The Trustees noted that the Growth, Tax-Exempt and Small Cap funds have been in operation for a number of years, and based on the distribution strategy of the Funds will probably not see significant increases in size. The Trustees further noted that CMC has already reduced, through voluntary waivers, the management fees for the International Fund, which commenced operations in 2009. However, the Trustees determined that they would continue to monitor the growth of the International Fund and consider whether there were additional opportunities to realize benefits from economies of scale for shareholders in the future.
Based on the factors as described above, the Trustees, including all of the independent trustees present, concluded that the investment management fees and subadvisory fees were fair and reasonable especially in view of the investment performance and quality of services provided. In reaching this conclusion, no single factor was considered determinative.
Keeley Asset Management Subadvisory Agreement
Keeley Asset Management (Keeley) is responsible for managing a portion (approximately 25%) of the portfolio of the Small Cap Fund. The Trustees originally retained Keeley under the terms of a Subadvisory Agreement dated August 1, 2006. During the in-person meeting on December 10-11, 2009, the Trustees reviewed material provided by Keeley. The Trustees determined that they were not satisfied with the quality and extent of the information provided and therefore voted to extend the Subadvisory Agreement through the next regularly scheduled meeting of the Trustees, during which time additional information would be requested from Keeley. The Trustees, including all independent Trustees, met at an in person meeting on February 9, 2010 to review the additional information provided by Keeley. Upon review of the additional information provided specifically related to trading operations, the Trustees, including all of the independent Trustees, determined that they were not satisfied with the quality of services provided and voted to terminate Keeley’s Subadvisory Agreement.
In considering the Agreements, the Trustees reviewed and evaluated information and factors they believed to be relevant and appropriate in the exercise of their reasonable business judgment.
A-18
While individual Trustees may have weighed certain factors differently, the Trustees determinations with respect to the Agreements were based on a comprehensive consideration of all information provided to the Trustees throughout the year, and specifically with respect to the consideration of the Agreements. In connection with their deliberations, the independent Trustees met separately in executive session on several occasions, with independent legal counsel, to review the relevant materials and consider their responsibilities under relevant laws and regulations.
A-19
Report of Independent Registered Public Accounting Firm
The Board of Trustees and Shareholders
Clearwater Investment Trust:
We have audited the accompanying statements of assets and liabilities, including the schedules of investments, of Clearwater Growth Fund, Clearwater Small Cap Fund, Clearwater Tax-Exempt Bond Fund, and Clearwater International Fund (funds within Clearwater Investment Trust) (the Funds) as of December 31, 2009, and the related statements of operations for the year or period then ended, the statements of changes in net assets for each of the years or periods in the two-year period then ended, and the financial highlights for each of the years or periods in the five-year period then ended. These financial statements and financial highlights are the responsibility of the Funds’ management. Our responsibility is to express an opinion on these financial statements and financial highlights based on our audits.
We conducted our audits in accordance with the standards of the Public Company Accounting Oversight Board (United States). Those standards require that we plan and perform the audits to obtain reasonable assurance about whether the financial statements and financial highlights are free of material misstatement. An audit includes examining, on a test basis, evidence supporting the amounts and disclosures in the financial statements. Our procedures included confirmation of securities owned as of December 31, 2009, by correspondence with the custodian and brokers or by other appropriate auditing procedures where replies from brokers were not received. An audit also includes assessing the accounting principles used and significant estimates made by management, as well as evaluating the overall financial statement presentation. We believe that our audits provide a reasonable basis for our opinion.
In our opinion, the financial statements and financial highlights referred to above present fairly, in all material respects, the financial position of Clearwater Growth Fund, Clearwater Small Cap Fund, Clearwater Tax-Exempt Bond Fund, and Clearwater International Fund as of December 31, 2009, the results of their operations for the year or period then ended, the changes in their net assets for each of the years or periods in the two-year period then ended, and the financial highlights for each of the years or periods in the five-year period then ended, in conformity with U.S. generally accepted accounting principles.
/s/ KPMG LLP
Minneapolis, Minnesota
February 26, 2010
CLEARWATER INVESTMENT TRUST
Statements of Assets and Liabilities
December 31, 2009
| | | | | | | | | | | | | |
| | Growth
Fund | | Small Cap
Fund | | Tax-Exempt
Bond Fund | | International
Fund | |
Assets | |
Investments in securities, at fair value (identified cost: $219,797,937 Growth Fund; $183,979,346 Small Cap Fund; $553,658,511 Tax-Exempt Bond Fund; $220,330,599 International Fund) | | $ | 294,775,266 | | | 214,855,860 | | | 539,879,917 | | | 287,400,491 | |
Cash and cash equivalents | | | — | | | — | | | 5,298 | | | 6,443,945 | |
Foreign currencies, at value (cost: $156,445) | | | — | | | — | | | — | | | 156,382 | |
Receivable for securities sold | | | 1,877,497 | | | 3,326,735 | | | 557,205 | | | 151,129 | |
Receivable for shares of beneficial interest sold | | | — | | | — | | | 200,700 | | | — | |
Accrued dividend and interest receivable, less the allowance for uncollectible interest of $597,609 (Tax-Exempt Bond Fund) | | | 384,734 | | | 188,357 | | | 6,604,354 | | | 359,366 | |
Foreign tax reclaimable receivable | | | — | | | — | | | — | | | 143,998 | |
Unrealized appreciation on forward foreign currency exchange contracts | | | — | | | — | | | — | | | 5,831 | |
Total assets | | | 297,037,497 | | | 218,370,952 | | | 547,247,474 | | | 294,661,142 | |
Liabilities | | | | | | | | | | | | | |
| | | | | | | | | | | | | |
Payables for investment securities purchased | | | — | | | 3,221,889 | | | 3,453,826 | | | 1,185,474 | |
Payables for fund shares redeemed | | | 3,652,447 | | | 329,899 | | | 917,386 | | | 328 | |
Accrued investment advisory fee | | | 197,195 | | | 484,223 | | | 482,511 | | | 568,546 | |
Unrealized depreciation on forward foreign currency exchange contracts | | | — | | | — | | | — | | | 4,899 | |
Total liabilities | | | 3,849,642 | | | 4,036,011 | | | 4,853,723 | | | 1,759,247 | |
Net assets | | $ | 293,187,855 | | | 214,334,941 | | | 542,393,751 | | | 292,901,895 | |
Capital | | | | | | | | | | | | | |
| | | | | | | | | | | | | |
Capital stock and additional paid-in capital (authorized unlimited number of shares at no par value for each Fund: outstanding 12,527,061; 14,874,041; 58,619,344; and 22,257,269 shares, respectively) | | $ | 236,185,498 | | | 228,843,400 | | | 564,712,778 | | | 225,668,748 | |
Undistributed net investment income (loss) | | | 133,061 | | | — | | | 188 | | | (679,781 | ) |
Accumulated net realized gain (loss) | | | (18,108,033 | ) | | (45,384,973 | ) | | (8,540,621 | ) | | 843,369 | |
Unrealized appreciation (depreciation) of investments | | | 74,977,329 | | | 30,876,514 | | | (13,778,594 | ) | | 67,069,559 | |
Net assets | | $ | 293,187,855 | | | 214,334,941 | | | 542,393,751 | | | 292,901,895 | |
Net asset value per share of outstanding capital stock | | $ | 23.40 | | | 14.41 | | | 9.25 | | | 13.16 | |
| |
See accompanying notes to financial statements. | |
2
CLEARWATER INVESTMENT TRUST
Statements of Operations
Year ended December 31, 2009
| | | | | | | | | | | | | |
| | Growth
Fund | | Small Cap
Fund | | Tax-Exempt
Bond Fund | | International
Fund* | |
Investment income: | | | | | | | | | | | | | |
Income: | | | | | | | | | | | | | |
Dividends (net of foreign taxes withheld of $555, $527, $0, and $490,792 respectively) | | $ | 5,350,914 | | | 1,443,713 | | | 2,032,088 | | | 4,658,912 | |
Interest | | | 6,723 | | | 40,625 | | | 24,752,362 | | | 16,735 | |
Total income | | | 5,357,637 | | | 1,484,338 | | | 26,784,450 | | | 4,675,647 | |
| | | | | | | | | | | | | |
Expenses: | | | | | | | | | | | | | |
Federal excise taxes | | | — | | | — | | | 61 | | | — | |
Investment advisory fee | | | 1,066,576 | | | 2,203,193 | | | 2,818,053 | | | 1,754,776 | |
Voluntary fee reduction | | | (402,929 | ) | | (652,798 | ) | | (1,127,221 | ) | | (140,724 | ) |
Total expenses | | | 663,647 | | | 1,550,395 | | | 1,690,893 | | | 1,614,052 | |
Net investment income (loss) | | | 4,693,990 | | | (66,057 | ) | | 25,093,557 | | | 3,061,595 | |
Realized and unrealized gain (loss) on investments: | | | | | | | | | | | | | |
Net realized gain (loss) on security transactions | | | (8,594,039 | ) | | (12,244,262 | ) | | (3,545,962 | ) | | 5,289,409 | |
Net realized gain (loss) on foreign currency transactions | | | — | | | — | | | — | | | 272,268 | |
Unrealized appreciation during the period | | | 68,041,563 | | | 71,407,497 | | | 62,240,551 | | | 67,069,892 | |
Unrealized appreciation on forward foreign currency exchange contracts during the period | | | — | | | — | | | — | | | 932 | |
Translation of other assets and liabilities denominated in foreign currencies during the period | | | — | | | — | | | — | | | (1,265 | ) |
Net gain on investments | | | 59,447,524 | | | 59,163,235 | | | 58,694,589 | | | 72,631,236 | |
| | | | | | | | | | | | | |
Net increase in net assets from operations | | $ | 64,141,514 | | | 59,097,178 | | | 83,788,146 | | | 75,692,831 | |
| | | | | | | | | | | | | |
See accompanying notes to financial statements. |
| | | | | | | | | | | | | |
* Period from February 5, 2009 (commencement of operations) to December 31, 2009. | |
| | | | | | | | | | | | | |
3
CLEARWATER INVESTMENT TRUST
Statements of Changes in Net Assets
Years ended December 31, 2009 and 2008
| | | | | | | | | | | | | |
| | Growth Fund | | Small Cap Fund | |
| | 12/31/2009 | | 12/31/2008 | | 12/31/2009 | | 12/31/2008 | |
Operations: | | | | | | | | | | | | | |
Net investment income (loss) | | $ | 4,693,990 | | | 5,402,700 | | | (66,057 | ) | | 632,123 | |
Net realized gain (loss) on investments | | | (8,594,039 | ) | | (3,244,756 | ) | | (12,244,262 | ) | | (33,071,302 | ) |
Change in unrealized appreciation (depreciation) during the period | | | 68,041,563 | | | (129,750,015 | ) | | 71,407,497 | | | (50,669,506 | ) |
Net increase (decrease) in net assets from operations | | | 64,141,514 | | | (127,592,071 | ) | | 59,097,178 | | | (83,108,685 | ) |
Distributions to shareholders from: | | | | | | | | | | | | | |
Net investment income | | | (4,613,011 | ) | | (5,407,889 | ) | | — | | | (619,899 | ) |
Net realized gain on investments | | | — | | | — | | | — | | | — | |
Total distributions to shareholders | | | (4,613,011 | ) | | (5,407,889 | ) | | — | | | (619,899 | ) |
Capital share transactions: | | | | | | | | | | | | | |
Proceeds from shares sold | | | 85,875,365 | | | 44,225,789 | | | 75,386,269 | | | 70,802,034 | |
Reinvestment of distributions from net investment income and gain | | | 4,613,011 | | | 5,407,889 | | | — | | | 619,899 | |
Payments for shares redeemed | | | (54,091,900 | ) | | (50,362,010 | ) | | (40,994,631 | ) | | (113,834,227 | ) |
Increase (decrease) in net assets from capital share transactions | | | 36,396,476 | | | (728,332 | ) | | 34,391,638 | | | (42,412,293 | ) |
Total increase (decrease) in net assets | | | 95,924,979 | | | (133,728,292 | ) | | 93,488,816 | | | (126,140,877 | ) |
Net assets: | | | | | | | | | | | | | |
At the beginning of the period | | | 197,262,876 | | | 330,991,168 | | | 120,846,125 | | | 246,987,001 | |
At the end of the period | | $ | 293,187,855 | | | 197,262,876 | | | 214,334,941 | | | 120,846,124 | |
Undistributed net investment income (loss) | | $ | 133,061 | | | 52,082 | | | (53,833 | ) | | 12,224 | |
| | | | | | | | | | |
| | Tax-Exempt Bond Fund | | International
Fund | |
| | 12/31/2009 | | 12/31/2008 | | 12/31/09* | |
Operations: | | | | | | | | | | |
Net investment income (loss) | | $ | 25,093,557 | | | 18,391,619 | | | 3,061,595 | |
Net realized gain (loss) on investments | | | (3,545,962 | ) | | (3,472,572 | ) | | 5,561,677 | |
Change in unrealized appreciation (depreciation) during the period | | | 62,240,551 | | | (64,059,902 | ) | | 67,069,559 | |
Net increase (decrease) in net assets from operations | | | 83,788,146 | | | (49,140,855 | ) | | 75,692,831 | |
Distributions to shareholders from: | | | | | | | | | | |
Net investment income | | | (25,117,859 | ) | | (18,367,129 | ) | | (4,013,644 | ) |
Net realized gain on investments | | | — | | | — | | | (4,446,040 | ) |
Total distributions to shareholders | | | (25,117,859 | ) | | (18,367,129 | ) | | (8,459,684 | ) |
Capital share transactions: | | | | | | | | | | |
Proceeds from shares sold | | | 120,179,220 | | | 171,622,315 | | | 244,076,067 | |
Reinvestment of distributions from net investment income and gain | | | 25,117,859 | | | 18,367,120 | | | 8,459,684 | |
Payments for shares redeemed | | | (32,421,588 | ) | | (89,028,497 | ) | | (26,867,003 | ) |
Increase (decrease) in net assets from capital share transactions | | | 112,875,491 | | | 100,960,938 | | | 225,668,748 | |
Total increase (decrease) in net assets | | | 171,545,778 | | | 33,452,954 | | | 292,901,895 | |
Net assets: | | | | | | | | | | |
At the beginning of the period | | | 370,847,973 | | | 337,395,019 | | | — | |
At the end of the period | | $ | 542,393,751 | | | 370,847,973 | | | 292,901,895 | |
Undistributed net investment income (loss) | | $ | 188 | | | 24,490 | | | (669,341 | ) |
See accompanying notes to financial statements.
* Period from February 5, 2009 (commencement of operations) to December 31, 2009.
4
CLEARWATER INVESTMENT TRUST
Notes to Financial Statements
December 31, 2009
Clearwater Investment Trust (the Trust) was established on January 12, 1987 as a Massachusetts business trust and is registered under the Investment Company Act of 1940 (as amended) as a diversified open end management investment company and presently includes four series of funds: Clearwater Growth Fund, Clearwater Small Cap Fund, Clearwater Tax-Exempt Bond Fund, and Clearwater International Fund (the Funds). The Trust’s declaration of trust permits the Board of Trustees to create additional funds in the future. The investment objective of the Clearwater Growth, Small Cap, and International Funds is long term capital growth. The investment objective of the Clearwater Tax-Exempt Bond Fund is high current income that is exempt from federal income tax, consistent with preservation of capital. The Clearwater International Fund commenced operations on February 5, 2009.
The Clearwater Growth Fund is passively managed to track but not replicate the Russell 1000® Index (the Index), an unmanaged, capitalization weighted index of the largest 1000 public companies in the United States. The Fund is managed so that its holdings match the holdings of the Index as closely as possible while attempting to minimize the realization of taxable gains. This means that the Fund will not buy and sell securities to match changes in the composition of securities in the Index. Instead, the Fund’s portfolio is adjusted periodically to reflect the holdings and weightings of the Index, but only after consideration of the Fund’s policy to minimize realization of taxable gains.
The Clearwater Small Cap Fund invests primarily in equity securities of issuers with market capitalizations, at the time of investment, no greater than the range of capitalizations of the companies included in the Russell 2000® Index, an unmanaged, capitalization weighted. The Fund may invest up to 20% of its assets in microcap securities, generally defined as securities with a market capitalization under $300 million.
The Clearwater Tax-Exempt Bond Fund invests at least 80% of its assets in municipal securities, which are debt obligations issued by or for the U.S. states, territories and possessions, and the District of Columbia. The interest on these securities is generally exempt from regular federal income tax and may also be exempt from federal alternative minimum tax. However, the Fund may invest up to 20% of its assets in securities that generate interest income subject to federal alternative minimum tax.
The Clearwater International Fund, using a “multi-style, multi-manager” approach, allocates portions of its assets among subadvisers who employ distinct investment styles. The Fund currently has four subadvisers, Parametric Portfolio Associates (Parametric), AXA Rosenberg Investment Management LLC (AXA Rosenberg), Artisan Partners Limited Partnership (Artisan Partners), and Eagle Global Advisors, LLC (Eagle). The Fund generally invests at least 80% of the value of its net assets in equity securities that trade in markets outside the United States. Such securities are generally issued by companies domiciled outside of the United States or companies that derive more than half of their revenues or pre-tax income from activities occurring outside of the United States. The Fund diversifies its investments among a number of different countries throughout the world, and may invest in companies of any size. The Fund does not currently intend to invest more than 20% of its net assets in the equity securities of developing or emerging market issuers.
CLEARWATER INVESTMENT TRUST
Notes to Financial Statements
December 31, 2009
| |
(2) | Summary of Significant Accounting Policies |
| |
The significant accounting policies followed by the Funds are as follows: |
| |
(a) | Investments in Securities |
| |
| Investments in U.S. and foreign equity securities are valued at the last sales price or the regular trading session closing price on the principal exchange or market where they are traded. Foreign security values are stated in U.S. dollars. Equity securities which have not traded on the date of valuation or securities for which sales prices are not generally reported are valued at the mean between the last bid and asked prices. Debt securities maturing more than 60 days from the valuation date are valued at the market price supplied by an independent pricing vendor; those securities with maturities of less than 60 days when acquired, or which subsequently are within 60 days of maturity, are valued at amortized cost, which approximates fair value. Securities for which no market quotations are readily available (including those the trading of which has been suspended) will be valued at fair value as determined in good faith by the board of trustees, although the actual computations may be made by persons acting pursuant to the direction of the board. |
| |
| Security transactions are accounted for on the trade date which is the date the securities are purchased or sold. Realized gains and losses are calculated on an identified cost basis. Dividend income is recognized on the ex-dividend date or, for foreign securities, as soon as the information is available. Interest income, including amortization of original issue discount and premium, is accrued daily. |
| |
(b) | Foreign Currency Translations |
| |
| The International Fund invests in securities which are purchased and sold in foreign currencies as a principal investment strategy. The cost of purchases and proceeds from sales of investments, interest and dividend income are translated into U.S. dollars using the spot market rate of exchange prevailing on the respective dates of such transactions. The value of the International Fund’s assets as measured in U.S. dollars therefore may be affected favorably or unfavorably by changes in foreign currency exchange rates and exchange control regulations. The gains or losses, if any, on investments resulting from changes in foreign exchange rates are included in the Statements of Operations with net realized and unrealized gain (loss) on investments. The realized gains or losses, if any, on translations of other assets and liabilities denominated in foreign currencies are included in foreign currency transactions on the Statements of Operations. The International Fund also will incur costs in converting U.S. dollars to local currencies, and vice versa. The International Fund therefore may enter into foreign currency transactions as a principal investment strategy. |
| |
| Risks may arise upon investing in foreign securities including, but not limited to, political, social or economic instability in the country of the issuer, the difficulty of predicting international trade patterns, the possibility of the imposition of exchange controls, expropriation, limits on removal of currency or other assets, nationalization of assets, foreign withholding and income tax and possible delays in the settlement of foreign stock exchange transactions. The principal markets on which these securities trade may have less volume and liquidity, and may be more volatile, than securities markets in the United States. |
CLEARWATER INVESTMENT TRUST
Notes to Financial Statements
December 31, 2009
| |
(c) | Forward Foreign Currency Exchange Contracts |
| |
| The International Fund enters into forward foreign currency exchange contracts for the purchase or sale of a specific foreign currency at a fixed price on a future date as a hedge against either specific transactions or the portfolio position. The objective of the International Fund’s foreign currency hedging transactions is to reduce the risk that the U.S. dollar value of the International Fund’s foreign currency denominated securities will decline in value due to changes in foreign currency exchange rates. Forward foreign currency exchange contracts are marked-to-market daily at the applicable exchange rates and any resulting unrealized gains or losses are recorded in the financial statements. The International Fund records realized gains or losses at the time the forward foreign currency exchange contract is offset by entering into a closing transaction with the same counterparty or is extinguished by delivery of the currency. |
| |
| Risks may arise upon entering into forward foreign currency exchange contracts from the potential of the issuer to default on its obligations under the contract and from unanticipated movements in the value of a foreign currency relative to the U.S. dollar. The contractual amounts of forward foreign currency exchange contracts do not necessarily represent the amounts potentially subject to risk. The measurement of risks associated with these instruments is meaningful only when all related and offsetting transactions are considered. The Statements of Operations reflect realized gains or losses, if any, in net realized gain (loss) on foreign currency transactions and unrealized gains or losses in unrealized appreciation (depreciation) on forward foreign currency exchange contracts. Additional information on derivative instruments and how these positions may impact the financial statements is found in Note 9. |
| |
(d) | Spot Contracts |
| |
| The International Fund enters into spot contracts in order to buy or sell a certain amount of foreign currency at the current market rate, with settlement occurring in two business days. The International Fund may enter into spot contracts in order to make payments, or to receive payments, based on trading activity in a foreign currency. A spot contract allows the International Fund to buy or sell foreign currency on the day it chooses to deal. |
| |
| Risks may arise upon entering into spot contracts from unanticipated movements in the value of a foreign currency relative to the U.S. dollar in a short period of time. Additional information on derivative instruments and how these positions may impact the financial statements is found in Note 9. |
| |
(e) | Cash and Cash Equivalents |
| |
| For the International Fund, cash and cash equivalents include cash and short-term deposits maintained in foreign currencies. |
| |
(f) | Recoverable Taxes |
| |
| The balance disclosed as foreign tax reclaimable receivable represents net amounts withheld by foreign governments on dividend income earned in the respective countries subject to reclamation. All reclaims are paid directly to the International Fund. |
CLEARWATER INVESTMENT TRUST
Notes to Financial Statements
December 31, 2009
| |
(g) | Federal Taxes |
| |
| The Trust’s policy is to comply with the requirements of the Internal Revenue Code applicable to regulated investment companies. On a calendar-year basis, the Funds intend to distribute substantially all of their net investment income and realized gains, if any, to avoid the payment of federal income and excise taxes. Therefore, no income tax provision is required. Each fund is treated as a separate entity for federal income tax purposes. |
| |
| Management has yet to file a federal tax return for the International Fund as operations commenced on February 5, 2009. Therefore, management has not yet analyzed the International Fund’s tax positions; however, the International Fund anticipates concluding that no provision for income tax will be required in the International Fund’s financial statements for December 31, 2009. Management has analyzed the other three funds’ tax positions taken on federal tax returns for all open tax years and has concluded that as of December 31, 2009, no provision for income tax would be required in the Funds’ financial statements. The Funds’ federal and Minnesota state income and federal excise tax returns for the 2006, 2007, 2008 and 2009 tax years for which the applicable statutes of limitations have not expired remain subject to examination by the Internal Revenue Service and state departments of revenue. |
| |
| Net investment income and net realized gains (losses) for the Funds may differ for financial statement and tax purposes. The character of distributions made during the year from net investment income or net realized gains, if any, may differ from their ultimate characterization for federal income tax purposes. Also, due to the timing of dividend distributions, the period or fiscal year in which amounts are distributed may differ from the period or year that the income or realized gains (losses) were recorded by the Funds. The tax character of distributions paid by the funds during the years ended December 31, 2009 and 2008 was as follows: |
| | | | | | | | | | | | | |
| | Tax-Exempt | | Ordinary Income | |
| | 2009 | | 2008 | | 2009 | | 2008 | |
|
Growth Fund | | $ | — | | | — | | | 4,613,011 | | | 5,407,889 | |
Small Cap Fund | | | — | | | — | | | — | | | 619,899 | |
Tax-Exempt Bond Fund | | | 24,795,282 | | | 18,268,358 | | | 322,577 | | | 98,771 | |
International Fund* | | | — | | | — | | | 8,459,684 | | | — | |
| |
| *Commenced investment operations on February 5, 2009. |
| |
| Qualified Dividend Income Under the Jobs and Growth Tax Relief Reconciliation Act of 2003 (the “Act”), 100% of ordinary dividends paid during the years ended December 31, 2008 and 2009 for the Growth Fund, 100% of ordinary dividends paid during the year ended December 31, 2008 for the Small Cap Fund, and 47.02% of ordinary dividends paid during the period ended December 31, 2009 for the International Fund are designated as “qualified dividend income”, as defined in the Act, subject to reduced tax rates in 2009. |
CLEARWATER INVESTMENT TRUST
Notes to Financial Statements
December 31, 2009
| |
| Foreign Tax Credit The International Fund intends to make an election that will allow shareholders to treat their proportionate share of foreign taxes paid by the Fund as having been paid by them. The amounts per share which represent income from sources within foreign countries and the foreign tax credit were 0.2286 and 0.0221, respectively. |
| |
| As of December 31, 2009, the components of distributable earnings on a tax basis were as follows: |
| | | | | | | | | | | | | |
| | Growth Fund | | Small Cap
Fund | | Tax-Exempt
Bond Fund | | International
Fund* | |
|
Undistributed ordinary income | | $ | 133,061 | | | (53,833 | ) | | 188 | | | 1,066,168 | |
Undistributed capital gain | | | — | | | — | | | — | | | — | |
Accumulated capital losses | | | (17,834,842 | ) | | (45,354,932 | ) | | (8,540,621 | ) | | — | |
Unrealized appreciation (depreciation) | | | 74,704,138 | | | 30,846,473 | | | (13,778,594 | ) | | 66,167,973 | |
|
Total | | $ | 57,002,357 | | | (14,562,292 | ) | | (22,319,027 | ) | | 67,234,141 | |
| |
| *Commenced investment operations on February 5, 2009. |
| |
| On the statements of assets and liabilities, due to permanent book-to-tax differences, the following adjustments have been made: |
| | | | | | | | | | | | | |
| | Growth Fund | | Small Cap Fund | | Tax-Exempt
Bond Fund | | International
Fund* | |
|
Undistributed net investment income | | $ | — | | $ | 53,833 | | $ | — | | $ | 272,268 | |
Accumulated net realized gains (loss) | | | — | | | — | | | — | | | (272,268 | ) |
Additional paid-in capital | | | — | | | (53,833 | ) | | — | | | — | |
| |
| *Commenced investment operations on February 5, 2009. |
| |
(h) | Distributions to Shareholders |
| |
| Distributions to shareholders from net investment income, if any, are declared annually for the Growth, Small Cap, and International Funds and declared daily, payable monthly, for the Tax-Exempt Bond Fund. Distributions to shareholders from net realized gains, if any, are declared annually for all Funds. Distributions are paid in cash or reinvested in additional shares. |
| |
(i) | Use of Estimates |
| |
| The preparation of financial statements in conformity with U.S. generally accepted accounting principles requires management to make estimates and assumptions that affect the reported amounts of assets and liabilities and disclosure of contingent assets and liabilities at the date of the financial statements and the reported amounts of increase and decrease in net assets from operations during the period. Actual results could differ from those estimates. |
CLEARWATER INVESTMENT TRUST
Notes to Financial Statements
December 31, 2009
| |
(j) | Recent Accounting Pronouncements |
| |
| In April 2009, the Financial Accounting Standards Board (“FASB”) issued additional guidance related to fair value measurement. This guidance requires enhanced disclosures about the inputs and valuation technique(s) used to measure fair value and a discussion of changes in valuation techniques and related inputs, if any, during the period. In addition, the three-level hierarchy disclosure and the level three roll-forward disclosure are to be expanded for each major category of equity and debt securities. There were no changes to the financial position of the Funds and the results of their operations upon adoption of this guidance. Management believes that appropriate disclosures, reflecting the potential impact of this guidance, have been made for the current period as part of the Notes to Financial Statements and Schedule of Investments. |
| |
| In June 2009, the FASB issued guidance establishing general standards of accounting for and disclosure of events that occur after the balance sheet date, but before the financial statements are issued. Management has evaluated subsequent events for the Funds as described in note 10. |
| |
(3) | Fair Value Measurements |
| |
Fair value is an estimate of the price the Funds would receive upon selling a security in a timely transaction to an independent buyer in the principal or most advantageous market of the security. Fair value measurement guidance establishes a three-tier hierarchy to maximize the use of observable market data and minimize the use of unobservable inputs and to establish classification of fair value measurements for disclosure purposes. Various inputs are used in determining the value of the Funds’ investments, as described in note 2(a) above. These inputs are summarized in the three broad levels listed below. |
|
• | Level 1 – quoted prices in active markets for identical securities |
| |
• | Level 2 – other significant observable inputs including quoted prices for similar investments, interest rates, prepayment speeds, credit risk, etc. or quoted prices for identical or similar assets in markets that are not active. Inputs that are derived principally from or corroborated by observable market data. An adjustment to any observable input that is significant to the fair value may render the measurement a Level 3 measurement. |
| |
• | Level 3 – valuations based on unobservable inputs, which may include the advisor’s own assumptions in determining the fair value of an investment. |
| |
Investments are valued as of the close of business on the New York Stock Exchange, normally 4:00pm Eastern time. Security transactions are accounted for as of trade date. Wherever possible, the Funds use independent pricing services approved by the Board of Trustees to value their estimates. When prices are not readily available, or are determined not to reflect fair value, the Funds may value these securities at fair value as determined in accordance with the procedures approved by the Funds’ Board of Trustees. |
|
The inputs or methodology used for valuing securities are not necessarily an indication of the risk associated with investing in those securities. The following is a summary of the investments of each Fund as of December 31, 2009 using the Fair Value methodology and broad levels described above: |
CLEARWATER INVESTMENT TRUST
Notes to Financial Statements
December 31, 2009
| | | | | | | |
| Investments in Securities at Value |
| | Growth
Fund (a) | | Small Cap
Fund (b) | |
|
Level 1 | | $ | 294,775,266 | | | 214,416,140 | |
Level 2 | | | — | | | 439,720 | |
Level 3 | | | — | | | — | |
|
Total | | $ | 294,775,266 | | | 214,855,860 | |
| |
(a) | For the Growth Fund, 100% of the investment value is compromised of equity securities and cash equivalents. See the Fund’s Schedule of Investments for industry classification. |
| |
(b) | For the Small Cap Fund, 100% of the investment value is compromised of equity and fixed income securities and cash equivalents. See the Fund’s Schedule of Investments for industry classification. Level 2 securities are fixed income securities. |
| | | | | | | | | | | | | |
Clearwater Tax-Exempt Bond Fund (c) | | Level 1
Quoted
Prices | | Level 2
Other
Significant
Observable
Inputs | | Level 3
Significant
Unobservable
Inputs | | Total | |
| | | | | | | | | | | | | |
Cash Equivalents | | | | | | | | | | | | | |
STIF- Type Instrument | | $ | — | | | 15,798,249 | | | — | | | 15,798,249 | |
Total Cash Equivalents | | | — | | | 15,798,249 | | | — | | | 15,798,249 | |
Fixed Income | | | | | | | | | | | | | |
Closed-End Funds | | | 36,715,907 | | | — | | | — | | | 36,715,907 | |
Municipal Bonds | | | — | | | 486,482,817 | | | 552,924 | | | 487,035,741 | |
Other Asset Backed | | | — | | | 330,020 | | | — | | | 330,020 | |
Total Fixed Income | | | 36,715,907 | | | 486,812,837 | | | 552,924 | | | 524,081,668 | |
|
Total | | $ | 36,715,907 | | | 502,611,086 | | | 552,924 | | | 539,879,917 | |
|
(c) For this fund, 100% of the investment value is compromised of closed-end funds, fixed income securities, and cash equivalents. Level 2 securities are primarily fixed income securities. |
CLEARWATER INVESTMENT TRUST
Notes to Financial Statements
December 31, 2009
The following is a reconciliation of investments for the Clearwater Tax-Exempt Bond Fund in which significant unobservable inputs (Level 3) were used in determining fair value:
| | | | |
| | Municipal
Bonds | |
Balance as of 12/31/08 | | $ | — | |
Net realized gain (loss) | | | — | |
Net change in unrealized appreciation (depreciation) | | | 71,716 | |
Net purchases (sales) | | | 481,208 | |
Net transfers in and/or out of Level 3 | | | — | |
Balance as of 12/31/09 | | $ | 552,924 | |
As of December 31, 2009 total change in unrealized gains or losses on Level 3 securities still held at year end and included in the change in net assets was $0.
CLEARWATER INVESTMENT TRUST
Notes to Financial Statements
December 31, 2009
| | | | | | | | | | | | | |
Clearwater International Fund (d) | | Level 1
Quoted
Prices | | Level 2
Other
Significant
Observable
Inputs | | Level 3
Significant
Unobservable
Inputs | | Total | |
| | | | | | | | | | | | | |
Common Stock | | | | | | | | | | | | | |
Consumer Discretionary | | $ | 3,628,715 | | | 33,471,223 | | | — | | | 37,099,938 | |
Consumer Staple | | | 2,955,426 | | | 25,345,048 | | | — | | | 28,300,474 | |
Energy | | | 5,648,177 | | | 17,616,871 | | | 421,737 | | | 23,686,785 | |
Financials | | | 7,639,687 | | | 61,454,335 | | | — | | | 69,094,022 | |
Health Care | | | 3,152,567 | | | 18,219,055 | | | — | | | 21,371,622 | |
Industrials | | | 1,389,329 | | | 32,876,771 | | | 188,354 | | | 34,454,454 | |
Information Technology | | | 3,177,965 | | | 13,346,030 | | | 160,485 | | | 16,684,480 | |
Materials | | | 6,748,229 | | | 23,946,149 | | | — | | | 30,694,378 | |
Telecommunication Services | | | 1,358,040 | | | 10,694,860 | | | — | | | 12,052,900 | |
Utilities | | | 258,838 | | | 11,118,935 | | | — | | | 11,377,773 | |
Total Common Stock | | | 35,956,973 | | | 248,089,277 | | | 770,576 | | | 284,816,826 | |
Preferred Stocks | | | | | | | | | | | | | |
Consumer Discretionary | | | — | | | 263,052 | | | — | | | 263,052 | |
Consumer Staples | | | — | | | 122,867 | | | — | | | 122,867 | |
Energy | | | 627,372 | | | — | | | — | | | 627,372 | |
Health Care | | | — | | | 79,614 | | | — | | | 79,614 | |
Materials | | | 412,012 | | | — | | | — | | | 412,012 | |
Utilities | | | — | | | 76,820 | | | — | | | 76,820 | |
Total Preferred Stock | | | 1,039,384 | | | 542,353 | | | — | | | 1,581,737 | |
Corporate Bonds | | | — | | | — | | | 995,466 | | | 995,466 | |
Total Corporate Bonds | | | — | | | — | | | 995,466 | | | 995,466 | |
Rights | | | | | | | | | | | | | |
Energy | | | — | | | 2,927 | | | — | | | 2,927 | |
Total Rights | | | — | | | 2,927 | | | — | | | 2,927 | |
Warrants | | | | | | | | | | | | | |
Financials | | | 3,535 | | | — | | | — | | | 3,535 | |
Total Warrants | | | 3,535 | | | — | | | — | | | 3,535 | |
|
Total | | $ | 36,999,892 | | | 248,634,557 | | | 1,766,042 | | | 287,400,491 | |
| | | | | | | | | | | | | |
Other Financial Instruments* | | $ | — | | | 932 | | | — | | | 932 | |
|
*Other Financial instruments include futures and forwards, if applicable. |
(d) For this fund, 100% of the investment value is compromised of equity securities, corporate bonds, rights, and warrants. See the Fund’s Schedule of Investments for geographical classification. Level 2 securities are primarily foreign securities where the closing price has been adjusted by application of a systematic process for events occurring after the close of the foreign exchange.
CLEARWATER INVESTMENT TRUST
Notes to Financial Statements
December 31, 2009
| |
| The following is a reconciliation of investments for the Clearwater International Fund in which significant unobservable inputs (Level 3) were used in determining fair value: |
| | | | | | | | | | | | | |
| | Common Stock | | | | |
| | Energy | | Industrials | | Information
Technology | | Corporate
Bonds | |
Balance as of 2/5/09* | | $ | — | | | — | | | — | | | — | |
Net realized gain (loss) | | | — | | | — | | | — | | | — | |
Net change in unrealized appreciation (depreciation) | | | 86,686 | | | 40,022 | | | 21,042 | | | (58,993 | ) |
Net purchases (sales) | | | 335,051 | | | 148,332 | | | 139,443 | | | 1,054,459 | |
Net transfers in and/or out of Level 3 | | | — | | | — | | | — | | | — | |
Balance as of 12/31/09 | | $ | 421,737 | | | 188,354 | | | 160,485 | | | 995,466 | |
| |
| *Commenced investment operations on February 5, 2009. |
| |
| As of December 31, 2009 total change in unrealized gains or losses on Level 3 securities still held at year end and included in the change in net assets was $88,757. |
| |
(4) | Investment Security Transactions |
The cost of purchases and proceeds from sales of securities, other than temporary investments in short term securities, for the period ended December 31, 2009, were as follows:
| | | | | | | |
| | Purchases | | Sales | |
|
Growth Fund | | $ | 88,485,288 | | | 51,246,757 | |
Small Cap Fund | | | 180,562,530 | | | 148,167,992 | |
Tax-Exempt Bond Fund | | | 202,852,431 | | | 104,241,263 | |
International Fund* | | | 285,010,450 | | | 69,969,260 | |
*Fund commenced operations on February 5, 2009.
| |
(5) | Capital Share Transactions |
Transactions in shares of each fund for the periods ended December 31, 2009 and 2008 were as follows:
| | | | | | | | | | | | | |
| | Growth Fund | | Small Cap Fund | |
| | 2009 | | 2008 | | 2009 | | 2008 | |
|
Sold | | | 4,317,991 | | | 1,825,122 | | | 6,858,845 | | | 5,527,593 | |
Issued for reinvested distributions | | | 197,053 | | | 290,747 | | | — | | | 59,663 | |
Redeemed | | | (2,592,135 | ) | | (2,338,433 | ) | | (3,617,902 | ) | | (8,764,097 | ) |
|
Increase | | | 1,922,909 | | | (222,564 | ) | | 3,240,943 | | | (3,176,841 | ) |
CLEARWATER INVESTMENT TRUST
Notes to Financial Statements
December 31, 2009
| | | | | | | | | | |
| | Tax-Exempt Bond Fund | | International
Fund* | |
| | 2009 | | 2008 | | 2009 | |
|
Sold | | | 13,601,897 | | | 19,251,653 | | | 23,904,428 | |
Issued for reinvested distributions | | | 2,823,365 | | | 2,036,379 | | | 642,834 | |
Redeemed | | | (3,640,932 | ) | | (10,437,584 | ) | | (2,289,993 | ) |
|
Increase | | | 12,784,330 | | | 10,850,448 | | | 22,257,269 | |
* Fund commenced operations on February 5, 2009.
| |
(6) | Capital Loss Carry Over |
For federal income tax purposes, the Growth Fund, Small Cap Fund, Tax-Exempt Bond Fund, and International Fund have capital loss carryovers of $17,834,842, $45,354,932, $8,540,621, and $0, respectively, at December 31, 2009, which, if not offset by subsequent capital gains, will expire as follows:
| | | | | | | | | | | | | |
| | Growth Fund | | Small Cap
Fund | | Tax-Exempt
Bond Fund | | International
Fund | |
|
Year of expiration: | | | | | | | | | | | | | |
2010 | | $ | 5,878,353 | | | — | | | — | | | — | |
2012 | | | — | | | — | | | — | | | — | |
2013 | | | 183,070 | | | — | | | 508,252 | | | — | |
2014 | | | — | | | — | | | — | | | — | |
2015 | | | — | | | — | | | 1,013,836 | | | — | |
2016 | | | 3,166,401 | | | 33,061,735 | | | 3,472,571 | | | — | |
2017 | | | 8,607,018 | | | 12,293,197 | | | 3,545,962 | | | — | |
|
Total | | $ | 17,834,842 | | | 45,354,932 | | | 8,540,621 | | | — | |
| |
(7) | Expenses and Related-Party Transactions |
The Trust has a contract for investment advisory services with Clearwater Management Company (CMC), a management firm of which the Trust’s President and Treasurer is a shareholder. Under terms of an agreement, Clearwater Growth Fund, Clearwater Small Cap Fund, Clearwater Tax-Exempt Bond Fund and Clearwater International Fund pay a fee equal to an annual rate of 0.45%, 1.35%, 0.60% and 1.00% of average net assets, respectively. CMC is responsible for the payment or reimbursement of all the Funds’ expenses, except brokerage, taxes, interest, and extraordinary expenses. CMC has periodically reduced its management fee for each of the Funds through voluntary waivers. As of December 31, 2009, the management fee paid by the Growth Fund net of voluntary waiver is 0.28%. Effective July 1, 2008 CMC voluntarily reduced the fees paid by the Clearwater Small Cap Fund and Clearwater Tax-Exempt Bond Fund funds to 0.95% and 0.36%, respectively. On October 1, 2009 CMC voluntarily reduced the fees paid by the Clearwater International Fund to 0.80%. These voluntary fee reductions may be discontinued at any time.
CLEARWATER INVESTMENT TRUST
Notes to Financial Statements
December 31, 2009
In addition to fees and expenses which the Funds bear directly, the Funds indirectly bear a pro rata share of the fees and expenses of the acquired funds in which it invests. Such indirect expenses are not included in any of the reported expense ratios.
CMC has entered into sub advisory contracts with independent investment advisory firms for each fund to provide daily investment management services. CMC pays each subadviser an annual fee, based on average daily net assets, in the following amounts:
| | | | | | | | | | | | | | |
| | | | Growth
Fund | | | Small Cap Fund | | | Tax-Exempt Bond
Fund | | | International Fund | |
| | | | | | | | | | | | | | |
| | | | | | | | | | | | | | |
| Parametric Portfolio Associates | | | 0.15% of net assets | | | | | | | | | 0.15% of net assets | |
| | | | | | | | | | | | | | |
| | | | | | | | | | | | | | |
| Kennedy Capital Management, Inc. | | | | | | 0.85% of the first $50 million in net assets it manages and then 0.80% of net assets in excess of $50 million | | | | | | | |
| | | | | | | | | | | | | | |
| | | | | | | | | | | | | | |
| Keeley Asset Management | | | | | | 1.00% of the first $2 million in net assets it manages, then 0.85% of the next $8 million in net assets, and then 0.70% of net assets in excess of $10 million | | | | | | | |
| | | | | | | | | | | | | | |
| | | | | | | | | | | | | | |
| Sit Fixed Income Advisers II, LLC | | | | | | | | | 0.40% of the first $20 million in net assets and decreasing in reduced percentages to 0.20% of net assets in excess of $75 million | | | | |
| | | | | | | | | | | | | | |
| | | | | | | | | | | | | | |
| AXA Rosenberg | | | | | | | | | | | | 0.85% of the first $50 million in net assets it manages, then 0.75% of the next $50 million in net assets, and then 0.65% of net assets in excess of $100 million | |
| | | | | | | | | | | | | | |
| | | | | | | | | | | | | | |
| Artisan Partners, LP | | | | | | | | | | | | 0.80% of the first $50 million in net assets it manages, then 0.60% of the next $50 million in net assets, and then 0.50% of net assets in excess of $100 million | |
| | | | | | | | | | | | | | |
| | | | | | | | | | | | | | |
| Eagle Global Advisors, LLC | | | | | | | | | | | | 0.60% of the first $100 million in net assets it manages and then 0.50% of net assets in excess of $100 million | |
| | | | | | | | | | | | | | |
CLEARWATER INVESTMENT TRUST
Notes to Financial Statements
December 31, 2009
Per share data (rounded to the nearest cent) for a share of capital stock outstanding throughout the years and selected information for each year is as follows:
| | | | | | | | | | | | | | | | |
| | Year ended December 31, | |
Growth Fund | | 2009 | | 2008 | | 2007 | | 2006 | | 2005 | |
|
Net asset value, beginning of year | | $ | 18.60 | | | 30.57 | | | 29.47 | | | 26.03 | | | 24.93 | |
|
Income from investment operations: | | | | | | | | | | | | | | | | |
Net investment income | | | 0.39 | | | 0.51 | | | 0.48 | | | 0.40 | | | 0.37 | |
Net realized and unrealized gain (loss) | | | 4.78 | | | (11.96 | ) | | 1.10 | | | 3.44 | | | 1.10 | |
Total from investment operations | | | 5.17 | | | (11.45 | ) | | 1.58 | | | 3.84 | | | 1.47 | |
Less distributions: | | | | | | | | | | | | | | | | |
Dividends from net investment income | | | (0.37 | ) | | (0.52 | ) | | (0.48 | ) | | (0.40 | ) | | (0.37 | ) |
Distributions from net realized gains | | | — | | | — | | | — | | | — | | | — | |
Total distributions | | | (0.37 | ) | | (0.52 | ) | | (0.48 | ) | | (0.40 | ) | | (0.37 | ) |
|
Net asset value, end of year | | $ | 23.40 | | | 18.60 | | | 30.57 | | | 29.47 | | | 26.03 | |
|
Total return (a) | | | 27.9 | % | | (37.5 | )% | | 5.4 | % | | 14.8 | % | | 5.9 | % |
|
Net assets, end of year (000s omitted) | | $ | 293,188 | | | 197,263 | | | 330,991 | | | 291,513 | | | 229,371 | |
|
Ratio of expenses to average net assets (b) (c) | | | 0.28 | % | | 0.28 | % | | 0.28 | % | | 0.31 | % | | 0.36 | % |
|
Ratio of net investment income to average net assets (b) | | | 1.98 | % | | 1.92 | % | | 1.61 | % | | 1.56 | % | | 1.52 | % |
|
Portfolio turnover rate (excluding short-term securities) | | | 21.83 | % | | 14.71 | % | | 17.99 | % | | 5.24 | % | | 5.80 | % |
| |
(a) | Total return figures are based on the change in net asset value of a share during the period and assume reinvestment of distributions at net asset value. |
| |
(b) | Total fund expenses are contractually limited to 0.45% of average daily net assets. However, during the years ended December 31, 2009, 2008, 2007, 2006, and 2005, the investment advisor voluntarily reduced management fees otherwise payable by the Funds. Had the Fund incurred these expenses, the ratio of expenses to average daily net assets would have been 0.45%, 0.45%, 0.45%, 0.45%, and 0.45%, for the years ended December 31, 2009, 2008, 2007, 2006, and 2005, respectively, and the ratio of net investment income to average daily net assets would have been 1.81%, 1.75%, 1.44%, 1.42%, and 1.43%, respectively. |
| |
(c) | In addition to fees and expenses which the Fund bears directly, the Fund indirectly bears a pro rata share of the fees and expenses of the acquired funds in which it invests. Such indirect expenses are not included in the above reported expense ratios. |
CLEARWATER INVESTMENT TRUST
Notes to Financial Statements
December 31, 2009
| | | | | | | | | | | | | | | | |
| Year ended December 31, | |
Small Cap Fund | | 2009 | | 2008 | | 2007 | | 2006 | | 2005 | |
|
Net asset value, beginning of year | | $ | 10.39 | | | 16.68 | | | 18.71 | | | 18.09 | | | 19.14 | |
|
Income from investment operations: | | | | | | | | | | | | | | | | |
Net investment income (loss) | | | — | | | 0.05 | | | — | | | (0.04 | ) | | (0.04 | ) |
Net realized and unrealized gains (losses) | | | 4.02 | | | (6.29 | ) | | 0.58 | | | 3.13 | | | 1.81 | |
Total from investment operations | | | 4.02 | | | (6.24 | ) | | 0.58 | | | 3.09 | | | 1.77 | |
Less distributions: | | | | | | | | | | | | | | | | |
Distributions from net investment income | | | — | | | (0.05 | ) | | — | | | — | | | — | |
Distributions from net realized gains | | | — | | | — | | | (2.61 | ) | | | (2.47 | ) | | (2.82 | ) |
|
Total distributions | | | — | | | (0.05 | ) | | (2.61 | ) | | (2.47 | ) | | (2.82 | ) |
|
Net asset value, end of year | | $ | 14.41 | | | 10.39 | | | 16.68 | | | 18.71 | | | 18.09 | |
|
Total return (a) | | | 38.7 | % | | (37.4 | )% | | 3.1 | % | | 17.1 | % | | 9.2 | % |
|
Net assets, end of year (000s omitted) | | $ | 214,335 | | | 120,846 | | | 246,987 | | | 253,846 | | | 203,351 | |
|
Ratio of expenses to average net assets (b) (c) | | | 0.95 | % | | 0.95 | % | | 0.98 | % | | 1.03 | % | | 1.14 | % |
|
Ratio of net investment income (loss) to average net assets (b) | | | (0.04 | )% | | 0.32 | % | | — | % | | (0.23 | )% | | (0.19 | )% |
|
Portfolio turnover rate (excluding short-term securities) | | | 95.13 | % | | 117.12 | % | | 115.19 | % | | 69.57 | % | | 73.65 | % |
| |
(a) | Total return figures are based on the change in net asset value of a share during the period and assume reinvestment of distributions at net asset value. |
| |
(b) | Total fund expenses are contractually limited to 1.35% of average daily net assets. However, during the years ended December 31, 2009, 2008, 2007, 2006, and 2005, the investment advisor voluntarily reduced management fees otherwise payable by the Funds. Had the Fund incurred these expenses, the ratio of expenses to average daily net assets would have been 1.35%, 1.35%, 1.35%, 1.35%, and 1.35%, for the years ended December 31, 2009, 2008, 2007, 2006, and 2005, respectively, and the ratio of net investment income (loss) to average daily net assets would have been (0.44)%, (0.08)%, (0.37)%, (0.55)%, and (0.40)%, respectively. |
| |
(c) | In addition to fees and expenses which the Fund bears directly, the Fund indirectly bears a pro rata share of the fees and expenses of the acquired funds in which it invests. Such indirect expenses are not included in the above reported expense ratios. |
CLEARWATER INVESTMENT TRUST
Notes to Financial Statements
December 31, 2009
| | | | | | | | | | | | | | | | |
Tax-Exempt
Bond Fund | | Year ended December 31, | |
| 2009 | | 2008 | | 2007 | | 2006 | | 2005 | |
|
Net asset value, beginning of year | | $ | 8.09 | | | 9.64 | | | 10.06 | | | 10.00 | | | 10.03 | |
|
Income from investment operations: | | | | | | | | | | | | | | | | |
Net investment income | | | 0.47 | | | 0.46 | | | 0.46 | | | 0.43 | | | 0.48 | |
Net realized and unrealized gains | | | 1.16 | | | (1.55 | ) | | (0.42 | ) | | 0.06 | | | (0.03 | ) |
Total from investment operations | | | 1.63 | | | (1.09 | ) | | 0.04 | | | 0.49 | | | 0.45 | |
Less distributions: | | | | | | | | | | | | | | | | |
Distributions from net investment income | | | (0.47 | ) | | (0.46 | ) | | (0.46 | ) | | (0.43 | ) | | (0.48 | ) |
Distributions from net realized gains | | | — | | | — | | | — | | | — | | | — | |
Total distributions | | | (0.47 | ) | | (0.46 | ) | | (0.46 | ) | | (0.43 | ) | | (0.48 | ) |
|
Net asset value, end of year | | $ | 9.25 | | | 8.09 | | | 9.64 | | | 10.06 | | | 10.00 | |
|
Total return (a) | | | 20.6 | % | | (11.80 | )% | | 0.60 | % | | 5.3 | % | | 4.6 | % |
|
Net assets, end of year (000s omitted) | | $ | 542,394 | | | 370,848 | | | 337,395 | | | 283,745 | | | 225,476 | |
|
Ratio of expenses to average net assets (b) (c) | | | 0.36 | % | | 0.37 | % | | 0.38 | % | | 0.42 | % | | 0.48 | % |
|
Ratio of net investment income to average net assets (b) | | | 5.36 | % | | 5.03 | % | | 4.75 | % | | 4.66 | % | | 4.77 | % |
|
Portfolio turnover rate (excluding short-term securities) | | | 22.90 | % | | 32.20 | % | | 27.58 | % | | 40.20 | % | | 41.39 | % |
| |
(a) | Total return figures are based on the change in net asset value of a share during the period and assume reinvestment of distributions at net asset value. |
| |
(b) | Total fund expenses are contractually limited to 0.60% of average daily net assets. However, during the years ended December 31, 2009, 2008, 2007, 2006, and 2005 the investment advisor voluntarily reduced management fees otherwise payable by the Funds. Had the Fund incurred these expenses, the ratio of expenses to average daily net assets would have been 0.60%, 0.60%, 0.60%, 0.60%, and 0.60%, for the years ended December 31, 2009, 2008, 2007, 2006, and 2005, respectively, and the ratio of net investment income to average daily net assets would have been 5.10%, 4.80%, 4.53%, 4.48%, and 4.65%, respectively. |
| |
(c) | In addition to fees and expenses which the Fund bears directly, the Fund indirectly bears a pro rata share of the fees and expenses of the acquired funds in which it invests. Such indirect expenses are not included in the above reported expense ratios. |
CLEARWATER INVESTMENT TRUST
Notes to Financial Statements
December 31, 2009
| | | | |
| | Year ended
December 31, | |
International Fund | | 2009 (a)(b) | |
|
Net asset value, beginning of period | | $ | 10.00 | |
|
Income from investment operations: | | | | |
Net investment income | | | 0.19 | |
Net realized and unrealized gains | | | 3.35 | |
Total from investment operations | | | 3.54 | |
Less distributions: | | | | |
Distributions from net investment income | | | (0.18 | ) |
Distributions from net realized gains | | | (0.20 | ) |
Total distributions | | | (0.38 | ) |
|
Net asset value, end of year | | $ | 13.16 | |
|
Total return (c) | | | 35.48 | % |
|
Net assets, end of year (000s omitted) | | $ | 292,902 | |
|
Ratio of expenses to average net assets (d)(e) | | | 0.92 | % |
|
Ratio of net investment income to average net assets (d)(e) | | | 1.74 | % |
|
Portfolio turnover rate (excluding short-term securities) | | | 35.33 | % |
| |
(a) | Commenced investment operations on February 5, 2009. |
| |
(b) | Net investment income for the period ended was calculated using the average shares outstanding method. |
| |
(c) | Total return figures are based on the change in net asset value of a share during the period and assume reinvestment of distributions at net asset value. Total return is not annualized for periods less than one year. |
| |
(d) | Total fund expenses are contractually limited to 1.00% of average daily net assets. However, during the period ended December 31, 2009, the investment advisor voluntarily reduced management fees otherwise payable by the Fund. Had the Fund incurred these expenses, the ratio of expenses to average daily net assets would have been 1.00%, for the period ended December 31, 2009, and the ratio of net investment income to average daily net assets would have been 1.66%. |
|
(e) | Annualized for periods less than one year. |
CLEARWATER INVESTMENT TRUST
Notes to Financial Statements
December 31, 2009
| |
(9) | Derivative Instruments |
| |
| None of the derivatives held in the International Fund have been designated as hedging instruments. Information concerning the types of derivatives in which the International Fund invests, the objectives for using them and their related risks can be found in Note 2. |
| |
| Below are the types of derivatives in the International Fund by location as presented in the Statement of Assets and Liabilities as of December 31, 2009: |
| |
| | | | | | | | | | | |
| | | ASSETS | | | | LIABILITIES | | | |
Derivative type | | Statement of Assets and
Liabilities Location | | Value | | Statement of Assets and
Liabilities Location | | Value | |
Foreign exchange contracts | | Unrealized appreciation on forward foreign currency exchange contracts | | $ | 5,831 | | Unrealized depreciation on forward foreign currency exchange contracts | | $ | 4,899 | |
The following tables set forth by primary risk exposure the International Fund’s realized gains (losses) and change in unrealized gains (losses) by type of derivative contract for the period ended December 31, 2009:
| | | | | | | | | | | | | |
AMOUNT OF REALIZED GAIN (LOSS) ON
DERIVATIVE CONTRACTS | | CHANGE IN UNREALIZED APPRECIATION
(DEPRECIATION) ON DERIVATIVE CONTRACTS |
Derivative type | | Statement of
Operations Location | | | Value | | Derivative type | | Statement of
Operations Location | | | Value | |
Foreign exchange contracts | | Net realized gain (loss) on foreign currency transactions | | $ | 661,749 | | Foreign exchange contracts | | Change in unrealized appreciation (depreciation) on forward foreign currency exchange contracts during the period | | $ | 932 | |
The following table presents the volume of derivative activity for the period ended December 31, 2009. Derivative activity during the period is measured by number of transactions during the period and average notional amount for foreign exchange contracts.
| | | | | | | |
| | Foreign Exchange Contracts | |
| | Number
of Transactions | | Average
Notional Amount | |
Clearwater International Fund | | | 3,430 | | | $81,830 | |
CLEARWATER INVESTMENT TRUST
Notes to Financial Statements
December 31, 2009
| |
(10) | Subsequent Events |
| |
| On February 9, 2010, the Board of Trustees voted to terminate the subadvisory contract of Keeley Asset Management Corporation (“Keeley”.) Keeley, one of two subadvisers to the Clearwater Small Cap Fund, manages approximately 25% of the assets of the Small Cap Fund. As of the date of this report, Keeley has been notified of the Board of Trustees’ decision. |
| |
| Management has evaluated subsequent events for the Funds through the date the financial statements were issued, and has concluded there are no additional events that require financial statement disclosure and/or adjustments to the financial statements. |
|
CLEARWATER INVESTMENT TRUST |
Schedule of Investments - Clearwater Growth Fund |
December 31, 2009 |
| | | | | | | | | | | | | |
Shares | | Security | | Cost | | Fair
value (a) | | Percent
of
net assets | |
Common stocks: | | | | | | | | | | |
Consumer discretionary: | | | | | | | | | | |
| 800 | | AARON S INC | | $ | 24,772 | | | 22,184 | | | | |
| 2,300 | | ABERCROMBIE + FITCH CO | | | 50,218 | | | 80,155 | | | | |
| 2,900 | | ADVANCE AUTO PARTS | | | 103,545 | | | 117,392 | | | | |
| 1,400 | | AEROPOSTALE (b) | | | 53,991 | | | 47,670 | | | | |
| 8,150 | | AMAZON COM INC (b) | | | 416,559 | | | 1,096,338 | | | | |
| 3,300 | | AMERICAN EAGLE OUTFITTERS INC | | | 33,099 | | | 56,034 | | | | |
| 2,100 | | AUTOLIV | | | 50,385 | | | 91,056 | | | | |
| 1,200 | | AUTOZONE INC (b) | | | 111,271 | | | 189,684 | | | | |
| 7,975 | | BED BATH + BEYOND INC (b) | | | 241,621 | | | 308,074 | | | | |
| 8,450 | | BEST BUY CO INC | | | 232,128 | | | 333,437 | | | | |
| 1,400 | | BIG LOTS INC (b) | | | 15,477 | | | 40,572 | | | | |
| 2,800 | | BJS WHSL CLUB INC (b) | | | 93,845 | | | 91,588 | | | | |
| 1,300 | | BLACK + DECKER CORPORATION | | | 44,208 | | | 84,279 | | | | |
| 3,800 | | BORG WARNER INC | | | 107,106 | | | 126,236 | | | | |
| 11,950 | | BRINKER INTL INC | | | 176,297 | | | 178,294 | | | | |
| 8,300 | | BROCADE COMMUNICATIONS SYS INC (b) | | | 52,215 | | | 63,329 | | | | |
| 6,400 | | CABLEVISION SYS CORP | | | 104,096 | | | 165,248 | | | | |
| 5,468 | | CARMAX INC (b) | | | 78,791 | | | 132,599 | | | | |
| 16,000 | | CARNIVAL CORP (b) | | | 508,260 | | | 507,040 | | | | |
| 14,043 | | CBS CORP NEW | | | 273,383 | | | 197,304 | | | | |
| 1,200 | | CENTRAL EUROPEAN MEDIA ENTERPR (b) | | | 24,318 | | | 28,332 | | | | |
| 5,100 | | CHICOS FAS INC (b) | | | 55,562 | | | 71,655 | | | | |
| 1,000 | | CHIPOTLE MEXICAN GRILL INC (b) | | | 83,937 | | | 88,160 | | | | |
| 4,500 | | CLEAR CHANNEL OUTDOOR HLDGS IN (b) | | | 27,962 | | | 46,755 | | | | |
| 7,500 | | COACH INC | | | 71,549 | | | 273,975 | | | | |
| 75,567 | | COMCAST CORP NEW | | | 1,337,579 | | | 1,274,060 | | | | |
| 2,600 | | COPART INC (b) | | | 76,486 | | | 95,238 | | | | |
| 11,800 | | COSTCO WHSL CORP NEW | | | 446,725 | | | 698,206 | | | | |
| 6,900 | | D R HORTON INC | | | 46,031 | | | 75,003 | | | | |
| 4,200 | | DARDEN RESTAURANTS INC | | | 109,766 | | | 147,294 | | | | |
| 1,500 | | DICKS SPORTING GOODS INC (b) | | | 24,803 | | | 37,305 | | | | |
| 23,748 | | DIRECTV GROUP INC (b) | | | 390,682 | | | 791,996 | | | | |
| 9,296 | | DISCOVERY COMMUNICATIONS INC (b) | | | 167,124 | | | 246,530 | | | | |
| 5,700 | | DISH NETWORK CORP | | | 174,889 | | | 118,389 | | | | |
| 48,860 | | DISNEY WALT CO | | | 1,096,498 | | | 1,575,735 | | | | |
| 2,000 | | DOLBY LABORATORIES INC (b) | | | 43,420 | | | 95,460 | | | | |
| 2,500 | | DOLLAR TREE INC (b) | | | 70,662 | | | 120,750 | | | | |
| 3,600 | | DREAMWORKS ANIMATION SKG (b) | | | 77,238 | | | 143,820 | | | | |
| 6,220 | | EXPEDIA INC DEL (b) | | | 124,528 | | | 159,916 | | | | |
| 5,600 | | FAMILY DLR STORES INC | | | 141,708 | | | 155,848 | | | | |
| 3,000 | | FOOT LOCKER INC | | | 40,394 | | | 33,420 | | | | |
| 83,163 | | FORD MTR CO DEL (b) | | | 506,171 | | | 831,630 | | | | |
| 4,300 | | FORTUNE BRANDS INC | | | 149,332 | | | 185,760 | | | | |
| 5,100 | | GAMESTOP CORP NEW (b) | | | 46,725 | | | 111,894 | | | | |
| 3,100 | | GANNETT INC | | | 25,746 | | | 46,035 | | | | |
| 12,000 | | GAP INC | | | 191,181 | | | 251,400 | | | | |
| 2,200 | | GARMIN LTD | | | 40,557 | | | 67,540 | | | | |
| 7,900 | | GENTEX CORP | | | 112,612 | | | 141,015 | | | | |
| 5,050 | | GENUINE PARTS CO | | | 153,969 | | | 191,698 | | | | |
| 4,200 | | GOODYEAR TIRE AND RUBBER (b) | | | 114,093 | | | 59,220 | | | | |
| 1,600 | | GUESS INC | | | 59,816 | | | 67,680 | | | | |
| 2,081 | | HANESBRANDS INC (b) | | | 53,684 | | | 50,173 | | | | |
| 6,750 | | HARLEY DAVIDSON INC | | | 39,547 | | | 170,100 | | | | |
| 4,300 | | HARMAN INTL INDS INC NEW | | | 74,799 | | | 151,704 | | | | |
| 4,700 | | HASBRO INC | | | 119,921 | | | 150,682 | | | | |
| 6,600 | | HERTZ GLOBAL HLDGS INC (b) | | | 37,676 | | | 78,672 | | | | |
| 41,025 | | HOME DEPOT INC | | | 204,348 | | | 1,186,853 | | | | |
| 2,710 | | IAC INTERACTIVECORP (b) | | | 66,598 | | | 55,501 | | | | |
| | |
See accompanying notes to financial statements. | 23 | (Continued) |
|
CLEARWATER INVESTMENT TRUST |
Schedule of Investments - Clearwater Growth Fund |
December 31, 2009 |
| | | | | | | | | | | | | |
Shares | | Security | | Cost | | Fair
value (a) | | Percent
of
net assets | |
Consumer discretionary (Cont’d): | | | | | | | | | | |
| 7,800 | | INTERNATIONAL GAME TECHNOLOGY | | $ | 211,426 | | | 146,406 | | | | |
| 15,600 | | INTERPUBLIC GROUP COS INC (b) | | | 40,950 | | | 115,128 | | | | |
| 5,300 | | J C PENNEY INC | | | 210,583 | | | 141,033 | | | | |
| 13,250 | | JOHNSON CTLS INC | | | 201,230 | | | 360,930 | | | | |
| 1,200 | | KB HOME | | | 31,938 | | | 16,416 | | | | |
| 8,450 | | KOHLS CORP (b) | | | 127,787 | | | 455,709 | | | | |
| 2,800 | | LAMAR ADVERTISING CO (b) | | | 29,498 | | | 87,052 | | | | |
| 6,200 | | LAS VEGAS SANDS CORP (b) | | | 42,935 | | | 92,628 | | | | |
| 3,700 | | LEGGETT +PLATT INC | | | 74,495 | | | 75,480 | | | | |
| 4,700 | | LENNAR CORP | | | 64,339 | | | 60,019 | | | | |
| 16,837 | | LIBERTY MEDIA CORP NEW - INTERACTIVE (b) | | | 134,351 | | | 182,513 | | | | |
| 4,440 | | LIBERTY MEDIA CORP NEW - CAPITAL (b) | | | 22,396 | | | 106,027 | | | | |
| 1,272 | | LIBERTY MEDIA STARZ SE A WI (b) | | | 18,267 | | | 58,703 | | | | |
| 8,090 | | LIMITED BRANDS INC | | | 92,851 | | | 155,652 | | | | |
| 41,500 | | LOWES COS INC | | | 765,581 | | | 970,685 | | | | |
| 3,300 | | M.D.C. HOLDINGS INC | | | 109,610 | | | 102,432 | | | | |
| 9,300 | | MACYS INC | | | 172,825 | | | 155,868 | | | | |
| 7,869 | | MARRIOTT INTL INC NEW | | | 130,250 | | | 214,430 | | | | |
| 8,700 | | MATTEL INC | | | 164,712 | | | 173,826 | | | | |
| 29,500 | | MCDONALDS CORP | | | 1,053,307 | | | 1,841,980 | | | | |
| 5,390 | | MCGRAW HILL COS INC | | | 156,956 | | | 180,619 | | | | |
| 3,700 | | MGM MIRACE INC (b) | | | 23,921 | | | 33,744 | | | | |
| 1,800 | | MOHAWK INDS INC (b) | | | 128,808 | | | 85,680 | | | | |
| 800 | | NETFLIX COM INC (b) | | | 32,332 | | | 44,112 | | | | |
| 4,200 | | NEWELL RUBBERMAID INC | | | 97,738 | | | 63,042 | | | | |
| 71,975 | | NEWS CORP | | | 943,234 | | | 985,338 | | | | |
| 8,800 | | NIKE INC | | | 324,896 | | | 581,416 | | | | |
| 4,300 | | NORDSTROM INC | | | 45,233 | | | 161,594 | | | | |
| 100 | | NVR INC (b) | | | 51,543 | | | 71,071 | | | | |
| 4,200 | | O REILLY AUTOMOTIVE INC (b) | | | 144,100 | | | 160,104 | | | | |
| 4,500 | | OFFICE DEPOT INC (b) | | | 65,209 | | | 29,025 | | | | |
| 7,495 | | OMNICOM GROUP | | | 278,273 | | | 293,429 | | | | |
| 1,500 | | PANERA BREAD CO (b) | | | 69,668 | | | 100,455 | | | | |
| 1,900 | | PENN NATL GAMING INC (b) | | | 71,272 | | | 51,642 | | | | |
| 2,900 | | PETSMART INC | | | 64,210 | | | 77,401 | | | | |
| 1,500 | | PHILLIPS VAN HEUSEN CORP | | | 61,290 | | | 61,020 | | | | |
| 1,500 | | POLO RALPH LAUREN CORP | | | 31,320 | | | 121,470 | | | | |
| 1,100 | | PRICELINECOM INC (b) | | | 120,841 | | | 240,350 | | | | |
| 10,400 | | PULTE HOMES INC | | | 106,280 | | | 104,000 | | | | |
| 6,200 | | RADIOSHACK CORP | | | 75,547 | | | 120,900 | | | | |
| 6,000 | | REGAL ENTMT GROUP | | | 86,655 | | | 86,640 | | | | |
| 3,500 | | ROSS STORES INC | | | 80,292 | | | 149,485 | | | | |
| 2,000 | | ROYAL CARIBBEAN CRUISES LTD | | | 25,110 | | | 50,560 | | | | |
| 2,300 | | SCRIPPS NETWORKS INTERACTIVE I | | | 91,239 | | | 95,450 | | | | |
| 1,227 | | SEARS HLDGS CORP (b) | | | 78,518 | | | 102,393 | | | | |
| 3,000 | | SHERWIN WILLIAMS CO | | | 150,183 | | | 184,950 | | | | |
| 2,600 | | SIGNET JEWELERS LTS (b) | | | 52,469 | | | 69,472 | | | | |
| 1,400 | | SNAP ON INC | | | 52,729 | | | 59,164 | | | | |
| 2,900 | | STANLEY WORKS | | | 129,263 | | | 149,379 | | | | |
| 19,350 | | STAPLES INC | | | 327,531 | | | 475,817 | | | | |
| 18,450 | | STARBUCKS CORP (b) | | | 249,339 | | | 425,457 | | | | |
| 5,010 | | STARWOOD HOTELS + RESORTS INC | | | 224,617 | | | 183,216 | | | | |
| 23,200 | | TARGET CORP | | | 883,352 | | | 1,122,184 | | | | |
| 1,900 | | THOR INDS INC | | | 22,316 | | | 59,660 | | | | |
| 4,200 | | TIFFANY +CO NEW | | | 122,192 | | | 180,600 | | | | |
| 9,279 | | TIME WARNER CABLE INC | | | 408,963 | | | 384,058 | | | | |
| 30,733 | | TIME WARNER INC | | | 788,784 | | | 895,560 | | | | |
| 10,347 | | TJX COS INC NEW | | | 205,891 | | | 378,183 | | | | |
| 4,700 | | TOLL BROS INC (b) | | | 102,805 | | | 88,407 | | | | |
| | |
See accompanying notes to financial statements. | 24 | (Continued) |
|
CLEARWATER INVESTMENT TRUST |
Schedule of Investments - Clearwater Growth Fund |
December 31, 2009 |
| | | | | | | | | | | | | |
Shares | | Security | | Cost | | Fair
value (a) | | Percent
of
net assets | |
Consumer discretionary (Cont’d): | | | | | | | | | | |
| 800 | | TRW AUTOMOTIVE HLDGS CORP (b) | | $ | 18,216 | | | 19,104 | | | | |
| 3,227 | | URBAN OUTFITTERS INC (b) | | | 61,562 | | | 112,913 | | | | |
| 2,900 | | V F CORP | | | 180,557 | | | 212,396 | | | | |
| 16,457 | | VIACOM INC NEW (b) | | | 520,692 | | | 489,267 | | | | |
| 7,400 | | VIRGIN MEDIA INC | | | 115,726 | | | 124,542 | | | | |
| 3,166 | | WABCO HLDGS INC | | | 71,725 | | | 81,651 | | | | |
| 700 | | WABTEC | | | 25,603 | | | 28,588 | | | | |
| 57,096 | | WAL MART STORES INC | | | 2,638,122 | | | 3,051,781 | | | | |
| 100 | | WASHINGTON POST CO | | | 43,247 | | | 43,960 | | | | |
| 9,090 | | WENDYS/ARBYS GROUP INC | | | 56,673 | | | 42,632 | | | | |
| 2,300 | | WHIRLPOOLCORP | | | 98,184 | | | 185,518 | | | | |
| 1,000 | | WILEY JOHN + SONS INC | | | 40,649 | | | 41,880 | | | | |
| 600 | | WMS INDUSTRIES INC (b) | | | 24,981 | | | 24,000 | | | | |
| 5,475 | | WYNDHAM WORLDWIDE CORP | | | 24,501 | | | 110,431 | | | | |
| 1,600 | | WYNN RESORTS LTD | | | 42,372 | | | 93,168 | | | | |
| 11,416 | | YUM BRANDS INC | | | 146,079 | | | 399,218 | | | | |
| | | | | | | | | | | | | |
| | | | | | 24,183,027 | | | 33,284,927 | | | 11.35 | % |
Consumer staples: | | | | | | | | | | |
| 1,600 | | ALBERTO CULIVER CO NEW | | | 38,952 | | | 46,864 | | | | |
| 57,100 | | ALTRIA GROUP INC | | | 597,136 | | | 1,120,873 | | | | |
| 15,900 | | ARCHER DANIELS MIDLAND CO | | | 350,257 | | | 497,829 | | | | |
| 12,162 | | AVON PRODS INC | | | 310,053 | | | 383,103 | | | | |
| 3,144 | | BROWN FORMAN CORP | | | 115,946 | | | 168,424 | | | | |
| 3,200 | | BUNGE LIMITED | | | 255,908 | | | 204,256 | | | | |
| 7,300 | | CAMPBELL SOUP CO | | | 204,835 | | | 246,740 | | | | |
| 1,500 | | CENTRAL EUROPEAN DISTR CORP (b) | | | 21,353 | | | 42,615 | | | | |
| 3,000 | | CHURCH AND DWIGHT INC | | | 157,235 | | | 181,350 | | | | |
| 3,600 | | CLOROX CO | | | 190,920 | | | 219,600 | | | | |
| 61,659 | | COCA COLA CO | | | 2,445,980 | | | 3,514,563 | | | | |
| 6,200 | | COCA COLA ENTERPRISES INC | | | 118,931 | | | 131,440 | | | | |
| 12,390 | | COLGATE PALMOLIVE CO | | | 727,954 | | | 1,017,839 | | | | |
| 15,000 | | CONAGRA INC | | | 326,418 | | | 345,750 | | | | |
| 4,600 | | CONSTELLATION BRANDS INC (b) | | | 63,227 | | | 73,278 | | | | |
| 1,300 | | CORN PRODUCTS INTL INC | | | 29,972 | | | 37,999 | | | | |
| 40,522 | | CVS CAREMARK CORP | | | 863,946 | | | 1,305,214 | | | | |
| 3,700 | | DEAN FOODS CO NEW (b) | | | 73,612 | | | 66,748 | | | | |
| 5,773 | | DEL MONTE FOODS CO | | | 57,723 | | | 65,466 | | | | |
| 6,000 | | DR PEPPER SNAPPLE GROUP INC (b) | | | 125,060 | | | 169,800 | | | | |
| 1,200 | | FLOWERS FOODS INC | | | 25,434 | | | 28,512 | | | | |
| 7,100 | | GENERAL MLS INC | | | 328,188 | | | 502,751 | | | | |
| 800 | | GREEN MTN COFFEE ROASTERS (b) | | | 44,948 | | | 65,176 | | | | |
| 1,600 | | HANSEN NAT CORP (b) | | | 61,969 | | | 61,440 | | | | |
| 8,075 | | HEINZ H JCO | | | 303,404 | | | 345,287 | | | | |
| 1,900 | | HERBALIFE LTD | | | 52,204 | | | 77,083 | | | | |
| 3,100 | | HERSHEY CO / THE | | | 120,285 | | | 110,949 | | | | |
| 3,100 | | HORMEL FOODS CORP | | | 111,616 | | | 119,195 | | | | |
| 5,600 | | KELLOGG CO | | | 258,254 | | | 297,920 | | | | |
| 10,250 | | KIMBERLY CLARK CORP | | | 587,793 | | | 653,028 | | | | |
| 44,838 | | KRAFT FOODS INC (b) | | | 900,485 | | | 1,218,697 | | | | |
| 16,400 | | KROGER CO | | | 292,193 | | | 336,692 | | | | |
| 2,667 | | LAUDER ESTEE COS INC | | | 103,843 | | | 128,976 | | | | |
| 3,300 | | LORILLARD INC | | | 157,432 | | | 264,759 | | | | |
| 2,800 | | MCCORMICK+ CO INC | | | 97,399 | | | 101,164 | | | | |
| 80,478 | | MERCK + CO INC NEW | | | 2,270,379 | | | 2,940,666 | | | | |
| 2,400 | | MOLSON COORS BREWING CO | | | 78,697 | | | 108,384 | | | | |
| 1,000 | | NBTY INC (b) | | | 21,300 | | | 43,540 | | | | |
| 3,700 | | PEPSI BOTTLING GROUP INC | | | 103,155 | | | 138,750 | | | | |
| 900 | | PEPSIAMERICAS INC | | | 23,765 | | | 26,334 | | | | |
| 40,626 | | PEPSICO INC | | | 1,773,663 | | | 2,470,061 | | | | |
| | |
See accompanying notes to financial statements. | 25 | (Continued) |
|
CLEARWATER INVESTMENT TRUST |
Schedule of Investments - Clearwater Growth Fund |
December 31, 2009 |
| | | | | | | | | | | | | |
Shares | | Security | | Cost | | Fair
value (a) | | Percent
of
net assets | |
Consumer staples (Cont’d): | | | | | | | | | | |
| 52,700 | | PHILIP MORRIS INTL ORD SHR | | $ | 1,138,121 | | | 2,539,613 | | | | |
| 77,489 | | PROCTER AND GAMBLE CO | | | 2,361,508 | | | 4,698,158 | | | | |
| 2,100 | | RALCORP HLDGS INC NEW (b) | | | 128,338 | | | 125,391 | | | | |
| 3,300 | | REYNOLDS AMERN INC | | | 124,559 | | | 174,801 | | | | |
| 11,419 | | SAFEWAY INC | | | 225,733 | | | 243,111 | | | | |
| 20,650 | | SARA LEE CORP | | | 225,034 | | | 251,517 | | | | |
| 5,400 | | SMITHFIELD FOODS INC (b) | | | 108,846 | | | 82,026 | | | | |
| 2,700 | | SMUCKER JM CO | | | 124,838 | | | 166,725 | | | | |
| 4,606 | | SUPERVALU INC | | | 89,569 | | | 58,542 | | | | |
| 14,000 | | SYSCO CORP | | | 285,312 | | | 391,160 | | | | |
| 2,100 | | TERRA INDS INC | | | 102,659 | | | 67,599 | | | | |
| 9,527 | | TYSON FOODS INC (DEL) | | | 111,286 | | | 116,896 | | | | |
| 23,050 | | WALGREEN CO | | | 270,653 | | | 846,396 | | | | |
| 3,000 | | WHOLE FOODS MKT INC (b) | | | 64,425 | | | 82,350 | | | | |
| | | | | | | | | | | | | |
| | | | | | 20,152,696 | | | 29,723,399 | | | 10.14 | % |
Energy: | | | | | | | | | | |
| 14,546 | | ANADARKO PETE CORP | | | 641,100 | | | 907,961 | | | | |
| 8,334 | | APACHE CORP | | | 370,833 | | | 859,819 | | | | |
| 7,500 | | BAKER HUGHES INC | | | 443,015 | | | 303,600 | | | | |
| 10,000 | | BJ SVCS CO | | | 226,632 | | | 186,000 | | | | |
| 1,804 | | CABOT OIL+ GAS CORP | | | 57,973 | | | 78,636 | | | | |
| 5,000 | | CAMERON INTL CORP (b) | | | 131,489 | | | 209,000 | | | | |
| 15,086 | | CHESAPEAKE ENERGY CORP | | | 355,404 | | | 390,426 | | | | |
| 52,095 | | CHEVRON CORP | | | 2,701,263 | | | 4,010,794 | | | | |
| 2,800 | | CIMAREX ENERGY CO | | | 154,862 | | | 148,316 | | | | |
| 3,200 | | CONCHO RES INC (b) | | | 107,893 | | | 143,680 | | | | |
| 39,144 | | CONOCOPHILLIPS | | | 1,303,880 | | | 1,999,084 | | | | |
| 4,631 | | CONSOL ENERGY INC | | | 120,948 | | | 230,624 | | | | |
| 1,000 | | CONTINENTAL RES INC OK (b) | | | 20,765 | | | 42,890 | | | | |
| 9,300 | | DENBURY RES INC (b) | | | 88,955 | | | 137,640 | | | | |
| 14,023 | | DEVON ENERGY CORPORATION NEW | | | 719,712 | | | 1,030,691 | | | | |
| 1,700 | | DIAMOND OFFSHORE DRILLING INC | | | 159,726 | | | 167,314 | | | | |
| 4,100 | | DRESSER RAND GROUP INC (b) | | | 134,747 | | | 129,601 | | | | |
| 17,400 | | EL PASO CORP | | | 139,789 | | | 171,042 | | | | |
| 1,200 | | ENCORE AQUISITION CO (b) | | | 85,206 | | | 57,624 | | | | |
| 3,654 | | ENSCO INTERNATIONAL SPON ADR (d) | | | 161,474 | | | 145,941 | | | | |
| 7,900 | | EOG RESOURCES INC | | | 319,223 | | | 768,670 | | | | |
| 3,700 | | EXCO RES INC | | | 56,238 | | | 78,551 | | | | |
| 8,400 | | EXTERRAN HLDGS INC (b) | | | 175,098 | | | 180,180 | | | | |
| 126,033 | | EXXON MOBIL CORP | | | 6,126,570 | | | 8,594,190 | | | | |
| 3,200 | | FMC TECHNOLOGIES INC (b) | | | 138,073 | | | 185,088 | | | | |
| 4,100 | | FRONTIER OIL CORP | | | 57,462 | | | 49,364 | | | | |
| 22,858 | | HALLIBURTON CO | | | 509,109 | | | 687,797 | | | | |
| 2,200 | | HELIX ENERGY SOLUTIONS GROUP (b) | | | 23,551 | | | 25,850 | | | | |
| 3,100 | | HELMERICH AND PAYNE INC | | | 39,003 | | | 123,628 | | | | |
| 6,600 | | HESS CORP | | | 450,982 | | | 399,300 | | | | |
| 1,200 | | HOLLY CORP | | | 22,578 | | | 30,756 | | | | |
| 23,586 | | MARATHON OIL CORP | | | 631,024 | | | 736,355 | | | | |
| 4,100 | | MARINER ENERGY INC (b) | | | 52,383 | | | 47,601 | | | | |
| 2,000 | | MASSEY ENERGY CORP | | | 68,948 | | | 84,020 | | | | |
| 5,200 | | MURPHY OIL CORP | | | 172,519 | | | 281,840 | | | | |
| 5,400 | | NABORS INDUSTRIES LTD (b) | | | 164,133 | | | 118,206 | | | | |
| 9,622 | | NATIONAL OILWELL VARCO INC | | | 245,031 | | | 424,234 | | | | |
| 5,142 | | NEWFIELD EXPL CO (b) | | | 222,527 | | | 247,999 | | | | |
| 4,200 | | NOBLE ENERGY INC | | | 158,333 | | | 299,124 | | | | |
| 20,214 | | OCCIDENTAL PETE CORP | | | 397,871 | | | 1,644,409 | | | | |
| 2,000 | | OCEANEERING INTL INC (b) | | | 102,370 | | | 117,040 | | | | |
| 900 | | OIL STATES INTL INC (b) | | | 54,464 | | | 35,361 | | | | |
| 5,600 | | PATTERSON UTI ENERGY INC | | | 114,212 | | | 85,960 | | | | |
| | |
See accompanying notes to financial statements. | 26 | (Continued) |
|
CLEARWATER INVESTMENT TRUST |
Schedule of Investments - Clearwater Growth Fund |
December 31, 2009 |
| | | | | | | | | | | | | |
Shares | | Security | | Cost | | Fair
value (a) | | Percent
of
net assets | |
Energy (Cont’d): | | | | | | | | | | |
| 6,700 | | PEABODY ENERGY CORP | | $ | 188,391 | | | 302,907 | | | | |
| 3,200 | | PIONEER NAT RES CO | | | 48,507 | | | 154,144 | | | | |
| 3,300 | | PLAINS EXPL + PRODTN CO (b) | | | 92,785 | | | 91,278 | | | | |
| 5,600 | | PRIDE INTERNATIONAL INC (b) | | | 176,387 | | | 178,696 | | | | |
| 5,810 | | QUICKSILVER RES INC (b) | | | 119,305 | | | 87,208 | | | | |
| 4,800 | | RANGE RESCORP | | | 198,185 | | | 239,280 | | | | |
| 1,100 | | ROWAN COS INC | | | 50,419 | | | 24,904 | | | | |
| 4,700 | | SANDRIDGE ENERGY INC (b) | | | 41,069 | | | 44,321 | | | | |
| 30,500 | | SCHLUMBERGER LTD | | | 1,622,723 | | | 1,985,245 | | | | |
| 5,200 | | SMITH INTL INC | | | 112,076 | | | 141,284 | | | | |
| 9,300 | | SOUTHWESTERN ENERGY CO (b) | | | 163,645 | | | 448,260 | | | | |
| 2,400 | | SUNOCO INC | | | 50,440 | | | 62,640 | | | | |
| 4,700 | | SUPERIOR ENERGY SVCS INC (b) | | | 169,835 | | | 114,163 | | | | |
| 1,800 | | TESORO CORP | | | 28,809 | | | 24,390 | | | | |
| 2,300 | | TIDEWATER INC | | | 118,715 | | | 110,285 | | | | |
| 10,710 | | VALERO ENERGY CORP | | | 111,500 | | | 179,393 | | | | |
| 1,300 | | WHITING PETE CORP NEW (b) | | | 73,761 | | | 92,885 | | | | |
| 20,275 | | WILLIAMS COS INC | | | 386,539 | | | 427,397 | | | | |
| 12,846 | | XTO ENERGY INC | | | 369,473 | | | 597,724 | | | | |
| | | | | | | | | | | | | |
| | | | | | 22,549,925 | | | 31,902,609 | | | 10.88 | % |
Financials: | | | | | | | | | | |
| 500 | | AFFILIATED MANAGERS GROUP INC (b) | | | 28,438 | | | 33,675 | | | | |
| 13,250 | | AFLAC INC | | | 403,500 | | | 612,813 | | | | |
| 700 | | ALEXANDRIA REAL ESTATE EQUIT | | | 25,015 | | | 45,003 | | | | |
| 2,700 | | ALLIED WORLD ASSURANCE COMPANY | | | 86,630 | | | 124,389 | | | | |
| 10,500 | | ALLSTATE CORP | | | 409,968 | | | 315,420 | | | | |
| 4,829 | | AMB PPTY CORP | | | 161,507 | | | 123,381 | | | | |
| 30,033 | | AMERICAN EXPRESS CO | | | 1,023,561 | | | 1,216,937 | | | | |
| 1,800 | | AMERICAN FINL GROUP INC OHIO | | | 29,745 | | | 44,910 | | | | |
| 2,600 | | AMERICAN INTL GROUP INC (b) | | | 40,854 | | | 77,948 | | | | |
| 2,700 | | AMERICREDIT CORP (b) | | | 31,865 | | | 51,408 | | | | |
| 7,191 | | AMERIPRISE FINL INC | | | 278,023 | | | 279,155 | | | | |
| 14,400 | | ANNALY CAPITAL MANAGEMENT INC | | | 233,405 | | | 249,840 | | | | |
| 7,000 | | AON CORP | | | 213,108 | | | 268,380 | | | | |
| 6,028 | | APARTMENT INVT + MGMT CO | | | 121,929 | | | 95,966 | | | | |
| 1,600 | | ARCH CAP GROUP LTD (b) | | | 101,982 | | | 114,480 | | | | |
| 2,000 | | ASPEN INSURANCE HOLDINGS LTD (b) | | | 45,330 | | | 50,900 | | | | |
| 4,100 | | ASSOCIATED BANC CORP | | | 116,092 | | | 45,141 | | | | |
| 4,300 | | ASSURANT INC | | | 180,126 | | | 126,764 | | | | |
| 1,834 | | AVALONBAY CMNTYS INC | | | 136,479 | | | 150,590 | | | | |
| 5,100 | | AXIS CAPITAL HOLDINGS LTD | | | 187,376 | | | 144,891 | | | | |
| 3,400 | | BANCORPSOUTH INC | | | 62,679 | | | 79,764 | | | | |
| 34,001 | | BANK NEW YORK MELLON CORP | | | 1,012,806 | | | 951,008 | | | | |
| 224,565 | | BANK OF AMERICA CORP | | | 5,518,546 | | | 3,381,949 | | | | |
| 24,058 | | BB+T CORP | | | 615,407 | | | 610,351 | | | | |
| 5,206 | | BERKLEY WR CORP | | | 157,149 | | | 128,276 | | | | |
| 600 | | BLACKROCK INC CLA | | | 110,619 | | | 139,320 | | | | |
| 3,688 | | BOSTON PPTYS INC | | | 200,830 | | | 247,354 | | | | |
| 6,500 | | BRANDYWINE RLTY TR | | | 106,523 | | | 74,100 | | | | |
| 1,100 | | BRE PPTYS INC | | | 25,471 | | | 36,388 | | | | |
| 2,600 | | BROWN + BROWN INC | | | 50,447 | | | 46,722 | | | | |
| 900 | | CAMDEN PPTY TR | | | 24,791 | | | 38,133 | | | | |
| 11,447 | | CAPITAL ONE FINL CORP | | | 360,144 | | | 438,878 | | | | |
| 6,900 | | CAPITALSOURCE INC | | | 23,267 | | | 27,393 | | | | |
| 3,700 | | CB RICHARD ELLIS GROUP INC (b) | | | 84,241 | | | 50,209 | | | | |
| 14,200 | | CHIMERA INVT CORP | | | 49,341 | | | 55,096 | | | | |
| 8,000 | | CHUBB CORP | | | 365,714 | | | 393,440 | | | | |
| 2,756 | | CINCINNATI FINL CORP | | | 103,501 | | | 72,317 | | | | |
| 409,315 | | CITIGROUP INC | | | 2,701,389 | | | 1,354,833 | | | | |
| | |
See accompanying notes to financial statements. | 27 | (Continued) |
|
CLEARWATER INVESTMENT TRUST |
Schedule of Investments - Clearwater Growth Fund |
December 31, 2009 |
| | | | | | | | | | | | | |
Shares | | Security | | Cost | | Fair
value (a) | | Percent
of
net assets | |
Financials (Cont’d): | | | | | | | | | | |
| 1,300 | | CITY NATL CORP | | $ | 47,574 | | | 59,280 | | | | |
| 1,573 | | CME GROUP INC | | | 449,149 | | | 528,449 | | | | |
| 4,300 | | COMERICA INC | | | 217,302 | | | 127,151 | | | | |
| 900 | | CORPORATE OFFICE PPTYS TR | | | 25,241 | | | 32,967 | | | | |
| 2,800 | | CORRECTIONS CORP AMER NEW (b) | | | 56,290 | | | 68,740 | | | | |
| 2,300 | | DIGITAL RLTY TR INC | | | 91,488 | | | 115,644 | | | | |
| 20,987 | | DISCOVER FINL SVCS | | | 310,849 | | | 308,719 | | | | |
| 2,800 | | DOUGLAS EMMETT INC | | | 24,514 | | | 39,900 | | | | |
| 2,500 | | DUKE RLTY CORP | | | 64,721 | | | 30,425 | | | | |
| 900 | | ENDURANCE SPECIALTY HOLDINGS | | | 25,106 | | | 33,507 | | | | |
| 5,416 | | EQUITY RESIDENTIAL | | | 174,162 | | | 182,952 | | | | |
| 2,900 | | ERIE INDTY CO | | | 151,861 | | | 113,158 | | | | |
| 2,400 | | EVEREST REINSURANCE GROUP LTD | | | 184,908 | | | 205,632 | | | | |
| 900 | | FEDERAL RLTY INVT TR | | | 48,629 | | | 60,948 | | | | |
| 3,000 | | FEDERATED INVS INC PA | | | 71,403 | | | 82,500 | | | | |
| 6,281 | | FIDELITY NATL FINL INC | | | 104,831 | | | 84,542 | | | | |
| 17,400 | | FIFTH THIRD BANCORP | | | 138,329 | | | 169,650 | | | | |
| 900 | | FIRST AMERICAN CORP | | | 28,508 | | | 29,799 | | | | |
| 600 | | FIRST CTZNS BANCSHARES INC N C | | | 86,506 | | | 98,406 | | | | |
| 15,847 | | FIRST HORIZON NATL CORP | | | 213,316 | | | 212,350 | | | | |
| 3,200 | | FIRST NIAGARA FINL GROUP INC | | | 37,456 | | | 44,512 | | | | |
| 3,659 | | FRANKLIN RES INC | | | 208,927 | | | 385,476 | | | | |
| 3,500 | | FULTON FINL CORP PA | | | 37,748 | | | 30,520 | | | | |
| 1,600 | | GALLAGHER ARTHUR J + CO | | | 34,040 | | | 36,016 | | | | |
| 15,500 | | GENWORTH FINL INC (b) | | | 192,577 | | | 175,925 | | | | |
| 13,000 | | GLG PARTNERS INC (b) | | | 48,200 | | | 41,860 | | | | |
| 13,426 | | GOLDMAN SACHS GROUP INC | | | 1,422,609 | | | 2,266,846 | | | | |
| 400 | | GREENHILL + CO INC | | | 27,762 | | | 32,096 | | | | |
| 1,200 | | HANOVER INS GROUP INC | | | 51,342 | | | 53,316 | | | | |
| 7,800 | | HARTFORD FINANCIAL SVCS GRP | | | 284,978 | | | 181,428 | | | | |
| 1,000 | | HCC INS HLDGS INC | | | 24,155 | | | 27,970 | | | | |
| 7,100 | | HCP INC | | | 118,485 | | | 216,834 | | | | |
| 4,000 | | HEALTH CARE REIT INC | | | 162,580 | | | 177,280 | | | | |
| 1,800 | | HOSPITALITY PPTYS TR | | | 23,967 | | | 42,678 | | | | |
| 14,422 | | HOST HOTELS + RESORTS INC | | | 138,467 | | | 168,305 | | | | |
| 6,400 | | HRPT PPTYS TR | | | 56,139 | | | 41,408 | | | | |
| 9,800 | | HUDSON CITY BANCORP INC | | | 155,183 | | | 134,554 | | | | |
| 11,100 | | HUNTINGTON BANCSHARES INC | | | 51,227 | | | 40,515 | | | | |
| 2,100 | | INTERCONTINENTAL EXCHANGE INC (b) | | | 266,834 | | | 235,830 | | | | |
| 9,000 | | INVESCO LTD | | | 201,525 | | | 211,410 | | | | |
| 1,200 | | INVESTMENT TECHNOLOGY GROUP (b) | | | 25,026 | | | 23,640 | | | | |
| 7,200 | | JANUS CAP GROUP INC | | | 93,054 | | | 96,840 | | | | |
| 2,700 | | JEFFERIES GROUP INC NEW (b) | | | 64,508 | | | 64,071 | | | | |
| 2,700 | | JONES LANG LASALLE INC | | | 155,615 | | | 163,080 | | | | |
| 99,246 | | JPMORGAN CHASE + CO | | | 3,049,718 | | | 4,135,581 | | | | |
| 12,900 | | KEYCORP NEW | | | 160,418 | | | 71,595 | | | | |
| 11,901 | | KIMCO RLTY CORP | | | 259,284 | | | 161,021 | | | | |
| 6,152 | | LEGG MASON INC | | | 147,960 | | | 185,544 | | | | |
| 3,500 | | LEUCADIA NATL CORP (b) | | | 126,468 | | | 83,265 | | | | |
| 1,100 | | LIBERTY PROPERTY | | | 24,811 | | | 35,211 | | | | |
| 9,248 | | LINCOLN NATL CORP IN | | | 312,337 | | | 230,090 | | | | |
| 6,700 | | LOEWS CORP | | | 155,821 | | | 243,545 | | | | |
| 5,251 | | MACERICH CO | | | 139,318 | | | 188,773 | | | | |
| 5,200 | | MACK CA RLTY CORP | | | 157,688 | | | 179,764 | | | | |
| 700 | | MARKEL CORP (b) | | | 237,260 | | | 238,000 | | | | |
| 12,578 | | MARSH + MCLENNAN COS INC | | | 320,563 | | | 277,722 | | | | |
| 6,299 | | MARSHALL + ILSLEY CORP NEW | | | 75,858 | | | 34,330 | | | | |
| 7,800 | | MBIA INC (b) | | | 38,883 | | | 31,044 | | | | |
| 1,300 | | MERCURY GEN CORP | | | 38,019 | | | 51,038 | | | | |
| | |
See accompanying notes to financial statements. | 28 | (Continued) |
|
CLEARWATER INVESTMENT TRUST |
Schedule of Investments - Clearwater Growth Fund |
December 31, 2009 |
| | | | | | | | | | | | | |
Shares | | Security | | Cost | | Fair
value (a) | | Percent
of
net assets | |
Financials (Cont’d): | | | | | | | | | | |
| 13,700 | | METLIFE INC | | $ | 433,601 | | | 484,295 | | | | |
| 4,400 | | MOODYS CORP | | | 173,138 | | | 117,920 | | | | |
| 35,560 | | MORGAN STANLEY | | | 1,051,333 | | | 1,052,576 | | | | |
| 600 | | MORNINGSTAR INC (b) | | | 26,109 | | | 29,004 | | | | |
| 900 | | MSCI INC (b) | | | 25,745 | | | 28,620 | | | | |
| 4,000 | | NASDAQ OMX GROUP INC (b) | | | 124,060 | | | 79,280 | | | | |
| 1,500 | | NATIONWIDE HEALTH PPTYS INC | | | 48,338 | | | 52,770 | | | | |
| 9,749 | | NEW YORK CMNTY BANCORP INC | | | 112,805 | | | 141,458 | | | | |
| 94,002 | | NORTHERN TRUST CORP | | | 459,256 | | | 492,665 | | | | |
| 6,500 | | NYSE EURONEXT | | | 317,543 | | | 164,450 | | | | |
| 8,925 | | OLD REP INTL CORP | | | 135,413 | | | 89,607 | | | | |
| 2,100 | | ONEBEACON INSURANCE GROUP LTD | | | 46,442 | | | 28,938 | | | | |
| 1,000 | | PARTNERRE LTD | | | 66,204 | | | 74,660 | | | | |
| 6,023 | | PEOPLES UTD FINL INC | | | 94,488 | | | 100,584 | | | | |
| 5,485 | | PLUM CREEK TIMBER CO INC | | | 142,391 | | | 207,114 | | | | |
| 15,125 | | PNC FINL SVCS GROUP INC | | | 652,287 | | | 798,449 | | | | |
| 68,200 | | POPULAR INC | | | 151,745 | | | 154,132 | | | | |
| 6,400 | | PRICE T ROWE GROUP INC | | | 128,107 | | | 340,800 | | | | |
| 7,450 | | PRINCIPAL FINANCIAL GROUP | | | 258,099 | | | 179,098 | | | | |
| 17,748 | | PROGRESSIVE CORP OHIO (b) | | | 307,204 | | | 319,287 | | | | |
| 11,872 | | PROLOGIS | | | 262,406 | | | 162,528 | | | | |
| 2,200 | | PROTECTIVE LIFE CORP | | | 24,849 | | | 36,410 | | | | |
| 10,600 | | PRUDENTIAL FINL INC | | | 388,745 | | | 527,456 | | | | |
| 3,691 | | PUBLIC STORAGE | | | 271,725 | | | 300,632 | | | | |
| 2,825 | | RAYMOND JAMES FINANCIAL INC | | | 70,271 | | | 67,150 | | | | |
| 2,700 | | REALTY INCOME CORP | | | 66,843 | | | 69,957 | | | | |
| 3,900 | | REGENCY CTRS CORP | | | 103,877 | | | 136,734 | | | | |
| 23,099 | | REGIONS FINL CORP NEW | | | 98,977 | | | 122,194 | | | | |
| 2,900 | | RENAISSANCERE HOLDINGS LTD | | | 136,231 | | | 154,135 | | | | |
| 21,400 | | SCHWAB CHARLES CORP | | | 186,608 | | | 402,748 | | | | |
| 5,400 | | SEI INVESTMENTS CO | | | 74,937 | | | 94,608 | | | | |
| 1,500 | | SENIOR HSG PPTSY TR | | | 25,073 | | | 32,805 | | | | |
| 8,295 | | SIMON PPTY GROUP INC NEW | | | 523,598 | | | 661,941 | | | | |
| 1,500 | | SL GREEN RLTY CORP | | | 32,888 | | | 75,360 | | | | |
| 11,200 | | SLM CORP (b) | | | 149,572 | | | 126,224 | | | | |
| 3,300 | | ST JOE CO (b) | | | 98,033 | | | 95,337 | | | | |
| 16,835 | | STATE STREET CORPORATION | | | 752,885 | | | 732,996 | | | | |
| 14,334 | | SUNTRUST BKS INC | | | 249,943 | | | 290,837 | | | | |
| 2,100 | | TAUBMAN CENTERS INC | | | 62,942 | | | 75,411 | | | | |
| 3,900 | | TCF FINANCIAL CORP | | | 33,574 | | | 53,118 | | | | |
| 7,566 | | TD AMERITRADE HLDG CORP (b) | | | 121,495 | | | 146,629 | | | | |
| 5,700 | | TFS FINL CORP | | | 68,529 | | | 69,198 | | | | |
| 3,500 | | TORCHMARK INC | | | 157,289 | | | 153,825 | | | | |
| 1,100 | | TRANSATLANTIC HLDGS INC | | | 71,062 | | | 57,321 | | | | |
| 14,088 | | TRAVELERS COS INC | | | 553,459 | | | 702,428 | | | | |
| 2,400 | | UDR INC | | | 24,876 | | | 39,456 | | | | |
| 4,000 | | UNITRIN INC | | | 101,606 | | | 88,200 | | | | |
| 8,900 | | UNUM GROUP | | | 140,762 | | | 173,728 | | | | |
| 49,185 | | US BANCORP DEL | | | 1,083,267 | | | 1,107,154 | | | | |
| 1,100 | | VALIDUS HOLDINGS LTD | | | 23,557 | | | 29,634 | | | | |
| 5,613 | | VALLEY NATL BANCORP | | | 95,555 | | | 79,312 | | | | |
| 4,700 | | VENTAS INC | | | 202,147 | | | 205,578 | | | | |
| 12,000 | | VISA INC | | | 954,352 | | | 1,049,520 | | | | |
| 3,244 | | VORNADO RLTY TR | | | 240,879 | | | 226,885 | | | | |
| 3,200 | | WADDELL + REED FINL INC | | | 83,222 | | | 97,728 | | | | |
| 5,200 | | WASHINGTON FED INC | | | 71,016 | | | 100,568 | | | | |
| 1,900 | | WEINGARTEN RLTY INVS | | | 25,128 | | | 37,601 | | | | |
| 122,245 | | WELLS FARGO + CO NEW | | | 2,151,914 | | | 3,299,393 | | | | |
| 2,800 | | WHITNEY HLDG CORP | | | 53,158 | | | 25,508 | | | | |
| | |
See accompanying notes to financial statements. | 29 | (Continued) |
|
CLEARWATER INVESTMENT TRUST |
Schedule of Investments - Clearwater Growth Fund |
December 31, 2009 |
| | | | | | | | | | | | | |
Shares | | Security | | Cost | | Fair
value (a) | | Percent
of
net assets | |
Financials (Cont’d): | | | | | | | | | | |
| 1,900 | | WILMINGTON TR CORP | | $ | 24,197 | | | 23,446 | | | | |
| 7,225 | | XL CAPITAL LTD | | | 92,119 | | | 132,434 | | | | |
| 3,500 | | ZIONS BANCORP | | | 167,964 | | | 44,905 | | | | |
| | | | | | 41,945,115 | | | 42,965,910 | | | 14.65 | % |
Healthcare: | | | | | | | | | | | |
| 44,135 | | ABBOTT LABS | | | 1,832,261 | | | 2,382,849 | | | | |
| 10,600 | | AETNA INC | | | 167,862 | | | 336,020 | | | | |
| 2,000 | | ALEXION PHARMACEUTICALS INC (b) | | | 77,450 | | | 97,640 | | | | |
| 6,386 | | ALLERGAN INC | | | 259,743 | | | 402,382 | | | | |
| 7,200 | | AMERISOURCEBERGEN CORP | | | 115,968 | | | 187,704 | | | | |
| 25,550 | | AMGEN INC (b) | | | 306,444 | | | 1,445,364 | | | | |
| 2,700 | | AMYLIN PHARMACEUTICALS INC (b) | | | 82,493 | | | 38,313 | | | | |
| 2,200 | | BARD C R INC | | | 143,930 | | | 171,380 | | | | |
| 17,300 | | BAXTER INTL INC | | | 585,541 | | | 1,015,164 | | | | |
| 1,900 | | BECKMAN COULTER INC | | | 99,749 | | | 124,336 | | | | |
| 6,400 | | BECTON DICKINSON + CO | | | 410,281 | | | 504,704 | | | | |
| 7,150 | | BIOGEN IDEC INC (b) | | | 90,430 | | | 382,525 | | | | |
| 2,300 | | BIOMARIN PHARMACEUTICAL INC (b) | | | 67,195 | | | 43,263 | | | | |
| 32,550 | | BOSTON SCIENTIFIC CORP (b) | | | 361,757 | | | 292,950 | | | | |
| 57,600 | | BRISTOL MYERS SQUIBB CO | | | 1,410,785 | | | 1,454,400 | | | | |
| 7,450 | | CARDINAL HEALTH INC | | | 276,076 | | | 240,188 | | | | |
| 3,875 | | CAREFUSION CORP (b) | | | 111,234 | | | 96,914 | | | | |
| 12,136 | | CELGENE CORP (b) | | | 433,140 | | | 675,732 | | | | |
| 1,800 | | CEPHALON INC (b) | | | 99,644 | | | 112,338 | | | | |
| 800 | | CHARLES RIV LABORATORIES INTL (b) | | | 24,460 | | | 26,952 | | | | |
| 7,200 | | CIGNA CORP | | | 116,553 | | | 253,944 | | | | |
| 3,000 | | COMMUNITY HEALTH SYS INC NEW (b) | | | 97,596 | | | 106,800 | | | | |
| 1,400 | | COVANCE INC (b) | | | 82,457 | | | 76,398 | | | | |
| 2,546 | | COVENTRY HEALTH CARE INC (b) | | | 100,005 | | | 61,842 | | | | |
| 3,225 | | DAVITA INC (b) | | | 123,269 | | | 189,437 | | | | |
| 2,900 | | DENDREON CORP (b) | | | 74,487 | | | 76,212 | | | | |
| 3,700 | | DENTSPLY INTL INC NEW | | | 102,583 | | | 130,129 | | | | |
| 1,900 | | EDWARDS LIFESCIENCES CORP (b) | | | 118,152 | | | 165,015 | | | | |
| 2,800 | | ENDO PHARMACEUTICALS HLDGS (b) | | | 65,974 | | | 57,428 | | | | |
| 6,900 | | EXPRESS SCRIPTS INC (b) | | | 329,552 | | | 596,505 | | | | |
| 12,650 | | FOREST LABS INC (b) | | | 365,314 | | | 406,192 | | | | |
| 1,600 | | GEN PROBE INC NEW (b) | | | 66,869 | | | 68,640 | | | | |
| 5,400 | | GENZYME CORP (b) | | | 314,254 | | | 264,654 | | | | |
| 23,860 | | GILEAD SCIENCES INC (b) | | | 603,150 | | | 1,032,661 | | | | |
| 9,200 | | HEALTH MGMT ASSOC (b) | | | 59,662 | | | 66,884 | | | | |
| 2,450 | | HEALTH NET INC (b) | | | 64,669 | | | 57,061 | | | | |
| 1,900 | | HENRY SCHEIN INC (b) | | | 86,167 | | | 99,940 | | | | |
| 1,300 | | HILL ROM HLDGS | | | 38,228 | | | 31,187 | | | | |
| 3,700 | | HILLENBRAND INC | | | 88,840 | | | 69,708 | | | | |
| 8,108 | | HOLOGIC INC (b) | | | 180,379 | | | 117,566 | | | | |
| 6,405 | | HOSPIRA INC (b) | | | 231,083 | | | 326,655 | | | | |
| 4,100 | | HUMANA INC (b) | | | 46,352 | | | 179,949 | | | | |
| 1,400 | | IDEXX LABS INC (b) | | | 60,410 | | | 74,816 | | | | |
| 3,400 | | ILLUMINA INC (b) | | | 140,152 | | | 104,210 | | | | |
| 7,700 | | IMS HEALTH INC | | | 151,365 | | | 162,162 | | | | |
| 900 | | INTUITIVE SURGICAL INC (b) | | | 221,425 | | | 272,988 | | | | |
| 1,800 | | INVERNESSMED INNOVATIONS INC (b) | | | 57,627 | | | 74,718 | | | | |
| 72,984 | | JOHNSON +JOHNSON | | | 2,877,910 | | | 4,700,899 | | | | |
| 1,931 | | KINETIC CONCEPTS INC (b) | | | 71,019 | | | 72,702 | | | | |
| 8,800 | | KING PHARMACEUTICALS INC (b) | | | 93,510 | | | 107,976 | | | | |
| 3,200 | | LABORATORY CORP AMER HLDGS (b) | | | 89,704 | | | 239,488 | | | | |
| 5,773 | | LIFE TECHNOLOGIES CORP (b) | | | 181,311 | | | 301,524 | | | | |
| 26,994 | | LILLY ELI+ CO | | | 1,052,349 | | | 963,956 | | | | |
| 1,950 | | LINCARE HLDGS INC (b) | | | 58,492 | | | 72,384 | | | | |
| | |
See accompanying notes to financial statements. | 30 | (Continued) |
|
CLEARWATER INVESTMENT TRUST |
Schedule of Investments - Clearwater Growth Fund |
December 31, 2009 |
| | | | | | | | | | | | | |
Shares | | Security | | Cost | | Fair
value (a) | | Percent
of
net assets | |
Healthcare (Cont’d): | | | | | | | | | | |
| 5,700 | | MCKESSON CORP | | $ | 202,597 | | | 356,250 | | | | |
| 12,056 | | MEDCO HEALTH SOLUTIONS INC (b) | | | 238,755 | | | 770,499 | | | | |
| 400 | | MEDNAX INC (b) | | | 21,950 | | | 24,044 | | | | |
| 33,350 | | MEDTRONIC INC | | | 525,672 | | | 1,466,733 | | | | |
| 2,853 | | MILLIPORECORP (b) | | | 170,051 | | | 206,415 | | | | |
| 7,500 | | MYLAN INC (b) | | | 87,384 | | | 138,225 | | | | |
| 2,400 | | MYRIAD GENETICS INC (b) | | | 88,020 | | | 62,640 | | | | |
| 1,200 | | OMNICARE INC | | | 29,082 | | | 29,016 | | | | |
| 900 | | OSI PHARMACEUTICALS INC (b) | | | 25,799 | | | 27,927 | | | | |
| 4,200 | | PATTERSON COS INC (b) | | | 117,791 | | | 117,516 | | | | |
| 1,800 | | PERRIGO CO | | | 59,715 | | | 71,712 | | | | |
| 217,390 | | PFIZER INC | | | 2,286,730 | | | 3,954,324 | | | | |
| 5,400 | | PHARMACEUTICAL PROD DEV INC | | | 120,112 | | | 126,576 | | | | |
| 4,165 | | QUEST DIAGNOSTICS INC | | | 169,785 | | | 251,483 | | | | |
| 2,000 | | RESMED INC (b) | | | 81,990 | | | 104,540 | | | | |
| 12,600 | | SERVICE CORP INTL | | | 90,438 | | | 103,194 | | | | |
| 8,639 | | ST JUDE MED INC (b) | | | 254,799 | | | 317,742 | | | | |
| 7,200 | | STRYKER CORP | | | 119,192 | | | 362,664 | | | | |
| 12,900 | | TENET HEALTHCARE CORP (b) | | | 56,567 | | | 69,531 | | | | |
| 10,300 | | THERMO FISHER SCIENTIFIC INC (b) | | | 318,047 | | | 491,207 | | | | |
| 1,200 | | UNITED THERAPEUTICS CORP DEL (b) | | | 50,361 | | | 63,180 | | | | |
| 28,602 | | UNITEDHEALTH GROUP INC | | | 604,604 | | | 871,789 | | | | |
| 4,136 | | UNIVERSAL HEALTH SVCS INC | | | 96,639 | | | 126,148 | | | | |
| 1,100 | | VALEANT PHARMACEUTICALS INTL (b) | | | 25,273 | | | 34,969 | | | | |
| 5,000 | | VARIAN MED SYS INC (b) | | | 184,300 | | | 234,250 | | | | |
| 2,400 | | VCA ANTECH INC (b) | | | 71,120 | | | 59,808 | | | | |
| 5,000 | | VERTEX PHARMACEUTICALS INC (b) | | | 140,315 | | | 214,250 | | | | |
| 2,600 | | WATERS CORP (b) | | | 60,997 | | | 161,096 | | | | |
| 3,175 | | WATSON PHARMACEUTICALS INC (b) | | | 79,361 | | | 125,762 | | | | |
| 2,666 | | WEBMD HEALTH CORP | | | 58,227 | | | 102,614 | | | | |
| 11,049 | | WELLPOINT INC (b) | | | 403,743 | | | 644,046 | | | | |
| 5,974 | | ZIMMER HOLDINGS INC (b) | | | 319,510 | | | 353,123 | | | | |
| | | | | | 22,526,230 | | | 33,657,019 | | | 11.48 | % |
Industrials: | | | | | | | | | | |
| 18,450 | | 3M CO | | | 1,287,872 | | | 1,525,262 | | | | |
| 2,800 | | AECOM TECHNOLOGY CORP (b) | | | 81,858 | | | 77,000 | | | | |
| 4,210 | | AGCO CORP (b) | | | 174,615 | | | 136,151 | | | | |
| 2,300 | | AMETEK INC NEW | | | 73,221 | | | 87,952 | | | | |
| 4,400 | | AMR CORP DEL (b) | | | 32,583 | | | 34,012 | | | | |
| 3,300 | | APOLLO GROUP INC (b) | | | 209,131 | | | 199,914 | | | | |
| 1,700 | | AVERY DENNISON CORP | | | 90,518 | | | 62,033 | | | | |
| 2,000 | | BE AEROSPACE INC (b) | | | 58,542 | | | 47,000 | | | | |
| 8,400 | | BLOCK H +R INC | | | 103,744 | | | 190,008 | | | | |
| 19,900 | | BOEING CO | | | 546,085 | | | 1,077,187 | | | | |
| 1,700 | | BUCYRUS INTL INC NEW | | | 47,502 | | | 95,829 | | | | |
| 6,347 | | BURLINGTON NORTHN SANTA FE | | | 257,012 | | | 625,941 | | | | |
| 5,800 | | C H ROBINSON WORLDWIDE INC | | | 299,661 | | | 340,634 | | | | |
| 1,600 | | CAREER ED CORP (b) | | | 26,824 | | | 37,296 | | | | |
| 3,000 | | CARLISLE COS INC | | | 76,640 | | | 102,780 | | | | |
| 18,604 | | CATERPILLAR INC | | | 711,546 | | | 1,060,242 | | | | |
| 3,700 | | CINTAS CORP | | | 122,389 | | | 96,385 | | | | |
| 2,027 | | CON WAY INC | | | 44,529 | | | 70,763 | | | | |
| 4,300 | | CONTINENTAL AIRLS INC (b) | | | 102,190 | | | 77,056 | | | | |
| 3,900 | | CONVERGYS CORP (b) | | | 69,089 | | | 41,925 | | | | |
| 700 | | COPA HOLDINGS S A | | | 26,884 | | | 38,129 | | | | |
| 4,500 | | COVANTA HLDG CORP (b) | | | 119,422 | | | 81,405 | | | | |
| 3,948 | | CRANE CO | | | 66,572 | | | 120,888 | | | | |
| 10,400 | | CSX CORP | | | 113,293 | | | 504,296 | | | | |
| 5,800 | | CUMMINS INC | | | 172,148 | | | 265,988 | | | | |
| | |
See accompanying notes to financial statements. | 31 | (Continued) |
|
CLEARWATER INVESTMENT TRUST |
Schedule of Investments - Clearwater Growth Fund |
December 31, 2009 |
| | | | | | | | | | | | | |
Shares | | Security | | Cost | | Fair
value (a) | | Percent
of
net assets | |
Industrials (Cont’d): | | | | | | | | | | |
| 5,600 | | DANAHER CORP | | $ | 256,759 | | | 421,120 | | | | |
| 11,200 | | DEERE + CO | | | 438,491 | | | 605,808 | | | | |
| 33,250 | | DELTA AIRLINES INC DE (b) | | | 329,324 | | | 378,385 | | | | |
| 1,978 | | DEVRY INC DEL | | | 93,134 | | | 112,212 | | | | |
| 1,600 | | DONALDSON CO INC | | | 63,715 | | | 68,064 | | | | |
| 6,000 | | DONNELLEY R R + SONS CO | | | 177,337 | | | 133,620 | | | | |
| 5,925 | | DOVER CORP | | | 251,755 | | | 246,539 | | | | |
| 1,987 | | DUN + BRADSTREET CORP DEL NEW | | | 49,383 | | | 167,643 | | | | |
| 4,300 | | EATON CORP | | | 166,977 | | | 273,566 | | | | |
| 18,400 | | EMERSON ELEC CO | | | 543,306 | | | 783,840 | | | | |
| 1,397 | | ENERGIZER HLDGS INC (b) | | | 87,823 | | | 85,608 | | | | |
| 5,400 | | EXPEDITORS INTL WA INC | | | 208,985 | | | 187,542 | | | | |
| 400 | | FACTSET RESH SYS INC | | | 26,742 | | | 26,348 | | | | |
| 3,600 | | FASTENAL CO | | | 139,138 | | | 149,904 | | | | |
| 9,653 | | FEDEX CORP | | | 384,189 | | | 805,543 | | | | |
| 1,200 | | FIRST SOLAR INC (b) | | | 159,446 | | | 162,480 | | | | |
| 1,300 | | FLOWSERVE CORP | | | 119,620 | | | 122,889 | | | | |
| 4,250 | | FLUOR CORP NEW | | | 127,616 | | | 191,420 | | | | |
| 2,300 | | FTI CONSULTING INC (b) | | | 119,264 | | | 108,468 | | | | |
| 900 | | GARDNER DENVER INC | | | 50,054 | | | 38,295 | | | | |
| 1,400 | | GATX CORPORATION | | | 24,276 | | | 40,250 | | | | |
| 700 | | GENERAL CABLE CORP (b) | | | 50,306 | | | 20,594 | | | | |
| 8,700 | | GENERAL DYNAMICS CORP | | | 397,697 | | | 593,079 | | | | |
| 284,800 | | GENERAL ELEC CO | | | 5,691,867 | | | 4,309,024 | | | | |
| 1,000 | | GLOBAL PMTS INC | | | 33,115 | | | 53,860 | | | | |
| 3,700 | | GOODRICH CORP | | | 111,298 | | | 237,725 | | | | |
| 4,100 | | GRACO INC | | | 162,258 | | | 117,137 | | | | |
| 1,700 | | GRAINGER W W INC | | | 74,317 | | | 164,611 | | | | |
| 2,200 | | HARSCO CORP | | | 59,517 | | | 70,906 | | | | |
| 2,200 | | HEWITT ASSOCS INC (b) | | | 70,939 | | | 92,972 | | | | |
| 17,600 | | HONEYWELL INTL INC | | | 471,639 | | | 689,920 | | | | |
| 2,400 | | HUBBELL INC | | | 102,187 | | | 113,520 | | | | |
| 2,100 | | HUNT J B TRANS SVCS INC | | | 40,530 | | | 67,767 | | | | |
| 2,500 | | IDEX CORP | | | 58,238 | | | 77,875 | | | | |
| 12,624 | | ILLINOIS TOOL WKS INC | | | 530,139 | | | 605,826 | | | | |
| 5,400 | | IRON MTN INC PA (b) | | | 121,527 | | | 122,904 | | | | |
| 3,600 | | ITT CORP NEW | | | 168,296 | | | 179,064 | | | | |
| 1,300 | | ITT EDL SVCS INC (b) | | | 52,038 | | | 124,748 | | | | |
| 3,000 | | JABIL CIRCUIT INC | | | 49,755 | | | 52,110 | | | | |
| 4,468 | | JACOBS ENGR GROUP INC (b) | | | 138,179 | | | 168,041 | | | | |
| 2,238 | | JOY GLOBAL INC | | | 102,549 | | | 115,458 | | | | |
| 2,900 | | KANSAS CITY SOUTHERN (b) | | | 46,328 | | | 96,541 | | | | |
| 4,900 | | KBR INC | | | 103,168 | | | 93,100 | | | | |
| 3,300 | | L 3 COMMUNICATIONS HLDG CORP | | | 220,484 | | | 286,935 | | | | |
| 1,200 | | LANDSTAR SYS INC | | | 38,351 | | | 46,524 | | | | |
| 1,100 | | LINCOLN ELEC HLDGS INC | | | 60,456 | | | 58,806 | | | | |
| 7,900 | | LOCKHEED MARTIN CORP | | | 527,289 | | | 595,265 | | | | |
| 18,900 | | MANITOWOC INC | | | 182,102 | | | 188,433 | | | | |
| 2,475 | | MANPOWER INC WIS | | | 96,158 | | | 135,086 | | | | |
| 8,800 | | MASCO CORP | | | 173,216 | | | 121,528 | | | | |
| 5,700 | | MCDERMOTT INTL INC (b) | | | 102,274 | | | 136,857 | | | | |
| 2,500 | | MOLEX INC | | | 68,986 | | | 53,875 | | | | |
| 4,900 | | MONSTER WORLDWIDE INC (b) | | | 76,056 | | | 85,260 | | | | |
| 1,500 | | NAVISTAR INTL CORP INC (b) | | | 59,705 | | | 57,975 | | | | |
| 9,760 | | NORFOLK SOUTHN CORP | | | 347,169 | | | 511,619 | | | | |
| 8,160 | | NORTHROP GRUMMAN CORP | | | 460,053 | | | 455,736 | | | | |
| 1,500 | | OSHKOSH CORP | | | 47,135 | | | 55,545 | | | | |
| 1,700 | | OVERSEAS SHIPHOLDING GROUP INC | | | 109,761 | | | 74,715 | | | | |
| 2,600 | | OWENS CORNING NEW (b) | | | 59,847 | | | 66,664 | | | | |
| | |
See accompanying notes to financial statements. | 32 | (Continued) |
|
CLEARWATER INVESTMENT TRUST |
Schedule of Investments - Clearwater Growth Fund |
December 31, 2009 |
| | | | | | | | | | | | | |
Shares | | Security | | Cost | | Fair
value (a) | | Percent
of
net assets | |
Industrials (Cont’d): | | | | | | | | | | |
| 9,189 | | PACCAR INC | | $ | 122,594 | | | 333,285 | | | | |
| 2,200 | | PALL CORP | | | 55,214 | | | 79,640 | | | | |
| 3,950 | | PARKER HANNIFIN CORP | | | 212,565 | | | 212,826 | | | | |
| 2,200 | | PENTAIR INC | | | 72,761 | | | 71,060 | | | | |
| 5,700 | | PITNEY BOWES INC | | | 182,172 | | | 129,732 | | | | |
| 4,600 | | PRECISION CASTPARTS CORP | | | 369,776 | | | 507,610 | | | | |
| 5,300 | | QUANTA SERVICES INC (b) | | | 92,074 | | | 110,452 | | | | |
| 10,100 | | RAYTHEON CO | | | 403,423 | | | 520,352 | | | | |
| 2,200 | | RELIANCE STL + ALUM CO | | | 61,215 | | | 95,084 | | | | |
| 8,022 | | REPUBLIC SVCS INC | | | 141,864 | | | 227,103 | | | | |
| 3,300 | | ROBERT HALF INTL INC | | | 85,171 | | | 88,209 | | | | |
| 5,250 | | ROCKWELL AUTOMATION INC | | | 73,987 | | | 246,645 | | | | |
| 6,514 | | ROCKWELL COLLINS INC | | | 230,297 | | | 360,615 | | | | |
| 1,600 | | ROPER INDS | | | 104,136 | | | 83,792 | | | | |
| 1,800 | | SHAW GROUP INC (b) | | | 92,083 | | | 51,750 | | | | |
| 15,375 | | SOUTHWEST AIRLS CO | | | 117,253 | | | 175,736 | | | | |
| 1,300 | | SPIRIT AEROSYSTEMS HLDGS INC (b) | | | 24,954 | | | 25,818 | | | | |
| 1,400 | | SPX CORP | | | 92,591 | | | 76,580 | | | | |
| 2,880 | | STERICYCLE INC (b) | | | 153,242 | | | 158,890 | | | | |
| 100 | | STRAYER ED INC | | | 21,912 | | | 21,249 | | | | |
| 2,300 | | SUNPOWER CORP (b) | | | 134,286 | | | 54,464 | | | | |
| 500 | | TELEFLEX INC | | | 22,515 | | | 26,945 | | | | |
| 2,700 | | TEREX CORP NEW (b) | | | 90,082 | | | 53,487 | | | | |
| 6,750 | | TEXTRON INC | | | 147,724 | | | 126,968 | | | | |
| 1,790 | | TOTAL SYS SVCS INC | | | 55,518 | | | 30,913 | | | | |
| 1,500 | | TRINITY INDS INC | | | 41,498 | | | 26,160 | | | | |
| 14,600 | | UNION PAC CORP | | | 619,841 | | | 932,940 | | | | |
| 19,440 | | UNITED PARCEL SVC INC | | | 1,257,748 | | | 1,115,273 | | | | |
| 21,750 | | UNITED TECHNOLOGIES CORP | | | 931,586 | | | 1,509,668 | | | | |
| 2,500 | | URS CORP NEW (b) | | | 94,338 | | | 111,300 | | | | |
| 2,000 | | USG CORP (b) | | | 12,350 | | | 28,100 | | | | |
| 2,300 | | UTI WORLDWIDE INC (b) | | | 26,669 | | | 32,936 | | | | |
| 1,900 | | WALTER ENERGY INC | | | 44,977 | | | 143,089 | | | | |
| 1,100 | | WASTE CONNECTIONS INC (b) | | | 29,915 | | | 36,674 | | | | |
| 10,150 | | WASTE MGMT INC DEL | | | 183,295 | | | 343,172 | | | | |
| | | | | | 26,397,739 | | | 31,351,740 | | | 10.69 | % |
Information technology: | | | | | | | | | | |
| 15,400 | | ACTIVISION BLIZZARD INC (b) | | | 141,131 | | | 171,094 | | | | |
| 14,524 | | ADOBE SYSTEMS INC (b) | | | 368,313 | | | 534,193 | | | | |
| 14,300 | | ADVANCED MICRO DEVICES INC (b) | | | 64,279 | | | 138,424 | | | | |
| 2,200 | | AFFILIATED COMPUTER SVCS INC (b) | | | 100,152 | | | 131,318 | | | | |
| 9,900 | | AGILENT TECHNOLOGIES INC (b) | | | 233,287 | | | 307,593 | | | | |
| 3,300 | | AKAMAI TECHNOLOGIES INC (b) | | | 45,920 | | | 83,589 | | | | |
| 1,900 | | ALLIANCE DATA SYSTEMS CORP (b) | | | 92,734 | | | 122,721 | | | | |
| 1,800 | | ALLSCRIPT MISYS HEALTCAR SOLNS (b) | | | 26,667 | | | 36,414 | | | | |
| 6,400 | | ALTERA CORP | | | 120,963 | | | 144,832 | | | | |
| 7,600 | | AMDOCS LTD (b) | | | 221,261 | | | 216,828 | | | | |
| 4,000 | | AMPHENOL CORP NEW | | | 168,180 | | | 184,720 | | | | |
| 9,400 | | ANALOG DEVICES INC | | | 135,404 | | | 296,852 | | | | |
| 1,200 | | ANSYS INC (b) | | | 30,630 | | | 52,152 | | | | |
| 2,793 | | AOL INC(b) | | | 56,124 | | | 65,021 | | | | |
| 24,000 | | APPLE INC (b) | | | 1,560,804 | | | 5,060,640 | | | | |
| 33,100 | | APPLIED MATERIALS INC | | | 443,417 | | | 461,414 | | | | |
| 2,200 | | ARROW ELECTRS INC (b) | | | 73,136 | | | 65,142 | | | | |
| 6,586 | | AUTODESK INCORPORATED (b) | | | 207,114 | | | 167,350 | | | | |
| 12,466 | | AUTOMATIC DATA PROCESSING INC | | | 435,900 | | | 533,794 | | | | |
| 3,600 | | AVNET INC (b) | | | 98,190 | | | 108,576 | | | | |
| 4,550 | | BMC SOFTWARE INC (b) | | | 89,322 | | | 182,455 | | | | |
| | |
See accompanying notes to financial statements. | 33 | (Continued) |
|
CLEARWATER INVESTMENT TRUST |
Schedule of Investments - Clearwater Growth Fund |
December 31, 2009 |
| | | | | | | | | | | | | |
Shares | | Security | | Cost | | Fair
value (a) | | Percent
of
net assets | |
Information technology (Cont’d): | | | | | | | | | | |
| 13,212 | | BROADCOM CORP (b) | | $ | 246,055 | | | 415,517 | | | | |
| 3,080 | | BROADRIDGE FINL SOLUTIONS INC | | | 52,817 | | | 69,485 | | | | |
| 10,925 | | CA INC | | | 208,510 | | | 245,376 | | | | |
| 13,200 | | CADENCE DESIGN SYS INC (b) | | | 171,534 | | | 79,068 | | | | |
| 2,000 | | CERNER CORP (b) | | | 129,491 | | | 164,880 | | | | |
| 152,750 | | CISCO SYS INC (b) | | | 1,089,676 | | | 3,656,835 | | | | |
| 4,534 | | CITRIX SYS INC (b) | | | 56,437 | | | 188,660 | | | | |
| 7,600 | | COGNIZANT TECHNOLOGY SOLUTIONS (b) | | | 141,799 | | | 344,280 | | | | |
| 2,074 | | COMMSCOPE INC (b) | | | 90,418 | | | 55,023 | | | | |
| 5,322 | | COMPUTER SCIENCES CORP (b) | | | 246,664 | | | 306,175 | | | | |
| 8,000 | | COMPUWARE CORP (b) | | | 54,024 | | | 57,840 | | | | |
| 45,700 | | CORNING INC | | | 582,505 | | | 882,467 | | | | |
| 2,300 | | CREE INC (b) | | | 79,378 | | | 129,651 | | | | |
| 2,700 | | CYPRESS SEMICONDUCTOR CORP (b) | | | 8,499 | | | 28,512 | | | | |
| 41,650 | | DELL INC (b) | | | 965,028 | | | 598,094 | | | | |
| 27,500 | | EBAY INC (b) | | | 271,802 | | | 647,350 | | | | |
| 9,900 | | ELECTRONIC ARTS INC (b) | | | 355,096 | | | 175,725 | | | | |
| 50,910 | | EMC CORP (b) | | | 449,879 | | | 889,398 | | | | |
| 1,000 | | EQUINIX INC (b) | | | 77,505 | | | 106,150 | | | | |
| 1,400 | | F5 NETWORKS INC (b) | | | 32,375 | | | 74,172 | | | | |
| 1,600 | | FAIRCHILD SEMICONDUCTOR INTL (b) | | | 21,840 | | | 15,984 | | | | |
| 9,402 | | FIDELITY NATL INFORMATION SVC | | | 170,292 | | | 220,383 | | | | |
| 4,650 | | FISERV INC (b) | | | 142,355 | | | 225,432 | | | | |
| 4,100 | | FLIR SYS INC (b) | | | 127,455 | | | 134,152 | | | | |
| 6,467 | | GOOGLE INC (b) | | | 2,321,932 | | | 4,009,411 | | | | |
| 2,800 | | HARRIS CORP DEL | | | 37,337 | | | 133,140 | | | | |
| 64,727 | | HEWLETT PACKARD CO | | | 1,462,985 | | | 3,334,088 | | | | |
| 1,200 | | IHS INC (b) | | | 65,421 | | | 65,772 | | | | |
| 6,300 | | INGRAM MICRO INC (b) | | | 83,129 | | | 109,935 | | | | |
| 6,110 | | INTEGRATED DEVICE TECHNOLOGY (b) | | | 79,318 | | | 39,532 | | | | |
| 157,200 | | INTEL CORP | | | 1,173,524 | | | 3,206,880 | | | | |
| 34,600 | | INTERNATIONAL BUSINESS MACHS | | | 3,079,500 | | | 4,529,140 | | | | |
| 9,100 | | INTERSIL CORP | | | 137,970 | | | 139,594 | | | | |
| 7,800 | | INTUIT (b) | | | 187,603 | | | 239,538 | | | | |
| 1,000 | | ITRON INC (b) | | | 56,573 | | | 67,570 | | | | |
| 14,267 | | JUNIPER NETWORKS INC (b) | | | 289,096 | | | 380,501 | | | | |
| 6,100 | | KLA TENCOR CORP | | | 210,231 | | | 220,576 | | | | |
| 3,000 | | LAM RESH CORP (b) | | | 83,706 | | | 117,630 | | | | |
| 2,371 | | LENDERPROCESSING SVCS INC | | | 76,903 | | | 96,405 | | | | |
| 3,800 | | LEXMARK INTL INC (b) | | | 106,458 | | | 98,724 | | | | |
| 8,200 | | LINEAR TECHNOLOGY CORP | | | 205,881 | | | 250,428 | | | | |
| 28,600 | | LSI CORP (b) | | | 120,263 | | | 171,886 | | | | |
| 11,900 | | MARVELL TECHNOLOGY GROUP LTD (b) (d) | | | 129,265 | | | 246,925 | | | | |
| 2,200 | | MASTERCARD INC | | | 273,924 | | | 563,156 | | | | |
| 7,000 | | MAXIM INTEGRATED PRODS INC | | | 125,147 | | | 142,100 | | | | |
| 3,900 | | MCAFEE INC (b) | | | 96,027 | | | 158,223 | | | | |
| 6,914 | | MEMC ELECTR MATLS INC (b) | | | 212,290 | | | 94,169 | | | | |
| 1,300 | | METTLER TOLEDO INTL INC (b) | | | 87,484 | | | 136,487 | | | | |
| 5,400 | | MICROCHIP TECHNOLOGY INC | | | 101,340 | | | 156,924 | | | | |
| 19,100 | | MICRON TECHNOLOGY INC (b) | | | 94,334 | | | 201,696 | | | | |
| 1,000 | | MICROS SYS INC (b) | | | 26,215 | | | 31,030 | | | | |
| 206,750 | | MICROSOFT CORP | | | 2,699,338 | | | 6,303,808 | | | | |
| 79,200 | | MOTOROLA INC | | | 517,157 | | | 614,592 | | | | |
| 6,600 | | NATIONAL SEMICONDUCTOR CORP | | | 102,715 | | | 101,376 | | | | |
| 4,000 | | NCR CORP NEW (b) | | | 85,604 | | | 44,520 | | | | |
| 8,800 | | NETAPP INC (b) | | | 216,784 | | | 302,632 | | | | |
| 5,200 | | NOVELL INC (b) | | | 31,071 | | | 21,580 | | | | |
| 2,800 | | NOVELLUS SYS INC (b) | | | 70,810 | | | 65,352 | | | | |
| 7,100 | | NUANCE COMMUNICATIONS INC (b) | | | 101,494 | | | 110,334 | | | | |
| | |
See accompanying notes to financial statements. | 34 | (Continued) |
|
CLEARWATER INVESTMENT TRUST |
Schedule of Investments - Clearwater Growth Fund |
December 31, 2009 |
| | | | | | | | | | | | | |
Shares | | Security | | Cost | | Fair
value (a) | | Percent
of
net assets | |
Information technology (Cont’d): | | | | | | | | | | |
| 16,650 | | NVIDIA CORP (b) | | $ | 175,158 | | | 311,022 | | | | |
| 10,700 | | ON SEMICONDUCTOR CORP (b) | | | 93,650 | | | 94,267 | | | | |
| 107,062 | | ORACLE CORP | | | 744,533 | | | 2,627,301 | | | | |
| 7,266 | | PAYCHEX INC | | | 101,485 | | | 222,630 | | | | |
| 3,400 | | PERKINELMER INC | | | 53,706 | | | 70,006 | | | | |
| 3,200 | | PMC SIERRA INC (b) | | | 26,160 | | | 27,712 | | | | |
| 5,700 | | QLOGIC CORP (b) | | | 82,128 | | | 107,559 | | | | |
| 45,150 | | QUALCOMM INC | | | 1,290,482 | | | 2,088,639 | | | | |
| 4,500 | | RAMBUS INC DEL (b) | | | 79,087 | | | 109,800 | | | | |
| 4,200 | | RED HAT INC (b) | | | 61,669 | | | 129,780 | | | | |
| 2,300 | | ROVI CORP (b) | | | 55,715 | | | 73,301 | | | | |
| 6,000 | | SAIC INC (b) | | | 112,830 | | | 113,640 | | | | |
| 2,600 | | SALESFORCE COM INC (b) | | | 124,820 | | | 191,802 | | | | |
| 7,800 | | SANDISK CORP (b) | | | 118,234 | | | 226,122 | | | | |
| 12,100 | | SEAGATE TECHNOLOGY | | | 118,421 | | | 220,099 | | | | |
| 500 | | SOHU COM INC (b) | | | 36,563 | | | 28,640 | | | | |
| 22,056 | | SUN MICROSYSTEMS INC (b) | | | 293,357 | | | 206,665 | | | | |
| 800 | | SYBASE INC (b) | | | 28,388 | | | 34,720 | | | | |
| 21,819 | | SYMANTEC CORP (b) | | | 187,612 | | | 390,342 | | | | |
| 4,200 | | SYNOPSYS INC (b) | | | 88,560 | | | 93,576 | | | | |
| 11,950 | | TELLABS INC (b) | | | 70,500 | | | 67,876 | | | | |
| 4,500 | | TERADATA CORP (b) | | | 73,317 | | | 141,435 | | | | |
| 4,400 | | TERADYNE INC (b) | | | 40,150 | | | 47,212 | | | | |
| 29,300 | | TEXAS INSTRS INC | | | 567,475 | | | 763,558 | | | | |
| 3,800 | | TRIMBLE NAVIGATION LTD (b) | | | 87,764 | | | 95,760 | | | | |
| 6,800 | | VERISIGN INC (b) | | | 137,208 | | | 164,832 | | | | |
| 7,800 | | VISHAY INTERTECHNOLOGY INC (b) | | | 54,625 | | | 65,130 | | | | |
| 1,500 | | VMWARE INC (b) | | | 47,285 | | | 63,570 | | | | |
| 5,900 | | WESTERN DIGITAL CORP (b) | | | 91,433 | | | 260,485 | | | | |
| 18,044 | | WESTERN UN CO | | | 160,005 | | | 340,129 | | | | |
| 17,050 | | XEROX CORP | | | 118,213 | | | 144,243 | | | | |
| 6,750 | | XILINX INC | | | 47,180 | | | 169,155 | | | | |
| 31,340 | | YAHOO INC (b) | | | 473,723 | | | 525,885 | | | | |
| | | | | | 31,074,617 | | | 55,498,276 | | | 18.94 | % |
Materials: | | | | | | | | | | |
| 4,475 | | AIR PRODS + CHEMS INC | | | 251,100 | | | 362,744 | | | | |
| 1,900 | | AIRGAS INC | | | 100,686 | | | 90,440 | | | | |
| 4,316 | | AK STL HLDG CORP | | | 137,899 | | | 92,147 | | | | |
| 1,900 | | ALBEMARLE CORP | | | 53,108 | | | 69,103 | | | | |
| 27,800 | | ALCOA INC | | | 511,326 | | | 448,136 | | | | |
| 2,500 | | ALLEGHENY TECHNOLOGIES INC | | | 61,863 | | | 111,925 | | | | |
| 2,900 | | ALPHA NAT RES INC (b) | | | 89,756 | | | 125,802 | | | | |
| 800 | | APTARGROUP INC | | | 27,324 | | | 28,592 | | | | |
| 4,900 | | ARCH COAL INC | | | 44,088 | | | 109,025 | | | | |
| 1,600 | | ASHLAND INC NEW | | | 47,358 | | | 63,392 | | | | |
| 3,032 | | BALL CORP | | | 70,662 | | | 156,754 | | | | |
| 4,200 | | BEMIS CO INC | | | 93,645 | | | 124,530 | | | | |
| 2,600 | | CELANESE CORP DE | | | 126,875 | | | 83,460 | | | | |
| 2,800 | | CF INDS HLDGS INC | | | 247,282 | | | 254,184 | | | | |
| 3,500 | | CLIFFS NAT RES INC | | | 98,835 | | | 161,315 | | | | |
| 500 | | COMPASS MINERALS INTL INC | | | 27,453 | | | 33,595 | | | | |
| 6,300 | | CROWN HLDGS INC (b) | | | 128,704 | | | 161,154 | | | | |
| 3,537 | | CYTEC INDS INC | | | 195,563 | | | 128,818 | | | | |
| 31,950 | | DOW CHEM CO | | | 919,702 | | | 882,779 | | | | |
| 28,625 | | DU PONT EI DE NEMOURS + CO | | | 1,020,415 | | | 963,804 | | | | |
| 1,938 | | EAGLE MATLS INC | | | 37,630 | | | 50,485 | | | | |
| 1,500 | | EASTMAN CHEM CO | | | 58,012 | | | 90,360 | | | | |
| 5,871 | | ECOLAB INC | | | 222,515 | | | 261,729 | | | | |
| 1,900 | | FMC CORP | | | 113,204 | | | 105,944 | | | | |
| | |
See accompanying notes to financial statements. | 35 | (Continued) |
|
CLEARWATER INVESTMENT TRUST |
Schedule of Investments - Clearwater Growth Fund |
December 31, 2009 |
| | | | | | | | | | | | | |
Shares | | Security | | Cost | | Fair
value (a) | | Percent
of
net assets | |
Materials (Cont’d): | | | | | | | | | | |
| 10,248 | | FREEPORT MCMORAN COPPER + GOLD (b) | | $ | 517,188 | | | 822,812 | | | | |
| 1,700 | | GREIF INC | | | 77,348 | | | 91,766 | | | | |
| 5,100 | | HUNTSMAN CORP | | | 96,099 | | | 57,579 | | | | |
| 11,531 | | INTERNATIONAL PAPER CO | | | 207,197 | | | 308,800 | | | | |
| 1,000 | | INTREPID POTASH INC (b) | | | 30,875 | | | 29,170 | | | | |
| 4,583 | | INTRNTNL FLAVRS + FRAGRNCS INC | | | 98,592 | | | 188,545 | | | | |
| 1,400 | | JARDEN CORP | | | 25,277 | | | 43,274 | | | | |
| 1,500 | | LUBRIZOL CORP | | | 72,108 | | | 109,425 | | | | |
| 700 | | MARTIN MARIETTA MATLS INC | | | 27,965 | | | 62,587 | | | | |
| 6,975 | | MEADWESTVACO CORP | | | 124,312 | | | 199,694 | | | | |
| 14,515 | | MONSANTO CO NEW | | | 392,660 | | | 1,186,601 | | | | |
| 3,900 | | MOSAIC CO | | | 88,490 | | | 232,947 | | | | |
| 11,945 | | NEWMONT MNG CORP | | | 300,671 | | | 565,118 | | | | |
| 11,200 | | NUCOR CORP | | | 328,331 | | | 522,480 | | | | |
| 3,950 | | OWENS ILL INC (b) | | | 57,616 | | | 129,837 | | | | |
| 3,200 | | PACKAGING CORP AMER | | | 55,674 | | | 73,632 | | | | |
| 3,850 | | PACTIV CORP (b) | | | 52,072 | | | 92,939 | | | | |
| 5,186 | | PPG INDS INC | | | 252,007 | | | 303,588 | | | | |
| 7,650 | | PRAXAIR INC | | | 343,228 | | | 614,372 | | | | |
| 4,648 | | RAYONIER INC | | | 106,877 | | | 195,960 | | | | |
| 900 | | ROYAL GOLD INC | | | 39,371 | | | 42,390 | | | | |
| 6,000 | | RPM INTL INC | | | 61,643 | | | 121,980 | | | | |
| 700 | | SCOTTS MIRACLE GRO CO | | | 25,183 | | | 27,517 | | | | |
| 3,400 | | SEALED AIR CORP NEW | | | 82,806 | | | 74,324 | | | | |
| 3,200 | | SIGMA ALDRICH | | | 187,446 | | | 161,696 | | | | |
| 4,800 | | SONOCO PRODS CO | | | 114,335 | | | 140,400 | | | | |
| 4,400 | | SOUTHERN COPPER CORP DEL | | | 52,866 | | | 144,804 | | | | |
| 3,600 | | STEEL DYNAMICS INC | | | 87,525 | | | 63,792 | | | | |
| 2,000 | | TEMPLE INLAND INC | | | 22,890 | | | 42,220 | | | | |
| 2,349 | | TITANIUM METALS CORP | | | 62,648 | | | 29,409 | | | | |
| 3,100 | | UNITED STS STL CORP NEW | | | 160,947 | | | 170,872 | | | | |
| 3,200 | | VALSPAR CORP | | | 68,240 | | | 86,848 | | | | |
| 2,957 | | VULCAN MATLS CO | | | 159,237 | | | 155,745 | | | | |
| | | | | | 9,064,720 | | | 12,053,338 | | | 4.11 | % |
Telecommunication services: | | | | | | | | | | |
| 7,750 | | AMERICAN TOWER CORP (b) | | | 147,487 | | | 334,878 | | | | |
| 156,715 | | AT+T INC | | | 3,952,780 | | | 4,392,721 | | | | |
| 9,119 | | CENTURYTEL INC | | | 250,897 | | | 330,199 | | | | |
| 7,300 | | CROWN CASTLE INTL CORP (b) | | | 152,053 | | | 284,992 | | | | |
| 3,040 | | ECHOSTAR CORP (b) | | | 67,049 | | | 61,226 | | | | |
| 11,525 | | FRONTIER COMMUNICATIONS CORP | | | 88,166 | | | 90,010 | | | | |
| 8,000 | | JDS UNIPHASE CORP (b) | | | 111,480 | | | 66,000 | | | | |
| 700 | | LEAP WIRELESS INTL INC (b) | | | 36,068 | | | 12,285 | | | | |
| 8,353 | | LIBERTY GLOBAL INC (b) | | | 185,541 | | | 183,014 | | | | |
| 4,800 | | NEUSTAR INC (b) | | | 79,848 | | | 110,592 | | | | |
| 4,100 | | NII HLDGS INC (b) | | | 83,778 | | | 137,678 | | | | |
| 15,600 | | QWEST COMMUNICATIONS INTL INC | | | 54,570 | | | 65,676 | | | | |
| 3,100 | | SBA COMMUNCATIONS CORP (b) | | | 83,846 | | | 105,896 | | | | |
| 65,266 | | SPRINT NEXTEL CORP (b) | | | 244,716 | | | 238,874 | | | | |
| 2,700 | | TELEPHONE + DATA SYS INC | | | 72,097 | | | 91,584 | | | | |
| 4,500 | | TW TELECOM INC (b) | | | 50,425 | | | 77,130 | | | | |
| 1,780 | | UNITED STATES CELLULAR CORP (b) | | | 89,053 | | | 75,490 | | | | |
| 76,083 | | VERIZON COMMUNICATIONS | | | 2,503,225 | | | 2,520,630 | | | | |
| 11,424 | | WINDSTREAM CORP | | | 138,133 | | | 125,550 | | | | |
| | | | | | 8,391,211 | | | 9,304,424 | | | 3.17 | % |
Utilities: | | | | | | | | | | |
| 16,567 | | AES CORP (b) | | | 226,300 | | | 220,507 | | | | |
| 4,500 | | AGL RES INC | | | 135,198 | | | 164,115 | | | | |
| | |
See accompanying notes to financial statements. | 36 | (Continued) |
|
CLEARWATER INVESTMENT TRUST |
Schedule of Investments - Clearwater Growth Fund |
December 31, 2009 |
| | | | | | | | | | | | | |
Shares | | Security | | Cost | | Fair
value (a) | | Percent
of
net assets | |
Utilities (Cont’d): | | | | | | | | | | |
| 5,800 | | ALLEGHENY ENERGY INC | | $ | 242,823 | | | 136,184 | | | | |
| 1,000 | | ALLIANT ENERGY CORP | | | 24,835 | | | 30,260 | | | | |
| 7,000 | | AMEREN CORP | | | 250,596 | | | 195,650 | | | | |
| 10,900 | | AMERICAN ELEC PWR INC | | | 348,057 | | | 379,211 | | | | |
| 3,700 | | AMERICAN WATER WORKS | | | 72,499 | | | 82,917 | | | | |
| 3,488 | | AQUA AMER INC | | | 67,899 | | | 61,075 | | | | |
| 8,600 | | CALPINE CORP (b) | | | 57,319 | | | 94,600 | | | | |
| 5,800 | | CENTERPOINT ENERGY INC | | | 66,308 | | | 84,158 | | | | |
| 10,200 | | CMS ENERGY CORP | | | 144,342 | | | 159,732 | | | | |
| 6,600 | | CONSOLIDATED EDISON INC | | | 273,555 | | | 299,838 | | | | |
| 4,615 | | CONSTELLATION ENERGY GROUP INC | | | 191,729 | | | 162,310 | | | | |
| 11,962 | | DOMINION RES INC VA NEW | | | 401,376 | | | 465,561 | | | | |
| 1,100 | | DPL INC | | | 24,481 | | | 30,360 | | | | |
| 5,300 | | DTE ENERGY CO | | | 213,573 | | | 231,027 | | | | |
| 40,113 | | DUKE ENERGY HLDG CORP | | | 550,659 | | | 690,345 | | | | |
| 8,700 | | DYNEGY INC DEL (b) | | | 61,901 | | | 15,747 | | | | |
| 8,525 | | EDISON INTL | | | 182,117 | | | 296,500 | | | | |
| 4,764 | | ENTERGY CORP NEW | | | 192,987 | | | 389,886 | | | | |
| 4,000 | | EQT CORP | | | 132,900 | | | 175,680 | | | | |
| 16,232 | | EXELON CORP | | | 734,097 | | | 793,258 | | | | |
| 7,016 | | FIRSTENERGY CORP | | | 357,121 | | | 325,893 | | | | |
| 13,672 | | FPL GROUP INC | | | 674,053 | | | 722,155 | | | | |
| 2,800 | | GREAT PLAINS ENERGY INC | | | 43,498 | | | 54,292 | | | | |
| 1,300 | | HAWAIIAN ELEC INDS INC | | | 24,005 | | | 27,170 | | | | |
| 3,300 | | INTEGRYS ENERGY GROUP INC | | | 164,560 | | | 138,567 | | | | |
| 3,500 | | ITC HLDGS CORP | | | 154,844 | | | 182,315 | | | | |
| 10,600 | | MDU RES GROUP INC | | | 242,945 | | | 250,160 | | | | |
| 6,600 | | MIRANT CORP NEW (b) | | | 240,189 | | | 100,782 | | | | |
| 2,900 | | NALCO HLDG CO | | | 58,310 | | | 73,979 | | | | |
| 1,500 | | NATIONAL FUEL GAS CO N J | | | 38,322 | | | 75,000 | | | | |
| 7,800 | | NISOURCE INC | | | 128,106 | | | 119,964 | | | | |
| 2,600 | | NORTHEAST UTILS | | | 64,649 | | | 67,054 | | | | |
| 9,000 | | NRG ENERGY INC (b) | | | 211,851 | | | 212,490 | | | | |
| 2,700 | | NSTAR | | | 92,265 | | | 99,360 | | | | |
| 6,200 | | NV ENERGY INC | | | 76,954 | | | 76,756 | | | | |
| 2,400 | | OGE ENERGY CORP | | | 43,344 | | | 88,536 | | | | |
| 4,100 | | ONEOK INC NEW | | | 155,972 | | | 182,737 | | | | |
| 700 | | ORMAT TECHNOLOGIES INC | | | 27,311 | | | 26,488 | | | | |
| 6,028 | | PEPCO HLDGS INC | | | 119,419 | | | 101,572 | | | | |
| 6,300 | | PETROHAWK ENERGY CORP (b) | | | 154,795 | | | 151,137 | | | | |
| 9,400 | | PG+E CORP | | | 213,041 | | | 419,710 | | | | |
| 2,400 | | PINNACLE WEST CAP CORP | | | 71,637 | | | 87,792 | | | | |
| 11,487 | | PPL CORP | | | 361,188 | | | 371,145 | | | | |
| 6,131 | | PROGRESS ENERGY INC | | | 230,254 | | | 251,432 | | | | |
| 13,084 | | PUBLIC SVC ENTERPRISE GROUP | | | 400,201 | | | 435,043 | | | | |
| 5,800 | | QUESTAR CORP | | | 66,188 | | | 241,106 | | | | |
| 15,600 | | RRI ENERGY INC (b) | | | 147,247 | | | 89,232 | | | | |
| 4,800 | | SCANA CORP NEW | | | 166,536 | | | 180,864 | | | | |
| 5,200 | | SEMPRA ENERGY | | | 259,640 | | | 291,096 | | | | |
| 25,259 | | SOUTHERN CO | | | 733,132 | | | 841,630 | | | | |
| 2,200 | | SOUTHERN UN CO NEW | | | 28,347 | | | 49,940 | | | | |
| 19,654 | | SPECTRA ENERGY CORP | | | 353,549 | | | 403,104 | | | | |
| 7,600 | | TECO ENERGY INC | | | 90,842 | | | 123,272 | | | | |
| 3,100 | | UGI CORP NEW | | | 51,203 | | | 74,989 | | | | |
| 1,400 | | WESTSTAR ENERGY INC | | | 25,767 | | | 30,408 | | | | |
| 3,710 | | WISCONSIN ENERGY CORP | | | 71,536 | | | 184,869 | | | | |
| | |
See accompanying notes to financial statements. | 37 | (Continued) |
|
CLEARWATER INVESTMENT TRUST |
Schedule of Investments - Clearwater Growth Fund |
December 31, 2009 |
| | | | | | | | | | | | | |
Shares | | Security | | Cost | | Fair
value (a) | | Percent
of
net assets | |
Utilities (Cont’d): | | | | | | | | | | |
| 12,125 | | XCEL ENERGY INC | | | 108,918 | | | 257,293 | | | | |
| | | | | | 11,047,284 | | | 12,568,251 | | | 4.29 | % |
| | Sub-total Common Stock: | | | 217,332,564 | | | 292,309,893 | | | | |
Cash equivalents: | | | | | | | | | | |
| 2,465,373 | | SSGA MONEY MARKET FUND, current rate 0.01% | | | 2,465,373 | | | 2,465,373 | | | | |
| | | | | | 2,465,373 | | | 2,465,373 | | | 0.84% | |
| | | Grand total (c) | | $ | 219,797,937 | | | 294,775,266 | | | 100.54 | % |
| |
Notes to Schedule of Investments: |
(a) | Securities are valued in accordance with procedures described in note 2 to the financial statements. |
(b) | Currently non-income producing assets. |
(c) | At December 31, 2009, the cost for Federal income tax purposes was $220,071,128. The aggregate gross unrealized appreciation and depreciation of investments in securities based of this cost were as follows: |
| | | | |
Gross unrealized appreciation | | $ | 86,988,909 | |
Gross unrealized depreciation | | | (12,284,771 | ) |
Net unrealized appreciation | | $ | 74,704,138 | |
| |
(d) | Foreign security values are stated in U.S. dollars. As of December 31, 2009 the value of foreign stocks or depository receipts of companies based outside of the United States represented 0.13% of net assets. |
| | |
See accompanying notes to financial statements. | 38 | (Continued) |
|
CLEARWATER INVESTMENT TRUST |
|
Schedule of Investments – Clearwater Growth Fund |
|
December 31, 2009 |
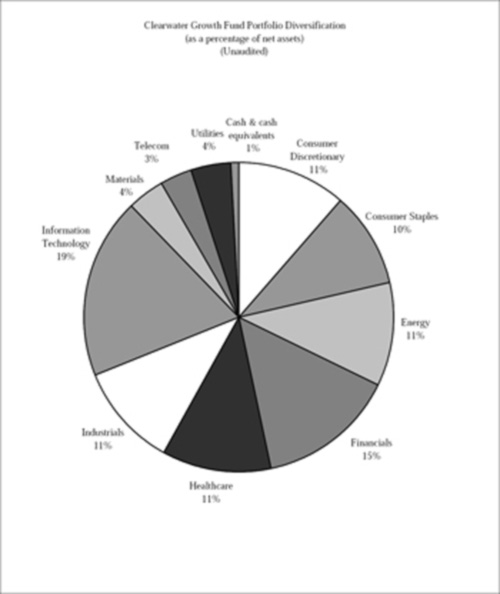
See accompanying notes to financial statements.
39
|
CLEARWATER INVESTMENT TRUST |
Schedule of Investments - Clearwater Small Cap Fund |
December 31, 2009 |
| | | | | | | | | | | | | |
Shares/Par | | Security | | Cost | | Fair
value (a) | | Percent
of
net assets | |
Common stocks: | | | | | | | | | | |
Consumer discretionary: | | | | | | | | | | |
| 19,250 | | AFC ENTERPRISES INC (b) | | $ | 121,439 | | | 157,080 | | | | |
| 15,000 | | BALLANTYNE OMAHA INC (b) | | | 52,800 | | | 55,950 | | | | |
| 98,250 | | BLOCKBUSTER INC (b) | | | 69,266 | | | 65,828 | | | | |
| 16,900 | | CACHE INC (b) | | | 83,234 | | | 77,233 | | | | |
| 9,550 | | CARMIKE CINEMAS INC (b) | | | 66,407 | | | 72,198 | | | | |
| 31,800 | | CENTURY CASINOS INC (b) | | | 56,023 | | | 85,542 | | | | |
| 17,750 | | CHRISTOPHER + BANKS CORP (b) | | | 115,108 | | | 135,255 | | | | |
| 10,796 | | COLE KENNETH PRODTNS INC | | | 78,482 | | | 104,181 | | | | |
| 191,551 | | COMMERCIAL VEH GROUP INC (b) | | | 1,227,705 | | | 1,147,390 | | | | |
| 45,000 | | D R HORTON INC | | | 519,425 | | | 489,150 | | | | |
| 30,100 | | DENNYS CORP (b) | | | 72,199 | | | 65,919 | | | | |
| 168,223 | | ENTERCOM COMMUNICATIONS CORP (b) | | | 913,259 | | | 1,189,337 | | | | |
| 5,650 | | FINISH LINE INC | | | 48,034 | | | 70,908 | | | | |
| 12,247 | | FUEL SYS SOLUTIONS INC (b) | | | 225,394 | | | 505,066 | | | | |
| 32,000 | | GAYLORD ENTMT CO NEW (b) | | | 812,882 | | | 632,000 | | | | |
| 284,200 | | HANCOCK FABRICS INC (b) | | | 405,103 | | | 989,016 | | | | |
| 26,500 | | HANESBRANDS INC (b) | | | 605,173 | | | 638,915 | | | | |
| 41,371 | | JO ANN STORES INC (b) | | | 621,727 | | | 1,499,285 | | | | |
| 157,242 | | KNOLOGY INC (b) | | | 1,296,635 | | | 1,721,800 | | | | |
| 19,600 | | LIZ CLAIBORNE INC (b) | | | 78,422 | | | 110,348 | | | | |
| 5,000 | | NATIONAL PRESTO INDS INC | | | 553,356 | | | 553,356 | | | | |
| 26,750 | | NEW YORK + CO INC (b) | | | 131,511 | | | 114,758 | | | | |
| 13,929 | | O CHARLEYS INC (b) | | | 90,533 | | | 91,235 | | | | |
| 50,000 | | ORIENT EXPRESS HOTELS LTD (b) | | | 752,944 | | | 507,000 | | | | |
| 17,450 | | OUTDOOR CHANNEL HLDGS INC (b) | | | 103,414 | | | 101,210 | | | | |
| 90,595 | | PACIFIC SUNWEAR OF CALIF (b) | | | 274,694 | | | 360,568 | | | | |
| 11,150 | | PC CONNECTION INC (b) | | | 67,079 | | | 75,263 | | | | |
| 27,000 | | PETSMART INC | | | 584,596 | | | 720,630 | | | | |
| 51,000 | | POINT BLANK SOLUTIONS INC (b) | | | 8,411 | | | 21,420 | | | | |
| 52,000 | | PULTE HOMES INC | | | 641,251 | | | 520,000 | | | | |
| 36,890 | | RC2 CORP (b) | | | 545,422 | | | 544,128 | | | | |
| 81,787 | | RUBIOS RESTAURANTS INC (b) | | | 591,003 | | | 589,684 | | | | |
| 13,000 | | SNAP ON INC | | | 589,135 | | | 549,380 | | | | |
| 18,750 | | STAMPS COM INC (b) | | | 170,444 | | | 168,750 | | | | |
| 33,600 | | SUMMER INFANT INC (b) | | | 147,728 | | | 150,864 | | | | |
| 25,000 | | TOLL BROS INC (b) | | | 489,250 | | | 470,250 | | | | |
| 11,850 | | VAIL RESORTS INC (b) | | | 430,566 | | | 447,930 | | | | |
| 17,000 | | WABCO HLDGS INC | | | 693,225 | | | 438,430 | | | | |
| 83,365 | | WABTEC | | | 2,714,507 | | | 3,404,627 | | | | |
| 18,300 | | WET SEAL INC (b) | | | 60,606 | | | 63,135 | | | | |
| 40,703 | | WMS INDUSTRIES INC (b) | | | 1,187,956 | | | 1,628,120 | | | | |
| 30,000 | | WYNDHAM WORLDWIDE CORP | | | 766,350 | | | 605,100 | | | | |
| | | | | | 19,062,696 | | | 21,938,237 | | | 10.24 | % |
Consumer staples: | | | | | | | | | | |
| 84,344 | | AMERICAN ITALIAN PASTA CO (b) | | | 2,397,560 | | | 2,934,328 | | | | |
| 14,990 | | CHATTEM INC (b) | | | 826,370 | | | 1,398,567 | | | | |
| 3,850 | | CHIQUITA BRANDS INTL INC (b) | | | 39,516 | | | 69,454 | | | | |
| 23,000 | | DR PEPPERSNAPPLE GROUP INC (b) | | | 361,424 | | | 650,900 | | | | |
| 27,000 | | FLOWERS FOODS INC | | | 511,723 | | | 641,520 | | | | |
| 10,157 | | MEDIFAST INC (b) | | | 44,131 | | | 310,601 | | | | |
| 15,300 | | OMEGA PROTEIN CORP (b) | | | 80,482 | | | 66,708 | | | | |
| 11,713 | | ORCHIDS PAPER PRODS CO DEL (b) | | | 217,823 | | | 234,494 | | | | |
| 65,000 | | SALLY BEAUTY HLDGS INC (b) | | | 562,956 | | | 497,250 | | | | |
| 8,000 | | SCHIFF NUTRITION INTL INC | | | 47,373 | | | 62,560 | | | | |
| 3,150 | | SENECA FOODS CORP NEW (b) | | | 72,431 | | | 75,191 | | | | |
| 20,350 | | SMART BALANCE INC (b) | | | 112,536 | | | 122,100 | | | | |
| 103,375 | | SPARTAN STORES INC (b) | | | 1,951,945 | | | 1,477,229 | | | | |
| 34,270 | | TREEHOUSE FOODS INC (b) | | | 893,361 | | | 1,331,732 | | | | |
| 114,728 | | WINN DIXIE STORES INC (b) | | | 1,597,170 | | | 1,151,869 | | | | |
| | | | | | 9,716,801 | | | 11,024,503 | | | 5.14 | % |
Energy: | | | | | | | | | | |
| 18,000 | | COMSTOCK RES INC (b) | | | 530,236 | | | 730,260 | | | | |
| 11,000 | | CONTANGO OIL + GAS CO (b) | | | 491,222 | | | 517,110 | | | | |
| 43,102 | | DRIL QUIPINC (b) | | | 1,210,965 | | | 2,434,401 | | | | |
| 36,000 | | EXCO RES INC | | | 599,107 | | | 764,280 | | | | |
| 22,000 | | FOSTER WHEELER AG (b) | | | 462,159 | | | 647,680 | | | | |
| 19,000 | | GASTAR EXPLORATION LTD (b) | | | 80,573 | | | 91,010 | | | | |
| 22,000 | | GOODRICH PETE CORP (b) | | | 668,990 | | | 535,700 | | | | |
| | |
See accompanying notes to financial statements. | 40 | (Continued) |
|
CLEARWATER INVESTMENT TRUST |
Schedule of Investments - Clearwater Small Cap Fund |
December 31, 2009 |
| | | | | | | | | | | | | |
Shares/Par | | Security | | Cost | | Fair
value (a) | | Percent
of
net assets | |
| 354,870 | | HERCULES OFFSHORE INC (b) | | $ | 1,785,841 | | | 1,696,279 | | | | |
| 97,450 | | ICO INC NEW | | | 595,720 | | | 712,360 | | | | |
| 165,996 | | NEWPARK RES INC (b) | | | 457,290 | | | 702,163 | | | | |
| 31,425 | | OIL STATES INTL INC (b) | | | 756,469 | | | 1,234,688 | | | | |
| 84,716 | | PENN VA CORP | | | 1,553,687 | | | 1,803,604 | | | | |
| 101,881 | | TESCO CORP (b) | | | 991,177 | | | 1,315,284 | | | | |
| 31,000 | | WILLBROS GROUP INC (b) | | | 506,987 | | | 522,970 | | | | |
| | | | | | 10,690,424 | | | 13,707,788 | | | 6.40 | % |
Financials: | | | | | | | | | | | |
| 25,475 | | ABINGTON BANCORP INC PENN | | | 218,319 | | | 175,523 | | | | |
| 114,162 | | AMTRUST FINANCIAL SERVICES | | | 1,115,412 | | | 1,349,395 | | | | |
| 24,950 | | ASPEN INSURANCE HOLDINGS LTD | | | 542,201 | | | 634,978 | | | | |
| 6,200 | | BERKSHIRE HILL BANCORP INC | | | 136,967 | | | 128,216 | | | | |
| 12,950 | | BOFI HLDG INC (b) | | | 122,275 | | | 129,500 | | | | |
| 6,200 | | BROOKLINE BANCORP INC DEL | | | 58,884 | | | 61,442 | | | | |
| 52,900 | | CAPLEASE INC | | | 99,337 | | | 231,702 | | | | |
| 12,650 | | CENTERSTATE BKS FL INC | | | 101,228 | | | 127,639 | | | | |
| 35,330 | | COMMUNITY TR BANCORP INC | | | 986,982 | | | 863,819 | | | | |
| 23,150 | | COMMUNITY WEST BANCSHARES | | | 63,660 | | | 68,756 | | | | |
| 52,352 | | CONSECO INC (b) | | | 79,254 | | | 261,760 | | | | |
| 37,125 | | CORPORATE OFFICE PPTYS TR | | | 1,133,963 | | | 1,359,889 | | | | |
| 46,607 | | DELPHI FINL GROUP INC | | | 1,044,202 | | | 1,042,599 | | | | |
| 9,800 | | DIME CMNTY BANCORP INC | | | 90,017 | | | 114,856 | | | | |
| 11,590 | | ENCORE BANCSHARES INC (b) | | | 89,013 | | | 92,141 | | | | |
| 50,000 | | EPOCH HLDG CORP | | | 662,894 | | | 522,500 | | | | |
| 130,220 | | FIRST FINL BANCORP | | | 992,086 | | | 1,896,003 | | | | |
| 16,911 | | FIRST INDL RLTY TR INC | | | 87,598 | | | 88,445 | | | | |
| 54,145 | | FIRST MERCHANTS CORP | | | 801,386 | | | 321,621 | | | | |
| 77,000 | | FIRST NIAGARA FINL GROUP INC | | | 1,110,190 | | | 1,071,070 | | | | |
| 17,650 | | FIRST POTOMAC RLTY TR | | | 191,130 | | | 221,861 | | | | |
| 37,000 | | FORESTAR GROUP INC (b) | | | 757,077 | | | 813,260 | | | | |
| 3,750 | | FPIC INS GROUP INC (b) | | | 125,718 | | | 144,825 | | | | |
| 22,000 | | GALLAGHER ARTHUR J + CO | | | 421,012 | | | 495,220 | | | | |
| 65,537 | | HALLMARK FINL SVCS INC (b) | | | 482,762 | | | 521,675 | | | | |
| 27,860 | | HEALTHCARE RLTY TR | | | 436,462 | | | 597,876 | | | | |
| 15,000 | | HERITAGE FINL CORP WASH | | | 172,500 | | | 206,700 | | | | |
| 34,080 | | HOME FED BANCORP INC MD | | | 450,267 | | | 453,605 | | | | |
| 45,965 | | HORACE MANN EDUCATORS CORP NEW | | | 516,168 | | | 574,563 | | | | |
| 7,470 | | HORIZON BANCORP IND | | | 100,149 | | | 121,163 | | | | |
| 11,500 | | IBERIABANK CORP | | | 529,273 | | | 618,815 | | | | |
| 24,000 | | LEGG MASON INC | | | 598,797 | | | 723,840 | | | | |
| 48,963 | | MB FINL INC | | | 628,558 | | | 965,550 | | | | |
| 10,650 | | MIDSOUTH BANCORP INC | | | 143,187 | | | 148,035 | | | | |
| 98,706 | | MISSION WEST PPTYS INC MD | | | 686,679 | | | 709,696 | | | | |
| 59,495 | | NATIONAL RETAIL PPTYS INC | | | 1,006,844 | | | 1,262,484 | | | | |
| 168,531 | | NORTHWEST BANCSHARES INC/MD (b) | | | 1,687,814 | | | 1,907,771 | | | | |
| 59,875 | | OLD NATL BANCORP IND | | | 626,150 | | | 744,246 | | | | |
| 12,150 | | PACIFIC CONTL CORP | | | 123,071 | | | 138,996 | | | | |
| 39,125 | | PACWEST BANCORP DEL | | | 642,198 | | | 788,369 | | | | |
| 46,250 | | PHOENIX COS INC NEW | | | 152,504 | | | 128,575 | | | | |
| 15,900 | | PINNACLE FINL PARTNERS INC (b) | | | 200,699 | | | 226,098 | | | | |
| 21,491 | | PLATINUM UNDERWRITERS HOLDINGS | | | 634,576 | | | 822,890 | | | | |
| 22,200 | | RADIAN GROUP INC | | | 140,345 | | | 162,282 | | | | |
| 57,098 | | RAYMOND JAMES FINANCIAL INC | | | 882,436 | | | 1,357,219 | | | | |
| 37,406 | | REDWOOD TR INC. | | | 491,241 | | | 540,891 | | | | |
| 7,650 | | SCBT FINL CORP | | | 195,177 | | | 211,829 | | | | |
| 10,450 | | STEWART INFORMATION SVCS CORP | | | 150,432 | | | 117,876 | | | | |
| 182,816 | | SWS GROUP INC | | | 2,318,384 | | | 2,212,074 | | | | |
| 227,644 | | U STORE IT TR | | | 1,311,801 | | | 1,666,354 | | | | |
| 17,586 | | UNITED FINL BANCORP INC MD | | | 221,791 | | | 230,552 | | | | |
| 11,950 | | UNIVEST CORP PA | | | 200,179 | | | 209,484 | | | | |
| 35,000 | | WALTER INV MGMT CORP | | | 465,880 | | | 501,550 | | | | |
| 12,500 | | WASHINGTON BKG CO OAK HBR WASH | | | 112,500 | | | 149,250 | | | | |
| 85,159 | | WESTFIELD FINL INC NEW | | | 873,425 | | | 702,562 | | | | |
| 80,151 | | WHITNEY HLDG CORP | | | 757,112 | | | 730,176 | | | | |
| 5,992 | | WSFS FINL CORP | | | 155,746 | | | 153,575 | | | | |
| | | | | | 29,125,915 | | | 32,823,635 | | | 15.31 | % |
Healthcare: | | | | | | | | | | | |
| 20,800 | | ALPHA PRO TECH LTD (b) | | | 113,091 | | | 94,016 | | | | |
| 16,000 | | AMERICAN DENTAL PARTNERS INC (b) | | | 202,701 | | | 206,400 | | | | |
| 130,874 | | AMERICAN MED SYS HLDGS (b) | | | 1,390,130 | | | 2,524,559 | | | | |
| | | | | | | | | | | | | |
| | |
See accompanying notes to financial statements. | 41 | (Continued) |
|
CLEARWATER INVESTMENT TRUST |
Schedule of Investments - Clearwater Small Cap Fund |
December 31, 2009 |
| | | | | | | | | | | | | |
Shares/Par | | Security | | Cost | | Fair
value (a) | | Percent
of
net assets | |
| 21,000 | | AMERISOURCEBERGEN CORP | | $ | 346,011 | | | 547,470 | | | | |
| 10,240 | | BIO RAD LABORATORIES INC (b) | | | 725,502 | | | 987,750 | | | | |
| 7,150 | | BIOCLINICA INC (b) | | | 22,813 | | | 30,388 | | | | |
| 108,334 | | BRUKER CORP (b) | | | 462,174 | | | 1,306,508 | | | | |
| 29,513 | | CATALYST HEALTH SOLUTIONS INC (b) | | | 576,978 | | | 1,076,339 | | | | |
| 141,100 | | CELERA CORP (b) | | | 838,052 | | | 975,001 | | | | |
| 13,000 | | COVIDIEN PLC | | | 542,107 | | | 622,570 | | | | |
| 27,350 | | ENZON PHARMACEUTICALS INC (b) | | | 279,576 | | | 287,996 | | | | |
| 44,550 | | FIVE STAR QUALITY CARE INC (b) | | | 72,324 | | | 154,589 | | | | |
| 126,303 | | HEALTHSOUTH CORP (b) | | | 2,014,523 | | | 2,370,707 | | | | |
| 121,806 | | HEALTHSPRING INC (b) | | | 1,540,405 | | | 2,145,004 | | | | |
| 59,523 | | HEALTHTRONICS INC (b) | | | 118,564 | | | 157,141 | | | | |
| 28,000 | | HILL ROM HLDGS | | | 548,960 | | | 671,720 | | | | |
| 22,920 | | HOME DIAGNOSTICS INC DEL (b) | | | 143,623 | | | 139,812 | | | | |
| 39,249 | | ICU MEDICAL INC (b) | | | 1,439,860 | | | 1,430,234 | | | | |
| 13,350 | | INTEGRAMED AMER INC (b) | | | 101,490 | | | 104,264 | | | | |
| 72,844 | | MARTEK BIOSCIENCES CORP (b) | | | 1,613,936 | | | 1,379,665 | | | | |
| 89,709 | | ORTHOFIX INTERNATIONAL NV (b) | | | 1,994,545 | | | 2,778,288 | | | | |
| 20,000 | | PATTERSON COS INC (b) | | | 448,311 | | | 559,600 | | | | |
| 28,000 | | PERRIGO CO | | | 567,665 | | | 1,115,520 | | | | |
| 30,000 | | PHARMERICA CORP (b) | | | 563,950 | | | 476,400 | | | | |
| 56,700 | | PHC INC MASS (b) | | | 77,648 | | | 62,370 | | | | |
| 85,870 | | PSYCHIATRIC SOLUTIONS INC (b) | | | 1,365,949 | | | 1,815,292 | | | | |
| 11,511 | | SUN HEALTHCARE GROUP INC (b) | | | 100,152 | | | 105,556 | | | | |
| 32,197 | | THORATEC CORP (b) | | | 862,317 | | | 866,743 | | | | |
| 19,300 | | UNIVERSAL HEALTH SVCS INC | | | 371,017 | | | 588,650 | | | | |
| 8,850 | | US PHYSICAL THERAPY INC (b) | | | 130,440 | | | 149,831 | | | | |
| 98,667 | | ZOLL MED CORP (b) | | | 1,669,475 | | | 2,636,382 | | | | |
| | | | | | 21,244,290 | | | 28,366,763 | | | 13.23 | % |
Industrials: | | | | | | | | | | | |
| 62,320 | | ACTUANT CORP | | | 982,793 | | | 1,154,790 | | | | |
| 15,000 | | ACUITY BRANDS INC | | | 533,328 | | | 534,600 | | | | |
| 27,000 | | AECOM TECHNOLOGY CORP (b) | | | 628,313 | | | 742,500 | | | | |
| 46,160 | | ALLIED DEFENSE GROUP INC (b) | | | 218,110 | | | 219,260 | | | | |
| 13,822 | | APPLIED SIGNAL TECHNOLOGY INC | | | 285,938 | | | 266,626 | | | | |
| 37,709 | | ARGON ST INC (b) | | | 731,306 | | | 819,039 | | | | |
| 33,438 | | BE AEROSPACE INC (b) | | | 899,808 | | | 785,793 | | | | |
| 20,000 | | BRINKS HOME SEC HLDGS INC (b) | | | 459,348 | | | 652,800 | | | | |
| 18,000 | | BUCYRUS INTL INC NEW | | | 429,218 | | | 1,014,660 | | | | |
| 5,800 | | CASCADE CORP | | | 147,005 | | | 159,442 | | | | |
| 32,500 | | CHICAGO BRDG + IRON CO N V | | | 631,117 | | | 657,150 | | | | |
| 60,780 | | COINSTAR INC (b) | | | 1,814,685 | | | 1,688,468 | | | | |
| 50,000 | | COLFAX CORP (b) | | | 570,484 | | | 602,000 | | | | |
| 28,000 | | COVANTA HLDG CORP (b) | | | 524,966 | | | 506,520 | | | | |
| 48,350 | | CURTISS WRIGHT CORP | | | 1,769,264 | | | 1,514,322 | | | | |
| 31,515 | | DHT MARITIME INC (b) | | | 121,277 | | | 115,975 | | | | |
| 20,110 | | DIAMOND MGMT TECHNOLOGY | | | 144,083 | | | 148,211 | | | | |
| 5,400 | | ENNIS INC | | | 69,365 | | | 90,666 | | | | |
| 20,000 | | ENPRO INDS INC (b) | | | 569,233 | | | 528,200 | | | | |
| 33,297 | | ESCO TECHNOLOGIES INC | | | 1,307,236 | | | 1,193,697 | | | | |
| 4,000 | | ESPEY MFS + ELECTRS CORP | | | 75,489 | | | 76,480 | | | | |
| 8,500 | | FLOWSERVE CORP | | | 433,671 | | | 803,505 | | | | |
| 23,500 | | FOSTER L B CO (b) | | | 542,920 | | | 700,535 | | | | |
| 23,141 | | FRANKLIN ELEC INC | | | 648,128 | | | 672,940 | | | | |
| 40,140 | | GARDNER DENVER INC | | | 1,287,203 | | | 1,707,957 | | | | |
| 73,922 | | GENCORP INC (b) | | | 302,165 | | | 517,454 | | | | |
| 19,950 | | GENESEE & WYO INC (b) | | | 502,922 | | | 651,168 | | | | |
| 17,300 | | GP STRATEGIES CORP (b) | | | 117,512 | | | 130,269 | | | | |
| 12,250 | | HAWAIIAN HLDGS INC (b) | | | 80,581 | | | 85,750 | | | | |
| 46,053 | | HORNBECK OFFSHORE SVCS INC NEW (b) | | | 1,053,471 | | | 1,072,114 | | | | |
| 185,009 | | ICONIX BRAND GROUP INC (b) | | | 2,062,825 | | | 2,340,364 | | | | |
| 31,005 | | II VI INC (b) | | | 614,710 | | | 985,959 | | | | |
| 57,975 | | INSITUFORM TECHNOLOGIES INC (b) | | | 830,866 | | | 1,317,192 | | | | |
| 11,554 | | INSTEEL INDS INC | | | 126,930 | | | 150,202 | | | | |
| 317,200 | | ITEX CORP (b) | | | 215,520 | | | 253,760 | | | | |
| 40,000 | | JOHN BEAN TECHNOLOGIES CORP | | | 516,680 | | | 680,400 | | | | |
| 14,500 | | JOY GLOBAL INC | | | 562,673 | | | 748,055 | | | | |
| 25,000 | | KANSAS CITY SOUTHERN (b) | | | 582,716 | | | 832,250 | | | | |
| 23,250 | | KIRBY CORP (b) | | | 564,537 | | | 809,798 | | | | |
| 27,700 | | KOPPERS HLDGS INC | | | 1,096,440 | | | 843,188 | | | | |
| 50,000 | | MANITOWOC INC | | | 471,335 | | | 498,500 | | | | |
| 27,000 | | MCDERMOTT INTL INC (b) | | | 591,053 | | | 648,270 | | | | |
| | |
See accompanying notes to financial statements. | 42 | (Continued) |
|
CLEARWATER INVESTMENT TRUST |
Schedule of Investments - Clearwater Small Cap Fund |
December 31, 2009 |
| | | | | | | | | | | | | |
Shares/Par | | Security | | Cost | | Fair
value (a) | | Percent
of
net assets | |
| 50,600 | | MERRIMAC INDS INC (b) | | $ | 746,285 | | | 805,046 | | | | |
| 24,450 | | METALICO INC (b) | | | 101,565 | | | 120,294 | | | | |
| 55,000 | | MUELLER WTR PRODS INC | | | 715,610 | | | 286,000 | | | | |
| 45,000 | | ORBITAL SCIENCES CORP (b) | | | 567,545 | | | 686,700 | | | | |
| 14,765 | | PRIMORIS SVCS CORP | | | 118,256 | | | 117,677 | | | | |
| 170,431 | | SANMINA CORPORATION (b) | | | 1,274,549 | | | 1,879,854 | | | | |
| 16,000 | | SHAW GROUP INC (b) | | | 688,592 | | | 460,000 | | | | |
| 15,600 | | SPARTON CORP | | | 81,422 | | | 94,224 | | | | |
| 19,000 | | TENNANT CO | | | 696,347 | | | 497,610 | | | | |
| 24,000 | | TEREX CORP NEW (b) | | | 686,125 | | | 475,440 | | | | |
| 12,500 | | THOMAS + BETTS CORP (b) | | | 547,678 | | | 447,375 | | | | |
| 14,000 | | TYCO INTERNATIONAL LTD BERMUDA (d) | | | 644,066 | | | 499,520 | | | | |
| 105,256 | | VALASSIS COMMUNICATIONS INC (b) | | | 145,184 | | | 1,921,975 | | | | |
| 18,000 | | WRIGHT EXPRESS CORP (b) | | | 495,073 | | | 573,480 | | | | |
| | | | | | 33,625,516 | | | 38,786,024 | | | 18.11 | % |
Information technology: | | | | | | | | | | |
| 100,731 | | 8X8 INC NEW (b) | | | 67,050 | | | 152,104 | | | | |
| 223,450 | | ADAPTEC INC (b) | | | 658,079 | | | 748,558 | | | | |
| 70,400 | | ALLIANCE FIBER OPTIC PRODS INC | | | 65,111 | | | 84,480 | | | | |
| 170,888 | | ANAREN INC (b) | | | 1,913,337 | | | 2,571,864 | | | | |
| 67,075 | | ARRIS GROUP INC (b) | | | 675,768 | | | 766,667 | | | | |
| 35,825 | | AXT INC (b) | | | 51,441 | | | 116,431 | | | | |
| 25,707 | | BLUEPHOENIX SOLUTIONS LTD (b) | | | 47,987 | | | 65,039 | | | | |
| 77,300 | | BRIDGELINE SOFTWARE INC (b) | | | 96,931 | | | 92,760 | | | | |
| 28,000 | | BROADRIDGE FINL SOLUTIONS INC | | | 458,289 | | | 631,680 | | | | |
| 21,080 | | CACI INTLINC (b) | | | 837,819 | | | 1,029,758 | | | | |
| 55,312 | | CALAMP CORP (b) | | | 37,264 | | | 190,273 | | | | |
| 255,562 | | CIBER INC (b) | | | 815,304 | | | 881,689 | | | | |
| 75,552 | | COMTECH TELECOMMUNICATIONS (b) | | | 2,053,844 | | | 2,648,098 | | | | |
| 33,410 | | CPI INTL INC (b) | | | 373,606 | | | 442,348 | | | | |
| 23,612 | | DIGITAL RIV INC (b) | | | 527,638 | | | 637,288 | | | | |
| 61,474 | | DYNAMICS RESH CORP (b) | | | 486,263 | | | 652,239 | | | | |
| 13,100 | | EPICOR SOFTWARE CORP (b) | | | 88,497 | | | 99,822 | | | | |
| 34,389 | | EVOLVING SYS INC (b) | | | 202,586 | | | 214,931 | | | | |
| 23,369 | | FREQUENCYELECTRS INC (b) | | | 82,836 | | | 120,117 | | | | |
| 66,619 | | GILAT SATELLITE NETWORKS LTD (b) | | | 319,207 | | | 307,114 | | | | |
| 715,700 | | GRAPHON CORP (b) | | | 200,687 | | | 60,835 | | | | |
| 7,300 | | INDUSTRIAL SVCS AMER INC FL (b) | | | 62,421 | | | 70,372 | | | | |
| 24,435 | | INFOSPACE INC (b) | | | 172,950 | | | 209,408 | | | | |
| 10,769 | | INTEGRAL SYS INC MD (b) | | | 91,609 | | | 93,260 | | | | |
| 20,000 | | LENDERPROCESSING SVCS INC | | | 548,268 | | | 813,200 | | | | |
| 334,794 | | LOOKSMART LTD (b) | | | 508,526 | | | 341,490 | | | | |
| 21,600 | | MAGMA DESIGN AUTOMATION INC (b) | | | 51,529 | | | 49,896 | | | | |
| 8,755 | | MEDIWARE INFORMATION SYS INC (b) | | | 38,653 | | | 62,379 | | | | |
| 39,039 | | MERCURY COMPUTER SYS INC (b) | | | 275,399 | | | 429,819 | | | | |
| 34,923 | | MONOLITHIC PWR SYS INC (b) | | | 762,773 | | | 837,104 | | | | |
| 41,800 | | NAPCO SEC TECH INC (b) | | | 68,377 | | | 69,806 | | | | |
| 15,400 | | NU HORIZONS ELECTRS CORP (b) | | | 64,909 | | | 63,448 | | | | |
| 4,850 | | OSI SYS INC (b) | | | 77,781 | | | 132,308 | | | | |
| 219,368 | | RADIANT SYS INC (b) | | | 1,954,999 | | | 2,281,427 | | | | |
| 25,450 | | REALNETWORKS INC (b) | | | 78,391 | | | 94,420 | | | | |
| 425,339 | | RF MICRO DEVICES INC (b) | | | 1,615,253 | | | 2,028,867 | | | | |
| 44,545 | | ROVI CORP (b) | | | 782,652 | | | 1,419,649 | | | | |
| 232,980 | | SELECTICAINC DEL (b) | | | 97,461 | | | 53,818 | | | | |
| 97,238 | | SKILLSOFT PUB LTD CO (b) (d) | | | 731,216 | | | 1,019,054 | | | | |
| 152,805 | | SMITH MICRO SOFTWARE INC (b) | | | 1,426,686 | | | 1,396,638 | | | | |
| 29,350 | | SPECTRUM CTL INC (b) | | | 232,736 | | | 277,945 | | | | |
| 49,617 | | SYNAPTICSINC (b) | | | 1,336,068 | | | 1,520,761 | | | | |
| 49,499 | | SYNNEX CORP (b) | | | 1,351,630 | | | 1,517,639 | | | | |
| 93,316 | | TAKE TWO INTERACTIVE SOFTWARE (b) | | | 821,447 | | | 937,826 | | | | |
| 15,150 | | TELECOMMUNICATION SYS INC (b) | | | 114,764 | | | 146,652 | | | | |
| 24,518 | | TELEDYNE TECHNOLOGIES INC (b) | | | 1,035,996 | | | 940,510 | | | | |
| 76,663 | | TIER TECHNOLOGIES INC (b) | | | 594,640 | | | 613,304 | | | | |
| 37,433 | | UNISYS CORP (b) | | | 970,072 | | | 1,443,416 | | | | |
| 14,300 | | UNITED ONLINE INC | | | 87,953 | | | 102,817 | | | | |
| 31,114 | | VIRAGE LOGIC CORP (b) | | | 82,172 | | | 171,127 | | | | |
| | | | | | 26,096,878 | | | 31,652,455 | | | 14.76 | % |
Materials: | | | | | | | | | | |
| 17,000 | | APTARGROUP INC | | | 711,338 | | | 607,580 | | | | |
| 15,000 | | ASHLAND INC NEW | | | 551,175 | | | 594,300 | | | | |
| 17,000 | | BEMIS CO INC | | | 490,899 | | | 504,050 | | | | |
| | | | | | | | | | | | | |
| | |
See accompanying notes to financial statements. | 43 | (Continued) |
|
CLEARWATER INVESTMENT TRUST |
Schedule of Investments - Clearwater Small Cap Fund |
December 31, 2009 |
| | | | | | | | | | | | | |
Shares/Par | | Security | | Cost | | Fair
value (a) | | Percent
of
net assets | |
| 9,100 | | BOISE INC (b) | | $ | 51,147 | | | 48,321 | | | | |
| 14,200 | | BUCKEYE TECHNOLOGIES INC (b) | | | 145,651 | | | 138,592 | | | | |
| 43,054 | | CALGON CARBON CORP (b) | | | 522,811 | | | 598,451 | | | | |
| 50,000 | | CAPITAL GOLD CORP (b) | | | 39,250 | | | 44,550 | | | | |
| 43,514 | | CARPENTER TECHNOLOGY CORP | | | 788,135 | | | 1,172,702 | | | | |
| 20,000 | | CLEARWATER PAPER CORP (b) | | | 457,261 | | | 1,099,400 | | | | |
| 10,500 | | DELTIC TIMBER CORP | | | 503,271 | | | 484,890 | | | | |
| 19,000 | | GRACE W R + CO DEL NEW (b) | | | 465,151 | | | 481,650 | | | | |
| 29,000 | | GREIF INC | | | 1,556,979 | | | 1,565,420 | | | | |
| 5,750 | | HORSEHEAD HLDG CORP (b) | | | 63,382 | | | 73,313 | | | | |
| 6,850 | | INNOPHOS HLDGS INC | | | 121,326 | | | 157,482 | | | | |
| 16,715 | | INNOSPEC INC | | | 141,068 | | | 168,654 | | | | |
| 20,000 | | KAPSTONE PAPER + PKGING CORP (b) | | | 145,550 | | | 197,000 | | | | |
| 20,050 | | NORTH AMERN GALVANIZING (b) | | | 87,008 | | | 97,243 | | | | |
| 27,350 | | NORTH AMERN PALLADIUM LTD (b) | | | 85,777 | | | 95,725 | | | | |
| 39,016 | | ROCK TENN CO | | | 1,261,225 | | | 1,966,797 | | | | |
| 14,000 | | TEXAS INDS INC | | | 775,328 | | | 489,860 | | | | |
| 11,900 | | UFP TECHNOLOGIES INC (b) | | | 68,689 | | | 77,350 | | | | |
| 7,000 | | UNIVERSAL STAINLESS + ALLOY PR (b) | | | 104,537 | | | 132,020 | | | | |
| 42,000 | | ZEP INC | | | 601,927 | | | 727,440 | | | | |
| | | | | | 9,738,885 | | | 11,522,788 | | | 5.38 | % |
Utilities: | | | | | | | | | | | |
| 21,030 | | ALLETE INC | | | 671,405 | | | 687,260 | | | | |
| 2,300 | | AMERICAN STS WTR CO | | | 77,315 | | | 81,443 | | | | |
| 27,000 | | AMERICAN WATER WORKS | | | 583,883 | | | 605,070 | | | | |
| 19,000 | | CLECO CORP NEW | | | 470,134 | | | 519,270 | | | | |
| 2,315 | | CONNECTICUT WTR SVC INC | | | 56,233 | | | 57,343 | | | | |
| 14,000 | | ITC HLDGS CORP | | | 638,988 | | | 729,260 | | | | |
| 19,090 | | MIDDLESEX WTR CO | | | 335,970 | | | 336,557 | | | | |
| 35,289 | | NEUSTAR INC (b) | | | 616,478 | | | 813,059 | | | | |
| 81,250 | | NEUTRAL TANDEM INC (b) | | | 2,110,622 | | | 1,848,438 | | | | |
| 129,091 | | NGP CAP RES CO | | | 1,533,590 | | | 1,049,510 | | | | |
| 19,000 | | OTTER TAIL CORP | | | 562,474 | | | 471,200 | | | | |
| 7,027 | | PENNICHUCK CORP | | | 133,375 | | | 148,481 | | | | |
| 40,000 | | PETROHAWK ENERGY CORP (b) | | | 448,994 | | | 959,600 | | | | |
| 24,500 | | PORTLAND GEN ELEC CO | | | 677,887 | | | 500,045 | | | | |
| 177,407 | | PREMIERE GLOBAL SVCS INC (b) | | | 2,059,651 | | | 1,463,608 | | | | |
| 7,250 | | SJW CORP | | | 169,508 | | | 163,633 | | | | |
| 25,925 | | SOUTHWEST GAS CORP | | | 639,058 | | | 739,640 | | | | |
| 17,900 | | SOUTHWEST WTR CO | | | 86,020 | | | 105,431 | | | | |
| 191,357 | | SYNIVERSE HLDGS INC (b) | | | 2,730,279 | | | 3,344,920 | | | | |
| 36,767 | | UIL HLDG CORP | | | 1,045,701 | | | 1,032,417 | | | | |
| 18,400 | | UNITIL CORP | | | 367,931 | | | 422,832 | | | | |
| 14,479 | | YORK WTR CO | | | 186,988 | | | 210,090 | | | | |
| | | | | | 16,202,485 | | | 16,289,106 | | | 7.60 | % |
ETFs: | | | | | | | | | | | | |
Commodities: | | | | | | | | | | | | |
| 12,650 | | CHARDAN 2008 CHINA ACQUISITION (b) | | | 118,727 | | | 113,218 | | | | |
| 23,000 | | POWERSHARES DB MULTI SECTOR (b) | | | 591,023 | | | 608,120 | | | | |
| 25,000 | | SPDR SER TR | | | 610,828 | | | 556,250 | | | | |
| 27,000 | | TERRITORIAL BANCORP INC (b) | | | 402,472 | | | 487,350 | | | | |
| | | | | | 1,723,051 | | | 1,764,938 | | | 0.82 | % |
Convertible Bonds: | | | | | | | | | | | |
Industrials: | | | | | | | | | | | | |
| 487,900 | | GENCORP INC, 2.25% rate, due 2024 | | | 212,502 | | | 439,720 | | | 0.20 | % |
Cash equivalents: | | | | | | | | | | |
| 6,539,904 | | SSGA MONEY MARKET FUND, Current rate 0.01% | | $ | 6,539,904 | | | 6,539,904 | | | 3.05 | % |
| | | | | | 6,539,904 | | | 6,539,904 | | | | |
| | | | | | | | | | | | | |
| | | Grand Total (c) | | $ | 183,979,346 | | | 214,855,860 | | | 100.24 | % |
| | | | | | | | | | | | | |
| | |
See accompanying notes to financial statements. | 44 | (Continued) |
|
CLEARWATER INVESTMENT TRUST |
Schedule of Investments - Clearwater Small Cap Fund |
December 31, 2009 |
| | | | | | | | | | | | | |
Shares/Par | | Security | | Cost | | Fair
value (a) | | Percent
of
net assets | |
| | | | | | | | | | |
Notes to Schedule of Investments: | | | | | | | | | | |
| (a) | | Securities are valued in accordance with procedures described in note 2 to the financial statements. | | | | | | | |
| (b) | | Currently non-income producing assets. | | | | | | | |
| (c) | | At December 31, 2009, the cost for Federal income tax purposes was $184,009,387. The aggregate gross unrealized appreciation and depreciation of investments in securities based on this cost were as follows: |
| | | Gross unrealized appreciation | | $ | 39,671,938 | | | | | | | |
| | | Gross unrealized depreciation | | | (8,825,465 | ) | | | | | | |
| | | Net unrealized appreciation | | $ | 30,846,473 | | | | | | | |
| (d) | | Foreign security values are stated in U.S. dollars. As of December 31, 2009, the value of stocks or depository receipts represented 0.71% of net assets. |
| | | | | | | | | | | | | |
| | | | | | | | | | | | | |
| | |
See accompanying notes to financial statements. | 45 | (Continued) |
CLEARWATER INVESTMENT TRUST
Schedule of Investments – Clearwater Small Cap Fund
December 31, 2009
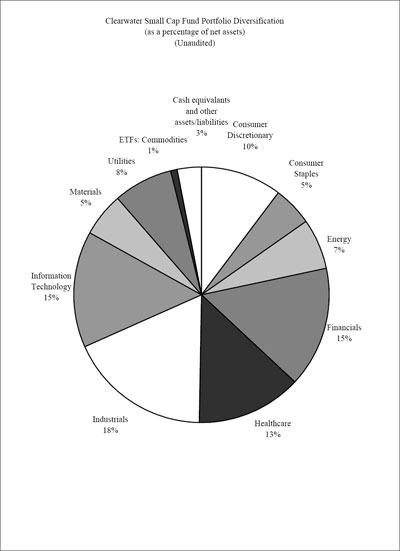
See accompanying notes to financial statements.
46
|
CLEARWATER INVESTMENT TRUST |
Schedule of Investments - Clearwater Tax-Exempt Bond Fund |
December 31, 2009 |
| | | | | | | | | | | | | | | | | |
Par/Shares | | Security | | Maturity
date | | Coupon
rate | | Cost | | Fair
Value (a) | | Percent
of
net assets | |
Closed-End funds: | | | | | | | | | | | | | |
| 47,200 | | AMERICAN MUN INCOME | | | | | | $ | 554,976 | | | 658,440 | | | | |
| 182,800 | | BLACKROCK LONG TERM MUN | | | | | | | 1,875,574 | | | 1,868,216 | | | | |
| 18,200 | | BLACKROCK MUN BD TR | | | | | | | 169,379 | | | 253,344 | | | | |
| 25,100 | | BLACKROCK MUN INCOME TR II | | | | | | | 237,725 | | | 343,619 | | | | |
| 21,837 | | BLACKROCK MUNI YIELD | | | | | | | 275,930 | | | 279,077 | | | | |
| 186,000 | | BLACKROCK MUNIHOLDINGS FL INSD | | | | | | | 2,175,942 | | | 2,416,140 | | | | |
| 59,500 | | BLACKROCK MUNIHOLDINGS INSD FD | | | | | | | 749,861 | | | 772,905 | | | | |
| 71,200 | | BLACKROCK MUNIYIELD FLA FD INC | | | | | | | 905,807 | | | 902,816 | | | | |
| 78,300 | | BLACKROCK MUNIYIELD INSD FD | | | | | | | 1,032,557 | | | 961,524 | | | | |
| 76,179 | | BLACKROCK MUNIYIELD MI INSD FD | | | | | | | 1,014,103 | | | 988,803 | | | | |
| 71,700 | | BLACKROCK MUNIYIELD MICH INSD | | | | | | | 860,594 | | | 851,796 | | | | |
| 54,700 | | BLACKROCK MUNIYIELD PA INSD | | | | | | | 774,527 | | | 727,510 | | | | |
| 28,100 | | BLACKROCK MUNIYIELD QUALITY FD | | | | | | | 333,747 | | | 330,456 | | | | |
| 12,500 | | DREYFUS STRATEGIC MUN BD FD | | | | | | | 68,613 | | | 96,125 | | | | |
| 209,000 | | DWS MUN INCOME TR | | | | | | | 2,278,136 | | | 2,462,020 | | | | |
| 1,000 | | EATON VANCE | | | | | | | 8,280 | | | 11,430 | | | | |
| 62,900 | | EATON VANCE INCS CA MU II | | | | | | | 702,542 | | | 720,205 | | | | |
| 1,100 | | EATON VANCE INSD MI MUN BD FD | | | | | | | 15,510 | | | 14,641 | | | | |
| 26,905 | | EATON VANCE MUN INCOME TR | | | | | | | 286,929 | | | 310,484 | | | | |
| 10,800 | | FEDERATED PREMIER MUN INCOME | | | | | | | 128,672 | | | 161,028 | | | | |
| 57,200 | | INVESTMENT GRADE MUNI INC FD | | | | | | | 772,405 | | | 808,236 | | | | |
| 129,600 | | MBIA CAP CLAYMORE MANAGED | | | | | | | 1,664,733 | | | 1,709,424 | | | | |
| 6,500 | | MFS HIGH INCOME NUM TR | | | | | | | 23,108 | | | 31,395 | | | | |
| 67,200 | | MORGAN STANLEY DEAN WITTER | | | | | | | 507,600 | | | 534,240 | | | | |
| 95,900 | | MSDW QUAL MUNI INVESTMENT TR | | | | | | | 1,173,337 | | | 1,214,094 | | | | |
| 90,881 | | MSDW QUALITY MUNICIPAL INCOM | | | | | | | 1,024,407 | | | 1,096,025 | | | | |
| 10,299 | | NEUBERGER BERMAN INTER MUN FD | | | | | | | 126,917 | | | 138,831 | | | | |
| 31,103 | | NUVEEN CALIF INVT QUALITY MUN | | | | | | | 373,215 | | | 399,363 | | | | |
| 13,700 | | NUVEEN CALIF MUN MKT | | | | | | | 157,825 | | | 180,292 | | | | |
| 41,700 | | NUVEEN DIVID ADVANTAGE MUN FD | | | | | | | 475,800 | | | 562,950 | | | | |
| 17,000 | | NUVEEN DIVID ADVANTAGE MUN FD3 | | | | | | | 185,431 | | | 228,990 | | | | |
| 13,500 | | NUVEEN INSD DIVID ADVANTAGE | | | | | | | 181,771 | | | 192,915 | | | | |
| 4,800 | | NUVEEN MASS PREM INCOME MUN FD | | | | | | | 65,734 | | | 65,040 | | | | |
| 30,600 | | NUVEEN MICH PREM INCOME MUN FD | | | | | | | 404,605 | | | 375,462 | | | | |
| 44,600 | | NUVEEN MUN ADVANTAGE FD INC | | | | | | | 522,316 | | | 636,888 | | | | |
| 15,500 | | NUVEEN N J INVT QUALITY MUN FD | | | | | | | 211,528 | | | 200,260 | | | | |
| 10,100 | | NUVEEN PA DIVID ADVANTAGE MUN | | | | | | | 127,549 | | | 133,522 | | | | |
| 48,500 | | NUVEEN PA INVT QUALITY MUN FD | | | | | | | 673,352 | | | 637,775 | | | | |
| 238,709 | | NUVEEN PREM INCOME MUN FD 2 | | | | | | | 3,273,534 | | | 3,181,991 | | | | |
| 27,100 | | NUVEEN PREMIER INC | | | | | | | 367,653 | | | 351,758 | | | | |
| 161,890 | | PUTNAM MUN OPPORTUITIES TR | | | | | | | 1,838,267 | | | 1,801,836 | | | | |
| 84,500 | | SPECIAL OPPORTUNITIES FUND | | | | | | | 1,116,261 | | | 1,189,760 | | | | |
| 83,800 | | VAN KAMPEN MERRITT | | | | | | | 954,508 | | | 1,194,150 | | | | |
| 114,300 | | VAN KAMPEN MERRITT ADVANTAGE | | | | | | | 1,329,113 | | | 1,308,735 | | | | |
| 84,239 | | VAN KAMPEN MERRITT PA | | | | | | | 1,114,508 | | | 1,073,205 | | | | |
| 37,800 | | VAN KAMPEN MERRITT SELECT SECT | | | | | | | 398,849 | | | 431,676 | | | | |
| 63,277 | | VAN KAMPEN MERRITT TR INVT | | | | | | | 894,508 | | | 877,019 | | | | |
| 22,000 | | WESTERN ASSET MGNT MUNS FD INC | | | | | | | 240,488 | | | 268,400 | | | | |
| 48,606 | | WESTERN ASSET PARTNERS FD INC | | | | | | | 620,291 | | | 647,432 | | | | |
| 12,700 | | WESTERN INTER MUNI FD INC | | | | | | | 111,045 | | | 113,665 | | | | |
| | | | | | | | | | 35,380,061 | | | 36,715,907 | | | 6.77 | % |
Municipal bonds: | | | | | | | | | | | | | |
| 2,000,000 | | ABAG FIN AUTH FOR NONPROFIT CO | | 2/15/2019 | | 5.375 | | $ | 1,774,548 | | | 1,933,440 | | | | |
| 405,000 | | ABILENE TEX HEALTH FACS DEV | | 11/15/2028 | | 5.150 | | | 405,000 | | | 278,543 | | | | |
| 500,000 | | ADAMS CNTY PA INDL DEV AUTH | | 8/15/2021 | | 5.875 | | | 500,035 | | | 528,030 | | | | |
| 1,500,000 | | AGUA CALIENTE BAND CAHUILLA | | 7/1/2018 | | 6.000 | | | 1,465,764 | | | 1,462,665 | | | | |
| | |
See accompanying notes to financial statements. | 47 | (Continued) |
|
CLEARWATER INVESTMENT TRUST |
Schedule of Investments - Clearwater Tax-Exempt Bond Fund |
December 31, 2009 |
| | | | | | | | | | | | | | | | | |
Par/Shares | | Security | | Maturity
date | | Coupon
rate | | Cost | | Fair
Value (a) | | Percent
of
net assets | |
| 715,000 | | ALABAMA HSG FIN AUTH SINGLE | | 4/1/2038 | | 4.500 | | $ | 531,077 | | | 661,168 | | | | |
| 1,380,000 | | ALABAMA HSG FIN AUTH SINGLE | | 10/1/2028 | | 5.250 | | | 1,380,000 | | | 1,425,775 | | | | |
| 200,000 | | ALABAMA SPL CARE FACS FING AUT | | 11/1/2019 | | 5.000 | | | 208,677 | | | 202,698 | | | | |
| 870,000 | | ALACHUA CNTY FLA HEALTH FACS A | | 12/1/2011 | | 6.000 | | | 870,000 | | | 872,219 | | | | |
| 500,000 | | ALASKA HSG FIN CORP HOME MTG | | 12/1/2033 | | 5.450 | | | 500,000 | | | 515,860 | | | | |
| 1,000,000 | | ALASKA HSG FIN CORP HOME MTG | | 12/1/2034 | | 5.250 | | | 997,150 | | | 1,018,490 | | | | |
| 250,000 | | ALASKA INDL DEV + EXPT AUTH CM | | 12/1/2011 | | 5.450 | | | 250,000 | | | 252,115 | | | | |
| 350,000 | | ALASKA INDL DEV + EXPT AUTH CM | | 12/1/2010 | | 5.400 | | | 350,000 | | | 348,849 | | | | |
| 1,500,000 | | ALASKA ST HSG FIN CORP | | 6/1/2032 | | 5.250 | | | 1,280,162 | | | 1,515,255 | | | | |
| 2,000,000 | | ALASKA ST HSG FIN CORP | | 12/1/2034 | | 5.250 | | | 2,008,080 | | | 2,048,580 | | | | |
| 240,000 | | ALBANY N Y INDL DEV AGY CIVIC | | 5/1/2016 | | 6.500 | | | 240,000 | | | 151,198 | | | | |
| 350,000 | | ALEUTIANS EAST BOROUGH ALASKA | | 6/1/2025 | | 5.500 | | | 314,639 | | | 311,252 | | | | |
| 500,000 | | ALEXANDRIA VA REDEV + HSG AUTH | | 10/1/2029 | | 6.125 | | | 527,161 | | | 508,270 | | | | |
| 1,025,000 | | ALISAL CALIF UN SCH DIST (c) | | 8/1/2025 | | 6.221 | | | 408,151 | | | 422,936 | | | | |
| 350,000 | | ALLEGHENY CNTY PA HOSP DEV AUT | | 4/1/2010 | | 3.875 | | | 349,558 | | | 350,280 | | | | |
| 500,000 | | ANDERSON IND ECONOMIC DEV REV | | 10/1/2021 | | 4.750 | | | 495,983 | | | 456,075 | | | | |
| 410,000 | | ARBOR GREENE CMNTY DEV DIST FL | | 5/1/2019 | | 5.000 | | | 417,018 | | | 407,257 | | | | |
| 500,000 | | ARIZONA HEALTH FACS AUTH | | 10/1/2010 | | 4.750 | | | 500,000 | | | 500,330 | | | | |
| 1,066,620 | | ARIZONA HEALTH FACS AUTH REV | | 7/1/2027 | | 5.250 | | | 1,035,137 | | | 836,625 | | | | |
| 1,750,000 | | ARLINGTON TEX SPL OBLIG | | 8/15/2034 | | 5.000 | | | 1,876,760 | | | 1,757,385 | | | | |
| 1,060,000 | | ASMS PUB EDL BLDG AUTH MOBILE | | 9/1/2026 | | 4.375 | | | 1,030,573 | | | 1,038,429 | | | | |
| 900,000 | | ATLANTA GA TAX ALLOCATION | | 1/1/2020 | | 5.400 | | | 894,932 | | | 879,633 | | | | |
| 750,000 | | ATLANTA GA WTR + WASTEWTR REV | | 11/1/2029 | | 6.000 | | | 750,000 | | | 792,120 | | | | |
| 650,000 | | ATOKA CNTY OKLA HEALTHCARE | | 10/1/2018 | | 5.875 | | | 642,763 | | | 608,316 | | | | |
| 630,000 | | AUSTIN TEX CONVENTION ENTERPRI | | 1/1/2012 | | 6.000 | | | 585,340 | | | 630,706 | | | | |
| 50,000 | | AUSTIN TEX UTIL SYS REV | | 5/15/2018 | | 5.250 | | | 50,054 | | | 50,152 | | | | |
| 400,000 | | AVE MARIA STEWARDSHIP CMNTY DE | | 11/1/2012 | | 4.800 | | | 399,741 | | | 306,720 | | | | |
| 250,000 | | BAPTIST RD RURAL TRANSN AUTH | | 12/1/2017 | | 4.800 | | | 250,000 | | | 198,175 | | | | |
| 495,000 | | BELMONT CMNTY DEV DIST FLA CAP (b) | | 11/1/2014 | | 5.125 | | | 494,460 | | | 113,637 | | | | |
| 500,000 | | BERKELEY CNTY S C SCH DIST INS | | 12/1/2024 | | 5.250 | | | 513,302 | | | 514,935 | | | | |
| 500,000 | | BERKELEY CNTY S C SCH DIST INS | | 12/1/2019 | | 5.250 | | | 518,879 | | | 522,065 | | | | |
| 750,000 | | BERKELEY CNTY S C SCH DIST INS | | 12/1/2020 | | 5.000 | | | 759,385 | | | 789,113 | | | | |
| 300,000 | | BEXAR CNTY TEX HEALTH FACS DEV | | 7/1/2027 | | 5.000 | | | 308,106 | | | 259,575 | | | | |
| 250,000 | | BEXAR CNTY TEX HSG FIN CORP MU | | 12/1/2021 | | 6.500 | | | 267,749 | | | 222,743 | | | | |
| 805,000 | | BEXAR CNTY TEX HSG FIN CORP MU | | 4/1/2030 | | 9.000 | | | 802,479 | | | 477,285 | | | | |
| 1,005,000 | | BEXAR CNTY TEX HSG FIN CORP MU (b) | | 6/1/2031 | | 10.500 | | | 1,005,000 | | | 301,279 | | | | |
| 890,000 | | BEXAR CNTY TEX HSG FIN CORP MU | | 12/1/2036 | | 9.250 | | | 868,392 | | | 633,030 | | | | |
| 570,000 | | BEXAR CNTY TEX HSG FIN CORP MU | | 8/1/2030 | | 8.125 | | | 550,028 | | | 434,779 | | | | |
| 455,000 | | BEXAR CNTY TEX HSG FIN CORP MU | | 9/15/2021 | | 8.750 | | | 455,000 | | | 448,052 | | | | |
| 100,000 | | BEXAR CNTY TEX HSG FIN CORP MU | | 6/1/2011 | | 5.500 | | | 99,521 | | | 96,002 | | | | |
| 600,000 | | BEXAR CNTY TEX HSG FIN CORP MU | | 8/1/2030 | | 6.100 | | | 517,278 | | | 485,292 | | | | |
| 500,000 | | BIRMINGHAM-SOUTHERN COLLEGE AL | | 12/1/2019 | | 5.350 | | | 504,807 | | | 441,685 | | | | |
| 98,824 | | BISMARCK STATE COLLEGE | | 4/1/2032 | | 5.010 | | | 100,545 | | | 97,892 | | | | |
| 650,000 | | BI-STATE DEV AGY MO ILL MET | | 10/1/2033 | | 5.250 | | | 650,000 | | | 650,150 | | | | |
| 250,000 | | BLUE ASH OHIO TAX INCREMENT | | 12/1/2021 | | 5.000 | | | 253,058 | | | 228,980 | | | | |
| 240,000 | | BLYTHE CALIF REDEV AGY REDEV P | | 5/1/2028 | | 5.800 | | | 193,295 | | | 211,836 | | | | |
| 500,000 | | BOONE CNTY IND REDEV COMMN | | 8/1/2023 | | 5.375 | | | 505,724 | | | 500,875 | | | | |
| 750,000 | | BOONE CNTY IND REDEV COMMN | | 8/1/2028 | | 5.000 | | | 741,033 | | | 696,765 | | | | |
| 500,000 | | BOONE CNTY MO HOSP REV | | 8/1/2028 | | 5.750 | | | 517,061 | | | 519,170 | | | | |
| 700,000 | | BOSTON MASS REV | | 10/1/2031 | | 6.125 | | | 701,637 | | | 728,553 | | | | |
| 150,000 | | BRANSON COMM PK CMNTY IMPT | | 6/1/2010 | | 5.000 | | | 149,847 | | | 150,086 | | | | |
| 1,265,000 | | BRAZOS CNTY TEX HEALTH FAC DEV | | 1/1/2032 | | 5.375 | | | 1,263,160 | | | 1,216,879 | | | | |
| 500,000 | | BRAZOS CNTY TEX HEALTH FAC DEV | | 1/1/2033 | | 5.500 | | | 505,397 | | | 485,405 | | | | |
| 400,000 | | BRAZOS RIV TEX HBR NAV DIST | | 5/15/2033 | | 4.950 | | | 400,000 | | | 360,920 | | | | |
| 232,000 | | BRIDGEVILLE DEL SPL OBLIG | | 7/1/2035 | | 5.125 | | | 232,000 | | | 179,027 | | | | |
| 500,000 | | BROOKLYN ARENA LOCAL DEV CORP | | 7/15/2030 | | 6.000 | | | 494,164 | | | 509,800 | | | | |
| 250,000 | | BROWNSBURG IND REDEV AUTH ECON | | 2/1/2029 | | 4.700 | | | 250,000 | | | 252,925 | | | | |
| | |
See accompanying notes to financial statements. | 48 | (Continued) |
|
CLEARWATER INVESTMENT TRUST |
Schedule of Investments - Clearwater Tax-Exempt Bond Fund |
December 31, 2009 |
| | | | | | | | | | | | | | | | | |
Par/Shares | | Security | | Maturity
date | | Coupon
rate | | Cost | | Fair
Value (a) | | Percent
of
net assets | |
| 250,000 | | BROWNSBURG IND REDEV AUTH ECON | | 8/1/2024 | | 4.625 | | $ | 250,000 | | | 254,465 | | | | |
| 895,000 | | BUCKEYE OHIO TOB SETTLEMENT | | 6/1/2024 | | 5.125 | | | 859,386 | | | 807,281 | | | | |
| 165,000 | | BULLHEAD CITY ARIZ SPL ASSMT | | 1/1/2010 | | 6.100 | | | 165,876 | | | 165,000 | | | | |
| 750,000 | | BUNCOME CNTY N C PROJ DEV FING | | 8/1/2024 | | 6.750 | | | 737,021 | | | 683,265 | | | | |
| 250,000 | | BURKE CNTY GA DEV AUTH POLLUTN | | 10/1/2032 | | 4.375 | | | 250,000 | | | 252,053 | | | | |
| 100,000 | | BURLINGTON KANS POLLUTION CTL | | 6/1/2031 | | 5.300 | | | 98,554 | | | 101,726 | | | | |
| 395,000 | | BUTLER CNTY PA GEN AUTH REV | | 10/1/2034 | | 0.894 | | | 395,000 | | | 266,329 | | | | |
| 360,000 | | CALIFORNIA CMNTYS HSG FIN AGY | | 10/1/2011 | | 5.000 | | | 359,743 | | | 351,583 | | | | |
| 180,000 | | CALIFORNIA CMNTYS HSG FIN AGY | | 12/1/2011 | | 5.000 | | | 179,860 | | | 175,667 | | | | |
| 145,000 | | CALIFORNIA CMNTYS HSG FIN AGY | | 8/1/2012 | | 4.650 | | | 144,828 | | | 140,625 | | | | |
| 260,000 | | CALIFORNIA CMNTYS HSG FIN AGY | | 11/1/2012 | | 4.850 | | | 259,425 | | | 251,238 | | | | |
| 140,000 | | CALIFORNIA CNTY CALIF TOB SECU | | 6/1/2023 | | 5.625 | | | 134,465 | | | 139,849 | | | | |
| 150,000 | | CALIFORNIA CNTY CALIF TOB SECU | | 6/1/2021 | | 4.500 | | | 148,284 | | | 133,299 | | | | |
| 500,000 | | CALIFORNIA CNTY CALIF TOB SECU | | 6/1/2036 | | 5.000 | | | 494,926 | | | 379,830 | | | | |
| 500,000 | | CALIFORNIA HEALTH FACS FING | | 3/1/2033 | | 5.000 | | | 504,342 | | | 462,515 | | | | |
| 500,000 | | CALIFORNIA HEALTH FACS FING | | 4/1/2010 | | 5.300 | | | 501,319 | | | 502,765 | | | | |
| 500,000 | | CALIFORNIA HSG FIN AGY REV | | 8/1/2033 | | 5.450 | | | 480,719 | | | 499,975 | | | | |
| 1,000,000 | | CALIFORNIA INFRASTRUCTURE + EC | | 2/1/2030 | | 6.000 | | | 1,014,367 | | | 1,066,500 | | | | |
| 750,000 | | CALIFORNIA MUN FIN AUTH ED REV | | 6/1/2026 | | 5.250 | | | 744,467 | | | 652,095 | | | | |
| 500,000 | | CALIFORNIA MUN FIN AUTH REV | | 5/1/2025 | | 6.875 | | | 498,808 | | | 508,015 | | | | |
| 750,000 | | CALIFORNIA MUN FIN AUTH SR LIV | | 5/15/2029 | | 5.875 | | | 750,000 | | | 762,638 | | | | |
| 1,500,000 | | CALIFORNIA SCH FACS FING AUTH (c) | | 8/1/2029 | | 1.994 | | | 1,017,405 | | | 1,018,350 | | | | |
| 40,000 | | CALIFORNIA ST | | 10/1/2020 | | 5.250 | | | 40,949 | | | 40,118 | | | | |
| 1,000,000 | | CALIFORNIA ST PUB WKS BRD LEAS | | 3/1/2016 | | 5.625 | | | 978,382 | | | 1,001,120 | | | | |
| 750,000 | | CALIFORNIA STATEWIDE CMNTYS | | 4/1/2037 | | 5.125 | | | 756,954 | | | 608,460 | | | | |
| 750,000 | | CALIFORNIA STATEWIDE CMNTYS | | 6/1/2017 | �� | 5.400 | | | 747,702 | | | 693,690 | | | | |
| 200,000 | | CALIFORNIA STATEWIDE CMNTYS DE | | 4/20/2036 | | 7.000 | | | 200,000 | | | 213,784 | | | | |
| 500,000 | | CALIFORNIA STATEWIDE CMNTYS DE | | 5/15/2032 | | 5.750 | | | 493,140 | | | 485,275 | | | | |
| 400,000 | | CALIFORNIA STATEWIDE CMNTYS DE | | 8/15/2031 | | 5.500 | | | 371,386 | | | 400,552 | | | | |
| 350,000 | | CALIFORNIA STATEWIDE CMNTYS DE | | 9/1/2029 | | 6.000 | | | 350,000 | | | 299,604 | | | | |
| 610,000 | | CALIFORNIA STATEWIDE CMNTYS DE | | 11/20/2036 | | 6.150 | | | 643,013 | | | 730,780 | | | | |
| 350,000 | | CAMBRIDGE PA AREA JT AUTH GTD | | 12/1/2028 | | 5.625 | | | 341,812 | | | 326,641 | | | | |
| 1,000,000 | | CAMERON TEX ED CORP REV | | 8/15/2021 | | 5.000 | | | 830,497 | | | 896,210 | | | | |
| 80,000 | | CAPE GIRARDEAU CNTY MO INDL DE | | 6/1/2032 | | 5.750 | | | 82,925 | | | 75,944 | | | | |
| 335,000 | | CAPITAL TR AGY FLA MULTIFAMILY | | 6/1/2013 | | 4.750 | | | 335,000 | | | 254,975 | | | | |
| 750,000 | | CAPITAL TR AGY FLA MULTIFAMILY | | 6/1/2038 | | 5.875 | | | 763,285 | | | 338,513 | | | | |
| 1,256,853 | | CARLSBAD N M INDL DEV REV | | 4/15/2021 | | 5.750 | | | 1,291,152 | | | 1,121,955 | | | | |
| 125,000 | | CARSON CITY NEV HOSP REV | | 9/1/2031 | | 5.750 | | | 130,187 | | | 119,911 | | | | |
| 750,000 | | CARTHAGE MO HOSP REV | | 4/1/2010 | | 4.500 | | | 748,827 | | | 749,550 | | | | |
| 1,000,000 | | CENTER UNI SCH DIST CALIF (c) | | 8/1/2031 | | 6.074 | | | 280,286 | | | 234,680 | | | | |
| 900,000 | | CENTINELA VALLEY CALIF UN HIGH | | 8/1/2033 | | 5.500 | | | 912,048 | | | 927,720 | | | | |
| 595,000 | | CHANDLER PARK ACADEMY MICH | | 11/1/2022 | | 5.000 | | | 434,163 | | | 540,736 | | | | |
| 270,000 | | CHARLESTON CNTY S C HOSP FACS | | 10/1/2019 | | 5.500 | | | 276,926 | | | 275,214 | | | | |
| 400,000 | | CHARTIERS VALLEY PA INDL + COM | | 8/15/2012 | | 5.000 | | | 398,536 | | | 403,152 | | | | |
| 500,000 | | CHATHAM CNTY GA HOSP AUTH REV | | 1/1/2034 | | 5.500 | | | 520,517 | | | 436,915 | | | | |
| 250,000 | | CHESTERFIELD CNTY VA INDL DEV | | 6/1/2017 | | 5.875 | | | 255,501 | | | 259,605 | | | | |
| 275,000 | | CHESTERFIELD CNTY VA INDL DEV | | 7/1/2019 | | 5.200 | | | 255,098 | | | 277,934 | | | | |
| 750,000 | | CHICAGO ILL | | 1/1/2035 | | 5.500 | | | 758,807 | | | 758,903 | | | | |
| 20,000 | | CHICAGO ILL MET HSG DEV CORP M | | 7/1/2022 | | 6.850 | | | 20,574 | | | 20,035 | | | | |
| 500,000 | | CITIZEN POTAWATOMI NATION OKLA | | 9/1/2016 | | 6.500 | | | 500,000 | | | 487,160 | | | | |
| 250,000 | | CLARK CNTY NEV ECONOMIC DEV RE | | 5/15/2033 | | 5.375 | | | 254,283 | | | 250,020 | | | | |
| 455,000 | | CLARK CNTY NEV IMPT DIST | | 2/1/2019 | | 5.000 | | | 456,587 | | | 390,709 | | | | |
| 355,000 | | CLEARWATER FLA HSG AUTH REV | | 5/1/2024 | | 5.350 | | | 256,872 | | | 285,676 | | | | |
| 500,000 | | CLEVELAND CNTY OKLA JUSTICE | | 3/1/2029 | | 5.750 | | | 488,092 | | | 526,005 | | | | |
| 475,000 | | CLEVELAND-CUYAHOGA CNTY OHIO P | | 5/15/2016 | | 6.250 | | | 449,944 | | | 470,055 | | | | |
| 1,110,000 | | CLEVELAND-CUYAHOGA CNTY OHIO P | | 5/15/2023 | | 5.250 | | | 985,284 | | | 815,961 | | | | |
| 750,000 | | CLIFTON TEX HIGHER ED FIN CORP | | 2/15/2018 | | 7.750 | | | 738,877 | | | 847,223 | | | | |
| | |
See accompanying notes to financial statements. | 49 | (Continued) |
|
CLEARWATER INVESTMENT TRUST |
Schedule of Investments - Clearwater Tax-Exempt Bond Fund |
December 31, 2009 |
| | | | | | | | | | | | | | | | | |
Par/Shares | | Security | | Maturity
date | | Coupon
rate | | Cost | | Fair
Value (a) | | Percent
of
net assets | |
| 1,000,000 | | COCONINO CNTY ARIZ POLLUTN CTL | | 6/1/2034 | | 5.500 | | $ | 1,000,000 | | | 1,053,400 | | | | |
| 425,000 | | COLLIER CNTY FLA HSG FIN AUTH | | 8/15/2015 | | 5.250 | | | 423,670 | | | 439,743 | | | | |
| 750,000 | | COLO HSG FIN AUTH SINGLE | | 11/1/2034 | | 5.000 | | | 750,109 | | | 757,635 | | | | |
| 150,000 | | COLORADO EDL + CULTURAL FACS | | 6/15/2012 | | 4.625 | | | 148,807 | | | 148,865 | | | | |
| 1,000,000 | | COLORADO EDL + CULTURAL FACS | | 6/1/2033 | | 5.500 | | | 974,241 | | | 1,012,910 | | | | |
| 835,000 | | COLORADO EDL + CULTURAL FACS | | 11/15/2028 | | 6.750 | | | 835,000 | | | 891,129 | | | | |
| 20,000 | | COLORADO HEALTH FACS AUTH REV | | 11/15/2020 | | 5.125 | | | 19,794 | | | 23,572 | | | | |
| 280,000 | | COLORADO HEALTH FACS AUTH REV | | 11/15/2020 | | 5.125 | | | 277,109 | | | 290,567 | | | | |
| 600,000 | | COLORADO HEALTH FACS AUTH REV | | 9/15/2022 | | 5.000 | | | 593,846 | | | 580,770 | | | | |
| 1,000,000 | | COLORADO HSG + FIN AUTH | | 11/1/2029 | | 5.500 | | | 1,000,000 | | | 1,042,160 | | | | |
| 1,000,000 | | COLORADO HSG + FIN AUTH | | 10/1/2029 | | 5.400 | | | 1,000,000 | | | 1,034,490 | | | | |
| 4,000,000 | | COMAL TEX INDPT SCH DIST (c) | | 2/1/2037 | | 6.119 | | | 781,717 | | | 789,040 | | | | |
| 1,750,000 | | COMPARK BUSINESS CAMPUS MET | | 12/1/2027 | | 5.750 | | | 1,568,175 | | | 1,419,705 | | | | |
| 260,000 | | CONCORDE ESTATES CMNTY DEV DIS (b) | | 5/1/2011 | | 5.000 | | | 259,667 | | | 90,844 | | | | |
| 1,250,000 | | CONNECTICUT ST DEV AUTH POLLUT | | 9/1/2028 | | 5.850 | | | 1,319,355 | | | 1,257,738 | | | | |
| 450,000 | | CONNECTICUT ST HEALTH + EDL | | 7/1/2025 | | 6.000 | | | 455,242 | | | 446,864 | | | | |
| 375,000 | | CONNERTON WEST CMNTY DEV DIST (b) | | 5/1/2016 | | 5.125 | | | 374,474 | | | 144,064 | | | | |
| 420,000 | | CONWAY ARK HOSP REV | | 8/1/2022 | | 5.250 | | | 412,388 | | | 416,170 | | | | |
| 375,000 | | COOK CNTY ILL SCH DIST NO 148 | | 12/1/2027 | | 4.500 | | | 347,723 | | | 396,458 | | | | |
| 1,105,000 | | CORONA-NORCO CALIF UNI SCH DIS (c) | | 8/1/2039 | | 1.728 | | | 664,208 | | | 709,101 | | | | |
| 637,000 | | CORTLAND ILL SPL TAX REV | | 3/1/2017 | | 5.500 | | | 632,374 | | | 382,767 | | | | |
| 500,000 | | CRAWFORD CNTY PA INDL DEV AUTH | | 11/1/2031 | | 6.000 | | | 492,225 | | | 522,845 | | | | |
| 960,000 | | CROW FIN AUTH MONT TRIBAL PURP | | 10/1/2017 | | 5.650 | | | 920,567 | | | 961,603 | | | | |
| 1,250,000 | | CROWN POINT IND ECONOMIC DEV | | 11/15/2013 | | 6.500 | | | 1,250,000 | | | 1,249,875 | | | | |
| 1,000,000 | | CULLMAN CNTY ALA HEALTH CARE A | | 2/1/2023 | | 6.250 | | | 978,085 | | | 977,270 | | | | |
| 500,000 | | CUYAHOGA CNTY OHIO HSG MTG REV | | 3/20/2042 | | 5.700 | | | 514,336 | | | 522,925 | | | | |
| 3,415,000 | | DALLAS TEX HSG FIN CORP MULTI- | | 10/20/2032 | | 6.750 | | | 3,398,180 | | | 3,555,254 | | | | |
| 225,000 | | DALTON GA DEV AUTH REV | | 8/15/2026 | | 5.250 | | | 226,882 | | | 214,666 | | | | |
| 1,000,000 | | DELAWARE ST HEALTH FACS AUTH R | | 6/1/2030 | | 5.000 | | | 798,128 | | | 891,770 | | | | |
| 500,000 | | DELAWARE ST HSG AUTH REV | | 7/1/2031 | | 5.200 | | | 500,000 | | | 509,385 | | | | |
| 221,618 | | DENHAM SPRINGS-LIVINGSTON HSG | | 11/1/2040 | | 5.000 | | | 230,165 | | | 222,183 | | | | |
| 500,000 | | DENVER COLO CITY + CNTY ARPT | | 11/15/2031 | | 5.000 | | | 493,440 | | | 508,945 | | | | |
| 1,500,000 | | DENVER COLO CITY + CNTY EXCISE | | 9/1/2023 | | 6.000 | | | 1,607,752 | | | 1,693,515 | | | | |
| 500,000 | | DENVER COLO CONVENTION CTR | | 12/1/2030 | | 5.000 | | | 512,399 | | | 423,960 | | | | |
| 750,000 | | DENVER COLO CONVENTION CTR | | 12/1/2026 | | 5.125 | | | 781,556 | | | 664,058 | | | | |
| 205,000 | | DETROIT CMNTY HIGH SCH MICH | | 11/1/2010 | | 5.000 | | | 205,000 | | | 203,815 | | | | |
| 500,000 | | DETROIT LAKES MINN HSG + | | 8/1/2034 | | 5.440 | | | 500,000 | | | 499,035 | | | | |
| 750,000 | | DETROIT MICH | | 4/1/2020 | | 5.250 | | | 753,903 | | | 625,020 | | | | |
| 500,000 | | DINUBA CALIF FING AUTH LEASE R | | 9/1/2038 | | 5.375 | | | 494,570 | | | 375,440 | | | | |
| 1,105,000 | | DIRECTOR ST NEV DEPT BUSINESS (b) | | 11/15/2014 | | 6.000 | | | 1,095,777 | | | 665,254 | | | | |
| 2,000,000 | | DISTRICT COLUMBIA REV | | 7/1/2025 | | 6.000 | | | 2,027,635 | | | 2,038,220 | | | | |
| 500,000 | | DISTRICT COLUMBIA REV | | 6/1/2026 | | 5.000 | | | 509,508 | | | 417,860 | | | | |
| 3,000,000 | | DUBLIN CALIF UNI SCH DIST (c) | | 8/1/2034 | | 6.378 | | | 640,747 | | | 595,050 | | | | |
| 390,000 | | DURBIN CROSSING CMNTY DEV DIST | | 11/1/2010 | | 4.875 | | | 389,911 | | | 320,529 | | | | |
| 500,000 | | E-470 PUB HWY AUTH COLO REV | | 9/1/2024 | | 5.500 | | | 506,272 | | | 492,545 | | | | |
| 225,000 | | EAST BATON ROUGE LA MTG FIN AU | | 10/1/2024 | | 4.625 | | | 225,000 | | | 229,169 | | | | |
| 500,000 | | EAST BATON ROUGE LA MTG FIN AU | | 10/1/2034 | | 5.000 | | | 500,000 | | | 500,330 | | | | |
| 565,000 | | EAST CHICAGO IND REDEV COMMN | | 1/15/2015 | | 5.250 | | | 565,000 | | | 576,882 | | | | |
| 550,000 | | EAST CHICAGO IND REDEV COMMN | | 7/15/2014 | | 5.000 | | | 550,000 | | | 562,997 | | | | |
| 980,000 | | EAST POINT GA | | 2/1/2026 | | 8.000 | | | 1,108,030 | | | 993,955 | | | | |
| 800,000 | | EDEN PRAIRIE MINN MULTIFAMILY | | 2/20/2043 | | 6.200 | | | 873,094 | | | 850,472 | | | | |
| 200,000 | | EL PASO CNTY TEX HSG FIN CORP | | 12/1/2015 | | 7.000 | | | 200,000 | | | 194,902 | | | | |
| 750,000 | | EL PASO DE ROBLES CALIF REDEV | | 7/1/2033 | | 6.375 | | | 741,394 | | | 766,335 | | | | |
| 878,648 | | EL PASO TEX HSG FIN CORP MTG R | | 4/1/2033 | | 6.180 | | | 911,702 | | | 931,446 | | | | |
| 500,000 | | ELKHART CNTY IND HOSP AUTH REV | | 8/15/2020 | | 5.250 | | | 506,939 | | | 502,455 | | | | |
| 2,000,000 | | EMERY CNTY UTAH POLLUTN CTL RE | | 11/1/2023 | | 5.650 | | | 2,022,199 | | | 2,000,000 | | | | |
| 1,550,000 | | ERIE CNTY OHIO HOSP FACS REV | | 8/15/2032 | | 5.625 | | | 1,565,874 | | | 1,415,925 | | | | |
| | |
See accompanying notes to financial statements. | 50 | (Continued) |
|
CLEARWATER INVESTMENT TRUST |
Schedule of Investments - Clearwater Tax-Exempt Bond Fund |
December 31, 2009 |
| | | | | | | | | | | | | | | | | |
Par/Shares | | Security | | Maturity
date | | Coupon
rate | | Cost | | Fair
Value (a) | | Percent
of
net assets | |
| 500,000 | | ERIE CNTY OHIO HOSP FACS REV | | 8/15/2013 | | 6.000 | | $ | 523,667 | | | 524,230 | | | | |
| 1,000,000 | | ERIE CNTY PA HOSP AUTH REV | | 7/1/2027 | | 7.000 | | | 1,000,000 | | | 1,001,800 | | | | |
| 250,000 | | ESCONDIDO CALIF UN HIGH SCH DI (c) | | 5/1/2019 | | 6.449 | | | 137,542 | | | 151,903 | | | | |
| 500,000 | | ESTHERVILLE IOWA HOSP REV | �� | 7/1/2020 | | 6.300 | | | 505,746 | | | 509,490 | | | | |
| 500,000 | | FAIRFAX CNTY VA REDEV + HSG AU | | 8/1/2039 | | 5.600 | | | 500,000 | | | 521,415 | | | | |
| 250,000 | | FARGO N D HEALTH SYS REV | | 6/1/2027 | | 5.375 | | | 246,645 | | | 250,033 | | | | |
| 2,910,108 | | FARGO N D UNIV FACS REV | | 11/29/2027 | | 5.110 | | | 2,910,108 | | | 3,153,276 | | | | |
| 750,000 | | FARMINGTON N M POLLUTN CTL REV | | 12/1/2016 | | 5.700 | | | 750,000 | | | 749,955 | | | | |
| 250,000 | | FARMINGTON N M POLLUTN CTL REV | | 12/1/2016 | | 6.300 | | | 250,000 | | | 250,108 | | | | |
| 170,000 | | FARMINGTON N M POLLUTN CTL REV | | 4/1/2022 | | 5.800 | | | 173,195 | | | 168,953 | | | | |
| 500,000 | | FARMINGTON N MEX HOSP REV | | 6/1/2022 | | 5.000 | | | 508,653 | | | 513,060 | | | | |
| 739,000 | | FARMS NEW KENT VA CMNTY DEV | | 3/1/2036 | | 5.125 | | | 739,000 | | | 466,102 | | | | |
| 1,000,000 | | FESTIVAL RANCH CMNTY FACS DIST | | 7/15/2024 | | 6.250 | | | 1,017,912 | | | 1,010,690 | | | | |
| 315,000 | | FIDDLERS CREEK CMNTY DEV DIST (b) | | 5/1/2013 | | 5.750 | | | 313,815 | | | 125,874 | | | | |
| 950,000 | | FLAGSTAFF ARIZ INDL DEV AUTH R | | 7/1/2022 | | 5.500 | | | 869,496 | | | 785,460 | | | | |
| 490,000 | | FLORIDA HSG FIN CORP REV | | 7/1/2033 | | 5.450 | | | 490,000 | | | 501,961 | | | | |
| 1,000,000 | | FLORIDA HSG FIN CORP REV | | 7/1/2034 | | 5.300 | | | 1,000,000 | | | 1,018,490 | | | | |
| 905,000 | | FOREST CREEK CMNTY DEV DIST (b) | | 5/1/2011 | | 4.850 | | | 904,702 | | | 537,018 | | | | |
| 1,000,000 | | FOREST GROVE ORE REV | | 5/1/2030 | | 6.000 | | | 982,611 | | | 1,016,260 | | | | |
| 500,000 | | FORT ML S C SCH FACS CORP | | 12/1/2030 | | 5.250 | | | 496,999 | | | 504,595 | | | | |
| 1,000,000 | | FORT ML S C SCH FACS CORP | | 12/1/2029 | | 5.250 | | | 992,818 | | | 1,009,770 | | | | |
| 1,000,000 | | FORT PIERCE FLA CAP IMPT REV | | 9/1/2025 | | 5.750 | | | 984,723 | | | 1,116,180 | | | | |
| 1,000,000 | | FRANKLIN CNTY OHIO HEALTH CARE | | 7/1/2035 | | 5.125 | | | 581,609 | | | 707,470 | | | | |
| 1,000,000 | | FRUITA COLO REV | | 1/1/2018 | | 7.000 | | | 965,232 | | | 1,007,900 | | | | |
| 1,245,000 | | FULTON CNTY GA DEV AUTH REV | | 11/1/2028 | | 5.250 | | | 1,071,883 | | | 973,192 | | | | |
| 330,000 | | FULTON CNTY PA INDL DEV AUTH | | 7/1/2011 | | 5.375 | | | 329,686 | | | 332,274 | | | | |
| 1,000,000 | | FYI PROPERTIES WASH LEASE REV | | 6/1/2034 | | 5.500 | | | 980,167 | | | 1,064,180 | | | | |
| 1,128,989 | | GALVESTON CNTY TEX MUN UTIL | | 2/23/2010 | | 6.690 | | | 1,128,989 | | | 959,076 | | | | |
| 500,000 | | GARDEN GROVE CALIF CTFS PARTN | | 8/1/2023 | | 5.700 | | | 512,069 | | | 501,805 | | | | |
| 400,000 | | GEISINGER AUTH PA HEALTH SYS | | 5/1/2037 | | 0.958 | | | 400,000 | | | 273,800 | | | | |
| 500,000 | | GILA CNTY ARIZ UNI SCH DIST NO | | 7/1/2028 | | 3.000 | | | 475,823 | | | 532,540 | | | | |
| 1,000,000 | | GOLDEN ST TOB SECURITIZATION (c) | | 6/1/2022 | | 1.294 | | | 851,993 | | | 904,570 | | | | |
| 1,000,000 | | GOLDEN ST TOB SECURITIZATION | | 6/1/2047 | | 5.125 | | | 848,123 | | | 671,410 | | | | |
| 885,000 | | GRAND FORKS N D HEALTH CARE FA | | 12/1/2010 | | 6.625 | | | 885,000 | | | 887,531 | | | | |
| 2,000,000 | | GRAND FORKS N D HEALTH CARE SY | | 8/15/2027 | | 5.625 | | | 2,000,000 | | | 1,992,120 | | | | |
| 500,000 | | GRAND VALLEY MICH ST UNIV REV | | 12/1/2024 | | 5.300 | | | 494,877 | | | 526,260 | | | | |
| 985,000 | | GRAVOIS BLUFFS TRANSN DEV DIST | | 5/1/2032 | | 4.750 | | | 695,981 | | | 748,196 | | | | |
| 500,000 | | GREENS PARKWAY MUN UTIL DIST | | 9/1/2032 | | 5.500 | | | 484,262 | | | 501,820 | | | | |
| 500,000 | | GUNNISON CNTY COLO | | 7/15/2019 | | 6.099 | | | 509,641 | | | 506,545 | | | | |
| 1,000,000 | | HAMDEN CONN FAC REV | | 1/1/2014 | | 6.125 | | | 983,499 | | | 986,290 | | | | |
| 750,000 | | HAMILTON CNTY OHIO HEALTH CARE | | 1/1/2037 | | 5.000 | | | 628,409 | | | 611,768 | | | | |
| 500,000 | | HAMMOND IND REDEV DIST REV | | 1/15/2017 | | 6.000 | | | 500,000 | | | 506,735 | | | | |
| 1,250,000 | | HARRIS CNTY TEX CULTURAL ED | | 8/15/2021 | | 6.750 | | | 1,250,000 | | | 1,243,913 | | | | |
| 500,000 | | HARRIS CNTY TEX DEPT ED PUB FA | | 2/15/2023 | | 5.750 | | | 507,722 | | | 540,380 | | | | |
| 250,000 | | HARRISONVILLE MO ANNUAL | | 11/1/2028 | | 4.625 | | | 242,193 | | | 234,853 | | | | |
| 1,500,000 | | HARTNELL CALIF CMNTY COLLEGE D (c) | | 8/1/2034 | | 3.593 | | | 625,001 | | | 730,305 | | | | |
| 350,000 | | HARVEY ILL | | 12/1/2027 | | 5.500 | | | 358,083 | | | 335,370 | | | | |
| 1,000,000 | | HAWAII ST DEPT BUDGET + FIN | | 11/15/2023 | | 7.875 | | | 966,945 | | | 1,079,020 | | | | |
| 590,000 | | HAWAII ST DEPT BUDGET + FIN SP | | 11/15/2029 | | 8.750 | | | 581,697 | | | 632,203 | | | | |
| 500,000 | | HAWAII ST DEPT BUDGET + FIN SP | | 11/15/2014 | | 6.400 | | | 500,000 | | | 505,385 | | | | |
| 2,000,000 | | HAWTHORNE CALIF SCH DIST CTFS | | 12/1/2029 | | 0.000 | | | 1,495,400 | | | 1,495,360 | | | | |
| 360,000 | | HEALTH CARE AUTH FOR BAPTIST | | 11/15/2018 | | 5.000 | | | 370,578 | | | 359,215 | | | | |
| 1,500,000 | | HEALTH CARE AUTH FOR BAPTIST | | 11/15/2036 | | 6.125 | | | 1,500,000 | | | 1,586,670 | | | | |
| 1,000,000 | | HELENDALE CALIF SCH DIST (c) | | 8/1/2034 | | 2.437 | | | 551,233 | | | 567,580 | | | | |
| 1,500,000 | | HENDERSON NEV LOC IMPT DISTS | | 9/1/2010 | | 4.500 | | | 1,500,000 | | | 1,178,820 | | | | |
| 205,000 | | HENDERSON NEV LOC IMPT DISTS | | 9/1/2011 | | 4.300 | | | 185,151 | | | 199,896 | | | | |
| 255,000 | | HIGHLANDS CNTY FLA HEALTH FACS | | 11/15/2027 | | 5.000 | | | 257,701 | | | 250,260 | | | | |
| | |
See accompanying notes to financial statements. | 51 | (Continued) |
|
CLEARWATER INVESTMENT TRUST |
Schedule of Investments - Clearwater Tax-Exempt Bond Fund |
December 31, 2009 |
| | | | | | | | | | | | | | | | | |
Par/Shares | | Security | | Maturity
date | | Coupon
rate | | Cost | | Fair
Value (a) | | Percent
of
net assets | |
| 500,000 | | HIMALAYA WTR + SANTN DIST COLO | | 12/1/2035 | | 5.000 | | $ | 513,067 | | | 422,520 | | | | |
| 250,000 | | HOLLYWOOD FLA CMNTY REDEV AGY | | 3/1/2024 | | 5.625 | | | 204,458 | | | 237,455 | | | | |
| 1,260,000 | | HOPKINS CNTY KY HOSP REV | | 11/15/2011 | | 6.625 | | | 1,251,981 | | | 1,263,213 | | | | |
| 500,000 | | HOPKINS CNTY TEX HOSP DIST | | 2/15/2023 | | 5.500 | | | 488,101 | | | 457,505 | | | | |
| 279,000 | | HOUMA-TERREBONNE PUB TR FING A | | 12/1/2040 | | 5.150 | | | 291,034 | | | 281,957 | | | | |
| 250,000 | | HOWARD CNTY MD RETIREMENT | | 4/1/2027 | | 5.250 | | | 255,432 | | | 202,673 | | | | |
| 400,000 | | HUNTSVILLE-REDSTONE VLG ALA | | 1/1/2015 | | 5.250 | | | 400,000 | | | 390,824 | | | | |
| 500,000 | | HURON CNTY OHIO HOSP FACS REV | | 12/1/2022 | | 5.000 | | | 501,826 | | | 501,825 | | | | |
| 110,000 | | IDAHO HEALTH FACS AUTH HOSP | | 8/1/2010 | | 6.000 | | | 110,118 | | | 108,907 | | | | |
| 85,000 | | IDAHO HSG + FIN ASSN | | 8/1/2010 | | 5.750 | | | 85,000 | | | 84,803 | | | | |
| 245,000 | | IDAHO HSG + FIN ASSN | | 8/1/2017 | | 6.250 | | | 245,000 | | | 227,644 | | | | |
| 250,000 | | IDAHO HSG + FIN ASSN | | 6/1/2021 | | 5.500 | | | 250,000 | | | 241,965 | | | | |
| 250,000 | | IDAHO HSG + FIN ASSN | | 7/1/2021 | | 5.625 | | | 249,256 | | | 239,293 | | | | |
| 250,000 | | IDAHO HSG + FIN ASSN | | 12/1/2018 | | 5.500 | | | 247,381 | | | 226,035 | | | | |
| 750,000 | | IDAHO HSG + FIN ASSN | | 7/1/2021 | | 9.000 | | | 750,000 | | | 843,945 | | | | |
| 500,000 | | IDAHO HSG + FIN ASSN SINGLE | | 1/1/2040 | | 5.500 | | | 500,000 | | | 513,725 | | | | |
| 500,000 | | IDAHO HSG + FIN ASSN SINGLE | | 7/1/2038 | | 5.500 | | | 500,000 | | | 516,050 | | | | |
| 750,000 | | IDAHO HSG + FIN ASSN SINGLE | | 7/1/2026 | | 5.650 | | | 770,301 | | | 772,785 | | | | |
| 730,000 | | ILLINOIS DEV FIN AUTH POLLUTN | | 3/1/2014 | | 5.500 | | | 735,697 | | | 730,022 | | | | |
| 195,000 | | ILLINOIS DEV FIN AUTH POLLUTN | | 2/1/2024 | | 5.700 | | | 198,767 | | | 195,025 | | | | |
| 250,000 | | ILLINOIS DEV FIN AUTH REV | | 5/15/2021 | | 5.500 | | | 258,746 | | | 250,175 | | | | |
| 135,000 | | ILLINOIS DEV FIN AUTH REV | | 7/1/2019 | | 6.050 | | | 135,813 | | | 134,807 | | | | |
| 500,000 | | ILLINOIS EDL FACS AUTH REVS | | 10/1/2032 | | 5.700 | | | 501,675 | | | 501,460 | | | | |
| 600,000 | | ILLINOIS FIN AUTH ED REV | | 9/1/2027 | | 5.000 | | | 567,709 | | | 432,558 | | | | |
| 500,000 | | ILLINOIS FIN AUTH REV | | 5/15/2012 | | 5.100 | | | 498,891 | | | 496,540 | | | | |
| 500,000 | | ILLINOIS FIN AUTH REV | | 5/15/2029 | | 5.250 | | | 506,764 | | | 504,690 | | | | |
| 350,000 | | ILLINOIS FIN AUTH REV | | 8/15/2023 | | 6.000 | | | 364,292 | | | 352,545 | | | | |
| 750,000 | | ILLINOIS FIN AUTH REV | | 11/15/2035 | | 5.000 | | | 750,000 | | | 742,853 | | | | |
| 375,000 | | ILLINOIS FIN AUTH REV | | 4/1/2026 | | 5.000 | | | 381,490 | | | 336,379 | | | | |
| 610,000 | | ILLINOIS FIN AUTH REV | | 8/15/2026 | | 6.000 | | | 624,690 | | | 525,369 | | | | |
| 875,000 | | ILLINOIS FIN AUTH REV | | 2/1/2037 | | 5.250 | | | 873,218 | | | 735,464 | | | | |
| 500,000 | | ILLINOIS FIN AUTH REV | | 2/15/2038 | | 5.875 | | | 506,082 | | | 416,885 | | | | |
| 1,000,000 | | ILLINOIS FIN AUTH REV | | 11/15/2026 | | 5.250 | | | 969,699 | | | 842,190 | | | | |
| 500,000 | | ILLINOIS FIN AUTH REV | | 11/15/2016 | | 5.000 | | | 511,659 | | | 462,840 | | | | |
| 650,000 | | ILLINOIS FIN AUTH REV | | 5/15/2015 | | 5.250 | | | 657,553 | | | 642,928 | | | | |
| 250,000 | | ILLINOIS FIN AUTH REV | | 5/15/2038 | | 5.750 | | | 257,208 | | | 203,078 | | | | |
| 150,000 | | ILLINOIS FIN AUTH REV | | 12/1/2036 | | 5.000 | | | 151,651 | | | 125,886 | | | | |
| 250,000 | | ILLINOIS FIN AUTH REV | | 12/1/2021 | | 5.000 | | | 255,408 | | | 235,208 | | | | |
| 500,000 | | ILLINOIS FIN AUTH REV | | 3/15/2027 | | 5.000 | | | 522,258 | | | 509,965 | | | | |
| 750,000 | | ILLINOIS FIN AUTH REV | | 5/15/2026 | | 5.750 | | | 728,259 | | | 588,780 | | | | |
| 600,000 | | ILLINOIS FIN AUTH REV | | 5/15/2012 | | 5.250 | | | 601,961 | | | 588,204 | | | | |
| 400,000 | | ILLINOIS FIN AUTH REV (b) | | 11/15/2016 | | 5.400 | | | 396,582 | | | 159,840 | | | | |
| 1,250,000 | | ILLINOIS FIN AUTH REV | | 11/15/2022 | | 5.250 | | | 1,247,590 | | | 1,261,150 | | | | |
| 250,000 | | ILLINOIS FIN AUTH REV | | 11/15/2026 | | 5.750 | | | 252,349 | | | 255,213 | | | | |
| 500,000 | | ILLINOIS FIN AUTH REV | | 3/1/2038 | | 6.000 | | | 484,792 | | | 532,205 | | | | |
| 750,000 | | ILLINOIS FIN AUTH REV | | 11/1/2029 | | 6.375 | | | 741,184 | | | 813,870 | | | | |
| 440,000 | | ILLINOIS FIN AUTH SPORTS FAC (b) | | 12/1/2035 | | 7.000 | | | 436,658 | | | 109,309 | | | | |
| 500,000 | | ILLINOIS FIN AUTH SPORTS FAC | | 10/1/2037 | | 6.250 | | | 484,013 | | | 312,290 | | | | |
| 750,000 | | ILLINOIS FIN AUTH SPORTS FAC | | 10/1/2027 | | 6.125 | | | 730,224 | | | 489,908 | | | | |
| 750,000 | | ILLINOIS HEALTH FACS AUTH REV | | 8/15/2028 | | 5.375 | | | 737,022 | | | 746,895 | | | | |
| 500,000 | | ILLINOIS HEALTH FACS AUTH REV | | 7/1/2033 | | 6.000 | | | 517,905 | | | 503,125 | | | | |
| 500,000 | | ILLINOIS HEALTH FACS AUTH REV | | 2/15/2037 | | 5.150 | | | 501,495 | | | 492,070 | | | | |
| 2,100,000 | | ILLINOIS HEALTH FACS AUTH REV | | 8/15/2033 | | 5.100 | | | 2,144,424 | | | 2,085,615 | | | | |
| 750,000 | | ILLINOIS HEALTH FACS AUTH REV | | 5/15/2014 | | 6.250 | | | 751,580 | | | 757,403 | | | | |
| 500,000 | | ILLINOIS HSG DEV AUTH MULTI | | 7/1/2028 | | 4.800 | | | 500,000 | | | 494,860 | | | | |
| 250,000 | | INDEPENDENCE MO THIRTY-NINTH | | 9/1/2032 | | 6.875 | | | 250,000 | | | 238,543 | | | | |
| 500,000 | | INDIANA BD BK REV | | 2/1/2029 | | 5.500 | | | 490,134 | | | 534,230 | | | | |
| | |
See accompanying notes to financial statements. | 52 | (Continued) |
CLEARWATER INVESTMENT TRUST
Schedule of Investments - Clearwater Tax-Exempt Bond Fund
December 31, 2009
| | | | | | | | | | | | | | | | | |
Par/Shares | | Security | | Maturity
date | | Coupon
rate | | Cost | | Fair
Value (a) | | Percent
of
net assets | |
| 250,000 | | INDIANA HEALTH + EDL FAC FING | | 11/15/2025 | | 5.250 | | $ | 255,040 | | | 235,843 | | | | |
| 500,000 | | INDIANA HEALTH + EDL FAC FING | | 11/15/2035 | | 5.250 | | | 475,617 | | | 433,945 | | | | |
| 500,000 | | INDIANA HEALTH + EDL FAC FING | | 2/15/2036 | | 5.250 | | | 502,630 | | | 450,805 | | | | |
| 1,000,000 | | INDIANA HEALTH + EDL FAC FING | | 2/15/2030 | | 5.250 | | | 735,014 | | | 944,180 | | | | |
| 1,750,000 | | INDIANA HEALTH + EDL FAC FING | | 3/1/2022 | | 5.500 | | | 1,612,124 | | | 1,774,675 | | | | |
| 500,000 | | INDIANA HEALTH FAC FING AUTH H | | 2/15/2017 | | 5.125 | | | 491,810 | | | 500,315 | | | | |
| 350,000 | | INDIANA HEALTH FAC FING AUTH H | | 2/15/2018 | | 5.250 | | | 358,571 | | | 350,259 | | | | |
| 1,315,000 | | INDIANA HEALTH FAC FING AUTH R | | 8/15/2018 | | 5.000 | | | 1,178,791 | | | 1,299,522 | | | | |
| 280,000 | | INDIANA ST DEV FIN AUTH POLLUT | | 3/1/2030 | | 5.000 | | | 280,938 | | | 280,081 | | | | |
| 1,500,000 | | INDIANA ST FIN AUTH REV | | 7/1/2039 | | 5.750 | | | 1,527,368 | | | 1,541,985 | | | | |
| 1,000,000 | | INDIANA ST FIN AUTH REV | | 10/1/2021 | | 6.000 | | | 1,000,000 | | | 999,890 | | | | |
| 250,000 | | INDUSTRY CALIF URBAN DEV AGY | | 5/1/2021 | | 4.750 | | | 254,188 | | | 241,978 | | | | |
| 750,000 | | INGLEWOOD CALIF REDEV AGY TAX | | 5/1/2014 | | 5.250 | | | 728,755 | | | 757,170 | | | | |
| 300,000 | | INTERCOMMUNITY HOSP FING AUTH | | 11/1/2019 | | 5.250 | | | 310,182 | | | 286,659 | | | | |
| 976,715 | | INTERMEDIATE SCH DIST 287 MINN | | 1/1/2028 | | 5.460 | | | 996,118 | | | 959,164 | | | | |
| 5,779,136 | | INTERMEDIATE SCH DIST 287 MINN | | 11/1/2032 | | 5.295 | | | 5,523,740 | | | 5,672,106 | | | | |
| 200,000 | | IOWA FIN AUTH RETIREMENT CMNTY | | 11/15/2011 | | 4.750 | | | 199,116 | | | 200,610 | | | | |
| 120,000 | | IOWA FIN AUTH SR HSG REV | | 11/1/2011 | | 5.000 | | | 120,000 | | | 118,446 | | | | |
| 400,000 | | IOWA FIN AUTH SR HSG REV | | 12/1/2014 | | 5.000 | | | 397,739 | | | 344,508 | | | | |
| 500,000 | | IOWA FIN AUTH SR LIVING FAC | | 11/15/2027 | | 5.500 | | | 509,909 | | | 350,595 | | | | |
| 1,000,000 | | IOWA STUDENT LN LIQUIDITY CORP | | 12/1/2027 | | 5.500 | | | 976,620 | | | 994,320 | | | | |
| 1,000,000 | | JACKSON CNTY MICH HOSP FIN | | 6/1/2017 | | 5.250 | | | 954,142 | | | 994,500 | | | | |
| 475,000 | | JACKSONVILLE FLA ECONOMIC DEV | | 9/1/2017 | | 6.000 | | | 475,000 | | | 484,890 | | | | |
| 1,000,000 | | JACKSONVILLE FLA HEALTH FACS A | | 11/1/2027 | | 5.000 | | | 957,907 | | | 984,860 | | | | |
| 500,000 | | JACKSONVILLE FLA HEALTH FACS A | | 11/1/2022 | | 5.000 | | | 495,312 | | | 505,780 | | | | |
| 400,000 | | JEFFERSON CNTY ALA MULTIFAMILY | | 9/1/2012 | | 5.400 | | | 396,230 | | | 400,756 | | | | |
| 1,500,000 | | JEFFERSON CNTY KY MTG REV | | 11/15/2013 | | 6.125 | | | 1,500,000 | | | 1,502,265 | | | | |
| 205,000 | | JEFFERSON PARISH LA FIN AUTH | | 6/1/2033 | | 5.000 | | | 215,867 | | | 211,078 | | | | |
| 1,250,000 | | JEFFERSON PARISH LA FIN AUTH | | 6/1/2038 | | 5.000 | | | 1,310,398 | | | 1,248,625 | | | | |
| 250,000 | | JEFFERSON PARISH LA FIN AUTH | | 12/1/2048 | | 5.700 | | | 262,476 | | | 266,915 | | | | |
| 700,000 | | JOPLIN MO INDL DEV AUTH INDL R | | 5/15/2017 | | 5.500 | | | 708,407 | | | 616,315 | | | | |
| 155,000 | | JUBAN PARC CMNTY DEV DEV DIST | | 10/1/2014 | | 5.150 | | | 155,000 | | | 136,408 | | | | |
| 2,220,000 | | KALISPEL TRIBE INDIANS | | 1/1/2016 | | 6.200 | | | 2,159,319 | | | 2,090,152 | | | | |
| 1,000,000 | | KANSAS CITY MO INDL DEV AUTH M | | 11/20/2039 | | 5.100 | | | 1,000,000 | | | 1,001,480 | | | | |
| 3,500,000 | | KANSAS CITY MO INDL DEV AUTH M | | 1/1/2012 | | 5.000 | | | 3,467,202 | | | 3,469,235 | | | | |
| 1,000,000 | | KANSAS ST DEV FIN AUTH HOSP RE | | 11/15/2029 | | 5.500 | | | 976,320 | | | 1,031,440 | | | | |
| 700,000 | | KATY TEX DEV AUTH REV | | 6/1/2011 | | 5.800 | | | 694,048 | | | 700,049 | | | | |
| 1,000,000 | | KENT HOSP FIN AUTH MICH REV | | 7/1/2035 | | 6.000 | | | 1,063,115 | | | 822,820 | | | | |
| 500,000 | | KENTUCKY ECONOMIC DEV FIN AUTH | | 11/20/2035 | | 5.375 | | | 500,000 | | | 525,000 | | | | |
| 200,000 | | KENTUCKY ECONOMIC DEV FIN AUTH | | 12/1/2033 | | 6.000 | | | 198,473 | | | 219,058 | | | | |
| 250,000 | | KENTUCKY ECONOMIC DEV FIN AUTH | | 10/1/2012 | | 6.250 | | | 253,057 | | | 257,928 | | | | |
| 750,000 | | KENTUCKY ECONOMIC DEV FIN AUTH | | 10/1/2018 | | 6.000 | | | 729,127 | | | 788,348 | | | | |
| 500,000 | | KENTUCKY HSG CORP HSG REV | | 7/1/2039 | | 5.150 | | | 500,000 | | | 509,740 | | | | |
| 250,000 | | KENTWOOD MICH ECONOMIC DEV | | 11/15/2014 | | 5.250 | | | 248,600 | | | 233,938 | | | | |
| 2,705,000 | | KERRVILLE TEX HEALTH FACS DEV | | 8/15/2035 | | 5.450 | | | 2,694,304 | | | 2,433,256 | | | | |
| 750,000 | | KING CNTY WASH HSG AUTH REV | | 5/1/2028 | | 5.200 | | | 750,000 | | | 779,393 | | | | |
| 900,000 | | KLICKITAT CNTY WASH PUB HOSP | | 12/1/2020 | | 6.000 | | | 829,417 | | | 862,434 | | | | |
| 750,000 | | KNOX CNTY TENN HEALTH EDL + HS | | 4/15/2031 | | 6.500 | | | 635,875 | | | 787,988 | | | | |
| 500,000 | | LA VERNIA TEX HIGHER ED FIN CO | | 2/15/2018 | | 6.000 | | | 500,000 | | | 473,215 | | | | |
| 1,647,000 | | LAFAYETTE LA PUB TR FING AUTH | | 1/1/2041 | | 5.350 | | | 1,692,781 | | | 1,683,152 | | | | |
| 360,000 | | LAKE ASHTON II CMNTY DEV DIST | | 11/1/2010 | | 4.875 | | | 360,130 | | | 272,074 | | | | |
| 650,000 | | LAKELAND FLA HOSP SYS REV | | 11/15/2032 | | 5.000 | | | 661,091 | | | 617,682 | | | | |
| 250,000 | | LAKELAND FLA RETIREMENT CMNTY | | 1/1/2019 | | 5.875 | | | 250,000 | | | 243,120 | | | | |
| 750,000 | | LAKESIDE 370 LEVEE DIST MO | | 4/1/2028 | | 7.000 | | | 750,000 | | | 737,768 | | | | |
| 750,000 | | LANCASTER CALIF REDEV AGY TAX | | 8/1/2024 | | 6.000 | | | 737,091 | | | 786,713 | | | | |
| 400,000 | | LANGSTON OKLA ECONOMIC DEV | | 5/1/2026 | | 5.250 | | | 413,299 | | | 351,932 | | | | |
| 2,000,000 | | LAS VEGAS NEV REDEV AGY TAX IN | | 6/15/2023 | | 7.500 | | | 1,978,872 | | | 2,252,480 | | | | |
| | |
See accompanying notes to financial statements. | 53 | (Continued) |
CLEARWATER INVESTMENT TRUST
Schedule of Investments - Clearwater Tax-Exempt Bond Fund
December 31, 2009
| | | | | | | | | | | | | | | | | |
Par/Shares | | Security | | Maturity
date | | Coupon
rate | | Cost | | Fair
Value (a) | | Percent
of
net assets | |
| 250,000 | | LEE CNTY FLA INDL DEV AUTH HEA | | 11/15/2029 | | 5.000 | | $ | 255,083 | | | 205,095 | | | | |
| 750,000 | | LEE CNTY FLA INDL DEV AUTH IND | | 6/15/2027 | | 5.250 | | | 754,080 | | | 578,730 | | | | |
| 400,000 | | LEE CNTY S C SCH FACS INC | | 12/1/2031 | | 6.000 | | | 366,294 | | | 393,276 | | | | |
| 250,000 | | LEHIGH CNTY PA GEN PURP AUTH | | 8/15/2042 | | 1.203 | | | 250,000 | | | 154,875 | | | | |
| 200,000 | | LEWISVILLE TEX COMBINATION CON | | 9/1/2028 | | 5.700 | | | 131,009 | | | 189,222 | | | | |
| 45,000 | | LEWISVILLE TEX INDPT SCH DIST | | 8/15/2025 | | 5.000 | | | 45,410 | | | 47,224 | | | | |
| 500,000 | | LOMBARD ILL PUB FACS CORP | | 1/1/2015 | | 6.375 | | | 500,000 | | | 448,260 | | | | |
| 300,000 | | LOMBARD ILL PUB FACS CORP | | 1/1/2025 | | 5.500 | | | 317,773 | | | 217,224 | | | | |
| 550,000 | | LOMBARD ILL PUB FACS CORP | | 1/1/2030 | | 5.500 | | | 579,026 | | | 369,490 | | | | |
| 1,750,000 | | LOMBARD ILL PUB FACS CORP | | 1/1/2036 | | 5.250 | | | 1,781,189 | | | 1,689,870 | | | | |
| 250,000 | | LOMPOC CALIF HEALTHCARE DIST | | 8/1/2034 | | 5.000 | | | 253,058 | | | 241,080 | | | | |
| 320,000 | | LORAIN CNTY OHIO HOSP REV | | 9/1/2016 | | 5.625 | | | 324,385 | | | 320,454 | | | | |
| 330,000 | | LORAIN CNTY OHIO HOSP REV | | 9/1/2027 | | 5.500 | | | 336,149 | | | 330,102 | | | | |
| 1,000,000 | | LOS ANGELES CALIF CMNTY COLLEG | | 8/1/2033 | | 6.000 | | | 1,034,415 | | | 1,115,680 | | | | |
| 400,000 | | LOS ANGELES CALIF CTFS PARTN | | 2/1/2018 | | 5.700 | | | 352,498 | | | 400,052 | | | | |
| 1,000,000 | | LOS ANGELES CALIF CTFS PARTN | | 2/1/2027 | | 5.000 | | | 1,000,926 | | | 1,004,470 | | | | |
| 1,250,000 | | LOS ANGELES CALIF HSG AUTH | | 6/1/2029 | | 5.000 | | | 1,089,154 | | | 1,137,050 | | | | |
| 500,000 | | LOUDOUN CNTY VA INDL DEV AUTH | | 8/1/2028 | | 7.000 | | | 500,000 | | | 505,440 | | | | |
| 475,000 | | LOUISIANA HSG FIN AGY SINGLE | | 6/1/2040 | | 6.550 | | | 501,847 | | | 518,273 | | | | |
| 340,000 | | LOUISIANA HSG FIN AGY SINGLE | | 6/1/2038 | | 5.850 | | | 363,977 | | | 364,126 | | | | |
| 200,000 | | LOUISIANA HSG FIN AGY SINGLE | | 12/1/2022 | | 4.800 | | | 200,000 | | | 208,038 | | | | |
| 1,570,000 | | LOUISIANA HSG FIN AGY SINGLE | | 12/1/2038 | | 5.700 | | | 1,651,089 | | | 1,616,645 | | | | |
| 235,000 | | LOUISIANA HSG FIN AGY SINGLE | | 6/1/2039 | | 5.600 | | | 242,902 | | | 249,124 | | | | |
| 500,000 | | LOUISIANA HSG FIN AGY SINGLE | | 12/1/2034 | | 5.100 | | | 500,000 | | | 507,450 | | | | |
| 460,000 | | LOUISIANA LOC GOVT ENVIR FACS | | 6/20/2028 | | 8.000 | | | 460,000 | | | 380,158 | | | | |
| 500,000 | | LOUISIANA PUB FACS AUTH HOSP R | | 7/1/2024 | | 6.750 | | | 519,545 | | | 531,155 | | | | |
| 500,000 | | LOUISIANA PUB FACS AUTH REV | | 2/15/2036 | | 0.883 | | | 500,000 | | | 324,000 | | | | |
| 15,000 | | LUBBOCK TEX HEALTH FACS DEV | | 1/20/2010 | | 5.000 | | | 15,000 | | | 15,023 | | | | |
| 105,000 | | LUBBOCK TEX HEALTH FACS DEV | | 3/20/2012 | | 5.000 | | | 105,000 | | | 108,972 | | | | |
| 350,000 | | LUCAS CNTY OHIO HEALTH CARE | | 8/15/2015 | | 6.375 | | | 342,888 | | | 357,018 | | | | |
| 1,495,000 | | LUZERNE CNTY PA | | 11/1/2026 | | 7.000 | | | 1,601,552 | | | 1,684,013 | | | | |
| 150,000 | | LYNN HAVEN FLA CAP IMPT REV | | 12/1/2016 | | 5.000 | | | 150,000 | | | 150,513 | | | | |
| 560,284 | | LYONS COLO REV | | 11/30/2016 | | 4.750 | | | 565,351 | | | 505,740 | | | | |
| 250,000 | | MADEIRA CMNTY DEV DIST FLA SPL (b) | | 11/1/2014 | | 5.250 | | | 249,568 | | | 130,278 | | | | |
| 460,000 | | MADISON CNTY FLA REV | | 7/1/2025 | | 6.000 | | | 453,153 | | | 345,285 | | | | |
| 210,000 | | MADISON CNTY NY INDL DEV AGY C | | 2/1/2017 | | 4.500 | | | 207,110 | | | 200,176 | | | | |
| 250,000 | | MAGNOLIA CREEK FLA CMNTY DEV D (b) | | 5/1/2014 | | 5.600 | | | 250,000 | | | 153,135 | | | | |
| 1,000,000 | | MAINE EDL LN AUTH STUDENT LN R | | 12/1/2027 | | 5.625 | | | 1,000,000 | | | 1,042,620 | | | | |
| 1,000,000 | | MALTA ILL TAX INCREMENT REV | | 12/30/2025 | | 5.750 | | | 1,000,000 | | | 613,470 | | | | |
| 500,000 | | MANCHESTER N H HSG + REDEV | | 1/1/2015 | | 6.750 | | | 504,803 | | | 483,995 | | | | |
| 500,000 | | MANCHESTER N H HSG + REDEV (c) | | 1/1/2020 | | 5.248 | | | 290,702 | | | 208,315 | | | | |
| 557,000 | | MANHATTAN ILL SPL SVC AREA SPL | | 3/1/2022 | | 5.750 | | | 557,000 | | | 356,864 | | | | |
| 500,000 | | MANSFIELD OHIO | | 12/1/2024 | | 6.000 | | | 528,645 | | | 548,120 | | | | |
| 2,000,000 | | MANTECA CALIF FING AUTH SWR | | 12/1/2033 | | 5.000 | | | 1,854,360 | | | 1,896,780 | | | | |
| 500,000 | | MARICOPA CNTY ARIZ ELEM SCH | | 7/1/2020 | | 6.250 | | | 513,197 | | | 577,110 | | | | |
| 300,000 | | MARICOPA CNTY ARIZ ELEM SCH | | 7/1/2024 | | 8.000 | | | 308,627 | | | 324,894 | | | | |
| 1,000,000 | | MARICOPA CNTY ARIZ UNI SCH DIS | | 7/1/2026 | | 6.250 | | | 1,019,685 | | | 1,139,290 | | | | |
| 235,000 | | MARION CNTY IND CONVENTION + R | | 6/1/2027 | | 5.000 | | | 222,781 | | | 235,038 | | | | |
| 500,000 | | MARQUIS CMNTY DEV AUTH VA REV | | 9/1/2013 | | 5.100 | | | 500,000 | | | 456,565 | | | | |
| 130,000 | | MARYLAND ST ECONOMIC DEV CORP | | 12/1/2011 | | 4.750 | | | 129,528 | | | 119,461 | | | | |
| 450,000 | | MARYLAND ST HEALTH + HIGHER | | 7/1/2029 | | 6.750 | | | 440,431 | | | 525,677 | | | | |
| 500,000 | | MARYLAND ST HEALTH + HIGHER | | 1/1/2027 | | 4.625 | | | 461,910 | | | 481,355 | | | | |
| 240,000 | | MARYLAND ST HEALTH + HIGHER | | 1/1/2017 | | 5.000 | | | 240,000 | | | 219,252 | | | | |
| 500,000 | | MASHANTUCKET WESTERN PEQUOT TR | | 9/1/2036 | | 5.500 | | | 509,182 | | | 261,075 | | | | |
| 1,000,000 | | MASSACHUSETTS DEV FIN AGY SR | | 6/1/2014 | | 6.250 | | | 1,000,000 | | | 1,001,470 | | | | |
| 250,000 | | MASSACHUSETTS ST | | 5/1/2037 | | 0.758 | | | 250,000 | | | 183,875 | | | | |
| 460,000 | | MASSACHUSETTS ST DEV FIN AGY | | 10/1/2017 | | 5.000 | | | 467,363 | | | 427,276 | | | | |
| | |
See accompanying notes to financial statements. | 54 | (Continued) |
CLEARWATER INVESTMENT TRUST
Schedule of Investments - Clearwater Tax-Exempt Bond Fund
December 31, 2009
| | | | | | | | | | | | | | | | | |
Par/Shares | | Security | | Maturity
date | | Coupon
rate | | Cost | | Fair
Value (a) | | Percent
of
net assets | |
| 750,000 | | MASSACHUSETTS ST HEALTH + EDL | | 7/1/2016 | | 5.500 | | $ | 762,139 | | | 654,660 | | | | |
| 464,000 | | MASSACHUSETTS ST HEALTH + EDL | | 10/1/2017 | | 6.000 | | | 470,131 | | | 459,147 | | | | |
| 2,480,000 | | MASSACHUSETTS ST HEALTH + EDL | | 7/1/2013 | | 7.300 | | | 2,480,000 | | | 2,486,994 | | | | |
| 235,000 | | MASSACHUSETTS ST HEALTH + EDL | | 7/1/2028 | | 5.000 | | | 241,648 | | | 235,068 | | | | |
| 1,050,000 | | MASSACHUSETTS ST HEALTH + EDL | | 1/15/2012 | | 5.125 | | | 1,046,455 | | | 1,054,368 | | | | |
| 1,000,000 | | MASSACHUSETTS ST HSG FIN AGY H | | 12/1/2033 | | 5.350 | | | 1,000,000 | | | 1,023,070 | | | | |
| 1,000,000 | | MASSACHUSETTS ST HSG FIN AGY H | | 6/1/2040 | | 5.050 | | | 1,000,000 | | | 1,001,440 | | | | |
| 100,000 | | MASSACHUSETTS ST INDL FIN AGY | | 9/1/2017 | | 5.450 | | | 100,000 | | | 100,083 | | | | |
| 145,000 | | MASSACHUSETTS ST TPK AUTH MET | | 1/1/2027 | | 5.000 | | | 147,179 | | | 145,009 | | | | |
| 225,000 | | MASSACHUSETTS ST TPK AUTH MET | | 1/1/2029 | | 5.250 | | | 231,479 | | | 225,068 | | | | |
| 500,000 | | MASSACHUSETTS ST TPK AUTH MET | | 1/1/2017 | | 5.125 | | | 507,894 | | | 500,540 | | | | |
| 1,000,000 | | MASSACHUSETTS ST TPK AUTH WEST | | 1/1/2017 | | 5.550 | | | 1,000,000 | | | 1,004,330 | | | | |
| 265,000 | | MATAGORDA CNTY TEX NAV DIST NO | | 6/1/2026 | | 5.250 | | | 270,828 | | | 258,163 | | | | |
| 80,000 | | MATAGORDA CNTY TEX NAV DIST NO | | 6/1/2026 | | 5.250 | | | 80,573 | | | 77,936 | | | | |
| 1,750,000 | | MC ALESTER OKLA PUB WKS AUTH U (c) | | 2/1/2030 | | 5.480 | | | 587,979 | | | 568,645 | | | | |
| 200,000 | | MEAD VLG NEB TAX INCREMENT REV | | 7/1/2012 | | 5.125 | | | 200,000 | | | 105,104 | | | | |
| 500,000 | | MESQUITE NEV REDEV AGY TAX | | 6/1/2014 | | 5.750 | | | 495,187 | | | 513,675 | | | | |
| 500,000 | | MESQUITE TEX HEALTH FACS DEV C | | 2/15/2015 | | 5.000 | | | 502,217 | | | 493,760 | | | | |
| 1,830,000 | | MET GOVT NASHVILLE + DAVIDSON (b) | | 12/20/2040 | | 7.500 | | | 1,830,000 | | | 1,216,511 | | | | |
| 855,000 | | MET GOVT NASHVILLE + DAVIDSON (b) | | 6/20/2036 | | 10.000 | | | 855,000 | | | 514,351 | | | | |
| 1,070,000 | | MET GOVT NASHVILLE + DAVIDSON (b) | | 12/20/2020 | | 8.000 | | | 1,070,000 | | | 639,368 | | | | |
| 500,000 | | METROPOLITAN PIER + EXPOSITION | | 6/15/2027 | | 6.500 | | | 500,000 | | | 501,165 | | | | |
| 2,000,000 | | METROPOLITAN WASHINGTON D C AR (c) | | 10/1/2041 | | 1.425 | | | 1,274,061 | | | 1,399,640 | | | | |
| 500,000 | | MIAMI BEACH FLA HEALTH FACS | | 11/15/2028 | | 5.375 | | | 505,528 | | | 407,460 | | | | |
| 500,000 | | MIAMI CNTY OHIO HOSP FAC | | 5/15/2018 | | 5.250 | | | 510,324 | | | 525,635 | | | | |
| 1,500,000 | | MIAMI-DADE CNTY FLA SPL OBLIG (c) | | 10/1/2026 | | 6.250 | | | 536,092 | | | 496,575 | | | | |
| 750,000 | | MIAMI-DADE CNTY FLA WTR + SWR | | 10/1/2023 | | 6.000 | | | 762,155 | | | 853,245 | | | | |
| 1,000,000 | | MICHIGAN MUN BD AUTH REV | | 5/1/2023 | | 5.750 | | | 1,032,708 | | | 1,090,360 | | | | |
| 500,000 | | MICHIGAN PUB EDL FACS AUTH REV | | 11/1/2028 | | 6.350 | | | 500,000 | | | 503,815 | | | | |
| 300,000 | | MICHIGAN PUB EDL FACS AUTH REV | | 9/1/2022 | | 5.000 | | | 300,000 | | | 249,447 | | | | |
| 750,000 | | MICHIGAN PUB EDL FACS AUTH REV | | 9/1/2016 | | 6.000 | | | 750,000 | | | 736,628 | | | | |
| 475,000 | | MICHIGAN PUB EDL FACS AUTH REV | | 10/1/2023 | | 6.250 | | | 475,000 | | | 401,456 | | | | |
| 500,000 | | MICHIGAN PUB EDL FACS AUTH REV | | 9/1/2021 | | 8.000 | | | 500,000 | | | 536,075 | | | | |
| 175,000 | | MICHIGAN ST HOSP FIN AUTH REV | | 6/1/2028 | | 5.000 | | | 178,118 | | | 169,666 | | | | |
| 1,000,000 | | MICHIGAN ST HOSP FIN AUTH REV | | 12/1/2023 | | 6.125 | | | 988,446 | | | 1,093,630 | | | | |
| 545,000 | | MICHIGAN ST HSG DEV AUTH RENTA | | 10/1/2038 | | 5.700 | | | 545,000 | | | 565,852 | | | | |
| 625,000 | | MICHIGAN ST HSG DEV AUTH RENTA | | 10/1/2020 | | 5.375 | | | 596,624 | | | 654,931 | | | | |
| 1,000,000 | | MICHIGAN ST HSG DEV AUTH RENTA | | 10/1/2034 | | 5.625 | | | 1,000,000 | | | 1,027,360 | | | | |
| 1,000,000 | | MICHIGAN ST STRATEGIC FD LTD | | 9/1/2029 | | 5.450 | | | 1,056,853 | | | 1,003,550 | | | | |
| 280,000 | | MICHIGAN TOB SETTLEMENT FIN | | 6/1/2022 | | 5.125 | | | 263,001 | | | 249,718 | | | | |
| 500,000 | | MILLSBORO DEL SPL OBLG | | 7/1/2036 | | 5.450 | | | 500,000 | | | 317,385 | | | | |
| 523,084 | | MINNESOTA ST HIGHER ED FACS | | 10/1/2016 | | 4.493 | | | 526,814 | | | 523,241 | | | | |
| 235,000 | | MINNESOTA ST HSG FIN AGY | | 1/1/2020 | | 5.000 | | | 225,165 | | | 237,876 | | | | |
| 1,000,000 | | MINNESOTA ST HSG FIN AGY | | 1/1/2040 | | 5.100 | | | 1,000,000 | | | 1,001,490 | | | | |
| 500,000 | | MINNESOTA ST HSG FIN AGY | | 7/1/2034 | | 5.050 | | | 500,000 | | | 502,625 | | | | |
| 400,000 | | MISSISSIPPI HOME CORP SINGLE F | | 6/1/2039 | | 6.750 | | | 424,669 | | | 446,340 | | | | |
| 500,000 | | MISSOURI DEV FIN BRD | | 6/1/2029 | | 5.625 | | | 486,435 | | | 516,020 | | | | |
| 500,000 | | MISSOURI ST DEV FIN BRD INFRAS | | 4/1/2027 | | 6.000 | | | 506,558 | | | 511,325 | | | | |
| 500,000 | | MISSOURI ST DEV FIN BRD INFRAS | | 10/1/2027 | | 6.125 | | | 483,948 | | | 516,810 | | | | |
| 250,000 | | MISSOURI ST DEV FIN BRD INFRAS | | 4/1/2025 | | 5.125 | | | 252,773 | | | 253,075 | | | | |
| 500,000 | | MISSOURI ST DEV FIN BRD INFRAS | | 4/1/2028 | | 4.750 | | | 485,114 | | | 474,215 | | | | |
| 500,000 | | MISSOURI ST DEV FIN BRD INFRAS | | 11/1/2025 | | 5.500 | | | 491,669 | | | 515,555 | | | | |
| 980,000 | | MISSOURI ST HEALTH + EDL FACS | | 2/1/2022 | | 5.125 | | | 1,010,461 | | | 941,966 | | | | |
| 500,000 | | MISSOURI ST HEALTH + EDL FACS | | 2/1/2027 | | 4.875 | | | 505,215 | | | 444,785 | | | | |
| 650,000 | | MISSOURI ST HSG DEV COMMN | | 7/1/2042 | | 5.250 | | | 641,018 | | | 642,012 | | | | |
| 470,000 | | MISSOURI ST HSG DEV COMMN SING | | 9/1/2034 | | 5.250 | | | 466,784 | | | 482,521 | | | | |
| 450,000 | | MISSOURI ST HSG DEV COMMN SING | | 9/1/2034 | | 5.350 | | | 450,000 | | | 463,775 | | | | |
| | |
See accompanying notes to financial statements. | 55 | (Continued) |
CLEARWATER INVESTMENT TRUST
Schedule of Investments - Clearwater Tax-Exempt Bond Fund
December 31, 2009
| | | | | | | | | | | | | | | | | |
Par/Shares | | Security | | Maturity
date | | Coupon
rate | | Cost | | Fair
Value (a) | | Percent
of
net assets | |
| 475,000 | | MODESTO CALIF IRR DIST CTFS PA | | 7/1/2022 | | 5.300 | | $ | 449,069 | | | 475,219 | | | | |
| 1,000,000 | | MOHAVE CNTY ARIZ INDL DEV AUTH | | 5/1/2015 | | 7.250 | | | 992,152 | | | 1,063,710 | | | | |
| 1,550,000 | | MONTANA ST BRD HSG | | 12/1/2039 | | 5.500 | | | 1,550,277 | | | 1,594,067 | | | | |
| 250,000 | | MONTGOMERY ALA EDL BLDG AUTH F | | 10/1/2032 | | 5.250 | | | 259,761 | | | 221,495 | | | | |
| 250,000 | | MONTGOMERY ALA MED CLINIC BRD | | 3/1/2031 | | 5.250 | | | 255,256 | | | 225,180 | | | | |
| 1,500,000 | | MONTGOMERY CNTY OHIO HEALTH | | 9/20/2032 | | 6.550 | | | 1,456,803 | | | 1,539,000 | | | | |
| 750,000 | | MONTGOMERY CNTY OHIO REV | | 11/15/2039 | | 5.250 | | | 750,000 | | | 796,035 | | | | |
| 750,000 | | MONTGOMERY CNTY PA HIGHER ED | | 6/1/2025 | | 5.000 | | | 740,450 | | | 750,525 | | | | |
| 650,000 | | MONTGOMERY CNTY PA INDL DEV AU | | 2/1/2014 | | 5.375 | | | 647,060 | | | 601,101 | | | | |
| 375,000 | | MONTGOMERY CNTY PA INDL DEV AU | | 2/1/2028 | | 6.125 | | | 369,957 | | | 283,894 | | | | |
| 200,000 | | MOUNT CARBON MET DIST COLO
REV (b) (c) (e) | | 6/1/2043 | | 8.000 | | | - | | | - | | | | |
| 800,000 | | MOUNT CARBON MET DIST COLO REV (b) | | 6/1/2043 | | 7.000 | | | 800,000 | | | 231,440 | | | | |
| 400,000 | | NASSAU CNTY N Y INDL DEV AGY | | 1/1/2018 | | 5.875 | | | 396,850 | | | 399,420 | | | | |
| 500,000 | | NEVADA HSG DIV SINGLE FAMILY | | 10/1/2039 | | 5.375 | | | 500,000 | | | 514,085 | | | | |
| 1,500,000 | | NEVADA HSG DIV SINGLE FAMILY | | 10/1/2040 | | 5.100 | | | 1,500,000 | | | 1,500,975 | | | | |
| 140,000 | | NEW HAMPSHIRE HEALTH + ED FACS | | 7/1/2011 | | 5.000 | | | 140,339 | | | 141,998 | | | | |
| 155,000 | | NEW HAMPSHIRE HEALTH + ED FACS | | 7/1/2014 | | 5.000 | | | 155,360 | | | 164,471 | | | | |
| 500,000 | | NEW HAMPSHIRE HEALTH + ED FACS | | 8/1/2038 | | 6.000 | | | 489,943 | | | 524,475 | | | | |
| 570,000 | | NEW HAMPSHIRE HGR EDL + HLTH F | | 10/1/2010 | | 5.700 | | | 570,000 | | | 571,870 | | | | |
| 925,000 | | NEW HAMPSHIRE ST HSG FIN AUTH | | 7/1/2038 | | 6.625 | | | 975,987 | | | 1,023,355 | | | | |
| 750,000 | | NEW HAMPSHIRE ST HSG FIN AUTH | | 7/1/2034 | | 5.375 | | | 750,000 | | | 768,548 | | | | |
| 300,000 | | NEW JERSEY ECONOMIC DEV AUTH | | 1/1/2015 | | 5.000 | | | 297,381 | | | 294,288 | | | | |
| 500,000 | | NEW JERSEY HEALTH CARE FACS FI | | 1/1/2025 | | 6.000 | | | 505,500 | | | 509,530 | | | | |
| 235,000 | | NEW JERSEY HEALTH CARE FACS FI | | 2/1/2021 | | 5.000 | | | 239,834 | | | 237,068 | | | | |
| 415,000 | | NEW JERSEY HEALTH CARE FACS FI | | 7/1/2015 | | 5.750 | | | 408,271 | | | 432,438 | | | | |
| 485,000 | | NEW JERSEY HEALTH CARE FACS FI | | 11/15/2033 | | 0.983 | | | 485,000 | | | 321,070 | | | | |
| 2,500,000 | | NEW JERSEY HEALTH CARE FACS FI | | 7/1/2016 | | 6.250 | | | 2,500,000 | | | 2,503,575 | | | | |
| 750,000 | | NEW JERSEY ST EDL FACS AUTH | | 12/1/2023 | | 7.125 | | | 738,560 | | | 854,580 | | | | |
| 500,000 | | NEW JERSEY ST HIGHER ED ASSIST | | 6/1/2024 | | 5.375 | | | 497,256 | | | 530,895 | | | | |
| 2,500,000 | | NEW JERSEY ST HIGHER ED ASSIST | | 6/1/2027 | | 5.000 | | | 2,496,319 | | | 2,622,400 | | | | |
| 500,000 | | NEW JERSEY ST HSG + MTG FIN AG | | 10/1/2030 | | 6.450 | | | 541,671 | | | 537,980 | | | | |
| 925,000 | | NEW JERSEY ST HSG + MTG FIN AG | | 10/1/2034 | | 5.000 | | | 925,000 | | | 923,622 | | | | |
| 2,360,000 | | NEW JERSEY ST HSG + MTG FIN AG | | 10/1/2037 | | 5.000 | | | 2,342,335 | | | 2,356,295 | | | | |
| 800,000 | | NEW JERSEY ST HSG + MTG FIN AG | | 10/1/2035 | | 5.000 | | | 800,000 | | | 801,704 | | | | |
| 30,000 | | NEW MEXICO MTG FIN AUTH | | 1/1/2026 | | 6.950 | | | 31,486 | | | 30,729 | | | | |
| 1,000,000 | | NEW MEXICO MTG FIN AUTH | | 9/1/2029 | | 5.000 | | | 1,000,000 | | | 1,012,410 | | | | |
| 1,045,000 | | NEW MEXICO MTG FIN AUTH | | 3/1/2036 | | 5.450 | | | 1,045,000 | | | 1,074,521 | | | | |
| 500,000 | | NEW MEXICO MTG FIN AUTH | | 9/1/2029 | | 4.800 | | | 500,000 | | | 498,075 | | | | |
| 1,000,000 | | NEW MEXICO MTG FIN AUTH | | 9/1/2034 | | 5.000 | | | 1,000,000 | | | 995,720 | | | | |
| 250,000 | | NEW MEXICO ST HOSP EQUIP LN CO | | 8/15/2017 | | 5.000 | | | 249,208 | | | 221,373 | | | | |
| 500,000 | | NEW ORLEANS LA AVIATION BRD | | 1/1/2025 | | 6.000 | | | 489,347 | | | 500,345 | | | | |
| 250,000 | | NEW ORLEANS LA AVIATION BRD RE | | 1/1/2023 | | 6.000 | | | 249,091 | | | 283,238 | | | | |
| 230,000 | | NEW ORLEANS LA SEW SVC REV | | 6/1/2010 | | 5.200 | | | 230,470 | | | 230,131 | | | | |
| 750,000 | | NEW ORLEANS LA SEW SVC REV | | 6/1/2024 | | 6.000 | | | 739,288 | | | 793,620 | | | | |
| 500,000 | | NEW RIVER CMNTY DEV DIST FLA (b) | | 5/1/2013 | | 5.000 | | | 498,953 | | | 209,850 | | | | |
| 640,000 | | NEW YORK N Y CITY HSG DEV CORP | | 11/1/2024 | | 5.100 | | | 548,433 | | | 660,006 | | | | |
| 250,000 | | NEW YORK N Y CITY INDL DEV AGY | | 1/1/2029 | | 6.125 | | | 246,535 | | | 281,725 | | | | |
| 1,000,000 | | NEW YORK ST DORM AUTH REV | | 8/15/2024 | | 6.450 | | | 998,331 | | | 1,059,340 | | | | |
| 350,000 | | NEW YORK ST DORM AUTH REVS | | 7/1/2019 | | 6.875 | | | 361,439 | | | 358,666 | | | | |
| 990,000 | | NEW YORK ST DORM AUTH REVS | | 7/1/2015 | | 6.050 | | | 990,000 | | | 992,426 | | | | |
| 750,000 | | NEW YORK ST DORM AUTH REVS NON | | 7/1/2029 | | 6.250 | | | 762,280 | | | 838,770 | | | | |
| 500,000 | | NEW YORK ST DORM AUTH REVS NON | | 8/15/2038 | | 6.000 | | | 531,096 | | | 537,790 | | | | |
| 1,820,000 | | NEW YORK ST MED CARE FACS FIN | | 2/15/2035 | | 6.375 | | | 1,802,136 | | | 1,824,095 | | | | |
| 960,000 | | NEW YORK ST MED CARE FACS FIN | | 8/15/2023 | | 6.300 | | | 960,000 | | | 963,216 | | | | |
| 250,000 | | NEW YORK ST URBAN DEV CORP | | 7/1/2016 | | 5.500 | | | 250,000 | | | 250,920 | | | | |
| 500,000 | | NOBLESVILLE IND REDEV AUTH | | 2/1/2031 | | 5.125 | | | 495,204 | | | 518,065 | | | | |
| 325,000 | | NORCO CALIF REDEV AGY TAX ALLO | | 3/1/2021 | | 6.250 | | | 323,677 | | | 352,323 | | | | |
| | |
See accompanying notes to financial statements. | 56 | (Continued) |
CLEARWATER INVESTMENT TRUST
Schedule of Investments - Clearwater Tax-Exempt Bond Fund
December 31, 2009
| | | | | | | | | | | | �� | | | | | |
Par/Shares | | Security | | Maturity
date | | Coupon
rate | | Cost | | Fair
Value (a) | | Percent
of
net assets | |
| 500,000 | | NORTH CAROLINA MED CARE COMMN | | 10/1/2020 | | 5.500 | | $ | 510,353 | | | 496,355 | | | | |
| 1,300,000 | | NORTH CAROLINA MED CARE COMMN | | 10/1/2035 | | 4.750 | | | 1,300,000 | | | 1,285,999 | | | | |
| 500,000 | | NORTH CAROLINA MED CARE COMMN | | 10/1/2034 | | 5.800 | | | 541,137 | | | 482,770 | | | | |
| 250,000 | | NORTH CAROLINA MED CARE COMMN | | 1/1/2032 | | 5.250 | | | 248,693 | | | 180,068 | | | | |
| 1,000,000 | | NORTH CENT TEX HEALTH FAC DEV | | 5/15/2017 | | 5.000 | | | 1,002,710 | | | 1,003,610 | | | | |
| 2,000,000 | | NORTH DAKOTA ST HSG FIN AGY | | 7/1/2039 | | 5.450 | | | 2,000,000 | | | 2,052,920 | | | | |
| 1,000,000 | | NORTH DAKOTA ST HSG FIN AGY | | 7/1/2034 | | 5.350 | | | 1,000,000 | | | 1,022,940 | | | | |
| 750,000 | | NORTH OAKS MINN SR HSG REV | | 10/1/2022 | | 5.750 | | | 739,999 | | | 741,263 | | | | |
| 350,000 | | NORTH RANGE MET DIST NO 1 COLO | | 12/15/2024 | | 5.000 | | | 360,966 | | | 275,835 | | | | |
| 500,000 | | NORTH TEX TWY AUTH DALLAS NORT | | 1/1/2025 | | 6.000 | | | 500,000 | | | 538,890 | | | | |
| 250,000 | | NORTH TEX TWY AUTH REV | | 1/1/2031 | | 6.125 | | | 254,054 | | | 262,183 | | | | |
| 1,000,000 | | NORTH TEX TWY AUTH REV (c) | | 1/1/2042 | | 1.154 | | | 691,973 | | | 740,620 | | | | |
| 1,000,000 | | NORTH TEX TWY AUTH REV (c) | | 1/1/2028 | | 5.900 | | | 351,147 | | | 367,460 | | | | |
| 3,000,000 | | NORTHEAST TEX MUN WTR DIST (c) | | 9/1/2027 | | 8.519 | | | 689,758 | | | 840,390 | | | | |
| 500,000 | | NORTHERN CALIF GAS AUTH NO 1 | | 7/1/2027 | | 0.914 | | | 500,000 | | | 376,250 | | | | |
| 220,000 | | NORTHERN CALIF PWR AGY PUB PWR | | 7/1/2032 | | 5.200 | | | 224,270 | | | 220,022 | | | | |
| 2,000,000 | | NORWALK-LA MIRADA CALIF UNI SC (c) | | 8/1/2029 | | 3.256 | | | 1,062,325 | | | 1,095,540 | | | | |
| 300,000 | | OAK ISLAND N C ENTERPRISE SYS | | 6/1/2028 | | 5.750 | | | 293,312 | | | 327,792 | | | | |
| 300,000 | | OAK ISLAND N C ENTERPRISE SYS | | 6/1/2029 | | 5.875 | | | 295,703 | | | 329,193 | | | | |
| 250,000 | | OAKLAND CALIF UNI SCH DIST ALA | | 8/1/2024 | | 5.000 | | | 258,987 | | | 246,175 | | | | |
| 100,000 | | OAKRIDGE CMNTY DEV DIST FLA | | 5/1/2018 | | 5.250 | | | 100,335 | | | 100,493 | | | | |
| 500,000 | | OHIO ST HIGHER EDL FAC REV | | 12/1/2024 | | 5.500 | | | 508,763 | | | 545,580 | | | | |
| 500,000 | | OHIO ST HSG FIN AGY RESIDENTIA | | 9/1/2033 | | 5.450 | | | 500,000 | | | 514,560 | | | | |
| 755,000 | | OHIO ST HSG FIN AGY RESIDENTIA | | 9/1/2028 | | 6.125 | | | 755,203 | | | 824,166 | | | | |
| 750,000 | | OHIO ST HSG FIN AGY RESIDENTIA | | 9/1/2033 | | 5.400 | | | 750,000 | | | 770,303 | | | | |
| 1,000,000 | | OHIO ST HSG FIN AGY RESIDENTIA | | 9/1/2029 | | 4.750 | | | 1,000,000 | | | 999,940 | | | | |
| 500,000 | | OKLAHOMA DEV FIN AUTH | | 6/1/2014 | | 5.250 | | | 500,000 | | | 536,775 | | | | |
| 980,000 | | OKLAHOMA HSG FIN AGY SINGLE | | 9/1/2038 | | 6.500 | | | 1,038,918 | | | 1,083,586 | | | | |
| 500,000 | | OKLAHOMA HSG FIN AGY SINGLE | | 3/1/2032 | | 5.150 | | | 500,000 | | | 509,110 | | | | |
| 500,000 | | OLIVER CNTY N D POLLUTN CTL RE | | 1/1/2027 | | 5.300 | | | 501,158 | | | 502,270 | | | | |
| 1,000,000 | | ORANGE CNTY FLA HEALTH FACS AU | | 10/1/2021 | | 6.250 | | | 983,549 | | | 1,140,580 | | | | |
| 500,000 | | OREGON HEALTH SCIENCES UNIV RE | | 7/1/2039 | | 5.750 | | | 485,482 | | | 525,000 | | | | |
| 600,000 | | OREGON ST | | 10/1/2031 | | 5.125 | | | 595,571 | | | 605,598 | | | | |
| 500,000 | | ORLANDO FLA CMNTY REDEV AGY TA | | 9/1/2021 | | 5.250 | | | 509,098 | | | 529,905 | | | | |
| 500,000 | | ORLEANS PARISH LA PARISHWIDE S | | 9/1/2020 | | 5.500 | | | 500,000 | | | 499,960 | | | | |
| 520,000 | | ORLEANS PARISH LA SCH BRD (c) | | 2/1/2015 | | 5.586 | | | 387,825 | | | 378,383 | | | | |
| 3,685,000 | | PACHECO CALIF UN SCH DIST CTFS (c) | | 2/1/2037 | | 6.471 | | | 658,271 | | | 644,249 | | | | |
| 1,000,000 | | PALM BAY FLA UTIL REV (c) | | 10/1/2031 | | 5.920 | | | 281,406 | | | 283,700 | | | | |
| 675,000 | | PALM BEACH CNTY FL HEALTH FACS | | 11/15/2029 | | 5.125 | | | 683,548 | | | 629,910 | | | | |
| 420,000 | | PALM BEACH CNTY FLA HEALTH FAC | | 10/1/2011 | | 5.500 | | | 420,289 | | | 420,571 | | | | |
| 1,000,000 | | PALM BEACH CNTY FLA HEALTH FAC | | 11/15/2022 | | 5.375 | | | 910,886 | | | 913,400 | | | | |
| 175,000 | | PANTHER TRACE II FLA CMNTY DEV | | 11/1/2010 | | 5.000 | | | 175,203 | | | 168,460 | | | | |
| 630,000 | | PARKLANDS LEE CMNTY DEV DIST (b) | | 5/1/2011 | | 5.125 | | | 629,789 | | | 346,324 | | | | |
| 1,665,000 | | PATTERSON CALIF JT UNI SCH DIS (c) | | 8/1/2027 | | 6.548 | | | 536,363 | | | 604,079 | | | | |
| 750,000 | | PELL CITY ALA SPL CARE FACS FI | | 12/1/2027 | | 5.250 | | | 617,897 | | | 712,380 | | | | |
| 1,500,000 | | PENNSYLVANIA ECONOMIC DEV FING | | 10/15/2023 | | 6.250 | | | 1,466,020 | | | 1,584,135 | | | | |
| 500,000 | | PENNSYLVANIA ST HIGHER EDL | | 3/15/2030 | | 5.750 | | | 431,999 | | | 493,485 | | | | |
| 500,000 | | PENNSYLVANIA ST HIGHER EDL | | 7/1/2039 | | 0.844 | | | 500,000 | | | 318,000 | | | | |
| 75,000 | | PENNSYLVANIA ST HIGHER EDL FAC | | 11/15/2016 | | 5.875 | | | 78,861 | | | 71,868 | | | | |
| 1,000,000 | | PENNSYLVANIA ST TPK COMMN TPK (c) | | 6/1/2033 | | 1.774 | | | 661,355 | | | 726,170 | | | | |
| 1,025,000 | | PENNSYLVANIA ST TPK COMMN TPK (c) | | 12/1/2030 | | 2.281 | | | 637,804 | | | 659,659 | | | | |
| 2,000,000 | | PEORIA ILL PUB BLDG COMMN SCH (c) | | 12/1/2021 | | 5.601 | | | 1,035,652 | | | 1,075,460 | | | | |
| 5,000,000 | | PEORIA ILL PUB BLDG COMMN SCH (c) | | 12/1/2026 | | 6.233 | | | 1,768,855 | | | 1,835,250 | | | | |
| 500,000 | | PEORIA ILL PUB BLDG COMMN SCH (c) | | 12/1/2022 | | 6.149 | | | 228,723 | | | 250,175 | | | | |
| 1,000,000 | | PHILADELPHIA PA HOSPS + HIGHER | | 11/15/2023 | | 6.625 | | | 1,000,986 | | | 1,000,010 | | | | |
| 135,000 | | PHOENIX ARIZ STR + HWY USER RE | | 7/1/2011 | | 6.250 | | | 136,336 | | | 135,608 | | | | |
| 450,000 | | PIMA CNTY ARIZ INDL DEV AUTH | | 2/1/2015 | | 7.250 | | | 450,000 | | | 449,960 | | | | |
| | |
See accompanying notes to financial statements. | 57 | (Continued) |
CLEARWATER INVESTMENT TRUST
Schedule of Investments - Clearwater Tax-Exempt Bond Fund
December 31, 2009
| | | | | | | | | | | | | | | | | |
Par/Shares | | Security | | Maturity
date | | Coupon
rate | | Cost | | Fair
Value (a) | | Percent
of
net assets | |
| 130,000 | | PIMA CNTY ARIZ INDL DEV AUTH | | 8/1/2012 | | 6.250 | | $ | 130,000 | | | 131,656 | | | | |
| 325,000 | | PIMA CNTY ARIZ INDL DEV AUTH | | 2/1/2015 | | 6.625 | | | 325,000 | | | 312,078 | | | | |
| 115,000 | | PIMA CNTY ARIZ INDL DEV AUTH | | 7/1/2012 | | 5.000 | | | 114,864 | | | 112,315 | | | | |
| 245,000 | | PIMA CNTY ARIZ INDL DEV AUTH | | 7/1/2024 | | 6.100 | | | 240,956 | | | 216,769 | | | | |
| 200,000 | | PIMA CNTY ARIZ INDL DEV AUTH | | 12/15/2016 | | 5.250 | | | 198,269 | | | 187,564 | | | | |
| 480,000 | | PIMA CNTY ARIZ INDL DEV AUTH | | 12/1/2018 | | 6.375 | | | 480,000 | | | 468,053 | | | | |
| 1,290,000 | | PIMA CNTY ARIZ INDL DEV AUTH | | 7/1/2031 | | 6.750 | | | 935,281 | | | 1,181,730 | | | | |
| 375,000 | | PIMA CNTY ARIZ INDL DEV AUTH | | 6/1/2016 | | 6.000 | | | 375,000 | | | 347,633 | | | | |
| 150,000 | | PIMA CNTY ARIZ INDL DEV AUTH | | 7/1/2023 | | 5.700 | | | 154,171 | | | 128,348 | | | | |
| 1,100,000 | | PIMA CNTY ARIZ INDL DEV AUTH | | 12/1/2017 | | 5.350 | | | 977,474 | | | 1,016,840 | | | | |
| 465,000 | | PIMA CNTY ARIZ INDL DEV AUTH | | 7/1/2014 | | 4.650 | | | 464,059 | | | 432,924 | | | | |
| 250,000 | | PIMA CNTY ARIZ INDL DEV AUTH | | 6/1/2022 | | 5.000 | | | 253,851 | | | 212,658 | | | | |
| 500,000 | | PIMA CNTY ARIZ INDL DEV AUTH | | 7/1/2022 | | 5.375 | | | 505,114 | | | 441,025 | | | | |
| 205,000 | | PIMA CNTY ARIZ INDL DEV AUTH | | 7/1/2015 | | 5.125 | | | 204,261 | | | 195,916 | | | | |
| 500,000 | | PINAL CNTY ARIZ CTFS PARTN | | 12/1/2023 | | 5.250 | | | 474,401 | | | 509,510 | | | | |
| 500,000 | | PINAL CNTY ARIZ INDL DEV AUTH | | 10/1/2020 | | 5.250 | | | 522,939 | | | 485,965 | | | | |
| 300,000 | | PINAL CNTY ARIZ INDL DEV AUTH | | 10/1/2018 | | 5.250 | | | 248,804 | | | 296,868 | | | | |
| 370,000 | | PINGREE GROVE ILL SPL SVC AREA | | 3/1/2015 | | 5.250 | | | 367,824 | | | 329,159 | | | | |
| 225,000 | | PITT CNTY N C REV | | 12/1/2010 | | 5.375 | | | 227,754 | | | 232,110 | | | | |
| 1,000,000 | | PITTSBURG CALIF REDEV AGY TAX | | 9/1/2028 | | 6.500 | | | 976,666 | | | 1,093,330 | | | | |
| 250,000 | | PLAINFIELD IND CMNTY HIGH SCH | | 7/15/2023 | | 5.000 | | | 247,326 | | | 262,060 | | | | |
| 500,000 | | PLEASANT VALLEY CALIF SCH DIST | | 2/1/2022 | | 5.850 | | | 498,122 | | | 547,785 | | | | |
| 750,000 | | PLEASANTS CNTY W VA POLLUTN CT | | 5/1/2015 | | 6.150 | | | 781,118 | | | 750,900 | | | | |
| 750,000 | | PORT CORPUS CHRISTI AUTH TEX | | 12/1/2022 | | 5.650 | | | 750,000 | | | 759,045 | | | | |
| 1,750,000 | | PORT EVERGLADES AUTH FLA PORT | | 9/1/2016 | | 5.000 | | | 1,753,256 | | | 1,760,553 | | | | |
| 415,000 | | PORTLAND ME HSG DEV CORP | | 8/1/2015 | | 4.875 | | | 415,000 | | | 409,111 | | | | |
| 250,000 | | PORTLAND ME HSG DEV CORP | | 8/1/2021 | | 5.700 | | | 250,000 | | | 242,773 | | | | |
| 105,000 | | PRIVATE COLLEGES + UNIVS AUTH | | 10/1/2029 | | 5.375 | | | 105,196 | | | 97,112 | | | | |
| 500,000 | | PROVIDENCE R I HSG AUTH HSG | | 9/1/2027 | | 5.000 | | | 508,813 | | | 514,680 | | | | |
| 250,000 | | PROVIDENCE R I HSG AUTH HSG | | 9/1/2026 | | 5.000 | | | 255,530 | | | 258,935 | | | | |
| 250,000 | | PROVO UTAH CHARTER SCH REV | | 6/15/2037 | | 5.500 | | | 250,000 | | | 191,215 | | | | |
| 450,000 | | PUERTO RICO COMWLTH HWY + TRAN | | 7/1/2045 | | 0.724 | | | 450,000 | | | 215,775 | | | | |
| 500,000 | | PUERTO RICO ELEC PWR AUTH PWR | | 7/1/2025 | | 0.874 | | | 500,000 | | | 381,125 | | | | |
| 500,000 | | PUERTO RICO SALES TAX FING | | 8/1/2057 | | 1.118 | | | 500,000 | | | 319,750 | | | | |
| 750,000 | | QUAIL CREEK CMNTY FACS DIST | | 7/15/2016 | | 5.150 | | | 750,000 | | | 685,373 | | | | |
| 750,000 | | QUINAULT INDIAN NATION WASH | | 12/1/2015 | | 5.800 | | | 744,871 | | | 650,828 | | | | |
| 1,000,000 | | REDONDO BEACH CALIF UNI SCH (c) | | 8/1/2034 | | 1.702 | | | 659,233 | | | 676,770 | | | | |
| 500,000 | | RENO NEV HOSP REV | | 6/1/2020 | | 5.500 | | | 508,396 | | | 526,170 | | | | |
| 400,000 | | RENO NEV HOSP REV | | 6/1/2032 | | 5.250 | | | 412,607 | | | 374,004 | | | | |
| 750,000 | | RENO-SPARKS INDIAN COLONY NEV | | 6/1/2021 | | 5.000 | | | 766,014 | | | 755,700 | | | | |
| 500,000 | | RHODE ISLAND HSG + MTG FIN COR | | 10/1/2038 | | 5.625 | | | 500,000 | | | 518,475 | | | | |
| 500,000 | | RHODE ISLAND ST HEALTH + EDL | | 5/15/2030 | | 6.250 | | | 493,158 | | | 551,000 | | | | |
| 250,000 | | RHODE ISLAND ST HEALTH + EDL B | | 5/15/2026 | | 5.250 | | | 255,458 | | | 249,985 | | | | |
| 500,000 | | RHODE ISLAND ST STUDENT LN AUT | | 12/1/2027 | | 5.750 | | | 500,000 | | | 503,350 | | | | |
| 500,000 | | RICHARDSON TEX HOSP AUTH HOSP | | 12/1/2028 | | 5.625 | | | 515,176 | | | 436,035 | | | | |
| 500,000 | | RICHMOND CALIF JT PWRS FING AU | | 7/1/2024 | | 6.250 | | | 500,000 | | | 525,500 | | | | |
| 325,000 | | RICHMOND IND HOSP AUTH REV | | 1/1/2029 | | 6.500 | | | 314,642 | | | 343,109 | | | | |
| 1,345,000 | | RIO GRANDE VY HEALTH FACS DEV | | 8/1/2012 | | 6.400 | | | 1,345,000 | | | 1,348,389 | | | | |
| 500,000 | | RIVERSIDE MO INDL DEV AUTH | | 5/1/2020 | | 5.000 | | | 502,610 | | | 501,490 | | | | |
| 550,000 | | RIVERSIDE MO INDL DEV AUTH | | 5/1/2027 | | 4.500 | | | 520,858 | | | 469,436 | | | | |
| 250,000 | | RIVERWOOD ESTATES CMNTY DEV (b) | | 5/1/2013 | | 5.000 | | | 250,000 | | | 49,925 | | | | |
| 750,000 | | ROCKPORT IND POLLUTION CTL REV | | 6/1/2025 | | 4.625 | | | 726,737 | | | 718,433 | | | | |
| 500,000 | | ROSS COUNTY OHIO HOSP REV | | 12/1/2028 | | 5.750 | | | 502,721 | | | 520,845 | | | | |
| 2,200,000 | | ROWLAND CALIF UNI SCH DIST (c) | | 8/1/2027 | | 6.252 | | | 752,035 | | | 741,708 | | | | |
| 1,000,000 | | SACRAMENTO CALIF CITY FING AUT (c) | | 12/1/2021 | | 5.200 | | | 543,751 | | | 482,220 | | | | |
| 500,000 | | SACRAMENTO CNTY CALIF CTFS PAR | | 10/1/2027 | | 4.750 | | | 500,339 | | | 449,420 | | | | |
| 250,000 | | SACRAMENTO CNTY CALIF SANTN DI | | 12/1/2035 | | 0.701 | | | 250,000 | | | 190,188 | | | | |
| | |
See accompanying notes to financial statements. | 58 | (Continued) |
CLEARWATER INVESTMENT TRUST
Schedule of Investments - Clearwater Tax-Exempt Bond Fund
December 31, 2009
| | | | | | | | | | | | | | | | | |
Par/Shares | | Security | | Maturity
date | | Coupon
rate | | Cost | | Fair
Value (a) | | Percent
of
net assets | |
| 350,000 | | SACRAMENTO CNTY CALIF WTR FING | | 6/1/2039 | | 0.741 | | $ | 350,000 | | | 233,538 | | | | |
| 1,355,000 | | SADDLEBACK VY UNI SCH DIST CAL | | 9/1/2017 | | 5.650 | | | 1,355,000 | | | 1,360,230 | | | | |
| 750,000 | | SAGINAW MICH HOSP FIN AUTH | | 7/1/2030 | | 6.500 | | | 744,268 | | | 759,840 | | | | |
| 2,500,000 | | SALEM-KEIZER ORE SCH DIST NO (c) | | 6/15/2023 | | 5.259 | | | 1,243,608 | | | 1,358,600 | | | | |
| 1,750,000 | | SAN BERNARDINO CNTY CALIF CTFS | | 8/1/2028 | | 5.000 | | | 1,795,967 | | | 1,650,810 | | | | |
| 85,000 | | SAN DIEGO CALIF PUB FACS FING | | 5/15/2025 | | 5.000 | | | 85,876 | | | 85,046 | | | | |
| 1,505,000 | | SAN DIEGO CALIF PUB FACS FING | | 5/15/2027 | | 5.250 | | | 1,515,506 | | | 1,505,933 | | | | |
| 65,000 | | SAN DIEGO CALIF PUB FACS FING | | 5/15/2025 | | 5.000 | | | 65,169 | | | 65,000 | | | | |
| 500,000 | | SAN DIEGO CALIF REDEV AGY | | 9/1/2023 | | 5.000 | | | 448,406 | | | 496,545 | | | | |
| 1,000,000 | | SAN FRANCISCO CALIF CITY + | | 5/1/2039 | | 6.000 | | | 1,036,077 | | | 1,059,240 | | | | |
| 500,000 | | SAN FRANCISCO CALIF CITY + CNT | | 10/1/2033 | | 5.250 | | | 504,968 | | | 503,455 | | | | |
| 750,000 | | SAN GORGONIO CALIF MEM HEALTHC | | 8/1/2027 | | 7.000 | | | 766,526 | | | 804,068 | | | | |
| 250,000 | | SAN JOAQUIN HILLS CALIF TRANSN | | 1/15/2030 | | 5.250 | | | 253,749 | | | 211,550 | | | | |
| 250,000 | | SANTA CLARA CALIF REDEV AGY TA | | 6/1/2015 | | 5.000 | | | 251,742 | | | 251,443 | | | | |
| 1,250,000 | | SARASOTA CNTY FLA HEALTH FACS | | 1/1/2027 | | 5.500 | | | 1,021,386 | | | 1,135,663 | | | | |
| 250,000 | | SARASOTA NATL CMNTY DEV DIST (b) | | 5/1/2039 | | 5.300 | | | 248,193 | | | 139,323 | | | | |
| 1,000,000 | | SCAGO EDL FACS CORP FOR | | 12/1/2026 | | 5.000 | | | 1,041,451 | | | 1,036,010 | | | | |
| 500,000 | | SCOTTSDALE ARIZ INDL DEV AUTH | | 9/1/2030 | | 5.250 | | | 483,437 | | | 464,250 | | | | |
| 200,000 | | SEMINOLE TRIBE FLA SPL OBLIG | | 10/1/2022 | | 5.750 | | | 206,296 | | | 193,836 | | | | |
| 500,000 | | SEMINOLE TRIBE FLA SPL OBLIG | | 10/1/2024 | | 5.500 | | | 505,649 | | | 468,270 | | | | |
| 250,000 | | SENECA NATION INDIANS CAP | | 12/1/2023 | | 5.000 | | | 248,749 | | | 206,500 | | | | |
| 625,000 | | SHELBY CNTY TENN HEALTH EDL + (b) | | 1/1/2029 | | 5.550 | | | 556,863 | | | 63,156 | | | | |
| 150,000 | | SHELBY CNTY TENN HEALTH EDL + (b) | | 1/1/2019 | | 5.350 | | | 134,966 | | | 15,372 | | | | |
| 750,000 | | SHELBY CNTY TENN HEALTH EDL + | | 9/1/2016 | | 5.250 | | | 745,819 | | | 719,400 | | | | |
| 350,000 | | SHELBY CNTY TENN HEALTH EDL + | | 9/1/2011 | | 4.900 | | | 350,000 | | | 355,012 | | | | |
| 1,000,000 | | SKOWHEGAN ME POLLUTN CTL REV | | 11/1/2013 | | 5.900 | | | 1,000,000 | | | 1,004,390 | | | | |
| 1,250,000 | | SMYRNA TENN HSG ASSN INC MULTI | | 10/20/2035 | | 6.450 | | | 1,254,906 | | | 1,301,163 | | | | |
| 550,000 | | SNOHOMISH CNTY WASH HSG AUTH H | | 4/1/2026 | | 6.400 | | | 550,000 | | | 551,777 | | | | |
| 500,000 | | SOUTH BAYSIDE WASTE MGMT AUTH | | 9/1/2029 | | 6.250 | | | 518,706 | | | 538,660 | | | | |
| 250,000 | | SOUTH CAROLINA HSG FIN + DEV A | | 7/1/2032 | | 5.500 | | | 250,000 | | | 258,160 | | | | |
| 475,000 | | SOUTH CAROLINA JOBS ECONOMIC D | | 4/1/2024 | | 5.000 | | | 485,707 | | | 470,193 | | | | |
| 500,000 | | SOUTH CAROLINA JOBS ECONOMIC D | | 11/15/2027 | | 6.000 | | | 503,865 | | | 392,225 | | | | |
| 750,000 | | SOUTH CAROLINA JOBS ECONOMIC D | | 11/15/2042 | | 5.150 | | | 750,000 | | | 712,530 | | | | |
| 695,000 | | SOUTH CAROLINA JOBS-ECONOMIC | | 11/1/2010 | | 4.650 | | | 695,000 | | | 694,868 | | | | |
| 750,000 | | SOUTH CAROLINA JOBS-ECONOMIC | | 5/1/2011 | | 5.000 | | | 750,000 | | | 761,265 | | | | |
| 1,000,000 | | SOUTH CAROLINA JOBS-ECONOMIC | | 4/1/2030 | | 6.000 | | | 969,154 | | | 973,630 | | | | |
| 650,000 | | SOUTH CAROLINA ST ED ASSISTANC | | 10/1/2029 | | 5.100 | | | 642,003 | | | 655,915 | | | | |
| 1,000,000 | | SOUTH COAST CONSERVANCY DIST I | | 1/1/2028 | | 5.250 | | | 994,172 | | | 1,048,890 | | | | |
| 400,000 | | SOUTH INDIAN RIV WTR CTL DIST | | 8/1/2031 | | 4.625 | | | 371,775 | | | 347,740 | | | | |
| 170,000 | | SOUTH LAKE CNTY HOSP DIST FLA | | 10/1/2022 | | 6.000 | | | 171,276 | | | 171,720 | | | | |
| 300,000 | | SOUTHERN MINN MUN PWR AGY PWR | | 1/1/2013 | | 4.205 | | | 300,000 | | | 281,277 | | | | |
| 250,000 | | SOUTHWESTERN ILL DEV AUTH REV | | 8/15/2015 | | 5.375 | | | 256,488 | | | 252,615 | | | | |
| 1,500,000 | | SOUTHWESTERN ILL DEV AUTH REV | | 8/15/2029 | | 5.625 | | | 1,538,803 | | | 1,450,620 | | | | |
| 240,000 | | SOUTHWESTERN ILL DEV AUTH REV | | 11/1/2026 | | 5.625 | | | 238,368 | | | 169,610 | | | | |
| 690,000 | | SOUTHWESTERN ILL DEV AUTH REV | | 10/1/2022 | | 7.000 | | | 690,000 | | | 639,506 | | | | |
| 750,000 | | SPARKS NEV REDEV AGY TAX | | 6/1/2020 | | 6.400 | | | 719,215 | | | 696,645 | | | | |
| 1,000,000 | | SPARKS NEV REDEV AGY TAX | | 6/1/2020 | | 7.250 | | | 989,223 | | | 988,790 | | | | |
| 500,000 | | SPARKS NEV TOURISM IMPT DIST | | 6/15/2020 | | 6.500 | | | 483,453 | | | 457,755 | | | | |
| 294,000 | | ST BERNARD PARISH LA HOME MTG | | 3/1/2039 | | 5.800 | | | 288,206 | | | 302,485 | | | | |
| 1,025,000 | | ST JOHN BAPTIST PARISH LA REV | | 6/1/2037 | | 5.125 | | | 1,025,000 | | | 927,676 | | | | |
| 250,000 | | ST JOHNS CNTY FLA INDL DEV AUT | | 8/1/2034 | | 5.625 | | | 241,119 | | | 221,365 | | | | |
| 500,000 | | ST JOHNS CNTY FLA INDL DEV AUT | | 1/1/2016 | | 5.000 | | | 466,718 | | | 453,965 | | | | |
| 215,000 | | ST JOHNS CNTY FLA INDL DEV AUT | | 10/1/2017 | | 5.000 | | | 215,000 | | | 193,040 | | | | |
| 500,000 | | ST JOSEPH CNTY IND ECONOMIC DE | | 5/15/2038 | | 6.000 | | | 366,779 | | | 411,830 | | | | |
| 460,000 | | ST JOSEPH CNTY IND ECONOMIC DE | | 5/15/2026 | | 6.000 | | | 332,035 | | | 407,367 | | | | |
| 400,000 | | ST JOSEPH CNTY IND ECONOMIC DE | | 5/15/2014 | | 5.750 | | | 406,918 | | | 402,500 | | | | |
| 500,000 | | ST JOSEPH CNTY IND HOSP AUTH | | 2/15/2028 | | 5.250 | | | 508,946 | | | 413,565 | | | | |
| | |
See accompanying notes to financial statements. | 59 | (Continued) |
|
CLEARWATER INVESTMENT TRUST |
Schedule of Investments - Clearwater Tax-Exempt Bond Fund |
December 31, 2009 |
| | | | | | | | | | | | | | | | | |
Par/Shares | | Security | | Maturity
date | | Coupon
rate | | Cost | | Fair
Value (a) | | Percent
of
net assets | |
| 1,000,000 | | ST JOSEPH MO INDL DEV AUTH TAX | | 11/1/2019 | | 5.100 | | $ | 988,539 | | | 910,470 | | | | |
| 500,000 | | ST JOSEPH MO INDL DEV AUTH TAX | | 11/1/2023 | | 5.375 | | | 496,349 | | | 438,755 | | | | |
| 250,000 | | ST LOUIS CNTY MO INDL DEV | | 9/1/2021 | | 5.375 | | | 254,458 | | | 238,413 | | | | |
| 250,000 | | ST LOUIS CNTY MO INDL DEV AUTH | | 11/15/2022 | | 5.000 | | | 253,179 | | | 208,198 | | | | |
| 415,000 | | ST LOUIS MO INDL DEV AUTH TAX | | 5/1/2026 | | 5.125 | | | 412,672 | | | 316,890 | | | | |
| 223,495 | | ST TAMMANY PARISH LA FIN AUTH | | 12/1/2039 | | 5.250 | | | 228,516 | | | 231,653 | | | | |
| 165,000 | | STERLING HILL CMNTY DEV DIST | | 11/1/2010 | | 5.500 | | | 164,868 | | | 154,153 | | | | |
| 500,000 | | STONEYBROOK SOUTH CMNTY DEV (b) | | 11/1/2015 | | 5.450 | | | 498,601 | | | 216,015 | | | | |
| 500,000 | | SULLIVAN CNTY TENN HEALTH EDL | | 9/1/2036 | | 5.250 | | | 516,181 | | | 420,710 | | | | |
| 345,000 | | SUMMIT ACADEMY NORTH MICH PUB | | 11/1/2011 | | 4.750 | | | 345,053 | | | 334,364 | | | | |
| 750,000 | | TARRANT CNTY TEX CULTURAL ED | | 11/15/2036 | | 6.000 | | | 772,452 | | | 653,160 | | | | |
| 1,000,000 | | TARRANT CNTY TEX CULTURAL ED | | 11/15/2026 | | 6.000 | | | 1,035,383 | | | 931,700 | | | | |
| 1,000,000 | | TARRANT CNTY TEX CULTURAL ED | | 5/15/2027 | | 5.125 | | | 706,913 | | | 901,320 | | | | |
| 250,000 | | TARRANT CNTY TEX CULTURAL ED | | 2/15/2013 | | 5.000 | | | 249,783 | | | 241,173 | | | | |
| 500,000 | | TARRANT CNTY TEX CULTURAL ED | | 11/15/2016 | | 5.250 | | | 485,941 | | | 491,770 | | | | |
| 950,000 | | TARRANT CNTY TEX CULTURAL ED | | 9/1/2023 | | 5.000 | | | 937,952 | | | 965,447 | | | | |
| 1,000,000 | | TARRANT CNTY TEX CULTURAL ED | | 11/15/2014 | | 6.500 | | | 1,000,000 | | | 1,001,120 | | | | |
| 500,000 | | TARRANT CNTY TEX CULTURAL ED | | 11/15/2019 | | 5.750 | | | 495,355 | | | 505,215 | | | | |
| 500,000 | | TARRANT CNTY TEX CULTURAL ED | | 2/15/2014 | | 6.500 | | | 500,000 | | | 500,300 | | | | |
| 1,000,000 | | TARRANT CNTY TEX CULTURAL ED | | 2/15/2016 | | 7.250 | | | 1,000,000 | | | 1,000,740 | | | | |
| 1,000,000 | | TENNESSEE HSG DEV AGY | | 7/1/2038 | | 5.450 | | | 1,000,000 | | | 1,025,980 | | | | |
| 330,000 | | TENNESSEE HSG DEV AGY | | 7/1/2031 | | 4.500 | | | 330,000 | | | 342,055 | | | | |
| 215,000 | | TENNESSEE HSG DEV AGY MTG FIN | | 7/1/2023 | | 5.200 | | | 216,780 | | | 219,580 | | | | |
| 795,000 | | TERREBONNE PARISH LA | | 3/1/2024 | | 5.875 | | | 801,925 | | | 908,733 | | | | |
| 185,000 | | TEXAS MUN GAS ACQUISITION + SU | | 12/15/2026 | | 6.250 | | | 177,530 | | | 199,891 | | | | |
| 250,000 | | TEXAS MUN GAS ACQUISITION + SU | | 12/15/2026 | | 1.620 | | | 250,000 | | | 171,750 | | | | |
| 1,000,000 | | TEXAS ST DEPT HSG + CMNTY AFFA | | 7/1/2039 | | 5.450 | | | 1,000,000 | | | 1,026,460 | | | | |
| 1,000,000 | | TEXAS ST PUB FIN AUTH CHARTER | | 8/15/2030 | | 5.000 | | | 873,938 | | | 829,870 | | | | |
| 400,000 | | TEXAS ST PUB FIN AUTH CHARTER | | 9/1/2018 | | 5.500 | | | 400,000 | | | 370,772 | | | | |
| 800,000 | | TEXAS ST STUDENT HSG AUTH (b) | | 1/1/2033 | | 11.000 | | | 800,000 | | | 8 | | | | |
| 300,000 | | TOBACCO SETTLEMENT FING CORP N | | 6/1/2015 | | 5.000 | | | 307,553 | | | 303,675 | | | | |
| 425,000 | | TODD CREEK FARMS MET DIST NO 1 | | 12/1/2009 | | 4.750 | | | 425,000 | | | 212,330 | | | | |
| 750,000 | | TOLEDO-LUCAS CNTY OHIO PORT | | 12/1/2035 | | 5.375 | | | 649,010 | | | 610,455 | | | | |
| 750,000 | | TOLOMATO CMNTY DEV DIST FLA | | 5/1/2017 | | 6.375 | | | 750,000 | | | 665,348 | | | | |
| 2,000,000 | | TORRANCE CALIF UNI SCH DIST (c) | | 8/1/2023 | | 6.197 | | | 872,806 | | | 926,360 | | | | |
| 2,000,000 | | TRAVIS CNTY TEX HEALTH FACS | | 11/15/2035 | | 4.750 | | | 2,000,000 | | | 1,976,760 | | | | |
| 840,000 | | TRAVIS CNTY TEX HSG FIN CORP M (b) | | 6/1/2035 | | 9.250 | | | 840,000 | | | 326,768 | | | | |
| 1,000,000 | | TULSA OKLA TULSA INDL AUTH REV | | 10/1/2027 | | 6.000 | | | 1,029,668 | | | 1,094,760 | | | | |
| 350,000 | | TYLER TEX HEALTH FACS DEV CORP | | 11/1/2037 | | 5.375 | | | 347,625 | | | 341,824 | | | | |
| 500,000 | | ULSTER CNTY N Y INDL DEV AGY | | 9/15/2013 | | 5.100 | | | 497,487 | | | 496,600 | | | | |
| 500,000 | | ULSTER CNTY N Y INDL DEV AGY | | 9/15/2016 | | 5.250 | | | 494,424 | | | 462,440 | | | | |
| 350,000 | | UNIVERSITY CALIF REVS | | 5/15/2031 | | 5.750 | | | 361,970 | | | 396,732 | | | | |
| 240,000 | | UNIVERSITY CITY MO INDL DEV AU | | 12/20/2030 | | 6.000 | | | 250,653 | | | 237,175 | | | | |
| 250,000 | | UNIVERSITY ILL UNIV REVS | | 4/1/2038 | | 5.750 | | | 257,948 | | | 272,228 | | | | |
| 671,000 | | UTAH ASSOCIATED MUNI POWER SYS | | 5/1/2022 | | 4.750 | | | 671,000 | | | 552,924 | | | | |
| 500,000 | | UTAH HSG CORP SINGLE FAMILY MT | | 1/1/2040 | | 5.550 | | | 500,000 | | | 512,220 | | | | |
| 600,000 | | UTAH ST CHARTER SCH FIN AUTH | | 7/15/2018 | | 6.375 | | | 600,000 | | | 583,662 | | | | |
| 390,000 | | VALLEY ALA SPL CARE FACS FING | | 11/1/2011 | | 5.450 | | | 393,651 | | | 386,900 | | | | |
| 1,015,000 | | VERANO CTR CMNTY DEV DIST FLA | | 11/1/2012 | | 5.000 | | | 1,015,000 | | | 623,728 | | | | |
| 1,500,000 | | VERMONT EDL + HEALTH BLDGS FIN | | 12/1/2027 | | 6.125 | | | 1,502,610 | | | 1,506,750 | | | | |
| 500,000 | | VERMONT EDL + HEALTH BLDGS FIN | | 1/1/2023 | | 5.375 | | | 455,221 | | | 487,460 | | | | |
| 215,000 | | VERRADO CMNTY FACS DIST NO 1 | | 7/15/2013 | | 6.000 | | | 215,000 | | | 220,420 | | | | |
| 300,000 | | VIGO CNTY IND HOSP AUTH REV | | 9/1/2027 | | 5.500 | | | 296,971 | | | 253,671 | | | | |
| 1,500,000 | | VIRGINIA ST HSG AUTH DEV AUTH | | 12/1/2039 | | 5.000 | | | 1,500,000 | | | 1,504,410 | | | | |
| 750,000 | | VIRGINIA ST HSG DEV AUTH | | 7/1/2025 | | 6.000 | | | 750,000 | | | 816,030 | | | | |
| 500,000 | | VIRGINIA ST HSG DEV AUTH COMWL | | 7/1/2031 | | 5.350 | | | 502,836 | | | 505,015 | | | | |
| 2,000,000 | | VIRGINIA ST HSG DEV AUTH COMWL | | 7/1/2036 | | 5.375 | | | 2,091,358 | | | 2,016,160 | | | | |
| | |
See accompanying notes to financial statements. | 60 | (Continued) |
|
CLEARWATER INVESTMENT TRUST |
Schedule of Investments - Clearwater Tax-Exempt Bond Fund
December 31, 2009 |
| | | | | | | | | | | | | | | | | |
Par/Shares | | Security | | Maturity
date | | Coupon
rate | | Cost | | Fair
Value (a) | | Percent
of
net assets | |
| 250,000 | | WALKER FIELD COLO PUB ARPT AUT | | 12/1/2027 | | 4.750 | | $ | 228,506 | | | 226,148 | | | | |
| 500,000 | | WASHINGTON CNTY VA INDL DEV AU | | 7/1/2019 | | 7.250 | | | 493,200 | | | 598,070 | | | | |
| 500,000 | | WASHINGTON ST HEALTH CARE FACS | | 8/1/2028 | | 6.250 | | | 516,723 | | | 533,455 | | | | |
| 500,000 | | WASHINGTON ST HEALTH CARE FACS | | 3/1/2024 | | 6.500 | | | 477,726 | | | 538,560 | | | | |
| 1,000,000 | | WASHINGTON ST HEALTH CARE FACS | | 3/1/2029 | | 7.125 | | | 974,473 | | | 1,111,110 | | | | |
| 470,000 | | WASHINGTON ST HEALTH CARE FACS | | 2/15/2027 | | 5.000 | | | 386,750 | | | 437,213 | | | | |
| 1,000,000 | | WASHINGTON ST HSG FIN COMMN | | 12/1/2033 | | 5.450 | | | 1,000,000 | | | 1,050,890 | | | | |
| 650,000 | | WASHINGTON ST HSG FIN COMMN NO | | 1/1/2013 | | 5.100 | | | 650,000 | | | 634,465 | | | | |
| 1,150,000 | | WASHINGTON ST HSG FIN COMMN NO | | 1/1/2017 | | 5.250 | | | 1,146,600 | | | 997,177 | | | | |
| 435,000 | | WATERS EDGE CMNTY DEV DIST FLA | | 11/1/2012 | | 5.000 | | | 435,046 | | | 245,906 | | | | |
| 500,000 | | WATERSET NORTH CMNTY DEV DIST (b) | | 11/1/2015 | | 6.550 | | | 498,780 | | | 309,385 | | | | |
| 750,000 | | WEATHERFORD HOSP AUTH OKLA REV | | 5/1/2016 | | 6.000 | | | 764,021 | | | 716,490 | | | | |
| 1,000,000 | | WEST CAMPUS HSG LLC ARIZ STUDE | | 7/1/2025 | | 5.000 | | | 872,528 | | | 933,460 | | | | |
| 240,000 | | WEST VLGS IMPT DIST FLA REV (b) | | 5/1/2037 | | 5.500 | | | 240,000 | | | 115,742 | | | | |
| 665,000 | | WESTERN GENERATION AGY ORE | | 1/1/2021 | | 5.000 | | | 670,519 | | | 603,527 | | | | |
| 200,000 | | WESTPARK CMNTY FACS DIST AZ | | 7/15/2016 | | 4.900 | | | 200,000 | | | 184,712 | | | | |
| 500,000 | | WHITEHOUSE TEX INDPT SCH DIST (c) | | 2/15/2025 | | 4.650 | | | 249,558 | | | 248,475 | | | | |
| 255,000 | | WILL CNTY ILL SPL ED JT | | 1/1/2021 | | 5.500 | | | 264,450 | | | 266,100 | | | | |
| 750,000 | | WINNEBAGO + STEPHENSON CNTYS I (c) | | 1/1/2019 | | 5.250 | | | 469,974 | | | 465,105 | | | | |
| 460,000 | | WISCONSIN HEALTH + EDL FACS | | 8/15/2016 | | 4.600 | | | 458,945 | | | 448,394 | | | | |
| 1,000,000 | | WISCONSIN HEALTH + EDL FACS | | 12/1/2034 | | 5.000 | | | 1,000,000 | | | 1,001,430 | | | | |
| 1,000,000 | | WISCONSIN ST GEN REV | | 5/1/2027 | | 6.000 | | | 1,025,066 | | | 1,144,380 | | | | |
| 1,000,000 | | WISCONSIN ST HEALTH + EDL FA | | 11/15/2025 | | 5.750 | | | 990,186 | | | 1,000,940 | | | | |
| 500,000 | | WISCONSIN ST HEALTH + EDL FACS | | 8/15/2026 | | 5.875 | | | 476,186 | | | 500,010 | | | | |
| 350,000 | | WISCONSIN ST HEALTH + EDL FACS | | 7/1/2021 | | 6.000 | | | 358,827 | | | 353,689 | | | | |
| 500,000 | | WISCONSIN ST HEALTH + EDL FACS | | 2/15/2032 | | 5.250 | | | 488,454 | | | 473,080 | | | | |
| 450,000 | | WISCONSIN ST HEALTH + EDL FACS | | 7/1/2017 | | 6.000 | | | 460,901 | | | 458,703 | | | | |
| 250,000 | | WISCONSIN ST HEALTH + EDL FACS | | 8/15/2017 | | 5.250 | | | 249,425 | | | 250,130 | | | | |
| 525,000 | | WISCONSIN ST HEALTH + EDL FACS | | 2/15/2018 | | 6.250 | | | 506,768 | | | 530,822 | | | | |
| 205,000 | | WISCONSIN ST HEALTH + EDL FACS | | 11/15/2023 | | 6.000 | | | 217,874 | | | 212,796 | | | | |
| 250,000 | | WISCONSIN ST HEALTH + EDL FACS | | 11/15/2032 | | 6.000 | | | 268,190 | | | 256,860 | | | | |
| 200,000 | | WISCONSIN ST HEALTH + EDL FACS | | 3/1/2015 | | 4.650 | | | 200,000 | | | 197,524 | | | | |
| 400,000 | | WISCONSIN ST HEALTH + EDL FACS | | 9/1/2015 | | 5.000 | | | 400,000 | | | 389,776 | | | | |
| 500,000 | | WISCONSIN ST HEALTH + EDL FACS | | 8/15/2024 | | 6.500 | | | 347,828 | | | 499,970 | | | | |
| 750,000 | | WISCONSIN ST HEALTH + EDL FACS | | 4/15/2033 | | 6.400 | | | 764,827 | | | 765,465 | | | | |
| 400,000 | | WISCONSIN ST HEALTH + EDL FACS | | 8/15/2023 | | 5.600 | | | 401,410 | | | 400,880 | | | | |
| 500,000 | | WISCONSIN ST HEALTH + EDL FACS | | 8/15/2034 | | 6.750 | | | 507,322 | | | 496,980 | | | | |
| 500,000 | | WISCONSIN ST HEALTH + EDL FACS | | 6/1/2028 | | 5.700 | | | 519,012 | | | 489,380 | | | | |
| 1,550,000 | | WISCONSIN ST HEALTH + EDL FACS | | 8/15/2023 | | 5.500 | | | 1,551,707 | | | 1,550,481 | | | | |
| 1,000,000 | | WISCONSIN ST HEALTH + EDL FACS | | 8/15/2022 | | 5.750 | | | 900,322 | | | 971,990 | | | | |
| 1,000,000 | | WISCONSIN ST HEALTH + EDL FACS | | 5/15/2029 | | 5.125 | | | 853,782 | | | 893,130 | | | | |
| 500,000 | | WISCONSIN ST HEALTH + EDL FACS | | 7/1/2026 | | 5.000 | | | 505,122 | | | 462,385 | | | | |
| 500,000 | | WISCONSIN ST HEALTH + EDL FACS | | 1/15/2025 | | 5.650 | | | 507,622 | | | 510,635 | | | | |
| 1,000,000 | | WISCONSIN ST HEALTH + EDL FACS | | 9/15/2014 | | 5.400 | | | 1,000,000 | | | 995,080 | | | | |
| 825,000 | | WOODHILL PUB FAC CORP TEX | | 12/1/2015 | | 7.250 | | | 817,158 | | | 830,693 | | | | |
| 750,000 | | WYOMING CMNTY DEV AUTH HSG REV | | 12/1/2023 | | 5.250 | | | 760,123 | | | 783,885 | | | | |
| 250,000 | | WYOMING MUN PWR AGY PWR SUPPLY | | 1/1/2028 | | 5.500 | | | 254,842 | | | 265,263 | | | | |
| 250,000 | | YUBA CITY CALIF REDEV AGY TAX | | 9/1/2027 | | 5.125 | | | 254,341 | | | 216,778 | | | | |
| | |
See accompanying notes to financial statements. | 61 | (Continued) |
|
CLEARWATER INVESTMENT TRUST |
Schedule of Investments - Clearwater Tax-Exempt Bond Fund
December 31, 2009 |
| | | | | | | | | | | | | | | | | |
Par/Shares | | Security | | Maturity
date | | Coupon
rate | | Cost | | Fair
Value (a) | | Percent
of
net assets | |
| 355,000 | | ZEPHYR RIDGE CMNTY DEV DIST (b) | | 5/1/2013 | | 5.250 | | $ | 355,475 | | | 141,933 | | | | |
| | | | | | | | | | 502,076,952 | | | 487,035,741 | | | 89.79 | % |
Other Asset Backed: | | | | | | | | | | | | | |
| 400,000 | | NORTHERN MARIANA ISLANDS | | 10/1/2022 | | 5.000 | | $ | 403,249 | | | 330,020 | | | | |
| | | | | | | | | | 403,249 | | | 330,020 | | | 0.06 | % |
Cash Equivalents: | | | | | | | | | | | | | |
| 15,798,249 | | SSGA TAX-EXEMPT MONEY MARKET FUND, Current rate 0.00% | | | | | | $ | 15,798,249 | | | 15,798,249 | | | | |
| | | | | | | | | | 15,798,249 | | | 15,798,249 | | | 2.91 | % |
| | | | | | | | | | | | | | | | | |
| | | Grand total (d) | | | | | | $ | 553,658,511 | | | 539,879,917 | | | 99.54 | % |
Notes to Schedule of Investments:
| | |
| (a) | Securities are valued in accordance with procedures described in note 2 to the December 31, 2009 financial statements. |
| (b) | Currently non-income producing assets. For long-term debt securities, item identified is in default as to payment of interest and/or principal. |
| (c) | For zero coupon bonds, the interest rate disclosed represents the annualized effective yield on the date of acquisition. |
| (d) | At December 31, 2009, the cost for Federal income tax purposes was $553,658,511. The aggregate gross unrealized appreciation and depreciation of investments in securities based on this cost were as follows: |
| | | | |
Gross unrealized appreciation | | $ | 15,052,078 | |
Gross unrealized depreciation | | | (28,830,672 | ) |
Net unrealized depreciation | | $ | (13,778,594 | ) |
| | |
| (e) | This security is being fair-valued according to procedures adopted by the Board of Trustees. |
Distribution of investments representing geographic diversification, as a percentage of total investments at fair value, is as follows:
| | | | |
Geographical Diversification | | | Percent | |
| | | | |
California | | | 9.46 | % |
Texas | | | 8.09 | |
Indiana | | | 6.39 | |
Illinois | | | 6.05 | |
Florida | | | 4.84 | |
Missouri | | | 3.38 | |
Arizona | | | 3.29 | |
Louisiana | | | 2.69 | |
Michigan | | | 2.47 | |
Pennsylvania | | | 2.28 | |
South Carolina | | | 1.85 | |
Other | | | 49.21 | |
| | | 100.00 | % |
| | |
See accompanying notes to financial statements. | 62 | (Continued) |
|
CLEARWATER INVESTMENT TRUST |
|
Schedule of Investments – Clearwater Tax-Exempt Bond Fund |
|
December 31, 2009 |
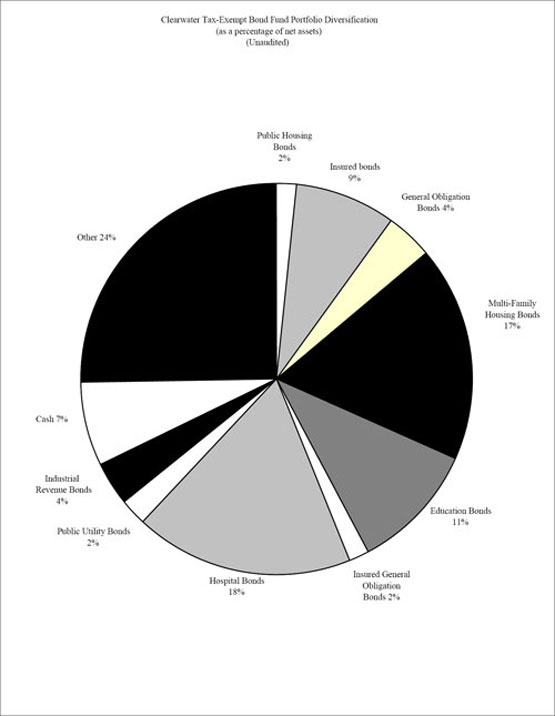
See accompanying notes to financial statements.
63
|
CLEARWATER INVESTMENT TRUST |
Schedule of Investments - Clearwater International Fund
December 31, 2009 |
| | | | | | | | | | | | | |
Shares | | Security | | Cost | | Fair
value (a) | | Percent
of
net assets | |
Common Stocks: | | | | | | | | | | |
Australia: | | | | | | | | | | |
| 6,144 | | AGL ENERGY LTD. | | $ | 60,957 | | | 77,285 | | | | |
| 51,722 | | ALUMINA LTD.(b) | | | 50,177 | | | 84,932 | | | | |
| 51,166 | | AMCOR LTD. | | | 184,011 | | | 285,046 | | | | |
| 37,706 | | AMP LTD. | | | 144,346 | | | 227,091 | | | | |
| 16,005 | | ARISTOCRAT LEISURE LTD. | | | 56,089 | | | 57,129 | | | | |
| 32,151 | | ASCIANO GROUP(b) | | | 51,907 | | | 51,907 | | | | |
| 8,612 | | ASX LTD. | | | 204,977 | | | 268,219 | | | | |
| 35,980 | | AUSTRALIA & NEW ZEALAND BANKING GROUP LTD. | | | 408,509 | | | 732,042 | | | | |
| 19,517 | | AXA ASIA PACIFIC HOLDINGS LTD. | | | 47,802 | | | 114,836 | | | | |
| 6,281 | | BENDIGO AND ADELAIDE BANK LTD. | | | 52,780 | | | 55,064 | | | | |
| 179,910 | | BGP HOLDINGS PLC -
FRACTIONAL SHARES(b) | | | - | | | - | | | | |
| 53,357 | | BHP BILLITON LTD. | | | 1,211,028 | | | 2,043,241 | | | | |
| 1,182 | | BILLABONG INTERNATIONAL LTD. | | | 7,263 | | | 11,491 | | | | |
| 14,237 | | BIOTA HOLDINGS LTD.(b) | | | 30,770 | | | 30,475 | | | | |
| 30,685 | | BLUESCOPE STEEL LTD. | | | 54,658 | | | 84,673 | | | | |
| 10,867 | | BORAL LTD. | | | 30,867 | | | 57,425 | | | | |
| 23,100 | | BRAMBLES LTD. | | | 103,155 | | | 139,936 | | | | |
| 57,933 | | CFS RETAIL PROPERTY TRUST | | | 66,005 | | | 98,116 | | | | |
| 26,098 | | COCA-COLA AMATIL LTD. | | | 157,258 | | | 268,934 | | | | |
| 971 | | COCHLEAR LTD. | | | 35,893 | | | 59,958 | | | | |
| 22,621 | | COMMONWEALTH BANK OF AUSTRALIA | | | 527,768 | | | 1,103,049 | | | | |
| 8,520 | | COMPUTERSHARE LTD. | | | 47,796 | | | 86,876 | | | | |
| 27,153 | | CROWN LTD. | | | 161,888 | | | 194,403 | | | | |
| 7,833 | | CSL LTD. | | | 178,272 | | | 227,878 | | | | |
| 41,838 | | CSR LTD. | | | 48,720 | | | 67,293 | | | | |
| 25,100 | | DAVID JONES LTD. | | | 93,275 | | | 120,773 | | | | |
| 44,394 | | DEXUS PROPERTY GROUP | | | 24,235 | | | 33,522 | | | | |
| 23,200 | | DOWNER EDI LTD. | | | 125,795 | | | 193,378 | | | | |
| 94,235 | | FAIRFAX MEDIA LTD. | | | 116,376 | | | 145,352 | | | | |
| 21,110 | | FORTESCUE METALS GROUP LTD.(b) | | | 37,574 | | | 83,136 | | | | |
| 72,738 | | FOSTER’S GROUP LTD. | | | 279,006 | | | 357,933 | | | | |
| 82,900 | | GOODMAN FIELDER LTD. | | | 114,131 | | | 120,668 | | | | |
| 93,686 | | GOODMAN GROUP | | | 48,414 | | | 52,723 | | | | |
| 179,910 | | GPT GROUP | | | 55,818 | | | 96,621 | | | | |
| 34,615 | | HARVEY NORMAN HOLDINGS LTD. | | | 79,261 | | | 129,978 | | | | |
| 19,665 | | INCITEC PIVOT LTD. | | | 31,737 | | | 62,320 | | | | |
| 75,725 | | INSURANCE AUSTRALIA GROUP LTD. | | | 198,206 | | | 271,240 | | | | |
| 7,000 | | JB HI-FI LTD. | | | 71,699 | | | 140,783 | | | | |
| 8,444 | | LEIGHTON HOLDINGS LTD. | | | 230,900 | | | 285,312 | | | | |
| 3,157 | | LEND LEASE CORP. LTD. | | | 10,919 | | | 28,768 | | | | |
| 5,587 | | MACQUARIE GROUP LTD. | | | 112,772 | | | 239,199 | | | | |
| 31,339 | | MACQUARIE INFRASTRUCTURE GROUP | | | 32,101 | | | 37,346 | | | | |
| 49,680 | | METCASH LTD. | | | 136,834 | | | 198,849 | | | | |
| 37,974 | | MIRVAC GROUP | | | 50,570 | | | 52,829 | | | | |
| 30,511 | | NATIONAL AUSTRALIA BANK LTD. | | | 465,492 | | | 742,430 | | | | |
| 7,658 | | NEWCREST MINING LTD. | | | 173,651 | | | 240,008 | | | | |
| 8,316 | | NUFARM LTD. | | | 80,753 | | | 81,245 | | | | |
| 46,887 | | ONESTEEL LTD. | | | 82,657 | | | 139,484 | | | | |
| 17,026 | | ORICA LTD. | | | 237,242 | | | 394,640 | | | | |
| 12,164 | | ORIGIN ENERGY LTD. | | | 118,319 | | | 182,616 | | | | |
| 68,197 | | OZ MINERALS LTD.(b) | | | 31,654 | | | 71,310 | | | | |
| 14,231 | | PALADIN ENERGY LTD.(b) | | | 54,196 | | | 52,814 | | | | |
| 416 | | PERPETUAL LTD. | | | 7,027 | | | 13,729 | | | | |
| 22,200 | | PRIMARY HEALTH CARE LTD. | | | 92,581 | | | 118,716 | | | | |
| 36,732 | | QANTAS AIRWAYS LTD. | | | 46,697 | | | 97,625 | | | | |
| 15,840 | | QBE INSURANCE GROUP LTD. | | | 228,176 | | | 361,541 | | | | |
| 6,931 | | RIO TINTO LTD. | | | 244,955 | | | 458,595 | | | | |
| 12,740 | | SANTOS LTD. | | | 130,070 | | | 160,421 | | | | |
| 1,300 | | SIMS METAL MANAGEMENT LTD. | | | 14,504 | | | 25,447 | | | | |
| 4,345 | | SONIC HEALTHCARE LTD. | | | 31,728 | | | 59,841 | | | | |
| 60,029 | | STOCKLAND | | | 127,913 | | | 210,953 | | | | |
| 63,773 | | SUNCORP-METWAY LTD. | | | 400,866 | | | 492,435 | | | | |
| 20,677 | | TABCORP HOLDINGS LTD. | | | 93,266 | | | 128,218 | | | | |
| 47,346 | | TATTS GROUP LTD. | | | 81,620 | | | 103,282 | | | | |
| 50,033 | | TELSTRA CORP. LTD. | | | 108,102 | | | 153,330 | | | | |
| | |
See accompanying notes to the financial statements. | 64 | |
|
CLEARWATER INVESTMENT TRUST |
Schedule of Investments - Clearwater International Fund
December 31, 2009 |
| | | | | | | | | | | | | |
Shares | | Security | | Cost | | Fair
value (a) | | Percent
of
net assets | |
Australia (Cont’d): | | | | | | | | | | |
| 18,889 | | TOLL HOLDINGS LTD. | | $ | 78,539 | | | 147,199 | | | | |
| 13,099 | | TRANSURBAN GROUP | | | 36,728 | | | 64,889 | | | | |
| 6,600 | | UGL LTD. | | | 69,426 | | | 84,040 | | | | |
| 16,997 | | WESFARMERS LTD. | | | 225,362 | | | 472,563 | | | | |
| 2,560 | | WESFARMERS LTD. - PPS | | | 32,507 | | | 71,175 | | | | |
| 35,413 | | WESTFIELD GROUP | | | 253,766 | | | 394,936 | | | | |
| 52,832 | | WESTPAC BANKING CORP. | | | 701,839 | | | 1,189,207 | | | | |
| 8,877 | | WOODSIDE PETROLEUM LTD. | | | 262,926 | | | 373,097 | | | | |
| 19,482 | | WOOLWORTHS LTD. | | | 346,571 | | | 487,988 | | | | |
| 2,623 | | WORLEYPARSONS LTD. | | | 30,535 | | | 67,948 | | | | |
| | | | | | 10,662,187 | | | 16,719,751 | | | 5.71 | % |
Austria: | | | | | | | | | | |
| 2,800 | | CONWERT IMMOBILIEN INVEST S.E.(b) | | | 36,528 | | | 34,274 | | | | |
| 3,566 | | ERSTE GROUP BANK A.G. | | | 63,769 | | | 132,180 | | | | |
| 10,758 | | OMV A.G. | | | 413,819 | | | 471,107 | | | | |
| 1,965 | | RAIFFEISEN INTERNATIONAL BANK HOLDING A.G. | | | 63,526 | | | 111,222 | | | | |
| 2,668 | | STRABAG S.E. | | | 82,131 | | | 78,655 | | | | |
| 2,648 | | TELEKOM AUSTRIA A.G. | | | 37,131 | | | 37,807 | | | | |
| 915 | | VERBUND - OESTERREICHISCHE ELEKTRIZITA-ETSWIRTSCHAFTS A.G., CLASS A | | | 30,953 | | | 38,793 | | | | |
| 2,303 | | VOESTALPINE A.G. | | | 32,585 | | | 83,978 | | | | |
| 22,080 | | WIENERBERGER A.G.(b) | | | 353,186 | | | 400,784 | | | | |
| | | | | | 1,113,628 | | | 1,388,800 | | | 0.47 | % |
Belgium: | | | | | | | | | | |
| 10,113 | | ANHEUSER-BUSCH INBEV N.V. | | | 285,546 | | | 522,476 | | | | |
| 519 | | BELGACOM S.A. | | | 15,605 | | | 18,720 | | | | |
| 329 | | COLRUYT S.A. | | | 74,892 | | | 79,325 | | | | |
| 6,304 | | DELHAIZE GROUP S.A. | | | 427,953 | | | 482,838 | | | | |
| 8,109 | | DEXIA S.A.(b) | | | 54,868 | | | 51,010 | | | | |
| 48,619 | | FORTIS(b) | | | 87,769 | | | 180,126 | | | | |
| 4,744 | | GROUPE BRUXELLES LAMBERT S.A. | | | 400,216 | | | 446,453 | | | | |
| 12,245 | | KBC GROEP N.V.(b) | | | 345,008 | | | 530,279 | | | | |
| 400 | | MOBISTAR S.A. | | | 25,537 | | | 27,354 | | | | |
| 346 | | NATIONALE A PORTEFEUILLE | | | 15,895 | | | 18,452 | | | | |
| 4,025 | | SOLVAY S.A., CLASS A | | | 345,045 | | | 433,919 | | | | |
| 2,000 | | TESSENDERLO CHEMIE N.V. | | | 64,857 | | | 65,753 | | | | |
| 7,091 | | UCB S.A. | | | 207,141 | | | 296,942 | | | | |
| 8,135 | | UMICORE S.A. | | | 147,016 | | | 270,893 | | | | |
| | | | | | 2,497,348 | | | 3,424,540 | | | 1.17 | % |
Brazil: | | | | | | | | | | |
| 20,180 | | ALL AMERICA LATINA LOGISTICA S.A. | | | 148,332 | | | 188,354 | | | | |
| 22,600 | | COSAN LTD., CLASS A(b) | | | 142,408 | | | 196,620 | | | | |
| | | | | | 290,740 | | | 384,974 | | | 0.13 | % |
Canada: | | | | | | | | | | |
| 1,200 | | AGNICO-EAGLE MINES LTD. | | | 65,709 | | | 65,311 | | | | |
| 2,453 | | AGNICO-EAGLE MINES LTD. (NEW YORK EXCHANGE) | | | 133,193 | | | 132,462 | | | | |
| 4,100 | | AGRIUM, INC. | | | 203,806 | | | 256,468 | | | | |
| 10,032 | | AGRIUM, INC. (NEW YORK EXCHANGE) | | | 415,571 | | | 616,968 | | | | |
| 3,300 | | ATCO LTD., CLASS I | | | 106,845 | | | 145,684 | | | | |
| 9,325 | | BANK OF MONTREAL | | | 262,240 | | | 494,971 | | | | |
| 17,702 | | BANK OF NOVA SCOTIA | | | 459,610 | | | 827,391 | | | | |
| 16,161 | | BARRICK GOLD CORP. | | | 524,194 | | | 636,420 | | | | |
| 7,403 | | BCE, INC. | | | 151,150 | | | 204,397 | | | | |
| 2,740 | | BIOVAIL CORP. | | | 29,140 | | | 38,250 | | | | |
| 2,840 | | BOMBARDIER, INC., CLASS B | | | 12,874 | | | 13,035 | | | | |
| 11,627 | | BROOKFIELD ASSET MANAGEMENT, INC., CLASS A | | | 172,468 | | | 257,887 | | | | |
| 5,526 | | BROOKFIELD PROPERTIES CORP. | | | 35,639 | | | 66,975 | | | | |
| 5,966 | | CAE, INC. | | | 34,194 | | | 49,100 | | | | |
| 8,679 | | CAMECO CORP. | | | 149,232 | | | 279,203 | | | | |
| 6,028 | | CANADIAN IMPERIAL BANK OF COMMERCE | | | 233,781 | | | 389,529 | | | | |
| 8,847 | | CANADIAN NATIONAL RAILWAY CO. | | | 339,073 | | | 480,923 | | | | |
| 9,199 | | CANADIAN NATURAL RESOURCES LTD. | | | 384,523 | | | 661,868 | | | | |
| 2,400 | | CANADIAN PACIFIC RAILWAY LTD. | | | 108,164 | | | 130,323 | | | | |
| 3,842 | | CANADIAN PACIFIC RAILWAY LTD. (NEW YORK EXCHANGE) | | | 120,622 | | | 207,468 | | | | |
| 3,300 | | CANADIAN TIRE CORP. LTD., CLASS A | | | 160,092 | | | 181,435 | | | | |
| | |
See accompanying notes to the financial statements. | 65 | (Continued) |
|
CLEARWATER INVESTMENT TRUST |
Schedule of Investments - Clearwater International Fund |
December 31, 2009 |
| | | | | | | | | | | | | |
Shares | | Security | | Cost | | Fair
value (a) | | Percent
of
net assets | |
Canada (Cont’d): | | | | | | | | | | |
| 11,700 | | CELESTICA, INC.(b) | | $ | 92,195 | | | 111,425 | | | | |
| 12,895 | | CENOVUS ENERGY, INC. | | | 254,999 | | | 324,954 | | | | |
| 10,919 | | CGI GROUP, INC., CLASS A (NEW YORK EXCHANGE)(b) | | | 90,696 | | | 148,062 | | | | |
| 2,000 | | COGECO CABLE, INC. | | | 61,878 | | | 66,933 | | | | |
| 400 | | CRESCENT POINT ENERGY CORP. | | | 12,990 | | | 15,104 | | | | |
| 1,861 | | CRESCENT POINT ENERGY CORP. (OTC EXCHANGE) | | | 38,774 | | | 69,955 | | | | |
| 200 | | ELDORADO GOLD CORP.(b) | | | 2,158 | | | 2,853 | | | | |
| 5,137 | | ELDORADO GOLD CORP. (NYSE)(b) | | | 44,130 | | | 72,791 | | | | |
| 6,935 | | ENBRIDGE, INC. (NEW YORK EXCHANGE) | | | 213,474 | | | 320,536 | | | | |
| 14,993 | | ENCANA CORP. | | | 352,865 | | | 485,623 | | | | |
| 6,047 | | ENERPLUS RESOURCES FUND | | | 113,667 | | | 138,839 | | | | |
| 600 | | FAIRFAX FINANCIAL HOLDINGS LTD. | | | 212,775 | | | 235,220 | | | | |
| 225 | | FAIRFAX FINANCIAL HOLDINGS LTD. (NEW YORK EXCHANGE) | | | 56,130 | | | 87,741 | | | | |
| 100 | | FINNING INTERNATIONAL, INC. | | | 1,588 | | | 1,595 | | | | |
| 2,500 | | FIRST QUANTUM MINERALS LTD. | | | 158,804 | | | 191,857 | | | | |
| 2,400 | | GEORGE WESTON LTD. | | | 120,933 | | | 153,570 | | | | |
| 3,052 | | GILDAN ACTIVEWEAR, INC.(b) | | | 33,435 | | | 74,408 | | | | |
| 14,001 | | GOLDCORP, INC. | | | 447,524 | | | 550,799 | | | | |
| 2,600 | | HUDBAY MINERALS, INC.(b) | | | 21,377 | | | 33,736 | | | | |
| 12,100 | | IAMGOLD CORP. | | | 128,001 | | | 191,017 | | | | |
| 4,138 | | IAMGOLD CORP. (NEW YORK EXCHANGE) | | | 29,152 | | | 64,718 | | | | |
| 6,421 | | IMPERIAL OIL LTD. | | | 227,021 | | | 248,236 | | | | |
| 2,710 | | INMET MINING CORP. | | | 151,525 | | | 165,270 | | | | |
| 3,879 | | IVANHOE MINES LTD.(b) | | | 23,410 | | | 56,672 | | | | |
| 5,500 | | KINROSS GOLD CORP. | | | 103,672 | | | 101,867 | | | | |
| 11,663 | | KINROSS GOLD CORP. (NEW YORK EXCHANGE) | | | 193,100 | | | 214,599 | | | | |
| 800 | | LAURENTIAN BANK OF CANADA | | | 32,794 | | | 32,701 | | | | |
| 4,000 | | MAGNA INTERNATIONAL, INC., CLASS A | | | 203,182 | | | 203,704 | | | | |
| 3,269 | | MAGNA INTERNATIONAL, INC., CLASS A (NEW YORK EXCHANGE) | | | 86,809 | | | 165,346 | | | | |
| 29,897 | | MANULIFE FINANCIAL CORP. | | | 417,759 | | | 548,311 | | | | |
| 6,100 | | MAPLE LEAF FOODS, INC. | | | 42,197 | | | 68,068 | | | | |
| 20,478 | | MDS, INC.(b) | | | 131,142 | | | 160,365 | | | | |
| 3,469 | | METHANEX CORP. | | | 31,828 | | | 67,611 | | | | |
| 4,400 | | NATIONAL BANK OF CANADA | | | 172,738 | | | 253,441 | | | | |
| 400 | | NEW GOLD, INC.(b) | | | 1,728 | | | 1,453 | | | | |
| 5,400 | | NEXEN, INC. | | | 127,812 | | | 130,220 | | | | |
| 11,014 | | NEXEN, INC. (NEW YORK EXCHANGE) | | | 198,615 | | | 263,565 | | | | |
| 11,800 | | NORTHGATE MINERALS CORP.(b) | | | 39,374 | | | 36,557 | | | | |
| 1,560 | | OPEN TEXT CORP.(b) | | | 48,602 | | | 63,414 | | | | |
| 2,253 | | PAN AMERICAN SILVER CORP.(b) | | | 41,183 | | | 53,644 | | | | |
| 10,621 | | PENN WEST ENERGY TRUST | | | 114,717 | | | 186,930 | | | | |
| 700 | | PETROBANK ENERGY & RESOURCES LTD.(b) | | | 28,042 | | | 34,276 | | | | |
| 4,827 | | POTASH CORP. OF SASKATCHEWAN, INC. | | | 405,561 | | | 523,730 | | | | |
| 10,641 | | PROVIDENT ENERGY TRUST | | | 38,685 | | | 71,508 | | | | |
| 2,850 | | QUADRA MINING LTD.(b) | | | 36,906 | | | 39,541 | | | | |
| 3,200 | | QUEBECOR, INC., CLASS B | | | 48,599 | | | 83,287 | | | | |
| 8,055 | | RESEARCH IN MOTION LTD.(b) | | | 378,783 | | | 544,035 | | | | |
| 2,101 | | RITCHIE BROS AUCTIONEERS, INC. | | | 37,504 | | | 47,125 | | | | |
| 10,965 | | ROGERS COMMUNICATIONS, INC., CLASS B | | | 267,397 | | | 339,915 | | | | |
| 22,638 | | ROYAL BANK OF CANADA | | | 693,739 | | | 1,212,265 | | | | |
| 600 | | SHAW COMMUNICATIONS, INC., CLASS B | | | 11,047 | | | 12,432 | | | | |
| 9,661 | | SHAW COMMUNICATIONS, INC., CLASS B (NEW YORK EXCHANGE) | | | 153,543 | | | 198,727 | | | | |
| 11,600 | | SHERRITT INTERNATIONAL CORP. | | | 74,351 | | | 72,872 | | | | |
| 800 | | SHOPPERS DRUG MART CORP. | | | 32,588 | | | 34,736 | | | | |
| 100 | | SILVER WHEATON CORP.(b) | | | 1,327 | | | 1,518 | | | | |
| 4,651 | | SILVER WHEATON CORP. (NEW YORK EXCHANGE)(b) | | | 33,510 | | | 69,858 | | | | |
| 2,800 | | SINO-FOREST CORP., CLASS A(b) | | | 39,140 | | | 51,886 | | | | |
| 200 | | SNC-LAVALIN GROUP, INC. | | | 5,085 | | | 10,325 | | | | |
| 11,589 | | SUN LIFE FINANCIAL, INC. | | | 229,193 | | | 332,836 | | | | |
| 27,764 | | SUNCOR ENERGY, INC. | | | 661,747 | | | 980,347 | | | | |
| 19,786 | | TALISMAN ENERGY, INC. | | | 227,686 | | | 368,811 | | | | |
| 10,975 | | TECK RESOURCES LTD., CLASS B(b) | | | 52,057 | | | 383,796 | | | | |
| 2,800 | | TELUS CORP. (NON VOTING) | | | 73,440 | | | 87,682 | | | | |
| 4,274 | | TELUS CORP. (NON VOTING) (NEW YORK EXCHANGE) | | | 113,886 | | | 133,135 | | | | |
| | |
See accompanying notes to the financial statements. | 66 | (Continued) |
|
CLEARWATER INVESTMENT TRUST |
Schedule of Investments - Clearwater International Fund |
December 31, 2009 |
| | | | | | | | | | | | | |
Shares | | Security | | Cost | | Fair
value (a) | | Percent
of
net assets | |
Canada (Cont’d): | | | | | | | | | | |
| 25,400 | | THOMPSON CREEK METALS CO., INC.(b) | | $ | 296,574 | | | 297,688 | | | | |
| 2,872 | | TIM HORTONS, INC. | | | 85,313 | | | 87,625 | | | | |
| 14,270 | | TORONTO-DOMINION (THE) BANK | | | 506,973 | | | 895,014 | | | | |
| 5,081 | | TRANSALTA CORP. | | | 79,391 | | | 113,154 | | | | |
| 12,940 | | TRANSCANADA CORP. | | | 339,196 | | | 444,748 | | | | |
| 3,700 | | TRANSCONTINENTAL, INC., CLASS A | | | 47,559 | | | 45,709 | | | | |
| 2,300 | | WEST FRASER TIMBER CO. LTD. | | | 56,982 | | | 72,574 | | | | |
| 17,840 | | YAMANA GOLD, INC. | | | 185,520 | | | 204,699 | | | | |
| 15,431 | | YAMANA GOLD, INC. (NEW YORK EXCHANGE) | | | 136,678 | | | 175,605 | | | | |
| | | | | | 14,356,875 | | | 20,471,237 | | | 6.99 | % |
China: | | | | | | | | | | |
| 83,000 | | FOSUN INTERNATIONAL | | | 58,863 | | | 57,548 | | | | |
| 90,000 | | GEELY AUTOMOBILE HOLDINGS LTD. | | | 22,981 | | | 48,979 | | | | |
| 6,000 | | KINGBOARD CHEMICAL HOLDINGS LTD. | | | 14,300 | | | 23,641 | | | | |
| 3,400 | | MINDRAY MEDICAL INTERNATIONAL LTD. ADR | | | 113,624 | | | 115,328 | | | | |
| | | | | | 209,768 | | | 245,496 | | | 0.08 | % |
Cyprus: | | | | | | | | | | |
| 8,127 | | BANK OF CYPRUS PUBLIC CO. LTD. | | | 51,271 | | | 56,648 | | | | |
| | | | | | 51,271 | | | 56,648 | | | 0.02 | % |
Czech Republic: | | | | | | | | | | |
| | | | | | | | | | | | | |
| 9,900 | | CENTRAL EUROPEAN MEDIA ENTERPRISES LTD.,
CLASS A(b) | | | 234,673 | | | 233,739 | | | | |
| | | | | | 234,673 | | | 233,739 | | | 0.08 | % |
Denmark: | | | | | | | | | | |
| 10 | | A.P. MOLLER - MAERSK A/S, CLASS A | | | 46,408 | | | 67,412 | | | | |
| 14 | | A.P. MOLLER - MAERSK A/S, CLASS B | | | 65,265 | | | 97,896 | | | | |
| 5,410 | | CARLSBERG A/S, CLASS B | | | 289,741 | | | 399,234 | | | | |
| 500 | | COLOPLAST A/S, CLASS B | | | 46,109 | | | 45,442 | | | | |
| 6,700 | | DANSKE BANK A/S (BEARER)(b) | | | 59,247 | | | 152,550 | | | | |
| 4,000 | | DSV A/S(b) | | | 31,768 | | | 71,760 | | | | |
| 200 | | FLSMIDTH & CO. A/S | | | 6,013 | | | 14,006 | | | | |
| 6,400 | | H. LUNDBECK A/S | | | 125,836 | | | 116,487 | | | | |
| 1,971 | | JYSKE BANK A/S (REGISTERED)(b) | | | 70,321 | | | 76,716 | | | | |
| 8,400 | | NOVO-NORDISK A/S, CLASS B | | | 408,903 | | | 537,447 | | | | |
| 500 | | NOVOZYMES A/S, CLASS B | | | 39,158 | | | 51,844 | | | | |
| 4,800 | | SYDBANK A/S(b) | | | 100,836 | | | 123,635 | | | | |
| 325 | | TOPDANMARK A/S(b) | | | 33,362 | | | 44,005 | | | | |
| 900 | | TRYGVESTA A/S | | | 49,560 | | | 59,409 | | | | |
| 2,700 | | VESTAS WIND SYSTEMS A/S(b) | | | 119,280 | | | 165,203 | | | | |
| | | | | | 1,491,807 | | | 2,023,046 | | | 0.69 | % |
Finland: | | | | | | | | | | |
| 3,422 | | CITYCON OYJ | | | 15,339 | | | 14,418 | | | | |
| 1,805 | | ELISA OYJ | | | 24,004 | | | 41,236 | | | | |
| 7,306 | | FORTUM OYJ | | | 150,746 | | | 197,926 | | | | |
| 6,000 | | HUHTAMAKI OYJ | | | 58,689 | | | 83,457 | | | | |
| 5,400 | | KEMIRA OYJ | | | 78,926 | | | 80,132 | | | | |
| 1,396 | | KESKO OYJ, CLASS B | | | 30,705 | | | 46,044 | | | | |
| 1,628 | | KONE OYJ, CLASS B | | | 35,674 | | | 69,581 | | | | |
| 2,462 | | KONECRANES OYJ | | | 73,579 | | | 66,961 | | | | |
| 6,963 | | METSO OYJ | | | 107,876 | | | 244,812 | | | | |
| 1,251 | | NESTE OIL OYJ | | | 14,206 | | | 22,186 | | | | |
| 54,075 | | NOKIA OYJ | | | 649,882 | | | 694,203 | | | | |
| 2,240 | | NOKIAN RENKAAT OYJ | | | 31,307 | | | 54,349 | | | | |
| 2,272 | | OUTOKUMPU OYJ | | | 32,298 | | | 42,721 | | | | |
| 10,565 | | POHJOLA BANK PLC | | | 85,425 | | | 114,329 | | | | |
| 1,988 | | RAUTARUUKKI OYJ | | | 39,419 | | | 45,645 | | | | |
| 9,039 | | SAMPO OYJ, CLASS A | | | 136,245 | | | 219,372 | | | | |
| 3,280 | | SANOMA OYJ | | | 66,330 | | | 73,606 | | | | |
| 15,829 | | STORA ENSO OYJ, CLASS R(b) | | | 79,306 | | | 110,952 | | | | |
| 38,934 | | UPM-KYMMENE OYJ | | | 401,499 | | | 463,036 | | | | |
| 317 | | WARTSILA OYJ | | | 7,248 | | | 12,672 | | | | |
| | | | | | 2,118,703 | | | 2,697,638 | | | 0.92 | % |
France: | | | | | | | | | | |
| 1,275 | | ACCOR S.A. | | | 45,335 | | | 69,263 | | | | |
| | |
See accompanying notes to the financial statements. | 67 | (Continued) |
|
CLEARWATER INVESTMENT TRUST |
Schedule of Investments - Clearwater International Fund |
December 31, 2009 |
| | | | | | | | | | | | | |
Shares | | Security | | Cost | | Fair
value (a) | | Percent
of
net assets | |
France (Cont’d): | | | | | | | | | | |
| 551 | | AEROPORTS DE PARIS | | $ | 28,858 | | | 44,321 | | | | |
| 4,557 | | AIR FRANCE-KLM(b) | | | 56,714 | | | 71,051 | | | | |
| 3,942 | | AIR LIQUIDE S.A. | | | 332,322 | | | 465,325 | | | | |
| 38,015 | | ALCATEL-LUCENT(b) | | | 63,037 | | | 127,318 | | | | |
| 3,194 | | ALSTOM S.A. | | | 178,537 | | | 221,913 | | | | |
| 4,400 | | ARKEMA S.A. | | | 124,681 | | | 161,674 | | | | |
| 4,208 | | ATOS ORIGIN S.A.(b) | | | 175,785 | | | 191,594 | | | | |
| 39,310 | | AXA S.A. | | | 618,293 | | | 929,686 | | | | |
| 14,810 | | BNP PARIBAS | | | 701,455 | | | 1,168,705 | | | | |
| 3,237 | | BOUYGUES S.A. | | | 115,573 | | | 168,814 | | | | |
| 735 | | BUREAU VERITAS S.A. | | | 29,322 | | | 38,073 | | | | |
| 9,662 | | CAP GEMINI S.A. | | | 447,200 | | | 437,643 | | | | |
| 9,700 | | CARREFOUR S.A. | | | 357,241 | | | 466,368 | | | | |
| 538 | | CASINO GUICHARD PERRACHON S.A. | | | 35,576 | | | 48,215 | | | | |
| 648 | | CHRISTIAN DIOR S.A. | | | 36,000 | | | 66,602 | | | | |
| 5,031 | | CIE DE SAINT-GOBAIN | | | 154,127 | | | 270,051 | | | | |
| 3,619 | | CIE GENERALE DE GEOPHYSIQUE-VERITAS(b) | | | 61,263 | | | 77,188 | | | | |
| 3,462 | | CIE GENERALE D’OPTIQUE ESSILOR INTERNATIONAL S.A. | | | 134,447 | | | 206,105 | | | | |
| 1,684 | | CNP ASSURANCES | | | 109,875 | | | 163,041 | | | | |
| 2,031 | | COMPAGNIE GENERALE DES ESTABLISSEMENTS MICHELIN, CLASS B | | | 81,301 | | | 155,788 | | | | |
| 20,881 | | CREDIT AGRICOLE S.A. | | | 316,227 | | | 364,030 | | | | |
| 6,932 | | DANONE S.A. | | | 319,849 | | | 422,152 | | | | |
| 812 | | DASSAULT SYSTEMES S.A. | | | 31,121 | | | 46,218 | | | | |
| 2,824 | | EDF S.A. | | | 110,257 | | | 168,042 | | | | |
| 614 | | EIFFAGE S.A. | | | 30,643 | | | 34,690 | | | | |
| 193 | | ERAMET | | | 51,818 | | | 60,103 | | | | |
| 486 | | EURAZEO | | | 9,917 | | | 33,914 | | | | |
| 3,941 | | EUTELSAT COMMUNICATIONS | | | 93,691 | | | 126,441 | | | | |
| 742 | | FONCIERE DES REGIONS | | | 75,390 | | | 75,883 | | | | |
| 45,252 | | FRANCE TELECOM S.A. | | | 1,037,303 | | | 1,129,819 | | | | |
| 20,995 | | GDF SUEZ | | | 732,731 | | | 910,837 | | | | |
| 800 | | GECINA S.A. | | | 91,225 | | | 86,589 | | | | |
| 15,541 | | GEMALTO N.V.(b) | | | 561,204 | | | 668,830 | | | | |
| 648 | | HERMES INTERNATIONAL | | | 64,251 | | | 86,194 | | | | |
| 304 | | ILIAD S.A. | | | 29,549 | | | 36,216 | | | | |
| 900 | | IMERYS S.A. | | | 46,092 | | | 53,528 | | | | |
| 2,335 | | KLEPIERRE | | | 57,367 | | | 94,986 | | | | |
| 3,031 | | LAFARGE S.A. | | | 151,025 | | | 249,257 | | | | |
| 5,112 | | LAGARDERE S.C.A. | | | 204,311 | | | 206,272 | | | | |
| 11,054 | | LEGRAND S.A. | | | 273,831 | | | 308,237 | | | | |
| 3,065 | | L’OREAL S.A. | | | 209,621 | | | 340,290 | | | | |
| 3,492 | | LVMH MOET HENNESSY LOUIS VUITTON S.A. | | | 231,949 | | | 392,087 | | | | |
| 24,670 | | NATIXIS(b) | | | 41,439 | | | 122,807 | | | | |
| 991 | | NEOPOST S.A. | | | 83,847 | | | 81,877 | | | | |
| 1,800 | | NEXANS S.A. | | | 137,750 | | | 142,074 | | | | |
| 2,400 | | NEXITY | | | 51,711 | | | 87,542 | | | | |
| 2,322 | | PERNOD-RICARD S.A. | | | 127,714 | | | 199,308 | | | | |
| 10,844 | | PEUGEOT S.A.(b) | | | 310,495 | | | 363,280 | | | | |
| 1,531 | | PPR | | | 112,344 | | | 183,457 | | | | |
| 42,571 | | PUBLICIS GROUPE | | | 1,350,444 | | | 1,726,963 | | | | |
| 3,682 | | RENAULT S.A.(b) | | | 98,990 | | | 187,490 | | | | |
| 4,202 | | SAFRAN S.A. | | | 40,399 | | | 81,747 | | | | |
| 22,914 | | SANOFI-AVENTIS S.A. | | | 1,331,959 | | | 1,796,144 | | | | |
| 2,772 | | SCHNEIDER ELECTRIC S.A. | | | 184,092 | | | 321,140 | | | | |
| 4,213 | | SCOR S.E. | | | 96,983 | | | 105,232 | | | | |
| 3,311 | | SES S.A. | | | 62,443 | | | 74,243 | | | | |
| 13,340 | | SOCIETE GENERALE | | | 696,349 | | | 923,023 | | | | |
| 71,113 | | SOCIETE TELEVISION FRANCAISE 1 | | | 804,719 | | | 1,313,231 | | | | |
| 26,179 | | SODEXO | | | 1,416,550 | | | 1,495,210 | | | | |
| 3,762 | | SUEZ ENVIRONNEMENT CO. | | | 55,709 | | | 86,908 | | | | |
| 2,104 | | TECHNIP S.A. | | | 91,352 | | | 147,434 | | | | |
| 3,278 | | TELEPERFORMANCE | | | 103,005 | | | 105,837 | | | | |
| 2,172 | | THALES S.A. | | | 86,735 | | | 111,305 | | | | |
| 69,011 | | TOTAL S.A. | | | 3,705,203 | | | 4,422,309 | | | | |
| 1,022 | | UNIBAIL-RODAMCO S.E. | | | 139,734 | | | 224,980 | | | | |
| 5,400 | | VALEO S.A.(b) | | | 137,678 | | | 187,760 | | | | |
| | |
See accompanying notes to the financial statements. | 68 | (Continued) |
|
CLEARWATER INVESTMENT TRUST |
Schedule of Investments - Clearwater International Fund |
December 31, 2009 |
| | | | | | | | | | | | | |
Shares | | Security | | Cost | | Fair
value (a) | | Percent
of
net assets | |
France (Cont’d): | | | | | | | | | | |
| 736 | | VALLOUREC S.A. | | $ | 62,762 | | | 133,867 | | | | |
| 5,373 | | VEOLIA ENVIRONNEMENT | | | 121,010 | | | 176,674 | | | | |
| 12,029 | | VINCI S.A. | | | 525,428 | | | 673,741 | | | | |
| 16,691 | | VIVENDI S.A. | | | 444,560 | | | 492,744 | | | | |
| | | | | | 21,037,718 | | | 27,411,680 | | | 9.36 | % |
Germany: | | | | | | | | | | |
| 2,785 | | ADIDAS A.G. | | | 94,549 | | | 150,366 | | | | |
| 6,822 | | ALLIANZ S.E. (REGISTERED) | | | 583,368 | | | 849,150 | | | | |
| 13,539 | | BASF S.E. | | | 453,717 | | | 839,772 | | | | |
| 11,362 | | BAYER A.G. | | | 588,578 | | | 908,104 | | | | |
| 5,264 | | BAYERISCHE MOTOREN WERKE A.G. | | | 165,963 | | | 239,308 | | | | |
| 828 | | BEIERSDORF A.G. | | | 35,556 | | | 54,417 | | | | |
| 400 | | BILFINGER & BERGER A.G. | | | 24,232 | | | 30,762 | | | | |
| 246 | | CELESIO A.G. | | | 4,967 | | | 6,250 | | | | |
| 15,061 | | COMMERZBANK A.G.(b) | | | 101,357 | | | 126,275 | | | | |
| 14,380 | | DAIMLER A.G. (REGISTERED) | | | 446,526 | | | 768,276 | | | | |
| 10,170 | | DEUTSCHE BANK A.G. (REGISTERED) | | | 467,613 | | | 716,806 | | | | |
| 3,260 | | DEUTSCHE BOERSE A.G. | | | 193,092 | | | 271,039 | | | | |
| 3,261 | | DEUTSCHE LUFTHANSA A.G. | | | 35,709 | | | 54,747 | | | | |
| 13,453 | | DEUTSCHE POST A.G. | | | 152,569 | | | 258,851 | | | | |
| 1,670 | | DEUTSCHE POSTBANK A.G.(b) | | | 32,356 | | | 54,569 | | | | |
| 38,416 | | DEUTSCHE TELEKOM A.G. (REGISTERED) | | | 477,824 | | | 567,363 | | | | |
| 42,499 | | E.ON A.G. | | | 1,309,637 | | | 1,774,225 | | | | |
| 900 | | FREENET A.G.(b) | | | 13,396 | | | 12,103 | | | | |
| 3,418 | | FRESENIUS MEDICAL CARE A.G. & CO. KGAA | | | 133,793 | | | 180,976 | | | | |
| 2,738 | | GEA GROUP A.G. | | | 27,680 | | | 60,958 | | | | |
| 600 | | GENERALI DEUTSCHLAND HOLDING A.G. | | | 64,991 | | | 63,116 | | | | |
| 1,250 | | HANNOVER RUECKVERSICHERUNG A.G.(b) | | | 56,829 | | | 58,674 | | | | |
| 2,510 | | HEIDELBERGCEMENT A.G. | | | 150,337 | | | 172,651 | | | | |
| 5,864 | | HENKEL A.G. & CO. KGAA | | | 204,743 | | | 261,881 | | | | |
| 1,550 | | HOCHTIEF A.G. | | | 59,506 | | | 118,449 | | | | |
| 60,378 | | INFINEON TECHNOLOGIES A.G.(b) | | | 293,789 | | | 333,319 | | | | |
| 2,921 | | K+S A.G. | | | 149,718 | | | 167,908 | | | | |
| 3,000 | | LANXESS A.G. | | | 109,818 | | | 112,925 | | | | |
| 2,240 | | LINDE A.G. | | | 160,885 | | | 269,616 | | | | |
| 1,438 | | MAN S.E. | | | 62,202 | | | 111,995 | | | | |
| 1,310 | | MERCK KGAA | | | 110,683 | | | 122,443 | | | | |
| 2,503 | | METRO A.G. | | | 81,367 | | | 152,565 | | | | |
| 3,476 | | MUENCHENER RUECKVERSICHERUNGS A.G. (REGISTERED) | | | 451,147 | | | 541,860 | | | | |
| 1,400 | | RHEINMETALL A.G. | | | 88,521 | | | 89,789 | | | | |
| 11,398 | | RWE A.G. | | | 862,103 | | | 1,107,624 | | | | |
| 582 | | SALZGITTER A.G. | | | 34,934 | | | 56,890 | | | | |
| 12,974 | | SAP A.G. | | | 477,368 | | | 611,902 | | | | |
| 12,496 | | SIEMENS A.G. (REGISTERED) | | | 746,053 | | | 1,146,164 | | | | |
| 8,668 | | SUEDZUCKER A.G. | | | 179,419 | | | 179,966 | | | | |
| 6,245 | | THYSSENKRUPP A.G. | | | 125,145 | | | 235,198 | | | | |
| 19,068 | | TUI A.G.(b) | | | 168,196 | | | 159,063 | | | | |
| 845 | | VOLKSWAGEN A.G. | | | 100,947 | | | 93,473 | | | | |
| 517 | | WACKER CHEMIE A.G. | | | 55,413 | | | 90,170 | | | | |
| | | | | | 10,136,596 | | | 14,181,958 | | | 4.84 | % |
Greece: | | | | | | | | | | |
| 10,237 | | ALPHA BANK A.E.(b) | | | 72,204 | | | 118,431 | | | | |
| 14,947 | | COCA COLA HELLENIC BOTTLING CO. S.A. | | | 266,059 | | | 340,519 | | | | |
| 6,637 | | EFG EUROBANK ERGASIAS S.A.(b) | | | 60,957 | | | 73,607 | | | | |
| 2,715 | | HELLENIC TELECOMMUNICATIONS ORGANIZATION S.A. | | | 39,270 | | | 39,751 | | | | |
| 9,422 | | MARFIN INVESTMENT GROUP S.A.(b) | | | 27,970 | | | 26,798 | | | | |
| 31,179 | | NATIONAL BANK OF GREECE S.A.(b) | | | 805,283 | | | 795,031 | | | | |
| 2,600 | | OPAP S.A. | | | 67,020 | | | 56,919 | | | | |
| 7,703 | | PIRAEUS BANK S.A.(b) | | | 62,054 | | | 87,893 | | | | |
| 10,592 | | PUBLIC POWER CORP. S.A.(b) | | | 218,953 | | | 195,495 | | | | |
| | | | | | 1,619,770 | | | 1,734,444 | | | 0.59 | % |
Hong Kong: | | | | | | | | | | |
| 28,900 | | BANK OF EAST ASIA LTD. | | | 56,861 | | | 113,474 | | | | |
| 23,000 | | BELLE INTERNATIONAL HOLDINGS LTD. | | | 11,860 | | | 26,569 | | | | |
| 288,100 | | BOC HONG KONG HOLDINGS LTD. | | | 557,627 | | | 647,975 | | | | |
| | |
See accompanying notes to the financial statements. | 69 | (Continued) |
|
CLEARWATER INVESTMENT TRUST |
Schedule of Investments - Clearwater International Fund |
December 31, 2009 |
| | | | | | | | | | | | | |
Shares | | Security | | Cost | | Fair
value (a) | | Percent
of
net assets | |
Hong Kong (Cont’d): | | | | | | | | | | |
| 118,000 | | CATHAY PACIFIC AIRWAYS LTD.(b) | | $ | 168,449 | | | 218,669 | | | | |
| 20,000 | | CHEUNG KONG HOLDINGS LTD. | | | 172,258 | | | 256,484 | | | | |
| 92,000 | | CHINESE ESTATES HOLDINGS LTD. | | | 158,122 | | | 156,666 | | | | |
| 26,000 | | CLP HOLDINGS LTD. | | | 173,831 | | | 175,687 | | | | |
| 24,600 | | ESPRIT HOLDINGS LTD.(b) | | | 153,947 | | | 161,911 | | | | |
| 70,000 | | FIRST PACIFIC CO. | | | 22,580 | | | 42,422 | | | | |
| 33,000 | | FOXCONN INTERNATIONAL HOLDINGS LTD.(b) | | | 22,488 | | | 37,992 | | | | |
| 118,800 | | GENTING SINGAPORE PLC(b) | | | 60,942 | | | 108,798 | | | | |
| 130,500 | | GUOCO GROUP LTD. | | | 1,152,659 | | | 1,389,127 | | | | |
| 17,000 | | HANG LUNG GROUP LTD. | | | 50,690 | | | 84,104 | | | | |
| 30,000 | | HANG LUNG PROPERTIES LTD. | | | 64,007 | | | 117,213 | | | | |
| 11,500 | | HANG SENG BANK LTD. | | | 124,740 | | | 169,188 | | | | |
| 13,000 | | HENDERSON LAND DEVELOPMENT CO. LTD. | | | 45,544 | | | 96,868 | | | | |
| 53,600 | | HKR INTERNATIONAL LTD. | | | 10,888 | | | 22,500 | | | | |
| 91,000 | | HONG KONG & CHINA GAS CO. LTD. | | | 149,918 | | | 226,975 | | | | |
| 3,600 | | HONG KONG AIRCRAFT ENGINEERING CO. LTD. | | | 43,253 | | | 46,642 | | | | |
| 15,000 | | HONG KONG EXCHANGES AND CLEARING LTD. | | | 136,476 | | | 267,046 | | | | |
| 10,500 | | HONGKONG & SHANGHAI (THE) HOTELS | | | 9,511 | | | 15,346 | | | | |
| 10,500 | | HONGKONG ELECTRIC HOLDINGS LTD. | | | 57,773 | | | 57,054 | | | | |
| 14,000 | | HONGKONG LAND HOLDINGS LTD. | | | 53,838 | | | 68,898 | | | | |
| 400 | | HOPEWELL HIGHWAY INFRASTRUCTURE LTD. | | | 229 | | | 244 | | | | |
| 4,000 | | HOPEWELL HOLDINGS LTD. | | | 10,853 | | | 12,888 | | | | |
| 36,000 | | HUTCHISON WHAMPOA LTD. | | | 189,637 | | | 246,203 | | | | |
| 11,000 | | HYSAN DEVELOPMENT CO. LTD. | | | 26,964 | | | 31,148 | | | | |
| 60,000 | | INDUSTRIAL & COMMERCIAL BANK OF CHINA ASIA LTD. | | | 95,978 | | | 129,846 | | | | |
| 27,000 | | KERRY PROPERTIES LTD. | | | 90,767 | | | 136,336 | | | | |
| 60,000 | | LI & FUNG LTD. | | | 147,736 | | | 246,938 | | | | |
| 67,500 | | LINK REIT (THE) | | | 137,581 | | | 171,777 | | | | |
| 16,500 | | MTR CORP. | | | 38,268 | | | 56,685 | | | | |
| 100,800 | | NEW WORLD CHINA LAND LTD. | | | 56,159 | | | 38,014 | | | | |
| 128,000 | | NEW WORLD DEVELOPMENT LTD. | | | 206,069 | | | 261,252 | | | | |
| 21,000 | | NOBLE GROUP LTD. | | | 47,425 | | | 48,112 | | | | |
| 84,000 | | PACIFIC CENTURY PREMIUM DEVELOPMENTS LTD.(b) | | | 21,943 | | | 22,765 | | | | |
| 22,000 | | ROAD KING INFRASTRUCTURE LTD. | | | 7,853 | | | 17,022 | | | | |
| 22,000 | | SHANGRI-LA ASIA LTD. | | | 29,709 | | | 41,152 | | | | |
| 24,000 | | SINO LAND CO. LTD. | | | 28,396 | | | 46,335 | | | | |
| 20,000 | | SUN HUNG KAI PROPERTIES LTD. | | | 177,898 | | | 296,780 | | | | |
| 19,000 | | SWIRE PACIFIC LTD., CLASS A | | | 143,178 | | | 229,060 | | | | |
| 7,000 | | TELEVISION BROADCASTS LTD. | | | 23,754 | | | 33,590 | | | | |
| 8,000 | | VTECH HOLDINGS LTD. | | | 53,894 | | | 76,276 | | | | |
| 37,000 | | WHARF HOLDINGS LTD. | | | 94,826 | | | 211,577 | | | | |
| 72,000 | | WHEELOCK & CO. LTD. | | | 197,650 | | | 219,097 | | | | |
| 38,000 | | YUE YUEN INDUSTRIAL HOLDINGS LTD. | | | 77,204 | | | 109,753 | | | | |
| | | | | | 5,362,233 | | | 7,190,458 | | | 2.46 | % |
India: | | | | | | | | | | |
| 15,400 | | STERLITE INDUSTRIES INDIA LTD. ADR | | | 179,852 | | | 280,588 | | | | |
| | | | | | 179,852 | | | 280,588 | | | 0.10 | % |
Ireland: | | | | | | | | | | |
| 13,706 | | ACCENTURE PLC, CLASS A | | | 461,785 | | | 568,799 | | | | |
| 40,144 | | COVIDIEN PLC | | | 1,516,294 | | | 1,922,496 | | | | |
| 8,371 | | CRH PLC | | | 189,905 | | | 228,820 | | | | |
| 3,509 | | CRH PLC (DUBLIN EXCHANGE) | | | 87,097 | | | 95,050 | | | | |
| 6,400 | | DCC PLC | | | 149,159 | | | 178,731 | | | | |
| 666 | | ELAN CORP. PLC(b) | | | 5,141 | | | 4,168 | | | | |
| 5,458 | | ELAN CORP. PLC (DUBLIN EXCHANGE)(b) | | | 31,760 | | | 35,014 | | | | |
| 268,622 | | EXPERIAN PLC | | | 2,114,267 | | | 2,655,511 | | | | |
| 1,776 | | KERRY GROUP PLC, CLASS A | | | 35,054 | | | 55,892 | | | | |
| 11,192 | | SHIRE PLC | | | 130,296 | | | 218,869 | | | | |
| 2,000 | | SMURFIT KAPPA GROUP PLC(b) | | | 17,837 | | | 17,771 | | | | |
| | | | | | 4,738,595 | | | 5,981,121 | | | 2.04 | % |
Italy: | | | | | | | | | | |
| 41,159 | | A2A S.P.A. | | | 67,304 | | | 86,150 | | | | |
| 10,890 | | ACEA S.P.A. | | | 115,836 | | | 116,334 | | | | |
| 16,788 | | ASSICURAZIONI GENERALI S.P.A. | | | 262,629 | | | 450,103 | | | | |
| 4,399 | | ATLANTIA S.P.A. | | | 77,023 | | | 114,348 | | | | |
| 21,582 | | AUTOGRILL S.P.A.(b) | | | 157,490 | | | 271,440 | | | | |
| | |
See accompanying notes to the financial statements. | 70 | (Continued) |
CLEARWATER INVESTMENT TRUST
Schedule of Investments - Clearwater International Fund
December 31, 2009
| | | | | | | | | | | | | |
Shares | | Security | | Cost | | Fair
value (a) | | Percent
of
net assets | |
Italy (Cont’d): | | | | | | | | | | |
| 2,752 | | BANCA CARIGE S.P.A. | | $ | 7,205 | | | 7,324 | | | | |
| 20,519 | | BANCA MONTE DEI PASCHI DI SIENA S.P.A. | | | 32,088 | | | 35,927 | | | | |
| 16,061 | | BANCA POPOLARE DI MILANO SCARL | | | 86,045 | | | 113,937 | | | | |
| 7,997 | | BANCO POPOLARE S.C.(b) | | | 26,095 | | | 59,859 | | | | |
| 57,000 | | BENI STABILI S.P.A. | | | 48,278 | | | 46,850 | | | | |
| 2,148 | | BULGARI S.P.A. | | | 9,445 | | | 17,736 | | | | |
| 28,000 | | CIR-COMPAGNIE INDUSTRIALI RIUNITE S.P.A.(b) | | | 66,216 | | | 72,298 | | | | |
| 3,000 | | CREDITO EMILIANO S.P.A.(b) | | | 19,955 | | | 23,026 | | | | |
| 273 | | DANIELI & C OFFICINE MECCANICHE S.P.A. | | | 6,735 | | | 6,723 | | | | |
| 123,780 | | ENEL S.P.A. | | | 560,402 | | | 718,776 | | | | |
| 38,255 | | ENI S.P.A. | | | 748,863 | | | 973,932 | | | | |
| 20,667 | | FIAT S.P.A.(b) | | | 233,093 | | | 300,782 | | | | |
| 30,348 | | FINMECCANICA S.P.A. | | | 458,377 | | | 483,997 | | | | |
| 6,942 | | FONDIARIA-SAI S.P.A. | | | 114,569 | | | 109,745 | | | | |
| 49,000 | | HERA S.P.A. | | | 102,112 | | | 113,387 | | | | |
| 229,730 | | INTESA SANPAOLO S.P.A.(b) | | | 782,338 | | | 1,029,330 | | | | |
| 15,009 | | INTESA SANPAOLO S.P.A. (RNC)(b) | | | 52,629 | | | 50,126 | | | | |
| 4,000 | | ITALCEMENTI S.P.A. | | | 54,890 | | | 54,634 | | | | |
| 886 | | LOTTOMATICA S.P.A. | | | 14,246 | | | 17,752 | | | | |
| 1,095 | | LUXOTTICA GROUP S.P.A. | | | 14,342 | | | 28,366 | | | | |
| 8,238 | | MEDIASET S.P.A. | | | 35,497 | | | 67,311 | | | | |
| 14,375 | | MEDIOBANCA S.P.A.(b) | | | 131,569 | | | 170,558 | | | | |
| 41,558 | | MEDIOLANUM S.P.A. | | | 143,594 | | | 258,049 | | | | |
| 8,678 | | MILANO ASSICURAZIONI S.P.A. | | | 26,985 | | | 25,333 | | | | |
| 20,039 | | PARMALAT S.P.A. | | | 36,886 | | | 56,151 | | | | |
| 2,966 | | PRYSMIAN S.P.A. | | | 29,515 | | | 51,919 | | | | |
| 3,842 | | SAIPEM S.P.A. | | | 66,811 | | | 131,983 | | | | |
| 53,519 | | SNAM RETE GAS S.P.A. | | | 243,142 | | | 266,132 | | | | |
| 5,506 | | SOCIETA INIZIATIVE AUTOSTRADALI E SERVIZI S.P.A. | | | 27,910 | | | 51,423 | | | | |
| 158,727 | | TELECOM ITALIA S.P.A. | | | 212,786 | | | 246,174 | | | | |
| 6,028 | | TENARIS S.A. | | | 60,927 | | | 128,882 | | | | |
| 22,370 | | TERNA S.P.A. | | | 71,955 | | | 96,253 | | | | |
| 229,149 | | UNICREDIT S.P.A.(b) | | | 360,753 | | | 762,233 | | | | |
| 11,384 | | UNIONE DI BANCHE ITALIANE SCPA | | | 126,588 | | | 163,067 | | | | |
| | | | | | 5,693,123 | | | 7,778,350 | | | 2.66 | % |
Japan: | | | | | | | | | | | | |
| 2,000 | | 77 BANK (THE) LTD. | | | 10,160 | | | 10,584 | | | | |
| 3,940 | | ACOM CO. LTD. | | | 63,512 | | | 59,765 | | | | |
| 26,500 | | ADERANS HOLDINGS CO. LTD. | | | 315,561 | | | 311,126 | | | | |
| 5,200 | | ADVANTEST CORP. | | | 86,387 | | | 135,103 | | | | |
| 44,000 | | AEON CO. LTD. | | | 319,438 | | | 355,769 | | | | |
| 4,800 | | AEON CREDIT SERVICE CO. LTD. | | | 49,903 | | | 46,121 | | | | |
| 1,100 | | AEON MALL CO. LTD. | | | 23,091 | | | 21,286 | | | | |
| 12,000 | | AIOI INSURANCE CO. LTD. | | | 49,160 | | | 57,373 | | | | |
| 9,100 | | AISIN SEIKI CO. LTD. | | | 200,523 | | | 260,092 | | | | |
| 42,000 | | AJINOMOTO CO., INC. | | | 314,561 | | | 395,403 | | | | |
| 2,000 | | AMADA CO. LTD. | | | 10,582 | | | 12,412 | | | | |
| 11,800 | | ASAHI BREWERIES LTD. | | | 150,391 | | | 216,401 | | | | |
| 15,000 | | ASAHI GLASS CO. LTD. | | | 80,697 | | | 140,518 | | | | |
| 13,000 | | ASAHI KASEI CORP. | | | 46,220 | | | 64,961 | | | | |
| 7,600 | | ASTELLAS PHARMA, INC. | | | 243,758 | | | 283,090 | | | | |
| 11,000 | | BANK OF KYOTO (THE) LTD. | | | 98,298 | | | 88,770 | | | | |
| 23,000 | | BANK OF YOKOHAMA (THE) LTD. | | | 96,740 | | | 104,159 | | | | |
| 1,300 | | BENESSE HOLDINGS, INC. | | | 48,395 | | | 54,364 | | | | |
| 13,800 | | BRIDGESTONE CORP. | | | 205,726 | | | 241,836 | | | | |
| 5,700 | | BROTHER INDUSTRIES LTD. | | | 42,142 | | | 65,117 | | | | |
| 1,100 | | CANON MARKETING JAPAN, INC. | | | 15,818 | | | 16,154 | | | | |
| 29,000 | | CANON, INC. | | | 921,129 | | | 1,225,977 | | | | |
| 21,200 | | CASIO COMPUTER CO. LTD. | | | 170,465 | | | 168,550 | | | | |
| 29 | | CENTRAL JAPAN RAILWAY CO. | | | 162,730 | | | 193,454 | | | | |
| 15,000 | | CHIBA BANK (THE) LTD. | | | 81,968 | | | 89,514 | | | | |
| 13,800 | | CHUBU ELECTRIC POWER CO., INC. | | | 306,766 | | | 328,865 | | | | |
| 1,900 | | CHUGAI PHARMACEUTICAL CO. LTD. | | | 30,706 | | | 35,398 | | | | |
| 3,200 | | CHUGOKU ELECTRIC POWER (THE) CO., INC. | | | 69,825 | | | 61,026 | | | | |
| 43,000 | | CHUO MITSUI TRUST HOLDINGS, INC. | | | 152,603 | | | 143,515 | | | | |
| 7,900 | | CITIZEN HOLDINGS CO. LTD. | | | 31,581 | | | 44,946 | | | | |
| 2,000 | | COCA-COLA WEST CO. LTD. | | | 30,433 | | | 35,173 | | | | |
| | |
See accompanying notes to the financial statements. | 71 | (Continued) |
CLEARWATER INVESTMENT TRUST
Schedule of Investments - Clearwater International Fund
December 31, 2009
| | | | | | | | | | | | | |
Shares | | Security | | Cost | | Fair
value (a) | | Percent
of
net assets | |
Japan (Cont’d): | | | | | | | | | | |
| 13,000 | | COSMO OIL CO. LTD. | | $ | 41,210 | | | 27,212 | | | | |
| 84,419 | | CREDIT SAISON CO. LTD. | | | 1,052,480 | | | 945,111 | | | | |
| 31,000 | | DAI NIPPON PRINTING CO. LTD. | | | 306,775 | | | 390,876 | | | | |
| 25,000 | | DAIHATSU MOTOR CO. LTD. | | | 236,519 | | | 248,801 | | | | |
| 13,100 | | DAIICHI SANKYO CO. LTD. | | | 225,226 | | | 274,094 | | | | |
| 4,300 | | DAIKIN INDUSTRIES LTD. | | | 117,015 | | | 167,819 | | | | |
| 18,000 | | DAINIPPON SUMITOMO PHARMA CO. LTD. | | | 151,857 | | | 187,974 | | | | |
| 1,200 | | DAITO TRUST CONSTRUCTION CO. LTD. | | | 42,344 | | | 56,587 | | | | |
| 6,000 | | DAIWA HOUSE INDUSTRY CO. LTD. | | | 45,826 | | | 64,199 | | | | |
| 241,000 | | DAIWA SECURITIES GROUP, INC. | | | 1,400,753 | | | 1,208,187 | | | | |
| 4,000 | | DENKI KAGAKU KOGYO K.K. | | | 7,188 | | | 17,888 | | | | |
| 6,300 | | DENSO CORP. | | | 131,613 | | | 188,812 | | | | |
| 13,500 | | DENTSU, INC. | | | 249,927 | | | 310,687 | | | | |
| 13,000 | | DOWA HOLDINGS CO. LTD. | | | 55,385 | | | 72,151 | | | | |
| 5,400 | | EAST JAPAN RAILWAY CO. | | | 295,862 | | | 340,739 | | | | |
| 2,400 | | EISAI CO. LTD. | | | 71,075 | | | 87,976 | | | | |
| 2,100 | | ELECTRIC POWER DEVELOPMENT CO. LTD. | | | 62,041 | | | 59,550 | | | | |
| 4,500 | | ELPIDA MEMORY, INC.(b) | | | 56,436 | | | 73,402 | | | | |
| 1,800 | | FAMILYMART CO. LTD. | | | 52,590 | | | 53,049 | | | | |
| 2,600 | | FANUC LTD. | | | 182,941 | | | 241,762 | | | | |
| 700 | | FAST RETAILING CO. LTD. | | | 76,899 | | | 130,647 | | | | |
| 46,000 | | FUJI HEAVY INDUSTRIES LTD.(b) | | | 163,396 | | | 223,237 | | | | |
| 32,600 | | FUJIFILM HOLDINGS CORP. | | | 874,138 | | | 973,920 | | | | |
| 58,000 | | FUJITSU LTD. | | | 223,927 | | | 372,997 | | | | |
| 11,000 | | FUKUOKA FINANCIAL GROUP, INC. | | | 36,036 | | | 38,172 | | | | |
| 15,000 | | FURUKAWA ELECTRIC CO. LTD. | | | 48,082 | | | 62,425 | | | | |
| 5,000 | | GS YUASA CORP. | | | 36,696 | | | 36,695 | | | | |
| 6,000 | | GUNMA BANK (THE) LTD. | | | 31,571 | | | 30,466 | | | | |
| 12,000 | | HACHIJUNI BANK (THE) LTD. | | | 67,350 | | | 69,809 | | | | |
| 2,330 | | HAKUHODO DY HOLDINGS, INC. | | | 123,624 | | | 112,513 | | | | |
| 10,000 | | HANKYU HANSHIN HOLDINGS, INC. | | | 45,714 | | | 44,396 | | | | |
| 500 | | HIROSE ELECTRIC CO. LTD. | | | 48,402 | | | 52,114 | | | | |
| 7,000 | | HIROSHIMA BANK (THE) LTD. | | | 26,154 | | | 26,826 | | | | |
| 600 | | HISAMITSU PHARMACEUTICAL CO., INC. | | | 17,668 | | | 19,359 | | | | |
| 3,000 | | HITACHI CHEMICAL CO. LTD. | | | 54,135 | | | 60,389 | | | | |
| 213,000 | | HITACHI LTD.(b) | | | 635,526 | | | 652,381 | | | | |
| 25,000 | | HOKUHOKU FINANCIAL GROUP, INC. | | | 45,996 | | | 50,868 | | | | |
| 5,000 | | HOKURIKU ELECTRIC POWER CO. | | | 118,737 | | | 108,800 | | | | |
| 35,100 | | HONDA MOTOR CO. LTD. | | | 940,398 | | | 1,186,803 | | | | |
| 5,000 | | HOYA CORP. | | | 100,495 | | | 132,554 | | | | |
| 1,600 | | IBIDEN CO. LTD. | | | 37,951 | | | 56,982 | | | | |
| 300 | | IDEMITSU KOSAN CO. LTD. | | | 23,804 | | | 17,376 | | | | |
| 24,000 | | IHI CORP(b) | | | 31,334 | | | 38,043 | | | | |
| 11 | | INPEX CORP. | | | 77,116 | | | 82,560 | | | | |
| 19,800 | | ISETAN MITSUKOSHI HOLDINGS LTD. | | | 181,732 | | | 178,425 | | | | |
| 52,000 | | ISUZU MOTORS LTD.(b) | | | 110,941 | | | 97,136 | | | | |
| 2,800 | | ITO EN LTD. | | | 50,888 | | | 41,994 | | | | |
| 21,000 | | ITOCHU CORP. | | | 104,195 | | | 154,422 | | | | |
| 8,000 | | J FRONT RETAILING CO. LTD.(b) | | | 31,099 | | | 35,249 | | | | |
| 6 | | JAPAN REAL ESTATE INVESTMENT CORP. | | | 46,693 | | | 44,041 | | | | |
| 2 | | JAPAN RETAIL FUND INVESTMENT CORP. | | | 8,807 | | | 8,952 | | | | |
| 5,000 | | JAPAN STEEL WORKS (THE) LTD. | | | 47,736 | | | 62,874 | | | | |
| 61 | | JAPAN TOBACCO, INC. | | | 146,043 | | | 205,824 | | | | |
| 7,100 | | JFE HOLDINGS, INC. | | | 169,478 | | | 279,598 | | | | |
| 4,000 | | JGC CORP. | | | 53,048 | | | 73,636 | | | | |
| 7,000 | | JOYO BANK (THE) LTD. | | | 32,424 | | | 27,951 | | | | |
| 5,100 | | JS GROUP CORP. | | | 59,682 | | | 87,748 | | | | |
| 3,100 | | JSR CORP. | | | 39,530 | | | 62,840 | | | | |
| 5,000 | | JTEKT CORP. | | | 36,670 | | | 63,895 | | | | |
| 45 | | JUPITER TELECOMMUNICATIONS CO. LTD. | | | 27,159 | | | 44,582 | | | | |
| 7,000 | | KAJIMA CORP. | | | 15,004 | | | 14,051 | | | | |
| 11,000 | | KAMIGUMI CO. LTD. | | | 72,240 | | | 79,930 | | | | |
| 9,000 | | KANEKA CORP. | | | 58,676 | | | 57,097 | | | | |
| 7,500 | | KANSAI ELECTRIC POWER (THE) CO., INC. | | | 155,419 | | | 169,057 | | | | |
| 2,000 | | KANSAI PAINT CO. LTD. | | | 10,449 | | | 16,607 | | | | |
| 10,000 | | KAO CORP. | | | 208,279 | | | 233,449 | | | | |
| 35,000 | | KAWASAKI HEAVY INDUSTRIES LTD. | | | 71,135 | | | 88,226 | | | | |
| 20,000 | | KAWASAKI KISEN KAISHA LTD.(b) | | | 71,674 | | | 56,674 | | | | |
| | |
See accompanying notes to the financial statements. | 72 | (Continued) |
CLEARWATER INVESTMENT TRUST
Schedule of Investments - Clearwater International Fund
December 31, 2009
| | | | | | | | | | | | | |
Shares | | Security | | Cost | | Fair
value (a) | | Percent
of
net assets | |
Japan (Cont’d): | | | | | | | | | | | |
| 50 | | KDDI CORP. | | $ | 240,697 | | | 263,669 | | | | |
| 6,000 | | KEIHIN ELECTRIC EXPRESS RAILWAY CO. LTD. | | | 45,614 | | | 43,950 | | | | |
| 3,000 | | KEIO CORP. | | | 15,740 | | | 18,074 | | | | |
| 5,000 | | KEISEI ELECTRIC RAILWAY CO. LTD. | | | 23,110 | | | 27,324 | | | | |
| 710 | | KEYENCE CORP. | | | 131,805 | | | 146,374 | | | | |
| 6,000 | | KIKKOMAN CORP. | | | 52,867 | | | 73,301 | | | | |
| 22,000 | | KIRIN HOLDINGS CO. LTD. | | | 229,978 | | | 350,728 | | | | |
| 114,000 | | KOBE STEEL LTD.(b) | | | 204,331 | | | 206,477 | | | | |
| 15,100 | | KOMATSU LTD. | | | 187,238 | | | 314,805 | | | | |
| 3,900 | | KONAMI CORP. | | | 61,913 | | | 69,550 | | | | |
| 24,000 | | KONICA MINOLTA HOLDINGS, INC. | | | 227,037 | | | 246,147 | | | | |
| 21,000 | | KUBOTA CORP. | | | 129,773 | | | 193,113 | | | | |
| 5,500 | | KURARAY CO. LTD. | | | 46,234 | | | 64,380 | | | | |
| 4,300 | | KURITA WATER INDUSTRIES LTD. | | | 96,931 | | | 134,348 | | | | |
| 2,000 | | KYOCERA CORP. | | | 133,049 | | | 176,387 | | | | |
| 3,000 | | KYOWA HAKKO KIRIN CO. LTD. | | | 23,089 | | | 31,561 | | | | |
| 2,000 | | KYUSHU ELECTRIC POWER CO., INC. | | | 43,079 | | | 41,131 | | | | |
| 2,000 | | LAWSON, INC. | | | 82,866 | | | 88,110 | | | | |
| 2,000 | | MAKITA CORP. | | | 45,574 | | | 68,052 | | | | |
| 79,000 | | MARUBENI CORP. | | | 365,997 | | | 430,074 | | | | |
| 25,900 | | MARUI GROUP CO. LTD. | | | 161,870 | | | 158,761 | | | | |
| 121,000 | | MAZDA MOTOR CORP.(b) | | | 279,981 | | | 276,654 | | | | |
| 6,400 | | MEDIPAL HOLDINGS CORP. | | | 76,171 | | | 79,022 | | | | |
| 1,700 | | MEIJI HOLDINGS CO. LTD.(b) | | | 54,895 | | | 63,949 | | | | |
| 21,300 | | MEITEC CORP. | | | 373,573 | | | 286,973 | | | | |
| 71,000 | | MITSUBISHI CHEMICAL HOLDINGS CORP. | | | 297,720 | | | 299,199 | | | | |
| 20,500 | | MITSUBISHI CORP. | | | 285,767 | | | 509,688 | | | | |
| 32,000 | | MITSUBISHI ELECTRIC CORP.(b) | | | 148,393 | | | 236,258 | | | | |
| 18,000 | | MITSUBISHI ESTATE CO. LTD. | | | 212,941 | | | 285,506 | | | | |
| 17,000 | | MITSUBISHI GAS CHEMICAL CO., INC. | | | 75,149 | | | 85,378 | | | | |
| 57,000 | | MITSUBISHI HEAVY INDUSTRIES LTD. | | | 185,317 | | | 200,164 | | | | |
| 4,000 | | MITSUBISHI LOGISTICS CORP. | | | 45,017 | | | 46,814 | | | | |
| 54,000 | | MITSUBISHI MATERIALS CORP.(b) | | | 143,137 | | | 132,228 | | | | |
| 48,000 | | MITSUBISHI MOTORS CORP.(b) | | | 72,153 | | | 66,142 | | | | |
| 14,000 | | MITSUBISHI RAYON CO. LTD. | | | 50,572 | | | 56,015 | | | | |
| 17,000 | | MITSUBISHI TANABE PHARMA CORP. | | | 186,584 | | | 211,419 | | | | |
| 331,700 | | MITSUBISHI UFJ FINANCIAL GROUP, INC. | | | 1,688,793 | | | 1,624,066 | | | | |
| 1,290 | | MITSUBISHI UFJ LEASE & FINANCE CO. LTD. | | | 33,945 | �� | | 38,695 | | | | |
| 86,000 | | MITSUI & CO. LTD. | | | 1,030,046 | | | 1,217,512 | | | | |
| 64,000 | | MITSUI CHEMICALS, INC. | | | 213,175 | | | 164,578 | | | | |
| 35,000 | | MITSUI ENGINEERING & SHIPBUILDING CO. LTD. | | | 83,842 | | | 83,707 | | | | |
| 14,000 | | MITSUI FUDOSAN CO. LTD. | | | 160,770 | | | 235,099 | | | | |
| 3,000 | | MITSUI MINING & SMELTING CO. LTD.(b) | | | 5,391 | | | 7,764 | | | | |
| 17,000 | | MITSUI OSK LINES LTD. | | | 90,171 | | | 89,238 | | | | |
| 4,100 | | MITSUI SUMITOMO INSURANCE GROUP HOLDINGS, INC. | | | 92,149 | | | 104,056 | | | | |
| 213,500 | | MIZUHO FINANCIAL GROUP, INC. | | | 400,783 | | | 382,020 | | | | |
| 29,000 | | MIZUHO SECURITIES CO. LTD. | | | 61,853 | | | 86,802 | | | | |
| 2,500 | | MURATA MANUFACTURING CO. LTD. | | | 101,583 | | | 123,440 | | | | |
| 15,300 | | NAMCO BANDAI HOLDINGS, INC. | | | 160,210 | | | 145,578 | | | | |
| 143,000 | | NEC CORP.(b) | | | 400,041 | | | 368,352 | | | | |
| 3,000 | | NGK INSULATORS LTD. | | | 44,485 | | | 65,277 | | | | |
| 4,000 | | NGK SPARK PLUG CO. LTD. | | | 38,761 | | | 45,032 | | | | |
| 1,600 | | NIDEC CORP. | | | 75,128 | | | 147,120 | | | | |
| 6,000 | | NIKON CORP. | | | 75,728 | | | 118,336 | | | | |
| 1,300 | | NINTENDO CO. LTD. | | | 318,917 | | | 308,186 | | | | |
| 11 | | NIPPON BUILDING FUND, INC. | | | 90,970 | | | 83,337 | | | | |
| 9,000 | | NIPPON ELECTRIC GLASS CO. LTD. | | | 66,934 | | | 122,777 | | | | |
| 4,000 | | NIPPON EXPRESS CO. LTD. | | | 11,192 | | | 16,361 | | | | |
| 20,000 | | NIPPON MEAT PACKERS, INC. | | | 223,663 | | | 229,797 | | | | |
| 57,000 | | NIPPON MINING HOLDINGS, INC. | | | 300,034 | | | 244,032 | | | | |
| 36,000 | | NIPPON OIL CORP. | | | 186,393 | | | 166,673 | | | | |
| 3,100 | | NIPPON PAPER GROUP, INC. | | | 78,898 | | | 79,113 | | | | |
| 40,000 | | NIPPON SHEET GLASS CO. LTD. | | | 130,762 | | | 114,420 | | | | |
| 69,000 | | NIPPON STEEL CORP. | | | 191,872 | | | 278,962 | | | | |
| 9,300 | | NIPPON TELEGRAPH & TELEPHONE CORP. | | | 356,996 | | | 365,816 | | | | |
| 16,000 | | NIPPON YUSEN K.K. | | | 49,744 | | | 48,954 | | | | |
| 19,000 | | NIPPONKOA INSURANCE CO. LTD. | | | 112,818 | | | 107,464 | | | | |
| 17,000 | | NISHI-NIPPON CITY BANK (THE) LTD. | | | 40,901 | | | 41,528 | | | | |
| | |
See accompanying notes to the financial statements. | 73 | (Continued) |
|
CLEARWATER INVESTMENT TRUST |
Schedule of Investments - Clearwater International Fund |
December 31, 2009 |
| | | | | | | | | | | | | |
Shares | | Security | | Cost | | Fair
value (a) | | Percent
of
net assets | |
Japan (Cont’d): | | | | | | | | | | |
| 76,600 | | NISSAN MOTOR CO. LTD.(b) | | $ | 467,775 | | | 669,484 | | | | |
| 2,500 | | NISSHIN SEIFUN GROUP, INC. | | | 25,731 | | | 33,578 | | | | |
| 3,000 | | NISSHINBO HOLDINGS, INC. | | | 23,700 | | | 27,467 | | | | |
| 600 | | NITORI CO. LTD. | | | 33,819 | | | 44,645 | | | | |
| 3,200 | | NITTO DENKO CORP. | | | 77,639 | | | 114,034 | | | | |
| 55,500 | | NOMURA HOLDINGS, INC. | | | 330,624 | | | 409,011 | | | | |
| 2,700 | | NOMURA RESEARCH INSTITUTE LTD. | | | 43,930 | | | 52,885 | | | | |
| 6,000 | | NSK LTD. | | | 24,006 | | | 44,036 | | | | |
| 2,000 | | NTN CORP. | | | 5,258 | | | 8,984 | | | | |
| 92 | | NTT DATA CORP. | | | 257,128 | | | 284,108 | | | | |
| 284 | | NTT DOCOMO, INC. | | | 404,857 | | | 395,618 | | | | |
| 58 | | NTT URBAN DEVELOPMENT CORP. | | | 54,407 | | | 38,457 | | | | |
| 8,000 | | ODAKYU ELECTRIC RAILWAY CO. LTD. | | | 62,234 | | | 61,305 | | | | |
| 13,000 | | OJI PAPER CO. LTD. | | | 49,994 | | | 54,149 | | | | |
| 4,000 | | OLYMPUS CORP. | | | 61,766 | | | 128,526 | | | | |
| 18,600 | | OMRON CORP. | | | 240,757 | | | 331,806 | | | | |
| 3,500 | | ONO PHARMACEUTICAL CO. LTD. | | | 164,828 | | | 149,548 | | | | |
| 8,000 | | ONWARD HOLDINGS CO. LTD. | | | 54,094 | | | 49,251 | | | | |
| 800 | | ORIENTAL LAND CO. LTD. | | | 50,479 | | | 52,529 | | | | |
| 5,210 | | ORIX CORP. | | | 294,705 | | | 354,309 | | | | |
| 24,000 | | OSAKA GAS CO. LTD. | | | 74,241 | | | 80,859 | | | | |
| 26,900 | | PANASONIC CORP. | | | 324,687 | | | 384,686 | | | | |
| 6,000 | | PANASONIC ELECTRIC WORKS CO. LTD. | | | 41,492 | | | 72,130 | | | | |
| 153 | | RAKUTEN, INC.(b) | | | 84,827 | | | 116,295 | | | | |
| 4,500 | | RESONA HOLDINGS, INC. | | | 59,717 | | | 45,440 | | | | |
| 31,000 | | RICOH CO. LTD. | | | 386,457 | | | 437,226 | | | | |
| 1,200 | | RINNAI CORP. | | | 52,047 | | | 57,714 | | | | |
| 2,400 | | ROHM CO. LTD. | | | 139,232 | | | 155,852 | | | | |
| 17,800 | | SANKYO CO. LTD. | | | 973,932 | | | 886,691 | | | | |
| 500 | | SANTEN PHARMACEUTICAL CO. LTD. | | | 14,009 | | | 15,987 | | | | |
| 40,500 | | SAPPORO HOKUYO HOLDINGS, INC. | | | 128,847 | | | 146,512 | | | | |
| 10,000 | | SAPPORO HOLDINGS LTD. | | | 50,459 | | | 54,468 | | | | |
| 433 | | SBI HOLDINGS, INC. | | | 45,378 | | | 76,958 | | | | |
| 3,400 | | SECOM CO. LTD. | | | 133,812 | | | 160,820 | | | | |
| 8,300 | | SEGA SAMMY HOLDINGS, INC. | | | 76,320 | | | 98,921 | | | | |
| 18,000 | | SEIKO EPSON CORP. | | | 274,961 | | | 288,800 | | | | |
| 25,000 | | SEINO HOLDINGS CORP. | | | 196,920 | | | 158,348 | | | | |
| 13,000 | | SEKISUI CHEMICAL CO. LTD. | | | 66,177 | | | 80,380 | | | | |
| 9,000 | | SEKISUI HOUSE LTD. | | | 71,203 | | | 80,723 | | | | |
| 13,000 | | SEVEN & I HOLDINGS CO. LTD. | | | 286,258 | | | 263,862 | | | | |
| 4 | | SEVEN BANK LTD. | | | 9,649 | | | 7,945 | | | | |
| 20,000 | | SHARP CORP. | | | 174,731 | | | 251,663 | | | | |
| 4,200 | | SHIKOKU ELECTRIC POWER CO. | | | 116,898 | | | 108,336 | | | | |
| 4,000 | | SHIMADZU CORP. | | | 25,419 | | | 26,519 | | | | |
| 1,000 | | SHIMAMURA CO. LTD. | | | 61,206 | | | 95,130 | | | | |
| 6,600 | | SHIMANO, INC. | | | 263,681 | | | 264,158 | | | | |
| 2,000 | | SHIMIZU CORP. | | | 7,530 | | | 7,170 | | | | |
| 6,600 | | SHIN-ETSU CHEMICAL CO. LTD. | | | 318,188 | | | 372,012 | | | | |
| 23,000 | | SHINSEI BANK LTD.(b) | | | 30,028 | | | 24,926 | | | | |
| 4,000 | | SHIONOGI & CO. LTD. | | | 67,679 | | | 86,506 | | | | |
| 4,000 | | SHISEIDO CO. LTD. | | | 57,787 | | | 76,667 | | | | |
| 8,000 | | SHIZUOKA BANK (THE) LTD. | | | 74,794 | | | 69,328 | | | | |
| 21,000 | | SHOWA DENKO K.K. | | | 33,824 | | | 41,880 | | | | |
| 7,400 | | SHOWA SHELL SEKIYU K.K. | | | 69,579 | | | 60,209 | | | | |
| 600 | | SMC CORP. | | | 57,789 | | | 67,817 | | | | |
| 12,700 | | SOFTBANK CORP. | | | 185,167 | | | 296,835 | | | | |
| 21,900 | | SOJITZ CORP. | | | 34,134 | | | 41,139 | | | | |
| 19,000 | | SOMPO JAPAN INSURANCE, INC. | | | 112,829 | | | 120,913 | | | | |
| 14,200 | | SONY CORP. | | | 310,061 | | | 411,608 | | | | |
| 33 | | SONY FINANCIAL HOLDINGS, INC.(b) | | | 85,415 | | | 86,067 | | | | |
| 2,200 | | SQUARE ENIX HOLDINGS CO. LTD. | | | 51,210 | | | 46,152 | | | | |
| 2,700 | | STANLEY ELECTRIC CO. LTD. | | | 30,745 | | | 54,297 | | | | |
| 83,000 | | SUMITOMO CHEMICAL CO. LTD. | | | 380,007 | | | 362,266 | | | | |
| 17,400 | | SUMITOMO CORP. | | | 156,343 | | | 175,132 | | | | |
| 8,800 | | SUMITOMO ELECTRIC INDUSTRIES LTD. | | | 75,679 | | | 109,074 | | | | |
| 12,000 | | SUMITOMO HEAVY INDUSTRIES LTD.(b) | | | 39,379 | | | 60,566 | | | | |
| 42,000 | | SUMITOMO METAL INDUSTRIES LTD. | | | 86,872 | | | 111,975 | | | | |
| 26,000 | | SUMITOMO METAL MINING CO. LTD. | | | 368,307 | | | 383,278 | | | | |
| | |
See accompanying notes to the financial statements. | 74 | (Continued) |
|
CLEARWATER INVESTMENT TRUST |
Schedule of Investments - Clearwater International Fund |
December 31, 2009 |
| | | | | | | | | | | | | |
Shares | | Security | | Cost | | Fair
value (a) | | Percent
of
net assets | |
Japan (Cont’d): | | | | | | | | | | |
| 13,000 | | SUMITOMO MITSUI FINANCIAL GROUP, INC. | | $ | 412,074 | | | 370,625 | | | | |
| 7,000 | | SUMITOMO REALTY & DEVELOPMENT CO. LTD. | | | 81,291 | | | 131,288 | | | | |
| 19,000 | | SUMITOMO TRUST & BANKING (THE) CO. LTD. | | | 75,378 | | | 92,367 | | | | |
| 1,000 | | SURUGA BANK (THE) LTD. | | | 8,247 | | | 8,674 | | | | |
| 5,800 | | SUZUKEN CO. LTD. | | | 156,522 | | | 189,931 | | | | |
| 17,400 | | SUZUKI MOTOR CORP. | | | 397,688 | | | 427,259 | | | | |
| 1,950 | | T&D HOLDINGS, INC. | | | 46,156 | | | 39,744 | | | | |
| 11,000 | | TAISEI CORP. | | | 19,821 | | | 18,832 | | | | |
| 11,000 | | TAISHO PHARMACEUTICAL CO. LTD. | | | 208,263 | | | 188,203 | | | | |
| 2,000 | | TAIYO NIPPON SANSO CORP. | | | 11,493 | | | 21,212 | | | | |
| 31,000 | | TAKASHIMAYA CO. LTD. | | | 196,197 | | | 196,061 | | | | |
| 11,400 | | TAKEDA PHARMACEUTICAL CO. LTD. | | | 404,837 | | | 468,035 | | | | |
| 6,000 | | TDK CORP. | | | 324,325 | | | 365,859 | | | | |
| 63,000 | | TEIJIN LTD. | | | 147,752 | | | 202,496 | | | | |
| 2,600 | | TERUMO CORP. | | | 95,419 | | | 155,599 | | | | |
| 2,000 | | THK CO. LTD. | | | 29,290 | | | 35,328 | | | | |
| 19,000 | | TOBU RAILWAY CO. LTD. | | | 97,844 | | | 99,040 | | | | |
| 1,000 | | TOHO CO. LTD. | | | 13,412 | | | 16,203 | | | | |
| 6,800 | | TOHOKU ELECTRIC POWER CO., INC. | | | 143,233 | | | 134,410 | | | | |
| 11,600 | | TOKIO MARINE HOLDINGS, INC. | | | 296,326 | | | 314,864 | | | | |
| 5,000 | | TOKUYAMA CORP. | | | 31,864 | | | 27,863 | | | | |
| 11,300 | | TOKYO BROADCASTING SYSTEM HOLDINGS, INC. | | | 161,887 | | | 157,465 | | | | |
| 20,900 | | TOKYO ELECTRIC POWER (THE) CO., INC. | | | 517,637 | | | 523,872 | | | | |
| 3,200 | | TOKYO ELECTRON LTD. | | | 128,746 | | | 204,618 | | | | |
| 46,000 | | TOKYO GAS CO. LTD. | | | 160,535 | | | 183,376 | | | | |
| 11,000 | | TOKYO TATEMONO CO. LTD. | | | 57,243 | | | 41,798 | | | | |
| 14,000 | | TOKYU CORP. | | | 57,421 | | | 55,719 | | | | |
| 20,000 | | TOKYU LAND CORP. | | | 69,576 | | | 73,417 | | | | |
| 4,000 | | TONENGENERAL SEKIYU K.K. | | | 37,796 | | | 33,330 | | | | |
| 44,000 | | TOPPAN PRINTING CO. LTD. | | | 348,519 | | | 355,962 | | | | |
| 17,000 | | TORAY INDUSTRIES, INC. | | | 70,413 | | | 91,599 | | | | |
| 99,000 | | TOSHIBA CORP.(b) | | | 358,134 | | | 545,982 | | | | |
| 6,000 | | TOTO LTD. | | | 30,029 | | | 37,957 | | | | |
| 13,100 | | TOYO SEIKAN KAISHA LTD. | | | 226,725 | | | 198,225 | | | | |
| 1,000 | | TOYO SUISAN KAISHA LTD. | | | 23,262 | | | 22,922 | | | | |
| 9,200 | | TOYOTA AUTO BODY CO. LTD. | | | 172,671 | | | 173,500 | | | | |
| 4,500 | | TOYOTA INDUSTRIES CORP. | | | 109,227 | | | 133,605 | | | | |
| 56,700 | | TOYOTA MOTOR CORP. | | | 1,988,335 | | | 2,382,299 | | | | |
| 18,000 | | TOYOTA TSUSHO CORP. | | | 240,764 | | | 265,439 | | | | |
| 2,500 | | TREND MICRO, INC.(b) | | | 74,501 | | | 95,012 | | | | |
| 1,700 | | TSUMURA & CO. | | | 50,505 | | | 54,754 | | | | |
| 8,000 | | UBE INDUSTRIES LTD. | | | 13,963 | | | 21,905 | | | | |
| 700 | | UNICHARM CORP. | | | 42,705 | | | 65,532 | | | | |
| 1,000 | | USHIO, INC. | | | 14,106 | | | 16,648 | | | | |
| 130 | | USS CO. LTD. | | | 5,696 | | | 7,894 | | | | |
| 104 | | WEST JAPAN RAILWAY CO. | | | 351,579 | | | 348,119 | | | | |
| 236 | | YAHOO! JAPAN CORP. | | | 62,283 | | | 70,547 | | | | |
| 2,500 | | YAKULT HONSHA CO. LTD. | | | 42,793 | | | 75,269 | | | | |
| 1,270 | | YAMADA DENKI CO. LTD. | | | 52,100 | | | 85,343 | | | | |
| 1,000 | | YAMAGUCHI FINANCIAL GROUP, INC. | | | 8,604 | | | 9,254 | | | | |
| 5,200 | | YAMAHA CORP. | | | 59,268 | | | 61,862 | | | | |
| 18,400 | | YAMAHA MOTOR CO. LTD.(b) | | | 167,312 | | | 231,064 | | | | |
| 9,000 | | YAMATO HOLDINGS CO. LTD. | | | 96,669 | | | 124,442 | | | | |
| 13,000 | | YAMAZAKI BAKING CO. LTD. | | | 144,946 | | | 153,863 | | | | |
| | | | | | 45,498,611 | | | 51,476,561 | | | 17.57 | % |
Kazakhstan: | | | | | | | | | | |
| 6,700 | | KAZMUNAIGAS EXPLORATION PRODUCTION GDR(c) | | | 136,347 | | | 167,345 | | | | |
| | | | | | 136,347 | | | 167,345 | | | 0.06 | % |
Luxembourg: | | | | | | | | | | |
| 4,700 | | TENARIS S.A. ADR | | | 174,591 | | | 200,455 | | | | |
| | | | | | 174,591 | | | 200,455 | | | 0.07 | % |
Mexico: | | | | | | | | | | |
| 8,000 | | DESARROLLADORA HOMEX S.A.B. DE C.V. ADR(b) | | | 247,156 | | | 268,960 | | | | |
| 12,000 | | FOMENTO ECONOMICO MEXICANO S.A.B. DE C.V. ADR | | | 407,894 | | | 574,560 | | | | |
| | | | | | 655,050 | | | 843,520 | | | 0.29 | % |
| | |
See accompanying notes to the financial statements. | 75 | (Continued) |
|
CLEARWATER INVESTMENT TRUST |
Schedule of Investments - Clearwater International Fund |
December 31, 2009 |
| | | | | | | | | | | | | |
Shares | | Security | | Cost | | Fair
value (a) | | Percent
of
net assets | |
Netherlands: | | | | | | | | | | |
| 18,835 | | AEGON N.V.(b) | | $ | 80,557 | | | 120,032 | | | | |
| 7,474 | | AKZO NOBEL N.V. | | | 362,401 | | | 492,629 | | | | |
| 13,648 | | ARCELORMITTAL | | | 291,140 | | | 619,001 | | | | |
| 7,500 | | ARCELORMITTAL ADR | | | 298,751 | | | 343,125 | | | | |
| 5,963 | | ASML HOLDING N.V. | | | 107,018 | | | 202,818 | | | | |
| 1,079 | | CORIO N.V. | | | 43,024 | | | 73,693 | | | | |
| 1,000 | | CSM | | | 26,748 | | | 26,334 | | | | |
| 6,423 | | EUROPEAN AERONAUTIC DEFENCE & SPACE CO. N.V. | | | 81,439 | | | 128,303 | | | | |
| 347 | | FUGRO N.V. - CVA | | | 9,792 | | | 19,816 | | | | |
| 1,187 | | HEINEKEN HOLDING N.V. | | | 29,352 | | | 49,731 | | | | |
| 3,004 | | HEINEKEN N.V. | | | 84,487 | | | 142,339 | | | | |
| 56,293 | | ING GROEP N.V. - CVA(b) | | | 360,449 | | | 544,192 | | | | |
| 15,811 | | KONINKLIJKE AHOLD N.V. | | | 177,973 | | | 209,763 | | | | |
| 1,387 | | KONINKLIJKE DSM N.V. | | | 35,669 | | | 68,006 | | | | |
| 48,874 | | KONINKLIJKE KPN N.V. | | | 658,918 | | | 828,983 | | | | |
| 18,384 | | KONINKLIJKE PHILIPS ELECTRONICS N.V. | | | 321,594 | | | 544,348 | | | | |
| 2,100 | | NUTRECO HOLDING N.V. | | | 100,913 | | | 117,720 | | | | |
| 2,977 | | QIAGEN N.V.(b) | | | 47,317 | | | 66,501 | | | | |
| 3,773 | | RANDSTAD HOLDING N.V.(b) | | | 73,225 | | | 186,552 | | | | |
| 7,654 | | REED ELSEVIER N.V. | | | 82,220 | | | 93,914 | | | | |
| 28,296 | | ROYAL DUTCH SHELL PLC, CLASS A
(AMSTERDAM EXCHANGE) | | | 776,909 | | | 855,890 | | | | |
| 55,333 | | ROYAL DUTCH SHELL PLC, CLASS A
(LONDON EXCHANGE) | | | 1,285,886 | | | 1,670,661 | | | | |
| 43,008 | | ROYAL DUTCH SHELL PLC, CLASS B
(LONDON EXCHANGE) | | | 990,131 | | | 1,253,266 | | | | |
| 6,056 | | SBM OFFSHORE N.V. | | | 85,999 | | | 118,498 | | | | |
| 2,181 | | SNS REAAL N.V.(b) | | | 6,124 | | | 13,186 | | | | |
| 8,454 | | TNT N.V. | | | 150,536 | | | 258,766 | | | | |
| 28,402 | | UNILEVER N.V. - CVA | | | 579,364 | | | 925,481 | | | | |
| 35,957 | | WOLTERS KLUWER N.V. | | | 649,198 | | | 788,108 | | | | |
| | | | | | 7,797,134 | | | 10,761,656 | | | 3.67 | % |
New Zealand: | | | | | | | | | | |
| 94,900 | | AIR NEW ZEALAND LTD. | | | 65,801 | | | 83,210 | | | | |
| 7,139 | | CONTACT ENERGY LTD.(b) | | | 21,310 | | | 31,778 | | | | |
| 280,000 | | FISHER & PAYKEL APPLIANCES HOLDINGS LTD.(b) | | | 134,280 | | | 117,095 | | | | |
| 14,246 | | FLETCHER BUILDING LTD. | | | 48,135 | | | 82,190 | | | | |
| 25,416 | | TELECOM CORP. OF NEW ZEALAND LTD. | | | 36,442 | | | 45,997 | | | | |
| | | | | | 305,968 | | | 360,270 | | | 0.12 | % |
Norway: | | | | | | | | | | |
| 5,400 | | AKER SOLUTIONS ASA | | | 66,267 | | | 70,128 | | | | |
| 13,800 | | DNB NOR ASA(b) | | | 88,172 | | | 149,789 | | | | |
| 16,500 | | NORSK HYDRO ASA(b) | | | 64,864 | | | 137,145 | | | | |
| 52,000 | | ORKLA ASA | | | 454,296 | | | 507,314 | | | | |
| 7,000 | | RENEWABLE ENERGY CORP. ASA(b) | | | 52,028 | | | 53,546 | | | | |
| 6,600 | | SEADRILL LTD. | | | 70,381 | | | 167,160 | | | | |
| 28,548 | | STATOIL ASA | | | 557,031 | | | 712,006 | | | | |
| 15,000 | | STOREBRAND ASA(b) | | | 52,704 | | | 101,758 | | | | |
| 10,900 | | TELENOR ASA(b) | | | 62,904 | | | 152,872 | | | | |
| 2,740 | | TGS NOPEC GEOPHYSICAL CO. ASA(b) | | | 41,201 | | | 49,444 | | | | |
| 2,500 | | YARA INTERNATIONAL ASA | | | 58,115 | | | 113,185 | | | | |
| | | | | | 1,567,963 | | | 2,214,347 | | | 0.76 | % |
Papua New Guinea: | | | | | | | | | | |
| 71,600 | | LIHIR GOLD LTD. | | | 181,656 | | | 208,847 | | | | |
| | | | | | 181,656 | | | 208,847 | | | 0.07 | % |
Poland: | | | | | | | | | | |
| 13,200 | | CENTRAL EUROPEAN DISTRIBUTION CORP.(b) | | | 395,705 | | | 375,012 | | | | |
| | | | | | 395,705 | | | 375,012 | | | 0.13 | % |
Portugal: | | | | | | | | | | |
| 180,326 | | BANCO COMERCIAL PORTUGUES S.A. | | | 209,999 | | | 216,424 | | | | |
| 49,885 | | BANCO ESPIRITO SANTO S.A. (REGISTERED) | | | 320,911 | | | 324,243 | | | | |
| 3,480 | | BRISA AUTO-ESTRADAS DE PORTUGAL S.A. | | | 21,107 | | | 35,558 | | | | |
| 8,464 | | CIMPOR CIMENTOS DE PORTUGAL SGPS S.A. | | | 39,214 | | | 77,990 | | | | |
| 10,721 | | ENERGIAS DE PORTUGAL S.A. | | | 35,902 | | | 47,451 | | | | |
| 2,881 | | GALP ENERGIA SGPS S.A., CLASS B | | | 35,487 | | | 49,595 | | | | |
| 6,408 | | JERONIMO MARTINS SGPS S.A. | | | 30,015 | | | 63,738 | | | | |
| | |
See accompanying notes to the financial statements. | 76 | (Continued) |
CLEARWATER INVESTMENT TRUST
Schedule of Investments - Clearwater International Fund
December 31, 2009
| | | | | | | | | | | | | |
Shares | | Security | | Cost | | Fair
value (a) | | Percent
of
net assets | |
Portugal (Cont’d): | | | | | | | | | | |
| 7,384 | | PORTUGAL TELECOM, SGPS, S.A. (REGISTERED) | | $ | 57,187 | | | 89,763 | | | | |
| 1,430 | | ZON MULTIMEDIA SERVICOS DE TELECOMUNICACOES E
MULTIMEDIA SGPS S.A.(b) | | | 7,522 | | | 8,812 | | | | |
| | | | | | 757,344 | | | 913,574 | | | 0.31 | % |
Russia: | | | | | | | | | | |
| 7,500 | | LUKOIL OAO ADR (OTC EXCHANGE) | | | 377,750 | | | 423,000 | | | | |
| 14,900 | | TMK OAO GDR (REGISTERED)(b)(c) | | | 198,704 | | | 254,392 | | | | |
| | | | | | 576,454 | | | 677,392 | | | 0.23 | % |
Singapore: | | | | | | | | | | |
| 37,000 | | ARA ASSET MANAGEMENT LTD.(d) | | | 21,410 | | | 22,808 | | | | |
| 49,500 | | CAPITALAND LTD. | | | 85,171 | | | 146,613 | | | | |
| 62,000 | | CAPITAMALL TRUST | | | 54,263 | | | 78,614 | | | | |
| 6,000 | | CITY DEVELOPMENTS LTD. | | | 21,796 | | | 48,942 | | | | |
| 98,500 | | DBS GROUP HOLDINGS LTD. | | | 761,307 | | | 1,070,943 | | | | |
| 44,000 | | FRASER AND NEAVE LTD. | | | 92,102 | | | 130,748 | | | | |
| 13,000 | | JARDINE CYCLE & CARRIAGE LTD. | | | 131,929 | | | 248,063 | | | | |
| 95,200 | | KEPPEL CORP. LTD. | | | 437,381 | | | 553,921 | | | | |
| 28,000 | | OLAM INTERNATIONAL LTD. | | | 32,014 | | | 52,436 | | | | |
| 44,000 | | OVERSEA-CHINESE BANKING CORP. LTD. | | | 141,236 | | | 283,224 | | | | |
| 67,000 | | SEMBCORP INDUSTRIES LTD. | | | 139,890 | | | 174,973 | | | | |
| 22,000 | | SEMBCORP MARINE LTD. | | | 32,803 | | | 57,329 | | | | |
| 53,000 | | SIA ENGINEERING CO. LTD. | | | 91,417 | | | 124,991 | | | | |
| 12,000 | | SINGAPORE AIRLINES LTD. | | | 70,334 | | | 126,697 | | | | |
| 6,000 | | SINGAPORE AIRPORT TERMINAL SERVICES LTD. | | | 9,257 | | | 11,647 | | | | |
| 26,000 | | SINGAPORE EXCHANGE LTD. | | | 117,041 | | | 153,258 | | | | |
| 25,000 | | SINGAPORE PRESS HOLDINGS LTD. | | | 41,026 | | | 64,970 | | | | |
| 23,000 | | SINGAPORE TECHNOLOGIES ENGINEERING LTD. | | | 52,809 | | | 52,867 | | | | |
| 112,000 | | SINGAPORE TELECOMMUNICATIONS LTD. | | | 184,276 | | | 246,635 | | | | |
| 25,000 | | UNITED OVERSEAS BANK LTD. | | | 160,579 | | | 347,901 | | | | |
| 50,000 | | UOL GROUP LTD. | | | 116,101 | | | 143,464 | | | | |
| 30,000 | | WILMAR INTERNATIONAL LTD. | | | 137,044 | | | 136,144 | | | | |
| | | | | | 2,931,186 | | | 4,277,188 | | | 1.46 | % |
South Africa: | | | | | | | | | | |
| 13,000 | | MTN GROUP LTD. | | | 204,338 | | | 206,653 | | | | |
| | | | | | 204,338 | | | 206,653 | | | 0.07 | % |
South Korea: | | | | | | | | | | |
| 11,010 | | DAEWOO SHIPBUILDING & MARINE ENGINEERING
CO. LTD.(b) | | | 163,205 | | | 164,616 | | | | |
| 3,900 | | DAISHIN SECURITIES CO. LTD. | | | 49,482 | | | 52,270 | | | | |
| 1,670 | | DOOSAN CORP.(b) | | | 119,520 | | | 136,108 | | | | |
| 3,530 | | DOOSAN ENGINEERING & CONSTRUCTION CO. LTD.(b) | | | 18,146 | | | 22,619 | | | | |
| 4,860 | | GS HOLDINGS CORP.(b) | | | 115,158 | | | 140,545 | | | | |
| 7,820 | | HANA FINANCIAL GROUP, INC.(b) | | | 199,668 | | | 221,883 | | | | |
| 660 | | HONAM PETROCHEMICAL CORP.(b) | | | 46,228 | | | 57,817 | | | | |
| 1,270 | | HYUNDAI MIPO DOCKYARD(b) | | | 115,177 | | | 111,921 | | | | |
| 860 | | HYUNDAI MOBIS(b) | | | 75,091 | | | 125,443 | | | | |
| 2,580 | | HYUNDAI STEEL CO.(b) | | | 175,471 | | | 190,306 | | | | |
| 30 | | KCC CORP. | | | 8,652 | | | 9,549 | | | | |
| 940 | | KOREA ZINC CO. LTD.(b) | | | 102,511 | | | 163,789 | | | | |
| 570 | | KT&G CORP.(b) | | | 32,906 | | | 31,496 | | | | |
| 620 | | LG CHEM LTD.(b) | | | 66,232 | | | 120,955 | | | | |
| 1,390 | | LG DACOM CORP.(b) | | | 18,791 | | | 21,167 | | | | |
| 1,100 | | LG ELECTRONICS, INC.(b) | | | 100,585 | | | 114,023 | | | | |
| 13,970 | | LG TELECOM LTD.(b) | | | 93,163 | | | 101,629 | | | | |
| 351 | | LOTTE CHILSUNG BEVERAGE CO. LTD.(b) | | | 230,200 | | | 253,867 | | | | |
| 700 | | LOTTE SHOPPING CO. LTD.(b) | | | 150,716 | | | 208,114 | | | | |
| 180 | | NHN CORP.(b) | | | 26,072 | | | 29,723 | | | | |
| 320 | | PACIFIC CORP.(b) | | | 27,999 | | | 43,296 | | | | |
| 130 | | SAMSUNG FIRE & MARINE INSURANCE CO. LTD. | | | 18,653 | | | 22,202 | | | | |
| 1,540 | | SAMSUNG HEAVY INDUSTRIES CO. LTD.(b) | | | 30,409 | | | 31,836 | | | | |
| 600 | | SAMSUNG SDI CO. LTD.(b) | | | 73,275 | | | 75,976 | | | | |
| 10 | | SHINSEGAE CO. LTD.(b) | | | 3,890 | | | 4,616 | | | | |
| 910 | | SK CHEMICALS CO. LTD.(b) | | | 47,721 | | | 52,078 | | | | |
| 150 | | SK ENERGY CO. LTD.(b) | | | 15,693 | | | 15,041 | | | | |
| 2,470 | | SK HOLDINGS CO. LTD.(b) | | | 217,640 | | | 188,020 | | | | |
| 5,570 | | SK NETWORKS CO. LTD.(b) | | | 53,283 | | | 50,363 | | | | |
| | |
See accompanying notes to the financial statements. | 77 | (Continued) |
CLEARWATER INVESTMENT TRUST
Schedule of Investments - Clearwater International Fund
December 31, 2009
| | | | | | | | | | | | | |
Shares | | Security | | Cost | | Fair
value (a) | | Percent
of
net assets | |
South Korea (Cont’d): | | | | | | | | | | |
| 2,864 | | YOUNGONE CORP.(b) | | $ | 19,141 | | | 28,672 | | | | |
| 716 | | YOUNGONE HOLDINGS CO. LTD.(b) | | | 11,688 | | | 21,347 | | | | |
| | | | | | 2,426,366 | | | 2,811,287 | | | 0.96% | |
Spain: | | | | | | | | | | |
| 3,888 | | ABERTIS INFRAESTRUCTURAS S.A. | | | 61,599 | | | 87,733 | | | | |
| 346 | | ACCIONA S.A. | | | 36,569 | | | 44,939 | | | | |
| 5,493 | | ACERINOX S.A. | | | 67,660 | | | 113,624 | | | | |
| 2,447 | | ACS ACTIVIDADES DE CONSTRUCCION Y SERVICIOS S.A. | | | 105,135 | | | 121,659 | | | | |
| 56,329 | | BANCO BILBAO VIZCAYA ARGENTARIA S.A. | | | 484,462 | | | 1,020,357 | | | | |
| 68,824 | | BANCO DE SABADELL S.A. | | | 462,996 | | | 382,278 | | | | |
| 1,518 | | BANCO DE VALENCIA S.A.(b) | | | 11,083 | | | 11,554 | | | | |
| 3,485 | | BANCO PASTOR S.A. | | | 24,171 | | | 24,390 | | | | |
| 11,714 | | BANCO POPULAR ESPANOL S.A. | | | 65,229 | | | 85,524 | | | | |
| 190,053 | | BANCO SANTANDER S.A. | | | 1,814,273 | | | 3,122,534 | | | | |
| 20,320 | | BANKINTER S.A. ADR | | | 213,507 | | | 206,537 | | | | |
| 150 | | CONSTRUCCIONES Y AUXILIAR DE FERROCARRILES S.A. | | | 65,457 | | | 80,470 | | | | |
| 15,374 | | CRITERIA CAIXACORP S.A. | | | 47,978 | | | 72,651 | | | | |
| 5,333 | | EDP RENOVAVEIS S.A.(b) | | | 49,408 | | | 50,413 | | | | |
| 2,531 | | ENAGAS | | | 38,143 | | | 56,017 | | | | |
| 16,085 | | FERROVIAL S.A. | | | 79,147 | | | 187,846 | | | | |
| 4,723 | | FOMENTO DE CONSTRUCCIONES Y CONTRATAS S.A. | | | 176,603 | | | 198,094 | | | | |
| 2,763 | | GAMESA CORP. TECNOLOGICA S.A. | | | 35,059 | | | 46,318 | | | | |
| 4,262 | | GAS NATURAL SDG S.A. | | | 52,029 | | | 91,743 | | | | |
| 2,222 | | GRIFOLS S.A. | | | 33,845 | | | 38,719 | | | | |
| 13,908 | | IBERDROLA RENOVABLES S.A. | | | 53,405 | | | 66,262 | | | | |
| 52,737 | | IBERDROLA S.A. | | | 387,105 | | | 502,025 | | | | |
| 4,941 | | INDITEX S.A. | | | 202,632 | | | 306,161 | | | | |
| 630 | | INDRA SISTEMAS S.A. | | | 12,890 | | | 14,820 | | | | |
| 52,369 | | MAPFRE S.A. | | | 157,161 | | | 218,814 | | | | |
| 2,111 | | RED ELECTRICA CORP. S.A. | | | 88,270 | | | 116,995 | | | | |
| 11,060 | | REPSOL YPF S.A. | | | 198,814 | | | 295,290 | | | | |
| 8,100 | | SACYR VALLEHERMOSO S.A.(b) | | | 149,700 | | | 92,342 | | | | |
| 83,959 | | TELEFONICA S.A. | | | 1,741,867 | | | 2,340,055 | | | | |
| 981 | | ZARDOYA OTIS S.A. | | | 15,577 | | | 19,123 | | | | |
| | | | | | 6,931,774 | | | 10,015,287 | | | 3.42 | % |
Sweden: | | | | | | | | | | |
| 4,550 | | ALFA LAVAL AB | | | 35,782 | | | 62,632 | | | | |
| 7,400 | | ASSA ABLOY AB, CLASS B | | | 89,466 | | | 141,706 | | | | |
| 9,200 | | ATLAS COPCO AB, CLASS A | | | 72,813 | | | 134,449 | | | | |
| 4,000 | | ATLAS COPCO AB, CLASS B | | | 31,058 | | | 51,889 | | | | |
| 20,000 | | BOLIDEN AB | | | 199,963 | | | 255,573 | | | | |
| 15,000 | | ELECTROLUX AB, CLASS B(b) | | | 274,638 | | | 352,074 | | | | |
| 3,200 | | GETINGE AB, CLASS B | | | 37,616 | | | 60,728 | | | | |
| 6,800 | | HENNES & MAURITZ AB, CLASS B | | | 274,862 | | | 376,301 | | | | |
| 400 | | HOLMEN AB, CLASS B | | | 8,156 | | | 10,203 | | | | |
| 17,500 | | HUSQVARNA AB, CLASS B(b) | | | 64,201 | | | 129,198 | | | | |
| 11,800 | | INVESTOR AB, CLASS B | | | 161,782 | | | 218,138 | | | | |
| 18,000 | | MEDA AB, CLASS A | | | 167,364 | | | 162,378 | | | | |
| 1,600 | | MILLICOM INTERNATIONAL CELLULAR S.A. SDR | | | 87,461 | | | 118,637 | | | | |
| 200 | | MODERN TIMES GROUP AB, CLASS B(b) | | | 3,437 | | | 9,898 | | | | |
| 1,659 | | NCC AB, CLASS B | | | 15,289 | | | 27,260 | | | | |
| 41,200 | | NORDEA BANK AB | | | 230,517 | | | 417,374 | | | | |
| 13,973 | | SANDVIK AB | | | 86,678 | | | 167,490 | | | | |
| 7,800 | | SCANIA AB, CLASS B | | | 65,585 | | | 100,043 | | | | |
| 2,200 | | SECURITAS AB, CLASS B | | | 16,310 | | | 21,471 | | | | |
| 20,400 | | SKANDINAVISKA ENSKILDA BANKEN AB, CLASS A(b) | | | 71,603 | | | 125,419 | | | | |
| 3,000 | | SKANSKA AB, CLASS B | | | 25,978 | | | 51,051 | | | | |
| 13,800 | | SKF AB, CLASS B | | | 141,836 | | | 237,033 | | | | |
| 5,400 | | SSAB AB, CLASS A | | | 48,129 | | | 91,297 | | | | |
| 42,600 | | SVENSKA CELLULOSA AB, CLASS B | | | 420,916 | | | 569,053 | | | | |
| 6,900 | | SVENSKA HANDELSBANKEN AB, CLASS A | | | 116,989 | | | 197,340 | | | | |
| 18,300 | | SWEDBANK AB, CLASS A(b) | | | 58,744 | | | 182,046 | | | | |
| 6,600 | | SWEDISH MATCH AB | | | 95,099 | | | 144,279 | | | | |
| 3,900 | | TELE2 AB, CLASS B | | | 34,548 | | | 59,749 | | | | |
| 45,000 | | TELEFONAKTIEBOLAGET LM ERICSSON, CLASS B | | | 406,347 | | | 413,909 | | | | |
| 30,500 | | TELIASONERA AB | | | 151,188 | | | 220,204 | | | | |
| 15,032 | | TRELLEBORG AB, CLASS B(b) | | | 103,955 | | | 112,188 | | | | |
| | |
See accompanying notes to the financial statements. | 78 | (Continued) |
CLEARWATER INVESTMENT TRUST
Schedule of Investments - Clearwater International Fund
December 31, 2009
| | | | | | | | | | | | | |
Shares | | Security | | Cost | | Fair
value (a) | | Percent
of
net assets | |
Sweden (Cont’d): | | | | | | | | | | |
| 5,800 | | VOLVO AB, CLASS A | | $ | 29,472 | | | 49,099 | | | | |
| 9,500 | | VOLVO AB, CLASS B | | | 49,520 | | | 80,939 | | | | |
| | | | | | 3,677,302 | | | 5,351,048 | | | 1.83 | % |
Switzerland: | | | | | | | | | | | | |
| 41,343 | | ABB LTD. (REGISTERED)(b) | | | 579,344 | | | 790,730 | | | | |
| 19,000 | | ABB LTD. ADR(b) | | | 319,423 | | | 362,900 | | | | |
| 1,591 | | ACTELION LTD. (REGISTERED)(b) | | | 73,405 | | | 84,977 | | | | |
| 32,879 | | ADECCO S.A. (REGISTERED) | | | 1,467,951 | | | 1,815,285 | | | | |
| 2,727 | | ARYZTA A.G. | | | 68,593 | | | 101,718 | | | | |
| 2,676 | | BALOISE-HOLDING (REGISTERED) | | | 188,738 | | | 222,911 | | | | |
| 295 | | BANQUE CANTONALE VAUDOISE (REGISTERED) | | | 87,690 | | | 116,995 | | | | |
| 148 | | BKW FMB ENERGIE A.G. | | | 11,039 | | | 11,509 | | | | |
| 8,185 | | COMPAGNIE FINANCIERE RICHEMONT S.A., CLASS A | | | 130,638 | | | 273,889 | | | | |
| 18,108 | | CREDIT SUISSE GROUP A.G. (REGISTERED) | | | 547,506 | | | 891,873 | | | | |
| 3,082 | | EFG INTERNATIONAL A.G. (REGISTERED) | | | 32,625 | | | 42,339 | | | | |
| 250 | | FLUGHAFEN ZUERICH A.G. (REGISTERED) | | | 65,195 | | | 75,239 | | | | |
| 3,728 | | GAM HOLDING LTD.(b) | | | 22,832 | | | 45,366 | | | | |
| 953 | | GEBERIT A.G. (REGISTERED) | | | 83,492 | | | 168,817 | | | | |
| 2,116 | | GIVAUDAN S.A. (REGISTERED) | | | 1,377,074 | | | 1,684,081 | | | | |
| 420 | | HELVETIA HOLDING A.G. (REGISTERED) | | | 131,688 | | | 129,723 | | | | |
| 3,916 | | HOLCIM LTD. (REGISTERED)(b) | | | 168,212 | | | 303,565 | | | | |
| 3,728 | | JULIUS BAER GROUP LTD. | | | 78,764 | | | 130,207 | | | | |
| 967 | | KUEHNE & NAGEL INTERNATIONAL A.G. (REGISTERED) | | | 57,750 | | | 93,546 | | | | |
| 63 | | LINDT & SPRUENGLI A.G. (PARTCIPATION CERTIFICATE) | | | 108,277 | | | 135,323 | | | | |
| 1 | | LINDT & SPRUENGLI A.G. (REGISTERED) | | | 17,927 | | | 24,575 | | | | |
| 6,301 | | LOGITECH INTERNATIONAL S.A. (REGISTERED)(b) | | | 70,452 | | | 108,399 | | | | |
| 98,039 | | NESTLE S.A. (REGISTERED) | | | 3,516,604 | | | 4,763,186 | | | | |
| 2,629 | | NOBEL BIOCARE HOLDINGS A.G. (REGISTERED) | | | 45,806 | | | 87,990 | | | | |
| 86,907 | | NOVARTIS A.G. (REGISTERED) | | | 3,598,924 | | | 4,735,064 | | | | |
| 16,781 | | PANALPINA WELTTRANSPORT HOLDING A.G. | | | 1,229,672 | | | 1,068,317 | | | | |
| 19,385 | | PARGESA HOLDING S.A. (BEARER) | | | 1,349,195 | | | 1,697,674 | | | | |
| 2,800 | | PSP SWISS PROPERTY A.G. (REGISTERED)(b) | | | 108,194 | | | 158,456 | | | | |
| 12,394 | | ROCHE HOLDING A.G. (GENUSSCHEIN) | | | 1,602,744 | | | 2,108,498 | | | | |
| 755 | | SCHINDLER HOLDING A.G. (PARTICIPATION
CERTIFICATE) | | | 34,888 | | | 57,923 | | | | |
| 121 | | SGS S.A. (REGISTERED) | | | 130,564 | | | 157,565 | | | | |
| 648 | | SONOVA HOLDING A.G. (REGISTERED) | | | 35,616 | | | 78,359 | | | | |
| 32,678 | | STMICROELECTRONICS N.V. | | | 179,389 | | | 296,306 | | | | |
| 257 | | STRAUMANN HOLDING A.G. (REGISTERED) | | | 41,380 | | | 72,444 | | | | |
| 1,872 | | SULZER A.G. (REGISTERED) | | | 96,613 | | | 145,850 | | | | |
| 475 | | SWATCH GROUP (THE) A.G. (BEARER) | | | 59,791 | | | 119,562 | | | | |
| 2,391 | | SWATCH GROUP (THE) A.G. (REGISTERED) | | | 61,462 | | | 114,330 | | | | |
| 2,654 | | SWISS LIFE HOLDING A.G. (REGISTERED)(b) | | | 201,157 | | | 336,194 | | | | |
| 1,084 | | SWISS PRIME SITE A.G. (REGISTERED)(b) | | | 61,838 | | | 60,787 | | | | |
| 6,101 | | SWISS REINSURANCE CO. LTD. (REGISTERED) | | | 120,654 | | | 292,315 | | | | |
| 196 | | SWISSCOM A.G. (REGISTERED) | | | 51,472 | | | 74,747 | | | | |
| 1,549 | | SYNGENTA A.G. (REGISTERED) | | | 322,477 | | | 434,073 | | | | |
| 1,901 | | TAMEDIA A.G. (REGISTERED) | | | 113,489 | | | 137,514 | | | | |
| 65,277 | | TYCO ELECTRONICS LTD. | | | 1,312,886 | | | 1,602,550 | | | | |
| 311 | | VONTOBEL HOLDING A.G. (REGISTERED) | | | 8,146 | | | 8,883 | | | | |
| 32,967 | | XSTRATA PLC(b) | | | 249,475 | | | 580,674 | | | | |
| 3,097 | | ZURICH FINANCIAL SERVICES A.G. | | | 523,186 | | | 673,395 | | | | |
| | | | | | 20,744,237 | | | 27,476,623 | | | 9.38 | % |
Taiwan: | | | | | | | | | | |
| 17,000 | | HON HAI PRECISION INDUSTRY CO.
LTD. GDR (REGISTERED)(c) | | | 139,443 | | | 160,485 | | | | |
| 36,000 | | UNITED MICROELECTRONICS CORP. ADR(b) | | | 129,453 | | | 139,680 | | | | |
| | | | | | 268,896 | | | 300,165 | | | 0.10 | % |
Turkey: | | | | | | | | | | |
| 33,900 | | TURKCELL ILETISIM HIZMET A/S ADR | | | 505,305 | | | 592,911 | | | | |
| 32,000 | | TURKIYE IS BANKASI, CLASS C | | | 139,567 | | | 134,780 | | | | |
| | | | | | 644,872 | | | 727,691 | | | 0.25 | % |
United Kingdom: | | | | | | | | | | |
| 52,662 | | 3I GROUP PLC | | | 232,331 | | | 238,064 | | | | |
| 2,834 | | ADMIRAL GROUP PLC | | | 35,119 | | | 54,062 | | | | |
| 60,000 | | AEGIS GROUP PLC | | | 66,259 | | | 114,727 | | | | |
| | |
See accompanying notes to the financial statements. | 79 | (Continued) |
|
CLEARWATER INVESTMENT TRUST |
Schedule of Investments - Clearwater International Fund |
December 31, 2009 |
| | | | | | | | | | | | | |
Shares | | Security | | Cost | | Fair
value (a) | | Percent
of
net assets | |
United Kingdom (Cont’d): | | | | | | | | | | |
| 4,578 | | AMEC PLC | | $ | 34,931 | | | 58,112 | | | | |
| 19,418 | | ANGLO AMERICAN PLC(b) | | | 352,834 | | | 840,393 | | | | |
| 13,900 | | ANGLO AMERICAN PLC ADR(b) | | | 208,562 | | | 301,352 | | | | |
| 4,811 | | ANTOFAGASTA PLC | | | 33,978 | | | 76,283 | | | | |
| 3,799 | | ASSOCIATED BRITISH FOODS PLC | | | 35,240 | | | 50,415 | | | | |
| 21,123 | | ASTRAZENECA PLC | | | 727,751 | | | 992,514 | | | | |
| 7,700 | | ASTRAZENECA PLC ADR | | | 341,392 | | | 361,438 | | | | |
| 2,131 | | AUTONOMY CORP. PLC(b) | | | 36,969 | | | 51,958 | | | | |
| 45,007 | | AVIVA PLC | | | 146,727 | | | 285,043 | | | | |
| 52,226 | | BAE SYSTEMS PLC | | | 264,193 | | | 300,971 | | | | |
| 9,301 | | BALFOUR BEATTY PLC | | | 46,031 | | | 38,650 | | | | |
| 277,676 | | BARCLAYS PLC | | | 1,051,273 | | | 1,223,635 | | | | |
| 22,303 | | BARRATT DEVELOPMENTS PLC(b) | | | 64,624 | | | 44,585 | | | | |
| 9,800 | | BERKELEY GROUP HOLDINGS PLC(b) | | | 138,307 | | | 128,855 | | | | |
| 50,697 | | BG GROUP PLC | | | 790,328 | | | 907,876 | | | | |
| 33,136 | | BHP BILLITON PLC | | | 673,032 | | | 1,058,460 | | | | |
| 293,608 | | BP PLC | | | 2,013,483 | | | 2,839,552 | | | | |
| 163,660 | | BRIT INSURANCE HOLDINGS N.V. | | | 544,264 | | | 519,376 | | | | |
| 57,994 | | BRITISH AMERICAN TOBACCO PLC | | | 1,497,265 | | | 1,881,370 | | | | |
| 11,630 | | BRITISH LAND CO. PLC | | | 61,579 | | | 89,149 | | | | |
| 17,468 | | BRITISH SKY BROADCASTING GROUP PLC | | | 116,486 | | | 157,356 | | | | |
| 132,209 | | BT GROUP PLC | | | 159,975 | | | 286,263 | | | | |
| 5,069 | | BUNZL PLC | | | 39,524 | | | 54,953 | | | | |
| 8,202 | | BURBERRY GROUP PLC | | | 40,549 | | | 78,638 | | | | |
| 43,666 | | CABLE & WIRELESS PLC | | | 93,422 | | | 98,619 | | | | |
| 56,942 | | CADBURY PLC | | | 510,808 | | | 732,745 | | | | |
| 40,577 | | CAIRN ENERGY PLC(b) | | | 155,293 | | | 216,243 | | | | |
| 16,980 | | CAPITA GROUP (THE) PLC | | | 162,367 | | | 204,811 | | | | |
| 5,873 | | CARNIVAL PLC(b) | | | 158,859 | | | 200,556 | | | | |
| 26,476 | | CARPETRIGHT PLC | | | 301,694 | | | 402,609 | | | | |
| 82,257 | | CENTRICA PLC | | | 290,637 | | | 371,503 | | | | |
| 4,900 | | CHARTER INTERNATIONAL PLC | | | 58,832 | | | 56,633 | | | | |
| 11,669 | | COBHAM PLC | | | 30,337 | | | 47,037 | | | | |
| 194,699 | | COMPASS GROUP PLC | | | 1,044,777 | | | 1,390,595 | | | | |
| 45,000 | | COOKSON GROUP PLC(b) | | | 274,831 | | | 302,875 | | | | |
| 2,400 | | DERWENT LONDON PLC | | | 33,709 | | | 50,691 | | | | |
| 134,647 | | DIAGEO PLC | | | 1,859,884 | | | 2,348,172 | | | | |
| 4,482 | | DRAX GROUP PLC | | | 29,953 | | | 30,003 | | | | |
| 90,000 | | DSG INTERNATIONAL PLC(b) | | | 44,484 | | | 52,960 | | | | |
| 17,000 | | EASYJET PLC(b) | | | 68,995 | | | 95,779 | | | | |
| 2,760 | | EURASIAN NATURAL RESOURCES CORP. | | | 15,790 | | | 40,708 | | | | |
| 3,153 | | F&C ASSET MANAGEMENT PLC | | | 29,436 | | | 3,836 | | | | |
| 42,094 | | FIRSTGROUP PLC | | | 220,675 | | | 287,171 | | | | |
| 9,699 | | G4S PLC | | | 26,165 | | | 40,825 | | | | |
| 94,577 | | GLAXOSMITHKLINE PLC | | | 1,456,829 | | | 2,003,451 | | | | |
| 12,300 | | GLAXOSMITHKLINE PLC ADR | | | 464,571 | | | 519,675 | | | | |
| 23,505 | | HAMMERSON PLC | | | 111,120 | | | 159,622 | | | | |
| 36,031 | | HAYS PLC | | | 49,874 | | | 60,068 | | | | |
| 141,705 | | HOME RETAIL GROUP PLC | | | 624,153 | | | 645,953 | | | | |
| 303,952 | | HSBC HOLDINGS PLC | | | 2,067,385 | | | 3,468,821 | | | | |
| 47,114 | | ICAP PLC | | | 306,383 | | | 326,506 | | | | |
| 11,465 | | IMI PLC | | | 43,254 | | | 95,943 | | | | |
| 18,809 | | IMPERIAL TOBACCO GROUP PLC | | | 441,612 | | | 592,772 | | | | |
| 198,000 | | INCHCAPE PLC(b) | | | 99,847 | | | 94,252 | | | | |
| 44,000 | | INFORMA PLC | | | 221,968 | | | 225,087 | | | | |
| 6,290 | | INTERCONTINENTAL HOTELS GROUP PLC | | | 49,219 | | | 90,012 | | | | |
| 20,434 | | INTERNATIONAL POWER PLC | | | 61,912 | | | 101,104 | | | | |
| 12,127 | | INVENSYS PLC | | | 29,802 | | | 58,102 | | | | |
| 1,449 | | INVESTEC PLC | | | 4,767 | | | 9,933 | | | | |
| 98,470 | | ITV PLC(b) | | | 52,339 | | | 83,138 | | | | |
| 29,306 | | J. SAINSBURY PLC | | | 141,007 | | | 152,375 | | | | |
| 24,000 | | JOHN WOOD GROUP PLC | | | 114,936 | | | 118,558 | | | | |
| 2,494 | | JOHNSON MATTHEY PLC | | | 35,938 | | | 61,602 | | | | |
| 13,709 | | KAZAKHMYS PLC(b) | | | 207,233 | | | 286,837 | | | | |
| 32,000 | | KESA ELECTRICALS PLC | | | 74,333 | | | 76,313 | | | | |
| 167,414 | | KINGFISHER PLC | | | 562,185 | | | 613,691 | | | | |
| 26,728 | | LADBROKES PLC | | | 75,304 | | | 58,814 | | | | |
| 64,858 | | LANCASHIRE HOLDINGS LTD. | | | 497,453 | | | 465,718 | | | | |
| | |
See accompanying notes to the financial statements. | 80 | (Continued) |
|
CLEARWATER INVESTMENT TRUST |
Schedule of Investments - Clearwater International Fund |
December 31, 2009 |
| | | | | | | | | | | | | |
Shares | | Security | | Cost | | Fair
value (a) | | Percent
of
net assets | |
United Kingdom (Cont’d): | | | | | | | | | | |
| 15,511 | | LAND SECURITIES GROUP PLC | | $ | 113,585 | | | 169,990 | | | | |
| 376,802 | | LEGAL & GENERAL GROUP PLC | | | 436,334 | | | 484,921 | | | | |
| 6,025 | | LIBERTY INTERNATIONAL PLC | | | 30,406 | | | 49,619 | | | | |
| 651,760 | | LLOYDS BANKING GROUP PLC(b) | | | 487,762 | | | 523,233 | | | | |
| 112,000 | | LOGICA PLC | | | 223,591 | | | 205,417 | | | | |
| 15,627 | | LONDON STOCK EXCHANGE GROUP PLC | | | 182,319 | | | 180,808 | | | | |
| 1,021 | | LONMIN PLC(b) | | | 17,874 | | | 31,698 | | | | |
| 114,062 | | MAN GROUP PLC | | | 547,596 | | | 561,082 | | | | |
| 59,083 | | MARKS & SPENCER GROUP PLC | | | 301,804 | | | 383,294 | | | | |
| 55,840 | | MEGGITT PLC | | | 173,197 | | | 234,247 | | | | |
| 10,000 | | MILLENNIUM & COPTHORNE HOTELS PLC | | | 62,797 | | | 59,807 | | | | |
| 30,000 | | MONDI PLC | | | 68,373 | | | 162,098 | | | | |
| 75,637 | | NATIONAL GRID PLC | | | 658,763 | | | 826,800 | | | | |
| 2,148 | | NEXT PLC | | | 36,823 | | | 71,614 | | | | |
| 211,185 | | OLD MUTUAL PLC(b) | | | 251,201 | | | 368,768 | | | | |
| 44,003 | | PEARSON PLC | | | 491,502 | | | 632,575 | | | | |
| 3,682 | | PERSIMMON PLC(b) | | | 23,950 | | | 27,881 | | | | |
| 37,653 | | PRUDENTIAL PLC | | | 197,463 | | | 383,576 | | | | |
| 37,834 | | QINETIQ GROUP PLC | | | 86,838 | | | 98,927 | | | | |
| 868 | | RANDGOLD RESOURCES LTD. | | | 57,706 | | | 68,969 | | | | |
| 169,000 | | RAVEN RUSSIA LTD. | | | 138,165 | | | 125,357 | | | | |
| 8,289 | | RECKITT BENCKISER GROUP PLC | | | 310,166 | | | 449,083 | | | | |
| 26,043 | | REED ELSEVIER PLC | | | 198,766 | | | 213,860 | | | | |
| 8,908 | | REXAM PLC | | | 37,583 | | | 41,620 | | | | |
| 22,251 | | RIO TINTO PLC | | | 635,826 | | | 1,199,254 | | | | |
| 1,700 | | RIO TINTO PLC ADR | | | 271,697 | | | 366,163 | | | | |
| 27,303 | | ROLLS-ROYCE GROUP PLC(b) | | | 114,815 | | | 213,070 | | | | |
| 248,250 | | ROYAL BANK OF SCOTLAND GROUP PLC(b) | | | 114,766 | | | 116,441 | | | | |
| 144,299 | | RSA INSURANCE GROUP PLC | | | 280,010 | | | 280,762 | | | | |
| 13,128 | | SABMILLER PLC | | | 190,619 | | | 384,974 | | | | |
| 36,567 | | SAGE GROUP (THE) PLC | | | 89,661 | | | 129,823 | | | | |
| 102,620 | | SAVILLS PLC | | | 501,195 | | | 530,288 | | | | |
| 3,966 | | SCHRODERS PLC | | | 45,826 | | | 84,657 | | | | |
| 11,992 | | SCOTTISH & SOUTHERN ENERGY PLC | | | 191,679 | | | 224,099 | | | | |
| 10,277 | | SEGRO PLC | | | 36,889 | | | 56,729 | | | | |
| 7,999 | | SERCO GROUP PLC | | | 42,799 | | | 68,005 | | | | |
| 4,954 | | SEVERN TRENT PLC | | | 76,220 | | | 86,539 | | | | |
| 67,850 | | SIGNET JEWELERS LTD.(b) | | | 1,431,408 | | | 1,812,952 | | | | |
| 14,044 | | SMITH & NEPHEW PLC | | | 98,628 | | | 144,206 | | | | |
| 2,453 | | SMITHS GROUP PLC | | | 28,519 | | | 40,138 | | | | |
| 30,509 | | STANDARD CHARTERED PLC | | | 430,791 | | | 764,028 | | | | |
| 31,857 | | STANDARD LIFE PLC | | | 83,454 | | | 110,544 | | | | |
| 1,041 | | TATE & LYLE PLC | | | 5,037 | | | 7,240 | | | | |
| 117,017 | | TESCO PLC | | | 568,842 | | | 804,006 | | | | |
| 42,000 | | THOMAS COOK GROUP PLC | | | 148,858 | | | 155,980 | | | | |
| 35,601 | | TOMKINS PLC | | | 77,381 | | | 109,910 | | | | |
| 12,600 | | TRAVIS PERKINS PLC(b) | | | 127,764 | | | 171,866 | | | | |
| 51,072 | | TUI TRAVEL PLC | | | 202,079 | | | 210,204 | | | | |
| 10,352 | | TULLOW OIL PLC | | | 136,852 | | | 215,881 | | | | |
| 32,525 | | UNILEVER PLC | | | 712,326 | | | 1,041,105 | | | | |
| 48,679 | | UNILEVER PLC ADR | | | 1,233,703 | | | 1,552,860 | | | | |
| 2,333 | | UNITED BUSINESS MEDIA LTD. | | | 13,794 | | | 17,327 | | | | |
| 8,787 | | UNITED UTILITIES GROUP PLC | | | 62,187 | | | 69,915 | | | | |
| 9,943 | | VEDANTA RESOURCES PLC | | | 320,924 | | | 410,956 | | | | |
| 22,337 | | VITEC GROUP (THE) PLC | | | 110,273 | | | 139,487 | | | | |
| 937,541 | | VODAFONE GROUP PLC | | | 1,689,658 | | | 2,171,076 | | | | |
| 994 | | WHITBREAD PLC | | | 10,069 | | | 22,355 | | | | |
| 42,339 | | WM MORRISON SUPERMARKETS PLC | | | 156,009 | | | 188,760 | | | | |
| 4,513 | | WOLSELEY PLC(b) | | | 70,476 | | | 90,283 | | | | |
| 23,432 | | WPP PLC | | | 141,019 | | | 228,812 | | | | |
| | | | | | 38,543,995 | | | 50,952,707 | | | 17.40 | % |
| | | | | | | | | | | | | |
United States: | | | | | | | | | | |
| 28,028 | | ARCH CAPITAL GROUP LTD.(b) | | | 1,722,915 | | | 2,005,403 | | | | |
| 6,080 | | GERDAU AMERISTEEL CORP. | | | 19,730 | | | 50,160 | | | | |
| 5,729 | | THOMSON REUTERS CORP. | | | 151,051 | | | 184,760 | | | | |
| 1,676 | | THOMSON REUTERS CORP. (TORONTO EXCHANGE) | | | 36,183 | | | 54,407 | | | | |
| | | | | | 1,929,879 | | | 2,294,730 | | | 0.78 | % |
| | |
See accompanying notes to the financial statements. | 81 | (Continued) |
CLEARWATER INVESTMENT TRUST
Schedule of Investments - Clearwater International Fund
December 31, 2009
| | | | | | | | | | | | | |
Shares | | Security | | Cost | | Fair
value (a) | | Percent
of
net assets | |
| United States (Cont’d): | | | | | | | | | | |
Preferred Stocks: | |
| Brazil: | | | | | | | | | | | | |
| 14,800 | | PETROLEO BRASILEIRO S.A. ADR | | $ | 499,840 | | | 627,372 | | | | |
| 16,600 | | VALE S.A. ADR | | | 282,397 | | | 412,012 | | | | |
| | | | | | 782,237 | | | 1,039,384 | | | 0.35 | % |
| | | | | | | | | | | | | |
| Germany: | | | | | | | | | | | | |
| 1,114 | | FRESENIUS S.E. | | | 51,175 | | | 79,614 | | | | |
| 2,360 | | HENKEL A.G. & CO. KGAA | | | 60,940 | | | 122,867 | | | | |
| 1,391 | | PORSCHE AUTOMOBIL HOLDING S.E. | | | 75,417 | | | 87,368 | | | | |
| 861 | | RWE A.G. | | | 54,598 | | | 76,820 | | | | |
| 1,869 | | VOLKSWAGEN A.G. | | | 107,218 | | | 175,684 | | | | |
| | | | | | 349,348 | | | 542,353 | | | 0.19 | % |
| | | | | | | | | | |
Corporate Bonds: | | | | | | | | | | |
| United Kingdom: | |
| 210,449 | | HSBC BANK PLC(b)(c) | | | 1,054,459 | | | 995,466 | | | | |
| | | | | | 1,054,459 | | | 995,466 | | | 0.34 | % |
| | | | | | | | | | | | | |
Rights: | | | | | | | | | | | | |
| 639 | | WOODSIDE PETROLEUM LTD. | | | - | | | 2,927 | | | | |
| | | | | | - | | | 2,927 | | | 0.00 | % |
Warrants: | | | | | | | | | | | | |
| 742 | | FONCIERE DES REGIONS, EXP. 12/31/10, STRIKE
65.00 EURO(b) | | | - | | | 627 | | | | |
| 13,691 | | MEDIOBANCA S.P.A., EXP. 3/18/11, STRIKE 9.00 EURO(b) | | | - | | | 2,110 | | | | |
| 11,384
| | UNIONE DI BANCHE ITALIANE SCPA, EXP. 6/30/11, STRIKE
12.30 EURO(b) | | | | | | 798 | | | | |
| | | | | | - | | | 3,535 | | | 0.00 | % |
| | | | | | | | | | | | | |
| | | Grand total(e) | | $ | 220,330,599 | | | 287,400,491 | | | 98.12 | % |
Notes to Schedule of Investments:
| | |
| (a) | Securities are valued in accordance with procedures described in note 2 to the financial statements. |
| (b) | Currently non-income producing assets. |
| (c) | Restricted security that has been deemed illiquid. At December 31, 2009, the value of these restricted securities amounted to approximately $1,577,688 or 0.54% of net assets. Additional information on each restricted security is as follows: |
| | | | | | |
SECURITY | | ACQUISITION AND
ENFORCEABLE DATE | | AQUISITION
COST |
HON HAI PRECISION INDUSTRY PRODUCTION GDR (REGISTERED) | | 10/28/09 - 10/29/09 | | | 139,443 | |
HSBC BANK PLC | | 10/09/09 - 12/11/09 | | | 1,054,459 | |
KAZMUNAIGAS EXPLORATION PRODUCTION GDR | | 9/25/09 - 9/28/09 | | | 136,347 | |
TMK OAO GDR (REGISTERED) | | 8/28/09 - 12/3/09 | | | 198,704 | |
| | |
| (d) | Security exempt from registration under Rule 144A of the Securities Act of 1933. This security may not be publicly sold without registration under the Securities Act of 1933. The value of this security is determined by valuations supplied by a pricing service or brokers, or if not available in accordance with procedures established by the Board of Trustees of the Fund. |
| (e) | At December 31, 2009, the cost for Federal income tax purposes was $221,232,184. The aggregate gross unrealized appreciation and depreciation of investments in securities based on this cost were as follows: |
| | | | | |
| Gross unrealized appreciation | | $ | 68,864,156 | |
| Gross unrealized depreciation | | | (2,695,849 | ) |
| Net unrealized appreciation | | $ | 66,168,307 | |
| | |
See accompanying notes to the financial statements. | 82 | (Continued) |
CLEARWATER INVESTMENT TRUST
Schedule of Investments - Clearwater International Fund
December 31, 2009
At December 31, 2009, the Clearwater International Fund’s investments (unaudited) were denominated in the following currencies:
| | | | |
Concentration by Currency | | Percent of
Investments | |
Euro | | | 27.33 | % |
British Pound | | | 18.24 | |
Japanese Yen | | | 17.91 | |
U.S. Dollar | | | 12.11 | |
Swiss Franc | | | 8.57 | |
Austrialan Dollar | | | 5.89 | |
All other currencies less than 5% | | | 9.95 | |
| | | 100.00 | % |
At December 31, 2009, the Clearwater International Fund had outstanding forward foreign currency exchange contracts as follows:
| | | | | | | | | | | | | | | |
Contracts To
Deliver
Currency | | Amount
(Local
Currency) | | In
Exchange
For
Currency | | Amount
(Local
Currency) | | Settlement
Date | | Unrealized
Gain(Loss) | |
Euro | | | 311 | | United States Dollar | | | 444 | | | 01/04/10 | | $ | (2 | ) |
United States Dollar | | | 141,093 | | Australian Dollar | | | 157,329 | | | 01/04/10 | | | 169 | |
Unites States Dollar | | | 333,082 | | British Pound | | | 209,618 | | | 01/04/10 | | | 5,485 | |
United States Dollar | | | 133,547 | | Euro | | | 93,051 | | | 01/04/10 | | | (155 | ) |
United States Dollar | | | 91,393 | | Singapore Dollar | | | 128,315 | | | 01/04/10 | | | (62 | ) |
United States Dollar | | | 5,024 | | Swiss Franc | | | 5,209 | | | 01/04/10 | | | 12 | |
Euro | | | 23,551 | | British Pound | | | 21,000 | | | 01/05/10 | | | 158 | |
Euro | | | 12,147 | | United States Dollar | | | 17,394 | | | 01/05/10 | | | (18 | ) |
United States Dollar | | | 373,528 | | Japanese Yen | | | 34,353,367 | | | 01/05/10 | | | (4,662 | ) |
United States Dollar | | | 5,064 | | Swiss Franc | | | 5,245 | | | 01/05/10 | | | 7 | |
| | | | | | | | | | | | | $ | 932 | |
| |
See accompanying notes to the financial statements. | 83 |
CLEARWATER INVESTMENT TRUST
Schedule of Investments – Clearwater International Fund
December 31, 2009
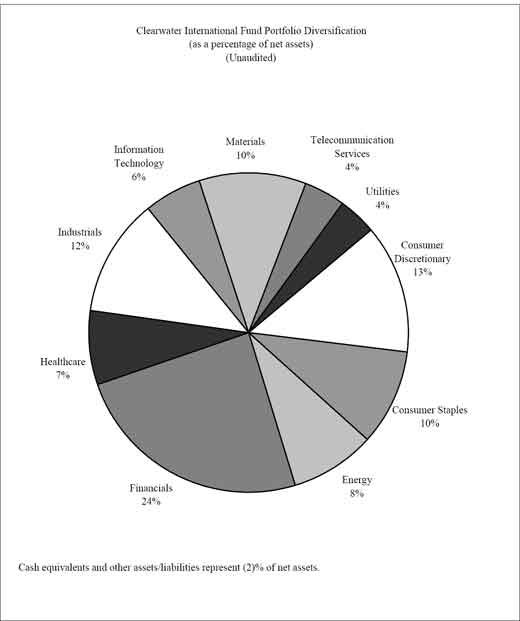
See accompanying notes to financial statements.
84
CLEARWATER INVESTMENT TRUST
FORM N-CSR
Item 2 Code of Ethics (annual report only)
| | | |
| a) | As of the end of the period covered by this report, the Trustees of the Clearwater Investment Trust have adopted a code of ethics that applies to the Trust’s principal executive officer, principal financial officer, principal accounting officer or controller, or persons performing similar functions, regardless of whether these individuals are employed by the trust or a third party. |
| b) | For purposes of this Item, the term “code of ethics” means written standards that are reasonably designed to deter wrongdoing and to promote: |
| | 1. | Honest and ethical conduct, including the ethical handling of actual or apparent conflicts of interest between personal and professional relationships; |
| | 2. | Full, fair, accurate, timely, and understandable disclosure in reports and documents that a registrant files with, or submits to, the Commission and in other public communications made by the registrant; |
| | 3. | Compliance with applicable governmental laws, rules, and regulations; |
| | 4. | The prompt internal reporting of violations of the code to an appropriate person or persons identified in the code’ and |
| | 5. | Accountability for adherence to the code. |
| c) | During the period covered by this report no amendment has been made to the Trust’s code of ethics referred to in (a) above. |
| d) | During the period covered by this report, the Trustees have granted no waivers, including implicit waivers, from any provisions of the Trust’s code of ethics referred to in (a) above. |
| e) | Not applicable. |
| f) | See Item 12(a). |
Item 3 Audit Committee Financial Expert (annual report only)
The Board of Trustees of the Clearwater Investment Trust consists of six members, four of whom are Independent Trustees as defined by the Investment Company Act of 1940. The Board of Trustees does not include an “audit committee financial expert” as defined by Section 407 of the Sarbanes-Oxley Act of 2002 and the rules promulgated thereunder. Given the restrictive nature of the definition of an “audit committee financial expert”, the Trustees have determined that the Trust’s investor constituency is highly unlikely to include anyone meeting that definition. Furthermore, the Trustees have determined that given the nature of investment company financial statements in general and the investment policies of the Trust’s fund offerings in particular that the independent trustees possess the necessary skills and experience to perform the functions of the audit committee.
Item 4 Principal Accountant Fees and Services (annual report only) (accrual basis)
| | | |
a) | Audit Fees | 2008 = $78,000 | 2007 = $79,000 |
b) | Audit-Related Fees | 2009 = None | 2008 = None |
c) | Tax Fees | 2009 = None | 2008 = None |
d) | All Other Fees | 2009 = None | 2008 = None |
e) | | | |
| | | | |
| | | 1. | The Independent Trustees have not adopted pre-approval policies and procedures regarding the provision of audit or non-audit services to the trust, as described in paragraph (c)(7) of Rule 2-01 of Regulation S-X, as they require that all such proposed services be approved by them in advance. |
| | | 2. | No services were pre-approved by the Independent Trustees pursuant to paragraph (c)(7) of Rule 2-01 of Regulation S-X. |
| f) | Not applicable. |
| g) | Non-Audit Related Fees Provided to the Trust or to the Trust’s Investment Adviser |
| | | | 2009 = $0 2008 = $4,500 |
| h) | The Trust’s Principal Accountant provides the examination required by Rule 206(4)-2(a)(3)(ii) regarding the custody and safekeeping of client funds and securities. These fees were pre-approved by the Trust’s audit committee. |
Item 5 Audit Committee of Listed Registrants (annual report only)
The Audit Committee includes the four members of the Board of Trustees who have been deemed independent. The Audit Committee has adopted a charter.
Item 6 Schedule of Investments (annual and semi-annual report)
See Item 1.
Item 7 Disclosure of Proxy Voting Policies and Procedures for Closed-End Management Investment Companies
Not applicable (the Trust is an open-end Management Investment Company)
Item 8 Portfolio Managers of Closed-End Management Investment Companies
Not applicable (the Trust is an open-end Management Investment Company)
Item 9 Purchases of Equity Securities by Closed-End Management Investment Company and Affiliated Purchasers.
Not applicable (the Trust is an open-end Management Investment Company)
Item 10 Submission of Matters to a Vote of Security Holders
There have been no material changes to the procedures by which shareholders may recommend nominees to the Board of Trustees.
Item 11 Controls and Procedures
| | |
| a) | The Trust’s principal executive officer and principal financial officer have concluded that the Trust’s disclosure controls and procedures (as defined in Rule 30a-3(c) under the Investment company Act of 1940, as amended) are effective based on their evaluation of these controls and procedures as of a date within 90 days of the filing date of this document. |
| b) | There have been no significant changes in the Trust’s internal controls over financial reporting since the filing of the last report that have materially affected, or are reasonably likely to materially affect, the Trust’s internal control over financial reporting. |
Item 12 Exhibits
| | |
| a) | The Clearwater Investment Trust Code of Ethics for the President, Treasurer and Principal Accounting Officer is attached. |
| b) | The certifications for each principal executive and principal financial officer of the Trust as required by Rule 30a-2(a) of the Investment Company Act of 1940 are attached. |
| c) | No written solicitations to purchase securities were sent or delivered during the period covered by this report by or on behalf of the Trust. |
Signatures
Pursuant to the requirements of the Securities Exchange Act of 1934 and the Investment Company Act of 1940, the Registrant has duly caused this report to be signed on its behalf by the undersigned, thereunto duly authorized.
| | |
Registrant: | Clearwater Investment Trust | |
| | |
| /s/George H. Weyerhaeuser, Jr. | |
| | |
| George H. Weyerhaeuser, Jr.
Chairman | |
| | |
Date: | March 1, 2010 | |
Pursuant to the requirements of the Securities Exchange Act of 1934 and the Investment Company Act of 1040, this report has been signed below by the following persons on behalf of the registrant and in the capacities and on the dates indicated.
| | |
| /s/George H. Weyerhaeuser, Jr. | |
| | |
| George H. Weyerhaeuser, Jr.
Chairman | |
| | |
Date: | March 1, 2010 | |
| | |
Pursuant to the requirements of the Securities Exchange Act of 1934 and the Investment Company Act of 1040, this report has been signed below by the following persons on behalf of the registrant and in the capacities and on the dates indicated.
| | |
| /s/George H. Weyerhaeuser, Jr. | |
| | |
| George H. Weyerhaeuser, Jr.
Treasurer | |
| | |
Date: | March 1, 2010 | |