For federal income tax purposes, the Growth Fund, Small Cap Fund, Tax-Exempt Bond Fund, and International Fund have capital loss carryovers of $10,839,788, $12,956,601, $7,429,939, and $0, respectively, at December 31, 2010, which, if not offset by subsequent capital gains, will expire as follows:
The following capital loss carryforwards were utilized at December 31, 2010, for U.S. Federal income tax purposes:
CLEARWATER INVESTMENT TRUST
Notes to Financial Statements
December 31, 2010
The Regulated Investment Company Modernization Act of 2010 (the “Act”) was enacted on December 22, 2010. The Act makes changes to several tax rules impacting the Funds. In general, the provisions of the Act will be effective for the Funds’ fiscal year ending December 31, 2011. Although the Act provides several benefits, including the unlimited carryover of future capital losses, there may be a greater likelihood that all or a portion of each fund’s pre-enactment capital loss carryovers may expire without being utilized due to the fact that post-enactment capital losses get utilized before pre-enactment capital loss carryovers. Relevant information regarding the impact of the Act on the Fund, if any, will be contained within the “Federal Taxes” section of the financial statement notes for the fiscal year ending December 31, 2011.
(7) Expenses and Related-Party Transactions
The Trust has a contract for investment advisory services with Clearwater Management Company (“CMC”). Under terms of separate agreements, Clearwater Growth Fund, Clearwater Small Cap Fund, Clearwater Tax-Exempt Bond Fund and Clearwater International Fund pay a fee equal to an annual rate of 0.45%, 1.35%, 0.60% and 1.00% of average net assets, respectively. CMC is responsible for the payment or reimbursement of all the Funds’ expenses, except brokerage, taxes, interest, and extraordinary expenses. CMC has periodically reduced its management fee for each of the Funds through voluntary waivers. As of December 31, 2010, the management fees paid by the Small Cap, Tax-Exempt and International Funds net of voluntary waiver are 0.95%, 0.36%, and 0.80%, respectively. Previously, CMC periodically reduced its management fee for the Growth Fund through a voluntary waiver to 0.28%. Effective December 1, 2010, this voluntary waiver was discontinued. For the year ended, December 31, 2010, the effective expense rate for the Clearwater Growth Fund was 0.30%
In addition to fees and expenses which the Funds bear directly, the Funds indirectly bear a pro rata share of the fees and expenses of any acquired funds in which they invest, such as short-term investments in mutual funds and investments in closed-end funds. Such indirect expenses are not included in any of the reported expense ratios.
CMC has entered into sub advisory contracts with independent investment advisory firms for each fund to provide daily investment management services. The sub advisory fee for the Clearwater Growth Fund, payable to Parametric, Heartland, Osterweis and Knightsbridge, is equal to an annual rate of 0.14% of net assets, an annual rate of 0.65% of net assets, an annual rate of 0.75% of net assets, and an annual rate of 0.75% on the first $20 million in net assets it manages and then decreasing to 0.50% of net assets in excess of $20 million, respectively.
The sub advisory fee for the Clearwater Small Cap Fund, payable to Kennedy Capital Management, Inc. is equal to an annual rate of 0.85% on the first $50 million in net assets it manages and then decreasing to 0.80% of net assets in excess of $50 million.
The sub advisory fee for the Clearwater Small Cap Fund, payable to Keeley Asset Management, is equal to an annual rate of 1.00% on the first $2 million in net assets it manages, decreasing to 0.85% on the next $8 million in net assets, and further decreasing to 0.70% of net assets in excess of $10 million.
The sub advisory fee for the Clearwater Tax-Exempt Bond Fund, payable to Sit Fixed Income Advisers II, LLC, is equal to an annual rate of 0.40% on the first $20 million in net assets it manages and then decreasing in reduced percentages to 0.20% of net assets it manages in excess of $75 million.
CLEARWATER INVESTMENT TRUST
Notes to Financial Statements
December 31, 2010
The sub advisory fee for the Clearwater International Fund, payable to Parametric, is equal to an annual rate of 0.15% of net assets. The sub advisory fee, payable to AXA Rosenberg, is equal to an annual rate of 0.85% on the first $50 million in net asses it manages, decreasing to 0.75% on the next $50 million in net assets, and further decreasing to 0.65% of net assets in excess of $100 million. The sub advisory fee, payable to Artisan Partners, is equal to an annual rate of 0.80% on the first $50 million in net assets it manages, decreasing to 0.60% on the next $50 million in net assets, and further decreasing to 0.50% of net assets in excess of $100 million. The sub advisory fee, payable to Eagle, is equal to an annual rate of 0.60% on the first $100 million in net assets it manages and then decreasing to 0.50% of net assets in excess of $100 million.
(8) Derivative Instruments
Information concerning the types of derivatives in which the International Fund invests, the objectives for using them and their related risks can be found in Note 2.
Below are the types of derivatives in the International Fund by location as presented in the Statement of Assets and Liabilities as of December 31, 2010:
| | | | | | | | | | |
| | ASSETS | | | | | LIABILITIES | | | |
Derivative Type | | Statement of Assets and
Liabilities Location | | | Value | | Statement of Assets and
Liabilities Location | | | Value |
|
Forward foreign | | Unrealized appreciation on | | | | | Unrealized depreciation on | | | |
exchange | | forward foreign currency | | | | | forward foreign currency | | | |
contracts | | exchange contracts | | $ | 5,103 | | exchange contracts | | $ | 56 |
The following tables set forth by primary risk exposure the International Fund’s realized gains (losses) and change in unrealized gains (losses) by type of derivative contract for the year ended December 31, 2010:
| | | | | | | | | | | | |
AMOUNT OF REALIZED GAIN (LOSS) ON
DERIVATIVE CONTRACTS | | CHANGE IN UNREALIZED APPRECIATION
(DEPRECIATION) ON DERVIATIVE CONTRACTS |
Derivative Type | | Statement of
Operations Location | | | Value | | Derivative Type | | Statement of
Operations Location | | | Value |
| | Net realized loss on | | | | | | | Net change in unrealized | | | |
Forward foreign | | forward foreign | | | | | Forward foreign | | appreciation on forward foreign | | | |
exchange | | currency exchange | | | | | exchange | | currency exchange contracts | | | |
contracts | | contracts | | $ | (1,897 | ) | contracts | | during the year | | $ | 4,115 |
CLEARWATER INVESTMENT TRUST
Notes to Financial Statements
December 31, 2010
The following table presents the volume of derivative activity for the year ended December 31, 2010. Derivative activity during the year is measured by number of transactions during the period and average notional amount for foreign exchange contracts.
| | | | | | | |
| | Foreign Exchange Contracts | |
| | Number of
Transactions | | Average Notional
Amount | |
Clearwater International Fund | | | 508 | | $ | 51,870 | |
| |
(9) | Subsequent Events |
| |
Management has evaluated subsequent events for the Funds through the date the financial statements were issued, and has concluded there are no recognized or non-recognized subsequent events that require financial statement disclosure and/or adjustments to the financial statements. |
CLEARWATER INVESTMENT TRUST
Financial Highlights
December 31, 2010
Per share data (rounded to the nearest cent) for a share of capital stock outstanding throughout the years and selected information for each year is as follows:
| | | | | | | | | | | | | | | | |
| | Year ended December 31, | |
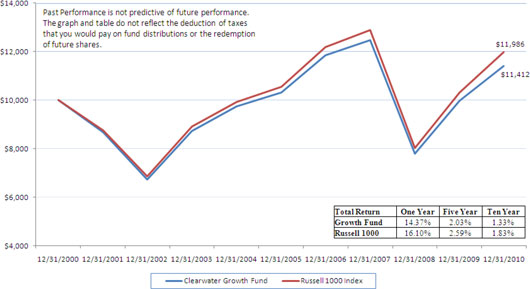
Growth Fund | | 2010 | | 2009 | | 2008 | | 2007 | | 2006 | |
Net asset value, beginning of year | | $ | 23.40 | | | 18.60 | | | 30.57 | | | 29.47 | | | 26.03 | |
Income from investment operations: | | | | | | | | | | | | | | | | |
Net investment income | | | 0.38 | | | 0.39 | | | 0.51 | | | 0.48 | | | 0.40 | |
Net realized and unrealized gain (loss) | | | 2.99 | | | 4.78 | | | (11.96 | ) | | 1.10 | | | 3.44 | |
Total from investment operations | | | 3.37 | | | 5.17 | | | (11.45 | ) | | 1.58 | | | 3.84 | |
Less distributions: | | | | | | | | | | | | | | | | |
Dividends from net investment income | | | (0.39 | ) | | (0.37 | ) | | (0.52 | ) | | (0.48 | ) | | (0.40 | ) |
Distributions from net realized gains | | | — | | | — | | | — | | | — | | | — | |
Total distributions | | | (0.39 | ) | | (0.37 | ) | | (0.52 | ) | | (0.48 | ) | | (0.40 | ) |
Net asset value, end of year | | $ | 26.38 | | | 23.40 | | | 18.60 | | | 30.57 | | | 29.47 | |
Total return (a) | | | 14.4 | % | | 27.9 | % | | (37.5 | )% | | 5.4 | % | | 14.8 | % |
Net assets, end of year (000s omitted) | | $ | 344,270 | | | 293,188 | | | 197,263 | | | 330,991 | | | 291,513 | |
Ratio of expenses, net of waivers, to average net assets (b) (c) | | | 0.30 | % | | 0.28 | % | | 0.28 | % | | 0.28 | % | | 0.31 | % |
Ratio of expenses, before waivers, to average net assets (b) (c) | | | 0.45 | % | | 0.45 | % | | 0.45 | % | | 0.45 | % | | 0.45 | % |
Ratio of net investment income, net of waivers, to average net assets (b) | | | 1.60 | % | | 1.98 | % | | 1.92 | % | | 1.61 | % | | 1.56 | % |
Ratio of net investment income, before waivers, to average net assets (b) | | | 1.45 | % | | 1.81 | % | | 1.75 | % | | 1.44 | % | | 1.42 | % |
Portfolio turnover rate (excluding short-term securities) | | | 43.65 | % | | 21.83 | % | | 14.71 | % | | 17.99 | % | | 5.24 | % |
| | |
| (a) | Total return figures are based on the change in net asset value of a share during the year and assume reinvestment of distributions at net asset value. |
| | |
| (b) | Effective December 1, 2010, the investment advisor discontinued the voluntary waiver previously in effect. |
| | |
| (c) | In addition to fees and expenses which the Fund bears directly, the Fund indirectly bears a pro rata share of the fees and expenses of any acquired funds in which it invests. Such indirect expenses are not included in the above reported expense ratios. |
CLEARWATER INVESTMENT TRUST
Financial Highlights
December 31, 2010
| | | | | | | | | | | | | | | | |
| | Year ended December 31, | |
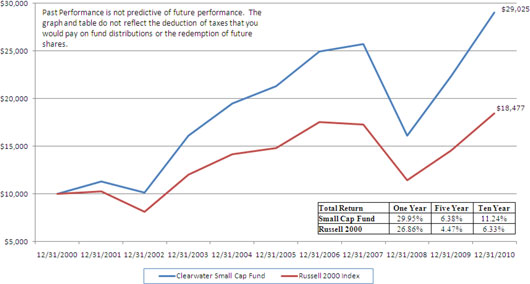
Small Cap Fund | | 2010 | | 2009 | | 2008 | | 2007 | | 2006 | |
Net asset value, beginning of year | | $ | 14.41 | | | 10.39 | | | 16.68 | | | 18.71 | | | 18.09 | |
Income from investment operations: | | | | | | | | | | | | | | | | |
Net investment income (loss) | | | — | | | — | | | 0.05 | | | — | | | (0.04 | ) |
Net realized and unrealized gains (losses) | | | 4.31 | | | 4.02 | | | (6.29 | ) | | 0.58 | | | 3.13 | |
Total from investment operations | | | 4.31 | | | 4.02 | | | (6.24 | ) | | 0.58 | | | 3.09 | |
Less distributions: | | | | | | | | | | | | | | | | |
Distributions from net investment income | | | (0.02 | ) | | — | | | (0.05 | ) | | — | | | — | |
Distributions from net realized gains | | | — | | | — | | | — | | | (2.61 | ) | | (2.47 | ) |
Total distributions | | | (0.02 | ) | | — | | | (0.05 | ) | | (2.61 | ) | | (2.47 | ) |
Net asset value, end of year | | $ | 18.70 | | | 14.41 | | | 10.39 | | | 16.68 | | | 18.71 | |
Total return (a) | | | 30.0 | % | | 38.7 | % | | (37.4 | )% | | 3.1 | % | | 17.1 | % |
Net assets, end of year (000s omitted) | | $ | 256,237 | | | 214,335 | | | 120,846 | | | 246,987 | | | 253,846 | |
Ratio of expenses, net of waivers, to average net assets (b) | | | 0.95 | % | | 0.95 | % | | 0.95 | % | | 0.98 | % | | 1.03 | % |
Ratio of expenses, before waivers, to average net assets (b) | | | 1.35 | % | | 1.35 | % | | 1.35 | % | | 1.35 | % | | 1.35 | % |
Ratio of net investment income (loss), net of waivers, to average net assets | | | (0.02 | )% | | (0.04 | )% | | 0.32 | % | | — | % | | (0.23 | )% |
Ratio of net investment income (loss), before waivers, to average net assets | | | (0.42 | )% | | (0.44 | )% | | (0.08 | )% | | (0.37 | )% | | (0.55 | )% |
Portfolio turnover rate (excluding short-term securities) | | | 71.05 | % | | 95.13 | % | | 117.12 | % | | 115.19 | % | | 69.57 | % |
| | |
| (a) | Total return figures are based on the change in net asset value of a share during the year and assume reinvestment of distributions at net asset value. |
| | |
| (b) | In addition to fees and expenses which the Fund bears directly, the Fund indirectly bears a pro rata share of the fees and expenses of any acquired funds in which it invests. Such indirect expenses are not included in the above reported expense ratios. |
CLEARWATER INVESTMENT TRUST
Financial Highlights
December 31, 2010
| | | | | | | | | | | | | | | | |
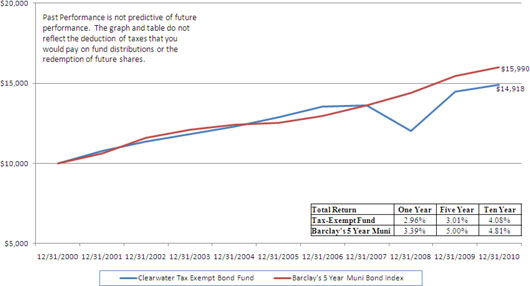
Tax-Exempt | | Year ended December 31, | |
Bond Fund | | 2010 | | 2009 | | 2008 | | 2007 | | 2006 | |
Net asset value, beginning of year | | $ | 9.25 | | | 8.09 | | | 9.64 | | | 10.06 | | | 10.00 | |
Income from investment operations: | | | | | | | | | | | | | | | | |
Net investment income | | | 0.47 | | | 0.47 | | | 0.46 | | | 0.46 | | | 0.43 | |
Net realized and unrealized gains (losses) | | | (0.19 | ) | | 1.16 | | | (1.55 | ) | | (0.42 | ) | | 0.06 | |
Total from investment operations | | | 0.28 | | | 1.63 | | | (1.09 | ) | | 0.04 | | | 0.49 | |
Less distributions: | | | | | | | | | | | | | | | | |
Distributions from net investment income | | | (0.47 | ) | | (0.47 | ) | | (0.46 | ) | | (0.46 | ) | | (0.43 | ) |
Distributions from net realized gains | | | — | | | — | | | — | | | — | | | — | |
Total distributions | | | (0.47 | ) | | (0.47 | ) | | (0.46 | ) | | (0.46 | ) | | (0.43 | ) |
Net asset value, end of year | | $ | 9.06 | | | 9.25 | | | 8.09 | | | 9.64 | | | 10.06 | |
Total return (a) | | | 3.0 | % | | 20.6 | % | | (11.8 | )% | | 0.6 | % | | 5.3 | % |
Net assets, end of year (000s omitted) | | $ | 516,202 | | | 542,394 | | | 370,848 | | | 337,395 | | | 283,745 | |
Ratio of expenses, net of waivers, to average net assets (b) | | | 0.36 | % | | 0.36 | % | | 0.37 | % | | 0.38 | % | | 0.42 | % |
Ratio of expenses, before waivers, to average net assets (b) | | | 0.60 | % | | 0.60 | % | | 0.60 | % | | 0.60 | % | | 0.60 | % |
Ratio of net investment income, net of waivers, to average net assets | | | 5.00 | % | | 5.34 | % | | 5.03 | % | | 4.75 | % | | 4.66 | % |
Ratio of net investment income, before waivers, to average net assets | | | 4.76 | % | | 5.10 | % | | 4.80 | % | | 4.53 | % | | 4.48 | % |
Portfolio turnover rate (excluding short-term securities) | | | 28.95 | % | | 22.90 | % | | 32.20 | % | | 27.58 | % | | 40.20 | % |
| | |
| (a) | Total return figures are based on the change in net asset value of a share during the year and assume reinvestment of distributions at net asset value. |
| | |
| (b) | In addition to fees and expenses which the Fund bears directly, the Fund indirectly bears a pro rata share of the fees and expenses of any acquired funds in which it invests. Such indirect expenses are not included in the above reported expense ratios. |
CLEARWATER INVESTMENT TRUST
Financial Highlights
December 31, 2010
| | | | | | | |
| | | | | | | |
| | Year ended
December 31, | | Period ended
December 31, | |
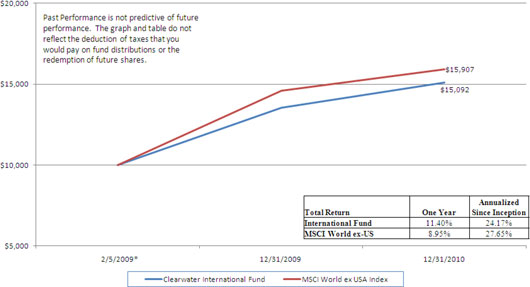
International Fund | | 2010 | | 2009 (c)(d) | |
| | | | | | | |
Net asset value, beginning of period | | $ | 13.16 | | | 10.00 | |
Income from investment operations: | | | | | | | |
Net investment income | | | 0.23 | | | 0.19 | |
Net realized and unrealized gains | | | 1.27 | | | 3.35 | |
Total from investment operations | | | 1.50 | | | 3.54 | |
Less distributions: | | | | | | | |
Distributions from net investment income | | | (0.23 | ) | | (0.18 | ) |
Distributions from net realized gains | | | (0.10 | ) | | (0.20 | ) |
Total distributions | | | (0.33 | ) | | (0.38 | ) |
| | | | | | | |
Net asset value, end of period | | $ | 14.33 | | | 13.16 | |
| | | | | | | |
Total return (a) | | | 11.4 | % | | 35.5 | % |
| | | | | | | |
Net assets, end of period (000s omitted) | | $ | 346,415 | | | 292,902 | |
| | | | | | | |
Ratio of expenses, net of waivers, to average net assets (b) | | | 0.80 | % | | 0.92 | % |
| | | | | | | |
Ratio of expenses, before waivers, to average net assets (b) | | | 1.00 | % | | 1.00 | % |
| | | | | | | |
Ratio of net investment income, net of waivers, to average net assets (b) | | | 1.77 | % | | 1.74 | % |
| | | | | | | |
Ratio of net investment income, before waivers, to average net assets (b) | | | 1.57 | % | | 1.66 | % |
| | | | | | | |
Portfolio turnover rate (excluding short-term securities) | | | 30.82 | % | | 35.33 | % |
| |
(a) | Total return figures are based on the change in net asset value of a share during the period and assume reinvestment of distributions at net asset value. Total return is not annualized for periods less than one year. |
| |
(b) | Annualized for periods less than one year. |
| |
(c) | Commenced investment operations on February 5, 2009. |
| |
(d) | Net investment income for the period ended was calculated using the average shares outstanding method. |
CLEARWATER INVESTMENT TRUST
Schedule of Investments - Clearwater Growth Fund
December 31, 2010
| | | | | | | | | | | | | |
Shares | | Security | | Cost | | Fair
value (a) | | Percent
of
net assets | |
Common stocks: | | | | | | | | | | |
Consumer discretionary: | | | | | | | | | | |
| 1,200 | | AARON S INC | | $ | 24,772 | | | 24,468 | | | | |
| 2,300 | | ABERCROMBIE & FITCH CO-CL A | | | 50,218 | | | 132,549 | | | | |
| 1,500 | | ADVANCE AUTO PARTS INC | | | 53,558 | | | 99,225 | | | | |
| 6,150 | | AMAZON.COM INC (b) | | | 274,722 | | | 1,107,000 | | | | |
| 3,300 | | AMERICAN EAGLE OUTFITTERS | | | 33,099 | | | 48,279 | | | | |
| 1,100 | | AUTOLIV INC (c) | | | 19,410 | | | 86,834 | | | | |
| 500 | | AUTOZONE INC (b) | | | 32,038 | | | 136,295 | | | | |
| 4,575 | | BED BATH & BEYOND INC (b) | | | 120,780 | | | 224,861 | | | | |
| 4,800 | | BEST BUY CO INC | | | 84,882 | | | 164,592 | | | | |
| 1,400 | | BIG LOTS INC (b) | | | 15,477 | | | 42,644 | | | | |
| 1,900 | | BJ’S WHOLESALE CLUB INC (b) | | | 62,368 | | | 91,010 | | | | |
| 2,200 | | BORGWARNER INC (b) | | | 51,799 | | | 159,192 | | | | |
| 5,450 | | BRINKER INTERNATIONAL INC | | | 73,275 | | | 113,796 | | | | |
| 5,300 | | BROCADE COMMUNICATIONS SYS (b) | | | 27,300 | | | 28,037 | | | | |
| 6,400 | | CABLEVISION SYSTEMS-NY GRP-A | | | 85,854 | | | 216,576 | | | | |
| 4,168 | | CARMAX INC (b) | | | 50,984 | | | 132,876 | | | | |
| 7,800 | | CARNIVAL CORP | | | 234,585 | | | 359,658 | | | | |
| 6,043 | | CBS CORP-CLASS B NON VOTING | | | 52,350 | | | 115,119 | | | | |
| 2,400 | | CENTRAL EUROPEAN MEDIA ENT-A (b)(c) | | | 50,118 | | | 48,840 | | | | |
| 5,100 | | CHICO’S FAS INC | | | 55,562 | | | 61,353 | | | | |
| 11,800 | | CLEAR CHANNEL OUTDOOR-CL A (b) | | | 98,115 | | | 165,672 | | | | |
| 5,000 | | COACH INC | | | 19,161 | | | 276,550 | | | | |
| 40,567 | | COMCAST CORP-CLASS A | | | 643,281 | | | 891,257 | | | | |
| 7,800 | | COSTCO WHOLESALE CORP | | | 237,671 | | | 563,238 | | | | |
| 6,900 | | D R HORTON INC | | | 46,031 | | | 82,317 | | | | |
| 2,300 | | DARDEN RESTAURANTS INC | | | 47,909 | | | 106,812 | | | | |
| 1,500 | | DICK’S SPORTING GOODS INC (b) | | | 24,803 | | | 56,250 | | | | |
| 14,821 | | DIRECTV-CLASS A (b) | | | 174,284 | | | 591,803 | | | | |
| 2,000 | | DOLBY LABORATORIES INC-CL A (b) | | | 43,420 | | | 133,400 | | | | |
| 3,350 | | DOLLAR TREE INC (b) | | | 61,517 | | | 187,868 | | | | |
| 3,600 | | DREAMWORKS ANIMATION SKG-A (b) | | | 77,238 | | | 106,092 | | | | |
| 5,320 | | EXPEDIA INC | | | 102,537 | | | 133,479 | | | | |
| 500 | | FAMILY DOLLAR STORES | | | 12,653 | | | 24,855 | | | | |
| 3,000 | | FOOT LOCKER INC | | | 40,394 | | | 58,860 | | | | |
| 59,163 | | FORD MOTOR CO (b) | | | 305,760 | | | 993,347 | | | | |
| 4,300 | | FORTUNE BRANDS INC | | | 149,332 | | | 259,075 | | | | |
| 4,600 | | GAMESTOP CORP-CLASS A (b) | | | 34,643 | | | 105,248 | | | | |
| 3,100 | | GANNETT INC | | | 25,746 | | | 46,779 | | | | |
| 7,700 | | GAP INC/THE | | | 112,586 | | | 170,478 | | | | |
| 4,500 | | GARMIN LTD (c) | | | 104,221 | | | 139,455 | | | | |
| 7,500 | | GENTEX CORP | | | 106,860 | | | 221,700 | | | | |
| 3,450 | | GENUINE PARTS CO | | | 102,425 | | | 177,123 | | | | |
| 800 | | GUESS? INC | | | 27,580 | | | 37,856 | | | | |
| 1,700 | | HANESBRANDS INC (b) | | | 43,166 | | | 43,180 | | | | |
| 6,750 | | HARLEY-DAVIDSON INC | | | 39,547 | | | 234,023 | | | | |
| 4,300 | | HARMAN INTERNATIONAL (b) | | | 74,799 | | | 199,090 | | | | |
| 400 | | HASBRO INC | | | 10,206 | | | 18,872 | | | | |
| 6,600 | | HERTZ GLOBAL HOLDINGS INC (b) | | | 37,676 | | | 95,634 | | | | |
| 33,825 | | HOME DEPOT INC | | | 22,060 | | | 1,185,905 | | | | |
| 2,710 | | IAC/INTERACTIVECORP (b) | | | 66,598 | | | 77,777 | | | | |
| 15,600 | | INTERPUBLIC GROUP OF COS INC (b) | | | 40,950 | | | 165,672 | | | | |
| 2,500 | | INTL GAME TECHNOLOGY | | | 29,763 | | | 44,225 | | | | |
| 6,800 | | J.C. PENNEY CO INC | | | 259,828 | | | 219,708 | | | | |
| 31,050 | | JOHNSON CONTROLS INC | | | 874,850 | | | 1,186,110 | | | | |
| 7,750 | | KOHLS CORP (b) | | | 86,001 | | | 421,135 | | | | |
| 2,800 | | LAMAR ADVERTISING CO-A (b) | | | 29,498 | | | 111,552 | | | | |
| 5,738 | | LAS VEGAS SANDS CORP (b) | | | 39,736 | | | 263,661 | | | | |
| 400 | | LEAR CORP (b) | | | 31,536 | | | 39,484 | | | | |
| 2,500 | | LEGGETT & PLATT INC | | | 48,888 | | | 56,900 | | | | |
| 4,700 | | LENNAR CORP-A | | | 64,339 | | | 88,125 | | | | |
| 4,440 | | LIBERTY MEDIA CORP-CAP SER A (b) | | | 22,396 | | | 277,766 | | | | |
| | |
See accompanying notes to financial statements. | 25 | (Continued) |
CLEARWATER INVESTMENT TRUST
Schedule of Investments - Clearwater Growth Fund
December 31, 2010
| | | | | | | | | | | | | |
Shares | | Security | | Cost | | Fair
value (a) | | Percent
of
net assets | |
Consumer discretionary (Cont’d): | | | | | | | | | | |
| 9,800 | | LIBERTY MEDIA CORP-INTER A (b) | | $ | 30,625 | | | 154,546 | | | | |
| 1,272 | | LIBERTY MEDIA-STARZ SERIES A (b) | | | 18,267 | | | 84,563 | | | | |
| 6,190 | | LIMITED BRANDS INC | | | 70,745 | | | 190,219 | | | | |
| 46,400 | | LOWE’S COS INC | | | 884,987 | | | 1,163,712 | | | | |
| 3,100 | | MACYS INC | | | 29,714 | | | 78,430 | | | | |
| 1,600 | | MADISON SQUARE GAR INC-A (b) | | | 18,242 | | | 41,248 | | | | |
| 41,730 | | MARKS & SPENCER PLC-ADR (c)(d) | | | 485,763 | | | 479,895 | | | | |
| 4,969 | | MARRIOTT INTERNATIONAL-CL A | | | 63,668 | | | 206,412 | | | | |
| 4,200 | | MATTEL INC | | | 75,213 | | | 106,806 | | | | |
| 16,400 | | MCDONALD’S CORP | | | 370,761 | | | 1,258,864 | | | | |
| 4,700 | | MCGRAW-HILL COMPANIES INC | | | 121,958 | | | 171,127 | | | | |
| 2,200 | | MDC HOLDINGS INC | | | 73,073 | | | 63,294 | | | | |
| 7,000 | | MGM RESORTS INTERNATIONAL (b) | | | 61,970 | | | 103,950 | | | | |
| 13,000 | | MOHAWK INDUSTRIES INC (b) | | | 768,826 | | | 737,880 | | | | |
| 34,000 | | NEWS CORP-CL A | | | 354,723 | | | 495,040 | | | | |
| 4,400 | | NIKE INC -CL B | | | 126,358 | | | 375,848 | | | | |
| 4,300 | | NORDSTROM INC | | | 45,233 | | | 182,234 | | | | |
| 100 | | NVR INC (b) | | | 51,543 | | | 69,102 | | | | |
| 2,395 | | OMNICOM GROUP | | | 60,312 | | | 109,691 | | | | |
| 2,300 | | O’REILLY AUTOMOTIVE INC (b) | | | 69,869 | | | 138,966 | | | | |
| 1,500 | | PANERA BREAD COMPANY-CLASS A (b) | | | 69,668 | | | 151,815 | | | | |
| 1,600 | | PENN NATIONAL GAMING INC (b) | | | 59,240 | | | 56,240 | | | | |
| 2,600 | | PETSMART INC | | | 55,966 | | | 103,532 | | | | |
| 700 | | PHILLIPS-VAN HEUSEN | | | 26,254 | | | 44,107 | | | | |
| 1,500 | | POLO RALPH LAUREN CORP | | | 31,320 | | | 166,380 | | | | |
| 600 | | PRICELINE.COM INC (b) | | | 55,053 | | | 239,730 | | | | |
| 8,600 | | PULTEGROUP INC (b) | | | 87,785 | | | 64,672 | | | | |
| 6,200 | | RADIOSHACK CORP | | | 75,547 | | | 114,638 | | | | |
| 3,000 | | REGAL ENTERTAINMENT GROUP-A | | | 30,735 | | | 35,220 | | | | |
| 2,300 | | ROSS STORES INC | | | 36,395 | | | 145,475 | | | | |
| 2,900 | | ROYAL CARIBBEAN CRUISES LTD (b) | | | 48,744 | | | 136,300 | | | | |
| 600 | | SCRIPPS NETWORKS INTER-CL A | | | 21,337 | | | 31,050 | | | | |
| 1,227 | | SEARS HOLDINGS CORP (b) | | | 78,518 | | | 90,491 | | | | |
| 1,585 | | SHERWIN-WILLIAMS CO/THE | | | 72,398 | | | 132,744 | | | | |
| 2,600 | | SIGNET JEWELERS LTD (b)(c) | | | 52,469 | | | 112,840 | | | | |
| 700 | | SNAP ON INC | | | 17,991 | | | 39,606 | | | | |
| 2,557 | | STANLEY BLACK & DECKER INC | | | 72,048 | | | 170,987 | | | | |
| 15,250 | | STAPLES INC | | | 239,208 | | | 347,243 | | | | |
| 15,750 | | STARBUCKS CORP | | | 204,658 | | | 506,048 | | | | |
| 810 | | STARWOOD HOTELS & RESORTS | | | 17,520 | | | 49,232 | | | | |
| 12,200 | | TARGET CORP | | | 353,659 | | | 733,586 | | | | |
| 6,600 | | THOMSON REUTERS CORP | | | 244,751 | | | 245,982 | | | | |
| 1,900 | | THOR INDUSTRIES INC | | | 22,316 | | | 64,524 | | | | |
| 4,200 | | TIFFANY & CO | | | 122,192 | | | 261,534 | | | | |
| 6,279 | | TIME WARNER CABLE | | | 208,890 | | | 414,602 | | | | |
| 21,833 | | TIME WARNER INC | | | 498,014 | | | 702,368 | | | | |
| 5,047 | | TJX COMPANIES INC | | | 86,032 | | | 224,036 | | | | |
| 2,900 | | TOLL BROTHERS INC (b) | | | 61,023 | | | 55,100 | | | | |
| 800 | | TRW AUTOMOTIVE HOLDINGS CORP (b) | | | 18,215 | | | 42,160 | | | | |
| 3,227 | | URBAN OUTFITTERS INC (b) | | | 61,561 | | | 115,559 | | | | |
| 1,700 | | VF CORP | | | 87,064 | | | 146,506 | | | | |
| 8,457 | | VIACOM INC-CLASS B | | | 218,418 | | | 334,982 | | | | |
| 5,300 | | VIRGIN MEDIA INC | | | 78,460 | | | 144,372 | | | | |
| 1,966 | | WABCO HOLDINGS INC (b) | | | 30,196 | | | 119,788 | | | | |
| 700 | | WABTEC CORP | | | 25,602 | | | 37,023 | | | | |
| 26,396 | | WAL-MART STORES INC | | | 1,091,485 | | | 1,423,536 | | | | |
| 29,960 | | WALT DISNEY CO/THE | | | 587,934 | | | 1,123,800 | | | | |
| 2,300 | | WHIRLPOOL CORP | | | 98,183 | | | 204,309 | | | | |
| 5,475 | | WYNDHAM WORLDWIDE CORP | | | 24,500 | | | 164,030 | | | | |
| 1,600 | | WYNN RESORTS LTD | | | 42,371 | | | 166,143 | | | | |
| 9,016 | | YUM! BRANDS INC | | | 78,830 | | | 442,234 | | | | |
| | | | | | 15,047,555 | | | 29,767,888 | | | 8.65 | % |
| | |
See accompanying notes to financial statements. | 26 | (Continued) |
CLEARWATER INVESTMENT TRUST
Schedule of Investments - Clearwater Growth Fund
December 31, 2010
| | | | | | | | | | | | |
Shares | | Security | | Cost | | Fair
value (a) | | Percent
of
net assets | |
Consumer staples: | | | | | | | | | | | |
| 1,600 | | ALBERTO-CULVER CO | | $ | 38,952 | | | 59,264 | | | | |
| 31,300 | | ALTRIA GROUP INC | | | 154,111 | | | 770,606 | | | | |
| 10,900 | | ARCHER-DANIELS-MIDLAND CO | | | 201,692 | | | 327,872 | | | | |
| 7,162 | | AVON PRODUCTS INC | | | 161,290 | | | 208,128 | | | | |
| 1,944 | | BROWN-FORMAN CORP-CLASS B | | | 57,343 | | | 135,341 | | | | |
| 13,900 | | BUNGE LTD | | | 938,386 | | | 910,728 | | | | |
| 2,500 | | CAMPBELL SOUP CO | | | 82,729 | | | 86,875 | | | | |
| 1,500 | | CENTRAL EURO DISTRIBUTION CP (b) | | | 21,353 | | | 34,350 | | | | |
| 2,000 | | CHURCH & DWIGHT CO INC | | | 100,310 | | | 138,040 | | | | |
| 4,000 | | CLOROX COMPANY | | | 216,975 | | | 253,120 | | | | |
| 32,261 | | COCA-COLA CO/THE | | | 992,260 | | | 2,121,806 | | | | |
| 2,300 | | COCA-COLA ENTERPRISES | | | 39,664 | | | 57,569 | | | | |
| 7,390 | | COLGATE PALMOLIVE CO | | | 422,681 | | | 593,934 | | | | |
| 3,500 | | CONAGRA FOODS INC | | | 67,841 | | | 79,030 | | | | |
| 6,000 | | CONSTELLATION BRANDS INC-A (b) | | | 88,385 | | | 132,900 | | | | |
| 1,300 | | CORN PRODUCTS INTL INC | | | 29,972 | | | 59,800 | | | | |
| 31,795 | | COSAN LTD-CLASS A SHARES (c) | | | 441,269 | | | 433,048 | | | | |
| 44,922 | | CVS CAREMARK CORP | | | 992,800 | | | 1,561,938 | | | | |
| 5,773 | | DEL MONTE FOODS CO | | | 57,723 | | | 108,532 | | | | |
| 17,920 | | DIAGEO PLC-SPONSORED ADR (c)(d) | | | 1,296,437 | | | 1,331,994 | | | | |
| 6,000 | | DR PEPPER SNAPPLE GROUP INC | | | 125,060 | | | 210,960 | | | | |
| 1,867 | | ESTEE LAUDER COMPANIES-CL A | | | 70,943 | | | 150,667 | | | | |
| 1,200 | | FLOWERS FOODS INC | | | 25,434 | | | 32,292 | | | | |
| 12,400 | | GENERAL MLS INC | | | 277,056 | | | 441,316 | | | | |
| 2,400 | | GREEN MOUNTAIN COFFEE ROASTE (b) | | | 44,948 | | | 78,864 | | | | |
| 900 | | HANSEN NATURAL CORP (b) | | | 30,956 | | | 47,052 | | | | |
| 1,900 | | HERBALIFE LTD (c) | | | 52,204 | | | 129,903 | | | | |
| 1,700 | | HERSHEY CO / THE | | | 62,743 | | | 80,155 | | | | |
| 3,500 | | HJ HEINZ CO | | | 111,698 | | | 173,110 | | | | |
| 1,200 | | HORMEL FOODS CORP | | | 43,206 | | | 61,512 | | | | |
| 1,600 | | JM SMUCKER CO/THE | | | 64,617 | | | 105,040 | | | | |
| 2,300 | | KELLOGG CO | | | 99,285 | | | 117,484 | | | | |
| 4,050 | | KIMBERLY CLARK CORP | | | 202,323 | | | 255,312 | | | | |
| 21,538 | | KRAFT FOODS INC-CLASS A | | | 246,937 | | | 678,662 | | | | |
| 14,600 | | KROGER CO | | | 250,327 | | | 326,456 | | | | |
| 1,374 | | LORILLARD INC | | | 34,726 | | | 112,750 | | | | |
| 800 | | MCCORMICK & CO-NON VTG SHRS | | | 24,815 | | | 37,224 | | | | |
| 51,978 | | MERCK & CO. INC. | | | 1,241,233 | | | 1,873,287 | | | | |
| 1,800 | | MOLSON COORS BREWING CO -B | | | 54,437 | | | 90,342 | | | | |
| 11,515 | | NESTLE SA-SPONS ADR FOR REG (c)(d) | | | 646,154 | | | 677,312 | | | | |
| 33,800 | | PEPSICO INC | | | 1,372,242 | | | 2,208,154 | | | | |
| 34,432 | | PHILIP MORRIS INTERNATIONAL | | | 359,253 | | | 2,015,305 | | | | |
| 51,160 | | PROCTER & GAMBLE CO/THE | | | 926,550 | | | 3,291,123 | | | | |
| 300 | | RALCORP HOLDINGS INC (b) | | | 18,248 | | | 19,503 | | | | |
| 3,000 | | REYNOLDS AMERICAN INC | | | 29,474 | | | 97,860 | | | | |
| 47,419 | | SAFEWAY INC | | | 1,001,322 | | | 1,066,453 | | | | |
| 13,350 | | SARA LEE CORP | | | 110,338 | | | 233,759 | | | | |
| 4,400 | | SMITHFIELD FOODS INC (b) | | | 81,906 | | | 90,772 | | | | |
| 7,900 | | SYSCO CORP | | | 121,025 | | | 232,260 | | | | |
| 9,527 | | TYSON FOODS INC-CL A | | | 111,285 | | | 164,055 | | | | |
| 42,930 | | UNILEVER N V -NY SHARES (c) | | | 1,291,746 | | | 1,348,002 | | | | |
| 21,050 | | WALGREEN CO | | | 255,879 | | | 820,108 | | | | |
| 4,400 | | WHOLE FOODS MARKET INC | | | 116,392 | | | 222,597 | | | | |
| | | 15,906,935 | | | 26,894,526 | | | 7.81 | % |
Energy: | | | | | | | | | | |
| 10,646 | | ANADARKO PETROLEUM CORP | | | 387,404 | | | 810,799 | | | | |
| 12,291 | | APACHE CORP | | | 803,684 | | | 1,465,456 | | | | |
| 1,700 | | ATWOOD OCEANICS INC (b) | | | 51,221 | | | 63,529 | | | | |
| 3,300 | | BAKER HUGHES INC | | | 131,950 | | | 188,661 | | | | |
| 1,504 | | CABOT OIL & GAS CORP | | | 38,739 | | | 56,926 | | | | |
| 4,800 | | CAMERON INTERNATIONAL CORP (b) | | | 124,988 | | | 243,504 | | | | |
| 8,700 | | CHESAPEAKE ENERGY CORP | | | 167,088 | | | 225,417 | | | | |
| 34,095 | | CHEVRON CORP | | | 1,499,394 | | | 3,111,169 | | | | |
| | | | | | | | | | | | | | | |
| | |
See accompanying notes to financial statements. | 27 | (Continued) |
CLEARWATER INVESTMENT TRUST
Schedule of Investments - Clearwater Growth Fund
December 31, 2010
| | | | | | | | | | | | | |
Shares | | Security | | Cost | | Fair
value (a) | | Percent
of
net assets | |
Energy (Cont’d): | | | | | | | | | | | |
| 7,800 | | CIMAREX ENERGY CO | | $ | 593,462 | | | 690,534 | | | | |
| 15,000 | | CLOUD PEAK ENERGY INC (b) | | | 343,546 | | | 348,450 | | | | |
| 1,700 | | CONCHO RESOURCES INC (b) | | | 49,632 | | | 149,039 | | | | |
| 29,844 | | CONOCOPHILLIPS | | | 803,147 | | | 2,032,376 | | | | |
| 5,431 | | CONSOL ENERGY INC | | | 148,332 | | | 264,707 | | | | |
| 1,000 | | CONTINENTAL RESOURCES INC/OK (b) | | | 20,765 | | | 58,850 | | | | |
| 9,300 | | DENBURY RESOURCES INC (b) | | | 88,950 | | | 177,537 | | | | |
| 37,700 | | DEVON ENERGY CORPORATION | | | 2,459,521 | | | 2,959,827 | | | | |
| 400 | | DIAMOND OFFSHORE DRILLING | | | 24,190 | | | 26,748 | | | | |
| 3,000 | | DRESSER-RAND GROUP INC (b) | | | 98,595 | | | 127,770 | | | | |
| 17,400 | | EL PASO CORP | | | 139,789 | | | 239,424 | | | | |
| 21,955 | | ENERGY TRANSFER EQUITY LP | | | 869,738 | | | 857,782 | | | | |
| 18,750 | | ENSCO PLC-SPON ADR (c)(d) | | | 941,499 | | | 1,000,875 | | | | |
| 26,075 | | ENTERPRISE PRODUCTS PARTNERS | | | 1,074,465 | | | 1,084,981 | | | | |
| 6,200 | | EOG RESOURCES INC | | | 160,571 | | | 566,742 | | | | |
| 3,700 | | EXCO RESOURCES INC | | | 56,238 | | | 71,854 | | | | |
| 7,000 | | EXTERRAN HOLDINGS INC (b) | | | 145,915 | | | 167,650 | | | | |
| 85,951 | | EXXON MOBIL CORP | | | 3,404,310 | | | 6,284,737 | | | | |
| 1,200 | | FMC TECHNOLOGIES INC (b) | | | 33,690 | | | 106,692 | | | | |
| 4,100 | | FRONTIER OIL CORP (b) | | | 57,462 | | | 73,841 | | | | |
| 15,158 | | HALLIBURTON CO | | | 274,762 | | | 618,901 | | | | |
| 3,100 | | HELMERICH & PAYNE | | | 39,003 | | | 150,288 | | | | |
| 4,900 | | HESS CORP | | | 313,547 | | | 375,046 | | | | |
| 2,000 | | HOLLY CORP | | | 52,098 | | | 81,540 | | | | |
| 19,395 | | MAGELLAN MIDSTREAM PARTNERS | | | 1,080,995 | | | 1,095,818 | | | | |
| 28,586 | | MARATHON OIL CORP | | | 813,274 | | | 1,058,540 | | | | |
| 1,700 | | MASSEY ENERGY CO | | | 54,661 | | | 91,205 | | | | |
| 5,200 | | MURPHY OIL CORP | | | 172,519 | | | 387,660 | | | | |
| 8,722 | | NATIONAL OILWELL VARCO INC | | | 214,854 | | | 586,555 | | | | |
| 5,142 | | NEWFIELD EXPLORATION CO (b) | | | 222,527 | | | 370,790 | | | | |
| 4,200 | | NOBLE ENERGY INC | | | 158,333 | | | 361,536 | | | | |
| 21,614 | | OCCIDENTAL PETROLEUM CORP | | | 513,483 | | | 2,120,333 | | | | |
| 1,700 | | OCEANEERING INTL INC (b) | | | 87,015 | | | 125,171 | | | | |
| 47,900 | | PATTERSON-UTI ENERGY INC | | | 1,062,044 | | | 1,032,245 | | | | |
| 3,500 | | PEABODY ENERGY CORP | | | 69,937 | | | 223,930 | | | | |
| 3,200 | | PIONEER NATURAL RESOURCES CO | | | 48,507 | | | 277,824 | | | | |
| 3,300 | | PLAINS EXPLORATION & PRODUCT (b) | | | 92,785 | | | 106,062 | | | | |
| 4,600 | | PRIDE INTERNATIONAL INC (b) | | | 141,383 | | | 151,800 | | | | |
| 44,000 | | QEP RESOURCES INC | | | 1,513,042 | | | 1,597,640 | | | | |
| 3,700 | | RANGE RESOURCES CORP | | | 128,867 | | | 166,426 | | | | |
| 700 | | ROWAN COMPANIES INC (b) | | | 19,887 | | | 24,437 | | | | |
| 23,400 | | SANDRIDGE ENERGY INC (b) | | | 153,249 | | | 171,288 | | | | |
| 20,600 | | SCHLUMBERGER LTD | | | 579,055 | | | 1,720,100 | | | | |
| 9,300 | | SOUTHWESTERN ENERGY CO (b) | | | 163,645 | | | 348,099 | | | | |
| 2,400 | | SUNOCO INC | | | 50,440 | | | 96,744 | | | | |
| 600 | | SUPERIOR ENERGY SERVICES INC (b) | | | 21,266 | | | 20,994 | | | | |
| 1,800 | | TESORO CORP (b) | | | 28,808 | | | 33,372 | | | | |
| 17,700 | | TIDEWATER INC | | | 895,470 | | | 952,968 | | | | |
| 3,939 | | ULTRA PETROLEUM CORP (b) | | | 180,069 | | | 188,166 | | | | |
| 14,210 | | VALERO ENERGY CORP | | | 172,649 | | | 328,535 | | | | |
| 19,400 | | WEATHERFORD INTL LTD (b)(c) | | | 279,487 | | | 442,320 | | | | |
| 1,300 | | WHITING PETROLEUM CORP (b) | | | 73,760 | | | 152,347 | | | | |
| 113,840 | | WILLIAMS COS INC | | | 2,623,645 | | | 2,814,124 | | | | |
| | | | | | 27,013,351 | | | 41,728,681 | | | 12.12 | % |
Financials: | | | | | | | | | | |
| 6,000 | | ACE LTD (c) | | | 317,873 | | | 373,500 | | | | |
| 800 | | AFFILIATED MANAGERS GROUP (b) | | | 48,196 | | | 79,376 | | | | |
| 9,850 | | AFLAC INC | | | 262,100 | | | 555,836 | | | | |
| 700 | | ALEXANDRIA REAL ESTATE EQUIT | | | 24,992 | | | 51,282 | | | | |
| 2,700 | | ALLIED WORLD ASSURANCE CO (c) | | | 86,630 | | | 160,488 | | | | |
| 29,100 | | ALLSTATE CORP | | | 985,329 | | | 927,708 | | | | |
| 19,433 | | AMERICAN EXPRESS CO | | | 587,716 | | | 834,064 | | | | |
| 1,800 | | AMERICAN FINANCIAL GROUP INC | | | 29,745 | | | 58,122 | | | | |
| 2,600 | | AMERICAN INTERNATIONAL GROUP (b) | | | 40,854 | | | 149,812 | | | | |
| 3,591 | | AMERIPRISE FINANCIAL INC | | | 94,747 | | | 206,662 | | | | |
| | |
See accompanying notes to financial statements. | 28 | (Continued) |
CLEARWATER INVESTMENT TRUST
Schedule of Investments - Clearwater Growth Fund
December 31, 2010
| | | | | | | | | | | | | |
Shares | | Security | | Cost | | Fair
value (a) | | Percent
of
net assets | |
Financials (Cont’d): | | | | | | | | | | |
| 4,900 | | ANNALY CAPITAL MANAGEMENT IN | | $ | 78,180 | | | 87,808 | | | | |
| 6,348 | | AON CORP | | | 173,358 | | | 292,071 | | | | |
| 3,628 | | APARTMENT INVT & MGMT CO -A | | | 39,421 | | | 93,748 | | | | |
| 1,600 | | ARCH CAPITAL GROUP LTD (b)(c) | | | 101,982 | | | 140,880 | | | | |
| 1,600 | | ARTHUR J GALLAGHER & CO | | | 34,040 | | | 46,528 | | | | |
| 2,000 | | ASPEN INSURANCE HOLDINGS LTD (c) | | | 45,330 | | | 57,240 | | | | |
| 2,500 | | ASSURANT INC | | | 60,538 | | | 96,300 | | | | |
| 5,500 | | ASSURED GUARANTY LTD (c) | | | 75,350 | | | 97,350 | | | | |
| 734 | | AVALONBAY COMMUNITIES INC | | | 31,138 | | | 82,612 | | | | |
| 2,400 | | AXIS CAPITAL HOLDINGS LTD (c) | | | 81,468 | | | 86,112 | | | | |
| 47,850 | | BANCORPSOUTH INC | | | 699,472 | | | 763,208 | | | | |
| 244,018 | | BANK OF AMERICA CORP | | | 5,053,712 | | | 3,255,200 | | | | |
| 19,601 | | BANK OF NEW YORK MELLON CORP | | | 538,667 | | | 591,950 | | | | |
| 44,422 | | BB&T CORP | | | 1,114,923 | | | 1,167,854 | | | | |
| 23,600 | | BERKSHIRE HATHAWAY INC-CL B (b) | | | 1,929,002 | | | 1,890,596 | | | | |
| 1,142 | | BLACKROCK INC | | | 202,635 | | | 217,642 | | | | |
| 3,388 | | BOSTON PROPERTIES INC | | | 171,467 | | | 291,707 | | | | |
| 1,100 | | BRE PROPERTIES INC | | | 25,471 | | | 47,850 | | | | |
| 2,600 | | BROWN & BROWN INC | | | 50,447 | | | 62,244 | | | | |
| 900 | | CAMDEN PROPERTY TRUST | | | 24,532 | | | 48,582 | | | | |
| 10,747 | | CAPITAL ONE FINANCIAL CORP | | | 323,988 | | | 457,392 | | | | |
| 6,900 | | CAPITALSOURCE INC | | | 23,267 | | | 48,990 | | | | |
| 2,400 | | CB RICHARD ELLIS GROUP INC-A (b) | | | 45,504 | | | 49,152 | | | | |
| 14,200 | | CHIMERA INVESTMENT CORP | | | 49,341 | | | 58,362 | | | | |
| 2,700 | | CHUBB CORP | | | 86,607 | | | 161,028 | | | | |
| 4,900 | | CIT GROUP INC (b) | | | 183,899 | | | 230,790 | | | | |
| 707,545 | | CITIGROUP INC (b) | | | 3,314,179 | | | 3,346,688 | | | | |
| 1,300 | | CITY NATIONAL CORP | | | 47,574 | | | 79,768 | | | | |
| 873 | | CME GROUP INC | | | 181,749 | | | 280,888 | | | | |
| 900 | | CORPORATE OFFICE PROPERTIES | | | 24,641 | | | 31,455 | | | | |
| 1,600 | | CORRECTIONS CORP OF AMERICA (b) | | | 25,672 | | | 40,096 | | | | |
| 400 | | DIGITAL REALTY TRUST INC | | | 15,650 | | | 20,616 | | | | |
| 16,287 | | DISCOVER FINANCIAL SERVICES | | | 233,079 | | | 301,798 | | | | |
| 2,800 | | DOUGLAS EMMETT INC | | | 22,554 | | | 46,480 | | | | |
| 3,300 | | EAST WEST BANCORP INC | | | 53,889 | | | 64,515 | | | | |
| 900 | | ENDURANCE SPECIALTY HOLDINGS (c) | | | 25,106 | | | 41,463 | | | | |
| 5,416 | | EQUITY RESIDENTIAL | | | 174,162 | | | 281,361 | | | | |
| 2,400 | | EVEREST RE GROUP LTD (c) | | | 184,908 | | | 203,568 | | | | |
| 900 | | FEDERAL REALTY INVS TRUST | | | 48,473 | | | 70,137 | | | | |
| 800 | | FEDERATED INVESTORS INC-CL B | | | 17,620 | | | 20,936 | | | | |
| 17,400 | | FIFTH THIRD BANCORP | | | 138,329 | | | 255,432 | | | | |
| 600 | | FIRST CITIZENS BCSHS -CL A | | | 86,506 | | | 113,430 | | | | |
| 16,851 | | FIRST HORIZON NATIONAL CORP (b) | | | 213,278 | | | 198,505 | | | | |
| 3,200 | | FIRST NIAGARA FINANCIAL GRP | | | 37,456 | | | 44,736 | | | | |
| 20,095 | | FIRST REPUBLIC BANK/SAN FRAN (b) | | | 543,972 | | | 585,166 | | | | |
| 3,359 | | FRANKLIN RESOURCES INC | | | 189,834 | | | 373,554 | | | | |
| 3,500 | | FULTON FINANCIAL CORP | | | 37,748 | | | 36,190 | | | | |
| 98,000 | | GENWORTH FINANCIAL INC-CL A (b) | | | 1,239,704 | | | 1,287,720 | | | | |
| 13,000 | | GOLDMAN SACHS GROUP INC | | | 1,342,905 | | | 2,186,080 | | | | |
| 400 | | GREENHILL & CO INC | | | 27,762 | | | 32,672 | | | | |
| 1,200 | | HANOVER INSURANCE GROUP INC | | | 51,342 | | | 56,064 | | | | |
| 6,000 | | HARTFORD FINANCIAL SVCS GRP | | | 123,208 | | | 158,940 | | | | |
| 1,000 | | HCC INSURANCE HOLDINGS INC | | | 24,155 | | | 28,940 | | | | |
| 7,100 | | HCP INC | | | 113,708 | | | 261,209 | | | | |
| 400 | | HEALTH CARE REIT INC | | | 14,103 | | | 19,056 | | | | |
| 1,800 | | HOSPITALITY PROPERTIES TRUST | | | 23,967 | | | 41,472 | | | | |
| 10,122 | | HOST HOTELS & RESORTS INC | | | 69,685 | | | 180,880 | | | | |
| 678 | | HOWARD HUGHES CORP/THE (b) | | | 20,502 | | | 36,897 | | | | |
| 7,500 | | HUDSON CITY BANCORP INC | | | 118,763 | | | 95,550 | | | | |
| 11,100 | | HUNTINGTON BANCSHARES INC | | | 51,227 | | | 76,257 | | | | |
| 82,675 | | INLAND REAL ESTATE CORP | | | 707,855 | | | 727,540 | | | | |
| 4,000 | | INVESCO LTD | | | 61,778 | | | 96,240 | | | | |
| 3,500 | | JANUS CAPITAL GROUP INC | | | 39,533 | | | 45,395 | | | | |
| 2,700 | | JEFFERIES GROUP INC | | | 64,508 | | | 71,901 | | | | |
| 300 | | JONES LANG LASALLE INC | | | 17,291 | | | 25,176 | | | | |
| 71,046 | | JPMORGAN CHASE & CO | | | 1,879,857 | | | 3,013,771 | | | | |
| | |
See accompanying notes to financial statements. | 29 | (Continued) |
CLEARWATER INVESTMENT TRUST
Schedule of Investments - Clearwater Growth Fund
December 31, 2010
| | | | | | | | | | | | | |
Shares | | Security | | Cost | | Fair
value (a) | | Percent
of
net assets | |
Financials (Cont’d): | | | | | | | | | | |
| 5,900 | | KEYCORP | | $ | 30,061 | | | 52,215 | | | | |
| 6,601 | | KIMCO REALTY CORP | | | 77,824 | | | 119,082 | | | | |
| 3,852 | | LEGG MASON INC | | | 55,351 | | | 139,712 | | | | |
| 1,100 | | LIBERTY PROPERTY TRUST | | | 24,364 | | | 35,112 | | | | |
| 4,948 | | LINCOLN NATIONAL CORP | | | 141,984 | | | 137,604 | | | | |
| 6,000 | | LOEWS CORP | | | 131,444 | | | 233,460 | | | | |
| 700 | | M & T BANK CORP | | | 50,526 | | | 60,935 | | | | |
| 5,123 | | MACERICH CO/THE | | | 127,300 | | | 242,677 | | | | |
| 5,200 | | MACK-CALI REALTY CORP | | | 154,599 | | | 171,912 | | | | |
| 600 | | MARKEL CORP (b) | | | 203,366 | | | 226,878 | | | | |
| 7,178 | | MARSH & MCLENNAN COS | | | 174,543 | | | 196,247 | | | | |
| 12,899 | | MARSHALL & ILSLEY CORP | | | 96,056 | | | 89,261 | | | | |
| 7,800 | | MBIA INC (b) | | | 38,883 | | | 93,522 | | | | |
| 1,300 | | MERCURY GENERAL CORP | | | 38,019 | | | 55,913 | | | | |
| 10,800 | | METLIFE INC | | | 327,156 | | | 479,952 | | | | |
| 47,197 | | MORGAN STANLEY | | | 1,354,110 | | | 1,284,230 | | | | |
| 1,400 | | MORNINGSTAR INC | | | 57,577 | | | 74,312 | | | | |
| 2,400 | | MSCI INC-A (b) | | | 68,930 | | | 93,504 | | | | |
| 8,949 | | NEW YORK COMMUNITY BANCORP | | | 102,889 | | | 168,689 | | | | |
| 6,502 | | NORTHERN TRUST CORP | | | 301,334 | | | 360,276 | | | | |
| 3,800 | | NYSE EURONEXT | | | 120,213 | | | 113,924 | | | | |
| 5,125 | | OLD REP INTL CORP | | | 59,894 | | | 69,854 | | | | |
| 1,000 | | PARTNERRE LTD (c) | | | 66,204 | | | 80,350 | | | | |
| 10,031 | | PEOPLE’S UNITED FINANCIAL | | | 144,869 | | | 140,534 | | | | |
| 5,085 | | PLUM CREEK TIMBER CO | | | 128,128 | | | 190,433 | | | | |
| 26,200 | | PNC FINANCIAL SERVICES GROUP | | | 1,312,789 | | | 1,590,864 | | | | |
| 32,200 | | POPULAR INC (b)(c) | | | 71,645 | | | 101,108 | | | | |
| 5,050 | | PRINCIPAL FINANCIAL GROUP | | | 125,030 | | | 164,428 | | | | |
| 6,048 | | PROGRESSIVE CORP | | | 80,691 | | | 120,174 | | | | |
| 7,100 | | PROLOGIS | | | 73,876 | | | 102,524 | | | | |
| 2,200 | | PROTECTIVE LIFE CORP | | | 24,849 | | | 58,608 | | | | |
| 8,500 | | PRUDENTIAL FINANCIAL INC | | | 257,378 | | | 499,035 | | | | |
| 1,091 | | PUBLIC STORAGE | | | 67,691 | | | 110,649 | | | | |
| 32,425 | | RAYMOND JAMES FINANCIAL INC | | | 1,021,413 | | | 1,060,298 | | | | |
| 2,700 | | REALTY INCOME CORP | | | 64,486 | | | 92,340 | | | | |
| 3,900 | | REGENCY CENTERS CORP | | | 97,960 | | | 164,736 | | | | |
| 28,699 | | REGIONS FINANCIAL CORP | | | 133,361 | | | 200,893 | | | | |
| 2,900 | | RENAISSANCERE HOLDINGS LTD (c) | | | 136,231 | | | 184,701 | | | | |
| 21,400 | | SCHWAB (CHARLES) CORP | | | 186,608 | | | 366,154 | | | | |
| 5,400 | | SEI INVESTMENTS COMPANY | | | 74,937 | | | 128,466 | | | | |
| 49,325 | | SELECTIVE INSURANCE GROUP | | | 867,714 | | | 895,249 | | | | |
| 1,500 | | SENIOR HOUSING PROP TRUST | | | 24,126 | | | 32,910 | | | | |
| 3,595 | | SIMON PROPERTY GROUP INC | | | 157,583 | | | 357,667 | | | | |
| 1,500 | | SL GREEN REALTY CORP | | | 32,888 | | | 101,265 | | | | |
| 6,500 | | SLM CORP (b) | | | 56,402 | | | 81,835 | | | | |
| 6,835 | | STATE STREET CORP | | | 273,996 | | | 316,734 | | | | |
| 14,334 | | SUNTRUST BANKS INC | | | 249,943 | | | 422,996 | | | | |
| 52,395 | | SYMETRA FINANCIAL CORP | | | 647,597 | | | 717,812 | | | | |
| 48,100 | | SYNOVUS FINANCIAL CORP | | | 126,481 | | | 126,984 | | | | |
| 6,349 | | T ROWE PRICE GROUP INC | | | 125,884 | | | 409,764 | | | | |
| 2,100 | | TAUBMAN CENTERS INC | | | 62,222 | | | 106,008 | | | | |
| 3,900 | | TCF FINANCIAL CORP | | | 33,574 | | | 57,759 | | | | |
| 5,566 | | TD AMERITRADE HOLDING CORP | | | 85,425 | | | 105,698 | | | | |
| 19,125 | | TORCHMARK CORP | | | 1,098,064 | | | 1,142,528 | | | | |
| 20,650 | | TRANSATLANTIC HOLDINGS INC | | | 1,090,193 | | | 1,065,953 | | | | |
| 10,688 | | TRAVELERS COS INC/THE | | | 378,568 | | | 595,428 | | | | |
| 2,400 | | UDR INC | | | 24,876 | | | 56,448 | | | | |
| 4,000 | | UNITRIN INC | | | 101,606 | | | 98,160 | | | | |
| 37,500 | | UNUM GROUP | | | 815,810 | | | 908,250 | | | | |
| 36,185 | | US BANCORP | | | 742,051 | | | 975,909 | | | | |
| 1,100 | | VALIDUS HOLDINGS LTD (c) | | | 23,556 | | | 33,671 | | | | |
| 1,593 | | VALLEY NATL BANCORP | | | 25,082 | | | 22,780 | | | | |
| 1,800 | | VENTAS INC | | | 73,052 | | | 94,464 | | | | |
| 4,500 | | VISA INC-CLASS A SHARES | | | 314,289 | | | 316,710 | | | | |
| 2,900 | | VORNADO REALTY TRUST | | | 206,690 | | | 241,657 | | | | |
| 2,900 | | WADDELL & REED FINANCIAL-A | | | 75,336 | | | 102,341 | | | | |
| 5,200 | | WASHINGTON FEDERAL INC | | | 71,015 | | | 87,984 | | | | |
| | |
See accompanying notes to financial statements. | 30 | (Continued) |
CLEARWATER INVESTMENT TRUST
Schedule of Investments - Clearwater Growth Fund
December 31, 2010
| | | | | | | | | | | | | |
Shares | | Security | | Cost | | Fair
value (a) | | Percent
of
net assets | |
Financials (Cont’d): | | | | | | | | | | |
| 1,900 | | WEINGARTEN REALTY INVESTORS | | $ | 25,127 | | | 45,144 | | | | |
| 86,945 | | WELLS FARGO & CO | | | 1,186,941 | | | 2,694,426 | | | | |
| 1,106 | | WR BERKLEY CORP | | | 29,275 | | | 30,282 | | | | |
| 60,000 | | XL GROUP PLC (c) | | | 1,178,206 | | | 1,309,200 | | | | |
| | | | | | 43,338,294 | | | 52,108,170 | | | 15.14 | % |
Healthcare: | | | | | | | | | | |
| 42,435 | | ABBOTT LABORATORIES | | | 1,728,762 | | | 2,033,061 | | | | |
| 8,703 | | AETNA INC | | | 122,419 | | | 265,529 | | | | |
| 200 | | ALCON INC (c) | | | 30,135 | | | 32,680 | | | | |
| 1,800 | | ALERE INC (b) | | | 57,627 | | | 65,880 | | | | |
| 1,500 | | ALEXION PHARMACEUTICALS INC (b) | | | 58,088 | | | 120,825 | | | | |
| 5,507 | | ALLERGAN INC | | | 201,259 | | | 378,166 | | | | |
| 7,200 | | AMERISOURCEBERGEN CORP | | | 115,968 | | | 245,664 | | | | |
| 26,700 | | AMGEN INC (b) | | | 365,908 | | | 1,465,830 | | | | |
| 22,100 | | BAXTER INTERNATIONAL INC | | | 830,917 | | | 1,118,702 | | | | |
| 1,900 | | BECKMAN COULTER INC | | | 99,749 | | | 142,937 | | | | |
| 3,900 | | BECTON DICKINSON AND CO | | | 226,543 | | | 329,628 | | | | |
| 6,550 | | BIOGEN IDEC INC (b) | | | 82,841 | | | 439,178 | | | | |
| 113,800 | | BOSTON SCIENTIFIC CORP (b) | | | 812,353 | | | 861,466 | | | | |
| 20,100 | | BRISTOL-MYERS SQUIBB CO | | | 454,721 | | | 532,248 | | | | |
| 3,400 | | CARDINAL HEALTH INC | | | 102,635 | | | 130,254 | | | | |
| 53,000 | | CAREFUSION CORP (b) | | | 1,261,278 | | | 1,362,100 | | | | |
| 6,436 | | CELGENE CORP (b) | | | 146,839 | | | 380,625 | | | | |
| 300 | | CEPHALON INC (b) | | | 14,717 | | | 18,516 | | | | |
| 800 | | CHARLES RIVER LABORATORIES (b) | | | 24,460 | | | 28,432 | | | | |
| 5,700 | | CIGNA CORP | | | 89,680 | | | 208,962 | | | | |
| 3,000 | | COMMUNITY HEALTH SYSTEMS INC (b) | | | 97,596 | | | 112,110 | | | | |
| 700 | | COVANCE INC (b) | | | 31,465 | | | 35,987 | | | | |
| 20,400 | | COVIDIEN PLC (c) | | | 861,243 | | | 931,464 | | | | |
| 1,700 | | CR BARD INC | | | 111,570 | | | 156,009 | | | | |
| 1,425 | | DAVITA INC (b) | | | 21,812 | | | 99,023 | | | | |
| 3,700 | | DENTSPLY INTERNATIONAL INC | | | 102,583 | | | 126,429 | | | | |
| 3,800 | | EDWARDS LIFESCIENCES CORP (b) | | | 118,152 | | | 307,192 | | | | |
| 10,700 | | ELI LILLY & CO | | | 372,409 | | | 374,928 | | | | |
| 10,300 | | ENDO PHARMACEUT HLDGS INC (b) | | | 292,835 | | | 367,813 | | | | |
| 9,100 | | EXPRESS SCRIPTS INC (b) | | | 173,782 | | | 491,855 | | | | |
| 26,150 | | FOREST LABORATORIES INC (b) | | | 801,233 | | | 836,277 | | | | |
| 19,760 | | GEN-PROBE INC (b) | | | 1,048,654 | | | 1,152,996 | | | | |
| 700 | | GENZYME CORP (b) | | | 36,911 | | | 49,840 | | | | |
| 14,260 | | GILEAD SCIENCES INC (b) | | | 231,726 | | | 516,782 | | | | |
| 9,200 | | HEALTH MGMT ASSOCIATES INC-A (b) | | | 59,662 | | | 87,768 | | | | |
| 60,090 | | HEALTHSOUTH CORP (b) | | | 1,079,018 | | | 1,244,464 | | | | |
| 1,900 | | HENRY SCHEIN INC (b) | | | 86,167 | | | 116,641 | | | | |
| 1,300 | | HILL-ROM HOLDINGS INC | | | 38,228 | | | 51,181 | | | | |
| 1,708 | | HOLOGIC INC (b) | | | 12,625 | | | 32,145 | | | | |
| 6,405 | | HOSPIRA INC (b) | | | 231,083 | | | 356,694 | | | | |
| 3,900 | | HUMANA INC (b) | | | 39,107 | | | 213,486 | | | | |
| 1,400 | | IDEXX LABORATORIES INC (b) | | | 60,410 | | | 96,908 | | | | |
| 700 | | INTUITIVE SURGICAL INC (b) | | | 165,982 | | | 180,425 | | | | |
| 61,184 | | JOHNSON & JOHNSON | | | 2,714,406 | | | 3,784,230 | | | | |
| 1,931 | | KINETIC CONCEPTS INC (b) | | | 71,019 | | | 80,870 | | | | |
| 8,800 | | KING PHARMACEUTICALS INC (b) | | | 93,510 | | | 123,640 | | | | |
| 800 | | LABORATORY CRP OF AMER HLDGS (b) | | | 18,788 | | | 70,336 | | | | |
| 4,373 | | LIFE TECHNOLOGIES CORP (b) | | | 134,809 | | | 242,702 | | | | |
| 2,325 | | LINCARE HOLDINGS INC | | | 46,233 | | | 62,380 | | | | |
| 5,700 | | MCKESSON CORP | | | 202,597 | | | 401,166 | | | | |
| 2,200 | | MEAD JOHNSON NUTRITION CO | | | 103,422 | | | 136,950 | | | | |
| 9,756 | | MEDCO HEALTH SOLUTIONS INC (b) | | | 137,776 | | | 597,750 | | | | |
| 13,800 | | MEDTRONIC INC | | | 482,727 | | | 511,842 | | | | |
| 62,000 | | MYLAN INC (b) | | | 1,189,888 | | | 1,310,060 | | | | |
| 1,200 | | OMNICARE INC | | | 29,082 | | | 30,468 | | | | |
| 3,500 | | PATTERSON COS INC | | | 93,515 | | | 107,205 | | | | |
| 2,900 | | PERRIGO CO | | | 109,545 | | | 183,657 | | | | |
| 170,725 | | PFIZER INC | | | 1,402,986 | | | 2,989,395 | | | | |
| 1,300 | | PHARMACEUTICAL PRODUCT DEVEL | | | 24,770 | | | 35,282 | | | | |
| 8,065 | | QUEST DIAGNOSTICS INC | | | 391,363 | | | 435,268 | | | | |
| 4,000 | | RESMED INC (b) | | | 81,990 | | | 138,560 | | | | |
| | |
See accompanying notes to financial statements. | 31 | (Continued) |
CLEARWATER INVESTMENT TRUST
Schedule of Investments - Clearwater Growth Fund
December 31, 2010
| | | | | | | | | | | | | |
Shares | | Security | | Cost | | Fair
value (a) | | Percent
of
net assets | |
Healthcare (Cont’d): | | | | | | | | | | |
| 12,600 | | SERVICE CORP INTERNATIONAL | | $ | 90,438 | | | 103,950 | | | | |
| 8,639 | | ST JUDE MEDICAL INC (b) | | | 254,799 | | | 369,317 | | | | |
| 7,200 | | STRYKER CORP | | | 119,192 | | | 386,640 | | | | |
| 12,900 | | TENET HEALTHCARE CORP (b) | | | 56,567 | | | 86,301 | | | | |
| 7,400 | | THERMO FISHER SCIENTIFIC INC (b) | | | 156,536 | | | 409,664 | | | | |
| 17,202 | | UNITEDHEALTH GROUP INC | | | 273,316 | | | 621,164 | | | | |
| 2,036 | | UNIVERSAL HEALTH SERVICES-B | | | 38,822 | | | 88,403 | | | | |
| 46,095 | | VALEANT PHARMACEUTICALS INTE (c) | | | 1,296,247 | | | 1,304,028 | | | | |
| 5,000 | | VARIAN MEDICAL SYSTEMS INC (b) | | | 184,300 | | | 346,400 | | | | |
| 1,200 | | VCA ANTECH INC (b) | | | 28,592 | | | 27,948 | | | | |
| 3,000 | | VERTEX PHARMACEUTICALS INC (b) | | | 74,804 | | | 105,090 | | | | |
| 2,600 | | WATERS CORP (b) | | | 60,996 | | | 202,046 | | | | |
| 3,175 | | WATSON PHARMACEUTICALS INC (b) | | | 79,360 | | | 163,989 | | | | |
| 2,666 | | WEBMD HEALTH CORP (b) | | | 58,226 | | | 136,126 | | | | |
| 9,249 | | WELLPOINT INC (b) | | | 325,437 | | | 525,898 | | | | |
| 3,374 | | ZIMMER HOLDINGS INC (b) | | | 140,046 | | | 181,115 | | | | |
| | | | | | 23,467,256 | | | 34,398,940 | | | 9.99 | % |
Industrials: | | | | | | | | | | |
| 9,087 | | 3M CO | | | 561,634 | | | 784,208 | | | | |
| 35,000 | | ABB LTD-SPON ADR (b)(c)(d) | | | 715,485 | | | 785,750 | | | | |
| 610 | | AGCO CORP (b) | | | 23,281 | | | 30,903 | | | | |
| 3,450 | | AMETEK INC | | | 73,221 | | | 135,413 | | | | |
| 19,800 | | AMR CORP (b) | | | 151,331 | | | 154,242 | | | | |
| 32,970 | | AVERY DENNISON CORP | | | 1,344,184 | | | 1,395,950 | | | | |
| 2,700 | | BABCOCK & WILCOX COMPANY (b) | | | 35,478 | | | 69,093 | | | | |
| 1,700 | | BE AEROSPACE INC (b) | | | 47,626 | | | 62,951 | | | | |
| 17,400 | | BOEING CO/THE | | | 411,597 | | | 1,135,524 | | | | |
| 1,700 | | BUCYRUS INTERNATIONAL INC | | | 47,502 | | | 151,980 | | | | |
| 3,400 | | C.H. ROBINSON WORLDWIDE INC | | | 164,205 | | | 272,646 | | | | |
| 1,600 | | CAREER EDUCATION CORP (b) | | | 26,824 | | | 33,168 | | | | |
| 2,200 | | CARLISLE COS INC | | | 45,116 | | | 87,428 | | | | |
| 11,604 | | CATERPILLAR INC | | | 322,821 | | | 1,086,831 | | | | |
| 2,500 | | CHICAGO BRIDGE & IRON-NY SHR (b)(c) | | | 50,995 | | | 82,250 | | | | |
| 5,700 | | CINTAS CORP | | | 175,434 | | | 159,372 | | | | |
| 2,027 | | CON-WAY INC | | | 44,529 | | | 74,127 | | | | |
| 1,400 | | COOPER INDUSTRIES PLC | | | 60,725 | | | 81,606 | | | | |
| 1,300 | | COPA HOLDINGS SA-CLASS A (c) | | | 61,294 | | | 76,492 | | | | |
| 3,948 | | CRANE CO | | | 66,572 | | | 162,144 | | | | |
| 9,300 | | CSX CORP | | | 97,923 | | | 600,873 | | | | |
| 3,800 | | CUMMINS INC | | | 53,831 | | | 418,038 | | | | |
| 11,163 | | DANAHER CORP | | | 255,642 | | | 526,559 | | | | |
| 7,300 | | DEERE & CO | | | 199,160 | | | 606,265 | | | | |
| 150,000 | | DELTA AIR LINES INC (b) | | | 1,891,832 | | | 1,890,000 | | | | |
| 678 | | DEVRY INC | | | 31,924 | | | 32,530 | | | | |
| 1,600 | | DONALDSON CO INC | | | 63,715 | | | 93,248 | | | | |
| 3,325 | | DOVER CORP | | | 122,574 | | | 194,346 | | | | |
| 1,987 | | DUN & BRADSTREET CORP | | | 49,383 | | | 163,113 | | | | |
| 4,200 | | EATON CORP | | | 158,064 | | | 426,342 | | | | |
| 32,875 | | EMCOR GROUP INC (b) | | | 934,677 | | | 952,718 | | | | |
| 15,500 | | EMERSON ELECTRIC CO | | | 422,332 | | | 886,135 | | | | |
| 1,197 | | ENERGIZER HOLDINGS INC (b) | | | 74,281 | | | 87,261 | | | | |
| 3,200 | | EXPEDITORS INTL WASH INC | | | 115,188 | | | 174,720 | | | | |
| 1,900 | | FASTENAL CO | | | 62,225 | | | 113,829 | | | | |
| 6,653 | | FEDEX CORP | | | 130,734 | | | 618,796 | | | | |
| 300 | | FIRST SOLAR INC (b) | | | 23,489 | | | 39,042 | | | | |
| 1,300 | | FLOWSERVE CORP | | | 119,620 | | | 154,986 | | | | |
| 2,550 | | FLUOR CORP | | | 52,518 | | | 168,963 | | | | |
| 300 | | GARDNER DENVER INC | | | 16,685 | | | 20,646 | | | | |
| 1,400 | | GATX CORP | | | 24,276 | | | 49,392 | | | | |
| 258,400 | | GENERAL ELECTRIC CO | | | 4,753,642 | | | 4,726,136 | | | | |
| 1,000 | | GLOBAL PAYMENTS INC | | | 33,115 | | | 46,210 | | | | |
| 3,200 | | GOODRICH CORP | | | 95,088 | | | 281,824 | | | | |
| 6,200 | | H&R BLOCK INC | | | 58,017 | | | 73,842 | | | | |
| 1,600 | | HARSCO CORP | | | 28,236 | | | 45,312 | | | | |
| 17,600 | | HONEYWELL INTERNATIONAL INC | | | 471,639 | | | 935,616 | | | | |
| 2,200 | | HUBBELL INC -CL B | | | 91,526 | | | 132,286 | | | | |
| 2,100 | | HUNT (JB) TRANSPRT SVCS INC | | | 40,530 | | | 85,701 | | | | |
| | |
See accompanying notes to financial statements. | 32 | (Continued) |
CLEARWATER INVESTMENT TRUST
Schedule of Investments - Clearwater Growth Fund
December 31, 2010
| | | | | | | | | | | | | |
Shares | | Security | | Cost | | Fair
value (a) | | Percent
of
net assets | |
| Industrials (Cont’d): | | | | | | | | | | |
| 2,500 | | IDEX CORP | | $ | 58,238 | | | 97,800 | | | | |
| 6,424 | | ILLINOIS TOOL WORKS | | | 223,340 | | | 343,042 | | | | |
| 3,700 | | INGERSOLL-RAND PLC (c) | | | 140,926 | | | 174,233 | | | | |
| 5,400 | | IRON MOUNTAIN INC | | | 121,527 | | | 135,054 | | | | |
| 1,600 | | ITT CORP | | | 52,360 | | | 83,376 | | | | |
| 1,300 | | ITT EDUCATIONAL SERVICES INC (b) | | | 52,038 | | | 82,797 | | | | |
| 3,000 | | JABIL CIRCUIT INC | | | 49,755 | | | 60,270 | | | | |
| 2,068 | | JACOBS ENGINEERING GROUP INC (b) | | | 46,598 | | | 94,818 | | | | |
| 2,038 | | JOY GLOBAL INC | | | 92,539 | | | 176,797 | | | | |
| 2,900 | | KANSAS CITY SOUTHERN (b) | | | 46,328 | | | 138,794 | | | | |
| 2,800 | | KBR INC | | | 55,655 | | | 85,316 | | | | |
| 17,000 | | KIRBY CORP (b) | | | 764,537 | | | 748,850 | | | | |
| 2,400 | | L-3 COMMUNICATIONS HOLDINGS | | | 143,754 | | | 169,176 | | | | |
| 1,200 | | LANDSTAR SYSTEM INC | | | 38,351 | | | 49,128 | | | | |
| 700 | | LINCOLN ELECTRIC HOLDINGS | | | 28,970 | | | 45,689 | | | | |
| 2,600 | | LOCKHEED MARTIN CORP | | | 74,846 | | | 181,766 | | | | |
| 12,500 | | MANITOWOC COMPANY INC | | | 120,438 | | | 163,875 | | | | |
| 1,475 | | MANPOWER INC | | | 46,518 | | | 92,571 | | | | |
| 48,000 | | MASTEC INC (b) | | | 709,778 | | | 700,320 | | | | |
| 5,500 | | MCDERMOTT INTL INC (b) | | | 36,783 | | | 113,795 | | | | |
| 3,900 | | MONSTER WORLDWIDE INC (b) | | | 48,446 | | | 92,157 | | | | |
| 1,300 | | NAVISTAR INTERNATIONAL CORP (b) | | | 51,064 | | | 75,283 | | | | |
| 5,360 | | NORFOLK SOUTHERN CORP | | | 121,639 | | | 336,715 | | | | |
| 3,660 | | NORTHROP GRUMMAN CORP | | | 154,856 | | | 237,095 | | | | |
| 2,300 | | OSHKOSH CORP (b) | | | 74,375 | | | 81,052 | | | | |
| 28,475 | | OVERSEAS SHIPHOLDING GROUP | | | 1,035,187 | | | 1,008,585 | | | | |
| 2,600 | | OWENS CORNING (b) | | | 59,847 | | | 80,990 | | | | |
| 8,389 | | PACCAR INC | | | 91,278 | | | 481,696 | | | | |
| 2,200 | | PALL CORP | | | 55,214 | | | 109,076 | | | | |
| 2,850 | | PARKER HANNIFIN CORP | | | 123,853 | | | 245,955 | | | | |
| 2,200 | | PENTAIR INC | | | 72,761 | | | 80,322 | | | | |
| 2,100 | | PRECISION CASTPARTS CORP | | | 126,967 | | | 292,341 | | | | |
| 4,100 | | QUANTA SERVICES INC (b) | | | 52,132 | | | 81,672 | | | | |
| 6,500 | | RAYTHEON COMPANY | | | 191,236 | | | 301,210 | | | | |
| 2,200 | | RELIANCE STEEL & ALUMINUM | | | 61,215 | | | 112,420 | | | | |
| 44,843 | | REPUBLIC SERVICES INC | | | 1,203,205 | | | 1,339,012 | | | | |
| 1,900 | | ROBERT HALF INTL INC | | | 47,352 | | | 58,140 | | | | |
| 5,250 | | ROCKWELL AUTOMATION INC | | | 73,987 | | | 376,478 | | | | |
| 5,214 | | ROCKWELL COLLINS INC | | | 154,727 | | | 303,768 | | | | |
| 300 | | ROPER INDUSTRIES INC | | | 19,526 | | | 22,929 | | | | |
| 14,100 | | SOUTHWEST AIRLINES CO | | | 100,966 | | | 183,018 | | | | |
| 1,800 | | SPIRIT AEROSYSTEMS HOLD-CL A (b) | | | 35,134 | | | 37,458 | | | | |
| 1,000 | | SPX CORP | | | 51,053 | | | 71,490 | | | | |
| 2,080 | | STERICYCLE INC (b) | | | 99,902 | | | 168,314 | | | | |
| 1,100 | | TEEKAY CORP (c) | | | 31,416 | | | 36,388 | | | | |
| 16,775 | | TELEFLEX INC | | | 856,456 | | | 902,663 | | | | |
| 1,400 | | TEREX CORP (b) | | | 29,239 | | | 43,456 | | | | |
| 52,000 | | TEXTRON INC | | | 1,211,937 | | | 1,229,280 | | | | |
| 10,500 | | TYCO INTERNATIONAL LTD (c) | | | 388,274 | | | 435,120 | | | | |
| 7,600 | | UNION PACIFIC CORP | | | 219,426 | | | 704,216 | | | | |
| 15 | | UNITED CONTINENTAL HOLDINGS (b) | | | 314 | | | 357 | | | | |
| 7,240 | | UNITED PARCEL SERVICE-CL B | | | 374,766 | | | 525,479 | | | | |
| 16,850 | | UNITED TECHNOLOGIES CORP | | | 637,287 | | | 1,326,432 | | | | |
| 2,500 | | URS CORP (b) | | | 94,337 | | | 104,025 | | | | |
| 2,000 | | USG CORP (b) | | | 12,349 | | | 33,660 | | | | |
| 4,100 | | UTI WORLDWIDE INC (c) | | | 50,356 | | | 86,920 | | | | |
| 1,800 | | WALTER ENERGY INC | | | 42,608 | | | 230,112 | | | | |
| 1,650 | | WASTE CONNECTIONS INC | | | 29,914 | | | 45,424 | | | | |
| 9,450 | | WASTE MANAGEMENT INC | | | 159,686 | | | 348,421 | | | | |
| 23,100 | | WERNER ENTERPRISES INC | | | 524,871 | | | 522,059 | | | | |
| 1,700 | | WW GRAINGER INC | | | 74,316 | | | 234,786 | | | | |
| | | | | | 26,648,473 | | | 38,090,248 | | | 11.07 | % |
Information technology: | | | | | | | | | | |
| 4,700 | | ACCENTURE PLC-CL A (c) | | | 182,665 | | | 227,903 | | | | |
| 10,800 | | ACTIVISION BLIZZARD INC | | | 63,094 | | | 134,352 | | | | |
| 8,924 | | ADOBE SYSTEMS INC (b) | | | 163,063 | | | 274,681 | | | | |
| 14,300 | | ADVANCED MICRO DEVICES (b) | | | 64,279 | | | 116,974 | | | | |
| | |
See accompanying notes to financial statements. | 33 | (Continued) |
CLEARWATER INVESTMENT TRUST
Schedule of Investments - Clearwater Growth Fund
December 31, 2010
| | | | | | | | | | | | | |
Shares | | Security | | Cost | | Fair
value (a) | | Percent
of
net assets | |
Information technology (Cont’d): | | | | | | | | | | |
| 34,810 | | AGILENT TECHNOLOGIES INC (b) | | $ | 1,161,050 | | | 1,442,178 | | | | |
| 3,300 | | AKAMAI TECHNOLOGIES INC (b) | | | 45,920 | | | 155,265 | | | | |
| 1,600 | | ALLIANCE DATA SYSTEMS CORP (b) | | | 75,650 | | | 113,648 | | | | |
| 5,000 | | ALTERA CORP | | | 94,155 | | | 177,900 | | | | |
| 3,100 | | AMPHENOL CORP-CL A | | | 130,340 | | | 163,618 | | | | |
| 8,600 | | ANALOG DEVICES INC | | | 120,368 | | | 323,962 | | | | |
| 2,400 | | ANSYS INC (b) | | | 81,726 | | | 124,968 | | | | |
| 2,393 | | AOL INC (b) | | | 44,922 | | | 56,738 | | | | |
| 15,000 | | APPLE INC (b) | | | 411,858 | | | 4,838,400 | | | | |
| 16,400 | | APPLIED MATERIALS INC | | | 190,748 | | | 230,420 | | | | |
| 700 | | ARROW ELECTRONICS INC (b) | | | 18,814 | | | 23,975 | | | | |
| 44,200 | | ATMI INC (b) | | | 876,365 | | | 881,348 | | | | |
| 2,486 | | AUTODESK INC (b) | | | 54,831 | | | 94,965 | | | | |
| 4,066 | | AUTOMATIC DATA PROCESSING | | | 132,231 | | | 188,174 | | | | |
| 56,200 | | AVNET INC (b) | | | 1,856,540 | | | 1,856,286 | | | | |
| 62,475 | | BENCHMARK ELECTRONICS INC (b) | | | 1,082,348 | | | 1,134,546 | | | | |
| 4,550 | | BMC SOFTWARE INC (b) | | | 89,322 | | | 214,487 | | | | |
| 9,791 | | BROADCOM CORP-CL A | | | 161,988 | | | 426,398 | | | | |
| 2,180 | | BROADRIDGE FINANCIAL SOLUTIO | | | 33,318 | | | 47,807 | | | | |
| 35,655 | | CA INC | | | 807,587 | | | 871,408 | | | | |
| 4,200 | | CADENCE DESIGN SYS INC (b) | | | 24,003 | | | 34,692 | | | | |
| 900 | | CERNER CORP (b) | | | 40,604 | | | 85,266 | | | | |
| 105,450 | | CISCO SYSTEMS INC (b) | | | 160,814 | | | 2,133,254 | | | | |
| 4,234 | | CITRIX SYSTEMS INC (b) | | | 47,866 | | | 289,648 | | | | |
| 6,300 | | COGNIZANT TECH SOLUTIONS-A (b) | | | 95,625 | | | 461,727 | | | | |
| 9,557 | | COMPUTER SCIENCES CORP | | | 447,904 | | | 474,027 | | | | |
| 117,595 | | COMPUWARE CORP (b) | | | 1,273,339 | | | 1,372,334 | | | | |
| 900 | | CORELOGIC INC | | | 16,993 | | | 16,668 | | | | |
| 25,400 | | CORNING INC | | | 205,191 | | | 490,728 | | | | |
| 1,800 | | CREE INC (b) | | | 56,445 | | | 118,602 | | | | |
| 2,700 | | CYPRESS SEMICONDUCTOR CORP (b) | | | 8,499 | | | 50,166 | | | | |
| 6,750 | | DELL INC (b) | | | 80,373 | | | 91,463 | | | | |
| 5,600 | | EBAY INC (b) | | | 46,264 | | | 155,848 | | | | |
| 3,900 | | ELECTRONIC ARTS INC (b) | | | 73,745 | | | 63,882 | | | | |
| 34,310 | | EMC CORP/MASS (b) | | | 233,560 | | | 785,699 | | | | |
| 1,000 | | EQUINIX INC (b) | | | 77,505 | | | 81,260 | | | | |
| 1,300 | | F5 NETWORKS INC (b) | | | 30,063 | | | 169,208 | | | | |
| 1,600 | | FAIRCHILD SEMICONDUCTOR INTE (b) | | | 21,840 | | | 24,976 | | | | |
| 7,802 | | FIDELITY NATIONAL INFORMATIO | | | 135,427 | | | 213,697 | | | | |
| 3,950 | | FISERV INC (b) | | | 108,063 | | | 231,312 | | | | |
| 2,400 | | FLIR SYSTEMS INC (b) | | | 58,222 | | | 71,400 | | | | |
| 4,167 | | GOOGLE INC-CL A (b) | | | 1,257,780 | | | 2,475,073 | | | | |
| 2,800 | | HARRIS CORP | | | 37,337 | | | 126,840 | | | | |
| 64,697 | | HEWLETT-PACKARD CO | | | 1,661,289 | | | 2,723,744 | | | | |
| 700 | | IHS INC-CLASS A (b) | | | 30,839 | | | 56,273 | | | | |
| 7,200 | | INGRAM MICRO INC-CL A (b) | | | 99,833 | | | 137,448 | | | | |
| 100,300 | | INTEL CORP | | | 208,477 | | | 2,109,309 | | | | |
| 3,600 | | INTERSIL CORP-A | | | 50,850 | | | 54,972 | | | | |
| 19,041 | | INTL BUSINESS MACHINES CORP | | | 1,535,376 | | | 2,794,457 | | | | |
| 5,000 | | INTUIT INC (b) | | | 103,285 | | | 246,500 | | | | |
| 1,300 | | ITRON INC (b) | | | 73,205 | | | 72,085 | | | | |
| 10,967 | | JUNIPER NETWORKS INC (b) | | | 215,572 | | | 404,902 | | | | |
| 2,600 | | KLA-TENCOR CORPORATION | | | 86,094 | | | 100,464 | | | | |
| 3,000 | | LAM RESEARCH CORP (b) | | | 83,706 | | | 155,340 | | | | |
| 2,371 | | LENDER PROCESSING SERVICES | | | 76,903 | | | 69,992 | | | | |
| 2,000 | | LEXMARK INTERNATIONAL INC-A (b) | | | 30,530 | | | 69,640 | | | | |
| 5,400 | | LINEAR TECHNOLOGY CORP | | | 119,475 | | | 186,786 | | | | |
| 28,600 | | LSI CORP (b) | | | 120,263 | | | 171,314 | | | | |
| 7,800 | | MARVELL TECHNOLOGY GROUP LTD (b)(c) | | | 55,397 | | | 144,690 | | | | |
| 1,700 | | MASTERCARD INC-CLASS A | | | 182,283 | | | 380,987 | | | | |
| 7,000 | | MAXIM INTEGRATED PRODUCTS | | | 125,147 | | | 165,340 | | | | |
| 3,900 | | MCAFEE INC (b) | | | 96,027 | | | 180,609 | | | | |
| 1,300 | | METTLER-TOLEDO INTERNATIONAL (b)(c) | | | 87,484 | | | 196,573 | | | | |
| 59,800 | | MICREL INC | | | 817,532 | | | 776,802 | | | | |
| 4,200 | | MICROCHIP TECHNOLOGY INC | | | 66,924 | | | 143,682 | | | | |
| 19,100 | | MICRON TECHNOLOGY INC (b) | | | 94,334 | | | 153,182 | | | | |
| 1,000 | | MICROS SYSTEMS INC (b) | | | 26,215 | | | 43,860 | | | | |
| | |
See accompanying notes to financial statements. | 34 | (Continued) |
|
CLEARWATER INVESTMENT TRUST |
Schedule of Investments - Clearwater Growth Fund |
December 31, 2010 |
| | | | | | | | | | | | | |
Shares | | Security | | Cost | | Fair
value (a) | | Percent
of
net assets | |
Information technology (Cont’d): |
| 199,125 | | MICROSOFT CORP | | $ | 2,534,698 | | | 5,559,570 | | | | |
| 63,900 | | MOTOROLA INC (b) | | | 392,845 | | | 579,573 | | | | |
| 1,600 | | NATIONAL SEMICONDUCTOR CORP | | | 12,291 | | | 22,016 | | | | |
| 4,200 | | NETAPP INC (b) | | | 94,994 | | | 230,832 | | | | |
| 1,600 | | NOVELLUS SYSTEMS INC (b) | | | 40,000 | | | 51,712 | | | | |
| 4,800 | | NUANCE COMMUNICATIONS INC (b) | | | 63,624 | | | 87,264 | | | | |
| 8,900 | | NVIDIA CORP (b) | | | 60,716 | | | 137,060 | | | | |
| 4,000 | | ON SEMICONDUCTOR CORPORATION (b) | | | 30,100 | | | 39,520 | | | | |
| 70,462 | | ORACLE CORP | | | 105,191 | | | 2,205,461 | | | | |
| 7,266 | | PAYCHEX INC | | | 101,485 | | | 224,592 | | | | |
| 3,400 | | PERKINELMER INC | | | 53,706 | | | 87,788 | | | | |
| 3,200 | | PMC - SIERRA INC (b) | | | 26,160 | | | 27,488 | | | | |
| 5,100 | | QLOGIC CORP (b) | | | 72,882 | | | 86,802 | | | | |
| 31,483 | | QUALCOMM INC | | | 704,505 | | | 1,558,094 | | | | |
| 4,000 | | RAMBUS INC (b) | | | 70,262 | | | 81,920 | | | | |
| 4,200 | | RED HAT INC (b) | | | 61,669 | | | 191,730 | | | | |
| 2,300 | | ROVI CORP (b) | | | 55,715 | | | 142,623 | | | | |
| 2,800 | | SAIC INC (b) | | | 52,654 | | | 44,408 | | | | |
| 1,900 | | SALESFORCE.COM INC (b) | | | 86,711 | | | 250,800 | | | | |
| 5,300 | | SANDISK CORP (b) | | | 51,149 | | | 264,258 | | | | |
| 12,100 | | SEAGATE TECHNOLOGY (b)(c) | | | 118,421 | | | 181,863 | | | | |
| 20,519 | | SYMANTEC CORP (b) | | | 166,785 | | | 343,488 | | | | |
| 3,800 | | SYNOPSYS INC (b) | | | 79,130 | | | 102,258 | | | | |
| 104,750 | | TELLABS INC | | | 690,340 | | | 710,205 | | | | |
| 4,500 | | TERADATA CORP (b) | | | 73,317 | | | 185,220 | | | | |
| 4,400 | | TERADYNE INC (b) | | | 40,149 | | | 61,776 | | | | |
| 17,400 | | TEXAS INSTRUMENTS INC | | | 280,526 | | | 565,500 | | | | |
| 2,500 | | TRIMBLE NAVIGATION LTD (b) | | | 38,162 | | | 99,825 | | | | |
| 27,550 | | TYCO ELECTRONICS LTD (c) | | | 911,112 | | | 975,270 | | | | |
| 7,800 | | VISHAY INTERTECHNOLOGY INC (b) | | | 48,930 | | | 114,504 | | | | |
| 557 | | VISHAY PRECISION GROUP (b) | | | 5,691 | | | 10,494 | | | | |
| 1,500 | | VMWARE INC-CLASS A (b) | | | 47,284 | | | 133,365 | | | | |
| 50,280 | | WEBSENSE INC (b) | | | 1,071,507 | | | 1,018,170 | | | | |
| 5,900 | | WESTERN DIGITAL CORP (b) | | | 91,432 | | | 200,010 | | | | |
| 67,000 | | WESTERN UNION CO | | | 1,063,848 | | | 1,244,190 | | | | |
| 24,707 | | XEROX CORP | | | 183,105 | | | 284,625 | | | | |
| 6,750 | | XILINX INC | | | 47,179 | | | 195,614 | | | | |
| 25,340 | | YAHOO! INC (b) | | | 276,920 | | | 421,403 | | | | |
| | | | | | 28,432,879 | | | 54,398,413 | | | 15.80% | |
Materials: | | | | | | | | | | |
| 3,375 | | AIR PRODUCTS & CHEMICALS INC | | | 165,820 | | | 306,956 | | | | |
| 400 | | AIRGAS INC | | | 16,882 | | | 24,984 | | | | |
| 1,300 | | ALBEMARLE CORP | | | 29,153 | | | 72,514 | | | | |
| 9,700 | | ALCOA INC | | | 109,718 | | | 149,283 | | | | |
| 1,600 | | ALLEGHENY TECHNOLOGIES INC | | | 39,592 | | | 88,288 | | | | |
| 1,400 | | ALPHA NATURAL RESOURCES INC (b) | | | 35,679 | | | 84,042 | | | | |
| 25,000 | | ANGLOGOLD ASHANTI-SPON ADR (c)(d) | | | 1,237,738 | | | 1,230,750 | | | | |
| 800 | | APTARGROUP INC | | | 27,324 | | | 38,056 | | | | |
| 4,900 | | ARCH COAL INC | | | 44,088 | | | 171,794 | | | | |
| 1,600 | | ASHLAND INC | | | 47,358 | | | 81,376 | | | | |
| 1,532 | | BALL CORP | | | 11,968 | | | 104,253 | | | | |
| 16,790 | | BAYER AG-SPONSORED ADR (c)(d) | | | 1,301,173 | | | 1,231,714 | | | | |
| 3,000 | | BEMIS COMPANY | | | 66,889 | | | 97,980 | | | | |
| 126,000 | | CEMEX SAB-SPONS ADR PART CER (b)(c)(d) | | | 1,255,864 | | | 1,349,460 | | | | |
| 1,100 | | CF INDUSTRIES HOLDINGS INC | | | 97,135 | | | 148,665 | | | | |
| 1,700 | | CLIFFS NATURAL RESOURCES INC | | | 42,764 | | | 132,617 | | | | |
| 500 | | COMPASS MINERALS INTERNATION | | | 27,453 | | | 44,635 | | | | |
| 40,325 | | CROWN HOLDINGS INC (b) | | | 1,219,867 | | | 1,346,049 | | | | |
| 537 | | CYTEC INDUSTRIES INC | | | 28,176 | | | 28,493 | | | | |
| 1,000 | | DOMTAR CORP (c) | | | 52,480 | | | 75,920 | | | | |
| 17,500 | | DOW CHEMICAL CO/THE | | | 416,708 | | | 597,450 | | | | |
| 13,425 | | DU PONT (E.I.) DE NEMOURS | | | 398,402 | | | 669,639 | | | | |
| 1,938 | | EAGLE MATERIALS INC | | | 37,630 | | | 54,749 | | | | |
| 1,500 | | EASTMAN CHEMICAL CO | | | 58,012 | | | 126,120 | | | | |
| 3,371 | | ECOLAB INC | | | 113,674 | | | 169,966 | | | | |
| 1,900 | | FMC CORP | | | 113,204 | | | 151,791 | | | | |
| 11,848 | | FREEPORT-MCMORAN COPPER | | | 650,032 | | | 1,422,826 | | | | |
| | |
See accompanying notes to financial statements. | 35 | (Continued) |
|
CLEARWATER INVESTMENT TRUST |
Schedule of Investments - Clearwater Growth Fund |
December 31, 2010 |
| | | | | | | | | | | | | |
Shares | | Security | | Cost | | Fair
value (a) | | Percent
of
net assets | |
Materials (Cont’d): |
| 116,925 | | GAMMON GOLD INC (b)(c) | | $ | 901,896 | | | 954,834 | | | | |
| 900 | | GREIF INC-CL A | | | 27,104 | | | 55,710 | | | | |
| 9,431 | | INTERNATIONAL PAPER CO | | | 117,152 | | | 256,900 | | | | |
| 3,683 | | INTL FLAVORS & FRAGRANCES | | | 79,231 | | | 204,738 | | | | |
| 1,000 | | INTREPID POTASH INC (b) | | | 30,875 | | | 37,290 | | | | |
| 3,100 | | JARDEN CORP | | | 77,025 | | | 95,697 | | | | |
| 1,500 | | LUBRIZOL CORP | | | 72,108 | | | 160,320 | | | | |
| 700 | | MARTIN MARIETTA MATERIALS | | | 27,965 | | | 64,568 | | | | |
| 2,875 | | MEADWESTVACO CORP | | | 30,334 | | | 75,210 | | | | |
| 10,115 | | MONSANTO CO | | | 47,604 | | | 704,409 | | | | |
| 2,600 | | MOSAIC CO/THE | | | 41,501 | | | 198,536 | | | | |
| 26,900 | | NEWMONT MINING CORP | | | 1,240,322 | | | 1,652,467 | | | | |
| 10,344 | | NUCOR CORP | | | 287,672 | | | 453,274 | | | | |
| 3,950 | | OWENS-ILLINOIS INC (b) | | | 57,616 | | | 121,265 | | | | |
| 2,100 | | PACKAGING CORP OF AMERICA | | | 30,902 | | | 54,264 | | | | |
| 3,986 | | PPG INDUSTRIES INC | | | 180,558 | | | 335,103 | | | | |
| 6,450 | | PRAXAIR INC | | | 258,706 | | | 615,782 | | | | |
| 4,648 | | RAYONIER INC | | | 104,763 | | | 244,113 | | | | |
| 2,600 | | ROYAL GOLD INC | | | 115,996 | | | 142,038 | | | | |
| 6,500 | | RPM INTERNATIONAL INC | | | 72,503 | | | 143,650 | | | | |
| 700 | | SCOTTS MIRACLE-GRO CO-CL A | | | 25,183 | | | 35,539 | | | | |
| 6,500 | | SEALED AIR CORP | | | 160,306 | | | 165,425 | | | | |
| 300 | | SIGMA-ALDRICH | | | 17,362 | | | 19,968 | | | | |
| 3,600 | | SONOCO PRODUCTS CO | | | 74,518 | | | 121,212 | | | | |
| 3,200 | | SOUTHERN COPPER CORP | | | 38,447 | | | 155,968 | | | | |
| 2,000 | | TEMPLE-INLAND INC | | | 22,889 | | | 42,480 | | | | |
| 1,000 | | UNITED STATES STEEL CORP | | | 27,344 | | | 58,420 | | | | |
| 26,025 | | UNIVERSAL FOREST PRODUCTS | | | 946,196 | | | 1,012,373 | | | | |
| 3,200 | | VALSPAR CORP | | | 68,239 | | | 110,335 | | | | |
| 2,057 | | VULCAN MATERIALS CO | | | 94,088 | | | 91,248 | | | | |
| | | | | | 12,921,188 | | | 18,383,506 | | | 5.34% | |
Telecommunication services: | | | | | | | | | | |
| 650 | | AMERICAN TOWER CORP-CL A (b) | | | 6,123 | | | 33,566 | | | | |
| 157,915 | | AT&T INC | | | 3,917,094 | | | 4,639,543 | | | | |
| 27,875 | | DIGITALGLOBE INC (b) | | | 861,797 | | | 883,916 | | | | |
| 2,140 | | ECHOSTAR CORP-A (b) | | | 36,471 | | | 53,436 | | | | |
| 5,800 | | LIBERTY GLOBAL INC-A (b) | | | 103,484 | | | 205,204 | | | | |
| 4,800 | | NEUSTAR INC-CLASS A (b) | | | 79,848 | | | 125,040 | | | | |
| 77,283 | | VERIZON COMMUNICATIONS INC | | | 2,375,855 | | | 2,765,185 | | | | |
| | | | | | 7,380,672 | | | 8,705,890 | | | 2.53% | |
Utilities: | | | | | | | | | | |
| 10,700 | | AES CORP (b) | | | 132,801 | | | 130,326 | | | | |
| 4,500 | | AGL RESOURCES INC | | | 135,198 | | | 161,325 | | | | |
| 2,800 | | ALLEGHENY ENERGY INC | | | 74,298 | | | 67,872 | | | | |
| 1,000 | | ALLIANT ENERGY CORP | | | 24,835 | | | 36,770 | | | | |
| 1,600 | | AMEREN CORPORATION | | | 40,872 | | | 45,104 | | | | |
| 9,200 | | AMERICAN ELECTRIC POWER | | | 289,948 | | | 331,016 | | | | |
| 34,455 | | AMERICAN WATER WORKS CO INC | | | 840,292 | | | 871,367 | | | | |
| 1,888 | | AQUA AMERICA INC | | | 32,248 | | | 42,442 | | | | |
| 8,600 | | CALPINE CORP (b) | | | 57,319 | | | 114,724 | | | | |
| 5,800 | | CENTERPOINT ENERGY INC | | | 66,308 | | | 91,176 | | | | |
| 10,200 | | CMS ENERGY CORP | | | 144,342 | | | 189,720 | | | | |
| 4,589 | | CONSOLIDATED EDISON INC | | | 184,849 | | | 227,477 | | | | |
| 2,715 | | CONSTELLATION ENERGY GROUP (b) | | | 79,463 | | | 83,160 | | | | |
| 8,862 | | DOMINION RESOURCES INC/VA | | | 284,452 | | | 378,585 | | | | |
| 1,100 | | DPL INC | | | 24,481 | | | 28,281 | | | | |
| 2,800 | | DTE ENERGY COMPANY | | | 105,289 | | | 126,896 | | | | |
| 22,213 | | DUKE ENERGY CORP | | | 247,310 | | | 395,614 | | | | |
| 8,525 | | EDISON INTERNATIONAL | | | 182,117 | | | 329,065 | | | | |
| 3,664 | | ENTERGY CORP | | | 102,452 | | | 259,521 | | | | |
| 4,000 | | EQT CORP | | | 132,900 | | | 179,360 | | | | |
| 6,500 | | EXELON CORP | | | 245,607 | | | 270,660 | | | | |
| 2,100 | | FIRSTENERGY CORP | | | 79,683 | | | 77,742 | | | | |
| 8,700 | | GREAT PLAINS ENERGY INC | | | 157,250 | | | 168,693 | | | | |
| 35,400 | | HAWAIIAN ELECTRIC INDS | | | 782,060 | | | 806,766 | | | | |
| 3,500 | | ITC HOLDINGS CORP | | | 154,844 | | | 216,930 | | | | |
| 97,000 | | KOREA ELEC POWER CORP-SP ADR (b)(c)(d) | | | 1,222,268 | | | 1,310,470 | | | | |
�� | | |
See accompanying notes to financial statements. | 36 | (Continued) |
|
CLEARWATER INVESTMENT TRUST |
Schedule of Investments - Clearwater Growth Fund |
December 31, 2010 |
| | | | | | | | | | | | | |
Shares | | Security | | Cost | | Fair
value (a) | | Percent
of
net assets | |
Utilities (Cont’d): | | | | | | | |
| 20,715 | | NALCO HOLDING CO | | $ | 614,105 | | | 661,637 | | | | |
| 1,500 | | NATIONAL FUEL GAS CO | | | 38,322 | | | 98,430 | | | | |
| 4,000 | | NEXTERA ENERGY INC | | | 157,876 | | | 207,960 | | | | |
| 6,900 | | NISOURCE INC | | | 111,901 | | | 121,578 | | | | |
| 2,600 | | NORTHEAST UTILITIES | | | 64,649 | | | 82,888 | | | | |
| 5,600 | | NRG ENERGY INC (b) | | | 111,284 | | | 109,424 | | | | |
| 1,800 | | NSTAR | | | 60,859 | | | 75,942 | | | | |
| 6,200 | | NV ENERGY INC | | | 76,954 | | | 87,110 | | | | |
| 2,400 | | OGE ENERGY CORP | | | 43,344 | | | 109,296 | | | | |
| 1,700 | | ONEOK INC | | | 69,220 | | | 94,299 | | | | |
| 7,700 | | P G & E CORP | | | 145,781 | | | 368,368 | | | | |
| 4,028 | | PEPCO HOLDINGS INC | | | 71,539 | | | 73,511 | | | | |
| 4,200 | | PETROHAWK ENERGY CORP (b) | | | 94,073 | | | 76,650 | | | | |
| 2,400 | | PINNACLE WEST CAPITAL | | | 71,637 | | | 99,480 | | | | |
| 69,925 | | PNM RESOURCES INC | | | 855,647 | | | 910,424 | | | | |
| 1,600 | | PPL CORPORATION | | | 35,717 | | | 42,112 | | | | |
| 4,600 | | PROGRESS ENERGY INC | | | 166,393 | | | 200,008 | | | | |
| 8,384 | | PUBLIC SERVICE ENTERPRISE GP | | | 245,903 | | | 266,695 | | | | |
| 59,945 | | QUESTAR CORP | | | 1,009,492 | | | 1,043,642 | | | | |
| 4,800 | | SCANA CORP | | | 166,536 | | | 194,880 | | | | |
| 3,200 | | SEMPRA ENERGY | | | 149,225 | | | 167,936 | | | | |
| 11,300 | | SOUTHERN CO | | | 258,573 | | | 431,999 | | | | |
| 32,700 | | SOUTHERN UNION CO | | | 766,513 | | | 787,089 | | | | |
| 10,954 | | SPECTRA ENERGY CORP | | | 155,906 | | | 273,740 | | | | |
| 7,600 | | TECO ENERGY INC | | | 90,842 | | | 135,280 | | | | |
| 3,100 | | UGI CORP | | | 51,203 | | | 97,898 | | | | |
| 1,400 | | WESTAR ENERGY INC | | | 25,766 | | | 35,224 | | | | |
| 2,410 | | WISCONSIN ENERGY CORP | | | 46,468 | | | 141,853 | | | | |
| 4,825 | | XCEL ENERGY INC | | | 43,341 | | | 113,629 | | | | |
| | | | | | 11,622,555 | | | 14,050,044 | | | 4.08% | |
| | Sub-total Common Stock: | | | 211,779,158 | | | 318,526,306 | | | | |
| Short-term investments | | | | | | | | | | |
| 24,212,191 | | NORTHERN INSTL GOVERNMENT SELECT PORTFOLIO, 0.01% (e) | | | 24,212,191 | | | 24,212,191 | | | | |
| | Sub-total Short-term investments: | | | 24,212,191 | | | 24,212,191 | | | 7.03 | % |
| Grand total (f) | | $ | 235,991,349 | | | 342,738,497 | | | 99.56 | % |
| | |
Notes to Schedule of Investments: |
(a) | | Securities are valued in accordance with procedures described in Note 2 to the financial statements. |
(b) | | Currently non-income producing assets. |
(c) | | Foreign security values are stated in U.S. dollars. As of December 31, 2010 the value of foreign stocks or depository receipts of companies based outside of the United States represented 6.08% of net assets. |
(d) | | Securities are American Depository Receipts of companies based outside of the United States representing 2.73% of net assets. |
(e) | | The short-term investment is a money market portfolio of the investment company, Northern Institutional Funds. |
(f) | | At December 31, 2010, the cost for Federal income tax purposes was $236,302,569. The aggregate gross |
| | unrealized appreciation and depreciation of investments in securities based of this cost were as follows: |
| | | | | | | | | | | | | |
| | | Gross unrealized appreciation | | $ | 110,416,258 | | | | | | | |
| | | Gross unrealized depreciation | | | (3,980,330 | ) | | | | | | |
| | | Net unrealized appreciation | | $ | 106,435,928 | | | | | | | |
| | |
See accompanying notes to financial statements. | 37 | (Continued) |
|
CLEARWATER INVESTMENT TRUST |
|
Schedule of Investments – Clearwater Growth Fund |
|
December 31, 2010 |
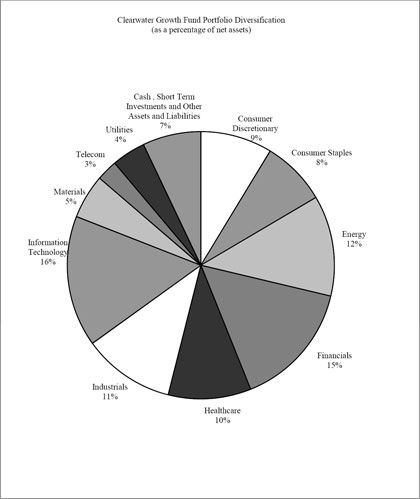
| | |
See accompanying notes to financial statements. | 38 | (Continued) |
|
CLEARWATER INVESTMENT TRUST |
Schedule of Investments - Clearwater Small Cap Fund |
December 31, 2010 |
| | | | | | | | | | | | | |
Shares/Par | | Security | | Cost | | Fair
value (a) | | Percent
of
net assets | |
Common stocks: | | | | | | | | | | |
Consumer discretionary: | | | | | | | | | | |
| 7,419 | | BERKSHIRE HILLS | | $ | 163,389 | | | 163,960 | | | | |
| 20,039 | | CACHE INC (b) | | | 102,394 | | | 88,973 | | | | |
| 31,800 | | CENTURY CASINOS INC (b) | | | 56,023 | | | 76,956 | | | | |
| 11,952 | | CHEROKEE INC | | | 221,806 | | | 224,817 | | | | |
| 15,660 | | CHRISTOPHER & BANKS CORP | | | 101,380 | | | 96,309 | | | | |
| 11,909 | | CLARUS CORPORATION (b) | | | 71,811 | | | 94,200 | | | | |
| 53,715 | | COOPER TIRE & RUBBER | | | 1,144,202 | | | 1,266,600 | | | | |
| 13,939 | | COST PLUS INC/CALIFORNIA (b) | | | 30,610 | | | 135,208 | | | | |
| 140,000 | | DENNY’S CORP (b) | | | 540,636 | | | 501,200 | | | | |
| 25,245 | | DGSE COMPANIES INC (b) | | | 53,897 | | | 108,049 | | | | |
| 209,340 | | ENTERCOM COMMUNICATIONS-CL A (b) | | | 1,309,720 | | | 2,424,157 | | | | |
| 150,425 | | EXIDE TECHNOLOGIES (b) | | | 874,135 | | | 1,415,499 | | | | |
| 32,000 | | GAYLORD ENTERTAINMENT CO (b) | | | 812,882 | | | 1,150,080 | | | | |
| 37,257 | | GENESCO INC (b) | | | 972,076 | | | 1,396,765 | | | | |
| 284,200 | | HANCOCK FABRICS INC /DE (b) | | | 405,103 | | | 289,884 | | | | |
| 26,500 | | HANESBRANDS INC (b) | | | 605,173 | | | 673,100 | | | | |
| 38,205 | | HILLENBRAND INC | | | 786,755 | | | 795,046 | | | | |
| 162,556 | | ICONIX BRAND GROUP INC (b) | | | 1,888,537 | | | 3,138,956 | | | | |
| 29,023 | | INTERCLICK INC (b) | | | 166,264 | | | 155,854 | | | | |
| 46,827 | | JO-ANN STORES INC (b) | | | 1,165,078 | | | 2,819,922 | | | | |
| 96,989 | | KNOLOGY INC (b) | | | 760,265 | | | 1,515,938 | | | | |
| 31,000 | | MADISON SQUARE GAR INC-A (b) | | | 599,247 | | | 799,180 | | | | |
| 104,166 | | MAIDENFORM BRANDS INC (b) | | | 2,599,170 | | | 2,476,026 | | | | |
| 8,530 | | MDC PARTNERS INC-A (c) | | | 100,501 | | | 147,313 | | | | |
| 35,760 | | MOTORCAR PARTS OF AMERICA IN (b) | | | 193,256 | | | 466,310 | | | | |
| 14,795 | | O’CHARLEYS INC (b) | | | 100,199 | | | 106,524 | | | | |
| 53,000 | | ORIENT EXPRESS HOTELS LTD -A (b)(c) | | | 788,949 | | | 688,470 | | | | |
| 54,483 | | OUTDOOR CHANNEL HOLDINGS INC (b) | | | 310,890 | | | 390,643 | | | | |
| 6,663 | | OXFORD INDUSTRIES INC | | | 176,883 | | | 170,639 | | | | |
| 13,143 | | PACIFIC SUNWEAR OF CALIF (b) | | | 75,200 | | | 71,235 | | | | |
| 7,953 | | PEP BOYS-MANNY MOE & JACK | | | 69,260 | | | 106,809 | | | | |
| 27,000 | | PETSMART INC | | | 584,596 | | | 1,075,140 | | | | |
| 127,143 | | RC2 CORP (b) | | | 2,110,646 | | | 2,767,903 | | | | |
| 7,012 | | RED ROBIN GOURMET BURGERS (b) | | | 147,025 | | | 150,548 | | | | |
| 38,659 | | ROCKY BRANDS INC (b) | | | 324,736 | | | 388,136 | | | | |
| 65,000 | | SALLY BEAUTY HOLDINGS INC (b) | | | 562,956 | | | 944,450 | | | | |
| 16,387 | | SINCLAIR BROADCAST GROUP-A | | | 82,427 | | | 134,046 | | | | |
| 21,626 | | STANDARD MOTOR PRODS | | | 194,451 | | | 296,276 | | | | |
| 110,993 | | STONERIDGE INC (b) | | | 1,193,175 | | | 1,752,579 | | | | |
| 20,998 | | SUMMER INFANT INC (b) | | | 159,590 | | | 159,165 | | | | |
| 17,793 | | TANDY LEATHER FACTORY INC | | | 81,842 | | | 82,915 | | | | |
| 32,000 | | TOLL BROTHERS INC (b) | | | 621,879 | | | 608,000 | | | | |
| 21,291 | | TUESDAY MORNING CORP (b) | | | 91,110 | | | 112,416 | | | | |
| 13,000 | | VAIL RESORTS INC (b) | | | 472,042 | | | 676,520 | | | | |
| 55,242 | | VALASSIS COMMUNICATIONS INC (b) | | | 1,013,704 | | | 1,787,079 | | | | |
| 18,973 | | WET SEAL INC/THE-CLASS A (b) | | | 71,805 | | | 70,200 | | | | |
| 20,391 | | WMS INDUSTRIES INC (b) | | | 805,678 | | | 922,489 | | | | |
| 75,561 | | WOLVERINE WORLD WIDE INC | | | 2,111,986 | | | 2,408,885 | | | | |
| 30,000 | | WYNDHAM WORLDWIDE CORP | | | 766,350 | | | 898,800 | | | | |
| | | | | | 28,641,689 | | | 39,190,169 | | | 15.29% | |
Consumer staples: | | | | | | | | | | |
| 9,459 | | CENTRAL GARDEN & PET CO (b) | | | 93,683 | | | 93,077 | | | | |
| 8,712 | | CHIQUITA BRANDS INTL (b) | | | 120,865 | | | 122,142 | | | | |
| 21,000 | | DR PEPPER SNAPPLE GROUP INC | | | 329,293 | | | 738,360 | | | | |
| 27,000 | | FLOWERS FOODS INC | | | 511,723 | | | 726,570 | | | | |
| 6,012 | | MEDIFAST INC (b) | | | 168,274 | | | 173,627 | | | | |
| 26,977 | | OMEGA PROTEIN CORP (b) | | | 136,109 | | | 218,514 | | | | |
| 5,407 | | SENECA FOODS CORP - CL A (b) | | | 131,132 | | | 145,881 | | | | |
| 51,650 | | SPARTAN STORES INC | | | 696,730 | | | 875,468 | | | | |
| 28,667 | | SPECTRUM BRANDS HOLDINGS INC (b) | | | 776,934 | | | 893,550 | | | | |
| 34,875 | | TREEHOUSE FOODS INC (b) | | | 1,368,586 | | | 1,781,764 | | | | |
| | | | | | 4,333,329 | | | 5,768,953 | | | 2.25% | |
Energy: | | | | | | | | | | |
| 34,550 | | CARRIZO OIL & GAS INC (b) | | | 1,087,272 | | | 1,191,630 | | | | |
| 11,000 | | CONTANGO OIL & GAS (b) | | | 487,508 | | | 637,230 | | | | |
| 37,368 | | DHT HOLDINGS INC (c) | | | 145,321 | | | 173,761 | | | | |
| 10,000 | | DRIL-QUIP INC (b) | | | 474,728 | | | 777,200 | | | | |
| 11,429 | | GASTAR EXPLORATION LTD (b) | | | 51,174 | | | 49,145 | | | | |
| 5,453 | | GEORESOURCES INC (b) | | | 112,004 | | | 121,111 | | | | |
| 178,489 | | GMX RESOURCES INC (b) | | | 1,163,827 | | | 985,259 | | | | |
| | |
See accompanying notes to financial statements. | 39 | (Continued) |
|
CLEARWATER INVESTMENT TRUST |
Schedule of Investments - Clearwater Small Cap Fund |
December 31, 2010 |
| | | | | | | | | | | | | |
Shares/Par | | Security | | Cost | | Fair value (a) | | Percent of net assets | |
Energy (Cont’d): | | | | | | | | | | |
| 340,670 | | HERCULES OFFSHORE INC (b) | | $ | 1,661,536 | | | 1,178,718 | | | | |
| 42,500 | | MCDERMOTT INTL INC (b) | | | 509,483 | | | 879,325 | | | | |
| 30,000 | | OASIS PETROLEUM INC (b) | | | 507,417 | | | 813,600 | | | | |
| 40,000 | | PETROHAWK ENERGY CORP (b) | | | 448,994 | | | 730,000 | | | | |
| 185,277 | | PIONEER DRILLING COMPANY (b) | | | 1,424,875 | | | 1,632,290 | | | | |
| 16,000 | | QEP RESOURCES INC | | | 587,366 | | | 580,960 | | | | |
| 48,522 | | SUPERIOR ENERGY SERVICES INC (b) | | | 933,194 | | | 1,697,785 | | | | |
| 129,586 | | TESCO CORP (b)(c) | | | 1,306,204 | | | 2,057,826 | | | | |
| 185,103 | | VAALCO ENERGY INC (b) | | | 1,033,402 | | | 1,325,337 | | | | |
| | | | | | 11,934,305 | | | 14,831,177 | | | 5.79% | |
Financials: | | | | | | | | | | |
| 25,470 | | ABINGTON BANCORP INC | | | 219,131 | | | 303,857 | | | | |
| 4,398 | | AMERICAN SAFETY INS HOLDINGS (b) | | | 89,930 | | | 94,029 | | | | |
| 103,762 | | AMTRUST FINANCIAL SERVICES | | | 1,099,658 | | | 1,815,835 | | | | |
| 25,000 | | ARTHUR J GALLAGHER & CO | | | 505,110 | | | 727,000 | | | | |
| 35,184 | | ASPEN INSURANCE HOLDINGS LTD (c) | | | 844,609 | | | 1,006,966 | | | | |
| 16,474 | | ASSOCIATED ESTATES REALTY CP | | | 215,954 | | | 251,887 | | | | |
| 336,650 | | BANNER CORPORATION | | | 673,300 | | | 781,028 | | | | |
| 119,964 | | BRANDYWINE REALTY TRUST | | | 1,417,666 | | | 1,397,581 | | | | |
| 23,469 | | BROOKLINE BANCORP INC | | | 226,566 | | | 254,639 | | | | |
| 25,000 | | CAPITOL FEDERAL FINANCIAL IN | | | 297,626 | | | 297,750 | | | | |
| 52,900 | | CAPLEASE INC | | | 86,376 | | | 307,878 | | | | |
| 61,945 | | CHESAPEAKE LODGING TRUST | | | 1,016,155 | | | 1,165,185 | | | | |
| 25,976 | | COGDELL SPENCER INC | | | 162,846 | | | 150,661 | | | | |
| 33,580 | | COMMUNITY TRUST BANCORP INC | | | 935,205 | | | 972,477 | | | | |
| 42,244 | | CORPORATE OFFICE PROPERTIES | | | 1,326,546 | | | 1,476,428 | | | | |
| 42,307 | | DELPHI FINANCIAL GROUP-CL A | | | 947,862 | | | 1,220,134 | | | | |
| 13,279 | | EDUCATION REALTY TRUST INC | | | 78,080 | | | 103,178 | | | | |
| 8,752 | | EMC INS GROUP INC | | | 196,630 | | | 198,145 | | | | |
| 50,000 | | EPOCH HOLDING CORP | | | 662,894 | | | 776,500 | | | | |
| 49,000 | | FIRST AMERICAN FINANCIAL | | | 686,145 | | | 732,060 | | | | |
| 76,053 | | FIRST MERCHANTS CORP | | | 437,305 | | | 673,830 | | | | |
| 77,000 | | FIRST NIAGARA FINANCIAL GRP | | | 1,110,190 | | | 1,076,460 | | | | |
| 17,650 | | FIRST POTOMAC REALTY TRUST | | | 186,947 | | | 296,873 | | | | |
| 38,000 | | FORESTAR GROUP INC (b) | | | 775,560 | | | 733,400 | | | | |
| 14,629 | | GLIMCHER REALTY TRUST | | | 89,720 | | | 122,884 | | | | |
| 32,895 | | HALLMARK FINL SERVICES INC (b) | | | 228,631 | | | 299,345 | | | | |
| 10,617 | | HERITAGE FINANCIAL CORP (b) | | | 132,888 | | | 147,789 | | | | |
| 18,272 | | HFF INC-CLASS A (b) | | | 139,290 | | | 176,508 | | | | |
| 40,080 | | HOME FEDERAL BANCORP INC/MD | | | 519,241 | | | 491,782 | | | | |
| 26,373 | | HORACE MANN EDUCATORS | | | 333,290 | | | 475,769 | | | | |
| 7,470 | | HORIZON BANCORP INDIANA | | | 100,149 | | | 197,955 | | | | |
| 34,116 | | IBERIABANK CORP | | | 1,751,722 | | | 2,017,279 | | | | |
| 16,950 | | KAISER FEDERAL FINANCIAL GRO | | | 169,500 | | | 196,281 | | | | |
| 24,000 | | LEGG MASON INC | | | 598,797 | | | 870,480 | | | | |
| 60,453 | | MB FINANCIAL INC | | | 840,868 | | | 1,047,046 | | | | |
| 136,190 | | MEDICAL PROPERTIES TRUST INC | | | 1,301,712 | | | 1,474,938 | | | | |
| 6,600 | | MIDSOUTH BANCORP INC | | | 97,614 | | | 101,376 | | | | |
| 98,706 | | MISSION WEST PROPERTIES | | | 685,178 | | | 660,343 | | | | |
| 15,375 | | NATIONAL FINANCIAL PARTNERS (b) | | | 176,331 | | | 206,025 | | | | |
| 51,795 | | NATIONAL RETAIL PROPERTIES | | | 843,115 | | | 1,372,568 | | | | |
| 169,893 | | NGP CAPITAL RESOURCES CO | | | 1,727,068 | | | 1,563,016 | | | | |
| 173,681 | | NORTHWEST BANCSHARES INC | | | 1,751,562 | | | 2,042,489 | | | | |
| 7,178 | | PACIFIC CONTINENTAL CORP | | | 64,948 | | | 72,211 | | | | |
| 33,525 | | PACWEST BANCORP | | | 720,094 | | | 716,765 | | | | |
| 13,111 | | PARK STERLING CORP | | | 80,326 | | | 80,764 | | | | |
| 77,048 | | PHOENIX COMPANIES INC (b) | | | 213,226 | | | 195,702 | | | | |
| 5,892 | | PINNACLE FINANCIAL PARTNERS (b) | | | 72,214 | | | 80,013 | | | | |
| 25,206 | | PLATINUM UNDERWRITERS HLDGS (c) | | | 794,564 | | | 1,133,514 | | | | |
| 39,936 | | PRESIDENTIAL LIFE CORP | | | 397,782 | | | 396,564 | | | | |
| 56,310 | | PRIVATEBANCORP INC | | | 820,228 | | | 809,738 | | | | |
| 7,040 | | PROVIDENT NEW YORK BANCORP | | | 74,958 | | | 73,850 | | | | |
| 43,187 | | REDWOOD TRUST INC | | | 554,008 | | | 644,782 | | | | |
| 4,290 | | RENASANT CORP | | | 74,344 | | | 72,544 | | | | |
| 17,983 | | RETAIL OPPORTUNITY INVESTMEN | | | 177,842 | | | 178,212 | | | | |
| 2,337 | | SCBT FINANCIAL CORP | | | 73,981 | | | 76,537 | | | | |
| 3,436 | | SOUTHSIDE BANCSHARES INC | | | 74,343 | | | 72,397 | | | | |
| 25,000 | | SPDR KBW REGIONAL BANKING ET | | | 610,828 | | | 661,250 | | | | |
| 4,697 | | STELLARONE CORP | | | 74,170 | | | 68,294 | | | | |
| 111,825 | | SWS GROUP INC | | | 1,285,988 | | | 564,716 | | | | |
| 33,000 | | TERRITORIAL BANCORP INC | | | 510,807 | | | 657,030 | | | | |
| 8,490 | | TOWER BANCORP INC | | | 193,076 | | | 187,120 | | | | |
| 10,070 | | UNITED FINANCIAL BANCORP INC | | | 126,155 | | | 153,769 | | | | |
| | |
See accompanying notes to financial statements. | 40 | (Continued) |
CLEARWATER INVESTMENT TRUST
Schedule of Investments - Clearwater Small Cap Fund
December 31, 2010
| | | | | | | | | | | | | |
Shares/Par | | Security | | Cost | | Fair
value (a) | | Percent
of
net assets | |
Financials (Cont’d): | | | | | | | | | | |
| 8,805 | | UNIVEST CORP OF PENNSYLVANIA | | $ | 145,377 | | | 168,792 | | | | |
| 9,969 | | URSTADT BIDDLE - CLASS A | | | 162,823 | | | 193,897 | | | | |
| 138,587 | | U-STORE-IT TRUST | | | 783,847 | | | 1,320,734 | | | | |
| 35,000 | | WALTER INVESTMENT MANAGEMENT | | | 465,880 | | | 627,900 | | | | |
| 7,423 | | WASHINGTON BANKING CO | | | 66,807 | | | 101,769 | | | | |
| 91,922 | | WESTFIELD FINANCIAL INC | | | 928,902 | | | 850,279 | | | | |
| | | | | | 35,232,485 | | | 40,436,797 | | | 15.78% | |
Healthcare: | | | | | | | | | | | | |
| 36,496 | | ALPHATEC HOLDINGS INC (b) | | | 146,970 | | | 98,539 | | | | |
| 10,305 | | AMERICAN DENTAL PARTNERS INC (b) | | | 129,621 | | | 139,221 | | | | |
| 83,602 | | AMERICAN MEDICAL SYS HLDGS (b) | | | 1,274,906 | | | 1,576,734 | | | | |
| 21,000 | | AMERISOURCEBERGEN CORP | | | 346,011 | | | 716,520 | | | | |
| 21,285 | | BIOSCRIP INC (b) | | | 94,580 | | | 111,321 | | | | |
| 32,039 | | CATALYST HEALTH SOLUTIONS INC (b) | | | 823,343 | | | 1,489,493 | | | | |
| 17,000 | | COVIDIEN PLC (c) | | | 712,946 | | | 776,220 | | | | |
| 116,191 | | DEL GLOBAL TECHNOLOGIES CORP (b) | | | 73,162 | | | 85,981 | | | | |
| 119,491 | | EMDEON INC-CLASS A (b) | | | 1,496,358 | | | 1,617,908 | | | | |
| 8,478 | | ENZON PHARMACEUTICALS INC (b) | | | 84,744 | | | 103,177 | | | | |
| 9,005 | | ERESEARCH TECHNOLOGY INC (b) | | | 68,983 | | | 66,187 | | | | |
| 44,749 | | GENOPTIX INC (b) | | | 930,031 | | | 851,126 | | | | |
| 39,000 | | HANGER ORTHOPEDIC GROUP INC (b) | | | 758,300 | | | 826,410 | | | | |
| 111,989 | | HEALTHSOUTH CORP (b) | | | 1,835,652 | | | 2,319,292 | | | | |
| 122,203 | | HEALTHSPRING INC (b) | | | 1,701,576 | | | 3,242,046 | | | | |
| 59,654 | | HEALTHSTREAM INC (b) | | | 304,984 | | | 479,618 | | | | |
| 27,000 | | HILL-ROM HOLDINGS INC | | | 525,200 | | | 1,062,990 | | | | |
| 11,346 | | INTEGRAMED AMERICA INC (b) | | | 87,872 | | | 98,029 | | | | |
| 15,310 | | MEDTOX SCIENTIFIC INC | | | 178,719 | | | 200,561 | | | | |
| 111,633 | | ORTHOFIX INTERNATIONAL NV (b)(c) | | | 2,645,345 | | | 3,237,357 | | | | |
| 20,000 | | PATTERSON COS INC | | | 448,311 | | | 612,600 | | | | |
| 18,000 | | PERRIGO CO | | | 357,095 | | | 1,139,940 | | | | |
| 65,411 | | PHC INC-CL A (MASS) (b) | | | 89,016 | | | 106,620 | | | | |
| 98,812 | | REHABCARE GROUP INC (b) | | | 2,655,785 | | | 2,341,844 | | | | |
| 9,400 | | RURAL/METRO CORP (b) | | | 80,597 | | | 137,052 | | | | |
| 74,571 | | ZOLL MEDICAL CORP (b) | | | 1,393,051 | | | 2,776,278 | | | | |
| | | | | | 19,243,158 | | | 26,213,064 | | | 10.23 | % |
Industrials: | | | | | | | | | | |
| 52,550 | | ACTUANT CORP-A | | | 978,276 | | | 1,398,881 | | | | |
| 15,000 | | ACUITY BRANDS INC | | | 533,328 | | | 865,050 | | | | |
| 27,000 | | AECOM TECHNOLOGY CORP (b) | | | 628,313 | | | 755,190 | | | | |
| 369,922 | | AIR TRANSPORT SERVICES GROUP (b) | | | 1,986,229 | | | 2,922,384 | | | | |
| 12,950 | | APPLIED SIGNAL TECHNOLOGY | | | 234,997 | | | 490,676 | | | | |
| 49,000 | | AVIS BUDGET GROUP INC (b) | | | 667,732 | | | 762,440 | | | | |
| 36,464 | | AZZ INC | | | 1,197,313 | | | 1,458,925 | | | | |
| 30,000 | | BABCOCK & WILCOX COMPANY (b) | | | 683,537 | | | 767,700 | | | | |
| 16,296 | | BREEZE-EASTERN CORP (b) | | | 116,687 | | | 115,539 | | | | |
| 6,455 | | CASCADE CORP | | | 167,661 | | | 305,192 | | | | |
| 18,400 | | CECO ENVIRONMENTAL CORP (b) | | | 102,166 | | | 109,664 | | | | |
| 32,500 | | CHICAGO BRIDGE & IRON-NY SHR (b)(c) | | | 631,117 | | | 1,069,250 | | | | |
| 50,000 | | COLFAX CORP (b) | | | 570,484 | | | 920,500 | | | | |
| 157,447 | | COMMERCIAL VEHICLE GROUP INC (b) | | | 994,004 | | | 2,558,514 | | | | |
| 28,000 | | COVANTA HOLDING CORP | | | 524,966 | | | 481,320 | | | | |
| 38,950 | | CURTISS-WRIGHT CORP | | | 1,362,005 | | | 1,293,140 | | | | |
| 108,564 | | DOLAN CO/THE (b) | | | 1,093,238 | | | 1,511,211 | | | | |
| 42,921 | | DUCOMMUN INC | | | 861,733 | | | 934,819 | | | | |
| 6,698 | | DXP ENTERPRISES INC (b) | | | 103,879 | | | 160,752 | | | | |
| 5,400 | | ENNIS INC | | | 69,365 | | | 92,340 | | | | |
| 20,000 | | ENPRO INDUSTRIES INC (b) | | | 569,233 | | | 831,200 | | | | |
| 31,748 | | ESCO TECHNOLOGIES INC | | | 1,122,637 | | | 1,201,344 | | | | |
| 25,921 | | FEDERAL SIGNAL CORP | | | 146,630 | | | 177,818 | | | | |
| 8,500 | | FLOWSERVE CORP | | | 433,671 | | | 1,013,370 | | | | |
| 23,500 | | FOSTER (LB) CO-A (b) | | | 542,920 | | | 962,090 | | | | |
| 24,000 | | FOSTER WHEELER AG (b)(c) | | | 513,529 | | | 828,480 | | | | |
| 13,079 | | GARDNER DENVER INC | | | 290,540 | | | 900,097 | | | | |
| 103,562 | | GENCORP INC (b) | | | 531,683 | | | 535,416 | | | | |
| 19,950 | | GENESEE & WYOMING INC-CL A (b) | | | 502,922 | | | 1,056,353 | | | | |
| 9,177 | | GP STRATEGIES CORP (b) | | | 62,336 | | | 93,972 | | | | |
| 77,300 | | GRAFTECH INTERNATIONAL LTD (b) | | | 1,066,786 | | | 1,533,632 | | | | |
| 37,000 | | GREENBRIER COMPANIES INC (b) | | | 533,907 | | | 776,630 | | | | |
| 32,541 | | HAWAIIAN HOLDINGS INC (b) | | | 190,221 | | | 255,121 | | | | |
| 28,964 | | II-VI INC (b) | | | 662,148 | | | 1,342,771 | | | | |
| 16,247 | | ITEX CORP | | | 61,311 | | | 76,361 | | | | |
| 40,000 | | JOHN BEAN TECHNOLOGIES CORP | | | 516,680 | | | 805,200 | | | | |
| 13,500 | | JOY GLOBAL INC | | | 521,593 | | | 1,171,125 | | | | |
| | |
See accompanying notes to financial statements. | 41 | (Continued) |
CLEARWATER INVESTMENT TRUST
Schedule of Investments - Clearwater Small Cap Fund
December 31, 2010
| | | | | | | | | | | | | |
Shares/Par | | Security | | Cost | | Fair
value (a) | | Percent
of
net assets | |
Industrials (Cont’d): | | | | | | | | | | |
| 25,000 | | KANSAS CITY SOUTHERN (b) | | $ | 582,716 | | | 1,196,500 | | | | |
| 14,125 | | LABARGE INC (b) | | | 168,481 | | | 221,904 | | | | |
| 16,133 | | LADISH CO INC (b) | | | 407,445 | | | 784,225 | | | | |
| 21,548 | | LYDALL INC (b) | | | 147,110 | | | 173,461 | | | | |
| 68,369 | | MAGNETEK INC (b) | | | 98,223 | | | 92,298 | | | | |
| 57,000 | | MANITOWOC COMPANY INC | | | 550,335 | | | 747,270 | | | | |
| 356,032 | | METALICO INC (b) | | | 2,167,487 | | | 2,093,468 | | | | |
| 20,886 | | MIDDLEBY CORP (b) | | | 942,301 | | | 1,763,196 | | | | |
| 5,500 | | NATIONAL PRESTO INDS INC | | | 611,385 | | | 715,055 | | | | |
| 1,917 | | PREFORMED LINE PRODUCTS CO | | | 65,250 | | | 112,192 | | | | |
| 35,000 | | RR DONNELLEY & SONS CO | | | 602,981 | | | 611,450 | | | | |
| 20,000 | | SHAW GROUP INC (b) | | | 806,578 | | | 684,600 | | | | |
| 53,172 | | SL INDS INC (b) | | | 636,887 | | | 929,978 | | | | |
| 5,000 | | SMITH (A.O.) CORP | | | 212,859 | | | 190,400 | | | | |
| 13,000 | | SNAP-ON INC | | | 589,135 | | | 735,540 | | | | |
| 77,973 | | SPARTON CORP (b) | | | 466,655 | | | 642,498 | | | | |
| 16,987 | | STANDEX INTERNATIONAL CORP | | | 406,921 | | | 508,081 | | | | |
| 35,902 | | TELEDYNE TECHNOLOGIES INC (b) | | | 1,513,741 | | | 1,578,611 | | | | |
| 19,000 | | TENNANT CO | | | 696,347 | | | 729,790 | | | | |
| 27,000 | | TEREX CORP (b) | | | 757,805 | | | 838,080 | | | | |
| 12,500 | | THOMAS & BETTS CORP (b) | | | 547,678 | | | 603,750 | | | | |
| 8,998 | | TRIUMPH GROUP INC | | | 735,215 | | | 804,511 | | | | |
| 6,558 | | TWIN DISC INC | | | 117,142 | | | 195,822 | | | | |
| 15,500 | | TYCO INTERNATIONAL LTD (c) | | | 700,631 | | | 642,320 | | | | |
| 11,850 | | UNITEK GLOBAL SERVICES INC (b) | | | 112,575 | | | 116,367 | | | | |
| 11,627 | | UQM TECHNOLOGIES INC (b) | | | 22,754 | | | 26,626 | | | | |
| 76,458 | | VALENCE TECHNOLOGY INC (b) | | | 69,670 | | | 128,449 | | | | |
| 47,593 | | WABTEC CORP | | | 1,511,442 | | | 2,517,194 | | | | |
| | | | | | 38,023,526 | | | 52,918,103 | | | 20.66 | % |
Information technology: | | | | | | | | | | |
| 32,339 | | ACTUATE CORP (b) | | | 170,165 | | | 184,332 | | | | |
| 321,617 | | ADPT CORP (b) | | | 1,025,541 | | | 942,338 | | | | |
| 14,371 | | ALLIANCE FIBER (b) | | | 113,238 | | | 225,337 | | | | |
| 130,204 | | ANAREN INC (b) | | | 1,392,560 | | | 2,714,753 | | | | |
| 30,347 | | BLUE COAT SYSTEMS INC (b) | | | 706,666 | | | 906,465 | | | | |
| 126,517 | | BRIDGELINE DIGITAL INC (b) | | | 177,249 | | | 180,919 | | | | |
| 32,000 | | BROADRIDGE FINANCIAL SOLUTION | | | 543,517 | | | 701,760 | | | | |
| 40,681 | | COMTECH TELECOMMUNICATIONS | | | 1,040,993 | | | 1,128,084 | | | | |
| 40,000 | | CORELOGIC INC | | | 809,814 | | | 740,800 | | | | |
| 123,500 | | DDI CORP | | | 1,029,259 | | | 1,452,360 | | | | |
| 52,372 | | DYNAMICS RESEARCH CORP (b) | | | 393,179 | | | 701,785 | | | | |
| 54,328 | | EASYLINK SERVICES INTL-CL A (b) | | | 179,179 | | | 228,178 | | | | |
| 15,073 | | EMAGIN CORPORATION (b) | | | 73,966 | | | 90,438 | | | | |
| 24,770 | | EMS TECHNOLOGIES INC (b) | | | 450,363 | | | 489,951 | | | | |
| 22,716 | | EPICOR SOFTWARE CORP (b) | | | 203,082 | | | 229,432 | | | | |
| 106,019 | | EVOLVING SYSTEMS INC | | | 731,107 | | | 882,078 | | | | |
| 27,547 | | FREQUENCY ELECTRONICS INC (b) | | | 109,078 | | | 184,840 | | | | |
| 60,713 | | GILAT SATELLITE NETWORKS LTD (b)(c) | | | 283,657 | | | 301,744 | | | | |
| 36,920 | | GLOBAL CASH ACCESS HOLDINGS (b) | | | 104,567 | | | 117,775 | | | | |
| 18,976 | | IEC ELECTRONICS CORP (b) | | | 101,678 | | | 144,218 | | | | |
| 20,880 | | INTEGRAL SYSTEMS INC/MD (b) | | | 163,064 | | | 206,921 | | | | |
| 14,889 | | INTERNET MEDIA SERVICES INC (b)(d) | | | 723 | | | 350 | | | | |
| 9,815 | | KULICKE & SOFFA INDUSTRIES (b) | | | 73,875 | | | 70,668 | | | | |
| 106,765 | | KVH INDUSTRIES INC (b) | | | 1,409,275 | | | 1,275,842 | | | | |
| 44,487 | | LANTRONIX INC (b) | | | 148,858 | | | 164,602 | | | | |
| 345,992 | | LOOKSMART LTD (b) | | | 468,636 | | | 730,043 | | | | |
| 90,283 | | MAGMA DESIGN AUTOMATION INC (b) | | | 237,809 | | | 452,318 | | | | |
| 24,422 | | MERCURY COMPUTER SYSTEMS INC (b) | | | 184,968 | | | 448,876 | | | | |
| 27,855 | | MICRONETICS INC (b) | | | 143,538 | | | 122,562 | | | | |
| 84,945 | | MKS INSTRUMENTS INC (b) | | | 1,809,026 | | | 2,080,303 | | | | |
| 41,800 | | NAPCO SECURITY TECHNOLOGIES (b) | | | 68,377 | | | 74,822 | | | | |
| 5,138 | | NCI INC-A (b) | | | 116,324 | | | 118,123 | | | | |
| 47,282 | | NETSCOUT SYSTEMS INC (b) | | | 694,420 | | | 1,087,959 | | | | |
| 20,525 | | NOVA MEASURING INSTRUMENTS (b)(c) | | | 101,038 | | | 170,563 | | | | |
| 32,889 | | OCCAM NETWORKS INC (b) | | | 243,506 | | | 285,148 | | | | |
| 100,560 | | OCLARO INC (b) | | | 1,426,484 | | | 1,322,364 | | | | |
| 42,609 | | ONLINE RESOURCES CORP (b) | | | 195,869 | | | 198,132 | | | | |
| 12,915 | | OSI SYSTEMS INC (b) | | | 333,292 | | | 469,589 | | | | |
| 556,312 | | QUANTUM CORP (b) | | | 1,582,236 | | | 2,069,481 | | | | |
| 28,598 | | QUEPASA CORP (b) | | | 233,174 | | | 334,597 | | | | |
| 76,875 | | QUEST SOFTWARE INC (b) | | | 1,336,414 | | | 2,132,513 | | | | |
| 19,783 | | REALNETWORKS INC (b) | | | 64,831 | | | 83,089 | | | | |
| 177,594 | | RF MICRO DEVICES INC (b) | | | 761,991 | | | 1,305,316 | | | | |
| | |
See accompanying notes to financial statements. | 42 | (Continued) |
CLEARWATER INVESTMENT TRUST
Schedule of Investments - Clearwater Small Cap Fund
December 31, 2010
| | | | | | | | | | | | | |
| | | | | | | | | | | | | |
Shares/Par | | Security | | Cost | | Fair
value (a) | | Percent
of
net assets | |
Information technology (Cont’d): | | | | | | | | | | |
| 28,874 | | ROVI CORP (b) | | $ | 576,815 | | | 1,790,477 | | | | |
| 230,455 | | SANMINA-SCI CORP (b) | | | 2,222,382 | | | 2,645,623 | | | | |
| 33,870 | | SELECTICA INC (b) | | | 195,859 | | | 165,963 | | | | |
| 9,958 | | SIGMATRON INTERNATIONAL INC (b) | | | 63,863 | | | 63,731 | | | | |
| 16,050 | | SILICON GRAPHICS INTERNATION (b) | | | 114,693 | | | 144,932 | | | | |
| 20,076 | | SMART MODULAR TECHNOLOGIES (b) | | | 110,502 | | | 115,638 | | | | |
| 12,793 | | SMITH MICRO SOFTWARE INC (b) | | | 108,421 | | | 201,362 | | | | |
| 22,450 | | SPECTRUM CONTROL INC (b) | | | 176,736 | | | 336,526 | | | | |
| 82,365 | | SYNIVERSE HOLDINGS INC (b) | | | 1,076,698 | | | 2,540,960 | | | | |
| 85,284 | | SYNNEX CORP (b) | | | 2,378,233 | | | 2,660,861 | | | | |
| 23,523 | | TAKE-TWO INTERACTIVE SOFTWRE (b) | | | 233,071 | | | 287,922 | | | | |
| 107,274 | | TIER TECHNOLOGIES INC (b) | | | 702,933 | | | 642,571 | | | | |
| 76,461 | | TNS INC (b) | | | 1,730,020 | | | 1,590,389 | | | | |
| 29,927 | | TOLLGRADE COMMUNICATIONS INC (b) | | | 209,138 | | | 277,723 | | | | |
| 98,767 | | UNISYS CORP (b) | | | 2,851,575 | | | 2,557,078 | | | | |
| 48,882 | | WEB.COM GROUP INC (b) | | | 237,886 | | | 413,053 | | | | |
| 45,378 | | WESTELL TECHNOLOGIES INC-A (b) | | | 65,588 | | | 148,386 | | | | |
| 18,000 | | WRIGHT EXPRESS CORP (b) | | | 495,073 | | | 828,000 | | | | |
| 37,077 | | ZORAN CORP (b) | | | 296,853 | | | 326,278 | | | | |
| | | | | | 35,282,925 | | | 45,489,241 | | | 17.75 | % |
Materials: | | | | | | | | | | |
| 17,000 | | APTARGROUP INC | | | 711,338 | | | 808,690 | | | | |
| 15,000 | | ASHLAND INC | | | 551,175 | | | 762,900 | | | | |
| 20,500 | | BEMIS COMPANY | | | 601,990 | | | 669,530 | | | | |
| 9,463 | | BUCKEYE TECHNOLOGIES INC | | | 93,096 | | | 198,818 | | | | |
| 12,000 | | CLEARWATER PAPER CORP (b) | | | 271,297 | | | 939,600 | | | | |
| 1,100 | | CONTANGO ORE INC (b) | | | 3,714 | | | 11,550 | | | | |
| 11,500 | | DELTIC TIMBER CORP | | | 546,288 | | | 647,910 | | | | |
| 268,798 | | ENTROPIC COMMUNI (b) | | | 2,232,807 | | | 3,247,080 | | | | |
| 10,684 | | GREIF INC-CL A | | | 455,256 | | | 661,340 | | | | |
| 11,184 | | HORSEHEAD HOLDING CORP (b) | | | 114,883 | | | 145,839 | | | | |
| 5,435 | | INNOPHOS HOLDINGS INC | | | 123,237 | | | 196,095 | | | | |
| 18,143 | | INNOSPEC INC (b) | | | 155,995 | | | 370,117 | | | | |
| 20,000 | | KAPSTONE PAPER AND PACKAGING (b) | | | 145,550 | | | 306,000 | | | | |
| 38,668 | | KOPPERS HOLDINGS INC | | | 1,067,633 | | | 1,383,541 | | | | |
| 147,325 | | NEO MATERIAL TECHNOLOGIES IN (b)(c) | | | 592,826 | | | 1,163,868 | | | | |
| 4,119 | | OLYMPIC STEEL INC | | | 90,167 | | | 118,133 | | | | |
| 253,509 | | OMNOVA SOLUTIONS INC (b) | | | 1,742,920 | | | 2,119,335 | | | | |
| 63,347 | | ROCK-TENN COMPANY -CL A | | | 2,395,021 | | | 3,417,571 | | | | |
| 8,981 | | STEPAN CO | | | 638,960 | | | 684,981 | | | | |
| 5,004 | | SYNALLOY CORP | | | 60,595 | | | 60,648 | | | | |
| 14,000 | | TEXAS INDUSTRIES INC | | | 775,328 | | | 640,920 | | | | |
| 46,492 | | UNITED STATES ANTIMONY CORP (b) | | | 20,564 | | | 27,895 | | | | |
| 84,369 | | WHX CORP (b) | | | 184,683 | | | 1,095,109 | | | | |
| 19,000 | | WR GRACE & CO (b) | | | 465,151 | | | 667,469 | | | | |
| 39,000 | | ZEP INC | | | 555,900 | | | 775,319 | | | | |
| | | | | | 14,596,374 | | | 21,120,258 | | | 8.24 | % |
Utilities: | | | | | | | | | | |
| 21,030 | | ALLETE INC | | | 671,405 | | | 783,577 | | | | |
| 27,000 | | AMERICAN WATER WORKS CO INC | | | 583,883 | | | 682,829 | | | | |
| 19,000 | | CLECO CORPORATION | | | 470,134 | | | 584,439 | | | | |
| 14,000 | | ITC HOLDINGS CORP | | | 638,988 | | | 867,719 | | | | |
| 53,371 | | PORTLAND GENERAL ELECTRIC CO | | | 1,104,732 | | | 1,158,150 | | | | |
| 31,000 | | QUESTAR CORP | | | 521,602 | | | 539,709 | | | | |
| 7,540 | | SJW CORP | | | 172,466 | | | 199,583 | | | | |
| 22,525 | | SOUTHWEST GAS CORP | | | 552,857 | | | 825,991 | | | | |
| 32,317 | | UIL HOLDINGS CORP | | | 917,736 | | | 968,216 | | | | |
| 21,012 | | UNITIL CORP | | | 457,904 | | | 477,812 | | | | |
| | | | | | 6,091,707 | | | 7,088,025 | | | 2.77 | % |
| | | Sub-total Common Stock: | | | 193,379,498 | | | 253,055,787 | | | | |
Short-term investments: | | | | | | | | | | |
| 5,133,720 | | NORTHERN INSTL GOVERNMENT SELECT PORTFOLIO, 0.01% (e) | | | 5,133,720 | | | 5,133,720 | | | | |
| | | Sub-total Short-term investments: | | | 5,133,720 | | | 5,133,720 | | | 2.00 | % |
| | | Grand Total (f) | | $ | 198,513,218 | | | 258,189,507 | | | 100.76 | % |
| | |
See accompanying notes to financial statements. | 43 | (Continued) |
CLEARWATER INVESTMENT TRUST
Schedule of Investments - Clearwater Small Cap Fund
December 31, 2010
| | | | | | | | | | | | | |
Notes to Schedule of Investments: | | | | | | | | | | |
| (a) | | Securities are valued in accordance with procedures described in note 2 to the financial statements. | |
| (b) | | Currently non-income producing assets. | | | | | | | | | | |
| (c) | | Foreign security values are stated in U.S. dollars. As of December 31, 2010, the value of stocks or depository receipts represented 5.23% of net assets. | |
| (d) | | This security is being fair valued according to procedures adopted by the Board of Trustees. | | | | |
| (e) | | The short-term investment is a money market portfolio of the investment company, Northern Institutional Funds. | |
| (f) | | At December 31, 2010, the cost for Federal income tax purposes was $198,543,256. The aggregate gross unrealized appreciation and depreciation of investments in securities based on this cost were as follows: | |
| | | Gross unrealized appreciation | | $ | 63,891,094 | | | | | | | |
| | | Gross unrealized depreciation | | | (4,244,843 | ) | | | | | | |
| | | Net unrealized appreciation | | $ | 59,646,251 | | | | | | | |
| | |
See accompanying notes to financial statements. | 44 | (Continued) |
CLEARWATER INVESTMENT TRUST
Schedule of Investments – Clearwater Small Cap Fund
December 31, 2010
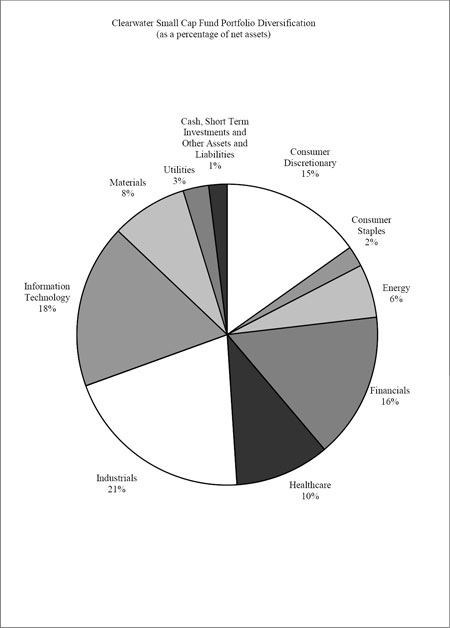
| | |
See accompanying notes to financial statements. | 45 | (continued) |
CLEARWATER INVESTMENT TRUST
Schedule of Investments - Clearwater Tax-Exempt Bond Fund
December 31, 2010
| | | | | | | | | | | | | | | | | |
Par/Shares | | Security | | Maturity
date | | Coupon
rate | | Cost | | Fair
Value (a) | | Percent
of
net assets | |
Closed-End funds: | | | | | | | | | | | | | | |
| 47,200 | | AMERICAN MUNI INCOME PT | | | | | | $ | 554,976 | | | 606,992 | | | | |
| 208,600 | | BLACKROCK LNG-TM MUN ADV | | | | | | | 2,133,992 | | | 2,102,688 | | | | |
| 35,600 | | BLACKROCK MUN INC TRUST | | | | | | | 373,567 | | | 466,360 | | | | |
| 18,200 | | BLACKROCK MUNI BOND TRUST | | | | | | | 169,379 | | | 249,886 | | | | |
| 54,700 | | BLACKROCK MUNIYIELD PENNS | | | | | | | 774,527 | | | 735,715 | | | | |
| 21,837 | | BLACKROCK MUNIYIELD QUALI | | | | | | | 275,930 | | | 268,813 | | | | |
| 71,200 | | BLACKROCK MUNIYIELD INVES | | | | | | | 905,807 | | | 924,176 | | | | |
| 81,800 | | BLACKROCK MUNIYIELD MI QU | | | | | | | 981,525 | | | 990,598 | | | | |
| 59,500 | | BLACKROCK MUNIHOLDINGS QU | | | | | | | 749,861 | | | 711,620 | | | | |
| 78,300 | | BLACKROCK MUNIYIELD QUALI | | | | | | | 1,032,557 | | | 976,401 | | | | |
| 28,100 | | BLACKROCK MUNIYIELD QUAL | | | | | | | 333,747 | | | 318,935 | | | | |
| 186,000 | | BLACKROCK MUNIHOLDINGS QU | | | | | | | 2,175,942 | | | 2,390,100 | | | | |
| 76,179 | | BLACKROCK MUNIYIELD MI QU | | | | | | | 1,014,103 | | | 1,016,990 | | | | |
| 12,500 | | DREYFUS STRATEGIC MUNI BD | | | | | | | 68,613 | | | 94,750 | | | | |
| 209,000 | | DWS MUNICIPAL INCOME TRUS | | | | | | | 2,278,136 | | | 2,386,780 | | | | |
| 26,905 | | EATON VANCE MUNICIPAL INC | | | | | | | 286,929 | | | 299,453 | | | | |
| 1,000 | | EATON VANCE CAL MUNI BOND | | | | | | | 8,280 | | | 11,250 | | | | |
| 66,800 | | EATON VANCE CALI MUN BOND | | | | | | | 744,489 | | | 734,800 | | | | |
| 1,100 | | EATON VANCE MICHI MUNI BN | | | | | | | 15,510 | | | 13,563 | | | | |
| 10,800 | | FEDERATED PREMIER MUNI IN | | | | | | | 128,672 | | | 143,316 | | | | |
| 68,200 | | INVESCO MUNICIPAL PREMIUM | | | | | | | 515,130 | | | 516,956 | | | | |
| 101,881 | | INVESCO QUALITY MUNI INC | | | | | | | 1,164,128 | | | 1,253,136 | | | | |
| 95,900 | | INVESCO QUALITY MUNI INV | | | | | | | 1,173,337 | | | 1,198,750 | | | | |
| 37,800 | | INVESCO VAN KAMPEN S S MN | | | | | | | 398,849 | | | 424,116 | | | | |
| 83,800 | | INVESCO VAN KAMPEN TRUST | | | | | | | 954,508 | | | 1,142,194 | | | | |
| 94,239 | | INVESCO VAN KAMPEN PENN V | | | | | | | 1,240,054 | | | 1,192,123 | | | | |
| 74,277 | | INVESCO VAN KAMPEN TRUST | | | | | | | 1,042,890 | | | 991,598 | | | | |
| 124,300 | | INVESCO VAN KAMPEN AD MIT | | | | | | | 1,443,464 | | | 1,409,562 | | | | |
| 56,248 | | MANAGED DURATION INVESTME | | | | | | | 714,557 | | | 737,411 | | | | |
| 6,500 | | MFS HIGH INCOME MUNICIPAL | | | | | | | 23,108 | | | 30,615 | | | | |
| 10,299 | | NEUBERGER BERMAN INTMD MU | | | | | | | 126,917 | | | 143,259 | | | | |
| 31,103 | | NUVEEN CAL INV QUAL MUNI | | | | | | | 373,215 | | | 392,831 | | | | |
| 13,700 | | NUVEEN CAL MUNI MKT OPPOR | | | | | | | 157,825 | | | 174,401 | | | | |
| 42,560 | | NUVEEN DIVIDEND ADV MUNI | | | | | | | 523,323 | | | 565,197 | | | | |
| 41,700 | | NUVEEN DVD ADVANTAGE MUNI | | | | | | | 475,800 | | | 537,930 | | | | |
| 13,500 | | NUVEEN INSD DVD ADV MUNI | | | | | | | 181,771 | | | 183,600 | | | | |
| 4,800 | | NUVEEN MA PREMIUM INC MUN | | | | | | | 65,734 | | | 64,080 | | | | |
| 30,600 | | NUVEEN MI PREMIUM INC MUN | | | | | | | 404,605 | | | 400,248 | | | | |
| 44,600 | | NUVEEN MUNI ADVANTAGE FUN | | | | | | | 522,316 | | | 583,368 | | | | |
| 15,500 | | NUVEEN NJ INV QUAL MUNI F | | | | | | | 211,528 | | | 203,360 | | | | |
| 10,100 | | NUVEEN PA DVD ADV MUNI FD | | | | | | | 127,549 | | | 133,118 | | | | |
| 48,500 | | NUVEEN PENN INV QUAL MUNI | | | | | | | 673,352 | | | 646,505 | | | | |
| 238,709 | | NUVEEN PREMIUM INC MUNI F | | | | | | | 3,273,534 | | | 3,160,507 | | | | |
| 27,100 | | NUVEEN PREMIER MUNI INC F | | | | | | | 367,653 | | | 353,655 | | | | |
| 216,190 | | PUTNAM MUNI OPPORTUNITIES | | | | | | | 2,450,699 | | | 2,347,823 | | | | |
| 12,700 | | WESTERN ASSET INTERMEDIAT | | | | | | | 111,045 | | | 120,523 | | | | |
| 22,000 | | WESTERN ASSET MANAGED MUN | | | | | | | 240,488 | | | 265,540 | | | | |
| 48,606 | | WESTERN ASSET MUNICIPAL P | | | | | | | 620,291 | | | 644,517 | | | | |
| | | | | | | | | | 34,584,212 | | | 35,260,109 | | | 6.83 | % |
Municipal bonds: | | | | | | | | | | | | | | |
| 750,000 | | ABAG FIN AUTH FOR NONPROFIT CORPS CALIF REV | | 9/1/2037 | | 6.00 | | | 745,014 | | | 728,573 | | | | |
| 1,000,000 | | ABAG FIN AUTH FOR NONPROFIT CORPS CALIF REV | | 7/1/2037 | | 5.75 | | | 954,256 | | | 940,580 | | | | |
| 1,000,000 | | ABERDEEN S D ECONOMIC DEV REV | | 5/1/2029 | | 5.63 | | | 964,007 | | | 936,400 | | | | |
| 1,500,000 | | AGUA CALIENTE BAND CAHUILLA INDIANS CALIF REV | | 7/1/2018 | | 6.00 | | | 1,468,924 | | | 1,425,420 | | | | |
| 1,500,000 | | ALASKA ST HSG FIN CORP | | 6/1/2032 | | 5.25 | | | 1,284,690 | | | 1,501,545 | | | | |
| 960,000 | | ALASKA HSG FIN CORP HOME MTG REV | | 12/1/2034 | | 5.25 | | | 957,318 | | | 948,365 | | | | |
| 500,000 | | ALASKA HSG FIN CORP MTG REV | | 12/1/2040 | | 4.63 | | | 495,019 | | | 443,130 | | | | |
| 445,000 | | ALASKA HSG FIN CORP HOME MTG REV | | 12/1/2033 | | 5.45 | | | 445,000 | | | 448,800 | | | | |
| 2,000,000 | | ALASKA ST HSG FIN CORP | | 12/1/2034 | | 5.25 | | | 2,006,599 | | | 2,000,600 | | | | |
| 200,000 | | ALABAMA SPL CARE FACS FING AUTH MOBILE HOSP REV | | 11/1/2019 | | 5.00 | | | 206,512 | | | 200,594 | | | | |
| 650,000 | | ALABAMA HSG FIN AUTH SINGLE FAMILY MTG REV | | 4/1/2038 | | 4.50 | | | 484,960 | | | 573,723 | | | | |
| 1,320,000 | | ALABAMA HSG FIN AUTH SINGLE FAMILY MTG REV | | 10/1/2028 | | 5.25 | | | 1,320,000 | | | 1,327,788 | | | | |
| 500,000 | | ALAMEDA CORRIDOR TRANSN AUTH CALIF REV (b)(c) | | 10/1/2024 | | 1.60 | | | 409,986 | | | 393,854 | | | | |
| 600,000 | | ALASKA INDL DEV & EXPT AUTH CMNTY PROVIDER REV | | 12/1/2011 | | 5.45 | | | 600,000 | | | 394,290 | | | | |
| 240,000 | | ALBANY N Y INDL DEV AGY CIVIC FAC REV (b) | | 5/1/2016 | | 6.50 | | | 240,000 | | | 95,645 | | | | |
| 350,000 | | ALEUTIANS EAST BOROUGH ALASKA PROJ REV | | 6/1/2025 | | 5.50 | | | 316,018 | | | 300,969 | | | | |
| 485,000 | | ALEXANDRIA VA REDEV & HSG AUTH MULTI-FAMILY HSG REV | | 10/1/2029 | | 6.13 | | | 508,298 | | | 487,100 | | | | |
| 1,025,000 | | ALISAL CALIF UN SCH DIST (b)(c) | | 8/1/2025 | | 10.55 | | | 446,541 | | | 417,770 | | | | |
| 1,000,000 | | ALLEGHENY CNTY PA INDL DEV AUTH CHRTR SCH REV | | 8/15/2026 | | 5.90 | | | 1,000,000 | | | 904,320 | | | | |
| 1,500,000 | | CLIFTON TEX HIGHER ED FIN CORPED REV | | 8/15/2028 | | 7.00 | | | 1,462,817 | | | 1,448,415 | | | | |
| 1,750,000 | | ARLINGTON TEX SPL OBLIG | | 8/15/2034 | | 5.00 | | | 1,872,269 | | | 1,750,508 | | | | |
| 965,000 | | ASMS PUB EDL BLDG AUTH MOBILE ALA REV | | 9/1/2026 | | 4.38 | | | 939,313 | | | 914,434 | | | | |
| 500,000 | | ATLANTA GA ARPT REV | | 1/1/2020 | | 5.75 | | | 502,500 | | | 504,080 | | | | |
| | |
See accompanying notes to financial statements. | 46 | (Continued) |
CLEARWATER INVESTMENT TRUST
Schedule of Investments - Clearwater Tax-Exempt Bond Fund
December 31, 2010
| | | | | | | | | | | | | | | | | |
Par/Shares | | Security | | Maturity
date | | Coupon
rate | | Cost | | Fair
Value (a) | | Percent
of
net assets | |
Municipal bonds (Cont’d): | | | | | | | | | | | | | |
| 500,000 | | ATLANTA GA ARPT REV | | 1/1/2030 | | 6.00 | | $ | 520,981 | | | 529,285 | | | | |
| 1,000,000 | | ATLANTA GA ARPT REV (b) | | 1/1/2030 | | 5.60 | | | 924,130 | | | 919,970 | | | | |
| 630,000 | | AUSTIN TEX CONVENTION ENTERPRISES INC CONVENTION CTR | | 1/1/2012 | | 6.00 | | | 606,558 | | | 629,761 | | | | |
| 400,000 | | AVE MARIA STEWARDSHIP CMNTY DEV DIST FLA | | 11/1/2012 | | 4.80 | | | 399,828 | | | 370,120 | | | | |
| 1,028,683 | | ARIZONA HEALTH FACS AUTH REV | | 7/1/2027 | | 5.25 | | | 997,486 | | | 854,588 | | | | |
| 1,000,000 | | BAY CNTY FLA EDL FACS REV | | 9/1/2030 | | 5.25 | | | 981,935 | | | 831,260 | | | | |
| 500,000 | | BERKELEY CNTY S C SCH DIST INSTALLMENT LEASE | | 12/1/2024 | | 5.25 | | | 510,131 | | | 505,895 | | | | |
| 1,000,000 | | BEXAR CNTY TEX HEALTH FACS DEV CORP REV | | 7/1/2030 | | 5.88 | | | 984,123 | | | 952,670 | | | | |
| 250,000 | | BEXAR CNTY TEX HSG FIN CORP MULTI FAMILY HSG REV | | 12/1/2021 | | 6.50 | | | 265,871 | | | 232,798 | | | | |
| 500,000 | | BEXAR CNTY TEX HSG FIN CORP MULTI FAMILY HSG REV | | 1/1/2021 | | 5.70 | | | 445,412 | | | 462,265 | | | | |
| 600,000 | | BEXAR CNTY TEX HSG FIN CORP MULTI FAMILY HSG REV | | 8/1/2030 | | 6.10 | | | 518,489 | | | 532,374 | | | | |
| 890,000 | | BEXAR CNTY TEX HSG FIN CORP MULTI FAMILY HSG REV | | 12/1/2036 | | 9.25 | | | 868,580 | | | 617,785 | | | | |
| 445,000 | | BEXAR CNTY TEX HSG FIN CORP MULTI FAMILY HSG REV | | 9/15/2021 | | 8.75 | | | 445,000 | | | 438,548 | | | | |
| 365,000 | | BEXAR CNTY TEX HSG FIN CORP MULTI FAMILY HSG REV | | 8/1/2030 | | 8.13 | | | 352,455 | | | 313,265 | | | | |
| 805,000 | | BEXAR CNTY TEX HSG FIN CORP MULTI FAMILY HSG REV (b) | | 4/1/2030 | | 9.00 | | | 802,520 | | | 158,988 | | | | |
| 1,005,000 | | BEXAR CNTY TEX HSG FIN CORP MULTI FAMILY HSG REV (b) | | 6/1/2031 | | 10.50 | | | 1,005,000 | | | 298,344 | | | | |
| 1,000,000 | | BIRMINGHAM ALA ARPT AUTH ARPT REV | | 7/1/2030 | | 5.25 | | | 970,303 | | | 988,580 | | | | |
| 500,000 | | BIRMINGHAM-SOUTHERN COLLEGE AL PVT EDL BLDG AUTH TUITION | | 12/1/2019 | | 5.35 | | | 504,110 | | | 436,285 | | | | |
| 96,381 | | BISMARCK STATE COLLEGE (d) | | 4/1/2032 | | 5.01 | | | 98,017 | | | 96,381 | | | | |
| 650,000 | | BI-STATE DEV AGY MO ILL MET DIST MASS TRAN SALES TAX | | 10/1/2033 | | 5.25 | | | 650,000 | | | 649,090 | | | | |
| 1,000,000 | | BLOOMINGTON MINN HSG REV | | 12/1/2030 | | 6.00 | | | 971,716 | | | 938,170 | | | | |
| 500,000 | | BOONE CNTY MO HOSP REV | | 8/1/2028 | | 5.75 | | | 515,445 | | | 502,105 | | | | |
| 700,000 | | BOSTON MASS REV | | 10/1/2031 | | 6.13 | | | 701,236 | | | 714,350 | | | | |
| 500,000 | | BOWLING GREEN OHIO STUDENT HSGREV | | 6/1/2031 | | 5.75 | | | 491,733 | | | 457,380 | | | | |
| 965,000 | | BRAZOS CNTY TEX HEALTH FAC DEV CORP FRANCISCAN SVCS CORP REV | | 1/1/2032 | | 5.38 | | | 954,386 | | | 888,128 | | | | |
| 500,000 | | BRAZOS CNTY TEX HEALTH FAC DEV CORP FRANCISCAN SVCS CORP REV | | 1/1/2033 | | 5.50 | | | 504,881 | | | 462,795 | | | | |
| 204,000 | | BRIDGEVILLE DEL SPL OBLIG | | 7/1/2035 | | 5.13 | | | 204,000 | | | 134,218 | | | | |
| 890,000 | | BUCKEYE OHIO TOB SETTLEMENT FING AUTH | | 6/1/2024 | | 5.13 | | | 856,213 | | | 685,407 | | | | |
| 750,000 | | BUNCOME CNTY N C PROJ DEV FING REV | | 8/1/2024 | | 6.75 | | | 737,558 | | | 649,148 | | | | |
| 395,000 | | BUTLER CNTY PA GEN AUTH REV | | 10/1/2034 | | 0.90 | | | 395,000 | | | 236,834 | | | | |
| 350,000 | | CALIFORNIA STATEWIDE CMNTYS DEV AUTH SPL TAX | | 9/1/2029 | | 6.00 | | | 350,000 | | | 289,741 | | | | |
| 385,000 | | CALIFORNIA CMNTYS HSG FIN AGY LEASE REV | | 11/1/2012 | | 4.85 | | | 382,409 | | | 209,521 | | | | |
| 750,000 | | CALIFORNIA STATEWIDE CMNTYS DEV AUTH REV | | 6/1/2017 | | 5.40 | | | 747,961 | | | 738,008 | | | | |
| 500,000 | | CALIFORNIA STATEWIDE CMNTYS DEV AUTH REV | | 10/1/2025 | | 5.75 | | | 487,839 | | | 471,715 | | | | |
| 1,500,000 | | CALIFORNIA SCH FACS FING AUTH REV (b) | | 1/1/2021 | | 6.00 | | | 1,500,000 | | | 1,492,545 | | | | |
| 1,500,000 | | CALIFORNIA STATEWIDE CMNTYS DEV AUTH REV | | 1/1/2016 | | 5.25 | | | 1,491,771 | | | 1,484,445 | | | | |
| 750,000 | | CALIFORNIA MUN FIN AUTH SR LIVING REV | | 5/15/2029 | | 5.88 | | | 750,000 | | | 751,170 | | | | |
| 570,000 | | CALIFORNIA MUN FIN AUTH CHARTER SCH LEASE REV | | 9/1/2022 | | 5.50 | | | 575,294 | | | 526,463 | | | | |
| 750,000 | | CALIFORNIA MUN FIN AUTH ED REV | | 6/1/2026 | | 5.25 | | | 744,594 | | | 634,890 | | | | |
| 500,000 | | CALIFORNIA HSG FIN AGY REV | | 8/1/2033 | | 5.45 | | | 481,119 | | | 470,905 | | | | |
| 750,000 | | CALIFORNIA HSG FIN AGY REV | | 8/1/2038 | | 5.50 | | | 754,412 | | | 682,830 | | | | |
| 500,000 | | CALIFORNIA HEALTH FACS FING AUTH REV | | 3/1/2033 | | 5.00 | | | 503,040 | | | 443,015 | | | | |
| 145,000 | | CALIFORNIA CMNTYS HSG FIN AGY LEASE REV | | 8/1/2012 | | 4.65 | | | 144,892 | | | 79,015 | | | | |
| 500,000 | | CALIFORNIA INFRASTRUCTURE & ECONOMIC DEV BK ST SCH FD | | 8/15/2029 | | 5.75 | | | 505,253 | | | 484,965 | | | | |
| 1,000,000 | | CALIFORNIA INFRASTRUCTURE & ECONOMIC DEV BK REV | | 2/1/2030 | | 6.00 | | | 1,011,859 | | | 1,029,780 | | | | |
| 600,000 | | CALIFORNIA STATEWIDE CMNTYS DEV AUTH MULTIFAMILY REV | | 11/20/2036 | | 6.15 | | | 628,663 | | | 672,858 | | | | |
| 500,000 | | CALIFORNIA MUN FIN AUTH REV | | 5/1/2025 | | 6.88 | | | 498,853 | | | 517,150 | | | | |
| 1,500,000 | | CALIFORNIA SCH FACS FING AUTH REV (b)(c) | | 8/1/2029 | | 2.42 | | | 1,037,415 | | | 1,013,985 | | | | |
| 500,000 | | CALIFORNIA ST PUB WKS BRD LEASE REV | | 10/1/2030 | | 5.75 | | | 503,384 | | | 483,910 | | | | |
| 500,000 | | CALIFORNIA STATEWIDE CMNTYS DEV AUTH | | 5/15/2032 | | 5.75 | | | 493,295 | | | 471,255 | | | | |
| 400,000 | | CALIFORNIA STATEWIDE CMNTYS DEV AUTH CTFS PARTN | | 8/15/2031 | | 5.50 | | | 372,061 | | | 384,900 | | | | |
| 200,000 | | CALIFORNIA STATEWIDE CMNTYS DEV AUTHR EV | | 4/20/2036 | | 7.00 | | | 200,000 | | | 210,640 | | | | |
| 500,000 | | CALIFORNIA CNTY CALIF TOB SECURITIZATION AGY TOB | | 6/1/2036 | | 5.00 | | | 495,020 | | | 350,760 | | | | |
| 135,000 | | CALIFORNIA CNTY CALIF TOB SECURITIZATION AGY TOB | | 6/1/2021 | | 4.50 | | | 133,560 | | | 114,881 | | | | |
| 130,000 | | CALIFORNIA CNTY CALIF TOB SECURITIZATION AGY TOB | | 6/1/2023 | | 5.63 | | | 125,119 | | | 129,419 | | | | |
| 260,000 | | CAMERON TEX ED CORP REV | | 8/15/2021 | | 5.00 | | | 205,126 | | | 229,117 | | | | |
| 1,000,000 | | CAPITAL AREA CULTURAL ED FACS FIN CORP TEX REV | | 4/1/2024 | | 5.50 | | | 978,692 | | | 954,460 | | | | |
| 750,000 | | CAPITAL TR AGY FLA MULTIFAMILYREV | | 6/1/2038 | | 5.88 | | | 762,991 | | | 239,903 | | | | |
| 255,000 | | CAPITAL TR AGY FLA MULTIFAMILYREV | | 6/1/2013 | | 4.75 | | | 255,000 | | | 81,567 | | | | |
| 1,177,292 | | CARLSBAD N M INDL DEV REV | | 4/15/2021 | | 5.75 | | | 1,207,298 | | | 1,072,913 | | | | |
| 125,000 | | CARSON CITY NEV HOSP REV | | 9/1/2031 | | 5.75 | | | 129,903 | | | 118,763 | | | | |
| 900,000 | | CENTINELA VALLEY CALIF UN HIGH SCH DIST | | 8/1/2033 | | 5.50 | | | 911,786 | | | 845,739 | | | | |
| 595,000 | | CHANDLER PARK ACADEMY MICH PUB SCH ACADEMY REV | | 11/1/2022 | | 5.00 | | | 441,448 | | | 529,276 | | | | |
| 400,000 | | CHARTIERS VALLEY PA INDL & COML DEV AUTH REV | | 8/15/2012 | | 5.00 | | | 399,070 | | | 400,580 | | | | |
| 500,000 | | CHATHAM CNTY GA HOSP AUTH REV | | 1/1/2034 | | 5.50 | | | 519,648 | | | 410,940 | | | | |
| 275,000 | | CHESTERFIELD CNTY VA INDL DEV AUTH MULTI-FAMILY REV | | 7/1/2019 | | 5.20 | | | 256,688 | | | 275,195 | | | | |
| 250,000 | | CHESTERFIELD CNTY VA INDL DEV AUTH POLLUTN CTL REV | | 6/1/2017 | | 5.88 | | | 254,823 | | | 255,525 | | | | |
| 15,000 | | CHICAGO ILL MET HSG DEV CORP MTG REV | | 7/1/2022 | | 6.85 | | | 15,357 | | | 15,022 | | | | |
| 1,000,000 | | CHICAGO-REF-A-AGM | | 1/1/2027 | | 5.00 | | | 962,659 | | | 960,610 | | | | |
| 500,000 | | CITIZEN POTAWATOMI NATION OKLASR OBLIG TAX REV | | 9/1/2016 | | 6.50 | | | 500,000 | | | 478,055 | | | | |
| 250,000 | | CLARK CNTY NEV ECONOMIC DEV REV | | 5/15/2033 | | 5.38 | | | 254,067 | | | 237,240 | | | | |
| 455,000 | | CLARK CNTY NEV IMPT DIST | | 2/1/2019 | | 5.00 | | | 456,399 | | | 386,700 | | | | |
| 1,000,000 | | CLARK CNTY NEV PASSENGER FAC CHARGE REV | | 7/1/2030 | | 5.00 | | | 984,651 | | | 954,450 | | | | |
| | |
See accompanying notes to financial statements. | 47 | (Continued) |
CLEARWATER INVESTMENT TRUST
Schedule of Investments - Clearwater Tax-Exempt Bond Fund
December 31, 2010
| | | | | | | | | | | | | | | | | |
Par/Shares | | Security | | Maturity
date | | Coupon
rate | | Cost | | Fair
Value (a) | | Percent
of
net assets | |
Municipal bonds (Cont’d): | | | | | | | | | | | | | | |
| 500,000 | | CLAYTON GA SO REGL MED | | 8/1/2030 | | 5.00 | | | 489,615 | | | 484,205 | | | | |
| 355,000 | | CLEARWATER FLA HSG AUTH REV | | 5/1/2024 | | 5.35 | | | 260,490 | | | 300,348 | | | | |
| 500,000 | | CLEVELAND CNTY OKLA JUSTICE AUTH SALES TAX REV | | 3/1/2029 | | 5.75 | | | 488,437 | | | 509,410 | | | | |
| 1,000,000 | | CLIFTON TEX HIGHER ED FIN CORPED REV | | 12/1/2030 | | 6.00 | | | 982,809 | | | 902,270 | | | | |
| 1,000,000 | | CLIFTON TEX HIGHER ED FIN CORPED REV | | 12/1/2025 | | 5.70 | | | 991,985 | | | 909,160 | | | | |
| 750,000 | | CLIFTON TEX HIGHER ED FIN CORPED REV | | 2/15/2018 | | 7.75 | | | 739,888 | | | 839,138 | | | | |
| 1,000,000 | | COMMUNITY MEM HOSP DIST MO HOSP REV | | 12/1/2034 | | 6.68 | | | 884,208 | | | 810,120 | | | | |
| 350,000 | | COLORADO EDL & CULTURAL FACS AUTH REV | | 12/1/2039 | | 5.13 | | | 330,600 | | | 309,922 | | | | |
| 835,000 | | COLORADO EDL & CULTURAL FACS AUTH REV | | 11/15/2028 | | 6.75 | | | 835,000 | | | 887,204 | | | | |
| 1,000,000 | | COLORADO EDL & CULTURAL FACS AUTH REV | | 7/1/2034 | | 5.60 | | | 993,452 | | | 905,690 | | | | |
| 1,000,000 | | COLORADO EDL & CULTURAL FACS AUTH REV | | 6/1/2033 | | 5.50 | | | 974,789 | | | 949,370 | | | | |
| 1,500,000 | | COLORADO EDL & CULTURAL FACS AUTH INDPT SCH REV | | 5/1/2030 | | 6.00 | | | 1,458,098 | | | 1,430,640 | | | | |
| 940,000 | | COLORADO HSG & FIN AUTH | | 10/1/2029 | | 5.40 | | | 940,000 | | | 939,915 | | | | |
| 845,000 | | COLORADO HSG & FIN AUTH | | 11/1/2029 | | 5.50 | | | 845,000 | | | 844,932 | | | | |
| 625,000 | | COLO HSG FIN AUTH SINGLE FAMILY MTG REV | | 11/1/2034 | | 5.00 | | | 625,049 | | | 626,550 | | | | |
| 365,000 | | COLLIER CNTY FLA HSG FIN AUTH MULTIFAMILY REV | | 8/15/2015 | | 5.25 | | | 364,037 | | | 372,588 | | | | |
| 1,000,000 | | COLTON CALIF JT UNI SCH DIST (b)(c) | | 8/1/2035 | | 3.46 | | | 540,774 | | | 466,570 | | | | |
| 1,750,000 | | COMPARK BUSINESS CAMPUS MET DIST COLO | | 12/1/2027 | | 5.75 | | | 1,571,970 | | | 1,414,578 | | | | |
| 375,000 | | CONNERTON WEST CMNTY DEV DIST FLA CAP IMPT REV (b) | | 5/1/2016 | | 5.13 | | | 374,540 | | | 142,350 | | | | |
| 1,105,000 | | CORONA-NORCO CALIF UNI SCH DIST (b)(c) | | 8/1/2039 | | 2.24 | | | 675,711 | | | 728,096 | | | | |
| 637,000 | | CORTLAND ILL SPL TAX REV | | 3/1/2017 | | 5.50 | | | 632,914 | | | 394,985 | | | | |
| 500,000 | | CRAWFORD CNTY PA INDL DEV AUTH | | 11/1/2031 | | 6.00 | | | 492,401 | | | 509,795 | | | | |
| 880,000 | | CROW FIN AUTH MONT TRIBAL PURP REV | | 10/1/2017 | | 5.65 | | | 847,589 | | | 881,822 | | | | |
| 1,250,000 | | CROWN POINT IND ECONOMIC DEV REV | | 11/15/2013 | | 6.50 | | | 1,250,000 | | | 1,240,875 | | | | |
| 1,000,000 | | CONNECTICUT ST HSG FIN AUTH | | 11/15/2035 | | 4.75 | | | 1,000,000 | | | 946,880 | | | | |
| 1,250,000 | | CONNECTICUT ST DEV AUTH POLLUTN CTL REV | | 9/1/2028 | | 5.85 | | | 1,311,738 | | | 1,257,563 | | | | |
| 1,000,000 | | CENTER UNI SCH DIST CALIF (b)(c) | | 8/1/2031 | | 12.90 | | | 300,383 | | | 226,510 | | | | |
| 1,000,000 | | CULLMAN CNTY ALA HEALTH CARE AUTH | | 2/1/2023 | | 6.25 | | | 979,190 | | | 966,260 | | | | |
| 500,000 | | CUYAHOGA CNTY OHIO HSG MTG REV | | 3/20/2042 | | 5.70 | | | 513,834 | | | 509,470 | | | | |
| 3,354,000 | | DALLAS TEX HSG FIN CORP MULTI | | 10/20/2032 | | 6.75 | | | 3,333,363 | | | 3,444,625 | | | | |
| 1,000,000 | | DAMON RUN CONSERVANCY DIST IND | | 1/1/2027 | | 6.38 | | | 1,017,981 | | | 1,004,230 | | | | |
| 2,000,000 | | DAMON RUN CONSERVANCY DIST IND | | 7/1/2025 | | 6.10 | | | 2,046,452 | | | 1,998,100 | | | | |
| 500,000 | | DISTRICT COLUMBIA REV | | 6/1/2026 | | 5.00 | | | 508,209 | | | 416,085 | | | | |
| 500,000 | | METROPOLITAN WASHINGTON D C ARPTS AUTH DULLES TOLL ROAD REV | | 7/1/2033 | | 5.45 | | | 500,000 | | | 488,600 | | | | |
| 750,000 | | DE KALB CNTY GA HOSP AUTH REV ANTIC CTFS | | 9/1/2030 | | 6.00 | | | 742,245 | | | 740,558 | | | | |
| 475,000 | | DELAWARE ST HSG AUTH REV | | 7/1/2031 | | 5.20 | | | 475,000 | | | 468,288 | | | | |
| 500,000 | | DELANO CALIF FING AUTH REV | | 12/1/2025 | | 5.00 | | | 493,779 | | | 468,945 | | | | |
| 500,000 | | DELAWARE RIV PORT AUTH PA & N J | | 1/1/2022 | | 5.70 | | | 500,000 | | | 500,570 | | | | |
| 500,000 | | DELTA CNTY COLO MEM HOSP DIST | | 9/1/2030 | | 5.50 | | | 488,793 | | | 463,165 | | | | |
| 178,630 | | DENHAM SPRINGS-LIVINGSTON HSG & MTG FIN AUTH LA SGLE F M REV | | 11/1/2040 | | 5.00 | | | 185,175 | | | 181,145 | | | | |
| 500,000 | | DENVER COLO CITY & CNTY ARPT REV | | 11/15/2031 | | 5.00 | | | 493,608 | | | 481,165 | | | | |
| 500,000 | | DENVER COLO CONVENTION CTR HOTEL AUTH REV | | 12/1/2030 | | 5.00 | | | 511,940 | | | 408,670 | | | | |
| 500,000 | | DETROIT LAKES MINN HSG & HEALTH FACS REV | | 8/1/2034 | | 2.39 | | | 500,000 | | | 491,845 | | | | |
| 750,000 | | DETROIT SER A | | 4/1/2020 | | 5.25 | | | 752,771 | | | 638,775 | | | | |
| 500,000 | | DINUBA CALIF FING AUTH LEASE REV | | 9/1/2038 | | 5.38 | | | 494,652 | | | 368,530 | | | | |
| 1,105,000 | | DIRECTOR ST NEV DEPT BUSINESS & INDUSTRY (b) | | 11/15/2014 | | 6.00 | | | 1,097,305 | | | 666,735 | | | | |
| 3,000,000 | | DUBLIN CALIF UNI SCH DIST (b)(c) | | 8/1/2034 | | 15.06 | | | 682,232 | | | 580,140 | | | | |
| 500,000 | | EAST BATON ROUGE LA MTG FIN AUTH SINGLE FAMILY REV | | 10/1/2034 | | 5.00 | | | 500,000 | | | 481,790 | | | | |
| 500,000 | | E-470 PUB HWY AUTH COLO REV | | 9/1/2024 | | 5.50 | | | 505,296 | | | 501,385 | | | | |
| 565,000 | | EAST CHICAGO IND REDEV COMMN LAKE FRONT REDEV AREA TAX | | 1/15/2015 | | 5.25 | | | 565,000 | | | 573,419 | | | | |
| 550,000 | | EAST CHICAGO IND REDEV COMMN LAKE FRONT REDEV AREA TAX | | 7/15/2014 | | 5.00 | | | 550,000 | | | 556,534 | | | | |
| 950,000 | | EAST POINT GA | | 2/1/2026 | | 8.00 | | | 1,064,482 | | | 952,955 | | | | |
| 800,000 | | EDEN PRAIRIE MINN MULTIFAMILY HSG REV | | 2/20/2043 | | 6.20 | | | 868,908 | | | 842,240 | | | | |
| 2,045,000 | | EDEN TWP CALIF HEALTHCARE DIST CTFS PARTN | | 6/1/2030 | | 6.00 | | | 2,021,772 | | | 1,928,701 | | | | |
| 140,000 | | EL PASO CNTY TEX HSG FIN CORP MULTIFAMILY HSG REV | | 12/1/2015 | | 7.00 | | | 140,000 | | | 140,010 | | | | |
| 750,000 | | EL PASO DE ROBLES CALIF REDEV AGY TAX ALLOCATION REV | | 7/1/2033 | | 6.38 | | | 741,557 | | | 760,050 | | | | |
| 794,940 | | EL PASO TEX HSG FIN CORP MTG REV | | 4/1/2033 | | 6.18 | | | 822,186 | | | 832,072 | | | | |
| 500,000 | | ELKHART CNTY IND HOSP AUTH REV | | 8/15/2020 | | 5.25 | | | 504,009 | | | 500,180 | | | | |
| 2,000,000 | | EMERY CNTY UTAH POLLUTN CTL REV | | 11/1/2023 | | 5.65 | | | 2,019,469 | | | 2,004,500 | | | | |
| 1,155,000 | | ENTERPRISE CALIF ELEM SCH DIST (b)(c) | | 8/1/2035 | | 3.73 | | | 602,247 | | | 515,939 | | | | |
| 1,000,000 | | ERIE CNTY PA HOSP AUTH REV | | 7/1/2027 | | 7.00 | | | 1,000,000 | | | 975,230 | | | | |
| 1,000,000 | | ERIE CNTY OHIO HOSP FACS REV | | 8/15/2032 | | 5.63 | | | 1,009,752 | | | 949,040 | | | | |
| 500,000 | | ESTHERVILLE IOWA HOSP REV | | 7/1/2020 | | 6.30 | | | 503,757 | | | 505,295 | | | | |
| 500,000 | | FAIRFAX CNTY VA REDEV & HSG AUTH MULTIFAMILY REV | | 8/1/2039 | | 5.60 | | | 500,000 | | | 508,865 | | | | |
| 250,000 | | FARGO N D HEALTH SYS REV | | 6/1/2027 | | 5.38 | | | 246,761 | | | 239,088 | | | | |
| 2,861,643 | | FARGO N D UNIV FACS REV | | 11/29/2027 | | 5.11 | | | 2,861,643 | | | 2,767,466 | | | | |
| 239,000 | | FARMS NEW KENT VA CMNTY DEV AUTH SPL ASSMT | | 3/1/2036 | | 5.13 | | | 239,000 | | | 160,371 | | | | |
| 1,000,000 | | FESTIVAL RANCH CMNTY FACS DISTARIZ | | 7/15/2024 | | 6.25 | | | 1,016,474 | | | 992,310 | | | | |
| 315,000 | | FIDDLERS CREEK CMNTY DEV DIST NO 2 FLA SPL ASSMT REV (b) | | 5/1/2013 | | 5.75 | | | 314,118 | | | 100,611 | | | | |
| 750,000 | | FLORIDA HIGHER EDL FACS FING AUTH REV | | 7/1/2032 | | 5.38 | | | 759,691 | | | 718,223 | | | | |
| 420,000 | | FLORIDA HSG FIN CORP REV | | 7/1/2033 | | 5.45 | | | 420,000 | | | 421,331 | | | | |
| 1,960,000 | | FLORIDA HSG FIN CORP REV | | 7/1/2034 | | 5.30 | | | 1,982,307 | | | 1,921,310 | | | | |
| | |
See accompanying notes to financial statements. | 48 | (Continued) |
|
CLEARWATER INVESTMENT TRUST |
Schedule of Investments - Clearwater Tax-Exempt Bond Fund |
December 31, 2010 |
| | | | | | | | | | | | | | | | | |
Par/Shares | | Security | | Maturity
date | | Coupon
rate | | Cost | | Fair
Value (a) | | Percent
of
net assets | |
Municipal bonds (Cont’d): | | | | | | | | | | | | | | |
| 900,000 | | FLAGSTAFF ARIZ INDL DEV AUTH REV | | 7/1/2022 | | 5.50 | | $ | 827,851 | | | 827,892 | | | | |
| 1,400,000 | | FLINT MICH HOSP BLDG AUTH REV | | 7/1/2020 | | 6.00 | | | 1,360,298 | | | 1,354,822 | | | | |
| 675,000 | | FOREST CREEK CMNTY DEV DIST FLA CAP IMPT REV | | 11/1/2013 | | 7.00 | | | 851,395 | | | 648,986 | | | | |
| 250,000 | | FOREST GROVE ORE REV | | 5/1/2030 | | 6.00 | | | 245,764 | | | 255,185 | | | | |
| 1,000,000 | | FRANKLIN CNTY OHIO HEALTH CARE FACS REV | | 7/1/2035 | | 5.13 | | | 585,977 | | | 831,530 | | | | |
| 1,245,000 | | FULTON CNTY GA DEV AUTH REV | | 11/1/2028 | | 5.25 | | | 1,076,434 | | | 945,851 | | | | |
| 1,000,000 | | FYI PROPERTIES WASH LEASE REV | | 6/1/2034 | | 5.50 | | | 980,557 | | | 1,026,360 | | | | |
| 1,000,000 | | GAINESVILLE & HALL CNTY GA HOSP AUTH REV ANTIC CTFS | | 2/15/2030 | | 5.00 | | | 971,218 | | | 926,740 | | | | |
| 500,000 | | GAINESVILLE & HALL CNTY GA DEVAUTH RETIREMENT CMNTY REV | | 11/15/2029 | | 6.38 | | | 516,172 | | | 505,180 | | | | |
| 1,206,508 | | GALVESTON CNTY TEX MUN UTIL DIST NO 52 | | 3/1/2011 | | 6.16 | | | 1,206,508 | | | 964,483 | | | | |
| 400,000 | | GEISINGER AUTH PA HEALTH SYS | | 5/1/2037 | | 0.96 | | | 400,000 | | | 256,352 | | | | |
| 500,000 | | GILA CNTY ARIZ UNI SCH DIST NO 10 PAYSON | | 7/1/2028 | | 5.75 | | | 476,766 | | | 520,360 | | | | |
| 750,000 | | GLENDALE CALIF REDEV AGY TAX ALLOCATION REV | | 12/1/2024 | | 5.50 | | | 739,184 | | | 726,585 | | | | |
| 1,000,000 | | GOLDEN ST TOB SECURITIZATION CORP CALIF TOB SETTLEMENT REV | | 6/1/2047 | | 5.13 | | | 849,251 | | | 603,960 | | | | |
| 2,000,000 | | GRAND FORKS N D HEALTH CARE SYS REV | | 8/15/2027 | | 5.63 | | | 2,000,000 | | | 1,921,640 | | | | |
| 500,000 | | GRAND VALLEY MICH ST UNIV REV | | 12/1/2024 | | 5.30 | | | 495,108 | | | 514,280 | | | | |
| 500,000 | | GUAM GOVT DEPT ED CTFS PARTN | | 12/1/2015 | | 5.50 | | | 497,831 | | | 504,685 | | | | |
| 500,000 | | GUNNISON CNTY COLO | | 7/15/2019 | | 6.10 | | | 508,861 | | | 494,820 | | | | |
| 1,000,000 | | HAMDEN CONN FAC REV | | 1/1/2014 | | 6.13 | | | 987,223 | | | 1,005,340 | | | | |
| 1,000,000 | | HAMMOND IND LOC PUB IMPT BD BKSPL REV | | 8/15/2025 | | 6.50 | | | 1,023,849 | | | 1,012,210 | | | | |
| 500,000 | | HAMMOND IND REDEV DIST REV | | 1/15/2017 | | 6.00 | | | 500,000 | | | 495,555 | | | | |
| 1,500,000 | | HARBOR POINT INFRASTRUCTURE IMPT DIST CONN SPL OBLIG REV | | 4/1/2022 | | 7.00 | | | 1,500,000 | | | 1,516,035 | | | | |
| 1,250,000 | | HARRIS CNTY TEX CULTURAL ED FACS FIN CORP REV | | 8/15/2021 | | 6.75 | | | 1,250,000 | | | 1,238,688 | | | | |
| 1,000,000 | | HARRISON CNTY TEX HEALTH FACS DEV CORP REV | | 7/1/2028 | | 5.25 | | | 985,843 | | | 899,410 | | | | |
| 1,500,000 | | HARTNELL CALIF CMNTY COLLEGE DIST(b)(c) | | 8/1/2034 | | 5.71 | | | 647,613 | | | 709,020 | | | | |
| 350,000 | | HARVEY-REF-SER A | | 12/1/2027 | | 5.50 | | | 357,234 | | | 312,074 | | | | |
| 2,000,000 | | HAWTHORNE CALIF SCH DIST CTFS PARTN (b)(c) | | 12/1/2029 | | 1.69 | | | 1,517,336 | | | 1,486,880 | | | | |
| 1,000,000 | | HAWTHORNE SD-CABS-C (b)(c) | | 11/1/2026 | | 11.90 | | | 354,608 | | | 326,290 | | | | |
| 1,000,000 | | HEALDSBURG REDEV-SOTO | | 8/1/2034 | | 5.38 | | | 990,039 | | | 970,690 | | | | |
| 1,000,000 | | HELENDALE CONV CABS (b)(c) | | 8/1/2034 | | 3.31 | | | 564,723 | | | 545,000 | | | | |
| 590,000 | | HAWAII ST DEPT BUDGET & FIN SPL PURP REV | | 11/15/2029 | | 8.75 | | | 581,859 | | | 667,898 | | | | |
| 500,000 | | HAWAII ST DEPT BUDGET & FIN SPL PURP REV | | 11/15/2014 | | 6.40 | | | 500,000 | | | 501,755 | | | | |
| 1,000,000 | | HAWAII ST DEPT BUDGET & FIN SPL PURP REV | | 11/15/2023 | | 7.88 | | | 968,295 | | | 1,059,850 | | | | |
| 1,500,000 | | HAWAII ST DEPT BUDGET & FIN SPL PURP REV | | 11/15/2033 | | 8.00 | | | 1,584,501 | | | 1,578,045 | | | | |
| 500,000 | | HIGHLANDS CNTY FLA HEALTH FACS AUTH REV | | 11/15/2032 | | 5.13 | | | 501,639 | | | 469,630 | | | | |
| 255,000 | | HIGHLANDS CNTY FLA HEALTH FACS AUTH REV | | 11/15/2027 | | 5.00 | | | 257,577 | | | 246,797 | | | | |
| 500,000 | | HIMALAYA WTR & SANTN DIST COLO | | 12/1/2035 | | 5.00 | | | 512,655 | | | 422,665 | | | | |
| 500,000 | | HOPKINS CNTY TEX HOSP DIST HOSP REV | | 2/15/2023 | | 5.50 | | | 488,729 | | | 454,555 | | | | |
| 250,000 | | HOUMA-TERREBONNE PUB TR FING AUTH LA SINGLE FAMILY MTG REV | | 12/1/2040 | | 5.15 | | | 260,258 | | | 255,475 | | | | |
| 250,000 | | HOWARD CNTY MD RETIREMENT CMNTY REV | | 4/1/2027 | | 5.25 | | | 254,792 | | | 199,235 | | | | |
| 400,000 | | HUNTSVILLE-REDSTONE VLG ALA SPL CARE FACS FING AUTH | | 1/1/2015 | | 5.25 | | | 400,000 | | | 391,548 | | | | |
| 400,000 | | IOWA FIN AUTH SR HSG REV | | 12/1/2014 | | 5.00 | | | 398,155 | | | 367,208 | | | | |
| 500,000 | | IOWA FIN AUTH SR LIVING FAC REV | | 11/15/2027 | | 5.50 | | | 508,863 | | | 358,705 | | | | |
| 1,000,000 | | IOWA STUDENT LN LIQUIDITY CORP STUDENT LN REV | | 12/1/2027 | | 5.50 | | | 977,394 | | | 956,470 | | | | |
| 750,000 | | IDAHO HSG & FIN ASSN NONPROFIT FACS REV | | 7/1/2021 | | 9.00 | | | 750,000 | | | 848,475 | | | | |
| 250,000 | | IDAHO HSG & FIN ASSN NONPROFIT FACS REV | | 12/1/2018 | | 5.50 | | | 247,614 | | | 236,773 | | | | |
| 270,000 | | IDAHO HSG & FIN ASSN SINGLE FAMILY MTG REV | | 1/1/2040 | | 5.50 | | | 270,000 | | | 271,642 | | | | |
| 250,000 | | IDAHO HSG & FIN ASSN NONPROFIT FACS REV | | 7/1/2021 | | 5.63 | | | 249,304 | | | 234,263 | | | | |
| 750,000 | | IDAHO HSG & FIN ASSN NONPROFIT FACS REV | | 7/1/2030 | | 5.50 | | | 750,000 | | | 633,405 | | | | |
| 245,000 | | IDAHO HSG & FIN ASSN NONPROFIT FACS REV | | 8/1/2017 | | 6.25 | | | 245,000 | | | 233,069 | | | | |
| 1,000,000 | | IDAHO HSG & FIN ASSN NONPROFIT FACS REV | | 2/1/2026 | | 6.50 | | | 1,000,000 | | | 995,180 | | | | |
| 445,000 | | IDAHO HSG & FIN ASSN SINGLE FAMILY MTG REV | | 7/1/2038 | | 5.50 | | | 445,000 | | | 448,605 | | | | |
| 720,000 | | IDAHO HSG & FIN ASSN SINGLE FAMILY MTG REV | | 7/1/2026 | | 5.65 | | | 737,861 | | | 720,000 | | | | |
| 250,000 | | IDAHO HSG & FIN ASSN NONPROFIT FACS REV | | 6/1/2021 | | 5.50 | | | 250,000 | | | 237,438 | | | | |
| 250,000 | | ILLINOIS DEV FIN AUTH REV | | 5/15/2021 | | 5.50 | | | 256,822 | | | 250,010 | | | | |
| 195,000 | | ILLINOIS DEV FIN AUTH POLLUTN CTL REV | | 2/1/2024 | | 5.70 | | | 196,814 | | | 194,279 | | | | |
| 500,000 | | ILLINOIS FIN AUTH REV | | 3/15/2027 | | 5.00 | | | 521,233 | | | 483,255 | | | | |
| 610,000 | | ILLINOIS FIN AUTH REV | | 8/15/2026 | | 6.00 | | | 624,030 | | | 507,435 | | | | |
| 250,000 | | ILLINOIS FIN AUTH REV | | 11/15/2026 | | 5.75 | | | 252,105 | | | 238,258 | | | | |
| 1,250,000 | | ILLINOIS FIN AUTH REV | | 11/15/2022 | | 5.25 | | | 1,247,725 | | | 1,211,600 | | | | |
| 1,000,000 | | ILLINOIS FIN AUTH REV | | 11/15/2026 | | 5.25 | | | 970,611 | | | 849,110 | | | | |
| 500,000 | | ILLINOIS FIN AUTH REV | | 11/15/2016 | | 5.00 | | | 510,185 | | | 462,910 | | | | |
| 500,000 | | ILLINOIS FIN AUTH REV | | 3/1/2038 | | 6.00 | | | 484,999 | | | 518,220 | | | | |
| 440,000 | | ILLINOIS FIN AUTH SPORTS FAC REV (b) | | 12/1/2035 | | 7.00 | | | 436,698 | | | 39,455 | | | | |
| 500,000 | | ILLINOIS FIN AUTH REV | | 5/15/2012 | | 5.10 | | | 499,341 | | | 493,605 | | | | |
| 250,000 | | ILLINOIS FIN AUTH REV | | 5/15/2038 | | 5.75 | | | 257,038 | | | 197,738 | | | | |
| 600,000 | | ILLINOIS FIN AUTH ED REV | | 9/1/2027 | | 5.00 | | | 567,776 | | | 453,420 | | | | |
| 750,000 | | ILLINOIS FIN AUTH SPORTS FAC REV (b) | | 10/1/2027 | | 6.13 | | | 730,795 | | | 149,783 | | | | |
| 500,000 | | ILLINOIS FIN AUTH SPORTS FAC REV (b) | | 10/1/2037 | | 6.25 | | | 484,210 | | | 99,830 | | | | |
| 500,000 | | ILLINOIS FIN AUTH REV | | 5/15/2029 | | 5.25 | | | 506,098 | | | 475,095 | | | | |
| 1,500,000 | | ILLINOIS FIN AUTH REV | | 8/15/2036 | | 5.25 | | | 1,473,949 | | | 1,342,830 | | | | |
| 750,000 | | ILLINOIS FIN AUTH REV | | 5/15/2026 | | 5.75 | | | 729,066 | | | 669,645 | | | | |
| 600,000 | | ILLINOIS FIN AUTH REV | | 5/15/2012 | | 5.25 | | | 601,165 | | | 596,520 | | | | |
| | |
See accompanying notes to financial statements. | 49 | (Continued) |
|
CLEARWATER INVESTMENT TRUST |
Schedule of Investments - Clearwater Tax-Exempt Bond Fund |
December 31, 2010 |
| | | | | | | | | | | | | | | | | |
Par/Shares | | Security | | Maturity date | | Coupon rate | | Cost | | Fair
Value (a) | | Percent
of
net assets | |
Municipal bonds (Cont’d): | | | | | | | | | | | | | | |
| 150,000 | | ILLINOIS FIN AUTH REV | | 12/1/2036 | | 5.00 | | $ | 151,445 | | | 119,298 | | | | |
| 805,000 | | ILLINOIS FIN AUTH REV | | 2/1/2037 | | 5.25 | | | 801,349 | | | 681,111 | | | | |
| 350,000 | | ILLINOIS FIN AUTH REV | | 8/15/2023 | | 6.00 | | | 362,954 | | | 358,565 | | | | |
| 1,000,000 | | ILLINOIS FIN AUTH REV | | 5/15/2017 | | 6.00 | | | 1,000,000 | | | 980,270 | | | | |
| 630,000 | | ILLINOIS HEALTH FACS AUTH REV | | 5/15/2014 | | 6.25 | | | 630,878 | | | 635,185 | | | | |
| 500,000 | | ILLINOIS HEALTH FACS AUTH REV | | 7/1/2033 | | 6.00 | | | 513,103 | | | 505,245 | | | | |
| 750,000 | | ILLINOIS HEALTH FACS AUTH REV | | 8/15/2028 | | 5.38 | | | 737,435 | | | 707,948 | | | | |
| 2,100,000 | | ILLINOIS HEALTH FACS AUTH REV | | 8/15/2033 | | 5.10 | | | 2,132,811 | | | 1,981,518 | | | | |
| 500,000 | | ILLINOIS HEALTH FACS AUTH REV | | 2/15/2037 | | 5.15 | | | 501,109 | | | 472,555 | | | | |
| 750,000 | | ILLINOIS FIN AUTH REV | | 11/1/2029 | | 6.38 | | | 741,412 | | | 780,615 | | | | |
| 500,000 | | INDIANA BD BK REV | | 2/1/2029 | | 5.50 | | | 490,432 | | | 517,105 | | | | |
| 1,250,000 | | INDIANA ST FIN AUTH REV | | 7/1/2039 | | 5.75 | | | 1,270,925 | | | 1,243,063 | | | | |
| 1,000,000 | | INDIANA HEALTH & EDL FAC FING AUTH HOSP REV | | 2/15/2030 | | 5.25 | | | 740,688 | | | 903,700 | | | | |
| 500,000 | | INDIANA HEALTH & EDL FAC FING AUTH HOSP REV | | 2/15/2036 | | 5.25 | | | 502,255 | | | 435,870 | | | | |
| 1,315,000 | | INDIANA HEALTH FAC FING AUTH REV | | 8/15/2018 | | 5.00 | | | 1,191,097 | | | 1,309,161 | | | | |
| 500,000 | | INDIANA HEALTH FAC FING AUTH HOSP REV | | 2/15/2017 | | 5.13 | | | 492,781 | | | 500,320 | | | | |
| 1,000,000 | | INDIANA FIN AUTH HOSP REV | | 3/1/2030 | | 5.13 | | | 950,966 | | | 924,620 | | | | |
| 1,750,000 | | INDIANA HEALTH & EDL FAC FING AUTH HOSP REV | | 3/1/2022 | | 5.50 | | | 1,618,806 | | | 1,736,473 | | | | |
| 250,000 | | INDEPENDENCE MO THIRTY-NINTH STR TRANSN DIST REV | | 9/1/2032 | | 6.88 | | | 250,000 | | | 231,103 | | | | |
| 1,000,000 | | INDIANA ST FIN AUTH REV | | 10/1/2021 | | 6.00 | | | 1,000,000 | | | 983,590 | | | | |
| 6,857,179 | | INTERMEDIATE SCH DIST 287 MINNLEASE REV | | 11/1/2032 | | 5.30 | | | 6,621,105 | | | 6,390,754 | | | | |
| 450,000 | | JACKSONVILLE FLA ECONOMIC DEV COMMN HEALTH CARE FACS REV | | 9/1/2017 | | 6.00 | | | 450,000 | | | 450,936 | | | | |
| 1,000,000 | | JACKSONVILLE FLA HEALTH FACS AUTH | | 11/1/2027 | | 5.00 | | | 959,372 | | | 916,690 | | | | |
| 250,000 | | JEFFERSON PARISH LA FIN AUTH REV | | 12/1/2048 | | 5.70 | | | 261,802 | | | 263,575 | | | | |
| 145,000 | | JEFFERSON PARISH LA FIN AUTH REV | | 6/1/2033 | | 5.00 | | | 152,476 | | | 147,572 | | | | |
| 1,210,000 | | JEFFERSON PARISH LA FIN AUTH REV | | 6/1/2038 | | 5.00 | | | 1,264,233 | | | 1,173,083 | | | | |
| 1,209,000 | | JEFFERSON CNTY KY MTG REV | | 11/15/2013 | | 6.13 | | | 1,209,000 | | | 1,211,212 | | | | |
| 700,000 | | JOPLIN MO INDL DEV AUTH INDL REV | | 5/15/2017 | | 5.50 | | | 707,451 | | | 668,801 | | | | |
| 1,930,000 | | KALISPEL TRIBE INDIANS PRIORITY DISTR WASH REV | | 1/1/2016 | | 6.20 | | | 1,877,682 | | | 1,792,140 | | | | |
| 200,000 | | KATY TEX DEV AUTH REV | | 6/1/2011 | | 5.80 | | | 199,483 | | | 200,144 | | | | |
| 250,000 | | KENTWOOD MICH ECONOMIC DEV | | 11/15/2014 | | 5.25 | | | 248,858 | | | 243,673 | | | | |
| 2,655,000 | | KERRVILLE TEX HEALTH FACS DEV CORP HOSP REV | | 8/15/2035 | | 5.45 | | | 2,638,072 | | | 2,311,762 | | | | |
| 750,000 | | KING CNTY WASH HSG AUTH REV | | 5/1/2028 | | 5.20 | | | 750,000 | | | 756,668 | | | | |
| 500,000 | | KIRKWOOD MO INDL DEV AUTH RETIREMENT CMNTY REV | | 5/15/2021 | | 8.00 | | | 500,000 | | | 521,325 | | | | |
| 500,000 | | KIRKWOOD MO INDL DEV AUTH RETIREMENT CMNTY REV | | 5/15/2015 | | 6.50 | | | 500,000 | | | 496,585 | | | | |
| 500,000 | | KIRKWOOD MO INDL DEV AUTH RETIREMENT CMNTY REV | | 11/15/2015 | | 7.00 | | | 500,000 | | | 500,845 | | | | |
| 900,000 | | KLICKITAT CNTY WASH PUB HOSP DIST NO 2 HOSP REV | | 12/1/2020 | | 6.00 | | | 833,721 | | | 833,922 | | | | |
| 1,390,000 | | KREMMLING COLO MEM HOSP DIST CTFS PARTN | | 12/1/2022 | | 6.00 | | | 1,375,446 | | | 1,346,285 | | | | |
| 1,250,000 | | KANSAS CITY MO INDL DEV AUTH REV | | 9/1/2023 | | 5.45 | | | 1,250,000 | | | 1,170,538 | | | | |
| 1,000,000 | | KANSAS CITY MO INDL DEV AUTH MULTIFAMILY HSG REV | | 11/20/2039 | | 5.10 | | | 1,000,000 | | | 961,960 | | | | |
| 4,500,000 | | KANSAS CITY MO INDL DEV AUTH MULTIFAMILY HSG REV | | 1/1/2012 | | 5.00 | | | 4,474,984 | | | 4,496,985 | | | | |
| 1,000,000 | | KANSAS ST DEV FIN AUTH HOSP REV | | 11/15/2029 | | 5.50 | | | 976,984 | | | 1,036,860 | | | | |
| 500,000 | | KENTUCKY ECONOMIC DEV FIN AUTHMULTIFAMILY HSG REV | | 11/20/2035 | | 5.38 | | | 500,000 | | | 509,785 | | | | |
| 250,000 | | KENTUCKY ECONOMIC DEV FIN AUTHHEALTH SYS REV | | 10/1/2012 | | 6.25 | | | 251,882 | | | 253,290 | | | | |
| 200,000 | | KENTUCKY ECONOMIC DEV FIN AUTHLOUISVILLE ARENA PROJ REV | | 12/1/2033 | | 6.00 | | | 198,502 | | | 205,522 | | | | |
| 500,000 | | KENTUCKY HSG CORP HSG REV | | 7/1/2039 | | 5.15 | | | 500,000 | | | 494,840 | | | | |
| 1,000,000 | | LOS ANGELES CALIF CTFS PARTN | | 2/1/2027 | | 5.00 | | | 1,000,494 | | | 977,270 | | | | |
| 1,250,000 | | LOS ANGELES CALIF HSG AUTH | | 6/1/2029 | | 5.00 | | | 1,091,686 | | | 1,056,213 | | | | |
| 500,000 | | LOS ANGELES CALIF UNI SCH DIST CTFS PARTN | | 10/1/2031 | | 5.00 | | | 443,229 | | | 443,935 | | | | |
| 440,000 | | LOUISIANA LOC GOVT ENVIR FACS CMNTY DEV AUTH REV | | 6/20/2028 | | 8.00 | | | 440,000 | | | 350,979 | | | | |
| 500,000 | | LOUISIANA PUB FACS AUTH REV | | 2/15/2036 | | 0.89 | | | 500,000 | | | 351,580 | | | | |
| 500,000 | | LOUISIANA PUB FACS AUTH HOSP REV | | 7/1/2024 | | 6.75 | | | 515,629 | | | 521,750 | | | | |
| 235,000 | | LOUISIANA HSG FIN AGY SINGLE FAMILY MTG REV | | 6/1/2039 | | 5.60 | | | 242,514 | | | 241,126 | | | | |
| 1,345,000 | | LOUISIANA HSG FIN AGY SINGLE FAMILY MTG REV | | 12/1/2038 | | 5.70 | | | 1,406,505 | | | 1,421,773 | | | | |
| 500,000 | | LOUISIANA HSG FIN AGY SINGLE FAMILY MTG REV | | 12/1/2034 | | 5.10 | | | 500,000 | | | 491,165 | | | | |
| 285,000 | | LOUISIANA HSG FIN AGY SINGLE FAMILY MTG REV | | 6/1/2038 | | 5.85 | | | 302,959 | | | 298,748 | | | | |
| 455,000 | | LA VERNIA TEX HIGHER ED FIN CORP ED REV | | 2/15/2018 | | 6.00 | | | 455,000 | | | 443,416 | | | | |
| 1,251,000 | | LAFAYETTE LA PUB TR FING AUTH SINGLE FAMILY MTG REV | | 1/1/2041 | | 5.35 | | | 1,280,524 | | | 1,291,445 | | | | |
| 250,000 | | LAKELAND FLA RETIREMENT CMNTY | | 1/1/2019 | | 5.88 | | | 250,000 | | | 248,193 | | | | |
| 750,000 | | LAKESIDE 370 LEVEE DIST MO | | 4/1/2028 | | 7.00 | | | 750,000 | | | 670,718 | | | | |
| 500,000 | | LANCASTER CNTY NEB HOSP AUTH NO 1 HEALTH FACS REV | | 1/1/2023 | | 5.13 | | | 496,644 | | | 498,005 | | | | |
| 750,000 | | LANCASTER CALIF REDEV AGY TAX ALLOCATION | | 8/1/2024 | | 6.00 | | | 737,657 | | | 778,980 | | | | |
| 2,000,000 | | LAS VEGAS NEV REDEV AGY TAX INCREMENT REV | | 6/15/2023 | | 7.50 | | | 1,979,814 | | | 2,211,960 | | | | |
| 250,000 | | LEE CNTY FLA INDL DEV AUTH HEALTH CARE FACS REV | | 11/15/2029 | | 5.00 | | | 254,493 | | | 208,115 | | | | |
| 400,000 | | LEE CNTY S C SCH FACS INC INSTALLMENT PUR REV | | 12/1/2031 | | 6.00 | | | 366,997 | | | 379,904 | | | | |
| 750,000 | | LEE CNTY FLA INDL DEV AUTH INDL DEV REV | | 6/15/2027 | | 5.25 | | | 753,620 | | | 624,878 | | | | |
| 250,000 | | LEHIGH CNTY PA GEN PURP AUTH REVS | | 8/15/2042 | | 1.21 | | | 250,000 | | | 157,375 | | | | |
| 750,000 | | LEMON GROVE CALIF CMNTY DEV AGY TAX ALLOCATION | | 8/1/2025 | | 5.15 | | | 750,000 | | | 685,170 | | | | |
| 200,000 | | LEWISVILLE TEX COMBINATION CONTRACT REV | | 9/1/2028 | | 5.70 | | | 132,452 | | | 184,102 | | | | |
| 1,750,000 | | LOMBARD ILL PUB FACS CORP CONFERENCE CTR & HOTEL REV | | 1/1/2036 | | 5.25 | | | 1,776,603 | | | 1,009,820 | | | | |
| 500,000 | | LOMBARD ILL PUB FACS CORP CONFERENCE CTR & HOTEL REV | | 1/1/2015 | | 6.38 | | | 500,000 | | | 410,380 | | | | |
| 550,000 | | LOMBARD ILL PUB FACS CORP CONFERENCE CTR & HOTEL REV | | 1/1/2030 | | 5.50 | | | 577,862 | | | 324,418 | | | | |
| 250,000 | | LOMPOC CALIF HEALTHCARE DIST | | 8/1/2034 | | 5.00 | | | 252,446 | | | 225,050 | | | | |
| | |
See accompanying notes to financial statements. | 50 | (Continued) |
|
CLEARWATER INVESTMENT TRUST |
Schedule of Investments - Clearwater Tax-Exempt Bond Fund |
December 31, 2010 |
|
| | | | | | | | | | | | | | | | | |
Par/Shares | | Security | | Maturity
date | | Coupon
rate | | Cost | | Fair
Value (a) | | Percent
of
net assets | |
Municipal bonds (Cont’d): |
| 500,000 | | LOUDOUN CNTY VA INDL DEV AUTH RESIDENTIAL CARE FAC REV | | 8/1/2028 | | 7.00 | | $ | 500,000 | | | 502,800 | | | | |
| 350,000 | | LUCAS CNTY OHIO HEALTH CARE FAC REV | | 8/15/2015 | | 6.38 | | | 343,961 | | | 354,046 | | | | |
| 1,495,000 | | LUZERNE CNTY PA | | 11/1/2026 | | 7.00 | | | 1,597,380 | | | 1,622,867 | | | | |
| 490,945 | | LYONS COLO REV | | 11/30/2016 | | 4.75 | | | 494,827 | | | 446,544 | | | | |
| 645,000 | | MASSACHUSETTS DEV FIN AGY SR LIVING FAC REV | | 6/1/2014 | | 6.25 | | | 645,000 | | | 636,892 | | | | |
| 1,000,000 | | MASSACHUSETTS ST DEV FIN AGY REV | | 7/1/2030 | | 6.38 | | | 986,218 | | | 996,690 | | | | |
| 775,000 | | MASSACHUSETTS ST HEALTH & EDL FACS AUTH REV | | 1/15/2012 | | 5.13 | | | 773,630 | | | 770,350 | | | | |
| 750,000 | | MASSACHUSETTS ST HEALTH & EDL FACS AUTH REV | | 7/1/2024 | | 5.38 | | | 750,782 | | | 725,205 | | | | |
| 1,000,000 | | MASSACHUSETTS ST HSG FIN AGY HSG REV | | 6/1/2040 | | 5.05 | | | 1,000,000 | | | 957,170 | | | | |
| 1,925,000 | | MASSACHUSETTS ST HEALTH & EDL FACS AUTH REV | | 7/1/2013 | | 7.30 | | | 1,925,000 | | | 1,931,526 | | | | |
| 1,000,000 | | MASSACHUSETTS ST DEV FIN AGY REV | | 1/1/2030 | | 5.50 | | | 1,035,873 | | | 1,002,810 | | | | |
| 500,000 | | MASSACHUSETTS ST HEALTH & EDL FACS AUTH REV | | 10/15/2026 | | 5.50 | | | 504,288 | | | 513,985 | | | | |
| 1,000,000 | | MASSACHUSETTS ST HSG FIN AGY HSG REV | | 12/1/2033 | | 5.35 | | | 1,000,000 | | | 1,001,160 | | | | |
| 875,000 | | MASSACHUSETTS ST TPK AUTH WESTERN TPK REV | | 1/1/2017 | | 5.55 | | | 875,000 | | | 878,640 | | | | |
| 450,000 | | MADISON CNTY FLA REV | | 7/1/2025 | | 6.00 | | | 443,570 | | | 391,590 | | | | |
| 250,000 | | MAGNOLIA CREEK FLA CMNTY DEV DIST (b) | | 5/1/2014 | | 5.60 | | | 250,000 | | | 119,975 | | | | |
| 1,000,000 | | MALTA ILL TAX INCREMENT REV | | 12/30/2025 | | 5.75 | | | 1,000,000 | | | 624,200 | | | | |
| 500,000 | | MANCHESTER N H HSG & REDEV AUTH REV | | 1/1/2015 | | 6.75 | | | 494,218 | | | 476,020 | | | | |
| 500,000 | | MANCHESTER N H HSG & REDEV AUTH REV (b)(c) | | 1/1/2020 | | 7.87 | | | 305,767 | | | 221,200 | | | | |
| 452,000 | | MANHATTAN ILL SPL SVC AREA SPL TAX | | 3/1/2022 | | 5.75 | | | 452,000 | | | 248,329 | | | | |
| 500,000 | | MANSFIELD-VAR PURP IM | | 12/1/2024 | | 6.00 | | | 526,384 | | | 538,240 | | | | |
| 825,000 | | MANTECA CALIF FING AUTH SWR REV | | 12/1/2033 | | 5.00 | | | 762,873 | | | 803,228 | | | | |
| 300,000 | | MARICOPA CNTY ARIZ ELEM SCH DIST NO 21 MURPHY | | 7/1/2024 | | 8.00 | | | 308,262 | | | 318,681 | | | | |
| 1,000,000 | | MARICOPA CNTY ARIZ UNI SCH DIST NO 89 DYSART | | 7/1/2026 | | 6.25 | | | 1,017,849 | | | 1,091,220 | | | | |
| 439,000 | | MARQUIS CMNTY DEV AUTH VA REV | | 9/1/2013 | | 5.10 | | | 439,000 | | | 399,143 | | | | |
| 450,000 | | MARYLAND ST HEALTH & HIGHER EDL FACS AUTH REV | | 7/1/2029 | | 6.75 | | | 440,673 | | | 494,514 | | | | |
| 500,000 | | MASHANTUCKET WESTERN PEQUOT TRIBE CONN (b) | | 9/1/2036 | | 5.50 | | | 509,035 | | | 222,600 | | | | |
| 500,000 | | MASSACHUSETTS EDL FING AUTH ED LN REV | | 1/1/2027 | | 5.20 | | | 500,000 | | | 480,065 | | | | |
| 2,500,000 | | MASSACHUSETTS EDL FING AUTH ED LN REV | | 1/1/2028 | | 5.25 | | | 2,507,772 | | | 2,375,950 | | | | |
| 1,750,000 | | MC ALESTER OKLA PUB WKS AUTH UTIL SYS REV (b)(c) | | 2/1/2030 | | 11.04 | | | 610,058 | | | 598,745 | | | | |
| 750,000 | | MAINE EDL LN AUTH STUDENT LN REV | | 12/1/2027 | | 5.63 | | | 750,000 | | | 754,703 | | | | |
| 200,000 | | MEAD VLG NEB TAX INCREMENT REV (b) | | 7/1/2012 | | 5.13 | | | 200,000 | | | 132,936 | | | | |
| 2,000,000 | | METROPOLITAN WASHINGTON D C ARPTS AUTH DULLES TOLL ROAD REV (b)(c) | | 10/1/2041 | | 1.80 | | | 1,292,235 | | | 1,404,200 | | | | |
| 1,070,000 | | MET GOVT NASHVILLE & DAVIDSON CNTY TENN H & E FACS BRD REV (b) | | 12/20/2020 | | 8.00 | | | 1,070,000 | | | 545,989 | | | | |
| 500,000 | | MET GOVT NASHVILLE & DAVIDSON CNTY TENN INDL DEV BRD REV | | 2/15/2015 | | 9.75 | | | 516,190 | | | 555,720 | | | | |
| 1,830,000 | | MET GOVT NASHVILLE & DAVIDSON CNTY TENN H & E FACS BRD REV (b) | | 12/20/2040 | | 7.50 | | | 1,830,000 | | | 1,073,405 | | | | |
| 855,000 | | MET GOVT NASHVILLE & DAVIDSON CNTY TENN H & E FACS BRD REV (b) | | 6/20/2036 | | 10.00 | | | 855,000 | | | 421,524 | | | | |
| 500,000 | | MICHIGAN PUB EDL FACS AUTH REV | | 9/1/2021 | | 8.00 | | | 500,000 | | | 542,215 | | | | |
| 500,000 | | MICHIGAN PUB EDL FACS AUTH REV | | 11/1/2028 | | 6.35 | | | 500,000 | | | 481,485 | | | | |
| 300,000 | | MICHIGAN PUB EDL FACS AUTH REV | | 9/1/2022 | | 5.00 | | | 300,000 | | | 258,045 | | | | |
| 750,000 | | MICHIGAN PUB EDL FACS AUTH REV | | 9/1/2016 | | 6.00 | | | 750,000 | | | 757,088 | | | | |
| 450,000 | | MICHIGAN PUB EDL FACS AUTH REV | | 10/1/2023 | | 6.25 | | | 450,000 | | | 382,590 | | | | |
| 1,500,000 | | MICHIGAN ST HOSP FIN AUTH REV | | 6/1/2034 | | 6.13 | | | 1,572,738 | | | 1,524,030 | | | | |
| 1,000,000 | | MICHIGAN ST HSG DEV AUTH RENTAL HSG REV | | 10/1/2034 | | 5.63 | | | 1,000,000 | | | 1,004,580 | | | | |
| 1,000,000 | | MICHIGAN MUN BD AUTH REV | | 5/1/2023 | | 5.75 | | | 1,029,926 | | | 1,064,330 | | | | |
| 750,000 | | MICHIGAN PUB EDL FACS AUTH REV | | 6/1/2020 | | 6.00 | | | 743,300 | | | 734,153 | | | | |
| 625,000 | | MICHIGAN ST HSG DEV AUTH RENTAL HSG REV | | 10/1/2020 | | 5.38 | | | 598,571 | | | 637,844 | | | | |
| 545,000 | | MICHIGAN ST HSG DEV AUTH RENTAL HSG REV | | 10/1/2038 | | 5.70 | | | 545,000 | | | 553,126 | | | | |
| 1,000,000 | | MICHIGAN ST STRATEGIC FD LTD OBLIG REV | | 9/1/2029 | | 5.45 | | | 1,049,608 | | | 961,430 | | | | |
| 310,000 | | MICHIGAN TOB SETTLEMENT FIN AUTH TOB SETTLEMENT ASSET | | 6/1/2022 | | 5.13 | | | 289,943 | | | 262,629 | | | | |
| 1,500,000 | | MIAMI-DADE CNTY FLA SPL OBLIG (b)(c) | | 10/1/2026 | | 10.87 | | | 572,789 | | | 519,270 | | | | |
| 500,000 | | PALM BEACH CNTY FL HEALTH FACS AUTH RETIREMENT CMNTY REV | | 8/1/2030 | | 6.00 | | | 485,400 | | | 495,425 | | | | |
| 1,000,000 | | MICHIGAN ST HOSP FIN AUTH REV | | 12/1/2023 | | 6.13 | | | 988,985 | | | 1,087,050 | | | | |
| 496,000 | | MILLSBORO DEL SPL OBLG | | 7/1/2036 | | 5.45 | | | 496,000 | | | 337,052 | | | | |
| 2,500,000 | | MINNESOTA ST HSG FIN AGY (b) | | 11/1/2013 | | 6.00 | | | 2,483,800 | | | 2,481,875 | | | | |
| 1,000,000 | | MINNESOTA ST OFFICE OF HIGHER ED REV | | 11/1/2029 | | 5.00 | | | 1,000,000 | | | 959,860 | | | | |
| 495,000 | | MINNESOTA ST HSG FIN AGY | | 7/1/2034 | | 5.05 | | | 495,000 | | | 481,071 | | | | |
| 985,000 | | MINNESOTA ST HSG FIN AGY | | 1/1/2040 | | 5.10 | | | 985,000 | | | 944,733 | | | | |
| 457,941 | | MINNESOTA ST HIGHER ED FACS AUTH REV | | 10/1/2016 | | 4.49 | | | 460,781 | | | 460,244 | | | | |
| 220,000 | | MINNESOTA ST HSG FIN AGY | | 1/1/2020 | | 5.00 | | | 211,504 | | | 220,667 | | | | |
| 500,000 | | MISSOURI ST DEV FIN BRD INFRASTRUCTURE FACS REV | | 10/1/2027 | | 6.13 | | | 484,452 | | | 510,475 | | | | |
| 500,000 | | MISSOURI ST DEV FIN BRD INFRASTRUCTURE FACS REV | | 11/1/2025 | | 5.50 | | | 492,006 | | | 505,980 | | | | |
| 500,000 | | MISSOURI DEV FIN BRD INFRASTRUCTURE FACS LEASEHOLD | | 6/1/2029 | | 5.63 | | | 486,823 | | | 502,515 | | | | |
| 500,000 | | MISSOURI ST DEV FIN BRD INFRASTRUCTURE FACS REV | | 4/1/2027 | | 6.00 | | | 504,666 | | | 506,120 | | | | |
| 500,000 | | MISSOURI ST HEALTH & EDL FACS AUTH REV | | 2/1/2035 | | 5.38 | | | 498,282 | | | 452,775 | | | | |
| 435,000 | | MISSOURI ST HSG DEV COMMN SINGLE FAMILY MTG REV | | 9/1/2034 | | 5.35 | | | 435,000 | | | 437,253 | | | | |
| 650,000 | | MISSOURI ST HSG DEV COMMN MULTIFAMILY HSG REV | | 7/1/2042 | | 5.25 | | | 641,122 | | | 626,743 | | | | |
| 345,000 | | MISSOURI ST HSG DEV COMMN SINGLE FAMILY MTG REV | | 9/1/2034 | | 5.25 | | | 342,687 | | | 345,383 | | | | |
| 980,000 | | MISSOURI ST HEALTH & EDL FACS AUTH REV | | 2/1/2022 | | 5.13 | | | 1,008,331 | | | 973,659 | | | | |
| 1,000,000 | | MOBERLY MO INDL DEV AUTH | | 9/1/2024 | | 6.00 | | | 1,020,261 | | | 985,260 | | | | |
| 450,000 | | MODESTO CALIF IRR DIST CTFS PARTN | | 7/1/2022 | | 5.30 | | | 426,805 | | | 451,170 | | | | |
| 1,000,000 | | MOHAVE CNTY ARIZ INDL DEV AUTHCORRECTIONAL FACS CONTRACT REV | | 5/1/2015 | | 7.25 | | | 993,398 | | | 1,054,360 | | | | |
| 1,500,000 | | MONTGOMERY CNTY OHIO HEALTH CARE FACS REV | | 9/20/2032 | | 6.55 | | | 1,457,638 | | | 1,517,505 | | | | |
| | |
See accompanying notes to financial statements. | 51 | (Continued) |
|
CLEARWATER INVESTMENT TRUST |
Schedule of Investments - Clearwater Tax-Exempt Bond Fund |
December 31, 2010 |
| | | | | | | | | | | | | | | | | |
Par/Shares | | Security | | Maturity
date | | Coupon rate | | Cost | | Fair
Value (a) | | Percent
of
net assets | |
Municipal bonds (Cont’d): | | | | | | | | | | | | | | |
| 650,000 | | MONTGOMERY CNTY PA INDL DEV AUTH REV | | 2/1/2014 | | 5.38 | | $ | 647,720 | | | 625,976 | | | | |
| 375,000 | | MONTGOMERY CNTY PA INDL DEV AUTH REV | | 2/1/2028 | | 6.13 | | | 370,114 | | | 328,046 | | | | |
| 500,000 | | MONTGOMERY CNTY MD HSG OPPTYS COMMN MULTIFAMILY REV | | 7/1/2037 | | 5.13 | | | 500,000 | | | 475,340 | | | | |
| 500,000 | | MOORHEAD MINN REV | | 6/1/2027 | | 5.65 | | | 494,714 | | | 485,410 | | | | |
| 310,000 | | MISSISSIPPI HOME CORP SINGLE FAM MTG REV | | 6/1/2039 | | 6.75 | | | 327,405 | | | 338,114 | | | | |
| 1,480,000 | | MONTANA ST BRD HSG | | 12/1/2039 | | 5.50 | | | 1,480,239 | | | 1,489,768 | | | | |
| 800,000 | | MOUNT CARBON MET DIST COLO REV | | 6/1/2043 | | 7.00 | | | 800,000 | | | 229,520 | | | | |
| 200,000 | | MOUNT CARBON MET DIST COLO REV | | 6/1/2043 | | 8.00 | | | - | | | 20,000 | | | | |
| 500,000 | | NORTHERN CALIF GAS AUTH NO 1 | | 7/1/2027 | | 0.92 | | | 500,000 | | | 332,635 | | | | |
| 1,000,000 | | NORTH CENT TEX HEALTH FAC DEV CORP REV | | 5/15/2017 | | 5.00 | | | 1,000,000 | | | 1,001,060 | | | | |
| 750,000 | | NORTH OAKS MINN SR HSG REV | | 10/1/2022 | | 5.75 | | | 740,543 | | | 744,240 | | | | |
| 1,250,000 | | NORTH TEX TWY AUTH REV | | 1/1/2031 | | 6.13 | | | 1,302,569 | | | 1,259,338 | | | | |
| 1,000,000 | | NORTH TEX TWY AUTH REV (b)(c) | | 1/1/2028 | | 10.85 | | | 372,133 | | | 354,750 | | | | |
| 1,000,000 | | NORTH TEX TWY AUTH REV (b)(c) | | 1/1/2042 | | 1.40 | | | 699,960 | | | 774,110 | | | | |
| 500,000 | | NORTH TEX TWY AUTH DALLAS NORTH TWY SYS REV | | 1/1/2025 | | 6.00 | | | 500,000 | | | 521,260 | | | | |
| 750,000 | | NAPLES FLA HOSP REV | | 10/1/2026 | | 5.50 | | | 754,384 | | | 715,455 | | | | |
| 920,000 | | NORTH DAKOTA ST HSG FIN AGY | | 7/1/2034 | | 5.35 | | | 920,000 | | | 920,000 | | | | |
| 1,820,000 | | NORTH DAKOTA ST HSG FIN AGY | | 7/1/2039 | | 5.45 | | | 1,820,000 | | | 1,827,025 | | | | |
| 500,000 | | MEAD VLG NEB TAX INCREMENT REV (b) | | 9/1/2036 | | 5.90 | | | 500,000 | | | 503,245 | | | | |
| 500,000 | | NEW JERSEY ST HSG & MTG FIN AGY REV | | 10/1/2030 | | 6.45 | | | 537,815 | | | 516,225 | | | | |
| 500,000 | | NEW ORLEANS LA AVIATION BRD GULF OPPORTUNITY ZONE CFC REV | | 1/1/2025 | | 6.00 | | | 489,793 | | | 507,925 | | | | |
| 750,000 | | NEW ORLEANS LA SEW SVC REV | | 6/1/2024 | | 6.00 | | | 739,767 | | | 775,973 | | | | |
| 115,000 | | NEW RIVER CMNTY DEV DIST FLA CAP IMPT REV | | 5/1/2013 | | 5.00 | | | 114,821 | | | 1 | | | | |
| 70,000 | | NEW RIVER CMNTY DEV DIST FLA CAP IMPT REV (b)(c) | | 5/1/2038 | | 0.37 | | | 62,675 | | | 40,653 | | | | |
| 175,000 | | NEW RIVER CMNTY DEV DIST FLA CAP IMPT REV (b)(c) | | 5/1/2038 | | 0.80 | | | 139,961 | | | 63,235 | | | | |
| 70,000 | | NEW RIVER CMNTY DEV DIST FLA CAP IMPT REV (b)(c) | | 5/1/2015 | | 1.20 | | | 63,711 | | | 55,824 | | | | |
| 135,000 | | NEW RIVER CMNTY DEV DIST FLA CAP IMPT REV (b)(c) | | 5/1/2018 | | 1.37 | | | 116,922 | | | 51,566 | | | | |
| 1,000,000 | | NEW HAMPSHIRE HEALTH & ED FACS AUTH HOSP REV | | 10/1/2024 | | 5.00 | | | 985,656 | | | 967,100 | | | | |
| 500,000 | | NEW HAMPSHIRE HEALTH & ED FACS AUTH REV | | 8/1/2038 | | 6.00 | | | 490,078 | | | 523,510 | | | | |
| 745,000 | | NEW HAMPSHIRE ST HSG FIN AUTH SINGLE FAMILY MTG REV | | 7/1/2034 | | 5.38 | | | 745,000 | | | 746,199 | | | | |
| 825,000 | | NEW HAMPSHIRE ST HSG FIN AUTH SINGLE FAMILY MTG REV | | 7/1/2038 | | 6.63 | | | 866,795 | | | 909,101 | | | | |
| 45,000 | | NEW JERSEY ECONOMIC DEV AUTH REV | | 1/1/2015 | | 5.00 | | | 44,678 | | | 44,123 | | | | |
| 500,000 | | NEW JERSEY ST HIGHER ED ASSISTANCE AUTH STUDENT LN REV | | 6/1/2024 | | 5.38 | | | 497,385 | | | 503,170 | | | | |
| 2,500,000 | | NEW JERSEY ST HIGHER ED ASSISTANCE AUTH STUDENT LN REV | | 6/1/2027 | | 5.00 | | | 2,496,455 | | | 2,559,200 | | | | |
| 360,000 | | NEW JERSEY HEALTH CARE FACS FING AUTH REV | | 7/1/2015 | | 5.75 | | | 355,084 | | | 384,948 | | | | |
| 2,500,000 | | NEW JERSEY HEALTH CARE FACS FING AUTH REV | | 7/1/2016 | | 6.25 | | | 2,500,000 | | | 2,504,250 | | | | |
| 2,335,000 | | NEW JERSEY ST HSG & MTG FIN AGY REV | | 10/1/2037 | | 5.00 | | | 2,317,821 | | | 2,238,471 | | | | |
| 925,000 | | NEW JERSEY ST HSG & MTG FIN AGY REV | | 10/1/2034 | | 5.00 | | | 925,000 | | | 888,888 | | | | |
| 800,000 | | NEW JERSEY ST HSG & MTG FIN AGY REV | | 10/1/2035 | | 5.00 | | | 800,000 | | | 773,480 | | | | |
| 4,250,000 | | NEW JERSEY ST TRANSN TR FD AUTH (b)(c) | | 12/15/2025 | | 9.43 | | | 1,794,096 | | | 1,742,840 | | | | |
| 1,000,000 | | NEW JERSEY ST HSG & MTG FIN AGY MULT-FAMILY REV | | 5/1/2041 | | 4.95 | | | 969,395 | | | 925,860 | | | | |
| 25,000 | | NEW MEXICO MTG FIN AUTH | | 1/1/2026 | | 6.95 | | | 26,192 | | | 25,333 | | | | |
| 995,000 | | NEW MEXICO MTG FIN AUTH | | 9/1/2029 | | 5.00 | | | 995,000 | | | 971,339 | | | | |
| 995,000 | | NEW MEXICO MTG FIN AUTH | | 9/1/2034 | | 5.00 | | | 995,000 | | | 954,941 | | | | |
| 500,000 | | NEW MEXICO MTG FIN AUTH | | 9/1/2029 | | 4.80 | | | 500,000 | | | 472,715 | | | | |
| 1,030,000 | | NEW MEXICO MTG FIN AUTH | | 3/1/2036 | | 5.45 | | | 1,030,000 | | | 1,034,635 | | | | |
| 500,000 | | NOBLESVILLE IND REDEV AUTH ECONOMIC DEV REV | | 2/1/2031 | | 5.13 | | | 495,333 | | | 494,725 | | | | |
| 325,000 | | NORCO CALIF REDEV AGY TAX ALLOCATION | | 3/1/2021 | | 6.25 | | | 323,761 | | | 349,921 | | | | |
| 500,000 | | NORCO CALIF REDEV AGY TAX ALLOCATION | | 3/1/2032 | | 5.88 | | | 492,512 | | | 474,065 | | | | |
| 1,300,000 | | NORTH CAROLINA MED CARE COMMN HEALTH CARE FACS REV | | 10/1/2035 | | 6.63 | | | 1,300,000 | | | 1,156,805 | | | | |
| 2,000,000 | | NORTH DAKOTA ST HSG FIN AGY | | 7/1/2040 | | 5.05 | | | 2,000,000 | | | 1,863,880 | | | | |
| 1,000,000 | | NORTH DAKOTA ST HSG FIN AGY | | 7/1/2030 | | 4.75 | | | 1,000,000 | | | 937,110 | | | | |
| 350,000 | | NORTH RANGE MET DIST NO 1 COLO | | 12/15/2024 | | 5.00 | | | 359,592 | | | 283,427 | | | | |
| 1,000,000 | | NORTH TEX TWY AUTH REV | | 1/1/2034 | | 6.00 | | | 1,000,000 | | | 1,002,230 | | | | |
| 2,000,000 | | NORWALK-LA MIRADA CALIF UNI SCH DIST (b)(c) | | 8/1/2029 | | 4.51 | | | 1,097,139 | | | 980,940 | | | | |
| 220,000 | | NORTHERN CALIF PWR AGY PUB PWR REV | | 7/1/2032 | | 5.20 | | | 223,640 | | | 205,304 | | | | |
| 1,000,000 | | NORTHERN IL UNIV-RF-AUX (b) | | 4/1/2026 | | 5.50 | | | 1,017,290 | | | 1,008,560 | | | | |
| 400,000 | | NORTHERN MARIANA ISLANDS COMWLTH | | 10/1/2022 | | 5.00 | | | 403,006 | | | 342,480 | | | | |
| 405,000 | | NEVADA HSG DIV SINGLE FAMILY MTG REV | | 10/1/2039 | | 5.38 | | | 405,000 | | | 413,517 | | | | |
| 1,350,000 | | NEVADA HSG DIV SINGLE FAMILY MTG REV | | 10/1/2040 | | 5.10 | | | 1,350,000 | | | 1,288,332 | | | | |
| 750,000 | | NEW YORK ST DORM AUTH REVS NONST SUPPORTED DEBT | | 7/1/2029 | | 6.25 | | | 761,136 | | | 807,795 | | | | |
| 350,000 | | NEW YORK ST DORM AUTH REVS | | 7/1/2019 | | 6.88 | | | 355,280 | | | 356,888 | | | | |
| 1,820,000 | | NEW YORK ST MED CARE FACS FIN AGY REV | | 2/15/2035 | | 6.38 | | | 1,802,433 | | | 1,825,296 | | | | |
| 865,000 | | NEW YORK ST MED CARE FACS FIN AGY REV | | 8/15/2023 | | 6.30 | | | 865,000 | | | 867,863 | | | | |
| 210,000 | | NEW YORK ST URBAN DEV CORP | | 7/1/2016 | | 5.50 | | | 210,000 | | | 210,752 | | | | |
| 250,000 | | NEW YORK N Y CITY INDL DEV AGY REV | | 1/1/2029 | | 6.13 | | | 246,633 | | | 265,483 | | | | |
| 1,000,000 | | NEW YORK ST DORM AUTH REV | | 8/15/2024 | | 6.45 | | | 998,402 | | | 1,025,480 | | | | |
| 300,000 | | OAK ISLAND N C ENTERPRISE SYS REV | | 6/1/2028 | | 5.75 | | | 293,520 | | | 313,821 | | | | |
| 300,000 | | OAK ISLAND N C ENTERPRISE SYS REV | | 6/1/2029 | | 5.88 | | | 295,824 | | | 315,108 | | | | |
| 500,000 | | OHIO ST AIR QUALITY DEV AUTH REV | | 5/1/2026 | | 5.15 | | | 496,971 | | | 477,010 | | | | |
| 725,000 | | OHIO ST HSG FIN AGY RESIDENTIAL MTG REV | | 9/1/2033 | | 5.40 | | | 725,000 | | | 728,103 | | | | |
| 375,000 | | OHIO ST HSG FIN AGY RESIDENTIAL MTG REV | | 9/1/2033 | | 5.45 | | | 375,000 | | | 377,621 | | | | |
| 660,000 | | OHIO ST HSG FIN AGY RESIDENTIAL MTG REV | | 9/1/2028 | | 6.13 | | | 660,000 | | | 699,316 | | | | |
| | |
See accompanying notes to financial statements. | 52 | (Continued) |
CLEARWATER INVESTMENT TRUST
Schedule of Investments - Clearwater Tax-Exempt Bond Fund
December 31, 2010
| | | | | | | | | | | | | | | | | |
Par/Shares | | Security | | Maturity
date | | Coupon
rate | | Cost | | Fair
Value (a) | | Percent
of
net assets | |
Municipal bonds (Cont’d): | | | | | | | | | | | | | | |
| 500,000 | | OHIO ST HIGHER EDL FAC REV | | 12/1/2024 | | 5.50 | | $ | 507,972 | | | 528,875 | | | | |
| 880,000 | | OKLAHOMA HSG FIN AGY SINGLE FAMILY MTG REV | | 9/1/2038 | | 6.50 | | | 928,010 | | | 954,624 | | | | |
| 480,000 | | OKLAHOMA HSG FIN AGY SINGLE FAMILY MTG REV | | 3/1/2032 | | 5.15 | | | 480,000 | | | 476,664 | | | | |
| 500,000 | | OREGON HEALTH SCIENCES UNIV REV | | 7/1/2039 | | 5.75 | | | 485,671 | | | 514,185 | | | | |
| 480,000 | | OREGON ST VETERANS WELFARE | | 10/1/2031 | | 5.13 | | | 476,548 | | | 480,120 | | | | |
| 1,000,000 | | ORANGE CNTY FLA HEALTH FACS AUTH REV | | 10/1/2021 | | 6.25 | | | 984,520 | | | 1,112,570 | | | | |
| 1,000,000 | | OVERLAND PK KANS TRANSN DEV DIST SALES TAX REV | | 4/1/2032 | | 5.90 | | | 1,000,000 | | | 963,580 | | | | |
| 1,500,000 | | PENNSYLVANIA ECONOMIC DEV FINGAUTH HEALTH SYS REV | | 10/15/2023 | | 6.25 | | | 1,467,601 | | | 1,557,300 | | | | |
| 500,000 | | PENNSYLVANIA ST HIGHER EDL FACS AUTH REV | | 7/1/2039 | | 0.85 | | | 500,000 | | | 260,155 | | | | |
| 1,025,000 | | PENNSYLVANIA ST TPK COMMN TPK REV (b)(c) | | 12/1/2030 | | 2.91 | | | 652,431 | | | 682,927 | | | | |
| 1,500,000 | | PENNSYLVANIA ST TPK COMMN TPK REV (b)(c) | | 12/1/2038 | | 1.44 | | | 1,070,553 | | | 1,022,940 | | | | |
| 1,000,000 | | PENNSYLVANIA ST TPK COMMN TPK REV (b)(c) | | 6/1/2033 | | 2.19 | | | 673,101 | | | 752,710 | | | | |
| 2,935,000 | | PENNSYLVANIA ST TPK COMMN TPK REV (b)(c) | | 12/1/2035 | | 1.17 | | | 2,272,407 | | | 1,989,343 | | | | |
| 750,000 | | PENNSYLVANIA ST TPK COMMN TPK REV (b)(c) | | 12/1/2035 | | 2.01 | | | 500,014 | | | 516,563 | | | | |
| 1,405,000 | | PACHECO CALIF UN SCH DIST CTFSPARTNB (b)(c) | | 2/1/2037 | | 15.26 | | | 274,466 | | | 351,798 | | | | |
| 2,280,000 | | PACHECO CALIF UN SCH DIST CTFSPARTN (b)(c) | | 2/1/2037 | | 15.27 | | | 445,275 | | | 396,515 | | | | |
| 1,000,000 | | PALM BAY UTIL IMPT (b)(c) | | 10/1/2031 | | 11.87 | | | 298,896 | | | 272,980 | | | | |
| 1,000,000 | | PALM BEACH CNTY FLA HEALTH FACS AUTH REV | | 11/15/2022 | | 5.38 | | | 915,390 | | | 905,520 | | | | |
| 675,000 | | PALM BEACH CNTY FL HEALTH FACS AUTH RETIREMENT CMNTY REV | | 11/15/2029 | | 5.13 | | | 682,621 | | | 611,604 | | | | |
| 600,000 | | PARKLANDS LEE CMNTY DEV DIST FLA SPL ASSMT (b) | | 5/1/2011 | | 5.13 | | | 599,935 | | | 296,940 | | | | |
| 1,665,000 | | PATTERSON CALIF JT UNI SCH DIST (b)(c) | | 8/1/2027 | | 12.31 | | | 571,979 | | | 581,984 | | | | |
| 750,000 | | PELL CITY ALA SPL CARE FACS FING AUTH REV | | 12/1/2027 | | 5.25 | | | 621,702 | | | 695,205 | | | | |
| 500,000 | | PEORIA ILL PUB BLDG COMMN SCH DIST FACS REV (b)(c) | | 12/1/2022 | | 9.39 | | | 242,949 | | | 258,930 | | | | |
| 2,000,000 | | PEORIA ILL PUB BLDG COMMN SCH DIST FACS REV (b)(c) | | 12/1/2021 | | 8.01 | | | 1,094,261 | | | 1,127,620 | | | | |
| 5,000,000 | | PEORIA ILL PUB BLDG COMMN SCH DIST FACS REV (b)(c) | | 12/1/2026 | | 11.11 | | | 1,878,339 | | | 1,858,450 | | | | |
| 1,000,000 | | PHILADELPHIA PA HOSPS & HIGHER ED FACS AUTH HOSP REV | | 11/15/2023 | | 6.63 | | | 1,000,860 | | | 1,000,500 | | | | |
| 70,000 | | PHOENIX ARIZ STR & HWY USER REV | | 7/1/2011 | | 6.25 | | | 70,236 | | | 70,300 | | | | |
| 330,000 | | PIMA CNTY ARIZ INDL DEV AUTH ED REV | | 6/1/2016 | | 6.00 | | | 330,000 | | | 322,252 | | | | |
| 1,000,000 | | PIMA CNTY ARIZ INDL DEV AUTH ED REV | | 7/1/2026 | | 5.00 | | | 863,559 | | | 798,120 | | | | |
| 500,000 | | PIMA CNTY ARIZ INDL DEV AUTH ED REV | | 7/1/2031 | | 6.75 | | | 364,594 | | | 467,725 | | | | |
| 460,000 | | PIMA CNTY ARIZ INDL DEV AUTH ED REV | | 12/1/2018 | | 6.38 | | | 460,000 | | | 452,277 | | | | |
| 250,000 | | PIMA CNTY ARIZ INDL DEV AUTH ED REV | | 6/1/2022 | | 5.00 | | | 253,408 | | | 215,188 | | | | |
| 1,000,000 | | PIMA CNTY ARIZ INDL DEV AUTH REV | | 9/1/2029 | | 5.75 | | | 1,000,000 | | | 1,006,750 | | | | |
| 170,000 | | PIMA CNTY ARIZ INDL DEV AUTH ED REV | | 7/1/2015 | | 5.13 | | | 169,486 | | | 168,589 | | | | |
| 200,000 | | PIMA CNTY ARIZ INDL DEV AUTH ED REV | | 12/15/2016 | | 5.25 | | | 198,479 | | | 198,084 | | | | |
| 1,045,000 | | PIMA CNTY ARIZ INDL DEV AUTH ED REV | | 12/1/2017 | | 5.35 | | | 934,221 | | | 996,157 | | | | |
| 1,000,000 | | PIMA CNTY ARIZ INDL DEV AUTH CHARTER SCH REV | | 4/1/2022 | | 5.88 | | | 1,000,000 | | | 938,410 | | | | |
| 455,000 | | PIMA CNTY ARIZ INDL DEV AUTH ED REV | | 7/1/2022 | | 5.38 | | | 459,133 | | | 405,178 | | | | |
| 70,000 | | PIMA CNTY ARIZ INDL DEV AUTH ED REV | | 8/1/2012 | | 6.25 | | | 70,000 | | | 71,462 | | | | |
| 185,000 | | PIMA CNTY ARIZ INDL DEV AUTH ED REV | | 7/1/2024 | | 6.10 | | | 182,080 | | | 169,704 | | | | |
| 500,000 | | PINAL CNTY ARIZ CTFS PARTN | | 12/1/2023 | | 5.25 | | | 475,640 | | | 504,905 | | | | |
| 300,000 | | PINAL CNTY ARIZ INDL DEV AUTH CORRECTIONAL FACS CONTRACT REV | | 10/1/2018 | | 5.25 | | | 253,030 | | | 293,076 | | | | |
| 1,000,000 | | PITTSBURG CALIF REDEV AGY TAX ALLOC | | 9/1/2028 | | 6.50 | | | 977,319 | | | 1,061,130 | | | | |
| 500,000 | | PLEASANT VALLEY CALIF SCH DIST VENTURA CNTY | | 2/1/2022 | | 5.85 | | | 498,232 | | | 539,295 | | | | |
| 750,000 | | PLEASANTS CNTY W VA POLLUTN CTL REV | | 5/1/2015 | | 6.15 | | | 771,425 | | | 751,133 | | | | |
| 750,000 | | PORT CORPUS CHRISTI AUTH TEX NUECES CNTY GEN REV | | 12/1/2022 | | 5.65 | | | 750,000 | | | 723,878 | | | | |
| 1,750,000 | | PORT EVERGLADES AUTH FLA PORT | | 9/1/2016 | | 5.00 | | | 1,750,110 | | | 1,780,730 | | | | |
| 1,000,000 | | FOREST GROVE ORE REV | | 12/1/2025 | | 6.00 | | | 985,437 | | | 992,160 | | | | |
| 250,000 | | PORTLAND ME HSG DEV CORP | | 8/1/2021 | | 5.70 | | | 250,000 | | | 246,865 | | | | |
| 450,000 | | PUERTO RICO COMWLTH HWY & TRANSN AUTH TRANSN REV | | 7/1/2045 | | 0.73 | | | 450,000 | | | 235,584 | | | | |
| 500,000 | | PUERTO RICO ELEC PWR AUTH PWR REV | | 7/1/2025 | | 0.88 | | | 500,000 | | | 370,465 | | | | |
| 1,000,000 | | PUERTO RICO SALES TAX FING CORP SALES TAX REV (b)(c) | | 8/1/2033 | | 3.37 | | | 570,551 | | | 604,330 | | | | |
| 500,000 | | PUERTO RICO SALES TAX FING CORP SALES TAX REV | | 8/1/2057 | | 1.12 | | | 500,000 | | | 283,870 | | | | |
| 500,000 | | PROVIDENCE R I HSG AUTH HSG REV | | 9/1/2027 | | 5.00 | | | 508,259 | | | 476,580 | | | | |
| 250,000 | | PROVIDENCE R I HSG AUTH HSG REV | | 9/1/2026 | | 5.00 | | | 255,192 | | | 241,550 | | | | |
| 245,000 | | PROVO UTAH CHARTER SCH REV | | 6/15/2037 | | 5.50 | | | 245,000 | | | 176,586 | | | | |
| 750,000 | | QUAIL CREEK CMNTY FACS DIST ARIZ | | 7/15/2016 | | 5.15 | | | 750,000 | | | 722,565 | | | | |
| 750,000 | | QUINAULT INDIAN NATION WASH | | 12/1/2015 | | 5.80 | | | 745,616 | | | 648,518 | | | | |
| 2,000,000 | | ILLINOIS FIN AUTH SPORTS FAC REV | | 6/1/2024 | | 6.25 | | | 2,045,923 | | | 2,028,240 | | | | |
| 975,000 | | RAMONA CALIF UNI SCH DIST CTFS PARTN (b)(c) | | 5/1/2032 | | 1.10 | | | 789,440 | | | 769,022 | | | | |
| 1,000,000 | | REDONDO BEACH CALIF UNI SCH DIST (b)(c) | | 8/1/2034 | | 2.10 | | | 670,477 | | | 697,120 | | | | |
| 1,500,000 | | REGIONAL TRANSN DIST COLO PRIVATE ACTIVITY REV | | 1/15/2034 | | 6.00 | | | 1,485,129 | | | 1,488,855 | | | | |
| 750,000 | | RENO-SPARKS INDIAN COLONY NEV | | 6/1/2021 | | 5.00 | | | 765,015 | | | 727,463 | | | | |
| 400,000 | | RENO NEV HOSP REV | | 6/1/2032 | | 5.25 | | | 411,156 | | | 364,524 | | | | |
| 500,000 | | RENO NEV HOSP REV | | 6/1/2020 | | 5.50 | | | 507,582 | | | 526,320 | | | | |
| 500,000 | | RHODE ISLAND ST HEALTH & EDL BLDG CORP REV | | 5/15/2030 | | 6.25 | | | 493,329 | | | 530,705 | | | | |
| 285,000 | | RHODE ISLAND ST HEALTH & EDL BLDG CORP REV | | 5/15/2026 | | 5.25 | | | 289,238 | | | 272,526 | | | | |
| 495,000 | | RHODE ISLAND HSG & MTG FIN CORP | | 10/1/2038 | | 5.63 | | | 495,000 | | | 502,158 | | | | |
| 500,000 | | RHODE ISLAND ST STUDENT LN AUTH STUDENT LN REV | | 12/1/2027 | | 5.75 | | | 500,000 | | | 487,835 | | | | |
| 500,000 | | RICHARDSON TEX HOSP AUTH HOSP | | 12/1/2028 | | 5.63 | | | 513,594 | | | 446,290 | | | | |
| 325,000 | | RICHMOND IND HOSP AUTH REV | | 1/1/2029 | | 6.50 | | | 314,921 | | | 343,655 | | | | |
| 500,000 | | RICHMOND CALIF JT PWRS FING AUTH REV | | 7/1/2024 | | 6.25 | | | 500,000 | | | 527,550 | | | | |
| 1,000,000 | | RICHMOND CALIF CMNTY REDEV AGYTAX ALLOC | | 9/1/2030 | | 6.00 | | | 971,832 | | | 975,460 | | | | |
| | |
See accompanying notes to financial statements. | 53 | (Continued) |
CLEARWATER INVESTMENT TRUST
Schedule of Investments - Clearwater Tax-Exempt Bond Fund
December 31, 2010
| | | | | | | | | | | | | | | | | |
Par/Shares | | Security | | Maturity
date | | Coupon
rate | | Cost | | Fair
Value (a) | | Percent
of
net assets | |
Municipal bonds (Cont’d): | | | | | | | | | | | | | | |
| 925,000 | | RIO GRANDE VY HEALTH FACS DEV CORP TEX HOSP REV | | 8/1/2012 | | 6.40 | | $ | 925,000 | | | 927,692 | | | | |
| 550,000 | | RIVERSIDE MO INDL DEV AUTH INDL DEV REV | | 5/1/2027 | | 4.50 | | | 521,889 | | | 492,938 | | | | |
| 1,000,000 | | RIVERSIDE CNTY CALIF REDEV AGY TAX ALLOC | | 10/1/2030 | | 6.00 | | | 1,014,623 | | | 962,980 | | | | |
| 1,000,000 | | RIVERSIDE CNTY CALIF REDEV AGY TAX ALLOC | | 10/1/2025 | | 6.00 | | | 995,050 | | | 980,730 | | | | |
| 250,000 | | RIVERWOOD ESTATES CMNTY DEV DIST FLA SPL ASSMT (b) | | 5/1/2013 | | 5.00 | | | 250,000 | | | 43,025 | | | | |
| 500,000 | | ROSS COUNTY OHIO HOSP REV | | 12/1/2028 | | 5.75 | | | 502,480 | | | 503,130 | | | | |
| 2,200,000 | | ROWLAND CALIF UNI SCH DIST (b)(c) | | 8/1/2027 | | 11.00 | | | 799,327 | | | 738,738 | | | | |
| 500,000 | | SOUTH BAYSIDE WASTE MGMT AUTH CALIF SOLID WASTE ENTERPRISE | | 9/1/2029 | | 6.25 | | | 517,213 | | | 516,485 | | | | |
| 1,000,000 | | SOUTH CAROLINA JOBS-ECONOMIC DEV AUTH STUDENT HSG REV | | 4/1/2030 | | 6.00 | | | 969,943 | | | 972,990 | | | | |
| 1,000,000 | | SOUTH COAST CONSERVANCY DIST IND | | 1/1/2028 | | 5.25 | | | 994,372 | | | 1,026,360 | | | | |
| 500,000 | | SACRAMENTO CNTY CALIF CTFS PARTN | | 10/1/2027 | | 4.75 | | | 500,258 | | | 436,885 | | | | |
| 1,000,000 | | SACRAMENTO CALIF CITY FING AUTH REV (b)(c) | | 12/1/2021 | | 7.46 | | | 572,777 | | | 493,660 | | | | |
| 500,000 | | SACRAMENTO CALIF PWR AUTH COGENERATION PROJ REV | | 7/1/2022 | | 4.50 | | | 432,788 | | | 465,695 | | | | |
| 250,000 | | SACRAMENTO CNTY CALIF SANTN DIST FING AUTH REV | | 12/1/2035 | | 0.73 | | | 250,000 | | | 168,153 | | | | |
| 350,000 | | SACRAMENTO CNTY CALIF WTR FINGAUTH REV | | 6/1/2039 | | 0.77 | | | 350,000 | | | 201,243 | | | | |
| 1,200,000 | | SADDLEBACK VY UNI SCH DIST CALIF PUB FING AUTH SPL TAX REV | | 9/1/2017 | | 5.65 | | | 1,200,000 | | | 1,204,452 | | | | |
| 2,000,000 | | SALINE CNTY MO INDL DEV AUTH HEALTH FACS REV | | 12/1/2020 | | 5.00 | | | 1,980,732 | | | 1,900,780 | | | | |
| 500,000 | | SALINE CNTY MO INDL DEV AUTH HEALTH FACS REV | | 12/1/2028 | | 5.60 | | | 488,941 | | | 453,235 | | | | |
| 1,750,000 | | SAN BERNARDINO CNTY CALIF CTFS PARTN | | 8/1/2028 | | 5.00 | | | 1,789,266 | | | 1,587,898 | | | | |
| 500,000 | | SAN DIEGO CALIF REDEV AGY | | 9/1/2023 | | 5.00 | | | 450,906 | | | 489,545 | | | | |
| 1,000,000 | | SAN FRANCISCO CALIF CITY & CNTY ARPTS COMMN INTL ARPT REV | | 5/1/2039 | | 6.00 | | | 1,033,032 | | | 1,047,210 | | | | |
| 750,000 | | SAN GORGONIO CALIF MEM HEALTHCARE | | 8/1/2027 | | 7.00 | | | 764,784 | | | 802,425 | | | | |
| 250,000 | | SAN JOAQUIN HILLS CALIF TRANSN CORRIDOR AGY TOLL RD REV | | 1/15/2030 | | 5.25 | | | 251,234 | | | 220,035 | | | | |
| 1,000,000 | | SANTA PAULA CALIF UTIL AUTH WASTEWTR ENTERPRISE REV | | 2/1/2030 | | 5.00 | | | 987,857 | | | 940,200 | | | | |
| 250,000 | | SARASOTA NATL CMNTY DEV DIST FLA SPL ASSMT (b) | | 5/1/2039 | | 5.30 | | | 248,217 | | | 44,850 | | | | |
| 1,250,000 | | SARASOTA CNTY FLA HEALTH FACS AUTH RETIREMENT FAC REV | | 1/1/2027 | | 5.50 | | | 1,026,750 | | | 1,083,138 | | | | |
| 750,000 | | SARTELL MINN HEALTH CARE & HSG FACS REV | | 9/1/2029 | | 6.63 | | | 753,318 | | | 721,455 | | | | |
| 560,000 | | SOUTH CAROLINA ST ED ASSISTANCE AUTH REV | | 10/1/2029 | | 5.10 | | | 553,316 | | | 545,446 | | | | |
| 245,000 | | SOUTH CAROLINA HSG FIN & DEV AUTH MTG REV | | 7/1/2032 | | 5.50 | | | 245,000 | | | 247,693 | | | | |
| 500,000 | | SOUTH CAROLINA JOBS ECONOMIC DEV AUTH REV | | 11/15/2027 | | 6.00 | | | 503,467 | | | 401,530 | | | | |
| 200,000 | | SEMINOLE TRIBE FLA SPL OBLIG REV | | 10/1/2022 | | 5.75 | | | 205,620 | | | 196,138 | | | | |
| 500,000 | | SEMINOLE TRIBE FLA SPL OBLIG REV | | 10/1/2024 | | 5.50 | | | 505,044 | | | 469,240 | | | | |
| 500,000 | | SEMINOLE TRIBE FLA | | 10/1/2017 | | 5.13 | | | 500,000 | | | 482,970 | | | | |
| 250,000 | | SENECA NATION INDIANS CAP IMPTS AUTH N Y SPL OBLIG | | 12/1/2023 | | 5.00 | | | 248,813 | | | 197,948 | | | | |
| 150,000 | | SHELBY CNTY TENN HEALTH EDL & HSG FACS BRD REV (b) | | 1/1/2019 | | 5.35 | | | 134,966 | | | 16,235 | | | | |
| 625,000 | | SHELBY CNTY TENN HEALTH EDL & HSG FACS BRD REV (b) | | 1/1/2029 | | 5.55 | | | 556,863 | | | 62,763 | | | | |
| 500,000 | | SKAGIT CNTY WASH PUB HOSP DIST NO 001 REV | | 12/1/2030 | | 6.00 | | | 513,133 | | | 488,620 | | | | |
| 1,250,000 | | SMYRNA TENN HSG ASSN INC MULTIFAMILY HSG REV | | 10/20/2035 | | 6.45 | | | 1,253,728 | | | 1,286,600 | | | | |
| 550,000 | | SNOHOMISH CNTY WASH HSG AUTH HSG REV | | 4/1/2026 | | 6.40 | | | 550,000 | | | 551,584 | | | | |
| 750,000 | | SOUTH CAROLINA JOBS ECONOMIC DEV AUTH REV | | 11/15/2042 | | 5.15 | | | 750,000 | | | 720,428 | | | | |
| 660,000 | | SOUTHWESTERN ILL DEV AUTH REV | | 10/1/2022 | | 7.00 | | | 660,000 | | | 609,734 | | | | |
| 750,000 | | SPARKS NEV REDEV AGY TAX INCREMENT REV | | 6/1/2020 | | 6.40 | | | 721,278 | | | 696,840 | | | | |
| 1,000,000 | | SPARKS NEV REDEV AGY TAX INCREMENT REV | | 6/1/2020 | | 7.25 | | | 989,938 | | | 984,890 | | | | |
| 1,000,000 | | SPARKS NEV REDEV AGY TAX INCREMENT REV | | 1/15/2022 | | 5.00 | | | 977,549 | | | 963,740 | | | | |
| 490,000 | | SPARKS NEV TOURISM IMPT DIST NO 1 REV | | 6/15/2020 | | 6.50 | | | 474,880 | | | 466,421 | | | | |
| 229,000 | | ST BERNARD PARISH LA HOME MTG AUTH SINGLE FAMILY MTG REV | | 3/1/2039 | | 5.80 | | | 224,547 | | | 228,979 | | | | |
| 1,025,000 | | ST JOHN BAPTIST PARISH LA REV | | 6/1/2037 | | 5.13 | | | 1,025,000 | | | 921,824 | | | | |
| 500,000 | | ST JOHNS CNTY FLA INDL DEV AUTH HEALTH CARE | | 1/1/2016 | | 5.00 | | | 471,428 | | | 459,010 | | | | |
| 500,000 | | ST JOHNS CNTY FLA INDL DEV AUTH REV | | 8/1/2040 | | 5.88 | | | 492,751 | | | 485,975 | | | | |
| 400,000 | | ST JOSEPH CNTY IND ECONOMIC DEV REV | | 5/15/2014 | | 5.75 | | | 405,476 | | | 394,148 | | | | |
| 500,000 | | ST JOSEPH CNTY IND ECONOMIC DEV REV | | 5/15/2038 | | 6.00 | | | 367,978 | | | 456,315 | | | | |
| 460,000 | | ST JOSEPH CNTY IND ECONOMIC DEV REV | | 5/15/2026 | | 6.00 | | | 335,556 | | | 434,396 | | | | |
| 500,000 | | ST JOSEPH CNTY IND HOSP AUTH HEALTH FACS REV (b) | | 2/15/2028 | | 5.25 | | | 507,503 | | | 190,650 | | | | |
| 1,000,000 | | ST JOSEPH MO INDL DEV AUTH TAXINCREMENT REV | | 11/1/2019 | | 5.10 | | | 989,454 | | | 925,570 | | | | |
| 500,000 | | ST JOSEPH MO INDL DEV AUTH TAXINCREMENT REV | | 11/1/2023 | | 5.38 | | | 496,531 | | | 429,980 | | | | |
| 1,000,000 | | ST PAUL MINN PORT AUTH REV | | 12/1/2036 | | 5.00 | | | 974,480 | | | 957,940 | | | | |
| 175,341 | | ST TAMMANY PARISH LA FIN AUTH SINGLE FAMILY MTG REV | | 12/1/2039 | | 5.25 | | | 179,099 | | | 180,175 | | | | |
| 300,000 | | SOUTHERN MINN MUN PWR AGY PWR SUPPLY SYS REV | | 1/1/2013 | | 0.00 | | | 300,000 | | | 290,841 | | | | |
| 500,000 | | STONEYBROOK SOUTH CMNTY DEV DIST FLA SPL ASSMT REV (b) | | 11/1/2015 | | 5.45 | | | 498,792 | | | 212,500 | | | | |
| 500,000 | | SULLIVAN CNTY TENN HEALTH EDL & HSG FACS BRD HOSP REV | | 9/1/2036 | | 5.25 | | | 515,725 | | | 425,170 | | | | |
| 2,500,000 | | HAWTHORNE CALIF SCH DIST CTFS PARTN | | 12/1/2037 | | 1.37 | | | 1,824,776 | | | 1,810,500 | | | | |
| 175,000 | | SUMMIT ACADEMY NORTH MICH PUB SCH ACADEMY REV | | 11/1/2011 | | 4.75 | | | 175,013 | | | 175,387 | | | | |
| 213,000 | | SOUTHWESTERN ILL DEV AUTH REV | | 8/15/2015 | | 5.38 | | | 217,219 | | | 214,265 | | | | |
| 1,500,000 | | SOUTHWESTERN ILL DEV AUTH REV | | 8/15/2029 | | 5.63 | | | 1,533,689 | | | 1,383,615 | | | | |
| 225,000 | | SOUTHWESTERN ILL DEV AUTH REV | | 11/1/2026 | | 5.63 | | | 223,526 | | | 154,807 | | | | |
| 1,000,000 | | TARRANT CNTY TEX CULTURAL ED FACS FIN CORP RETIREMENT FAC | | 2/15/2016 | | 7.25 | | | 1,000,000 | | | 1,006,720 | | | | |
| 250,000 | | TARRANT CNTY TEX CULTURAL ED FACS FIN CORP RETIREMENT FAC | | 2/15/2013 | | 5.00 | | | 249,849 | | | 242,898 | | | | |
| 500,000 | | TARRANT CNTY TEX CULTURAL ED FACS FIN CORP RETIREMENT FAC | | 2/15/2014 | | 6.50 | | | 500,000 | | | 497,865 | | | | |
| 1,000,000 | | TARRANT CNTY TEX CULTURAL ED FACS FIN CORP RETIREMENT FAC | | 5/15/2027 | | 5.13 | | | 714,849 | | | 868,980 | | | | |
| 750,000 | | TARRANT CNTY TEX CULTURAL ED FACS FIN CORP RETIREMENT FAC | | 11/15/2019 | | 7.75 | | | 750,000 | | | 775,613 | | | | |
| 250,000 | | TARRANT CNTY TEX CULTURAL ED FACS FIN CORP RETIREMENT FAC | | 11/15/2014 | | 6.25 | | | 250,000 | | | 248,203 | | | | |
| 1,000,000 | | TARRANT CNTY TEX CULTURAL ED FACS FIN CORP RETIREMENT FAC | | 11/15/2026 | | 6.00 | | | 1,033,823 | | | 986,840 | | | | |
| | |
See accompanying notes to financial statements. | 54 | (Continued) |
| | |
CLEARWATER INVESTMENT TRUST
Schedule of Investments - Clearwater Tax-Exempt Bond Fund
December 31, 2010
| | | | | | | | | | | | | | | | | |
Par/Shares | | Security | | Maturity
date | | Coupon
rate | | Cost | | Fair
Value (a) | | Percent
of
net assets | |
Municipal bonds (Cont’d): |
| 750,000 | | TARRANT CNTY TEX CULTURAL ED FACS FIN CORP RETIREMENT FAC | | 11/15/2036 | | 6.00 | | $ | 771,881 | | | 685,815 | | | | |
| 1,000,000 | | TARRANT CNTY TEX CULTURAL ED FACS FIN CORP RETIREMENT FAC | | 11/15/2014 | | 6.50 | | | 1,000,000 | | | 982,860 | | | | |
| 795,000 | | TERREBONNE PARISH LA | | 3/1/2024 | | 5.88 | | | 801,333 | | | 873,808 | | | | |
| 800,000 | | TEXAS ST STUDENT HSG AUTH (b) | | 1/1/2033 | | 11.00 | | | 800,000 | | | 8 | | | | |
| 965,000 | | TENNESSEE HSG DEV AGY | | 7/1/2038 | | 5.45 | | | 965,000 | | | 969,121 | | | | |
| 200,000 | | TENNESSEE HSG DEV AGY MTG FIN | | 7/1/2023 | | 5.20 | | | 201,212 | | | 202,052 | | | | |
| 425,000 | | TODD CREEK FARMS MET DIST NO 1 COLO WTR REV (b) | | 12/1/2009 | | 4.75 | | | 425,000 | | | 211,438 | | | | |
| 750,000 | | TOLOMATO CMNTY DEV DIST FLA | | 5/1/2017 | | 6.38 | | | 750,000 | | | 621,158 | | | | |
| 2,000,000 | | TORRANCE CALIF UNI SCH DIST (b)(c) | | 8/1/2023 | | 9.54 | | | 927,689 | | | 956,920 | | | | |
| 840,000 | | TRAVIS CNTY TEX HSG FIN CORP MULTI FAMILY HSG REV (b) | | 6/1/2035 | | 9.25 | | | 840,000 | | | 158,374 | | | | |
| 1,000,000 | | TRAVIS CNTY TEX HEALTH FACS DEV CORP REV | | 11/1/2016 | | 6.25 | | | 1,000,000 | | | 990,290 | | | | |
| 1,000,000 | | TULSA OKLA TULSA INDL AUTH REV | | 10/1/2027 | | 6.00 | | | 1,027,313 | | | 1,057,010 | | | | |
| 1,250,000 | | TUSTIN CALIF UNI SCH DIST (b)(c) | | 8/1/2028 | | 4.10 | | | 729,630 | | | 705,013 | | | | |
| 400,000 | | TEXAS ST PUB FIN AUTH CHARTER SCH FIN CORP REV | | 9/1/2018 | | 5.50 | | | 400,000 | | | 381,908 | | | | |
| 250,000 | | TEXAS MUN GAS ACQUISITION & SUPPLY CORP I GAS SUPPLY REV | | 12/15/2026 | | 1.65 | | | 250,000 | | | 167,635 | | | | |
| 185,000 | | TEXAS MUN GAS ACQUISITION & SUPPLY CORP I GAS SUPPLY REV | | 12/15/2026 | | 6.25 | | | 177,778 | | | 195,763 | | | | |
| 2,000,000 | | TEXAS PRIVATE ACTIVITY SURFACE TRANSPORTATION CORP | | 6/30/2033 | | 7.50 | | | 2,061,487 | | | 2,103,940 | | | | |
| 500,000 | | TEXAS ST PUB FIN AUTH CHARTER SCH FIN CORP REV | | 2/15/2030 | | 6.00 | | | 500,000 | | | 477,545 | | | | |
| 1,000,000 | | TEXAS ST PUB FIN AUTH CHARTER SCH FIN CORP REV | | 8/15/2030 | | 5.00 | | | 877,121 | | | 833,960 | | | | |
| 745,000 | | TEXAS ST DEPT HSG & CMNTY AFFAIRS RESIDENTIAL MTG REV | | 7/1/2039 | | 5.45 | | | 745,000 | | | 747,876 | | | | |
| 375,000 | | ULSTER CNTY N Y INDL DEV AGY CIVIC FAC REV | | 9/15/2013 | | 5.10 | | | 373,588 | | | 366,195 | | | | |
| 500,000 | | ULSTER CNTY N Y INDL DEV AGY CIVIC FAC REV | | 9/15/2016 | | 5.25 | | | 495,132 | | | 460,025 | | | | |
| 495,000 | | UTAH HSG CORP SINGLE FAMILY MTG REV | | 1/1/2040 | | 5.55 | | | 495,000 | | | 497,252 | | | | |
| 500,000 | | UTAH ST CHARTER SCH FIN AUTH CHARTER SCH REV | | 1/1/2032 | | 4.95 | | | 500,000 | | | 476,405 | | | | |
| 1,000,000 | | UTAH HSG CORP SINGLE FAMILY MTG REV | | 7/1/2034 | | 4.60 | | | 1,000,000 | | | 981,720 | | | | |
| 600,000 | | UTAH ST CHARTER SCH FIN AUTH CHARTER SCH REV | | 7/15/2018 | | 6.38 | | | 600,000 | | | 586,854 | | | | |
| 500,000 | | UTAH HSG CORP SINGLE FAMILY MTG REV | | 7/15/2025 | | 6.50 | | | 500,000 | | | 495,355 | | | | |
| 671,000 | | UTAH ASSOC MUNI POWER (d) | | 5/1/2022 | | 4.75 | | | 671,000 | | | 671,000 | | | | |
| 750,000 | | VIRGINIA ST HSG DEV AUTH COMWLTH MTG | | 7/1/2025 | | 6.00 | | | 750,000 | | | 787,823 | | | | |
| 1,500,000 | | VIRGINIA ST HSG AUTH DEV AUTH | | 12/1/2039 | | 5.00 | | | 1,500,000 | | | 1,442,745 | | | | |
| 425,000 | | VIRGINIA ST HSG DEV AUTH COMWLTH MTG | | 7/1/2031 | | 5.35 | | | 425,826 | | | 425,527 | | | | |
| 2,000,000 | | VIRGINIA ST HSG DEV AUTH COMWLTH MTG | | 7/1/2036 | | 5.38 | | | 2,078,037 | | | 2,014,000 | | | | |
| 750,000 | | VALLEJO CITY CALIF UNI SCH DIST SPL TAX | | 9/1/2031 | | 4.15 | | | 544,951 | | | 486,930 | | | | |
| 985,000 | | VERANO CTR CMNTY DEV DIST FLA | | 11/1/2012 | | 5.00 | | | 985,000 | | | 738,217 | | | | |
| 165,000 | | VERRADO CMNTY FACS DIST NO 1 ARIZ | | 7/15/2013 | | 6.00 | | | 165,000 | | | 170,152 | | | | |
| 300,000 | | VIGO CNTY IND HOSP AUTH REV | | 9/1/2027 | | 5.50 | | | 297,075 | | | 272,261 | | | | |
| 1,500,000 | | VERMONT EDL & HEALTH BLDGS FING AGY REV | | 12/1/2027 | | 6.13 | | | 1,501,020 | | | 1,468,634 | | | | |
| 1,000,000 | | WEST CAMPUS HSG LLC ARIZ STUDENT HSG REV | | 7/1/2025 | | 5.00 | | | 877,568 | | | 901,369 | | | | |
| 500,000 | | WEST ORANGE HEALTHCARE DIST FLA REV | | 2/1/2031 | | 5.80 | | | 502,535 | | | 494,129 | | | | |
| 235,000 | | WEST VLGS IMPT DIST FLA REV (b) | | 5/1/2037 | | 5.50 | | | 235,000 | | | 104,943 | | | | |
| 500,000 | | WASHINGTON ST HEALTH CARE FACS AUTH REV | | 8/1/2028 | | 6.25 | | | 515,171 | | | 531,564 | | | | |
| 1,150,000 | | WASHINGTON ST HSG FIN COMMN NONPROFIT REV | | 1/1/2017 | | 5.25 | | | 1,147,012 | | | 999,326 | | | | |
| 650,000 | | WASHINGTON ST HSG FIN COMMN NONPROFIT REV | | 1/1/2013 | | 5.10 | | | 650,000 | | | 620,632 | | | | |
| 500,000 | | WASHINGTON ST HEALTH CARE FACS AUTH REV | | 3/1/2024 | | 6.50 | | | 478,685 | | | 527,779 | | | | |
| 1,000,000 | | WASHINGTON ST HEALTH CARE FACS AUTH REV | | 3/1/2029 | | 7.13 | | | 975,109 | | | 1,071,679 | | | | |
| 420,000 | | WATERS EDGE CMNTY DEV DIST FLACAP IMPT REV (b) | | 11/1/2012 | | 5.00 | | | 420,018 | | | 184,757 | | | | |
| 500,000 | | WATERSET NORTH CMNTY DEV DIST FLA SPL ASSMT REV (b) | | 11/1/2015 | | 6.55 | | | 498,942 | | | 300,624 | | | | |
| 130,000 | | WESTPARK CMNTY FACS DIST AZ | | 7/15/2016 | | 4.90 | | | 130,000 | | | 124,070 | | | | |
| 1,000,000 | | WISCONSIN ST GEN REV | | 5/1/2027 | | 6.00 | | | 1,022,966 | | | 1,103,209 | | | | |
| 1,000,000 | | WISCONSIN ST HEALTH & EDL FACS AUTH REV | | 12/1/2034 | | 9.00 | | | 1,000,000 | | | 996,430 | | | | |
| 350,000 | | WISCONSIN ST HEALTH & EDL FACS AUTH REV | | 7/1/2021 | | 6.00 | | | 357,247 | | | 359,617 | | | | |
| 750,000 | | WISCONSIN ST HEALTH & EDL FACSAUTH REV | | 4/15/2033 | | 6.40 | | | 764,115 | | | 758,152 | | | | |
| 960,000 | | WISCONSIN ST HEALTH & EDL FACS AUTH REV | | 2/15/2029 | | 5.60 | | | 952,696 | | | 950,236 | | | | |
| 500,000 | | WISCONSIN ST HEALTH & EDL FACS AUTH REV | | 6/1/2028 | | 5.70 | | | 515,575 | | | 467,014 | | | | |
| 1,000,000 | | WISCONSIN ST HEALTH & EDL FACS AUTH REV | | 9/15/2014 | | 5.40 | | | 1,000,000 | | | 990,669 | | | | |
| 525,000 | | WISCONSIN ST HEALTH & EDL FACS AUTH REV | | 2/15/2018 | | 6.25 | | | 508,451 | | | 525,703 | | | | |
| 500,000 | | WISCONSIN ST HEALTH & EDL FACS AUTH REV | | 7/1/2026 | | 5.00 | | | 504,835 | | | 454,934 | | | | |
| 1,000,000 | | WISCONSIN ST HEALTH & EDL FACS AUTH REV | | 8/15/2022 | | 5.75 | | | 905,597 | | | 1,002,719 | | | | |
| 500,000 | | WISCONSIN ST HEALTH & EDL FACS AUTH REV | | 8/15/2024 | | 6.50 | | | 352,493 | | | 487,624 | | | | |
| 500,000 | | WISCONSIN ST HEALTH & EDL FACS AUTH REV | | 8/15/2034 | | 6.75 | | | 507,070 | | | 482,259 | | | | |
| 750,000 | | WISCONSIN ST HEALTH & EDL FACS AUTH REV | | 5/15/2029 | | 5.13 | | | 600,857 | | | 657,779 | | | | |
| 195,000 | | WISCONSIN ST HEALTH & EDL FACS AUTH REV | | 11/15/2023 | | 6.00 | | | 206,362 | | | 199,566 | | | | |
| 250,000 | | WISCONSIN ST HEALTH & EDL FACS AUTH REV | | 11/15/2032 | | 6.00 | | | 267,313 | | | 252,837 | | | | |
| 750,000 | | WISCONSIN ST HEALTH & EDL FACS AUTH REV | | 6/1/2030 | | 6.00 | | | 750,000 | | | 704,992 | | | | |
| 610,000 | | WISCONSIN ST HEALTH & EDL FACS AUTH REV | | 11/15/2025 | | 5.75 | | | 604,252 | | | 610,402 | | | | |
| 1,000,000 | | WISCONSIN ST HEALTH & EDL FACS AUTH REV | | 10/1/2027 | | 5.38 | | | 977,785 | | | 956,809 | | | | |
| 500,000 | | WISCONSIN ST HEALTH & EDL FACS AUTH REV | | 12/1/2030 | | 5.25 | | | 493,903 | | | 474,014 | | | | |
| 1,000,000 | | WISCONSIN ST HEALTH & EDL FACS AUTH REV | | 7/1/2030 | | 5.75 | | | 1,027,930 | | | 982,759 | | | | |
| 500,000 | | WISCONSIN ST HEALTH & EDL FACS AUTH REV | | 2/15/2032 | | 5.25 | | | 488,735 | | | 457,629 | | | | |
| 500,000 | | WISCONSIN ST HEALTH & EDL FACS AUTH REV | | 1/15/2025 | | 5.65 | | | 504,738 | | | 505,789 | | | | |
| 400,000 | | WISCONSIN ST HEALTH & EDL FACS AUTH REV | | 8/15/2023 | | 5.60 | | | 401,307 | | | 396,759 | | | | |
| 255,000 | | WILL CNTY ILL SPL ED JT AGREEMENT DIST 843 LINCOLN-WAY | | 1/1/2021 | | 5.50 | | | 263,726 | | | 262,394 | | | | |
| 750,000 | | WINNEBAGO & STEPHENSON CNTYS ILL CMNTY UNIT SCH DIST NO 321 (b)(c) | | 1/1/2019 | | 6.88 | | | 494,746 | | | 517,598 | | | | |
| | |
See accompanying notes to financial statements. | 55 | (Continued) |
CLEARWATER INVESTMENT TRUST
Schedule of Investments - Clearwater Tax-Exempt Bond Fund
December 31, 2010
| | | | | | | | | | | | | | | | | |
Par/Shares | | Security | | Maturity
date | | Coupon
rate | | Cost | | Fair
Value (a) | | Percent
of
net assets | |
Municipal bonds (Cont’d): |
| 335,000 | | WISCONSIN ST HEALTH & EDL FACS AUTH REV | | 8/15/2026 | | 5.88 | | $ | 319,618 | | | 326,266 | | | | |
| 700,000 | | WOODHILL PUB FAC CORP TEX MULTIFAMILY REV | | 12/1/2015 | | 7.25 | | | 694,275 | | | 706,180 | | | | |
| 530,000 | | WESTERN GENERATION AGY ORE COGENERATION PROJ REV | | 1/1/2021 | | 5.00 | | | 533,502 | | | 473,066 | | | | |
| 750,000 | | WYOMING CMNTY DEV AUTH HSG REV | | 12/1/2023 | | 5.25 | | | 759,132 | | | 770,819 | | | | |
| 1,500,000 | | WYANDOTTE CNTY/KANS CITY KANS UNI GOVT SPL OBLIG REV (b)(c) | | 6/1/2021 | | 8.45 | | | 804,678 | | | 798,030 | | | | |
| 500,000 | | YORBA LINDA CALIF REDEV AGY TAX ALLOCATION REV (b)(c) | | 9/1/2027 | | 12.29 | | | 166,035 | | | 147,984 | | | | |
| 355,000 | | ZEPHYR RIDGE CMNTY DEV DIST FLA CAP IMPT REV (b) | | 5/1/2013 | | 5.25 | | | 355,351 | | | 140,898 | | | | |
| | | Sub-total Municipal Bonds | | | | | | | 497,051,395 | | | 471,025,667 | | | 91.25 | % |
Short-term investments: |
| 8,475,514 | | NORTHERN INSTL TAX-EXEMPT PORTFOLIO, 0.03% (e) | | | | | | | 8,475,514 | | | 8,475,514 | | | | |
| | | Sub-total Short-term investments: | | | | | | | 8,475,514 | | | 8,475,514 | | | 1.64 | % |
| | | Grand total (f) | | | | | | $ | 540,111,121 | | | 514,761,290 | | | 99.72 | % |
Notes to Schedule of Investments: |
| �� | | |
| | (a) | Securities are valued in accordance with procedures described in Note 2 to the financial statements. |
| | (b) | Currently non-income producing assets. For long-term debt securities, item identified is in default as to payment of interest |
| | | and/or principal. |
| | (c) | For zero coupon bonds, the interest rate disclosed represents the annualized effective yield on the date of acquisition. |
| | (d) | This security is being fair-valued according to procedures adopted by the Board of Trustees. |
| | (e) | The short-term investment is a money market portfolio of the investment company, Northern Institutional Funds. |
| | (f) | At December 31, 2010, the cost for Federal income tax purposes was $540,111,121. The aggregate gross unrealized appreciation and depreciation of investments in securities based on this cost were as follows: |
| | | Gross unrealized appreciation | | | | | | $ | 8,460,777 | | | | | | | |
| | | Gross unrealized depreciation | | | | | | | (33,810,608 | ) | | | | | | |
| | | Net unrealized depreciation | | | | | | $ | (25,349,831 | ) | | | | | | |
Distribution of investments representing geographic diversification, as a percentage of total investments at fair value, is as follows:
| | | | |
Geographical Diversification | | | Percent | |
|
California | | | 12.28 | % |
Illinois | | | 8.59 | |
Texas | | | 8.05 | |
Florida | | | 6.96 | |
Arizona | | | 3.68 | |
Missouri | | | 3.68 | |
Indiana | | | 3.41 | |
Wisconsin | | | 3.14 | |
Colorado | | | 3.00 | |
Louisiana | | | 2.73 | |
Other | | | 44.48 | |
| | | 100.00 | % |
| | |
See accompanying notes to financial statements. | 56 | (Continued) |
CLEARWATER INVESTMENT TRUST
Schedule of Investments – Clearwater Tax-Exempt Bond Fund
December 31, 2010
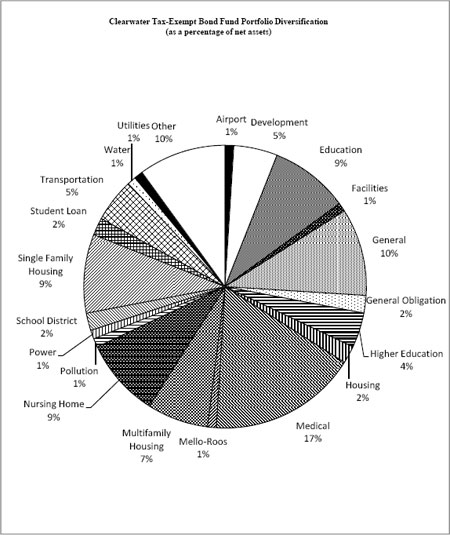
| | |
See accompanying notes to financial statements. | 57 | (continued) |
CLEARWATER INVESTMENT TRUST
Schedule of Investments - Clearwater International Fund
December 31, 2010
| | | | | | | | | | | | | |
Shares | | Security | | Cost | | Fair
value (a) | | Percent
of
net assets | |
Common stocks: | | | | | | | | | | |
Australia: | | | | | | | | | | |
| 17,844 | | AGL ENERGY LTD | | $ | 215,924 | | | 277,824 | | | | |
| 51,722 | | ALUMINA LTD | | | 50,177 | | | 131,131 | | | | |
| 22,815 | | AMCOR LIMITED | | | 74,580 | | | 157,435 | | | | |
| 37,706 | | AMP LTD | | | 144,346 | | | 203,912 | | | | |
| 16,005 | | ARISTOCRAT LEISURE LTD | | | 56,089 | | | 48,922 | | | | |
| 33,298 | | ASCIANO LTD (b) | | | 49,426 | | | 54,295 | | | | |
| 4,112 | | ASX LTD | | | 84,309 | | | 158,395 | | | | |
| 42,961 | | AUST AND NZ BANKING GROUP | | | 561,645 | | | 1,025,507 | | | | |
| 19,517 | | AXA ASIA PACIFIC HOLDINGS | | | 47,802 | | | 125,898 | | | | |
| 1,214 | | BANK OF QUEENSLAND LTD | | | 10,871 | | | 12,895 | | | | |
| 6,281 | | BENDIGO AND ADELAIDE BANK | | | 52,780 | | | 63,889 | | | | |
| 179,910 | | BGP HOLDINGS PLC (b) | | | - | | | - | | | | |
| 58,575 | | BHP BILLITON LTD | | | 1,409,751 | | | 2,709,620 | | | | |
| 1,182 | | BILLABONG INTERNATIONAL LTD | | | 7,263 | | | 9,848 | | | | |
| 55,100 | | BLUESCOPE STEEL LTD | | | 106,835 | | | 126,739 | | | | |
| 13,040 | | BORAL LTD | | | 38,661 | | | 64,388 | | | | |
| 24,400 | | BRAMBLES LTD | | | 108,335 | | | 177,602 | | | | |
| 2,900 | | CALTEX AUSTRALIA LTD | | | 37,894 | | | 42,602 | | | | |
| 43,633 | | CFS RETAIL PROPERTY TRUST | | | 50,404 | | | 78,506 | | | | |
| 38,300 | | CFS RETAIL PROPERTY TRUST | | | 64,189 | | | 68,911 | | | | |
| 28,298 | | COCA-COLA AMATIL LTD | | | 178,894 | | | 314,169 | | | | |
| 971 | | COCHLEAR LTD | | | 35,893 | | | 79,819 | | | | |
| 26,215 | | COMMONWEALTH BANK OF AUSTRAL | | | 711,623 | | | 1,360,613 | | | | |
| 8,520 | | COMPUTERSHARE LTD | | | 47,796 | | | 93,894 | | | | |
| 38,753 | | CROWN LTD | | | 246,016 | | | 326,841 | | | | |
| 9,576 | | CSL LTD | | | 226,091 | | | 355,262 | | | | |
| 41,838 | | CSR LTD | | | 48,720 | | | 71,855 | | | | |
| 8,070 | | DART ENERGY LTD (b) | | | 5,627 | | | 9,487 | | | | |
| 85,105 | | DEXUS PROPERTY GROUP | | | 62,970 | | | 69,167 | | | | |
| 5,726 | | DULUXGROUP LTD | | | 5,840 | | | 16,098 | | | | |
| 180,435 | | FAIRFAX MEDIA LTD | | | 251,231 | | | 258,242 | | | | |
| 1,900 | | FLEETWOOD CORPORATION LTD (b) | | | 23,315 | | | 25,231 | | | | |
| 2,200 | | FLIGHT CENTRE LTD | | | 50,557 | | | 55,732 | | | | |
| 21,110 | | FORTESCUE METALS GROUP LTD (b) | | | 37,574 | | | 141,138 | | | | |
| 50,738 | | FOSTER’S GROUP LTD | | | 203,854 | | | 294,618 | | | | |
| 93,686 | | GOODMAN GROUP | | | 48,414 | | | 62,254 | | | | |
| 35,982 | | GPT GROUP | | | 55,818 | | | 108,146 | | | | |
| 34,615 | | HARVEY NORMAN HOLDINGS LTD | | | 79,261 | | | 104,037 | | | | |
| 21,900 | | ILUKA RESOURCES LTD (b) | | | 152,553 | | | 204,629 | | | | |
| 19,665 | | INCITEC PIVOT LTD | | | 31,737 | | | 79,610 | | | | |
| 53,125 | | INSURANCE AUSTRALIA GROUP LT (b) | | | 138,476 | | | 210,721 | | | | |
| 2,244 | | LEIGHTON HOLDINGS LTD | | | 29,819 | | | 70,610 | | | | |
| 10,015 | | LEND LEASE CORP LIMITED | | | 61,130 | | | 88,357 | | | | |
| 4,498 | | MACARTHUR COAL LTD | | | 51,823 | | | 58,858 | | | | |
| 6,268 | | MACQUARIE ATLAS ROADS GROUP (b) | | | 2,373 | | | 9,740 | | | | |
| 7,065 | | MACQUARIE GROUP LTD | | | 164,941 | | | 267,306 | | | | |
| 65,948 | | METCASH LTD | | | 212,747 | | | 277,090 | | | | |
| 4,000 | | MINERAL RESOURCES LTD | | | 37,806 | | | 50,420 | | | | |
| 37,974 | | MIRVAC GROUP | | | 50,570 | | | 47,555 | | | | |
| 34,500 | | MOUNT GIBSON IRON LTD (b) | | | 52,969 | | | 74,771 | | | | |
| 35,937 | | NATIONAL AUSTRALIA BANK LTD | | | 582,953 | | | 870,698 | | | | |
| 13,000 | | NEW HOPE CORP LTD | | | 65,879 | | | 64,456 | | | | |
| 12,972 | | NEWCREST MINING LTD | | | 371,329 | | | 536,285 | | | | |
| 116,487 | | ONESTEEL LTD | | | 277,273 | | | 308,429 | | | | |
| 7,126 | | ORICA LIMITED | | | 66,068 | | | 181,394 | | | | |
| 15,652 | | ORIGIN ENERGY LTD | | | 168,941 | | | 266,577 | | | | |
| 74,197 | | OZ MINERALS LTD | | | 41,896 | | | 130,464 | | | | |
| 14,231 | | PALADIN ENERGY LTD (b) | | | 54,196 | | | 71,723 | | | | |
| 38,400 | | PANAUST LTD (b) | | | 28,583 | | | 34,938 | | | | |
| 416 | | PERPETUAL LTD | | | 7,027 | | | 13,273 | | | | |
| 116,632 | | QANTAS AIRWAYS LTD (b) | | | 222,335 | | | 302,851 | | | | |
| 19,365 | | QBE INSURANCE GROUP LTD | | | 267,517 | | | 359,312 | | | | |
| 8,245 | | RIO TINTO LTD | | | 321,508 | | | 720,414 | | | | |
| 16,799 | | SANTOS LTD | | | 180,505 | | | 225,833 | | | | |
| 1,300 | | SIMS METAL MANAGEMENT LTD | | | 14,504 | | | 28,666 | | | | |
| 9,824 | | SONIC HEALTHCARE LTD | | | 79,849 | | | 116,499 | | | | |
| | |
See accompanying notes to financial statements. | 58 | (Continued) |
CLEARWATER INVESTMENT TRUST
Schedule of Investments - Clearwater International Fund
December 31, 2010
| | | | | | | | | | | | | |
Shares | | Security | | Cost | | Fair
value (a) | | Percent
of
net assets | |
Australia (Cont’d): | | | | | | | | | | |
| 121,829 | | STOCKLAND (b) | | $ | 354,514 | | | 448,364 | | | | |
| 67,773 | | SUNCORP GROUP LTD | | | 426,885 | | | 596,537 | | | | |
| 42,177 | | TABCORP HOLDINGS LTD | | | 208,429 | | | 306,565 | | | | |
| 96,846 | | TATTS GROUP LTD | | | 186,970 | | | 255,434 | | | | |
| 69,046 | | TELSTRA CORP LTD | | | 158,437 | | | 196,934 | | | | |
| 11,689 | | TOLL HOLDINGS LTD | | | 48,972 | | | 68,471 | | | | |
| 13,099 | | TRANSURBAN GROUP | | | 36,728 | | | 68,562 | | | | |
| 18,625 | | WESFARMERS LTD | | | 275,011 | | | 609,290 | | | | |
| 2,560 | | WESFARMERS LTD-PPS | | | 32,507 | | | 84,532 | | | | |
| 35,413 | | WESTFIELD GROUP | | | 200,586 | | | 346,821 | | | | |
| 35,413 | | WESTFIELD RETAIL TRUST (b) | | | 53,180 | | | 93,041 | | | | |
| 52,832 | | WESTPAC BANKING CORP | | | 701,839 | | | 1,199,563 | | | | |
| 11,991 | | WOODSIDE PETROLEUM LTD | | | 392,813 | | | 521,716 | | | | |
| 19,482 | | WOOLWORTHS LTD | | | 346,571 | | | 537,146 | | | | |
| 2,623 | | WORLEYPARSONS LTD | | | 30,535 | | | 71,703 | | | | |
| | | | | | 12,682,059 | | | 20,361,080 | | | 5.88 | % |
Austria: | | | | | | | | | | |
| 3,566 | | ERSTE GROUP BANK AG | | | 63,769 | | | 167,448 | | | | |
| 10,586 | | IMMOEAST A.G. (b) | | | - | | | - | | | | |
| 15,879 | | IMMOFINANZ AG (b) | | | 51,791 | | | 67,666 | | | | |
| 14,958 | | OMV AG | | | 573,376 | | | 621,627 | | | | |
| 1,965 | | RAIFFEISEN BANK INTERNATIONA | | | 63,526 | | | 107,657 | | | | |
| 313 | | STRABAG SE-BR | | | 5,505 | | | 8,574 | | | | |
| 6,287 | | TELEKOM AUSTRIA AG | | | 88,325 | | | 88,380 | | | | |
| 915 | | VERBUND AG | | | 30,953 | | | 34,089 | | | | |
| 2,303 | | VOESTALPINE AG | | | 32,585 | | | 109,711 | | | | |
| | | | | | 909,830 | | | 1,205,152 | | | 0.35 | % |
Belgium: | | | | | | | | | | |
| 48,619 | | AGEAS | | | 87,769 | | | 111,096 | | | | |
| 12,078 | | ANHEUSER-BUSCH INBEV NV | | | 385,199 | | | 690,772 | | | | |
| 5,100 | | ANHEUSER-BUSCH INBEV SPN ADR (c) | | | 318,185 | | | 291,159 | | | | |
| 1,320 | | CNP -CIE NATL A PORTEFEUILLE | | | 65,973 | | | 64,558 | | | | |
| 1,645 | | COLRUYT SA (b) | | | 74,892 | | | 83,640 | | | | |
| 8,404 | | DELHAIZE GROUP | | | 582,741 | | | 620,685 | | | | |
| 5,979 | | GROUPE BRUXELLES LAMBERT SA | | | 483,152 | | | 502,785 | | | | |
| 7,945 | | KBC GROEP NV (b) | | | 246,574 | | | 270,726 | | | | |
| 400 | | MOBISTAR SA | | | 25,537 | | | 25,929 | | | | |
| 625 | | SOLVAY SA | | | 36,847 | | | 66,605 | | | | |
| 9,491 | | UCB SA | | | 281,368 | | | 325,562 | | | | |
| 2,966 | | UMICORE | | | 53,114 | | | 154,255 | | | | |
| | | | | | 2,641,351 | | | 3,207,772 | | | 0.93 | % |
Bermuda: | | | | | | | | | | |
| 60,474 | | LANCASHIRE HOLDINGS LTD | | | 461,199 | | | 521,385 | | | | |
| 6,600 | | SEADRILL LTD | | | 70,381 | | | 223,050 | | | | |
| | | | | | 531,580 | | | 744,435 | | | 0.21 | % |
Brazil: | | | | | | | | | | |
| 14,900 | | BANCO BRADESCO-ADR (c) | | | 290,011 | | | 302,321 | | | | |
| 36,600 | | BRASIL BROKERS PARTICIPACOES | | | 201,667 | | | 210,560 | | | | |
| 600 | | HRT PARTICIPACOES EM PETROLE (b) | | | 577,239 | | | 574,699 | | | | |
| | | | | | 1,068,917 | | | 1,087,580 | | | 0.31 | % |
Britain: | | | | | | | | | | |
| 52,662 | | 3I GROUP PLC | | | 232,331 | | | 269,710 | | | | |
| 2,834 | | ADMIRAL GROUP PLC | | | 35,119 | | | 66,939 | | | | |
| 4,578 | | AMEC PLC | | | 34,931 | | | 82,080 | | | | |
| 46,000 | | AMLIN PLC | | | 302,852 | | | 293,251 | | | | |
| 22,551 | | ANGLO AMERICAN PLC | | | 483,866 | | | 1,172,713 | | | | |
| 19,600 | | ANGLO AMERICAN PLC-UNSP ADR (c) | | | 333,272 | | | 511,756 | | | | |
| 4,811 | | ANTOFAGASTA PLC | | | 33,978 | | | 120,911 | | | | |
| 19,184 | | ARM HOLDINGS PLC | | | 71,627 | | | 126,605 | | | | |
| 16,299 | | ASSOCIATED BRITISH FOODS PLC | | | 218,984 | | | 300,107 | | | | |
| 22,292 | | ASTRAZENECA PLC | | | 778,768 | | | 1,015,533 | | | | |
| 10,000 | | ASTRAZENECA PLC-SPONS ADR (c) | | | 461,598 | | | 461,900 | | | | |
| 2,131 | | AUTONOMY CORP PLC (b) | | | 36,969 | | | 50,002 | | | | |
| 45,179 | | AVIVA PLC | | | 147,874 | | | 276,818 | | | | |
| 5,239 | | BABCOCK INTL GROUP PLC | | | 47,416 | | | 46,639 | | | | |
| 120,026 | | BAE SYSTEMS PLC | | | 650,696 | | | 617,525 | | | | |
| 80,626 | | BALFOUR BEATTY PLC | | | 341,838 | | | 393,320 | | | | |
| | |
See accompanying notes to financial statements. | 59 | (Continued) |
CLEARWATER INVESTMENT TRUST
Schedule of Investments - Clearwater International Fund
December 31, 2010
| | | | | | | | | | | | | |
Shares | | Security | | Cost | | Fair
value (a) | | Percent
of
net assets | |
Britain (Cont’d): | | | | | | | | | | |
| 277,676 | | BARCLAYS PLC | | $ | 1,051,273 | | | 1,132,724 | | | | |
| 58,418 | | BG PLC (b) | | | 917,965 | | | 1,180,366 | | | | |
| 37,298 | | BHP BILLITON PLC | | | 795,489 | | | 1,483,409 | | | | |
| 4,500 | | BHP BILLITON PLC-ADR (c) | | | 354,720 | | | 362,250 | | | | |
| 307,544 | | BP PLC | | | 2,039,977 | | | 2,232,228 | | | | |
| 11,825 | | BRITISH AIRWAYS PLC (b) | | | 49,663 | | | 50,238 | | | | |
| 60,994 | | BRITISH AMERICAN TOBACCO PLC | | | 1,607,805 | | | 2,342,635 | | | | |
| 11,630 | | BRITISH LAND CO PLC | | | 61,579 | | | 95,102 | | | | |
| 17,468 | | BRITISH SKY BROADCASTING GRO | | | 116,486 | | | 200,441 | | | | |
| 368,009 | | BT GROUP PLC | | | 791,671 | | | 1,037,342 | | | | |
| 5,069 | | BUNZL PLC | | | 39,524 | | | 56,822 | | | | |
| 8,202 | | BURBERRY GROUP PLC | | | 40,549 | | | 143,731 | | | | |
| 20,702 | | CABLE & WIRELESS WORLDWIDE | | | 27,090 | | | 21,205 | | | | |
| 40,577 | | CAIRN ENERGY PLC (b) | | | 155,293 | | | 265,702 | | | | |
| 16,980 | | CAPITA GROUP PLC | | | 162,367 | | | 184,384 | | | | |
| 6,025 | | CAPITAL & COUNTIES PROPERTIE | | | 6,933 | | | 14,156 | | | | |
| 6,025 | | CAPITAL SHOPPING CENTRES GRO | | | 23,472 | | | 39,227 | | | | |
| 34,000 | | CARILLION PLC | | | 178,605 | | | 203,764 | | | | |
| 8,602 | | CARNIVAL PLC | | | 279,378 | | | 399,919 | | | | |
| 29,130 | | CARPETRIGHT PLC | | | 323,811 | | | 362,871 | | | | |
| 82,257 | | CENTRICA PLC | | | 290,637 | | | 425,258 | | | | |
| 11,669 | | COBHAM PLC | | | 30,337 | | | 37,022 | | | | |
| 28,000 | | COLT GROUP SA (b) | | | 53,210 | | | 60,111 | | | | |
| 268,758 | | COMPASS GROUP PLC | | | 1,681,663 | | | 2,434,459 | | | | |
| 65,000 | | COOKSON GROUP PLC (b) | | | 439,737 | | | 667,320 | | | | |
| 115,087 | | DIAGEO PLC | | | 1,568,947 | | | 2,126,227 | | | | |
| 8,724 | | DRAX GROUP PLC | | | 50,000 | | | 50,094 | | | | |
| 2,968 | | ENQUEST PLC (b) | | | 3,713 | | | 6,455 | | | | |
| 2,760 | | EURASIAN NATURAL RESOURCES | | | 15,790 | | | 45,096 | | | | |
| 54,094 | | FIRSTGROUP PLC | | | 286,166 | | | 335,911 | | | | |
| 9,699 | | G4S PLC | | | 26,165 | | | 38,499 | | | | |
| 91,912 | | GLAXOSMITHKLINE PLC | | | 1,410,189 | | | 1,776,883 | | | | |
| 12,300 | | GLAXOSMITHKLINE PLC-SPON ADR (c) | | | 464,571 | | | 482,406 | | | | |
| 17,505 | | HAMMERSON PLC | | | 69,535 | | | 113,860 | | | | |
| 36,031 | | HAYS PLC | | | 49,874 | | | 72,409 | | | | |
| 126,209 | | HOME RETAIL GROUP | | | 499,329 | | | 370,908 | | | | |
| 336,940 | | HSBC HOLDINGS PLC (b) | | | 2,439,627 | | | 3,420,308 | | | | |
| 12,114 | | ICAP PLC | | | 51,874 | | | 101,043 | | | | |
| 30,665 | | IMI PLC | | | 253,515 | | | 451,793 | | | | |
| 18,809 | | IMPERIAL TOBACCO GROUP PLC | | | 441,612 | | | 577,106 | | | | |
| 30,000 | | INCHCAPE PLC (b) | | | 123,756 | | | 166,789 | | | | |
| 17,590 | | INTERCONTINENTAL HOTELS GROU | | | 253,023 | | | 340,880 | | | | |
| 23,055 | | INTERMEDIATE CAPITAL GROUP | | | 117,259 | | | 119,659 | | | | |
| 20,434 | | INTERNATIONAL POWER PLC | | | 61,912 | | | 139,411 | | | | |
| 1,741 | | INTERTEK GROUP PLC | | | 50,306 | | | 48,179 | | | | |
| 12,127 | | INVENSYS PLC | | | 29,802 | | | 66,968 | | | | |
| 27,249 | | INVESTEC PLC | | | 193,266 | | | 223,886 | | | | |
| 98,470 | | ITV PLC (b) | | | 52,339 | | | 107,542 | | | | |
| 13,894 | | JOHNSON MATTHEY PLC | | | 337,176 | | | 441,465 | | | | |
| 4,109 | | KAZAKHMYS PLC | | | 31,447 | | | 103,396 | | | | |
| 30,414 | | KINGFISHER PLC | | | 60,107 | | | 124,898 | | | | |
| 15,511 | | LAND SECURITIES GROUP PLC | | | 113,585 | | | 162,991 | | | | |
| 424,802 | | LEGAL & GENERAL GROUP PLC | | | 491,661 | | | 640,770 | | | | |
| 1,600,060 | | LLOYDS BANKING GROUP PLC (b) | | | 1,352,294 | | | 1,638,953 | | | | |
| 136,000 | | LOGICACMG PLC (b) | | | 271,521 | | | 277,763 | | | | |
| 3,727 | | LONDON STOCK EXCHANGE GROUP | | | 38,197 | | | 48,693 | | | | |
| 3,321 | | LONMIN PLC (b) | | | 69,014 | | | 101,793 | | | | |
| 33,399 | | MAN GROUP PLC | | | 106,502 | | | 154,131 | | | | |
| 25,083 | | MARKS & SPENCER GROUP PLC | | | 101,882 | | | 144,301 | | | | |
| 19,659 | | MEGGITT PLC | | | 45,921 | | | 113,404 | | | | |
| 15,000 | | MILLENNIUM & COPTHORNE HOTEL | | | 101,388 | | | 138,094 | | | | |
| 30,000 | | MONDI PLC | | | 68,373 | | | 240,174 | | | | |
| 63,965 | | NATIONAL GRID PLC | | | 475,389 | | | 551,483 | | | | |
| 2,148 | | NEXT PLC | | | 36,823 | | | 66,140 | | | | |
| 6,000 | | NORTHUMBRIAN WATER GROUP PLC | | | 33,655 | | | 30,963 | | | | |
| 211,185 | | OLD MUTUAL PLC | | | 251,201 | | | 405,309 | | | | |
| 38,984 | | PEARSON PLC | | | 553,963 | | | 612,649 | | | | |
| | |
See accompanying notes to financial statements. | 60 | (Continued) |
CLEARWATER INVESTMENT TRUST
Schedule of Investments - Clearwater International Fund
December 31, 2010
| | | | | | | | | | | | | |
Shares | | Security | | Cost | | Fair
value (a) | | Percent
of
net assets | |
Britain (Cont’d): | | | | | | | | | | |
| 20,700 | | PENNON GROUP PLC | | $ | 182,327 | | | 206,545 | | | | |
| 5,085 | | PETROFAC LTD | | | 95,413 | | | 125,815 | | | | |
| 46,210 | | PRUDENTIAL PLC | | | 267,423 | | | 481,257 | | | | |
| 602,560 | | QINETIQ GROUP PLC | | | 1,166,904 | | | 1,221,261 | | | | |
| 10,671 | | RECKITT BENCKISER GROUP PLC | | | 434,025 | | | 586,448 | | | | |
| 184,575 | | REED ELSEVIER PLC | | | 1,441,371 | | | 1,558,247 | | | | |
| 68,541 | | REXAM PLC | | | 319,882 | | | 355,523 | | | | |
| 25,868 | | RIO TINTO PLC | | | 842,466 | | | 1,809,404 | | | | |
| 27,303 | | ROLLS-ROYCE GROUP PLC (b) | | | 108,772 | | | 265,194 | | | | |
| 248,250 | | ROYAL BANK OF SCOTLAND GROUP (b) | | | 114,766 | | | 151,216 | | | | |
| 40,053 | | RSA INSURANCE GROUP PLC | | | 76,424 | | | 78,182 | | | | |
| 21,731 | | SAGE GROUP PLC/THE | | | 74,327 | | | 92,628 | | | | |
| 29,306 | | SAINSBURY (J) PLC | | | 141,007 | | | 171,932 | | | | |
| 122,249 | | SAVILLS PLC | | | 591,275 | | | 736,076 | | | | |
| 3,966 | | SCHRODERS PLC | | | 45,826 | | | 114,700 | | | | |
| 17,487 | | SCOTTISH & SOUTHERN ENERGY | | | 292,525 | | | 333,977 | | | | |
| 10,277 | | SEGRO PLC | | | 36,889 | | | 45,889 | | | | |
| 7,999 | | SERCO GROUP PLC | | | 42,799 | | | 69,276 | | | | |
| 4,954 | | SEVERN TRENT PLC | | | 76,220 | | | 114,155 | | | | |
| 52,148 | | SIGNET JEWELERS LTD (b) | | | 1,023,171 | | | 2,263,223 | | | | |
| 14,044 | | SMITH & NEPHEW PLC | | | 98,628 | | | 148,123 | | | | |
| 5,313 | | SMITHS GROUP PLC | | | 80,666 | | | 103,127 | | | | |
| 16,562 | | SOUTH AFRICAN BREWERIES (b) | | | 295,625 | | | 582,657 | | | | |
| 35,540 | | STANDARD CHARTERED PLC | | | 550,423 | | | 956,087 | | | | |
| 145,857 | | STANDARD LIFE PLC | | | 399,382 | | | 491,186 | | | | |
| 1,041 | | TATE & LYLE PLC | | | 5,037 | | | 8,407 | | | | |
| 137,122 | | TESCO PLC | | | 702,562 | | | 908,576 | | | | |
| 58,647 | | THOMAS COOK GROUP PLC | | | 199,514 | | | 173,452 | | | | |
| 13,300 | | TRAVIS PERKINS PLC | | | 127,864 | | | 219,383 | | | | |
| 9,072 | | TUI TRAVEL PLC | | | 30,186 | | | 34,822 | | | | |
| 16,151 | | TULLOW OIL PLC | | | 238,242 | | | 317,526 | | | | |
| 38,065 | | UNILEVER PLC | | | 875,570 | | | 1,164,960 | | | | |
| 37,297 | | UNILEVER PLC-SPONSORED ADR (c) | | | 905,720 | | | 1,151,731 | | | | |
| 8,787 | | UNITED UTILITIES GROUP PLC | | | 62,187 | | | 81,101 | | | | |
| 2,343 | | VEDANTA RESOURCES PLC | | | 35,450 | | | 91,943 | | | | |
| 928,295 | | VODAFONE GROUP PLC | | | 1,671,709 | | | 2,399,581 | | | | |
| 18,500 | | VODAFONE GROUP PLC-SP ADR (c) | | | 460,348 | | | 488,955 | | | | |
| 13,800 | | WEIR GROUP PLC/THE | | | 191,219 | | | 382,969 | | | | |
| 15,094 | | WHITBREAD PLC | | | 333,324 | | | 421,233 | | | | |
| 39,500 | | WILLIAM HILL PLC | | | 105,002 | | | 105,122 | | | | |
| 42,339 | | WM MORRISON SUPERMARKETS | | | 156,009 | | | 176,641 | | | | |
| | | | | | 43,682,501 | | | 59,606,707 | | | 17.20 | % |
Canada: | | | | | | | | | | | | |
| 6,300 | | ADVANTAGE OIL & GAS LTD (b) | | | 43,266 | | | 42,830 | | | | |
| 3,442 | | AGNICO-EAGLE MINES LTD | | | 198,299 | | | 264,001 | | | | |
| 11,232 | | AGRIUM INC | | | 479,092 | | | 1,030,996 | | | | |
| 6,700 | | ALIMENTATION COUCHE-TARD -B | | | 165,741 | | | 182,334 | | | | |
| 2,700 | | ATCO LTD -CLASS I | | | 84,929 | | | 160,614 | | | | |
| 11,468 | | BANK OF MONTREAL | | | 388,026 | | | 660,213 | | | | |
| 19,897 | | BANK OF NOVA SCOTIA | | | 575,222 | | | 1,138,108 | | | | |
| 18,008 | | BARRICK GOLD CORP | | | 602,311 | | | 957,665 | | | | |
| 7,800 | | BCE INC | | | 164,418 | | | 276,588 | | | | |
| 8,660 | | BOMBARDIER INC-B | | | 44,066 | | | 43,634 | | | | |
| 11,627 | | BROOKFIELD ASSET MANAGE-CL A | | | 172,468 | | | 387,063 | | | | |
| 25,840 | | CAE INC | | | 218,066 | | | 298,577 | | | | |
| 1,700 | | CALFRAC WELL SERVICES LTD | | | 41,139 | | | 58,539 | | | | |
| 11,679 | | CAMECO CORP | | | 234,805 | | | 472,046 | | | | |
| 7,499 | | CAN IMPERIAL BK OF COMMERCE | | | 334,499 | | | 587,922 | | | | |
| 9,614 | | CANADIAN NATL RAILWAY CO | | | 389,611 | | | 639,043 | | | | |
| 22,671 | | CANADIAN NATURAL RESOURCES | | | 540,039 | | | 1,007,046 | | | | |
| 4,842 | | CANADIAN PACIFIC RAILWAY LTD | | | 155,812 | | | 313,988 | | | | |
| 3,260 | | CANADIAN TIRE CORP-CLASS A | | | 163,013 | | | 223,564 | | | | |
| 2,500 | | CANADIAN UTILITIES LTD-A | | | 126,015 | | | 136,774 | | | | |
| 15,213 | | CENOVUS ENERGY INC | | | 314,780 | | | 505,680 | | | | |
| 4,200 | | CGI GROUP INC - CLASS A (b) | | | 66,100 | | | 72,651 | | | | |
| 10,919 | | CGI GROUP INC - CLASS A (NEW YORK EXCHANGE) (b) | | | 90,696 | | | 188,462 | | | | |
| 3,261 | | CRESCENT POINT ENERGY CORP | | | 91,062 | | | 145,066 | | | | |
| | |
See accompanying notes to financial statements. | 61 | (Continued) |
CLEARWATER INVESTMENT TRUST
Schedule of Investments - Clearwater International Fund
December 31, 2010
| | | | | | | | | | | | | |
Shares | | Security | | Cost | | Fair
value (a) | | Percent
of
net assets | |
Canada (Cont’d): | | | | | | | | | | |
| 4,600 | | DAYLIGHT ENERGY LTD | | $ | 45,685 | | | 47,788 | | | | |
| 1,300 | | DOREL INDUSTRIES-CL B | | | 42,946 | | | 45,105 | | | | |
| 1,700 | | DUNDEE CORP -CL A (b) | | | 29,862 | | | 34,963 | | | | |
| 11,658 | | ELDORADO GOLD CORP | | | 147,527 | | | 216,489 | | | | |
| 7,936 | | ENBRIDGE INC | | | 263,158 | | | 447,590 | | | | |
| 16,793 | | ENCANA CORP | | | 404,507 | | | 489,012 | | | | |
| 6,047 | | ENERPLUS RESOURCES FUND (b) | | | 113,667 | | | 186,489 | | | | |
| 949 | | FAIRFAX FINANCIAL HLDGS LTD | | | 324,299 | | | 389,727 | | | | |
| 7,400 | | FINNING INTERNATIONAL INC | | | 183,675 | | | 201,607 | | | | |
| 1,400 | | FIRST QUANTUM MINERALS LTD | | | 126,385 | | | 152,060 | | | | |
| 3,052 | | GILDAN ACTIVEWEAR INC (b) | | | 33,435 | | | 86,951 | | | | |
| 14,001 | | GOLDCORP INC | | | 447,524 | | | 643,766 | | | | |
| 1,200 | | HOME CAPITAL GROUP INC | | | 50,741 | | | 62,502 | | | | |
| 8,203 | | IAMGOLD CORP | | | 91,103 | | | 146,013 | | | | |
| 7,165 | | IMPERIAL OIL LTD | | | 255,881 | | | 290,326 | | | | |
| 600 | | INMET MINING CORPORATION | | | 27,545 | | | 46,620 | | | | |
| 3,879 | | IVANHOE MINES LTD (b) | | | 22,068 | | | 88,907 | | | | |
| 20,211 | | KINROSS GOLD CORP | | | 341,556 | | | 383,201 | | | | |
| 2,100 | | LINAMAR CORP | | | 38,757 | | | 42,978 | | | | |
| 13,500 | | LUNDIN MINING CORP (b) | | | 78,502 | | | 98,568 | | | | |
| 100 | | MACDONALD DETTWILER & ASSOC (b) | | | 4,346 | | | 5,086 | | | | |
| 11,938 | | MAGNA INTERNATIONAL INC | | | 223,849 | | | 621,885 | | | | |
| 34,136 | | MANULIFE FINANCIAL CORP | | | 456,763 | | | 586,456 | | | | |
| 3,469 | | METHANEX CORP | | | 31,828 | | | 105,458 | | | | |
| 2,610 | | NATIONAL BANK OF CANADA | | | 88,730 | | | 179,855 | | | | |
| 23,914 | | NEXEN INC | | | 479,052 | | | 548,014 | | | | |
| 11,800 | | NORTHGATE MINERALS CORP (b) | | | 39,374 | | | 37,738 | | | | |
| 2,700 | | NUVISTA ENERGY LTD | | | 32,415 | | | 25,117 | | | | |
| 1,560 | | OPEN TEXT CORP (b) | | | 48,602 | | | 71,854 | | | | |
| 1,300 | | PACE OIL AND GAS LTD (b) | | | 5,385 | | | 10,686 | | | | |
| 2,253 | | PAN AMERICAN SILVER CORP | | | 41,183 | | | 92,846 | | | | |
| 10,621 | | PENN WEST ENERGY TRUST | | | 114,717 | | | 254,054 | | | | |
| 1,300 | | PETROBANK ENERGY & RESOURCES (b) | | | 27,920 | | | 33,012 | | | | |
| 5,262 | | POTASH CORP OF SASKATCHEWAN | | | 456,856 | | | 814,715 | | | | |
| 10,641 | | PROVIDENT ENERGY TRUST-UTS (b) | | | 33,300 | | | 84,596 | | | | |
| 3,200 | | QUADRA FNX MINING LTD (b) | | | 46,304 | | | 53,905 | | | | |
| 700 | | QUEBECOR INC -CL B | | | 9,236 | | | 26,484 | | | | |
| 8,496 | | RESEARCH IN MOTION (b) | | | 390,098 | | | 493,872 | | | | |
| 2,101 | | RITCHIE BROS AUCTIONEERS | | | 37,504 | | | 48,428 | | | | |
| 10,965 | | ROGERS COMMUNICATIONS INC-B | | | 267,397 | | | 379,718 | | | | |
| 26,310 | | ROYAL BANK OF CANADA | | | 887,281 | | | 1,377,592 | | | | |
| 1,600 | | SAPUTO INC | | | 43,054 | | | 63,688 | | | | |
| 10,061 | | SHAW COMMUNICATIONS INC-B | | | 160,660 | | | 215,141 | | | | |
| 4,700 | | SHERRITT INTERNATIONAL CORP | | | 35,088 | | | 40,036 | | | | |
| 600 | | SHOPPERS DRUG MART CORP | | | 22,437 | | | 23,853 | | | | |
| 2,500 | | SILVER WHEATON CORP (b) | | | 57,728 | | | 98,005 | | | | |
| 6,863 | | SILVER WHEATON CORP (NEW YORK EXCHANGE) (b) | | | 71,004 | | | 267,931 | | | | |
| 500 | | SNC-LAVALIN GROUP INC | | | 19,219 | | | 30,055 | | | | |
| 11,589 | | SUN LIFE FINANCIAL INC | | | 229,193 | | | 348,829 | | | | |
| 27,764 | | SUNCOR ENERGY INC | | | 661,747 | | | 1,063,084 | | | | |
| 22,619 | | TALISMAN ENERGY INC | | | 278,651 | | | 501,916 | | | | |
| 12,027 | | TECK RESOURCES LTD-CLS B | | | 104,689 | | | 743,629 | | | | |
| 4,274 | | TELUS CORPORATION -NON VOTE | | | 113,886 | | | 186,175 | | | | |
| 33,400 | | THOMPSON CREEK METALS CO INC (b) | | | 404,611 | | | 491,648 | | | | |
| 5,889 | | TIM HORTONS INC | | | 188,354 | | | 242,949 | | | | |
| 2,900 | | TOROMONT INDUSTRIES LTD | | | 77,974 | | | 89,712 | | | | |
| 16,563 | | TORONTO-DOMINION BANK | | | 671,143 | | | 1,230,797 | | | | |
| 5,081 | | TRANSALTA CORP | | | 79,391 | | | 107,768 | | | | |
| 14,285 | | TRANSCANADA CORP | | | 389,230 | | | 543,401 | | | | |
| 7,800 | | TRICAN WELL SERVICE LTD | | | 123,904 | | | 157,986 | | | | |
| 10,769 | | VALEANT PHARMACEUTICALS INTE | | | 252,275 | | | 305,138 | | | | |
| 2,256 | | VERMILION ENERGY INC | | | 83,841 | | | 104,866 | | | | |
| 1,100 | | WEST FRASER TIMBER CO LTD | | | 25,324 | | | 51,817 | | | | |
| 1,600 | | WESTON (GEORGE) LTD | | | 121,006 | | | 135,487 | | | | |
| 36,331 | | YAMANA GOLD INC | | | 353,699 | | | 465,929 | | | | |
| | | | | | | | | | | | | |
| | | | | | 17,042,546 | | | 27,255,277 | | | 7.87 | % |
| | |
See accompanying notes to financial statements. | 62 | (Continued) |
CLEARWATER INVESTMENT TRUST
Schedule of Investments - Clearwater International Fund
December 31, 2010
| | | | | | | | | | | | | |
Shares | | Security | | Cost | | Fair
value (a) | | Percent
of
net assets | |
China: | | | | | | | | | | | | |
| 77,000 | | AAC ACOUSTIC TECHNOLOGIES | | $ | 203,584 | | | 205,569 | | | | |
| 20,400 | | FOCUS MEDIA HOLDING-ADR (b)(c) | | | 359,449 | | | 447,372 | | | | |
| 118,000 | | FOSUN INTERNATIONAL | | | 87,459 | | | 86,690 | | | | |
| 369,930 | | IND & COMM BK OF CHINA - H | | | 292,088 | | | 275,579 | | | | |
| 20,000 | | XINGDA INT’L HOLDINGS | | | 10,194 | | | 21,615 | | | | |
| | | | | | 952,774 | | | 1,036,825 | | | 0.30 | % |
Columbia: | | | | | | | | | | | | |
| 799 | | PETROMINERALES LTD (b) | | | 22,707 | | | 26,646 | | | | |
| | | | | | 22,707 | | | 26,646 | | | 0.01 | % |
Cyprus: | | | | | | | | | | | | |
| 9,794 | | BANK OF CYPRUS PUBLIC CO LTD | | | 42,468 | | | 33,766 | | | | |
| | | | | | 42,468 | | | 33,766 | | | 0.01 | % |
Denmark: | | | | | | | | | | | | |
| 10 | | A P MOLLER - MAERSK A/S - A | | | 46,408 | | | 88,095 | | | | |
| 20 | | A P MOLLER - MAERSK A/S - B | | | 112,871 | | | 181,102 | | | | |
| 10,539 | | CARLSBERG AS-B | | | 745,020 | | | 1,055,208 | | | | |
| 500 | | COLOPLAST-B | | | 46,110 | | | 67,945 | | | | |
| 9,800 | | DANSKE BANK A/S (b) | | | 125,891 | | | 251,234 | | | | |
| 4,000 | | DSV A/S | | | 31,768 | | | 88,418 | | | | |
| 200 | | FLSMIDTH & CO-B SHS | | | 6,013 | | | 19,075 | | | | |
| 7,951 | | H LUNDBECK A/S | | | 147,209 | | | 151,093 | | | | |
| 200 | | JYSKE BANK-REG (b) | | | 4,423 | | | 9,286 | | | | |
| 9,900 | | NOVO NORDISK A/S-B | | | 554,060 | | | 1,116,353 | | | | |
| 500 | | NOVOZYMES A/S-B SHARES | | | 39,158 | | | 69,648 | | | | |
| 325 | | TOPDANMARK A/S (b) | | | 33,362 | | | 42,970 | | | | |
| 900 | | TRYG A/S | | | 49,560 | | | 41,547 | | | | |
| | | | | | 1,941,853 | | | 3,181,974 | | | 0.92 | % |
Finland: | | | | | | | | | | | | |
| 1,805 | | ELISA OYJ | | | 21,851 | | | 39,243 | | | | |
| 7,306 | | FORTUM OYJ (b) | | | 150,746 | | | 219,956 | | | | |
| 7,285 | | KEMIRA OYJ | | | 103,325 | | | 113,897 | | | | |
| 1,396 | | KESKO OYJ-B SHS | | | 30,705 | | | 65,160 | | | | |
| 8,664 | | KONE OYJ-B | | | 358,012 | | | 481,623 | | | | |
| 11,779 | | METSO OYJ | | | 264,384 | | | 657,931 | | | | |
| 1,251 | | NESTE OIL OYJ | | | 14,206 | | | 19,977 | | | | |
| 45,358 | | NOKIA OYJ (b) | | | 466,406 | | | 469,127 | | | | |
| 2,240 | | NOKIAN RENKAAT OYJ | | | 31,307 | | | 82,165 | | | | |
| 2,272 | | OUTOKUMPU OYJ | | | 32,298 | | | 42,140 | | | | |
| 10,565 | | POHJOLA BANK PLC | | | 85,425 | | | 126,636 | | | | |
| 1,988 | | RAUTARUUKKI OYJ | | | 39,419 | | | 46,516 | | | | |
| 5,573 | | SAMPO OYJ-A SHS | | | 77,600 | | | 149,314 | | | | |
| 559 | | SANOMA OYJ | | | 6,931 | | | 12,116 | | | | |
| 19,829 | | STORA ENSO OYJ-R SHS | | | 105,318 | | | 203,629 | | | | |
| 38,934 | | UPM-KYMMENE OYJ | | | 401,499 | | | 687,791 | | | | |
| 3,876 | | WARTSILA OYJ | | | 196,080 | | | 295,744 | | | | |
| | | | | | 2,385,512 | | | 3,712,965 | | | 1.07 | % |
France: | | | | | | | | | | | | |
| 1,275 | | ACCOR SA | | | 29,826 | | | 56,735 | | | | |
| 551 | | ADP | | | 28,858 | | | 43,493 | | | | |
| 4,557 | | AIR FRANCE-KLM (b) | | | 56,714 | | | 82,999 | | | | |
| 4,624 | | AIR LIQUIDE SA | | | 383,798 | | | 584,774 | | | | |
| 38,015 | | ALCATEL-LUCENT (b) | | | 63,037 | | | 110,741 | | | | |
| 2,325 | | ALSTOM | | | 125,921 | | | 111,256 | | | | |
| 4,400 | | ARKEMA | | | 124,681 | | | 316,735 | | | | |
| 608 | | ATOS ORIGIN SA (b) | | | 15,429 | | | 32,368 | | | | |
| 30,926 | | AXA SA | | | 438,278 | | | 514,504 | | | | |
| 819 | | BIOMERIEUX | | | 79,843 | | | 80,789 | | | | |
| 22,110 | | BNP PARIBAS | | | 1,172,670 | | | 1,406,639 | | | | |
| 3,837 | | BOUYGUES SA | | | 142,415 | | | 165,381 | | | | |
| 735 | | BUREAU VERITAS SA | | | 29,322 | | | 55,708 | | | | |
| 1,862 | | CAP GEMINI | | | 62,328 | | | 86,911 | | | | |
| 9,700 | | CARREFOUR SA | | | 357,241 | | | 399,874 | | | | |
| 4,738 | | CASINO GUICHARD PERRACHON | | | 405,237 | | | 461,866 | | | | |
| 648 | | CHRISTIAN DIOR | | | 36,000 | | | 92,565 | | | | |
| 9,789 | | CNP ASSURANCES | | | 166,866 | | | 176,656 | | | | |
| 6,264 | | COMPAGNIE DE SAINT-GOBAIN | | | 203,267 | | | 322,261 | | | | |
| 19,360 | | CREDIT AGRICOLE SA | | | 241,398 | | | 245,871 | | | | |
| | |
See accompanying notes to financial statements. | 63 | (Continued) |
CLEARWATER INVESTMENT TRUST
Schedule of Investments - Clearwater International Fund
December 31, 2010
| | | | | | | | | | | | | |
Shares | | Security | | Cost | | Fair
value (a) | | Percent
of
net assets | |
France (Cont’d): | | | | | | | | | | | | |
| 9,764 | | DANONE | | $ | 490,226 | | | 613,488 | | | | |
| 812 | | DASSAULT SYSTEMES SA | | | 31,122 | | | 61,219 | | | | |
| 3,633 | | EDENRED (b) | | | 65,572 | | | 86,001 | | | | |
| 4,099 | | EDF | | | 160,627 | | | 168,129 | | | | |
| 614 | | EIFFAGE (b) | | | 30,643 | | | 27,080 | | | | |
| 193 | | ERAMET | | | 51,818 | | | 66,152 | | | | |
| 3,462 | | ESSILOR INTERNATIONAL | | | 134,447 | | | 222,866 | | | | |
| 510 | | EURAZEO | | | 9,917 | | | 37,816 | | | | |
| 3,941 | | EUTELSAT COMMUNICATIONS | | | 92,604 | | | 144,243 | | | | |
| 29,665 | | FRANCE TELECOM SA | | | 681,844 | | | 618,195 | | | | |
| 20,995 | | GDF SUEZ | | | 732,731 | | | 753,279 | | | | |
| 1,364 | | GECINA SA (b) | | | 142,556 | | | 150,025 | | | | |
| 6,331 | | GROUPE EUROTUNNEL SA - REGR | | | 49,553 | | | 55,667 | | | | |
| 648 | | HERMES INTERNATIONAL | | | 64,252 | | | 135,731 | | | | |
| 304 | | ILIAD SA | | | 29,549 | | | 33,067 | | | | |
| 2,335 | | KLEPIERRE | | | 57,367 | | | 84,230 | | | | |
| 3,031 | | LAFARGE SA | | | 151,025 | | | 190,038 | | | | |
| 1,212 | | LAGARDERE S.C.A. | | | 30,640 | | | 49,931 | | | | |
| 3,772 | | LEGRAND SA | | | 68,920 | | | 153,607 | | | | |
| 3,974 | | L’OREAL | | | 310,044 | | | 441,184 | | | | |
| 5,619 | | LVMH MOET HENNESSY LOUIS VUI | | | 573,423 | | | 924,300 | | | | |
| 2,472 | | M6-METROPOLE TELEVISION | | | 58,547 | | | 59,789 | | | | |
| 2,031 | | MICHELIN (CGDE)-B | | | 78,557 | | | 145,740 | | | | |
| 24,670 | | NATIXIS (b) | | | 41,439 | | | 115,381 | | | | |
| 991 | | NEOPOST SA | | | 83,847 | | | 86,341 | | | | |
| 2,898 | | PERNOD-RICARD SA | | | 177,566 | | | 272,471 | | | | |
| 13,344 | | PEUGEOT SA (b) | | | 387,525 | | | 506,586 | | | | |
| 1,531 | | PPR | | | 112,344 | | | 243,455 | | | | |
| 33,053 | | PUBLICIS GROUPE | | | 1,032,702 | | | 1,722,548 | | | | |
| 3,682 | | RENAULT SA (b) | | | 98,990 | | | 214,027 | | | | |
| 4,202 | | SAFRAN SA | | | 40,399 | | | 148,798 | | | | |
| 22,527 | | SANOFI-AVENTIS | | | 1,307,314 | | | 1,440,393 | | | | |
| 4,171 | | SCHNEIDER ELECTRIC SA | | | 355,993 | | | 624,244 | | | | |
| 1,813 | | SCOR SE | | | 36,441 | | | 46,031 | | | | |
| 18,085 | | SOCIETE GENERALE | | | 998,189 | | | 971,978 | | | | |
| 21,253 | | SODEXO | | | 1,125,358 | | | 1,464,580 | | | | |
| 3,762 | | SUEZ ENVIRONNEMENT CO | | | 55,709 | | | 77,668 | | | | |
| 2,589 | | TECHNIP SA | | | 116,011 | | | 239,059 | | | | |
| 39,846 | | TELEVISION FRANCAISE (T.F.1) | | | 417,486 | | | 692,188 | | | | |
| 2,172 | | THALES SA | | | 86,735 | | | 75,999 | | | | |
| 75,214 | | TOTAL SA | | | 4,011,520 | | | 3,985,086 | | | | |
| 1,568 | | UNIBAIL-RODAMCO SE | | | 183,033 | | | 310,101 | | | | |
| 6,400 | | VALEO SA (b) | | | 172,988 | | | 363,167 | | | | |
| 2,024 | | VALLOUREC | | | 112,949 | | | 212,583 | | | | |
| 5,373 | | VEOLIA ENVIRONNEMENT | | | 121,010 | | | 157,022 | | | | |
| 8,329 | | VINCI SA | | | 346,780 | | | 452,762 | | | | |
| 19,603 | | VIVENDI | | | 505,588 | | | 529,139 | | | | |
| 3,595 | | ZODIAC AEROSPACE | | | 196,748 | | | 269,980 | | | | |
| | | | | | 20,383,777 | | | 25,791,490 | | | 7.45 | % |
Germany: | | | | | | | | | | | | |
| 462 | | AAREAL BANK AG (b) | | | 11,027 | | | 14,076 | | | | |
| 2,785 | | ADIDAS AG (b) | | | 94,549 | | | 181,945 | | | | |
| 8,135 | | ALLIANZ SE-REG | | | 732,172 | | | 966,722 | | | | |
| 24,933 | | BASF SE (b) | | | 1,215,619 | | | 1,989,045 | | | | |
| 14,206 | | BAYER AG-REG | | | 752,479 | | | 1,049,767 | | | | |
| 14,464 | | BAYERISCHE MOTOREN WERKE AG | | | 786,641 | | | 1,137,446 | | | | |
| 1,012 | | BEIERSDORF AG | | | 47,436 | | | 56,155 | | | | |
| 4,000 | | BILFINGER BERGER SE | | | 273,213 | | | 337,810 | | | | |
| 6,246 | | CELESIO AG | | | 195,305 | | | 155,243 | | | | |
| 6,290 | | COMMERZBANK AG (b) | | | 22,833 | | | 46,682 | | | | |
| 916 | | CONTINENTAL AG (b) | | | 47,943 | | | 72,389 | | | | |
| 15,532 | | DAIMLER AG-REGISTERED SHARES (b) | | | 498,387 | | | 1,052,902 | | | | |
| 15,255 | | DEUTSCHE BANK AG-REGISTERED | | | 692,276 | | | 797,049 | | | | |
| 4,009 | | DEUTSCHE BOERSE AG | | | 243,499 | | | 277,499 | | | | |
| 22,261 | | DEUTSCHE LUFTHANSA-REG (b) | | | 350,690 | | | 486,509 | | | | |
| 13,453 | | DEUTSCHE POST AG-REG | | | 152,569 | | | 228,307 | | | | |
| 41,318 | | DEUTSCHE TELEKOM AG-REG | | | 511,289 | | | 533,074 | | | | |
| | |
See accompanying notes to financial statements. | 64 | (Continued) |
|
CLEARWATER INVESTMENT TRUST |
Schedule of Investments - Clearwater International Fund |
December 31, 2010 |
| | | | | | | | | | | | | |
Shares | | Security | | Cost | | Fair
value (a) | | Percent
of
net assets | |
Germany (Cont’d): | | | | | | | | | | |
| 28,508 | | E.ON AG | | $ | 799,004 | | | 873,698 | | | | |
| 3,418 | | FRESENIUS MEDICAL CARE AG & | | | 133,793 | | | 197,448 | | | | |
| 734 | | FRESENIUS SE | | | 48,634 | | | 61,547 | | | | |
| 2,738 | | GEA GROUP AG (b) | | | 27,680 | | | 79,138 | | | | |
| 1,851 | | HANNOVER RUECKVERSICHERU-REG | | | 87,646 | | | 99,272 | | | | |
| 20,211 | | HEIDELBERGCEMENT AG | | | 1,025,256 | | | 1,266,650 | | | | |
| 10,464 | | HENKEL AG & CO KGAA | | | 419,473 | | | 539,945 | | | | |
| 1,550 | | HOCHTIEF AG | | | 59,506 | | | 131,606 | | | | |
| 41,437 | | INFINEON TECHNOLOGIES AG (b) | | | 306,215 | | | 385,550 | | | | |
| 2,921 | | K+S AG | | | 149,718 | | | 219,988 | | | | |
| 3,044 | | LINDE AG | | | 269,615 | | | 461,878 | | | | |
| 1,901 | | MAN SE | | | 119,821 | | | 226,058 | | | | |
| 1,310 | | MERCK KGAA | | | 110,683 | | | 104,769 | | | | |
| 2,503 | | METRO AG | | | 81,367 | | | 180,212 | | | | |
| 4,000 | | MTU AERO ENGINES HOLDING AG | | | 220,475 | | | 270,515 | | | | |
| 3,476 | | MUENCHENER RUECKVER AG-REG | | | 451,147 | | | 526,963 | | | | |
| 8,093 | | RWE AG | | | 564,143 | | | 539,534 | | | | |
| 582 | | SALZGITTER AG | | | 34,934 | | | 44,928 | | | | |
| 17,103 | | SAP AG | | | 683,559 | | | 870,749 | | | | |
| 14,083 | | SIEMENS AG-REG | | | 898,057 | | | 1,744,499 | | | | |
| 4,100 | | SIEMENS AG-SPONS ADR | | | 427,864 | | | 509,425 | | | | |
| 2,068 | | SUEDZUCKER AG | | | 43,410 | | | 55,061 | | | | |
| 6,245 | | THYSSENKRUPP AG | | | 125,145 | | | 258,571 | | | | |
| 22,071 | | TUI AG (b) | | | 245,701 | | | 309,676 | | | | |
| 493 | | VOLKSWAGEN AG | | | 49,099 | | | 69,765 | | | | |
| 517 | | WACKER CHEMIE AG | | | 55,413 | | | 90,226 | | | | |
| | | | | | 14,065,285 | | | 19,500,291 | | | 5.63 | % |
Greece: | | | | | | | | | | |
| 11,140 | | ALPHA BANK A.E. (b) | | | 55,130 | | | 56,567 | | | | |
| 3,147 | | COCA-COLA HELLENIC BOTTLING | | | 40,208 | | | 81,414 | | | | |
| 12,167 | | EFG EUROBANK ERGASIAS (b) | | | 60,017 | | | 60,969 | | | | |
| 16,096 | | NATIONAL BANK OF GREECE (b) | | | 208,323 | | | 130,128 | | | | |
| 4,045 | | OPAP SA | | | 65,259 | | | 69,944 | | | | |
| 8,795 | | PIRAEUS BANK S.A. (b) | | | 44,788 | | | 42,897 | | | | |
| 11,492 | | PUBLIC POWER CORP | | | 189,989 | | | 164,929 | | | | |
| | | | | | 663,714 | | | 606,848 | | | 0.18 | % |
Guernsey: | | | | | | | | | | |
| 329,768 | | RAVEN RUSSIA LTD | | | 274,940 | | | 321,332 | | | | |
| 36,637 | | RESOLUTION LTD (b) | | | 143,696 | | | 133,717 | | | | |
| | | | | | 418,636 | | | 455,049 | | | 0.13 | % |
Hong Kong: | | | | | | | | | | |
| 71,400 | | AIA GROUP LTD (b) | | | 206,993 | | | 200,724 | | | | |
| 59,100 | | BANK OF EAST ASIA | | | 184,595 | | | 247,507 | | | | |
| 20,000 | | BELLE INTERNATIONAL HOLDINGS | | | 9,604 | | | 33,812 | | | | |
| 207,600 | | BOC HONG KONG HOLDINGS LTD | | | 377,750 | | | 706,483 | | | | |
| 92,000 | | BRIGHTOIL PETROLEUM HOLDINGS | | | 43,584 | | | 47,939 | | | | |
| 97,000 | | CATHAY PACIFIC AIRWAYS | | | 135,947 | | | 267,700 | | | | |
| 24,000 | | CHEUNG KONG HOLDINGS LTD | | | 234,661 | | | 370,236 | | | | |
| 34,500 | | CLP HOLDINGS LTD | | | 236,618 | | | 280,090 | | | | |
| 174,000 | | CNOOC LTD | | | 349,790 | | | 412,818 | | | | |
| 42,000 | | DAH CHONG HONG | | | 29,216 | | | 44,581 | | | | |
| 12,800 | | DAH SING BANKING GROUP LTD | | | 23,096 | | | 21,739 | | | | |
| 11,600 | | DAH SING FINANCIAL | | | 82,246 | | | 75,892 | | | | |
| 23,862 | | ESPRIT HOLDINGS LTD | | | 151,145 | | | 113,594 | | | | |
| 33,000 | | FOXCONN INTERNATIONAL HLDGS (b) | | | 22,488 | | | 23,055 | | | | |
| 17,000 | | GREAT EAGLE HOLDINGS LTD | | | 44,170 | | | 52,822 | | | | |
| 106,500 | | GUOCO GROUP LTD | | | 906,505 | | | 1,414,093 | | | | |
| 17,000 | | HANG LUNG GROUP LTD | | | 50,690 | | | 111,768 | | | | |
| 40,000 | | HANG LUNG PROPERTIES LTD | | | 110,431 | | | 187,074 | | | | |
| 11,500 | | HANG SENG BANK LTD | | | 124,740 | | | 189,094 | | | | |
| 20,000 | | HENDERSON LAND DEVELOPMENT | | | 96,864 | | | 136,381 | | | | |
| 100,100 | | HONG KONG & CHINA GAS | | | 149,918 | | | 235,944 | | | | |
| 19,900 | | HONG KONG EXCHANGES & CLEAR | | | 250,145 | | | 451,392 | | | | |
| 10,500 | | HONGKONG & SHANGHAI HOTELS | | | 9,511 | | | 17,995 | | | | |
| 56,500 | | HONGKONG ELECTRIC HOLDINGS | | | 333,731 | | | 356,199 | | | | |
| 400 | | HOPEWELL HIGHWAY INFRASTRUCT | | | 229 | | | 307 | | | | |
| 4,000 | | HOPEWELL HOLDINGS LTD | | | 10,853 | | | 12,557 | | | | |
| 48,000 | | HOPSON DEVELOPMENT HOLDINGS (b) | | | 75,765 | | | 51,629 | | | | |
| | |
See accompanying notes to financial statements. | 65 | (Continued) |
|
CLEARWATER INVESTMENT TRUST |
Schedule of Investments - Clearwater International Fund |
December 31, 2010 |
| | | | | | | | | | | | | |
Shares | | Security | | Cost | | Fair
value (a) | | Percent
of
net assets | |
Hong Kong (Cont’d): | | | | | | | | | | |
| 42,000 | | HUTCHISON WHAMPOA LTD | | $ | 253,519 | | | 432,303 | | | | |
| 74,000 | | JOHNSON ELECTRIC HOLDINGS | | | 40,277 | | | 52,936 | | | | |
| 27,000 | | KERRY PROPERTIES LTD | | | 90,767 | | | 140,691 | | | | |
| 6,000 | | KINGBOARD CHEMICALS HOLDINGS | | | 14,300 | | | 35,935 | | | | |
| 54,000 | | LI & FUNG LTD | | | 132,174 | | | 313,342 | | | | |
| 127,500 | | LINK REIT | | | 285,741 | | | 396,165 | | | | |
| 16,500 | | MTR CORP | | | 38,268 | | | 60,078 | | | | |
| 143,000 | | NEW WORLD DEVELOPMENT | | | 234,526 | | | 268,620 | | | | |
| 4,000 | | NOBLE GROUP LTD | | | 5,575 | | | 6,763 | | | | |
| 43,500 | | NWS HOLDINGS LTD | | | 52,824 | | | 66,042 | | | | |
| 16,000 | | ORIENT OVERSEAS INTL LTD | | | 118,890 | | | 155,217 | | | | |
| 30,000 | | SANDS CHINA LTD (b) | | | 50,128 | | | 65,926 | | | | |
| 22,000 | | SHANGRI-LA ASIA LTD | | | 29,709 | | | 59,725 | | | | |
| 24,000 | | SINO LAND CO | | | 28,396 | | | 44,898 | | | | |
| 2,900 | | SINO-FOREST CORP (b) | | | 50,418 | | | 67,925 | | | | |
| 23,000 | | SUN HUNG KAI PROPERTIES | | | 222,078 | | | 382,035 | | | | |
| 19,000 | | SWIRE PACIFIC LTD-A | | | 143,178 | | | 312,416 | | | | |
| 3,000 | | TELEVISION BROADCASTS LTD | | | 9,222 | | | 16,211 | | | | |
| 37,000 | | WHARF HOLDINGS LTD | | | 94,826 | | | 284,676 | | | | |
| 78,000 | | WHEELOCK & CO LTD | | | 215,231 | | | 315,620 | | | | |
| 59,000 | | YUE YUEN INDUSTRIAL HLDG | | | 143,841 | | | 212,169 | | | | |
| | | | | | 6,505,173 | | | 9,753,118 | | | 2.82 | % |
Ireland: | | | | | | | | | | |
| 29,561 | | ACCENTURE PLC-CL A | | | 1,108,546 | | | 1,433,413 | | | | |
| 42,294 | | COVIDIEN PLC | | | 1,574,285 | | | 1,931,144 | | | | |
| 10,635 | | CRH PLC | | | 228,294 | | | 221,953 | | | | |
| 8,000 | | DCC PLC | | | 190,798 | | | 252,289 | | | | |
| 5,458 | | ELAN CORP PLC (b) | | | 31,760 | | | 28,809 | | | | |
| 666 | | ELAN CORP PLC (LONDON EXCHANGE) (b) | | | 5,141 | | | 3,693 | | | | |
| 248,114 | | EXPERIAN PLC | | | 1,913,477 | | | 3,086,875 | | | | |
| 3,196 | | ICON PLC - SPONSORED ADR (b)(c) | | | 69,787 | | | 69,992 | | | | |
| 1,776 | | KERRY GROUP PLC-A | | | 35,054 | | | 59,141 | | | | |
| 11,192 | | SHIRE PLC | | | 130,296 | | | 269,239 | | | | |
| 2,000 | | SMURFIT KAPPA GROUP PLC (b) | | | 17,837 | | | 19,510 | | | | |
| 2,333 | | UNITED BUSINESS MEDIA LTD | | | 13,794 | | | 25,097 | | | | |
| 23,432 | | WPP PLC | | | 141,019 | | | 288,421 | | | | |
| | | | | | 5,460,088 | | | 7,689,576 | | | 2.22 | % |
Israel: | | | | | | | | | | |
| 13,486 | | BANK HAPOALIM BM (b) | | | 51,982 | | | 70,195 | | | | |
| 11,685 | | BANK LEUMI LE-ISRAEL | | | 51,733 | | | 59,833 | | | | |
| 36,809 | | BEZEQ ISRAELI TELECOM CORP | | | 89,512 | | | 112,237 | | | | |
| 384 | | DELEK GROUP LTD | | | 108,528 | | | 98,908 | | | | |
| 8,857 | | ISRAEL CHEMICALS LTD | | | 105,188 | | | 151,831 | | | | |
| 64 | | ISRAEL CORP LIMITED/THE (b) | | | 50,868 | | | 77,644 | | | | |
| 66,665 | | ISRAEL DISCOUNT BANK-A (b) | | | 133,568 | | | 152,079 | | | | |
| 1,600 | | KOOR INDUSTRIES LTD | | | 40,363 | | | 39,002 | | | | |
| 14,564 | | MAKHTESHIM-AGAN INDUSTRIES (b) | | | 52,915 | | | 74,657 | | | | |
| 15,796 | | MIZRAHI TEFAHOT BANK LTD | | | 153,857 | | | 173,607 | | | | |
| 11,803 | | TEVA PHARMACEUTICAL-SP ADR (c) | | | 674,494 | | | 615,290 | | | | |
| | | | | | 1,513,008 | | | 1,625,283 | | | 0.47 | % |
Italy: | | | | | | | | | | |
| 41,159 | | A2A SPA | | | 67,304 | | | 56,595 | | | | |
| 2,890 | | ACEA SPA (b) | | | 31,698 | | | 33,212 | | | | |
| 19,503 | | ASSICURAZIONI GENERALI | | | 310,560 | | | 370,332 | | | | |
| 4,618 | | ATLANTIA SPA | | | 77,005 | | | 94,230 | | | | |
| 12,162 | | AUTOGRILL SPA (b) | | | 72,812 | | | 171,781 | | | | |
| 2,752 | | BANCA CARIGE SPA | | | 7,205 | | | 5,766 | | | | |
| 10,061 | | BANCA POPOLARE DI MILANO | | | 43,243 | | | 35,224 | | | | |
| 16,537 | | BANCO POPOLARE SCARL | | | 73,635 | | | 74,912 | | | | |
| 2,003 | | BENETTON GROUP SPA | | | 14,818 | | | 13,175 | | | | |
| 2,148 | | BULGARI SPA | | | 9,445 | | | 23,207 | | | | |
| 707 | | DANIELI & CO (b) | | | 18,567 | | | 22,627 | | | | |
| 118,832 | | ENEL SPA (b) | | | 533,144 | | | 593,883 | | | | |
| 34,744 | | ENI SPA | | | 661,873 | | | 758,626 | | | | |
| 2,842 | | EXOR SPA | | | 48,366 | | | 93,727 | | | | |
| 23,667 | | FIAT SPA | | | 293,240 | | | 487,983 | | | | |
| | |
See accompanying notes to financial statements. | 66 | (Continued) |
|
CLEARWATER INVESTMENT TRUST |
Schedule of Investments - Clearwater International Fund |
December 31, 2010 |
| | | | | | | | | | | | | |
Shares | | Security | | Cost | | Fair
value (a) | | Percent
of
net assets | |
Italy (Cont’d): | | | | | | | | | | |
| 3,656 | | FINMECCANICA SPA | | $ | 44,203 | | | 41,551 | | | | |
| 642 | | FONDIARIA-SAI SPA (b) | | | 7,308 | | | 5,375 | | | | |
| 101,826 | | INTESA SANPAOLO (b) | | | 265,964 | | | 276,217 | | | | |
| 18,247 | | INTESA SANPAOLO-RNC | | | 48,163 | | | 43,475 | | | | |
| 6,000 | | ITALCEMENTI SPA | | | 79,057 | | | 50,712 | | | | |
| 1,095 | | LUXOTTICA GROUP SPA | | | 14,342 | | | 33,361 | | | | |
| 58,238 | | MEDIASET SPA | | | 394,018 | | | 352,339 | | | | |
| 7,202 | | MEDIOBANCA SPA | | | 50,231 | | | 64,095 | | | | |
| 34,777 | | MEDIOLANUM SPA | | | 120,164 | | | 143,714 | | | | |
| 20,039 | | PARMALAT SPA | | | 36,886 | | | 54,894 | | | | |
| 2,966 | | PRYSMIAN SPA | | | 29,515 | | | 50,533 | | | | |
| 3,842 | | SAIPEM SPA | | | 66,811 | | | 189,135 | | | | |
| 48,516 | | SNAM RETE GAS | | | 216,794 | | | 241,170 | | | | |
| 158,727 | | TELECOM ITALIA SPA | | | 212,786 | | | 205,104 | | | | |
| 22,370 | | TERNA SPA | | | 71,955 | | | 94,460 | | | | |
| 5,082 | | UBI BANCA SCPA | | | 44,449 | | | 44,481 | | | | |
| 251,615 | | UNICREDIT SPA | | | 406,327 | | | 520,479 | | | | |
| | | | | | 4,371,888 | | | 5,246,375 | | | 1.51 | % |
Japan: | | | | | | | | | | |
| 2,000 | | 77 BANK LTD/THE | | | 10,160 | | | 10,617 | | | | |
| 5,200 | | ADVANTEST CORP | | | 86,387 | | | 117,649 | | | | |
| 46,100 | | AEON CO LTD | | | 344,949 | | | 576,862 | | | | |
| 4,800 | | AEON CREDIT SERVICE CO LTD | | | 49,903 | | | 67,867 | | | | |
| 1,100 | | AEON MALL CO LTD | | | 23,091 | | | 29,534 | | | | |
| 2,300 | | AISIN SEIKI CO LTD | | | 37,584 | | | 81,384 | | | | |
| 50,000 | | AJINOMOTO CO INC | | | 387,741 | | | 520,976 | | | | |
| 2,900 | | ALFRESA HOLDINGS CORP | | | 138,845 | | | 128,760 | | | | |
| 95,000 | | ALL NIPPON AIRWAYS CO LTD (b) | | | 304,805 | | | 354,522 | | | | |
| 2,000 | | AMADA CO LTD | | | 10,582 | | | 16,282 | | | | |
| 20,300 | | ASAHI BREWERIES LTD | | | 342,455 | | | 393,280 | | | | |
| 15,000 | | ASAHI GLASS CO LTD | | | 80,697 | | | 175,321 | | | | |
| 22,000 | | ASAHI KASEI CORP | | | 99,438 | | | 143,607 | | | | |
| 7,600 | | ASTELLAS PHARMA INC | | | 243,758 | | | 289,702 | | | | |
| 11,000 | | BANK OF KYOTO LTD/THE | | | 98,298 | | | 104,318 | | | | |
| 23,000 | | BANK OF YOKOHAMA LTD/THE | | | 96,740 | | | 119,258 | | | | |
| 1,300 | | BENESSE HOLDINGS INC | | | 48,395 | | | 59,881 | | | | |
| 13,800 | | BRIDGESTONE CORP | | | 205,726 | | | 266,673 | | | | |
| 5,700 | | BROTHER INDUSTRIES LTD | | | 42,142 | | | 84,524 | | | | |
| 35,000 | | CANON INC | | | 1,202,051 | | | 1,814,795 | | | | |
| 1,100 | | CANON MARKETING JAPAN INC | | | 15,818 | | | 15,661 | | | | |
| 3,800 | | CASIO COMPUTER CO LTD | | | 28,796 | | | 30,655 | | | | |
| 29 | | CENTRAL JAPAN RAILWAY CO | | | 162,730 | | | 242,876 | | | | |
| 15,000 | | CHIBA BANK LTD/THE (b) | | | 81,968 | | | 97,544 | | | | |
| 13,800 | | CHUBU ELECTRIC POWER CO INC | | | 306,766 | | | 339,248 | | | | |
| 1,900 | | CHUGAI PHARMACEUTICAL CO LTD | | | 30,706 | | | 34,867 | | | | |
| 3,200 | | CHUGOKU ELECTRIC POWER CO | | | 69,825 | | | 65,030 | | | | |
| 36,000 | | CHUO MITSUI TRUST HOLDINGS | | | 125,658 | | | 149,420 | | | | |
| 7,900 | | CITIZEN HOLDINGS CO LTD | | | 31,581 | | | 54,487 | | | | |
| 2,000 | | COCA-COLA WEST CO LTD | | | 30,433 | | | 36,234 | | | | |
| 73,000 | | COSMO OIL COMPANY LTD | | | 182,679 | | | 239,156 | | | | |
| 66,119 | | CREDIT SAISON CO LTD | | | 787,612 | | | 1,087,139 | | | | |
| 25,000 | | DAI NIPPON PRINTING CO LTD | | | 234,314 | | | 340,543 | | | | |
| 23,000 | | DAIHATSU MOTOR CO LTD | | | 270,880 | | | 352,958 | | | | |
| 125 | | DAI-ICHI LIFE INSURANCE (b) | | | 157,718 | | | 203,064 | | | | |
| 13,100 | | DAIICHI SANKYO CO LTD | | | 225,226 | | | 286,706 | | | | |
| 4,300 | | DAIKIN INDUSTRIES LTD | | | 117,015 | | | 152,524 | | | | |
| 1,200 | | DAITO TRUST CONSTRUCT CO LTD | | | 42,344 | | | 82,174 | | | | |
| 6,000 | | DAIWA HOUSE INDUSTRY CO LTD | | | 45,826 | | | 73,750 | | | | |
| 186,300 | | DAIWA SECURITIES GROUP INC | | | 1,120,308 | | | 959,106 | | | | |
| 1,600 | | DENA CO LTD | | | 49,492 | | | 57,384 | | | | |
| 4,000 | | DENKI KAGAKU KOGYO K K | | | 7,188 | | | 19,016 | | | | |
| 8,200 | | DENSO CORP | | | 185,234 | | | 282,982 | | | | |
| 2,900 | | DENTSU INC | | | 48,680 | | | 90,043 | | | | |
| 13,000 | | DOWA HOLDINGS CO LTD | | | 55,385 | | | 85,339 | | | | |
| 6,200 | | EAST JAPAN RAILWAY CO | | | 344,432 | | | 403,184 | | | | |
| 3,800 | | EISAI CO LTD | | | 120,732 | | | 137,597 | | | | |
| 2,100 | | ELECTRIC POWER DEVELOPMENT C | | | 62,041 | | | 65,876 | | | | |
| | |
See accompanying notes to financial statements. | 67 | (Continued) |
|
CLEARWATER INVESTMENT TRUST |
Schedule of Investments - Clearwater International Fund |
December 31, 2010 |
| | | | | | | | | | | | | |
Shares | | Security | | Cost | | Fair
value (a) | | Percent
of
net assets | |
Japan (Cont’d): | | | | | | | | | | |
| 1,800 | | FAMILYMART CO LTD | | $ | 52,590 | | | 67,838 | | | | |
| 3,100 | | FANUC CORP | | | 243,447 | | | 476,108 | | | | |
| 700 | | FAST RETAILING CO LTD | | | 76,899 | | | 111,474 | | | | |
| 50,000 | | FUJI HEAVY INDUSTRIES LTD | | | 206,605 | | | 387,961 | | | | |
| 37,300 | | FUJIFILM HOLDINGS CORP | | | 1,035,482 | | | 1,348,784 | | | | |
| 22,000 | | FUJIKURA LTD | | | 122,650 | | | 111,092 | | | | |
| 31,000 | | FUJITSU LTD | | | 124,538 | | | 215,719 | | | | |
| 79,000 | | FUKUOKA FINANCIAL GROUP INC | | | 308,478 | | | 343,462 | | | | |
| 15,000 | | FURUKAWA ELECTRIC CO LTD | | | 48,082 | | | 67,431 | | | | |
| 5,000 | | GS YUASA CORP | | | 36,696 | | | 34,609 | | | | |
| 6,000 | | GUNMA BANK LTD/THE | | | 31,571 | | | 32,958 | | | | |
| 12,000 | | HACHIJUNI BANK LTD/THE | | | 67,350 | | | 67,099 | | | | |
| 3,220 | | HAKUHODO DY HOLDINGS INC | | | 174,361 | | | 184,609 | | | | |
| 15,000 | | HANKYU HOLDINGS CORP (b) | | | 71,596 | | | 69,648 | | | | |
| 500 | | HIROSE ELECTRIC CO LTD | | | 48,402 | | | 56,347 | | | | |
| 7,000 | | HIROSHIMA BANK LTD/THE | | | 26,154 | | | 29,485 | | | | |
| 600 | | HISAMITSU PHARMACEUTICAL CO | | | 17,668 | | | 25,273 | | | | |
| 3,000 | | HITACHI CHEMICAL CO LTD | | | 54,135 | | | 62,111 | | | | |
| 2,200 | | HITACHI CONSTRUCTION MACHINE (b) | | | 48,655 | | | 52,728 | | | | |
| 153,000 | | HITACHI LTD | | | 463,298 | | | 815,937 | | | | |
| 15,900 | | HOKKAIDO ELECTRIC POWER CO | | | 332,832 | | | 325,074 | | | | |
| 25,000 | | HOKUHOKU FINANCIAL GROUP INC | | | 45,996 | | | 50,804 | | | | |
| 5,000 | | HOKURIKU ELECTRIC POWER CO | | | 118,737 | | | 122,854 | | | | |
| 40,000 | | HONDA MOTOR CO LTD | | | 1,114,704 | | | 1,583,866 | | | | |
| 7,100 | | HOYA CORP | | | 150,194 | | | 172,442 | | | | |
| 1,600 | | IBIDEN CO LTD | | | 37,951 | | | 50,487 | | | | |
| 300 | | IDEMITSU KOSAN CO LTD | | | 23,804 | | | 31,850 | | | | |
| 24,000 | | IHI CORP | | | 31,334 | | | 53,502 | | | | |
| 26 | | INPEX CORP | | | 126,100 | | | 152,265 | | | | |
| 11,100 | | ISETAN MITSUKOSHI HOLDINGS L | | | 111,994 | | | 129,054 | | | | |
| 47,000 | | ISUZU MOTORS LTD | | | 100,274 | | | 213,600 | | | | |
| 28,000 | | ITOCHU CORP | | | 163,531 | | | 283,470 | | | | |
| 8,000 | | J FRONT RETAILING CO LTD | | | 31,099 | | | 43,747 | | | | |
| 6 | | JAPAN REAL ESTATE INVESTMENT | | | 46,693 | | | 62,222 | | | | |
| 8 | | JAPAN RETAIL FUND INVESTMENT | | | 8,807 | | | 15,341 | | | | |
| 5,000 | | JAPAN STEEL WORKS LTD | | | 47,736 | | | 52,221 | | | | |
| 77 | | JAPAN TOBACCO INC | | | 200,326 | | | 284,979 | | | | |
| 7,400 | | JFE HOLDINGS INC | | | 181,345 | | | 257,744 | | | | |
| 4,000 | | JGC CORP | | | 53,048 | | | 87,051 | | | | |
| 7,000 | | JOYO BANK LTD/THE | | | 32,424 | | | 30,778 | | | | |
| 5,100 | | JS GROUP CORP | | | 59,682 | | | 112,246 | | | | |
| 3,100 | | JSR CORP | | | 39,530 | | | 57,843 | | | | |
| 29,900 | | JTEKT CORP | | | 274,921 | | | 352,788 | | | | |
| 45 | | JUPITER TELECOMMUNICATIONS | | | 27,159 | | | 47,331 | | | | |
| 79,180 | | JX HOLDINGS INC | | | 390,898 | | | 537,334 | | | | |
| 7,000 | | KAJIMA CORP | | | 15,004 | | | 18,622 | | | | |
| 16,000 | | KAMIGUMI CO LTD | | | 112,464 | | | 134,395 | | | | |
| 38,000 | | KANEKA CORP | | | 253,846 | | | 263,493 | | | | |
| 11,900 | | KANSAI ELECTRIC POWER CO INC | | | 258,103 | | | 293,712 | | | | |
| 2,000 | | KANSAI PAINT CO LTD | | | 10,449 | | | 19,361 | | | | |
| 18,600 | | KAO CORP | | | 435,196 | | | 501,231 | | | | |
| 92,000 | | KAWASAKI HEAVY INDUSTRIES | | | 220,820 | | | 309,334 | | | | |
| 20,000 | | KAWASAKI KISEN KAISHA LTD | | | 71,674 | | | 87,938 | | | | |
| 50 | | KDDI CORP | | | 240,697 | | | 288,815 | | | | |
| 6,000 | | KEIKYU CORP | | | 45,614 | | | 52,984 | | | | |
| 3,000 | | KEIO CORP | | | 15,740 | | | 20,470 | | | | |
| 5,000 | | KEISEI ELECTRIC RAILWAY CO | | | 23,110 | | | 33,377 | | | | |
| 710 | | KEYENCE CORP | | | 131,805 | | | 205,671 | | | | |
| 6,000 | | KIKKOMAN CORP | | | 52,867 | | | 67,247 | | | | |
| 20,000 | | KINTETSU CORP | | | 66,744 | | | 62,566 | | | | |
| 15,000 | | KIRIN HOLDINGS CO LTD | | | 169,540 | | | 210,423 | | | | |
| 51,000 | | KOBE STEEL LTD | | | 74,632 | | | 129,394 | | | | |
| 15,100 | | KOMATSU LTD | | | 187,238 | | | 456,940 | | | | |
| 3,900 | | KONAMI CORP | | | 61,913 | | | 82,905 | | | | |
| 18,500 | | KONICA MINOLTA HOLDINGS INC | | | 174,028 | | | 192,305 | | | | |
| 21,000 | | KUBOTA CORP | | | 129,773 | | | 198,895 | | | | |
| 5,500 | | KURARAY CO LTD | | | 46,234 | | | 78,848 | | | | |
| 4,300 | | KURITA WATER INDUSTRIES LTD | | | 96,931 | | | 135,471 | | | | |
| | |
See accompanying notes to financial statements. | 68 | (Continued) |
|
CLEARWATER INVESTMENT TRUST |
Schedule of Investments - Clearwater International Fund |
December 31, 2010 |
| | | | | | | | | | | | | |
Shares | | Security | | Cost | | Fair
value (a) | | Percent
of
net assets | |
Japan (Cont’d): |
| 2,700 | | KYOCERA CORP | | $ | 198,000 | | | 275,674 | | | | |
| 3,000 | | KYOWA HAKKO KIRIN CO LTD | | | 23,089 | | | 30,889 | | | | |
| 4,300 | | KYUSHU ELECTRIC POWER CO INC | | | 96,737 | | | 96,387 | | | | |
| 4,300 | | LAWSON INC | | | 186,552 | | | 212,633 | | | | |
| 700 | | MABUCHI MOTOR CO LTD | | | 36,674 | | | 36,080 | | | | |
| 10,400 | | MAKITA CORP | | | 298,565 | | | 425,254 | | | | |
| 44,000 | | MARUBENI CORP | | | 181,070 | | | 309,433 | | | | |
| 6,500 | | MARUI GROUP CO LTD | | | 32,287 | | | 52,997 | | | | |
| 32,000 | | MAZDA MOTOR CORP | | | 59,801 | | | 91,830 | | | | |
| 22,700 | | MEDIPAL HOLDINGS CORP | | | 268,711 | | | 250,222 | | | | |
| 6,900 | | MEIJI HOLDINGS CO LTD | | | 260,803 | | | 311,884 | | | | |
| 7,540 | | MEITEC CORP (b) | | | 124,966 | | | 161,305 | | | | |
| 76,500 | | MITSUBISHI CHEMICAL HOLDINGS | | | 336,902 | | | 519,147 | | | | |
| 34,600 | | MITSUBISHI CORP | | | 648,370 | | | 936,658 | | | | |
| 32,000 | | MITSUBISHI ELECTRIC CORP | | | 148,393 | | | 335,789 | | | | |
| 18,000 | | MITSUBISHI ESTATE CO LTD | | | 212,941 | | | 333,868 | | | | |
| 17,000 | | MITSUBISHI GAS CHEMICAL CO | | | 75,149 | | | 120,810 | | | | |
| 57,000 | | MITSUBISHI HEAVY INDUSTRIES | | | 185,317 | | | 214,117 | | | | |
| 4,000 | | MITSUBISHI LOGISTICS CORP | | | 45,017 | | | 53,305 | | | | |
| 108,000 | | MITSUBISHI MATERIALS CORP (b) | | | 293,296 | | | 344,509 | | | | |
| 48,000 | | MITSUBISHI MOTORS CORP (b) | | | 72,153 | | | 69,759 | | | | |
| 5,000 | | MITSUBISHI TANABE PHARMA | | | 54,031 | | | 84,428 | | | | |
| 419,200 | | MITSUBISHI UFJ FINANCIAL GRO | | | 2,059,726 | | | 2,266,539 | | | | |
| 3,960 | | MITSUBISHI UFJ LEASE & FINAN | | | 130,425 | | | 157,047 | | | | |
| 71,000 | | MITSUI & CO LTD | | | 824,847 | | | 1,172,640 | | | | |
| 102,000 | | MITSUI CHEMICALS INC | | | 317,085 | | | 365,570 | | | | |
| 35,000 | | MITSUI ENGINEER & SHIPBUILD | | | 83,842 | | | 92,680 | | | | |
| 14,000 | | MITSUI FUDOSAN CO LTD | | | 160,770 | | | 279,159 | | | | |
| 3,000 | | MITSUI MINING & SMELTING CO | | | 5,391 | | | 9,902 | | | | |
| 17,000 | | MITSUI OSK LINES LTD | | | 90,171 | | | 115,994 | | | | |
| 314,000 | | MIZUHO FINANCIAL GROUP INC | | | 567,650 | | | 591,696 | | | | |
| 29,000 | | MIZUHO SECURITIES CO LTD | | | 61,853 | | | 83,221 | | | | |
| 10,280 | | MS&AD INSURANCE GROUP HOLDIN | | | 242,067 | | | 257,653 | | | | |
| 3,600 | | MURATA MANUFACTURING CO LTD | | | 162,615 | | | 252,285 | | | | |
| 23,500 | | NAMCO BANDAI HOLDINGS INC | | | 240,157 | | | 252,384 | | | | |
| 41,000 | | NEC CORP | | | 114,733 | | | 123,211 | | | | |
| 123,000 | | NEC CORP | | | 342,135 | | | 369,634 | | | | |
| 3,000 | | NGK INSULATORS LTD | | | 44,485 | | | 48,957 | | | | |
| 3,000 | | NGK SPARK PLUG CO LTD | | | 28,359 | | | 46,038 | | | | |
| 1,600 | | NIDEC CORP | | | 75,128 | | | 161,786 | | | | |
| 6,000 | | NIKON CORP | | | 75,728 | | | 121,709 | | | | |
| 11,500 | | NIKON CORP | | | 209,644 | | | 233,275 | | | | |
| 1,600 | | NINTENDO CO LTD | | | 401,254 | | | 469,593 | | | | |
| 11 | | NIPPON BUILDING FUND INC | | | 90,970 | | | 112,854 | | | | |
| 9,000 | | NIPPON ELECTRIC GLASS CO LTD | | | 66,934 | | | 129,911 | | | | |
| 17,000 | | NIPPON EXPRESS CO LTD | | | 60,747 | | | 76,632 | | | | |
| 72,000 | | NIPPON EXPRESS CO LTD | | | 277,746 | | | 324,557 | | | | |
| 6,000 | | NIPPON MEAT PACKERS INC | | | 72,315 | | | 78,405 | | | | |
| 3,100 | | NIPPON PAPER GROUP INC | | | 78,898 | | | 81,324 | | �� | | |
| 11,000 | | NIPPON SHEET GLASS CO LTD | | | 30,764 | | | 29,670 | | | | |
| 83,000 | | NIPPON STEEL CORP | | | 239,272 | | | 298,496 | | | | |
| 9,300 | | NIPPON TELEGRAPH & TELEPHONE | | | 356,996 | | | 420,938 | | | | |
| 29,000 | | NIPPON YUSEN | | | 99,727 | | | 128,581 | | | | |
| 45,000 | | NIPPON YUSEN | | | 175,208 | | | 199,523 | | | | |
| 17,000 | | NISHI-NIPPON CITY BANK LTD | | | 40,901 | | | 51,716 | | | | |
| 74,000 | | NISHI-NIPPON CITY BANK LTD | | | 209,165 | | | 225,116 | | | | |
| 55,000 | | NISSAN MOTOR CO LTD | | | 480,250 | | | 523,624 | | | | |
| 42,600 | | NISSAN MOTOR CO LTD | | | 187,438 | | | 405,571 | | | | |
| 2,500 | | NISSHIN SEIFUN GROUP INC | | | 25,731 | | | 31,745 | | | | |
| 3,000 | | NISSHINBO HOLDINGS INC | | | 23,700 | | | 32,884 | | | | |
| 1,300 | | NISSIN FOODS HOLDINGS CO LTD | | | 47,622 | | | 46,592 | | | | |
| 600 | | NITORI HOLDINGS CO LTD | | | 33,819 | | | 52,467 | | | | |
| 3,200 | | NITTO DENKO CORP | | | 77,639 | | | 150,751 | | | | |
| 35,200 | | NKSJ HOLDINGS INC (b) | | | 219,922 | | | 259,251 | | | | |
| 48,500 | | NOMURA HOLDINGS INC | | | 262,863 | | | 307,628 | | | | |
| 2,700 | | NOMURA RESEARCH INSTITUTE LT | | | 43,930 | | | 60,123 | | | | |
| 6,000 | | NSK LTD | | | 24,006 | | | 54,241 | | | | |
| | |
See accompanying notes to financial statements. | 69 | (Continued) |
|
CLEARWATER INVESTMENT TRUST |
Schedule of Investments - Clearwater International Fund |
December 31, 2010 |
| | | | | | | | | | | | | |
Shares | | Security | | Cost | | Fair
value (a) | | Percent
of
net assets | |
Japan (Cont’d): |
| 29,000 | | NTN CORP | | $ | 116,432 | | | 153,940 | | | | |
| 15 | | NTT DATA CORP | | | 39,108 | | | 51,931 | | | | |
| 284 | | NTT DOCOMO INC | | | 404,857 | | | 495,989 | | | | |
| 58 | | NTT URBAN DEVELOPMENT CORP | | | 54,407 | | | 57,147 | | | | |
| 12,000 | | OBAYASHI CORP | | | 48,665 | | | 55,275 | | | | |
| 8,000 | | ODAKYU ELECTRIC RAILWAY CO | | | 62,234 | | | 74,488 | | | | |
| 13,000 | | OJI PAPER CO LTD | | | 49,994 | | | 62,924 | | | | |
| 4,000 | | OLYMPUS CORP | | | 61,766 | | | 121,093 | | | | |
| 7,300 | | OMRON CORP | | | 99,962 | | | 193,393 | | | | |
| 1,400 | | ONO PHARMACEUTICAL CO LTD | | | 60,256 | | | 65,350 | | | | |
| 8,000 | | ONWARD HOLDINGS CO LTD | | | 54,094 | | | 69,266 | | | | |
| 800 | | ORIENTAL LAND CO LTD | | | 50,479 | | | 74,094 | | | | |
| 7,210 | | ORIX CORP | | | 484,775 | | | 709,512 | | | | |
| 86,000 | | OSAKA GAS CO LTD | | | 307,684 | | | 333,646 | | | | |
| 30,500 | | PANASONIC CORP | | | 376,359 | | | 433,118 | | | | |
| 153 | | RAKUTEN INC (b) | | | 84,827 | | | 128,138 | | | | |
| 30,000 | | RICOH CO LTD | | | 378,821 | | | 439,689 | | | | |
| 1,200 | | RINNAI CORP | | | 52,047 | | | 73,306 | | | | |
| 1,800 | | ROHM CO LTD | | | 99,465 | | | 117,497 | | | | |
| 15,900 | | SANKYO CO LTD | | | 848,356 | | | 897,871 | | | | |
| 2,600 | | SANTEN PHARMACEUTICAL CO LTD | | | 85,886 | | | 90,303 | | | | |
| 35,000 | | SAPPORO HOKUYO HOLDINGS INC | | | 109,166 | | | 163,806 | | | | |
| 10,000 | | SAPPORO HOLDINGS LTD | | | 50,459 | | | 45,324 | | | | |
| 433 | | SBI HOLDINGS INC | | | 45,378 | | | 65,702 | | | | |
| 3,400 | | SECOM CO LTD | | | 133,812 | | | 161,010 | | | | |
| 4,100 | | SEGA SAMMY HOLDINGS INC | | | 38,822 | | | 78,017 | | | | |
| 12,900 | | SEIKO EPSON CORP | | | 193,547 | | | 235,141 | | | | |
| 25,000 | | SEINO HOLDINGS CO LTD | | | 196,920 | | | 171,811 | | | | |
| 13,000 | | SEKISUI CHEMICAL CO LTD | | | 66,177 | | | 93,345 | | | | |
| 6,000 | | SEKISUI HOUSE LTD | | | 44,394 | | | 60,670 | | | | |
| 13,000 | | SEVEN & I HOLDINGS CO LTD | | | 286,258 | | | 347,441 | | | | |
| 4 | | SEVEN BANK LTD | | | 9,649 | | | 8,469 | | | | |
| 20,000 | | SHARP CORP | | | 174,731 | | | 206,174 | | | | |
| 4,200 | | SHIKOKU ELECTRIC POWER CO | | | 116,898 | | | 123,527 | | | | |
| 4,000 | | SHIMADZU CORP | | | 25,419 | | | 31,086 | | | | |
| 1,000 | | SHIMAMURA CO LTD | | | 61,206 | | | 92,741 | | | | |
| 1,500 | | SHIMANO INC | | | 58,204 | | | 76,299 | | | | |
| 2,000 | | SHIMIZU CORP | | | 7,530 | | | 8,547 | | | | |
| 6,600 | | SHIN-ETSU CHEMICAL CO LTD | | | 318,188 | | | 357,663 | | | | |
| 4,000 | | SHIONOGI & CO LTD | | | 67,679 | | | 78,972 | | | | |
| 3,000 | | SHISEIDO CO LTD | | | 43,317 | | | 65,547 | | | | |
| 8,000 | | SHIZUOKA BANK LTD/THE (b) | | | 74,794 | | | 73,799 | | | | |
| 21,000 | | SHOWA DENKO K K | | | 33,824 | | | 47,331 | | | | |
| 7,400 | | SHOWA SHELL SEKIYU KK | | | 69,579 | | | 67,808 | | | | |
| 600 | | SMC CORP | | | 57,789 | | | 102,791 | | | | |
| 14,200 | | SOFTBANK CORP | | | 235,288 | | | 491,617 | | | | |
| 21,900 | | SOJITZ CORP | | | 34,134 | | | 48,011 | | | | |
| 17,300 | | SONY CORP | | | 411,992 | | | 623,658 | | | | |
| 33 | | SONY FINANCIAL HOLDINGS INC | | | 85,415 | | | 133,514 | | | | |
| 2,700 | | STANLEY ELECTRIC CO LTD | | | 30,745 | | | 50,446 | | | | |
| 97,000 | | SUMITOMO CHEMICAL CO LTD | | | 443,397 | | | 477,869 | | | | |
| 21,300 | | SUMITOMO CORP | | | 207,214 | | | 301,423 | | | | |
| 13,100 | | SUMITOMO ELECTRIC INDUSTRIES | | | 127,803 | | | 181,994 | | | | |
| 12,000 | | SUMITOMO HEAVY INDUSTRIES | | | 39,379 | | | 77,149 | | | | |
| 62,000 | | SUMITOMO METAL INDUSTRIES | | | 136,710 | | | 152,721 | | | | |
| 18,000 | | SUMITOMO METAL MINING CO LTD | | | 242,021 | | | 314,581 | | | | |
| 23,000 | | SUMITOMO MITSUI FINANCIAL GR | | | 728,366 | | | 819,226 | | | | |
| 7,000 | | SUMITOMO REALTY & DEVELOPMNT | | | 81,291 | | | 167,168 | | | | |
| 23,000 | | SUMITOMO TRUST & BANKING CO | | | 99,242 | | | 145,036 | | | | |
| 1,000 | | SURUGA BANK LTD | | | 8,247 | | | 9,311 | | | | |
| 500 | | SUZUKEN CO LTD | | | 12,835 | | | 15,272 | | | | |
| 5,700 | | SUZUKI MOTOR CORP | | | 102,733 | | | 140,405 | | | | |
| 19,400 | | T&D HOLDINGS INC | | | 440,678 | | | 492,205 | | | | |
| 11,000 | | TAISEI CORP | | | 19,821 | | | 25,741 | | | | |
| 2,000 | | TAISHO PHARMACEUTICAL CO LTD | | | 40,190 | | | 43,772 | | | | |
| 2,000 | | TAIYO NIPPON SANSO CORP | | | 11,493 | | | 17,661 | | | | |
| 27,000 | | TAKASHIMAYA CO LTD | | | 194,251 | | | 231,446 | | | | |
| | |
See accompanying notes to financial statements. | 70 | (Continued) |
CLEARWATER INVESTMENT TRUST
Schedule of Investments - Clearwater International Fund
December 31, 2010
| | | | | | | | | | | | | |
Shares | | Security | | Cost | | Fair
value (a) | | Percent
of
net assets | |
Japan (Cont’d): | | | | | | | | | | | |
| 3,400 | | TAKATA CORP | | $ | 83,835 | | | 100,584 | | | | |
| 13,400 | | TAKEDA PHARMACEUTICAL CO LTD | | | 499,404 | | | 659,324 | | | | |
| 1,500 | | TDK CORP | | | 58,582 | | | 104,380 | | | | |
| 83,000 | | TEIJIN LTD | | | 212,360 | | | 354,719 | | | | |
| 2,600 | | TERUMO CORP | | | 95,419 | | | 146,341 | | | | |
| 2,000 | | THK CO LTD | | | 29,290 | | | 45,989 | | | | |
| 19,000 | | TOBU RAILWAY CO LTD | | | 97,844 | | | 106,708 | | | | |
| 1,000 | | TOHO CO LTD | | | 13,412 | | | 16,060 | | | | |
| 6,800 | | TOHOKU ELECTRIC POWER CO INC | | | 143,233 | | | 151,588 | | | | |
| 11,600 | | TOKIO MARINE HOLDINGS INC | | | 296,326 | | | 346,741 | | | | |
| 14,400 | | TOKYO BROADCASTING SYSTEM | | | 196,223 | | | 204,489 | | | | |
| 24,700 | | TOKYO ELECTRIC POWER CO INC | | | 607,774 | | | 603,250 | | | | |
| 3,200 | | TOKYO ELECTRON LTD | | | 128,746 | | | 202,577 | | | | |
| 46,000 | | TOKYO GAS CO LTD | | | 160,535 | | | 203,957 | | | | |
| 14,000 | | TOKYO TATEMONO CO LTD | | | 52,674 | | | 64,833 | | | | |
| 14,000 | | TOKYU CORP | | | 57,421 | | | 64,143 | | | | |
| 20,000 | | TOKYU LAND CORP | | | 69,576 | | | 100,500 | | | | |
| 4,000 | | TONENGENERAL SEKIYU KK | | | 37,796 | | | 43,747 | | | | |
| 48,000 | | TOPPAN PRINTING CO LTD | | | 383,614 | | | 438,654 | | | | |
| 17,000 | | TORAY INDUSTRIES INC | | | 70,413 | | | 101,547 | | | | |
| 66,000 | | TOSHIBA CORP | | | 197,553 | | | 359,289 | | | | |
| 6,000 | | TOTO LTD | | | 30,029 | | | 43,526 | | | | |
| 15,900 | | TOYO SEIKAN KAISHA LTD | | | 265,689 | | | 302,554 | | | | |
| 1,000 | | TOYO SUISAN KAISHA LTD | | | 23,262 | | | 22,255 | | | | |
| 9,200 | | TOYOTA AUTO BODY CO LTD | | | 172,671 | | | 171,777 | | | | |
| 2,300 | | TOYOTA INDUSTRIES CORP | | | 51,959 | | | 71,413 | | | | |
| 46,900 | | TOYOTA MOTOR CORP | | | 1,599,107 | | | 1,859,971 | | | | |
| 19,700 | | TOYOTA TSUSHO CORP | | | 264,953 | | | 346,960 | | | | |
| 2,500 | | TREND MICRO INC (b) | | | 74,501 | | | 82,549 | | | | |
| 1,700 | | TSUMURA & CO | | | 50,505 | | | 55,045 | | | | |
| 8,000 | | UBE INDUSTRIES LTD | | | 13,963 | | | 24,041 | | | | |
| 2,100 | | UNICHARM CORP | | | 42,706 | | | 83,541 | | | | |
| 23,800 | | UNIHAIR CO LTD (b) | | | 281,701 | | | 319,507 | | | | |
| 1,000 | | USHIO INC | | | 14,106 | | | 19,066 | | | | |
| 130 | | USS CO LTD | | | 5,696 | | | 10,631 | | | | |
| 126 | | WEST JAPAN RAILWAY CO | | | 427,214 | | | 470,985 | | | | |
| 236 | | YAHOO JAPAN CORP | | | 62,283 | | | 91,559 | | | | |
| 2,500 | | YAKULT HONSHA CO LTD | | | 42,793 | | | 72,019 | | | | |
| 1,270 | | YAMADA DENKI CO LTD | | | 52,100 | | | 86,654 | | | | |
| 2,000 | | YAMAGUCHI FINANCIAL GROUP IN | | | 18,216 | | | 20,248 | | | | |
| 15,100 | | YAMAHA CORP | | | 164,370 | | | 187,463 | | | | |
| 11,300 | | YAMAHA MOTOR CO LTD (b) | | | 134,328 | | | 184,126 | | | | |
| 9,000 | | YAMATO HOLDINGS CO LTD | | | 96,669 | | | 128,138 | | | | |
| 12,000 | | YOKOGAWA ELECTRIC CORP | | | 94,287 | | | 95,475 | | | | |
| | | | | | 49,315,381 | | | 63,267,029 | | | 18.25 | % |
Jersey: | | | | | | | | | | | | |
| 868 | | RANDGOLD RESOURCES LTD | | | 57,706 | | | 71,385 | | | | |
| | | | | | 57,706 | | | 71,385 | | | 0.02 | % |
Luxembourg: | | | | | | | | | | | |
| 15,315 | | ARCELORMITTAL | | | 336,733 | | | 580,798 | | | | |
| 1,600 | | MILLICOM INTL CELLULAR-SDR | | | 87,461 | | | 153,676 | | | | |
| 3,311 | | SES | | | 62,443 | | | 78,821 | | | | |
| 6,028 | | TENARIS SA | | | 60,927 | | | 147,810 | | | | |
| | | | | | 547,564 | | | 961,105 | | | 0.28 | % |
Macau: | | | | | | | | | | |
| 30,000 | | WYNN MACAU LTD | | | 50,423 | | | 67,161 | | | | |
| | | | | | 50,423 | | | 67,161 | | | 0.02 | % |
Mexico: | | | | | | | | | | | | |
| 13,800 | | DESARROLLADORA HOMEX-ADR (b)(c) | | | 414,776 | | | 466,578 | | | | |
| 7,700 | | FOMENTO ECONOMICO MEX-SP ADR (c) | | | 236,240 | | | 430,584 | | | | |
| 2,393 | | FRESNILLO PLC | | | 48,607 | | | 62,231 | | | | |
| 86,000 | | GENOMMA LAB INTERNACIONAL-B (b) | | | 157,664 | | | 205,853 | | | | |
| | | | | | 857,287 | | | 1,165,246 | | | 0.34 | % |
Netherlands: | | | | | | | | | | | | |
| 27,148 | | AEGON NV (b) | | | 127,577 | | | 166,004 | | | | |
| 9,407 | | AKZO NOBEL | | | 457,135 | | | 584,332 | | | | |
| 5,963 | | ASML HOLDING NV | | | 107,018 | | | 230,281 | | | | |
| | |
See accompanying notes to financial statements. | 71 | (Continued) |
CLEARWATER INVESTMENT TRUST
Schedule of Investments - Clearwater International Fund
December 31, 2010
| | | | | | | | | | | | | |
Shares | | Security | | Cost | | Fair
value (a) | | Percent
of
net assets | |
Netherlands (Cont’d): | | | | | | | | | | |
| 28,133 | | BRIT INSURANCE HOLDINGS NV (b) | | $ | 328,384 | | | 457,034 | | | | |
| 1,079 | | CORIO NV | | | 43,024 | | | 69,230 | | | | |
| 5,200 | | CSM | | | 148,650 | | | 181,985 | | | | |
| 2,751 | | DELTA LLOYD NV | | | 50,800 | | | 55,454 | | | | |
| 6,423 | | EADS NV (b) | | | 81,439 | | | 149,686 | | | | |
| 1,198 | | FUGRO NV-CVA | | | 57,119 | | | 98,453 | | | | |
| 12,624 | | GEMALTO | | | 426,701 | | | 537,198 | | | | |
| 1,747 | | HEINEKEN HOLDING NV | | | 53,733 | | | 75,929 | | | | |
| 3,004 | | HEINEKEN NV | | | 84,487 | | | 147,280 | | | | |
| 70,094 | | ING GROEP NV-CVA (b) | | | 469,277 | | | 681,880 | | | | |
| 27,137 | | KONINKLIJKE AHOLD NV | | | 326,725 | | | 358,128 | | | | |
| 2,539 | | KONINKLIJKE DSM NV | | | 86,313 | | | 144,550 | | | | |
| 72,374 | | KONINKLIJKE KPN NV | | | 1,004,855 | | | 1,056,090 | | | | |
| 18,384 | | KONINKLIJKE PHILIPS ELECTRON | | | 321,594 | | | 563,055 | | | | |
| 3,200 | | NUTRECO NV | | | 177,318 | | | 242,839 | | | | |
| 2,977 | | QIAGEN N.V. (b) | | | 47,317 | | | 58,199 | | | | |
| 3,773 | | RANDSTAD HOLDING NV (b) | | | 73,225 | | | 199,150 | | | | |
| 11,940 | | REED ELSEVIER NV | | | 133,131 | | | 147,697 | | | | |
| 94,127 | | ROYAL DUTCH SHELL PLC-A SHS | | | 2,363,341 | | | 3,128,860 | | | | |
| 46,554 | | ROYAL DUTCH SHELL PLC-B SHS | | | 1,089,498 | | | 1,535,085 | | | | |
| 6,056 | | SBM OFFSHORE NV | | | 85,999 | | | 135,670 | | | | |
| 2,181 | | SNS REAAL (b) | | | 6,124 | | | 9,297 | | | | |
| 8,454 | | TNT NV | | | 150,536 | | | 223,113 | | | | |
| 28,402 | | UNILEVER NV-CVA | | | 579,364 | | | 884,302 | | | | |
| 6,193 | | WOLTERS KLUWER (b) | | | 101,075 | | | 135,719 | | | | |
| | | | | | 8,981,759 | | | 12,256,500 | | | 3.54 | % |
New Zealand: | | | | | | | | | | | |
| 7,267 | | CONTACT ENERGY LTD (b) | | | 21,310 | | | 35,265 | | | | |
| 14,246 | | FLETCHER BUILDING LTD | | | 48,135 | | | 85,000 | | | | |
| 25,416 | | TELECOM CORP OF NEW ZEALAND | | | 36,442 | | | 42,960 | | | | |
| | | | | | 105,887 | | | 163,225 | | | 0.05 | % |
Norway: | | | | | | | | | | |
| 3,900 | | AKER SOLUTIONS ASA | | | 51,913 | | | 66,336 | | | | |
| 17,600 | | DNB NOR ASA | | | 139,946 | | | 247,029 | | | | |
| 3,600 | | FRED OLSEN ENERGY ASA (b) | | | 100,130 | | | 159,051 | | | | |
| 31,521 | | NORSK HYDRO ASA | | | 131,018 | | | 230,178 | | | | |
| 12,000 | | ORKLA ASA | | | 80,407 | | | 116,605 | | | | |
| 20,900 | | RENEWABLE ENERGY CORP ASA (b) | | | 51,708 | | | 63,720 | | | | |
| 29,448 | | STATOIL ASA | | | 576,188 | | | 699,473 | | | | |
| 10,900 | | TELENOR ASA | | | 62,904 | | | 177,087 | | | | |
| 4,000 | | YARA INTERNATIONAL ASA | | | 109,527 | | | 231,359 | | | | |
| | | | | | 1,303,741 | | | 1,990,838 | | | 0.57 | % |
Papua New Guinea: | | | | | | | | | | |
| 1,700 | | OIL SEARCH LTD | | | 11,427 | | | 12,235 | | | | |
| | | | | | 11,427 | | | 12,235 | | | 0.00 | % |
Portugal: | | | | | | | | | | | | |
| 14,486 | | BANCO ESPIRITO SANTO-REG | | | 65,645 | | | 55,749 | | | | |
| 3,480 | | BRISA-AUTO-ESTRADAS PORTUGAL | | | 21,107 | | | 24,270 | | | | |
| 8,464 | | CIMPOR-CIMENTOS DE PORTUGAL | | | 39,214 | | | 57,343 | | | | |
| 12,192 | | EDP-ENERGIAS DE PORTUGAL SA | | | 41,221 | | | 40,583 | | | | |
| 2,881 | | GALP ENERGIA SGPS SA-B SHRS | | | 35,487 | | | 55,206 | | | | |
| 6,408 | | JERONIMO MARTINS | | | 30,015 | | | 97,616 | | | | |
| 37,175 | | PORTUGAL TELECOM SGPS SA-REG | | | 459,082 | | | 416,285 | | | | |
| | | | | | 691,771 | | | 747,052 | | | 0.22 | % |
Russia: | | | | | | | | | | | |
| 62,800 | | ROSNEFT OJSC-REG S GDR (b) | | | 424,989 | | | 449,648 | | | | |
| 25,200 | | TMK-GDR REG S (b) | | | 417,226 | | | 520,632 | | | | |
| | | | | | 842,215 | | | 970,280 | | | 0.28 | % |
Singapore: | | | | | | | | | | | |
| 30,000 | | ASCENDAS REAL ESTATE INV TRT | | | 49,252 | | | 48,388 | | | | |
| 109,000 | | CAPITACOMMERCIAL TRUST | | | 120,707 | | | 127,398 | | | | |
| 49,500 | | CAPITALAND LTD | | | 85,171 | | | 143,095 | | | | |
| 36,000 | | CAPITAMALL TRUST (b) | | | 34,178 | | | 54,699 | | | | |
| 11,000 | | CITY DEVELOPMENTS LTD | | | 70,839 | | | 107,654 | | | | |
| 51,000 | | COSCO CORP SINGAPORE LTD | | | 48,134 | | | 85,041 | | | | |
| 106,500 | | DBS GROUP HOLDINGS LTD | | | 846,917 | | | 1,188,335 | | | | |
| 13,000 | | FORTUNE REIT | | | 5,158 | | | 6,690 | | | | |
| | |
See accompanying notes to financial statements. | 72 | (Continued) |
CLEARWATER INVESTMENT TRUST
Schedule of Investments - Clearwater International Fund
December 31, 2010
| | | | | | | | | | | | | |
Shares | | Security | | Cost | | Fair
value (a) | | Percent
of
net assets | |
Singapore (Cont’d): | | | | | | | | | | |
| 75,000 | | FRASER AND NEAVE LTD | | $ | 214,133 | | | 374,598 | | | | |
| 118,800 | | GENTING SINGAPORE PLC (b) | | | 60,943 | | | 202,725 | | | | |
| 9,000 | | HI-P INTERNATIONAL LTD (b) | | | 6,828 | | | 7,153 | | | | |
| 11,000 | | JARDINE CYCLE & CARRIAGE LTD | | | 97,679 | | | 313,704 | | | | |
| 196,200 | | KEPPEL CORP LTD | | | 1,125,391 | | | 1,730,579 | | | | |
| 4,000 | | K-GREEN TRUST (b) | | | 1,432 | | | 3,319 | | | | |
| 28,000 | | OLAM INTERNATIONAL LTD | | | 32,014 | | | 68,507 | | | | |
| 44,000 | | OVERSEA-CHINESE BANKING CORP | | | 141,236 | | | 338,732 | | | | |
| 93,000 | | SEMBCORP INDUSTRIES LTD | | | 228,763 | | | 372,471 | | | | |
| 22,000 | | SEMBCORP MARINE LTD | | | 32,803 | | | 92,054 | | | | |
| 14,000 | | SIA ENGINEERING CO LTD | | | 20,258 | | | 46,144 | | | | |
| 12,000 | | SINGAPORE AIRLINES LTD | | | 70,334 | | | 143,060 | | | | |
| 13,000 | | SINGAPORE EXCHANGE LTD | | | 40,226 | | | 85,291 | | | | |
| 25,000 | | SINGAPORE PRESS HOLDINGS LTD (b) | | | 41,026 | | | 77,530 | | | | |
| 23,000 | | SINGAPORE TECH ENGINEERING | | | 52,809 | | | 61,291 | | | | |
| 137,000 | | SINGAPORE TELECOM LTD | | | 242,938 | | | 325,587 | | | | |
| 50,000 | | STARHILL GLOBAL REIT | | | 20,684 | | | 24,350 | | | | |
| 99,000 | | SUNTEC REIT | | | 98,210 | | | 115,710 | | | | |
| 8,000 | | UNITED ENGINEERS LTD (b) | | | 15,529 | | | 16,955 | | | | |
| 25,000 | | UNITED OVERSEAS BANK LTD | | | 160,579 | | | 354,534 | | | | |
| 47,000 | | UOL GROUP LIMITED (b) | | | 121,410 | | | 173,955 | | | | |
| | | | | | 4,085,581 | | | 6,689,549 | | | 1.93 | % |
South Korea: | | | | | | | | | | |
| 430 | | CJ CHEILJEDANG CORP (b) | | | 91,936 | | | 82,219 | | | | |
| 890 | | CJ CORP (b) | | | 51,821 | | | 61,874 | | | | |
| 1,360 | | DAELIM INDUSTRIAL CO LTD (b) | | | 82,546 | | | 140,805 | | | | |
| 2,360 | | DAISHIN SECURITIES CO. (b) | | | 29,927 | | | 34,415 | | | | |
| 2,690 | | DONGBU INSURANCE CO LTD (b) | | | 83,391 | | | 106,661 | | | | |
| 890 | | DOOSAN CORP (b) | | | 99,096 | | | 120,768 | | | | |
| 3,090 | | GS HOLDINGS (b) | | | 112,129 | | | 177,520 | | | | |
| 180 | | GS HOME SHOPPING INC (b) | | | 11,109 | | | 17,335 | | | | |
| 1,260 | | HALLA CLIMATE CONTROL (b) | | | 24,557 | | | 22,205 | | | | |
| 6,843 | | HANA FINANCIAL GROUP | | | 170,292 | | | 261,082 | | | | |
| 4,850 | | HANWHA CHEMICAL CORP (b) | | | 61,676 | | | 132,479 | | | | |
| 1,220 | | HYOSUNG CORPORATION (b) | | | 119,364 | | | 113,948 | | | | |
| 790 | | HYUNDAI MIPO DOCKYARD (b) | | | 67,775 | | | 155,926 | | | | |
| 150 | | HYUNDAI STEEL CO (b) | | | 13,008 | | | 16,455 | | | | |
| 9,730 | | INDUSTRIAL BANK OF KOREA (b) | | | 119,744 | | | 160,752 | | | | |
| 6,050 | | KANGWON LAND INC (b) | | | 107,865 | | | 148,998 | | | | |
| 2,190 | | KIA MOTORS CORPORATION (b) | | | 57,502 | | | 97,642 | | | | |
| 828 | | KOREA ZINC CO LTD (b) | | | 90,286 | | | 201,729 | | | | |
| 3,430 | | KT&G CORP (b) | | | 189,118 | | | 195,542 | | | | |
| 279 | | LOTTE CHILSUNG BEVERAGE CO (b) | | | 180,038 | | | 236,003 | | | | |
| 510 | | LOTTE SHOPPING CO (b) | | | 104,433 | | | 212,556 | | | | |
| 1,610 | | MIRAE ASSET SECURITIES CO LT | | | 78,699 | | | 84,976 | | | | |
| 1,020 | | NH INVESTMENT & SECURITIES | | | 9,590 | | | 9,347 | | | | |
| 100 | | NHN CORP (b) | | | 13,537 | | | 20,002 | | | | |
| 510 | | SAMSUNG C&T CORP (b) | | | 31,067 | | | 35,456 | | | | |
| 120 | | SAMSUNG FIRE & MARINE INS (b) | | | 18,522 | | | 23,791 | | | | |
| 7,850 | | SAMSUNG HEAVY INDUSTRIES (b) | | | 181,434 | | | 284,977 | | | | |
| 250 | | SAMYANG CORPORATION (b) | | | 14,802 | | | 15,376 | | | | |
| 20 | | SHINSEGAE CO LTD (b) | | | 8,483 | | | 10,820 | | | | |
| 310 | | SK ENERGY CO LTD (b) | | | 38,846 | | | 52,991 | | | | |
| 1,820 | | SK HOLDINGS CO LTD (b) | | | 155,087 | | | 223,711 | | | | |
| 5,810 | | SK NETWORKS CO LTD (b) | | | 55,710 | | | 68,344 | | | | |
| 500 | | WOONGJIN COWAY CO LTD (b) | | | 16,420 | | | 17,755 | | | | |
| | | | | | 2,489,810 | | | 3,544,460 | | | 1.02 | % |
Spain: | | | | | | | | | | |
| 4,500 | | ABENGOA (b) | | | 129,412 | | | 110,493 | | | | |
| 4,082 | | ABERTIS INFRAESTRUCTURAS SA | | | 61,599 | | | 73,393 | | | | |
| 5,493 | | ACERINOX SA | | | 66,922 | | | 96,340 | | | | |
| 2,447 | | ACS ACTIVIDADES CONS Y SERV | | | 105,135 | | | 114,691 | | | | |
| 66,802 | | BANCO BILBAO VIZCAYA ARGENTA | | | 585,775 | | | 674,850 | | | | |
| 13,498 | | BANCO DE SABADELL SA | | | 64,346 | | | 53,209 | | | | |
| 51,061 | | BANCO POPULAR ESPANOL | | | 343,582 | | | 262,009 | | | | |
| 125,228 | | BANCO SANTANDER SA (b) | | | 953,246 | | | 1,326,664 | | | | |
| 173 | | CONSTRUCC Y AUX DE FERROCARR | | | 78,797 | | | 90,158 | | | | |
| | |
See accompanying notes to financial statements. | 73 | (Continued) |
CLEARWATER INVESTMENT TRUST
Schedule of Investments - Clearwater International Fund
December 31, 2010
| | | | | | | | | | | | | |
Shares | | Security | | Cost | | Fair
value (a) | | Percent
of
net assets | |
Spain (Cont’d): | | | | | | | | | | |
| 24,405 | | CRITERIA CAIXACORP SA | | | $98,086 | | | 129,860 | | | | |
| 2,531 | | ENAGAS | | | 38,143 | | | 50,444 | | | | |
| 16,085 | | FERROVIAL SA | | | 79,147 | | | 159,808 | | | | |
| 3,797 | | FOMENTO DE CONSTRUC Y CONTRA | | | 150,651 | | | 99,752 | | | | |
| 2,805 | | GAMESA CORP TECNOLOGICA SA (b) | | | 23,996 | | | 21,410 | | | | |
| 21,362 | | GAS NATURAL SDG SA | | | 318,614 | | | 327,988 | | | | |
| 2,222 | | GRIFOLS SA | | | 33,845 | | | 30,286 | | | | |
| 13,908 | | IBERDROLA RENOVABLES SA | | | 53,405 | | | 49,362 | | | | |
| 65,599 | | IBERDROLA SA | | | 462,139 | | | 505,613 | | | | |
| 4,941 | | INDITEX | | | 202,632 | | | 369,940 | | | | |
| 16,420 | | MAPFRE SA | | | 54,049 | | | 45,595 | | | | |
| 2,111 | | RED ELECTRICA CORPORACION SA | | | 88,270 | | | 99,295 | | | | |
| 13,070 | | REPSOL YPF SA | | | 249,017 | | | 364,148 | | | | |
| 68,940 | | TELEFONICA SA | | | 1,394,523 | | | 1,562,863 | | | | |
| 1,030 | | ZARDOYA OTIS SA | | | 15,577 | | | 14,507 | | | | |
| | | | | | 5,650,908 | | | 6,632,678 | | | 1.91 | % |
Sweden: | | | | | | | | | | |
| 4,550 | | ALFA LAVAL AB | | | 35,782 | | | 95,860 | | | | |
| 7,400 | | ASSA ABLOY AB-B | | | 89,466 | | | 208,495 | | | | |
| 9,200 | | ATLAS COPCO AB-A SHS | | | 72,813 | | | 232,126 | | | | |
| 19,000 | | ATLAS COPCO AB-B SHS | | | 331,283 | | | 429,672 | | | | |
| 1,910 | | AXFOOD AB (b) | | | 64,408 | | | 71,421 | | | | |
| 1,100 | | CDON GROUP (b) | | | 2,942 | | | 5,086 | | | | |
| 17,000 | | ELECTROLUX AB-SER B | | | 320,805 | | | 482,766 | | | | |
| 49,000 | | ERICSSON LM-B SHS | | | 453,735 | | | 569,350 | | | | |
| 3,200 | | GETINGE AB-B SHS | | | 37,616 | | | 67,037 | | | | |
| 15,150 | | HENNES & MAURITZ AB-B SHS | | | 327,861 | | | 504,563 | | | | |
| 3,700 | | HEXAGON AB-B SHS | | | 56,830 | | | 79,327 | | | | |
| 400 | | HOLMEN AB-B SHARES | | | 8,156 | | | 13,167 | | | | |
| 17,500 | | HUSQVARNA AB-B SHS | | | 64,201 | | | 146,097 | | | | |
| 11,800 | | INVESTOR AB-B SHS | | | 161,782 | | | 252,463 | | | | |
| 3,000 | | KINNEVIK INVESTMENT AB-B (b) | | | 51,225 | | | 61,108 | | | | |
| 22,800 | | MEDA AB-A SHS (b) | | | 179,779 | | | 173,564 | | | | |
| 1,100 | | MODERN TIMES GROUP-B SHS | | | 50,174 | | | 72,779 | | | | |
| 8,000 | | NCC AB-B SHS (b) | | | 132,699 | | | 175,800 | | | | |
| 50,800 | | NORDEA BANK AB (b) | | | 331,033 | | | 552,500 | | | | |
| 1,600 | | RATOS AB-B SHS | | | 51,337 | | | 59,234 | | | | |
| 13,973 | | SANDVIK AB | | | 86,678 | | | 272,362 | | | | |
| 7,800 | | SCANIA AB-B SHS | | | 65,585 | | | 179,407 | | | | |
| 30,200 | | SECURITAS AB-B SHS | | | 334,777 | | | 353,151 | | | | |
| 20,400 | | SKANDINAVISKA ENSKILDA BAN-A | | | 71,603 | | | 170,156 | | | | |
| 5,600 | | SKANSKA AB-B SHS | | | 76,386 | | | 110,987 | | | | |
| 13,800 | | SKF AB-B SHARES | | | 141,836 | | | 393,124 | | | | |
| 5,400 | | SSAB AB-A SHARES | | | 48,129 | | | 90,725 | | | | |
| 41,976 | | SVENSKA CELLULOSA AB-B SHS | | | 412,152 | | | 662,796 | | | | |
| 6,900 | | SVENSKA HANDELSBANKEN-A SHS | | | 116,989 | | | 220,465 | | | | |
| 18,300 | | SWEDBANK AB - A SHARES (b) | | | 58,744 | | | 255,216 | | | | |
| 6,600 | | SWEDISH MATCH AB | | | 95,099 | | | 191,058 | | | | |
| 3,900 | | TELE2 AB-B SHS | | | 34,548 | | | 80,948 | | | | |
| 36,500 | | TELIASONERA AB | | | 199,153 | | | 289,251 | | | | |
| 15,032 | | TRELLEBORG AB-B SHS | | | 103,955 | | | 158,906 | | | | |
| 5,800 | | VOLVO AB-A SHS (b) | | | 29,472 | | | 99,170 | | | | |
| 58,100 | | VOLVO AB-B SHS (b) | | | 689,395 | | | 1,023,644 | | | | |
| | | | | | 5,388,428 | | | 8,803,781 | | | 2.54 | % |
Switzerland: | | | | | | | | | �� | |
| 41,343 | | ABB LTD-REG (b) | | | 560,773 | | | 921,116 | | | | |
| 17,000 | | ABB LTD-SPON ADR (b)(c) | | | 269,654 | | | 381,650 | | | | |
| 1,591 | | ACTELION LTD-REG (b) | | | 73,405 | | | 87,129 | | | | |
| 36,970 | | ADECCO SA-REG | | | 1,734,763 | | | 2,422,026 | | | | |
| 300 | | ALLREAL HOLDING AG-REG | | | 41,087 | | | 43,704 | | | | |
| 2,727 | | ARYZTA AG (b) | | | 68,593 | | | 125,860 | | | | |
| 2,289 | | BALOISE HOLDING AG - REG | | | 185,242 | | | 222,798 | | | | |
| 148 | | BKW FMB ENERGIE AG | | | 11,039 | | | 11,192 | | | | |
| 8,185 | | CIE FINANCIERE RICHEMON-BR A | | | 130,638 | | | 481,509 | | | | |
| 12,459 | | CLARIANT AG-REG (b) | | | 179,875 | | | 252,398 | | | | |
| 18,108 | | CREDIT SUISSE GROUP AG-REG | | | 547,506 | | | 729,608 | | | | |
| 3,082 | | EFG INTERNATIONAL AG | | | 32,625 | | | 42,195 | | | | |
| | |
See accompanying notes to financial statements. | 74 | (Continued) |
|
CLEARWATER INVESTMENT TRUST |
Schedule of Investments - Clearwater International Fund |
December 31, 2010 |
| | | | | | | | | | | | | |
Shares | | Security | | Cost | | Fair
value (a) | | Percent
of
net assets | |
Switzerland (Cont’d): | | | | | | | | | | |
| 120 | | FORBO HOLDING AG-REG | | $ | 63,400 | | | 75,728 | | | | |
| 7,257 | | GAM HOLDING AG (b) | | | 78,489 | | | 119,925 | | | | |
| 953 | | GEBERIT AG-REG | | | 83,492 | | | 220,380 | | | | |
| 476 | | GIVAUDAN-REG | | | 276,626 | | | 513,714 | | | | |
| 560 | | HELVETIA HOLDING AG-REG | | | 180,864 | | | 215,333 | | | | |
| 3,916 | | HOLCIM LTD-REG | | | 168,212 | | | 295,923 | | | | |
| 3,728 | | JULIUS BAER GROUP LTD | | | 78,764 | | | 174,652 | | | | |
| 967 | | KUEHNE & NAGEL INTL AG-REG | | | 57,750 | | | 134,460 | | | | |
| 55 | | LINDT & SPRUENGLI AG-PC | | | 90,640 | | | 166,249 | | | | |
| 3 | | LINDT & SPRUENGLI AG-REG | | | 75,352 | | | 96,585 | | | | |
| 6,301 | | LOGITECH INTERNATIONAL-REG (b) | | | 70,452 | | | 119,964 | | | | |
| 863 | | LONZA GROUP AG-REG | | | 59,400 | | | 69,184 | | | | |
| 91,645 | | NESTLE SA-REG | | | 3,275,296 | | | 5,366,809 | | | | |
| 2,629 | | NOBEL BIOCARE HOLDING AG-REG | | | 45,806 | | | 49,575 | | | | |
| 84,967 | | NOVARTIS AG-REG | | | 3,516,081 | | | 4,993,916 | | | | |
| 9,216 | | PANALPINA WELTTRANSPORT -REG (b) | | | 638,290 | | | 1,187,826 | | | | |
| 19,480 | | PARGESA HOLDING SA-BR | | | 1,361,824 | | | 1,654,370 | | | | |
| 1,450 | | PARGESA HOLDING SA-BR | | | 94,567 | | | 123,144 | | | | |
| 12,394 | | ROCHE HOLDING AG-GENUSSCHEIN | | | 1,602,744 | | | 1,816,165 | | | | |
| 4,279 | | SCHINDLER HOLDING AG-REG | | | 355,774 | | | 512,148 | | | | |
| 755 | | SCHINDLER HOLDING-PART CERT | | | 34,888 | | | 89,315 | | | | |
| 121 | | SGS SA-REG | | | 130,564 | | | 203,063 | | | | |
| 27 | | SIKA AG-BR | | | 52,359 | | | 59,231 | | | | |
| 648 | | SONOVA HOLDING AG-REG | | | 35,616 | | | 83,658 | | | | |
| 65,678 | | STMICROELECTRONICS NV | | | 438,245 | | | 679,205 | | | | |
| 257 | | STRAUMANN HOLDING AG-REG | | | 41,380 | | | 58,826 | | | | |
| 1,872 | | SULZER AG-REG | | | 96,613 | | | 285,328 | | | | |
| 475 | | SWATCH GROUP AG/THE-BR | | | 59,791 | | | 211,760 | | | | |
| 2,391 | | SWATCH GROUP AG/THE-REG | | | 61,462 | | | 192,830 | | | | |
| 3,454 | | SWISS LIFE HOLDING AG-REG (b) | | | 283,601 | | | 499,485 | | | | |
| 9,001 | | SWISS REINSURANCE CO LTD-REG | | | 262,435 | | | 484,264 | | | | |
| 451 | | SWISSCOM AG-REG | | | 152,347 | | | 198,311 | | | | |
| 1,734 | | SYNGENTA AG-REG | | | 377,174 | | | 507,259 | | | | |
| 1,901 | | TAMEDIA AG-REG (b) | | | 113,489 | | | 252,335 | | | | |
| 4,746 | | TRANSOCEAN LTD (b) | | | 325,038 | | | 325,140 | | | | |
| 59,520 | | TYCO ELECTRONICS LTD | | | 1,190,727 | | | 2,107,008 | | | | |
| 19,300 | | UBS AG-REG (b) | | | 318,432 | | | 316,876 | | | | |
| 400 | | UNIQUE ZURICH AIRPORT-REG (b) | | | 144,877 | | | 163,436 | | | | |
| 36,346 | | XSTRATA PLC | | | 298,411 | | | 853,105 | | | | |
| 3,853 | | ZURICH FINANCIAL SERVICES AG | | | 705,997 | | | 998,151 | | | | |
| 4,513 | | WOLSELEY PLC (b) | | | 70,476 | | | 143,958 | | | | |
| | | | | | 21,202,945 | | | 32,339,779 | | | 9.34 | % |
Taiwan: | | | | | | | | | | |
| 33,600 | | HON HAI PRECISION-GDR REG S (c) | | | 258,773 | | | 271,152 | | | | |
| | | | | | 258,773 | | | 271,152 | | | 0.08 | % |
Turkey: | | | | | | | | | | |
| 36,900 | | TURKCELL ILETISIM HIZMET-ADR (c) | | | 556,561 | | | 632,097 | | | | |
| 46,757 | | TURKIYE IS BANKASI-C | | | 139,566 | | | 166,552 | | | | |
| | | | | | 696,127 | | | 798,649 | | | 0.23 | % |
United States: | | | | | | | | | | |
| 19,703 | | ARCH CAPITAL GROUP LTD (b) | | | 1,157,280 | | | 1,734,849 | | | | |
| 5,526 | | BROOKFIELD PROPERTIES CORP | | | 32,353 | | | 96,871 | | | | |
| 13,600 | | CENTRAL EURO DISTRIBUTION CP (b) | | | 387,094 | | | 311,439 | | | | |
| 3,384 | | KRAFT FOODS INC-CLASS A | | | 10,684 | | | 106,630 | | | | |
| 1,159 | | SYNTHES INC (b) | | | 141,367 | | | 156,570 | | | | |
| 7,405 | | THOMSON REUTERS CORP | | | 187,233 | | | 276,287 | | | | |
| | | | | | 1,916,011 | | | 2,682,646 | | | 0.77 | % |
| | Sub-total Common Stock: | | | 241,739,411 | | | 335,562,959 | | | | |
| | | | | | | | | | | | | |
Preferred Stocks: | | | | | | | | | | |
| Austria: | | | | | | | | | | |
| 1,003 | | VIENNA INSURANCE GROUP AG | | | 49,974 | | | 52,130 | | | | |
| | | | | | 49,974 | | | 52,130 | | | 0.02 | % |
| Brazil: | | | | | | | | | | |
| 15,200 | | PETROLEO BRASILEIRO-SPON ADR (c) | | | 481,349 | | | 519,384 | | | | |
| 29,300 | | VALE SA-SP PREF ADR (c) | | | 636,136 | | | 885,446 | | | | |
| | | | | | 1,117,485 | | | 1,404,830 | | | 0.40 | % |
| | |
See accompanying notes to financial statements. | 75 | (Continued) |
|
CLEARWATER INVESTMENT TRUST |
Schedule of Investments - Clearwater International Fund |
December 31, 2010 |
| | | | | | | | | | | | | |
Shares | | Security | | Cost | | Fair
value (a) | | Percent
of
net assets | |
Germany: | | | | | | | | | | |
| 1,521 | | BAYERISCHE MOTOREN WERKE-PFD | | $ | 49,611 | | | 78,250 | | | | |
| 1,114 | | FRESENIUS SE-PREF | | | 51,175 | | | 95,375 | | | | |
| 2,360 | | HENKEL AG & CO KGAA VORZUG | | | 60,940 | | | 146,754 | | | | |
| 1,443 | | PORSCHE AUTOMOBIL HLDG-PFD | | | 70,934 | | | 115,039 | | | | |
| 861 | | RWE AG-NON VTG PFD | | | 54,598 | | | 55,214 | | | | |
| 3,087 | | VOLKSWAGEN AG-PFD | | | 235,465 | | | 500,785 | | | | |
| | | | | | 522,723 | | | 991,417 | | | 0.29 | % |
| | | Sub-total Preferred Stock: | | | 1,690,182 | | | 2,448,377 | | | | |
| | | | | | | | | | | | | |
| Corporate Bonds: | | | | | | | | | | |
| United Kingdom: | | | | | | | | | | |
| 163,772 | | HSBC BANK PLC | | | | | | | | | | |
| | | 0.00%, 9/25/11 | | | 751,620 | | | 819,483 | | | | |
| | | Sub-total Corporate Bonds: | | | 751,620 | | | 819,483 | | | 0.24 | % |
| | | | | | | | | | | | | |
| Rights: | | | | | | | | | �� | |
| 3,879 | | IVANHOE MINES LTD-RT-W/I | | | 1,342 | | | 5,431 | | | | |
| | | Sub-total Rights: | | | 1,342 | | | 5,431 | | | 0.00 | % |
| | | | | | | | | | | | | |
| Warrants: | | | | | | | | | | |
| | | | | | | | | | | | | |
| 11,384 | | UBI BANCA SCPA-CW11 (b) | | | - | | | 48 | | | | |
| | | Sub-total Warrants: | | | - | | | 48 | | | 0.00 | % |
| | | | | | | | | | | | | |
| Short-term investments: | | | | | | | | | | |
| 7,747,967 | | NORTHERN INSTL GOVERNMENT SELECT PORTFOLIO, 0.01% (d) | | | 7,747,967 | | | 7,747,967 | | | | |
| | | Sub-total Short-term investments: | | | 7,747,967 | | | 7,747,967 | | | 2.24 | % |
| Grand total (e) | | $ | 251,930,522 | | | 346,584,265 | | | 100.05 | % |
| | |
Notes to Schedule of Investments: |
(a) | | Securities are valued in accordance with procedures described in Note 2 to the financial statements. |
(b) | | Currently non-income producing assets. |
(c) | | Securities are American Depository Receipts of companies based outside of the United States representing 2.82% of net assets. |
(d) | | The short-term investment is a money market portfolio of the investment company, Northern Institutional Funds. |
(e) | | At December 31, 2010, the cost for Federal income tax purposes was $253,209,535. The aggregate gross unrealized appreciation |
| | and depreciation of investments in securities based of this cost were as follows: |
| | | | | | | | | | | | | |
| | | Gross unrealized appreciation | | $ | 95,384,386 | | | | | | | |
| | | Gross unrealized depreciation | | | (2,009,656) | | | | | | | |
| Net unrealized appreciation | | $ | 93,374,730 | | | | | | | |
| | |
See accompanying notes to financial statements. | 76 | (Continued) |
|
CLEARWATER INVESTMENT TRUST |
Schedule of Investments - Clearwater International Fund |
December 31, 2010 |
At December 31, 2010, the Clearwater International Fund’s investments were denominated in the following currencies:
| | | | |
Concentration by Currency | | | Percent of
Long-Term
Investments | |
Euro | | | 22.78 | % |
British Pound | | | 18.81 | |
Japanese Yen | | | 18.67 | |
United States Dollar | | | 12.80 | |
Swiss Franc | | | 8.36 | |
Australian Dollar | | | 6.01 | |
All other currencies less than 5% | | | 12.57 | |
| | | 100.00 | % |
At December 31, 2010, the Clearwater International Fund had outstanding forward foreign currency exchange contracts as follows:
| | | | | | | | | | | | | | | |
Contracts to
Deliver Currency | | Amount
(Local
Currency) | | In Exchange
for Currency | | Amount
(Local
Currency) | | Settlement
Date | | Unrealized
Gain (Loss) | |
United States Dollar | | | 60,667 | | Euro | | | 45,849 | | | 1/3/2011 | | | 599 | |
United States Dollar | | | 14,883 | | Euro | | | 11,251 | | | 1/3/2011 | | | 150 | |
United States Dollar | | | 70,973 | | Hong Kong Dollar | | | 552,312 | | | 1/3/2011 | | | 90 | |
United States Dollar | | | 70,812 | | Norwegian Krone | | | 418,527 | | | 1/3/2011 | | | 903 | |
United States Dollar | | | 103,169 | | Swedish Kronor | | | 701,851 | | | 1/3/2011 | | | 1,172 | |
United States Dollar | | | 1,013 | | British Pound | | | 653 | | | 1/4/2011 | | | 6 | |
United States Dollar | | | 69,981 | | British Pound | | | 45,278 | | | 1/4/2011 | | | 608 | |
United States Dollar | | | 47,792 | | British Pound | | | 30,921 | | | 1/4/2011 | | | 415 | |
United States Dollar | | | 47,495 | | Euro | | | 35,810 | | | 1/4/2011 | | | 357 | |
United States Dollar | | | 29,410 | | Japanese Yen | | | 2,412,517 | | | 1/4/2011 | | | 304 | |
United States Dollar | | | 28,744 | | Euro | | | 21,468 | | | 1/5/2011 | | | (56 | ) |
United States Dollar | | | 13,390 | | Japanese Yen | | | 1,099,476 | | | 1/5/2011 | | | 152 | |
United States Dollar | | | 65,909 | | Japanese Yen | | | 5,369,618 | | | 1/5/2011 | | | 229 | |
United States Dollar | | | 29,622 | | Japanese Yen | | | 2,414,471 | | | 1/6/2011 | | | 118 | |
| | | | | | | | | | | | | $ | 5,047 | |
At December 31, 2010, the Clearwater International Fund had outstanding spot foreign currency transactions as follows:
| | | | | | | | | | | | | | | |
Contracts to
Deliver Currency | | Amount (Local
Currency) | | In Exchange
for Currency | | Amount
(Local
Currency) | | Settlement
Date | | Unrealized
Gain (Loss) | |
Hong Kong Dollar | | | 12,828 | | United States Dollar | | | 1,648 | | | 1/3/2011 | | $ | (2 | ) |
Hong Kong Dollar | | | 9,570 | | United States Dollar | | | 1,230 | | | 1/3/2011 | | | (2 | ) |
United States Dollar | | | 8,458 | | Korean Won | | | 9,606,380 | | | 1/3/2011 | | | 7 | |
Norwegian Krone | | | 25,581 | | United States Dollar | | | 4,378 | | | 1/4/2011 | | | (5 | ) |
| | | | | | | | | | | | | $ | (2 | ) |
| | |
See accompanying notes to financial statements. | 77 | (Continued) |
|
CLEARWATER INVESTMENT TRUST
|
Schedule of Investments – Clearwater International Fund |
December 31, 2010 |
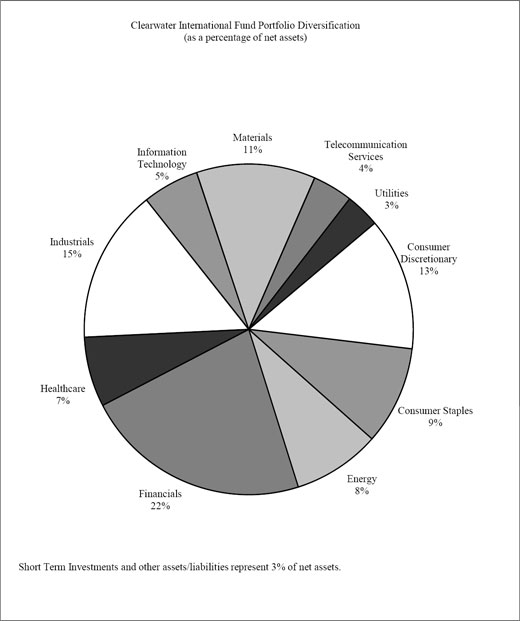
| |
See accompanying notes to financial statements. | 78 |
Item 2. Code of Ethics
| (a) | As of the end of the period covered by this Report, the Board of Trustees (the “Trustees”) of Clearwater Investment Trust (the “Trust”), adopted a code of ethics that applies to the Trust’s President/Principal Executive Officer and Chief Financial Officer/Treasurer or persons performing similar function whether or not those individuals are employed by the Trust or third parties. |
| | |
| (c) | During the period covered by this Report the Trustees adopted an amendment to the Trust’s code of ethics referred to in (a) above to augment the provisions of the Trust’s code of ethics that address honest and ethical conduct, including ethical handling of actual or apparent conflicts of interest between personal and professional relationships; full, fair, accurate, timely, and understandable disclosure in reports and documents that the Trust files with, or submits to, the Securities and Exchange Commission and in other public communications made by the Trust; and the prompt internal reporting of violations of the Trust’s code of ethics to an appropriate person or persons identified in the Trust’s code of ethics. |
| | |
| (d) | During the period covered by this report, the Trustees have granted no waivers, including implicit waivers, from any provisions of the Trust’s code of ethics referred to in (a) above. |
| | |
| (e) | Not applicable. |
| | |
| (f) | See Item 12(a). |
Item 3. Audit Committee Financial Expert
The Board of Trustees of the Trust consists of six members, four of whom are Independent Trustees as defined by the Investment Company Act of 1940. The Board of Trustees does not include an “audit committee financial expert” as defined by Section 407 of the Sarbanes-Oxley Act of 2002 and the rules promulgated thereunder. Given the restrictive nature of the definition of an “audit committee financial expert”, the Trustees have determined that no current member of the Board of Trustees of the Trust qualifies as an “audit committee financial expert”. Furthermore, the Trustees have determined that given the nature of investment company financial statements in general and the investment policies of the Trust’s fund offerings in particular that the independent trustees possess the necessary skills and experience to perform the functions of the audit committee.
Item 4. Principal Accountant Fees and Services
| | (a) | Audit Fees | 2010 = $78,000 | 2009 = $62,675 |
| | | | | |
| | (b) | Audit-Related Fees | 2010 = $0 | 2009 = $0 |
| | | | | |
| | (c) | Tax Fees | 2010 = $20,000 | 2009 = $0 |
| | | | | |
| | (d) | All Other Fees | 2010 = $0 | 2009 = $0 |
| | | | | |
| | (e) | | | |
| | | | | |
| | | | 1. | The Independent Trustees have not adopted pre-approval policies and procedures regarding the provision of audit or non-audit services to the trust, as described in paragraph (c)(7) of Rule 2-01 of Regulation S-X, as they require that all such proposed services be approved by them in advance. |
| | | | | | | |
| | | | 2. | No services were pre-approved by the Independent Trustees pursuant to paragraph (c)(7) of Rule 2-01 of Regulation S-X. |
| | | | | |
| | (f) | Not applicable. |
| | | | | |
| | (g) | Non-Audit Related Fees Provided to the Trust or to the Trust’s Investment Adviser. |
| | | | | |
| | | 2010 = $0 | 2009 = $0 | |
| | | | | |
| | (h) | Not applicable. |
Item 5. Audit Committee of Listed Registrants
The Audit Committee includes the four members of the Board of Trustees who have been deemed independent. The Audit Committee has adopted a charter.
Item 6. Investments
See Item 1.
Item 7. Disclosure of Proxy Voting Policies and Procedures for Closed-End Management Investment Companies
Not applicable (the Trust is an open-end management investment company)
Item 8. Portfolio Managers of Closed-End Management Investment Companies
Not applicable (the Trust is an open-end management investment company)
Item 9. Purchases of Equity Securities by Closed-End Management Investment Company and Affiliated Purchasers
Not applicable (the Trust is an open-end management investment company)
Item 10. Submission of Matters to a Vote of Security Holders
There have been no material changes to the procedures by which shareholders may recommend nominees to the Board of Trustees.
Item 11. Controls and Procedures
| (a) | The Trust’s principal executive officer and principal financial officer have concluded that the Trust’s disclosure controls and procedures (as defined in Rule 30a-3(c) under the Investment company Act of 1940, as amended) are effective based on their evaluation of these controls and procedures as of a date within 90 days of the filing date of this document. |
| | |
| (b) | There have been no significant changes in the Trust’s internal controls over financial reporting since the filing of the last report that have materially affected, or are reasonably likely to materially affect, the Trust’s internal control over financial reporting. |
Item 12. Exhibits
| (a) | The Clearwater Investment Trust Code of Ethics for the President, Chief Financial Officer and Treasurer is attached. |
| | |
| (b) | The certifications for each principal executive and principal financial officer of the Trust as required by Rule 30a-2(a) of the Investment Company Act of 1940 are attached. |
| | |
| (c) | No written solicitations to purchase securities were sent or delivered during the period covered by this report by or on behalf of the Trust. |
SIGNATURES
Pursuant to the requirements of the Securities Exchange Act of 1934 and the Investment Company Act of 1940, the registrant has duly caused this report to be signed on its behalf by the undersigned, thereunto duly authorized.
| | Clearwater Investment Trust |
| | | |
| | By | /s/ George H. Weyerhaeuser, Jr. |
| | | George H. Weyerhaeuser, Jr., Chairman |
| | | |
| | Date: March 10, 2011 |
Pursuant to the requirements of the Securities Exchange Act of 1934 and the Investment Company Act of 1940, this report has been signed below by the following persons on behalf of the registrant and in the capacities and on the dates indicated.
| | Clearwater Investment Trust |
| | | |
| | By | /s/ George H. Weyerhaeuser, Jr. |
| | | George H. Weyerhaeuser, Jr., Chairman |
| | | |
| | Date: March 10, 2011 |
| | Clearwater Investment Trust |
| | | |
| | By | /s/ George H. Weyerhaeuser, Jr. |
| | | George H. Weyerhaeuser, Jr., Treasurer |
| | | |
| | Date: March 10, 2011 |