Exhibit (c)(3)
CONFIDENTIAL
Project Castle
Fairness Opinion Presentation to the Special Committee of the Board of Directors
September 26, 2003

INTRODUCTION
The following materials were prepared solely for discussion at the meeting of the Special Committee of the Board of Directors of Castle (“Company”) scheduled for September 26, 2003.
In preparing this presentation, we have, with your consent, relied upon information provided by the Company, Moat and Guard and other publicly available information. We have not independently verified any of such information, and have relied on it being complete and accurate in all material respects.
Please note that this presentation is based on the business and operations of Castle as represented to us as of the date hereof, and does not purport to take into consideration any information or events arising subsequent to such date. SG Cowen makes no representation or warranty that there has been no material change in the information provided or reviewed by us in connection herewith.
The information contained herein is confidential and has been prepared exclusively for the benefit and use of the Special Committee of the Board of Directors of the Company in its consideration of the proposed transaction, and may not be used for any other purpose or be discussed, reproduced, disseminated, quoted or referred to at any time, in any manner or for any purpose without our prior written consent. This presentation is not for the benefit of, and does not convey any rights or remedies to, any holder of securities of the Company or any other person.
This presentation is subject to the assumptions, qualifications and limitations set forth herein and in the form of our fairness opinion letter, included as an appendix to this presentation, and does not constitute a recommendation by SG Cowen to the Board of Directors or shareholders of the Company on how to vote with respect to the proposed transaction.
 | | 1 | | |
TABLE OF CONTENTS
| |
1. | | EXECUTIVE SUMMARY |
| |
2. | | CASTLE OVERVIEW |
| |
3. | | VALUATION CONSIDERATIONS |
|
APPENDIX |
| | |
| | | A. | | Form of SG Cowen Fairness Opinion |
| | 2 | | |
EXECUTIVE SUMMARY
| | 3 | | |
 | | EXECUTIVE SUMMARY
|
TRANSACTION OVERVIEW
| Structure | | • | | Bridge, a wholly owned subsidiary of Moat, to be merged with and into Castle, with Castle as the surviving corporation |
| | |
| Consideration | | • | | Castle shareholders to exchange each outstanding share of Castle stock for $12.00 per share or an aggregate of $145.2 million based on 12.1 million common shares outstanding of Castle using the treasury stock method(a) |
| | | |
| | | | | • | | No less than $16 million of such consideration shall be provided by Castle |
| | | |
| | | | | • | | Outstanding shares of Castle and options to purchase shares of Castle held by certain members of Castle management to be converted into shares of Moat and options to purchase shares of Moat, respectively(b) |
| | |
| Financing | | • | | Guard represents that Moat will have sufficient funds to consummate the transaction |
| | | |
| | | | | • | | There is no financing condition |
| (a) | The total shares outstanding consist of 11.146 million primary common shares outstanding and 0.958 million common shares from options using the treasury stock method. |
| (b) | Such members of management include messrs. Foy and Provenzano and may also include Mr. Asen; for the purposes of this analysis, SG Cowen has assumed that such Moat shares and options to purchase Moat shares have an equivalent value to the value otherwise payable to such share and option holders pursuant to the Merger Agreement. |
| | 4 | | |
| | EXECUTIVE SUMMARY
|
OTHER KEY TRANSACTION TERMS(a)
Transaction Considerations
| | Comments
|
| | |
| Treatment of Options | | • | | Generally, options to purchase Castle stock shall be accelerated and converted into the right to receive an amount in cash equal to the difference between $12.00 and the exercise price of such option. |
| | |
| | | • | | Options to purchase Castle stock held by certain members of Castle management(b) shall be converted into the right to receive Moat options with an equivalent embedded value. |
| | |
| Non-Solicitation Provision | | • | | Castle may not solicit or negotiate other acquisition proposals, or enter into an agreement with respect to other acquisition proposals, subject to a fiduciary out for unsolicited bona fide acquisition proposals (each an “Acquisition Proposal”) to the extent (i) the Board of Directors or the Special Committee determines in good faith after consultation with counsel that failing to take such action is inconsistent with their fiduciary duties, (ii) the Acquisition Proposal is reasonably likely to lead to a written proposal that is more favorable from a financial point of view, reasonably capable of being consummated in a timely manner (including financing), and of a nature that not accepting it would be inconsistent with their fiduciary duties, and (iii) prior to furnishing information to the source of the proposal, the Company enters into a confidentiality agreement with terms no less favorable to the Company than the agreement entered into with Guard. |
| | |
| | | • | | Castle has a duty to promptly notify Moat of any Acquisition Proposals and keep Moat materially informed of the status of such Acquisition Proposal. |
| (a) | Based on draft Agreement and Plan of Merger, dated September 25, 2003 (the “Merger Agreement”). |
| (b) | Such members of management include messrs. Foy, Provenzano and potentially Mr. Asen. |
| | 5 | | |
| | EXECUTIVE SUMMARY
|
OTHER KEY TRANSACTION TERMS(a)
Transaction Considerations
| | Comments
|
| Termination | | • | | The Agreement may be terminated under the following circumstances. |
| | |
| | | • | | Mutual written consent of Castle and Moat. |
| | |
| | | • | | By Castle or Moat to the extent that (i) the merger is prohibited by any law or government order, (ii) the merger has not been consummated by March 15, 2004, except by either party to the extent the merger has not been consummated due to their failure to perform any covenant or obligation under the Agreement, or (iii) the Castle shareholders fail to approve the merger. |
| | |
| | | • | | By Moat to the extent that (i) Castle breaches the Agreement and such breach is not cured within 10 day’s notice thereof, or (ii) the Board of Directors or Special Committee of Castle withdraws its recommendation of the merger, or approves or recommends any other Acquisition Proposal. |
| | |
| | | • | | By Castle to the extent that (i) Moat breaches the Agreement and such breach is not cured within 10 day’s of notice thereof, or (ii) pursuant to the fiduciary obligations of the Board of Directors as set forth above. |
| | |
| Termination Fee and Expenses | | • | | Each party is responsible for its own expenses. |
| | |
| | | • | | Termination fee equal to 2.2% of the fully diluted equity value transaction or $3.2 million based on 12.1 million common shares outstanding of Castle using the treasury stock method. |
| | |
| | | • | | Termination fee payable to the extent that the agreement is terminated (i) by Castle pursuant to the fiduciary obligations of the Board of Directors, or (ii) by Moat pursuant to its rights set forth above, and Castle closes a transaction pursuant to a prior Acquisition Proposal within 180 days thereafter. |
| (a) | Based on draft Agreement and Plan of Merger, dated September 25, 2003 (the “Merger Agreement”). |
| | 6 | | |
| | EXECUTIVE SUMMARY
|
OTHER KEY TRANSACTION TERMS(a)
Transaction Considerations
| | Comments
|
| Conditions to Closing | | • | | Conditions to Castle and Moat’s obligations: (i) Castle shareholder approval, (ii) absence of any governmental prohibition, and (iii) expiration of any required waiting period under HSR. |
| | |
| | | • | | Conditions to Moat’s obligations: (i) Castle representations and warranties are true and correct other than to the extent any breach does not cause a Company Material Adverse Effect (other than representations and warranties related to performance obligations under the agreement, Castle’s capitalization, transaction expenses and indebtedness), (ii) Castle shall have performed all material obligations under the Merger Agreement, (iii) certain members of management of Castle shall have rolled over their Castle shares(b), (iv) no Material Company Adverse Effect shall have occurred, (v) no pending litigation prohibiting the merger, (vi) no more than 7% of Castle’s shareholders shall have exercised dissenters rights, (vii) receipt of customary officers’ certificates, and (viii) receipt of director resignations. A “Company Material Adverse Effect” includes any effect that (i) is materially adverse to the business, financial condition or results of operations of Castle other than any Excluded Matters, or (ii) prevents or materially delays Castle from performing its obligations under the agreement or consummating the merger. “Excluded Matters” includes (i) general changes in economic conditions or the software industry, (ii) a change in the market price or trading volume of Castle shares or financial markets generally, (iii) any force majeur, (iv) changes resulting from the public announcement of the agreement, (v) any action agreed to by Moat and Castle, (vi) any change in accounting rules, or (vii) any change resulting from a breach of the Agreement by Moat. |
| | |
| | | • | | Conditions to Castle’s obligations: (i) Moat representations are true and correct other than to the extent any breach does not cause a Purchaser Material Adverse Effect, (ii) Moat has performed all material obligations under the Agreement, and (iii) receipt of customary officers’ certificates. “Purchaser Material Adverse Effect” includes any effect that prevents or materially delays Moat from performing its obligations under the agreement or consummating the merger. |
| | |
| Closing | | • | | Within three business days of satisfaction of the conditions to closing. |
| | |
| D&O Insurance | | • | | Prior to closing, Castle shall procure a “tail” directors’ and officers’ liability insurance policy with terms and conditions reasonably satisfactory to the board of directors so long as the cost does not exceed a cap to be determined prior to signing the Merger Agreement. |
| (a) | Based on draft Agreement and Plan of Merger, dated September 25, 2003 (the “Merger Agreement”). |
| (b) | Such members of management include messrs. Foy, Provenzano and potentially Mr. Asen. |
| | 7 | | |
| | EXECUTIVE SUMMARY
|
TRANSACTION STATISTICS
Transaction Value(a)
| | |
Offer Price per Share | | $ | 12.00 |
Total Equity Value to Castle’s Shareholders(b) | | $ | 145.2 |
Net Cash | | $ | 26.8 |
Net Transaction Value (Enterprise Value) | | $ | 118.5 |
Transaction Multiples
| | | | | |
| | | Statistic
| | Multiple
| |
LQA Revenue | | $ | 105.1 | | 1.1 | x |
LTM Revenue | | | 103.3 | | 1.1 | |
2003E Revenue | | | 107.8 | | 1.1 | |
2004E Revenue | | | 116.0 | | 1.0 | |
| | |
LQA EBITDA | | $ | 8.9 | | 13.2 | x |
LTM EBITDA | | | 8.2 | | 14.4 | |
2003E EBITDA | | | 10.2 | | 11.7 | |
2004E EBITDA | | | 12.8 | | 9.3 | |
| | |
LQA Net Income | | $ | 3.9 | | 30.2 | x |
LTM Net Income | | | 3.7 | | 31.8 | |
2003E Net Income | | | 5.0 | | 23.6 | |
2004E Net Income | | | 7.0 | | 16.9 | |
| | |
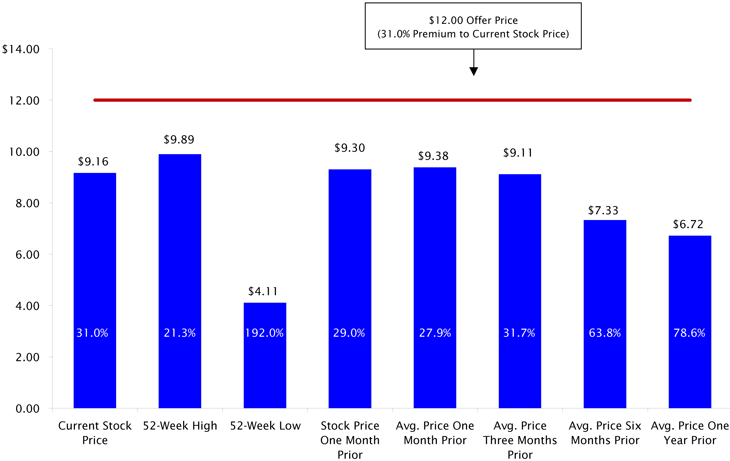
Premiums Paid
| | | | | |
| | | Price
| | Premium
| |
Castle Spot Price as of 09/25/03 | | $ | 9.16 | | 31 | % |
Castle Price One Week Prior | | | 9.40 | | 28 | % |
Castle Price One Month Prior | | | 9.30 | | 29 | % |
Castle Price Three Months Prior | | | 7.70 | | 56 | % |
| (a) | US$ in millions, other than per share amounts. |
| (b) | Total equity value based on 11.146 million primary shares outstanding and 0.958 million common shares outstanding from options using the treasury stock method. |
| | 8 | | |
| | EXECUTIVE SUMMARY
|
ANTICIPATED TIMELINE TO CLOSE
Next Steps and Timing
Action
| | Approximate Best Case Timing
|
Signing of Definitive Agreement | | September 26, 2003 |
Announce Signing of Merger Agreement | | September 29, 2003 |
File Proxy materials with SEC | | Week of October 13, 2003 |
| | |
| | | SEC Review
| | No SEC Review
|
Receive SEC clearance | | Week of November 24, 2003 | | Week of October 27, 2003 |
Mail Proxy Statement to Castle Stockholders | | Week of November 24, 2003 | | Week of October 27, 2003 |
Castle Stockholders’ Meeting | | Week of December 23, 2003 | | Week of November 24, 2003 |
Closing | | Week of December 23, 2003 | | Week of November 24, 2003 |
| | 9 | | |
CASTLE OVERVIEW
| | 10 | | |
| | CASTLE OVERVIEW
|
CASTLE OVERVIEW(a)
Business Description
| • | Provider of customer interaction management (CIM) solutions |
| | • | | Core products help companies effectively manage customer interactions via voice, email, the Web and fax |
| | • | | Acquisition of Cellit in January 2002 increased inbound market capabilities |
Sales and Marketing
| • | The company licenses and sells its products through a network of distributors and resellers as well as a direct sales force |
Customers
| • | Castle solutions are used by more than 1,200 companies worldwide |
| | • | | Customer verticals include financial institutions, telecommunications, utilities, healthcare and retailers |
Representative Historical Customers
Advanta | | British Telecom | | New Century Financial Corp. | | Volkswagen |
| | | |
American Express | | Cigna | | Pitney Bowes | | Wells Fargo |
| | | |
AT&T | | Discover | | Prudential Financial | | Williams Communications |
| | | |
Air Jamaica Vacations | | FleetBoston Financial | | Sprint | | Xerox Limited |
| | | |
Blue Shield of California | | GE Capital | | Time Warner Cable | | |
| | | |
BMW | | Household Finance Corp. | | United Parcel Service | | |
| (a) | Source: Castle Website and Form 10-K for the period ended December 31, 2002. |
| | 11 | | |
| | CASTLE OVERVIEW
|
CASTLE OVERVIEW (CONTINUED)
Selected Product Summary(a)
Product/Description
EnsemblePro—Combines the best functionality from all of Castle’s products together in a single unified solution. Designed from the ground up to incorporate the broad multimedia functionality required by today’s contact centers—including ACD, predictive dialing, IVR, email, web chat and collaboration, universal queuing, recording and reporting—EnsemblePro also offers the ability to connect with and add value to existing contact center point solutions. Its unified nature greatly reduces the complexities traditionally associated with implementing, owning and operating multimedia contact centers
Unison—An industry-leading outbound and blended call management solution designed to automate proactive customer contact activities. It manages outbound and blended calling campaigns, and provides high-productivity tools to increase the number of calls handled and the quality of each customer contact
Ensemble—Customer interaction management suite that seamlessly integrates inbound and outbound calling. Ensemble is a modular platform, allowing companies to deploy the product in stages and increase its functionality as their needs expand. The system is designed to leverage a company’s existing investment in telephony and systems infrastructure, while enabling rapid deployment
LYRICall—Castle’s browser-based scripting solution harnesses the power and simplicity of browser technology to deliver robust, platform independent agent screens and scripts. The software links front-line agents with back-office customer information systems, enabling agents to quickly and seamlessly access data to execute successful customer contacts
| (a) | Source: Castle Website and Form 10-K for the period ended December 31, 2002. |
| | 12 | | |
| | CASTLE OVERVIEW
|
CASTLE MANAGEMENT AND BOARD OF DIRECTORS
Executive Officers
Name
| | Position
|
James D. Foy* | | President, Chief Executive Officer and Director |
| |
Michael J. Provenzano, III* | | Vice President, Finance, Chief Financial Officer and Treasurer |
| |
Ralph S. Breslauer | | Executive Vice President, Sales and Marketing |
| |
Alexander Tellez | | Executive Vice President, Engineering |
| |
Kristina Lengyel | | Vice President, Global Technical Services |
| |
Mark Donovan | | Senior Vice President, Operations and Customer Services |
Board of Directors
Name
| | Age
| | Position
|
Alphonse M. Lucchese | | 67 | | Chairman |
| | |
R. Scott Asen* | | 58 | | General Partner, AB Associates, LP |
| | |
Peter Gyenes | | 57 | | Chairman and Chief Executive Officer, Ascential Software Corporation |
| * | Indicates that the executive or board member intends to convert his shares of Castle and options to purchase Castle shares into shares of Moat and options to purchase Moat shares. With respect to Asen, Mr. Asen may or may not convert his shares of Castle and options to purchase shares of Castle into shares of Moat and options to purchase Moat shares. |
| | 13 | | |
| | CASTLE OVERVIEW
|
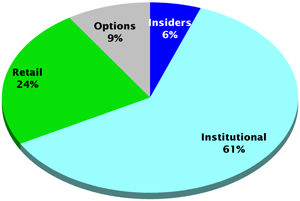
CASTLE SUMMARY OWNERSHIP PROFILE
Ownership by Major Classification
| | | Primary Shares
| | | Fully Diluted(a)
| |
Share Class/ Owner
| | Shares
| | % of
Total
| | | Shares
| | % of
Total
| |
Insiders(b) | | | | | | | | | | |
Alphonse M. Lucchese | | 132,500 | | 1.2 | % | | 710,206 | | 5.8 | % |
R. Scott Asen | | 513,841 | | 4.6 | % | | 540,091 | | 4.4 | % |
James D. Foy | | 10,000 | | 0.1 | % | | 235,000 | | 1.9 | % |
Mark Donovan | | 5,500 | | 0.0 | % | | 136,124 | | 1.1 | % |
Other insiders (5 persons) | | 19,312 | | 0.2 | % | | 321,688 | | 2.6 | % |
| | |
| |
|
| |
| |
|
|
Total Insiders | | 675,653 | | 6.1 | % | | 1,806,985 | | 14.7 | % |
| | | | |
Institutional(c) | | | | | | | | | | |
Husic Capital Management | | 1,222,046 | | 11.0 | % | | 1,222,046 | | 10.0 | % |
Neuberger Berman LLC | | 1,149,965 | | 10.3 | % | | 1,149,965 | | 9.4 | % |
Shufro, Rose & Co. LLC | | 707,315 | | 6.3 | % | | 707,315 | | 5.8 | % |
Disciplined Growth Investors, Inc. | | 533,900 | | 4.8 | % | | 533,900 | | 4.3 | % |
Kopp Investment Advisors, Inc. | | 519,600 | | 4.7 | % | | 519,600 | | 4.2 | % |
S Squared Technology Corp. | | 436,300 | | 3.9 | % | | 436,300 | | 3.6 | % |
Dimensional Fund Advisors, Inc. | | 391,206 | | 3.5 | % | | 391,206 | | 3.2 | % |
Other Institutional Investors | | 2,593,349 | | 23.3 | % | | 2,593,349 | | 21.1 | % |
| | |
| |
|
| |
| |
|
|
Total Institutional Investors | | 7,553,681 | | 67.8 | % | | 7,553,681 | | 61.5 | % |
| | | | |
Retail(c) | | 2,916,720 | | 26.2 | % | | 2,916,720 | | 23.8 | % |
| | | | |
Total Shares Outstanding(d) | | 11,146,054 | | 100.0 | % | | 12,277,386 | | 100.0 | % |
| (a) | Fully diluted shares assumes conversion of outstanding stock options that were exercisable within 60 days of March 24, 2003 per Proxy Statement dated April 14, 2003. |
| (b) | Per Proxy Statement dated April 14, 2003. |
| (c) | Per FactSet as of September 25, 2003. |
| (d) | Per 10-Q for quarter ending June 30, 2003. |
| | 14 | | |
| | CASTLE OVERVIEW
|
CASTLE STOCK PERFORMANCE—LATEST TWELVE MONTHS
Trading Statistics
Current | | $ | 9.16 |
3 Month Avg. | | | 9.11 |
6 Month Avg. | | | 7.33 |
| |
Average—LTM | | | 6.72 |
High—LTM | | | 9.89 |
Low—LTM | | | 4.11 |
| |
Avg. Vol.—LTM | | | 48,655 |
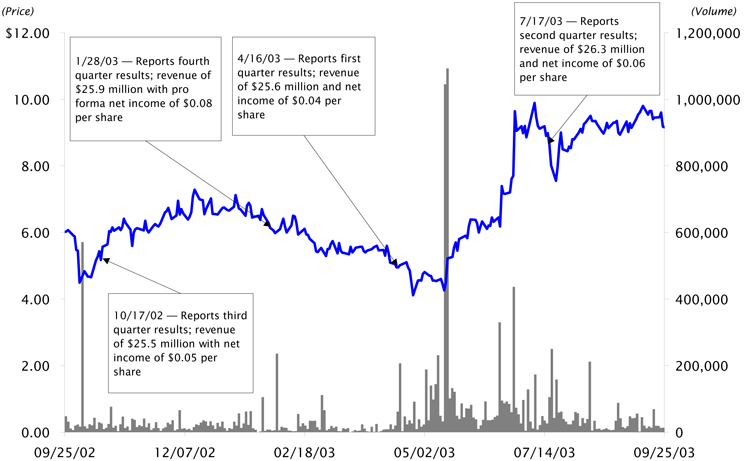
Source: FactSet as of September 25, 2003.
| | 15 | | |
| | CASTLE OVERVIEW
|
HISTORICAL STOCK PRICE PERFORMANCE—LATEST TWELVE MONTHS
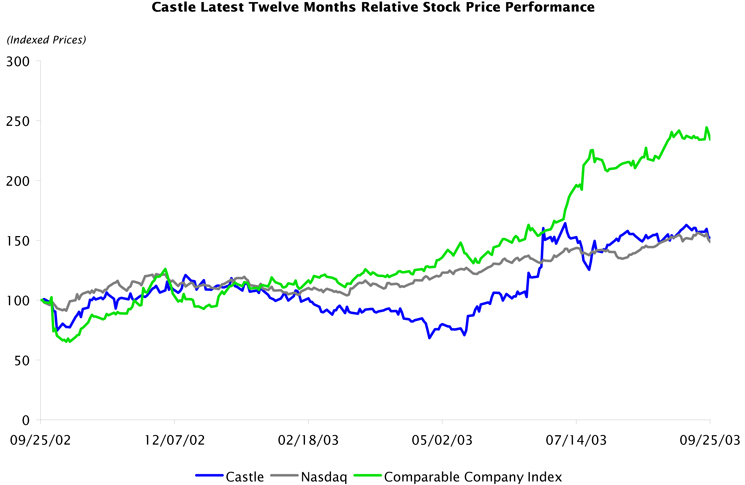
Source: FactSet as of September 25, 2003.
Note: All prices are indexed and market cap weighted.
Note: Comparable Company Index includes NICE, WITS, ASPT, APRS, ININ and PKSI.
| | 16 | | |
| | CASTLE OVERVIEW
|
CASTLE HISTORICAL TRADING PERFORMANCE(a)
Avg. Close: | | $ | 6.72 |
Avg. Volume: | | | 48,655 |
Avg. $/Day: | | $ | 314,505 |
Total Volume: | | | 12,309,779 |
Shares O/S: | | | 11,146,054 |
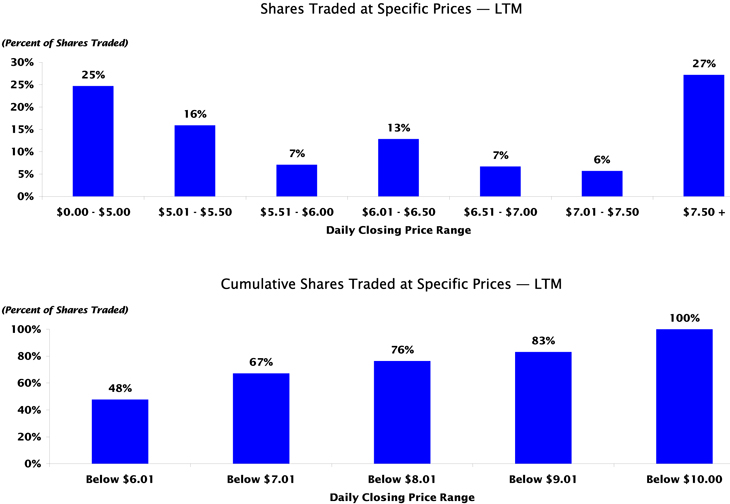
| (a) | Data as per FactSet as of September 25, 2003. |
| | 17 | | |
| | CASTLE OVERVIEW
|
ANNUAL HISTORICAL AND PROJECTED FINANCIAL SUMMARY(a)
| (a) | Historical data as per Castle SEC filings on forms 10-K and 10-Q. Projected financial information, including Q3 2003, per management of Castle as of September 25, 2003; SG Cowen has assumed, with Castle’s consent, that such projections provide a reasonable basis for this analysis. |
| (b) | Historical pro forma results include amortization from 2002 acquisition, but exclude other non-recurring charges. |
| | 18 | | |
| | CASTLE OVERVIEW
|
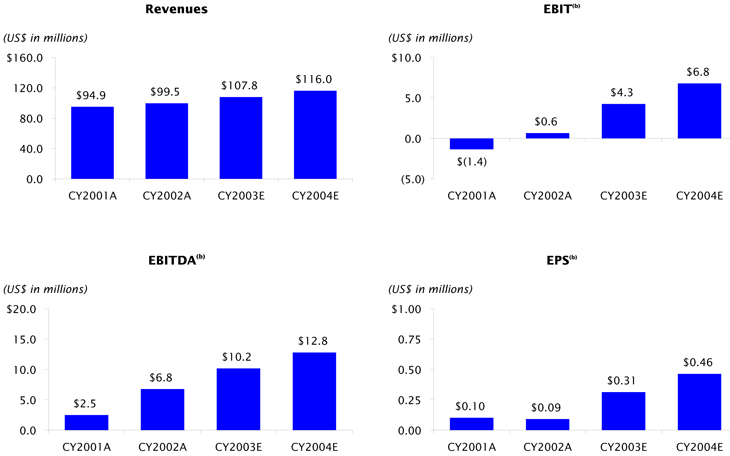
FINANCIAL REVIEW
Historical and Projected Financial Information(a)
(US$ in millions, except per share data)
| | | CY 2001A
| | | CY 2002A
| | | CY 2003E
| | | CY 2004E
| |
Total revenue | | $ | 94.9 | | | $ | 99.5 | | | $ | 107.8 | | | $ | 116.0 | |
Gross Margin | | | 60.3 | | | | 63.2 | | | | 66.4 | | | | 74.3 | |
EBIT(b) | | | (1.4 | ) | | | 0.6 | | | | 4.3 | | | | 6.8 | |
EBITDA | | | 2.5 | | | | 6.8 | | | | 10.2 | | | | 12.8 | |
Net Income | | | 1.3 | | | | 1.1 | | | | 3.7 | | | | 5.7 | |
EPS | | $ | 0.10 | | | $ | 0.09 | | | $ | 0.31 | | | $ | 0.46 | |
| | | | |
Revenue growth rate (Y/Y) | | | (0 | )% | | | 5 | % | | | 8 | % | | | 8 | % |
| | | | |
Gross margin | | | 64 | % | | | 64 | % | | | 62 | % | | | 64 | % |
Operating margin | | | (1 | )% | | | 1 | % | | | 4 | % | | | 6 | % |
Net Income | | | 1 | % | | | 1 | % | | | 3 | % | | | 5 | % |
Summary Balance Sheet(a)
(US$ in millions)
| | | 12/31/01
| | 12/31/02
| | 6/30/03
|
Cash | | $ | 67.9 | | $ | 35.1 | | $ | 27.2 |
Debt | | | 0.0 | | | 0.6 | | | 0.4 |
Stockholders Equity | | | 70.5 | | | 57.6 | | | 56.1 |
| (a) | Historical data as per Castle SEC filings on forms 10-K and 10-Q. Projected financial information, including Q3 2003, per management of Castle as of September 21, 2003. SG Cowen has assumed, with Castle’s consent, that such projections provide a reasonable basis for this analysis. |
| (b) | Includes amortization of purchased intangible assets from 2002 acquisition, but excludes other non-recurring charges. |
| | 19 | | |
VALUATION CONSIDERATIONS
| | 20 | | |
| | VALUATION CONSIDERATIONS
|
IMPLIED MULTIPLES VS. COMPARABLE COMPANY TRADING MULTIPLES(a)
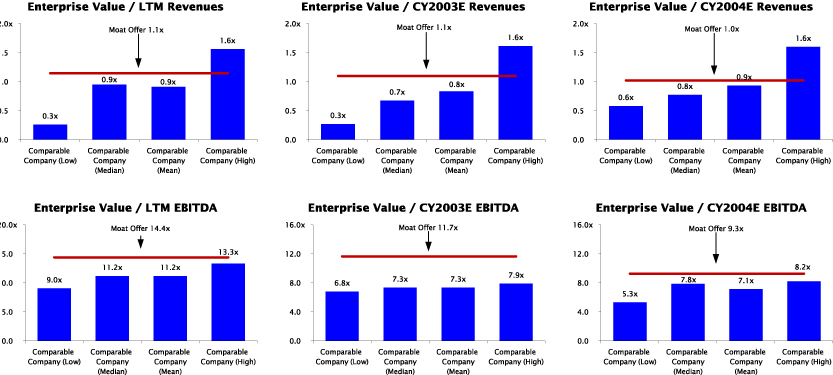
| (a) | Stock price data as of September 25, 2003. |
| | 21 | | |
| | VALUATION CONSIDERATIONS
|
COMPARABLE COMPANY ANALYSIS—MARKET DATA
Comparable Company Analysis
(US$ in millions, except per share data)
Company (Quarter as of)
| | Enterprise
Value(a)
| | Net
Cash
| | Market
Value(a)
| | Enterprise Value as a Multiple of:
| | | P/E
| |
| | | | | Revenues
| | | EBITDA
| | |
| | | | | LQA
| | | LTM
| | | CY03E(b)
| | | CY04E(b)
| | | LQA
| | | LTM
| | | CY03E(b)
| | | CY04E(b)
| | | CY03E(b)
| | | CY04E(b)
| |
Aspect Communications (06/03)(c) | | $ | 573 | | $ | 56 | | $ | 629 | | 1.6 | x | | 1.6 | x | | 1.6 | x | | 1.6 | x | | 7.2 | x | | 9.0 | x | | 7.9 | x | | 7.8 | x | | 23.6 | x | | 22.3 | x |
NICE(06/03)(d) | | | 248 | | | 87 | | | 335 | | 1.1 | | | 1.3 | | | 1.1 | | | 0.9 | | | 9.2 | | | 13.3 | | | 6.8 | | | 5.3 | | | 23.1 | | | 18.0 | |
Witness Systems (06/03)(e) | | | 65 | | | 40 | | | 105 | | 0.6 | | | 0.5 | | | 0.6 | | | 0.6 | | | NM | | | NM | | | NM | | | 8.2 | | | NM | | | 35.9 | |
Interactive Intelligence (06/03)(d) | | | 34 | | | 15 | | | 50 | | 0.7 | | | 0.7 | | | 0.7 | | | 0.6 | | | NM | | | 29.2 | (f) | | 12.6 | (f) | | 10.3 | (f) | | NM | | | NM | |
Primus Knowledge Solutions (06/03) | | | 24 | | | 11 | | | 35 | | 1.6 | | | 1.2 | | | NA | | | NA | | | NM | | | NM | | | NA | | | NA | | | NA | | | NA | |
Apropos Technology (06/03)(d) | | | 5 | | | 39 | | | 45 | | 0.3 | | | 0.3 | | | 0.3 | | | NA | | | NM | | | NM | | | NM | | | NA | | | NM | | | NA | |
| | | | | | | | | | | | | |
High | | | | | | | | | | | 1.6 | x | | 1.6 | x | | 1.6 | x | | 1.6 | x | | 9.2 | x | | 13.3 | x | | 7.9 | x | | 8.2 | x | | 23.6 | x | | 35.9 | x |
Mean | | | | | | | | | | | 1.0 | x | | 0.9 | x | | 0.8 | x | | 0.9 | x | | 8.2 | x | | 11.2 | x | | 7.3 | x | | 7.1 | x | | 23.3 | x | | 25.4 | x |
Median | | | | | | | | | | | 0.9 | x | | 0.9 | x | | 0.7 | x | | 0.8 | x | | 8.2 | x | | 11.2 | x | | 7.3 | x | | 7.8 | x | | 23.3 | x | | 22.3 | x |
Low | | | | | | | | | | | 0.3 | x | | 0.3 | x | | 0.3 | x | | 0.6 | x | | 7.2 | x | | 9.0 | x | | 6.8 | x | | 5.3 | x | | 23.1 | x | | 18.0 | x |
| | | | | | | | | | | | | |
Castle (06/03) @ ($12.00)(g) | | $ | 118 | | $ | 27 | | $ | 145 | | 1.1 | x | | 1.1 | x | | 1.1 | x | | 1.0 | x | | 13.2 | x | | 14.4 | x | | 11.7 | x | | 9.3 | x | | 28.2 | x | | 21.0 | x |
| (a) | Enterprise value equal to market cap. plus net debt; as of September 25, 2003. |
| (b) | Estimates from SG Cowen where available, otherwise FirstCall or Wall Street research. |
| (c) | Aspect Communications market cap assumes conversion of convertible preferred equity. |
| (d) | Projected EBITDA based on Wall Street research estimated operating income plus depreciation and amortization calculated based on LTM percent of revenue. |
| (e) | Witness Systems historical results shown pro forma for the Erytel acquisition. |
| (f) | Excluded from summary statistics (mean, median, high and low) calculations. |
| (g) | Projected financial information, including Q3 2003, per management of Castle as of September 25, 2003, adjusted to exclude amortization related to 2002 acquisition. SG Cowen has assumed, with Castle’s consent, that such projections provide a reasonable basis for this analysis. |
| | 22 | | |
| | VALUATION CONSIDERATIONS
|
COMPARABLE COMPANY ANALYSIS—OPERATING DATA
Comparable Company Analysis
(US$ in millions, except per share data)
| | | Revenues
| | Operating Statistics EBITDA
| | LTM Margins
| | | Revenue Growth
| |
Company
| | LQA
| | LTM
| | CY03E(a)
| | CY04E(a)
| | LQA
| | | LTM
| | | CY03E(a)
| | | CY04E(a)
| | Gross
| | | Oper.
| | | ’02A/
’03E(a)
| | | ’03E/
’04E(a)
| |
Aspect Communications | | $ | 358 | | $ | 367 | | $ | 355 | | $ | 358 | | $ | 79 | | | $ | 63 | | | $ | 73 | | | $ | 73 | | 56 | % | | 10 | % | | (10 | )% | | 1 | % |
NICE(b) | | | 225 | | | 198 | | | 236 | | | 276 | | | 27 | | | | 19 | | | | 37 | | | | 47 | | 50 | % | | 0 | % | | 45 | % | | 17 | % |
Witness Systems(c) | | | 117 | | | 135 | | | 116 | | | 112 | | | 0 | | | | (11 | ) | | | (7 | ) | | | 8 | | 65 | % | | (13 | )% | | (18 | )% | | (4 | )% |
Interactive Intelligence(b) | | | 48 | | | 50 | | | 51 | | | 53 | | | (0 | ) | | | 1 | | | | 3 | | | | 3 | | 72 | % | | (8 | )% | | 7 | % | | 4 | % |
Primus Knowledge Solutions | | | 15 | | | 20 | | | NA | | | NA | | | (9 | ) | | | (4 | ) | | | NA | | | | NA | | 75 | % | | (31 | )% | | NA | | | NA | |
Apropos Technology(b) | | | 19 | | | 20 | | | 19 | | | NA | | | (5 | ) | | | (9 | ) | | | (3 | ) | | | NA | | 72 | % | | (50 | )% | | (8 | )% | | NA | |
| | | | | | | | | | | | |
High | | | | | | | | | | | | | | | | | | | | | | | | | | | | | 75 | % | | 10 | % | | 45 | % | | 17 | % |
Mean | | | | | | | | | | | | | | | | | | | | | | | | | | | | | 65 | % | | (15 | )% | | 3 | % | | 5 | % |
Median | | | | | | | | | | | | | | | | | | | | | | | | | | | | | 69 | % | | (10 | )% | | (8 | )% | | 3 | % |
Low | | | | | | | | | | | | | | | | | | | | | | | | | | | | | 50 | % | | (50 | )% | | (18 | )% | | (4 | )% |
| | | | | | | | | | | | |
Castle(d) | | $ | 105 | | $ | 103 | | $ | 108 | | $ | 116 | | $ | 9 | | | $ | 8 | | | $ | 10 | | | $ | 13 | | 62 | % | | 4 | % | | 8 | % | | 8 | % |
| (a) | Estimates from SG Cowen where available, otherwise FirstCall or Wall Street research. |
| (b) | Projected EBITDA based on Wall Street research estimated operating income plus depreciation and amortization calculated based on LTM percent of revenue. |
| (c) | Witness Systems historical results shown pro forma for the Erytel acquisition. |
| (d) | Projected financial information, including Q3 2003, per management of Castle as of September 21, 2003. SG Cowen has assumed, with Castle’s consent, that such projections provide a reasonable basis for this analysis. |
| | 23 | | |
| | VALUATION CONSIDERATIONS
|
IMPLIED MULTIPLES VS. SELECTED M&A TRANSACTIONS
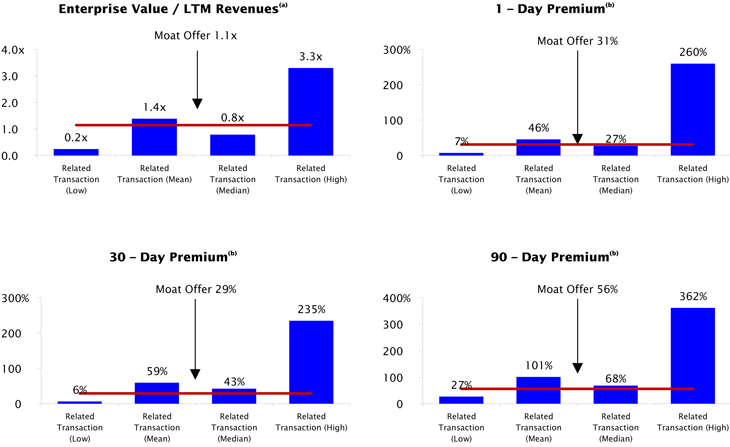
| (a) | Based on precedent call center software transactions (see page 26). |
| (b) | Based on LTM public software transactions (see page 27). |
| | 24 | | |
| | VALUATION CONSIDERATIONS
|
PRECEDENT TRANSACTIONS—CALL CENTER SOFTWARE
Precedent Transaction Analysis(a)
(US$ in millions, except per share data)
Announce Date
| | Target/ Acquiror
| | Target Description
| | Announced
Ent. Value(b)
| | | Ent. Value/
LTM REVs
| | | Premium
| |
| | | | | | 1-Day
| | | 30-Day
| | | 90-Day
| |
04/24/03 | | SpeechWorks International/ScanSoft | | Provider of speech technologies and services | | $ | 128 | | | 3.3 | x | | 85 | % | | 85 | % | | 104 | % |
02/26/03 | | Eyretel/Witness Systems | | Provider of high-volume recording solutions | | | 23 | | | 0.3 | x | | 20 | % | | 133 | % | | 104 | % |
11/06/02 | | Syntellect/Enghouse Systems | | Provider of self-service speech solutions | | | 8 | | | 0.2 | x | | 243 | % | | 167 | % | | 132 | % |
07/31/02 | | Thales Contact Solutions/Nice Systems | | Developer of customer facing Call Center technology | | | 56 | | | 0.8 | x | | NA | | | NA | | | NA | |
05/29/02 | | Telera/Alcatel | | Provider of a voice web application platform | | | 106 | | | NA | | | NA | | | NA | | | NA | |
03/12/02 | | Delano Technology/divine | | Provider e-business interaction software | | | 23 | | | 1.3 | x | | 6 | % | | (11 | )% | | (1 | )% |
01/10/02 | | Cellit/Davox | | Developer of inbound call center software | | | 18 | | | 3.2 | x | | NA | | | NA | | | NA | |
04/09/01 | | Broadbase Software/Kana Communications | | Provider of critical e-commerce infrastructure | | | (53 | ) | | NM | | | 28 | % | | (61 | )% | | (81 | )% |
07/09/01 | | eShare/Divine | | Provider of Customer Interaction Management solutions | | | 49 | | | 0.6 | x | | 126 | % | | 129 | % | | 285 | % |
| | | | | | | |
HIGH | | | | | | | | | | 3.3 | x | | 243 | % | | 167 | % | | 285 | % |
MEAN | | | | | | | | | | 1.4 | | | 85 | % | | 74 | % | | 91 | % |
MEDIAN | | | | | | | | | | 0.8 | | | 56 | % | | 107 | % | | 104 | % |
LOW | | | | | | | | | | 0.2 | | | 6 | % | | (61 | )% | | (81 | )% |
| | | | | | | |
Castle @Deal | | | | | | $ | 118 | | | 1.1 | x | | 31 | % | | 29 | % | | 56 | % |
| (a) | Source: SEC filings, company press releases and Wall Street research. |
| (b) | Enterprise value equals market value minus net cash. |
| | 25 | | |
| | VALUATION CONSIDERATIONS
|
PREMIUMS ANALYSIS—LTM SOFTWARE TRANSACTION $50 TO $250 MILLION
Premiums Analysis—Software Transactions $50 to $250 Million(a)
(US$ in millions, except per share data)
| | | Date Ann.
| | Target
Name
| | Acquiror Name
| | Consideration
| | Value(b)
| | 1-Day Prem.
| | | 30-Day Prem.
| | | 90-Day Prem.
| |
1 | | 09/09/03 | | Lightspan | | PLATO Learning | | Stock | | $ | 167 | | 38 | % | | 63 | % | | 27 | % |
2 | | 08/06/03 | | iManage | | Interwoven | | Cash and Stock | | | 108 | | 24 | % | | 26 | % | | 68 | % |
3 | | 08/04/03 | | Mercator Software | | Ascential Software | | Cash | | | 115 | | 22 | % | | 97 | % | | 114 | % |
4 | | 07/23/03 | | Brio Software | | Hyperion | | Cash and Stock | | | 142 | | 27 | % | | 58 | % | | 108 | % |
5 | | 07/16/03 | | Timberline | | Sage Group | | Cash | | | 104 | | 33 | % | | 41 | % | | 68 | % |
6 | | 07/10/03 | | Sherwood International | | Sungard Data Systems | | Cash | | | 106 | | 10 | % | | 21 | % | | 63 | % |
7 | | 06/26/03 | | Triple G Systems Group Inc | | GE Medical Systems | | Cash | | | 55 | | 15 | % | | 6 | % | | 65 | % |
8 | | 06/23/03 | | Comshare Inc | | Geac Computer Corp Ltd | | Cash | | | 51 | | 26 | % | | 37 | % | | 116 | % |
9 | | 06/06/03 | | Corel Corp | | Vector Capital | | Cash | | | 96 | | 10 | % | | 17 | % | | 29 | % |
10 | | 04/24/03 | | SpeechWorks International | | ScanSoft | | Stock | | | 166 | | 85 | % | | 85 | % | | 104 | % |
11 | | 04/03/03 | | Elite Information Group | | Thomson | | Cash | | | 122 | | 40 | % | | 43 | % | | 49 | % |
12 | | 02/05/03 | | H.T.E. | | SunGard Data Systems | | Cash | | | 122 | | 48 | % | | 43 | % | | 69 | % |
13 | | 01/22/03 | | Resonate | | GTG Acquisition Corp | | Cash | | | 53 | | 7 | % | | 50 | % | | 59 | % |
14 | | 01/21/03 | | Caminus | | SunGard Data Systems | | Cash | | | 154 | | 260 | % | | 235 | % | | 362 | % |
15 | | 01/13/03 | | Numerical Technologies | | Synopsys | | Cash | | | 239 | | 89 | % | | 126 | % | | 106 | % |
16 | | 12/23/02 | | Inktomi | | Yahoo | | Cash | | | 249 | | 41 | % | | 30 | % | | 334 | % |
17 | | 11/08/02 | | Prophet 21 | | Investor Group | | Cash | | | 68 | | 25 | % | | 40 | % | | 34 | % |
18 | | 10/28/02 | | Infinium Software | | SSA Global Technologies | | Cash | | | 105 | | 21 | % | | 49 | % | | 39 | % |
| | | | | | | | |
| | | | | | | HIGH | | | | | | | 260 | % | | 235 | % | | 362 | % |
| | | | | | | MEAN | | | | | | | 46 | % | | 59 | % | | 101 | % |
| | | | | | | MEDIAN | | | | | | | 27 | % | | 43 | % | | 68 | % |
| | | | | | | LOW | | | | | | | 7 | % | | 6 | % | | 27 | % |
| | | | | | | | |
| | | | | | | Castle @Deal | | | | | | | 31 | % | | 29 | % | | 56 | % |
| (a) | Based on acquisitions of public software companies with and announced enterprise value between $50MM and $250MM during the last twelve months. |
| (b) | Transaction value per SDC. |
| | 26 | | |
| | VALUATION CONSIDERATIONS
|
PREMIUMS ANALYSIS
Source: FactSet as of September 25, 2003.
| | 27 | | |
| | VALUATION CONSIDERATIONS
|
DISCOUNTED CASH FLOW ANALYSIS—SUMMARY
EBITDA Multiple
Revenue Multiple
| | 28 | | |
| | VALUATION CONSIDERATIONS
|
EBITDA DISCOUNTED CASH FLOW ANALYSIS—SENSITIVITY(a)
Present Value of Enterprise
(US$ in millions)
Discount Rate
| | Terminal EBITDA Multiple
|
| | 5.0x
| | 6.0x
| | 7.0x
|
12.5% | | $ | 109.8 | | $ | 124.2 | | $ | 138.7 |
15.0% | | | 99.3 | | | 112.2 | | | 125.1 |
17.5% | | | 90.2 | | | 101.7 | | | 113.2 |
Present Value of Equity
(US$ in millions)
Discount Rate
| | Terminal EBITDA Multiple
|
| | 5.0x
| | 6.0x
| | 7.0x
|
12.5% | | $ | 136.5 | | $ | 151.0 | | $ | 165.5 |
15.0% | | | 126.1 | | | 139.0 | | | 151.9 |
17.5% | | | 116.9 | | | 128.4 | | | 140.0 |
Implied Perpetual growth Rate
Discount Rate
| | Terminal EBITDA
Multiple
| |
| | 5.0x
| | | 6.0x
| | | 7.0x
| |
12.5% | | 0.1 | % | | 2.2 | % | | 3.7 | % |
15.0% | | 2.6 | % | | 4.7 | % | | 6.2 | % |
17.5% | | 5.1 | % | | 7.2 | % | | 8.7 | % |
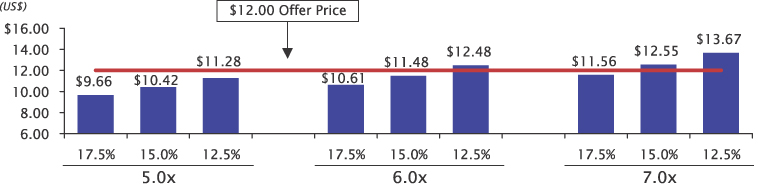
Present Value of Equity Per Share
(US$ in millions)
Discount Rate
| | Terminal EBITDA Multiple
|
| | 5.0x
| | 6.0x
| | 7.0x
|
12.5% | | $ | 11.28 | | $ | 12.48 | | $ | 13.67 |
15.0% | | | 10.42 | | | 11.48 | | | 12.55 |
17.5% | | | 9.66 | | | 10.61 | | | 11.56 |
| (a) | Discount rates are based on a range of rates around the weighted average cost of capital (WACC) of a set of comparable companies. |
| | 29 | | |
| | VALUATION CONSIDERATIONS
|
EBITDA DISCOUNTED CASH FLOW ANALYSIS
Preliminary Discounted Cash Flow Analysis(a)(b)
(US$ in millions, except per share data)
| | | Historical
| | Projected
| | | CAGR
(2003-2008)
| |
| Fiscal Years ending December 31, | | 2001
| | | 2002
| | 2003
| | | 2004
| | | 2005
| | | 2006
| | | 2007
| | | 2008
| | |
Net Sales | | $ | 94.9 | | | $ | 99.5 | | $ | 107.8 | | | $ | 116.0 | | | $ | 124.5 | | | $ | 133.7 | | | $ | 143.7 | | | $ | 154.5 | | | 7.5 | % |
EBITDA | | | 2.5 | | | | 6.8 | | | 10.2 | | | | 12.8 | | | | 16.3 | | | | 18.3 | | | | 22.5 | | | | 26.8 | | | 21.4 | % |
EBIT | | | (1.4 | ) | | | 0.6 | | | 4.3 | | | | 6.8 | | | | 11.2 | | | | 15.3 | | | | 19.5 | | | | 23.8 | | | 41.1 | % |
Less: Taxes | | | 0.1 | | | | 0.4 | | | 1.2 | | | | 1.9 | | | | 4.2 | | | | 6.0 | | | | 7.6 | | | | 9.3 | | | | |
EBIAT(c) | | | (1.5 | ) | | | 0.3 | | | 3.0 | | | | 4.9 | | | | 7.1 | | | | 9.3 | | | | 11.9 | | | | 14.5 | | | | |
| | |
|
|
| |
|
| |
|
|
| |
|
|
| |
|
|
| |
|
|
| |
|
|
| |
|
|
| | | |
Plus: Depreciation and Amortization | | | | | | | | | | 5.9 | | | | 6.0 | | | | 5.0 | | | | 3.0 | | | | 3.0 | | | | 3.0 | | | | |
Less: Capital Expenditures | | | | | | | | | | (3.2 | ) | | | (3.0 | ) | | | (3.0 | ) | | | (3.0 | ) | | | (3.0 | ) | | | (3.0 | ) | | | |
Less: Increase in Working Capital | | | | | | | | | | (1.3 | ) | | | 0.1 | | | | 0.5 | | | | 0.4 | | | | 0.5 | | | | 0.5 | | | | |
| | | | | | | | | |
|
|
| |
|
|
| |
|
|
| |
|
|
| |
|
|
| |
|
|
| | | |
Unlevered Free Cash Flow(d) | | | | | | | | | | 1.1 | | | | 7.9 | | | | 9.6 | | | | 9.7 | | | | 12.3 | | | | 15.0 | | | | |
| | | | | | | | | |
|
|
| |
|
|
| |
|
|
| |
|
|
| |
|
|
| |
|
|
| | | |
| Discount Rate(e) | | 12.5%
| | | 15.0%
| | | 17.5%
| |
Assumed Terminal EBITDA Multiple
| | 5.0x
| | | 6.0x
| | | 7.0x
| | | 5.0x
| | | 6.0x
| | | 7.0x
| | | 5.0x
| | | 6.0x
| | | 7.0x
| |
Terminal Year EBITDA | | $ | 26.8 | | | $ | 26.8 | | | $ | 26.8 | | | $ | 26.8 | | | $ | 26.8 | | | $ | 26.8 | | | $ | 26.8 | | | $ | 26.8 | | | $ | 26.8 | |
Terminal Value | | | 134.2 | | | | 161.1 | | | | 187.9 | | | | 134.2 | | | | 161.1 | | | | 187.9 | | | | 134.2 | | | | 161.1 | | | | 187.9 | |
PV of Terminal Value | | | 72.3 | | | | 86.8 | | | | 101.3 | | | | 64.4 | | | | 77.3 | | | | 90.2 | | | | 57.6 | | | | 69.1 | | | | 80.6 | |
PV of Free Cash Flows | | | 37.4 | | | | 37.4 | | | | 37.4 | | | | 34.9 | | | | 34.9 | | | | 34.9 | | | | 32.6 | | | | 32.6 | | | | 32.6 | |
| | |
|
|
| |
|
|
| |
|
|
| |
|
|
| |
|
|
| |
|
|
| |
|
|
| |
|
|
| |
|
|
|
Implied Enterprise Value | | $ | 109.8 | | | $ | 124.2 | | | $ | 138.7 | | | $ | 99.3 | | | $ | 112.2 | | | $ | 125.1 | | | $ | 90.2 | | | $ | 101.7 | | | $ | 113.2 | |
| | |
|
|
| |
|
|
| |
|
|
| |
|
|
| |
|
|
| |
|
|
| |
|
|
| |
|
|
| |
|
|
|
Less: Total Debt(f) | | | (0.4 | ) | | | (0.4 | ) | | | (0.4 | ) | | | (0.4 | ) | | | (0.4 | ) | | | (0.4 | ) | | | (0.4 | ) | | | (0.4 | ) | | | (0.4 | ) |
Plus: Cash & Equivalents(f) | | | 27.2 | | | | 27.2 | | | | 27.2 | | | | 27.2 | | | | 27.2 | | | | 27.2 | | | | 27.2 | | | | 27.2 | | | | 27.2 | |
| | |
|
|
| |
|
|
| |
|
|
| |
|
|
| |
|
|
| |
|
|
| |
|
|
| |
|
|
| |
|
|
|
Implied Equity Value | | $ | 136.5 | | | $ | 151.0 | | | $ | 165.5 | | | $ | 126.1 | | | $ | 139.0 | | | $ | 151.9 | | | $ | 116.9 | | | $ | 128.4 | | | $ | 140.0 | |
| | |
|
|
| |
|
|
| |
|
|
| |
|
|
| |
|
|
| |
|
|
| |
|
|
| |
|
|
| |
|
|
|
Equity Value per Diluted Share | | $ | 11.28 | | | $ | 12.48 | | | $ | 13.67 | | | $ | 10.42 | | | $ | 11.48 | | | $ | 12.55 | | | $ | 9.66 | | | $ | 10.61 | | | $ | 11.56 | |
| (a) | Valuation date is 9/30/03. Cash flows discounted to present applying the full year convention. |
| (b) | 2003 to 2008 per management estimates as of September 25, 2003. |
| (c) | EBIAT is defined as earnings before interest after tax. |
| (d) | 2003 free cash flow has been pro rated for portion of fiscal year remaining from the valuation date of 9/30/03. |
| (e) | Based on weighted average cost of capital of comparable companies. |
| (f) | Per balance sheet dated 6/30/03. |
| | 30 | | |
| | VALUATION CONSIDERATIONS
|
REVENUE DISCOUNTED CASH FLOW ANALYSIS—SENSITIVITY(a)
Present Value of Enterprise
(US$ in millions)
| |
Discount Rate
| | Terminal Revenue Multiple
|
| | 0.7x
| | 0.9x
| | 1.1x
|
12.5% | | $ | 95.7 | | $ | 112.4 | | $ | 129.0 |
15.0% | | | 86.8 | | | 101.7 | | | 116.5 |
17.5% | | | 79.0 | | | 92.2 | | | 105.5 |
Present Value of Equity
(US$ in millions)
| |
Discount Rate
| | Terminal Revenue Multiple
|
| | 0.7x
| | 0.9x
| | 1.1x
|
12.5% | | $ | 122.5 | | $ | 139.1 | | $ | 155.8 |
15.0% | | | 113.6 | | | 128.4 | | | 143.2 |
17.5% | | | 105.7 | | | 119.0 | | | 132.2 |
Implied Perpetual Growth Rate
Discount Rate
| | Terminal Revenue
Multiple
| |
| | 0.7x
| | | 0.9x
| | | 1.1x
| |
| 12.5% | | (2.9 | )% | | 0.6 | % | | 2.7 | % |
| 15.0% | | (0.4 | )% | | 3.1 | % | | 5.2 | % |
| 17.5% | | 2.1 | % | | 5.6 | % | | 7.7 | % |
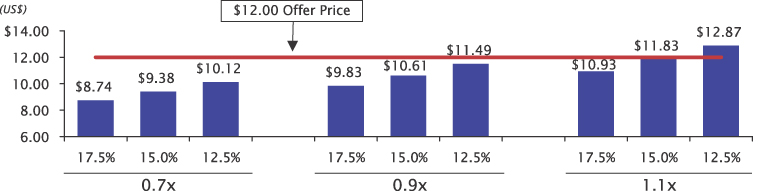
Present Value of Equity Per Share
(US$ in millions)
| |
Discount Rate
| | Terminal Revenue Multiple
|
| | 0.7x
| | 0.9x
| | 1.1x
|
| 12.5% | | $ | 10.12 | | $ | 11.49 | | $ | 12.87 |
| 15.0% | | | 9.38 | | | 10.61 | | | 11.83 |
| 17.5% | | | 8.74 | | | 9.83 | | | 10.93 |
| (a) | Discount rates are based on a range of rates around the weighted average cost of capital (WACC) of a set of comparable companies. |
| | 31 | | |
| | VALUATION CONSIDERATION
|
REVENUE DISCOUNTED CASH FLOW ANALYSIS
Preliminary Discounted Cash Flow Analysis(a)(b)
(US$ in millions, except per share data)
| | | Historical
| | Projected
| | | CAGR (2003-2008)
| |
Fiscal Years ending December 31,
| | 2001
| | | 2002
| | 2003
| | | 2004
| | | 2005
| | | 2006
| | | 2007
| | | 2008
| | |
Net Sales | | $ | 94.9 | | | $ | 99.5 | | $ | 107.8 | | | $ | 116.0 | | | $ | 124.5 | | | $ | 133.7 | | | $ | 143.7 | | | $ | 154.5 | | | 7.5 | % |
EBITDA | | | 2.5 | | | | 6.8 | | | 10.2 | | | | 12.8 | | | | 16.3 | | | | 18.3 | | | | 22.5 | | | | 26.8 | | | 21.4 | % |
EBIT | | | (1.4 | ) | | | 0.6 | | | 4.3 | | | | 6.8 | | | | 11.2 | | | | 15.3 | | | | 19.5 | | | | 23.8 | | | 41.1 | % |
Less: Taxes | | | 0.1 | | | | 0.4 | | | 1.2 | | | | 1.9 | | | | 4.2 | | | | 6.0 | | | | 7.6 | | | | 9.3 | | | | |
EBIAT(c) | | | (1.5 | ) | | | 0.3 | | | 3.0 | | | | 4.9 | | | | 7.1 | | | | 9.3 | | | | 11.9 | | | | 14.5 | | | | |
| | |
|
|
| |
|
| |
|
|
| |
|
|
| |
|
|
| |
|
|
| |
|
|
| |
|
|
| | | |
Plus: Depreciation and Amortization | | | | | | | | | | 5.9 | | | | 6.0 | | | | 5.0 | | | | 3.0 | | | | 3.0 | | | | 3.0 | | | | |
Less: Capital Expenditures | | | | | | | | | | (3.2 | ) | | | (3.0 | ) | | | (3.0 | ) | | | (3.0 | ) | | | (3.0 | ) | | | (3.0 | ) | | | |
Less: Increase in Working Capital | | | | | | | | | | (1.3 | ) | | | 0.1 | | | | 0.5 | | | | 0.4 | | | | 0.5 | | | | 0.5 | | | | |
| | | | | | | | | |
|
|
| |
|
|
| |
|
|
| |
|
|
| |
|
|
| |
|
|
| | | |
Unlevered Free Cash Flow(d) | | | | | | | | | | 1.1 | | | | 7.9 | | | | 9.6 | | | | 9.7 | | | | 12.3 | | | | 15.0 | | | | |
| | | | | | | | | |
|
|
| |
|
|
| |
|
|
| |
|
|
| |
|
|
| |
|
|
| | | |
Discount Rate(e) Assumed Terminal Revenue
Multiple
| | 12.5%
| | | 15.0%
| | | 17.5%
| |
| | 0.7x
| | | 0.9x
| | | 1.1x
| | | 0.7x
| | | 0.9x
| | | 1.1x
| | | 0.7x
| | | 0.9x
| | | 1.1x
| |
Terminal Year Revenue | | $ | 154.5 | | | $ | 154.5 | | | $ | 154.5 | | | $ | 154.5 | | | $ | 154.5 | | | $ | 154.5 | | | $ | 154.5 | | | $ | 154.5 | | | $ | 154.5 | |
Terminal Value | | | 108.1 | | | | 139.0 | | | | 169.9 | | | | 108.1 | | | | 139.0 | | | | 169.9 | | | | 108.1 | | | | 139.0 | | | | 169.9 | |
PV of Terminal Value | | | 58.3 | | | | 74.9 | | | | 91.6 | | | | 51.9 | | | | 66.8 | | | | 81.6 | | | | 46.4 | | | | 59.6 | | | | 72.9 | |
PV of Free Cash Flows | | | 37.4 | | | | 37.4 | | | | 37.4 | | | | 34.9 | | | | 34.9 | | | | 34.9 | | | | 32.6 | | | | 32.6 | | | | 32.6 | |
| | |
|
|
| |
|
|
| |
|
|
| |
|
|
| |
|
|
| |
|
|
| |
|
|
| |
|
|
| |
|
|
|
Implied Enterprise Value | | $ | 95.7 | | | $ | 112.4 | | | $ | 129.0 | | | $ | 86.8 | | | $ | 101.7 | | | $ | 116.5 | | | $ | 79.0 | | | $ | 92.2 | | | $ | 105.5 | |
| | |
|
|
| |
|
|
| |
|
|
| |
|
|
| |
|
|
| |
|
|
| |
|
|
| |
|
|
| |
|
|
|
Less: Total Debt(f) | | | (0.4 | ) | | | (0.4 | ) | | | (0.4 | ) | | | (0.4 | ) | | | (0.4 | ) | | | (0.4 | ) | | | (0.4 | ) | | | (0.4 | ) | | | (0.4 | ) |
Plus: Cash & Equivalents(f) | | | 27.2 | | | | 27.2 | | | | 27.2 | | | | 27.2 | | | | 27.2 | | | | 27.2 | | | | 27.2 | | | | 27.2 | | | | 27.2 | |
| | |
|
|
| |
|
|
| |
|
|
| |
|
|
| |
|
|
| |
|
|
| |
|
|
| |
|
|
| |
|
|
|
Implied Equity Value | | $ | 122.5 | | | $ | 139.1 | | | $ | 155.8 | | | $ | 113.6 | | | $ | 128.4 | | | $ | 143.2 | | | $ | 105.7 | | | $ | 119.0 | | | $ | 132.2 | |
| | |
|
|
| |
|
|
| |
|
|
| |
|
|
| |
|
|
| |
|
|
| |
|
|
| |
|
|
| |
|
|
|
Equity Value per Diluted Share | | $ | 10.12 | | | $ | 11.49 | | | $ | 12.87 | | | $ | 9.38 | | | $ | 10.61 | | | $ | 11.83 | | | $ | 8.74 | | | $ | 9.83 | | | $ | 10.93 | |
| (a) | Valuation date is 9/30/03. Cash flows discounted to present applying the full year convention. |
| (b) | 2003 to 2008 per management estimates as of September 25, 2003. |
| (c) | EBIAT is defined as earnings before interest after tax. |
| (d) | 2003 free cash flow has been pro rated for portion of fiscal year remaining from the valuation date of 9/30/03. |
| (e) | Based on weighted average cost of capital of comparable companies. |
| (f) | Per balance sheet dated 6/30/03. |
| | 32 | | |
DISCOUNTED CASH FLOW—CASTLE PROJECTIONS
Income Statement Items
(US$ in millions, except per share data)
| | | Historical
| | | Projected(a)
| |
| | | 2000
| | | 2001
| | | 2002
| | | 2003
| | | 2004
| | | 2005
| | | 2006
| | | 2007
| | | 2008
| |
Revenues | | $ | 95.2 | | | $ | 94.9 | | | $ | 99.5 | | | $ | 107.8 | | | $ | 116.0 | | | $ | 124.5 | | | $ | 133.7 | | | $ | 143.7 | | | $ | 154.5 | |
%Growth | | | 2.4 | % | | | (0.3 | )% | | | 4.8 | % | | | 8.4 | % | | | 7.6 | % | | | 7.3 | % | | | 7.4 | % | | | 7.5 | % | | | 7.5 | % |
| | | | | | | | | |
EBITDA | | $ | 6.6 | | | $ | 2.5 | | | $ | 6.8 | | | $ | 10.2 | | | $ | 12.8 | | | $ | 16.3 | | | $ | 18.3 | | | $ | 22.5 | | | $ | 26.8 | |
%of Revenues | | | 7.0 | % | | | 2.6 | % | | | 6.8 | % | | | 9.4 | % | | | 11.0 | % | | | 13.1 | % | | | 13.7 | % | | | 15.6 | % | | | 17.4 | % |
| | | | | | | | | |
EBIT | | $ | 2.7 | | | $ | (1.4 | ) | | $ | 0.6 | | | $ | 4.3 | | | $ | 6.8 | | | $ | 11.2 | | | $ | 15.3 | | | $ | 19.5 | | | $ | 23.8 | |
%of Revenues | | | 2.8 | % | | | (1.4 | )% | | | 0.6 | % | | | 4.0 | % | | | 5.8 | % | | | 9.0 | % | | | 11.4 | % | | | 13.5 | % | | | 15.4 | % |
| | | | | | | | | |
Net Income | | $ | 4.6 | | | $ | 1.3 | | | $ | 1.1 | | | $ | 3.7 | | | $ | 5.7 | | | $ | 8.5 | | | $ | 11.1 | | | $ | 14.1 | | | $ | 17.3 | |
%of Revenues | | | 4.9 | % | | | 1.3 | % | | | 1.1 | % | | | 3.4 | % | | | 4.9 | % | | | 6.8 | % | | | 8.3 | % | | | 9.8 | % | | | 11.2 | % |
Cash Flow Items
(US$ in millions, except per share data)
| | | Historical
| | | Projected(a)
| |
| | | 2000
| | | 2001
| | | 2002
| | | 2003
| | | 2004
| | | 2005
| | | 2006
| | | 2007
| | | 2008
| |
Capital Expenditures | | $ | 1.0 | | | $ | 2.9 | | | $ | 4.1 | | | $ | 3.2 | | | $ | 3.0 | | | $ | 3.0 | | | $ | 3.0 | | | $ | 3.0 | | | $ | 3.0 | |
%of Revenues | | | 1.1 | % | | | 3.1 | % | | | 4.1 | % | | | 3.0 | % | | | 2.6 | % | | | 2.4 | % | | | 2.2 | % | | | 2.1 | % | | | 1.9 | % |
| | | | | | | | | |
Depreciation and Amortization | | $ | 4.0 | | | $ | 3.8 | | | $ | 6.1 | | | $ | 5.9 | | | $ | 6.0 | | | $ | 5.0 | | | $ | 3.0 | | | $ | 3.0 | | | $ | 3.0 | |
%of Revenues | | | 4.2 | % | | | 4.0 | % | | | 6.2 | % | | | 5.5 | % | | | 5.2 | % | | | 4.0 | % | | | 2.2 | % | | | 2.1 | % | | | 1.9 | % |
| | | | | | | | | |
Changes in Working Capital | | $ | (5.1 | ) | | $ | 2.6 | | | $ | (1.2 | ) | | $ | 1.3 | | | $ | (0.1 | ) | | $ | (0.5 | ) | | $ | (0.4 | ) | | $ | (0.5 | ) | | $ | (0.5 | ) |
%of Change in Revenues | | | (227.2 | )% | | | 2.8 | % | | | (25.6 | )% | | | 15.8 | % | | | (0.9 | )% | | | (6.0 | )% | | | (4.1 | )% | | | (4.5 | )% | | | (4.4 | )% |
| | | | | | | | | |
Free Cash Flow | | $ | 8.6 | | | $ | 1.8 | | | $ | 3.5 | | | $ | 4.4 | | | $ | 7.9 | | | $ | 9.6 | | | $ | 9.7 | | | $ | 12.3 | | | $ | 15.0 | |
%of Revenues | | | 9.0 | % | | | 1.9 | % | | | 3.5 | % | | | 4.1 | % | | | 6.9 | % | | | 7.7 | % | | | 7.2 | % | | | 8.6 | % | | | 9.7 | % |
| (a) | CY2000-2002 per public filings; 2003 to 2008 per management estimates as of September 25, 2003. |
| | 33 | | |
WEIGHTED AVERAGE COST OF CAPITAL CALCULATION
WACC
| | | | | | Comparables
| |
A. Cost of Debt (Kd) | | | | | | |
Estimated Cost of Borrowing(1) | | | | | 7.5 | % |
Tax Rate(2) | | | | | 35.0 | % |
| | | | | |
|
|
| | | Kd= | | | 4.88 | % |
| | | | | |
|
|
B. Cost of Equity (Ke) | | | | | | |
Risk Free Rate (5 Year Treasuries)(3) | | | | | 3.0 | % |
Beta(4) | | | | | 1.16 | |
Market Risk Premium(5) | | | | | 10.5 | % |
| | | | | |
|
|
| | | Ke= | (6) | | 15.20 | % |
| | | | | |
|
|
C. Weighted Average Cost of Capital(K) | | | | | | |
Industry/Company Debt to Capitalization Ratio(7) | | | | | 3.6 | % |
Implicit Equity to Capitalization Ratio | | | | | 96.4 | % |
| | | | | |
|
|
| | | K= | | | 14.83 | % |
| | | | | |
|
|
| (3) | 5-year treasury yield as of September 25, 2003 |
| (4) | Beta equals relevered average of unlevered industry betas; Source: Bloomberg Raw Betas as of September 25, 2003. |
| (5) | Based on Ibbotson research, (7% long-horizon equity risk premium + 3.53% micro-cap premium) |
| (6) | Ke equals risk free rate plus the product of beta and market premium |
| (7) | Industry debt/cap ratio derived from comparable companies |
| | 34 | | |
LEVERAGED BUYOUT TRANSACTION SUMMARY(a)
CASTLE MBO Sources and Uses of Funds
(Dollars in millions)
Assumes Transaction Closes 12/31/03
| | |
Sources
| | | | % of Total
| |
Cash | | | 30.0 | | 20.2 | % |
Revolving Credit | | | 0.0 | | 0.0 | % |
Senior Notes | | | 35.0 | | 23.5 | % |
Senior Sub-Debt | | | 0.0 | | 0.0 | % |
Mgt Rollover | | | 2.5 | | 1.7 | % |
Preferred Equity | | | 0.0 | | 0.0 | % |
Common Equity | | | 81.1 | | 54.6 | % |
| | |
|
| | | |
Total Sources | | $ | 148.6 | | 100.0 | % |
| | |
|
| | | |
| | |
Uses
| | | | % of Total
| |
| Increase in Cash | | | — | �� | 0.0 | % |
| Refinance Debt | | | 0.4 | | 0.3 | % |
| Acquisition of CASTLE Stock | | | 145.2 | | 97.7 | % |
| Transaction Fees | | | 3.0 | | 2.0 | % |
| | |
|
| | | |
| Total Uses | | $ | 148.6 | | 100.0 | % |
| | |
|
| | | |
CASTLE MBO Assumptions
| | | |
Interest Rates
| | PIK
| | Int. Rate
| | | Ownership
| |
| Cash Balances | | | | | 1.5 | % | | 0.0 | % |
| Revolving Credit | | | | | 6.5 | % | | 0.0 | % |
| Senior Notes | | | | | 7.5 | % | | 0.0 | % |
| Senior Sub-Debt | | | | | 14.0 | % | | 0.0 | % |
| Preferred Equity | | | | | 10.0 | % | | 0.0 | % |
| Castle Fully-Diluted Shares | | | | | 12.1 | | | | |
| Price per Share | | | | $ | 12.00 | | | | |
| Mgt Equity(b) | | | | | 0.2 | | | MM Shares | |
| Mgt Rollover as %of Mgt Equity | | | | | 100 | % | | | |
Acquisition Multiples
Enterprise Value as a Multiple of
| |
| 2003E Revenue | | 1.07 | x |
| 2004E Revenue | | 1.00 | |
| 2003E EBITDA | | 11.4 | x |
| 2004E EBITDA | | 9.0 | |
| CASTLE Transaction Overview |
| (Dollars in millions) |
| | | |
Fiscal Year Ending
December 31,
| | | | | Hist
| | Projected
| |
| | | | | | 2003
| | 2004
| | | 2005
| | | 2006
| | | 2007
| | | 2008
| | | 2009
| | | 2010
| | | 2011
| | | 2012
| | | 2013
| |
Net Sales | | | | | $ | 107.8 | | $ | 116.0 | | | $ | 124.5 | | | $ | 133.7 | | | $ | 143.7 | | | $ | 154.5 | | | $ | 169.9 | | | $ | 186.9 | | | $ | 205.6 | | | $ | 226.2 | | | $ | 248.8 | |
EBITDA | | | | | | 10.2 | | | 12.8 | | | | 16.3 | | | | 18.3 | | | | 22.5 | | | | 26.8 | | | | 31.3 | | | | 36.4 | | | | 42.0 | | | | 48.3 | | | | 55.3 | |
Operating Income | | | | | | 4.3 | | | 6.8 | | | | 11.2 | | | | 15.3 | | | | 19.5 | | | | 23.8 | | | | 28.0 | | | | 32.7 | | | | 38.0 | | | | 43.9 | | | | 50.4 | |
| | | | | | | | | | | | |
Total Debt | | | | | $ | — | | $ | 29.4 | | | $ | 21.5 | | | $ | 12.9 | | | $ | 1.4 | | | $ | — | | | $ | — | | | $ | — | | | $ | — | | | $ | — | | | $ | — | |
Total Net Debt | | | | | | — | | | 29.4 | | | | 21.5 | | | | 12.9 | | | | 1.4 | | | | (13.4 | ) | | | (30.8 | ) | | | (51.3 | ) | | | (75.2 | ) | | | (102.8 | ) | | | (134.8 | ) |
| | | | | | | | | | | | |
Total Debt/EBITDA | | | | | | | | | 2.3 | x | | | 1.3 | x | | | 0.7 | x | | | 0.1 | x | | | 0.0 | x | | | 0.0 | x | | | 0.0 | x | | | 0.0 | x | | | 0.0 | x | | | 0.0 | x |
Total Debt/EBITDA—Capex | | | | | | | | | 3.0 | | | | 1.6 | | | | 0.8 | | | | 0.1 | | | | 0.0 | | | | 0.0 | | | | 0.0 | | | | 0.0 | | | | 0.0 | | | | 0.0 | |
EBITDA/Cash Interest Expense | | | | | | | | | 4.9 | | | | 7.4 | | | | 11.3 | | | | 23.2 | | | | NM | | | | NM | | | | NM | | | | NM | | | | NM | | | | NM | |
EBITDA—Cap. Ex./Cash Interest | | | | | | | | | 3.7 | | | | 6.0 | | | | 9.5 | | | | 20.1 | | | | NM | | | | NM | | | | NM | | | | NM | | | | NM | | | | NM | |
| | | | | | | | | | | | |
Senior Debt/Total Capitalization | | | | | | | | | 25.5 | % | | | 19.0 | % | | | 11.5 | % | | | 1.2 | % | | | 0.0 | % | | | 0.0 | % | | | 0.0 | % | | | 0.0 | % | | | 0.0 | % | | | 0.0 | % |
Senior Debt/Initial Senior Debt | | | | | | | | | 84.1 | % | | | 61.4 | % | | | 36.9 | % | | | 3.9 | % | | | 0.0 | % | | | 0.0 | % | | | 0.0 | % | | | 0.0 | % | | | 0.0 | % | | | 0.0 | % |
Total Debt/Total Capitalization | | | | | | | | | 25.5 | % | | | 19.0 | % | | | 11.5 | % | | | 1.2 | % | | | 0.0 | % | | | 0.0 | % | | | 0.0 | % | | | 0.0 | % | | | 0.0 | % | | | 0.0 | % |
| | | | | | | | | | | | |
Returns to Senior Notes | | | | | | | | | | | | | | | | | | | | | | | | | | | | | | | | | | | | | | | | | | | | | | |
EBITDA Exit Multiple: | | 5.0 | x | | | | | | 7.5 | % | | | 7.5 | % | | | 7.5 | % | | | 7.5 | % | | | 7.5 | % | | | 7.5 | % | | | 7.5 | % | | | 7.5 | % | | | 7.5 | % | | | 7.5 | % |
| | | 6.0 | | | | | | | 7.5 | % | | | 7.5 | % | | | 7.5 | % | | | 7.5 | % | | | 7.5 | % | | | 7.5 | % | | | 7.5 | % | | | 7.5 | % | | | 7.5 | % | | | 7.5 | % |
| | | 7.0 | | | | | | | 7.5 | % | | | 7.5 | % | | | 7.5 | % | | | 7.5 | % | | | 7.5 | % | | | 7.5 | % | | | 7.5 | % | | | 7.5 | % | | | 7.5 | % | | | 7.5 | % |
| | | | | | | | | | | | |
Returns to Common Equity | | | | | | | | | | | | | | | | | | | | | | | | | | | | | | | | | | | | | | | | | | | | | | |
EBITDA Exit Multiple: | | 5.0 | x | | | | | | -15.5 | % | | | -2.1 | % | | | 7.3 | % | | | 12.0 | % | | | 14.4 | % | | | 15.8 | % | | | 16.6 | % | | | 17.0 | % | | | 17.3 | % | | | NM | |
| | | 6.0 | | | | | | | -4.7 | % | | | 5.0 | % | | | 12.4 | % | | | 15.8 | % | | | 17.4 | % | | | 18.2 | % | | | 18.6 | % | | | 18.7 | % | | | 18.8 | % | | | NM | |
| | | 7.0 | | | | | | | 5.0 | % | | | 11.2 | % | | | 16.8 | % | | | 19.2 | % | | | 20.0 | % | | | 20.3 | % | | | 20.4 | % | | | 20.3 | % | | | 20.1 | % | | | NM | |
| (a) | Based on capitalization assumptions set forth in Guard’s offer dated July 28, 2003 with interest assumptions per SG Cowen. |
| (b) | Management equity based on shares of Castle and options to purchase shares of Castle held by messrs. Foy and Provenzano using the treasury stock method; although Mr. Asen may participate, his shares and options have not been included for this analysis. |
| | 35 | | |
APPENDIX
| | 36 | | |
FORM OF SG COWEN FAIRNESS OPINION
| | 37 | | |