UNITED STATES
SECURITIES AND EXCHANGE COMMISSION
Washington, D.C. 20549
FORM N-CSR
CERTIFIED SHAREHOLDER REPORT OF REGISTERED
MANAGEMENT INVESTMENT COMPANIES
Investment Company Act file number | 33-12791 & 811-5069 | |||||||
| ||||||||
EquiTrust Variable Insurance Series Fund | ||||||||
(Exact name of registrant as specified in charter) | ||||||||
| ||||||||
5400 University Avenue, West Des Moines IA |
| 50266-5997 | ||||||
(Address of principal executive offices) |
| (Zip code) | ||||||
| ||||||||
Kristi Rojohn, 5400 University Avenue, West Des Moines IA 50266-5997 | ||||||||
(Name and address of agent for service) | ||||||||
| ||||||||
Registrant’s telephone number, including area code: | 515/225-5400 |
| ||||||
| ||||||||
Date of fiscal year end: | December 31, 2005 |
| ||||||
| ||||||||
Date of reporting period: | June 30, 2005 |
| ||||||
Item 1. Reports to Stockholders.

EquiTrust Variable Insurance Series Fund
Semi-Annual Report
June 30, 2005
5400 University Avenue
West Des Moines, IA 50266
1-877-860-2904
1-515-225-5586
This report is not to be distributed unless preceded or accompanied by a current prospectus.
PRESIDENT'S LETTER
Dear Shareholder:
Equities recorded broad losses for the first half of 2005, with some segments of the equity market faring better than others. The S&P 500 Stock Composite Index (the "S&P 500") declined 0.81%, but the Dow Jones Industrial Average fell 3.65% and the NASDAQ Composite dropped 5.12%. Small cap stocks fared somewhat better than the latter two indices, with the Russell 2000 Index declining 1.21%.
In contrast to the declines in the equity market, fixed income indices generally recorded positive returns. The Lehman Brothers U.S. Aggregate Bond Index, a measure of the broad domestic fixed income security market, recorded a gain of 2.51% for the period. Investment grade corporate, high yield corporate and fixed rate mortgage-backed securities recorded modest single-digit gains in aggregate, while holders of long-term government securities benefited from a sharp decrease in the interest rate on the thirty-year Treasury bond. Lehman's benchmark for this segment of the market, the U.S. Long Treasury Index, returned 8.26% for the period.
Interest rates have incurred significant change since the beginning of the year, with short-term rates rising and long-term rates declining. The Federal Reserve Board (the "Fed") effectively raised short-term interest rates by hiking the Federal Funds rate by 100 basis points (1%) between the beginning of the year and the end of June. This has benefited holders of money market mutual funds, as the rates paid on these accounts have also increased. Long-term interest rates have generally declined, with the yields on the ten-year and thirty-year Treasury bonds decreasing again to historic lows. Fixed mortgage rates have declined as well, providing further stimulus for the buoyant U.S. housing market.
The U.S. economy continues to grow at a relatively average rate, while some measures show inflation pressures to be low or even subsiding. Corporate earnings growth has slowed considerably since 2004, but corporate balance sheets continue to strengthen. The financial markets have seemingly responded in kind, with long-term interest rates - those most impacted by inflation - receding to historic lows and equities generally retaining their fair - but unexciting - valuation. Returns for both equities and fixed income securities are likely to be restrained near-term due, in part, to these conditions.
In this environment, we continue to emphasize the importance of having an appropriate asset allocation plan. The EquiTrust portfolios provide a means for our investors to gain exposure to both the domestic equity and fixed income markets. Below is a summary of how the individual portfolios have performed so far this year.
Money Market: The interest rates offered by money market funds are closely related to the target rates set by the Federal Open Market Committee ("FOMC"). The FOMC meets several times throughout the year to determine the target Federal Funds rate (the overnight lending rate between banks). Rates have been raised at a measured pace over the last year to 3.25% as of the June 30th meeting. The market is anticipating that the increases will continue throughout the rest of 2005. The Federal Funds rate is expected to be 4.00% by year-end. While inflation remains a concern, the FOMC has stated that it believes inflation is "well contained" in the long term. As of June 30, 2005, the Money Market Portfolio had a 7-day yield of 2.49%.
High Grade Bond: Over the first half of the year the Treasury yield curve got flatter with the two-year Treasury yield rising by 57 basis points (.57%) to 3.63%, the ten-year Treasury yield falling 30 basis points (.30%) to 3.19%, and the thirty-year Treasury yield falling 64 basis points (.64%) to 4.19%. The sector with the worst relative performance in the Lehman Brothers U.S. Aggregate Index ("Aggregate Index") for this period was the Investment Grade Corporate Index, as corporate spreads expanded as a result of problems in the auto sector and increased concerns over companies taking actions that are detrimental to credit quality.
During the six-month period ended June 30, 2005, the High Grade Bond Portfolio underperformed the Aggregate Index, as reflected by the 2.22% total return produced by the Portfolio versus the 2.51% total return produced by the Index. The total returns for the major components of the Aggregate Index for this period were as follows: U.S. Fixed Rate Mortgage Backed Securities (34% of the Index), 2.15%; U.S. Treasury Securities (26% of the Index), 3.20%; and U.S. Investment Grade Corporate Securities (20% of the Index), 2.36%. The Index had an effective duration1 of 4.16 as of June 30, 2005. In comparison, the Portfolio had approximately 36% of its assets invested in fixed rate mortgage-backed securities, 34% in corporate securities, 14% in cash equivalents, 9% in government agencies, 6% in U.S. Treasuries and 1% in preferred stock. The effective duration of the Portfolio was 3.60. The Portfolio unde rperformed the Index mainly because of its underexposure to outperforming Treasury issues and Portfolio expenses.
Given the very flat yield curve and our view that the Federal Reserve is not done raising short term interest rates, we feel it is not an appropriate time to take more interest rate risk than the Aggregate Index.
Strategic Yield: The Lehman Brothers High Yield Index ("High Yield Index") generated a total return of 1.11% during the six-month period ending June 30, 2005, outperforming U.S. equities (the S&P 500 returned –0.81%) but underperforming the Lehman Brothers U.S. Investment Grade Corporate Securities Index (which had a total return of 2.36%). The option-adjusted spread on the High Yield Index finished the current period at 367 basis points (3.67%), which was 79 basis points (0.79%) higher than at the start of the year. The High Yield Index had a negative excess return of 155 basis points (–1.55%) relative to duration neutral Treasuries
1 Duration is a measure of interest rate risk for individual securities and portfolios. The lower the duration for a security or portfolio, the less sensitive it is to movements in interest rates.
2
during the period. The range of total return by rating category was dispersed with the Caa-rated component of the Index returning –1.19%, Ba-rated component returning 2.27% and B-rated component returning 1.06% over the six-month reporting period.
During the six-month reporting period, the Portfolio produced a total return of 2.89%, exceeding that of the High Yield Index. Its performance was helped by having less exposure to both high yield issues and lower rated issues relative to the Index; in general, the lowest rated issues were the worst performers during the period. A higher exposure to investment grade corporate securities than the Index also helped to increase our returns relative to the Index and more than offset Portfolio expenses.
The Portfolio has historically invested in a mix of high yield and investment grade issues attempting to find attractive issues in both markets. As always, we will seek out securities in both the investment grade and non-investment grade markets that we feel offer attractive potential returns for the amount of risk taken.
Managed: The Managed Portfolio returned 2.15% through June 30, 2005, relative to a loss of 0.81% for the S&P 500. The Portfolio remains most heavily allocated to quality equities, though its fixed income and cash holdings constitute a significant portion of its assets. The cash holdings aided the Portfolio's relative performance modestly, while its equity holdings outperformed the S&P 500 in all sectors except the materials sector.
Equity valuations generally improved from the beginning of the year but remain unattractive on a long-term basis. The S&P 500's price-to-earnings (P/E) multiple on trailing earnings2 was around 19.2 times trailing earnings at the end of June, just below the benchmark's 25-year average around 19.7 times. However, this still compares to a longer-term, 79-year average near sixteen times trailing earnings.
Equities are still more attractive than fixed income securities given the historically low level of intermediate and long-term interest rates. As such, we are finding value in large cap S&P 500 names such as Wal-Mart, Anheuser Busch and Boston Scientific, all of which were new holdings during the year.
Value Growth: Value Growth outperformed the S&P 500 in the first half of 2005, returning 2.83% compared to the S&P 500's decline of 0.81%. The Portfolio trailed the benchmark only in its materials and utilities weighting, while it led the S&P 500 most significantly in the consumer discretionary and energy sectors.
During the first half of the year, we made significant changes to the Portfolio's exposure in the energy and financials sectors and also added numerous new positions in S&P 500 constituents. Notwithstanding the energy sector's reasonable valuation and its long-term potential, we reduced Value Growth's exposure to the sector given its strong performance over the past eighteen months. Our concerns about the current economics of the financials sector led us to trim the Portfolio's exposure to commercial banks, and we additionally modified its holdings in the insurance industry. We have been finding value in large cap S&P 500 stocks across most sectors in the benchmark; over the past six months, we have added new positions in Wal-Mart, Anheuser-Busch, Deere & Co., International Paper and Metlife. Notably, these have historically been favorites of growth-stock investors.
Over the past twelve to eighteen months, we have positioned the Portfolio defensively against the eventual decline in earnings growth. Relative to the S&P 500, it remains significantly overweight in the health care and energy sectors and underweight in the consumer discretionary, financials and technology sectors. At this point, our strategy of adding large cap S&P 500 growth stocks has moved the Portfolio towards more a core-like position relative to the S&P 500. We anticipate that it will remain so as long as valuation among large cap stocks remains more compelling relative to that of small cap stocks.
Blue Chip: The Blue Chip Portfolio passively tracks the direction of the large capitalization equity market. Year-to-date, the Portfolio has declined 1.48%, relative to total returns of –0.81% for the S&P 500 and –3.65% for the Dow Jones Industrial Average. The Portfolio remains substantially invested in common stocks of large companies and is designed for those investors who prefer substantial exposure to common stocks at all times or who wish to make their own market value judgments.
We appreciate your investment in the Fund and we take seriously our task of seeking to grow and protect that investment. Thank you for continued support of the Fund.

Craig A. Lang
President
July 29, 2005
An investment in the Money Market Portfolio is neither insured nor guaranteed by the Federal Deposit Insurance Corporation or any other government agency. Although the Portfolio seeks to preserve the net asset value of $1.00 per share, it is possible to lose money by investing in the Portfolio.
Past performance is not a guarantee of future results.
2 Trailing earnings are the aggregate per share earnings over the past twelve months for the stocks in the S&P 500.
3
EQUITRUST VARIABLE INSURANCE SERIES FUND
June 30, 2005
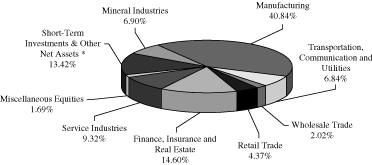
Value Growth Portfolio
Portfolio Holdings by Industry Sector
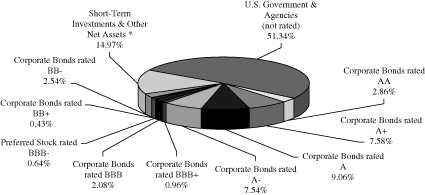
High Grade Bond Portfolio
Portfolio Holdings by Credit Quality and Type of Security**
Strategic Yield Portfolio
Portfolio Holdings by Credit Quality and Type of Security**
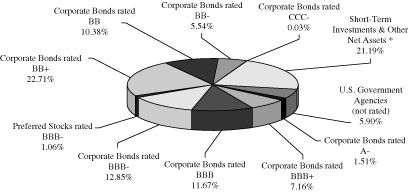
* This category may include short-term investments in commercial paper, money market mutual funds and U.S. government agencies, along with cash, receivables, prepaid expenses and other assets, less liabilities.
** Credit quality as reported by Standard & Poor's.
4
EQUITRUST VARIABLE INSURANCE SERIES FUND
June 30, 2005
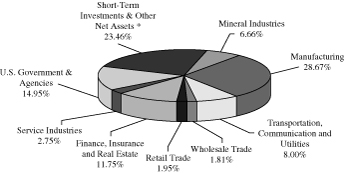
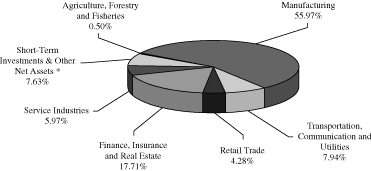
Managed Portfolio
Portfolio Holdings by Industry Sector
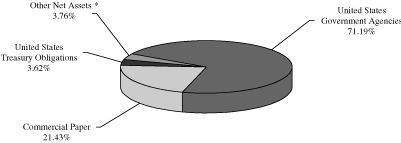
Money Market Portfolio
Portfolio Holdings by Asset Type
Blue Chip Portfolio
Portfolio Holdings by Industry Sector
* This category may include short-term investments in commercial paper, money market mutual funds and U.S. government agencies, along with cash, receivables, prepaid expenses and other assets, less liabilities.
5
Expense Example:
As a shareholder of the Fund, you incur ongoing costs, including management fees and other Fund expenses. This Example is intended to help you understand your ongoing costs (in dollars) of investing in a given Portfolio of the Fund and to compare these costs with the ongoing costs of investing in other mutual funds. The Example is based on an investment of $1,000 invested on January 1, 2005 and held until June 30, 2005.
Actual Expenses –
The first line for each Portfolio in the table below provides information about actual account values and actual expenses for that Portfolio. You may use the information in this line, together with the amount you invested, to estimate the expenses that you paid over the period. Simply divide your account value by $1,000 (for example, an $8,600 account value divided by $1,000 = 8.6), then multiply the result by the number in the first line under the heading entitled "Expenses Paid During Period" for the same Portfolio to estimate the expenses you paid on your account during this period.
Hypothetical Example for Comparison Purposes –
The second line for each Portfolio in the table below provides information about hypothetical account values and hypothetical expenses based on the actual expense ratio of that Portfolio and an assumed rate of return of 5% per year before expenses, which is not the actual return of the Portfolio. The hypothetical account values and expenses may not be used to estimate the actual ending account balance or expenses you paid for the period. You may use this information to compare the ongoing costs of investing in a given Portfolio of the Fund with other funds. To do so, compare this 5% hypothetical example with the 5% hypothetical examples that appear in the shareholder reports of the other funds.
| Beginning Account Value 1/1/2005 | Ending Account Value 6/30/2005 | Expenses Paid During Period* 1/1/2005 - 6/30/2005 | Annualized Expense Ratio | ||||||||||||||||
| Value Growth | 0.58 | % | |||||||||||||||||
| Actual | $ | 1,000 | $ | 1,028.30 | $ | 2.92 | |||||||||||||
| Hypothetical ** | $ | 1,000 | $ | 1,022.12 | $ | 2.91 | |||||||||||||
| High Grade Bond | 0.45 | % | |||||||||||||||||
| Actual | $ | 1,000 | $ | 1,022.20 | $ | 2.24 | |||||||||||||
| Hypothetical ** | $ | 1,000 | $ | 1,022.78 | $ | 2.24 | |||||||||||||
| Strategic Yield | 0.59 | % | |||||||||||||||||
| Actual | $ | 1,000 | $ | 1,028.90 | $ | 2.98 | |||||||||||||
| Hypothetical ** | $ | 1,000 | $ | 1,022.06 | $ | 2.97 | |||||||||||||
| Managed | 0.56 | % | |||||||||||||||||
| Actual | $ | 1,000 | $ | 1,021.50 | $ | 2.83 | |||||||||||||
| Hypothetical ** | $ | 1,000 | $ | 1,022.20 | $ | 2.83 | |||||||||||||
| Money Market | 0.57 | % | |||||||||||||||||
| Actual | $ | 1,000 | $ | 1,010.10 | $ | 2.84 | |||||||||||||
| Hypothetical ** | $ | 1,000 | $ | 1,022.17 | $ | 2.86 | |||||||||||||
| Blue Chip | 0.31 | % | |||||||||||||||||
| Actual | $ | 1,000 | $ | 985.20 | $ | 1.52 | |||||||||||||
| Hypothetical ** | $ | 1,000 | $ | 1,023.47 | $ | 1.55 | |||||||||||||
* Expenses are equal to the Annualized Expense Ratio as shown in the table for each Portfolio, multiplied by the average account value over the period, multiplied by 181 days divided by 364 to reflect the one-half year period.
** Hypothetical examples are based on a 5% return before expenses.
6
(This page has been left blank intentionally.)
7
EQUITRUST VARIABLE INSURANCE SERIES FUND
STATEMENTS OF ASSETS AND LIABILITIES
June 30, 2005
(Unaudited)
| Value Growth Portfolio | High Grade Bond Portfolio | Strategic Yield Portfolio | Managed Portfolio | Money Market Portfolio | Blue Chip Portfolio | ||||||||||||||||||||||
| ASSETS | |||||||||||||||||||||||||||
| Investments in securities, at value (cost - $51,679,172; $31,092,937; $31,952,422; $68,309,528; $6,598,364; and $68,630,207, respectively) | $ | 58,623,763 | $ | 31,952,509 | $ | 33,513,224 | $ | 78,363,403 | $ | 6,598,364 | $ | 81,523,037 | |||||||||||||||
| Cash | 12,335 | 60,059 | 33,044 | 17,018 | 7,251 | 28,882 | |||||||||||||||||||||
| Accrued dividends and interest receivable | 68,950 | 236,651 | 561,154 | 140,277 | 5,037 | 91,794 | |||||||||||||||||||||
| Receivable for fund shares sold | 170 | 15,799 | 9,568 | 14,375 | 260,095 | 1,698 | |||||||||||||||||||||
| Receivable for investment securities sold | 191,694 | - | - | 182,851 | - | - | |||||||||||||||||||||
| Prepaid expense and other assets | 890 | 462 | 474 | 1,147 | 85 | 1,310 | |||||||||||||||||||||
| Total Assets | 58,897,802 | 32,265,480 | 34,117,464 | 78,719,071 | 6,870,832 | 81,646,721 | |||||||||||||||||||||
| LIABILITIES | |||||||||||||||||||||||||||
| Payable for fund shares redeemed | 72,280 | 31,702 | 31,554 | 68,760 | 8,868 | 78,897 | |||||||||||||||||||||
| Accrued expenses | 7,276 | 5,306 | 5,006 | 8,419 | 5,659 | 9,937 | |||||||||||||||||||||
| Total Liabilities | 79,556 | 37,008 | 36,560 | 77,179 | 14,527 | 88,834 | |||||||||||||||||||||
| NET ASSETS | $ | 58,818,246 | $ | 32,228,472 | $ | 34,080,904 | $ | 78,641,892 | $ | 6,856,305 | $ | 81,557,887 | |||||||||||||||
| ANALYSIS OF NET ASSETS | |||||||||||||||||||||||||||
| Paid-in Capital | $ | 55,838,811 | $ | 31,369,330 | $ | 34,780,588 | $ | 65,872,963 | $ | 6,856,305 | $ | 74,950,554 | |||||||||||||||
| Accumulated undistibuted net investment income | 389,384 | - | - | 839,210 | - | 788,520 | |||||||||||||||||||||
| Accumulated undistibuted net realized gain (loss) from investment transactions | (4,354,540 | ) | (430 | ) | (2,260,486 | ) | 1,875,844 | - | (7,074,017 | ) | |||||||||||||||||
| Net unrealized appreciation of investments | 6,944,591 | 859,572 | 1,560,802 | 10,053,875 | - | 12,892,830 | |||||||||||||||||||||
| NET ASSETS | $ | 58,818,246 | $ | 32,228,472 | $ | 34,080,904 | $ | 78,641,892 | $ | 6,856,305 | $ | 81,557,887 | |||||||||||||||
| Shares issued and outstanding as of June 30, 2005 | 4,460,126 | 3,111,198 | 3,635,710 | 5,092,526 | 6,856,305 | 2,401,127 | |||||||||||||||||||||
| NET ASSET VALUE PER SHARE | $ | 13.19 | $ | 10.36 | $ | 9.37 | $ | 15.44 | $ | 1.00 | $ | 33.97 | |||||||||||||||
See accompanying notes.
8
9
EQUITRUST VARIABLE INSURANCE SERIES FUND
STATEMENTS OF OPERATIONS
Six Months Ended June 30, 2005
(Unaudited)
| Value Growth Portfolio | High Grade Bond Portfolio | Strategic Yield Portfolio | Managed Portfolio | Money Market Portfolio | Blue Chip Portfolio | ||||||||||||||||||||||
| INVESTMENT INCOME | |||||||||||||||||||||||||||
| Dividends | $ | 446,201 | $ | 8,100 | $ | 14,175 | $ | 539,037 | $ | - | $ | 827,820 | |||||||||||||||
| Interest | 110,379 | 755,086 | 993,968 | 513,610 | 80,779 | 87,562 | |||||||||||||||||||||
| Foreign tax withholding | (1,333 | ) | - | - | (1,897 | ) | - | - | |||||||||||||||||||
| Total Investment Income | 555,247 | 763,186 | 1,008,143 | 1,050,750 | 80,779 | 915,382 | |||||||||||||||||||||
| EXPENSES | |||||||||||||||||||||||||||
| Paid to EquiTrust Investment Management Services, Inc.: | |||||||||||||||||||||||||||
| Investment advisory and management fees | 128,909 | 45,993 | 71,646 | 168,822 | 7,755 | 82,490 | |||||||||||||||||||||
| Accounting fees | 14,320 | 7,665 | 7,961 | 14,977 | 1,551 | 14,841 | |||||||||||||||||||||
| Custodial fees | 2,882 | 2,665 | 2,183 | 3,409 | 3,206 | 2,261 | |||||||||||||||||||||
| Professional fees | 8,894 | 5,290 | 5,417 | 11,155 | 2,105 | 12,289 | |||||||||||||||||||||
| Reports to shareholders | 1,145 | 588 | 601 | 1,469 | 129 | 1,667 | |||||||||||||||||||||
| Trustees' fees and expenses | 2,656 | 1,433 | 1,496 | 3,501 | 271 | 3,825 | |||||||||||||||||||||
| Insurance and bonds | 686 | 356 | 361 | 879 | 65 | 1,011 | |||||||||||||||||||||
| Miscellaneous | 6,371 | 4,364 | 4,476 | 7,328 | 2,613 | 8,478 | |||||||||||||||||||||
| Total Expenses | 165,863 | 68,354 | 94,141 | 211,540 | 17,695 | 126,862 | |||||||||||||||||||||
| Net Investment Income | 389,384 | 694,832 | 914,002 | 839,210 | 63,084 | 788,520 | |||||||||||||||||||||
| NET REALIZED AND UNREALIZED GAIN (LOSS) ON INVESTMENTS | |||||||||||||||||||||||||||
| Net realized gain (loss) from investment transactions | 2,074,308 | (430 | ) | 1,392 | 1,932,188 | - | 396 | ||||||||||||||||||||
| Change in unrealized appreciation (depreciation) of investments | (879,618 | ) | (7,128 | ) | 43,568 | (1,100,050 | ) | - | (2,036,449 | ) | |||||||||||||||||
| Net Gain (Loss) on Investments | 1,194,690 | (7,558 | ) | 44,960 | 832,138 | - | (2,036,053 | ) | |||||||||||||||||||
| Net Increase (Decrease) in Net Assets Resulting from Operations | $ | 1,584,074 | $ | 687,274 | $ | 958,962 | $ | 1,671,348 | $ | 63,084 | $ | (1,247,533 | ) | ||||||||||||||
See accompanying notes.
10
EQUITRUST VARIABLE INSURANCE SERIES FUND
STATEMENTS OF CHANGES IN NET ASSETS
Value Growth Portfolio | High Grade Bond Portfolio | ||||||||||||||||||
| Six Months Ended June 30, 2005 (Unaudited) | Year Ended December 31, 2004 | Six Months Ended June 30, 2005 (Unaudited) | Year Ended December 31, 2004 | ||||||||||||||||
| OPERATIONS | |||||||||||||||||||
| Net investment income | $ | 389,384 | $ | 662,829 | $ | 694,832 | $ | 1,218,691 | |||||||||||
| Net realized gain (loss) from investment transactions | 2,074,308 | 2,173,686 | (430 | ) | 43,870 | ||||||||||||||
| Change in unrealized appreciation (depreciation) of investments | (879,618 | ) | 3,213,722 | (7,128 | ) | (51,531 | ) | ||||||||||||
| Net Increase (Decrease) in Net Assets Resulting from Operations | 1,584,074 | 6,050,237 | 687,274 | 1,211,030 | |||||||||||||||
| DIVIDENDS AND DISTRIBUTIONS TO SHAREHOLDERS FROM | |||||||||||||||||||
| Net investment income | (665,116 | ) | (563,058 | ) | (694,832 | ) | (1,218,691 | ) | |||||||||||
| Net realized gain from investment transactions | - | - | (43,870 | ) | (70,428 | ) | |||||||||||||
| Total Dividends and Distributions | (665,116 | ) | (563,058 | ) | (738,702 | ) | (1,289,119 | ) | |||||||||||
| CAPITAL SHARE TRANSACTIONS | (454,327 | ) | 54,029 | 2,300,043 | 3,398,714 | ||||||||||||||
| Total Increase (Decrease) in Net Assets | 464,631 | 5,541,208 | 2,248,615 | 3,320,625 | |||||||||||||||
| NET ASSETS | |||||||||||||||||||
| Beginning of period | 58,353,615 | 52,812,407 | 29,979,857 | 26,659,232 | |||||||||||||||
| End of period (including undistributed net investment income as set forth below) | $ | 58,818,246 | $ | 58,353,615 | $ | 32,228,472 | $ | 29,979,857 | |||||||||||
| Undistributed Net Investment Income | $ | 389,384 | $ | 665,116 | $ | - | $ | - | |||||||||||
See accompanying notes.
11
EQUITRUST VARIABLE INSURANCE SERIES FUND
STATEMENTS OF CHANGES IN NET ASSETS (continued)
| Strategic Yield Portfolio | Managed Portfolio | ||||||||||||||||||
| Six Months Ended June 30, 2005 (Unaudited) | Year Ended December 31, 2004 | Six Months Ended June 30, 2005 (Unaudited) | Year Ended December 31, 2004 | ||||||||||||||||
| OPERATIONS | |||||||||||||||||||
| Net investment income | $ | 914,002 | $ | 1,685,239 | $ | 839,210 | $ | 1,297,777 | |||||||||||
| Net realized gain (loss) from investment transactions | 1,392 | 148,802 | 1,932,188 | 2,810,450 | |||||||||||||||
| Change in unrealized appreciation (depreciation) of investments | 43,568 | 581,354 | (1,100,050 | ) | 1,790,691 | ||||||||||||||
| Net Increase (Decrease) in Net Assets Resulting from Operations | 958,962 | 2,415,395 | 1,671,348 | 5,898,918 | |||||||||||||||
| DIVIDENDS AND DISTRIBUTIONS TO SHAREHOLDERS FROM | |||||||||||||||||||
| Net investment income | (914,002 | ) | (1,685,239 | ) | (1,297,777 | ) | (1,367,844 | ) | |||||||||||
| Net realized gain from investment transactions | - | - | (1,299,691 | ) | - | ||||||||||||||
| Total Dividends and Distributions | (914,002 | ) | (1,685,239 | ) | (2,597,468 | ) | (1,367,844 | ) | |||||||||||
| CAPITAL SHARE TRANSACTIONS | 3,398,452 | 4,408,930 | 4,692,305 | 3,611,860 | |||||||||||||||
| Total Increase (Decrease) in Net Assets | 3,443,412 | 5,139,086 | 3,766,185 | 8,142,934 | |||||||||||||||
| NET ASSETS | |||||||||||||||||||
| Beginning of period | 30,637,492 | 25,498,406 | 74,875,707 | 66,732,773 | |||||||||||||||
| End of period (including undistributed net investment income as set forth below) | $ | 34,080,904 | $ | 30,637,492 | $ | 78,641,892 | $ | 74,875,707 | |||||||||||
| Undistributed Net Investment Income | $ | - | $ | - | $ | 839,210 | $ | 1,297,777 | |||||||||||
| Money Market Portfolio | Blue Chip Portfolio | ||||||||||||||||||
| Six Months Ended June 30, 2005 (Unaudited) | Year Ended December 31, 2004 | Six Months Ended June 30, 2005 (Unaudited) | Year Ended December 31, 2004 | ||||||||||||||||
| OPERATIONS | |||||||||||||||||||
| Net investment income | $ | 63,084 | $ | 45,967 | $ | 788,520 | $ | 1,621,030 | |||||||||||
| Net realized gain (loss) from investment transactions | - | - | 396 | (616,554 | ) | ||||||||||||||
| Change in unrealized appreciation (depreciation) of investments | - | - | (2,036,449 | ) | 3,865,719 | ||||||||||||||
| Net Increase (Decrease) in Net Assets Resulting from Operations | 63,084 | 45,967 | (1,247,533 | ) | 4,870,195 | ||||||||||||||
| DIVIDENDS AND DISTRIBUTIONS TO SHAREHOLDERS FROM | |||||||||||||||||||
| Net investment income | (63,084 | ) | (45,967 | ) | (1,621,030 | ) | (1,194,008 | ) | |||||||||||
| Net realized gain from investment transactions | - | - | - | - | |||||||||||||||
| Total Dividends and Distributions | (63,084 | ) | (45,967 | ) | (1,621,030 | ) | (1,194,008 | ) | |||||||||||
| CAPITAL SHARE TRANSACTIONS | 264,240 | (135,487 | ) | (533,677 | ) | 1,451,850 | |||||||||||||
| Total Increase (Decrease) in Net Assets | 264,240 | (135,487 | ) | (3,402,240 | ) | 5,128,037 | |||||||||||||
| NET ASSETS | |||||||||||||||||||
| Beginning of period | 6,592,065 | 6,727,552 | 84,960,127 | 79,832,090 | |||||||||||||||
| End of period (including undistributed net investment income as set forth below) | $ | 6,856,305 | $ | 6,592,065 | $ | 81,557,887 | $ | 84,960,127 | |||||||||||
| Undistributed Net Investment Income | $ | - | $ | - | $ | 788,520 | $ | 1,621,030 | |||||||||||
See accompanying notes.
12
13
EQUITRUST VARIABLE INSURANCE SERIES FUND
SCHEDULE OF INVESTMENTS
VALUE GROWTH PORTFOLIO
June 30, 2005
(Unaudited)
| Shares Held | Value | ||||||||||
| COMMON STOCKS (86.58%) | |||||||||||
| AUTOMOTIVE REPAIR, SERVICES AND PARKING (0.63%) | |||||||||||
| Ryder System, Inc. | �� | 10,100 | $ | 369,660 | |||||||
| BUSINESS SERVICES (4.69%) | |||||||||||
| Affiliated Computer Services, Inc.-Class A (1) | 5,800 | 296,380 | |||||||||
| Computer Associates International, Inc. | 12,174 | 334,541 | |||||||||
| Compuware Corp. (1) | 16,050 | 115,399 | |||||||||
| Electronic Data Systems Corp. | 5,745 | 110,591 | |||||||||
| Fair Isaac & Co., Inc. | 4,719 | 172,243 | |||||||||
| First Data Corp. | 3,520 | 141,293 | |||||||||
| Microsoft Corp. | 16,425 | 407,997 | |||||||||
| Oracle Corp. (1) | 12,300 | 162,360 | |||||||||
| SunGard Data Systems, Inc. (1) | 6,200 | 218,054 | |||||||||
| Symantec Corp. (1) | 18,016 | 391,668 | |||||||||
| Veritas Software Corp. (1) | 16,800 | 409,920 | |||||||||
| 2,760,446 | |||||||||||
| CHEMICALS AND ALLIED PRODUCTS (14.28%) | |||||||||||
| Abbott Laboratories | 8,000 | 392,080 | |||||||||
| Biogen Idec, Inc. (1) | 4,620 | 159,159 | |||||||||
| Bristol-Myers Squibb Co. | 18,220 | 455,136 | |||||||||
| Colgate-Palmolive Co. | 3,255 | 162,457 | |||||||||
| E.I. du Pont de Nemours & Co. | 12,555 | 539,991 | |||||||||
| GlaxoSmithKline PLC | 5,500 | 266,805 | |||||||||
| IVAX Corp. (1) | 17,000 | 365,500 | |||||||||
| Johnson & Johnson | 9,525 | 619,125 | |||||||||
| KV Pharmaceutical Co.-Class A (1) | 12,700 | 212,725 | |||||||||
| Merck & Co., Inc. | 9,764 | 300,731 | |||||||||
| Mylan Laboratories, Inc. | 40,025 | 770,081 | |||||||||
| Olin Corp. | 6,400 | 116,736 | |||||||||
| Perrigo Co. | 25,615 | 357,073 | |||||||||
| Pfizer, Inc. | 36,036 | 993,873 | |||||||||
| Schering-Plough Corp. | 23,200 | 442,192 | |||||||||
| Sensient Technologies Corp. | 56,375 | 1,161,889 | |||||||||
| SurModics, Inc. (1) | 7,277 | 315,603 | |||||||||
| Taro Pharmaceutical Industries, Ltd. (1) | 6,600 | 191,862 | |||||||||
| Teva Pharmaceutical Industries, Ltd. | 10,216 | 318,126 | |||||||||
| Wyeth | 5,835 | 259,657 | |||||||||
| 8,400,801 | |||||||||||
| COMMUNICATIONS (2.91%) | |||||||||||
| BellSouth Corp. | 11,000 | 292,270 | |||||||||
| Centurytel, Inc. | 19,300 | 668,359 | |||||||||
| Comcast Corp.-Class A (1) | 3,235 | 99,315 | |||||||||
| Nextel Communications, Inc. (1) | 20,200 | 652,662 | |||||||||
| 1,712,606 | |||||||||||
| DEPOSITORY INSTITUTIONS (7.69%) | |||||||||||
| AmSouth Bancorp. | 13,425 | 349,050 | |||||||||
| Bank of America Corp. | 12,204 | 556,624 | |||||||||
| Bank of New York Co., Inc. | 8,681 | 249,839 | |||||||||
| Shares Held | Value | ||||||||||
| BOK Financial Corp. | 7,000 | $ | 322,840 | ||||||||
| Citigroup, Inc. | 23,183 | 1,071,750 | |||||||||
| National City Corp. | 6,830 | 233,040 | |||||||||
| New York Community Bancorp., Inc. | 23,156 | 419,587 | |||||||||
| U. S. Bancorp. | 20,450 | 597,140 | |||||||||
| Wachovia Corp. | 7,650 | 379,440 | |||||||||
| Wilmington Trust Corp. | 9,500 | 342,095 | |||||||||
| 4,521,405 | |||||||||||
| EATING AND DRINKING PLACES (0.68%) | |||||||||||
| Wendy's International, Inc. | 8,400 | 400,260 | |||||||||
| ELECTRIC, GAS AND SANITARY SERVICES (3.69%) | |||||||||||
| Alliant Energy Corp. | 8,660 | 243,779 | |||||||||
| Atmos Energy Corp. | 17,012 | 489,946 | |||||||||
| Black Hills Corp. | 7,520 | 277,112 | |||||||||
| Nisource, Inc. | 16,000 | 395,680 | |||||||||
| Pepco Holdings, Inc. | 16,200 | 387,828 | |||||||||
| Xcel Energy, Inc. | 19,405 | 378,786 | |||||||||
| 2,173,131 | |||||||||||
| ELECTRONIC AND OTHER ELECTRICAL EQUIPMENT (2.99%) | |||||||||||
| Acuity Brands, Inc. | 11,417 | 293,303 | |||||||||
| ADC Telecommunications, Inc. (1) | 18,205 | 396,323 | |||||||||
| Cisco Systems, Inc. (1) | 30,600 | 584,766 | |||||||||
| ECI Telecom, Ltd. (1) | 10,000 | 83,000 | |||||||||
| Emerson Electric Co. | 2,300 | 144,049 | |||||||||
| Intel Corp. | 8,900 | 231,934 | |||||||||
| JDS Uniphase Corp. (1) | 16,400 | 24,928 | |||||||||
| 1,758,303 | |||||||||||
| ENGINEERING AND MANAGEMENT SERVICES (0.38%) | |||||||||||
| Shaw Group, Inc. (1) | 10,400 | 223,704 | |||||||||
| FOOD AND KINDRED PRODUCTS (3.20%) | |||||||||||
| Anheuser-Busch Cos., Inc. | 6,395 | 292,571 | |||||||||
| Coca-Cola Co. | 6,680 | 278,890 | |||||||||
| ConAgra Foods, Inc. | 24,000 | 555,840 | |||||||||
| General Mills, Inc. | 4,110 | 192,307 | |||||||||
| Sara Lee Corp. | 23,400 | 463,554 | |||||||||
| TreeHouse Foods, Inc. (1) | 3,397 | 96,854 | |||||||||
| 1,880,016 | |||||||||||
| FOOD STORES (1.39%) | |||||||||||
| 7-Eleven, Inc. (1) | 14,780 | 446,947 | |||||||||
| Kroger Co. (1) | 19,526 | 371,580 | |||||||||
| 818,527 | |||||||||||
| GENERAL MERCHANDISE STORES (2.30%) | |||||||||||
| Federated Department Stores, Inc. | 6,008 | 440,266 | |||||||||
| Fred's, Inc. | 23,865 | 395,682 | |||||||||
| Target Corp. | 5,300 | 288,373 | |||||||||
| Wal-Mart Stores, Inc. | 4,700 | 226,540 | |||||||||
| 1,350,861 | |||||||||||
14
EQUITRUST VARIABLE INSURANCE SERIES FUND
SCHEDULE OF INVESTMENTS
VALUE GROWTH PORTFOLIO (continued)
| Shares Held | Value | ||||||||||
| HEALTH SERVICES (2.88%) | |||||||||||
| Laboratory Corp. of America Holdings (1) | 10,660 | $ | 531,934 | ||||||||
| Lifepoint Hospitals, Inc. (1) | 11,463 | 579,111 | |||||||||
| Universal Health Services, Inc.-Class B | 9,420 | 585,736 | |||||||||
| 1,696,781 | |||||||||||
| HOLDING AND OTHER INVESTMENT OFFICES (0.89%) | |||||||||||
| Highwoods Properties, Inc. | 17,500 | 520,800 | |||||||||
| INDUSTRIAL MACHINERY AND EQUIPMENT (3.62%) | |||||||||||
| Deere & Co. | 3,990 | 261,305 | |||||||||
| EMC Corp. (1) | 22,500 | 308,475 | |||||||||
| Hewlett-Packard Co. | 6,000 | 141,060 | |||||||||
| Ingersoll-Rand Co., Ltd.-Class A | 9,950 | 709,932 | |||||||||
| Solectron Corp. (1) | 22,500 | 85,275 | |||||||||
| SPX Corp. | 9,023 | 414,878 | |||||||||
| Stanley Works (The) | 4,600 | 209,484 | |||||||||
| 2,130,409 | |||||||||||
| INSTRUMENTS AND RELATED PRODUCTS (4.01%) | |||||||||||
| Agilent Technologies, Inc. (1) | 7,000 | 161,140 | |||||||||
| Becton Dickinson & Co. | 13,226 | 693,968 | |||||||||
| Boston Scientific Corp. (1) | 4,770 | 128,790 | |||||||||
| Fisher Scientific International, Inc. (1) | 8,176 | 530,622 | |||||||||
| Medtronic, Inc. | 6,300 | 326,277 | |||||||||
| Perkinelmer, Inc. | 11,900 | 224,910 | |||||||||
| Steris Corp. | 11,448 | 295,015 | |||||||||
| 2,360,722 | |||||||||||
| INSURANCE CARRIERS (5.48%) | |||||||||||
| Allstate Corp. | 8,095 | 483,676 | |||||||||
| American International Group, Inc. | 9,740 | 565,894 | |||||||||
| MBIA, Inc. | 11,400 | 676,134 | |||||||||
| MetLife, Inc. | 3,795 | 170,547 | |||||||||
| Protective Life Corp. | 9,300 | 392,646 | |||||||||
| Safeco Corp. | 6,240 | 339,082 | |||||||||
| WellPoint, Inc. (1) | 8,532 | 594,168 | |||||||||
| 3,222,147 | |||||||||||
| METAL MINING (1.42%) | |||||||||||
| Barrick Gold Corp. | 20,000 | 500,600 | |||||||||
| Placer Dome, Inc. | 21,600 | 332,208 | |||||||||
| 832,808 | |||||||||||
| MISCELLANEOUS MANUFACTURING INDUSTRIES (0.46%) | |||||||||||
| Hasbro, Inc. | 12,900 | 268,191 | |||||||||
| MOTION PICTURES (0.74%) | |||||||||||
| News Corp.,-Class A | 17,040 | 275,707 | |||||||||
| Time Warner, Inc. (1) | 9,600 | 160,416 | |||||||||
| 436,123 | |||||||||||
| Shares Held | Value | ||||||||||
| NONDEPOSITORY INSTITUTIONS (0.54%) | |||||||||||
| Federal Home Loan Mortgage Corp. | 4,900 | $ | 319,627 | ||||||||
| OIL AND GAS EXTRACTION (5.48%) | |||||||||||
| Apache Corp. | 5,200 | 335,920 | |||||||||
| Burlington Resources, Inc. | 20,000 | 1,104,800 | |||||||||
| Occidental Petroleum Co. | 8,600 | 661,598 | |||||||||
| Rowan Cos., Inc. | 16,900 | 502,099 | |||||||||
| Whiting Petroleum Corp. (1) | 17,100 | 620,901 | |||||||||
| 3,225,318 | |||||||||||
| PAPER AND ALLIED PRODUCTS (1.40%) | |||||||||||
| Abitibi Consolidated, Inc. | 92,600 | 414,848 | |||||||||
| International Paper Co. | 8,700 | 262,827 | |||||||||
| Sonoco Products Co. | 5,500 | 145,750 | |||||||||
| 823,425 | |||||||||||
| PETROLEUM AND COAL PRODUCTS (4.47%) | |||||||||||
| BP PLC | 6,000 | 374,280 | |||||||||
| Chevron Corp. | 14,100 | 788,472 | |||||||||
| ConocoPhillips | 25,466 | 1,464,040 | |||||||||
| 2,626,792 | |||||||||||
| PRIMARY METAL INDUSTRIES (0.72%) | |||||||||||
| Northwest Pipe Co. (1) | 18,215 | 423,499 | |||||||||
| PRINTING AND PUBLISHING (1.63%) | |||||||||||
| Belo Corp.-Series A . | 26,400 | 632,808 | |||||||||
| R.R. Donnelley & Sons Co. | 9,400 | 324,394 | |||||||||
| 957,202 | |||||||||||
| RAILROAD TRANSPORTATION (0.24%) | |||||||||||
| Union Pacific Corp. | 2,155 | 139,644 | |||||||||
| TOBACCO PRODUCTS (1.55%) | |||||||||||
| Altria Group, Inc. | 14,100 | 911,706 | |||||||||
| TRANSPORTATION EQUIPMENT (2.51%) | |||||||||||
| Federal Signal Corp. | 13,300 | 207,480 | |||||||||
| Honeywell International, Inc. | 23,500 | 860,805 | |||||||||
| ITT Industries, Inc. | 4,185 | 408,582 | |||||||||
| 1,476,867 | |||||||||||
| WHOLESALE TRADE - NONDURABLE GOODS (2.02%) | |||||||||||
| Dean Foods Co. (1) | 16,986 | 598,587 | |||||||||
| Safeway, Inc. | 26,230 | 592,536 | |||||||||
| 1,191,123 | |||||||||||
| MISCELLANEOUS EQUITIES (1.69%) | |||||||||||
| H & Q Life Sciences Investors | 25,359 | 402,450 | |||||||||
| NASDAQ-100 Trust | 16,100 | 592,319 | |||||||||
| 994,769 | |||||||||||
| Total Common Stocks (Cost $43,983,082) | 50,927,673 | ||||||||||
15
EQUITRUST VARIABLE INSURANCE SERIES FUND
SCHEDULE OF INVESTMENTS
VALUE GROWTH PORTFOLIO (continued)
| Shares Held | Value | ||||||||||
| SHORT-TERM INVESTMENTS (13.09%) | |||||||||||
| MONEY MARKET MUTUAL FUND (1.28%) | |||||||||||
| Blackrock Liquidity Funds, T-Fund Portfolio (Cost $752,233) | 752,233 | $ | 752,233 | ||||||||
| Principal Amount | |||||||||||
| COMMERCIAL PAPER (2.89%) | |||||||||||
| DEPOSITORY INSTITUTIONS (1.70%) | |||||||||||
| Citigroup CP., 3.07%, due 07/01/05 | $ | 1,000,000 | 1,000,000 | ||||||||
| FOOD AND KINDRED PRODUCTS (1.19%) | |||||||||||
| Coca-Cola Co., due 07/08/05 | 700,000 | 699,568 | |||||||||
| Total Commercial Paper (Cost $1,699,568) | 1,699,568 | ||||||||||
| UNITED STATES GOVERNMENT AGENCIES (8.92%) | |||||||||||
| Federal Home Loan Bank, due 07/06/05 | 1,250,000 | 1,249,489 | |||||||||
| Federal Home Loan Bank, due 07/15/05 | 900,000 | 898,921 | |||||||||
| Federal Home Loan Bank, due 07/22/05 | 725,000 | 723,675 | |||||||||
| Federal Home Loan Mortgage Corp., due 07/12/05 | 1,500,000 | 1,498,628 | |||||||||
| Federal National Mortgage Assoc., due 07/20/05 | 875,000 | 873,576 | |||||||||
| Total United States Government Agencies (Cost $5,244,289) | 5,244,289 | ||||||||||
| Total Short-Term Investments (Cost $7,696,090) | 7,696,090 | ||||||||||
| Total Investments (99.67%) (Cost $51,679,172) | 58,623,763 | ||||||||||
| OTHER ASSETS LESS LIABILITIES (0.33%) | |||||||||||
| Cash, receivables, prepaid expense and other assets, less liabilities | 194,483 | ||||||||||
| Total Net Assets (100.00%) | $ | 58,818,246 | |||||||||
(1) Non-income producing securities.
See accompanying notes.
16
EQUITRUST VARIABLE INSURANCE SERIES FUND
SCHEDULE OF INVESTMENTS
HIGH GRADE BOND PORTFOLIO
June 30, 2005
(Unaudited)
| Shares Held | Value | ||||||||||
| PREFERRED STOCKS (0.64%) | |||||||||||
| HOLDING AND OTHER INVESTMENT OFFICES | |||||||||||
| New Plan Excel Realty Trust-Series D, 7.80% (Cost $200,000) | 4,000 | $ | 205,875 | ||||||||
| Principal Amount | |||||||||||
| CORPORATE BONDS (33.05%) | |||||||||||
| DEPOSITORY INSTITUTIONS (2.48%) | |||||||||||
| Washington Mutual Bank, 5.65%, due 08/15/14 | $ | 750,000 | 799,102 | ||||||||
| ELECTRIC, GAS AND SANITARY SERVICES (6.01%) | |||||||||||
| Maritime & NE Pipeline, 144A, 7.70%, due 11/30/19 (1) | 700,000 | 834,876 | |||||||||
| Oglethorpe Power Corp., 6.974%, due 06/30/11 | 235,000 | 250,870 | |||||||||
| PacifiCorp, 6.90%, due 11/15/11 | 750,000 | 850,837 | |||||||||
| 1,936,583 | |||||||||||
| FOOD STORES (2.07%) | |||||||||||
| Ahold Finance USA, Inc., 8.25%, due 07/15/10 | 600,000 | 666,000 | |||||||||
| FOOD AND KINDRED PRODUCTS (3.12%) | |||||||||||
| Diageo Capital PLC, 4.375%, due 05/03/10 | 1,000,000 | 1,004,780 | |||||||||
| HOLDING AND OTHER INVESTMENT OFFICES (2.11%) | |||||||||||
| Security Capital Pacific, 7.20%, due 03/01/13 | 275,000 | 310,128 | |||||||||
| Washington REIT, 6.898%, due 02/15/18 | 350,000 | 368,988 | |||||||||
| 679,116 | |||||||||||
| HOTELS AND MOTELS (0.47%) | |||||||||||
| Meditrust, 7.60%, due 09/13/05 | 150,000 | 152,062 | |||||||||
| INSURANCE CARRIERS (2.86%) | |||||||||||
| SunAmerica, 8.125%, due 04/28/23 | 700,000 | 922,789 | |||||||||
| SECURITY AND COMMODITY BROKERS (6.85%) | |||||||||||
| Goldman Sachs Group, Inc., 5.125%, due 01/15/15 | 900,000 | 923,139 | |||||||||
| Morgan Stanley-Series MTNC, 5.125%, due 02/11/19 | 1,300,000 | 1,284,374 | |||||||||
| 2,207,513 | |||||||||||
| Principal Amount | Value | ||||||||||
| TOBACCO PRODUCTS (2.57%) | |||||||||||
| UST, Inc., 7.25%, due 06/01/09 | $ | 750,000 | $ | 830,347 | |||||||
| TRANSPORTATION - BY AIR (4.08%) | |||||||||||
| Continental Airlines, Inc., 6.545%, due 08/02/20 | 411,879 | 410,355 | |||||||||
| Federal Express, 7.50%, due 01/15/18 | 198,832 | 233,736 | |||||||||
| Northwest Airlines-Series 1999-2A, 7.575%, due 03/01/19 | 671,515 | 671,549 | |||||||||
| 1,315,640 | |||||||||||
| TRANSPORTATION EQUIPMENT (0.43%) | |||||||||||
| Ford Motor Co., 9.215%, due 09/15/21 | 150,000 | 139,140 | |||||||||
| Total Corporate Bonds (Cost $10,020,486) | 10,653,072 | ||||||||||
| MORTGAGE-BACKED SECURITIES (32.77%) | |||||||||||
| FEDERAL NATIONAL MORTGAGE ASSOCIATION (FNMA) (0.01%) | |||||||||||
| Pool # 50276, 9.50%, due 02/01/20 | 1,326 | 1,475 | |||||||||
| GOVERNMENT NATIONAL MORTGAGE ASSOCIATION (GNMA) (32.76%) | |||||||||||
| Pool # 1512, 7.50%, due 12/20/23 | 32,610 | 35,014 | |||||||||
| Pool # 2631, 7.00%, due 08/01/28 | 41,279 | 43,573 | |||||||||
| Pool # 2658, 6.50%, due 10/01/28 | 72,160 | 75,247 | |||||||||
| Pool # 2701, 6.50%, due 01/20/29 | 85,545 | 89,136 | |||||||||
| Pool # 2796, 7.00%, due 08/01/29 | 73,555 | 77,595 | |||||||||
| Pool # 3039, 6.50%, due 02/01/31 | 29,989 | 31,235 | |||||||||
| Pool # 3040, 7.00%, due 02/01/31 | 54,712 | 57,696 | |||||||||
| Pool # 3188, 6.50%, due 02/20/32 | 182,075 | 189,616 | |||||||||
| Pool # 3239, 6.50%, due 05/01/32 | 165,769 | 172,636 | |||||||||
| Pool # 3261, 6.50%, due 07/20/32 | 322,196 | 335,542 | |||||||||
| Pool # 3320, 5.50%, due 12/01/32 | 1,122,446 | 1,145,813 | |||||||||
| Pool # 3333, 5.50%, due 01/01/33 | 929,028 | 948,055 | |||||||||
| Pool # 3375, 5.50%, due 04/01/33 | 144,843 | 147,809 | |||||||||
| Pool # 3390, 5.50%, due 05/01/33 | 647,380 | 660,639 | |||||||||
| Pool # 3403, 5.50%, due 06/01/33 | 1,098,578 | 1,121,078 | |||||||||
| Pool # 3458, 5.00%, due 10/01/33 | 805,521 | 810,649 | |||||||||
| Pool # 3499, 5.00%, due 01/01/34 | 1,257,380 | 1,265,110 | |||||||||
| Pool # 3556, 5.50%, due 05/01/34 | 1,367,030 | 1,394,845 | |||||||||
| Pool # 3623, 5.00%, due 10/01/34 | 1,892,757 | 1,904,394 | |||||||||
| Pool # 22630, 6.50% due 08/01/28 | 39,882 | 41,589 | |||||||||
| Pool # 276337, 10.00%, due 08/15/19 | 9,343 | 10,621 | |||||||||
| 10,557,892 | |||||||||||
| Total Mortgage-Backed Securities (Cost $10,336,629) | 10,559,367 | ||||||||||
17
EQUITRUST VARIABLE INSURANCE SERIES FUND
SCHEDULE OF INVESTMENTS
HIGH GRADE BOND PORTFOLIO (continued)
| Principal Amount | Value | ||||||||||
| UNITED STATES GOVERNMENT AGENCIES (12.42%) | |||||||||||
| Federal Home Loan Bank, 5.50%, due 05/18/15 . | $ | 1,000,000 | $ | 1,008,826 | |||||||
| Federal Home Loan Mortgage Corp., 4.65%, due 10/10/13 | 1,000,000 | 983,650 | |||||||||
| Federal National Mortgage Assoc., 5.55%, due 06/08/15 | 1,000,000 | 1,002,048 | |||||||||
| Government National Mortgage Assoc., 5.00%, due 05/01/30 | 1,000,000 | 1,008,956 | |||||||||
| Total United States Government Agencies (Cost $3,990,044) | 4,003,480 | ||||||||||
| UNITED STATES TREASURY OBLIGATION (6.15%) | |||||||||||
| U.S. Treasury Note, 2.50%, due 05/31/06 (Cost $1,997,103) | 2,000,000 | 1,982,040 | |||||||||
| SHORT-TERM INVESTMENTS (14.11%) | |||||||||||
| COMMERCIAL PAPER (5.51%) | |||||||||||
| NONDEPOSITORY INSTITUTIONS (3.03%) | |||||||||||
| American Express Credit Corp., 3.24%, due 07/26/05 | 500,000 | 500,000 | |||||||||
| American General Finance Corp., 3.13%, due 07/11/05 | 475,000 | 475,000 | |||||||||
| 975,000 | |||||||||||
| PETROLEUM AND COAL PRODUCTS (2.48%) | |||||||||||
| ChevronTexaco Corp., 3.24%, due 07/22/05 | 800,000 | 800,000 | |||||||||
| Total Commercial Paper (Cost $1,775,000) . | 1,775,000 | ||||||||||
| UNITED STATES GOVERNMENT AGENCIES (7.36%) | |||||||||||
| Federal Home Loan Bank, due 07/06/05 | 200,000 | 199,918 | |||||||||
| Federal Home Loan Bank, due 07/15/05 | 975,000 | 973,831 | |||||||||
| Federal Home Loan Mortgage Corp., due 07/19/05 . | 1,200,000 | 1,198,124 | |||||||||
| Total United States Government Agencies (Cost $2,371,873) . | 2,371,873 | ||||||||||
See accompanying notes.
| Shares Held | Value | ||||||||||
| MONEY MARKET MUTUAL FUND (1.24%) | |||||||||||
| Blackrock Liquidity Funds, T-Fund Portfolio (Cost $401,802) | 401,802 | $ | 401,802 | ||||||||
| Total Short-Term Investments (Cost $4,548,675). | 4,548,675 | ||||||||||
| Total Investments (99.14%) (Cost $31,092,937) | 31,952,509 | ||||||||||
| OTHER ASSETS LESS LIABILITIES (0.86%) | |||||||||||
| Cash, receivables, prepaid expense and other assets, less liabilities. | 275,963 | ||||||||||
| Total Net Assets (100.00%) | $ | 32,228,472 | |||||||||
(1) Each unit was purchased at 104.481 on 04/20/01. As of 06/30/05, the carrying value of each unit was 119.268, representing $834,876 or 2.59% of total net assets.
18
EQUITRUST VARIABLE INSURANCE SERIES FUND
SCHEDULE OF INVESTMENTS
STRATEGIC YIELD PORTFOLIO
June 30, 2005
(Unaudited)
| Shares Held | Value | ||||||||||
| PREFERRED STOCKS (1.06%) | |||||||||||
| HOLDING AND OTHER INVESTMENT OFFICES | |||||||||||
| New Plan Excel Realty Trust- Series D, 7.80% (Cost $350,000) | 7,000 | $ | 360,282 | ||||||||
| Principal Amount | |||||||||||
| CORPORATE BONDS (71.85%) | |||||||||||
| APPAREL AND ACCESSORY STORES (4.54%) | |||||||||||
| Woolworth (FW) Corp., 8.50%, due 01/15/22 | $ | 1,400,000 | 1,547,000 | ||||||||
| CHEMICALS AND ALLIED PRODUCTS (5.17%) | |||||||||||
| Lyondell Chemical Co., 9.625%, due 05/01/07 | 900,000 | 965,250 | |||||||||
| Nova Chemicals, Ltd., 7.875%, due 09/15/25 | 800,000 | 796,000 | |||||||||
| 1,761,250 | |||||||||||
| COMMUNICATIONS (1.51%) | |||||||||||
| Telephone & Data Systems, Inc., 7.00%, due 08/01/06 | 500,000 | 514,315 | |||||||||
| ELECTRIC, GAS AND SANITARY SERVICES (10.34%) | |||||||||||
| Alliant Energy Resources, Inc., 9.75%, due 01/15/13 | 1,000,000 | 1,300,760 | |||||||||
| ESI Tractebel, 7.99%, due 12/30/11 | 292,000 | 311,888 | |||||||||
| Indianapolis Power & Light Co., 7.05%, due 02/01/24 | 750,000 | 774,593 | |||||||||
| Semco Energy, Inc., 7.125%, due 05/15/08 | 900,000 | 922,500 | |||||||||
| Waterford 3 Nuclear Power Plant, 8.09%, due 01/02/17 | 193,776 | 213,626 | |||||||||
| 3,523,367 | |||||||||||
| GENERAL MERCHANDISE STORES (0.03%) | |||||||||||
| DR Structured Finance, 8.35%, due 02/15/04 (1) | 115,462 | 11,546 | |||||||||
| HOLDING AND OTHER INVESTMENT OFFICES (18.29%) | |||||||||||
| Bradley Operating LP, 7.20%, due 01/15/08 | 450,000 | 472,887 | |||||||||
| Federal Realty Investment Trust, 7.48%, due 08/15/26 | 600,000 | 652,248 | |||||||||
| First Industrial LP, 7.60%, due 07/15/28 | 700,000 | 820,295 | |||||||||
| Principal Amount | Value | ||||||||||
| First Industrial LP, 7.75%, due 04/15/32 | $ | 500,000 | $ | 601,305 | |||||||
| HRPT Properties, 6.25%, due 08/15/16 | 375,000 | 404,719 | |||||||||
| iStar Financial, Inc., 7.00%, due 03/15/08 | 300,000 | 318,666 | |||||||||
| iStar Financial, Inc.-Series B, 5.70%, due 03/01/14 | 1,171,000 | 1,193,682 | |||||||||
| Price Development Co., 7.29%, due 03/11/08 | 337,500 | 351,655 | |||||||||
| Spieker Properties LP, 7.35%, due 12/01/17 | 1,200,000 | 1,420,356 | |||||||||
| 6,235,813 | |||||||||||
| INSURANCE CARRIERS (5.24%) | |||||||||||
| Markel Capital Trust, 8.71%, due 01/01/46 | 1,000,000 | 1,087,950 | |||||||||
| PXRE Capital Trust, 8.85%, due 02/01/27 | 670,000 | 698,475 | |||||||||
| 1,786,425 | |||||||||||
| MOTION PICTURES (3.00%) | |||||||||||
| Time Warner, Inc., 8.375%, due 03/15/23 | 800,000 | 1,021,464 | |||||||||
| PAPER AND ALLIED PRODUCTS (8.98%) | |||||||||||
| Bowater, Inc., 9.375%, due 12/15/21 | 900,000 | 972,000 | |||||||||
| Cascades, Inc., 7.25%, due 02/15/13 | 1,000,000 | 990,000 | |||||||||
| Potlatch Corp., 12.50%, due 12/01/09 | 900,000 | 1,098,000 | |||||||||
| 3,060,000 | |||||||||||
| TRANSPORTATION - BY AIR (4.00%) | |||||||||||
| Continental Airlines, Inc., 7.461%, due 04/01/15 | 1,241,304 | 1,166,453 | |||||||||
| Northwest Airlines-Series 1999-2A, 7.575%, due 03/01/19 | 197,257 | 197,267 | |||||||||
| 1,363,720 | |||||||||||
| WATER TRANSPORTATION (6.63%) | |||||||||||
| Overseas Shipholding Group, Inc., 8.75%, due 12/01/13 | 1,100,000 | 1,245,750 | |||||||||
| Windsor Petroleum Transportation, 144A, 7.84%, due 01/15/21 (2) | 1,000,000 | 1,013,240 | |||||||||
| 2,258,990 | |||||||||||
| WHOLESALE TRADE - NONDURABLE GOODS (4.12%) | |||||||||||
| Safeway, Inc., 7.45%, due 09/15/27. | 1,200,000 | 1,405,152 | |||||||||
| Total Corporate Bonds (Cost $22,949,396) | 24,489,042 | ||||||||||
19
EQUITRUST VARIABLE INSURANCE SERIES FUND
SCHEDULE OF INVESTMENTS
STRATEGIC YIELD PORTFOLIO (continued)
| Principal Amount | Value | ||||||||||
| UNITED STATES GOVERNMENT AGENCIES (5.90%) | |||||||||||
| Federal Home Loan Bank, 5.50%, due 05/18/15 . | $ | 1,000,000 | $ | 1,008,826 | |||||||
| Federal National Mortgage Assoc., 5.55%, due 06/08/15 | 1,000,000 | 1,002,048 | |||||||||
| Total United States Government Agencies (Cost $2,000,000) | 2,010,874 | ||||||||||
| SHORT-TERM INVESTMENTS (19.52%) | |||||||||||
| COMMERCIAL PAPER (7.48%) | |||||||||||
| FOOD AND KINDRED PRODUCTS (1.17%) | |||||||||||
| Coca-Cola Enterprises, due 07/13/05 | 400,000 | 399,591 | |||||||||
| NONDEPOSITORY INSTITUTIONS (6.31%) | |||||||||||
| American Express Credit Corp., 3.23%, due 07/11/05 | 1,100,000 | 1,100,000 | |||||||||
| American General Finance Corp., 3.12%, due 07/18/05 | 150,000 | 150,000 | |||||||||
| General Electric Capital Corp., 3.02%, due 07/06/05 | 900,000 | 900,000 | |||||||||
| 2,150,000 | |||||||||||
| Total Commercial Paper (Cost $2,549,591) | 2,549,591 | ||||||||||
| UNITED STATES GOVERNMENT AGENCIES (10.54%) | |||||||||||
| Federal Home Loan Bank, due 07/13/05 | 300,000 | 299,695 | |||||||||
| Federal Home Loan Bank, due 07/22/05 | 1,100,000 | 1,097,984 | |||||||||
| Federal Home Loan Mortgage Corp., due 07/19/05 . | 950,000 | 948,512 | |||||||||
| Federal National Mortgage Assoc., due 07/18/05 | 250,000 | 249,647 | |||||||||
| Federal National Mortgage Assoc., due 07/27/05 | 1,000,000 | 997,702 | |||||||||
| Total United States Government Agencies (Cost $3,593,540) | 3,593,540 | ||||||||||
See accompanying notes.
| Shares Held | Value | ||||||||||
| MONEY MARKET MUTUAL FUND (1.50%) | |||||||||||
| Blackrock Liquidity Funds, T-Fund Portfolio (Cost $509,896) | 509,895 | $ | 509,895 | ||||||||
| Total Short-Term Investments (Cost $6,653,027) | 6,653,026 | ||||||||||
| Total Investments (98.33%) (Cost $31,952,423) | 33,513,224 | ||||||||||
| OTHER ASSETS LESS LIABILITIES (1.67%) | |||||||||||
| Cash, receivables, prepaid expense and other assets, less liabilities | 567,680 | ||||||||||
| Total Net Assets (100.00%) | $ | 34,080,904 | |||||||||
(1) This security is past due. Partial or no interest was received from this security on its last scheduled interest payment date.
(2) Each unit was purchased at 80.500 on 08/26/99. As of 06/30/05, the carrying value of each unit was 101.324, representing $1,013,240 or 2.97% of net assets.
20
EQUITRUST VARIABLE INSURANCE SERIES FUND
SCHEDULE OF INVESTMENTS
MANAGED PORTFOLIO
June 30, 2005
(Unaudited)
| Shares Held | Value | ||||||||||
| COMMON STOCKS (61.59%) | |||||||||||
| AUTOMOTIVE REPAIR, SERVICES AND PARKING (0.62%) | |||||||||||
| Ryder System, Inc. | 13,300 | $ | 486,780 | ||||||||
| BUSINESS SERVICES (0.52%) | |||||||||||
| Electronic Data Systems Corp. | 7,500 | 144,375 | |||||||||
| Veritas Software Corp. (1) | 10,900 | 265,960 | |||||||||
| 410,335 | |||||||||||
| CHEMICALS AND ALLIED PRODUCTS (10.38%) | |||||||||||
| Bristol-Myers Squibb Co. | 19,605 | 489,733 | |||||||||
| Colgate-Palmolive Co. | 4,230 | 211,119 | |||||||||
| E.I. du Pont de Nemours & Co. | 16,475 | 708,590 | |||||||||
| GlaxoSmithKline PLC | 4,700 | 227,997 | |||||||||
| IVAX Corp. (1) | 21,375 | 459,562 | |||||||||
| Johnson & Johnson | 12,527 | 814,255 | |||||||||
| KV Pharmaceutical Co.-Class A (1) | 12,600 | 211,050 | |||||||||
| Merck & Co., Inc | 15,158 | 466,866 | |||||||||
| Mylan Laboratories, Inc... | 50,025 | 962,481 | |||||||||
| Olin Corp | 17,100 | 311,904 | |||||||||
| Pfizer, Inc | 47,104 | 1,299,128 | |||||||||
| Schering-Plough Corp. | 15,700 | 299,242 | |||||||||
| Sensient Technologies Corp. | 73,945 | 1,524,006 | |||||||||
| Taro Pharmaceutical Industries, Ltd. (1) | 6,030 | 175,292 | |||||||||
| 8,161,225 | |||||||||||
| COMMUNICATIONS (2.65%) | |||||||||||
| BellSouth Corp. | 21,800 | 579,226 | |||||||||
| Centurytel, Inc | 24,040 | 832,505 | |||||||||
| Comcast Corp.-Class A (1) | 3,930 | 120,651 | |||||||||
| Nextel Communications, Inc. (1) | 17,200 | 555,732 | |||||||||
| 2,088,114 | |||||||||||
| DEPOSITORY INSTITUTIONS (7.00%) | |||||||||||
| AmSouth Bancorp. | 19,910 | 517,660 | |||||||||
| Bank of America Corp. | 14,072 | 641,824 | |||||||||
| Bank of New York Co., Inc. | 11,229 | 323,171 | |||||||||
| BOK Financial Corp. | 9,100 | 419,692 | |||||||||
| Citigroup, Inc. | 19,822 | 916,371 | |||||||||
| National City Corp. | 8,695 | 296,673 | |||||||||
| New York Community Bancorp., Inc. | 44,834 | 812,392 | |||||||||
| U. S. Bancorp | 24,470 | 714,524 | |||||||||
| Wachovia Corp. | 8,328 | 413,069 | |||||||||
| Wilmington Trust Corp. | 12,500 | 450,125 | |||||||||
| 5,505,501 | |||||||||||
| ELECTRIC, GAS AND SANITARY SERVICES (5.13%) | |||||||||||
| Alliant Energy Corp. | 22,115 | 622,537 | |||||||||
| Atmos Energy Corp. | 38,252 | 1,101,658 | |||||||||
| Black Hills Corp. | 9,655 | 355,787 | |||||||||
| Shares Held | Value | ||||||||||
| Nisource, Inc. | 20,300 | $ | 502,019 | ||||||||
| Pepco Holdings, Inc. | 40,600 | 971,964 | |||||||||
| Xcel Energy, Inc. | 24,690 | 481,949 | |||||||||
| 4,035,914 | |||||||||||
| ELECTRONIC AND OTHER ELECTRIC EQUIPMENT (1.05%) | |||||||||||
| Acuity Brands, Inc. | 15,101 | 387,945 | |||||||||
| Cisco Systems, Inc. (1) | 20,100 | 384,111 | |||||||||
| Emerson Electric Co. | 800 | 50,104 | |||||||||
| 822,160 | |||||||||||
| ENGINEERING AND MANAGEMENT SERVICES (0.57%) | |||||||||||
| Shaw Group, Inc. (1) | 21,000 | 451,710 | |||||||||
| FOOD AND KINDRED PRODUCTS (1.94%) | |||||||||||
| Anheuser-Busch Cos., Inc. | 7,910 | 361,883 | |||||||||
| ConAgra Foods, Inc. | 24,914 | 577,008 | |||||||||
| Sara Lee Corp. | 24,100 | 477,421 | |||||||||
| TreeHouse Foods, Inc. (1) | 3,814 | 108,731 | |||||||||
| 1,525,043 | |||||||||||
| FOOD STORES (0.61%) | |||||||||||
| Kroger Co. (1) | 25,186 | 479,290 | |||||||||
| GENERAL MERCHANDISE STORES (1.34%) | |||||||||||
| Federated Department Stores, Inc. | 7,681 | 562,864 | |||||||||
| Fred's, Inc. | 11,840 | 196,307 | |||||||||
| Wal-Mart Stores, Inc. | 6,100 | 294,020 | |||||||||
| 1,053,191 | |||||||||||
| HEALTH SERVICES (1.04%) | |||||||||||
| Lifepoint Hospitals, Inc. (1) | 8,429 | 425,833 | |||||||||
| Universal Health Services, Inc.-Class B | 6,350 | 394,843 | |||||||||
| 820,676 | |||||||||||
| HOLDING AND OTHER INVESTMENT OFFICES (0.81%) | |||||||||||
| Highwoods Properties, Inc. | 21,500 | 639,840 | |||||||||
| INDUSTRIAL MACHINERY AND EQUIPMENT (2.46%) | |||||||||||
| Hewlett-Packard Co. | 6,900 | 162,219 | |||||||||
| Ingersoll-Rand Co., Ltd.-Class A | 10,222 | 729,340 | |||||||||
| SPX Corp. | 10,246 | 471,111 | |||||||||
| Stanley Works (The) | 12,500 | 569,250 | |||||||||
| 1,931,920 | |||||||||||
| INSTRUMENTS AND RELATED PRODUCTS (1.74%) | |||||||||||
| Becton Dickinson & Co. | 13,835 | 725,922 | |||||||||
| Fisher Scientific International, Inc. (1) | 3,920 | 254,408 | |||||||||
21
EQUITRUST VARIABLE INSURANCE SERIES FUND
SCHEDULE OF INVESTMENTS
MANAGED PORTFOLIO (continued)
| Shares Held | Value | ||||||||||
| INSTRUMENTS AND RELATED PRODUCTS (1.74%) - continued | |||||||||||
| Steris Corp. | 14,946 | $ | 385,158 | ||||||||
| 1,365,488 | |||||||||||
| INSURANCE CARRIERS (3.94%) | |||||||||||
| Allstate Corp. | 10,395 | 621,101 | |||||||||
| American International Group, Inc. | 6,170 | 358,477 | |||||||||
| MBIA, Inc. | 7,781 | 461,491 | |||||||||
| MetLife, Inc. | 4,855 | 218,184 | |||||||||
| Protective Life Corp. | 6,200 | 261,764 | |||||||||
| Safeco Corp. | 7,925 | 430,645 | |||||||||
| WellPoint, Inc. (1) | 10,778 | 750,580 | |||||||||
| 3,102,242 | |||||||||||
| METAL MINING (2.30%) | |||||||||||
| Barrick Gold Corp. | 41,200 | 1,031,236 | |||||||||
| Placer Dome, Inc. | 50,500 | 776,690 | |||||||||
| 1,807,926 | |||||||||||
| OIL AND GAS EXTRACTION (4.36%) | |||||||||||
| Apache Corp. | 6,700 | 432,820 | |||||||||
| Burlington Resources, Inc. | 15,000 | 828,600 | |||||||||
| Occidental Petroleum Co. | 16,500 | 1,269,345 | |||||||||
| Rowan Cos., Inc. | 16,700 | 496,157 | |||||||||
| Whiting Petroleum Corp. (1) | 11,000 | 399,410 | |||||||||
| 3,426,332 | |||||||||||
| PAPER AND ALLIED PRODUCTS (2.49%) | |||||||||||
| Abitibi Consolidated, Inc. | 133,500 | 598,080 | |||||||||
| International Paper Co. | 22,900 | 691,809 | |||||||||
| P.H. Glatfelter Co. | 31,300 | 388,120 | |||||||||
| Sonoco Products Co. . | 10,600 | 280,900 | |||||||||
| 1,958,909 | |||||||||||
| PETROLEUM AND COAL PRODUCTS (2.92%) | |||||||||||
| BP PLC | 8,100 | 505,278 | |||||||||
| ConocoPhillips | 31,224 | 1,795,068 | |||||||||
| 2,300,346 | |||||||||||
| PRIMARY METAL INDUSTRIES (0.09%) | |||||||||||
| Wolverine Tube, Inc. (1) | 11,400 | 66,918 | |||||||||
| PRINTING AND PUBLISHING (1.70%) | |||||||||||
| Belo Corp.-Series A | 29,600 | 709,512 | |||||||||
| R.R. Donnelley & Sons Co. | 18,100 | 624,631 | |||||||||
| 1,334,143 | |||||||||||
| RAILROAD TRANSPORTATION (0.22%) | |||||||||||
| Union Pacific Corp. | 2,710 | 175,608 | |||||||||
| TOBACCO PRODUCTS (1.27%) | |||||||||||
| Altria Group, Inc. | 15,400 | 995,764 | |||||||||
| Shares Held | Value | ||||||||||
| TRANSPORTATION EQUIPMENT (2.63%) | |||||||||||
| Federal Signal Corp. | 36,400 | $ | 567,840 | ||||||||
| Honeywell International, Inc. | 27,400 | 1,003,662 | |||||||||
| ITT Industries, Inc. | 5,095 | 497,425 | |||||||||
| 2,068,927 | |||||||||||
| WHOLESALE TRADE - NONDURABLE GOODS (1.81%) | |||||||||||
| Dean Foods Co. (1) | 19,069 | 671,992 | |||||||||
| Safeway, Inc. | 33,280 | 751,795 | |||||||||
| 1,423,787 | |||||||||||
| Total Common Stocks (Cost $38,489,191) | 48,438,089 | ||||||||||
| Principal Amount | |||||||||||
| MORTGAGE-BACKED SECURITIES (4.49%) | |||||||||||
| GOVERNMENT NATIONAL MORTGAGE ASSOCIATION (GNMA) | |||||||||||
| Pool # 2796, 7.00%, due 08/01/29 | $ | 110,333 | 116,392 | ||||||||
| Pool # 3040, 7.00%, due 02/01/31 | 68,391 | 72,120 | |||||||||
| Pool # 3188, 6.50%, due 02/20/32 | 182,074 | 189,616 | |||||||||
| Pool # 3239, 6.50%, due 05/01/32 | 277,627 | 289,127 | |||||||||
| Pool # 3333, 5.50%, due 01/01/33 | 406,450 | 414,775 | |||||||||
| Pool # 3403, 5.50%, due 06/01/33 | 346,310 | 353,403 | |||||||||
| Pool # 3442, 5.00%, due 09/01/33 | 1,204,134 | 1,211,799 | |||||||||
| Pool # 3459, 5.50%, due 10/01/33 | 861,131 | 878,768 | |||||||||
| Total Mortgage-Backed Securities (Cost $3,439,790) | 3,526,000 | ||||||||||
| UNITED STATES GOVERNMENT AGENCIES (10.46%) | |||||||||||
| Government National Mortgage Assoc., 5.00%, due 09/01/23 | 700,000 | 704,498 | |||||||||
| Government National Mortgage Assoc., 5.00%, due 09/01/29 | 600,000 | 605,920 | |||||||||
| Government National Mortgage Assoc., 5.00%, due 05/01/30 | 1,560,000 | 1,573,972 | |||||||||
| Government National Mortgage Assoc., 5.00%, due 06/01/31 | 1,300,000 | 1,315,449 | |||||||||
| Government National Mortgage Assoc., 5.00%, due 05/01/33 | 780,000 | 785,789 | |||||||||
| Government National Mortgage Assoc., 5.00%, due 06/01/33 | 1,693,200 | 1,717,631 | |||||||||
| Government National Mortgage Assoc., 3.47%, due 04/01/34 | 587,943 | 578,830 | |||||||||
22
EQUITRUST VARIABLE INSURANCE SERIES FUND
SCHEDULE OF INVESTMENTS
MANAGED PORTFOLIO (continued)
| Principal Amount | Value | ||||||||||
| UNITED STATES GOVERNMENT AGENCIES (10.46%) - continued | |||||||||||
| Government National Mortgage Assoc., 4.00%, due 10/01/34 | $ | 954,669 | $ | 944,722 | |||||||
| Total United States Government Agencies (Cost $8,208,044) | 8,226,811 | ||||||||||
| SHORT-TERM INVESTMENTS (23.11%) | |||||||||||
| COMMERCIAL PAPER (9.00%) | |||||||||||
| DEPOSITORY INSTITUTIONS (2.93%) | |||||||||||
| Citigroup CP, 3.06%, due 07/11/05 | 2,300,000 | 2,300,000 | |||||||||
| NONDEPOSITORY INSTITUTIONS (6.07%) | |||||||||||
| American Express Credit Corp., 3.03%, due 07/06/05 | 2,000,000 | 2,000,000 | |||||||||
| American General Finance Corp., 3.12%, due 07/20/05 | 275,000 | 275,000 | |||||||||
| American General Finance Corp., 3.26%, due 07/21/05 | 1,300,000 | 1,300,000 | |||||||||
| General Electric Capital Corp., 3.05%, due 07/18/05 | 1,200,000 | 1,200,000 | |||||||||
| 4,775,000 | |||||||||||
| Total Commercial Paper (Cost $7,075,000) | 7,075,000 | ||||||||||
| UNITED STATES GOVERNMENT AGENCIES (13.38%) | |||||||||||
| Federal Home Loan Bank, due 07/13/05 | 1,200,000 | 1,198,816 | |||||||||
| Federal Home Loan Bank, due 07/27/05 | 850,000 | 848,167 | |||||||||
| Federal Home Loan Bank, due 08/12/05 | 650,000 | 647,646 | |||||||||
| Federal Home Loan Bank, due 08/17/05 | 1,100,000 | 1,095,473 | |||||||||
| Federal Home Loan Mortgage Corp., due 08/01/05 | 1,700,000 | 1,695,499 | |||||||||
| Federal National Mortgage Assoc., due 07/20/05 | 2,900,000 | 2,895,366 | |||||||||
| Federal National Mortgage Assoc., due 08/03/05 | 1,350,000 | 1,346,194 | |||||||||
| Federal National Mortgage Assoc., due 08/10/05 | 800,000 | 797,173 | |||||||||
| Total United States Government Agencies (Cost $10,524,334) | 10,524,334 | ||||||||||
See accompanying notes.
| Shares Held | Value | ||||||||||
| MONEY MARKET MUTUAL FUND (0.73%) | |||||||||||
| Blackrock Liquidity Funds, T-Fund Portfolio (Cost $573,169) | 573,169 | $ | 573,169 | ||||||||
| Total Short-Term Investments (Cost $18,172,503) | 18,172,503 | ||||||||||
| Total Investments (99.65%) (Cost $68,309,528) | 78,363,403 | ||||||||||
| OTHER ASSETS LESS LIABILITIES (0.35%) | |||||||||||
| Cash, receivables, prepaid expense and other assets, less liabilities | 278,489 | ||||||||||
| Total Net Assets (100.00%) | $ | 78,641,892 | |||||||||
(1) Non-income producing securities.
23
EQUITRUST VARIABLE INSURANCE SERIES FUND
SCHEDULE OF INVESTMENTS
MONEY MARKET PORTFOLIO
June 30, 2005
(Unaudited)
| Annualized Yield on Purchase Date | Principal Amount | Value | |||||||||||||
| SHORT-TERM INVESTMENTS (96.24%) | |||||||||||||||
| COMMERCIAL PAPER (21.43%) | |||||||||||||||
| FOOD AND KINDRED PRODUCTS (3.64%) | |||||||||||||||
| Coca-Cola Enterprises, due 07/21/05 | 3.041 | % | $ | 250,000 | $ | 249,578 | |||||||||
| NONDEPOSITORY INSTITUTIONS (13.85%) | |||||||||||||||
| American Express Credit Corp., 3.06%, due 07/29/05 | 3.063 | 250,000 | 250,000 | ||||||||||||
| American General Finance Corp., 3.15%, due 08/02/05 | 3.149 | 275,000 | 275,000 | ||||||||||||
| General Electric Capital Corp., 3.30%, due 09/07/05 | 3.297 | 175,000 | 175,000 | ||||||||||||
| International Business Machines Corp., 3.01%, due 07/07/05 | 3.012 | 250,000 | 250,000 | ||||||||||||
| 950,000 | |||||||||||||||
| PETROLEUM AND COAL PRODUCTS (3.94%) | |||||||||||||||
| ChevronTexaco Corp., 2.76%, due 07/01/05 | 2.756 | 270,000 | 270,000 | ||||||||||||
| Total Commercial Paper (Cost $1,469,578) | 1,469,578 | ||||||||||||||
| UNITED STATES GOVERNMENT AGENCIES (71.19%) | |||||||||||||||
| Federal Home Loan Bank, due 07/15/05 | 3.168 | 225,000 | 224,727 | ||||||||||||
| Federal Home Loan Bank, due 07/22/05 | 3.003 | 250,000 | 249,569 | ||||||||||||
| Federal Home Loan Bank, due 07/25/05 | 3.013 | 250,000 | 249,506 | ||||||||||||
| Federal Home Loan Bank, due 08/19/05 | 3.146 | 200,000 | 199,159 | ||||||||||||
| Federal Home Loan Bank, due 09/02/05 | 3.247 | 200,000 | 198,885 | ||||||||||||
| Federal Home Loan Bank, due 09/07/05 | 3.240 | 225,000 | 223,650 | ||||||||||||
| Federal Home Loan Bank, due 09/09/05 | 3.260 | 225,000 | 223,602 | ||||||||||||
| Federal Home Loan Bank, due 09/14/05 | 3.328 | 200,000 | 198,642 | ||||||||||||
| Federal Home Loan Bank, due 09/28/05 | 3.384 | 250,000 | 247,954 | ||||||||||||
| Federal Home Loan Mortgage Corp., due 07/11/05 | 3.006 | 150,000 | 149,877 | ||||||||||||
| Federal Home Loan Mortgage Corp., due 07/19/05 | 3.151 | 225,000 | 224,651 | ||||||||||||
| Federal Home Loan Mortgage Corp., due 08/01/05 | 3.125 | 250,000 | 249,338 | ||||||||||||
| Federal Home Loan Mortgage Corp., due 08/08/05 | 3.102 | 225,000 | 224,276 | ||||||||||||
| Federal Home Loan Mortgage Corp., due 08/23/05 | 3.213 | 225,000 | 223,955 | ||||||||||||
| Federal Home Loan Mortgage Corp., due 09/27/05 | 3.394 | 200,000 | 198,377 | ||||||||||||
| Federal National Mortgage Assoc., due 07/06/05 | 2.998 | 250,000 | 249,897 | ||||||||||||
| Federal National Mortgage Assoc., due 07/13/05 | 3.099 | 250,000 | 249,745 | ||||||||||||
| Federal National Mortgage Assoc., due 07/27/05 | 3.104 | 225,000 | 224,504 | ||||||||||||
| Federal National Mortgage Assoc., due 08/03/05 | 3.122 | 200,000 | 199,437 | ||||||||||||
| Federal National Mortgage Assoc., due 08/24/05 | 3.192 | 250,000 | 248,825 | ||||||||||||
| Federal National Mortgage Assoc., due 08/31/05 | 3.246 | 200,000 | 198,921 | ||||||||||||
| Federal National Mortgage Assoc., due 09/28/05 | 3.405 | 225,000 | 223,147 | ||||||||||||
| Total United States Government Agencies (Cost $4,880,644) | 4,880,644 | ||||||||||||||
| UNITED STATES TREASURY OBLIGATION (3.62%) | |||||||||||||||
| U.S. Treasury Bill, due 09/29/05 (Cost $248,142) | 3.036 | 250,000 | 248,142 | ||||||||||||
| Total Short-Term Investments (Cost $6,598,364) | 6,598,364 | ||||||||||||||
| OTHER ASSETS LESS LIABILITIES (3.76%) | |||||||||||||||
| Cash, receivables, prepaid expense and other assets, less liabilities | 257,941 | ||||||||||||||
| Total Net Assets (100.00%) | $ | 6,856,305 | |||||||||||||
See accompanying notes.
24
EQUITRUST VARIABLE INSURANCE SERIES FUND
SCHEDULE OF INVESTMENTS
BLUE CHIP PORTFOLIO
June 30, 2005
(Unaudited)
| Shares Held | Value | ||||||||||
| COMMON STOCKS (92.37%) | |||||||||||
| BUSINESS SERVICES (3.80%) | |||||||||||
| Microsoft Corp. | 93,758 | $ | 2,328,949 | ||||||||
| Oracle Corp. (1) | 58,314 | 769,745 | |||||||||
| 3,098,694 | |||||||||||
| CHEMICALS AND ALLIED PRODUCTS (15.39%) | |||||||||||
| Abbott Laboratories | 25,260 | 1,237,993 | |||||||||
| Amgen, Inc. (1) | 18,200 | 1,100,372 | |||||||||
| Bristol-Myers Squibb Co. | 36,063 | 900,854 | |||||||||
| Dow Chemical Co. | 10,720 | 477,362 | |||||||||
| E.I. du Pont de Nemours & Co. | 16,081 | 691,644 | |||||||||
| Eli Lilly & Co. | 18,022 | 1,004,006 | |||||||||
| Johnson & Johnson | 43,580 | 2,832,700 | |||||||||
| Merck & Co., Inc. | 28,928 | 890,982 | |||||||||
| Pfizer, Inc. | 45,282 | 1,248,878 | |||||||||
| Procter & Gamble Co. | 41,042 | 2,164,966 | |||||||||
| 12,549,757 | |||||||||||
| COMMUNICATIONS (4.43%) | |||||||||||
| Comcast Corp.-Class A (1) | 22,486 | 690,320 | |||||||||
| SBC Communications, Inc. | 35,565 | 844,669 | |||||||||
| Verizon Communications | 37,307 | 1,288,957 | |||||||||
| Viacom, Inc.-Class B | 24,668 | 789,869 | |||||||||
| 3,613,815 | |||||||||||
| DEPOSITORY INSTITUTIONS (10.53%) | |||||||||||
| Bank of America | 46,596 | 2,125,244 | |||||||||
| Citigroup, Inc. | 49,326 | 2,280,341 | |||||||||
| J. P. Morgan Chase & Co. | 47,270 | 1,669,576 | |||||||||
| Wachovia Corp. | 25,980 | 1,288,608 | |||||||||
| Wells Fargo Co. | 19,900 | 1,225,442 | |||||||||
| 8,589,211 | |||||||||||
| EATING AND DRINKING PLACES (1.76%) | |||||||||||
| McDonald's Corp. | 51,752 | 1,436,118 | |||||||||
| ELECTRIC, GAS AND SANITARY SERVICES (3.51%) | |||||||||||
| Dominion Resources, Inc. | 11,600 | 851,324 | |||||||||
| Exelon Corp. | 24,600 | 1,262,718 | |||||||||
| Southern Co. | 21,650 | 750,605 | |||||||||
| 2,864,647 | |||||||||||
| ELECTRONIC AND OTHER ELECTRIC EQUIPMENT (8.22%) | |||||||||||
| Cisco Systems, Inc. (1) | 62,268 | 1,189,941 | |||||||||
| General Electric Co. | 73,576 | 2,549,408 | |||||||||
| Intel Corp. | 58,206 | 1,516,848 | |||||||||
| Motorola, Inc. | 37,949 | 692,949 | |||||||||
| Texas Instruments, Inc. | 27,001 | 757,918 | |||||||||
| 6,707,064 | |||||||||||
| Shares Held | Value | ||||||||||
| FOOD AND KINDRED PRODUCTS (3.02%) | |||||||||||
| Anheuser Busch & Cos., Inc. | 11,432 | $ | 523,014 | ||||||||
| Coca-Cola Co. (The) | 26,389 | 1,101,741 | |||||||||
| PepsiCo, Inc. | 15,518 | 836,886 | |||||||||
| 2,461,641 | |||||||||||
| FORESTRY (0.50%) | |||||||||||
| Weyerhaeuser Co. | 6,400 | 407,360 | |||||||||
| GENERAL MERCHANDISE STORES (2.52%) | |||||||||||
| Wal-Mart Stores, Inc. | 42,623 | 2,054,429 | |||||||||
| INDUSTRIAL MACHINERY AND EQUIPMENT (8.42%) | |||||||||||
| 3M Co. | 17,808 | 1,287,518 | |||||||||
| Applied Materials, Inc. | 24,000 | 388,320 | |||||||||
| Caterpillar, Inc. | 14,307 | 1,363,600 | |||||||||
| Dell, Inc. (1) | 31,210 | 1,233,107 | |||||||||
| EMC Corp. (1) | 38,068 | 521,912 | |||||||||
| Hewlett-Packard Co. | 41,279 | 970,469 | |||||||||
| International Business Machines Corp. | 14,821 | 1,099,718 | |||||||||
| 6,864,644 | |||||||||||
| INSURANCE CARRIERS (2.70%) | |||||||||||
| American International Group, Inc. | 37,964 | 2,205,708 | |||||||||
| LUMBER AND WOOD PRODUCTS (1.24%) | |||||||||||
| Home Depot, Inc. | 25,913 | 1,008,016 | |||||||||
| MOTION PICTURES (2.17%) | |||||||||||
| Disney (Walt) Co. | 36,832 | 927,430 | |||||||||
| Time Warner, Inc. (1) | 50,502 | 843,888 | |||||||||
| 1,771,318 | |||||||||||
| NONDEPOSITORY INSTITUTIONS (4.48%) | |||||||||||
| American Express Co. | 52,797 | 2,810,384 | |||||||||
| Federal National Mortgage Assoc. | 14,400 | 840,960 | |||||||||
| 3,651,344 | |||||||||||
| PETROLEUM AND COAL PRODUCTS (7.62%) | |||||||||||
| Chevron Corp. | 39,400 | 2,203,248 | |||||||||
| Exxon Mobil Corp. | 69,771 | 4,009,739 | |||||||||
| 6,212,987 | |||||||||||
| PRIMARY METAL INDUSTRIES (0.99%) | |||||||||||
| Alcoa, Inc. | 30,898 | 807,365 | |||||||||
| TOBACCO PRODUCTS (3.09%) | |||||||||||
| Altria Group, Inc. | 38,965 | 2,519,477 | |||||||||
| TRANSPORTATION EQUIPMENT (7.98%) | |||||||||||
| Boeing Co. (The) | 32,082 | 2,117,412 | |||||||||
| General Motors Corp. | 16,700 | 567,800 | |||||||||
25
EQUITRUST VARIABLE INSURANCE SERIES FUND
SCHEDULE OF INVESTMENTS
BLUE CHIP PORTFOLIO (continued)
| Shares Held | Value | ||||||||||
| TRANSPORTATION EQUIPMENT (7.98%) - continued | |||||||||||
| Honeywell International, Inc. | 38,024 | $ | 1,392,819 | ||||||||
| United Technologies Corp. | 47,402 | 2,434,093 | |||||||||
| 6,512,124 | |||||||||||
| Total Common Stocks (Cost $62,442,889) | 75,335,719 | ||||||||||
| SHORT-TERM INVESTMENTS (7.59%) | |||||||||||
| MONEY MARKET MUTUAL FUND (0.49%) | |||||||||||
| Blackrock Liquidity Funds, T-Fund Portfolio (Cost $394,873) | 394,873 | 394,873 | |||||||||
| Principal Amount | |||||||||||
| COMMERCIAL PAPER (1.35%) | |||||||||||
| FOOD AND KINDRED PRODUCTS (0.80%) | |||||||||||
| Coca-Cola Enterprises, due 07/07/05 | $ | 650,000 | 649,672 | ||||||||
| NONDEPOSITORY INSTITUTIONS (0.55%) | |||||||||||
| General Electric Capital Corp., 3.06%, due 07/07/05 | 450,000 | 450,000 | |||||||||
| Total Commercial Paper (Cost $1,099,672) | 1,099,672 | ||||||||||
| UNITED STATES GOVERNMENT AGENCIES (5.75%) | |||||||||||
| Federal Home Loan Bank, due 07/21/05 | 3,600,000 | 3,593,779 | |||||||||
| Federal Home Loan Mortgage Corp., due 07/12/05 | 1,100,000 | 1,098,994 | |||||||||
| Total United States Government Agencies (Cost $4,692,773) | 4,692,773 | ||||||||||
| Total Short-Term Investments (Cost $6,187,318) | 6,187,318 | ||||||||||
| Total Investments (99.96%) (Cost $68,630,207) | 81,523,037 | ||||||||||
| OTHER ASSETS LESS LIABILITIES (0.04%) | |||||||||||
| Cash, receivables, prepaid expense and other assets, less liabilities | 34,850 | ||||||||||
| Total Net Assets (100.00%) | $ | 81,557,887 | |||||||||
(1) Non-income producing securities.
See accompanying notes.
26
EQUITRUST VARIABLE INSURANCE SERIES FUND
NOTES TO FINANCIAL STATEMENTS
June 30, 2005
(Unaudited)
1. Significant Accounting Policies
Organization
EquiTrust Variable Insurance Series Fund (the "Fund") is registered under the Investment Company Act of 1940, as amended, as a no-load, open-end diversified management investment company, or mutual fund. The Fund is authorized to issue an unlimited number of shares of beneficial interest with no par value. The Fund currently consists of six portfolios (known as the Value Growth, High Grade Bond, Strategic Yield, Managed, Money Market and Blue Chip Portfolios). Shares of the Fund are sold only to certain life insurance company's separate accounts to fund the benefits under variable insurance contracts issued by such life insurance companies, including Farm Bureau Life Insurance Company and EquiTrust Life Insurance Company (see Note 3).
Security Valuation
All portfolios, other than the Money Market Portfolio, value their investment securities that are traded on any national exchange at the last sale price on the day of valuation or, lacking any sales, at the mean between the closing bid and asked prices. Investments traded in the over-the-counter market are valued at the mean between the bid and asked prices or yield equivalent as obtained from one or more dealers that make markets in the securities. In situations when liquidation of holdings at quoted market prices is questionable or market quotations are not readily available, investments are valued at fair value as determined in good faith by the Fund's Board of Trustees. Short-term investments are valued at market value, except that obligations maturing in 90 days or less are valued using the amortized cost method of valuation described below with respect to the Money Market Portfolio, which approximates market v alue.
The Money Market Portfolio values investments at amortized cost, which approximates market value. Under the amortized cost method, a security is valued at its cost on the date of purchase and thereafter is adjusted to reflect a constant amortization to maturity of the difference between the principal amount due at maturity and the cost of the investment to the portfolio.
Income and Investment Transactions
For financial reporting purposes, investment transactions are recorded on the trade date. The identified cost basis has been used in determining the net realized gain or loss from investment transactions and unrealized appreciation or depreciation on investments. Dividend income is recorded on the ex-dividend date and interest is recognized on an accrual basis. Discounts and premiums on investments purchased are amortized over the life of the respective investments.
Dividends and Distributions to Shareholders
On each day that the net asset value per share is calculated in the High Grade Bond, Strategic Yield and Money Market Portfolios, that Portfolio's net investment income will be declared, as of the close of the New York Stock Exchange, as a dividend to shareholders of record prior to the declaration. With respect to the High Grade Bond and Strategic Yield Portfolios, any net short-term and long-term gains will be declared and distributed periodically, but in no event less frequently than annually. Dividends and distributions of the other portfolios are recorded on the ex-dividend date. Dividends and distributions from net investment income and net realized gain from investments are determined in accordance with federal tax regulations, which may differ from accounting principles generally accepted in the United States. These differences are primarily due to differing treatments for certain basis adjustments resulting from corporate reorganizations, and income and basis adjustments resulting from a taxable spin-off. Permanent book and tax basis differences are reclassified within the capital accounts based on their federal tax-basis treatment; temporary differences do not require reclassification.
Dividends and distributions which exceed current and accumulated earnings and profits for federal income tax purposes are reported as return of capital distributions.
Use of Estimates
The preparation of financial statements in conformity with accounting principles generally accepted in the United States requires management to make estimates and assumptions that affect the reported amounts of assets and liabilities and disclosure of contingent assets and liabilities at the date of the financial statements and the reported amounts of revenues and expenses during the reporting period. Actual results could differ from those estimates.
27
EQUITRUST VARIABLE INSURANCE SERIES FUND
NOTES TO FINANCIAL STATEMENTS (continued)
1. Significant Accounting Policies (continued)
Indemnifications
Under the Fund's organizational documents, its present and past officers and trustees are indemnified against certain liability arising out of the performance of their duties to the Fund. At the discretion of the Board of Trustees, employees and agents may also be indemnified. In addition, in the normal course of business the Fund enters into contracts that contain a variety of representations and warranties which provide general indemnifications. The Fund's maximum exposure under these arrangements is unknown, as this would involve future claims that may be made against the Fund that have not yet occurred.
2. Federal Income Taxes
No provision for federal income taxes is considered necessary because the Fund is qualified as a "regulated investment company" under the Internal Revenue Code and intends to distribute each year substantially all of its net investment income and realized capital gains to shareholders.
As of June 30, 2005, the following Portfolios had approximate net capital loss carryforwards set forth below:
| Portfolio | |||||||||||||||
| Net Capital Loss Carryforwards Expire In: | Value Growth | Strategic Yield | Blue Chip | ||||||||||||
| 2006 | $ | 1,491,000 | $ | - | $ | - | |||||||||
| 2008 | 2,848,000 | - | - | ||||||||||||
| 2010 | - | 1,689,000 | 1,786,000 | ||||||||||||
| 2011 | - | 571,000 | 4,672,000 | ||||||||||||
| 2012 | - | - | 556,000 | ||||||||||||
| 2013 | - | - | 60,000 | ||||||||||||
| $ | 4,339,000 | $ | 2,260,000 | $ | 7,074,000 | ||||||||||
During 2005, the Value Growth and Strategic Yield Portfolios utilized approximately $2,052,000 and $2,000 of capital loss carryforwards, respectively.
As of June 30, 2005, the components of accumulated earnings and capital gains (losses) on a tax basis were identical to those reported in the statements of assets and liabilities, except as follows:
| Portfolio | |||||||||||
| Value Growth | Managed | ||||||||||
| Undistributed ordinary income | $ | 389,384 | $ | 839,210 | |||||||
| Accumulated capital gains (losses) | (4,338,914 | ) | 1,907,785 | ||||||||
| Net unrealized appreciation of investments | 6,928,965 | 10,021,934 | |||||||||
| Total accumulated earnings | $ | 2,979,435 | $ | 12,768,929 | |||||||
During 2002, the Managed Portfolio held securities in a company that completed a corporate inversion. The event resulted in realized capital gains for the investment being recognized for tax but not for book purposes. As of June 30, 2005, unrealized appreciation and accumulated capital gains book and tax differences related to the corporate inversion were $31,941.
During 2004, the Value Growth Portfolio held a security that completed a taxable spin-off. The unrealized appreciation and accumulated capital gains differences were $15,626.
3. Management Contract and Transactions with Affiliates
The Fund has entered into agreements with EquiTrust Investment Management Services, Inc. ("EquiTrust Investment") relating to the management of the Portfolios and the investment of their assets. Pursuant to these agreements, fees paid to EquiTrust Investment are as follows: (1) annual investment advisory and management fees, which are based on each portfolio's average daily net assets as follows: Value Growth Portfolio - 0.45%; High Grade Bond Portfolio - 0.30%; Strategic Yield Portfolio - 0.45%; Managed
28
EQUITRUST VARIABLE INSURANCE SERIES FUND
NOTES TO FINANCIAL STATEMENTS (continued)
3. Management Contract and Transactions with Affiliates (continued)
Portfolio - 0.45%; Money Market Portfolio - 0.25%; and Blue Chip Portfolio - 0.20%, and (2) accounting fees, which are based on each Portfolio's daily net assets at an annual rate of 0.05%, with a maximum per portfolio annual expense of $30,000.
The Fund entered into an agreement with EquiTrust Investment whereby EquiTrust Investment also serves as the Fund's shareholder service, transfer and dividend disbursing agent. EquiTrust Marketing Services, LLC serves as the principal underwriter and distributor. There are no fees paid by the Fund associated with these services.
EquiTrust Investment has agreed to reimburse the Portfolios annually for total expenses (excluding brokerage, interest, taxes and extraordinary expenses) in excess of 1.50% of each Portfolio's average daily net assets. The amount reimbursed, however, shall not exceed the amount of the investment advisory and management fee paid by the Portfolio for such period. During the period ended June 30, 2005, EquiTrust Investment further agreed to reimburse any Portfolio, to the extent that annual operating expenses, including the investment advisory fee, exceed 0.65%. For the six month period ended June 30, 2005, no expense reimbursements were made to the Fund by EquiTrust Investment.
Certain officers and trustees of the Fund are also officers of EquiTrust Investment, Farm Bureau Life Insurance Company and other affiliated entities. As of June 30, 2005, the total number of the shares of each Portfolio owned by Farm Bureau Life Insurance Company, EquiTrust Life Insurance Company and related separate accounts were as follows:
| Portfolio | Shares | ||||||
| Value Growth | 4,401,085 | ||||||
| High Grade Bond | 2,950,789 | ||||||
| Strategic Yield | 3,382,621 | ||||||
| Managed | 4,962,355 | ||||||
| Money Market | 5,197,113 | ||||||
| Blue Chip | 2,357,330 | ||||||
4. Capital Share Transactions
Transactions in shares of beneficial interest for each Portfolio were as follows:
| Shares Sold | Shares Issued In Reinvestment of Dividends and Distributions | Shares Redeemed | Net Increase (Decrease) | ||||||||||||||||||||||||||||||||
| Portfolio | Shares | Amount | Shares | Amount | Shares | Amount | Shares | Amount | |||||||||||||||||||||||||||
| Six month period ended June 30, 2005: | |||||||||||||||||||||||||||||||||||
| Value Growth | 112,605 | $ | 1,434,625 | 53,423 | $ | 665,116 | 200,009 | $ | 2,554,068 | (33,981 | ) | $ | (454,327 | ) | |||||||||||||||||||||
| High Grade Bond | 299,224 | 3,085,618 | 71,530 | 738,702 | 147,786 | 1,524,277 | 222,968 | 2,300,043 | |||||||||||||||||||||||||||
| Strategic Yield | 395,377 | 3,689,215 | 97,753 | 914,002 | 128,571 | 1,204,765 | 364,559 | 3,398,452 | |||||||||||||||||||||||||||
| Managed | 322,007 | 4,870,885 | 175,742 | 2,597,468 | 183,604 | 2,776,048 | 314,145 | 4,692,305 | |||||||||||||||||||||||||||
| Money Market | 20,140,611 | 20,140,611 | 50,307 | 50,307 | 19,926,678 | 19,926,678 | 264,240 | 264,240 | |||||||||||||||||||||||||||
| Blue Chip | 59,876 | 2,041,317 | 48,130 | 1,621,030 | 122,765 | 4,196,024 | (14,759 | ) | (533,677 | ) | |||||||||||||||||||||||||
| Year ended December 31, 2004: | |||||||||||||||||||||||||||||||||||
| Value Growth | 272,309 | $ | 3,248,659 | 47,356 | $ | 563,058 | 314,657 | $ | 3,757,688 | 5,008 | $ | 54,029 | |||||||||||||||||||||||
| High Grade Bond | 498,678 | 5,149,599 | 124,573 | 1,289,118 | 293,329 | 3,040,003 | 329,922 | 3,398,714 | |||||||||||||||||||||||||||
| Strategic Yield | 547,463 | 5,049,478 | 181,300 | 1,675,145 | 250,424 | 2,315,693 | 478,339 | 4,408,930 | |||||||||||||||||||||||||||
| Managed | 436,280 | 6,407,882 | 94,010 | 1,367,844 | 282,774 | 4,163,866 | 247,516 | 3,611,860 | |||||||||||||||||||||||||||
| Money Market | 29,459,979 | 29,459,979 | 33,224 | 33,224 | 29,628,690 | 29,628,690 | (135,487 | ) | (135,487 | ) | |||||||||||||||||||||||||
| Blue Chip | 174,207 | 5,808,441 | 35,399 | 1,194,008 | 166,223 | 5,550,599 | 43,383 | 1,451,850 | |||||||||||||||||||||||||||
29
EQUITRUST VARIABLE INSURANCE SERIES FUND
NOTES TO FINANCIAL STATEMENTS (continued)
5. Investment Transactions
For the six month period ended June, 30, 2005, the cost of investment securities purchased and proceeds from investment securities sold (not including short-term investments and U.S. Government securities) by Portfolio, were as follows:
| Portfolio | Purchases | Sales | |||||||||
| Value Growth | $ | 4,432,319 | $ | 5,209,518 | |||||||
| High Grade Bond | 1,893,282 | 31,479 | |||||||||
| Strategic Yield | 588,610 | 224,110 | |||||||||
| Managed | 4,378,132 | 4,808,387 | |||||||||
| Blue Chip | - | - | |||||||||
The basis of the Fund's investments in securities and the net unrealized appreciation of investments for U.S. federal income tax purposes as of June 30, 2005, by Portfolio, was composed of the following:
| Tax Cost of Investments | Gross Unrealized | Net Unrealized Appreciation | |||||||||||||||||
| Portfolio | in Securities | Appreciation | Depreciation | of Investments | |||||||||||||||
| Value Growth | $ | 51,694,798 | $ | 11,647,702 | $ | 4,718,737 | $ | 6,928,965 | |||||||||||
| High Grade Bond | 31,092,937 | 891,079 | 31,507 | 859,572 | |||||||||||||||
| Strategic Yield | 31,952,422 | 1,738,707 | 177,905 | 1,560,802 | |||||||||||||||
| Managed | 68,341,469 | 12,291,116 | 2,269,182 | 10,021,934 | |||||||||||||||
| Blue Chip | 68,630,207 | 21,628,920 | 8,736,090 | 12,892,830 | |||||||||||||||
The basis for U.S. federal income tax purposes and financial reporting purposes for investments in the Money Market Portfolio is the same and is equal to the underlying investments' carrying value.
6. Dividends and Distributions to Shareholders
Dividends from net investment income for the following Portfolios are declared daily and were payable on the last business day of the month as follows:
| Portfolio | |||||||||||||||
| Payable Date | High Grade Bond | Strategic Yield | Money Market | ||||||||||||
| January 31, 2005 | $ | 0.0378 | $ | 0.0430 | $ | 0.0014 | |||||||||
| February 28, 2005 | 0.0383 | 0.0475 | 0.0014 | ||||||||||||
| March 31, 2005 | 0.0395 | 0.0454 | 0.0016 | ||||||||||||
| April 29, 2005 | 0.0366 | 0.0412 | 0.0017 | ||||||||||||
| May 31, 2005 | 0.0398 | 0.0443 | 0.0020 | ||||||||||||
| June 30, 2005 | 0.0404 | 0.0454 | 0.0020 | ||||||||||||
| Total dividends per share | $ | 0.2324 | $ | 0.2668 | $ | 0.0101 | |||||||||
In addition, dividends and distributions to shareholders from net investment income and net realized gain on investment transactions were paid during the six month period ended June 30, 2005 for the following Portfolios:
Ordinary Income Dividends:
| Portfolio | Declaration Date | Record Date | Payable Date | Amount Per Share | |||||||||||||||
| Value Growth | 1/19/05 | 1/19/05 | 1/20/05 | $ | 0.1482 | ||||||||||||||
| Managed | 1/19/05 | 1/19/05 | 1/20/05 | 0.2711 | |||||||||||||||
| Blue Chip | 1/19/05 | 1/19/05 | 1/20/05 | 0.6730 | |||||||||||||||
30
EQUITRUST VARIABLE INSURANCE SERIES FUND
NOTES TO FINANCIAL STATEMENTS (continued)
6. Dividends and Distributions to Shareholders (continued)
Capital Gains Distributions:
| Portfolio | Declaration Date | Record Date | Payable Date | Amount Per Share | |||||||||||||||
| High Grade Bond | 1/19/05 | 1/19/05 | 1/20/05 | $ | 0.0151 | ||||||||||||||
| Managed | 1/19/05 | 1/19/05 | 1/20/05 | 0.2715 | |||||||||||||||
The federal income tax character of dividends and distributions to shareholders during 2005 and 2004 was the same for financial reporting purposes.
31
EQUITRUST VARIABLE INSURANCE SERIES FUND
FINANCIAL HIGHLIGHTS
Period ended June 30, 2005 (Unaudited) and
Years Ended December 31, 2004, 2003, 2002, 2001 and 2000
| Value Growth Portfolio | High Grade Bond Portfolio | ||||||||||||||||||||||||||||||||||||||||||||||||||
| 2005 | 2004 | 2003 | 2002 | 2001 | 2000 | 2005 | 2004 | 2003 | 2002 | 2001 | 2000 | ||||||||||||||||||||||||||||||||||||||||
| Net asset value, beginning of period | $ | 12.98 | $ | 11.76 | $ | 9.14 | $ | 10.39 | $ | 9.92 | $ | 8.69 | $ | 10.38 | $ | 10.42 | $ | 10.39 | $ | 10.08 | $ | 9.82 | $ | 9.49 | |||||||||||||||||||||||||||
| Income From Investment Operations | |||||||||||||||||||||||||||||||||||||||||||||||||||
| Net investment income | 0.09 | 0.15 | 0.12 | 0.14 | 0.18 | 0.22 | 0.23 | 0.45 | 0.47 | 0.50 | 0.62 | 0.67 | |||||||||||||||||||||||||||||||||||||||
| Net gains (losses) on securities (both realized and unrealized) | 0.27 | 1.20 | 2.64 | (1.20 | ) | 0.50 | 1.20 | - | - | 0.08 | 0.32 | 0.26 | 0.34 | ||||||||||||||||||||||||||||||||||||||
| Total from investment operations | 0.36 | 1.35 | 2.76 | (1.06 | ) | 0.68 | 1.42 | 0.23 | 0.45 | 0.55 | 0.82 | 0.88 | 1.01 | ||||||||||||||||||||||||||||||||||||||
| Less Distributions | |||||||||||||||||||||||||||||||||||||||||||||||||||
| Dividends (from net investment income) | (0.15 | ) | (0.13 | ) | (0.14 | ) | (0.19 | ) | (0.21 | ) | (0.19 | ) | (0.23 | ) | (0.45 | ) | (0.47 | ) | (0.50 | ) | (0.62 | ) | (0.67 | ) | |||||||||||||||||||||||||||
| Distributions (from capital gains) | - | - | - | - | - | - | (0.02 | ) | (0.04 | ) | (0.05 | ) | (0.01 | ) | - | (0.01 | ) | ||||||||||||||||||||||||||||||||||
| Total distributions | (0.15 | ) | (0.13 | ) | (0.14 | ) | (0.19 | ) | (0.21 | ) | (0.19 | ) | (0.25 | ) | (0.49 | ) | (0.52 | ) | (0.51 | ) | (0.62 | ) | (0.68 | ) | |||||||||||||||||||||||||||
| Net asset value, end of period | $ | 13.19 | $ | 12.98 | $ | 11.76 | $ | 9.14 | $ | 10.39 | $ | 9.92 | $ | 10.36 | $ | 10.38 | $ | 10.42 | $ | 10.39 | $ | 10.08 | $ | 9.82 | |||||||||||||||||||||||||||
| Total Return: | |||||||||||||||||||||||||||||||||||||||||||||||||||
| Total investment return based on net asset value (1) | 2.83 | % | 11.53 | % | 30.68 | % | (10.43 | )% | 6.98 | % | 16.71 | % | 2.22 | % | 4.30 | % | 5.43 | % | 8.37 | % | 9.10 | % | 11.14 | % | |||||||||||||||||||||||||||
| Ratios/Supplemental Data: | |||||||||||||||||||||||||||||||||||||||||||||||||||
| Net assets, end of period (000's omitted) | $ | 58,818 | $ | 58,354 | $ | 52,812 | $ | 40,953 | $ | 45,522 | $ | 40,173 | $ | 32,228 | $ | 29,980 | $ | 26,659 | $ | 24,984 | $ | 18,908 | $ | 13,934 | |||||||||||||||||||||||||||
| Ratio of total expenses to average net assets | 0.58 | %(2) | 0.58 | % | 0.63 | % | 0.59 | % | 0.57 | % | 0.57 | % | 0.45 | %(2) | 0.45 | % | 0.49 | % | 0.46 | % | 0.45 | % | 0.45 | % | |||||||||||||||||||||||||||
| Ratio of net expenses to average net assets | 0.58 | %(2) | 0.58 | % | 0.63 | % | 0.59 | % | 0.57 | % | 0.56 | % | 0.45 | %(2) | 0.45 | % | 0.49 | % | 0.46 | % | 0.45 | % | 0.45 | % | |||||||||||||||||||||||||||
| Ratio of net investment income to average net assets | 1.36 | %(2) | 1.22 | % | 1.26 | % | 1.46 | % | 1.89 | % | 2.34 | % | 4.53 | %(2) | 4.34 | % | 4.51 | % | 4.92 | % | 6.10 | % | 7.03 | % | |||||||||||||||||||||||||||
| Portfolio turnover rate | 9 | %(3) | 17 | % | 17 | % | 15 | % | 40 | % | 78 | % | 6 | %(3) | 26 | % | 28 | % | 22 | % | 17 | % | 7 | % | |||||||||||||||||||||||||||
| Strategic Yield Portfolio | |||||||||||||||||||||||||||
| 2005 | 2004 | 2003 | 2002 | 2001 | 2000 | ||||||||||||||||||||||
| Net asset value, beginning of period | $ | 9.37 | $ | 9.13 | $ | 8.75 | $ | 8.90 | $ | 8.82 | $ | 9.30 | |||||||||||||||
| Income From Investment Operations | |||||||||||||||||||||||||||
| Net investment income | 0.27 | 0.55 | 0.63 | 0.62 | 0.73 | 0.75 | |||||||||||||||||||||
| Net gains (losses) on securities (both realized and unrealized) | - | 0.24 | 0.38 | (0.15 | ) | 0.08 | (0.48 | ) | |||||||||||||||||||
| Total from investment operations | 0.27 | 0.79 | 1.01 | 0.47 | 0.81 | 0.27 | |||||||||||||||||||||
| Less Distributions | |||||||||||||||||||||||||||
| Dividends (from net investment income) | (0.27 | ) | (0.55 | ) | (0.63 | ) | (0.62 | ) | (0.73 | ) | (0.75 | ) | |||||||||||||||
| Distributions (from capital gains) | - | - | - | - | - | - | |||||||||||||||||||||
| Total distributions | (0.27 | ) | (0.55 | ) | (0.63 | ) | (0.62 | ) | (0.73 | ) | (0.75 | ) | |||||||||||||||
| Net asset value, end of period | $ | 9.37 | $ | 9.37 | $ | 9.13 | $ | 8.75 | $ | 8.90 | $ | 8.82 | |||||||||||||||
| Total Return: | |||||||||||||||||||||||||||
| Total investment return based on net asset value (1) | 2.89 | % | 8.94 | % | 11.97 | % | 5.43 | % | 9.22 | % | 3.05 | % | |||||||||||||||
| Ratios/Supplemental Data: | |||||||||||||||||||||||||||
| Net assets, end of period (000's omitted) | $ | 34,081 | $ | 30,637 | $ | 25,498 | $ | 22,395 | $ | 20,182 | $ | 16,410 | |||||||||||||||
| Ratio of total expenses to average net assets | 0.59 | %(2) | 0.59 | % | 0.65 | % | 0.61 | % | 0.59 | % | 0.59 | % | |||||||||||||||
| Ratio of net expenses to average net assets | 0.59 | %(2) | 0.59 | % | 0.65 | % | 0.61 | % | 0.59 | % | 0.58 | % | |||||||||||||||
| Ratio of net investment income to average net assets | 5.74 | %(2) | 5.98 | % | 7.07 | % | 7.04 | % | 7.93 | % | 8.30 | % | |||||||||||||||
| Portfolio turnover rate | 1 | %(3) | 34 | % | 32 | % | 34 | % | 33 | % | 3 | % | |||||||||||||||
Note: Per share amounts have been calculated on the basis of monthly per share amounts (using average monthly outstanding shares) accumulated for the period.
(1) Total investment return is calculated assuming an initial investment made at the net asset value at the beginning of the period, reinvestment of all dividends and distributions at net asset value during the period, and redemption on the last day of the period, and is not annualized for periods less than one year.
(2) Computed on an annualized basis.
(3) Not annualized.
See accompanying notes.
32
33
EQUITRUST VARIABLE INSURANCE SERIES FUND
FINANCIAL HIGHLIGHTS (continued)
| Managed Portfolio | Money Market Portfolio | ||||||||||||||||||||||||||||||||||||||||||||||||||
| 2005 | 2004 | 2003 | 2002 | 2001 | 2000 | 2005 | 2004 | 2003 | 2002 | 2001 | 2000 | ||||||||||||||||||||||||||||||||||||||||
| Net asset value, beginning of period | $ | 15.67 | $ | 14.73 | $ | 12.34 | $ | 13.00 | $ | 12.58 | $ | 10.54 | $ | 1.00 | $ | 1.00 | $ | 1.00 | $ | 1.00 | $ | 1.00 | $ | 1.00 | |||||||||||||||||||||||||||
| Income From Investment Operations | |||||||||||||||||||||||||||||||||||||||||||||||||||
| Net investment income | 0.16 | 0.27 | 0.30 | 0.34 | 0.44 | 0.59 | 0.01 | 0.01 | 0.01 | 0.01 | 0.03 | 0.06 | |||||||||||||||||||||||||||||||||||||||
| Net gains (losses) on securities (both realized and unrealized) | 0.15 | 0.97 | 2.43 | (0.57 | ) | 0.55 | 2.11 | - | - | - | - | - | - | ||||||||||||||||||||||||||||||||||||||
| Total from investment operations | 0.31 | 1.24 | 2.73 | (0.23 | ) | 0.99 | 2.70 | 0.01 | 0.01 | 0.01 | 0.01 | 0.03 | 0.06 | ||||||||||||||||||||||||||||||||||||||
| Less Distributions | |||||||||||||||||||||||||||||||||||||||||||||||||||
| Dividends (from net investment income) | (0.27 | ) | (0.30 | ) | (0.34 | ) | (0.43 | ) | (0.57 | ) | (0.66 | ) | (0.01 | ) | (0.01 | ) | (0.01 | ) | (0.01 | ) | (0.03 | ) | (0.06 | ) | |||||||||||||||||||||||||||
| Distributions (from capital gains) | (0.27 | ) | - | - | - | - | - | - | - | - | - | - | - | ||||||||||||||||||||||||||||||||||||||
| Total distributions | (0.54 | ) | (0.30 | ) | (0.34 | ) | (0.43 | ) | (0.57 | ) | (0.66 | ) | (0.01 | ) | (0.01 | ) | (0.01 | ) | (0.01 | ) | (0.03 | ) | (0.06 | ) | |||||||||||||||||||||||||||
| Net asset value, end of period | $ | 15.44 | $ | 15.67 | $ | 14.73 | $ | 12.34 | $ | 13.00 | $ | 12.58 | $ | 1.00 | $ | 1.00 | $ | 1.00 | $ | 1.00 | $ | 1.00 | $ | 1.00 | |||||||||||||||||||||||||||
| Total Return: | |||||||||||||||||||||||||||||||||||||||||||||||||||
| Total investment return based on net asset value (1) | 2.15 | % | 8.58 | % | 22.72 | % | (1.80 | )% | 8.12 | % | 27.39 | % | 1.01 | % | 0.74 | % | 0.52 | % | 1.16 | % | 3.51 | % | 5.85 | % | |||||||||||||||||||||||||||
| Ratios/Supplemental Data: | |||||||||||||||||||||||||||||||||||||||||||||||||||
| Net assets, end of period (000's omitted) | $ | 78,642 | $ | 74,876 | $ | 66,733 | $ | 54,428 | $ | 53,795 | $ | 48,012 | $ | 6,856 | $ | 6,592 | $ | 6,728 | $ | 8,150 | $ | 9,320 | $ | 7,233 | |||||||||||||||||||||||||||
| Ratio of total expenses to average net assets | 0.56 | %(2) | 0.56 | % | 0.62 | % | 0.58 | % | 0.56 | % | 0.56 | % | 0.57 | %(2) | 0.56 | % | 0.59 | % | 0.52 | % | 0.50 | % | 0.50 | % | |||||||||||||||||||||||||||
| Ratio of net expenses to average net assets | 0.56 | %(2) | 0.56 | % | 0.62 | % | 0.58 | % | 0.56 | % | 0.55 | % | 0.57 | %(2) | 0.56 | % | 0.59 | % | 0.52 | % | 0.48 | % | 0.48 | % | |||||||||||||||||||||||||||
| Ratio of net investment income to average net assets | 2.24 | %(2) | 1.87 | % | 2.35 | % | 2.73 | % | 3.47 | % | 4.96 | % | 2.03 | %(2) | 0.72 | % | 0.53 | % | 1.16 | % | 3.41 | % | 5.74 | % | |||||||||||||||||||||||||||
| Portfolio turnover rate | 9 | %(3) | 26 | % | 24 | % | 18 | % | 40 | % | 85 | % | - | %(3) | - | % | - | % | - | % | - | % | - | % | |||||||||||||||||||||||||||
| Blue Chip Portfolio | |||||||||||||||||||||||||||
| 2005 | 2004 | 2003 | 2002 | 2001 | 2000 | ||||||||||||||||||||||
| Net asset value, beginning of period | $ | 35.17 | $ | 33.65 | $ | 27.22 | $ | 34.14 | $ | 39.29 | $ | 43.98 | |||||||||||||||
| Income From Investment Operations | |||||||||||||||||||||||||||
| Net investment income | 0.33 | 0.67 | 0.50 | 0.46 | 0.50 | 0.56 | |||||||||||||||||||||
| Net gains (losses) on securities (both realized and unrealized) | (0.86 | ) | 1.35 | 6.38 | (6.88 | ) | (4.83 | ) | (4.26 | ) | |||||||||||||||||
| Total from investment operations | (0.53 | ) | 2.02 | 6.88 | (6.42 | ) | (4.33 | ) | (3.70 | ) | |||||||||||||||||
| Less Distributions | |||||||||||||||||||||||||||
| Dividends (from net investment income) | (0.67 | ) | (0.50 | ) | (0.45 | ) | (0.50 | ) | (0.56 | ) | (0.53 | ) | |||||||||||||||
| Distributions (from capital gains) | - | - | - | - | (0.26 | ) | (0.46 | ) | |||||||||||||||||||
| Total distributions | (0.67 | ) | (0.50 | ) | (0.45 | ) | (0.50 | ) | (0.82 | ) | (0.99 | ) | |||||||||||||||
| Net asset value, end of period | $ | 33.97 | $ | 35.17 | $ | 33.65 | $ | 27.22 | $ | 34.14 | $ | 39.29 | |||||||||||||||
| Total Return: | |||||||||||||||||||||||||||
| Total investment return based on net asset value (1) | (1.48 | )% | 6.07 | % | 25.70 | % | (19.07 | )% | (11.28 | )% | (8.52 | )% | |||||||||||||||
| Ratios/Supplemental Data: | |||||||||||||||||||||||||||
| Net assets, end of period (000's omitted) | $ | 81,558 | $ | 84,960 | $ | 79,832 | $ | 63,699 | $ | 79,124 | $ | 87,118 | |||||||||||||||
| Ratio of total expenses to average net assets | 0.31 | %(2) | 0.30 | % | 0.36 | % | 0.31 | % | 0.28 | % | 0.27 | % | |||||||||||||||
| Ratio of net expenses to average net assets | 0.31 | %(2) | 0.30 | % | 0.36 | % | 0.31 | % | 0.28 | % | 0.27 | % | |||||||||||||||
| Ratio of net investment income to average net assets | 1.91 | %(2) | 2.00 | % | 1.72 | % | 1.50 | % | 1.42 | % | 1.39 | % | |||||||||||||||
| Portfolio turnover rate | - | %(3) | 1 | % | 17 | % | - | % | - | % | 13 | % | |||||||||||||||
Note: Per share amounts have been calculated on the basis of monthly per share amounts (using average monthly outstanding shares) accumulated for the period.
(1) Total investment return is calculated assuming an initial investment made at the net asset value at the beginning of the period, reinvestment of all dividends and distributions at net asset value during the period, and redemption on the last day of the period, and is not annualized for periods less than one year.
(2) Computed on an annualized basis.
(3) Not annualized.
See accompanying notes.
34
35
Information on Proxy Voting:
EquiTrust Variable Insurance Series Fund (the "Fund") has delegated the authority to vote proxies related to the Fund's portfolio securities to the Fund's investment adviser, EquiTrust Investment Management Services, Inc. (the "Adviser"). A description of the policies and procedures that the Adviser uses in fulfilling this responsibility is available, without charge, upon request by calling 1-877-860-2904. It also appears in the Fund's Statement of Additional information, which can be found on the SEC's website at http://www.sec.gov. The Fund's proxy voting record for the most recent 12-month period ended June 30, 2005 is available without charge, by calling the toll-free number listed above or by accessing the SEC's website.
Form N-Q Disclosure:
The Fund files a complete schedule of portfolio holdings for its first and third quarters of each fiscal year with the SEC on Form N-Q. The Fund's Forms N-Q are available on the SEC's website at http://www.sec.gov or may be reviewed and copied at the SEC's Public Reference Room in Washington, D.C. Information regarding the operation of the Public Reference Room may be obtained by calling 1-800-SEC-0330. A copy of Form N-Q is also available, without charge, by calling the Fund at 1-877-860-2904.
36
Item 2. Code of Ethics.
Not applicable to this filing.
Item 3. Audit Committee Financial Expert.
Not applicable to this filing.
Item 4. Principal Accountant Fees and Services.
Not applicable to this filing.
Item 5. Audit Committee of Listed Registrants.
Not applicable.
Item 6. Schedules of Investments.
See Item 1.
Item 7. Disclosure of Proxy Voting Policies and Procedures for Closed-End Management Investment Companies.
Not applicable.
Item 8. Portfolio Managers of Closed-End Management Investment Company.
Not applicable.
Item 9. Purchase of Equity Securities by Closed-End Management Investment Company and Affiliated Purchasers.
Not applicable.
Item 10. Submission of Matters to a Vote of Security Holders.
On November 18, 2004, the registrant adopted procedures by which shareholders may recommend nominees to the registrant’s board of trustees. Those procedures specify that shareholders may recommend candidates for board positions by forwarding their correspondence by U.S. mail or courier service to the registrant’s secretary to the attention of the Chairman of the Nominating Committee. Suggestions for candidates for specific positions must be received by such date as established by the Nominating Committee.
Item 11. Controls and Procedures
(a) The registrant’s principal executive and principal financial officers, or persons performing similar functions, have concluded that the registrant’s disclosure controls and procedures (as defined in Rule 30a-3(c) under the Investment Company Act of 1940, as amended (the “1940 Act”) (17 CFR 270.30a-3(c))) are effective, as of a date within 90 days of the filing date of the report that includes the disclosure required by this paragraph, based on their evaluation of these controls and procedures required by Rule 30a-3(b) under the 1940 Act (17 CFR 270.30a-3(b)) and Rules 13a-15(b) or 15d-15(b) under the Exchange Act (17 CFR 240.13a-15(b) or 240.15d-15(b)).
(b) There has been no change to the registrant’s internal control over financial reporting that occurred during the second fiscal quarter of the period covered by this report that has materially affected, or is reasonably likely to materially affect, the registrant’s internal control over financial reporting.
Item 12. Exhibits.
| (a)(1) | Not applicable to this filing. |
|
|
|
| (a)(2) | Certifications pursuant to Section 302 of the Sarbanes-Oxley Act of 2002 are attached hereto. |
|
|
|
| (a)(3) | Not applicable. |
|
|
|
| (b) | Certifications pursuant to Section 906 of the Sarbanes-Oxley Act of 2002 are attached hereto. |
SIGNATURES
Pursuant to the requirements of the Securities Exchange Act of 1934 and the Investment Company Act of 1940, the registrant has duly caused this report to be signed on its behalf by the undersigned, thereunto duly authorized.
(Registrant) | EquiTrust Variable Insurance Series Fund |
| |||
|
| ||||
|
| ||||
By: | /s/ Dennis M. Marker |
| |||
| Name: | Dennis M. Marker | |||
| Title: | Chief Executive Officer | |||
| Date: | 8/19/05 |
| ||
Pursuant to the requirements of the Securities Exchange Act of 1934 and the Investment Company Act of 1940, this report has been signed below by the following persons on behalf of the registrant and in the capacities and on the dates indicated.
By: | /s/ Dennis M. Marker |
| |||
| Name: | Dennis M. Marker | |||
| Title: | Chief Executive Officer | |||
| Date: | 8/19/05 |
| ||
|
| ||||
|
| ||||
By: | /s/ James W. Noyce |
| |||
| Name: | James W. Noyce | |||
| Title: | Chief Financial Officer | |||
| Date: | 8/18/05 |
| ||