UNITED STATES
SECURITIES AND EXCHANGE COMMISSION
Washington, D.C. 20549
FORM N-CSR
CERTIFIED SHAREHOLDER REPORT OF REGISTERED
MANAGEMENT INVESTMENT COMPANIES
Investment Company Act file number 33-12791 & 811-5069
EquiTrust Variable Insurance Series Fund
(Exact name of registrant as specified in charter)
| 5400 University Avenue, West Des Moines IA | 50266-5997 | |
| (Address of principal executive offices) | (Zip code) |
Kristi Rojohn, 5400 University Avenue, West Des Moines IA 50266-5997
(Name and address of agent for service)
Registrant’s telephone number, including area code: 515/225-5400
Date of fiscal year end: December 31, 2007
Date of reporting period: June 30, 2007
| Item 1. | Reports to Stockholders. |
EquiTrust Variable Insurance Series Fund

SEMI-ANNUAL REPORT
JUNE 30, 2007

5400 University Avenue
West Des Moines, IA 50266
1-877-860-2904
1-515-225-5586
This report is not to be distributed unless preceded or accompanied by a current prospectus.
PRESIDENT’S LETTER
Dear Shareholder:
Equities started 2007 sluggishly but turned in a strong performance for the first half of the year. For the six-month period ended June 30, 2007, the S&P 500 Composite Index (the “S&P 500”) recorded a total return of 6.96%. The Dow Jones Industrial Average (the “Dow”) turned in a commanding performance within domestic stocks, gaining 8.75% for the period. Small-caps, as measured by the Russell 2000 Index, returned a respectable 6.45%. International stocks roared through the first half of 2007 with the developed markets’ MSCI EAFE Index gaining 11.09% and the MSCI Emerging Markets Index recording a total return of 17.75%.
Rising interest rates squeezed fixed-income returns for most U.S. fixed-income benchmarks in the first half of 2007. Because bond values move in the opposite direction of interest rates, a rise in rates consequently leads to lower bond values. On a total return basis, the broad Lehman Brothers U.S. Aggregate Index (the “Aggregate Index”) gained just 0.98% as falling bond values partially offset coupons for the period. Investment grade corporate securities suffered the most from the rise in rates, with the Lehman Brothers U.S. Investment Grade Corporate Index (the “Corporate Index”) gaining just 0.71% for the six months ended June 30, 2007. The Lehman Brothers U.S. Corporate High Yield (the “High Yield Index”) was the best performer among fixed income indices for the period, with a gain of just 2.87%.
Corporate earnings growth and the U.S. economy as a whole have slowed since the end of 2006. However, continued inflation concerns and low unemployment rates have kept the Federal Reserve Board (the “Fed”) from lowering short-term interest rates thus far in 2007. The S&P 500 companies grew earnings just over 8% during the first three months of 2007 and likely around 7% in the second quarter. Both numbers score as average relative to history, but represent a significant slowing from the double-digit gains achieved in the 14 prior quarters. Reflecting a slowing housing market and nominal business investment spending, the U.S. economy expanded at a below-trend level of just under 1% in the first quarter of 2007. It regained momentum in the second quarter, though, growing over 3% and giving the Fed further reason to leave rates alone. As a reminder, the Fed raised the Federal Funds rate to 5.25% in June 2006 and has not changed the benchmark rate since. The implication from the Fed’s inaction is the economy can sufficiently support itself without stimulus from lower borrowing costs. Interestingly, short-term rates are rising world-wide as the central banks in other countries tighten their money supply in order to prevent inflation-inducing growth.
Both the domestic equity and fixed-income markets have demonstrated significant volatility in the last six months, particularly relative to recent periods. The EquiTrust Variable Insurance Series Fund portfolios provide a means of gaining exposure to both these markets. Below is a summary of portfolio and market performance for the six-month period ended June 30, 2007.
Money Market: The interest rates offered by money market funds are closely related to the target rates set by the Federal Open Market Committee (the “FOMC”). The FOMC meets several times throughout the year to determine the target Fed Funds rate, or overnight lending rates between banks. The Fed Funds target rate has been held at 5.25% since the summer of 2006 due to the FOMC’s prediction that the economy would slow to a more sustainable rate of growth with moderate inflation. The U.S. economy did slow significantly during the first half of 2007 with GDP growth at a mere 0.70% for the first quarter, the slowest growth in four years. The Core Consumer Price Index (the ”CPI”), which is the measure of inflation, rose above the FOMC’s target of a 1-2% increase during the first half of the year. CPI, excluding energy and food costs however, appears to have moderated to a level more consistent with the FOMC’s outlook for the economy. Inflation expectations will remain a carefully-watched guide going forward. The sub-prime housing market also remains a concern yet the Committee has decided not to get involved at this time despite the pressure applied by Congress for intervention. The FOMC’s outlook for a soft-landing appears to be materializing in 2007 with the probability for a change in the Fed Funds target rate dwindling. On June 29, 2007, the Money Market Portfolio had a 7-day yield of 4.86%.
High Grade Bond: U.S. Treasury yields rose over the six-month period ended June 30, 2007. During the period, the two-year Treasury yield rose by 5 basis points (“bp”) (.05%) to 5.02%, the ten-year Treasury yield rose by 32 bp (0.32%) to 5.12% and the thirty-year Treasury yield rose by 31 bp (0.31%) to 5.12%.
During the six-month period ended June 30, 2007, the High Grade Bond Portfolio outperformed the Aggregate Index as reflected by the 1.21% total return produced by the Portfolio versus the 0.98% total return produced by the Aggregate Index. The
1
total returns for the major components of the Aggregate Index for this period were as follows: U.S. Fixed Rate Mortgage Backed Securities (38% of the Aggregate Index) 1.05%; U.S. Treasury Securities (23% of the Aggregate Index) 1.01%; and U.S. Investment Grade Credit Securities (22% of the Aggregate Index) 0.76%. The Aggregate Index had an effective duration of 4.70 as of June 30, 2007. In comparison, the Portfolio had approximately 42% of its assets invested in corporate securities, 37% in fixed-rate mortgage backed securities, 14% in cash equivalents and 7% in U.S. Government Agencies. The effective duration of the Portfolio was 4.46. The Portfolio outperformed the Aggregate Index mainly because its overexposure to outperforming cash was more than enough to offset Portfolio’s expenses.
Given the recent increase in Treasury yields, we will be more willing to increase the duration of the Portfolio to be more closely aligned with the Aggregate Index.
Strategic Yield: The High Yield Index produced a return of 2.87% over the six-month reporting period ended June 30, 2007. The option-adjusted spread on the High Yield Index finished the current period at 292 bp (2.92%), which was 22 bp (0.22%) more than at the start of the period. The High Yield Index was helped by a low level of actual defaults and the relative stability in the overall credit quality of the high yield market.
During the six-month reporting period, the Strategic Yield Portfolio produced a total return of 1.72%, lagging that of the High Yield Index but exceeding the 0.71% return of the Corporate Index. The Portfolio’s performance was hindered by having a lower exposure to high yield issues than the High Yield Index as well as its expenses. At the end of the period, the Portfolio had approximately 41% of its assets invested in securities rated investment grade, 40% invested in securities rated high yield by Moody’s or S&P and 19% invested in cash equivalents.
The Portfolio has historically invested in a mix of high yield and investment grade issues attempting to find attractive issues in both markets. As always, we will attempt to seek securities in both the investment grade and non-investment grade markets that we feel offer attractive potential returns for the amount of risk taken.
Managed: The Managed Portfolio returned 4.48% for the six-month period ended June 30, 2007, compared to a gain of 6.96% for the S&P 500. The Portfolio’s equity holdings matched the performance of the S&P 500. Its fixed-income holdings, however, declined with the market-wide rise in longer-maturity interest rates, while the cash position offered only a modest gain.
The offset to the rise in interest rates was that we opportunistically added to the Portfolio’s position of high quality GNMA securities at higher, attractive yields. We still prefer the large-cap segment of the domestic equity market, but the recent back-up in interest rates has made high quality fixed-income positions strong competition for even dividend-paying big-cap stocks.
Value Growth: The Value Growth Portfolio returned 6.94% for the period, falling just short of the S&P 500’s total return of 6.96%. By sector, the S&P 500 achieved its highest gains in the energy, industrials and information technology sectors. Only the financials sector recorded a decline for the period.
The Portfolio likewise achieved strong performance from its energy, industrials and technology exposure. Its gain in the energy sector roughly matched that in the S&P 500, while relative outperformance in its industrials holdings offset a more modest relative return in its technology holdings.
The broad rise in financial assets in recent years has left few opportunities for attractive investments. Domestically, small-cap stocks remain at elevated valuations relative to large-cap stocks. From a world-wide equity standpoint, valuations for non-U.S. stocks have been driven up as well as investors continue to move money towards the returns this segment has recorded in the past five years. This leaves us searching through the attractive valuations of the domestic market’s largest names, e.g. GE, Proctor & Gamble, and Johnson & Johnson. We believe this segment currently provides the most attractive risk-return profile across the universe of global equities.
Blue Chip: The Blue Chip Portfolio passively tracks the direction of the large capitalization equity market. It remains substantially invested in common stocks of large companies and is designed for those investors who prefer substantial exposure to common stocks at all times or who wish to make their own market value judgments. The Portfolio performed in-line with the S&P 500 for the six-month period ended June 30, 2007, gaining 6.91% compared to 6.96% for the S&P 500. Interestingly, the S&P 500’s returns were heavily attributable to its smaller constituents, where the Portfolio has little representation. Instead, the Portfolio’s core position in large- and mega-cap stocks outperformed this segment in the S&P 500 and contributed the most to the Portfolio’s performance for the period.
2
We appreciate your investment in the Fund and we take seriously our task of seeking to grow and protect that investment. Thank you for continued support of the Fund.

Craig A. Lang
President
July 29, 2007
An investment in the Money Market Portfolio is neither insured nor guaranteed by the Federal Deposit Insurance Corporation or any other government agency. Although the Portfolio seeks to preserve the net asset value of $1.00 per share, it is possible to lose money by investing in the Portfolio.
Past performance is not a guarantee of future results.
3
EQUITRUST VARIABLE INSURANCE SERIES FUND
June 30, 2007
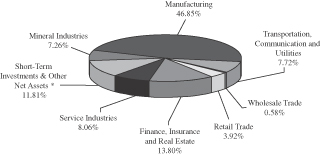
Value Growth Portfolio
Portfolio Holdings by Industry Sector
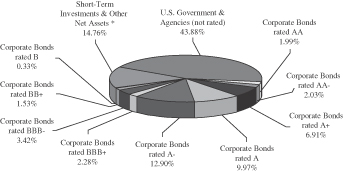
High Grade Bond Portfolio
Portfolio Holdings by Credit Quality and Type of Security**
Strategic Yield Portfolio
Portfolio Holdings by Credit Quality and Type of Security**
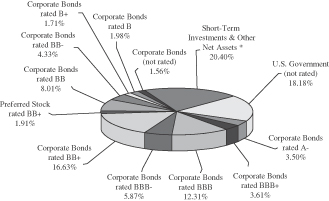
| * | This category may include short-term investments in commercial paper, money market mutual funds and U.S. government agencies, along with cash, receivables, prepaid expenses and other assets, less liabilities. |
| ** | Credit quality as reported by Standard & Poor’s. |
4
EQUITRUST VARIABLE INSURANCE SERIES FUND
June 30, 2007
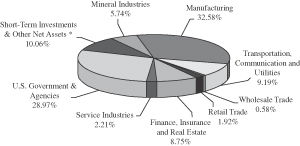
Managed Portfolio
Portfolio Holdings by Industry Sector
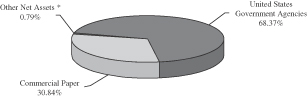
Money Market Portfolio
Portfolio Holdings by Asset Type
Blue Chip Portfolio
Portfolio Holdings by Industry Sector
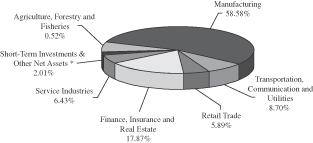
| * | This category may include short-term investments in commercial paper, money market mutual funds and U.S. government agencies, along with cash, receivables, prepaid expenses and other assets, less liabilities. |
5
Expense Example:
As a shareholder of the Fund, you incur ongoing costs, including management fees and other Fund expenses. This Example is intended to help you understand your ongoing costs (in dollars) of investing in a given Portfolio of the Fund and to compare these costs with the ongoing costs of investing in other mutual funds. The Example is based on an investment of $1,000 invested on January 1, 2007 and held until June 30, 2007.
Actual Expenses –
The first line for each Portfolio in the table below provides information about actual account values and actual expenses for that Portfolio. You may use the information in this line, together with the amount you invested, to estimate the expenses that you paid over the period. Simply divide your account value by $1,000 (for example, an $8,600 account value divided by $1,000 = 8.6), then multiply the result by the number in the first line under the heading entitled “Expenses Paid During Period” for the same Portfolio to estimate the expenses you paid on your account during this period.
Hypothetical Example for Comparison Purposes –
The second line for each Portfolio in the table below provides information about hypothetical account values and hypothetical expenses based on the actual expense ratio of that Portfolio and an assumed rate of return of 5% per year before expenses, which is not the actual return of the Portfolio. The hypothetical account values and expenses may not be used to estimate the actual ending account balance or expenses you paid for the period. You may use this information to compare the ongoing costs of investing in a given Portfolio of the Fund with other funds. To do so, compare this 5% hypothetical example with the 5% hypothetical examples that appear in the shareholder reports of the other funds.
| Beginning Account Value 1/1/2007 | Ending Account Value 6/30/2007 | Expenses Paid During Period* 1/1/2007 - 6/30/2007 | Annualized Expense Ratio | |||||||||
Value Growth | 0.56 | % | ||||||||||
Actual | $ | 1,000 | $ | 1,069.43 | $ | 2.88 | ||||||
Hypothetical** | $ | 1,000 | $ | 1,022.22 | $ | 2.81 | ||||||
High Grade Bond | 0.43 | % | ||||||||||
Actual | $ | 1,000 | $ | 1,012.14 | $ | 2.14 | ||||||
Hypothetical** | $ | 1,000 | $ | 1,022.88 | $ | 2.15 | ||||||
Strategic Yield | 0.58 | % | ||||||||||
Actual | $ | 1,000 | $ | 1,017.25 | $ | 2.89 | ||||||
Hypothetical** | $ | 1,000 | $ | 1,022.13 | $ | 2.90 | ||||||
Managed | 0.54 | % | ||||||||||
Actual | $ | 1,000 | $ | 1,044.84 | $ | 2.74 | ||||||
Hypothetical** | $ | 1,000 | $ | 1,022.32 | $ | 2.71 | ||||||
Money Market | 0.49 | % | ||||||||||
Actual | $ | 1,000 | $ | 1,023.75 | $ | 2.46 | ||||||
Hypothetical** | $ | 1,000 | $ | 1,022.57 | $ | 2.46 | ||||||
Blue Chip | 0.29 | % | ||||||||||
Actual | $ | 1,000 | $ | 1,069.12 | $ | 1.50 | ||||||
Hypothetical** | $ | 1,000 | $ | 1,023.55 | $ | 1.47 | ||||||
| * | Expenses are equal to the Annualized Expense Ratio as shown in the table for each Portfolio, multiplied by the average account value over the period, multiplied by 182 days divided by 367 to reflect the one-half year period. |
| ** | Hypothetical examples are based on a 5% return before expenses. |
6
EQUITRUST VARIABLE INSURANCE SERIES FUND
STATEMENTS OF ASSETS AND LIABILITIES
June 30, 2007
(Unaudited)
| Value Growth Portfolio | High Grade Bond Portfolio | Strategic Yield Portfolio | Managed Portfolio | Money Market Portfolio | Blue Chip Portfolio | ||||||||||||||||
ASSETS | |||||||||||||||||||||
Investments in securities, at value (cost — $58,775,412; $42,334,574; $42,998,573; $84,979,965; $17,293,391; and $63,608,895, respectively) | $ | 68,976,081 | $ | 41,844,209 | $ | 43,096,770 | $ | 96,727,391 | $ | 17,293,391 | $ | 94,975,134 | |||||||||
Cash | — | — | — | — | 21,339 | — | |||||||||||||||
Receivables: | |||||||||||||||||||||
Accrued dividends and interest | 73,541 | 373,984 | 517,746 | 223,444 | 22,366 | 86,360 | |||||||||||||||
Fund shares sold | 673 | 44,233 | 50,209 | 15,033 | 131,002 | 5,842 | |||||||||||||||
Investment securities sold | 566,568 | — | — | 797,186 | — | — | |||||||||||||||
Prepaid expense and other assets | 1,634 | 962 | 1,012 | 2,313 | 207 | 2,247 | |||||||||||||||
Total Assets | 69,618,497 | 42,263,388 | 43,665,737 | 97,765,367 | 17,468,305 | 95,069,583 | |||||||||||||||
LIABILITIES | |||||||||||||||||||||
Payables: | |||||||||||||||||||||
Fund shares redeemed | 74,637 | 92,275 | 48,345 | 85,052 | 26,431 | 80,969 | |||||||||||||||
Investment securities purchased | 137,202 | — | — | 209,070 | — | — | |||||||||||||||
Dividends | — | — | — | — | 4,858 | — | |||||||||||||||
Accrued expenses | 13,196 | 9,308 | 9,928 | 16,230 | 4,851 | 17,213 | |||||||||||||||
Total Liabilities | 225,035 | 101,583 | 58,273 | 310,352 | 36,140 | 98,182 | |||||||||||||||
NET ASSETS | $ | 69,393,462 | $ | 42,161,805 | $ | 43,607,464 | $ | 97,455,015 | $ | 17,432,165 | $ | 94,971,401 | |||||||||
ANALYSIS OF NET ASSETS | |||||||||||||||||||||
Paid-in Capital | $ | 56,946,348 | $ | 42,664,575 | $ | 45,588,103 | $ | 81,847,651 | $ | 17,432,165 | $ | 68,738,367 | |||||||||
Accumulated undistributed net investment income | 922,455 | — | — | 1,936,347 | — | 888,597 | |||||||||||||||
Accumulated undistributed net realized gain (loss) from investment transactions | 1,323,990 | (12,405 | ) | (2,078,836 | ) | 1,923,591 | — | (6,021,802 | ) | ||||||||||||
Net unrealized appreciation (depreciation) of investments | 10,200,669 | (490,365 | ) | 98,197 | 11,747,426 | — | 31,366,239 | ||||||||||||||
NET ASSETS | $ | 69,393,462 | $ | 42,161,805 | $ | 43,607,464 | $ | 97,455,015 | $ | 17,432,165 | $ | 94,971,401 | |||||||||
Shares issued and outstanding as of June 30, 2007 | 4,536,953 | 4,229,131 | 4,815,933 | 6,153,011 | 17,432,165 | 2,230,563 | |||||||||||||||
NET ASSET VALUE PER SHARE | $ | 15.30 | $ | 9.97 | $ | 9.05 | $ | 15.84 | $ | 1.00 | $ | 42.58 | |||||||||
See accompanying notes.
7
EQUITRUST VARIABLE INSURANCE SERIES FUND
STATEMENTS OF OPERATIONS
Six Months Ended June 30, 2007
(Unaudited)
| Value Growth Portfolio | High Grade Bond Portfolio | Strategic Yield Portfolio | Managed Portfolio | Money Market Portfolio | Blue Chip Portfolio | |||||||||||||||||||
INVESTMENT INCOME | ||||||||||||||||||||||||
Dividends | $ | 876,431 | $ | 9,776 | $ | 48,107 | $ | 1,157,648 | $ | — | $ | 966,260 | ||||||||||||
Interest | 235,690 | 1,152,630 | 1,452,462 | 1,038,244 | 305,435 | 55,645 | ||||||||||||||||||
Less foreign tax withholding | (2,062 | ) | — | — | (2,802 | ) | — | — | ||||||||||||||||
Total Investment Income | 1,110,059 | 1,162,406 | 1,500,569 | 2,193,090 | 305,435 | 1,021,905 | ||||||||||||||||||
EXPENSES | ||||||||||||||||||||||||
Paid to EquiTrust Investment Management Services, Inc.: | ||||||||||||||||||||||||
Investment advisory and management fees | 150,609 | 60,366 | 94,689 | 213,597 | 14,479 | 91,267 | ||||||||||||||||||
Accounting fees | 15,081 | 10,061 | 10,521 | 14,880 | 2,896 | 15,046 | ||||||||||||||||||
Custodial fees | 3,711 | 3,566 | 3,977 | 4,421 | 4,751 | 3,390 | ||||||||||||||||||
Professional fees | 6,396 | 4,302 | 4,422 | 8,481 | 2,248 | 8,415 | ||||||||||||||||||
Trustees’ fees and expenses | 2,728 | 1,624 | 1,698 | 3,856 | 548 | 3,728 | ||||||||||||||||||
Insurance and bonds | 1,120 | 655 | 692 | 1,578 | 136 | 1,537 | ||||||||||||||||||
Miscellaneous | 7,973 | 5,608 | 5,684 | 9,950 | 3,437 | 9,944 | ||||||||||||||||||
Total Expenses | 187,618 | 86,182 | 121,683 | 256,763 | 28,495 | 133,327 | ||||||||||||||||||
Fees paid indirectly | (14 | ) | (8 | ) | (9 | ) | (20 | ) | (4 | ) | (19 | ) | ||||||||||||
Net Expenses | 187,604 | 86,174 | 121,674 | 256,743 | 28,491 | 133,308 | ||||||||||||||||||
Net Investment Income | 922,455 | 1,076,232 | 1,378,895 | 1,936,347 | 276,944 | 888,597 | ||||||||||||||||||
NET REALIZED AND UNREALIZED GAIN (LOSS) ON INVESTMENTS | ||||||||||||||||||||||||
Net realized gain (loss) from investment transactions | 1,088,015 | (2,703 | ) | (11,153 | ) | 1,546,401 | — | 24 | ||||||||||||||||
Change in unrealized appreciation (depreciation) of investments | 2,507,767 | (602,922 | ) | (627,773 | ) | 690,760 | — | 5,297,036 | ||||||||||||||||
Net Gain (Loss) on Investments | 3,595,782 | (605,625 | ) | (638,926 | ) | 2,237,161 | — | 5,297,060 | ||||||||||||||||
Net Increase in Net Assets Resulting from Operations | $ | 4,518,237 | $ | 470,607 | $ | 739,969 | $ | 4,173,508 | $ | 276,944 | $ | 6,185,657 | ||||||||||||
See accompanying notes.
8
EQUITRUST VARIABLE INSURANCE SERIES FUND
STATEMENTS OF CHANGES IN NET ASSETS
| Value Growth Portfolio | High Grade Bond Portfolio | Strategic Yield Portfolio | ||||||||||||||||||||||
| Six Months Ended June 30, 2007 (Unaudited) | Year Ended December 31, 2006 | Six Months Ended June 30, 2007 (Unaudited) | Year Ended December 31, 2006 | Six Months Ended June 30, 2007 (Unaudited) | Year Ended December 31, 2006 | |||||||||||||||||||
OPERATIONS | ||||||||||||||||||||||||
Net investment income | $ | 922,455 | $ | 1,163,459 | $ | 1,076,232 | $ | 1,872,291 | $ | 1,378,895 | $ | 2,345,363 | ||||||||||||
Net realized gain (loss) from investment transactions | 1,088,015 | 3,278,691 | (2,703 | ) | 11,739 | (11,153 | ) | 192,090 | ||||||||||||||||
Change in unrealized appreciation (depreciation) of investments | 2,507,767 | 2,698,622 | (602,922 | ) | (117,348 | ) | (627,773 | ) | 59,718 | |||||||||||||||
Net Increase in Net Assets Resulting from Operations | 4,518,237 | 7,140,772 | 470,607 | 1,766,682 | 739,969 | 2,597,171 | ||||||||||||||||||
DIVIDENDS AND DISTRIBUTIONS TO | ||||||||||||||||||||||||
Net investment income | (1,163,459 | ) | (836,213 | ) | (1,076,232 | ) | (1,872,291 | ) | (1,378,895 | ) | (2,345,363 | ) | ||||||||||||
Net realized gain from investment transactions | (2,257,123 | ) | — | (21,030 | ) | — | — | — | ||||||||||||||||
Total Dividends and Distributions | (3,420,582 | ) | (836,213 | ) | (1,097,262 | ) | (1,872,291 | ) | (1,378,895 | ) | (2,345,363 | ) | ||||||||||||
CAPITAL SHARE TRANSACTIONS | 2,583,571 | (815,694 | ) | 3,417,239 | 4,530,988 | 2,765,351 | 4,161,889 | |||||||||||||||||
Total Increase in Net Assets | 3,681,226 | 5,488,865 | 2,790,584 | 4,425,379 | 2,126,425 | 4,413,697 | ||||||||||||||||||
NET ASSETS | ||||||||||||||||||||||||
Beginning of period | 65,712,236 | 60,223,371 | 39,371,221 | 34,945,842 | 41,481,039 | 37,067,342 | ||||||||||||||||||
End of period (including accumulated undistributed net investment income as set forth below) | $ | 69,393,462 | $ | 65,712,236 | $ | 42,161,805 | $ | 39,371,221 | $ | 43,607,464 | $ | 41,481,039 | ||||||||||||
Accumulated Undistributed Net Investment Income | $ | 922,455 | $ | 1,163,459 | $ | — | $ | — | $ | — | $ | — | ||||||||||||
See accompanying notes.
9
EQUITRUST VARIABLE INSURANCE SERIES FUND
STATEMENTS OF CHANGES IN NET ASSETS (continued)
| Managed Portfolio | Money Market Portfolio | Blue Chip Portfolio | ||||||||||||||||||||||
| Six Months Ended June 30, 2007 (Unaudited) | Year Ended December 31, 2006 | Six Months Ended June 30, 2007 (Unaudited) | Year Ended December 31, 2006 | Six Months Ended June 30, 2007 (Unaudited) | Year Ended December 31, 2006 | |||||||||||||||||||
OPERATIONS | ||||||||||||||||||||||||
Net investment income | $ | 1,936,347 | $ | 2,642,530 | $ | 276,944 | $ | 331,846 | $ | 888,597 | $ | 1,750,924 | ||||||||||||
Net realized gain (loss) from investment transactions | 1,546,401 | 4,225,459 | — | — | 24 | 1,052,194 | ||||||||||||||||||
Change in unrealized appreciation (depreciation) of investments | 690,760 | 3,188,122 | — | — | 5,297,036 | 10,911,429 | ||||||||||||||||||
Net Increase in Net Assets Resulting from Operations | 4,173,508 | 10,056,111 | 276,944 | 331,846 | 6,185,657 | 13,714,547 | ||||||||||||||||||
DIVIDENDS AND DISTRIBUTIONS TO | ||||||||||||||||||||||||
Net investment income | (2,642,530 | ) | (1,836,551 | ) | (276,944 | ) | (331,846 | ) | (1,750,924 | ) | (1,635,261 | ) | ||||||||||||
Net realized gain from investment transactions | (3,999,345 | ) | (4,783,738 | ) | — | — | — | — | ||||||||||||||||
Total Dividends and Distributions | (6,641,875 | ) | (6,620,289 | ) | (276,944 | ) | (331,846 | ) | (1,750,924 | ) | (1,635,261 | ) | ||||||||||||
CAPITAL SHARE TRANSACTIONS | 6,127,504 | 6,991,954 | 8,875,183 | 2,269,352 | 275,561 | (4,319,584 | ) | |||||||||||||||||
Total Increase in Net Assets | 3,659,137 | 10,427,776 | 8,875,183 | 2,269,352 | 4,710,294 | 7,759,702 | ||||||||||||||||||
NET ASSETS | ||||||||||||||||||||||||
Beginning of period | 93,795,878 | 83,368,102 | 8,556,982 | 6,287,630 | 90,261,107 | 82,501,405 | ||||||||||||||||||
End of period (including accumulated undistributed net investment income as set forth below) | $ | 97,455,015 | $ | 93,795,878 | $ | 17,432,165 | $ | 8,556,982 | $ | 94,971,401 | $ | 90,261,107 | ||||||||||||
Accumulated Undistributed Net Investment Income | $ | 1,936,347 | $ | 2,642,530 | $ | — | $ | — | $ | 888,597 | $ | 1,750,924 | ||||||||||||
See accompanying notes.
10
EQUITRUST VARIABLE INSURANCE SERIES FUND
SCHEDULE OF INVESTMENTS
VALUE GROWTH PORTFOLIO
June 30, 2007
(Unaudited)
| Shares Held | Value | ||||
COMMON STOCKS (88.19%) | |||||
APPAREL AND OTHER TEXTILE PRODUCTS (0.31%) | |||||
Jones Apparel Group, Inc. | 7,500 | $ | 211,875 | ||
BUSINESS SERVICES (4.99%) | |||||
Compuware Corp. (1) | 16,050 | 190,353 | |||
eBay, Inc. (1) | 13,135 | 422,684 | |||
Electronic Data Systems Corp. | 5,745 | 159,309 | |||
First Data Corp. | 3,520 | 114,998 | |||
Intuit, Inc. (1) | 11,555 | 347,574 | |||
Microsoft Corp. | 37,205 | 1,096,431 | |||
Oracle Corp. (1) | 25,000 | 492,750 | |||
Symantec Corp. (1) | 28,002 | 565,640 | |||
Western Union Co. | 3,520 | 73,322 | |||
| 3,463,061 | |||||
CHEMICALS AND ALLIED PRODUCTS (11.54%) | |||||
Abbott Laboratories | 8,000 | 428,400 | |||
Amgen, Inc. (1) | 6,265 | 346,392 | |||
Colgate-Palmolive Co. | 5,355 | 347,272 | |||
Dow Chemical Co. | 5,330 | 235,693 | |||
E.I. du Pont de Nemours & Co. | 14,655 | 745,060 | |||
GlaxoSmithKline PLC | 5,500 | 288,035 | |||
Johnson & Johnson | 18,830 | 1,160,305 | |||
KV Pharmaceutical Co.-Class A (1) | 12,700 | 345,948 | |||
Mylan Laboratories, Inc. | 10,205 | 185,629 | |||
Novartis AG | 5,700 | 319,599 | |||
Pfizer, Inc. | 54,021 | 1,381,317 | |||
Procter & Gamble Co. | 11,480 | 702,461 | |||
Schering-Plough Corp. | 14,980 | 455,991 | |||
Teva Pharmaceutical Industries, Ltd. | 17,691 | 729,754 | |||
Wyeth | 5,835 | 334,579 | |||
| 8,006,435 | |||||
COMMUNICATIONS (2.82%) | |||||
Alltel Corp. | 5,700 | 385,035 | |||
Comcast Corp.-Class A (1) | 18,765 | 527,672 | |||
Sprint Nextel Corp. | 33,013 | 683,699 | |||
Verizon Communications, Inc. | 8,800 | 362,296 | |||
| 1,958,702 | |||||
DEPOSITORY INSTITUTIONS (7.00%) | |||||
Bank of America Corp. | 23,154 | 1,131,999 | |||
Bank of New York Co., Inc. | 19,271 | 798,590 | |||
Citigroup, Inc. | 23,183 | 1,189,056 | |||
National City Corp. | 6,830 | 227,576 | |||
New York Community Bancorp., Inc. | 23,156 | 394,115 | |||
Regions Financial Corp. | 9,273 | 306,936 | |||
U. S. Bancorp. | 9,135 | 300,998 | |||
Wachovia Corp. | 9,950 | 509,938 | |||
| 4,859,208 | |||||
| Shares Held | Value | ||||
ELECTRIC, GAS AND SANITARY SERVICES (3.69%) | |||||
Atmos Energy Corp. | 11,267 | $ | 338,686 | ||
CMS Energy Corp. | 28,300 | 486,760 | |||
Helmerich & Payne | 14,600 | 517,132 | |||
Pepco Holdings, Inc. | 16,200 | 456,840 | |||
Pinnacle West Capital Corp. | 9,200 | 366,620 | |||
Xcel Energy, Inc. | 19,405 | 397,220 | |||
| 2,563,258 | |||||
ELECTRONIC AND OTHER ELECTRICAL | |||||
Adaptec, Inc. (1) | 43,100 | 164,211 | |||
ADC Telecommunications, Inc. (1) | 18,205 | 333,698 | |||
Cisco Systems, Inc. (1) | 30,600 | 852,210 | |||
ECI Telecom, Ltd. (1) | 10,000 | 91,500 | |||
Emerson Electric Co. | 4,600 | 215,280 | |||
General Electric Co. | 75,330 | 2,883,632 | |||
Helen of Troy, Ltd. (1) | 8,966 | 242,082 | |||
Intel Corp. | 17,500 | 415,800 | |||
JDS Uniphase Corp. (1) | 12,750 | 171,233 | |||
Qualcomm, Inc. | 4,200 | 182,238 | |||
| 5,551,884 | |||||
FABRICATED METAL PRODUCTS (0.88%) | |||||
Illinois Tool Works, Inc. | 11,255 | 609,908 | |||
FOOD AND KINDRED PRODUCTS (4.05%) | |||||
Anheuser-Busch Cos., Inc. | 9,930 | 517,949 | |||
Coca-Cola Co. (The) | 16,170 | 845,853 | |||
Coca-Cola Enterprises, Inc. | 17,485 | 419,640 | |||
General Mills, Inc. | 4,110 | 240,106 | |||
Kraft Foods, Inc. | 2,948 | 103,917 | |||
PepsiCo, Inc. | 10,510 | 681,574 | |||
| 2,809,039 | |||||
FOOD STORES (0.47%) | |||||
Kroger Co. | 11,686 | 328,727 | |||
GENERAL MERCHANDISE STORES (1.95%) | |||||
Target Corp. | 13,790 | 877,044 | |||
Wal-Mart Stores, Inc. | 9,835 | 473,162 | |||
| 1,350,206 | |||||
HEALTH SERVICES (0.89%) | |||||
Health Management Associates, Inc. | 30,000 | 340,800 | |||
Lifepoint Hospitals, Inc. (1) | 7,163 | 277,065 | |||
| 617,865 | |||||
HOLDING AND OTHER INVESTMENT | |||||
H & Q Life Sciences Investors | 31,363 | 424,655 | |||
11
EQUITRUST VARIABLE INSURANCE SERIES FUND
SCHEDULE OF INVESTMENTS
VALUE GROWTH PORTFOLIO (continued)
| Shares Held | Value | ||||
INDUSTRIAL MACHINERY AND EQUIPMENT (6.08%) | |||||
3M Co. | 14,430 | $ | 1,252,380 | ||
Deere & Co. | 1,990 | 240,273 | |||
EMC Corp. (1) | 53,600 | 970,160 | |||
Hewlett-Packard Co. | 6,000 | 267,720 | |||
Ingersoll-Rand Co., Ltd.-Class A | 25,600 | 1,403,392 | |||
Solectron Corp. (1) | 22,500 | 82,800 | |||
| 4,216,725 | |||||
INSTRUMENTS AND RELATED PRODUCTS (5.52%) | |||||
Agilent Technologies, Inc. (1) | 7,000 | 269,080 | |||
Becton Dickinson & Co. | 8,826 | 657,537 | |||
Boston Scientific Corp. (1) | 4,770 | 73,172 | |||
Danaher Corp. | 2,400 | 181,200 | |||
Excel Technology, Inc. (1) | 6,600 | 184,404 | |||
Medtronic, Inc. | 15,340 | 795,532 | |||
Stryker Corp. | 7,030 | 443,523 | |||
Thermo Fisher Scientific, Inc. (1) | 16,352 | 845,725 | |||
Zimmer Holdings, Inc. (1) | 4,480 | 380,307 | |||
| 3,830,480 | |||||
INSURANCE AGENTS, BROKERS AND | |||||
Arthur J. Gallagher & Co. | 12,365 | 344,736 | |||
INSURANCE CARRIERS (3.32%) | |||||
Allstate Corp. | 4,910 | 302,014 | |||
American International Group, Inc. | 9,740 | 682,092 | |||
MBIA, Inc. | 4,690 | 291,812 | |||
MetLife, Inc. | 7,595 | 489,726 | |||
Safeco Corp. | 3,223 | 200,664 | |||
WellPoint, Inc. (1) | 4,222 | 337,042 | |||
| 2,303,350 | |||||
METAL MINING (1.72%) | |||||
Barrick Gold Corp. | 24,946 | 725,180 | |||
Newmont Mining Corp. | 12,000 | 468,720 | |||
| 1,193,900 | |||||
MOTION PICTURES (1.41%) | |||||
News Corp.-Class A | 17,040 | 361,418 | |||
Time Warner, Inc. | 29,390 | 618,366 | |||
| 979,784 | |||||
MOTOR FREIGHT TRANSPORTATION AND WAREHOUSING (0.85%) | |||||
United Parcel Service, Inc.-Class B | 5,675 | 414,275 | |||
Werner Enterprises, Inc. | 8,805 | 177,421 | |||
| 591,696 | |||||
NONDEPOSITORY INSTITUTIONS (0.78%) | |||||
Federal Home Loan Mortgage Corp. | 4,900 | 297,430 | |||
SLM Corp. | 4,275 | 246,155 | |||
| 543,585 | |||||
OIL AND GAS EXTRACTION (5.54%) | |||||
Anadarko Petroleum Corp. | 9,700 | 504,303 | |||
| Shares Held | Value | ||||
Apache Corp. | 5,200 | $ | 424,268 | ||
Baker Hughes, Inc. | 6,200 | 521,606 | |||
BJ Services Co. | 11,500 | 327,060 | |||
Noble Corp. | 4,300 | 419,336 | |||
Occidental Petroleum Co. | 9,500 | 549,860 | |||
Rowan Cos., Inc. | 16,900 | 692,562 | |||
Weatherford Intl, Inc. (1) | 7,300 | 403,252 | |||
| 3,842,247 | |||||
PAPER AND ALLIED PRODUCTS (1.43%) | |||||
Abitibi Consolidated, Inc. (1) | 92,600 | 272,244 | |||
Kimberly-Clark Corp. | 10,720 | 717,061 | |||
| 989,305 | |||||
PERSONAL SERVICES (0.77%) | |||||
Cintas Corp. | 13,560 | 534,671 | |||
PETROLEUM AND COAL PRODUCTS (4.06%) | |||||
BP PLC | 6,000 | 432,840 | |||
Chevron Corp. | 14,100 | 1,187,784 | |||
ConocoPhillips | 15,257 | 1,197,675 | |||
| 2,818,299 | |||||
PRIMARY METAL INDUSTRIES (0.47%) | |||||
Northwest Pipe Co. (1) | 9,085 | 323,153 | |||
PRINTING AND PUBLISHING (1.05%) | |||||
Belo Corp.-Series A | 14,835 | 305,453 | |||
R.R. Donnelley & Sons Co. | 8,110 | 352,866 | |||
Tribune Co. | 2,305 | 67,767 | |||
| 726,086 | |||||
RAILROAD TRANSPORTATION (0.36%) | |||||
Union Pacific Corp. | 2,155 | 248,148 | |||
RETAIL — DRUG STORES AND PROPRIETARY | |||||
Walgreen Co. | 7,200 | 313,488 | |||
RETAIL — HOME FURNITURE AND FURNISHINGS STORES (0.36%) | |||||
Bed Bath & Beyond, Inc. (1) | 7,010 | 252,290 | |||
RETAIL — LUMBER & OTHER BUILDING MATERIALS DEALERS (0.69%) | |||||
Lowe’s Companies, Inc. | 15,690 | 481,526 | |||
SECURITY AND COMMODITY BROKERS (1.59%) | |||||
Adams Express Co. | 59,500 | 885,955 | |||
Ameriprise Financial, Inc. | 3,380 | 214,867 | |||
| 1,100,822 | |||||
TOBACCO PRODUCTS (0.43%) | |||||
Altria Group, Inc. | 4,260 | 298,796 | |||
12
EQUITRUST VARIABLE INSURANCE SERIES FUND
SCHEDULE OF INVESTMENTS
VALUE GROWTH PORTFOLIO (continued)
| Shares Held | Value | ||||
TRANSPORTATION EQUIPMENT (3.03%) | |||||
Federal Signal Corp. | 13,300 | $ | 210,938 | ||
Honeywell International, Inc. | 23,500 | 1,322,580 | |||
ITT Industries, Inc. | 8,370 | 571,504 | |||
| 2,105,022 | |||||
WHOLESALE TRADE — NONDURABLE GOODS (0.58%) | |||||
SYSCO Corp. | 12,130 | 400,169 | |||
Total Common Stocks | 61,193,101 | ||||
SHORT-TERM INVESTMENTS (11.21%) | |||||
MONEY MARKET MUTUAL FUND (0.20%) | |||||
JP Morgan U.S. Treasury Plus | 141,902 | 141,902 | |||
| Principal Amount | |||||
COMMERCIAL PAPER (3.39%) | |||||
NONDEPOSITORY INSTITUTIONS | |||||
American General Finance Corp., 5.30%, due 07/10/07 | $1,000,000 | 1,000,000 | |||
General Electric Capital Corp., | 1,000,000 | 1,000,000 | |||
HSBC Finance Corp., | 350,000 | 350,000 | |||
Total Commercial Paper | 2,350,000 | ||||
UNITED STATES GOVERNMENT AGENCIES (7.62%) | |||||
Federal Farm Credit Bank, | 1,200,000 | 1,199,656 | |||
Federal Farm Credit Bank, | 1,000,000 | 996,468 | |||
Federal Home Loan Bank Corp., | 1,100,000 | 1,099,060 | |||
Federal Home Loan Mortgage Corp., | 1,200,000 | 1,197,263 | |||
Federal National Mortgage Assoc., | 800,000 | 798,631 | |||
Total United States | 5,291,078 | ||||
Total Short-Term Investments | 7,782,980 | ||||
Total Investments (99.40%) | 68,976,081 | ||||
| Principal Amount | Value | ||||
OTHER ASSETS LESS LIABILITIES (0.60%) | |||||
Cash, receivables, prepaid expense and other assets, less liabilities | $ | 417,381 | |||
Total Net Assets (100.00%) | $ | 69,393,462 | |||
| (1) | Non-income producing securities. |
See accompanying notes.
13
EQUITRUST VARIABLE INSURANCE SERIES FUND
SCHEDULE OF INVESTMENTS
HIGH GRADE BOND PORTFOLIO
June 30, 2007
(Unaudited)
| Principal Amount | Value | |||||
CORPORATE BONDS (41.36%) | ||||||
DEPOSITORY INSTITUTIONS (11.44%) | ||||||
Comerica Bank, 5.20%, due 08/22/17 | $ | 1,000,000 | $ | 930,130 | ||
Fifth Third Bancorp, | 1,000,000 | 967,230 | ||||
Huntington National Bank, | 700,000 | 671,377 | ||||
PNC Preferred FD, 144A, | 1,500,000 | 1,525,230 | ||||
Washington Mutual Bank, | 750,000 | 729,225 | ||||
| 4,823,192 | ||||||
ELECTRIC, GAS AND SANITARY | ||||||
Maritime & NE Pipeline, 144A, | 700,000 | 765,205 | ||||
Oglethorpe Power Corp., | 748,000 | 767,194 | ||||
PacifiCorp, 6.90%, due 11/15/11 | 750,000 | 789,420 | ||||
Westar Energy, Inc., | 1,000,000 | 935,350 | ||||
| 3,257,169 | ||||||
FOOD AND KINDRED PRODUCTS (2.31%) | ||||||
Diageo Capital PLC, | 1,000,000 | 972,510 | ||||
FOOD STORES (1.53%) | ||||||
Ahold Finance USA, Inc., | 600,000 | 645,000 | ||||
FURNITURE AND FIXTURES (1.20%) | ||||||
Steelcase, Inc., 6.50%, due 08/15/11 | 500,000 | 506,910 | ||||
HOLDING AND OTHER INVESTMENT | ||||||
Security Capital Pacific, | 275,000 | 288,002 | ||||
Washington REIT, | 700,000 | 673,540 | ||||
Washington REIT, | 350,000 | 353,490 | ||||
| 1,315,032 | ||||||
INSURANCE CARRIERS (5.59%) | ||||||
Prudential Financial, Inc., | 1,500,000 | 1,515,765 | ||||
SunAmerica, Inc., | 700,000 | 839,335 | ||||
| 2,355,100 | ||||||
| Principal Amount | Value | |||||
SECURITY AND COMMODITY BROKERS (4.86%) | ||||||
Goldman Sachs Group, Inc., | $ | 900,000 | $ | 857,736 | ||
Morgan Stanley-Series MTNC, | 1,300,000 | 1,192,997 | ||||
| 2,050,733 | ||||||
TOBACCO PRODUCTS (1.83%) | ||||||
UST, Inc., 7.25%, due 06/01/09 | 750,000 | 773,603 | ||||
TRANSPORTATION — BY AIR (1.42%) | ||||||
Continental Airlines, Inc., | 389,652 | 394,464 | ||||
Federal Express, 7.50%, due 01/15/18 | 189,738 | 203,625 | ||||
| 598,089 | ||||||
TRANSPORTATION EQUIPMENT (0.33%) | ||||||
Ford Motor Co., | 150,000 | 138,000 | ||||
Total Corporate Bonds | 17,435,338 | |||||
MORTGAGE-BACKED SECURITIES (31.67%) | ||||||
FEDERAL HOME LOAN MORTGAGE CORPORATION (FHLMC) (9.22%) | ||||||
Pool # G02648, 5.50%, due 12/01/36 | 1,469,345 | 1,418,103 | ||||
Pool # 3023, 5.50%, due 08/01/35 | 1,537,851 | 1,511,952 | ||||
Pool # 3051, 5.50%, due 10/01/25 | 1,000,000 | 955,020 | ||||
| 3,885,075 | ||||||
FEDERAL NATIONAL MORTGAGE ASSOCIATION (FNMA) (4.18%) | ||||||
Pool # 50276, 9.50%, due 02/01/20 | 851 | 931 | ||||
Pool # 256103, 5.50%, due 02/01/26 | 858,914 | 838,490 | ||||
Pool # 897144, 6.00%, due 09/01/36 | 934,265 | 924,936 | ||||
| 1,764,357 | ||||||
GOVERNMENT NATIONAL MORTGAGE ASSOCIATION (GNMA) (18.27%) | ||||||
Pool # 1512, 7.50%, due 12/01/23 | 16,544 | 17,253 | ||||
Pool # 2631, 7.00%, due 08/01/28 | 21,313 | 22,172 | ||||
Pool # 2658, 6.50%, due 10/01/28 | 39,963 | 40,863 | ||||
Pool # 2701, 6.50%, due 01/01/29 | 50,059 | 51,191 | ||||
Pool # 2796, 7.00%, due 08/01/29 | 38,719 | 40,279 | ||||
Pool # 3039, 6.50%, due 02/01/31 | 15,845 | 16,191 | ||||
Pool # 3040, 7.00%, due 02/01/31 | 26,004 | 27,038 | ||||
Pool # 3188, 6.50%, due 02/01/32 | 93,246 | 95,201 | ||||
Pool # 3239, 6.50%, due 05/01/32 | 88,052 | 89,899 | ||||
Pool # 3261, 6.50%, due 07/01/32 | 169,310 | 172,861 | ||||
Pool # 3320, 5.50%, due 12/01/32 | 700,444 | 680,478 | ||||
14
EQUITRUST VARIABLE INSURANCE SERIES FUND
SCHEDULE OF INVESTMENTS
HIGH GRADE BOND PORTFOLIO (continued)
| Principal Amount | Value | |||||
GOVERNMENT NATIONAL MORTGAGE ASSOCIATION (GNMA) (18.27%) — continued | ||||||
Pool # 3333, 5.50%, due 01/01/33 | $ | 578,308 | $ | 561,692 | ||
Pool # 3375, 5.50%, due 04/01/33 | 87,241 | 84,734 | ||||
Pool # 3390, 5.50%, due 05/01/33 | 384,611 | 373,561 | ||||
Pool # 3403, 5.50%, due 06/01/33 | 648,333 | 629,705 | ||||
Pool # 3458, 5.00%, due 10/01/33 | 567,819 | 536,037 | ||||
Pool # 3499, 5.00%, due 01/01/34 | 882,965 | 833,241 | ||||
Pool # 3556, 5.50%, due 05/01/34 | 900,250 | 874,102 | ||||
Pool # 3623, 5.00%, due 10/01/34 | 1,458,934 | 1,376,774 | ||||
Pool # 22630, 6.50%, due 08/01/28 | 22,682 | 23,193 | ||||
Pool # 276337, 10.00%, due 08/01/19 | 5,528 | 6,137 | ||||
Pool # 643816, 6.00%, due 07/01/25 | 1,152,588 | 1,150,741 | ||||
| 7,703,343 | ||||||
Total Mortgage-Backed Securities | 13,352,775 | |||||
UNITED STATES GOVERNMENT AGENCIES (12.21%) | ||||||
Federal Home Loan Bank, | 1,000,000 | 981,631 | ||||
Federal Home Loan Mortgage Corp., | 1,000,000 | 954,600 | ||||
Federal National Mortgage Assoc., | 1,000,000 | 983,882 | ||||
Federal National Mortgage Assoc., | 300,000 | 298,458 | ||||
Government National Mortgage Assoc., 5.00%, due 05/01/30 | 1,000,000 | 973,405 | ||||
Government National Mortgage Assoc., 5.50%, due 07/01/32 | 1,000,000 | 955,701 | ||||
Total United States Government Agencies (Cost $5,261,338) | 5,147,677 | |||||
SHORT-TERM INVESTMENTS (14.01%) | ||||||
COMMERCIAL PAPER (3.38%) | ||||||
FOOD AND KINDRED PRODUCTS (2.25%) | ||||||
Coca-Cola Enterprises, Inc., 144A, | 950,000 | 947,631 | ||||
NONDEPOSITORY INSTITUTIONS (1.13%) | ||||||
American General Finance, | 275,000 | 275,000 | ||||
HSBC Finance Corp., | 200,000 | 200,000 | ||||
| 475,000 | ||||||
Total Commercial Paper | 1,422,631 | |||||
| Principal Amount | Value | |||||
UNITED STATES GOVERNMENT AGENCIES (10.17%) | ||||||
Federal Home Loan Bank, | $ | 500,000 | $ | 499,573 | ||
Federal Home Loan Bank, | 800,000 | 798,749 | ||||
Federal Home Loan Bank, | 800,000 | 798,513 | ||||
Federal Home Loan Bank, | 1,000,000 | 997,155 | ||||
Federal National Mortgage Assoc., | 1,200,000 | 1,195,893 | ||||
Total United States | 4,289,883 | |||||
| Shares Held | ||||||
MONEY MARKET MUTUAL FUND (0.46%) | ||||||
JPMorgan U.S. Treasury Plus | 195,905 | 195,905 | ||||
Total Short-Term Investments | 5,908,419 | |||||
Total Investments (99.25%) | 41,844,209 | |||||
OTHER ASSETS LESS LIABILITIES (0.75%) | ||||||
Cash, receivables, prepaid expense and other assets, less liabilities | 317,596 | |||||
Total Net Assets (100.00%) | $ | 42,161,805 | ||||
| (1) | Restricted Securities: |
| PNC Preferred FD, was purchased at 100.000 on 11/29/06. As of 06/30/07, the carrying value of each unit was 101.682, representing $1,525,230 or 3.62% of total net assets. |
| Maritime & NE Pipeline was purchased at 104.481 on 04/20/01. As of 06/30/07, the carrying value of each unit was 109.315, representing $765,205 or 1.81% of total net assets. |
| Coca-Cola Enterprises, Inc., was purchased at 99.721 on 06/28/07. As of 06/30/07, the carrying value of each unit was 99.751, representing $947,631 or 2.25% of total net assets. |
| As of 06/30/07, the carrying value of all restricted securities was $3,238,066 or 7.68% of total net assets. |
See accompanying notes.
15
EQUITRUST VARIABLE INSURANCE SERIES FUND
SCHEDULE OF INVESTMENTS
STRATEGIC YIELD PORTFOLIO
June 30, 2007
(Unaudited)
| Shares Held | Value | |||||
PREFERRED STOCKS (1.91%) | ||||||
DEPOSITORY INSTITUTIONS | ||||||
Sovereign Capital | 32,000 | $ | 831,680 | |||
| Principal Amount | ||||||
CORPORATE BONDS (59.51%) | ||||||
APPAREL AND ACCESSORY STORES (3.28%) | ||||||
Woolworth (FW) Corp., | $ | 1,400,000 | 1,431,500 | |||
CHEMICALS AND ALLIED PRODUCTS (5.43%) | ||||||
Chemtura Corp., | 1,700,000 | 1,623,500 | ||||
Nova Chemicals, Ltd., | 800,000 | 746,000 | ||||
| 2,369,500 | ||||||
DEPOSITORY INSTITUTIONS (3.50%) | ||||||
PNC Preferred FD, 144A, | 1,500,000 | 1,525,230 | ||||
ELECTRIC, GAS AND SANITARY SERVICES (3.13%) | ||||||
ESI Tractebel, 7.99%, due 12/30/11 | 264,000 | 269,302 | ||||
Semco Energy, Inc., | 900,000 | 906,750 | ||||
Waterford 3 Nuclear Power Plant, | 187,287 | 190,746 | ||||
| 1,366,798 | ||||||
FURNITURE AND FIXTURES (3.02%) | ||||||
Steelcase, Inc., 6.50%, due 08/15/11 | 1,300,000 | 1,317,966 | ||||
HOLDING AND OTHER INVESTMENT OFFICES (17.91%) | ||||||
Federal Realty Investment Trust, | 600,000 | 648,064 | ||||
First Industrial LP, | 700,000 | 757,603 | ||||
First Industrial LP, | 500,000 | 553,525 | ||||
HRPT Properties, | 1,075,000 | 1,085,610 | ||||
Hospitality Properties Trust, | 1,300,000 | 1,339,221 | ||||
iStar Financial, Inc., | 300,000 | 304,629 | ||||
| Principal Amount | Value | |||||
iStar Financial, Inc.-Series B, | $ | 1,171,000 | $ | 1,137,041 | ||
Price Development Co., | 112,500 | 113,015 | ||||
Rouse Company, LP (The), | 2,000,000 | 1,870,940 | ||||
| 7,809,648 | ||||||
INSURANCE CARRIERS (1.56%) | ||||||
PXRE Capital Trust, | 670,000 | 680,050 | ||||
MOTION PICTURES (2.13%) | ||||||
Time Warner, Inc., | 800,000 | 927,296 | ||||
OIL & GAS FIELD EXPLORATION SERVICES (2.28%) | ||||||
Sabine Pass LNG LP., 144A, | 1,000,000 | 992,500 | ||||
PAPER AND ALLIED PRODUCTS (6.63%) | ||||||
Bowater, Inc., 9.375%, due 12/15/21 | 900,000 | 864,000 | ||||
Cascades, Inc., 7.25%, due 02/15/13 | 1,000,000 | 982,500 | ||||
Potlatch Corp., | 900,000 | 1,045,125 | ||||
| 2,891,625 | ||||||
TRANSPORTATION — BY AIR (2.72%) | ||||||
Continental Airlines, Inc., | 1,164,771 | 1,186,028 | ||||
WATER TRANSPORTATION (5.07%) | ||||||
Overseas Shipholding Group, Inc., 8.75%, due 12/01/13 | 1,100,000 | 1,199,000 | ||||
Windsor Petroleum Transportation, 144A, 7.84%, due 01/15/21 (1) | 1,000,000 | 1,011,630 | ||||
| 2,210,630 | ||||||
WHOLESALE TRADE — NONDURABLE GOODS (2.85%) | ||||||
Safeway, Inc., 7.45%, due 09/15/27 | 1,200,000 | 1,241,352 | ||||
Total Corporate Bonds | 25,950,123 | |||||
MORTGAGE-BACKED SECURITIES (12.08%) | ||||||
FEDERAL HOME LOAN MORTGAGE CORPORATION (FHLMC) (8.04%) | ||||||
Pool # G02648, 5.50%, due 12/01/36 | 1,469,345 | 1,418,103 | ||||
Pool # 3023, 5.50%, due 08/01/35 | 1,153,389 | 1,133,964 | ||||
Pool # 3051, 5.50%, due 10/01/25 | 1,000,000 | 955,020 | ||||
| 3,507,087 | ||||||
16
EQUITRUST VARIABLE INSURANCE SERIES FUND
SCHEDULE OF INVESTMENTS
STRATEGIC YIELD PORTFOLIO (continued)
| Principal Amount | Value | |||||
FEDERAL NATIONAL MORTGAGE ASSOCIATION (FNMA) (4.04%) | ||||||
Pool # 256103, 5.50%, due 02/01/26 | $ | 858,914 | $ | 838,490 | ||
Pool # 897144, 6.00%, due 09/01/36 | 934,265 | 924,936 | ||||
| 1,763,426 | ||||||
Total Mortgage-Backed Securities | 5,270,513 | |||||
UNITED STATES GOVERNMENT AGENCIES (6.10%) | ||||||
Federal Home Loan Bank, | 1,000,000 | 981,631 | ||||
Federal National Mortgage Assoc., | 1,000,000 | 983,882 | ||||
Federal National Mortgage Assoc., | 700,000 | 696,401 | ||||
Total United States Government Agencies | 2,661,914 | |||||
SHORT-TERM INVESTMENTS (19.23%) | ||||||
COMMERCIAL PAPER (7.05%) | ||||||
FOOD AND KINDRED PRODUCTS (3.21%) | ||||||
Coca-Cola Enterprises, Inc., 144A, | 1,400,000 | 1,398,766 | ||||
NONDEPOSITORY INSTITUTIONS (3.84%) | ||||||
American Express Credit Corp., | 275,000 | 275,000 | ||||
General Electric Capital Corp., | 200,000 | 200,000 | ||||
General Electric Capital Corp., | 200,000 | 200,000 | ||||
HSBC Finance Corp., | 1,000,000 | 1,000,000 | ||||
| 1,675,000 | ||||||
Total Commercial Paper | 3,073,766 | |||||
UNITED STATES GOVERNMENT AGENCIES (11.90%) | ||||||
Federal Farm Credit Bank, | 1,100,000 | 1,096,115 | ||||
Federal Home Loan Mortgage Corp., | 1,000,000 | 999,712 | ||||
Federal Home Loan Mortgage Corp., | 1,100,000 | 1,097,499 | ||||
Federal National Mortgage Assoc., | 1,000,000 | 998,147 | ||||
| Principal Amount | Value | |||||
Federal National Mortgage Assoc., | $ | 1,000,000 | $ | 995,615 | ||
Total United States | 5,187,088 | |||||
| Shares Held | ||||||
MONEY MARKET MUTUAL FUND (0.28%) | ||||||
JPMorgan U.S. Treasury Plus | 121,686 | 121,686 | ||||
Total Short-Term Investments | 8,382,540 | |||||
Total Investments (98.83%) | 43,096,770 | |||||
OTHER ASSETS LESS LIABILITIES (1.17%) | ||||||
Cash, receivables, prepaid expense and other assets, less liabilities | 510,694 | |||||
Total Net Assets (100.00%) | $ | 43,607,464 | ||||
| (1) | Restricted Securities: |
| PNC Preferred FD, was purchased at 100.000 on 11/29/2006. As of 06/30/07, the carrying value of each unit was 101.682, representing $1,525,230 or 3.50% of total net assets. |
| Sabine Pass LNG, LP., was purchased at 100.000 on 11/01/2006. As of 06/30/07, the carrying value of each unit was 99.250, representing $992,500 or 2.28% of total net assets. |
| Windsor Petroleum Transportation was purchased at 80.500 on 08/26/99. As of 06/30/07, the carrying value of each unit was 101.163, representing $1,011,630 or 2.32% of total net assets. |
| Coca-Cola Enterprises, Inc., was purchased at 99.561 on 06/06/07. As of 06/30/07, the carrying value of each unit was 99.912, representing $1,398,766 or 3.21% of total net assets. |
| As of 06/30/07, the carrying value of all restricted securities was $4,928,126 or 11.31% of total net assets. |
See accompanying notes.
17
EQUITRUST VARIABLE INSURANCE SERIES FUND
SCHEDULE OF INVESTMENTS
MANAGED PORTFOLIO
June 30, 2007
(Unaudited)
| Shares Held | Value | ||||
COMMON STOCKS (60.97%) | |||||
APPAREL AND OTHER TEXTILE PRODUCTS (0.28%) | |||||
Jones Apparel Group, Inc. | 9,600 | $ | 271,200 | ||
BUSINESS SERVICES (0.54%) | |||||
Electronic Data Systems Corp. | 7,500 | 207,975 | |||
Microsoft Corp. | 10,800 | 318,276 | |||
| 526,251 | |||||
CHEMICALS AND ALLIED PRODUCTS (9.69%) | |||||
Abbott Laboratories | 19,800 | 1,060,290 | |||
Amgen, Inc. (1) | 3,900 | 215,631 | |||
Colgate-Palmolive Co. | 7,430 | 481,836 | |||
Dow Chemical Co. | 13,965 | 617,533 | |||
E.I. du Pont de Nemours & Co. | 16,475 | 837,589 | |||
GlaxoSmithKline PLC | 4,700 | 246,139 | |||
Johnson & Johnson | 26,662 | 1,642,913 | |||
KV Pharmaceutical Co.-Class A (1) | 12,600 | 343,224 | |||
Mylan Laboratories, Inc. | 11,890 | 216,279 | |||
Novartis Ag . | 8,060 | 451,924 | |||
Pfizer, Inc. | 67,204 | 1,718,406 | |||
Procter & Gamble Co. | 12,225 | 748,048 | |||
Schering-Plough Corp. | 15,700 | 477,908 | |||
Teva Pharmaceutical Industries, Ltd. | 9,399 | 387,709 | |||
| 9,445,429 | |||||
COMMUNICATIONS (1.87%) | |||||
Comcast Corp.-Class A (1) . | 13,590 | 382,151 | |||
Sprint Nextel Corp. | 46,171 | 956,201 | |||
Verizon Communications, Inc. | 11,800 | 485,806 | |||
| 1,824,158 | |||||
DEPOSITORY INSTITUTIONS (4.92%) | |||||
Bank of America Corp. | 19,272 | 942,208 | |||
Bank of New York Co., Inc. | 11,229 | 465,330 | |||
Citigroup, Inc. | 19,822 | 1,016,670 | |||
National City Corp. | 8,695 | 289,717 | |||
New York Community Bancorp., Inc. | 44,834 | 763,075 | |||
Regions Financial Corp. | 13,974 | 462,539 | |||
U. S. Bancorp. | 12,895 | 424,890 | |||
Wachovia Corp. | 8,328 | 426,810 | |||
| 4,791,239 | |||||
ELECTRIC, GAS AND SANITARY SERVICES (5.15%) | |||||
Atmos Energy Corp. | 38,252 | 1,149,855 | |||
Pepco Holdings, Inc. | 40,600 | 1,144,920 | |||
Pinnacle West Capital Corp. | 24,200 | 964,370 | |||
Tortoise Energy Capital Corp. | 41,665 | 1,252,033 | |||
Xcel Energy, Inc. | 24,690 | 505,404 | |||
| 5,016,582 | |||||
| Shares Held | Value | ||||
ELECTRONIC AND OTHER ELECTRICAL | |||||
Cisco Systems, Inc. (1) | 20,100 | $ | 559,785 | ||
Emerson Electric Co. | 1,600 | 74,880 | |||
General Electric Co. | 106,965 | 4,094,620 | |||
Helen of Troy, Ltd. (1) | 12,334 | 333,018 | |||
Intel Corp. | 11,900 | 282,744 | |||
| 5,345,047 | |||||
FABRICATED METAL PRODUCTS (0.56%) | |||||
Illinois Tool Works, Inc. | 10,155 | 550,300 | |||
FOOD AND KINDRED PRODUCTS (2.05%) | |||||
Anheuser-Busch Cos., Inc. | 11,995 | 625,659 | |||
Coca-Cola Co. (The) | 10,380 | 542,978 | |||
Kraft Foods, Inc. | 2,799 | 98,665 | |||
PepsiCo, Inc. | 11,320 | 734,102 | |||
| 2,001,404 | |||||
GENERAL MERCHANDISE STORES (1.31%) | |||||
Target Corp. | 4,760 | 302,736 | |||
Wal-Mart Stores, Inc. | 20,290 | 976,152 | |||
| 1,278,888 | |||||
HEALTH SERVICES (0.89%) | |||||
Health Management Associates, Inc. | 47,700 | 541,872 | |||
Lifepoint Hospitals, Inc. (1) | 8,429 | 326,034 | |||
| 867,906 | |||||
HOLDING AND OTHER INVESTMENT | |||||
iShares MSCI Japan Index | 34,030 | 494,456 | |||
H & Q Life Sciences Investors | 17,360 | 235,054 | |||
| 729,510 | |||||
INDUSTRIAL MACHINERY AND EQUIPMENT (3.27%) | |||||
3M Co. | 20,305 | 1,762,271 | |||
Hewlett-Packard Co. | 6,900 | 307,878 | |||
Ingersoll-Rand Co., Ltd.-Class A | 20,444 | 1,120,740 | |||
| 3,190,889 | |||||
INSTRUMENTS AND RELATED PRODUCTS (1.84%) | |||||
Becton Dickinson & Co. | 6,235 | 464,508 | |||
Stryker Corp. | 7,190 | 453,617 | |||
Thermo Fisher Scientific, Inc. (1) | 7,840 | 405,485 | |||
Zimmer Holdings, Inc. (1) | 5,500 | 466,895 | |||
| 1,790,505 | |||||
INSURANCE AGENTS, BROKERS AND | |||||
Arthur J. Gallagher & Co. | 17,455 | 486,645 | |||
18
EQUITRUST VARIABLE INSURANCE SERIES FUND
SCHEDULE OF INVESTMENTS
MANAGED PORTFOLIO (continued)
| Shares Held | Value | ||||
INSURANCE CARRIERS (2.28%) | |||||
Allstate Corp. | 7,140 | $ | 439,181 | ||
American International Group, Inc. | 6,170 | 432,085 | |||
MetLife, Inc. | 9,755 | 629,002 | |||
Safeco Corp. | 4,693 | 292,186 | |||
WellPoint, Inc. (1) | 5,328 | 425,334 | |||
| 2,217,788 | |||||
METAL MINING (2.43%) | |||||
Barrick Gold Corp. | 57,916 | 1,683,618 | |||
Newmont Mining Corp. | 17,500 | 683,550 | |||
| 2,367,168 | |||||
MOTOR FREIGHT TRANSPORTATION AND WAREHOUSING (0.50%) | |||||
United Parcel Service, Inc.-Class B | 6,720 | 490,560 | |||
NONDEPOSITORY CREDIT INSTITUTIONS (0.30%) | |||||
SLM Corp. | 5,095 | 293,370 | |||
OIL AND GAS EXTRACTION (4.66%) | |||||
Anadarko Petroleum Corp. | 13,700 | 712,263 | |||
Apache Corp. | 6,700 | 546,653 | |||
Baker Hughes, Inc. | 8,700 | 731,931 | |||
Occidental Petroleum Co. | 22,250 | 1,287,830 | |||
Rowan Cos., Inc. | 16,700 | 684,366 | |||
Weatherford International, Inc. (1) | 10,500 | 580,020 | |||
| 4,543,063 | |||||
PAPER AND ALLIED PRODUCTS (1.43%) | |||||
Abitibi Consolidated, Inc. (1) | 133,500 | 392,490 | |||
Kimberly-Clark Corp. | 15,015 | 1,004,354 | |||
| 1,396,844 | |||||
PERSONAL SERVICES (0.78%) | |||||
Cintas Corp. | 19,235 | 758,436 | |||
PETROLEUM AND COAL PRODUCTS (2.50%) | |||||
BP PLC | 8,100 | 584,334 | |||
ConocoPhillips | 23,570 | 1,850,245 | |||
| 2,434,579 | |||||
PIPELINES, EXCEPT NATURAL GAS (1.35%) | |||||
Kinder Morgan Management LLC (1) | 25,298 | 1,312,966 | |||
PRINTING AND PUBLISHING (0.95%) | |||||
Belo Corp.-Series A | 17,370 | 357,648 | |||
R.R. Donnelley & Sons Co. | 10,925 | 475,347 | |||
Tribune Co. | 3,119 | 91,699 | |||
| 924,694 | |||||
RAILROAD TRANSPORTATION (0.32%) | |||||
Union Pacific Corp. | 2,710 | 312,057 | |||
RETAIL — DRUG STORES AND PROPRIETARY STORES (0.37%) | |||||
Walgreen Co. | 8,300 | 361,382 | |||
| Shares Held | Value | |||||
RETAIL — LUMBER & OTHER BUILDING MATERIAL DEALERS (0.24%) | ||||||
Lowe’s Companies | 7,525 | $ | 230,942 | |||
TOBACCO PRODUCTS (0.29%) | ||||||
Altria Group, Inc. | 4,045 | 283,716 | ||||
TRANSPORTATION EQUIPMENT (2.89%) | ||||||
Federal Signal Corp. | 36,400 | 577,304 | ||||
Honeywell International, Inc. | 27,400 | 1,542,072 | ||||
ITT Industries, Inc. | 10,190 | 695,773 | ||||
| 2,815,149 | ||||||
WHOLESALE TRADE — NONDURABLE GOODS (0.58%) | ||||||
SYSCO Corp. | 17,085 | 563,634 | ||||
Total Common Stocks | 59,422,301 | |||||
| Principal Amount | ||||||
MORTGAGE-BACKED SECURITIES (2.20%) | ||||||
GOVERNMENT NATIONAL MORTGAGE ASSOCIATION (GNMA) | ||||||
Pool # 2796, 7.00%, due 08/01/29 | $ | 58,078 | 60,419 | |||
Pool # 3040, 7.00%, due 02/01/31 | 32,506 | 33,797 | ||||
Pool # 3188, 6.50%, due 02/01/32 | 93,246 | 95,201 | ||||
Pool # 3239, 6.50%, due 05/01/32 | 147,468 | 150,561 | ||||
Pool # 3333, 5.50%, due 01/01/33 | 253,010 | 245,740 | ||||
Pool # 3403, 5.50%, due 06/01/33 | 204,377 | 198,505 | ||||
Pool # 3442, 5.00%, due 09/01/33 | 855,208 | 807,341 | ||||
Pool # 3459, 5.50%, due 10/01/33 | 569,858 | 553,485 | ||||
Total Mortgage-Backed Securities | 2,145,049 | |||||
UNITED STATES GOVERNMENT AGENCIES (26.77%) | ||||||
Federal National Mortgage Assoc., 6.00%, due 11/09/15 | 975,000 | 969,988 | ||||
Government National Mortgage Assoc., 5.00%, due 09/01/23 | 700,000 | 681,490 | ||||
Government National Mortgage Assoc., 5.50%, due 05/01/24 | 2,000,000 | 1,934,048 | ||||
Government National Mortgage Assoc., 5.00%, due 05/01/29 | 1,000,000 | 932,386 | ||||
Government National Mortgage Assoc., 5.00%, due 09/01/29 | 600,000 | 585,070 | ||||
Government National Mortgage Assoc., 5.00%, due 05/01/30 | 1,560,000 | 1,518,512 | ||||
Government National Mortgage Assoc., 5.00%, due 04/01/31 | 1,500,000 | 1,462,423 | ||||
Government National Mortgage Assoc., 5.00%, due 06/01/31 | 1,300,000 | 1,252,754 | ||||
19
EQUITRUST VARIABLE INSURANCE SERIES FUND
SCHEDULE OF INVESTMENTS
MANAGED PORTFOLIO (continued)
| Principal Amount | Value | |||||
UNITED STATES GOVERNMENT | ||||||
Government National Mortgage Assoc., 5.00%, due 01/01/32 | $ | 1,064,000 | $ | 994,843 | ||
Government National Mortgage Assoc., 5.50%, due 02/01/32 | 1,300,000 | 1,298,267 | ||||
Government National Mortgage Assoc., 5.00%, due 07/01/32 | 500,000 | 471,265 | ||||
Government National Mortgage Assoc., 5.50%, due 07/01/32 | 2,250,000 | 2,150,327 | ||||
Government National Mortgage Assoc., 5.50%, due 11/01/32 | 2,000,000 | 1,969,666 | ||||
Government National Mortgage Assoc., 5.50%, due 02/01/33 | 2,500,000 | 2,361,555 | ||||
Government National Mortgage Assoc., 5.00%, due 05/01/33 | 780,000 | 732,872 | ||||
Government National Mortgage Assoc., 5.00%, due 06/01/33 | 1,693,200 | 1,606,342 | ||||
Government National Mortgage Assoc., 3.47%, due 04/01/34 | 363,431 | 349,791 | ||||
Government National Mortgage Assoc., 4.00%, due 10/01/34 | 686,565 | 657,197 | ||||
Government National Mortgage Assoc., 5.50%, due 12/01/34 | 2,000,000 | 1,884,638 | ||||
Government National Mortgage Assoc., 5.25%, due 01/01/35 | 1,000,000 | 933,301 | ||||
Government National Mortgage Assoc., 5.50%, due 06/01/36 | 1,448,667 | 1,337,114 | ||||
Total United States | 26,083,849 | |||||
SHORT-TERM INVESTMENTS (9.31%) | ||||||
COMMERCIAL PAPER (2.92%) | ||||||
DEPOSITORY INSTITUTIONS (1.02%) | ||||||
Citigroup CP, | 1,000,000 | 1,000,000 | ||||
FOOD AND KINDRED PRODUCTS (0.26%) | ||||||
Coca Cola Enterprises, 144A | 250,000 | 249,633 | ||||
INSURANCE CARRIERS (0.46%) | ||||||
Prudential Funding LLC., | 250,000 | 250,000 | ||||
Prudential Funding LLC., | 200,000 | 200,000 | ||||
| 450,000 | ||||||
| Principal Amount | Value | |||||
NONDEPOSITORY INSTITUTIONS (1.18%) | ||||||
American Express Credit Corp., | $ | 650,000 | $ | 650,000 | ||
General Electric Capital Corp., | 500,000 | 500,000 | ||||
| 1,150,000 | ||||||
Total Commercial Paper | 2,849,633 | |||||
UNITED STATES GOVERNMENT AGENCIES (6.24%) | ||||||
Federal Farm Credit Bank, | 1,100,000 | 1,095,934 | ||||
Federal Home Loan Bank, | 1,000,000 | 998,715 | ||||
Federal Home Loan Mortgage Corp., | 500,000 | 499,642 | ||||
Federal Home Loan Mortgage Corp., | 500,000 | 499,642 | ||||
Federal Home Loan Mortgage Corp., | 900,000 | 897,953 | ||||
Federal National Mortgage Assoc., | 700,000 | 698,799 | ||||
Federal National Mortgage Assoc., | 1,000,000 | 997,147 | ||||
Federal National Mortgage Assoc., | 900,000 | 897,044 | ||||
Total United States | 6,085,234 | |||||
| Shares Held | ||||||
MONEY MARKET MUTUAL FUND (0.15%) | ||||||
JPMorgan U.S. Treasury Plus | 141,325 | 141,325 | ||||
Total Short-Term Investments | 9,076,192 | |||||
Total Investments (99.25%) | 96,727,391 | |||||
OTHER ASSETS LESS LIABILITIES (0.75%) | ||||||
Cash, receivables, prepaid expense and other assets, less liabilities | 727,624 | |||||
Total Net Assets (100.00%) | $ | 97,455,015 | ||||
| (1) | Non-income producing securities. |
| (2) | Restricted Security: |
| Coca-Cola Enterprises, Inc., was purchased at 99.794 on 06/26/07. As of 06/30/07, the carrying value of each unit was 99.853, representing $249,633 or 0.26% of total net assets. |
See accompanying notes.
20
EQUITRUST VARIABLE INSURANCE SERIES FUND
SCHEDULE OF INVESTMENTS
MONEY MARKET PORTFOLIO
June 30, 2007
(Unaudited)
| Annualized Yield on Purchase Date | Principal Amount | Value | |||||||
SHORT-TERM INVESTMENTS (99.21%) | |||||||||
COMMERCIAL PAPER (30.84%) | |||||||||
FOOD AND KINDRED PRODUCTS (4.56%) | |||||||||
Coca-Cola Enterprises, Inc., 144A, due 07/06/07 (1) | 5.379 | % | $ | 250,000 | $ | 249,779 | |||
Coca-Cola Enterprises, Inc., 144A, due 08/09/07 (1) | 5.387 | 250,000 | 248,533 | ||||||
Coca-Cola Enterprises, Inc., 144A, due 08/28/07 (1) | 5.392 | 300,000 | 297,408 | ||||||
| 795,720 | |||||||||
INSURANCE CARRIERS (4.16%) | |||||||||
Prudential Funding LLC, 5.249%, due 07/05/07 | 5.249 | 225,000 | 225,000 | ||||||
Prudential Funding LLC, 5.213%, due 07/20/07 | 5.213 | 250,000 | 250,000 | ||||||
Prudential Funding LLC, 5.232%, due 08/01/07 | 5.232 | 250,000 | 250,000 | ||||||
| 725,000 | |||||||||
NONDEPOSITORY INSTITUTIONS (17.53%) | |||||||||
American Express Credit Corp., 5.271%, due 07/24/07 | 5.271 | 240,000 | 240,000 | ||||||
American Express Credit Corp., 5.246%, due 08/14/07 | 5.246 | 300,000 | 300,000 | ||||||
American Express Credit Corp., 5.278%, due 08/22/07 | 5.278 | 250,000 | 250,000 | ||||||
American General Finance Corp., 5.264%, due 07/17/07 | 5.264 | 300,000 | 300,000 | ||||||
American General Finance Corp., 5.267%, due 08/03/07 | 5.267 | 250,000 | 250,000 | ||||||
American General Finance Corp., 5.268%, due 08/30/07 | 5.268 | 300,000 | 300,000 | ||||||
General Electric Capital Corp., 5.250%, due 07/10/07 | 5.250 | 390,000 | 390,000 | ||||||
General Electric Capital Corp., 5.289%, due 07/25/07 | 5.289 | 250,000 | 250,000 | ||||||
General Electric Capital Corp., 5.275%, due 08/16/07 | 5.275 | 225,000 | 225,000 | ||||||
HSBC Finance Corp., 5.258%, due 07/06/07 | 5.258 | 250,000 | 250,000 | ||||||
HSBC Finance Corp., 5.273%, due 07/20/07 | 5.273 | 300,000 | 300,000 | ||||||
| 3,055,000 | |||||||||
PETROLEUM AND COAL PRODUCTS (4.59%) | |||||||||
Chevron Corp., 5.235%, due 07/19/07 | 5.235 | 300,000 | 300,000 | ||||||
Chevron Corp., 5.212%, due 07/31/07 | 5.212 | 250,000 | 250,000 | ||||||
Chevron Corp., 5.217%, due 08/07/07 | 5.217 | 250,000 | 250,000 | ||||||
| 800,000 | |||||||||
Total Commercial Paper (Cost $5,375,720) | 5,375,720 | ||||||||
UNITED STATES GOVERNMENT AGENCIES (68.37%) | |||||||||
Federal Farm Credit Bank, due 07/05/07 | 5.181 | 275,000 | 274,805 | ||||||
Federal Farm Credit Bank, due 07/11/07 | 5.187 | 300,000 | 299,532 | ||||||
Federal Farm Credit Bank, due 07/23/07 | 5.173 | 300,000 | 299,025 | ||||||
Federal Farm Credit Bank, due 07/25/07 | 5.170 | 200,000 | 199,294 | ||||||
Federal Farm Credit Bank, due 07/26/07 | 5.208 | 300,000 | 298,891 | ||||||
Federal Home Loan Bank, due 07/11/07 | 5.234 | 275,000 | 274,567 | ||||||
Federal Home Loan Bank, due 07/18/07 | 5.207 | 600,000 | 598,463 | ||||||
Federal Home Loan Bank, due 07/26/07 | 5.222 | 250,000 | 249,074 | ||||||
Federal Home Loan Bank, due 07/27/07 | 5.213 | 500,000 | 498,079 | ||||||
Federal Home Loan Bank, due 08/02/07 | 5.208 | 275,000 | 273,711 | ||||||
Federal Home Loan Bank, due 08/08/07 | 5.206 | 250,000 | 248,617 | ||||||
Federal Home Loan Bank, due 08/17/07 | 5.236 | 250,000 | 248,290 | ||||||
Federal Home Loan Bank, due 08/23/07 | 5.194 | 250,000 | 248,094 | ||||||
21
EQUITRUST VARIABLE INSURANCE SERIES FUND
SCHEDULE OF INVESTMENTS
MONEY MARKET PORTFOLIO (continued)
| Annualized Yield on Purchase Date | Principal Amount | Value | |||||||
UNITED STATES GOVERNMENT AGENCIES (68.37%) — continued | |||||||||
Federal Home Loan Bank, due 08/24/07 | 5.238 | % | $ | 275,000 | $ | 272,846 | |||
Federal Home Loan Bank, due 08/29/07 | 5.245 | 250,000 | 247,863 | ||||||
Federal Home Loan Bank, due 08/31/07 | 5.241 | 325,000 | 322,132 | ||||||
Federal Home Loan Mortgage Corp., due 07/09/07 | 5.210 | 300,000 | 299,615 | ||||||
Federal Home Loan Mortgage Corp., due 07/16/07 | 5.216 | 350,000 | 349,202 | ||||||
Federal Home Loan Mortgage Corp., due 07/23/07 | 5.215 | 225,000 | 224,263 | ||||||
Federal Home Loan Mortgage Corp., due 07/30/07 | 5.199 | 500,000 | 497,873 | ||||||
Federal Home Loan Mortgage Corp., due 08/06/07 | 5.216 | 250,000 | 248,685 | ||||||
Federal Home Loan Mortgage Corp., due 08/10/07 | 5.260 | 250,000 | 248,532 | ||||||
Federal Home Loan Mortgage Corp., due 08/13/07 | 5.243 | 250,000 | 248,430 | ||||||
Federal Home Loan Mortgage Corp., due 08/21/07 | 5.203 | 250,000 | 248,161 | ||||||
Federal Home Loan Mortgage Corp., due 08/27/07 | 5.232 | 200,000 | 198,351 | ||||||
Federal Home Loan Mortgage Corp., due 09/04/07 | 5.272 | 300,000 | 297,167 | ||||||
Federal Home Loan Mortgage Corp., due 09/10/07 | 5.236 | 300,000 | 296,933 | ||||||
Federal Home Loan Mortgage Corp., due 09/17/07 | 5.278 | 300,000 | 296,611 | ||||||
Federal National Mortgage Assoc., due 07/02/07 | 5.216 | 700,000 | 699,800 | ||||||
Federal National Mortgage Assoc., due 07/03/07 | 5.257 | 300,000 | 299,870 | ||||||
Federal National Mortgage Assoc., due 07/12/07 | 5.222 | 600,000 | 598,972 | ||||||
Federal National Mortgage Assoc., due 07/13/07 | 5.225 | 350,000 | 349,350 | ||||||
Federal National Mortgage Assoc., due 07/25/07 | 5.243 | 375,000 | 373,658 | ||||||
Federal National Mortgage Assoc., due 08/14/07 | 5.231 | 150,000 | 149,039 | ||||||
Federal National Mortgage Assoc., due 08/15/07 | 5.223 | 225,000 | 223,529 | ||||||
Federal National Mortgage Assoc., due 08/20/07 | 5.228 | 400,000 | 397,099 | ||||||
Federal National Mortgage Assoc., due 09/05/07 | 5.262 | 275,000 | 272,369 | ||||||
Federal National Mortgage Assoc., due 09/26/07 | 5.243 | 250,000 | 246,879 | ||||||
Total United States Government Agencies (Cost $11,917,671) | 11,917,671 | ||||||||
Total Short-Term Investments (Cost $17,293,391) | 17,293,391 | ||||||||
OTHER ASSETS LESS LIABILITIES (0.79%) | |||||||||
Cash, receivables, prepaid expense and other assets, less liabilities | 138,774 | ||||||||
Total Net Assets (100.00%) | $ | 17,432,165 | |||||||
| (1) | Restricted Securities: |
| Three Coca-Cola Enterprises, Inc. securities were purchased at 99.138 on 05/08/07, 99.180 on 6/14/07, and 99.092 on 06/27/07. As of 06/30/07, the carrying value of each was 99.912, 99.413, and 99.136, respectively. As of 06/30/07, the combined carrying value was $795,720 or 4.56% of total net assets. |
See accompanying notes.
22
EQUITRUST VARIABLE INSURANCE SERIES FUND
SCHEDULE OF INVESTMENTS
BLUE CHIP PORTFOLIO
June 30, 2007
(Unaudited)
| Shares Held | Value | ||||
COMMON STOCKS (97.99%) | |||||
BUSINESS SERVICES (4.04%) | |||||
Microsoft Corp. | 91,883 | $ | 2,707,792 | ||
Oracle Corp. (1) | 57,149 | 1,126,407 | |||
| 3,834,199 | |||||
CHEMICALS AND ALLIED PRODUCTS (14.03%) | |||||
Abbott Laboratories | 24,755 | 1,325,630 | |||
Amgen, Inc. (1) | 17,835 | 986,097 | |||
Bristol-Myers Squibb Co. | 35,343 | 1,115,425 | |||
Dow Chemical Co. | 10,505 | 464,531 | |||
E.I. du Pont de Nemours & Co. | 15,756 | 801,035 | |||
Eli Lilly & Co. | 17,662 | 986,953 | |||
Johnson & Johnson | 42,710 | 2,631,790 | |||
Merck & Co., Inc. | 28,348 | 1,411,730 | |||
Pfizer, Inc. | 44,377 | 1,134,720 | |||
Procter & Gamble Co. | 40,222 | 2,461,184 | |||
| 13,319,095 | |||||
COMMUNICATIONS (5.06%) | |||||
AT&T, Inc. | 34,855 | 1,446,483 | |||
CBS Corp.-Class B | 12,084 | 402,639 | |||
Citadel Broadcasting Corp. | 2,771 | 17,873 | |||
Comcast Corp.-Class A (1) | 33,054 | 929,478 | |||
Verizon Communications | 36,562 | 1,505,258 | |||
Viacom, Inc.-Class B (1) | 12,084 | 503,057 | |||
| 4,804,788 | |||||
DEPOSITORY INSTITUTIONS (10.14%) | |||||
Bank of America Corp. | 45,666 | 2,232,611 | |||
Citigroup, Inc. | 48,341 | 2,479,410 | |||
J. P. Morgan Chase & Co. | 46,325 | 2,244,446 | |||
Wachovia Corp. | 25,460 | 1,304,825 | |||
Wells Fargo Co. | 39,005 | 1,371,806 | |||
| 9,633,098 | |||||
EATING AND DRINKING PLACES (2.71%) | |||||
McDonald’s Corp. | 50,717 | 2,574,395 | |||
ELECTRIC, GAS AND SANITARY | |||||
Dominion Resources, Inc. | 11,370 | 981,345 | |||
Exelon Corp. | 24,105 | 1,750,023 | |||
Southern Co. | 21,215 | 727,462 | |||
| 3,458,830 | |||||
ELECTRONIC AND OTHER ELECTRICAL EQUIPMENT (7.86%) | |||||
Cisco Systems, Inc. (1) | 61,023 | 1,699,491 | |||
General Electric Co. | 72,106 | 2,760,218 | |||
Intel Corp. | 57,041 | 1,355,294 | |||
Motorola, Inc. | 37,189 | 658,245 | |||
| Shares Held | Value | ||||
Texas Instruments, Inc. | 26,461 | $ | 995,727 | ||
| 7,468,975 | |||||
FOOD AND KINDRED PRODUCTS (4.06%) | |||||
Anheuser Busch Cos., Inc. | 11,202 | 584,296 | |||
Coca-Cola Co. (The) | 25,859 | 1,352,684 | |||
Kraft Foods, Inc. | 26,424 | 931,446 | |||
PepsiCo, Inc. | 15,208 | 986,239 | |||
| 3,854,665 | |||||
FORESTRY (0.52%) | |||||
Weyerhaeuser Co. | 6,270 | 494,891 | |||
GENERAL MERCHANDISE STORES (2.12%) | |||||
Wal-Mart Stores, Inc. | 41,773 | 2,009,699 | |||
INDUSTRIAL MACHINERY AND | |||||
3M Co. | 17,453 | 1,514,746 | |||
Applied Materials, Inc. | 23,520 | 467,342 | |||
Caterpillar, Inc. | 28,044 | 2,195,845 | |||
Dell, Inc. (1) | 30,585 | 873,202 | |||
EMC Corp. (1) | 37,308 | 675,275 | |||
Hewlett-Packard Co. | 40,454 | 1,805,057 | |||
International Business Machines Corp. | 14,526 | 1,528,861 | |||
| 9,060,328 | |||||
INSURANCE CARRIERS (2.74%) | |||||
American International Group, Inc. | 37,204 | 2,605,396 | |||
MOTION PICTURES (2.39%) | |||||
Disney (Walt) Co. | 36,092 | 1,232,181 | |||
Time Warner, Inc. | 49,492 | 1,041,312 | |||
| 2,273,493 | |||||
NONDEPOSITORY INSTITUTIONS (4.30%) | |||||
American Express Co. | 51,742 | 3,165,576 | |||
Federal National Mortgage Assoc. | 14,090 | 920,500 | |||
| 4,086,076 | |||||
PETROLEUM AND COAL PRODUCTS (9.47%) | |||||
Chevron Corp. | 38,610 | 3,252,506 | |||
Exxon Mobil Corp. | 68,376 | 5,735,379 | |||
| 8,987,885 | |||||
PRIMARY METAL INDUSTRIES (1.29%) | |||||
Alcoa, Inc. | 30,278 | 1,227,167 | |||
RETAIL — LUMBER & OTHER BUILDING MATERIALS DEALERS (1.06%) | |||||
Home Depot, Inc. | 25,393 | 999,215 | |||
23
EQUITRUST VARIABLE INSURANCE SERIES FUND
SCHEDULE OF INVESTMENTS
BLUE CHIP PORTFOLIO (continued)
| Shares Held | Value | |||||
SECURITY AND COMMODITY BROKERS (0.69%) | ||||||
Ameriprise Financial, Inc. | 10,349 | $ | 657,886 | |||
TOBACCO PRODUCTS (2.82%) | ||||||
Altria Group, Inc. | 38,185 | 2,678,296 | ||||
TRANSPORTATION EQUIPMENT (9.51%) | ||||||
Boeing Co. (The) | 31,442 | 3,023,463 | ||||
General Motors Corp. | 16,365 | 618,597 | ||||
Honeywell International, Inc. | 37,264 | 2,097,218 | ||||
United Technologies Corp. | 46,457 | 3,295,195 | ||||
| 9,034,473 | ||||||
Total Common Stocks | 93,062,850 | |||||
SHORT-TERM INVESTMENTS (2.02%) | ||||||
MONEY MARKET MUTUAL FUND (0.23%) | ||||||
JPMorgan U.S. Treasury Plus | 215,484 | 215,484 | ||||
| Principal Amount | ||||||
COMMERCIAL PAPER (0.53%) | ||||||
NONDEPOSITORY INSTITUTIONS | ||||||
American Express Credit Corp. | $ | 275,000 | 275,000 | |||
American General Finance Corp., | 225,000 | 225,000 | ||||
Total Commercial Paper | 500,000 | |||||
UNITED STATES GOVERNMENT | ||||||
Federal Home Loan Bank, | 150,000 | 149,872 | ||||
Federal Home Loan Bank, | 275,000 | 273,941 | ||||
Federal National Mortgage Assoc., | 150,000 | 149,957 | ||||
Federal National Mortgage Assoc., | 225,000 | 224,648 | ||||
Federal National Mortgage Assoc., | 200,000 | 199,344 | ||||
Federal National Mortgage Assoc., | 200,000 | 199,038 | ||||
Total United States | 1,196,800 | |||||
| Principal Amount | Value | |||||
Total Short-Term Investments | $ | 1,912,284 | ||||
Total Investments (100.01%) | 94,975,134 | |||||
OTHER ASSETS LESS LIABILITIES (-0.01%) | ||||||
Cash, receivables, prepaid expense and other assets, less liabilities | (3,733 | ) | ||||
Total Net Assets (100.00%) | $ | 94,971,401 | ||||
| (1) | Non-income producing securities. |
See accompanying notes.
24
EQUITRUST VARIABLE INSURANCE SERIES FUND
NOTES TO FINANCIAL STATEMENTS
June 30, 2007
(Unaudited)
| 1. | Significant Accounting Policies |
Organization
EquiTrust Variable Insurance Series Fund (the “Fund”) is registered under the Investment Company Act of 1940, as amended, as a no-load, open-end diversified management investment company, or mutual fund. The Fund is authorized to issue an unlimited number of shares of beneficial interest with no par value. The Fund currently consists of six portfolios (known as the Value Growth, High Grade Bond, Strategic Yield, Managed, Money Market and Blue Chip Portfolios). Shares of the Fund are sold only to certain life insurance companies’ separate accounts to fund the benefits under variable insurance contracts issued by such life insurance companies, including Farm Bureau Life Insurance Company and EquiTrust Life Insurance Company (see Note 3).
Security Valuation
All Portfolios, other than the Money Market Portfolio, value their investment securities that are traded on any national exchange at the last sale price on the day of valuation or, lacking any sales, at the mean between the closing bid and asked prices. Investments traded in the over-the-counter market are valued at the mean between the bid and asked prices or yield equivalent as obtained from one or more dealers that make markets in the securities. In situations where market quotations are not readily available or quoted market prices are not reliable, investments are valued at fair value in accordance with the procedures adopted by the Fund’s Board of Trustees. Short-term investments are valued at market value, except that obligations maturing in 90 days or less are valued using the amortized cost method of valuation described below with respect to the Money Market Portfolio, which approximates market value.
The Money Market Portfolio values investments at amortized cost, which approximates market value. Under the amortized cost method, a security is valued at its cost on the date of purchase and thereafter is adjusted to reflect a constant amortization to maturity of the difference between the principal amount due at maturity and the cost of the investment to the Portfolio.
Income and Investment Transactions
For financial reporting purposes, investment transactions are recorded on the trade date. The identified cost basis has been used in determining the net realized gain or loss from investment transactions and unrealized appreciation or depreciation on investments. Dividend income is recorded on the ex-dividend date and interest is recognized on an accrual basis. Discounts and premiums on investments purchased are amortized over the life of the respective investments.
Dividends and Distributions to Shareholders
On each day that the net asset value per share is calculated in the High Grade Bond and Strategic Yield Portfolios, that Portfolio’s net investment income will be declared, as of the close of the New York Stock Exchange, as a dividend to shareholders of record prior to the declaration. With respect to the Money Market Portfolio, each day the net asset value per share is calculated, net investment income and any realized gains and losses from investment transactions will be declared, as of the close of the New York Stock Exchange, as a dividend to shareholders of record prior to the declaration. With respect to the High Grade Bond and Strategic Yield Portfolios, any net short-term and long-term gains will be declared and distributed periodically, but in no event less frequently than annually. Dividends and distributions of the other Portfolios are recorded on the ex-dividend date. Dividends and distributions from net investment income and net realized gain from investments are determined in accordance with federal tax regulations, which may differ from U.S. generally accepted accounting principles. These differences are primarily due to differing treatments for certain basis adjustments resulting from a taxable spin-off and taxable mergers. Permanent book and tax basis differences are reclassified within the capital accounts based on their federal tax-basis treatment; temporary differences do not require reclassification.
25
EQUITRUST VARIABLE INSURANCE SERIES FUND
NOTES TO FINANCIAL STATEMENTS (continued)
| 1. | Significant Accounting Policies (continued) |
Dividends and distributions which exceed current and accumulated earnings and profits for federal income tax purposes are reported as return of capital distributions.
Use of Estimates
The preparation of financial statements in conformity with U.S. generally accepted accounting principles requires management to make estimates and assumptions that affect the reported amounts of assets and liabilities and disclosure of contingent assets and liabilities at the date of the financial statements and the reported amounts of revenues and expenses during the reporting period. Actual results could differ from those estimates.
Indemnifications
Under the Fund’s organizational documents, its present and past officers and trustees are indemnified against certain liability arising out of the performance of their duties to the Fund. At the discretion of the Board of Trustees, employees and agents may also be indemnified. In addition, in the normal course of business the Fund enters into contracts that contain a variety of representations and warranties which provide general indemnifications. The Fund’s maximum exposure under these arrangements is unknown, as this would involve future claims that may be made against the Fund that have not yet occurred.
New Accounting Pronouncements
Effective January 1, 2007 the Fund adopted Financial Accounting Standards Board (FASB) Interpretation No. 48 “Accounting for Uncertainty in Income Taxes” (FIN 48). FIN 48 provides guidance for how uncertain tax positions should be recognized, measured, presented and disclosed in the financial statements. FIN 48 requires the evaluation of tax positions taken or expected to be taken in the course of preparing the Fund’s tax returns to determine whether the tax positions are “more-likely-than-not” of being sustained by the applicable tax authority. Tax positions not determined to meet the more-likely-than-not threshold would be recorded as a benefit or expense in the current year. The adoption of FIN 48 during the current fiscal year resulted in no impact to the financial statements. The Fund is no longer subject to U.S. federal, state and local income tax examinations by tax authorities for tax years prior to 2003.
In September 2006, the FASB issued Statement on Financial Accounting Standards No. 157 “Fair Value Measurements” (SFAS 157). This standard establishes a single authoritative definition of fair value, sets out a framework for measuring fair value and requires additional disclosures about fair value measurements. SFAS 157 is effective for financial statements issued for fiscal years beginning after November 15, 2007 and interim periods within those financial statements. As of June 30, 2007, the Fund does not believe the adoption of SFAS 157 will impact the financial statement amounts, however, additional disclosures may be required about the inputs used to develop the measurements and the effect of certain of the measurements on changes in net assets for the period.
| 2. | Federal Income Taxes |
No provision for federal income taxes is considered necessary because the Fund is qualified as a “regulated investment company” under the Internal Revenue Code and intends to distribute each year substantially all of its net investment income and realized capital gains to shareholders.
26
EQUITRUST VARIABLE INSURANCE SERIES FUND
NOTES TO FINANCIAL STATEMENTS (continued)
| 2. | Federal Income Taxes (continued) |
As of June 30, 2007, the following Portfolios had approximate net capital loss carryforwards set forth below:
| Portfolio | |||||||||
Net Capital Loss Carryforwards Expire In: | High Grade Bond | Strategic Yield | Blue Chip | ||||||
2010 | $ | — | $ | 1,497,000 | $ | 728,000 | |||
2011 | — | 571,000 | 4,672,000 | ||||||
2012 | — | — | 556,000 | ||||||
2013 | — | — | 60,000 | ||||||
2015 | 12,000 | 11,000 | 6,000 | ||||||
| $ | 12,000 | $ | 2,079,000 | $ | 6,022,000 | ||||
For the six month period ended June 30, 2007, the Portfolios did not utilize any of their previous capital loss carryforwards.
As of June 30, 2007, the components of accumulated earnings and capital gains (losses) on a tax basis were identical to those reported in the statements of assets and liabilities, except as follows:
| Portfolio | ||||||||||
| Value Growth | Strategic Yield | Managed | ||||||||
Undistributed ordinary income | $ | 922,455 | $ | 7,750 | $ | 1,936,347 | ||||
Undistributed capital gains | 1,135,832 | — | 1,762,821 | |||||||
Accumulated capital losses | — | (2,078,836 | ) | — | ||||||
Net unrealized appreciation of investments | 10,388,827 | 98,197 | 11,908,196 | |||||||
Other timing differences | — | (7,750 | ) | — | ||||||
Total accumulated earnings | $ | 12,447,114 | $ | (1,980,639 | ) | $ | 15,607,364 | |||
Differences between book and tax amounts are primarily attributable to taxable spin-offs, mergers and corporate inversions. Additionally, the Strategic Yield Portfolio held a trust preferred security which accrues income for tax purposes and not financial reporting purposes.
| 3. | Management Contract and Transactions with Affiliates |
The Fund has entered into agreements with EquiTrust Investment Management Services, Inc. (“EquiTrust Investment”) relating to the management of the Portfolios and the investment of their assets. Pursuant to these agreements, fees paid to EquiTrust Investment are as follows: (1) annual investment advisory and management fees, which are based on each Portfolio’s average daily net assets as follows: Value Growth Portfolio — 0.45%; High Grade Bond Portfolio — 0.30%; Strategic Yield Portfolio — 0.45%; Managed Portfolio — 0.45%; Money Market Portfolio — 0.25% ; and Blue Chip Portfolio — 0.20%, and (2) accounting fees, which are based on each Portfolio’s daily net assets at an annual rate of 0.05%, with a maximum per Portfolio annual expense of $30,000.
The Fund has entered into an agreement with EquiTrust Investment whereby EquiTrust Investment also serves as the Fund’s shareholder service, transfer and dividend disbursing agent. EquiTrust Marketing Services, LLC serves as the principal underwriter and distributor. There are no fees paid by the Fund associated with these services.
27
EQUITRUST VARIABLE INSURANCE SERIES FUND
NOTES TO FINANCIAL STATEMENTS (continued)
| 3. | Management Contract and Transactions with Affiliates (continued) |
EquiTrust Investment has agreed to reimburse the Portfolios annually for total expenses (excluding brokerage, interest, taxes and extraordinary expenses) in excess of 1.50% of each Portfolio’s average daily net assets. The amount reimbursed, however, shall not exceed the amount of the investment advisory and management fee paid by the Portfolio for such period. During the six month period ended June 30, 2007, EquiTrust Investment further agreed to reimburse any Portfolio, to the extent that annual operating expenses, including the investment advisory fee, exceed 0.65%. For the six month period ended June 30, 2007, no expense reimbursements were made to the Fund by EquiTrust Investment.
Certain officers and trustees of the Fund are also officers of EquiTrust Investment, Farm Bureau Life Insurance Company and other affiliated entities. As of June 30, 2007, the total number of the shares of each Portfolio owned by Farm Bureau Life Insurance Company, EquiTrust Life Insurance Company and related separate accounts were as follows:
Portfolio | Shares | |
Value Growth | 4,435,731 | |
High Grade Bond | 3,785,637 | |
Strategic Yield | 4,146,180 | |
Managed | 5,810,972 | |
Money Market | 12,251,883 | |
Blue Chip | 2,151,146 |
| 4. | Expense Offset Arrangements |
The Fund and other mutual funds managed by EquiTrust Investment have an agreement with the custodian banks to indirectly pay a portion of the custodians’ fees through credits earned by the Funds’ cash on deposit with the bank. This deposit agreement is an alternative to overnight investments. Custodial fees have been adjusted to reflect amounts that would have been paid without this agreement, with a corresponding adjustment reflected as fees paid indirectly in the statements of operations.
| 5. | Capital Share Transactions |
Transactions in shares of beneficial interest for each Portfolio were as follows:
| Shares Sold | Shares Issued In Reinvestment of Dividends and Distributions | Shares Redeemed | Net Increase (Decrease) | |||||||||||||||||||
Portfolio | Shares | Amount | Shares | Amount | Shares | Amount | Shares | Amount | ||||||||||||||
Six month period ended June 30, 2007: | ||||||||||||||||||||||
Value Growth | 171,764 | $ | 2,547,728 | 238,535 | $ | 3,420,582 | 227,969 | $ | 3,384,739 | 182,330 | $ | 2,583,571 | ||||||||||
High Grade Bond | 434,246 | 4,382,636 | 108,756 | 1,097,262 | 204,283 | 2,062,659 | 338,719 | 3,417,239 | ||||||||||||||
Strategic Yield | 407,290 | 3,737,229 | 150,219 | 1,378,895 | 255,839 | 2,350,773 | 301,670 | 2,765,351 | ||||||||||||||
Managed | 211,542 | 3,310,959 | 438,408 | 6,641,875 | 244,380 | 3,825,330 | 405,570 | 6,127,504 | ||||||||||||||
Money Market | 32,386,886 | 32,386,886 | 247,157 | 247,157 | 23,758,860 | 23,758,860 | 8,875,183 | 8,875,183 | ||||||||||||||
Blue Chip | 77,126 | 3,169,351 | 43,697 | 1,750,924 | 113,006 | 4,644,714 | 7,817 | 275,561 | ||||||||||||||
Year ended December 31, 2006: | ||||||||||||||||||||||
Value Growth | 255,896 | $ | 3,609,647 | 60,639 | $ | 836,213 | 373,100 | $ | 5,261,554 | (56,565 | ) | $ | (815,694 | ) | ||||||||
High Grade Bond | 596,516 | 5,992,257 | 186,353 | 1,872,291 | 332,120 | 3,333,560 | 450,749 | 4,530,988 | ||||||||||||||
Strategic Yield | 717,781 | 6,518,284 | 258,257 | 2,345,363 | 518,599 | 4,701,758 | 457,439 | 4,161,889 | ||||||||||||||
Managed | 468,970 | 7,173,849 | 445,511 | 6,620,289 | 442,686 | 6,802,184 | 471,795 | 6,991,954 | ||||||||||||||
Money Market | 36,344,869 | 36,344,869 | 276,847 | 276,847 | 34,352,364 | 34,352,364 | 2,269,352 | 2,269,352 | ||||||||||||||
Blue Chip | 101,702 | 3,765,368 | 46,259 | 1,635,261 | 264,053 | 9,720,213 | (116,092 | ) | (4,319,584 | ) | ||||||||||||
28
EQUITRUST VARIABLE INSURANCE SERIES FUND
NOTES TO FINANCIAL STATEMENTS (continued)
| 6. | Investment Transactions |
For the six month period ended June 30, 2007, the cost of investment securities purchased and proceeds from investment securities sold (not including short-term investments and U.S. Government securities) by Portfolio, were as follows:
Portfolio | Purchases | Sales | ||||
Value Growth | $ | 6,858,555 | $ | 5,097,676 | ||
High Grade Bond | 1,498,350 | 332,832 | ||||
Strategic Yield | 1,915,040 | 2,878,422 | ||||
Managed | 9,001,479 | 5,557,187 | ||||
Blue Chip | — | 34 | ||||
The basis of the Fund’s investments in securities and the net unrealized appreciation (depreciation) of investments for U.S. federal income tax purposes as of June 30, 2007, by Portfolio, was composed of the following:
Portfolio | Tax Cost of Investments in Securities | Gross Unrealized | Net Unrealized Appreciation (Depreciation) of Investments | ||||||||||
| Appreciation | Depreciation | ||||||||||||
Value Growth | $ | 58,587,254 | $ | 13,516,602 | $ | 3,127,775 | $ | 10,388,827 | |||||
High Grade Bond | 42,334,574 | 262,200 | 752,565 | (490,365 | ) | ||||||||
Strategic Yield | 42,998,573 | 715,563 | 617,366 | 98,197 | |||||||||
Managed | 84,819,195 | 14,484,045 | 2,575,849 | 11,908,196 | |||||||||
Blue Chip | 63,608,895 | 36,739,839 | 5,373,600 | 31,366,239 | |||||||||
The basis for U.S. federal income tax purposes and financial reporting purposes for investments in the Money Market Portfolio is the same and is equal to the underlying investments’ carrying value.
| 7. | Dividends and Distributions to Shareholders |
Dividends from net investment income for the following Portfolios are declared daily and were payable on the last business day of the month as follows:
| Portfolio | |||||||||
Payable Date | High Grade Bond | Strategic Yield | Money Market | ||||||
January 31, 2007 | $ | 0.0479 | $ | 0.0587 | $ | 0.0041 | |||
February 28, 2007 | 0.0450 | 0.0622 | 0.0037 | ||||||
March 30, 2007 | 0.0425 | 0.0434 | 0.0039 | ||||||
April 30, 2007 | 0.0458 | 0.0446 | 0.0040 | ||||||
May 31, 2007 | 0.0437 | 0.0473 | 0.0041 | ||||||
June 29, 2007 | 0.0426 | 0.0426 | 0.0038 | ||||||
Total dividends per share | $ | 0.2675 | $ | 0.2988 | $ | 0.0236 | |||
29
EQUITRUST VARIABLE INSURANCE SERIES FUND
NOTES TO FINANCIAL STATEMENTS (continued)
| 7. | Dividends and Distributions to Shareholders (continued) |
In addition, dividends and distributions to shareholders from net investment income and net realized gain on investment transactions were paid during the six month period ended June 30, 2007 for the following Portfolios:
Ordinary Income Dividends:
Portfolio | Declaration Date | Record Date | Payable Date | Amount Per Share | |||||
Value Growth | 1/17/07 | 1/17/07 | 1/18/07 | $ | 0.2670 | ||||
Managed | 1/17/07 | 1/17/07 | 1/18/07 | 0.4611 | |||||
Blue Chip | 1/17/07 | 1/17/07 | 1/18/07 | 0.7877 | |||||
Capital Gains Distributions:
Portfolio | Declaration Date | Record Date | Payable Date | Amount Per Share | |||||
Value Growth | 1/17/07 | 1/17/07 | 1/18/07 | $ | 0.5181 | ||||
High Grade | 1/17/07 | 1/17/07 | 1/18/07 | 0.0054 | |||||
Managed | 1/17/07 | 1/17/07 | 1/18/07 | 0.6979 | |||||
30
EQUITRUST VARIABLE INSURANCE SERIES FUND
FINANCIAL HIGHLIGHTS
Period ended June 30, 2007 (Unaudited) and
Years Ended December 31, 2006, 2005, 2004, 2003 and 2002
| Value Growth Portfolio | High Grade Bond Portfolio | |||||||||||||||||||||||||||||||||||||||||||||||
| 2007 | 2006 | 2005 | 2004 | 2003 | 2002 | 2007 | 2006 | 2005 | 2004 | 2003 | 2002 | |||||||||||||||||||||||||||||||||||||
Net asset value, beginning of period | $ | 15.09 | $ | 13.65 | $ | 12.98 | $ | 11.76 | $ | 9.14 | $ | 10.39 | $ | 10.12 | $ | 10.16 | $ | 10.38 | $ | 10.42 | $ | 10.39 | $ | 10.08 | ||||||||||||||||||||||||
Income From Investment Operations | ||||||||||||||||||||||||||||||||||||||||||||||||
Net investment income | 0.20 | 0.27 | 0.19 | 0.15 | 0.12 | 0.14 | 0.27 | 0.51 | 0.47 | 0.45 | 0.47 | 0.50 | ||||||||||||||||||||||||||||||||||||
Net gains (losses) on securities (both realized and unrealized) | 0.80 | 1.36 | 0.63 | 1.20 | 2.64 | (1.20 | ) | (0.14 | ) | (0.04 | ) | (0.20 | ) | — | 0.08 | 0.32 | ||||||||||||||||||||||||||||||||
Total from investment operations | 1.00 | 1.63 | 0.82 | 1.35 | 2.76 | (1.06 | ) | 0.13 | 0.47 | 0.27 | 0.45 | 0.55 | 0.82 | |||||||||||||||||||||||||||||||||||
Less Distributions | ||||||||||||||||||||||||||||||||||||||||||||||||
Dividends (from net investment income) | (0.27 | ) | (0.19 | ) | (0.15 | ) | (0.13 | ) | (0.14 | ) | (0.19 | ) | (0.27 | ) | (0.51 | ) | (0.47 | ) | (0.45 | ) | (0.47 | ) | (0.50 | ) | ||||||||||||||||||||||||
Distributions (from capital gains) | (0.52 | ) | — | — | — | — | — | (0.01 | ) | — | (0.02 | ) | (0.04 | ) | (0.05 | ) | (0.01 | ) | ||||||||||||||||||||||||||||||
Total distributions | (0.79 | ) | (0.19 | ) | (0.15 | ) | (0.13 | ) | (0.14 | ) | (0.19 | ) | (0.28 | ) | (0.51 | ) | (0.49 | ) | (0.49 | ) | (0.52 | ) | (0.51 | ) | ||||||||||||||||||||||||
Net asset value, end of period | $ | 15.30 | $ | 15.09 | $ | 13.65 | $ | 12.98 | $ | 11.76 | $ | 9.14 | $ | 9.97 | $ | 10.12 | $ | 10.16 | $ | 10.38 | $ | 10.42 | $ | 10.39 | ||||||||||||||||||||||||
Total Return: | ||||||||||||||||||||||||||||||||||||||||||||||||
Total investment return based on net asset value (1) | 6.94 | % | 12.07 | % | 6.41 | % | 11.53 | % | 30.68 | % | (10.43 | )% | 1.21 | % | 4.78 | % | 2.65 | % | 4.30 | % | 5.43 | % | 8.37 | % | ||||||||||||||||||||||||
Ratios/Supplemental Data: | ||||||||||||||||||||||||||||||||||||||||||||||||
Net assets, end of period (000’s omitted) | $ | 69,393 | $ | 65,712 | $ | 60,223 | $ | 58,354 | $ | 52,812 | $ | 40,953 | $ | 42,162 | $ | 39,371 | $ | 34,946 | $ | 29,980 | $ | 26,659 | $ | 24,984 | ||||||||||||||||||||||||
Ratio of total expenses to average net assets | 0.56 | %(2) | 0.58 | % | 0.58 | % | 0.58 | % | 0.63 | % | 0.59 | % | 0.43 | %(2) | 0.44 | % | 0.45 | % | 0.45 | % | 0.49 | % | 0.46 | % | ||||||||||||||||||||||||
Ratio of net expenses to average net assets | 0.56 | %(2) | 0.58 | % | 0.58 | % | 0.58 | % | 0.63 | % | 0.59 | % | 0.43 | %(2) | 0.44 | % | 0.45 | % | 0.45 | % | 0.49 | % | 0.46 | % | ||||||||||||||||||||||||
Ratio of net investment income to average net assets | 2.76 | %(2) | 1.88 | % | 1.42 | % | 1.22 | % | 1.26 | % | 1.46 | % | 5.34 | %(2) | 5.08 | % | 4.63 | % | 4.34 | % | 4.51 | % | 4.92 | % | ||||||||||||||||||||||||
Portfolio turnover rate | 9 | %(3) | 30 | % | 18 | % | 17 | % | 17 | % | 15 | % | 6 | %(3) | 17 | % | 12 | % | 26 | % | 28 | % | 22 | % | ||||||||||||||||||||||||
Note: Net investment income per share amounts have been calculated based on average shares outstanding for the period.
| (1) | Total investment return is calculated assuming an initial investment made at the net asset value at the beginning of the period, reinvestment of all dividends and distributions at net asset value during the period, redemption on the last day of the period, and is not annualized for periods less than one year. |
| (2) | Computed on an annualized basis. |
| (3) | Not annualized. |
See accompanying notes.
31
EQUITRUST VARIABLE INSURANCE SERIES FUND
FINANCIAL HIGHLIGHTS (continued)
| Strategic Yield Portfolio | Managed Portfolio | |||||||||||||||||||||||||||||||||||||||||||||||
| 2007 | 2006 | 2005 | 2004 | 2003 | 2002 | 2007 | 2006 | 2005 | 2004 | 2003 | 2002 | |||||||||||||||||||||||||||||||||||||
Net asset value, beginning of period | $ | 9.19 | $ | 9.14 | $ | 9.37 | $ | 9.13 | $ | 8.75 | $ | 8.90 | $ | 16.32 | $ | 15.80 | $ | 15.67 | $ | 14.73 | $ | 12.34 | $ | 13.00 | ||||||||||||||||||||||||
Income From Investment Operations | ||||||||||||||||||||||||||||||||||||||||||||||||
Net investment income | 0.30 | 0.55 | 0.53 | 0.55 | 0.63 | 0.62 | 0.32 | 0.49 | 0.35 | 0.27 | 0.30 | 0.34 | ||||||||||||||||||||||||||||||||||||
Net gains (losses) on securities (both realized and unrealized) | (0.14 | ) | 0.05 | (0.23 | ) | 0.24 | 0.38 | (0.15 | ) | 0.36 | 1.28 | 0.32 | 0.97 | 2.43 | (0.57 | ) | ||||||||||||||||||||||||||||||||
Total from investment operations | 0.16 | 0.60 | 0.30 | 0.79 | 1.01 | 0.47 | 0.68 | 1.77 | 0.67 | 1.24 | 2.73 | (0.23 | ) | |||||||||||||||||||||||||||||||||||
Less Distributions | ||||||||||||||||||||||||||||||||||||||||||||||||
Dividends (from net investment income) | (0.30 | ) | (0.55 | ) | (0.53 | ) | (0.55 | ) | (0.63 | ) | (0.62 | ) | (0.46 | ) | (0.37 | ) | (0.27 | ) | (0.30 | ) | (0.34 | ) | (0.43 | ) | ||||||||||||||||||||||||
Distributions (from capital gains) | — | — | — | — | — | — | (0.70 | ) | (0.88 | ) | (0.27 | ) | — | — | — | |||||||||||||||||||||||||||||||||
Total distributions | (0.30 | ) | (0.55 | ) | (0.53 | ) | (0.55 | ) | (0.63 | ) | (0.62 | ) | (1.16 | ) | (1.25 | ) | (0.54 | ) | (0.30 | ) | (0.34 | ) | (0.43 | ) | ||||||||||||||||||||||||
Net asset value, end of period | $ | 9.05 | $ | 9.19 | $ | 9.14 | $ | 9.37 | $ | 9.13 | $ | 8.75 | $ | 15.84 | $ | 16.32 | $ | 15.80 | $ | 15.67 | $ | 14.73 | $ | 12.34 | ||||||||||||||||||||||||
Total Return: | ||||||||||||||||||||||||||||||||||||||||||||||||
Total investment return based on net asset value (1) | 1.72 | % | 6.79 | % | 3.26 | % | 8.94 | % | 11.97 | % | 5.43 | % | 4.48 | % | 11.99 | % | 4.53 | % | 8.58 | % | 22.72 | % | (1.80 | )% | ||||||||||||||||||||||||
Ratios/Supplemental Data: | ||||||||||||||||||||||||||||||||||||||||||||||||
Net assets, end of period (000’s omitted) | $ | 43,607 | $ | 41,481 | $ | 37,067 | $ | 30,637 | $ | 25,498 | $ | 22,395 | $ | 97,455 | $ | 93,796 | $ | 83,368 | $ | 74,876 | $ | 66,733 | $ | 54,428 | ||||||||||||||||||||||||
Ratio of total expenses to average net assets | 0.58 | %(2) | 0.58 | % | 0.59 | % | 0.59 | % | 0.65 | % | 0.61 | % | 0.54 | %(2) | 0.55 | % | 0.56 | % | 0.56 | % | 0.62 | % | 0.58 | % | ||||||||||||||||||||||||
Ratio of net expenses to average net assets | 0.58 | %(2) | 0.58 | % | 0.59 | % | 0.59 | % | 0.65 | % | 0.61 | % | 0.54 | %(2) | 0.55 | % | 0.56 | % | 0.56 | % | 0.62 | % | 0.58 | % | ||||||||||||||||||||||||
Ratio of net investment income to average net assets | 6.55 | %(2) | 6.04 | % | 5.71 | % | 5.98 | % | 7.07 | % | 7.04 | % | 4.08 | %(2) | 2.98 | % | 2.34 | % | 1.87 | % | 2.35 | % | 2.73 | % | ||||||||||||||||||||||||
Portfolio turnover rate | 12 | %(3) | 16 | % | 1 | % | 34 | % | 32 | % | 34 | % | 7 | %(3) | 24 | % | 24 | % | 26 | % | 24 | % | 18 | % | ||||||||||||||||||||||||
Note: Net investment income per share amounts have been calculated based on average shares outstanding for the period.
| (1) | Total investment return is calculated assuming an initial investment made at the net asset value at the beginning of the period, reinvestment of all dividends and distributions at net asset value during the period, redemption on the last day of the period, and is not annualized for periods less than one year. |
| (2) | Computed on an annualized basis. |
| (3) | Not annualized. |
See accompanying notes.
32
EQUITRUST VARIABLE INSURANCE SERIES FUND
FINANCIAL HIGHLIGHTS (continued)
| Money Market Portfolio | Blue Chip Portfolio | |||||||||||||||||||||||||||||||||||||||||||||||
| 2007 | 2006 | 2005 | 2004 | 2003 | 2002 | 2007 | 2006 | 2005 | 2004 | 2003 | 2002 | |||||||||||||||||||||||||||||||||||||
Net asset value, beginning of period | $ | 1.00 | $ | 1.00 | $ | 1.00 | $ | 1.00 | $ | 1.00 | $ | 1.00 | $ | 40.61 | $ | 35.27 | $ | 35.17 | $ | 33.65 | $ | 27.22 | $ | 34.14 | ||||||||||||||||||||||||
Income From Investment Operations | ||||||||||||||||||||||||||||||||||||||||||||||||
Net investment income | 0.02 | 0.04 | 0.02 | 0.01 | 0.01 | 0.01 | 0.40 | 0.79 | 0.70 | 0.67 | 0.50 | 0.46 | ||||||||||||||||||||||||||||||||||||
Net gains (losses) on securities (both realized and unrealized) | — | — | — | — | — | — | 2.36 | 5.25 | 0.07 | 1.35 | 6.38 | (6.88 | ) | |||||||||||||||||||||||||||||||||||
Total from investment operations | 0.02 | 0.04 | 0.02 | 0.01 | 0.01 | 0.01 | 2.76 | 6.04 | 0.77 | 2.02 | 6.88 | (6.42 | ) | |||||||||||||||||||||||||||||||||||
Less Distributions | ||||||||||||||||||||||||||||||||||||||||||||||||
Dividends (from net investment income) | (0.02 | ) | (0.04 | ) | (0.02 | ) | (0.01 | ) | (0.01 | ) | (0.01 | ) | (0.79 | ) | (0.70 | ) | (0.67 | ) | (0.50 | ) | (0.45 | ) | (0.50 | ) | ||||||||||||||||||||||||
Distributions (from capital gains) | — | — | — | — | — | — | — | — | — | — | — | — | ||||||||||||||||||||||||||||||||||||
Total distributions | (0.02 | ) | (0.04 | ) | (0.02 | ) | (0.01 | ) | (0.01 | ) | (0.01 | ) | (0.79 | ) | (0.70 | ) | (0.67 | ) | (0.50 | ) | (0.45 | ) | (0.50 | ) | ||||||||||||||||||||||||
Net asset value, end of period | $ | 1.00 | $ | 1.00 | $ | 1.00 | $ | 1.00 | $ | 1.00 | $ | 1.00 | $ | 42.58 | $ | 40.61 | $ | 35.27 | $ | 35.17 | $ | 33.65 | $ | 27.22 | ||||||||||||||||||||||||
Total Return: | ||||||||||||||||||||||||||||||||||||||||||||||||
Total investment return based on net asset value (1) | 2.38 | % | 4.43 | % | 2.50 | % | 0.74 | % | 0.52 | % | 1.16 | % | 6.91 | % | 17.42 | % | 2.29 | % | 6.07 | % | 25.70 | % | (19.07 | )% | ||||||||||||||||||||||||
Ratios/Supplemental Data: | ||||||||||||||||||||||||||||||||||||||||||||||||
Net assets, end of period (000’s omitted) | $ | 17,432 | $ | 8,557 | $ | 6,288 | $ | 6,592 | $ | 6,728 | $ | 8,150 | $ | 94,971 | $ | 90,261 | $ | 82,501 | $ | 84,960 | $ | 79,832 | $ | 63,699 | ||||||||||||||||||||||||
Ratio of total expenses to average net assets | 0.49 | %(2) | 0.54 | % | 0.61 | % | 0.56 | % | 0.59 | % | 0.52 | % | 0.29 | %(2) | 0.31 | % | 0.31 | % | 0.30 | % | 0.36 | % | 0.31 | % | ||||||||||||||||||||||||
Ratio of net expenses to average net assets | 0.49 | %(2) | 0.54 | % | 0.61 | % | 0.56 | % | 0.59 | % | 0.52 | % | 0.29 | %(2) | 0.31 | % | 0.31 | % | 0.30 | % | 0.36 | % | 0.31 | % | ||||||||||||||||||||||||
Ratio of net investment income to average net assets | 4.76 | %(2) | 4.37 | % | 2.47 | % | 0.72 | % | 0.53 | % | 1.16 | % | 1.95 | %(2) | 2.07 | % | 1.98 | % | 2.00 | % | 1.72 | % | 1.50 | % | ||||||||||||||||||||||||
Portfolio turnover rate | — | %(3) | — | % | — | % | — | % | — | % | — | % | — | %(3) | — | % | — | % | 1 | % | 17 | % | — | % | ||||||||||||||||||||||||
Note: Net investment income per share amounts have been calculated based on average shares outstanding for the period.
| (1) | Total investment return is calculated assuming an initial investment made at the net asset value at the beginning of the period, reinvestment of all dividends and distributions at net asset value during the period, redemption on the last day of the period, and is not annualized for periods less than one year. |
| (2) | Computed on an annualized basis. |
| (3) | Not annualized. |
See accompanying notes.
33
Information on Proxy Voting
EquiTrust Variable Insurance Series Fund (the “Fund”) has delegated the authority to vote proxies related to the Fund’s portfolio securities to the Fund’s investment adviser, EquiTrust Management Services, Inc. (the “Adviser”). A description of the policies and procedures that the Adviser uses in fulfilling this responsibility is available, without charge, upon request by calling 1-877-860-2904. It also appears in the Fund’s Statement of Additional Information, which can be found on the SEC’s website at http://www.sec.gov. The Fund’s proxy voting record for the most recent 12-month period ended June 30, 2007 is available, without charge, by calling the toll-free number listed above or by accessing the SEC’s website.
Form N-Q Disclosure:
The Fund files a complete schedule of portfolio holdings for its first and third quarters of each fiscal year with the SEC on Form N-Q. The Fund’s Forms N-Q are available on the SEC’s website at http://sec.gov or may be reviewed and copies at the SEC’s Public Reference Room in Washington, D.C. Information regarding the operation of the Public Reference Room may be obtained by calling 1-800-SEC-0330. A copy of Form N-Q is also available, without charge, by calling the Fund at 1-877-860-2904.
34
| Item 2. | Code of Ethics. |
Not applicable to this filing.
| Item 3. | Audit Committee Financial Expert. |
Not applicable to this filing.
| Item 4. | Principal Accountant Fees and Services. |
Not applicable to this filing.
| Item 5. | Audit Committee of Listed Registrants. |
Not applicable.
| Item 6. | Schedules of Investments. |
See Item 1.
| Item 7. | Disclosure of Proxy Voting Policies and Procedures for Closed-End Management Investment Companies. |
Not applicable.
| Item 8. | Portfolio Managers of Closed-End Management Investment Company. |
Not applicable.
| Item 9. | Purchase of Equity Securities by Closed-End Management Investment Company and Affiliated Purchasers. |
Not applicable.
| Item 10. | Submission of Matters to a Vote of Security Holders. |
On November 18, 2004, the registrant adopted procedures by which shareholders may recommend nominees to the registrant’s board of trustees. Those procedures specify that shareholders may recommend candidates for board positions by forwarding their correspondence by U.S. mail or courier service to the registrant’s secretary to the attention of the Chairman of the Nominating Committee. Suggestions for candidates for specific positions must be received by such date as established by the Nominating Committee.
| Item 11. | Controls and Procedures |
| (a) | The registrant’s principal executive and principal financial officers, or persons performing similar functions, have concluded that the registrant’s disclosure controls and procedures (as defined in Rule 30a-3(c) under the Investment Company Act of 1940, as amended (the “1940 Act”) (17 CFR 270.30a-3(c))) are effective, as of a date within 90 days of the filing date of the report that includes the disclosure required by this paragraph, based on their evaluation of these controls and procedures required by Rule 30a-3(b) under the 1940 Act (17 CFR 270.30a-3(b)) and Rules 13a-15(b) or 15d-15(b) under the Exchange Act (17 CFR 240.13a-15(b) or 240.15d-15(b)). |
| (b) | There has been no change to the registrant’s internal control over financial reporting that occurred during the second fiscal quarter of the period covered by this report that has materially affected, or is reasonably likely to materially affect, the registrant’s internal control over financial reporting. |
| Item 12. | Exhibits. |
| (a)(1) | Not applicable to this filing. |
| (a)(2) | Certifications pursuant to Section 302 of the Sarbanes-Oxley Act of 2002 are attached hereto. |
| (a)(3) | Not applicable. |
| (b) | Certifications pursuant to Section 906 of the Sarbanes-Oxley Act of 2002 are attached hereto. |
SIGNATURES
Pursuant to the requirements of the Securities Exchange Act of 1934 and the Investment Company Act of 1940, the registrant has duly caused this report to be signed on its behalf by the undersigned, thereunto duly authorized.
| (Registrant) EquiTrust Variable Insurance Series Fund | ||||
| By: | /s/ Dennis M. Marker | |||
| Name: | Dennis M. Marker | |||
| Title: | Chief Executive Officer | |||
| Date: | 8/20/07 | |||
Pursuant to the requirements of the Securities Exchange Act of 1934 and the Investment Company Act of 1940, this report has been signed below by the following persons on behalf of the registrant and in the capacities and on the dates indicated.
| By: | /s/ Dennis M. Marker | |||
| Name: | Dennis M. Marker | |||
| Title: | Chief Executive Officer | |||
| Date: | 8/20/07 | |||
| By: | /s/ James P. Brannen | |||
| Name: | James P. Brannen | |||
| Title: | Chief Financial Officer | |||
| Date: | 8/20/07 | |||