Santander Holdings USA, Inc. 4Q11 Investor Update April 2012
2 Disclaimer Banco Santander, S.A. (“Santander”), Santander Holdings USA, Inc. (“SHUSA”), Sovereign Bank, N.A. (“Sovereign”), and Santander Consumer USA, Inc. (“SCUSA”) caution that this presentation contains forward-looking statements within the meaning of the U.S. Private Securities Litigation Reform Act of 1995. These forward-looking statements are found in various places throughout this presentation and include, without limitation, statements concerning our future business development and economic performance. While these forward-looking statements represent our judgment and future expectations concerning the development of our business, a number of risks, uncertainties, and other important factors could cause actual developments and results to different materially from our expectations. These factors include, but are not limited to: (1) general market, macro-economic, governmental, and regulatory trends; (2) movements in local and international securities markets, currency exchange rates, and interest rates; (3) competitive pressures; (4) technological developments; and (5) changes in the financial position or credit worthiness of our customers, obligors, and counterparties. The risk factors and other key factors that we have indicated in our past and future filings and reports, including our Annual Report on Form 10-K for the year ended December 31, 2011 and other filings and reports with the Securities and Exchange Commission of the United States of America (the “SEC”), could adversely affect our business and financial performance. Other unknown and unpredictable factors could cause actual results to differ materially from those in the forward- looking statements. The information contained in this presentation is not complete. It is subject to, and must be read in conjunction with, all other publicly available information, including reports filed with or furnished to the SEC, press releases, and other relevant information. Because this information is intended only to assist investors, it does not constitute investment advice or an offer to invest or to provide management services. It is subject to correction, completion, and amendment without notice. It is not our intention to state, indicate, or imply in any manner that current or past results are indicative of future results or expectations. As with all investments, there are associated risks, and you could lose money investing. Prior to making any investment, a prospective investor should consult with its own investment, accounting, legal, and tax advisers to evaluate independently the risks, consequences, and suitability of that investment. The information in this presentation is not intended to constitute “research” as that term is defined by applicable regulations. Nothing in this presentation constitutes investment, legal, accounting, or tax advice, or a representation that any investment or strategy is suitable or appropriate to your individual circumstances, or otherwise constitutes a personal recommendation to you. Recipients of this presentation should obtain advice based on their own individual circumstances from their own tax, financial, legal, and other advisers before making an investment decision, and only make such decisions on the basis of the investor’s own objectives, experience, and resources. In making this presentation available, Santander, SHUSA, Sovereign, and SCUSA give no advice and make no recommendation to buy, sell, or otherwise deal in shares or other securities of Santander, SHUSA, Sovereign, or SCUSA, or in any other securities or investments whatsoever. No offering of Securities shall be made in the United States except pursuant to registration under the U.S. Securities Act of 1933, as amended, or an exemption therefrom. Nothing contained in this presentation is intended to constitute an invitation or inducement to engage in investment activity for the purposes of the prohibition on financial promotion in the U.K. Financial Services and Markets Act 2000. In this presentation, we will sometimes refer to certain non-GAAP figures or financial ratios to help illustrate certain concepts. These ratios, each of which is defined in this document, include Pre-Tax Pre-Provision Income, the Tangible Common Equity to Tangible Assets Ratio, and the Texas Ratio. This information supplements our results as reported in accordance with GAAP and should not be viewed in isolation from, or as a substitute for, our GAAP results. We believe that this additional information and the reconciliations we provide may be useful to investors, analysts, regulators and others as they evaluate the impact of these respective items on our results for the periods presented due to the extent to which the items are not indicative of our ongoing operations. Where applicable, we provide GAAP reconciliations for such additional information. Note: Nothing in this presentation should be construed as a profit forecast. Past performance should not be taken as an indication or guarantee of future performance, and no representation or warranty, express or implied, is made regarding performance. Information, opinions, and estimates contained in this presentation reflect a judgment at its original date of publication by Santander, SHUSA, Sovereign, and SCUSA and are subject to change without notice. Santander, SHUSA, Sovereign, and SCUSA have no obligation to update, modify, or amend this presentation or to otherwise notify a recipient thereof in the event that any information, opinion, or estimate set forth herein changes or subsequently becomes inaccurate. This presentation is provided for information purposes only.
3 AGENDA SHUSA Overview and Highlights Q4 2011 Summary Liquidity Capital Sovereign Bank Review Review Phase II: Building the Franchise SCUSA Investor Transaction Appendix
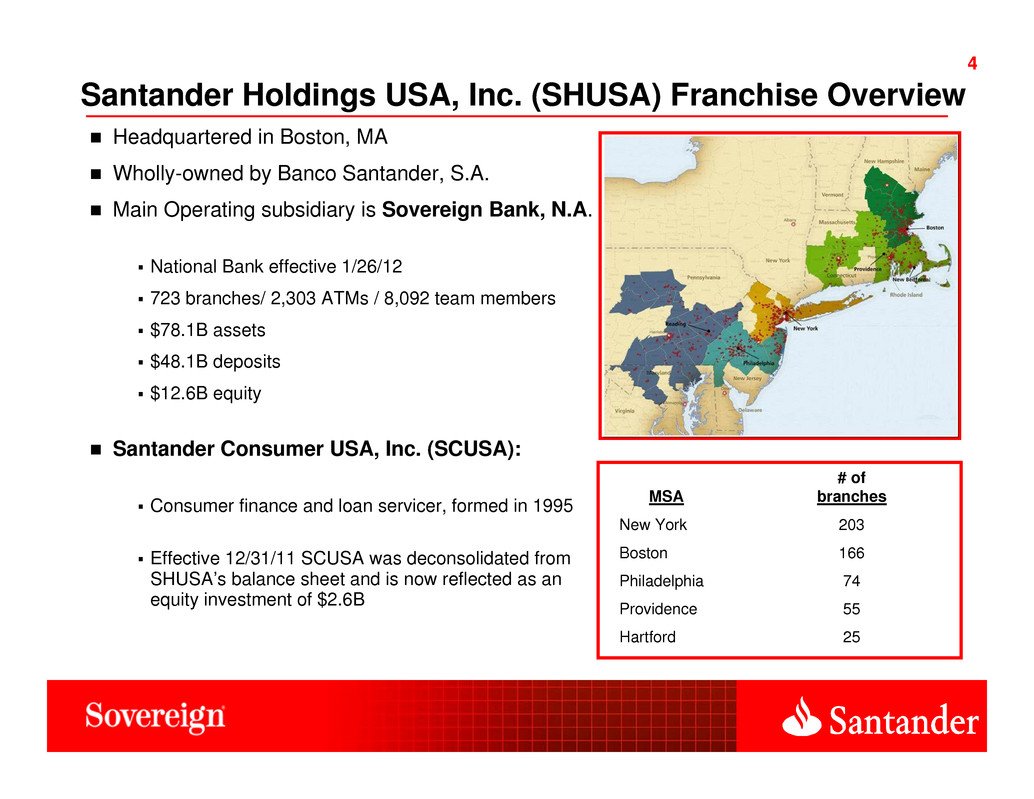
4 4 Santander Holdings USA, Inc. (SHUSA) Franchise Overview Headquartered in Boston, MA Wholly-owned by Banco Santander, S.A. Main Operating subsidiary is Sovereign Bank, N.A. National Bank effective 1/26/12 723 branches/ 2,303 ATMs / 8,092 team members $78.1B assets $48.1B deposits $12.6B equity Santander Consumer USA, Inc. (SCUSA): Consumer finance and loan servicer, formed in 1995 Effective 12/31/11 SCUSA was deconsolidated from SHUSA’s balance sheet and is now reflected as an equity investment of $2.6B MSA # of branches New York 203 Boston 166 Philadelphia 74 Providence 55 Hartford 25
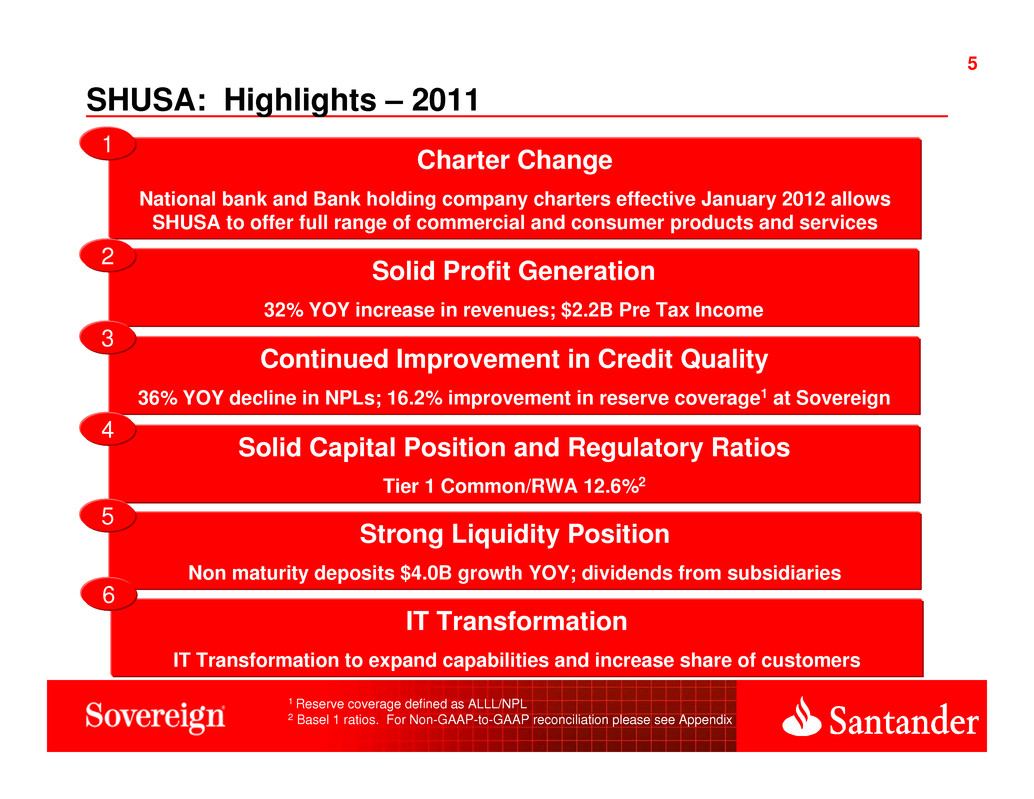
5 5 SHUSA: Highlights – 2011 Charter Change National bank and Bank holding company charters effective January 2012 allows SHUSA to offer full range of commercial and consumer products and services 1 Continued Improvement in Credit Quality 36% YOY decline in NPLs; 16.2% improvement in reserve coverage1 at Sovereign Solid Profit Generation 32% YOY increase in revenues; $2.2B Pre Tax Income 3 2 Solid Capital Position and Regulatory Ratios Tier 1 Common/RWA 12.6%2 4 Strong Liquidity Position Non maturity deposits $4.0B growth YOY; dividends from subsidiaries 5 1 Reserve coverage defined as ALLL/NPL 2 Basel 1 ratios. For Non-GAAP-to-GAAP reconciliation please see Appendix IT Transformation IT Transformation to expand capabilities and increase share of customers 6
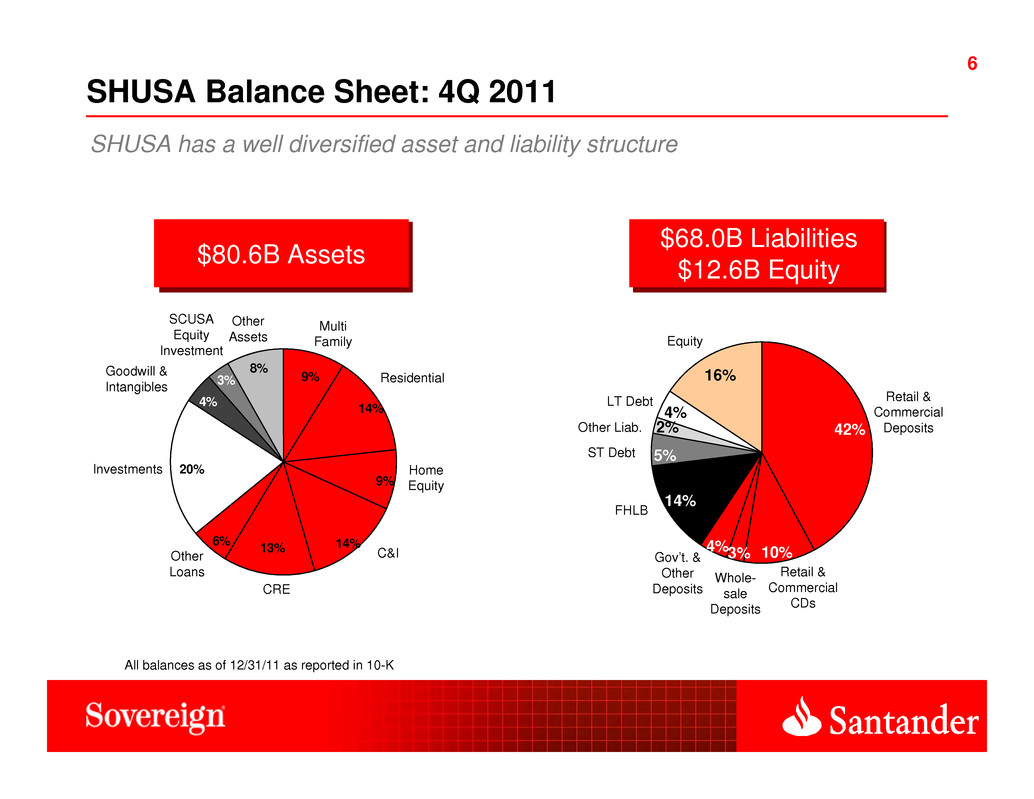
6 6 42% 10%3%4% 14% 5% 2% 4% 16% SHUSA Balance Sheet: 4Q 2011 Retail & Commercial Deposits LT Debt Equity Other Liab. FHLB ST Debt $80.6B Assets $68.0B Liabilities $12.6B Equity SHUSA has a well diversified asset and liability structure All balances as of 12/31/11 as reported in 10-K Retail & Commercial CDs Whole- sale Deposits Gov’t. & Other Deposits 9% 14% 9% 14%13%6% 20% 4% 3% 8% Multi Family Residential Home Equity C&I CRE Other Loans Investments Goodwill & Intangibles SCUSA Equity Investment Other Assets
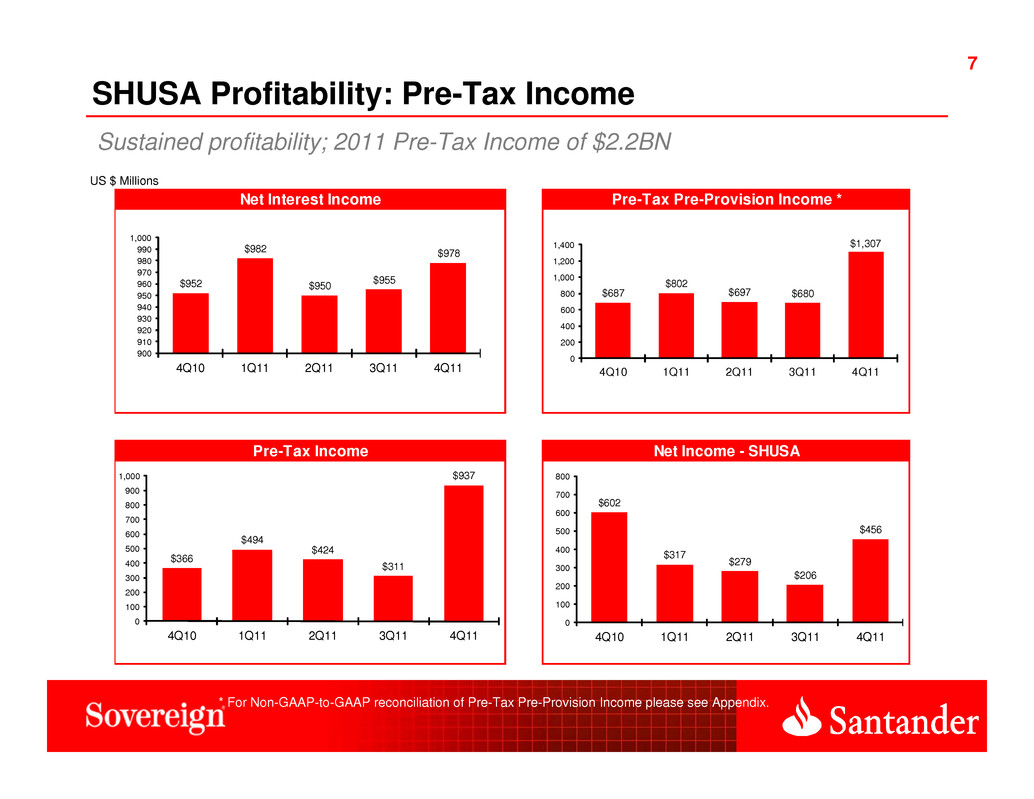
7 7 SHUSA Profitability: Pre-Tax Income Sustained profitability; 2011 Pre-Tax Income of $2.2BN US $ Millions * For Non-GAAP-to-GAAP reconciliation of Pre-Tax Pre-Provision Income please see Appendix. Net Interest Income Pre-Tax Pre-Provision Income * Pre-Tax Income Net Income - SHUSA $687 $802 $697 $680 $1,307 0 200 400 600 800 1,000 1,200 1,400 4Q10 1Q11 2Q11 3Q11 4Q11 $952 $982 $950 $955 $978 900 910 920 930 940 950 960 970 980 990 1,000 4Q10 1Q11 2Q11 3Q11 4Q11 $366 $494 $424 $311 $937 0 100 200 300 400 500 600 700 800 900 1,000 4Q10 1Q11 2Q11 3Q11 4Q11 $602 $317 $279 $206 $456 0 100 200 300 400 500 600 700 800 4Q10 1Q11 2Q11 3Q11 4Q11
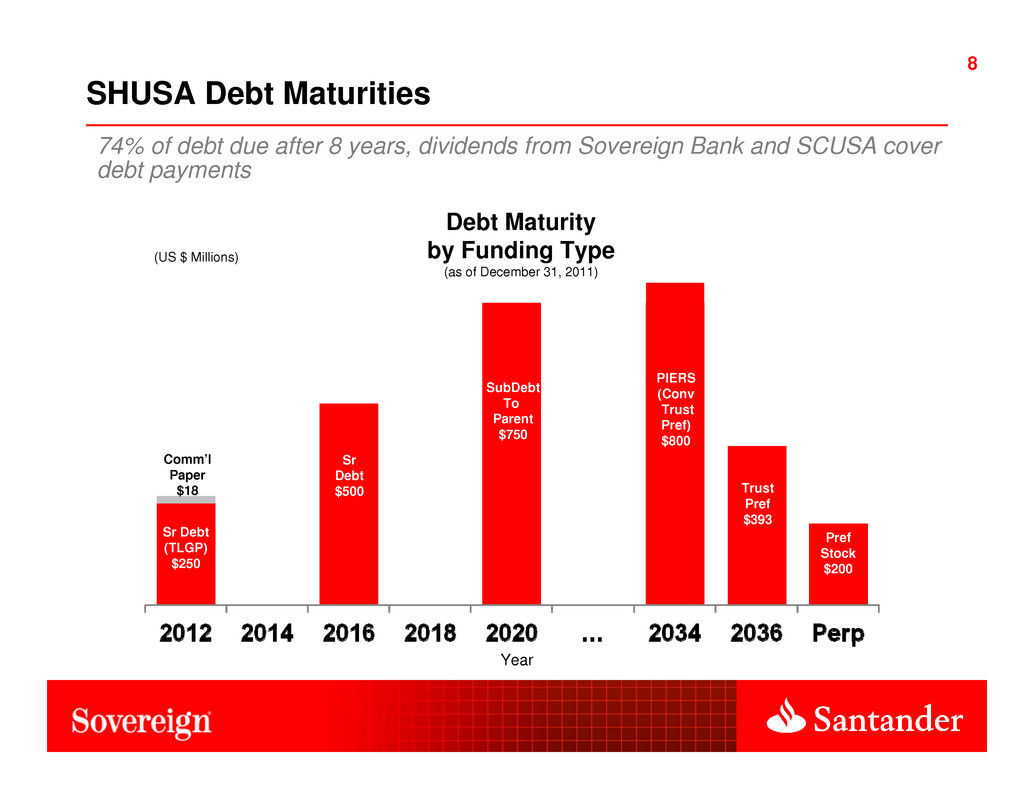
SHUSA Debt Maturities Sr Debt (TLGP) $250 SubDebt To Parent $750 PIERS (Conv Trust Pref) $800 Trust Pref $393 Pref Stock $200 (US $ Millions) Year Comm’l Paper $18 Debt Maturity by Funding Type (as of December 31, 2011) Sr Debt $500 74% of debt due after 8 years, dividends from Sovereign Bank and SCUSA cover debt payments 8
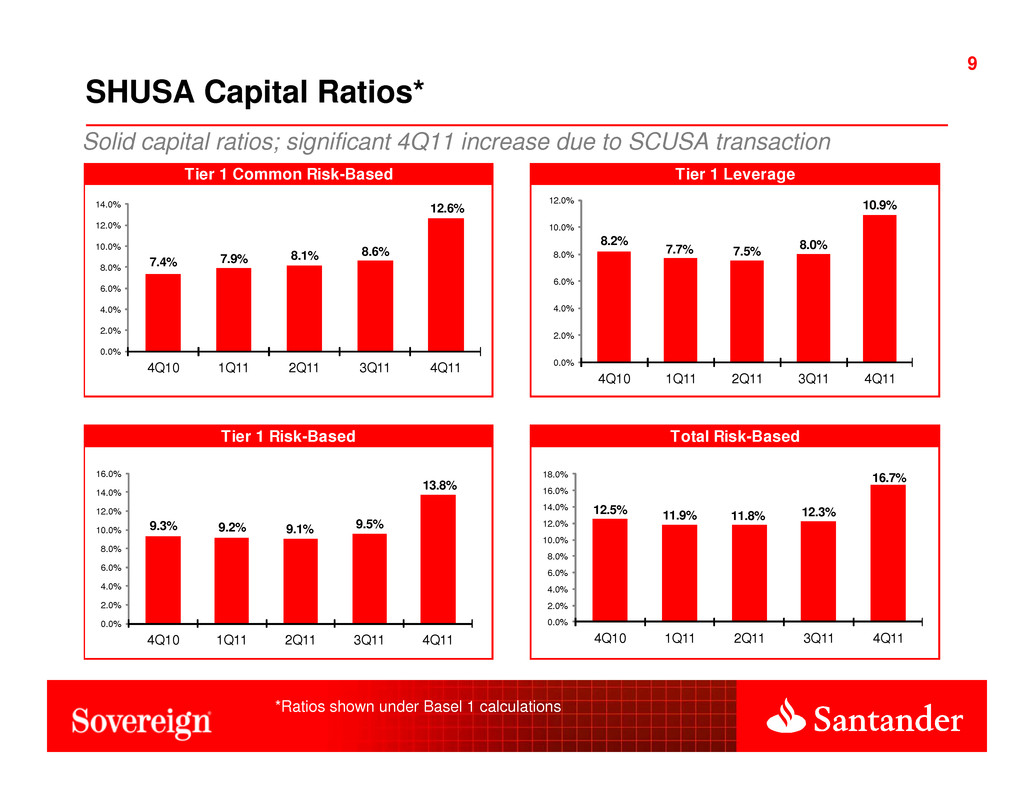
SHUSA Capital Ratios* Solid capital ratios; significant 4Q11 increase due to SCUSA transaction *Ratios shown under Basel 1 calculations 9 Total Risk-Based Tier 1 Common Risk-Based Tier 1 Leverage Tier 1 Risk-Based 7.4% 7.9% 8.1% 8.6% 12.6% 0.0% 2.0% 4.0% 6.0% 8.0% 10.0% 12.0% 14.0% 4Q10 1Q11 2Q11 3Q11 4Q11 8.2% 7.7% 7.5% 8.0% 10.9% 0.0% 2.0% 4.0% 6.0% 8.0% 10.0% 12.0% 4Q10 1Q11 2Q11 3Q11 4Q11 9.3% 9.2% 9.1% 9.5% 13.8% 0.0% 2.0% 4.0% 6.0% 8.0% 10.0% 12.0% 14.0% 16.0% 4Q10 1Q11 2Q11 3Q11 4Q11 12.5% 11.9% 11.8% 12.3% 16.7% 0.0% 2.0% 4.0% 6.0% 8.0% 10.0% 12.0% 14.0% 16.0% 18.0% 4Q10 1Q11 2Q11 3Q11 4Q11
AGENDA SHUSA Overview and Highlights Q4 2011 Summary Liquidity Capital Sovereign Bank Review Review Phase II: Building the Franchise SCUSA Investor Transaction Appendix
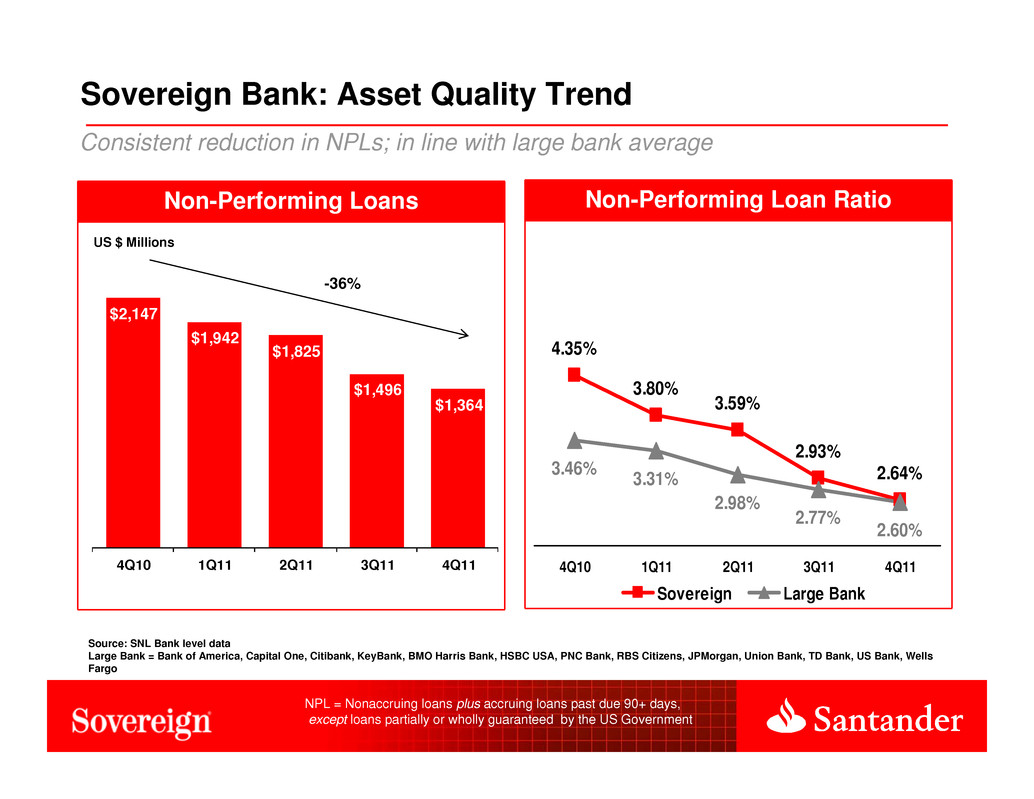
Non-Performing Loan RatioNon-Performing Loans Sovereign Bank: Asset Quality Trend Consistent reduction in NPLs; in line with large bank average Source: SNL Bank level data Large Bank = Bank of America, Capital One, Citibank, KeyBank, BMO Harris Bank, HSBC USA, PNC Bank, RBS Citizens, JPMorgan, Union Bank, TD Bank, US Bank, Wells Fargo $2,147 $1,942 $1,825 $1,496 $1,364 4Q10 1Q11 2Q11 3Q11 4Q11 US $ Millions -36% NPL = Nonaccruing loans plus accruing loans past due 90+ days, except loans partially or wholly guaranteed by the US Government 3.80% 3.59% 2.93% 2.64% 4.35% 3.46% 3.31% 2.98% 2.77% 2.60% 4Q10 1Q11 2Q11 3Q11 4Q11 Sovereign Large Bank
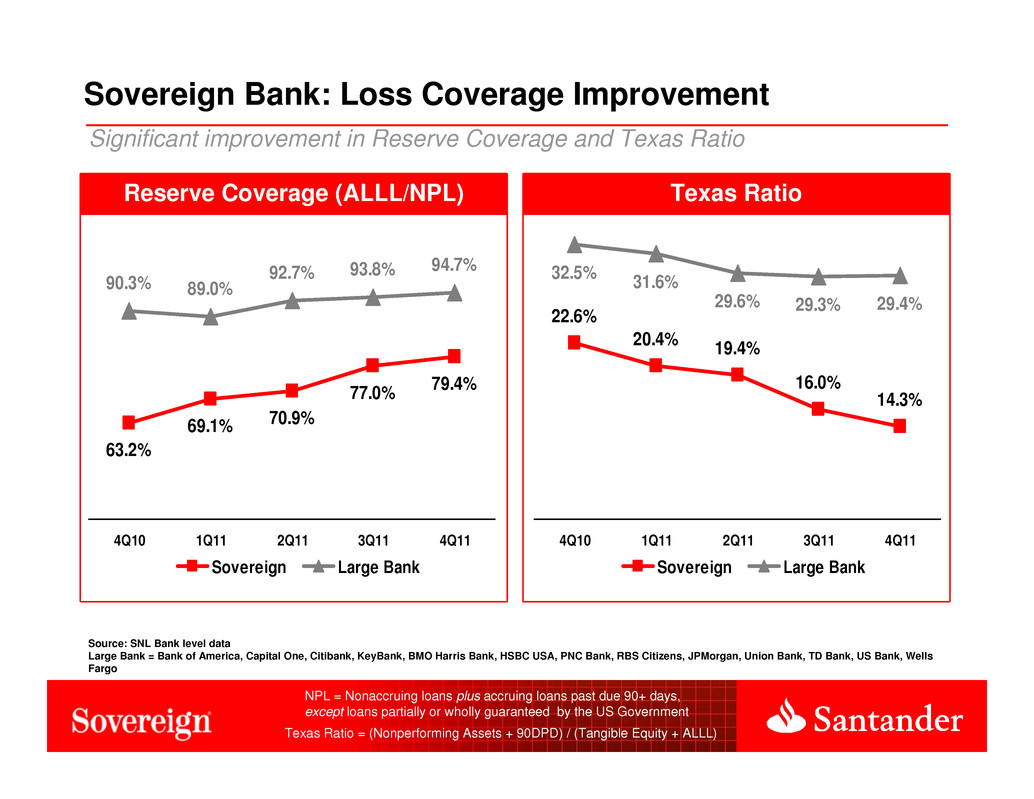
Significant improvement in Reserve Coverage and Texas Ratio Reserve Coverage (ALLL/NPL) Sovereign Bank: Loss Coverage Improvement Texas Ratio Source: SNL Bank level data Large Bank = Bank of America, Capital One, Citibank, KeyBank, BMO Harris Bank, HSBC USA, PNC Bank, RBS Citizens, JPMorgan, Union Bank, TD Bank, US Bank, Wells Fargo 69.1% 70.9% 77.0% 79.4% 63.2% 90.3% 89.0% 92.7% 93.8% 94.7% 4Q10 1Q11 2Q11 3Q11 4Q11 Sovereign Large Bank 20.4% 19.4% 16.0% 14.3% 22.6% 32.5% 31.6% 29.6% 29.3% 29.4% 4Q10 1Q11 2Q11 3Q11 4Q11 Sovereign Large Bank NPL = Nonaccruing loans plus accruing loans past due 90+ days, except loans partially or wholly guaranteed by the US Government Texas Ratio = (Nonperforming Assets + 90DPD) / (Tangible Equity + ALLL)
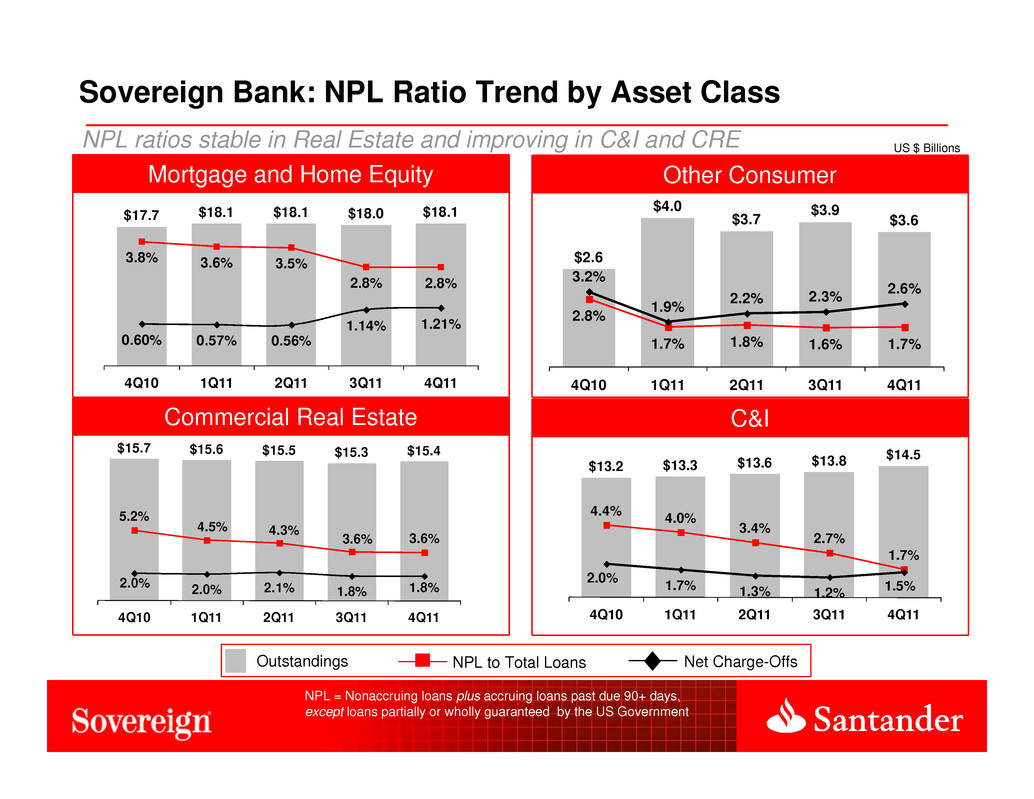
NPL ratios stable in Real Estate and improving in C&I and CRE US $ Billions Mortgage and Home Equity Commercial Real Estate Other Consumer C&I Outstandings NPL to Total Loans Net Charge-Offs Sovereign Bank: NPL Ratio Trend by Asset Class NPL = Nonaccruing loans plus accruing loans past due 90+ days, except loans partially or wholly guaranteed by the US Government $15.7 $15.6 $15.5 $15.3 $15.4 5.2% 4.5% 4.3% 3.6% 3.6% 2.0% 2.0% 2.1% 1.8% 1.8% 4Q10 1Q11 2Q11 3Q11 4Q11 $13.2 $13.3 $13.6 $13.8 $14.5 4.4% 4.0% 3.4% 2.7% 1.7% 2.0% 1.7% 1.3% 1.2% 1.5% 4Q10 1Q11 2Q11 3Q11 4Q11 $2.6 $4.0 $3.7 $3.9 $3.6 2.8% 1.7% 1.8% 1.6% 1.7% 3.2% 1.9% 2.2% 2.3% 2.6% 4Q10 1Q11 2Q11 3Q11 4Q11 $17.7 $18.1 $18.1 $18.0 $18.1 3.8% 3.6% 3.5% 2.8% 2.8% 0.60% 0.57% 0.56% 1.14% 1.21% 4Q10 1Q11 2Q11 3Q11 4Q11
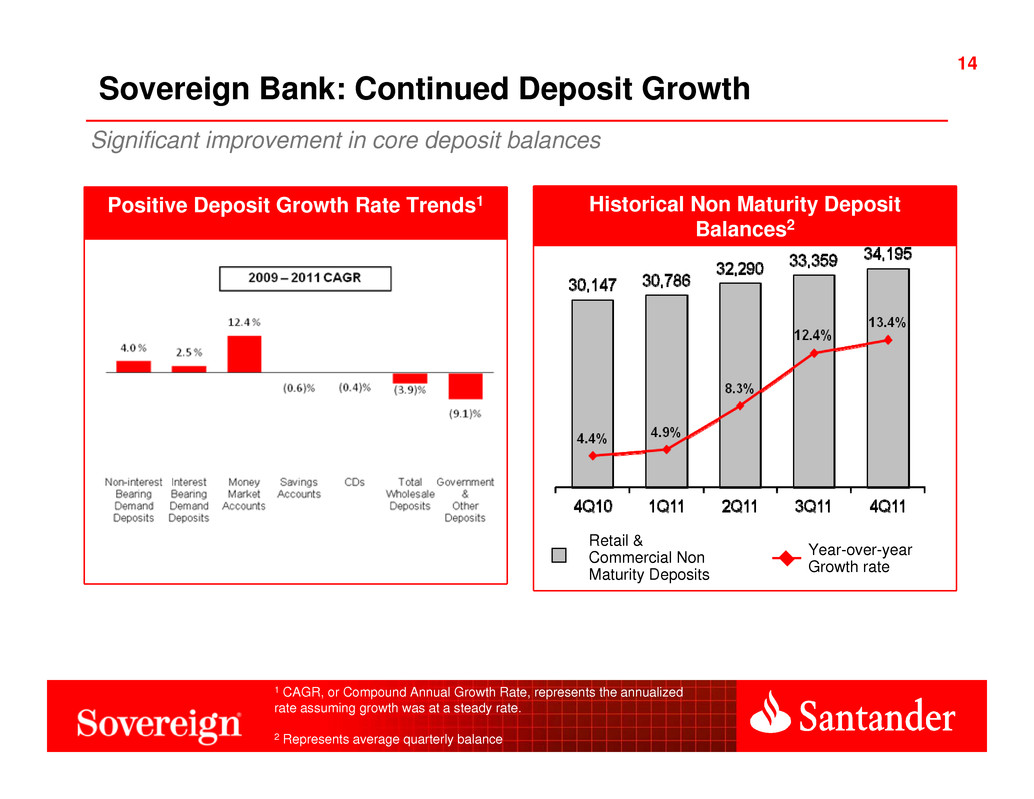
14 Historical Non Maturity Deposit Balances2 Significant improvement in core deposit balances Sovereign Bank: Continued Deposit Growth Year-over-year Growth rate Retail & Commercial Non Maturity Deposits 1 CAGR, or Compound Annual Growth Rate, represents the annualized rate assuming growth was at a steady rate. 2 Represents average quarterly balance Positive Deposit Growth Rate Trends1
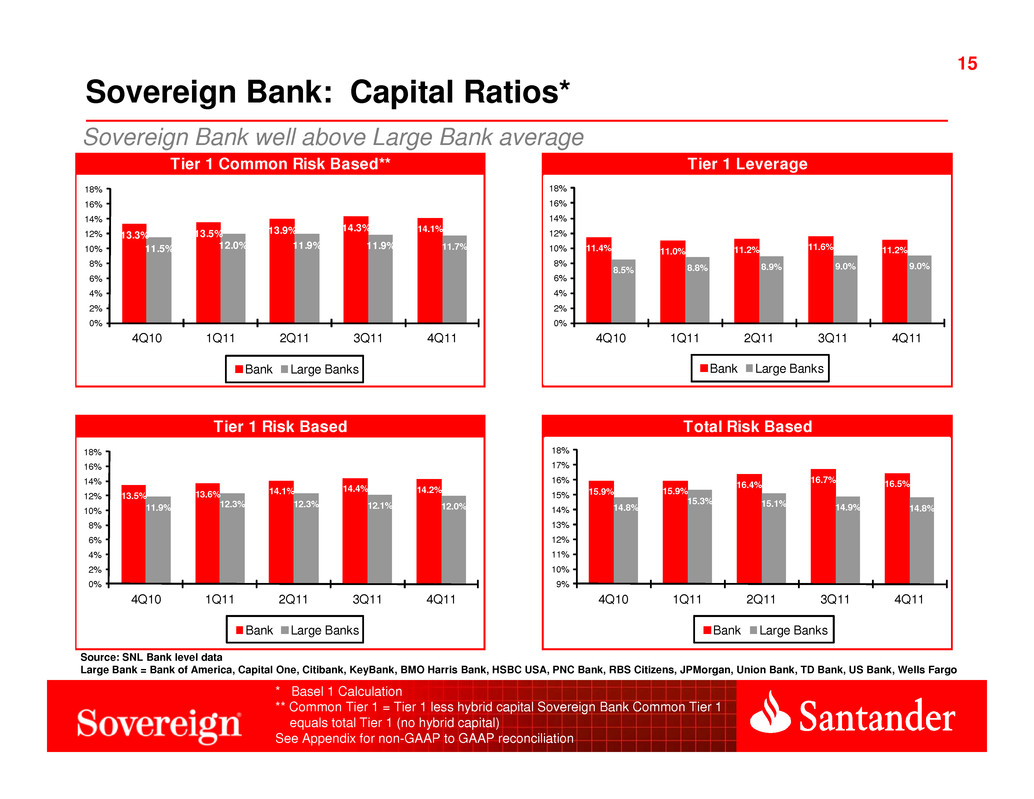
15 Sovereign Bank: Capital Ratios* Sovereign Bank well above Large Bank average * Basel 1 Calculation ** Common Tier 1 = Tier 1 less hybrid capital Sovereign Bank Common Tier 1 equals total Tier 1 (no hybrid capital) See Appendix for non-GAAP to GAAP reconciliation Source: SNL Bank level data Large Bank = Bank of America, Capital One, Citibank, KeyBank, BMO Harris Bank, HSBC USA, PNC Bank, RBS Citizens, JPMorgan, Union Bank, TD Bank, US Bank, Wells Fargo Tier 1 Common Risk Based** Tier 1 Leverage Tier 1 Risk Based Total Risk Based 13.9% 13.3% 13.5% 13.9% 14.3% 11.3% 11.5% 12.0% 11.9% 11.9% 0% 2% 4% 6% 8% 10% 12% 14% 16% 18% 3Q10 4Q10 1Q11 2Q11 3Q11 Bank Large Banks 11.3% 11.4% 11.0% 11.2% 11.6% 8.5% 8.5% 8.8% 8.9% 9.0% 0% 2% 4% 6% 8% 10% 12% 14% 16% 18% 3Q10 4Q10 1Q11 2Q11 3Q11 Bank Large Banks 14.0% 13.5% 13.6% 14.1% 14.4% 11.7% 11.9% 12.3% 12.3% 12.1% 0% 2% 4% 6% 8% 10% 12% 14% 16% 18% 3Q10 4Q10 1Q11 2Q11 3Q11 Bank Large Banks 17.0% 15.9% 15.9% 16.4% 16.7% 14.8% 14.8% 15.3% 15.1% 14.9% 14% 14% 15% 15% 16% 16% 17% 17% 18% 3Q10 4Q10 1Q11 2Q11 3Q11 Bank Large Banks 13.3% .5 13.9% 14.3 .1 .5 12.0% 1 9 .7 4 1 1 2 3 4 .4 11.0% .2 11.6% 11.2% 8.8 .9 9 0 4 1 1 2 3 4 13.5% .6 14.1% 14.4 .2 .9 12.3% .1 .0 4 1 1 2 3 4 15.9% 15.9% 16.4% 16.7% 16.5% 14.8% 15.3% 15.1% 14.9% 14.8% 9 10 11% 12% 13% 14% 15% 16% 17 4 1 1 2 3 4
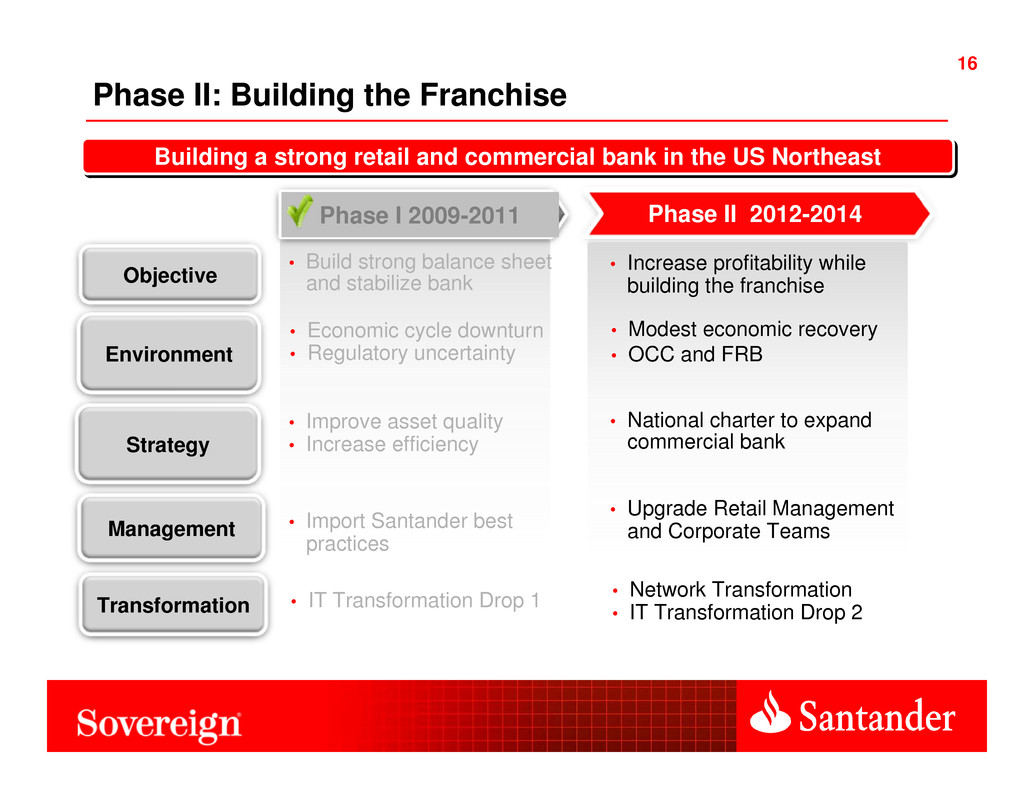
16 Phase II: Building the Franchise Objective Strategy Management Environment • Increase profitability while building the franchise • Modest economic recovery • OCC and FRB • National charter to expand commercial bank • Upgrade Retail Management and Corporate Teams • Build strong balance sheet and stabilize bank • Improve asset quality • Increase efficiency • Import Santander best practices • Economic cycle downturn • Regulatory uncertainty Phase I 2009-2011 Phase II 2012-2014 Building a strong retail and commercial bank in the US Northeastil i il i l i • IT Transformation Drop 1Transformation • Network Transformation • IT Transformation Drop 2
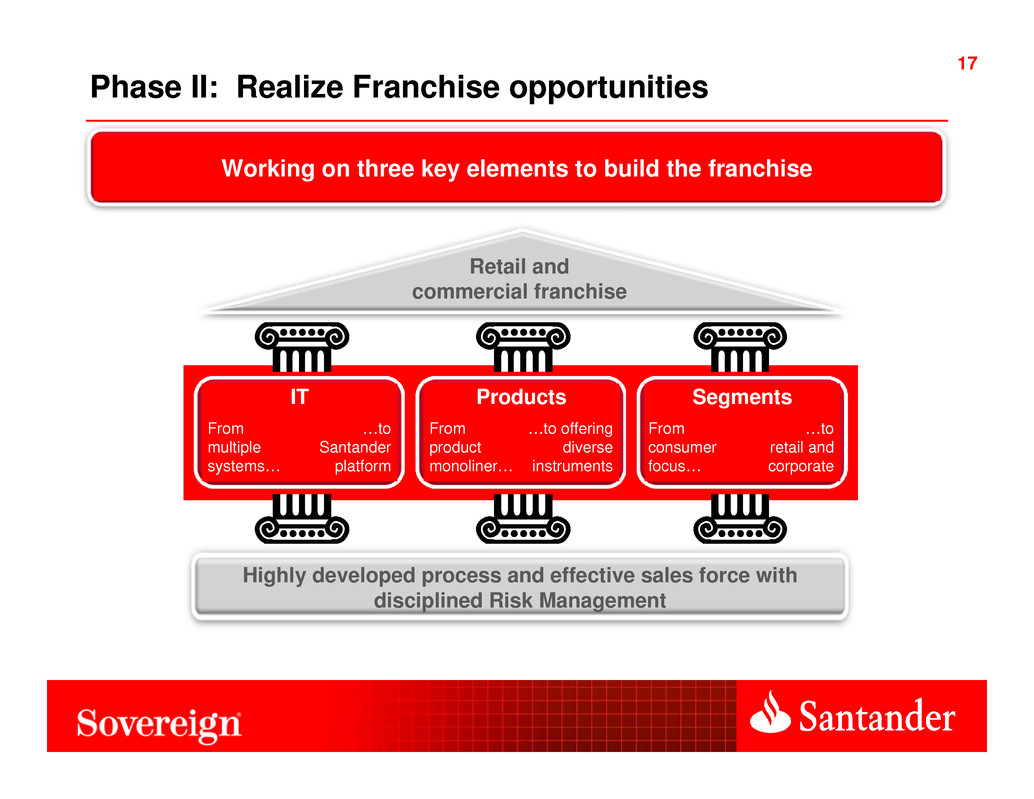
17 Phase II: Realize Franchise opportunities Working on three key elements to build the franchise Retail and commercial franchise Highly developed process and effective sales force with disciplined Risk Management IT Products Segments From multiple systems… …to Santander platform From product monoliner… …to offering diverse instruments From consumer focus… …to retail and corporate
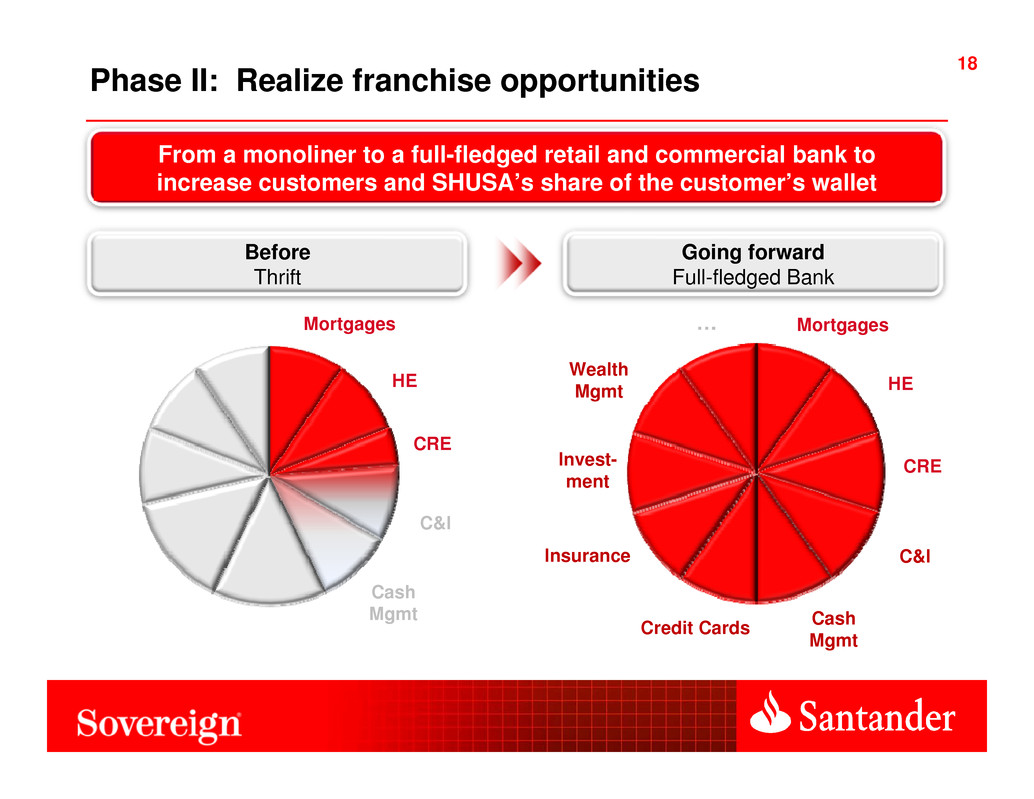
18 Phase II: Realize franchise opportunities From a monoliner to a full-fledged retail and commercial bank to increase customers and SHUSA’s share of the customer’s wallet HE Mortgages C&I Before Thrift Going forward Full-fledged Bank CRE Cash Mgmt HE Mortgages Credit Cards C&IInsurance … CRE Wealth Mgmt Cash Mgmt Invest- ment
19 AGENDA SHUSA Overview and Highlights Q4 2011 Summary Liquidity Capital Sovereign Bank Review Review Phase II: Building the Franchise SCUSA Investor Transaction Appendix
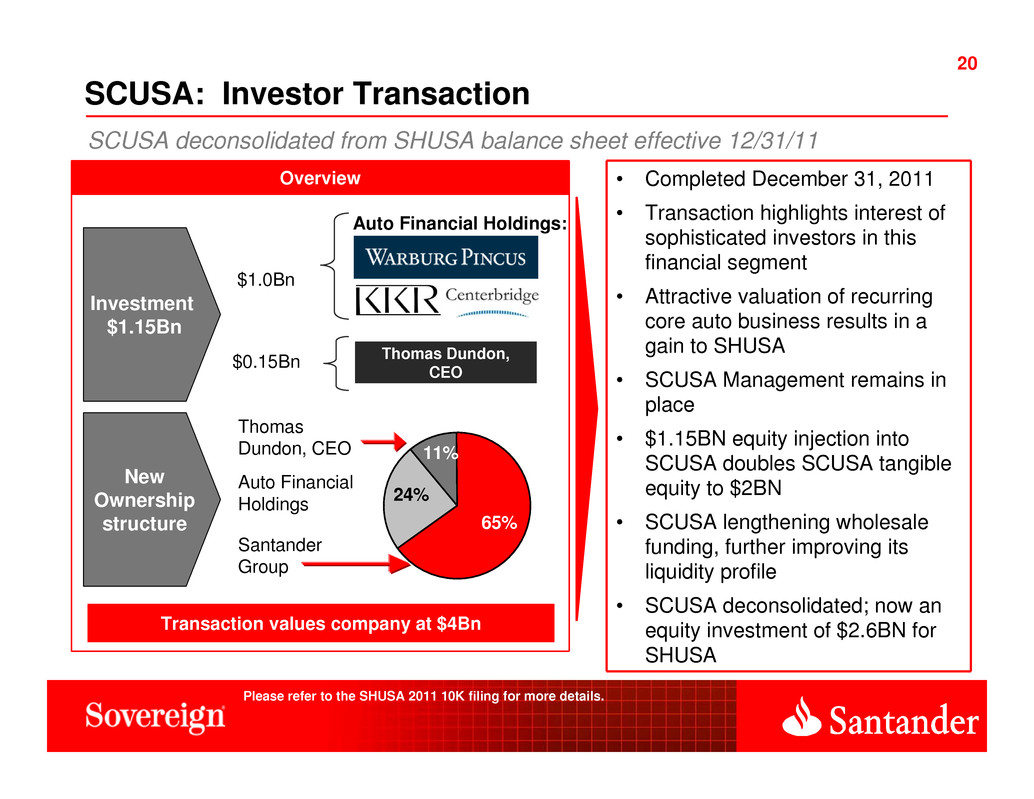
20 20 Overview Thomas Dundon, CEO SCUSA: Investor Transaction • Completed December 31, 2011 • Transaction highlights interest of sophisticated investors in this financial segment • Attractive valuation of recurring core auto business results in a gain to SHUSA • SCUSA Management remains in place • $1.15BN equity injection into SCUSA doubles SCUSA tangible equity to $2BN • SCUSA lengthening wholesale funding, further improving its liquidity profile • SCUSA deconsolidated; now an equity investment of $2.6BN for SHUSA SCUSA deconsolidated from SHUSA balance sheet effective 12/31/11 Thomas Dundon, CEO $0.15Bn $1.0Bn 65% 24% 11% Investment $1.15Bn New Ownership structure Auto Financial Holdings Santander Group Transaction values company at $4Bn Auto Financial Holdings: Please refer to the SHUSA 2011 10K filing for more details.
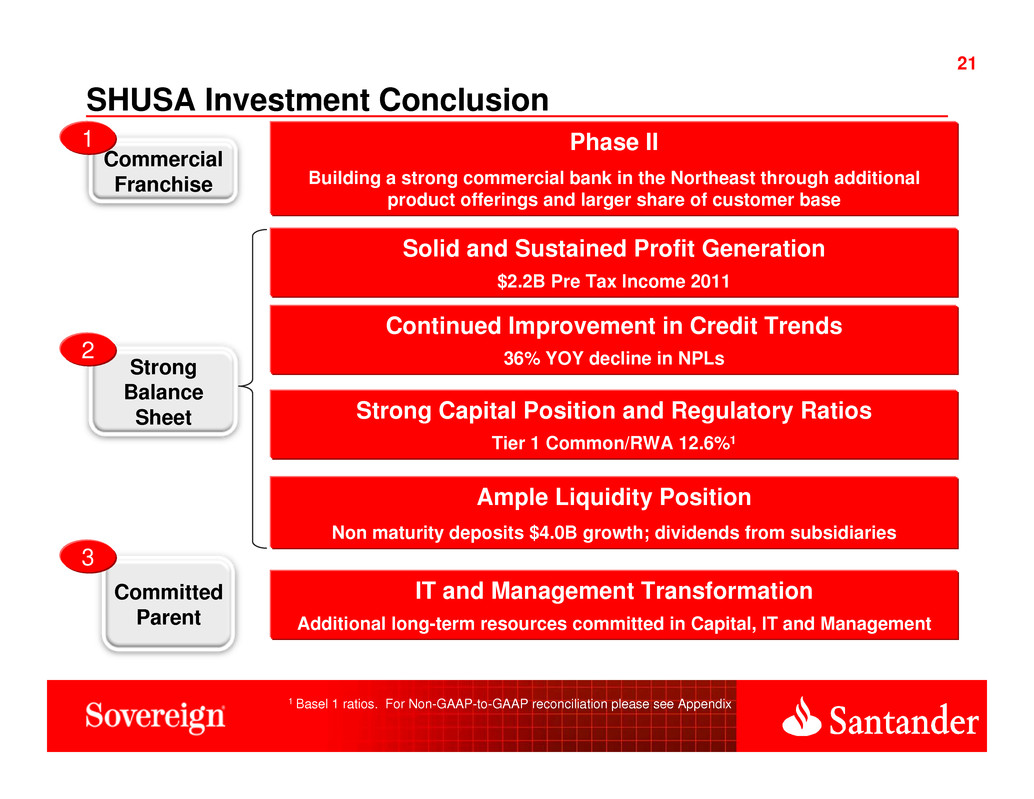
21 21 Strong Balance Sheet Commercial Franchise SHUSA Investment Conclusion Solid and Sustained Profit Generation $2.2B Pre Tax Income 2011 Strong Capital Position and Regulatory Ratios Tier 1 Common/RWA 12.6%1 Continued Improvement in Credit Trends 36% YOY decline in NPLs2 Ample Liquidity Position Non maturity deposits $4.0B growth; dividends from subsidiaries IT and Management Transformation Additional long-term resources committed in Capital, IT and Management 1 1 Basel 1 ratios. For Non-GAAP-to-GAAP reconciliation please see Appendix Phase II Building a strong commercial bank in the Northeast through additional product offerings and larger share of customer base Committed Parent 3
22 22 AGENDA SHUSA Overview and Highlights Q4 2011 Summary Liquidity Capital Sovereign Bank Review Review Phase II: Building the Franchise SCUSA Investor Transaction Appendix
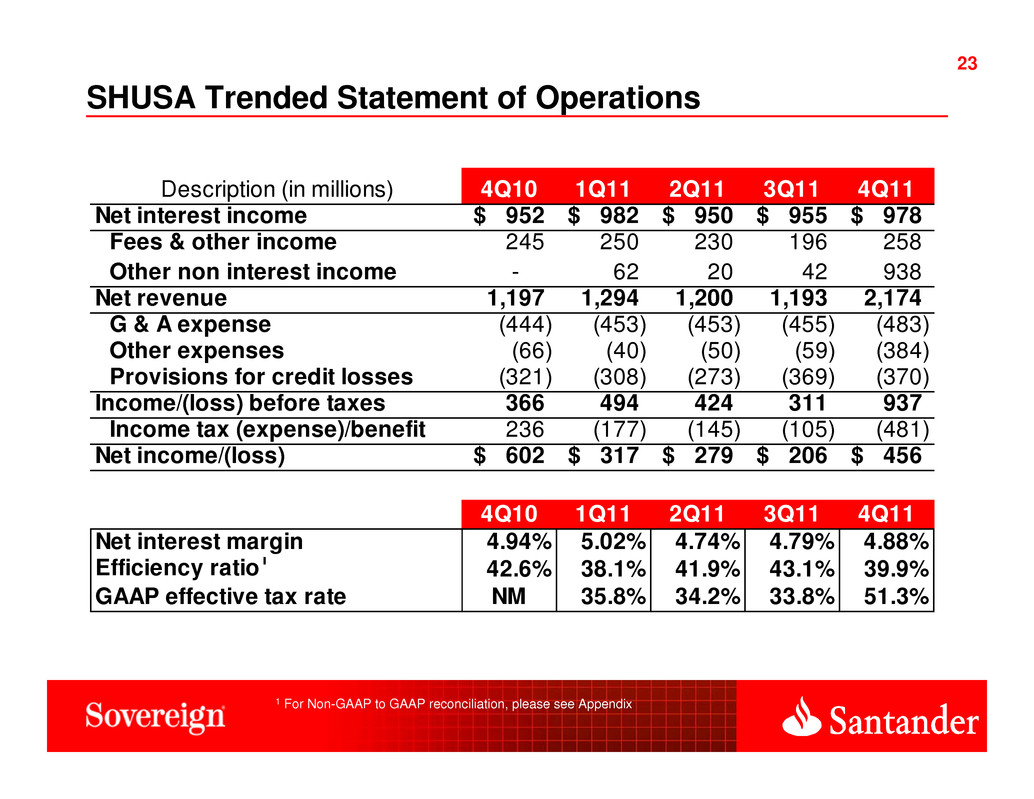
23 23 SHUSA Trended Statement of Operations 1 For Non-GAAP to GAAP reconciliation, please see Appendix Description (in millions) 4Q10 1Q11 2Q11 3Q11 4Q11 Net interest income 952$ 982$ 950$ 955$ 978$ Fees & other income 245 250 230 196 258 Other non interest income - 62 20 42 938 Net revenue 1,197 1,294 1,200 1,193 2,174 G & A expense (444) (453) (453) (455) (483) Other expenses (66) (40) (50) (59) (384) Provisions for credit losses (321) (308) (273) (369) (370) Income/(loss) before taxes 366 494 424 311 937 Income tax (expense)/benefit 236 (177) (145) (105) (481) Net income/(loss) 602$ 317$ 279$ 206$ 456$ 4Q10 1Q11 2Q11 3Q11 4Q11 Net interest margin 4.94% 5.02% 4.74% 4.79% 4.88% Efficiency ratio1 42.6% 38.1% 41.9% 43.1% 39.9% GAAP effective tax rate NM 35.8% 34.2% 33.8% 51.3%
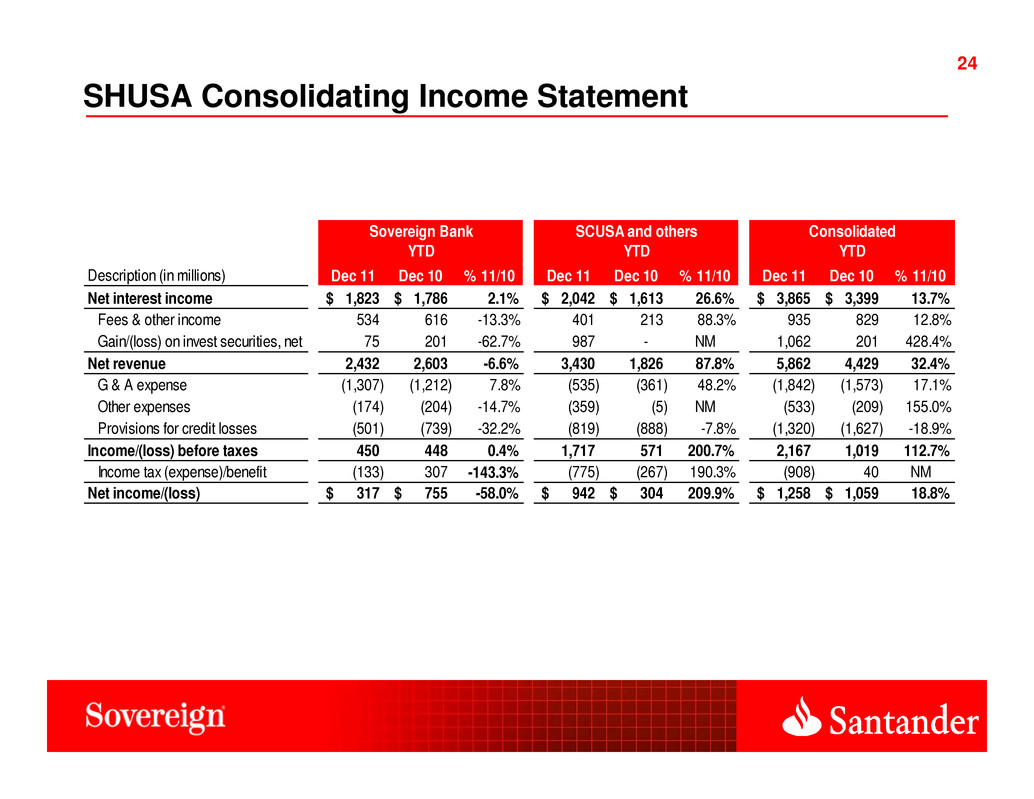
24 24 SHUSA Consolidating Income Statement YTD YTD YTD Description (in millions) Dec 11 Dec 10 % 11/10 Dec 11 Dec 10 % 11/10 Dec 11 Dec 10 % 11/10 Net interest income 1,823$ 1,786$ 2.1% 2,042$ 1,613$ 26.6% 3,865$ 3,399$ 13.7% Fees & other income 534 616 -13.3% 401 213 88.3% 935 829 12.8% Gain/(loss) on invest securities, net 75 201 -62.7% 987 - NM 1,062 201 428.4% Net revenue 2,432 2,603 -6.6% 3,430 1,826 87.8% 5,862 4,429 32.4% G & A expense (1,307) (1,212) 7.8% (535) (361) 48.2% (1,842) (1,573) 17.1% Other expenses (174) (204) -14.7% (359) (5) NM (533) (209) 155.0% Provisions for credit losses (501) (739) -32.2% (819) (888) -7.8% (1,320) (1,627) -18.9% Income/(loss) before taxes 450 448 0.4% 1,717 571 200.7% 2,167 1,019 112.7% Income tax (expense)/benefit (133) 307 -143.3% (775) (267) 190.3% (908) 40 NM Net income/(loss) 317$ 755$ -58.0% 942$ 304$ 209.9% 1,258$ 1,059$ 18.8% Sovereign Bank SCUSA and others Consolidated
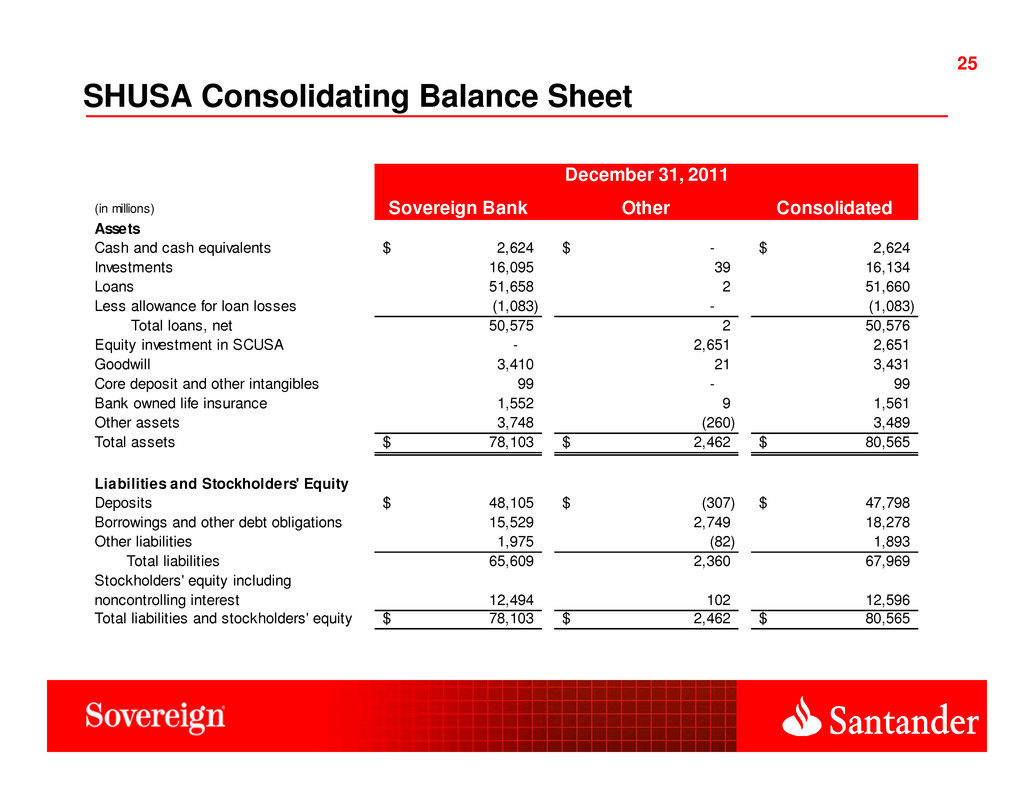
25 25 SHUSA Consolidating Balance Sheet (in millions) Sovereign Bank Other Consolidated Assets Cash and cash equivalents 2,624$ -$ 2,624$ Investments 16,095 39 16,134 Loans 51,658 2 51,660 Less allowance for loan losses (1,083) - (1,083) Total loans, net 50,575 2 50,576 Equity investment in SCUSA - 2,651 2,651 Goodwill 3,410 21 3,431 Core deposit and other intangibles 99 - 99 Bank owned life insurance 1,552 9 1,561 Other assets 3,748 (260) 3,489 Total assets 78,103$ 2,462$ 80,565$ Liabilities and Stockholders' Equity Deposits 48,105$ (307)$ 47,798$ Borrowings and other debt obligations 15,529 2,749 18,278 Other liabilities 1,975 (82) 1,893 Total liabilities 65,609 2,360 67,969 Stockholders' equity including noncontrolling interest 12,494 102 12,596 Total liabilities and stockholders' equity 78,103$ 2,462$ 80,565$ December 31, 2011
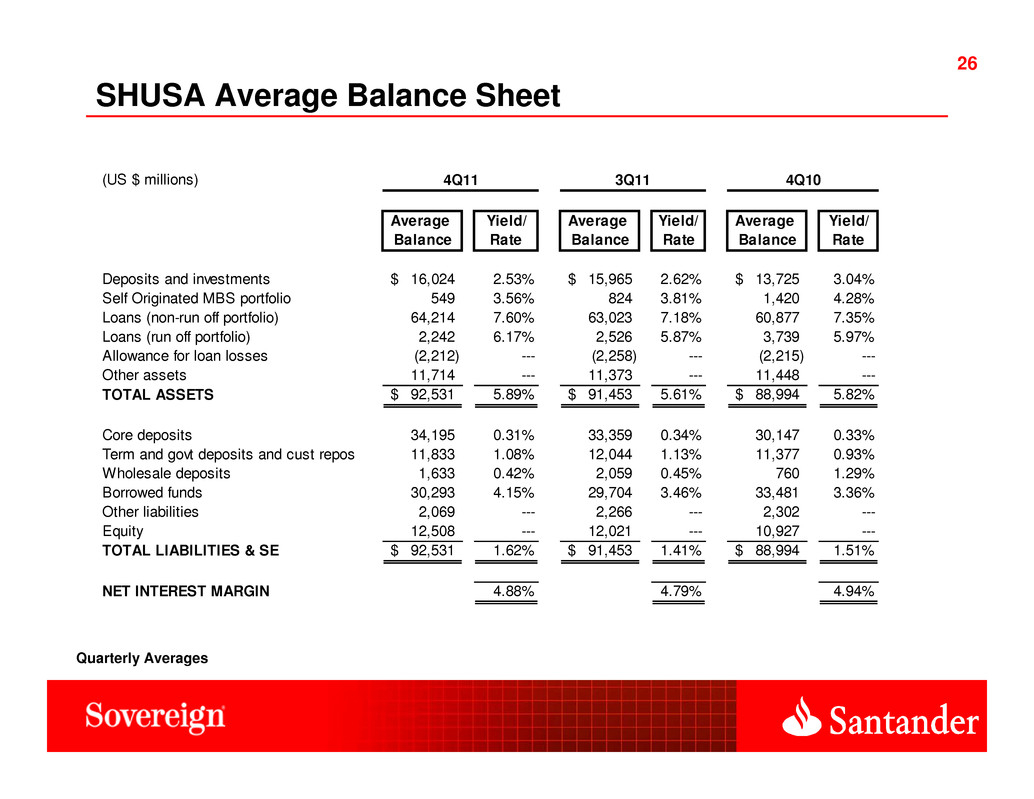
26 26 Quarterly Averages SHUSA Average Balance Sheet (US $ millions) Average Yield/ Average Yield/ Average Yield/ Balance Rate Balance Rate Balance Rate Deposits and investments 16,024$ 2.53% 15,965$ 2.62% 13,725$ 3.04% Self Originated MBS portfolio 549 3.56% 824 3.81% 1,420 4.28% Loans (non-run off portfolio) 64,214 7.60% 63,023 7.18% 60,877 7.35% Loans (run off portfolio) 2,242 6.17% 2,526 5.87% 3,739 5.97% Allowance for loan losses (2,212) --- (2,258) --- (2,215) --- Other assets 11,714 --- 11,373 --- 11,448 --- TOTAL ASSETS 92,531$ 5.89% 91,453$ 5.61% 88,994$ 5.82% Core deposits 34,195 0.31% 33,359 0.34% 30,147 0.33% Term and govt deposits and cust repos 11,833 1.08% 12,044 1.13% 11,377 0.93% Wholesale deposits 1,633 0.42% 2,059 0.45% 760 1.29% Borrowed funds 30,293 4.15% 29,704 3.46% 33,481 3.36% Other liabilities 2,069 --- 2,266 --- 2,302 --- Equity 12,508 --- 12,021 --- 10,927 --- TOTAL LIABILITIES & SE 92,531$ 1.62% 91,453$ 1.41% 88,994$ 1.51% NET INTEREST MARGIN 4.88% 4.79% 4.94% 4Q11 3Q11 4Q10
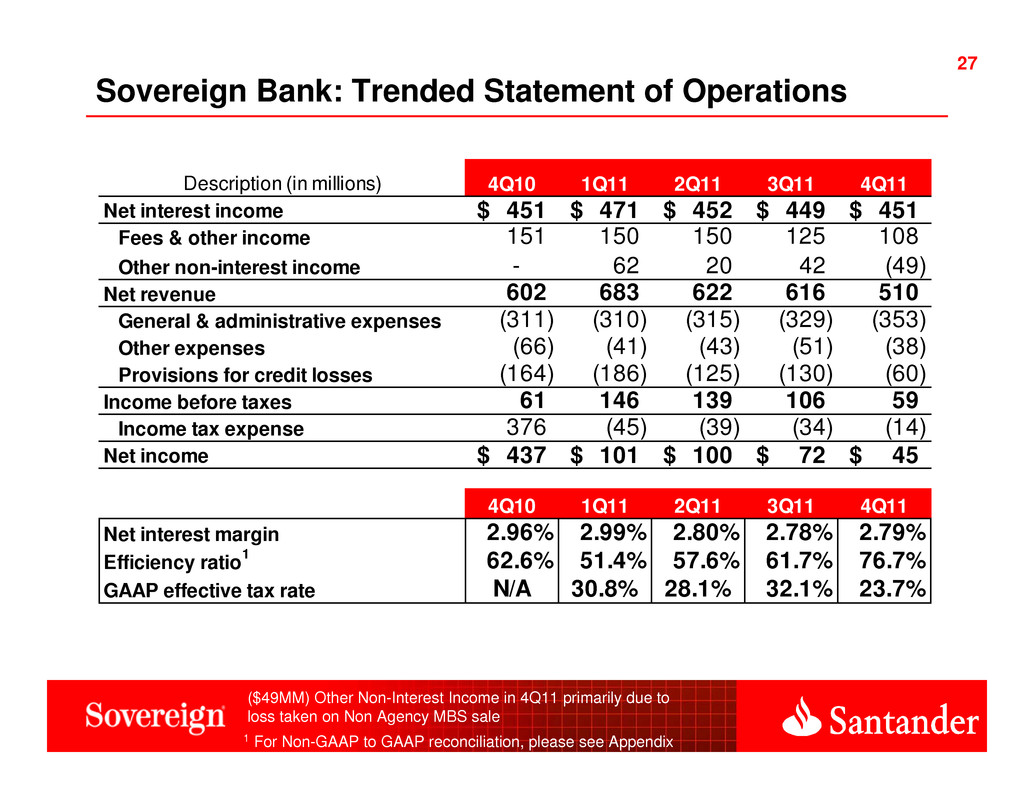
27 27 Sovereign Bank: Trended Statement of Operations 1 For Non-GAAP to GAAP reconciliation, please see Appendix Description (in millions) 4Q10 1Q11 2Q11 3Q11 4Q11 Net interest income 451$ 471$ 452$ 449$ 451$ Fees & other income 151 150 150 125 108 Other non-interest income - 62 20 42 (49) Net revenue 602 683 622 616 510 General & administrative expenses (311) (310) (315) (329) (353) Other expenses (66) (41) (43) (51) (38) Provisions for credit losses (164) (186) (125) (130) (60) Income before taxes 61 146 139 106 59 Income tax expense 376 (45) (39) (34) (14) Net income 437$ 101$ 100$ 72$ 45$ 4Q10 1Q11 2Q11 3Q11 4Q11 Net interest margin 2.96% 2.99% 2.80% 2.78% 2.79% Efficiency ratio1 62.6% 51.4% 57.6% 61.7% 76.7% GAAP effective tax rate N/A 30.8% 28.1% 32.1% 23.7% ($49MM) Other Non-Interest Income in 4Q11 primarily due to loss taken on Non Agency MBS sale
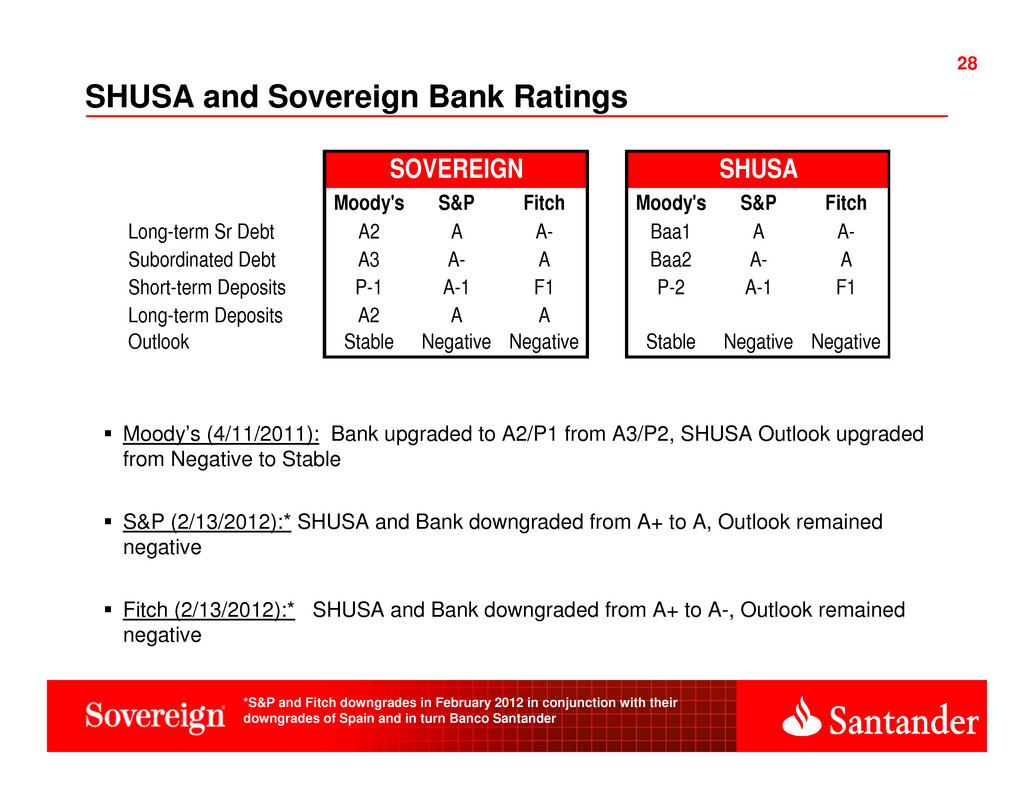
28 28 Moody’s (4/11/2011): Bank upgraded to A2/P1 from A3/P2, SHUSA Outlook upgraded from Negative to Stable S&P (2/13/2012):* SHUSA and Bank downgraded from A+ to A, Outlook remained negative Fitch (2/13/2012):* SHUSA and Bank downgraded from A+ to A-, Outlook remained negative SHUSA and Sovereign Bank Ratings *S&P and Fitch downgrades in February 2012 in conjunction with their downgrades of Spain and in turn Banco Santander Moody's S&P Fitch Moody's S&P Fitch Long-term Sr Debt A2 A A- Baa1 A A- Subordinated Debt A3 A- A Baa2 A- A Short-term Deposits P-1 A-1 F1 P-2 A-1 F1 Long-term Deposits A2 A A Outlook Stable Negative Negative Stable Negative Negative SHUSASOVEREIGN
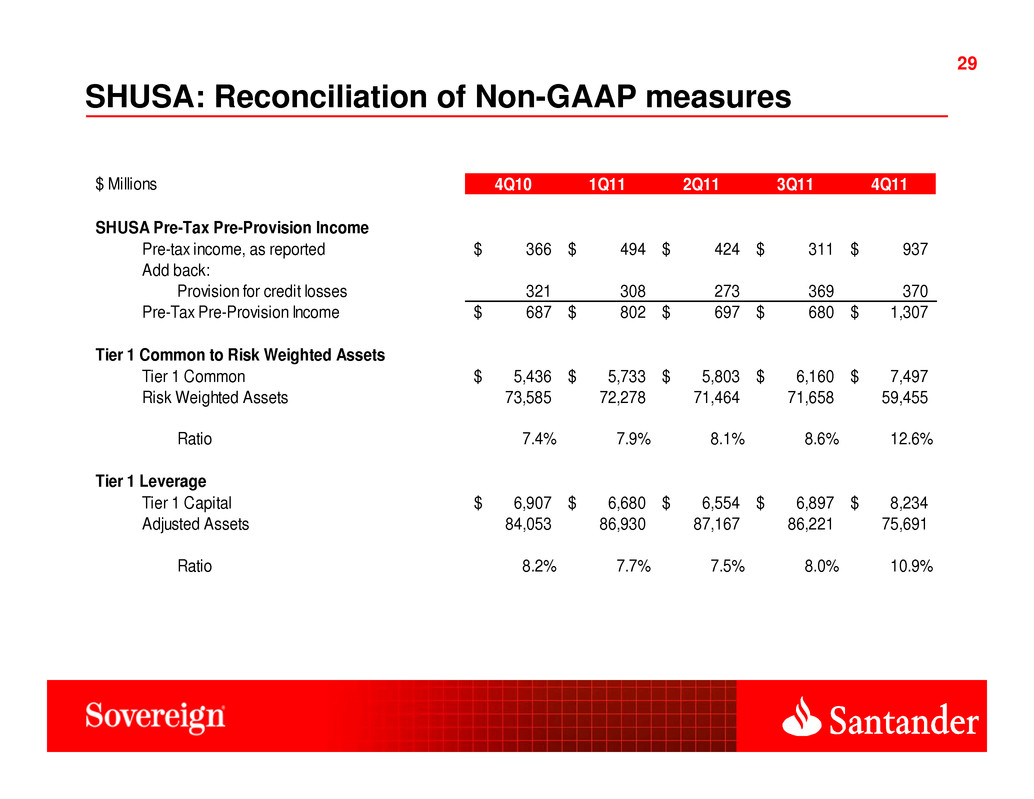
29 29 SHUSA: Reconciliation of Non-GAAP measures $ Millions 4Q10 1Q11 2Q11 3Q11 4Q11 SHUSA Pre-Tax Pre-Provision Income Pre-tax income, as reported 366$ 494$ 424$ 311$ 937$ Add back: Provision for credit losses 321 308 273 369 370 Pre-Tax Pre-Provision Income 687$ 802$ 697$ 680$ 1,307$ Tier 1 Common to Risk Weighted Assets Tier 1 Common 5,436$ 5,733$ 5,803$ 6,160$ 7,497$ Risk Weighted Assets 73,585 72,278 71,464 71,658 59,455 Ratio 7.4% 7.9% 8.1% 8.6% 12.6% Tier 1 Leverage Tier 1 Capital 6,907$ 6,680$ 6,554$ 6,897$ 8,234$ Adjusted Assets 84,053 86,930 87,167 86,221 75,691 Ratio 8.2% 7.7% 7.5% 8.0% 10.9%
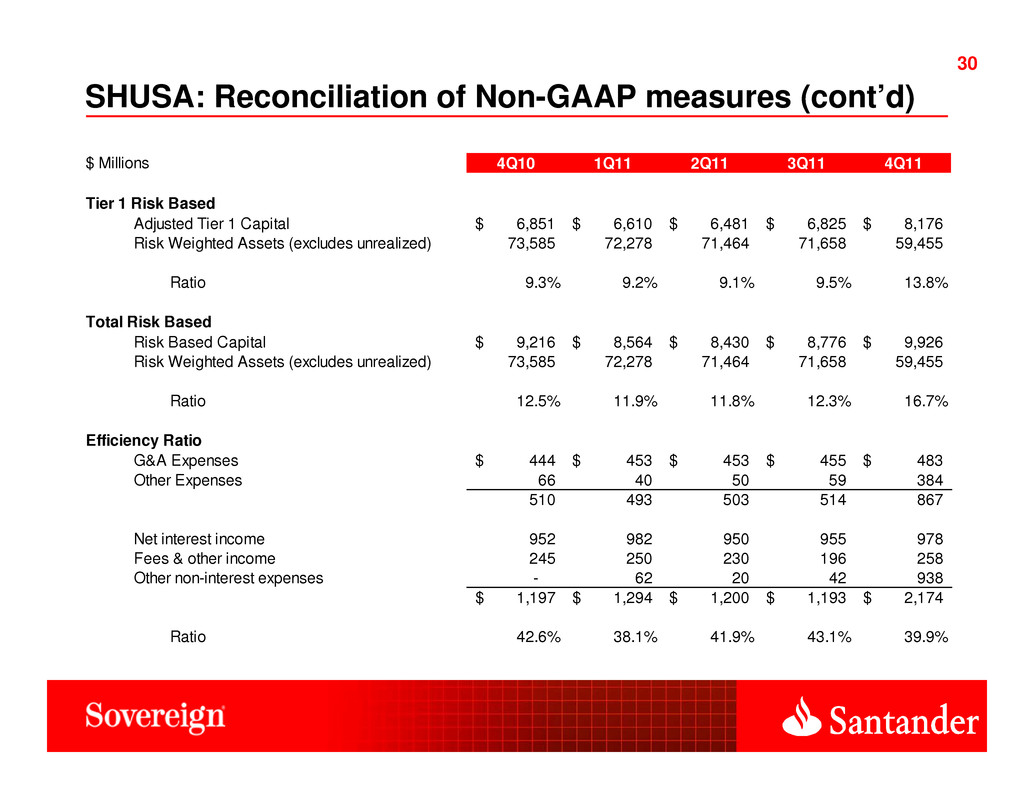
30 30 SHUSA: Reconciliation of Non-GAAP measures (cont’d) $ Millions 4Q10 1Q11 2Q11 3Q11 4Q11 Tier 1 Risk Based Adjusted Tier 1 Capital 6,851$ 6,610$ 6,481$ 6,825$ 8,176$ Risk Weighted Assets (excludes unrealized) 73,585 72,278 71,464 71,658 59,455 Ratio 9.3% 9.2% 9.1% 9.5% 13.8% Total Risk Based Risk Based Capital 9,216$ 8,564$ 8,430$ 8,776$ 9,926$ Risk Weighted Assets (excludes unrealized) 73,585 72,278 71,464 71,658 59,455 Ratio 12.5% 11.9% 11.8% 12.3% 16.7% Efficiency Ratio G&A Expenses 444$ 453$ 453$ 455$ 483$ Other Expenses 66 40 50 59 384 510 493 503 514 867 Net interest income 952 982 950 955 978 Fees & other income 245 250 230 196 258 Other non-interest expenses - 62 20 42 938 1,197$ 1,294$ 1,200$ 1,193$ 2,174$ Ratio 42.6% 38.1% 41.9% 43.1% 39.9%
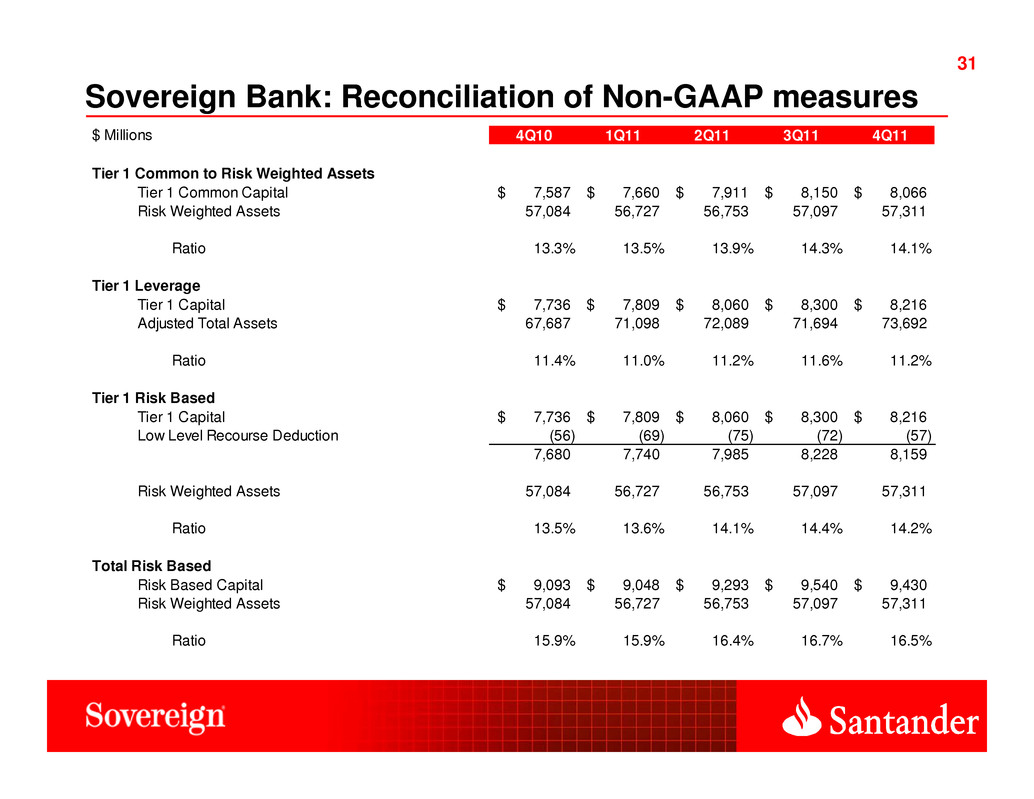
31 31 Sovereign Bank: Reconciliation of Non-GAAP measures $ Millions 4Q10 1Q11 2Q11 3Q11 4Q11 Tier 1 Common to Risk Weighted Assets Tier 1 Common Capital 7,587$ 7,660$ 7,911$ 8,150$ 8,066$ Risk Weighted Assets 57,084 56,727 56,753 57,097 57,311 Ratio 13.3% 13.5% 13.9% 14.3% 14.1% Tier 1 Leverage Tier 1 Capital 7,736$ 7,809$ 8,060$ 8,300$ 8,216$ Adjusted Total Assets 67,687 71,098 72,089 71,694 73,692 Ratio 11.4% 11.0% 11.2% 11.6% 11.2% Tier 1 Risk Based Tier 1 Capital 7,736$ 7,809$ 8,060$ 8,300$ 8,216$ Low Level Recourse Deduction (56) (69) (75) (72) (57) 7,680 7,740 7,985 8,228 8,159 Risk Weighted Assets 57,084 56,727 56,753 57,097 57,311 Ratio 13.5% 13.6% 14.1% 14.4% 14.2% Total Risk Based Risk Based Capital 9,093$ 9,048$ 9,293$ 9,540$ 9,430$ Risk Weighted Assets 57,084 56,727 56,753 57,097 57,311 Ratio 15.9% 15.9% 16.4% 16.7% 16.5%
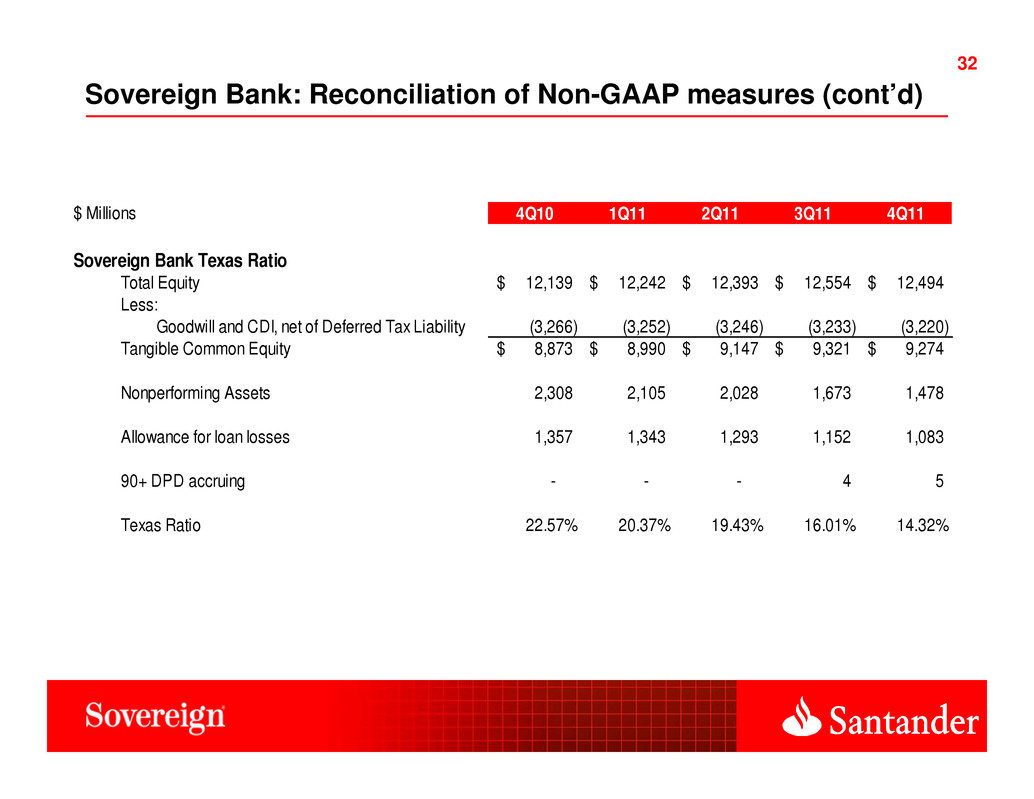
32 32 Sovereign Bank: Reconciliation of Non-GAAP measures (cont’d) $ Millions 4Q10 1Q11 2Q11 3Q11 4Q11 Sovereign Bank Texas Ratio Total Equity 12,139$ 12,242$ 12,393$ 12,554$ 12,494$ Less: Goodwill and CDI, net of Deferred Tax Liability (3,266) (3,252) (3,246) (3,233) (3,220) Tangible Common Equity 8,873$ 8,990$ 9,147$ 9,321$ 9,274$ Nonperforming Assets 2,308 2,105 2,028 1,673 1,478 Allowance for loan losses 1,357 1,343 1,293 1,152 1,083 90+ DPD accruing - - - 4 5 Texas Ratio 22.57% 20.37% 19.43% 16.01% 14.32%


