SECURITIES AND EXCHANGE COMMISSION
WASHINGTON, DC 20549
FORM N-CSR
CERTIFIED SHAREHOLDER REPORT OF REGISTERED
MANAGEMENT INVESTMENT COMPANIES
Investment Company Act file number: 811-05071 / 33-13247
SATURNA INVESTMENT TRUST
(Exact Name of Registrant as Specified in Charter)
1300 N. State Street
Bellingham, Washington 98225-4730
(Address of Principal Executive Offices, including ZIP Code)
Elliot S. Cohen
1300 N. State Street
Bellingham, Washington 98225-4730
(Name and Address of Agent for Service)
Registrant’s Telephone Number – (360) 734-9900 Ext. 1804
Date of fiscal year end: November 30, 2024
Date of reporting period: November 30, 2024
Item 1. Report To Shareowners
0000811860sit:C000153268Member2021-10-31
Annual Shareholder Report - November 30, 2024
The objective of the Sextant Bond Income Fund is current income. This Annual Shareholder Report contains important information about the Sextant Bond Income Fund for the period of December 1, 2023 to November 30, 2024. You can find additional information about the Fund at www.saturna.com/sextant/bond-income-fund. You can also request this information by contacting us at 1-800-728-8762 or investorservices@saturna.com. The report describes changes to the Fund that occurred during the reporting period.
What were the Fund’s costs for the last year?
(Based on a hypothetical $10,000 investment)
| Class Name | Cost of a $10,000 Investment | Cost Paid as a % of a $10,000 Investment |
|---|
| Sextant Bond Income | $67 | 0.65% |
|---|
How did the Fund perform over the last year?
For the fiscal year ended November 30, 2024, the Sextant Bond Income Fund returned 6.73% and the Bloomberg US Aggregate Index returned 6.88%. For the five-year period ended November 30, 2024, the Fund reported an annualized total return of -1.05%, compared to -0.01% for the Bloomberg US Aggregate Index. The primary reason for the Fund’s underperformance was a higher allocation to longer-duration securities relative to the Bloomberg US Aggregate Index.
Factors Affecting Past Performance
Elevated inflation, an uncertain growth outlook, and a global election cycle made 2024 another volatile year across fixed income markets. Although the Federal Funds Rate was reduced by 100 basis points, the yield curve experienced a pronounced steepening, demonstrating the opposing forces of a weakening labor market, strong output growth, and high inflation expectations. Last December, a steep drop in long-end yields was a large contributor to one-year performance. However, since the beginning of 2024, longer duration was generally a detractor. Together, the portfolio's performance kept pace with the Bloomberg US Aggregate Index, only underperforming by 15 basis points despite the longer duration.
Even amid macroeconomic and political uncertainty, corporate debt was well-bid, leading to extensive spread compression across both investment-grade and high-yield debt. Credit-risky debt rallied as investors welcomed the newfound yield, with participants aiming to lock in the higher yield no matter the cost. The Fund maintained a lower weighting to credit-risky debt, instead opting for yield enhancement in other areas of the market. This positioning should help reduce volatility in case the market experiences a risk-off move during 2025.
Looking Forward
To end the year, politics was top of mind as the United States headed to the polls in November. Along with a new regime comes a new set of opportunities and risks in 2025. As policy becomes clearer, the Sextant Bond Income Fund will remain defensively positioned, ready to take advantage of any new developments. While adaptability is crucial, our goal has always been to choose good companies and invest through cycles rather than engaging in market timing with outsized active bets.
How did the Fund perform over the past 10 years?
The Cumulative Performance chart reflects a hypothetical $10,000 investment in the class of shares noted. Past performance does not guarantee future results. The graph and table do not reflect the deduction of taxes that a shareholder would pay on Fund distributions or redemption of Fund shares.
November 30, 2014 through November 30, 2024 with initial investment of $10,000.
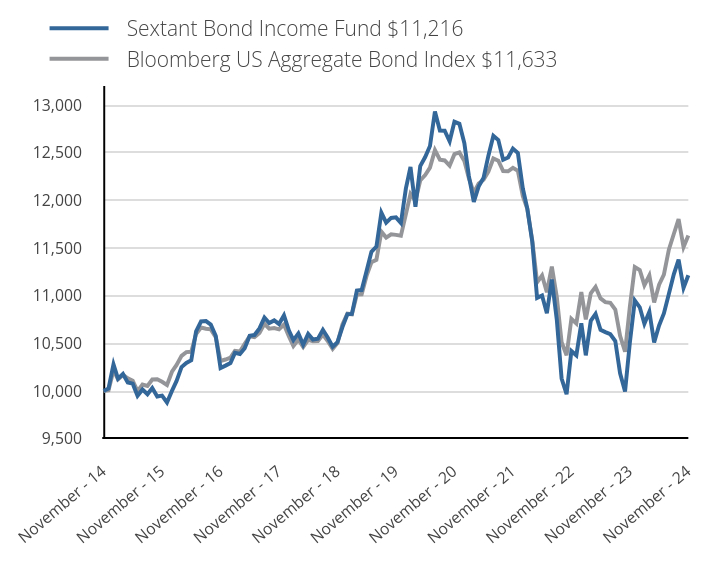
| Sextant Bond Income Fund $11,216 | Bloomberg US Aggregate Bond Index $11,633 |
|---|
| November - 14 | 10,000 | 10,000 |
|---|
| December - 14 | 10,027 | 10,009 |
|---|
| January - 15 | 10,280 | 10,219 |
|---|
| February - 15 | 10,131 | 10,123 |
|---|
| March - 15 | 10,180 | 10,170 |
|---|
| April - 15 | 10,091 | 10,134 |
|---|
| May - 15 | 10,078 | 10,109 |
|---|
| June - 15 | 9,951 | 9,999 |
|---|
| July - 15 | 10,017 | 10,069 |
|---|
| August - 15 | 9,967 | 10,054 |
|---|
| September - 15 | 10,033 | 10,122 |
|---|
| October - 15 | 9,944 | 10,124 |
|---|
| November - 15 | 9,953 | 10,097 |
|---|
| December - 15 | 9,881 | 10,064 |
|---|
| January - 16 | 10,002 | 10,203 |
|---|
| February - 16 | 10,106 | 10,275 |
|---|
| March - 16 | 10,252 | 10,370 |
|---|
| April - 16 | 10,296 | 10,409 |
|---|
| May - 16 | 10,323 | 10,412 |
|---|
| June - 16 | 10,626 | 10,599 |
|---|
| July - 16 | 10,730 | 10,666 |
|---|
| August - 16 | 10,734 | 10,654 |
|---|
| September - 16 | 10,697 | 10,648 |
|---|
| October - 16 | 10,581 | 10,566 |
|---|
| November - 16 | 10,242 | 10,316 |
|---|
| December - 16 | 10,267 | 10,331 |
|---|
| January - 17 | 10,295 | 10,351 |
|---|
| February - 17 | 10,401 | 10,421 |
|---|
| March - 17 | 10,389 | 10,415 |
|---|
| April - 17 | 10,450 | 10,496 |
|---|
| May - 17 | 10,581 | 10,576 |
|---|
| June - 17 | 10,588 | 10,566 |
|---|
| July - 17 | 10,658 | 10,611 |
|---|
| August - 17 | 10,770 | 10,706 |
|---|
| September - 17 | 10,713 | 10,655 |
|---|
| October - 17 | 10,741 | 10,662 |
|---|
| November - 17 | 10,704 | 10,648 |
|---|
| December - 17 | 10,794 | 10,697 |
|---|
| January - 18 | 10,635 | 10,574 |
|---|
| February - 18 | 10,535 | 10,473 |
|---|
| March - 18 | 10,605 | 10,540 |
|---|
| April - 18 | 10,487 | 10,462 |
|---|
| May - 18 | 10,600 | 10,537 |
|---|
| June - 18 | 10,541 | 10,524 |
|---|
| July - 18 | 10,550 | 10,526 |
|---|
| August - 18 | 10,643 | 10,594 |
|---|
| September - 18 | 10,563 | 10,526 |
|---|
| October - 18 | 10,466 | 10,443 |
|---|
| November - 18 | 10,514 | 10,505 |
|---|
| December - 18 | 10,672 | 10,698 |
|---|
| January - 19 | 10,807 | 10,812 |
|---|
| February - 19 | 10,810 | 10,805 |
|---|
| March - 19 | 11,054 | 11,013 |
|---|
| April - 19 | 11,060 | 11,016 |
|---|
| May - 19 | 11,263 | 11,211 |
|---|
| June - 19 | 11,462 | 11,352 |
|---|
| July - 19 | 11,515 | 11,377 |
|---|
| August - 19 | 11,872 | 11,672 |
|---|
| September - 19 | 11,767 | 11,610 |
|---|
| October - 19 | 11,817 | 11,645 |
|---|
| November - 19 | 11,823 | 11,639 |
|---|
| December - 19 | 11,763 | 11,630 |
|---|
| January - 20 | 12,124 | 11,854 |
|---|
| February - 20 | 12,351 | 12,068 |
|---|
| March - 20 | 11,933 | 11,997 |
|---|
| April - 20 | 12,361 | 12,210 |
|---|
| May - 20 | 12,455 | 12,267 |
|---|
| June - 20 | 12,571 | 12,344 |
|---|
| July - 20 | 12,933 | 12,528 |
|---|
| August - 20 | 12,733 | 12,427 |
|---|
| September - 20 | 12,732 | 12,420 |
|---|
| October - 20 | 12,620 | 12,365 |
|---|
| November - 20 | 12,825 | 12,486 |
|---|
| December - 20 | 12,804 | 12,504 |
|---|
| January - 21 | 12,601 | 12,414 |
|---|
| February - 21 | 12,258 | 12,235 |
|---|
| March - 21 | 11,985 | 12,082 |
|---|
| April - 21 | 12,146 | 12,177 |
|---|
| May - 21 | 12,239 | 12,217 |
|---|
| June - 21 | 12,470 | 12,303 |
|---|
| July - 21 | 12,679 | 12,440 |
|---|
| August - 21 | 12,634 | 12,417 |
|---|
| September - 21 | 12,427 | 12,309 |
|---|
| October - 21 | 12,451 | 12,306 |
|---|
| November - 21 | 12,544 | 12,342 |
|---|
| December - 21 | 12,498 | 12,311 |
|---|
| January - 22 | 12,126 | 12,045 |
|---|
| February - 22 | 11,914 | 11,911 |
|---|
| March - 22 | 11,564 | 11,580 |
|---|
| April - 22 | 10,978 | 11,141 |
|---|
| May - 22 | 11,003 | 11,213 |
|---|
| June - 22 | 10,816 | 11,037 |
|---|
| July - 22 | 11,171 | 11,306 |
|---|
| August - 22 | 10,748 | 10,987 |
|---|
| September - 22 | 10,132 | 10,512 |
|---|
| October - 22 | 9,967 | 10,376 |
|---|
| November - 22 | 10,420 | 10,758 |
|---|
| December - 22 | 10,375 | 10,709 |
|---|
| January - 23 | 10,711 | 11,039 |
|---|
| February - 23 | 10,375 | 10,753 |
|---|
| March - 23 | 10,737 | 11,026 |
|---|
| April - 23 | 10,810 | 11,093 |
|---|
| May - 23 | 10,643 | 10,972 |
|---|
| June - 23 | 10,619 | 10,933 |
|---|
| July - 23 | 10,597 | 10,926 |
|---|
| August - 23 | 10,526 | 10,856 |
|---|
| September - 23 | 10,187 | 10,580 |
|---|
| October - 23 | 9,995 | 10,413 |
|---|
| November - 23 | 10,509 | 10,884 |
|---|
| December - 23 | 10,951 | 11,301 |
|---|
| January - 24 | 10,879 | 11,270 |
|---|
| February - 24 | 10,707 | 11,111 |
|---|
| March - 24 | 10,832 | 11,213 |
|---|
| April - 24 | 10,511 | 10,930 |
|---|
| May - 24 | 10,688 | 11,116 |
|---|
| June - 24 | 10,815 | 11,221 |
|---|
| July - 24 | 11,019 | 11,483 |
|---|
| August - 24 | 11,225 | 11,648 |
|---|
| September - 24 | 11,380 | 11,804 |
|---|
| October - 24 | 11,084 | 11,511 |
|---|
| November - 24 | 11,216 | 11,633 |
|---|
Annual Average Total Return
| 1 Year | 5 Year | 10 Year |
|---|
| Sextant Bond Income | 6.73% | -1.05% | 1.15% |
|---|
| Bloomberg US Aggregate Bond Index | 6.88% | -0.01% | 1.52% |
|---|
Past performance does not guarantee future results. The "Average Annual Return" and "Cumulative Performance" tables assume the reinvestment of dividends and capital shares. Performance results do not reflect the deduction of taxes that a shareowner might pay on fund distributions or the redemptions of fund shares. Please visit www.saturna.com/sextant/bond-income-fund for more recent performance information.
Annual Shareholder Report - November 30, 2024
| Total Net Assets | $11,104,589 |
|---|
| # of Portfolio Holdings | 45 |
|---|
| Advisory Fees Paid | $31,231 |
|---|
| Portfolio Turnover Rate | 4% |
|---|
You may have consented to receive one shareholder report at your address if you and one or more individuals in your home have an account with the Fund (householding). If you wish to receive a copy of this document at a new address, contact 1-800-728-8762.
What did the Fund invest in?
| United States Treasury Bond (4.250% due 05/15/2039) | 6.9% |
| United States Treasury Bond (3.375% due 11/15/2048) | 4.2% |
| United States Treasury Bond (5.375% due 02/15/2031) | 3.9% |
| Apple (4.500% due 02/23/2036) | 3.2% |
| Microsoft (4.200% due 11/3/2035) | 3.1% |
| Intel (4.000% due 12/15/2032) | 3.0% |
| Home Depot (5.875% due 12/16/2036) | 2.9% |
| Minnesota Housing Finance Agency (5.925% due 07/1/2049) | 2.8% |
| Maryland Community Development Administration (5.991% due 09/1/2044) | 2.7% |
| Burlington Northern Santa Fe (5.050% due 03/1/2041) | 2.7% |
| Government | 28.8% |
| Financials | 10.4% |
| Technology | 9.8% |
| Health Care | 9.3% |
| Industrials | 6.2% |
| Energy | 5.3% |
| Consumer Discretionary | 5.3% |
| Utilities | 4.9% |
| Consumer Staples | 4.8% |
| Materials | 4.6% |
| Other Sectors | 8.2% |
| Other Assets (net of liabilities) | 2.4% |
If you wish to view additional information about the Fund, including but not limited to the Fund's prospectus, financial statements, holdings, or proxy voting information, please visit www.saturna.com/forms#mutual-fund-library.
1300 N. State Street
Bellingham, WA 98225
1-800-728-8762
Annual Shareholder Report - November 30, 2024
The objective of the Sextant Core Fund is long-term appreciation and capital preservation. This Annual Shareholder Report contains important information about the Sextant Core Fund for the period of December 1, 2023 to November 30, 2024. You can find additional information about the Fund at www.saturna.com/sextant/core-fund. You can also request this information by contacting us at 1-800-728-8762 or investorservices@saturna.com. The report describes changes to the Fund that occurred during the reporting period.
What were the Fund’s costs for the last year?
(Based on a hypothetical $10,000 investment)
| Class Name | Cost of a $10,000 Investment | Cost Paid as a % of a $10,000 Investment |
|---|
| Sextant Core | $80 | 0.74% |
|---|
How did the Fund perform over the last year?
The Sextant Core Fund returned 16.84% for the fiscal year ended November 30, 2024. The Fund’s benchmark, a 60/40 blend of the S&P Global 1200 Equity Index and the Bloomberg US Aggregate Bond Index returned 18.97% for the same period. At fiscal year-end, the Fund recorded a 30-day yield of 1.08% and reported turnover of 17% for 2024.
Factors Affecting Past Performance
Equities
The Sextant Core Fund’s mandate allocates a 60% weight in equity securities, with two-thirds being US-domiciled companies and one-third foreign-domiciled companies. The Fund generally holds equity positions in larger companies with strong balance sheets. The average market capitalization of positions held by the Fund was $404.2 billion with 20% total debt-to-market capitalization at year-end. The Fund’s 61.75% equity allocation was comprised of 59 positions across 15 countries.
Fixed Income
The Sextant Core Fund targets an allocation of 40% cash and investment-grade fixed-income securities. During the fiscal year, the Federal Reserve cut interest rate by 75 basis points (bps) from 5.375% at the mid-point to 4.625%. Despite cuts, longer-term treasuries were largely flat on the year, with the 10-year rising 48 bps from the start of easing through the end of fiscal year 2024.
Looking Forward
The US equity and bond markets ended fiscal 2024 with a buoyant November, driven by expectations that further rate cuts were likely and economic growth remained sturdy. In 2023, we noted that cuts may be in store for 2024, and the reason for those cuts is just as important as the amount. We maintain this view, acknowledging slow and steady cuts driven by cooling inflation should be supportive, whereas rapid cuts due to deteriorating real economic growth would be troubling. Such uncertainty bolsters the value of a 60/40 portfolio, where bonds can provide a ballast and equities a sail.
How did the Fund perform over the past 10 years?
The Cumulative Performance chart reflects a hypothetical $10,000 investment in the class of shares noted. Past performance does not guarantee future results. The graph and table do not reflect the deduction of taxes that a shareholder would pay on Fund distributions or redemption of Fund shares.
November 30, 2014 through November 30, 2024 with initial investment of $10,000.
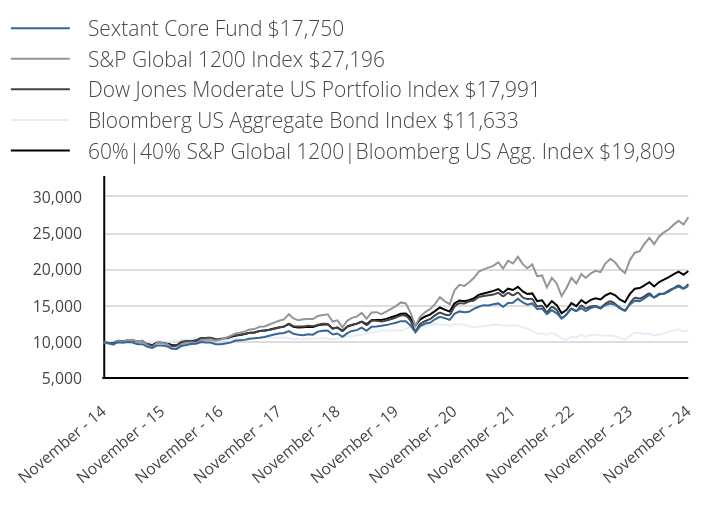
| Sextant Core Fund $17,750 | S&P Global 1200 Index $27,196 | Dow Jones Moderate US Portfolio Index $17,991 | Bloomberg US Aggregate Bond Index $11,633 | 60%|40% S&P Global 1200|Bloomberg US Agg. Index $19,809 |
|---|
| November - 14 | 10,000 | 10,000 | 10,000 | 10,000 | 10,000 |
|---|
| December - 14 | 9,871 | 9,836 | 9,944 | 10,009 | 9,906 |
|---|
| January - 15 | 9,775 | 9,659 | 9,923 | 10,219 | 9,881 |
|---|
| February - 15 | 10,016 | 10,209 | 10,198 | 10,123 | 10,182 |
|---|
| March - 15 | 9,960 | 10,051 | 10,169 | 10,170 | 10,106 |
|---|
| April - 15 | 10,032 | 10,331 | 10,252 | 10,134 | 10,261 |
|---|
| May - 15 | 9,968 | 10,356 | 10,247 | 10,109 | 10,266 |
|---|
| June - 15 | 9,743 | 10,111 | 10,108 | 9,999 | 10,075 |
|---|
| July - 15 | 9,751 | 10,247 | 10,128 | 10,069 | 10,185 |
|---|
| August - 15 | 9,381 | 9,579 | 9,776 | 10,054 | 9,780 |
|---|
| September - 15 | 9,244 | 9,240 | 9,592 | 10,122 | 9,599 |
|---|
| October - 15 | 9,582 | 9,975 | 9,995 | 10,124 | 10,058 |
|---|
| November - 15 | 9,562 | 9,924 | 9,950 | 10,097 | 10,017 |
|---|
| December - 15 | 9,451 | 9,752 | 9,824 | 10,064 | 9,899 |
|---|
| January - 16 | 9,137 | 9,192 | 9,484 | 10,203 | 9,613 |
|---|
| February - 16 | 9,103 | 9,129 | 9,544 | 10,275 | 9,600 |
|---|
| March - 16 | 9,511 | 9,769 | 10,062 | 10,370 | 10,040 |
|---|
| April - 16 | 9,647 | 9,931 | 10,175 | 10,409 | 10,155 |
|---|
| May - 16 | 9,766 | 9,977 | 10,193 | 10,412 | 10,184 |
|---|
| June - 16 | 9,800 | 9,902 | 10,282 | 10,599 | 10,211 |
|---|
| July - 16 | 10,038 | 10,325 | 10,591 | 10,666 | 10,499 |
|---|
| August - 16 | 9,995 | 10,361 | 10,594 | 10,654 | 10,516 |
|---|
| September - 16 | 9,978 | 10,403 | 10,645 | 10,648 | 10,539 |
|---|
| October - 16 | 9,740 | 10,237 | 10,447 | 10,566 | 10,406 |
|---|
| November - 16 | 9,732 | 10,372 | 10,487 | 10,316 | 10,390 |
|---|
| December - 16 | 9,850 | 10,619 | 10,577 | 10,331 | 10,544 |
|---|
| January - 17 | 9,962 | 10,891 | 10,784 | 10,351 | 10,715 |
|---|
| February - 17 | 10,221 | 11,186 | 10,996 | 10,421 | 10,918 |
|---|
| March - 17 | 10,290 | 11,341 | 11,046 | 10,415 | 11,006 |
|---|
| April - 17 | 10,341 | 11,513 | 11,171 | 10,496 | 11,140 |
|---|
| May - 17 | 10,497 | 11,765 | 11,303 | 10,576 | 11,321 |
|---|
| June - 17 | 10,549 | 11,830 | 11,346 | 10,566 | 11,353 |
|---|
| July - 17 | 10,626 | 12,145 | 11,550 | 10,611 | 11,555 |
|---|
| August - 17 | 10,730 | 12,183 | 11,603 | 10,706 | 11,618 |
|---|
| September - 17 | 10,919 | 12,447 | 11,719 | 10,655 | 11,747 |
|---|
| October - 17 | 11,092 | 12,707 | 11,864 | 10,662 | 11,897 |
|---|
| November - 17 | 11,207 | 12,960 | 12,057 | 10,648 | 12,033 |
|---|
| December - 17 | 11,286 | 13,151 | 12,178 | 10,697 | 12,161 |
|---|
| January - 18 | 11,549 | 13,875 | 12,554 | 10,574 | 12,507 |
|---|
| February - 18 | 11,181 | 13,298 | 12,229 | 10,473 | 12,148 |
|---|
| March - 18 | 11,050 | 13,030 | 12,181 | 10,540 | 12,032 |
|---|
| April - 18 | 10,972 | 13,171 | 12,170 | 10,462 | 12,074 |
|---|
| May - 18 | 11,111 | 13,221 | 12,267 | 10,537 | 12,136 |
|---|
| June - 18 | 11,059 | 13,198 | 12,235 | 10,524 | 12,117 |
|---|
| July - 18 | 11,479 | 13,628 | 12,411 | 10,526 | 12,355 |
|---|
| August - 18 | 11,610 | 13,765 | 12,552 | 10,594 | 12,462 |
|---|
| September - 18 | 11,618 | 13,867 | 12,507 | 10,526 | 12,485 |
|---|
| October - 18 | 11,076 | 12,860 | 11,875 | 10,443 | 11,902 |
|---|
| November - 18 | 11,216 | 13,027 | 12,024 | 10,505 | 12,023 |
|---|
| December - 18 | 10,765 | 12,077 | 11,545 | 10,698 | 11,585 |
|---|
| January - 19 | 11,271 | 13,000 | 12,216 | 10,812 | 12,166 |
|---|
| February - 19 | 11,572 | 13,369 | 12,425 | 10,805 | 12,370 |
|---|
| March - 19 | 11,678 | 13,559 | 12,559 | 11,013 | 12,570 |
|---|
| April - 19 | 12,024 | 14,056 | 12,793 | 11,016 | 12,848 |
|---|
| May - 19 | 11,581 | 13,246 | 12,386 | 11,211 | 12,495 |
|---|
| June - 19 | 12,140 | 14,116 | 12,933 | 11,352 | 13,050 |
|---|
| July - 19 | 12,193 | 14,151 | 12,980 | 11,377 | 13,081 |
|---|
| August - 19 | 12,273 | 13,887 | 12,855 | 11,672 | 13,070 |
|---|
| September - 19 | 12,370 | 14,218 | 12,989 | 11,610 | 13,229 |
|---|
| October - 19 | 12,539 | 14,595 | 13,198 | 11,645 | 13,455 |
|---|
| November - 19 | 12,689 | 14,977 | 13,410 | 11,639 | 13,664 |
|---|
| December - 19 | 12,917 | 15,486 | 13,692 | 11,630 | 13,939 |
|---|
| January - 20 | 12,898 | 15,350 | 13,632 | 11,854 | 13,973 |
|---|
| February - 20 | 12,315 | 14,093 | 12,990 | 12,068 | 13,387 |
|---|
| March - 20 | 11,375 | 12,277 | 11,630 | 11,997 | 12,321 |
|---|
| April - 20 | 12,240 | 13,546 | 12,532 | 12,210 | 13,172 |
|---|
| May - 20 | 12,588 | 14,155 | 12,935 | 12,267 | 13,552 |
|---|
| June - 20 | 12,700 | 14,564 | 13,190 | 12,344 | 13,821 |
|---|
| July - 20 | 13,170 | 15,250 | 13,697 | 12,528 | 14,294 |
|---|
| August - 20 | 13,509 | 16,213 | 14,071 | 12,427 | 14,790 |
|---|
| September - 20 | 13,330 | 15,672 | 13,831 | 12,420 | 14,490 |
|---|
| October - 20 | 13,095 | 15,242 | 13,763 | 12,365 | 14,226 |
|---|
| November - 20 | 13,923 | 17,133 | 14,888 | 12,486 | 15,341 |
|---|
| December - 20 | 14,255 | 17,898 | 15,367 | 12,504 | 15,760 |
|---|
| January - 21 | 14,140 | 17,758 | 15,335 | 12,414 | 15,641 |
|---|
| February - 21 | 14,207 | 18,214 | 15,612 | 12,235 | 15,792 |
|---|
| March - 21 | 14,598 | 18,845 | 15,756 | 12,082 | 16,041 |
|---|
| April - 21 | 14,894 | 19,700 | 16,222 | 12,177 | 16,528 |
|---|
| May - 21 | 15,113 | 20,033 | 16,378 | 12,217 | 16,718 |
|---|
| June - 21 | 15,075 | 20,263 | 16,483 | 12,303 | 16,880 |
|---|
| July - 21 | 15,247 | 20,504 | 16,566 | 12,440 | 17,076 |
|---|
| August - 21 | 15,351 | 21,008 | 16,791 | 12,417 | 17,314 |
|---|
| September - 21 | 14,884 | 20,133 | 16,346 | 12,309 | 16,822 |
|---|
| October - 21 | 15,418 | 21,235 | 16,782 | 12,306 | 17,373 |
|---|
| November - 21 | 15,447 | 20,831 | 16,460 | 12,342 | 17,195 |
|---|
| December - 21 | 15,982 | 21,754 | 16,813 | 12,311 | 17,634 |
|---|
| January - 22 | 15,480 | 20,748 | 16,164 | 12,045 | 16,993 |
|---|
| February - 22 | 15,175 | 20,195 | 15,957 | 11,911 | 16,645 |
|---|
| March - 22 | 15,352 | 20,730 | 15,955 | 11,580 | 16,725 |
|---|
| April - 22 | 14,595 | 19,090 | 14,980 | 11,141 | 15,677 |
|---|
| May - 22 | 14,644 | 19,201 | 15,021 | 11,213 | 15,772 |
|---|
| June - 22 | 13,877 | 17,557 | 14,163 | 11,037 | 14,863 |
|---|
| July - 22 | 14,418 | 18,852 | 14,859 | 11,306 | 15,666 |
|---|
| August - 22 | 13,995 | 18,065 | 14,432 | 10,987 | 15,097 |
|---|
| September - 22 | 13,257 | 16,362 | 13,386 | 10,512 | 13,982 |
|---|
| October - 22 | 13,877 | 17,475 | 13,821 | 10,376 | 14,480 |
|---|
| November - 22 | 14,624 | 18,877 | 14,629 | 10,758 | 15,390 |
|---|
| December - 22 | 14,323 | 18,093 | 14,296 | 10,709 | 14,979 |
|---|
| January - 23 | 14,693 | 19,391 | 15,075 | 11,039 | 15,808 |
|---|
| February - 23 | 14,303 | 18,841 | 14,656 | 10,753 | 15,375 |
|---|
| March - 23 | 14,723 | 19,486 | 14,928 | 11,026 | 15,847 |
|---|
| April - 23 | 14,912 | 19,821 | 14,996 | 11,093 | 16,049 |
|---|
| May - 23 | 14,643 | 19,653 | 14,762 | 10,972 | 15,898 |
|---|
| June - 23 | 15,122 | 20,822 | 15,296 | 10,933 | 16,443 |
|---|
| July - 23 | 15,321 | 21,494 | 15,661 | 10,926 | 16,756 |
|---|
| August - 23 | 15,152 | 20,969 | 15,265 | 10,856 | 16,468 |
|---|
| September - 23 | 14,653 | 20,060 | 14,757 | 10,580 | 15,872 |
|---|
| October - 23 | 14,423 | 19,522 | 14,351 | 10,413 | 15,517 |
|---|
| November - 23 | 15,192 | 21,308 | 15,350 | 10,884 | 16,650 |
|---|
| December - 23 | 15,732 | 22,324 | 16,112 | 11,301 | 17,381 |
|---|
| January - 24 | 15,661 | 22,530 | 16,015 | 11,270 | 17,458 |
|---|
| February - 24 | 16,046 | 23,529 | 16,322 | 11,111 | 17,824 |
|---|
| March - 24 | 16,523 | 24,350 | 16,715 | 11,213 | 18,263 |
|---|
| April - 24 | 16,148 | 23,488 | 16,189 | 10,930 | 17,690 |
|---|
| May - 24 | 16,675 | 24,564 | 16,585 | 11,116 | 18,296 |
|---|
| June - 24 | 16,696 | 25,113 | 16,692 | 11,221 | 18,611 |
|---|
| July - 24 | 16,959 | 25,537 | 17,126 | 11,483 | 18,974 |
|---|
| August - 24 | 17,406 | 26,179 | 17,440 | 11,648 | 19,369 |
|---|
| September - 24 | 17,669 | 26,709 | 17,801 | 11,804 | 19,708 |
|---|
| October - 24 | 17,345 | 26,192 | 17,450 | 11,511 | 19,283 |
|---|
| November - 24 | 17,750 | 27,196 | 17,991 | 11,633 | 19,809 |
|---|
Effective May 31, 2024, the performance benchmark against which the Fund compares its performance was changed from the Dow Jones Moderate U.S. Portfolio Index to the S&P Global 1200 Index, the Bloomberg US Aggregate Bond Index, and a 60%|40% S&P Global 1200 Index and Bloomberg US Aggregate Bond Index composite, which the investment adviser believes better reflects the Fund’s investment approach.
Annual Average Total Return
| 1 Year | 5 Year | 10 Year |
|---|
| Sextant Core | 16.84% | 6.94% | 5.91% |
|---|
| S&P Global 1200 Index | 27.63% | 12.66% | 10.51% |
|---|
| Dow Jones Moderate US Portfolio Index | 17.20% | 6.05% | 6.04% |
|---|
| Bloomberg US Aggregate Bond Index | 6.88% | -0.01% | 1.52% |
|---|
| 60%|40% S&P Global 1200|Bloomberg US Agg. Index | 18.97% | 7.71% | 7.07% |
|---|
Past performance does not guarantee future results. The "Average Annual Return" and "Cumulative Performance" tables assume the reinvestment of dividends and capital shares. Performance results do not reflect the deduction of taxes that a shareowner might pay on fund distributions or the redemptions of fund shares. Please visit www.saturna.com/sextant/core-fund for more recent performance information.
Annual Shareholder Report - November 30, 2024
| Total Net Assets | $26,794,132 |
|---|
| # of Portfolio Holdings | 79 |
|---|
| Advisory Fees Paid | $124,345 |
|---|
| Portfolio Turnover Rate | 17% |
|---|
You may have consented to receive one shareholder report at your address if you and one or more individuals in your home have an account with the Fund (householding). If you wish to receive a copy of this document at a new address, contact 1-800-728-8762.
What did the Fund invest in?
| Eaton | 2.8% |
| Oracle | 2.2% |
| Microsoft | 2.1% |
| Apple | 2.0% |
| Pacificorp (6.000% due 01/15/2039) | 2.0% |
| Comcast (5.650% due 06/15/2035) | 2.0% |
| Agnico-Eagle Mines | 1.9% |
| Motorola Solutions | 1.9% |
| Dominion Energy | 1.9% |
| SAP ADR | 1.9% |
| Technology | 20.3% |
| Industrials | 14.9% |
| Consumer Discretionary | 6.2% |
| Health Care | 6.0% |
| Communications | 5.9% |
| Financials | 5.9% |
| Utilities | 5.6% |
| Consumer Staples | 5.2% |
| Materials | 4.7% |
| Government | 2.5% |
| Other Sectors | 3.6% |
| Other Assets (net of liabilities) | 19.2% |
If you wish to view additional information about the Fund, including but not limited to the Fund's prospectus, financial statements, holdings, or proxy voting information, please visit www.saturna.com/forms#mutual-fund-library.
1300 N. State Street
Bellingham, WA 98225
1-800-728-8762
| SEXTANT GLOBAL HIGH INCOME FUND
Sextant Global High Income Fund
Annual Shareholder Report - November 30, 2024
The objective of the Sextant Global High Income Fund is high income, with a secondary objective of capital preservation. This Annual Shareholder Report contains important information about the Sextant Global High Income Fund for the period of December 1, 2023 to November 30, 2024. You can find additional information about the Fund at www.saturna.com/sextant/global-high-income-fund. You can also request this information by contacting us at 1-800-728-8762 or investorservices@saturna.com. The report describes changes to the Fund that occurred during the reporting period.
What were the Fund’s costs for the last year?
(Based on a hypothetical $10,000 investment)
| Class Name | Cost of a $10,000 Investment | Cost Paid as a % of a $10,000 Investment |
|---|
| Sextant Global High Income Fund | $80 | 0.75% |
|---|
How did the Fund perform over the last year?
The Sextant Global High Income Fund completed fiscal year ended November 30, 2024 with a total return of 12.42%. The Fund distributed net income amounting to 3.79% of average net assets during the fiscal year.
The Fund’s equity benchmark, the S&P Global 1200 Index, returned 27.63%, and the Fund’s fixed income benchmark, the Bloomberg Global High Yield Corporate Bond Index returned 11.88% at fiscal year ended November 30, 2024.
Global equity market performance was led by strong returns from large capitalization US stocks, particularly those of technology companies such as semiconductor manufacturers and cloud infrastructure providers that stand to benefit from soaring investment in artificial intelligence. Gradually cooling inflation allowed the Federal Reserve to begin cutting interest rates. As a result of the Fund’s global income objective, it tends to underperform during periods when returns are driven by lower-dividend US stocks — which have led market performance for much of the past decade.
With a generally flat yield curve during the fiscal year along with tight credit spreads, the Fund recycled proceeds from maturing bonds and other sources of cash into shorter-term money market securities, reducing sensitivity to longer-term interest rates.
Equities
Incumbent political parties are being swept out of office throughout the developed world, and the resulting political upheaval creates uncertainty, power vacuums, and opportunities for change — both positive and negative. Trump’s incoming administration will likely be more confrontational than Biden’s, adding uncertainty and risk for investments in non-US companies.
Fixed Income
With Republicans controlling the three branches of US government, they must balance conservatives’ desires to curb federal spending and narrow the budget deficit with determination to extend past tax cuts and possibly cut other taxes further. Trump’s pledge to impose tariffs adds further uncertainty to their impact on inflation and economic growth. Adding these up, the Fund’s bias will be to limit investment in longer-term bonds until their rates rise further or we develop conviction that an economic slowdown is more likely.
How did the Fund perform over the past 10 years?
The Cumulative Performance chart reflects a hypothetical $10,000 investment in the class of shares noted. Past performance does not guarantee future results. The graph and table do not reflect the deduction of taxes that a shareholder would pay on Fund distributions or redemption of Fund shares.
November 30, 2014 through November 30, 2024 with initial investment of $10,000.
| Sextant Global High Income Fund $15,217 | S&P Global 1200 Index $27,196 | Bloomberg Global High Yield Corp. Index $15,134 |
|---|
| November - 14 | 10,000 | 10,000 | 10,000 |
|---|
| December - 14 | 9,858 | 9,836 | 9,806 |
|---|
| January - 15 | 9,801 | 9,659 | 9,730 |
|---|
| February - 15 | 10,009 | 10,209 | 9,960 |
|---|
| March - 15 | 9,735 | 10,051 | 9,839 |
|---|
| April - 15 | 10,161 | 10,331 | 10,046 |
|---|
| May - 15 | 9,924 | 10,356 | 10,041 |
|---|
| June - 15 | 9,678 | 10,111 | 9,927 |
|---|
| July - 15 | 9,431 | 10,247 | 9,886 |
|---|
| August - 15 | 9,137 | 9,579 | 9,742 |
|---|
| September - 15 | 8,673 | 9,240 | 9,481 |
|---|
| October - 15 | 9,062 | 9,975 | 9,743 |
|---|
| November - 15 | 8,916 | 9,924 | 9,514 |
|---|
| December - 15 | 8,575 | 9,752 | 9,322 |
|---|
| January - 16 | 8,334 | 9,192 | 9,170 |
|---|
| February - 16 | 8,465 | 9,129 | 9,197 |
|---|
| March - 16 | 8,986 | 9,769 | 9,681 |
|---|
| April - 16 | 9,518 | 9,931 | 10,022 |
|---|
| May - 16 | 9,267 | 9,977 | 10,021 |
|---|
| June - 16 | 9,528 | 9,902 | 10,054 |
|---|
| July - 16 | 9,798 | 10,325 | 10,322 |
|---|
| August - 16 | 10,029 | 10,361 | 10,514 |
|---|
| September - 16 | 10,260 | 10,403 | 10,569 |
|---|
| October - 16 | 10,270 | 10,237 | 10,560 |
|---|
| November - 16 | 10,139 | 10,372 | 10,450 |
|---|
| December - 16 | 10,250 | 10,619 | 10,626 |
|---|
| January - 17 | 10,533 | 10,891 | 10,819 |
|---|
| February - 17 | 10,722 | 11,186 | 10,936 |
|---|
| March - 17 | 10,848 | 11,341 | 10,936 |
|---|
| April - 17 | 10,911 | 11,513 | 11,106 |
|---|
| May - 17 | 11,016 | 11,765 | 11,259 |
|---|
| June - 17 | 11,016 | 11,830 | 11,303 |
|---|
| July - 17 | 11,372 | 12,145 | 11,497 |
|---|
| August - 17 | 11,487 | 12,183 | 11,522 |
|---|
| September - 17 | 11,676 | 12,447 | 11,613 |
|---|
| October - 17 | 11,697 | 12,707 | 11,650 |
|---|
| November - 17 | 11,661 | 12,960 | 11,676 |
|---|
| December - 17 | 11,833 | 13,151 | 11,719 |
|---|
| January - 18 | 12,275 | 13,875 | 11,880 |
|---|
| February - 18 | 11,833 | 13,298 | 11,728 |
|---|
| March - 18 | 11,919 | 13,030 | 11,690 |
|---|
| April - 18 | 11,984 | 13,171 | 11,699 |
|---|
| May - 18 | 11,855 | 13,221 | 11,566 |
|---|
| June - 18 | 11,822 | 13,198 | 11,576 |
|---|
| July - 18 | 12,221 | 13,628 | 11,726 |
|---|
| August - 18 | 11,984 | 13,765 | 11,737 |
|---|
| September - 18 | 12,199 | 13,867 | 11,813 |
|---|
| October - 18 | 11,822 | 12,860 | 11,580 |
|---|
| November - 18 | 11,930 | 13,027 | 11,460 |
|---|
| December - 18 | 11,687 | 12,077 | 11,313 |
|---|
| January - 19 | 12,325 | 13,000 | 11,777 |
|---|
| February - 19 | 12,571 | 13,369 | 11,958 |
|---|
| March - 19 | 12,537 | 13,559 | 12,040 |
|---|
| April - 19 | 12,615 | 14,056 | 12,198 |
|---|
| May - 19 | 12,280 | 13,246 | 12,036 |
|---|
| June - 19 | 12,839 | 14,116 | 12,362 |
|---|
| July - 19 | 12,861 | 14,151 | 12,381 |
|---|
| August - 19 | 12,459 | 13,887 | 12,381 |
|---|
| September - 19 | 12,716 | 14,218 | 12,410 |
|---|
| October - 19 | 12,839 | 14,595 | 12,526 |
|---|
| November - 19 | 12,772 | 14,977 | 12,565 |
|---|
| December - 19 | 13,028 | 15,486 | 12,832 |
|---|
| January - 20 | 12,809 | 15,350 | 12,827 |
|---|
| February - 20 | 12,299 | 14,093 | 12,619 |
|---|
| March - 20 | 10,830 | 12,277 | 11,088 |
|---|
| April - 20 | 11,328 | 13,546 | 11,644 |
|---|
| May - 20 | 11,632 | 14,155 | 12,147 |
|---|
| June - 20 | 11,741 | 14,564 | 12,347 |
|---|
| July - 20 | 11,935 | 15,250 | 12,951 |
|---|
| August - 20 | 12,093 | 16,213 | 13,132 |
|---|
| September - 20 | 11,668 | 15,672 | 12,949 |
|---|
| October - 20 | 11,425 | 15,242 | 12,988 |
|---|
| November - 20 | 12,324 | 17,133 | 13,582 |
|---|
| December - 20 | 12,673 | 17,898 | 13,879 |
|---|
| January - 21 | 12,811 | 17,758 | 13,906 |
|---|
| February - 21 | 12,987 | 18,214 | 13,973 |
|---|
| March - 21 | 13,226 | 18,845 | 13,896 |
|---|
| April - 21 | 13,414 | 19,700 | 14,106 |
|---|
| May - 21 | 13,691 | 20,033 | 14,208 |
|---|
| June - 21 | 13,628 | 20,263 | 14,245 |
|---|
| July - 21 | 13,552 | 20,504 | 14,249 |
|---|
| August - 21 | 13,628 | 21,008 | 14,317 |
|---|
| September - 21 | 13,641 | 20,133 | 14,212 |
|---|
| October - 21 | 13,766 | 21,235 | 14,135 |
|---|
| November - 21 | 13,540 | 20,831 | 13,914 |
|---|
| December - 21 | 14,015 | 21,754 | 14,152 |
|---|
| January - 22 | 14,067 | 20,748 | 13,770 |
|---|
| February - 22 | 14,118 | 20,195 | 13,528 |
|---|
| March - 22 | 14,195 | 20,730 | 13,370 |
|---|
| April - 22 | 13,336 | 19,090 | 12,781 |
|---|
| May - 22 | 13,554 | 19,201 | 12,785 |
|---|
| June - 22 | 12,579 | 17,557 | 11,866 |
|---|
| July - 22 | 12,823 | 18,852 | 12,409 |
|---|
| August - 22 | 12,592 | 18,065 | 12,156 |
|---|
| September - 22 | 11,848 | 16,362 | 11,576 |
|---|
| October - 22 | 12,182 | 17,475 | 11,830 |
|---|
| November - 22 | 12,977 | 18,877 | 12,297 |
|---|
| December - 22 | 12,925 | 18,093 | 12,362 |
|---|
| January - 23 | 13,576 | 19,391 | 12,868 |
|---|
| February - 23 | 13,231 | 18,841 | 12,656 |
|---|
| March - 23 | 13,456 | 19,486 | 12,808 |
|---|
| April - 23 | 13,589 | 19,821 | 12,959 |
|---|
| May - 23 | 13,085 | 19,653 | 12,783 |
|---|
| June - 23 | 13,377 | 20,822 | 13,029 |
|---|
| July - 23 | 13,695 | 21,494 | 13,229 |
|---|
| August - 23 | 13,416 | 20,969 | 13,208 |
|---|
| September - 23 | 13,310 | 20,060 | 13,032 |
|---|
| October - 23 | 13,071 | 19,522 | 12,897 |
|---|
| November - 23 | 13,536 | 21,308 | 13,527 |
|---|
| December - 23 | 14,221 | 22,324 | 14,031 |
|---|
| January - 24 | 14,180 | 22,530 | 14,031 |
|---|
| February - 24 | 14,069 | 23,529 | 14,078 |
|---|
| March - 24 | 14,484 | 24,350 | 14,221 |
|---|
| April - 24 | 14,359 | 23,488 | 14,088 |
|---|
| May - 24 | 14,871 | 24,564 | 14,298 |
|---|
| June - 24 | 14,664 | 25,113 | 14,375 |
|---|
| July - 24 | 14,830 | 25,537 | 14,659 |
|---|
| August - 24 | 15,134 | 26,179 | 14,962 |
|---|
| September - 24 | 15,521 | 26,709 | 15,211 |
|---|
| October - 24 | 15,093 | 26,192 | 15,074 |
|---|
| November - 24 | 15,217 | 27,196 | 15,134 |
|---|
Annual Average Total Return
| 1 Year | 5 Year | 10 Year |
|---|
| Sextant Global High Income Fund | 12.42% | 3.57% | 4.29% |
|---|
| S&P Global 1200 Index | 27.63% | 12.66% | 10.51% |
|---|
| Bloomberg Global High Yield Corp. Index | 11.88% | 3.79% | 4.23% |
|---|
Past performance does not guarantee future results. The "Average Annual Return" and "Cumulative Performance" tables assume the reinvestment of dividends and capital shares. Performance results do not reflect the deduction of taxes that a shareowner might pay on fund distributions or the redemptions of fund shares. Please visit www.saturna.com/sextant/global-high-income-fund for more recent performance information.
| SEXTANT GLOBAL HIGH INCOME FUND
Sextant Global High Income Fund
Annual Shareholder Report - November 30, 2024
| Total Net Assets | $9,543,532 |
|---|
| # of Portfolio Holdings | 36 |
|---|
| Advisory Fees Paid | $32,336 |
|---|
| Portfolio Turnover Rate | -% |
|---|
You may have consented to receive one shareholder report at your address if you and one or more individuals in your home have an account with the Fund (householding). If you wish to receive a copy of this document at a new address, contact 1-800-728-8762.
What did the Fund invest in?
| Southern Copper | 5.3% |
| Skandinaviska Enskilda Banken, Cl A | 3.6% |
| ANZ Group Holdings ADR | 3.2% |
| Cisco Systems | 3.1% |
| Nintendo | 3.1% |
| BHP Biliton ADR | 3.1% |
| Virtu Financial | 3.0% |
| YUM! Brands (3.625% due 03/15/2031) | 2.8% |
| SK Telecom ADR | 2.8% |
| Verizon Communications | 2.8% |
| Communications | 15.3% |
| Materials | 13.1% |
| Financials | 11.9% |
| Industrials | 9.4% |
| Consumer Discretionary | 8.5% |
| Technology | 6.2% |
| Health Care | 5.3% |
| Energy | 5.3% |
| Government | 3.1% |
| Consumer Staples | 1.9% |
| Other Sectors | 0.5% |
| Other Assets (net of liabilities) | 19.5% |
| United States | 33.1% |
| Australia | 10.1% |
| Peru | 5.3% |
| Norway | 4.8% |
| Sweden | 3.6% |
| Japan | 3.1% |
| Switzerland | 3.0% |
| South Korea | 2.8% |
| Netherlands | 2.6% |
| United Kingdom | 2.3% |
| Other Countries | 29.3% |
If you wish to view additional information about the Fund, including but not limited to the Fund's prospectus, financial statements, holdings, or proxy voting information, please visit www.saturna.com/forms#mutual-fund-library.
1300 N. State Street
Bellingham, WA 98225
1-800-728-8762
Annual Shareholder Report - November 30, 2024
The objective of the Sextant Growth Fund is long-term capital growth. This Annual Shareholder Report contains important information about the Sextant Growth Fund for the period of December 1, 2023 to November 30, 2024. You can find additional information about the Fund at www.saturna.com/sextant/growth-fund. You can also request this information by contacting us at 1-800-728-8762 or investorservices@saturna.com. The report describes changes to the Fund that occurred during the reporting period.
What were the Fund’s costs for the last year?
(Based on a hypothetical $10,000 investment)
| Class Name | Cost of a $10,000 Investment | Cost Paid as a % of a $10,000 Investment |
|---|
| Investor Shares | $111 | 0.96% |
|---|
How did the Fund perform over the last year?
For the fiscal year ended November 30, 2024, Sextant Growth Fund Investor Shares returned 30.23%, trailing the 33.89% return for the S&P 500 Index for the same period. As was the case in the previous fiscal year, the Fund returns suffered in comparison to the S&P 500 Index due to a handful of mega-cap Technology and artificial intelligence (AI) related stocks driving Index returns.
What Factors Influenced Performance?
Similarly to 2023, Nvidia was the dominant contributor to Index returns as other mega-cap stocks jumped on the AI/data center/large language model bandwagon. The Fund holds a position in Nvidia, but the benchmark weight is more than double the Fund’s exposure.
We hold positions in Alphabet, Amazon, Apple, Meta Platforms, and Microsoft as well — all the Magnificent Seven stocks except Tesla — but typically at lower exposures than represented in the benchmarks. That said, Fund performance was boosted by several holdings not included among the mega-caps. These include Broadcom, Oracle, and ServiceNow in Technology, Boston Scientific in Health Care, and Motorola Solutions in Communications. The aforementioned stocks all appreciated by at least 50% over the course of the year.
Other strong performers included Costco, Johnson Controls, and TJX. Portfolio returns were diminished by declines in the value of Adobe, Lululemon, Advanced Micro Devices, and Zoetis. As long-term investors, our interpretation of the long-term operational thesis behind an investment matters more than any short-term period of weakness.
Looking Forward
The US economy currently enjoys solid positive momentum, which is likely to continue well into the new year. While the new administration appears determined to implement a wide range of policy initiatives that will depart significantly from the past, executing on the changes will take time — as it will for the effects to be felt.
Stock markets discount expectations well before the realities resonate in the economy or corporate earnings so we are reliant on the market’s interpretation of the mix of policy prescriptions. Following the pre-Christmas fiscal gymnastics, it appears that adopting a long-term government funding solution will be the first challenge, one likely to feature a plethora of political pyrotechnics.
How did the Fund perform over the past 10 years?
The Cumulative Performance chart reflects a hypothetical $10,000 investment in the class of shares noted. Past performance does not guarantee future results. The graph and table do not reflect the deduction of taxes that a shareholder would pay on Fund distributions or redemption of Fund shares.
May 31, 2014 through November 30, 2024 with initial investment of $10,000.
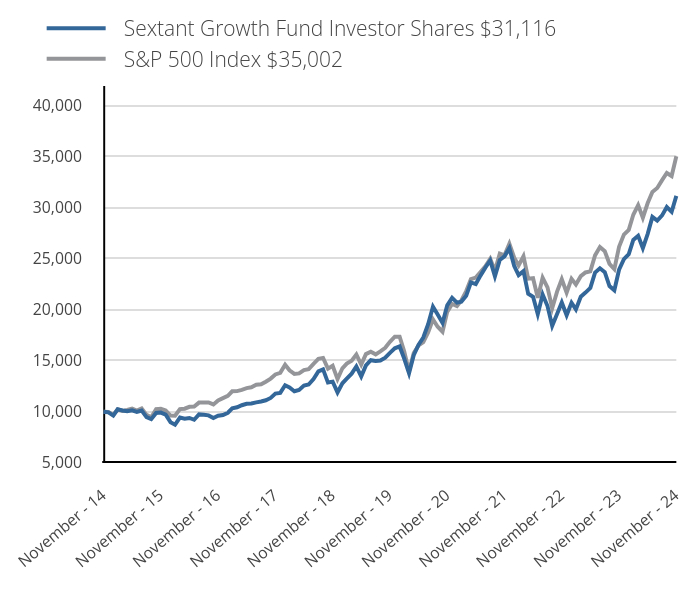
| Sextant Growth Fund Investor Shares $31,116 | S&P 500 Index $35,002 |
|---|
| November - 14 | 10,000 | 10,000 |
|---|
| December - 14 | 9,928 | 9,975 |
|---|
| January - 15 | 9,613 | 9,675 |
|---|
| February - 15 | 10,235 | 10,231 |
|---|
| March - 15 | 10,118 | 10,070 |
|---|
| April - 15 | 10,038 | 10,166 |
|---|
| May - 15 | 10,125 | 10,297 |
|---|
| June - 15 | 9,973 | 10,098 |
|---|
| July - 15 | 10,110 | 10,309 |
|---|
| August - 15 | 9,469 | 9,687 |
|---|
| September - 15 | 9,268 | 9,447 |
|---|
| October - 15 | 9,875 | 10,244 |
|---|
| November - 15 | 9,913 | 10,275 |
|---|
| December - 15 | 9,715 | 10,113 |
|---|
| January - 16 | 8,972 | 9,611 |
|---|
| February - 16 | 8,729 | 9,598 |
|---|
| March - 16 | 9,418 | 10,249 |
|---|
| April - 16 | 9,302 | 10,289 |
|---|
| May - 16 | 9,385 | 10,474 |
|---|
| June - 16 | 9,207 | 10,501 |
|---|
| July - 16 | 9,731 | 10,888 |
|---|
| August - 16 | 9,686 | 10,903 |
|---|
| September - 16 | 9,636 | 10,905 |
|---|
| October - 16 | 9,372 | 10,706 |
|---|
| November - 16 | 9,594 | 11,103 |
|---|
| December - 16 | 9,670 | 11,322 |
|---|
| January - 17 | 9,893 | 11,537 |
|---|
| February - 17 | 10,325 | 11,995 |
|---|
| March - 17 | 10,423 | 12,009 |
|---|
| April - 17 | 10,632 | 12,132 |
|---|
| May - 17 | 10,765 | 12,303 |
|---|
| June - 17 | 10,799 | 12,380 |
|---|
| July - 17 | 10,910 | 12,635 |
|---|
| August - 17 | 10,992 | 12,673 |
|---|
| September - 17 | 11,111 | 12,935 |
|---|
| October - 17 | 11,342 | 13,237 |
|---|
| November - 17 | 11,766 | 13,642 |
|---|
| December - 17 | 11,832 | 13,794 |
|---|
| January - 18 | 12,585 | 14,584 |
|---|
| February - 18 | 12,364 | 14,046 |
|---|
| March - 18 | 11,999 | 13,689 |
|---|
| April - 18 | 12,121 | 13,742 |
|---|
| May - 18 | 12,549 | 14,073 |
|---|
| June - 18 | 12,661 | 14,160 |
|---|
| July - 18 | 13,198 | 14,686 |
|---|
| August - 18 | 13,942 | 15,165 |
|---|
| September - 18 | 14,144 | 15,251 |
|---|
| October - 18 | 12,846 | 14,209 |
|---|
| November - 18 | 12,936 | 14,498 |
|---|
| December - 18 | 11,882 | 13,189 |
|---|
| January - 19 | 12,777 | 14,246 |
|---|
| February - 19 | 13,232 | 14,704 |
|---|
| March - 19 | 13,720 | 14,989 |
|---|
| April - 19 | 14,427 | 15,596 |
|---|
| May - 19 | 13,450 | 14,605 |
|---|
| June - 19 | 14,531 | 15,635 |
|---|
| July - 19 | 15,038 | 15,859 |
|---|
| August - 19 | 14,957 | 15,608 |
|---|
| September - 19 | 15,010 | 15,900 |
|---|
| October - 19 | 15,280 | 16,245 |
|---|
| November - 19 | 15,758 | 16,834 |
|---|
| December - 19 | 16,204 | 17,342 |
|---|
| January - 20 | 16,384 | 17,335 |
|---|
| February - 20 | 15,199 | 15,908 |
|---|
| March - 20 | 13,752 | 13,944 |
|---|
| April - 20 | 15,531 | 15,731 |
|---|
| May - 20 | 16,554 | 16,480 |
|---|
| June - 20 | 17,252 | 16,808 |
|---|
| July - 20 | 18,558 | 17,756 |
|---|
| August - 20 | 20,274 | 19,032 |
|---|
| September - 20 | 19,513 | 18,309 |
|---|
| October - 20 | 18,685 | 17,822 |
|---|
| November - 20 | 20,406 | 19,773 |
|---|
| December - 20 | 21,142 | 20,533 |
|---|
| January - 21 | 20,667 | 20,326 |
|---|
| February - 21 | 20,770 | 20,886 |
|---|
| March - 21 | 21,348 | 21,801 |
|---|
| April - 21 | 22,648 | 22,964 |
|---|
| May - 21 | 22,486 | 23,125 |
|---|
| June - 21 | 23,319 | 23,665 |
|---|
| July - 21 | 24,094 | 24,227 |
|---|
| August - 21 | 24,795 | 24,963 |
|---|
| September - 21 | 23,241 | 23,802 |
|---|
| October - 21 | 24,844 | 25,470 |
|---|
| November - 21 | 25,197 | 25,294 |
|---|
| December - 21 | 26,003 | 26,427 |
|---|
| January - 22 | 24,256 | 25,060 |
|---|
| February - 22 | 23,369 | 24,309 |
|---|
| March - 22 | 23,754 | 25,212 |
|---|
| April - 22 | 21,531 | 23,013 |
|---|
| May - 22 | 21,242 | 23,056 |
|---|
| June - 22 | 19,543 | 21,152 |
|---|
| July - 22 | 21,472 | 23,103 |
|---|
| August - 22 | 20,334 | 22,161 |
|---|
| September - 22 | 18,404 | 20,120 |
|---|
| October - 22 | 19,559 | 21,749 |
|---|
| November - 22 | 20,692 | 22,964 |
|---|
| December - 22 | 19,438 | 21,641 |
|---|
| January - 23 | 20,660 | 23,001 |
|---|
| February - 23 | 20,003 | 22,440 |
|---|
| March - 23 | 21,241 | 23,263 |
|---|
| April - 23 | 21,652 | 23,626 |
|---|
| May - 23 | 22,107 | 23,729 |
|---|
| June - 23 | 23,608 | 25,297 |
|---|
| July - 23 | 24,030 | 26,110 |
|---|
| August - 23 | 23,647 | 25,694 |
|---|
| September - 23 | 22,293 | 24,469 |
|---|
| October - 23 | 21,877 | 23,955 |
|---|
| November - 23 | 23,893 | 26,142 |
|---|
| December - 23 | 24,929 | 27,330 |
|---|
| January - 24 | 25,411 | 27,789 |
|---|
| February - 24 | 26,814 | 29,273 |
|---|
| March - 24 | 27,214 | 30,215 |
|---|
| April - 24 | 26,009 | 28,981 |
|---|
| May - 24 | 27,406 | 30,418 |
|---|
| June - 24 | 29,067 | 31,509 |
|---|
| July - 24 | 28,705 | 31,893 |
|---|
| August - 24 | 29,209 | 32,666 |
|---|
| September - 24 | 30,031 | 33,364 |
|---|
| October - 24 | 29,554 | 33,061 |
|---|
| November - 24 | 31,116 | 35,002 |
|---|
Annual Average Total Return
| 1 Year | 5 Year | 10 Year |
|---|
| Investor Shares | 30.23% | 14.58% | 12.02% |
|---|
| S&P 500 Index | 33.89% | 15.75% | 13.33% |
|---|
Past performance does not guarantee future results. The "Average Annual Return" and "Cumulative Performance" tables assume the reinvestment of dividends and capital shares. Performance results do not reflect the deduction of taxes that a shareowner might pay on fund distributions or the redemptions of fund shares. Please visit www.saturna.com/sextant/growth-fund for more recent performance information.
Annual Shareholder Report - November 30, 2024
| Total Net Assets | $75,697,326 |
|---|
| # of Portfolio Holdings | 30 |
|---|
| Advisory Fees Paid | $344,509 |
|---|
| Portfolio Turnover Rate | 6% |
|---|
You may have consented to receive one shareholder report at your address if you and one or more individuals in your home have an account with the Fund (householding). If you wish to receive a copy of this document at a new address, contact 1-800-728-8762.
What did the Fund invest in?
| Microsoft | 10.2% |
| Apple | 8.6% |
| Amazon.com | 7.4% |
| Alphabet, Class A | 7.1% |
| Nvidia | 6.4% |
| Costco Wholesale | 4.5% |
| Oracle | 4.3% |
| Motorola Solutions | 3.9% |
| Mastercard, Class A | 3.6% |
| TJX Companies | 3.1% |
| Infrastructure Software | 17.1% |
| Semiconductor Devices | 14.7% |
| Communications Equipment | 12.5% |
| Internet Media & Services | 9.2% |
| Online Marketplace | 7.4% |
| Medical Devices | 5.2% |
| Mass Merchants | 4.5% |
| Specialty Apparel Stores | 4.4% |
| Other Financial Services | 3.6% |
| Application Software | 3.0% |
| Other Industries | 15.8% |
| Other Assets (net of liabilities) | 2.6% |
If you wish to view additional information about the Fund, including but not limited to the Fund's prospectus, financial statements, holdings, or proxy voting information, please visit www.saturna.com/forms#mutual-fund-library.
1300 N. State Street
Bellingham, WA 98225
1-800-728-8762
Annual Shareholder Report - November 30, 2024
The objective of the Sextant Growth Fund is long-term capital growth. This Annual Shareholder Report contains important information about the Sextant Growth Fund for the period of December 1, 2023 to November 30, 2024. You can find additional information about the Fund at www.saturna.com/sextant/growth-fund. You can also request this information by contacting us at 1-800-728-8762 or investorservices@saturna.com. The report describes changes to the Fund that occurred during the reporting period.
What were the Fund’s costs for the last year?
(Based on a hypothetical $10,000 investment)
| Class Name | Cost of a $10,000 Investment | Cost Paid as a % of a $10,000 Investment |
|---|
| Z Shares | $83 | 0.72% |
|---|
How did the Fund perform over the last year?
For the fiscal year ended November 30, 2024, Sextant Growth Fund Z Shares returned 30.23%, trailing the 33.89% return for the S&P 500 Index for the same period. As was the case in the previous fiscal year, the Fund returns suffered in comparison to the S&P 500 Index due to a handful of mega-cap Technology and artificial intelligence (AI) related stocks driving Index returns.
What Factors Influenced Performance?
Similarly to 2023, Nvidia was the dominant contributor to Index returns as other mega-cap stocks jumped on the AI/data center/large language model bandwagon. The Fund holds a position in Nvidia, but the benchmark weight is more than double the Fund’s exposure.
We hold positions in Alphabet, Amazon, Apple, Meta Platforms, and Microsoft as well — all the Magnificent Seven stocks except Tesla — but typically at lower exposures than represented in the benchmarks. That said, Fund performance was boosted by several holdings not included among the mega-caps. These include Broadcom, Oracle, and ServiceNow in Technology, Boston Scientific in Health Care, and Motorola Solutions in Communications. The aforementioned stocks all appreciated by at least 50% over the course of the year.
Other strong performers included Costco, Johnson Controls, and TJX. Portfolio returns were diminished by declines in the value of Adobe, Lululemon, Advanced Micro Devices, and Zoetis. As long-term investors, our interpretation of the long-term operational thesis behind an investment matters more than any short-term period of weakness.
Looking Forward
The US economy currently enjoys solid positive momentum, which is likely to continue well into the new year. While the new administration appears determined to implement a wide range of policy initiatives that will depart significantly from the past, executing on the changes will take time — as it will for the effects to be felt.
Stock markets discount expectations well before the realities resonate in the economy or corporate earnings so we are reliant on the market’s interpretation of the mix of policy prescriptions. Following the pre-Christmas fiscal gymnastics, it appears that adopting a long-term government funding solution will be the first challenge, one likely to feature a plethora of political pyrotechnics.
How did the Fund perform since inception?
The Cumulative Performance chart reflects a hypothetical $10,000 investment in the class of shares noted. Past performance does not guarantee future results. The graph and table do not reflect the deduction of taxes that a shareholder would pay on Fund distributions or redemption of Fund shares.
June 30, 2017 through November 30, 2024 with initial investment of $10,000.
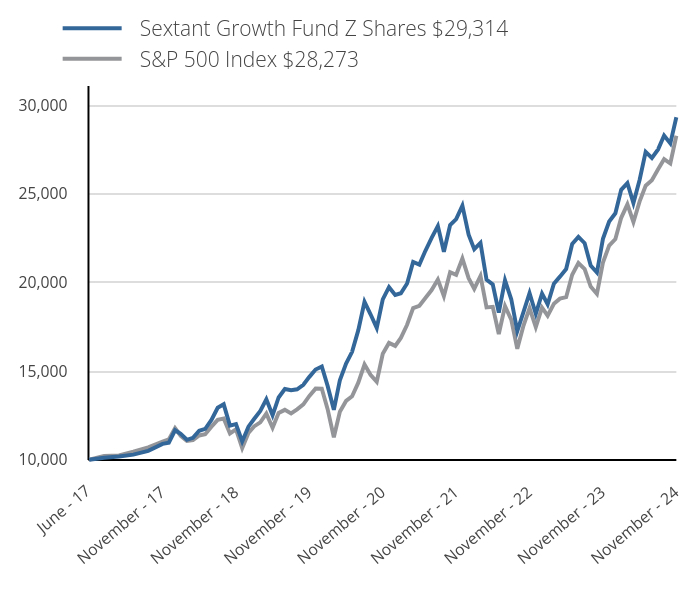
| Sextant Growth Fund Z Shares $29,314 | S&P 500 Index $28,273 |
|---|
| June - 17 | 10,000 | 10,000 |
|---|
| July - 17 | 10,107 | 10,206 |
|---|
| August - 17 | 10,178 | 10,237 |
|---|
| September - 17 | 10,285 | 10,448 |
|---|
| October - 17 | 10,499 | 10,692 |
|---|
| November - 17 | 10,893 | 11,020 |
|---|
| December - 17 | 10,957 | 11,142 |
|---|
| January - 18 | 11,661 | 11,780 |
|---|
| February - 18 | 11,455 | 11,346 |
|---|
| March - 18 | 11,120 | 11,058 |
|---|
| April - 18 | 11,233 | 11,100 |
|---|
| May - 18 | 11,631 | 11,367 |
|---|
| June - 18 | 11,736 | 11,437 |
|---|
| July - 18 | 12,239 | 11,863 |
|---|
| August - 18 | 12,930 | 12,250 |
|---|
| September - 18 | 13,123 | 12,319 |
|---|
| October - 18 | 11,921 | 11,477 |
|---|
| November - 18 | 12,004 | 11,711 |
|---|
| December - 18 | 11,030 | 10,654 |
|---|
| January - 19 | 11,862 | 11,508 |
|---|
| February - 19 | 12,291 | 11,877 |
|---|
| March - 19 | 12,751 | 12,108 |
|---|
| April - 19 | 13,406 | 12,598 |
|---|
| May - 19 | 12,503 | 11,797 |
|---|
| June - 19 | 13,512 | 12,629 |
|---|
| July - 19 | 13,986 | 12,810 |
|---|
| August - 19 | 13,915 | 12,607 |
|---|
| September - 19 | 13,968 | 12,843 |
|---|
| October - 19 | 14,224 | 13,122 |
|---|
| November - 19 | 14,671 | 13,598 |
|---|
| December - 19 | 15,086 | 14,008 |
|---|
| January - 20 | 15,259 | 14,003 |
|---|
| February - 20 | 14,161 | 12,850 |
|---|
| March - 20 | 12,812 | 11,263 |
|---|
| April - 20 | 14,471 | 12,707 |
|---|
| May - 20 | 15,428 | 13,312 |
|---|
| June - 20 | 16,084 | 13,577 |
|---|
| July - 20 | 17,306 | 14,342 |
|---|
| August - 20 | 18,906 | 15,373 |
|---|
| September - 20 | 18,204 | 14,789 |
|---|
| October - 20 | 17,433 | 14,396 |
|---|
| November - 20 | 19,042 | 15,972 |
|---|
| December - 20 | 19,730 | 16,586 |
|---|
| January - 21 | 19,294 | 16,418 |
|---|
| February - 21 | 19,386 | 16,871 |
|---|
| March - 21 | 19,937 | 17,610 |
|---|
| April - 21 | 21,150 | 18,550 |
|---|
| May - 21 | 21,003 | 18,679 |
|---|
| June - 21 | 21,784 | 19,115 |
|---|
| July - 21 | 22,514 | 19,569 |
|---|
| August - 21 | 23,176 | 20,164 |
|---|
| September - 21 | 21,729 | 19,226 |
|---|
| October - 21 | 23,231 | 20,573 |
|---|
| November - 21 | 23,566 | 20,431 |
|---|
| December - 21 | 24,329 | 21,347 |
|---|
| January - 22 | 22,693 | 20,242 |
|---|
| February - 22 | 21,870 | 19,636 |
|---|
| March - 22 | 22,231 | 20,365 |
|---|
| April - 22 | 20,159 | 18,589 |
|---|
| May - 22 | 19,888 | 18,623 |
|---|
| June - 22 | 18,303 | 17,086 |
|---|
| July - 22 | 20,114 | 18,661 |
|---|
| August - 22 | 19,050 | 17,900 |
|---|
| September - 22 | 17,249 | 16,252 |
|---|
| October - 22 | 18,333 | 17,567 |
|---|
| November - 22 | 19,397 | 18,549 |
|---|
| December - 22 | 18,230 | 17,481 |
|---|
| January - 23 | 19,372 | 18,579 |
|---|
| February - 23 | 18,765 | 18,126 |
|---|
| March - 23 | 19,928 | 18,791 |
|---|
| April - 23 | 20,324 | 19,084 |
|---|
| May - 23 | 20,756 | 19,167 |
|---|
| June - 23 | 22,166 | 20,434 |
|---|
| July - 23 | 22,568 | 21,090 |
|---|
| August - 23 | 22,213 | 20,754 |
|---|
| September - 23 | 20,947 | 19,765 |
|---|
| October - 23 | 20,556 | 19,349 |
|---|
| November - 23 | 22,459 | 21,116 |
|---|
| December - 23 | 23,434 | 22,076 |
|---|
| January - 24 | 23,898 | 22,447 |
|---|
| February - 24 | 25,221 | 23,645 |
|---|
| March - 24 | 25,602 | 24,406 |
|---|
| April - 24 | 24,474 | 23,409 |
|---|
| May - 24 | 25,792 | 24,570 |
|---|
| June - 24 | 27,362 | 25,452 |
|---|
| July - 24 | 27,023 | 25,761 |
|---|
| August - 24 | 27,501 | 26,386 |
|---|
| September - 24 | 28,284 | 26,950 |
|---|
| October - 24 | 27,841 | 26,705 |
|---|
| November - 24 | 29,314 | 28,273 |
|---|
Annual Average Total Return
| 1 Year | 5 Year | Since Inception |
|---|
| Z Shares | 30.52% | 14.85% | 15.25% |
|---|
| S&P 500 Index | 33.89% | 15.75% | 14.77% |
|---|
Past performance does not guarantee future results. The "Average Annual Return" and "Cumulative Performance" tables assume the reinvestment of dividends and capital shares. Performance results do not reflect the deduction of taxes that a shareowner might pay on fund distributions or the redemptions of fund shares. Please visit www.saturna.com/sextant/growth-fund for more recent performance information.
Annual Shareholder Report - November 30, 2024
| Total Net Assets | $75,697,326 |
|---|
| # of Portfolio Holdings | 30 |
|---|
| Advisory Fees Paid | $344,509 |
|---|
| Portfolio Turnover Rate | 6% |
|---|
You may have consented to receive one shareholder report at your address if you and one or more individuals in your home have an account with the Fund (householding). If you wish to receive a copy of this document at a new address, contact 1-800-728-8762.
What did the Fund invest in?
| Microsoft | 10.2% |
| Apple | 8.6% |
| Amazon.com | 7.4% |
| Alphabet, Class A | 7.1% |
| Nvidia | 6.4% |
| Costco Wholesale | 4.5% |
| Oracle | 4.3% |
| Motorola Solutions | 3.9% |
| Mastercard, Class A | 3.6% |
| TJX Companies | 3.1% |
| Infrastructure Software | 17.1% |
| Semiconductor Devices | 14.7% |
| Communications Equipment | 12.5% |
| Internet Media & Services | 9.2% |
| Online Marketplace | 7.4% |
| Medical Devices | 5.2% |
| Mass Merchants | 4.5% |
| Specialty Apparel Stores | 4.4% |
| Other Financial Services | 3.6% |
| Application Software | 3.0% |
| Other Industries | 15.8% |
| Other Assets (net of liabilities) | 2.6% |
If you wish to view additional information about the Fund, including but not limited to the Fund's prospectus, financial statements, holdings, or proxy voting information, please visit www.saturna.com/forms#mutual-fund-library.
1300 N. State Street
Bellingham, WA 98225
1-800-728-8762
Sextant International Fund
Annual Shareholder Report - November 30, 2024
The objective of the Sextant International Fund is long-term capital growth. This Annual Shareholder Report contains important information about the Sextant International Fund for the period of December 1, 2023 to November 30, 2024. You can find additional information about the Fund at www.saturna.com/sextant/international-fund. You can also request this information by contacting us at 1-800-728-8762 or investorservices@saturna.com. The report describes changes to the Fund that occurred during the reporting period.
What were the Fund’s costs for the last year?
(Based on a hypothetical $10,000 investment)
| Class Name | Cost of a $10,000 Investment | Cost Paid as a % of a $10,000 Investment |
|---|
| Investor Shares | $100 | 0.95% |
|---|
How did the Fund perform over the last year?
For the fiscal year ended November 30, 2024, the Sextant International Fund Investor Shares returned 9.82%. The MSCI EAFE Index returned 12.44% for the same period.
Factors Affecting Past Performance
The Sextant International Fund mandates 65% of net assets be held in companies with market capitalization greater than $1 billion as well as their headquarters and at least half of their assets and earnings outside the US. The Fund generally holds equity positions in larger companies with strong balance sheets. In terms of performance contribution, Financials was the primary detractor since it was the strongest performing sector this year and the Fund had no exposure. Industrials, Consumer Discretionary, Materials, and Technology were moderate contributors.
Looking Forward
In recent months, investor attention shifted from fears of a recession from mismanaged monetary policy, to fears of inflation potentially rearing its head again because of the new administration’s fiscal policy. A reasonable outcome is that global growth continues to bifurcate with relative strength coming from countries such as the US and India, while the eurozone struggles to keep pace. From an investment perspective, two categories of companies are poised to emerge as frontrunners as we approach 2025: productivity enablers, or enterprises offering products and services designed to boost efficiency for other businesses, and AI adopters, or organizations effectively implementing productivity-enhancing technologies internally.
These winners will ride the wave of a dual transformation from the widespread adoption of artificial intelligence and the ongoing digitization of the economy. This technological convergence is set to reshape competitive landscapes across industries, favoring those at the forefront of innovation and adaptation.
Unfortunately, this will likely lead to the disruption of certain legacy business models, services, and conventional jobs. This, in turn, may trigger negative market sentiment in the affected industry verticals. It will be important for investors to stay active in avoiding these pitfalls, while adequately participating in the companies that will define the future economy.
How did the Fund perform over the past 10 years?
The Cumulative Performance chart reflects a hypothetical $10,000 investment in the class of shares noted. Past performance does not guarantee future results. The graph and table do not reflect the deduction of taxes that a shareholder would pay on Fund distributions or redemption of Fund shares.
May 31, 2014 through November 30, 2024 with initial investment of $10,000.
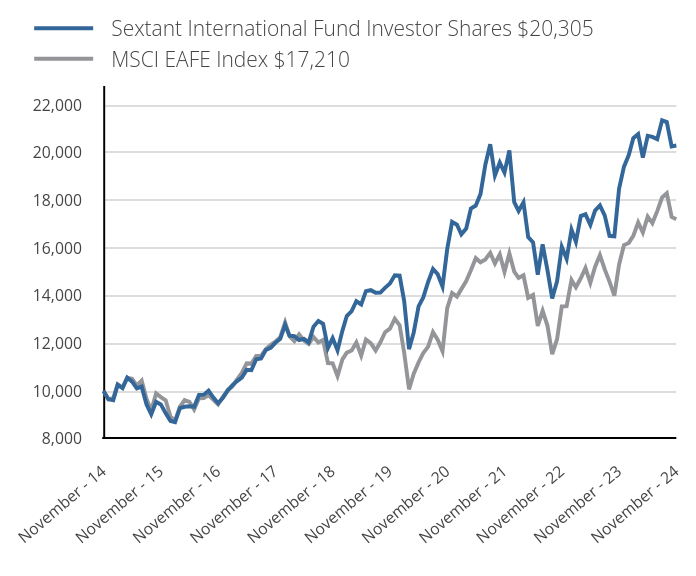
| Sextant International Fund Investor Shares $20,305 | MSCI EAFE Index $17,210 |
|---|
| November - 14 | 10,000 | 10,000 |
|---|
| December - 14 | 9,657 | 9,656 |
|---|
| January - 15 | 9,619 | 9,704 |
|---|
| February - 15 | 10,259 | 10,285 |
|---|
| March - 15 | 10,129 | 10,139 |
|---|
| April - 15 | 10,562 | 10,561 |
|---|
| May - 15 | 10,394 | 10,519 |
|---|
| June - 15 | 10,110 | 10,224 |
|---|
| July - 15 | 10,187 | 10,436 |
|---|
| August - 15 | 9,438 | 9,670 |
|---|
| September - 15 | 9,024 | 9,182 |
|---|
| October - 15 | 9,547 | 9,901 |
|---|
| November - 15 | 9,442 | 9,748 |
|---|
| December - 15 | 9,073 | 9,618 |
|---|
| January - 16 | 8,744 | 8,924 |
|---|
| February - 16 | 8,698 | 8,763 |
|---|
| March - 16 | 9,284 | 9,341 |
|---|
| April - 16 | 9,343 | 9,622 |
|---|
| May - 16 | 9,363 | 9,546 |
|---|
| June - 16 | 9,343 | 9,230 |
|---|
| July - 16 | 9,836 | 9,698 |
|---|
| August - 16 | 9,850 | 9,707 |
|---|
| September - 16 | 10,021 | 9,830 |
|---|
| October - 16 | 9,725 | 9,630 |
|---|
| November - 16 | 9,488 | 9,439 |
|---|
| December - 16 | 9,719 | 9,764 |
|---|
| January - 17 | 10,032 | 10,047 |
|---|
| February - 17 | 10,239 | 10,193 |
|---|
| March - 17 | 10,419 | 10,485 |
|---|
| April - 17 | 10,565 | 10,760 |
|---|
| May - 17 | 10,892 | 11,169 |
|---|
| June - 17 | 10,879 | 11,153 |
|---|
| July - 17 | 11,338 | 11,475 |
|---|
| August - 17 | 11,372 | 11,472 |
|---|
| September - 17 | 11,725 | 11,762 |
|---|
| October - 17 | 11,812 | 11,942 |
|---|
| November - 17 | 12,027 | 12,069 |
|---|
| December - 17 | 12,193 | 12,265 |
|---|
| January - 18 | 12,782 | 12,881 |
|---|
| February - 18 | 12,324 | 12,301 |
|---|
| March - 18 | 12,302 | 12,092 |
|---|
| April - 18 | 12,143 | 12,381 |
|---|
| May - 18 | 12,193 | 12,119 |
|---|
| June - 18 | 12,041 | 11,975 |
|---|
| July - 18 | 12,702 | 12,270 |
|---|
| August - 18 | 12,941 | 12,035 |
|---|
| September - 18 | 12,825 | 12,144 |
|---|
| October - 18 | 11,809 | 11,179 |
|---|
| November - 18 | 12,223 | 11,166 |
|---|
| December - 18 | 11,713 | 10,627 |
|---|
| January - 19 | 12,529 | 11,327 |
|---|
| February - 19 | 13,149 | 11,617 |
|---|
| March - 19 | 13,354 | 11,703 |
|---|
| April - 19 | 13,770 | 12,043 |
|---|
| May - 19 | 13,636 | 11,482 |
|---|
| June - 19 | 14,194 | 12,167 |
|---|
| July - 19 | 14,233 | 12,014 |
|---|
| August - 19 | 14,123 | 11,704 |
|---|
| September - 19 | 14,131 | 12,045 |
|---|
| October - 19 | 14,343 | 12,479 |
|---|
| November - 19 | 14,515 | 12,622 |
|---|
| December - 19 | 14,858 | 13,034 |
|---|
| January - 20 | 14,841 | 12,763 |
|---|
| February - 20 | 13,776 | 11,611 |
|---|
| March - 20 | 11,759 | 10,073 |
|---|
| April - 20 | 12,459 | 10,732 |
|---|
| May - 20 | 13,556 | 11,206 |
|---|
| June - 20 | 13,930 | 11,592 |
|---|
| July - 20 | 14,581 | 11,864 |
|---|
| August - 20 | 15,126 | 12,476 |
|---|
| September - 20 | 14,906 | 12,157 |
|---|
| October - 20 | 14,386 | 11,673 |
|---|
| November - 20 | 15,955 | 13,484 |
|---|
| December - 20 | 17,099 | 14,113 |
|---|
| January - 21 | 16,985 | 13,964 |
|---|
| February - 21 | 16,577 | 14,279 |
|---|
| March - 21 | 16,821 | 14,621 |
|---|
| April - 21 | 17,662 | 15,073 |
|---|
| May - 21 | 17,785 | 15,579 |
|---|
| June - 21 | 18,266 | 15,408 |
|---|
| July - 21 | 19,499 | 15,526 |
|---|
| August - 21 | 20,356 | 15,801 |
|---|
| September - 21 | 19,050 | 15,354 |
|---|
| October - 21 | 19,588 | 15,735 |
|---|
| November - 21 | 19,172 | 15,005 |
|---|
| December - 21 | 20,094 | 15,775 |
|---|
| January - 22 | 17,932 | 15,014 |
|---|
| February - 22 | 17,560 | 14,750 |
|---|
| March - 22 | 17,923 | 14,862 |
|---|
| April - 22 | 16,461 | 13,913 |
|---|
| May - 22 | 16,240 | 14,037 |
|---|
| June - 22 | 14,884 | 12,738 |
|---|
| July - 22 | 16,160 | 13,374 |
|---|
| August - 22 | 15,070 | 12,740 |
|---|
| September - 22 | 13,892 | 11,554 |
|---|
| October - 22 | 14,609 | 12,176 |
|---|
| November - 22 | 16,054 | 13,550 |
|---|
| December - 22 | 15,549 | 13,564 |
|---|
| January - 23 | 16,771 | 14,664 |
|---|
| February - 23 | 16,266 | 14,360 |
|---|
| March - 23 | 17,347 | 14,734 |
|---|
| April - 23 | 17,418 | 15,165 |
|---|
| May - 23 | 16,975 | 14,543 |
|---|
| June - 23 | 17,577 | 15,209 |
|---|
| July - 23 | 17,790 | 15,703 |
|---|
| August - 23 | 17,365 | 15,103 |
|---|
| September - 23 | 16,514 | 14,594 |
|---|
| October - 23 | 16,497 | 14,004 |
|---|
| November - 23 | 18,490 | 15,306 |
|---|
| December - 23 | 19,407 | 16,122 |
|---|
| January - 24 | 19,905 | 16,216 |
|---|
| February - 24 | 20,616 | 16,515 |
|---|
| March - 24 | 20,785 | 17,077 |
|---|
| April - 24 | 19,798 | 16,658 |
|---|
| May - 24 | 20,714 | 17,324 |
|---|
| June - 24 | 20,670 | 17,048 |
|---|
| July - 24 | 20,572 | 17,551 |
|---|
| August - 24 | 21,363 | 18,123 |
|---|
| September - 24 | 21,292 | 18,298 |
|---|
| October - 24 | 20,270 | 17,306 |
|---|
| November - 24 | 20,305 | 17,210 |
|---|
Annual Average Total Return
| 1 Year | 5 Year | 10 Year |
|---|
| Investor Shares | 9.82% | 6.94% | 7.34% |
|---|
| MSCI EAFE Index | 12.44% | 6.39% | 5.57% |
|---|
Past performance does not guarantee future results. The "Average Annual Return" and "Cumulative Performance" tables assume the reinvestment of dividends and capital shares. Performance results do not reflect the deduction of taxes that a shareowner might pay on fund distributions or the redemptions of fund shares. Please visit www.saturna.com/sextant/international-fund for more recent performance information.
Sextant International Fund
Annual Shareholder Report - November 30, 2024
| Total Net Assets | $72,220,400 |
|---|
| # of Portfolio Holdings | 30 |
|---|
| Advisory Fees Paid | $370,093 |
|---|
| Portfolio Turnover Rate | 19% |
|---|
You may have consented to receive one shareholder report at your address if you and one or more individuals in your home have an account with the Fund (householding). If you wish to receive a copy of this document at a new address, contact 1-800-728-8762.
What did the Fund invest in?
| MercadoLibre | 7.7% |
| Novo Nordisk ADR | 7.4% |
| Wolters Kluwer | 7.2% |
| Taiwan Semiconductor ADR | 5.9% |
| ASML Holding NY | 5.0% |
| SAP ADR | 4.8% |
| Broadcom | 4.7% |
| NICE Systems ADR | 4.4% |
| Ferguson Enterprises | 4.3% |
| Dassault Systemes ADR | 4.2% |
| United States | 13.1% |
| Netherlands | 12.2% |
| France | 10.3% |
| Germany | 7.7% |
| Argentina | 7.7% |
| Denmark | 7.4% |
| Ireland | 6.1% |
| Switzerland | 6.0% |
| United Kingdom | 6.0% |
| Taiwan | 5.9% |
| Other Countries | 17.6% |
| Application Software | 14.4% |
| Semiconductor Manufacturing | 10.9% |
| IT Services | 10.5% |
| Large Pharma | 9.9% |
| Electrical Power Equipment | 8.8% |
| Online Marketplace | 7.7% |
| Commercial & Residential Building Equipment & Systems | 5.2% |
| Semiconductor Devices | 4.7% |
| Industrial Wholesale & Rental | 4.3% |
| Basic & Diversified Chemicals | 3.2% |
| Other Industries | 18.3% |
| Other Assets (net of liabilities) | 2.1% |
If you wish to view additional information about the Fund, including but not limited to the Fund's prospectus, financial statements, holdings, or proxy voting information, please visit www.saturna.com/forms#mutual-fund-library.
1300 N. State Street
Bellingham, WA 98225
1-800-728-8762
Sextant International Fund
Annual Shareholder Report - November 30, 2024
The objective of the Sextant International Fund is long-term capital growth. This Annual Shareholder Report contains important information about the Sextant International Fund for the period of December 1, 2023 to November 30, 2024. You can find additional information about the Fund at www.saturna.com/sextant/international-fund. You can also request this information by contacting us at 1-800-728-8762 or investorservices@saturna.com. The report describes changes to the Fund that occurred during the reporting period.
What were the Fund’s costs for the last year?
(Based on a hypothetical $10,000 investment)
| Class Name | Cost of a $10,000 Investment | Cost Paid as a % of a $10,000 Investment |
|---|
| Z Shares | $76 | 0.72% |
|---|
How did the Fund perform over the last year?
For the fiscal year ended November 30, 2024, the Sextant International Fund Z Shares returned 10.04%. The MSCI EAFE Index returned 12.44% for the same period.
Factors Affecting Past Performance
The Sextant International Fund mandates 65% of net assets be held in companies with market capitalization greater than $1 billion as well as their headquarters and at least half of their assets and earnings outside the US. The Fund generally holds equity positions in larger companies with strong balance sheets. In terms of performance contribution, Financials was the primary detractor since it was the strongest performing sector this year and the Fund had no exposure. Industrials, Consumer Discretionary, Materials, and Technology were moderate contributors.
Looking Forward
In recent months, investor attention shifted from fears of a recession from mismanaged monetary policy, to fears of inflation potentially rearing its head again because of the new administration’s fiscal policy. A reasonable outcome is that global growth continues to bifurcate with relative strength coming from countries such as the US and India, while the eurozone struggles to keep pace. From an investment perspective, two categories of companies are poised to emerge as frontrunners as we approach 2025: productivity enablers, or enterprises offering products and services designed to boost efficiency for other businesses, and AI adopters, or organizations effectively implementing productivity-enhancing technologies internally.
These winners will ride the wave of a dual transformation from the widespread adoption of artificial intelligence and the ongoing digitization of the economy. This technological convergence is set to reshape competitive landscapes across industries, favoring those at the forefront of innovation and adaptation.
Unfortunately, this will likely lead to the disruption of certain legacy business models, services, and conventional jobs. This, in turn, may trigger negative market sentiment in the affected industry verticals. It will be important for investors to stay active in avoiding these pitfalls, while adequately participating in the companies that will define the future economy.
How did the Fund perform since inception?
The Cumulative Performance chart reflects a hypothetical $10,000 investment in the class of shares noted. Past performance does not guarantee future results. The graph and table do not reflect the deduction of taxes that a shareholder would pay on Fund distributions or redemption of Fund shares.
June 30, 2017 through November 30, 2024 with initial investment of $10,000.
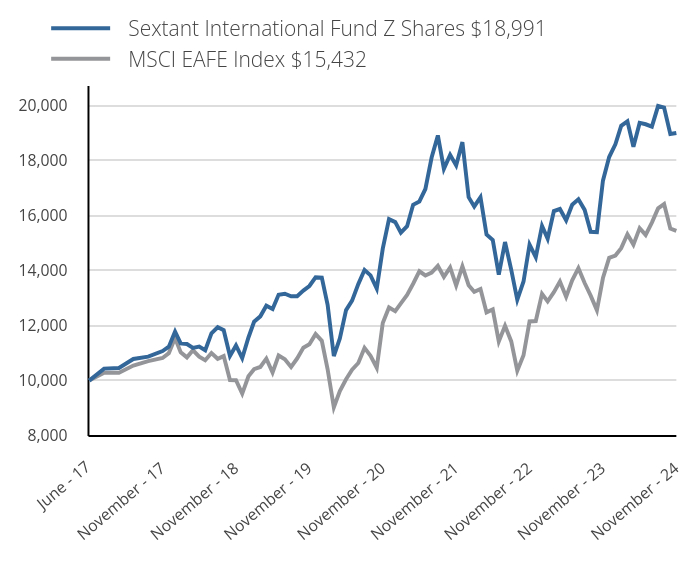
| Sextant International Fund Z Shares $18,991 | MSCI EAFE Index $15,432 |
|---|
| June - 17 | 10,000 | 10,000 |
|---|
| July - 17 | 10,435 | 10,289 |
|---|
| August - 17 | 10,459 | 10,287 |
|---|
| September - 17 | 10,783 | 10,547 |
|---|
| October - 17 | 10,869 | 10,708 |
|---|
| November - 17 | 11,073 | 10,821 |
|---|
| December - 17 | 11,229 | 10,997 |
|---|
| January - 18 | 11,777 | 11,549 |
|---|
| February - 18 | 11,349 | 11,030 |
|---|
| March - 18 | 11,329 | 10,842 |
|---|
| April - 18 | 11,189 | 11,101 |
|---|
| May - 18 | 11,236 | 10,867 |
|---|
| June - 18 | 11,102 | 10,737 |
|---|
| July - 18 | 11,717 | 11,002 |
|---|
| August - 18 | 11,937 | 10,791 |
|---|
| September - 18 | 11,831 | 10,889 |
|---|
| October - 18 | 10,895 | 10,023 |
|---|
| November - 18 | 11,276 | 10,012 |
|---|
| December - 18 | 10,813 | 9,528 |
|---|
| January - 19 | 11,566 | 10,156 |
|---|
| February - 19 | 12,138 | 10,416 |
|---|
| March - 19 | 12,333 | 10,493 |
|---|
| April - 19 | 12,717 | 10,798 |
|---|
| May - 19 | 12,601 | 10,295 |
|---|
| June - 19 | 13,116 | 10,909 |
|---|
| July - 19 | 13,152 | 10,772 |
|---|
| August - 19 | 13,058 | 10,494 |
|---|
| September - 19 | 13,065 | 10,800 |
|---|
| October - 19 | 13,268 | 11,189 |
|---|
| November - 19 | 13,434 | 11,317 |
|---|
| December - 19 | 13,752 | 11,687 |
|---|
| January - 20 | 13,737 | 11,444 |
|---|
| February - 20 | 12,752 | 10,411 |
|---|
| March - 20 | 10,888 | 9,032 |
|---|
| April - 20 | 11,534 | 9,623 |
|---|
| May - 20 | 12,557 | 10,048 |
|---|
| June - 20 | 12,903 | 10,394 |
|---|
| July - 20 | 13,504 | 10,638 |
|---|
| August - 20 | 14,016 | 11,187 |
|---|
| September - 20 | 13,820 | 10,901 |
|---|
| October - 20 | 13,339 | 10,467 |
|---|
| November - 20 | 14,790 | 12,090 |
|---|
| December - 20 | 15,859 | 12,655 |
|---|
| January - 21 | 15,753 | 12,521 |
|---|
| February - 21 | 15,368 | 12,803 |
|---|
| March - 21 | 15,602 | 13,110 |
|---|
| April - 21 | 16,381 | 13,515 |
|---|
| May - 21 | 16,502 | 13,969 |
|---|
| June - 21 | 16,956 | 13,816 |
|---|
| July - 21 | 18,098 | 13,921 |
|---|
| August - 21 | 18,900 | 14,168 |
|---|
| September - 21 | 17,690 | 13,767 |
|---|
| October - 21 | 18,196 | 14,109 |
|---|
| November - 21 | 17,811 | 13,454 |
|---|
| December - 21 | 18,657 | 14,145 |
|---|
| January - 22 | 16,658 | 13,462 |
|---|
| February - 22 | 16,321 | 13,225 |
|---|
| March - 22 | 16,658 | 13,326 |
|---|
| April - 22 | 15,301 | 12,475 |
|---|
| May - 22 | 15,104 | 12,586 |
|---|
| June - 22 | 13,845 | 11,421 |
|---|
| July - 22 | 15,030 | 11,991 |
|---|
| August - 22 | 14,018 | 11,423 |
|---|
| September - 22 | 12,932 | 10,360 |
|---|
| October - 22 | 13,598 | 10,918 |
|---|
| November - 22 | 14,939 | 12,149 |
|---|
| December - 22 | 14,478 | 12,163 |
|---|
| January - 23 | 15,613 | 13,149 |
|---|
| February - 23 | 15,153 | 12,876 |
|---|
| March - 23 | 16,156 | 13,211 |
|---|
| April - 23 | 16,230 | 13,598 |
|---|
| May - 23 | 15,819 | 13,040 |
|---|
| June - 23 | 16,387 | 13,637 |
|---|
| July - 23 | 16,584 | 14,080 |
|---|
| August - 23 | 16,197 | 13,542 |
|---|
| September - 23 | 15,399 | 13,086 |
|---|
| October - 23 | 15,391 | 12,557 |
|---|
| November - 23 | 17,259 | 13,724 |
|---|
| December - 23 | 18,115 | 14,455 |
|---|
| January - 24 | 18,578 | 14,540 |
|---|
| February - 24 | 19,248 | 14,808 |
|---|
| March - 24 | 19,413 | 15,312 |
|---|
| April - 24 | 18,487 | 14,936 |
|---|
| May - 24 | 19,355 | 15,534 |
|---|
| June - 24 | 19,306 | 15,287 |
|---|
| July - 24 | 19,223 | 15,737 |
|---|
| August - 24 | 19,967 | 16,250 |
|---|
| September - 24 | 19,909 | 16,407 |
|---|
| October - 24 | 18,950 | 15,517 |
|---|
| November - 24 | 18,991 | 15,432 |
|---|
Annual Average Total Return
| 1 Year | 5 Year | Since Inception |
|---|
| Z Shares | 10.04% | 7.17% | 8.74% |
|---|
| MSCI EAFE Index | 12.44% | 6.39% | 5.73% |
|---|
Past performance does not guarantee future results. The "Average Annual Return" and "Cumulative Performance" tables assume the reinvestment of dividends and capital shares. Performance results do not reflect the deduction of taxes that a shareowner might pay on fund distributions or the redemptions of fund shares. Please visit www.saturna.com/sextant/international-fund for more recent performance information.
Sextant International Fund
Annual Shareholder Report - November 30, 2024
| Total Net Assets | $72,220,400 |
|---|
| # of Portfolio Holdings | 30 |
|---|
| Advisory Fees Paid | $370,093 |
|---|
| Portfolio Turnover Rate | 19% |
|---|
You may have consented to receive one shareholder report at your address if you and one or more individuals in your home have an account with the Fund (householding). If you wish to receive a copy of this document at a new address, contact 1-800-728-8762.
What did the Fund invest in?
| MercadoLibre | 7.7% |
| Novo Nordisk ADR | 7.4% |
| Wolters Kluwer | 7.2% |
| Taiwan Semiconductor ADR | 5.9% |
| ASML Holding NY | 5.0% |
| SAP ADR | 4.8% |
| Broadcom | 4.7% |
| NICE Systems ADR | 4.4% |
| Ferguson Enterprises | 4.3% |
| Dassault Systemes ADR | 4.2% |
| United States | 13.1% |
| Netherlands | 12.2% |
| France | 10.3% |
| Germany | 7.7% |
| Argentina | 7.7% |
| Denmark | 7.4% |
| Ireland | 6.1% |
| Switzerland | 6.0% |
| United Kingdom | 6.0% |
| Taiwan | 5.9% |
| Other Countries | 17.6% |
| Application Software | 14.4% |
| Semiconductor Manufacturing | 10.9% |
| IT Services | 10.5% |
| Large Pharma | 9.9% |
| Electrical Power Equipment | 8.8% |
| Online Marketplace | 7.7% |
| Commercial & Residential Building Equipment & Systems | 5.2% |
| Semiconductor Devices | 4.7% |
| Industrial Wholesale & Rental | 4.3% |
| Basic & Diversified Chemicals | 3.2% |
| Other Industries | 18.3% |
| Other Assets (net of liabilities) | 2.1% |
If you wish to view additional information about the Fund, including but not limited to the Fund's prospectus, financial statements, holdings, or proxy voting information, please visit www.saturna.com/forms#mutual-fund-library.
1300 N. State Street
Bellingham, WA 98225
1-800-728-8762
| SEXTANT SHORT-TERM BOND
Sextant Short-Term Bond Fund
Annual Shareholder Report - November 30, 2024
The objective of the Sextant Short-Term Bond Fund is capital preservation and current income. This Annual Shareholder Report contains important information about the Sextant Short-Term Bond Fund for the period of December 1, 2023 to November 30, 2024. You can find additional information about the Fund at www.saturna.com/sextant/short-term-bond-fund. You can also request this information by contacting us at 1-800-728-8762 or investorservices@saturna.com. The report describes changes to the Fund that occurred during the reporting period.
What were the Fund’s costs for the last year?
(Based on a hypothetical $10,000 investment)
| Class Name | Cost of a $10,000 Investment | Cost Paid as a % of a $10,000 Investment |
|---|
| Sextant Short-Term Bond | $61 | 0.60% |
|---|
How did the Fund perform over the last year?
For the fiscal year ended November 30, 2024, the Sextant Short-Term Bond Fund returned 4.71%. The Bloomberg US Aggregate 1-3 Year Index returned 5.41%, while the Bloomberg US Aggregate Index returned 6.88%. For the five-year period ended November 30, 2024, the Fund reported an annualized total return of 1.23%, compared to 1.53% for the Bloomberg US Aggregate 1-3 Year Index and -0.01% for the Bloomberg US Aggregate Index. The primary reason for the Fund’s underperformance over the past year was the Fund’s defensive cash position and a lack of exposure to securitized debt. The five-year outperformance relative to the Bloomberg US Aggregate Index is due to the fund’s shorter duration.
Factors Affecting Past Performance
Elevated inflation, an uncertain growth outlook, and a global election cycle made 2024 another volatile year across fixed income markets. Although the Federal Funds Rate was reduced by 100 basis points, the yield curve experienced a pronounced steepening, demonstrating the opposing forces of a weakening labor market, strong output growth, and high inflation expectations. The Sextant Short-Term Bond Fund’s 44.5% weighting to securities maturating within 1-3 years outperformed other areas of the curve, benefitting from the movement on the short end.
Even amid macroeconomic and political uncertainty, corporate debt was well-bid, leading to extensive spread compression across both investment-grade and high-yield debt. Credit-risky debt rallied as investors welcomed the newfound yield, with participants aiming to lock in the higher yield no matter the cost. The Fund maintained a lower weighting to credit-risky debt, instead opting for yield enhancement in other areas of the market.
Looking Forward
To end the year, politics was top of mind as the United States headed to the polls in November. Along with a new regime comes a new set of opportunities and risks in 2025. As policy becomes clearer, the Sextant Short-Term Bond Fund will remain defensively positioned, ready to take advantage of any new developments. While adaptability is crucial, our goal has always been to choose good companies and invest through cycles rather than engaging in market timing with outsized active bets.
How did the Fund perform over the past 10 years?
The Cumulative Performance chart reflects a hypothetical $10,000 investment in the class of shares noted. Past performance does not guarantee future results. The graph and table do not reflect the deduction of taxes that a shareholder would pay on Fund distributions or redemption of Fund shares.
November 30, 2014 through November 30, 2024 with initial investment of $10,000.
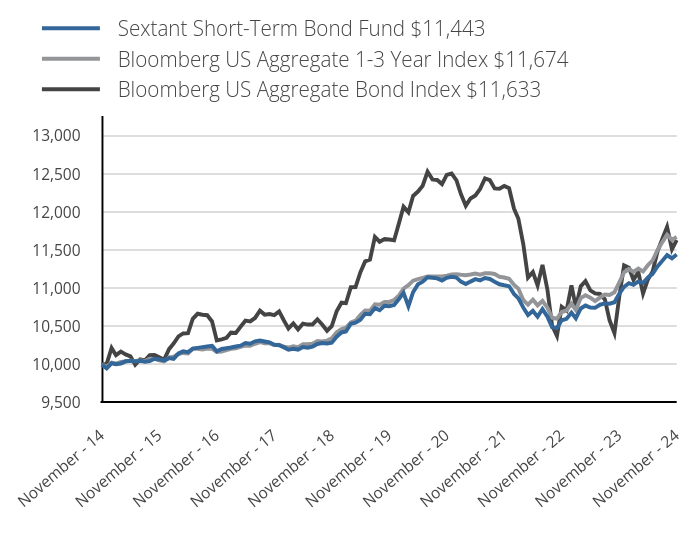
| Sextant Short-Term Bond Fund $11,443 | Bloomberg US Aggregate 1-3 Year Index $11,674 | Bloomberg US Aggregate Bond Index $11,633 |
|---|
| November - 14 | 10,000 | 10,000 | 10,000 |
|---|
| December - 14 | 9,950 | 9,975 | 10,009 |
|---|
| January - 15 | 10,017 | 10,026 | 10,219 |
|---|
| February - 15 | 10,005 | 10,011 | 10,123 |
|---|
| March - 15 | 10,015 | 10,033 | 10,170 |
|---|
| April - 15 | 10,043 | 10,042 | 10,134 |
|---|
| May - 15 | 10,051 | 10,050 | 10,109 |
|---|
| June - 15 | 10,040 | 10,047 | 9,999 |
|---|
| July - 15 | 10,049 | 10,053 | 10,069 |
|---|
| August - 15 | 10,039 | 10,047 | 10,054 |
|---|
| September - 15 | 10,047 | 10,077 | 10,122 |
|---|
| October - 15 | 10,077 | 10,074 | 10,124 |
|---|
| November - 15 | 10,067 | 10,055 | 10,097 |
|---|
| December - 15 | 10,056 | 10,041 | 10,064 |
|---|
| January - 16 | 10,085 | 10,093 | 10,203 |
|---|
| February - 16 | 10,075 | 10,103 | 10,275 |
|---|
| March - 16 | 10,145 | 10,139 | 10,370 |
|---|
| April - 16 | 10,174 | 10,153 | 10,409 |
|---|
| May - 16 | 10,163 | 10,147 | 10,412 |
|---|
| June - 16 | 10,210 | 10,208 | 10,599 |
|---|
| July - 16 | 10,219 | 10,209 | 10,666 |
|---|
| August - 16 | 10,229 | 10,199 | 10,654 |
|---|
| September - 16 | 10,238 | 10,211 | 10,648 |
|---|
| October - 16 | 10,246 | 10,207 | 10,566 |
|---|
| November - 16 | 10,173 | 10,166 | 10,316 |
|---|
| December - 16 | 10,204 | 10,172 | 10,331 |
|---|
| January - 17 | 10,215 | 10,191 | 10,351 |
|---|
| February - 17 | 10,225 | 10,208 | 10,421 |
|---|
| March - 17 | 10,238 | 10,214 | 10,415 |
|---|
| April - 17 | 10,248 | 10,233 | 10,496 |
|---|
| May - 17 | 10,282 | 10,250 | 10,576 |
|---|
| June - 17 | 10,273 | 10,246 | 10,566 |
|---|
| July - 17 | 10,305 | 10,273 | 10,611 |
|---|
| August - 17 | 10,315 | 10,294 | 10,706 |
|---|
| September - 17 | 10,303 | 10,281 | 10,655 |
|---|
| October - 17 | 10,292 | 10,279 | 10,662 |
|---|
| November - 17 | 10,261 | 10,257 | 10,648 |
|---|
| December - 17 | 10,254 | 10,260 | 10,697 |
|---|
| January - 18 | 10,225 | 10,233 | 10,574 |
|---|
| February - 18 | 10,195 | 10,223 | 10,473 |
|---|
| March - 18 | 10,206 | 10,239 | 10,540 |
|---|
| April - 18 | 10,197 | 10,229 | 10,462 |
|---|
| May - 18 | 10,231 | 10,267 | 10,537 |
|---|
| June - 18 | 10,222 | 10,268 | 10,524 |
|---|
| July - 18 | 10,236 | 10,274 | 10,526 |
|---|
| August - 18 | 10,270 | 10,310 | 10,594 |
|---|
| September - 18 | 10,282 | 10,303 | 10,526 |
|---|
| October - 18 | 10,276 | 10,314 | 10,443 |
|---|
| November - 18 | 10,287 | 10,344 | 10,505 |
|---|
| December - 18 | 10,365 | 10,425 | 10,698 |
|---|
| January - 19 | 10,421 | 10,466 | 10,812 |
|---|
| February - 19 | 10,434 | 10,483 | 10,805 |
|---|
| March - 19 | 10,534 | 10,552 | 11,013 |
|---|
| April - 19 | 10,550 | 10,575 | 11,016 |
|---|
| May - 19 | 10,587 | 10,650 | 11,211 |
|---|
| June - 19 | 10,665 | 10,708 | 11,352 |
|---|
| July - 19 | 10,661 | 10,705 | 11,377 |
|---|
| August - 19 | 10,740 | 10,789 | 11,672 |
|---|
| September - 19 | 10,713 | 10,784 | 11,610 |
|---|
| October - 19 | 10,771 | 10,821 | 11,645 |
|---|
| November - 19 | 10,765 | 10,821 | 11,639 |
|---|
| December - 19 | 10,781 | 10,846 | 11,630 |
|---|
| January - 20 | 10,861 | 10,907 | 11,854 |
|---|
| February - 20 | 10,940 | 10,996 | 12,068 |
|---|
| March - 20 | 10,765 | 11,040 | 11,997 |
|---|
| April - 20 | 10,951 | 11,100 | 12,210 |
|---|
| May - 20 | 11,052 | 11,121 | 12,267 |
|---|
| June - 20 | 11,087 | 11,137 | 12,344 |
|---|
| July - 20 | 11,145 | 11,154 | 12,528 |
|---|
| August - 20 | 11,138 | 11,155 | 12,427 |
|---|
| September - 20 | 11,130 | 11,155 | 12,420 |
|---|
| October - 20 | 11,101 | 11,154 | 12,365 |
|---|
| November - 20 | 11,137 | 11,165 | 12,486 |
|---|
| December - 20 | 11,150 | 11,180 | 12,504 |
|---|
| January - 21 | 11,141 | 11,184 | 12,414 |
|---|
| February - 21 | 11,087 | 11,177 | 12,235 |
|---|
| March - 21 | 11,055 | 11,171 | 12,082 |
|---|
| April - 21 | 11,088 | 11,180 | 12,177 |
|---|
| May - 21 | 11,120 | 11,194 | 12,217 |
|---|
| June - 21 | 11,104 | 11,177 | 12,303 |
|---|
| July - 21 | 11,135 | 11,196 | 12,440 |
|---|
| August - 21 | 11,122 | 11,196 | 12,417 |
|---|
| September - 21 | 11,087 | 11,187 | 12,309 |
|---|
| October - 21 | 11,053 | 11,151 | 12,306 |
|---|
| November - 21 | 11,039 | 11,141 | 12,342 |
|---|
| December - 21 | 11,027 | 11,124 | 12,311 |
|---|
| January - 22 | 10,926 | 11,045 | 12,045 |
|---|
| February - 22 | 10,869 | 10,995 | 11,911 |
|---|
| March - 22 | 10,748 | 10,846 | 11,580 |
|---|
| April - 22 | 10,649 | 10,786 | 11,141 |
|---|
| May - 22 | 10,704 | 10,852 | 11,213 |
|---|
| June - 22 | 10,628 | 10,777 | 11,037 |
|---|
| July - 22 | 10,727 | 10,834 | 11,306 |
|---|
| August - 22 | 10,629 | 10,747 | 10,987 |
|---|
| September - 22 | 10,489 | 10,615 | 10,512 |
|---|
| October - 22 | 10,479 | 10,601 | 10,376 |
|---|
| November - 22 | 10,581 | 10,689 | 10,758 |
|---|
| December - 22 | 10,600 | 10,710 | 10,709 |
|---|
| January - 23 | 10,681 | 10,798 | 11,039 |
|---|
| February - 23 | 10,607 | 10,717 | 10,753 |
|---|
| March - 23 | 10,736 | 10,872 | 11,026 |
|---|
| April - 23 | 10,774 | 10,909 | 11,093 |
|---|
| May - 23 | 10,748 | 10,877 | 10,972 |
|---|
| June - 23 | 10,744 | 10,833 | 10,933 |
|---|
| July - 23 | 10,785 | 10,879 | 10,926 |
|---|
| August - 23 | 10,802 | 10,919 | 10,856 |
|---|
| September - 23 | 10,797 | 10,913 | 10,580 |
|---|
| October - 23 | 10,817 | 10,948 | 10,413 |
|---|
| November - 23 | 10,928 | 11,075 | 10,884 |
|---|
| December - 23 | 11,019 | 11,208 | 11,301 |
|---|
| January - 24 | 11,067 | 11,253 | 11,270 |
|---|
| February - 24 | 11,045 | 11,214 | 11,111 |
|---|
| March - 24 | 11,091 | 11,259 | 11,213 |
|---|
| April - 24 | 11,070 | 11,221 | 10,930 |
|---|
| May - 24 | 11,142 | 11,303 | 11,116 |
|---|
| June - 24 | 11,189 | 11,366 | 11,221 |
|---|
| July - 24 | 11,286 | 11,501 | 11,483 |
|---|
| August - 24 | 11,361 | 11,606 | 11,648 |
|---|
| September - 24 | 11,434 | 11,702 | 11,804 |
|---|
| October - 24 | 11,393 | 11,635 | 11,511 |
|---|
| November - 24 | 11,443 | 11,674 | 11,633 |
|---|
Effective May 31, 2024, the Fund is adding a new performance benchmark, the Bloomberg US Aggregate Bond Index, which the investment adviser believes better reflects the Fund’s investment approach.
Annual Average Total Return
| 1 Year | 5 Year | 10 Year |
|---|
| Sextant Short-Term Bond | 4.71% | 1.23% | 1.36% |
|---|
| Bloomberg US Aggregate 1-3 Year Index | 5.41% | 1.53% | 1.56% |
|---|
| Bloomberg US Aggregate Bond Index | 6.88% | -0.01% | 1.52% |
|---|
Past performance does not guarantee future results. The "Average Annual Return" and "Cumulative Performance" tables assume the reinvestment of dividends and capital shares. Performance results do not reflect the deduction of taxes that a shareowner might pay on fund distributions or the redemptions of fund shares. Please visit www.saturna.com/sextant/short-term-bond-fund for more recent performance information.
| SEXTANT SHORT-TERM BOND
Sextant Short-Term Bond Fund
Annual Shareholder Report - November 30, 2024
| Total Net Assets | $12,544,555 |
|---|
| # of Portfolio Holdings | 35 |
|---|
| Advisory Fees Paid | $26,681 |
|---|
| Portfolio Turnover Rate | 23% |
|---|
You may have consented to receive one shareholder report at your address if you and one or more individuals in your home have an account with the Fund (householding). If you wish to receive a copy of this document at a new address, contact 1-800-728-8762.
What did the Fund invest in?
| United States Treasury Bond (6.125% due 08/15/2029) | 8.2% |
| United States Treasury Note (2.625% due 12/31/2025) | 5.9% |
| United States Treasury Note (2.250% due 08/15/2027) | 5.7% |
| United States Treasury Note (2.375% due 05/15/2027) | 5.0% |
| United States Treasury Bond (1.500% due 02/15/2025) | 4.7% |
| Florida Power & Light (2.850% due 04/1/2025) | 3.3% |
| Federal Farm Credit Bank (4.800% due 11/13/2029) | 3.2% |
| United States Treasury Note (2.875% due 04/30/2025) | 3.2% |
| Bank of America (3.500% due 04/19/2026) | 3.1% |
| Koninklijke KPN (8.375% due 10/1/2030) | 2.8% |
| Government | 40.1% |
| Financials | 16.1% |
| Utilities | 7.0% |
| Communications | 6.3% |
| Consumer Staples | 5.2% |
| Technology | 4.9% |
| Consumer Discretionary | 4.1% |
| Materials | 2.4% |
| Industrials | 1.6% |
| Health Care | 1.2% |
| Other Assets (net of liabilities) | 11.1% |
If you wish to view additional information about the Fund, including but not limited to the Fund's prospectus, financial statements, holdings, or proxy voting information, please visit www.saturna.com/forms#mutual-fund-library.
1300 N. State Street
Bellingham, WA 98225
1-800-728-8762
Saturna Sustainable Bond Fund
Annual Shareholder Report - November 30, 2024
The objective of the Saturna Sustainable Bond Fund is current income and capital preservation. This Annual Shareholder Report contains important information about the Saturna Sustainable Bond Fund for the period of December 1, 2023 to November 30, 2024. You can find additional information about the Fund at www.saturna.com/sustainable/bond-fund. You can also request this information by contacting us at 1-800-728-8762 or investorservices@saturna.com. The report describes changes to the Fund that occurred during the reporting period.
What were the Fund’s costs for the last year?
(Based on a hypothetical $10,000 investment)
| Class Name | Cost of a $10,000 Investment | Cost Paid as a % of a $10,000 Investment |
|---|
| Sustainable Bond | $66 | 0.65% |
|---|
How did the Fund perform over the last year?
For the year-to-date ended November 30, 2024, the Saturna Sustainable Bond Fund returned 0.11%. The FTSE World Broad Investment-Grade Bond Index returned 0.69%. The Fund reported a 30-day yield of 4.30%.
The Saturna Sustainable Bond Fund portfolio held 44 securities, excluding cash, as of November 30, 2024. For the same period, the Fund reported an effective duration of 4.72 years, reflecting an increase from 2.80 years as of May 31, 2024. The FTSE World Broad Investment-Grade Bond Index reported an effective duration of 6.57 years. The Fund extended its duration to lock in higher yields with the expectation of further benchmark rate reductions. This comes during an interest rate environment characterized by higher rates and the Federal Reserve's Open Market Committee lowering of benchmark rates.
As of November 30, 2024, Saturna Sustainable Bond Fund held 59.93% of its assets in US dollar-denominated securities, followed by 13.01% in euro-denominated securities, and 6.32% in Canadian dollar-denominated securities. The Fund retained a currency weighting of 5.75% to the Colombian peso, 5.10% to the Mexican peso, 4.08% to the British pound, 2.91% to the Brazilian real, and 2.90% to the Australian dollar. In contrast, the FTSE World Broad Investment-Grade Bond Index had 53.16% of its portfolio in the US dollar, 27.87% in the euro, and 5.98% in Japanese yen.
How did the Fund perform since inception?
The Cumulative Performance chart reflects a hypothetical $10,000 investment in the class of shares noted. Past performance does not guarantee future results. The graph and table do not reflect the deduction of taxes that a shareholder would pay on Fund distributions or redemption of Fund shares.
March 31, 2015 through November 30, 2024 with initial investment of $10,000.
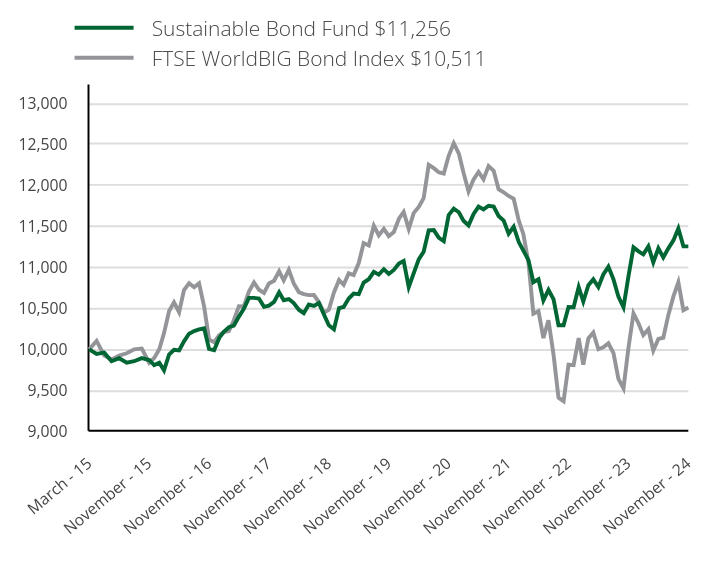
| Sustainable Bond Fund $11,256 | FTSE WorldBIG Bond Index $10,511 |
|---|
| March - 15 | 10,000 | 10,000 |
|---|
| April - 15 | 9,945 | 10,103 |
|---|
| May - 15 | 9,960 | 9,926 |
|---|
| June - 15 | 9,856 | 9,878 |
|---|
| July - 15 | 9,893 | 9,924 |
|---|
| August - 15 | 9,839 | 9,953 |
|---|
| September - 15 | 9,856 | 10,001 |
|---|
| October - 15 | 9,894 | 10,009 |
|---|
| November - 15 | 9,871 | 9,838 |
|---|
| December - 15 | 9,809 | 9,896 |
|---|
| January - 16 | 9,837 | 10,002 |
|---|
| February - 16 | 9,744 | 10,199 |
|---|
| March - 16 | 9,938 | 10,468 |
|---|
| April - 16 | 9,996 | 10,574 |
|---|
| May - 16 | 9,988 | 10,453 |
|---|
| June - 16 | 10,099 | 10,724 |
|---|
| July - 16 | 10,191 | 10,807 |
|---|
| August - 16 | 10,224 | 10,757 |
|---|
| September - 16 | 10,244 | 10,806 |
|---|
| October - 16 | 10,257 | 10,521 |
|---|
| November - 16 | 10,006 | 10,122 |
|---|
| December - 16 | 9,990 | 10,088 |
|---|
| January - 17 | 10,140 | 10,173 |
|---|
| February - 17 | 10,214 | 10,212 |
|---|
| March - 17 | 10,271 | 10,223 |
|---|
| April - 17 | 10,291 | 10,355 |
|---|
| May - 17 | 10,400 | 10,527 |
|---|
| June - 17 | 10,496 | 10,524 |
|---|
| July - 17 | 10,628 | 10,704 |
|---|
| August - 17 | 10,628 | 10,816 |
|---|
| September - 17 | 10,621 | 10,727 |
|---|
| October - 17 | 10,519 | 10,688 |
|---|
| November - 17 | 10,534 | 10,804 |
|---|
| December - 17 | 10,579 | 10,838 |
|---|
| January - 18 | 10,696 | 10,952 |
|---|
| February - 18 | 10,600 | 10,842 |
|---|
| March - 18 | 10,614 | 10,971 |
|---|
| April - 18 | 10,565 | 10,804 |
|---|
| May - 18 | 10,484 | 10,699 |
|---|
| June - 18 | 10,442 | 10,674 |
|---|
| July - 18 | 10,547 | 10,662 |
|---|
| August - 18 | 10,531 | 10,663 |
|---|
| September - 18 | 10,566 | 10,578 |
|---|
| October - 18 | 10,425 | 10,449 |
|---|
| November - 18 | 10,293 | 10,485 |
|---|
| December - 18 | 10,244 | 10,695 |
|---|
| January - 19 | 10,503 | 10,847 |
|---|
| February - 19 | 10,517 | 10,788 |
|---|
| March - 19 | 10,621 | 10,928 |
|---|
| April - 19 | 10,680 | 10,907 |
|---|
| May - 19 | 10,673 | 11,053 |
|---|
| June - 19 | 10,816 | 11,298 |
|---|
| July - 19 | 10,856 | 11,268 |
|---|
| August - 19 | 10,946 | 11,508 |
|---|
| September - 19 | 10,912 | 11,390 |
|---|
| October - 19 | 10,978 | 11,470 |
|---|
| November - 19 | 10,920 | 11,381 |
|---|
| December - 19 | 10,969 | 11,431 |
|---|
| January - 20 | 11,047 | 11,594 |
|---|
| February - 20 | 11,079 | 11,676 |
|---|
| March - 20 | 10,760 | 11,468 |
|---|
| April - 20 | 10,927 | 11,662 |
|---|
| May - 20 | 11,097 | 11,737 |
|---|
| June - 20 | 11,191 | 11,844 |
|---|
| July - 20 | 11,452 | 12,250 |
|---|
| August - 20 | 11,455 | 12,210 |
|---|
| September - 20 | 11,363 | 12,161 |
|---|
| October - 20 | 11,319 | 12,145 |
|---|
| November - 20 | 11,637 | 12,361 |
|---|
| December - 20 | 11,717 | 12,514 |
|---|
| January - 21 | 11,672 | 12,388 |
|---|
| February - 21 | 11,570 | 12,157 |
|---|
| March - 21 | 11,513 | 11,926 |
|---|
| April - 21 | 11,650 | 12,069 |
|---|
| May - 21 | 11,741 | 12,163 |
|---|
| June - 21 | 11,707 | 12,075 |
|---|
| July - 21 | 11,752 | 12,236 |
|---|
| August - 21 | 11,741 | 12,179 |
|---|
| September - 21 | 11,627 | 11,954 |
|---|
| October - 21 | 11,570 | 11,916 |
|---|
| November - 21 | 11,411 | 11,871 |
|---|
| December - 21 | 11,496 | 11,836 |
|---|
| January - 22 | 11,309 | 11,570 |
|---|
| February - 22 | 11,204 | 11,405 |
|---|
| March - 22 | 11,088 | 11,059 |
|---|
| April - 22 | 10,820 | 10,434 |
|---|
| May - 22 | 10,855 | 10,465 |
|---|
| June - 22 | 10,598 | 10,138 |
|---|
| July - 22 | 10,726 | 10,356 |
|---|
| August - 22 | 10,610 | 9,932 |
|---|
| September - 22 | 10,295 | 9,412 |
|---|
| October - 22 | 10,295 | 9,367 |
|---|
| November - 22 | 10,517 | 9,815 |
|---|
| December - 22 | 10,514 | 9,808 |
|---|
| January - 23 | 10,760 | 10,137 |
|---|
| February - 23 | 10,584 | 9,813 |
|---|
| March - 23 | 10,784 | 10,134 |
|---|
| April - 23 | 10,854 | 10,205 |
|---|
| May - 23 | 10,760 | 10,002 |
|---|
| June - 23 | 10,913 | 10,025 |
|---|
| July - 23 | 11,007 | 10,075 |
|---|
| August - 23 | 10,854 | 9,954 |
|---|
| September - 23 | 10,643 | 9,641 |
|---|
| October - 23 | 10,514 | 9,526 |
|---|
| November - 23 | 10,889 | 10,018 |
|---|
| December - 23 | 11,244 | 10,439 |
|---|
| January - 24 | 11,195 | 10,316 |
|---|
| February - 24 | 11,159 | 10,174 |
|---|
| March - 24 | 11,256 | 10,245 |
|---|
| April - 24 | 11,061 | 9,986 |
|---|
| May - 24 | 11,232 | 10,128 |
|---|
| June - 24 | 11,122 | 10,142 |
|---|
| July - 24 | 11,232 | 10,421 |
|---|
| August - 24 | 11,329 | 10,646 |
|---|
| September - 24 | 11,475 | 10,819 |
|---|
| October - 24 | 11,256 | 10,477 |
|---|
| November - 24 | 11,256 | 10,511 |
|---|
Annual Average Total Return
| 1 Year | 5 Year | Since Inception |
|---|
| Sustainable Bond | 3.36% | 0.61% | 1.23% |
|---|
| FTSE WorldBIG Bond Index | 4.92% | -1.58% | 0.47% |
|---|
Past performance does not guarantee future results. The "Average Annual Return" and "Cumulative Performance" tables assume the reinvestment of dividends and capital shares. Performance results do not reflect the deduction of taxes that a shareowner might pay on fund distributions or the redemptions of fund shares. Please visit www.saturna.com/sustainable/bond-fund for more recent performance information.
Saturna Sustainable Bond Fund
Annual Shareholder Report - November 30, 2024
| Total Net Assets | $36,291,467 |
|---|
| # of Portfolio Holdings | 44 |
|---|
| Advisory Fees Paid | $134,373 |
|---|
| Portfolio Turnover Rate | 25% |
|---|
You may have consented to receive one shareholder report at your address if you and one or more individuals in your home have an account with the Fund (householding). If you wish to receive a copy of this document at a new address, contact 1-800-728-8762.
What did the Fund invest in?
| State Street (Quarterly US LIBOR plus 100) (6.552% due 06/15/2047) | 4.8% |
| AXA (5.125% due 01/17/2027) | 4.6% |
| Munich RE (1.000% due 05/26/2042) | 4.4% |
| First Abu Dhabi Bank PJSC (5.125% due 10/13/2027) | 4.2% |
| United Utilities (6.875% due 08/15/2028) | 4.1% |
| Canadian Imperial Bank (4.375% due 10/28/2080) | 4.1% |
| Int'l Bk Recon & Develop (5.000% due 10/7/2026) | 3.5% |
| MAF Global Securities (7.875% due PERP) | 3.4% |
| Natura Cosmeticos SA (4.125% due 05/3/2028) | 3.2% |
| Starbucks (2.450% due 06/15/2026) | 3.2% |
| Financials | 31.0% |
| Government | 19.9% |
| Real Estate | 7.1% |
| Consumer Staples | 5.8% |
| Technology | 5.6% |
| Utilities | 4.1% |
| Health Care | 4.0% |
| Consumer Discretionary | 3.2% |
| Communications | 2.4% |
| Materials | 2.4% |
| Other Sectors | 5.4% |
| Other Assets (net of liabilities) | 9.1% |
| United States | 21.5% |
| United Arab Emirates | 11.9% |
| Germany | 9.8% |
| United Kingdom | 7.9% |
| Finland | 6.9% |
| Canada | 6.1% |
| Netherlands | 5.2% |
| France | 4.6% |
| Brazil | 3.2% |
| Singapore | 3.0% |
| Other Countries | 19.9% |
If you wish to view additional information about the Fund, including but not limited to the Fund's prospectus, financial statements, holdings, or proxy voting information, please visit www.saturna.com/forms#mutual-fund-library.
1300 N. State Street
Bellingham, WA 98225
1-800-728-8762
Saturna Sustainable Equity Fund
Annual Shareholder Report - November 30, 2024
The objective of the Saturna Sustainable Equity Fund is capital appreciation. This Annual Shareholder Report contains important information about the Saturna Sustainable Equity Fund for the period of December 1, 2023 to November 30, 2024. You can find additional information about the Fund at www.saturna.com/sustainable/equity-fund. You can also request this information by contacting us at 1-800-728-8762 or investorservices@saturna.com. The report describes changes to the Fund that occurred during the reporting period.
What were the Fund’s costs for the last year?
(Based on a hypothetical $10,000 investment)
| Class Name | Cost of a $10,000 Investment | Cost Paid as a % of a $10,000 Investment |
|---|
| Sustainable Equity | $82 | 0.75% |
|---|
How did the Fund perform over the last year?
For the fiscal year ended November 30, 2024, the Saturna Sustainable Equity Fund rose 18.80%, trailing the S&P Global 1200 Index which returned 27.63%. The Morningstar Global Large-Stock Blend category returned 22.97% for the same period. The greatest contributors to underperformance were relative underweights to the US and the financial sector, as well as a cash overweight.
Domestic equities outperformed their foreign counterparts as US economic growth remains resilient, outpacing trends and most of the globe. While US politics feature plenty of bombast, such uncertainty is a global fixture. 2024 was the year of the challenger as incumbents fared poorly.
We highlight politics as a realm whose importance is rivaled by its unpredictability. Much ink is spilled attempting to forecast policies and their possible consequences — intended or otherwise. We believe predictions are risks, and as always, we focus on allocating capital to quality companies poised to adapt to changing circumstances. Considering possible futures is paramount to our role as stewards of your capital. Believing we can accurately forecast the future is antithetical to it. In equity investing, uncertainty is opportunity.
We realigned the portfolio in October and November, selling less adaptable companies and allocating to more resilient ones. In October, we sold Legrand, Lululemon, and Reckitt Benckiser. We added Broadcom, Fuji Electric, Dollarama, and Canadian Pacific Kansas City.
Fuji Electric is a top industrial power supply company in Japan benefitting from near-shoring and grid modernization. Broadcom is an infrastructure software and semiconductor company whose networking silicon and chip design prowess allow hyperscalers to train and deploy ever-larger artificial intelligence models. Dollarama is Canada's leading dollar store, selling affordable everyday essentials to households pressured by rising living costs. Canadian Pacific Kansas City operates critical railways connecting the US, Canada, and Mexico. Demographic and near-shoring realities necessitate closer economic ties between these three countries, despite ongoing political threats.
In November, we sold Lowe's, Kenvue, and Haleon and added Linde — whose services reduce the carbon intensity of industrial activities — and renewable energy generator NextEra Energy.
How did the Fund perform since inception?
The Cumulative Performance chart reflects a hypothetical $10,000 investment in the class of shares noted. Past performance does not guarantee future results. The graph and table do not reflect the deduction of taxes that a shareholder would pay on Fund distributions or redemption of Fund shares.
March 31, 2015 through November 30, 2024 with initial investment of $10,000.
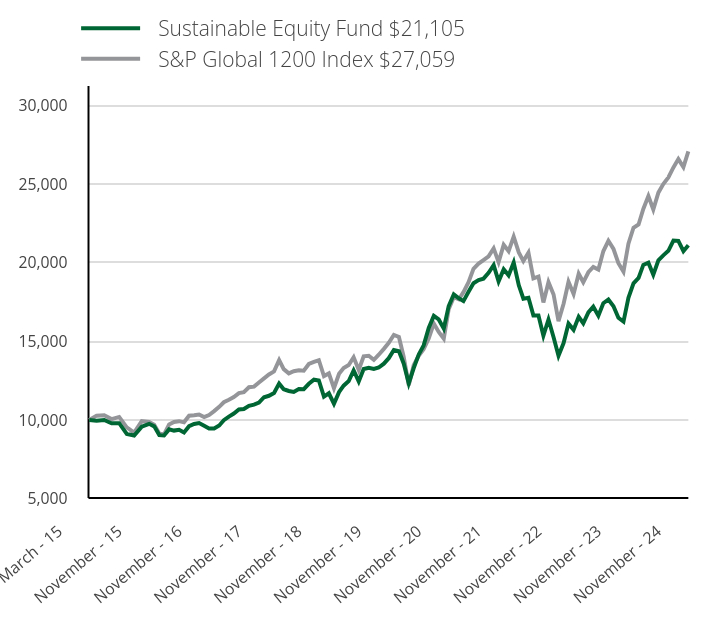
| Sustainable Equity Fund $21,105 | S&P Global 1200 Index $27,059 |
|---|
| March - 15 | 10,000 | 10,000 |
|---|
| April - 15 | 9,960 | 10,279 |
|---|
| May - 15 | 10,000 | 10,304 |
|---|
| June - 15 | 9,790 | 10,060 |
|---|
| July - 15 | 9,800 | 10,196 |
|---|
| August - 15 | 9,118 | 9,531 |
|---|
| September - 15 | 9,018 | 9,193 |
|---|
| October - 15 | 9,579 | 9,925 |
|---|
| November - 15 | 9,759 | 9,874 |
|---|
| December - 15 | 9,599 | 9,703 |
|---|
| January - 16 | 9,047 | 9,146 |
|---|
| February - 16 | 9,017 | 9,082 |
|---|
| March - 16 | 9,408 | 9,720 |
|---|
| April - 16 | 9,328 | 9,881 |
|---|
| May - 16 | 9,378 | 9,927 |
|---|
| June - 16 | 9,208 | 9,852 |
|---|
| July - 16 | 9,609 | 10,273 |
|---|
| August - 16 | 9,749 | 10,308 |
|---|
| September - 16 | 9,810 | 10,351 |
|---|
| October - 16 | 9,629 | 10,186 |
|---|
| November - 16 | 9,459 | 10,320 |
|---|
| December - 16 | 9,462 | 10,566 |
|---|
| January - 17 | 9,654 | 10,836 |
|---|
| February - 17 | 9,987 | 11,130 |
|---|
| March - 17 | 10,219 | 11,284 |
|---|
| April - 17 | 10,410 | 11,455 |
|---|
| May - 17 | 10,673 | 11,706 |
|---|
| June - 17 | 10,703 | 11,770 |
|---|
| July - 17 | 10,905 | 12,084 |
|---|
| August - 17 | 10,975 | 12,121 |
|---|
| September - 17 | 11,106 | 12,384 |
|---|
| October - 17 | 11,449 | 12,643 |
|---|
| November - 17 | 11,540 | 12,895 |
|---|
| December - 17 | 11,711 | 13,085 |
|---|
| January - 18 | 12,310 | 13,805 |
|---|
| February - 18 | 11,955 | 13,231 |
|---|
| March - 18 | 11,843 | 12,964 |
|---|
| April - 18 | 11,782 | 13,104 |
|---|
| May - 18 | 11,975 | 13,154 |
|---|
| June - 18 | 11,955 | 13,131 |
|---|
| July - 18 | 12,300 | 13,559 |
|---|
| August - 18 | 12,564 | 13,696 |
|---|
| September - 18 | 12,514 | 13,797 |
|---|
| October - 18 | 11,487 | 12,795 |
|---|
| November - 18 | 11,700 | 12,962 |
|---|
| December - 18 | 11,036 | 12,016 |
|---|
| January - 19 | 11,775 | 12,935 |
|---|
| February - 19 | 12,185 | 13,301 |
|---|
| March - 19 | 12,472 | 13,491 |
|---|
| April - 19 | 13,149 | 13,985 |
|---|
| May - 19 | 12,452 | 13,179 |
|---|
| June - 19 | 13,241 | 14,045 |
|---|
| July - 19 | 13,323 | 14,079 |
|---|
| August - 19 | 13,241 | 13,817 |
|---|
| September - 19 | 13,334 | 14,146 |
|---|
| October - 19 | 13,580 | 14,521 |
|---|
| November - 19 | 13,929 | 14,902 |
|---|
| December - 19 | 14,452 | 15,407 |
|---|
| January - 20 | 14,370 | 15,273 |
|---|
| February - 20 | 13,596 | 14,022 |
|---|
| March - 20 | 12,329 | 12,215 |
|---|
| April - 20 | 13,287 | 13,478 |
|---|
| May - 20 | 14,153 | 14,084 |
|---|
| June - 20 | 14,741 | 14,491 |
|---|
| July - 20 | 15,854 | 15,173 |
|---|
| August - 20 | 16,617 | 16,131 |
|---|
| September - 20 | 16,390 | 15,593 |
|---|
| October - 20 | 15,813 | 15,165 |
|---|
| November - 20 | 17,235 | 17,046 |
|---|
| December - 20 | 17,977 | 17,808 |
|---|
| January - 21 | 17,729 | 17,669 |
|---|
| February - 21 | 17,553 | 18,122 |
|---|
| March - 21 | 18,142 | 18,750 |
|---|
| April - 21 | 18,691 | 19,600 |
|---|
| May - 21 | 18,887 | 19,932 |
|---|
| June - 21 | 18,980 | 20,161 |
|---|
| July - 21 | 19,353 | 20,400 |
|---|
| August - 21 | 19,839 | 20,902 |
|---|
| September - 21 | 18,804 | 20,031 |
|---|
| October - 21 | 19,570 | 21,128 |
|---|
| November - 21 | 19,187 | 20,726 |
|---|
| December - 21 | 20,007 | 21,645 |
|---|
| January - 22 | 18,560 | 20,643 |
|---|
| February - 22 | 17,706 | 20,093 |
|---|
| March - 22 | 17,769 | 20,625 |
|---|
| April - 22 | 16,645 | 18,993 |
|---|
| May - 22 | 16,645 | 19,104 |
|---|
| June - 22 | 15,354 | 17,468 |
|---|
| July - 22 | 16,384 | 18,757 |
|---|
| August - 22 | 15,260 | 17,974 |
|---|
| September - 22 | 14,084 | 16,280 |
|---|
| October - 22 | 14,885 | 17,386 |
|---|
| November - 22 | 16,124 | 18,782 |
|---|
| December - 22 | 15,727 | 18,002 |
|---|
| January - 23 | 16,557 | 19,293 |
|---|
| February - 23 | 16,147 | 18,746 |
|---|
| March - 23 | 16,840 | 19,387 |
|---|
| April - 23 | 17,198 | 19,721 |
|---|
| May - 23 | 16,630 | 19,553 |
|---|
| June - 23 | 17,418 | 20,717 |
|---|
| July - 23 | 17,649 | 21,385 |
|---|
| August - 23 | 17,229 | 20,863 |
|---|
| September - 23 | 16,494 | 19,959 |
|---|
| October - 23 | 16,252 | 19,423 |
|---|
| November - 23 | 17,765 | 21,201 |
|---|
| December - 23 | 18,686 | 22,212 |
|---|
| January - 24 | 19,025 | 22,417 |
|---|
| February - 24 | 19,853 | 23,410 |
|---|
| March - 24 | 19,991 | 24,227 |
|---|
| April - 24 | 19,227 | 23,370 |
|---|
| May - 24 | 20,139 | 24,440 |
|---|
| June - 24 | 20,458 | 24,986 |
|---|
| July - 24 | 20,744 | 25,408 |
|---|
| August - 24 | 21,402 | 26,047 |
|---|
| September - 24 | 21,381 | 26,574 |
|---|
| October - 24 | 20,723 | 26,059 |
|---|
| November - 24 | 21,105 | 27,059 |
|---|
Annual Average Total Return
| 1 Year | 5 Year | Since Inception |
|---|
| Sustainable Equity | 18.80% | 8.67% | 8.00% |
|---|
| S&P Global 1200 Index | 27.63% | 12.66% | 10.81% |
|---|
Past performance does not guarantee future results. The "Average Annual Return" and "Cumulative Performance" tables assume the reinvestment of dividends and capital shares. Performance results do not reflect the deduction of taxes that a shareowner might pay on fund distributions or the redemptions of fund shares. Please visit www.saturna.com/sustainable/equity-fund for more recent performance information.
Saturna Sustainable Equity Fund
Annual Shareholder Report - November 30, 2024
| Total Net Assets | $25,180,488 |
|---|
| # of Portfolio Holdings | 45 |
|---|
| Advisory Fees Paid | $120,369 |
|---|
| Portfolio Turnover Rate | 19% |
|---|
You may have consented to receive one shareholder report at your address if you and one or more individuals in your home have an account with the Fund (householding). If you wish to receive a copy of this document at a new address, contact 1-800-728-8762.
What did the Fund invest in?
| Nvidia | 5.5% |
| Novo Nordisk ADR | 4.3% |
| Taiwan Semiconductor ADR | 3.9% |
| Schneider Electric ADR | 3.5% |
| Wolters Kluwer | 3.3% |
| Nintendo ADR | 3.3% |
| Apple | 2.9% |
| Eli Lilly | 2.9% |
| Assa Abloy ADR | 2.7% |
| ServiceNow | 2.7% |
| United States | 34.1% |
| Japan | 8.4% |
| France | 8.0% |
| Netherlands | 7.0% |
| Switzerland | 6.5% |
| United Kingdom | 6.4% |
| Canada | 4.7% |
| Denmark | 4.3% |
| Ireland | 4.2% |
| Taiwan | 3.9% |
| Other Countries | 12.5% |
| Large Pharma | 11.7% |
| Semiconductor Devices | 9.8% |
| IT Services | 8.3% |
| Electrical Power Equipment | 7.5% |
| Semiconductor Manufacturing | 5.8% |
| Infrastructure Software | 5.1% |
| Consumer Electronics | 4.9% |
| Personal Care Products | 4.4% |
| Application Software | 3.3% |
| Communications Equipment | 2.9% |
| Other Industries | 28.6% |
| Other Assets (net of liabilities) | 7.7% |
If you wish to view additional information about the Fund, including but not limited to the Fund's prospectus, financial statements, holdings, or proxy voting information, please visit www.saturna.com/forms#mutual-fund-library.
1300 N. State Street
Bellingham, WA 98225
1-800-728-8762
Item 2. Code of Ethics
Registrant has adopted a code of ethics that applies to the registrant’s principal executive officer and principal financial officer or persons performing similar functions, which is included with this submission as Exhibit (a)(1) and posted on the Registrant’s website at https://www.saturna.com/code-ethics. Requests may also be made via telephone at 1-800-728-8762, and will be processed within one business day of receiving such request.
Item 3. Audit Committee Financial Expert
(a)(1)(i) The Trustees of Saturna Investment Trust determined, at their quarterly meeting of November 30, 2014, that the Trust shall have at least one audit committee financial expert serving on its Audit & Compliance Committee.
(a)(2) Mr. Ron Fielding, independent Trustee (as defined for investment companies), presently serves as financial expert.
Item 4. Principal Accountant Fees and Services
(a) Audit Fees
For the fiscal years ending November 30, 2024, and 2023 the aggregate audit fees billed for professional services rendered by the principal accountant were $105,100 and $102,000, respectively.
(b) Audit-Related Fees
There were no fees billed by the principal accountant for assurance and related services that were not included under paragraph (a) for the fiscal years ending November 30, 2024, and 2023.
(c) Tax Fees
For the fiscal years ending November 30, 2024, and 2023, the aggregate tax fees billed for professional tax preparation services rendered by the principal accountant were $27,425 and $26,750 respectively. Service includes preparation of the Funds’ federal and state income tax returns.
(d) All Other Fees
There were no other fees billed by the principal accountant for the fiscal years ending November 30, 2024, and 2023.
(e)(1) Audit Committee Pre-Approval Policies and Procedures
The following is an excerpt from the Saturna Investment Trust Audit & Compliance Committee Charter:
D. Oversight of Independent Auditors
3. Pre-approval of Audit and Non-Audit Services. Except as provided below, the Committee’s prior approval is necessary for the engagement of the independent auditors to provide any audit or non-audit services for the Trust and any non-audit services for any entity controlling, controlled by or under common control with Saturna that provides ongoing services to the Trust (Saturna and each such entity, an “Adviser Affiliate”) where the engagement relates directly to the operations or financial reporting of the Trust. Non-audit services that qualify under the de minimis exception described in the Securities Exchange Act of 1934, as amended, and applicable rules thereunder, that were not pre-approved by the Committee, must be approved by the Committee prior to the completion of the audit. Pre-approval by the Committee is not required for engagements entered into pursuant to (a) pre-approval policies and procedures established by the Committee, or (b) pre-approval granted by one or more members of the Committee to whom, or by a subcommittee to which, the Committee has delegated pre-approval authority, provided in either case, that the Committee is informed of each such service at its next regular meeting.
(e)(2) Percentages of Services
None of the services described in each of paragraphs (b) through (d) were approved by the audit committee pursuant to paragraph (c)(7)(i)(C) of Rule 2-01 of Regulation S-X.
(f) Not applicable.
(g) Aggregate Non-Audit Fees
The aggregate non-audit fees billed by the principal accountant for services rendered to the Registrant are shown above in the response to Item 4(b), (c) and (d) above.
(1) The aggregate non-audit fees billed by the principal accountant for services rendered to the Registrant’s investment adviser, Saturna Capital Corporation (“Saturna”), for the fiscal years ended November 30, 2024, and 2023 were:
| | Fiscal Year Ended |
| | November 2024 | November 2023 |
All other fees: | $27,425 | $26,750 |
The fees listed above consist of fees paid by Saturna to the Registrant’s principal accountant for its review and report on Saturna’s internal transfer agency control procedures and Saturna’s custody control procedures.
(2) The aggregate non-audit fees billed by the principal accountant for services rendered to entities controlling, controlled by, or under common control with Saturna, for the fiscal years ended November 30, 2024, and 2023 were:
| | Fiscal Year Ended |
| | November 2024 | November 2023 |
All other fees: | None | None |
(h) Registrant’s Audit Committee
The Registrant’s Audit Committee has considered the provision of non-audit services that were rendered to Saturna, and any entity controlling, controlled by or under common control with Saturna that provides ongoing services to the Registrant, that were not pre-approved pursuant to Rule 2-01 (c)(7)(ii) of Regulation S-X and has determined that the provision of such services is compatible with maintaining the independence of the Registrant’s principal accountant.
Item 5. Audit Committee of Listed Registrants
Not applicable.
Item 6. Investments
(a) The Schedule of Investments is fully answered in Item 7.
Item 7. Financial Statements and Financial Highlights for Open-End Management Investment Companies.
Sextant
Short-Term
Bond
Fund
4
Schedule
of
Investments
4
Statement
of
Assets
and
Liabilities
and
Statement
of
Operations
6
Statements
of
Changes
in
Net
Assets
7
Financial
Highlights
8
Sextant
Bond
Income
Fund
9
Schedule
of
Investments
9
Statement
of
Assets
and
Liabilities
and
Statement
of
Operations
11
Statements
of
Changes
in
Net
Assets
12
Financial
Highlights
13
Sextant
Core
Fund
14
Schedule
of
Investments
14
Statement
of
Assets
and
Liabilities
and
Statement
of
Operations
18
Statements
of
Changes
in
Net
Assets
19
Financial
Highlights
20
Sextant
Global
High
Income
Fund
21
Schedule
of
Investments
21
Statement
of
Assets
and
Liabilities
and
Statement
of
Operations
23
Statements
of
Changes
in
Net
Assets
24
Financial
Highlights
25
Sextant
Growth
Fund
26
Schedule
of
Investments
26
Statement
of
Assets
and
Liabilities
and
Statement
of
Operations
28
Statements
of
Changes
in
Net
Assets
29
Financial
Highlights
30
Sextant
International
Fund
31
Schedule
of
Investments
31
Statement
of
Assets
and
Liabilities
and
Statement
of
Operations
33
Statements
of
Changes
in
Net
Assets
34
Financial
Highlights
35
Notes
To
Financial
Statements
36
Note
1
-
Organization
36
Note
3
-
Transactions
with
Affiliated
Persons
40
Note
4
-
Distributions
to
Shareowners
41
Note
5
-
Federal
Income
Taxes
41
Note
6
-
Investments
42
Note
7
-
Custodian
42
Note
8
-
Subsequent
Events
42
Report
of
Independent
Registered
Public
Accounting
Firm
43
Form
N-CSR
Items
8-11
44
Renewal
of
Investment
Advisory
Contract
45
Summary
Information
48
Sextant
Short-Term
Bond
Fund
The
accompanying
notes
are
an
integral
part
of
these
financial
statements.
Government
Bonds
-
45.2%
Coupon
/
Maturity
Face
Amount
Market
Value
Percentage
of
Net
Assets
Financials
Federal
Farm
Credit
Bank
4.800%
due
11/13/2029
$
400,000
$
400,252
3.2%
Federal
Home
Loan
Bank
4.000%
due
09/17/2029
250,000
246,302
1.9%
646,554
5.1%
Government
United
States
Treasury
Bond
1.500%
due
02/15/2025
600,000
596,332
4.7%
United
States
Treasury
Bond
5.250%
due
02/15/2029
300,000
314,250
2.5%
United
States
Treasury
Bond
3.625%
due
03/31/2028
300,000
295,394
2.4%
United
States
Treasury
Bond
5.500%
due
08/15/2028
300,000
315,141
2.5%
United
States
Treasury
Bond
6.125%
due
08/15/2029
950,000
1,032,012
8.2%
United
States
Treasury
Note
2.875%
due
04/30/2025
400,000
397,462
3.2%
United
States
Treasury
Note
2.375%
due
05/15/2027
650,000
623,340
5.0%
United
States
Treasury
Note
2.250%
due
08/15/2027
750,000
714,433
5.7%
United
States
Treasury
Note
2.625%
due
12/31/2025
750,000
736,553
5.9%
5,024,917
40.1%
Total
Government
Bonds
(Cost
$5,719,525)
$5,671,471
45.2%
Corporate
Bonds
-
43.7%
Coupon
/
Maturity
Face
Amount
Market
Value
Percentage
of
Net
Assets
Communications
Koninklijke
KPN
8.375%
due
10/01/2030
300,000
351,968
2.8%
Take-Two
Interactive
Software
3.700%
due
04/14/2027
350,000
342,467
2.7%
Verizon
Communication
4.016%
due
12/03/2029
100,000
97,036
0.8%
791,471
6.3%
Consumer
Discretionary
AutoZone
3.250%
due
04/15/2025
300,000
298,201
2.4%
O'Reilly
Automotive
3.600%
due
09/01/2027
150,000
146,066
1.2%
VF
2.400%
due
04/23/2025
67,000
66,175
0.5%
510,442
4.1%
Consumer
Staples
Dollar
General
4.150%
due
11/01/2025
250,000
248,054
2.0%
Kroger
7.700%
due
06/01/2029
100,000
111,331
0.9%
Procter
&
Gamble
2.800%
due
03/25/2027
300,000
290,777
2.3%
650,162
5.2%
Financials
Bank
of
America
3.500%
due
04/19/2026
400,000
394,075
3.1%
JPMorgan
Chase
3.300%
due
04/01/2026
350,000
344,428
2.8%
PayPal
Holdings
2.650%
due
10/01/2026
300,000
290,248
2.3%
Visa
3.150%
due
12/14/2025
350,000
345,398
2.8%
1,374,149
11.0%
Health
Care
Biogen
4.050%
due
09/15/2025
100,000
99,421
0.8%
Johnson
&
Johnson
2.450%
due
03/01/2026
50,000
48,839
0.4%
148,260
1.2%
Industrials
Ferguson
Finance
1
4.250%
due
04/20/2027
200,000
197,338
1.6%
Materials
DuPont
De
Nemours
4.493%
due
11/15/2025
308,000
306,858
2.4%
Technology
Microsoft
3.300%
due
02/06/2027
100,000
98,087
0.8%
Sextant
Short-Term
Bond
Fund
The
accompanying
notes
are
an
integral
part
of
these
financial
statements.
Corporate
Bonds
-
43.7%
Coupon
/
Maturity
Face
Amount
Market
Value
Percentage
of
Net
Assets
Technology
(continued)
NXP
BV/NXP
Funding
5.350%
due
03/01/2026
$
100,000
$
100,502
0.8%
Oracle
2.950%
due
05/15/2025
325,000
322,216
2.5%
Qualcomm
3.250%
due
05/20/2027
100,000
97,312
0.8%
618,117
4.9%
Utilities
Exelon
Generation
3.250%
due
06/01/2025
250,000
247,734
2.0%
Florida
Power
&
Light
2.850%
due
04/01/2025
420,000
417,628
3.3%
United
Utilities
6.875%
due
08/15/2028
200,000
213,823
1.7%
879,185
7.0%
Total
Corporate
Bonds
(Cost
$5,531,900)
$5,475,982
43.7%
Total
investments
(Cost
$11,251,425)
$11,147,453
88.9%
Other
assets
(net
of
liabilities)
1,397,102
11.1%
Total
net
assets
$12,544,555
100.0%
1
Security
was
purchased
pursuant
to
Rule
144A
under
the
Securities
Act
of
1933
and
may
be
sold
in
transactions
exempt
from
registration
only
to
qualified
institutional
buyers
or
in
public
offering
registered
under
the
Securities
Act
of
1933.
These
securities
have
been
deemed
liquid
under
guidelines
approved
by
the
Trust's
Board
of
Trustees.
At
November
30,
2024,
the
aggregate
value
of
these
securities
was
$197,338
representing
1.6%
of
total
net
assets.
Sextant
Short-Term
Bond
Fund
The
accompanying
notes
are
an
integral
part
of
these
financial
statements.
Statement
of
Assets
and
Liabilities
Statement
of
Operations
As
of
November
30,
2024
Assets
Investments
in
securities,
at
value
(Cost
$11,251,425)
$
11,147,453
Cash
1,311,445
Interest
receivable
97,491
Prepaid
expenses
2,316
Receivable
for
Fund
shares
sold
525
Total
assets
12,559,230
Liabilities
Accrued
audit
expenses
5,189
Accrued
advisory
fees
3,129
Accrued
retirement
plan
custody
fee
2,880
Payable
for
Fund
shares
redeemed
1,484
Accrued
legal
expenses
362
Accrued
Chief
Compliance
Officer
expenses
328
Accrued
other
operating
expenses
248
Accrued
printing
fees
1,055
Total
liabilities
14,675
Net
assets
$12,544,555
Analysis
of
net
assets
Paid-in
capital
(unlimited
shares
authorized,
without
par
value)
$12,789,070
Total
distributable
earnings
(244,515)
Net
assets
applicable
to
Fund
shares
outstanding
$12,544,555
Fund
shares
outstanding
2,532,871
Net
asset
value,
offering,
and
redemption
price
per
share
$4.95
Year
ended
November
30,
2024
Investment
income
Interest
income
$
373,620
Total
investment
income
373,620
Expenses
Investment
advisory
fees
55,287
Filing
and
registration
fees
18,167
Audit
fees
6,392
Chief
Compliance
Officer
expenses
3,638
Trustee
fees
3,275
Retirement
plan
custodial
fees
3,003
Legal
fees
2,999
Custodian
fees
449
Other
operating
expenses
2,010
Total
gross
expenses
95,220
Less
adviser
fees
waived
(28,426)
Less
custodian
fee
credits
(449)
Net
expenses
66,345
Net
investment
income
$307,275
Net
decrease
in
unrealized
depreciation
on
investments
208,805
Net
gain
on
investments
208,805
Net
increase
in
net
assets
resulting
from
operations
$516,080
Sextant
Short-Term
Bond
Fund
The
accompanying
notes
are
an
integral
part
of
these
financial
statements.
Statements
of
Changes
in
Net
Assets
Year
ended
November
30,
2024
Year
ended
November
30,
2023
Increase
(Decrease)
in
net
assets
from
operations
From
operations
Net
investment
income
$307,275
$218,039
Net
realized
loss
on
investments
–
(48,629)
Net
decrease
in
unrealized
depreciation
on
investments
208,805
205,877
Net
increase
in
net
assets
516,080
375,287
Distributions
to
shareowners
from
Net
dividend
and
distribution
to
shareholders
(307,217)
(221,971)
Capital
share
transactions
Proceeds
from
the
sale
of
shares
2,234,822
1,538,887
Value
of
shares
issued
in
reinvestment
of
dividends
and
distributions
305,973
220,156
Cost
of
shares
redeemed
(1,038,586)
(3,388,310)
Total
capital
shares
transactions
1,502,209
(1,629,267)
Total
increase
(decrease)
in
net
assets
1,711,072
(1,475,951)
Net
assets
Beginning
of
year
10,833,483
12,309,434
End
of
year
$12,544,555
$10,833,483
Shares
of
the
Fund
sold
and
redeemed
Sextant
Short-Term
Bond
(STBFX)
Number
of
shares
sold
452,695
319,707
Number
of
shares
issued
in
reinvestment
of
dividends
and
distributions
62,250
45,613
Number
of
shares
redeemed
(211,925)
(701,000)
Net
increase
(decrease)
in
number
of
shares
outstanding
303,020
(335,680)
–
–
Sextant
Short-Term
Bond
Fund:
Financial
Highlights
The
accompanying
notes
are
an
integral
part
of
these
financial
statements.
tin
Sextant
Short-Term
Bond
(STBFX)
Selected
data
per
share
of
outstanding
capital
stock
throughout
each
year:
Year
ended
November
30,
2024
2023
2022
2021
2020
A
A
A
A
A
A
Net
asset
value
at
beginning
of
year
$4.86
$4.80
$5.07
$5.17
$5.08
Income
from
investment
operations
Net
investment
income
0.14
0.09
0.06
0.06
0.08
Net
gains
(losses)
on
securities
(both
realized
and
unrealized)
0.09
0.07
(0.27)
(0.10)
0.09
Total
from
investment
operations
0.23
0.16
(0.21)
(0.04)
0.17
Less
distributions
Dividends
(from
net
investment
income)
(0.14)
(0.10)
(0.06)
(0.06)
(0.08)
Total
distributions
(0.14)
(0.10)
(0.06)
(0.06)
(0.08)
Net
asset
value
at
end
of
year
$4.95
$4.86
$4.80
$5.07
$5.17
Total
Return
4.71%
3.28%
(4.15)%
(0.88)%
3.46%
Ratios
/
supplemental
data
Net
assets
($000),
end
of
year
$12,545
$10,833
$12,309
$11,920
$11,426
Ratio
of
expenses
to
average
net
assets
Before
custodian
fee
credits
0.86%
0.90%
0.88%
0.66%
0.90%
After
advisory
fees
waiver
0.60%
0.60%
0.60%
0.59%
0.60%
After custodian
fee
credits
0.60%
0.60%
0.60%
0.59%
0.60%
Ratio
of
net
investment
income
after
custodian
fee
credits to
average
net
assets
2.78%
1.95%
1.23%
1.07%
1.64%
Portfolio
turnover
rate
23%
24%
41%
29%
36%
The
accompanying
notes
are
an
integral
part
of
these
financial
statements.
Corporate
Bonds
-
62.5%
Coupon
/
Maturity
Face
Amount
Market
Value
Percentage
of
Net
Assets
Communications
Bellsouth
6.875%
due
10/15/2031
$
200,000
$
219,623
2.0%
Koninklijke
KPN
8.375%
due
10/01/2030
200,000
234,645
2.1%
454,268
4.1%
Consumer
Discretionary
Home
Depot
5.875%
due
12/16/2036
300,000
325,151
2.9%
Lowe's
5.800%
due
10/15/2036
250,000
264,132
2.4%
589,283
5.3%
Consumer
Staples
Kimberly
Clark
5.300%
due
03/01/2041
100,000
102,277
0.9%
Procter
&
Gamble
5.500%
due
02/01/2034
200,000
212,299
1.9%
Unilever
Capital
5.900%
due
11/15/2032
200,000
216,857
2.0%
531,433
4.8%
Energy
Baker
Hughes
6.875%
due
01/15/2029
100,000
108,096
1.0%
Canadian
Natural
Resources
6.450%
due
06/30/2033
225,000
240,868
2.1%
Statoil
7.150%
due
01/15/2029
224,000
243,929
2.2%
592,893
5.3%
Financials
Affiliated
Managers
Group
3.500%
due
08/01/2025
250,000
247,651
2.2%
Bank
Of
New
York
Mellon
MTN
3.300%
due
08/23/2029
250,000
234,769
2.1%
Chubb
Ina
Holdings
4.350%
due
11/03/2045
100,000
89,120
0.8%
State
Street
6.552%
due
06/15/2047
150,000
133,585
1.2%
UBS
AG
Stamford
CT
7.750%
due
09/01/2026
200,000
209,276
1.9%
914,401
8.2%
Health
Care
Becton
Dickinson
6.700%
due
08/01/2028
240,000
249,384
2.2%
Johnson
&
Johnson
4.950%
due
05/15/2033
226,000
235,592
2.1%
Johnson
&
Johnson
5.850%
due
07/15/2038
50,000
55,029
0.5%
Medtronic
4.375%
due
03/15/2035
260,000
250,597
2.3%
Merck
6.500%
due
12/01/2033
215,000
244,162
2.2%
1,034,764
9.3%
Industrials
Burlington
Northern
Santa
Fe
5.050%
due
03/01/2041
310,000
305,015
2.7%
Deere
8.100%
due
05/15/2030
95,000
110,964
1.0%
United
Technologies
6.050%
due
06/01/2036
250,000
270,707
2.5
%
686,686
6.2%
Materials
Praxair
3.550%
due
11/07/2042
350,000
289,483
2.6%
Stora
Enso
OYJ
1
7.250%
due
04/15/2036
200,000
217,527
2.0%
507,010
4.6%
Technology
Apple
4.500%
due
02/23/2036
350,000
350,319
3.2%
Intel
4.000%
due
12/15/2032
360,000
333,919
3.0%
Microsoft
5.300%
due
02/08/2041
50,000
56,267
0.5%
Microsoft
4.200%
due
11/03/2035
350,000
342,371
3.1%
1,082,876
9.8%
Utilities
Alabama
Power
4.150%
due
08/15/2044
200,000
172,216
1.5%
Florida
Power
&
Light
5.950%
due
10/01/2033
100,000
107,628
1.0%
The
accompanying
notes
are
an
integral
part
of
these
financial
statements.
Corporate
Bonds
-
62.5%
Coupon
/
Maturity
Face
Amount
Market
Value
Percentage
of
Net
Assets
Utilities
(continued)
Puget
Sound
Energy
4.434%
due
11/15/2041
$
300,000
$
261,729
2.4%
541,573
4.9%
Total
Corporate
Bonds
(Cost
$7,641,228)
$6,935,187
62.5%
Government
Bonds
-
25.5%
Coupon
/
Maturity
Face
Amount
Market
Value
Percentage
of
Net
Assets
Financials
Federal
Home
Loan
Bank
5.000%
due
10/14/2044
250,000
250,642
2.2%
Government
United
States
Treasury
Bond
5.250%
due
02/15/2029
170,000
178,075
1.6%
United
States
Treasury
Bond
5.375%
due
02/15/2031
400,000
428,125
3.9%
United
States
Treasury
Bond
6.250%
due
05/15/2030
75,000
82,793
0.7%
United
States
Treasury
Bond
4.250%
due
05/15/2039
770,000
764,977
6.9%
United
States
Treasury
Bond
6.125%
due
08/15/2029
225,000
244,424
2.2%
United
States
Treasury
Bond
3.125%
due
11/15/2041
145,000
122,842
1.1%
United
States
Treasury
Bond
3.375%
due
11/15/2048
560,000
464,953
4.2%
United
States
Treasury
Note
2.875%
due
05/15/2052
400,000
300,359
2.7%
2,586,548
23.3%
Total
Government
Bonds
(Cost
$3,434,876)
$2,837,190
25.5%
Municipals
Bonds
-
7.4%
Coupon
/
Maturity
Face
Amount
Market
Value
Percentage
of
Net
Assets
General
Obligation
New
York
NY
5.846%
due
06/01/2040
200,000
210,702
1.9%
Government
Bonds
Maryland
Community
Development
Administration
5.991%
due
09/01/2044
300,000
305,632
2.7%
Minnesota
Housing
Finance
Agency
5.925%
due
07/01/2049
300,000
306,386
2.8%
612,018
5.5%
Total
Municipals
Bonds
(Cost
$819,150)
$822,720
7.4%
Mortgage
Backed
-
2.2%
Coupon
/
Maturity
Face
Amount
Market
Value
Percentage
of
Net
Assets
US
Government
Agency
Federal
National
Mortgage
Association
4.500%
due
11/01/2044
248,801
242,263
2.2%
Total
Mortgage
Backed
(Cost
$245,006)
$242,263
2.2%
Total
investments
(Cost
$12,140,260)
$10,837,360
97.6%
Other
assets
(net
of
liabilities)
267,229
2.4%
Total
net
assets
$11,104,589
100.0%
1
Security
was
purchased
pursuant
to
Rule
144A
under
the
Securities
Act
of
1933
and
may
be
sold
in
transactions
exempt
from
registration
only
to
qualified
institutional
buyers
or
in
public
offering
registered
under
the
Securities
Act
of
1933.
These
securities
have
been
deemed
liquid
under
guidelines
approved
by
the
Trust's
Board
of
Trustees.
At
November
30,
2024,
the
aggregate
value
of
these
securities
was
$217,527
representing
2.0%
of
total
net
assets.
MTN:
Medium
Term
Note
The
accompanying
notes
are
an
integral
part
of
these
financial
statements.
Statement
of
Assets
and
Liabilities
Statement
of
Operations
As
of
November
30,
2024
Assets
Investments
in
securities,
at
value
(Cost
$12,140,260)
$
10,837,360
Cash
461,109
Interest
receivable
125,684
Prepaid
expenses
1,288
Receivable
for
Fund
shares
sold
809
Total
assets
11,426,250
Liabilities
Payable
for
securities
purchased
305,100
Accrued
audit
expenses
4,366
Payable
for
Fund
shares
redeemed
2,923
Accrued
advisory
fees
2,832
Accrued
retirement
plan
custody
fee
2,478
Distributions
payable
1,601
Accrued
Chief
Compliance
Officer
expenses
348
Accrued
legal
expenses
307
Accrued
trustee
expenses
295
Accrued
other
operating
expenses
1,411
Total
liabilities
321,661
Net
assets
$11,104,589
Analysis
of
net
assets
Paid-in
capital
(unlimited
shares
authorized,
without
par
value)
$12,424,578
Total
distributable
earnings
(1,319,989)
Net
assets
applicable
to
Fund
shares
outstanding
$11,104,589
Fund
shares
outstanding
2,506,679
Net
asset
value,
offering,
and
redemption
price
per
share
$4.43
Year
ended
November
30,
2024
Investment
income
Interest
income
$
387,478
Total
investment
income
387,478
Expenses
Investment
advisory
fees
51,939
Filing
and
registration
fees
17,447
Audit
fees
5,645
Chief
Compliance
Officer
expenses
3,337
Trustee
fees
3,279
Legal
fees
2,601
Retirement
plan
custodial
fees
2,578
Custodian
fees
419
Other
operating
expenses
1,404
Total
gross
expenses
88,649
Less
adviser
fees
waived
(20,708)
Less
custodian
fee
credits
(420)
Net
expenses
67,521
Net
investment
income
$319,957
Net
realized
loss
from
investments
$(765)
Net
de
crease
in
unrealized
depreciation
on
investments
335,170
Net
gain
on
investments
334,405
Net
increase
in
net
assets
resulting
from
operations
$654,362
The
accompanying
notes
are
an
integral
part
of
these
financial
statements.
Statements
of
Changes
in
Net
Assets
Year
ended
November
30,
2024
Year
ended
November
30,
2023
Increase
in
net
assets
from
operations
From
operations
Net
investment
income
$319,957
$278,280
Net
realized
loss
on
investments
(765)
(400)
Net
increase
(decrease)
in
unrealized
de
preciation
on
investments
335,170
(162,297)
Net
increase
in
net
assets
654,362
115,583
Distributions
to
shareowners
from
Net
dividend
and
distribution
to
shareholders
(319,948)
(279,913)
Capital
share
transactions
Proceeds
from
the
sale
of
shares
1,234,078
1,281,464
Value
of
shares
issued
in
reinvestment
of
dividends
and
distributions
301,911
273,882
Cost
of
shares
redeemed
(839,611)
(1,131,452)
Total
capital
shares
transactions
696,378
423,894
Total
increase
in
net
assets
1,030,792
259,564
Net
assets
Beginning
of
year
10,073,797
9,814,233
End
of
year
$11,104,589
$10,073,797
Shares
of
the
Fund
sold
and
redeemed
Sextant
Bond
Income
(SBIFX)
Number
of
shares
sold
276,721
302,431
Number
of
shares
issued
in
reinvestment
of
dividends
and
distributions
68,821
63,138
Number
of
shares
redeemed
(193,742)
(258,610)
Net
increase
in
number
of
shares
outstanding
151,800
106,959
–
–
Sextant
Bond
Income
Fund:
Financial
Highlights
The
accompanying
notes
are
an
integral
part
of
these
financial
statements.
tin
Sextant
Bond
Income
(SBIFX)
Selected
data
per
share
of
outstanding
capital
stock
throughout
each
year:
Year
ended
November
30,
2024
2023
2022
2021
2020
A
A
A
A
A
A
Net
asset
value
at
beginning
of
year
$4.28
$4.37
$5.40
$5.65
$5.34
Income
from
investment
operations
Net
investment
income
0.13
0.13
0.12
0.13
0.14
Net
gains
(losses)
on
securities
(both
realized
and
unrealized)
0.15
(0.09)
(1.03)
(0.25)
0.31
Total
from
investment
operations
0.28
0.04
(0.91)
(0.12)
0.45
Less
distributions
Dividends
(from
net
investment
income)
(0.13)
(0.13)
(0.12)
(0.13)
(0.14)
Total
distributions
(0.13)
(0.13)
(0.12)
(0.13)
(0.14)
Net
asset
value
at
end
of
year
$4.43
$4.28
$4.37
$5.40
$5.65
Total
Return
6.73%
0.86%
(16.94)%
(2.19)%
8.48%
Ratios
/
supplemental
data
Net
assets
($000),
end
of
year
$11,105
$10,074
$9,814
$12,533
$14,042
Ratio
of
expenses
to
average
net
assets
Before
custodian
fee
credits
0.85%
0.96%
1.03%
0.58%
0.63%
After
advisory
fees
waiver
0.65%
0.65%
0.65%
0.53%
0.48%
After custodian
fee
credits
0.65%
0.65%
0.65%
0.53%
0.48%
Ratio
of
net
investment
income
after
custodian
fee
credits to
average
net
assets
3.08%
2.91%
2.58%
2.31%
2.50%
Portfolio
turnover
rate
4%
0%
0%
3%
13%
The
accompanying
notes
are
an
integral
part
of
these
financial
statements.
Common
Stock
-
61.7%
Number
of
Shares
Cost
Market
Value
Country
1
Percentage
of
Net
Assets
Communications
Internet
Media
&
Services
Alphabet,
Class
A
2,650
$
175,570
$
447,717
United
States
1.7%
Meta
Platforms
Inc,
Class
A
325
174,623
186,654
United
States
0.7%
350,193
634,371
2.4%
Consumer
Discretionary
Apparel,
Footwear
&
Accessory
Design
Hermes
International
55
135,065
119,982
France
0.4%
Automotive
Retailers
AutoZone
2
60
158,534
190,173
United
States
0.7%
O'Reilly
Automotive
2
160
135,486
198,915
United
States
0.8%
294,020
389,088
1.5%
Home
Products
Stores
Lowe's
1,100
75,376
299,673
United
States
1.1%
Specialty
Apparel
Stores
Ross
Stores
1,390
108,387
215,269
United
States
0.8%
TJX
Companies
2,700
139,837
339,363
United
States
1.3%
248,224
554,632
2.1%
752,685
1,363,375
5.1%
Consumer
Staples
Agricultural
Producers
Darling
Ingredients
2
1,250
70,975
50,663
United
States
0.2%
Household
Products
Procter
&
Gamble
1,450
138,928
259,927
United
States
1.0%
Packaged
Food
Danone
ADR
25,000
305,091
343,000
France
1.3%
General
Mills
3,800
246,333
251,788
United
States
0.9%
Nestle
ADR
1,000
73,990
86,780
Switzerland
0.3%
625,414
681,568
2.5%
Personal
Care
Products
Unilever
ADR
3,000
187,193
179,520
United
Kingdom
0.7%
1,022,510
1,171,678
4.4%
Energy
Exploration
&
Production
ConocoPhillips
800
31,822
86,672
United
States
0.3%
Refining
&
Marketing
Phillips
66
1,100
73,403
147,378
United
States
0.5%
Renewable
Energy
Equipment
Enphase
Energy
2
4,000
421,035
285,400
United
States
1.1%
526,260
519,450
1.9%
Financials
Consumer
Finance
Visa
900
138,795
283,572
United
States
1.0%
Diversified
Banks
JPMorgan
Chase
&
Co.
600
142,572
149,832
United
States
0.6%
Institutional
Brokerage
Virtu
Financial
11,000
185,000
410,410
United
States
1.5%
Other
Financial
Services
Mastercard,
Class
A
400
112,624
213,176
United
States
0.8%
The
accompanying
notes
are
an
integral
part
of
these
financial
statements.
Common
Stock
-
61.7%
Number
of
Shares
Cost
Market
Value
Country
1
Percentage
of
Net
Assets
Financials
(continued)
P&C
Insurance
Chubb
810
$
102,989
$
233,871
Switzerland
0.9%
681,980
1,290,861
4.8%
Health
Care
Large
Pharma
AstraZeneca
ADR
5,250
343,085
355,005
United
States
1.3%
GlaxoSmithKline
ADR
6,750
242,626
230,377
United
Kingdom
0.9%
Novo
Nordisk
ADR
4,000
139,787
427,200
Denmark
1.6%
725,498
1,012,582
3.8%
Managed
Care
UnitedHealth
Group
390
174,009
237,978
United
States
0.9%
Medical
Devices
Boston
Scientific
2
2,500
167,240
226,650
United
States
0.9%
Medical
Equipment
GE
Healthcare
Technologies
1,400
112,985
116,508
United
States
0.4%
1,179,732
1,593,718
6.0%
Industrials
Building
Construction
EMCOR
Group
Inc.
700
255,510
357,084
United
States
1.3%
Commercial
&
Residential
Building
Equipment
&
Systems
Johnson
Controls
International
3,800
159,032
318,668
United
States
1.2%
NIBE
Industrier
AB,
Class
B
30,000
193,873
127,044
Sweden
0.5%
Trane
400
131,521
166,488
Ireland
0.6%
484,426
612,200
2.3%
Electrical
Components
Prysmian
S.P.A
1,750
112,610
115,373
Italy
0.4%
Electrical
Power
Equipment
Eaton
2,000
298,440
750,840
Ireland
2.8%
Fuji
Electric
Co.,
Ltd.
4,000
204,741
225,167
Japan
0.8%
503,181
976,007
3.6%
Flow
Control
Equipment
Parker
Hannifin
500
60,804
351,450
United
States
1.3%
Industrial
Wholesale
&
Rental
Fastenal
1,745
40,514
145,812
United
States
0.6%
Rail
Freight
Canadian
Pacific
Kansas
City
2,568
182,009
196,683
Canada
0.7%
Waste
Management
Republic
Services
950
116,161
207,385
United
States
0.8%
1,755,215
2,961,994
11.0%
Materials
Agricultural
Chemicals
Corteva
5,500
291,392
342,320
United
States
1.3%
Basic
&
Diversified
Chemicals
Linde
560
75,239
258,154
United
Kingdom
1.0%
Iron
BHP
Biliton
ADR
2,750
159,117
144,788
Australia
0.5%
The
accompanying
notes
are
an
integral
part
of
these
financial
statements.
Common
Stock
-
61.7%
Number
of
Shares
Cost
Market
Value
Country
1
Percentage
of
Net
Assets
Materials
(continued)
Precious
Metals
Agnico-Eagle
Mines
6,150
$
299,837
$
519,183
Canada
1.9%
825,585
1,264,445
4.7%
Technology
Application
Software
Adobe
2
110
52,960
56,752
United
States
0.2%
SAP
ADR
2,100
321,112
498,960
Germany
1.9%
374,072
555,712
2.1%
Communications
Equipment
Apple
2,250
123,699
533,992
United
States
2.0%
Motorola
Solutions
1,025
264,513
512,193
United
States
1.9%
388,212
1,046,185
3.9%
Infrastructure
Software
Microsoft
1,350
313,140
571,671
United
States
2.1%
Oracle
3,100
124,402
573,004
United
States
2.2%
437,542
1,144,675
4.3%
IT
Services
Wolters
Kluwer
NV
2,000
277,883
333,676
Netherlands
1.2%
Semiconductor
Devices
Broadcom
2,400
296,613
388,992
United
States
1.5%
Infineon
Technologies
ADR
775
14,098
25,187
Germany
0.1%
Micron
Technology
1,550
59,028
151,822
United
States
0.6%
Nvidia
3,250
281,928
449,313
United
States
1.7%
NXP
Semiconductors
775
67,275
177,762
Netherlands
0.6%
718,942
1,193,076
4.5%
Semiconductor
Manufacturing
ASML
Holding
NY
85
61,423
58,362
Netherlands
0.2%
Taiwan
Semiconductor
ADR
2,300
318,550
424,718
Taiwan
1.6%
379,973
483,080
1.8%
2,576,624
4,756,404
17.8%
Utilities
Integrated
Electric
Utilities
Dominion
Energy
8,500
406,683
499,375
United
States
1.9%
NextEra
Energy
5,925
185,168
466,120
United
States
1.7%
591,851
965,495
3.6%
Total
Common
Stock
$10,262,635
$16,521,791
61.7%
Corporate
Bonds
-
16.2%
Coupon
/
Maturity
Face
Amount
Market
Value
Country
1
Percentage
of
Net
Assets
Communications
Bellsouth
Capital
Funding
7.875%
due
02/15/2030
150,000
163,663
United
States
0.6%
Comcast
5.650%
due
06/15/2035
500,000
524,578
United
States
2.0%
Expedia
Group
5.000%
due
02/15/2026
250,000
250,346
United
States
0.9%
938,587
3.5%
Consumer
Discretionary
Lowe's
4.250%
due
09/15/2044
250,000
205,695
United
States
0.8%
Stanford
University
4.013%
due
05/01/2042
100,000
89,811
United
States
0.3%
295,506
1.1%
Consumer
Staples
Coca
Cola
1.000%
due
03/15/2028
250,000
225,766
United
States
0.8%
The
accompanying
notes
are
an
integral
part
of
these
financial
statements.
Corporate
Bonds
-
16.2%
Coupon
/
Maturity
Face
Amount
Market
Value
Country
1
Percentage
of
Net
Assets
Financials
Charles
Schwab
3.000%
due
03/10/2025
$
300,000
$
298,560
United
States
1.1%
Industrials
Burlington
Northern
Santa
Fe
Bond
6.200%
due
08/15/2036
150,000
166,353
United
States
0.6%
CSX
Corp
4.650%
due
03/01/2068
300,000
260,457
United
States
1.0%
FedEx
3.900%
due
02/01/2035
250,000
226,724
United
States
0.9%
Legrand
France
Yankee
8.500%
due
02/15/2025
170,000
170,944
France
0.6%
Union
Pacific
3.375%
due
02/01/2035
250,000
222,160
United
States
0.8%
1,046,638
3.9%
Real
Estate
Welltower
4.250%
due
04/15/2028
350,000
345,352
United
States
1.3%
Technology
Oracle
2.950%
due
04/01/2030
500,000
456,897
United
States
1.7%
Qualcomm
3.250%
due
05/20/2027
220,000
214,087
United
States
0.8%
670,984
2.5%
Utilities
Pacificorp
6.000%
due
01/15/2039
500,000
529,221
United
States
2.0%
Total
Corporate
Bonds
(Cost
$4,649,600)
$4,350,614
16.2%
Government
Bonds
-
2.5%
Coupon
/
Maturity
Face
Amount
Market
Value
Country
1
Percentage
of
Net
Assets
Government
United
States
Treasury
Bond
4.500%
due
02/15/2036
137,000
141,736
United
States
0.5%
United
States
Treasury
Bond
3.625%
due
02/15/2044
155,000
137,387
United
States
0.5%
United
States
Treasury
Note
1.125%
due
01/15/2025
400,000
398,341
United
States
1.5%
Total
Government
Bonds
(Cost
$726,010)
$677,464
2.5%
Municipals
Bonds
-
0.4%
Coupon
/
Maturity
Face
Amount
Market
Value
Country
1
Percentage
of
Net
Assets
Utility
Networks
Tacoma
WA
Elec
Sys
Revenue
5.966%
due
01/01/2035
100,000
105,345
United
States
0.4%
Total
Municipals
Bonds
(Cost
$116,513)
$105,345
0.4%
Total
investments
(Cost
$15,754,758)
$21,655,214
80.8%
Other
assets
(net
of
liabilities)
5,138,918
19.2%
Total
net
assets
$26,794,132
100.0%
1
Country
of
domicile
2
Non-income
producing
ADR:
American
Depositary
Receipt
Yankee:
Dollar-denominated
bonds
issued
in
the
U.S.
by
foreign
banks
or
corporations
The
accompanying
notes
are
an
integral
part
of
these
financial
statements.
Statement
of
Assets
and
Liabilities
Statement
of
Operations
As
of
November
30,
2024
Assets
Investments
in
securities,
at
value
(Cost
$15,754,758)
$
21,655,214
Cash
5,032,378
Interest
receivable
82,975
Dividends
receivable
30,600
Receivable
for
Fund
shares
sold
12,190
Prepaid
expenses
5,138
Total
assets
26,818,495
Liabilities
Accrued
advisory
fees
10,826
Accrued
audit
expenses
7,663
Accrued
retirement
plan
custody
fee
4,014
Accrued
Chief
Compliance
Officer
expenses
616
Accrued
legal
expenses
260
Accrued
other
operating
expenses
984
Total
liabilities
24,363
Net
assets
$26,794,132
Analysis
of
net
assets
Paid-in
capital
(unlimited
shares
authorized,
without
par
value)
$20,198,920
Total
distributable
earnings
6,595,212
Net
assets
applicable
to
Fund
shares
outstanding
$26,794,132
Fund
shares
outstanding
1,531,314
Net
asset
value,
offering,
and
redemption
price
per
share
$17.50
Year
ended
November
30,
2024
Investment
income
Interest
income
$
441,696
Dividend
Income
(Net
of
foreign
tax
of
$10,078)
221,743
Total
investment
income
663,439
Expenses
Investment
advisory
fees
124,345
Filing
and
registration
fees
17,369
Audit
fees
12,797
Chief
Compliance
Officer
expenses
7,354
Trustee
fees
6,765
Legal
fees
5,522
Retirement
plan
custodial
fees
4,108
ReFlow
fees
2,455
Custodian
fees
1,105
Other
operating
expenses
3,543
Total
gross
expenses
185,363
Less
custodian
fee
credits
(1,105)
Net
expenses
184,258
Net
investment
income
$479,181
Net
realized
gain
from
investments
and
foreign
currency
$1,068,421
A
Net
Increase
in
unrealized
appreciation
on
investments
and
foreign
currency
2,278,060
Net
gain
on
investments
3,346,481
Net
increase
in
net
assets
resulting
from
operations
$3,825,662
A
Includes
$824,642
in
net
realized
gains
from
redemptions
in-kind
The
accompanying
notes
are
an
integral
part
of
these
financial
statements.
Statements
of
Changes
in
Net
Assets
Year
ended
November
30,
2024
Year
ended
November
30,
2023
Increase
in
net
assets
from
operations
From
operations
Net
investment
income
$479,181
$343,070
Net
realized
gain
on
investments
and
foreign
currency
1,068,421
722,143
Net
increase
(decrease)
in
unrealized
appreciation
on
investments
and
foreign
currency
2,278,060
(258,801)
Net
increase
in
net
assets
3,825,662
806,412
Distributions
to
shareowners
from
Net
dividend
and
distribution
to
shareholders
(351,859)
(282,074)
Capital
share
transactions
Proceeds
from
the
sale
of
shares
6,679,609
5,941,201
Value
of
shares
issued
in
reinvestment
of
dividends
and
distributions
351,248
281,446
Cost
of
shares
redeemed
(4,905,264)
(4,834,213)
Total
capital
shares
transactions
2,125,593
1,388,434
Total
increase
in
net
assets
5,599,396
1,912,772
Net
assets
Beginning
of
year
21,194,736
19,281,964
End
of
year
$26,794,132
$21,194,736
Shares
of
the
Fund
sold
and
redeemed
Sextant
Core
(SCORX)
Number
of
shares
sold
410,667
400,225
Number
of
shares
issued
in
reinvestment
of
dividends
and
distributions
22,749
19,424
Number
of
shares
redeemed
(295,026)
(323,202)
Net
increase
in
number
of
shares
outstanding
138,390
96,447
–
–
Sextant
Core
Fund:
Financial
Highlights
The
accompanying
notes
are
an
integral
part
of
these
financial
statements.
tin
Sextant
Core
(SCORX)
Selected
data
per
share
of
outstanding
capital
stock
throughout
each
year:
Year
ended
November
30,
2024
2023
2022
2021
2020
A
A
A
A
A
A
Net
asset
value
at
beginning
of
year
$15.22
$14.87
$16.20
$14.81
$14.31
Income
from
investment
operations
Net
investment
income
0.32
0.26
0.21
0.24
0.19
Net
gains
(losses)
on
securities
(both
realized
and
unrealized)
2.21
0.30
(1.03)
1.36
1.13
Total
from
investment
operations
2.53
0.56
(0.82)
1.60
1.32
Less
distributions
Dividends
(from
net
investment
income)
(0.25)
(0.19)
(0.25)
(0.21)
(0.20)
Distributions
(from
capital
gains)
–
(0.02)
(0.26)
–
(0.62)
Total
distributions
(0.25)
(0.21)
(0.51)
(0.21)
(0.82)
Net
asset
value
at
end
of
year
$17.50
$15.22
$14.87
$16.20
$14.81
Total
Return
16.84%
3.88%
(5.32)%
10.95%
9.72%
Ratios
/
supplemental
data
Net
assets
($000),
end
of
year
$26,794
$21,195
$19,282
$18,932
$18,962
Ratio
of
expenses
to
average
net
assets
Before
custodian
fee
credits
0.74%
0.86%
0.90%
0.57%
0.88%
After custodian
fee
credits
0.74%
0.85%
0.90%
0.56%
0.88%
Ratio
of
net
investment
income
after
custodian
fee
credits to
average
net
assets
1.93%
1.72%
1.44%
1.52%
1.40%
Portfolio
turnover
rate
17%
13%
10%
14%
19%
Sextant
Global
High
Income
Fund
The
accompanying
notes
are
an
integral
part
of
these
financial
statements.
Common
Stock
-
50.0%
Number
of
Shares
Cost
Market
Value
Country
1
Percentage
of
Net
Assets
Communications
Wireless
Telecommunications
Orange
ADR
20,000
$
270,393
$
213,200
France
2.2%
SK
Telecom
ADR
11,000
265,273
266,420
South
Korea
2.8%
Telenor
ASA
20,000
265,603
235,518
Norway
2.5%
Verizon
Communications
6,000
294,820
266,040
United
States
2.8%
1,096,089
981,178
10.3%
Consumer
Discretionary
Automobiles
Volkswagen
AG
1,500
274,363
128,520
Germany
1.3%
Energy
Exploration
&
Production
Woodside
Energy
Group
ADR
8,500
174,552
136,340
Australia
1.4%
Integrated
Oils
Shell
ADR
3,800
241,426
246,012
Netherlands
2.6%
415,978
382,352
4.0%
Financials
Banks
ANZ
Group
Holdings
ADR
15,000
244,950
307,650
Australia
3.2%
Skandinaviska
Enskilda
Banken,
Cl
A
25,000
233,632
346,232
Sweden
3.6%
478,582
653,882
6.8%
Institutional
Brokerage
Virtu
Financial
7,500
119,775
279,825
United
States
3.0%
598,357
933,707
9.8%
Health
Care
Large
Pharma
GlaxoSmithKline
ADR
6,500
267,211
221,845
United
Kingdom
2.3%
Novartis
ADR
2,500
134,038
264,425
Switzerland
2.8%
Sandoz
Group
AG-ADR
500
7,234
22,797
Switzerland
0.2%
408,483
509,067
5.3%
Materials
Base
Metals
Norsk
Hydro
ASA
35,000
314,618
217,214
Norway
2.3%
South32
ADR
19,000
134,773
230,090
Australia
2.4%
Southern
Copper
5,111
335,962
512,889
Peru
5.3%
785,353
960,193
10.0%
Iron
BHP
Biliton
ADR
5,500
186,488
289,575
Australia
3.1%
971,841
1,249,768
13.1%
Technology
Communications
Equipment
Cisco
Systems
5,000
179,892
296,050
United
States
3.1%
Consumer
Electronics
Nintendo
5,000
223,480
292,337
Japan
3.1%
403,372
588,387
6.2%
Total
Common
Stock
$4,168,483
$4,772,979
50.0%
Corporate
Bonds
-
26.9%
Coupon
/
Maturity
Face
Amount
Market
Value
Country
1
Percentage
of
Net
Assets
Communications
Comcast
4.650%
due
07/15/2042
250,000
230,709
United
States
2.4%
Sextant
Global
High
Income
Fund
The
accompanying
notes
are
an
integral
part
of
these
financial
statements.
Corporate
Bonds
-
26.9%
Coupon
/
Maturity
Face
Amount
Market
Value
Country
1
Percentage
of
Net
Assets
Communications
(continued)
Netflix
4.375%
due
11/15/2026
$
250,000
$
249,660
United
States
2.6%
480,369
5.0%
Consumer
Discretionary
Ford
Motor
6.375%
due
02/01/2029
220,000
226,305
United
States
2.4%
MDC
Holdings
3.850%
due
01/15/2030
200,000
190,387
United
States
2.0%
YUM!
Brands
3.625%
due
03/15/2031
295,000
267,073
United
States
2.8%
683,765
7.2%
Consumer
Staples
Grupo
Bimbo
2
4.875%
due
06/27/2044
200,000
180,923
Mexico
1.9%
Energy
Petrobras
International
Finance
6.875%
due
01/20/2040
50,000
50,305
Brazil
0.5%
Petrobras
International
Finance
6.750%
due
01/27/2041
80,000
78,780
Brazil
0.8%
129,085
1.3%
Financials
Lincoln
National
6.919%
due
04/20/2067
250,000
200,573
United
States
2.1%
Industrials
Burlington
Northern
Santa
Fe
5.050%
due
03/01/2041
200,000
196,784
United
States
2.1%
CSX
Corp
4.650%
due
03/01/2068
250,000
217,047
United
States
2.3%
Delta
Air
Lines
3.750%
due
10/28/2029
250,000
233,101
United
States
2.4%
Norfolk
Southern
5.100%
due
08/01/2118
275,000
248,901
United
States
2.6%
895,833
9.4%
Total
Corporate
Bonds
(Cost
$2,847,245)
$2,570,548
26.9%
Government
Bonds
-
3.1%
Coupon
/
Maturity
Face
Amount
Market
Value
Country
1
Percentage
of
Net
Assets
Government
Colombia
Republic
8.375%
due
02/15/2027
125,000
129,813
Colombia
1.4%
Republic
of
Argentina
1.000%
due
07/09/2029
9,276
7,179
Argentina
0.1%
Republic
of
Argentina
1.500%
due
07/09/2046
242,500
153,447
Argentina
1.6%
Total
Government
Bonds
(Cost
$360,466)
$290,439
3.1%
Municipals
Bonds
-
0.5%
Coupon
/
Maturity
Face
Amount
Market
Value
Country
1
Percentage
of
Net
Assets
Municipal
Bonds
Colony
TX
NFM
Sales
Tax
Revenue
7.625%
due
10/01/2042
50,000
49,998
United
States
0.5%
Total
Municipals
Bonds
(Cost
$50,000)
$49,998
0.5%
Total
investments
(Cost
$7,426,194)
$7,683,964
80.5%
Other
assets
(net
of
liabilities)
1,859,568
19.5%
Total
net
assets
$9,543,532
100.0%
1
Denotes
a
country
or
region
of
primary
exposure
2
Security
was
purchased
pursuant
to
Regulation
S
under
the
Securities
Act
of
1933
which
exempts
from
registration
securities
offered
and
sold
outside
of
the
United
States.
Such
a
security
cannot
be
sold
in
the
United
States
without
either
an
effective
registration
statement
filed
pursuant
to
the
Securities
Act
of
1933,
or
pursuant
to
an
exemption
from
registration.
These
Securities
have
been
deemed
liquid
under
guidelines
approved
by
the
Trust's
Board
of
Trustees.
At
November
30,
2024,
the
aggregate
value
of
these
securities
was
$180,923
representing
1.9%
of
total
net
assets.
ADR:
American
Depositary
Receipt
Sextant
Global
High
Income
Fund
The
accompanying
notes
are
an
integral
part
of
these
financial
statements.
Statement
of
Assets
and
Liabilities
Statement
of
Operations
As
of
November
30,
2024
Assets
Investments
in
securities,
at
value
(Cost
$7,426,194)
$
7,683,964
Cash
1,798,057
Interest
receivable
48,692
Dividends
receivable
26,623
Prepaid
expenses
1,629
Receivable
for
Fund
shares
sold
1,320
Total
assets
9,560,285
Liabilities
Accrued
audit
expenses
5,383
Payable
for
Fund
shares
redeemed
4,097
Accrued
advisory
fees
3,538
Accrued
retirement
plan
custody
fee
1,857
Accrued
legal
expenses
340
Accrued
Chief
Compliance
Officer
expenses
338
Accrued
trustee
expenses
138
Accrued
other
operating
expenses
1,062
Total
liabilities
16,753
Net
assets
$9,543,532
Analysis
of
net
assets
Paid-in
capital
(unlimited
shares
authorized,
without
par
value)
$9,022,840
Total
distributable
earnings
520,692
Net
assets
applicable
to
Fund
shares
outstanding
$9,543,532
Fund
shares
outstanding
867,678
Net
asset
value,
offering,
and
redemption
price
per
share
$11.00
Year
ended
November
30,
2024
Investment
income
Interest
income
$
237,239
Dividend
Income
(Net
of
foreign
tax
of
$20,524)
196,611
Total
investment
income
433,850
Expenses
Investment
advisory
fees
47,792
Filing
and
registration
fees
20,580
Audit
fees
5,797
Chief
Compliance
Officer
expenses
3,256
Trustee
fees
3,030
Legal
fees
2,607
Retirement
plan
custodial
fees
2,004
Custodian
fees
677
Other
operating
expenses
2,015
Total
gross
expenses
87,758
Less
adviser
fees
waived
(15,456)
Less
custodian
fee
credits
(677)
Net
expenses
71,625
Net
investment
income
$362,225
Net
realized
loss
from
investments
and
foreign
currency
$(83,829)
Net
increase
in
unrealized
appreciation
on
investments
and
foreign
currency
842,395
Net
gain
on
investments
758,566
Net
increase
in
net
assets
resulting
from
operations
$1,120,791
Sextant
Global
High
Income
Fund
The
accompanying
notes
are
an
integral
part
of
these
financial
statements.
Statements
of
Changes
in
Net
Assets
Year
ended
November
30,
2024
Year
ended
November
30,
2023
Increase
in
net
assets
from
operations
From
operations
Net
investment
income
$362,225
$413,582
Net
realized
loss
on
investments
and
foreign
currency
(83,829)
(11,956)
Net
increase
(decrease)
in
unrealized
appreciation
(depreciation)
on
investments
and
foreign
currency
842,395
(13,885)
Net
increase
in
net
assets
1,120,791
387,741
Distributions
to
shareowners
from
Net
dividend
and
distribution
to
shareholders
(401,403)
(305,551)
Capital
share
transactions
Proceeds
from
the
sale
of
shares
626,869
511,784
Value
of
shares
issued
in
reinvestment
of
dividends
and
distributions
392,421
298,310
Cost
of
shares
redeemed
(1,633,902)
(507,318)
Total
capital
shares
transactions
(614,612)
302,776
Total
increase
in
net
assets
104,776
384,966
Net
assets
Beginning
of
year
9,438,756
9,053,790
End
of
year
$9,543,532
$9,438,756
Shares
of
the
Fund
sold
and
redeemed
Sextant
Global
High
Income
Fund
(SGHIX)
Number
of
shares
sold
59,340
50,804
Number
of
shares
issued
in
reinvestment
of
dividends
and
distributions
38,472
30,440
Number
of
shares
redeemed
(155,609)
(50,276)
Net
increase
(decrease)
in
number
of
shares
outstanding
(57,797)
30,968
–
–
Sextant
Global
High
Income
Fund:
Financial
Highlights
The
accompanying
notes
are
an
integral
part
of
these
financial
statements.
tin
Sextant
Global
High
Income
Fund
(SGHIX)
Selected
data
per
share
of
outstanding
capital
stock
throughout
each
year:
Year
ended
November
30,
2024
2023
2022
2021
2020
A
A
A
A
A
A
Net
asset
value
at
beginning
of
year
$10.20
$10.12
$10.77
$10.15
$11.42
Income
from
investment
operations
Net
investment
income
0.40
0.45
0.40
0.33
0.31
Net
gains
(losses)
on
securities
(both
realized
and
unrealized)
0.83
(0.03)
(0.83)
0.65
(0.66)
Total
from
investment
operations
1.23
0.42
(0.43)
0.98
(0.35)
Less
distributions
Dividends
(from
net
investment
income)
(0.43)
(0.34)
(0.22)
(0.36)
(0.40)
Distributions
(from
capital
gains)
–
–
–
–
(0.52)
Total
distributions
(0.43)
(0.34)
(0.22)
(0.36)
(0.92)
Net
asset
value
at
end
of
year
$11.00
$10.20
$10.12
$10.77
$10.15
Total
Return
12.42%
4.31%
(4.16)%
9.87%
(3.51)%
Ratios
/
supplemental
data
Net
assets
($000),
end
of
year
$9,544
$9,439
$9,054
$9,150
$8,615
Ratio
of
expenses
to
average
net
assets
Before
custodian
fee
credits
0.92%
0.96%
0.98%
0.78%
0.70%
After
advisory
fees
waiver
0.76%
0.75%
0.75%
0.70%
0.56%
After custodian
fee
credits
0.75%
0.74%
0.74%
0.69%
0.55%
Ratio
of
net
investment
income
after
custodian
fee
credits to
average
net
assets
3.79%
4.45%
3.87%
3.11%
3.12%
Portfolio
turnover
rate
0%
8%
20%
27%
27%
The
accompanying
notes
are
an
integral
part
of
these
financial
statements.
Common
Stock
-
97
.4
%
Number
of
Shares
Cost
Market
Value
Percentage
of
Net
Assets
Communications
Internet
Media
&
Services
Alphabet,
Class
A
31,680
$
898,428
$
5,352,336
7.1%
Meta
Platforms
Inc,
Class
A
2,800
1,335,391
1,608,096
2.1%
2,233,819
6,960,432
9.2%
Consumer
Discretionary
Automotive
Retailers
O'Reilly
Automotive
1
1,300
1,094,232
1,616,186
2.2%
Home
Products
Stores
Lowe's
5,600
198,283
1,525,608
2.0%
Online
Marketplace
Amazon.com
1
26,980
162,991
5,608,872
7.4%
Specialty
Apparel
Stores
Lululemon
Athletica
1
3,000
965,595
961,980
1.3%
TJX
Companies
19,000
824,767
2,388,110
3.1%
1,790,362
3,350,090
4.4%
3,245,868
12,100,756
16.0%
Consumer
Staples
Mass
Merchants
Costco
Wholesale
3,509
410,438
3,410,327
4.5%
Non-Alcoholic
Beverages
Monster
Beverage
1
32,200
1,489,661
1,775,186
2.3%
1,900,099
5,185,513
6.8%
Financials
Other
Financial
Services
Mastercard,
Class
A
5,096
463,823
2,715,862
3.6%
Health
Care
Medical
Devices
Boston
Scientific
1
22,000
981,996
1,994,520
2.6%
Edwards
Lifesciences
1
10,500
346,070
749,175
1.0%
Stryker
3,000
374,100
1,176,450
1.6%
1,702,166
3,920,145
5.2%
Specialty
&
Generic
Pharma
Zoetis
6,000
998,110
1,051,500
1.4%
2,700,276
4,971,645
6.6%
Industrials
Commercial
&
Residential
Building
Equipment
&
Systems
Johnson
Controls
International
22,500
1,043,161
1,886,850
2.5%
Industrial
Wholesale
&
Rental
Ferguson
Enterprises
6,250
1,141,985
1,349,563
1.8%
Infrastructure
Construction
Quanta
Services
5,000
1,347,130
1,722,600
2.2%
3,532,276
4,959,013
6.5%
Materials
Agricultural
Chemicals
Corteva
16,900
735,537
1,051,856
1.4%
The
accompanying
notes
are
an
integral
part
of
these
financial
statements.
Common
Stock
-
97.4%
Number
of
Shares
Cost
Market
Value
Percentage
of
Net
Assets
Technology
Application
Software
Adobe
1
4,450
$
23,404
$
2,295,888
3.0%
Communications
Equipment
Apple
27,350
8,060
6,490,976
8.6%
Motorola
Solutions
6,000
1,346,591
2,998,200
3.9%
1,354,651
9,489,176
12.5%
Infrastructure
Software
Microsoft
18,170
838,685
7,694,268
10.2%
Oracle
17,500
901,024
3,234,700
4.3%
ServiceNow
1
1,900
1,225,009
1,993,936
2.6%
2,964,718
12,922,904
17.1%
Semiconductor
Devices
Advanced
Micro
Devices
1
9,500
758,357
1,303,163
1.7%
Broadcom
12,750
1,200,407
2,066,520
2.7%
Monolithic
Power
Systems
1,100
521,986
624,404
0.8%
Nvidia
35,000
493,219
4,838,750
6.4%
Qualcomm
7,900
1,066,689
1,252,387
1.7%
Texas
Instruments
5,100
648,430
1,025,253
1.4%
4,689,088
11,110,477
14.7%
9,031,861
35,818,445
47.3%
Total
investments
$23,843,559
$
73,763,522
97.4%
Other
assets
(net
of
liabilities)
1,933,804
2.6%
Total
net
assets
$
75,697,326
100.0%
1
Non-income
producing
The
accompanying
notes
are
an
integral
part
of
these
financial
statements.
Statement
of
Assets
and
Liabilities
Statement
of
Operations
As
of
November
30,
2024
Assets
Investments
in
securities,
at
value
(Cost
$23,843,559)
$
73,763,522
Cash
1,960,107
Dividends
receivable
24,798
Receivable
for
Fund
shares
sold
15,262
Prepaid
expenses
8,428
Interest
receivable
5,239
Total
assets
75,777,356
Liabilities
Accrued
advisory
fees
30,644
Accrued
audit
expenses
30,454
Accrued
retirement
plan
custody
fee
7,589
Accrued
Chief
Compliance
Officer
expenses
1,783
Accrued
legal
expenses
1,680
Accrued
12b-1
distribution
fees
886
Accrued
other
operating
expenses
905
Accrued
printing
fees
6,089
Total
liabilities
80,030
Net
assets
$75,697,326
Analysis
of
net
assets
Paid-in
capital
(unlimited
shares
authorized,
without
par
value)
$24,162,933
Total
distributable
earnings
51,534,393
Net
assets
applicable
to
Fund
shares
outstanding
$75,697,326
Net
asset
value
per
Investor
Shares
SSGFX
Net
assets,
at
value
$4,374,490
Shares
outstanding
77,045
Net
asset
value,
offering
and
redemption
price
per
share
$56.78
Net
asset
value
per
Z
Shares
SGZFX
Net
assets,
at
value
$71,322,836
Shares
outstanding
1,252,553
Net
asset
value,
offering
and
redemption
price
per
share
$56.94
Year
ended
November
30,
2024
Investment
income
Dividend
Income
$
505,397
Interest
income
19,395
Miscellaneous
income
798
Total
investment
income
525,590
Expenses
Investment
advisory
fees
344,509
Audit
fees
37,812
Filing
and
registration
fees
30,109
Chief
Compliance
Officer
expenses
21,078
Trustee
fees
19,597
Legal
fees
16,745
12b-1
distribution
fees
10,521
Retirement
plan
custodial
fees
7,885
1,025
Investor
Shares
–
1,050
Z
Shares
7,885
ReFlow
fees
6,560
Custodian
fees
2,820
Other
operating
expenses
9,950
Total
gross
expenses
507,586
Less
custodian
fee
credits
(2,820)
Net
expenses
504,766
Net
investment
income
$20,824
Net
realized
gain
from
investments
$4,521,347
A
Net
Increase
in
unrealized
appreciation
on
investments
13,547,532
Net
gain
on
investments
18,068,879
Net
increase
in
net
assets
resulting
from
operations
$18,089,703
A
Includes
$2,643,239
in
net
realized
gains
from
redemptions
in-kind
The
accompanying
notes
are
an
integral
part
of
these
financial
statements.
Statements
of
Changes
in
Net
Assets
Year
ended
November
30,
2024
Year
ended
November
30,
2023
Increase
in
net
assets
from
operations
From
operations
Net
investment
income
(loss)
$20,824
$(2,487)
Net
realized
gain
on
investments
4,521,347
865,127
Net
increase
in
unrealized
appreciation
on
investments
13,547,532
7,620,469
Net
increase
in
net
assets
18,089,703
8,483,109
Distributions
to
shareowners
from
1,025
Net
dividend
and
distribution
to
shareholders
-
Investor
Shares
–
(116,456)
1,050
Net
dividend
and
distribution
to
shareholders
-
Z
Shares
(32,415)
(1,184,886)
Total
distributions
(32,415)
(1,301,342)
Capital
share
transactions
Proceeds
from
the
sale
of
shares
1,025
Investor
Shares
327,619
491,401
1,050
Z
Shares
7,200,447
4,454,320
Value
of
shares
issued
in
reinvestment
of
dividends
and
distributions
1,025
Investor
Shares
–
86,817
1,050
Z
Shares
31,513
1,154,557
Cost
of
shares
redeemed
1,025
Investor
Shares
(2,102,716)
(1,032,724)
1,050
Z
Shares
(9,418,833)
(5,613,472)
Total
capital
shares
transactions
(3,961,970)
(459,101)
Total
increase
in
net
assets
14,095,318
6,722,666
Net
assets
Beginning
of
year
61,602,008
54,879,342
End
of
year
$75,697,326
$61,602,008
Shares
of
the
Fund
sold
and
redeemed
Investor
Shares
(SSGFX)
Number
of
shares
sold
6,533
11,981
Number
of
shares
issued
in
reinvestment
of
dividends
and
distributions
–
2,413
Number
of
shares
redeemed
(45,655)
(25,330)
Net
decrease
in
number
of
shares
outstanding
(39,122)
(10,936)
Z
Shares
(SGZFX)
Number
of
shares
sold
144,526
111,231
Number
of
shares
issued
in
reinvestment
of
dividends
and
distributions
695
32,134
Number
of
shares
redeemed
(188,002)
(140,223)
Net
increase
(decrease)
in
number
of
shares
outstanding
(42,781)
3,142
–
–
Sextant
Growth
Fund:
Financial
Highlights
The
accompanying
notes
are
an
integral
part
of
these
financial
statements.
tin
Investor
Shares
(SSGFX)
Selected
data
per
share
of
outstanding
capital
stock
throughout
each
year:
Year
ended
November
30,
2024
2023
2022
2021
2020
A
A
A
A
A
A
Net
asset
value
at
beginning
of
year
$43.60
$38.72
$51.39
$41.86
$33.25
Income
from
investment
operations
Net
investment
income
A
(0.10)
(0.09)
(0.13)
0.09
(0.03)
Net
gains
(losses)
on
securities
(both
realized
and
unrealized)
13.28
5.89
(8.24)
9.70
9.58
Total
from
investment
operations
13.18
5.80
(8.37)
9.79
9.55
Less
distributions
Dividends
(from
net
investment
income)
–
–
(0.05)
(0.03)
(0.01)
Distributions
(from
capital
gains)
–
(0.92)
(4.25)
(0.23)
(0.93)
Total
distributions
–
(0.92)
(4.30)
(0.26)
(0.94)
Net
asset
value
at
end
of
year
$56.78
$43.60
$38.72
$51.39
$41.86
Total
Return
30.23%
15.47%
(17.88)%
23.48%
29.49%
Ratios
/
supplemental
data
Net
assets
($000),
end
of
year
$4,374
$5,065
$4,921
$6,411
$5,197
Ratio
of
expenses
to
average
net
assets
Before
custodian
fee
credits
0.96%
1.04%
1.21%
0.74%
1.05%
After custodian
fee
credits
0.96%
1.04%
1.20%
0.74%
1.05%
Ratio
of
net
investment
income
after
custodian
fee
credits to
average
net
assets
(0.19)%
(0.22)%
(0.32)%
0.20%
(0.08)%
Portfolio
turnover
rate
6%
10%
23%
18%
17%
Z
Shares
(SGZFX)
Selected
data
per
share
of
outstanding
capital
stock
throughout
each
year:
Year
ended
November
30,
2024
2023
2022
2021
2020
A
A
A
A
A
A
Net
asset
value
at
beginning
of
year
$43.65
$38.66
$51.30
$41.78
$33.16
Income
from
investment
operations
Net
investment
income
A
0.02
0.01
(0.03)
0.20
0.05
Net
gains
(losses)
on
securities
(both
realized
and
unrealized)
13.30
5.90
(8.22)
9.66
9.56
Total
from
investment
operations
13.32
5.91
(8.25)
9.86
9.61
Less
distributions
Dividends
(from
net
investment
income)
(0.03)
–
(0.14)
(0.11)
(0.06)
Distributions
(from
capital
gains)
–
(0.92)
(4.25)
(0.23)
(0.93)
Total
distributions
(0.03)
(0.92)
(4.39)
(0.34)
(0.99)
Net
asset
value
at
end
of
year
$56.94
$43.65
$38.66
$51.30
$41.78
Total
Return
30.52%
15.79%
(17.69)%
23.76%
29.79%
Ratios
/
supplemental
data
Net
assets
($000),
end
of
year
$71,323
$56,537
$49,958
$62,277
$53,776
Ratio
of
expenses
to
average
net
assets
Before
custodian
fee
credits
0.72%
0.80%
0.97%
0.51%
0.82%
After custodian
fee
credits
0.72%
0.80%
0.97%
0.50%
0.82%
Ratio
of
net
investment
income
after
custodian
fee
credits to
average
net
assets
0.04%
0.02%
(0.08)%
0.43%
0.14%
Portfolio
turnover
rate
6%
10%
23%
18%
17%
A
Calculated
using
average
shares
outstanding
The
accompanying
notes
are
an
integral
part
of
these
financial
statements.
Common
Stock
-
97.9%
Number
of
Shares
Cost
Market
Value
Country
1
Percentage
of
Net
Assets
Consumer
Discretionary
Apparel,
Footwear
&
Accessory
Design
Hermes
International
600
$
569,152
$
1,308,896
France
1.8%
Online
Marketplace
MercadoLibre
2
2,770
229,727
5,498,921
Argentina
7.7%
798,879
6,807,817
9.5%
Consumer
Staples
Packaged
Food
Danone
15,000
948,276
1,025,463
France
1.4%
Health
Care
Health
Care
Supplies
Alcon
20,800
1,171,874
1,848,080
Switzerland
2.5%
Large
Pharma
AstraZeneca
ADR
11,500
742,970
777,630
United
States
1.1%
Novo
Nordisk
ADR
49,975
306,246
5,337,330
Denmark
7.4%
Sandoz
Group
AG
22,000
909,244
1,005,350
Switzerland
1.4%
1,958,460
7,120,310
9.9%
Medical
Equipment
Siemens
Healthineers
AG
38,250
2,175,905
2,075,738
Germany
2.9%
5,306,239
11,044,128
15.3%
Industrials
Commercial
&
Residential
Building
Equipment
&
Systems
Assa
Abloy
AB
51,400
1,222,737
1,575,600
Sweden
2.2%
Johnson
Controls
International
26,450
1,740,360
2,218,097
United
States
3.0%
2,963,097
3,793,697
5.2%
Electrical
Components
Prysmian
S.P.A.
14,100
909,066
929,578
Italy
1.3%
Electrical
Power
Equipment
Eaton
5,275
887,004
1,980,340
Ireland
2.8%
Fuji
Electric
Co.,
Ltd.
39,900
2,175,996
2,246,033
Japan
3.1%
Schneider
Electric
SE
8,200
1,559,393
2,111,395
France
2.9%
4,622,393
6,337,768
8.8%
Industrial
Automation
Controls
ABB
Ltd.
26,000
1,339,713
1,484,235
Switzerland
2.1%
Industrial
Wholesale
&
Rental
Ferguson
Enterprises
Inc.
14,560
2,584,771
3,143,941
United
States
4.3%
12,419,040
15,689,219
21.7%
Materials
Basic
&
Diversified
Chemicals
Linde
5,025
1,292,608
2,316,475
United
Kingdom
3.2%
Iron
Rio
Tinto
ADR
32,800
1,773,219
2,061,152
United
Kingdom
2.8%
3,065,827
4,377,627
6.0%
Technology
Application
Software
Dassault
Systemes
ADR
88,115
998,519
3,038,205
France
4.2%
NICE
Systems
ADR
17,350
936,821
3,165,334
Israel
4.4%
OpenText
23,400
896,365
712,062
Canada
1.0%
The
accompanying
notes
are
an
integral
part
of
these
financial
statements.
Common
Stock
-
97.9%
Number
of
Shares
Cost
Market
Value
Country
1
Percentage
of
Net
Assets
Technology
(continued)
Application
Software
(continued)
SAP
ADR
14,500
$
2,088,317
$
3,445,200
Germany
4.8%
4,920,022
10,360,801
14.4%
Consumer
Electronics
Nintendo
17,000
724,213
993,945
Japan
1.4%
IT
Services
Accenture,
Class
A
2,240
413,974
811,709
Ireland
1.1%
Experian
33,000
1,053,313
1,575,790
Ireland
2.2%
Wolters
Kluwer
31,139
607,304
5,194,132
Netherlands
7.2%
2,074,591
7,581,631
10.5%
Semiconductor
Devices
Broadcom
20,950
3,333,434
3,395,576
United
States
4.7%
Semiconductor
Manufacturing
ASML
Holding
NY
5,245
182,923
3,601,270
Netherlands
5.0%
Taiwan
Semiconductor
ADR
23,320
2,419,020
4,306,271
Taiwan
5.9%
2,601,943
7,907,541
10.9%
13,654,203
30,239,494
41.9%
Utilities
Power
Generation
Iberdrola
107,385
1,104,303
1,530,472
Spain
2.1%
Total
investments
$37,296,767
$70,714,220
97.9%
Other
assets
(net
of
liabilities)
1,506,180
2.1%
Total
net
assets
$72,220,400
100.0%
1
Country
of
domicile
2
Non-income
producing
ADR:
American
Depositary
Receipt
The
accompanying
notes
are
an
integral
part
of
these
financial
statements.
Statement
of
Assets
and
Liabilities
Statement
of
Operations
As
of
November
30,
2024
Assets
Investments
in
securities,
at
value
(Cost
$37,296,767)
$
70,714,220
Cash
1,457,799
Dividends
receivable
116,041
Prepaid
expenses
8,583
Interest
receivable
7,994
Receivable
for
Fund
shares
sold
3,702
Total
assets
72,308,339
Liabilities
Accrued
advisory
fees
29,613
Accrued
audit
expenses
22,472
Payable
for
Fund
shares
redeemed
13,288
Accrued
12b-1
distribution
fees
8,685
Accrued
retirement
plan
custody
fee
5,293
Accrued
Chief
Compliance
Officer
expenses
1,815
Accrued
legal
expenses
1,714
Accrued
other
operating
expenses
5,059
Total
liabilities
87,939
Net
assets
$72,220,400
Analysis
of
net
assets
Paid-in
capital
(unlimited
shares
authorized,
without
par
value)
$38,407,647
Total
distributable
earnings
33,812,753
Net
assets
applicable
to
Fund
shares
outstanding
$72,220,400
Net
asset
value
per
Investor
Shares
SSIFX
Net
assets,
at
value
$42,365,884
Shares
outstanding
1,854,936
Net
asset
value,
offering
and
redemption
price
per
share
$22.84
Net
asset
value
per
Z
Shares
SIFZX
Net
assets,
at
value
$29,854,516
Shares
outstanding
1,300,380
Net
asset
value,
offering
and
redemption
price
per
share
$22.96
Year
ended
November
30,
2024
Investment
income
Dividend
Income
(Net
of
foreign
tax
of
$98,553)
$
974,127
Interest
income
22,012
Total
investment
income
996,139
Expenses
Investment
advisory
fees
370,093
12b-1
distribution
fees
108,717
Audit
fees
40,000
Filing
and
registration
fees
30,308
Chief
Compliance
Officer
expenses
22,251
Trustee
fees
20,897
Legal
fees
17,730
Custodian
fees
7,765
ReFlow
fees
7,063
Retirement
plan
custodial
fees
5,512
1,125
Investor
Shares
209
1,150
Z
Shares
5,303
Other
operating
expenses
12,455
Total
gross
expenses
642,791
Less
custodian
fee
credits
(7,765)
Net
expenses
635,026
Net
investment
income
$361,113
Net
realized
gain
from
investments
and
foreign
currency
$3,213,628
A
Net
Increase
in
unrealized
appreciation
on
investments
and
foreign
currency
2,865,854
Net
gain
on
investments
6,079,482
Net
increase
in
net
assets
resulting
from
operations
$6,440,595
A
Includes
$2,540,500
in
net
realized
gains
from
redemptions
in-kind
The
accompanying
notes
are
an
integral
part
of
these
financial
statements.
Statements
of
Changes
in
Net
Assets
Year
ended
November
30,
2024
Year
ended
November
30,
2023
Increase
in
net
assets
from
operations
From
operations
Net
investment
income
$361,113
$318,734
Net
realized
gain
on
investments
and
foreign
currency
3,213,628
693,030
Net
increase
in
unrealized
appreciation
on
investments
and
foreign
currency
2,865,854
7,566,421
Net
increase
in
net
assets
6,440,595
8,578,185
Distributions
to
shareowners
from
1,125
Net
dividend
and
distribution
to
shareholders
-
Investor
Shares
(132,998)
–
1,150
Net
dividend
and
distribution
to
shareholders
-
Z
Shares
(155,645)
–
Total
distributions
(288,643)
–
Capital
share
transactions
Proceeds
from
the
sale
of
shares
1,125
Investor
Shares
8,686,947
3,809,054
1,150
Z
Shares
8,404,438
4,771,807
Value
of
shares
issued
in
reinvestment
of
dividends
and
distributions
1,125
Investor
Shares
130,108
–
1,150
Z
Shares
148,724
–
Cost
of
shares
redeemed
1,125
Investor
Shares
(7,139,784)
(4,606,292)
1,150
Z
Shares
(8,460,512)
(5,094,933)
Total
capital
shares
transactions
1,769,921
(1,120,364)
Total
increase
in
net
assets
7,921,873
7,457,821
Net
assets
Beginning
of
year
64,298,527
56,840,706
End
of
year
$72,220,400
$64,298,527
Shares
of
the
Fund
sold
and
redeemed
Investor
Shares
(SSIFX)
Number
of
shares
sold
380,727
196,993
Number
of
shares
issued
in
reinvestment
of
dividends
and
distributions
5,990
–
Number
of
shares
redeemed
(311,169)
(241,734)
Net
increase
(decrease)
in
number
of
shares
outstanding
75,548
(44,741)
Z
Shares
(SIFZX)
Number
of
shares
sold
363,964
248,209
Number
of
shares
issued
in
reinvestment
of
dividends
and
distributions
6,825
–
Number
of
shares
redeemed
(365,110)
(265,131)
Net
increase
(decrease)
in
number
of
shares
outstanding
5,679
(16,922)
–
–
Sextant
International
Fund:
Financial
Highlights
The
accompanying
notes
are
an
integral
part
of
these
financial
statements.
tin
Investor
Shares
(SSIFX)
Selected
data
per
share
of
outstanding
capital
stock
throughout
each
year:
Year
ended
November
30,
2024
2023
2022
2021
2020
A
A
A
A
A
A
Net
asset
value
at
beginning
of
year
$20.87
$18.11
$23.49
$19.62
$18.50
Income
from
investment
operations
Net
investment
income
A
0.09
0.08
0.09
0.10
0.12
Net
gains
(losses)
on
securities
(both
realized
and
unrealized)
1.96
2.68
(3.58)
3.85
1.66
Total
from
investment
operations
2.05
2.76
(3.49)
3.95
1.78
Less
distributions
Dividends
(from
net
investment
income)
(0.08)
–
(0.13)
(0.08)
(0.11)
Distributions
(from
capital
gains)
–
–
(1.76)
–
(0.55)
Total
distributions
(0.08)
–
(1.89)
(0.08)
(0.66)
Net
asset
value
at
end
of
year
$22.84
$20.87
$18.11
$23.49
$19.62
Total
Return
9.82%
15.24%
(16.31)%
20.16%
9.86%
Ratios
/
supplemental
data
Net
assets
($000),
end
of
year
$42,366
$37,141
$33,029
$46,560
$51,141
Ratio
of
expenses
to
average
net
assets
Before
custodian
fee
credits
0.96%
1.06%
1.28%
0.93%
0.83%
After custodian
fee
credits
0.95%
1.05%
1.27%
0.92%
0.82%
Ratio
of
net
investment
income
after
custodian
fee
credits to
average
net
assets
0.40%
0.43%
0.48%
0.46%
0.70%
Portfolio
turnover
rate
19%
16%
33%
22%
16%
Z
Shares
(SIFZX)
Selected
data
per
share
of
outstanding
capital
stock
throughout
each
year:
Year
ended
November
30,
2024
2023
2022
2021
2020
A
A
A
A
A
A
Net
asset
value
at
beginning
of
year
$20.98
$18.15
$23.55
$19.67
$18.55
Income
from
investment
operations
Net
investment
income
A
0.14
0.13
0.13
0.15
0.15
Net
gains
(losses)
on
securities
(both
realized
and
unrealized)
1.96
2.70
(3.59)
3.85
1.67
Total
from
investment
operations
2.10
2.83
(3.46)
4.00
1.82
Less
distributions
Dividends
(from
net
investment
income)
(0.12)
–
(0.18)
(0.12)
(0.15)
Distributions
(from
capital
gains)
–
–
(1.76)
–
(0.55)
Total
distributions
(0.12)
–
(1.94)
(0.12)
(0.70)
Net
asset
value
at
end
of
year
$22.96
$20.98
$18.15
$23.55
$19.67
Total
Return
10.04%
15.59%
(16.17)%
20.42%
10.09%
Ratios
/
supplemental
data
Net
assets
($000),
end
of
year
$29,855
$27,157
$23,812
$28,929
$26,921
Ratio
of
expenses
to
average
net
assets
Before
custodian
fee
credits
0.73%
0.83%
1.04%
0.72%
0.63%
After custodian
fee
credits
0.72%
0.82%
1.03%
0.71%
0.63%
Ratio
of
net
investment
income
after
custodian
fee
credits to
average
net
assets
0.62%
0.66%
0.72%
0.68%
0.87%
Portfolio
turnover
rate
19%
16%
33%
22%
16%
A
Calculated
using
average
shares
outstanding
Notes
To
Financial
Statements
Note
1
-
Organization
Saturna
Investment
Trust
(the
“Trust”)
was
established
under
Washington
State
Law
as
a
business
trust
on
February
20,
1987.
The
Trust
is
registered
as
an
open-end,
diversified
management
company
under
the
Investment
Company
Act
of
1940,
as
amended.
The
Trust
currently
offers
shares
of
eight
portfolio
series:
Sextant
Short-Term
Bond
Fund,
Sextant
Bond
Income
Fund,
Sextant
Core
Fund,
Sextant
Global
High
Income
Fund,
Sextant
Growth
Fund,
Sextant
International
Fund
(each,
a
“Fund”,
and
collectively,
the
“Funds”),
Saturna
Sustainable
Equity
Fund,
and
Saturna
Sustainable
Bond
Fund.
Saturna
Sustainable
Equity
Fund
and
Saturna
Sustainable
Bond
Fund
are
offered
through
separate
prospectuses
and
have
a
separate
shareholder
report.
Sextant
Growth
Investor
Shares
(previously
known
as
Idaho
Limited
Maturity
Tax-Exempt
Fund
until
October
12,
1990,
then
Northwest
Growth
Fund
until
September
28,
1995,
when
the
investment
objective
of
only
Northwest
stocks
was
changed)
commenced
operations
as
an
equity
fund
on
December
30,
1990.
Sextant
Growth
Fund
Z
Shares
began
operations
June
2,
2017.
Sextant
International
Investor
Shares
began
operations
September
28,
1995
and
Sextant
International
Fund
Z
Shares
began
operations
on
June
2,
2017.
Sextant
Short-Term
Bond
began
operations
September
28,
1995.
Sextant
Bond
Income
Fund
(previously
known
as
Washington
Tax-Exempt
Fund
until
September
28,
1995,
when
the
investment
objective
of
only
Washington
State
Municipal
Bonds
was
changed)
began
operations
on
March
1,
1993.
Sextant
Core
Fund
commenced
operations
March
30,
2007.
Sextant
Global
High
Income
Fund
commenced
operations
March
30,
2012.
Each
Fund
is
an
investment
company
and
accordingly
follows
the
investment
company
accounting
and
reporting
guidance
of
the
Financial
Accounting
Standards
Board
(FASB)
Accounting
Standard
Codification
Topic
946
“Financial
Services
-
Investment
Companies”.
Each
class
of
shares
of
a
Fund
represents
an
interest
in
the
same
portfolio
of
investments
of
the
Fund
and
has
in
all
respects
the
same
rights
and
obligations
as
each
other
class
of
the
Fund,
except
that
each
class
bears
its
own
class
expenses,
and
each
class
has
exclusive
voting
rights
on
matters
affecting
that
class.
Each
class
of
shares
may
be
subject
to
different
investment
minimums
and
other
conditions
of
eligibility
as
may
be
described
in
the
prospectus
for
the
particular
class
of
shares,
as
from
time
to
time
in
effect.
Income,
realized
and
unrealized
capital
gains
and
losses,
and
expenses
to
be
paid
by
a
Fund
and
not
allocated
to
a
particular
class
as
provided
below,
shall
be
allocated
to
each
class
on
the
basis
of
relative
net
assets.
Expenses
allocable
to
a
specific
class
are
expenses
specifically
incurred
by
or
for
such
class
including
the
following:
Distribution
fees;
Retirement
plan
custodial
fees;
and
Any
applicable
service
fees.
Net
investment
income
dividends
and
capital
gain
distributions
paid
by
the
Fund
on
each
class
of
its
shares
will
be
calculated
in
the
same
manner
on
the
same
day
and
at
the
same
time.
Investment
risks:
Growth
,
International,
Core,
Short-Term
Bond,
Bond
Income,
and
Global
High
Income
Funds
:
The
value
of
each
Fund’s
shares
rises
and
falls
as
the
value
of
the
securities
in
which
the
Fund
invests
goes
up
and
down.
Fund
share
prices,
yields,
and
total
returns
will
change
with
market
fluctuations
as
well
as
the
fortunes
of
the
countries,
industries,
and
companies
in
which
the
Fund
invests.
The
Funds
do
not
use
derivatives
to
hedge
currency,
interest
rate,
or
credit
risk.
Liquidity
risk
exists
when
particular
investments
are
difficult
to
sell.
If
a
Fund
holds
illiquid
investments,
its
portfolio
may
be
more
difficult
to
value,
especially
in
changing
markets.
Investments
by
a
Fund
in
foreign
securities
and
those
that
are
thinly
traded,
such
as
lower
quality
issuers
and
smaller
companies,
tend
to
involve
greater
liquidity
risk.
If
a
Fund
is
forced
to
sell
or
unwind
these
investments
to
meet
redemptions
or
for
other
cash
needs,
the
Fund
may
suffer
a
penalty.
Additionally,
the
market
for
certain
investments
may
become
illiquid
under
adverse
market
or
economic
conditions
independent
of
any
specific
adverse
changes
in
the
conditions
of
a
particular
issuer.
In
such
cases,
the
Fund,
due
to
limitations
on
investments
in
illiquid
securities
and
the
difficulty
in
purchasing
and
selling
such
securities,
may
be
unable
to
achieve
its
investment
objective.
Growth
and
Core
Funds
:
Smaller
companies
involve
higher
investment
risks
in
that
they
often
have
limited
product
lines,
markets,
and
resources,
or
their
securities
may
trade
less
frequently
and
have
greater
price
fluctuation
than
those
of
larger
companies.
Growth
stocks,
which
can
be
priced
on
future
expectations
rather
than
current
results,
may
decline
substantially
when
expectations
are
not
met.
International
,
Core
,
Short-Term
Bond
,
Bond
Income
,
and
Global
High
Income
Funds
:
Foreign
investing
involves
risks
not
normally
associated
with
investing
in
US
securities.
These
include
fluctuations
in
currency
exchange
rates,
less
public
information
about
securities,
less
governmental
market
supervision,
and
the
lack
of
uniform
financial,
social,
and
political
standards.
Foreign
investing
heightens
the
risk
of
confiscatory
taxation,
seizure
or
nationalization
of
assets,
currency
controls,
or
adverse
political
or
social
developments
that
affect
investments.
The
risks
of
investing
in
foreign
securities
are
typically
greater
in
less
developed
or
emerging
countries.
Core
Fund
:
The
Core
Fund
has
the
risks
of
growth
stocks,
foreign
securities,
credit,
and
interest
rates
—
but
these
risks
are
mitigated
by
spreading
its
investments
in
both
stocks
and
bonds,
and
by
favoring
income-producing
securities
and
those
of
larger,
more
seasoned
companies.
Short-Term
Bond,
Bond
Income
,
Global
High
Income
,
and
Core
Funds
:
Bonds
entail
credit
risk,
which
is
the
possibility
that
a
bond
will
not
be
able
to
pay
interest
or
principal
when
due.
If
the
credit
quality
of
a
bond
is
perceived
to
decline,
investors
will
demand
a
higher
yield,
which
means
a
lower
price
on
that
bond
to
compensate
for
the
higher
level
of
risk.
Interest
rate
fluctuations
affect
bond
prices
and
a
Fund’s
net
asset
value,
but
not
the
income
received
by
the
Fund
from
its
portfolio
securities.
Because
prices
and
yields
on
debt
securities
vary
over
time,
a
Fund’s
yield
also
varies.
Bonds
with
embedded
callable
options
also
contain
an
element
of
prepayment
risk.
When
interest
rates
decline,
issuers
can
retire
their
debt
and
reissue
bonds
at
a
lower
interest
rate.
This
hurts
investors
because
yields
available
for
reinvestment
will
have
declined
and
upward
price
mobility
on
callable
bonds
is
generally
limited
by
the
call
price.
Notes
To
Financial
Statements
(continued)
Global
High
Income
Fund
:
Issuers
of
high-yield
securities
are
generally
not
as
financially
strong
as
those
issuing
higher
quality
securities.
These
issuers
are
more
likely
to
encounter
financial
difficulties
and
are
more
vulnerable
to
changes
in
the
relevant
economy,
such
as
a
recession
or
a
sustained
period
of
rising
interest
rates,
that
could
affect
their
ability
to
make
interest,
principal,
and
dividend
payments
as
expected.
The
prices
of
high-yield
securities
generally
fluctuate
more
than
those
of
higher
quality.
High-yield
securities
are
generally
more
illiquid
(harder
to
sell)
and
harder
to
value.
The
Funds
may
invest
substantially
in
one
or
more
sectors,
which
can
increase
volatility
and
exposure
to
issuers
specific
to
a
particular
sector
or
industry.
Note
2
-
Significant
Accounting
Policies
The
following
is
a
summary
of
the
significant
accounting
policies,
in
conformity
with
accounting
principles
generally
accepted
in
the
United
States
of
America,
which
are
consistently
followed
by
the
Funds
in
preparation
of
their
financial
statements.
Security
valuation:
Investments
in
securities
traded
on
a
national
securities
exchange
and
over-the-counter
securities
for
which
sale
prices
are
available
are
valued
at
that
price.
Securities
for
which
there
are
no
sales
are
valued
at
the
latest
bid
price.
Debt
securities
are
valued
using
bid-side
valuations
provided
by
an
independent
service.
The
service
determines
valuations
using
factors
such
as
yields
or
prices
of
bonds
of
comparable
quality,
type
of
issue,
coupon
maturity,
ratings,
trading
activity,
and
general
market
conditions.
Fixed-income
debt
instruments,
such
as
commercial
paper,
bankers’
acceptances,
and
US
Treasury
Bills,
with
a
maturity
of
60
days
or
less
are
valued
at
amortized
cost,
which
approximates
market
value.
Any
discount
or
premium
is
accreted
or
amortized
on
a
straight-line
basis
until
maturity.
Foreign
markets
may
close
before
the
time
as
of
which
the
Funds’
share
prices
are
determined.
Because
of
this,
events
occurring
after
the
close
and
before
the
determination
of
the
Funds’
share
prices
may
have
a
material
effect
on
the
values
of
some
or
all
of
the
Funds’
foreign
securities.
To
account
for
this,
the
Funds
may
use
outside
pricing
services
for
valuation
of
their
non-US
securities.
In
cases
in
which
there
is
not
a
readily
available
market
price,
a
fair
value
for
such
security
is
determined
in
good
faith
by
the
Funds'
investment
adviser
(Saturna
Capital),
whom
the
Board
of
Trustees
has
designated
as
the
Funds’
valuation
designee
to
perform
fair
value
determinations
relating
to
all
Fund
investments.
Security
transactions
are
recorded
on
the
trade
date.
Realized
gains
and
losses
on
sales
of
securities
are
recorded
on
the
identified
cost
basis.
Foreign
currency:
Investment
securities
and
other
assets
and
liabilities
denominated
in
foreign
currencies
are
translated
into
US
dollar
amounts
at
the
date
of
valuation.
Purchases
and
sales
of
investment
securities
and
income
and
expense
items
denominated
in
foreign
currencies
are
translated
into
US
dollar
amounts
on
the
respective
dates
of
such
transactions.
The
Funds
do
not
isolate
that
portion
of
the
results
of
operations
resulting
from
changes
in
foreign
exchange
rates
on
investments
from
the
fluctuations
arising
from
changes
in
market
prices
of
securities
held.
Such
fluctuations
are
included
with
the
net
realized
and
unrealized
gain
or
loss
from
investments.
Reported
net
realized
foreign
exchange
gains
or
losses
arise
from
sales
of
foreign
currencies,
currency
gains
or
losses
realized
between
the
trade
and
settlement
dates
on
securities
transactions,
and
the
difference
between
the
amounts
of
dividends,
interest,
and
foreign
withholding
taxes
recorded
on
the
Funds’
books
and
the
US
dollar
equivalent
of
the
amounts
actually
received
or
paid.
Net
unrealized
foreign
exchange
gains
and
losses
arise
from
changes
in
the
fair
values
of
assets
and
liabilities,
other
than
investments
in
securities
at
fiscal
period
end,
resulting
from
changes
in
exchange
rates.
Share
valuation:
Each
Fund
computes
the
share
price
of
each
share
class
by
dividing
the
net
assets
attributable
to
each
share
class
by
the
outstanding
shares
of
that
class.
Each
share
class
represents
an
interest
in
the
same
investment
portfolio.
Each
share
class
is
identical
in
all
respects
except
that
each
class
bears
its
own
class
expenses,
and
each
class
has
exclusive
voting
rights
on
matters
affecting
that
class.
As
a
result
of
the
differences
in
the
expenses
borne
by
each
share
class,
the
share
price
and
distributions
will
vary
among
a
Fund’s
share
classes.
The
Funds’
shares
are
not
priced
or
traded
on
days
the
New
York
Stock
Exchange
is
closed.
The
NAV
is
both
the
offering
and
redemption
price
per
share.
Share
Valuation
Inputs
as
of
November
30,
2024
Level
1
Level
2
Level
3
Funds
Quoted
Price
Significant
Observable
Input
Significant
Unobservable
Input
Total
Short-Term
Bond
Fund
Corporate
Bonds
1
$–
$5,475,982
$–
$5,475,982
Government
Bonds
1
$–
$5,671,471
$–
$5,671,471
Total
Assets
$–
$11,147,453
$–
$11,147,453
Bond
Income
Fund
Corporate
Bonds
1
$–
$6,935,187
$–
$6,935,187
Government
Bonds
1
$–
$2,837,190
$–
$2,837,190
Mortgage
Backed
1
$–
$242,263
$–
$242,263
Municipals
Bonds
1
$–
$822,720
$–
$822,720
Total
Assets
$–
$10,837,360
$–
$10,837,360
Core
Fund
Note
1
-
Organization
(continued)
Notes
To
Financial
Statements
(continued)
Fair
value
measurements:
Accounting
Standards
Codification
(ASC)
820
establishes
a
three-
tier
framework
for
measuring
fair
value
based
on
a
hierarchy
of
inputs.
The
hierarchy
distinguishes
between
market
data
obtained
from
independent
sources
(observable
inputs)
and
the
Funds’
own
market
assumptions
(unobservable
inputs).
These
inputs
are
used
in
determining
the
value
of
the
Funds’
investments
and
are
summarized
below.
Level
1
-
Unadjusted
quoted
prices
in
active
markets
for
identical
assets
or
liabilities
that
the
Trust
has
the
ability
to
access.
Level
2
-
Observable
inputs
other
than
quoted
prices
in
Level
1
that
are
observable
for
the
asset
or
liability,
either
directly
or
indirectly.
These
inputs
may
include
quoted
prices
for
the
identical
instrument
on
an
inactive
market,
prices
for
similar
instruments,
interest
rates,
prepayment
speeds,
credit
risk,
yield
curves,
default
rates,
and
similar
data.
Level
3
−
Unobservable
inputs
for
the
asset
or
liability,
to
the
extent
relevant
observable
inputs
are
not
available,
representing
the
Trust’s
own
assumptions
about
the
assumptions
a
market
participant
would
use
in
valuing
the
asset
or
liability,
and
would
be
based
on
the
best
information
available.
Common
Stock
Communications
$634,371
$–
$–
$634,371
Consumer
Discretionary
$1,243,393
$119,982
$–
$1,363,375
Consumer
Staples
$1,171,678
$–
$–
$1,171,678
Energy
$519,450
$–
$–
$519,450
Financials
$1,290,861
$–
$–
$1,290,861
Health
Care
$1,593,718
$–
$–
$1,593,718
Industrials
$2,494,410
$467,584
$–
$2,961,994
Materials
$1,264,445
$–
$–
$1,264,445
Technology
$4,756,404
$–
$–
$4,756,404
Utilities
$965,495
$–
$–
$965,495
Total
Common
Stock
$15,934,225
$587,566
$–
$16,521,791
Corporate
Bonds
1
$–
$4,350,614
$–
$4,350,614
Government
Bonds
1
$–
$677,464
$–
$677,464
Municipals
Bonds
1
$–
$105,345
$–
$105,345
Total
Assets
$15,934,225
$5,720,989
$–
$21,655,214
Global
High
Income
Fund
Common
Stock
Communications
$745,660
$235,518
$–
$981,178
Consumer
Discretionary
$–
$128,520
$–
$128,520
Energy
$382,352
$–
$–
$382,352
Financials
$587,475
$346,232
$–
$933,707
Health
Care
$509,067
$–
$–
$509,067
Materials
$1,032,554
$217,214
$–
$1,249,768
Technology
$296,050
$292,337
$–
$588,387
Total
Common
Stock
$3,553,158
$1,219,821
$–
$4,772,979
Corporate
Bonds
1
$–
$2,570,548
$–
$2,570,548
Government
Bonds
1
$–
$290,439
$–
$290,439
Municipals
Bonds
1
$–
$49,998
$–
$49,998
Total
Assets
$3,553,158
$4,130,806
$–
$7,683,964
Growth
Fund
Common
Stock
1
$73,763,522
$–
$–
$73,763,522
Total
Assets
$73,763,522
$–
$–
$73,763,522
International
Fund
Common
Stock
Consumer
Discretionary
$5,498,921
$1,308,896
$–
$6,807,817
Consumer
Staples
$–
$1,025,463
$–
$1,025,463
Health
Care
$7,963,040
$3,081,088
$–
$11,044,128
Industrials
$7,342,378
$8,346,841
$–
$15,689,219
Materials
$4,377,627
$–
$–
$4,377,627
Technology
$22,475,627
$7,763,867
$–
$30,239,494
Utilities
$–
$1,530,472
$–
$1,530,472
Total
Common
Stock
$47,657,593
$23,056,627
$–
$70,714,220
Total
Assets
$47,657,593
$23,056,627
$–
$70,714,220
1
See
the
Schedule
of
Investments
for
additional
details.
Note
2
-
Significant
Accounting
Policies
(continued)
Notes
To
Financial
Statements
(continued)
The
availability
of
observable
inputs
can
vary
from
security
to
security
and
is
affected
by
a
wide
variety
of
factors,
including,
for
example,
the
type
of
security,
whether
the
security
is
new
and
not
yet
established
in
the
marketplace,
the
liquidity
of
markets,
and
other
characteristics
particular
to
the
security.
To
the
extent
that
valuation
is
based
on
models
or
inputs
that
are
less
observable
or
unobservable
in
the
market,
the
determination
of
fair
value
requires
more
judgment.
Accordingly,
the
degree
of
judgment
exercised
in
determining
fair
value
is
greatest
for
instruments
categorized
in
Level
3.
The
inputs
used
to
measure
fair
value
may
fall
into
different
levels
of
the
fair
value
hierarchy.
In
such
cases,
for
disclosure
purposes,
the
level
in
the
fair
value
hierarchy
within
which
the
fair
value
measurement
falls
in
its
entirety
is
determined
based
on
the
lowest
level
input
that
is
significant
to
the
fair
value
measurement
in
its
entirety.
The
inputs
or
methodology
used
for
valuing
securities
are
not
necessarily
an
indication
of
the
risk
associated
with
investing
in
those
securities.
Investment
concentration:
The
Funds
may
have
deposits
of
cash
with
the
custodian
from
time
to
time
for
one
or
more
reasons.
“Other
assets
(net
of
liabilities)”
in
the
Funds’
Schedules
of
Investments
primarily
represents
cash
on
deposit
with
the
custodian.
Cash
on
deposit
will
vary
widely
over
time.
Accounting
Standards
Codification
(“ASC”)
825,
“Financial
Instruments,”
identifies
these
items
as
a
concentration
of
credit
risk.
The
risk
is
managed
by
careful
financial
analysis
and
review
of
the
custodian’s
operations,
resources,
and
protections
available
to
the
Trust.
This
process
includes
evaluation
of
other
financial
institutions
providing
investment
company
custody
services.
ReFlow
Liquidity
Program:
The
Funds
may
participate
in
the
ReFlow
Fund,
LLC
("ReFlow")
liquidity
program,
which
is
designed
to
provide
an
alternative
liquidity
source
on
days
when
redemptions
of
Fund
shares
exceed
purchases.
Under
the
program,
ReFlow
is
available
to
provide
cash
to
the
Funds
to
meet
all,
or
a
portion,
of
daily
net
shareowner
redemptions.
Following
purchases
of
Fund
shares,
ReFlow
then
generally
redeems
those
shares
when
the
Fund
experiences
net
sales,
at
the
end
of
a
maximum
holding
period
determined
by
ReFlow
(currently
8
days)
or
at
other
times
at
ReFlow's
discretion.
For
use
of
the
ReFlow
service,
a
participating
Fund
pays
a
fee
to
ReFlow
each
time
it
purchases
Fund
shares,
calculated
by
applying
to
the
purchase
amount
a
fee
rate
determined
through
an
automated
daily
"Dutch
auction"
among
other
participating
mutual
funds
seeking
liquidity
that
day.
The
current
minimum
fee
rate
is
0.14%
of
the
value
of
the
Fund
shares
purchased
by
ReFlow,
although
the
Fund
may
submit
a
bid
at
a
higher
fee
rate
if
it
determines
that
doing
so
is
in
the
best
interest
of
Fund
shareowners.
In
accordance
with
federal
securities
laws,
ReFlow
is
prohibited
from
acquiring
more
than
3%
of
the
outstanding
voting
securities
of
a
Fund.
ReFlow
will
periodically
redeem
its
entire
share
position
in
the
Fund
and
request
that
such
redemption
be
met
in
kind
in
accordance
with
the
Funds'
in-kind
redemption
policies.
There
is
no
assurance
that
ReFlow
will
have
sufficient
funds
available
to
meet
the
Funds’
liquidity
needs
on
a
particular
day.
During
the
fiscal
year
ended
November
30,
2024
,
only
the
Growth,
International,
and
Core
Funds
participated
in
ReFlow.
Fees
associated
with
ReFlow
are
disclosed
in
the
Statements
of
Operations.
Federal
income
taxes:
Each
Fund
intends
to
comply
with
the
requirements
of
the
Internal
Revenue
Code
necessary
to
qualify
as
a
regulated
investment
company
and
to
make
the
requisite
distributions
of
income
and
capital
gains
to
its
shareowners
sufficient
to
relieve
it
from
all
or
substantially
all
federal
income
taxes.
Therefore,
no
federal
income
tax
provision
is
required.
The
Funds
recognize
the
tax
benefits
of
uncertain
tax
positions
only
where
the
position
is
“more
likely
than
not”
to
be
sustained
assuming
examination
by
tax
authorities.
Management
has
analyzed
the
Funds’
tax
positions
and
has
concluded
that
no
liability
for
unrecognized
tax
benefits
should
be
recorded
related
to
uncertain
tax
positions
taken
on
returns
filed
for
open
tax
years
(2021
−
2023)
or
expected
to
be
taken
in
the
Funds’
2024
tax
returns.
The
Funds
identify
their
major
tax
jurisdiction
as
US
federal
and
foreign
jurisdictions
where
the
Funds
make
significant
investments;
however,
the
Funds
are
not
aware
of
any
tax
positions
for
which
it
is
reasonably
possible
that
the
total
amounts
of
unrecognized
tax
benefits
will
change
materially
in
the
next
12
months.
Reclassification
of
capital
accounts:
Accounting
principles
generally
accepted
in
the
United
States
of
America
require
that
certain
components
of
net
assets
relating
to
permanent
differences
be
reclassified
between
financial
and
tax
reporting.
These
reclassifications
are
as
of
the
fiscal
year
ended
November
30,
2024
,
and
have
no
effect
on
net
assets
or
NAV
per
share.
These
reclassifications
were
primarily
due
to
redemptions
in
kind
and
operating
losses.
As
of
November
30,
2024,
there
were
no
reclassifications
to
the
Bond
Income
Fund
Distributions
to
shareowners:
For
the
Sextant
Short-Term
Bond
Fund
and
Sextant
Bond
Income
Fund
,
dividends
to
shareowners
from
net
investment
income
are
paid
daily
and
distributed
on
the
last
business
day
of
each
month.
For
the
Sextant
Core
Fund
,
Sextant
Global
High
Income
Fund
,
Sextant
Growth
Fund
,
and
Sextant
International
Fund
,
dividends
to
shareowners
from
net
investment
income,
if
any,
are
paid
annually,
typically
by
the
end
of
the
year.
Distributions
of
capital
gains,
if
any,
are
made
at
least
annually,
and
as
required
to
comply
with
federal
excise
tax
requirements.
Distributions
to
shareowners
are
determined
in
accordance
with
income
tax
regulations
and
are
recorded
on
the
ex-dividend
date.
Dividends
are
paid
in
shares
of
the
Funds,
at
the
net
asset
value
on
the
payable
date.
Shareowners
may
elect
to
take
distributions
if
they
total
$10
or
more
in
cash.
Short-Term
Bond
Fund
Bond
Income
Fund
Distributable
earnings
$(58)
$(9)
Paid-in
Capital
$58
$9
Core
Fund
Global
High
Income
Fund
Distributable
earnings
$(824,642)
$(514)
Paid-in
Capital
$824,642
$514
Growth
Fund
International
Fund
Distributable
earnings
$(2,643,239)
$(2,542,698)
Paid-in
Capital
$2,643,239
$2,542,698
Note
2
-
Significant
Accounting
Policies
(continued)
Notes
To
Financial
Statements
(continued)
Use
of
estimates:
The
preparation
of
financial
statements
in
conformity
with
accounting
principles
generally
accepted
in
the
United
States
of
America
requires
management
to
make
estimates
and
assumptions
that
affect
the
reported
amounts
of
assets
and
liabilities
and
disclosure
of
contingent
assets
and
liabilities
at
the
date
of
the
financial
statements
and
the
reported
amounts
of
increases
and
decreases
in
net
assets
during
the
reporting
period.
Actual
results
could
differ
from
those
estimates.
Foreign
taxes:
Withholding
taxes
on
foreign
dividends
are
paid
(a
portion
of
which
may
be
reclaimable)
or
provided
for
in
accordance
with
the
applicable
country’s
tax
rules
and
rates
and
are
disclosed
in
the
Statement
of
Operations.
Withholding
tax
reclaims
are
filed
in
certain
countries
to
recover
a
portion
of
the
amounts
previously
withheld.
The
Funds
record
a
reclaim
receivable
based
on
a
number
of
factors,
including
a
jurisdiction’s
legal
obligation
to
pay
reclaims
as
well
as
payment
history
and
market
convention.
LIBOR
Transition
Risks
A
Fund
may
invest
in
certain
debt
securities
or
other
financial
instruments
that
utilize
the
London
Interbank
Offered
Rate
(“LIBOR”)
as
a
benchmark
or
reference
rate
for
various
interest
rate
calculations.
A
benchmark
or
reference
rate
may
be
a
significant
factor
in
determining
the
cost
of
financing
to
a
Fund
or
an
investment’s
value
or
return
to
a
Fund,
and
may
be
used
in
other
ways
that
affect
a
Fund’s
investment
performance.
LIBOR
was
discontinued
as
a
floating
rate
benchmark
after
June
30,
2023.
It
is
anticipated
that
financial
instruments,
such
as
certain
floating
rate
bonds,
that
previously
utilized
LIBOR
have
transitioned
to
using
the
Secured
Overnight
Financing
Rate
(“SOFR”),
which
is
a
broad
measure
of
the
cost
of
overnight
borrowings
secured
by
US
Treasury
securities.
The
transition
from
LIBOR
to
SOFR
(or
any
other
replacement
rate)
may
lead
to
a
reduction
in
the
value
of
some
LIBOR-based
investments,
as
well
as
significant
market
uncertainty,
increased
volatility,
and
illiquidity
in
markets
for
various
instruments,
which
may
result
in
prolonged
adverse
market
conditions
and
impact
a
Fund’s
performance
or
NAV.
Other:
Interest
income
is
recognized
on
an
accrual
basis.
Premiums
on
securities
purchased
are
amortized,
and
discounts
are
accreted
using
the
yield
to
maturity
method
over
the
lives
of
the
respective
securities
or
where
applicable,
to
the
first
call
date
of
the
securities
with
premiums.
Dividends
from
equity
securities
are
recorded
as
income
on
the
ex-dividend
date
or
as
soon
as
information
is
available
to
the
Fund.
Note
3
-
Transactions
with
Affiliated
Persons
Under
contracts
approved
annually
by
the
Trust’s
Board
of
Trustees,
including
those
Trustees
who
are
not
parties
to
the
contract
or
“interested
persons”
(as
defined
in
the
Investment
Company
Act
of
1940)
of
such
parties
or
the
Trust
(the
“Independent
Trustees”),
Saturna
Capital
Corporation
(“Saturna
Capital”)
provides
investment
advisory
services
and
certain
other
administrative
services
required
to
conduct
Trust
business.
Expenses
incurred
by
the
Trust
on
behalf
of
the
Funds
(e.g.,
legal
fees)
are
allocated
to
the
Funds
on
the
basis
of
relative
daily
average
net
assets.
For
such
services,
each
of
the
Funds
pays
the
adviser
a
base
Investment
Advisory
and
Administrative
Services
Fee
of
0.50%
of
average
net
assets
per
annum,
payable
monthly
for
each
of
the
Funds.
In
addition,
the
adviser
has
agreed
to
certain
limits
on
other
expenses,
as
described
below.
The
adviser
has
undertaken
to
limit
expenses
through
March
31,
2024
of
Sextant
Short-Term
Bond
Fund
to
0.60%,
Sextant
Bond
Income
Fund
to
0.65%
and
Sextant
Global
High
Income
to
0.75%.
For
the
year
ended
November
30,
2024
,
the
advisory
fees
incurred
were
as
follows:
1
In
accordance
with
the
expense
limitation
noted
above,
for
the
year
ended
November
30,
2024
,
Saturna
Capital
waived
a
portion
of
the
advisory
fees
of
the
Sextant
Short-Term
Bond
Fund,
Sextant
Bond
Income
Fund,
and
Sextant
Global
High
Income
Fund.
The
adviser
cannot
recoup
previously
waived
fees.
Saturna
Brokerage
Services,
Inc.
(“SBS”),
a
discount
brokerage
and
subsidiary
of
Saturna
Capital
Corporation,
is
registered
as
a
broker-dealer
and
acts
as
distributor.
On
October
3,
2006,
the
Funds
adopted
a
Distribution
Plan
in
accordance
with
Rule
12b-1
under
the
1940
Act.
The
plan
provides
that
the
Funds
will
pay
a
fee
to
SBS
at
an
annual
rate
of
0.25%
of
the
average
net
assets
of
the
Funds.
On
June
2,
2017,
12b-1
fees
were
terminated
for
all
Funds
except
Sextant
Growth
Investor
Shares
and
Sextant
International
Investor
Shares.
SBS
is
used
to
effect
equity
portfolio
transactions
for
the
Trust.
SBS
currently
executes
portfolio
transactions
without
commission.
Transactions
effected
through
other
brokers
are
subject
to
commissions
payable
to
that
broker.
Saturna
Trust
Company
(“STC”),
a
subsidiary
of
Saturna
Capital,
acts
as
retirement
plan
custodian
for
the
Funds.
Each
class
of
shares
of
a
Fund
pays
an
annual
fee
of
$10
per
account
for
retirement
plan
services
to
Saturna
Trust
Company.
For
the
fiscal
year
ended
November
30,
2024
,
the
Funds
incurred
the
following
retirement
plan
custodial
fees
to
STC:
Advisory
Fees
Advisory
Fees
Waived
600
Short-Term
Bond
Fund
$55,287
$(28,426)
650
Bond
Income
Fund
$51,939
$(20,708)
700
Core
Fund
$124,345
n/a
750
Global
High
Income
Fund
$47,792
$(15,456)
800
Growth
Fund
$344,509
n/a
850
International
Fund
$370,093
n/a
Distribution
(12b-1)
fees
600
Short-Term
Bond
Fund
n/a
650
Bond
Income
Fund
n/a
700
Core
Fund
n/a
750
Global
High
Income
Fund
n/a
800
Growth
Fund
Z
Shares
(
SGZFX
)
n/a
800
Growth
Fund
Investor
Shares
(
SSGFX
)
$10,521
850
International
Fund
Z
Shares
(
SIFZX
)
n/a
850
International
Fund
Investor
Shares
(
SSIFX
)
$108,717
Retirement
plan
custodial
fees
600
Short-Term
Bond
Fund
(STBFX)
$3,003
650
Bond
Income
Fund
(SBIFX)
$2,578
700
Core
Fund
(SCORX)
$4,108
750
Global
High
Income
Fund
(SGHIX)
$2,004
1,025
Growth
Fund
Investor
Shares
(SSGFX)
n/a
1,050
Growth
Fund
Z
Shares
(SGZFX)
$7,885
1,125
International
Fund
Investor
Shares
(SSIFX)
$209
1,150
International
Fund
Z
Shares
(SIFZX)
$5,303
Note
2
-
Significant
Accounting
Policies
(continued)
Notes
To
Financial
Statements
(continued)
Ms.
Jane
Carten
serves
as
a
trustee
and
president
of
the
Trust.
She
is
also
a
director
and
president
of
Saturna
Capital,
vice
president
of
Saturna
Trust
Company,
and
chairman
of
Saturna
Sendirian
Berhad
.
Ms.
Carten
is
not
compensated
by
the
Trust.
For
the
fiscal
year
ended
November
30,
2024
,
the
Saturna
Investment
Trust
incurred
$73,213
of
total
expenses
for
the
independent
Trustee’s
compensation
and
Trust
board
meetings.
The
Sextant
Funds
incurred
$56,843
of
these
total
expenses.
On
November
30,
2024
,
the
trustees,
officers,
and
their
affiliates
(including
Saturna
Capital
Corporation)
as
a
group,
owned
the
following
percentages
of
outstanding
shares:
The
officers
of
the
Trust
are
paid
by
Saturna
Capital
Corporation,
not
the
Trust,
except
the
Chief
Compliance
Officer,
who
is
partially
compensated
by
the
Trust.
For
the
fiscal
year
ended
November
30,
2024
,
the
Funds
paid
the
following
compensation
expenses
for
the
Chief
Compliance
Officer:
Note
4
-
Distributions
to
Shareowners
The
tax
characteristics
of
distributions
paid
for
the
fiscal
year
ended
November
30,
2024
,
and
the
year
ended
November
30,
2023
,
were
as
follows:
Note
5
-
Federal
Income
Taxes
The
cost
basis
of
investments
for
federal
income
tax
purposes
at
November
30,
2024
,
were
as
follows:
Trustees',
officers',
and
affiliates'
ownership
600
Short-Term
Bond
Fund
(STBFX)
51.19%
650
Bond
Income
Fund
(SBIFX)
36.75%
700
Core
Fund
(SCORX)
33.61%
750
Global
High
Income
Fund
(SGHIX)
62.00%
800
Growth
Fund
(SGZFX
and
SSGFX)
20.46%
850
International
Fund
(SIFZX
and
SSIFX)
30.69%
Chief
Compliance
Officer
600
Short-Term
Bond
Fund
$3,638
650
Bond
Income
Fund
$3,337
700
Core
Fund
$7,354
750
Global
High
Income
Fund
$3,256
800
Growth
Fund
$21,078
850
International
Fund
$22,251
Short-Term
Bond
Fund
November
30,
2024
November
30,
2023
Ordinary
Income
$307,217
$221,971
Bond
Income
Fund
November
30,
2024
November
30,
2023
Ordinary
Income
$319,948
$279,913
Core
Fund
November
30,
2024
November
30,
2023
Ordinary
Income
$351,859
$250,849
Long-term
capital
gain
1
$–
$31,225
Global
High
Income
Fund
November
30,
2024
November
30,
2023
Ordinary
Income
$401,403
$305,551
Growth
Fund
November
30,
2024
November
30,
2023
Ordinary
Income
$32,415
$–
Long-term
capital
gain
1
$–
$1,301,342
International
Fund
November
30,
2024
November
30,
2023
Ordinary
Income
$288,643
$–
1
Long-Term
Capital
Gain
dividend
designated
at
20%
rate
pursuant
to
Section
852(b
)(
3)
of
the
Internal
Revenue
Code.
Short-Term
Bond
Fund
Bond
Income
Fund
Cost
of
investments
$11,251,425
$12,140,260
Gross
tax
unrealized
appreciation
$23,098
$37,565
Gross
tax
unrealized
depreciation
$(127,070)
$(1,340,465)
Net
tax
unrealized
depreciation
$(103,972)
$(1,302,900)
Core
Fund
Global
High
Income
Fund
Cost
of
investments
$15,754,758
$7,426,194
Gross
tax
unrealized
appreciation
$6,595,012
$1,118,044
Gross
tax
unrealized
depreciation
$(694,556)
$(860,274)
Net
tax
unrealized
appreciation
$5,900,456
$257,770
Growth
Fund
International
Fund
Cost
of
investments
$23,843,559
$37,296,767
Gross
tax
unrealized
appreciation
$50,042,576
$33,908,501
Gross
tax
unrealized
depreciation
$(122,613)
$(491,048)
Net
tax
unrealized
appreciation
$49,919,963
$33,417,453
Note
3
-
Transactions
with
Affiliated
Persons
(continued)
Notes
To
Financial
Statements
(continued)
As
of
November
30,
2024
,
the
components
of
distributable
earnings
on
a
tax
basis
were
as
follows:
Late
year
losses
incurred
after
December
31
within
the
fiscal
year
are
deemed
to
arise
on
the
first
business
day
of
the
following
fiscal
year
for
tax
purposes.
For
the
year
ended
November
30,
2024
,
the
Growth
Fund
deferred,
on
a
tax
basis,
late
year
ordinary
losses
of
$11,591.
At
November
30,
2024
,
the
Funds
had
the
following
capital
loss
carryforwards
and
loss
deferrals,
subject
to
regulation.
Loss
carryforwards
may
be
used
to
offset
future
net
capital
gains
realized
for
federal
income
tax
purposes.
For
the
year
ended
November
30,
2024,
Core
Fund
utilized
$8,009,
Global
High
Income
utilized
$87,
Growth
utilized
$252,087,
and
International
utilized
$544,256
of
short-term
capital
loss
carry
forward.
Note
6
-
Investments
Investment
transactions
other
than
short-term
investments
and
redemptions
in-kind
for
the
fiscal
year
ended
November
30,
2024
,
were
as
follows:
Redemptions
in-kind
for
the
fiscal
period
ended
November
30,
2024
,
were
as
follows:
Note
7
-
Custodian
Under
agreements
in
place
with
the
Trust’s
custodian,
UMB
Bank,
custody
fees
are
reduced
by
credits
for
cash
balances.
For
the
fiscal
year
ended
November
30,
2024
,
such
reductions
were
as
follows:
Note
8
-
Subsequent
Events
The
Funds
declared
the
payment
of
a
distribution
to
be
paid
on
December
19,
2024,
to
all
shareowners
of
record
on
December
18,
2024
as
follows:
There
were
no
other
events
or
transactions
during
the
period
that
materially
impacted
the
amounts
or
disclosures
in
the
Fund’s
financial
statements.
Short-Term
Bond
Fund
Accumulated
capital
and
other
losses
$(140,543)
Tax
accumulated
earnings
$(140,543)
Unrealized
Depreciation
$(103,972)
Total
accumulated
earnings
$(244,515)
Bond
Income
Fund
Accumulated
capital
and
other
losses
$(17,089)
Tax
accumulated
earnings
$(17,089)
Unrealized
Depreciation
$(1,302,900)
Total
accumulated
earnings
$(1,319,989)
Core
Fund
Undistributed
ordinary
income
$459,121
Accumulated
capital
gains
$235,659
Tax
accumulated
earnings
$694,780
Unrealized
Appreciation
$5,900,456
Other
unrealized
accumulated
losses
$(24)
Total
accumulated
earnings
$6,595,212
Global
High
Income
Fund
Undistributed
ordinary
income
$278,309
Accumulated
capital
and
other
losses
$(15,396)
Tax
accumulated
earnings
$262,913
Unrealized
Appreciation
$257,770
Other
unrealized
gains
$9
Total
accumulated
earnings
$520,692
Growth
Fund
Accumulated
capital
gains
$1,626,021
Tax
accumulated
earnings
$1,626,021
Unrealized
Appreciation
$49,919,963
Other
accumulated
net
income
$(11,591)
Total
accumulated
earnings
$51,534,393
International
Fund
Undistributed
ordinary
income
$247,377
Accumulated
capital
gains
$2,668,778
Tax
accumulated
earnings
$395,488
Unrealized
Appreciation
$33,417,453
Other
unrealized
accumulated
losses
$(188)
Total
accumulated
earnings
$33,812,753
Short-Term
Bond
Fund
Bond
Income
Fund
Short
term
loss
carryforward
$47,267
$–
Long
term
loss
carryforward
$93,276
$17,089
Total
Capital
loss
carryforward
$140,543
$17,089
Global
High
Income
Fund
Short
term
loss
carryforward
$15,396
Total
Capital
loss
carryforward
$15,396
Purchases
Sales
600
Short-Term
Bond
Fund
$5,562,801
$2,310,000
650
Bond
Income
Fund
$2,325,080
$375,000
700
Core
Fund
$4,944,478
$3,828,802
750
Global
High
Income
Fund
$–
$652,402
800
Growth
Fund
$3,870,205
$5,680,017
850
International
Fund
$19,213,924
$13,555,239
Purchases
Sales
700
Core
Fund
$–
$1,235,895
800
Growth
Fund
$–
$3,409,290
850
International
Fund
$–
$3,506,570
Custodian
Fee
Credits
600
Short-Term
Bond
Fund
$449
650
Bond
Income
Fund
$420
700
Core
Fund
$1,105
750
Global
High
Income
Fund
$677
800
Growth
Fund
$2,820
850
International
Fund
$7,765
Ordinary
Income
Short-Term
Capital
Gain
Long-Term
Capital
Gain
600
Core
$0.3100
$–
$0.1510
650
Global
High
Income
$0.3214
$–
$–
700
Growth
(Investor
Shares)
$-
$–
$1.2157
750
Growth
(Z
Shares)
$-
$–
$1.2157
800
International
(Investor
Shares)
$-
$–
$0.1180
850
International
(Z
Shares)
$0.0200
$–
$0.1180
Note
5
-
Federal
Income
Taxes
(continued)
Report
of
Independent
Registered
Public
Accounting
Firm
To
the
Board
of
Trustees
of
Saturna
Investment
Trust
and
the
Shareholders
of
Sextant
Mutual
Funds
Opinion
on
the
Financial
Statements
We
have
audited
the
accompanying
statement
of
assets
and
liabilities
of
the
Sextant
Short
Term
Bond
Fund,
Sextant
Bond
Income
Fund,
Sextant
Core
Fund,
Sextant
Global
High
Income
Fund,
Sextant
Growth
Fund
and
Sextant
International
Fund
(the
“Funds”),
each
a
series
of
Saturna
Investment
Trust,
including
the
schedules
of
investments,
as
of
November
30,
2024,
the
related
statements
of
operations
for
the
year
then
ended,
the
statements
of
changes
in
net
assets
for
each
of
the
two
years
in
the
period
then
ended,
the
financial
highlights
for
each
of
the
five
years
in
the
period
then
ended,
and
the
related
notes
(collectively
referred
to
as
the
“financial
statements”).
In
our
opinion,
the
financial
statements
present
fairly,
in
all
material
respects,
the
financial
position
of
the
Funds
as
of
November
30,
2024,
the
results
of
their
operations
for
the
year
then
ended,
the
changes
in
their
net
assets
for
each
of
the
two
years
in
the
period
then
ended
and
their
financial
highlights
for
each
of
the
five
years
in
the
period
then
ended,
in
conformity
with
accounting
principles
generally
accepted
in
the
United
States
of
America.
Basis
for
Opinion
These
financial
statements
are
the
responsibility
of
the
Fund’s
management.
Our
responsibility
is
to
express
an
opinion
on
the
Funds’
financial
statements
based
on
our
audits.
We
are
a
public
accounting
firm
registered
with
the
Public
Company
Accounting
Oversight
Board
(United
States)
(“PCAOB”)
and
are
required
to
be
independent
with
respect
to
the
Funds
in
accordance
with
the
U.S.
federal
securities
laws
and
the
applicable
rules
and
regulations
of
the
Securities
and
Exchange
Commission
and
the
PCAOB.
We
have
served
as
the
auditor
of
one
or
more
of
the
funds
in
the
Trust
since
1997.
We
conducted
our
audits
in
accordance
with
the
standards
of
the
PCAOB.
Those
standards
require
that
we
plan
and
perform
the
audits
to
obtain
reasonable
assurance
about
whether
the
financial
statements
are
free
of
material
misstatement,
whether
due
to
error
or
fraud.
The
Funds
are
not
required
to
have,
nor
were
we
engaged
to
perform,
an
audit
of
the
Funds’
internal
control
over
financial
reporting.
As
part
of
our
audits
we
are
required
to
obtain
an
understanding
of
internal
control
over
financial
reporting,
but
not
for
the
purpose
of
expressing
an
opinion
on
the
effectiveness
of
the
Funds’
internal
control
over
financial
reporting.
Accordingly,
we
express
no
such
opinion.
Our
audits
included
performing
procedures
to
assess
the
risks
of
material
misstatement
of
the
financial
statements,
whether
due
to
error
or
fraud,
and
performing
procedures
that
respond
to
those
risks.
Such
procedures
included
examining,
on
a
test
basis,
evidence
regarding
the
amounts
and
disclosures
in
the
financial
statements.
Our
audits
also
included
evaluating
the
accounting
principles
used
and
significant
estimates
made
by
management,
as
well
as
evaluating
the
overall
presentation
of
the
financial
statements.
Our
procedures
included
confirmation
of
securities
owned
as
of
November
30,
2024
by
correspondence
with
the
custodian
and
brokers,
when
replies
were
not
received
from
brokers,
we
performed
other
auditing
procedures.
We
believe
that
our
audits
provide
a
reasonable
basis
for
our
opinion.
Philadelphia,
Pennsylvania
January
29,
2025
Tait,
Weller
&
Baker
LLP
Item
8.
Changes
in
and
Disagreements
with
Accountants
for
Open-End
Management
Investment
Companies.
Not
applicable.
Item
9.
Proxy
Disclosures
for
Open-End
Management
Investment
Companies.
Not
applicable.
Item
10.
Remuneration
Paid
to
Directors,
Officers,
and
Others
of
Open-End
Management
Investment
Companies.
The
Funds’
disclosure
of
remuneration
items
is
included
as
part
of
the
Financial
Statements
filed
under
Item
7
of
this
form.
Item
11.
Statement
Regarding
Basis
for
Approval
of
Investment
Advisory
Contract.
The
Funds’
Investment
Advisory
Contract
is
included
as
part
of
the
Financial
Statements
filed
under
Item
7
of
this
form.
Renewal
of
Investment
Advisory
Contract
During
their
meeting
of
September
17,
2024,
the
Trustees
of
Saturna
Investment
Trust,
including
the
Independent
Trustees,
discussed
the
renewal
of
the
current
Advisory
Agreement
with
the
Trust,
on
behalf
of
each
of
the
Funds,
and
Saturna
Capital,
and
the
proposed
amendment
to
the
current
Advisory
Agreement
(the
“Amendment”)
to
implement
a
single
advisory
and
administrative
fee
rate
based
on
a
Fund’s
average
daily
net
assets
and
eliminate
the
current
performance
fee
adjustment,
whereby
each
Fund’s
base
advisory
and
administrative
fee
of
0.50%
is
adjusted
0.10%
or
0.20%
higher
or
lower,
depending
upon
how
much
the
Fund
outperforms
or
underperforms
the
average
12-month
total
return
of
the
funds
in
its
respective
Morningstar,
Inc.
(“Morningstar”)
category
(“Performance
Fee
Adjustment”).
The
Adviser
cited
the
following
reasons
for
its
recommendation
to
approve
the
Amendment:
The
Performance
Fee
Adjustment
structure
has
failed
to
increase
investor
demand
and
attract
significant
assets
for
the
Funds,
making
it
more
difficult
for
them
to
realize
economies
of
scale.
The
Adviser
also
noted
that
the
Performance
Fee
Adjustment
structure
also
is
not
in
line
with
that
of
peer
funds.
The
methodology
used
to
calculate
the
Performance
Fee
Adjustment
is
complex,
preventing
the
Funds
from
being
more
competitive
in
the
mutual
fund
marketplace
because
it
is
more
difficult
to
educate
investors
and
their
financial
intermediaries
about
investing
in
complex
products.
The
Amendment
is
intended
to
make
the
fee
structure
of
each
Fund
less
complicated
and
more
understandable
to
investors
and
their
investment
advisers.
The
performance-based
fee
structure
creates
uncertainty
for
investors
in
reasonably
predicting
Fund
expenses,
due
to
fluctuations
in
advisory
and
administrative
fees
and
total
expense
ratios
that
can
result
from
fund
performance
fluctuations.
Saturna
Capital
believes
that
the
changes
would
increase
the
competitiveness
and
marketability
of
the
Funds
and
thus
create
the
potential
to
grow
overall
assets.
If
the
Funds’
assets
grow,
Saturna
Capital
could
receive
more
in
advisory
and
administrative
fees,
because
the
overall
average
daily
net
assets
on
which
it
will
collect
advisory
and
administrative
fees
will
be
greater.
If
Fund
assets
grow,
shareowners
may
realize
economies
of
scale
due
to
a
Fund’s
fixed
costs
(other
than
the
advisory
and
administrative
fee)
being
allocated
across
a
larger
asset
base,
which
could
lower
average
Fund
expenses;
however,
there
is
no
guarantee
that
such
economies
will
be
realized.
At
the
recommendation
of
Saturna
Capital,
the
Board,
including
a
majority
of
the
Independent
Trustees,
approved
the
renewal
of
the
Agreement,
and
the
proposed
Amendment
to
the
Agreement,
between
the
Adviser
and
the
Trust,
on
behalf
of
each
Fund.
The
Board,
including
a
majority
of
the
Independent
Trustees,
also
recommended
approval
of
the
Amendment
by
shareowners
of
each
Fund.
The
Board
and
the
Independent
Trustees
determined
that
the
information
received
and
the
basis
for
the
renewal
of
the
Advisory
Agreement
also
would
support
the
Board’s
approval
of
the
proposed
Amendment;
these
considerations
included
materials
received
by
the
Board
in
connection
with
the
proposed
change
in
fee
structure
as
reflected
in
the
proposed
Amendment.
In
considering
the
renewal
of
the
Agreement
and
the
approval
of
the
Amendment,
the
Board,
including
the
Independent
Trustees,
considered
the
factors
it
deemed
relevant,
including
the
nature,
quality
and
extent
of
services
provided,
the
performance
of
each
Fund,
expenses
and
fees,
the
profitability
of
Saturna
Capital,
the
potential
for
economies
of
scale
that
may
be
shared
with
each
Fund
and
its
shareowners
as
each
Fund’s
assets
grow,
and
any
other
benefits
derived
by
Saturna
Capital
from
its
relationship
with
the
Funds.
With
respect
to
the
Amendment,
the
Trustees
also
considered
that
the
only
changes
that
the
Amendment
makes
to
the
current
Agreement
are
(i)
the
elimination
of
the
Performance
Fee
Adjustment
and
adoption
of
a
more
conventional
single
advisory
and
administrative
fee
rate
based
on
each
Fund’s
average
daily
net
assets,
and
(ii)
updating
the
date
of
effectiveness.
The
Trustees
further
considered
that,
to
the
extent
Saturna
Capital
receives
more
in
advisory
and
administrative
fees
as
a
result
of
the
Amendment,
Mr.
Kaiser
and
Mrs.
Carten
would
benefit
as
a
result
of
their
ownership
interest
in
Saturna
Capital.
The
Trustees
considered
that
the
Funds
will
not
bear
the
expenses
related
to
the
above-referenced
changes,
including
the
expenses
relating
to
the
Special
Meeting
and
the
preparation,
printing
and
mailing
of
the
proxy
materials
and
all
related
solicitations.
In
their
deliberations,
the
Trustees
did
not
identify
any
single
factor
which
alone
was
responsible
for
the
decision
to
approve
the
Agreement
and
the
Amendment,
and
each
Trustee
may
have
given
different
weights
to
different
factors,
and,
thus,
each
Trustee
may
have
had
a
different
basis
for
his
or
her
decision.
The
Trustees
considered
Saturna
Capital’s
specific
responsibilities
in
all
aspects
of
day-to-day
management
of
the
Funds
as
well
as
the
qualifications,
experience
and
responsibilities
of
the
Funds’
portfolio
managers
and
other
key
personnel
at
Saturna
Capital.
The
Trustees
discussed
Saturna
Capital’s
experience,
ability,
and
commitment
to
quality
service
through
performing
internally
such
functions
as
shareowner
servicing,
administration,
accounting,
marketing,
and
distribution
—
all
in
addition
to
investment
management.
The
Trustees
took
into
consideration
Saturna
Capital’s
continued
avoidance
of
significant
operational
and
compliance
problems,
plus
its
continued
investments
in
infrastructure,
information
management
systems,
personnel,
training,
compliance,
and
investor
education
materials,
all
designed
to
provide
high
quality
investor
services
and
meet
investor
needs.
They
recognized
Saturna
Capital’s
efforts
to
recruit
and
retain
qualified
and
experienced
staff
and
improve
the
capital
base
on
which
Saturna
Capital
operates,
which
the
Trustees
believe
is
important
to
the
long-term
success
of
the
Funds.
They
considered
Saturna
Capital’s
focus
on
investors
and
its
efforts
to
avoid
potential
conflicts
of
interest.
The
Trustees
considered
the
investment
performance
of
each
Fund
over
time,
including
each
Fund’s
average
annual
total
returns
relative
to
its
benchmark
for
the
one-,
three-,
five-,
ten-,
and
fifteen-
year
periods,
as
applicable,
ended
July
31,
2024.
The
Trustees
also
considered
comparative
information
from
Morningstar,
which
provides
independent
analysis
of
mutual
fund
data
and,
among
Renewal
of
Investment
Advisory
Contract
(continued)
other
things,
ranks
mutual
fund
performance
within
categories
comprised
of
similarly
managed
funds.
The
Trustees
considered
and
discussed
each
Fund’s
performance
relative
to
the
Fund’s
Morningstar
category
for
the
one-,
three-,
five-,
ten-,
and
fifteen-
year
periods,
as
applicable,
ended
July
31,
2024.
The
Trustees
also
considered
each
Fund’s
Morningstar
performance
rankings
(one
through
five
stars)
and
noted
the
sustainability
ratings
assigned
to
some
of
the
Funds
by
Morningstar.
The
Trustees
noted
that
the
short-term
performance
of
the
Sextant
International
Fund
was
in
the
first
quartile
for
its
Morningstar
category
for
the
one-
year
period,
medium-term
performance
was
in
the
third
and
first
quartiles
for
the
respective
three-
and
five-year
periods,
and
long-term
performance
was
in
the
third
and
first
quartiles
for
the
respective
ten-
and
fifteen-year
periods.
The
Trustees
noted
that
the
short-
term
performance
of
the
Sextant
Growth
Fund
was
in
the
first
quartile
for
its
Morningstar
category
for
the
one-year
period,
medium-term
performance
was
in
the
second
and
first
quartiles
for
the
respective
three-
and
five-year
periods,
and
long-term
performance
was
in
the
third
and
fourth
quartiles
for
the
respective
ten-
and
fifteen-year
periods.
The
Trustees
noted
that
the
short-
term
performance
of
the
Sextant
Short-Term
Bond
Fund
was
in
the
first
quartile
for
its
Morningstar
category
for
the
one-year
period,
medium-term
performance
was
in
the
third
and
fourth
quartiles
for
the
respective
three-
and
five-year
periods,
and
long-term
performance
was
in
the
fourth
quartile
for
the
ten-
and
fifteen-
year
periods.
The
Trustees
noted
that
the
short-term
performance
of
the
Sextant
Bond
Income
Fund
was
in
the
first
quartile
for
its
Morningstar
category
for
the
one-year
period,
medium-term
performance
was
in
the
second
and
fourth
quartiles
for
the
respective
three-
and
five-year
periods,
and
long-term
performance
was
in
the
fourth
quartile
for
the
ten-
and
fifteen-year
periods.
The
Trustees
noted
that
the
short-term
performance
of
the
Sextant
Core
Fund
was
in
the
first
quartile
for
its
Morningstar
category
for
the
one-year
period,
medium-term
performance
was
in
the
third
and
second
quartiles
for
the
respective
three-
and
five-year
periods,
and
long-term
performance
was
in
the
fourth
quartile
for
the
ten-
and
fifteen-year
periods.
The
Trustees
noted
that
the
short-term
performance
of
the
Sextant
Global
High-Income
Fund
was
in
the
second
quartile
for
its
Morningstar
category
for
the
one-year
period,
and
medium-
and
longer-term
performance
was
in
the
fourth
quartile
for
the
three-,
five-,
and
ten-year
periods.
The
Trustees
also
considered
each
Fund’s
Morningstar
performance
ranking
(one
through
five
stars),
noting
that
the
overall
Morningstar
rating
for
the
Sextant
International
Fund
was
four
stars,
Sextant
Growth
and
Sextant
Core
Funds
were
both
rated
three
stars,
and
Sextant
Short-
Term
Bond,
Sextant
Bond
Income,
and
Sextant
Global
High
Income
were
each
rated
two
stars.
The
Trustees
noted
the
generally
risk-averse
investment
style
of
the
Funds
and
other
factors
which
can
affect
each
Fund’s
performance
relative
to
its
broader
Morningstar
category.
The
Trustees
also
noted
certain
differences
between
each
Fund
and
the
peer
funds
within
its
Morningstar
category,
including
differences
in
investment
strategies
and
asset
size.
The
Trustees
found
that
Saturna
Capital
continued
to
manage
each
Fund
in
a
manner
that
is
designed
to
be
risk-
averse
and
attractive
to
long-term
investors.
The
Trustees
discussed
and
considered
the
efforts
of
Saturna
Capital
to
make
additional
resources
available
to
assist
in
managing
the
Funds.
The
Trustees
also
considered
Saturna
Capital’s
focus
on
improving
investment
performance
without
incurring
materially
higher
levels
of
risk.
The
Trustees
also
considered
the
performance
and
expenses
of
each
Fund
as
compared
to
a
smaller
group
of
funds
compiled
by
Saturna
Capital
with
similar
investment
objectives
and
strategies.
The
Trustees
considered
these
comparative
performance
and
expense
data,
along
with
the
comparative
data
published
by
Morningstar
and
each
Fund’s
performance
relative
to
its
benchmark,
to
evaluate
each
Fund’s
performance
over
near-term
and
long-term
time
periods,
as
applicable.
The
Trustees
evaluated
the
performance
fee
structure
of
the
advisory
and
administrative
fee
under
the
current
Agreement,
noting
that,
if
approved
by
the
Trustees
and
by
shareowners,
the
Amendment
would
replace
the
performance
fee
structure
with
a
single
advisory
and
administrative
fee
rate
based
on
a
Fund’s
average
daily
net
assets.
The
Trustees
also
reviewed
the
fees
and
expenses
of
each
Fund,
including
comparative
data
on
fees
and
expenses
published
by
Morningstar,
and
considered
the
components
of
the
Funds’
operating
expenses.
The
Trustees
noted
the
steps
that
Saturna
Capital
has
undertaken
to
maintain
competitive
levels
of
Fund
operating
expenses.
They
noted
the
significant
sponsorship
of
the
Funds
by
Saturna
Capital
evidenced,
in
part,
by
certain
fees
and
expenses
paid
by
Saturna
Capital
out
of
its
own
resources.
The
Trustees
recognized
that
Saturna
Capital’s
efforts
help
make
the
Funds
more
widely
available
and
less
expensive
than
would
otherwise
be
the
case
without
Saturna
Capital’s
efforts.
The
Trustees
recognized
that
each
Fund
remains
relatively
small
and
there
have
not
been
opportunities
to
consider
economies
of
scale.
The
Trustees
noted
Saturna
Capital’s
commitment
to
continue
operating
the
Funds
and
the
costs
undertaken
by
Saturna
Capital.
The
Trustees
considered
Saturna
Capital’s
representation
that,
if
approved,
the
changes
reflected
in
the
Amendment
would
create
the
potential
to
grow
the
Funds’
overall
assets,
which
potentially
could
benefit
the
Funds’
shareowners
due
to
economies
of
scale
due
to
a
Fund’s
fixed
costs
(other
than
the
advisory
and
administrative
fee)
being
allocated
across
a
larger
asset
base,
which
could
lower
average
Fund
expenses.
The
Trustees
considered
that
the
proposed
single
advisory
and
administrative
fee
rate
for
each
Fund
in
the
Amendment
does
not
reflect
economies
of
scale
for
the
benefit
of
the
Funds’
shareowners.
The
Trustees
reviewed
Saturna
Capital’s
financial
information
and
discussed
the
issue
of
Saturna
Capital’s
profitability,
or
lack
thereof,
as
related
to
management
and
administration
of
the
Trust.
They
discussed
the
reasonableness
of
Saturna
Capital’s
profitability
as
part
of
their
evaluation
of
whether
each
Fund’s
advisory
and
administrative
fees
bear
a
reasonable
relationship
to
the
mix
of
services
provided
by
Saturna
Capital,
including
the
nature,
extent,
and
quality
of
such
services.
The
Trustees
recognized
that
profitability
information
in
future
years
would
differ
from
that
reviewed
previously
as
a
result
of
the
elimination
of
the
Performance
Fee
Adjustment.
The
Trustees
noted
that,
due
to
the
elimination
of
the
Performance
Fee
Adjustment,
in
the
event
that
Renewal
of
Investment
Advisory
Contract
(continued)
the
Amendment
is
approved
by
shareowners,
profitability
would
no
longer
be
directly
affected
by
investment
performance
relative
to
the
average
12-month
total
return
of
the
funds
in
a
Fund’s
Morningstar
category.
The
Trustees
considered
and
compared
the
fees
charged
by
Saturna
Capital
to
other
types
of
accounts,
including
non-mutual
fund
advisory
clients.
The
Trustees
noted
the
differences
between
the
full
range
of
services
Saturna
Capital
provides
to
the
Funds,
including
investment
advisory
and
administrative
services,
transfer
agency
services,
and
other
services,
as
compared
to
the
investment
advisory
services
provided
to
the
other
advisory
accounts.
In
considering
the
Amendment,
the
Trustees
considered
the
current
advisory
and
administrative
fee
rate
paid
by
a
Fund
to
Saturna
Capital
under
the
Agreement
and
the
proposed
advisory
and
administrative
fee
rate
payable
by
a
Fund
to
Saturna
Capital
pursuant
to
the
Amendment.
With
respect
to
the
proposed
elimination
of
the
Performance
Fee
Adjustment
and
the
implementation
of
a
single
advisory
and
administrative
fee
rate
as
provided
in
the
Amendment,
the
Trustees
considered
the
pro
forma
total
expense
ratio
of
each
Fund
and
its
share
classes
in
comparison
to
the
average
total
expense
ratio
of
the
funds
in
its
Morningstar
category
for
various
periods.
In
doing
so,
the
Trustees
considered
that
the
Funds’
pro
forma
total
expense
ratios
were
higher
than
their
respective
Morningstar
category
averages
in
certain
years
and
lower
in
others.
The
Trustees
considered
potential
benefits
to
Saturna
Capital’s
other
business
lines
from
acting
as
investment
adviser
to
the
Funds,
but
also
recognized
that
Saturna
Capital’s
other
business
lines
also
potentially
benefit
the
Funds.
The
Trustees
also
noted
that
there
were
no
soft
dollar
arrangements
with
respect
to
trading
in
the
Funds’
portfolios.
The
Trustees
considered
whether
there
are
other
potential
benefits
to
Saturna
Capital
in
continuing
to
manage
the
Funds
and
the
Trustees
found
that
there
were
no
material
benefits
other
than
Saturna
Capital’s
receipt
of
advisory
and
administrative
fees
and
the
fact
that
Saturna
Brokerage
Services,
a
wholly
owned
subsidiary
of
Saturna
Capital,
receives
distribution
and
shareowner
services
fees
under
Rule
12b-
1,
which
it
would
not
otherwise
receive
if
Saturna
Capital
did
not
serve
as
the
investment
manager
for
the
Funds.
The
Trustees
also
noted
that
Saturna
Brokerage
Services
voluntarily
waives
brokerage
commissions
for
executing
Fund
portfolio
transactions,
resulting
in
lower
transaction
costs.
The
Trustees
concluded
based
on
their
business
judgement
that
the
fees
paid
by
each
Fund
to
Saturna
Capital
were,
from
an
arm’s-
length
bargaining
perspective,
reasonable
and
in
the
best
interest
of
the
Fund
and
its
shareowners
in
light
of
the
services
provided,
comparative
performance,
expense
and
advisory
and
administrative
fee
information,
costs
of
services
provided,
profits
to
be
realized,
and
benefits
derived
or
to
be
derived
by
Saturna
Capital
from
its
relationship
with
the
Fund.
Following
this
discussion,
the
Trustees,
including
the
Independent
Trustees,
unanimously
agreed
to
renew
each
Fund’s
Agreement
with
Saturna
Capital,
and
to
approve
the
Amendment.
Availability
of
Quarterly
Portfolio
Information
(1)
The
Sextant
Funds
file
complete
schedules
of
portfolio
holdings
with
the
SEC
for
the
first
and
third
quarters
of
each
fiscal
year
as
an
exhibit
to
their
reports
on
Form
N-PORT.
(2)
The
Funds’
Form
N-PORT
reports
are
available
on
the
SEC’s
website
at
www.sec.gov
and
at
www.sextantfunds.com.
(3)
The
Funds
posts
a
complete
schedule
of
portfolio
holdings
after
the
end
of
each
month,
available
to
investors
at
www.
sextantfunds.com.
Privacy
Statement
At
Saturna
Capital
and
Saturna
Investment
Trust,
we
understand
the
importance
of
maintaining
the
privacy
of
your
financial
information.
We
want
to
assure
you
that
we
protect
the
confidentiality
of
any
personal
information
that
you
share
with
us.
In
addition,
we
do
not
sell
information
about
our
current
or
former
customers.
In
the
course
of
our
relationship,
we
gather
certain
nonpublic
information
about
you,
including
your
name,
address,
investment
choices,
and
account
information.
We
do
not
disclose
your
information
to
unaffiliated
third
parties
unless
it
is
necessary
to
process
a
transaction;
service
your
account;
deliver
your
account
statements,
shareowner
reports,
and
other
information;
or
as
required
by
law.
When
we
disclose
information
to
unaffiliated
third
parties,
we
require
a
contract
to
restrict
the
companies’
use
of
customer
information
and
from
sharing
or
using
it
for
any
purposes
other
than
performing
the
services
for
which
they
were
required.
We
may
share
information
within
the
Saturna
Capital
family
of
companies
in
the
course
of
informing
you
about
products
or
services
that
may
address
your
investing
needs.
We
maintain
our
own
technology
resources
to
minimize
the
need
for
any
third-party
services,
and
restrict
access
to
information
within
Saturna.
We
maintain
physical,
electronic,
and
procedural
safeguards
to
guard
your
personal
information.
If
you
have
any
questions
or
concerns
about
the
security
or
privacy
of
your
information,
please
call
us
at
1-800-728-8762.
Morningstar
Ratings
3
Sustainable
Equity
Fund
4
Schedule
of
Investments
4
Statement
of
Assets
and
Liabilities
and
Statement
of
Operations
7
Statement
of
Changes
in
Net
Assets
8
Financial
Highlights
9
Sustainable
Bond
Fund
10
Schedule
of
Investments
10
Statement
of
Assets
and
Liabilities
and
Statement
of
Operations
13
Statement
of
Changes
in
Net
Assets
14
Financial
Highlights
15
Notes
To
Financial
Statements
16
Note
1
–
Organization
16
Note
2
–
Significant
Accounting
Policies
16
Note
3
–
Transactions
with
Affiliated
Persons
19
Note
4
–
Distributions
to
Shareowners
20
Note
5
–
Federal
Income
Taxes
20
Note
6
–
Investments
20
Note
7
–
Custodian
20
Note
8
–
Subsequent
Events
20
Report
of
Independent
Registered
Public
Accounting
Firm
21
Form
N-CSR
Items
8-11
22
Renewal
of
Investment
Advisory
Contract
23
Summary
Information
25
Morningstar
Rating
(as
of
November
30,
2024)
The
Morningstar
Sustainability
Rating
and
the
Morningstar
Portfolio
Sustainability
Score
are
not
based
on
fund
performance
and
are
not
equivalent
to
the
Morningstar
Rating
("Star
Rating").
©
2024
Morningstar®.
All
rights
reserved.
Morningstar,
Inc.
is
an
independent
fund
performance
monitor.
The
information
contained
herein:
(1)
is
proprietary
to
Morningstar
and/or
its
content
providers;
(2)
may
not
be
copied
or
distributed;
and
(3)
is
not
warranted
to
be
accurate,
complete,
or
timely.
Neither
Morningstar
nor
its
content
providers
are
responsible
for
any
damages
or
losses
arising
from
any
use
of
this
information.
A
Morningstar
Ratings™
("Star
Ratings")
are
as
of
November
30,
2024
.
The
Morningstar
Rating
™
for
funds,
or
"star
rating",
is
calculated
for
managed
products
(including
mutual
funds,
variable
annuity
and
variable
life
subaccounts,
exchange-traded
funds,
closed-end
funds,
and
separate
accounts)
with
at
least
a
three-year
history.
Exchange-traded
funds
and
open-ended
mutual
funds
are
considered
a
single
population
for
comparative
purposes.
It
is
calculated
based
on
a
Morningstar
Risk-Adjusted
Return
measure
that
accounts
for
variation
in
a
managed
product's
monthly
excess
performance
(not
including
the
effects
of
sales
charges,
loads,
and
redemption
fees),
placing
more
emphasis
on
downward
variations
and
rewarding
consistent
performance.
The
top
10%
of
products
in
each
product
category
receive
5
stars,
the
next
22.5%
receive
4
stars,
the
next
35%
receive
3
stars,
the
next
22.5%
receive
2
stars,
and
the
bottom
10%
receive
1
star.
The
Overall
Morningstar
Rating
for
a
managed
product
is
derived
from
a
weighted
average
of
the
performance
figures
associated
with
its
three-,
five-,
and
10-year
(if
applicable)
Morningstar
Rating
metrics.
The
weights
are:
100%
three-year
rating
for
36-59
months
of
total
returns,
60%
five-year
rating/40%
three-year
rating
for
60-119
months
of
total
returns,
and
50%
10-year
rating/30%
five-year
rating/20%
three-year
rating
for
120
or
more
months
of
total
returns.
While
the
10-year
overall
star
rating
formula
seems
to
give
the
most
weight
to
the
10-year
period,
the
most
recent
three-year
period
actually
has
the
greatest
impact
because
it
is
included
in
all
three
rating
periods.
B
Morningstar
Sustainability
Ratings
are
as
of
October
31,
2024
.
The
Morningstar
Sustainability
Rating
™
is
intended
to
measure
how
well
the
issuing
companies
of
the
securities
within
a
fund’s
portfolio
are
managing
their
environmental,
social,
and
governance
(“ESG”)
risks
and
opportunities
relative
to
the
fund’s
Morningstar
category
peers.
The
Morningstar
Sustainability
Rating
calculation
is
a
two-step
process.
First,
each
fund
with
at
least
50%
of
assets
covered
by
a
company-level
ESG
score
from
Sustainalytics
receives
a
Morningstar
Portfolio
Sustainability
Score
™
.
The
Morningstar
Portfolio
Sustainability
Score
is
an
asset-weighted
average
of
normalized
company-level
ESG
scores
with
deductions
made
for
controversial
incidents
by
the
issuing
companies,
such
as
environmental
accidents,
fraud,
or
discriminatory
behavior.
The
Morningstar
Sustainability
Rating
is
then
assigned
to
all
scored
funds
within
Morningstar
Categories
in
which
at
least
ten
(10)
funds
receive
a
Portfolio
Sustainability
Score
and
is
determined
by
each
fund's
rank
within
the
following
distribution:
High
(highest
10%),
Above
Average
(next
22.5%),
Average
(next
35%),
Below
Average
(next
22.5%),
and
Low
(lowest
10%).
The
Morningstar
Sustainability
Rating
is
depicted
by
globe
icons
where
High
equals
5
globes
and
Low
equals
1
globe.
A
Sustainability
Rating
is
assigned
to
any
fund
that
has
more
than
half
of
its
underlying
assets
rated
by
Sustainalytics
and
is
within
a
Morningstar
Category
with
at
least
10
scored
funds;
therefore,
the
rating
is
not
limited
to
funds
with
explicit
sustainable
or
responsible
investment
mandates.
Morningstar
updates
its
Sustainability
Ratings
monthly.
Portfolios
receive
a
Morningstar
Portfolio
Sustainability
Score
and
Sustainability
Rating
one
month
and
six
business
days
after
their
reported
as-of
date
based
on
the
most
recent
portfolio.
As
part
of
the
evaluation
process,
Morningstar
uses
Sustainalytics’
ESG
scores
from
the
same
month
as
the
portfolio
as-of
date.
Saturna
Sustainable
Equity
Fund
was
rated
on
98%
of
assets
under
management.
Saturna
Sustainable
Bond
Fund
was
rated
on
89%
of
assets
under
management.
%
Rank
in
Category
is
the
fund’s
percentile
rank
for
the
specified
time
period
relative
to
all
funds
that
have
the
same
Morningstar
category.
The
highest
(or
most
favorable)
percentile
rank
is
1
and
the
lowest
(or
least
favorable)
percentile
rank
is
100.
The
top-
performing
fund
in
a
category
will
always
receive
a
rank
of
1.
Percentile
ranks
within
categories
are
most
useful
in
those
categories
that
have
a
large
number
of
funds.
The
Funds’
portfolios
are
actively
managed
and
are
subject
to
change,
which
may
result
in
different
Morningstar
Sustainability
Ratings
over
time.
Morningstar™
Ratings
A
1
Year
3
Year
5
Year
Overall
Sustainability
Rating™
B
Saturna
Sustainable
Equity
Fund
–
“Global
Large-Stock
Blend”
Category
SEEFX
n/a
%
Rank
in
Category
79
89
74
89
4
Number
of
Funds
in
Category
336
316
302
329
8,318
Saturna
Sustainable
Bond
Fund
–
“Global
Bond”
Category
SEBFX
n/a
%
Rank
in
Category
77
36
32
36
10
Number
of
Funds
in
Category
165
164
151
164
2,384
The
accompanying
notes
are
an
integral
part
of
these
financial
statements.
Common
Stock
-
92.3%
Number
of
Shares
Cost
Market
Value
Country
1
Percentage
of
Net
Assets
Consumer
Discretionary
Home
Products
Stores
Home
Depot
1,500
$
279,738
$
643,695
United
States
2.6%
Specialty
Apparel
Stores
TJX
Companies
5,000
238,191
628,450
United
States
2.5%
517,929
1,272,145
5.1%
Consumer
Staples
Mass
Merchants
Dollarama
Inc
2,400
249,901
250,003
Canada
1.0%
Packaged
Food
Danone
ADR
31,200
422,529
428,064
France
1.7%
Personal
Care
Products
L'Oreal
ADR
5,400
297,824
376,380
France
1.5%
Unicharm
ADR
40,500
326,015
208,170
Japan
0.8%
Unilever
ADR
8,800
466,958
526,592
United
Kingdom
2.1%
1,090,797
1,111,142
4.4%
1,763,227
1,789,209
7.1%
Financials
Consumer
Finance
Paypal
2
2,900
674,351
251,633
United
States
1.0%
Life
Insurance
Aviva
ADR
45,600
416,983
567,264
United
Kingdom
2.2%
Other
Financial
Services
Mastercard,
Class
A
860
171,375
458,328
United
States
1.8%
P&C
Insurance
Chubb
2,000
287,787
577,460
Switzerland
2.3%
1,550,496
1,854,685
7.3%
Health
Care
Large
Pharma
Eli
Lilly
900
514,269
715,815
United
States
2.9%
GlaxoSmithKline
ADR
9,200
369,834
313,996
United
Kingdom
1.2%
Novartis
ADR
4,300
374,482
454,811
Switzerland
1.8%
Novo
Nordisk
ADR
10,200
324,489
1,089,360
Denmark
4.3%
Roche
Holding
ADR
9,000
406,003
326,160
Switzerland
1.3%
Sandoz
Group
AG-ADR
860
20,210
39,211
Switzerland
0.2%
2,009,287
2,939,353
11.7%
Industrials
Commercial
&
Residential
Building
Equipment
&
Systems
Assa
Abloy
ADR
44,500
515,234
683,209
Sweden
2.7%
Electrical
Components
TE
Connectivity
Ltd.
3,200
356,052
483,584
Ireland
1.9%
Electrical
Power
Equipment
Fuji
Electric
Co.
Ltd.
8,500
510,462
478,478
Japan
1.9%
Schneider
Electric
ADR
17,100
424,554
881,847
France
3.5%
Siemens
ADR
5,300
361,107
514,259
Germany
2.1%
1,296,123
1,874,584
7.5%
Industrial
Wholesale
&
Rental
Ferguson
Enterprises
2,500
413,249
539,825
United
States
2.1%
The
accompanying
notes
are
an
integral
part
of
these
financial
statements.
Common
Stock
-
92.3%
Number
of
Shares
Cost
Market
Value
Country
1
Percentage
of
Net
Assets
Industrials
(continued)
Rail
Freight
Canadian
Pacific
Kansas
City
3,200
$
248,512
$
245,088
Canada
1.0%
2,829,170
3,826,290
15.2%
Materials
Agricultural
Chemicals
Corteva
3,000
180,770
186,720
United
States
0.7%
Basic
&
Diversified
Chemicals
Linde
500
223,806
230,495
United
Kingdom
0.9%
Specialty
Chemicals
Ecolab
1,500
237,915
373,155
United
States
1.5%
642,491
790,370
3.1%
Technology
Application
Software
Adobe
2
1,000
108,410
515,930
United
States
2.0%
Dassault
Systemes
ADR
9,100
194,033
313,768
France
1.3%
302,443
829,698
3.3%
Communications
Equipment
Apple
3,028
83,313
718,635
United
States
2.9%
Consumer
Electronics
Nintendo
ADR
56,625
633,295
829,556
Japan
3.3%
Sony
ADR
20,000
261,557
401,000
Japan
1.6%
894,852
1,230,556
4.9%
Electronics
Components
Murata
Manufacturing
12,000
203,199
200,031
Japan
0.8%
Infrastructure
Software
Microsoft
1,438
62,724
608,936
United
States
2.4%
ServiceNow
2
650
392,951
682,136
United
States
2.7%
455,675
1,291,072
5.1%
IT
Services
Accenture,
Class
A
1,600
275,166
579,792
Ireland
2.3%
CGI
Group,
Class
A
6,000
421,997
679,176
Canada
2.7%
Wolters
Kluwer
5,022
376,238
837,693
Netherlands
3.3%
1,073,401
2,096,661
8.3%
Semiconductor
Devices
Broadcom
2,500
430,000
405,200
United
States
1.6%
Nvida
10,000
479,045
1,382,500
United
States
5.5%
NXP
Semiconductors
1,960
215,841
449,565
Netherlands
1.8%
STMicroelectronics
ADR
9,000
381,679
229,500
Switzerland
0.9%
1,506,565
2,466,765
9.8%
Semiconductor
Manufacturing
ASML
Holding
NY
700
523,104
480,627
Netherlands
1.9%
Taiwan
Semiconductor
ADR
5,325
406,030
983,315
Taiwan
3.9%
929,134
1,463,942
5.8%
5,448,582
10,297,360
40.9%
The
accompanying
notes
are
an
integral
part
of
these
financial
statements.
Common
Stock
-
92.3%
Number
of
Shares
Cost
Market
Value
Country
1
Percentage
of
Net
Assets
Utilities
Integrated
Electric
Utilities
NextEra
Energy
6,100
$
466,374
$
479,887
United
States
1.9%
Total
investments
$15,227,556
$23,249,299
92.3%
Other
assets
(net
of
liabilities)
1,931,189
7.7%
Total
net
assets
$25,180,488
100.0%
1
Country
of
domicile
unless
otherwise
indicated
2
Non-income
producing
ADR:
American
Depositary
Receipt
The
accompanying
notes
are
an
integral
part
of
these
financial
statements.
Statement
of
Assets
and
Liabilities
Statement
of
Operations
As
of
November
30,
2024
Assets
Investments
in
securities,
at
value
(Cost
$15,227,556)
$
23,249,299
Cash
1,906,673
Dividends
receivable
43,923
Interest
receivable
7,678
Prepaid
expenses
904
Receivable
for
Fund
shares
sold
549
Total
assets
25,209,026
Liabilities
Accrued
audit
expenses
13,234
Accrued
advisory
fees
11,016
Accrued
retirement
plan
custody
fee
2,407
Accrued
legal
expenses
638
Accrued
Chief
Compliance
Officer
expenses
584
Accrued
other
operating
expenses
659
Total
liabilities
28,538
Net
assets
$25,180,488
Analysis
of
net
assets
Paid-in
capital
(unlimited
shares
authorized,
without
par
value)
$17,235,145
Total
distributable
earnings
7,945,343
Net
assets
applicable
to
Fund
shares
outstanding
$25,180,488
Fund
shares
outstanding
1,265,765
Net
asset
value,
offering,
and
redemption
price
per
share
$19.89
Year
ended
November
30,
2024
Investment
income
Dividend
Income
(Net
of
foreign
tax
of
$37,051)
$
322,513
Interest
income
56,833
Total
investment
income
379,346
Expenses
Investment
advisory
fees
157,585
Filing
and
registration
fees
22,388
Audit
fees
12,576
Chief
Compliance
Officer
expenses
7,193
Trustee
fees
6,784
Legal
fees
5,882
Retirement
plan
custodial
fees
2,477
Custodian
fees
1,487
Other
operating
expenses
4,160
Total
gross
expenses
220,532
Less
adviser
fees
waived
(37,216)
Less
custodian
fee
credits
(1,487)
Net
expenses
181,829
Net
investment
income
$197,517
Net
realized
gain
from
investments
and
foreign
currency
$361,852
Net
Increase
in
unrealized
appreciation
on
investments
and
foreign
currency
3,474,062
Net
gain
on
investments
3,835,914
Net
increase
in
net
assets
resulting
from
operations
$4,033,431
The
accompanying
notes
are
an
integral
part
of
these
financial
statements.
Statements
of
Changes
in
Net
Assets
Year
ended
November
30,
2024
Year
ended
November
30,
2023
Increase
in
net
assets
from
operations
From
operations
Net
investment
income
$197,517
$220,519
Net
realized
gain
(loss)
on
investments
and
foreign
currency
361,852
(449,805)
Net
increase
in
unrealized
appreciation
on
investments
and
foreign
currency
3,474,062
2,164,681
Net
increase
in
net
assets
4,033,431
1,935,395
Distributions
to
shareowners
from
Net
dividend
and
distribution
to
shareholders
(219,353)
(177,042)
Capital
share
transactions
Proceeds
from
the
sale
of
shares
1,812,109
2,443,907
Value
of
shares
issued
in
reinvestment
of
dividends
and
distributions
219,353
176,949
Cost
of
shares
redeemed
(1,982,332)
(2,844,207)
Total
capital
shares
transactions
49,129
(223,351)
Total
increase
in
net
assets
3,863,207
1,535,002
Net
assets
Beginning
of
year
21,317,281
19,782,279
End
of
year
$25,180,488
$21,317,281
Shares
of
the
Fund
sold
and
redeemed
Sustainable
Equity
(SEEFX)
Number
of
shares
sold
97,530
151,731
Number
of
shares
issued
in
reinvestment
of
dividends
and
distributions
12,563
11,688
Number
of
shares
redeemed
(104,652)
(180,213)
Net
increase
(decrease)
in
number
of
shares
outstanding
5,441
(16,794)
–
–
Sustainable
Equity
Fund:
Financial
Highlights
The
accompanying
notes
are
an
integral
part
of
these
financial
statements.
tin
Sustainable
Equity
(SEEFX)
Selected
data
per
share
of
outstanding
capital
stock
throughout
each
year:
Year
ended
November
30,
2024
2023
2022
2021
2020
A
A
A
A
A
A
Net
asset
value
at
beginning
of
year
$16.91
$15.49
$18.55
$16.72
$13.58
Income
from
investment
operations
Net
investment
income
0.15
0.17
0.14
0.13
0.10
Net
gains
(losses)
on
securities
(both
realized
and
unrealized)
3.01
1.39
(3.08)
1.76
3.11
Total
from
investment
operations
3.16
1.56
(2.94)
1.89
3.21
Less
distributions
Dividends
(from
net
investment
income)
(0.18)
(0.14)
(0.12)
(0.06)
(0.07)
Total
distributions
(0.18)
(0.14)
(0.12)
(0.06)
(0.07)
Net
asset
value
at
end
of
year
$19.89
$16.91
$15.49
$18.55
$16.72
Total
Return
18.80%
10.18%
(15.96)%
11.32%
23.74%
Ratios
/
supplemental
data
Net
assets
($000),
end
of
year
$25,180
$21,317
$19,782
$25,375
$16,834
Ratio
of
expenses
to
average
net
assets
Before
custodian
fee
credits
0.91%
0.97%
0.93%
0.85%
0.78%
After
advisory
fees
waiver
0.76%
0.76%
0.76%
0.76%
0.75%
After custodian
fee
credits
0.75%
0.75%
0.75%
0.75%
0.73%
Ratio
of
net
investment
income
after
custodian
fee
credits to
average
net
assets
0.81%
1.10%
0.84%
0.71%
0.61%
Portfolio
turnover
rate
19%
3%
9%
8%
13%
The
accompanying
notes
are
an
integral
part
of
these
financial
statements.
Corporate
Bonds
-
69.8%
Coupon
/
Maturity
Face
Amount
Market
Value
Country
1
Percentage
of
Net
Assets
Communications
Koninklijke
KPN
8.375%
due
10/01/2030
$
750,000
$
879,919
Netherlands
2.4%
Consumer
Discretionary
Starbucks
2.450%
due
06/15/2026
1,200,000
1,162,806
United
States
3.2%
Consumer
Staples
Coty
2
4.750%
due
04/15/2026
EUR
750,000
792,212
United
States
2.2%
Coty
3
5.000%
due
04/15/2026
131,000
130,481
United
States
0.4%
Natura
Cosmeticos
SA
4.125%
due
05/03/2028
1,250,000
1,163,821
Brazil
3.2%
2,086,514
5.8%
Energy
Masdar
Abu
Dhabi
2
4.875%
due
07/25/2029
750,000
746,040
United
Arab
Emirates
2.1%
Financials
AXA
2,4
5.125%
due
01/17/2027
1,700,000
1,687,741
France
4.6%
Canadian
Imperial
Bank
5
4.375%
due
10/28/2080
CAD
2,100,000
1,495,400
Canada
4.1%
Commonwealth
Bank
Australia
(Quarterly
BBSW
plus
0.41%)
6
4.731%
due
12/23/2026
AUD
850,000
552,418
Australia
1.5%
First
Abu
Dhabi
Bank
PJSC
2
5.125%
due
10/13/2027
1,500,000
1,516,689
United
Arab
Emirates
4.2%
MAF
Sukuk
2
4.638%
due
05/14/2029
800,000
789,218
United
Arab
Emirates
2.2%
Munich
RE
2,7
1.000%
due
05/26/2042
EUR
1,800,000
1,591,985
Germany
4.4%
State
Street
(Quarterly
US
LIBOR
plus
100)
6
6.552%
due
06/15/2047
1,950,000
1,736,603
United
States
4.8%
Toronto-Dominion
Bank
2
1.128%
due
12/09/2025
CAD
500,000
349,134
Canada
1.0%
Women's
Livelihood
Bond
Asset
II
B
3
3.950%
due
12/10/2024
600,000
600,000
Singapore
1.7%
Women's
Livelihood
Bond
Asset
II
C
3
3.900%
due
12/23/2025
500,000
474,842
Singapore
1.3%
10,794,030
29.8%
Health
Care
Koninklijke
Philips
7.125%
due
05/15/2025
1,000,000
1,006,473
Netherlands
2.8%
Novartis
Capital
3.000%
due
11/20/2025
250,000
246,397
Switzerland
0.7%
Roche
3
2.625%
due
05/15/2026
200,000
194,992
Switzerland
0.5%
1,447,862
4.0%
Information
Technology
Iron
Mountain
3
4.875%
due
09/15/2029
500,000
481,582
United
States
1.3%
Materials
Stora
Enso
OYJ
3
7.250%
due
04/15/2036
500,000
543,817
Finland
1.5%
Stora
Enso
OYJ
2
7.250%
due
04/15/2036
300,000
326,291
Finland
0.9%
870,108
2.4%
Real
Estate
Iron
Mountain
UK
PLC
2
3.875%
due
11/15/2025
GBP
750,000
938,228
United
States
2.6%
MAF
Global
Securities
2,8,9
7.875%
due
PERP
1,200,000
1,239,150
United
Arab
Emirates
3.4%
Prologis
1.250%
due
10/15/2030
500,000
414,171
United
States
1.1%
2,591,549
7.1%
Technology
Nokia
OYJ
2
2.375%
due
05/15/2025
EUR
500,000
526,206
Finland
1.4%
Nokia
OYJ
2
4.375%
due
08/21/2031
EUR
1,000,000
1,113,563
Finland
3.1%
RELX
4.000%
due
03/18/2029
400,000
390,268
United
Kingdom
1.1%
2,030,037
5.6%
Telecommunication
Services
Telecom
Italia
Capital
6.000%
due
09/30/2034
250,000
244,952
Italy
0.7%
The
accompanying
notes
are
an
integral
part
of
these
financial
statements.
BBSW:
Bank
Bill
Swap
Rate
Corporate
Bonds
-
69.8%
Coupon
/
Maturity
Face
Amount
Market
Value
Country
1
Percentage
of
Net
Assets
Telecommunication
Services
(continued)
Telecom
Italia
SPA
2
1.625%
due
01/18/2029
EUR
$
500,000
$
492,826
Italy
1.3%
737,778
2.0%
Utilities
United
Utilities
6.875%
due
08/15/2028
1,400,000
1,496,764
United
Kingdom
4.1%
Total
Corporate
Bonds
(Cost
$25,653,179)
$25,324,989
69.8%
Government
Bonds
-
21.1%
Coupon
/
Maturity
Face
Amount
Market
Value
Country
1
Percentage
of
Net
Assets
Financials
Federal
Home
Loan
Bank
1.650%
due
10/06/2031
500,000
417,384
United
States
1.2%
Government
Asian
Development
Bank
6.000%
due
02/05/2026
BRL
3,000,000
466,743
Philippines
1.3%
European
Bk
Recon
&
Dev
5.000%
due
01/27/2025
BRL
3,000,000
494,067
United
Kingdom
1.4%
Export-Import
Bank
Korea
5.125%
due
01/11/2033
500,000
514,950
Korea
1.4%
Inter-American
Devel
BK
7.500%
due
12/05/2024
MXN
20,000,000
980,924
United
States
2.7%
International
Finance
12.000%
due
11/03/2027
COP
3,000,000,000
720,230
United
States
10
2.0%
Int'l
Bk
Recon
&
Develop
4.250%
due
01/22/2026
MXN
15,000,000
694,779
Germany
1.9%
Int'l
Bk
Recon
&
Develop
5.000%
due
10/07/2026
COP
6,000,000,000
1,259,777
Germany
3.5%
Ontario
2.650%
due
02/05/2025
CAD
500,000
356,553
Canada
1.0%
Perusahaan
Penerbit
SBSN
2
3.550%
due
06/09/2051
500,000
369,760
Indonesia
1.0%
Queensland
Treasury
2
2.500%
due
03/06/2029
AUD
750,000
455,434
Australia
1.2%
Republic
of
Chile
4.340%
due
03/07/2042
500,000
439,750
Chile
1.2%
United
Kingdom
Gilt
2
0.875%
due
07/31/2033
GBP
500,000
485,198
United
Kingdom
1.3%
7,238,165
19.9%
Total
Government
Bonds
(Cost
$8,322,571)
$7,655,549
21.1%
Total
investments
(Cost
$33,975,750)
$32,980,538
90.9%
Other
assets
(net
of
liabilities)
3,310,929
9.1%
Total
net
assets
$36,291,467
100.0%
1
Denotes
a
country
or
region
of
primary
exposure
2
Security
was
purchased
pursuant
to
Regulation
S
under
the
Securities
Act
of
1933
which
exempts
from
registration
securities
offered
and
sold
outside
of
the
United
States.
Such
a
security
cannot
be
sold
in
the
United
States
without
either
an
effective
registration
statement
filed
pursuant
to
the
Securities
Act
of
1933,
or
pursuant
to
an
exemption
from
registration.
These
Securities
have
been
deemed
liquid
under
guidelines
approved
by
the
Trust's
Board
of
Trustees.
At
November
30,
2024,
the
aggregate
value
of
these
securities
was
$13,070,541
representing
35.9%
of
total
net
assets.
3
Security
was
purchased
pursuant
to
Rule
144A
under
the
Securities
Act
of
1933
and
may
be
sold
in
transactions
exempt
from
registration
only
to
qualified
institutional
buyers
or
in
public
offering
registered
under
the
Securities
Act
of
1933.
These
securities
have
been
deemed
liquid
under
guidelines
approved
by
the
Trust's
Board
of
Trustees.
At
November
30,
2024,
the
aggregate
value
of
these
securities
was
$1,944,132
representing
5.4%
of
total
net
assets.
4
AXA
is
a
fixed
to
float
bond.
The
bond
has
a
fixed
rate
until
01/17/2027.
The
interest
rate
represents
the
rate
in
effect
at
November
30,
2024.
5
Canadian
Imperial
Bank
is
a
fixed
to
float
bond.
The
bond
has
a
fixed
rate
until
10/28/2025.
The
interest
rate
represents
the
rate
in
effect
at
November
30,
2024.
6
Variable
rate
security.
The
interest
rate
represents
the
rate
in
effect
at
November
30,
2024
and
resets
periodically
based
on
the
parenthetically
disclosed
reference
rate
and
spread.
7
Munich
RE
is
a
fixed
to
float
bond.
The
bond
has
a
fixed
rate
until
05/26/2032.
The
interest
rate
represents
the
rate
in
effect
at
November
30,
2024.
8
Security
is
perpetual
in
nature
with
no
stated
maturity
date.
9
Coupon
rates
for
floating
and
adjustable
rate
securities
reflect
the
rates
in
effect
at
period
end.
10
Country
of
domicile
LIBOR:
London
Interbank
Offered
Rates
PCL:
Public
Company
Limited
SA:
Special
Assessment
AUD
:
Australian
dollar
BRL
:
Brazilian
real
The
accompanying
notes
are
an
integral
part
of
these
financial
statements.
CAD
:
Canadian
dollar
COP
:
Colombian
peso
EUR
:
Euro
GBP
:
British
pound
MXN
:
Mexican
peso
USD
:
United
States
dollar
The
accompanying
notes
are
an
integral
part
of
these
financial
statements.
Statement
of
Assets
and
Liabilities
Statement
of
Operations
As
of
November
30,
2024
Assets
Investments
in
securities,
at
value
(Cost
$33,975,750)
$
32,980,538
Cash
2,828,680
Interest
receivable
461,720
Receivable
for
Fund
shares
sold
50,171
Prepaid
expenses
2,868
Total
assets
36,323,977
Liabilities
Accrued
advisory
fees
13,604
Accrued
audit
expenses
11,258
Accrued
retirement
plan
custody
fee
1,373
Payable
for
Fund
shares
redeemed
1,276
Accrued
legal
expenses
966
Accrued
Chief
Compliance
Officer
expenses
962
Accrued
trustee
expenses
64
Accrued
other
operating
expenses
907
Accrued
printing
fees
2,100
Total
liabilities
32,510
Net
assets
$36,291,467
Analysis
of
net
assets
Paid-in
capital
(unlimited
shares
authorized,
without
par
value)
$38,491,260
Total
distributable
earnings
(2,199,793)
Net
assets
applicable
to
Fund
shares
outstanding
$36,291,467
Fund
shares
outstanding
3,923,691
Net
asset
value,
offering,
and
redemption
price
per
share
$9.25
Year
ended
November
30,
2024
Investment
income
Interest
income
$
1,683,330
Total
investment
income
1,683,330
Expenses
Investment
advisory
fees
180,510
Filing
and
registration
fees
23,694
Audit
fees
18,484
Chief
Compliance
Officer
expenses
10,561
Trustee
fees
9,586
Legal
fees
8,407
Custodian
fees
5,863
Retirement
plan
custodial
fees
1,434
Other
operating
expenses
6,791
Total
gross
expenses
265,330
Less
adviser
fees
waived
(46,137)
Less
custodian
fee
credits
(5,863)
Net
expenses
213,330
Net
investment
income
$1,470,000
Net
realized
loss
from
investments
and
foreign
currency
$(502,327)
Net
de
crease
in
unrealized
depreciation
on
investments
and
foreign
currency
54,552
Net
loss
on
investments
(447,775)
Net
increase
in
net
assets
resulting
from
operations
$1,022,225
The
accompanying
notes
are
an
integral
part
of
these
financial
statements.
Statements
of
Changes
in
Net
Assets
Year
ended
November
30,
2024
Year
ended
November
30,
2023
Increase
in
net
assets
from
operations
From
operations
Net
investment
income
$1,470,000
$1,148,799
Net
realized
loss
on
investments
and
foreign
currency
(502,327)
(1,123,261)
Net
decrease
in
unrealized
depreciation
on
investments
and
foreign
currency
54,552
914,606
Net
increase
in
net
assets
1,022,225
940,144
Distributions
to
shareowners
from
Net
dividend
and
distribution
to
shareholders
(1,086,688)
(183,662)
Capital
share
transactions
Proceeds
from
the
sale
of
shares
12,010,681
7,936,631
Value
of
shares
issued
in
reinvestment
of
dividends
and
distributions
1,083,701
182,968
Cost
of
shares
redeemed
(6,193,776)
(8,125,858)
Total
capital
shares
transactions
6,900,605
(6,259)
Total
increase
in
net
assets
6,836,142
750,223
Net
assets
Beginning
of
year
29,455,325
28,705,102
End
of
year
$36,291,467
$29,455,325
Shares
of
the
Fund
sold
and
redeemed
Sustainable
Bond
(SEBFX)
Number
of
shares
sold
1,300,801
863,856
Number
of
shares
issued
in
reinvestment
of
dividends
and
distributions
117,922
20,330
Number
of
shares
redeemed
(668,295)
(894,442)
Net
increase
(decrease)
in
number
of
shares
outstanding
750,428
(10,256)
–
–
Sustainable
Bond
Fund:
Financial
Highlights
The
accompanying
notes
are
an
integral
part
of
these
financial
statements.
tin
Sustainable
Bond
(SEBFX)
Selected
data
per
share
of
outstanding
capital
stock
throughout
each
year:
Year
ended
November
30,
2024
2023
2022
2021
2020
A
A
A
A
A
A
Net
asset
value
at
beginning
of
year
$9.28
$9.02
$10.02
$10.25
$9.70
Income
from
investment
operations
Net
investment
income
0.41
0.36
0.22
0.20
0.23
Net
gains
(losses)
on
securities
(both
realized
and
unrealized)
(0.10)
(0.04)
(0.98)
(0.42)
0.42
Total
from
investment
operations
0.31
0.32
(0.76)
(0.22)
0.65
Less
distributions
Dividends
(from
net
investment
income)
(0.34)
(0.06)
(0.05)
(0.01)
(0.10)
Distributions
(from
capital
gains)
–
–
(0.19)
–
–
Total
distributions
(0.34)
(0.06)
(0.24)
(0.01)
(0.10)
Net
asset
value
at
end
of
year
$9.25
$9.28
$9.02
$10.02
$10.25
Total
Return
3.36%
3.55%
(7.83)%
(2.14)%
6.78%
Ratios
/
supplemental
data
Net
assets
($000),
end
of
year
$36,291
$29,455
$28,705
$26,048
$21,973
Ratio
of
expenses
to
average
net
assets
Before
custodian
fee
credits
0.81%
0.83%
0.74%
0.86%
0.85%
After
advisory
fees
waiver
0.67%
0.67%
0.66%
0.66%
0.67%
After custodian
fee
credits
0.65%
0.65%
0.65%
0.65%
0.65%
Ratio
of
net
investment
income
after
custodian
fee
credits to
average
net
assets
4.48%
3.89%
2.35%
1.99%
2.33%
Portfolio
turnover
rate
25%
54%
80%
65%
63%
Notes
To
Financial
Statements
Note
1
–
Organization
Saturna
Investment
Trust
(the
“Trust”)
was
established
under
Washington
State
Law
as
a
business
trust
on
February
20,
1987.
The
Trust
is
registered
as
an
open-end,
diversified
management
company
under
the
Investment
Company
Act
of
1940,
as
amended.
The
Trust
currently
offers
shares
of
eight
portfolio
series,
two
of
which
are
covered
by
this
annual
report:
Saturna
Sustainable
Equity
Fund
and
Saturna
Sustainable
Bond
Fund
(the
“Funds”).
The
Sextant
Short-
Term
Bond
Fund,
Sextant
Bond
Income
Fund,
Sextant
Core
Fund,
Sextant
Global
High
Income
Fund,
Sextant
Growth
Fund,
and
Sextant
International
Fund
are
offered
through
separate
prospectuses
and
have
a
separate
shareholder
report.
Saturna
Sustainable
Equity
Fund
and
Saturna
Sustainable
Bond
Fund
commenced
operations
on
March
27,
2015.
Each
Fund
is
an
investment
company
and
accordingly
follows
the
investment
company
accounting
and
reporting
guidance
of
the
Financial
Accounting
Standards
Board
(FASB)
Accounting
Standard
Codification
Topic
946
“Financial
Services
–
Investment
Companies.”
Investment
risks:
Sustainable
Equity
Fund
and
Sustainable
Bond
Fund
:
The
value
of
each
Fund’s
shares
rises
and
falls
as
the
value
of
the
securities
in
which
the
Fund
invests
goes
up
and
down.
Fund
share
prices,
yields,
and
total
returns
will
change
with
market
fluctuations
as
well
as
the
fortunes
of
the
countries,
industries,
and
companies
in
which
the
Fund
invests.
The
Funds
do
not
use
derivatives
to
hedge
currency,
interest
rate,
or
credit
risk.
The
Fund’s
adviser
employs
a
proprietary
sustainable
rating
system
based
on
its
own,
as
well
as
third-party,
data
to
identify
issuers
believed
to
present
low
environmental,
social,
and
governance
(ESG)
risks.
Ratings
are
dependent
upon
the
associated
ESG
risks
that
are
most
pertinent
to
the
sector
in
which
an
issuer
operates.
The
ratings
process
associated
with
sustainable
and
responsible
investing
reduces
the
investable
universe
for
each
Fund,
which
limits
opportunities
and
may
increase
the
risk
of
loss
during
market
declines.
The
adviser
believes
that
sustainable
investing
may
mitigate
security-specific
risk,
but
there
is
no
guarantee
that
the
securities
favored
by
our
investment
process
will
perform
better
and
may
perform
worse
than
those
that
are
not
favored.
The
Funds
may
invest
substantially
in
one
or
more
sectors,
which
can
increase
volatility
and
exposure
to
issues
specific
to
a
particular
sector
or
industry.
Foreign
investing
involves
risks
not
normally
associated
with
investing
in
US
securities.
These
include
fluctuations
in
currency
exchange
rates,
less
public
information
about
securities,
less
governmental
market
supervision,
and
the
lack
of
uniform
financial,
social,
and
political
standards.
Foreign
investing
heightens
the
risk
of
confiscatory
taxation,
seizure
or
nationalization
of
assets,
establishment
of
currency
controls,
or
adverse
political
or
social
developments
that
affect
investments.
The
risks
of
investing
in
foreign
securities
are
typically
greater
in
less
developed
or
emerging
countries.
Liquidity
risk
exists
when
particular
investments
are
difficult
to
sell.
If
a
Fund
holds
illiquid
investments,
its
portfolio
may
be
more
difficult
to
value,
especially
in
changing
markets.
Investments
by
a
Fund
in
foreign
securities
and
those
that
are
thinly
traded,
such
as
lower
quality
issuers,
and
smaller
companies
tend
to
involve
greater
liquidity
risk.
If
a
Fund
is
forced
to
sell
or
unwind
these
investments
to
meet
redemptions
or
for
other
cash
needs,
the
Fund
may
suffer
a
penalty.
Additionally,
the
market
for
certain
investments
may
become
illiquid
under
adverse
market
or
economic
conditions
independent
of
any
specific
adverse
changes
in
the
conditions
of
a
particular
issuer.
In
such
cases,
the
Fund,
due
to
limitations
on
investments
in
illiquid
securities
and
the
difficulty
in
purchasing
and
selling
such
securities,
may
be
unable
to
achieve
its
investment
objective.
Sustainable
Bond
Fund
:
The
risks
inherent
in
the
Sustainable
Bond
Fund
depend
primarily
on
the
terms
and
quality
of
the
obligations
in
its
portfolio,
as
well
as
on
bond
market
conditions.
When
interest
rates
rise,
bond
prices
fall.
When
interest
rates
fall,
bond
prices
go
up.
Bonds
with
longer
maturities
usually
are
more
sensitive
to
interest
rate
changes
than
bonds
with
shorter
maturities.
The
Fund
entails
credit
risk,
which
is
the
possibility
that
a
bond
will
not
be
able
to
pay
interest
or
principal
when
due.
If
the
credit
quality
of
a
bond
is
perceived
to
decline,
investors
will
demand
a
higher
yield,
which
means
a
lower
price
on
that
bond
to
compensate
for
the
higher
level
of
risk.
The
Fund
may
invest
a
portion
of
its
assets
in
securities
issued
by
government
sponsored
entities
such
as
Fannie
Mae,
Freddie
Mac,
and
the
Federal
Home
Loan
Banks
in
the
US.
Foreign
governments
also
sponsor
similar
entities,
which
may
promote
activities
such
as
low-cost
housing
or
alternative
energy.
The
Fund
may
also
invest
in
the
issues
of
regional,
state,
and
local
governments.
The
terms
of
such
issues
can
be
complex,
and
there
can
be
no
assurance
that
a
government
entity
will
support
such
enterprises
that
encounter
financial
difficulty.
Issuers
of
high-yield
securities
are
generally
not
as
financially
strong
as
those
issuing
higher
quality
securities.
These
issuers
are
more
likely
to
encounter
financial
difficulties
and
are
more
vulnerable
to
changes
in
the
relevant
economy
that
could
affect
their
ability
to
make
interest
and
principal
payments
as
expected.
High-yield
bonds
may
have
low
or
no
ratings,
and
may
be
considered
“junk
bonds.”
Bond
investments,
especially
mortgage-backed
and
asset-backed
securities,
are
subject
to
the
risk
that
borrowers
will
prepay
the
principal
more
quickly
than
expected
(prepayment
risk)
or
more
slowly
than
expected
(extension
risk),
which
will
affect
the
yield,
average
life,
and
price
of
the
securities.
Note
2
–
Significant
Accounting
Policies
The
following
is
a
summary
of
the
significant
accounting
policies,
in
conformity
with
accounting
principles
generally
accepted
in
the
United
States
of
America,
which
are
consistently
followed
by
the
Funds
in
preparation
of
their
financial
statements.
Security
valuation:
Investments
in
securities
traded
on
a
national
securities
exchange
and
over-the-counter
securities
for
which
sale
prices
are
available
are
valued
at
that
price.
Securities
for
which
there
are
no
sales
are
valued
at
the
latest
bid
price.
Debt
securities
are
valued
using
bid-side
valuations
provided
by
an
independent
service.
The
service
determines
valuations
using
factors
such
as
yields
or
prices
of
bonds
of
comparable
quality,
type
of
issue,
coupon
maturity,
ratings,
trading
activity,
and
general
market
conditions.
Fixed-income
debt
instruments,
such
as
commercial
paper,
bankers’
acceptances,
and
US
Treasury
Bills,
with
a
maturity
of
60
days
or
less
are
valued
at
amortized
cost,
which
approximates
market
value.
Notes
To
Financial
Statements
(continued)
Foreign
markets
may
close
before
the
time
as
of
which
the
Funds’
share
prices
are
determined.
Because
of
this,
events
occurring
after
the
close
and
before
the
determination
of
the
Funds’
share
prices
may
have
a
material
effect
on
the
values
of
some
or
all
of
the
Funds’
foreign
securities.
To
account
for
this,
the
Funds
may
use
outside
pricing
services
for
valuation
of
their
non-US
securities.
In
cases
in
which
there
is
not
a
readily
available
market
price,
a
fair
value
for
such
security
is
determined
in
good
faith
by
the
Funds'
investment
adviser
(Saturna
Capital),
whom
the
Board
of
Trustees
has
designated
as
the
Funds’
valuation
designee
to
perform
fair
value
determinations
relating
to
all
Fund
investments.
Security
transactions
are
recorded
on
the
trade
date.
Realized
gains
and
losses
on
sales
of
securities
are
recorded
on
the
identified
cost
basis.
Foreign
currency:
Investment
securities
and
other
assets
and
liabilities
denominated
in
foreign
currencies
are
translated
into
US
dollar
amounts
at
the
date
of
valuation.
Purchases
and
sales
of
investment
securities
and
income
and
expense
items
denominated
in
foreign
currencies
are
translated
into
US
dollar
amounts
on
the
respective
dates
of
such
transactions.
The
Funds
do
not
isolate
that
portion
of
the
results
of
operations
resulting
from
changes
in
foreign
exchange
rates
on
investments
from
the
fluctuations
arising
from
changes
in
market
prices
of
securities
held.
Such
fluctuations
are
included
with
the
net
realized
and
unrealized
gain
or
loss
from
investments.
Reported
net
realized
foreign
exchange
gains
or
losses
arise
from
sales
of
foreign
currencies,
currency
gains
or
losses
realized
between
the
trade
and
settlement
dates
on
securities
transactions,
and
the
difference
between
the
amounts
of
dividends,
interest,
and
foreign
withholding
taxes
recorded
on
the
Funds’
books
and
the
US
dollar
equivalent
of
the
amounts
actually
received
or
paid.
Net
unrealized
foreign
exchange
gains
and
losses
arise
from
changes
in
the
fair
values
of
assets
and
liabilities,
other
than
investments
in
securities
at
fiscal
period
end,
resulting
from
changes
in
exchange
rates.
Share
valuation:
Each
Fund
computes
the
share
price
of
each
share
class
by
dividing
the
net
assets
attributable
to
each
share
class
by
the
outstanding
shares
of
that
class.
Each
share
class
represents
an
interest
in
the
same
investment
portfolio.
Each
share
class
is
identical
in
all
respects
except
that
each
class
bears
its
own
class
expenses,
and
each
class
has
exclusive
voting
rights
on
matters
affecting
that
class.
As
a
result
of
the
differences
in
the
expenses
borne
by
each
share
class,
the
share
price
and
distributions
will
vary
among
a
Fund’s
share
classes.
The
Funds’
shares
are
not
priced
or
traded
on
days
the
New
York
Stock
Exchange
is
closed.
The net
asset
value
(NAV)
is
both
the
offering
and
redemption
price
per
share.
Share
Valuation
Inputs
as
of
November
30,
2024
Level
1
Level
2
Level
3
Funds
Quoted
Price
Significant
Observable
Input
Significant
Unobservable
Input
Total
Sustainable
Equity
Fund
Common
Stock
Consumer
Discretionary
$1,272,145
$–
$–
$1,272,145
Consumer
Staples
$1,789,209
$–
$–
$1,789,209
Financials
$1,854,685
$–
$–
$1,854,685
Health
Care
$2,939,353
$–
$–
$2,939,353
Industrials
$3,347,812
$478,478
$–
$3,826,290
Materials
$790,370
$–
$–
$790,370
Technology
$9,259,636
$1,037,724
$–
$10,297,360
Utilities
$479,887
$–
$–
$479,887
Total
Common
Stock
$21,733,097
$1,516,202
$–
$23,249,299
Total
Assets
$21,733,097
$1,516,202
$–
$23,249,299
Sustainable
Bond
Fund
Corporate
Bonds
1
$–
$25,324,989
$–
$25,324,989
Government
Bonds
1
$–
$7,655,549
$–
$7,655,549
Total
Assets
$–
$32,980,538
$–
$32,980,538
1
See
the
Schedule
of
Investments
for
additional
details.
Note
2
–
Significant
Accounting
Policies
(continued)
Notes
To
Financial
Statements
(continued)
The
following
is
a
reconciliation
of
assets
and
liabilities
for
which
Level
3
inputs
were
used
in
determining
value
for
the
Sustainable
Equity
Fund.
The
Fund
has
adopted
a
policy
of
recording
any
transfers
of
investment
securities
between
the
different
levels
in
the
fair
value
hierarchy
as
of
the
end
of
the
year.
Fair
value
measurements:
Accounting
Standards
Codification
(ASC)
820
establishes
a
three-
tier
framework
for
measuring
fair
value
based
on
a
hierarchy
of
inputs.
The
hierarchy
distinguishes
between
market
data
obtained
from
independent
sources
(observable
inputs)
and
the
Funds’
own
market
assumptions
(unobservable
inputs).
These
inputs
are
used
in
determining
the
value
of
the
Funds’
investments
and
are
summarized
below.
Level
1
-
Unadjusted
quoted
prices
in
active
markets
for
identical
assets
or
liabilities
that
the
Trust
has
the
ability
to
access.
Level
2
-
Observable
inputs
other
than
quoted
prices
in
Level
1
that
are
observable
for
the
asset
or
liability,
either
directly
or
indirectly.
These
inputs
may
include
quoted
prices
for
the
identical
instrument
on
an
inactive
market,
prices
for
similar
instruments,
interest
rates,
prepayment
speeds,
credit
risk,
yield
curves,
default
rates,
and
similar
data.
Level
3
−
Unobservable
inputs
for
the
asset
or
liability,
to
the
extent
relevant
observable
inputs
are
not
available,
representing
the
Trust’s
own
assumptions
about
the
assumptions
a
market
participant
would
use
in
valuing
the
asset
or
liability,
and
would
be
based
on
the
best
information
available.
The
availability
of
observable
inputs
can
vary
from
security
to
security
and
is
affected
by
a
wide
variety
of
factors,
including,
for
example,
the
type
of
security,
whether
the
security
is
new
and
not
yet
established
in
the
marketplace,
the
liquidity
of
markets,
and
other
characteristics
particular
to
the
security.
To
the
extent
that
valuation
is
based
on
models
or
inputs
that
are
less
observable
or
unobservable
in
the
market,
the
determination
of
fair
value
requires
more
judgment.
Accordingly,
the
degree
of
judgment
exercised
in
determining
fair
value
is
greatest
for
instruments
categorized
in
Level
3.
The
inputs
used
to
measure
fair
value
may
fall
into
different
levels
of
the
fair
value
hierarchy.
In
such
cases,
for
disclosure
purposes,
the
level
in
the
fair
value
hierarchy
within
which
the
fair
value
measurement
falls
in
its
entirety
is
determined
based
on
the
lowest
level
input
that
is
significant
to
the
fair
value
measurement
in
its
entirety.
The
inputs
or
methodology
used
for
valuing
securities
are
not
necessarily
an
indication
of
the
risk
associated
with
investing
in
those
securities.
Concentration
of
credit
risk:
The
Funds
may
have
deposits
of
cash
with
the
custodian
from
time
to
time
for
one
or
more
reasons.
“Other
assets
(net
of
liabilities)”
in
the
Funds’
Schedules
of
Investments
primarily
represents
cash
on
deposit
with
the
custodian.
Cash
on
deposit
will
vary
widely
over
time.
Accounting
Standards
Codification
(“ASC”)
825,
“Financial
Instruments,”
identifies
these
items
as
a
concentration
of
credit
risk.
The
risk
is
managed
by
careful
financial
analysis
and
review
of
the
custodian’s
operations,
resources,
and
protections
available
to
the
Trust.
This
process
includes
evaluation
of
other
financial
institutions
providing
investment
company
custody
services.
Federal
income
taxes:
Each
Fund
intends
to
comply
with
the
requirements
of
the
Internal
Revenue
Code
necessary
to
qualify
as
a
regulated
investment
company
and
to
make
the
requisite
distributions
of
income
and
capital
gains
to
its
shareowners
sufficient
to
relieve
it
from
all
or
substantially
all
federal
income
taxes.
Therefore,
no
federal
income
tax
provision
is
required.
The
Funds
recognize
the
tax
benefits
of
uncertain
tax
positions
only
where
the
position
is
“more
likely
than
not”
to
be
sustained
assuming
examination
by
tax
authorities.
Management
has
analyzed
the
Funds’
tax
positions
and
has
concluded
that
no
liability
for
unrecognized
tax
benefits
should
be
recorded
related
to
uncertain
tax
positions
taken
on
returns
filed
for
open
tax
years
(2021−2023)
or
expected
to
be
taken
in
the
Funds’
2024
tax
returns.
The
Funds
identify
their
major
tax
jurisdiction
as
US
federal
and
foreign
jurisdictions
where
the
Funds
make
significant
investments;
however,
the
Funds
are
not
aware
of
any
tax
positions
for
which
it
is
reasonably
possible
that
the
total
amounts
of
unrecognized
tax
benefits
will
change
materially
in
the
next
12
months.
Reclassification
of
capital
accounts:
Accounting
principles
generally
accepted
in
the
United
States
of
America
require
that
certain
components
of
net
assets
relating
to
permanent
differences
be
reclassified
between
financial
and
tax
reporting.
As
of
November
30,
2024
,
there
were
no
reclassifications
to
the
capital
accounts
for
Sustainable
Bond
Fund.
Distributions
to
shareowners:
Sustainable
Equity
Fund
and
Sustainable
Bond
Fund
pay
income
dividends
annually,
typically
by
the
end
of
the
year.
As
a
result
of
its
investment
strategy,
the
Saturna
Sustainable
Equity
Fund
may
not
pay
income
dividends.
For
both
Funds,
distributions
of
capital
gains,
if
any,
are
made
at
least
annually,
and
as
required
to
comply
with
federal
excise
tax
requirements.
Distributions
to
shareowners
are
determined
in
accordance
with
income
tax
regulations
and
are
recorded
on
the
ex-dividend
date.
Dividends
are
paid
in
shares
of
the
Funds,
at
the
net
asset
value
on
the
payable
date.
Shareowners
may
elect
to
take
distributions
if
they
total
$10
or
more
in
cash.
Use
of
estimates:
The
preparation
of
financial
statements
in
conformity
with
accounting
principles
generally
accepted
in
the
United
States
of
America
requires
management
to
make
estimates
and
assumptions
that
affect
the
reported
amounts
of
assets
and
liabilities
and
Common
Stocks
Beginning
Balance
$158,467
Total
realized
gain
(loss)
$(56,859)
Change
in
unrealized appreciation
(depreciation)
$96,761
Net
purchases
$-
Net
Sales
$(198,369)
Transfers
into
Level
3
$-
Transfers
out
of
Level
3
$-
Ending
Balance
$0
Sustainable
Equity
Fund
Distributable
earnings
$(2,636)
Paid-in
Capital
$2,636
Note
2
–
Significant
Accounting
Policies
(continued)
Notes
To
Financial
Statements
(continued)
disclosure
of
contingent
assets
and
liabilities
at
the
date
of
the
financial
statements
and
the
reported
amounts
of
increases
and
decreases
in
net
assets
during
the
reporting
period.
Actual
results
could
differ
from
those
estimates.
Foreign
taxes:
Withholding
taxes
on
foreign
dividends
are
paid
(a
portion
of
which
may
be
reclaimable)
or
provided
for
in
accordance
with
the
applicable
country’s
tax
rules
and
rates
and
are
disclosed
in
the
Statement
of
Operations.
Withholding
tax
reclaims
are
filed
in
certain
countries
to
recover
a
portion
of
the
amounts
previously
withheld.
The
Funds
record
a
reclaim
receivable
based
on
a
number
of
factors,
including
a
jurisdiction’s
legal
obligation
to
pay
reclaims
as
well
as
payment
history
and
market
convention.
LIBOR
Transition
Risk:
A
Fund
may
invest
in
certain
debt
securities
or
other
financial
instruments
that
utilize
the
London
Interbank
Offered
Rate
(“LIBOR”)
as
a
benchmark
or
reference
rate
for
various
interest
rate
calculations.
A
benchmark
or
reference
rate
may
be
a
significant
factor
in
determining
the
cost
of
financing
to
a
Fund
or
an
investment’s
value
or
return
to
a
Fund,
and
may
be
used
in
other
ways
that
affect
a
Fund’s
investment
performance.
LIBOR
was
discontinued
as
a
floating
rate
benchmark
after
June
30,
2023.
It
is
anticipated
that
financial
instruments,
such
as
certain
floating
rate
bonds,
that
previously
utilized
LIBOR
have
transitioned
to
using
the
Secured
Overnight
Financing
Rate
(“SOFR”),
which
is
a
broad
measure
of
the
cost
of
overnight
borrowings
secured
by
US
Treasury
securities.
The
transition
from
LIBOR
to
SOFR
(or
any
other
replacement
rate)
may
lead
to
a
reduction
in
the
value
of
some
LIBOR-based
investments,
as
well
as
significant
market
uncertainty,
increased
volatility,
and
illiquidity
in
markets
for
various
instruments,
which
may
result
in
prolonged
adverse
market
conditions
and
impact
a
Fund’s
performance
or
NAV.
Other:
Interest
income
is
recognized
on
an
accrual
basis.
Premiums
on
securities
purchased
are
amortized,
and
discounts
are
accreted
using
the
yield
to
maturity
method
over
the
lives
of
the
respective
securities
or
where
applicable,
to
the
first
call
date
of
the
securities
with
premiums.
Dividends
from
equity
securities
are
recorded
as
income
on
the
ex-dividend
date
or
as
soon
as
information
is
available
to
the
Fund.
Note
3
–
Transactions
with
Affiliated
Persons
Under
contracts
approved
annually
by
the
Board
of
Trustees,
including
those
who
are
not
parties
to
the
contract
or
“interested
persons”
(as
defined
in
the
Investment
Company
Act
of
1940)
of
such
parties
or
the
Trust
(the
“Independent
Trustees”),
Saturna
Capital
Corporation
(“Saturna
Capital”)
provides
investment
advisory
services
and
certain
other
administrative
services
required
to
conduct
Trust
business.
Expenses
incurred
by
the
Trust
on
behalf
of
the
Funds
(e.g.,
legal
fees)
are
allocated
to
the
Funds
on
the
basis
of
relative
daily
average
net
assets.
For
such
services,
each
of
the
Funds
pays
the
adviser
an
Investment
Advisory
and
Administrative
Services
Fee
of
0.65%
for
the
Sustainable
Equity
Fund
and
0.55%
for
the
Sustainable
Bond
Fund
of
average
net
assets
per
annum,
payable
monthly.
In
addition,
the
adviser
has
agreed
to
certain
limits
on
other
expenses,
as
described
below
The
Adviser
has
undertaken
to
limit
expenses
of
the
Sustainable
Equity
Fund
to
0.75%
and
the
Sustainable
Bond
Fund
to
0.65%
through
March
31,
2025.
For
the
fiscal
year
ended
November
30,
2024
,
the
advisory
fees
incurred
were
as
follows:
1
In
accordance
with
the
expense
limitation
noted
above,
for
the
fiscal
year
ended
November
30,
2024
,
Saturna
Capital
waived
a
portion
of
the
advisory
fees
of
the
Sustainable
Equity
Fund
and
Sustainable
Bond
Fund.
The
adviser
cannot
recoup
previously
waived
fees.
Saturna
Brokerage
Services,
Inc.
(“SBS”),
a
discount
brokerage
and
subsidiary
of
Saturna
Capital
Corporation,
is
registered
as
a
broker-
dealer
and
acts
as
distributor.
On
December
19,
2014,
the
Funds
adopted
a
Distribution
Plan
in
accordance
with
Rule
12b-1
under
the
1940
Act.
On
June
2,
2017,
12b-1
fees
were
terminated
for
both
Saturna
Sustainable
Funds.
SBS
is
used
to
effect
equity
portfolio
transactions
for
the
Trust.
SBS
currently
executes
portfolio
transactions
without
commission.
Transactions
effected
through
other
brokers
are
subject
to
commissions
payable
to
that
broker.
Saturna
Trust
Company
(“STC”),
a
subsidiary
of
Saturna
Capital,
acts
as
retirement
plan
custodian
for
the
Funds.
Each
class
of
shares
of
a
Fund
pays
an
annual
fee
of
$10
per
account
for
retirement
plan
services
to
Saturna
Trust
Company.
For
the
fiscal
year
ended
November
30,
2024
,
the
Funds
incurred
the
following
retirement
plan
custodial
fees
to
STC:
Ms.
Jane
Carten
serves
as
a
trustee
and
president
of
the
Trust.
She
is
also
a
director
and
president
of
Saturna
Capital,
vice
president
of
Saturna
Trust
Company,
and
chairman
of
Saturna
Sendirian
Berhad.
Ms.
Carten
is
not
compensated
by
the
Trust.
For
the
fiscal
year
ended
November
30,
2024
,
the
Saturna
Investment
Trust
incurred
$73,213
of
total
expenses
for
the
Independent
Trustee's
compensation
and
Trust
board
meetings.
The
Saturna
Sustainable
Funds
incurred
$16,370
of
these
total
expenses.
On
November
30,
2024
,
the
trustees,
officers,
and
their
affiliates
(including
Saturna
Capital
Corporation)
as
a
group,
owned
the
following
percentages
of
outstanding
shares:
The
officers
of
the
Trust
are
paid
by
Saturna
Capital
Corporation,
not
the
Trust,
except
the
Chief
Compliance
Officer,
who
is
partially
compensated
by
the
Trust.
For
the
fiscal
year
ended
November
30,
2024
,
the
Funds
paid
the
following
compensation
expenses
for
the
Chief
Compliance
Officer:
Advisory
Fees
Advisory
Fees
Waived
900
Sustainable
Equity
Fund
$157,585
$(37,216)
950
Sustainable
Bond
Fund
$180,510
$(46,137)
Retirement
plan
custodial
fees
900
Sustainable
Equity
Fund
(SEEFX)
$2,477
950
Sustainable
Bond
Fund
(SEBFX)
$1,434
Trustees',
officers',
and
affiliates'
ownership
900
Sustainable
Equity
Fund(SEEFX)
36.59%
950
Sustainable
Bond
Fund(SEBFX)
14.58%
Chief
Compliance
Officer
900
Sustainable
Equity
Fund
$7,193
950
Sustainable
Bond
Fund
$10,561
Note
2
–
Significant
Accounting
Policies
(continued)
Notes
To
Financial
Statements
(continued)
Note
4
–
Distributions
to
Shareowners
The
tax
characteristics
of
distributions
paid
for
the
fiscal
year
ended
November
30,
2024
,
and
the
fiscal
year
ended
November
30,
2023
,
were
as
follows:
Note
5
–
Federal
Income
Taxes
The
cost
basis
of
investments
for
federal
income
tax
purposes
at
November
30,
2024
,
were
as
follows:
As
of
November
30,
2024
,
the
components
of
distributable
earnings
on
a
tax
basis
were
as
follows:
At
November
30,
2024
,
the
Funds
had
the
following
capital
loss
carryforwards
and
loss
deferrals,
subject
to
regulation.
Prior
to
their
expiration,
loss
carryforwards
may
be
used
to
offset
future
net
capital
gains
realized
for
federal
income
tax
purposes.
For
the
year
ended
November
30,
2024
,
Sustainable
Equity
Fund
utilized
$387,076
of
long-term
capital
loss
carryforward.
Note
6
–
Investments
Investment
transactions
other
than
short-term
investments
for
the
fiscal
year
ended
November
30,
2024
,
were
as
follows:
Note
7
–
Custodian
Under
agreements
in
place
with
the
Trust’s
custodian,
UMB
Bank,
custody
fees
are
reduced
by
credits
for
cash
balances.
For
the
fiscal
year
ended
November
30,
2024
,
such
reductions
were
as
follows:
Note
8
–
Subsequent
Events
The
Funds
declared
the
payment
of
a
distribution
to
be
paid
on
December
19,
2024,
to
all
shareowners
of
record
on
December
18,
2024
as
follows:
There
were
no
other
events
or
transactions
during
the
period
that
materially
impacted
the
amounts
or
disclosures
in
the
Funds’
financial
statements.
Sustainable
Equity
Fund
November
30,
2024
November
30,
2023
Ordinary
Income
$219,353
$177,042
Sustainable
Bond
Fund
November
30,
2024
November
30,
2023
Ordinary
Income
$1,086,688
$183,662
Sustainable
Equity
Fund
Sustainable
Bond
Fund
Cost
of
investments
$15,227,828
$33,975,750
Gross
tax
unrealized
appreciation
$9,008,660
$271,968
Gross
tax
unrealized
depreciation
$(987,191)
$(1,267,180)
Net
tax
unrealized
appreciation
(depreciation)
$8,021,469
$(995,212)
Sustainable
Equity
Fund
Undistributed
ordinary
income
$196,209
Accumulated
capital
and
other
losses
$(272,337)
Tax
accumulated
earnings
$(76,128)
Unrealized
Appreciation
$8,021,471
Total
accumulated
earnings
$7,945,343
Sustainable
Bond
Fund
Undistributed
ordinary
income
$1,056,335
Accumulated
capital
and
other
losses
$(2,232,280)
Tax
accumulated
earnings
$(1,175,945)
Unrealized
Depreciation
$(995,212)
Other
unrealized
accumulated
losses
$(28,636)
Total
accumulated
earnings
$(2,199,793)
Sustainable
Equity
Fund
Sustainable
Bond
Fund
Short
term
loss
carryforward
$190,723
$929,372
Long
term
loss
carryforward
$81,614
$1,302,908
Total
Capital
loss
carryforward
$272,337
$2,232,280
Purchases
Sales
900
Sustainable
Equity
Fund
$4,171,449
$4,821,777
950
Sustainable
Bond
Fund
$14,826,121
$7,965,337
Custodian
Fee
Credits
900
Sustainable
Equity
Fund
$1,487
950
Sustainable
Bond
Fund
$5,863
Ordinary
Income
Short-Term
Capital
Gain
Long-Term
Capital
Gain
900
Sustainable
Equity
Fund
$0.0932
$–
$–
950
Sustainable
Bond
Fund
$0.2910
$–
$–
Report
of
Independent
Registered
Public
Accounting
Firm
To
the
Board
of
Trustees
of
Saturna
Investment
Trust
and
the
Shareholders
of
Saturna
Sustainable
Funds
Opinion
on
the
Financial
Statements
We
have
audited
the
accompanying
statements
of
assets
and
liabilities
of
Sustainable
Equity
Fund
,
and
Sustainable
Bond
Fund
,
(the
“Funds”),
each
a
series
of
Saturna
Investment
Trust,
including
the
schedules
of
investments,
as
of
November
30,
2024
,
the
related
statements
of
operations
for
the
year
then
ended,
the
statements
of
changes
in
net
assets
for
each
of
the
two
years
in
the
period
then
ended,
and
financial
highlights
for
each
of
the
five
years
in
the
period
then
ended,
and
the
related
(collectively
referred
to
as
the
“financial
statements”).
In
our
opinion,
the
financial
statements
present
fairly,
in
all
material
respects,
the
financial
position
of
the
Funds
as
of
November
30,
2024
,
the
results
of
their
operations
for
the
year
then
ended,
the
changes
in
their
net
assets
for
each
of
the
two
years
in
the
period
then
ended
and
their
financial
highlights
for
each
of
the
five
years
in
the
period
then
ended,
in
conformity
with
accounting
principles
generally
accepted
in
the
United
States
of
America.
Basis
for
Opinion
These
financial
statements
are
the
responsibility
of
the
Trust’s
management.
Our
responsibility
is
to
express
an
opinion
on
the
Funds’
financial
statements
based
on
our
audits.
We
are
a
public
accounting
firm
registered
with
the
Public
Company
Accounting
Oversight
Board
(United
States)
(“PCAOB”)
and
are
required
to
be
independent
with
respect
to
the
Funds
in
accordance
with
the
U.S.
federal
securities
laws
and
the
applicable
rules
and
regulations
of
the
Securities
and
Exchange
Commission
and
the
PCAOB.
We
have
served
as
the
auditor
of
one
or
more
of
the
funds
in
the
Trust
since
1995.
We
conducted
our
audits
in
accordance
with
the
standards
of
the
PCAOB.
Those
standards
require
that
we
plan
and
perform
the
audits
to
obtain
reasonable
assurance
about
whether
the
financial
statements
are
free
of
material
misstatement,
whether
due
to
error
or
fraud.
The
Funds
are
not
required
to
have,
nor
were
we
engaged
to
perform,
an
audit
of
the
Funds’
internal
control
over
financial
reporting.
As
part
of
our
audits
we
are
required
to
obtain
an
understanding
of
internal
control
over
financial
reporting,
but
not
for
the
purpose
of
expressing
an
opinion
on
the
effectiveness
of
the
Funds’
internal
control
over
financial
reporting.
Accordingly,
we
express
no
such
opinion.
Our
audits
included
performing
procedures
to
assess
the
risks
of
material
misstatement
of
the
financial
statements,
whether
due
to
error
or
fraud,
and
performing
procedures
that
respond
to
those
risks.
Such
procedures
included
examining,
on
a
test
basis,
evidence
regarding
the
amounts
and
disclosures
in
the
financial
statements.
Our
audits
also
included
evaluating
the
accounting
principles
used
and
significant
estimates
made
by
management,
as
well
as
evaluating
the
overall
presentation
of
the
financial
statements.
Our
procedures
included
confirmation
of
securities
owned
as
of
November
30,
2024
by
correspondence
with
the
custodian
and
brokers,
when
replies
were
not
received
from
brokers,
we
performed
other
auditing
procedures.
We
believe
that
our
audits
provide
a
reasonable
basis
for
our
opinion.
Philadelphia,
Pennsylvania
January
29,
2025
Tait,
Weller
&
Baker
LLP
Item
8.
Changes
in
and
Disagreements
with
Accountants
for
Open-End
Management
Investment
Companies.
Not
applicable.
Item
9.
Proxy
Disclosures
for
Open-End
Management
Investment
Companies.
Not
applicable.
Item
10.
Remuneration
Paid
to
Directors,
Officers,
and
Others
of
Open-End
Management
Investment
Companies.
The
Funds’
disclosure
of
remuneration
items
is
included
as
part
of
the
Financial
Statements
filed
under
Item
7
of
this
form.
Item
11.
Statement
Regarding
Basis
for
Approval
of
Investment
Advisory
Contract.
The
Funds’
Investment
Advisory
Contract
is
included
as
part
of
the
Financial
Statements
filed
under
Item
7
of
this
form
.
Renewal
of
Investment
Advisory
Contract
During
their
meeting
of
September
17,
2024,
the
Trustees
of
Saturna
Investment
Trust
(the
“Board”
or
“Trustees”),
including
the
Independent
Trustees,
discussed
the
continuance
of
the
Investment
Advisory
and
Administrative
Services
Agreement
(“Agreement”)
between
the
Trust,
on
behalf
of
each
Fund,
and
Saturna
Capital.
In
considering
the
renewal
of
the
Agreement,
the
Board,
including
the
Independent
Trustees,
considered
the
factors
it
deemed
relevant,
including
the
nature,
quality
and
extent
of
services
provided,
the
performance
of
each
Fund,
expenses
and
fees,
the
profitability
of
Saturna,
the
potential
for
economies
of
scale
that
may
be
shared
with
each
Fund
and
its
shareholders
as
each
Fund’s
assets
grow,
and
any
other
benefits
derived
by
Saturna
from
its
relationship
with
the
Funds.
In
their
deliberations,
the
Trustees
did
not
identify
any
single
factor
which
alone
was
responsible
for
the
decision
to
approve
the
agreements,
and
each
Trustee
may
have
given
different
weights
to
different
factors,
and,
thus,
each
Trustee
may
have
had
a
different
basis
for
his
or
her
decision.
The
Trustees
considered
Saturna
Capital’s
specific
responsibilities
in
all
aspects
of
day-to-day
management
of
the
Funds
as
well
as
the
qualifications,
experience
and
responsibilities
of
the
Funds’
portfolio
managers
and
other
key
personnel
at
Saturna
Capital.
The
Trustees
discussed
Saturna
Capital’s
experience,
ability,
and
commitment
to
quality
service
through
performing
internally
such
functions
as
shareowner
servicing,
administration,
accounting,
marketing,
and
distribution
—
all
in
addition
to
investment
management.
The
Trustees
took
into
consideration
Saturna
Capital’s
continued
avoidance
of
significant
operational
and
compliance
problems,
plus
its
continued
investments
in
infrastructure,
information
management
systems,
personnel,
training,
compliance,
and
investor
education
materials,
all
designed
to
provide
high
quality
investor
services
and
meet
investor
needs.
They
recognized
Saturna
Capital’s
efforts
to
recruit
and
retain
qualified
and
experienced
staff
and
improve
the
capital
base
on
which
Saturna
Capital
operates,
which
the
Trustees
believe
is
important
to
the
long-term
success
of
the
Funds.
They
considered
Saturna
Capital’s
focus
on
investors
and
its
efforts
to
avoid
potential
conflicts
of
interest.
The
Trustees
considered
the
investment
performance
of
each
Fund.
The
Trustees
considered
each
Fund’s
average
annual
total
returns
relative
to
its
benchmark
for
relevant
periods
ended
July
31,
2024,
noting
that
the
Sustainable
Equity
Fund
underperformed
its
benchmark
for
the
one-,
three-
and
five-year
periods
and
that
the
Sustainable
Bond
Fund
outperformed
its
benchmark
for
the
one-,
three-,
and
five-year
periods.
The
Trustees
considered
comparative
performance
information
from
Morningstar,
Inc.
(“Morningstar”),
which
provides
independent
analysis
of
mutual
fund
data
and,
among
other
things,
ranks
mutual
fund
performance
within
categories
comprised
of
similarly
managed
funds.
The
Trustees
considered
the
short-
and
medium-term
performance
of
the
Sustainable
Equity
Fund
relative
to
the
Fund’s
Morningstar
category
for
the
one-,
three-
and
five-year
periods
ended
July
31,
2024,
noting
the
Fund
was
in
the
fourth
quartile
for
the
one-year
period,
third
quartile
for
the
three-year
period,
and
the
second
quartile
for
the
five-year
period.
The
Trustees
considered
the
short-
and
medium-term
performance
of
the
Sustainable
Bond
Fund
relative
to
the
Fund’s
Morningstar
category
for
the
one-,
three-
and
five-
year
periods
ended
July
31,
2024,
noting
the
Fund
was
in
the
first
quartile
for
all
three
periods.
The
Trustees
also
considered
each
Fund’s
Morningstar
performance
rating
(one
through
five
stars),
and
each
Fund’s
performance
rating
relative
to
its
category
selected
by
and
Thomas
Reuters
Lipper,
noting
that
the
overall
Morningstar
rating
for
both
Funds
was
four
stars.
The
Trustees
also
noted
the
high
sustainability
ratings
assigned
to
the
Funds
by
Morningstar.
The
Trustees
noted
the
generally
risk-averse
investment
style
of
the
Funds
and
other
factors
which
can
affect
each
Fund’s
performance
relative
to
its
broader
Morningstar
category.
The
Trustees
also
noted
certain
differences
between
each
Fund
and
the
peer
funds
within
its
Morningstar
category,
including
differences
in
investment
strategies
and
asset
size.
The
Trustees
found
that
Saturna
Capital
continued
to
manage
each
Fund
in
a
manner
that
is
designed
to
be
risk-
averse
and
attractive
to
long-term
investors.
The
Trustees
discussed
and
considered
the
efforts
of
Saturna
Capital
to
make
additional
resources
available
to
assist
in
managing
the
Funds.
The
Trustees
also
considered
Saturna
Capital’s
focus
on
improving
investment
performance
without
incurring
materially
higher
levels
of
risk.
The
Trustees
also
considered
the
performance
and
expenses
of
each
Fund
as
compared
to
a
smaller
group
of
funds
with
similar
investment
objectives
and
strategies,
including
socially
responsible
funds,
and
a
range
of
asset
sizes.
The
Trustees
considered
these
comparative
performance
and
expense
data,
along
with
the
comparative
data
published
by
Morningstar
and
each
Fund’s
performance
relative
to
its
benchmark,
to
evaluate
the
Fund’s
performance
over
near-term
and
medium-term
time
periods.
The
Trustees
also
reviewed
the
fees
and
expenses
of
each
Fund,
including
comparative
data
on
fees
and
expenses
published
by
Morningstar,
and
considered
the
components
of
the
Fund’s
operating
expenses.
The
Trustees
noted
the
steps
that
Saturna
Capital
has
undertaken
to
maintain
competitive
levels
of
Fund
operating
expenses.
They
noted
the
significant
sponsorship
of
the
Funds
by
Saturna
Capital
evidenced,
in
part,
by
certain
fees
and
expenses
paid
by
Saturna
Capital
out
of
its
own
resources.
The
Trustees
recognized
Saturna
Capital’s
efforts
help
make
the
Funds
more
widely
available
and
less
expensive
than
would
otherwise
be
the
case
without
Saturna
Capital’s
efforts.
The
Trustees
recognized
that
each
Fund
remains
relatively
small
and
there
have
not
been
opportunities
to
consider
economies
of
scale.
The
Trustees
noted
Saturna
Capital’s
commitment
to
continue
operating
the
Funds
and
the
costs
undertaken
by
Saturna
Capital.
The
Trustees
reviewed
Saturna
Capital’s
financial
information
and
discussed
the
issue
of
Saturna
Capital’s
profitability,
or
lack
thereof,
as
related
to
management
and
administration
of
the
Trust.
They
discussed
the
reasonableness
of
Saturna
Capital’s
profitability
as
part
of
their
evaluation
of
whether
each
Fund’s
advisory
fees
bear
a
reasonable
relationship
to
the
mix
of
services
provided
by
Saturna
Capital,
including
the
nature,
extent,
and
quality
of
such
services.
The
Trustees
considered
and
compared
the
fees
charged
by
Saturna
Capital
to
other
types
of
accounts,
including
non-mutual
fund
advisory
clients.
The
Trustees
noted
the
differences
between
the
full
range
of
services
Saturna
Capital
provides
to
the
Funds,
including
investment
advisory
and
administrative
services,
transfer
agency
services,
and
other
services,
as
compared
to
the
investment
advisory
services
provided
to
the
other
advisory
accounts.
Renewal
of
Investment
Advisory
Contract
(continued)
The
Trustees
considered
potential
benefits
to
Saturna
Capital’s
other
business
lines
from
acting
as
investment
adviser
to
the
Funds,
but
also
recognized
that
Saturna
Capital’s
other
business
lines
also
potentially
benefit
the
Funds.
The
Trustees
also
noted
that
there
were
not
soft
dollar
arrangements
with
respect
to
trading
in
the
Funds’
portfolios.
The
Trustees
considered
whether
there
are
other
potential
benefits
to
Saturna
Capital
in
continuing
to
manage
the
Funds
and
the
Trustees
found
that
there
were
no
material
benefits
other
than
Saturna
Capital’s
receipt
of
advisory
fees.
The
Trustees
also
noted
with
respect
to
the
Sustainable
Equity
Fund
that
Saturna
Brokerage
Services
voluntarily
waives
brokerage
commissions
for
executing
Fund
portfolio
transactions,
resulting
in
lower
transaction
costs.
The
Trustees
concluded
based
on
their
business
judgement
that
the
fees
paid
by
each
Fund
to
Saturna
Capital
were,
from
an
arm’s-
length
bargaining
perspective,
reasonable
and
in
the
best
interest
of
the
Fund
and
its
shareowners
in
light
of
the
services
provided,
comparative
performance,
expense
and
advisory
fee
information,
costs
of
services
provided,
profits
to
be
realized,
and
benefits
derived
or
to
be
derived
by
Saturna
Capital
from
its
relationship
with
the
Fund.
Following
this
discussion,
the
Trustees,
including
the
Independent
Trustees,
unanimously
agreed
to
renew
each
Fund’s
Agreement
with
Saturna
Capital.
Availability
of
Quarterly
Portfolio
Information
(1)
The
Saturna
Sustainable
Funds
file
complete
schedules
of
portfolio
holdings
with
the
SEC
for
the
first
and
third
quarters
of
each
fiscal
year
as
an
exhibit
to
their
reports
on
Form
N-PORT.
(2)
The
Funds’
Form
N-PORT
reports
are
available
on
the
SEC’s
website
at
www.sec.gov
and
at
www.saturnasustainable.com.
(3)
The
Funds
post
a
complete
schedule
of
portfolio
holdings
after
the
end
of
each
month,
available
to
investors
at
www.
saturnasustainable.com.
Privacy
Statement
At
Saturna
Capital
and
Saturna
Investment
Trust,
we
understand
the
importance
of
maintaining
the
privacy
of
your
financial
information.
We
want
to
assure
you
that
we
protect
the
confidentiality
of
any
personal
information
that
you
share
with
us.
In
addition,
we
do
not
sell
information
about
our
current
or
former
customers.
In
the
course
of
our
relationship,
we
gather
certain
nonpublic
information
about
you,
including
your
name,
address,
investment
choices,
and
account
information.
We
do
not
disclose
your
information
to
unaffiliated
third
parties
unless
it
is
necessary
to
process
a
transaction;
service
your
account;
deliver
your
account
statements,
shareowner
reports,
and
other
information;
or
as
required
by
law.
When
we
disclose
information
to
unaffiliated
third
parties,
we
require
a
contract
to
restrict
the
companies’
use
of
customer
information
and
from
sharing
or
using
it
for
any
purposes
other
than
performing
the
services
for
which
they
were
required.
We
may
share
information
within
the
Saturna
Capital
family
of
companies
in
the
course
of
informing
you
about
products
or
services
that
may
address
your
investing
needs.
We
maintain
our
own
technology
resources
to
minimize
the
need
for
any
third-party
services,
and
restrict
access
to
information
within
Saturna.
We
maintain
physical,
electronic,
and
procedural
safeguards
to
guard
your
personal
information.
If
you
have
any
questions
or
concerns
about
the
security
or
privacy
of
your
information,
please
call
us
at
1-800-728-8762.
Item 8. Changes in and Disagreements with Accountants for Open-End Management Investment Companies.
Not applicable.
Item 9. Proxy Disclosures for Open-End Management Investment Companies.
The information is disclosed as part of the Financial Statements included in Item 7 of this Form N-CSR.
Item 10. Remuneration Paid to Directors, Officers, and Others of Open-End Management Investment Companies.
The Funds’ disclosure of remuneration items is included as part of the Financial Statements filed under Item 7 of this form.
Item 11. Statement Regarding Basis for Approval of Investment Advisory Contract.
The information is disclosed as part of the Financial Statements included in Item 7 of this Form N-CSRS, as applicable.
Item 12. Disclosure of Proxy Voting Policies and Procedures for Closed-End Management Investment Companies.
Not applicable.
Item 13. Portfolio Managers of Closed-End Management Investment Companies.
Not applicable.
Item 14. Purchases of Equity Securities by Closed-End Management Investment Company and Affiliated Purchasers.
Not applicable.
Item 15. Submission of Matters to a Vote of Security Holders.
No changes to report.
Item 16. Controls and Procedures.
a. The Registrant’s President and Treasurer have concluded, based on their evaluation of the Registrant’s disclosure controls and procedures (as defined in Rule 30a-3(c) under the Investment Company Act of 1940 (the “Act”)) as conducted within 90 days of the filing date of this report, that those disclosure controls and procedures provide reasonable assurance that the material information required to be disclosed by the Registrant on this report is recorded, processed, summarized and reported within the time periods specified in the Securities and Exchange Commission’s rules and forms.
b. There were no significant changes in the Registrant’s internal control over financial reporting (as defined in Rule 30e-3(d) under the Act) that occurred during the period covered by this report that has materially affected, or is reasonably likely to materially affect, the Registrant’s internal control over financial reporting.
Item 17. Disclosure of Securities Lending Activities for Closed-End Management Investment Companies.
Not applicable.
Item 18. Recovery of Erroneously Awarded Compensation.
Not applicable.
Item 19. Exhibits.
Exhibits included with this filing:
(a)(1) Code of Ethics.
(a)(2) Not applicable.
(a)(3) Certification pursuant to Rule 30a-2(a) under the Investment Company Act of 1940 (17 CFR 270.30a-2(a)) is filed and attached hereto as Exhibit 99.CERT.
(b) Certification pursuant to Rule 30a-2(b) under the Investment Company Act of 1940 (17 CFR 270.30a-2(b)) is furnished and attached hereto as Exhibit 99.906.CERT.
SIGNATURES
Pursuant to the requirements of the Securities Exchange Act of 1934 and the Investment Company Act of 1940, the registrant has duly caused this report to be signed on its behalf by the undersigned, thereunto duly authorized.
SATURNA INVESTMENT TRUST
By:
/s/ Jane K. Carten, President
Signature and Title
Jane K. Carten, President
Printed name and Title
January 29, 2025
Date
Pursuant to the requirements of the Securities Exchange Act of 1940, this report has been signed below by the following persons on behalf of the registrant and in the capacities indicated.
By:
/s/ Jane K. Carten, President
Jane K. Carten
January 29, 2025
Date
By:
/s/Christopher R. Fankhauser, Treasurer
Christopher R. Fankhauser
January 29, 2025
Date