SECURITIES AND EXCHANGE COMMISSION
WASHINGTON, DC 20549
FORM N-CSR
CERTIFIED SHAREHOLDER REPORT OF REGISTERED
MANAGEMENT INVESTMENT COMPANIES
Investment Company Act file number: 811-05071 or 33-13247
SATURNA INVESTMENT TRUST
(Exact Name of Registrant as Specified in Charter)
1300 N. State Street
Bellingham, Washington 98225-4730
(Address of Principal Executive Offices, including ZIP Code)
Elliot S. Cohen
1300 N. State Street
Bellingham, Washington 98225-4730
(Name and Address of Agent for Service)
Registrant's Telephone Number – (360) 734-9900 Ext. 1804
Date of fiscal year end: November 30, 2022
Date of reporting period: November 30, 2022
Item 1. Report to Shareowners
| | |
| Performance Summary (as of December 31, 2022) | | (unaudited) |
| | | | | | | | | | | | | | | | | | | | | | | | | | | | |
| | | | | | | | | | | | | | | | | | | | | | | Expense Ratio1 | |
| | | | | | | |
Average Annual Total Returns | | | 1 Year | | | | 3 Year | | | | 5 Year | | | | 10 Year | | | | 15 Year | | | | Gross | | | | Net | |
| | | | | | | |
Sextant Short-Term Bond Fund (STBFX) | | | -3.87% | | | | -0.56% | | | | 0.66% | | | | 0.75% | | | | 1.46% | | | | 0.66% | | | | 0.60% | |
| | | | | | | |
Bloomberg US Aggregate 1-3 Years Index | | | -3.72% | | | | -0.42% | | | | 0.86% | | | | 0.86% | | | | 1.58% | | | | | | | | n/a | |
| | | | | | | |
FTSE USBIG Govt/Corp 1-3 Year Bond (returns as of May 31, 2022) | | | -3.51% | | | | 0.58% | | | | 1.11% | | | | 1.02% | | | | 1.92% | | | | | | | | n/a | |
| | | | | | | |
Sextant Bond Income Fund (SBIFX) | | | -16.99% | | | | -4.10% | | | | -0.79% | | | | 0.75% | | | | 2.49% | | | | | | | | 0.58% | |
| | | | | | | |
Bloomberg US Aggregate | | | -13.01% | | | | -2.71% | | | | 0.02% | | | | 1.06% | | | | 2.66% | | | | | | | | n/a | |
| | | | | | | |
FTSE US Broad Investment-Grade Bond Index | | | -13.28% | | | | -2.76% | | | | 0.01% | | | | 1.05% | | | | 2.70% | | | | | | | | n/a | |
| | | | | | | |
Sextant Core Fund (SCORX) | | | -10.38% | | | | 3.51% | | | | 4.88% | | | | 5.48% | | | | 4.38% | | | | | | | | 0.57% | |
| | | | | | | |
Dow Jones Moderate US Portfolio Index | | | -14.97% | | | | 1.45% | | | | 3.25% | | | | 5.65% | | | | 4.91% | | | | | | | | n/a | |
| | | | | | | |
Sextant Global High Income Fund (SGHIX) | | | -7.78% | | | | -0.26% | | | | 1.78% | | | | 3.92% | | | | n/a | | | | 0.78% | | | | 0.75% | |
| | | | | | | |
S&P Global 1200 Index | | | -16.83% | | | | 5.32% | | | | 6.58% | | | | 9.33% | | | | 5.97% | | | | | | | | n/a | |
| | | | | | | |
Bloomberg Global High Yield Corporate Index | | | -12.65% | | | | -1.24% | | | | 1.07% | | | | 3.20% | | | | 5.55% | | | | | | | | n/a | |
| | | | | | | |
Sextant Growth Fund Investor Shares (SSGFX) | | | -25.25% | | | | 6.25% | | | | 10.44% | | | | 11.20% | | | | 7.64% | | | | | | | | 0.74% | |
| | | | | | | |
Sextant Growth Fund Z Shares (SGZFX) | | | -25.07% | | | | 6.51% | | | | 10.72% | | | | n/a | | | | n/a | | | | | | | | 0.51% | |
| | | | | | | |
S&P 500 Index | | | -18.11% | | | | 7.66% | | | | 9.41% | | | | 12.56% | | | | 8.80% | | | | | | | | n/a | |
| | | | | | | |
Sextant International Fund Investor Shares (SSIFX) | | | -22.62% | | | | 1.53% | | | | 4.98% | | | | 5.29% | | | | 3.45% | | | | | | | | 0.93% | |
| | | | | | | |
Sextant International Fund Z Shares (SIFZX) | | | -22.40% | | | | 1.73% | | | | 5.21% | | | | n/a | | | | n/a | | | | | | | | 0.72% | |
| | | | | | | |
MSCI EAFE Index | | | -14.01% | | | | 1.34% | | | | 2.03% | | | | 5.16% | | | | 2.29% | | | | | | | | n/a | |
| 1 | By regulation, expense ratios shown in this table are as stated in the Funds’ most recent prospectus, which is dated March 30, 2022, and incorporate results for the fiscal year ended November 30, 2021. Ratios presented in this table differ from the expense ratios shown elsewhere in this report as they represent different periods. Also by regulation, the performance in this table represents the most recent quarter-end performance rather than performance through the Funds’ most recent fiscal period. |
Performance data quoted above represents past performance, is before any taxes payable by shareowners, and is no guarantee of future results. Current performance may be higher or lower than that stated herein. Performance current to the most recent month-end is available by calling toll-free 1-800-728-8762 or visiting www.sextantfunds.com. Average annual total returns are historical and include change in share value as well as reinvestment of dividends and capital gains, if any. The investment return and principal value of an investment will fluctuate so that an investor’s shares, when redeemed, may be worth more or less than their original cost. Funds that invest in foreign securities may involve greater risk, including political and economic uncertainties of foreign countries as well as the risk of currency fluctuations.
Z Shares of Sextant Growth and International Funds began operations June 2, 2017.
A note about risk: Please see Notes to Financial Statements beginning on page 55 for a discussion of investment risks. For a more detailed discussion of the risks associated with each Fund, please see the Funds’ prospectus or each Fund’s summary prospectus.
A Fund’s 30-Day Yield, sometimes referred to as “standardized yield” or “SEC yield,” is expressed as an annual percentage rate using a method of calculation adopted by the Securities and Exchange Commission (SEC). The 30-Day Yield provides an estimate of a Fund’s investment income rate, but may not equal the actual income distribution rate.
Indices: The S&P 500 Index is an index comprised of 500 widely held common stocks considered to be representative of the US stock market in general. The MSCI EAFE Index is an international index focused on Europe, Australasia, and the Far East. The S&P Global 1200 Index is a global stock market index covering nearly 70% of the world’s equity markets. The Dow Jones Moderate Portfolio Index is a broad-based index of stock and bond prices. The FTSE US Broad Investment-Grade Bond Index is a broad-based index of medium and long-term investment-grade bond prices. Investors cannot invest directly in the
Continued on page 5
Please consider an investment’s objectives, risks, charges, and expenses carefully before investing. To obtain this and other important information about the Sextant Funds in a prospectus or summary prospectus, ask your financial adviser, visit www.sextantfunds.com, or call toll-free 1-800-728-8762. Please read the prospectus or summary prospectus carefully before investing.
| | | | | | | | | | |
| | | | | | |
| 2 | | | | | | | | November 30, 2022 | | Annual Report |
| | |
| | (unaudited) |
| Fellow Shareowners: | | January 19, 2023 |
In 2022, three consecutive years of highly remunerative stock market returns collided with persistent inflation, the Federal Reserve pushing rates sharply higher, and Russia’s invasion of Ukraine causing food and energy prices to soar. These combined forces, abetted by high valuations, drove equities to their worst annual performance since 2008 and the Global Financial Crisis. Since the end of World War II there have been only three years when the S&P 500 declined by a greater percentage than in 2022: 1974, following the previous year’s OPEC oil price hikes; 2002, following the 2001 Dot Com crash and amid growing tensions over possible war in Iraq; and 2008, as mentioned above.
For the fiscal year ended November 30, 2022, the S&P 500 Index fell -9.21% and the Dow Jones Moderate Portfolio Index lost -11.12%. Foreign markets fared similarly during the period, with the MSCI EAFE Index falling -9.70% and the S&P Global 1200 Index declining -9.38%. Fixed-income markets also faced challenges; the FTSE USBIG Bond Index lost -13.07% and the Bloomberg US Aggregate Index fell -12.84% while the shorter-term Bloomberg US Aggregate 1-3 Year Index fell -4.06%.
How did the Sextant Funds perform in this environment? To paraphrase the old chestnut, when the going gets tough, the tough provide downside protection. No investor enjoys a decline in value, but in 2022 the Sextant Funds’ performance mitigated the downdrafts experienced across the competition and provided returns well ahead of each Fund’s Morningstar category averages. That downside protection was provided not only by the equity funds but also by the hybrid and bond funds. Fixed-income markets suffered one of the worst years in memory, but the investments among the Sextant Funds proved resilient.
For the fiscal year ended November 30, 2022, Sextant Growth Fund Investor Shares declined -17.88%, trailing the S&P 500, but besting the Morningstar Large Growth Category which fell -23.55%. Sextant International Fund Investor Shares retreated -16.31%, compared to the Morningstar Foreign Large Growth Category which fell -20.40%. Sextant Core Fund was somewhat of a bright spot, declining only -5.32%, beating its benchmark Dow Jones Moderate Portfolio Index and the Morningstar Allocation 50% - 70% Equity Category which fell -8.59%. Sextant Global High Income Fund retreated -4.16%, also besting the Morningstar Global Allocation Category’s return of -7.72%. Sextant Bond Income Fund declined -16.94% versus the Morningstar Long-Term Bond Category which fell -23.77%, and Sextant Short-Term Bond Fund declined -4.15% versus the Morningstar Short-Term Bond Category which fell -5.37%.
The Sextant Funds offer investors a broad mix of investment vehicles: growth equities, international exposure, and a blended portfolio, plus global high income and short-term and long-term fixed-income options. We believe this array of portfolios serves our investors in both bull and bear markets by providing basic elements to build a low-expense, balanced investment program emphasizing a value approach to investing.
| | | | | | | | | | |
| | | | | | |
| Annual Report | | November 30, 2022 | | | | | | | | 3 |
The annualized expense ratios of the six no-12b-1 fee Sextant Fund share classes range from 0.60% to 1.28%. Saturna Capital helped by capping expenses for the Sextant Short-Term, Sextant Bond Income, and Sextant Global High Income Funds. Overall assets of the Funds were $162 million as of November 30, 2022.
Shareowner Vote
On January 10, 2023, the Trust convened a Special Meeting of Shareowners where shareowners voted to remove the performance fee adjustment (sometimes referred to as a fulcrum fee) from Sextant Growth, Sextant Core, Sextant Global High Income, Sextant Bond Income, and Sextant Short-Term Bond Funds. While the meeting was adjourned to allow more shareowners of the Sextant International Fund to vote, we expect that Fund to meet quorum to remove the performance fee (the adjourned meeting will reconvene on February 6). The Funds’ investment adviser, Saturna Capital, believes this change will simplify the funds’ fee structures resulting in investors better understanding fund fees which could enhance the Funds’ marketability and give them the best chance to grow in the volatile markets we undoubtedly face. More details about the Special Meeting and the shareowner vote are on page 69.
Going Forward
As we embark upon the new year, no question figures more prominently among investors than “What are your market expectations?” Such queries carry greater urgency, given the significant decline in 2022 and recessionary worries in 2023. In response to this question, we typically reply that we are not market prognosticators, preferring to focus on the long-term outlook for the stocks in which we invest. Every four years, however, we arrive upon a market phenomenon with an unblemished multi-decade record of calling the market over the coming year – the Midterm Effect. From 1945 to 2019, the one-year return of the S&P 500 has been positive in 19 out of 19 of the years following a midterm election. For the same period, returns for the S&P 500 in the years following a midterm election averaged 16.28% compared to an average return of 7.99% in other years.
From 1942 until now, the S&P 500 has had 17 down years. However, in that time, there have been only three pairs of consecutive down years (1973-1974, 2000-2001, and 2001-2002). Considering the market’s 2022 downdraft, this perhaps provides another reason for optimism regarding the prospects for 2023 and for remaining engaged with the markets.
We undoubtedly face more economic turmoil, but we retain faith in the power of human resilience and creativity. We will continue to hold the wheel, actively charting a course through turbulent waters. We thank you for your continued investment with us.
Respectfully,
(photo omitted)
Jane Carten,
President
(photo omitted)
Gary Goldfogel,
Independent Board Chairman
| | | | | | | | | | |
| | | | | | |
| 4 | | | | | | | | November 30, 2022 | | Annual Report |
| | | | |
| Performance Summary (as of November 30, 2022) | | (unaudited) |
| | | | | | | | | | | | | | | | | | | | | | | | | | | | |
| | | | | | | | | | | | | | | | | | | | | | | Expense Ratio1 | |
| | | | | | | |
Average Annual Total Returns | | | 1 Year | | | | 3 Year | | | | 5 Year | | | | 10 Year | | | | 15 Year | | | | Gross | | | | Net | |
| | | | | | | |
Sextant Short-Term Bond Fund (STBFX) | | | -4.15% | | | | -0.57% | | | | 0.62% | | | | 0.74% | | | | 1.46% | | | | 0.66% | | | | 0.60% | |
| | | | | | | |
Bloomberg US Aggregate 1-3 Year Index | | | -4.06% | | | | -0.41% | | | | 0.83% | | | | 0.85% | | | | 1.60% | | | | | | | | n/a | |
| | | | | | | |
FTSE USBIG Govt/Corp 1-3 Year Bond (returns as of May 31, 2022) | | | -3.51% | | | | 0.58% | | | | 1.11% | | | | 1.02% | | | | 1.92% | | | | | | | | n/a | |
| | | | | | | |
Sextant Bond Income Fund (SBIFX) | | | -16.94% | | | | -4.12% | | | | -0.54% | | | | 0.76% | | | | 2.51% | | | | | | | | 0.58% | |
| | | | | | | |
Bloomberg US Aggregate Bond Index | | | -12.84% | | | | -2.59% | | | | 0.21% | | | | 1.09% | | | | 2.71% | | | | | | | | n/a | |
| | | | | | | |
FTSE US Broad Investment-Grade Bond Index | | | -13.07% | | | | -2.61% | | | | 0.22% | | | | 1.09% | | | | 2.75% | | | | | | | | n/a | |
| | | | | | | |
Sextant Core Fund (SCORX) | | | -5.32% | | | | 4.84% | | | | 5.47% | | | | 5.81% | | | | 4.48% | | | | | | | | 0.57% | |
| | | | | | | |
Dow Jones Moderate US Portfolio Index | | | -11.12% | | | | 2.94% | | | | 3.94% | | | | 6.04% | | | | 5.03% | | | | | | | | n/a | |
| | | | | | | |
Sextant Global High Income Fund (SGHIX) | | | -4.16% | | | | 0.53% | | | | 2.16% | | | | 4.14% | | | | n/a | | | | 0.78% | | | | 0.75% | |
| | | | | | | |
S&P Global 1200 Index | | | -9.38% | | | | 8.00% | | | | 7.81% | | | | 10.02% | | | | 6.17% | | | | | | | | n/a | |
| | | | | | | |
Bloomberg Global High Yield Corp | | | -11.62% | | | | -0.72% | | | | 1.04% | | | | 3.35% | | | | 5.52% | | | | | | | | n/a | |
| | | | | | | |
Sextant Growth Fund Investor Shares (SSGFX) | | | -17.88% | | | | 9.50% | | | | 11.95% | | | | 12.03% | | | | 8.10% | | | | | | | | 0.74% | |
| | | | | | | |
Sextant Growth Fund Z Shares (SGZFX) | | | -17.69% | | | | 9.75% | | | | 12.23% | | | | n/a | | | | n/a | | | | | | | | 0.51% | |
| | | | | | | |
S&P 500 Index | | | -9.21% | | | | 10.88% | | | | 10.97% | | | | 13.33% | | | | 9.18% | | | | | | | | n/a | |
| | | | | | | |
Sextant International Fund Investor Shares (SSIFX) | | | -16.31% | | | | 3.41% | | | | 5.95% | | | | 5.92% | | | | 3.59% | | | | | | | | 0.93% | |
| | | | | | | |
Sextant International Fund Z Shares (SIFZX) | | | -16.17% | | | | 3.60% | | | | 6.17% | | | | n/a | | | | n/a | | | | | | | | 0.72% | |
| | | | | | | |
MSCI EAFE Index | | | -9.70% | | | | 2.39% | | | | 2.34% | | | | 5.48% | | | | 2.13% | | | | | | | | n/a | |
| 1 | By regulation, expense ratios shown in this table are as stated in the Funds’ most recent prospectus, which is dated March 30, 2022, and incorporate results for the fiscal year ended November 30, 2021. Ratios presented in this table differ from the expense ratios shown elsewhere in this report as they represent different periods. |
Performance data quoted above represents past performance, is before any taxes payable by shareowners, and is no guarantee of future results. Current performance may be higher or lower than that stated herein. Performance current to the most recent month-end is available by calling toll-free 1-800-728-8762 or visiting www.sextantfunds.com. Average annual total returns are historical and include change in share value as well as reinvestment of dividends and capital gains, if any. The investment return and principal value of an investment will fluctuate so that an investor’s shares, when redeemed, may be worth more or less than their original cost. Funds that invest in foreign securities may involve greater risk, including political and economic uncertainties of foreign countries, as well as the risk of currency fluctuations.
Continued from page 2
indices. The Bloomberg US Aggregate Bond Index is a broad-based, flagship benchmark that measures the investment-grade, US dollar-denominated, fixed-rate taxable bond market. The Bloomberg US Aggregate 1-3 Years Index tracks bonds with 1 to 3-year maturities within the flagship Bloomberg US Aggregate Bond Index. The FTSE Gov./Corp. Investment Grade Index 1-3 Years is a broad-based index of shorter-term, investment-grade US government and corporate bond prices that reflects no deductions for fees, expenses, or taxes. The FTSE USBIG Govt/Corp 1-3 Year Index is presented through May 31, 2022, as it was discontinued as of that date by the index provider. Effective May 31, 2022, the performance benchmark against which the Sextant Bond Income Fund compares its performance was changed from the FTSE US Broad Investment Grade Index to the Bloomberg US Aggregate Bond Index, which the investment adviser believes better reflects the Fund’s investment approach.
| | | | | | | | | | |
| | | | | | |
| Annual Report | | November 30, 2022 | | | | | | | | 5 |
Sextant Short-Term Bond Fund
| | |
Performance Summary | | (unaudited) |
| | | | | | | | | | | | | | | | |
Average Annual Total Returns as of November 30, 2022 | |
| | | | | |
| | | 1 Year | | | 5 Year | | | 10 Year | | | Expense Ratio1 | |
| | | | |
Sextant Short-Term Bond Fund | | | -4.15% | | | | 0.62% | | | | 0.74% | | | | 0.66% | |
| | | | |
Bloomberg US Aggregate 1-3 Year Index | | | -4.06% | | | | 0.83% | | | | 0.85% | | | | n/a | |
| | | | |
FTSE USBIG Govt/Corp 1-3 Year Bond (returns as of May 31, 2022) | | | -3.51% | | | | 1.11% | | | | 1.02% | | | | n/a | |
Growth of $10,000
| | |
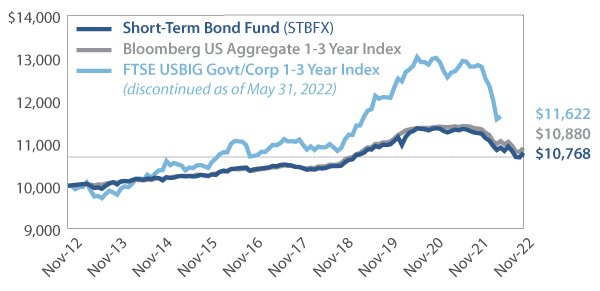 | | Comparison of any mutual fund to a market index must be made bearing in mind that the index is expense-free. Conversely, the fund will (1) be actively managed; (2) have an objective other than mirroring the index, such as limiting risk; (3) bear transaction and other costs; (4) stand ready to buy and sell its securities to shareowners on a daily basis; and (5) provide a wide range of services. The graph compares $10,000 invested in the Fund on November 30, 2012, to an identical amount invested in the Bloomberg US Aggregate 1-3 Years Index (the Fund’s current index) and the FTSE USBIG Govt/Corp 1-3 Year Index. Both are broad-based indices of shorter-term investment grade US government and corporate bond prices. The graph shows that an investment in the Fund would have risen to $10,768 versus $10,880 in the Bloomberg Index and $11,622 in the FTSE Index. The FTSE USBIG Govt/Corp 1-3 Year Index is presented through May 31, 2022, as it was discontinued as of that date by the index provider. |
Past performance does not guarantee future results. The “Growth of $10,000” graph and “Average Annual Returns” performance table assume the reinvestment of dividends and capital gains. They do not reflect the deduction of taxes that a shareowner might pay on fund distributions or the redemption of fund shares.
| 1 | By regulation, the expense ratio shown in this table is as stated in the Fund’s most recent prospectus which is dated March 30, 2022, and incorporates results for the fiscal year ended November 30, 2021, before fee waivers. The actual expense ratio, shown in the most recent prospectus after fee waivers, was 0.60%. The ratio presented in this table differs from expense ratios shown elsewhere in this report as they represent different periods. |
Fund Objective
The objectives of the Short-Term Bond Fund are capital preservation and current income.
| | | | |
Top 10 Holdings | |
| |
| % of Total Net Assets | |
| |
United States Treasury Note (2.50% due 08/15/2023) | | | 6.8% | |
| |
United States Cash Management Bill (0.00% due 01/05/2023) | | | 4.8% | |
| |
United States Cash Management Bill (0.00% due 04/20/2023) | | | 4.8% | |
| |
United States Treasury Note (2.625% due 12/31/2025) | | | 4.7% | |
| |
Swiss Re America Holding (7.00% due 02/15/2026) | | | 3.2% | |
| |
Qualcomm (2.60% due 01/30/2023) | | | 3.2% | |
| |
Gilead Sciences (2.50% due 09/01/2023) | | | 3.2% | |
| |
Microsoft (2.375% due 05/01/2023) | | | 3.2% | |
| |
United States Treasury Note (2.875% due 04/30/2025) | | | 3.1% | |
| |
Exelon Generation (3.25% due 06/01/2025) | | | 3.1% | |
| | | | | | | | | | | | |
Portfolio Diversification | |
| | | |
| % of Total Net Assets | | | | | | | | | |
| | | |
Government Bonds | | | 34.0% | | | ∎ | | | | | 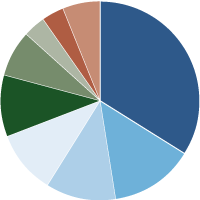
| |
Financials | | | 13.7% | | | ∎ | | |
Technology | | | 11.2% | | | ∎ | | |
Utilities | | | 10.4% | | | ∎ | | |
Consumer Staples | | | 9.9% | | | ∎ | | |
Materials | | | 7.5% | | | ∎ | | |
Consumer Discretionary | | | 3.7% | | | ∎ | | |
Health Care | | | 3.6% | | | ∎ | | |
Other Assets (net of liabilities) | | | 6.0% | | | ∎ | | |
| | | | | | | | | | |
| | | | | | |
| 6 | | | | | | | | November 30, 2022 | | Annual Report |
Sextant Short-Term Bond Fund
| | |
Discussion of Fund Performance | | (unaudited) |
(photo omitted)
Fiscal Year 2022
The Sextant Short-Term Bond Fund returned -4.15% for the 12-month period ended November 30, 2022. The Fund’s return was lower than the -4.06% return of the Bloomberg US Aggregate 1-3 Year Index, but higher than the -5.37% average return of its Morningstar Short-Term Bond peer group. For the five-year period ended November 30, 2022, the Fund provided a 0.62% annualized total return versus 0.83% for the Index and 0.88% for the Morningstar peer group. The Fund’s share price was $5.07 at the end of fiscal year 2021, then fell to $4.80 at the end of fiscal year 2022. The Fund’s 30-day yield was 1.53% and its unsubsidized 30-day yield was 1.08%. The Fund’s expense ratio was 0.60%.
Factors Affecting Past Performance
2022 was a tumultuous year for bond markets; the trailing 12-month returns of intermediate-term government bonds between November 2021 and October 2022 were the worst of any 12-month period since 1926.1 The driving forces behind the bond market sell-off were decades-high inflation and the resulting need for the Federal Reserve (the “Fed”) to hike rates at a pace not seen since the 1980s. After starting the year near-zero, the Fed raised rates by 375 basis points (bps) by the end of November. The rapid pace in hikes caught markets off guard, leading to elevated volatility in bonds.
The Sextant Short-Term Bond Fund outperformed its Morningstar peer group over the year largely due to the Fund’s favorable duration and credit positioning. Increased inflation expectations signaled the potential for further shocks, so we lowered the Fund’s duration. Between November 30, 2021, and November 30, 2022, the Fund lowered its effective duration from 2.15 to 1.82 years; meanwhile, the Morningstar peer group maintained its duration of around 2.70 years. Rates across the front-end of the yield curve rose approximately 400 bps in 2022. This rise in yields had a greater impact on longer-dated securities; the ICE BofA 1-3 Year US Corporate Index dropped -4.40% and the ICE BofA 3-5 Year US Corporate Index dropped -8.26%.
The Sextant Short-Term Bond Fund was favorably positioned in high-quality credits. At fiscal year-end 2021, the Fund’s holdings averaged an A credit rating while its Morningstar peer group had a BBB average rating. At fiscal year-end 2022, both the Fund and its peer group averaged an A+ rating. The ICE BofA US Corporate Index for A-rated credits returned -14.70% for the 2022 fiscal year, while the ICE BofA US Corporate Index for BBB-rated credits returned -15.82%.
Management Fee Calculations
The Sextant Short-Term Bond Fund calculates the performance part of its management fee by comparing the Fund’s return to its Morningstar category’s average return. As of November 30, 2022, the Fund had a 12-month return of -4.15%, leading the Morningstar category average of -5.37% by more than 1% but less than 2%. Therefore, the base annual management fee of 0.50% for the Fund was increased to 0.60% for the month of December 2022.
| 1 | Rekenthaler, John. “The Worst Bond Market Ever.” Morningstar, November 21, 2022. https://www.morningstar.com/articles/1126416/the-worst-bond-market-ever |
| | | | | | | | | | |
| | | | | | |
| Annual Report | | November 30, 2022 | | | | | | | | 7 |
Sextant Short-Term Bond Fund
| | | | | | | | | | | | | | | | | | |
| | | Schedule of Investments | | | | | | | | | | | | As of November 30, 2022 | |
| | | | | | | |
| | | Corporate Bonds – 60.0% | | | | Coupon / Maturity | | Face Amount | | | Market Value | | | Percentage of Net Assets | |
| | | | | | |
| | | Consumer Discretionary | | | | | | | | | | | | | |
| | | | | | | |
| | | AutoZone | | | | 3.25% due 04/15/2025 | | | $300,000 | | | | $288,215 | | | | 2.4% | |
| | | | | | | |
| | | EBAY | | | | 2.75% due 01/30/2023 | | | 100,000 | | | | 99,685 | | | | 0.8% | |
| | | | | | | |
| | | VF | | | | 2.40% due 04/23/2025 | | | 67,000 | | | | 62,716 | | | | 0.5% | |
| | | | | | | |
| | | | | | | | | | | | | 450,616 | | | | 3.7% | |
| | | | | | |
| | | Consumer Staples | | | | | | | | | | | | | |
| | | | | | | |
| | | Costco Wholesale | | | | 2.75% due 05/18/2024 | | | 385,000 | | | | 375,799 | | | | 3.1% | |
| | | | | | | |
| | | Dollar General | | | | 4.15% due 11/01/2025 | | | 300,000 | | | | 293,425 | | | | 2.4% | |
| | | | | | | |
| | | Procter & Gamble | | | | 2.80% due 03/25/2027 | | | 250,000 | | | | 235,249 | | | | 1.9% | |
| | | | | | | |
| | | Walmart | | | | 2.85% due 07/08/2024 | | | 325,000 | | | | 316,724 | | | | 2.5% | |
| | | | | | | |
| | | | | | | | | | | | | 1,221,197 | | | | 9.9% | |
| | | | | | |
| | | Financials | | | | | | | | | | | | | |
| | | | | | | |
| | | Bank of America Corp | | | | 3.50% due 04/19/2026 | | | 400,000 | | | | 383,175 | | | | 3.1% | |
| | | | | | | |
| | | JPMorgan Chase & Co | | | | 3.30% due 04/01/2026 | | | 300,000 | | | | 286,075 | | | | 2.4% | |
| | | | | | | |
| | | PayPal Holdings | | | | 2.65% due 10/01/2026 | | | 300,000 | | | | 278,314 | | | | 2.3% | |
| | | | | | | |
| | | Swiss Re America Holding | | | | 7.00% due 02/15/2026 | | | 378,000 | | | | 399,789 | | | | 3.2% | |
| | | | | | | |
| | | Visa | | | | 3.15% due 12/14/2025 | | | 350,000 | | | | 336,666 | | | | 2.7% | |
| | | | | | | |
| | | | | | | | | | | | | 1,684,019 | | | | 13.7% | |
| | | | | | |
| | | Health Care | | | | | | | | | | | | | |
| | | | | | | |
| | | Gilead Sciences | | | | 2.50% due 09/01/2023 | | | 400,000 | | | | 392,631 | | | | 3.2% | |
| | | | | | | |
| | | Johnson & Johnson | | | | 2.45% due 03/01/2026 | | | 50,000 | | | | 47,391 | | | | 0.4% | |
| | | | | | | |
| | | | | | | | | | | | | 440,022 | | | | 3.6% | |
| | | | | | |
| | | Materials | | | | | | | | | | | | | |
| | | | | | | |
| | | BHP Billiton | | | | 3.85% due 09/30/2023 | | | 150,000 | | | | 148,573 | | | | 1.2% | |
| | | | | | | |
| | | DuPont De Nemours | | | | 4.493% due 11/15/2025 | | | 383,000 | | | | 379,527 | | | | 3.1% | |
| | | | | | | |
| | | Kinross Gold | | | | 5.95% due 03/15/2024 | | | 250,000 | | | | 250,823 | | | | 2.0% | |
| | | | | | | |
| | | Mosaic | | | | 4.25% due 11/15/2023 | | | 150,000 | | | | 148,499 | | | | 1.2% | |
| | | | | | | |
| | | | | | | | | | | | | 927,422 | | | | 7.5% | |
| | | | | | |
| | | Technology | | | | | | | | | | | | | |
| | | | | | | |
| | | Microsoft | | | | 2.375% due 05/01/2023 | | | 395,000 | | | | 391,420 | | | | 3.2% | |
| | | | | | | |
| | | Oracle | | | | 2.95% due 05/15/2025 | | | 275,000 | | | | 261,781 | | | | 2.1% | |
| | | | | | | |
| | | Qualcomm | | | | 2.60% due 01/30/2023 | | | 400,000 | | | | 398,866 | | | | 3.2% | |
| | | | | | | |
| | | Take-Two Interactive Software | | | | 3.70% due 04/14/2027 | | | 350,000 | | | | 331,521 | | | | 2.7% | |
| | | | | | | |
| | | | | | | | | | | | | 1,383,588 | | | | 11.2% | |
Continued on next page.
| | | | | | | | | | | | |
| | | | | | | |
| 8 | | | | | | | | November 30, 2022 | | Annual Report | | The accompanying notes are an integral part of these financial statements. |
Sextant Short-Term Bond Fund
| | | | | | | | | | | | | | | | | | |
| | | Schedule of Investments | | | | | | | | | | | | As of November 30, 2022 | |
| | | | | | | |
| | | Corporate Bonds – 60.0% | | | | Coupon / Maturity | | Face Amount | | | Market Value | | | Percentage of Net Assets | |
| | | | | | |
| | | Utilities | | | | | | | | | | | | | |
| | | | | | | |
| | | Edison International | | | | 3.55% due 11/15/2024 | | | $350,000 | | | | $336,622 | | | | 2.8% | |
| | | | | | | |
| | | Exelon Generation | | | | 3.25% due 06/01/2025 | | | 400,000 | | | | 383,651 | | | | 3.1% | |
| | | | | | | |
| | | Florida Power & Light | | | | 2.85% due 04/01/2025 | | | 320,000 | | | | 306,840 | | | | 2.5% | |
| | | | | | | |
| | | PacifiCorp | | | | 2.95% due 06/01/2023 | | | 250,000 | | | | 247,245 | | | | 2.0% | |
| | | | | | | |
| | | | | | | | | | | | | 1,274,358 | | | | 10.4% | |
| | | | | | |
| | | | | | | | | | | | | | | | | | |
| | | | | | | |
| | Total Corporate Bonds | | | | (Cost $7,764,815) | | | | | | | $7,381,222 | | | | 60.0% | |
| | | | | | |
| | | | | | | | | | | | | | | | | | |
| | | | | | | |
| | | Government Bonds – 34.0% | | | | Coupon / Maturity | | Face Amount | | | Market Value | | | Percentage of Net Assets | |
| | | | | | |
| | | Government Sponsored | | | | | | | | | | | | | |
| | | | | | | |
| | | Federal Farm Credit Bank | | | | 3.50% due 12/20/2023 | | | $200,000 | | | | $196,821 | | | | 1.6% | |
| | | | | | | |
| | | Federal Home Loan Bank | | | | 3.375% due 12/08/2023 | | | 300,000 | | | | 295,652 | | | | 2.4% | |
| | | | | | | |
| | | | | | | | | | | | | 492,473 | | | | 4.0% | |
| | | | | | |
| | | United States Treasury Bills | | | | | | | | | | | | | |
| | | | | | | |
| | | United States Cash Management Bill | | | | 0.00% due 01/05/2023 | | | 600,000 | | | | 597,788 | | | | 4.8% | |
| | | | | | | |
| | | United States Cash Management Bill | | | | 0.00% due 04/20/2023 | | | 600,000 | | | | 589,838 | | | | 4.8% | |
| | | | | | | |
| | | | | | | | | | | | | 1,187,626 | | | | 9.6% | |
| | | | | | |
| | | United States Treasury Notes | | | | | | | | | | | | | |
| | | | | | | |
| | | United States Treasury Note | | | | 2.50% due 08/15/2023 | | | 850,000 | | | | 836,752 | | | | 6.8% | |
| | | | | | | |
| | | United States Treasury Note | | | | 0.125% due 08/31/2023 | | | 300,000 | | | | 289,863 | | | | 2.4% | |
| | | | | | | |
| | | United States Treasury Note | | | | 2.25% due 10/31/2024 | | | 100,000 | | | | 96,051 | | | | 0.7% | |
| | | | | | | |
| | | United States Treasury Note | | | | 2.875% due 04/30/2025 | | | 400,000 | | | | 387,219 | | | | 3.1% | |
| | | | | | | |
| | | United States Treasury Note | | | | 2.625% due 12/31/2025 | | | 600,000 | | | | 574,594 | | | | 4.7% | |
| | | | | | | |
| | | United States Treasury Note | | | | 2.375% due 05/15/2027 | | | 350,000 | | | | 327,906 | | | | 2.7% | |
| | | | | | | |
| | | | | | | | | | | | | 2,512,385 | | | | 20.4% | |
| | | | | | |
| | | | | | | | | | | | | | | | | | |
| | | | | | | |
| | Total Government Bonds | | | | (Cost $4,327,545) | | | | | | | $4,192,484 | | | | 34.0% | |
| | | | | | |
| | | | | | | | | | | | | | | | | | | |
| | | | | | |
| | Total investments | | | | (Cost $12,092,360) | | | | | | | $11,573,706 | | | | 94.0% | |
| | | | | | |
| | Other assets (net of liabilities) | | | | | | | | | | | 735,728 | | | | 6.0% | |
| | | | | | |
| | Total net assets | | | | | | | | | | | $12,309,434 | | | | 100.0% | |
| | | | | | | |
| | | | | | | | | | | | | | | | | | |
| | | | | | | | | | | | |
| | | | | | | |
| The accompanying notes are an integral part of these financial statements. | | Annual Report | | November 30, 2022 | | | | | | | | 9 |
Sextant Short-Term Bond Fund
| | | | | | | | | | | | |
Bond Quality Diversification | | | | (unaudited) | |
| | | |
| % of Total Net Assets | | | | | | | | | |
Rated “AAA” | | | 21.6% | | | ∎ | | | | | 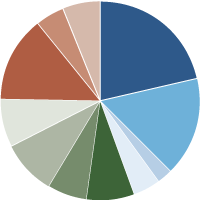
| |
Rated “AA+” | | | 16.0% | | | ∎ | | |
Rated “AA” | | | 2.5% | | | ∎ | | |
Rated “AA-” | | | 4.6% | | | ∎ | | |
Rated “A+” | | | 7.6% | | | ∎ | | |
Rated “A” | | | 6.4% | | | ∎ | | |
Rated “A-” | | | 9.0% | | | ∎ | | |
Rated “BBB+” | | | 7.6% | | | ∎ | | |
Rated “BBB” | | | 13.9% | | | ∎ | | |
Rated “BBB-” | | | 4.8% | | | ∎ | | |
Other assets (net of liabilities) | | | 6.0% | | | ∎ | | |
|
| Credit ratings are the lesser of S&P Global Ratings or Moody’s Investors Service. If neither S&P nor Moody’s rate a particular security, that security is categorized as not rated (except for US Treasury securities and securities issued or backed by US agencies which inherit the credit rating for the US government). Ratings range from AAA (highest) to D (lowest). Bonds rated BBB or above are considered investment grade. Credit ratings BB and below are lower-rated securities (junk bonds). Ratings apply to the creditworthiness of the issuers of the underlying securities and not the Fund or its shares. Ratings may be subject to change. | |
| | | | | | | | | | | | |
| | | | | | | |
| 10 | | | | | | | | November 30, 2022 | | Annual Report | | The accompanying notes are an integral part of these financial statements. |
Sextant Short-Term Bond Fund
Statement of Assets and Liabilities
| | | | |
| As of November 30, 2022 | |
| | |
| | | | |
| |
Assets | | | | |
| |
Investments in securities, at value
(Cost $12,092,360) | | | $11,573,706 | |
| |
Cash | | | 664,901 | |
| |
Dividends and interest receivable | | | 75,393 | |
| |
Prepaid expenses | | | 9,638 | |
| |
Receivable for Fund shares sold | | | 227 | |
| | | | |
| |
Total assets | | | 12,323,865 | |
| | | | |
| |
Liabilities | | | | |
| |
Accrued audit expenses | | | 5,180 | |
| |
Accrued retirement plan custody fee | | | 2,860 | |
| |
Payable for Fund shares redeemed | | | 2,700 | |
| |
Accrued printing fees | | | 1,995 | |
| |
Accrued Chief Compliance Officer expenses | | | 494 | |
| |
Accrued other expenses | | | 456 | |
| |
Accrued advisory fees | | | 400 | |
| |
Accrued legal expenses | | | 299 | |
| |
Accrued trustee expenses | | | 47 | |
| | | | |
| |
Total liabilities | | | 14,431 | |
| | | | |
| |
Net Assets | | | $12,309,434 | |
| | |
| | | | |
| | |
Analysis of net assets | | | | |
| |
Paid-in capital (unlimited shares authorized, without par value) | | | 12,916,528 | |
| |
Total distributable earnings | | | (607,094 | ) |
| | | | |
| |
Net assets applicable to Fund shares outstanding | | | $12,309,434 | |
| | |
| | | | |
Fund shares outstanding | | | 2,565,531 | |
| | |
Net asset value, offering, and redemption price per share | | | $4.80 | |
| | | | | |
Statement of Operations
| | | | |
| Year ended November 30, 2022 | |
| | |
| | | | |
| |
Investment income | | | | |
| |
Interest income | | | $219,711 | |
| | | | |
| |
Total investment income | | | 219,711 | |
| | | | |
| |
Expenses | | | | |
| |
Investment advisory fees | | | 59,906 | |
| |
Filing and registration fees | | | 26,931 | |
| |
Audit fees | | | 6,818 | |
| |
Retirement plan custodial fees | | | 2,780 | |
| |
Chief Compliance Officer expenses | | | 2,428 | |
| |
Legal fees | | | 2,421 | |
| |
Trustee fees | | | 2,209 | |
| |
Other expenses | | | 1,271 | |
| |
Printing and posting fees | | | 639 | |
| |
Custodian fees | | | 487 | |
| | | | |
| |
Total gross expenses | | | 105,890 | |
| | | | |
| |
Less adviser fees waived | | | (33,392 | ) |
| |
Less custodian fee credits | | | (487 | ) |
| | | | |
| |
Net expenses | | | 72,011 | |
| | | | |
| |
Net investment income | | | $147,700 | |
| | |
| | | | |
| | |
| | | | |
| |
Net realized loss from investments | | | $(83,277 | ) |
| |
Net decrease in unrealized appreciation on investments | | | (565,403 | ) |
| | | | |
| |
Net loss on investments | | | $(648,680 | ) |
| | |
| | | | |
| | |
Net decrease in net assets resulting from operations | | | $(500,980 | ) |
| | | | | |
| | | | | | | | | | | | |
| | | | | | | |
| The accompanying notes are an integral part of these financial statements. | | Annual Report | | November 30, 2022 | | | | | | | | 11 |
Sextant Short-Term Bond Fund
| | | | | | | | |
Statements of Changes in Net Assets | | | Year ended November 30, 2022 | | | | Year ended November 30, 2021 | |
| | | |
Increase in net assets from operations | | | | | | | | |
| | |
From operations | | | | | | | | |
| | |
Net investment income | | | $147,700 | | | | $132,187 | |
| | |
Net realized gain (loss) on investment | | | (83,277 | ) | | | 15,076 | |
| | |
Net decrease in unrealized appreciation | | | (565,403 | ) | | | (257,024 | ) |
| | | | | | | | |
| | |
Net decrease in net assets | | | (500,980 | ) | | | (109,761 | ) |
| | | | | | | | |
| | |
| | | | | | | | |
| | |
Distributions to shareowners | | | (147,690 | ) | | | (132,185 | ) |
| | |
| | | | | | | | |
| | |
Capital share transactions | | | | | | | | |
| | |
Proceeds from sales of shares | | | 1,690,769 | | | | 2,465,536 | |
| | |
Value of shares issued in reinvestment of dividends | | | 147,117 | | | | 131,473 | |
| | |
Cost of shares redeemed | | | (799,511 | ) | | | (1,861,789 | ) |
| | | | | | | | |
| | |
Total capital shares transactions | | | 1,038,375 | | | | 735,220 | |
| | | | | | | | |
| | |
Total increase in net assets | | | 389,705 | | | | 493,274 | |
| | | |
| | | | | | | | |
| | | |
Net assets | | | | | | | | |
| | |
Beginning of year | | | 11,919,729 | | | | 11,426,455 | |
| | |
End of year | | | $12,309,434 | | | | $11,919,729 | |
| | | |
| | | | | | | | |
| | | |
Shares of the Fund sold and redeemed | | | | | | | | |
| | |
Number of shares sold | | | 345,687 | | | | 478,913 | |
| | |
Number of shares issued in reinvestment of dividends | | | 30,209 | | | | 25,661 | |
| | |
Number of shares redeemed | | | (162,491 | ) | | | (362,936 | ) |
| | | | | | | | |
| | |
Net increase in number of shares outstanding | | | 213,405 | | | | 141,638 | |
| | | |
| | | | | | | | |
| | | | | | | | | | | | | | | | | | | | |
Financial Highlights | | | For year ended November 30, | |
| | | | | |
Selected data per share of outstanding capital stock throughout each year: | | | 2022 | | | | 2021 | | | | 2020 | | | | 2019 | | | | 2018 | |
| | | | | | |
Net asset value at beginning of year | | | $5.07 | | | | $5.17 | | | | $5.08 | | | | $4.94 | | | | $5.00 | |
| | | | | |
Income from investment operations | | | | | | | | | | | | | | | | | | | | |
| | | | | |
Net investment income | | | 0.06 | | | | 0.06 | | | | 0.08 | | | | 0.09 | | | | 0.07 | |
| | | | | |
Net gains (losses) on securities (both realized and unrealized) | | | (0.27 | ) | | | (0.10 | ) | | | 0.09 | | | | 0.14 | | | | (0.06 | ) |
| | | | | | | | | | | | | | | | | | | | |
| | | | | |
Total from investment operations | | | (0.21 | ) | | | (0.04 | ) | | | 0.17 | | | | 0.23 | | | | 0.01 | |
| | | | | | | | | | | | | | | | | | | | |
| | | | | |
Less distributions | | | | | | | | | | | | | | | | | | | | |
| | | | | |
Dividends (from net investment income) | | | (0.06 | ) | | | (0.06 | ) | | | (0.08 | ) | | | (0.09 | ) | | | (0.07 | ) |
| | | | | |
Distributions from capital gains | | | - | | | | - | | | | - | | | | - | | | | (0.00 | )A |
| | | | | | | | | | | | | | | | | | | | |
| | | | | |
Total distributions | | | (0.06 | ) | | | (0.06 | ) | | | (0.08 | ) | | | (0.09 | ) | | | (0.07 | ) |
| | | | | | | | | | | | | | | | | | | | |
| | | | | |
| | | | | | | | | | | | | | | | | | | | |
| | | | | |
Net asset value at end of year | | | $4.80 | | | | $5.07 | | | | $5.17 | | | | $5.08 | | | | $4.94 | |
| | | | | | |
| | | | | | | | | | | | | | | | | | | | |
Total return | | | (4.15 | )% | | | (0.88 | )% | | | 3.46% | | | | 4.64% | | | | 0.26% | |
| | | | | | |
Ratios / supplemental data | | | | | | | | | | | | | | | | | | | | |
| | | | | |
Net assets ($000), end of year | | | $12,309 | | | | $11,920 | | | | $11,426 | | | | $11,089 | | | | $10,276 | |
| | | | | |
Ratio of expenses to average net assets | | | | | | | | | | | | | | | | | | | | |
| | | | | |
Before adviser fees waiver and custodian fee credits | | | 0.88% | | | | 0.66% | | | | 0.90% | | | | 0.87% | | | | 0.91% | |
| | | | | |
After adviser fees waiver | | | 0.60% | | | | 0.59% | | | | 0.60% | | | | 0.61% | | | | 0.61% | |
| | | | | |
After adviser fees waiver and custodian fee credits | | | 0.60% | | | | 0.59% | | | | 0.60% | | | | 0.60% | | | | 0.60% | |
| | | | | |
Ratio of net investment income after adviser fee waivers and custodian fee credits to average net assets | | | 1.23% | | | | 1.07% | | | | 1.64% | | | | 1.75% | | | | 1.44% | |
| | | | | |
Portfolio turnover rate | | | 41% | | | | 29% | | | | 36% | | | | 32% | | | | 36% | |
| | | | | | |
| | | | | | | | | | | | | | | | | | | | |
| | | | | | | | | | | | | | | | | | | | |
A Amount is less than $0.01. | | | | | | | | | | | | | | | | | | | | |
| | | | | | | | | | | | |
| | | | | | | |
| 12 | | | | | | | | November 30, 2022 | | Annual Report | | The accompanying notes are an integral part of these financial statements. |
Sextant Bond Income Fund
| | |
Performance Summary | | (unaudited) |
| | | | | | | | | | | | | | | | |
Average Annual Total Returns as of November 30, 2022 | |
| | | | | |
| | | 1 Year | | | 5 Year | | | 10 Year | | | Expense Ratio1 | |
| | | | |
Sextant Bond Income Fund | | | -16.94% | | | | 0.54% | | | | 0.76% | | | | 0.58% | |
| | | | |
Bloomberg US Aggregate Bond Index | | | -12.84% | | | | 0.21% | | | | 1.09% | | | | n/a | |
| | | | |
FTSE US Broad Investment-Grade Bond Index | | | -13.07% | | | | 0.22% | | | | 1.09% | | | | n/a | |
Growth of $10,000
| | |
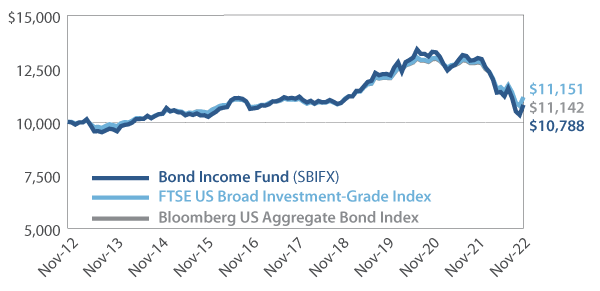 | | Comparison of any mutual fund to a market index must be made bearing in mind that the index is expense-free. Conversely, the fund will (1) be actively managed; (2) have an objective other than mirroring the index, such as limiting risk; (3) bear transaction and other costs; (4) stand ready to buy and sell its securities to shareowners on a daily basis; and (5) provide a wide range of services. The graph compares $10,000 invested in the Fund on November 30, 2012, to an identical amount invested in the FTSE US Broad Investment-Grade Bond Index, a broad-based index of medium and long-term investment-grade bond prices, and the Bloomberg US Aggregate Bond Index, a broad-based, flagship benchmark that measures the investment-grade, US dollar-denominated, fixed-rate taxable bond market. The graph shows that an investment in the Fund would have risen to $10,788 versus $11,151 in the FTSE US Broad Investment-Grade Bond Index and $11,142 in the Bloomberg US Aggregate Bond Index. Effective May 31, 2022, the performance benchmark against which the Fund compares its performance was changed from the FTSE US Broad Investment Grade Index to the Bloomberg US Aggregate Bond Index, which the investment adviser believes better reflects the Fund’s investment approach. |
Past performance does not guarantee future results. The “Growth of $10,000” graph and “Average Annual Returns” performance table assume the reinvestment of dividends and capital gains. They do not reflect the deduction of taxes that a shareowner might pay on fund distributions or the redemption of fund shares.
| 1 | By regulation, the expense ratio shown in this table is as stated in the Fund’s most recent prospectus which is dated March 30, 2022, and incorporates results for the fiscal year ended November 30, 2021, before fee waivers. The expense ratio shown in the most recent prospectus after fee waivers was 0.58%. The ratio presented in this table differs from expense ratios shown elsewhere in this report as they represent different periods. |
Fund Objective
The objective of the Bond Income Fund is current income.
| | | | |
Top 10 Holdings | |
| |
| % of Total Net Assets | |
| |
United States Treasury Bond (4.25% due 05/15/2039) | | | 8.2% | |
| |
United States Treasury Bond (3.375% due 11/15/2048) | | | 5.1% | |
| |
United States Treasury Bond (5.375% due 02/15/2031) | | | 4.6% | |
| |
Apple (4.50% due 02/23/2036) | | | 3.6% | |
| |
Microsoft (4.20% due 11/03/2035) | | | 3.5% | |
| |
Intel (4.00% due 12/15/2032) | | | 3.4% | |
| |
Home Depot (5.875% due 12/16/2036) | | | 3.3% | |
| |
Burlington Northern Santa Fe (5.05% due 03/01/2041) | | | 3.1% | |
| |
Praxair (3.55% due 11/07/2042) | | | 2.9% | |
| |
United Technologies (6.05% due 06/01/2036) | | | 2.7% | |
| | | | | | | | | | | | |
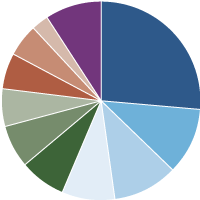
Portfolio Diversification | | | | | | | | | | | | |
| | | |
| % of Total Net Assets | | | | | | | | | |
| | | |
Government Bonds | | | 26.4% | | | ∎ | | | |
| 
|
|
Technology | | | 11.0% | | | ∎ | | |
Health Care | | | 10.6% | | | ∎ | | |
Financials | | | 8.6% | | | ∎ | | |
Utilities | | | 7.4% | | | ∎ | | |
Industrials | | | 7.0% | | | ∎ | | |
| | | |
Energy | | | 6.0% | | | ∎ | | | | | | |
| | | |
Consumer Discretionary | | | 5.8% | | | ∎ | | | | | | |
| | | |
Consumer Staples | | | 5.4% | | | ∎ | | | | | | |
| | | |
Materials | | | 2.9% | | | ∎ | | | | | | |
| | | |
Other assets (net of liabilities) | | | 8.9% | | | ∎ | | | | | | |
| | | | | | | | | | |
| | | | | | |
| Annual Report | | November 30, 2022 | | | | | | | | 13 |
Sextant Bond Income Fund
| | |
Discussion of Fund Performance | | (unaudited) |
(photo omitted)
Fiscal Year 2022
For the fiscal year ended November 30, 2022, the Sextant Bond Income Fund returned -16.94%, trailing the FTSE USBIG Bond Index, which returned -13.07%, and the Bloomberg US Aggregate Index, which returned -12.84%. For the five years ended November 30, 2022, the Fund narrowly underperformed both indices with an annualized total return of -0.54%, compared to 0.22% for the FTSE USBIG Bond Index, and 0.21% for the Bloomberg US Aggregate Bond Index. The primary reason for the Fund’s underperformance was that the Fund had a longer maturity profile relative the Indices, and 2022 was a year of rising rates.
Factors Affecting Past Performance
Over the fiscal year, we observed pervasive high inflation, energy supply constraints, and ever-increasing debts and deficits among world economies. The shape of the Treasury yield curve shifted dramatically over the 12-month period, moving from an upward sloping curve to a curve with an inversion of 70 basis points (bps) in the two-year and 10-year Treasurys. The entire curve also shifted upward, and the six-month Treasury rose a staggering 458 bps. With such a dramatic rise in yields, performance was generally worse for longer duration bonds and better for shorter duration bonds, with almost all fixed-income securities producing a negative return.
As of November 30, 2022, Sextant Bond Income Fund had 61.21% of assets in bonds maturing in 10+ years, while the FTSE USBIG Bond Index had around 19%, and the Bloomberg US Aggregate Bond Index has 17.20%. The Fund’s effective duration of eight years was significantly longer than that of both indices which had effective durations of around six years. More exposure to movements in interest rates resulted in additional downward movement in net asset value (NAV). However, the Fund was positioned as conservatively as possible within its objectives and mandate.
During the year, the Sextant Bond Income Fund maintained an average effective maturity of 11.4 years, down from 12.7 years at the end of fiscal 2021, and defensively positioned relative to the Morningstar Long-Term Bond category average of 19.0 years. The Fund also targets holdings with a bigger coupon, allowing income to contribute to price stability. As a result, the Fund was in the 11th percentile for the year ended November 30, 2022, in the Morningstar Long-Term Bond category.
Looking Forward
We expect continued upward pressure on yields and the Treasury yield curve for the next fiscal year. Inflation will likely continue to be present. We are defensively positioning the portfolio to withstand anticipated yield curve changes, currency movements, and inflationary pressures. Our goal has always been to choose good companies and invest through cycles.
Management Fee Calculations
The Sextant Bond Income Fund calculates the performance part of its management fee by comparing the Fund’s return to its Morningstar category’s average return. As of November 30, 2022, the Fund had a 12-month return of -16.94%, ahead of the Morningstar category average of -23.77% by more than 2%. Therefore, the base annual management fee of 0.50% for the Fund was increased to 0.70% for the month of December 2022.
| | | | | | | | | | |
| | | | | | |
| 14 | | | | | | | | November 30, 2022 | | Annual Report |
Sextant Bond Income Fund
| | | | | | | | | | | | | | | | | | |
| | | Schedule of Investments | | | | | | | | | | | | As of November 30, 2022 | |
| | | | | | | |
| | | Corporate Bonds – 64.7% | | | | Coupon / Maturity | | Face Amount | | | Market Value | | | Percentage of Net Assets | |
| | | | | | |
| | | Consumer Discretionary | | | | | | | | | | | | | |
| | | | | | | |
| | | Home Depot | | | | 5.875% due 12/16/2036 | | | $300,000 | | | | $324,494 | | | | 3.3% | |
| | | | | | | |
| | | Lowe’s | | | | 5.80% due 10/15/2036 | | | 250,000 | | | | 246,117 | | | | 2.5% | |
| | | | | | | |
| | | | | | | | | | | | | 570,611 | | | | 5.8% | |
| | | | | | |
| | | Consumer Staples | | | | | | | | | | | | | |
| | | | | | | |
| | | Kimberly Clark | | | | 5.30% due 03/01/2041 | | | 100,000 | | | | 100,632 | | | | 1.0% | |
| | | | | | | |
| | | Procter & Gamble | | | | 5.50% due 02/01/2034 | | | 200,000 | | | | 211,152 | | | | 2.2% | |
| | | | | | | |
| | | Unilever Capital | | | | 5.90% due 11/15/2032 | | | 200,000 | | | | 217,502 | | | | 2.2% | |
| | | | | | | |
| | | | | | | | | | | | | 529,286 | | | | 5.4% | |
| | | | | | |
| | | Energy | | | | | | | | | | | | | |
| | | | | | | |
| | | Baker Hughes | | | | 6.875% due 01/15/2029 | | | 100,000 | | | | 104,347 | | | | 1.1% | |
| | | | | | | |
| | | Canadian Natural Resources | | | | 6.45% due 06/30/2033 | | | 225,000 | | | | 231,594 | | | | 2.4% | |
| | | | | | | |
| | | Statoil | | | | 7.15% due 01/15/2029 | | | 224,000 | | | | 249,539 | | | | 2.5% | |
| | | | | | | |
| | | | | | | | | | | | | 585,480 | | | | 6.0% | |
| | | | | | |
| | | Financials | | | | | | | | | | | | | |
| | | | | | | |
| | | Affiliated Managers Group | | | | 3.50% due 08/01/2025 | | | 250,000 | | | | 240,439 | | | | 2.4% | |
| | | | | | | |
| | | Bank Of New York Mellon MTN | | | | 3.30% due 08/23/2029 | | | 250,000 | | | | 224,765 | | | | 2.3% | |
| | | | | | | |
| | | Chubb Ina Holdings | | | | 4.35% due 11/03/2045 | | | 100,000 | | | | 87,935 | | | | 0.9% | |
| | | | | | | |
| | | State Street(Quarterly US LIBOR plus 100)1 | | | | 4.29257% due 06/15/2047 | | | 100,000 | | | | 75,081 | | | | 0.8% | |
| | | | | | | |
| | | UBS AG Stamford CT | | | | 7.75% due 09/01/2026 | | | 200,000 | | | | 215,220 | | | | 2.2% | |
| | | | | | | |
| | | | | | | | | | | | | 843,440 | | | | 8.6% | |
| | | | | | |
| | | Health Care | | | | | | | | | | | | | |
| | | | | | | |
| | | Becton Dickinson | | | | 6.70% due 08/01/2028 | | | 240,000 | | | | 252,032 | | | | 2.6% | |
| | | | | | | |
| | | Johnson & Johnson | | | | 4.95% due 05/15/2033 | | | 226,000 | | | | 237,446 | | | | 2.4% | |
| | | | | | | |
| | | Johnson & Johnson | | | | 5.85% due 07/15/2038 | | | 50,000 | | | | 55,451 | | | | 0.6% | |
| | | | | | | |
| | | Medtronic | | | | 4.375% due 03/15/2035 | | | 260,000 | | | | 249,392 | | | | 2.5% | |
| | | | | | | |
| | | Merck & Co. | | | | 6.50% due 12/01/2033 | | | 215,000 | | | | 244,960 | | | | 2.5% | |
| | | | | | | |
| | | | | | | | | | | | | 1,039,281 | | | | 10.6% | |
| | | | | | |
| | | Industrials | | | | | | | | | | | | | |
| | | | | | | |
| | | Burlington Northern Santa Fe | | | | 5.05% due 03/01/2041 | | | 310,000 | | | | 304,747 | | | | 3.1% | |
| | | | | | | |
| | | Deere & Co. | | | | 8.10% due 05/15/2030 | | | 95,000 | | | | 113,493 | | | | 1.2% | |
| | | | | | | |
| | | United Technologies | | | | 6.05% due 06/01/2036 | | | 250,000 | | | | 267,451 | | | | 2.7% | |
| | | | | | | |
| | | | | | | | | | | | | 685,691 | | | | 7.0% | |
| | | | | | |
| | | Materials | | | | | | | | | | | | | |
| | | | | | | |
| | | Praxair | | | | 3.55% due 11/07/2042 | | | 350,000 | | | | 283,152 | | | | 2.9% | |
| | | | | | | |
| | | | | | | | | | | | | | | | | | |
Continued on next page.
| | | | | | | | | | | | |
| | | | | | | |
| The accompanying notes are an integral part of these financial statements. | | Annual Report | | November 30, 2022 | | | | | | | | 15 |
Sextant Bond Income Fund
| | | | | | | | | | | | | | | | | | |
| | | Schedule of Investments | | | | | | | | | | | | As of November 30, 2022 | |
| | | | | | | |
| | | Corporate Bonds – 64.7% | | | | Coupon / Maturity | | Face Amount | | | Market Value | | | Percentage of Net Assets | |
| | | | | | |
| | | Technology | | | | | | | | | | | | | |
| | | | | | | |
| | | Apple | | | | 4.50% due 02/23/2036 | | | $350,000 | | | | $351,858 | | | | 3.6% | |
| | | | | | | |
| | | Intel | | | | 4.00% due 12/15/2032 | | | 360,000 | | | | 334,831 | | | | 3.4% | |
| | | | | | | |
| | | Microsoft | | | | 4.20% due 11/03/2035 | | | 350,000 | | | | 344,411 | | | | 3.5% | |
| | | | | | | |
| | | Microsoft | | | | 5.30% due 02/08/2041 | | | 50,000 | | | | 53,800 | | | | 0.5% | |
| | | | | | | |
| | | | | | | | | | | | | 1,084,900 | | | | 11.0% | |
| | | | | | |
| | | Utilities | | | | | | | | | | | | | |
| | | | | | | |
| | | Alabama Power | | | | 4.15% due 08/15/2044 | | | 200,000 | | | | 167,559 | | | | 1.7% | |
| | | | | | | |
| | | Entergy Louisiana | | | | 5.40% due 11/01/2024 | | | 200,000 | | | | 201,709 | | | | 2.1% | |
| | | | | | | |
| | | Florida Power & Light | | | | 5.95% due 10/01/2033 | | | 100,000 | | | | 105,735 | | | | 1.0% | |
| | | | | | | |
| | | Puget Sound Energy | | | | 4.434% due 11/15/2041 | | | 300,000 | | | | 252,968 | | | | 2.6% | |
| | | | | | | |
| | | | | | | | | | | | | 727,971 | | | | 7.4% | |
| | | | | | |
| | | | | | | | | | | | | | | | | | |
| | | | | | | |
| | Total Corporate Bonds | | | | (Cost $7,265,037) | | | | | | | $6,349,812 | | | | 64.7% | |
| | | | | | |
| | | | | | | | | | | | | | | | | | |
| | | | | | | |
| | | Government Bonds – 26.4% | | | | Coupon / Maturity | | Face Amount | | | Market Value | | | Percentage of Net Assets | |
| | | | | | |
| | | Foreign Government Bonds | | | | | | | | | | | | | |
| | | | | | | |
| | | Quebec Canada Yankee | | | | 7.125% due 02/09/2024 | | | $175,000 | | | | $179,653 | | | | 1.8% | |
| | | | | | | |
| | | | | | | | | | | | | | | | | | |
| | | | | |
| | | United States Treasury Bonds | | | | | | | | | | | |
| | | | | | | |
| | | United States Treasury Bond | | | | 5.25% due 02/15/2029 | | | 170,000 | | | | 182,418 | | | | 1.9% | |
| | | | | | | |
| | | United States Treasury Bond | | | | 6.125% due 08/15/2029 | | | 225,000 | | | | 254,865 | | | | 2.6% | |
| | | | | | | |
| | | United States Treasury Bond | | | | 6.25% due 05/15/2030 | | | 75,000 | | | | 86,830 | | | | 0.9% | |
| | | | | | | |
| | | United States Treasury Bond | | | | 5.375% due 02/15/2031 | | | 400,000 | | | | 445,313 | | | | 4.6% | |
| | | | | | | |
| | | United States Treasury Bond | | | | 4.25% due 05/15/2039 | | | 770,000 | | | | 807,898 | | | | 8.2% | |
| | | | | | | |
| | | United States Treasury Bond | | | | 3.125% due 11/15/2041 | | | 145,000 | | | | 127,606 | | | | 1.3% | |
| | | | | | | |
| | | United States Treasury Bond | | | | 3.375% due 11/15/2048 | | | 560,000 | | | | 505,116 | | | | 5.1% | |
| | | | | | | |
| | | | | | | | | | | | | 2,410,046 | | | | 24.6% | |
| | | | | | |
| | | | | | | | | | | | | | | | | | |
| | | | | | | |
| | Total Government Bonds | | | | (Cost $3,150,247) | | | | | | | $2,589,699 | | | | 26.4% | |
| | | | | | |
| | | | | | | | | | | | | | | | | | | |
| | | | | | |
| | Total investments | | | | (Cost $10,415,284) | | | | | | | $8,939,511 | | | | 91.1% | |
| | | | | | |
| | Other assets (net of liabilities) | | | | | | | | | | | 874,722 | | | | 8.9% | |
| | | | | | |
| | Total net assets | | | | | | | | | | | $9,814,233 | | | | 100.0% | |
| | | | | | | |
| | | | | | | | | | | | | | | | | | |
| 1 | Variable rate security. The interest rate represents the rate in effect at November 30, 2022 and resets periodically based on the parenthetically disclosed reference rate and spread. |
| | | | | | | | | | | | |
| | | | | | | |
| 16 | | | | | | | | November 30, 2022 | | Annual Report | | The accompanying notes are an integral part of these financial statements. |
Sextant Bond Income Fund
| | | | | | | | | | | | |
Bond Quality Diversification | | | | | | | | | | | (unaudited) | |
| | | |
| % of Total Net Assets | | | | | | | | | |
| | | |
Rated “AAA” | | | 31.6% | | | ∎ | | | | | 
| |
Rated “AA+” | | | 3.6% | | | ∎ | | |
Rated “AA-” | | | 6.5% | | | ∎ | | |
Rated “A+” | | | 9.1% | | | ∎ | | |
Rated “A” | | | 10.5% | | | ∎ | | |
Rated “A-” | | | 14.2% | | | ∎ | | |
Rated “BBB+” | | | 9.8% | | | ∎ | | |
Rated “BBB” | | | 3.4% | | | ∎ | | |
Rated “BBB-” | | | 2.4% | | | ∎ | | |
Other assets (net of liabilities) | | | 8.9% | | | ∎ | | |
| | | | | | |
Credit ratings are the lesser of S&P Global Ratings or Moody’s Investors Service. If neither S&P nor Moody’s rate a particular security, that security is categorized as not rated (except for US Treasury securities and securities issued or backed by US agencies which inherit the credit rating for the US government). Ratings range from AAA (highest) to D (lowest). Bonds rated BBB or above are considered investment grade. Credit ratings BB and below are lower-rated securities (junk bonds). Ratings apply to the creditworthiness of the issuers of the underlying securities and not the Fund or its shares. Ratings may be subject to change. |
| | | | | | | | | | | | |
| | | | | | | |
| The accompanying notes are an integral part of these financial statements. | | Annual Report | | November 30, 2022 | | | | | | | | 17 |
Sextant Bond Income Fund
Statement of Assets and Liabilities
| | | | |
| As of November 30, 2022 | |
| | |
| | | | |
| |
Assets | | | | |
| |
Investments in securities, at value
(Cost $10,415,284) | | | $8,939,511 | |
| |
Cash | | | 768,887 | |
| |
Interest receivable | | | 106,862 | |
| |
Prepaid expenses | | | 10,758 | |
| |
Other assets | | | 400 | |
| |
Receivable for Fund shares sold | | | 137 | |
| | | | |
| |
Total assets | | | 9,826,555 | |
| | | | |
| |
Liabilities | | | | |
| |
Accrued audit expenses | | | 4,079 | |
| |
Accrued retirement plan custody fee | | | 2,386 | |
| |
Accrued advisory fees | | | 1,597 | |
| |
Accrued postage fees | | | 1,456 | |
| |
Accrued printing fees | | | 1,147 | |
| |
Accrued authentication expenses | | | 832 | |
| |
Accrued Chief Compliance Officer expenses | | | 401 | |
| |
Accrued legal expenses | | | 294 | |
| |
Accrued trustee expenses | | | 130 | |
| | | | |
| |
Total liabilities | | | 12,322 | |
| | | | |
| |
Net assets | | | $9,814,233 | |
| | |
| | | | |
| | |
Analysis of net assets | | | | |
| |
Paid-in capital (unlimited shares authorized, without par value) | | | $11,304,300 | |
| |
Total distributable earnings | | | (1,490,067 | ) |
| | | | |
| |
Net assets applicable to Fund shares outstanding | | | $9,814,233 | |
| | |
| | | | |
Fund shares outstanding | | | 2,247,920 | |
| | |
Net asset value, offering, and redemption price per share | | | $4.37 | |
| | | | | |
Statement of Operations
| | | | |
| Year ended November 30, 2022 | |
| | |
| | | | |
| |
Investment income | | | | |
| |
Interest income | | | $347,122 | |
| | | | |
| |
Total investment income | | | 347,122 | |
| | | | |
| |
Expenses | | | | |
| |
Investment advisory fees | | | 65,241 | |
| |
Filing and registration fees | | | 26,844 | |
| |
Audit fees | | | 7,000 | |
| |
Trustee fees | | | 2,762 | |
| |
Retirement plan custodial fees | | | 2,393 | |
| |
Chief Compliance Officer expenses | | | 2,033 | |
| |
Legal fees | | | 2,007 | |
| |
Other expenses | | | 1,331 | |
| |
Custodian fees | | | 440 | |
| |
Printing and postage fees | | | 259 | |
| | | | |
| |
Total gross expenses | | | 110,310 | |
| | | | |
| |
Less adviser fees waived | | | (39,940 | ) |
| |
Less custodian fee credits | | | (440 | ) |
| | | | |
| |
Net expenses | | | 69,930 | |
| | | | |
| |
Net investment income | | | $277,192 | |
| | |
| | | | |
| | |
| | | | |
| |
Net decrease in unrealized appreciation on investments | | | $(2,368,106 | ) |
| | | | |
| |
Net loss on investments | | | $(2,368,106 | ) |
| | |
| | | | |
| | |
Net decrease in net assets resulting from operations | | | $(2,090,914 | ) |
| | | | | |
| | | | | | | | | | | | |
| | | | | | | |
| 18 | | | | | | | | November 30, 2022 | | Annual Report | | The accompanying notes are an integral part of these financial statements. |
Sextant Bond Income Fund
| | | | | | | | |
Statements of Changes in Net Assets | | | Year ended November 30, 2022 | | | | Year ended November 30, 2021 | |
| | | |
Decrease in net assets from operations | | | | | | | | |
| | |
From operations | | | | | | | | |
| | |
Net investment income | | | $277,192 | | | | $299,437 | |
| | |
Net decrease in unrealized appreciation | | | (2,368,106 | ) | | | (616,441 | ) |
| | | | | | | | |
| | |
Net decrease in net assets | | | (2,090,914 | ) | | | (317,004 | ) |
| | | | | | | | |
| | |
| | | | | | | | |
| | |
Distributions to shareowners | | | (277,203 | ) | | | (299,448 | ) |
| | |
| | | | | | | | |
| | |
Capital share transactions | | | | | | | | |
| | |
Proceeds from sales of shares | | | 507,351 | | | | 687,194 | |
| | |
Value of shares issued in reinvestment of dividends | | | 270,589 | | | | 284,490 | |
| | |
Cost of shares redeemed | | | (1,128,328 | ) | | | (1,864,640 | ) |
| | | | | | | | |
| | |
Total capital share transactions | | | (350,388 | ) | | | (892,956 | ) |
| | | | | | | | |
| | |
Total decrease in net assets | | | (2,718,505 | ) | | | (1,509,408 | ) |
| | | |
| | | | | | | | |
| | | |
Net assets | | | | | | | | |
| | |
Beginning of year | | | 12,532,738 | | | | 14,042,146 | |
| | |
End of year | | | $9,814,233 | | | | $12,532,738 | |
| | | |
| | | | | | | | |
| | | |
Shares of the Fund sold and redeemed | | | | | | | | |
| | |
Number of shares sold | | | 104,214 | | | | 126,340 | |
| | |
Number of shares issued in reinvestment of dividends | | | 57,728 | | | | 52,576 | |
| | |
Number of shares redeemed | | | (233,970 | ) | | | (345,387 | ) |
| | | | | | | | |
| | |
Net decrease in number of shares outstanding | | | (72,028 | ) | | | (166,471 | ) |
| | | |
| | | | | | | | |
| | | | | | | | | | | | | | | | | | | | |
Financial Highlights | | | | | | | For year ended November 30, | | | | | |
| | | | | |
Selected data per share of outstanding capital stock throughout each year: | | | 2022 | | | | 2021 | | | | 2020 | | | | 2019 | | | | 2018 | |
| | | | | | |
Net asset value at beginning of year | | | $5.40 | | | | $5.65 | | | | $5.34 | | | | $4.89 | | | | $5.14 | |
| | | | | |
Income from investment operations | | | | | | | | | | | | | | | | | | | | |
| | | | | |
Net investment income | | | 0.12 | | | | 0.13 | | | | 0.14 | | | | 0.15 | | | | 0.16 | |
| | | | | |
Net gains (losses) on securities (both realized and unrealized) | | | (1.03 | ) | | | (0.25 | ) | | | 0.31 | | | | 0.45 | | | | (0.25 | ) |
| | | | | | | | | | | | | | | | | | | | |
| | | | | |
Total from investment operations | | | (0.91 | ) | | | (0.12 | ) | | | 0.45 | | | | 0.60 | | | | (0.09 | ) |
| | | | | | | | | | | | | | | | | | | | |
| | | | | |
Less distributions | | | | | | | | | | | | | | | | | | | | |
| | | | | |
Dividends (from net investment income) | | | (0.12 | ) | | | (0.13 | ) | | | (0.14 | ) | | | (0.15 | ) | | | (0.16 | ) |
| | | | | | | | | | | | | | | | | | | | |
| | | | | |
Total distributions | | | (0.12 | ) | | | (0.13 | ) | | | (0.14 | ) | | | (0.15 | ) | | | (0.16 | ) |
| | | | | | | | | | | | | | | | | | | | |
| | | | | |
| | | | | | | | | | | | | | | | | | | | |
| | | | | |
Net asset value at end of year | | | $4.37 | | | | $5.40 | | | | $5.65 | | | | $5.34 | | | | $4.89 | |
| | | | | | |
| | | | | | | | | | | | | | | | | | | | |
Total return | | | (16.94)% | | | | (2.19)% | | | | 8.48% | | | | 12.45% | | | | (1.78)% | |
| | | | | | |
Ratios / supplemental data | | | | | | | | | | | | | | | | | | | | |
| | | | | |
Net assets ($000), end of year | | | $9,814 | | | | $12,533 | | | | $14,042 | | | | $12,454 | | | | $10,933 | |
| | | | | |
Ratio of expenses to average net assets | | | | | | | | | | | | | | | | | | | | |
| | | | | |
Before adviser fees waiver and custodian fee credits | | | 1.03% | | | | 0.58% | | | | 0.63% | | | | 0.71% | | | | 0.86% | |
| | | | | |
After adviser fees waiver | | | 0.65% | | | | 0.53% | | | | 0.48% | | | | 0.55% | | | | 0.66% | |
| | | | | |
After adviser fees waiver and custodian fee credits | | | 0.65% | | | | 0.53% | | | | 0.48% | | | | 0.55% | | | | 0.65% | |
| | | | | |
Ratio of net investment income after adviser fee waiver and custodian credits to average net assets | | | 2.58% | | | | 2.31% | | | | 2.50% | | | | 2.96% | | | | 3.20% | |
| | | | | |
Portfolio turnover rate | | | 0% | | | | 3% | | | | 13% | | | | 21% | | | | 0% | |
| | | | | | |
| | | | | | | | | | | | | | | | | | | | |
| | | | | | | | | | | | |
| | | | | | | |
| The accompanying notes are an integral part of these financial statements. | | Annual Report | | November 30, 2022 | | | | | | | | 19 |
Sextant Core Fund
| | |
Performance Summary | | (unaudited) |
| | | | | | | | | | | | | | | | |
Average Annual Total Returns as of November 30, 2022 | |
| | | | | |
| | | 1 Year | | | 5 Year | | | 10 Year | | | Expense Ratio1 | |
| | | | |
Sextant Core Fund | | | -5.32% | | | | 5.47% | | | | 5.81% | | | | 0.57% | |
| | | | |
Dow Jones Moderate US Portfolio Index | | | -11.12% | | | | 3.94% | | | | 6.04% | | | | n/a | |
Growth of $10,000
| | |
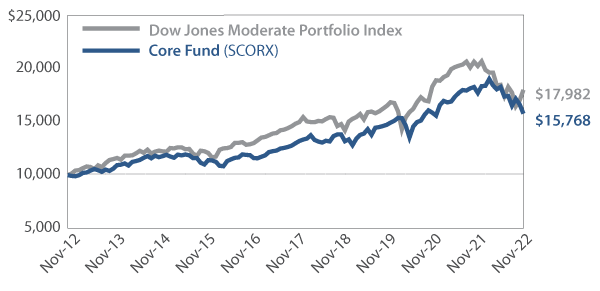 | | Comparison of any mutual fund to a market index must be made bearing in mind that the index is expense-free. Conversely, the fund will (1) be actively managed; (2) have an objective other than mirroring the index, such as limiting risk; (3) bear transaction and other costs; (4) stand ready to buy and sell its securities to shareowners on a daily basis; and (5) provide a wide range of services. The graph compares $10,000 invested in the Fund on November 30, 2012, to an identical amount invested in the Dow Jones Moderate US Portfolio Index, a broad-based index of stock and bond prices. The graph shows that an investment in the Fund would have risen to $15,768 versus $17,982 in the Index. |
Past performance does not guarantee future results. The “Growth of $10,000” graph and “Average Annual Returns” performance table assume the reinvestment of dividends and capital gains. They do not reflect the deduction of taxes that a shareowner might pay on fund distributions or the redemption of fund shares.
| 1 | By regulation, the expense ratio shown in this table is as stated in the Fund’s most recent prospectus, which is dated March 30, 2022, and incorporates results for the fiscal year ended November 30, 2021. The ratio presented in this table differs from expense ratios shown elsewhere in this report as they represent different periods. |
Fund Objective
The objectives of the Core Fund are long-term appreciation and capital preservation.
| | | | |
Top 10 Holdings | | | | |
| |
| % of Total Net Assets | |
| |
United States Treasury Note (0.125% due 08/31/2023) | | | 4.5 | % |
| |
ConocoPhillips | | | 2.6 | % |
| |
United States Treasury Bond (6.25% due 08/15/2023) | | | 2.3 | % |
| |
Novo Nordisk ADR | | | 2.1 | % |
| |
United States Treasury Note (1.125% due 01/15/2025) | | | 1.9 | % |
| |
Johnson Controls International | | | 1.8 | % |
| |
United States Treasury Note (2.75% due 11/15/2023) | | | 1.8 | % |
| |
NextEra Energy | | | 1.8 | % |
| |
Linde | | | 1.7 | % |
| |
Welltower (4.25% due 04/15/2028) | | | 1.7 | % |
| | | | | | | | | | | | |
Asset Allocation | | | | | | | | | | | | |
| | | |
| % of Total Net Assets | | | | | | | |
| | | |
Equity Securities | | | 57.4% | | | ∎ | | | | | 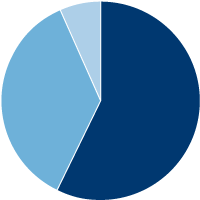 | |
Fixed-Income Securities | | | 36.2% | | | ∎ | | |
Other assets (net of liabilities) | | | 6.4% | | | ∎ | | |
| | | | | | | | |
Portfolio Diversification | | | | | | | | |
| | |
| | | % of Total Net Assets | |
| | |
Sectors | | | Equity | | | | Bonds | |
| | |
Industrials | | | 10.2% | | | | 5.3% | |
| | |
Government Bonds | | | 0.0% | | | | 14.3% | |
| | |
Health Care | | | 9.3% | | | | 2.1% | |
| | |
Technology | | | 9.1% | | | | 1.1% | |
| | |
Consumer Discretionary | | | 7.1% | | | | 2.8% | |
| | |
Financials | | | 3.9% | | | | 3.2% | |
| | |
Communications | | | 2.9% | | | | 3.9% | |
| | |
Energy | | | 4.7% | | | | 0.0% | |
| | |
Consumer Staples | | | 3.3% | | | | 1.1% | |
| | |
Materials | | | 4.3% | | | | 0.0% | |
| | |
Utilities | | | 2.6% | | | | 1.3% | |
| | |
Municipal Bonds | | | 0.0% | | | | 1.1% | |
| | |
Total | | | 57.4% | | | | 36.2% | |
| | | | | | | | | | |
| | | | | | |
| 20 | | | | | | | | November 30, 2022 | | Annual Report |
Sextant Core Fund
| | |
Discussion of Fund Performance | | (unaudited) |
(photo omitted)
Fiscal Year 2022
The Sextant Core Fund produced a one-year return of -5.32% as of November 30, 2022. The Fund’s benchmark, the Dow Jones Moderate Portfolio Index, returned -11.12% for the same period. The Fund outperformed the benchmark for each month of the year. At fiscal year-end, the Fund recorded a 30-day yield of 1.88% and reported turnover of 10.23% for 2022.
(photo omitted)
Factors Affecting Past Performance
Equities
The Sextant Core Fund’s mandate allocates a 60% weight in equity securities, with two-thirds being US-domiciled companies and one-third foreign-domiciled companies. The Fund generally holds equity positions in larger companies with strong balance sheets; the average market capitalization of positions held by the Fund was $118.7 billion with 22% total debt to market capitalization at fiscal year-end. The Fund’s 57.49% equity allocation at year-end was comprised of 53 positions across 10 countries.
At fiscal year-end 2021, the largest sector of the equity portion of the Sextant Core Fund was Technology at 21.9%, followed by Health Care (16.8%), and Industrials (12.8%). At the end of fiscal year 2022, the largest sector of the equity portion of the portfolio was Industrials at 17.7%, followed by Health Care (16.3%), and Technology (17.5%). Positive contributors from the Energy, Industrial, and Health Care sectors were offset by positions in the Materials, Technology, and Financial sectors.
Fixed Income
The Sextant Core Fund targets an allocation of 40% cash and investment-grade fixed-income securities. The Federal Reserve (the “Fed”) raised interest rates aggressively during the year, with five rate hikes increasing the federal funds rate by 3% as the Fed attempted to cool demand and slow the rate of inflation. Higher interest rates caused the prices of existing bonds to fall, but also provided the opportunity to reinvest interest payments and proceeds from maturing bonds at these higher interest rate levels and cushion portfolio volatility.
Looking Forward
The US equity market ended the fiscal year in a downtrend, with expectations that year-over-year economic and corporate earnings comparisons may face growing pressure in 2023. There are risks to growth in Europe and parts of Asia as well. The US capital markets appear to anticipate tighter monetary policy in combination with moderating fiscal policy during the first quarter of fiscal year 2023. Existing risks to economic growth such as deglobalization, supply chain interruption, and workforce issues are now joined by concerns of potentially persistent inflation — notably energy costs.
Management Fee Calculations
The Sextant Core Fund calculates the performance part of its management fee by comparing the Fund’s return to its Morningstar category’s average return. As of November 30, 2022, the Fund had a 12-month return of -5.32%, ahead of the Morningstar category average of -8.59% by more than 2%. Therefore, the base annual management fee of 0.50% for the Fund was increased to 0.70% for the month of December 2022.
| | | | | | | | | | |
| | | | | | |
| Annual Report | | November 30, 2022 | | | | | | | | 21 |
Sextant Core Fund
| | | | | | | | | | | | | | | | | | | | | | |
| | | Schedule of Investments | | | | | | | | | As of November 30, 2022 | |
| | | | | | | | |
| | | Common Stocks – 57.4% | | | | Number of Shares | | | Cost | | | Market
Value | | | Country1 | | Percentage
of Net
Assets | |
| | | | | | | |
| | | Communications | | | | | | | | | | | | | | | | |
| | | | | | | | |
| | | Internet Media | | | | | | | | | | | | | | | | |
| | | | | | | | |
| | | Alphabet, Class A2 | | | | | 2,000 | | | | $77,588 | | | | $201,980 | | | United States | | | 1.0% | |
| | | | | | | | |
| | | Telecom Carriers | | | | | | | | | | | | | | | | |
| | | | | | | | |
| | | BCE | | | | | 4,000 | | | | 168,153 | | | | 190,560 | | | Canada | | | 1.0% | |
| | | | | | | | |
| | | Telus | | | | | 8,000 | | | | 143,751 | | | | 170,480 | | | Canada | | | 0.9% | |
| | | | | | | | |
| | | | | | | | | | | | | | | | | | | | | | | |
| | | | | | | | |
| | | | | | | | | | | | 311,904 | | | | 361,040 | | | | | | 1.9% | |
| | | | | | | | |
| | | | | | | | | | | 389,492 | | | | 563,020 | | | | | | 2.9% | |
| | | | | | | |
| | | Consumer Discretionary | | | | | | | | | | | | | | | | |
| | | | | | | |
| | | Automotive Retailers | | | | | | | | | | | | | | |
| | | | | | | | |
| | | O’Reilly Automotive2 | | | | | 160 | | | | 135,486 | | | | 138,326 | | | United States | | | 0.7% | |
| | | | | | | | |
| | | Home Products Stores | | | | | | | | | | | | | | | | |
| | | | | | | | |
| | | Floor & Decor Holdings2 | | | | | 1,900 | | | | 138,164 | | | | 141,797 | | | United States | | | 0.8% | |
| | | | | | | | |
| | | Home Depot | | | | | 600 | | | | 114,158 | | | | 194,394 | | | United States | | | 1.0% | |
| | | | | | | | |
| | | Lowe’s | | | | | 1,100 | | | | 75,376 | | | | 233,805 | | | United States | | | 1.2% | |
| | | | | | | | |
| | | | | | | | | | | | | | | | | | | | | | | |
| | | | | | | | |
| | | | | | | | | | | | 327,698 | | | | 569,996 | | | | | | 3.0% | |
| | | | | | | | |
| | | Specialty Apparel Stores | | | | | | | | | | | | | | | | |
| | | | | | | | |
| | | Lululemon Athletica2 | | | | | 550 | | | | 177,757 | | | | 209,171 | | | United States | | | 1.1% | |
| | | | | | | | |
| | | Ross Stores | | | | | 2,000 | | | | 148,198 | | | | 235,340 | | | United States | | | 1.2% | |
| | | | | | | | |
| | | TJX Companies | | | | | 2,700 | | | | 139,837 | | | | 216,135 | | | United States | | | 1.1% | |
| | | | | | | | |
| | | | | | | | | | | | | | | | | | | | | | | |
| | | | | | | | |
| | | | | | | | | | | | 465,792 | | | | 660,646 | | | | | | 3.4% | |
| | | | | | | | |
| | | | | | | | | | | 928,976 | | | | 1,368,968 | | | | | | 7.1% | |
| | | | | | | |
| | | Consumer Staples | | | | | | | | | | | | | | | | |
| | | | | | | | |
| | | Beverages | | | | | | | | | | | | | | | | |
| | | | | | | | |
| | | PepsiCo | | | | | 1,250 | | | | 126,934 | | | | 231,887 | | | United States | | | 1.2% | |
| | | | | | | | |
| | | Household Products | | | | | | | | | | | | | | | | |
| | | | | | | | |
| | | Procter & Gamble | | | | | 1,150 | | | | 93,040 | | | | 171,534 | | | United States | | | 0.9% | |
| | | | | | | | |
| | | Packaged Food | | | | | | | | | | | | | | | | |
| | | | | | | | |
| | | Nestle ADR | | | | | 1,900 | | | | 147,925 | | | | 226,081 | | | Switzerland | | | 1.2% | |
| | | | | | | | |
| | | | | | | | | | | 367,899 | | | | 629,502 | | | | | | 3.3% | |
| | | | | | | |
| | | Energy | | | | | | | | | | | | | | | | |
| | | | | | | | |
| | | Exploration & Production | | | | | | | | | | | | | | | | |
| | | | | | | | |
| | | ConocoPhillips | | | | | 4,000 | | | | 159,112 | | | | 494,040 | | | United States | | | 2.6% | |
| | | | | | | | |
| | | Integrated Oils | | | | | | | | | | | | | | | | |
| | | | | | | | |
| | | Shell ADR | | | | | 5,100 | | | | 191,607 | | | | 298,197 | | | Netherlands | | | 1.5% | |
| | | | | | | | |
| | | Refining & Marketing | | | | | | | | | | | | | | | | |
| | | | | | | | |
| | | Phillips 66 | | | | | 1,100 | | | | 73,403 | | | | 119,284 | | | United States | | | 0.6% | |
| | | | | | | | |
| | | | | | | | | | | 424,122 | | | | 911,521 | | | | | | 4.7% | |
Continued on next page.
| | | | | | | | | | | | |
| | | | | | | |
| 22 | | | | | | | | November 30, 2022 | | Annual Report | | The accompanying notes are an integral part of these financial statements. |
Sextant Core Fund
| | | | | | | | | | | | | | | | | | | | | | |
| | | Schedule of Investments | | | | | | | | | | | As of November 30, 2022 | |
| | | | | | | | |
| | | Common Stocks – 57.4% | | | | Number of Shares | | | Cost | | | Market Value | | | Country1 | | Percentage of Net Assets | |
| | | | | | | |
| | | Financials | | | | | | | | | | | | | | | | |
| | | | | | | | |
| | | Consumer Finance | | | | | | | | | | | | | | | | |
| | | | | | | | |
| | | Mastercard, Class A | | | | | 500 | | | | $137,490 | | | | $178,200 | | | United States | | | 0.9% | |
| | | | | | | | |
| | | Visa | | | | | 900 | | | | 138,795 | | | | 195,300 | | | United States | | | 1.0% | |
| | | | | | | | |
| | | | | | | | | | | | | | | | | | | | | | | |
| | | | | | | | |
| | | | | | | | | | | | 276,285 | | | | 373,500 | | | | | | 1.9% | |
| | | | | | | | |
| | | Institutional Brokerage | | | | | | | | | | | | | | | | |
| | | | | | | | |
| | | Virtu Financial | | | | | 9,000 | | | | 149,940 | | | | 199,620 | | | United States | | | 1.1% | |
| | | | | | | | |
| | | P&C Insurance | | | | | | | | | | | | | | | | |
| | | | | | | | |
| | | Chubb | | | | | 810 | | | | 102,989 | | | | 177,868 | | | Switzerland | | | 0.9% | |
| | | | | | | | |
| | | | | | | | | | | 529,214 | | | | 750,988 | | | | | | 3.9% | |
| | | | | | | |
| | | Health Care | | | | | | | | | | | | | | | | |
| | | | | | | | |
| | | Large Pharma | | | | | | | | | | | | | | | | |
| | | | | | | | |
| | | AstraZeneca ADR | | | | | 3,000 | | | | 178,388 | | | | 203,910 | | | United Kingdom | | | 1.1% | |
| | | | | | | | |
| | | Bristol-Myers Squibb | | | | | 3,200 | | | | 170,677 | | | | 256,896 | | | United States | | | 1.3% | |
| | | | | | | | |
| | | Johnson & Johnson | | | | | 1,515 | | | | 131,720 | | | | 269,670 | | | United States | | | 1.4% | |
| | | | | | | | |
| | | Novo Nordisk ADR | | | | | 3,300 | | | | 162,632 | | | | 411,180 | | | Denmark | | | 2.1% | |
| | | | | | | | |
| | | Pfizer | | | | | 4,100 | | | | 136,419 | | | | 205,533 | | | United States | | | 1.1% | |
| | | | | | | | |
| | | | | | | | | | | | | | | | | | | | | | | |
| | | | | | | | |
| | | | | | | | | | | | 779,836 | | | | 1,347,189 | | | | | | 7.0% | |
| | | | | | | | |
| | | Managed Care | | | | | | | | | | | | | | | | |
| | | | | | | | |
| | | UnitedHealth Group | | | | | 300 | | | | 103,583 | | | | 164,328 | | | United States | | | 0.8% | |
| | | | | | | | |
| | | Medical Devices | | | | | | | | | | | | | | | | |
| | | | | | | | |
| | | Abbott Laboratories | | | | | 2,700 | | | | 97,630 | | | | 290,466 | | | United States | | | 1.5% | |
| | | | | | | | |
| | | | | | | | | | | 981,049 | | | | 1,801,983 | | | | | | 9.3% | |
| | | | | | | |
| | | Industrials | | | | | | | | | | | | | | | | |
| | | | | | | |
| | | Commercial & Residential Building
Equipment & Systems | | | | | | | | | | | | | | |
| | | | | | | | |
| | | Honeywell International | | | | | 1,000 | | | | 49,532 | | | | 219,550 | | | United States | | | 1.2% | |
| | | | | | | | |
| | | Johnson Controls International | | | | | 5,350 | | | | 205,042 | | | | 355,454 | | | United States | | | 1.8% | |
| | | | | | | | |
| | | | | | | | | | | | | | | | | | | | | | | |
| | | | | | | | |
| | | | | | | | | | | | 254,574 | | | | 575,004 | | | | | | 3.0% | |
| | | | | | | | |
| | | Electrical Power Equipment | | | | | | | | | | | | | | | | |
| | | | | | | | |
| | | Eaton Corp | | | | | 2,000 | | | | 298,440 | | | | 326,900 | | | United States | | | 1.7% | |
| | | | | | | |
| | | Flow Control Equipment | | | | | | | | | | | | | | |
| | | | | | | | |
| | | Parker Hannifin | | | | | 800 | | | | 78,065 | | | | 239,152 | | | United States | | | 1.2% | |
| | | | | | | |
| | | Industrial Distribution & Rental | | | | | | | | | | | | | | | | | | |
| | | | | | | | |
| | | Fastenal | | | | | 2,800 | | | | 64,603 | | | | 144,228 | | | United States | | | 0.8% | |
| | | | | | | | |
| | | Industrial Machinery | | | | | | | | | | | | | | | | |
| | | | | | | | |
| | | Illinois Tool Works | | | | | 525 | | | | 116,199 | | | | 119,422 | | | United States | | | 0.6% | |
| | | | | | | | |
| | | Rail Freight | | | | | | | | | | | | | | | | |
| | | | | | | | |
| | | Canadian National Railway | | | | | 2,000 | | | | 86,366 | | | | 256,860 | | | Canada | | | 1.3% | |
| | | | | | | | |
| | | Canadian Pacific Railway | | | | | 2,018 | | | | 142,794 | | | | 165,294 | | | Canada | | | 0.9% | |
| | | | | | | | |
| | | | | | | | | | | | | | | | | | | | | | | |
| | | | | | | | |
| | | | | | | | | | | | 229,160 | | | | 422,154 | | | | | | 2.2% | |
Continued on next page.
| | | | | | | | | | | | |
| | | | | | | |
| The accompanying notes are an integral part of these financial statements. | | Annual Report | | November 30, 2022 | | | | | | | | 23 |
Sextant Core Fund
| | | | | | | | | | | | | | | | | | | | | | |
| | | Schedule of Investments | | | | | | | | | As of November 30, 2022 | |
| | | | | | | | |
| | | Common Stocks – 57.4% | | | | Number of Shares | | | Cost | | | Market Value | | | Country1 | | Percentage of Net Assets | |
| | | | | | | |
| | | Industrials (continued) | | | | | | | | | | | | | | | | |
| | | | | | | | |
| | | Waste Management | | | | | | | | | | | | | | | | |
| | | | | | | | |
| | | Republic Services | | | | | 950 | | | | $116,161 | | | | $132,326 | | | United States | | | 0.7% | |
| | | | | | | | |
| | | | | | | | | | | 1,157,202 | | | | 1,959,186 | | | | | | 10.2% | |
| | | | | | | |
| | | Materials | | | | | | | | | | | | | | | | |
| | | | | | | | |
| | | Basic & Diversified Chemicals | | | | | | | | | | | | | | | | |
| | | | | | | | |
| | | Linde | | | | | 1,000 | | | | 102,982 | | | | 336,480 | | | Ireland | | | 1.7% | |
| | | | | | | | |
| | | Precious Metal Mining | | | | | | | | | | | | | | | | |
| | | | | | | | |
| | | Barrick Gold | | | | | 10,000 | | | | 177,238 | | | | 163,200 | | | Canada | | | 0.8% | |
| | | | | | | | |
| | | Newmont | | | | | 4,000 | | | | 162,593 | | | | 189,880 | | | United States | | | 1.0% | |
| | | | | | | | |
| | | | | | | | | | | | | | | | | | | | | | | |
| | | | | | | | |
| | | | | | | | | | | | 339,831 | | | | 353,080 | | | | | | 1.8% | |
| | | | | | | | |
| | | Specialty Chemicals | | | | | | | | | | | | | | | | |
| | | | | | | | |
| | | RPM International | | | | | 1,400 | | | | 44,141 | | | | 145,068 | | | United States | | | 0.8% | |
| | | | | | | | |
| | | | | | | | | | | 486,954 | | | | 834,628 | | | | | | 4.3% | |
| | | | | | | |
| | | Technology | | | | | | | | | | | | | | | | |
| | | | | | | | |
| | | Application Software | | | | | | | | | | | | | | | | |
| | | | | | | | |
| | | Activision Blizzard | | | | | 1,900 | | | | 141,605 | | | | 140,505 | | | United States | | | 0.7% | |
| | | | | | | | |
| | | Communications Equipment | | | | | | | | | | | | | | | | |
| | | | | | | | |
| | | Apple | | | | | 1,900 | | | | 44,723 | | | | 281,257 | | | United States | | | 1.5% | |
| | | | | | | | |
| | | Motorola Solutions | | | | | 770 | | | | 187,585 | | | | 209,594 | | | United States | | | 1.1% | |
| | | | | | | | |
| | | | | | | | | | | | | | | | | | | | | | | |
| | | | | | | | |
| | | | | | | | | | | | 232,308 | | | | 490,851 | | | | | | 2.6% | |
| | | | | | | | |
| | | Consumer Electronics | | | | | | | | | | | | | | | | |
| | | | | | | | |
| | | Sony ADR | | | | | 1,900 | | | | 146,607 | | | | 157,833 | | | Japan | | | 0.8% | |
| | | | | | | | |
| | | Information Services | | | | | | | | | | | | | | | | | | | | |
| | | | | | | | |
| | | Experian | | | | | 2,300 | | | | 79,023 | | | | 80,408 | | | United States | | | 0.4% | |
| | | | | | | | |
| | | Infrastructure Software | | | | | | | | | | | | | | | | |
| | | | | | | | |
| | | Microsoft | | | | | 800 | | | | 99,998 | | | | 204,112 | | | United States | | | 1.1% | |
| �� | | | | | | | |
| | | Oracle | | | | | 3,100 | | | | 124,402 | | | | 257,393 | | | United States | | | 1.3% | |
| | | | | | | | |
| | | | | | | | | | | | | | | | | | | | | | | |
| | | | | | | | |
| | | | | | | | | | | | 224,400 | | | | 461,505 | | | | | | 2.4% | |
| | | | | | | | |
| | | Semiconductor Devices | | | | | | | | | | | | | | | | |
| | | | | | | | |
| | | Infineon Technologies ADR | | | | | 4,775 | | | | 105,273 | | | | 161,013 | | | Germany | | | 0.8% | |
| | | | | | | | |
| | | Micron Technology | | | | | 1,550 | | | | 59,028 | | | | 89,358 | | | United States | | | 0.4% | |
| | | | | | | | |
| | | NXP Semiconductors | | | | | 950 | | | | 90,828 | | | | 167,048 | | | Netherlands | | | 0.9% | |
| | | | | | | | |
| | | Qualcomm | | | | | 100 | | | | 5,186 | | | | 12,649 | | | United States | | | 0.1% | |
| | | | | | | | |
| | | | | | | | | | | | | | | | | | | | | | | |
| | | | | | | | |
| | | | | | | | | | | | 260,315 | | | | 430,068 | | | | | | 2.2% | |
| | | | | | | | |
| | | | | | | | | | | 1,084,258 | | | | 1,761,170 | | | | | | 9.1% | |
Continued on next page.
| | | | | | | | | | | | |
| | | | | | | |
| 24 | | | | | | | | November 30, 2022 | | Annual Report | | The accompanying notes are an integral part of these financial statements. |
Sextant Core Fund
| | | | | | | | | | | | | | | | | | | | | | |
| | | Schedule of Investments | | | | | | | | | As of November 30, 2022 | |
| | | | | | | | |
| | | Common Stocks – 57.4% | | | | Number of Shares | | | Cost | | | Market Value | | | Country1 | | Percentage of Net Assets | |
| | | | | | | |
| | | Utilities | | | | | | | | | | | | | | | | |
| | | | | | | | |
| | | Integrated Utilities | | | | | | | | | | | | | | | | |
| | | | | | | | |
| | | Duke Energy | | | | | 1,600 | | | | $141,145 | | | | $159,888 | | | United States | | | 0.8% | |
| | | | | | | | |
| | | NextEra Energy | | | | | 4,000 | | | | 72,152 | | | | 338,800 | | | United States | | | 1.8% | |
| | | | | | | | |
| | | | | | | | | | | 213,297 | | | | 498,688 | | | | | | 2.6% | |
| | | | | | | |
| | | | | | | | | | | | | | | | | | | | | | |
| | | | | | | | |
| | Total Common Stocks | | | | | | | | | $6,562,463 | | | | $11,079,654 | | | | | | 57.4% | |
| | | | | | | | | | | | | | | | | | |
| | | | | | | |
| | | Corporate Bonds – 20.8% | | | | Coupon / Maturity | | Face Amount | | | Market Value | | | Percentage of Net Assets | |
| | | | | | |
| | | Communications | | | | | | | | | | | | | |
| | | | | | | |
| | | Bellsouth Capital Funding | | | | 7.875% due 02/15/2030 | | | $150,000 | | | | $162,005 | | | | 0.9% | |
| | | | | | | |
| | | Comcast Corp | | | | 5.65% due 06/15/2035 | | | 300,000 | | | | 313,388 | | | | 1.6% | |
| | | | | | | |
| | | Walt Disney | | | | 6.40% due 12/15/2035 | | | 250,000 | | | | 276,839 | | | | 1.4% | |
| | | | | | | |
| | | | | | | | | | | | | 752,232 | | | | 3.9% | |
| | | | | | |
| | | Consumer Discretionary | | | | | | | | | | | | | |
| | | | | | | |
| | | Expedia Group | | | | 5.00% due 02/15/2026 | | | 250,000 | | | | 249,013 | | | | 1.3% | |
| | | | | | | |
| | | Lowe’s | | | | 4.25% due 09/15/2044 | | | 250,000 | | | | 194,934 | | | | 1.0% | |
| | | | | | | |
| | | Stanford University | | | | 4.013% due 05/01/2042 | | | 100,000 | | | | 87,649 | | | | 0.5% | |
| | | | | | | |
| | | | | | | | | | | | | 531,596 | | | | 2.8% | |
| | | | | | |
| | | Consumer Staples | | | | | | | | | | | | | |
| | | | | | | |
| | | Coca Cola Co | | | | 1.00% due 03/15/2028 | | | 250,000 | | | | 211,415 | | | | 1.1% | |
| | | | | | | |
| | | | | | | | | | | | | | | | | | |
| | | | | | |
| | | Financials | | | | | | | | | | | | | |
| | | | | | | |
| | | Charles Schwab Corp | | | | 3.00% due 03/10/2025 | | | 300,000 | | | | 288,607 | | | | 1.5% | |
| | | | | | | |
| | | Welltower | | | | 4.25% due 04/15/2028 | | | 350,000 | | | | 330,234 | | | | 1.7% | |
| | | | | | | |
| | | | | | | | | | | | | 618,841 | | | | 3.2% | |
| | | | | | |
| | | Health Care | | | | | | | | | | | | | |
| | | | | | | |
| | | Cardinal Health | | | | 3.50% due 11/15/2024 | | | 155,000 | | | | 149,963 | | | | 0.8% | |
| | | | | | | |
| | | Gilead Sciences | | | | 3.70% due 04/01/2024 | | | 250,000 | | | | 245,841 | | | | 1.3% | |
| | | | | | | |
| | | | | | | | | | | | | 395,804 | | | | 2.1% | |
| | | | | | |
| | | Industrials | | | | | | | | | | | | | |
| | | | | | | |
| | | Burlington Northern Santa Fe | | | | 6.20% due 08/15/2036 | | | 150,000 | | | | 164,384 | | | | 0.9% | |
| | | | | | | |
| | | CSX Corp | | | | 4.65% due 03/01/2068 | | | 300,000 | | | | 257,053 | | | | 1.3% | |
| | | | | | | |
| | | FedEx | | | | 3.90% due 02/01/2035 | | | 250,000 | | | | 213,515 | | | | 1.1% | |
| | | | | | | |
| | | Legrand France Yankee | | | | 8.50% due 02/15/2025 | | | 170,000 | | | | 183,795 | | | | 0.9% | |
| | | | | | | |
| | | Union Pacific | | | | 3.375% due 02/01/2035 | | | 250,000 | | | | 213,255 | | | | 1.1% | |
| | | | | | | |
| | | | | | | | | | | | | 1,032,002 | | | | 5.3% | |
Continued on next page.
| | | | | | | | | | | | |
| | | | | | | |
| The accompanying notes are an integral part of these financial statements. | | Annual Report | | November 30, 2022 | | | | | | | | 25 |
Sextant Core Fund
| | | | | | | | | | | | | | | | | | |
| | | Schedule of Investments | | | | | | | | | | | | As of November 30, 2022 | |
| | | | | | | |
| | | Corporate Bonds – 20.8% | | | | Coupon / Maturity | | Face Amount | | | Market Value | | | Percentage of Net Assets | |
| | | | | | |
| | | Technology | | | | | | | | | | | | | |
| | | | | | | |
| | | Qualcomm | | | | 3.25% due 05/20/2027 | | | $220,000 | | | | $209,831 | | | | 1.1% | |
| | | | | | | |
| | | | | | | | | | | | | | | | | | |
| | | | | | |
| | | Utilities | | | | | | | | | | | | | |
| | | | | | | |
| | | PacifiCorp | | | | 6.00% due 01/15/2039 | | | 250,000 | | | | 260,371 | | | | 1.3% | |
| | | | | | | |
| | Total Corporate Bonds | | | | (Cost $4,563,336) | | | | | | | $4,012,092 | | | | 20.8% | |
| | | | | | |
| | | | | | | | | | | | | | | | | | |
| | | | | | | |
| | | Government Bonds – 14.3% | | | | Coupon / Maturity | | Face Amount | | | Market Value | | | Percentage of Net Assets | |
| | | | | | |
| | | United States Treasury Bills | | | | | | | | | | | | | |
| | | | | | | |
| | | United States Treasury Bill | | | | 0.00% due 01/26/2023 | | | $250,000 | | | | $248,425 | | | | 1.3% | |
| | | | | | | |
| | | | | | | | | | | | | | | | | | |
| | | | | | |
| | | United States Treasury Bonds | | | | | | | | | | | | | |
| | | | | | | |
| | | United States Treasury Bond | | | | 6.25% due 08/15/2023 | | | 438,000 | | | | 442,791 | | | | 2.3% | |
| | | | | | | |
| | | United States Treasury Bond | | | | 4.50% due 02/15/2036 | | | 137,000 | | | | 148,816 | | | | 0.8% | |
| | | | | | | |
| | | United States Treasury Bond | | | | 3.625% due 02/15/2044 | | | 155,000 | | | | 145,076 | | | | 0.7% | |
| | | | | | | |
| | | | | | | | | | | | | 736,683 | | | | 3.8% | |
| | | | | | |
| | | United States Treasury Notes | | | | | | | | | | | | | |
| | | | | | | |
| | | United States Treasury Note | | | | 0.125% due 08/31/2023 | | | 900,000 | | | | 869,590 | | | | 4.5% | |
| | | | | | | |
| | | United States Treasury Note | | | | 2.75% due 11/15/2023 | | | 350,000 | | | | 343,465 | | | | 1.8% | |
| | | | | | | |
| | | United States Treasury Note | | | | 2.00% due 05/31/2024 | | | 80,000 | | | | 76,987 | | | | 0.4% | |
| | | | | | | |
| | | United States Treasury Note | | | | 1.125% due 01/15/2025 | | | 400,000 | | | | 373,953 | | | | 1.9% | |
| | | | | | | |
| | | United States Treasury Note | | | | 1.625% due 04/30/2023 | | | 106,000 | | | | 104,696 | | | | 0.6% | |
| | | | | | | |
| | | | | | | | | | | | | 1,768,691 | | | | 9.2% | |
| | | | | | |
| | | | | | | | | | | | | | | | | | |
| | | | | | | |
| | Total Government Bonds | | | | (Cost $2,826,905) | | | | | | | $2,753,799 | | | | 14.3% | |
| | | | | | |
| | | | | | | | | | | | | | | | | | |
Continued on next page.
| | | | | | | | | | | | |
| | | | | | | |
| 26 | | | | | | | | November 30, 2022 | | Annual Report | | The accompanying notes are an integral part of these financial statements. |
Sextant Core Fund
| | | | | | | | | | | | | | | | | | |
| | | Schedule of Investments | | | | | | | | | | | | As of November 30, 2022 | |
| | | | | | | |
| | | Municipal Bonds – 1.1% | | | | Coupon / Maturity | | Face Amount | | | Market Value | | | Percentage of Net Assets | |
| | | | | | |
| | | General Obligation | | | | | | | | | | | | | |
| | | | | | | |
| | | Skagit SD #1 | | | | 4.613% due 12/01/2022 | | | $100,000 | | | | $100,000 | | | | 0.5% | |
| | | | | | | |
| | | | | | | | | | | | | | | | | | |
| | | | | | |
| | | Utility Networks | | | | | | | | | | | | | |
| | | | | | | |
| | | Tacoma WA Elec Sys Revenue | | | | 5.966% due 01/01/2035 | | | 100,000 | | | | 107,405 | | | | 0.6% | |
| | | | | | | |
| | | | | | | | | | | | | | | | | | |
| | | | | | |
| | | | | | | | | | | | | | | | | | |
| | | | | | | |
| | Total Municipal Bonds | | | | (Cost $219,081) | | | | | | | $207,405 | | | | 1.1% | |
| | | | | | |
| | | | | | | | | | | | | | | | | | | |
| | | | | | |
| | Total investments | | | | (Cost $14,171,785) | | | | | | | $18,052,950 | | | | 93.6% | |
| | | | | | |
| | Other assets (net of liabilities) | | | | | | | | | | | 1,229,014 | | | | 6.4% | |
| | | | | | |
| | Total net assets | | | | | | | | | | | $19,281,964 | | | | 100.0% | |
| | | | | | | |
| | | | | | | | | | | | | | | | | | |
ADR: American Depositary Receipt
| | | | | | | | | | | | |
Bond Quality Diversification | | | | (unaudited) | |
| | | |
| % of Total Net Assets | | | | | | | | | |
| | | |
AAA | | | 9.5% | | | ∎ | | | | | 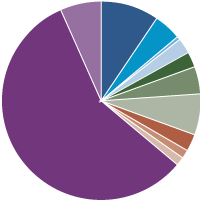
| |
AA+ | | | 4.5% | | | ∎ | | |
AA- | | | 0.6% | | | ∎ | | |
A+ | | | 2.4% | | | ∎ | | |
A | | | 2.6% | | | ∎ | | |
A- | | | 4.5% | | | ∎ | | |
BBB+ | | | 6.7% | | | ∎ | | |
BBB | | | 2.8% | | | ∎ | | |
BBB- | | | 1.3% | | | ∎ | | |
Not Rated | | | 1.3% | | | ∎ | | |
Equity | | | 57.4% | | | ∎ | | |
Other Assets (net of liabilities) | | | 6.4% | | | ∎ | | |
Credit ratings are the lesser of S&P Global Ratings or Moody’s Investors Service. If neither S&P nor Moody’s rate a particular security, that security is categorized as not rated (except for US Treasury securities and securities issued or backed by US agencies which inherit the credit rating for the US government). Ratings range from AAA (highest) to D (lowest). Bonds rated BBB or above are considered investment grade. Credit ratings BB and below are lower-rated securities (junk bonds). Ratings apply to the creditworthiness of the issuers of the underlying securities and not the Fund or its shares. Ratings may be subject to change. | |
| | | | | | | | | | | | |
| | | | | | | |
| The accompanying notes are an integral part of these financial statements. | | Annual Report | | November 30, 2022 | | | | | | | | 27 |
Sextant Core Fund
Statement of Assets and Liabilities
| | | | |
| As of November 30, 2022 | |
| | |
| | | | |
| |
Assets | | | | |
| |
Investments in securities, at value
(Cost $14,171,785) | | | $18,052,950 | |
| |
Cash | | | 1,133,691 | |
| |
Dividends and interest receivable | | | 99,200 | |
| |
Prepaid expenses | | | 10,636 | |
| |
Receivable for Fund shares sold | | | 4,093 | |
| | | | |
| |
Total assets | | | 19,300,570 | |
| | | | |
| |
Liabilities | | | | |
| |
Accrued advisory fees | | | 7,671 | |
| |
Accrued audit expenses | | | 5,721 | |
| |
Accrued retirement plan custody fee | | | 3,069 | |
| |
Accrued printing fees | | | 1,307 | |
| |
Accrued Chief Compliance Officer expenses | | | 477 | |
| |
Accrued other liabilities | | | 202 | |
| |
Accrued legal expenses | | | 134 | |
| |
Accrued trustee expenses | | | 25 | |
| | | | |
| |
Total liabilities | | | 18,606 | |
| | | | |
| |
Net assets | | | $19,281,964 | |
| | |
| | | | |
| | |
Analysis of net assets | | | | |
| |
Paid-in capital (unlimited shares authorized, without par value) | | | $15,131,626 | |
| |
Total distributable earnings | | | 4,150,338 | |
| | | | |
| |
Net assets applicable to Fund shares outstanding | | | $19,281,964 | |
| | |
| | | | |
Fund shares outstanding | | | 1,296,477 | |
| | |
Net asset value, offering, and redemption price per share | | | $14.87 | |
| | | | | |
Statement of Operations
| | | | |
| Year ended November 30, 2022 | |
| | |
| | | | |
| |
Investment income | | | | |
| |
Dividend Income (net of foreign tax of $9,156) | | | $224,125 | |
| |
Interest income | | | 210,047 | |
| | | | |
| |
Total investment income | | | 434,172 | |
| | | | |
| |
Expenses | | | | |
| |
Investment adviser fees | | | 107,230 | |
| |
Filing and registration fees | | | 27,904 | |
| |
Audit fees | | | 10,642 | |
| |
Legal fees | | | 4,419 | |
| |
Other operating expenses | | | 4,325 | |
| |
Trustee fees | | | 4,273 | |
| |
Chief Compliance Officer expenses | | | 3,721 | |
| |
Retirement plan custodial fees | | | 3,172 | |
| |
Printing and postage fees | | | 806 | |
| |
Custodian fees | | | 782 | |
| | | | |
| |
Total gross expenses | | | 167,274 | |
| | | | |
| |
Less custodian fee credits | | | (782 | ) |
| | | | |
| |
Net expenses | | | 166,492 | |
| | | | |
| |
Net investment income | | | $267,680 | |
| | |
| | | | |
| | |
| | | | |
| |
Net realized gain from investments and foreign currencyA | | | $231,120 | |
| |
Net decrease in unrealized appreciation on investments and foreign currency | | | (1,517,213 | ) |
| | | | |
| |
Net loss on investments | | | $(1,286,093 | ) |
| | |
| | | | |
| | |
Net decrease in net assets resulting from operations | | | $(1,018,413 | ) |
| | | | | |
| A | Includes $211,414 in net realized gains from redemptions in-kind. |
| | | | | | | | | | | | |
| | | | | | | |
| 28 | | | | | | | | November 30, 2022 | | Annual Report | | The accompanying notes are an integral part of these financial statements. |
Sextant Core Fund
| | | | | | | | |
Statements of Changes in Net Assets | | | Year ended November 30, 2022 | | | | Year ended November 30, 2021 | |
| | | |
Increase (decrease) in net assets from operations | | | | | | | | |
| | |
From operations | | | | | | | | |
| | |
Net investment income | | | $267,680 | | | | $298,083 | |
| | |
Net realized gain on investment | | | 231,120 | | | | 787,546 | |
| | |
Net increase (decrease) in unrealized appreciation | | | (1,517,213 | ) | | | 937,969 | |
| | | | | | | | |
| | |
Net increase (decrease) in net assets | | | (1,018,413 | ) | | | 2,023,598 | |
| | | | | | | | |
| | |
| | | | | | | | |
| | |
Distributions to shareowners | | | (596,464 | ) | | | (265,566 | ) |
| | |
| | | | | | | | |
| | |
Capital share transactions | | | | | | | | |
| | |
Proceeds from sales of shares | | | 3,995,234 | | | | 3,977,089 | |
| | |
Value of shares issued in reinvestment of dividends | | | 595,223 | | | | 265,047 | |
| | |
Cost of shares redeemed | | | (2,625,501 | ) | | | (6,030,588 | ) |
| | | | | | | | |
| | |
Total capital share transactions | | | 1,964,956 | | | | (1,788,452 | ) |
| | | | | | | | |
| | |
Total increase (decrease) in net assets | | | 350,079 | | | | (30,420 | ) |
| | | |
| | | | | | | | |
| | | |
Net assets | | | | | | | | |
| | |
Beginning of year | | | 18,931,885 | | | | 18,962,305 | |
| | |
End of year | | | $19,281,964 | | | | $18,931,885 | |
| | | |
| | | | | | | | |
| | | |
Shares of the Fund sold and redeemed | | | | | | | | |
| | |
Number of shares sold | | | 269,720 | | | | 254,960 | |
| | |
Number of shares issued in reinvestment of dividends | | | 36,856 | | | | 17,812 | |
| | |
Number of shares redeemed | | | (179,014 | ) | | | (384,653 | ) |
| | | | | | | | |
| | |
Net increase (decrease) in number of shares outstanding | | | 127,562 | | | | (111,881 | ) |
| | | |
| | | | | | | | |
| | | | | | | | | | | | | | | | | | | | |
Financial Highlights | | | For year ended November 30, | |
| | | | | |
Selected data per share of outstanding capital stock throughout each year: | | | 2022 | | | | 2021 | | | | 2020 | | | | 2019 | | | | 2018 | |
| | | | | | |
Net asset value at beginning of year | | | $16.20 | | | | $14.81 | | | | $14.31 | | | | $12.84 | | | | $12.99 | |
| | | | | |
Income from investment operations | | | | | | | | | | | | | | | | | | | | |
| | | | | |
Net investment income | | | 0.21 | | | | 0.24 | | | | 0.19 | | | | 0.19 | | | | 0.18 | |
| | | | | |
Net gains (losses) on securities (both realized and unrealized) | | | (1.03 | ) | | | 1.36 | | | | 1.13 | | | | 1.45 | | | | (0.16 | ) |
| | | | | | | | | | | | | | | | | | | | |
| | | | | |
Total from investment operations | | | (0.82 | ) | | | 1.60 | | | | 1.32 | | | | 1.64 | | | | 0.02 | |
| | | | | | | | | | | | | | | | | | | | |
| | | | | |
Less distributions | | | | | | | | | | | | | | | | | | | | |
| | | | | |
Dividends (from net investment income) | | | (0.25 | ) | | | (0.21 | ) | | | (0.20 | ) | | | (0.17 | ) | | | (0.17 | ) |
| | | | | |
Distributions (from capital gains) | | | (0.26 | ) | | | - | | | | (0.62 | ) | | | - | | | | - | |
| | | | | | | | | | | | | | | | | | | | |
| | | | | |
Total distributions | | | (0.51 | ) | | | (0.21 | ) | | | (0.82 | ) | | | (0.17 | ) | | | (0.17 | ) |
| | | | | | | | | | | | | | | | | | | | |
| | | | | |
| | | | | | | | | | | | | | | | | | | | |
| | | | | |
Net asset value at end of year | | | $14.87 | | | | $16.20 | | | | $14.81 | | | | $14.31 | | | | $12.84 | |
| | | | | | |
| | | | | | | | | | | | | | | | | | | | |
Total return | | | (5.32)% | | | | 10.95% | | | | 9.72% | | | | 13.04% | | | | 0.16% | |
| | | | | | |
Ratios / supplemental data | | | | | | | | | | | | | | | | | | | | |
| | | | | |
Net assets ($000), end of year | | | $19,282 | | | | $18,932 | | | | $18,962 | | | | $16,875 | | | | $12,851 | |
| | | | | |
Ratio of expenses to average net assets | | | | | | | | | | | | | | | | | | | | |
| | | | | |
Before custodian fee credits | | | 0.90% | | | | 0.57% | | | | 0.88% | | | | 0.90% | | | | 0.88% | |
| | | | | |
After custodian fee credits | | | 0.90% | | | | 0.56% | | | | 0.88% | | | | 0.90% | | | | 0.87% | |
| | | | | |
Ratio of net investment income after custodian fee credits to average net assets | | | 1.44% | | | | 1.52% | | | | 1.40% | | | | 1.63% | | | | 1.41% | |
| | | | | |
Portfolio turnover rate | | | 10% | | | | 14% | | | | 19% | | | | 28% | | | | 30% | |
| | | | | | |
| | | | | | | | | | | | | | | | | | | | |
| | | | | | | | | | | | |
| | | | | | | |
| The accompanying notes are an integral part of these financial statements. | | Annual Report | | November 30, 2022 | | | | | | | | 29 |
Sextant Global High Income Fund
| | |
Performance Summary | | (unaudited) |
| | | | | | | | | | | | | | | | |
Average Annual Total Returns as of November 30, 2022 | |
| | | | | |
| | | 1 Year | | | 5 Year | | | 10 Year | | | Expense Ratio1 | |
| | | | |
Sextant Global High Income Fund | | | -4.16% | | | | 2.16% | | | | 4.14% | | | | 0.78% | |
| | | | |
S&P Global 1200 Index | | | -9.38% | | | | 7.81% | | | | 10.02% | | | | n/a | |
| | | | |
Bloomberg Global High Yield Corporate Index | | | -11.62% | | | | 1.04% | | | | 3.35% | | | | n/a | |
Growth of $10,000
| | |
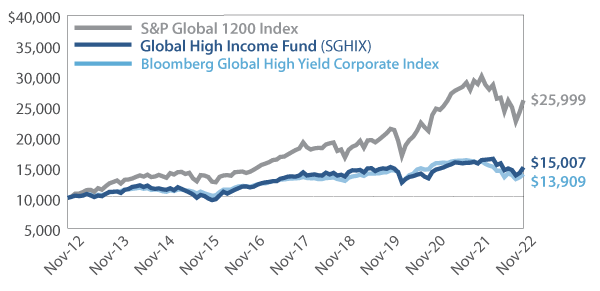 | | Comparison of any mutual fund to a market index must be made bearing in mind that the index is expense-free. Conversely, the fund will (1) be actively managed; (2) have an objective other than mirroring the index, such as limiting risk; (3) bear transaction and other costs; (4) stand ready to buy and sell its securities to shareowners on a daily basis; and (5) provide a wide range of services. The graph compares $10,000 invested in the Fund on November 30, 2012 to an identical amount invested in the S&P Global 1200 Index, a global stock market index covering nearly 70% of the world’s equity markets. The graph shows that an investment in the Fund would have risen to $15,007 versus $25,999 in the S&P Global 1200 Index and $13,909 in the Bloomberg Global High Yield Corporate Index. |
Past performance does not guarantee future results. The “Growth of $10,000” graph and “Average Annual Returns” performance table assume the reinvestment of dividends and capital gains. They do not reflect the deduction of taxes that a shareowner might pay on fund distributions or the redemption of fund shares.
| 1 | By regulation, the expense ratio shown in this table is as stated in the Fund’s most recent prospectus, which is dated March 30, 2022, and incorporates results for the fiscal year ended November 30, 2021, before fee waivers. The actual expense ratio, shown in the most recent prospectus after fee waivers, was 0.75%. The ratio presented in this table differs from expense ratios shown elsewhere in this report as they represent different periods. |
Fund Objective
The objective of the Global High Income Fund is high income, with a secondary objective of capital preservation.
| | | | |
Top 10 Holdings | |
| |
| % of Total Net Assets | |
| |
United States Treasury Bill (0.00% due 01/26/2023) | | | 5.5% | |
| |
United States Treasury Note (0.125% due 08/31/2023) | | | 4.3% | |
| |
BHP Biliton ADR | | | 3.8% | |
| |
Southern Copper | | | 3.4% | |
| |
Skandinaviska Enskilda Banken, Class A | | | 3.1% | |
| |
South32 ADR | | | 2.9% | |
| |
Norsk Hydro ASA | | | 2.9% | |
| |
Cisco Systems | | | 2.7% | |
| |
Netflix (4.375% due 11/15/2026) | | | 2.7% | |
| |
Total ADR | | | 2.6% | |
| | | | | | | | | | | | |
Asset Allocation | | | | | | | | | | | | |
| | | | |
| % of Total Net Assets | | | | | | | | | | | | |
| | | |
Equity Securities | | | 44.7% | | | ∎ | | | | | 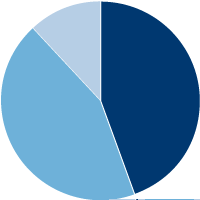
| |
Fixed-Income Securities | | | 43.5% | | | ∎ | | |
Other assets (net of liabilities) | | | 11.8% | | | ∎ | | |
| | | |
| | | | | | | | | | | | |
| | | | | | | | |
Portfolio Diversification | | | | | | | | |
| | |
| | | % of Total Net Assets | |
| | |
Sectors | | | Equity | | | | Fixed Income | |
| | |
Government Bonds | | | 0.0% | | | | 13.3% | |
| | |
Communications | | | 8.0% | | | | 5.2% | |
| | |
Materials | | | 13.0% | | | | 0.0% | |
| | |
Consumer Discretionary | | | 2.4% | | | | 10.0% | |
| | |
Financials | | | 6.7% | | | | 4.1% | |
| | |
Industrials | | | 0.0% | | | | 7.1% | |
| | |
Energy | | | 5.6% | | | | 1.3% | |
| | |
Technology | | | 5.0% | | | | 0.0% | |
| | |
Health Care | | | 4.0% | | | | 0.0% | |
| | |
Consumer Staples | | | 0.0% | | | | 1.9% | |
| | |
Municipal Bonds | | | 0.0% | | | | 0.6% | |
| | |
Total | | | 44.7% | | | | 43.5% | |
| | | | | | | | | | |
| | | | | | |
| 30 | | | | | | | | November 30, 2022 | | Annual Report |
Sextant Global High Income Fund
| | |
Discussion of Fund Performance | | (unaudited) |
(photo omitted)
Fiscal Year 2022
The Sextant Global High Income Fund returned -4.16% for fiscal year 2022. The Fund’s 30-day SEC yield on November 30, 2022 was 4.52%. The Fund’s equity benchmark, the S&P Global 1200, returned -9.38%. The Fund’s fixed-income benchmark, the Bloomberg Global High Yield Corporate Bond Index, returned -11.62%.
Factors Affecting Past Performance
War, high inflation, and rising interest rates were major factors that impacted performance in 2022. Higher inflation was more stubborn than the Federal Reserve had anticipated, so they embarked on an aggressive series of interest rate hikes. Those rising interest rates caused bond prices to decrease, while the threat of inflation and higher interest rates led investors to lower the prices they were willing to pay for speculative growth stocks, which had led the market for several years.
The combination of poor stock and bond returns led to an unusually bad year for portfolios that invest in both. Given these circumstances, we were proud the Sextant Global High Income Fund produced returns that exceeded both its equity and fixed-income benchmarks.
Positive contributors to the Sextant Global High Income Fund’s performance during the fiscal year included producers in the Materials and Energy sectors, amid a period of higher inflation and energy prices. Detractors from performance were concentrated in the transportation industry, such as automobile manufacturers and railroads, as well as in the Communications sector, such as telecom, media, and equipment.
Looking Forward
Equities
The decline in equity prices during the fiscal year left stocks trading close to what we would characterize as fair value, assuming the economy does not fall into a major recession. With the tumult of short-term and longer-term currents at play, which companies and industries are best positioned to navigate the choppy seas ahead might be a more important question than the general outlook for equities.
Fixed Income
Despite the rapid increase in interest rates during 2022, it is our view that the yield curve and forward rates point to rate cuts by the latter half of 2023. Interest rates are already higher than they have been for much of the past decade, which we believe suggests a better year for bonds unless inflation unexpectedly picks up again in 2023.
Management Fee Calculations
The Sextant Global High Income Fund calculates the performance part of its management fee by comparing the Fund’s return to its Morningstar category’s average return. As of November 30, 2022, the Fund had a 12-month return of -4.16%, leading the Morningstar category average of -7.72% by more than 2%. Therefore, the base annual management fee of 0.50% for the Fund was increased to 0.70% for the month of December 2022.
| | | | | | | | | | |
| | | | | | |
| Annual Report | | November 30, 2022 | | | | | | | | 31 |
Sextant Global High Income Fund
| | | | | | | | | | | | | | | | | | | | | | |
| | | Schedule of Investments | | | | | | | | | | | As of November 30, 2022 | |
| | | | | | | | |
| | | Common Stocks – 44.7% | | | | Number of Shares | | | Cost | | | Market Value | | | Country1 | | Percentage of Net Assets | |
| | | | | | | |
| | | Communications | | | | | | | | | | | | | | | | |
| | | | | | | | |
| | | Telecom Carriers | | | | | | | | | | | | | | | | |
| | | | | | | | |
| | | Orange ADR | | | | | 20,000 | | | | $270,393 | | | | $203,800 | | | France | | | 2.3% | |
| | | | | | | | |
| | | SK Telecom ADR | | | | | 6,073 | | | | 167,682 | | | | 130,266 | | | South Korea | | | 1.4% | |
| | | | | | | | |
| | | Telenor ASA | | | | | 20,000 | | | | 265,603 | | | | 191,650 | | | Norway | | | 2.1% | |
| | | | | | | | |
| | | Verizon Communications | | | | | 5,000 | | | | 256,300 | | | | 194,900 | | | United States | | | 2.2% | |
| | | | | | | | |
| | | | | | | | | | | 959,978 | | | | 720,616 | | | | | | 8.0% | |
| | | | | | | |
| | | Consumer Discretionary | | | | | | | | | | | | | | | | |
| | | | | | | | |
| | | Automobiles | | | | | | | | | | | | | | | | |
| | | | | | | | |
| | | Volkswagen AG | | | | | 1,500 | | | | 274,363 | | | | 219,235 | | | Germany | | | 2.4% | |
| | | | | | | | |
| | | | | | | | | | | | | | | | | | | | | | |
| | | | | | | |
| | | Energy | | | | | | | | | | | | | | | | |
| | | | | | | | |
| | | Exploration & Production | | | | | | | | | | | | | | | | |
| | | | | | | | |
| | | Woodside Energy Group | | | | | 1,987 | | | | 22,630 | | | | 50,112 | | | Australia | | | 0.5% | |
| | | | | | | | |
| | | Integrated Oils | | | | | | | | | | | | | | | | |
| | | | | | | | |
| | | Shell Plc ADR | | | | | 3,800 | | | | 241,426 | | | | 222,186 | | | Netherlands | | | 2.5% | |
| | | | | | | | |
| | | Total ADR | | | | | 3,800 | | | | 202,607 | | | | 237,196 | | | France | | | 2.6% | |
| | | | | | | | |
| | | | | | | | | | | | | | | | | | | | | | | |
| | | | | | | | |
| | | | | | | | | | | | 444,033 | | | | 459,382 | | | | | | 5.1% | |
| | | | | | | | |
| | | | | | | | | | | 466,663 | | | | 509,494 | | | | | | 5.6% | |
| | | | | | | |
| | | Financials | | | | | | | | | | | | | | | | |
| | | | | | | | |
| | | Banks | | | | | | | | | | | | | | | | |
| | | | | | | | |
| | | Skandinaviska Enskilda Banken, Class A | | | | | 25,000 | | | | 233,632 | | | | 283,891 | | | Sweden | | | 3.1% | |
| | | | | | | | |
| | | Institutional Brokerage | | | | | | | | | | | | | | | | |
| | | | | | | | |
| | | Virtu Financial | | | | | 7,500 | | | | 119,775 | | | | 166,350 | | | United States | | | 1.9% | |
| | | | | | | | |
| | | Investment Companies | | | | | | | | | | | | | | | | |
| | | | | | | | |
| | | ICAHN Enterprises Depositary Unit | | | | | 3,000 | | | | 159,646 | | | | 153,540 | | | United States | | | 1.7% | |
| | | | | | | | |
| | | | | | | | | | | 513,053 | | | | 603,781 | | | | | | 6.7% | |
| | | | | | | |
| | | Health Care | | | | | | | | | | | | | | | | |
| | | | | | | | |
| | | Large Pharma | | | | | | | | | | | | | | | | |
| | | | | | | | |
| | | GlaxoSmithKline ADR | | | | | 4,000 | | | | 176,215 | | | | 138,360 | | | United Kingdom | | | 1.5% | |
| | | | | | | | |
| | | Novartis ADR | | | | | 2,500 | | | | 141,271 | | | | 223,900 | | | Switzerland | | | 2.5% | |
| | | | | | | | |
| | | | | | | | | | | 317,486 | | | | 362,260 | | | | | | 4.0% | |
| | | | | | | |
| | | Materials | | | | | | | | | | | | | | | | |
| | | | | | | | |
| | | Base Metals | | | | | | | | | | | | | | | | |
| | | | | | | | |
| | | Norsk Hydro ASA | | | | | 35,000 | | | | 314,617 | | | | 260,297 | | | Norway | | | 2.9% | |
| | | | | | | | |
| | | South32 ADR | | | | | 19,000 | | | | 134,773 | | | | 264,480 | | | Australia | | | 2.9% | |
| | | | | | | | |
| | | Southern Copper | | | | | 5,000 | | | | 335,962 | | | | 305,100 | | | Peru | | | 3.4% | |
| | | | | | | | |
| | | | | | | | | | | | | | | | | | | | | | | |
| | | | | | | | |
| | | | | | | | | | | | 785,352 | | | | 829,877 | | | | | | 9.2% | |
Continued on next page.
| | | | | | | | | | | | |
| | | | | | | |
| 32 | | | | | | | | November 30, 2022 | | Annual Report | | The accompanying notes are an integral part of these financial statements. |
Sextant Global High Income Fund
| | | | | | | | | | | | | | | | | | | | |
| | | Schedule of Investments | | | | | | | | | | As of November 30, 2022 | |
| | | | | | | | |
| | | Common Stocks – 44.7% | | | | Number of Shares | | Cost | | | Market Value | | | Country1 | | Percentage of Net Assets | |
| | | | | | | |
| | | Materials (continued) | | | | | | | | | | | | | | | |
| | | | | | | | |
| | | Steel Raw Material Suppliers | | | | | | | | | | | | | | | |
| | | | | | | | |
| | | BHP Biliton ADR | | | | 5,500 | | | $186,489 | | | | $345,400 | | | Australia | | | 3.8% | |
| | | | | | | | |
| | | | | | | | | 971,841 | | | | 1,175,277 | | | | | | 13.0% | |
| | | | | | | |
| | | Technology | | | | | | | | | | | | | | | |
| | | | | | | | |
| | | Communications Equipment | | | | | | | | | | | | | | | |
| | | | | | | | |
| | | Cisco Systems | | | | 5,000 | | | 179,892 | | | | 248,600 | | | United States | | | 2.7% | |
| | | | | | | | |
| | | Consumer Electronics | | | | | | | | | | | | | | | |
| | | | | | | | |
| | | Nintendo | | | | 5,000 | | | 223,480 | | | | 212,158 | | | Japan | | | 2.3% | |
| | | | | | | | |
| | | | | | | | | 403,372 | | | | 460,758 | | | | | | 5.0% | |
| | | | | | | |
| | | | | | | | | | | | | | | | | | | | |
| | | | | | | |
| | Total Common Stock | | | | | $3,906,756 | | | | $4,051,421 | | | | | | 44.7% | |
| | | | | | | |
| | | | | | | | | | | | | | | | | | | | |
| | | | | | | | |
| | | Corporate Bonds – 29.6% | | | | Coupon / Maturity | | Face Amount | | | Market Value | | | Country1 | | Percentage of Net Assets | |
| | | | | | | |
| | | Communications | | | | | | | | | | | | | | | |
| | | | | | | | |
| | | Comcast Corp | | | | 4.65% due 07/15/2042 | | | $250,000 | | | | $227,390 | | | United States | | | 2.5% | |
| | | | | | | | |
| | | Netflix | | | | 4.375% due 11/15/2026 | | | 250,000 | | | | 241,346 | | | United States | | | 2.7% | |
| | | | | | | | |
| | | | | | | | | | | | | 468,736 | | | | | | 5.2% | |
| | | | | | | |
| | | Consumer Discretionary | | | | | | | | | | | | | | | |
| | | | | | | | |
| | | ADT | | | | 4.125% due 06/15/2023 | | | 150,000 | | | | 148,516 | | | United States | | | 1.6% | |
| | | | | | | | |
| | | Delta Air Lines | | | | 3.75% due 10/28/2029 | | | 250,000 | | | | 214,053 | | | United States | | | 2.4% | |
| | | | | | | | |
| | | Ford Motor | | | | 6.375% due 02/01/2029 | | | 220,000 | | | | 215,699 | | | United States | | | 2.4% | |
| | | | | | | | |
| | | MDC Holdings | | | | 3.85% due 01/15/2030 | | | 200,000 | | | | 160,864 | | | United States | | | 1.8% | |
| | | | | | | | |
| | | YUM! Brands | | | | 3.625% due 03/15/2031 | | | 195,000 | | | | 162,581 | | | United States | | | 1.8% | |
| | | | | | | | |
| | | | | | | | | | | | | 901,713 | | | | | | 10.0% | |
| | | | | | | |
| | | Consumer Staples | | | | | | | | | | | | | | | |
| | | | | | | | |
| | | Grupo Bimbo2 | | | | 4.875% due 06/27/2044 | | | 200,000 | | | | 174,840 | | | Mexico | | | 1.9% | |
| | | | | | | | |
| | | | | | | | | | | | | | | | | | | | |
| | | | | | | |
| | | Energy | | | | | | | | | | | | | | | |
| | | | | | | | |
| | | Petrobras International Finance | | | | 6.875% due 01/20/2040 | | | 50,000 | | | | 46,375 | | | Brazil | | | 0.5% | |
| | | | | | | | |
| | | Petrobras International Finance | | | | 6.75% due 01/27/2041 | | | 80,000 | | | | 72,802 | | | Brazil | | | 0.8% | |
| | | | | | | | |
| | | | | | | | | | | | | 119,177 | | | | | | 1.3% | |
| | | | | | | |
| | | Financials | | | | | | | | | | | | | | | |
| | | | | | | | |
| | | Lincoln National (3 month LIBOR plus 2.04%)3 | | | | 6.28257% due 04/20/2067 | | | 250,000 | | | | 176,446 | | | United States | | | 1.9% | |
| | | | | | | | |
| | | Royal Bank of Scotland | | | | 6.125% due 12/15/2022 | | | 200,000 | | | | 199,976 | | | United Kingdom | | | 2.2% | |
| | | | | | | | |
| | | | | | | | | | | | | 376,422 | | | | | | 4.1% | |
Continued on next page.
| | | | | | | | | | | | |
| | | | | | | |
| The accompanying notes are an integral part of these financial statements. | | Annual Report | | November 30, 2022 | | | | | | | | 33 |
Sextant Global High Income Fund
| | | | | | | | | | | | | | | | | | | | |
| | | Schedule of Investments | | | | | | | | | | As of November 30, 2022 | |
| | | | | | | | |
| | | Corporate Bonds – 29.6% | | | | Coupon / Maturity | | Face Amount | | | Market Value | | | Country1 | | Percentage of Net Assets | |
| | | | | | | |
| | | Industrials | | | | | | | | | | | | | | | |
| | | | | | | | |
| | | Burlington Northern Santa Fe | | | | 5.05% due 03/01/2041 | | | $200,000 | | | | $196,611 | | | United States | | | 2.2% | |
| | | | | | | | |
| | | CSX Corp | | | | 4.65% due 03/01/2068 | | | 250,000 | | | | 214,211 | | | United States | | | 2.4% | |
| | | | | | | | |
| | | Norfolk Southern Corp | | | | 5.10% due 08/01/2118 | | | 275,000 | | | | 228,300 | | | United States | | | 2.5% | |
| | | | | | | | |
| | | | | | | | | | | | | 639,122 | | | | | | 7.1% | |
| | | | | | | |
| | | | | | | | | | | | | | | | | | | | |
| | | | | | | |
| | Total Corporate Bonds | | (Cost $3,115,708) | | | | | | | $2,680,010 | | | | | | 29.6% | |
| | | | | | | |
| | | | | | | | | | | | | | | | | | | | |
| | | | | | | | |
| | | Government Bonds – 13.3% | | | | Coupon / Maturity | | Face Amount | | | Market Value | | | Country1 | | Percentage of Net Assets | |
| | | | | | | |
| | | Foreign Government Bonds | | | | | | | | | | | | | | | |
| | | | | | | | |
| | | Colombia Republic | | | | 8.375% due 02/15/2027 | | | $125,000 | | | | $125,301 | | | Colombia | | | 1.4% | |
| | | | | | | | |
| | | Federal Republic of Brazil | | | | 8.50% due 01/05/2024 | | | BRL 750,000 | | | | 136,260 | | | Brazil | | | 1.5% | |
| | | | | | | | |
| | | Republic of Argentina | | | | 1.00% due 07/09/2029 | | | 9,276 | | | | 2,361 | | | Argentina | | | 0.0% | 4 |
| | | | | | | | |
| | | Republic of Argentina | | | | 0.125% due 07/09/2046 | | | 242,500 | | | | 58,194 | | | Argentina | | | 0.6% | |
| | | | | | | | |
| | | | | | | | | | | | | 322,116 | | | | | | 3.5% | |
| | | | | | | |
| | | United States Treasury Bills | | | | | | | | | | | | | | | |
| | | | | | | | |
| | | United States Treasury Bill | | | | 0.00% due 01/26/2023 | | | 500,000 | | | | 496,851 | | | United States | | | 5.5% | |
| | | | | | | | |
| | | | | | | | | | | | | | | | | | | | |
| | | | | | | |
| | | United States Treasury Notes | | | | | | | | | | | | | | | |
| | | | | | | | |
| | | United States Treasury Note | | | | 0.125% due 08/31/2023 | | | 400,000 | | | | 386,484 | | | United States | | | 4.3% | |
| | | | | | | | |
| | | | | | | | | | | | | | | | | | | | |
| | | | | | | |
| | | | | | | | | | | | | | | | | | | | |
| | | | | | | | |
| | Total Government Bonds | | | | (Cost $1,486,000) | | | | | | | $1,205,451 | | | | | | 13.3% | |
| | | | | | | |
| | | | | | | | | | | | | | | | | | | | |
| | | | | | | | |
| | | Municipal Bonds – 0.6% | | | | Coupon / Maturity | | Face Amount | | | Market Value | | | Country1 | | Percentage of Net Assets | |
| | | | | | | |
| | | Real Estate | | | | | | | | | | | | | | | |
| | | | | | | | |
| | | Colony TX NFM Sales Tax Revenue | | | | 7.625% due 10/01/2042 | | | $50,000 | | | | $50,897 | | | United States | | | 0.6% | |
| | | | | | | | |
| | | | | | | | | | | | | | | | | | | | |
| | | | | | | |
| | | | | | | | | | | | | | | | | | | | | |
| | | | | | | | |
| | Total Municipal Bonds | | | | (Cost $50,135) | | | | | | | $50,897 | | | | | | 0.6% | |
| | | | | | | |
| | | | | | | | | | | | | | | | | | | | | |
| | | | | | | |
| | Total investments | | | | (Cost $8,558,599) | | | | | | | $7,987,779 | | | | | | 88.2% | |
| | | | | | | |
| | Other assets (net of liabilities) | | | | | | | | | | | 1,066,011 | | | | | | 11.8% | |
| | | | | | | |
| | Total net assets | | | | | | | | | | | $9,053,790 | | | | | | 100.0% | |
| | | | | | | | |
| | | | | | | | | | | | | | | | | | | | |
| 1 | Denotes a country or region of primary exposure |
| 2 | Security was purchased pursuant to Regulation S under the Securities Act of 1933 which exempts from registration securities offered and sold outside of the United States. Such a security cannot be sold in the United States without either an effective registration statement filed pursuant to the Securities Act of 1933, or pursuant to an exemption from registration. These securities have been deemed liquid under guidelines approved by the Trust’s Board of Trustees. At November 30, 2022, the aggregate value of these securities was $174,840 representing 1.9% of net assets. |
| 3 | Variable rate security. The interest rate represents the rate in effect at November 30, 2022 and resets periodically based on the parenthetically disclosed reference rate and spread. |
ADR: American Depositary Receipt BRL: Brazilian Real
| | | | | | | | | | | | |
| | | | | | | |
| 34 | | | | | | | | November 30, 2022 | | Annual Report | | The accompanying notes are an integral part of these financial statements. |
Sextant Global High Income Fund
| | | | | | | | | | | | | | |
| | | Schedule of Investments | | | | | | | | As of November 30, 2022 |
| | | | |
Countries | | | (unaudited) | |
| |
| |
|
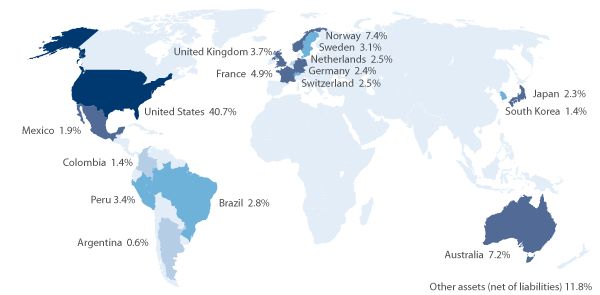 | |
|
| Weightings shown are a percentage of total net assets. | |
| | | | | | | | | | | | |
Bond Quality Diversification | | | | (unaudited) | |
| | | |
| % of Total Net Assets | | | | | | | | | |
| | | |
AA+ | | | 4.3% | | | ∎ | | | | | 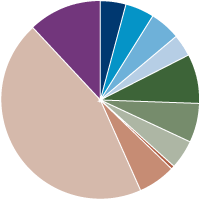
| |
A- | | | 4.7% | | | ∎ | | |
BBB+ | | | 4.9% | | | ∎ | | |
BBB | | | 3.8% | | | ∎ | | |
BB+ | | | 8.1% | | | ∎ | | |
BB | | | 6.3% | | | ∎ | | |
BB- | | | 4.7% | | | ∎ | | |
CCC+ | | | 0.6% | | | ∎ | | |
Not Rated | | | 6.1% | | | ∎ | | |
Equity | | | 44.7% | | | ∎ | | |
Other assets (net of liabilities) | | | 11.8% | | | ∎ | | |
| | | | | | |
|
| Credit ratings are the lesser of S&P Global Ratings or Moody’s Investors Service. If neither S&P nor Moody’s rate a particular security, that security is categorized as not rated (except for US Treasury securities and securities issued or backed by US agencies which inherit the credit rating for the US government). Ratings range from AAA (highest) to D (lowest). Bonds rated BBB or above are considered investment grade. Credit ratings BB and below are lower-rated securities (junk bonds). Ratings apply to the creditworthiness of the issuers of the underlying securities and not the Fund or its shares. Ratings may be subject to change. |
| | | | | | | | | | | | |
| | | | | | | |
| The accompanying notes are an integral part of these financial statements. | | Annual Report | | November 30, 2022 | | | | | | | | 35 |
Sextant Global High Income Fund
Statement of Assets and Liabilities
| | | | |
| As of November 30, 2022 | |
| | |
| | | | |
| |
Assets | | | | |
| |
Investments in securities, at value
(Cost $8,558,599) | | | $7,987,779 | |
| |
Cash | | | 1,003,219 | |
| |
Dividends and interest receivable | | | 70,138 | |
| |
Prepaid expenses | | | 3,667 | |
| |
Receivable for Fund shares sold | | | 864 | |
| | | | |
| |
Total assets | | | 9,065,667 | |
| | | | |
| |
Liabilities | | | | |
| |
Accrued audit expenses | | | 4,858 | |
| |
Accrued advisory fees | | | 2,078 | |
| |
Accrued retirement plan custody fee | | | 1,819 | |
| |
Accrued printing fees | | | 1,337 | |
| |
Payable for Fund shares redeemed | | | 1,000 | |
| |
Accrued other operating expenses | | | 385 | |
| |
Accrued Chief Compliance Officer expenses | | | 276 | |
| |
Accrued legal expenses | | | 124 | |
| | | | |
| |
Total liabilities | | | 11,877 | |
| | | | |
| |
Net assets | | | $9,053,790 | |
| | |
| | | | |
| | |
Analysis of net assets | | | | |
| |
Paid-in capital (unlimited shares authorized, without par value) | | | $9,333,266 | |
| |
Total distributable earnings | | | (279,476 | ) |
| | | | |
| |
Net assets applicable to Fund shares outstanding | | | $9,053,790 | |
| | |
| | | | |
Fund shares outstanding | | | 894,507 | |
| | |
Net asset value, offering and redemption price per share | | | $10.12 | |
| | | | | |
Statement of Operations
��
| | | | |
| Year ended November 30, 2022 | |
| | |
| | | | |
| |
Investment income | | | | |
| |
Dividend Income (net of foreign tax of ($29,651) | | | $249,186 | |
| |
Interest income | | | 176,550 | |
| | | | |
| |
Total investment income | | | 425,736 | |
| | | | |
| |
Expenses | | | | |
| |
Investment advisory fees | | | 58,630 | |
| |
Filing and registration fees | | | 17,988 | |
| |
Audit fees | | | 5,172 | |
| |
Retirement plan custodial fees | | | 1,875 | |
| |
Legal fees | | | 1,742 | |
| |
Chief Compliance Officer expenses | | | 1,407 | |
| |
Trustee fees | | | 1,277 | |
| |
Other expenses | | | 1,263 | |
| |
Printing and postage fees | | | 769 | |
| |
Custodian fees | | | 629 | |
| | | | |
| |
Total gross expenses | | | 90,752 | |
| | | | |
| |
Less adviser fees waived | | | (21,784 | ) |
| |
Less custodian fee credits | | | (629 | ) |
| | | | |
| |
Net expenses | | | 68,339 | |
| | | | |
| |
Net investment income | | | $357,397 | |
| | |
| | | | |
| | |
| | | | |
| |
Net realized gain from investments and foreign currency | | | $111,672 | |
| |
Net decrease in unrealized appreciation on investments and foreign currency | | | (890,600 | ) |
| | | | |
| |
Net loss on investments | | | $(778,928 | ) |
| | |
| | | | |
| | |
Net decrease in net assets resulting from operations | | | $(421,531 | ) |
| | | | | |
| | | | | | | | | | | | |
| | | | | | | |
| 36 | | | | | | | | November 30, 2022 | | Annual Report | | The accompanying notes are an integral part of these financial statements. |
Sextant Global High Income Fund
| | | | | | | | |
Statements of Changes in Net Assets | | | Year ended November 30, 2022 | | | | Year ended November 30, 2021 | |
| | | |
Increase (decrease) in net assets from operations | | | | | | | | |
| | |
From operations | | | | | | | | |
| | |
Net investment income | | | $357,397 | | | | $279,765 | |
| | |
Net realized gain on investment | | | 111,672 | | | | 186,963 | |
| | |
Net increase (decrease) in unrealized appreciation | | | (890,600 | ) | | | 344,554 | |
| | | | | | | | |
| | |
Net increase (decrease) in net assets | | | (421,531 | ) | | | 811,282 | |
| | | | | | | | |
| | |
| | | | | | | | |
| | |
Distributions to shareowners | | | (182,768 | ) | | | (289,162 | ) |
| | |
| | | | | | | | |
| | |
Capital share transactions | | | | | | | | |
| | |
Proceeds from sales of shares | | | 1,011,369 | | | | 1,477,957 | |
| | |
Value of shares issued in reinvestment of dividends | | | 178,216 | | | | 282,380 | |
| | |
Cost of shares redeemed | | | (681,194 | ) | | | (1,747,724 | ) |
| | | | | | | | |
| | |
Total capital shares transactions | | | 508,391 | | | | 12,613 | |
| | | | | | | | |
| | |
Total increase (decrease) in net assets | | | (95,908 | ) | | | 534,733 | |
| | | |
| | | | | | | | |
| | | |
Net assets | | | | | | | | |
| | |
Beginning of year | | | 9,149,698 | | | | 8,614,965 | |
| | |
End of year | | | $9,053,790 | | | | $9,149,698 | |
| | | |
| | | | | | | | |
| | | |
Shares of the Fund sold and redeemed | | | | | | | | |
| | |
Number of shares sold | | | 95,974 | | | | 139,723 | |
| | |
Number of shares issued in reinvestment of dividends | | | 16,548 | | | | 27,875 | |
| | |
Number of shares redeemed | | | (67,643 | ) | | | (166,437 | ) |
| | | | | | | | |
| | |
Net increase in number of shares outstanding | | | 44,879 | | | | 1,161 | |
| | | |
| | | | | | | | |
| | | | | | | | | | | | | | | | | | | | |
Financial Highlights | | | For year ended November 30, | |
| | | | | |
Selected data per share of outstanding capital stock throughout each year: | | | 2022 | | | | 2021 | | | | 2020 | | | | 2019 | | | | 2018 | |
| | | | | | |
Net asset value at beginning of year | | | $10.77 | | | | $10.15 | | | | $11.42 | | | | $11.07 | | | | $11.12 | |
| | | | | |
Income from investment operations | | | | | | | | | | | | | | | | | | | | |
| | | | | |
Net investment income | | | 0.40 | | | | 0.33 | | | | 0.31 | | | | 0.42 | | | | 0.40 | |
| | | | | |
Net gains (losses) on securities (both realized and unrealized) | | | (0.83 | ) | | | 0.65 | | | | (0.66 | ) | | | 0.32 | | | | (0.15 | ) |
| | | | | | | | | | | | | | | | | | | | |
| | | | | |
Total from investment operations | | | (0.43 | ) | | | 0.98 | | | | (0.35 | ) | | | 0.74 | | | | 0.25 | |
| | | | | | | | | | | | | | | | | | | | |
| | | | | |
Less distributions | | | | | | | | | | | | | | | | | | | | |
| | | | | |
Dividends from net investment income | | | (0.22 | ) | | | (0.36 | ) | | | (0.40 | ) | | | (0.39 | ) | | | (0.30 | ) |
| | | | | |
Distribution from capital gains | | | - | | | | - | | | | (0.52 | ) | | | - | | | | - | |
| | | | | | | | | | | | | | | | | | | | |
| | | | | |
Total distributions | | | (0.22 | ) | | | (0.36 | ) | | | (0.92 | ) | | | (0.39 | ) | | | (0.30 | ) |
| | | | | | | | | | | | | | | | | | | | |
| | | | | |
| | | | | | | | | | | | | | | | | | | | |
| | | | | |
Net asset value at end of year | | | $10.12 | | | | $10.77 | | | | $10.15 | | | | $11.42 | | | | $11.07 | |
| | | | | | |
| | | | | | | | | | | | | | | | | | | | |
Total return | | | (4.16 | )% | | | 9.87% | | | | (3.51 | )% | | | 7.06% | | | | 2.31% | |
| | | | | | |
Ratios / supplemental data | | | | | | | | | | | | | | | | | | | | |
| | | | | |
Net assets ($000), end of year | | | $9,054 | | | | $9,150 | | | | $8,615 | | | | $9,893 | | | | $8,827 | |
| | | | | |
Ratio of expenses to average net assets | | | | | | | | | | | | | | | | | | | | |
| | | | | |
Before adviser fee waivers and custodian fee credits | | | 0.98% | | | | 0.78% | | | | 0.70% | | | | 1.11% | | | | 0.97% | |
| | | | | |
After adviser fee waivers | | | 0.75% | | | | 0.70% | | | | 0.56% | | | | 0.76% | | | | 0.75% | |
| | | | | |
After adviser fees waiver and custodian fee credits | | | 0.74% | | | | 0.69% | | | | 0.55% | | | | 0.75% | | | | 0.75% | |
| | | | | |
Ratio of net investment income after adviser fee waivers and custodian fee credits to average net assets | | | 3.87% | | | | 3.11% | | | | 3.12% | | | | 3.72% | | | | 3.43% | |
| | | | | |
Portfolio turnover rate | | | 20% | | | | 27% | | | | 27% | | | | 33% | | | | 10% | |
| | | | | | |
| | | | | | | | | | | | | | | | | | | | |
| | | | | | | | | | | | |
| | | | | | | |
| The accompanying notes are an integral part of these financial statements. | | Annual Report | | November 30, 2022 | | | | | | | | 37 |
Sextant Growth Fund
| | |
Performance Summary | | (unaudited) |
| | | | | | | | | | | | | | | | |
Average Annual Total Returns as of November 30, 2022 | |
| | | | | |
| | | 1 Year | | | 5 Year | | | 10 Year | | | Expense Ratio1 | |
| | | | |
Sextant Growth Fund Investor Shares (SSGFX) | | | -17.88% | | | | 11.95% | | | | 12.03% | | | | 0.74% | |
| | | | |
Sextant Growth Fund Z Shares (SGZFX)2 | | | -17.69% | | | | 12.23% | | | | n/a | | | | 0.51% | |
| | | | |
S&P 500 Index | | | -9.21% | | | | 10.97% | | | | 13.33% | | | | n/a | |
Growth of $10,000
| | |
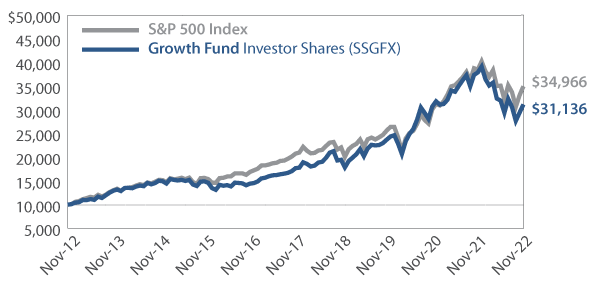 | | Comparison of any mutual fund to a market index must be made bearing in mind that the index is expense-free. Conversely, the fund will (1) be actively managed; (2) have an objective other than mirroring the index, such as limiting risk; (3) bear transaction and other costs; (4) stand ready to buy and sell its securities to shareowners on a daily basis; and (5) provide a wide range of services. The graph compares $10,000 invested in Investor Shares of the Fund on November 30, 2012, to an identical amount invested in the S&P 500 Index, an index comprised of 500 widely held common stocks considered to be representative of the US stock market in general. The graph shows that an investment in the Investor Shares of the Fund would have risen to $31,136 versus $34,966 in the Index. |
Past performance does not guarantee future results. The “Growth of $10,000” graph and “Average Annual Returns” performance table assume the reinvestment of dividends and capital gains. They do not reflect the deduction of taxes that a shareowner might pay on fund distributions or the redemption of fund shares.
| 1 | By regulation, the expense ratios shown in this table are as stated in the Fund’s most recent prospectus, which is dated March 30, 2022, and incorporate results for the fiscal year ended November 30, 2021. The ratios presented in this table differ from expense ratios shown elsewhere in this report as they represent different periods. |
| 2 | Sextant Growth Fund Z Shares (SGZFX) began operations June 2, 2017. |
Fund Objective
The objective of the Growth Fund is long-term capital growth.
| | | | |
Top 10 Holdings | |
| |
| % of Total Net Assets | |
| |
Apple | | | 9.4% | |
| |
Microsoft | | | 8.8% | |
| |
Alphabet, Class A | | | 5.8% | |
| |
Mastercard, Class A | | | 5.8% | |
| |
Amazon.com | | | 4.7% | |
| |
Lowe’s | | | 4.3% | |
| |
Abbott Laboratories | | | 4.1% | |
| |
Costco Wholesale | | | 3.4% | |
| |
RPM International | | | 3.4% | |
| |
Corteva | | | 3.4% | |
| | | | | | | | | | | | |
Portfolio Diversification | |
| | | |
| % of Total Net Assets | | | | | | | | | |
| | | |
Communications Equipment | | | 12.4% | | | ∎ | | | | | 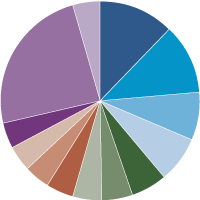
| |
Infrastructure Software | | | 11.4% | | | ∎ | | |
Medical Devices | | | 7.8% | | | ∎ | | |
Consumer Finance | | | 7.5% | | | ∎ | | |
Internet Media | | | 5.8% | | | ∎ | | |
Specialty Chemicals | | | 4.9% | | | ∎ | | |
E-Commerce Discretionary | | | 4.7% | | | ∎ | | |
Semiconductor Devices | | | 4.4% | | | ∎ | | |
Home Products Stores | | | 4.3% | | | ∎ | | |
Commercial & Residential Building Equipment & Systems | | | 4.2% | | | ∎ | | |
Specialty Apparel Stores | | | 4.2% | | | ∎ | | |
Industries < 4.0% | | | 24.2% | | | ∎ | | |
Other Assets (net of liabilities) | | | 4.2% | | | ∎ | | |
| | | | | | | | | | |
| | | | | | |
| 38 | | | | | | | | November 30, 2022 | | Annual Report |
Sextant Growth Fund
| | |
Discussion of Fund Performance | | (unaudited) |
photo omitted
Fiscal Year 2022
For the fiscal year ended November 30, 2022, the Sextant Growth Fund Investor Shares declined -17.88%, trailing the -9.21% drop for the S&P 500 Index. The Fund was resilient relative to other large capitalization growth-oriented funds over the financial year; its Morningstar Large Growth category peer group declined an average of -23.55%. In 2017, the Fund introduced its Z Shares, which had no 12b-1 fee expense, and as of writing, 91.03% of the Fund benefits from this lower expense option.
Factors Affecting Past Performance
After three years of buoyant stock market performance (fueled in part by ultra-low bond yields) the Federal Reserve (the “Fed”) aggressively hiked interest rates in response to persistent inflation. As a result, in 2022 the S&P 500 suffered its worst year since 2008 and the Global Financial Crisis. The Sextant Growth Fund performed well relative to its growth-oriented peers, but it was still a difficult fiscal year for investors holding the Fund. Unsurprisingly, large Technology-oriented stocks suffered the most, including Alphabet (Google), Amazon, Nvidia, Adobe, and Qualcomm. Health Care equipment company Edwards Lifesciences also fell significantly due to medical procedures delayed by COVID-19. Take-Two Interactive suffered a letdown as well, following the active gaming environment in the early stages of the pandemic.
Despite the carnage affecting much of Tech, certain stocks fared comparatively better, including Apple, Mastercard (which was sold off early in the pandemic as travel came to a halt), Texas Instruments, and Oracle. We experienced positive returns from our Materials and Consumer Staples investments; coatings company RPM and crop science leader Corteva contributed to the former while Costco and Monster Beverage lifted the latter.
Looking Forward
The economy is growing, unemployment remains low, wages are rising, and energy prices have fallen. Despite these positives, conversations regarding the economic and stock market outlook (not that the two are closely related over the short-term) focus on the likelihood and potential severity of recession. Monetary policy works with a lag, and we still do not know the effect of the Fed’s raising rates from near-zero at the start of 2022 to over 4% at year end. Despite arguably shooting in the dark, the Fed has committed to further rate increases pushing toward 5%. In our view, persistent yield curve inversions point to recession, but only time will tell.
Management Fee Calculations
The Sextant Growth Fund calculates the performance part of its management fee by comparing the Fund’s return to its Morningstar category’s average return. As of November 30, 2022, the Investor Shares of the Fund had a 12-month return of -17.88%, leading the Morningstar category average of -23.55% by more than 2%. Therefore, the base annual management fee of 0.50% for the Fund was increased to 0.70% for the month of December 2022.
| | | | | | | | | | |
| | | | | | |
| Annual Report | | November 30, 2022 | | | | | | | | 39 |
Sextant Growth Fund
| | | | | | | | | | | | | | | | | | |
| | | Schedule of Investments | | | | | | | | | | | | As of November 30, 2022 | |
| | | | | | | |
| | | Common Stock – 95.8% | | | | Number of Shares | | Cost | | | Market Value | | | Percentage of Net Assets | |
| | | | | | |
| | | Communications | | | | | | | | | | | | | |
| | | | | | | |
| | | Internet Media | | | | | | | | | | | | | |
| | | | | | | |
| | | Alphabet, Class A1 | | | | 31,680 | | | $898,428 | | | | $3,199,363 | | | | 5.8% | |
| | | | | | | |
| | | | | | | | | | | | | | | | | | |
| | | | | | |
| | | Consumer Discretionary | | | | | | | | | | | | | |
| | | | | | | |
| | | Apparel, Footwear & Accessory Design | | | | | | | | | | | | | |
| | | | | | | |
| | | Nike, Class B | | | | 10,276 | | | 528,776 | | | | 1,127,175 | | | | 2.1% | |
| | | | | | | |
| | | Automotive Retailers | | | | | | | | | | | | | |
| | | | | | | |
| | | O’Reilly Automotive1 | | | | 1,300 | | | 1,094,232 | | | | 1,123,902 | | | | 2.0% | |
| | | | | | | |
| | | E-Commerce Discretionary | | | | | | | | | | | | | |
| | | | | | | |
| | | Amazon.com1 | | | | 26,980 | | | 162,991 | | | | 2,604,649 | | | | 4.7% | |
| | | | | | | |
| | | Home Products Stores | | | | | | | | | | | | | |
| | | | | | | |
| | | Lowe’s | | | | 11,200 | | | 794,834 | | | | 2,380,560 | | | | 4.3% | |
| | | | | | | |
| | | Specialty Apparel Stores | | | | | | | | | | | | | |
| | | | | | | |
| | | Lululemon Athletica1 | | | | 2,000 | | | 662,115 | | | | 760,620 | | | | 1.4% | |
| | | | | | | |
| | | TJX Companies | | | | 19,000 | | | 824,767 | | | | 1,520,950 | | | | 2.8% | |
| | | | | | | |
| | | | | | | | | | | | | | | | | | | |
| | | | | | | |
| | | | | | | | | | 1,486,882 | | | | 2,281,570 | | | | 4.2% | |
| | | | | | | |
| | | | | | | | | 4,067,715 | | | | 9,517,856 | | | | 17.3% | |
| | | | | | |
| | | Consumer Staples | | | | | | | | | | | | | |
| | | | | | | |
| | | Beverages | | | | | | | | | | | | | |
| | | | | | | |
| | | Monster Beverage | | | | 16,100 | | | 1,489,661 | | | | 1,656,046 | | | | 3.1% | |
| | | | | | | |
| | | Mass Merchants | | | | | | | | | | | | | |
| | | | | | | |
| | | Costco Wholesale | | | | 3,509 | | | 410,438 | | | | 1,892,228 | | | | 3.4% | |
| | | | | | | |
| | | | | | | | | 1,900,099 | | | | 3,548,274 | | | | 6.5% | |
| | | | | | |
| | | Financials | | | | | | | | | | | | | |
| | | | | | | |
| | | Consumer Finance | | | | | | | | | | | | | |
| | | | | | | |
| | | Mastercard, Class A | | | | 8,914 | | | 806,925 | | | | 3,176,950 | | | | 5.8% | |
| | | | | | | |
| | | Paypal1 | | | | 12,000 | | | 1,120,068 | | | | 940,920 | | | | 1.7% | |
| | | | | | | |
| | | | | | | | | 1,926,993 | | | | 4,117,870 | | | | 7.5% | |
| | | | | | |
| | | Health Care | | | | | | | | | | | | | |
| | | | | | | |
| | | Managed Care | | | | | | | | | | | | | |
| | | | | | | |
| | | Elevance Health | | | | 2,250 | | | 1,076,105 | | | | 1,199,070 | | | | 2.2% | |
Continued on next page.
| | | | | | | | | | | | |
| | | | | | | |
| 40 | | | | | | | | November 30, 2022 | | Annual Report | | The accompanying notes are an integral part of these financial statements. |
Sextant Growth Fund
| | | | | | | | | | | | | | | | | | | | |
| | | Schedule of Investments | | | | | | As of November 30, 2022 | |
| | | | | | | |
| | | Common Stock – 95.8% | | | | Number of Shares | | | Cost | | | Market Value | | | Percentage of Net Assets | |
| | | | | | |
| | | Health Care (continued) | | | | | | | | | | | | | | |
| | | | | | | |
| | | Medical Devices | | | | | | | | | | | | | | |
| | | | | | | |
| | | Abbott Laboratories | | | | | 20,799 | | | | $646,854 | | | | $2,237,556 | | | | 4.1% | |
| | | | | | | |
| | | Boston Scientific1 | | | | | 12,000 | | | | 502,017 | | | | 543,240 | | | | 1.0% | |
| | | | | | | |
| | | Edwards Lifesciences1 | | | | | 10,500 | | | | 346,070 | | | | 811,125 | | | | 1.4% | |
| | | | | | | |
| | | Stryker | | | | | 3,000 | | | | 374,100 | | | | 701,670 | | | | 1.3% | |
| | | | | | | |
| | | | | | | | | | | | | | | | | | | | | |
| | | | | | | |
| | | | | | | | | | | | 1,869,041 | | | | 4,293,591 | | | | 7.8% | |
| | | | | | | |
| | | Specialty Pharma | | | | | | | | | | | | | | |
| | | | | | | |
| | | Horizon Therapeutics Plc1 | | | | | 18,000 | | | | 1,788,699 | | | | 1,805,220 | | | | 3.3% | |
| | | | | | | |
| | | | | | | | | | | 4,733,845 | | | | 7,297,881 | | | | 13.3% | |
| | | | | | |
| | | Industrials | | | | | | | | | | | | | | |
| | | | | | | |
| | | Commercial & Residential Building
Equipment & Systems | | | | | | | | | | | | | | |
| | | | | | | |
| | | Honeywell International | | | | | 3,750 | | | | 792,329 | | | | 823,313 | | | | 1.5% | |
| | | | | | | |
| | | Johnson Controls International | | | | | 22,500 | | | | 1,043,161 | | | | 1,494,900 | | | | 2.7% | |
| | | | | | | |
| | | | | | | | | | | | | | | | | | | | | |
| | | | | | | |
| | | | | | | | | | | | 1,835,490 | | | | 2,318,213 | | | | 4.2% | |
| | | | | | | |
| | | Measurement Instruments | | | | | | | | | | | | | | |
| | | | | | | |
| | | Trimble1 | | | | | 17,000 | | | | 732,676 | | | | 1,015,750 | | | | 1.9% | |
| | | | | | | |
| | | | | | | | | | | 2,568,166 | | | | 3,333,963 | | | | 6.1% | |
| | | | | | |
| | | Materials | | | | | | | | | | | | | | |
| | | | | | | |
| | | Agricultural Chemicals | | | | | | | | | | | | | | |
| | | | | | | |
| | | Corteva | | | | | 27,500 | | | | 1,174,068 | | | | 1,846,900 | | | | 3.4% | |
| | | | | | | |
| | | Specialty Chemicals | | | | | | | | | | | | | | |
| | | | | | | |
| | | Albemarle Corp | | | | | 3,000 | | | | 857,974 | | | | 833,970 | | | | 1.5% | |
| | | | | | | |
| | | RPM International | | | | | 18,000 | | | | 737,644 | | | | 1,865,160 | | | | 3.4% | |
| | | | | | | |
| | | | | | | | | | | | | | | | | | | | | |
| | | | | | | |
| | | | | | | | | | | | 1,595,618 | | | | 2,699,130 | | | | 4.9% | |
| | | | | | | |
| | | | | | | | | | | 2,769,686 | | | | 4,546,030 | | | | 8.3% | |
| | | | | | |
| | | Technology | | | | | | | | | | | | | | |
| | | | | | | |
| | | Application Software | | | | | | | | | | | | | | |
| | | | | | | |
| | | Adobe1 | | | | | 4,450 | | | | 23,404 | | | | 1,534,938 | | | | 2.8% | |
| | | | | | | |
| | | Communications Equipment | | | | | | | | | | | | | | |
| | | | | | | |
| | | Apple | | | | | 34,700 | | | | 10,226 | | | | 5,136,641 | | | | 9.4% | |
| | | | | | | |
| | | Motorola Solutions | | | | | 6,000 | | | | 1,346,591 | | | | 1,633,200 | | | | 3.0% | |
| | | | | | | |
| | | | | | | | | | | | | | | | | | | | | |
| | | | | | | |
| | | | | | | | | | | | 1,356,817 | | | | 6,769,841 | | | | 12.4% | |
Continued on next page.
| | | | | | | | | | | | |
| | | | | | | |
| The accompanying notes are an integral part of these financial statements. | | Annual Report | | November 30, 2022 | | | | | | | | 41 |
Sextant Growth Fund
| | | | | | | | | | | | | | | | | | | | |
| | | Schedule of Investments | | | | | | As of November 30, 2022 | |
| | | | | | | |
| | | Common Stock – 95.8% | | | | Number of Shares | | | Cost | | | Market Value | | | Percentage of Net Assets | |
| | | | | | |
| | | Technology (continued) | | | | | | | | | | | | | | |
| | | | | | | |
| | | Infrastructure Software | | | | | | | | | | | | | | |
| | | | | | | |
| | | Microsoft | | | | | 18,920 | | | | $872,435 | | | | $4,827,249 | | | | 8.8% | |
| | | | | | | |
| | | Oracle | | | | | 17,500 | | | | 901,024 | | | | 1,453,025 | | | | 2.6% | |
| | | | | | | |
| | | | | | | | | | | | | | | | | | | | | |
| | | | | | | |
| | | | | | | | | | | | 1,773,459 | | | | 6,280,274 | | | | 11.4% | |
| | | | | | | |
| | | Semiconductor Devices | | | | | | | | | | | | | | |
| | | | | | | |
| | | Advanced Micro Devices1 | | | | | 3,500 | | | | 258,328 | | | | 271,705 | | | | 0.5% | |
| | | | | | | |
| | | NVIDIA | | | | | 2,900 | | | | 349,582 | | | | 490,767 | | | | 0.9% | |
| | | | | | | |
| | | Qualcomm | | | | | 3,700 | | | | 250,083 | | | | 468,013 | | | | 0.8% | |
| | | | | | | |
| | | Texas Instruments | | | | | 6,600 | | | | 939,244 | | | | 1,191,036 | | | | 2.2% | |
| | | | | | | |
| | | | | | | | | | | | | | | | | | | | | |
| | | | | | | |
| | | | | | | | | | | | 1,797,237 | | | | 2,421,521 | | | | 4.4% | |
| | | | | | | |
| | | | | | | | | | | 4,950,917 | | | | 17,006,574 | | | | 31.0% | |
| | | | | | |
| | | | | | | | | | | | | | | | | | | | | |
| | | | | | |
| | Total investments | | | | | | | | | $23,815,849 | | | | $52,567,811 | | | | 95.8% | |
| | | | | | |
| | Other assets (net of liabilities) | | | | | | | | | | | | | 2,311,531 | | | | 4.2% | |
| | | | | | |
| | Total net assets | | | | | | | | | | | | | $54,879,342 | | | | 100.0% | |
| | | | | | | |
| | | | | | | | | | | | | | | | | | | | |
| | | | | | | | | | | | |
| | | | | | | |
| 42 | | | | | | | | November 30, 2022 | | Annual Report | | The accompanying notes are an integral part of these financial statements. |
Sextant Growth Fund
Statement of Assets and Liabilities
| | | | |
| As of November 30, 2022 | |
| |
Assets | | | | |
| |
Investments in securities, at value (Cost $23,815,849) | | | $52,567,811 | |
| |
Cash | | | 2,329,611 | |
| |
Dividends receivable | | | 28,062 | |
| |
Prepaid expenses | | | 11,128 | |
| |
Other assets | | | 2,278 | |
| |
Receivable for Fund shares sold | | | 1,215 | |
| | | | |
| |
Total assets | | | 54,940,105 | |
| | | | |
| |
Liabilities | | | | |
| |
Accrued advisory fees | | | 21,522 | |
| |
Accrued audit expenses | | | 20,413 | |
| |
Accrued printing fees | | | 8,137 | |
| |
Accrued retirement plan custody fee | | | 7,091 | |
| |
Accrued Chief Compliance Officer expenses | | | 1,795 | |
| |
Accrued 12b-1 distribution fees | | | 964 | |
| |
Accrued other liabilities | | | 794 | |
| |
Accrued trustee expenses | | | 47 | |
| | | | |
| |
Total liabilities | | | 60,763 | |
| | | | |
| |
Net assets | | | $54,879,342 | |
| | |
| | | | |
| | |
Analysis of net assets | | | | |
| |
Paid-in capital (unlimited shares authorized, without par value) | | | $24,827,327 | |
| |
Total distributable earnings | | | 30,052,015 | |
| | | | |
| |
Net assets applicable to Fund shares outstanding | | | $54,879,342 | |
| | |
| | | | |
| | |
Net asset value per Investor Share | | | SSGFX | |
| |
Net assets, at value | | | $4,921,308 | |
| |
Shares outstanding | | | 127,103 | |
| |
Net asset value, offering and redemption price per share | | | $38.72 | |
| | |
| | | | | |
| |
Net asset value per Z Share | | | SGZFX | |
| |
Net assets, at value | | | $49,958,034 | |
| |
Shares outstanding | | | 1,292,192 | |
| |
Net asset value, offering and redemption price per share | | | $38.66 | |
| | |
| | | | |
Statement of Operations
| | | | |
| Year ended November 30, 2022 | |
| | |
| | | | |
| |
Investment income | | | | |
| |
Dividend income | | | $510,725 | |
| |
Miscellaneous income | | | 7,033 | |
| | | | |
| |
Total investment income | | | 517,758 | |
| | | | |
| |
Expenses | | | | |
| |
Investment adviser fees | | | 409,151 | |
| |
Filing and registration fees | | | 51,219 | |
| |
Audit fees | | | 36,800 | |
| |
Legal fees | | | 15,536 | |
| |
Trustee fees | | | 15,515 | |
| |
Distribution fees - Investor Shares | | | 13,386 | |
| |
Other expenses | | | 13,051 | |
| |
Chief Compliance Officer expenses | | | 12,480 | |
| |
Retirement plan custodial fees | | | | |
| |
Z Shares | | | 7,133 | |
| |
Custodian fees | | | 2,374 | |
| |
Printing and postage fees | | | 2,149 | |
| | | | |
| |
Total gross expenses | | | 578,794 | |
| | | | |
| |
Less custodian fee credits | | | (2,374 | ) |
| | | | |
| |
Net expenses | | | 576,420 | |
| | | | |
| |
Net investment loss | | | $(58,662 | ) |
| | |
| | | | |
| | |
| | | | |
| |
Net realized gain from investmentsA | | | $3,334,840 | |
| |
Net decrease in unrealized appreciation on investments | | | (15,204,651 | ) |
| | | | |
| |
Net loss on investments | | | $(11,869,811 | ) |
| | |
| | | | |
| | |
Net decrease in net assets resulting from operations | | | $(11,928,473 | ) |
| | | | | |
| A | Includes $2,035,066 in net realized gains from redemptions in-kind. |
| | | | | | | | | | | | |
| | | | | | | |
| The accompanying notes are an integral part of these financial statements. | | Annual Report | | November 30, 2022 | | | | | | | | 43 |
Sextant Growth Fund
| | | | | | | | |
Statements of Changes in Net Assets | | | Year ended November 30, 2022 | | | | Year ended November 30, 2021 | |
| | | |
Increase (decrease) in net assets from operations | | | | | | | | |
| | |
From operations | | | | | | | | |
| | |
Net investment income (loss) | | | $(58,662 | ) | | | $262,926 | |
| | |
Net realized gain on investment | | | 3,334,840 | | | | 5,700,455 | |
| | |
Net increase (decrease) in unrealized appreciation | | | (15,204,651 | ) | | | 7,556,816 | |
| | | | | | | | |
| | |
Net increase (decrease) in net assets | | | (11,928,473 | ) | | | 13,520,197 | |
| | | | | | | | |
| | |
Distributions to shareowners | | | | | | | | |
| | |
Net distribution to shareholders - Investor Shares | | | (540,647 | ) | | | (30,963 | ) |
| | |
Net distribution to shareholders - Z Shares | | | (5,339,476 | ) | | | (427,260 | ) |
| | | | | | | | |
| | |
Total distributions | | | (5,880,123 | ) | | | (458,223 | ) |
| | | | | | | | |
| | |
Capital share transactions | | | | | | | | |
| | |
Proceeds from sales of shares | | | | | | | | |
| | |
Investor Shares | | | 541,196 | | | | 553,150 | |
| | |
Z Shares | | | 5,439,562 | | | | 2,308,439 | |
| | |
Value of shares issued in reinvestment of dividends | | | | | | | | |
| | |
Investor Shares | | | 401,784 | | | | 22,980 | |
| | |
Z Shares | | | 5,211,605 | | | | 419,115 | |
| | |
Cost of shares redeemed | | | | | | | | |
| | |
Investor Shares | | | (754,189 | ) | | | (526,990 | ) |
| | |
Z Shares | | | (6,840,020 | ) | | | (6,123,451 | ) |
| | | | | | | | |
| | |
Total capital share transactions | | | 3,999,938 | | | | (3,346,757 | ) |
| | | | | | | | |
| | |
Total increase (decrease) in net assets | | | (13,808,658 | ) | | | 9,715,217 | |
| | | |
| | | | | | | | |
| | | |
Net assets | | | | | | | | |
| | |
Beginning of year | | | 68,688,000 | | | | 58,972,783 | |
| | |
End of year | | | $54,879,342 | | | | $68,688,000 | |
| | | |
| | | | | | | | |
| | | |
Shares of the Fund sold and redeemed | | | | | | | | |
| | |
Investor Shares (SSGFX) | | | | | | | | |
| | |
Number of shares sold | | | 12,552 | | | | 11,715 | |
| | |
Number of shares issued in reinvestment of dividends and distributions | | | 8,391 | | | | 536 | |
| | |
Number of shares redeemed | | | (18,600 | ) | | | (11,644 | ) |
| | | | | | | | |
| | |
Net increase in number of shares outstanding | | | 2,343 | | | | 607 | |
| | | | | | | | |
| | |
Z Shares (SGZFX) | | | | | | | | |
| | |
Number of shares sold | | | 133,138 | | | | 50,253 | |
| | |
Number of shares issued in reinvestment of dividends and distributions | | | 109,258 | | | | 9,829 | |
| | |
Number of shares redeemed | | | (164,183 | ) | | | (133,335 | ) |
| | | | | | | | |
| | |
Net increase (decrease) in number of shares outstanding | | | 78,213 | | | | (73,253 | ) |
| | | |
| | | | | | | | |
| | | | | | | | | | | | |
| | | | | | | |
| 44 | | | | | | | | November 30, 2022 | | Annual Report | | The accompanying notes are an integral part of these financial statements. |
Sextant Growth Fund: Financial Highlights
| | | | | | | | | | | | | | | | | | | | |
Investor Shares (SSGFX) | | | For year ended November 30, | |
| | | | | |
Selected data per share of outstanding capital stock throughout each year: | | | 2022 | | | | 2021 | | | | 2020 | | | | 2019 | | | | 2018 | |
| | | | | | |
Net asset value at beginning of year | | | $51.39 | | | | $41.86 | | | | $33.25 | | | | $28.70 | | | | $27.51 | |
| | | | | |
Income from investment operations | | | | | | | | | | | | | | | | | | | | |
| | | | | |
Net investment incomeA | | | (0.13 | ) | | | 0.09 | | | | (0.03 | ) | | | (0.03 | ) | | | 0.07 | |
| | | | | |
Net gains (losses) on securities (both realized and unrealized) | | | (8.24 | ) | | | 9.70 | | | | 9.58 | | | | 5.86 | | | | 2.53 | |
| | | | | | | | | | | | | | | | | | | | |
| | | | | |
Total from investment operations | | | (8.37 | ) | | | 9.79 | | | | 9.55 | | | | 5.83 | | | | 2.60 | |
| | | | | | | | | | | | | | | | | | | | |
| | | | | |
Less distributions | | | | | | | | | | | | | | | | | | | | |
| | | | | |
Dividends (from net investment income) | | | (0.05 | ) | | | (0.03 | ) | | | (0.01 | ) | | | (0.04 | ) | | | (0.07 | ) |
| | | | | |
Distributions (from capital gains) | | | (4.25 | ) | | | (0.23 | ) | | | (0.93 | ) | | | (1.24 | ) | | | (1.34 | ) |
| | | | | | | | | | | | | | | | | | | | |
| | | | | |
Total distributions | | | (4.30 | ) | | | (0.26 | ) | | | (0.94 | ) | | | (1.28 | ) | | | (1.41 | ) |
| | | | | | | | | | | | | | | | | | | | |
| | | | | |
| | | | | | | | | | | | | | | | | | | | |
| | | | | |
Net asset value at end of year | | | $38.72 | | | | $51.39 | | | | $41.86 | | | | $33.25 | | | | $28.70 | |
| | | | | | |
| | | | | | | | | | | | | | | | | | | | |
Total return | | | (17.88 | )% | | | 23.48% | | | | 29.49% | | | | 21.81% | | | | 9.95% | |
| | | | | | |
Ratios / supplemental data | | | | | | | | | | | | | | | | | | | | |
| | | | | |
Net assets ($000), end of year | | | $4,921 | | | | $6,411 | | | | $5,197 | | | | $4,533 | | | | $5,037 | |
| | | | | |
Ratio of expenses to average net assets | | | | | | | | | | | | | | | | | | | | |
| | | | | |
Before custodian fee credits | | | 1.21% | | | | 0.74% | | | | 1.05% | | | | 1.20% | | | | 0.92% | |
| | | | | |
After custodian fee credits | | | 1.20% | | | | 0.74% | | | | 1.05% | | | | 1.20% | | | | 0.92% | |
| | | | | |
Ratio of net investment income after custodian fee credits to average net assets | | | (0.32 | )% | | | 0.20% | | | | (0.08 | )% | | | (0.07 | )% | | | 0.25% | |
| | | | | |
Portfolio turnover rate | | | 23% | | | | 18% | | | | 17% | | | | 10% | | | | 17% | |
| | | | | | |
| | | | | | | | | | | | | | | | | | | | |
| | | | | | | | | | | | | | | | | | | | |
Z Shares (SGZFX) | | | For year ended November 30, | |
| | | | | |
Selected data per share of outstanding capital stock throughout each year: | | | 2022 | | | | 2021 | | | | 2020 | | | | 2019 | | | | 2018 | |
| | | | | | |
Net asset value at beginning of year | | | $51.30 | | | | $41.78 | | | | $33.16 | | | | $28.65 | | | | $27.50 | |
| | | | | |
Income from investment operations | | | | | | | | | | | | | | | | | | | | |
| | | | | |
Net investment incomeA | | | (0.03 | ) | | | 0.20 | | | | 0.05 | | | | 0.08 | | | | 0.13 | |
| | | | | |
Net gains on securities (both realized and unrealized) | | | (8.22 | ) | | | 9.66 | | | | 9.56 | | | | 5.82 | | | | 2.53 | |
| | | | | | | | | | | | | | | | | | | | |
| | | | | |
Total from investment operations | | | (8.25 | ) | | | 9.86 | | | | 9.61 | | | | 5.90 | | | | 2.66 | |
| | | | | | | | | | | | | | | | | | | | |
| | | | | |
Less distributions | | | | | | | | | | | | | | | | | | | | |
| | | | | |
Dividends (from net investment income) | | | (0.14 | ) | | | (0.11 | ) | | | (0.06 | ) | | | (0.15 | ) | | | (0.17 | ) |
| | | | | |
Distributions (from capital gains) | | | (4.25 | ) | | | (0.23 | ) | | | (0.93 | ) | | | (1.24 | ) | | | (1.34 | ) |
| | | | | | | | | | | | | | | | | | | | |
| | | | | |
Total distributions | | | (4.39 | ) | | | (0.34 | ) | | | (0.99 | ) | | | (1.39 | ) | | | (1.51 | ) |
| | | | | | | | | | | | | | | | | | | | |
| | | | | |
| | | | | | | | | | | | | | | | | | | | |
| | | | | |
Net asset value at end of year | | | $38.66 | | | | $51.30 | | | | $41.78 | | | | $33.16 | | | | $28.65 | |
| | | | | | |
| | | | | | | | | | | | | | | | | | | | |
Total return | | | (17.69 | )% | | | 23.76% | | | | 29.79% | | | | 22.22% | | | | 10.20% | |
| | | | | | |
Ratios / supplemental data | | | | | | | | | | | | | | | | | | | | |
| | | | | |
Net assets ($000), end of year | | | $49,958 | | | | $62,277 | | | | $53,776 | | | | $40,978 | | | | $34,191 | |
| | | | | |
Ratio of expenses to average net assets | | | | | | | | | | | | | | | | | | | | |
| | | | | |
Before custodian fee credits | | | 0.97% | | | | 0.51% | | | | 0.82% | | | | 0.90% | | | | 0.70% | |
| | | | | |
After custodian fee credits | | | 0.97% | | | | 0.50% | | | | 0.82% | | | | 0.90% | | | | 0.70% | |
| | | | | |
Ratio of net investment income after custodian fee credits to average net assets | | | (0.08 | )% | | | 0.43% | | | | 0.14% | | | | 0.23% | | | | 0.47% | |
| | | | | |
Portfolio turnover rate | | | 23% | | | | 18% | | | | 17% | | | | 10% | | | | 17% | |
| | | | | | |
| | | | | | | | | | | | | | | | | | | | |
| A | Calculated using average shares outstanding |
| | | | | | | | | | | | |
| | | | | | | |
| The accompanying notes are an integral part of these financial statements. | | Annual Report | | November 30, 2022 | | | | | | | | 45 |
Sextant International Fund
| | |
Performance Summary | | (unaudited) |
| | | | | | | | | | | | | | | | |
Average Annual Total Returns as of November 30, 2022 | |
| | | | | |
| | | 1 Year | | | 5 Year | | | 10 Year | | | Expense Ratio1 | |
| | | | |
Sextant International Fund Investor Shares (SSIFX) | | | -16.31% | | | | 5.95% | | | | 5.92% | | | | 0.93% | |
| | | | |
Sextant International Fund Z Shares (SIFZX)2 | | | -16.17% | | | | 6.17% | | | | n/a | | | | 0.72% | |
| | | | |
MSCI EAFE Index | | | -9.70% | | | | 2.34% | | | | 5.48% | | | | n/a | |
Growth of $10,000
| | |
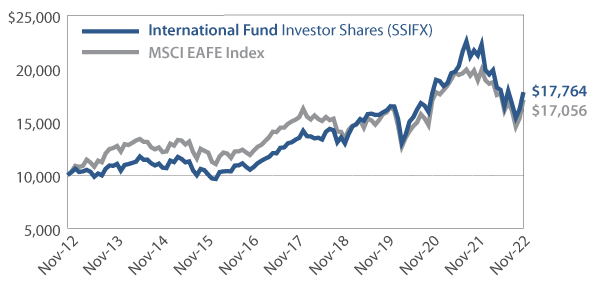 | | Comparison of any mutual fund to a market index must be made bearing in mind that the index is unmanaged, and expense-free. Conversely, the fund will (1) be actively managed; (2) have an objective other than mirroring the index, such as limiting risk; (3) bear transaction and other costs; (4) stand ready to buy and sell its securities to shareowners on a daily basis; and (5) provide a wide range of services. The graph compares $10,000 invested in Investor Shares of the Fund on November 30, 2012, to an identical amount invested in the MSCI EAFE Index, an international index focused on Europe, Australasia, and the Far East. The graph shows that an investment in Investor Shares of the Fund would have risen to $17,764 versus $17,056 in the Index. |
Past performance does not guarantee future results. The “Growth of $10,000” graph and “Average Annual Returns” performance table assume the reinvestment of dividends and capital gains. They do not reflect the deduction of taxes that a shareowner might pay on fund distributions or the redemption of fund shares.
| 1 | By regulation, the expense ratios shown in this table are as stated in the Fund’s most recent prospectus, which is dated March 30, 2022, and incorporate results for the fiscal year ended November 30, 2021. The ratios presented in this table differ from expense ratios shown elsewhere in this report as they represent different periods. |
| 2 | Sextant International Fund Z Shares (SIFZX) began operations June 2, 2017. |
Fund Objective
The objective of the International Fund is long-term capital growth.
| | | | |
Top 10 Holdings | | | | |
| | |
| | | % of Total Net Assets | |
| |
Novo Nordisk ADR | | | 7.0% | |
| |
Wolters Kluwer | | | 5.9% | |
| |
ASML | | | 5.9% | |
| |
NICE Systems ADR | | | 5.5% | |
| |
MercadoLibre | | | 5.3% | |
| |
Dassault Systemes ADR | | | 5.1% | |
| |
Accenture, Class A | | | 4.0% | |
| |
Rio Tinto ADR | | | 4.0% | |
| |
Sony ADR | | | 3.7% | |
| |
United States Treasury Bill (0.00% due 01/05/2023) | | | 3.5% | |
| | | | | | | | | | | | |
Asset Allocation | | | | | | | | | | | | |
| | | |
| % of Total Net Assets | | | | | | | |
| | | |
Equity Securities | | | 92.5% | | | ∎ | | | | |  | |
Fixed-Income Securities | | | 3.5% | | | ∎ | | |
Other assets (net of liabilities) | | | 4.0% | | | ∎ | | |
| | | | | | | | |
Portfolio Diversification | | | | | | | | |
| | |
| | | % of Total Net Assets | |
| | |
| | | Equity | | | | Fixed Income | |
| | |
Technology | | | 36.1% | | | | 0.0% | |
| | |
Health Care | | | 15.7% | | | | 0.0% | |
| | |
Materials | | | 12.7% | | | | 0.0% | |
| | |
Consumer Discretionary | | | 9.3% | | | | 0.0% | |
| | |
Industrials | | | 4.9% | | | | 0.0% | |
| | |
Utilities | | | 3.8% | | | | 0.0% | |
| | |
Energy | | | 3.6% | | | | 0.0% | |
| | |
Consumer Staples | | | 3.5% | | | | 0.0% | |
| | |
Government Bonds | | | 0.0% | | | | 3.5% | |
| | |
Communications | | | 2.9% | | | | 0.0% | |
| | |
Total | | | 92.5% | | | | 3.5% | |
| | | | | | | | | | |
| | | | | | |
| 46 | | | | | | | | November 30, 2022 | | Annual Report |
Sextant International Fund
| | |
Discussion of Fund Performance | | (unaudited) |
(photo omitted)
Fiscal Year 2022
For the fiscal year ended November 30, 2022, the Sextant International Fund Z Shares returned -16.17%. The MSCI EAFE Index returned -9.70% for the same period. The Fund trailed the benchmark for most of the first half of the year, and then outperformed the benchmark during the second half. At fiscal year-end, the Z Shares of the Fund recorded a 30-day yield of 0.77%. The Fund reported turnover of 33%.
Factors Affecting Past Performance
The Sextant International Fund mandates that 65% of net assets be held in companies with their headquarters and at least half of their assets and earnings outside the US, and with market capitalizations greater than $1 billion. The Fund generally holds equity positions in larger companies with strong balance sheets. The Energy sector produced the largest positive contribution to returns, followed by the Materials sector. At the industry level, pharmaceuticals produced the largest positive contribution to returns. All other sectors detracted from returns. The Technology sector generated the largest negative contribution.
The Sextant International Fund increased its number of equity positions from 31 to 35 over the fiscal year and decreased the average equity position size to 1.08%. The Fund’s top three sectors represented 64.6% of the portfolio: Technology at 36.2%, Health Care at 15.7%, and Materials at 12.7%. The top three positions represented 18.8% of assets. Positions spanned 17 countries, led by the Netherlands, France, and Canada. Global diabetes care leader Novo Nordisk achieved strong revenue growth and was the largest contributor to returns, while softening demand for licenses led 3D design software company Dassault Systèmes to be the largest detractor.
Looking Forward
After a year marked by significant global disruption, established equity markets ended 2022 in a general downtrend. For 2023, many issues remain unresolved, and outcomes are uncertain. The Federal Reserve marches forward, undeterred in its effort to tame inflation. Consequently, it is our view that financial conditions are likely to remain tight as central bankers keep target policy rates much higher than in the recent past. Outside of the US, elevated energy prices and political unrest continue to prove troublesome. In our view, such an environment likely pressures consumer demand, corporate earnings, and equity valuations alike.
Management Fee Calculations
The Sextant International Fund calculates the performance part of its management fee by comparing the Fund’s return to its Morningstar category’s average return. As of November 30, 2022, the Investor Shares of the Fund had a 12-month return of -16.31%, leading the Morningstar category average of -20.40% by more than 2%. Therefore, the base annual management fee of 0.50% for the Fund was increased to 0.70% for the month of December 2022.
| | | | | | | | | | |
| | | | | | |
| Annual Report | | November 30, 2022 | | | | | | | | 47 |
Sextant International Fund
| | | | | | | | | | | | | | | | | | | | | | |
| | | Schedule of Investments | | | | | | | | | | | | | | | As of November 30, 2022 | |
| | | | | | | | |
| | | Common Stocks – 92.5% | | | | Number of Shares | | | Cost | | | Market Value | | | Country1 | | Percentage of Net Assets | |
| | | | | | | |
| | | Communications | | | | | | | | | | | | | | | | |
| | | | | | | | |
| | | Telecom Carriers | | | | | | | | | | | | | | | | |
| | | | | | | | |
| | | Telus | | | | | 78,000 | | | | $560,986 | | | | $1,662,180 | | | Canada | | | 2.9% | |
| | | | | | | | |
| | | | | | | | | | | | | | | | | | | | | | |
| | | | | | | |
| | | Consumer Discretionary | | | | | | | | | | | | | | | | |
| | | | | | | |
| | | Apparel, Footwear & Accessory
Design | | | | | | | | | | | | | | |
| | | | | | | | |
| | | Hermes International | | | | | 600 | | | | 569,152 | | | | 964,910 | | | France | | | 1.7% | |
| | | | | | | |
| | | E-Commerce Discretionary | | | | | | | | | | | | | | |
| | | | | | | | |
| | | MercadoLibre2 | | | | | 3,215 | | | | 266,633 | | | | 2,993,117 | | | Argentina | | | 5.3% | |
| | | | | | | | |
| | | Specialty Apparel Stores | | | | | | | | | | | | | | | | |
| | | | | | | | |
| | | Lululemon Athletica2 | | | | | 3,500 | | | | 1,066,230 | | | | 1,331,085 | | | United States | | | 2.3% | |
| | | | | | | | |
| | | | | | | | | | | 1,902,015 | | | | 5,289,112 | | | | | | 9.3% | |
| | | | | | | |
| | | Consumer Staples | | | | | | | | | | | | | | | | |
| | | | | | | | |
| | | Household Products | | | | | | | | | | | | | | | | |
| | | | | | | | |
| | | L’Oreal | | | | | 3,400 | | | | 1,099,801 | | | | 1,263,459 | | | France | | | 2.2% | |
| | | | | | | | |
| | | Packaged Food | | | | | | | | | | | | | | | | |
| | | | | | | | |
| | | Nestle S.A. | | | | | 6,000 | | | | 652,766 | | | | 709,269 | | | Switzerland | | | 1.3% | |
| | | | | | | | |
| | | | | | | | | | | 1,752,567 | | | | 1,972,728 | | | | | | 3.5% | |
| | | | | | | |
| | | Energy | | | | | | | | | | | | | | | | |
| | | | | | | | |
| | | Integrated Oils | | | | | | | | | | | | | | | | |
| | | | | | | | |
| | | Equinor ADR | | | | | 21,000 | | | | 786,076 | | | | 808,080 | | | Norway | | | 1.4% | |
| | | | | | | | |
| | | TotalEnergies SE ADR | | | | | 20,000 | | | | 1,136,128 | | | | 1,248,400 | | | France | | | 2.2% | |
| | | | | | | | |
| | | | | | | | | | | 1,922,204 | | | | 2,056,480 | | | | | | 3.6% | |
| | | | | | | |
| | | Health Care | | | | | | | | | | | | | | | | |
| | | | | | | | |
| | | Biotech | | | | | | | | | | | | | | | | |
| | | | | | | | |
| | | BioNTech SE | | | | | 4,500 | | | | 650,502 | | | | 751,590 | | | Germany | | | 1.3% | |
| | | | | | | | |
| | | Large Pharma | | | | | | | | | | | | | | | | |
| | | | | | | | |
| | | AstraZeneca ADR | | | | | 17,000 | | | | 1,023,786 | | | | 1,155,490 | | | United Kingdom | | | 2.0% | |
| | | | | | | | |
| | | Novartis ADR | | | | | 15,150 | | | | 750,549 | | | | 1,356,834 | | | Switzerland | | | 2.4% | |
| | | | | | | | |
| | | Novo Nordisk ADR | | | | | 31,700 | | | | 388,514 | | | | 3,949,820 | | | Denmark | | | 7.0% | |
| | | | | | | | |
| | | | | | | | | | | | 2,162,849 | | | | 6,462,144 | | | | | | 11.4% | |
| | | | | | | | |
| | | Medical Equipment | | | | | | | | | | | | | | | | |
| | | | | | | | |
| | | Alcon | | | | | 25,000 | | | | 1,294,019 | | | | 1,722,250 | | | Switzerland | | | 3.0% | |
| | | | | | | | |
| | | | | | | | | | | 4,107,370 | | | | 8,935,984 | | | | | | 15.7% | |
Continued on next page.
| | | | | | | | | | | | |
| | | | | | | |
| 48 | | | | | | | | November 30, 2022 | | Annual Report | | The accompanying notes are an integral part of these financial statements. |
Sextant International Fund
| | | | | | | | | | | | | | | | | | | | | | |
| | | Schedule of Investments | | | | | | | | | | | | | | | As of November 30, 2022 | |
| | | | | | | | |
| | | Common Stocks – 92.5% | | | | Number of Shares | | | Cost | | | Market Value | | | Country1 | | Percentage of Net Assets | |
| | | | | | | |
| | | Industrials | | | | | | | | | | | | | | | | |
| | | | | | | |
| | | Commercial & Residential
Building Equipment & Systems | | | | | | | | | | | | | | |
| | | | | | | | |
| | | NIBE Industrier AB Class B | | | | | 40,000 | | | | $352,733 | | | | $371,904 | | | Sweden | | | 0.6% | |
| | | | | | | |
| | | Electrical Power Equipment | | | | | | | | | | | | | | |
| | | | | | | | |
| | | Eaton Corp PLC | | | | | 5,000 | | | | 760,124 | | | | 817,250 | | | United States | | | 1.4% | |
| | | | | | | |
| | | Infrastructure Construction | | | | | | | | | | | | | | |
| | | | | | | | |
| | | Alfen Beheer BV2 | | | | | 3,300 | | | | 353,319 | | | | 319,682 | | | Netherlands | | | 0.6% | |
| | | | | | | | |
| | | Rail Freight | | | | | | | | | | | | | | | | |
| | | | | | | | |
| | | Canadian National Railway | | | | | 10,000 | | | | 1,164,265 | | | | 1,284,300 | | | Canada | | | 2.3% | |
| | | | | | | | |
| | | | | | | | | | | 2,630,441 | | | | 2,793,136 | | | | | | 4.9% | |
| | | | | | | |
| | | Materials | | | | | | | | | | | | | | | | |
| | | | | | | | |
| | | Agricultural Chemicals | | | | | | | | | | | | | | | | |
| | | | | | | | |
| | | Nutrien | | | | | 7,500 | | | | 635,850 | | | | 603,000 | | | Canada | | | 1.1% | |
| | | | | | | |
| | | Basic & Diversified Chemicals | | | | | | | | | | | | | | |
| | | | | | | | |
| | | Linde | | | | | 5,500 | | | | 1,397,250 | | | | 1,850,640 | | | Ireland | | | 3.3% | |
| | | | | | | | |
| | | Precious Metal Mining | | | | | | | | | | | | | | | | |
| | | | | | | | |
| | | Agnico-Eagle Mines | | | | | 18,000 | | | | 829,730 | | | | 906,660 | | | Canada | | | 1.6% | |
| | | | | | | | |
| | | Barrick Gold | | | | | 43,000 | | | | 720,837 | | | | 701,760 | | | Canada | | | 1.2% | |
| | | | | | | | |
| | | | | | | | | | | | 1,550,567 | | | | 1,608,420 | | | | | | 2.8% | |
| | | | | | | |
| | | Steel Raw Material Suppliers | | | | | | | | | | | | | | |
| | | | | | | | |
| | | BHP Biliton ADR | | | | | 14,000 | | | | 803,126 | | | | 879,200 | | | Australia | | | 1.5% | |
| | | | | | | | |
| | | Rio Tinto ADR | | | | | 32,800 | | | | 1,773,219 | | | | 2,251,392 | | | United Kingdom | | | 4.0% | |
| | | | | | | | |
| | | | | | | | | | | | 2,576,345 | | | | 3,130,592 | | | | | | 5.5% | |
| | | | | | | | |
| | | | | | | | | | | 6,160,012 | | | | 7,192,652 | | | | | | 12.7% | |
| | | | | | | |
| | | Technology | | | | | | | | | | | | | | | | |
| | | | | | | | |
| | | Application Software | | | | | | | | | | | | | | | | |
| | | | | | | | |
| | | Dassault Systemes ADR | | | | | 78,215 | | | | 586,207 | | | | 2,879,876 | | | France | | | 5.1% | |
| | | | | | | | |
| | | NICE Systems ADR | | | | | 16,075 | | | | 608,235 | | | | 3,121,283 | | | Israel | | | 5.5% | |
| | | | | | | | |
| | | | | | | | | | | | 1,194,442 | | | | 6,001,159 | | | | | | 10.6% | |
| | | | | | | | |
| | | Consumer Electronics | | | | | | | | | | | | | | | | |
| | | | | | | | |
| | | Nintendo | | | | | 34,000 | | | | 1,490,299 | | | | 1,442,672 | | | Japan | | | 2.5% | |
| | | | | | | | |
| | | Sony ADR | | | | | 25,000 | | | | 1,506,327 | | | | 2,076,750 | | | Japan | | | 3.7% | |
| | | | | | | | |
| | | | | | | | | | | | 2,996,626 | | | | 3,519,422 | | | | | | 6.2% | |
| | | | | | | | |
| | | Electronics Components | | | | | | | | | | | | | | | | |
| | | | | | | | |
| | | Varta AG | | | | | 6,200 | | | | 382,159 | | | | 181,279 | | | Germany | | | 0.3% | |
| | | | | | | | |
| | | Information Services | | | | | | | | | | | | | | | | |
| | | | | | | | |
| | | Experian PLC | | | | | 33,000 | | | | 1,053,313 | | | | 1,153,681 | | | United States | | | 2.0% | |
| | | | | | | | |
| | | Wolters Kluwer | | | | | 31,000 | | | | 578,573 | | | | 3,380,586 | | | Netherlands | | | 5.9% | |
| | | | | | | | |
| | | | | | | | | | | | 1,631,886 | | | | 4,534,267 | | | | | | 7.9% | |
Continued on next page.
| | | | | | | | | | | | |
| | | | | | | |
| The accompanying notes are an integral part of these financial statements. | | Annual Report | | November 30, 2022 | | | | | | | | 49 |
Sextant International Fund
| | | | | | | | | | | | | | | | | | | | | | |
| | | Schedule of Investments | | | | | | | | | | | | | | | As of November 30, 2022 | |
| | | | | | | | |
| | | Common Stocks –
92.5% | | | | Number of Shares | | | Cost | | | Market Value | | | Country1 | | Percentage of Net Assets | |
| | | | | | | |
| | | Technology
(continued) | | | | | | | | | | | | | | | | |
| | | | | | | | |
| | | IT Services | | | | | | | | | | | | | | | | |
| | | | | | | | |
| | | Accenture, Class A | | | | | 7,600 | | | | $1,404,545 | | | | $2,287,068 | | | Ireland | | | 4.0% | |
| | | | | | | | |
| | | Semiconductor
Devices | | | | | | | | | | | | | | | | |
| | | | | | | | |
| | | STMicroelectronics | | | | | 17,000 | | | | 531,165 | | | | 660,960 | | | Switzerland | | | 1.2% | |
| | | | | | | |
| | | Semiconductor
Manufacturing | | | | | | | | | | | | | | |
| | | | | | | | |
| | | ASML | | | | | 5,475 | | | | 190,945 | | | | 3,329,457 | | | Netherlands | | | 5.9% | |
| | | | | | | | |
| | | | | | | | | | | 8,331,768 | | | | 20,513,612 | | | | | | 36.1% | |
| | | | | | | |
| | | Utilities | | | | | | | | | | | | | | | | |
| | | | | | | | |
| | | Power Generation | | | | | | | | | | | | | | | | |
| | | | | | | | |
| | | Iberdrola | | | | | 99,851 | | | | 1,007,508 | | | | 1,116,193 | | | Spain | | | 2.0% | |
| | | | | | | | |
| | | Northland Power | | | | | 38,000 | | | | 1,225,865 | | | | 1,053,360 | | | Canada | | | 1.8% | |
| | | | | | | | |
| | | | | | | | | | | 2,233,373 | | | | 2,169,553 | | | | | | 3.8% | |
| | | | | | | |
| | | | | | | | | | | | | | | | | | | | | | | |
| | | | | | | | |
| | Total Common Stocks | | | | | | | | | $29,600,736 | | | | $52,585,437 | | | | | | 92.5% | |
| | | | | | | |
| | | | | | | | | | | | | | | | | | | | | | |
| | | | | | | | |
| | | Government Bonds –
3.5% | | | | Coupon / Maturity | | | Face Amount | | | Market Value | | | Country1 | | Percentage of Net Assets | |
| | | | | | | |
| | | United States Treasury Bills | | | | | | | | | | | | | | | | |
| | | | | | | | |
| | | United States Treasury Bill | | | | | 0.00% due 01/05/2023 | | | | $2,000,000 | | | | $1,992,628 | | | United States | | | 3.5% | |
| | | | | | | |
| | | | | | | | | | | | | | | | | | | | | | |
| | | | | | | | |
| | Total Government Bonds | | | | | (Cost $1,992,766) | | | | | | | | $1,992,628 | | | | | | 3.5% | |
| | | | | | | |
| | | | | | | | | | | | | | | | | | | | | | | |
| | | | | | |
| | Total investments | | | | | (Cost $31,593,502) | | | | $54,578,065 | | | | | | 96.0% | |
| | | | | | | |
| | Other assets (net of liabilities) | | | | | | | | | | | | | 2,262,641 | | | | | | 4.0% | |
| | | | | | | |
| | Total net assets | | | | | | | | | | | | | $56,840,706 | | | | | | 100.0% | |
| | | | | | | | |
| | | | | | | | | | | | | | | | | | | | | | |
ADR: American Depositary Receipt
| | | | | | | | | | | | |
| | | | | | | |
| 50 | | | | | | | | November 30, 2022 | | Annual Report | | The accompanying notes are an integral part of these financial statements. |
Sextant International Fund
| | | | | | | | | | | | | | | | |
Schedule of Investments | | | | | | | | | | | | | As of November 30, 2022 | |
| | | | |
Countries | | | (unaudited) | |
| |
| |
|
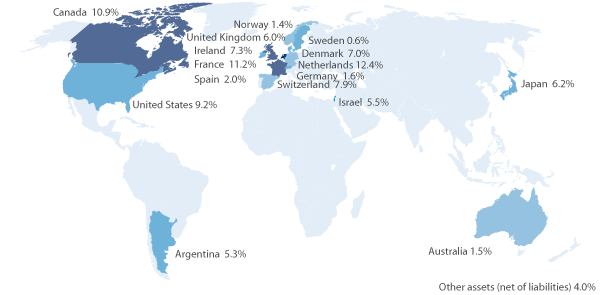 | |
|
Weightings shown are a percentage of total net assets. | |
| | | | | | | | | | | | |
| | | | | | | |
| The accompanying notes are an integral part of these financial statements. | | Annual Report | | November 30, 2022 | | | | | | | | 51 |
Sextant International Fund
Statement of Assets and Liabilities
| | | | |
| As of November 30, 2022 | |
| | |
| | | | |
| |
Assets | | | | |
| |
Investments in securities, at value
(Cost $31,593,502) | | | $54,578,065 | |
| |
Cash | | | 2,183,641 | |
| |
Recoverable tax receivable | | | 152,445 | |
| |
Dividends receivable | | | 33,982 | |
| |
Prepaid expenses | | | 10,688 | |
| |
Receivable for Fund shares sold | | | 9,200 | |
| | | | |
| |
Total assets | | | 56,968,021 | |
| | | | |
| |
Liabilities | | | | |
| |
Payable for Fund shares redeemed | | | 63,273 | |
| |
Accrued advisory fees | | | 22,294 | |
| |
Accrued audit expenses | | | 14,056 | |
| |
Accrued 12b-1 distribution fees | | | 6,487 | |
| |
Accrued postage | | | 5,965 | |
| |
Accrued printing fees | | | 5,547 | |
| |
Accrued retirement plan custody fee | | | 5,004 | |
| |
Accrued Chief Compliance Officer expenses | | | 2,647 | |
| |
Accrued other operating expenses | | | 824 | |
| |
Accrued legal expenses | | | 721 | |
| |
Accrued trustee expenses | | | 497 | |
| | | | |
| |
Total liabilities | | | 127,315 | |
| | | | |
| |
Net assets | | | $56,840,706 | |
| | |
| | | | |
| | |
Analysis of net assets | | | | |
| |
Paid-in capital (unlimited shares authorized, without par value) | | | $33,998,406 | |
| |
Total distributable earnings | | | 22,842,300 | |
| | | | |
| |
Net assets applicable to Fund shares outstanding | | | $56,840,706 | |
| | |
| | | | |
| | |
Net asset value per Investor Share | | | SSIFX | |
| |
Net assets, at value | | | $33,029,171 | |
| |
Shares outstanding | | | 1,824,130 | |
| | | | |
| |
Net asset value, offering and redemption price per share | | | $18.11 | |
| | |
| | | | |
| | |
Net asset value per Z Share | | | SIFZX | |
| |
Net assets, at value | | | $23,811,535 | |
| |
Shares outstanding | | | 1,311,623 | |
| | | | |
| |
Net asset value, offering and redemption price per share | | | $18.15 | |
| | |
| | | | |
Statement of Operations
| | | | |
| Year ended November 30, 2022 | |
| | |
| | | | |
| |
Investment income | | | | |
| |
Dividend income (net of foreign tax ($118,668) | | | $1,052,234 | |
| |
Interest income | | | 5,768 | |
| | | | |
| |
Total investment income | | | 1,058,002 | |
| | | | |
| |
Expenses | | | | |
| |
Investment advisory fees | | | 448,072 | |
| |
Distribution fees - Investor Shares | | | 90,414 | |
| |
Filing and registration fees | | | 62,260 | |
| |
Audit fees | | | 39,931 | |
| |
Legal fees | | | 15,067 | |
| |
ReFlow fees | | | 13,446 | |
| |
Chief Compliance Officer expenses | | | 12,878 | |
| |
Trustee fees | | | 12,639 | |
| |
Other operating expenses | | | 8,184 | |
| |
Custodian fees | | | 6,174 | |
| |
Retirement plan custodial fees | | | | |
| |
Investor Shares | | | 35 | |
| |
Z Shares | | | 5,086 | |
| |
Printing and postage fees | | | 613 | |
| | | | |
| |
Total gross expenses | | | 714,799 | |
| | | | |
| |
Less custodian fee credits | | | (6,174 | ) |
| | | | |
| |
Net expenses | | | 708,625 | |
| | | | |
| |
Net investment income | | | $349,377 | |
| | |
| | | | |
| | |
| | | | |
| |
Net realized gain from investments and foreign currencyA | | | $2,861,583 | |
| |
Net decrease in unrealized appreciation on investments and foreign currency | | | (14,960,190 | ) |
| | | | |
| |
Net loss on investments | | | $(12,098,607 | ) |
| | |
| | | | |
| | |
Net decrease in net assets resulting from operations | | | $(11,749,230 | ) |
| | | | | |
| A | Includes $4,737,112 in net realized gains from redemptions in-kind. |
| | | | | | | | | | | | |
| | | | | | | |
| 52 | | | | | | | | November 30, 2022 | | Annual Report | | The accompanying notes are an integral part of these financial statements. |
| | |
| Sextant International Fund | | |
| | | | | | | | |
Statements of Changes in Net Assets | | | Year ended November 30, 2022 | | | | Year ended November 30, 2021 | |
| | | |
Decrease in net assets from operations | | | | | | | | |
| | |
From operations | | | | | | | | |
| | |
Net investment income | | | $349,377 | | | | $432,239 | |
| | |
Net realized gain on investment | | | 2,861,583 | | | | 22,095,159 | |
| | |
Net decrease in unrealized appreciation | | | (14,960,190 | ) | | | (7,848,741 | ) |
| | | | | | | | |
| | |
Net increase (decrease) in net assets | | | (11,749,230 | ) | | | 14,678,657 | |
| | | | | | | | |
| | |
Distributions to shareowners | | | | | | | | |
| | |
Net distribution to shareholders - Investor Shares | | | (3,698,513 | ) | | | (193,665 | ) |
| | |
Net distribution to shareholders - Z Shares | | | (2,376,574 | ) | | | (162,812 | ) |
| | | | | | | | |
| | |
Total distributions | | | (6,075,087 | ) | | | (356,477 | ) |
| | | | | | | | |
| | |
Capital share transactions | | | | | | | | |
| | |
Proceeds from sales of shares | | | | | | | | |
| | |
Investor Shares | | | 1,495,198 | | | | 4,951,355 | |
| | |
Z Shares | | | 7,854,075 | | | | 17,392,993 | |
| | |
Value of shares issued in reinvestment of dividends | | | | | | | | |
| | |
Investor Shares | | | 3,613,417 | | | | 190,430 | |
| | |
Z Shares | | | 2,277,923 | | | | 156,810 | |
| | |
Cost of shares redeemed | | | | | | | | |
| | |
Investor Shares | | | (7,772,262 | ) | | | (18,619,163 | ) |
| | |
Z Shares | | | (8,292,788 | ) | | | (20,966,859 | ) |
| | | | | | | | |
| | |
Total capital share transactions | | | (824,437 | ) | | | (16,894,434 | ) |
| | | | | | | | |
| | |
Total decrease in net assets | | | (18,648,754 | ) | | | (2,572,254 | ) |
| | | |
| | | | | | | | |
| | | |
Net assets | | | | | | | | |
| | |
Beginning of year | | | 75,489,460 | | | | 78,061,714 | |
| | |
End of year | | | $56,840,706 | | | | $75,489,460 | |
| | | |
| | | | | | | | |
| | | |
Shares of the Fund sold and redeemed | | | | | | | | |
| | |
Investor Shares (SSIFX) | | | | | | | | |
| | |
Number of shares sold | | | 76,818 | | | | 210,865 | |
| | |
Number of shares issued in reinvestment of dividends and distributions | | | 163,800 | | | | 9,231 | |
| | |
Number of shares redeemed | | | (398,331 | ) | | | (845,292 | ) |
| | | | | | | | |
| | |
Net decrease in number of shares outstanding | | | (157,713 | ) | | | (625,196 | ) |
| | | | | | | | |
| | |
Z Shares (SIFZX) | | | | | | | | |
| | |
Number of shares sold | | | 404,546 | | | | 775,296 | |
| | |
Number of shares issued in reinvestment of dividends and distributions | | | 103,214 | | | | 7,594 | |
| | |
Number of shares redeemed | | | (424,756 | ) | | | (922,890 | ) |
| | | | | | | | |
| | |
Net increase (decrease) in number of shares outstanding | | | 83,004 | | | | (140,000 | ) |
| | | | | | | | | | | | |
| | | | | | | |
| The accompanying notes are an integral part of these financial statements. | | Annual Report | | November 30, 2022 | | | | | | | | 53 |
Sextant International Fund: Financial Highlights
| | | | | | | | | | | | | | | | | | | | |
Investor Shares (SSIFX) | | | | | | | For year ended November 30, | | | | | |
| | | | | |
Selected data per share of outstanding capital stock throughout each year: | | | 2022 | | | | 2021 | | | | 2020 | | | | 2019 | | | | 2018 | |
| | | | | | |
Net asset value at beginning of year | | | $23.49 | | | | $19.62 | | | | $18.50 | | | | $16.83 | | | | $17.98 | |
| | | | | |
Income from investment operations | | | | | | | | | | | | | | | | | | | | |
| | | | | |
Net investment incomeA | | | 0.09 | | | | 0.10 | | | | 0.12 | | | | 0.12 | | | | 0.15 | |
| | | | | |
Net gains (losses) on securities (both realized and unrealized) | | | (3.58 | ) | | | 3.85 | | | | 1.66 | | | | 2.74 | | | | 0.14 | |
| | | | | | | | | | | | | | | | | | | | |
| | | | | |
Total from investment operations | | | (3.49 | ) | | | 3.95 | | | | 1.78 | | | | 2.86 | | | | 0.29 | |
| | | | | | | | | | | | | | | | | | | | |
| | | | | |
Less distributions | | | | | | | | | | | | | | | | | | | | |
| | | | | |
Dividends (from net investment income) | | | (0.13 | ) | | | (0.08 | ) | | | (0.11 | ) | | | (0.15 | ) | | | (0.17 | ) |
| | | | | |
Distributions (from capital gains) | | | (1.76 | ) | | | - | | | | (0.55 | ) | | | (1.04 | ) | | | (1.27 | ) |
| | | | | | | | | | | | | | | | | | | | |
| | | | | |
Total distributions | | | (1.89 | ) | | | (0.08 | ) | | | (0.66 | ) | | | (1.19 | ) | | | (1.44 | ) |
| | | | | | | | | | | | | | | | | | | | |
| | | | | |
| | | | | | | | | | | | | | | | | | | | |
| | | | | |
Net asset value at end of year | | | $18.11 | | | | $23.49 | | | | $19.62 | | | | $18.50 | | | | $16.83 | |
| | | | | | |
| | | | | | | | | | | | | | | | | | | | |
Total return | | | (16.31 | )% | | | 20.16% | | | | 9.86% | | | | 18.82% | | | | 1.63% | |
| | | | | | |
Ratios / supplemental data | | | | | | | | | | | | | | | | | | | | |
| | | | | |
Net assets ($000), end of year | | | $33,029 | | | | $46,560 | | | | $51,141 | | | | $67,390 | | | | $41,688 | |
| | | | | |
Ratio of expenses to average net assets | | | | | | | | | | | | | | | | | | | | |
| | | | | |
Before custodian fee credits | | | 1.28% | | | | 0.93% | | | | 0.83% | | | | 1.07% | | | | 1.05% | |
| | | | | |
After custodian fee credits | | | 1.27% | | | | 0.92% | | | | 0.82% | | | | 1.06% | | | | 1.04% | |
| | | | | |
Ratio of net investment income after custodian fee credits to average net assets | | | 0.48% | | | | 0.46% | | | | 0.70% | | | | 0.62% | | | | 0.89% | |
| | | | | |
Portfolio turnover rate | | | 33% | | | | 22% | | | | 16% | | | | 6% | | | | 2% | |
| | | | | | |
| | | | | | | | | | | | | | | | | | | | |
Z Shares (SIFZX) | | | | | | | For year ended November 30, | | | | | |
| | | | | |
Selected data per share of outstanding capital stock throughout each year: | | | 2022 | | | | 2021 | | | | 2020 | | | | 2019 | | | | 2018 | |
| | | | | | |
Net asset value at beginning of year | | | $23.55 | | | | $19.67 | | | | $18.55 | | | | $16.87 | | | | $18.00 | |
| | | | | |
Income from investment operations | | | | | | | | | | | | | | | | | | | | |
| | | | | |
Net investment incomeA | | | 0.13 | | | | 0.15 | | | | 0.15 | | | | 0.19 | | | | 0.19 | |
| | | | | |
Net gains (losses) on securities (both realized and unrealized) | | | (3.59 | ) | | | 3.85 | | | | 1.67 | | | | 2.72 | | | | 0.14 | |
| | | | | | | | | | | | | | | | | | | | |
| | | | | |
Total from investment operations | | | (3.46 | ) | | | 4.00 | | | | 1.82 | | | | 2.91 | | | | 0.33 | |
| | | | | | | | | | | | | | | | | | | | |
| | | | | |
Less distributions | | | | | | | | | | | | | | | | | | | | |
| | | | | |
Dividends (from net investment income) | | | (0.18 | ) | | | (0.12 | ) | | | (0.15 | ) | | | (0.19 | ) | | | (0.19 | ) |
| | | | | |
Distributions (from capital gains) | | | (1.76 | ) | | | - | | | | (0.55 | ) | | | (1.04 | ) | | | (1.27 | ) |
| | | | | | | | | | | | | | | | | | | | |
| | | | | |
Total distributions | | | (1.94 | ) | | | (0.12 | ) | | | (0.70 | ) | | | (1.23 | ) | | | (1.46 | ) |
| | | | | | | | | | | | | | | | | | | | |
| | | | | |
| | | | | | | | | | | | | | | | | | | | |
| | | | | |
Net asset value at end of year | | | $18.15 | | | | $23.55 | | | | $19.67 | | | | $18.55 | | | | $16.87 | |
| | | | | | |
| | | | | | | | | | | | | | | | | | | | |
Total return | | | (16.17 | )% | | | 20.42% | | | | 10.09% | | | | 19.14% | | | | 1.83% | |
| | | | | | |
Ratios / supplemental data | | | | | | | | | | | | | | | | | | | | |
| | | | | |
Net assets ($000), end of year | | | $23,812 | | | | $28,929 | | | | $26,921 | | | | $30,963 | | | | $20,692 | |
| | | | | |
Ratio of expenses to average net assets | | | | | | | | | | | | | | | | | | | | |
| | | | | |
Before custodian fee credits | | | 1.04% | | | | 0.72% | | | | 0.63% | | | | 0.85% | | | | 0.84% | |
| | | | | |
After custodian fee credits | | | 1.03% | | | | 0.71% | | | | 0.63% | | | | 0.84% | | | | 0.82% | |
| | | | | |
Ratio of net investment income after custodian fee credits to average net assets | | | 0.72% | | | | 0.68% | | | | 0.87% | | | | 0.91% | | | | 1.13% | |
| | | | | |
Portfolio turnover rate | | | 33% | | | | 22% | | | | 16% | | | | 6% | | | | 2% | |
| | | | | | |
| | | | | | | | | | | | | | | | | | | | |
| A | Calculated using average shares outstanding |
| | | | | | | | | | | | |
| | | | | | | |
| 54 | | | | | | | | November 30, 2022 | | Annual Report | | The accompanying notes are an integral part of these financial statements. |
| | |
Notes to Financial Statements | | |
NOTE 1 – Organization
Saturna Investment Trust (the “Trust”) was established under Washington State Law as a business trust on February 20, 1987. The Trust is registered as an open-end, diversified management company under the Investment Company Act of 1940, as amended. Nine portfolio series have been created to date: Sextant Short-Term Bond Fund, Sextant Bond Income Fund, Sextant Core Fund, Sextant Global High Income Fund, Sextant Growth Fund, Sextant International Fund (each, a “Fund”, and collectively, the “Funds”), Idaho Tax-Exempt Fund, Saturna Sustainable Equity Fund, and Saturna Sustainable Bond Fund. Idaho Tax-Exempt Fund, Saturna Sustainable Equity Fund, and Saturna Sustainable Bond Fund are offered through separate prospectuses, the results of which are contained in separate reports.
Sextant Growth Investor Shares (previously known as Idaho Limited Maturity Tax-Exempt Fund until October 12, 1990, then Northwest Growth Fund until September 28, 1995, when the investment objective of only Northwest stocks was changed) commenced operations as an equity fund on December 30, 1990. Sextant Growth Fund Z Shares began operations June 2, 2017. Sextant International Investor Shares began operations September 28, 1995 and Sextant International Fund Z Shares began operations on June 2, 2017. Sextant Short-Term Bond began operations September 28, 1995. Sextant Bond Income Fund (previously known as Washington Tax-Exempt Fund until September 28, 1995, when the investment objective of only Washington State Municipal Bonds was changed) began operations on March 1, 1993. Sextant Core Fund commenced operations March 30, 2007. Sextant Global High Income Fund commenced operations March 30, 2012.
Each Fund is an investment company and accordingly follows the investment company accounting and reporting guidance of the Financial Accounting Standards Board (FASB) Accounting Standard Codification Topic 946 “Financial Services - Investment Companies”.
Each class of shares of a Fund represents an interest in the same portfolio of investments of the Fund and has in all respects the same rights and obligations as each other class of the Fund, except that each class bears its own class expenses, and each class has exclusive voting rights. Each class of shares may be subject to different investment minimums and other conditions of eligibility as may be described in the prospectus for the particular class of shares, as from time to time in effect.
Income, realized and unrealized capital gains and losses, and expenses to be paid by a Fund and not allocated to a particular class as provided below, shall be allocated to each class on the basis of relative net assets. Expenses allocable to a specific class are expenses specifically incurred by or for such class including the following:
| | • | | Retirement plan custodial fees; and |
| | • | | Any applicable service fees. |
Net investment income dividends and capital gain distributions paid by the Fund on each class of its shares will be calculated in the same manner on the same day and at the same time.
Investment risks:
Growth, International, Core, Short-Term Bond, Bond Income, and Global High Income Funds: The value of each Fund’s shares rises and falls as the value of the securities in which the Fund invests goes up and down. Fund share prices, yields, and total returns will change with market fluctuations as well as the fortunes of the countries, industries, and companies in which the Fund invests. The Funds do not use derivatives to hedge currency, interest rate, or credit risk.
Liquidity risk exists when particular investments are difficult to sell. If a Fund holds illiquid investments, its portfolio may be more difficult to value, especially in changing markets. Investments by a Fund in foreign securities and those that are thinly traded, such as lower quality issuers and smaller companies, tend to involve greater liquidity risk. If a Fund is forced to sell or unwind these investments to meet redemptions or for other cash needs, the Fund may suffer a penalty. Additionally, the market for certain investments may become illiquid under adverse market or economic conditions independent of any specific adverse changes in the conditions of a particular issuer. In such cases, the Fund, due to limitations on investments in illiquid securities and the difficulty in purchasing and selling such securities, may be unable to achieve its investment objective.
Growth and Core Funds: Smaller companies involve higher investment risks in that they often have limited product lines, markets, and resources, or their securities may trade less frequently and have greater price fluctuation than those of larger companies.
Growth stocks, which can be priced on future expectations rather than current results, may decline substantially when expectations are not met.
International, Core, Short-Term Bond, Bond Income, and Global High Income Funds: Foreign investing involves risks not normally associated with investing in US securities. These include fluctuations in currency exchange rates, less public information about securities, less governmental market supervision, and the lack of uniform financial, social, and political standards. Foreign investing heightens the risk of confiscatory taxation, seizure or nationalization of assets, currency controls, or adverse political or social developments that affect investments. The risks of investing in foreign securities are typically greater in less developed or emerging countries.
Core Fund: The Core Fund has the risks of growth stocks, foreign securities, credit, and interest rates – but these risks are mitigated by spreading its investments in both stocks and bonds, and by favoring income-producing securities and those of larger, more seasoned companies.
Short-Term Bond, Bond Income, Global High Income, and Core Funds: Bonds entail credit risk, which is the possibility that a bond will not be able to pay interest or principal when due. If the credit quality of a bond is perceived to decline, investors will demand a higher yield, which means a lower price on that bond to compensate for the higher level of risk.
Interest rate fluctuations affect bond prices and a Fund’s net asset value, but not the income received by the Fund from its portfolio securities. Because prices and yields on debt securities vary over time, a Fund’s yield also varies. Bonds with embedded callable options also contain an element of prepayment risk. When interest rates decline, issuers can retire their debt and reissue bonds at a lower interest rate. This hurts investors because yields available for reinvestment will have declined and upward price mobility on callable bonds is generally limited by the call price.
Global High Income Fund: Issuers of high-yield securities are generally not as strong financially as those issuing higher quality securities. These issuers are more likely to encounter financial difficulties and are more vulnerable to changes in the relevant economy, such as a recession or a sustained period of rising interest rates, that could affect their ability to make interest, principal, and dividend payments as expected. The prices of high-yield securities generally fluctuate more than those of higher quality. High-yield securities are generally more illiquid (harder to sell) and harder to value.
The Funds may invest substantially in one or more sectors, which can increase volatility and exposure to issues specific to a particular sector or industry.
NOTE 2 – Significant Accounting Policies
The following is a summary of the significant accounting policies, in conformity with accounting principles generally accepted in the United States of America, which are consistently followed by the Funds in preparation of their financial statements.
| | | | | | | | | | |
| | | | | | |
| Annual Report | | November 30, 2022 | | | | | | | | 55 |
| | |
| Notes to Financial Statements (continued) | | |
Security valuation:
Investments in securities traded on a national securities exchange and over-the-counter securities for which sale prices are available are valued at that price. Securities for which there are no sales are valued at the latest bid price.
Debt securities are valued using bid-side valuations provided by an independent service. The service determines valuations using factors such as yields or prices of bonds of comparable quality, type of issue, coupon maturity, ratings, trading activity, and general market conditions.
Fixed-income debt instruments, such as commercial paper, bankers’ acceptances and US Treasury Bills, with a maturity of 60 days or less are valued at amortized cost, which approximates market value. Any discount or premium is accreted or amortized on a straight-line basis until maturity.
Foreign markets may close before the time as of which the Funds’ share prices are determined. Because of this, events occurring after the close and before the determination of the Funds’ share prices may have a material effect on the values of some or all of the Funds’ foreign securities. To account for this, the Funds may use outside pricing services for valuation of their non-US securities.
In cases in which there is not a readily available market price, a fair value for such security is determined in good faith under the direction of the Board of Trustees. The Board of Trustees has designated the adviser (Saturna Capital) as each Fund’s valuation designee to perform fair value functions in accordance with valuation policies and procedures adopted by the adviser, subject to the Board of Trustee’s oversight.
Security transactions are recorded on the trade date. Realized gains and losses on sales of securities are recorded on the identified cost basis.
Foreign currency:
Investment securities and other assets and liabilities denominated in foreign currencies are translated into US dollar amounts at the date of valuation. Purchases and sales of investment securities and income and expense items denominated in foreign currencies are translated into US dollar amounts on the respective dates of such transactions.
The Funds do not isolate that portion of the results of operations resulting from changes in foreign exchange rates on investments from the fluctuations arising from changes in market prices of securities held. Such fluctuations are included with the net realized and unrealized gain or loss from investments.
Reported net realized foreign exchange gains or losses arise from sales of foreign currencies, currency gains or losses realized between the trade and settlement dates on securities transactions, and the difference between the amounts of dividends, interest, and foreign withholding taxes recorded on the Funds’ books and the US dollar equivalent of the amounts actually received or paid. Net unrealized foreign exchange gains and losses arise from changes in the fair values of assets and liabilities, other than investments in securities at the fiscal period end, resulting from changes in exchange rates.
Share valuation:
The net asset value (“NAV”) per share of each Fund is calculated by dividing the sum of the value of the securities held by each Fund, plus cash and other assets, minus all liabilities (including estimated accrued expenses) by the total number of shares outstanding for each Fund, rounded to the nearest cent. The Funds’ shares are not priced or traded on days the New York Stock Exchange is closed. The NAV is the offering and redemption price per share.
Fair value measurements:
Accounting Standards Codification (ASC) 820 establishes a three-tier framework for measuring fair value based on a hierarchy of inputs. The hierarchy distinguishes between market data obtained from independent sources (observable inputs) and the Funds’ own market assumptions (unobservable inputs). These inputs are used in determining the value of the Funds’ investments and are summarized below.
| | Level 1 — | Unadjusted quoted prices in active markets for identical assets or liabilities that the Trust has the ability to access. |
| | Level 2 — | Observable inputs other than quoted prices in Level 1 that are observable for the asset or liability, either directly or indirectly. These inputs may include quoted prices for the identical instrument on an inactive market, prices for similar instruments, interest rates, prepayment speeds, credit risk, yield curves, default rates, and similar data. |
| | Level 3 — | Unobservable inputs for the asset or liability, to the extent relevant observable inputs are not available, representing the Trust’s own assumptions about the assumptions a market participant would use in valuing the asset or liability, and would be based on the best information available. |
The availability of observable inputs can vary from security to security and is affected by a wide variety of factors, including, for example, the type of security, whether the security is new and not yet established in the marketplace, the liquidity of markets, and other characteristics particular to the security. To the extent that valuation is based on models or inputs that are less observable or unobservable in the market, the determination of fair value requires more judgment. Accordingly, the degree of judgment exercised in determining fair value is greatest for instruments categorized in Level 3.
The inputs used to measure fair value may fall into different levels of the fair value hierarchy. In such cases, for disclosure purposes, the level in the fair value hierarchy within which the fair value measurement falls in its entirety, is determined based on the lowest level input that is significant to the fair value measurement in its entirety.
The inputs or methodology used for valuing securities are not necessarily an indication of the risk associated with investing in those securities.
The following is a summary of the inputs used as of November 30, 2022, in valuing the Funds’ investments carried at value:
| | | | | | | | | | | | | | | | |
| | | | |
| Funds | | Level 1 | | | Level 2 | | | Level 3 | | | Total | |
| | | | | |
Short-Term Bond | | | | | | | | | | | | | | | | |
| | | | |
Corporate Bonds1 | | | $- | | | | $7,381,222 | | | | $- | | | | $7,381,222 | |
| | | | |
Government Bonds1 | | | $- | | | | $4,192,484 | | | | $- | | | | $4,192,484 | |
| | | | |
Total Assets | | | $- | | | | $11,573,706 | | | | $- | | | | $11,573,706 | |
| | | | | |
| | | | | | | | | | | | | | | | |
| | | | | |
Bond Income | | | | | | | | | | | | | | | | |
| | | | |
Corporate Bonds1 | | | $- | | | | $6,349,812 | | | | $- | | | | $6,349,812 | |
| | | | |
Government Bonds1 | | | $- | | | | $2,589,699 | | | | $- | | | | $2,589,699 | |
| | | | |
Total Assets | | | $- | | | | $8,939,511 | | | | $- | | | | $8,939,511 | |
| | | | | | | | | | | | | | | | | |
Continued on next page.
| | | | | | | | | | |
| | | | | | |
| 56 | | | | | | | | November 30, 2022 | | Annual Report |
| | |
| Notes to Financial Statements (continued) | | |
The following is a summary of the inputs used as of November 30, 2022, in valuing the Funds’ investments carried at value (continued):
| | | | | | | | | | | | | | | | |
| | | | |
| Funds | | Level 1 | | | Level 2 | | | Level 3 | | | Total | |
| | | | | |
Core | | | | | | | | | | | | | | | | |
| | | | |
Common Stocks | | | | | | | | | | | | | | | | |
| | | | |
Communications | | | $563,020 | | | | $- | | | | $- | | | | $563,020 | |
| | | | |
Consumer Discretionary | | | 1,368,968 | | | | - | | | | - | | | | 1,368,968 | |
| | | | |
Consumer Staples | | | 629,502 | | | | - | | | | - | | | | 629,502 | |
| | | | |
Energy | | | 911,521 | | | | - | | | | - | | | | 911,521 | |
| | | | |
Financials | | | 750,988 | | | | - | | | | - | | | | 750,988 | |
| | | | |
Health Care | | | 1,801,983 | | | | - | | | | - | | | | 1,801,983 | |
| | | | |
Industrials | | | 1,959,186 | | | | - | | | | - | | | | 1,959,186 | |
| | | | |
Materials | | | 834,628 | | | | - | | | | - | | | | 834,628 | |
| | | | |
Technology | | | 1,680,762 | | | | 80,408 | | | | - | | | | 1,761,170 | |
| | | | |
Utilities | | | 498,688 | | | | - | | | | - | | | | 498,688 | |
| | | | |
Total Common Stocks1 | | | $10,999,246 | | | | $80,408 | | | | $- | | | | $11,079,654 | |
| | | | |
Corporate Bonds1 | | | $- | | | | $4,012,092 | | | | $- | | | | $4,012,092 | |
| | | | |
Government Bonds1 | | | $- | | | | $2,753,799 | | | | $- | | | | $2,753,799 | |
| | | | |
Municipal Bonds1 | | | $- | | | | $207,405 | | | | $- | | | | $207,405 | |
| | | | |
Total Assets | | | $10,999,246 | | | | $7,053,704 | | | | $- | | | | $18,052,950 | |
| | | | | |
| | | | | | | | | | | | | | | | |
| | | | | |
Global High Income | | | | | | | | | | | | | | | | |
| | | | |
Common Stocks | | | | | | | | | | | | | | | | |
| | | | |
Communications | | | $528,966 | | | | $191,650 | | | | $- | | | | $720,616 | |
| | | | |
Consumer Discretionary | | | - | | | | 219,235 | | | | - | | | | 219,235 | |
| | | | |
Energy | | | 509,494 | | | | - | | | | - | | | | 509,494 | |
| | | | |
Financials | | | 319,890 | | | | 283,891 | | | | - | | | | 603,781 | |
| | | | |
Health Care | | | 362,260 | | | | - | | | | - | | | | 362,260 | |
| | | | |
Materials | | | 914,980 | | | | 260,297 | | | | - | | | | 1,175,277 | |
| | | | |
Technology | | | 248,600 | | | | 212,158 | | | | - | | | | 460,758 | |
| | | | |
Total Common Stocks | | | $2,884,190 | | | | $1,167,231 | | | | $- | | | | $4,051,421 | |
| | | | |
Corporate Bonds1 | | | $- | | | | $2,680,010 | | | | $- | | | | $2,680,010 | |
| | | | |
Government Bonds1 | | | $- | | | | $1,205,451 | | | | $- | | | | $1,205,451 | |
| | | | |
Municipal Bonds1 | | | $- | | | | $50,897 | | | | $- | | | | $50,897 | |
| | | | |
Total | | | $2,884,190 | | | | $5,103,589 | | | | $- | | | | $7,987,779 | |
| | | | | |
| | | | | | | | | | | | | | | | |
| | | | | | | | | | | | | | | | | |
| | | | | |
Growth | | | | | | | | | | | | | | | | |
| | | | |
Common Stocks1 | | | $52,567,811 | | | | $- | | | | $- | | | | $52,567,811 | |
| | | | |
Total Assets | | | $52,567,811 | | | | $- | | | | $- | | | | $52,567,811 | |
| | | | | |
| | | | | | | | | | | | | | | | |
| | | | | |
International | | | | | | | | | | | | | | | | |
| | | | |
Common Stocks | | | | | | | | | | | | | | | | |
| | | | |
Communications | | | $1,662,180 | | | | $- | | | | $- | | | | $1,662,180 | |
| | | | |
Consumer Discretionary | | | 4,324,202 | | | | 964,910 | | | | - | | | | 5,289,112 | |
| | | | |
Consumer Staples | | | - | | | | 1,972,728 | | | | - | | | | 1,972,728 | |
| | | | |
Energy | | | 2,056,480 | | | | - | | | | - | | | | 2,056,480 | |
| | | | |
Health Care | | | 8,935,984 | | | | - | | | | - | | | | 8,935,984 | |
| | | | |
Industrial | | | 2,101,550 | | | | 691,586 | | | | - | | | | 2,793,136 | |
| | | | |
Materials | | | 7,192,652 | | | | - | | | | - | | | | 7,192,652 | |
| | | | |
Technology | | | 14,355,394 | | | | 6,158,218 | | | | - | | | | 20,513,612 | |
| | | | |
Utilities | | | 1,053,360 | | | | 1,116,193 | | | | - | | | | 2,169,553 | |
| | | | |
Total Common Stocks | | | $41,681,802 | | | | $10,903,635 | | | | $- | | | | $52,585,437 | |
| | | | |
Government Bonds1 | | | $- | | | | $1,992,628 | | | | $- | | | | $1,992,628 | |
| | | | |
Total Assets | | | $41,681,802 | | | | $12,896,263 | | | | $- | | | | $54,578,065 | |
| | | | | | | | | | | | | | | | | |
| 1 | See Schedule of Investments for industry breakout. |
| | | | | | | | | | |
| | | | | | |
| Annual Report | | November 30, 2022 | | | | | | | | 57 |
| | |
| Notes to Financial Statements (continued) | | |
ReFlow Liquidity Program:
The Funds may participate in the ReFlow Fund, LLC (“ReFlow”) liquidity program, which is designed to provide an alternative liquidity source on days when redemptions of Fund shares exceed purchases. Under the program, ReFlow is available to provide cash to the Funds to meet all, or a portion, of daily net shareowner redemptions. Following purchases of Fund shares, ReFlow then generally redeems those shares when the Fund experiences net sales, at the end of a maximum holding period determined by ReFlow (currently 14 days) or at other times at ReFlow’s discretion. For use of the ReFlow service, a participating Fund pays a fee to ReFlow each time it purchases Fund shares, calculated by applying to the purchase amount a fee rate determined through an automated daily “Dutch auction” among other participating mutual funds seeking liquidity that day. The current minimum fee rate is 0.20% of the value of the Fund shares purchased by ReFlow, although the Fund may submit a bid at a higher fee rate if it determines that doing so is in the best interest of Fund shareowners. In accordance with federal securities laws, ReFlow is prohibited from acquiring more than 3% of the outstanding voting securities of a Fund. ReFlow will periodically redeem its entire share position in the Fund and request that such redemption be met in kind in accordance with the Funds’ in-kind redemption policies. There is no assurance that ReFlow will have sufficient funds available to meet the Funds’ liquidity needs on a particular day. During the period ended November 30, 2022, Sextant Growth, Sextant International, and Sextant Core Funds participated in ReFlow. Fees associated with ReFlow are disclosed in the Statements of Operations
Investment concentration:
The Funds may have deposits of cash with the custodian from time to time for one or more reasons. “Other assets (net of liabilities)” in the Funds’ Schedules of Investments primarily represents cash on deposit with the custodian. Cash on deposit will vary widely over time. Accounting Standards Codification (“ASC”) 825, “Financial Instruments,” identifies these items as a concentration of credit risk. The risk is managed by careful financial analysis and review of the custodian’s operations, resources, and protections available to the Trust. This process includes evaluation of other financial institutions providing investment company custody services.
Federal income taxes:
The Funds intend to comply with the requirements of the Internal Revenue Code necessary to qualify as a regulated investment company and to make the requisite distributions of income and capital gains to its shareowners sufficient to relieve it from all or substantially all federal income taxes. Therefore, no federal income tax provision is required.
The Funds recognize the tax benefits of uncertain tax positions only where the position is “more likely than not” to be sustained assuming examination by tax authorities. Management has analyzed the Funds’ tax positions and has concluded that no liability for unrecognized tax benefits should be recorded related to uncertain tax positions taken on returns filed for open tax years (2019 – 2021) or expected to be taken in the Funds’ 2022 tax returns. The Funds identify their major tax jurisdictions as US federal and foreign jurisdictions where the Funds make significant investments; however, the Funds are not aware of any tax positions for which it is reasonably possible that the total amounts of unrecognized tax benefits will change materially in the next twelve months.
Reclassification of capital accounts:
Accounting principles generally accepted in the United States of America require that certain components of net assets relating to permanent differences be reclassified between financial and tax reporting. These reclassifications have no effect on net assets or net asset value per share.
As of November 30, 2022, the reclassification of capital accounts were as follows:
| | | | | | | | |
| | | |
| | | Core | | | International | |
| | |
Distributable Earnings | | | $(211,414 | ) | | | $(3,382,036 | ) |
| | |
Paid-in capital | | | $211,414 | | | | $3,382,036 | |
| | | |
| | | | | | | | |
| | | |
| | | Short-Term Bond | | | Growth | |
| | |
Distributable Earnings | | | $53 | | | | $(1,976,404 | ) |
| | |
Paid-in capital | | | $(53 | ) | | | $1,976,404 | |
| | | | | | | | | |
These reclassifications were primarily due to redemptions in kind and operating losses.
The Bond Income and Global High Income Funds had no reclassification of capital accounts.
Distributions to shareowners:
For the Sextant Short-Term Bond Fund and Sextant Bond Income Fund, dividends to shareowners from net investment income are paid daily and distributed on the last business day of each month. For the Sextant Core Fund, Sextant Global High Income Fund, Sextant Growth Fund, and Sextant International Fund, dividends to shareowners from net investment income are payable annually, typically by the end of the year. Distributions of capital gains, if any, are made at least annually, and as required to comply with federal excise tax requirements. Distributions to shareowners are determined in accordance with income tax regulations and are recorded on the ex-dividend date. Dividends are paid in shares of the Funds, at the net asset value on the payable date. Shareowners may elect to take distributions if they total $10 or more in cash.
Use of estimates:
The preparation of financial statements in conformity with accounting principles generally accepted in the United States of America requires management to make estimates and assumptions that affect the reported amounts of assets and liabilities and disclosure of contingent assets and liabilities at the date of the financial statements and the reported amounts of increases and decreases in net assets from operations during the reporting period. Actual results could differ from those estimates.
Foreign taxes:
Withholding taxes on foreign dividends are paid (a portion of which may be reclaimable) or provided for in accordance with the applicable country’s tax rules and rates and are disclosed in the Statement of Operations. Withholding tax reclaims are filed in certain countries to recover a portion of the amounts previously withheld. The Funds record a reclaim receivable based on a number of factors, including a jurisdiction’s legal obligation to pay reclaims as well as payment history and market convention.
LIBOR Transition Risk:
A Fund may invest in certain debt securities or other financial instruments that utilize the London Interbank Offered Rate (“LIBOR”) as a benchmark or reference rate for various interest rate calculations. LIBOR may be a significant factor in determining the cost of financing to a Fund or an investment’s value or return to a Fund, and may be used in other ways that affect a Fund’s investment performance.
Publication of LIBOR benchmarks for most maturities and currencies ceased as of December 31, 2021, and publication of the remaining benchmarks is scheduled to be phased out on June 30, 2023. It is anticipated that financial instruments, such as certain floating rate bonds, that currently utilize LIBOR will transition to using the Secured Overnight Financing Rate (“SOFR”), which is a broad measure of the cost of overnight borrowings secured by US Treasury
| | | | | | | | | | |
| | | | | | |
| 58 | | | | | | | | November 30, 2022 | | Annual Report |
| | |
| Notes to Financial Statements (continued) | | |
securities. However, various counterparties or other entities may be unwilling or unable to utilize SOFR or may be unable to modify existing agreements or instruments in a timely manner. The transition from LIBOR to SOFR (or any other replacement rate) may lead to a reduction in the value of some LIBOR-based investments, as well as significant market uncertainty, increased volatility, and illiquidity in markets for various instruments, which may result in prolonged adverse market conditions and impact a Fund’s performance or NAV.
Other:
Interest income is recognized on an accrual basis. Premiums on securities purchased are amortized, and discounts are accreted using the yield to maturity method over the lives of the respective securities or where applicable, to the first call date of the securities with premiums. Dividends from equity securities are recorded as income on the ex-dividend date or as soon as information is available to the fund.
NOTE 3 – Transactions with Affiliated Persons
Under contracts approved annually by the Trust’s Board of Trustees, including those Trustees who are not parties to the contract or “interested persons” (as defined in the Investment Company Act of 1940) of such parties or the Trust (the “Independent Trustees”), Saturna Capital Corporation (“Saturna Capital”) provides investment advisory services and certain other administrative services required to conduct Trust business. Expenses incurred by the Trust on behalf of the Funds (e.g., legal fees) are allocated to the Funds on the basis of relative daily average net assets. For such services, each of the Funds pays the adviser a base Investment Advisory and Administrative Services Fee of 0.50% of average net assets per annum, payable monthly for each of the Funds. In addition, the adviser has agreed to certain limits on other expenses, as described below.
The base Advisory Fee is subject to adjustment up or down depending on the investment performance of the Fund relative to a specified index.
| | • | | For each month in which the Fund’s total investment return (change in net asset value plus all distributions reinvested) for the one year period through that month outperforms or underperforms the total return of a specified index for that period by 1% or more but less than 2%, the Base Fee is increased or decreased by the annual rate of 0.10% of the Fund’s average daily net assets for the preceding year. |
| | • | | If the outperformance or underperformance is 2% or more, then the adjustment is at the annual rate of 0.20%. |
For the fiscal year ended November 30, 2022, due to the performance adjustment the Advisory Fee amounts charged or reduced in addition to the Base Fee were as follows:
| | | | | | | | | | | | |
| | | | |
| | | Base Fees | | | Performance
Fee | | | Adviser
Fee | |
| | | |
Short-Term Bond | | | $59,959 | | | | $(53 | ) | | | $59,906 | |
| | | |
Bond Income | | | $53,792 | | | | $11,449 | | | | $65,241 | |
| | | |
Core | | | $93,034 | | | | $14,196 | | | | $107,230 | |
| | | |
Global High Income | | | $46,133 | | | | $12,497 | | | | $58,630 | |
| | | |
Growth | | | $292,101 | | | | $117,050 | | | | $409,151 | |
| | | |
International | | | $302,999 | | | | $145,073 | | | | $448,072 | |
| | | | | | | | | | | | | |
The adviser has voluntarily undertaken to limit expenses through March 31, 2023 of Sextant Short-Term Bond Fund to 0.60% and Sextant Global High Income to 0.75%. For the year ended November 30, 2022, the advisory fees incurred were as follows:
| | | | | | | | | | | | |
| | | | |
| | | Adviser
Fees | | | Adviser Fees
Waived | | | Expense
Reimbursement | |
| | | |
Short-Term Bond | | | $59,906 | | | | $(33,392 | ) | | | $- | |
| | | |
Bond Income | | | $65,241 | | | | $(39,940 | ) | | | $- | |
| | | |
Core | | | $107,230 | | | | $- | | | | $- | �� |
| | | |
Global High Income | | | $58,630 | | | | $(21,784 | ) | | | $- | |
| | | |
Growth | | | $409,151 | | | | $- | | | | $- | |
| | | |
International | | | $448,072 | | | | $- | | | | $- | |
| | | | | | | | | | | | | |
In accordance with the expense limitation noted above, for the year ended November 30, 2022, Saturna Capital waived a portion of the advisory fees of the Sextant Short-Term Bond Fund, Sextant Bond Income Fund, and Sextant Global High Income Fund. The adviser cannot recoup previously waived fees.
Saturna Brokerage Services, Inc. (“SBS”), a discount brokerage and subsidiary of Saturna Capital Corporation, is registered as a broker-dealer and acts as distributor. On October 3, 2006, The Funds adopted a Distribution Plan in accordance with Rule 12b-1 under the 1940 Act. The plan provides that the Funds will pay a fee to SBS at an annual rate of 0.25% of the average net assets of the Funds. On June 2, 2017, 12b-1 fees were terminated for all Funds except Sextant Growth Investor Shares and Sextant International Investor Shares.
During the year ended November 30, 2022, the Trust paid SBS the following amounts:
| | | | |
| |
| Distribution (12b-1) Fees | |
| |
Short-Term Bond | | | n/a | |
| |
Bond Income | | | n/a | |
| |
Core | | | n/a | |
| |
Global High Income | | | n/a | |
| |
Growth Investor Shares (SSGFX) | | | $13,386 | |
| |
Growth Z Shares (SGZFX) | | | n/a | |
| |
International Investor Shares (SSIFX) | | | $90,414 | |
| |
International Z Shares (SIFZX) | | | n/a | |
| | | | | |
SBS is used to effect portfolio transactions for the Trust. SBS currently executes portfolio transactions without commission. Transactions effected through other brokers are subject to commissions payable to that broker.
Saturna Trust Company (“STC”), a subsidiary of Saturna Capital, acts as retirement plan custodian for Fund shareowners. Each Fund pays an annual fee of $10 per account for retirement plan services to Saturna Trust Company. For the year ended November 30, 2022, the Funds incurred the following amounts:
| | | | |
| |
| Retirement plan custodial fees | |
| |
Short-Term Bond | | | $2,780 | |
| |
Bond Income | | | $2,393 | |
| |
Core | | | $3,172 | |
| |
Global High Income | | | $1,875 | |
| |
Growth Investor Shares (SSGFX) | | | $- | |
| |
Growth Z Shares (SGZFX) | | | $7,133 | |
| |
International Investor Shares (SSIFX) | | | $35 | |
| |
International Z Shares (SIFZX) | | | $5,086 | |
| | | | | |
| | | | | | | | | | |
| | | | | | |
| Annual Report | | November 30, 2022 | | | | | | | | 59 |
| | |
| Notes to Financial Statements (continued) | | |
Mrs. Jane Carten serves as a trustee and president of the Trust. She is also a director and president of Saturna Capital and vice president of Saturna Trust Company. Mrs. Carten is not compensated by the Trust. For the year ended November 30, 2022, the Saturna Investment Trust incurred $47,605 of total expenses for the independent Trustee’s compensation and Trust board meetings. The Sextant Funds incurred $38,675 of these total expenses.
The officers of the Trust are paid by Saturna Capital, not the Trust, except the Chief Compliance Officer, who may be partially compensated by the Trust. For the year ended November 30, 2022, the Funds paid the following compensation expenses for the Chief Compliance Officer:
| | | | |
| |
| Chief Compliance Officer | |
| |
Short-Term Bond | | | $2,428 | |
| |
Bond Income | | | $2,033 | |
| |
Core | | | $3,721 | |
| |
Global High Income | | | $1,407 | |
| |
Growth | | | $12,480 | |
| |
International | | | $12,878 | |
| | | | | |
On November 30, 2022, the trustees, officers, and their affiliates as a group owned 38.41%, 29.69%, 31.24%, 56.01%, 0.53%, 19.61%, 0.07%, and 31.17% of the outstanding shares of Short-Term Bond Fund, Bond Income Fund, Core Fund, Global High Income Fund, Growth Fund Investor Shares, Growth Fund Z Shares, International Fund Investor Shares, and International Fund Z Shares, respectively.
NOTE 4 – Distributions to Shareowners
The tax characteristics of distributions paid during the fiscal years ended November 30, 2022, and 2021, were as follows:
| | | | | | | | |
| | | |
| | | Year ended November 30, 2022 | | | Year ended
November 30, 2021 | |
| | |
Short-Term Bond Fund | | | | | | | | |
| | |
Ordinary income | | | $147,690 | | | | $132,185 | |
| | |
Bond Income Fund | | | | | | | | |
| | |
Ordinary income | | | $277,203 | | | | $299,448 | |
| | |
Core Fund | | | | | | | | |
| | |
Ordinary income | | | $288,518 | | | | $265,566 | |
| | |
Long-Term capital gain1 | | | $307,946 | | | | $- | |
| | |
Global High Income Fund | | | | | | | | |
| | |
Ordinary income | | | $182,768 | | | | $289,162 | |
| | |
Growth Fund | | | | | | | | |
| | |
Ordinary income | | | $1,801,284 | | | | $144,220 | |
| | |
Long-term capital gain1 | | | $4,078,839 | | | | $314,003 | |
| | | |
| | | | | | | | |
| | | |
| | | Year ended
November 30, 2022 | | | Year ended
November 30, 2021 | |
| | |
International Fund | | | | | | | | |
| | |
Ordinary income | | | $475,898 | | | | $356,477 | |
| | |
Long-term capital gain1 | | | $5,599,189 | | | | $3,899,440 | |
| 1 | Long-Term Capital Gain dividend designated at 20% rate pursuant to Section 852(b)(3) of the Internal Revenue Code. |
NOTE 5 – Federal Income Taxes
The cost basis of investments for federal income tax purposes as of November 30, 2022 was as follows:
| | | | | | | | |
| | | |
| | | Short-Term Bond | | | Bond Income | |
| | |
Cost of investments | | | $12,092,360 | | | | $10,415,284 | |
| | | | | | | | |
| | |
Gross tax unrealized appreciation | | | $1,901 | | | | $8,360 | |
| | |
Gross tax unrealized depreciation | | | $(520,555 | ) | | | $(1,484,133 | ) |
| | | | | | | | |
| | |
Net tax unrealized depreciation | | | $(518,654 | ) | | | $(1,475,773 | ) |
| | | |
| | | | | | | | |
| | | |
| | | Core | | | Global High Income | |
| | |
Cost of investments | | | $14,171,785 | | | | $8,558,599 | |
| | | | | | | | |
| | |
Gross tax unrealized appreciation | | | $4,532,330 | | | | $642,596 | |
| | |
Gross tax unrealized depreciation | | | $(651,165 | ) | | | $(1,213,416 | ) |
| | | | | | | | |
| | |
Net tax unrealized appreciation (depreciation) | | | $3,881,165 | | | | $(570,820 | ) |
| | | |
| | | | | | | | |
| | | |
| | | Growth | | | International | |
| | |
Cost of investments | | | $23,815,849 | | | | $31,593,502 | |
| | | | | | | | |
| | |
Gross tax unrealized appreciation | | | $29,168,608 | | | | $23,543,676 | |
| | |
Gross tax unrealized depreciation | | | $(416,646 | ) | | | $(559,113 | ) |
| | | | | | | | |
| | |
Net tax unrealized appreciation | | | $28,751,962 | | | | $22,984,563 | |
| | | | | | | | | |
As of November 30, 2022, components of distributable earnings on a tax basis were as follows:
| | | | | | | | |
| | | |
Short-Term Bond | | | | | | | | |
| | |
Undistributed ordinary income | | | | | | | $3,474 | |
| | | | | | | | |
| | |
Tax accumulated earnings | | | | | | | $3,474 | |
| | |
Accumulated capital losses | | | | | | | $(91,914 | ) |
| | |
Unrealized depreciation | | | | | | | $(518,654 | ) |
| | | | | | | | |
| | |
Total accumulated earnings | | | | | | | $(607,094 | ) |
| | | |
| | | | | | | | |
| | | |
Bond Income | | | | | | | | |
| | |
Undistributed ordinary income | | | | | | | $1,630 | |
| | | | | | | | |
| | |
Tax accumulated earnings | | | | | | | $1,630 | |
| | |
Accumulated capital losses | | | | | | | $(15,924 | ) |
| | |
Unrealized depreciation | | | | | | | $(1,475,773 | ) |
| | | | | | | | |
| | |
Total accumulated earnings | | | | | | | $(1,490,067 | ) |
| | | |
| | | | | | | | |
| | | |
Core | | | | | | | | |
| | |
Undistributed ordinary income | | | | | | | $239,213 | |
| | |
Accumulated capital gains | | | | | | | $29,953 | |
| | | | | | | | |
| | |
Tax accumulated earnings | | | | | | | $269,166 | |
| | |
Unrealized appreciation | | | | | | | $3,881,165 | |
| | |
Other unrealized loss | | | | | | | $7 | |
| | | | | | | | |
| | |
Total accumulated earnings | | | | | | | $4,150,338 | |
| | | | | | | | | |
| | | | | | | | | | |
| | | | | | |
| 60 | | | | | | | | November 30, 2022 | | Annual Report |
| | |
| Notes to Financial Statements (continued) | | |
| | | | | | | | |
| | | |
Global High Income | | | | | | | | |
| | |
Undistributed ordinary income | | | | | | | $294,292 | |
| | | | | | | | |
| | |
Tax accumulated earnings | | | | | | | $294,292 | |
| | |
Accumulated capital gains | | | | | | | $(3,036 | ) |
| | |
Unrealized depreciation | | | | | | | $(570,820 | ) |
| | |
Other unrealized gains | | | | | | | $88 | |
| | | | | | | | |
| | |
Total accumulated earnings | | | | | | | $(279,476 | ) |
| | | |
| | | | | | | | |
| | | |
Growth | | | | | | | | |
| | |
Undistributed ordinary income | | | | | | | $15 | |
| | |
Accumulated capital gains | | | | | | | $1,300,038 | |
| | | | | | | | |
| | |
Tax accumulated earnings | | | | | | | $1,300,053 | |
| | |
Unrealized appreciation | | | | | | | $28,751,962 | |
| | | | | | | | |
| | |
Total accumulated earnings | | | | | | | $30,052,015 | |
| | | |
| | | | | | | | |
| | | |
International | | | | | | | | |
| | |
Accumulated capital losses | | | | | | | $(142,690 | ) |
| | |
Unrealized appreciation | | | | | | | $22,984,563 | |
| | |
Other unrealized gain | | | | | | | $427 | |
| | | | | | | | |
| | |
Total accumulated earnings | | | | | | | $22,842,300 | |
| | | | | | | | | |
As of November 30, 2022, the Funds had capital loss carryforwards as follows, subject to regulation.
| | | | | | | | |
| | |
| | | | Carryforward | | | | Expiration | |
| | | |
Short-Term Bond Fund | | | | | | | | |
| | |
Short-term loss carryforward | | | $35,693 | | | | Unlimited | |
| | |
Long-term loss carryforward | | | $56,221 | | | | Unlimited | |
| | |
| | | | $91,914 | | | | | |
| | |
| | | | | | | | |
| | | |
Bond Income Fund | | | | | | | | |
| | |
Long-term loss carryforward | | | $15,924 | | | | Unlimited | |
| | |
| | | | $15,924 | | | | | |
| | | |
| | | | | | | | |
| | | |
Global High Income Fund | | | | | | | | |
| | |
Short-term loss carryforward | | | $3,036 | | | | Unlimited | |
| | |
| | | | $3,036 | | | | | |
| | | |
| | | | | | | | |
| | | |
International Fund | | | | | | | | |
| | |
Short-term loss carryforward | | | $142,690 | | | | Unlimited | |
| | |
| | | | $142,690 | | | | | |
NOTE 6 – Investments
Investment transactions other than short-term investments and redemptions in-kind for the fiscal year ended November 30, 2022, were as follows:
| | | | | | | | |
| | | |
| | | Purchases | | | Sales | |
| | |
Short-Term Bond | | | $4,637,166 | | | | $4,631,047 | |
| | |
Bond Income | | | $- | | | | $160,000 | |
| | |
Core | | | $4,528,070 | | | | $1,765,652 | |
| | |
Global High Income | | | $2,389,392 | | | | $1,645,657 | |
| | |
Growth | | | $12,740,940 | | | | $13,306,719 | |
| | |
International | | | $19,087,358 | | | | $21,075,471 | |
| | | | | | | | | |
Redemptions in-kind for the fiscal year ended November 30, 2022, were as follows:
| | | | | | | | |
| | | |
| | | Purchases | | | Sales | |
| | |
Core | | | - | | | | $362,885 | |
| | |
Growth | | | - | | | | $2,556,013 | |
| | |
International | | | - | | | | $5,838,589 | |
| | | | | | | | | |
NOTE 7 – Custodian
Under agreements in place with the Trust’s custodian, UMB Bank, custody fees are reduced by credits for cash balances. Such reductions for the fiscal year ended November 30, 2022, were as follows:
| | | | |
| |
| Custodian Fee Credits | |
| |
Short-Term Bond | | | $487 | |
| |
Bond Income | | | $440 | |
| |
Core | | | $782 | |
| |
Global High Income | | | $629 | |
| |
Growth | | | $2,374 | |
| |
International | | | $6,174 | |
| | | | | |
NOTE 8 – COVID-19 Pandemic
The global outbreak of COVID-19 (commonly referred to as “coronavirus”) has disrupted economic markets and the prolonged economic impact is uncertain. Although vaccines for COVID-19 are becoming more widely available, the ultimate economic fallout from the pandemic, amid the spread of COVID-19 variants, and the long-term impact on economies, markets, industries and individual companies are not known. The operational and financial performance of individual companies and the market in general depends on future developments, including the duration and spread of any future outbreaks and the pace of recovery which may vary from market to market, and such uncertainty may in turn adversely affect the value and liquidity of the Fund’s investments, impair a Fund’s ability to satisfy redemption requests, and negatively impact a Fund’s performance.
NOTE 9 – Subsequent Events
In preparing these financial statements, the Funds have evaluated events and transactions for potential recognition or disclosure through the date the financial statements were issued.
The Funds currently have an outstanding Proxy to remove the fulcrum fee from the Funds. The vote has been adjourned until February 6, 2023.
The Funds declared the payment of a distribution to be paid on December 15, 2022, to all shareowners of record on December 14, 2022, as follows:
| | | | | | | | | | | | |
| | | | |
| | | Income | | | Long-Term
Capital Gain | | | Short-Term
Capital Gain | |
| | | |
Core | | | $0.1920 | | | | $0.0239 | | | | $- | |
| | | |
Global High Income | | | 0.3420 | | | | - | | | | - | |
| | | |
Growth (Investor Shares) | | | - | | | | 0.9175 | | | | - | |
| | | |
Growth (Z Shares) | | | - | | | | 0.9175 | | | | - | |
| | | |
International (Investor Shares) | | | - | | | | - | | | | - | |
| | | |
International (Z Shares) | | | - | | | | - | | | | - | |
| | | | | | | | | | | | | |
There were no other events or transactions during the period that materially impacted the amounts or disclosures in the Funds’ financial statements.
| | | | | | | | | | |
| | | | | | |
| Annual Report | | November 30, 2022 | | | | | | | | 61 |
Report of Independent Registered Public Accounting Firm
To the Board of Trustees of
Saturna Investment Trust
and the Shareholders of Sextant Mutual Funds
Opinion on the Financial Statements
We have audited the accompanying statement of assets and liabilities of the Sextant Short Term Bond Fund, Sextant Bond Income Fund, Sextant Core Fund, Sextant Global High Income Fund, Sextant Growth Fund and Sextant International Fund (the “Funds”), each a series of Saturna Investment Trust, including the schedules of investments, as of November 30, 2022, the related statements of operations for the year then ended, the statements of changes in net assets for each of the two years in the period then ended, the financial highlights for each of the five years in the period then ended, and the related notes (collectively referred to as the “financial statements”). In our opinion, the financial statements present fairly, in all material respects, the financial position of the Funds as of November 30, 2022, the results of their operations for the year then ended, the changes in their net assets for each of the two years in the period then ended and their financial highlights for each of the five years in the period then ended, in conformity with accounting principles generally accepted in the United States of America.
Basis for Opinion
These financial statements are the responsibility of the Funds’ management. Our responsibility is to express an opinion on the Funds’ financial statements based on our audits. We are a public accounting firm registered with the Public Company Accounting Oversight Board (United States) (“PCAOB”) and are required to be independent with respect to the Funds in accordance with the U.S. federal securities laws and the applicable rules and regulations of the Securities and Exchange Commission and the PCAOB. We have served as the auditor of one or more of the funds in the Trust since 1997.
We conducted our audits in accordance with the standards of the PCAOB. Those standards require that we plan and perform the audits to obtain reasonable assurance about whether the financial statements are free of material misstatement, whether due to error or fraud. The Funds are not required to have, nor were we engaged to perform, an audit of their internal control over financial reporting. As part of our audits we are required to obtain an understanding of internal control over financial reporting, but not for the purpose of expressing an opinion on the effectiveness of the Funds internal control over financial reporting. Accordingly, we express no such opinion.
Our audits included performing procedures to assess the risks of material misstatement of the financial statements, whether due to error or fraud, and performing procedures that respond to those risks. Such procedures included examining, on a test basis, evidence regarding the amounts and disclosures in the financial statements. Our audits also included evaluating the accounting principles used and significant estimates made by management, as well as evaluating the overall presentation of the financial statements. Our procedures included confirmation of securities owned as of November 30, 2022 by correspondence with the custodian. We believe that our audits provide a reasonable basis for our opinion.
Philadelphia, Pennsylvania
January 27, 2023
/s/ Tait, Weller & Baker LLP
Tait, Weller & Baker LLP
| | | | | | | | | | |
| | | | | | |
| 62 | | | | | | | | November 30, 2022 | | Annual Report |
All mutual funds have operating expenses. As a Sextant Fund shareowner, you incur ongoing costs, including management fees, distribution (or service) 12b-1 fees, and other fund expenses such as shareowner reports (such as this one). Operating expenses, which are deducted from a fund’s gross earnings, directly reduce the investment return of a fund. Mutual funds (unlike other financial investments) only report their results after deduction of operating expenses.
With the Sextant Funds, unlike many other mutual funds, you do not incur sales charges (loads) on purchases, reinvested dividends, or other distributions. You do not incur redemption fees or exchange fees. You may incur fees related to extra services requested by you for your account, such as bank wires. The examples below are intended to help you understand your ongoing costs (in dollars) of investing in the Funds and to compare these costs with the ongoing costs of investing in other mutual funds.
Examples
The following example is based on an investment of $1,000 invested at the beginning of the period and held for the entire period (June 1, 2022, to November 30, 2022).
Actual Expenses
The first line for each Fund provides information about actual account values and actual expenses. You may use the information in this line, together with the amount you have invested, to estimate the expenses you paid over the period. Simply divide your account value by $1,000 (for example, an $8,600 account value divided by $1,000 = 8.6), then multiply the result by the number in the first line under the heading entitled “Expenses Paid During Period” to estimate the expenses you paid on your account during this period. The Funds may charge for extra services (such as domestic bank wires, international bank wires, or overnight courier delivery of redemption checks) rendered on request, which you may need to estimate to determine your total expenses.
Hypothetical Example For Comparison Purposes
The second line provides information about hypothetical account values and hypothetical expenses based on the Fund’s actual expense ratio (based on the last six months) and an assumed rate of return of 5% per year before expenses, which is not the Fund’s actual return. The hypothetical account values and expenses may not be used to estimate the actual ending balance or expenses you paid for the period. You may use this information to compare ongoing costs of investing in the Fund and other mutual funds. To do so, compare this 5% hypothetical example with the 5% hypothetical examples that appear in the shareowner reports of other mutual funds. You may wish to add other fees that are not included in the expenses shown in the table, such as charges for extra services like bank wires.
Please note that the expenses shown in the tables are meant to highlight your ongoing costs only and do not reflect any transactional costs, such as sales charges (loads), redemption fees or exchange fees (note that the Sextant Funds do not charge any such transactional costs). Therefore, the “Hypothetical” line of each fund is useful in comparing ongoing costs only, and may not help you determine the relative total costs of owning different funds.
| | | | | | | | | | | | | | | | |
| | | | | |
| | | Beginning Account Value
(June 1, 2022) | | | Ending
Account Value
(November 30,
2022) | | | Expenses Paid
During Period1 | | | Annualized
Expense Ratio | |
| | | | |
Short-Term Bond Fund | | | $1,000 | | | | $988.50 | | | | $2.99 | | | | 0.60% | |
| | | | |
Hypothetical (5% return before expenses) | | | $1,000 | | | | $1,022.06 | | | | $3.04 | | | | 0.60% | |
| | | | |
Bond Income Fund | | | $1,000 | | | | $947.00 | | | | $3.17 | | | | 0.65% | |
| | | | |
Hypothetical (5% return before expenses) | | | $1,000 | | | | $1,021.81 | | | | $3.30 | | | | 0.65% | |
| | | | |
Core Fund | | | $1,000 | | | | $998.70 | | | | $4.99 | | | | 1.00% | |
| | | | |
Hypothetical (5% return before expenses) | | | $1,000 | | | | $1,020.08 | | | | $5.04 | | | | 1.00% | |
| | | | |
Global High Income Fund | | | $1,000 | | | | $957.40 | | | | $3.59 | | | | 0.73% | |
| | | | |
Hypothetical (5% return before expenses) | | | $1,000 | | | | $1,021.40 | | | | $3.71 | | | | 0.73% | |
| | | | |
Growth Fund Investor Shares | | | $1,000 | | | | $974.10 | | | | $6.32 | | | | 1.28% | |
| | | | |
Hypothetical (5% return before expenses) | | | $1,000 | | | | $1,018.66 | | | | $6.47 | | | | 1.28% | |
| | | | |
Growth Fund Z Shares | | | $1,000 | | | | $975.30 | | | | $5.16 | | | | 1.04% | |
| | | | |
Hypothetical (5% return before expenses) | | | $1,000 | | | | $1,019.85 | | | | $5.28 | | | | 1.04% | |
| | | | |
International Fund Investor Shares | | | $1,000 | | | | $988.50 | | | | $6.58 | | | | 1.32% | |
| | | | |
Hypothetical (5% return before expenses) | | | $1,000 | | | | $1,018.46 | | | | $6.67 | | | | 1.32% | |
| | | | |
International Fund Z Shares | | | $1,000 | | | | $989.10 | | | | $5.37 | | | | 1.08% | |
| | | | |
Hypothetical (5% return before expenses) | | | $1,000 | | | | $1,019.67 | | | | $5.46 | | | | 1.08% | |
| 1 | Expenses are equal to the annualized expense ratio indicated above (based on the most recent semi-annual period of June 1, 2022, through November 30, 2022), multiplied by the average account value over the period, multiplied by 183/365 (to reflect the one-half year period). |
| | | | | | | | | | |
| | | | | | |
| Annual Report | | November 30, 2022 | | | | | | | | 63 |
| | |
| Trustees and Officers | | (unaudited) |
| | | | | | | | |
| | | |
| Name, Address, and Age | | Position(s) Held with Trust and
Number of Saturna Fund
Portfolios Overseen | | Principal occupation(s) during past 5 years, including Directorships | | Other
Directorships
held by Trustee |
|
Independent Trustees |
| | | | |
(photo omitted) | | Marina E. Adshade (55) 1300 N. State Street Bellingham WA 98225 | | Independent Trustee (since 2017); Nine | | Professor of Economics, University of British Columbia, Vancouver; Author | | None |
| | | | |
(photo omitted) | | Ronald H. Fielding, MA, MBA, CFA (73) 1300 N. State Street Bellingham WA 98225 | | Independent Trustee (since 2009); Thirteen | | Director, ICI Mutual Insurance Company | | Amana Mutual Funds Trust |
| | | | |
(photo omitted) | | Gary A. Goldfogel, MD (64) 1300 N. State Street Bellingham WA 98225 | | Chairman (since 2017); Independent Trustee (since 1995); Nine | | Medical Examiner (pathologist) | | None |
| | | | |
(photo omitted) | | Jim V. McKinney (61) 1300 N. State Street Bellingham WA 98225 | | Independent Trustee (since 2017); Nine | | President/CEO, Apple Mountain LLC, consulting and development; Former US Army Foreign Area Officer | | None |
| | | | |
(photo omitted) | | Sarah E.D. Rothenbuhler (54) 1300 N. State Street Bellingham WA 98225 | | Independent Trustee (since 2017); Nine | | CEO, Birch Equipment (industrial rentals and sales) | | None |
|
Interested Trustee |
| | | | |
(photo omitted) | | Jane K. Carten, MBA (47) 1300 N. State Street Bellingham WA 98225 | | President, Trustee (since 2017); Nine | | President and Director, Saturna Capital Corporation Vice President and Director, Saturna Trust Company President, Saturna Brokerage Services | | None |
| | | | | | | | | | |
| | | | | | |
| 64 | | | | | | | | November 30, 2022 | | Annual Report |
| | |
| Trustees and Officers (continued) | | (unaudited) |
| | | | | | | | |
| | | |
| Name (Age) and Address | | Position(s) held with Trust and
Number of Saturna Fund
Portfolios Overseen | | Principal occupation(s) during past 5 years, including Directorships | | Other
Directorships
held by Trustee |
|
Officers Who Are Not Trustees |
| | | | |
(photo omitted) | | Bryce R. Fegley (47) 1300 N. State Street Bellingham, WA 98225 | | Vice President (since 2020); N/A | | Portfolio Manager and Senior Investment Analyst, Saturna Capital | | N/A |
| | | | |
(photo omitted) | | Christopher R. Fankhauser (50) 1300 N. State Street Bellingham, WA 98225 | | Treasurer1 (since 2002); N/A | | Chief Operations Officer, Saturna Capital Corporation Vice President and Chief Operations Officer, Saturna Brokerage Services Director, Vice President, and Chief Operations Officer, Saturna Trust Company | | N/A |
| | | | |
(photo omitted) | | Michael E. Lewis (61) 1300 N. State Street Bellingham, WA 98225 | | Chief Compliance Officer1 (since 2012); N/A | | Chief Compliance Officer, Saturna Capital, Saturna Trust Company, and Affiliated Funds | | N/A |
| | | | |
(photo omitted) | | Jacob A. Stewart (42) 1300 N. State Street Bellingham, WA 98225 | | Anti-Money Laundering Officer1 (since 2015); N/A | | Anti-Money Laundering Officer, Saturna Capital Corporation, Saturna Brokerage Services Chief Compliance Officer, Saturna Brokerage Services Bank Secrecy Act Officer, Saturna Trust Company | | N/A |
| | | | |
(photo omitted) | | Elliot S. Cohen (59) 1300 N. State Street Bellingham, WA 98225 | | Secretary (since 2022); N/A | | Chief Legal Officer, Saturna Capital Corporation; Former Associate General Counsel for Russell Investments | | N/A |
Term of Office: each Trustee serves for the lifetime of the Trust or until they die, resign, are removed, or not re-elected by the shareowners. Each officer serves a one-year term subject to annual reappointment by the Trustees.
The Trust’s Statement of Additional Information, available without charge upon request by calling Saturna Capital at 1-800-728-8762 and on the Funds’ website, www.sextantfunds.com, includes additional information about the Trustees.
On November 30, 2022, the trustees, officers, and their affiliates as a group owned 38.41%, 29.69%, 31.24%, 56.01%, 0.53%, 19.61%, 0.07%, and 31.17% of the outstanding shares of Short-Term Bond Fund, Bond Income Fund, Core Fund, Global High Income Fund, Growth Fund Investor Shares, Growth Fund Z Shares, International Fund Investor Shares, and International Fund Z Shares, respectively. Saturna Capital Corporation is the Trust’s adviser and Saturna Brokerage Services, Inc. is the Trust’s distributor.
During the year ended November 30, 2022, the Independent Trustess were each paid by the Trust: (1) $2,000 annual retainer plus $1,000 per board meeting attended (in person or by phone), plus reimbursement of travel expenses; (2) $250 for committee meetings; and (3) $250 per quarter for serving as chariman of the board or any committee.
Mrs. Carten is an Interested Trustee by reason of her positions with the Trust’s adviser (Saturna Capital Corporation) and underwriter (Saturna Brokerage Services), and is the primary manager of the Saturna Sustainable Equity Fund portfolio. She is paid by Saturna Capital a salary, plus a bonus for each month the Saturna Sustainable Equity Fund portfolio earns a 4 or 5 star rating from Morningstar (see www.saturna.com). The officers are paid by Saturna Capital and not the Trust. As of November 30, 2022, all Saturna Capital employees listed above as officers owned shares in one or more of the Saturna Investment Trust funds, with Mrs. Carten owning (directly or indirectly) over $1.55 million.
| 1 | Holds the same position with Amana Mututal Funds Trust |
| | | | | | | | | | |
| | | | | | |
| Annual Report | | November 30, 2022 | | | | | | | | 65 |
| | |
| Renewal of Investment Advisory Contract | | (unaudited) |
During their meeting of September 13, 2022, the Trustees of Saturna Investment Trust, including the Independent Trustees, discussed the renewal of the current Advisory Agreement with the Trust, on behalf of each of the Funds, and Saturna Capital, and the proposed amendment to the current Advisory Agreement (the “Amendment”) to implement a single advisory and administrative fee rate based on a Fund’s average daily net assets and eliminate the current performance fee adjustment, whereby each Fund’s base advisory and administrative fee of 0.50% is adjusted 0.10% or 0.20% higher or lower, depending upon how much the Fund outperforms or underperforms the average 12-month total return of the funds in its respective Morningstar, Inc. (“Morningstar”) category (“Performance Fee Adjustment”). The Adviser cited the following reasons for its recommendation to approve the Amendment:
| | • | | The Performance Fee Adjustment structure has failed to increase investor demand and attract significant assets for the Funds, making it more difficult for them to realize economies of scale. The Adviser also noted that the Performance Fee Adjustment structure also is not in line with that of peer funds. |
| | • | | The methodology used to calculate the Performance Fee Adjustment is complex, preventing the Funds from being more competitive in the mutual fund marketplace because it is more difficult to educate investors and their financial intermediaries about investing in complex products. The Amendment is intended to make the fee structure of each Fund less complicated and more understandable to investors and their investment advisers. |
| | • | | The performance-based fee structure creates uncertainty for investors in reasonably predicting Fund expenses, due to fluctuations in advisory and administrative fees and total expense ratios that can result from fund performance fluctuations. |
| | • | | Saturna Capital believes that the changes would increase the competitiveness and marketability of the Funds and thus create the potential to grow overall assets. If the Funds’ assets grow, Saturna Capital could receive more in advisory and administrative fees, because the overall average daily net assets on which it will collect advisory and administrative fees will be greater. If Fund assets grow, shareowners may realize economies of scale due to a Fund’s fixed costs (other than the advisory and administrative fee) being allocated across a larger asset base, which could lower average Fund expenses; however, there is no guarantee that such economies will be realized. |
At the recommendation of Saturna Capital, the Board, including a majority of the Independent Trustees, approved the renewal of the Agreement, and the proposed Amendment to the Agreement, between the Adviser and the Trust, on behalf of each Fund subject to approval by the funds’ shareholders at a shareowners meeting scheduled for January 10, 2023. The Board, including a majority of the Independent Trustees, also recommended approval of the Amendment by shareowners of each Fund.
The Board and the Independent Trustees determined that the information received and the basis for the renewal of the Advisory Agreement also would support the Board’s approval of the proposed Amendment; these considerations included materials received by the Board in connection with the proposed change in fee structure as reflected in the proposed Amendment. In considering the renewal of the Agreement and the approval of the Amendment, the Board, including the Independent Trustees, considered the factors it deemed relevant, including the nature, quality and extent of services provided, the performance of each Fund, expenses and fees, the profitability of Saturna Capital, the potential for economies of scale that may be shared with each Fund and its shareowners as each Fund’s assets grow, and any other benefits derived by Saturna Capital from its relationship with the Funds.
With respect to the Amendment, the Trustees also considered that the only changes that the Amendment makes to the current Agreement are (i) the elimination of the Performance Fee Adjustment and adoption of a more conventional single advisory and administrative fee rate based on each Fund’s average daily net assets, and (ii) updating the date of effectiveness. The Trustees further considered that, to the extent Saturna Capital receives more in advisory and administrative fees as a result of the Amendment, Mr. Kaiser and Mrs. Carten would benefit as a result of their ownership interest in Saturna Capital.
The Trustees considered that the Funds will not bear the expenses related to the above-referenced changes, including the expenses relating to the Special Meeting of Shareowners and the preparation, printing and mailing of the proxy materials and all related solicitations.
In their deliberations, the Trustees did not identify any single factor which alone was responsible for the decision to approve the Agreement and the Amendment, and each Trustee may have given different weights to different factors, and, thus, each Trustee may have had a different basis for his or her decision.
The Trustees considered Saturna Capital’s specific responsibilities in all aspects of day-to-day management of the Funds as well as the qualifications, experience and responsibilities of the Funds’ portfolio managers and other key personnel at Saturna Capital. The Trustees discussed Saturna Capital’s experience, ability, and commitment to quality service through performing internally such functions as shareowner servicing, administration, accounting, marketing, and distribution — all in addition to investment management. The Trustees took into consideration Saturna Capital’s continued avoidance of significant operational and compliance problems, plus its continued investments in infrastructure, information management systems, personnel, training, compliance, and investor education materials, all designed to provide high quality investor services and meet investor needs. They recognized Saturna Capital’s efforts to recruit and retain qualified and experienced staff and improve the capital base on which Saturna Capital operates, which the Trustees believe is important to the long-term success of the Funds. They considered Saturna Capital’s focus on investors and its efforts to avoid potential conflicts of interest.
| | | | | | | | | | |
| | | | | | |
| 66 | | | | | | | | November 30, 2022 | | Annual Report |
| | |
| Renewal of Investment Advisory Contract (continued) | | (unaudited) |
The Trustees considered the investment performance of each Fund over time, including each Fund’s average annual total returns relative to its benchmark for the one-, three-, five-, ten-, and fifteen-year periods, as applicable, ended July 31, 2022. The Trustees also considered comparative information from Morningstar, which provides independent analysis of mutual fund data and, among other things, ranks mutual fund performance within categories comprised of similarly managed funds. The Trustees considered and discussed each Fund’s performance relative to the Fund’s Morningstar category for the one-, three-, five-, ten-, and fifteen-year periods, as applicable, ended July 31, 2022. The Trustees also considered each Fund’s Morningstar performance rankings (one through five stars) and noted the sustainability ratings assigned to some of the Funds by Morningstar. The Trustees noted that the short-term performance of the Sextant International Fund was in the first quartile for its Morningstar category for the one-year period, medium-term performance was in the third and first quartiles for the respective three- and five-year periods, and long-term performance was in the third and first quartiles for the respective ten- and fifteen-year periods. The Trustees noted that the short- term performance of the Sextant Growth Fund was in the first quartile for its Morningstar category for the one-year period, medium-term performance was in the second and first quartiles for the respective three- and five-year periods, and long-term performance was in the third and fourth quartiles for the respective ten- and fifteen-year periods. The Trustees noted that the short- term performance of the Sextant Short-Term Bond Fund was in the first quartile for its Morningstar category for the one-year period, medium-term performance was in the third and fourth quartiles for the respective three- and five-year periods, and long-term performance was in the fourth quartile for the ten- and fifteen-year periods. The Trustees noted that the short-term performance of the Sextant Bond Income Fund was in the first quartile for its Morningstar category for the one-year period, medium-term performance was in the second and fourth quartiles for the respective three- and five-year periods, and long-term performance was in the fourth quartile for the ten- and fifteen-year periods. The Trustees noted that the short-term performance of the Sextant Core Fund was in the first quartile for its Morningstar category for the one-year period, medium-term performance was in the third and second quartiles for the respective three- and five-year periods, and long-term performance was in the fourth quartile for the ten- and fifteen-year periods. The Trustees noted that the short-term performance of the Sextant Global High Income Fund was in the second quartile for its Morningstar category for the one-year period, and medium- and longer-term performance was in the fourth quartile for the three-, five-, and ten-year periods.
The Trustees also considered each Fund’s Morningstar performance ranking (one through five stars), noting that the overall Morningstar rating for the Sextant International Fund was four stars, Sextant Growth and Sextant Core Funds were both rated three stars, and Sextant Short-Term Bond, Sextant Bond Income, and Sextant Global High Income were each rated two stars.
The Trustees noted the generally risk-averse investment style of the Funds and other factors which can affect each Fund’s performance relative to its broader Morningstar category. The Trustees also noted certain differences between each Fund and the peer funds within its Morningstar category, including differences in investment strategies and asset size. The Trustees found that Saturna Capital continued to manage each Fund in a manner that is designed to be risk-averse and attractive to long-term investors. The Trustees discussed and considered the efforts of Saturna Capital to make additional resources available to assist in managing the Funds. The Trustees also considered Saturna Capital’s focus on improving investment performance without incurring materially higher levels of risk.
The Trustees also considered the performance and expenses of each Fund as compared to a smaller group of funds compiled by Saturna Capital with similar investment objectives and strategies. The Trustees considered these comparative performance and expense data, along with the comparative data published by Morningstar and each Fund’s performance relative to its benchmark, to evaluate each Fund’s performance over near-term and long-term time periods, as applicable. The Trustees evaluated the performance fee structure of the advisory and administrative fee under the current Agreement, noting that, if approved by the Trustees and by shareowners, the Amendment would replace the performance fee structure with a single advisory and administrative fee rate based on a Fund’s average daily net assets.
The Trustees also reviewed the fees and expenses of each Fund, including comparative data on fees and expenses published by Morningstar, and considered the components of the Funds’ operating expenses. The Trustees noted the steps that Saturna Capital has undertaken to maintain competitive levels of Fund operating expenses. They noted the significant sponsorship of the Funds by Saturna Capital evidenced, in part, by certain fees and expenses paid by Saturna Capital out of its own resources. The Trustees recognized that Saturna Capital’s efforts help make the Funds more widely available and less expensive than would otherwise be the case without Saturna Capital’s efforts.
The Trustees recognized that each Fund remains relatively small and there have not been opportunities to consider economies of scale. The Trustees noted Saturna Capital’s commitment to continue operating the Funds and the costs undertaken by Saturna Capital. The Trustees considered Saturna Capital’s representation that, if approved, the changes reflected in the Amendment would create the potential to grow the Funds’ overall assets, which potentially could benefit the Funds’ shareowners due to economies of scale due to a Fund’s fixed costs (other than the advisory and administrative fee) being allocated across a larger asset base, which could lower average Fund expenses. The Trustees considered that the proposed single advisory and administrative fee rate for each Fund in the Amendment does not reflect economies of scale for the benefit of the Funds’ shareowners.
| | | | | | | | | | |
| | | | | | |
| Annual Report | | November 30, 2022 | | | | | | | | 67 |
| | |
| Renewal of Investment Advisory Contract (continued) | | (unaudited) |
The Trustees reviewed Saturna Capital’s financial information and discussed the issue of Saturna Capital’s profitability, or lack thereof, as related to management and administration of the Trust. They discussed the reasonableness of Saturna Capital’s profitability as part of their evaluation of whether each Fund’s advisory and administrative fees bear a reasonable relationship to the mix of services provided by Saturna Capital, including the nature, extent, and quality of such services. The Trustees recognized that profitability information in future years would differ from that reviewed previously as a result of the elimination of the Performance Fee Adjustment. The Trustees noted that, due to the elimination of the Performance Fee Adjustment, in the event that the Amendment is approved by shareowners, profitability would no longer be directly affected by investment performance relative to the average 12-month total return of the funds in a Fund’s Morningstar category.
The Trustees considered and compared the fees charged by Saturna Capital to other types of accounts, including non-mutual fund advisory clients. The Trustees noted the differences between the full range of services Saturna Capital provides to the Funds, including investment advisory and administrative services, transfer agency services, and other services, as compared to the investment advisory services provided to the other advisory accounts.
In considering the Amendment, the Trustees considered the current advisory and administrative fee rate paid by a Fund to Saturna Capital under the Agreement and the proposed advisory and administrative fee rate payable by a Fund to Saturna Capital pursuant to the Amendment. With respect to the proposed elimination of the Performance Fee Adjustment and the implementation of a single advisory and administrative fee rate as provided in the Amendment, the Trustees considered the pro forma total expense ratio of each Fund and its share classes in comparison to the average total expense ratio of the funds in its Morningstar category for various periods. In doing so, the Trustees considered that the Funds’ pro forma total expense ratios were higher than their respective Morningstar category averages in certain years and lower in others.
The Trustees considered potential benefits to Saturna Capital’s other business lines from acting as investment adviser to the Funds, but also recognized that Saturna Capital’s other business lines also potentially benefit the Funds. The Trustees also noted that there were no soft dollar arrangements with respect to trading in the Funds’ portfolios. The Trustees considered whether there are other potential benefits to Saturna Capital in continuing to manage the Funds and the Trustees found that there were no material benefits other than Saturna Capital’s receipt of advisory and administrative fees and the fact that Saturna Brokerage Services, a wholly owned subsidiary of Saturna Capital, receives distribution and shareowner services fees under Rule 12b- 1, which it would not otherwise receive if Saturna Capital did not serve as the investment manager for the Funds. The Trustees also noted that Saturna Brokerage Services voluntarily waives brokerage commissions for executing Fund portfolio transactions, resulting in lower transaction costs.
The Trustees concluded based on their business judgement that the fees paid by each Fund to Saturna Capital were, from an arm’s length bargaining perspective, reasonable and in the best interest of the Fund and its shareowners in light of the services provided, comparative performance, expense and advisory and administrative fee information, costs of services provided, profits to be realized, and benefits derived or to be derived by Saturna Capital from its relationship with the Fund. Following this discussion, the Trustees, including the Independent Trustees, unanimously agreed to renew each Fund’s Agreement with Saturna Capital, and to approve the Amendment.
| | | | | | | | | | |
| | | | | | |
| 68 | | | | | | | | November 30, 2022 | | Annual Report |
| | |
| Results of Shareowner Meeting | | |
On January 10, 2023, shareowners of the Saturna Investment Trust convened a Special Meeting. The meeting record date was November 21, 2022.
At the meeting, six proposals to remove the performance fee adjustment (the “fulcrum” fee) were considered and five were approved: Sextant Growth, Sextant Core, Sextant Short-Term Bond, Sextant Bond Income, and Sextant Global High Income.
Also at the meeting, six proposals to adjourn the meeting, if necessary, were considered and approved. The meeting was adjourned to February 6, 2023, only for the Sextant International Fund to allow more shareowners to vote.
The following shares were voted at the meeting:
| | | | | | | | | | | | | | | | |
| | | | |
Sextant Growth Fund | | | | | | | | | | | | | |
| | | Outstanding Shares | | | For | | | Against | | | Abstain | |
| | | | |
Proposal 1 | | | 1,423,260 | | | | 706,374 | | | | 53,655 | | | | 9,718 | |
| | | | |
Proposal 7A | | | 1,423,260 | | | | 707,549 | | | | 50,584 | | | | 11,614 | |
| | | | | |
| | | | | | | | | | | | | | | | |
| | | | |
Sextant International Fund | | | | | | | | | | | | | |
| | | Outstanding Shares | | | For | | | Against | | | Abstain | |
| | | | |
Proposal 2 | | | 3,141,707 | | | | 1,227,447 | | | | 109,199 | | | | 66,756 | |
| | | | |
Proposal 7B | | | 3,141,707 | | | | 1,240,862 | | | | 95,661 | | | | 66,878 | |
| | | | | |
| | | | | | | | | | | | | | | | |
| | | | | |
Sextant Core Fund | | | | | | | | | | | | | | | | |
| | | Outstanding Shares | | | For | | | Against | | | Abstain | |
| | | | |
Proposal 3 | | | 1,294,945 | | | | 690,127 | | | | 27,800 | | | | 254 | |
| | | | |
Proposal 7C | | | 1,294,945 | | | | 695,408 | | | | 22,520 | | | | 254 | |
| | | | | |
| | | | | | | | | | | | | | | | |
| | | | |
Sextant Short-Term Bond Fund | | | | | | | | | | | | | |
| | | Outstanding Shares | | | For | | | Against | | | Abstain | |
| | | | |
Proposal 4 | | | 2,560,524 | | | | 1,491,533 | | | | 59,060 | | | | 20,067 | |
| | | | |
Proposal 7D | | | 2,560,524 | | | | 1,482,676 | | | | 57,906 | | | | 30,079 | |
| | | | | |
| | | | | | | | | | | | | | | | |
| | | | |
Sextant Bond Income Fund | | | | | | | | | | | | | |
| | | Outstanding Shares | | | For | | | Against | | | Abstain | |
| | | | |
Proposal 5 | | | 2,242,249 | | | | 1,433,311 | | | | 69,214 | | | | 970 | |
| | | | |
Proposal 7E | | | 2,242,249 | | | | 1,432,289 | | | | 68,798 | | | | 2,409 | |
| | | | | |
| | | | | | | | | | | | | | | | |
| | | | |
Sextant Global High Income Fund | | | | | | | | | | | | | |
| | | Outstanding Shares | | | For | | | Against | | | Abstain | |
| | | | |
Proposal 6 | | | 894,652 | | | | 567,815 | | | | 22,470 | | | | 297 | |
| | | | |
Proposal 7F | | | 894,652 | | | | 568,880 | | | | 21,405 | | | | 297 | |
| | | | | |
| | | | | | | | | | | | | | | | |
| | | | | | | | | | |
| | | | | | |
| Annual Report | | November 30, 2022 | | | | | | | | 69 |
Availability of Portfolio Information
| (1) | The Sextant Funds file complete schedules of portfolio holdings with the SEC for the first and third quarters of each fiscal year as an exhibit to its reports on Form N-PORT. Previously, this information was filed on Form N-Q. |
| (2) | The Funds’ Form N-PORT reports are available on the SEC’s website at www.sec.gov and at www.sextantfunds.com. |
| (3) | The Funds make a complete schedule of portfolio holdings after the end of each month available to investors at www.sextantfunds.com. |
Householding Policy
To reduce expenses, we may mail only one copy of the Funds’ prospectus, each annual and semi-annual report, and proxy statements when necessary, to those addresses shared by two or more accounts. If you wish to receive individual and/or more copies of these documents, please call us at 1-800-728-8762 or write to us at Saturna Capital/Sextant Mutual Funds, P.O. Box N, Bellingham, WA 98227. We will begin sending you individual copies 30 days after receiving your request.
If you are currently receiving multiple copies and wish to receive only one copy, please call us at 1-800-728-8762 or write to us at Saturna Capital/Sextant Mutual Funds, P.O. Box N, Bellingham, WA 98227. We will begin sending you a single copy with subsequent report mailings.
Availability of Proxy Voting Information
| (1) | A description of the policies and procedures that the Funds use to determine how to vote proxies relating to portfolio securities is available (a) without charge, upon request, by calling Saturna Capital at 1-800-728-8762; (b) on the Funds’ website at www.sextantfunds.com; and (c) on the SEC’s website at www.sec.gov. |
| (2) | Information regarding how each Fund voted proxies relating to portfolio securities during the most recent 12-month period ended June 30 is available (a) without charge, upon request, by calling Saturna Capital at 1-800-728-8762; (b) on the Funds’ website at www.sextantfunds.com; and (c) on the SEC’s website at www.sec. gov. |
Privacy Statement
At Saturna Capital and Saturna Investment Trust, we understand the importance of maintaining the privacy of your financial information. We want to assure you that we protect the confidentiality of any personal information that you share with us. In addition, we do not sell information about our current or former customers.
In the course of our relationship, we gather certain nonpublic information about you, including your name, address, investment choices, and account information. We do not disclose your information to unaffiliated third parties unless it is necessary to process a transaction; service your account; deliver your account statements, shareowner reports and other information; or as required by law. When we disclose information to unaffiliated third parties, we require a contract to restrict the companies’ use of customer information and from sharing or using it for any purposes other than performing the services for which they were required.
We may share information within the Saturna Capital family of companies in the course of informing you about products or services that may address your investing needs.
We maintain our own technology resources to minimize the need for any third party services, and restrict access to information within Saturna. We maintain physical, electronic, and procedural safeguards to guard your personal information. If you have any questions or concerns about the security or privacy of your information, please call us at 1-800-728-8762.
| | | | | | | | | | |
| | | | | | |
| 70 | | | | | | | | November 30, 2022 | | Annual Report |
Except for this legend, this page has been left blank intentionally.
| | | | | | | | | | |
| | | | | | |
| Annual Report | | November 30, 2022 | | | | | | | | 71 |
| | |
| Performance Summary (as of December 31, 2022) | | (unaudited) |
| | | | | | | | | | | | | | | | | | | | | | | | |
Average Annual Returns (before any taxes paid by shareowners) | | | | | | | | | | | | | | | | | | | | | | | | |
| | | | | | | | | | | | | | | | | | | | Expense Ratio1 | |
| | | | | | |
| | | 1 Year | | | | 3 Year | | | | 5 Year | | | | 10 Year | | | | Gross | | | | Net | |
| | | | | | |
Sustainable Equity Fund (SEEFX) | | | -21.39% | | | | 2.86% | | | | 6.07% | | | | n/a | | | | 0.85% | | | | 0.75% | |
| | | | | | |
S&P Global 1200 Index | | | -16.83% | | | | 5.32% | | | | 6.58% | | | | 9.33% | | | | n/a | | | | n/a | |
| | | | | | |
| | | | | | | | | | | | | | | | | | | | | | | | |
| | | | | | |
Sustainable Bond Fund (SEBFX) | | | -8.54% | | | | -1.40% | | | | -0.12% | | | | n/a | | | | 0.86% | | | | 0.65% | |
| | | | | | |
FTSE WorldBIG Bond Index | | | -17.14% | | | | -4.98% | | | | -1.98% | | | | -0.54% | | | | n/a | | | | n/a | |
| 1 | By regulation, expense ratios shown in these tables are as stated in the Funds’ most recent Prospectus, dated March 30, 2022, and incorporate results for the fiscal year ended November 30, 2021. Ratios presented in this table differ from the expense ratios shown elsewhere in this report as they represent different periods. Also by regulation, the performance in this table represents the most recent quarter-end performance rather than performance through the Funds’ most recent fiscal period. Saturna Capital, the Fund’s adviser, has voluntarily capped actual expenses of the Sustainable Equity Fund at 0.75% and actual expenses of the Sustainable Bond Fund at 0.65% through March 31, 2023. |
Performance data quoted in this report represents past performance, is before any taxes payable by shareowners, and is no guarantee of future results. Current performance may be higher or lower than that stated herein. Performance current to the most recent month-end is available by calling toll-free 1-800-728-8762 or visiting www.saturnasustainable.com. Average annual total returns are historical and include change in share value as well as reinvestment of dividends and capital gains, if any. The investment return and principal value of an investment will fluctuate so that an investor’s shares, when redeemed, may be worth more or less than their original cost. Funds that invest in foreign securities may involve greater risk, including political and economic uncertainties of foreign countries as well as the risk of currency fluctuations.
A note about risk: Please see Notes to Financial Statements beginning on page 22 for a discussion of investment risks. For a more detailed discussion of the risks associated with each Fund, please see the Funds’ prospectus or each Fund’s summary prospectus.
A Fund’s 30-Day Yield, sometimes referred to as “standardized yield” or “SEC yield,” is expressed as an annual percentage rate using a method of calculation adopted by the Securities and Exchange Commission (SEC). The 30-Day Yield provides an estimate of a Fund’s investment income rate, but may not equal the actual income distribution rate.
The S&P Global 1200 Index is a global stock market index covering nearly 70% of the world’s equity markets. The FTSE WorldBIG Bond Index is a multi-asset, multi-currency benchmark, which provides a broad-based measure of the global fixed-income markets. Investors cannot invest directly in the indices.
The Saturna Sustainable Funds limit the securities they purchase to those consistent with sustainable principles. This limits opportunities and may affect performance.
Please consider an investment’s objectives, risks, charges, and expenses carefully before investing. To obtain this and other important information about the Saturna Sustainable Funds in a prospectus or summary prospectus, ask your financial adviser, visit www.saturnasustainable.com, or call toll-free 1-800-728-8762. Please read the prospectus or summary prospectus carefully before investing.
| | | | | | | | | | |
| | | | | | |
| 2 | | | | | | | | November 30, 2022 | | Annual Report |
| | |
| Fellow Shareowners: | | January 19, 2023 |
In 2022, three consecutive years of highly remunerative stock market returns collided with persistent inflation, the Federal Reserve pushing rates sharply higher, and Russia’s invasion of Ukraine causing food and energy prices to soar. These combined forces, abetted by high valuations, drove equities to their worst annual performance since 2008 and the Global Financial Crisis. Since the end of World War II there have been only three years when the S&P 500 declined by a greater percentage than in 2022: 1974, following the previous year’s OPEC oil price hikes; 2002, following the 2001 Dot Com crash and amid growing tensions over possible war in Iraq; and 2008, as mentioned above. Technology stocks led the sell-off in 2022, placed at risk by extended valuations as rising interest rates reduced the value of future cash flows.
For the fiscal year ended November 30, 2022, the S&P 500 Index fell -9.21% while the S&P Global 1200 Index fell -9.38% and the broader MSCI All Country World Index lost -11.19%. Saturna Sustainable Equity Fund trailed, posting a -15.96% decrease for the same period. Bond markets were similarly roiled with the FTSE WorldBIG Bond Index losing -17.32% and the Bloomberg US Aggregate Index falling -12.84%. Saturna Sustainable Bond Fund fared better, losing just -7.83% comparatively. Year-over-year, assets of the Funds fell -5.7% to more than $48 million.
We’re pleased to report strong ratings for both performance relative to peers and sustainability from independent performance monitor Morningstar. As of December 31, 2022, both Saturna Sustainable Equity Fund and Saturna Sustainable Bond Fund were rated 4 Stars Overall (among 337 Global Large-Stock Blend funds for the Equity Fund and 192 Global Bond funds for the Bond Fund). As of November 30, 2022, Saturna Sustainable Equity ranked in the 6th percentile (among 7,758 in the Global Equity Large Cap category) for sustainability and earned a “High” 5 Globe rating, and Saturna Sustainable Bond ranked in the 11th percentile (among 1,951 funds in the Global Fixed Income category) and earned an “Above Average” 4 Globe rating. See page 5 for further details.
Morningstar®
| | |
| Saturna Sustainable Equity (SEEFX) |
| |
| Overall Rating™ | | Sustainability Rating™ |
| ê ê ê ê | | ø ø ø ø ø |
Among 337 Global Large-Stock Blend Funds, based on risk-adjusted performance
| | |
| Saturna Sustainable Bond (SEBFX) |
| |
| Overall Rating™ | | Sustainability Rating™ |
| ê ê ê ê | | ø ø ø ø ø |
Among 192 Global Bond Funds, based on risk-adjusted performance
| | | | | | | | | | |
| | | | | | |
| Annual Report | | November 30, 2022 | | | | | | | | 3 |
Going Forward
As we embark upon the new year, no question figures more prominently among investors than “What are your market expectations?” Such queries carry greater urgency, given the significant decline in 2022 and recessionary worries in 2023. In response to this question, we typically reply that we are not market prognosticators, preferring to focus on the long-term outlook for the stocks in which we invest. Every four years, however, we arrive upon a market phenomenon with an unblemished multi-decade record of calling the market over the coming year — the Midterm Effect. From 1945 to 2019, the one-year return of the S&P 500 has been positive in 19 out of 19 of the years following a midterm election. For the same period, returns for the S&P 500 in the years following a midterm election averaged 16.28% compared to an average return of 7.99% in other years.
From 1942 until now, the S&P 500 has had 17 down years. However, in that time, there have been only three pairs of consecutive down years (1973-1974, 2000-2001, and 2001-2002). Considering the market’s 2022 downdraft, this perhaps provides another reason for optimism regarding the prospects for 2023 and for remaining engaged with the markets.
While higher interest rates continue to haunt the markets, holders of long-term bonds are at short-term risk of price declines. Investors around the world — not just Americans — generally have confidence that they will survive the economic storms.
Businesses across the globe are publishing more and better data regarding their environmental, social and governance (“ESG”) habits and goals. While many CEOs understand the business case for responsibly handling resources and stakeholders for the long-term good of the planet and their smaller communities, we acknowledge that political headwinds exist for ESG investing practitioners.
With recession fears looming and persistent inflation, we undoubtedly face more economic turmoil, but we retain faith in the power of human resilience and creativity. Thank you for investing with us. We stand ready to serve you in both bull and bear markets by providing steady navigation amid the rising tide.
Respectfully,
(photo omitted)
Jane Carten,
President
(photo omitted)
Gary Goldfogel,
Independent Board Chairman
| | | | | | | | | | |
| | |
| | Saturna Sustainable Funds Portfolio Management | | |
| | | | | |
| | (photo omitted) | | Jane Carten MBA Saturna Sustainable Equity Fund Portfolio Manager | | (photo omitted) | | Patrick Drum MBA, CFA®, CFP® Saturna Sustainable Bond Fund Portfolio Manager | | |
| | | | | |
| | (photo omitted) | | Scott Klimo CFA® Saturna Sustainable Equity Fund Deputy Portfolio Manager | | (photo omitted) | | Elizabeth Alm CFA® Saturna Sustainable Bond Fund Deputy Portfolio Manager | | |
| | | | | | | | | | |
| | | | | | |
| 4 | | | | | | | | November 30, 2022 | | Annual Report |
| | | | |
| Morningstar Ratings™ | | As of December 31, 2022 | | (unaudited) |
| | | | | | | | | | |
| | | | | |
| Morningstar™ RatingsA | | 1 Year | | 3 Year | | 5 Year | | Overall | | Sustainability Rating™ B |
| | | |
| Saturna Sustainable Equity Fund – “Global Large-Stock Blend” Category | | | | |
| | | | | |
| SEEFX | | n/a | | êêê | | êêêê | | êêêê | | ø ø ø ø ø |
| | | | | |
% Rank in Category | | 85 | | 72 | | 24 | | n/a | | 6 |
| | | | | |
| Number of Funds in Category | | 367 | | 337 | | 288 | | 337 | | 7,758 |
| | | |
| Saturna Sustainable Bond Fund – “Global Bond” Category | | | | |
| | | | | |
| SEBFX | | n/a | | êêêê | | êêêê | | êêêê | | ø ø ø ø ø |
| | | | | |
% Rank in Category | | 21 | | 13 | | 19 | | n/a | | 11 |
| | | | | |
| Number of Funds in Category | | 201 | | 192 | | 170 | | 192 | | 1,951 |
The Morningstar Sustainability Ratings are not based on fund performance and are not equivalent to the Morningstar Rating (“Star Rating”).
© 2023 Morningstar®. All rights reserved. Morningstar, Inc. is an independent fund performance monitor. The information contained herein: (1) is proprietary to Morningstar and/or its content providers; (2) may not be copied or distributed; and (3) is not warranted to be accurate, complete, or timely. Neither Morningstar nor its content providers are responsible for any damages or losses arising from any use of this information.
| A | Morningstar Ratings™ (“Star Ratings”) are as of December 31, 2022. The Morningstar Rating™ for funds, or “star rating”, is calculated for managed products (including mutual funds, variable annuity and variable life subaccounts, exchange-traded funds, closed-end funds, and separate accounts) with at least a three-year history. Exchange-traded funds and open-ended mutual funds are considered a single population for comparative purposes. It is calculated based on a Morningstar Risk-Adjusted Return measure that accounts for variation in a managed product’s monthly excess performance (not including the effects of sales charges, loads, and redemption fees), placing more emphasis on downward variations and rewarding consistent performance. The top 10% of products in each product category receive 5 stars, the next 22.5% receive 4 stars, the next 35% receive 3 stars, the next 22.5% receive 2 stars, and the bottom 10% receive 1 star. The Overall Morningstar Rating for a managed product is derived from a weighted average of the performance figures associated with its three-, five-, and 10-year (if applicable) Morningstar Rating metrics. The weights are: 100% three-year rating for 36-59 months of total returns, 60% five-year rating/40% three-year rating for 60-119 months of total returns, and 50% 10-year rating/30% five-year rating/20% three-year rating for 120 or more months of total returns. While the 10-year overall star rating formula seems to give the most weight to the 10-year period, the most recent three-year period actually has the greatest impact because it is included in all three rating periods. |
| B | Morningstar Sustainability Ratings are as of November 30, 2022. The Morningstar Sustainability Rating™ is intended to measure how well the issuing companies of the securities within a fund’s portfolio are managing their environmental, social, and governance (“ESG”) risks and opportunities relative to the fund’s Morningstar category peers. The Morningstar Sustainability Rating calculation is a two-step process. First, each fund with at least 50% of assets covered by a company-level ESG score from Sustainalytics receives a Morningstar Portfolio Sustainability Score™. The Morningstar Portfolio Sustainability Score is an asset-weighted average of normalized company-level ESG scores with deductions made for controversial incidents by the issuing companies, such as environmental accidents, fraud, or discriminatory behavior. The Morningstar Sustainability Rating is then assigned to all scored funds within Morningstar Categories in which at least ten (10) funds receive a Portfolio Sustainability Score and is determined by each fund’s rank within the following distribution: High (highest 10%), Above Average (next 22.5%), Average (next 35%), Below Average (next 22.5%), and Low (lowest 10%). The Morningstar Sustainability Rating is depicted by globe icons where High equals 5 globes and Low equals 1 globe. |
A Sustainability Rating is assigned to any fund that has more than half of its underlying assets rated by Sustainalytics and is within a Morningstar Category with at least 10 scored funds; therefore, the rating it is not limited to funds with explicit sustainable or responsible investment mandates. Morningstar updates its Sustainability Ratings monthly. Portfolios receive a Morningstar Portfolio Sustainability Score and Sustainability Rating one month and six business days after their reported as-of date based on the most recent portfolio. As part of the evaluation process, Morningstar uses Sustainalytics’ ESG scores from the same month as the portfolio as-of date.
Saturna Sustainable Equity Fund was rated on 99% of Assets Under Management. Saturna Sustainable Bond Fund was rated on 92% of Assets Under Management.
% Rank in Category is the fund’s percentile rank for the specified time period relative to all funds that have the same Morningstar category. The highest (or most favorable) percentile rank is 1 and the lowest (or least favorable) percentile rank is 100. The top-performing fund in a category will always receive a rank of 1. Percentile ranks within categories are most useful in those categories that have a large number of funds.
The Funds’ portfolios are actively managed and are subject to change, which may result in different Morningstar Sustainability Ratings over time.
| | | | | | | | | | |
| | | | | | |
| Annual Report | | November 30, 2022 | | | | | | | | 5 |
| | |
| Saturna Sustainable Equity Fund: Performance Summary | | (unaudited) |
| | | | | | | | | | | | | | | | |
Average Annual Returns as of November 30, 2022 | | | | | | | | | | | | | | | | |
| | | | | |
| | | 1 Year | | | 5 Year | | | 10 Year | | | Expense Ratio1 | |
| | | | |
Sustainable Equity Fund (SEEFX)2 | | | -15.96% | | | | 6.92% | | | | n/a | | | | 0.85% | |
| | | | |
S&P Global 1200 Index | | | -9.38% | | | | 7.81% | | | | 10.02% | | | | n/a | |
Growth of $10,000
| | |
 | | Comparison of any mutual fund to a market index must be made bearing in mind that the index is expense-free. Conversely, the fund will (1) be actively managed; (2) have an objective other than mirroring the index, such as limiting risk; (3) bear transaction and other costs; (4) stand ready to buy and sell its securities to shareowners on a daily basis; and (5) provide a wide range of services. The graph compares $10,000 invested in the Fund on March 27, 2015, to an identical amount invested in the Standard & Poor’s Global 1200 Index, a global stock market index covering nearly 70% of the world’s equity markets. The graph shows that an investment in the Fund would have risen to $16,124 versus $18,782 in the Index. |
Past performance does not guarantee future results. The “Growth of $10,000” graph and “Average Annual Returns” performance table assume the reinvestment of dividends and capital gains. They do not reflect the deduction of taxes that a shareowner might pay on fund distributions or the redemption of fund shares.
| 1 | By regulation, the expense ratio shown in this table is as stated in the Fund’s most recent prospectus which is dated March 30, 2022, and incorporates results for the fiscal year ended November 30, 2021, before fee waivers. The expense ratio shown in the most recent prospectus after fee waivers was 0.75%. The ratio presented in this table differs from expense ratios shown elsewhere in this report as they represent different periods. |
| 2 | Operations commenced on March 27, 2015. |
Fund Objective
The objective of the Sustainable Equity Fund is capital appreciation.
| | | | |
Top 10 Holdings | |
| |
| % of Total Net Assets | |
| |
Novo Nordisk ADR | | | 3.2% | |
| |
Nintendo ADR | | | 3.1% | |
| |
Tractor Supply | | | 2.9% | |
| |
Wolters Kluwer | | | 2.8% | |
| |
Johnson Matthey | | | 2.7% | |
| |
CGI Group, Class A | | | 2.6% | |
| |
Lowe’s | | | 2.6% | |
| |
Assa Abloy ADR | | | 2.6% | |
| |
Legrand | | | 2.5% | |
| |
Schneider Electric ADR | | | 2.5% | |
| | | | | | | | | | | | |
Portfolio Diversification | |
| | | |
| % of Total Net Assets | | | | | | | | | |
| | | |
Large Pharma | | | 12.7% | | | ∎ | | | | | 
| |
Home Products Stores | | | 8.0% | | | ∎ | | |
Household Products | | | 6.8% | | | ∎ | | |
Specialty Chemicals | | | 5.8% | | | ∎ | | |
Commercial & Residential Building Equipment & Systems | | | 5.1% | | | ∎ | | |
IT Services | | | 5.0% | | | ∎ | | |
Consumer Electronics | | | 4.8% | | | ∎ | | |
Electrical Power Equipment | | | 4.4% | | | ∎ | | |
Application Software | | | 3.1% | | | ∎ | | |
Information Services | | | 2.8% | | | ∎ | | |
Consumer Finance | | | 2.7% | | | ∎ | | |
Life Insurance | | | 2.5% | | | ∎ | | |
Industries < 2.5% | | | 24.2% | | | ∎ | | |
Other Assets (net of liabilities) | | | 12.1% | | | ∎ | | |
| | | | | | | | | | |
| | | | | | |
| 6 | | | | | | | | November 30, 2022 | | Annual Report |
| | |
| Saturna Sustainable Equity Fund: Discussion of Fund Performance | | (unaudited) |
(photo omitted)
Fiscal Year 2022
For the fiscal year ended November 30, 2022, the Saturna Sustainable Equity Fund declined -15.96%, trailing the -9.21% drop for the S&P 500 Index. The S&P Global 1200 declined -9.38% for the same period.
(photo omitted)
Factors Affecting Past Performance
After three years of buoyant stock market performance (fueled in part by ultra-low bond yields) the Federal Reserve (the “Fed”) aggressively hiked interest rates in response to persistent inflation. As a result, in 2022 the S&P 500 suffered its worst year since 2008 and the Global Financial Crisis. Investors holding the Sustainable Equity Fund had a challenging year due to the downturn in financial markets.
Energy was the best performing sector in 2022, the only sector to post a gain rather than a loss, and is specifically excluded by prospectus in our portfolio. Despite the difficult environment for sustainable investors, certain stocks fared comparatively well. We experienced positive returns from Health Care, with Novo Nordisk being the top contributor to the Sustainable Equity Fund for the year. The outlook for diabetes management remains strong and we intend to hold our position in the future. We also benefited from positions in the insurance industry and the Consumer Staples sector. Insurance companies Chubb and Aviva contributed to the former while TJX and Tractor Supply lifted the latter.
Inflation concerns and the toll of war in Ukraine led European stocks to fall. As a global fund, Sustainable Equity Fund was exposed and affected. Two of the largest detractors in the Fund this year, Koninklijke Philips and Adidas, which are both domiciled in Europe, were weaned down as of November 30, 2022, and have since been fully ejected from the portfolio. The third largest detractor was US-based PayPal, which we are keeping, and we hold our conviction that there is plenty of room for the payments giant to grow.
Looking Forward
The economy is growing, unemployment remains low, wages are rising, and energy prices have fallen. Despite these positives, conversations regarding the economic and stock market outlook (not that the two are closely related over the short-term) focus on the likelihood and potential severity of recession. Monetary policy works with a lag, and we still do not know the effect of the Fed’s raising rates from near-zero at the start of 2022 to over 4% at year end. Despite arguably shooting in the dark, the Fed has committed to further rate increases pushing toward 5%. In our view, persistent yield curve inversions point to recession, but only time will tell.
| | | | | | | | | | |
| | | | | | |
| Annual Report | | November 30, 2022 | | | | | | | | 7 |
| | |
| Saturna Sustainable Equity Fund: Schedule of Investments | | As of November 30, 2022 |
| | | | | | | | | | | | | | | | | | | | | | |
| | | | | | | | |
| | | Common Stocks – 87.9% | | | | Number of Shares | | | Cost | | | Market Value | | | Country1 | | Percentage of Net Assets | |
| | | | | | | |
| | | Communications | | | | | | | | | | | | | | | | |
| | | | | | | | |
| | | Cable & Satellite | | | | | | | | | | | | | | | | |
| | | | | | | | |
| | | Shaw Communications, Class B | | | | | 5,000 | | | | $132,286 | | | | $136,450 | | | Canada | | | 0.7% | |
| | | | | | | | |
| | | Entertainment Content | | | | | | | | | | | | | | | | |
| | | | | | | | |
| | | Walt Disney Company2 | | | | | 2,600 | | | | 460,792 | | | | 254,462 | | | United States | | | 1.3% | |
| | | | | | | | |
| | | | | | | | | | | 593,078 | | | | 390,912 | | | | | | 2.0% | |
| | | | | | | |
| | | Consumer Discretionary | | | | | | | | | | | | | | | | |
| | | | | | | | |
| | | Apparel, Footwear & Accessory
Design | | | | | | | | | | | | | | | | |
| | | | | | | | |
| | | adidas ADR | | | | | 3,145 | | | | 484,293 | | | | 202,884 | | | Germany | | | 1.0% | |
| | | | | | | | |
| | | Home Products Stores | | | | | | | | | | | | | | | | |
| | | | | | | | |
| | | Home Depot | | | | | 1,500 | | | | 279,738 | | | | 485,985 | | | United States | | | 2.5% | |
| | | | | | | | |
| | | Lowe’s | | | | | 2,400 | | | | 326,722 | | | | 510,120 | | | United States | | | 2.6% | |
| | | | | | | | |
| | | Tractor Supply | | | | | 2,500 | | | | 453,570 | | | | 565,775 | | | United States | | | 2.9% | |
| | | | | | | | |
| | | | | | | | | | | | | | | | | | | | | | | |
| | | | | | | | |
| | | | | | | | | | | | 1,060,030 | | | | 1,561,880 | | | | | | 8.0% | |
| | | | | | | | |
| | | Other Commercial Services | | | | | | | | | | | | | | | | |
| | | | | | | | |
| | | Ecolab | | | | | 1,500 | | | | 237,915 | | | | 224,745 | | | United States | | | 1.1% | |
| | | | | | | | |
| | | Restaurants | | | | | | | | | | | | | | | | | | | | |
| | | | | | | | |
| | | Starbucks | | | | | 3,213 | | | | 237,202 | | | | 328,369 | | | United States | | | 1.7% | |
| | | | | | | | |
| | | Specialty Apparel Stores | | | | | | | | | | | | | | | | |
| | | | | | | | |
| | | TJX Companies | | | | | 5,000 | | | | 238,192 | | | | 400,250 | | | United States | | | 2.0% | |
| | | | | | | | |
| | | | | | | | | | | | | | | | | | | | | | | |
| | | | | | | | |
| | | | | | | | | | | 2,257,632 | | | | 2,718,128 | | | | | | 13.8% | |
| | | | | | | |
| | | Consumer Staples | | | | | | | | | | | | | | | | |
| | | | | | | | |
| | | Household Products | | | | | | | | | | | | | | | | |
| | | | | | | | |
| | | Haleon ADR2 | | | | | 11,500 | | | | 84,283 | | | | 79,235 | | | United Kingdom | | | 0.4% | |
| | | | | | | | |
| | | L’Oreal ADR | | | | | 5,400 | | | | 297,824 | | | | 401,814 | | | France | | | 2.0% | |
| | | | | | | | |
| | | Reckitt Benckiser Group ADR | | | | | 16,700 | | | | 280,226 | | | | 244,154 | | | United Kingdom | | | 1.2% | |
| | | | | | | | |
| | | Unicharm ADR | | | | | 40,500 | | | | 326,015 | | | | 300,510 | | | Japan | | | 1.5% | |
| | | | | | | | |
| | | Unilever ADR | | | | | 6,600 | | | | 340,612 | | | | 332,508 | | | United Kingdom | | | 1.7% | |
| | | | | | | | |
| | | | | | | | | | | | | | | | | | | | | | | |
| | | | | | | | |
| | | | | | | | | | | | 1,328,960 | | | | 1,358,221 | | | | | | 6.8% | |
| | | | | | | | |
| | | Packaged Food | | | | | | | | | | | | | | | | |
| | | | | | | | |
| | | Danone ADR | | | | | 31,200 | | | | 422,529 | | | | 326,664 | | | France | | | 1.7% | |
| | | | | | | | |
| | | | | | | | | | | | | | | | | | | | | | | |
| | | | | | | | |
| | | | | | | | | | | 1,751,489 | | | | 1,684,885 | | | | | | 8.5% | |
| | | | | | | |
| | | Energy | | | | | | | | | | | | | | | | |
| | | | | | | | |
| | | Renewable Energy Equipment | | | | | | | | | | | | | | | | |
| | | | | | | | |
| | | Vestas Wind Systems | | | | | 11,000 | | | | 199,477 | | | | 282,775 | | | Denmark | | | 1.4% | |
| | | | | | | | |
| | | | | | | | | | | | | | | | | | | | | | | |
| | | | | | | | |
| | | | | | | | | | | | | | | | | | | | | | |
Continued on next page.
| | | | | | | | | | | | |
| | | | | | | |
| 8 | | | | | | | | November 30, 2022 | | Annual Report | | The accompanying notes are an integral part of these financial statements. |
| | |
| Saturna Sustainable Equity Fund: Schedule of Investments | | As of November 30, 2022 |
| | | | | | | | | | | | | | | | | | | | | | |
| | | | | | | | |
| | | Common Stocks – 87.9% | | | | Number of Shares | | | Cost | | | Market Value | | | Country1 | | Percentage of Net Assets | |
| | | | | | | |
| | | Financials | | | | | | | | | | | | | | | | |
| | | | | | | | |
| | | Consumer Finance | | | | | | | | | | | | | | | | |
| | | | | | | | |
| | | Mastercard, Class A | | | | | 860 | | | | $171,375 | | | | $306,504 | | | United States | | | 1.5% | |
| | | | | | | | |
| | | PayPal | | | | | 2,900 | | | | 674,351 | | | | 227,389 | | | United States | | | 1.2% | |
| | | | | | | | |
| | | | | | | | | | | | | | | | | | | | | | | |
| | | | | | | | |
| | | | | | | | | | | | 845,726 | | | | 533,893 | | | | | | 2.7% | |
| | | | | | | | |
| | | Life Insurance | | | | | | | | | | | | | | | | |
| | | | | | | | |
| | | Aviva ADR | | | | | 45,600 | | | | 416,983 | | | | 491,112 | | | United Kingdom | | | 2.5% | |
| | | | | | | | |
| | | P&C Insurance | | | | | | | | | | | | | | | | |
| | | | | | | | |
| | | Chubb | | | | | 2,000 | | | | 287,787 | | | | 439,180 | | | Switzerland | | | 2.2% | |
| | | | | | | | |
| | | | | | | | | | | 1,550,496 | | | | 1,464,185 | | | | | | 7.4% | |
| | | | | | | |
| | | Health Care | | | | | | | | | | | | | | | | |
| | | | | | | | |
| | | Biotech | | | | | | | | | | | | | | | | |
| | | | | | | | |
| | | BioNTech SE ADR | | | | | 800 | | | | 125,059 | | | | 133,616 | | | Germany | | | 0.7% | |
| | | | | | | | |
| | | Large Pharma | | | | | | | | | | | | | | | | |
| | | | | | | | |
| | | GlaxoSmithKline ADR | | | | | 9,200 | | | | 369,834 | | | | 318,228 | | | United Kingdom | | | 1.6% | |
| | | | | | | | |
| | | Johnson & Johnson | | | | | 2,300 | | | | 365,640 | | | | 409,400 | | | United States | | | 2.1% | |
| | | | | | | | |
| | | Novartis ADR | | | | | 4,300 | | | | 394,692 | | | | 385,108 | | | Switzerland | | | 1.9% | |
| | | | | | | | |
| | | Novo Nordisk ADR | | | | | 5,100 | | | | 324,489 | | | | 635,460 | | | Denmark | | | 3.2% | |
| | | | | | | | |
| | | Pfizer | | | | | 8,000 | | | | 290,709 | | | | 401,040 | | | United States | | | 2.0% | |
| | | | | | | | |
| | | Roche Holding ADR | | | | | 9,000 | | | | 406,003 | | | | 368,280 | | | Switzerland | | | 1.9% | |
| | | | | | | | |
| | | | | | | | | | | | | | | | | | | | | | | |
| | | | | | | | |
| | | | | | | | | | | | 2,151,367 | | | | 2,517,516 | | | | | | 12.7% | |
| | | | | | | | |
| | | | | | | | | | | 2,276,426 | | | | 2,651,132 | | | | | | 13.4% | |
| | | | | | | |
| | | Industrials | | | | | | | | | | | | | | | | |
| | | | | | | | |
| | | Commercial & Residential
Building Equipment & Systems | | | | | | | | | | | | | | | | |
| | | | | | | | |
| | | Assa Abloy ADR | | | | | 44,500 | | | | 515,233 | | | | 509,525 | | | Sweden | | | 2.6% | |
| | | | | | | | |
| | | Legrand | | | | | 6,200 | | | | 520,793 | | | | 499,868 | | | France | | | 2.5% | |
| | | | | | | | |
| | | | | | | | | | | | | | | | | | | | | | | |
| | | | | | | | |
| | | | | | | | | | | | 1,036,026 | | | | 1,009,393 | | | | | | 5.1% | |
| | | | | | | | |
| | | Electrical Components | | | | | | | | | | | | | | | | |
| | | | | | | | |
| | | TE Connectivity | | | | | 3,200 | | | | 356,052 | | | | 403,584 | | | Switzerland | | | 2.0% | |
| | | | | | | | |
| | | Electrical Power Equipment | | | | | | | | | | | | | | | | |
| | | | | | | | |
| | | Schneider Electric ADR | | | | | 17,100 | | | | 424,554 | | | | 499,662 | | | France | | | 2.5% | |
| | | | | | | | |
| | | Siemens ADR | | | | | 5,300 | | | | 361,107 | | | | 367,555 | | | Germany | | | 1.9% | |
| | | | | | | | |
| | | | | | | | | | | | | | | | | | | | | | | |
| | | | | | | | |
| | | | | | | | | | | | 785,661 | | | | 867,217 | | | | | | 4.4% | |
| | | | | | | | |
| | | | | | | | | | | | | | | | | | | | | | | |
| | | | | | | | |
| | | | | | | | | | | 2,177,739 | | | | 2,280,194 | | | | | | 11.5% | |
| | | | | | | |
| | | Materials | | | | | | | | | | | | | | | | |
| | | | | | | | |
| | | Specialty Chemicals | | | | | | | | | | | | | | | | |
| | | | | | | | |
| | | DSM Koninklijke | | | | | 1,928 | | | | 255,228 | | | | 247,437 | | | Netherlands | | | 1.2% | |
| | | | | | | | |
| | | Johnson Matthey | | | | | 21,031 | | | | 690,073 | | | | 527,521 | | | United Kingdom | | | 2.7% | |
| | | | | | | | |
| | | Novozymes ADR | | | | | 6,550 | | | | 329,753 | | | | 378,525 | | | Denmark | | | 1.9% | |
| | | | | | | | |
| | | | | | | | | | | 1,275,054 | | | | 1,153,483 | | | | | | 5.8% | |
Continued on next page.
| | | | | | | | | | | | |
| | | | | | | |
| The accompanying notes are an integral part of these financial statements. | | Annual Report | | November 30, 2022 | | | | | | | | 9 |
| | |
| Saturna Sustainable Equity Fund: Schedule of Investments | | As of November 30, 2022 |
| | | | | | | | | | | | | | | | | | | | | | |
| | | | | | | | |
| | | Common Stocks – 87.9% | | | | Number of Shares | | | Cost | | | Market Value | | | Country1 | | Percentage of Net Assets | |
| | | | | | | |
| | | Technology | | | | | | | | | | | | | | | | |
| | | | | | | | |
| | | Application Software | | | | | | | | | | | | | | | | |
| | | | | | | | |
| | | Adobe2 | | | | | 1,000 | | | | $108,410 | | | | $344,930 | | | United States | | | 1.7% | |
| | | | | | | | |
| | | Dassault Systemes ADR | | | | | 7,530 | | | | 119,029 | | | | 277,255 | | | France | | | 1.4% | |
| | | | | | | | |
| | | | | | | | | | | | | | | | | | | | | | | |
| | | | | | | | |
| | | | | | | | | | | | 227,439 | | | | 622,185 | | | | | | 3.1% | |
| | | | | | | | |
| | | Communications Equipment | | | | | | | | | | | | | | | | |
| | | | | | | | |
| | | Apple | | | | | 3,028 | | | | 83,313 | | | | 448,235 | | | United States | | | 2.3% | |
| | | | | | | | |
| | | Consumer Electronics | | | | | | | | | | | | | | | | |
| | | | | | | | |
| | | Nintendo ADR | | | | | 56,625 | | | | 633,296 | | | | 607,586 | | | Japan | | | 3.1% | |
| | | | | | | | |
| | | Sony ADR | | | | | 4,000 | | | | 261,556 | | | | 332,280 | | | Japan | | | 1.7% | |
| | | | | | | | |
| | | | | | | | | | | | | | | | | | | | | | | |
| | | | | | | | |
| | | | | | | | | | | | 894,852 | | | | 939,866 | | | | | | 4.8% | |
| | | | | | | | |
| | | Electronics Components | | | | | | | | | | | | | | | | |
| | | | | | | | |
| | | Murata Manufacturing | | | | | 4,000 | | | | 203,199 | | | | 217,133 | | | Japan | | | 1.1% | |
| | | | | | | | |
| | | Information Services | | | | | | | | | | | | | | | | |
| | | | | | | | |
| | | Wolters Kluwer | | | | | 5,000 | | | | 371,604 | | | | 545,256 | | | Netherlands | | | 2.8% | |
| | | | | | | | |
| | | Infrastructure Software | | | | | | | | | | | | | | | | |
| | | | | | | | |
| | | Microsoft | | | | | 1,438 | | | | 62,724 | | | | 366,891 | | | United States | | | 1.8% | |
| | | | | | | | |
| | | IT Services | | | | | | | | | | | | | | | | |
| | | | | | | | |
| | | Accenture, Class A | | | | | 1,600 | | | | 275,166 | | | | 481,488 | | | Ireland | | | 2.4% | |
| | | | | | | | |
| | | CGI Group, Class A2 | | | | | 6,000 | | | | 421,997 | | | | 523,860 | | | Canada | | | 2.6% | |
| | | | | | | | |
| | | | | | | | | | | | | | | | | | | | | | | |
| | | | | | | | |
| | | | | | | | | | | | 697,163 | | | | 1,005,348 | | | | | | 5.0% | |
| | | | | | | | |
| | | Semiconductor Devices | | | | | | | | | | | | | | | | |
| | | | | | | | |
| | | NXP Semiconductors | | | | | 1,800 | | | | 179,525 | | | | 316,512 | | | Netherlands | | | 1.6% | |
| | | | | | | | |
| | | STMicroelectronics ADR | | | | | 3,900 | | | | 136,216 | | | | 151,632 | | | Switzerland | | | 0.8% | |
| | | | | | | | |
| | | | | | | | | | | | | | | | | | | | | | | |
| | | | | | | | |
| | | | | | | | | | | | 315,741 | | | | 468,144 | | | | | | 2.4% | |
| | | | | | | | |
| | | Semiconductor Manufacturing | | | | | | | | | | | | | | | | |
| | | | | | | | |
| | | Taiwan Semiconductor ADR | | | | | 1,825 | | | | 69,799 | | | | 151,438 | | | Taiwan | | | 0.8% | |
| | | | | | | | |
| | | | | | | | | | | 2,925,834 | | | | 4,764,496 | | | | | | 24.1% | |
| | | | | | | |
| | | | | | | | | | | | | | | | | | | | | | | |
| | | | | | | |
| | Total investments | | | | | | | | | $15,007,225 | | | | $17,390,190 | | | | | | 87.9% | |
| | | | | | | |
| | Other assets (net of liabilities) | | | | | | | | | | | | | 2,392,089 | | | | | | 12.1% | |
| | | | | | | |
| | Total net assets | | | | | | | | | | | | | $19,782,279 | | | | | | 100.0% | |
| | | | | | | | |
| | | | | | | | | | | | | | | | | | | | | | |
| 2 | Non-income producing security |
ADR: American Depositary Receipt
| | | | | | | | | | | | |
| | | | | | | |
| 10 | | | | | | | | November 30, 2022 | | Annual Report | | The accompanying notes are an integral part of these financial statements. |
| | |
| Saturna Sustainable Equity Fund: Schedule of Investments | | As of November 30, 2022 |
| | | | |
Countries | | | (unaudited) | |
| | |
| | | | |
 | |
|
Other assets (net of liabilities) 12.1% Weightings shown are a percentage of total net assets. | |
| | | | | | | | | | | | |
| | | | | | | |
| The accompanying notes are an integral part of these financial statements. | | Annual Report | | November 30, 2022 | | | | | | | | 11 |
Saturna Sustainable Equity Fund
Statement of Assets and Liabilities
| | | | |
| As of November 30, 2022 | |
| | |
| | | | |
| |
Assets | | | | |
| |
Investments in securities, at value (Cost $15,007,225) | | | $17,390,190 | |
| |
Cash | | | 2,368,338 | |
| |
Dividends and interest receivable | | | 41,643 | |
| |
Prepaid expenses | | | 3,721 | |
| |
Receivable for Fund shares sold | | | 2,220 | |
| | | | |
| |
Total assets | | | 19,806,112 | |
| | | | |
| |
Liabilities | | | | |
| |
Accrued audit expenses | | | 11,506 | |
| |
Accrued advisory fees | | | 7,979 | |
| |
Accrued retirement plan custody fee | | | 1,943 | |
| |
Accrued other expenses | | | 1,131 | |
| |
Accrued Chief Compliance Officer expenses | | | 669 | |
| |
Accrued legal expenses | | | 585 | |
| |
Accrued trustee expenses | | | 20 | |
| | | | |
| |
Total liabilities | | | 23,833 | |
| | | | |
| |
Net assets | | | $19,782,279 | |
| | |
| | | | |
| | |
Analysis of net assets | | | | |
| |
Paid-in capital (unlimited shares authorized, without par value) | | | $17,406,731 | |
| |
Total distributable earnings | | | 2,375,548 | |
| | | | |
| |
Net assets applicable to Fund shares outstanding | | | $19,782,279 | |
| | |
| | | | |
Fund shares outstanding | | | 1,277,118 | |
| | |
Net asset value, offering, and redemption price per share | | | $15.49 | |
Statement of Operations
| | | | |
| Year ended November 30, 2022 | |
| | |
| | | | |
| |
Investment income | | | | |
| |
Dividend income (net of foreign tax of ($38,988)) | | | $337,297 | |
| | | | |
| |
Total investment income | | | 337,297 | |
| | | | |
| |
Expenses | | | | |
| |
Advisory fees | | | 138,001 | |
| |
Filing and registration fees | | | 19,652 | |
| |
Audit fees | | | 14,001 | |
| |
Legal fees | | | 6,391 | |
| |
Trustee fees | | | 5,720 | |
| |
Chief Compliance Officer expenses | | | 4,730 | |
| |
Other operating expenses | | | 3,010 | |
| |
Retirement plan custodial fees | | | 2,658 | |
| |
Custodian fees | | | 1,512 | |
| |
Printing and Postage fees | | | 1,460 | |
| | | | |
| |
Total gross expenses | | | 197,135 | |
| | | | |
| |
Less adviser fees waived | | | (36,392 | ) |
| |
Less custodian fee credits | | | (1,512 | ) |
| | | | |
| |
Net expenses | | | 159,231 | |
| | | | |
| |
Net investment income | | | $178,066 | |
| | |
| | | | |
| | |
| | | | |
| |
Net realized gain from investments and foreign currency | | | $147,255 | |
| |
Net decrease in unrealized appreciation on investments and foreign currency | | | (4,324,755 | ) |
| | | | |
| |
Net loss on investments and foreign currency | | | $(4,177,500 | ) |
| | |
| | | | |
| | |
Net decrease in net assets resulting from operations | | | $(3,999,434 | ) |
| | | | | |
| | | | | | | | | | | | |
| | | | | | | |
| 12 | | | | | | | | November 30, 2022 | | Annual Report | | The accompanying notes are an integral part of these financial statements. |
Saturna Sustainable Equity Fund
| | | | | | | | |
Statements of Changes of Net Assets | | | Year ended November 30, 2022 | | | | Year ended November 30, 2021 | |
| | | |
Increase (decrease) in net assets from operations | | | | | | | | |
| | |
From operations | | | | | | | | |
| | |
Net investment income | | | $178,066 | | | | $160,381 | |
| | |
Net realized gain (loss) on investment and foreign currency | | | 147,255 | | | | (35,745 | ) |
| | |
Net increase (decrease) in unrealized appreciation on investments and foreign currencies | | | (4,324,755 | ) | | | 2,048,413 | |
| | | | | | | | |
| | |
Net increase (decrease) in net assets resulting from operations | | | (3,999,434 | ) | | | 2,173,049 | |
| | | | | | | | |
| | |
| | | | | | | | |
| | |
Distributions to shareowners | | | (164,336 | ) | | | (62,912 | ) |
| | |
| | | | | | | | |
| | |
Capital share transactions | | | | | | | | |
| | |
Proceeds from sales of shares | | | 2,792,479 | | | | 7,491,624 | |
| | |
Value of shares issued in reinvestment of dividends | | | 163,667 | | | | 62,910 | |
| | |
Cost of shares redeemed | | | (4,385,092 | ) | | | (1,123,380 | ) |
| | | | | | | | |
| | |
Total capital shares transactions | | | (1,428,946 | ) | | | 6,431,154 | |
| | | | | | | | |
| | |
Total increase (decrease) in net assets | | | (5,592,716 | ) | | | 8,541,291 | |
| | | |
| | | | | | | | |
| | | |
Net assets | | | | | | | | |
| | |
Beginning of year | | | 25,374,995 | | | | 16,833,704 | |
| | |
End of year | | | $19,782,279 | | | | $25,374,995 | |
| | | |
Shares of the Fund sold and redeemed | | | | | | | | |
| | |
Number of shares sold | | | 168,148 | | | | 418,656 | |
| | |
Number of shares issued in reinvestment of dividends | | | 8,692 | | | | 3,664 | |
| | |
Number of shares redeemed | | | (267,640 | ) | | | (61,059 | ) |
| | | | | | | | |
| | |
Net increase (decrease) in number of shares outstanding | | | (90,800 | ) | | | 361,261 | |
| | | |
| | | | | | | | |
| | | | | | | | | | | | | | | | | | | | |
Financial Highlights | | | For year ended November 30, | |
| | | | | |
Selected data per share of outstanding capital stock throughout each year: | | | 2022 | | | | 2021 | | | | 2020 | | | | 2019 | | | | 2018 | |
| | | | | | |
Net asset value at beginning of year | | | $18.55 | | | | $16.72 | | | | $13.58 | | | | $11.51 | | | | $11.44 | |
| | | | | |
Income from investment operations | | | | | | | | | | | | | | | | | | | | |
| | | | | |
Net investment income | | | 0.14 | | | | 0.13 | | | | 0.10 | | | | 0.09 | | | | 0.09 | |
| | | | | |
Net gains (losses) on securities (both realized and unrealized) | | | (3.08 | ) | | | 1.76 | | | | 3.11 | | | | 2.08 | | | | 0.07 | |
| | | | | | | | | | | | | | | | | | | | |
| | | | | |
Total from investment operations | | | (2.94 | ) | | | 1.89 | | | | 3.21 | | | | 2.17 | | | | 0.16 | |
| | | | | | | | | | | | | | | | | | | | |
| | | | | |
Less distributions | | | | | | | | | | | | | | | | | | | | |
| | | | | |
Dividends (from net investment income) | | | (0.12 | ) | | | (0.06 | ) | | | (0.07 | ) | | | (0.10 | ) | | | (0.09 | ) |
| | | | | | | | | | | | | | | | | | | | |
| | | | | |
Total distributions | | | (0.12 | ) | | | (0.06 | ) | | | (0.07 | ) | | | (0.10 | ) | | | (0.09 | ) |
| | | | | | | | | | | | | | | | | | | | |
| | | | | |
| | | | | | | | | | | | | | | | | | | | |
| | | | | |
Net asset value at end of year | | | $15.49 | | | | $18.55 | | | | $16.72 | | | | $13.58 | | | | $11.51 | |
| | | | | | |
| | | | | | | | | | | | | | | | | | | | |
Total return | | | (15.96% | ) | | | 11.32% | | | | 23.74% | | | | 19.04% | | | | 1.39% | |
| | | | | | |
Ratios / supplemental data | | | | | | | | | | | | | | | | | | | | |
| | | | | |
Net assets ($000), end of year | | | $19,782 | | | | $25,375 | | | | $16,834 | | | | $8,185 | | | | $5,658 | |
| | | | | |
Ratio of expenses to average net assets | | | | | | | | | | | | | | | | | | | | |
| | | | | |
Before fee waivers | | | 0.93% | | | | 0.85% | | | | 0.78% | | | | 1.81% | | | | 1.27% | |
| | | | | |
After fee waivers | | | 0.76% | | | | 0.76% | | | | 0.75% | | | | 0.78% | | | | 0.76% | |
| | | | | |
After fee waivers and custodian fee credits | | | 0.75% | | | | 0.75% | | | | 0.73% | | | | 0.75% | | | | 0.75% | |
| | | | | |
Ratio of net investment income after fee waivers and custodian fee credits to average net assets | | | 0.84% | | | | 0.71% | | | | 0.61% | | | | 0.80% | | | | 0.82% | |
| | | | | |
Portfolio turnover rate | | | 9% | | | | 8% | | | | 13% | | | | 13% | | | | 8% | |
| | | | | | |
| | | | | | | | | | | | | | | | | | | | |
| | | | | | | | | | | | |
| | | | | | | |
| The accompanying notes are an integral part of these financial statements. | | Annual Report | | November 30, 2022 | | | | | | | | 13 |
Saturna Sustainable Bond Fund: Performance Summary
| | | | | | | | | | | | | | | | |
Average Annual Returns as of November 30, 2022 | |
| | | | | |
| | | 1 Year | | | 5 Year | | | 10 Year | | | Expense Ratio1 | |
| | | | |
Sustainable Bond Fund (SEBFX)2 | | | -7.83% | | | | -0.03% | | | | n/a | | | | 0.86% | |
| | | | |
FTSE WorldBIG Bond Index | | | -17.32% | | | | -1.90% | | | | -0.55% | | | | n/a | |
Growth of $10,000
| | |
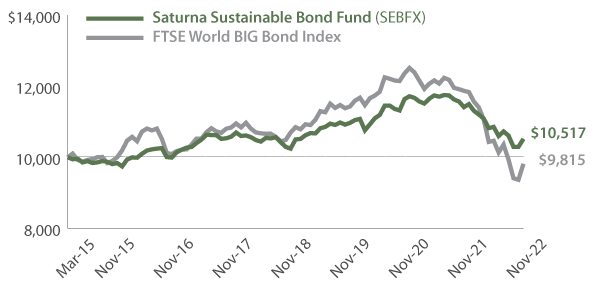 | | Comparison of any mutual fund to a market index must be made bearing in mind that the index is expense-free. Conversely, the fund will (1) be actively managed; (2) have an objective other than mirroring the index, such as limiting risk; (3) bear transaction and other costs; (4) stand ready to buy and sell its securities to shareowners on a daily basis; and (5) provide a wide range of services. The graph compares $10,000 invested in the Fund on March 27, 2015, to an identical amount invested in the FTSE WorldBIG Bond Index, a multi-asset, multi-currency benchmark, which provides a broad-based measure of the global fixed-income markets. The graph shows that an investment in the Fund would have risen to $10,517 versus rising to $9,815 in the Index. |
Past performance does not guarantee future results. The “Growth of $10,000” graph and “Average Annual Returns” performance table assume the reinvestment of dividends and capital gains. They do not reflect the deduction of taxes that a shareowner might pay on fund distributions or the redemption of fund shares.
| 1 | By regulation, the expense ratio shown in this table is as stated in the Fund’s most recent prospectus which is dated March 30, 2022, and incorporates results for the fiscal year ended November 30, 2021, before fee waivers. The expense ratio shown in the most recent prospectus after fee waivers was 0.65%. The ratio presented in this table differs from expense ratios shown elsewhere in this report as they represent different periods. |
| 2 | Operations commenced March 27, 2015. |
Fund Objective
The objectives of the Sustainable Bond Fund are current income and capital preservation.
| | | | |
Top 10 Holdings | |
| �� |
| % of Total Net Assets | |
| |
INTL BK RECON & DEVELOP (4.25% due 01/22/2026) | | | 5.4% | |
| |
New York City NY Hsg Dev Corp (1.67% due 05/01/2062) | | | 5.2% | |
| |
Canadian Imperial Bank (4.375% due 10/28/2080) | | | 4.5% | |
| |
United States Treasury Bond (2.75% due 11/15/2042) | | | 3.9% | |
| |
Sheridan Co Redev Agy Incr Revenue (2.40% due 12/01/2029) | | | 3.8% | |
| |
Koninklijke Philips (7.125% due 05/15/2025) | | | 3.6% | |
| |
Santa Cruz CA Redev Agy MF Rev (1.73% due 08/15/2035) | | | 3.5% | |
| |
Asian Development Bank (6.00% due 02/05/2026) | | | 3.4% | |
| |
International Finance Corp (4.60% due 01/27/2023) | | | 3.3% | |
| |
MAF Sukuk (4.638% due 05/14/2029) | | | 2.7% | |
| | | | | | | | | | | | |
Portfolio Diversification | | | | | |
| | |
| % of Total Net Assets | | | | | |
| | | |
Government Bonds | | | 27.7% | | | ∎ | | | | | 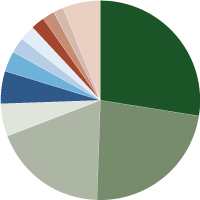
| |
Financials | | | 23.0% | | | ∎ | | |
Municipal Bonds | | | 18.6% | | | ∎ | | |
Technology | | | 5.4% | | | ∎ | | |
Health Care | | | 5.1% | | | ∎ | | |
Utilities | | | 3.3% | | | ∎ | | |
Consumer Staples | | | 2.5% | | | ∎ | | |
Consumer Discretionary | | | 2.5% | | | ∎ | | |
Industrials | | | 2.2% | | | ∎ | | |
Materials | | | 2.1% | | | ∎ | | |
| | | |
Communications | | | 1.7% | | | ∎ | | | | | | |
| | | |
Other Assets (net of liabilities) | | | 5.9% | | | ∎ | | | | | | |
| | | | | | | | | | |
| | | | | | |
| 14 | | | | | | | | November 30, 2022 | | Annual Report |
| | |
| Saturna Sustainable Bond Fund: Discussion of Fund Performance | | (unaudited) |
(photo omitted)
Fiscal Year 2022
For the fiscal year ended November 30, 2022, Saturna Sustainable Bond Fund produced a total return of -7.83% and the FTSE WorldBIG Bond Index returned -17.32%. The Fund had an effective duration1 (price sensitivity to changes in interest rates) of 3.49 years relative to more than 6.5 years for the Index. Some of the major factors that led to the Fund’s performance were that the Fund had a shorter duration and was underweight the euro compared to the Index.
(photo omitted)
Factors Affecting Past Performance
Over the fiscal year, we observed pervasive high inflation, energy supply constraints, and ever-increasing debts and deficits among world economies. The shape of the Treasury yield curve shifted dramatically over the 12-month period, moving from an upward sloping curve to a curve with an inversion of 70 basis points (bps) in the two-year and 10-year Treasurys. The entire curve also shifted upward, and the six-month Treasury rose a staggering 458 bps. With such a dramatic rise in yields, performance was generally worse for longer duration bonds and better for shorter duration bonds, with almost all fixed-income securities producing a negative return.
The Sustainable Bond Fund was positioned very defensively going into 2022 due to expected volatility. One defensive tactic was to hold positions in municipal variable rate notes (VRDNs). These positions helped drive outperformance relative to the benchmark. VRDNs are always priced at 100, so they don’t experience price fluctuations that impact other bonds. They also offer either daily or weekly put features that keep duration low while offering excellent liquidity. As of fiscal year-end, the Fund held 19.80% in these securities.
Currency movement also played an important role in performance. At fiscal year-end, the Sustainable Bond Fund held 24.59% of its portfolio in foreign currencies. The Fund had no exposure to the euro, while the Index had 28.1% exposure to the currency. From November 30, 2021, to November 30, 2022, the euro depreciated -8.2% relative to the dollar.
Looking Forward
We expect continued upward pressure on yields and the Treasury yield curve for the next fiscal year. In our view, inflation will likely continue to be present. We are defensively positioning the portfolio to withstand anticipated yield curve changes, currency movements, and inflationary pressures. Our goal has always been to choose good companies and invest through cycles.
| 1 | For fixed to floating rate perpetual bonds, the end of the fixed coupon period is used to calculate effective duration. |
| | | | | | | | | | |
| | | | | | |
| Annual Report | | November 30, 2022 | | | | | | | | 15 |
| | |
| Saturna Sustainable Bond Fund: Schedule of Investments | | As of November 30, 2022 |
| | | | | | | | | | | | | | | | | | | | |
| | | | | | | | |
| | | Corporate Bonds – 47.8% | | | | Coupon / Maturity | | Face Amount | | | Market Value | | | Country1 | | Percentage of Net Assets | |
| | | | | | |
| | | Communications | | | | | | | | | | | | | |
| | | | | | | | |
| | | Telecom Italia2 | | | | 5.303% due 05/30/2024 | | | $500,000 | | | | $484,250 | | | Italy | | | 1.7% | |
| | | | | | | | |
| | | | | | | | | | | | | | | | | | | | |
| | | | | | |
| | | Consumer Discretionary | | | | | | | | | | | | | |
| | | | | | | | |
| | | Barry Callebaut2 | | | | 5.50% due 06/15/2023 | | | 500,000 | | | | 496,677 | | | Belgium | | | 1.7% | |
| | | | | | | | |
| | | Starbucks | | | | 2.45% due 06/15/2026 | | | 250,000 | | | | 233,441 | | | United States | | | 0.8% | |
| | | | | | | | |
| | | | | | | | | | | | | 730,118 | | | | | | 2.5% | |
| | | | | | |
| | | Consumer Staples | | | | | | | | | | | | | |
| | | | | | | | |
| | | Coty2 | | | | 5.00% due 04/15/2026 | | | 250,000 | | | | 238,235 | | | United States | | | 0.8% | |
| | | | | | | | |
| | | Danone2 | | | | 2.589% due 11/02/2023 | | | 500,000 | | | | 488,164 | | | France | | | 1.7% | |
| | | | | | | | |
| | | | | | | | | | | | | 726,399 | | | | | | 2.5% | |
| | | | | | |
| | | Financials | | | | | | | | | | | | | |
| | | | | | | | |
| | | Aust & NZ Banking Group2 | | | | 4.50% due 03/19/2024 | | | 500,000 | | | | 492,745 | | | Australia | | | 1.7% | |
| | | | | | | | |
| | | AXA3,4 | | | | 5.125% due 01/17/2047 | | | 750,000 | | | | 709,728 | | | France | | | 2.5% | |
| | | | | | | | |
| | | Bank of Montreal | | | | 3.30% due 02/05/2024 | | | 500,000 | | | | 490,627 | | | Canada | | | 1.7% | |
| | | | | | | | |
| | | Bank of New Zealand3 | | | | 3.648% due 11/16/2023 | | | NZD 500,000 | | | | 309,569 | | | New Zealand | | | 1.1% | |
| | | | | | | | |
| | | Bank of Nova Scotia | | | | 4.90% due PERP | | | 750,000 | | | | 714,375 | | | Canada | | | 2.5% | |
| | | | | | | | |
| | | Canadian Imperial Bank5 | | | | 4.375% due 10/28/2080 | | | CAD 1,900,000 | | | | 1,289,715 | | | Canada | | | 4.5% | |
| | | | | | | | |
| | | MAF Sukuk3 | | | | 4.638% due 05/14/2029 | | | 800,000 | | | | 766,300 | | | United Arab Emirates | | | 2.7% | |
| | | | | | | | |
| | | Prologis LP | | | | 1.25% due 10/15/2030 | | | 200,000 | | | | 152,598 | | | United States | | | 0.5% | |
| | | | | | | | |
| | | Toronto-Dominion Bank3 | | | | 1.128% due 12/09/2025 | | | CAD 500,000 | | | | 332,322 | | | Canada | | | 1.2% | |
| | | | | | | | |
| | | Voya Financial6 | | | | 4.70% due 01/23/2048 | | | 400,000 | | | | 295,100 | | | United States | | | 1.0% | |
| | | | | | | | |
| | | WLB Asset II C PTE Ltd2 | | | | 3.90% due 12/23/2025 | | | 500,000 | | | | 465,644 | | | Singapore | | | 1.6% | |
| | | | | | | | |
| | | Women’s Livelihood Bond Asset II B2 | | | | 3.95% due 12/10/2024 | | | 600,000 | | | | 568,900 | | | Singapore | | | 2.0% | |
| | | | | | | | |
| | | | | | | | | | | | | 6,587,623 | | | | | | 23.0% | |
| | | | | | |
| | | Health Care | | | | | | | | | | | | | |
| | | | | | | | |
| | | Koninklijke Philips | | | | 7.125% due 05/15/2025 | | | 1,000,000 | | | | 1,022,856 | | | Netherlands | | | 3.6% | |
| | | | | | | | |
| | | Novartis Captial | | | | 3.00% due 11/20/2025 | | | 250,000 | | | | 240,951 | | | Switzerland | | | 0.8% | |
| | | | | | | | |
| | | Roche2 | | | | 2.625% due 05/15/2026 | | | 200,000 | | | | 187,834 | | | Switzerland | | | 0.7% | |
| | | | | | | | |
| | | | | | | | | | | | | 1,451,641 | | | | | | 5.1% | |
| | | | | | |
| | | Industrials | | | | | | | | | | | | | |
| | | | | | | | |
| | | Odfjell SE (Quarterly NIBOR plus 5.75%)3,7 | | | | 9.09% due 01/21/2025 | | | NOK 6,000,000 | | | | 618,406 | | | Norway | | | 2.2% | |
| | | | | | | | |
| | | | | | | | | | | | | | | | | | | | |
| | | | | | |
| | | Materials | | | | | | | | | | | | | |
| | | | | | | | |
| | | BALL | | | | 5.25% due 07/01/2025 | | | 400,000 | | | | 398,694 | | | United States | | | 1.4% | |
| | | | | | | | |
| | | Stora Enso OYJ2 | | | | 7.25% due 04/15/2036 | | | 200,000 | | | | 212,775 | | | Finland | | | 0.7% | |
| | | | | | | | |
| | | | | | | | | | | | | 611,469 | | | | | | 2.1% | |
Continued on next page.
| | | | | | | | | | | | |
| | | | | | | |
| 16 | | | | | | | | November 30, 2022 | | Annual Report | | The accompanying notes are an integral part of these financial statements. |
| | |
| Saturna Sustainable Bond Fund: Schedule of Investments | | As of November 30, 2022 |
| | | | | | | | | | | | | | | | | | | | |
| | | | | | | | |
| | | Corporate Bonds – 47.8% | | | | Coupon / Maturity | | Face Amount | | | Market Value | | | Country1 | | Percentage of Net Assets | |
| | | | | | |
| | | Technology | | | | | | | | | | | | | |
| | | | | | | | |
| | | Koninklijke KPN | | | | 8.375% due 10/01/2030 | | | $250,000 | | | | $280,474 | | | Netherlands | | | 1.0% | |
| | | | | | | | |
| | | Microsoft | | | | 5.30% due 02/08/2041 | | | 600,000 | | | | 645,592 | | | United States | | | 2.2% | |
| | | | | | | | |
| | | Microsoft | | | | 3.625% due 12/15/2023 | | | 250,000 | | | | 247,669 | | | United States | | | 0.9% | |
| | | | | | | | |
| | | RELX | | | | 4.00% due 03/18/2029 | | | 400,000 | | | | 374,723 | | | United Kingdom | | | 1.3% | |
| | | | | | | | |
| | | | | | | | | | | | | 1,548,458 | | | | | | 5.4% | |
| | | | | | |
| | | Utilities | | | | | | | | | | | | | |
| | | | | | | | |
| | | Tabreed Sukuk3 | | | | 5.50% due 10/31/2025 | | | 750,000 | | | | 753,492 | | | United Arab Emirates | | | 2.6% | |
| | | | | | | | |
| | | United Utilities | | | | 6.875% due 08/15/2028 | | | 185,000 | | | | 194,851 | | | United Kingdom | | | 0.7% | |
| | | | | | | | |
| | | | | | | | | | | | | 948,343 | | | | | | 3.3% | |
| | | | | | | |
| | | | | | | | | | | | | | | | | | | | |
| | | | | | | |
| | Total Corporate Bonds | | (Cost $15,105,383) | | | | | | | $13,706,707 | | | | | | 47.8% | |
| | | | | | | |
| | | | | | | | | | | | | | | | | | | | |
| | | | | | | | |
| | | Government Bonds – 27.7% | | | | Coupon / Maturity | | Face Amount | | | Market Value | | | Country1 | | Percentage of Net Assets | |
| | | | | | | |
| | | Government Bonds | | | | | | | | | | | | | | | |
| | | | | | | | |
| | | Asian Development Bank | | | | 6.00% due 02/05/2026 | | | BRL 6,000,000 | | | | $988,563 | | | Philippines | | | 3.4% | |
| | | | | | | | |
| | | Inter-American Devel BK | | | | 7.50% due 12/05/2024 | | | MXN 15,000,000 | | | | 719,990 | | | United States | | | 2.5% | |
| | | | | | | | |
| | | International Finance Corp3 | | | | 4.60% due 01/27/2023 | | | BRL 5,000,000 | | | | 951,661 | | | Brazil | | | 3.3% | |
| | | | | | | | |
| | | INTL BK RECON & DEVELOP | | | | 4.25% due 01/22/2026 | | | MXN 35,000,000 | | | | 1,545,921 | | | Germany | | | 5.4% | |
| | | | | | | | |
| | | Ontario | | | | 2.65% due 02/05/2025 | | | CAD 500,000 | | | | 361,021 | | | Canada | | | 1.3% | |
| | | | | | | | |
| | | Perusahaan Penerbit SBSN3 | | | | 3.55% due 06/09/2051 | | | 1,000,000 | | | | 755,809 | | | Indonesia | | | 2.6% | |
| | | | | | | | |
| | | | | | | | | | | | | 5,322,965 | | | | | | 18.5% | |
| | | | | | |
| | | Government Sponsored | | | | | | | | | | | | | |
| | | | | | | | |
| | | Federal Farm Credit Bank | | | | 3.50% due 12/20/2023 | | | 250,000 | | | | 246,026 | | | United States | | | 0.9% | |
| | | | | | | | |
| | | Federal Home Loan Bank | | | | 1.65% due 10/06/2031 | | | 500,000 | | | | 397,477 | | | United States | | | 1.4% | |
| | | | | | | | |
| | | | | | | | | | | | | 643,503 | | | | | | 2.3% | |
| | | | | | |
| | | United States Treasury
Bonds | | | | | | | | | | | | | |
| | | | | | | | |
| | | United States Treasury Bond | | | | 2.250% due 08/15/2027 | | | 500,000 | | | | 464,941 | | | United States | | | 1.6% | |
| | | | | | | | |
| | | United States Treasury Bond | | | | 3.250% due 05/15/2042 | | | 1,250,000 | | | | 1,116,211 | | | United States | | | 3.9% | |
| | | | | | | | |
| | | United States Treasury Bond | | | | 2.875% due 05/15/2052 | | | 500,000 | | | | 412,344 | | | United States | | | 1.4% | |
| | | | | | | | |
| | | | | | | | | | | | | 1,993,496 | | | | | | 6.9% | |
| | | | | | | |
| | | | | | | | | | | | | | | | | | | | |
| | | | | | | |
| | | Total Government Bonds | | (Cost $8,541,872) | | | | | | | $7,959,964 | | | | | | 27.7% | |
| | | | | | | |
| | | | | | | | | | | | | | | | | | | | |
Continued on next page.
| | | | | | | | | | | | |
| | | | | | | |
| The accompanying notes are an integral part of these financial statements. | | Annual Report | | November 30, 2022 | | | | | | | | 17 |
| | |
| Saturna Sustainable Bond Fund: Schedule of Investments | | As of November 30, 2022 |
| | | | | | | | | | | | | | | | | | | | |
| | | | | | | | |
| | | Municipal Bonds – 18.6% | | | | Coupon / Maturity | | Face Amount | | | Market Value | | | Country1 | | Percentage of Net Assets | |
| | | | | | | |
| | | Floating Rate Bonds | | | | | | | | | | | | | | | |
| | | | | | | | |
| | | Educational Services | | | | | | | | | | | | | | | |
| | | | | | | | |
| | | Washington St Hgh Edu Facs Auth8 | | | | 1.95% due 05/01/2028 | | | $400,000 | | | | $400,000 | | | United States | | | 1.4% | |
| | | | | | | | |
| | | Government Bonds | | | | | | | | | | | | | | | |
| | | | | | | | |
| | | Tarrant Cnty Tx Hsg Fin Corp8 | | | | 1.96% due 02/15/2036 | | | 350,000 | | | | 350,000 | | | United States | | | 1.2% | |
| | | | | | | | |
| | | Water Supply | | | | | | | | | | | | | | | |
| | | | | | | | |
| | | Utah Water Finance Agency Revenue8 | | | | 1.95% due 10/01/2035 | | | 500,000 | | | | 500,000 | | | United States | | | 1.7% | |
| | | | | | | | |
| | | Financial Services | | | | | | | | | | | | | | | |
| | | | | | | | |
| | | Massachusetts St Hsg Fin Agy Hsg Re8 | | | | 1.88% due 12/01/2048 | | | 500,000 | | | | 500,000 | | | United States | | | 1.8% | |
| | | | | | | | |
| | | New York City NY Hsg Dev Corp8 | | | | 1.88% due 05/01/2062 | | | 1,500,000 | | | | 1,500,000 | | | United States | | | 5.2% | |
| | | | | | | | |
| | | Santa Cruz CA Redev Agy MF Rev8 | | | | 1.96% due 08/15/2035 | | | 1,000,000 | | | | 1,000,000 | | | United States | | | 3.5% | |
| | | | | | | | |
| | | Sheridan Co Redev Agy Incr Revenue8 | | | | 3.90% due 12/01/2029 | | | 1,100,000 | | | | 1,100,000 | | | United States | | | 3.8% | |
| | | | | | | | |
| | | | | | | | | | | | | | | | | | | | | |
| | | | | | | | |
| | | | | | | | | | | | 4,100,000 | | | | | 14.3% | |
| | | | | | | | |
| | | | | | | | | | | | | | | | | | | | |
| | | | | | | |
| | | | | | | | | | | | | | | | | | | | |
| | | | | | | | |
| | Total Municipal Bonds | | | | (Cost $5,350,000) | | | | | | | $5,350,000 | | | | | | 18.6% | |
| | | | | | | |
| | | | | | | | | | | | | | | | | | | | | |
| | | | | | | |
| | Total investments | | | | (Cost $28,997,255) | | | | | | | $27,016,671 | | | | | | 94.1% | |
| | | | | | | |
| | Other assets (net of liabilities) | | | | | | | | | | | 1,688,431 | | | | | | 5.9% | |
| | | | | | | |
| | Total net assets | | | | | | | | | | | $28,705,102 | | | | | | 100.0% | |
| | | | | | | | |
| | | | | | | | | | | | | | | | | | | | |
| 1 | Denotes a country or region of primary exposure |
| 2 | Security was purchased pursuant to Rule 144A under the Securities Act of 1933 and may be sold in transactions exempt from registration only to qualified institutional buyers or in public offering registered under the Securities Act of 1933. These securities have been deemed liquid under guidelines approved by the Trust’s Board of Trustees. At November 30, 2022, the net value of these securities was $3,635,224 representing 12.7% of net assets. |
| 3 | Security was purchased pursuant to Regulation S under the Securities Act of 1933 which exempts from registration securities offered and sold outside of the United States. Such a security cannot be sold in the United States without either an effective registration statement filed pursuant to the Securities Act of 1933, or pursuant to an exemption from registration. These securities have been deemed liquid under guidelines approved by the Trust’s Board of Trustees. At November 30, 2022, the aggregate value of these securities was $5,197,287 representing 18.1% of net assets. |
| 4 | AXA is a fixed to float bond. The bond has a fixed rate until 01/17/2027. The interest rate represents the rate in effect at November 30, 2022. |
| 5 | Canadian Imperial Bank is a fixed to float bond. The bond has a fixed rate until 10/28/2025. The interest rate represents the rate in effect at November 30, 2022. |
| 6 | Voya Financial is a fixed to float bond. The bond has a fixed rate until 01/23/2028. The interest rate represents the rate in effect at November 30, 2022. |
| 7 | Variable rate security. The interest rate represents the rate in effect at November 30, 2022 and resets periodically based on the parenthetically disclosed reference rate and spread. |
| 8 | Variable rate security. Rate as of period end and maturity is the date the principal owed can be recovered through demand. |
PERP: Security is perpetual in nature and has no stated maturity
BRL: Brazilian Real
CAD: Canadian Dollar
MXN: Mexican Peso
NOK: Norwegian Krone
NZD: New Zealand Dollar
| | | | | | | | | | | | |
| | | | | | | |
| 18 | | | | | | | | November 30, 2022 | | Annual Report | | The accompanying notes are an integral part of these financial statements. |
| | |
| Saturna Sustainable Bond Fund: Schedule of Investments | | As of November 30, 2022 |
| | | | |
Countries | | | (unaudited) | |
| | |
| | | | |
|
 | |
|
Other assets (net of liabilities) 5.9% Weightings shown are a percentage of total net assets. | |
| | | | | | | | | | | | |
Bond Quality Diversification | | | | (unaudited) | |
| | | |
| % of Total Net Assets | | | | | | | | | |
| | | |
Rated “AAA” | | | 25.8% | | | ∎ | | | | | 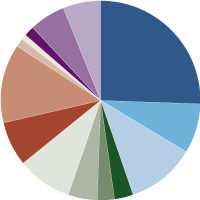
| |
Rated “AA+” | | | 7.9% | | | ∎ | | |
Rated “AA” | | | 11.1% | | | ∎ | | |
Rated “A+” | | | 3.2% | | | ∎ | | |
Rated “A” | | | 2.6% | | | ∎ | | |
Rated “A-” | | | 4.7% | | | ∎ | | |
Rated “BBB+” | | | 9.1% | | | ∎ | | |
Rated “BBB” | | | 7.0% | | | ∎ | | |
Rated “BBB-” | | | 13.0% | | | ∎ | | |
Rated “BB+” | | | 1.4% | | | ∎ | | |
Rated “BB-” | | | 0.8% | | | ∎ | | |
Rated “B+” | | | 1.7% | | | ∎ | | |
Not Rated | | | 5.8% | | | ∎ | | |
| | | |
Other Assets (net of liabilities) | | | 5.9% | | | ∎ | | | | | | |
|
| Credit ratings are the lesser of S&P Global Ratings or Moody’s Investors Service. If neither S&P nor Moody’s rate a particular security, that security is categorized as not rated (except for US Treasury securities and securities issued or backed by US agencies which inherit the credit rating for the US government). Ratings range from AAA (highest) to D (lowest). Bonds rated BBB or above are considered investment grade. Credit ratings BB and below are lower-rated securities (junk bonds). Ratings apply to the creditworthiness of the issuers of the underlying securities and not the fund or its shares. Ratings may be subject to change. | |
| | | | | | | | | | | | |
| | | | | | | |
| The accompanying notes are an integral part of these financial statements. | | Annual Report | | November 30, 2022 | | | | | | | | 19 |
Saturna Sustainable Bond Fund
Statement of Assets and Liabilities
| | | | |
| As of November 30, 2022 | |
| | |
| | | | |
| |
Assets | | | | |
| |
Investments in securities, at value (Cost $28,997,255) | | | $27,016,671 | |
| |
Cash | | | 1,317,432 | |
| |
Dividends and interest receivable | | | 416,777 | |
| |
Receivable for Fund shares sold | | | 5,784 | |
| |
Prepaid expenses | | | 4,044 | |
| | | | |
| |
Total assets | | | 28,760,708 | |
| | | | |
| |
Liabilities | | | | |
| |
Payable for Fund shares redeemed | | | 26,950 | |
| |
Accrued advisory fees | | | 9,743 | |
| |
Accrued audit expenses | | | 9,440 | |
| |
Accrued printing fees | | | 3,414 | |
| |
Accrued trustee expenses | | | 2,551 | |
| |
Accrued other expenses | | | 1,328 | |
| |
Accrued retirement plan custody fee | | | 1,158 | |
| |
Accrued Chief Compliance Officer expenses | | | 836 | |
| |
Accrued legal expenses | | | 186 | |
| | | | |
| |
Total liabilities | | | 55,606 | |
| | | | |
| |
Net assets | | | $28,705,102 | |
| | |
| | | | |
| | |
Analysis of net assets | | | | |
| |
Paid-in capital (unlimited shares authorized, without par value) | | | $31,596,914 | |
| |
Total distributable earnings | | | (2,891,812 | ) |
| | | | |
| |
Net assets applicable to Fund shares outstanding | | | $28,705,102 | |
| | |
| | | | |
Fund shares outstanding | | | 3,183,519 | |
| | |
Net asset value, offering, and redemption price per share | | | $9.02 | |
| | | | | |
Statement of Operations
| | | | |
| Year ended November 30, 2022 | |
| | |
| | | | |
| |
Investment income | | | | |
| |
Interest income (net withholding tax of ($2,750)) | | | $885,946 | |
| | | | |
| |
Total investment income | | | 885,946 | |
| | | | |
| |
Expenses | | | | |
| |
Advisory fees | | | 162,536 | |
| |
Filing and registration fees | | | 22,247 | |
| |
Audit fees | | | 17,048 | |
| |
Legal fees | | | 5,379 | |
| |
Custodian fees | | | 3,632 | |
| |
Chief Compliance Officer expenses | | | 2,678 | |
| |
Other operating expenses | | | 2,625 | |
| |
Retirement plan custodial fees | | | 1,148 | |
| |
Trustee fees | | | 615 | |
| |
Printing and Postage fee expense | | | 342 | |
| | | | |
| |
Total gross expenses | | | 218,250 | |
| | | | |
| |
Less adviser fees waived | | | (22,532 | ) |
| |
Less custodian fee credits | | | (3,632 | ) |
| | | | |
| |
Net expenses | | | 192,086 | |
| | | | |
| |
Net investment income | | | $693,860 | |
| | |
| | | | |
| | |
| | | | |
| |
Net realized loss from investments and foreign currency | | | ($1,581,895 | ) |
| |
Net increase in unrealized depreciation on investments and foreign currency | | | (1,620,632 | ) |
| | | | |
| |
Net loss on investments | | | $(3,202,527 | ) |
| | |
| | | | |
| | |
Net decrease in net assets resulting from operations | | | $(2,508,667 | ) |
| | | | | |
| | | | | | | | | | | | |
| | | | | | | |
| 20 | | | | | | | | November 30, 2022 | | Annual Report | | The accompanying notes are an integral part of these financial statements. |
Saturna Sustainable Bond Fund
| | | | | | | | |
Statements of Changes in Net Assets | | | Year ended November 30, 2022 | | | | Year ended November 30, 2021 | |
| | | |
Increase in net assets from operations | | | | | | | | |
| | |
From operations | | | | | | | | |
| | |
Net investment income | | | $693,860 | | | | $496,055 | |
| | |
Net realized gain (loss) on investments and foreign currency | | | (1,581,895 | ) | | | 232,318 | |
| | |
Net decrease in unrealized appreciation | | | (1,620,632 | ) | | | (1,319,157 | ) |
| | | | | | | | |
| | |
Net decrease in net assets | | | (2,508,667 | ) | | | (590,784 | ) |
| | | | | | | | |
| | |
| | | | | | | | |
| | |
Distributions to shareowners | | | (610,282 | ) | | | (24,312 | ) |
| | |
| | | | | | | | |
| | |
Capital share transactions | | | | | | | | |
| | |
Proceeds from sales of shares | | | 11,780,938 | | | | 9,497,512 | |
| | |
Value of shares issued in reinvestment of dividends | | | 610,114 | | | | 21,141 | |
| | |
Cost of shares redeemed | | | (6,614,809 | ) | | | (4,828,279 | ) |
| | | | | | | | |
| | |
Total capital share transactions | | | 5,776,243 | | | | 4,690,374 | |
| | | | | | | | |
| | |
Total increase in net assets | | | 2,657,294 | | | | 4,075,278 | |
| | | |
| | | | | | | | |
| | | |
Net assets | | | | | | | | |
| | |
Beginning of year | | | 26,047,808 | | | | 21,972,530 | |
| | |
End of year | | | $28,705,102 | | | | $26,047,808 | |
| | | |
| | | | | | | | |
| | | |
Shares of the Fund sold and redeemed | | | | | | | | |
| | |
Number of shares sold | | | 1,247,651 | | | | 926,301 | |
| | |
Number of shares issued in reinvestment of dividends | | | 62,130 | | | | 2,063 | |
| | |
Number of shares redeemed | | | (726,101 | ) | | | (471,445 | ) |
| | | | | | | | |
| | |
Net increase in number of shares outstanding | | | 583,680 | | | | 456,919 | |
| | | |
| | | | | | | | |
| | | | | | | | | | | | | | | | | | | | |
Financial Highlights | | | For year ended November 30, | |
| | | | | |
Selected data per share of outstanding capital stock throughout each year: | | | 2022 | | | | 2021 | | | | 2020 | | | | 2019 | | | | 2018 | |
| | | | | | |
Net asset value at beginning of year | | | $10.02 | | | | $10.25 | | | | $9.70 | | | | $9.39 | | | | $9.87 | |
| | | | | |
Income from investment operations | | | | | | | | | | | | | | | | | | | | |
| | | | | |
Net investment income | | | 0.22 | | | | 0.20 | | | | 0.23 | | | | 0.28 | | | | 0.26 | |
| | | | | |
Net gains (losses) on securities (both realized and unrealized) | | | (0.98 | ) | | | (0.42 | ) | | | 0.42 | | | | 0.29 | | | | (0.48 | ) |
| | | | | �� | | | | | | | | | | | | | | | |
| | | | | |
Total from investment operations | | | (0.76 | ) | | | (0.22 | ) | | | 0.65 | | | | 0.57 | | | | (0.22 | ) |
| | | | | | | | | | | | | | | | | | | | |
| | | | | |
Less distributions | | | | | | | | | | | | | | | | | | | | |
| | | | | |
Dividends (from net investment income) | | | (0.05 | ) | | | (0.01 | ) | | | (0.10 | ) | | | (0.26 | ) | | | (0.26 | ) |
| | | | | |
Capital gains distribution | | | (0.19 | ) | | | - | | | | - | | | | - | | | | - | |
| | | | | | | | | | | | | | | | | | | | |
| | | | | |
Total distributions | | | (0.24 | ) | | | (0.01 | ) | | | (0.10 | ) | | | (0.26 | ) | | | (0.26 | ) |
| | | | | | | | | | | | | | | | | | | | |
| | | | | |
| | | | | | | | | | | | | | | | | | | | |
| | | | | |
Net asset value at end of year | | | $9.02 | | | | $10.02 | | | | $10.25 | | | | $9.70 | | | | $9.39 | |
| | | | | | |
| | | | | | | | | | | | | | | | | | | | |
Total return | | | (7.83% | ) | | | (2.14 | )% | | | 6.78% | | | | 6.09% | | | | (2.29 | )% |
| | | | | | |
Ratios / supplemental data | | | | | | | | | | | | | | | | | | | | |
| | | | | |
Net assets ($000), end of year | | | $28,705 | | | | $26,048 | | | | $21,973 | | | | $27,775 | | | | $31,647 | |
| | | | | |
Ratio of expenses to average net assets | | | | | | | | | | | | | | | | | | | | |
| | | | | |
Before fee waivers | | | 0.74% | | | | 0.86% | | | | 0.85% | | | | 0.83% | | | | 0.77% | |
| | | | | |
After fee waivers | | | 0.66% | | | | 0.66% | | | | 0.67% | | | | 0.66% | | | | 0.66% | |
| | | | | |
After fee waivers and custodian fee credits | | | 0.65% | | | | 0.65% | | | | 0.65% | | | | 0.65% | | | | 0.65% | |
| | | | | |
Ratio of net investment income after fee waivers and custodian fee credits to average net assets | | | 2.35% | | | | 1.99% | | | | 2.33% | | | | 2.87% | | | | 2.99% | |
| | | | | |
Portfolio turnover rate | | | 80% | | | | 65% | | | | 63% | | | | 38% | | | | 25% | |
| | | | | | |
| | | | | | | | | | | | | | | | | | | | |
| | | | | | | | | | | | |
| | | | | | | |
| The accompanying notes are an integral part of these financial statements. | | Annual Report | | November 30, 2022 | | | | | | | | 21 |
| | |
| Notes to Financial Statements | | |
NOTE 1 – Organization
Saturna Investment Trust (the “Trust”) was established under Washington State Law as a business trust on February 20, 1987. The Trust is registered as an open-end, diversified management company under the Investment Company Act of 1940, as amended. Nine portfolio series have been created to date, two of which are covered by this annual report: Saturna Sustainable Equity Fund and Saturna Sustainable Bond Fund (the “Funds”). The Sextant Short-Term Bond Fund, Sextant Bond Income Fund, Sextant Core Fund, Sextant Global High Income Fund, Sextant Growth Fund, Sextant International Fund, and the Idaho Tax-Exempt Fund are offered through separate prospectuses, the results of which are contained in separate reports.
Saturna Sustainable Equity Fund and Saturna Sustainable Bond Fund commenced operations on March 27, 2015.
Each Fund is an investment company and accordingly follows the investment company accounting and reporting guidance of the Financial Accounting Standards Board (FASB) Accounting Standard Codification Topic 946 “Financial Services – Investment Companies”.
Investment risks:
Saturna Sustainable Equity and Saturna Sustainable Bond Funds: The value of each Fund’s shares rises and falls as the value of the securities in which the Fund invests goes up and down. Fund share prices, yields, and total returns will change with market fluctuations as well as the fortunes of the countries, industries, and companies in which the Fund invests. The Funds do not use derivatives to hedge currency, interest rate, or credit risk.
Ratings are dependent upon the associated ESG risks that are most pertinent to the sector in which an issuer operates. The ratings process associated with sustainable and responsible investing reduces the investable universe for each Fund, which limits opportunities and may increase the risk of loss during market declines. The adviser believes that sustainable investing may mitigate security-specific risk, but there is no guarantee that the securities favored by our investment process will perform better and may perform worse than those that are not favored.
The Funds may invest substantially in one or more sectors, which can increase volatility and exposure to issues specific to a particular sector or industry.
Foreign investing involves risks not normally associated with investing in US securities. These include fluctuations in currency exchange rates, less public information about securities, less governmental market supervision, and the lack of uniform financial, social, and political standards. Foreign investing heightens the risk of confiscatory taxation, seizure or nationalization of assets, establishment of currency controls, or adverse political or social developments that affect investments. The risks of investing in foreign securities are typically greater in less developed or emerging countries.
Liquidity risk exists when particular investments are difficult to sell. If a Fund holds illiquid investments, its portfolio may be more difficult to value, especially in changing markets. Investments by a Fund in foreign securities and those that are thinly traded, such as lower quality issuers, and smaller companies tend to involve greater liquidity risk. If a Fund is forced to sell or unwind these investments to meet redemptions or for other cash needs, the Fund may suffer a penalty. Additionally, the market for certain investments may become illiquid under adverse market or economic conditions independent of any specific adverse changes in the conditions of a particular issuer. In such cases, the Fund, due to limitations on investments in illiquid securities and the difficulty in purchasing and selling such securities, may be unable to achieve its investment objective.
Saturna Sustainable Bond Fund: The risks inherent in the Saturna Sustainable Bond Fund depend primarily on the terms and quality of the obligations in its portfolio, as well as on bond market conditions. When interest rates rise, bond prices fall. When interest rates fall, bond prices go up. Bonds with longer maturities usually are more sensitive to interest rate changes than bonds with shorter maturities. The Fund entails credit risk, which is the possibility that a bond will not be able to pay interest or principal when due. If the credit quality of a bond is perceived to decline, investors will demand a higher yield, which means a lower price on that bond to compensate for the higher level of risk.
The Fund may invest a portion of its assets in securities issued by government sponsored entities such as Fannie Mae, Freddie Mac, and the Federal Home Loan Banks in the US. Foreign governments also sponsor similar entities, which may promote activities such as low-cost housing or alternative energy. The Fund may also invest in the issues of regional, state, and local governments. The terms of such issues can be complex, and there can be no assurance that a government entity will support such enterprises that encounter financial difficulty.
Issuers of high-yield securities are generally not as strong financially as those issuing higher quality securities. These issuers are more likely to encounter financial difficulties and are more vulnerable to changes in the relevant economy that could affect their ability to make interest and principal payments as expected. High-yield bonds may have low or no ratings, and may be considered “junk bonds.”
Bond investments, especially mortgage-backed and asset-backed securities, are subject to the risk that borrowers will prepay the principal more quickly than expected (prepayment risk) or more slowly than expected (extension risk), which will affect the yield, average life, and price of the securities.
NOTE 2 – Significant Accounting Policies
The following is a summary of the significant accounting policies, in conformity with accounting principles generally accepted in the United States of America, which are consistently followed by the Funds in preparation of their financial statements.
Security valuation:
Investments in securities traded on a national securities exchange and over-the-counter securities for which sale prices are available are valued at that price. Securities for which there are no sales are valued at the latest bid price.
Debt securities are valued using bid-side valuations provided by an independent service. The service determines valuations using factors such as yields or prices of bonds of comparable quality, type of issue, coupon maturity, ratings, trading activity, and general market conditions.
| | | | | | | | | | |
| | | | | | |
| 22 | | | | | | | | November 30, 2022 | | Annual Report |
| | |
| Notes to Financial Statements (continued) | | |
Fixed-income debt instruments, such as commercial paper, bankers’ acceptances, and US Treasury Bills, with a maturity of 60 days or less are valued at amortized cost, which approximates market value.
Foreign markets may close before the time as of which the Funds’ share prices are determined. Because of this, events occurring after the close and before the determination of the Funds’ share prices may have a material effect on the values of some or all of the Funds’ foreign securities. To account for this, the Funds may use outside pricing services for valuation of their non-US securities.
In cases in which there is not a readily available market price, a fair value for such security is determined in good faith under the direction of the Board of Trustees. The Board of Trustees has designated the adviser (Saturna Capital) as each Fund’s valuation designee to perform fair value functions in accordance with valuation policies and procedures adopted by the adviser, subject to the Board of Trustee’s oversight.
Security transactions are recorded on the trade date. Realized gains and losses on sales of securities are recorded on the identified cost basis.
Foreign currency:
Investment securities and other assets and liabilities denominated in foreign currencies are translated into US dollar amounts at the date of valuation. Purchases and sales of investment securities and income and expense items denominated in foreign currencies are translated into US dollar amounts on the respective dates of such transactions.
The Funds do not isolate that portion of the results of operations resulting from changes in foreign exchange rates on investments from the fluctuations arising from changes in market prices of securities held. Such fluctuations are included with the net realized and unrealized gain or loss from investments.
Reported net realized foreign exchange gains or losses arise from sales of foreign currencies, currency gains or losses realized between the trade and settlement dates on securities transactions, and the difference between the amounts of dividends, interest, and foreign withholding taxes recorded on the Funds’ books and the US dollar equivalent of the amounts actually received or paid. Net unrealized foreign exchange gains and losses arise from changes in the fair values of assets and liabilities, other than investments in securities at fiscal period end, resulting from changes in exchange rates.
Share valuation:
The net asset value (“NAV”) per share of each Fund is calculated by dividing the sum of the value of the securities held by each Fund, plus cash and other assets, minus all liabilities (including estimated accrued expenses) by the total number of shares outstanding for each Fund, rounded to the nearest cent. The Funds’ shares are not priced or traded on days the New York Stock Exchange is closed. The NAV is the offering and redemption price per share.
Fair value measurements:
Accounting Standards Codification (ASC) 820 establishes a three-tier framework for measuring fair value based on a hierarchy of inputs. The hierarchy distinguishes between market data obtained from independent sources (observable inputs) and the Funds’ own market assumptions (unobservable inputs). These inputs are used in determining the value of the Funds’ investments and are summarized below.
| | Level 1 — | Unadjusted quoted prices in active markets for identical assets or liabilities that the Trust has the ability to access. |
| | Level 2 — | Observable inputs other than quoted prices in Level 1 that are observable for the asset or liability, either directly or indirectly. These inputs may include quoted prices for the identical instrument on an inactive market, prices for similar instruments, interest rates, prepayment speeds, credit risk, yield curves, default rates, and similar data. |
| | Level 3 — | Unobservable inputs for the asset or liability, to the extent relevant observable inputs are not available, representing the Trust’s own assumptions about the assumptions a market participant would use in valuing the asset or liability, and would be based on the best information available. |
The availability of observable inputs can vary from security to security and is affected by a wide variety of factors, including, for example, the type of security, whether the security is new and not yet established in the marketplace, the liquidity of markets, and other characteristics particular to the security. To the extent that valuation is based on models or inputs that are less observable or unobservable in the market, the determination of fair value requires more judgment. Accordingly, the degree of judgment exercised in determining fair value is greatest for instruments categorized in Level 3.
The inputs used to measure fair value may fall into different levels of the fair value hierarchy. In such cases, for disclosure purposes, the level in the fair value hierarchy within which the fair value measurement falls in its entirety, is determined based on the lowest level input that is significant to the fair value measurement in its entirety.
The inputs or methodology used for valuing securities are not necessarily an indication of the risk associated with investing in those securities.
The table on page 24 is a summary of the inputs used as of November 30, 2022, in valuing the Funds’ investments carried at fair value.
| | | | | | | | | | |
| | | | | | |
| Annual Report | | November 30, 2022 | | | | | | | | 23 |
| | |
| Notes to Financial Statements (continued) | | |
The following is a summary of the inputs used as of November 30, 2022, in valuing the Funds’ investments carried at value:
| | | | | | | | | | | | | | | | |
| | | | |
| Funds | | Level 1
Quoted Price | | | Level 2
Significant Observable Input | | | Level 3
Significant Unobservable Input | | | Total | |
| | | | | |
Sustainable Equity Fund | | | | | | | | | | | | | | | | |
| | | | |
Common Stocks | | | | | | | | | | | | | | | | |
| | | | |
Communications | | | $390,912 | | | | $- | | | | $- | | | | $390,912 | |
| | | | |
Consumer Discretionary | | | 2,718,128 | | | | - | | | | - | | | | 2,718,128 | |
| | | | |
Consumer Staples | | | 1,684,885 | | | | - | | | | - | | | | 1,684,885 | |
| | | | |
Energy | | | - | | | | 282,775 | | | | - | | | | 282,775 | |
| | | | |
Financials | | | 1,464,185 | | | | - | | | | - | | | | 1,464,185 | |
| | | | |
Health Care | | | 2,651,132 | | | | - | | | | - | | | | 2,651,132 | |
| | | | |
Industrials | | | 1,780,326 | | | | 499,868 | | | | - | | | | 2,280,194 | |
| | | | |
Materials | | | 378,525 | | | | 774,958 | | | | - | | | | 1,153,483 | |
| | | | |
Technology | | | 4,002,107 | | | | 762,389 | | | | - | | | | 4,764,496 | |
| | | | |
Total Assets | | | $15,070,200 | | | | $2,319,990 | | | | $- | | | | $17,390,190 | |
| | | | | |
| | | | | | | | | | | | | | | | |
| | | | | |
Sustainable Bond Fund | | | | | | | | | | | | | | | | |
| | | | |
Corporate Bonds1 | | | $- | | | | $13,706,707 | | | | $- | | | | $13,706,707 | |
| | | | |
Government Bonds1 | | | $- | | | | 7,959,964 | | | | - | | | | 7,959,964 | |
| | | | |
Municipal Bonds1 | | | $- | | | | 5,350,000 | | | | - | | | | 5,350,000 | |
| | | | |
Total Assets | | | $- | | | | $27,016,671 | | | | $- | | | | $27,016,671 | |
| 1 | See Schedule of Investments for industry breakout. |
| | | | | | | | | | |
| | | | | | |
| 24 | | | | | | | | November 30, 2022 | | Annual Report |
| | |
| Notes To Financial Statements (continued) | | |
Concentration of credit risk:
The Funds may have deposits of cash with the custodian from time to time for one or more reasons. “Other assets (net of liabilities)” in the Funds’ Schedules of Investments primarily represents cash on deposit with the custodian. Cash on deposit will vary widely over time. Accounting Standards Codification (“ASC”) 825, “Financial Instruments,” identifies these items as a concentration of credit risk. The risk is managed by careful financial analysis and review of the custodian’s operations, resources, and protections available to the Trust. This process includes evaluation of other financial institutions providing investment company custody services.
Federal income taxes:
The Funds intend to comply with the requirements of the Internal Revenue Code necessary to qualify as a regulated investment company and to make the requisite distributions of income and capital gains to its shareowners sufficient to relieve them from all or substantially all federal income taxes. Therefore, no federal income tax provision is required.
The Funds recognize the tax benefits of uncertain tax positions only where the position is “more likely than not” to be sustained assuming examination by tax authorities. Management has analyzed the Funds’ tax positions and has concluded that no liability for unrecognized tax benefits should be recorded related to uncertain tax positions taken on returns filed for open tax years (2019-2021) or expected to be taken in the Funds’ 2022 tax returns. The Funds identify their major tax jurisdictions as US federal and foreign jurisdictions where the Funds make significant investments; however, the Funds are not aware of any tax positions for which it is reasonably possible that the total amounts of unrecognized tax benefits will change materially in the next 12 months.
Reclassification of capital accounts:
Accounting principles generally accepted in the United States of America require that certain components of net assets relating to permanent differences be reclassified between financial and tax reporting.
As of November 30, 2022, there were no reclassifications to the capital accounts.
Distributions to shareowners:
Sustainable Bond Fund and Sustainable Equity Fund pays income dividends annually, typically by the end of the year. As a result of its investment strategy, the Saturna Sustainable Equity Fund may not pay income dividends. For both Funds, distributions of capital gains, if any, are made at least annually, and as required to comply with federal excise tax requirements. Distributions to shareowners are determined in accordance with income tax regulations and are recorded on the ex-dividend date. Dividends are paid in shares of the Funds, at the net asset value on the payable date. Shareowners may elect to take distributions if they total $10 or more in cash.
Use of estimates:
The preparation of financial statements in conformity with accounting principles generally accepted in the United States of America requires management to make estimates and assumptions that affect the reported amounts of assets and liabilities and disclosure of contingent assets and liabilities at the date of the financial statements and the reported amounts of increases and decreases in net assets from operations during the reporting period. Actual results could differ from those estimates.
Foreign taxes:
Withholding taxes on foreign dividends are paid (a portion of which may be reclaimable) or provided for in accordance with the applicable country’s tax rules and rates and are disclosed in the Statement of Operations. Withholding tax reclaims are filed in certain countries to recover a portion of the amounts previously withheld. The Funds record a reclaim receivable based on a number of factors, including a jurisdiction’s legal obligation to pay reclaims as well as payment history and market convention.
LIBOR Transition Risk:
A Fund may invest in certain debt securities or other financial instruments that utilize the London Interbank Offered Rate (“LIBOR”) as a benchmark or reference rate for various interest rate calculations. LIBOR may be a significant factor in determining the cost of financing to a Fund or an investment’s value or return to a Fund, and may be used in other ways that affect a Fund’s investment performance.
Publication of LIBOR benchmarks for most maturities and currencies ceased as of December 31, 2021, and publication of the remaining benchmarks is scheduled to be phased out on June 30, 2023. It is anticipated that financial instruments, such as certain floating rate bonds, that currently utilize LIBOR will transition to using the Secured Overnight Financing Rate (“SOFR”), which is a broad measure of the cost of overnight borrowings secured by US Treasury securities. However, various counterparties or other entities may be unwilling or unable to utilize SOFR or may be unable to modify existing agreements or instruments in a timely manner. The transition from LIBOR to SOFR (or any other replacement rate) may lead to a reduction in the value of some LIBOR-based investments, as well as significant market uncertainty, increased volatility, and illiquidity in markets for various instruments, which may result in prolonged adverse market conditions and impact a Fund’s performance or NAV.
Other:
Interest income is recognized on an accrual basis. Premiums on securities purchased are amortized, and discounts are accreted using the yield to maturity method over the lives of the respective securities or where applicable, to the first call date of the securities with premiums. Dividends from equity securities are recorded as income on the ex-dividend date or as soon as information is available to the fund.
| | | | | | | | | | |
| | | | | | |
| Annual Report | | November 30, 2022 | | | | | | | | 25 |
| | |
| Notes to Financial Statements (continued) | | |
NOTE 3 – Transactions with Affiliated Persons
Under contracts approved annually by the Board of Trustees, including those who are not parties to the contract or “interested persons” (as defined in the Investment Company Act of 1940) of such parties or the Trust (the “Independent Trustees”), Saturna Capital Corporation (“Saturna Capital”) provides investment advisory services and certain other administrative services required to conduct Trust business. Expenses incurred by the Trust on behalf of the Funds (e.g., legal fees) are allocated to the Funds on the basis of relative daily average net assets. For such services, each of the Funds pays the adviser an Investment Advisory and Administrative Services Fee of 0.65% for the Sustainable Equity Fund and 0.55% for the Sustainable Bond Fund of average net assets per annum, payable monthly. In addition, the adviser has agreed to certain limits on other expenses, as described below.
The Adviser has voluntarily undertaken to limit expenses of the Sustainable Equity Fund to 0.75% and the Sustainable Bond Fund to 0.65% through March 31, 2023. For the fiscal year ended November 30, 2022, the advisory fees incurred were as follows:
| | | | | | | | |
| | | |
| | | Adviser Fees | | | Adviser Fees Waived | |
| | |
Sustainable Equity | | | $138,001 | | | | $(36,392 | ) |
| | |
Sustainable Bond | | | $162,536 | | | | $(22,532 | ) |
In accordance with the expense limitation noted above, for the fiscal year ended November 30, 2022, Saturna Capital waived a portion of the advisory fees of the Sustainable Equity Fund and Sustainable Bond Fund. The adviser cannot recoup previously waived fees.
Saturna Brokerage Services, Inc. (“SBS”), a discount brokerage and subsidiary of Saturna Capital Corporation, is registered as a broker-dealer and acts as distributor. On December 19, 2014, the Funds adopted a Distribution Plan in accordance with Rule 12b-1 under the 1940 Act. On June 2, 2017, 12b-1 fees were terminated for both Saturna Sustainable Funds.
SBS is used to effect portfolio transactions for the Trust. SBS currently executes portfolio transactions without commission. Transactions effected through other brokers are subject to commissions payable to that broker.
Saturna Trust Company (“STC”), a subsidiary of Saturna Capital, acts as retirement plan custodian for Fund shareowners. Each Fund pays an annual fee of $10 per account for retirement plan services to Saturna Trust Company. For the fiscal year ended November 30, 2022, the Funds incurred the following amounts:
| | | | |
| | |
| | | Retirement plan custodial fees | |
| |
Sustainable Equity | | | $2,658 | |
| |
Sustainable Bond | | | $1,148 | |
Mrs. Jane Carten serves as a trustee and president of the Trust. She is also a director and president of Saturna Capital and vice president of Saturna Trust Company. Mrs. Carten is not compensated by the Trust. For the fiscal year ended November 30, 2022, the Saturna Investment Trust incurred $47,605 of total expenses for the Independent Trustee’s compensation and Trust board meetings. The Saturna Sustainable Funds incurred $6,335 of these total expenses.
The officers of the Trust are paid by Saturna Capital, not the Trust, except the Chief Compliance Officer, who may be partially compensated by the Trust. For the fiscal year ended November 30, 2022, the Funds paid the following compensation expenses for the Chief Compliance Officer:
| | | | |
| | |
| | | Chief Compliance Officer | |
| |
Sustainable Equity | | | $4,730 | |
| |
Sustainable Bond | | | $2,678 | |
On November 30, 2022, the trustees, officers, and their affiliates as a group owned 36.38% and 13.87% of the outstanding shares of Sustainable Equity Fund and Sustainable Bond Fund, respectively.
NOTE 4 – Distributions to Shareowners
The tax characteristics of distributions paid during the fiscal year ended November 30, 2022, and the fiscal year ended November 30, 2021, were as follows:
| | | | | | | | |
| | | |
| | | Year ended
November 30, 2022 | | | Year ended
November 30, 2021 | |
| | |
Sustainable Equity Fund | | | | | | | | |
| | |
Ordinary income | | | $164,336 | | | | $62,912 | |
| | |
Sustainable Bond Fund | | | | | | | | |
| | |
Ordinary income | | | $610,282 | | | | $24,312 | |
| | | | | | | | | | |
| | | | | | |
| 26 | | | | | | | | November 30, 2022 | | Annual Report |
| | |
| Notes to Financial Statements (continued) | | |
NOTE 5 – Federal Income Taxes
The cost basis of investments for federal income tax purposes on November 30, 2022, was as follows:
| | | | | | | | |
| | | |
| | | Sustainable Equity | | | Sustainable Bond | |
| | |
Cost of investments | | | $15,007,225 | | | | $28,997,255 | |
| | | | | | | | |
| | |
Gross tax unrealized appreciation | | | $4,089,288 | | | | $5,751 | |
| | |
Gross tax unrealized depreciation | | | $(1,706,323 | ) | | | $(1,986,335 | ) |
| | | | | | | | |
| | |
Net tax unrealized appreciation (depreciation) | | | $2,382,965 | | | | $(1,980,584 | ) |
As of November 30, 2022, components of distributable earnings on a tax basis were as follows:
| | | | |
| | |
| Sustainable Equity | | | |
| |
Undistributed ordinary income | | | $177,513 | |
| | | | |
| |
Tax accumulated earnings | | | 177,513 | |
| |
Accumulated capital losses | | | (184,694 | ) |
| |
Unrealized appreciation | | | 2,382,965 | |
| |
Other unrealized gains | | | (236 | ) |
| | | | |
| |
Total accumulated earnings | | | $2,375,548 | |
| | |
| | | | |
| | |
Sustainable Bond | | | | |
| |
Undistributed net investment income (loss) | | | $129,089 | |
| | | | |
| |
Tax accumulated earnings | | | 129,089 | |
| |
Accumulated capital gains | | | (1,027,895 | ) |
| |
Unrealized depreciation | | | (1,980,584 | ) |
| |
Other unrealized losses | | | (12,422 | ) |
| | | | |
| |
Total accumulated earnings | | | $(2,891,812 | ) |
| | | | | |
On November 30, 2022, the Funds had capital loss carryforwards as follows, subject to regulation.
| | | | | | | | |
| | |
| | | | Carryforward | | | | Expiration | |
| | | |
Sustainable Equity Fund | | | | | | | | |
| | |
Short-term loss carryforward | | | $184,694 | | | | Unlimited | |
| | |
| | | | $184,694 | | | | | |
| | |
| | | | | | | | |
| | |
| | | | Carryforward | | | | Expiration | |
| | | |
Sustainable Bond Fund | | | | | | | | |
| | |
Short-term loss carryforward | | | $574,534 | | | | Unlimited | |
| | |
Long-term loss carryforward | | | $456,361 | | | | | |
| | |
| | | | $1,027,895 | | | | | |
NOTE 6 – Investments
Investment transactions other than short-term investments for the fiscal year ended November 30, 2022, were as follows:
| | | | | | | | |
| | | |
| | | Purchases | | | Sales | |
| | |
Sustainable Equity | | | $1,681,485 | | | | $3,303,284 | |
| | |
Sustainable Bond | | | $29,678,495 | | | | $21,115,290 | |
| | | | | | | | | |
NOTE 7 – Custodian
Under agreements in place with the Trust’s custodian, UMB Bank, custody fees are reduced by credits for cash balances. Such reductions for the year ended November 30, 2022, were as follows:
| | | | |
| | |
| | | Custodian Fee Credits | |
| |
| Sustainable Equity | | | $1,512 | |
| |
| Sustainable Bond | | | $3,632 | |
NOTE 8 – COVID-19 Pandemic
The global outbreak of COVID-19 (commonly referred to as “coronavirus”) has disrupted economic markets and the prolonged economic impact is uncertain. Although vaccines for COVID-19 are becoming more widely available, the ultimate economic fallout from the pandemic, amid the spread of COVID-19 variants, and the long-term impact on economies, markets, industries and individual companies are not known. The operational and financial performance of individual companies and the market in general depends on future developments, including the duration and spread of any future outbreaks and the pace of recovery which may vary from market to market, and such uncertainty may in turn adversely affect the value and liquidity of a Fund’s investments, impair a Fund’s ability to satisfy redemption requests, and negatively impact the Fund’s performance.
NOTE 9 – Subsequent Events
The Sustainable Equity Fund and the Sustainable Bond Fund each declared a distribution to be paid on December 15, 2022, to all share owners of record on December 14, 2022, as follows:
| | | | | | | | | | | | |
| | | | |
| | | Dividend
Income | | | Short-Term
Capital Gain | | | Long-Term
Capital Gain | |
| | | |
Sustainable Equity | | | $0.1400 | | | | $- | | | | $- | |
| | | |
Sustainable Bond | | | $0.0580 | | | | $- | | | | $- | |
| | | | | | | | | | | | | |
There were no other events or transactions during the period that materially impacted the amounts or disclosures in the Funds’ financial statements.
| | | | | | | | | | |
| | | | | | |
| Annual Report | | November 30, 2022 | | | | | | | | 27 |
Report of Independent Registered Public Accounting Firm
To the Board of Trustees of
Saturna Investment Trust
and the Shareholders of Saturna Sustainable Funds
Opinion on the Financial Statements
We have audited the accompanying statement of assets and liabilities of Saturna Sustainable Equity Fund and Saturna Sustainable Bond Fund, (the “Funds”), each a series of Saturna Investment Trust, including the schedules of investments, as of November 30, 2022, the related statements of operations for the year then ended, the statements of changes in net assets for each of the two years in the period then ended, the financial highlights for each of the five years then ended, and the related notes (collectively referred to as the “financial statements”). In our opinion, the financial statements present fairly, in all material respects, the financial position of the Funds as of November 30, 2022, the results of their operations for the year then ended, the changes in their net assets for each of the two years in the period then ended and their financial highlights each of the five years then ended, in conformity with accounting principles generally accepted in the United States of America.
Basis for Opinion
These financial statements are the responsibility of the Funds’ management. Our responsibility is to express an opinion on the Funds’ financial statements based on our audits. We are a public accounting firm registered with the Public Company Accounting Oversight Board (United States) (“PCAOB”) and are required to be independent with respect to the Funds in accordance with the U.S. federal securities laws and the applicable rules and regulations of the Securities and Exchange Commission and the PCAOB. We have served as the auditor of one or more of the funds in the Trust since 1997.
We conducted our audits in accordance with the standards of the PCAOB. Those standards require that we plan and perform the audits to obtain reasonable assurance about whether the financial statements are free of material misstatement, whether due to error or fraud. The Funds are not required to have, nor were we engaged to perform, an audit of their internal control over financial reporting. As part of our audits we are required to obtain an understanding of internal control over financial reporting, but not for the purpose of expressing an opinion on the effectiveness of the Funds internal control over financial reporting. Accordingly, we express no such opinion.
Our audits included performing procedures to assess the risks of material misstatement of the financial statements, whether due to error or fraud, and performing procedures that respond to those risks. Such procedures included examining, on a test basis, evidence regarding the amounts and disclosures in the financial statements. Our audits also included evaluating the accounting principles used and significant estimates made by management, as well as evaluating the overall presentation of the financial statements. Our procedures included confirmation of securities owned as of November 30, 2022 by correspondence with the custodian. We believe that our audits provide a reasonable basis for our opinion.
Philadelphia, Pennsylvania
January 27, 2023
/s/ Tait, Weller & Baker LLP
Tait, Weller & Baker LLP
| | | | | | | | | | |
| | | | | | |
| 28 | | | | | | | | November 30, 2022 | | Annual Report |
Expenses
All mutual funds have operating expenses. As a Saturna Sustainable Fund shareowner, you incur ongoing costs, including management fees and other Fund expenses such as shareowner reports (like this one). Operating expenses, which are deducted from a fund’s gross earnings, directly reduce the investment return of a fund. Mutual funds (unlike other financial investments) only report their results after deduction of operating expenses.
With the Saturna Sustainable Funds, unlike many mutual funds, you do not incur sales charges (loads) on purchases, reinvested dividends, or other distributions. You do not incur redemption fees or exchange fees. You may incur fees related to extra services requested by you for your account, such as bank wires. The examples below are intended to help you understand your ongoing costs (in dollars) of investing in the Funds and to compare these costs with the ongoing costs of investing in other mutual funds.
Examples
The following examples are based on an investment of $1,000 invested at the beginning of the period and held for the entire period (June 1, 2022 to November 30, 2022).
Actual Expenses
The first line for each Fund provides information about actual account values and actual expenses. You may use the information in this line, together with the amount you have invested, to estimate the expenses that you paid over the period. Simply divide your account value by $1,000 (for example, an $8,600 account value divided by $1,000 = 8.6), then multiply the result by the number in the first line under the heading entitled “Expenses Paid (unaudited) During Period” to estimate the expenses you paid on your account during this period. The Funds may charge for extra services (such as domestic bank wires, international bank wires, or overnight courier delivery of redemption checks) rendered on request, which you may need to estimate to determine your total expenses.
Hypothetical Example For Comparison Purposes
The second line for each Fund provides information about hypothetical account values and hypothetical expenses based on each Fund’s actual expense ratio (based on the last six months) and an assumed rate of return of 5% per year before expenses, which is not the Fund’s actual return. The hypothetical account values and expenses may not be used to estimate the actual ending account balance or expenses you paid for the period. You may use this information to compare the ongoing costs of investing in the Funds and other mutual funds. To do so, compare this 5% hypothetical example with the 5% hypothetical examples that appear in the shareowner reports of other mutual funds. You may wish to add other fees that are not included in the expenses shown in the table, such as IRA fees charged by custodians other than Saturna Trust Company (note that Saturna does not charge such fees to shareowners directly on Saturna IRAs, ESAs, or HSAs with the Saturna Sustainable Funds), and charges for extra services such as bank wires.
Please note that the expenses shown in the tables are meant to highlight your ongoing costs only and do not reflect any transactional costs, such as sales charges (loads) or exchange fees (note that the Saturna Sustainable Funds do not assess any such transactional costs). Therefore, the “Hypothetical” line of each fund is useful in comparing ongoing costs only, and may not help you determine the relative total costs of owning different funds.
| | | | | | | | | | | | | | | | |
| | | | | |
| | | Beginning
Account Value
[June 1, 2022] | | | Ending
Account Value
[November 30,
2022] | | | Expenses Paid
During Period | | | Annualized
Expense Ratio | |
| | | | | |
| | | | | | | | | | | | | | | | |
| | | | |
Sustainable Equity Fund (SEEFX), Actual | | | $1,000.00 | | | | $968.70 | | | | $3.70 | | | | 0.75% | |
| | | | |
Hypothetical (5% return before expenses) | | | $1,000.00 | | | | $1,021.31 | | | | $3.80 | | | | 0.75% | |
| | | | | |
| | | | | | | | | | | | | | | | |
| | | | |
Sustainable Bond Fund (SEBFX), Actual | | | $1,000.00 | | | | $968.90 | | | | $3.21 | | | | 0.65% | |
| | | | |
Hypothetical (5% return before expenses) | | | $1,000.00 | | | | $1,021.81 | | | | $3.29 | | | | 0.65% | |
Expenses are equal to annualized expense ratios indicated above (based on the most recent fiscal period of June 1, 2022 through November 30, 2022) multiplied by the average account value over the period, multiplied by 183/365 (to reflect the one-half year period).
| | | | | | | | | | |
| | | | | | |
| Annual Report | | November 30, 2022 | | | | | | | | 29 |
| | |
| Trustees and Officers | | (unaudited) |
| | | | | | | | |
| Name, Address, and Age | | Position(s) Held with Trust and
Number of Saturna Fund
Portfolios Overseen | | Principal occupation(s) during past
5 years, including Directorships | | Other
Directorships
held by Trustee |
| | | |
Independent Trustees | | | | | | |
| | | | |
(photo omitted) | | Marina E. Adshade (55) 1300 N. State Street Bellingham WA 98225 | | Independent Trustee (since 2017); Nine | | Professor of Economics, University of British Columbia, Vancouver Author | | None |
| | | | |
(photo omitted) | | Ronald H. Fielding, MA, MBA, CFA (73) 1300 N. State Street Bellingham WA 98225 | | Independent Trustee (since 2009); Thirteen | | Director, ICI Mutual Insurance Company | | Amana Mutual Funds Trust |
| | | | |
(photo omitted) | | Gary A. Goldfogel, MD (64) 1300 N. State Street Bellingham WA 98225 | | Chairman (since 2017); Independent Trustee (since 1995); Nine | | Medical Examiner (pathologist) | | None |
| | | | |
(photo omitted) | | Jim V. McKinney (61) 1300 N. State Street Bellingham WA 98225 | | Independent Trustee (since 2017); Nine | | President/CEO, Apple Mountain LLC, consulting and development Former - US Army Foreign Area Officer | | None |
| | | | |
(photo omitted) | | Sarah E.D. Rothenbuhler (54) 1300 N. State Street Bellingham WA 98225 | | Independent Trustee (since 2017); Nine | | CEO, Birch Equipment (industrial rentals and sales) | | None |
| | | |
Interested Trustee | | | | | | |
| | | | |
(photo omitted) | | Jane K. Carten, MBA (47) 1300 N. State Street Bellingham WA 98225 | | President, Trustee (since 2017); Nine | | President and Director, Saturna Capital Corporation Vice President and Director, Saturna Trust Company President, Saturna Brokerage Services | | None |
| | | | | | | | | | |
| | | | | | |
| 30 | | | | | | | | November 30, 2022 | | Annual Report |
| | |
| Trustees and Officers (continued) | | (unaudited) |
| | | | | | | | |
| Name (Age) and Address | | Position(s) held with Trust and Number of Saturna Fund Portfolios Overseen | | Principal occupation(s) during past 5 years, including Directorships | | Other Directorships held by Trustee |
| | | |
Officers Who Are Not Trustees | | | | | | |
| | | | |
(photo omitted) | | Bryce R. Fegley (47) 1300 N. State Street Bellingham, WA 98225 | | Vice President (since 2020);
N/A | | Portfolio Manager and Senior Investment Analyst, Saturna Capital | | N/A |
| | | | |
(photo omitted) | | Christopher R. Fankhauser (50) 1300 N. State Street Bellingham, WA 98225 | | Treasurer1 (since 2002);
N/A | | Chief Operations Officer, Saturna Capital Corporation Vice President and Chief Operations Officer, Saturna Brokerage Services Director, Vice President, and Chief Operations Officer, Saturna Trust Company | | N/A |
| | | | |
(photo omitted) | | Michael E. Lewis (61) 1300 N. State Street Bellingham, WA 98225 | | Chief Compliance Officer1 (since 2012);
N/A | | Chief Compliance Officer, Saturna Capital, Saturna Trust Company, and Affiliated Funds | | N/A |
| | | | |
(photo omitted) | | Jacob A. Stewart (42) 1300 N. State Street Bellingham, WA 98225 | | Anti-Money Laundering Officer1 (since 2015);
N/A | | Anti-Money Laundering Officer, Saturna Capital Corporation, Saturna Brokerage Services Chief Compliance Officer, Saturna Brokerage Services Bank Secrecy Act Officer, Saturna Trust Company | | N/A |
| | | | |
(photo omitted) | | Elliot Cohen (59) 1300 N. State Street Bellingham, WA 98225 | | Secretary1 (since 2022);
N/A | | Chief Legal Officer, Saturna Capital Corporation; Former Associate General Counsel for Russell Investments | | N/A |
| | | | | |
| | | | | | | | |
Term of Office: each Trustee serves for the lifetime of the Trust or until they die, resign, are removed, or not re-elected by the shareowners. Each officer serves a one-year term subject to annual reappointment by the Trustees.
The Trust’s Statement of Additional Information, available without charge upon request by calling Saturna Capital at 1-800-728-8762 and on the Funds’ website, www.saturnasustainable.com, includes additional information about the Trustees.
On November 30, 2022, the trustees, officers, and their affiliates as a group owned 36.38% and 13.87% of the outstanding shares of Sustainable Equity and Sustainable Bond Funds, respectively.
During the year ended November 30, 2022, the Independent Trustees were each paid by the Trust: (1) $2,000 annual retainer plus $1,000 per board meeting attended (in person or by phone), plus reimbursement of travel expenses; (2) $250 for committee meetings; and (3) $250 per quarter for serving as chairman of the board or any committee.
Mrs. Carten is an Interested Trustee by reason of her positions with the Trust’s adviser (Saturna Capital Corporation) and underwriter (Saturna Brokerage Services), and is the primary manager of the Saturna Sustainable Equity Fund portfolio. She is paid by Saturna Capital a salary, plus a bonus for each month the Saturna Sustainable Equity Fund portfolio earns a 4 or 5 star rating from Morningstar (see www.saturna.com). The officers are paid by Saturna Capital and not the Trust. As of November 30, 2022, all Saturna Capital employees listed above as officers owned shares in one or more of the Saturna Investment Trust funds, with Mrs. Carten owning (directly or indirectly) over $1.55 million.
| 1 | Holds the same position with Amana Mutual Funds Trust |
| | | | | | | | | | |
| | | | | | |
| Annual Report | | November 30, 2022 | | | | | | | | 31 |
| | |
| Renewal of Investment Advisory Contract | | (unaudited) |
During their meeting of September 13, 2022, the Trustees of Saturna Investment Trust (the “Board” or “Trustees”), including the Independent Trustees, discussed the continuance of the Investment Advisory and Administrative Services Agreement (“Agreement”) between the Trust, on behalf of each Fund, and Saturna Capital. In considering the renewal of the Agreement, the Board, including the Independent Trustees, considered the factors it deemed relevant, including the nature, quality and extent of services provided, the performance of each Fund, expenses and fees, the profitability of Saturna, the potential for economies of scale that may be shared with each Fund and its shareholders as each Fund’s assets grow, and any other benefits derived by Saturna from its relationship with the Funds. In their deliberations, the Trustees did not identify any single factor which alone was responsible for the decision to approve the agreements, and each Trustee may have given different weights to different factors, and, thus, each Trustee may have had a different basis for his or her decision.
The Trustees considered Saturna Capital’s specific responsibilities in all aspects of day-to-day management of the Funds as well as the qualifications, experience and responsibilities of the Funds’ portfolio managers and other key personnel at Saturna Capital. The Trustees discussed Saturna Capital’s experience, ability, and commitment to quality service through performing internally such functions as shareowner servicing, administration, accounting, marketing, and distribution — all in addition to investment management. The Trustees took into consideration Saturna Capital’s continued avoidance of significant operational and compliance problems, plus its continued investments in infrastructure, information management systems, personnel, training, compliance, and investor education materials, all designed to provide high quality investor services and meet investor needs. They recognized Saturna Capital’s efforts to recruit and retain qualified and experienced staff and improve the capital base on which Saturna Capital operates, which the Trustees believe is important to the long-term success of the Funds. They considered Saturna Capital’s focus on investors and its efforts to avoid potential conflicts of interest.
The Trustees considered the investment performance of each Fund. The Trustees considered each Fund’s average annual total returns relative to its benchmark for relevant periods ended July 31, 2022, noting that the Sustainable Equity Fund underperformed its benchmark for the one-, three- and five-year periods and that the Sustainable Bond Fund outperformed its benchmark for the one-, three-, and five-year periods. The Trustees considered comparative performance information from Morningstar, Inc. (“Morningstar”), which provides independent analysis of mutual fund data and, among other things, ranks mutual fund performance within categories comprised of similarly managed funds. The Trustees considered the short- and medium-term performance of the Sustainable Equity Fund relative to the Fund’s Morningstar category for the one-, three- and five-year periods ended July 31, 2022, noting the Fund was in the fourth quartile for the one-year period, third quartile for the three-year period, and the second quartile for the five-year period. The Trustees considered the short- and medium-term performance of the Sustainable Bond Fund relative to the Fund’s Morningstar category for the one-, three- and five- year periods ended July 31, 2021, noting the Fund was in the first quartile for all three periods. The Trustees also considered each Fund’s Morningstar performance rating (one through five stars), and each Fund’s performance rating relative to its category selected by and Thomas Reuters Lipper, noting that the overall Morningstar rating for both Funds was four stars. The Trustees also noted the high sustainability ratings assigned to the Funds by Morningstar.
The Trustees noted the generally risk-averse investment style of the Funds and other factors which can affect each Fund’s performance relative to its broader Morningstar category. The Trustees also noted certain differences between each Fund and the peer funds within its Morningstar category, including differences in investment strategies and asset size. The Trustees found that Saturna Capital continued to manage each Fund in a manner that is designed to be risk-averse and attractive to long-term investors. The Trustees discussed and considered the efforts of Saturna Capital to make additional resources available to assist in managing the Funds. The Trustees also considered Saturna Capital’s focus on improving investment performance without incurring materially higher levels of risk.
The Trustees also considered the performance and expenses of each Fund as compared to a smaller group of funds with similar investment objectives and strategies, including socially responsible funds, and a range of asset sizes. The Trustees considered these comparative performance and expense data, along with the comparative data published by Morningstar and each Fund’s performance relative to its benchmark, to evaluate the Fund’s performance over near-term and medium-term time periods.
The Trustees also reviewed the fees and expenses of each Fund, including comparative data on fees and expenses published by Morningstar, and considered the components of the Fund’s operating expenses. The Trustees noted the steps that Saturna Capital has undertaken to maintain competitive levels of Fund operating expenses. They noted the significant sponsorship of the Funds by Saturna Capital evidenced, in part, by certain fees and expenses paid by Saturna Capital out of its own resources. The Trustees recognized Saturna Capital’s efforts help make the Funds more widely available and less expensive than would otherwise be the case without Saturna Capital’s efforts.
The Trustees recognized that each Fund remains relatively small and there have not been opportunities to consider economies of scale. The Trustees noted Saturna Capital’s commitment to continue operating the Funds and the costs undertaken by Saturna Capital.
| | | | | | | | | | |
| | | | | | |
| 32 | | | | | | | | November 30, 2022 | | Annual Report |
| | |
| Renewal of Investment Advisory Contract (continued) | | (unaudited) |
The Trustees reviewed Saturna Capital’s financial information and discussed the issue of Saturna Capital’s profitability, or lack thereof, as related to management and administration of the Trust. They discussed the reasonableness of Saturna Capital’s profitability as part of their evaluation of whether each Fund’s advisory fees bear a reasonable relationship to the mix of services provided by Saturna Capital, including the nature, extent, and quality of such services.
The Trustees considered and compared the fees charged by Saturna Capital to other types of accounts, including non-mutual fund advisory clients. The Trustees noted the differences between the full range of services Saturna Capital provides to the Funds, including investment advisory and administrative services, transfer agency services, and other services, as compared to the investment advisory services provided to the other advisory accounts.
The Trustees considered potential benefits to Saturna Capital’s other business lines from acting as investment adviser to the Funds, but also recognized that Saturna Capital’s other business lines also potentially benefit the Funds. The Trustees also noted that there were not soft dollar arrangements with respect to trading in the Funds’ portfolios. The Trustees considered whether there are other potential benefits to Saturna Capital in continuing to manage the Funds and the Trustees found that there were no material benefits other than Saturna Capital’s receipt of advisory fees. The Trustees also noted with respect to the Sustainable Equity Fund that Saturna Brokerage Services voluntarily waives brokerage commissions for executing Fund portfolio transactions, resulting in lower transaction costs.
The Trustees concluded based on their business judgement that the fees paid by each Fund to Saturna Capital were, from an arm’s length bargaining perspective, reasonable and in the best interest of the Fund and its shareowners in light of the services provided, comparative performance, expense and advisory fee information, costs of services provided, profits to be realized, and benefits derived or to be derived by Saturna Capital from its relationship with the Fund. Following this discussion, the Trustees, including the Independent Trustees, unanimously agreed to renew each Fund’s Agreement with Saturna Capital.
| | | | | | | | | | |
| | | | | | |
| Annual Report | | November 30, 2022 | | | | | | | | 33 |
Availability of Portfolio Information
| (1) | The Saturna Sustainable Funds file complete schedules of portfolio holdings with the SEC for the first and third quarters of each fiscal year as an exhibit to its reports on Form N-PORT. Previously, this information was filed on Form N-Q. |
| (2) | The Funds’ Form N-PORT reports are available on the SEC’s website at www.sec.gov and at www.saturnasustainable.com. |
| (3) | The Funds make a complete schedule of portfolio holdings after the end of each month available to investors at www.saturnasustainable.com. |
Availability of Proxy Voting Information
| (1) | A description of the policies and procedures that the Funds use to determine how to vote proxies relating to portfolio securities is available (a) without charge, upon request, by calling Saturna Capital at 1-800-728-8762; (b) on the Funds’ website at www.saturnasustainable.com; and (c) on the SEC’s website at www.sec.gov. |
| (2) | Information regarding how each Fund voted proxies relating to portfolio securities during the most recent 12-month period ended June 30 is available (a) without charge, upon request, by calling Saturna Capital at 1-800-728-8762; (b) on the Funds’ website at www.saturnasustainable.com; and (c) on the SEC’s website at www.sec.gov. |
| | | | | | | | | | |
| | | | | | |
| 34 | | | | | | | | November 30, 2022 | | Annual Report |
Householding Policy
To reduce expenses, we may mail only one copy of the Funds’ prospectus, each annual and semi-annual report, and proxy statements when necessary, to those addresses shared by two or more accounts. If you wish to receive individual and/or more copies of these documents, please call us at 1-800-728-8762 or write to us at Saturna Capital/Saturna Sustainable Funds, P.O. Box N, Bellingham, WA 98227. We will begin sending you individual copies 30 days after receiving your request.
If you are currently receiving multiple copies and wish to receive only one copy, please call us at 1-800-728-8762 or write to us at Saturna Capital/Saturna Sustainable Funds, P.O. Box N, Bellingham, WA 98227. We will begin sending you a single copy with subsequent report mailings.
Privacy Policy
At Saturna Capital and Saturna Investment Trust, we understand the importance of maintaining the privacy of your financial information. We want to assure you that we protect the confidentiality of any personal information that you share with us. In addition, we do not sell information about our current or former customers.
In the course of our relationship, we gather certain nonpublic information about you, including your name, address, investment choices, and account information. We do not disclose your information to unaffiliated third parties unless it is necessary to process a transaction; service your account; deliver your account statements, shareowner reports and other information; or as required by law. When we disclose information to unaffiliated third parties, we require a contract to restrict the companies’ use of customer information and from sharing or using it for any purposes other than performing the services for which they were required.
We may share information within the Saturna Capital family of companies in the course of informing you about products or services that may address your investing needs.
We maintain our own technology resources to minimize the need for any third party services, and restrict access to information within Saturna. We maintain physical, electronic, and procedural safeguards to guard your personal information. If you have any questions or concerns about the security or privacy of your information, please call us at 1-800-728-8762.
| | | | | | | | | | |
| | | | | | |
| Annual Report | | November 30, 2022 | | | | | | | | 35 |
| | |
| Performance Summary (as of December 31, 2022) | | (unaudited) |
| | | | | | | | | | | | | | | | | | | | | | | | |
Average Annual Returns (before any taxes paid by shareowners) | |
| | | | | | |
| | | 1 Year | | | | 3 Year | | | | 5 Year | | | | 10 Year | | | | 15 Year | | | | Expense Ratio | |
| | | | | | |
Idaho Tax-Exempt Fund | | | -5.07% | | | | -0.43% | | | | 1.11% | | | | 1.55% | | | | 2.52% | | | | 0.67% | 1 |
| | | | | | |
S&P Idaho Municipal Bond Index | | | -7.86% | | | | -0.46% | | | | 1.34% | | | | 2.48% | | | | 3.71% | | | | n/a | |
| | | | | | |
“Muni Single State Intermediate” Category Average2 | | | -7.71% | | | | -1.14% | | | | 0.58% | | | | 1.29% | | | | 2.42% | | | | 0.83% | |
Performance data quoted in this report represents past performance, is before any taxes payable by shareowners, and is no guarantee of future results. Current performance may be higher or lower than that stated herein. Performance current to the most recent month-end is available by calling toll-free 1-800-728-8762 or visiting www.idahotaxexemptfund.com. Average annual total returns are historical and include change in share value as well as reinvestment of dividends and capital gains, if any. The investment return and principal value of an investment will fluctuate so that an investor’s shares, when redeemed, may be worth more or less than their original cost.
Please consider an investment’s objectives, risks, charges, and expenses carefully before investing. To obtain this and other important information about the Idaho Tax-Exempt Fund in a prospectus or summary prospectus, ask your financial adviser, visit www.idahotaxexemptfund.com, or call toll-free 1-800-728-8762. Please read the prospectus or summary prospectus carefully before investing.
A note about risk: See Notes to Financial Statements for a discussion of investment risks. For a more detailed discussion of the risks associated with the Fund, please see the Fund’s prospectus or summary prospectus.
| 1 | By regulation, the expense ratio shown in this table is as stated in the Fund’s most recent prospectus, which is dated March 30, 2022, and incorporates results for the fiscal year ended November 30, 2021. The ratio presented in this table differs from expense ratios shown elsewhere in this report as they represent different fiscal periods. |
| 2 | Source: Morningstar December 31, 2022. Morningstar, Inc. is an independent fund performance monitor. Category returns are determined monthly from total returns by Morningstar, by category as determined by Morningstar. Category average expense ratios are determined by Morningstar from prospectus level data reported by funds in the category. |
On the cover: Winter in Downtown Wallace, Idaho.
| | | | | | | | | | |
| | | | | | |
| 2 | | | | | | | | November 30, 2022 | | Annual Report |
| | |
| Fellow Shareowners: | | January 18, 2023 |
The Idaho Tax-Exempt Fund returned -5.47% for the fiscal year ended November 30, 2022, outperforming its benchmark S&P Idaho Municipal Index, which declined -7.92%. The Fund also outperformed the Morningstar Muni Single State Intermediate category, which fell -7.82%.
The outperformance was mainly due to the Fund’s conservative positioning in shorter-term bonds and investment-grade issuers. The bond market experienced a great deal of volatility amid rising rates during 2022. Bonds with longer maturities generally experienced more negative returns compared to bonds with shorter maturities, as the longer bonds tend to have higher exposure to interest rate risk.
The state of Idaho maintained its strong financial position and conservative fiscal management in 2022. The state’s revenues primarily come from individual income and sales taxes, both of which tend to be economically sensitive. Historically, when Idaho faced economic uncertainty, the state acted conservatively. During the first three months of fiscal year 2022, Idaho revenue from tax collections was $50 million below expectations.1 Despite this, lawmakers are still heading into 2023 with a $1.54 billion budget surplus. In September 2022, Governor Brad Little and the Idaho Legislature passed a law to issue tax rebates, reduce the income tax rate, and direct $410 million per year toward funding public school and career programs.2 Going forward, we expect to see added uncertainty in the economy. From a financial standpoint, the state of Idaho is ideally positioned to face this uncertainty.
The state also continues to benefit from favorable demographics. The latest census data shows that Idaho’s population grew by 16.5% between 2010 and 2020, the largest net migration of any state in the country.3 The state’s 2022 population growth rate of 1.8% was ranked second in the nation, while the national average growth rate was 0.4%. This also means growth in the number of workers and consumers, adding to economic activity. The surging population has put pressure on schools in the form of overcrowding and the need for more facilities. In Idaho, bonds require a two-thirds supermajority to pass, and only about 50% of all proposed bonds pass.4 Many school districts have facilities needs but are unable to pass bonds. We expect to see more districts aim to pass bonds or look to the state legislature for help in funding facilities.
The bond market had a challenging 2022. The Federal Reserve hiked rates an additional 50 basis points (bps) in December, bringing the target range to 4.25% - 4.5%, up from 0% - 0.25% at the beginning of the year. The shape of the Treasury yield curve shifted dramatically over the 12-month period, moving from an upward sloping curve to a curve with an inversion of 70 bps in the two-year and 10-year Treasurys. The entire curve also shifted upward, and the six-month Treasury rose a staggering 458 bps. While the end of the fourth quarter marked the end of 2022, it does not mean the challenges presented throughout the year have ceased. Risks remain elevated for financial assets and concerns of recession continue to ratchet higher.
Continued on next page.
| | | | | | | | | | |
| | | | | | |
| Annual Report | | November 30, 2022 | | | | | | | | 3 |
Municipal bonds tend to do well during recessions. Even during the two negative episodes in 1981 and 2008, poor performance was followed by a solid rebound in tax-exempt securities. However, we continue to be vigilant for potential challenges spurred by inflationary and credit pressures. Our security review and surveillance process emphasizes selecting securities with strong balance sheets and financial flexibility. The Idaho Tax-Exempt Fund continues to offer discriminating investors the opportunity to invest in high quality, tax-exempt securities in an exceptionally creditworthy state.
Respectfully,
(photo omitted)
Jane Carten MBA,
President
(photo omitted)
Elizabeth Alm CFA®,
Portfolio Manager
| 1 | Ridler, Keith. “Idaho Tax Collection Fall Short, but Budget Surplus Remains.” US News & World Report, October 17, 2022. https://www.usnews.com/news/best-states/ idaho/articles/2022-10-17/idaho-tax-collections-fall-short-but-budget-surplus-remains |
| 2 | Corbin, Clark. “Idaho lawmakers head into 2023 with projected $1.5B surplus – and ideas on how to use it.” Idaho Capital Sun, December 15, 2022. https:// idahocapitalsun.com/2022/12/15/idaho-lawmakers-head-into-2023-with-projected-1-5b-surplus-and-ideas-on-how-to-use-it/ |
| 3 | “Evaluation Estimates – 2020.” United States Census Bureau. https://www.census.gov/programs-surveys/popest/technical-documentation/research/evaluation-estimates.html |
| 4 | Flandro, Carly. “Decaying buildings and a record of failed bond elections: ‘It is quite atrocious’ in Salmon.” Idaho Education News, January 5, 2023. https://www. idahoednews.org/news/decaying-buildings-and-a-record-of-failed-bond-elections-it-is-quite-atrocious-in-salmon/ |
| | | | | | | | | | |
| | | | | | |
| 4 | | | | | | | | November 30, 2022 | | Annual Report |
| | |
Performance Summary | | (unaudited) |
| | | | | | | | | | | | | | | | |
Average Annual Returns (as of November 30, 2022) | |
| | | | | |
| | | 1 Year | | | 5 Year | | | 10 Year | | | Expense Ratio1 | |
| | | | |
Idaho Tax-Exempt Fund | | | -5.47% | | | | 1.22% | | | | 1.41% | | | | 0.67% | |
| | | | |
S&P Idaho Municipal Bond Index | | | -7.92% | | | | 1.48% | | | | 2.36% | | | | n/a | |
Growth of $10,000
| | |
 | | Comparison of any mutual fund to a market index must be made bearing in mind that the index is unmanaged and expense-free. Conversely, the fund will (1) be actively managed; (2) have an objective other than mirroring the index, such as limiting risk; (3) bear transaction and other costs; (4) stand ready to buy and sell its securities to shareowners on a daily basis; and (5) provide a wide range of services. The graph compares $10,000 invested in the Fund on November 30, 2012, to an identical amount invested in the Standard & Poor’s Idaho Municipal Bond Index, a broad-based index of Idaho municipal bond prices. The graph shows that an investment in the Fund would have risen to $11,507 versus $12,001 in the S&P Idaho Municipal Bond Index. |
Past performance does not guarantee future results. The “Growth of $10,000” graph and “Average Annual Returns” performance table assume the reinvestment of dividends and capital gains. They do not reflect the deduction of taxes that a shareowner might pay on fund distributions or the redemption of fund shares.
| 1 | By regulation, the expense ratio for the Fund shown in this table is as stated in the Fund’s most recent prospectus, which is dated March 30, 2022, and incorporates results for the fiscal year ended November 30, 2021. The ratio presented in this table differs from expense ratios shown elsewhere in this report as they represent different fiscal periods. |
Fund Objective
Idaho Tax-Exempt Fund seeks to provide income free from federal income, federal alternative minimum, and Idaho state income taxes. Preservation of capital is a secondary objective.
| | | | |
Top 10 Holdings | | | | |
| |
| % of Total Net Assets | |
| |
Teton Co, ID SCD #401 Driggs (4.00% due 09/15/2035) | | | 4.2% | |
| |
Canyon Co ID SCD #134 Middleton (4.00% due 09/15/2028) | | | 3.4% | |
| |
Nez Perce CO ISD #1 Lewiston (5.00% due 09/15/2029) | | | 2.9% | |
| |
Idaho Fish & Wildlife Foundation Rev (5.00% due 12/01/2033) | | | 2.9% | |
| |
Ada & Canyon Cos ID JSD #2 Meridian (5.00% due 08/15/2032) | | | 2.8% | |
| |
Idaho Falls ID COPs (4.00% due 09/15/2028) | | | 2.7% | |
| |
Bonneville & Bingham Cos JSD #93 (5.00% due 09/15/2032) | | | 2.6% | |
| |
Idaho St Bond Bank Auth Rev (4.00% due 09/15/2032) | | | 2.6% | |
| |
Twin Falls Co ID SCD #411 Series A (4.25% due 09/15/2030) | | | 2.5% | |
| |
Idaho Health Rev Trinity Health Grp (3.25% due 12/01/2028) | | | 2.5% | |
| | | | | | | | | | |
Portfolio Diversification | | | | | | | |
| | | |
| % of Total Net Assets | | | | | | | |
| | | |
General Obligation | | | 41.5% | | | ∎ | | | 
| |
State Education | | | 16.9% | | | ∎ |
Municipal Leases | | | 11.4% | | | ∎ |
Real Estate | | | 6.0% | | | ∎ |
Financial Services | | | 3.8% | | | ∎ |
Water Supply | | | 3.7% | | | ∎ |
Government Bonds | | | 3.2% | | | ∎ |
Medical - Hospitals | | | 2.5% | | | ∎ |
Government Bonds | | | 2.5% | | | ∎ |
Health Care Facilities | | | 2.2% | | | ∎ |
Pollution Control | | | 2.2% | | | ∎ |
Educational Services | | | 0.6% | | | ∎ |
Other assets (net of liabilities) | | | 3.5% | | | ∎ |
| | | | | | | | | | |
| | | | | | |
| Annual Report | | November 30, 2022 | | | | | | | | 5 |
| | |
Discussion of Fund Performance | | (unaudited) |
For the 12-month period ended November 30, 2022, the Idaho Tax-Exempt Fund returned -5.47% and the S&P Idaho Municipal Index returned -7.92%. For the five-year period, the Fund provided an annualized total return of 1.22% compared to an annualized return of 1.48% for the Index. One of the major factors that allowed the Fund to outperform the Index was that the Fund had a shorter duration.
Factors Affecting Past Performance
Over the fiscal year, we observed pervasive high inflation, energy supply constraints, and ever-increasing debts and deficits among world economies. The shape of the Treasury yield curve shifted dramatically over the 12-month period, moving from an upward sloping curve to a curve with an inversion of 70 basis points (bps) in the two-year and 10-year Treasurys. The entire curve also shifted upward, and the six-month Treasury rose a staggering 458 bps. With such a dramatic rise in yields, performance was generally worse for longer duration bonds and better for shorter duration bonds, with almost all fixed-income securities producing a negative return.
The municipal market also experienced dramatic upward shifts in yields. The Bloomberg Municipal Bond Index returned 1.97% for the fiscal year. Longer duration bonds significantly underperformed shorter duration bonds in the municipal market as well. The Idaho Tax-Exempt Fund has been defensively positioned to minimize net asset value (NAV) volatility, including having a modified duration of 4.93 years with a weighted average maturity of 9.42 years. The Index maintains a modified duration closer to 6.47 years and a weighted average maturity of 13.99 years. The longer maturities in the Index contributed to the outperformance of the Fund.
Looking Forward
We expect continued upward pressure on yields and the Treasury curve for the next fiscal year. Inflation will likely continue to be present. We are defensively positioning the portfolio to withstand anticipated yield curve changes, currency movements, and inflationary pressures. Our goal has always been to choose good companies and invest through cycles.
For those seeking a conservative investment vehicle, the Idaho Tax-Exempt Fund offers a portfolio of high-grade issues intended to provide income that is exempt from federal income, federal alternative minimum, and Idaho state income taxes. The Fund chooses not to invest in US territories such as Puerto Rico, Guam, and the US Virgin Islands to boost income at the expense of creditworthiness.
| | | | | | | | | | |
| | | | | | |
| 6 | | | | | | | | November 30, 2022 | | Annual Report |
| | | | | | | | | | | | | | | | | | |
| | | Schedule of Investments | | | | | | | | | | | | As of November 30, 2022 | |
| | | | | | | |
| | | Tax-Exempt Municipal Bonds – 94.0% | | | | Coupon / Maturity | | Face Amount | | | Market Value | | �� | Percentage of Net Assets | |
| | | | | | |
| | | Educational Services | | | | | | | | | | | | | |
| | | | | | | |
| | | Boise City ID Indep Sch Dist | | | | 5.00% due 08/01/2032 | | | $65,000 | | | | $72,141 | | | | 0.6% | |
| | | | | | | |
| | | | | | | | | | | | | | | | | | |
| | | | | | |
| | | Financial Services | | | | | | | | | | | | | |
| | | | | | | |
| | | Idaho Housing & Finance Rev | | | | 3.00% due 07/01/2036 | | | 50,000 | | | | 48,898 | | | | 0.4% | |
| | | | | | | |
| | | Idaho St Bond Bank Auth Rev | | | | 4.00% due 09/15/2032 | | | 95,000 | | | | 96,575 | | | | 0.8% | |
| | | | | | | |
| | | Idaho St Bond Bank Auth Rev | | | | 4.00% due 09/15/2032 | | | 310,000 | | | | 314,512 | | | | 2.6% | |
| | | | | | | |
| | | | | | | | | | | | | 459,985 | | | | 3.8% | |
| | | | | | |
| | | General Obligation | | | | | | | | | | | | | |
| | | | | | | |
| | | Ada & Canyon Cos ID JSD #2 Meridian | | | | 5.00% due 08/15/2032 | | | 325,000 | | | | 345,087 | | | | 2.8% | |
| | | | | | | |
| | | Ada & Canyon Cos ID JSD #3 Kuna | | | | 4.00% due 09/15/2027 | | | 100,000 | | | | 105,473 | | | | 0.9% | |
| | | | | | | |
| | | Boise City ID Independent SD | | | | 3.00% due 08/01/2038 | | | 100,000 | | | | 87,705 | | | | 0.7% | |
| | | | | | | |
| | | Bonneville & Bingham Cos JSD #93 | | | | 5.00% due 09/15/2032 | | | 300,000 | | | | 319,285 | | | | 2.6% | |
| | | | | | | |
| | | Canyon Co ID SCD #134 Middleton | | | | 4.00% due 09/15/2028 | | | 400,000 | | | | 414,345 | | | | 3.4% | |
| | | | | | | |
| | | Canyon Co ID SCD #135 Notus | | | | 3.25% due 09/15/2031 | | | 290,000 | | | | 293,882 | | | | 2.4% | |
| | | | | | | |
| | | Canyon Co ID SCD #135 Notus | | | | 3.25% due 09/15/2032 | | | 170,000 | | | | 170,957 | | | | 1.4% | |
| | | | | | | |
| | | Canyon Co ID SCD #139 Vallivue | | | | 5.00% due 09/15/2024 | | | 260,000 | | | | 260,501 | | | | 2.1% | |
| | | | | | | |
| | | Canyon Co ID Sch Dist #139 Vallivue | | | | 5.00% due 09/15/2030 | | | 200,000 | | | | 226,309 | | | | 1.8% | |
| | | | | | | |
| | | Caribou Franklin Bannock JSD #148 | | | | 3.25% due 09/15/2035 | | | 300,000 | | | | 300,893 | | | | 2.5% | |
| | | | | | | |
| | | Cassia Oneida Twin Falls JSD #151 | | | | 3.375% due 09/15/2034 | | | 160,000 | | | | 158,051 | | | | 1.3% | |
| | | | | | | |
| | | College of Western ID Annual Approp | | | | 4.00% due 10/01/2027 | | | 125,000 | | | | 129,872 | | | | 1.1% | |
| | | | | | | |
| | | Kootenai Co ID SCD #273 | | | | 4.00% due 08/15/2031 | | | 265,000 | | | | 274,454 | | | | 2.2% | |
| | | | | | | |
| | | Latah Co ID SCD #281 Moscow Ser B | | | | 4.00% due 08/15/2027 | | | 100,000 | | | | 100,956 | | | | 0.8% | |
| | | | | | | |
| | | Latah Co ID SCD #281 Moscow Ser B | | | | 4.00% due 08/15/2028 | | | 200,000 | | | | 201,898 | | | | 1.6% | |
| | | | | | | |
| | | Madison Co ID Sch Dist #321 Rexburg | | | | 5.00% due 09/15/2034 | | | 25,000 | | | | 27,004 | | | | 0.2% | |
| | | | | | | |
| | | Madison Co. Id. SDC #321 | | | | 5.00% due 09/15/2035 | | | 250,000 | | | | 269,693 | | | | 2.2% | |
| | | | | | | |
| | | Owyhee & Canyon Co. # 363 Marsing | | | | 4.00% due 09/15/2035 | | | 150,000 | | | | 153,924 | | | | 1.3% | |
| | | | | | | |
| | | SUN VLY ID | | | | 5.00% due 09/15/2029 | | | 40,000 | | | | 44,400 | | | | 0.4% | |
| | | | | | | |
| | | Teton Co, ID SCD #401 Driggs | | | | 4.00% due 09/15/2035 | | | 500,000 | | | | 514,331 | | | | 4.2% | |
| | | | | | | |
| | | Twin Falls Co ID SCD #411 Series A | | | | 4.00% due 09/15/2027 | | | 170,000 | | | | 173,978 | | | | 1.4% | |
| | | | | | | |
| | | Twin Falls Co ID SCD #411 Series A | | | | 4.25% due 09/15/2030 | | | 300,000 | | | | 308,319 | | | | 2.5% | |
| | | | | | | |
| | | Twin Falls Co ID SCD #411 Series B | | | | 4.75% due 09/15/2039 | | | 200,000 | | | | 207,279 | | | | 1.7% | |
| | | | | | | |
| | | | | | | | | | | | | 5,088,596 | | | | 41.5% | |
| | | | | | |
| | | Government Bonds | | | | | | | | | | | | | |
| | | | | | | |
| | | Idaho St Bldg Auth Health & Welfare | | | | 5.00% due 09/01/2043 | | | 25,000 | | | | 26,985 | | | | 0.2% | |
| | | | | | | |
| | | Idaho St Health Facs Auth | | | | 4.00% due 09/01/2045 | | | 265,000 | | | | 256,529 | | | | 2.1% | |
| | | | | | | |
| | | Idaho St Hsg & Fin Assn | | | | 5.00% due 07/15/2037 | | | 100,000 | | | | 108,222 | | | | 0.9% | |
| | | | | | | |
| | | | | | | | | | | | | 391,736 | | | | 3.2% | |
| | | | | | |
| | | Health Care Facilities | | | | | | | | | | | | | |
| | | | | | | |
| | | Idaho Health Faci Auth Hos Rev | | | | 5.00% due 12/01/2047 | | | 260,000 | | | | 263,805 | | | | 2.2% | |
| | | | | | | |
| | | | | | | | | | | | | | | | | | |
| | | | | | |
| | | Medical/Hospitals | | | | | | | | | | | | | |
| | | | | | | |
| | | Idaho Health Rev Trinity Health Grp | | | | 3.25% due 12/01/2028 | | | 300,000 | | | | 302,220 | | | | 2.5% | |
| | | | | | | |
| | | | | | | | | | | | | | | | | | |
Continued on next page.
| | | | | | | | | | | | |
| | | | | | | |
| The accompanying notes are an integral part of these financial statements. | | Annual Report | | November 30, 2022 | | | | | | | | 7 |
| | | | | | | | | | | | |
| | | Schedule of Investments | | | | | | | | | | As of November 30, 2022 |
| | | | | | | | | | | | | | | | | | |
| | | | | | | |
| | | Tax-Exempt Municipal Bonds – 94.0% | | | | Coupon / Maturity | | Face Amount | | | Market Value | | | Percentage of Net Assets | |
| | | | | | |
| | | Municipal Leases | | | | | | | | | | | | | |
| | | | | | | |
| | | Fremont Cnty ID Annual Approp COPS | | | | 4.00% due 09/01/2031 | | | $280,000 | | | | $296,138 | | | | 2.4% | |
| | | | | | | |
| | | Fremont Cnty ID Annual Approp COPS | | | | 4.00% due 09/01/2036 | | | 210,000 | | | | 215,147 | | | | 1.8% | |
| | | | | | | |
| | | Idaho Falls ID COPs | | | | 4.00% due 09/15/2028 | | | 310,000 | | | | 326,090 | | | | 2.7% | |
| | | | | | | |
| | | Idaho Falls ID COPS | | | | 4.00% due 09/15/2038 | | | 150,000 | | | | 151,854 | | | | 1.2% | |
| | | | | | | |
| | | Idaho St HLTH FACS ADA CNTY | | | | 4.00% due 09/01/2040 | | | 155,000 | | | | 152,471 | | | | 1.2% | |
| | | | | | | |
| | | Payette Cnty ID SCD#372 | | | | 4.00% due 09/15/2034 | | | 250,000 | | | | 254,956 | | | | 2.1% | |
| | | | | | | |
| | | | | | | | | | | | | 1,396,656 | | | | 11.4% | |
| | | | | | |
| | | Pollution Control | | | | | | | | | | | | | |
| | | | | | | |
| | | Idaho Bond Bank Authority | | | | 4.00% due 09/15/2032 | | | 130,000 | | | | 136,069 | | | | 1.1% | |
| | | | | | | |
| | | Idaho Bond Bank Authority | | | | 4.00% due 09/15/2033 | | | 135,000 | | | | 140,875 | | | | 1.1% | |
| | | | | | | |
| | | | | | | | | | | | | 276,944 | | | | 2.2% | |
| | | | | | |
| | | Real Estate | | | | | | | | | | | | | |
| | | | | | | |
| | | Idaho Fish & Wildlife Foundation Rev | | | | 5.00% due 12/01/2033 | | | 320,000 | | | | 351,958 | | | | 2.9% | |
| | | | | | | |
| | | Idaho Fish & Wildlife Foundation Rev | | | | 4.00% due 12/01/2036 | | | 200,000 | | | | 204,166 | | | | 1.7% | |
| | | | | | | |
| | | Idaho St HSG & FIN | | | | 2.25% due 07/01/2031 | | | 200,000 | | | | 179,015 | | | | 1.4% | |
| | | | | | | |
| | | | | | | | | | | | | 735,139 | | | | 6.0% | |
| | | | | | |
| | | State Education | | | | | | | | | | | | | |
| | | | | | | |
| | | Ada & Canyon ID SCH #3 Kuna | | | | 5.00% due 09/15/2030 | | | 25,000 | | | | 27,063 | | | | 0.2% | |
| | | | | | | |
| | | Boise State University ID Revenue | | | | 5.00% due 04/01/2028 | | | 125,000 | | | | 130,735 | | | | 1.1% | |
| | | | | | | |
| | | Boise State University ID Revenue | | | | 5.00% due 04/01/2032 | | | 160,000 | | | | 168,797 | | | | 1.4% | |
| | | | | | | |
| | | Idaho State University Revenue | | | | 4.00% due 04/01/2027 | | | 170,000 | | | | 175,022 | | | | 1.4% | |
| | | | | | | |
| | | Idaho State University Revenue | | | | 4.00% due 04/01/2030 | | | 245,000 | | | | 249,823 | | | | 2.0% | |
| | | | | | | |
| | | Idaho State University Revenue | | | | 3.00% due 04/01/2031 | | | 250,000 | | | | 233,077 | | | | 1.9% | |
| | | | | | | |
| | | Jefferson & Madison Cos. ID SCD#251 | | | | 5.00% due 09/15/2028 | | | 100,000 | | | | 112,042 | | | | 0.9% | |
| | | | | | | |
| | | Jefferson & Madison ID SCD #251 | | | | 5.00% due 09/15/2032 | | | 25,000 | | | | 27,866 | | | | 0.2% | |
| | | | | | | |
| | | Nez Perce CO ISD #1 Lewiston | | | | 5.00% due 09/15/2029 | | | 330,000 | | | | 359,030 | | | | 2.9% | |
| | | | | | | |
| | | North Idaho College Dormitory Rev | | | | 4.00% due 11/01/2030 | | | 285,000 | | | | 294,012 | | | | 2.4% | |
| | | | | | | |
| | | Univ of Idaho ID Revenues | | | | 4.00% due 04/01/2038 | | | 125,000 | | | | 128,058 | | | | 1.1% | |
| | | | | | | |
| | | University of Idaho Revenues | | | | 5.00% due 04/01/2038 | | | 150,000 | | | | 166,814 | | | | 1.4% | |
| | | | | | | |
| | | | | | | | | | | | | 2,072,339 | | | | 16.9% | |
| | | | | | |
| | | Water Supply | | | | | | | | | | | | | |
| | | | | | | |
| | | Payette Lakes Rec Wtr & Swr Rev | | | | 4.00% due 08/01/2032 | | | 195,000 | | | | 201,727 | | | | 1.6% | |
| | | | | | | |
| | | Payette Lakes Rec Wtr & Swr Rev | | | | 4.00% due 08/01/2034 | | | 255,000 | | | | 262,995 | | | | 2.1% | |
| | | | | | | |
| | | | | | | | | | | | | 464,722 | | | | 3.7% | |
| | | | | | |
| | | | | | | | | | | | | | | | | | |
| | | | | | | |
| | Total Municipal Bonds | | | | (Cost $11,940,768) | | | | | | | $11,524,283 | | | | 94.0% | |
| | | | | | |
| | | | | | | | | | | | | | | | | | |
| | | | | | | |
| | | Municipal Revenue Bonds – 2.5% | | | | Coupon / Maturity | | Face Amount | | | Market Value | | | Percentage of Net Assets | |
| | | | | | |
| | | Government Bonds | | | | | | | | | | | | | |
| | | | | | | |
| | | ID ST Hsg & Fin Assn Sales Tax Rev | | | | 5.00% due 08/15/2047 | | | $150,000 | | | | $162,480 | | | | 1.3% | |
| | | | | | | |
| | | ID St Hsg & Fin Assn Sales TX Rev | | | | 5.00% due 08/15/2042 | | | 125,000 | | | | 138,578 | | | | 1.2% | |
| | | | | | | |
| | Total Municipal Revenue Bonds | | | | (Cost $320,845) | | | | | | | $301,058 | | | | 2.5% | |
| | | | | | |
| | | | | | | | | | | | | | | | | | |
| | | | | | | |
| | Total investments | | | | (Cost $12,261,613) | | | | | | | $11,825,341 | | | | 96.5% | |
| | | | | | |
| | Other assets (net of liabilities) | | | | | | | | | | | 432,395 | | | | 3.5% | |
| | | | | | |
| | Total net assets | | | | | | | | | | | $12,257,736 | | | | 100.0% | |
| | | | | | | |
| | | | | | | | | | | | | | | | | | |
| | | | | | | | | | | | |
| | | | | | | |
| 8 | | | | | | | | November 30, 2022 | | Annual Report | | The accompanying notes are an integral part of these financial statements. |
| | | | | | | | | | | | |
Bond Quality Diversification | | | | | | | | | | | (unaudited) | |
| | |
| % of Total Net Assets | | | | | |
| | | |
AAA | | | 28.1% | | | ∎ | | | | | 
| |
AA+ | | | 22.6% | | | ∎ | | |
AA | | | 16.0% | | | ∎ | | |
AA- | | | 11.2% | | | ∎ | | |
A+ | | | 14.5% | | | ∎ | | |
A | | | 3.3% | | | ∎ | | |
Not Rated | | | 0.8% | | | ∎ | | |
Other Assets (net of liabilities) | | | 3.5% | | | ∎ | | |
| | | | | | |
|
| Credit ratings are the lesser of S&P Global Ratings or Moody’s Investors Service. If neither S&P nor Moody’s rate a particular security, that security is categorized as not rated (except for US Treasury securities and securities issued or backed by US agencies which inherit the credit rating for the US government). Ratings range from AAA (highest) to D (lowest). Bonds rated BBB or above are considered investment grade. Credit ratings BB and below are lower-rated securities (junk bonds). Ratings apply to the creditworthiness of the issuers of the underlying securities and not the Fund or its shares. Ratings may be subject to change. |
| | | | | | | | | | | | |
| | | | | | | |
| The accompanying notes are an integral part of these financial statements. | | Annual Report | | November 30, 2022 | | | | | | | | 9 |
Statement of Assets and Liabilities
| | | | |
| As of November 30, 2022 | |
| | |
| | | | |
| |
Assets | | | | |
| |
Investments in securities, at value
(Cost $12,261,613) | | | $11,825,341 | |
| |
Cash | | | 324,607 | |
| |
Interest receivable | | | 121,659 | |
| |
Prepaid expenses | | | 2,669 | |
| |
Other assets | | | 801 | |
| | | | |
| |
Total assets | | | 12,275,077 | |
| | | | |
| |
Liabilities | | | | |
| |
Accrued audit expenses | | | 5,921 | |
| |
Accrued advisory fees | | | 4,989 | |
| |
Distributions payable | | | 2,777 | |
| |
Payable for Fund shares redeemed | | | 1,505 | |
| |
Accrued printing fees | | | 792 | |
| |
Accrued other operating expenses | | | 549 | |
| |
Accrued Chief Compliance Officer expenses | | | 390 | |
| |
Accrued legal expenses | | | 229 | |
| |
Accrued retirement plan custody fee | | | 106 | |
| |
Accrued trustee expenses | | | 83 | |
| | | | |
| |
Total liabilities | | | 17,341 | |
| | | | |
| |
Net assets | | | $12,257,736 | |
| | |
| | | | |
| | |
Analysis of net assets | | | | |
| |
Paid-in capital (unlimited shares authorized, without par value) | | | $12,747,412 | |
| |
Total distributable earnings | | | (489,676 | ) |
| | | | |
| |
Net assets applicable to Fund shares outstanding | | | $12,257,736 | |
| | |
| | | | |
Fund shares outstanding | | | 2,364,263 | |
| | |
Net asset value, offering and redemption price per share | | | $5.18 | |
| | | | | |
Statement of Operations
| | | | |
| Year ended November 30, 2022 | |
| | |
| | | | |
| |
Investment income | | | | |
| |
Interest income | | | $338,901 | |
| | | | |
| |
Total investment income | | | 338,901 | |
| | | | |
| |
Expenses | | | | |
| |
Investment advisory fees | | | 68,955 | |
| |
Audit fees | | | 8,013 | |
| |
Filing and registration fees | | | 3,943 | |
| |
Trustee fees | | | 2,595 | |
| |
Legal fees | | | 2,273 | |
| |
Chief Compliance Officer expenses | | | 1,952 | |
| |
Transfer agent fees | | | 1,822 | |
| |
Other expenses | | | 1,716 | |
| |
Printing and postage expenses | | | 863 | |
| |
Custodian fees | | | 561 | |
| |
Retirement plan custodial fees | | | 110 | |
| | | | |
| |
Total gross expenses | | | 92,803 | |
| | | | |
| |
Less transfer agent fees waived | | | (1,822 | ) |
| |
Less custodian fee credits | | | (561 | ) |
| | | | |
| |
Net expenses | | | 90,420 | |
| | | | |
| |
Net investment income | | | $248,481 | |
| | |
| | | | |
| | |
| | | | |
| |
Net realized gain from investments | | | $2,999 | |
| |
Net decrease in unrealized appreciation on investments | | | (1,092,662 | ) |
| | | | |
| |
Net loss on investments | | | $(1,089,663 | ) |
| | |
| | | | |
| | |
Net decrease in net assets resulting from operations | | | $(841,182 | ) |
| | | | | |
| | | | | | | | | | | | |
| | | | | | | |
| 10 | | | | | | | | November 30, 2022 | | Annual Report | | The accompanying notes are an integral part of these financial statements. |
| | | | | | | | |
Statement of Changes of Net Assets | | | Year ended November 30, 2022 | | | | Year ended November 30, 2021 | |
| | | |
Decrease in net assets from operations | | | | | | | | |
| | |
From operations | | | | | | | | |
| | |
Net investment income | | | $248,481 | | | | $256,237 | |
| | |
Net realized gain on investment | | | 2,999 | | | | 27,674 | |
| | |
Net decrease in unrealized appreciation | | | (1,092,662 | ) | | | (211,219 | ) |
| | | | | | | | |
| | |
Net increase (decrease) in net assets | | | (841,182 | ) | | | 72,692 | |
| | | | | | | | |
| | |
| | | | | | | | |
| | |
Distributions to shareholders | | | (248,471 | ) | | | (256,226 | ) |
| | |
| | | | | | | | |
| | |
Capital share transactions | | | | | | | | |
| | |
Proceeds from sales of shares | | | 1,072,740 | | | | 1,605,737 | |
| | |
Value of shares issued in reinvestment of dividends | | | 216,054 | | | | 221,011 | |
| | |
Cost of shares redeemed | | | (2,829,281 | ) | | | (1,735,159 | ) |
| | | | | | | | |
| | |
Total capital share transactions | | | (1,540,487 | ) | | | 91,589 | |
| | | | | | | | |
| | |
Total decrease in net assets | | | (2,630,140 | ) | | | (91,945 | ) |
| | | |
| | | | | | | | |
| | | |
Net assets | | | | | | | | |
| | |
Beginning of year | | | 14,887,876 | | | | 14,979,821 | |
| | |
End of year | | | $12,257,736 | | | | $14,887,876 | |
| | | |
| | | | | | | | |
| | | |
Shares of the Fund sold and redeemed | | | | | | | | |
| | |
Number of shares sold | | | 200,745 | | | | 286,094 | |
| | |
Number of shares issued in reinvestment of dividends | | | 41,059 | | | | 39,403 | |
| | |
Number of shares redeemed | | | (545,627 | ) | | | (308,540 | ) |
| | | | | | | | |
| | |
Net increase (decrease) in number of shares outstanding | | | (303,823 | ) | | | 16,957 | |
| | | |
| | | | | | | | |
| | | | | | | | | | | | | | | | | | | | |
Financial Highlights | | | For the year ended November 30, | |
| | | | | |
Selected data per share of outstanding capital stock throughout each year: | | | 2022 | | | | 2021 | | | | 2020 | | | | 2019 | | | | 2018 | |
| | | | | | |
Net asset value at beginning of year | | | $5.58 | | | | $5.65 | | | | $5.55 | | | | $5.28 | | | | $5.37 | |
| | | | | |
Income from investment operations | | | | | | | | | | | | | | | | | | | | |
| | | | | |
Net investment income | | | 0.10 | | | | 0.10 | | | | 0.10 | | | | 0.11 | | | | 0.12 | |
| | | | | |
Net gains (losses) on securities (both realized & unrealized) | | | (0.40 | ) | | | (0.07 | ) | | | 0.10 | | | | 0.27 | | | | (0.09 | ) |
| | | | | | | | | | | | | | | | | | | | |
| | | | | |
Total from investment operations | | | (0.30 | ) | | | 0.03 | | | | 0.20 | | | | 0.38 | | | | 0.03 | |
| | | | | | | | | | | | | | | | | | | | |
| | | | | |
Less distributions | | | | | | | | | | | | | | | | | | | | |
| | | | | |
Dividends (from net investment income) | | | (0.10 | ) | | | (0.10 | ) | | | (0.10 | ) | | | (0.11 | ) | | | (0.12 | ) |
| | | | | | | | | | | | | | | | | | | | |
| | | | | |
Total distributions | | | (0.10 | ) | | | (0.10 | ) | | | (0.10 | ) | | | (0.11 | ) | | | (0.12 | ) |
| | | | | | | | | | | | | | | | | | | | |
| | | | | |
| | | | | | | | | | | | | | | | | | | | |
| | | | | |
Net asset value at end of year | | | $5.18 | | | | $5.58 | | | | $5.65 | | | | $5.55 | | | | $5.28 | |
| | | | | | |
Total return | | | (5.47)% | | | | 0.51% | | | | 3.67% | | | | 7.30% | | | | 0.51% | |
| | | | | | | | | | | | | | | | | | | | |
| | | | | | |
Ratios / supplemental data | | | | | | | | | | | | | | | | | | | | |
| | | | | |
Net assets ($000), end of year | | | $12,258 | | | | $14,888 | | | | $14,980 | | | | $13,487 | | | | $13,554 | |
| | | | | |
Ratio of expenses to average net assets | | | | | | | | | | | | | | | | | | | | |
| | | | | |
Before transfer agent fee waiver and custodian fee credits | | | 0.67% | | | | 0.67% | | | | 0.72% | | | | 0.69% | | | | 0.68% | |
| | | | | |
After transfer agent fee waiver | | | 0.66% | | | | 0.66% | | | | 0.71% | | | | 0.67% | | | | 0.67% | |
| | | | | |
After transfer agent fee waiver and custodian fee credits | | | 0.66% | | | | 0.66% | | | | 0.71% | | | | 0.67% | | | | 0.67% | |
| | | | | |
Ratio of net investment income after fee waiver and custodian credits to average net assets | | | 1.80% | | | | 1.75% | | | | 1.82% | | | | 2.07% | | | | 2.20% | |
| | | | | |
Portfolio turnover rate | | | 12% | | | | 9% | | | | 5% | | | | 4% | | | | 13% | |
| | | | | | |
| | | | | | | | | | | | | | | | | | | | |
| | | | | | | | | | | | |
| | | | | | | |
| The accompanying notes are an integral part of these financial statements. | | Annual Report | | November 30, 2022 | | | | | | | | 11 |
| | |
| Notes To Financial Statements | | |
Note 1 – Organization
Saturna Investment Trust (the “Trust”) was established under Washington State Law as a business trust on February 20, 1987. The Trust is registered as an open-end, diversified management company under the Investment Company Act of 1940, as amended. In addition to Idaho Tax-Exempt Fund (the “Fund”), eight portfolios have been created to date: Sextant Short-Term Bond Fund, Sextant Bond Income Fund, Sextant Core Fund, Sextant Global High Income Fund, Sextant Growth Fund, Sextant International Fund, Saturna Sustainable Equity Fund, and Saturna Sustainable Bond Fund (each, a “Fund”, and collectively, the “Funds”). The other eight portfolios are distributed through separate prospectuses and the results of those Funds are contained in separate reports.
The Idaho Tax-Exempt Fund was first authorized to sell shares of beneficial interest on September 4, 1987.
The Fund is an investment company and accordingly follows the investment accounting and reporting guidance of the Financial Accounting Standards Board (FASB) Accounting Standard Codification Topic 946 “Financial Services – Investment Companies.”
Investment risks:
The value of Fund shares rises and falls as the value of the bonds in which the Fund invests goes up and down. The risks inherent in the Fund depend primarily on the terms and quality of the obligations in the Fund’s portfolio, as well as on market conditions. When interest rates rise, bond prices fall. When interest rates fall, bond prices go up. Bonds with longer maturities, such as those held by the Fund, usually are more sensitive to interest rate changes than bonds with shorter maturities. Only consider investing in the Fund if you are willing to accept the risk that you may lose money.
The Fund entails credit risk, which is the possibility that a bond will not be able to pay interest or principal when due. If the credit quality of a bond is perceived to decline, investors will demand a higher yield, which means a lower price on that bond to compensate for the higher level of risk. If a security held by the Fund defaults on payment of interest or principal, the Fund’s income, ability to preserve capital, and liquidity would all be adversely affected.
Fund investments are susceptible to factors adversely affecting Idaho, such as political, economic, and financial trends unique to this relatively small state. Investing only in Idaho bonds means that the Fund’s investments are more concentrated than other mutual funds, and relatively few bond price changes may lead to underperformance compared to investments selected in greater number and/or from a wider universe.
The Fund is vulnerable to income tax rate changes, either at the Idaho or federal level, since part of municipal securities’ value is derived from the recipient’s ability to exclude interest payments from taxation.
Note 2 – Significant Accounting Policies
The following is a summary of the significant accounting policies, in conformity with accounting principles generally accepted in the United States of America, which are consistently followed by the Fund in the preparation of its financial statements.
Security valuation:
Debt securities are valued using bid-side valuations provided by an independent service. The service determines valuations using factors such as yields or prices of bonds of comparable quality, type of issue, coupon maturity, ratings, trading activity, and general market conditions. In the absence of a valuation from an independent service for a security, a fair value for such security is determined in good faith by or under the direction of the Board of Trustees.
Security transactions are recorded on trade date. Realized gains and losses on sales of securities are recorded on the identified cost basis.
Share valuation:
The net asset value (“NAV”) per share of the Fund is calculated by dividing the sum of the value of the securities held by the Fund, plus cash and other assets, minus all liabilities (including estimated accrued expenses) by the total number of shares outstanding for the Fund, rounded to the nearest cent. The Fund’s shares are not priced or traded on days the New York Stock Exchange is closed. The NAV is the offering and redemption price per share.
The Trustees have adopted certain policies and procedures with respect to frequent trading of Fund shares. The Fund is intended for long-term investment and does not permit rapid trading of its shares. The Fund cannot always identify all intermediaries, or detect or prevent trading that violates the Frequent Trading Policy through intermediaries or omnibus accounts.
Fair value measurements:
Accounting Standards Codification (ASC) 820 establishes a three-tier framework for measuring fair value based on a hierarchy of inputs. The hierarchy distinguishes between market data obtained from independent sources (observable inputs) and the Fund’s own market assumptions (unobservable inputs). These inputs are used in determining the value of the Fund’s investments and are summarized below.
| | Level 1 — | Unadjusted quoted prices in active markets for identical assets or liabilities that the Trust has the ability to access. |
| | Level 2 — | Observable inputs other than quoted prices in Level 1 that are observable for the asset or liability, either directly or indirectly. These inputs may include quoted prices for the identical instrument on an inactive market, prices for similar instruments, interest rates, prepayment speeds, credit risk, yield curves, default rates, and similar data. |
| | Level 3 — | Unobservable inputs for the asset or liability, to the extent relevant observable inputs are not available, representing the Trust’s own assumptions about the assumptions a market participant would use in valuing the asset or liability, and would be based on the best information available. |
| | | | | | | | | | |
| | | | | | |
| 12 | | | | | | | | November 30, 2022 | | Annual Report |
| | |
| Notes To Financial Statements (continued) | | |
The following table is a summary of the inputs used as of November 30, 2022, in valuing the Fund’s investments carried at value.
| | | | | | | | | | | | | | | | |
| | | | | |
| Fair Value Inputs | | Level 1 Quoted Price | | | Level 2 Significant Observable Input | | | Level 3 Significant Unobservable Input | | | Total | |
| | | | |
Municipal Bonds1 | | | $- | | | | $11,524,283 | | | | $- | | | | $11,524,283 | |
| | | | |
Municipal Revenue Bonds1 | | | $- | | | | $301,058 | | | | $- | | | | $301,058 | |
| | | | |
Total Assets | | | $- | | | | $11,825,341 | | | | $- | | | | $11,825,341 | |
| | | | | | | | | | | | | | | | | |
| ¹ | See Schedule of Investments for industry breakout. |
The availability of observable inputs can vary from security to security and is affected by a wide variety of factors, including, for example, the type of security, whether the security is new and not yet established in the marketplace, the liquidity of markets, and other characteristics particular to the security. To the extent that valuation is based on models or inputs that are less observable or unobservable in the market, the determination of fair value requires more judgment. Accordingly, the degree of judgment exercised in determining fair value is greatest for instruments categorized in Level 3.
The inputs used to measure fair value may fall into different levels of the fair value hierarchy. In such cases, for disclosure purposes, the level in the fair value hierarchy within which the fair value measurement falls in its entirety, is determined based on the lowest level input that is significant to the fair value measurement in its entirety.
The inputs or methodology used for valuing securities are not necessarily an indication of the risks associated with investing in those securities.
Income taxes:
The Fund intends to comply with the requirements of the Internal Revenue Code necessary to qualify as a regulated investment company and to make the requisite distributions of income and capital gains to its shareowners sufficient to relieve it from all or substantially all federal income taxes. As the Fund intends to meet requirements for tax-exempt income dividends, and the requirements of the Idaho Department of Revenue for income dividends exempt from Idaho state income tax, no income tax provisions are required. The Fund recognizes the tax benefits of uncertain tax positions only where the position is “more likely than not” to be sustained assuming examination by tax authorities. Management has analyzed the Fund’s tax positions and has concluded that no liability for unrecognized tax benefits should be recorded related to uncertain tax positions taken on returns filed for open tax years (2019 – 2021), or expected to be taken in the Fund’s 2022 tax return. The Fund identifies its major tax jurisdiction as US federal and foreign jurisdictions where the Fund makes significant investments; however, the Fund is not aware of any tax positions for which it is reasonably possible that the total amounts of unrecognized tax benefits will change materially in the next 12 months.
Reclassification of capital accounts:
Accounting principles generally accepted in the United States of America require that certain components of net assets relating to permanent differences be reclassified between financial and tax reporting.
As of November 30, 2022, there were no reclassifications to the capital accounts.
Distributions to shareowners:
The Fund’s dividends to shareowners from net investment income are paid daily and distributed on the last business day of each month. Distributions of capital gains, if any, are made at least annually and as required to comply with federal excise tax requirements. Distributions to shareowners are determined in accordance with income tax regulations and are recorded on the ex-dividend date. Dividends are paid in shares of the Fund, at the net asset value on the payable date. Shareowners may elect to take distributions in cash if they total $10 or more.
Use of estimates:
The preparation of financial statements in conformity with accounting principles generally accepted in the United States of America requires management to make estimates and assumptions that affect the reported amounts of assets and liabilities and disclosure of contingent assets and liabilities at the date of the financial statements and the reported amounts of increases and decreases in net assets from operations during the reporting period. Actual results could differ from those estimates.
| | | | | | | | | | |
| | | | | | |
| Annual Report | | November 30, 2022 | | | | | | | | 13 |
| | |
| Notes To Financial Statements (continued) | | |
LIBOR Transition Risk:
A Fund may invest in certain debt securities or other financial instruments that utilize the London Interbank Offered Rate (“LIBOR”) as a benchmark or reference rate for various interest rate calculations. LIBOR may be a significant factor in determining the cost of financing to a Fund or an investment’s value or return to a Fund, and may be used in other ways that affect a Fund’s investment performance. Publication of LIBOR benchmarks for most maturities and currencies ceased as of December 31, 2021, and publication of the remaining benchmarks is scheduled to be phased out on June 30, 2023. It is anticipated that financial instruments, such as certain floating rate bonds, that currently utilize LIBOR will transition to using the Secured Overnight Financing Rate (“SOFR”), which is a broad measure of the cost of overnight borrowings secured by US Treasury securities. However, various counterparties or other entities may be unwilling or unable to utilize SOFR or may be unable to modify existing agreements or instruments in a timely manner. The transition from LIBOR to SOFR (or any other replacement rate) may lead to a reduction in the value of some LIBOR-based investments, as well as significant market uncertainty, increased volatility, and illiquidity in markets for various instruments, which may result in prolonged adverse market conditions and impact a Fund’s performance or NAV.
Other:
Interest income is recognized on an accrual basis. Premiums on securities purchased are amortized and discounts are accreted using the yield to maturity method over the lives of the respective securities or where applicable, to the first call date of the securities with premiums.
Recent Accounting Pronouncement:
In December 2020, the Securities and Exchange Commission (“SEC”) adopted Rule 2a-5 under the 1940 Act, which establishes requirements for determining fair value in good faith for purposes of the 1940 Act, including related oversight and reporting requirements. The rule also defines when market quotations are “readily available” for purposes of the 1940 Act, the threshold for determining whether a fund must fair value a security. The SEC also adopted new Rule 31a-4 under the 1940 Act, which sets forth the recordkeeping requirements associated with fair value determinations. Finally, the SEC is rescinding previously issued guidance on related issues, including the role of a board in determining fair value and the accounting and auditing of fund investments. Rule 2a-5 and Rule 31a-4 became effective on March 8, 2021, with a compliance date of September 8, 2022. The Fund is in compliance with Rule 2a-5.
Note 3 – Transactions with Affiliated Persons
Under a contract approved by shareowners on September 28, 1995 and reviewed and approved annually by the Trust’s Board of Trustees, including those Trustees who are not parties to the contract or “interested persons” (as defined in the Investment Company Act of 1940) of such parties or the Trust (the “Independent Trustees”), Saturna Capital Corporation (“Saturna Capital”) provides investment advisory services and certain other administrative and distribution services to conduct the Fund’s business. For such services, the Fund pays an annual fee equal to 0.50% of its average daily net assets. For the fiscal year ended November 30, 2022, the Fund incurred advisory fee expenses of $68,955.
Expenses incurred by the Trust on behalf of the Fund (e.g., legal fees) are allocated to the Fund and the other Funds of the Trust on the basis of relative daily average net assets.
Saturna Capital also acts as transfer agent for the Fund, for which it did not receive any compensation during the fiscal year ended November 30, 2022. Saturna Capital has voluntarily elected to waive the transfer agent fee through November 30, 2023, to reduce the Fund’s operating expenses. Such fees, had they been charged, would have totaled $1,822.
Saturna Brokerage Services, Inc. (“SBS”), a discount brokerage and subsidiary of Saturna Capital, is registered as a broker-dealer and acts as distributor for the Fund.
Saturna Trust Company (“STC”), a subsidiary of Saturna Capital, acts as a retirement plan custodian for Fund shareowners. For the fiscal year ended November 30, 2022, the Fund incurred retirement plan custodial fees of $110.
Mrs. Jane Carten serves as a trustee and president of the Trust. She is also a director and the president of Saturna Capital and Saturna Trust Company. She is not compensated by the Trust. For the fiscal year ended November 30, 2022, the Saturna Investment Trust incurred $47,605 of total expenses for the independent Trustee’s compensation and Trusst board meetings. The Fund’s allocation of these expenses was $2,595.
The officers of the Trust are paid by Saturna Capital, not the Trust, except the Chief Compliance Officer, who is partially compensated by the Trust. For the fiscal year ended November 30, 2022, the Fund’s allocation of these expenses was $1,952.
On November 30, 2022, the trustees, officers, and their immediate families as a group directly or indirectly owned 16.17% of the outstanding shares of the Fund.
| | | | | | | | | | |
| | | | | | |
| 14 | | | | | | | | November 30, 2022 | | Annual Report |
| | |
| Notes To Financial Statements (continued) | | |
Note 4 – Distributions to Shareowners
The tax characteristics of distributions paid during the fiscal years ended November 30, 2022, and November 30, 2021, were as follows:
| | | | | | | | |
| | | |
| | | Year ended
November 30, 2022 | | | Year ended
November 30, 2021 | |
| |
| | |
Tax-exempt income | | | $248,471 | | | | $256,226 | |
| | |
Taxable income | | | $- | | | | $- | |
Note 5 – Federal Income Taxes
The cost basis of investments for federal income tax purposes as of November 30, 2022 were as follows:
| | | | |
| | |
Cost of investments | | | $12,261,613 | |
| | | | |
| |
Gross unrealized appreciation | | | $40,028 | |
| |
Gross unrealized depreciation | | | $(476,300 | ) |
| | | | |
| |
Net unrealized depreciation | | | $(436,272 | ) |
As of November 30, 2022, the components of distributable earnings on a tax basis were as follows:
| | | | |
| | |
Undistributed tax exempt income | | | $3,880 | |
| |
Accumulated capital loss | | | $(57,284 | ) |
| |
Unrealized depreciation | | | $(436,272 | ) |
| | | | |
| |
Total accumulated earnings | | | $(489,676 | ) |
As of November 30, 2022, the Fund had capital loss carryforwards as follows, subject to regulation.
| | | | | | | | |
| | |
| | | | Carryforward | | | | Expiration | |
| | |
Short-term loss carryforward | | | $55,441 | | | | Unlimited | |
| | |
Long-term loss carryforward | | | $1,843 | | | | Unlimited | |
| | |
| | | | $57,284 | | | | | |
Note 6 – Investments
During the year ended November 30, 2022, the Fund purchased $1,559,083 of securities and sold/matured $2,295,000 of securities.
Note 7 – Custodian
Under the agreement in place with UMB Bank, custody fees are reduced by credits for cash balances. Such reduction for the year ended November 30, 2022, amounted to $561.
Note 8 – COVID-19 Pandemic
The global outbreak of COVID-19 (commonly referred to as “coronavirus”) has disrupted economic markets and the prolonged economic impact is uncertain. Although vaccines for COVID-19 are becoming more widely available, the ultimate economic fallout from the pandemic, amid the spread of COVID-19 variants, and the long-term impact on economies, markets, industries and individual companies are not known. The operational and financial performance of individual companies and the market in general depends on future developments, including the duration and spread of any future outbreaks and the pace of recovery which may vary from market to market, and such uncertainty may in turn adversely affect the value and liquidity of the Fund’s investments, impair the Fund’s ability to satisfy redemption requests, and negatively impact the Fund’s performance.
Note 9 – Subsequent Events
In preparing these financial statements, the Funds have evaluated events and transactions for potential recognition or disclosure through the date the financial statements were issued.
There were no other events or transactions during the period that materially impacted the amounts or disclosures in the Funds’ financial statements.
| | | | | | | | | | |
| | | | | | |
| Annual Report | | November 30, 2022 | | | | | | | | 15 |
Report of Independent Registered Public Accounting Firm
To the Board of Trustees of
Saturna Investment Trust
and the Shareholders of Idaho Tax-Exempt Fund,
Opinion on the Financial Statements
We have audited the accompanying statement of assets and liabilities of Idaho Tax-Exempt Fund, (the “Fund”), a series of Saturna Investment Trust, including the schedule of investments, as of November 30, 2022, the related statement of operations for the year then ended, the statements of changes in net assets for each of the two years in the period then ended, the financial highlights for each of the five years in the period then ended, and the related notes (collectively referred to as the “financial statements”). In our opinion, the financial statements present fairly, in all material respects, the financial position of the Fund as of November 30, 2022, the results of its operations for the year then ended, the changes in its net assets for each of the two years in the period then ended and its financial highlights each of the five years in the period then ended, in conformity with accounting principles generally accepted in the United States of America.
Basis for Opinion
These financial statements are the responsibility of the Fund’s management. Our responsibility is to express an opinion on the Fund’s financial statements based on our audits. We are a public accounting firm registered with the Public Company Accounting Oversight Board (United States) (“PCAOB”) and are required to be independent with respect to the Fund in accordance with the U.S. federal securities laws and the applicable rules and regulations of the Securities and Exchange Commission and the PCAOB. We have served as the auditor of one or more of the funds in the Trust since 1997.
We conducted our audits in accordance with the standards of the PCAOB. Those standards require that we plan and perform the audits to obtain reasonable assurance about whether the financial statements are free of material misstatement, whether due to error or fraud. The Fund is not required to have, nor were we engaged to perform, an audit of its internal control over financial reporting. As part of our audits we are required to obtain an understanding of internal control over financial reporting, but not for the purpose of expressing an opinion on the effectiveness of the Fund’s internal control over financial reporting. Accordingly, we express no such opinion.
Our audits included performing procedures to assess the risks of material misstatement of the financial statements, whether due to error or fraud, and performing procedures that respond to those risks. Such procedures included examining, on a test basis, evidence regarding the amounts and disclosures in the financial statements. Our audits also included evaluating the accounting principles used and significant estimates made by management, as well as evaluating the overall presentation of the financial statements. Our procedures included confirmation of securities owned as of November 30, 2022 by correspondence with the custodian. We believe that our audits provide a reasonable basis for our opinion.
Philadelphia, Pennsylvania
January 27, 2023
/s/ Tait, Weller & Baker LLP
Tait, Weller & Baker LLP
| | | | | | | | | | |
| | | | | | |
| 16 | | | | | | | | November 30, 2022 | | Annual Report |
All mutual funds have operating expenses. As an Idaho Tax-Exempt Fund shareowner, you incur ongoing costs, including management fees and other fund expenses such as shareowner reports (like this one). Operating expenses, which are deducted from a fund’s gross earnings, directly reduce the investment return of a fund. Mutual funds (unlike other financial investments) only report their results after deduction of operating expenses.
With the Idaho Tax-Exempt Fund, unlike many mutual funds, you do not incur sales charges (loads) on purchases, reinvested dividends, or other distributions. You do not incur redemption fees or exchange fees. You may incur fees related to extra services requested by you for your account, such as bank wires. The examples below are intended to help you understand your ongoing costs (in dollars) of investing in the Fund and to compare these costs with the ongoing costs of investing in other mutual funds.
Example
The following example is based on an investment of $1,000 invested at the beginning of the period and held for the entire period (June 1, 2022, to November 30, 2022).
Actual Expenses
The first line provides information about actual account values and actual expenses. You may use the information in this line, together with the amount you have invested, to estimate the expenses that you paid over the period. Simply divide your account value by $1,000 (for example, an $8,600 account value divided by $1,000 = 8.6), then multiply the result by the number in the first line under the heading entitled “Expenses Paid During Period” to estimate the expenses you paid on your account during this period. The Fund may charge for extra services (such as domestic bank wires, international bank wires, or overnight courier delivery of redemption checks) rendered on request, which you may need to estimate to determine your total expenses.
Hypothetical Example for Comparison Purposes
The second line provides information about hypothetical account values and hypothetical expenses based on the Fund’s actual expense ratio (based on the last six months) and an assumed rate of return of 5% per year before expenses, which is not the Fund’s actual return. The hypothetical account values and expenses may not be used to estimate the actual ending account balance or expenses you paid for the period. You may use this information to compare the ongoing costs of investing in the Fund and other mutual funds. To do so, compare this 5% hypothetical example with the 5% hypothetical examples that appear in the shareowner reports of other mutual funds. You may wish to add other fees that are not included in the expenses shown in the table, such as charges for extra services like bank wires.
Please note that the expenses shown are meant to highlight your ongoing costs only and do not reflect any transactional costs, such as sales charges (loads), redemption fees, or exchange fees (note that the Idaho Tax-Exempt Fund does not charge any such transactional costs). Therefore, the “Hypothetical” line is useful in comparing ongoing costs only, and may not help you determine the relative total costs of owning different funds.
| | | | | | | | | | | | | | | | |
| | | | | |
| | | Beginning Account Value [June 1, 2022] | | | Ending Account Value [November 30, 2022] | | | Expenses Paid
During Period1 | | | Annualized
Expense Ratio | |
| | | | |
Actual | | | $1,000.00 | | | | $994.00 | | | | $3.37 | | | | 0.67% | |
| | | | |
Hypothetical (5% return before expenses) | | | $1,000.00 | | | | $1,021.69 | | | | $3.42 | | | | 0.67% | |
| 1 | Expenses are equal to Idaho Tax-Exempt Bond Fund’s annualized expense ratio of 0.65% (based on the most recent semi-annual period of June 1, 2022 through November 30, 2022) multiplied by the average account value over the period multiplied by 183/365 (to reflect the one-half year period). |
| | | | | | | | | | |
| | | | | | |
| Annual Report | | November 30, 2022 | | | | | | | | 17 |
| | |
| Trustees and Officers | | (unaudited) |
| | | | | | | | |
| | | | |
| Name, Address, and Age | | Position(s) Held with Trust and
Number of Saturna Fund
Portfolios Overseen | | Principal occupation(s) during past
5 years, including Directorships | | Other
Directorships
held by Trustee |
|
Independent Trustees |
| | | | |
(photo omitted) | | Marina E. Adshade (55) 1300 N. State Street Bellingham WA 98225 | | Independent Trustee (since 2017); Nine | | Professor of Economics, University of British Columbia, Vancouver; Author | | None |
| | | | |
(photo omitted) | | Ronald H. Fielding, MA, MBA, CFA (73) 1300 N. State Street Bellingham WA 98225 | | Independent Trustee (since 2009); Thirteen | | Director, ICI Mutual Insurance Company | | Amana Mutual Funds Trust |
| | | | |
(photo omitted) | | Gary A. Goldfogel, MD (64) 1300 N. State Street Bellingham WA 98225 | | Chairman (since 2017); Independent Trustee (since 1995); Nine | | Medical Examiner (pathologist) | | None |
| | | | |
(photo omitted) | | Jim V. McKinney (61) 1300 N. State Street Bellingham WA 98225 | | Independent Trustee (since 2017); Nine | | President/CEO, Apple Mountain LLC, consulting and development; Former US Army Foreign Area Officer | | None |
| | | | |
(photo omitted) | | Sarah E.D. Rothenbuhler (54) 1300 N. State Street Bellingham WA 98225 | | Independent Trustee (since 2017); Nine | | CEO, Birch Equipment (industrial rentals and sales) | | None |
|
Interested Trustee |
| | | | |
(photo omitted) | | Jane K. Carten, MBA (47) 1300 N. State Street Bellingham WA 98225 | | President, Trustee (since 2017); Nine | | President and Director, Saturna Capital Corporation Vice President and Director, Saturna Trust Company President, Saturna Brokerage Services | | None |
| | | | | | | | | | |
| | | | | | |
| 18 | | | | | | | | November 30, 2022 | | Annual Report |
| | |
| Trustees and Officers (continued) | | (unaudited) |
| | | | | | | | |
| | | | |
| Name (Age) and Address | | Position(s) held with Trust and
Number of Saturna Fund
Portfolios Overseen | | Principal occupation(s) during past
5 years, including Directorships | | Other
Directorships
held by Trustee |
|
Officers Who Are Not Trustees |
| | | | |
(photo omitted) | | Bryce R. Fegley (47) 1300 N. State Street Bellingham, WA 98225 | | Vice President (since 2020); N/A | | Portfolio Manager and Senior Investment Analyst, Saturna Capital | | N/A |
| | | | |
(photo omitted) | | Christopher R. Fankhauser (50) 1300 N. State Street Bellingham, WA 98225 | | Treasurer1 (since 2002); N/A | | Chief Operations Officer, Saturna Capital Corporation Vice President and Chief Operations Officer, Saturna Brokerage Services Director, Vice President, and Chief Operations Officer, Saturna Trust Company | | N/A |
| | | | |
(photo omitted) | | Michael E. Lewis (61) 1300 N. State Street Bellingham, WA 98225 | | Chief Compliance Officer1 (since 2012); N/A | | Chief Compliance Officer, Saturna Capital, Saturna Trust Company, and Affiliated Funds | | N/A |
| | | | |
(photo omitted) | | Jacob A. Stewart (42) 1300 N. State Street Bellingham, WA 98225 | | Anti-Money Laundering Officer1 (since 2015); N/A | | Anti-Money Laundering Officer, Saturna Capital Corporation, Saturna Brokerage Services Chief Compliance Officer, Saturna Brokerage Services Bank Secrecy Act Officer, Saturna Trust Company | | N/A |
| | | | |
(photo omitted) | | Elliot S. Cohen (59) 1300 N. State Street Bellingham, WA 98225 | | Secretary (since 2022); N/A | | Chief Legal Officer, Saturna Capital Corporation; Former Associate General Counsel for Russell Investments | | N/A |
Term of Office: each Trustee serves for the lifetime of the Trust or until they die, resign, are removed, or not re-elected by the shareowners. Each officer serves a one-year term subject to annual reappointment by the Trustees.
The Trust’s Statement of Additional Information, available without charge upon request by calling Saturna Capital at 1-800-728-8762 and on the Funds’ website, www.idahotaxexemptfund.com, includes additional information about the Trustees.
On November 30, 2022 the Trustees, officers, and their related accounts as a group owned 16.17% of the outstanding shares of the Fund.
During the year ended November 30, 2022, the Independent Trustees were each paid by the Trust: (1) $2,000 annual retainer plus $1,000 per board meeting attended (in person or by phone), plus reimbursement of travel expenses; (2) $250 for committee meetings; and (3) $250 per quarter for serving as chariman of the board or any committee.
Mrs. Carten is an Interested Trustee by reason of her positions with the Trust’s adviser (Saturna Capital Corporation) and underwriter (Saturna Brokerage Services), and is the primary manager of the Saturna Sustainable Equity Fund portfolio. She is paid by Saturna Capital a salary, plus a bonus for each month the Saturna Sustainable Equity Fund portfolio earns a 4 or 5 star rating from Morningstar (see www.saturna.com). The officers are paid by Saturna Capital and not the Trust. As of November 30, 2022, all Saturna Capital employees listed above as officers owned shares in one or more of the Saturna Investment Trust funds, with Mrs. Carten owning (directly or indirectly) over $1.55 million.
| 1 | Holds the same postion with Amana Mututal Funds Trust |
| | | | | | | | | | |
| | | | | | |
| Annual Report | | November 30, 2022 | | | | | | | | 19 |
| | |
| Renewal of Investment Advisory Contract | | (unaudited) |
During their meeting of September 13, 2022, the Trustees of Saturna Investment Trust (the “Board” or “Trustees”), including the Independent Trustees, discussed the continuance of the Investment Advisory and Administrative Services Agreement (“Agreement”) between the Trust, on behalf of the Fund, and Saturna Capital. In considering the renewal of the Agreement, the Board, including the Independent Trustees, considered the factors it deemed relevant, including the nature, quality and extent of services provided, the performance of each Fund, expenses and fees, the profitability of Saturna, the potential for economies of scale that may be shared with each Fund and its shareholders as each Fund’s assets grow, and any other benefits derived by Saturna from its relationship with the Funds. In their deliberations, the Trustees did not identify any single factor which alone was responsible for the decision to approve the agreements, and each Trustee may have given different weights to different factors, and, thus, each Trustee may have had a different basis for his or her decision.
The Trustees considered Saturna Capital’s specific responsibilities in all aspects of day-to-day management of the Fund as well as the qualifications, experience and responsibilities of the Fund’s portfolio manager and other key personnel at Saturna Capital. The Trustees discussed Saturna Capital’s experience, ability, and commitment to quality service through performing internally such functions as shareowner servicing, administration, accounting, marketing, and distribution – all in addition to investment management. The Trustees took into consideration Saturna Capital’s continued avoidance of significant operational and compliance problems, plus its continued investments in infrastructure, information management systems, personnel, training, compliance, and investor education materials, all designed to provide high quality investor services and meet investor needs. They recognized Saturna Capital’s efforts to recruit and retain qualified and experienced staff and improve the capital base on which Saturna Capital operates, which the Trustees believe is important to the long-term success of the Fund. They considered Saturna Capital’s focus on investors and its efforts to avoid potential conflicts of interest.
The Trustees considered the investment performance of the Fund over time, including the Fund’s average annual total returns relative to its benchmark for the one-, three-, five-, ten-, and fifteen year periods, all as of July 31, 2022. The Trustees also considered comparative performance information from Morningstar Inc. (“Morningstar”), which provides independent analysis of mutual fund data and, among other things, ranks mutual fund performance within categories comprised of similarly managed funds. The Trustees considered and discussed the Fund’s performance relative to its Morningstar category for the one-, three-, five-, ten-, and fifteen-year periods ended July 31, 2022. The Trustees also considered the Fund’s Morningstar overall performance rating (three stars), and the Fund’s performance rating relative to the Fund’s category selected by and Thomas Reuters Lipper (“Lipper”), as of July 31, 2022, noting that its Lipper total return rating was four on a scale of one to five, with five as the highest rating.
With respect to long-term performance, the Trustees found that the Fund was in the second quartile for its Morningstar category for the 10- and 15-year periods. The Trustees also considered the short- and medium-term performance of the Fund, noting that the Fund was in the first quartile for its Morningstar category for the one-, three- and five-year periods. The Trustees noted the risk-averse investment style of the Fund and other factors which can affect the Fund’s performance relative to its broader Morningstar category. The Trustees also noted certain differences between the Fund and the peer funds within its Morningstar category, including differences in investment strategies and asset size. The Trustees found that Saturna Capital continued to manage the Fund in a manner that is designed to be risk-averse and attractive to long- term investors. The Trustees discussed and considered the efforts of Saturna Capital to make additional resources available to assist in managing the Fund. The Trustees also considered Saturna Capital’s focus on improving investment performance without incurring materially higher levels of risk.
The Trustees also considered the performance and expenses of the Fund as compared to another Idaho municipal bond fund. The Trustees considered these comparative performance and expense data, along with the comparative data published by Morningstar and the Fund’s performance relative to its benchmark, to evaluate the Fund’s performance over near-term and long-term time periods.
The Trustees also reviewed the fees and expenses of the Fund, including comparative data on fees and expenses published by Morningstar, and considered the components of the Fund’s operating expenses. The Trustees noted the steps that Saturna Capital has undertaken to maintain competitive levels of Fund operating expenses. They noted the significant sponsorship of the Fund by Saturna Capital evidenced, in part, by certain fees and expenses paid by Saturna Capital out of its own resources. The Trustees recognized Saturna Capital’s efforts help make the Fund more widely available and less expensive than would otherwise be the case without Saturna Capital’s efforts.
The Trustees recognized that the Fund remains relatively small and there have not been opportunities to consider economies of scale. The Trustees noted Saturna Capital’s commitment to continue operating the Fund and the costs undertaken by Saturna Capital.
The Trustees reviewed Saturna Capital’s financial information and discussed the issue of Saturna Capital’s profitability, or lack thereof, as related to management and administration of the Trust. They discussed the reasonableness of Saturna Capital’s profitability as part of their evaluation of whether the advisory fees bear a reasonable relationship to the mix of services provided by Saturna Capital, including the nature, extent, and quality of such services.
The Trustees considered and compared the fees charged by Saturna Capital to other types of accounts, including non-mutual fund advisory clients. The Trustees noted the differences between the full range of services Saturna Capital provides to the Fund, including investment advisory and administrative services, transfer agency services, and other services, as compared to the investment advisory services provided to the other advisory accounts.
| | | | | | | | | | |
| | | | | | |
| 20 | | | | | | | | November 30, 2022 | | Annual Report |
| | |
| Renewal of Investment Advisory Contract (continued) | | (unaudited) |
The Trustees considered potential benefits to Saturna Capital’s other business lines from acting as investment adviser to the Fund, but also recognized that Saturna Capital’s other business lines also potentially benefit the Fund. The Trustees considered whether there are other potential benefits to Saturna Capital in continuing to manage the Fund and the Trustees found that there were no material benefits other than Saturna Capital’s receipt of advisory fees.
The Trustees concluded based on their business judgement that the fees paid by the Fund to Saturna Capital were, from an arm’s-length bargaining perspective, reasonable and in the best interest of the Fund and its shareowners in light of the services provided, comparative performance, expense and advisory fee information, costs of services provided, profits to be realized, and benefits derived or to be derived by Saturna Capital from its relationship with the Fund. Following this discussion, the Trustees, including the Independent Trustees, unanimously agreed to renew the Agreement of Idaho Tax-Exempt Fund with Saturna Capital.
| | | | | | | | | | |
| | | | | | |
| Annual Report | | November 30, 2022 | | | | | | | | 21 |
Availability of Quarterly Portfolio Information
| (1) | The Idaho Tax-Exempt Fund files a complete schedule of portfolio holdings with the SEC for the first and third quarters of each fiscal year as an exhibit to its reports on Form N-PORT. Previously, this information was filed on Form N-Q. |
| (2) | The Fund’s Form N-PORT reports are available on the SEC’s website at www.sec.gov. |
| (3) | The Fund makes a complete schedule of portfolio holdings after the end of each month available at www.idahotaxexemptfund.com. |
Availability of Proxy Voting Information
| (1) | A description of the policies and procedures that the Fund uses to determine how to vote proxies relating to portfolio securities is available (a) without charge, upon request, by calling Saturna Capital at 1-800-728-8762; (b) on the Fund’s website at www. idahotaxexemptfund.com; and (c) on the SEC’s website at www.sec.gov. |
| (2) | Information regarding how the Fund voted proxies relating to portfolio securities during the most recent 12-month period ended June 30 is available (a) without charge, upon request, by calling Saturna Capital at 1-800-728-8762; (b) on the Fund’s website at www.idahotaxexemptfund.com; and (c) on the SEC’s website at www.sec.gov. |
Householding Policy
To reduce expenses, we may mail only one copy of the Fund’s prospectus, each annual and semi-annual report, and proxy statement when necessary, to those addresses shared by two or more accounts. If you wish to receive individual and/or more copies of these documents, please call us at 1-800-728-8762 or write to us at Saturna Capital/Idaho Tax-Exempt Fund, P.O. Box N, Bellingham, WA 98227. We will begin sending you individual copies 30 days after receiving your request.
If you are currently receiving multiple copies and wish to receive only one copy, please call us at 1-800-728-8762 or write to us at Saturna Capital/Idaho Tax-Exempt Fund, P.O. Box N, Bellingham, WA 98227. We will begin sending you a single copy with subsequent report mailings.
| | | | | | | | | | |
| | | | | | |
| 22 | | | | | | | | November 30, 2022 | | Annual Report |
Privacy Statement
At Saturna Capital and the Idaho Tax-Exempt Fund, we understand the importance of maintaining the privacy of your financial information. We want to assure you that we protect the confidentiality of any personal information that you share with us. In addition, we do not sell information about our current or former customers.
In the course of our relationship, we gather certain nonpublic information about you, including your name, address, investment choices, and account information. We do not disclose your information to unaffiliated third parties unless it is necessary to process a transaction; service your account; deliver your account statements, shareowner reports and other information; or as required by law. When we disclose information to unaffiliated third parties, we require a contract to restrict the companies’ use of customer information and from sharing or using it for any purposes other than performing the services for which they were required.
We may share information within the Saturna Capital family of companies in the course of informing you about products or services that may address your investing needs.
We maintain our own technology resources to minimize the need for any third party services, and restrict access to information within Saturna. We maintain physical, electronic, and procedural safeguards to guard your personal information. If you have any questions or concerns about the security or privacy of your information please call us at 1-800-728-8762.
| | | | | | | | | | |
| | | | | | |
| Annual Report | | November 30, 2022 | | | | | | | | 23 |
This report is issued for the information of the shareowners of the 1300 North State Street Idaho Tax-Exempt Fund. It is not authorized for distribution to prospective investors unless it is accompanied or preceded by an Bellingham, WA 98225 effective prospectus relating to the securities of the Fund, a series www.saturna.com of Saturna Investment Trust. 1-800-728-8762 Saturna Brokerage Services, Distributor
Item 2. Code of Ethics.
Registrant has adopted a code of ethics that applies to the registrant’s principal executive officer and principal financial officer or persons performing similar functions, which is included with this submission as Exhibit (a)(1) and posted on the Registrant’s website at https://www.saturna.com/code-ethics. Requests may also be made via telephone at 1-800-728-8762, and will be processed within one business day of receiving such request.
Item 3. Audit Committee Financial Expert.
(a)(1)(i) The Trustees of Saturna Investment Trust determined, at their quarterly meeting of November 30, 2014, that the Trust shall have at least one audit committee financial expert serving on its Audit & Compliance Committee.
(a)(2) Mr. Ron Fielding, independent Trustee (as defined for investment companies), presently serves as financial expert.
Item 4. Principal Accountant Fees and Services.
(a) Audit Fees
For the fiscal years ending November 30, 2022, and 2021, the aggregate audit fees billed for professional services rendered by the principal accountant were $105,000 and $102,150, respectively.
(b) Audit-Related Fees
There were no fees billed by the principal accountant for assurance and related services that were not included under paragraph (a) for the fiscal years ending November 30, 2022, and 2021.
(c) Tax Fees
For the fiscal years ending November 30, 2022, and 2021, the aggregate tax fees billed for professional tax preparation services rendered by the principal accountant were $24,000 and $23,130, respectively. Service includes preparation of the Funds' federal and state income tax returns.
(d) All Other Fees
There were no other fees billed by the principal accountant for the fiscal years ending November 30, 2022, and 2021.
(e)(1) Audit Committee Pre-Approval Policies and Procedures
The following is an excerpt from the Saturna Investment Trust Audit & Compliance Committee Charter:
C. Oversight of Independent Auditors
3. Pre-approval of Audit and Non-Audit Services. Except as provided below, the Committee's prior approval is necessary for the engagement of the independent auditors to provide any audit or non-audit services for the Trust and any non-audit services for any entity controlling, controlled by or under common control with Saturna that provides ongoing services to the Trust (Saturna and each such entity, an "Adviser Affiliate") where the engagement relates directly to the operations or financial reporting of the Trust. Non-audit services that qualify under the de minimis exception described in the Securities Exchange Act of 1934, as amended, and applicable rules thereunder, that were not pre-approved by the Committee, must be approved by the Committee prior to the completion of the audit. Pre-approval by the Committee is not required for engagements entered into pursuant to (a) pre-approval policies and procedures established by the Committee, or (b) pre-approval granted by one or more members of the Committee to whom, or by a subcommittee to which, the Committee has delegated pre-approval authority, provided in either case, that the Committee is informed of each such service at its next regular meeting.
(e) (2) Percentages of Services
None of the services described in each of paragraphs (b) through (d) were approved by the audit committee pursuant to paragraph (c)(7)(i)(C) of Rule 2-01 of Regulation S-X.
(f) Not applicable.
(g) Aggregate Non-Audit Fees
The aggregate non-audit fees billed by the principal accountant for services rendered to the Registrant are shown above in the response to Item 4(b), (c) and (d) above.
(1) The aggregate non-audit fees billed by the principal accountant for services rendered to the Registrant's investment adviser, Saturna Capital Corporation ("Saturna"), for the fiscal years ended November 30, 2022, and 2021 were:
| Fiscal Year Ended |
| November 2022 | November 2021 |
All other fees: | $24,000 | $23,130 |
The fees listed above consist of fees paid by Saturna to the Registrant's principal accountant for its review and report on Saturna's internal transfer agency control procedures and Saturna's custody control procedures.
(2) The aggregate non-audit fees billed by the principal accountant for services rendered to entities controlling, controlled by, or under common control with Saturna, for the fiscal years ended November 30, 2022, and 2021 were:
| Fiscal Year Ended |
| November 2022 | November 2021 |
All other fees: | None | None |
(h) Registrant's Audit Committee
The Registrant's Audit Committee has considered the provision of non-audit services that were rendered to Saturna, and any entity controlling, controlled by or under common control with Saturna that provides ongoing services to the Registrant, that were not pre-approved pursuant to Rule 2-01(c)(7)(ii) of Regulation S-X and has determined that the provision of such services is compatible with maintaining the independence of the Registrant's principal accountant.
Item 5. Audit Committee of Listed Registrants.
Not applicable.
Item 6. Schedule of Investments.
The schedule is included as part of the report to shareholders filed under Item 1 of this Form.
Item 7. Disclosure of Proxy Voting Policies and Procedures for Closed-End Management Investment Companies.
Not applicable.
Item 8. Portfolio Managers of Closed-End Management Investment Companies.
Not applicable.
Item 9. Purchases of Equity Securities by Closed-End Management Investment Company and Affiliated Purchasers.
Not applicable.
Item 10. Submission of Matters to a Vote of Security Holders.
Not applicable.
Item 11. Controls and Procedures
a. The Registrant’s President and Treasurer have concluded, based on their evaluation of the Registrant’s disclosure controls and procedures (as defined in Rule 30a-3(c) under the Investment Company Act of 1940 (the “Act”)) as conducted within 90 days of the filing date of this report, that those disclosure controls and procedures provide reasonable assurance that the material information required to be disclosed by the Registrant on this report is recorded, processed, summarized and reported within the time periods specified in the Securities and Exchange Commission’s rules and forms.
b. There were no significant changes in the Registrant’s internal control over financial reporting (as defined in Rule 30e-3(d) under the Act) that occurred during the period covered by this report that has materially affected, or is reasonably likely to materially affect, the Registrant’s internal control over financial reporting.
Item 12. Disclosure of Securities Lending Activities for Closed-End Management Investment Companies.
Not applicable.
Item 13. Exhibits
Exhibits included with this filing:
(a)(1) Code of Ethics.
(a)(2) Certification pursuant to Rule 30a-2(a) under the Investment Company Act of 1940 (17 CFR 270.30a-2(a)) is filed and attached hereto as Exhibit 99.CERT.
(a)(3) Not applicable.
(b) Certification pursuant to Rule 30a-2(b) under the Investment Company Act of 1940 (17 CFR 270.30a-2(b)) is furnished and attached hereto as Exhibit 99.906CERT.
(c) Registrant's Rule 30e-3 Notices pursuant to Item 1(b) of Form N-CSR. Attached hereto as EX-99.30e-3Notice.
SIGNATURES
Pursuant to the requirements of the Securities Exchange Act of 1934 and the Investment Company Act of 1940, the registrant has duly caused this report to be signed on its behalf by the undersigned, thereunto duly authorized.
SATURNA INVESTMENT TRUST
By:
/s/ Jane K. Carten, President
Signature and Title
Jane K. Carten, President
Printed name and Title
January 30, 2023
Date
Pursuant to the requirements of the Securities Exchange Act of 1934 and the Investment Company Act of 1940, this report has been signed below by the following persons on behalf of the registrant and in the capacities and on the dates indicated.
By:
/s/ Jane K. Carten, President
Signature and Title
Jane K. Carten, President
Printed name and Title
January 30, 2023
Date
By:
/s/ Christopher R. Fankhauser, Treasurer
Signature and Title
Christopher R. Fankhauser, Treasurer
Printed name and Title
January 30, 2023
Date
# # #