Table of Contents
As filed with the Securities and Exchange Commission on May 15, 2015
Securities Act File No. 333-
U.S. SECURITIES AND EXCHANGE COMMISSION
WASHINGTON, D.C. 20549
FORM N-14
REGISTRATION STATEMENT
UNDER
| THE SECURITIES ACT OF 1933 | ||||
| Pre-Effective Amendment No. | ¨ | |||
| Post-Effective Amendment No. | ¨ |
(Check appropriate box or boxes)
THRIVENT MUTUAL FUNDS
(Exact Name of Registrant as Specified in Charter)
625 FOURTH AVENUE SOUTH
MINNEAPOLIS, MINNESOTA 55415
(Address of Principal Executive Offices)
(612) 844-4198
(Area Code and Telephone Number)
MICHAEL W. KREMENAK
SECRETARY AND CHIEF LEGAL OFFICER
THRIVENT MUTUAL FUNDS
625 FOURTH AVENUE SOUTH
MINNEAPOLIS, MINNESOTA 55415
(Name and Address of Agent for Service)
Approximate Date of Proposed Public Offering: As soon as practicable after this registration statement becomes effective. It is proposed that this filing will become effective on June 15, 2015 pursuant to Rule 488 under the Securities Act of 1933.
Title of Securities Being Registered: Shares of beneficial interest, par value $.01 per share. The Registrant has registered an indefinite number of shares of beneficial interest pursuant to Section 24(f) of the Investment Company Act of 1940, as amended, and is in a continuous offering of such shares under an effective registration statement (File Nos. 33-12911 and 811-5075). No filing fee is due herewith because of reliance on Section 24(f) of the Investment Company Act of 1940, as amended.
Table of Contents
LETTER FOR SHAREHOLDERS
Dear Shareholder:
The Board of Trustees of Thrivent Mutual Funds (the “Trust”) has scheduled special meetings of shareholders for August 14, 2015 to seek approval of five mergers. At the meetings, the shareholders for each of the series of the Trust listed in the first column below (each a “Target Fund”) will be asked to consider and approve an Agreement and Plan of Reorganization (an “Agreement”) providing for its reorganization into the Trust series listed in the second column below (each an “Acquiring Fund”).
TARGET FUND | ACQUIRING FUND | |
| Thrivent Partner Small Cap Growth Fund | Thrivent Small Cap Stock Fund | |
| Thrivent Partner Small Cap Value Fund | Thrivent Small Cap Stock Fund | |
| Thrivent Mid Cap Growth Fund | Thrivent Mid Cap Stock Fund | |
| Thrivent Partner Mid Cap Value Fund | Thrivent Mid Cap Stock Fund | |
| Thrivent Natural Resources Fund | Thrivent Large Cap Stock Fund |
If you are not planning to attend the meeting in person, please vote before August 14th in one of the ways described below.
If a merger is approved, your investment in the Target Fund will automatically be transferred into the corresponding Acquiring Fund listed above. We will send you a written confirmation after this takes place. This transfer is not expected to be a taxable event.
Your vote counts! You may vote quickly and easily in any one of these ways:
| • | Via Internet: see the instructions on the enclosed proxy card. |
| • | Via Telephone: see the instructions on the enclosed proxy card. |
| • | Via Mail: use the enclosed proxy card and postage-paid envelope. |
| • | In person: attend the shareholder meetings on August 14 at the Thrivent Financial corporate office in Minneapolis. |
If you’d like more information about the Funds, you may order a statement of additional information to the Funds’ prospectuses, a shareholder report or the statement of additional information regarding the proposed Fund reorganizations (request the “Reorganization SAI”) by:
| • | Telephone: 1-800-THRIVENT (1-800-847-4836) and say “mutual funds” |
| • | Mail: Thrivent Mutual Funds, P.O. Box 219348, Kansas City, Missouri 64121-9348 |
| • | Internet: |
| • | For a copy of a prospectus, a statement of additional information, or a shareholder report: |
www.thrivent.com
| • | For a copy of this Prospectus/Proxy Statement or the Reorganization SAI: |
www.proxy-direct.com/thr-26694
Thank you for taking this matter seriously and participating in this important process.
Sincerely,

David S. Royal
President
Thrivent Mutual Funds
Table of Contents
EXPLANATORY NOTE
| This Registration Statement is organized as follows: | ||||
| Page | ||||
Thrivent Partner Small Cap Growth Fund | 3 | |||
• Questions & Answers for Shareholders of Thrivent Partner Small Cap Growth Fund | ||||
• Notice of Special Meeting of Shareholders of Thrivent Partner Small Cap Growth Fund | ||||
• Prospectus/Proxy Statement Regarding Proposed Reorganization | ||||
Thrivent Partner Small Cap Value Fund | 31 | |||
• Questions & Answers for Shareholders of Thrivent Partner Small Cap Value Fund | ||||
• Notice of Special Meeting of Shareholders of Thrivent Partner Small Cap Value Fund | ||||
• Prospectus/Proxy Statement Regarding Proposed Reorganization | ||||
Thrivent Mid Cap Growth Fund | 61 | |||
• Questions & Answers for Shareholders of Thrivent Mid Cap Growth Fund | ||||
• Notice of Special Meeting of Shareholders of Thrivent Mid Cap Growth Fund | ||||
• Prospectus/Proxy Statement Regarding Proposed Reorganization | ||||
Thrivent Partner Mid Cap Value Fund | 89 | |||
• Questions & Answers for Shareholders of Thrivent Partner Mid Cap Value Fund | ||||
• Notice of Special Meeting of Shareholders of Thrivent Partner Mid Cap Value Fund | ||||
• Prospectus/Proxy Statement Regarding Proposed Reorganization | ||||
Thrivent Natural Resources Fund | 117 | |||
• Questions & Answers for Shareholders of Thrivent Natural Resources Fund | ||||
• Notice of Special Meeting of Shareholders of Thrivent Natural Resources Fund | ||||
• Prospectus/Proxy Statement Regarding Proposed Reorganization | ||||
Statement of Additional Information Regarding the Proposed Reorganizations | ||||
Part C Information | ||||
Exhibits | ||||
- 2 -
Table of Contents
Questions & Answers
For Shareholders of Thrivent Partner Small Cap Growth Fund
Although we recommend that you read the complete Prospectus/Proxy Statement, we have provided the following questions and answers to clarify and summarize the issues to be voted on.
Q: Why is a shareholder meeting being held?
A: A special meeting of shareholders (the “Meeting”) of Thrivent Partner Small Cap Growth Fund (the “Target Fund”) is being held to seek shareholder approval of a reorganization (the “Reorganization”) of the Target Fund into Thrivent Small Cap Stock Fund (the “Acquiring Fund”). Please refer to the Prospectus/Proxy Statement for a detailed explanation of the proposed Reorganization and for a more complete description of the Acquiring Fund.
Q: Why is the Reorganization being recommended?
A: After careful consideration, the Board of Trustees (the “Board”) of Thrivent Mutual Funds (the “Trust”) has determined that the Reorganization is in the best interests of the shareholders of the Target Fund and recommends that you cast your vote “FOR” the proposed Reorganization. The Target Fund and the Acquiring Fund have substantially similar investment objectives, and each is a diversified series of the Trust, an open-end management investment company registered under the Investment Company Act of 1940. Thrivent Asset Management, LLC (“Thrivent Asset Mgt.” or the “Adviser”) is the investment adviser for the Target Fund and the Acquiring Fund.
The Board believes that the Reorganization would be in the best interests of the shareholders of the Target Fund because: (i) shareholders will become shareholders of a larger combined fund with greater potential to increase asset size and achieve economies of scale (especially given the breakpoints in the advisory fee schedule for the Acquiring Fund), whereby certain administrative costs may be spread across the combined portfolio’s larger asset base and, therefore, may increase the combined portfolio’s overall efficiency in the long term; (ii) the Acquiring Fund invests in a more diversified portfolio of equities; (iii) the Acquiring Fund has achieved stronger performance than the Target Fund for the one-year period ended December 31, 2014, which corresponds to when Matthew Finn assumed primary portfolio management responsibilities for the Acquiring Fund, though there is no guarantee of future performance; (iv) the Adviser believes that it can most effectively manage the assets currently in the Target Fund by combining such assets with the Acquiring Fund into a single mandate and under the same portfolio manager; and (v) the Acquiring Fund has lower advisory fees than the Target Fund and the Target Fund shareholders will experience a lower expense ratio in the Acquiring Fund following the Reorganization.
Q: Who can vote?
A: Shareholders of the Target Fund are entitled to vote.
Q: How will the Reorganization affect me?
A: Assuming shareholders approve the proposed Reorganization, the assets of the Target Fund will be combined with those of the Acquiring Fund. The Class A and Institutional Class Shares of the Target Fund automatically would be exchanged for an equal dollar value of Class A and Institutional Class Shares of the Acquiring Fund. Following the Reorganization, the Target Fund will dissolve.
Q: Will I have to pay any commission or other similar fee as a result of the Reorganization?
A: No. You will not pay any commissions or other similar fees as a result of the Reorganization. If you hold Class A Shares of the Target Fund, you will receive Class A Shares of the Acquiring Fund. If you hold Institutional Class Shares of the Target Fund, you will receive Institutional Class Shares of the Acquiring Fund.
Table of Contents
Q: Will the total annual operating expenses that my portfolio investment bears increase as a result of the Reorganization?
A: No, they will likely decrease, and the investment management fee, which comprises a portion of the annual operating expenses, will decrease. For more information about how fund expenses may change as a result of the Reorganization, please see the comparative and pro forma table and related disclosures in the COMPARISON OF THE FUNDS—Expenses section of the Prospectus/Proxy Statement.
Q: Will I have to pay any U.S. federal income taxes as a result of the Reorganization?
A: The Reorganization is expected to be tax-free for federal income tax purposes. The Target Fund will seek an opinion of counsel to this effect. Generally, shareholders will not incur capital gains or losses on the exchange of Target Fund shares for Acquiring Fund shares as a result of the Reorganization.
Q: If shareholders of the Target Fund do not approve the Reorganization, what will happen to the Target Fund?
A: Thrivent Asset Mgt. will reassess what changes it would like to make to a Target Fund, including a possible repurposing of the Target Fund’s principal investment strategies or recommending a liquidation of the Target Fund to the Board. It may ultimately decide to make no changes.
Q: Who pays the costs of the Reorganization?
A: The expenses of the Reorganization, including the costs of the Meeting, will be paid by Thrivent Asset Mgt. or an affiliate and will not be borne by Target Fund shareholders.
Q: How can I vote?
A: Shareholders are invited to attend the Meeting and to vote in person. You may also vote by executing a proxy using one of three methods:
| • | By Internet: Instructions for casting your vote via the Internet can be found in the enclosed proxy voting materials. The required control number is printed on your enclosed proxy card. If this feature is used, there is no need to mail the proxy card. |
| • | By Telephone: Instructions for casting your vote via telephone can be found in the enclosed proxy voting materials. The toll-free number and required control number are printed on your enclosed proxy card. If this feature is used, there is no need to mail the proxy card. |
| • | By Mail: If you vote by mail, please indicate your voting instructions on the enclosed proxy card, date and sign the card, and return it in the envelope provided, which is addressed for your convenience and needs no postage if mailed in the United States. |
Shareholders who execute proxies by Internet, telephone or mail may revoke them at any time prior to the Meeting by filing with the Target Fund a written notice of revocation, by executing another proxy bearing a later date, by voting later by Internet or telephone or by attending the Meeting and voting in person. Merely attending the Meeting, however, will not revoke any previously submitted proxy.
Q: When should I vote?
A: Every vote is important and the Board encourages you to record your vote as soon as possible. Voting your proxy now will ensure that the necessary number of votes is obtained, without the time and expense required for additional proxy solicitation.
Q: Who should I call if I have questions about the proposal in the Prospectus/Proxy Statement?
A: Call 1-866-865-3843 with your questions.
- 2 -
Table of Contents
Q: How can I get more information about the Target and Acquiring Funds?
A: You may obtain (1) a prospectus, statement of additional information or annual/semiannual report for the Funds or (2) the statement of additional information regarding the Reorganization (request the “Reorganization SAI”) by:
| • | Telephone: 1-800-THRIVENT (1-800-847-4836) and say “mutual funds” |
| • | Mail: Thrivent Mutual Funds, P.O. Box 219348, Kansas City, Missouri 64121-9348 |
| • | Internet: |
| • | For a copy of a prospectus, a statement of additional information, or a shareholder report: |
www.thrivent.com
| • | For a copy of this Prospectus/Proxy Statement or the Reorganization SAI: |
www.proxy-direct.com/thr-26694
- 3 -
Table of Contents
Thrivent Partner Small Cap Growth Fund
a series of
THRIVENT MUTUAL FUNDS
625 Fourth Avenue South
Minneapolis, Minnesota 55415
(800) 847-4836
www.thrivent.com
NOTICE OF SPECIAL MEETING
OF SHAREHOLDERS
To be Held on August 14, 2015
NOTICE IS HEREBY GIVEN THAT a special meeting of shareholders (the “Meeting”) of Thrivent Partner Small Cap Growth Fund (the “Target Fund”), a series of Thrivent Mutual Funds (the “Trust”), will be held at the offices of Thrivent Financial for Lutherans, 625 Fourth Avenue South, Minneapolis, Minnesota 55415 on August 14, 2015 at 9:00 a.m. Central time for the following purposes:
| 1. | To approve an Agreement and Plan of Reorganization pursuant to which the Target Fund would (i) transfer all of its assets to Thrivent Small Cap Stock Fund (the “Acquiring Fund”), a series of the Trust, in exchange for Class A and Institutional Class Shares of the Acquiring Fund, (ii) distribute such Class A and Institutional Class Shares of the Acquiring Fund to shareholders of the Target Fund, and (iii) dissolve. |
| 2. | To transact such other business as may properly be presented at the Meeting or any adjournment thereof. |
The Board of Trustees of the Trust (the “Board”) has fixed the close of business on June 16, 2015 as the record date for the determination of shareholders entitled to notice of, and to vote at, the Meeting and all adjournments thereof.
Shareholders are invited to attend the meeting and vote in person. You may also vote by executing a proxy using one of three methods:
| • | By Internet—Instructions for casting your vote via the Internet can be found in the enclosed proxy voting materials. The required control number is printed on your enclosed proxy card. If this feature is used, there is no need to mail the proxy card. |
| • | By Telephone—Instructions for casting your vote via telephone can be found in the enclosed proxy voting materials. The toll-free number and required control number are printed on your enclosed proxy card. If this feature is used, there is no need to mail the proxy card. |
| • | By Mail—If you vote by mail, please indicate your voting instructions on the enclosed proxy card, date and sign the card, and return it in the envelope provided, which is addressed for your convenience and needs no postage if mailed in the United States. |
Shareholders who execute proxies by Internet, telephone, or mail may revoke them at any time prior to the Meeting by filing with the Target Fund a written notice of revocation, by executing another proxy bearing a later date, or by attending the Meeting and voting in person. Merely attending the Meeting, however, will not revoke any previously submitted proxy.
The Board recommends that you cast your vote FOR the proposed Reorganization as described in the Prospectus/Proxy Statement.
YOUR VOTE IS IMPORTANT
Please return your proxy card or record your voting instructions by telephone or via the Internet promptly no matter how many shares you own. In order to avoid the additional expense of further solicitation, we ask that you mail your proxy card or record your voting instructions by telephone or via the Internet promptly regardless of whether you plan to be present in person at the Meeting.
Date: , 2015

Michael W. Kremenak
Secretary
Thrivent Mutual Funds
Table of Contents
COMBINED PROSPECTUS/PROXY STATEMENT
THRIVENT PARTNER SMALL CAP GROWTH FUND
a series of
THRIVENT MUTUAL FUNDS
625 Fourth Avenue South
Minneapolis, Minnesota 55415
(800) 847-4836
, 2015
This Prospectus/Proxy Statement is furnished to you as a shareholder of Thrivent Partner Small Cap Growth Fund (the “Target Fund”), a series of Thrivent Mutual Funds (the “Trust”). A special meeting of shareholders of the Target Fund will be held on August 14, 2015 (the “Meeting”) to consider the approval of a Reorganization (the “Reorganization”) of the Target Fund into Thrivent Small Cap Stock Fund (the “Acquiring Fund”). The Board of Trustees of the Trust (the “Board”) requests that you vote your shares by completing and returning the enclosed proxy card or by recording your voting instructions by telephone or via the Internet regardless of whether you plan to be present at the Meeting in order to avoid the additional expense of further solicitation.
The Acquiring Fund and the Target Fund are sometimes referred to herein individually as a “Fund” or collectively as the “Funds.” Each of the Acquiring Fund and the Target Fund is organized as a diversified series of the Trust, an open-end management investment company registered under the Investment Company Act of 1940, as amended (the “1940 Act”).
The reorganization proposed for the Target Fund (the “Reorganization”) is not contingent upon the approval or completion of any other reorganization or merger.
This Prospectus/Proxy Statement sets forth concisely the information shareholders of the Target Fund ought to know before voting on the Reorganization. Please read it carefully and retain it for future reference.
The following documents, each having been filed with the Securities and Exchange Commission (the “SEC”), are incorporated herein by reference:
| • | The Thrivent Mutual Funds Prospectus, dated February 27, 2015 and as supplemented through the date hereof (the “Trust Prospectus”). |
| • | A Statement of Additional Information, dated , 2015, relating to this Combined Prospectus/Proxy Statement (the “Reorganization SAI”); |
| • | The Thrivent Mutual Funds Statement of Additional Information, dated February 27, 2015 and as supplemented through the date hereof (the “Trust SAI”). |
Copies of the foregoing may be obtained without charge by calling or writing the Fund as set forth below. If you wish to request the Reorganization SAI, please ask for the “Reorganization SAI.”
In addition, each Fund will furnish, without charge, a copy of its most recent annual report and subsequent semi-annual report, if any, to a shareholder upon request.
Copies of each Fund’s most recent prospectus, statement of additional information, annual report and semi-annual report can be obtained at www.thrivent.com. Requests for documents can also be made by calling (800) 847-4836 or writing Thrivent Mutual Funds, P.O. Box 219348, Kansas City, Missouri 64121-9348.
The Funds file reports and other information with the SEC. Information filed by the Funds with the SEC can be reviewed and copied at the SEC’s Public Reference Room in Washington, DC or on the EDGAR database on the SEC’s internet site (http://www.sec.gov). Information on the operation of the SEC’s Public Reference Room may be obtained by calling the SEC at (202) 551-8090. You can also request copies of these materials, upon payment of a duplicating fee, by electronic request at the SEC’s e-mail address (publicinfo@sec.gov) or by writing the Public Reference Section of the SEC, Washington, DC 20549-1520.
The Board knows of no business other than that discussed above that will be presented for consideration at the Meeting. If any other matter is properly presented, it is the intention of the persons named in the enclosed proxy to vote in accordance with their best judgment.
No person has been authorized to give any information or make any representation not contained in this Prospectus/Proxy Statement and, if so given or made, such information or representation must not be relied upon as having been authorized. This Prospectus/Proxy Statement does not constitute an offer to sell or a solicitation of an offer to buy any securities in any jurisdiction in which, or to any person to whom, it is unlawful to make such offer or solicitation.
Table of Contents
Neither the Securities and Exchange Commission nor any state regulator has approved or disapproved of these shares or passed upon the adequacy of this Prospectus/Proxy Statement. A representation to the contrary is a crime.
The date of this Prospectus/Proxy Statement is , 2015. The Prospectus/Proxy Statement will be sent to shareholders on or around July 1, 2015.
- 2 -
Table of Contents
TABLE OF CONTENTS
| Page | ||||
| 1 | ||||
| 1 | ||||
| 1 | ||||
| 3 | ||||
| 3 | ||||
| 3 | ||||
| 4 | ||||
| 4 | ||||
| 5 | ||||
| 6 | ||||
The Separate Accounts and the Retirement Plans | 6 | |||
| 8 | ||||
| 9 | ||||
| 10 | ||||
| 11 | ||||
| 14 | ||||
| 14 | ||||
| 15 | ||||
| 15 | ||||
| 15 | ||||
| 16 | ||||
| 16 | ||||
Material Federal Income Tax Consequences of the Reorganization | 17 | |||
| 19 | ||||
| 19 | ||||
| 19 | ||||
| 19 | ||||
| 20 | ||||
| 20 | ||||
| 20 | ||||
| 20 | ||||
| 20 | ||||
| 20 | ||||
| 21 | ||||
| 21 | ||||
Table of Contents
The following is a summary of certain information contained elsewhere in this Prospectus/Proxy Statement and is qualified in its entirety by reference to the more complete information contained in this Prospectus/Proxy Statement. Shareholders should read the entire Prospectus/Proxy Statement carefully.
The Board, including the trustees who are not “interested persons” (as defined in the 1940 Act) of each Fund, has unanimously approved an Agreement and Plan of Reorganization (the “Reorganization Agreement”) on behalf of each Fund, subject to Target Fund shareholder approval. The Reorganization Agreement provides for:
| • | the transfer of all of the assets of the Target Fund to the Acquiring Fund in exchange for Class A and Institutional Class Shares of the Acquiring Fund; |
| • | the distribution by the Target Fund of such Acquiring Fund Class A and Institutional Class Shares to Target Fund shareholders; and |
| • | the dissolution of the Target Fund. |
When the Reorganization is complete, Target Fund shareholders will hold Acquiring Fund shares. The aggregate value of the Acquiring Fund shares a Target Fund shareholder will receive in the Reorganization will equal the aggregate value of the Target Fund shares owned by such shareholder immediately prior to the Reorganization. After the Reorganization, the Acquiring Fund will continue to operate with the investment objective and investment policies set forth in this Prospectus/Proxy Statement.
As discussed in more detail elsewhere in this Prospectus/Proxy Statement, the Board believes that the Reorganization would be in the best interests of the Target Fund’s shareholders because: (i) shareholders will become shareholders of a larger combined fund with greater potential to increase asset size and achieve economies of scale; (ii) the Acquiring Fund invests in a more diversified portfolio of equities; (iii) the Acquiring Fund has achieved stronger performance over the one-year period ended December 31, 2014 with outperformance of 2.54%, which corresponds to when Matthew Finn assumed primary portfolio management responsibilities for the Acquiring Fund; (iv) Thrivent Asset Management, LLC (“Thrivent Asset Mgt.” or the “Adviser”) believes that it can most effectively manage the assets currently in the Target Fund by combining such assets with the Acquiring Fund into a single mandate and under the same portfolio manager; and (v) Target Fund shareholders will experience a lower expense ratio in the merged Acquiring Fund.
In addition, the Board, when determining whether to approve the Reorganization, considered, among other things, the future growth prospects of each of the Target Fund and the Acquiring Fund, the fact that the Target Fund shareholders would not experience any diminution in shareholder services as a result of the Reorganization, and the fact that the Reorganization is expected to be a tax-free reorganization for federal income tax purposes.
Background and Reasons for the Reorganization
The Target Fund and the Acquiring Fund have substantially similar investment objectives. The investment objective of the Target Fund is to seek to achieve long-term growth of capital. The investment objective of the Acquiring Fund is to seek long-term capital growth.
The two Funds also have similar, although not identical, principal investment strategies, which are described in more detail in the COMPARISON OF FUNDS—Investment Objective and Principal Strategies section of the Prospectus/Proxy Statement. Under normal circumstances, both Funds invest at least 80% of their net assets (plus the amount of any borrowing for investment purposes) in securities of small companies. In the case of the Target Fund, the Adviser focuses mainly in the securities of smaller U.S. companies which have market capitalizations similar to those companies included in widely known indices such as the S&P SmallCap 600 Growth Index, the Russell 2000® Growth Index, or the small company market capitalization classifications published by Lipper, Inc. In the case of the Acquiring Fund, the Adviser focuses mainly in the securities of smaller U.S. companies which have market capitalizations similar to those companies included in widely known indices such as the S&P SmallCap 600 Index or the Russell 2000® Index.
Table of Contents
In determining whether to recommend approval of the Reorganization Agreement to Target Fund shareholders, the Board considered a number of factors, including, but not limited to: (i) the expenses and advisory fees applicable to the Funds before the proposed Reorganization and the estimated expense ratios of the combined Fund after the proposed Reorganization; (ii) the comparative investment performance of the Funds; (iii) the future growth prospects of each Fund; (iv) the terms and conditions of the Reorganization Agreement; (v) whether the Reorganization would result in the dilution of shareholder interests; (vi) the compatibility of the Funds’ investment objectives, policies, risks and restrictions; (vii) the anticipated tax consequences of the proposed Reorganization; (viii) the compatibility of the Funds’ service features available to shareholders, including exchange privileges; and (ix) the estimated costs of the Reorganization. The Board concluded that these factors supported a determination to approve the Reorganization Agreement.
The Board has determined that the Reorganization is in the best interests of the Target Fund and that the interests of the Target Fund’s shareholders will not be diluted as a result of the Reorganization. In addition, the Board has determined that the Reorganization is in the best interests of the Acquiring Fund and that the interests of the Acquiring Fund’s shareholders will not be diluted as a result of the Reorganization.
The Board is asking shareholders of the Target Fund to approve the Reorganization at the Meeting to be held on August 14, 2015. If shareholders of the Target Fund approve the proposed Reorganization, it is expected that the closing date of the transaction (the “Closing Date”) will be after the close of business on or about August 28, 2015, but it may be at a different time as described herein. If shareholders of the Target Fund do not approve the proposed Reorganization, the Board will consider alternatives, including repurposing the Target Fund’s principal strategies.
The Board recommends that you vote “FOR” the Reorganization.
- 2 -
Table of Contents
Investment Objective and Principal Strategies
Investment Objective. The Target Fund and the Acquiring Fund have substantially similar investment objectives. The investment objective of the Target Fund is to seek to achieve long-term growth of capital. The investment objective of the Acquiring Fund is to seek long-term capital growth.
Principal Strategies. Under normal circumstances, both Funds invest at least 80% of their net assets (plus the amount of any borrowing for investment purposes) in securities of small companies. In the case of the Target Fund, the Adviser focuses mainly in the securities of smaller U.S. companies which have market capitalizations similar to those companies included in widely known indices such as the S&P SmallCap 600 Growth Index, the Russell 2000® Growth Index, or the small company market capitalization classifications published by Lipper, Inc. In the case of the Acquiring Fund, the Adviser focuses mainly in the securities of smaller companies which have market capitalizations similar to those companies included in widely known indices such as the S&P SmallCap 600 Index or the Russell 2000® Index. Should the Adviser determine that a Fund would benefit from reducing the percentage of its assets invested in securities of small companies from 80% to a lesser amount, it will notify shareholders at least 60 days prior to such a change.
Both Funds seek to achieve its investment objective by investing primarily in common stocks. The Advisers for both Funds use fundamental, quantitative, and technical investment research techniques to determine what securities to buy and sell. The Advisers look for small companies that, in their opinion:
| • | have an improving fundamental outlook; |
| • | have capable management; and |
| • | are financially sound. |
The Advisers may sell securities for a variety of reasons, such as to secure gains, limit losses, or reposition assets to more promising opportunities.
Fund Holdings. A description of the Funds’ policies and procedures with respect to the disclosure of the Funds’ portfolio securities is available on the Funds’ website.
The Funds are subject to similar principal risks. Both Funds are subject to Market Risk, Issuer Risk, Small Cap Risk, Liquidity Risk and Investment Adviser Risk. Both Funds are also subject to Volatility Risk, though each may be subject to different types of volatility risk. These risks are described below.
Principal risks to which both Funds are subject
Market Risk. Over time, securities markets generally tend to move in cycles with periods when security prices rise and periods when security prices decline. The value of the Fund’s investments may move with these cycles and, in some instances, increase or decrease more than the applicable market(s) as measured by the Fund’s benchmark index(es). The securities markets may also decline because of factors that affect a particular industry.
Issuer Risk. Issuer risk is the possibility that factors specific to a company to which the Fund’s portfolio is exposed will affect the market prices of the company’s securities and therefore the value of the Fund. Some factors affecting the performance of a company include demand for the company’s products or services, the quality of management of the company and brand recognition and loyalty. Common stock of a company is subordinate to other securities issued by the company. If a company becomes insolvent, interests of investors owning common stock will be subordinated to the interests of other investors in, and general creditors of, the company.
Small Cap Risk. Smaller, less seasoned companies often have greater price volatility, lower trading volume, and less liquidity than larger, more established companies. These companies tend to have small revenues, narrower product lines, less management depth and experience, small shares of their product or service markets, fewer financial resources, and less competitive strength than larger companies. Such companies seldom pay significant dividends that could cushion returns in a falling market.
- 3 -
Table of Contents
Liquidity Risk. Liquidity is the ability to sell a security relatively quickly for a price that most closely reflects the actual value of the security. Small capitalization stocks often have a less liquid resale market. As a result, the Fund may have difficulty selling or disposing of securities quickly in certain markets or may only be able to sell the holdings at prices substantially less than what the Fund believes they are worth.
Investment Adviser Risk. The Fund is actively managed and the success of its investment strategy depends significantly on the skills of the adviser(s) in assessing the potential of the investments in which the Fund invests. This assessment of investments may prove incorrect, resulting in losses or poor performance, even in rising markets.
Volatility Risk. Volatility risk is the risk that certain types of securities shift in and out of favor depending on market and economic conditions as well as investor sentiment.
Additional principal risks to which only the Target Fund is subject
Volatility Risk. Growth style investing includes the risk of investing in securities whose prices historically have been more volatile than other securities, especially over the short term. Stocks of growth companies historically have been more volatile than other securities, especially over the short term. Growth stock prices reflect projections of future earnings or revenues and if a company’s earnings or revenues fall short of expectations its stock price may fall dramatically.
The Board. The Board is responsible for the overall supervision of the operations of each Fund and performs the various duties imposed on the directors of investment companies by the 1940 Act and under applicable state law.
The Adviser. Thrivent Asset Mgt. is the investment adviser for each Fund. Thrivent Asset Mgt. and its investment advisory affiliate, Thrivent Financial for Lutherans (“Thrivent Financial”) have been in the investment advisory business since 1986 and managed approximately $96 billion in assets as of December 31, 2014, including approximately $41 billion in mutual fund assets. These advisory entities are located at 625 Fourth Avenue South, Minneapolis, Minnesota 55415.
The Adviser and the Trust received an exemptive order from the SEC that permits the Adviser and the Funds, with the approval of the Board, to retain one or more subadvisers for the Funds, or subsequently change a subadviser, without submitting the respective investment subadvisory agreements, or material amendments to those agreements, to a vote of the shareholders of the applicable Fund. The Adviser will notify shareholders of a Fund if there is a new subadviser for that Fund.
The Funds’ annual report to shareholders discusses the basis for the Board approving the investment advisory agreement during the period covered by the report.
Portfolio Management. David J. Lettenberger, CFA has served as portfolio manager of the Target Fund since 2014. Mr. Lettenberger has been with Thrivent Financial since 2013 and previously served as an associate portfolio manager.
Matthew D. Finn, CFA has served as lead portfolio manager of the Acquiring Fund since 2013. James M. Tinucci, CFA has served as the associate portfolio manager of the Acquiring Fund since 2015. Mr. Finn has been a portfolio manager at Thrivent Financial since 2004, when he joined the firm. Mr. Tinucci has been with Thrivent Financial since 2014, and previously held various positions at Thrivent Financial from 2007 to 2012. Prior to joining Thrivent Financial, Mr. Tinucci was a manager at Deloitte Consulting.
The Trust SAI provides information about the portfolio managers’ compensation, other accounts managed by the portfolio managers, and the portfolio managers’ ownership of shares of the Funds.
Advisory Fees. Each Fund pays an annual investment advisory fee to the Adviser. The advisory contract between the Adviser and the Fund provides for the following advisory fees for each class of shares of a Fund, expressed as an annual rate of average daily net assets:
- 4 -
Table of Contents
Target Fund
0.900% of average daily net assets up to $500 million
0.800% of average daily net assets over $500 million
Acquiring Fund
0.700% of average daily net assets up to $200 million
0.650% of average daily net assets greater than $200 million but not greater than $1 billion
0.600% of average daily net assets greater than $1 billion but not greater than $2.5 billion
0.550% of average daily net assets greater than $2.5 billion but not greater than $5 billion
0.525% of average daily net assets over $5 billion
During the twelve-months ended October 31, 2014, the contractual advisory fees for the Class A shares of the Target Fund were 0.92% of the Target Fund’s average daily net assets, and the contractual advisory fees for the Class I shares of the Target Fund were 0.90% of the Target Fund’s average daily net assets.
During the twelve-months ended October 31, 2014, the contractual advisory fees for the Class A shares of the Acquiring Fund were 0.68% of the Acquiring Fund’s average daily net assets, and the contractual advisory fees for the Class I shares of the Acquiring Fund were 0.68% of the Acquiring Fund’s average daily net assets.
For a complete description of each Fund’s advisory services, see the section of the Trust Prospectus entitled “Management” and the section of the Trust SAI entitled “Investment Adviser, Investment Subadvisers, and Fund Managers.”
12b-1 Plan. The Trust has adopted a Distribution Plan and Agreement pursuant to Rule 12b-1 under the 1940 Act (the “Rule 12b-1 Plan”) with respect to the Class A Shares of each Fund. Thrivent Investment Management Inc. (the “Distributor”), an affiliate of the Adviser, located at 625 Fourth Avenue South, Minneapolis, Minnesota 55415, serves as the distributor of each Fund. Under the Rule 12b-1 Plan, Class A Shares of each Fund pay the Distributor an aggregate fee for distribution and shareholder servicing equal to an annual rate of 0.25% of the average daily net asset value represented by such shares. Institutional Class Shares are not subject to a Rule 12b-1 Plan and the Funds do not pay any percentage of their assets attributable to Institutional Class Shares for distribution or shareholder servicing. For a complete description of these arrangements with respect to each Fund, see the section of the Class A Prospectus entitled “Shareholder Information—Rule 12b-1 Fees” and the section of the Trust SAI entitled “Underwriting and Distribution Service.” These sections are incorporated by reference herein.
Investments in the Target Fund by Certain Affiliated Funds
The Reorganization is not contingent upon the approval or completion of any other reorganization or merger. However, simultaneous with shareholders’ consideration of this Prospectus/Proxy Statement, shareholders of Thrivent Partner Small Cap Value Fund (the “Other Target Fund,” and collectively with the Target Fund, the “Target Funds”) are considering a reorganization of that fund into the Acquiring Fund. Therefore, pro forma financial and expense information presented in this Prospectus/Proxy Statement under the headings “COMPARISON OF THE FUNDS – Expenses” and “COMPARISON OF THE FUNDS – Capitalization”, and the pro forma information regarding the Acquiring and Target Funds in the Reorganization SAI (collectively, the “Pro Forma Information”), is presented on the basis of the alternate assumptions that the Reorganization involves solely the Target Fund or both of the Target Funds.
Other series of the Trust for which Thrivent Asset Mgt. is the investment adviser (the “Affiliated Funds”) currently invest in the Target Funds. The Affiliated Funds are asset allocation funds investing a range of asset categories and permit Thrivent Asset Mgt. to determine whether to invest directly in securities and other investments, in addition to, or instead of, investing in other series of the Fund (including the Target Funds). Over time, Thrivent Asset Mgt. has gradually invested a larger percentage of the Affiliated Funds’ assets in direct investments and has reduced the percentage of assets invested in other series of the Trust. Thrivent Asset Mgt. expects to continue decreasing the percentage of Affiliated Funds’ assets invested in other series over time. This trend of relying more heavily on direct investments is expected to accelerate since Thrivent Asset Mgt. has proposed changes that will simplify the investment advisory fee structure of the Affiliated Funds. These changes would encourage a more streamlined approach of direct investments, while accommodating investments in other series of
- 5 -
Table of Contents
the Trust when Thrivent Asset Mgt. deems it to be advisable. As a result, the Affiliated Funds are likely to redeem their holdings (if any) out of the Target Funds irrespective of whether the Reorganization is approved. These redemptions would most likely be processed as redemptions-in-kind, with the effect that the Affiliated Funds would receive a pro rata distribution of the Target Funds’ investments. These redemptions may be substantial, relative to the size of the Target Fund(s) prior to such redemption, and are likely to occur prior to the effective date of the Reorganization. The Pro Forma Information presented in this Prospectus/Proxy Statement and the Reorganization SAI does not include any effects of such redemptions.
The table below sets forth the fees and expenses that investors may pay to buy and hold shares of each of the Target Fund and the Acquiring Fund, including (i) the fees and expenses paid by the Target Fund for the twelve-month period ended December 31, 2014, (ii) the fees and expenses paid by the Acquiring Fund for the twelve-month period ended December 31, 2014, (iii) pro forma fees and expenses for the Acquiring Fund for the twelve-month period ended December 31, 2014, assuming the Reorganization had been completed as of the beginning of such period, and (iv) pro forma fees and expenses for the Acquiring Fund for the twelve-month period ended December 31, 2014, assuming that the Target Fund and Thrivent Partner Small Cap Value Fund (collectively referred to as the “Target Funds”) all merged into the Acquiring Fund as of the beginning of such period.
| Class A Shares | Institutional Class Shares | |||||||||||||||||||||||||||||||
| Actual | Pro Forma | Pro Forma | Actual | Pro Forma | Pro Forma | |||||||||||||||||||||||||||
| Target Fund | Acquiring Fund | Acquiring Fund (assuming merger with Target Fund) | Acquiring Fund (assuming merger with Target Funds) | Target Fund | Acquiring Fund | Acquiring Fund (assuming merger with Target Fund) | Acquiring Fund (assuming merger with Target Funds) | |||||||||||||||||||||||||
Shareholder Fees (fees paid directly from your investment) | ||||||||||||||||||||||||||||||||
Maximum Sales Charge (Load) Imposed on Purchases (as a percentage of offering price) | 5.50 | % | 5.50 | % | 5.50 | % | 5.50 | % | N/A | N/A | N/A | N/A | ||||||||||||||||||||
Maximum Deferred Sales Charge (Load) (as a percentage of net asset value at time of purchase or redemption, whichever is lower)* | 1.00 | % | 1.00 | % | 1.00 | % | 1.00 | % | N/A | N/A | N/A | N/A | ||||||||||||||||||||
Annual Fund Operating Expenses as a Percentage of Average Net Assets (expenses that are deducted from Fund assets) | ||||||||||||||||||||||||||||||||
Management Fees | 0.92 | % | 0.68 | % | 0.67 | % | 0.66 | % | 0.90 | % | 0.68 | % | 0.67 | % | 0.66 | % | ||||||||||||||||
Distribution and Service (12b-1 Fees) | 0.25 | % | 0.25 | % | 0.25 | % | 0.25 | % | — | — | — | — | ||||||||||||||||||||
Other Expenses | 0.56 | % | 0.32 | % | 0.32 | % | 0.31 | % | 0.12 | % | 0.07 | % | 0.06 | % | 0.08 | % | ||||||||||||||||
Acquired (Underlying) Fund Fees and Expenses | — | 0.01 | % | 0.01 | % | 0.01 | % | — | 0.01 | % | 0.01 | % | 0.01 | % | ||||||||||||||||||
Total Annual Operating Expenses | 1.73 | % | 1.26 | % | 1.25 | % | 1.23 | % | 1.02 | % | 0.76 | % | 0.74 | % | 0.75 | % | ||||||||||||||||
Less Expense Reimbursement** | 0.43 | % | — | — | — | 0.02 | % | — | — | — | ||||||||||||||||||||||
Net Annual Fund Operating Expenses | 1.30 | % | 1.26 | % | 1.25 | % | 1.23 | % | 1.00 | % | 0.76 | % | 0.74 | % | 0.75 | % | ||||||||||||||||
- 6 -
Table of Contents
| * | When you invest $1,000,000 or more, a deferred sales charge of 1% will apply to shares redeemed within one year. |
| ** | The Adviser has contractually agreed, through at least February 28, 2016, to waive certain fees and/or reimburse certain expenses associated with the Class A shares of the Thrivent Partner Small Cap Growth Fund in order to limit the Net Annual Fund Operating Expenses (excluding Acquired (Underlying) Fund Fees and Expenses, if any) to an annual rate of 1.30% of the average daily net assets of the Class A shares. This contractual provision, however, may be terminated before the indicated termination date upon the mutual agreement between the Independent Trustees of the Fund and the Adviser. |
| ** | The Adviser has contractually agreed, through at least February 28, 2016, to waive certain fees and/or reimburse certain expenses associated with the Institutional Class shares of the Thrivent Partner Small Cap Growth Fund in order to limit the Net Annual Fund Operating Expenses (excluding Acquired (Underlying) Fund Fees and Expenses, if any) to an annual rate of 1.00% of the average daily net assets of the Institutional Class shares. This contractual provision, however, may be terminated before the indicated termination date upon the mutual agreement between the Independent Trustees of the Fund and the Adviser. |
Example
The following example, using the actual and pro forma operating expenses for the twelve-month period ended October 31, 2014, is intended to help you compare the costs of investing in the Acquiring Fund pro forma after the Reorganization with the costs of investing in each of the Target Fund and the Acquiring Fund without the Reorganization. The example assumes that you invest $10,000 in each Fund for the time period indicated and that you redeem all of your shares at the end of each period. The example also assumes that your investments have a 5% return each year and that each Fund’s operating expenses remain the same each year. Although your actual returns may be higher or lower, based on these assumptions your costs would be:
| Actual | Pro Forma | |||||||||||||||
| Target Fund | Acquiring Fund | Acquiring Fund (assuming merger with the Target Fund) | Acquiring Fund (assuming merger with the Target Funds) | |||||||||||||
Total operating expenses for Class A Shares assuming redemption at the end of the period | ||||||||||||||||
One Year | $ | 675 | $ | 671 | $ | 670 | $ | 668 | ||||||||
Three Years | $ | 1,025 | $ | 928 | $ | 925 | $ | 919 | ||||||||
Five Years | $ | 1,399 | $ | 1,204 | $ | 1,199 | $ | 1,188 | ||||||||
Ten Years | $ | 2,445 | $ | 1,989 | $ | 1,978 | $ | 1,957 | ||||||||
Total operating expenses for Institutional Class Shares assuming redemption at the end of the period | ||||||||||||||||
One Year | $ | 102 | $ | 78 | $ | 76 | $ | 77 | ||||||||
Three Years | $ | 323 | $ | 243 | $ | 237 | $ | 240 | ||||||||
Five Years | $ | 561 | $ | 422 | $ | 411 | $ | 417 | ||||||||
Ten Years | $ | 1,246 | $ | 942 | $ | 918 | $ | 930 | ||||||||
Portfolio Turnover
Each Fund pays transaction costs, such as commissions, when it buys and sells securities (or “turns over” its portfolio). A higher portfolio turnover rate may indicate higher transaction costs and may result in higher taxes when Fund shares are held in a taxable account. These costs, which are not reflected in Total Annual Operating Expenses or in the Example, affect the Funds’ performance. During the fiscal year ended October 31, 2014, the Acquiring Fund’s and the Target Fund’s portfolio turnover rates were 56% and 94%, respectively, of the average value of their portfolios.
- 7 -
Table of Contents
Purchase, Valuation, Redemption and Exchange of Shares; Dividends and Distributions
Pricing of Fund Shares. The price of a Fund’s shares is based on the Fund’s net asset value (“NAV”). The Funds determine their NAV once daily at the close of trading on the New York Stock Exchange (“NYSE”), which is normally 4:00 p.m. Eastern Time. The Funds do not determine NAV on holidays observed by the NYSE or on any other day when the NYSE is closed. The NYSE is regularly closed on Saturdays and Sundays, New Year’s Day, Martin Luther King, Jr. Day, Presidents Day, Good Friday, Memorial Day, Independence Day, Labor Day, Thanksgiving Day and Christmas Day.
Each Fund determines its NAV for a particular class by dividing the total Fund assets attributable to that class, less all liabilities attributable to such class, by the total number of outstanding shares of that class. To determine the NAV, the other Funds generally value their securities at current market value using readily available market prices. If market prices are not available or if the Adviser determines that they do not accurately reflect fair value for a security, the Board has authorized the Adviser to make fair valuation determinations pursuant to policies approved by the Board. Fair valuation of a particular security is an inherently subjective process, with no single standard to utilize when determining a security’s fair value. In each case where a security is fair valued, consideration is given to the facts and circumstances relevant to the particular situation. This consideration includes a review of various factors set forth in the pricing policies adopted by the Board. For any portion of a Fund’s assets that are invested in other mutual funds, the NAV is calculated based upon the NAV of the mutual funds in which the Fund invests, and the prospectuses for those mutual funds explain the circumstances under which they will use fair value pricing and the effects of such a valuation.
Because many foreign markets close before the U.S. markets, significant events may occur between the close of the foreign market and the close of the U.S. markets, when the Fund’s assets are valued, that could have a material impact on the valuation of foreign securities (i.e., available price quotations for these securities may not necessarily reflect the occurrence of the significant event). The Funds, subject to oversight by the Board, evaluate the impact of these significant events and adjust the valuation of foreign securities to reflect the fair value as of the close of the U.S. markets to the extent that the available price quotations do not, in the Adviser’s opinion, adequately reflect the occurrence of the significant events.
Please note that the Target Fund and the Acquiring Fund have identical valuation policies. As a result, there will be no material change to the value of the Target Fund’s assets because of the Reorganization.
Also, the Target Fund and the Acquiring Fund have identical policies with respect to frequent purchases and redemptions and standing allocation orders (for more information, please see Frequent Trading Policies and Monitoring Processes and Standing Allocation Order disclosures in the Acquiring Fund’s Prospectus—these disclosures are incorporated herein by reference). The Reorganization will not affect these policies.
Class A Shares. The Class A Shares of each Fund are subject to an initial sales charge of up to 5.50%. The initial sales charge applicable to Class A Shares of the Acquiring Fund will be waived for Class A Shares acquired in the Reorganization. Any subsequent purchases of Class A Shares of the Acquiring Fund, excluding Class A Shares purchased through the automatic dividend reinvestment plan, after the Reorganization will be subject to an initial sales charge of up to 5.50%. The initial sales charge is reduced for investments in excess of $50,000. Purchases of Class A Shares of each Fund in amounts of $1 million or more are not subject to an initial sales charge, but a contingent deferred sales charge of up to 1.00% may be imposed on certain redemptions made within one year of purchase. No contingent deferred sales charge will be imposed on Class A Shares of the Target Fund in connection with the Reorganization. For additional information, please see the section entitled “Shareholder Information—Class A Shares” in the Class A Prospectus. This section is incorporated by reference herein.
Institutional Class Shares. Institutional Class Shares of each Fund are not subject to an initial sales charge or a contingent deferred sales charge. Institutional Class Shares are offered to institutions, church organizations, retirement plans sponsored by institutions and participants in various mutual fund asset allocation, fee-based investment advisory programs offered by the Distributor. For additional information, please see the section entitled “Shareholder Information—Institutional Class Shares” in the Institutional Class Prospectus. This section is incorporated by reference herein.
- 8 -
Table of Contents
Buying Shares. Shares of each Fund may be purchased through a shareholder’s registered representative, by mail, by telephone, by the Internet, by wire transfer, through an automatic investment plan or by exchange from other Thrivent mutual funds. For additional information regarding buying shares of each Fund and exchanging shares of each Fund, see the sections of the Trust Prospectus entitled “Shareholder Information—Buying Shares” and “Shareholder Information—Exchanging Shares Between Funds.”
Redeeming Shares. When a Fund receives a request for redemption, such Fund will redeem such shares at the next calculation of the Fund’s NAV. A Fund may postpone payment or suspend the right of redemption in unusual circumstances, as permitted by the SEC. When a shareholder purchases shares by check, electronic funds transfer (other than bank wire) or automatic investment plan and elects to redeem those shares soon after their purchase, the Fund may delay paying the redemption proceeds until the shareholder’s payment has cleared, which could take up to 10 days or more from the date of purchase. Shares may be redeemed by mail, by phone, by the Internet, by wire/ACH transfer or through a systematic withdrawal plan. For additional information regarding redeeming shares of each Fund, see the section of the Trust Prospectus entitled “Shareholder Information—Redeeming Shares.” This section is incorporated by reference herein.
Dividends and Distributions. Dividends of the Target Fund and the Acquiring Fund, if any, are generally declared and paid annually. Income dividends are derivative from investment income, including dividends, interest, and certain foreign currency gains received by each Fund. Capital gains distributions, if any, usually will be declared and paid in December for the prior twelve-month period ending October 31. Any election made by Target Fund shareholders in respect of the receipt of dividends and capital gains distributions will continue to apply to Class A and Institutional Class Shares of the Acquiring Fund received in the Reorganization. For additional information regarding these elections see the section of the Trust Prospectus entitle “Distribution Options.” This section is incorporated by reference herein.
The following table sets forth the capitalization of the Target Fund and the Acquiring Fund, as of October 31, 2014, and the pro forma capitalization of the Acquiring Fund as if the Reorganization occurred on that date. These numbers may differ as of the Closing Date.
| Actual | Pro Forma | |||||||||||||||
| Target Fund | Acquiring Fund | Acquiring Fund (assuming merger with the Target Fund) | Acquiring Fund (assuming merger with the Target Funds) | |||||||||||||
Net assets | ||||||||||||||||
Class A Shares | $ | 17,237,097 | $ | 259,839,518 | $ | 277,076,615 | $ | 373,393,130 | ||||||||
Institutional Class Shares | $ | 238,381 | $ | 90,790,306 | $ | 91,028,687 | $ | 251,663,893 | ||||||||
|
|
|
|
|
|
|
| |||||||||
Total Fund Net Assets | $ | 17,475,478 | $ | 350,629,824 | $ | 368,105,302 | $ | 625,057,023 | ||||||||
Net asset value per share | ||||||||||||||||
Class A Shares | $ | 15.12 | $ | 20.12 | $ | 20.12 | $ | 20.12 | ||||||||
Institutional Class Shares | $ | 15.72 | $ | 22.92 | $ | 22.92 | $ | 22.92 | ||||||||
Shares outstanding | ||||||||||||||||
Class A Shares | 1,139,712 | 12,913,722 | 13,770,385 | 18,557,203 | ||||||||||||
Institutional Class Shares | 15,165 | 3,960,533 | 3,970,932 | 10,978,287 | ||||||||||||
|
|
|
|
|
|
|
| |||||||||
Total Shares Outstanding | 1,154,877 | 16,874,255 | 17,741,317 | 29,535,490 | ||||||||||||
The pro forma shares outstanding reflect the issuance by the Acquiring Fund of: i) assuming a merger with the Target Fund, approximately 856,663 Class A Shares and 10,399 Institutional Class Shares (for a total of 867,062 shares); and ii) assuming a merger with the Target Funds, approximately 5,643,481 Class A Shares and 7,017,754 Institutional Class Shares (for a total of 12,661,235 shares). In each case, such issuance reflects the exchange of the assets of the Target Fund for newly issued Class A Shares and Institutional Class Shares of the Acquiring Fund, respectively, at the pro forma net asset value per share. The aggregate value of the Acquiring Fund shares that a Target Fund shareholder receives in the Reorganization will equal the aggregate value of the Target Fund shares owned immediately prior to the Reorganization.
- 9 -
Table of Contents
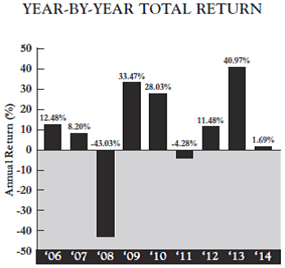
Annual Performance Information
The following chart shows the annual returns of the Target Fund since its inception and the Acquiring Fund for the past ten years. The bar charts include the effects of each Fund’s expenses, but not sales charges. If sales charges were included, returns would be lower than those shown. The table includes the effects of Fund expenses and maximum sales charges and assumes that you sold your shares at the end of the period. After-tax returns are shown only for the Class A Shares and after-tax returns for the Institutional Class Shares will differ from those shown for the Class A Shares. The after-tax returns are calculated using the historical highest individual federal marginal income tax rates and do not reflect the impact of state and local taxes. Actual after-tax returns depend on an investor’s tax situation and may differ from those shown and after-tax returns are not relevant to investors who hold their Fund shares through tax-deferred arrangements such as 401(k) plans or individual retirement accounts. How either Fund performed in the past (before and after taxes) is not necessarily an indication of how it will perform in the future.
Thrivent Partner Small Cap Growth Fund—Class A Shares
- 10 -
Table of Contents
Thrivent Small Cap Stock Fund—Class A Shares
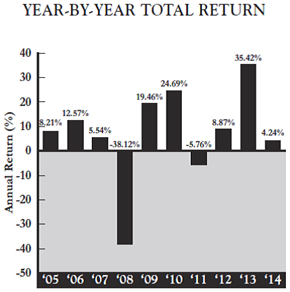
As a result of market activity, current performance may vary from the figures shown.
The Target Fund’s (Class A Shares) total return for the three-month period from January 1, 2015 to March 31, 2015 was 7.63%. The Acquiring Fund’s (Class A Shares) total return for the three-month period from January 1, 2015 to March 31, 2015 was 3.46%. Since its inception, the Target Fund’s (Class A Shares) highest quarterly return was 22.66% (for the quarter ended June 30, 2009) and its lowest quarterly return was -26.78% (for the quarter ended December 31, 2008). During the past 10 years, the Acquiring Fund’s (Class A Shares) highest quarterly return was 18.90% (for the quarter ended September 30, 2009) and its lowest quarterly return was -24.62% (for the quarter ended December 31, 2008).
Comparative Performance Information
As a basis for evaluating each Fund’s performance and risks, the following table shows how each Fund’s performance compares with broad-based market indices that the Adviser believes are appropriate benchmarks for such Fund. The Target Fund’s benchmark is the Russell 2000® Growth Index, which is comprised of small-cap companies with a greater-than-average growth orientation. The Acquiring Fund’s benchmark is the Russell 2000® Index, which is comprised of 2000 of the smaller companies in the Russell 3000® Index. Further, the table includes the effects of each Fund’s expenses, but not sales charges. If sales charges were included, returns would be lower than those shown.
Average annual total returns are shown below for each Fund for the periods ended December 31, 2014 (the most recently completed calendar year prior to the date of this Prospectus/Proxy Statement). Remember that past performance of a Fund is not indicative of its future performance.
Average Annual Total Returns for the Period ended December 31, 2014
- 11 -
Table of Contents
| Target Fund | Acquiring Fund | |||||||||||||||||||||||
| Past 1 Year | Past 5 Years | Since Inception (6/30/2005) | Past 1 Year | Past 5 Years | Past 10 Years | |||||||||||||||||||
Applicable Fund, Class A (before taxes) | -3.91 | % | 13.11 | % | 6.62 | % | -1.48 | % | 11.29 | % | 4.96 | % | ||||||||||||
(after taxes on distributions) | -6.28 | % | 11.52 | % | 5.70 | % | -4.17 | % | 10.64 | % | 3.77 | % | ||||||||||||
(after taxes on distributions and redemptions) | -0.35 | % | 10.30 | % | 5.18 | % | 1.10 | % | 8.95 | % | 3.70 | % | ||||||||||||
Russell 2000® Growth Index (reflects no deductions for fees, expenses or taxes) | 5.60 | % | 16.80 | % | 9.42 | % | — | — | — | |||||||||||||||
Russell 2000® Index (reflects no deductions for fees, expenses or taxes) | — | — | — | 4.89 | % | 15.55 | % | 7.77 | % | |||||||||||||||
- 12 -
Table of Contents
Financial Highlights of the Acquiring Fund
| Income from Investment Operations | Less Distributions From | Ratio to Average Net Assets** | Ratios to Average Net Assets Before Expenses Waived, Credited or Paid Indirectly** | |||||||||||||||||||||||||||||||||||||||||||||||||||||||||
| Net Asset Value, Beginning of Period | Net Investment Income/ (Loss) | Net Realized and Unrealized Gain/(Loss) on Investments(a) | Total from Investment Operations | Net Investment Income | Net Realized Gain on Investments | Total Distributions | Net Asset Value, End of Period | Total Return(b) | Net Assets, End of Period (in millions) | Expenses | Net Investment Income/ (Loss) | Expenses | Net Investment Income/ (Loss) | Portfolio Turnover Rate | ||||||||||||||||||||||||||||||||||||||||||||||
Class A Shares | ||||||||||||||||||||||||||||||||||||||||||||||||||||||||||||
Year Ended 10/31/2014 | $ | 18.52 | ($ | 0.05 | ) | $ | 1.80 | $ | 1.75 | $ | — | ($ | 0.15 | ) | ($ | 0.15 | ) | $ | 20.12 | 9.48 | % | $ | 259.80 | 1.25 | % | (0.15 | )% | 1.25 | % | (0.15 | )% | 56 | % | |||||||||||||||||||||||||||
Year Ended 10/31/2013 | 14.28 | (0.05 | ) | 4.29 | 4.24 | — | — | — | 18.52 | 29.69 | % | 255.6 | 1.29 | % | (0.16 | )% | 1.29 | % | (0.16 | )% | 66 | % | ||||||||||||||||||||||||||||||||||||||
Year Ended 10/31/2012 | 13.35 | (0.06 | ) | 0.99 | 0.93 | — | — | — | 14.28 | 6.97 | % | 216.6 | 1.33 | % | (0.31 | )% | 1.33 | % | (0.31 | )% | 91 | % | ||||||||||||||||||||||||||||||||||||||
Year Ended 10/31/2011 | 12.56 | (0.11 | ) | 0.90 | 0.79 | — | — | — | 13.35 | 6.29 | % | 226.3 | 1.37 | % | (0.67 | )% | 1.37 | % | (0.67 | )% | 99 | % | ||||||||||||||||||||||||||||||||||||||
Year Ended 10/31/2010 | 10.26 | (0.09 | ) | 2.39 | 2.30 | — | — | — | 12.56 | 22.42 | % | 239.1 | 1.46 | % | (0.62 | )% | 1.46 | % | (0.62 | )% | 203 | % | ||||||||||||||||||||||||||||||||||||||
Institutional Class Shares | ||||||||||||||||||||||||||||||||||||||||||||||||||||||||||||
Year Ended 10/31/2014 | 20.98 | 0.05 | 2.04 | 2.09 | — | (0.15 | ) | (0.15 | ) | 22.92 | 10.00 | % | 90.8 | 0.75 | % | 0.35 | % | 0.75 | % | 0.35 | % | 56 | % | |||||||||||||||||||||||||||||||||||||
Year Ended 10/31/2013 | 16.09 | 0.09 | 4.80 | 4.89 | — | — | — | 20.98 | 30.39 | % | 80.2 | 0.76 | % | 0.36 | % | 0.76 | % | 0.36 | % | 66 | % | |||||||||||||||||||||||||||||||||||||||
Year Ended 10/31/2012 | 14.96 | 0.05 | 1.08 | 1.13 | — | — | — | 16.09 | 7.55 | % | 63.4 | 0.77 | % | 0.26 | % | 0.77 | % | 0.26 | % | 91 | % | |||||||||||||||||||||||||||||||||||||||
Year Ended 10/31/2011 | 13.99 | 0.07 | 0.90 | 0.97 | — | — | — | 14.96 | 6.93 | % | 60.3 | 0.76 | % | (0.05 | )% | 0.76 | % | (0.05 | )% | 99 | % | |||||||||||||||||||||||||||||||||||||||
Year Ended 10/31/2010 | 11.35 | 0.02 | 2.62 | 2.64 | — | — | — | 13.99 | 23.26 | % | 68.6 | 0.78 | % | 0.05 | % | 0.78 | % | 0.05 | % | 203 | % | |||||||||||||||||||||||||||||||||||||||
| (a) | The amount shown may not correlate with the change in aggregate gains and losses of portfolio securities due to the timing of sales and redemptions of fund shares. |
| (b) | Total investment return assumes dividend reinvestment and does not reflect any deduction for applicable sales charges. Not annualized for periods less than one year. |
| * | All per share amounts have been rounded to the nearest cent. |
| ** | Computed on an annualized basis for periods less than one year |
The financial highlights for the Target Fund’s Class A Shares and Institutional Class Shares are available in the Thrivent Mutual Funds prospectus for each respective share class, dated February 27, 2015 and as supplemented through the date hereof and are incorporated herein by reference.
-13-
Table of Contents
Thrivent Asset Mgt., 625 Fourth Avenue South, Minneapolis, Minnesota 55415, provides administrative personnel and services necessary to operate the Funds and receives an administration fee from the Funds. The custodian for the Funds is State Street Bank and Trust Company, 225 Franklin Street, Boston, Massachusetts 02110. PricewaterhouseCoopers LLP, 225 South Sixth Street, Suite 1400, Minneapolis, MN 55402, serves as the Trust’s independent registered public accounting firm.
The Trust is an open-end management investment company registered under the Investment Company Act of 1940 (the “1940 Act”) and was organized as a Massachusetts Business Trust on March 10, 1987. The Trust is made up of 26 separate series or “Funds.” Each Fund of the Trust, other than the Thrivent Asset Allocation Funds and the Thrivent Natural Resources Fund, is diversified.
The Trust is authorized to issue shares of beneficial interest, par value $.01 per share, divisible into an indefinite number of different series and classes and operates as a “series company” as provided by Rule 18f-2 under the 1940 Act.
The Declaration of Trust of the Trust, as amended through the date hereof (the “Declaration of Trust”) provides that each shareholder shall be deemed to have agreed to be bound by its terms. A vote of shareholders and the Board may amend the Declaration of Trust. The Trust may issue an unlimited number of shares in one or more series as the Board of Trustees may authorize.
Each class is subject to such investment minimums and other conditions as set forth in the Trust’s current prospectuses. Such minimums are identical the same share classes of the Target Fund and the Acquiring Fund (so, for example, the Class A Shares of both Funds have the same initial and subsequent investment minimums). The Reorganization will not affect such investment minimums and other conditions.
Differences in expenses among classes are described in the Trust’s Amended and Restated Plan Pursuant to Rule 18f-3 under the 1940 Act. Class A and Institutional Class Shares pay the expenses associated with their different distribution arrangements. Each class may, at the Trustees’ discretion, also pay a different share of other expenses, not including advisory or custodial fees or other expenses related to the management of the Trust’s assets, if these expenses are actually incurred in a different amount by that class, or if the class receives services of a different kind or to a different degree than the other class. All other expenses will be allocated to each class on the basis of the net asset value of the particular Fund.
Each class of shares has identical voting rights except that each class has exclusive voting rights on any matter submitted to shareholders relating solely to the class or where the interests of one class differ from the interests of the other class. Class A Shares have exclusive voting rights on matters involving the Rule 12b-1 Distribution Plan. Matters submitted to shareholder vote must be approved by each Fund separately except:
| • | when required otherwise by the 1940 Act; or |
| • | when the Trustees determine that the matter does not affect all Funds; then, only the shareholders of the affected Funds may vote. |
Shares are freely transferable, and holders thereof are entitled to receive dividends declared by the Board, and receive the assets of their respective Fund in the event of liquidation. The Trust generally holds shareholder meetings only when required by law or at the written request of shareholders owning at least 10% of the Trust’s outstanding shares. Shareholders may remove the Trustees from office by votes cast in person or by proxy at a shareholder meeting.
At the request of shareholders holding 10% or more of the outstanding shares of the Trust, the Trust will hold a special meeting for the purpose of considering the removal of a Trustee(s) from office, and the Trust will cooperate with and assist shareholders of record who notify the Trust that they wish to communicate with other shareholders for the purpose of obtaining signatures to request such a meeting, all pursuant to and in accordance with Section 16(c) of the 1940 Act.
- 14 -
Table of Contents
Under Massachusetts law, shareholders of a business trust may be held personally liable, under certain circumstances, for the obligations of the Trust. However, the Declaration of Trust disclaims shareholder, Trustee and/or officer liability for acts performed on behalf of the Trust or for Trust obligations that are binding only on the assets and property of the Trust. The Funds include this disclaimer in each agreement, obligation, or contract entered into or executed by the Trust or the Board. The Declaration of Trust provides for indemnification out of the Trust’s assets for all losses and expenses of any shareholder held personally liable for the obligations of the Trust. The risk of a shareholder incurring financial loss on account of shareholder liability is remote because it is limited to circumstances where the Trust itself is unable to meet its obligations.
The Trust’s organizational documents are filed as part of the Trust’s registration statement with the SEC, and shareholders may obtain copies of such documents as described on the first page of this Prospectus/Proxy Statement and in the Questions and Answers preceding this Prospectus/Proxy Statement.
Payments to Broker-Dealers and Other Financial Intermediaries
If you purchase a Fund through a broker-dealer or other financial intermediary, the Fund and its related companies may pay the intermediary for the sale of Fund shares and related services. These payments may create a conflict of interest by influencing the broker-dealer or other intermediary and your salesperson to recommend the Fund over another investment. Ask your salesperson or visit your financial intermediary’s website for more information.
INFORMATION ABOUT THE REORGANIZATION
Under the Reorganization Agreement, the Target Fund will transfer all of its assets to the Acquiring Fund in exchange for Class A and Institutional Class Shares of the Acquiring Fund. The Acquiring Fund Class A and Institutional Class Shares issued to the Target Fund will have an aggregate value equal to the aggregate value of the Target Fund’s net assets immediately prior to the Reorganization. Upon receipt by the Target Fund of Acquiring Fund Class A and Institutional Class Shares, the Target Fund will distribute such shares of the Acquiring Fund to Target Fund shareholders. Then, as soon as practicable after the Closing Date of the Reorganization, the Target Fund will dissolve under applicable state law.
The Target Fund will distribute the Acquiring Fund Class A and Institutional Class Shares received by it pro rata to Target Fund shareholders of record in exchange for their interest in Class A and Institutional Class Shares of the Target Fund. This distribution will be accomplished by opening new accounts on the books of the Acquiring Fund in the names of the Target Fund shareholders and transferring to those shareholder accounts the Acquiring Fund Class A and Institutional Class Shares received by the Target Fund. Each newly-opened account on the books of the Acquiring Fund for the previous Target Fund shareholders will represent the respective pro rata number of Acquiring Fund Class A and Institutional Class Shares due such shareholder.
Accordingly, as a result of the Reorganization, each Target Fund shareholder would own Acquiring Fund Class A and Institutional Class Shares that would have an aggregate value immediately after the Reorganization equal to the aggregate value of that shareholder’s Target Fund shares immediately prior to the Reorganization. The interests of each of the Target Fund’s shareholders will not be diluted as a result of the Reorganization. However, as a result of the Reorganization, a shareholder of the Target Fund or the Acquiring Fund will hold a reduced percentage of ownership in the larger combined fund than the shareholder did in either of the separate Funds.
No sales charge or fee of any kind will be assessed to Target Fund shareholders in connection with their receipt of Acquiring Fund Class A and Institutional Class Shares in the Reorganization.
Approval of the Reorganization will constitute approval of amendments to any of the fundamental investment restrictions of the Target Fund that might otherwise be interpreted as impeding the Reorganization, but solely for the purpose of and to the extent necessary for consummation of the Reorganization.
- 15 -
Table of Contents
Terms of the Reorganization Agreement
The following is a summary of the material terms of the Reorganization Agreement. This summary is qualified in its entirety by reference to the form of Reorganization Agreement, a form of which is attached as Appendix A to the Reorganization SAI.
Pursuant to the Reorganization Agreement, the Acquiring Fund will acquire all of the assets of the Target Fund on the Closing Date in exchange for Class A and Institutional Class Shares of the Acquiring Fund. Subject to the Target Fund’s shareholders approving the Reorganization, the Closing Date shall occur on August 28, 2015 or such other date as determined by an officer of the Fund.
On the Closing Date, the Target Fund will transfer to the Acquiring Fund all of its assets. The Acquiring Fund will in turn transfer to the Target Fund a number of its Class A and Institutional Class Shares equal in value to the value of the net assets of the Target Fund transferred to the Acquiring Fund as of the Closing Date, as determined in accordance with the valuation method described in the Acquiring Fund’s then current prospectus. In order to minimize any potential for undesirable federal income and excise tax consequences in connection with the Reorganization, the Target Fund will distribute on or before the Closing Date all or substantially all of its undistributed net investment income (including net capital gains) as of such date.
The Target Fund expects to distribute Class A and Institutional Class Shares of the Acquiring Fund received by the Target Fund to shareholders of the Target Fund promptly after the Closing Date and then dissolve.
The Acquiring Fund and the Target Fund have made certain standard representations and warranties to each other regarding their capitalization, status and conduct of business. Unless waived in accordance with the Reorganization Agreement, the obligations of the parties to the Reorganization Agreement are conditioned upon, among other things:
| • | the approval of the Reorganization by the Target Fund’s shareholders; |
| • | the absence of any rule, regulation, order, injunction or proceeding preventing or seeking to prevent the consummation of the transactions contemplated by the Reorganization Agreement; |
| • | the receipt of all necessary approvals, registrations and exemptions under federal and state laws; |
| • | the truth in all material respects as of the Closing Date of the representations and warranties of the parties and performance and compliance in all material respects with the parties’ agreements, obligations and covenants required by the Reorganization Agreement; |
| • | the effectiveness under applicable law of the registration statement of the Acquiring Fund of which this Prospectus/Proxy Statement forms a part and the absence of any stop orders under the Securities Act of 1933, as amended, pertaining thereto; and |
| • | the receipt of an opinion of counsel relating to the characterization of the Reorganization as a tax-free reorganization for federal income tax purposes (as further described herein under the heading “Material Federal Income Tax Consequences of the Reorganization”). |
The Reorganization Agreement may be terminated or amended by the mutual consent of the parties either before or after approval thereof by the shareholders of the Target Fund, provided that no such amendment after such approval shall be made if it would have a material adverse effect on the interests of such Target Fund’s shareholders. The Reorganization Agreement also may be terminated by the non-breaching party if there has been a material misrepresentation, material breach of any representation or warranty, material breach of contract or failure of any condition to closing.
Reasons for the Proposed Reorganization
In determining whether to recommend approval of the Reorganization Agreement to Target Fund shareholders, the Board considered a number of factors, including, but not limited to: (i) the expenses and advisory fees applicable to the Funds before the proposed Reorganization and the estimated expense ratios of the combined portfolio after the proposed Reorganization; (ii) the comparative investment performance of the Funds; (iii) the future growth prospects of each Fund; (iv) the terms and conditions of the Reorganization Agreement; (v) whether the Reorganization would result in the dilution of shareholder interests; (vi) the compatibility of the Funds’
- 16 -
Table of Contents
investment objectives, policies, risks and restrictions; (vii) the anticipated tax consequences of the proposed Reorganization; (viii) the compatibility of the Funds’ service features available to shareholders, including exchange privileges; and (ix) the estimated costs of the Reorganization. The Board concluded that these factors supported a determination to approve the Reorganization Agreement.
The Board believes that the Reorganization would be in the best interests of the Target Fund’s shareholders because: (i) shareholders will become shareholders of a larger combined fund with greater potential to increase asset size and achieve economies of scale, whereby certain administrative costs may be spread across the combined fund’s larger asset base and, therefore, may increase the combined fund’s overall efficiency in the long term; (ii) the Acquiring Fund invests in a more diversified portfolio of equities; (iii) the Acquiring Fund has achieved stronger performance than the Target Fund for the one-year period ended December 31, 2014, which corresponds to when Matthew Finn assumed primary portfolio management responsibilities for the Acquiring Fund, though there is no guarantee of future performance; (iv) the Adviser believes that it can most effectively manage the assets currently in the Target Fund by combining such assets with the Acquiring Fund into a single mandate and under the same portfolio manager; and (v) the Acquiring Fund has lower advisory fees than the Target Fund and the Target Fund shareholders will experience a lower expense ratio in the Acquiring Fund following the Reorganization.
The Board has determined that the Reorganization is in the best interests of the Target Fund and that the interests of the Target Fund’s shareholders will not be diluted as a result of the Reorganization. In addition, the Board has determined that the Reorganization is in the best interests of the Acquiring Fund and that the interests of the Acquiring Fund shareholders will not be diluted as a result of the Reorganization.
Material Federal Income Tax Consequences of the Reorganization
The following is a general summary of the material anticipated U.S. federal income tax consequences of the Reorganization. This discussion is based upon the Internal Revenue Code of 1986, as amended (the “Code”), Treasury regulations, court decisions, published positions of the Internal Revenue Service (“IRS”) and other applicable authorities, all as in effect on the date hereof and all of which are subject to change or differing interpretations (possibly with retroactive effect). This discussion is limited to U.S. persons who hold shares of the Target Fund as capital assets for U.S. federal income tax purposes on the date of exchange.
This summary does not address all of the U.S. federal income tax consequences that may be relevant to a particular shareholder or to shareholders who may be subject to special treatment under U.S. federal income tax laws. No assurance can be given that the IRS would not assert or that a court would not sustain a position contrary to any of the tax aspects described below. Shareholders should consult their own tax advisers as to the U.S. federal income tax consequences of the Reorganization to them, as well as the effects of state, local and non-U.S. tax laws.
The Reorganization is expected to be a tax-free reorganization for U.S. federal income tax purposes. It is a condition to closing the Reorganization that the Target Fund and the Acquiring Fund receive an opinion from Reed Smith LLP, special counsel to each Fund, dated as of the Closing Date, regarding the characterization of the Reorganization as a “reorganization” within the meaning of Section 368(a)(1) of the Code. As such a reorganization, the U.S. federal income tax consequences of the Reorganization can be summarized as follows: to the effect that on the basis of existing provisions of the Code, the Treasury regulations promulgated thereunder, current administrative rules and court decisions, generally for U.S. federal income tax purposes, except as noted below:
| • | the Reorganization will constitute a reorganization within the meaning of Section 368(a)(1) of the Code, and the Target Fund and the Acquiring Fund will each be a “party to a reorganization” within the meaning of Section 368(b) of the Code; |
| • | under Section 361 of the Code, no gain or loss will be recognized by the Target Fund upon the transfer of its assets to the Acquiring Fund in exchange for Acquiring Fund shares, or upon the distribution of Acquiring Fund shares by the Target Fund to its shareholders in liquidation; |
| • | under Section 1032 of the Code, no gain or loss will be recognized by the Acquiring Fund upon receipt of the assets transferred to the Acquiring Fund in exchange for Acquiring Fund shares; |
| • | under Section 362(b) of the Code, the Acquiring Fund’s tax basis in each asset that the Acquiring Fund receives from the Target Fund will be the same as the Target Fund’s tax basis in such asset immediately prior to such exchange; |
- 17 -
Table of Contents
| • | under Section 1223(2) of the Code, the Acquiring Fund’s holding periods in each asset will include the Target Fund’s holding periods in such asset; |
| • | under Section 354 of the Code, no gain or loss will be recognized by shareholders of the Target Fund on the distribution of Acquiring Fund shares to them in exchange for their shares of the Target Fund; |
| • | under Section 358 of the Code, the aggregate tax basis of the Acquiring Fund shares that the Target Fund’s shareholders receive in exchange for their Target Fund shares will be the same as the aggregate tax basis of the Target Fund shares exchanged therefor; |
| • | under Section 1223(1) of the Code, a Target Fund shareholder’s holding period for the Acquiring Fund shares received in the Reorganization will be determined by including the holding period for the Target Fund shares exchanged therefor, provided that the shareholder held the Target Fund shares as a capital asset on the date of the exchange; and |
| • | under Section 381 of the Code, the Acquiring Fund will succeed to and take into account the items of the Target Fund described in Section 381(c) of the Code, subject to the conditions and limitations specified in Section 381, 382, 383 and 384 of the Code and the Treasury regulations thereunder. |
The opinion will be based on certain factual certifications made by the officers of the Target Fund and the Acquiring Fund and will also be based on customary assumptions such as the assumption that the Reorganization will be consummated in accordance with the Reorganization Agreement. The opinion is not a guarantee that the tax consequences of the Reorganization will be as described above. There is no assurance that the IRS or a court would agree with the opinion.
The Acquiring Fund intends to continue to be taxed under the rules applicable to regulated investment companies as defined in Section 851 of the Code which are the same rules currently applicable to Target Fund. In connection with the Reorganization, on or before the Closing Date, the Target Fund will declare to its shareholders a dividend which, together with all of its previous distributions, will have the effect of distributing to shareholders all of its investment company taxable income (computed without regard to the deduction for dividends paid), net tax-exempt interest income and net capital gains through the Closing Date.
A regulated investment company is permitted to carryforward net capital losses; however, net capital losses incurred in taxable years beginning on or before December 22, 2010 can be carried forward for eight taxable years only. Additionally capital losses incurred in taxable years beginning on or before December 22, 2010 cannot be utilized to offset capital gains until all net capital losses arising in tax years beginning after December 22, 2010 have been utilized. As a result, some net capital loss carryforwards incurred on or before December 22, 2010 may expire unused.
Immediately prior to the Reorganization, the Target Fund is not expected to have any unutilized capital loss carryforwards. The final amount of unutilized capital loss carryforwards for the Target Fund is subject to change and will not be determined until the Closing Date. As of April 9, 2015, the capital loss carryforward of the Target Fund and the Acquiring Fund was $0 and $0, respectively.
Generally, the Acquiring Fund will succeed to the capital loss carryforwards of the Target Fund, subject to the limitations described below. If the Target Fund has capital loss carryforwards, such capital losses would, in the absence of the Reorganization, generally be available to offset Target Fund capital gains, thereby reducing the amount of capital gain net income that must be distributed to the Target Fund shareholders.
Under Sections 382 and 383 of the Code, an “equity structure shift” arising as a result of a reorganization under Section 368(a)(1) of the Code can result in limitations on the post-reorganization Fund’s use of capital loss carryforwards of the participating Funds. An “equity structure shift” can trigger limitations on capital loss carryforwards where there is a more than 50% change in the ownership of a Fund.
Even though the Reorganization may result in a more than 50% change in ownership of either fund, the Adviser does not anticipate a limitation since the Funds are not expected to have capital loss carryforwards.
- 18 -
Table of Contents
This summary of the U.S. federal income tax consequences of the Reorganization is made without regard to the particular facts and circumstances of any shareholder. Shareholders are urged to consult their own tax advisors as to the specific consequences to them of the Reorganization, including the applicability and effect of state, local, non-U.S. and other tax laws.
It is not expected that the Reorganization will be a taxable event for any shareholder.
Expenses of the Reorganization
All expenses of the Reorganization will be paid by the Adviser or an affiliate and will not be borne by shareholders of the Target Fund.
Reorganization expenses include, but are not limited to: all costs related to the preparation and distribution of materials distributed to the Board; all expenses incurred in connection with the preparation of the Reorganization Agreement and a registration statement on Form N-14; SEC and state securities commission filing fees and legal and audit fees in connection with each Reorganization; the costs of printing and distributing this Prospectus/Proxy Statement; legal fees incurred preparing materials for the Boards attending the Board meetings and preparing the Board minutes; auditing fees associated with the Fund’s financial statements; portfolio transfer taxes (if any); and any similar expenses incurred in connection with the Reorganization. Management of the Funds estimates the total cost of the Reorganization to be approximately $92,000 ($186,000 for the Target Funds combined). If the Reorganization is not approved by shareholders, the Adviser will still bear the costs of the proposed Reorganization.
Any brokerage charges associated with the purchase or disposition of portfolio investments by the Target Fund prior to the Reorganization will be borne by the Target Fund. Any brokerage charges associated with the purchase or disposition of portfolio investments by the Acquiring Fund after the Reorganization will be borne by the Acquiring Fund.
The Board has unanimously approved the Reorganization, subject to shareholder approval. Approval of the Reorganization requires the affirmative vote of a “Majority of the Outstanding Voting Securities” of the Target Fund, which is, under the 1940 Act, the lesser of (1) 67% or more of the shares of the Fund present at the Meeting if the holders of more than 50% of the outstanding shares of the Fund are present or represented by proxy, or (2) more than 50% of the outstanding shares of the Fund.
The Board recommends voting “FOR” the proposed Reorganization.
At the close of business on the Record Date, the Acquiring Fund had outstanding shares. As of the Record Date, the trustees and officers of the Acquiring Fund as a group owned less than 1% of the shares of the Acquiring Fund. As of the Record Date, no person was known by the Acquiring Fund to own beneficially or of record as much as 5% of the Acquiring Fund shares except as follows:
Name | Class of Shares | Approximate Percentage of Ownership | ||||||
| % | ||||||||
| % | ||||||||
| % | ||||||||
At the close of business on the Record Date, the Target Fund had outstanding shares. As of the Record Date, the trustees and officers of the Target Fund as a group owned less than 1% of the shares of the Target Fund. As of the Record Date, no person was known by the Target Fund to own beneficially or of record as much as 5% of the shares of the Target Fund except as follows:
- 19 -
Table of Contents
Name | Class of Shares | Approximate Percentage of Ownership | ||||||
| % | ||||||||
Annual Meeting of Shareholders
There will be no annual or further special meetings of shareholders of the Trust unless required by applicable law or called by the Board in its discretion. Shareholders wishing to submit proposals for inclusion in a proxy statement for a subsequent shareholder meeting should send their written proposals to the Secretary of the Fund, 625 Fourth Avenue South, Minneapolis, Minnesota 55415. Shareholder proposals should be received in a reasonable time before the solicitation is made.
VOTING INFORMATION AND REQUIREMENTS
Approval of the Reorganization requires the affirmative vote of a “Majority of the Outstanding Voting Securities” of the Target Fund, which is, under the 1940 Act, the lesser of (1) 67% or more of the shares of the Fund present at the Meeting if the holders of more than 50% of the outstanding shares of the Fund are present or represented by proxy, or (2) more than 50% of the outstanding shares of the Fund.
The Board has fixed the close of business on June 16, 2015, as the Record Date for the determination of shareholders entitled to notice of, and to vote at, the Meeting. Target Fund shareholders on the Record Date are entitled to one vote for each share held, with no shares having cumulative voting rights.
One-third of the shares of the Target Fund outstanding and entitled to vote at the Meeting represented in person or by proxy constitutes a quorum.
Target Fund shareholders may vote in any one of four ways: (i) via the Internet, (ii) by telephone, (iii) by mail, by returning the proxy card, or (iv) in person at the Meeting. Instructions for Internet and telephone voting are included with the enclosed proxy materials. Shareholders who deliver voting instructions by methods (i), (ii) or (iii) may revoke them at any time prior to the Meeting by delivering a written notice of revocation, by executing another proxy card bearing a later date or by attending the Meeting and giving voting instructions in person. Merely attending the Meeting, however, will not revoke any previously submitted proxy. The required control number for Internet and telephone voting is printed on the enclosed proxy card. The control number is used to match voting proxy cards with shareholders’ respective accounts and to ensure that, if multiple proxy cards are executed, shares are voted in accordance with the proxy card bearing the latest date. The Target Fund employs procedures for Internet and telephone voting, such as requiring the control number from the proxy card in order to vote by either of these methods, which it considers to be reasonable to confirm that the instructions received are genuine. If reasonable procedures are employed, the Target Fund will not be liable for following Internet or telephone votes which it believes to be genuine.
Abstentions and broker non-votes (i.e., where a nominee such as a broker holding shares for beneficial owners votes on certain matters pursuant to discretionary authority or instructions from beneficial owners, but with respect to one or more proposals does not receive instructions from beneficial owners or does not exercise discretionary authority) will be deemed present for quorum purposes. Abstentions and broker non-votes have the same effect as votes “AGAINST” the Reorganization.
All properly executed proxies received prior to the Meeting will be voted at the Meeting in accordance with the instructions marked thereon or otherwise as provided therein. Proxies received prior to the Meeting on which no vote is indicated will be voted “FOR” the approval of the proposed Reorganization.
- 20 -
Table of Contents
Solicitation of proxies is being made primarily by the mailing of this Notice and Prospectus/Proxy Statement with its enclosures on or about July 1, 2015. Shareholders of the Target Fund whose shares are held by nominees, such as brokers, can vote their proxies by contacting their respective nominee. In addition to the solicitation of proxies by mail, employees of the Adviser and its affiliates, without additional compensation, may solicit proxies in person or by telephone, telegraph, facsimile or oral communication. The Target Fund may retain Computershare Fund Services (“Computershare”), a professional proxy solicitation firm, to assist with any necessary solicitation of proxies. The estimated cost of additional telephone solicitation by Computershare is approximately $7,500. The proxy solicitation expenses are an expense of the Reorganization and will be allocated as described above.
Other Matters to Come Before the Meeting
The Board knows of no business other than that described in the Notice that will be presented for consideration at the Meeting. If any other matters are properly presented, it is the intention of the persons named on the enclosed proxy to vote proxies in accordance with their best judgment.
In the event that a quorum is present at the Meeting but sufficient votes to approve the proposed Reorganization are not received, proxies (including abstentions and broker non-votes) will be voted in favor of one or more adjournments of the Meeting to permit further solicitation of proxies on the proposed Reorganization, provided that the Board determines that such an adjournment and additional solicitation is reasonable and in the interest of shareholders based on a consideration of all relevant factors, including the nature of the particular proposals, the percentage of votes then cast, the percentage of negative votes cast, the nature of the proposed solicitation activities and the nature of the reasons for such further solicitation. Any such adjournment will require the affirmative vote of the holders of a majority of the outstanding shares voted at the session of the Meeting to be adjourned.
If you cannot be present in person, you are requested to fill in, sign and return the enclosed proxy card, for which, no postage is required if mailed in the United States, or record your voting instructions by telephone or via the Internet promptly.
|
| Michael W. Kremenak |
| Secretary |
| Thrivent Mutual Funds |
- 21 -
Table of Contents
Questions & Answers
For Shareholders of Thrivent Partner Small Cap Value Fund
Although we recommend that you read the complete Prospectus/Proxy Statement, we have provided the following questions and answers to clarify and summarize the issues to be voted on.
Q: Why is a shareholder meeting being held?
A: A special meeting of shareholders (the “Meeting”) of Thrivent Partner Small Cap Value Fund (the “Target Fund”) is being held to seek shareholder approval of a reorganization (the “Reorganization”) of the Target Fund into Thrivent Small Cap Stock Fund (the “Acquiring Fund”). Please refer to the Prospectus/Proxy Statement for a detailed explanation of the proposed Reorganization and for a more complete description of the Acquiring Fund.
Q: Why is the Reorganization being recommended?
A: After careful consideration, the Board of Trustees (the “Board”) of Thrivent Mutual Funds (the “Trust”) has determined that the Reorganization is in the best interests of the shareholders of the Target Fund and recommends that you cast your vote “FOR” the proposed Reorganization. The Target Fund and the Acquiring Fund have substantially similar investment objectives, and each is a diversified series of the Trust, an open-end management investment company registered under the Investment Company Act of 1940. Thrivent Asset Management, LLC (“Thrivent Asset Mgt.” or the “Adviser”) is the investment adviser for the Target Fund and the Acquiring Fund.
The Board believes that the Reorganization would be in the best interests of the shareholders of the Target Fund because: (i) shareholders will become shareholders of a larger combined fund with greater potential to increase asset size and achieve economies of scale (especially given the breakpoints in the advisory fee schedule for the Acquiring Fund), whereby certain administrative costs may be spread across the combined portfolio’s larger asset base and, therefore, may increase the combined portfolio’s overall efficiency in the long term; (ii) the Acquiring Fund invests in a more diversified portfolio of equities; (iii) the Acquiring Fund has achieved stronger performance than the Target Fund for the one-year period ended December 31, 2014, which corresponds to when Matthew Finn assumed primary portfolio management responsibilities for the Acquiring Fund, though there is no guarantee of future performance; (iv) the Adviser believes that, given the turnover in portfolio management at T. Rowe Price, subadviser to the Target Fund, it can most effectively manage the assets currently in the Target Fund by combining such assets with the Acquiring Fund into a single mandate and under the same portfolio manager; and (v) the Target Fund shareholders will experience a lower expense ratio in the Acquiring Fund following the Reorganization.
Q: Who can vote?
A: Shareholders of the Target Fund are entitled to vote.
Q: How will the Reorganization affect me?
A: Assuming shareholders approve the proposed Reorganization, the assets of the Target Fund will be combined with those of the Acquiring Fund. The Class A and Institutional Class Shares of the Target Fund automatically would be exchanged for an equal dollar value of Class A and Institutional Class Shares of the Acquiring Fund. Following the Reorganization, the Target Fund will dissolve.
Q: Will I have to pay any commission or other similar fee as a result of the Reorganization?
A: No. You will not pay any commissions or other similar fees as a result of the Reorganization. If you hold Class A Shares of the Target Fund, you will receive Class A Shares of the Acquiring Fund. If you hold Institutional Class Shares of the Target Fund, you will receive Institutional Class Shares of the Acquiring Fund.
Table of Contents
Q: Will the total annual operating expenses that my portfolio investment bears increase as a result of the Reorganization?
A: No, they will likely decrease, and the investment management fee, which comprises a portion of the annual operating expenses, will decrease. For more information about how fund expenses may change as a result of the Reorganization, please see the comparative and pro forma table and related disclosures in the COMPARISON OF THE FUNDS—Expenses section of the Prospectus/Proxy Statement.
Q: Will I have to pay any U.S. federal income taxes as a result of the Reorganization?
A: The Reorganization is expected to be tax-free for federal income tax purposes. The Target Fund will seek an opinion of counsel to this effect. Generally, shareholders will not incur capital gains or losses on the exchange of Target Fund shares for Acquiring Fund shares as a result of the Reorganization.
Q: If shareholders of the Target Fund do not approve the Reorganization, what will happen to the Target Fund?
A: Thrivent Asset Mgt. will reassess what changes it would like to make to a Target Fund, including a possible repurposing of the Target Fund’s principal investment strategies or recommending a liquidation of the Target Fund to the Board. It may ultimately decide to make no changes.
Q: Who pays the costs of the Reorganization?
A: The expenses of the Reorganization, including the costs of the Meeting, will be paid by Thrivent Asset Mgt. or an affiliate and will not be borne by Target Fund shareholders.
Q: How can I vote?
A: Shareholders are invited to attend the Meeting and to vote in person. You may also vote by executing a proxy using one of three methods:
| • | By Internet: Instructions for casting your vote via the Internet can be found in the enclosed proxy voting materials. The required control number is printed on your enclosed proxy card. If this feature is used, there is no need to mail the proxy card. |
| • | By Telephone: Instructions for casting your vote via telephone can be found in the enclosed proxy voting materials. The toll-free number and required control number are printed on your enclosed proxy card. If this feature is used, there is no need to mail the proxy card. |
| • | By Mail: If you vote by mail, please indicate your voting instructions on the enclosed proxy card, date and sign the card, and return it in the envelope provided, which is addressed for your convenience and needs no postage if mailed in the United States. |
Shareholders who execute proxies by Internet, telephone or mail may revoke them at any time prior to the Meeting by filing with the Target Fund a written notice of revocation, by executing another proxy bearing a later date, by voting later by Internet or telephone or by attending the Meeting and voting in person. Merely attending the Meeting, however, will not revoke any previously submitted proxy.
Q: When should I vote?
A: Every vote is important and the Board encourages you to record your vote as soon as possible. Voting your proxy now will ensure that the necessary number of votes is obtained, without the time and expense required for additional proxy solicitation.
Q: Who should I call if I have questions about the proposal in the Prospectus/Proxy Statement?
A: Call 1-866-865-3843 with your questions.
- 2 -
Table of Contents
Q: How can I get more information about the Target and Acquiring Funds?
A: You may obtain (1) a prospectus, statement of additional information or annual/semiannual report for the Funds or (2) the statement of additional information regarding the Reorganization (request the “Reorganization SAI”) by:
| • | Telephone: 1-800-THRIVENT (1-800-847-4836) and say “mutual funds” |
| • | Mail: Thrivent Mutual Funds, P.O. Box 219348, Kansas City, Missouri 64121-9348 |
| • | Internet: |
| • | For a copy of a prospectus, a statement of additional information, or a shareholder report: |
www.thrivent.com
| • | For a copy of this Prospectus/Proxy Statement or the Reorganization SAI: |
www.proxy-direct.com/thr-26694
- 3 -
Table of Contents
Thrivent Partner Small Cap Value Fund
a series of
THRIVENT MUTUAL FUNDS
625 Fourth Avenue South
Minneapolis, Minnesota 55415
(800) 847-4836
www.thrivent.com
NOTICE OF SPECIAL MEETING
OF SHAREHOLDERS
To be Held on August 14, 2015
NOTICE IS HEREBY GIVEN THAT a special meeting of shareholders (the “Meeting”) of Thrivent Partner Small Cap Value Fund (the “Target Fund”), a series of Thrivent Mutual Funds (the “Trust”), will be held at the offices of Thrivent Financial for Lutherans, 625 Fourth Avenue South, Minneapolis, Minnesota 55415 on August 14, 2015 at 9:00 a.m. Central time for the following purposes:
| 1. | To approve an Agreement and Plan of Reorganization pursuant to which the Target Fund would (i) transfer all of its assets to Thrivent Small Cap Stock Fund (the “Acquiring Fund”), a series of the Trust, in exchange for Class A and Institutional Class Shares of the Acquiring Fund, (ii) distribute such Class A and Institutional Class Shares of the Acquiring Fund to shareholders of the Target Fund, and (iii) dissolve. |
| 2. | To transact such other business as may properly be presented at the Meeting or any adjournment thereof. |
The Board of Trustees of the Trust (the “Board”) has fixed the close of business on June 16, 2015 as the record date for the determination of shareholders entitled to notice of, and to vote at, the Meeting and all adjournments thereof.
Shareholders are invited to attend the meeting and vote in person. You may also vote by executing a proxy using one of three methods:
| • | By Internet—Instructions for casting your vote via the Internet can be found in the enclosed proxy voting materials. The required control number is printed on your enclosed proxy card. If this feature is used, there is no need to mail the proxy card. |
| • | By Telephone—Instructions for casting your vote via telephone can be found in the enclosed proxy voting materials. The toll-free number and required control number are printed on your enclosed proxy card. If this feature is used, there is no need to mail the proxy card. |
| • | By Mail—If you vote by mail, please indicate your voting instructions on the enclosed proxy card, date and sign the card, and return it in the envelope provided, which is addressed for your convenience and needs no postage if mailed in the United States. |
Shareholders who execute proxies by Internet, telephone, or mail may revoke them at any time prior to the Meeting by filing with the Target Fund a written notice of revocation, by executing another proxy bearing a later date, or by attending the Meeting and voting in person. Merely attending the Meeting, however, will not revoke any previously submitted proxy.
The Board recommends that you cast your vote FOR the proposed Reorganization as described in the Prospectus/Proxy Statement.
YOUR VOTE IS IMPORTANT
Please return your proxy card or record your voting instructions by telephone or via the Internet promptly no matter how many shares you own. In order to avoid the additional expense of further solicitation, we ask that you mail your proxy card or record your voting instructions by telephone or via the Internet promptly regardless of whether you plan to be present in person at the Meeting.
| Date: , 2015 |
|
| Michael W. Kremenak |
Secretary Thrivent Mutual Funds |
Table of Contents
COMBINED PROSPECTUS/PROXY STATEMENT
THRIVENT PARTNER SMALL CAP VALUE FUND
a series of
THRIVENT MUTUAL FUNDS
625 Fourth Avenue South
Minneapolis, Minnesota 55415
(800) 847-4836
, 2015
This Prospectus/Proxy Statement is furnished to you as a shareholder of Thrivent Partner Small Cap Value Fund (the “Target Fund”), a series of Thrivent Mutual Funds (the “Trust”). A special meeting of shareholders of the Target Fund will be held on August 14, 2015 (the “Meeting”) to consider the approval of a Reorganization (the “Reorganization”) of the Target Fund into Thrivent Small Cap Stock Fund (the “Acquiring Fund”). The Board of Trustees of the Trust (the “Board”) requests that you vote your shares by completing and returning the enclosed proxy card or by recording your voting instructions by telephone or via the Internet regardless of whether you plan to be present at the Meeting in order to avoid the additional expense of further solicitation.
The Acquiring Fund and the Target Fund are sometimes referred to herein individually as a “Fund” or collectively as the “Funds.” Each of the Acquiring Fund and the Target Fund is organized as a diversified series of the Trust, an open-end management investment company registered under the Investment Company Act of 1940, as amended (the “1940 Act”).
The reorganization proposed for the Target Fund (the “Reorganization”) is not contingent upon the approval or completion of any other reorganization or merger.
This Prospectus/Proxy Statement sets forth concisely the information shareholders of the Target Fund ought to know before voting on the Reorganization. Please read it carefully and retain it for future reference.
The following documents, each having been filed with the Securities and Exchange Commission (the “SEC”), are incorporated herein by reference:
| • | The Thrivent Mutual Funds Prospectus, dated February 27, 2015 and as supplemented through the date hereof (the “Trust Prospectus”). |
| • | A Statement of Additional Information, dated , 2015, relating to this Combined Prospectus/Proxy Statement (the “Reorganization SAI”); |
| • | The Thrivent Mutual Funds Statement of Additional Information, dated February 27, 2015 and as supplemented through the date hereof (the “Trust SAI”). |
Copies of the foregoing may be obtained without charge by calling or writing the Fund as set forth below. If you wish to request the Reorganization SAI, please ask for the “Reorganization SAI.”
In addition, each Fund will furnish, without charge, a copy of its most recent annual report and subsequent semi-annual report, if any, to a shareholder upon request.
Copies of each Fund’s most recent prospectus, statement of additional information, annual report and semi-annual report can be obtained at www.thrivent.com. Requests for documents can also be made by calling (800) 847-4836 or writing Thrivent Mutual Funds, P.O. Box 219348, Kansas City, Missouri 64121-9348.
The Funds file reports and other information with the SEC. Information filed by the Funds with the SEC can be reviewed and copied at the SEC’s Public Reference Room in Washington, DC or on the EDGAR database on the SEC’s internet site (http://www.sec.gov). Information on the operation of the SEC’s Public Reference Room may be obtained by calling the SEC at (202) 551-8090. You can also request copies of these materials, upon payment of a duplicating fee, by electronic request at the SEC’s e-mail address (publicinfo@sec.gov) or by writing the Public Reference Section of the SEC, Washington, DC 20549-1520.
The Board knows of no business other than that discussed above that will be presented for consideration at the Meeting. If any other matter is properly presented, it is the intention of the persons named in the enclosed proxy to vote in accordance with their best judgment.
No person has been authorized to give any information or make any representation not contained in this Prospectus/Proxy Statement and, if so given or made, such information or representation must not be relied upon as having been authorized. This Prospectus/Proxy Statement does not constitute an offer to sell or a solicitation of an offer to buy any securities in any jurisdiction in which, or to any person to whom, it is unlawful to make such offer or solicitation.
Table of Contents
Neither the Securities and Exchange Commission nor any state regulator has approved or disapproved of these shares or passed upon the adequacy of this Prospectus/Proxy Statement. A representation to the contrary is a crime.
The date of this Prospectus/Proxy Statement is , 2015. The Prospectus/Proxy Statement will be sent to shareholders on or around July 1, 2015.
- 2 -
Table of Contents
TABLE OF CONTENTS
| Page | ||||
| 1 | ||||
| 1 | ||||
| 1 | ||||
| 3 | ||||
| 3 | ||||
| 4 | ||||
| 5 | ||||
| 6 | ||||
| 7 | ||||
| 7 | ||||
The Separate Accounts and the Retirement Plans | 7 | |||
| 9 | ||||
| 10 | ||||
| 11 | ||||
| 12 | ||||
| 15 | ||||
| 15 | ||||
Payments to Broker-Dealers and Other Financial Intermediaries | 16 | |||
| 17 | ||||
| 17 | ||||
| 17 | ||||
| 18 | ||||
Material Federal Income Tax Consequences of the Reorganization | 19 | |||
| 20 | ||||
| 21 | ||||
| 21 | ||||
| 21 | ||||
| 21 | ||||
| 21 | ||||
| 21 | ||||
| 21 | ||||
| 22 | ||||
| 22 | ||||
| 22 | ||||
| 22 | ||||
Table of Contents
The following is a summary of certain information contained elsewhere in this Prospectus/Proxy Statement and is qualified in its entirety by reference to the more complete information contained in this Prospectus/Proxy Statement. Shareholders should read the entire Prospectus/Proxy Statement carefully.
The Board, including the trustees who are not “interested persons” (as defined in the 1940 Act) of each Fund, has unanimously approved an Agreement and Plan of Reorganization (the “Reorganization Agreement”) on behalf of each Fund, subject to Target Fund shareholder approval. The Reorganization Agreement provides for:
| • | the transfer of all of the assets of the Target Fund to the Acquiring Fund in exchange for Class A and Institutional Class Shares of the Acquiring Fund; |
| • | the distribution by the Target Fund of such Acquiring Fund Class A and Institutional Class Shares to Target Fund shareholders; and |
| • | the dissolution of the Target Fund. |
When the Reorganization is complete, Target Fund shareholders will hold Acquiring Fund shares. The aggregate value of the Acquiring Fund shares a Target Fund shareholder will receive in the Reorganization will equal the aggregate value of the Target Fund shares owned by such shareholder immediately prior to the Reorganization. After the Reorganization, the Acquiring Fund will continue to operate with the investment objective and investment policies set forth in this Prospectus/Proxy Statement.
As discussed in more detail elsewhere in this Prospectus/Proxy Statement, the Board believes that the Reorganization would be in the best interests of the Target Fund’s shareholders because: (i) shareholders will become shareholders of a larger combined fund with greater potential to increase asset size and achieve economies of scale; (ii) the Acquiring Fund invests in a more diversified portfolio of equities; (iii) the Acquiring Fund has achieved stronger performance over the one-year period ended December 31, 2014 with outperformance of 1.99%, which corresponds to when Matthew Finn assumed primary portfolio management responsibilities for the Acquiring Fund; (iv) Thrivent Asset Management, LLC (“Thrivent Asset Mgt.” or the “Adviser”) believes that, given the turnover in portfolio management at T. Rowe Price Associates, Inc. (“T. Rowe Price”), sub-adviser to the Target Fund, assets currently in the Target Fund can be most effectively managed by combining such assets with the Acquiring Fund into a single mandate and under the same portfolio manager; and (v) Target Fund shareholders will experience a lower expense ratio in the merged Acquiring Fund.
In addition, the Board, when determining whether to approve the Reorganization, considered, among other things, the future growth prospects of each of the Target Fund and the Acquiring Fund, the fact that the Target Fund shareholders would not experience any diminution in shareholder services as a result of the Reorganization, and the fact that the Reorganization is expected to be a tax-free reorganization for federal income tax purposes.
Background and Reasons for the Reorganization
The Target Fund and the Acquiring Fund have substantially similar investment objectives. The investment objective of the Target Fund is to seek long-term capital appreciation. The investment objective of the Acquiring Fund is to seek long-term capital growth.
The two Funds also have similar, although not identical, principal investment strategies, which are described in more detail in the COMPARISON OF FUNDS—Investment Objective and Principal Strategies section of this Prospectus/Proxy Statement. Under normal circumstances, both Funds invest at least 80% of their net assets (plus the amount of any borrowing for investment purposes) in securities of small companies. In the case of the Target Fund, the subadviser focuses mainly on U.S. companies with market capitalizations purchase that are within or below the range of companies included in the Russell 2000® Index. The Target Fund will not sell a security just because the company has grown to a market capitalization above the range. The Target Fund may, on occasion, purchase companies with a market capitalization outside the range. In the case of the Acquiring Fund, the Adviser focuses mainly in the securities of smaller U.S. companies which have market capitalizations similar to those companies included in widely known indices such as the S&P SmallCap 600 Index or the Russell 2000® Index.
Table of Contents
In determining whether to recommend approval of the Reorganization Agreement to Target Fund shareholders, the Board considered a number of factors, including, but not limited to: (i) the expenses and advisory fees applicable to the Funds before the proposed Reorganization and the estimated expense ratios of the combined Fund after the proposed Reorganization; (ii) the comparative investment performance of the Funds; (iii) the future growth prospects of each Fund; (iv) the terms and conditions of the Reorganization Agreement; (v) whether the Reorganization would result in the dilution of shareholder interests; (vi) the compatibility of the Funds’ investment objectives, policies, risks and restrictions; (vii) the anticipated tax consequences of the proposed Reorganization; (viii) the compatibility of the Funds’ service features available to shareholders, including exchange privileges; and (ix) the estimated costs of the Reorganization. The Board concluded that these factors supported a determination to approve the Reorganization Agreement.
The Board has determined that the Reorganization is in the best interests of the Target Fund and that the interests of the Target Fund’s shareholders will not be diluted as a result of the Reorganization. In addition, the Board has determined that the Reorganization is in the best interests of the Acquiring Fund and that the interests of the Acquiring Fund’s shareholders will not be diluted as a result of the Reorganization.
The Board is asking shareholders of the Target Fund to approve the Reorganization at the Meeting to be held on August 14, 2015. If shareholders of the Target Fund approve the proposed Reorganization, it is expected that the closing date of the transaction (the “Closing Date”) will be after the close of business on or about August 28, 2015, but it may be at a different time as described herein. If shareholders of the Target Fund do not approve the proposed Reorganization, the Board will consider alternatives, including repurposing the Target Fund’s principal strategies.
The Board recommends that you vote “FOR” the Reorganization.
- 2 -
Table of Contents
Investment Objective and Principal Strategies
Investment Objective. The Target Fund and the Acquiring Fund have substantially similar investment objectives. The investment objective of the Target Fund is to seek long-term capital appreciation. The investment objective of the Acquiring Fund is to seek long-term capital growth.
Principal Strategies. Under normal circumstances, both Funds invest at least 80% of their net assets (plus the amount of any borrowing for investment purposes) in securities of small companies. However, each Fund has a different investment strategy, as set forth below:
Target Fund Principal Investment Strategies.
In the case of the Target Fund, T. Rowe Price, the Target Fund’s subadviser, focuses mainly on U.S. companies with market capitalizations at time of purchase that are within or below the range of companies included in the Russell 2000® Index. The Target Fund will not sell a security just because the company has grown to a market capitalization above the range. The Target Fund may, on occasion, purchase companies with a market capitalization outside the range. Should the Adviser determine that the Target Fund would benefit from reducing the percentage of its assets invested in small company securities from 80% to a lesser amount, it will notify shareholders at least 60 days prior to such a change.
The Target Fund seeks to achieve its investment objective by investing primarily in common stocks. Investing in convertible securities is not a principal strategy of the Target Fund. The Target Fund ordinarily invests in equity securities of small companies that the subadviser believes are undervalued. A company’s securities may be undervalued because the company is temporarily overlooked or out of favor due to general economic conditions, a market decline, or industry conditions or developments affecting the particular company. The subadviser seeks to identify companies that appear to be undervalued by various measures, and may be temporarily out of favor, but have good prospects for capital appreciation. The Target Fund’s subadviser considers these factors, among others, in choosing companies:
| • | low price/earnings, price/book value, or price/cash flow ratios relative to the Russell 2000® Value Index, the company’s peers, or its own historic norm; low stock price relative to a company’s underlying asset values; |
| • | low stock price relative to a company’s underlying asset values; |
| • | above-average dividend yield relative to a company’s peers or its own historic norm; |
| • | a plan to improve the business through restructuring; and |
| • | a sound balance sheet and other positive financial characteristics. |
In pursuing its investment objective, the Target Fund’s management has the discretion to purchase some securities that do not meet its normal investment criteria, as described above, when it believes such purchase will provide an opportunity for substantial appreciation. These situations might arise when the Target Fund’s management believes a security could increase in value for a variety of reasons, including a change in management, an extraordinary corporate event, a new product introduction or innovation, or a favorable competitive development.
While most assets will be invested in U.S. common stocks, other securities may also be purchased, including preferred stock, convertible securities and warrants, bonds and debt securities, foreign stocks (up to 20% of total assets), futures and options, real estate investment trusts, and derivatives (up to 10% of total assets), in keeping with the Target Fund’s objective.
The subadviser may sell securities for a variety of reasons, such as to secure gains, limit losses, or reposition assets to more promising opportunities.
The subadviser uses fundamental investment research techniques to determine what securities to buy and sell.
- 3 -
Table of Contents
Acquiring Fund Principal Investment Strategies.
In the case of the Acquiring Fund, the Adviser focuses mainly in the securities of smaller U.S. companies which have market capitalizations similar to those companies included in widely known indices such as the S&P SmallCap 600 Index or the Russell 2000® Index. Should the Adviser determine that the Acquiring Fund would benefit from reducing the percentage of its assets invested in securities of small companies from 80% to a lesser amount, it will notify shareholders at least 60 days prior to of such a change. The Acquiring Fund seeks to achieve its investment objective by investing primarily in common stocks. Investing in convertible securities is not a principal strategy of the Acquiring Fund. The Adviser uses fundamental, quantitative, and technical investment research techniques to determine what securities to buy and sell. The Adviser looks for small companies that, in its opinion:
| • | have an improving fundamental outlook; |
| • | have capable management; and |
| • | are financially sound. |
The Adviser may sell securities for a variety of reasons, such as to secure gains, limit losses, or reposition assets to more promising opportunities.
Fund Holdings. A description of the Funds’ policies and procedures with respect to the disclosure of the Funds’ portfolio securities is available on the Funds’ website.
The Funds are subject to similar, as well as different, principal risks. Both Funds are subject to Market Risk, Issuer Risk, Small Cap Risk, Liquidity Risk and Investment Adviser Risk. Both Funds are also subject to Volatility Risk, though each may be subject to different types of volatility risk. The Target Fund is also subject to Foreign Securities Risk and Real Estate Investment Trust (REIT) Risk. These risks are described below.
Principal risks to which both Funds are subject
Market Risk. Over time, securities markets generally tend to move in cycles with periods when security prices rise and periods when security prices decline. The value of the Fund’s investments may move with these cycles and, in some instances, increase or decrease more than the applicable market(s) as measured by the Fund’s benchmark index(es). The securities markets may also decline because of factors that affect a particular industry.
Issuer Risk. Issuer risk is the possibility that factors specific to a company to which the Fund’s portfolio is exposed will affect the market prices of the company’s securities and therefore the value of the Fund. Some factors affecting the performance of a company include demand for the company’s products or services, the quality of management of the company and brand recognition and loyalty. Common stock of a company is subordinate to other securities issued by the company. If a company becomes insolvent, interests of investors owning common stock will be subordinated to the interests of other investors in, and general creditors of, the company.
Small Cap Risk. Smaller, less seasoned companies often have greater price volatility, lower trading volume, and less liquidity than larger, more established companies. These companies tend to have small revenues, narrower product lines, less management depth and experience, small shares of their product or service markets, fewer financial resources, and less competitive strength than larger companies. Such companies seldom pay significant dividends that could cushion returns in a falling market.
Liquidity Risk. Liquidity is the ability to sell a security relatively quickly for a price that most closely reflects the actual value of the security. Small capitalization stocks often have a less liquid resale market. As a result, the Fund may have difficulty selling or disposing of securities quickly in certain markets or may only be able to sell the holdings at prices substantially less than what the Fund believes they are worth.
Investment Adviser Risk. The Fund is actively managed and the success of its investment strategy depends significantly on the skills of the adviser(s) in assessing the potential of the investments in which the Fund invests. This assessment of investments may prove incorrect, resulting in losses or poor performance, even in rising markets.
- 4 -
Table of Contents
Volatility Risk. Volatility risk is the risk that certain types of securities shift in and out of favor depending on market and economic conditions as well as investor sentiment.
Additional principal risks to which only the Target Fund is subject
Volatility Risk. Stocks of undervalued companies may not rise as quickly as anticipated if the market doesn’t recognize their intrinsic values or if value stocks are out of favor. The value approach carries the risk that the market will not recognize a security’s intrinsic value for a long time or that a stock judged to be undervalued may actually be appropriately priced.
Foreign Securities Risk. To the extent the Target Fund’s portfolio is exposed to foreign securities, it is subject to various risks associated with such securities. Foreign securities are generally more volatile than their domestic counterparts, in part because of higher political and economic risks, lack of reliable information and fluctuations in currency exchange rates. Foreign securities also may be more difficult to resell than comparable U.S. securities because the markets for foreign securities are often less liquid. Even when a foreign security increases in price to its local currency, the appreciation may be diluted by adverse changes in exchange rates when the security’s value is converted to U.S. dollars. Foreign withholding taxes also may apply and errors and delays may occur in the settlement process for foreign securities.
Real Estate Investment Trust (REIT) Risk. REITs generally can be divided into three types: equity REITs, mortgage REITs and hybrid REITs (which combine the characteristics of equity REITs and mortgage REITs). Equity REITs will be affected by changes in the values of, and income from, the properties they own, while mortgage REITs may be affected by the credit quality of the mortgage loans they hold. All REIT types may be affected by changes in interest rates. REITs are subject to additional risks, including the fact that they are dependent on specialized management skills that may affect the REITs’ abilities to generate cash flows for operating purposes and for making investor distributions. REITs may have limited diversification and are subject to the risks associated with obtaining financing for real property. As with any investment, there is a risk that REIT securities and other real estate industry investments may be overvalued at the time of purchase. In addition, a REIT can pass its income through to its investors without any tax at the entity level if it complies with various requirements under the Internal Revenue Code. There is the risk, however, that a REIT held by the Target Fund will fail to qualify for this tax-free pass-through treatment of its income. By investing in REITs indirectly through the Target Fund, in addition to bearing a proportionate share of the expenses of the Target Fund, you will also indirectly bear similar expenses of the REITs in which the Target Fund invests.
The Board. The Board is responsible for the overall supervision of the operations of each Fund and performs the various duties imposed on the directors of investment companies by the 1940 Act and under applicable state law.
The Adviser. Thrivent Asset Mgt. is the investment adviser for each Fund. Thrivent Asset Mgt. and its investment advisory affiliate, Thrivent Financial for Lutherans (“Thrivent Financial”) have been in the investment advisory business since 1986 and managed approximately $96 billion in assets as of December 31, 2014, including approximately $41 billion in mutual fund assets. These advisory entities are located at 625 Fourth Avenue South, Minneapolis, Minnesota 55415.
The Adviser and the Trust received an exemptive order from the SEC that permits the Adviser and the Funds, with the approval of the Board, to retain one or more subadvisers for the Funds, or subsequently change a subadviser, without submitting the respective investment subadvisory agreements, or material amendments to those agreements, to a vote of the shareholders of the applicable Fund. The Adviser will notify shareholders of a Fund if there is a new subadviser for that Fund.
The Funds’ annual report to shareholders discusses the basis for the Board approving the investment advisory agreement during the period covered by the report.
Portfolio Management. Thrivent Asset Mgt. has engaged T. Rowe Price to subadvise the Target Fund. T. Rowe Price had approximately $746.8 billion under management, as of December 31, 2014. T. Rowe Price is located at 100 East Pratt Street, Baltimore, Maryland 21202. J. David Wagner, CFA has served as portfolio manager for the Target Fund since June 2014. Mr. Wagner is the lead portfolio manager for T. Rowe Price’s U.S. Small-Cap Value Equity Strategy. He also serves on the Investment Advisory Committees of the U.S. Small-Cap
- 5 -
Table of Contents
Core Equity and U.S. Small- Cap Growth Equity Strategies. Mr. Wagner is a vice president of T. Rowe Price Group, Inc., and T. Rowe Price Associates, Inc. Mr. Wagner joined the firm in 2000 as an analyst covering financial services after serving as a summer intern at T. Rowe Price in 1999. Prior to this, he was employed as an associate analyst in the antitrust area by National Economic Research Associates, Inc.
Matthew D. Finn, CFA has served as lead portfolio manager of the Acquiring Fund since 2013. James M. Tinucci, CFA has served as the associate portfolio manager of the Acquiring Fund since 2015. Mr. Finn has been a portfolio manager at Thrivent Financial since 2004, when he joined the firm. Mr. Tinucci has been with Thrivent Financial since 2014, and previously held various positions at Thrivent Financial from 2007 to 2012. Prior to joining Thrivent Financial, Mr. Tinucci was a manager at Deloitte Consulting.
The Trust SAI provides information about the portfolio managers’ compensation, other accounts managed by the portfolio managers, and the portfolio managers’ ownership of shares of the Funds.
Advisory Fees. Each Fund pays an annual investment advisory fee to the Adviser. The advisory contract between the Adviser and the Fund provides for the following advisory fees for each class of shares of a Fund, expressed as an annual rate of average daily net assets:
Target Fund | ||
0.700% of average daily net assets |
Acquiring Fund |
0.700% of average daily net assets up to $200 million |
0.650% of average daily net assets greater than $200 million but not greater than $1 billion |
0.600% of average daily net assets greater than $1 billion but not greater than $2.5 billion |
0.550% of average daily net assets greater than $2.5 billion but not greater than $5 billion |
0.525% of average daily net assets over $5 billion |
During the twelve-months ended October 31, 2014, the contractual advisory fees for the Class A shares of the Target Fund were 0.70% of the Target Fund’s average daily net assets, and the contractual advisory fees for the Class I shares of the Target Fund were 0.70% of the Target Fund’s average daily net assets.
During the twelve-months ended October 31, 2014, the contractual advisory fees for the Class A shares of the Acquiring Fund were 0.68% of the Acquiring Fund’s average daily net assets, and the contractual advisory fees for the Class I shares of the Acquiring Fund were 0.68% of the Acquiring Fund’s average daily net assets.
For a complete description of each Fund’s advisory services, see the section of the Trust Prospectus entitled “Management” and the section of the Trust SAI entitled “Investment Adviser, Investment Subadvisers, and Fund Managers.”
12b-1 Plan. The Trust has adopted a Distribution Plan and Agreement pursuant to Rule 12b-1 under the 1940 Act (the “Rule 12b-1 Plan”) with respect to the Class A Shares of each Fund. Thrivent Investment Management Inc. (the “Distributor”), an affiliate of the Adviser, located at 625 Fourth Avenue South, Minneapolis, Minnesota 55415, serves as the distributor of each Fund. Under the Rule 12b-1 Plan, Class A Shares of each Fund pay the Distributor an aggregate fee for distribution and shareholder servicing equal to an annual rate of 0.25% of the average daily net asset value represented by such shares. Institutional Class Shares are not subject to a Rule 12b-1 Plan and the Funds do not pay any percentage of their assets attributable to Institutional Class Shares for distribution or shareholder servicing. For a complete description of these arrangements with respect to each Fund, see the section of the Class A Prospectus entitled “Shareholder Information—Rule 12b-1 Fees” and the section of the Trust SAI entitled “Underwriting and Distribution Service.” These sections are incorporated by reference herein.
- 6 -
Table of Contents
Investments in the Target Fund by Certain Affiliated Funds
The Reorganization is not contingent upon the approval or completion of any other reorganization or merger. However, simultaneous with shareholders’ consideration of this Prospectus/Proxy Statement, shareholders of Thrivent Partner Small Cap Growth Fund (the “Other Target Fund,” and collectively with the Target Fund, the “Target Funds”) are considering a reorganization of that fund into the Acquiring Fund. Therefore, pro forma financial and expense information presented in this Prospectus/Proxy Statement under the headings “COMPARISON OF THE FUNDS – Expenses” and “COMPARISON OF THE FUNDS – Capitalization”, and the pro forma information regarding the Acquiring and Target Funds in the Reorganization SAI (collectively, the “Pro Forma Information”), is presented on the basis of the alternate assumptions that the Reorganization involves solely the Target Fund or both of the Target Funds.
Other series of the Trust for which Thrivent Asset Mgt. is the investment adviser (the “Affiliated Funds”) currently invest in the Target Funds. The Affiliated Funds are asset allocation funds investing a range of asset categories and permit Thrivent Asset Mgt. to determine whether to invest directly in securities and other investments, in addition to, or instead of, investing in other series of the Fund (including the Target Funds). Over time, Thrivent Asset Mgt. has gradually invested a larger percentage of the Affiliated Funds’ assets in direct investments and has reduced the percentage of assets invested in other series of the Trust. Thrivent Asset Mgt. expects to continue decreasing the percentage of Affiliated Funds’ assets invested in other series over time. This trend of relying more heavily on direct investments is expected to accelerate since Thrivent Asset Mgt. has proposed changes that will simplify the investment advisory fee structure of the Affiliated Funds. These changes would encourage a more streamlined approach of direct investments, while accommodating investments in other series of the Trust when Thrivent Asset Mgt. deems it to be advisable. As a result, the Affiliated Funds are likely to redeem their holdings (if any) out of the Target Funds irrespective of whether the Reorganization is approved. These redemptions would most likely be processed as redemptions-in-kind, with the effect that the Affiliated Funds would receive a pro rata distribution of the Target Funds’ investments. These redemptions may be substantial, relative to the size of the Target Fund(s) prior to such redemption, and are likely to occur prior to the effective date of the Reorganization. The Pro Forma Information presented in this Prospectus/Proxy Statement and the Reorganization SAI does not include any effects of such redemptions.
The table below sets forth the fees and expenses that investors may pay to buy and hold shares of each of the Target Fund and the Acquiring Fund, including (i) the fees and expenses paid by the Target Fund for the twelve-month period ended December 31, 2014, (ii) the fees and expenses paid by the Acquiring Fund for the twelve-month period ended December 31, 2014, (iii) pro forma fees and expenses for the Acquiring Fund for the twelve-month period ended December 31, 2014, assuming the Reorganization had been completed as of the beginning of such period, and (iv) pro forma fees and expenses for the Acquiring Fund for the twelve-month period ended December 31, 2014, assuming that the Target Fund and Thrivent Partner Small Cap Growth Fund (collectively referred to as the “Target Funds”) all merged into the Acquiring Fund as of the beginning of such period.
- 7 -
Table of Contents
| Class A Shares | Institutional Class Shares | |||||||||||||||||||||||||||||||
| Actual | Pro Forma | Pro Forma | Actual | Pro Forma | Pro Forma | |||||||||||||||||||||||||||
| Target Fund | Acquiring Fund | Acquiring Fund (assuming merger with Target Fund) | Acquiring Fund (assuming merger with Target Funds) | Target Fund | Acquiring Fund | Acquiring Fund (assuming merger with Target Fund) | Acquiring Fund (assuming merger with Target Funds) | |||||||||||||||||||||||||
Shareholder Fees (fees paid directly from your investment) | ||||||||||||||||||||||||||||||||
Maximum Sales Charge (Load) Imposed on Purchases (as a percentage of offering price) | 5.50 | % | 5.50 | % | 5.50 | % | 5.50 | % | N/A | N/A | N/A | N/A | ||||||||||||||||||||
Maximum Deferred Sales Charge (Load) (as a percentage of net asset value at time of purchase or redemption, whichever is lower)* | 1.00 | % | 1.00 | % | 1.00 | % | 1.00 | % | N/A | N/A | N/A | N/A | ||||||||||||||||||||
Annual Fund Operating Expenses as a Percentage of Average Net Assets (expenses that are deducted from Fund assets) | ||||||||||||||||||||||||||||||||
Management Fees | 0.70 | % | 0.68 | % | 0.67 | % | 0.66 | % | 0.70 | % | 0.68 | % | 0.67 | % | 0.66 | % | ||||||||||||||||
Distribution and Service (12b-1 Fees) | 0.25 | % | 0.25 | % | 0.25 | % | 0.25 | % | — | — | — | — | ||||||||||||||||||||
Other Expenses | 0.34 | % | 0.32 | % | 0.30 | % | 0.31 | % | 0.14 | % | 0.07 | % | 0.09 | % | 0.08 | % | ||||||||||||||||
Acquired (Underlying) Fund Fees and Expenses | 0.21 | % | 0.01 | % | 0.01 | % | 0.01 | % | 0.21 | % | 0.01 | % | 0.01 | % | 0.01 | % | ||||||||||||||||
Total Annual Operating Expenses | 1.50 | % | 1.26 | % | 1.23 | % | 1.23 | % | 1.05 | % | 0.76 | % | 0.77 | % | 0.75 | % | ||||||||||||||||
Less Expense Reimbursement | — | — | — | — | — | — | — | — | ||||||||||||||||||||||||
Net Annual Fund Operating Expenses | 1.50 | % | 1.26 | % | 1.23 | % | 1.23 | % | 1.05 | % | 0.76 | % | 0.77 | % | 0.75 | % | ||||||||||||||||
| * | When you invest $1,000,000 or more, a deferred sales charge of 1% will apply to shares redeemed within one year. |
Example
The following example, using the actual and pro forma operating expenses for the twelve-month period ended October 31, 2014, is intended to help you compare the costs of investing in the Acquiring Fund pro forma after the Reorganization with the costs of investing in each of the Target Fund and the Acquiring Fund without the Reorganization. The example assumes that you invest $10,000 in each Fund for the time period indicated and that you redeem all of your shares at the end of each period. The example also assumes that your investments have a 5% return each year and that each Fund’s operating expenses remain the same each year. Although your actual returns may be higher or lower, based on these assumptions your costs would be:
| Actual | Pro Forma | |||||||||||||||
| Target Fund | Acquiring Fund | Acquiring Fund (assuming merger with the Target Fund) | Acquiring Fund (assuming merger with the Target Funds) | |||||||||||||
Total operating expenses for Class A Shares assuming redemption at the end of the period | ||||||||||||||||
One Year | $ | 694 | $ | 671 | $ | 668 | $ | 668 | ||||||||
Three Years | $ | 998 | $ | 928 | $ | 919 | $ | 919 | ||||||||
Five Years | $ | 1,323 | $ | 1,204 | $ | 1,188 | $ | 1,188 | ||||||||
Ten Years | $ | 2,242 | $ | 1,989 | $ | 1,957 | $ | 1,957 | ||||||||
Total operating expenses for Institutional Class Shares assuming redemption at the end of the period | ||||||||||||||||
One Year | $ | 107 | $ | 78 | $ | 79 | $ | 77 | ||||||||
Three Years | $ | 334 | $ | 243 | $ | 246 | $ | 240 | ||||||||
Five Years | $ | 579 | $ | 422 | $ | 428 | $ | 417 | ||||||||
Ten Years | $ | 1,283 | $ | 942 | $ | 954 | $ | 930 | ||||||||
Portfolio Turnover
Each Fund pays transaction costs, such as commissions, when it buys and sells securities (or “turns over” its portfolio). A higher portfolio turnover rate may indicate higher transaction costs and may result in higher taxes when Fund shares are held in a taxable account. These costs, which are not reflected in Total Annual Operating Expenses or in the Example, affect the Funds’ performance. During the fiscal year ended October 31, 2014, the Acquiring Fund’s and the Target Fund’s portfolio turnover rates were 56% and 20%, respectively, of the average value of their portfolios.
- 8 -
Table of Contents
Purchase, Valuation, Redemption and Exchange of Shares; Dividends and Distributions
Pricing of Fund Shares. The price of a Fund’s shares is based on the Fund’s net asset value (“NAV”). The Funds determine their NAV once daily at the close of trading on the New York Stock Exchange (“NYSE”), which is normally 4:00 p.m. Eastern Time. The Funds do not determine NAV on holidays observed by the NYSE or on any other day when the NYSE is closed. The NYSE is regularly closed on Saturdays and Sundays, New Year’s Day, Martin Luther King, Jr. Day, Presidents Day, Good Friday, Memorial Day, Independence Day, Labor Day, Thanksgiving Day and Christmas Day.
Each Fund determines its NAV for a particular class by dividing the total Fund assets attributable to that class, less all liabilities attributable to such class, by the total number of outstanding shares of that class. To determine the NAV, the other Funds generally value their securities at current market value using readily available market prices. If market prices are not available or if the Adviser determines that they do not accurately reflect fair value for a security, the Board has authorized the Adviser to make fair valuation determinations pursuant to policies approved by the Board. Fair valuation of a particular security is an inherently subjective process, with no single standard to utilize when determining a security’s fair value. In each case where a security is fair valued, consideration is given to the facts and circumstances relevant to the particular situation. This consideration includes a review of various factors set forth in the pricing policies adopted by the Board. For any portion of a Fund’s assets that are invested in other mutual funds, the NAV is calculated based upon the NAV of the mutual funds in which the Fund invests, and the prospectuses for those mutual funds explain the circumstances under which they will use fair value pricing and the effects of such a valuation.
Because many foreign markets close before the U.S. markets, significant events may occur between the close of the foreign market and the close of the U.S. markets, when the Fund’s assets are valued, that could have a material impact on the valuation of foreign securities (i.e., available price quotations for these securities may not necessarily reflect the occurrence of the significant event). The Funds, subject to oversight by the Board, evaluate the impact of these significant events and adjust the valuation of foreign securities to reflect the fair value as of the close of the U.S. markets to the extent that the available price quotations do not, in the Adviser’s opinion, adequately reflect the occurrence of the significant events.
Please note that the Target Fund and the Acquiring Fund have identical valuation policies. As a result, there will be no material change to the value of the Target Fund’s assets because of the Reorganization.
Also, the Target Fund and the Acquiring Fund have identical policies with respect to frequent purchases and redemptions and standing allocation orders (for more information, please see Policy Regarding Frequent Trading Policies and Monitoring Processes and Standing Allocation Order disclosures in the Acquiring Fund’s Prospectus—these disclosures are incorporated herein by reference). The Reorganization will not affect these policies.
Class A Shares. The Class A Shares of each Fund are subject to an initial sales charge of up to 5.50%. The initial sales charge applicable to Class A Shares of the Acquiring Fund will be waived for Class A Shares acquired in the Reorganization. Any subsequent purchases of Class A Shares of the Acquiring Fund, excluding Class A Shares purchased through the automatic dividend reinvestment plan, after the Reorganization will be subject to an initial sales charge of up to 5.50%. The initial sales charge is reduced for investments in excess of $50,000. Purchases of Class A Shares of each Fund in amounts of $1 million or more are not subject to an initial sales charge, but a contingent deferred sales charge of up to 1.00% may be imposed on certain redemptions made within one year of purchase. No contingent deferred sales charge will be imposed on Class A Shares of the Target Fund in connection with the Reorganization. For additional information, please see the section entitled “Shareholder Information—Class A Shares” in the Class A Prospectus. This section is incorporated by reference herein.
Institutional Class Shares. Institutional Class Shares of each Fund are not subject to an initial sales charge or a contingent deferred sales charge. Institutional Class Shares are offered to institutions, church organizations, retirement plans sponsored by institutions and participants in various mutual fund asset allocation, fee-based investment advisory programs offered by the Distributor. For additional information, please see the section entitled “Shareholder Information—Institutional Class Shares” in the Institutional Class Prospectus. This section is incorporated by reference herein.
- 9 -
Table of Contents
Buying Shares. Shares of each Fund may be purchased through a shareholder’s registered representative, by mail, by telephone, by the Internet, by wire transfer, through an automatic investment plan or by exchange from other Thrivent mutual funds. For additional information regarding buying shares of each Fund and exchanging shares of each Fund, see the sections of the Trust Prospectus entitled “Shareholder Information—Buying Shares” and “Shareholder Information—Exchanging Shares Between Funds.”
Redeeming Shares. When a Fund receives a request for redemption, such Fund will redeem such shares at the next calculation of the Fund’s NAV. A Fund may postpone payment or suspend the right of redemption in unusual circumstances, as permitted by the SEC. When a shareholder purchases shares by check, electronic funds transfer (other than bank wire) or automatic investment plan and elects to redeem those shares soon after their purchase, the Fund may delay paying the redemption proceeds until the shareholder’s payment has cleared, which could take up to 10 days or more from the date of purchase. Shares may be redeemed by mail, by phone, by the Internet, by wire/ACH transfer or through a systematic withdrawal plan. For additional information regarding redeeming shares of each Fund, see the section of the Trust Prospectus entitled “Shareholder Information—Redeeming Shares.” This section is incorporated by reference herein.
Dividends and Distributions. Dividends of the Target Fund and the Acquiring Fund, if any, are generally declared and paid annually. Income dividends are derivative from investment income, including dividends, interest, and certain foreign currency gains received by each Fund. Capital gains distributions, if any, usually will be declared and paid in December for the prior twelve-month period ending October 31. Any election made by Target Fund shareholders in respect of the receipt of dividends and capital gains distributions will continue to apply to Class A and Institutional Class Shares of the Acquiring Fund received in the Reorganization. For additional information regarding these elections see the section of the Trust Prospectus entitle “Distribution Options.” This section is incorporated by reference herein.
Capitalization
The following table sets forth the capitalization of the Target Fund and the Acquiring Fund, as of October 31, 2014, and the pro forma capitalization of the Acquiring Fund as if the Reorganization occurred on that date. These numbers may differ as of the Closing Date.
| Actual | Pro Forma | |||||||||||||||
| Target Fund | Acquiring Fund | Acquiring Fund (assuming merger with the Target Fund) | Acquiring Fund (assuming merger with the Target Funds) | |||||||||||||
Net assets | ||||||||||||||||
Class A Shares | $ | 96,316,515 | $ | 259,839,518 | $ | 356,156,033 | $ | 373,393,130 | ||||||||
Institutional Class Shares | $ | 160,635,206 | $ | 90,790,306 | $ | 251,425,512 | $ | 251,663,893 | ||||||||
|
|
|
|
|
|
|
| |||||||||
Total Fund Net Assets | $ | 256,951,721 | $ | 350,629,824 | $ | 607,581,545 | $ | 625,057,023 | ||||||||
Net asset value per share | ||||||||||||||||
Class A Shares | $ | 21.15 | $ | 20.12 | $ | 20.12 | $ | 20.12 | ||||||||
Institutional Class Shares | $ | 22.31 | $ | 22.92 | $ | 22.92 | $ | 22.92 | ||||||||
Shares outstanding | ||||||||||||||||
Class A Shares | 4,553,438 | 12,913,722 | 17,700,540 | 18,557,203 | ||||||||||||
Institutional Class Shares | 7,200,919 | 3,960,533 | 10,967,888 | 10,978,287 | ||||||||||||
|
|
|
|
|
|
|
| |||||||||
Total Shares Outstanding | 11,754,357 | 16,874,255 | 28,668,428 | 29,535,490 | ||||||||||||
The pro forma shares outstanding reflect the issuance by the Acquiring Fund of: i) assuming a merger with the Target Fund, approximately 4,786,818 Class A Shares and 7,007,355 Institutional Class Shares (for a total of 11,794,173 shares); and ii) assuming a merger with the Target Funds, approximately 5,643,481 Class A Shares and 7,017,754 Institutional Class Shares (for a total of 12,661,235 shares). In each case, such issuance reflects the
- 10 -
Table of Contents
exchange of the assets of the Target Fund for newly issued Class A Shares and Institutional Class Shares of the Acquiring Fund, respectively, at the pro forma net asset value per share. The aggregate value of the Acquiring Fund shares that a Target Fund shareholder receives in the Reorganization will equal the aggregate value of the Target Fund shares owned immediately prior to the Reorganization.
Annual Performance Information
The following chart shows the annual returns of the Target Fund and the Acquiring Fund for the past ten years. The bar charts include the effects of each Fund’s expenses, but not sales charges. If sales charges were included, returns would be lower than those shown. The table includes the effects of Fund expenses and maximum sales charges and assumes that you sold your shares at the end of the period. After-tax returns are shown only for the Class A Shares and after-tax returns for the Institutional Class Shares will differ from those shown for the Class A Shares. The after-tax returns are calculated using the historical highest individual federal marginal income tax rates and do not reflect the impact of state and local taxes. Actual after-tax returns depend on an investor’s tax situation and may differ from those shown and after-tax returns are not relevant to investors who hold their Fund shares through tax-deferred arrangements such as 401(k) plans or individual retirement accounts. How either Fund performed in the past (before and after taxes) is not necessarily an indication of how it will perform in the future.
Thrivent Partner Small Cap Value Fund—Class A Shares
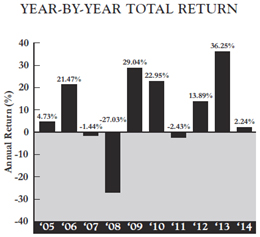
- 11 -
Table of Contents
Thrivent Small Cap Stock Fund—Class A Shares

As a result of market activity, current performance may vary from the figures shown.
The Target Fund’s (Class A Shares) total return for the three-month period from January 1, 2015 to March 31, 2015 was 1.14%. The Acquiring Fund’s (Class A Shares) total return for the three-month period from January 1, 2015 to March 31, 2015 was 3.46%. During the past 10 years, the Target Fund’s (Class A Shares) highest quarterly return was 22.79% (for the quarter ended June 30, 2009) and its lowest quarterly return was -24.14% (for the quarter ended December 31, 2008). During the past 10 years, the Acquiring Fund’s (Class A Shares) highest quarterly return was 18.90% (for the quarter ended September 30, 2009) and its lowest quarterly return was -24.62% (for the quarter ended December 31, 2008).
Comparative Performance Information
As a basis for evaluating each Fund’s performance and risks, the following table shows how each Fund’s performance compares with broad-based market indices that the Adviser believes are appropriate benchmarks for such Fund. The Target Fund’s benchmark is the Russell 2000® Value Index, which measures the performance of small-cap value stocks. The Acquiring Fund’s benchmark is the Russell 2000® Index, which is comprised of 2000 of the smaller companies in the Russell 3000® Index. Further, the table includes the effects of each Fund’s expenses, but not sales charges. If sales charges were included, returns would be lower than those shown.
Average annual total returns are shown below for each Fund for the periods ended December 31, 2014 (the most recently completed calendar year prior to the date of this Prospectus/Proxy Statement). Remember that past performance of a Fund is not indicative of its future performance.
Average Annual Total Returns for the Period ended December 31, 2014
- 12 -
Table of Contents
| Target Fund | Acquiring Fund | |||||||||||||||||||||||
| Past 1 Year | Past 5 Years | Past 10 Years | Past 1 Year | Past 5 Years | Past 10 Years | |||||||||||||||||||
Applicable Fund, Class A (before taxes) | -3.40 | % | 12.46 | % | 7.82 | % | -1.48 | % | 11.29 | % | 4.96 | % | ||||||||||||
(after taxes on distributions) | -6.96 | % | 11.18 | % | 6.41 | % | -4.17 | % | 10.64 | % | 3.77 | % | ||||||||||||
(after taxes on distributions and redemptions) | 0.86 | % | 9.86 | % | 5.91 | % | 1.10 | % | 8.95 | % | 3.70 | % | ||||||||||||
Russell 2000® Value Index (reflects no deductions for fees, expenses or taxes) | 4.22 | % | 14.26 | % | 6.89 | % | — | — | — | |||||||||||||||
Russell 2000® Index (reflects no deductions for fees, expenses or taxes) | — | — | — | 4.89 | % | 15.55 | % | 7.77 | % | |||||||||||||||
- 13 -
Table of Contents
Financial Highlights of the Acquiring Fund
| Income from Investment Operations | Less Distributions From | Ratio to Average Net Assets** | Ratios to Average Net Assets Before Expenses Waived, Credited or Paid Indirectly** | |||||||||||||||||||||||||||||||||||||||||||||||||||||||||
| Net Asset Value, Beginning of Period | Net Investment Income/ (Loss) | Net Realized and Unrealized Gain/(Loss) on Investments(a) | Total from Investment Operations | Net Investment Income | Net Realized Gain on Investments | Total Distributions | Net Asset Value, End of Period | Total Return(b) | Net Assets, End of Period (in millions) | Expenses | Net Investment Income/ (Loss) | Expenses | Net Investment Income/ (Loss) | Portfolio Turnover Rate | ||||||||||||||||||||||||||||||||||||||||||||||
Class A Shares | ||||||||||||||||||||||||||||||||||||||||||||||||||||||||||||
Year Ended 10/31/2014 | $ | 18.52 | ($0.05 | ) | $ | 1.80 | $ | 1.75 | $ | – | ($0.15 | ) | ($0.15 | ) | $ | 20.12 | 9.48 | % | $ | 259.80 | 1.25 | % | (0.15 | )% | 1.25 | % | (0.15 | )% | 56 | % | ||||||||||||||||||||||||||||||
Year Ended 10/31/2013 | 14.28 | (0.05 | ) | 4.29 | 4.24 | – | – | – | 18.52 | 29.69 | % | 255.6 | 1.29 | % | (0.16 | )% | 1.29 | % | (0.16 | )% | 66 | % | ||||||||||||||||||||||||||||||||||||||
Year Ended 10/31/2012 | 13.35 | (0.06 | ) | 0.99 | 0.93 | – | – | – | 14.28 | 6.97 | % | 216.6 | 1.33 | % | (0.31 | )% | 1.33 | % | (0.31 | )% | 91 | % | ||||||||||||||||||||||||||||||||||||||
Year Ended 10/31/2011 | 12.56 | (0.11 | ) | 0.90 | 0.79 | – | – | – | 13.35 | 6.29 | % | 226.3 | 1.37 | % | (0.67 | )% | 1.37 | % | (0.67 | )% | 99 | % | ||||||||||||||||||||||||||||||||||||||
Year Ended 10/31/2010 | 10.26 | (0.09 | ) | 2.39 | 2.30 | – | – | – | 12.56 | 22.42 | % | 239.1 | 1.46 | % | (0.62 | )% | 1.46 | % | (0.62 | )% | 203 | % | ||||||||||||||||||||||||||||||||||||||
Institutional Class Shares | ||||||||||||||||||||||||||||||||||||||||||||||||||||||||||||
Year Ended 10/31/2014 | 20.98 | 0.05 | 2.04 | 2.09 | – | (0.15 | ) | (0.15 | ) | 22.92 | 10.00 | % | 90.8 | 0.75 | % | 0.35 | % | 0.75 | % | 0.35 | % | 56 | % | |||||||||||||||||||||||||||||||||||||
Year Ended 10/31/2013 | 16.09 | 0.09 | 4.80 | 4.89 | – | – | – | 20.98 | 30.39 | % | 80.2 | 0.76 | % | 0.36 | % | 0.76 | % | 0.36 | % | 66 | % | |||||||||||||||||||||||||||||||||||||||
Year Ended 10/31/2012 | 14.96 | 0.05 | 1.08 | 1.13 | – | – | – | 16.09 | 7.55 | % | 63.4 | 0.77 | % | 0.26 | % | 0.77 | % | 0.26 | % | 91 | % | |||||||||||||||||||||||||||||||||||||||
Year Ended 10/31/2011 | 13.99 | 0.07 | 0.90 | 0.97 | – | – | – | 14.96 | 6.93 | % | 60.3 | 0.76 | % | (0.05 | )% | 0.76 | % | (0.05 | )% | 99 | % | |||||||||||||||||||||||||||||||||||||||
Year Ended 10/31/2010 | 11.35 | 0.02 | 2.62 | 2.64 | – | – | – | 13.99 | 23.26 | % | 68.6 | 0.78 | % | 0.05 | % | 0.78 | % | 0.05 | % | 203 | % | |||||||||||||||||||||||||||||||||||||||
| (a) | The amount shown may not correlate with the change in aggregate gains and losses of portfolio securities due to the timing of sales and redemptions of fund shares. |
| (b) | Total investment return assumes dividend reinvestment and does not reflect any deduction for applicable sales charges. Not annualized for periods less than one year. |
| * | All per share amounts have been rounded to the nearest cent. |
| ** | Computed on an annualized basis for periods less than one year |
The financial highlights for the Target Fund’s Class A Shares and Institutional Class Shares are available in the Thrivent Mutual Funds prospectus for each respective share class, dated February 27, 2015 and as supplemented through the date hereof and are incorporated herein by reference.
- 14 -
Table of Contents
Thrivent Asset Mgt., 625 Fourth Avenue South, Minneapolis, Minnesota 55415, provides administrative personnel and services necessary to operate the Funds and receives an administration fee from the Funds. The custodian for the Funds is State Street Bank and Trust Company, 225 Franklin Street, Boston, Massachusetts 02110. PricewaterhouseCoopers LLP, 225 South Sixth Street, Suite 1400, Minneapolis, MN 55402, serves as the Trust’s independent registered public accounting firm.
The Trust is an open-end management investment company registered under the Investment Company Act of 1940 (the “1940 Act”) and was organized as a Massachusetts Business Trust on March 10, 1987. The Trust is made up of 26 separate series or “Funds.” Each Fund of the Trust, other than the Thrivent Asset Allocation Funds and the Thrivent Natural Resources Fund, is diversified.
The Trust is authorized to issue shares of beneficial interest, par value $.01 per share, divisible into an indefinite number of different series and classes and operates as a “series company” as provided by Rule 18f-2 under the 1940 Act.
The Declaration of Trust of the Trust, as amended through the date hereof (the “Declaration of Trust”) provides that each shareholder shall be deemed to have agreed to be bound by its terms. A vote of shareholders and the Board may amend the Declaration of Trust. The Trust may issue an unlimited number of shares in one or more series as the Board of Trustees may authorize.
Each class is subject to such investment minimums and other conditions as set forth in the Trust’s current prospectuses. Such minimums are identical the same share classes of the Target Fund and the Acquiring Fund (so, for example, the Class A Shares of both Funds have the same initial and subsequent investment minimums). The Reorganization will not affect such investment minimums and other conditions.
Differences in expenses among classes are described in the Trust’s Amended and Restated Plan Pursuant to Rule 18f-3 under the 1940 Act. Class A and Institutional Class Shares pay the expenses associated with their different distribution arrangements. Each class may, at the Trustees’ discretion, also pay a different share of other expenses, not including advisory or custodial fees or other expenses related to the management of the Trust’s assets, if these expenses are actually incurred in a different amount by that class, or if the class receives services of a different kind or to a different degree than the other class. All other expenses will be allocated to each class on the basis of the net asset value of the particular Fund.
Each class of shares has identical voting rights except that each class has exclusive voting rights on any matter submitted to shareholders relating solely to the class or where the interests of one class differ from the interests of the other class. Class A Shares have exclusive voting rights on matters involving the Rule 12b-1 Distribution Plan. Matters submitted to shareholder vote must be approved by each Fund separately except:
| • | when required otherwise by the 1940 Act; or |
| • | when the Trustees determine that the matter does not affect all Funds; then, only the shareholders of the affected Funds may vote. |
Shares are freely transferable, and holders thereof are entitled to receive dividends declared by the Board, and receive the assets of their respective Fund in the event of liquidation. The Trust generally holds shareholder meetings only when required by law or at the written request of shareholders owning at least 10% of the Trust’s outstanding shares. Shareholders may remove the Trustees from office by votes cast in person or by proxy at a shareholder meeting.
At the request of shareholders holding 10% or more of the outstanding shares of the Trust, the Trust will hold a special meeting for the purpose of considering the removal of a Trustee(s) from office, and the Trust will cooperate with and assist shareholders of record who notify the Trust that they wish to communicate with other shareholders for the purpose of obtaining signatures to request such a meeting, all pursuant to and in accordance with Section 16(c) of the 1940 Act.
- 15 -
Table of Contents
Under Massachusetts law, shareholders of a business trust may be held personally liable, under certain circumstances, for the obligations of the Trust. However, the Declaration of Trust disclaims shareholder, Trustee and/or officer liability for acts performed on behalf of the Trust or for Trust obligations that are binding only on the assets and property of the Trust. The Funds include this disclaimer in each agreement, obligation, or contract entered into or executed by the Trust or the Board. The Declaration of Trust provides for indemnification out of the Trust’s assets for all losses and expenses of any shareholder held personally liable for the obligations of the Trust. The risk of a shareholder incurring financial loss on account of shareholder liability is remote because it is limited to circumstances where the Trust itself is unable to meet its obligations.
The Trust’s organizational documents are filed as part of the Trust’s registration statement with the SEC, and shareholders may obtain copies of such documents as described on the first page of this Prospectus/Proxy Statement and in the Questions and Answers preceding this Prospectus/Proxy Statement.
Payments to Broker-Dealers and Other Financial Intermediaries
If you purchase a Fund through a broker-dealer or other financial intermediary, the Fund and its related companies may pay the intermediary for the sale of Fund shares and related services. These payments may create a conflict of interest by influencing the broker-dealer or other intermediary and your salesperson to recommend the Fund over another investment. Ask your salesperson or visit your financial intermediary’s website for more information.
- 16 -
Table of Contents
INFORMATION ABOUT THE REORGANIZATION
Under the Reorganization Agreement, the Target Fund will transfer all of its assets to the Acquiring Fund in exchange for Class A and Institutional Class Shares of the Acquiring Fund. The Acquiring Fund Class A and Institutional Class Shares issued to the Target Fund will have an aggregate value equal to the aggregate value of the Target Fund’s net assets immediately prior to the Reorganization. Upon receipt by the Target Fund of Acquiring Fund Shares, the Target Fund will distribute such shares of the Acquiring Fund to Target Fund shareholders. Then, as soon as practicable after the Closing Date of the Reorganization, the Target Fund will dissolve under applicable state law.
The Target Fund will distribute the Acquiring Fund Class A and Institutional Class Shares received by it pro rata to Target Fund shareholders of record in exchange for their interest in Class A and Institutional Class Shares of the Target Fund. This distribution will be accomplished by opening new accounts on the books of the Acquiring Fund in the names of the Target Fund shareholders and transferring to those shareholder accounts the Acquiring Fund Class A and Institutional Class Shares received by the Target Fund. Each newly-opened account on the books of the Acquiring Fund for the previous Target Fund shareholders will represent the respective pro rata number of Acquiring Fund Class A and Institutional Class Shares due such shareholder
Accordingly, as a result of the Reorganization, each Target Fund shareholder would own Acquiring Fund Class A and Institutional Class Shares that would have an aggregate value immediately after the Reorganization equal to the aggregate value of that shareholder’s Target Fund shares immediately prior to the Reorganization. The interests of each of the Target Fund’s shareholders will not be diluted as a result of the Reorganization. However, as a result of the Reorganization, a shareholder of the Target Fund or the Acquiring Fund will hold a reduced percentage of ownership in the larger combined fund than the shareholder did in either of the separate Funds.
No sales charge or fee of any kind will be assessed to Target Fund shareholders in connection with their receipt of Acquiring Fund Class A and Institutional Class Shares in the Reorganization.
Approval of the Reorganization will constitute approval of amendments to any of the fundamental investment restrictions of the Target Fund that might otherwise be interpreted as impeding the Reorganization, but solely for the purpose of and to the extent necessary for consummation of the Reorganization.
Terms of the Reorganization Agreement
The following is a summary of the material terms of the Reorganization Agreement. This summary is qualified in its entirety by reference to the form of Reorganization Agreement, a form of which is attached as Appendix A to the Reorganization SAI.
Pursuant to the Reorganization Agreement, the Acquiring Fund will acquire all of the assets of the Target Fund on the Closing Date in exchange for Class A and Institutional Class Shares of the Acquiring Fund. Subject to the Target Fund’s shareholders approving the Reorganization, the Closing Date shall occur on August 28, 2015 or such other date as determined by an officer of the Fund.
On the Closing Date, the Target Fund will transfer to the Acquiring Fund all of its assets. The Acquiring Fund will in turn transfer to the Target Fund a number of its Class A and Institutional Class Shares equal in value to the value of the net assets of the Target Fund transferred to the Acquiring Fund as of the Closing Date, as determined in accordance with the valuation method described in the Acquiring Fund’s then current prospectus. In order to minimize any potential for undesirable federal income and excise tax consequences in connection with the Reorganization, the Target Fund will distribute on or before the Closing Date all or substantially all of its undistributed net investment income (including net capital gains) as of such date.
The Target Fund expects to distribute Class A and Institutional Class Shares of the Acquiring Fund received by the Target Fund to shareholders of the Target Fund promptly after the Closing Date and then dissolve.
- 17 -
Table of Contents
The Acquiring Fund and the Target Fund have made certain standard representations and warranties to each other regarding their capitalization, status and conduct of business. Unless waived in accordance with the Reorganization Agreement, the obligations of the parties to the Reorganization Agreement are conditioned upon, among other things:
| • | the approval of the Reorganization by the Target Fund’s shareholders; |
| • | the absence of any rule, regulation, order, injunction or proceeding preventing or seeking to prevent the consummation of the transactions contemplated by the Reorganization Agreement; |
| • | the receipt of all necessary approvals, registrations and exemptions under federal and state laws; |
| • | the truth in all material respects as of the Closing Date of the representations and warranties of the parties and performance and compliance in all material respects with the parties’ agreements, obligations and covenants required by the Reorganization Agreement; |
| • | the effectiveness under applicable law of the registration statement of the Acquiring Fund of which this Prospectus/Proxy Statement forms a part and the absence of any stop orders under the Securities Act of 1933, as amended, pertaining thereto; and |
| • | the receipt of an opinion of counsel relating to the characterization of the Reorganization as a tax-free reorganization for federal income tax purposes (as further described herein under the heading “Material Federal Income Tax Consequences of the Reorganization”). |
The Reorganization Agreement may be terminated or amended by the mutual consent of the parties either before or after approval thereof by the shareholders of the Target Fund, provided that no such amendment after such approval shall be made if it would have a material adverse effect on the interests of such Target Fund’s shareholders. The Reorganization Agreement also may be terminated by the non-breaching party if there has been a material misrepresentation, material breach of any representation or warranty, material breach of contract or failure of any condition to closing.
Reasons for the Proposed Reorganization
In determining whether to recommend approval of the Reorganization Agreement to Target Fund shareholders, the Board considered a number of factors, including, but not limited to: (i) the expenses and advisory fees applicable to the Funds before the proposed Reorganization and the estimated expense ratios of the combined portfolio after the proposed Reorganization; (ii) the comparative investment performance of the Funds; (iii) the future growth prospects of each Fund; (iv) the terms and conditions of the Reorganization Agreement; (v) whether the Reorganization would result in the dilution of shareholder interests; (vi) the compatibility of the Funds’ investment objectives, policies, risks and restrictions; (vii) the anticipated tax consequences of the proposed Reorganization; (viii) the compatibility of the Funds’ service features available to shareholders, including exchange privileges; and (ix) the estimated costs of the Reorganization. The Board concluded that these factors supported a determination to approve the Reorganization Agreement.
The Board believes that the Reorganization would be in the best interests of the Target Fund’s shareholders because: (i) shareholders will become shareholders of a larger combined fund with greater potential to increase asset size and achieve economies of scale (especially given the breakpoints in the advisory fee schedule for the Acquiring Fund), whereby certain administrative costs may be spread across the combined fund’s larger asset base and, therefore, may increase the combined fund’s overall efficiency in the long term; (ii) the Acquiring Fund invests in a more diversified portfolio of equities; (iii) the Acquiring Fund has achieved stronger performance than the Target Fund for the one-year period ended December 31, 2014, which corresponds to when Matthew Finn assumed primary portfolio management responsibilities for the Acquiring Fund, though there is no guarantee of future performance; (iv) Management believes that, given the turnover in portfolio management at T. Rowe Price, subadviser to the Target Fund, it can most effectively manage the assets currently in the Target Fund by combining such assets with the Acquiring Fund into a single mandate and under the same portfolio manager; and (v) Target Fund shareholders will experience a lower expense ratio in the Acquiring Fund following the Reorganization.
The Board has determined that the Reorganization is in the best interests of the Target Fund and that the interests of the Target Fund’s shareholders will not be diluted as a result of the Reorganization. In addition, the Board has determined that the Reorganization is in the best interests of the Acquiring Fund and that the interests of the Acquiring Fund shareholders will not be diluted as a result of the Reorganization.
- 18 -
Table of Contents
Material Federal Income Tax Consequences of the Reorganization
The following is a general summary of the material anticipated U.S. federal income tax consequences of the Reorganization. This discussion is based upon the Internal Revenue Code of 1986, as amended (the “Code”), Treasury regulations, court decisions, published positions of the Internal Revenue Service (“IRS”) and other applicable authorities, all as in effect on the date hereof and all of which are subject to change or differing interpretations (possibly with retroactive effect). This discussion is limited to U.S. persons who hold shares of the Target Fund as capital assets for U.S. federal income tax purposes on the date of exchange.
This summary does not address all of the U.S. federal income tax consequences that may be relevant to a particular shareholder or to shareholders who may be subject to special treatment under U.S. federal income tax laws. No assurance can be given that the IRS would not assert or that a court would not sustain a position contrary to any of the tax aspects described below. Shareholders should consult their own tax advisers as to the U.S. federal income tax consequences of the Reorganization to them, as well as the effects of state, local and non-U.S. tax laws.
The Reorganization is expected to be a tax-free reorganization for U.S. federal income tax purposes. It is a condition to closing the Reorganization that the Target Fund and the Acquiring Fund receive an opinion from Reed Smith LLP, special counsel to each Fund, dated as of the Closing Date, regarding the characterization of the Reorganization as a “reorganization” within the meaning of Section 368(a)(1) of the Code. As such a reorganization, the U.S. federal income tax consequences of the Reorganization can be summarized as follows: to the effect that on the basis of existing provisions of the Code, the Treasury regulations promulgated thereunder, current administrative rules and court decisions, generally for U.S. federal income tax purposes, except as noted below:
| • | the Reorganization will constitute a reorganization within the meaning of Section 368(a)(1) of the Code, and the Target Fund and the Acquiring Fund will each be a “party to a reorganization” within the meaning of Section 368(b) of the Code; |
| • | under Section 361 of the Code, no gain or loss will be recognized by the Target Fund upon the transfer of its assets to the Acquiring Fund in exchange for Acquiring Fund shares, or upon the distribution of Acquiring Fund shares by the Target Fund to its shareholders in liquidation; |
| • | under Section 1032 of the Code, no gain or loss will be recognized by the Acquiring Fund upon receipt of the assets transferred to the Acquiring Fund in exchange for Acquiring Fund shares; |
| • | under Section 362(b) of the Code, the Acquiring Fund’s tax basis in each asset that the Acquiring Fund receives from the Target Fund will be the same as the Target Fund’s tax basis in such asset immediately prior to such exchange; |
| • | under Section 1223(2) of the Code, the Acquiring Fund’s holding periods in each asset will include the Target Fund’s holding periods in such asset; |
| • | under Section 354 of the Code, no gain or loss will be recognized by shareholders of the Target Fund on the distribution of Acquiring Fund shares to them in exchange for their shares of the Target Fund; |
| • | under Section 358 of the Code, the aggregate tax basis of the Acquiring Fund shares that the Target Fund’s shareholders receive in exchange for their Target Fund shares will be the same as the aggregate tax basis of the Target Fund shares exchanged therefor; |
| • | under Section 1223(1) of the Code, a Target Fund shareholder’s holding period for the Acquiring Fund shares received in the Reorganization will be determined by including the holding period for the Target Fund shares exchanged therefor, provided that the shareholder held the Target Fund shares as a capital asset on the date of the exchange; and |
| • | under Section 381 of the Code, the Acquiring Fund will succeed to and take into account the items of the Target Fund described in Section 381(c) of the Code, subject to the conditions and limitations specified in Section 381, 382, 383 and 384 of the Code and the Treasury regulations thereunder. |
The opinion will be based on certain factual certifications made by the officers of the Target Fund and the Acquiring Fund and will also be based on customary assumptions such as the assumption that the Reorganization will be consummated in accordance with the Reorganization Agreement. The opinion is not a guarantee that the tax consequences of the Reorganization will be as described above. There is no assurance that the IRS or a court would agree with the opinion.
- 19 -
Table of Contents
The Acquiring Fund intends to continue to be taxed under the rules applicable to regulated investment companies as defined in Section 851 of the Code which are the same rules currently applicable to Target Fund. In connection with the Reorganization, on or before the Closing Date, the Target Fund will declare to its shareholders a dividend which, together with all of its previous distributions, will have the effect of distributing to shareholders all of its investment company taxable income (computed without regard to the deduction for dividends paid), net tax-exempt interest income and net capital gains through the Closing Date.
A regulated investment company is permitted to carryforward net capital losses; however, net capital losses incurred in taxable years beginning on or before December 22, 2010 can be carried forward for eight taxable years only. Additionally capital losses incurred in taxable years beginning on or before December 22, 2010 cannot be utilized to offset capital gains until all net capital losses arising in tax years beginning after December 22, 2010 have been utilized. As a result, some net capital loss carryforwards incurred on or before December 22, 2010 may expire unused.
Immediately prior to the Reorganization, the Target Fund is not expected to have any unutilized capital loss carryforwards. The final amount of unutilized capital loss carryforwards for the Target Fund is subject to change and will not be determined until the Closing Date. As of April 9, 2015, the capital loss carryforward of the Target Fund and the Acquiring Fund was $0 and $0, respectively.
Generally, the Acquiring Fund will succeed to the capital loss carryforwards of the Target Fund, subject to the limitations described below. If the Target Fund has capital loss carryforwards, such capital losses would, in the absence of the Reorganization, generally be available to offset Target Fund capital gains, thereby reducing the amount of capital gain net income that must be distributed to the Target Fund shareholders.
Under Sections 382 and 383 of the Code, an “equity structure shift” arising as a result of a reorganization under Section 368(a)(1) of the Code can result in limitations on the post-reorganization Fund’s use of capital loss carryforwards of the participating Funds. An “equity structure shift” can trigger limitations on capital loss carryforwards where there is a more than 50% change in the ownership of a Fund.
Even though the Reorganization may result in a more than 50% change in ownership of either fund, the Adviser does not anticipate a limitation since the Funds are not expected to have capital loss carryforwards.
This summary of the U.S. federal income tax consequences of the Reorganization is made without regard to the particular facts and circumstances of any shareholder. Shareholders are urged to consult their own tax advisors as to the specific consequences to them of the Reorganization, including the applicability and effect of state, local, non-U.S. and other tax laws.
It is not expected that the Reorganization will be a taxable event for any shareholder.
Expenses of the Reorganization
All expenses of the Reorganization will be paid by the Adviser or an affiliate and will not be borne by shareholders of the Target Fund.
Reorganization expenses include, but are not limited to: all costs related to the preparation and distribution of materials distributed to the Board; all expenses incurred in connection with the preparation of the Reorganization Agreement and a registration statement on Form N-14; SEC and state securities commission filing fees and legal and audit fees in connection with each Reorganization; the costs of printing and distributing this Prospectus/Proxy Statement; legal fees incurred preparing materials for the Boards attending the Board meetings and preparing the Board minutes; auditing fees associated with the Fund’s financial statements; portfolio transfer taxes (if any); and any similar expenses incurred in connection with the Reorganization. Management of the Funds estimates the total cost of the Reorganization to be approximately $94,000 ($186,000 for the Target Funds combined). If the Reorganization is not approved by shareholders, the Adviser will still bear the costs of the proposed Reorganization.
Any brokerage charges associated with the purchase or disposition of portfolio investments by the Target Fund prior to the Reorganization will be borne by the Target Fund. Any brokerage charges associated with the purchase or disposition of portfolio investments by the Acquiring Fund after the Reorganization will be borne by the Acquiring Fund.
- 20 -
Table of Contents
The Board has unanimously approved the Reorganization, subject to shareholder approval. Approval of the Reorganization requires the affirmative vote of a “Majority of the Outstanding Voting Securities” of the Target Fund, which is, under the 1940 Act, the lesser of (1) 67% or more of the shares of the Fund present at the Meeting if the holders of more than 50% of the outstanding shares of the Fund are present or represented by proxy, or (2) more than 50% of the outstanding shares of the Fund.
The Board recommends voting “FOR” the proposed Reorganization.
At the close of business on the Record Date, the Acquiring Fund had outstanding shares. As of the Record Date, the trustees and officers of the Acquiring Fund as a group owned less than 1% of the shares of the Acquiring Fund. As of the Record Date, no person was known by the Acquiring Fund to own beneficially or of record as much as 5% of the Acquiring Fund shares except as follows:
Name | Class of Shares | Approximate Percentage of Ownership | ||||||
| ____ | ____ | % | ||||||
| ____ | ____ | % | ||||||
| ____ | ____ | % | ||||||
At the close of business on the Record Date, the Target Fund had outstanding shares. As of the Record Date, the trustees and officers of the Target Fund as a group owned less than 1% of the shares of the Target Fund. As of the Record Date, no person was known by the Target Fund to own beneficially or of record as much as 5% of the shares of the Target Fund except as follows:
Name | Class of Shares | Approximate Percentage of Ownership | ||||||
| ____ | ____ | % | ||||||
| ____ | ____ | % | ||||||
Annual Meeting of Shareholders
There will be no annual or further special meetings of shareholders of the Trust unless required by applicable law or called by the Board in its discretion. Shareholders wishing to submit proposals for inclusion in a proxy statement for a subsequent shareholder meeting should send their written proposals to the Secretary of the Fund, 625 Fourth Avenue South, Minneapolis, Minnesota 55415. Shareholder proposals should be received in a reasonable time before the solicitation is made.
VOTING INFORMATION AND REQUIREMENTS
Approval of the Reorganization requires the affirmative vote of a “Majority of the Outstanding Voting Securities” of the Target Fund, which is, under the 1940 Act, the lesser of (1) 67% or more of the shares of the Fund present at the Meeting if the holders of more than 50% of the outstanding shares of the Fund are present or represented by proxy, or (2) more than 50% of the outstanding shares of the Fund.
The Board has fixed the close of business on June 16, 2015, as the Record Date for the determination of shareholders entitled to notice of, and to vote at, the Meeting. Target Fund shareholders on the Record Date are entitled to one vote for each share held, with no shares having cumulative voting rights.
- 21 -
Table of Contents
One-third of the shares of the Target Fund outstanding and entitled to vote at the Meeting represented in person or by proxy constitutes a quorum.
Target Fund shareholders may vote in any one of four ways: (i) via the Internet, (ii) by telephone, (iii) by mail, by returning the proxy card, or (iv) in person at the Meeting. Instructions for Internet and telephone voting are included with the enclosed proxy materials. Shareholders who deliver voting instructions by methods (i), (ii) or (iii) may revoke them at any time prior to the Meeting by delivering a written notice of revocation, by executing another proxy card bearing a later date or by attending the Meeting and giving voting instructions in person. Merely attending the Meeting, however, will not revoke any previously submitted proxy. The required control number for Internet and telephone voting is printed on the enclosed proxy card. The control number is used to match voting proxy cards with shareholders’ respective accounts and to ensure that, if multiple proxy cards are executed, shares are voted in accordance with the proxy card bearing the latest date. The Target Fund employs procedures for Internet and telephone voting, such as requiring the control number from the proxy card in order to vote by either of these methods, which it considers to be reasonable to confirm that the instructions received are genuine. If reasonable procedures are employed, the Target Fund will not be liable for following Internet or telephone votes which it believes to be genuine.
Abstentions and broker non-votes (i.e., where a nominee such as a broker holding shares for beneficial owners votes on certain matters pursuant to discretionary authority or instructions from beneficial owners, but with respect to one or more proposals does not receive instructions from beneficial owners or does not exercise discretionary authority) will be deemed present for quorum purposes. Abstentions and broker non-votes have the same effect as votes “AGAINST” the Reorganization.
All properly executed proxies received prior to the Meeting will be voted at the Meeting in accordance with the instructions marked thereon or otherwise as provided therein. Proxies received prior to the Meeting on which no vote is indicated will be voted “FOR” the approval of the proposed Reorganization.
Solicitation of proxies is being made primarily by the mailing of this Notice and Prospectus/Proxy Statement with its enclosures on or about July 1, 2015. Shareholders of the Target Fund whose shares are held by nominees, such as brokers, can vote their proxies by contacting their respective nominee. In addition to the solicitation of proxies by mail, employees of the Adviser and its affiliates, without additional compensation, may solicit proxies in person or by telephone, telegraph, facsimile or oral communication. The Target Fund may retain Computershare Fund Services (“Computershare”), a professional proxy solicitation firm, to assist with any necessary solicitation of proxies. We do not anticipate any expense for additional telephone solicitation by Computershare. The proxy solicitation expenses, if any, are an expense of the Reorganization and will be allocated as described above.
Other Matters to Come Before the Meeting
The Board knows of no business other than that described in the Notice that will be presented for consideration at the Meeting. If any other matters are properly presented, it is the intention of the persons named on the enclosed proxy to vote proxies in accordance with their best judgment.
In the event that a quorum is present at the Meeting but sufficient votes to approve the proposed Reorganization are not received, proxies (including abstentions and broker non-votes) will be voted in favor of one or more adjournments of the Meeting to permit further solicitation of proxies on the proposed Reorganization, provided that the Board determines that such an adjournment and additional solicitation is reasonable and in the interest of shareholders based on a consideration of all relevant factors, including the nature of the particular proposals, the percentage of votes then cast, the percentage of negative votes cast, the nature of the proposed solicitation activities and the nature of the reasons for such further solicitation. Any such adjournment will require the affirmative vote of the holders of a majority of the outstanding shares voted at the session of the Meeting to be adjourned.
- 22 -
Table of Contents
If you cannot be present in person, you are requested to fill in, sign and return the enclosed proxy card, for which, no postage is required if mailed in the United States, or record your voting instructions by telephone or via the Internet promptly.
Michael W. Kremenak |
Secretary |
Thrivent Mutual Funds |
- 23 -
Table of Contents
Questions & Answers
For Shareholders of Thrivent Mid Cap Growth Fund
Although we recommend that you read the complete Prospectus/Proxy Statement, we have provided the following questions and answers to clarify and summarize the issues to be voted on.
Q: Why is a shareholder meeting being held?
A: A special meeting of shareholders (the “Meeting”) of Thrivent Mid Cap Growth Fund (the “Target Fund”) is being held to seek shareholder approval of a reorganization (the “Reorganization”) of the Target Fund into Thrivent Mid Cap Stock Fund (the “Acquiring Fund”). Please refer to the Prospectus/Proxy Statement for a detailed explanation of the proposed Reorganization and for a more complete description of the Acquiring Fund.
Q: Why is the Reorganization being recommended?
A: After careful consideration, the Board of Trustees (the “Board”) of Thrivent Mutual Funds (the “Trust”) has determined that the Reorganization is in the best interests of the shareholders of the Target Fund and recommends that you cast your vote “FOR” the proposed Reorganization. The Target Fund and the Acquiring Fund have substantially similar investment objectives, and each is a diversified series of the Trust, an open-end management investment company registered under the Investment Company Act of 1940. Thrivent Asset Management, LLC (“Thrivent Asset Mgt.”) is the investment adviser for the Target Fund and the Acquiring Fund.
The Board believes that the Reorganization would be in the best interests of the shareholders of the Target Fund because: (i) a merger into the Acquiring Fund represents the most attractive viable option for the Target Fund given its lack of fit with the Adviser’s product strategy and the Adviser’s unwillingness to support the Target Fund indefinitely in its current form; (ii) the expenses of the Acquiring Fund, while higher than the Target Fund, are competitive within both its own Lipper peer group and that of the Target Fund; (iii) the Acquiring Fund invests in a more diversified portfolio of equities; and (iv) the Acquiring Fund has achieved stronger performance over the one-, three- and five-year periods ended December 31, 2014.
Q: Who can vote?
A: Shareholders of the Target Fund are entitled to vote.
Q: How will the Reorganization affect me?
A: Assuming shareholders approve the proposed Reorganization, the assets of the Target Fund will be combined with those of the Acquiring Fund. The Class A and Institutional Class Shares of the Target Fund would be exchanged for an equal dollar value of Class A and Institutional Class Shares of the Acquiring Fund. Following the Reorganization, the Target Fund will dissolve.
Q: Will I have to pay any commission or other similar fee as a result of the Reorganization?
A: No. You will not pay any commissions or other similar fees as a result of the Reorganization. If you hold Class A Shares of the Target Fund, you will receive Class A Shares of the Acquiring Fund. If you hold Institutional Class Shares of the Target Fund, you will receive Institutional Class Shares of the Acquiring Fund.
Q: Will the total annual operating expenses that my portfolio investment bears increase as a result of the Reorganization?
A: They will be higher. However, Management believes that such merger is preferable for Fund shareholders to any other viable alternative. The Target Fund has an advisory fee that is below median and its Class A Shares have the second lowest advisory fee of the 93 funds in their Lipper peer group, while its Institutional Class Shares have the lowest advisory fee among 85 funds in their Lipper peer group. The Adviser has lost money managing the Target Fund for a number of years. Given that the Target Fund does not fit in with the Adviser’s overall product strategy, the Adviser does not believe it would be appropriate to seek an increase in the advisory fee. However, the Adviser is also unwilling to continue to support the Target Fund indefinitely in its current form. The Adviser has considered other options, such as liquidation. The Adviser believes that a merger into the Acquiring Fund is the best viable option. For more information about how fund expenses may change as a result of the Reorganization, please see the comparative and pro forma table and related disclosures in the COMPARISON OF THE FUNDS—Expenses section of the Prospectus/Proxy Statement.
Table of Contents
Q: Will I have to pay any U.S. federal income taxes as a result of the Reorganization?
A: The Reorganization is expected to be tax-free for federal income tax purposes. The Target Fund will seek an opinion of counsel to this effect. Generally, shareholders will not incur capital gains or losses on the exchange of Target Fund shares for Acquiring Fund shares as a result of the Reorganization.
Q: If shareholders of the Target Fund do not approve the Reorganization, what will happen to the Target Fund?
A: Thrivent Asset Mgt. will reassess what changes it would like to make to a Target Fund, including a possible repurposing of the Target Fund’s principal investment strategies or recommending a liquidation of the Target Fund to the Board. It may ultimately decide to make no changes.
Q: Who pays the costs of the Reorganization?
A: The expenses of the Reorganization, including the costs of the Meeting, will be paid by Thrivent Asset Mgt. or an affiliate and will not be borne by Target Fund shareholders.
Q: How can I vote?
A: Shareholders are invited to attend the Meeting and to vote in person. You may also vote by executing a proxy using one of three methods:
| • | By Internet: Instructions for casting your vote via the Internet can be found in the enclosed proxy voting materials. The required control number is printed on your enclosed proxy card. If this feature is used, there is no need to mail the proxy card. |
| • | By Telephone: Instructions for casting your vote via telephone can be found in the enclosed proxy voting materials. The toll-free number and required control number are printed on your enclosed proxy card. If this feature is used, there is no need to mail the proxy card. |
| • | By Mail: If you vote by mail, please indicate your voting instructions on the enclosed proxy card, date and sign the card, and return it in the envelope provided, which is addressed for your convenience and needs no postage if mailed in the United States. |
Shareholders who execute proxies by Internet, telephone or mail may revoke them at any time prior to the Meeting by filing with the Target Fund a written notice of revocation, by executing another proxy bearing a later date, by voting later by Internet or telephone or by attending the Meeting and voting in person. Merely attending the Meeting, however, will not revoke any previously submitted proxy.
Q: When should I vote?
A: Every vote is important and the Board encourages you to record your vote as soon as possible. Voting your proxy now will ensure that the necessary number of votes is obtained, without the time and expense required for additional proxy solicitation.
Q: Who should I call if I have questions about the proposal in the Prospectus/Proxy Statement?
A: Call 1-866-865-3843 with your questions.
- 2 -
Table of Contents
Q: How can I get more information about the Target and Acquiring Funds?
A: You may obtain (1) a prospectus, statement of additional information or annual/semiannual report for the Funds or (2) the statement of additional information regarding the Reorganization (request the “Reorganization SAI”) by:
| • | Telephone: 1-800-THRIVENT (1-800-847-4836) and say “mutual funds” |
| • | Mail: Thrivent Mutual Funds, P.O. Box 219348, Kansas City, Missouri 64121-9348 |
| • | Internet: |
| • | For a copy of a prospectus, a statement of additional information, or a shareholder report: |
www.thrivent.com
| • | For a copy of this Prospectus/Proxy Statement or the Reorganization SAI: |
www.proxy-direct.com/thr-26694
- 3 -
Table of Contents
Thrivent Mid Cap Growth Fund
a series of
THRIVENT MUTUAL FUNDS
625 Fourth Avenue South
Minneapolis, Minnesota 55415
(800) 847-4836
www.thrivent.com
NOTICE OF SPECIAL MEETING
OF SHAREHOLDERS
To be Held on August 14, 2015
NOTICE IS HEREBY GIVEN THAT a special meeting of shareholders (the “Meeting”) of Thrivent Mid Cap Growth Fund (the “Target Fund”), a series of Thrivent Mutual Funds (the “Trust”), will be held at the offices of Thrivent Financial for Lutherans, 625 Fourth Avenue South, Minneapolis, Minnesota 55415 on August 14, 2015 at 9:00 a.m. Central time for the following purposes:
| 1. | To approve an Agreement and Plan of Reorganization pursuant to which the Target Fund would (i) transfer all of its assets to Thrivent Mid Cap Stock Fund (the “Acquiring Fund”), a series of the Trust, in exchange for Class A and Institutional Class Shares of the Acquiring Fund, (ii) distribute such Class A and Institutional Class Shares of the Acquiring Fund to shareholders of the Target Fund, and (iii) dissolve. |
| 2. | To transact such other business as may properly be presented at the Meeting or any adjournment thereof. |
The Board of Trustees of the Trust (the “Board”) has fixed the close of business on June 16, 2015 as the record date for the determination of shareholders entitled to notice of, and to vote at, the Meeting and all adjournments thereof.
Shareholders are invited to attend the meeting and vote in person. You may also vote by executing a proxy using one of three methods:
| • | By Internet—Instructions for casting your vote via the Internet can be found in the enclosed proxy voting materials. The required control number is printed on your enclosed proxy card. If this feature is used, there is no need to mail the proxy card. |
| • | By Telephone—Instructions for casting your vote via telephone can be found in the enclosed proxy voting materials. The toll-free number and required control number are printed on your enclosed proxy card. If this feature is used, there is no need to mail the proxy card. |
| • | By Mail—If you vote by mail, please indicate your voting instructions on the enclosed proxy card, date and sign the card, and return it in the envelope provided, which is addressed for your convenience and needs no postage if mailed in the United States. |
Shareholders who execute proxies by Internet, telephone, or mail may revoke them at any time prior to the Meeting by filing with the Target Fund a written notice of revocation, by executing another proxy bearing a later date, or by attending the Meeting and voting in person. Merely attending the Meeting, however, will not revoke any previously submitted proxy.
The Board recommends that you cast your vote FOR the proposed Reorganization as described in the Prospectus/Proxy Statement.
YOUR VOTE IS IMPORTANT
Please return your proxy card or record your voting instructions by telephone or via the Internet promptly no matter how many shares you own. In order to avoid the additional expense of further solicitation, we ask that you mail your proxy card or record your voting instructions by telephone or via the Internet promptly regardless of whether you plan to be present in person at the Meeting.
Date: , 2015
Michael W. Kremenak
Secretary
Thrivent Mutual Funds
Table of Contents
COMBINED PROSPECTUS/PROXY STATEMENT
THRIVENT MID CAP GROWTH FUND
a series of
THRIVENT MUTUAL FUNDS
625 Fourth Avenue South
Minneapolis, Minnesota 55415
(800) 847-4836
, 2015
This Prospectus/Proxy Statement is furnished to you as a shareholder of Thrivent Mid Cap Growth Fund (the “Target Fund”), a series of Thrivent Mutual Funds (the “Trust”). A special meeting of shareholders of the Target Fund will be held on August 14, 2015 (the “Meeting”) to consider the approval of a Reorganization (the “Reorganization”) of the Target Fund into Thrivent Mid Cap Stock Fund (the “Acquiring Fund”). The Board of Trustees of the Trust (the “Board”) requests that you vote your shares by completing and returning the enclosed proxy card or by recording your voting instructions by telephone or via the Internet regardless of whether you plan to be present at the Meeting in order to avoid the additional expense of further solicitation.
The Acquiring Fund and the Target Fund are sometimes referred to herein individually as a “Fund” or collectively as the “Funds.” Each of the Acquiring Fund and the Target Fund is organized as a diversified series of the Trust, an open-end management investment company registered under the Investment Company Act of 1940, as amended (the “1940 Act”).
The reorganization proposed for the Target Fund (the “Reorganization”) is not contingent upon the approval or completion of any other reorganization or merger.
This Prospectus/Proxy Statement sets forth concisely the information shareholders of the Target Fund ought to know before voting on the Reorganization. Please read it carefully and retain it for future reference.
The following documents, each having been filed with the Securities and Exchange Commission (the “SEC”), are incorporated herein by reference:
| • | The Thrivent Mutual Funds Prospectus, dated February 27, 2015 and as supplemented through the date hereof (the “Trust Prospectus”). |
| • | A Statement of Additional Information, dated , 2015, relating to this Combined Prospectus/Proxy Statement (the “Reorganization SAI”); |
| • | The Thrivent Mutual Funds Statement of Additional Information, dated February 27, 2015 and as supplemented through the date hereof (the “Trust SAI”). |
Copies of the foregoing may be obtained without charge by calling or writing the Fund as set forth below. If you wish to request the Reorganization SAI, please ask for the “Reorganization SAI.”
In addition, each Fund will furnish, without charge, a copy of its most recent annual report and subsequent semi-annual report, if any, to a shareholder upon request.
Copies of each Fund’s most recent prospectus, statement of additional information, annual report and semi-annual report can be obtained at www.thrivent.com. Requests for documents can also be made by calling (800) 847-4836 or writing Thrivent Mutual Funds, P.O. Box 219348, Kansas City, Missouri 64121-9348.
The Funds file reports and other information with the SEC. Information filed by the Funds with the SEC can be reviewed and copied at the SEC’s Public Reference Room in Washington, DC or on the EDGAR database on the SEC’s internet site (http://www.sec.gov). Information on the operation of the SEC’s Public Reference Room may be obtained by calling the SEC at (202) 551-8090. You can also request copies of these materials, upon payment of a duplicating fee, by electronic request at the SEC’s e-mail address (publicinfo@sec.gov) or by writing the Public Reference Section of the SEC, Washington, DC 20549-1520.
The Board knows of no business other than that discussed above that will be presented for consideration at the Meeting. If any other matter is properly presented, it is the intention of the persons named in the enclosed proxy to vote in accordance with their best judgment.
No person has been authorized to give any information or make any representation not contained in this Prospectus/Proxy Statement and, if so given or made, such information or representation must not be relied upon as having been authorized. This Prospectus/Proxy Statement does not constitute an offer to sell or a solicitation of an offer to buy any securities in any jurisdiction in which, or to any person to whom, it is unlawful to make such offer or solicitation.
Table of Contents
Neither the Securities and Exchange Commission nor any state regulator has approved or disapproved of these shares or passed upon the adequacy of this Prospectus/Proxy Statement. A representation to the contrary is a crime.
The date of this Prospectus/Proxy Statement is , 2015. The Prospectus/Proxy Statement will be sent to shareholders on or around July 1, 2015.
- 2 -
Table of Contents
| Page | ||||
| 1 | ||||
| 1 | ||||
| 1 | ||||
| 3 | ||||
| 3 | ||||
| 4 | ||||
| 4 | ||||
| 5 | ||||
| 5 | ||||
| 6 | ||||
The Separate Accounts and the Retirement Plans | 6 | |||
| 8 | ||||
| 9 | ||||
| 10 | ||||
| 11 | ||||
| 13 | ||||
| 13 | ||||
Payments to Broker-Dealers and Other Financial Intermediaries | 14 | |||
| 15 | ||||
| 15 | ||||
| 15 | ||||
| 16 | ||||
Material Federal Income Tax Consequences of the Reorganization | 16 | |||
| 18 | ||||
| 19 | ||||
| 19 | ||||
| 19 | ||||
| 19 | ||||
| 20 | ||||
| 20 | ||||
| 20 | ||||
| 20 | ||||
| 20 | ||||
| 20 | ||||
| 21 | ||||
Table of Contents
The following is a summary of certain information contained elsewhere in this Prospectus/Proxy Statement and is qualified in its entirety by reference to the more complete information contained in this Prospectus/Proxy Statement. Shareholders should read the entire Prospectus/Proxy Statement carefully.
The Board, including the trustees who are not “interested persons” (as defined in the 1940 Act) of each Fund, has unanimously approved an Agreement and Plan of Reorganization (the “Reorganization Agreement”) on behalf of each Fund, subject to Target Fund shareholder approval. The Reorganization Agreement provides for:
| • | the transfer of all of the assets of the Target Fund to the Acquiring Fund in exchange for Class A and Institutional Class Shares of the Acquiring Fund; |
| • | the distribution by the Target Fund of such Acquiring Fund Class A and Institutional Class Shares to Target Fund shareholders; and |
| • | the dissolution of the Target Fund. |
When the Reorganization is complete, Target Fund shareholders will hold Acquiring Fund shares. The aggregate value of the Acquiring Fund shares a Target Fund shareholder will receive in the Reorganization will equal the aggregate value of the Target Fund shares owned by such shareholder immediately prior to the Reorganization. After the Reorganization, the Acquiring Fund will continue to operate with the investment objective and investment policies set forth in this Prospectus/Proxy Statement.
As discussed in more detail elsewhere in this Prospectus/Proxy Statement, the Board believes that the Reorganization would be in the best interests of the Target Fund’s shareholders because: (i) a merger into the Acquiring Fund represents the most attractive viable option for the Target Fund given its lack of fit with Thrivent Asset Management LLC’s (“Thrivent Asset Mgt.” or the “Adviser”) product strategy and the Adviser’s unwillingness to support the Target Fund indefinitely in its current form; (ii) the expenses of the Acquiring Fund, while higher than the Target Fund’s, are competitive within both its own Lipper peer group and that of the Target Fund; (iii) the Acquiring Fund invests in a more diversified portfolio of equities; and (iv) the Acquiring Fund has achieved stronger performance over the one-, three- and five-year periods ended December 31, 2014, with Class A performance differences of 2.32%, 3.35% and 1.43%, respectively.
In addition, the Board, when determining whether to approve the Reorganization, considered, among other things, the future growth prospects of each of the Target Fund and the Acquiring Fund, the fact that the Target Fund shareholders would not experience any diminution in shareholder services as a result of the Reorganization, and the fact that the Reorganization is expected to be a tax-free reorganization for federal income tax purposes.
Background and Reasons for the Reorganization
The Target Fund and the Acquiring Fund have substantially similar investment objectives. The investment objective of the Target Fund is to seek long-term growth of capital. The investment objective of the Acquiring Fund is to seek long-term capital growth.
The two Funds also have similar, although not identical, principal investment strategies, which are described in more detail in the COMPARISON OF FUNDS—Investment Objective and Principal Strategies section of this Prospectus/Proxy Statement. Under normal circumstances, both Funds invest at least 80% of their net assets (plus the amount of any borrowing for investment purposes) in securities of mid-sized companies. In the case of the Target Fund, the Adviser focuses mainly on securities of mid-sized U.S. companies which have market capitalizations similar to those companies included in widely known mid cap indices such as the Russell Midcap® Growth Index or the S&P MidCap 400/Citigroup Growth Index at the time of the Target Fund’s investment. In the case of the Acquiring Fund, the Adviser focuses mainly on the securities of mid-sized U.S. companies which have market capitalizations similar to those included in widely known indices such as the Russell Midcap® Index or the S&P MidCap 400 Index.
Table of Contents
In determining whether to recommend approval of the Reorganization Agreement to Target Fund shareholders, the Board considered a number of factors, including, but not limited to: (i) the expenses and advisory fees applicable to the Funds before the proposed Reorganization and the estimated expense ratios of the combined Fund after the proposed Reorganization; (ii) the comparative investment performance of the Funds; (iii) the future growth prospects of each Fund; (iv) the terms and conditions of the Reorganization Agreement; (v) whether the Reorganization would result in the dilution of shareholder interests; (vi) the compatibility of the Funds’ investment objectives, policies, risks and restrictions; (vii) the anticipated tax consequences of the proposed Reorganization; (viii) the compatibility of the Funds’ service features available to shareholders, including exchange privileges; and (ix) the estimated costs of the Reorganization. The Board concluded that these factors supported a determination to approve the Reorganization Agreement.
The Board has determined that the Reorganization is in the best interests of the Target Fund and that the interests of the Target Fund’s shareholders will not be diluted as a result of the Reorganization. In addition, the Board has determined that the Reorganization is in the best interests of the Acquiring Fund and that the interests of the Acquiring Fund’s shareholders will not be diluted as a result of the Reorganization.
The Board is asking shareholders of the Target Fund to approve the Reorganization at the Meeting to be held on August 14, 2015. If shareholders of the Target Fund approve the proposed Reorganization, it is expected that the closing date of the transaction (the “Closing Date”) will be after the close of business on or about August 28, 2015, but it may be at a different time as described herein. If shareholders of the Target Fund do not approve the proposed Reorganization, the Board will consider alternatives, including repurposing the Target Fund’s principal strategies.
The Board recommends that you vote “FOR” the Reorganization.
- 2 -
Table of Contents
Investment Objective and Principal Strategies
Investment Objective. The Target Fund and the Acquiring Fund have substantially similar investment objectives. The investment objective of the Target Fund is to seek long-term growth of capital. The investment objective of the Acquiring Fund is to seek long-term capital growth.
Principal Strategies. Under normal circumstances, both Funds invest at least 80% of their net assets (plus the amount of any borrowing for investment purposes) in securities of mid-sized companies. However, each Fund has a different investment strategy, as set forth below:
Target Fund Principal Investment Strategies.
In the case of the Target Fund, the Adviser focuses mainly on securities of mid-sized U.S. companies which have market capitalizations similar to those companies included in widely known mid cap indices such as the Russell Midcap® Growth Index or the S&P MidCap 400/Citigroup Growth Index at the time of the Target Fund’s investment. Should the Adviser determine that the Target Fund would benefit from reducing the percentage of its assets invested in securities of mid cap companies from 80% to a lesser amount, it will notify shareholders at least 60 days prior to the change.
The Target Fund seeks to achieve its investment objective by investing primarily in common stocks. The Adviser uses fundamental, quantitative, and technical investment research techniques to determine what securities to buy and sell. The Adviser focuses on companies that have a strong record of earnings growth or show good prospects for growth in sales and earnings and also considers the trends in the market as a whole.
The Target Fund may sell securities for a variety of reasons, such as to secure gains, limit losses, or reposition assets into more promising opportunities.
Acquiring Fund Principal Investment Strategies.
In the case of the Acquiring Fund, the Adviser focuses mainly on the securities of mid-sized U.S. companies which have market capitalizations similar to those included in widely known indices such as the Russell Midcap® Index or the S&P MidCap 400 Index. Should the Adviser determine that the Acquiring Fund would benefit from reducing the percentage of its assets invested in mid cap securities from 80% to a lesser amount, it will notify shareholders at least 60 days prior to the change.
The Acquiring Fund seeks to achieve its investment objective by investing in common stocks. Investing in convertible securities is not a principal strategy of the Acquiring Fund. The Adviser uses fundamental, quantitative, and technical investment research techniques to determine what securities to buy and sell. The Adviser generally looks for mid-sized companies that, in its opinion:
| • | have prospects for growth in their sales and earnings; |
| • | are in an industry with a good economic outlook; |
| • | have high-quality management; and/or |
| • | have a strong financial position. |
The Adviser may sell securities for a variety of reasons, such as to secure gains, limit losses, or reposition assets to more promising opportunities.
Fund Holdings. A description of the Funds’ policies and procedures with respect to the disclosure of the Funds’ portfolio securities is available on the Funds’ website.
- 3 -
Table of Contents
The Funds are subject to similar principal risks. Both Funds are subject to Market Risk, Issuer Risk, Mid Cap Risk, and Investment Adviser Risk. Both Funds are also subject to Volatility Risk, though each may be subject to different types of volatility risk. These risks are described below.
Principal risks to which both Funds are subject
Market Risk. Over time, securities markets generally tend to move in cycles with periods when security prices rise and periods when security prices decline. The value of the Fund’s investments may move with these cycles and, in some instances, increase or decrease more than the applicable market(s) as measured by the Fund’s benchmark index(es). The securities markets may also decline because of factors that affect a particular industry.
Issuer Risk. Issuer risk is the possibility that factors specific to a company to which the Fund’s portfolio is exposed will affect the market prices of the company’s securities and therefore the value of the Fund. Some factors affecting the performance of a company include demand for the company’s products or services, the quality of management of the company and brand recognition and loyalty. Common stock of a company is subordinate to other securities issued by the company. If a company becomes insolvent, interests of investors owning common stock will be subordinated to the interests of other investors in, and general creditors of, the company.
Mid Cap Risk. Medium-sized companies often have greater price volatility, lower trading volume, and less liquidity than larger, more-established companies. These companies tend to have smaller revenues, narrower product lines, less management depth and experience, smaller shares of their product or service markets, fewer financial resources, and less competitive strength than larger companies.
Investment Adviser Risk. The Fund is actively managed and the success of its investment strategy depends significantly on the skills of the adviser(s) in assessing the potential of the investments in which the Fund invests. This assessment of investments may prove incorrect, resulting in losses or poor performance, even in rising markets.
Volatility Risk. Volatility risk is the risk that certain types of securities shift in and out of favor depending on market and economic conditions as well as investor sentiment.
Additional principal risks to which only the Target Fund is subject
Volatility Risk. Growth style investing includes the risk of investing in securities whose prices historically have been more volatile than other securities, especially over the short term. Growth stock prices reflect projection of future earnings or revenues and, if a company’s earnings or revenues fall short of expectations, its stock price may fall dramatically.
The Board. The Board is responsible for the overall supervision of the operations of each Fund and performs the various duties imposed on the directors of investment companies by the 1940 Act and under applicable state law.
The Adviser. Thrivent Asset Mgt. is the investment adviser for each Fund. Thrivent Asset Mgt. and its investment advisory affiliate, Thrivent Financial for Lutherans (“Thrivent Financial”) have been in the investment advisory business since 1986 and managed approximately $96 billion in assets as of December 31, 2014, including approximately $41 billion in mutual fund assets. These advisory entities are located at 625 Fourth Avenue South, Minneapolis, Minnesota 55415.
The Adviser and the Trust received an exemptive order from the SEC that permits the Adviser and the Funds, with the approval of the Board, to retain one or more subadvisers for the Funds, or subsequently change a subadviser, without submitting the respective investment subadvisory agreements, or material amendments to those agreements, to a vote of the shareholders of the applicable Fund. The Adviser will notify shareholders of a Fund if there is a new subadviser for that Fund.
The Funds’ annual report to shareholders discusses the basis for the Board approving the investment advisory agreement during the period covered by the report.
- 4 -
Table of Contents
Portfolio Management. Andrea J. Thomas, CFA has served as portfolio manager for the Target Fund since June 2003, and was an associate portfolio manager of the Target Fund from 1997 through 2002. She has been with Thrivent Financial since 1993. Brian J. Flanagan, CFA has served as portfolio manager of the Acquiring Fund since 2004. He has been with Thrivent Financial since 1994 and a portfolio manager since 2000.
The Trust SAI provides information about the portfolio managers’ compensation, other accounts managed by the portfolio managers, and the portfolio managers’ ownership of shares of the Funds.
Advisory Fees. Each Fund pays an annual investment advisory fee to the Adviser. The advisory contract between the Adviser and the Fund provides for the following advisory fees for each class of shares of a Fund, expressed as an annual rate of average daily net assets:
Target Fund |
0.450% of average daily net assets up to $100 million |
0.400% of average daily nets assets greater than $100 million but not greater than $250 million |
0.350% of average daily nets assets greater than $250 million but not greater than $500 million |
0.300% of average daily nets assets greater than $500 million but not greater than $1 billion |
0.250% of average daily nets assets over $1 billion |
Acquiring Fund |
0.700% of average daily net assets up to $200 million |
0.650% of average daily net assets greater than $200 million but not greater than $1 billion |
0.600% of average daily net assets greater than $1 billion but not greater than $2.5 billion |
0.550% of average daily net assets greater than $2.5 billion but not greater than $5 billion |
0.525% of average daily net assets over $5 billion |
During the twelve-months ended October 31, 2014, the contractual advisory fees for the Class A shares of the Target Fund were 0.39% of the Target Fund’s average daily net assets, and the contractual advisory fees for the Class I shares of the Target Fund were 0.39% of the Target Fund’s average daily net assets.
During the twelve-months ended October 31, 2014, the contractual advisory fees for the Class A shares of the Acquiring Fund were 0.66% of the Acquiring Fund’s average daily net assets, and the contractual advisory fees for the Class I shares of the Acquiring Fund were 0.66% of the Acquiring Fund’s average daily net assets.
For a complete description of each Fund’s advisory services, see the section of the Trust Prospectus entitled “Management” and the section of the Trust SAI entitled “Investment Adviser, Investment Subadvisers, and Fund Managers.”
12b-1 Plan. The Trust has adopted a Distribution Plan and Agreement pursuant to Rule 12b-1 under the 1940 Act (the “Rule 12b-1 Plan”) with respect to the Class A Shares of each Fund. Thrivent Investment Management Inc. (the “Distributor”), an affiliate of the Adviser, located at 625 Fourth Avenue South, Minneapolis, Minnesota 55415, serves as the distributor of each Fund. Under the Rule 12b-1 Plan, Class A Shares of each Fund pay the Distributor an aggregate fee for distribution and shareholder servicing equal to an annual rate of 0.25% of the average daily net asset value represented by such shares. Institutional Class Shares are not subject to a Rule 12b-1 Plan and the Funds do not pay any percentage of their assets attributable to Institutional Class Shares for distribution or shareholder servicing. For a complete description of these arrangements with respect to each Fund, see the section of the Class A Prospectus entitled “Shareholder Information—Rule 12b-1 Fees” and the section of the Trust SAI entitled “Underwriting and Distribution Service.” These sections are incorporated by reference herein.
Investments in the Target Fund by Certain Affiliated Funds
The Reorganization is not contingent upon the approval or completion of any other reorganization or merger. However, simultaneous with shareholders’ consideration of this Prospectus/Proxy Statement, shareholders of Thrivent Partner Mid Cap Value Fund (the “Other Target Fund,” and collectively with the Target Fund, the “Target Funds”) are considering a reorganization of that fund into the Acquiring Fund. Therefore, pro forma financial and expense information presented in this Prospectus/Proxy Statement under the headings “COMPARISON OF THE FUNDS – Expenses” and “COMPARISON OF THE FUNDS – Capitalization”, and the pro forma information regarding the Acquiring and Target Funds in the Reorganization SAI (collectively, the “Pro Forma Information”), is presented on the basis of the alternate assumptions that the Reorganization involves solely the Target Fund or both of the Target Funds.
- 5 -
Table of Contents
Other series of the Trust for which Thrivent Asset Mgt. is the investment adviser (the “Affiliated Funds”) currently invest in the Target Funds. The Affiliated Funds are asset allocation funds investing a range of asset categories and permit Thrivent Asset Mgt. to determine whether to invest directly in securities and other investments, in addition to, or instead of, investing in other series of the Fund (including the Target Funds). Over time, Thrivent Asset Mgt. has gradually invested a larger percentage of the Affiliated Funds’ assets in direct investments and has reduced the percentage of assets invested in other series of the Trust. Thrivent Asset Mgt. expects to continue decreasing the percentage of Affiliated Funds’ assets invested in other series over time. This trend of relying more heavily on direct investments is expected to accelerate since Thrivent Asset Mgt. has proposed changes that will simplify the investment advisory fee structure of the Affiliated Funds. These changes would encourage a more streamlined approach of direct investments, while accommodating investments in other series of the Trust when Thrivent Asset Mgt. deems it to be advisable. As a result, the Affiliated Funds are likely to redeem their holdings (if any) out of the Target Funds irrespective of whether the Reorganization is approved. These redemptions would most likely be processed as redemptions-in-kind, with the effect that the Affiliated Funds would receive a pro rata distribution of the Target Funds’ investments. These redemptions may be substantial, relative to the size of the Target Fund(s) prior to such redemption, and are likely to occur prior to the effective date of the Reorganization. The Pro Forma Information presented in this Prospectus/Proxy Statement and the Reorganization SAI does not include any effects of such redemptions.
The table below sets forth the fees and expenses that investors may pay to buy and hold shares of each of the Target Fund and the Acquiring Fund, including (i) the fees and expenses paid by the Target Fund for the twelve-month period ended December 31, 2014, (ii) the fees and expenses paid by the Acquiring Fund for the twelve-month period ended December 31, 2014, (iii) pro forma fees and expenses for the Acquiring Fund for the twelve-month period ended December 31, 2014, assuming the Reorganization had been completed as of the beginning of such period, and (iv) pro forma fees and expenses for the Acquiring Fund for the twelve-month period ended December 31, 2014, assuming that the Target Fund and Thrivent Partner Mid Cap Value Fund (collectively referred to as the “Target Funds”) all merged into the Acquiring Fund as of the beginning of such period.
| Class A Shares | Institutional Class Shares | |||||||||||||||||||||||||||||||
| Actual | Pro Forma | Pro Forma | Actual | Pro Forma | Pro Forma | |||||||||||||||||||||||||||
| Target Fund | Acquiring Fund | Acquiring Fund (assuming merger with Target Fund) | Acquiring Fund (assuming merger with Target Funds) | Target Fund | Acquiring Fund | Acquiring Fund (assuming merger with Target Fund) | Acquiring Fund (assuming merger with Target Funds) | |||||||||||||||||||||||||
Shareholder Fees (fees paid directly from your investment) | ||||||||||||||||||||||||||||||||
Maximum Sales Charge (Load) Imposed on Purchases (as a percentage of offering price) | 5.50 | % | 5.50 | % | 5.50 | % | 5.50 | % | N/A | N/A | N/A | N/A | ||||||||||||||||||||
Maximum Deferred Sales Charge (Load) (as a percentage of net asset value at time of purchase or redemption, whichever is lower)* | 1.00 | % | 1.00 | % | 1.00 | % | 1.00 | % | N/A | N/A | N/A | N/A | ||||||||||||||||||||
Annual Fund Operating Expenses as a Percentage of Average Net Assets (expenses that are deducted from Fund assets) | ||||||||||||||||||||||||||||||||
Management Fees | 0.39 | % | 0.66 | % | 0.64 | % | 0.64 | % | 0.39 | % | 0.66 | % | 0.64 | % | 0.64 | % | ||||||||||||||||
Distribution and Service (12b-1 Fees) | 0.25 | % | 0.25 | % | 0.25 | % | 0.25 | % | — | — | — | — | ||||||||||||||||||||
Other Expenses | 0.32 | % | 0.20 | % | 0.22 | % | 0.22 | % | 0.13 | % | 0.05 | % | 0.06 | % | 0.06 | % | ||||||||||||||||
Total Annual Operating Expenses | 0.96 | % | 1.11 | % | 1.11 | % | 1.11 | % | 0.52 | % | 0.71 | % | 0.70 | % | 0.70 | % | ||||||||||||||||
Less Expense Reimbursement | — | — | — | — | — | — | — | — | ||||||||||||||||||||||||
Net Annual Fund Operating Expenses | 0.96 | % | 1.11 | % | 1.11 | % | 1.11 | % | 0.52 | % | 0.71 | % | 0.70 | % | 0.70 | % | ||||||||||||||||
| * | When you invest $1,000,000 or more, a deferred sales charge of 1% will apply to shares redeemed within one year. |
- 6 -
Table of Contents
Example
The following example, using the actual and pro forma operating expenses for the twelve-month period ended October 31, 2014, is intended to help you compare the costs of investing in the Acquiring Fund pro forma after the Reorganization with the costs of investing in each of the Target Fund and the Acquiring Fund without the Reorganization. The example assumes that you invest $10,000 in each Fund for the time period indicated and that you redeem all of your shares at the end of each period. The example also assumes that your investments have a 5% return each year and that each Fund’s operating expenses remain the same each year. Although your actual returns may be higher or lower, based on these assumptions your costs would be:
| Actual | Pro Forma | |||||||||||||||
| Target Fund | Acquiring Fund | Acquiring Fund (assuming merger with the Target Fund) | Acquiring Fund (assuming merger with the Target Funds) | |||||||||||||
Total operating expenses for Class A Shares assuming redemption at the end of the period | ||||||||||||||||
One Year | $ | 643 | $ | 657 | $ | 657 | $ | 657 | ||||||||
Three Years | $ | 839 | $ | 883 | $ | 883 | $ | 883 | ||||||||
Five Years | $ | 1,052 | $ | 1,128 | $ | 1,128 | $ | 1,128 | ||||||||
Ten Years | $ | 1,663 | $ | 1,827 | $ | 1,827 | $ | 1,827 | ||||||||
Total operating expenses for Institutional Class Shares assuming redemption at the end of the period | ||||||||||||||||
One Year | $ | 53 | $ | 73 | $ | 72 | $ | 72 | ||||||||
Three Years | $ | 167 | $ | 227 | $ | 224 | $ | 224 | ||||||||
Five Years | $ | 291 | $ | 395 | $ | 390 | $ | 390 | ||||||||
Ten Years | $ | 653 | $ | 883 | $ | 871 | $ | 871 | ||||||||
Portfolio Turnover
Each Fund pays transaction costs, such as commissions, when it buys and sells securities (or “turns over” its portfolio). A higher portfolio turnover rate may indicate higher transaction costs and may result in higher taxes when Fund shares are held in a taxable account. These costs, which are not reflected in Total Annual Operating Expenses or in the Example, affect the Funds’ performance. During the fiscal year ended October 31, 2014, the Acquiring Fund’s and the Target Fund’s portfolio turnover rates were 27% and 45%, respectively, of the average value of their portfolios.
- 7 -
Table of Contents
Purchase, Valuation, Redemption and Exchange of Shares; Dividends and Distributions
Pricing of Fund Shares. The price of a Fund’s shares is based on the Fund’s net asset value (“NAV”). The Funds determine their NAV once daily at the close of trading on the New York Stock Exchange (“NYSE”), which is normally 4:00 p.m. Eastern Time. The Funds do not determine NAV on holidays observed by the NYSE or on any other day when the NYSE is closed. The NYSE is regularly closed on Saturdays and Sundays, New Year’s Day, Martin Luther King, Jr. Day, Presidents Day, Good Friday, Memorial Day, Independence Day, Labor Day, Thanksgiving Day and Christmas Day.
Each Fund determines its NAV for a particular class by dividing the total Fund assets attributable to that class, less all liabilities attributable to such class, by the total number of outstanding shares of that class. To determine the NAV, the other Funds generally value their securities at current market value using readily available market prices. If market prices are not available or if the Adviser determines that they do not accurately reflect fair value for a security, the Board has authorized the Adviser to make fair valuation determinations pursuant to policies approved by the Board. Fair valuation of a particular security is an inherently subjective process, with no single standard to utilize when determining a security’s fair value. In each case where a security is fair valued, consideration is given to the facts and circumstances relevant to the particular situation. This consideration includes a review of various factors set forth in the pricing policies adopted by the Board. For any portion of a Fund’s assets that are invested in other mutual funds, the NAV is calculated based upon the NAV of the mutual funds in which the Fund invests, and the prospectuses for those mutual funds explain the circumstances under which they will use fair value pricing and the effects of such a valuation.
Because many foreign markets close before the U.S. markets, significant events may occur between the close of the foreign market and the close of the U.S. markets, when the Fund’s assets are valued, that could have a material impact on the valuation of foreign securities (i.e., available price quotations for these securities may not necessarily reflect the occurrence of the significant event). The Funds, subject to oversight by the Board, evaluate the impact of these significant events and adjust the valuation of foreign securities to reflect the fair value as of the close of the U.S. markets to the extent that the available price quotations do not, in the Adviser’s opinion, adequately reflect the occurrence of the significant events.
Please note that the Target Fund and the Acquiring Fund have identical valuation policies. As a result, there will be no material change to the value of the Target Fund’s assets because of the Reorganization.
Also, the Target Fund and the Acquiring Fund have identical policies with respect to frequent purchases and redemptions and standing allocation orders (for more information, please see Policy Regarding Frequent Trading Policies and Monitoring Processes and Standing Allocation Order disclosures in the Acquiring Fund’s Prospectus—these disclosures are incorporated herein by reference). The Reorganization will not affect these policies.
Class A Shares. The Class A Shares of each Fund are subject to an initial sales charge of up to 5.50%. The initial sales charge applicable to Class A Shares of the Acquiring Fund will be waived for Class A Shares acquired in the Reorganization. Any subsequent purchases of Class A Shares of the Acquiring Fund, excluding Class A Shares purchased through the automatic dividend reinvestment plan, after the Reorganization will be subject to an initial sales charge of up to 5.50%. The initial sales charge is reduced for investments in excess of $50,000. Purchases of Class A Shares of each Fund in amounts of $1 million or more are not subject to an initial sales charge, but a contingent deferred sales charge of up to 1.00% may be imposed on certain redemptions made within one year of purchase. No contingent deferred sales charge will be imposed on Class A Shares of the Target Fund in connection with the Reorganization. For additional information, please see the section entitled “Shareholder Information—Class A Shares” in the Class A Prospectus. This section is incorporated by reference herein.
Institutional Class Shares. Institutional Class Shares of each Fund are not subject to an initial sales charge or a contingent deferred sales charge. Institutional Class Shares are offered to institutions, church organizations, retirement plans sponsored by institutions and participants in various mutual fund asset allocation, fee-based investment advisory programs offered by the Distributor. For additional information, please see the section entitled “Shareholder Information—Institutional Class Shares” in the Institutional Class Prospectus. This section is incorporated by reference herein.
Buying Shares. Shares of each Fund may be purchased through a shareholder’s registered representative, by mail, by telephone, by the Internet, by wire transfer, through an automatic investment plan or by exchange from other Thrivent mutual funds. For additional information regarding buying shares of each Fund and exchanging shares of each Fund, see the sections of the Trust Prospectus entitled “Shareholder Information—Buying Shares” and “Shareholder Information—Exchanging Shares Between Funds.”
- 8 -
Table of Contents
Redeeming Shares. When a Fund receives a request for redemption, such Fund will redeem such shares at the next calculation of the Fund’s NAV. A Fund may postpone payment or suspend the right of redemption in unusual circumstances, as permitted by the SEC. When a shareholder purchases shares by check, electronic funds transfer (other than bank wire) or automatic investment plan and elects to redeem those shares soon after their purchase, the Fund may delay paying the redemption proceeds until the shareholder’s payment has cleared, which could take up to 10 days or more from the date of purchase. Shares may be redeemed by mail, by phone, by the Internet, by wire/ACH transfer or through a systematic withdrawal plan. For additional information regarding redeeming shares of each Fund, see the section of the Trust Prospectus entitled “Shareholder Information—Redeeming Shares.” This section is incorporated by reference herein.
Dividends and Distributions. Dividends of the Target Fund and the Acquiring Fund, if any, are generally declared and paid annually. Income dividends are derivative from investment income, including dividends, interest, and certain foreign currency gains received by each Fund. Capital gains distributions, if any, usually will be declared and paid in December for the prior twelve-month period ending October 31. Any election made by Target Fund shareholders in respect of the receipt of dividends and capital gains distributions will continue to apply to Class A and Institutional Class Shares of the Acquiring Fund received in the Reorganization. For additional information regarding these elections see the section of the Trust Prospectus entitle “Distribution Options.” This section is incorporated by reference herein.
The following table sets forth the capitalization of the Target Fund and the Acquiring Fund, as of October 31, 2014, and the pro forma capitalization of the Acquiring Fund as if the Reorganization occurred on that date. These numbers may differ as of the Closing Date.
| Actual | Pro Forma | |||||||||||||||
| Target Fund | Acquiring Fund | Acquiring Fund (assuming merger with the Target Fund) | Acquiring Fund (assuming merger with the Target Funds) | |||||||||||||
Net assets | ||||||||||||||||
Class A Shares | $ | 269,694,383 | $ | 678,209,883 | $ | 947,904,266 | $ | 974,529,830 | ||||||||
Institutional Class Shares | $ | 167,195,076 | $ | 264,015,440 | $ | 431,210,516 | $ | 579,851,571 | ||||||||
|
|
|
|
|
|
|
| |||||||||
Total Fund Net Assets | $ | 436,889,459 | $ | 942,225,323 | $ | 1,379,114,782 | $ | 1,554,381,401 | ||||||||
Net asset value per share | ||||||||||||||||
Class A Shares | $ | 20.61 | $ | 23.55 | $ | 23.55 | $ | 23.55 | ||||||||
Institutional Class Shares | $ | 24.10 | $ | 25.54 | $ | 25.54 | $ | 25.54 | ||||||||
Shares outstanding | ||||||||||||||||
Class A Shares | 13,084,657 | 28,803,639 | 40,257,575 | 41,388,364 | ||||||||||||
Institutional Class Shares | 6,938,564 | 10,335,804 | 16,881,231 | 22,700,297 | ||||||||||||
|
|
|
|
|
|
|
| |||||||||
Total Shares Outstanding | 20,023,221 | 39,139,443 | 57,138,806 | 64,088,661 | ||||||||||||
The pro forma shares outstanding reflect the issuance by the Acquiring Fund of: i) assuming a merger with the Target Fund, approximately 11,453,936 Class A Shares and 6,545,427 Institutional Class Shares (for a total of 17,999,363 shares); and ii) assuming a merger with the Target Funds, approximately 12,584,726 Class A Shares and 12,364,493 Institutional Class Shares (for a total of 24,949,219 shares). In each case, such issuance reflects the exchange of the assets of the Target Fund for newly issued Class A Shares and Institutional Class Shares of the Acquiring Fund, respectively, at the pro forma net asset value per share. The aggregate value of the Acquiring Fund shares that a Target Fund shareholder receives in the Reorganization will equal the aggregate value of the Target Fund shares owned immediately prior to the Reorganization.
- 9 -
Table of Contents
Annual Performance Information
The following chart shows the annual returns of the Target Fund and the Acquiring Fund for the past ten years. The bar charts include the effects of each Fund’s expenses, but not sales charges. If sales charges were included, returns would be lower than those shown. The table includes the effects of Fund expenses and maximum sales charges and assumes that you sold your shares at the end of the period. After-tax returns are shown only for the Class A Shares and after-tax returns for the Institutional Class Shares will differ from those shown for the Class A Shares. The after-tax returns are calculated using the historical highest individual federal marginal income tax rates and do not reflect the impact of state and local taxes. Actual after-tax returns depend on an investor’s tax situation and may differ from those shown and after-tax returns are not relevant to investors who hold their Fund shares through tax-deferred arrangements such as 401(k) plans or individual retirement accounts. How either Fund performed in the past (before and after taxes) is not necessarily an indication of how it will perform in the future.
Thrivent Mid Cap Growth Fund—Class A Shares
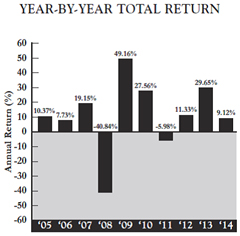
Thrivent Mid Cap Stock Fund—Class A Shares

As a result of market activity, current performance may vary from the figures shown.
The Target Fund’s (Class A Shares) total return for the three-month period from January 1, 2015 to March 31, 2015 was 5.82%. The Acquiring Fund’s (Class Shares) total return for the three-month period from January 1, 2015 to March 31, 2015 was 2.77%. During the past 10 years, the Target Fund’s (Class A Shares) highest quarterly return was 22.76% (for the quarter ended June 30, 2009) and its lowest quarterly return was -24.55% (for the quarter ended December 31, 2008). During the past 10 years, the Acquiring Fund’s (Class A Shares) highest quarterly return was 19.46% (for the quarter ended September 30, 2009) and its lowest quarterly return was -22.13% (for the quarter ended September 30, 2011).
- 10 -
Table of Contents
Comparative Performance Information
As a basis for evaluating each Fund’s performance and risks, the following table shows how each Fund’s performance compares with broad-based market indices that the Adviser believes are appropriate benchmarks for such Fund. The Target Fund’s benchmark is the Russell Midcap® Growth Index, which measures the performance of mid-cap growth stocks. The Acquiring Fund’s benchmark is the Russell Midcap® Index, which measure the performance of the smallest 800 securities in the Russell 1000® Index. Further, the table includes the effects of each Fund’s expenses, but not sales charges. If sales charges were included, returns would be lower than those shown.
Average annual total returns are shown below for each Fund for the periods ended December 31, 2014 (the most recently completed calendar year prior to the date of this Prospectus/Proxy Statement). Remember that past performance of a Fund is not indicative of its future performance.
Average Annual Total Returns for the Period ended December 31, 2014
| Target Fund | Acquiring Fund | |||||||||||||||||||||||
| Past 1 Year | Past 5 Years | Past 10 Years | Past 1 Year | Past 5 Years | Past 10 Years | |||||||||||||||||||
Applicable Fund, Class A (before taxes) | 3.13 | % | 12.29 | % | 8.36 | % | 5.29 | % | 13.69 | % | 8.07 | % | ||||||||||||
(after taxes on distributions) | 0.64 | % | 10.61 | % | 6.95 | % | 2.42 | % | 13.06 | % | 6.48 | % | ||||||||||||
(after taxes on distributions and redemptions) | 3.76 | % | 9.63 | % | 6.46 | % | 5.27 | % | 10.98 | % | 5.96 | % | ||||||||||||
Russell Midcap® Growth Index (reflects no deductions for fees, expenses or taxes) | 11.90 | % | 16.94 | % | 9.43 | % | — | — | — | |||||||||||||||
Russell Midcap® Index (reflects no deductions for fees, expenses or taxes) | — | — | — | 13.22 | % | 17.19 | % | 9.56 | % | |||||||||||||||
- 11 -
Table of Contents
Financial Highlights of the Acquiring Fund
| Income from Investment Operations | Less Distributions From | Ratio to Average Net Assets** | Ratios to Average Net Assets Before Expenses Waived, Credited or Paid Indirectly** | |||||||||||||||||||||||||||||||||||||||||||||||||||||||||
| Net Asset Value, Beginning of Period | Net Investment Income/ (Loss) | Net Realized and Unrealized Gain/ (Loss) on Investments(a) | Total from Investment Operations | Net Investment Income | Net Realized Gain on Investments | Total Distributions | Net Asset Value, End of Period | Total Return(b) | Net Assets, End of Period (in millions) | Expenses | Net Investment Income/ (Loss) | Expenses | Net Investment Income/ (Loss) | Portfolio Turnover Rate | ||||||||||||||||||||||||||||||||||||||||||||||
Class A Shares | ||||||||||||||||||||||||||||||||||||||||||||||||||||||||||||
Year Ended 10/31/2014 | $ | 20.38 | $ | 0.07 | $ | 3.10 | $ | 3.17 | $ | — | $ | — | $ | — | $ | 23.55 | 15.55 | % | $ | 678.20 | 1.11 | % | 0.30 | % | 1.11 | % | 0.30 | % | 27 | % | ||||||||||||||||||||||||||||||
Year Ended 10/31/2013 | 15.34 | 0.01 | 5.03 | 5.04 | — | — | — | 20.38 | 32.86 | % | 625.4 | 1.15 | % | 0.07 | % | 1.15 | % | 0.07 | % | 39 | % | |||||||||||||||||||||||||||||||||||||||
Year Ended 10/31/2012 | 14.30 | (0.01 | ) | 1.05 | 1.04 | — | — | — | 15.34 | 7.27 | % | 517.5 | 1.18 | % | (0.08 | )% | 1.18 | % | (0.08 | )% | 36 | % | ||||||||||||||||||||||||||||||||||||||
Year Ended 10/31/2011 | 13.49 | (0.02 | ) | 0.83 | 0.81 | — | — | — | 14.30 | 6.00 | % | 538.7 | 1.20 | % | (0.15 | )% | 1.20 | % | (0.15 | )% | 35 | % | ||||||||||||||||||||||||||||||||||||||
Year Ended 10/31/2010 | 10.89 | — | 2.60 | 2.60 | — | — | — | 13.49 | 23.88 | % | 571.1 | 1.25 | % | 0.01 | % | 1.25 | % | 0.01 | % | 69 | % | |||||||||||||||||||||||||||||||||||||||
Institutional Class Shares | ||||||||||||||||||||||||||||||||||||||||||||||||||||||||||||
Year Ended 10/31/2014 | 22.09 | 0.22 | 3.31 | 3.53 | (0.08 | ) | — | (0.08 | ) | 25.54 | 16.01 | % | 264.0 | 0.71 | % | 0.70 | % | 0.71 | % | 0.70 | % | 27 | % | |||||||||||||||||||||||||||||||||||||
Year Ended 10/31/2013 | 16.63 | 0.10 | 5.43 | 5.53 | (0.07 | ) | — | (0.07 | ) | 22.09 | 33.41 | % | 290.0 | 0.71 | % | 0.50 | % | 0.71 | % | 0.50 | % | 39 | % | |||||||||||||||||||||||||||||||||||||
Year Ended 10/31/2012 | 15.43 | 0.07 | 1.13 | 1.20 | — | — | — | 16.63 | 7.78 | % | 220.4 | 0.72 | % | 0.38 | % | 0.72 | % | 0.38 | % | 36 | % | |||||||||||||||||||||||||||||||||||||||
Year Ended 10/31/2011 | 14.53 | 0.06 | 0.89 | 0.95 | (0.05 | ) | — | (0.05 | ) | 15.43 | 6.51 | % | 215.6 | 0.71 | % | 0.33 | % | 0.71 | % | 0.33 | % | 35 | % | |||||||||||||||||||||||||||||||||||||
Year Ended 10/31/2010 | 11.71 | 0.07 | 2.79 | 2.86 | (0.04 | ) | — | (0.04 | ) | 14.53 | 24.50 | % | 216.6 | 0.73 | % | 0.55 | % | 0.73 | % | 0.55 | % | 69 | % | |||||||||||||||||||||||||||||||||||||
| (a) | The amount shown may not correlate with the change in aggregate gains and losses of portfolio securities due to the timing of sales and redemptions of fund shares. |
| (b) | Total investment return assumes dividend reinvestment and does not reflect any deduction for applicable sales charges. Not annualized for periods less than one year. |
| * | All per share amounts have been rounded to the nearest cent. |
| ** | Computed on an annualized basis for periods less than one year |
The financial highlights for the Target Fund’s Class A Shares and Institutional Class Shares are available in the Thrivent Mutual Funds prospectus for each respective share class, dated February 27, 2015 and as supplemented through the date hereof and are incorporated herein by reference.
- 12 -
Table of Contents
Thrivent Asset Mgt., 625 Fourth Avenue South, Minneapolis, Minnesota 55415, provides administrative personnel and services necessary to operate the Funds and receives an administration fee from the Funds. The custodian for the Funds is State Street Bank and Trust Company, 225 Franklin Street, Boston, Massachusetts 02110. PricewaterhouseCoopers LLP, 225 South Sixth Street, Suite 1400, Minneapolis, MN 55402, serves as the Trust’s independent registered public accounting firm.
The Trust is an open-end management investment company registered under the Investment Company Act of 1940 (the “1940 Act”) and was organized as a Massachusetts Business Trust on March 10, 1987. The Trust is made up of 26 separate series or “Funds.” Each Fund of the Trust, other than the Thrivent Asset Allocation Funds and the Thrivent Natural Resources Fund, is diversified.
The Trust is authorized to issue shares of beneficial interest, par value $.01 per share, divisible into an indefinite number of different series and classes and operates as a “series company” as provided by Rule 18f-2 under the 1940 Act.
The Declaration of Trust of the Trust, as amended through the date hereof (the “Declaration of Trust”) provides that each shareholder shall be deemed to have agreed to be bound by its terms. A vote of shareholders and the Board may amend the Declaration of Trust. The Trust may issue an unlimited number of shares in one or more series as the Board of Trustees may authorize.
Each class is subject to such investment minimums and other conditions as set forth in the Trust’s current prospectuses. Such minimums are identical the same share classes of the Target Fund and the Acquiring Fund (so, for example, the Class A Shares of both Funds have the same initial and subsequent investment minimums). The Reorganization will not affect such investment minimums and other conditions.
Differences in expenses among classes are described in the Trust’s Amended and Restated Plan Pursuant to Rule 18f-3 under the 1940 Act. Class A and Institutional Class Shares pay the expenses associated with their different distribution arrangements. Each class may, at the Trustees’ discretion, also pay a different share of other expenses, not including advisory or custodial fees or other expenses related to the management of the Trust’s assets, if these expenses are actually incurred in a different amount by that class, or if the class receives services of a different kind or to a different degree than the other class. All other expenses will be allocated to each class on the basis of the net asset value of the particular Fund.
Each class of shares has identical voting rights except that each class has exclusive voting rights on any matter submitted to shareholders relating solely to the class or where the interests of one class differ from the interests of the other class. Class A Shares have exclusive voting rights on matters involving the Rule 12b-1 Distribution Plan. Matters submitted to shareholder vote must be approved by each Fund separately except:
| • | when required otherwise by the 1940 Act; or |
| • | when the Trustees determine that the matter does not affect all Funds; then, only the shareholders of the affected Funds may vote. |
Shares are freely transferable, and holders thereof are entitled to receive dividends declared by the Board, and receive the assets of their respective Fund in the event of liquidation. The Trust generally holds shareholder meetings only when required by law or at the written request of shareholders owning at least 10% of the Trust’s outstanding shares. Shareholders may remove the Trustees from office by votes cast in person or by proxy at a shareholder meeting.
At the request of shareholders holding 10% or more of the outstanding shares of the Trust, the Trust will hold a special meeting for the purpose of considering the removal of a Trustee(s) from office, and the Trust will cooperate with and assist shareholders of record who notify the Trust that they wish to communicate with other shareholders for the purpose of obtaining signatures to request such a meeting, all pursuant to and in accordance with Section 16(c) of the 1940 Act.
- 13 -
Table of Contents
Under Massachusetts law, shareholders of a business trust may be held personally liable, under certain circumstances, for the obligations of the Trust. However, the Declaration of Trust disclaims shareholder, Trustee and/or officer liability for acts performed on behalf of the Trust or for Trust obligations that are binding only on the assets and property of the Trust. The Funds include this disclaimer in each agreement, obligation, or contract entered into or executed by the Trust or the Board. The Declaration of Trust provides for indemnification out of the Trust’s assets for all losses and expenses of any shareholder held personally liable for the obligations of the Trust. The risk of a shareholder incurring financial loss on account of shareholder liability is remote because it is limited to circumstances where the Trust itself is unable to meet its obligations.
The Trust’s organizational documents are filed as part of the Trust’s registration statement with the SEC, and shareholders may obtain copies of such documents as described on the first page of this Prospectus/Proxy Statement and in the Questions and Answers preceding this Prospectus/Proxy Statement.
Payments to Broker-Dealers and Other Financial Intermediaries
If you purchase a Fund through a broker-dealer or other financial intermediary, the Fund and its related companies may pay the intermediary for the sale of Fund shares and related services. These payments may create a conflict of interest by influencing the broker-dealer or other intermediary and your salesperson to recommend the Fund over another investment. Ask your salesperson or visit your financial intermediary’s website for more information.
- 14 -
Table of Contents
INFORMATION ABOUT THE REORGANIZATION
Under the Reorganization Agreement, the Target Fund will transfer all of its assets to the Acquiring Fund in exchange for Class A and Institutional Class Shares of the Acquiring Fund. The Acquiring Fund Class A and Institutional Class Shares issued to the Target Fund will have an aggregate value equal to the aggregate value of the Target Fund’s net assets immediately prior to the Reorganization. Upon receipt by the Target Fund of Acquiring Fund Class A and Institutional Class Shares, the Target Fund will distribute such shares of the Acquiring Fund to Target Fund shareholders. Then, as soon as practicable after the Closing Date of the Reorganization, the Target Fund will dissolve under applicable state law.
The Target Fund will distribute the Acquiring Fund Class A and Institutional Class Shares received by it pro rata to Target Fund shareholders of record in exchange for their interest in Class A and Institutional Class Shares of the Target Fund. This distribution will be accomplished by opening new accounts on the books of the Acquiring Fund in the names of the Target Fund shareholders and transferring to those shareholder accounts the Acquiring Fund Class A and Institutional Class Shares received by the Target Fund. Each newly-opened account on the books of the Acquiring Fund for the previous Target Fund shareholders will represent the respective pro rata number of Acquiring Fund Class A and Institutional Class Shares due such shareholder.
Accordingly, as a result of the Reorganization, each Target Fund shareholder would own Acquiring Fund Class A and Institutional Class Shares that would have an aggregate value immediately after the Reorganization equal to the aggregate value of that shareholder’s Target Fund shares immediately prior to the Reorganization. The interests of each of the Target Fund’s shareholders will not be diluted as a result of the Reorganization. However, as a result of the Reorganization, a shareholder of the Target Fund or the Acquiring Fund will hold a reduced percentage of ownership in the larger combined fund than the shareholder did in either of the separate Funds.
No sales charge or fee of any kind will be assessed to Target Fund shareholders in connection with their receipt of Acquiring Fund Class A and Institutional Class Shares in the Reorganization.
Approval of the Reorganization will constitute approval of amendments to any of the fundamental investment restrictions of the Target Fund that might otherwise be interpreted as impeding the Reorganization, but solely for the purpose of and to the extent necessary for consummation of the Reorganization.
Terms of the Reorganization Agreement
The following is a summary of the material terms of the Reorganization Agreement. This summary is qualified in its entirety by reference to the form of Reorganization Agreement, a form of which is attached as Appendix A to the Reorganization SAI.
Pursuant to the Reorganization Agreement, the Acquiring Fund will acquire all of the assets of the Target Fund on the Closing Date in exchange for Shares of the Acquiring Fund. Subject to the Target Fund’s shareholders approving the Reorganization, the Closing Date shall occur on August 28, 2015 or such other date as determined by an officer of the Fund.
On the Closing Date, the Target Fund will transfer to the Acquiring Fund all of its assets. The Acquiring Fund will in turn transfer to the Target Fund a number of its Class A and Institutional Class Shares equal in value to the value of the net assets of the Target Fund transferred to the Acquiring Fund as of the Closing Date, as determined in accordance with the valuation method described in the Acquiring Fund’s then current prospectus. In order to minimize any potential for undesirable federal income and excise tax consequences in connection with the Reorganization, the Target Fund will distribute on or before the Closing Date all or substantially all of its undistributed net investment income (including net capital gains) as of such date.
The Target Fund expects to distribute Class A and Institutional Class Shares of the Acquiring Fund received by the Target Fund to shareholders of the Target Fund promptly after the Closing Date and then dissolve.
- 15 -
Table of Contents
The Acquiring Fund and the Target Fund have made certain standard representations and warranties to each other regarding their capitalization, status and conduct of business. Unless waived in accordance with the Reorganization Agreement, the obligations of the parties to the Reorganization Agreement are conditioned upon, among other things:
| • | the approval of the Reorganization by the Target Fund’s shareholders; |
| • | the absence of any rule, regulation, order, injunction or proceeding preventing or seeking to prevent the consummation of the transactions contemplated by the Reorganization Agreement; |
| • | the receipt of all necessary approvals, registrations and exemptions under federal and state laws; |
| • | the truth in all material respects as of the Closing Date of the representations and warranties of the parties and performance and compliance in all material respects with the parties’ agreements, obligations and covenants required by the Reorganization Agreement; |
| • | the effectiveness under applicable law of the registration statement of the Acquiring Fund of which this Prospectus/Proxy Statement forms a part and the absence of any stop orders under the Securities Act of 1933, as amended, pertaining thereto; and |
| • | the receipt of an opinion of counsel relating to the characterization of the Reorganization as a tax-free reorganization for federal income tax purposes (as further described herein under the heading “Material Federal Income Tax Consequences of the Reorganization”). |
The Reorganization Agreement may be terminated or amended by the mutual consent of the parties either before or after approval thereof by the shareholders of the Target Fund, provided that no such amendment after such approval shall be made if it would have a material adverse effect on the interests of such Target Fund’s shareholders. The Reorganization Agreement also may be terminated by the non-breaching party if there has been a material misrepresentation, material breach of any representation or warranty, material breach of contract or failure of any condition to closing.
Reasons for the Proposed Reorganization
In determining whether to recommend approval of the Reorganization Agreement to Target Fund shareholders, the Board considered a number of factors, including, but not limited to: (i) the expenses and advisory fees applicable to the Funds before the proposed Reorganization and the estimated expense ratios of the combined portfolio after the proposed Reorganization; (ii) the comparative investment performance of the Funds; (iii) the future growth prospects of each Fund; (iv) the terms and conditions of the Reorganization Agreement; (v) whether the Reorganization would result in the dilution of shareholder interests; (vi) the compatibility of the Funds’ investment objectives, policies, risks and restrictions; (vii) the anticipated tax consequences of the proposed Reorganization; (viii) the compatibility of the Funds’ service features available to shareholders, including exchange privileges; and (ix) the estimated costs of the Reorganization. The Board concluded that these factors supported a determination to approve the Reorganization Agreement.
The Board believes that the Reorganization would be in the best interests of the Target Fund’s shareholders because: (i) a merger into the Acquiring Fund represents the most attractive viable option for the Target Fund given its lack of fit with the Adviser’s product strategy and the Adviser’s unwillingness to support the Target Fund indefinitely in its current form; (ii) the expenses of the Acquiring Fund, while higher than the Target Fund, are competitive within both its own Lipper peer group and that of the Target Fund; (iii) the Acquiring Fund invests in a more diversified portfolio of equities; and (iv) the Acquiring Fund has achieved stronger performance over the one-, three- and five-year periods ended December 31, 2014, with Class A performance differences of 2.32,%, 3.35% and 1.42%, respectively.
The Board has determined that the Reorganization is in the best interests of the Target Fund and that the interests of the Target Fund’s shareholders will not be diluted as a result of the Reorganization. In addition, the Board has determined that the Reorganization is in the best interests of the Acquiring Fund and that the interests of the Acquiring Fund shareholders will not be diluted as a result of the Reorganization.
Material Federal Income Tax Consequences of the Reorganization
The following is a general summary of the material anticipated U.S. federal income tax consequences of the Reorganization. This discussion is based upon the Internal Revenue Code of 1986, as amended (the “Code”), Treasury regulations, court decisions, published positions of the Internal Revenue Service (“IRS”) and other applicable authorities, all as in effect on the date hereof and all of which are subject to change or differing interpretations (possibly with retroactive effect). This discussion is limited to U.S. persons who hold shares of the Target Fund as capital assets for U.S. federal income tax purposes on the date of exchange.
- 16 -
Table of Contents
This summary does not address all of the U.S. federal income tax consequences that may be relevant to a particular shareholder or to shareholders who may be subject to special treatment under U.S. federal income tax laws. No assurance can be given that the IRS would not assert or that a court would not sustain a position contrary to any of the tax aspects described below. Shareholders should consult their own tax advisers as to the U.S. federal income tax consequences of the Reorganization to them, as well as the effects of state, local and non-U.S. tax laws.
The Reorganization is expected to be a tax-free reorganization for U.S. federal income tax purposes. It is a condition to closing the Reorganization that the Target Fund and the Acquiring Fund receive an opinion from Reed Smith LLP, special counsel to each Fund, dated as of the Closing Date, regarding the characterization of the Reorganization as a “reorganization” within the meaning of Section 368(a)(1) of the Code. As such a reorganization, the U.S. federal income tax consequences of the Reorganization can be summarized as follows: to the effect that on the basis of existing provisions of the Code, the Treasury regulations promulgated thereunder, current administrative rules and court decisions, generally for U.S. federal income tax purposes, except as noted below:
| • | the Reorganization will constitute a reorganization within the meaning of Section 368(a)(1) of the Code, and the Target Fund and the Acquiring Fund will each be a “party to a reorganization” within the meaning of Section 368(b) of the Code; |
| • | under Section 361 of the Code, no gain or loss will be recognized by the Target Fund upon the transfer of its assets to the Acquiring Fund in exchange for Acquiring Fund shares, or upon the distribution of Acquiring Fund shares by the Target Fund to its shareholders in liquidation; |
| • | under Section 1032 of the Code, no gain or loss will be recognized by the Acquiring Fund upon receipt of the assets transferred to the Acquiring Fund in exchange for Acquiring Fund shares; |
| • | under Section 362(b) of the Code, the Acquiring Fund’s tax basis in each asset that the Acquiring Fund receives from the Target Fund will be the same as the Target Fund’s tax basis in such asset immediately prior to such exchange; |
| • | under Section 1223(2) of the Code, the Acquiring Fund’s holding periods in each asset will include the Target Fund’s holding periods in such asset; |
| • | under Section 354 of the Code, no gain or loss will be recognized by shareholders of the Target Fund on the distribution of Acquiring Fund shares to them in exchange for their shares of the Target Fund; |
| • | under Section 358 of the Code, the aggregate tax basis of the Acquiring Fund shares that the Target Fund’s shareholders receive in exchange for their Target Fund shares will be the same as the aggregate tax basis of the Target Fund shares exchanged therefor; |
| • | under Section 1223(1) of the Code, a Target Fund shareholder’s holding period for the Acquiring Fund shares received in the Reorganization will be determined by including the holding period for the Target Fund shares exchanged therefor, provided that the shareholder held the Target Fund shares as a capital asset on the date of the exchange; and |
| • | under Section 381 of the Code, the Acquiring Fund will succeed to and take into account the items of the Target Fund described in Section 381(c) of the Code, subject to the conditions and limitations specified in Section 381, 382, 383 and 384 of the Code and the Treasury regulations thereunder. |
The opinion will be based on certain factual certifications made by the officers of the Target Fund and the Acquiring Fund and will also be based on customary assumptions such as the assumption that the Reorganization will be consummated in accordance with the Reorganization Agreement. The opinion is not a guarantee that the tax consequences of the Reorganization will be as described above. There is no assurance that the IRS or a court would agree with the opinion.
The Acquiring Fund intends to continue to be taxed under the rules applicable to regulated investment companies as defined in Section 851 of the Code which are the same rules currently applicable to Target Fund. In connection with the Reorganization, on or before the Closing Date, the Target Fund will declare to its shareholders a dividend which, together with all of its previous distributions, will have the effect of distributing to shareholders all of its investment company taxable income (computed without regard to the deduction for dividends paid), net tax-exempt interest income and net capital gains through the Closing Date.
- 17 -
Table of Contents
A regulated investment company is permitted to carryforward net capital losses; however, net capital losses incurred in taxable years beginning on or before December 22, 2010 can be carried forward for eight taxable years only. Additionally capital losses incurred in taxable years beginning on or before December 22, 2010 cannot be utilized to offset capital gains until all net capital losses arising in tax years beginning after December 22, 2010 have been utilized. As a result, some net capital loss carryforwards incurred on or before December 22, 2010 may expire unused.
Immediately prior to the Reorganization, the Target Fund is not expected to have any unutilized capital loss carryforwards. The final amount of unutilized capital loss carryforwards for the Target Fund is subject to change and will not be determined until the Closing Date. As of April 9, 2015, the capital loss carryforward of the Target Fund and the Acquiring Fund was $0 and $0, respectively.
Generally, the Acquiring Fund will succeed to the capital loss carryforwards of the Target Fund, subject to the limitations described below. If the Target Fund has capital loss carryforwards, such capital losses would, in the absence of the Reorganization, generally be available to offset Target Fund capital gains, thereby reducing the amount of capital gain net income that must be distributed to the Target Fund shareholders.
Under Sections 382 and 383 of the Code, an “equity structure shift” arising as a result of a reorganization under Section 368(a)(1) of the Code can result in limitations on the post-reorganization Fund’s use of capital loss carryforwards of the participating Funds. An “equity structure shift” can trigger limitations on capital loss carryforwards where there is a more than 50% change in the ownership of a Fund.
Even though the Reorganization may result in a more than 50% change in ownership of either fund, the Adviser does not anticipate a limitation since the Funds are not expected to have capital loss carryforwards.
This summary of the U.S. federal income tax consequences of the Reorganization is made without regard to the particular facts and circumstances of any shareholder. Shareholders are urged to consult their own tax advisors as to the specific consequences to them of the Reorganization, including the applicability and effect of state, local, non-U.S. and other tax laws.
It is not expected that the Reorganization will be a taxable event for any shareholder.
Expenses of the Reorganization
The expenses of the Reorganization will be paid by the Adviser or an affiliate and will not be borne by shareholders of the Target Fund.
Reorganization expenses include, but are not limited to: all costs related to the preparation and distribution of materials distributed to the Board; all expenses incurred in connection with the preparation of the Reorganization Agreement and a registration statement on Form N-14; SEC and state securities commission filing fees and legal and audit fees in connection with each Reorganization; the costs of printing and distributing this Prospectus/Proxy Statement; legal fees incurred preparing materials for the Boards attending the Board meetings and preparing the Board minutes; auditing fees associated with the Fund’s financial statements; portfolio transfer taxes (if any); and any similar expenses incurred in connection with the Reorganization. Management of the Funds estimates the total cost of the Reorganization to be approximately $119,000 ($204,000 for the Target Funds combined). If the Reorganization is not approved by shareholders, the Adviser will still bear the costs of the proposed Reorganization.
Any brokerage charges associated with the purchase or disposition of portfolio investments by the Target Fund prior to the Reorganization will be borne by the Target Fund. Any brokerage charges associated with the purchase or disposition of portfolio investments by the Acquiring Fund after the Reorganization will be borne by the Acquiring Fund. However, the Adviser has agreed to provide a reimbursement of investment advisory fees to the Acquiring Fund in the amount of $126,900, which is the estimated brokerage costs that will be incurred by the Acquiring Fund and Target Funds as a result of the Reorganization. Such reimbursement will be accrued during the month following the closing of the Reorganization.
- 18 -
Table of Contents
The Board has unanimously approved the Reorganization, subject to shareholder approval. Approval of the Reorganization requires the affirmative vote of a “Majority of the Outstanding Voting Securities” of the Target Fund, which is, under the 1940 Act, the lesser of (1) 67% or more of the shares of the Fund present at the Meeting if the holders of more than 50% of the outstanding shares of the Fund are present or represented by proxy, or (2) more than 50% of the outstanding shares of the Fund.
The Board recommends voting “FOR” the proposed Reorganization.
At the close of business on the Record Date, the Acquiring Fund had outstanding shares. As of the Record Date, the trustees and officers of the Acquiring Fund as a group owned less than 1% of the shares of the Acquiring Fund. As of the Record Date, no person was known by the Acquiring Fund to own beneficially or of record as much as 5% of the Acquiring Fund shares except as follows:
Name | Class of Shares | Approximate Percentage of Ownership | ||
| % | ||||
| % | ||||
| % |
At the close of business on the Record Date, the Target Fund had outstanding shares. As of the Record Date, the trustees and officers of the Target Fund as a group owned less than 1% of the shares of the Target Fund. As of the Record Date, no person was known by the Target Fund to own beneficially or of record as much as 5% of the shares of the Target Fund except as follows:
Name | Class of Shares | Approximate Percentage of Ownership | ||
| % |
Annual Meeting of Shareholders
There will be no annual or further special meetings of shareholders of the Trust unless required by applicable law or called by the Board in its discretion. Shareholders wishing to submit proposals for inclusion in a proxy statement for a subsequent shareholder meeting should send their written proposals to the Secretary of the Fund, 625 Fourth Avenue South, Minneapolis, Minnesota 55415. Shareholder proposals should be received in a reasonable time before the solicitation is made.
- 19 -
Table of Contents
VOTING INFORMATION AND REQUIREMENTS
Approval of the Reorganization requires the affirmative vote of a “Majority of the Outstanding Voting Securities” of the Target Fund, which is, under the 1940 Act, the lesser of (1) 67% or more of the shares of the Fund present at the Meeting if the holders of more than 50% of the outstanding shares of the Fund are present or represented by proxy, or (2) more than 50% of the outstanding shares of the Fund.
The Board has fixed the close of business on June 16, 2015, as the Record Date for the determination of shareholders entitled to notice of, and to vote at, the Meeting. Target Fund shareholders on the Record Date are entitled to one vote for each share held, with no shares having cumulative voting rights.
One-third of the shares of the Target Fund outstanding and entitled to vote at the Meeting represented in person or by proxy constitutes a quorum.
Target Fund shareholders may vote in any one of four ways: (i) via the Internet, (ii) by telephone, (iii) by mail, by returning the proxy card, or (iv) in person at the Meeting. Instructions for Internet and telephone voting are included with the enclosed proxy materials. Shareholders who deliver voting instructions by methods (i), (ii) or (iii) may revoke them at any time prior to the Meeting by delivering a written notice of revocation, by executing another proxy card bearing a later date or by attending the Meeting and giving voting instructions in person. Merely attending the Meeting, however, will not revoke any previously submitted proxy. The required control number for Internet and telephone voting is printed on the enclosed proxy card. The control number is used to match voting proxy cards with shareholders’ respective accounts and to ensure that, if multiple proxy cards are executed, shares are voted in accordance with the proxy card bearing the latest date. The Target Fund employs procedures for Internet and telephone voting, such as requiring the control number from the proxy card in order to vote by either of these methods, which it considers to be reasonable to confirm that the instructions received are genuine. If reasonable procedures are employed, the Target Fund will not be liable for following Internet or telephone votes which it believes to be genuine.
Abstentions and broker non-votes (i.e., where a nominee such as a broker holding shares for beneficial owners votes on certain matters pursuant to discretionary authority or instructions from beneficial owners, but with respect to one or more proposals does not receive instructions from beneficial owners or does not exercise discretionary authority) will be deemed present for quorum purposes. Abstentions and broker non-votes have the same effect as votes “AGAINST” the Reorganization.
All properly executed proxies received prior to the Meeting will be voted at the Meeting in accordance with the instructions marked thereon or otherwise as provided therein. Proxies received prior to the Meeting on which no vote is indicated will be voted “FOR” the approval of the proposed Reorganization.
Solicitation of proxies is being made primarily by the mailing of this Notice and Prospectus/Proxy Statement with its enclosures on or about July 1, 2015. Shareholders of the Target Fund whose shares are held by nominees, such as brokers, can vote their proxies by contacting their respective nominee. In addition to the solicitation of proxies by mail, employees of the Adviser and its affiliates, without additional compensation, may solicit proxies in person or by telephone, telegraph, facsimile or oral communication. The Target Fund may retain Computershare Fund Services (“Computershare”), a professional proxy solicitation firm, to assist with any necessary solicitation of proxies. We do not anticipate any expense for additional telephone solicitation by Computershare. The proxy solicitation expenses, if any, are an expense of the Reorganization and will be allocated as described above.
- 20 -
Table of Contents
Other Matters to Come Before the Meeting
The Board knows of no business other than that described in the Notice that will be presented for consideration at the Meeting. If any other matters are properly presented, it is the intention of the persons named on the enclosed proxy to vote proxies in accordance with their best judgment.
In the event that a quorum is present at the Meeting but sufficient votes to approve the proposed Reorganization are not received, proxies (including abstentions and broker non-votes) will be voted in favor of one or more adjournments of the Meeting to permit further solicitation of proxies on the proposed Reorganization, provided that the Board determines that such an adjournment and additional solicitation is reasonable and in the interest of shareholders based on a consideration of all relevant factors, including the nature of the particular proposals, the percentage of votes then cast, the percentage of negative votes cast, the nature of the proposed solicitation activities and the nature of the reasons for such further solicitation. Any such adjournment will require the affirmative vote of the holders of a majority of the outstanding shares voted at the session of the Meeting to be adjourned.
If you cannot be present in person, you are requested to fill in, sign and return the enclosed proxy card, for which, no postage is required if mailed in the United States, or record your voting instructions by telephone or via the Internet promptly.
Michael W. Kremenak |
| Secretary |
| Thrivent Mutual Funds |
- 21 -
Table of Contents
Questions & Answers
For Shareholders of Thrivent Partner Mid Cap Value Fund
Although we recommend that you read the complete Prospectus/Proxy Statement, we have provided the following questions and answers to clarify and summarize the issues to be voted on.
Q: Why is a shareholder meeting being held?
A: A special meeting of shareholders (the “Meeting”) of Thrivent Partner Mid Cap Value Fund (the “Target Fund”) is being held to seek shareholder approval of a reorganization (the “Reorganization”) of the Target Fund into Thrivent Mid Cap Stock Fund (the “Acquiring Fund”). Please refer to the Prospectus/Proxy Statement for a detailed explanation of the proposed Reorganization and for a more complete description of the Acquiring Fund.
Q: Why is the Reorganization being recommended?
A: After careful consideration, the Board of Trustees (the “Board”) of Thrivent Mutual Funds (the “Trust”) has determined that the Reorganization is in the best interests of the shareholders of the Target Fund and recommends that you cast your vote “FOR” the proposed Reorganization. The Target Fund and the Acquiring Fund have substantially similar investment objectives, and each is a diversified series of the Trust, an open-end management investment company registered under the Investment Company Act of 1940. Thrivent Asset Management, LLC (“Thrivent Asset Mgt.”) is the investment adviser for the Target Fund and the Acquiring Fund.
The Board believes that the Reorganization would be in the best interests of the shareholders of the Target Fund because: (i) shareholders will become shareholders of a larger combined fund with greater potential to increase asset size and achieve economies of scale; (ii) the Acquiring Fund invests in a more diversified portfolio of equities; and (iii) the Target Fund shareholders will experience a lower expense ratio in the merged Acquiring Fund.
Q: Who can vote?
A: Shareholders of the Target Fund are entitled to vote.
Q: How will the Reorganization affect me?
A: Assuming shareholders approve the proposed Reorganization, the assets of the Target Fund will be combined with those of the Acquiring Fund. The Class A and Institutional Class Shares of the Target Fund would be exchanged for an equal dollar value of Class A and Institutional Class Shares of the Acquiring Fund. Following the Reorganization, the Target Fund will dissolve.
Q: Will I have to pay any commission or other similar fee as a result of the Reorganization?
A: No. You will not pay any commissions or other similar fees as a result of the Reorganization. If you hold Class A Shares of the Target Fund, you will receive Class A Shares of the Acquiring Fund. If you hold Institutional Class Shares of the Target Fund, you will receive Institutional Class Shares of the Acquiring Fund.
Q: Will the total annual operating expenses that my portfolio investment bears increase as a result of the Reorganization?
A: No, they will likely decrease, and the investment management fee, which comprises a portion of the annual operating expenses, will decrease. For more information about how fund expenses may change as a result of the Reorganization, please see the comparative and pro forma table and related disclosures in the COMPARISON OF THE FUNDS—Expenses section of the Prospectus/Proxy Statement.
Q: Will I have to pay any U.S. federal income taxes as a result of the Reorganization?
A: The Reorganization is expected to be tax-free for federal income tax purposes. The Target Fund will seek an opinion of counsel to this effect. Generally, shareholders will not incur capital gains or losses on the exchange of Target Fund shares for Acquiring Fund shares as a result of the Reorganization.
Table of Contents
Q: If shareholders of the Target Fund do not approve the Reorganization, what will happen to the Target Fund?
A: Thrivent Asset Mgt. will reassess what changes it would like to make to a Target Fund, including a possible repurposing of the Target Fund’s principal investment strategies or recommending a liquidation of the Target Fund to the Board. It may ultimately decide to make no changes.
Q: Who pays the costs of the Reorganization?
A: The expenses of the Reorganization, including the costs of the Meeting, will be paid by Thrivent Asset Mgt. or an affiliate and will not be borne by Target Fund shareholders.
Q: How can I vote?
A: Shareholders are invited to attend the Meeting and to vote in person. You may also vote by executing a proxy using one of three methods:
| • | By Internet: Instructions for casting your vote via the Internet can be found in the enclosed proxy voting materials. The required control number is printed on your enclosed proxy card. If this feature is used, there is no need to mail the proxy card. |
| • | By Telephone: Instructions for casting your vote via telephone can be found in the enclosed proxy voting materials. The toll-free number and required control number are printed on your enclosed proxy card. If this feature is used, there is no need to mail the proxy card. |
| • | By Mail: If you vote by mail, please indicate your voting instructions on the enclosed proxy card, date and sign the card, and return it in the envelope provided, which is addressed for your convenience and needs no postage if mailed in the United States. |
Shareholders who execute proxies by Internet, telephone or mail may revoke them at any time prior to the Meeting by filing with the Target Fund a written notice of revocation, by executing another proxy bearing a later date, by voting later by Internet or telephone or by attending the Meeting and voting in person. Merely attending the Meeting, however, will not revoke any previously submitted proxy.
Q: When should I vote?
A: Every vote is important and the Board encourages you to record your vote as soon as possible. Voting your proxy now will ensure that the necessary number of votes is obtained, without the time and expense required for additional proxy solicitation.
Q: Who should I call if I have questions about the proposal in the Prospectus/Proxy Statement?
A: Call 1-866-865-3843 with your questions.
- 2 -
Table of Contents
Q: How can I get more information about the Target and Acquiring Funds?
A: You may obtain (1) a prospectus, statement of additional information or annual/semiannual report for the Funds or (2) the statement of additional information regarding the Reorganization (request the “Reorganization SAI”) by:
| • | Telephone: 1-800-THRIVENT (1-800-847-4836) and say “mutual funds” |
| • | Mail: Thrivent Mutual Funds, P.O. Box 219348, Kansas City, Missouri, 64121-9348 |
| • | Internet: |
| • | For a copy of a prospectus, a statement of additional information, or a shareholder report: |
www.thrivent.com
| • | For a copy of this Prospectus/Proxy Statement or the Reorganization SAI: |
www.proxy-direct.com/thr-26694
- 3 -
Table of Contents
Thrivent Partner Mid Cap Value Fund
a series of
THRIVENT MUTUAL FUNDS
625 Fourth Avenue South
Minneapolis, Minnesota 55415
(800) 847-4836
www.thrivent.com
NOTICE OF SPECIAL MEETING
OF SHAREHOLDERS
To be Held on August 14, 2015
NOTICE IS HEREBY GIVEN THAT a special meeting of shareholders (the “Meeting”) of Thrivent Partner Mid Cap Value Fund (the “Target Fund”), a series of Thrivent Mutual Funds (the “Trust”), will be held at the offices of Thrivent Financial for Lutherans, 625 Fourth Avenue South, Minneapolis, Minnesota 55415 on August 14, 2015 at 9:00 a.m. Central time for the following purposes:
| 1. | To approve an Agreement and Plan of Reorganization pursuant to which the Target Fund would (i) transfer all of its assets to Thrivent Mid Cap Stock Fund (the “Acquiring Fund”), a series of the Trust, in exchange for Class A and Institutional Class Shares of the Acquiring Fund, (ii) distribute such Class A and Institutional Class Shares of the Acquiring Fund to shareholders of the Target Fund, and (iii) dissolve. |
| 2. | To transact such other business as may properly be presented at the Meeting or any adjournment thereof. |
The Board of Trustees of the Trust (the “Board”) has fixed the close of business on June 16, 2015 as the record date for the determination of shareholders entitled to notice of, and to vote at, the Meeting and all adjournments thereof.
Shareholders are invited to attend the meeting and vote in person. You may also vote by executing a proxy using one of three methods:
| • | By Internet—Instructions for casting your vote via the Internet can be found in the enclosed proxy voting materials. The required control number is printed on your enclosed proxy card. If this feature is used, there is no need to mail the proxy card. |
| • | By telephone—Instructions for casting your vote via telephone can be found in the enclosed proxy voting materials. The toll-free number and required control number are printed on your enclosed proxy card. If this feature is used, there is no need to mail the proxy card. |
| • | By mail—If you vote by mail, please indicate your voting instructions on the enclosed proxy card, date and sign the card, and return it in the envelope provided, which is addressed for your convenience and needs no postage if mailed in the United States. |
Shareholders who execute proxies by Internet, telephone, or mail may revoke them at any time prior to the Meeting by filing with the Target Fund a written notice of revocation, by executing another proxy bearing a later date, or by attending the Meeting and voting in person. Merely attending the Meeting, however, will not revoke any previously submitted proxy.
The Board recommends that you cast your vote FOR the proposed Reorganization as described in the Prospectus/Proxy Statement.
YOUR VOTE IS IMPORTANT
Please return your proxy card or record your voting instructions by telephone or via the Internet promptly no matter how many shares you own. In order to avoid the additional expense of further solicitation, we ask that you mail your proxy card or record your voting instructions by telephone or via the Internet promptly regardless of whether you plan to be present in person at the Meeting.
Date: , 2015
Michael W. Kremenak
Secretary
Thrivent Mutual Funds
Table of Contents
COMBINED PROSPECTUS/PROXY STATEMENT
THRIVENT PARTNER MID CAP VALUE FUND
a series of
THRIVENT MUTUAL FUNDS
625 Fourth Avenue South
Minneapolis, Minnesota 55415
(800) 847-4836
, 2015
This Prospectus/Proxy Statement is furnished to you as a shareholder of Thrivent Partner Mid Cap Value Fund (the “Target Fund”), a series of Thrivent Mutual Funds (the “Trust”). A special meeting of shareholders of the Target Fund will be held on August 14, 2015 (the “Meeting”) to consider the approval of a Reorganization (the “Reorganization”) of the Target Fund into Thrivent Mid Cap Stock Fund (the “Acquiring Fund”). The Board of Trustees of the Trust (the “Board”) requests that you vote your shares by completing and returning the enclosed proxy card or by recording your voting instructions by telephone or via the Internet regardless of whether you plan to be present at the Meeting in order to avoid the additional expense of further solicitation.
The Acquiring Fund and the Target Fund are sometimes referred to herein individually as a “Fund” or collectively as the “Funds.” Each of the Acquiring Fund and the Target Fund is organized as a diversified series of the Trust, an open-end management investment company registered under the Investment Company Act of 1940, as amended (the “1940 Act”).
The reorganization proposed for the Target Fund (the “Reorganization”) is not contingent upon the approval or completion of any other reorganization or merger.
This Prospectus/Proxy Statement sets forth concisely the information shareholders of the Target Fund ought to know before voting on the Reorganization. Please read it carefully and retain it for future reference.
The following documents, each having been filed with the Securities and Exchange Commission (the “SEC”), are incorporated herein by reference:
| • | The Thrivent Mutual Funds Prospectus, dated February 27, 2015 and as supplemented through the date hereof (the “Trust Prospectus”). |
| • | A Statement of Additional Information, dated , 2015, relating to this Combined Prospectus/Proxy Statement (the “Reorganization SAI”); |
| • | The Thrivent Mutual Funds Statement of Additional Information, dated February 27, 2015 and as supplemented through the date hereof (the “Trust SAI”). |
Copies of the foregoing may be obtained without charge by calling or writing the Fund as set forth below. If you wish to request the Reorganization SAI, please ask for the “Reorganization SAI.”
In addition, each Fund will furnish, without charge, a copy of its most recent annual report and subsequent semi-annual report, if any, to a shareholder upon request.
Copies of each Fund’s most recent prospectus, statement of additional information, annual report and semi-annual report can be obtained at www.thrivent.com. Requests for documents can also be made by calling (800) 847-4836 or writing Thrivent Mutual Funds, P.O. Box 219348, Kansas City, Missouri, 64121-9348.
The Funds file reports and other information with the SEC. Information filed by the Funds with the SEC can be reviewed and copied at the SEC’s Public Reference Room in Washington, DC or on the EDGAR database on the SEC’s internet site (http://www.sec.gov). Information on the operation of the SEC’s Public Reference Room may be obtained by calling the SEC at (202) 551-8090. You can also request copies of these materials, upon payment of a duplicating fee, by electronic request at the SEC’s e-mail address (publicinfo@sec.gov) or by writing the Public Reference Section of the SEC, Washington, DC 20549-1520.
The Board knows of no business other than that discussed above that will be presented for consideration at the Meeting. If any other matter is properly presented, it is the intention of the persons named in the enclosed proxy to vote in accordance with their best judgment.
No person has been authorized to give any information or make any representation not contained in this Prospectus/Proxy Statement and, if so given or made, such information or representation must not be relied upon as having been authorized. This Prospectus/Proxy Statement does not constitute an offer to sell or a solicitation of an offer to buy any securities in any jurisdiction in which, or to any person to whom, it is unlawful to make such offer or solicitation.
Table of Contents
Neither the Securities and Exchange Commission nor any state regulator has approved or disapproved of these shares or passed upon the adequacy of this Prospectus/Proxy Statement. A representation to the contrary is a crime.
The date of this Prospectus/Proxy Statement is , 2015. The Prospectus/Proxy Statement will be sent to shareholders on or around July 1, 2015.
- 2 -
Table of Contents
| Page | ||||
| 1 | ||||
| 1 | ||||
| 1 | ||||
| 3 | ||||
| 3 | ||||
| 3 | ||||
| 4 | ||||
| 5 | ||||
| 6 | ||||
| 6 | ||||
The Separate Accounts and the Retirement Plans | 6 | |||
| 8 | ||||
| 9 | ||||
| 10 | ||||
| 11 | ||||
| 13 | ||||
| 13 | ||||
Payments to Broker-Dealers and Other Financial Intermediaries | 14 | |||
| 15 | ||||
| 15 | ||||
| 15 | ||||
| 16 | ||||
Material Federal Income Tax Consequences of the Reorganization | 16 | |||
| 18 | ||||
| 19 | ||||
| 19 | ||||
| 19 | ||||
| 19 | ||||
| 19 | ||||
| 19 | ||||
| 19 | ||||
| 20 | ||||
| 20 | ||||
| 20 | ||||
| 20 | ||||
Table of Contents
The following is a summary of certain information contained elsewhere in this Prospectus/Proxy Statement and is qualified in its entirety by reference to the more complete information contained in this Prospectus/Proxy Statement. Shareholders should read the entire Prospectus/Proxy Statement carefully.
The Board, including the trustees who are not “interested persons” (as defined in the 1940 Act) of each Fund, has unanimously approved an Agreement and Plan of Reorganization (the “Reorganization Agreement”) on behalf of each Fund, subject to Target Fund shareholder approval. The Reorganization Agreement provides for:
| • | the transfer of all of the assets of the Target Fund to the Acquiring Fund in exchange for Class A and Institutional Class Shares of the Acquiring Fund; |
| • | the distribution by the Target Fund of such Acquiring Fund Class A and Institutional Class Shares to Target Fund shareholders; and |
| • | the dissolution of the Target Fund. |
When the Reorganization is complete, Target Fund shareholders will hold Acquiring Fund shares. The aggregate value of the Acquiring Fund shares a Target Fund shareholder will receive in the Reorganization will equal the aggregate value of the Target Fund shares owned by such shareholder immediately prior to the Reorganization. After the Reorganization, the Acquiring Fund will continue to operate with the investment objective and investment policies set forth in this Prospectus/Proxy Statement.
As discussed in more detail elsewhere in this Prospectus/Proxy Statement, the Board believes that the Reorganization would be in the best interests of the Target Fund’s shareholders because: (i) shareholders will become shareholders of a larger combined fund with greater potential to increase asset size and achieve economies of scale; (ii) the Acquiring Fund invests in a more diversified portfolio of equities; and (iii) the Target Fund shareholders will experience a lower expense ratio in the merged Acquiring Fund.
In addition, the Board, when determining whether to approve the Reorganization, considered, among other things, the future growth prospects of each of the Target Fund and the Acquiring Fund, the fact that the Target Fund shareholders would not experience any diminution in shareholder services as a result of the Reorganization, and the fact that the Reorganization is expected to be a tax-free reorganization for federal income tax purposes.
Background and Reasons for the Reorganization
The Target Fund and the Acquiring Fund have substantially similar investment objectives. The investment objective of the Target Fund is to seek to achieve long-term capital appreciation. The investment objective of the Acquiring Fund is to seek long-term capital growth.
The two Funds also have similar, although not identical, principal investment strategies, which are described in more detail in the COMPARISON OF FUNDS—Investment Objective and Principal Strategies section of this Prospectus/Proxy Statement. Under normal circumstances, the Target Fund invests at least 80% of its net assets (plus the amount of any borrowings for investment purposes) in securities in mid cap issuers. Under normal circumstances, the Acquiring Fund invests at least 80% of its net assets (plus the amount of any borrowing for investment purposes) in securities of mid-sized companies. In the case of the Target Fund, the subadviser focuses mainly on the securities of mid cap issuers which have market capitalizations similar to companies constituting the Russell Midcap® Value Index at the time of investment. Although the Target Fund will invest primarily in publicly traded U.S. securities, it may invest up to 25% of its assets in foreign securities, including securities of issuers in emerging countries and securities in foreign currencies. In the case of the Acquiring Fund, the Adviser focuses mainly on the securities of mid-sized U.S. companies which have market capitalizations similar to those included in widely known indices such as the Russell Midcap® Index or the S&P MidCap 400 Index.
In determining whether to recommend approval of the Reorganization Agreement to Target Fund shareholders, the Board considered a number of factors, including, but not limited to: (i) the expenses and advisory fees applicable to the Funds before the proposed Reorganization and the estimated expense ratios of the combined Fund after the proposed Reorganization; (ii) the comparative investment performance of the Funds; (iii) the future
Table of Contents
growth prospects of each Fund; (iv) the terms and conditions of the Reorganization Agreement; (v) whether the Reorganization would result in the dilution of shareholder interests; (vi) the compatibility of the Funds’ investment objectives, policies, risks and restrictions; (vii) the anticipated tax consequences of the proposed Reorganization; (viii) the compatibility of the Funds’ service features available to shareholders, including exchange privileges; and (ix) the estimated costs of the Reorganization. The Board concluded that these factors supported a determination to approve the Reorganization Agreement.
The Board has determined that the Reorganization is in the best interests of the Target Fund and that the interests of the Target Fund’s shareholders will not be diluted as a result of the Reorganization. In addition, the Board has determined that the Reorganization is in the best interests of the Acquiring Fund and that the interests of the Acquiring Fund’s shareholders will not be diluted as a result of the Reorganization.
The Board is asking shareholders of the Target Fund to approve the Reorganization at the Meeting to be held on August 14, 2015. If shareholders of the Target Fund approve the proposed Reorganization, it is expected that the closing date of the transaction (the “Closing Date”) will be after the close of business on or about August 28, 2015, but it may be at a different time as described herein. If shareholders of the Target Fund do not approve the proposed Reorganization, the Board will consider alternatives, including repurposing the Target Fund’s principal strategies.
The Board recommends that you vote “FOR” the Reorganization.
- 2 -
Table of Contents
Investment Objective and Principal Strategies
Investment Objective. The Target Fund and the Acquiring Fund have substantially similar investment objectives. The investment objective of the Target Fund is to seek to achieve long-term capital appreciation. The investment objective of the Acquiring Fund is to seek long-term capital growth.
Principal Strategies. Under normal circumstances, the Target Fund at least 80% of its net assets (plus the amount of any borrowings for investment purposes) in securities in mid cap issuers. Under normal circumstances, the Acquiring Fund invests at least 80% of its net assets (plus the amount of any borrowing for investment purposes) in securities of mid-sized companies. Each Fund has a different investment strategy, as set forth below:
Target Fund Principal Investment Strategies.
In the case of the Target Fund, the subadviser focuses mainly on the securities of mid cap issuers which have market capitalizations similar to companies constituting the Russell Midcap® Value Index at the time of investment. Although the Target Fund will invest primarily in publicly traded U.S. securities, it may invest up to 25% of its assets in foreign securities, including securities of issuers in emerging countries and securities in foreign currencies. Should the Adviser determine that the Target Fund would benefit from reducing the percentage of its assets invested in securities of mid cap companies from 80% to a lesser amount, it will notify shareholders at least 60 days prior to the change.
The subadviser’s stock selection reflects a mid cap value style. The Target Fund ordinarily invests in equity securities of mid cap companies that the subadviser believes are undervalued.
The subadviser uses fundamental research techniques to determine what securities to buy and sell.
Acquiring Fund Principal Investment Strategies.
In the case of the Acquiring Fund, the Adviser focuses mainly on the securities of mid-sized U.S. companies which have market capitalizations similar to those included in widely known indices such as the Russell Midcap® Index or the S&P MidCap 400 Index. Should the Adviser determine that the Acquiring Fund would benefit from reducing the percentage of its assets invested in mid cap securities from 80% to a lesser amount, it will notify shareholders at least 60 days prior to the change.
The Acquiring Fund seeks to achieve its investment objective by investing in common stocks. Investing in convertible securities is not a principal strategy of the Acquiring Fund. The Adviser uses fundamental, quantitative, and technical investment research techniques to determine what securities to buy and sell. The Adviser generally looks for mid-sized companies that, in its opinion:
| • | have prospects for growth in their sales and earnings; |
| • | are in an industry with a good economic outlook; |
| • | have high-quality management; and/or |
| • | have a strong financial position. |
The Adviser may sell securities for a variety of reasons, such as to secure gains, limit losses, or reposition assets to more promising opportunities.
Fund Holdings. A description of the Funds’ policies and procedures with respect to the disclosure of the Funds’ portfolio securities is available on the Funds’ website.
The Funds are subject to similar principal risks. Both Funds are subject to Market Risk, Issuer Risk, Mid Cap Risk, and Investment Adviser Risk. Both Funds are also subject to Volatility Risk, though each may be subject to different types of volatility risk. The Target Fund is subject to Foreign Securities Risk. These risks are described below.
- 3 -
Table of Contents
Principal risks to which both Funds are subject
Market Risk. Over time, securities markets generally tend to move in cycles with periods when security prices rise and periods when security prices decline. The value of the Fund’s investments may move with these cycles and, in some instances, increase or decrease more than the applicable market(s) as measured by the Fund’s benchmark index(es). The securities markets may also decline because of factors that affect a particular industry.
Issuer Risk. Issuer risk is the possibility that factors specific to a company to which the Fund’s portfolio is exposed will affect the market prices of the company’s securities and therefore the value of the Fund. Some factors affecting the performance of a company include demand for the company’s products or services, the quality of management of the company and brand recognition and loyalty. Common stock of a company is subordinate to other securities issued by the company. If a company becomes insolvent, interests of investors owning common stock will be subordinated to the interests of other investors in, and general creditors of, the company.
Mid Cap Risk. Medium-sized companies often have greater price volatility, lower trading volume, and less liquidity than larger, more-established companies. These companies tend to have smaller revenues, narrower product lines, less management depth and experience, smaller shares of their product or service markets, fewer financial resources, and less competitive strength than larger companies.
Investment Adviser Risk. The Fund is actively managed and the success of its investment strategy depends significantly on the skills of the adviser(s) in assessing the potential of the investments in which the Fund invests. This assessment of investments may prove incorrect, resulting in losses or poor performance, even in rising markets.
Volatility Risk. Volatility risk is the risk that certain types of securities shift in and out of favor depending on market and economic conditions as well as investor sentiment.
Additional principal risks to which only the Target Fund is subject
Volatility Risk. Value style investing includes the risk that stocks of undervalued companies may not rise as quickly as anticipated if the market doesn’t recognize their intrinsic value or if value stocks are out of favor.
Foreign Securities Risk. To the extent the Target Fund’s portfolio is exposed to foreign securities, it is subject to various risks associated with such securities. Foreign securities are generally more volatile than their domestic counterparts, in part because of higher political and economic risks, lack of reliable information and fluctuations in currency exchange rates. Foreign securities also may be more difficult to resell than comparable U.S. securities because the markets for foreign securities are often less liquid. Even when a foreign security increases in price in its local currency, the appreciation may be diluted by adverse changes in exchange rates when the security’s value is converted to U.S. dollars. Foreign withholding taxes also may apply and errors and delays may occur in the settlement process for foreign securities.
The Board. The Board is responsible for the overall supervision of the operations of each Fund and performs the various duties imposed on the directors of investment companies by the 1940 Act and under applicable state law.
The Adviser. Thrivent Asset Management, LLC (“Thrivent Asset Mgt.” or the “Adviser”), is the investment adviser for each Fund. Thrivent Asset Mgt. and its investment advisory affiliate, Thrivent Financial for Lutherans (“Thrivent Financial”) have been in the investment advisory business since 1986 and managed approximately $96 billion in assets as of December 31, 2014, including approximately $41 billion in mutual fund assets. These advisory entities are located at 625 Fourth Avenue South, Minneapolis, Minnesota 55415.
The Adviser and the Trust received an exemptive order from the SEC that permits the Adviser and the Funds, with the approval of the Board, to retain one or more subadvisers for the Funds, or subsequently change a subadviser, without submitting the respective investment subadvisory agreements, or material amendments to those agreements, to a vote of the shareholders of the applicable Fund. The Adviser will notify shareholders of a Fund if there is a new subadviser for that Fund.
- 4 -
Table of Contents
The Funds’ annual report to shareholders discuss the basis for the Board approving the investment advisory agreement during the period covered by the report.
Portfolio Management. Thrivent Asset Mgt. has engaged Goldman Sachs Asset Management, L.P. (“GSAM”) to subadvise the Target Fund. GSAM uses its Value Team to manage the Target Fund. Sean Gallagher is a Managing Director and is the chief investment officer of the Team, which he has been with since 2000. Andrew Braun is a Managing Director and has been with the Team since 1997. Dolores Bamford, CFA is a Managing Director and has been with the Team since 2002. Timothy Ryan, CFA is a Vice President and has been with the Team since 2015. Brian J. Flanagan, CFA has served as portfolio manager of the Acquiring Fund since 2004. He has been with Thrivent Financial since 1994 and a portfolio manager since 2000.
The Trust SAI provides information about the portfolio managers’ compensation, other accounts managed by the portfolio managers, and the portfolio managers’ ownership of shares of the Funds.
Advisory Fees. Each Fund pays an annual investment advisory fee to the Adviser. The advisory contract between the Adviser and the Fund provides for the following advisory fees for each class of shares of a Fund, expressed as an annual rate of average daily net assets:
| Target Fund |
| 0.750% of average daily net assets up to $200 million |
| 0.700% of average daily nets assets over $200 million |
| Acquiring Fund |
| 0.700% of average daily net assets up to $200 million |
| 0.650% of average daily net assets greater than $200 million but not greater than $1 billion |
| 0.600% of average daily net assets greater than $1 billion but not greater than $2.5 billion |
| 0.550% of average daily net assets greater than $2.5 billion but not greater than $5 billion |
| 0.525% of average daily net assets over $5 billion |
During the twelve-months ended October 31, 2014, the contractual advisory fees for the Class A shares of the Target Fund were 0.75% of the Target Fund’s average daily net assets, and the contractual advisory fees for the Class I shares of the Target Fund were 0.75% of the Target Fund’s average daily net assets.
During the twelve-months ended October 31, 2014, the contractual advisory fees for the Class A shares of the Acquiring Fund were 0.66% of the Acquiring Fund’s average daily net assets, and the contractual advisory fees for the Class I shares of the Acquiring Fund were 0.66% of the Acquiring Fund’s average daily net assets.
For a complete description of each Fund’s advisory services, see the section of the Trust Prospectus entitled “Management” and the section of the Trust SAI entitled “Investment Adviser, Investment Subadvisers, and Fund Managers.”
12b-1 Plan. The Trust has adopted a Distribution Plan and Agreement pursuant to Rule 12b-1 under the 1940 Act (the “Rule 12b-1 Plan”) with respect to the Class A Shares of each Fund. Thrivent Investment Management Inc. (the “Distributor”), an affiliate of the Adviser, located at 625 Fourth Avenue South, Minneapolis, Minnesota 55415, serves as the distributor of each Fund. Under the Rule 12b-1 Plan, Class A Shares of each Fund pay the Distributor an aggregate fee for distribution and shareholder servicing equal to an annual rate of 0.25% of the average daily net asset value represented by such shares. Institutional Class Shares are not subject to a Rule 12b-1 Plan and the Funds do not pay any percentage of their assets attributable to Institutional Class Shares for distribution or shareholder servicing. For a complete description of these arrangements with respect to each Fund, see the section of the Class A Prospectus entitled “Shareholder Information—Rule 12b-1 Fees” and the section of the Trust SAI entitled “Underwriting and Distribution Service.” These sections are incorporated by reference herein.
- 5 -
Table of Contents
Investments in the Target Fund by Certain Affiliated Funds
The Reorganization is not contingent upon the approval or completion of any other reorganization or merger. However, simultaneous with shareholders’ consideration of this Prospectus/Proxy Statement, shareholders of Thrivent Mid Cap Growth Fund (the “Other Target Fund,” and collectively with the Target Fund, the “Target Funds”) are considering a reorganization of that fund into the Acquiring Fund. Therefore, pro forma financial and expense information presented in this Prospectus/Proxy Statement under the headings “COMPARISON OF THE FUNDS – Expenses” and “COMPARISON OF THE FUNDS – Capitalization”, and the pro forma information regarding the Acquiring and Target Funds in the Reorganization SAI (collectively, the “Pro Forma Information”), is presented on the basis of the alternate assumptions that the Reorganization involves solely the Target Fund or both of the Target Funds.
Other series of the Trust for which Thrivent Asset Mgt. is the investment adviser (the “Affiliated Funds”) currently invest in the Target Funds. The Affiliated Funds are asset allocation funds investing a range of asset categories and permit Thrivent Asset Mgt. to determine whether to invest directly in securities and other investments, in addition to, or instead of, investing in other series of the Fund (including the Target Funds). Over time, Thrivent Asset Mgt. has gradually invested a larger percentage of the Affiliated Funds’ assets in direct investments and has reduced the percentage of assets invested in other series of the Trust. Thrivent Asset Mgt. expects to continue decreasing the percentage of Affiliated Funds’ assets invested in other series over time. This trend of relying more heavily on direct investments is expected to accelerate since Thrivent Asset Mgt. has proposed changes that will simplify the investment advisory fee structure of the Affiliated Funds. These changes would encourage a more streamlined approach of direct investments, while accommodating investments in other series of the Trust when Thrivent Asset Mgt. deems it to be advisable. As a result, the Affiliated Funds are likely to redeem their holdings (if any) out of the Target Funds irrespective of whether the Reorganization is approved. These redemptions would most likely be processed as redemptions-in-kind, with the effect that the Affiliated Funds would receive a pro rata distribution of the Target Funds’ investments. These redemptions may be substantial, relative to the size of the Target Fund(s) prior to such redemption, and are likely to occur prior to the effective date of the Reorganization. The Pro Forma Information presented in this Prospectus/Proxy Statement and the Reorganization SAI does not include any effects of such redemptions.
The table below sets forth the fees and expenses that investors may pay to buy and hold shares of each of the Target Fund and the Acquiring Fund, including (i) the fees and expenses paid by the Target Fund for the twelve-month period ended December 31, 2014, (ii) the fees and expenses paid by the Acquiring Fund for the twelve-month period ended December 31, 2014, (iii) pro forma fees and expenses for the Acquiring Fund for the twelve-month period ended December 31, 2014, assuming the Reorganization had been completed as of the beginning of such period, and (iv) pro forma fees and expenses for the Acquiring Fund for the twelve-month period ended December 31, 2014, assuming that the Target Fund and Thrivent Mid Cap Growth Fund (collectively referred to as the “Target Funds”) all merged into the Acquiring Fund as of the beginning of such period.
| Class A Shares | Institutional Class Shares | |||||||||||||||||||||||||||||||
| Actual | Pro Forma | Pro Forma | Actual | Pro Forma | Pro Forma | |||||||||||||||||||||||||||
| Target Fund | Acquiring Fund | Acquiring Fund (assuming merger with Target Fund) | Acquiring Fund (assuming merger with Target Funds) | Target Fund | Acquiring Fund | Acquiring Fund (assuming merger with Target Fund) | Acquiring Fund (assuming merger with Target Funds) | |||||||||||||||||||||||||
Shareholder Fees (fees paid directly from your investment) | ||||||||||||||||||||||||||||||||
Maximum Sales Charge (Load) Imposed on Purchases (as a percentage of offering price) | 5.50 | % | 5.50 | % | 5.50 | % | 5.50 | % | N/A | N/A | N/A | N/A | ||||||||||||||||||||
- 6 -
Table of Contents
Maximum Deferred Sales Charge (Load) (as a percentage of net asset value at time of purchase or redemption, whichever is lower)* | 1.00 | % | 1.00 | % | 1.00 | % | 1.00 | % | N/A | N/A | N/A | N/A | ||||||||||||||||||||
Annual Fund Operating Expenses as a Percentage of Average Net Assets (expenses that are deducted from Fund assets) | ||||||||||||||||||||||||||||||||
Management Fees | 0.75 | % | 0.66 | % | 0.65 | % | 0.64 | % | 0.75 | % | 0.66 | % | 0.65 | % | 0.64 | % | ||||||||||||||||
Distribution and Service (12b-1 Fees) | 0.25 | % | 0.25 | % | 0.25 | % | 0.25 | % | — | — | — | — | ||||||||||||||||||||
Other Expenses | 0.46 | % | 0.20 | % | 0.21 | % | 0.22 | % | 0.13 | % | 0.05 | % | 0.05 | % | 0.06 | % | ||||||||||||||||
Total Annual Operating Expenses | 1.46 | % | 1.11 | % | 1.11 | % | 1.11 | % | 0.88 | % | 0.71 | % | 0.70 | % | 0.70 | % | ||||||||||||||||
Less Expense Reimbursement** | 0.21 | % | — | — | — | — | — | — | — | |||||||||||||||||||||||
Net Annual Fund Operating Expenses | 1.25 | % | 1.11 | % | 1.11 | % | 1.11 | % | 0.88 | % | 0.71 | % | 0.70 | % | 0.70 | % |
| * | When you invest $1,000,000 or more, a deferred sales charge of 1% will apply to shares redeemed within one year. |
| ** | The Adviser has contractually agreed, through at least February 28, 2016, to waive certain fees and/or reimburse certain expenses associated with the Class A shares of the Thrivent Partner Mid Cap Value Fund in order to limit the Net Annual Fund Operating Expenses (excluding Acquired (Underlying) Fund Fees and Expenses, if any) to an annual rate of 1.25% of the average daily net assets of the Class A shares. This contractual provision, however, may be terminated before the indicated termination date upon the mutual agreement between the Independent Trustees of the Fund and the Adviser. |
Example
The following example, using the actual and pro forma operating expenses for the twelve-month period ended October 31, 2014, is intended to help you compare the costs of investing in the Acquiring Fund pro forma after the Reorganization with the costs of investing in each of the Target Fund and the Acquiring Fund without the Reorganization. The example assumes that you invest $10,000 in each Fund for the time period indicated and that you redeem all of your shares at the end of each period. The example also assumes that your investments have a 5% return each year and that each Fund’s operating expenses remain the same each year. Although your actual returns may be higher or lower, based on these assumptions your costs would be:
| Actual | Pro Forma | |||||||||||||||
| Target Fund | Acquiring Fund | Acquiring Fund (assuming merger with the Target Fund) | Acquiring Fund (assuming merger with the Target Funds) | |||||||||||||
Total operating expenses for Class A Shares assuming redemption at the end of the period | ||||||||||||||||
One Year | $ | 670 | $ | 657 | $ | 657 | $ | 657 | ||||||||
Three Years | $ | 967 | $ | 883 | $ | 883 | $ | 883 | ||||||||
Five Years | $ | 1,285 | $ | 1,128 | $ | 1,128 | $ | 1,128 | ||||||||
Ten Years | $ | 2,183 | $ | 1,827 | $ | 1,827 | $ | 1,827 | ||||||||
Total operating expenses for Institutional Class Shares assuming redemption at the end of the period | ||||||||||||||||
One Year | $ | 90 | $ | 73 | $ | 72 | $ | 72 | ||||||||
Three Years | $ | 281 | $ | 227 | $ | 224 | $ | 224 | ||||||||
Five Years | $ | 488 | $ | 395 | $ | 390 | $ | 390 | ||||||||
Ten Years | $ | 1,084 | $ | 883 | $ | 871 | $ | 871 | ||||||||
- 7 -
Table of Contents
Portfolio Turnover
Each Fund pays transaction costs, such as commissions, when it buys and sells securities (or “turns over” its portfolio). A higher portfolio turnover rate may indicate higher transaction costs and may result in higher taxes when Fund shares are held in a taxable account. These costs, which are not reflected in Total Annual Operating Expenses or in the Example, affect the Funds’ performance. During the fiscal year ended October 31, 2014, the Acquiring Fund’s and the Target Fund’s portfolio turnover rates were 27% and 92%, respectively, of the average value of their portfolios.
Purchase, Valuation, Redemption and Exchange of Shares; Dividends and Distributions
Pricing of Fund Shares. The price of a Fund’s shares is based on the Fund’s net asset value (“NAV”). The Funds determine their NAV once daily at the close of trading on the New York Stock Exchange (“NYSE”), which is normally 4:00 p.m. Eastern Time. The Funds do not determine NAV on holidays observed by the NYSE or on any other day when the NYSE is closed. The NYSE is regularly closed on Saturdays and Sundays, New Year’s Day, Martin Luther King, Jr. Day, Presidents Day, Good Friday, Memorial Day, Independence Day, Labor Day, Thanksgiving Day and Christmas Day.
Each Fund determines its NAV for a particular class by dividing the total Fund assets attributable to that class, less all liabilities attributable to such class, by the total number of outstanding shares of that class. To determine the NAV, the other Funds generally value their securities at current market value using readily available market prices. If market prices are not available or if the Adviser determines that they do not accurately reflect fair value for a security, the Board has authorized the Adviser to make fair valuation determinations pursuant to policies approved by the Board. Fair valuation of a particular security is an inherently subjective process, with no single standard to utilize when determining a security’s fair value. In each case where a security is fair valued, consideration is given to the facts and circumstances relevant to the particular situation. This consideration includes a review of various factors set forth in the pricing policies adopted by the Board. For any portion of a Fund’s assets that are invested in other mutual funds, the NAV is calculated based upon the NAV of the mutual funds in which the Fund invests, and the prospectuses for those mutual funds explain the circumstances under which they will use fair value pricing and the effects of such a valuation.
Because many foreign markets close before the U.S. markets, significant events may occur between the close of the foreign market and the close of the U.S. markets, when the Fund’s assets are valued, that could have a material impact on the valuation of foreign securities (i.e., available price quotations for these securities may not necessarily reflect the occurrence of the significant event). The Funds, subject to oversight by the Board, evaluate the impact of these significant events and adjust the valuation of foreign securities to reflect the fair value as of the close of the U.S. markets to the extent that the available price quotations do not, in the Adviser’s opinion, adequately reflect the occurrence of the significant events.
Please note that the Target Fund and the Acquiring Fund have identical valuation policies. As a result, there will be no material change to the value of the Target Fund’s assets because of the Reorganization.
Also, the Target Fund and the Acquiring Fund have identical policies with respect to frequent purchases and redemptions and standing allocation orders (for more information, please see Policy Regarding Frequent Trading Policies and Monitoring Processes and Standing Allocation Order disclosures in the Acquiring Fund’s Prospectus—these disclosures are incorporated herein by reference). The Reorganization will not affect these policies.
Class A Shares. The Class A Shares of each Fund are subject to an initial sales charge of up to 5.50%. The initial sales charge applicable to Class A Shares of the Acquiring Fund will be waived for Class A Shares acquired in the Reorganization. Any subsequent purchases of Class A Shares of the Acquiring Fund, excluding Class A Shares purchased through the automatic dividend reinvestment plan, after the Reorganization will be subject to an initial sales charge of up to 5.50%. The initial sales charge is reduced for investments in excess of $50,000. Purchases of Class A Shares of each Fund in amounts of $1 million or more are not subject to an initial sales charge, but a contingent deferred sales charge of up to 1.00% may be imposed on certain redemptions made within one year of purchase. No contingent deferred sales charge will be imposed on Class A Shares of the Target Fund in connection with the Reorganization. For additional information, please see the section entitled “Shareholder Information—Class A Shares” in the Class A Prospectus. This section is incorporated by reference herein.
- 8 -
Table of Contents
Institutional Class Shares. Institutional Class Shares of each Fund are not subject to an initial sales charge or a contingent deferred sales charge. Institutional Class Shares are offered to institutions, church organizations, retirement plans sponsored by institutions and participants in various mutual fund asset allocation, fee-based investment advisory programs offered by the Distributor. For additional information, please see the section entitled “Shareholder Information—Institutional Class Shares” in the Institutional Class Prospectus. This section is incorporated by reference herein.
Buying Shares. Shares of each Fund may be purchased through a shareholder’s registered representative, by mail, by telephone, by the Internet, by wire transfer, through an automatic investment plan or by exchange from other Thrivent mutual funds. For additional information regarding buying shares of each Fund and exchanging shares of each Fund, see the sections of the Trust Prospectus entitled “Shareholder Information—Buying Shares” and “Shareholder Information—Exchanging Shares Between Funds.”
Redeeming Shares. When a Fund receives a request for redemption, such Fund will redeem such shares at the next calculation of the Fund’s NAV. A Fund may postpone payment or suspend the right of redemption in unusual circumstances, as permitted by the SEC. When a shareholder purchases shares by check, electronic funds transfer (other than bank wire) or automatic investment plan and elects to redeem those shares soon after their purchase, the Fund may delay paying the redemption proceeds until the shareholder’s payment has cleared, which could take up to 10 days or more from the date of purchase. Shares may be redeemed by mail, by phone, by the Internet, by wire/ACH transfer or through a systematic withdrawal plan. For additional information regarding redeeming shares of each Fund, see the section of the Trust Prospectus entitled “Shareholder Information—Redeeming Shares.” This section is incorporated by reference herein.
Dividends and Distributions. Dividends of the Target Fund and the Acquiring Fund, if any, are generally declared and paid annually. Income dividends are derivative from investment income, including dividends, interest, and certain foreign currency gains received by each Fund. Capital gains distributions, if any, usually will be declared and paid in December for the prior twelve-month period ending October 31. Any election made by Target Fund shareholders in respect of the receipt of dividends and capital gains distributions will continue to apply to Class A and Institutional Class Shares of the Acquiring Fund received in the Reorganization. For additional information regarding these elections see the section of the Trust Prospectus entitle “Distribution Options.” This section is incorporated by reference herein.
The following table sets forth the capitalization of the Target Fund and the Acquiring Fund, as of October 31, 2014, and the pro forma capitalization of the Acquiring Fund as if the Reorganization occurred on that date. These numbers may differ as of the Closing Date.
| Actual | Pro Forma | |||||||||||||||
| Target Fund | Acquiring Fund | Acquiring Fund (assuming merger with the Target Fund) | Acquiring Fund (assuming merger with the Target Funds) | |||||||||||||
Net assets | ||||||||||||||||
Class A Shares | $ | 26,625,564 | $ | 678,209,883 | $ | 704,835,447 | $ | 974,529,830 | ||||||||
Institutional Class Shares | $ | 148,641,055 | $ | 264,015,440 | $ | 412,656,495 | $ | 579,851,571 | ||||||||
|
|
|
|
|
|
|
| |||||||||
Total Fund Net Assets | $ | 175,266,619 | $ | 942,225,323 | $ | 1,117,491,942 | $ | 1,554,381,401 | ||||||||
Net asset value per share | ||||||||||||||||
Class A Shares | $ | 15.16 | $ | 23.55 | $ | 23.55 | $ | 23.55 | ||||||||
Institutional Class Shares | $ | 15.25 | $ | 25.54 | $ | 25.54 | $ | 25.54 | ||||||||
- 9 -
Table of Contents
| Actual | Pro Forma | |||||||||||||||
| Target Fund | Acquiring Fund | Acquiring Fund (assuming merger with the Target Funds) | Acquiring Fund (assuming merger with the Target Fund) | |||||||||||||
Shares outstanding | ||||||||||||||||
Class A Shares | 1,756,204 | 28,803,639 | 29,934,428 | 41,388,364 | ||||||||||||
Institutional Class Shares | 9,744,146 | 10,335,804 | 16,154,870 | 22,700,297 | ||||||||||||
|
|
|
|
|
|
|
| |||||||||
Total Shares Outstanding | 11,500,350 | 39,139,443 | 46,089,298 | 64,088,661 | ||||||||||||
The pro forma shares outstanding reflect the issuance by the Acquiring Fund of: i) assuming a merger with the Target Fund, approximately 1,130,790 Class A Shares and 5,819,066 Institutional Class Shares (for a total of 6,949,856 shares); and ii) assuming a merger with the Target Funds, approximately 12,584,726 Class A Shares and 12,364,493 Institutional Class Shares (for a total of 24,949,219 shares). In each case, such issuance reflects the exchange of the assets of the Target Fund for newly issued Class A Shares and Institutional Class Shares of the Acquiring Fund, respectively, at the pro forma net asset value per share. The aggregate value of the Acquiring Fund shares that a Target Fund shareholder receives in the Reorganization will equal the aggregate value of the Target Fund shares owned immediately prior to the Reorganization.
Annual Performance Information
The following chart shows the annual returns of the Target Fund since its inception and the Acquiring Fund for its past ten years. The bar charts include the effects of each Fund’s expenses, but not sales charges. If sales charges were included, returns would be lower than those shown. The table includes the effects of Fund expenses and maximum sales charges and assumes that you sold your shares at the end of the period. After-tax returns are shown only for the Class A Shares and after-tax returns for the Institutional Class Shares will differ from those shown for the Class A Shares. The after-tax returns are calculated using the historical highest individual federal marginal income tax rates and do not reflect the impact of state and local taxes. Actual after-tax returns depend on an investor’s tax situation and may differ from those shown and after-tax returns are not relevant to investors who hold their Fund shares through tax-deferred arrangements such as 401(k) plans or individual retirement accounts. How either Fund performed in the past (before and after taxes) is not necessarily an indication of how it will perform in the future.
Thrivent Partner Mid Cap Value Fund—Class A Shares
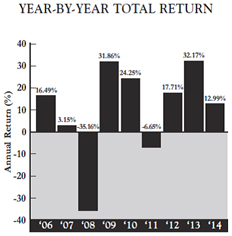
- 10 -
Table of Contents
Thrivent Mid Cap Stock Fund—Class A Shares
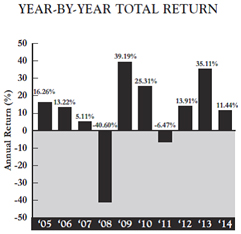
As a result of market activity, current performance may vary from the figures shown.
The Target Fund’s (Class A Shares) total return for the three-month period from January 1, 2015 to March 31, 2015 was 1.89%. The Acquiring Fund’s (Class A Shares) total return for the three-month period from January 1, 2015 to March 31, 2015 was 2.77%. Since its inception, the Target Fund’s (Class A Shares) highest quarterly return was 19.36% (for the quarter ended September 30, 2009) and its lowest quarterly return was -22.71% (for the quarter ended December 31, 2008). During the past 10 years, the Acquiring Fund’s (Class A Shares) highest quarterly return was 19.46% (for the quarter ended September 30, 2009) and its lowest quarterly return was -22.13% (for the quarter ended September 30, 2011).
Comparative Performance Information
As a basis for evaluating each Fund’s performance and risks, the following table shows how each Fund’s performance compares with broad-based market indices that the Adviser believes are appropriate benchmarks for such Fund. The Target Fund’s benchmark is the Russell Midcap® Value Index, which is comprised of mid-cap companies with lower-than-average price-to-book ratios and lower forecasted growth values. The Acquiring Fund’s benchmark is the Russell Midcap® Index, which measure the performance of the smallest 800 securities in the Russell 1000® Index. Further, the table includes the effects of each Fund’s expenses, but not sales charges. If sales charges were included, returns would be lower than those shown.
Average annual total returns are shown below for each Fund for the periods ended December 31, 2014 (the most recently completed calendar year prior to the date of this Prospectus/Proxy Statement). Remember that past performance of a Fund is not indicative of its future performance.
Average Annual Total Returns for the Period ended December 31, 2014
| Target Fund | Acquiring Fund | |||||||||||||||||||||||
| Past 1 Year | Past 5 Years | Since Inception (6/30/2005 | Past 1 Year | Past 5 Years | Past 10 Years | |||||||||||||||||||
Applicable Fund, Class A (before taxes) | 6.77 | % | 14.02 | % | 8.07 | % | 5.29 | % | 13.69 | % | 8.07 | % | ||||||||||||
(after taxes on distributions) | 2.89 | % | 11.74 | % | 6.60 | % | 2.42 | % | 13.06 | % | 6.48 | % | ||||||||||||
(after taxes on distributions and redemptions) | 5.61 | % | 10.68 | % | 6.10 | % | 5.27 | % | 10.98 | % | 5.96 | % | ||||||||||||
Russell Midcap® Value Index (reflects no deductions for fees, expenses or taxes) | 14.75 | % | 17.43 | % | 9.32 | % | — | — | — | |||||||||||||||
Russell Midcap® Index (reflects no deductions for fees, expenses or taxes) | — | — | — | 13.22 | % | 17.19 | % | 9.56 | % | |||||||||||||||
- 11 -
Table of Contents
Financial Highlights of the Acquiring Fund
| Income from Investment Operations | Less Distributions From | Ratio to Average Net Assets** | Ratios to Average Net Assets Before Expenses Waived, Credited or Paid Indirectly** | |||||||||||||||||||||||||||||||||||||||||||||||||||||||||
| Net Asset Value, Beginning of Period | Net Investment Income/ (Loss) | Net Realized and Unrealized Gain/(Loss) on Investments(a) | Total from Investment Operations | Net Investment Income | Net Realized Gain on Investments | Total Distributions | Net Asset Value, End of Period | Total Return(b) | Net Assets, End of Period (in millions) | Expenses | Net Investment Income/ (Loss) | Expenses | Net Investment Income/ (Loss) | Portfolio Turnover Rate | ||||||||||||||||||||||||||||||||||||||||||||||
Class A Shares | ||||||||||||||||||||||||||||||||||||||||||||||||||||||||||||
Year Ended 10/31/2014 | $ | 20.38 | $ | 0.07 | $ | 3.10 | $ | 3.17 | $ | — | $ | — | $ | — | $ | 23.55 | 15.55 | % | $ | 678.20 | 1.11 | % | 0.30 | % | 1.11 | % | 0.30 | % | 27 | % | ||||||||||||||||||||||||||||||
Year Ended 10/31/2013 | 15.34 | 0.01 | 5.03 | 5.04 | — | — | — | 20.38 | 32.86 | % | 625.4 | 1.15 | % | 0.07 | % | 1.15 | % | 0.07 | % | 39 | % | |||||||||||||||||||||||||||||||||||||||
Year Ended 10/31/2012 | 14.30 | (0.01 | ) | 1.05 | 1.04 | — | — | — | 15.34 | 7.27 | % | 517.5 | 1.18 | % | (0.08 | )% | 1.18 | % | (0.08 | )% | 36 | % | ||||||||||||||||||||||||||||||||||||||
Year Ended 10/31/2011 | 13.49 | (0.02 | ) | 0.83 | 0.81 | — | — | — | 14.30 | 6.00 | % | 538.7 | 1.20 | % | (0.15 | )% | 1.20 | % | (0.15 | )% | 35 | % | ||||||||||||||||||||||||||||||||||||||
Year Ended 10/31/2010 | 10.89 | — | 2.60 | 2.60 | — | — | — | 13.49 | 23.88 | % | 571.1 | 1.25 | % | 0.01 | % | 1.25 | % | 0.01 | % | 69 | % | |||||||||||||||||||||||||||||||||||||||
Institutional Class Shares | ||||||||||||||||||||||||||||||||||||||||||||||||||||||||||||
Year Ended 10/31/2014 | 22.09 | 0.22 | 3.31 | 3.53 | (0.08 | ) | — | (0.08 | ) | 25.54 | 16.01 | % | 264.0 | 0.71 | % | 0.70 | % | 0.71 | % | 0.70 | % | 27 | % | |||||||||||||||||||||||||||||||||||||
Year Ended 10/31/2013 | 16.63 | 0.10 | 5.43 | 5.53 | (0.07 | ) | — | (0.07 | ) | 22.09 | 33.41 | % | 290.0 | 0.71 | % | 0.50 | % | 0.71 | % | 0.50 | % | 39 | % | |||||||||||||||||||||||||||||||||||||
Year Ended 10/31/2012 | 15.43 | 0.07 | 1.13 | 1.20 | — | — | — | 16.63 | 7.78 | % | 220.4 | 0.72 | % | 0.38 | % | 0.72 | % | 0.38 | % | 36 | % | |||||||||||||||||||||||||||||||||||||||
Year Ended 10/31/2011 | 14.53 | 0.06 | 0.89 | 0.95 | (0.05 | ) | — | (0.05 | ) | 15.43 | 6.51 | % | 215.6 | 0.71 | % | 0.33 | % | 0.71 | % | 0.33 | % | 35 | % | |||||||||||||||||||||||||||||||||||||
Year Ended 10/31/2010 | 11.71 | 0.07 | 2.79 | 2.86 | (0.04 | ) | — | (0.04 | ) | 14.53 | 24.50 | % | 216.6 | 0.73 | % | 0.55 | % | 0.73 | % | 0.55 | % | 69 | % | |||||||||||||||||||||||||||||||||||||
| (a) | The amount shown may not correlate with the change in aggregate gains and losses of portfolio securities due to the timing of sales and redemptions of fund shares. |
| (b) | Total investment return assumes dividend reinvestment and does not reflect any deduction for applicable sales charges. Not annualized for periods less than one year. |
| * | All per share amounts have been rounded to the nearest cent. |
| ** | Computed on an annualized basis for periods less than one year |
The financial highlights for the Target Fund’s Class A Shares and Institutional Class Shares are available in the Thrivent Mutual Funds prospectus for each respective share class, dated February 27, 2015 and as supplemented through the date hereof and are incorporated herein by reference.
- 12 -
Table of Contents
Thrivent Asset Mgt., 625 Fourth Avenue South, Minneapolis, Minnesota 55415, provides administrative personnel and services necessary to operate the Funds and receives an administration fee from the Funds. The custodian for the Funds is State Street Bank and Trust Company, 225 Franklin Street, Boston, Massachusetts 02110. PricewaterhouseCoopers LLP, 225 South Sixth Street, Suite 1400, Minneapolis, MN 55402, serves as the Trust’s independent registered public accounting firm.
The Trust is an open-end management investment company registered under the Investment Company Act of 1940 (the “1940 Act”) and was organized as a Massachusetts Business Trust on March 10, 1987. The Trust is made up of 26 separate series or “Funds.” Each Fund of the Trust, other than the Thrivent Asset Allocation Funds and the Thrivent Natural Resources Fund, is diversified.
The Trust is authorized to issue shares of beneficial interest, par value $.01 per share, divisible into an indefinite number of different series and classes and operates as a “series company” as provided by Rule 18f-2 under the 1940 Act.
The Declaration of Trust of the Trust, as amended through the date hereof (the “Declaration of Trust”) provides that each shareholder shall be deemed to have agreed to be bound by its terms. A vote of shareholders and the Board may amend the Declaration of Trust. The Trust may issue an unlimited number of shares in one or more series as the Board of Trustees may authorize.
Each class is subject to such investment minimums and other conditions as set forth in the Trust’s current prospectuses. Such minimums are identical the same share classes of the Target Fund and the Acquiring Fund (so, for example, the Class A Shares of both Funds have the same initial and subsequent investment minimums). The Reorganization will not affect such investment minimums and other conditions.
Differences in expenses among classes are described in the Trust’s Amended and Restated Plan Pursuant to Rule 18f-3 under the 1940 Act. Class A and Institutional Class Shares pay the expenses associated with their different distribution arrangements. Each class may, at the Trustees’ discretion, also pay a different share of other expenses, not including advisory or custodial fees or other expenses related to the management of the Trust’s assets, if these expenses are actually incurred in a different amount by that class, or if the class receives services of a different kind or to a different degree than the other class. All other expenses will be allocated to each class on the basis of the net asset value of the particular Fund.
Each class of shares has identical voting rights except that each class has exclusive voting rights on any matter submitted to shareholders relating solely to the class or where the interests of one class differ from the interests of the other class. Class A Shares have exclusive voting rights on matters involving the Rule 12b-1 Distribution Plan. Matters submitted to shareholder vote must be approved by each Fund separately except:
| • | when required otherwise by the 1940 Act; or |
| • | when the Trustees determine that the matter does not affect all Funds; then, only the shareholders of the affected Funds may vote. |
Shares are freely transferable, and holders thereof are entitled to receive dividends declared by the Board, and receive the assets of their respective Fund in the event of liquidation. The Trust generally holds shareholder meetings only when required by law or at the written request of shareholders owning at least 10% of the Trust’s outstanding shares. Shareholders may remove the Trustees from office by votes cast in person or by proxy at a shareholder meeting.
At the request of shareholders holding 10% or more of the outstanding shares of the Trust, the Trust will hold a special meeting for the purpose of considering the removal of a Trustee(s) from office, and the Trust will cooperate with and assist shareholders of record who notify the Trust that they wish to communicate with other shareholders for the purpose of obtaining signatures to request such a meeting, all pursuant to and in accordance with Section 16(c) of the 1940 Act.
- 13 -
Table of Contents
Under Massachusetts law, shareholders of a business trust may be held personally liable, under certain circumstances, for the obligations of the Trust. However, the Declaration of Trust disclaims shareholder, Trustee and/or officer liability for acts performed on behalf of the Trust or for Trust obligations that are binding only on the assets and property of the Trust. The Funds include this disclaimer in each agreement, obligation, or contract entered into or executed by the Trust or the Board. The Declaration of Trust provides for indemnification out of the Trust’s assets for all losses and expenses of any shareholder held personally liable for the obligations of the Trust. The risk of a shareholder incurring financial loss on account of shareholder liability is remote because it is limited to circumstances where the Trust itself is unable to meet its obligations.
The Trust’s organizational documents are filed as part of the Trust’s registration statement with the SEC, and shareholders may obtain copies of such documents as described on the first page of this Prospectus/Proxy Statement and in the Questions and Answers preceding this Prospectus/Proxy Statement.
Payments to Broker-Dealers and Other Financial Intermediaries
If you purchase a Fund through a broker-dealer or other financial intermediary, the Fund and its related companies may pay the intermediary for the sale of Fund shares and related services. These payments may create a conflict of interest by influencing the broker-dealer or other intermediary and your salesperson to recommend the Fund over another investment. Ask your salesperson or visit your financial intermediary’s website for more information.
- 14 -
Table of Contents
INFORMATION ABOUT THE REORGANIZATION
Under the Reorganization Agreement, the Target Fund will transfer all of its assets to the Acquiring Fund in exchange for shares of the Acquiring Fund. The Acquiring Fund Class A and Institutional Class Shares issued to the Target Fund will have an aggregate value equal to the aggregate value of the Target Fund’s net assets immediately prior to the Reorganization. Upon receipt by the Target Fund of Acquiring Fund Shares, the Target Fund will distribute such Class A and Institutional Class Shares of the Acquiring Fund to Target Fund shareholders. Then, as soon as practicable after the Closing Date of the Reorganization, the Target Fund will dissolve under applicable state law.
The Target Fund will distribute the Acquiring Fund Class A and Institutional Class Shares received by it pro rata to Target Fund shareholders of record in exchange for their interest in Class A and Institutional Class Shares of the Target Fund. This distribution will be accomplished by opening new accounts on the books of the Acquiring Fund in the names of the Target Fund shareholders and transferring to those shareholder accounts the Acquiring Fund Class A and Institutional Class Shares received by the Target Fund. Each newly-opened account on the books of the Acquiring Fund for the previous Target Fund shareholders will represent the respective pro rata number of Acquiring Fund Class A and Institutional Class Shares due such shareholder.
Accordingly, as a result of the Reorganization, each Target Fund shareholder would own Acquiring Fund Class A and Institutional Class Shares that would have an aggregate value immediately after the Reorganization equal to the aggregate value of that shareholder’s Target Fund Class A and Institutional Class Shares immediately prior to the Reorganization. The interests of each of the Target Fund’s shareholders will not be diluted as a result of the Reorganization. However, as a result of the Reorganization, a shareholder of the Target Fund or the Acquiring Fund will hold a reduced percentage of ownership in the larger combined fund than the shareholder did in either of the separate Funds.
No sales charge or fee of any kind will be assessed to Target Fund shareholders in connection with their receipt of Acquiring Fund Class A and Institutional Class Shares in the Reorganization.
Approval of the Reorganization will constitute approval of amendments to any of the fundamental investment restrictions of the Target Fund that might otherwise be interpreted as impeding the Reorganization, but solely for the purpose of and to the extent necessary for consummation of the Reorganization.
Terms of the Reorganization Agreement
The following is a summary of the material terms of the Reorganization Agreement. This summary is qualified in its entirety by reference to the form of Reorganization Agreement, a form of which is attached as Appendix A to the Reorganization SAI.
Pursuant to the Reorganization Agreement, the Acquiring Fund will acquire all of the assets of the Target Fund on the Closing Date in exchange for Class A and Institutional Class Shares of the Acquiring Fund. Subject to the Target Fund’s shareholders approving the Reorganization, the Closing Date shall occur on August 28, 2015 or such other date as determined by an officer of the Fund.
On the Closing Date, the Target Fund will transfer to the Acquiring Fund all of its assets. The Acquiring Fund will in turn transfer to the Target Fund a number of its Class A and Institutional Class Shares equal in value to the value of the net assets of the Target Fund transferred to the Acquiring Fund as of the Closing Date, as determined in accordance with the valuation method described in the Acquiring Fund’s then current prospectus. In order to minimize any potential for undesirable federal income and excise tax consequences in connection with the Reorganization, the Target Fund will distribute on or before the Closing Date all or substantially all of its undistributed net investment income (including net capital gains) as of such date.
The Target Fund expects to distribute Class A and Institutional Class Shares of the Acquiring Fund received by the Target Fund to shareholders of the Target Fund promptly after the Closing Date and then dissolve.
- 15 -
Table of Contents
The Acquiring Fund and the Target Fund have made certain standard representations and warranties to each other regarding their capitalization, status and conduct of business. Unless waived in accordance with the Reorganization Agreement, the obligations of the parties to the Reorganization Agreement are conditioned upon, among other things:
| • | the approval of the Reorganization by the Target Fund’s shareholders; |
| • | the absence of any rule, regulation, order, injunction or proceeding preventing or seeking to prevent the consummation of the transactions contemplated by the Reorganization Agreement; |
| • | the receipt of all necessary approvals, registrations and exemptions under federal and state laws; |
| • | the truth in all material respects as of the Closing Date of the representations and warranties of the parties and performance and compliance in all material respects with the parties’ agreements, obligations and covenants required by the Reorganization Agreement; |
| • | the effectiveness under applicable law of the registration statement of the Acquiring Fund of which this Prospectus/Proxy Statement forms a part and the absence of any stop orders under the Securities Act of 1933, as amended, pertaining thereto; and |
| • | the receipt of an opinion of counsel relating to the characterization of the Reorganization as a tax-free reorganization for federal income tax purposes (as further described herein under the heading “Material Federal Income Tax Consequences of the Reorganization”). |
The Reorganization Agreement may be terminated or amended by the mutual consent of the parties either before or after approval thereof by the shareholders of the Target Fund, provided that no such amendment after such approval shall be made if it would have a material adverse effect on the interests of such Target Fund’s shareholders. The Reorganization Agreement also may be terminated by the non-breaching party if there has been a material misrepresentation, material breach of any representation or warranty, material breach of contract or failure of any condition to closing.
Reasons for the Proposed Reorganization
In determining whether to recommend approval of the Reorganization Agreement to Target Fund shareholders, the Board considered a number of factors, including, but not limited to: (i) the expenses and advisory fees applicable to the Funds before the proposed Reorganization and the estimated expense ratios of the combined portfolio after the proposed Reorganization; (ii) the comparative investment performance of the Funds; (iii) the future growth prospects of each Fund; (iv) the terms and conditions of the Reorganization Agreement; (v) whether the Reorganization would result in the dilution of shareholder interests; (vi) the compatibility of the Funds’ investment objectives, policies, risks and restrictions; (vii) the anticipated tax consequences of the proposed Reorganization; (viii) the compatibility of the Funds’ service features available to shareholders, including exchange privileges; and (ix) the estimated costs of the Reorganization. The Board concluded that these factors supported a determination to approve the Reorganization Agreement.
The Board believes that the Reorganization would be in the best interests of the Target Fund’s shareholders because: (i) shareholders will become shareholders of a larger combined fund with greater potential to increase asset size and achieve economies of scale; (ii) the Acquiring Fund invests in a more diversified portfolio of equities; and (iii) the Target Fund shareholders will experience a lower expense ratio in the merged Acquiring Fund.
The Board has determined that the Reorganization is in the best interests of the Target Fund and that the interests of the Target Fund’s shareholders will not be diluted as a result of the Reorganization. In addition, the Board has determined that the Reorganization is in the best interests of the Acquiring Fund and that the interests of the Acquiring Fund shareholders will not be diluted as a result of the Reorganization.
Material Federal Income Tax Consequences of the Reorganization
The following is a general summary of the material anticipated U.S. federal income tax consequences of the Reorganization. This discussion is based upon the Internal Revenue Code of 1986, as amended (the “Code”), Treasury regulations, court decisions, published positions of the Internal Revenue Service (“IRS”) and other applicable authorities, all as in effect on the date hereof and all of which are subject to change or differing interpretations (possibly with retroactive effect). This discussion is limited to U.S. persons who hold shares of the Target Fund as capital assets for U.S. federal income tax purposes on the date of exchange.
- 16 -
Table of Contents
This summary does not address all of the U.S. federal income tax consequences that may be relevant to a particular shareholder or to shareholders who may be subject to special treatment under U.S. federal income tax laws. No assurance can be given that the IRS would not assert or that a court would not sustain a position contrary to any of the tax aspects described below. Shareholders should consult their own tax advisers as to the U.S. federal income tax consequences of the Reorganization to them, as well as the effects of state, local and non-U.S. tax laws.
The Reorganization is expected to be a tax-free reorganization for U.S. federal income tax purposes. It is a condition to closing the Reorganization that the Target Fund and the Acquiring Fund receive an opinion from Reed Smith LLP, special counsel to each Fund, dated as of the Closing Date, regarding the characterization of the Reorganization as a “reorganization” within the meaning of Section 368(a)(1) of the Code. As such a reorganization, the U.S. federal income tax consequences of the Reorganization can be summarized as follows: to the effect that on the basis of existing provisions of the Code, the Treasury regulations promulgated thereunder, current administrative rules and court decisions, generally for U.S. federal income tax purposes, except as noted below:
| • | the Reorganization will constitute a reorganization within the meaning of Section 368(a)(1) of the Code, and the Target Fund and the Acquiring Fund will each be a “party to a reorganization” within the meaning of Section 368(b) of the Code; |
| • | under Section 361 of the Code, no gain or loss will be recognized by the Target Fund upon the transfer of its assets to the Acquiring Fund in exchange for Acquiring Fund shares, or upon the distribution of Acquiring Fund shares by the Target Fund to its shareholders in liquidation; |
| • | under Section 1032 of the Code, no gain or loss will be recognized by the Acquiring Fund upon receipt of the assets transferred to the Acquiring Fund in exchange for Acquiring Fund shares; |
| • | under Section 362(b) of the Code, the Acquiring Fund’s tax basis in each asset that the Acquiring Fund receives from the Target Fund will be the same as the Target Fund’s tax basis in such asset immediately prior to such exchange; |
| • | under Section 1223(2) of the Code, the Acquiring Fund’s holding periods in each asset will include the Target Fund’s holding periods in such asset; |
| • | under Section 354 of the Code, no gain or loss will be recognized by shareholders of the Target Fund on the distribution of Acquiring Fund shares to them in exchange for their shares of the Target Fund; |
| • | under Section 358 of the Code, the aggregate tax basis of the Acquiring Fund shares that the Target Fund’s shareholders receive in exchange for their Target Fund shares will be the same as the aggregate tax basis of the Target Fund shares exchanged therefor; |
| • | under Section 1223(1) of the Code, a Target Fund shareholder’s holding period for the Acquiring Fund shares received in the Reorganization will be determined by including the holding period for the Target Fund shares exchanged therefor, provided that the shareholder held the Target Fund shares as a capital asset on the date of the exchange; and |
| • | under Section 381 of the Code, the Acquiring Fund will succeed to and take into account the items of the Target Fund described in Section 381(c) of the Code, subject to the conditions and limitations specified in Section 381, 382, 383 and 384 of the Code and the Treasury regulations thereunder. |
The opinion will be based on certain factual certifications made by the officers of the Target Fund and the Acquiring Fund and will also be based on customary assumptions such as the assumption that the Reorganization will be consummated in accordance with the Reorganization Agreement. The opinion is not a guarantee that the tax consequences of the Reorganization will be as described above. There is no assurance that the IRS or a court would agree with the opinion.
The Acquiring Fund intends to continue to be taxed under the rules applicable to regulated investment companies as defined in Section 851 of the Code which are the same rules currently applicable to Target Fund. In connection with the Reorganization, on or before the Closing Date, the Target Fund will declare to its shareholders a dividend which, together with all of its previous distributions, will have the effect of distributing to shareholders all of its investment company taxable income (computed without regard to the deduction for dividends paid), net tax-exempt interest income and net capital gains through the Closing Date.
- 17 -
Table of Contents
A regulated investment company is permitted to carryforward net capital losses; however, net capital losses incurred in taxable years beginning on or before December 22, 2010 can be carried forward for eight taxable years only. Additionally capital losses incurred in taxable years beginning on or before December 22, 2010 cannot be utilized to offset capital gains until all net capital losses arising in tax years beginning after December 22, 2010 have been utilized. As a result, some net capital loss carryforwards incurred on or before December 22, 2010 may expire unused.
Immediately prior to the Reorganization, the Target Fund is not expected to have any unutilized capital loss carryforwards. The final amount of unutilized capital loss carryforwards for the Target Fund is subject to change and will not be determined until the Closing Date. As of April 9, 2015, the capital loss carryforward of the Target Fund and the Acquiring Fund was $0 and $0, respectively.
Generally, the Acquiring Fund will succeed to the capital loss carryforwards of the Target Fund, subject to the limitations described below. If the Target Fund has capital loss carryforwards, such capital losses would, in the absence of the Reorganization, generally be available to offset Target Fund capital gains, thereby reducing the amount of capital gain net income that must be distributed to the Target Fund shareholders.
Under Sections 382 and 383 of the Code, an “equity structure shift” arising as a result of a reorganization under Section 368(a)(1) of the Code can result in limitations on the post-reorganization Fund’s use of capital loss carryforwards of the participating Funds. An “equity structure shift” can trigger limitations on capital loss carryforwards where there is a more than 50% change in the ownership of a Fund.
Even though the Reorganization may result in a more than 50% change in ownership of either fund, the Adviser does not anticipate a limitation since the Funds are not expected to have capital loss carryforwards.
This summary of the U.S. federal income tax consequences of the Reorganization is made without regard to the particular facts and circumstances of any shareholder. Shareholders are urged to consult their own tax advisors as to the specific consequences to them of the Reorganization, including the applicability and effect of state, local, non-U.S. and other tax laws.
It is not expected that the Reorganization will be a taxable event for any shareholder.
Expenses of the Reorganization
All expenses of the Reorganization will be paid by the Adviser or an affiliate and will not be borne by shareholders of the Target Fund.
Reorganization expenses include, but are not limited to: all costs related to the preparation and distribution of materials distributed to the Board; all expenses incurred in connection with the preparation of the Reorganization Agreement and a registration statement on Form N-14; SEC and state securities commission filing fees and legal and audit fees in connection with each Reorganization; the costs of printing and distributing this Prospectus/Proxy Statement; legal fees incurred preparing materials for the Boards attending the Board meetings and preparing the Board minutes; auditing fees associated with the Fund’s financial statements; portfolio transfer taxes (if any); and any similar expenses incurred in connection with the Reorganization. Management of the Funds estimates the total cost of the Reorganization to be approximately $85,000 ($204,000 for the Target Funds combined). If the Reorganization is not approved by shareholders, the Adviser will still bear the costs of the proposed Reorganization.
Any brokerage charges associated with the purchase or disposition of portfolio investments by the Target Fund prior to the Reorganization will be borne by the Target Fund. Any brokerage charges associated with the purchase or disposition of portfolio investments by the Acquiring Fund after the Reorganization will be borne by the Acquiring Fund. However, the Adviser has agreed to provide a reimbursement of investment advisory fees to the Acquiring Fund in the amount of $126,900, which is the estimated brokerage costs that will be incurred by the Acquiring Fund and Target Funds as a result of the Reorganization. Such reimbursement will be accrued during the month following the closing of the Reorganization.
- 18 -
Table of Contents
The Board has unanimously approved the Reorganization, subject to shareholder approval. Approval of the Reorganization requires the affirmative vote of a “Majority of the Outstanding Voting Securities” of the Target Fund, which is, under the 1940 Act, the lesser of (1) 67% or more of the shares of the Fund present at the Meeting if the holders of more than 50% of the outstanding shares of the Fund are present or represented by proxy, or (2) more than 50% of the outstanding shares of the Fund.
The Board recommends voting “FOR” the proposed Reorganization.
At the close of business on the Record Date, the Acquiring Fund had outstanding shares. As of the Record Date, the trustees and officers of the Acquiring Fund as a group owned less than 1% of the shares of the Acquiring Fund. As of the Record Date, no person was known by the Acquiring Fund to own beneficially or of record as much as 5% of the Acquiring Fund shares except as follows:
Name | Class of Shares | Approximate Percentage of Ownership | ||||||
| ______ | ______ | % | ||||||
| ______ | ______ | % | ||||||
| ______ | ______ | % | ||||||
At the close of business on the Record Date, the Target Fund had outstanding shares. As of the Record Date, the trustees and officers of the Target Fund as a group owned less than 1% of the shares of the Target Fund. As of the Record Date, no person was known by the Target Fund to own beneficially or of record as much as 5% of the shares of the Target Fund except as follows:
Name | Class of Shares | Approximate Percentage of Ownership | ||||||
| ______ | ______ | % | ||||||
Annual Meeting of Shareholders
There will be no annual or further special meetings of shareholders of the Trust unless required by applicable law or called by the Board in its discretion. Shareholders wishing to submit proposals for inclusion in a proxy statement for a subsequent shareholder meeting should send their written proposals to the Secretary of the Fund, 625 Fourth Avenue South, Minneapolis, Minnesota 55415. Shareholder proposals should be received in a reasonable time before the solicitation is made.
VOTING INFORMATION AND REQUIREMENTS
Approval of the Reorganization requires the affirmative vote of a “Majority of the Outstanding Voting Securities” of the Target Fund, which is, under the 1940 Act, the lesser of (1) 67% or more of the shares of the Fund present at the Meeting if the holders of more than 50% of the outstanding shares of the Fund are present or represented by proxy, or (2) more than 50% of the outstanding shares of the Fund.
The Board has fixed the close of business on June 16, 2015, as the Record Date for the determination of shareholders entitled to notice of, and to vote at, the Meeting. Target Fund shareholders on the Record Date are entitled to one vote for each share held, with no shares having cumulative voting rights.
- 19 -
Table of Contents
One-third of the shares of the Target Fund outstanding and entitled to vote at the Meeting represented in person or by proxy constitutes a quorum.
Target Fund shareholders may vote in any one of four ways: (i) via the Internet, (ii) by telephone, (iii) by mail, by returning the proxy card, or (iv) in person at the Meeting. Instructions for Internet and telephone voting are included with the enclosed proxy materials. Shareholders who deliver voting instructions by methods (i), (ii) or (iii) may revoke them at any time prior to the Meeting by delivering a written notice of revocation, by executing another proxy card bearing a later date or by attending the Meeting and giving voting instructions in person. Merely attending the Meeting, however, will not revoke any previously submitted proxy. The required control number for Internet and telephone voting is printed on the enclosed proxy card. The control number is used to match voting proxy cards with shareholders’ respective accounts and to ensure that, if multiple proxy cards are executed, shares are voted in accordance with the proxy card bearing the latest date. The Target Fund employs procedures for Internet and telephone voting, such as requiring the control number from the proxy card in order to vote by either of these methods, which it considers to be reasonable to confirm that the instructions received are genuine. If reasonable procedures are employed, the Target Fund will not be liable for following Internet or telephone votes which it believes to be genuine.
Abstentions and broker non-votes (i.e., where a nominee such as a broker holding shares for beneficial owners votes on certain matters pursuant to discretionary authority or instructions from beneficial owners, but with respect to one or more proposals does not receive instructions from beneficial owners or does not exercise discretionary authority) will be deemed present for quorum purposes. Abstentions and broker non-votes have the same effect as votes “AGAINST” the Reorganization.
All properly executed proxies received prior to the Meeting will be voted at the Meeting in accordance with the instructions marked thereon or otherwise as provided therein. Proxies received prior to the Meeting on which no vote is indicated will be voted “FOR” the approval of the proposed Reorganization.
Solicitation of proxies is being made primarily by the mailing of this Notice and Prospectus/Proxy Statement with its enclosures on or about July 1, 2015. Shareholders of the Target Fund whose shares are held by nominees, such as brokers, can vote their proxies by contacting their respective nominee. In addition to the solicitation of proxies by mail, employees of the Adviser and its affiliates, without additional compensation, may solicit proxies in person or by telephone, telegraph, facsimile or oral communication. The Target Fund may retain Computershare Fund Services (“Computershare”), a professional proxy solicitation firm, to assist with any necessary solicitation of proxies. We do not anticipate any expense for additional telephone solicitation by Computershare. The proxy solicitation expenses, if any, are an expense of the Reorganization and will be allocated as described above.
Other Matters to Come Before the Meeting
The Board knows of no business other than that described in the Notice that will be presented for consideration at the Meeting. If any other matters are properly presented, it is the intention of the persons named on the enclosed proxy to vote proxies in accordance with their best judgment.
In the event that a quorum is present at the Meeting but sufficient votes to approve the proposed Reorganization are not received, proxies (including abstentions and broker non-votes) will be voted in favor of one or more adjournments of the Meeting to permit further solicitation of proxies on the proposed Reorganization, provided that the Board determines that such an adjournment and additional solicitation is reasonable and in the interest of shareholders based on a consideration of all relevant factors, including the nature of the particular proposals, the percentage of votes then cast, the percentage of negative votes cast, the nature of the proposed solicitation activities and the nature of the reasons for such further solicitation. Any such adjournment will require the affirmative vote of the holders of a majority of the outstanding shares voted at the session of the Meeting to be adjourned.
- 20 -
Table of Contents
If you cannot be present in person, you are requested to fill in, sign and return the enclosed proxy card, for which, no postage is required if mailed in the United States, or record your voting instructions by telephone or via the Internet promptly.
|
| Michael W. Kremenak |
| Secretary |
| Thrivent Mutual Funds |
- 21 -
Table of Contents
Questions & Answers
For Shareholders of Thrivent Natural Resources Fund
Although we recommend that you read the complete Prospectus/Proxy Statement, we have provided the following questions and answers to clarify and summarize the issues to be voted on.
Q: Why is a shareholder meeting being held?
A: A special meeting of shareholders (the “Meeting”) of Thrivent Natural Resources Fund (the “Target Fund”) is being held to seek shareholder approval of a reorganization (the “Reorganization”) of the Target Fund into Thrivent Large Cap Stock Fund (the “Acquiring Fund”). Please refer to the Prospectus/Proxy Statement for a detailed explanation of the proposed Reorganization and for a more complete description of the Acquiring Fund.
Q: Why is the Reorganization being recommended?
A: After careful consideration, the Board of Trustees (the “Board”) of Thrivent Mutual Funds (the “Trust”) has determined that the Reorganization is in the best interests of the shareholders of the Target Fund and recommends that you cast your vote “FOR” the proposed Reorganization. The Target Fund and the Acquiring Fund have identical investment objectives, and each is a series of the Trust, an open-end management investment company registered under the Investment Company Act of 1940. Thrivent Asset Management, LLC (“Thrivent Asset Mgt.”) is the investment adviser for the Target Fund and the Acquiring Fund.
The Board believes that the Reorganization would be in the best interests of the shareholders of the Target Fund because: (i) shareholders will become shareholders of a larger combined fund with greater potential to increase asset size and achieve economies of scale; (ii) the Acquiring Fund invests in a diversified portfolio of large cap equities and the Adviser believes it is the most similar of its current offerings to the investment objective and policies of the Target Fund; (iii) the Acquiring Fund has achieved stronger performance over the one-, three- and five-year periods ended December 31, 2014; and (iv) the Target Fund shareholders will experience a lower expense ratio in the merged Acquiring Fund.
Q: Who can vote?
A: Shareholders of the Target Fund are entitled to vote.
Q: How will the Reorganization affect me?
A: Assuming shareholders approve the proposed Reorganization, the assets of the Target Fund will be combined with those of the Acquiring Fund. The Class A and Institutional Class Shares of the Target Fund automatically would be exchanged for an equal dollar value of Class A and Institutional Class Shares of the Acquiring Fund. Following the Reorganization, the Target Fund will dissolve.
Q: Will I have to pay any commission or other similar fee as a result of the Reorganization?
A: No. You will not pay any commissions or other similar fees as a result of the Reorganization. If you hold Class A Shares of the Target Fund, you will receive Class A Shares of the Acquiring Fund. If you hold Institutional Class Shares of the Target Fund, you will receive Institutional Class Shares of the Acquiring Fund.
Q: Will the total annual operating expenses that my portfolio investment bears increase as a result of the Reorganization?
A: No, they will likely decrease, and the investment management fee, which comprises a portion of the annual operating expenses, will decrease. For more information about how fund expenses may change as a result of the Reorganization, please see the comparative and pro forma table and related disclosures in the COMPARISON OF THE FUNDS—Expenses section of the Prospectus/Proxy Statement.
Table of Contents
Q: Will I have to pay any U.S. federal income taxes as a result of the Reorganization?
A: The Reorganization is expected to be tax-free for federal income tax purposes. The Target Fund will seek an opinion of counsel to this effect. Generally, shareholders will not incur capital gains or losses on the exchange of Target Fund shares for Acquiring Fund shares as a result of the Reorganization.
Q: If shareholders of the Target Fund do not approve the Reorganization, what will happen to the Target Fund?
A: Thrivent Asset Mgt. will reassess what changes it would like to make to a Target Fund, including a possible repurposing of the Target Fund’s principal investment strategies or recommending a liquidation of the Target Fund to the Board. It may ultimately decide to make no changes.
Q: Who pays the costs of the Reorganization?
A: The expenses of the Reorganization, including the costs of the Meeting, will be paid by Thrivent Asset Mgt. or an affiliate and will not be borne by Target Fund shareholders.
Q: How can I vote?
A: Shareholders are invited to attend the Meeting and to vote in person. You may also vote by executing a proxy using one of three methods:
| • | By Internet: Instructions for casting your vote via the Internet can be found in the enclosed proxy voting materials. The required control number is printed on your enclosed proxy card. If this feature is used, there is no need to mail the proxy card. |
| • | By Telephone: Instructions for casting your vote via telephone can be found in the enclosed proxy voting materials. The toll-free number and required control number are printed on your enclosed proxy card. If this feature is used, there is no need to mail the proxy card. |
| • | By Mail: If you vote by mail, please indicate your voting instructions on the enclosed proxy card, date and sign the card, and return it in the envelope provided, which is addressed for your convenience and needs no postage if mailed in the United States. |
Shareholders who execute proxies by Internet, telephone or mail may revoke them at any time prior to the Meeting by filing with the Target Fund a written notice of revocation, by executing another proxy bearing a later date, by voting later by Internet or telephone or by attending the Meeting and voting in person. Merely attending the Meeting, however, will not revoke any previously submitted proxy.
Q: When should I vote?
A: Every vote is important and the Board encourages you to record your vote as soon as possible. Voting your proxy now will ensure that the necessary number of votes is obtained, without the time and expense required for additional proxy solicitation.
Q: Who should I call if I have questions about the proposal in the Prospectus/Proxy Statement?
A: Call 1-866-865-3843 with your questions.
- 2 -
Table of Contents
Q: How can I get more information about the Target and Acquiring Funds?
A: You may obtain (1) a prospectus, statement of additional information or annual/semiannual report for the Funds or (2) the statement of additional information regarding the Reorganization (request the “Reorganization SAI”) by:
| • | Telephone: 1-800-THRIVENT (1-800-847-4836) and say “mutual funds” |
| • | Mail: Thrivent Mutual Funds, P.O. Box 219348, Kansas City, Missouri 64121-9348 |
| • | Internet: |
| • | For a copy of a prospectus, a statement of additional information, or a shareholder report: |
www.thrivent.com — For a copy of this Prospectus/Proxy Statement or the Reorganization SAI:
www.proxy-direct.com/thr-26994
- 3 -
Table of Contents
Thrivent Natural Resources Fund
a series of
THRIVENT MUTUAL FUNDS
625 Fourth Avenue South
Minneapolis, Minnesota 55415
(800) 847-4836
www.thrivent.com
NOTICE OF SPECIAL MEETING
OF SHAREHOLDERS
To be Held on August 14, 2015
NOTICE IS HEREBY GIVEN THAT a special meeting of shareholders (the “Meeting”) of Thrivent Natural Resources Fund (the “Target Fund”), a series of Thrivent Mutual Funds (the “Trust”), will be held at the offices of Thrivent Financial for Lutherans, 625 Fourth Avenue South, Minneapolis, Minnesota 55415 on August 14, 2015 at 9:00 a.m. Central time for the following purposes:
| 1. | To approve an Agreement and Plan of Reorganization pursuant to which the Target Fund would (i) transfer all of its assets to Thrivent Large Cap Stock Fund (the “Acquiring Fund”), a series of the Trust, in exchange for Class A and Institutional Class Shares of the Acquiring Fund, (ii) distribute such Class A and Institutional Class Shares of the Acquiring Fund to shareholders of the Target Fund, and (iii) dissolve. |
| 2. | To transact such other business as may properly be presented at the Meeting or any adjournment thereof. |
The Board of Trustees of the Trust (the “Board”) has fixed the close of business on June 16, 2015 as the record date for the determination of shareholders entitled to notice of, and to vote at, the Meeting and all adjournments thereof.
Shareholders are invited to attend the meeting and vote in person. You may also vote by executing a proxy using one of three methods:
| • | By Internet—Instructions for casting your vote via the Internet can be found in the enclosed proxy voting materials. The required control number is printed on your enclosed proxy card. If this feature is used, there is no need to mail the proxy card. |
| • | By telephone—Instructions for casting your vote via telephone can be found in the enclosed proxy voting materials. The toll-free number and required control number are printed on your enclosed proxy card. If this feature is used, there is no need to mail the proxy card. |
| • | By mail—If you vote by mail, please indicate your voting instructions on the enclosed proxy card, date and sign the card, and return it in the envelope provided, which is addressed for your convenience and needs no postage if mailed in the United States. |
Shareholders who execute proxies by Internet, telephone, or mail may revoke them at any time prior to the Meeting by filing with the Target Fund a written notice of revocation, by executing another proxy bearing a later date, or by attending the Meeting and voting in person. Merely attending the Meeting, however, will not revoke any previously submitted proxy.
The Board recommends that you cast your vote FOR the proposed Reorganization as described in the Prospectus/Proxy Statement.
YOUR VOTE IS IMPORTANT
Please return your proxy card or record your voting instructions by telephone or via the Internet promptly no matter how many shares you own. In order to avoid the additional expense of further solicitation, we ask that you mail your proxy card or record your voting instructions by telephone or via the Internet promptly regardless of whether you plan to be present in person at the Meeting.
Date: , 2015
|
| Michael W. Kremenak |
Secretary Thrivent Mutual Funds |
Table of Contents
COMBINED PROSPECTUS/PROXY STATEMENT
THRIVENT NATURAL RESOURCES FUND
a series of
THRIVENT MUTUAL FUNDS
625 Fourth Avenue South
Minneapolis, Minnesota 55415
(800) 847-4836
, 2015
This Prospectus/Proxy Statement is furnished to you as a shareholder of Thrivent Natural Resources Fund (the “Target Fund”), a series of Thrivent Mutual Funds (the “Trust”). A special meeting of shareholders of the Target Fund will be held on August 14, 2015 (the “Meeting”) to consider the approval of a Reorganization (the “Reorganization”) of the Target Fund into Thrivent Large Cap Stock Fund (the “Acquiring Fund”). The Board of Trustees of the Trust (the “Board”) requests that you vote your shares by completing and returning the enclosed proxy card or by recording your voting instructions by telephone or via the Internet regardless of whether you plan to be present at the Meeting in order to avoid the additional expense of further solicitation.
The Acquiring Fund and the Target Fund are sometimes referred to herein individually as a “Fund” or collectively as the “Funds.” The Acquiring Fund is organized as a diversified series, and the Target Fund is organized as a non-diversified series, of the Trust, an open-end management investment company registered under the Investment Company Act of 1940, as amended (the “1940 Act”).
The reorganization proposed for the Target Fund (the “Reorganization”) is not contingent upon the approval or completion of any other reorganization or merger.
This Prospectus/Proxy Statement sets forth concisely the information shareholders of the Target Fund ought to know before voting on the Reorganization. Please read it carefully and retain it for future reference.
The following documents, each having been filed with the Securities and Exchange Commission (the “SEC”), are incorporated herein by reference:
| • | The Thrivent Mutual Funds Prospectus, dated February 27, 2015 and as supplemented through the date hereof (the “Trust Prospectus”). |
| • | A Statement of Additional Information, dated , 2015, relating to this Combined Prospectus/Proxy Statement (the “Reorganization SAI”); |
| • | The Thrivent Mutual Funds Statement of Additional Information, dated February 27, 2015 and as supplemented through the date hereof (the “Trust SAI”). |
Copies of the foregoing may be obtained without charge by calling or writing the Fund as set forth below. If you wish to request the Reorganization SAI, please ask for the “Reorganization SAI.”
In addition, each Fund will furnish, without charge, a copy of its most recent annual report and subsequent semi-annual report, if any, to a shareholder upon request.
Copies of each Fund’s most recent prospectus, statement of additional information, annual report and semi-annual report can be obtained at www.thrivent.com. Requests for documents can also be made by calling (800) 847-4836 or writing Thrivent Mutual Funds, P.O. Box 219348, Kansas City, Missouri 64121-9348.
The Funds file reports and other information with the SEC. Information filed by the Funds with the SEC can be reviewed and copied at the SEC’s Public Reference Room in Washington, DC or on the EDGAR database on the SEC’s internet site (http://www.sec.gov). Information on the operation of the SEC’s Public Reference Room may be obtained by calling the SEC at (202) 551-8090. You can also request copies of these materials, upon payment of a duplicating fee, by electronic request at the SEC’s e-mail address (publicinfo@sec.gov) or by writing the Public Reference Section of the SEC, Washington, DC 20549-1520.
The Board knows of no business other than that discussed above that will be presented for consideration at the Meeting. If any other matter is properly presented, it is the intention of the persons named in the enclosed proxy to vote in accordance with their best judgment.
Table of Contents
No person has been authorized to give any information or make any representation not contained in this Prospectus/Proxy Statement and, if so given or made, such information or representation must not be relied upon as having been authorized. This Prospectus/Proxy Statement does not constitute an offer to sell or a solicitation of an offer to buy any securities in any jurisdiction in which, or to any person to whom, it is unlawful to make such offer or solicitation.
Neither the Securities and Exchange Commission nor any state regulator has approved or disapproved of these shares or passed upon the adequacy of this Prospectus/Proxy Statement. A representation to the contrary is a crime.
The date of this Prospectus/Proxy Statement is , 2015. The Prospectus/Proxy Statement will be sent to shareholders on or around July 1, 2015.
Table of Contents
| Page | ||||
| 1 | ||||
| 1 | ||||
| 1 | ||||
| 3 | ||||
| 3 | ||||
| 3 | ||||
| 5 | ||||
| 6 | ||||
| 6 | ||||
| 7 | ||||
The Separate Accounts and the Retirement Plans | 7 | |||
| 8 | ||||
| 10 | ||||
| 10 | ||||
| 11 | ||||
| 14 | ||||
| 14 | ||||
Payments to Broker-Dealers and Other Financial Intermediaries | 15 | |||
| 16 | ||||
| 16 | ||||
| 16 | ||||
| 17 | ||||
Material Federal Income Tax Consequences of the Reorganization | 17 | |||
| 19 | ||||
| 20 | ||||
| 20 | ||||
| 20 | ||||
| 20 | ||||
| 20 | ||||
| 20 | ||||
| 21 | ||||
| 21 | ||||
| 21 | ||||
| 21 | ||||
| 21 | ||||
Table of Contents
The following is a summary of certain information contained elsewhere in this Prospectus/Proxy Statement and is qualified in its entirety by reference to the more complete information contained in this Prospectus/Proxy Statement. Shareholders should read the entire Prospectus/Proxy Statement carefully.
The Board, including the trustees who are not “interested persons” (as defined in the 1940 Act) of each Fund, has unanimously approved an Agreement and Plan of Reorganization (the “Reorganization Agreement”) on behalf of each Fund, subject to Target Fund shareholder approval. The Reorganization Agreement provides for:
| • | the transfer of all of the assets of the Target Fund to the Acquiring Fund in exchange for Class A and Institutional Class Shares of the Acquiring Fund; |
| • | the distribution by the Target Fund of such Acquiring Fund Class A and Institutional Class Shares to Target Fund shareholders; and |
| • | the dissolution of the Target Fund. |
When the Reorganization is complete, Target Fund shareholders will hold Acquiring Fund shares. The aggregate value of the Acquiring Fund shares a Target Fund shareholder will receive in the Reorganization will equal the aggregate value of the Target Fund shares owned by such shareholder immediately prior to the Reorganization. After the Reorganization, the Acquiring Fund will continue to operate with the investment objective and investment policies set forth in this Prospectus/Proxy Statement.
As discussed in more detail elsewhere in this Prospectus/Proxy Statement, the Board believes that the Reorganization would be in the best interests of the Target Fund’s shareholders because: (i) shareholders will become shareholders of a larger combined fund with greater potential to increase asset size and achieve economies of scale; (ii) the Acquiring Fund invests in a diversified portfolio of large cap equities and Thrivent Asset Management, LLC (“Thrivent Asset Mgt.” or the “Adviser”) believes it is the most similar of its current offerings to the investment objective and policies of the Target Fund; (iii) the Acquiring Fund has achieved stronger performance over the one-, three- and five-year periods ended December 31, 2014, with Class A performance differences of 23.41%, 20.83% and 8.29%, respectively; and (iv) the Target Fund shareholders will experience a lower expense ratio in the merged Acquiring Fund.
In addition, the Board, when determining whether to approve the Reorganization, considered, among other things, the future growth prospects of each of the Target Fund and the Acquiring Fund, the fact that the Target Fund shareholders would not experience any diminution in shareholder services as a result of the Reorganization, and the fact that the Reorganization is expected to be a tax-free reorganization for federal income tax purposes.
Background and Reasons for the Reorganization
The Target Fund and the Acquiring Fund have identical investment objectives. The investment objective of each Fund is to seek long-term capital growth.
The two Funds also have similar, although not identical, principal investment strategies, which are described in more detail in the COMPARISON OF FUNDS—Investment Objective and Principal Strategies section of this Prospectus/Proxy Statement. Under normal circumstances, the Target Fund invests at least 80% of its net assets (plus the amount of any borrowings for investment purposes) in natural resource investments. Natural resource investments are securities of issuers that (1) have at least 50% of their assets in natural resources, such as metals, fuels, timber, underdeveloped land and agricultural products or (2) derive at least 50% of their annual revenues from owning, exploring, mining, processing or otherwise developing, or providing goods and services with respect to, natural resources. These investments may also include synthetic instruments that have economic characteristics similar to these securities. Under normal circumstances, the Acquiring Fund invests at least 80% of its net assets (plus the amount of any borrowing for investment purposes) in securities of large companies. The Target Fund invests primarily in equity securities of companies in a variety of natural resource-related sectors, including energy, chemicals, oil, gas, paper, mining, steel or agriculture. The Target Fund also concentrates its investments in one or more of these sectors or in one or more issuers in the natural resources-related industries and, as a non-diversified fund under the Investment Company Act of 1940, focuses its investments in the securities of a
Table of Contents
relatively few number of issuers. In addition, the Target Fund intends to invest in real estate investment trusts (REITs). In the case of the Acquiring Fund, the adviser focuses mainly on the securities of large domestic and international companies which have market capitalizations similar to those in widely known indices such as the S&P 500 Index, the Russell 1000® Index, or the large company market capitalizations classifications published by Lipper, Inc.
In determining whether to recommend approval of the Reorganization Agreement to Target Fund shareholders, the Board considered a number of factors, including, but not limited to: (i) the expenses and advisory fees applicable to the Funds before the proposed Reorganization and the estimated expense ratios of the combined Fund after the proposed Reorganization; (ii) the comparative investment performance of the Funds; (iii) the future growth prospects of each Fund; (iv) the terms and conditions of the Reorganization Agreement; (v) whether the Reorganization would result in the dilution of shareholder interests; (vi) the compatibility of the Funds’ investment objectives, policies, risks and restrictions; (vii) the anticipated tax consequences of the proposed Reorganization; (viii) the compatibility of the Funds’ service features available to shareholders, including exchange privileges; and (ix) the estimated costs of the Reorganization. The Board concluded that these factors supported a determination to approve the Reorganization Agreement.
The Board has determined that the Reorganization is in the best interests of the Target Fund and that the interests of the Target Fund’s shareholders will not be diluted as a result of the Reorganization. In addition, the Board has determined that the Reorganization is in the best interests of the Acquiring Fund and that the interests of the Acquiring Fund’s shareholders will not be diluted as a result of the Reorganization.
The Board is asking shareholders of the Target Fund to approve the Reorganization at the Meeting to be held on August 14, 2015. If shareholders of the Target Fund approve the proposed Reorganization, it is expected that the closing date of the transaction (the “Closing Date”) will be after the close of business on or about August 28, 2015, but it may be at a different time as described herein. If shareholders of the Target Fund do not approve the proposed Reorganization, the Board will consider alternatives, including repurposing the Target Fund’s principal strategies.
The Board recommends that you vote “FOR” the Reorganization.
- 2 -
Table of Contents
Investment Objective and Principal Strategies
Investment Objective. The Target Fund and the Acquiring Fund have identical investment objectives. The investment objective of each Fund is to seek long-term capital growth.
Principal Strategies. Under normal circumstances, the Target Fund at least 80% of its net assets (plus the amount of any borrowings for investment purposes) in natural resource investments. Natural resource investments are securities of issuers that (1) have at least 50% of their assets in natural resources, such as metals, fuels, timber, underdeveloped land and agricultural products or (2) derive at least 50% of their annual revenues from owning, exploring, mining, processing or otherwise developing, or providing goods and services with respect to, natural resources. These investments may also include synthetic instruments that have economic characteristics similar to these securities. Under normal circumstances, the Acquiring Fund invests at least 80% of its net assets (plus the amount of any borrowing for investment purposes) in securities of large companies. Each Fund has a different investment strategy, as set forth below:
Target Fund Principal Investment Strategies.
The Target Fund invests primarily in equity securities of companies in a variety of natural resource-related sectors, including energy, chemicals, oil, gas, paper, mining, steel or agriculture. The Target Fund also concentrates its investments in one or more of these sectors or in one or more issuers in the natural resources-related industries and, as a non-diversified fund under the Investment Company Act of 1940, focuses its investments in the securities of a relatively few number of issuers. In addition, the Target Fund intends to invest in real estate investment trusts (REITs).
The Target Fund typically invests in both U.S. and non-U.S. companies, including companies located in emerging markets, and in securities denominated in both U.S. dollars and foreign currencies. The Target Fund may invest in securities of issuers with any market capitalization. Should the Adviser determine that the Target Fund would benefit from reducing the percentage of its net assets invested in natural resource investments from 80% to a lesser amount, it will notify shareholders at least 60 days prior to the change.
Acquiring Fund Principal Investment Strategies.
In the case of the Acquiring Fund, the Adviser focuses mainly on the securities of large domestic and international companies which have market capitalizations similar to those in widely known indices such as the S&P 500 Index, the Russell 1000® Index, or the large company market capitalizations classifications published by Lipper, Inc. Should the Adviser determine that the Acquiring Fund would benefit from reducing the percentage of its assets invested in securities of large cap companies from 80% to a lesser amount, it will notify shareholders at least 60 days prior to the change.
The Acquiring Fund seeks to achieve its investment objective by investing primarily in domestic and international common stocks. The Adviser uses fundamental, quantitative, and technical investment research techniques to determine what stocks to buy and sell. The Acquiring Fund may sell securities for a variety of reasons, such as to secure gains, limit losses, or reposition assets into more promising opportunities.
Fund Holdings. A description of the Funds’ policies and procedures with respect to the disclosure of the Funds’ portfolio securities is available on the Funds’ website.
The Funds are subject to some similar principal risks, although the risks between a sector fund and a large cap stock fund do differ. The Target Fund is subject to Natural Resources Industry Risk, Precious Metal-Related Securities Risk, Small and Mid Cap Risk, Non-Diversified Risk, and Real Estate Investment Trust (REIT) Risk. The Acquiring Fund is subject to Large Cap Stock Risk. Both Funds are subject to Market Risk, Issuer Risk, Foreign Securities Risk, and Investment Adviser Risk. Both Funds are also subject to Volatility Risk, though each may be subject to different types of volatility risk. These risks are described below.
- 3 -
Table of Contents
Principal risks to which both Funds are subject
Market Risk. Over time, securities markets generally tend to move in cycles with periods when security prices rise and periods when security prices decline. The value of the Fund’s investments may move with these cycles and, in some instances, increase or decrease more than the applicable market(s) as measured by the Fund’s benchmark index(es). The securities markets may also decline because of factors that affect a particular industry.
Issuer Risk. Issuer risk is the possibility that factors specific to a company to which the Fund’s portfolio is exposed will affect the market prices of the company’s securities and therefore the value of the Fund. Some factors affecting the performance of a company include demand for the company’s products or services, the quality of management of the company and brand recognition and loyalty. Common stock of a company is subordinate to other securities issued by the company. If a company becomes insolvent, interests of investors owning common stock will be subordinated to the interests of other investors in, and general creditors of, the company.
Foreign Securities Risk. To the extent the Fund’s portfolio is exposed to foreign securities, it is subject to various risks associated with such securities. Foreign securities are generally more volatile than their domestic counterparts, in part because of higher political and economic risks, lack of reliable information and fluctuations in currency exchange rates. Foreign securities may also be more difficult to resell than comparable U.S. securities because the markets for foreign securities are often less liquid. Even when a foreign security increases in price in its local currency, the appreciation may be diluted by adverse changes in exchange rates when the security’s value is converted to U.S. dollars. Foreign withholding taxes also may apply and errors and delays may occur in the settlement process for foreign securities. All of these risks may be heightened for securities of issuers located in, or with significant operations in, emerging markets countries.
Investment Adviser Risk. The Fund is actively managed and the success of its investment strategy depends significantly on the skills of the adviser(s) in assessing the potential of the investments in which the Fund invests. This assessment of investments may prove incorrect, resulting in losses or poor performance, even in rising markets.
Volatility Risk. Volatility risk is the risk that certain types of securities shift in and out of favor depending on market and economic conditions as well as investor sentiment.
Additional principal risks to which only the Target Fund is subject
Volatility Risk. The Target Fund follows an investing style that favors value investments. Value style investing includes the risk that stocks of undervalued companies may not rise as quickly as anticipated if the market does not recognize their intrinsic value or if value stocks are out of favor.
Natural Resources Industry Risk. As a sector fund that invests primarily in the natural resource sector, the Target Fund is subject to the risks associated with natural resource investments in addition to the general risk of the securities markets. The Target Fund therefore is more vulnerable to price movements of natural resources and factors that particularly affect the oil, gas, mining, energy, chemicals, paper, steel or agricultural sectors than a more broadly diversified fund. Because the Target Fund invests primarily in companies with natural resource assets, there is the risk that the Target Fund will perform poorly during a downturn in natural resource prices.
Precious Metal-Related Securities Risk. Prices of precious metals and of precious metal-related securities historically have been very volatile. The high volatility of precious metal prices may adversely affect the financial condition of companies involved with precious metals. The production and sale of precious metals by governments or central banks or other larger holders can be affected by various economic, financial, social and political factors, which may be unpredictable and may have a significant impact on the prices of precious metals. Other factors that may affect the prices of precious metals and securities related to them include changes in inflation, the outlook for inflation, and changes in industrial and commercial demand for precious metals.
Small and Mid Cap Risk. Small- and medium-sized companies often have greater price volatility, lower trading volumes, and less liquidity than larger, more established companies. These companies tend to have smaller revenues, narrower product lines, less management depth and experience, smaller shares of their product or service markets, fewer financial resources, and less competitive strength than larger companies. In addition, small-cap companies seldom pay significant dividends that could cushion returns in a falling market.
Non-Diversified Risk. The Target Fund is not “diversified” within the meaning of the 1940 Act. That means the Target Fund may invest a greater percentage of its assets in the securities of any single issuer compared to other funds. A non-diversified fund is generally more susceptible than a diversified portfolio to the risk that events or developments affecting a particular issuer or industry will significantly affect the Target Fund’s performance.
- 4 -
Table of Contents
Real Estate Investment Trust (REIT) Risk. REITs generally can be divided into three types: equity REITs, mortgage REITs and hybrid REITs (which combine the characteristics of equity REITs and mortgage REITs). Equity REITs will be affected by changes in the values of, and income from, the properties they own, while mortgage REITs may be affected by the credit quality of the mortgage loans they hold. All REIT types may be affected by changes in interest rates. REITs are subject to additional risks, including the fact that they are dependent on specialized management skills that may affect the REITs’ abilities to generate cash flows for operating purposes and for making investor distributions. REITs may have limited diversification and are subject to the risks associated with obtaining financing for real property. As with any investment, there is a risk that REIT securities and other real estate industry investments may be overvalued at the time of purchase. In addition, a REIT can pass its income through to its investors without any tax at the entity level if it complies with various requirements under the Internal Revenue Code. There is the risk, however, that a REIT held by the Target Fund will fail to qualify for this tax-free pass-through treatment of its income. By investing in REITs indirectly through the Target Fund, in addition to bearing a proportionate share of the expenses of the Target Fund, you will also indirectly bear similar expenses of the REITs in which the Target Fund invests.
Additional principal risks to which only the Acquiring Fund is subject
Large Cap Risk. Large cap companies may be unable to respond quickly to new competitive challenges such as changes in technology. They may also not be able to attain the high growth rate of successful smaller companies, especially during extended periods of economic expansion.
The Board. The Board is responsible for the overall supervision of the operations of each Fund and performs the various duties imposed on the directors of investment companies by the 1940 Act and under applicable state law.
The Adviser. Thrivent Asset Mgt. is the investment adviser for each Fund. Thrivent Asset Mgt. and its investment advisory affiliate, Thrivent Financial for Lutherans (“Thrivent Financial”) have been in the investment advisory business since 1986 and managed approximately $96 billion in assets as of December 31, 2014, including approximately $41 billion in mutual fund assets. These advisory entities are located at 625 Fourth Avenue South, Minneapolis, Minnesota 55415.
The Adviser and the Trust received an exemptive order from the SEC that permits the Adviser and the Funds, with the approval of the Board, to retain one or more subadvisers for the Funds, or subsequently change a subadviser, without submitting the respective investment subadvisory agreements, or material amendments to those agreements, to a vote of the shareholders of the applicable Fund. The Adviser will notify shareholders of a Fund if there is a new subadviser for that Fund.
The Funds’ annual report to shareholders discusses the basis for the Board approving the investment advisory agreement during the period covered by the report.
Portfolio Management. David C. Francis, CFA and Darren M. Bagwell, CFA have served as portfolio co-managers of the Target Fund since 2011. Mr. Francis is Vice president of Investment Equities and has been with Thrivent Financial since 2001. Mr. Bagwell has been with Thrivent Financial since 2002 in an investment management capacity and currently is the firm’s Director of Equity Research.
David C. Francis, CFA and Kurt J. Lauber, CFA have served as portfolio managers of the Acquiring Fund since 2011 and 2013, respectively. Mr. Lauber has been with Thrivent Financial since 2004 and previously served as an associate portfolio manager.
The Trust SAI provides information about the portfolio managers’ compensation, other accounts managed by the portfolio managers, and the portfolio managers’ ownership of shares of the Funds.
- 5 -
Table of Contents
Advisory Fees. Each Fund pays an annual investment advisory fee to the Adviser. The advisory contract between the Adviser and the Fund provides for the following advisory fees for each class of shares of a Fund, expressed as an annual rate of average daily net assets:
| Target Fund |
| 0.800% of average daily net assets up to $500 million |
| 0.750% of average daily nets assets over $500 million |
| Acquiring Fund |
| 0.650% of average daily net assets up to $500 million |
| 0.575% of average daily net assets greater than $500 million but not greater than $1 billion |
| 0.500% of average daily net assets greater than $1 billion but not greater than $2 billion |
| 0.475% of average daily net assets greater than $2 billion but not greater than $2.5 billion |
| 0.450% of average daily net assets greater than $2.5 billion but not greater than $5 billion |
| 0.425% of average daily net assets greater than $5 billion |
During the twelve-months ended October 31, 2014, the contractual advisory fees for the Class A shares of the Target Fund were 0.80% of the Target Fund’s average daily net assets, and the contractual advisory fees for the Class I shares of the Target Fund were 0.80% of the Target Fund’s average daily net assets.
During the twelve-months ended October 31, 2014, the contractual advisory fees for the Class A shares of the Acquiring Fund were 0.56% of the Acquiring Fund’s average daily net assets, and the contractual advisory fees for the Class I shares of the Acquiring Fund were 0.56% of the Acquiring Fund’s average daily net assets.
For a complete description of each Fund’s advisory services, see the section of the Trust Prospectus entitled “Management” and the section of the Trust SAI entitled “Investment Adviser, Investment Subadvisers, and Fund Managers.”
12b-1 Plan. The Trust has adopted a Distribution Plan and Agreement pursuant to Rule 12b-1 under the 1940 Act (the “Rule 12b-1 Plan”) with respect to the Class A Shares of each Fund. Thrivent Investment Management Inc. (the “Distributor”), an affiliate of the Adviser, located at 625 Fourth Avenue South, Minneapolis, Minnesota 55415, serves as the distributor of each Fund. Under the Rule 12b-1 Plan, Class A Shares of each Fund pay the Distributor an aggregate fee for distribution and shareholder servicing equal to an annual rate of 0.25% of the average daily net asset value represented by such shares. Institutional Class Shares are not subject to a Rule 12b-1 Plan and the Funds do not pay any percentage of their assets attributable to Institutional Class Shares for distribution or shareholder servicing. For a complete description of these arrangements with respect to each Fund, see the section of the Class A Prospectus entitled “Shareholder Information—Rule 12b-1 Fees” and the section of the Trust SAI entitled “Underwriting and Distribution Service.” These sections are incorporated by reference herein.
Investments in the Target Fund by Certain Affiliated Funds
Other series of the Trust for which Thrivent Asset Mgt. is the investment adviser may invest in one or both of the Target Funds. The investment strategies of these series (the “Affiliated Funds”) permit Thrivent Asset Mgt. to determine whether to invest directly in securities and other investments, in addition to, or instead of, investing in other series of the Fund (including the Target Funds). Over time, Thrivent Asset Mgt. has gradually invested a larger percentage of the Affiliated Funds’ assets in direct investments and has reduced the percentage of assets invested in other series of the Trust. Thrivent Asset Mgt. expects to continue decreasing the percentage of Affiliated Funds’ assets invested in other series over time. This trend of relying more heavily on direct investments is expected to accelerate since Thrivent Asset Mgt. has proposed changes that will simplify the investment advisory fee structure of the Affiliated Funds. These changes would encourage a more streamlined approach of direct investments, while accommodating investments in other series of the Trust when Thrivent Asset Mgt. deems it to be advisable. As a result, the Affiliated Funds are likely to redeem their holdings (if any) out of the Target Funds irrespective of whether the Reorganization is approved. These redemptions would most likely be processed as redemptions-in-kind, with the effect that the Affiliated Funds would receive a pro rata distribution of the Target Funds’ investments. These redemptions may be substantial, relative to the size of the Target Fund(s) prior to such redemption, and are
- 6 -
Table of Contents
likely to occur prior to the effective date of the Reorganization. The effect of these redemptions is not reflected in any of the following: i) the pro forma financial and expense information presented in this Prospectus/Proxy Statement under the headings “COMPARISON OF THE FUNDS – Expenses” and “COMPARISON OF THE FUNDS – Capitalization”; and ii) the pro forma information regarding the Acquiring and Target Funds in the Reorganization SAI.
The table below sets forth the fees and expenses that investors may pay to buy and hold shares of each of the Target Fund and the Acquiring Fund, including (i) the fees and expenses paid by the Target Fund for the twelve-month period ended December 31, 2014, (ii) the fees and expenses paid by the Acquiring Fund for the twelve-month period ended December 31, 2014, (iii) pro forma fees and expenses for the Acquiring Fund for the twelve-month period ended December 31, 2014, assuming the Reorganization had been completed as of the beginning of such period, and (iv) pro forma fees and expenses for the Acquiring Fund for the twelve-month period ended December 31, 2014, assuming that the Target Fund merged into the Acquiring Fund as of the beginning of such period.
| Class A Shares | Institutional Class Shares | |||||||||||||||||||||||
| Actual | Pro Forma | Actual | Pro Forma | |||||||||||||||||||||
| Target Fund | Acquiring Fund | Acquiring Fund (assuming merger with Target Fund) | Target Fund | Acquiring Fund | Acquiring Fund (assuming merger with Target Fund) | |||||||||||||||||||
Shareholder Fees (fees paid directly from your investment) | ||||||||||||||||||||||||
Maximum Sales Charge (Load) Imposed on Purchases (as a percentage of offering price | 5.50 | % | 5.50 | % | 5.50 | % | N/A | N/A | N/A | |||||||||||||||
Maximum Deferred Sales Charge (Load) (as a percentage of net asset value at time of purchase or redemption, whichever is lower)* | 1.00 | % | 1.00 | % | 1.0 | % | N/A | N/A | N/A | |||||||||||||||
Annual Fund Operating Expenses as a Percentage of Average Net Assets (expenses that are deducted from Fund assets) | ||||||||||||||||||||||||
Management Fees | 0.80 | % | 0.56 | % | 0.56 | % | 0.80 | % | 0.56 | % | 0.56 | % | ||||||||||||
Distribution and Service (12b-1 Fees) | 0.25 | % | 0.25 | % | 0.25 | % | — | — | — | |||||||||||||||
Other Expenses | 0.79 | % | 0.21 | % | 0.21 | % | 0.17 | % | 0.05 | % | 0.04 | % | ||||||||||||
Total Annual Operating Expenses | 1.84 | % | 1.02 | % | 1.02 | % | 0.97 | % | 0.61 | % | 0.60 | % | ||||||||||||
Less Expense Reimbursement** | 0.53 | % | — | — | — | — | — | |||||||||||||||||
Net Annual Fund Operating Expenses | 1.31 | % | 1.02 | % | 1.02 | % | 0.97 | % | 0.61 | % | 0.60 | % | ||||||||||||
| * | When you invest $1,000,000 or more, a deferred sales charge of 1% will apply to shares redeemed within one year. |
| ** | The Adviser has contractually agreed, through at least February 28, 2016, to waive certain fees and/or reimburse certain expenses associated with the Class A shares of the Thrivent Natural Resources Fund in order to limit the Net Annual Fund Operating Expenses (excluding Acquired Fund (Underlying Fund) Fees and Expenses, if any) to an annual rate of 1.30% of the average daily net assets of the Class A shares. This contractual provision, however, may be terminated before the indicated termination date upon the mutual agreement between the Independent Trustees of the Fund and the Adviser. |
- 7 -
Table of Contents
Example
The following example, using the actual and pro forma operating expenses for the twelve-month period ended October 31, 2014, is intended to help you compare the costs of investing in the Acquiring Fund pro forma after the Reorganization with the costs of investing in each of the Target Fund and the Acquiring Fund without the Reorganization. The example assumes that you invest $10,000 in each Fund for the time period indicated and that you redeem all of your shares at the end of each period. The example also assumes that your investments have a 5% return each year and that each Fund’s operating expenses remain the same each year. Although your actual returns may be higher or lower, based on these assumptions your costs would be:
| Actual | Pro Forma | |||||||||||
| Target Fund | Acquiring Fund | Acquiring Fund (assuming merger with the Target Fund) | ||||||||||
Total operating expenses for Class A shares assuming redemption at the end of the period | ||||||||||||
One Year | $ | 676 | $ | 648 | $ | 648 | ||||||
Three Years | $ | 1,048 | $ | 857 | $ | 857 | ||||||
Five Years | $ | 1,444 | $ | 1,082 | $ | 1,082 | ||||||
Ten Years | $ | 2,549 | $ | 1,729 | $ | 1,729 | ||||||
Total operating expenses for Institutional Class Shares assuming redemption at the end of the period | ||||||||||||
One Year | $ | 99 | $ | 62 | $ | 61 | ||||||
Three Years | $ | 309 | $ | 195 | $ | 192 | ||||||
Five Years | $ | 536 | $ | 340 | $ | 335 | ||||||
Ten Years | $ | 1,190 | $ | 762 | $ | 750 | ||||||
Portfolio Turnover
Each Fund pays transaction costs, such as commissions, when it buys and sells securities (or “turns over” its portfolio). A higher portfolio turnover rate may indicate higher transaction costs and may result in higher taxes when Fund shares are held in a taxable account. These costs, which are not reflected in Total Annual Operating Expenses or in the Example, affect the Funds’ performance. During the fiscal year ended October 31, 2014, the Acquiring Fund’s portfolio turnover rate was 65% of the average value of its portfolio, and during the fiscal year ended December 31, 2014, the Target Fund’s portfolio turnover rate was 58% of the average value of its portfolio.
Purchase, Valuation, Redemption and Exchange of Shares; Dividends and Distributions
Pricing of Fund Shares. The price of a Fund’s shares is based on the Fund’s net asset value (“NAV”). The Funds determine their NAV once daily at the close of trading on the New York Stock Exchange (“NYSE”), which is normally 4:00 p.m. Eastern Time. The Funds do not determine NAV on holidays observed by the NYSE or on any other day when the NYSE is closed. The NYSE is regularly closed on Saturdays and Sundays, New Year’s Day, Martin Luther King, Jr. Day, Presidents Day, Good Friday, Memorial Day, Independence Day, Labor Day, Thanksgiving Day and Christmas Day.
Each Fund determines its NAV for a particular class by dividing the total Fund assets attributable to that class, less all liabilities attributable to such class, by the total number of outstanding shares of that class. To determine the NAV, the other Funds generally value their securities at current market value using readily available market prices. If market prices are not available or if the Adviser determines that they do not accurately reflect fair value for a security, the Board has authorized the Adviser to make fair valuation determinations pursuant to policies approved by the Board. Fair valuation of a particular security is an inherently subjective process, with no single standard to utilize when determining a security’s fair value. In each case where a security is fair valued, consideration is given to the facts and circumstances relevant to the particular situation. This consideration includes a review of various factors set forth in the pricing policies adopted by the Board. For any portion of a Fund’s assets that are invested in other mutual funds, the NAV is calculated based upon the NAV of the mutual funds in which the Fund invests, and the prospectuses for those mutual funds explain the circumstances under which they will use fair value pricing and the effects of such a valuation.
- 8 -
Table of Contents
Because many foreign markets close before the U.S. markets, significant events may occur between the close of the foreign market and the close of the U.S. markets, when the Fund’s assets are valued, that could have a material impact on the valuation of foreign securities (i.e., available price quotations for these securities may not necessarily reflect the occurrence of the significant event). The Funds, subject to oversight by the Board, evaluate the impact of these significant events and adjust the valuation of foreign securities to reflect the fair value as of the close of the U.S. markets to the extent that the available price quotations do not, in the Adviser’s opinion, adequately reflect the occurrence of the significant events.
Please note that the Target Fund and the Acquiring Fund have identical valuation policies. As a result, there will be no material change to the value of the Target Fund’s assets because of the Reorganization.
Also, the Target Fund and the Acquiring Fund have identical policies with respect to frequent purchases and redemptions and standing allocation orders (for more information, please see Frequent Trading Policies and Monitoring Processes and Standing Allocation Order disclosures in the Acquiring Fund’s Prospectus—these disclosures are incorporated herein by reference). The Reorganization will not affect these policies.
Class A Shares. The Class A Shares of each Fund are subject to an initial sales charge of up to 5.50%. The initial sales charge applicable to Class A Shares of the Acquiring Fund will be waived for Class A Shares acquired in the Reorganization. Any subsequent purchases of Class A Shares of the Acquiring Fund, excluding Class A Shares purchased through the automatic dividend reinvestment plan, after the Reorganization will be subject to an initial sales charge of up to 5.50%. The initial sales charge is reduced for investments in excess of $50,000. Purchases of Class A Shares of each Fund in amounts of $1 million or more are not subject to an initial sales charge, but a contingent deferred sales charge of up to 1.00% may be imposed on certain redemptions made within one year of purchase. No contingent deferred sales charge will be imposed on Class A Shares of the Target Fund in connection with the Reorganization. For additional information, please see the section entitled “Shareholder Information—Class A Shares” in the Class A Prospectus. This section is incorporated by reference herein.
Institutional Class Shares. Institutional Class Shares of each Fund are not subject to an initial sales charge or a contingent deferred sales charge. Institutional Class Shares are offered to institutions, church organizations, retirement plans sponsored by institutions and participants in various mutual fund asset allocation, fee-based investment advisory programs offered by the Distributor. For additional information, please see the section entitled “Shareholder Information—Institutional Class Shares” in the Institutional Class Prospectus. This section is incorporated by reference herein.
Buying Shares. Shares of each Fund may be purchased through a shareholder’s registered representative, by mail, by telephone, by the Internet, by wire transfer, through an automatic investment plan or by exchange from other Thrivent mutual funds. For additional information regarding buying shares of each Fund and exchanging shares of each Fund, see the sections of the Trust Prospectus entitled “Shareholder Information—Buying Shares” and “Shareholder Information—Exchanging Shares Between Funds.”
Redeeming Shares. When a Fund receives a request for redemption, such Fund will redeem such shares at the next calculation of the Fund’s NAV. A Fund may postpone payment or suspend the right of redemption in unusual circumstances, as permitted by the SEC. When a shareholder purchases shares by check, electronic funds transfer (other than bank wire) or automatic investment plan and elects to redeem those shares soon after their purchase, the Fund may delay paying the redemption proceeds until the shareholder’s payment has cleared, which could take up to 10 days or more from the date of purchase. Shares may be redeemed by mail, by phone, by the Internet, by wire/ACH transfer or through a systematic withdrawal plan. For additional information regarding redeeming shares of each Fund, see the section of the Trust Prospectus entitled “Shareholder Information—Redeeming Shares.” This section is incorporated by reference herein.
Dividends and Distributions. Dividends of the Target Fund and the Acquiring Fund, if any, are generally declared and paid annually. Income dividends are derivative from investment income, including dividends, interest, and certain foreign currency gains received by each Fund. Capital gains distributions, if any, usually will be declared and paid in December for the prior twelve-month period ending December 31. Any election made by
- 9 -
Table of Contents
Target Fund shareholders in respect of the receipt of dividends and capital gains distributions will continue to apply to Class A and Institutional Class Shares of the Acquiring Fund received in the Reorganization. For additional information regarding these elections see the section of the Trust Prospectus entitle “Distribution Options.” This section is incorporated by reference herein.
The following table sets forth the capitalization of the Target Fund and the Acquiring Fund, as of October 31, 2014, and the pro forma capitalization of the Acquiring Fund as if the Reorganization occurred on that date. These numbers may differ as of the Closing Date.
| Actual | Pro Forma | |||||||||||
| Target Fund | Acquiring Fund | Acquiring Fund (assuming merger with the Target Fund) | ||||||||||
Net assets | ||||||||||||
Class A Shares | $ | 15,935,713 | $ | 1,593,994,317 | $ | 1,609,930,030 | ||||||
Institutional Class Shares | $ | 81,279,333 | $ | 174,194,494 | $ | 255,473,827 | ||||||
|
|
|
|
|
| |||||||
Total Fund Net Assets | $ | 97,215,046 | $ | 1,768,188,811 | $ | 1,865,403,857 | ||||||
Net asset value per share | ||||||||||||
Class A Shares | $ | 9.34 | $ | 27.75 | $ | 27.75 | ||||||
Institutional Class Shares | $ | 9.37 | $ | 27.99 | $ | 27.99 | ||||||
Shares outstanding | ||||||||||||
Class A Shares | 1,706,698 | 57,443,493 | 58,017,776 | |||||||||
Institutional Class Shares | 8,679,009 | 6,222,741 | 9,126,279 | |||||||||
|
|
|
|
|
| |||||||
Total Shares Outstanding | 10,385,707 | 63,666,234 | 67,144,055 | |||||||||
The pro forma shares outstanding reflect the issuance by the Acquiring Fund of approximately 574,283 shares for Class A Shares and 2,903,538 shares for Institutional Class Shares (for a total of 3,477,821 shares), reflecting the exchange of the assets of the Target Fund for newly issued Class A and Institutional Class Shares of the Acquiring Fund, respectively, at the pro forma net asset value per share. The aggregate value of the Acquiring Fund shares that a Target Fund shareholder receives in the Reorganization will equal the aggregate value of the Target Fund shares owned immediately prior to the Reorganization.
Annual Performance Information
The following chart shows the annual returns of the Target Fund since its inception and the Acquiring Fund for its past ten calendar years. The bar charts include the effects of each Fund’s expenses, but not sales charges. If sales charges were included, returns would be lower than those shown. The table includes the effects of Fund expenses and maximum sales charges and assumes that you sold your shares at the end of the period. After-tax returns are shown only for the Class A Shares and after-tax returns for the Institutional Class Shares will differ from those shown for the Class A Shares. The after-tax returns are calculated using the historical highest individual federal marginal income tax rates and do not reflect the impact of state and local taxes. Actual after-tax returns depend on an investor’s tax situation and may differ from those shown and after-tax returns are not relevant to investors who hold their Fund shares through tax-deferred arrangements such as 401(k) plans or individual retirement accounts. How either Fund performed in the past (before and after taxes) is not necessarily an indication of how it will perform in the future.
- 10 -
Table of Contents
Thrivent Natural Resources Fund—Class A Shares
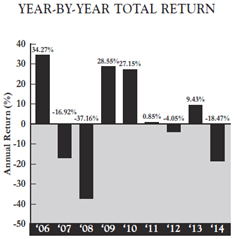
Thrivent Large Cap Stock Fund—Class A Shares
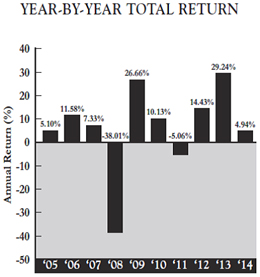
As a result of market activity, current performance may vary from the figures shown.
The Target Fund’s (Class A Shares) total return for the three month period from January 1, 2015 to March 31, 2015 was -1.86%. The Acquiring Fund’s (Class A Shares) total return for the three-month period from January 1, 2015 to March 31, 2015 was 4.19%. Since its inception, the Target Fund’s (Class A Shares) highest quarterly return was 32.53% (for the quarter ended September 30, 2009) and its lowest quarterly return was -38.18% (for the quarter ended December 31, 2008). During the past 10 years, the Acquiring Fund’s (Class A Shares) highest quarterly return was 16.12% (for the quarter ended September 30, 2009) and its lowest quarterly return was -22.40% (for the quarter ended December 31, 2008).
Comparative Performance Information
As a basis for evaluating each Fund’s performance and risks, the following table shows how each Fund’s performance compares with broad-based market indices that the Adviser believes are appropriate benchmarks for such Fund. The Target Fund’s benchmark is the S&P North American Natural Resources Index, which is a capitalization-weighted index that represents the natural resource industry. The Acquiring Fund’s benchmark is the
- 11 -
Table of Contents
MSCI World Large Cap Index—USD Net Returns, which measures the performance of large cap stocks in developed countries throughout the world. Further, the table includes the effects of each Fund’s expenses, but not sales charges. If sales charges were included, returns would be lower than those shown.
Average annual total returns are shown below for each Fund for the periods ended December 31, 2014 (the most recently completed calendar year prior to the date of this Prospectus/Proxy Statement). Remember that past performance of a Fund is not indicative of its future performance.
Average Annual Total Returns for the Period ended December 31, 2014
| Target Fund | Acquiring Fund | |||||||||||||||||||||||
| Past 1 Year | Past 5 Years | Since Inception (6/30/2005 | Past 1 Year | Past 5 Years | Past 10 Years | |||||||||||||||||||
Applicable Fund, Class A (before taxes) | -22.96 | % | 0.74 | % | -0.10 | % | -0.82 | % | 8.93 | % | 4.24 | % | ||||||||||||
(after taxes on distributions) | -23.03 | % | 0.45 | % | -0.90 | % | -3.09 | % | 7.50 | % | 3.00 | % | ||||||||||||
(after taxes on distributions and redemptions) | -12.93 | % | 0.47 | % | -0.34 | % | 1.30 | % | 6.88 | % | 3.14 | % | ||||||||||||
S&P North American Natural Resources Index (reflects no deductions for fees, expenses or taxes) | -9.77 | % | 4.28 | % | 6.34 | % | — | — | — | |||||||||||||||
MSCI World Large Cap Index—USD Net Returns (reflects no deductions for fees, expenses or taxes) | — | — | — | 4.90 | % | 9.89 | % | 5.82 | % | |||||||||||||||
- 12 -
Table of Contents
Financial Highlights of the Acquiring Fund
| Income from Investment Operations | Less Distributions From | Ratio to Average Net Assets** | Ratios to Average Net Assets Before Expenses Waived, Credited or Paid Indirectly** | |||||||||||||||||||||||||||||||||||||||||||||||||||||||||
| Net Asset Value, Beginning of Period | Net Investment Income/ (Loss) | Net Realized and Unrealized Gain/(Loss) on Investments(a) | Total from Investment Operations | Net Investment Income | Net Realized Gain on Investments | Total Distributions | Net Asset Value, End of Period | Total Return(b) | Net Assets, End of Period (in millions) | Expenses | Net Investment Income/ (Loss) | Expenses | Net Investment Income/ (Loss) | Portfolio Turnover Rate | ||||||||||||||||||||||||||||||||||||||||||||||
Class A Shares | ||||||||||||||||||||||||||||||||||||||||||||||||||||||||||||
Year Ended 10/31/2014 | 27.54 | 0.22 | 2.57 | 2.79 | (0.10 | ) | (2.48 | ) | (2.58 | ) | 27.75 | 11.06 | % | 1,594.0 | 1.02 | % | 0.82 | % | 1.02 | % | 0.82 | % | 65 | % | ||||||||||||||||||||||||||||||||||||
Year Ended 10/31/2013 | 23.64 | 0.19 | 5.24 | 5.43 | (0.25 | ) | (1.28 | ) | (1.53 | ) | 27.54 | 24.57 | % | 1,556.5 | 1.05 | % | 0.81 | % | 1.05 | % | 0.81 | % | 66 | % | ||||||||||||||||||||||||||||||||||||
Year Ended 10/31/2012 | 21.30 | 0.20 | 2.29 | 2.49 | (0.15 | ) | — | (0.15 | ) | 23.64 | 11.75 | % | 1,382.5 | 1.09 | % | 0.84 | % | 1.09 | % | 0.84 | % | 124 | % | |||||||||||||||||||||||||||||||||||||
Year Ended 10/31/2011 | 20.87 | 0.13 | 0.37 | 0.50 | (0.07 | ) | — | (0.07 | ) | 21.30 | 2.39 | % | 1,393.5 | 1.11 | % | 0.56 | % | 1.11 | % | 0.56 | % | 146 | % | |||||||||||||||||||||||||||||||||||||
Year Ended 10/31/2010 | 18.87 | 0.06 | 2.04 | 2.10 | (0.10 | ) | — | (0.10 | ) | 20.87 | 11.16 | % | 1,549.4 | 1.13 | % | 0.29 | % | 1.13 | % | 0.29 | % | 185 | % | |||||||||||||||||||||||||||||||||||||
Institutional Class Shares | ||||||||||||||||||||||||||||||||||||||||||||||||||||||||||||
Year Ended 10/31/2014 | 27.75 | 0.35 | 2.58 | 2.93 | (0.21 | ) | (2.48 | ) | (2.69 | ) | 27.99 | 11.53 | % | 174.2 | 0.61 | % | 1.24 | % | 0.61 | % | 1.24 | % | 65 | % | ||||||||||||||||||||||||||||||||||||
Year Ended 10/31/2013 | 23.82 | 0.30 | 5.27 | 5.57 | (0.36 | ) | (1.28 | ) | (1.64 | ) | 27.75 | 25.10 | % | 192.8 | 0.61 | % | 1.25 | % | 0.61 | % | 1.25 | % | 66 | % | ||||||||||||||||||||||||||||||||||||
Year Ended 10/31/2012 | 21.48 | 0.30 | 2.30 | 2.60 | (0.26 | ) | — | (0.26 | ) | 23.82 | 12.27 | % | 170.3 | 0.62 | % | 1.30 | % | 0.62 | % | 1.30 | % | 124 | % | |||||||||||||||||||||||||||||||||||||
Year Ended 10/31/2011 | 21.05 | 0.24 | 0.38 | 0.62 | (0.19 | ) | — | (0.19 | ) | 21.48 | 2.89 | % | 170.2 | 0.60 | % | 1.06 | % | 0.60 | % | 1.06 | % | 146 | % | |||||||||||||||||||||||||||||||||||||
Year Ended 10/31/2010 | 19.02 | 0.15 | 2.09 | 2.24 | (0.21 | ) | — | (0.21 | ) | 21.05 | 11.80 | % | 176.4 | 0.61 | % | 0.81 | % | 0.61 | % | 0.81 | % | 185 | % | |||||||||||||||||||||||||||||||||||||
| (a) | The amount shown may not correlate with the change in aggregate gains and losses of portfolio securities due to the timing of sales and redemptions of fund shares. |
| (b) | Total investment return assumes dividend reinvestment and does not reflect any deduction for applicable sales charges. Not annualized for periods less than one year. |
| * | All per share amounts have been rounded to the nearest cent. |
| ** | Computed on an annualized basis for periods less than one year |
The financial highlights for the Target Fund’s Class A Shares and Institutional Class Shares are available in the Thrivent Mutual Funds prospectus for each respective share class, dated February 27, 2015 and as supplemented through the date hereof and are incorporated herein by reference.
- 13 -
Table of Contents
Thrivent Asset Mgt., 625 Fourth Avenue South, Minneapolis, Minnesota 55415, provides administrative personnel and services necessary to operate the Funds and receives an administration fee from the Funds. The custodian for the Funds is State Street Bank and Trust Company, 225 Franklin Street, Boston, Massachusetts 02110. PricewaterhouseCoopers LLP, 225 South Sixth Street, Suite 1400, Minneapolis, MN 55402, serves as the Trust’s independent registered public accounting firm.
The Trust is an open-end management investment company registered under the Investment Company Act of 1940 (the “1940 Act”) and was organized as a Minnesota Business Trust on March 10, 1987. The Trust is made up of 26 separate series or “Funds.” Each Fund of the Trust, other than the Thrivent Asset Allocation Funds and the Target Fund, is diversified.
The Trust is authorized to issue shares of beneficial interest, par value $.01 per share, divisible into an indefinite number of different series and classes and operates as a “series company” as provided by Rule 18f-2 under the 1940 Act.
The Declaration of Trust of the Trust, as amended through the date hereof (the “Declaration of Trust”) provides that each shareholder shall be deemed to have agreed to be bound by its terms. A vote of shareholders and the Board may amend the Declaration of Trust. The Trust may issue an unlimited number of shares in one or more series as the Board of Trustees may authorize.
Each class is subject to such investment minimums and other conditions as set forth in the Trust’s current prospectuses. Such minimums are identical the same share classes of the Target Fund and the Acquiring Fund (so, for example, the Class A Shares of both Funds have the same initial and subsequent investment minimums). The Reorganization will not affect such investment minimums and other conditions.
Differences in expenses among classes are described in the Trust’s Amended and Restated Plan Pursuant to Rule 18f-3 under the 1940 Act. Class A and Institutional Class Shares pay the expenses associated with their different distribution arrangements. Each class may, at the Trustees’ discretion, also pay a different share of other expenses, not including advisory or custodial fees or other expenses related to the management of the Trust’s assets, if these expenses are actually incurred in a different amount by that class, or if the class receives services of a different kind or to a different degree than the other class. All other expenses will be allocated to each class on the basis of the net asset value of the particular Fund.
Each class of shares has identical voting rights except that each class has exclusive voting rights on any matter submitted to shareholders relating solely to the class or where the interests of one class differ from the interests of the other class. Class A Shares have exclusive voting rights on matters involving the Rule 12b-1 Distribution Plan. Matters submitted to shareholder vote must be approved by each Fund separately except:
| • | when required otherwise by the 1940 Act; or |
| • | when the Trustees determine that the matter does not affect all Funds; then, only the shareholders of the affected Funds may vote. |
Shares are freely transferable, and holders thereof are entitled to receive dividends declared by the Board, and receive the assets of their respective Fund in the event of liquidation. The Trust generally holds shareholder meetings only when required by law or at the written request of shareholders owning at least 10% of the Trust’s outstanding shares. Shareholders may remove the Trustees from office by votes cast in person or by proxy at a shareholder meeting.
At the request of shareholders holding 10% or more of the outstanding shares of the Trust, the Trust will hold a special meeting for the purpose of considering the removal of a Trustee(s) from office, and the Trust will cooperate with and assist shareholders of record who notify the Trust that they wish to communicate with other shareholders for the purpose of obtaining signatures to request such a meeting, all pursuant to and in accordance with Section 16(c) of the 1940 Act.
- 14 -
Table of Contents
Under Massachusetts law, shareholders of a business trust may be held personally liable, under certain circumstances, for the obligations of the Trust. However, the Declaration of Trust disclaims shareholder, Trustee and/or officer liability for acts performed on behalf of the Trust or for Trust obligations that are binding only on the assets and property of the Trust. The Funds include this disclaimer in each agreement, obligation, or contract entered into or executed by the Trust or the Board. The Declaration of Trust provides for indemnification out of the Trust’s assets for all losses and expenses of any shareholder held personally liable for the obligations of the Trust. The risk of a shareholder incurring financial loss on account of shareholder liability is remote because it is limited to circumstances where the Trust itself is unable to meet its obligations.
The Trust’s organizational documents are filed as part of the Trust’s registration statement with the SEC, and shareholders may obtain copies of such documents as described on the first page of this Prospectus/Proxy Statement and in the Questions and Answers preceding this Prospectus/Proxy Statement.
Payments to Broker-Dealers and Other Financial Intermediaries
If you purchase a Fund through a broker-dealer or other financial intermediary, the Fund and its related companies may pay the intermediary for the sale of Fund shares and related services. These payments may create a conflict of interest by influencing the broker-dealer or other intermediary and your salesperson to recommend the Fund over another investment. Ask your salesperson or visit your financial intermediary’s website for more information.
- 15 -
Table of Contents
INFORMATION ABOUT THE REORGANIZATION
Under the Reorganization Agreement, the Target Fund will transfer all of its assets to the Acquiring Fund in exchange for Class A and Institutional Class Shares of the Acquiring Fund. The Acquiring Fund shares issued to the Target Fund will have an aggregate value equal to the aggregate value of the Target Fund’s net assets immediately prior to the Reorganization. Upon receipt by the Target Fund of Acquiring Fund Class A and Institutional Class Shares, the Target Fund will distribute such shares of the Acquiring Fund to Target Fund shareholders. Then, as soon as practicable after the Closing Date of the Reorganization, the Target Fund will dissolve under applicable state law.
The Target Fund will distribute the Acquiring Fund Class A and Institutional Class Shares received by it pro rata to Target Fund shareholders of record in exchange for their interest in Class A and Institutional Class Shares of the Target Fund. This distribution will be accomplished by opening new accounts on the books of the Acquiring Fund in the names of the Target Fund shareholders and transferring to those shareholder accounts the Acquiring Fund Class A and Institutional Class Shares received by the Target Fund. Each newly-opened account on the books of the Acquiring Fund for the previous Target Fund shareholders will represent the respective pro rata number of Acquiring Fund Class A and Institutional Class Shares due such shareholder.
Accordingly, as a result of the Reorganization, each Target Fund shareholder would own Acquiring Fund Class A and Institutional Class Shares that would have an aggregate value immediately after the Reorganization equal to the aggregate value of that shareholder’s Target Fund shares immediately prior to the Reorganization. The interests of each of the Target Fund’s shareholders will not be diluted as a result of the Reorganization. However, as a result of the Reorganization, a shareholder of the Target Fund or the Acquiring Fund will hold a reduced percentage of ownership in the larger combined fund than the shareholder did in either of the separate Funds.
No sales charge or fee of any kind will be assessed to Target Fund shareholders in connection with their receipt of Acquiring Fund Class A and Institutional Class Shares in the Reorganization.
Approval of the Reorganization will constitute approval of amendments to any of the fundamental investment restrictions of the Target Fund that might otherwise be interpreted as impeding the Reorganization, but solely for the purpose of and to the extent necessary for consummation of the Reorganization.
Terms of the Reorganization Agreement
The following is a summary of the material terms of the Reorganization Agreement. This summary is qualified in its entirety by reference to the form of Reorganization Agreement, a form of which is attached as Appendix A to the Reorganization SAI.
Pursuant to the Reorganization Agreement, the Acquiring Fund will acquire all of the assets of the Target Fund on the Closing Date in exchange for Class A and Institutional Class Shares of the Acquiring Fund. Subject to the Target Fund’s shareholders approving the Reorganization, the Closing Date shall occur on August 28, 2015 or such other date as determined by an officer of the Fund.
On the Closing Date, the Target Fund will transfer to the Acquiring Fund all of its assets. The Acquiring Fund will in turn transfer to the Target Fund a number of its Class A and Institutional Class Shares equal in value to the value of the net assets of the Target Fund transferred to the Acquiring Fund as of the Closing Date, as determined in accordance with the valuation method described in the Acquiring Fund’s then current prospectus. In order to minimize any potential for undesirable federal income and excise tax consequences in connection with the Reorganization, the Target Fund will distribute on or before the Closing Date all or substantially all of its undistributed net investment income (including net capital gains) as of such date.
The Target Fund expects to distribute Class A and Institutional Class Shares of the Acquiring Fund received by the Target Fund to shareholders of the Target Fund promptly after the Closing Date and then dissolve.
- 16 -
Table of Contents
The Acquiring Fund and the Target Fund have made certain standard representations and warranties to each other regarding their capitalization, status and conduct of business. Unless waived in accordance with the Reorganization Agreement, the obligations of the parties to the Reorganization Agreement are conditioned upon, among other things:
| • | the approval of the Reorganization by the Target Fund’s shareholders; |
| • | the absence of any rule, regulation, order, injunction or proceeding preventing or seeking to prevent the consummation of the transactions contemplated by the Reorganization Agreement; |
| • | the receipt of all necessary approvals, registrations and exemptions under federal and state laws; |
| • | the truth in all material respects as of the Closing Date of the representations and warranties of the parties and performance and compliance in all material respects with the parties’ agreements, obligations and covenants required by the Reorganization Agreement; |
| • | the effectiveness under applicable law of the registration statement of the Acquiring Fund of which this Prospectus/Proxy Statement forms a part and the absence of any stop orders under the Securities Act of 1933, as amended, pertaining thereto; and |
| • | the receipt of an opinion of counsel relating to the characterization of the Reorganization as a tax-free reorganization for federal income tax purposes (as further described herein under the heading “Material Federal Income Tax Consequences of the Reorganization”). |
The Reorganization Agreement may be terminated or amended by the mutual consent of the parties either before or after approval thereof by the shareholders of the Target Fund, provided that no such amendment after such approval shall be made if it would have a material adverse effect on the interests of such Target Fund’s shareholders. The Reorganization Agreement also may be terminated by the non-breaching party if there has been a material misrepresentation, material breach of any representation or warranty, material breach of contract or failure of any condition to closing.
Reasons for the Proposed Reorganization
In determining whether to recommend approval of the Reorganization Agreement to Target Fund shareholders, the Board considered a number of factors, including, but not limited to: (i) the expenses and advisory fees applicable to the Funds before the proposed Reorganization and the estimated expense ratios of the combined portfolio after the proposed Reorganization; (ii) the comparative investment performance of the Funds; (iii) the future growth prospects of each Fund; (iv) the terms and conditions of the Reorganization Agreement; (v) whether the Reorganization would result in the dilution of shareholder interests; (vi) the compatibility of the Funds’ investment objectives, policies, risks and restrictions; (vii) the anticipated tax consequences of the proposed Reorganization; (viii) the compatibility of the Funds’ service features available to shareholders, including exchange privileges; and (ix) the estimated costs of the Reorganization. The Board concluded that these factors supported a determination to approve the Reorganization Agreement.
The Board believes that the Reorganization would be in the best interests of the Target Fund’s shareholders because: (i) shareholders will become shareholders of a larger combined fund with greater potential to increase asset size and achieve economies of scale; (ii) the Acquiring Fund invests in a diversified portfolio of large cap equities and Management believes it is the most similar of its current offerings to the investment objective and policies of the Target Fund; (iii) the Acquiring Fund has achieved stronger performance over the last one-, three- and five-year periods, with Class A performance differences of 23.41%, 20.83% and 8.29%, respectively; and (iv) the Target Fund shareholders will experience a lower expense ratio in the merged Acquiring Fund.
The Board has determined that the Reorganization is in the best interests of the Target Fund and that the interests of the Target Fund’s shareholders will not be diluted as a result of the Reorganization. In addition, the Board has determined that the Reorganization is in the best interests of the Acquiring Fund and that the interests of the Acquiring Fund shareholders will not be diluted as a result of the Reorganization.
Material Federal Income Tax Consequences of the Reorganization
The following is a general summary of the material anticipated U.S. federal income tax consequences of the Reorganization. This discussion is based upon the Internal Revenue Code of 1986, as amended (the “Code”), Treasury regulations, court decisions, published positions of the Internal Revenue Service (“IRS”) and other applicable authorities, all as in effect on the date hereof and all of which are subject to change or differing interpretations (possibly with retroactive effect). This discussion is limited to U.S. persons who hold shares of the Target Fund as capital assets for U.S. federal income tax purposes on the date of exchange.
- 17 -
Table of Contents
This summary does not address all of the U.S. federal income tax consequences that may be relevant to a particular shareholder or to shareholders who may be subject to special treatment under U.S. federal income tax laws. No assurance can be given that the IRS would not assert or that a court would not sustain a position contrary to any of the tax aspects described below. Shareholders should consult their own tax advisers as to the U.S. federal income tax consequences of the Reorganization to them, as well as the effects of state, local and non-U.S. tax laws.
The Reorganization is expected to be a tax-free reorganization for U.S. federal income tax purposes. It is a condition to closing the Reorganization that the Target Fund and the Acquiring Fund receive an opinion from Reed Smith LLP, special counsel to each Fund, dated as of the Closing Date, regarding the characterization of the Reorganization as a “reorganization” within the meaning of Section 368(a)(1) of the Code. As such a reorganization, the U.S. federal income tax consequences of the Reorganization can be summarized as follows: to the effect that on the basis of existing provisions of the Code, the Treasury regulations promulgated thereunder, current administrative rules and court decisions, generally for U.S. federal income tax purposes, except as noted below:
| • | the Reorganization will constitute a reorganization within the meaning of Section 368(a)(1) of the Code, and the Target Fund and the Acquiring Fund will each be a “party to a reorganization” within the meaning of Section 368(b) of the Code; |
| • | under Section 361 of the Code, no gain or loss will be recognized by the Target Fund upon the transfer of its assets to the Acquiring Fund in exchange for Acquiring Fund shares, or upon the distribution of Acquiring Fund shares by the Target Fund to its shareholders in liquidation; |
| • | under Section 1032 of the Code, no gain or loss will be recognized by the Acquiring Fund upon receipt of the assets transferred to the Acquiring Fund in exchange for Acquiring Fund shares; |
| • | under Section 362(b) of the Code, the Acquiring Fund’s tax basis in each asset that the Acquiring Fund receives from the Target Fund will be the same as the Target Fund’s tax basis in such asset immediately prior to such exchange; |
| • | under Section 1223(2) of the Code, the Acquiring Fund’s holding periods in each asset will include the Target Fund’s holding periods in such asset; |
| • | under Section 354 of the Code, no gain or loss will be recognized by shareholders of the Target Fund on the distribution of Acquiring Fund shares to them in exchange for their shares of the Target Fund; |
| • | under Section 358 of the Code, the aggregate tax basis of the Acquiring Fund shares that the Target Fund’s shareholders receive in exchange for their Target Fund shares will be the same as the aggregate tax basis of the Target Fund shares exchanged therefor; |
| • | under Section 1223(1) of the Code, a Target Fund shareholder’s holding period for the Acquiring Fund shares received in the Reorganization will be determined by including the holding period for the Target Fund shares exchanged therefor, provided that the shareholder held the Target Fund shares as a capital asset on the date of the exchange; and |
| • | under Section 381 of the Code, the Acquiring Fund will succeed to and take into account the items of the Target Fund described in Section 381(c) of the Code, subject to the conditions and limitations specified in Section 381, 382, 383 and 384 of the Code and the Treasury regulations thereunder. |
The opinion will be based on certain factual certifications made by the officers of the Target Fund and the Acquiring Fund and will also be based on customary assumptions such as the assumption that the Reorganization will be consummated in accordance with the Reorganization Agreement. The opinion is not a guarantee that the tax consequences of the Reorganization will be as described above. There is no assurance that the IRS or a court would agree with the opinion.
The Acquiring Fund intends to continue to be taxed under the rules applicable to regulated investment companies as defined in Section 851 of the Code which are the same rules currently applicable to Target Fund. In connection with the Reorganization, on or before the Closing Date, the Target Fund will declare to its shareholders a dividend which, together with all of its previous distributions, will have the effect of distributing to shareholders all of its investment company taxable income (computed without regard to the deduction for dividends paid), net tax-exempt interest income and net capital gains through the Closing Date.
- 18 -
Table of Contents
A regulated investment company is permitted to carryforward net capital losses; however, net capital losses incurred in taxable years beginning on or before December 22, 2010 can be carried forward for eight taxable years only. Additionally capital losses incurred in taxable years beginning on or before December 22, 2010 cannot be utilized to offset capital gains until all net capital losses arising in tax years beginning after December 22, 2010 have been utilized. As a result, some net capital loss carryforwards incurred on or before December 22, 2010 may expire unused.
Immediately prior to the Reorganization, the Target Fund is not expected to have any unutilized capital loss carryforwards. The final amount of unutilized capital loss carryforwards for the Target Fund is subject to change and will not be determined until the Closing Date. As of April 9, 2015, the capital loss carryforward of the Target Fund and the Acquiring Fund was $5,753,526 and $0, respectively.
Generally, the Acquiring Fund will succeed to the capital loss carryforwards of the Target Fund, subject to the limitations described below. If the Target Fund has capital loss carryforwards, such capital losses would, in the absence of the Reorganization, generally be available to offset Target Fund capital gains, thereby reducing the amount of capital gain net income that must be distributed to the Target Fund shareholders.
Under Sections 382 and 383 of the Code, an “equity structure shift” arising as a result of a reorganization under Section 368(a)(1) of the Code can result in limitations on the post-reorganization Fund’s use of capital loss carryforwards of the participating Funds. An “equity structure shift” can trigger limitations on capital loss carryforwards where there is a more than 50% change in the ownership of a Fund.
The ability of Large Cap Stock Fund to use this capital loss carryforward in the future is anticipated to be limited because Natural Resources Fund is expected to undergo an “equity structure shift”. As a result, the Acquiring Fund will be able to use such capital loss carryforwards in any year only up to an amount generally equal to the product of (i) the value of Target Fund on the date of the reorganization and (ii) the long-term tax-exempt rate as of that date, as published by the IRS. Based on these limitations, approximately $3.1 million of the Target Fund’s capital loss carryforward will not be available to offset gains. Management believes that the benefits to shareholders of the Target Fund in terms of lower expenses and the potential opportunity for better performance over the longer term outweigh the loss of such capital loss carryforwards.
This summary of the U.S. federal income tax consequences of the Reorganization is made without regard to the particular facts and circumstances of any shareholder. Shareholders are urged to consult their own tax advisors as to the specific consequences to them of the Reorganization, including the applicability and effect of state, local, non-U.S. and other tax laws.
It is not expected that the Reorganization will be a taxable event for any shareholder.
Expenses of the Reorganization
The expenses of the Reorganization will be paid by the Adviser or an affiliate and will not be borne by shareholders of the Target Fund.
Reorganization expenses include, but are not limited to: all costs related to the preparation and distribution of materials distributed to the Board; all expenses incurred in connection with the preparation of the Reorganization Agreement and a registration statement on Form N-14; SEC and state securities commission filing fees and legal and audit fees in connection with each Reorganization; the costs of printing and distributing this Prospectus/Proxy Statement; legal fees incurred preparing materials for the Boards attending the Board meetings and preparing the Board minutes; auditing fees associated with the Fund’s financial statements; portfolio transfer taxes (if any); and any similar expenses incurred in connection with the Reorganization. Management of the Funds estimates the total cost of the Reorganization to be approximately $85,000. If the Reorganization is not approved by shareholders, the Adviser will still bear the costs of the proposed Reorganization.
- 19 -
Table of Contents
Any brokerage charges associated with the purchase or disposition of portfolio investments by the Target Fund prior to the Reorganization will be borne by the Target Fund. Any brokerage charges associated with the purchase or disposition of portfolio investments by the Acquiring Fund after the Reorganization will be borne by the Acquiring Fund. However, the Adviser has agreed to provide a reimbursement of investment advisory fees to the Acquiring Fund in the amount of $14,000, which is the estimated brokerage costs that will be incurred by the Acquiring Fund and Target Fund as a result of the Reorganization. Such reimbursement will be accrued during the month following the closing of the Reorganization.
The Board has unanimously approved the Reorganization, subject to shareholder approval. Approval of the Reorganization requires the affirmative vote of a “Majority of the Outstanding Voting Securities” of the Target Fund, which is, under the 1940 Act, the lesser of (1) 67% or more of the shares of the Fund present at the Meeting if the holders of more than 50% of the outstanding shares of the Fund are present or represented by proxy, or (2) more than 50% of the outstanding shares of the Fund.
The Board recommends voting “FOR” the proposed Reorganization.
At the close of business on the Record Date, the Acquiring Fund had outstanding shares. As of the Record Date, the trustees and officers of the Acquiring Fund as a group owned less than 1% of the shares of the Acquiring Fund. As of the Record Date, no person was known by the Acquiring Fund to own beneficially or of record as much as 5% of the Acquiring Fund shares except as follows:
Name | Class of Shares | Approximate Percentage of Ownership | ||||
| % | ||||||
|
|
| ||||
| % | ||||||
|
|
| ||||
| % | |||||
At the close of business on the Record Date, the Target Fund had outstanding shares. As of the Record Date, the trustees and officers of the Target Fund as a group owned less than 1% of the shares of the Target Fund. As of the Record Date, no person was known by the Target Fund to own beneficially or of record as much as 5% of the shares of the Target Fund except as follows:
Name | Class of Shares | Approximate Percentage of Ownership | ||||
| % | ||||||
|
|
| ||||
| % | ||||||
|
|
| ||||
Annual Meeting of Shareholders
There will be no annual or further special meetings of shareholders of the Trust unless required by applicable law or called by the Board in its discretion. Shareholders wishing to submit proposals for inclusion in a proxy statement for a subsequent shareholder meeting should send their written proposals to the Secretary of the Fund, 625 Fourth Avenue South, Minneapolis, Minnesota 55415. Shareholder proposals should be received in a reasonable time before the solicitation is made.
VOTING INFORMATION AND REQUIREMENTS
Approval of the Reorganization requires the affirmative vote of a “Majority of the Outstanding Voting Securities” of the Target Fund, which is, under the 1940 Act, the lesser of (1) 67% or more of the shares of the Fund present at the Meeting if the holders of more than 50% of the outstanding shares of the Fund are present or represented by proxy, or (2) more than 50% of the outstanding shares of the Fund.
- 20 -
Table of Contents
The Board has fixed the close of business on June 16, 2015, as the Record Date for the determination of shareholders entitled to notice of, and to vote at, the Meeting. Target Fund shareholders on the Record Date are entitled to one vote for each share held, with no shares having cumulative voting rights.
One-third of the shares of the Target Fund outstanding and entitled to vote at the Meeting represented in person or by proxy constitutes a quorum.
Target Fund shareholders may vote in any one of four ways: (i) via the Internet, (ii) by telephone, (iii) by mail, by returning the proxy card, or (iv) in person at the Meeting. Instructions for Internet and telephone voting are included with the enclosed proxy materials. Shareholders who deliver voting instructions by methods (i), (ii) or (iii) may revoke them at any time prior to the Meeting by delivering a written notice of revocation, by executing another proxy card bearing a later date or by attending the Meeting and giving voting instructions in person. Merely attending the Meeting, however, will not revoke any previously submitted proxy. The required control number for Internet and telephone voting is printed on the enclosed proxy card. The control number is used to match voting proxy cards with shareholders’ respective accounts and to ensure that, if multiple proxy cards are executed, shares are voted in accordance with the proxy card bearing the latest date. The Target Fund employs procedures for Internet and telephone voting, such as requiring the control number from the proxy card in order to vote by either of these methods, which it considers to be reasonable to confirm that the instructions received are genuine. If reasonable procedures are employed, the Target Fund will not be liable for following Internet or telephone votes which it believes to be genuine.
Abstentions and broker non-votes (i.e., where a nominee such as a broker holding shares for beneficial owners votes on certain matters pursuant to discretionary authority or instructions from beneficial owners, but with respect to one or more proposals does not receive instructions from beneficial owners or does not exercise discretionary authority) will be deemed present for quorum purposes. Abstentions and broker non-votes have the same effect as votes “AGAINST” the Reorganization.
All properly executed proxies received prior to the Meeting will be voted at the Meeting in accordance with the instructions marked thereon or otherwise as provided therein. Proxies received prior to the Meeting on which no vote is indicated will be voted “FOR” the approval of the proposed Reorganization.
Solicitation of proxies is being made primarily by the mailing of this Notice and Prospectus/Proxy Statement with its enclosures on or about July 1, 2015. Shareholders of the Target Fund whose shares are held by nominees, such as brokers, can vote their proxies by contacting their respective nominee. In addition to the solicitation of proxies by mail, employees of the Adviser and its affiliates, without additional compensation, may solicit proxies in person or by telephone, telegraph, facsimile or oral communication. The Target Fund may retain Computershare Fund Services (“Computershare”), a professional proxy solicitation firm, to assist with any necessary solicitation of proxies. We do not anticipate any expense for additional telephone solicitation by Computershare. The proxy solicitation expenses, if any, are an expense of the Reorganization and will be allocated as described above.
Other Matters to Come Before the Meeting
The Board knows of no business other than that described in the Notice that will be presented for consideration at the Meeting. If any other matters are properly presented, it is the intention of the persons named on the enclosed proxy to vote proxies in accordance with their best judgment.
In the event that a quorum is present at the Meeting but sufficient votes to approve the proposed Reorganization are not received, proxies (including abstentions and broker non-votes) will be voted in favor of one or more adjournments of the Meeting to permit further solicitation of proxies on the proposed Reorganization, provided that the Board determines that such an adjournment and additional solicitation is reasonable and in the interest of shareholders based on a consideration of all relevant factors, including the nature of the particular
- 21 -
Table of Contents
proposals, the percentage of votes then cast, the percentage of negative votes cast, the nature of the proposed solicitation activities and the nature of the reasons for such further solicitation. Any such adjournment will require the affirmative vote of the holders of a majority of the outstanding shares voted at the session of the Meeting to be adjourned.
If you cannot be present in person, you are requested to fill in, sign and return the enclosed proxy card, for which, no postage is required if mailed in the United States, or record your voting instructions by telephone or via the Internet promptly.
Michael W. Kremenak |
| Secretary |
| Thrivent Mutual Funds |
- 22 -
Table of Contents
STATEMENT OF ADDITIONAL INFORMATION
Relating to the Acquisition of the Assets of
Thrivent Partner Small Cap Growth Fund and
Thrivent Partner Small Cap Value Fund
By and In Exchange for Shares of
Thrivent Small Cap Stock Fund
Thrivent Mid Cap Growth Fund and
Thrivent Partner Mid Cap Value Fund
By and In Exchange for Shares of
Thrivent Mid Cap Stock Fund
Thrivent Natural Resources Fund
By and In Exchange for Shares of
Thrivent Large Cap Stock Fund
, 2015
This Statement of Additional Information is available to the shareholders of Thrivent Partner Small Cap Growth Fund, Thrivent Partner Small Cap Value Fund, Thrivent Mid Cap Growth Fund, Thrivent Partner Mid Cap Value Fund, and Thrivent Natural Resources Fund (each a “Target Fund”), each a series of Thrivent Mutual Funds (the “Trust”), in connection with the proposed reorganizations (“the Reorganizations”) whereby all of the assets of the Target Fund would be transferred to Thrivent Small Cap Stock Fund, Thrivent Mid Cap Stock Fund, and Thrivent Large Cap Stock Fund (each, as applicable and as previously specified in the heading hereto, the “Acquiring Fund”), a series of the Trust, in exchange for Class A and Institutional Class Shares of the Acquiring Fund. Unless otherwise defined herein, capitalized terms have the meanings given to them in the Prospectus/Proxy Statement dated , 2015 related to the Reorganizations (the “Prospectus/Proxy Statement”). The Acquiring Fund and the Target Funds are sometimes referred to herein individually as a “Fund” or collectively as the “Funds”.
This Statement of Additional Information is not a prospectus and should be read in conjunction with the Prospectus/Proxy Statement. A copy of the Prospectus/Proxy Statement may be obtained, without charge, from, Computershare Fund Services by calling toll-free (866) 865-3843 or writing Computershare Fund Services, 280 Oser Avenue Hauppauge, NY 11788-8811.
The Acquiring Fund will provide, without charge, upon the request of any person to whom this Statement of Additional Information is delivered, a copy of any and all documents that have been incorporated by reference in the registration statement of which this Statement of Additional Information is a part.
Table of Contents
| Page | ||||
| 1 | ||||
| 1 | ||||
| 1 | ||||
| A-1 | ||||
Appendix B — Statement of Additional Information of the Trust | B-1 | |||
Table of Contents
The shareholders of the Target Funds are being asked to approve an Agreement and Plan of Reorganization (the “Reorganization Agreement”) pursuant to which each Target Fund would (i) transfer all of its assets to the Acquiring Fund in exchange for Class A and Institutional Share Class Shares of the Acquiring Fund, (ii) distribute such Acquiring Fund shares to shareholders of the Target Funds, and (iii) dissolve. A Form of the Reorganization Agreement is attached hereto as Appendix A.
ADDITIONAL INFORMATION ABOUT THE FUNDS
Incorporated herein by reference in its entirety is the Statement of Additional Information for the Trust, dated February 27, 2015 and as supplemented through the date hereof, which was filed with the Securities and Exchange Commission (the “SEC”) on February 26, 2015 and is attached hereto as Appendix B.
Incorporated herein by reference in their respective entireties are:
| (i) | the audited annual financial statements of each Target Fund, as of each Fund’s fiscal year end, along with the opinion of independent registered public accounting firm, included as part of each Target Fund’s Form N-CSR as filed with the SEC on December 29, 2014 (with the exception of the Thrivent Natural Resources Fund’s Form N-CSR, which was filed with the SEC on February 26, 2015); and |
| (ii) | the audited annual financial statements of the Acquiring Fund, as of each Fund’s fiscal year end, along with the opinion of independent registered public accounting firm, included as part of the Acquiring Fund’s Form N-CSR as filed with the SEC on December 29, 2014. |
Annual reports referenced as part of a Fund’s filing on Form N-CSR may be obtained by following the instructions on the cover of this Statement of Additional Information and may be reviewed and copied at the SEC’s Public Reference Room in Washington, DC or on the EDGAR database on the SEC’s Internet site (http://www.sec.gov). Information on the operation of the SEC’s Public Reference Room may be obtained by calling the SEC at (202) 551-8090. You can also request copies of these materials, upon payment of a duplicating fee, by electronic request at the SEC’s e-mail address (publicinfo@sec.gov) or by writing the Public Reference Section of the SEC, Washington, DC 20549-0102.
In addition to the financial statements incorporated herein by reference, this Statement of Additional Information contains the following unaudited pro forma information for each of the following Target Funds and Acquiring Funds:
| (i) | the pro forma statements of assets and liabilities of Thrivent Partner Small Cap Growth Fund (Target Fund) and Thrivent Small Cap Stock Fund (Acquiring Fund) as of October 31, 2014; |
| (ii) | the pro forma statements of assets and liabilities of Thrivent Partner Small Cap Value Fund (Target Fund) and Thrivent Small Cap Stock Fund (Acquiring Fund) as of October 31, 2014; |
| (iii) | the pro forma statements of assets and liabilities of Thrivent Partner Small Cap Growth Fund (Target Fund) and Thrivent Partner Small Cap Value Fund (Target Fund) and Thrivent Small Cap Stock Fund (Acquiring Fund) as of October 31, 2014; |
| (iv) | the pro forma statements of assets and liabilities of Thrivent Mid Cap Growth Fund (Target Fund) and Thrivent Mid Cap Stock Fund (Acquiring Fund) as of October 31, 2014 |
| (v) | the pro forma statements of assets and liabilities of Thrivent Partner Mid Cap Value Fund and Thrivent Mid Cap Stock Fund (the Acquiring Fund) as of October 31, 2014; |
| (vi) | the pro forma statements of assets and liabilities of Thrivent Mid Cap Growth Fund (Target Fund) and Thrivent Partner Mid Cap Value Fund (Target Fund) and Thrivent Mid Cap Stock Fund (Acquiring Fund) as of October 31, 2014; |
Table of Contents
| (vii) | the pro forma statements of operations of Thrivent Partner Small Cap Growth Fund (Target Fund) and Thrivent Small Cap Stock Fund (Acquiring Fund) as of October 31, 2014; |
| (viii) | the pro forma statements of operations of Thrivent Partner Small Cap Value Fund (Target Fund) and Thrivent Small Cap Stock Fund (Acquiring Fund) as of October 31, 2014; |
| (ix) | the pro forma statements of operations of Thrivent Partner Small Cap Growth Fund (Target Fund) and Thrivent Partner Small Cap Value Fund (Target Fund) and Thrivent Small Cap Stock Fund (Acquiring Fund) as of October 31, 2014; |
| (x) | the pro forma statements of operations of Thrivent Mid Cap Growth Fund (Target Fund) and Thrivent Mid Cap Stock Fund (Acquiring Fund) as of October 31, 2014 |
| (xi) | the pro forma statements of operations of Thrivent Partner Mid Cap Value Fund and Thrivent Mid Cap Stock Fund (the Acquiring Fund) as of October 31, 2014; |
| (xii) | the pro forma statements of operations of Thrivent Mid Cap Growth Fund (Target Fund) and Thrivent Partner Mid Cap Value Fund (Target Fund) and Thrivent Mid Cap Stock Fund (Acquiring Fund) as of October 31, 2014; |
| (xiii) | the pro forma schedule of investments of Thrivent Partner Small Cap Growth Fund (Target Fund) and Thrivent Small Cap Stock Fund (Acquiring Fund) as of October 31, 2014; |
| (xiv) | the pro forma schedule of investments of Thrivent Partner Small Cap Value Fund (Target Fund) and Thrivent Small Cap Stock Fund (Acquiring Fund) as of October 31, 2014; |
| (xv) | the pro forma schedule of investments of Thrivent Partner Small Cap Growth Fund (Target Fund) and Thrivent Partner Small Cap Value Fund (Target Fund) and Thrivent Small Cap Stock Fund (Acquiring Fund) as of October 31, 2014; |
| (xvi) | the pro forma schedule of investments of Thrivent Mid Cap Growth Fund (Target Fund) and Thrivent Mid Cap Stock Fund (Acquiring Fund) as of October 31, 2014 |
| (xvii) | the pro forma schedule of investments of Thrivent Partner Mid Cap Value Fund and Thrivent Mid Cap Stock Fund (the Acquiring Fund) as of October 31, 2014; |
| (xviii) | the pro forma schedule of investments of Thrivent Mid Cap Growth Fund (Target Fund) and Thrivent Partner Mid Cap Value Fund (Target Fund) and Thrivent Mid Cap Stock Fund (Acquiring Fund) as of October 31, 2014; |
| (ixx) | the notes to the pro forma financial statements of Thrivent Partner Small Cap Growth Fund (Target Fund) and Thrivent Partner Small Cap Value Fund (Target Fund) and Thrivent Small Cap Stock Fund (Acquiring Fund) as of October 31, 2014; and |
| (xx) | the notes to the pro forma financial statements of Thrivent Mid Cap Growth Fund (Target Fund) and Thrivent Partner Mid Cap Value Fund (Target Fund) and Thrivent Mid Cap Stock Fund (Acquiring Fund) as of October 31, 2014. |
This pro forma financial information gives effect to the proposed reorganization whereby all of the assets of each Target Fund would be transferred to the Acquiring Fund in exchange for Shares of the Acquiring Fund (earlier defined as a “Reorganization”). Under U.S. generally accepted accounting principles, the historical cost of investment securities will be applied to the surviving entity (i.e., the Acquiring Fund).
The unaudited pro forma combined statement of assets and liabilities and schedule of investments assumes that the Reorganization occurred on November 1, 2014, and the unaudited pro forma combined statement of operations, for the year ended October 31, 2014, present the results of operations of each Acquiring Fund as if the Reorganization had occurred on the first business day following the year ended October 31, 2014. The pro forma results of operations are not necessarily indicative of actual future results of operations. The statements of asset and liabilities and schedule of investments have been derived from the books and records of each Target Fund and Acquiring Fund utilized in calculating net asset values at October 31, 2014. The pro forma statements of operations for the year ended October 31, 2014 have been derived from the books and records of each Target Fund and Acquiring Fund at October 31, 2014.
- 2 -
Table of Contents
The unaudited pro forma combined financial statements should be read in conjunction with the separate annual financial statements of the Target Funds and the Acquiring Funds, which are incorporated herein by reference.
- 3 -
Table of Contents
Statement of Assets and Liabilities (unaudited) As of October 31, 2014 | Partner Small Cap Growth Fund | Small Cap Stock Fund | Pro-Forma Adjustments (1) | Small Cap Stock Fund Pro-Forma Combined (2) | ||||||||||||
Assets | ||||||||||||||||
Investments at cost | $ | 16,932,032 | $ | 307,284,011 | $ | 324,216,043 | ||||||||||
Investments in securities at value | 16,961,821 | 340,709,691 | $ | 357,671,512 | ||||||||||||
Investments in affiliates at value | 718,618 | 23,996,755 | $ | 24,715,373 | ||||||||||||
Investments at Value | 17,680,439 | 364,706,446 | 382,386,885 | |||||||||||||
Cash | 4,822 | — | 4,822 | |||||||||||||
Dividends and interest receivable | 298 | 116,505 | 116,803 | |||||||||||||
Prepaid expenses | 11,645 | 10,711 | 22,356 | |||||||||||||
Receivable for investments sold | 112,899 | 697,418 | 810,317 | |||||||||||||
Receivable for fund shares sold | 19,592 | 34,798 | 54,390 | |||||||||||||
Total Assets | 17,829,695 | 365,565,878 | 383,395,573 | |||||||||||||
Liabilities | ||||||||||||||||
Accrued expenses | 41,814 | 140,652 | 182,466 | |||||||||||||
Payable for investments purchased | 83,195 | 918,837 | 1,002,032 | |||||||||||||
Payable upon return of collateral for securities loaned | 217,215 | 13,527,930 | 13,745,145 | |||||||||||||
Payable for fund shares redeemed | 5,026 | 70,658 | 75,684 | |||||||||||||
Payable to affiliate | 6,967 | 277,977 | 284,944 | |||||||||||||
Total Liabilities | 354,217 | 14,936,054 | 15,290,271 | |||||||||||||
Net Assets | ||||||||||||||||
Capital stock (beneficial interest) | 14,959,530 | 256,563,779 | 271,523,309 | |||||||||||||
Accumulated undistributed net investment income/(loss) | (26,040 | ) | (97,003 | ) | (123,043 | ) | ||||||||||
Accumulated undistributed net realized gain/(loss) | 1,793,581 | 36,740,575 | 38,534,156 | |||||||||||||
Net unrealized appreciation/(depreciation) on: | ||||||||||||||||
Investments | 748,407 | 57,422,435 | 58,170,842 | |||||||||||||
Foreign currency transactions | 38 | 38 | ||||||||||||||
Total Net Assets | $ | 17,475,478 | $ | 350,629,824 | $ | 368,105,302 | ||||||||||
Class A Share Capital | $ | 17,237,097 | $ | 259,839,518 | $ | 277,076,615 | ||||||||||
Shares of beneficial interest outstanding (Class A) | 1,139,712 | 12,913,722 | 856,663 | 13,770,385 | ||||||||||||
Net asset value per share | $ | 15.12 | $ | 20.12 | $ | 20.12 | ||||||||||
Maximum public offering price | $ | 16.00 | $ | 21.29 | $ | 21.29 | ||||||||||
Institutional Class Share Capital | $ | 238,381 | $ | 90,790,306 | $ | 91,028,687 | ||||||||||
Shares of beneficial interest outstanding (Institutional Class) | 15,165 | 3,960,533 | 10,399 | 3,970,932 | ||||||||||||
Net asset value per share | $ | 15.72 | $ | 22.92 | $ | 22.92 | ||||||||||
| (1) | The adjustment is necessary to reflect capital shares outstanding post-reorganization |
| (2) | Thrivent Small Cap Stock Fund is the accounting survivor. |
- 4 -
Table of Contents
Statement of Assets and Liabilities (unaudited) As of October 31, 2014 | Partner Small Cap Value Fund | Small Cap Stock Fund | Pro-Forma Adjustments (1) | Small Cap Stock Fund Pro-Forma Combined (2) | ||||||||||||
Assets | ||||||||||||||||
Investments at cost | $ | 167,907,232 | $ | 307,284,011 | $ | 475,191,243 | ||||||||||
Investments in securities at value | 249,276,228 | 340,709,691 | $ | 589,985,919 | ||||||||||||
Investments in affiliates at value | 16,142,409 | 23,996,755 | $ | 40,139,164 | ||||||||||||
Investments at Value | 265,418,637 | 364,706,446 | 630,125,083 | |||||||||||||
Cash | — | — | — | |||||||||||||
Dividends and interest receivable | 136,922 | 116,505 | 253,427 | |||||||||||||
Prepaid expenses | 12,368 | 10,711 | 23,079 | |||||||||||||
Receivable for investments sold | 802,586 | 697,418 | 1,500,004 | |||||||||||||
Receivable for fund shares sold | 174,951 | 34,798 | 209,749 | |||||||||||||
Total Assets | 266,545,464 | 365,565,878 | 632,111,342 | |||||||||||||
Liabilities | ||||||||||||||||
Accrued expenses | 79,447 | 140,652 | 220,099 | |||||||||||||
Payable for investments purchased | 450,527 | 918,837 | 1,369,364 | |||||||||||||
Payable upon return of collateral for securities loaned | 8,739,961 | 13,527,930 | 22,267,891 | |||||||||||||
Payable for fund shares redeemed | 137,295 | 70,658 | 207,953 | |||||||||||||
Payable to affiliate | 186,513 | 277,977 | 464,490 | |||||||||||||
Total Liabilities | 9,593,743 | 14,936,054 | 24,529,797 | |||||||||||||
Net Assets | ||||||||||||||||
Capital stock (beneficial interest) | 127,079,043 | 256,563,779 | 383,642,822 | |||||||||||||
Accumulated undistributed net investment income/(loss) | 686,808 | (97,003 | ) | 589,805 | ||||||||||||
Accumulated undistributed net realized gain/(loss) | 31,674,465 | 36,740,575 | 68,415,040 | |||||||||||||
Net unrealized appreciation/(depreciation) on: | ||||||||||||||||
Investments | 97,511,405 | 57,422,435 | 154,933,840 | |||||||||||||
Foreign currency transactions | — | 38 | 38 | |||||||||||||
Total Net Assets | $ | 256,951,721 | $ | 350,629,824 | $ | 607,581,545 | ||||||||||
Class A Share Capital | $ | 96,316,515 | $ | 259,839,518 | $ | 356,156,033 | ||||||||||
Shares of beneficial interest outstanding (Class A) | 4,553,438 | 12,913,722 | 4,786,818 | 17,700,540 | ||||||||||||
Net asset value per share | $ | 21.15 | $ | 20.12 | $ | 20.12 | ||||||||||
Maximum public offering price | $ | 22.38 | $ | 21.29 | $ | 21.29 | ||||||||||
Institutional Class Share Capital | $ | 160,635,206 | $ | 90,790,306 | $ | 251,425,512 | ||||||||||
Shares of beneficial interest outstanding (Institutional Class) | 7,200,919 | 3,960,533 | 7,007,355 | 10,967,888 | ||||||||||||
Net asset value per share | $ | 22.31 | $ | 22.92 | $ | 22.92 | ||||||||||
| (1) | The adjustment is necessary to reflect capital shares outstanding post-reorganization |
| (2) | Thrivent Small Cap Stock Fund is the accounting survivor. |
- 5 -
Table of Contents
Statement of Assets and Liabilities (unaudited) As of October 31, 2014 | Partner Small Cap Growth Fund | Partner Small Cap Value Fund | Small Cap Stock Fund | Pro-Forma Adjustments (1) | Small Cap Stock Fund Pro-Forma Combined (2) | |||||||||||||||
Assets | ||||||||||||||||||||
Investments at cost | $ | 16,932,032 | $ | 167,907,232 | $ | 307,284,011 | $ | 492,123,275 | ||||||||||||
Investments in securities at value | 16,961,821 | 249,276,228 | 340,709,691 | 606,947,740 | ||||||||||||||||
Investments in affiliates at value | 718,618 | 16,142,409 | 23,996,755 | 40,857,782 | ||||||||||||||||
Investments at Value | 17,680,439 | 265,418,637 | 364,706,446 | 647,805,522 | ||||||||||||||||
Cash | 4,822 | — | — | 4,822 | ||||||||||||||||
Dividends and interest receivable | 298 | 136,922 | 116,505 | 253,725 | ||||||||||||||||
Prepaid expenses | 11,645 | 12,368 | 10,711 | 34,724 | ||||||||||||||||
Receivable for investments sold | 112,899 | 802,586 | 697,418 | 1,612,903 | ||||||||||||||||
Receivable for fund shares sold | 19,592 | 174,951 | 34,798 | 229,341 | ||||||||||||||||
Total Assets | 17,829,695 | 266,545,464 | 365,565,878 | 649,941,037 | ||||||||||||||||
Liabilities | ||||||||||||||||||||
Accrued expenses | 41,814 | 79,447 | 140,652 | 261,913 | ||||||||||||||||
Payable for investments purchased | 83,195 | 450,527 | 918,837 | 1,452,559 | ||||||||||||||||
Payable upon return of collateral for securities loaned | 217,215 | 8,739,961 | 13,527,930 | 22,485,106 | ||||||||||||||||
Payable for fund shares redeemed | 5,026 | 137,295 | 70,658 | 212,979 | ||||||||||||||||
Payable to affiliate | 6,967 | 186,513 | 277,977 | 471,457 | ||||||||||||||||
Total Liabilities | 354,217 | 9,593,743 | 14,936,054 | 24,884,014 | ||||||||||||||||
Net Assets | ||||||||||||||||||||
Capital stock (beneficial interest) | 14,959,530 | 127,079,043 | 256,563,779 | 398,602,352 | ||||||||||||||||
Accumulated undistributed net investment income/(loss) | (26,040 | ) | 686,808 | (97,003 | ) | 563,765 | ||||||||||||||
Accumulated undistributed net realized gain/(loss) | 1,793,581 | 31,674,465 | 36,740,575 | 70,208,621 | ||||||||||||||||
Net unrealized appreciation/(depreciation) on: | ||||||||||||||||||||
Investments | 748,407 | 97,511,405 | 57,422,435 | 155,682,247 | ||||||||||||||||
Foreign currency transactions | — | 38 | 38 | |||||||||||||||||
Total Net Assets | $ | 17,475,478 | $ | 256,951,721 | $ | 350,629,824 | $ | 625,057,023 | ||||||||||||
Class A Share Capital | $ | 17,237,097 | $ | 96,316,515 | $ | 259,839,518 | $ | 373,393,130 | ||||||||||||
Shares of beneficial interest outstanding (Class A) | 1,139,712 | 4,553,438 | 12,913,722 | 5,643,481 | 18,557,203 | |||||||||||||||
Net asset value per share | $ | 15.12 | $ | 21.15 | $ | 20.12 | $ | 20.12 | ||||||||||||
Maximum public offering price | $ | 16.00 | $ | 22.38 | $ | 21.29 | $ | 21.29 | ||||||||||||
Institutional Class Share Capital | $ | 238,381 | $ | 160,635,206 | $ | 90,790,306 | $ | 251,663,893 | ||||||||||||
Shares of beneficial interest outstanding (Institutional Class) | 15,165 | 7,200,919 | 3,960,533 | 7,017,754 | 10,978,287 | |||||||||||||||
Net asset value per share | $ | 15.72 | $ | 22.31 | $ | 22.92 | $ | 22.92 | ||||||||||||
| (1) | The adjustment is necessary to reflect capital shares outstanding post-reorganization |
| (2) | Thrivent Small Cap Stock Fund is the accounting survivor |
- 6 -
Table of Contents
Statement of Assets and Liabilities (unaudited) As of October 31, 2014 | Mid Cap Growth Fund | Mid Cap Stock Fund | Pro-Forma Adjustments (1) | Mid Cap Stock Fund Pro-Forma Combined (2) | ||||||||||||
Assets | ||||||||||||||||
Investments at cost | $ | 314,518,833 | $ | 729,542,708 | $ | 1,044,061,541 | ||||||||||
Investments in securities at value | 417,611,990 | 902,646,182 | $ | 1,320,258,172 | ||||||||||||
Investments in affiliates at value | 17,975,310 | 83,097,165 | $ | 101,072,475 | ||||||||||||
Investments at Value | 435,587,300 | 985,743,347 | 1,421,330,647 | |||||||||||||
Dividends and interest receivable | 56,831 | 341,772 | 398,603 | |||||||||||||
Prepaid expenses | 16,256 | 16,006 | 32,262 | |||||||||||||
Receivable for investments sold | 3,536,120 | 2,181,546 | 5,717,666 | |||||||||||||
Receivable for fund shares sold | 185,812 | 93,180 | 278,992 | |||||||||||||
Total Assets | 439,382,319 | 988,375,851 | 1,427,758,170 | |||||||||||||
Liabilities | ||||||||||||||||
Accrued expenses | 132,312 | 250,649 | 382,961 | |||||||||||||
Payable for investments purchased | 364,284 | 2,811,506 | 3,175,790 | |||||||||||||
Payable upon return of collateral for securities loaned | 1,575,210 | 42,247,150 | 43,822,360 | |||||||||||||
Payable for fund shares redeemed | 198,138 | 128,628 | 326,766 | |||||||||||||
Payable to affiliate | 222,916 | 712,595 | 935,511 | |||||||||||||
Total Liabilities | 2,492,860 | 46,150,528 | 48,643,388 | |||||||||||||
Net Assets | ||||||||||||||||
Capital stock (beneficial interest) | 273,279,173 | 580,408,572 | 853,687,745 | |||||||||||||
Accumulated undistributed net investment income/(loss) | (120,662 | ) | 2,770,224 | 2,649,562 | ||||||||||||
Accumulated undistributed net realized gain/(loss) | 42,662,481 | 102,845,888 | 145,508,369 | |||||||||||||
Net unrealized appreciation/(depreciation) on: | ||||||||||||||||
Investments | 121,068,467 | 256,200,639 | 377,269,106 | |||||||||||||
Total Net Assets | $ | 436,889,459 | $ | 942,225,323 | $ | 1,379,114,782 | ||||||||||
Class A Share Capital | $ | 269,694,383 | $ | 678,209,883 | $ | 947,904,266 | ||||||||||
Shares of beneficial interest outstanding (Class A) | 13,084,657 | 28,803,639 | 11,453,936 | 40,257,575 | ||||||||||||
Net asset value per share | $ | 20.61 | $ | 23.55 | $ | 23.55 | ||||||||||
Maximum public offering price | $ | 21.81 | $ | 24.92 | $ | 24.92 | ||||||||||
Institutional Class Share Capital | $ | 167,195,076 | $ | 264,015,440 | $ | 431,210,516 | ||||||||||
Shares of beneficial interest outstanding (Institutional Class) | 6,938,564 | 10,335,804 | 6,545,427 | 16,881,231 | ||||||||||||
Net asset value per share | $ | 24.10 | $ | 25.54 | $ | 25.54 | ||||||||||
- 7 -
Table of Contents
Statement of Assets and Liabilities (unaudited) As of October 31, 2014 | Mid Cap Growth Fund | Mid Cap Stock Fund | Pro-Forma Adjustments (1) | Mid Cap Stock Fund Pro-Forma Combined (2) | ||||||||||||
Assets | ||||||||||||||||
Investments at cost | $ | 314,518,833 | $ | 729,542,708 | $ | 1,044,061,541 | ||||||||||
Investments in securities at value | 417,611,990 | 902,646,182 | $ | 1,320,258,172 | ||||||||||||
Investments in affiliates at value | 17,975,310 | 83,097,165 | $ | 101,072,475 | ||||||||||||
Investments at Value | 435,587,300 | 985,743,347 | 1,421,330,647 | |||||||||||||
Dividends and interest receivable | 56,831 | 341,772 | 398,603 | |||||||||||||
Prepaid expenses | 16,256 | 16,006 | 32,262 | |||||||||||||
Receivable for investments sold | 3,536,120 | 2,181,546 | 5,717,666 | |||||||||||||
Receivable for fund shares sold | 185,812 | 93,180 | 278,992 | |||||||||||||
Total Assets | 439,382,319 | 988,375,851 | 1,427,758,170 | |||||||||||||
Liabilities | ||||||||||||||||
Accrued expenses | 132,312 | 250,649 | 382,961 | |||||||||||||
Payable for investments purchased | 364,284 | 2,811,506 | 3,175,790 | |||||||||||||
Payable upon return of collateral for securities loaned | 1,575,210 | 42,247,150 | 43,822,360 | |||||||||||||
Payable for fund shares redeemed | 198,138 | 128,628 | 326,766 | |||||||||||||
Payable to affiliate | 222,916 | 712,595 | 935,511 | |||||||||||||
Total Liabilities | 2,492,860 | 46,150,528 | 48,643,388 | |||||||||||||
Net Assets | ||||||||||||||||
Capital stock (beneficial interest) | 273,279,173 | 580,408,572 | 853,687,745 | |||||||||||||
Accumulated undistributed net investment income/(loss) | (120,662 | ) | 2,770,224 | 2,649,562 | ||||||||||||
Accumulated undistributed net realized gain/(loss) | 42,662,481 | 102,845,888 | 145,508,369 | |||||||||||||
Net unrealized appreciation/(depreciation) on: | ||||||||||||||||
Investments | 121,068,467 | 256,200,639 | 377,269,106 | |||||||||||||
Total Net Assets | $ | 436,889,459 | $ | 942,225,323 | $ | 1,379,114,782 | ||||||||||
Class A Share Capital | $ | 269,694,383 | $ | 678,209,883 | $ | 947,904,266 | ||||||||||
Shares of beneficial interest outstanding (Class A) | 13,084,657 | 28,803,639 | 11,453,936 | 40,257,575 | ||||||||||||
Net asset value per share | $ | 20.61 | $ | 23.55 | $ | 23.55 | ||||||||||
Maximum public offering price | $ | 21.81 | $ | 24.92 | $ | 24.92 | ||||||||||
Institutional Class Share Capital | $ | 167,195,076 | $ | 264,015,440 | $ | 431,210,516 | ||||||||||
Shares of beneficial interest outstanding (Institutional Class) | 6,938,564 | 10,335,804 | 6,545,427 | 16,881,231 | ||||||||||||
Net asset value per share | $ | 24.10 | $ | 25.54 | $ | 25.54 | ||||||||||
| (1) | The adjustment is necessary to reflect capital shares outstanding post-reorganization |
| (2) | Thrivent Mid Cap Stock Fund is the accounting survivor. |
- 8 -
Table of Contents
Statement of Assets and Liabilities (unaudited) As of October 31, 2014 | Partner Mid Cap Value Fund | Mid Cap Stock Fund | Pro-Forma Adjustments (1) | Mid Cap Stock Fund Pro-Forma Combined (2) | ||||||||||||
Assets | ||||||||||||||||
Investments at cost | $ | 152,476,533 | $ | 729,542,708 | $ | 882,019,241 | ||||||||||
Investments in securities at value | 169,881,226 | 902,646,182 | $ | 1,072,527,408 | ||||||||||||
Investments in affiliates at value | 5,641,758 | 83,097,165 | $ | 88,738,923 | ||||||||||||
Investments at Value | 175,522,984 | 985,743,347 | 1,161,266,331 | |||||||||||||
Dividends and interest receivable | 45,990 | 341,772 | 387,762 | |||||||||||||
Prepaid expenses | 11,983 | 16,006 | 27,989 | |||||||||||||
Receivable for investments sold | 1,563,867 | 2,181,546 | 3,745,413 | |||||||||||||
Receivable for fund shares sold | 70,216 | 93,180 | 163,396 | |||||||||||||
Total Assets | 177,215,040 | 988,375,851 | 1,165,590,891 | |||||||||||||
Liabilities | ||||||||||||||||
Accrued expenses | 49,458 | 250,649 | 300,107 | |||||||||||||
Payable for investments purchased | 1,769,588 | 2,811,506 | 4,581,094 | |||||||||||||
Payable upon return of collateral for securities loaned | — | 42,247,150 | 42,247,150 | |||||||||||||
Payable for fund shares redeemed | 7,838 | 128,628 | 136,466 | |||||||||||||
Payable to affiliate | 121,537 | 712,595 | 834,132 | |||||||||||||
Total Liabilities | 1,948,421 | 46,150,528 | 48,098,949 | |||||||||||||
Net Assets | ||||||||||||||||
Capital stock (beneficial interest) | 130,161,409 | 580,408,572 | 710,569,981 | |||||||||||||
Accumulated undistributed net investment income/(loss) | 803,059 | 2,770,224 | 3,573,283 | |||||||||||||
Accumulated undistributed net realized gain/(loss) | 21,255,700 | 102,845,888 | 124,101,588 | |||||||||||||
Net unrealized appreciation/(depreciation) on: | ||||||||||||||||
Investments | 23,046,451 | 256,200,639 | 279,247,090 | |||||||||||||
Total Net Assets | $ | 175,266,619 | $ | 942,225,323 | $ | 1,117,491,942 | ||||||||||
Class A Share Capital | $ | 26,625,564 | $ | 678,209,883 | $ | 704,835,447 | ||||||||||
Shares of beneficial interest outstanding (Class A) | 1,756,204 | 28,803,639 | 1,130,790 | 29,934,429 | ||||||||||||
Net asset value per share | $ | 15.16 | $ | 23.55 | $ | 23.55 | ||||||||||
Maximum public offering price | $ | 16.04 | $ | 24.92 | $ | 24.92 | ||||||||||
Institutional Class Share Capital | $ | 148,641,055 | $ | 264,015,440 | $ | 412,656,495 | ||||||||||
Shares of beneficial interest outstanding (Institutional Class) | 9,744,146 | 10,335,804 | 5,819,066 | 16,154,870 | ||||||||||||
Net asset value per share | $ | 15.25 | $ | 25.54 | $ | 25.54 | ||||||||||
| (1) | The adjustment is necessary to reflect capital shares outstanding post-reorganization |
| (2) | Thrivent Mid Cap Stock Fund is the accounting survivor. |
- 9 -
Table of Contents
Statement of Assets and Liabilities (unaudited) As of October 31, 2014 | Mid Cap Growth Fund | Partner Mid Cap Value Fund | Mid Cap Stock Fund | Pro-Forma Adjustments (1) | Mid Cap Stock Fund Pro-Forma Combined (2) | |||||||||||||||
Assets | ||||||||||||||||||||
Investments at cost | $ | 314,518,833 | $ | 152,476,533 | $ | 729,542,708 | $ | 1,196,538,074 | ||||||||||||
Investments in securities at value | 417,611,990 | 169,881,226 | 902,646,182 | $ | 1,490,139,398 | |||||||||||||||
Investments in affiliates at value | 17,975,310 | 5,641,758 | 83,097,165 | $ | 106,714,233 | |||||||||||||||
Investments at Value | 435,587,300 | 175,522,984 | 985,743,347 | 1,596,853,631 | ||||||||||||||||
Dividends and interest receivable | 56,831 | 45,990 | 341,772 | 444,593 | ||||||||||||||||
Prepaid expenses | 16,256 | 11,983 | 16,006 | 44,245 | ||||||||||||||||
Receivable for investments sold | 3,536,120 | 1,563,867 | 2,181,546 | 7,281,533 | ||||||||||||||||
Receivable for fund shares sold | 185,812 | 70,216 | 93,180 | 349,208 | ||||||||||||||||
Total Assets | 439,382,319 | 177,215,040 | 988,375,851 | 1,604,973,210 | ||||||||||||||||
Liabilities | ||||||||||||||||||||
Accrued expenses | 132,312 | 49,458 | 250,649 | 432,419 | ||||||||||||||||
Payable for investments purchased | 364,284 | 1,769,588 | 2,811,506 | 4,945,378 | ||||||||||||||||
Payable upon return of collateral for securities loaned | 1,575,210 | — | 42,247,150 | 43,822,360 | ||||||||||||||||
Payable for fund shares redeemed | 198,138 | 7,838 | 128,628 | 334,604 | ||||||||||||||||
Payable to affiliate | 222,916 | 121,537 | 712,595 | 1,057,048 | ||||||||||||||||
Total Liabilities | 2,492,860 | 1,948,421 | 46,150,528 | 50,591,809 | ||||||||||||||||
Net Assets | ||||||||||||||||||||
Capital stock (beneficial interest) | 273,279,173 | 130,161,409 | 580,408,572 | 983,849,154 | ||||||||||||||||
Accumulated undistributed net investment income/(loss) | (120,662 | ) | 803,059 | 2,770,224 | 3,452,621 | |||||||||||||||
Accumulated undistributed net realized gain/(loss) | 42,662,481 | 21,255,700 | 102,845,888 | 166,764,069 | ||||||||||||||||
Net unrealized appreciation/(depreciation) on: | ||||||||||||||||||||
Investments | 121,068,467 | 23,046,451 | 256,200,639 | 400,315,557 | ||||||||||||||||
Total Net Assets | $ | 436,889,459 | $ | 175,266,619 | $ | 942,225,323 | $ | 1,554,381,401 | ||||||||||||
Class A Share Capital | $ | 269,694,383 | $ | 26,625,564 | $ | 678,209,883 | $ | 974,529,830 | ||||||||||||
Shares of beneficial interest outstanding (Class A) | 13,084,657 | 1,756,204 | 28,803,639 | 12,584,726 | 41,388,365 | |||||||||||||||
Net asset value per share | $ | 20.61 | $ | 15.16 | $ | 23.55 | $ | 23.55 | ||||||||||||
Maximum public offering price | $ | 21.81 | $ | 16.04 | $ | 24.92 | $ | 24.92 | ||||||||||||
Institutional Class Share Capital | $ | 167,195,076 | $ | 148,641,055 | $ | 264,015,440 | $ | 579,851,571 | ||||||||||||
Shares of beneficial interest outstanding (Institutional Class) | 6,938,564 | 9,744,146 | 10,335,804 | 12,364,493 | 22,700,297 | |||||||||||||||
Net asset value per share | $ | 24.10 | $ | 15.25 | $ | 25.54 | $ | 25.54 | ||||||||||||
| (1) | The adjustment is necessary to reflect capital shares outstanding post-reorganization |
| (2) | Thrivent Mid Cap Stock Fund is the accounting survivor. |
- 10 -
Table of Contents
Statement of Operations (unaudited) For the year ended October 31, 2014 | Partner Small Cap Growth Fund | Small Cap Stock Fund | Pro-Forma Adjustments | Small Cap Stock Fund Pro-Forma Combined (11) | ||||||||||||
Investment Income | ||||||||||||||||
Dividends | $ | 575,826 | $ | 3,471,866 | $ | 4,047,692 | ||||||||||
Taxable interest | 1,900 | 4,436 | $ | 6,336 | ||||||||||||
Income from securities loaned | 41,489 | 350,416 | $ | 391,905 | ||||||||||||
Income from affiliated investments | 2,732 | 9,042 | $ | 11,774 | ||||||||||||
Foreign dividend tax withholding | (1,012 | ) | (50,923 | ) | $ | (51,935 | ) | |||||||||
Total Investment Income | 620,935 | 3,784,837 | 4,405,772 | |||||||||||||
Expenses | ||||||||||||||||
Adviser fees | 790,258 | 2,339,711 | 209,953 | 3,339,922 | (1) | |||||||||||
Sub-Adviser fees | 594,651 | — | (594,651 | ) | — | (2) | ||||||||||
Administrative service fees | 98,468 | 133,746 | (70,000 | ) | 162,213 | (3) | ||||||||||
Audit and legal fees | 26,860 | 28,130 | (26,085 | ) | 28,905 | (4) | ||||||||||
Custody fees | 21,029 | 16,773 | (900 | ) | 36,903 | (5) | ||||||||||
Distribution expenses Class A | 46,909 | 647,073 | — | 693,982 | (6) | |||||||||||
Insurance expenses | 4,985 | 5,903 | (4,043 | ) | 6,845 | (7) | ||||||||||
Printing and postage expenses Class A | 10,201 | 111,345 | — | 121,546 | (8) | |||||||||||
Printing and postage expenses Institutional Class | 537 | 343 | — | 880 | (8) | |||||||||||
SEC and state registration expenses | 29,136 | 31,611 | (28,642 | ) | 32,105 | (7) | ||||||||||
Transfer agent fees Class A | 61,095 | 532,496 | — | 593,591 | (8) | |||||||||||
Transfer agent fees Institutional Class | 405 | 806 | — | 1,211 | (9) | |||||||||||
Trustees’ fees | 10,943 | 22,570 | (10,341 | ) | 23,172 | (7) | ||||||||||
Other expenses | 10,734 | 12,147 | (9,310 | ) | 13,571 | (7) | ||||||||||
Total Expenses Before Reimbursement | 1,706,211 | 3,882,654 | (534,019 | ) | 5,054,846 | |||||||||||
Less: | ||||||||||||||||
Reimbursement from adviser | (62,881 | ) | — | 62,881 | — | (10) | ||||||||||
Total Net Expenses | 1,643,330 | 3,882,654 | (471,138 | ) | 5,054,846 | |||||||||||
Net Investment Income/(Loss) | (1,022,395 | ) | (97,817 | ) | 471,138 | (649,074 | ) | |||||||||
Realized and Unrealized Gains/(Losses) | ||||||||||||||||
Net realized gains/(losses) on: | ||||||||||||||||
Investments | 15,771,053 | 38,265,749 | 54,036,802 | |||||||||||||
In-kind redemptions | 28,735,118 | — | 28,735,118 | |||||||||||||
Distributions of realized capital gains from affiliated investments | 25 | 55 | 80 | |||||||||||||
Futures contracts | — | 847,682 | 847,682 | |||||||||||||
Foreign currenty and forw ard contract transactions | — | (1,358 | ) | (1,358 | ) | |||||||||||
Change in net unrealized appreciation/(depreciation) on: | ||||||||||||||||
Investments | (42,447,852 | ) | (6,704,001 | ) | (49,151,853 | ) | ||||||||||
Futures contracts | — | (870,806 | ) | (870,806 | ) | |||||||||||
Foreign currency transactions | — | 38 | 38 | |||||||||||||
Net Realized and Unrealized Gains/(Losses) | 2,058,344 | 31,537,359 | 33,595,703 | |||||||||||||
Net Increase/(Decrease) in Net Assets Resulting From Operations | $ | 1,035,949 | $ | 31,439,542 | $ | 32,946,629 | ||||||||||
| (1) | assumes an advisory fee of 70 bps on first $200 million in assets and 65 bps on the next $800 million |
| (2) | assumes no subadvisory fee on combined assets |
| (3) | assumes fixed administrative fees of $70,000 and variable administrative fee of 1.85 bps |
| (4) | assumes $23,077 for audit and tax services and $5,828 for legal |
| (5) | assumes combined expense of existing funds adjusted for per account charges such as Attestation exam fees and Compliance fees |
| (6) | assumes a distribution fee of 25 bps on Class A |
- 11 -
Table of Contents
| (7) | assumes expenses of surviving fund with adjustment for acquiring fund fees |
| (8) | assumes combined expense of existing funds |
| (9) | assumes combined estimate for surviving fund open Transfer Agent accounts with an $18 per account fee and sub Transfer Agent fees |
| (10) | assumes no expense waivers on combined funds |
| (11) | Thrivent Small Cap Stock Fund is the accounting survivor. |
- 12 -
Table of Contents
Statement of Operations (unaudited) For the year ended October 31, 2014 | Partner Small Cap Value Fund | Small Cap Stock Fund | Pro-Forma Adjustments | Small Cap Stock Fund Pro-Forma Combined (10) | ||||||||||||
Investment Income | ||||||||||||||||
Dividends | $ | 4,557,720 | $ | 3,471,866 | $ | 8,029,586 | ||||||||||
Taxable interest | 1,019 | 4,436 | $ | 5,455 | ||||||||||||
Income from securities loaned | 44,645 | 350,416 | $ | 395,061 | ||||||||||||
Income from affiliated investments | 3,358 | 9,042 | $ | 12,400 | ||||||||||||
Foreign dividend tax withholding | (3,399 | ) | (50,923 | ) | $ | (54,322 | ) | |||||||||
Total Investment Income | 4,603,343 | 3,784,837 | 8,388,180 | |||||||||||||
Expenses | ||||||||||||||||
Adviser fees | 276,226 | 2,339,711 | 1,514,010 | 4,129,947 | (1) | |||||||||||
Sub-Adviser fees | 1,651,721 | — | (1,651,721 | ) | — | (2) | ||||||||||
Administrative service fees | 120,953 | 133,746 | (70,000 | ) | 184,699 | (3) | ||||||||||
Audit and legal fees | 27,662 | 28,130 | (25,239 | ) | 30,553 | (4) | ||||||||||
Custody fees | 17,967 | 16,773 | (900 | ) | 33,840 | (5) | ||||||||||
Distribution expenses Class A | 245,533 | 647,073 | — | 892,606 | (6) | |||||||||||
Insurance expenses | 5,582 | 5,903 | (3,997 | ) | 7,488 | (7) | ||||||||||
Printing and postage expenses Class A | 37,506 | 111,345 | — | 148,851 | (8) | |||||||||||
Printing and postage expenses Institutional Class | 14,963 | 343 | — | 15,306 | (8) | |||||||||||
SEC and state registration expenses | 35,509 | 31,611 | (35,015 | ) | 32,105 | (7) | ||||||||||
Transfer agent fees Class A | 209,103 | 532,496 | — | 741,599 | (8) | |||||||||||
Transfer agent fees Institutional Class | 88,621 | 806 | — | 89,427 | (9) | |||||||||||
Trustees’ fees | 17,150 | 22,570 | (10,975 | ) | 28,745 | (7) | ||||||||||
Other expenses | 11,076 | 12,147 | (10,002 | ) | 13,221 | (7) | ||||||||||
Total Expenses Before Reimbursement | 2,759,572 | 3,882,654 | (293,839 | ) | 6,348,387 | |||||||||||
Less: | ||||||||||||||||
Reimbursement from adviser | — | — | — | — | ||||||||||||
Total Net Expenses | 2,759,572 | 3,882,654 | (293,839 | ) | 6,348,387 | |||||||||||
Net Investment Income/(Loss) | 1,843,771 | (97,817 | ) | 293,839 | 2,039,793 | |||||||||||
Realized and Unrealized Gains/(Losses) | ||||||||||||||||
Net realized gains/(losses) on: | ||||||||||||||||
Investments | 35,020,018 | 38,265,749 | 73,285,767 | |||||||||||||
Distributions of realized capital gains from affiliated investments | 12 | 55 | 67 | |||||||||||||
Futures contracts | — | 847,682 | 847,682 | |||||||||||||
Foreign currenty and forw ard contract transactions | (2,664 | ) | (1,358 | ) | (4,022 | ) | ||||||||||
Change in net unrealized appreciation/(depreciation) on: | ||||||||||||||||
Investments | (21,116,579 | ) | (6,704,001 | ) | (27,820,580 | ) | ||||||||||
Futures contracts | — | (870,806 | ) | (870,806 | ) | |||||||||||
Foreign currency transactions | — | 38 | 38 | |||||||||||||
Net Realized and Unrealized Gains/(Losses) | 13,900,787 | 31,537,359 | 45,438,146 | |||||||||||||
Net Increase/(Decrease) in Net Assets Resulting From Operations | $ | 15,744,558 | $ | 31,439,542 | $ | 47,477,939 | ||||||||||
| (1) | assumes an advisory fee of 70 bps on first $200 million in assets and 65 bps on the next $800 million |
| (2) | assumes no subadvisory fee on combined assets |
| (3) | assumes fixed administrative fees of $70,000 and variable administrative fee of 1.85 bps |
| (4) | assumes $24,725 for audit and tax services and $5,828 for legal |
| (5) | assumes combined expense of existing funds adjusted for per account charges such as Attestation exam fees and Compliance fees |
| (6) | assumes a distribution fee of 25 bps on Class A |
| (7) | assumes expenses of surviving fund with adjustment for acquiring fund fees |
- 13 -
Table of Contents
| (8) | assumes combined expense of existing funds |
| (9) | assumes combined estimate for surviving fund open Transfer Agent accounts with an $18 per account fee and sub Transfer Agent fees |
| (10) | Thrivent Small Cap Stock Fund is the accounting survivor. |
- 14 -
Table of Contents
Statement of Operations (unaudited) For the year ended October 31, 2014 | Partner Small Cap Growth Fund | Partner Small Cap Value Fund | Small Cap Stock Fund | Pro-Forma Adjustments | Small Cap Stock Fund Pro-Forma Combined (11) | |||||||||||||||
Investment Income | ||||||||||||||||||||
Dividends | $ | 575,826 | $ | 4,557,720 | $ | 3,471,866 | $ | 8,605,412 | ||||||||||||
Taxable interest | 1,900 | 1,019 | 4,436 | 7,355 | ||||||||||||||||
Income from securities loaned | 41,489 | 44,645 | 350,416 | 436,550 | ||||||||||||||||
Income from affiliated investments | 2,732 | 3,358 | 9,042 | 15,132 | ||||||||||||||||
Foreign dividend tax withholding | (1,012 | ) | (3,399 | ) | (50,923 | ) | (55,334 | ) | ||||||||||||
Total Investment Income | 620,935 | 4,603,343 | 3,784,837 | 9,009,115 | ||||||||||||||||
Expenses | ||||||||||||||||||||
Adviser fees | 790,258 | 276,226 | 2,339,711 | 1,723,964 | 5,130,159 | (1) | ||||||||||||||
Sub-Adviser fees | 594,651 | 1,651,721 | — | (2,246,372 | ) | — | (2) | |||||||||||||
Administrative service fees | 98,468 | 120,953 | 133,746 | (140,000 | ) | 213,166 | (3) | |||||||||||||
Audit and legal fees | 26,860 | 27,662 | 28,130 | (51,275 | ) | 31,377 | (4) | |||||||||||||
Custody fees | 21,029 | 17,967 | 16,773 | (1,800 | ) | 53,970 | (5) | |||||||||||||
Distribution expenses Class A | 46,909 | 245,533 | 647,073 | — | 939,515 | (6) | ||||||||||||||
Insurance expenses | 4,985 | 5,582 | 5,903 | (8,037 | ) | 8,433 | (7) | |||||||||||||
Printing and postage expenses Class A | 10,201 | 37,506 | 111,345 | — | 159,052 | (8) | ||||||||||||||
Printing and postage expenses Institutional Class | 537 | 14,963 | 343 | — | 15,843 | (8) | ||||||||||||||
SEC and state registration expenses | 29,136 | 35,509 | 31,611 | (63,531 | ) | 32,725 | (7) | |||||||||||||
Transfer agent fees Class A | 61,095 | 209,103 | 532,496 | — | 802,694 | (8) | ||||||||||||||
Transfer agent fees Institutional Class | 405 | 88,621 | 806 | — | 89,832 | (9) | ||||||||||||||
Trustees’ fees | 10,943 | 17,150 | 22,570 | (21,345 | ) | 29,318 | (7) | |||||||||||||
Other expenses | 10,734 | 11,076 | 12,147 | (19,298 | ) | 14,659 | (7) | |||||||||||||
Total Expenses Before Reimbursement | 1,706,211 | 2,759,572 | 3,882,654 | (827,694 | ) | 7,520,743 | ||||||||||||||
Less: | ||||||||||||||||||||
Reimbursement from adviser | (62,881 | ) | — | — | 62,881 | — | (10) | |||||||||||||
Total Net Expenses | 1,643,330 | 2,759,572 | 3,882,654 | (764,813 | ) | 7,520,743 | ||||||||||||||
Net Investment Income/(Loss) | (1,022,395 | ) | 1,843,771 | (97,817 | ) | 764,813 | 1,488,372 | |||||||||||||
Realized and Unrealized Gains/(Losses) | ||||||||||||||||||||
Net realized gains/(losses) on: | ||||||||||||||||||||
Investments | 15,771,053 | 35,020,018 | 38,265,749 | 89,056,820 | ||||||||||||||||
In-kind redemptions | 28,735,118 | — | 28,735,118 | |||||||||||||||||
Distributions of realized capital gains from affiliated investments | 25 | 12 | 55 | 92 | ||||||||||||||||
Futures contracts | — | — | 847,682 | 847,682 | ||||||||||||||||
Foreign currenty and forw ard contract transactions | — | (2,664 | ) | (1,358 | ) | (4,022 | ) | |||||||||||||
Change in net unrealized appreciation/(depreciation) on: | ||||||||||||||||||||
Investments | (42,447,852 | ) | (21,116,579 | ) | (6,704,001 | ) | (70,268,432 | ) | ||||||||||||
Futures contracts | — | — | (870,806 | ) | (870,806 | ) | ||||||||||||||
Foreign currency transactions | — | — | 38 | 38 | ||||||||||||||||
Net Realized and Unrealized Gains/(Losses) | 2,058,344 | 13,900,787 | 31,537,359 | 47,496,490 | ||||||||||||||||
Net Increase/(Decrease) in Net Assets Resulting From Operations | $ | 1,035,949 | $ | 15,744,558 | $ | 31,439,542 | $ | 48,984,862 | ||||||||||||
| (1) | assumes an advisory fee of 70 bps on first $200 million in assets and 65 bps on the next $800 million |
| (2) | assumes no subadvisory fee on combined assets |
| (3) | assumes fixed administrative fees of $70,000 and variable administrative fee of 1.85 bps |
| (4) | assumes $25,448 for audit and tax services and $5,929 for legal |
| (5) | assumes combined expense of existing funds adjusted for per account charges such as Attestation exam fees and Compliance fees |
| (6) | assumes a distribution fee of 25 bps on Class A |
| (7) | assumes expenses of surviving fund with adjustment for acquiring fund fees |
| (8) | assumes combined expense of existing funds |
| (9) | assumes combined estimate for surviving fund open Transfer Agent accounts with an $18 per account fee and sub Transfer Agent fees |
| (10) | assumes no expense waivers on combined funds |
| (11) | Thrivent Small Cap Stock Fund is the accounting survivor. |
- 15 -
Table of Contents
Statement of Operations (unaudited) For the year ended October 31, 2014 | Mid Cap Growth Fund | Mid Cap Stock Fund | Pro-Forma Adjustments | Mid Cap Stock Fund Pro-Forma Combined (8) | ||||||||||||
Investment Income | ||||||||||||||||
Dividends | $ | 3,058,004 | $ | 13,233,202 | $ | 16,291,206 | ||||||||||
Taxable interest | 3,047 | 11,588 | $ | 14,635 | ||||||||||||
Income from securities loaned | 16,613 | 347,781 | $ | 364,394 | ||||||||||||
Income from affiliated investments | 9,481 | 26,878 | $ | 36,359 | ||||||||||||
Foreign dividend tax withholding | (18,894 | ) | — | $ | (18,894 | ) | ||||||||||
Total Investment Income | 3,068,251 | 13,619,449 | 16,687,700 | |||||||||||||
Expenses | ||||||||||||||||
Adviser fees | 1,670,547 | 6,377,149 | 912,585 | 8,960,281 | (1) | |||||||||||
Administrative service fees | 149,050 | 248,725 | (70,000 | ) | 327,775 | (2) | ||||||||||
Audit and legal fees | 28,801 | 32,647 | (25,138 | ) | 36,310 | (3) | ||||||||||
Custody fees | 16,420 | 27,283 | (900 | ) | 42,803 | (4) | ||||||||||
Distribution expenses Class A | 669,903 | 1,661,613 | — | 2,331,515 | (5) | |||||||||||
Insurance expenses | 6,347 | 9,030 | (4,029 | ) | 11,348 | (6) | ||||||||||
Printing and postage expenses Class A | 121,795 | 170,910 | — | 292,705 | (7) | |||||||||||
Printing and postage expenses Institutional Class | 14,260 | 1,498 | — | 15,758 | (7) | |||||||||||
SEC and state registration expenses | 46,934 | 50,063 | (46,138 | ) | 50,859 | (6) | ||||||||||
Transfer agent fees Class A | 547,058 | 866,592 | — | 1,413,650 | (7) | |||||||||||
Transfer agent fees Institutional Class | 82,137 | 7,034 | — | 89,171 | (7) | |||||||||||
Trustees’ fees | 23,712 | 47,351 | (11,239 | ) | 59,825 | (6) | ||||||||||
Other expenses | 11,189 | 13,685 | (10,314 | ) | 14,560 | (6) | ||||||||||
Total Expenses Before Reimbursement | 3,388,153 | 9,513,580 | 744,827 | 13,646,560 | ||||||||||||
Less: | ||||||||||||||||
Reimbursement from adviser | — | — | — | — | ||||||||||||
Total Net Expenses | 3,388,153 | 9,513,580 | 744,827 | 13,646,560 | ||||||||||||
Net Investment Income/(Loss) | (319,902 | ) | 4,105,869 | (744,827 | ) | 3,041,140 | ||||||||||
Realized and Unrealized Gains/(Losses) | ||||||||||||||||
Net realized gains/(losses) on: | ||||||||||||||||
Investments | 43,811,423 | 128,307,139 | 172,118,562 | |||||||||||||
Distributions of realized capital gains from affiliated investments | 39 | 153 | 192 | |||||||||||||
Change in net unrealized appreciation/(depreciation) on: | ||||||||||||||||
Investments | (4,974,334 | ) | 8,668,049 | 3,693,715 | ||||||||||||
Net Realized and Unrealized Gains/(Losses) | 38,837,128 | 136,975,341 | 175,812,469 | |||||||||||||
Net Increase/(Decrease) in Net Assets Resulting From Operations | $ | 38,517,226 | $ | 141,081,210 | $ | 178,853,609 | ||||||||||
| (1) | assumes an advisory fee of 70 bps on first $200 million in assets, 65 bps on the next $800 million, and 60 bps after $1 billion |
| (2) | assumes fixed administrative fees of $70,000 and variable administrative fee of 1.85 bps |
| (3) | assumes $30,482 for audit and tax services and $5,828 for legal |
| (4) | assumes combined expense of existing funds adjusted for per account charges such as Attestation exam fees and Compliance fees |
| (5) | assumes a distribution fee of 25 bps on Class A |
| (6) | assumes expenses of surviving fund with adjustment for acquiring fund fees |
| (7) | assumes combined expense of existing funds |
| (8) | Thrivent Mid Cap Stock Fund is the accounting survivor. |
- 16 -
Table of Contents
Statement of Operations (unaudited) For the year ended October 31, 2014 | Partner Mid Cap Value Fund | Mid Cap Stock Fund | Pro-Forma Adjustments | Mid Cap Stock Fund Pro-Forma Combined (10) | ||||||||||||
Investment Income | ||||||||||||||||
Dividends | $ | 2,574,720 | $ | 13,233,202 | $ | 15,807,922 | ||||||||||
Taxable interest | 281 | 11,588 | $ | 11,869 | ||||||||||||
Income from securities loaned | — | 347,781 | $ | 347,781 | ||||||||||||
Income from affiliated investments | 1,448 | 26,878 | $ | 28,326 | ||||||||||||
Foreign dividend tax withholding | — | — | $ | — | ||||||||||||
Total Investment Income | 2,576,449 | 13,619,449 | 16,195,898 | |||||||||||||
Expenses | ||||||||||||||||
Adviser fees | 470,530 | 6,377,149 | 552,644 | 7,400,323 | (1) | |||||||||||
Subadviser fees | 784,266 | — | (784,266 | ) | — | (2) | ||||||||||
Administrative service fees | 100,952 | 248,725 | (70,000 | ) | 279,677 | (3) | ||||||||||
Audit and legal fees | 26,773 | 32,647 | (24,911 | ) | 34,509 | (4) | ||||||||||
Custody fees | 33,014 | 27,283 | (900 | ) | 59,397 | (5) | ||||||||||
Distribution expenses Class A | 66,235 | 1,661,613 | — | 1,727,847 | (6) | |||||||||||
Insurance expenses | 4,957 | 9,030 | (4,021 | ) | 9,966 | (7) | ||||||||||
Printing and postage expenses Class A | 11,156 | 170,910 | — | 182,066 | (8) | |||||||||||
Printing and postage expenses Institutional Class | 811 | 1,498 | — | 2,309 | (8) | |||||||||||
SEC and state registration expenses | 28,930 | 50,063 | (28,439 | ) | 50,554 | (7) | ||||||||||
Transfer agent fees Class A | 76,895 | 866,592 | — | 943,487 | (8) | |||||||||||
Transfer agent fees Institutional Class | 1,984 | 7,034 | — | 9,018 | (8) | |||||||||||
Trustees’ fees | 12,657 | 47,351 | (7,452 | ) | 52,556 | (7) | ||||||||||
Other expenses | 10,185 | 13,685 | (9,351 | ) | 14,519 | (7) | ||||||||||
Total Expenses Before Reimbursement | 1,629,345 | 9,513,580 | (376,696 | ) | 10,766,228 | |||||||||||
Less: | ||||||||||||||||
Reimbursement from adviser | (56,212 | ) | — | 56,212 | — | (9) | ||||||||||
Total Net Expenses | 1,573,133 | 9,513,580 | (320,484 | ) | 10,766,228 | |||||||||||
Net Investment Income/(Loss) | 1,003,316 | 4,105,869 | 320,484 | 5,429,670 | ||||||||||||
Realized and Unrealized Gains/(Losses) | ||||||||||||||||
Net realized gains/(losses) on: | ||||||||||||||||
Investments | 21,604,559 | 128,307,139 | 149,911,698 | |||||||||||||
In-kind redemptions | 2,285,789 | — | 2,285,789 | |||||||||||||
Distributions of realized capital gains from affiliated investments | 3 | 153 | 156 | |||||||||||||
Change in net unrealized appreciation/(depreciation) on: | ||||||||||||||||
Investments | (2,014,131 | ) | 8,668,049 | 6,653,918 | ||||||||||||
Net Realized and Unrealized Gains/(Losses) | 21,876,220 | 136,975,341 | 158,851,561 | |||||||||||||
Net Increase/(Decrease) in Net Assets Resulting From Operations | $ | 22,879,536 | $ | 141,081,210 | $ | 164,281,231 | ||||||||||
| (1) | assumes an advisory fee of 70 bps on first $200 million in assets, 65 bps on the next $800 million, and 60 bps after $1 billion |
| (2) | assumes no subadvisory fee on combined assets |
| (3) | assumes fixed administrative fees of $70,000 and variable administrative fee of 1.85 bps |
| (4) | assumes $28,681 for audit and tax services and $5,828 for legal |
| (5) | assumes combined expense of existing funds adjusted for per account charges such as Attestation exam fees and Compliance fees |
| (6) | assumes a distribution fee of 25 bps on Class A |
| (7) | assumes expenses of surviving fund with adjustment for acquiring fund fees |
| (8) | assumes combined expense of existing funds |
| (9) | assumes no expense waivers on combined funds |
| (10) | Thrivent Mid Cap Stock Fund is the accounting survivor. |
- 17 -
Table of Contents
Statement of Operations (unaudited) For the year ended October 31, 2014 | Mid Cap Growth Fund | Partner Mid Cap Value Fund | Mid Cap Stock Fund | Pro-Forma Adjustments | Mid Cap Stock Fund Pro-Forma Combined (10) | |||||||||||||||
Investment Income | ||||||||||||||||||||
Dividends | $ | 3,058,004 | $ | 2,574,720 | $ | 13,233,202 | $ | 18,865,926 | ||||||||||||
Taxable interest | 3,047 | 281 | 11,588 | 14,916 | ||||||||||||||||
Income from securities loaned | 16,613 | — | 347,781 | 364,394 | ||||||||||||||||
Income from affiliated investments | 9,481 | 1,448 | 26,878 | 37,807 | ||||||||||||||||
Foreign dividend tax withholding | (18,894 | ) | — | — | (18,894 | ) | ||||||||||||||
Total Investment Income | 3,068,251 | 2,576,449 | 13,619,449 | 19,264,149 | ||||||||||||||||
Expenses | ||||||||||||||||||||
Adviser fees | 1,670,547 | 470,530 | 6,377,149 | 1,445,892 | 9,964,118 | (1) | ||||||||||||||
Subadviser fees | — | 784,266 | — | (784,266 | ) | — | (2) | |||||||||||||
Administrative service fees | 149,050 | 100,952 | 248,725 | (140,000 | ) | 358,727 | (3) | |||||||||||||
Audit and legal fees | 28,801 | 26,773 | 32,647 | (50,002 | ) | 38,219 | (4) | |||||||||||||
Custody fees | 16,420 | 33,014 | 27,283 | (1,800 | ) | 74,916 | (5) | |||||||||||||
Distribution expenses Class A | 669,903 | 66,235 | 1,661,613 | — | 2,397,750 | (6) | ||||||||||||||
Insurance expenses | 6,347 | 4,957 | 9,030 | (8,048 | ) | 12,286 | (7) | |||||||||||||
Printing and postage expenses Class A | 121,795 | 11,156 | 170,910 | — | 303,861 | (8) | ||||||||||||||
Printing and postage expenses Institutional Class | 14,260 | 811 | 1,498 | — | 16,569 | (8) | ||||||||||||||
SEC and state registration expenses | 46,934 | 28,930 | 50,063 | (74,556 | ) | 51,371 | (7) | |||||||||||||
Transfer agent fees Class A | 547,058 | 76,895 | 866,592 | — | 1,490,545 | (8) | ||||||||||||||
Transfer agent fees Institutional Class | 82,137 | 1,984 | 7,034 | — | 91,155 | (8) | ||||||||||||||
Trustees’ fees | 23,712 | 12,657 | 47,351 | (18,800 | ) | 64,921 | (7) | |||||||||||||
Other expenses | 11,189 | 10,185 | 13,685 | (19,660 | ) | 15,399 | (7) | |||||||||||||
Total Expenses Before Reimbursement | 3,388,153 | 1,629,345 | 9,513,580 | 348,760 | 14,879,837 | |||||||||||||||
Less: | ||||||||||||||||||||
Reimbursement from adviser | — | (56,212 | ) | — | 56,212 | — | (9) | |||||||||||||
Total Net Expenses | 3,388,153 | 1,573,133 | 9,513,580 | 404,972 | 14,879,837 | |||||||||||||||
Net Investment Income/(Loss) | (319,902 | ) | 1,003,316 | 4,105,869 | (404,972 | ) | 4,384,312 | |||||||||||||
Realized and Unrealized Gains/(Losses) | ||||||||||||||||||||
Net realized gains/(losses) on: | ||||||||||||||||||||
Investments | 43,811,423 | 21,604,559 | 128,307,139 | 193,723,121 | ||||||||||||||||
| 2,285,789 | 2,285,789 | |||||||||||||||||||
Distributions of realized capital gains from affiliated investments | 39 | 3 | 153 | 195 | ||||||||||||||||
Change in net unrealized appreciation/(depreciation) on: | ||||||||||||||||||||
Investments | (4,974,334 | ) | (2,014,131 | ) | 8,668,049 | 1,679,584 | ||||||||||||||
Net Realized and Unrealized Gains/(Losses) | 38,837,128 | 21,876,220 | 136,975,341 | 197,688,689 | ||||||||||||||||
Net Increase/(Decrease) in Net Assets Resulting From Operations | $ | 38,517,226 | $ | 22,879,536 | $ | 141,081,210 | $ | 202,073,001 | ||||||||||||
| (1) | assumes an advisory fee of 70 bps on first $200 million in assets, 65 bps on the next $800 million, and 60 bps after $1 billion |
| (2) | assumes no subadvisory fee on combined assets |
| (3) | assumes fixed administrative fees of $70,000 and variable administrative fee of 1.85 bps |
| (4) | assumes $32,290 for audit and tax services and $5,929 for legal |
| (5) | assumes combined expense of existing funds adjusted for per account charges such as Attestation exam fees and Compliance fees |
| (6) | assumes a distribution fee of 25 bps on Class A |
| (7) | assumes expenses of surviving fund with adjustment for acquiring fund fees |
| (8) | assumes combined expense of existing funds |
| (9) | assumes no expense waivers on combined funds |
| (10) | Thrivent Mid Cap Stock Fund is the accounting survivor. |
- 18 -
Table of Contents
Pro Forma Combined Schedule of Investments—October 31, 2014
Thrivent Partner Small Cap Growth Fund and Thrivent Small Cap Stock Fund
| Combined Pro | Combined Pro | Combined Pro | Combined Pro | |||||||||||||||||||||||||||||
| Forma Shares | Forma Shares | Forma Value | Forma Value | |||||||||||||||||||||||||||||
| Partner Small | Small Cap | (assuming | (assuming | Partner Small | Small Cap | (assuming | (assuming | |||||||||||||||||||||||||
| Cap Growth | Stock Fund | merger with one | merger with two | Cap Growth | Stock Fund | merger with one | merger with two | |||||||||||||||||||||||||
Common Stock (97.2%) | Fund Share | Shares | Target Fund) | Target Funds) | Fund Value | Value | Target Fund) | Target Funds) | ||||||||||||||||||||||||
Consumer Discretionary (12.1%) | ||||||||||||||||||||||||||||||||
Aaron’s, Inc. | — | — | — | 146,600 | — | — | — | 3,629,816 | ||||||||||||||||||||||||
American Public Education, Inc.a | — | — | — | 26,000 | — | — | — | 805,740 | ||||||||||||||||||||||||
ANN, Inc.a | 2,185 | — | 2,185 | 2,185 | $ | 83,882 | — | 83,882 | 83,882 | |||||||||||||||||||||||
Ascent Capital Group, Inc.a | — | — | — | 11,500 | — | — | — | 739,450 | ||||||||||||||||||||||||
Brunswick Corporation | 5,026 | — | 5,026 | 33,326 | 235,217 | — | 235,217 | 1,559,657 | ||||||||||||||||||||||||
Burlington Stores, Inc.a | 4,468 | — | 4,468 | 4,468 | 187,388 | — | 187,388 | 187,388 | ||||||||||||||||||||||||
Cheesecake Factory, Inc. | — | 116,360 | 116,360 | 116,360 | — | $ | 5,345,578 | 5,345,578 | 5,345,578 | |||||||||||||||||||||||
Chuy’s Holdings, Inc.a | 1,500 | — | 1,500 | 1,500 | 44,865 | — | 44,865 | 44,865 | ||||||||||||||||||||||||
Core-Mark Holding Company, Inc. | 2,721 | — | 2,721 | 2,721 | 157,900 | — | 157,900 | 157,900 | ||||||||||||||||||||||||
Crocs, Inc.a | — | — | — | 42,500 | — | — | — | 496,400 | ||||||||||||||||||||||||
CSS Industries, Inc. | — | — | — | 39,200 | — | — | — | 1,119,552 | ||||||||||||||||||||||||
Del Frisco’s Restaurant Group, Inc.a | 6,454 | — | 6,454 | 6,454 | 149,862 | — | 149,862 | 149,862 | ||||||||||||||||||||||||
Dorman Products, Inc.a,b | — | — | — | 41,100 | — | — | — | 1,905,396 | ||||||||||||||||||||||||
Drew Industries, Inc. | — | — | — | 56,300 | — | — | — | 2,705,778 | ||||||||||||||||||||||||
Ethan Allen Interiors, Inc.b | — | — | — | 44,300 | — | — | — | 1,253,690 | ||||||||||||||||||||||||
Five Below, Inc.a,b | 3,512 | — | 3,512 | 3,512 | 140,023 | — | 140,023 | 140,023 | ||||||||||||||||||||||||
Fred’s, Inc. | — | — | — | 58,900 | — | — | — | 924,730 | ||||||||||||||||||||||||
G-III Apparel Group, Ltd.a | 3,097 | 42,200 | 45,297 | 45,297 | 245,747 | 3,348,570 | 3,594,317 | 3,594,317 | ||||||||||||||||||||||||
Haverty Furniture Companies, Inc. | — | — | — | 68,200 | — | — | — | 1,501,082 | ||||||||||||||||||||||||
HomeAway, Inc.a | 4,449 | — | 4,449 | 4,449 | 155,270 | — | 155,270 | 155,270 | ||||||||||||||||||||||||
Hooker Furniture Corporation | — | — | — | 30,800 | — | — | — | 470,932 | ||||||||||||||||||||||||
Houghton Mifflin Harcourt Companya | — | 272,500 | 272,500 | 272,500 | — | 5,452,725 | 5,452,725 | 5,452,725 | ||||||||||||||||||||||||
Ignite Restaurant Group, Inc.a,b | — | 166,621 | 166,621 | 166,621 | — | 1,148,019 | 1,148,019 | 1,148,019 | ||||||||||||||||||||||||
Imax Corporationa | 3,738 | — | 3,738 | 3,738 | 110,121 | — | 110,121 | 110,121 | ||||||||||||||||||||||||
Kate Spade & Companya | 4,670 | — | 4,670 | 4,670 | 126,697 | — | 126,697 | 126,697 | ||||||||||||||||||||||||
Lithia Motors, Inc. | 380 | — | 380 | 380 | 29,496 | — | 29,496 | 29,496 | ||||||||||||||||||||||||
M/I Homes, Inc.a | — | — | — | 46,100 | — | — | — | 992,994 | ||||||||||||||||||||||||
MarineMax, Inc.a | — | — | — | 10,700 | — | — | — | 205,119 | ||||||||||||||||||||||||
MDC Partners, Inc. | — | 294,817 | 294,817 | 294,817 | — | 6,102,712 | 6,102,712 | 6,102,712 | ||||||||||||||||||||||||
Meritage Homes Corporationa | — | — | — | 54,300 | — | — | — | 1,997,697 | ||||||||||||||||||||||||
Modine Manufacturing Companya | — | — | — | 99,600 | — | — | — | 1,277,868 | ||||||||||||||||||||||||
Multimedia Games Holding Company, Inc.a | 7,278 | — | 7,278 | 7,278 | 254,002 | — | 254,002 | 254,002 | ||||||||||||||||||||||||
National CineMedia, Inc. | — | — | — | 10,900 | — | — | — | 173,310 | ||||||||||||||||||||||||
New Media Investment Group, Inc. | — | — | — | 59,300 | — | — | — | 1,130,258 | ||||||||||||||||||||||||
NutriSystem, Inc. | — | 323,690 | 323,690 | 323,690 | — | 5,450,939 | 5,450,939 | 5,450,939 | ||||||||||||||||||||||||
Orient-Express Hotels, Ltd.a | — | — | — | 74,400 | — | — | — | 852,624 | ||||||||||||||||||||||||
Oxford Industries, Inc. | 2,686 | 61,340 | 64,026 | 64,026 | 164,517 | 3,757,075 | 3,921,592 | 3,921,592 | ||||||||||||||||||||||||
Papa John’s International, Inc. | — | 74,050 | 74,050 | 74,050 | — | 3,462,578 | 3,462,578 | 3,462,578 | ||||||||||||||||||||||||
Pier 1 Imports, Inc. | — | — | — | 109,550 | — | — | — | 1,413,195 | ||||||||||||||||||||||||
Quiksilver, Inc.a,b | — | — | — | 205,800 | — | — | — | 360,150 | ||||||||||||||||||||||||
Red Robin Gourmet Burgers, Inc.a | 2,036 | — | 2,036 | 13,236 | 111,919 | — | 111,919 | 727,583 | ||||||||||||||||||||||||
Restoration Hardware Holdings, Inc.a | 1,133 | — | 1,133 | 1,133 | 91,003 | — | 91,003 | 91,003 | ||||||||||||||||||||||||
Shiloh Industries, Inc.a | — | — | — | 94,900 | — | — | — | 1,617,096 | ||||||||||||||||||||||||
Shutterfly, Inc.a | 714 | — | 714 | 714 | 29,867 | — | 29,867 | 29,867 | ||||||||||||||||||||||||
Skechers USA, Inc.a | 2,851 | — | 2,851 | 2,851 | 156,092 | — | 156,092 | 156,092 | ||||||||||||||||||||||||
Sportsman’s Warehouse Holdings, Inc.a,b | — | — | — | 127,600 | — | — | — | 891,924 | ||||||||||||||||||||||||
Stein Mart, Inc. | — | — | — | 119,500 | — | — | — | 1,598,910 | ||||||||||||||||||||||||
Steven Madden, Ltd.a | — | — | — | 29,750 | — | — | — | 932,662 | ||||||||||||||||||||||||
Tenneco, Inc.a | 3,280 | — | 3,280 | 3,280 | 171,741 | — | 171,741 | 171,741 | ||||||||||||||||||||||||
Tuesday Morning Corporationa,b | — | 379,500 | 379,500 | 379,500 | — | 7,738,005 | 7,738,005 | 7,738,005 | ||||||||||||||||||||||||
Vail Resorts, Inc. | 1,382 | — | 1,382 | 1,382 | 119,349 | — | 119,349 | 119,349 | ||||||||||||||||||||||||
Winnebago Industries, Inc.a | — | — | — | 51,800 | — | — | — | 1,098,678 | ||||||||||||||||||||||||
|
|
|
|
|
|
|
|
|
|
|
|
|
|
|
| |||||||||||||||||
Total Consumer Discretionary | 2,764,958 | 41,806,201 | 44,571,159 | 76,606,314 | ||||||||||||||||||||||||||||
|
|
|
|
|
|
|
| |||||||||||||||||||||||||
- 19 -
Table of Contents
Consumer Staples (2.9%) | ||||||||||||||||||||||||||||||||
Alliance One International, Inc.a | — | — | — | 168,300 | — | — | — | 341,649 | ||||||||||||||||||||||||
B&G Foods, Inc. | 1,654 | — | 1,654 | 1,654 | 48,727 | — | 48,727 | 48,727 | ||||||||||||||||||||||||
Boston Beer Company, Inc.a | 916 | — | 916 | 916 | 228,084 | — | 228,084 | 228,084 | ||||||||||||||||||||||||
Natural Grocers by Vitamin Cottage, Inc.a | 2,786 | — | 2,786 | 2,786 | 50,455 | — | 50,455 | 50,455 | ||||||||||||||||||||||||
Pinnacle Foods, Inc. | — | — | — | 19,900 | — | — | — | 672,620 | ||||||||||||||||||||||||
Spartannash Company | — | — | — | 64,100 | — | — | — | 1,436,481 | ||||||||||||||||||||||||
TreeHouse Foods, Inc.a | — | 41,880 | 41,880 | 41,880 | — | 3,566,920 | 3,566,920 | 3,566,920 | ||||||||||||||||||||||||
United Natural Foods, Inc.a | 3,611 | — | 3,611 | 3,611 | 245,620 | — | 245,620 | 245,620 | ||||||||||||||||||||||||
WhiteWave Foods Companya | — | 170,950 | 170,950 | 170,950 | — | 6,364,468 | 6,364,468 | 6,364,468 | ||||||||||||||||||||||||
|
|
|
|
|
|
|
|
|
|
|
|
|
|
|
| |||||||||||||||||
Total Consumer Staples | 572,886 | 9,931,388 | 10,504,274 | 12,955,024 | ||||||||||||||||||||||||||||
|
|
|
|
|
|
|
|
|
|
|
|
|
|
|
| |||||||||||||||||
Energy (4.2%) | ||||||||||||||||||||||||||||||||
Atwood Oceanics, Inc.a | — | — | — | 17,000 | — | — | — | 691,050 | ||||||||||||||||||||||||
Bonanza Creek Energy, Inc.a | 547 | — | 547 | 547 | 24,746 | — | 24,746 | 24,746 | ||||||||||||||||||||||||
CARBO Ceramics, Inc.b | — | — | — | 5,600 | — | — | — | 289,352 | ||||||||||||||||||||||||
Cloud Peak Energy, Inc.a | — | — | — | 82,500 | — | — | — | 987,525 | ||||||||||||||||||||||||
Contango Oil & Gas Companya | — | — | — | 16,600 | — | — | — | 607,062 | ||||||||||||||||||||||||
Diamondback Energy, Inc.a | 572 | — | 572 | 572 | 39,147 | — | 39,147 | 39,147 | ||||||||||||||||||||||||
Energy XXI, Ltd.b | — | — | — | 30,700 | — | — | — | 236,083 | ||||||||||||||||||||||||
Gulf Island Fabrication, Inc. | — | — | — | 64,600 | — | — | — | 1,365,644 | ||||||||||||||||||||||||
Hercules Offshore, Inc.a,b | — | — | — | 140,100 | — | — | — | 231,165 | ||||||||||||||||||||||||
Kodiak Oil & Gas Corporationa | 10,911 | — | 10,911 | 10,911 | 117,730 | — | 117,730 | 117,730 | ||||||||||||||||||||||||
Market Vectors Oil Service ETF | — | 131,270 | 131,270 | 131,270 | — | 5,933,404 | 5,933,404 | 5,933,404 | ||||||||||||||||||||||||
Oasis Petroleum, Inc.a | 5,053 | 129,470 | 134,523 | 134,523 | 151,388 | 3,878,921 | 4,030,309 | 4,030,309 | ||||||||||||||||||||||||
PDC Energy, Inc.a | 515 | — | 515 | 11,815 | 22,516 | — | 22,516 | 516,552 | ||||||||||||||||||||||||
Penn Virginia Corporationa | 10,140 | — | 10,140 | 10,140 | 86,900 | — | 86,900 | 86,900 | ||||||||||||||||||||||||
Rex Energy Corporationa,b | 7,387 | 93,550 | 100,937 | 100,937 | 57,914 | 733,432 | 791,346 | 791,346 | ||||||||||||||||||||||||
Rosetta Resources, Inc.a | — | 65,490 | 65,490 | 65,490 | — | 2,490,585 | 2,490,585 | 2,490,585 | ||||||||||||||||||||||||
SemGroup Corporation | 1,817 | — | 1,817 | 1,817 | 139,455 | — | 139,455 | 139,455 | ||||||||||||||||||||||||
Teekay Tankers, Ltd.b | — | — | — | 268,500 | — | — | — | 1,138,440 | ||||||||||||||||||||||||
Tesco Corporation | — | — | — | 54,500 | — | — | — | 1,037,680 | ||||||||||||||||||||||||
Tetra Technologies, Inc.a | — | — | — | 104,200 | — | — | — | 993,026 | ||||||||||||||||||||||||
Trinidad Drilling, Ltd. | — | 269,591 | 269,591 | 269,591 | — | 1,755,732 | 1,755,732 | 1,755,732 | ||||||||||||||||||||||||
|
|
|
|
|
|
|
|
|
|
|
|
|
|
|
| |||||||||||||||||
Total Energy | 639,796 | 14,792,074 | 15,431,870 | 23,502,933 | ||||||||||||||||||||||||||||
|
|
|
|
|
|
|
|
|
|
|
|
|
|
|
| |||||||||||||||||
Financials (20.2%) | ||||||||||||||||||||||||||||||||
Affiliated Managers Group, Inc.a | — | 29,622 | 29,622 | 29,622 | — | 5,918,179 | 5,918,179 | 5,918,179 | ||||||||||||||||||||||||
Allied World Assurance Company Holdings AG | — | 46,780 | 46,780 | 46,780 | — | 1,777,640 | 1,777,640 | 1,777,640 | ||||||||||||||||||||||||
American Assets Trust, Inc. | — | 74,800 | 74,800 | 74,800 | — | 2,867,832 | 2,867,832 | 2,867,832 | ||||||||||||||||||||||||
Ares Capital Corporation | — | — | — | 99,900 | — | — | — | 1,597,401 | ||||||||||||||||||||||||
Argo Group International Holdings, Ltd. | — | 43,413 | 43,413 | 43,413 | — | 2,422,445 | 2,422,445 | 2,422,445 | ||||||||||||||||||||||||
Associated Estates Realty Corporation | — | — | — | 51,600 | — | — | — | 1,007,748 | ||||||||||||||||||||||||
Assured Guaranty, Ltd. | — | 116,310 | 116,310 | 140,510 | — | 2,684,435 | 2,684,435 | 3,242,971 | ||||||||||||||||||||||||
Bank of Kentucky Financial Corporation | — | — | — | 8,400 | — | — | — | 394,044 | ||||||||||||||||||||||||
Bank of the Ozarks, Inc. | 5,441 | — | 5,441 | 5,441 | 191,741 | — | 191,741 | 191,741 | ||||||||||||||||||||||||
BBCN Bancorp, Inc. | — | 186,200 | 186,200 | 255,400 | — | 2,632,868 | 2,632,868 | 3,611,356 | ||||||||||||||||||||||||
Catchmark Timber Trust, Inc. | — | — | — | 43,140 | — | — | — | 504,738 | ||||||||||||||||||||||||
CBL & Associates Properties, Inc. | — | — | — | 109,000 | — | — | — | 2,085,170 | ||||||||||||||||||||||||
Cedar Realty Trust, Inc. | — | — | — | 141,900 | — | — | — | 976,272 | ||||||||||||||||||||||||
Chesapeake Lodging Trust | 4,217 | — | 4,217 | 4,217 | 139,330 | — | 139,330 | 139,330 | ||||||||||||||||||||||||
CNO Financial Group, Inc. | — | 403,160 | 403,160 | 403,160 | — | 7,309,291 | 7,309,291 | 7,309,291 | ||||||||||||||||||||||||
CoBiz Financial, Inc. | — | — | — | 282,500 | — | — | — | 3,395,650 | ||||||||||||||||||||||||
Columbia Banking System, Inc. | — | — | — | 59,200 | — | — | — | 1,644,576 | ||||||||||||||||||||||||
Compass Diversified Holdings | — | — | — | 66,500 | — | — | — | 1,226,925 | ||||||||||||||||||||||||
East West Bancorp, Inc. | — | — | — | 116,200 | — | — | — | 4,271,512 | ||||||||||||||||||||||||
Education Realty Trust, Inc. | — | 179,800 | 179,800 | 179,800 | — | 2,024,548 | 2,024,548 | 2,024,548 |
- 20 -
Table of Contents
Employers Holdings, Inc. | — | — | — | 65,460 | — | — | — | 1,334,729 | ||||||||||||||||||||||||
Enstar Group, Ltd.a | — | — | — | 2,300 | — | — | — | 340,561 | ||||||||||||||||||||||||
Essent Group, Ltd.a | 6,565 | — | 6,565 | 6,565 | 159,792 | — | 159,792 | 159,792 | ||||||||||||||||||||||||
Evercore Partners, Inc. | 2,974 | — | 2,974 | 2,974 | 153,964 | — | 153,964 | 153,964 | ||||||||||||||||||||||||
Extra Space Storage, Inc. | — | 36,560 | 36,560 | 36,560 | — | 2,126,330 | 2,126,330 | 2,126,330 | ||||||||||||||||||||||||
First Potomac Realty Trust | — | — | — | 134,000 | — | — | — | 1,675,000 | ||||||||||||||||||||||||
Forestar Real Estate Group, Inc.a | — | — | — | 17,800 | — | — | — | 310,610 | ||||||||||||||||||||||||
Glacier Bancorp, Inc. | — | — | — | 90,900 | — | — | — | 2,607,921 | ||||||||||||||||||||||||
Golub Capital BDC, Inc. | — | — | — | 66,400 | — | — | — | 1,150,712 | ||||||||||||||||||||||||
Hanmi Financial Corporation | 3,787 | 246,270 | 250,057 | 250,057 | 81,231 | 5,282,492 | 5,363,723 | 5,363,723 | ||||||||||||||||||||||||
Hatteras Financial Corporation | — | — | — | 81,100 | — | — | — | 1,544,144 | ||||||||||||||||||||||||
HCC Insurance Holdings, Inc. | — | 57,870 | 57,870 | 57,870 | — | 3,020,235 | 3,020,235 | 3,020,235 | ||||||||||||||||||||||||
Hercules Technology Growth Capital, Inc. | — | — | — | 135,000 | — | — | — | 2,127,600 | ||||||||||||||||||||||||
Home Bancshares, Inc. | — | — | — | 75,400 | — | — | — | 2,406,768 | ||||||||||||||||||||||||
iShares Russell 2000 Growth Index Fund | 4,243 | — | 4,243 | 18,843 | 583,964 | — | 583,964 | 2,045,132 | ||||||||||||||||||||||||
iShares Russell 2000 Index Fund | — | 57,020 | 57,020 | 57,020 | — | 6,646,251 | 6,646,251 | 6,646,251 | ||||||||||||||||||||||||
iShares Russell 2000 Value Index Fund | — | — | — | — | — | — | — | — | ||||||||||||||||||||||||
Janus Capital Group, Inc. | — | — | — | 55,500 | — | — | — | 831,945 | ||||||||||||||||||||||||
JMP Group, Inc. | — | — | — | 46,800 | — | — | — | 341,640 | ||||||||||||||||||||||||
Kennedy-Wilson Holdings, Inc. | 6,237 | — | 6,237 | 6,237 | 168,960 | — | 168,960 | 168,960 | ||||||||||||||||||||||||
Kilroy Realty Corporation | — | — | — | 18,000 | — | — | — | 1,219,320 | ||||||||||||||||||||||||
Kite Realty Group Trust | — | — | — | 62,775 | — | — | — | 1,625,245 | ||||||||||||||||||||||||
LaSalle Hotel Properties | — | — | — | 61,400 | — | — | — | 2,407,494 | ||||||||||||||||||||||||
Main Street Capital Corporation | — | — | — | 19,800 | — | — | — | 629,244 | ||||||||||||||||||||||||
Meadowbrook Insurance Group, Inc. | — | — | — | 142,600 | — | — | — | 908,362 | ||||||||||||||||||||||||
National Interstate Corporation | — | — | — | 52,400 | — | — | — | 1,490,256 | ||||||||||||||||||||||||
PacWest Bancorp | 4,021 | 91,150 | 95,171 | 95,171 | 171,536 | 3,888,459 | 4,059,995 | 4,059,995 | ||||||||||||||||||||||||
Parkway Properties, Inc. | — | 103,400 | 103,400 | 103,400 | — | 2,073,170 | 2,073,170 | 2,073,170 | ||||||||||||||||||||||||
Pebblebrook Hotel Trust | — | 107,580 | 107,580 | 107,580 | — | 4,582,908 | 4,582,908 | 4,582,908 | ||||||||||||||||||||||||
Piper Jaffray Companiesa | — | — | — | 13,500 | — | — | — | 762,210 | ||||||||||||||||||||||||
Potlatch Corporation | — | — | — | 41,500 | — | — | — | 1,825,585 | ||||||||||||||||||||||||
ProAssurance Corporation | — | — | — | 95,500 | — | — | — | 4,467,490 | ||||||||||||||||||||||||
PS Business Parks, Inc. | — | — | — | 9,800 | — | — | — | 825,356 | ||||||||||||||||||||||||
Radian Group, Inc.b | — | — | — | 80,500 | — | — | — | 1,356,425 | ||||||||||||||||||||||||
Redwood Trust, Inc. | — | — | — | 144,400 | — | — | — | 2,713,276 | ||||||||||||||||||||||||
Safeguard Scientifics, Inc.a | — | — | — | 65,100 | — | — | — | 1,298,745 | ||||||||||||||||||||||||
Safety Insurance Group, Inc. | — | — | — | 4,300 | — | — | — | 268,234 | ||||||||||||||||||||||||
Sandy Spring Bancorp, Inc. | — | — | — | 85,600 | — | — | — | 2,208,480 | ||||||||||||||||||||||||
State Auto Financial Corporation | — | — | — | 35,000 | — | — | — | 732,550 | ||||||||||||||||||||||||
Strategic Hotels & Resorts, Inc.a | — | — | — | 20,100 | — | — | — | 258,285 | ||||||||||||||||||||||||
SVB Financial Groupa | — | 15,520 | 15,520 | 41,620 | — | 1,738,085 | 1,738,085 | 4,661,024 | ||||||||||||||||||||||||
Synovus Financial Corporation | — | 254,440 | 254,440 | 254,440 | — | 6,452,599 | 6,452,599 | 6,452,599 | ||||||||||||||||||||||||
TCP Capital Corporation | — | — | — | 45,400 | — | — | — | 766,806 | ||||||||||||||||||||||||
Terreno Realty Corporation | — | 150,490 | 150,490 | 150,490 | — | 3,169,319 | 3,169,319 | 3,169,319 | ||||||||||||||||||||||||
Texas Capital Bancshares, Inc.a | — | 31,660 | 31,660 | 31,660 | — | 1,936,009 | 1,936,009 | 1,936,009 | ||||||||||||||||||||||||
THL Credit, Inc. | — | — | — | 61,200 | — | — | — | 787,032 | ||||||||||||||||||||||||
Washington Real Estate Investment Trust | — | — | — | 48,400 | — | — | — | 1,367,784 | ||||||||||||||||||||||||
Western Alliance Bancorpa | 5,251 | 143,370 | 148,621 | 148,621 | 139,782 | 3,816,509 | 3,956,291 | 3,956,291 | ||||||||||||||||||||||||
Wintrust Financial Corporation | — | — | — | 56,500 | — | — | — | 2,617,080 | ||||||||||||||||||||||||
|
|
|
|
|
|
|
|
|
|
|
|
|
|
|
| |||||||||||||||||
Total Financials | 1,790,300 | 72,369,604 | 74,159,904 | 142,391,960 | ||||||||||||||||||||||||||||
|
|
|
|
|
|
|
|
|
|
|
|
|
|
|
| |||||||||||||||||
Health Care (10.8%) | ||||||||||||||||||||||||||||||||
Acadia Healthcare Company, Inc.a | 3,647 | — | 3,647 | 3,647 | 226,297 | — | 226,297 | 226,297 | ||||||||||||||||||||||||
Acorda Therapeutics, Inc.a | — | 70,100 | 70,100 | 70,100 | — | 2,440,882 | 2,440,882 | 2,440,882 | ||||||||||||||||||||||||
Akorn, Inc.a | 6,758 | 77,280 | 84,038 | 84,038 | 301,069 | 3,442,824 | 3,743,893 | 3,743,893 |
- 21 -
Table of Contents
Align Technology, Inc.a | 2,030 | 55,330 | 57,360 | 57,360 | 106,819 | 2,911,465 | 3,018,284 | 3,018,284 | ||||||||||||||||||||||||
Analogic Corporation | — | — | — | 11,900 | — | — | — | 867,986 | ||||||||||||||||||||||||
Atrion Corporation | — | — | — | 4,900 | — | — | — | 1,617,049 | ||||||||||||||||||||||||
BioScrip, Inc.a,b | — | 173,070 | 173,070 | 173,070 | — | 1,118,032 | 1,118,032 | 1,118,032 | ||||||||||||||||||||||||
Bruker Corporationa | 4,976 | — | 4,976 | 4,976 | 103,153 | — | 103,153 | 103,153 | ||||||||||||||||||||||||
Cardiovascular Systems, Inc.a | 4,130 | — | 4,130 | 4,130 | 128,030 | — | 128,030 | 128,030 | ||||||||||||||||||||||||
Centene Corporationa | 1,785 | — | 1,785 | 1,785 | 165,416 | — | 165,416 | 165,416 | ||||||||||||||||||||||||
Cubist Pharmaceuticals, Inc.a | 2,142 | — | 2,142 | 2,142 | 154,845 | — | 154,845 | 154,845 | ||||||||||||||||||||||||
Cyberonics, Inc.a | 3,344 | — | 3,344 | 3,344 | 175,560 | — | 175,560 | 175,560 | ||||||||||||||||||||||||
Depomed, Inc.a | 12,928 | — | 12,928 | 12,928 | 199,091 | — | 199,091 | 199,091 | ||||||||||||||||||||||||
ExamWorks Group, Inc.a,b | 7,135 | 222,172 | 229,307 | 229,307 | 276,695 | 8,615,830 | 8,892,525 | 8,892,525 | ||||||||||||||||||||||||
Furiex Pharmaceuticals, Inc. Contigent Value Righta,c | 2,923 | — | 2,923 | 2,923 | 28,499 | — | 28,499 | 28,499 | ||||||||||||||||||||||||
Healthcare Services Group, Inc. | 8,095 | — | 8,095 | 8,095 | 241,069 | — | 241,069 | 241,069 | ||||||||||||||||||||||||
Impax Laboratories, Inc.a | 7,028 | — | 7,028 | 7,028 | 203,601 | — | 203,601 | 203,601 | ||||||||||||||||||||||||
Ironwood Pharmaceuticals, Inc.a | 11,635 | — | 11,635 | 11,635 | 163,123 | — | 163,123 | 163,123 | ||||||||||||||||||||||||
LifePoint Hospitals, Inc.a | 2,121 | — | 2,121 | 2,121 | 148,470 | — | 148,470 | 148,470 | ||||||||||||||||||||||||
National Healthcare Corporation | — | — | — | 29,800 | — | — | — | 1,797,238 | ||||||||||||||||||||||||
Neurocrine Biosciences, Inc.a | 7,577 | 130,900 | 138,477 | 138,477 | 140,326 | 2,424,268 | 2,564,594 | 2,564,594 | ||||||||||||||||||||||||
NPS Pharmaceuticals, Inc.a | 3,088 | — | 3,088 | 3,088 | 84,611 | — | 84,611 | 84,611 | ||||||||||||||||||||||||
NuVasive, Inc.a | 7,851 | 190,723 | 198,574 | 198,574 | 321,106 | 7,800,571 | 8,121,677 | 8,121,677 | ||||||||||||||||||||||||
Puma Biotechnology, Inc.a | 717 | — | 717 | 717 | 179,680 | — | 179,680 | 179,680 | ||||||||||||||||||||||||
Team Health Holdings, Inc.a | 3,470 | — | 3,470 | 3,470 | 217,014 | — | 217,014 | 217,014 | ||||||||||||||||||||||||
Teleflex, Inc. | 2,169 | 61,950 | 64,119 | 64,119 | 247,526 | 7,069,734 | 7,317,260 | 7,317,260 | ||||||||||||||||||||||||
Triple-S Management Corporationa | — | — | — | 65,500 | — | — | — | 1,450,170 | ||||||||||||||||||||||||
West Pharmaceutical Services, Inc. | — | — | — | 85,200 | — | — | — | 4,366,500 | ||||||||||||||||||||||||
|
|
|
|
|
|
|
|
|
|
|
|
|
|
|
| |||||||||||||||||
Total Health Care | 3,812,000 | 35,823,606 | 39,635,606 | 49,734,549 | ||||||||||||||||||||||||||||
|
|
|
|
|
|
|
|
|
|
|
|
|
|
|
| |||||||||||||||||
Industrials (23.7%) | ||||||||||||||||||||||||||||||||
A.O. Smith Corporation | — | — | — | 61,500 | — | — | — | 3,281,025 | ||||||||||||||||||||||||
Aegion Corporationa | — | — | — | 69,100 | — | — | — | 1,265,912 | ||||||||||||||||||||||||
Alaska Air Group, Inc. | — | — | — | 118,200 | — | — | — | 6,291,786 | ||||||||||||||||||||||||
Apogee Enterprises, Inc. | — | 86,570 | 86,570 | 86,570 | — | 3,800,423 | 3,800,423 | 3,800,423 | ||||||||||||||||||||||||
Applied Industrial Technologies, Inc. | — | — | — | 28,000 | — | — | — | 1,366,680 | ||||||||||||||||||||||||
Astec Industries, Inc. | — | — | — | 28,700 | — | — | — | 1,088,017 | ||||||||||||||||||||||||
Beacon Roofing Supply, Inc.a | — | — | — | 99,400 | — | — | — | 2,750,398 | ||||||||||||||||||||||||
Celadon Group, Inc. | — | — | — | 59,600 | — | — | — | 1,159,816 | ||||||||||||||||||||||||
Chart Industries, Inc.a | 442 | — | 442 | 442 | 20,575 | — | 20,575 | 20,575 | ||||||||||||||||||||||||
Circor International, Inc. | — | — | — | 28,300 | — | — | — | 2,126,745 | ||||||||||||||||||||||||
CLARCOR, Inc. | — | 115,690 | 115,690 | 115,690 | — | 7,746,602 | 7,746,602 | 7,746,602 | ||||||||||||||||||||||||
Comfort Systems USA, Inc. | — | — | — | 71,900 | — | — | — | 1,104,384 | ||||||||||||||||||||||||
Curtiss-Wright Corporation | — | 64,420 | 64,420 | 64,420 | — | 4,458,508 | 4,458,508 | 4,458,508 | ||||||||||||||||||||||||
EMCOR Group, Inc. | — | 241,711 | 241,711 | 241,711 | — | 10,666,707 | 10,666,707 | 10,666,707 | ||||||||||||||||||||||||
ESCO Technologies, Inc. | — | — | — | 54,400 | — | — | — | 2,068,288 | ||||||||||||||||||||||||
Esterline Technologies Corporationa | — | 46,060 | 46,060 | 46,060 | — | 5,394,087 | 5,394,087 | 5,394,087 | ||||||||||||||||||||||||
Franklin Electric Company, Inc. | — | — | — | 38,100 | — | — | — | 1,422,654 | ||||||||||||||||||||||||
FTI Consulting, Inc.a | — | — | — | 36,800 | — | — | — | 1,485,984 | ||||||||||||||||||||||||
G & K Services, Inc. | — | — | — | 45,200 | — | — | — | 2,850,764 | ||||||||||||||||||||||||
GATX Corporation | — | 60,030 | 60,030 | 60,030 | — | 3,805,902 | 3,805,902 | 3,805,902 | ||||||||||||||||||||||||
Generac Holdings, Inc.a | 1,915 | — | 1,915 | 1,915 | 86,826 | — | 86,826 | 86,826 | ||||||||||||||||||||||||
Genesee & Wyoming, Inc.a | — | — | — | 31,300 | — | — | — | 3,011,060 | ||||||||||||||||||||||||
Gibraltar Industries, Inc.a | — | — | — | 55,600 | — | — | — | 847,900 | ||||||||||||||||||||||||
Granite Construction, Inc. | 2,276 | 130,275 | 132,551 | 132,551 | 84,007 | 4,808,450 | 4,892,457 | 4,892,457 | ||||||||||||||||||||||||
Greenbrier Companies, Inc.b | — | — | — | 21,200 | — | — | — | 1,325,848 | ||||||||||||||||||||||||
H&E Equipment Services, Inc. | 3,344 | — | 3,344 | 3,344 | 125,032 | — | 125,032 | 125,032 | ||||||||||||||||||||||||
Heico Corporation | 2,813 | — | 2,813 | 2,813 | 152,577 | — | 152,577 | 152,577 | ||||||||||||||||||||||||
Hillenbrand, Inc. | — | — | — | 7,920 | — | — | — | 263,657 | ||||||||||||||||||||||||
HNI Corporation | — | 143,800 | 143,800 | 143,800 | — | 6,708,270 | 6,708,270 | 6,708,270 | ||||||||||||||||||||||||
Hub Group, Inc.a | — | — | — | 30,100 | — | — | — | 1,092,329 | ||||||||||||||||||||||||
Huron Consulting Group, Inc.a | 1,853 | — | 1,853 | 1,853 | 128,987 | — | 128,987 | 128,987 | ||||||||||||||||||||||||
Interface, Inc. | 9,336 | 357,380 | 366,716 | 366,716 | 149,656 | 5,728,801 | 5,878,457 | 5,878,457 | ||||||||||||||||||||||||
Kaman Corporation | — | — | — | 35,000 | — | — | — | 1,507,100 |
- 22 -
Table of Contents
Kforce, Inc. | — | — | — | 91,400 | — | — | — | 2,115,910 | ||||||||||||||||||||||||
Kirby Corporationa | — | — | — | 28,900 | — | — | — | 3,195,762 | ||||||||||||||||||||||||
Korn/Ferry Internationala | — | 211,400 | 211,400 | 211,400 | — | 5,904,402 | 5,904,402 | 5,904,402 | ||||||||||||||||||||||||
Kratos Defense & Security Solutions, Inc.a | — | — | — | 96,900 | — | — | — | 675,393 | ||||||||||||||||||||||||
Landstar System, Inc. | — | 115,800 | 115,800 | 161,500 | — | 8,570,358 | 8,570,358 | 11,952,615 | ||||||||||||||||||||||||
Luxfer Holdings plc ADR | — | — | — | 33,500 | — | — | — | 533,655 | ||||||||||||||||||||||||
MasTec, Inc.a | 4,459 | — | 4,459 | 4,459 | 127,706 | — | 127,706 | 127,706 | ||||||||||||||||||||||||
Matson, Inc. | — | — | — | 53,100 | — | — | — | 1,512,819 | ||||||||||||||||||||||||
Matthews International Corporation | — | — | — | 52,500 | — | — | — | 2,419,200 | ||||||||||||||||||||||||
McGrath Rentcorp | — | — | — | 83,900 | — | — | — | 3,064,867 | ||||||||||||||||||||||||
Middleby Corporationa | 2,433 | — | 2,433 | 2,433 | 215,321 | — | 215,321 | 215,321 | ||||||||||||||||||||||||
Mine Safety Appliances Company | — | — | — | 29,400 | — | — | — | 1,689,618 | ||||||||||||||||||||||||
Navigant Consulting, Inc.a | — | — | — | 102,000 | — | — | — | 1,569,780 | ||||||||||||||||||||||||
Nordson Corporation | — | — | — | 22,600 | — | — | — | 1,730,030 | ||||||||||||||||||||||||
On Assignment, Inc.a | 7,045 | — | 7,045 | 7,045 | 205,010 | — | 205,010 | 205,010 | ||||||||||||||||||||||||
PGT, Inc.a | 6,119 | — | 6,119 | 6,119 | 57,549 | — | 57,549 | 57,549 | ||||||||||||||||||||||||
Pike Corporationa | — | — | — | 55,300 | — | — | — | 660,282 | ||||||||||||||||||||||||
Progressive Waste Solutions, Ltd. | — | 233,440 | 233,440 | 233,440 | — | 6,823,451 | 6,823,451 | 6,823,451 | ||||||||||||||||||||||||
Proto Labs, Inc.a | 3,623 | 10,790 | 14,413 | 14,413 | 236,836 | 705,342 | 942,178 | 942,178 | ||||||||||||||||||||||||
Quanex Building Products Corporation | — | — | — | 39,200 | — | — | — | 784,784 | ||||||||||||||||||||||||
RBC Bearings, Inc. | — | — | — | 10,300 | — | — | — | 625,725 | ||||||||||||||||||||||||
Ritchie Brothers Auctioneers, Inc. | 5,032 | 161,000 | 166,032 | 166,032 | 122,730 | 3,926,790 | 4,049,520 | 4,049,520 | ||||||||||||||||||||||||
Saia, Inc.a | 4,611 | — | 4,611 | 4,611 | 226,031 | — | 226,031 | 226,031 | ||||||||||||||||||||||||
Spirit Airlines, Inc.a | 3,444 | — | 3,444 | 3,444 | 251,791 | — | 251,791 | 251,791 | ||||||||||||||||||||||||
Sun Hydraulics Corporation | — | — | — | 24,300 | — | — | — | 967,383 | ||||||||||||||||||||||||
Swift Transportation Companya | 6,078 | — | 6,078 | 6,078 | 150,127 | — | 150,127 | 150,127 | ||||||||||||||||||||||||
Tennant Company | — | 72,390 | 72,390 | 72,390 | — | 5,337,315 | 5,337,315 | 5,337,315 | ||||||||||||||||||||||||
Tutor Perini Corporationa | 3,170 | — | 3,170 | 3,170 | �� | 88,792 | — | 88,792 | 88,792 | |||||||||||||||||||||||
Universal Forest Products, Inc. | — | — | — | 34,100 | — | — | — | 1,703,977 | ||||||||||||||||||||||||
Universal Truckload Services, Inc. | — | — | — | 42,700 | — | — | — | 1,123,864 | ||||||||||||||||||||||||
UTI Worldwide, Inc.a | — | — | — | 69,100 | — | — | — | 755,263 | ||||||||||||||||||||||||
WageWorks, Inc.a | 592 | — | 592 | 592 | 33,750 | — | 33,750 | 33,750 | ||||||||||||||||||||||||
Waste Connections, Inc. | — | — | — | 30,900 | — | — | — | 1,541,910 | ||||||||||||||||||||||||
Watsco, Inc. | 1,452 | — | 1,452 | 1,452 | 147,552 | — | 147,552 | 147,552 | ||||||||||||||||||||||||
Watts Water Technologies, Inc. | 1,683 | — | 1,683 | 1,683 | 102,040 | — | 102,040 | 102,040 | ||||||||||||||||||||||||
Woodward, Inc. | — | — | — | 40,780 | — | — | — | 2,088,344 | ||||||||||||||||||||||||
|
|
|
|
|
|
|
|
|
|
|
|
|
|
|
| |||||||||||||||||
Total Industrials | 2,712,895 | 84,385,408 | 87,098,303 | 155,549,473 | ||||||||||||||||||||||||||||
|
|
|
|
|
|
|
|
|
|
|
|
|
|
|
| |||||||||||||||||
Information Technology (14.7%) | ||||||||||||||||||||||||||||||||
A10 Networks, Inc.a | 5,504 | — | 5,504 | 5,504 | 24,218 | — | 24,218 | 24,218 | ||||||||||||||||||||||||
Advanced Energy Industries, Inc.a | — | — | — | 47,500 | — | — | — | 939,550 | ||||||||||||||||||||||||
Ambarella, Inc.a,b | 1,791 | — | 1,791 | 1,791 | 79,323 | — | 79,323 | 79,323 | ||||||||||||||||||||||||
Applied Micro Circuits Corporationa | 18,238 | — | 18,238 | 18,238 | 118,000 | — | 118,000 | 118,000 | ||||||||||||||||||||||||
Applied Optoelectronics, Inc.a | 2,852 | — | 2,852 | 2,852 | 46,031 | — | 46,031 | 46,031 | ||||||||||||||||||||||||
Aspen Technology, Inc.a | 4,820 | — | 4,820 | 4,820 | 178,003 | — | 178,003 | 178,003 | ||||||||||||||||||||||||
Atmel Corporationa | — | 405,100 | 405,100 | 405,100 | — | 3,005,842 | 3,005,842 | 3,005,842 | ||||||||||||||||||||||||
Badger Meter, Inc. | — | — | — | 6,700 | — | — | — | 381,364 | ||||||||||||||||||||||||
Belden, Inc. | 1,854 | — | 1,854 | 41,554 | 131,986 | — | 131,986 | 2,958,229 | ||||||||||||||||||||||||
Broadridge Financial Solutions, Inc. | — | 191,580 | 191,580 | 191,580 | — | 8,416,109 | 8,416,109 | 8,416,109 | ||||||||||||||||||||||||
Brooks Automation, Inc. | — | — | — | 75,400 | — | — | — | 929,682 | ||||||||||||||||||||||||
Cabot Microelectronics Corporationa | — | — | — | 46,100 | — | — | — | 2,223,403 | ||||||||||||||||||||||||
CalAmp Corporationa | 1,101 | — | 1,101 | 1,101 | 21,227 | — | 21,227 | 21,227 | ||||||||||||||||||||||||
Cardtronics, Inc.a | 4,311 | — | 4,311 | 4,311 | 165,499 | — | 165,499 | 165,499 | ||||||||||||||||||||||||
Cavium, Inc.a | 2,664 | — | 2,664 | 2,664 | 136,690 | — | 136,690 | 136,690 | ||||||||||||||||||||||||
ChannelAdvisor Corporationa | 4,441 | — | 4,441 | 4,441 | 61,685 | — | 61,685 | 61,685 | ||||||||||||||||||||||||
Cognex Corporationa | 3,148 | — | 3,148 | 19,048 | 124,535 | — | 124,535 | 753,539 | ||||||||||||||||||||||||
Coherent, Inc.a | 1,633 | — | 1,633 | 1,633 | 106,390 | — | 106,390 | 106,390 | ||||||||||||||||||||||||
Cohu, Inc. | — | — | — | 47,300 | — | — | — | 482,460 | ||||||||||||||||||||||||
Constant Contact, Inc.a | 4,181 | — | 4,181 | 4,181 | 147,840 | — | 147,840 | 147,840 | ||||||||||||||||||||||||
Cornerstone OnDemand, Inc.a | 5,017 | — | 5,017 | 5,017 | 181,967 | — | 181,967 | 181,967 |
- 23 -
Table of Contents
Dealertrack Technologies, Inc.a | 2,949 | — | 2,949 | 2,949 | 138,750 | — | 138,750 | 138,750 | ||||||||||||||||||||||||
Demandware, Inc.a | 3,437 | — | 3,437 | 3,437 | 206,048 | — | 206,048 | 206,048 | ||||||||||||||||||||||||
DST Systems, Inc. | 3,053 | 99,220 | 102,273 | 102,273 | 294,157 | 9,559,847 | 9,854,004 | 9,854,004 | ||||||||||||||||||||||||
dvanced Energy Industries, Inc.a | — | — | — | — | — | — | — | — | ||||||||||||||||||||||||
Electro Rent Corporation | — | — | — | 91,200 | — | — | — | 1,389,888 | ||||||||||||||||||||||||
Electro Scientific Industries, Inc. | — | — | — | 103,100 | — | — | — | 732,010 | ||||||||||||||||||||||||
Electronics for Imaging, Inc.a | 2,093 | — | 2,093 | 2,093 | 95,692 | — | 95,692 | 95,692 | ||||||||||||||||||||||||
Entegris, Inc.a | — | — | — | 45,700 | — | — | — | 620,606 | ||||||||||||||||||||||||
Fabrineta | — | — | — | 68,900 | — | — | — | 1,254,669 | ||||||||||||||||||||||||
FEI Company | — | 52,330 | 52,330 | 52,330 | — | 4,410,372 | 4,410,372 | 4,410,372 | ||||||||||||||||||||||||
Guidewire Software, Inc.a | 6,529 | 90,350 | 96,879 | 96,879 | 326,058 | 4,512,079 | 4,838,137 | 4,838,137 | ||||||||||||||||||||||||
Intersil Corporation | — | — | — | 27,600 | — | — | — | 366,804 | ||||||||||||||||||||||||
Intevac, Inc.a | — | — | — | 122,400 | — | — | — | 905,760 | ||||||||||||||||||||||||
Ixiaa | — | — | — | 113,500 | — | — | — | 1,093,005 | ||||||||||||||||||||||||
Littelfuse, Inc. | — | — | — | 14,600 | — | — | — | 1,424,084 | ||||||||||||||||||||||||
Manhattan Associates, Inc.a | 2,202 | — | 2,202 | 2,202 | 88,322 | — | 88,322 | 88,322 | ||||||||||||||||||||||||
MaxLinear, Inc.a | 14,291 | — | 14,291 | 14,291 | 101,323 | — | 101,323 | 101,323 | ||||||||||||||||||||||||
Methode Electronics, Inc. | 1,734 | — | 1,734 | 60,834 | 68,285 | — | 68,285 | 2,395,643 | ||||||||||||||||||||||||
Monolithic Power Systems, Inc. | 2,890 | — | 2,890 | 2,890 | 127,709 | — | 127,709 | 127,709 | ||||||||||||||||||||||||
Newport Corporationa | — | — | — | 27,800 | — | — | — | 497,342 | ||||||||||||||||||||||||
Plantronics, Inc. | — | 139,696 | 139,696 | 139,696 | ��� | 7,246,032 | 7,246,032 | 7,246,032 | ||||||||||||||||||||||||
Progress Software Corporationa | — | — | — | 76,000 | — | — | — | 1,968,400 | ||||||||||||||||||||||||
Proofpoint, Inc.a | 7,886 | — | 7,886 | 7,886 | 347,299 | — | 347,299 | 347,299 | ||||||||||||||||||||||||
ShoreTel, Inc.a | — | — | — | 137,400 | — | — | — | 1,111,566 | ||||||||||||||||||||||||
Sonus Networks, Inc.a | — | — | — | 224,200 | — | — | — | 777,974 | ||||||||||||||||||||||||
SPS Commerce, Inc.a | 395 | — | 395 | 395 | 23,029 | — | 23,029 | 23,029 | ||||||||||||||||||||||||
SunPower Corporationa | 1,583 | — | 1,583 | 1,583 | 50,403 | — | 50,403 | 50,403 | ||||||||||||||||||||||||
Synaptics, Inc.a | 958 | — | 958 | 958 | 65,556 | — | 65,556 | 65,556 | ||||||||||||||||||||||||
Synnex Corporation | — | — | — | 46,200 | — | — | — | 3,196,116 | ||||||||||||||||||||||||
Teradyne, Inc. | — | — | — | 53,800 | — | — | — | 989,920 | ||||||||||||||||||||||||
Textura Corporationa,b | — | 119,180 | 119,180 | 119,180 | — | 3,174,955 | 3,174,955 | 3,174,955 | ||||||||||||||||||||||||
Tyler Technologies, Inc.a | 602 | — | 602 | 602 | 67,376 | — | 67,376 | 67,376 | ||||||||||||||||||||||||
Ubiquiti Networks, Inc.b | — | 90,900 | 90,900 | 90,900 | — | 3,251,493 | 3,251,493 | 3,251,493 | ||||||||||||||||||||||||
Ultimate Software Group, Inc.a | 1,135 | — | 1,135 | 1,135 | 170,829 | — | 170,829 | 170,829 | ||||||||||||||||||||||||
Virtusa Corporationa | 5,107 | 165,267 | 170,374 | 170,374 | 209,285 | 6,772,642 | 6,981,927 | 6,981,927 | ||||||||||||||||||||||||
|
|
|
|
|
|
|
|
|
|
|
|
|
|
|
| |||||||||||||||||
Total Information Technology | 3,903,515 | 50,349,371 | 54,252,886 | 81,320,094 | ||||||||||||||||||||||||||||
|
|
|
|
|
|
|
|
|
|
|
|
|
|
|
| |||||||||||||||||
Materials (4.3%) | ||||||||||||||||||||||||||||||||
American Vanguard Corporationb | — | — | — | 42,400 | — | — | — | 489,296 | ||||||||||||||||||||||||
AptarGroup, Inc. | — | — | — | 49,800 | — | — | — | 3,099,552 | ||||||||||||||||||||||||
Carpenter Technology Corporation | — | — | — | 12,600 | — | — | — | 630,630 | ||||||||||||||||||||||||
Chemtura Corporationa | 5,039 | — | 5,039 | 5,039 | 117,358 | — | 117,358 | 117,358 | ||||||||||||||||||||||||
Clearwater Paper Corporationa | — | — | — | 45,400 | — | — | — | 2,921,490 | ||||||||||||||||||||||||
Eagle Materials, Inc. | — | 44,400 | 44,400 | 44,400 | — | 3,881,892 | 3,881,892 | 3,881,892 | ||||||||||||||||||||||||
Franco-Nevada Corporation | — | — | — | 16,800 | — | — | — | 786,450 | ||||||||||||||||||||||||
Graphic Packaging Holding Companya | 12,686 | — | 12,686 | 12,686 | 153,881 | — | 153,881 | 153,881 | ||||||||||||||||||||||||
Horsehead Holding Corporationa | — | 230,170 | 230,170 | 230,170 | — | 3,615,971 | 3,615,971 | 3,615,971 | ||||||||||||||||||||||||
Innospec, Inc. | — | — | — | 78,000 | — | — | — | 3,148,860 | ||||||||||||||||||||||||
KapStone Paper and Packaging Corporationa | 1,887 | — | 1,887 | 1,887 | 58,044 | — | 58,044 | 58,044 | ||||||||||||||||||||||||
Materials Select Sector SPDR Fund | — | 155,770 | 155,770 | 155,770 | — | 7,539,268 | 7,539,268 | 7,539,268 | ||||||||||||||||||||||||
Minerals Technologies, Inc. | — | — | — | 37,600 | — | — | — | 2,884,296 | ||||||||||||||||||||||||
Myers Industries, Inc. | — | — | — | 86,800 | — | — | — | 1,296,792 | ||||||||||||||||||||||||
PolyOne Corporation | 4,798 | — | 4,798 | 4,798 | 177,574 | — | 177,574 | 177,574 | ||||||||||||||||||||||||
Ryerson Holding Corporationa | — | — | — | 30,200 | — | — | — | 385,956 | ||||||||||||||||||||||||
Sandstorm Gold, Ltd.a,b | — | — | — | 140,400 | — | — | — | 405,756 | ||||||||||||||||||||||||
Schnitzer Steel Industries, Inc. | — | — | — | 29,100 | — | — | — | 685,305 | ||||||||||||||||||||||||
Senomyx, Inc.a,b | 10,396 | — | 10,396 | 10,396 | 82,336 | — | 82,336 | 82,336 | ||||||||||||||||||||||||
Stillwater Mining Companya | — | — | — | 51,200 | — | — | — | 672,256 | ||||||||||||||||||||||||
U.S. Silica Holdings, Inc. | 3,926 | — | 3,926 | 3,926 | 176,278 | — | 176,278 | 176,278 | ||||||||||||||||||||||||
Wausau Paper Corporation | — | — | — | 150,100 | — | — | — | 1,484,489 | ||||||||||||||||||||||||
|
|
|
|
|
|
|
|
|
|
|
|
|
|
|
| |||||||||||||||||
Total Materials | 765,471 | 15,037,131 | 15,802,602 | 34,693,730 | ||||||||||||||||||||||||||||
|
|
|
|
|
|
|
|
|
|
|
|
|
|
|
|
- 24 -
Table of Contents
Telecommunications Services (0.9%) | ||||||||||||||||||||||||||||||||
Cogent Communications Holdings | — | 97,803 | 97,803 | 97,803 | — | 3,319,434 | 3,319,434 | 3,319,434 | ||||||||||||||||||||||||
Premiere Global Services, Inc.a | — | — | — | 36,700 | — | — | — | 384,249 | ||||||||||||||||||||||||
|
|
|
|
|
|
|
|
|
|
|
|
|
|
|
| |||||||||||||||||
Total Telecommunication Services | — | 3,319,434 | 3,319,434 | 3,703,683 | ||||||||||||||||||||||||||||
|
|
|
|
|
|
|
|
|
|
|
|
|
|
|
| |||||||||||||||||
Utilities (3.5%) | ||||||||||||||||||||||||||||||||
Black Hills Corporation | — | — | — | 22,200 | — | — | — | 1,215,006 | ||||||||||||||||||||||||
Cleco Corporation | — | — | — | 71,100 | — | — | — | 3,822,336 | ||||||||||||||||||||||||
El Paso Electric Company | — | — | — | 47,400 | — | — | — | 1,793,616 | ||||||||||||||||||||||||
Laclede Group, Inc. | — | 36,930 | 36,930 | 36,930 | — | 1,874,936 | 1,874,936 | 1,874,936 | ||||||||||||||||||||||||
NorthWestern Corporation | — | 172,740 | 172,740 | 211,940 | — | 9,127,582 | 9,127,582 | 11,198,910 | ||||||||||||||||||||||||
PNM Resources, Inc. | — | — | — | 52,400 | — | — | — | 1,511,740 | ||||||||||||||||||||||||
Portland General Electric Company | — | 51,990 | 51,990 | 51,990 | — | 1,892,956 | 1,892,956 | 1,892,956 | ||||||||||||||||||||||||
Southwest Gas Corporation | — | — | — | 46,600 | — | — | — | 2,706,994 | ||||||||||||||||||||||||
|
|
|
|
|
|
|
|
|
|
|
|
|
|
|
| |||||||||||||||||
Total Utilities | — | 12,895,474 | 12,895,474 | 26,016,494 | ||||||||||||||||||||||||||||
|
|
|
|
|
|
|
|
|
|
|
|
|
|
|
| |||||||||||||||||
Total Common Stock (Cost $16,213,414, Cost $283,287,256, Combined Fund $299,500,670, Combined Funds $450,849,340) | 16,961,821 | 340,709,691 | 357,671,512 | 606,474,254 | ||||||||||||||||||||||||||||
|
|
|
|
|
|
|
|
|
|
|
|
|
|
|
| |||||||||||||||||
Preferred Stock (0.0%) | ||||||||||||||||||||||||||||||||
Health Care (0.0%) | ||||||||||||||||||||||||||||||||
National Healthcare Corporation, Convertibled | — | — | — | 30,846 | — | — | — | 473,486 | ||||||||||||||||||||||||
|
|
|
|
|
|
|
|
|
|
|
|
|
|
|
| |||||||||||||||||
Total Health Care | — | — | — | 473,486 | ||||||||||||||||||||||||||||
|
|
|
|
|
|
|
|
|
|
|
|
|
|
|
| |||||||||||||||||
Total Preferred Stock (Cost $0, Cost $0, Combined Fund $0, Combined Funds $416,153) | ||||||||||||||||||||||||||||||||
Collateral Held for Securities Loaned (3.7%) | ||||||||||||||||||||||||||||||||
Thrivent Cash Management Trust | 217,215 | 13,527,930 | 13,745,145 | 22,485,106 | 217,215 | 13,527,930 | 13,745,145 | 22,485,106 | ||||||||||||||||||||||||
|
|
|
|
|
|
|
|
|
|
|
|
|
|
|
| |||||||||||||||||
Total Collateral Held for Securities Loaned (Cost $217,215, Cost $13,527,930, Combined Fund $13,745,145, Combined Funds $22,485,106) | 217,215 | 13,527,930 | 13,745,145 | 22,485,106 | ||||||||||||||||||||||||||||
|
|
|
|
|
|
|
|
|
|
|
|
|
|
|
| |||||||||||||||||
Short-Term Investments (3.0%)e | ||||||||||||||||||||||||||||||||
Thrivent Cash Management Trust | 501,403 | 10,468,825 | 10,970,228 | 18,372,676 | 501,403 | 10,468,825 | 10,970,228 | 18,372,676 | ||||||||||||||||||||||||
|
|
|
|
|
|
|
|
|
|
|
|
|
|
|
| |||||||||||||||||
Total Short-Term Investments (at amortized cost) | 501,403 | 10,468,825 | 10,970,228 | 18,372,676 | ||||||||||||||||||||||||||||
|
|
|
|
|
|
|
|
|
|
|
|
|
|
|
| |||||||||||||||||
Total Investments (Cost $16,932,032, Cost $307,284,011, Combined Fund $324,216,043, Combined Funds 492,123,275) 103.9% | 17,680,439 | 364,706,446 | 382,386,885 | 647,805,522 | ||||||||||||||||||||||||||||
|
|
|
|
|
|
|
|
|
|
|
|
|
|
|
| |||||||||||||||||
Other Assets and Liabilities, Net (3.9)% | (204,961 | ) | (14,076,622 | ) | (14,281,583 | ) | (22,748,499 | ) | ||||||||||||||||||||||||
|
|
|
|
|
|
|
|
|
|
|
|
|
|
|
| |||||||||||||||||
Total Net Assets 100.0% | 17,475,478 | 350,629,824 | 368,105,302 | 625,057,023 | ||||||||||||||||||||||||||||
|
|
|
|
|
|
|
|
|
|
|
|
|
|
|
|
| (a) | Non-income producing security. |
| (b) | All or a portion of the security is on loan. |
| (c) | Security is fair valued. |
| (d) | Denotes perpetual securities. Perpetual securities pay an indefinite stream of interest, but may be called by the issuer at an earlier date. |
| (e) | The interest rate shown reflects the yield, coupon rate or the discount rate at the date of purchase. |
Definitions:
ADR - American Depositary Receipt, which are certificates for an underlying foreign security’s shares held by an issuing U.S. depository bank.
ETF - Exchange Traded Fund
- 25 -
Table of Contents
Partner Small Cap Growth Fund
Fair Valuation Measurements
The following table is a summary of the inputs used, as of October 31, 2014, in valuing Partner Small Cap Growth Fund’s assets carried at fair value.
Investments in Securities | Total | Level 1 | Level 2 | Level 3 | ||||||||||||
Common Stock | ||||||||||||||||
Consumer Discretionary | 2,764,958 | 2,764,958 | — | — | ||||||||||||
Consumer Staples | 572,886 | 572,886 | — | — | ||||||||||||
Energy | 639,796 | 639,796 | — | — | ||||||||||||
Financials | 1,790,300 | 1,790,300 | — | — | ||||||||||||
Health Care | 3,812,000 | 3,783,501 | — | 28,499 | ||||||||||||
Industrials | 2,712,895 | 2,712,895 | — | — | ||||||||||||
Information Technology | 3,903,515 | 3,903,515 | — | — | ||||||||||||
Materials | 765,471 | 765,471 | — | — | ||||||||||||
Telecommunications Services | — | — | — | — | ||||||||||||
Utilities | — | — | — | — | ||||||||||||
Preferred Stock | ||||||||||||||||
Health Care | — | — | — | — | ||||||||||||
Collateral Held for Securities Loaned | 217,215 | 217,215 | — | — | ||||||||||||
Short-Term Investments | 501,403 | 501,403 | — | — | ||||||||||||
|
|
|
|
|
|
|
| |||||||||
Total | $ | 17,680,439 | $ | 17,651,940 | — | $ | 28,499 | |||||||||
|
|
|
|
|
|
|
| |||||||||
There were no significant transfers between Levels during the period ended October 31, 2014. Transfers between Levels are identified as of the end of the period.
Small Cap Stock Fund
Fair Valuation Measurements
The following table is a summary of the inputs used, as of October 31, 2014, in valuing Small Cap Stock Fund’s assets carried at fair value.
Investments in Securities | Total | Level 1 | Level 2 | Level 3 | ||||||||||||
Common Stock | ||||||||||||||||
Consumer Discretionary | 41,806,201 | 41,806,201 | — | — | ||||||||||||
Consumer Staples | 9,931,388 | 9,931,388 | — | — | ||||||||||||
Energy | 14,792,074 | 13,036,342 | 1,755,732 | — | ||||||||||||
Financials | 72,369,604 | 72,369,604 | — | — | ||||||||||||
Health Care | 35,823,606 | 35,823,606 | — | — | ||||||||||||
Industrials | 84,385,408 | 84,385,408 | — | — | ||||||||||||
Information Technology | 50,349,371 | 50,349,371 | — | — | ||||||||||||
Materials | 15,037,131 | 15,037,131 | — | — | ||||||||||||
Telecommunications Services | 3,319,434 | 3,319,434 | — | — | ||||||||||||
Utilities | 12,895,474 | 12,895,474 | — | — | ||||||||||||
Preferred Stock | ||||||||||||||||
Health Care | — | — | — | — | ||||||||||||
Collateral Held for Securities Loaned | 13,527,930 | 13,527,930 | — | — | ||||||||||||
Short-Term Investments | 10,468,825 | 10,468,825 | — | — | ||||||||||||
|
|
|
|
|
|
|
| |||||||||
Total | $ | 364,706,446 | $ | 362,950,714 | $ | 1,755,732 | — | |||||||||
|
|
|
|
|
|
|
| |||||||||
There were no significant transfers between Levels during the period ended October 31, 2014. Transfers between Levels are identified as of the end of the period.
- 26 -
Table of Contents
Combined Pro Forma (assuming merger with Target Fund)
Fair Valuation Measurements
The following table is a summary of the inputs used, as of October 31, 2014, in valuing Small Cap Stock Fund’s assets carried at fair value.
Investments in Securities | Total | Level 1 | Level 2 | Level 3 | ||||||||||||
Common Stock | ||||||||||||||||
Consumer Discretionary | 44,571,159 | 44,571,159 | — | — | ||||||||||||
Consumer Staples | 10,504,274 | 10,504,274 | — | — | ||||||||||||
Energy | 15,431,870 | 13,676,138 | 1,755,732 | — | ||||||||||||
Financials | 74,159,904 | 74,159,904 | — | — | ||||||||||||
Health Care | 39,635,606 | 39,607,107 | — | 28,499 | ||||||||||||
Industrials | 87,098,303 | 87,098,303 | — | — | ||||||||||||
Information Technology | 54,252,886 | 54,252,886 | — | — | ||||||||||||
Materials | 15,802,602 | 15,802,602 | — | — | ||||||||||||
Telecommunications Services | 3,319,434 | 3,319,434 | — | — | ||||||||||||
Utilities | 12,895,474 | 12,895,474 | — | — | ||||||||||||
Preferred Stock | ||||||||||||||||
Health Care | — | — | — | — | ||||||||||||
Collateral Held for Securities Loaned | 13,745,145 | 13,745,145 | — | — | ||||||||||||
Short-Term Investments | 10,970,228 | 10,970,228 | — | — | ||||||||||||
|
|
|
|
|
|
|
| |||||||||
Total | $ | 382,386,885 | $ | 380,602,654 | $ | 1,755,732 | $ | 28,499 | ||||||||
|
|
|
|
|
|
|
| |||||||||
There were no significant transfers between Levels during the period ended October 31, 2014. Transfers between Levels are identified as of the end of the period.
Partner Small Cap Growth Fund
Investment in Affiliates
Affiliated issuers, as defined under the Investment Company Act of 1940, include those in which the Fund’s holdings of an issuer represent 5% or more of the outstanding voting securities of an issuer, or any affiliated mutual fund.
A summary of transactions for the fiscal year to date, in Partner Small Cap Growth Fund, is as follows:
Fund | Value October 31, 2013 | Gross Purchases | Gross Sales | Shares Held at October 31, 2014 | Value October 31, 2014 | Income Earned November 1, 2013 - October 31, 2014 | ||||||||||||||||||
Cash Management Trust- Collateral Investment | $ | 17,412,554 | $ | 86,799,739 | $ | 103,995,078 | 217,215 | $ | 217,215 | $ | 41,489 | |||||||||||||
Cash Management Trust- Short Term Investment | 8,052,231 | 49,099,783 | 56,650,611 | 501,403 | 501,403 | 2,732 | ||||||||||||||||||
Total Value and Income Earned | 25,464,785 | 718,618 | 44,221 | |||||||||||||||||||||
Small Cap Stock Fund
Investment in Affiliates
Affiliated issuers, as defined under the Investment Company Act of 1940, include those in which the Fund’s holdings of an issuer represent 5% or more of the outstanding voting securities of an issuer, or any affiliated mutual fund.
A summary of transactions for the fiscal year to date, in Small Cap Stock Fund, is as follows:
Fund | Value October 31, 2013 | Gross Purchases | Gross Sales | Shares Held at October 31, 2014 | Value October 31, 2014 | Income Earned November 1, 2013 - October 31, 2014 | ||||||||||||||||||
Cash Management Trust- Collateral Investment | $ | 26,183,357 | $ | 126,945,231 | $ | 139,600,658 | 13,527,930 | $ | 13,527,930 | $ | 350,416 | |||||||||||||
Cash Management Trust- Short Term Investment | 24,933,198 | 93,961,074 | 108,425,447 | 10,468,825 | 10,468,825 | 9,042 | ||||||||||||||||||
Total Value and Income Earned | 51,116,555 | 23,996,755 | 359,458 | |||||||||||||||||||||
There were no significant transfers between Levels during the period ended October 31, 2014. Transfers between Levels are identified as of the end of the period.
- 27 -
Table of Contents
Combined Pro Forma (assuming merger with Target Fund)
Investment in Affiliates
Affiliated issuers, as defined under the Investment Company Act of 1940, include those in which the Fund’s holdings of an issuer represent 5% or more of the outstanding voting securities of an issuer, or any affiliated mutual fund.
A summary of transactions for the fiscal year to date, in Small Cap Stock Fund, is as follows:
Fund | Value October 31, 2013 | Gross Purchases | Gross Sales | Shares Held at October 31, 2014 | Value October 31, 2014 | Income Earned November 1, 2013- October 31, 2014 | ||||||||||||||||||
Cash Management Trust-Collateral Investment | $ | 43,595,911 | $ | 213,744,970 | $ | 243,595,736 | $ | 13,745,145 | $ | 13,745,145 | $ | 391,905 | ||||||||||||
Cash Management Trust-Short Term Investment | $ | 32,985,429 | $ | 143,060,857 | $ | 165,076,058 | $ | 10,970,228 | $ | 10,970,228 | $ | 11,774 | ||||||||||||
Total Value and Income Earned | $ | 76,581,340 | $ | 24,715,373 | $ | 403,679 | ||||||||||||||||||
Small Cap Stock Fund
The following table summarizes the net realized gains/(losses) and Statement of Operations location, for the period ended October 31, 2014, for Small Cap Stock Fund’s investments in financial derivative instruments by primary risk exposure.
Derivatives by risk category | Statement of Operations Location | Realized Gains/(Losses) recognized in Income | ||||
Equity Contracts | ||||||
Futures | Net realized gains/(losses) on Futures contracts | 847,682 | ||||
Total Equity Contracts | 847,682 | |||||
|
| |||||
Total | $ | 847,682 | ||||
|
| |||||
The following table summarizes the change in net unrealized appreciation/(depreciation) and Statement of Operations location, for the period ended October 31, 2014, for Small Cap Stock Fund’s investments in financial derivative instruments by primary risk exposure.
Derivatives by risk category | Statement of Operations Location | Change in unrealized appreciation/(depreciation) recognized in Income | ||||
Equity Contracts | ||||||
Futures | Change in net unrealized appreciation/(depreciation) on Futures contracts | (870,806 | ) | |||
Total Equity Contracts | (870,806 | ) | ||||
|
| |||||
Total | (870,806 | ) | ||||
|
| |||||
The following table presents Small Cap Stock Fund’s average volume of derivative activity during the period ended October 31, 2014.
Derivative Risk Category | Futures (Notional)* | Futures (Percentage of Average Net Assets) | ||||||
Equity Contracts | $ | 10,060,362 | 2.90 | % | ||||
| * | Notional amount represents long or short, or both, derivative positions held by the Fund. |
- 28 -
Table of Contents
Pro Forma Combined Schedule of Investments—October 31, 2014
Thrivent Partner Small Cap Value Fund and Thrivent Small Cap Stock Fund
Common Stock (97.0%) | Partner Small Cap Value Fund Shares | Small Cap Stock Fund Shares | Combined Pro Forma Shares (assuming merger with one Target Fund) | Combined Pro Forma Shares (assuming merger with two Target Funds) | Partner Small Cap Value Fund Value | Small Cap Stock Fund Value | Combined Pro Forma Value (assuming merger with one Target Fund) | Combined Pro Forma Value (assuming merger with two Target Funds) | ||||||||||||||||||||||||
Consumer Discretionary (12.2%) | ||||||||||||||||||||||||||||||||
Aaron’s, Inc. | 146,600 | — | 146,600 | 146,600 | 3,629,816 | — | 3,629,816 | 3,629,816 | ||||||||||||||||||||||||
American Public Education, Inc.a | 26,000 | — | 26,000 | 26,000 | 805,740 | — | 805,740 | 805,740 | ||||||||||||||||||||||||
ANN, Inc.a | — | — | — | 2,185 | — | — | — | 83,882 | ||||||||||||||||||||||||
Ascent Capital Group, Inc.a | 11,500 | — | 11,500 | 11,500 | 739,450 | — | �� | 739,450 | 739,450 | |||||||||||||||||||||||
Brunswick Corporation | 28,300 | — | 28,300 | 33,326 | 1,324,440 | — | 1,324,440 | 1,559,657 | ||||||||||||||||||||||||
Burlington Stores, Inc.a | — | — | — | 4,468 | — | — | — | 187,388 | ||||||||||||||||||||||||
Cheesecake Factory, Inc. | — | 116,360 | 116,360 | 116,360 | — | $ | 5,345,578 | 5,345,578 | 5,345,578 | |||||||||||||||||||||||
Chuy’s Holdings, Inc.a | — | — | — | 1,500 | — | — | — | 44,865 | ||||||||||||||||||||||||
Core-Mark Holding Company, Inc. | — | — | — | 2,721 | — | — | — | 157,900 | ||||||||||||||||||||||||
Crocs, Inc.a | 42,500 | — | 42,500 | 42,500 | 496,400 | — | 496,400 | 496,400 | ||||||||||||||||||||||||
CSS Industries, Inc. | 39,200 | — | 39,200 | 39,200 | 1,119,552 | — | 1,119,552 | 1,119,552 | ||||||||||||||||||||||||
Del Frisco’s Restaurant Group, Inc.a | — | — | — | 6,454 | — | — | — | 149,862 | ||||||||||||||||||||||||
Dorman Products, Inc.a,b | 41,100 | — | 41,100 | 41,100 | 1,905,396 | — | 1,905,396 | 1,905,396 | ||||||||||||||||||||||||
Drew Industries, Inc. | 56,300 | — | 56,300 | 56,300 | 2,705,778 | — | 2,705,778 | 2,705,778 | ||||||||||||||||||||||||
Ethan Allen Interiors, Inc.b | 44,300 | — | 44,300 | 44,300 | 1,253,690 | — | 1,253,690 | 1,253,690 | ||||||||||||||||||||||||
Five Below, Inc.a,b | — | — | — | 3,512 | — | — | — | 140,023 | ||||||||||||||||||||||||
Fred’s, Inc. | 58,900 | — | 58,900 | 58,900 | 924,730 | — | 924,730 | 924,730 | ||||||||||||||||||||||||
G-III Apparel Group, Ltd.a | — | 42,200 | 42,200 | 45,297 | — | 3,348,570 | 3,348,570 | 3,594,317 | ||||||||||||||||||||||||
Haverty Furniture Companies, Inc. | 68,200 | — | 68,200 | 68,200 | 1,501,082 | — | 1,501,082 | 1,501,082 | ||||||||||||||||||||||||
HomeAway, Inc.a | — | — | — | 4,449 | — | — | — | 155,270 | ||||||||||||||||||||||||
Hooker Furniture Corporation | 30,800 | — | 30,800 | 30,800 | 470,932 | — | 470,932 | 470,932 | ||||||||||||||||||||||||
Houghton Mifflin Harcourt Companya | — | 272,500 | 272,500 | 272,500 | — | 5,452,725 | 5,452,725 | 5,452,725 | ||||||||||||||||||||||||
Ignite Restaurant Group, Inc.a,b | — | 166,621 | 166,621 | 166,621 | — | 1,148,019 | 1,148,019 | 1,148,019 | ||||||||||||||||||||||||
Imax Corporationa | — | — | — | 3,738 | — | — | — | 110,121 | ||||||||||||||||||||||||
Kate Spade & Companya | — | — | — | 4,670 | — | — | — | 126,697 | ||||||||||||||||||||||||
Lithia Motors, Inc. | — | — | — | 380 | — | — | — | 29,496 | ||||||||||||||||||||||||
M/I Homes, Inc.a | 46,100 | — | 46,100 | 46,100 | 992,994 | — | 992,994 | 992,994 | ||||||||||||||||||||||||
MarineMax, Inc.a | 10,700 | — | 10,700 | 10,700 | 205,119 | — | 205,119 | 205,119 | ||||||||||||||||||||||||
MDC Partners, Inc. | — | 294,817 | 294,817 | 294,817 | — | 6,102,712 | 6,102,712 | 6,102,712 | ||||||||||||||||||||||||
Meritage Homes Corporationa | 54,300 | — | 54,300 | 54,300 | 1,997,697 | — | 1,997,697 | 1,997,697 | ||||||||||||||||||||||||
Modine Manufacturing Companya | 99,600 | — | 99,600 | 99,600 | 1,277,868 | — | 1,277,868 | 1,277,868 | ||||||||||||||||||||||||
Multimedia Games Holding Company, Inc.a | — | — | — | 7,278 | — | — | — | 254,002 | ||||||||||||||||||||||||
National CineMedia, Inc. | 10,900 | — | 10,900 | 10,900 | 173,310 | — | 173,310 | 173,310 | ||||||||||||||||||||||||
New Media Investment Group, Inc. | 59,300 | — | 59,300 | 59,300 | 1,130,258 | — | �� | 1,130,258 | 1,130,258 | |||||||||||||||||||||||
NutriSystem, Inc. | — | 323,690 | 323,690 | 323,690 | — | 5,450,939 | 5,450,939 | 5,450,939 | ||||||||||||||||||||||||
Orient-Express Hotels, Ltd.a | 74,400 | — | 74,400 | 74,400 | 852,624 | — | 852,624 | 852,624 | ||||||||||||||||||||||||
Oxford Industries, Inc. | — | 61,340 | 61,340 | 64,026 | — | 3,757,075 | 3,757,075 | 3,921,592 | ||||||||||||||||||||||||
Papa John’s International, Inc. | — | 74,050 | 74,050 | 74,050 | — | 3,462,578 | 3,462,578 | 3,462,578 | ||||||||||||||||||||||||
Pier 1 Imports, Inc. | 109,550 | — | 109,550 | 109,550 | 1,413,195 | — | 1,413,195 | 1,413,195 | ||||||||||||||||||||||||
Quiksilver, Inc.a,b | 205,800 | — | 205,800 | 205,800 | 360,150 | — | 360,150 | 360,150 | ||||||||||||||||||||||||
Red Robin Gourmet Burgers, Inc.a | 11,200 | — | 11,200 | 13,236 | 615,664 | — | 615,664 | 727,583 | ||||||||||||||||||||||||
Restoration Hardware Holdings, Inc.a | — | — | — | 1,133 | — | — | — | 91,003 | ||||||||||||||||||||||||
Shiloh Industries, Inc.a | 94,900 | — | 94,900 | 94,900 | 1,617,096 | — | 1,617,096 | 1,617,096 | ||||||||||||||||||||||||
Shutterfly, Inc.a | — | — | — | 714 | — | — | — | 29,867 | ||||||||||||||||||||||||
Skechers USA, Inc.a | — | — | — | 2,851 | — | — | — | 156,092 | ||||||||||||||||||||||||
Sportsman’s Warehouse Holdings, Inc.a,b | 127,600 | — | 127,600 | 127,600 | 891,924 | — | 891,924 | 891,924 | ||||||||||||||||||||||||
Stein Mart, Inc. | 119,500 | — | 119,500 | 119,500 | 1,598,910 | — | 1,598,910 | 1,598,910 | ||||||||||||||||||||||||
Steven Madden, Ltd.a | 29,750 | — | 29,750 | 29,750 | 932,662 | — | 932,662 | 932,662 | ||||||||||||||||||||||||
Tenneco, Inc.a | — | — | — | 3,280 | — | — | — | 171,741 | ||||||||||||||||||||||||
Tuesday Morning Corporationa,b | — | 379,500 | 379,500 | 379,500 | — | 7,738,005 | 7,738,005 | 7,738,005 | ||||||||||||||||||||||||
Vail Resorts, Inc. | — | — | — | 1,382 | — | — | — | 119,349 | ||||||||||||||||||||||||
Winnebago Industries, Inc.a | 51,800 | — | 51,800 | 51,800 | 1,098,678 | — | 1,098,678 | 1,098,678 | ||||||||||||||||||||||||
|
|
|
|
|
|
|
|
|
|
|
|
|
|
|
| |||||||||||||||||
Total Consumer Discretionary | 32,035,155 | 41,806,201 | 73,841,356 | 76,606,314 | ||||||||||||||||||||||||||||
|
|
|
|
|
|
|
|
|
|
|
|
|
|
|
| |||||||||||||||||
- 29 -
Table of Contents
Consumer Staples (2.0%) | ||||||||||||||||||||||||||||||||
Alliance One International, Inc.a | 168,300 | — | 168,300 | 168,300 | 341,649 | — | 341,649 | 341,649 | ||||||||||||||||||||||||
B&G Foods, Inc. | — | — | — | 1,654 | — | — | — | 48,727 | ||||||||||||||||||||||||
Boston Beer Company, Inc.a | — | — | — | 916 | — | — | — | 228,084 | ||||||||||||||||||||||||
Natural Grocers by Vitamin Cottage, Inc.a | — | — | — | 2,786 | — | — | — | 50,455 | ||||||||||||||||||||||||
Pinnacle Foods, Inc. | 19,900 | — | 19,900 | 19,900 | 672,620 | — | 672,620 | 672,620 | ||||||||||||||||||||||||
Spartannash Company | 64,100 | — | 64,100 | 64,100 | 1,436,481 | — | 1,436,481 | 1,436,481 | ||||||||||||||||||||||||
TreeHouse Foods, Inc.a | — | 41,880 | 41,880 | 41,880 | — | 3,566,920 | 3,566,920 | 3,566,920 | ||||||||||||||||||||||||
United Natural Foods, Inc.a | — | — | — | 3,611 | — | — | — | 245,620 | ||||||||||||||||||||||||
WhiteWave Foods Companya | — | 170,950 | 170,950 | 170,950 | — | 6,364,468 | 6,364,468 | 6,364,468 | ||||||||||||||||||||||||
|
|
|
|
|
|
|
|
|
|
|
|
|
|
|
| |||||||||||||||||
Total Consumer Staples | 2,450,750 | 9,931,388 | 12,382,138 | 12,955,024 | ||||||||||||||||||||||||||||
|
|
|
|
|
|
|
|
|
|
|
|
|
|
|
| |||||||||||||||||
Energy (3.8%) | ||||||||||||||||||||||||||||||||
Atwood Oceanics, Inc.a | 17,000 | — | 17,000 | 17,000 | 691,050 | — | 691,050 | 691,050 | ||||||||||||||||||||||||
Bonanza Creek Energy, Inc.a | — | — | — | 547 | — | — | — | 24,746 | ||||||||||||||||||||||||
CARBO Ceramics, Inc.b | 5,600 | — | 5,600 | 5,600 | 289,352 | — | 289,352 | 289,352 | ||||||||||||||||||||||||
Cloud Peak Energy, Inc.a | 82,500 | — | 82,500 | 82,500 | 987,525 | — | 987,525 | 987,525 | ||||||||||||||||||||||||
Contango Oil & Gas Companya | 16,600 | — | 16,600 | 16,600 | 607,062 | — | 607,062 | 607,062 | ||||||||||||||||||||||||
Diamondback Energy, Inc.a | — | — | — | 572 | — | — | — | 39,147 | ||||||||||||||||||||||||
Energy XXI, Ltd.b | 30,700 | — | 30,700 | 30,700 | 236,083 | — | 236,083 | 236,083 | ||||||||||||||||||||||||
Gulf Island Fabrication, Inc. | 64,600 | — | 64,600 | 64,600 | 1,365,644 | — | 1,365,644 | 1,365,644 | ||||||||||||||||||||||||
Hercules Offshore, Inc.a,b | 140,100 | — | 140,100 | 140,100 | 231,165 | — | 231,165 | 231,165 | ||||||||||||||||||||||||
Kodiak Oil & Gas Corporationa | — | — | — | 10,911 | — | — | — | 117,730 | ||||||||||||||||||||||||
Market Vectors Oil Service ETF | — | 131,270 | 131,270 | 131,270 | — | 5,933,404 | 5,933,404 | 5,933,404 | ||||||||||||||||||||||||
Oasis Petroleum, Inc.a | — | 129,470 | 129,470 | 134,523 | — | 3,878,921 | 3,878,921 | 4,030,309 | ||||||||||||||||||||||||
PDC Energy, Inc.a | 11,300 | — | 11,300 | 11,815 | 494,036 | — | 494,036 | 516,552 | ||||||||||||||||||||||||
Penn Virginia Corporationa | — | — | — | 10,140 | — | — | — | 86,900 | ||||||||||||||||||||||||
Rex Energy Corporationa,b | — | 93,550 | 93,550 | 100,937 | — | 733,432 | 733,432 | 791,346 | ||||||||||||||||||||||||
Rosetta Resources, Inc.a | — | 65,490 | 65,490 | 65,490 | — | 2,490,585 | 2,490,585 | 2,490,585 | ||||||||||||||||||||||||
SemGroup Corporation | — | — | — | 1,817 | — | — | — | 139,455 | ||||||||||||||||||||||||
Teekay Tankers, Ltd.b | 268,500 | — | 268,500 | 268,500 | 1,138,440 | — | 1,138,440 | 1,138,440 | ||||||||||||||||||||||||
Tesco Corporation | 54,500 | — | 54,500 | 54,500 | 1,037,680 | — | 1,037,680 | 1,037,680 | ||||||||||||||||||||||||
Tetra Technologies, Inc.a | 104,200 | — | 104,200 | 104,200 | 993,026 | — | 993,026 | 993,026 | ||||||||||||||||||||||||
Trinidad Drilling, Ltd. | — | 269,591 | 269,591 | 269,591 | — | 1,755,732 | 1,755,732 | 1,755,732 | ||||||||||||||||||||||||
|
|
|
|
|
|
|
|
|
|
|
|
|
|
|
| |||||||||||||||||
Total Energy | 8,071,063 | 14,792,074 | 22,863,137 | 23,502,933 | ||||||||||||||||||||||||||||
|
|
|
|
|
|
|
|
|
|
|
|
|
|
|
| |||||||||||||||||
Financials (23.1%) | ||||||||||||||||||||||||||||||||
Affiliated Managers Group, Inc.a | — | 29,622 | 29,622 | 29,622 | — | 5,918,179 | 5,918,179 | 5,918,179 | ||||||||||||||||||||||||
Allied World Assurance Company Holdings AG | — | 46,780 | 46,780 | 46,780 | — | 1,777,640 | 1,777,640 | 1,777,640 | ||||||||||||||||||||||||
American Assets Trust, Inc. | — | 74,800 | 74,800 | 74,800 | — | 2,867,832 | 2,867,832 | 2,867,832 | ||||||||||||||||||||||||
Ares Capital Corporation | 99,900 | — | 99,900 | 99,900 | 1,597,401 | — | 1,597,401 | 1,597,401 | ||||||||||||||||||||||||
Argo Group International Holdings, Ltd. | — | 43,413 | 43,413 | 43,413 | — | 2,422,445 | 2,422,445 | 2,422,445 | ||||||||||||||||||||||||
Associated Estates Realty Corporation | 51,600 | — | 51,600 | 51,600 | 1,007,748 | — | 1,007,748 | 1,007,748 | ||||||||||||||||||||||||
Assured Guaranty, Ltd. | 24,200 | 116,310 | 140,510 | 140,510 | 558,536 | 2,684,435 | 3,242,971 | 3,242,971 | ||||||||||||||||||||||||
Bank of Kentucky Financial Corporation | 8,400 | — | 8,400 | 8,400 | 394,044 | — | 394,044 | 394,044 | ||||||||||||||||||||||||
Bank of the Ozarks, Inc. | — | — | — | 5,441 | — | — | — | 191,741 | ||||||||||||||||||||||||
BBCN Bancorp, Inc. | 69,200 | 186,200 | 255,400 | 255,400 | 978,488 | 2,632,868 | 3,611,356 | 3,611,356 | ||||||||||||||||||||||||
Catchmark Timber Trust, Inc. | 43,140 | — | 43,140 | 43,140 | 504,738 | — | 504,738 | 504,738 | ||||||||||||||||||||||||
CBL & Associates Properties, Inc. | 109,000 | — | 109,000 | 109,000 | 2,085,170 | — | 2,085,170 | 2,085,170 | ||||||||||||||||||||||||
Cedar Realty Trust, Inc. | 141,900 | — | 141,900 | 141,900 | 976,272 | — | 976,272 | 976,272 | ||||||||||||||||||||||||
Chesapeake Lodging Trust | — | — | — | 4,217 | — | — | — | 139,330 | ||||||||||||||||||||||||
CNO Financial Group, Inc. | — | 403,160 | 403,160 | 403,160 | — | 7,309,291 | 7,309,291 | 7,309,291 | ||||||||||||||||||||||||
CoBiz Financial, Inc. | 282,500 | — | 282,500 | 282,500 | 3,395,650 | — | 3,395,650 | 3,395,650 | ||||||||||||||||||||||||
Columbia Banking System, Inc. | 59,200 | — | 59,200 | 59,200 | 1,644,576 | — | 1,644,576 | 1,644,576 | ||||||||||||||||||||||||
Compass Diversified Holdings | 66,500 | — | 66,500 | 66,500 | 1,226,925 | — | 1,226,925 | 1,226,925 | ||||||||||||||||||||||||
East West Bancorp, Inc. | 116,200 | — | 116,200 | 116,200 | 4,271,512 | — | 4,271,512 | 4,271,512 | ||||||||||||||||||||||||
Education Realty Trust, Inc. | — | 179,800 | 179,800 | 179,800 | — | 2,024,548 | 2,024,548 | 2,024,548 | ||||||||||||||||||||||||
Employers Holdings, Inc. | 65,460 | — | 65,460 | 65,460 | 1,334,729 | — | 1,334,729 | 1,334,729 | ||||||||||||||||||||||||
Enstar Group, Ltd.a | 2,300 | — | 2,300 | 2,300 | 340,561 | — | 340,561 | 340,561 | ||||||||||||||||||||||||
Essent Group, Ltd.a | — | — | — | 6,565 | — | — | — | 159,792 |
- 30 -
Table of Contents
Evercore Partners, Inc. | — | — | — | 2,974 | — | — | — | 153,964 | ||||||||||||||||||||||||
Extra Space Storage, Inc. | — | 36,560 | 36,560 | 36,560 | — | 2,126,330 | 2,126,330 | 2,126,330 | ||||||||||||||||||||||||
First Potomac Realty Trust | 134,000 | — | 134,000 | 134,000 | 1,675,000 | — | 1,675,000 | 1,675,000 | ||||||||||||||||||||||||
Forestar Real Estate Group, Inc.a | 17,800 | — | 17,800 | 17,800 | 310,610 | — | 310,610 | 310,610 | ||||||||||||||||||||||||
Glacier Bancorp, Inc. | 90,900 | — | 90,900 | 90,900 | 2,607,921 | — | 2,607,921 | 2,607,921 | ||||||||||||||||||||||||
Golub Capital BDC, Inc. | 66,400 | — | 66,400 | 66,400 | 1,150,712 | — | 1,150,712 | 1,150,712 | ||||||||||||||||||||||||
Hanmi Financial Corporation | — | 246,270 | 246,270 | 250,057 | — | 5,282,492 | 5,282,492 | 5,363,723 | ||||||||||||||||||||||||
Hatteras Financial Corporation | 81,100 | — | 81,100 | 81,100 | 1,544,144 | — | 1,544,144 | 1,544,144 | ||||||||||||||||||||||||
HCC Insurance Holdings, Inc. | — | 57,870 | 57,870 | 57,870 | — | 3,020,235 | 3,020,235 | 3,020,235 | ||||||||||||||||||||||||
Hercules Technology Growth Capital, Inc. | 135,000 | — | 135,000 | 135,000 | 2,127,600 | — | 2,127,600 | 2,127,600 | ||||||||||||||||||||||||
Home Bancshares, Inc. | 75,400 | — | 75,400 | 75,400 | 2,406,768 | — | 2,406,768 | 2,406,768 | ||||||||||||||||||||||||
iShares Russell 2000 Growth Index Fund | 14,600 | — | 14,600 | 18,843 | 1,461,168 | — | 1,461,168 | 2,045,132 | ||||||||||||||||||||||||
iShares Russell 2000 Index Fund | — | 57,020 | 57,020 | 57,020 | — | 6,646,251 | 6,646,251 | 6,646,251 | ||||||||||||||||||||||||
iShares Russell 2000 Value Index Fund | — | — | — | — | — | — | — | — | ||||||||||||||||||||||||
Janus Capital Group, Inc. | 55,500 | — | 55,500 | 55,500 | 831,945 | — | 831,945 | 831,945 | ||||||||||||||||||||||||
JMP Group, Inc. | 46,800 | — | 46,800 | 46,800 | 341,640 | — | 341,640 | 341,640 | ||||||||||||||||||||||||
Kennedy-Wilson Holdings, Inc. | — | — | — | 6,237 | — | — | — | 168,960 | ||||||||||||||||||||||||
Kilroy Realty Corporation | 18,000 | — | 18,000 | 18,000 | 1,219,320 | — | 1,219,320 | 1,219,320 | ||||||||||||||||||||||||
Kite Realty Group Trust | 62,775 | — | 62,775 | 62,775 | 1,625,245 | — | 1,625,245 | 1,625,245 | ||||||||||||||||||||||||
LaSalle Hotel Properties | 61,400 | — | 61,400 | 61,400 | 2,407,494 | — | 2,407,494 | 2,407,494 | ||||||||||||||||||||||||
Main Street Capital Corporation | 19,800 | — | 19,800 | 19,800 | 629,244 | — | 629,244 | 629,244 | ||||||||||||||||||||||||
Meadowbrook Insurance Group, Inc. | 142,600 | — | 142,600 | 142,600 | 908,362 | — | 908,362 | 908,362 | ||||||||||||||||||||||||
National Interstate Corporation | 52,400 | — | 52,400 | 52,400 | 1,490,256 | — | 1,490,256 | 1,490,256 | ||||||||||||||||||||||||
PacWest Bancorp | — | 91,150 | 91,150 | 95,171 | — | 3,888,459 | 3,888,459 | 4,059,995 | ||||||||||||||||||||||||
Parkway Properties, Inc. | — | 103,400 | 103,400 | 103,400 | — | 2,073,170 | 2,073,170 | 2,073,170 | ||||||||||||||||||||||||
Pebblebrook Hotel Trust | — | 107,580 | 107,580 | 107,580 | — | 4,582,908 | 4,582,908 | 4,582,908 | ||||||||||||||||||||||||
Piper Jaffray Companiesa | 13,500 | — | 13,500 | 13,500 | 762,210 | — | 762,210 | 762,210 | ||||||||||||||||||||||||
Potlatch Corporation | 41,500 | — | 41,500 | 41,500 | 1,825,585 | — | 1,825,585 | 1,825,585 | ||||||||||||||||||||||||
ProAssurance Corporation | 95,500 | — | 95,500 | 95,500 | 4,467,490 | — | 4,467,490 | 4,467,490 | ||||||||||||||||||||||||
PS Business Parks, Inc. | 9,800 | — | 9,800 | 9,800 | 825,356 | — | 825,356 | 825,356 | ||||||||||||||||||||||||
Radian Group, Inc.b | 80,500 | — | 80,500 | 80,500 | 1,356,425 | — | 1,356,425 | 1,356,425 | ||||||||||||||||||||||||
Redwood Trust, Inc. | 144,400 | — | 144,400 | 144,400 | 2,713,276 | — | 2,713,276 | 2,713,276 | ||||||||||||||||||||||||
Safeguard Scientifics, Inc.a | 65,100 | — | 65,100 | 65,100 | 1,298,745 | — | 1,298,745 | 1,298,745 | ||||||||||||||||||||||||
Safety Insurance Group, Inc. | 4,300 | — | 4,300 | 4,300 | 268,234 | — | 268,234 | 268,234 | ||||||||||||||||||||||||
Sandy Spring Bancorp, Inc. | 85,600 | — | 85,600 | 85,600 | 2,208,480 | — | 2,208,480 | 2,208,480 | ||||||||||||||||||||||||
State Auto Financial Corporation | 35,000 | — | 35,000 | 35,000 | 732,550 | — | 732,550 | 732,550 | ||||||||||||||||||||||||
Strategic Hotels & Resorts, Inc.a | 20,100 | — | 20,100 | 20,100 | 258,285 | — | 258,285 | 258,285 | ||||||||||||||||||||||||
SVB Financial Groupa | 26,100 | 15,520 | 41,620 | 41,620 | 2,922,939 | 1,738,085 | 4,661,024 | 4,661,024 | ||||||||||||||||||||||||
Synovus Financial Corporation | — | 254,440 | 254,440 | 254,440 | — | 6,452,599 | 6,452,599 | 6,452,599 | ||||||||||||||||||||||||
TCP Capital Corporation | 45,400 | — | 45,400 | 45,400 | 766,806 | — | 766,806 | 766,806 | ||||||||||||||||||||||||
Terreno Realty Corporation | — | 150,490 | 150,490 | 150,490 | — | 3,169,319 | 3,169,319 | 3,169,319 | ||||||||||||||||||||||||
Texas Capital Bancshares, Inc.a | — | 31,660 | 31,660 | 31,660 | — | 1,936,009 | 1,936,009 | 1,936,009 | ||||||||||||||||||||||||
THL Credit, Inc. | 61,200 | — | 61,200 | 61,200 | 787,032 | — | 787,032 | 787,032 | ||||||||||||||||||||||||
Washington Real Estate Investment Trust | 48,400 | — | 48,400 | 48,400 | 1,367,784 | — | 1,367,784 | 1,367,784 | ||||||||||||||||||||||||
Western Alliance Bancorpa | — | 143,370 | 143,370 | 148,621 | — | 3,816,509 | 3,816,509 | 3,956,291 | ||||||||||||||||||||||||
Wintrust Financial Corporation | 56,500 | — | 56,500 | 56,500 | 2,617,080 | — | 2,617,080 | 2,617,080 | ||||||||||||||||||||||||
|
|
|
|
|
|
|
|
|
|
|
|
|
|
|
| |||||||||||||||||
Total Financials | 68,232,056 | 72,369,604 | 140,601,660 | 142,391,960 | ||||||||||||||||||||||||||||
|
|
|
|
|
|
|
|
|
|
|
|
|
|
|
| |||||||||||||||||
Health Care (17.6%) | ||||||||||||||||||||||||||||||||
Acadia Healthcare Company, Inc.a | — | — | — | 3,647 | — | — | — | 226,297 | ||||||||||||||||||||||||
Acorda Therapeutics, Inc.a | — | 70,100 | 70,100 | 70,100 | — | 2,440,882 | 2,440,882 | 2,440,882 | ||||||||||||||||||||||||
Akorn, Inc.a | — | 77,280 | 77,280 | 84,038 | — | 3,442,824 | 3,442,824 | 3,743,893 | ||||||||||||||||||||||||
Align Technology, Inc.a | — | 55,330 | 55,330 | 57,360 | — | 2,911,465 | 2,911,465 | 3,018,284 | ||||||||||||||||||||||||
Analogic Corporation | 11,900 | — | 11,900 | 11,900 | 867,986 | — | 867,986 | 867,986 | ||||||||||||||||||||||||
Atrion Corporation | 4,900 | — | 4,900 | 4,900 | 1,617,049 | — | 1,617,049 | 1,617,049 | ||||||||||||||||||||||||
BioScrip, Inc.a,b | — | 173,070 | 173,070 | 173,070 | — | 1,118,032 | 1,118,032 | 1,118,032 | ||||||||||||||||||||||||
Bruker Corporationa | — | — | — | 4,976 | — | — | — | 103,153 |
- 31 -
Table of Contents
Cardiovascular Systems, Inc.a | — | — | — | 4,130 | — | — | — | 128,030 | ||||||||||||||||||||||||
Centene Corporationa | — | — | — | 1,785 | — | — | — | 165,416 | ||||||||||||||||||||||||
Cubist Pharmaceuticals, Inc.a | — | — | — | 2,142 | — | — | — | 154,845 | ||||||||||||||||||||||||
Cyberonics, Inc.a | — | — | — | 3,344 | — | — | — | 175,560 | ||||||||||||||||||||||||
Depomed, Inc.a | — | — | — | 12,928 | — | — | — | 199,091 | ||||||||||||||||||||||||
ExamWorks Group, Inc.a,b | — | 222,172 | 222,172 | 229,307 | — | 8,615,830 | 8,615,830 | 8,892,525 | ||||||||||||||||||||||||
Furiex Pharmaceuticals, Inc. Contigent Value Righta,c | — | — | — | 2,923 | — | — | — | 28,499 | ||||||||||||||||||||||||
Healthcare Services Group, Inc. | — | — | — | 8,095 | — | — | — | 241,069 | ||||||||||||||||||||||||
Impax Laboratories, Inc.a | — | — | — | 7,028 | — | — | — | 203,601 | ||||||||||||||||||||||||
Ironwood Pharmaceuticals, Inc.a | — | — | — | 11,635 | — | — | — | 163,123 | ||||||||||||||||||||||||
LifePoint Hospitals, Inc.a | — | — | — | 2,121 | — | — | — | 148,470 | ||||||||||||||||||||||||
National Healthcare Corporation | 29,800 | — | 29,800 | 29,800 | 1,797,238 | — | 1,797,238 | 1,797,238 | ||||||||||||||||||||||||
Neurocrine Biosciences, Inc.a | — | 130,900 | 130,900 | 138,477 | — | 2,424,268 | 2,424,268 | 2,564,594 | ||||||||||||||||||||||||
NPS Pharmaceuticals, Inc.a | — | — | — | 3,088 | — | — | — | 84,611 | ||||||||||||||||||||||||
NuVasive, Inc.a | — | 190,723 | 190,723 | 198,574 | — | 7,800,571 | 7,800,571 | 8,121,677 | ||||||||||||||||||||||||
Puma Biotechnology, Inc.a | — | — | — | 717 | — | — | — | 179,680 | ||||||||||||||||||||||||
Team Health Holdings, Inc.a | — | — | — | 3,470 | — | — | — | 217,014 | ||||||||||||||||||||||||
Teleflex, Inc. | — | 61,950 | 61,950 | 64,119 | — | 7,069,734 | 7,069,734 | 7,317,260 | ||||||||||||||||||||||||
Triple-S Management Corporationa | 65,500 | — | 65,500 | 65,500 | 1,450,170 | — | 1,450,170 | 1,450,170 | ||||||||||||||||||||||||
West Pharmaceutical Services, Inc. | 85,200 | — | 85,200 | 85,200 | 4,366,500 | — | 4,366,500 | 4,366,500 | ||||||||||||||||||||||||
|
|
|
|
|
|
|
|
|
|
|
|
|
|
|
| |||||||||||||||||
Total Health Care | 10,098,943 | 35,823,606 | 45,922,549 | 49,734,549 | ||||||||||||||||||||||||||||
|
|
|
|
|
|
|
|
|
|
|
|
|
|
|
| |||||||||||||||||
Industrials (25.2%) | ||||||||||||||||||||||||||||||||
A.O. Smith Corporation | 61,500 | — | 61,500 | 61,500 | 3,281,025 | — | 3,281,025 | 3,281,025 | ||||||||||||||||||||||||
Aegion Corporationa | 69,100 | — | 69,100 | 69,100 | 1,265,912 | — | 1,265,912 | 1,265,912 | ||||||||||||||||||||||||
Alaska Air Group, Inc. | 118,200 | — | 118,200 | 118,200 | 6,291,786 | — | 6,291,786 | 6,291,786 | ||||||||||||||||||||||||
Apogee Enterprises, Inc. | — | 86,570 | 86,570 | 86,570 | — | 3,800,423 | 3,800,423 | 3,800,423 | ||||||||||||||||||||||||
Applied Industrial Technologies, Inc. | 28,000 | — | 28,000 | 28,000 | 1,366,680 | — | 1,366,680 | 1,366,680 | ||||||||||||||||||||||||
Astec Industries, Inc. | 28,700 | — | 28,700 | 28,700 | 1,088,017 | �� | — | 1,088,017 | 1,088,017 | |||||||||||||||||||||||
Beacon Roofing Supply, Inc.a | 99,400 | — | 99,400 | 99,400 | 2,750,398 | — | 2,750,398 | 2,750,398 | ||||||||||||||||||||||||
Celadon Group, Inc. | 59,600 | — | 59,600 | 59,600 | 1,159,816 | — | 1,159,816 | 1,159,816 | ||||||||||||||||||||||||
Chart Industries, Inc.a | — | — | — | 442 | — | — | — | 20,575 | ||||||||||||||||||||||||
Circor International, Inc. | 28,300 | — | 28,300 | 28,300 | 2,126,745 | — | 2,126,745 | 2,126,745 | ||||||||||||||||||||||||
CLARCOR, Inc. | — | 115,690 | 115,690 | 115,690 | — | 7,746,602 | 7,746,602 | 7,746,602 | ||||||||||||||||||||||||
Comfort Systems USA, Inc. | 71,900 | — | 71,900 | 71,900 | 1,104,384 | — | 1,104,384 | 1,104,384 | ||||||||||||||||||||||||
Curtiss-Wright Corporation | — | 64,420 | 64,420 | 64,420 | — | 4,458,508 | 4,458,508 | 4,458,508 | ||||||||||||||||||||||||
EMCOR Group, Inc. | — | 241,711 | 241,711 | 241,711 | — | 10,666,707 | 10,666,707 | 10,666,707 | ||||||||||||||||||||||||
ESCO Technologies, Inc. | 54,400 | — | 54,400 | 54,400 | 2,068,288 | — | 2,068,288 | 2,068,288 | ||||||||||||||||||||||||
Esterline Technologies Corporationa | — | 46,060 | 46,060 | 46,060 | — | 5,394,087 | 5,394,087 | 5,394,087 | ||||||||||||||||||||||||
Franklin Electric Company, Inc. | 38,100 | — | 38,100 | 38,100 | 1,422,654 | — | 1,422,654 | 1,422,654 | ||||||||||||||||||||||||
FTI Consulting, Inc.a | 36,800 | — | 36,800 | 36,800 | 1,485,984 | — | 1,485,984 | 1,485,984 | ||||||||||||||||||||||||
G & K Services, Inc. | 45,200 | — | 45,200 | 45,200 | 2,850,764 | — | 2,850,764 | 2,850,764 | ||||||||||||||||||||||||
GATX Corporation | — | 60,030 | 60,030 | 60,030 | — | 3,805,902 | 3,805,902 | 3,805,902 | ||||||||||||||||||||||||
Generac Holdings, Inc.a | — | — | — | 1,915 | — | — | — | 86,826 | ||||||||||||||||||||||||
Genesee & Wyoming, Inc.a | 31,300 | — | 31,300 | 31,300 | 3,011,060 | — | 3,011,060 | 3,011,060 | ||||||||||||||||||||||||
Gibraltar Industries, Inc.a | 55,600 | — | 55,600 | 55,600 | 847,900 | — | 847,900 | 847,900 | ||||||||||||||||||||||||
Granite Construction, Inc. | — | 130,275 | 130,275 | 132,551 | — | 4,808,450 | 4,808,450 | 4,892,457 | ||||||||||||||||||||||||
Greenbrier Companies, Inc.b | 21,200 | — | 21,200 | 21,200 | 1,325,848 | — | 1,325,848 | 1,325,848 | ||||||||||||||||||||||||
H&E Equipment Services, Inc. | — | — | — | 3,344 | — | — | — | 125,032 | ||||||||||||||||||||||||
Heico Corporation | — | — | — | 2,813 | — | — | — | 152,577 | ||||||||||||||||||||||||
Hillenbrand, Inc. | 7,920 | — | 7,920 | 7,920 | 263,657 | — | 263,657 | 263,657 | ||||||||||||||||||||||||
HNI Corporation | — | 143,800 | 143,800 | 143,800 | — | 6,708,270 | 6,708,270 | 6,708,270 | ||||||||||||||||||||||||
Hub Group, Inc.a | 30,100 | — | 30,100 | 30,100 | 1,092,329 | — | 1,092,329 | 1,092,329 | ||||||||||||||||||||||||
Huron Consulting Group, Inc.a | — | — | — | 1,853 | — | — | — | 128,987 | ||||||||||||||||||||||||
Interface, Inc. | — | 357,380 | 357,380 | 366,716 | — | 5,728,801 | 5,728,801 | 5,878,457 | ||||||||||||||||||||||||
Kaman Corporation | 35,000 | — | 35,000 | 35,000 | 1,507,100 | — | 1,507,100 | 1,507,100 | ||||||||||||||||||||||||
Kforce, Inc. | 91,400 | — | 91,400 | 91,400 | 2,115,910 | — | 2,115,910 | 2,115,910 | ||||||||||||||||||||||||
Kirby Corporationa | 28,900 | — | 28,900 | 28,900 | 3,195,762 | — | 3,195,762 | 3,195,762 | ||||||||||||||||||||||||
Korn/Ferry Internationala | — | 211,400 | 211,400 | 211,400 | — | 5,904,402 | 5,904,402 | 5,904,402 |
- 32 -
Table of Contents
Kratos Defense & Security Solutions, Inc.a | 96,900 | — | 96,900 | 96,900 | 675,393 | — | 675,393 | 675,393 | ||||||||||||||||||||||||
Landstar System, Inc. | 45,700 | 115,800 | 161,500 | 161,500 | 3,382,257 | 8,570,358 | 11,952,615 | 11,952,615 | ||||||||||||||||||||||||
Luxfer Holdings plc ADR | 33,500 | — | 33,500 | 33,500 | 533,655 | — | 533,655 | 533,655 | ||||||||||||||||||||||||
MasTec, Inc.a | — | — | — | 4,459 | — | — | — | 127,706 | ||||||||||||||||||||||||
Matson, Inc. | 53,100 | — | 53,100 | 53,100 | 1,512,819 | — | 1,512,819 | 1,512,819 | ||||||||||||||||||||||||
Matthews International Corporation | 52,500 | — | 52,500 | 52,500 | 2,419,200 | — | 2,419,200 | 2,419,200 | ||||||||||||||||||||||||
McGrath Rentcorp | 83,900 | — | 83,900 | 83,900 | 3,064,867 | — | 3,064,867 | 3,064,867 | ||||||||||||||||||||||||
Middleby Corporationa | — | — | — | 2,433 | — | — | — | 215,321 | ||||||||||||||||||||||||
Mine Safety Appliances Company | 29,400 | — | 29,400 | 29,400 | 1,689,618 | — | 1,689,618 | 1,689,618 | ||||||||||||||||||||||||
Navigant Consulting, Inc.a | 102,000 | — | 102,000 | 102,000 | 1,569,780 | — | 1,569,780 | 1,569,780 | ||||||||||||||||||||||||
Nordson Corporation | 22,600 | — | 22,600 | 22,600 | 1,730,030 | — | 1,730,030 | 1,730,030 | ||||||||||||||||||||||||
On Assignment, Inc.a | — | — | — | 7,045 | — | — | — | 205,010 | ||||||||||||||||||||||||
PGT, Inc.a | — | — | — | 6,119 | — | — | — | 57,549 | ||||||||||||||||||||||||
Pike Corporationa | 55,300 | — | 55,300 | 55,300 | 660,282 | — | 660,282 | 660,282 | ||||||||||||||||||||||||
Progressive Waste Solutions, Ltd. | — | 233,440 | 233,440 | 233,440 | — | 6,823,451 | 6,823,451 | 6,823,451 | ||||||||||||||||||||||||
Proto Labs, Inc.a | — | 10,790 | 10,790 | 14,413 | — | 705,342 | 705,342 | 942,178 | ||||||||||||||||||||||||
Quanex Building Products Corporation | 39,200 | — | 39,200 | 39,200 | 784,784 | — | 784,784 | 784,784 | ||||||||||||||||||||||||
RBC Bearings, Inc. | 10,300 | — | 10,300 | 10,300 | 625,725 | — | 625,725 | 625,725 | ||||||||||||||||||||||||
Ritchie Brothers Auctioneers, Inc. | — | 161,000 | 161,000 | 166,032 | — | 3,926,790 | 3,926,790 | 4,049,520 | ||||||||||||||||||||||||
Saia, Inc.a | — | — | — | 4,611 | — | — | — | 226,031 | ||||||||||||||||||||||||
Spirit Airlines, Inc.a | — | — | — | 3,444 | — | — | — | 251,791 | ||||||||||||||||||||||||
Sun Hydraulics Corporation | 24,300 | — | 24,300 | 24,300 | 967,383 | — | 967,383 | 967,383 | ||||||||||||||||||||||||
Swift Transportation Companya | — | — | — | 6,078 | — | — | — | 150,127 | ||||||||||||||||||||||||
Tennant Company | — | 72,390 | 72,390 | 72,390 | — | 5,337,315 | 5,337,315 | 5,337,315 | ||||||||||||||||||||||||
Tutor Perini Corporationa | — | — | — | 3,170 | — | — | — | 88,792 | ||||||||||||||||||||||||
Universal Forest Products, Inc. | 34,100 | — | 34,100 | 34,100 | 1,703,977 | — | 1,703,977 | 1,703,977 | ||||||||||||||||||||||||
Universal Truckload Services, Inc. | 42,700 | — | 42,700 | 42,700 | 1,123,864 | — | 1,123,864 | 1,123,864 | ||||||||||||||||||||||||
UTI Worldwide, Inc.a | 69,100 | — | 69,100 | 69,100 | 755,263 | — | 755,263 | 755,263 | ||||||||||||||||||||||||
WageWorks, Inc.a | — | — | — | 592 | — | — | — | 33,750 | ||||||||||||||||||||||||
Waste Connections, Inc. | 30,900 | — | 30,900 | 30,900 | 1,541,910 | — | 1,541,910 | 1,541,910 | ||||||||||||||||||||||||
Watsco, Inc. | — | — | — | 1,452 | — | — | — | 147,552 | ||||||||||||||||||||||||
Watts Water Technologies, Inc. | — | — | — | 1,683 | — | — | — | 102,040 | ||||||||||||||||||||||||
Woodward, Inc. | 40,780 | — | 40,780 | 40,780 | 2,088,344 | — | 2,088,344 | 2,088,344 | ||||||||||||||||||||||||
|
|
|
|
|
|
|
|
|
|
|
|
|
|
|
| |||||||||||||||||
Total Industrials | 68,451,170 | 84,385,408 | 152,836,578 | 155,549,473 | ||||||||||||||||||||||||||||
|
|
|
|
|
|
|
|
|
|
|
|
|
|
|
| |||||||||||||||||
Information Technology (12.7%) | ||||||||||||||||||||||||||||||||
A10 Networks, Inc.a | — | — | 5,504 | — | — | 24,218 | ||||||||||||||||||||||||||
Advanced Energy Industries, Inc.a | 47,500 | — | 47,500 | 47,500 | 939,550 | — | 939,550 | 939,550 | ||||||||||||||||||||||||
Ambarella, Inc.a,b | — | — | — | 1,791 | — | — | — | 79,323 | ||||||||||||||||||||||||
Applied Micro Circuits Corporationa | — | — | — | 18,238 | — | — | — | 118,000 | ||||||||||||||||||||||||
Applied Optoelectronics, Inc.a | — | — | — | 2,852 | — | — | — | 46,031 | ||||||||||||||||||||||||
Aspen Technology, Inc.a | — | — | — | 4,820 | — | — | — | 178,003 | ||||||||||||||||||||||||
Atmel Corporationa | — | 405,100 | 405,100 | 405,100 | — | 3,005,842 | 3,005,842 | 3,005,842 | ||||||||||||||||||||||||
Badger Meter, Inc. | 6,700 | — | 6,700 | 6,700 | 381,364 | — | 381,364 | 381,364 | ||||||||||||||||||||||||
Belden, Inc. | 39,700 | — | 39,700 | 41,554 | 2,826,243 | — | 2,826,243 | 2,958,229 | ||||||||||||||||||||||||
Broadridge Financial Solutions, Inc. | — | 191,580 | 191,580 | 191,580 | — | 8,416,109 | 8,416,109 | 8,416,109 | ||||||||||||||||||||||||
Brooks Automation, Inc. | 75,400 | — | 75,400 | 75,400 | 929,682 | — | 929,682 | 929,682 | ||||||||||||||||||||||||
Cabot Microelectronics Corporationa | 46,100 | — | 46,100 | 46,100 | 2,223,403 | — | 2,223,403 | 2,223,403 | ||||||||||||||||||||||||
CalAmp Corporationa | — | — | — | 1,101 | — | — | — | 21,227 | ||||||||||||||||||||||||
Cardtronics, Inc.a | — | — | — | 4,311 | — | — | �� | — | 165,499 | |||||||||||||||||||||||
Cavium, Inc.a | — | — | — | 2,664 | — | — | — | 136,690 | ||||||||||||||||||||||||
ChannelAdvisor Corporationa | — | — | — | 4,441 | — | — | — | 61,685 | ||||||||||||||||||||||||
Cognex Corporationa | 15,900 | — | 15,900 | 19,048 | 629,004 | — | 629,004 | 753,539 | ||||||||||||||||||||||||
Coherent, Inc.a | — | — | — | 1,633 | — | — | — | 106,390 | ||||||||||||||||||||||||
Cohu, Inc. | 47,300 | — | 47,300 | 47,300 | 482,460 | — | 482,460 | 482,460 | ||||||||||||||||||||||||
Constant Contact, Inc.a | — | — | — | 4,181 | — | — | — | 147,840 | ||||||||||||||||||||||||
Cornerstone OnDemand, Inc.a | — | — | — | 5,017 | — | — | — | 181,967 | ||||||||||||||||||||||||
Dealertrack Technologies, Inc.a | — | — | — | 2,949 | — | — | — | 138,750 | ||||||||||||||||||||||||
Demandware, Inc.a | — | — | — | 3,437 | — | — | — | 206,048 |
- 33 -
Table of Contents
DST Systems, Inc. | — | 99,220 | 99,220 | 102,273 | — | 9,559,847 | 9,559,847 | 9,854,004 | ||||||||||||||||||||||||
dvanced Energy Industries, Inc.a | — | — | — | — | — | — | — | — | ||||||||||||||||||||||||
Electro Rent Corporation | 91,200 | — | 91,200 | 91,200 | 1,389,888 | — | 1,389,888 | 1,389,888 | ||||||||||||||||||||||||
Electro Scientific Industries, Inc. | 103,100 | — | 103,100 | 103,100 | 732,010 | — | 732,010 | 732,010 | ||||||||||||||||||||||||
Electronics for Imaging, Inc.a | — | — | — | 2,093 | — | — | — | 95,692 | ||||||||||||||||||||||||
Entegris, Inc.a | 45,700 | — | 45,700 | 45,700 | 620,606 | — | 620,606 | 620,606 | ||||||||||||||||||||||||
Fabrineta | 68,900 | — | 68,900 | 68,900 | 1,254,669 | — | 1,254,669 | 1,254,669 | ||||||||||||||||||||||||
FEI Company | — | 52,330 | 52,330 | 52,330 | — | 4,410,372 | 4,410,372 | 4,410,372 | ||||||||||||||||||||||||
Guidewire Software, Inc.a | — | 90,350 | 90,350 | 96,879 | — | 4,512,079 | 4,512,079 | 4,838,137 | ||||||||||||||||||||||||
Intersil Corporation | 27,600 | — | 27,600 | 27,600 | 366,804 | — | 366,804 | 366,804 | ||||||||||||||||||||||||
Intevac, Inc.a | 122,400 | — | 122,400 | 122,400 | 905,760 | — | 905,760 | 905,760 | ||||||||||||||||||||||||
Ixiaa | 113,500 | — | 113,500 | 113,500 | 1,093,005 | — | 1,093,005 | 1,093,005 | ||||||||||||||||||||||||
Littelfuse, Inc. | 14,600 | — | 14,600 | 14,600 | 1,424,084 | — | 1,424,084 | 1,424,084 | ||||||||||||||||||||||||
Manhattan Associates, Inc.a | — | — | — | 2,202 | — | — | — | 88,322 | ||||||||||||||||||||||||
MaxLinear, Inc.a | — | — | — | 14,291 | — | — | — | 101,323 | ||||||||||||||||||||||||
Methode Electronics, Inc. | 59,100 | — | 59,100 | 60,834 | 2,327,358 | — | 2,327,358 | 2,395,643 | ||||||||||||||||||||||||
Monolithic Power Systems, Inc. | — | — | — | 2,890 | — | — | — | 127,709 | ||||||||||||||||||||||||
Newport Corporationa | 27,800 | — | 27,800 | 27,800 | 497,342 | — | 497,342 | 497,342 | ||||||||||||||||||||||||
Plantronics, Inc. | — | 139,696 | 139,696 | 139,696 | — | 7,246,032 | 7,246,032 | 7,246,032 | ||||||||||||||||||||||||
Progress Software Corporationa | 76,000 | — | 76,000 | 76,000 | 1,968,400 | — | 1,968,400 | 1,968,400 | ||||||||||||||||||||||||
Proofpoint, Inc.a | — | — | — | 7,886 | — | — | — | 347,299 | ||||||||||||||||||||||||
ShoreTel, Inc.a | 137,400 | — | 137,400 | 137,400 | 1,111,566 | — | 1,111,566 | 1,111,566 | ||||||||||||||||||||||||
Sonus Networks, Inc.a | 224,200 | — | 224,200 | 224,200 | 777,974 | — | 777,974 | 777,974 | ||||||||||||||||||||||||
SPS Commerce, Inc.a | — | — | — | 395 | — | — | — | 23,029 | ||||||||||||||||||||||||
SunPower Corporationa | — | — | — | 1,583 | — | — | — | 50,403 | ||||||||||||||||||||||||
Synaptics, Inc.a | — | — | — | 958 | — | — | — | 65,556 | ||||||||||||||||||||||||
Synnex Corporation | 46,200 | — | 46,200 | 46,200 | 3,196,116 | — | 3,196,116 | 3,196,116 | ||||||||||||||||||||||||
Teradyne, Inc. | 53,800 | — | 53,800 | 53,800 | 989,920 | — | 989,920 | 989,920 | ||||||||||||||||||||||||
Textura Corporationa,b | — | 119,180 | 119,180 | 119,180 | — | 3,174,955 | 3,174,955 | 3,174,955 | ||||||||||||||||||||||||
Tyler Technologies, Inc.a | — | — | — | 602 | — | — | — | 67,376 | ||||||||||||||||||||||||
Ubiquiti Networks, Inc.b | — | 90,900 | 90,900 | 90,900 | — | 3,251,493 | 3,251,493 | 3,251,493 | ||||||||||||||||||||||||
Ultimate Software Group, Inc.a | — | — | — | 1,135 | — | — | — | 170,829 | ||||||||||||||||||||||||
Virtusa Corporationa | — | 165,267 | 165,267 | 170,374 | — | 6,772,642 | 6,772,642 | 6,981,927 | ||||||||||||||||||||||||
|
|
|
|
|
|
|
|
|
|
|
|
|
|
|
| |||||||||||||||||
Total Information Technology | 27,067,208 | 50,349,371 | 77,416,579 | 81,320,094 | ||||||||||||||||||||||||||||
|
|
|
|
|
|
|
|
|
|
|
|
|
|
|
| |||||||||||||||||
Materials (5.6%) | ||||||||||||||||||||||||||||||||
American Vanguard Corporationb | 42,400 | — | 42,400 | 42,400 | 489,296 | — | 489,296 | 489,296 | ||||||||||||||||||||||||
AptarGroup, Inc. | 49,800 | — | 49,800 | 49,800 | 3,099,552 | — | 3,099,552 | 3,099,552 | ||||||||||||||||||||||||
Carpenter Technology Corporation | 12,600 | — | 12,600 | 12,600 | 630,630 | — | 630,630 | 630,630 | ||||||||||||||||||||||||
Chemtura Corporationa | — | — | 5,039 | — | — | 117,358 | ||||||||||||||||||||||||||
Clearwater Paper Corporationa | 45,400 | — | 45,400 | 45,400 | 2,921,490 | — | 2,921,490 | 2,921,490 | ||||||||||||||||||||||||
Eagle Materials, Inc. | 44,400 | 44,400 | 44,400 | 3,881,892 | 3,881,892 | 3,881,892 | ||||||||||||||||||||||||||
Franco-Nevada Corporation | 16,800 | — | 16,800 | 16,800 | 786,450 | — | 786,450 | 786,450 | ||||||||||||||||||||||||
Graphic Packaging Holding Companya | — | — | 12,686 | — | — | 153,881 | ||||||||||||||||||||||||||
Horsehead Holding Corporationa | 230,170 | 230,170 | 230,170 | 3,615,971 | 3,615,971 | 3,615,971 | ||||||||||||||||||||||||||
Innospec, Inc. | 78,000 | — | 78,000 | 78,000 | 3,148,860 | — | 3,148,860 | 3,148,860 | ||||||||||||||||||||||||
KapStone Paper and Packaging Corporationa | — | — | 1,887 | — | — | 58,044 | ||||||||||||||||||||||||||
Materials Select Sector SPDR Fund | 155,770 | 155,770 | 155,770 | 7,539,268 | 7,539,268 | 7,539,268 | ||||||||||||||||||||||||||
Minerals Technologies, Inc. | 37,600 | — | 37,600 | 37,600 | 2,884,296 | — | 2,884,296 | 2,884,296 | ||||||||||||||||||||||||
Myers Industries, Inc. | 86,800 | — | 86,800 | 86,800 | 1,296,792 | — | 1,296,792 | 1,296,792 | ||||||||||||||||||||||||
PolyOne Corporation | — | — | 4,798 | — | — | 177,574 | ||||||||||||||||||||||||||
Ryerson Holding Corporationa | 30,200 | — | 30,200 | 30,200 | 385,956 | — | 385,956 | 385,956 | ||||||||||||||||||||||||
Sandstorm Gold, Ltd.a,b | 140,400 | — | 140,400 | 140,400 | 405,756 | — | 405,756 | 405,756 | ||||||||||||||||||||||||
Schnitzer Steel Industries, Inc. | 29,100 | — | 29,100 | 29,100 | 685,305 | — | 685,305 | 685,305 | ||||||||||||||||||||||||
Senomyx, Inc.a,b | — | — | 10,396 | — | — | 82,336 | ||||||||||||||||||||||||||
Stillwater Mining Companya | 51,200 | — | 51,200 | 51,200 | 672,256 | — | 672,256 | 672,256 | ||||||||||||||||||||||||
U.S. Silica Holdings, Inc. | — | — | 3,926 | — | — | 176,278 | ||||||||||||||||||||||||||
Wausau Paper Corporation | 150,100 | — | 150,100 | 150,100 | 1,484,489 | — | 1,484,489 | 1,484,489 | ||||||||||||||||||||||||
|
|
|
|
|
|
|
|
|
|
|
|
|
|
|
| |||||||||||||||||
Total Materials | 18,891,128 | 15,037,131 | 33,928,259 | 34,693,730 | ||||||||||||||||||||||||||||
|
|
|
|
|
|
|
|
|
|
|
|
|
|
|
|
- 34 -
Table of Contents
Telecommunications Services (0.6%) | ||||||||||||||||||||||||||||||||
Cogent Communications Holdings | — | 97,803 | 97,803 | 97,803 | — | 3,319,434 | 3,319,434 | 3,319,434 | ||||||||||||||||||||||||
Premiere Global Services, Inc.a | 36,700 | — | 36,700 | 36,700 | 384,249 | — | 384,249 | 384,249 | ||||||||||||||||||||||||
|
|
|
|
|
|
|
|
|
|
|
|
|
|
|
| |||||||||||||||||
Total Telecommunication Services | 384,249 | 3,319,434 | 3,703,683 | 3,703,683 | ||||||||||||||||||||||||||||
|
|
|
|
|
|
|
|
|
|
|
|
|
|
|
| |||||||||||||||||
Utilities (4.3%) | ||||||||||||||||||||||||||||||||
Black Hills Corporation | 22,200 | — | 22,200 | 22,200 | 1,215,006 | — | 1,215,006 | 1,215,006 | ||||||||||||||||||||||||
Cleco Corporation | 71,100 | — | 71,100 | 71,100 | 3,822,336 | — | 3,822,336 | 3,822,336 | ||||||||||||||||||||||||
El Paso Electric Company | 47,400 | — | 47,400 | 47,400 | 1,793,616 | — | 1,793,616 | 1,793,616 | ||||||||||||||||||||||||
Laclede Group, Inc. | — | 36,930 | 36,930 | 36,930 | — | 1,874,936 | 1,874,936 | 1,874,936 | ||||||||||||||||||||||||
NorthWestern Corporation | 39,200 | 172,740 | 211,940 | 211,940 | 2,071,328 | 9,127,582 | 11,198,910 | 11,198,910 | ||||||||||||||||||||||||
PNM Resources, Inc. | 52,400 | — | 52,400 | 52,400 | 1,511,740 | — | 1,511,740 | 1,511,740 | ||||||||||||||||||||||||
Portland General Electric Company | — | 51,990 | 51,990 | 51,990 | — | 1,892,956 | 1,892,956 | 1,892,956 | ||||||||||||||||||||||||
Southwest Gas Corporation | 46,600 | — | 46,600 | 46,600 | 2,706,994 | — | 2,706,994 | 2,706,994 | ||||||||||||||||||||||||
|
|
|
|
|
|
|
|
|
|
|
|
|
|
|
| |||||||||||||||||
Total Utilities | 13,121,020 | 12,895,474 | 26,016,494 | 26,016,494 | ||||||||||||||||||||||||||||
|
|
|
|
|
|
|
|
|
|
|
|
|
|
|
| |||||||||||||||||
Total Common Stock (Cost $151,348,670, Cost $283,287,256, Combined Fund $434,635,926, | ||||||||||||||||||||||||||||||||
Combined Funds $450,849,340) | 248,802,742 | 340,709,691 | 589,512,433 | 606,474,254 | ||||||||||||||||||||||||||||
|
|
|
|
|
|
|
|
|
|
|
|
|
|
|
| |||||||||||||||||
Preferred Stock (0.1%) | ||||||||||||||||||||||||||||||||
Health Care (0.1%) | ||||||||||||||||||||||||||||||||
National Healthcare Corporation, Convertibled | 30,846 | — | 30,846 | 30,846 | 473,486 | — | 473,486 | 473,486 | ||||||||||||||||||||||||
|
|
|
|
|
|
|
|
|
|
|
|
|
|
|
| |||||||||||||||||
Total Health Care | 30,846 | — | 30,846 | 30,846 | 473,486 | — | 473,486 | 473,486 | ||||||||||||||||||||||||
|
|
|
|
|
|
|
|
|
|
|
|
|
|
|
| |||||||||||||||||
Total Perferred Stock (Cost $416,153, Cost $0, Combined Fund $416,153, Combined Funds $416,153) | ||||||||||||||||||||||||||||||||
Collateral Held for Securities Loaned (3.7%) | ||||||||||||||||||||||||||||||||
Thrivent Cash Management Trust | 8,739,961 | 13,527,930 | 22,267,891 | 22,485,106 | 8,739,961 | 13,527,930 | 22,267,891 | 22,485,106 | ||||||||||||||||||||||||
|
|
|
|
|
|
|
|
|
|
|
|
|
|
|
| |||||||||||||||||
Total Collateral Held for Securities Loaned (Cost $8,739,961, Cost $13,527,930, Combined Fund $22,267,891, Combined Funds $22,485,106) | 8,739,961 | 13,527,930 | 22,267,891 | 22,485,106 | ||||||||||||||||||||||||||||
|
|
|
|
|
|
|
|
|
|
|
|
|
|
|
| |||||||||||||||||
Short-Term Investments (2.9%)e | — | |||||||||||||||||||||||||||||||
Thrivent Cash Management Trust | 7,402,448 | 10,468,825 | 17,871,273 | 18,372,676 | 7,402,448 | 10,468,825 | 17,871,273 | 18,372,676 | ||||||||||||||||||||||||
|
|
|
|
|
|
|
|
|
|
|
|
|
|
|
| |||||||||||||||||
Total Short-Term Investments (at amortized cost) | 7,402,448 | 10,468,825 | 17,871,273 | 18,372,676 | ||||||||||||||||||||||||||||
|
|
|
|
|
|
|
|
|
|
|
|
|
|
|
| |||||||||||||||||
Total Investments (Cost $167,907,232, Cost $307,284,011, Combined Fund $475,191,243, Combined Funds 492,123,275) 103.7% | 265,418,637 | 364,706,446 | 630,125,083 | 647,805,522 | ||||||||||||||||||||||||||||
Other Assets and Liabilities, Net (3.7)% | (8,466,916 | ) | (14,076,622 | ) | (22,543,538 | ) | (22,748,499 | ) | ||||||||||||||||||||||||
|
|
|
|
|
|
|
|
|
|
|
|
|
|
|
| |||||||||||||||||
Total Net Assets 100.0% | 256,951,721 | 350,629,824 | 607,581,545 | 625,057,023 | ||||||||||||||||||||||||||||
|
|
|
|
|
|
|
|
|
|
|
|
|
|
|
|
| (a) | Non-income producing security. |
| (b) | All or a portion of the security is on loan. |
| (c) | Security is fair valued. |
| (d) | Denotes perpetual securities. Perpetual securities pay an indefinite stream of interest, but may be called by the issuer at an earlier date. |
| (e) | The interest rate shown reflects the yield, coupon rate or the discount rate at the date of purchase. |
Definitions:
ADR - American Depositary Receipt, which are certificates for an underlying foreign security’s shares held by an issuing U.S. depository bank.
ETF - Exchange Traded Fund
- 35 -
Table of Contents
Partner Small Cap Value Fund
Fair Valuation Measurements
The following table is a summary of the inputs used, as of October 31, 2014, in valuing Partner Small Cap Value Fund’s assets carried at fair value.
Investments in Securities | Total | Level 1 | Level 2 | Level 3 | ||||||||||||
Common Stock | ||||||||||||||||
Consumer Discretionary | 32,035,155 | 32,035,155 | — | — | ||||||||||||
Consumer Staples | 2,450,750 | 2,450,750 | — | — | ||||||||||||
Energy | 8,071,063 | 8,071,063 | — | — | ||||||||||||
Financials | 68,232,056 | 68,232,056 | — | — | ||||||||||||
Health Care | 10,098,943 | 10,098,943 | — | — | ||||||||||||
Industrials | 68,451,170 | 68,451,170 | — | — | ||||||||||||
Information Technology | 27,067,208 | 27,067,208 | — | — | ||||||||||||
Materials | 18,891,128 | 18,104,678 | 786,450 | — | ||||||||||||
Telecommunications Services | 384,249 | 384,249 | — | — | ||||||||||||
Utilities | 13,121,020 | 13,121,020 | — | — | ||||||||||||
Preferred Stock | ||||||||||||||||
Health Care | 473,486 | 473,486 | — | — | ||||||||||||
Collateral Held for Securities Loaned | 8,739,961 | 8,739,961 | — | — | ||||||||||||
Short-Term Investments | 7,402,448 | 7,402,448 | — | — | ||||||||||||
|
|
|
|
|
|
|
| |||||||||
Total | $ | 265,418,637 | $ | 264,632,187 | $ | 786,450 | — | |||||||||
|
|
|
|
|
|
|
| |||||||||
There were no significant transfers between Levels during the period ended October 31, 2014. Transfers between Levels are identified as of the end of the period.
Small Cap Stock Fund
Fair Valuation Measurements
The following table is a summary of the inputs used, as of October 31, 2014, in valuing Small Cap Stock Fund’s assets carried at fair value.
Investments in Securities | Total | Level 1 | Level 2 | Level 3 | ||||||||||||
Common Stock | ||||||||||||||||
Consumer Discretionary | 41,806,201 | 41,806,201 | — | — | ||||||||||||
Consumer Staples | 9,931,388 | 9,931,388 | — | — | ||||||||||||
Energy | 14,792,074 | 13,036,342 | 1,755,732 | — | ||||||||||||
Financials | 72,369,604 | 72,369,604 | — | — | ||||||||||||
Health Care | 35,823,606 | 35,823,606 | — | — | ||||||||||||
Industrials | 84,385,408 | 84,385,408 | — | — | ||||||||||||
Information Technology | 50,349,371 | 50,349,371 | — | — | ||||||||||||
Materials | 15,037,131 | 15,037,131 | — | — | ||||||||||||
Telecommunications Services | 3,319,434 | 3,319,434 | — | — | ||||||||||||
Utilities | 12,895,474 | 12,895,474 | — | — | ||||||||||||
Preferred Stock | ||||||||||||||||
Health Care | — | — | — | — | ||||||||||||
Collateral Held for Securities Loaned | 13,527,930 | 13,527,930 | — | — | ||||||||||||
Short-Term Investments | 10,468,825 | 10,468,825 | — | — | ||||||||||||
|
|
|
|
|
|
|
| |||||||||
Total | $ | 364,706,446 | $ | 362,950,714 | $ | 1,755,732 | — | |||||||||
|
|
|
|
|
|
|
| |||||||||
There were no significant transfers between Levels during the period ended October 31, 2014. Transfers between Levels are identified as of the end of the period.
- 36 -
Table of Contents
Combined Pro Forma (assuming merger with Target Fund)
Fair Valuation Measurements
The following table is a summary of the inputs used, as of October 31, 2014, in valuing Small Cap Stock Fund’s assets carried at fair value.
Investments in Securities | Total | Level 1 | Level 2 | Level 3 | ||||||||||||
Common Stock | ||||||||||||||||
Consumer Discretionary | 73,841,356 | 73,841,356 | — | — | ||||||||||||
Consumer Staples | 12,382,138 | 12,382,138 | — | — | ||||||||||||
Energy | 22,863,137 | 21,107,405 | 1,755,732 | — | ||||||||||||
Financials | 140,601,660 | 140,601,660 | — | — | ||||||||||||
Health Care | 45,922,549 | 45,922,549 | — | — | ||||||||||||
Industrials | 152,836,578 | 152,836,578 | — | — | ||||||||||||
Information Technology | 77,416,579 | 77,416,579 | — | — | ||||||||||||
Materials | 33,928,259 | 33,141,809 | 786,450 | — | ||||||||||||
Telecommunications Services | 3,703,683 | 3,703,683 | — | — | ||||||||||||
Utilities | 26,016,494 | 26,016,494 | — | — | ||||||||||||
Preferred Stock | ||||||||||||||||
Health Care | 473,486 | 473,486 | — | — | ||||||||||||
Collateral Held for Securities Loaned | 22,267,891 | 22,267,891 | — | — | ||||||||||||
Short-Term Investments | 17,871,273 | 17,871,273 | — | — | ||||||||||||
|
|
|
|
|
|
|
| |||||||||
Total | 630,125,083 | 627,582,901 | 2,542,182 | — | ||||||||||||
|
|
|
|
|
|
|
| |||||||||
There were no significant transfers between Levels during the period ended October 31, 2014. Transfers between Levels are identified as of the end of the period.
Partner Small Cap Value Fund
Investment in Affiliates
Affiliated issuers, as defined under the Investment Company Act of 1940, include those in which the Fund’s holdings of an issuer represent 5% or more of the outstanding voting securities of an issuer, or any affiliated mutual fund.
A summary of transactions for the fiscal year to date, in Partner Small Cap Value Fund, is as follows:
Fund | Value October 31, 2013 | Gross Purchases | Gross Sales | Shares Held at October 31, 2014 | Value October 31, 2014 | Income Earned November 1, 2013 - October 31, 2014 | ||||||||||||||||||
Cash Management Trust- Collateral Investment | $ | 4,609,450 | $ | 67,313,953 | $ | 63,183,442 | 8,739,961 | $ | 8,739,961 | $ | 44,645 | |||||||||||||
Cash Management Trust- Short Term Investment | 7,881,847 | 28,436,401 | 28,915,800 | 7,402,448 | 7,402,448 | 3,358 | ||||||||||||||||||
Total Value and Income Earned | 12,491,297 | 16,142,409 | 48,003 | |||||||||||||||||||||
Small Cap Stock Fund
Investment in Affiliates
Affiliated issuers, as defined under the Investment Company Act of 1940, include those in which the Fund’s holdings of an issuer represent 5% or more of the outstanding voting securities of an issuer, orany affiliated mutual fund.
A summary of transactions for the fiscal year to date, in Small Cap Stock Fund, is as follows:
Fund | Value October 31, 2013 | Gross Purchases | Gross Sales | Shares Held at October 31, 2014 | Value October 31, 2014 | Income Earned November 1, 2013 - October 31, 2014 | ||||||||||||||||||
Cash Management Trust- Collateral Investment | $ | 26,183,357 | $ | 126,945,231 | $ | 139,600,658 | 13,527,930 | $ | 13,527,930 | $ | 350,416 | |||||||||||||
Cash Management Trust- Short Term Investment | 24,933,198 | 93,961,074 | 108,425,447 | 10,468,825 | 10,468,825 | 9,042 | ||||||||||||||||||
Total Value and Income Earned | 51,116,555 | 23,996,755 | 359,458 | |||||||||||||||||||||
- 37 -
Table of Contents
Combined Pro Forma (assuming merger with Target Fund)
Investment in Affiliates
Affiliated issuers, as defined under the Investment Company Act of 1940, include those in which the Fund’s holdings of an issuer represent 5% or more of the outstanding voting securities of an issuer, or any affiliated mutual fund.
A summary of transactions for the fiscal year to date, in Small Cap Stock Fund, is as follows:
Fund | Value October 31, 2013 | Gross Purchases | Gross Sales | Shares Held at October 31, 2014 | Value October 31, 2014 | Income Earned November 1, 2013 - October 31, 2014 | ||||||||||||||||||
Cash Management Trust- Collateral Investment | $ | 30,792,807 | $ | 194,259,184 | $ | 202,784,100 | $ | 22,267,891 | $ | 22,267,891 | $ | 395,061 | ||||||||||||
Cash Management Trust- Short Term Investment | $ | 32,815,045 | $ | 122,397,475 | $ | 137,341,247 | $ | 17,871,273 | $ | 17,871,273 | $ | 12,400 | ||||||||||||
Total Value and Income Earned | $ | 63,607,852 | $ | 40,139,164 | $ | 407,461 | ||||||||||||||||||
Small Cap Stock Fund
The following table summarizes the net realized gains/(losses) and Statement of Operations location, for the period ended October 31, 2014, for Small Cap Stock Fund’s investments in financial derivative instruments by primary risk exposure.
Derivatives by risk category | Statement of Operations Location | Realized Gains/(Losses) recognized in Income | ||||
Equity Contracts | ||||||
Futures | Net realized gains/(losses) on Futures contracts | 847,682 | ||||
Total Equity Contracts | 847,682 | |||||
|
| |||||
Total | $ | 847,682 | ||||
|
| |||||
The following table summarizes the change in net unrealized appreciation/(depreciation) and Statement of Operations location, for the period ended October 31, 2014, for Small Cap Stock Fund’s investments in financial derivative instruments by primary risk exposure.
Derivatives by risk category | Statement of Operations Location | Change in unrealized appreciation/(depreciation) recognized in Income | ||||
Equity Contracts | ||||||
Futures | Change in net unrealized appreciation/(depreciation) on Futures contracts | (870,806 | ) | |||
Total Equity Contracts | (870,806 | ) | ||||
|
| |||||
Total | (870,806 | ) | ||||
|
| |||||
The following table presents Small Cap Stock Fund’s average volume of derivative activity during the period ended October 31, 2014.
Derivative Risk Category | Futures (Notional)* | Futures (Percentage of Average Net Assets) | ||||||
Equity Contracts | $ | 10,060,362 | 2.90 | % | ||||
| * | Notional amount represents long or short, or both, derivative positions held by the Fund. |
- 38 -
Table of Contents
Pro Forma Combined Schedule of Investments—October 31, 2014
Thrivent Partner Small Cap Growth Fund, Thrivent Partner Small Cap Value Fund, and Thrivent Small Cap Stock Fund
Common Stock (94.3%) | Partner Small Cap Growth Fund Share | Partner Small Cap Value Fund Shares | Small Cap Stock Fund Shares | Combined Pro Forma Shares (assuming merger with Target Funds) | Partner Small Cap Growth Fund Value | Partner Small Cap Value Fund Value | Small Cap Stock Fund Value | Combined Pro Forma Value (assuming merger with Target Funds) | ||||||||||||||||||||||||
Consumer Discretionary (12.3%) | ||||||||||||||||||||||||||||||||
Aaron’s, Inc. | — | 146,600 | — | 146,600 | — | 3,629,816 | — | 3,629,816 | ||||||||||||||||||||||||
American Public Education, Inc.a | — | 26,000 | — | 26,000 | — | 805,740 | — | 805,740 | ||||||||||||||||||||||||
ANN, Inc.a | 2,185 | — | — | 2,185 | $ | 83,882 | — | — | 83,882 | |||||||||||||||||||||||
Ascent Capital Group, Inc.a | — | 11,500 | — | 11,500 | — | 739,450 | — | 739,450 | ||||||||||||||||||||||||
Brunswick Corporation | 5,026 | 28,300 | — | 33,326 | 235,217 | 1,324,440 | — | 1,559,657 | ||||||||||||||||||||||||
Burlington Stores, Inc.a | 4,468 | — | — | 4,468 | 187,388 | — | — | 187,388 | ||||||||||||||||||||||||
Cheesecake Factory, Inc. | — | — | 116,360 | 116,360 | — | — | $ | 5,345,578 | 5,345,578 | |||||||||||||||||||||||
Chuy’s Holdings, Inc.a | 1,500 | — | — | 1,500 | 44,865 | — | — | 44,865 | ||||||||||||||||||||||||
Core-Mark Holding Company, Inc. | 2,721 | — | — | 2,721 | 157,900 | — | — | 157,900 | ||||||||||||||||||||||||
Crocs, Inc.a | — | 42,500 | — | 42,500 | — | 496,400 | — | 496,400 | ||||||||||||||||||||||||
CSS Industries, Inc. | — | 39,200 | — | 39,200 | — | 1,119,552 | — | 1,119,552 | ||||||||||||||||||||||||
Del Frisco’s Restaurant Group, Inc.a | 6,454 | — | — | 6,454 | 149,862 | — | — | 149,862 | ||||||||||||||||||||||||
Dorman Products, Inc.a,b | — | 41,100 | — | 41,100 | — | 1,905,396 | — | 1,905,396 | ||||||||||||||||||||||||
Drew Industries, Inc. | — | 56,300 | — | 56,300 | — | 2,705,778 | — | 2,705,778 | ||||||||||||||||||||||||
Ethan Allen Interiors, Inc.b | — | 44,300 | — | 44,300 | — | 1,253,690 | — | 1,253,690 | ||||||||||||||||||||||||
Five Below, Inc.a,b | 3,512 | — | — | 3,512 | 140,023 | — | — | 140,023 | ||||||||||||||||||||||||
Fred’s, Inc. | — | 58,900 | — | 58,900 | — | 924,730 | — | 924,730 | ||||||||||||||||||||||||
G-III Apparel Group, Ltd.a | 3,097 | — | 42,200 | 45,297 | 245,747 | — | 3,348,570 | 3,594,317 | ||||||||||||||||||||||||
Haverty Furniture Companies, Inc. | — | 68,200 | — | 68,200 | — | 1,501,082 | — | 1,501,082 | ||||||||||||||||||||||||
HomeAway, Inc.a | 4,449 | — | — | 4,449 | 155,270 | — | — | 155,270 | ||||||||||||||||||||||||
Hooker Furniture Corporation | — | 30,800 | — | 30,800 | — | 470,932 | — | 470,932 | ||||||||||||||||||||||||
Houghton Mifflin Harcourt Companya | — | — | 272,500 | 272,500 | — | — | 5,452,725 | 5,452,725 | ||||||||||||||||||||||||
Ignite Restaurant Group, Inc.a,b | — | — | 166,621 | 166,621 | — | — | 1,148,019 | 1,148,019 | ||||||||||||||||||||||||
Imax Corporationa | 3,738 | — | — | 3,738 | 110,121 | — | — | 110,121 | ||||||||||||||||||||||||
Kate Spade & Companya | 4,670 | — | — | 4,670 | 126,697 | — | — | 126,697 | ||||||||||||||||||||||||
Lithia Motors, Inc. | 380 | — | — | 380 | 29,496 | — | — | 29,496 | ||||||||||||||||||||||||
M/I Homes, Inc.a | — | 46,100 | — | 46,100 | — | 992,994 | — | 992,994 | ||||||||||||||||||||||||
MarineMax, Inc.a | — | 10,700 | — | 10,700 | — | 205,119 | — | 205,119 | ||||||||||||||||||||||||
MDC Partners, Inc. | — | — | 294,817 | 294,817 | — | — | 6,102,712 | 6,102,712 | ||||||||||||||||||||||||
Meritage Homes Corporationa | — | 54,300 | — | 54,300 | — | 1,997,697 | — | 1,997,697 | ||||||||||||||||||||||||
Modine Manufacturing Companya | — | 99,600 | — | 99,600 | — | 1,277,868 | — | 1,277,868 | ||||||||||||||||||||||||
Multimedia Games Holding Company, Inc.a | 7,278 | — | — | 7,278 | 254,002 | — | — | 254,002 | ||||||||||||||||||||||||
National CineMedia, Inc. | — | 10,900 | — | 10,900 | — | 173,310 | — | 173,310 | ||||||||||||||||||||||||
New Media Investment Group, Inc. | — | 59,300 | — | 59,300 | — | 1,130,258 | — | 1,130,258 | ||||||||||||||||||||||||
NutriSystem, Inc. | — | — | 323,690 | 323,690 | — | — | 5,450,939 | 5,450,939 | ||||||||||||||||||||||||
Orient-Express Hotels, Ltd.a | — | 74,400 | — | 74,400 | — | 852,624 | — | 852,624 | ||||||||||||||||||||||||
Oxford Industries, Inc. | 2,686 | — | 61,340 | 64,026 | 164,517 | — | 3,757,075 | 3,921,592 | ||||||||||||||||||||||||
Papa John’s International, Inc. | — | — | 74,050 | 74,050 | — | — | 3,462,578 | 3,462,578 | ||||||||||||||||||||||||
Pier 1 Imports, Inc. | — | 109,550 | — | 109,550 | — | 1,413,195 | — | 1,413,195 | ||||||||||||||||||||||||
Quiksilver, Inc.a,b | — | 205,800 | — | 205,800 | — | 360,150 | — | 360,150 | ||||||||||||||||||||||||
Red Robin Gourmet Burgers, Inc.a | 2,036 | 11,200 | — | 13,236 | 111,919 | 615,664 | — | 727,583 | ||||||||||||||||||||||||
Restoration Hardware Holdings, Inc.a | 1,133 | — | — | 1,133 | 91,003 | — | — | 91,003 | ||||||||||||||||||||||||
Shiloh Industries, Inc.a | — | 94,900 | — | 94,900 | — | 1,617,096 | — | 1,617,096 | ||||||||||||||||||||||||
Shutterfly, Inc.a | 714 | — | — | 714 | 29,867 | — | — | 29,867 | ||||||||||||||||||||||||
Skechers USA, Inc.a | 2,851 | — | — | 2,851 | 156,092 | — | — | 156,092 | ||||||||||||||||||||||||
Sportsman’s Warehouse Holdings, Inc.a,b | — | 127,600 | — | 127,600 | — | 891,924 | — | 891,924 | ||||||||||||||||||||||||
Stein Mart, Inc. | — | 119,500 | — | 119,500 | — | 1,598,910 | — | 1,598,910 | ||||||||||||||||||||||||
Steven Madden, Ltd.a | — | 29,750 | — | 29,750 | — | 932,662 | — | 932,662 | ||||||||||||||||||||||||
Tenneco, Inc.a | 3,280 | — | — | 3,280 | 171,741 | — | — | 171,741 | ||||||||||||||||||||||||
Tuesday Morning Corporationa,b | — | — | 379,500 | 379,500 | — | — | 7,738,005 | 7,738,005 | ||||||||||||||||||||||||
Vail Resorts, Inc. | 1,382 | — | — | 1,382 | 119,349 | — | — | 119,349 | ||||||||||||||||||||||||
Winnebago Industries, Inc.a | — | 51,800 | — | 51,800 | — | 1,098,678 | — | 1,098,678 | ||||||||||||||||||||||||
|
|
|
|
|
|
|
|
|
|
|
|
|
|
|
| |||||||||||||||||
Total Consumer Discretionary | 2,764,958 | 32,035,155 | 41,806,201 | 76,606,314 | ||||||||||||||||||||||||||||
|
|
|
|
|
|
|
|
|
|
|
|
|
|
|
| |||||||||||||||||
- 39 -
Table of Contents
Consumer Staples (2.1%) | ||||||||||||||||||||||||||||||||
Alliance One International, Inc.a | — | 168,300 | — | 168,300 | — | 341,649 | — | 341,649 | ||||||||||||||||||||||||
B&G Foods, Inc. | 1,654 | — | — | 1,654 | 48,727 | — | — | 48,727 | ||||||||||||||||||||||||
Boston Beer Company, Inc.a | 916 | — | — | 916 | 228,084 | — | — | 228,084 | ||||||||||||||||||||||||
Natural Grocers by Vitamin Cottage, Inc.a | 2,786 | — | — | 2,786 | 50,455 | — | — | 50,455 | ||||||||||||||||||||||||
Pinnacle Foods, Inc. | — | 19,900 | — | 19,900 | — | 672,620 | — | 672,620 | ||||||||||||||||||||||||
Spartannash Company | — | 64,100 | — | 64,100 | — | 1,436,481 | — | 1,436,481 | ||||||||||||||||||||||||
TreeHouse Foods, Inc.a | — | — | 41,880 | 41,880 | — | — | 3,566,920 | 3,566,920 | ||||||||||||||||||||||||
United Natural Foods, Inc.a | 3,611 | — | — | 3,611 | 245,620 | — | — | 245,620 | ||||||||||||||||||||||||
WhiteWave Foods Companya | — | — | 170,950 | 170,950 | — | — | 6,364,468 | 6,364,468 | ||||||||||||||||||||||||
|
|
|
|
|
|
|
|
|
|
|
|
|
|
|
| |||||||||||||||||
Total Consumer Staples | 572,886 | 2,450,750 | 9,931,388 | 12,955,024 | ||||||||||||||||||||||||||||
|
|
|
|
|
|
|
|
|
|
|
|
|
|
|
| |||||||||||||||||
Energy (3.8%) | ||||||||||||||||||||||||||||||||
Atwood Oceanics, Inc.a | — | 17,000 | — | 17,000 | — | 691,050 | — | 691,050 | ||||||||||||||||||||||||
Bonanza Creek Energy, Inc.a | 547 | — | — | 547 | 24,746 | — | — | 24,746 | ||||||||||||||||||||||||
CARBO Ceramics, Inc.b | — | 5,600 | — | 5,600 | — | 289,352 | — | 289,352 | ||||||||||||||||||||||||
Cloud Peak Energy, Inc.a | — | 82,500 | — | 82,500 | — | 987,525 | — | 987,525 | ||||||||||||||||||||||||
Contango Oil & Gas Companya | — | 16,600 | — | 16,600 | — | 607,062 | — | 607,062 | ||||||||||||||||||||||||
Diamondback Energy, Inc.a | 572 | — | — | 572 | 39,147 | — | — | 39,147 | ||||||||||||||||||||||||
Energy XXI, Ltd.b | — | 30,700 | — | 30,700 | — | 236,083 | — | 236,083 | ||||||||||||||||||||||||
Gulf Island Fabrication, Inc. | — | 64,600 | — | 64,600 | — | 1,365,644 | — | 1,365,644 | ||||||||||||||||||||||||
Hercules Offshore, Inc.a,b | — | 140,100 | — | 140,100 | — | 231,165 | — | 231,165 | ||||||||||||||||||||||||
Kodiak Oil & Gas Corporationa | 10,911 | — | — | 10,911 | 117,730 | — | — | 117,730 | ||||||||||||||||||||||||
Market Vectors Oil Service ETF | — | — | 131,270 | 131,270 | — | — | 5,933,404 | 5,933,404 | ||||||||||||||||||||||||
Oasis Petroleum, Inc.a | 5,053 | — | 129,470 | 134,523 | 151,388 | — | 3,878,921 | 4,030,309 | ||||||||||||||||||||||||
PDC Energy, Inc.a | 515 | 11,300 | — | 11,815 | 22,516 | 494,036 | — | 516,552 | ||||||||||||||||||||||||
Penn Virginia Corporationa | 10,140 | — | — | 10,140 | 86,900 | — | — | 86,900 | ||||||||||||||||||||||||
Rex Energy Corporationa,b | 7,387 | — | 93,550 | 100,937 | 57,914 | — | 733,432 | 791,346 | ||||||||||||||||||||||||
Rosetta Resources, Inc.a | — | — | 65,490 | 65,490 | — | — | 2,490,585 | 2,490,585 | ||||||||||||||||||||||||
SemGroup Corporation | 1,817 | — | — | 1,817 | 139,455 | — | — | 139,455 | ||||||||||||||||||||||||
Teekay Tankers, Ltd.b | — | 268,500 | — | 268,500 | — | 1,138,440 | — | 1,138,440 | ||||||||||||||||||||||||
Tesco Corporation | — | 54,500 | — | 54,500 | — | 1,037,680 | — | 1,037,680 | ||||||||||||||||||||||||
Tetra Technologies, Inc.a | — | 104,200 | — | 104,200 | — | 993,026 | — | 993,026 | ||||||||||||||||||||||||
Trinidad Drilling, Ltd. | — | — | 269,591 | 269,591 | — | — | 1,755,732 | 1,755,732 | ||||||||||||||||||||||||
|
|
|
|
|
|
|
|
|
|
|
|
|
|
|
| |||||||||||||||||
Total Energy | 639,796 | 8,071,063 | 14,792,074 | 23,502,933 | ||||||||||||||||||||||||||||
|
|
|
|
|
|
|
|
|
|
|
|
|
|
|
| |||||||||||||||||
Financials (22.8%) | ||||||||||||||||||||||||||||||||
Affiliated Managers Group, Inc.a | — | — | 29,622 | 29,622 | — | — | 5,918,179 | 5,918,179 | ||||||||||||||||||||||||
Allied World Assurance Company Holdings AG | — | — | 46,780 | 46,780 | — | — | 1,777,640 | 1,777,640 | ||||||||||||||||||||||||
American Assets Trust, Inc. | — | — | 74,800 | 74,800 | — | — | 2,867,832 | 2,867,832 | ||||||||||||||||||||||||
Ares Capital Corporation | — | 99,900 | — | 99,900 | — | 1,597,401 | — | 1,597,401 | ||||||||||||||||||||||||
Argo Group International Holdings, Ltd. | — | — | 43,413 | 43,413 | — | — | 2,422,445 | 2,422,445 | ||||||||||||||||||||||||
Associated Estates Realty Corporation | — | 51,600 | — | 51,600 | — | 1,007,748 | — | 1,007,748 | ||||||||||||||||||||||||
Assured Guaranty, Ltd. | — | 24,200 | 116,310 | 140,510 | — | 558,536 | 2,684,435 | 3,242,971 | ||||||||||||||||||||||||
Bank of Kentucky Financial Corporation | — | 8,400 | — | 8,400 | — | 394,044 | — | 394,044 | ||||||||||||||||||||||||
Bank of the Ozarks, Inc. | 5,441 | — | — | 5,441 | 191,741 | — | — | 191,741 | ||||||||||||||||||||||||
BBCN Bancorp, Inc. | — | 69,200 | 186,200 | 255,400 | — | 978,488 | 2,632,868 | 3,611,356 | ||||||||||||||||||||||||
Catchmark Timber Trust, Inc. | — | 43,140 | — | 43,140 | — | 504,738 | — | 504,738 | ||||||||||||||||||||||||
CBL & Associates Properties, Inc. | — | 109,000 | — | 109,000 | — | 2,085,170 | — | 2,085,170 | ||||||||||||||||||||||||
Cedar Realty Trust, Inc. | — | 141,900 | — | 141,900 | — | 976,272 | — | 976,272 | ||||||||||||||||||||||||
Chesapeake Lodging Trust | 4,217 | — | — | 4,217 | 139,330 | — | — | 139,330 | ||||||||||||||||||||||||
CNO Financial Group, Inc. | — | — | 403,160 | 403,160 | — | — | 7,309,291 | 7,309,291 | ||||||||||||||||||||||||
CoBiz Financial, Inc. | — | 282,500 | — | 282,500 | — | 3,395,650 | — | 3,395,650 | ||||||||||||||||||||||||
Columbia Banking System, Inc. | — | 59,200 | — | 59,200 | — | 1,644,576 | — | 1,644,576 | ||||||||||||||||||||||||
Compass Diversified Holdings | — | 66,500 | — | 66,500 | — | 1,226,925 | — | 1,226,925 | ||||||||||||||||||||||||
East West Bancorp, Inc. | — | 116,200 | — | 116,200 | — | 4,271,512 | — | 4,271,512 | ||||||||||||||||||||||||
Education Realty Trust, Inc. | — | — | 179,800 | 179,800 | — | — | 2,024,548 | 2,024,548 | ||||||||||||||||||||||||
Employers Holdings, Inc. | — | 65,460 | — | 65,460 | — | 1,334,729 | — | 1,334,729 | ||||||||||||||||||||||||
Enstar Group, Ltd.a | — | 2,300 | — | 2,300 | — | 340,561 | — | 340,561 | ||||||||||||||||||||||||
Essent Group, Ltd.a | 6,565 | — | — | 6,565 | 159,792 | — | — | 159,792 | ||||||||||||||||||||||||
Evercore Partners, Inc. | 2,974 | — | — | 2,974 | 153,964 | — | — | 153,964 | ||||||||||||||||||||||||
Extra Space Storage, Inc. | — | — | 36,560 | 36,560 | — | — | 2,126,330 | 2,126,330 | ||||||||||||||||||||||||
First Potomac Realty Trust | — | 134,000 | — | 134,000 | — | 1,675,000 | — | 1,675,000 |
- 40 -
Table of Contents
Forestar Real Estate Group, Inc.a | — | 17,800 | — | 17,800 | — | 310,610 | — | 310,610 | ||||||||||||||||||||||||
Glacier Bancorp, Inc. | — | 90,900 | — | 90,900 | — | 2,607,921 | — | 2,607,921 | ||||||||||||||||||||||||
Golub Capital BDC, Inc. | — | 66,400 | — | 66,400 | — | 1,150,712 | — | 1,150,712 | ||||||||||||||||||||||||
Hanmi Financial Corporation | 3,787 | — | 246,270 | 250,057 | 81,231 | — | 5,282,492 | 5,363,723 | ||||||||||||||||||||||||
Hatteras Financial Corporation | — | 81,100 | — | 81,100 | — | 1,544,144 | — | 1,544,144 | ||||||||||||||||||||||||
HCC Insurance Holdings, Inc. | — | — | 57,870 | 57,870 | — | — | 3,020,235 | 3,020,235 | ||||||||||||||||||||||||
Hercules Technology Growth Capital, Inc. | — | 135,000 | — | 135,000 | — | 2,127,600 | — | 2,127,600 | ||||||||||||||||||||||||
Home Bancshares, Inc. | — | 75,400 | — | 75,400 | — | 2,406,768 | — | 2,406,768 | ||||||||||||||||||||||||
iShares Russell 2000 Growth Index Fund | 4,243 | 14,600 | — | 18,843 | 583,964 | 1,461,168 | — | 2,045,132 | ||||||||||||||||||||||||
iShares Russell 2000 Index Fund | — | — | 57,020 | 57,020 | — | — | 6,646,251 | 6,646,251 | ||||||||||||||||||||||||
iShares Russell 2000 Value Index Fund | — | — | — | — | — | — | — | — | ||||||||||||||||||||||||
Janus Capital Group, Inc. | — | 55,500 | — | 55,500 | — | 831,945 | — | 831,945 | ||||||||||||||||||||||||
JMP Group, Inc. | — | 46,800 | — | 46,800 | — | 341,640 | — | 341,640 | ||||||||||||||||||||||||
Kennedy-Wilson Holdings, Inc. | 6,237 | — | — | 6,237 | 168,960 | — | — | 168,960 | ||||||||||||||||||||||||
Kilroy Realty Corporation | — | 18,000 | — | 18,000 | — | 1,219,320 | — | 1,219,320 | ||||||||||||||||||||||||
Kite Realty Group Trust | — | 62,775 | — | 62,775 | — | 1,625,245 | — | 1,625,245 | ||||||||||||||||||||||||
LaSalle Hotel Properties | — | 61,400 | — | 61,400 | — | 2,407,494 | — | 2,407,494 | ||||||||||||||||||||||||
Main Street Capital Corporation | — | 19,800 | — | 19,800 | — | 629,244 | — | 629,244 | ||||||||||||||||||||||||
Meadowbrook Insurance Group, Inc. | — | 142,600 | — | 142,600 | — | 908,362 | — | 908,362 | ||||||||||||||||||||||||
National Interstate Corporation | — | 52,400 | — | 52,400 | — | 1,490,256 | — | 1,490,256 | ||||||||||||||||||||||||
PacWest Bancorp | 4,021 | — | 91,150 | 95,171 | 171,536 | — | 3,888,459 | 4,059,995 | ||||||||||||||||||||||||
Parkway Properties, Inc. | — | — | 103,400 | 103,400 | — | — | 2,073,170 | 2,073,170 | ||||||||||||||||||||||||
Pebblebrook Hotel Trust | — | — | 107,580 | 107,580 | — | — | 4,582,908 | 4,582,908 | ||||||||||||||||||||||||
Piper Jaffray Companiesa | — | 13,500 | — | 13,500 | — | 762,210 | — | 762,210 | ||||||||||||||||||||||||
Potlatch Corporation | — | 41,500 | — | 41,500 | — | 1,825,585 | — | 1,825,585 | ||||||||||||||||||||||||
ProAssurance Corporation | — | 95,500 | — | 95,500 | — | 4,467,490 | — | 4,467,490 | ||||||||||||||||||||||||
PS Business Parks, Inc. | — | 9,800 | — | 9,800 | — | 825,356 | — | 825,356 | ||||||||||||||||||||||||
Radian Group, Inc.b | — | 80,500 | — | 80,500 | — | 1,356,425 | — | 1,356,425 | ||||||||||||||||||||||||
Redwood Trust, Inc. | — | 144,400 | — | 144,400 | — | 2,713,276 | — | 2,713,276 | ||||||||||||||||||||||||
Safeguard Scientifics, Inc.a | — | 65,100 | — | 65,100 | — | 1,298,745 | — | 1,298,745 | ||||||||||||||||||||||||
Safety Insurance Group, Inc. | — | 4,300 | — | 4,300 | — | 268,234 | — | 268,234 | ||||||||||||||||||||||||
Sandy Spring Bancorp, Inc. | — | 85,600 | — | 85,600 | — | 2,208,480 | — | 2,208,480 | ||||||||||||||||||||||||
State Auto Financial Corporation | — | 35,000 | — | 35,000 | — | 732,550 | — | 732,550 | ||||||||||||||||||||||||
Strategic Hotels & Resorts, Inc.a | — | 20,100 | — | 20,100 | — | 258,285 | — | 258,285 | ||||||||||||||||||||||||
SVB Financial Groupa | — | 26,100 | 15,520 | 41,620 | — | 2,922,939 | 1,738,085 | 4,661,024 | ||||||||||||||||||||||||
Synovus Financial Corporation | — | — | 254,440 | 254,440 | — | — | 6,452,599 | 6,452,599 | ||||||||||||||||||||||||
TCP Capital Corporation | — | 45,400 | — | 45,400 | — | 766,806 | — | 766,806 | ||||||||||||||||||||||||
Terreno Realty Corporation | — | — | 150,490 | 150,490 | — | — | 3,169,319 | 3,169,319 | ||||||||||||||||||||||||
Texas Capital Bancshares, Inc.a | — | — | 31,660 | 31,660 | — | — | 1,936,009 | 1,936,009 | ||||||||||||||||||||||||
THL Credit, Inc. | — | 61,200 | — | 61,200 | — | 787,032 | — | 787,032 | ||||||||||||||||||||||||
Washington Real Estate Investment Trust | — | 48,400 | — | 48,400 | — | 1,367,784 | — | 1,367,784 | ||||||||||||||||||||||||
Western Alliance Bancorpa | 5,251 | — | 143,370 | 148,621 | 139,782 | — | 3,816,509 | 3,956,291 | ||||||||||||||||||||||||
Wintrust Financial Corporation | — | 56,500 | — | 56,500 | — | 2,617,080 | — | 2,617,080 | ||||||||||||||||||||||||
|
|
|
|
|
|
|
|
|
|
|
|
|
|
|
| |||||||||||||||||
Total Financials | 1,790,300 | 68,232,056 | 72,369,604 | 142,391,960 | ||||||||||||||||||||||||||||
|
|
|
|
|
|
|
|
|
|
|
|
|
|
|
| |||||||||||||||||
Health Care (8.0%) | ||||||||||||||||||||||||||||||||
Acadia Healthcare Company, Inc.a | 3,647 | — | — | 3,647 | 226,297 | — | — | 226,297 | ||||||||||||||||||||||||
Acorda Therapeutics, Inc.a | — | — | 70,100 | 70,100 | — | — | 2,440,882 | 2,440,882 | ||||||||||||||||||||||||
Akorn, Inc.a | 6,758 | — | 77,280 | 84,038 | 301,069 | — | 3,442,824 | 3,743,893 | ||||||||||||||||||||||||
Align Technology, Inc.a | 2,030 | — | 55,330 | 57,360 | 106,819 | — | 2,911,465 | 3,018,284 | ||||||||||||||||||||||||
Analogic Corporation | — | 11,900 | — | 11,900 | — | 867,986 | — | 867,986 | ||||||||||||||||||||||||
Atrion Corporation | — | 4,900 | — | 4,900 | — | 1,617,049 | — | 1,617,049 | ||||||||||||||||||||||||
BioScrip, Inc.a,b | — | — | 173,070 | 173,070 | — | — | 1,118,032 | 1,118,032 | ||||||||||||||||||||||||
Bruker Corporationa | 4,976 | — | — | 4,976 | 103,153 | — | — | 103,153 | ||||||||||||||||||||||||
Cardiovascular Systems, Inc.a | 4,130 | — | — | 4,130 | 128,030 | — | — | 128,030 | ||||||||||||||||||||||||
Centene Corporationa | 1,785 | — | — | 1,785 | 165,416 | — | — | 165,416 | ||||||||||||||||||||||||
Cubist Pharmaceuticals, Inc.a | 2,142 | — | — | 2,142 | 154,845 | — | — | 154,845 | ||||||||||||||||||||||||
Cyberonics, Inc.a | 3,344 | — | — | 3,344 | 175,560 | — | — | 175,560 | ||||||||||||||||||||||||
Depomed, Inc.a | 12,928 | — | — | 12,928 | 199,091 | — | — | 199,091 | ||||||||||||||||||||||||
ExamWorks Group, Inc.a,b | 7,135 | — | 222,172 | 229,307 | 276,695 | — | 8,615,830 | 8,892,525 | ||||||||||||||||||||||||
Furiex Pharmaceuticals, Inc. Contigent Value Righta,c | 2,923 | — | — | 2,923 | 28,499 | — | — | 28,499 |
- 41 -
Table of Contents
Healthcare Services Group, Inc. | 8,095 | — | — | 8,095 | 241,069 | — | — | 241,069 | ||||||||||||||||||||||||
Impax Laboratories, Inc.a | 7,028 | — | — | 7,028 | 203,601 | — | — | 203,601 | ||||||||||||||||||||||||
Ironwood Pharmaceuticals, Inc.a | 11,635 | — | — | 11,635 | 163,123 | — | — | 163,123 | ||||||||||||||||||||||||
LifePoint Hospitals, Inc.a | 2,121 | — | — | 2,121 | 148,470 | — | — | 148,470 | ||||||||||||||||||||||||
National Healthcare Corporation | — | 29,800 | — | 29,800 | — | 1,797,238 | — | 1,797,238 | ||||||||||||||||||||||||
Neurocrine Biosciences, Inc.a | 7,577 | — | 130,900 | 138,477 | 140,326 | — | 2,424,268 | 2,564,594 | ||||||||||||||||||||||||
NPS Pharmaceuticals, Inc.a | 3,088 | — | — | 3,088 | 84,611 | — | — | 84,611 | ||||||||||||||||||||||||
NuVasive, Inc.a | 7,851 | — | 190,723 | 198,574 | 321,106 | — | 7,800,571 | 8,121,677 | ||||||||||||||||||||||||
Puma Biotechnology, Inc.a | 717 | — | — | 717 | 179,680 | — | — | 179,680 | ||||||||||||||||||||||||
Team Health Holdings, Inc.a | 3,470 | — | — | 3,470 | 217,014 | — | — | 217,014 | ||||||||||||||||||||||||
Teleflex, Inc. | 2,169 | — | 61,950 | 64,119 | 247,526 | — | 7,069,734 | 7,317,260 | ||||||||||||||||||||||||
Triple-S Management Corporationa | — | 65,500 | — | 65,500 | — | 1,450,170 | — | 1,450,170 | ||||||||||||||||||||||||
West Pharmaceutical Services, Inc. | — | 85,200 | — | 85,200 | — | 4,366,500 | — | 4,366,500 | ||||||||||||||||||||||||
|
|
|
|
|
|
|
|
|
|
|
|
|
|
|
| |||||||||||||||||
Total Health Care | 3,812,000 | 10,098,943 | 35,823,606 | 49,734,549 | ||||||||||||||||||||||||||||
|
|
|
|
|
|
|
|
|
|
|
|
|
|
|
| |||||||||||||||||
Industrials (24.9%) | ||||||||||||||||||||||||||||||||
A.O. Smith Corporation | — | 61,500 | — | 61,500 | — | 3,281,025 | — | 3,281,025 | ||||||||||||||||||||||||
Aegion Corporationa | — | 69,100 | — | 69,100 | — | 1,265,912 | — | 1,265,912 | ||||||||||||||||||||||||
Alaska Air Group, Inc. | — | 118,200 | — | 118,200 | — | 6,291,786 | — | 6,291,786 | ||||||||||||||||||||||||
Apogee Enterprises, Inc. | — | — | 86,570 | 86,570 | — | — | 3,800,423 | 3,800,423 | ||||||||||||||||||||||||
Applied Industrial Technologies, Inc. | — | 28,000 | — | 28,000 | — | 1,366,680 | — | 1,366,680 | ||||||||||||||||||||||||
Astec Industries, Inc. | — | 28,700 | — | 28,700 | — | 1,088,017 | — | 1,088,017 | ||||||||||||||||||||||||
Beacon Roofing Supply, Inc.a | — | 99,400 | — | 99,400 | — | 2,750,398 | — | 2,750,398 | ||||||||||||||||||||||||
Celadon Group, Inc. | — | 59,600 | — | 59,600 | — | 1,159,816 | — | 1,159,816 | ||||||||||||||||||||||||
Chart Industries, Inc.a | 442 | — | — | 442 | 20,575 | — | — | 20,575 | ||||||||||||||||||||||||
Circor International, Inc. | — | 28,300 | — | 28,300 | — | 2,126,745 | — | 2,126,745 | ||||||||||||||||||||||||
CLARCOR, Inc. | — | — | 115,690 | 115,690 | — | — | 7,746,602 | 7,746,602 | ||||||||||||||||||||||||
Comfort Systems USA, Inc. | — | 71,900 | — | 71,900 | — | 1,104,384 | — | 1,104,384 | ||||||||||||||||||||||||
Curtiss-Wright Corporation | — | — | 64,420 | 64,420 | — | — | 4,458,508 | 4,458,508 | ||||||||||||||||||||||||
EMCOR Group, Inc. | — | — | 241,711 | 241,711 | — | — | 10,666,707 | 10,666,707 | ||||||||||||||||||||||||
ESCO Technologies, Inc. | — | 54,400 | — | 54,400 | — | 2,068,288 | — | 2,068,288 | ||||||||||||||||||||||||
Esterline Technologies Corporationa | — | — | 46,060 | 46,060 | — | — | 5,394,087 | 5,394,087 | ||||||||||||||||||||||||
Franklin Electric Company, Inc. | — | 38,100 | — | 38,100 | — | 1,422,654 | — | 1,422,654 | ||||||||||||||||||||||||
FTI Consulting, Inc.a | — | 36,800 | — | 36,800 | — | 1,485,984 | — | 1,485,984 | ||||||||||||||||||||||||
G & K Services, Inc. | — | 45,200 | — | 45,200 | — | 2,850,764 | — | 2,850,764 | ||||||||||||||||||||||||
GATX Corporation | — | — | 60,030 | 60,030 | — | — | 3,805,902 | 3,805,902 | ||||||||||||||||||||||||
Generac Holdings, Inc.a | 1,915 | — | — | 1,915 | 86,826 | — | — | 86,826 | ||||||||||||||||||||||||
Genesee & Wyoming, Inc.a | — | 31,300 | — | 31,300 | — | 3,011,060 | — | 3,011,060 | ||||||||||||||||||||||||
Gibraltar Industries, Inc.a | — | 55,600 | — | 55,600 | — | 847,900 | — | 847,900 | ||||||||||||||||||||||||
Granite Construction, Inc. | 2,276 | — | 130,275 | 132,551 | 84,007 | — | 4,808,450 | 4,892,457 | ||||||||||||||||||||||||
Greenbrier Companies, Inc.b | — | 21,200 | — | 21,200 | — | 1,325,848 | — | 1,325,848 | ||||||||||||||||||||||||
H&E Equipment Services, Inc. | 3,344 | — | — | 3,344 | 125,032 | — | — | 125,032 | ||||||||||||||||||||||||
Heico Corporation | 2,813 | — | — | 2,813 | 152,577 | — | — | 152,577 | ||||||||||||||||||||||||
Hillenbrand, Inc. | — | 7,920 | — | 7,920 | — | 263,657 | — | 263,657 | ||||||||||||||||||||||||
HNI Corporation | — | — | 143,800 | 143,800 | — | — | 6,708,270 | 6,708,270 | ||||||||||||||||||||||||
Hub Group, Inc.a | — | 30,100 | — | 30,100 | — | 1,092,329 | — | 1,092,329 | ||||||||||||||||||||||||
Huron Consulting Group, Inc.a | 1,853 | — | — | 1,853 | 128,987 | — | — | 128,987 | ||||||||||||||||||||||||
Interface, Inc. | 9,336 | — | 357,380 | 366,716 | 149,656 | — | 5,728,801 | 5,878,457 | ||||||||||||||||||||||||
Kaman Corporation | — | 35,000 | — | 35,000 | — | 1,507,100 | — | 1,507,100 | ||||||||||||||||||||||||
Kforce, Inc. | — | 91,400 | — | 91,400 | — | 2,115,910 | — | 2,115,910 | ||||||||||||||||||||||||
Kirby Corporationa | — | 28,900 | — | 28,900 | — | 3,195,762 | — | 3,195,762 | ||||||||||||||||||||||||
Korn/Ferry Internationala | — | — | 211,400 | 211,400 | — | — | 5,904,402 | 5,904,402 | ||||||||||||||||||||||||
Kratos Defense & Security Solutions, Inc.a | — | 96,900 | — | 96,900 | — | 675,393 | — | 675,393 | ||||||||||||||||||||||||
Landstar System, Inc. | — | 45,700 | 115,800 | 161,500 | — | 3,382,257 | 8,570,358 | 11,952,615 | ||||||||||||||||||||||||
Luxfer Holdings plc ADR | — | 33,500 | — | 33,500 | — | 533,655 | — | 533,655 | ||||||||||||||||||||||||
MasTec, Inc.a | 4,459 | — | — | 4,459 | 127,706 | — | — | 127,706 | ||||||||||||||||||||||||
Matson, Inc. | — | 53,100 | — | 53,100 | — | 1,512,819 | — | 1,512,819 | ||||||||||||||||||||||||
Matthews International Corporation | — | 52,500 | — | 52,500 | — | 2,419,200 | — | 2,419,200 | ||||||||||||||||||||||||
McGrath Rentcorp | — | 83,900 | — | 83,900 | — | 3,064,867 | — | 3,064,867 | ||||||||||||||||||||||||
Middleby Corporationa | 2,433 | — | — | 2,433 | 215,321 | — | — | 215,321 | ||||||||||||||||||||||||
Mine Safety Appliances Company | — | 29,400 | — | 29,400 | — | 1,689,618 | — | 1,689,618 | ||||||||||||||||||||||||
Navigant Consulting, Inc.a | — | 102,000 | — | 102,000 | — | 1,569,780 | — | 1,569,780 |
- 42 -
Table of Contents
Nordson Corporation | — | 22,600 | — | 22,600 | — | 1,730,030 | — | 1,730,030 | ||||||||||||||||||||||||
On Assignment, Inc.a | 7,045 | — | — | 7,045 | 205,010 | — | — | 205,010 | ||||||||||||||||||||||||
PGT, Inc.a | 6,119 | — | — | 6,119 | 57,549 | — | — | 57,549 | ||||||||||||||||||||||||
Pike Corporationa | — | 55,300 | — | 55,300 | — | 660,282 | — | 660,282 | ||||||||||||||||||||||||
Progressive Waste Solutions, Ltd. | — | — | 233,440 | 233,440 | — | — | 6,823,451 | 6,823,451 | ||||||||||||||||||||||||
Proto Labs, Inc.a | 3,623 | — | 10,790 | 14,413 | 236,836 | — | 705,342 | 942,178 | ||||||||||||||||||||||||
Quanex Building Products Corporation | — | 39,200 | — | 39,200 | — | 784,784 | — | 784,784 | ||||||||||||||||||||||||
RBC Bearings, Inc. | — | 10,300 | — | 10,300 | — | 625,725 | — | 625,725 | ||||||||||||||||||||||||
Ritchie Brothers Auctioneers, Inc. | 5,032 | — | 161,000 | 166,032 | 122,730 | — | 3,926,790 | 4,049,520 | ||||||||||||||||||||||||
Saia, Inc.a | 4,611 | — | — | 4,611 | 226,031 | — | — | 226,031 | ||||||||||||||||||||||||
Spirit Airlines, Inc.a | 3,444 | — | — | 3,444 | 251,791 | — | — | 251,791 | ||||||||||||||||||||||||
Sun Hydraulics Corporation | — | 24,300 | — | 24,300 | — | 967,383 | — | 967,383 | ||||||||||||||||||||||||
Swift Transportation Companya | 6,078 | — | — | 6,078 | 150,127 | — | — | 150,127 | ||||||||||||||||||||||||
Tennant Company | — | — | 72,390 | 72,390 | — | — | 5,337,315 | 5,337,315 | ||||||||||||||||||||||||
Tutor Perini Corporationa | 3,170 | — | — | 3,170 | 88,792 | — | — | 88,792 | ||||||||||||||||||||||||
Universal Forest Products, Inc. | — | 34,100 | — | 34,100 | — | 1,703,977 | — | 1,703,977 | ||||||||||||||||||||||||
Universal Truckload Services, Inc. | — | 42,700 | — | 42,700 | — | 1,123,864 | — | 1,123,864 | ||||||||||||||||||||||||
UTI Worldwide, Inc.a | — | 69,100 | — | 69,100 | — | 755,263 | — | 755,263 | ||||||||||||||||||||||||
WageWorks, Inc.a | 592 | — | — | 592 | 33,750 | — | — | 33,750 | ||||||||||||||||||||||||
Waste Connections, Inc. | — | 30,900 | — | 30,900 | — | 1,541,910 | — | 1,541,910 | ||||||||||||||||||||||||
Watsco, Inc. | 1,452 | — | — | 1,452 | 147,552 | — | — | 147,552 | ||||||||||||||||||||||||
Watts Water Technologies, Inc. | 1,683 | — | — | 1,683 | 102,040 | — | — | 102,040 | ||||||||||||||||||||||||
Woodward, Inc. | — | 40,780 | — | 40,780 | — | 2,088,344 | — | 2,088,344 | ||||||||||||||||||||||||
|
|
|
|
|
|
|
|
|
|
|
|
|
|
|
| |||||||||||||||||
Total Industrials | 2,712,895 | 68,451,170 | 84,385,408 | 155,549,473 | ||||||||||||||||||||||||||||
|
|
|
|
|
|
|
|
|
|
|
|
|
|
|
| |||||||||||||||||
Information Technology (13.0%) | ||||||||||||||||||||||||||||||||
A10 Networks, Inc.a | 5,504 | — | 5,504 | 24,218 | — | 24,218 | ||||||||||||||||||||||||||
Advanced Energy Industries, Inc.a | — | 47,500 | — | 47,500 | — | 939,550 | — | 939,550 | ||||||||||||||||||||||||
Ambarella, Inc.a,b | 1,791 | — | — | 1,791 | 79,323 | — | — | 79,323 | ||||||||||||||||||||||||
Applied Micro Circuits Corporationa | 18,238 | — | — | 18,238 | 118,000 | — | — | 118,000 | ||||||||||||||||||||||||
Applied Optoelectronics, Inc.a | 2,852 | — | — | 2,852 | 46,031 | — | — | 46,031 | ||||||||||||||||||||||||
Aspen Technology, Inc.a | 4,820 | — | — | 4,820 | 178,003 | — | — | 178,003 | ||||||||||||||||||||||||
Atmel Corporationa | — | — | 405,100 | 405,100 | — | — | 3,005,842 | 3,005,842 | ||||||||||||||||||||||||
Badger Meter, Inc. | — | 6,700 | — | 6,700 | — | 381,364 | — | 381,364 | ||||||||||||||||||||||||
Belden, Inc. | 1,854 | 39,700 | — | 41,554 | 131,986 | 2,826,243 | — | 2,958,229 | ||||||||||||||||||||||||
Broadridge Financial Solutions, Inc. | — | — | 191,580 | 191,580 | — | — | 8,416,109 | 8,416,109 | ||||||||||||||||||||||||
Brooks Automation, Inc. | — | 75,400 | — | 75,400 | — | 929,682 | — | 929,682 | ||||||||||||||||||||||||
Cabot Microelectronics Corporationa | — | 46,100 | — | 46,100 | — | 2,223,403 | — | 2,223,403 | ||||||||||||||||||||||||
CalAmp Corporationa | 1,101 | — | — | 1,101 | 21,227 | — | — | 21,227 | ||||||||||||||||||||||||
Cardtronics, Inc.a | 4,311 | — | — | 4,311 | 165,499 | — | — | 165,499 | ||||||||||||||||||||||||
Cavium, Inc.a | 2,664 | — | — | 2,664 | 136,690 | — | — | 136,690 | ||||||||||||||||||||||||
ChannelAdvisor Corporationa | 4,441 | — | — | 4,441 | 61,685 | — | — | 61,685 | ||||||||||||||||||||||||
Cognex Corporationa | 3,148 | 15,900 | — | 19,048 | 124,535 | 629,004 | — | 753,539 | ||||||||||||||||||||||||
Coherent, Inc.a | 1,633 | — | — | 1,633 | 106,390 | — | — | 106,390 | ||||||||||||||||||||||||
Cohu, Inc. | — | 47,300 | — | 47,300 | — | 482,460 | — | 482,460 | ||||||||||||||||||||||||
Constant Contact, Inc.a | 4,181 | — | — | 4,181 | 147,840 | — | — | 147,840 | ||||||||||||||||||||||||
Cornerstone OnDemand, Inc.a | 5,017 | — | — | 5,017 | 181,967 | — | — | 181,967 | ||||||||||||||||||||||||
Dealertrack Technologies, Inc.a | 2,949 | — | — | 2,949 | 138,750 | — | — | 138,750 | ||||||||||||||||||||||||
Demandware, Inc.a | 3,437 | — | — | 3,437 | 206,048 | — | — | 206,048 | ||||||||||||||||||||||||
DST Systems, Inc. | 3,053 | — | 99,220 | 102,273 | 294,157 | — | 9,559,847 | 9,854,004 | ||||||||||||||||||||||||
dvanced Energy Industries, Inc.a | — | — | — | — | — | — | — | — | ||||||||||||||||||||||||
Electro Rent Corporation | — | 91,200 | — | 91,200 | — | 1,389,888 | — | 1,389,888 | ||||||||||||||||||||||||
Electro Scientific Industries, Inc. | — | 103,100 | — | 103,100 | — | 732,010 | — | 732,010 | ||||||||||||||||||||||||
Electronics for Imaging, Inc.a | 2,093 | — | — | 2,093 | 95,692 | — | — | 95,692 | ||||||||||||||||||||||||
Entegris, Inc.a | — | 45,700 | — | 45,700 | — | 620,606 | — | 620,606 | ||||||||||||||||||||||||
Fabrineta | — | 68,900 | — | 68,900 | — | 1,254,669 | — | 1,254,669 | ||||||||||||||||||||||||
FEI Company | — | — | 52,330 | 52,330 | — | — | 4,410,372 | 4,410,372 | ||||||||||||||||||||||||
Guidewire Software, Inc.a | 6,529 | — | 90,350 | 96,879 | 326,058 | — | 4,512,079 | 4,838,137 |
- 43 -
Table of Contents
Intersil Corporation | — | 27,600 | — | 27,600 | — | 366,804 | — | 366,804 | ||||||||||||||||||||||||
Intevac, Inc.a | — | 122,400 | — | 122,400 | — | 905,760 | — | 905,760 | ||||||||||||||||||||||||
Ixiaa | — | 113,500 | — | 113,500 | — | 1,093,005 | — | 1,093,005 | ||||||||||||||||||||||||
Littelfuse, Inc. | — | 14,600 | — | 14,600 | — | 1,424,084 | — | 1,424,084 | ||||||||||||||||||||||||
Manhattan Associates, Inc.a | 2,202 | — | — | 2,202 | 88,322 | — | — | 88,322 | ||||||||||||||||||||||||
MaxLinear, Inc.a | 14,291 | — | — | 14,291 | 101,323 | — | — | 101,323 | ||||||||||||||||||||||||
Methode Electronics, Inc. | 1,734 | 59,100 | — | 60,834 | 68,285 | 2,327,358 | — | 2,395,643 | ||||||||||||||||||||||||
Monolithic Power Systems, Inc. | 2,890 | — | — | 2,890 | 127,709 | — | — | 127,709 | ||||||||||||||||||||||||
Newport Corporationa | — | 27,800 | — | 27,800 | — | 497,342 | — | 497,342 | ||||||||||||||||||||||||
Plantronics, Inc. | — | — | 139,696 | 139,696 | — | — | 7,246,032 | 7,246,032 | ||||||||||||||||||||||||
Progress Software Corporationa | — | 76,000 | — | 76,000 | — | 1,968,400 | — | 1,968,400 | ||||||||||||||||||||||||
Proofpoint, Inc.a | 7,886 | — | — | 7,886 | 347,299 | — | — | 347,299 | ||||||||||||||||||||||||
ShoreTel, Inc.a | — | 137,400 | — | 137,400 | — | 1,111,566 | — | 1,111,566 | ||||||||||||||||||||||||
Sonus Networks, Inc.a | — | 224,200 | — | 224,200 | — | 777,974 | — | 777,974 | ||||||||||||||||||||||||
SPS Commerce, Inc.a | 395 | — | — | 395 | 23,029 | — | — | 23,029 | ||||||||||||||||||||||||
SunPower Corporationa | 1,583 | — | — | 1,583 | 50,403 | — | — | 50,403 | ||||||||||||||||||||||||
Synaptics, Inc.a | 958 | — | — | 958 | 65,556 | — | — | 65,556 | ||||||||||||||||||||||||
Synnex Corporation | — | 46,200 | — | 46,200 | — | 3,196,116 | — | 3,196,116 | ||||||||||||||||||||||||
Teradyne, Inc. | — | 53,800 | — | 53,800 | — | 989,920 | — | 989,920 | ||||||||||||||||||||||||
Textura Corporationa,b | — | — | 119,180 | 119,180 | — | — | 3,174,955 | 3,174,955 | ||||||||||||||||||||||||
Tyler Technologies, Inc.a | 602 | — | — | 602 | 67,376 | — | — | 67,376 | ||||||||||||||||||||||||
Ubiquiti Networks, Inc.b | — | — | 90,900 | 90,900 | — | — | 3,251,493 | 3,251,493 | ||||||||||||||||||||||||
Ultimate Software Group, Inc.a | 1,135 | — | — | 1,135 | 170,829 | — | — | 170,829 | ||||||||||||||||||||||||
Virtusa Corporationa | 5,107 | — | 165,267 | 170,374 | 209,285 | — | 6,772,642 | 6,981,927 | ||||||||||||||||||||||||
|
|
|
|
|
|
|
|
|
|
|
|
|
|
|
| |||||||||||||||||
Total Information Technology | 3,903,515 | 27,067,208 | 50,349,371 | 81,320,094 | ||||||||||||||||||||||||||||
|
|
|
|
|
|
|
|
|
|
|
|
|
|
|
| |||||||||||||||||
Materials (5.6%) | ||||||||||||||||||||||||||||||||
American Vanguard Corporationb | — | 42,400 | — | 42,400 | — | 489,296 | — | 489,296 | ||||||||||||||||||||||||
AptarGroup, Inc. | — | 49,800 | — | 49,800 | — | 3,099,552 | — | 3,099,552 | ||||||||||||||||||||||||
Carpenter Technology Corporation | — | 12,600 | — | 12,600 | — | 630,630 | — | 630,630 | ||||||||||||||||||||||||
Chemtura Corporationa | 5,039 | — | 5,039 | 117,358 | — | 117,358 | ||||||||||||||||||||||||||
Clearwater Paper Corporationa | — | 45,400 | — | 45,400 | — | 2,921,490 | — | 2,921,490 | ||||||||||||||||||||||||
Eagle Materials, Inc. | — | 44,400 | 44,400 | — | 3,881,892 | 3,881,892 | ||||||||||||||||||||||||||
Franco-Nevada Corporation | — | 16,800 | — | 16,800 | — | 786,450 | — | 786,450 | ||||||||||||||||||||||||
Graphic Packaging Holding Companya | 12,686 | — | 12,686 | 153,881 | — | 153,881 | ||||||||||||||||||||||||||
Horsehead Holding Corporationa | — | 230,170 | 230,170 | — | 3,615,971 | 3,615,971 | ||||||||||||||||||||||||||
Innospec, Inc. | — | 78,000 | — | 78,000 | — | 3,148,860 | — | 3,148,860 | ||||||||||||||||||||||||
KapStone Paper and Packaging Corporationa | 1,887 | — | 1,887 | 58,044 | — | 58,044 | ||||||||||||||||||||||||||
Materials Select Sector SPDR Fund | — | 155,770 | 155,770 | — | 7,539,268 | 7,539,268 | ||||||||||||||||||||||||||
Minerals Technologies, Inc. | — | 37,600 | — | 37,600 | — | 2,884,296 | — | 2,884,296 | ||||||||||||||||||||||||
Myers Industries, Inc. | — | 86,800 | — | 86,800 | — | 1,296,792 | — | 1,296,792 | ||||||||||||||||||||||||
PolyOne Corporation | 4,798 | — | 4,798 | 177,574 | — | 177,574 | ||||||||||||||||||||||||||
Ryerson Holding Corporationa | — | 30,200 | — | 30,200 | — | 385,956 | — | 385,956 | ||||||||||||||||||||||||
Sandstorm Gold, Ltd.a,b | — | 140,400 | — | 140,400 | — | 405,756 | — | 405,756 | ||||||||||||||||||||||||
Schnitzer Steel Industries, Inc. | — | 29,100 | — | 29,100 | — | 685,305 | — | 685,305 | ||||||||||||||||||||||||
Senomyx, Inc.a,b | 10,396 | — | 10,396 | 82,336 | — | 82,336 | ||||||||||||||||||||||||||
Stillwater Mining Companya | — | 51,200 | — | 51,200 | — | 672,256 | — | 672,256 | ||||||||||||||||||||||||
U.S. Silica Holdings, Inc. | 3,926 | — | 3,926 | 176,278 | — | 176,278 | ||||||||||||||||||||||||||
Wausau Paper Corporation | — | 150,100 | — | 150,100 | — | 1,484,489 | — | 1,484,489 | ||||||||||||||||||||||||
|
|
|
|
|
|
|
|
|
|
|
|
|
|
|
| |||||||||||||||||
Total Materials | 765,471 | 18,891,128 | 15,037,131 | 34,693,730 | ||||||||||||||||||||||||||||
|
|
|
|
|
|
|
|
|
|
|
|
|
|
|
| |||||||||||||||||
Telecommunications Services (0.6%) | ||||||||||||||||||||||||||||||||
Cogent Communications Holdings | — | — | 97,803 | 97,803 | — | — | 3,319,434 | 3,319,434 | ||||||||||||||||||||||||
Premiere Global Services, Inc.a | — | 36,700 | — | 36,700 | — | 384,249 | — | 384,249 | ||||||||||||||||||||||||
|
|
|
|
|
|
|
|
|
|
|
|
|
|
|
| |||||||||||||||||
Total Telecommunication Services | — | 384,249 | 3,319,434 | 3,703,683 | ||||||||||||||||||||||||||||
|
|
|
|
|
|
|
|
|
|
|
|
|
|
|
| |||||||||||||||||
Utilities (4.2%) | ||||||||||||||||||||||||||||||||
Black Hills Corporation | — | 22,200 | — | 22,200 | — | 1,215,006 | — | 1,215,006 | ||||||||||||||||||||||||
Cleco Corporation | — | 71,100 | — | 71,100 | — | 3,822,336 | — | 3,822,336 | ||||||||||||||||||||||||
El Paso Electric Company | — | 47,400 | — | 47,400 | — | 1,793,616 | — | 1,793,616 | ||||||||||||||||||||||||
Laclede Group, Inc. | — | — | 36,930 | 36,930 | — | — | 1,874,936 | 1,874,936 | ||||||||||||||||||||||||
NorthWestern Corporation | — | 39,200 | 172,740 | 211,940 | — | 2,071,328 | 9,127,582 | 11,198,910 | ||||||||||||||||||||||||
PNM Resources, Inc. | — | 52,400 | — | 52,400 | — | 1,511,740 | — | 1,511,740 | ||||||||||||||||||||||||
Portland General Electric Company | — | — | 51,990 | 51,990 | — | — | 1,892,956 | 1,892,956 | ||||||||||||||||||||||||
Southwest Gas Corporation | — | 46,600 | — | 46,600 | — | 2,706,994 | — | 2,706,994 | ||||||||||||||||||||||||
|
|
|
|
|
|
|
|
|
|
|
|
|
|
|
| |||||||||||||||||
Total Utilities | — | 13,121,020 | 12,895,474 | 26,016,494 | ||||||||||||||||||||||||||||
|
|
|
|
|
|
|
|
|
|
|
|
|
|
|
|
- 44 -
Table of Contents
Total Common Stock (Cost $16,213,414, Cost $151,348,670, Cost $283,287,256, Combined Funds $450,849,340) | 16,961,821 | 248,802,742 | 340,709,691 | 606,474,254 | ||||||||||||||||||||||||||||
|
|
|
|
|
|
|
|
|
|
|
|
|
|
|
| |||||||||||||||||
Preferred Stock (0.1%) | ||||||||||||||||||||||||||||||||
Health Care (0.1%) | ||||||||||||||||||||||||||||||||
National Healthcare Corporation, Convertibled | — | 30,846 | — | 30,846 | — | 473,486 | — | 473,486 | ||||||||||||||||||||||||
|
|
|
|
|
|
|
|
|
|
|
|
|
|
|
| |||||||||||||||||
Total Health Care | — | 30,846 | — | 30,846 | — | 473,486 | — | 473,486 | ||||||||||||||||||||||||
|
|
|
|
|
|
|
|
|
|
|
|
|
|
|
| |||||||||||||||||
Total Perferred Stock (Cost $0, Cost $416,153, Cost $0, Combined Funds $416,153) | ||||||||||||||||||||||||||||||||
Collateral Held for Securities Loaned (3.6%) | ||||||||||||||||||||||||||||||||
Thrivent Cash Management Trust | 217,215 | 8,739,961 | 13,527,930 | 22,485,106 | 217,215 | 8,739,961 | 13,527,930 | 22,485,106 | ||||||||||||||||||||||||
|
|
|
|
|
|
|
|
|
|
|
|
|
|
|
| |||||||||||||||||
Total Collateral Held for Securities Loaned (Cost $217,215, Cost $8,739,961, Cost $13,527,930, Combined Funds $22,485,106) | 217,215 | 8,739,961 | 13,527,930 | 22,485,106 | ||||||||||||||||||||||||||||
|
|
|
|
|
|
|
|
|
|
|
|
|
|
|
| |||||||||||||||||
Short-Term Investments (2.9%)e | ||||||||||||||||||||||||||||||||
Thrivent Cash Management Trust | 501,403 | 7,402,448 | 10,468,825 | 18,372,676 | 501,403 | 7,402,448 | 10,468,825 | 18,372,676 | ||||||||||||||||||||||||
|
|
|
|
|
|
|
|
|
|
|
|
|
|
|
| |||||||||||||||||
Total Short-Term Investments (at amortized cost) | 501,403 | 7,402,448 | 10,468,825 | 18,372,676 | ||||||||||||||||||||||||||||
|
|
|
|
|
|
|
|
|
|
|
|
|
|
|
| |||||||||||||||||
Total Investments (Cost $16,932,032, Cost $167,907,232, Cost $307,284,011, Combined Funds $492,123,275) 103.6% | 17,680,439 | 265,418,637 | 364,706,446 | 647,805,522 | ||||||||||||||||||||||||||||
|
|
|
|
|
|
|
|
|
|
|
|
|
|
|
| |||||||||||||||||
Other Assets and Liabilities, Net (3.6)% | (204,961 | ) | (8,466,916 | ) | (14,076,622 | ) | (22,748,499 | ) | ||||||||||||||||||||||||
|
|
|
|
|
|
|
|
|
|
|
|
|
|
|
| |||||||||||||||||
Total Net Assets 100.0% | 17,475,478 | 256,951,721 | 350,629,824 | 625,057,023 | ||||||||||||||||||||||||||||
|
|
|
|
|
|
|
|
|
|
|
|
|
|
|
|
| (a) | Non-income producing security. |
| (b) | All or a portion of the security is on loan. |
| (c) | Security is fair valued. |
| (d) | Denotes perpetual securities. Perpetual securities pay an indefinite stream of interest, but may be called by the issuer at an earlier date. |
| (e) | The interest rate shown reflects the yield, coupon rate or the discount rate at the date of purchase. |
| Definitions: |
| ADR | - American Depositary Receipt, which are certificates for an underlying foreign security’s shares held by an issuing U.S. depository bank. |
| ETF | - Exchange Traded Fund |
- 45 -
Table of Contents
| Partner Small Cap Growth Fund | ||||||||||||||||
| Fair Valuation Measurements | ||||||||||||||||
The following table is a summary of the inputs used, as of October 31, 2014, in valuing Partner Small Cap Growth Fund’s assets carried at fair value. |
| |||||||||||||||
Investments in Securities | Total | Level 1 | Level 2 | Level 3 | ||||||||||||
Common Stock | ||||||||||||||||
Consumer Discretionary | 2,764,958 | 2,764,958 | — | — | ||||||||||||
Consumer Staples | 572,886 | 572,886 | — | — | ||||||||||||
Energy | 639,796 | 639,796 | — | — | ||||||||||||
Financials | 1,790,300 | 1,790,300 | — | — | ||||||||||||
Health Care | 3,812,000 | 3,783,501 | — | 28,499 | ||||||||||||
Industrials | 2,712,895 | 2,712,895 | — | — | ||||||||||||
Information Technology | 3,903,515 | 3,903,515 | — | — | ||||||||||||
Materials | 765,471 | 765,471 | — | — | ||||||||||||
Telecommunications Services | — | — | — | — | ||||||||||||
Utilities | — | — | — | — | ||||||||||||
Preferred Stock | ||||||||||||||||
Health Care | — | — | — | — | ||||||||||||
Collateral Held for Securities Loaned | 217,215 | 217,215 | — | — | ||||||||||||
Short-Term Investments | 501,403 | 501,403 | — | — | ||||||||||||
|
|
|
|
|
|
|
| |||||||||
Total | $ | 17,680,439 | $ | 17,651,940 | — | $ | 28,499 | |||||||||
|
|
|
|
|
|
|
| |||||||||
There were no significant transfers between Levels during the period ended October 31, 2014. Transfers between Levels are identified as of the end of the period.
| Partner Small Cap Value Fund | ||||||||||||||||
| Fair Valuation Measurements | ||||||||||||||||
The following table is a summary of the inputs used, as of October 31, 2014, in valuing Partner Small Cap Value Fund’s assets carried at fair value. |
| |||||||||||||||
Investments in Securities | Total | Level 1 | Level 2 | Level 3 | ||||||||||||
Common Stock | ||||||||||||||||
Consumer Discretionary | 32,035,155 | 32,035,155 | — | — | ||||||||||||
Consumer Staples | 2,450,750 | 2,450,750 | — | — | ||||||||||||
Energy | 8,071,063 | 8,071,063 | — | — | ||||||||||||
Financials | 68,232,056 | 68,232,056 | — | — | ||||||||||||
Health Care | 10,098,943 | 10,098,943 | — | — | ||||||||||||
Industrials | 68,451,170 | 68,451,170 | — | — | ||||||||||||
Information Technology | 27,067,208 | 27,067,208 | — | — | ||||||||||||
Materials | 18,891,128 | 18,104,678 | 786,450 | — | ||||||||||||
Telecommunications Services | 384,249 | 384,249 | — | — | ||||||||||||
Utilities | 13,121,020 | 13,121,020 | — | — | ||||||||||||
Preferred Stock | ||||||||||||||||
Health Care | 473,486 | 473,486 | — | — | ||||||||||||
Collateral Held for Securities Loaned | 8,739,961 | 8,739,961 | — | — | ||||||||||||
Short-Term Investments | 7,402,448 | 7,402,448 | — | — | ||||||||||||
|
|
|
|
|
|
|
| |||||||||
Total | $ | 265,418,637 | $ | 264,632,187 | $ | 786,450 | — | |||||||||
|
|
|
|
|
|
|
| |||||||||
There were no significant transfers between Levels during the period ended October 31, 2014. Transfers between Levels are identified as of the end of the period.
- 46 -
Table of Contents
Small Cap Stock Fund
Fair Valuation Measurements
The following table is a summary of the inputs used, as of October 31, 2014, in valuing Small Cap Stock Fund’s assets carried at fair value.
Investments in Securities | Total | Level 1 | Level 2 | Level 3 | ||||||||||||
Common Stock | ||||||||||||||||
Consumer Discretionary | 41,806,201 | 41,806,201 | — | — | ||||||||||||
Consumer Staples | 9,931,388 | 9,931,388 | — | — | ||||||||||||
Energy | 14,792,074 | 13,036,342 | 1,755,732 | — | ||||||||||||
Financials | 72,369,604 | 72,369,604 | — | — | ||||||||||||
Health Care | 35,823,606 | 35,823,606 | — | — | ||||||||||||
Industrials | 84,385,408 | 84,385,408 | — | — | ||||||||||||
Information Technology | 50,349,371 | 50,349,371 | — | — | ||||||||||||
Materials | 15,037,131 | 15,037,131 | — | — | ||||||||||||
Telecommunications Services | 3,319,434 | 3,319,434 | — | — | ||||||||||||
Utilities | 12,895,474 | 12,895,474 | — | — | ||||||||||||
Preferred Stock | ||||||||||||||||
Health Care | — | — | — | — | ||||||||||||
Collateral Held for Securities Loaned | 13,527,930 | 13,527,930 | — | — | ||||||||||||
Short-Term Investments | 10,468,825 | 10,468,825 | — | — | ||||||||||||
|
|
|
|
|
|
|
| |||||||||
Total | $ | 364,706,446 | $ | 362,950,714 | $ | 1,755,732 | — | |||||||||
|
|
|
|
|
|
|
| |||||||||
There were no significant transfers between Levels during the period ended October 31, 2014. Transfers between Levels are identified as of the end of the period.
Combined Pro Forma (assuming merger with Target Funds)
Fair Valuation Measurements
The following table is a summary of the inputs used, as of October 31, 2014, in valuing Small Cap Stock Fund’s assets carried at fair value.
Investments in Securities | Total | Level 1 | Level 2 | Level 3 | ||||||||||||
Common Stock | ||||||||||||||||
Consumer Discretionary | 76,606,314 | 76,606,314 | — | — | ||||||||||||
Consumer Staples | 12,955,024 | 12,955,024 | — | — | ||||||||||||
Energy | 23,502,933 | 21,747,201 | 1,755,732 | — | ||||||||||||
Financials | 142,391,960 | 142,391,960 | — | — | ||||||||||||
Health Care | 49,734,549 | 49,706,050 | — | 28,499 | ||||||||||||
Industrials | 155,549,473 | 155,549,473 | — | — | ||||||||||||
Information Technology | 81,320,094 | 81,320,094 | — | — | ||||||||||||
Materials | 34,693,730 | 33,907,280 | 786,450 | — | ||||||||||||
Telecommunications Services | 3,703,683 | 3,703,683 | — | — | ||||||||||||
Utilities | 26,016,494 | 26,016,494 | — | — | ||||||||||||
Preferred Stock | ||||||||||||||||
Health Care | 473,486 | 473,486 | — | — | ||||||||||||
Collateral Held for Securities Loaned | 22,485,106 | 22,485,106 | — | — | ||||||||||||
Short-Term Investments | 18,372,676 | 18,372,676 | — | — | ||||||||||||
|
|
|
|
|
|
|
| |||||||||
Total | 647,805,522 | 645,234,841 | 2,542,182 | 28,499 | ||||||||||||
|
|
|
|
|
|
|
| |||||||||
There were no significant transfers between Levels during the period ended October 31, 2014. Transfers between Levels are identified as of the end of the period.
- 47 -
Table of Contents
Partner Small Cap Growth Fund
Investment in Affiliates
Affiliated issuers, as defined under the Investment Company Act of 1940, include those in which the Fund’s holdings of an issuer represent 5% or more of the outstanding voting securities of an issuer, or any affiliated mutual fund.
A summary of transactions for the fiscal year to date, in Partner Small Cap Growth Fund, is as follows:
Fund | Value October 31, 2013 | Gross Purchases | Gross Sales | Shares Held at October 31, 2014 | Value October 31, 2014 | Income Earned November 1, 2013 October 31, 2014 | ||||||||||||||||||
Cash Management Trust- Collateral Investment | $ | 17,412,554 | $ | 86,799,739 | $ | 103,995,078 | 217,215 | $ | 217,215 | $ | 41,489 | |||||||||||||
Cash Management Trust- Short Term Investment | 8,052,231 | 49,099,783 | 56,650,611 | 501,403 | 501,403 | 2,732 | ||||||||||||||||||
Total Value and Income Earned | 25,464,785 | 718,618 | 44,221 | |||||||||||||||||||||
| Partner Small Cap Value Fund | ||||||||||||
| Investment in Affiliates | ||||||||||||
| Affiliated issuers, as defined under the Investment Company Act of 1940, include those in which the Fund’s holdings of an issuer represent 5% or more of the outstanding voting securities of an issuer, or any affiliated mutual fund. | ||||||||||||
| A summary of transactions for the fiscal year to date, in Partner Small Cap Value Fund, is as follows: | ||||||||||||
Fund | Value October 31, 2013 | Gross Purchases | Gross Sales | Shares Held at October 31, 2014 | Value October 31, 2014 | Income Earned November 1, 2013 - October 31, 2014 | ||||||||||||||||||
Cash Management Trust- Collateral Investment | $ | 4,609,450 | $ | 67,313,953 | $ | 63,183,442 | 8,739,961 | $ | 8,739,961 | $ | 44,645 | |||||||||||||
Cash Management Trust- Short Term Investment | 7,881,847 | 28,436,401 | 28,915,800 | 7,402,448 | 7,402,448 | 3,358 | ||||||||||||||||||
Total Value and Income Earned | 12,491,297 | 16,142,409 | 48,003 | |||||||||||||||||||||
| Small Cap Stock Fund | ||||||||||||
| Investment in Affiliates | ||||||||||||
| Affiliated issuers, as defined under the Investment Company Act of 1940, include those in which the Fund’s holdings of an issuer represent 5% or more of the outstanding voting securities of an issuer, or any affiliated mutual fund. | ||||||||||||
| A summary of transactions for the fiscal year to date, in Small Cap Stock Fund, is as follows: | ||||||||||||
Fund | Value October 31, 2013 | Gross Purchases | Gross Sales | Shares Held at October 31, 2014 | Value October 31, 2014 | Income Earned November 1, 2013 - October 31, 2014 | ||||||||||||||||||
Cash Management Trust- Collateral Investment | $ | 26,183,357 | $ | 126,945,231 | $ | 139,600,658 | 13,527,930 | $ | 13,527,930 | $ | 350,416 | |||||||||||||
Cash Management Trust- Short Term Investment | 24,933,198 | 93,961,074 | 108,425,447 | 10,468,825 | 10,468,825 | 9,042 | ||||||||||||||||||
Total Value and Income Earned | 51,116,555 | 23,996,755 | 359,458 | |||||||||||||||||||||
| Combined Pro Forma (assuming merger with Target Funds) | ||||||||||||
| Investment in Affiliates | ||||||||||||
| Affiliated issuers, as defined under the Investment Company Act of 1940, include those in which the Fund’s holdings of an issuer represent 5% or more of the outstanding voting securities of an issuer, or any affiliated mutual fund. | ||||||||||||
| A summary of transactions for the fiscal year to date, in Small Cap Stock Fund, is as follows: | ||||||||||||
Fund | Value October 31, 2013 | Gross Purchases | Gross Sales | Shares Held at October 31, 2014 | Value October 31, 2014 | Income Earned November 1, 2013 - October 31, 2014 | ||||||||||||||||||
Cash Management Trust- Collateral Investment | $ | 48,205,361 | $ | 281,058,923 | $ | 306,779,178 | $ | 22,485,106 | $ | 22,485,106 | $ | 436,550 | ||||||||||||
Cash Management Trust- Short Term Investment | $ | 40,867,276 | $ | 171,497,258 | $ | 193,991,858 | $ | 18,372,676 | $ | 18,372,676 | $ | 15,132 | ||||||||||||
Total Value and Income Earned | $ | 89,072,637 | $ | 40,857,782 | $ | 451,682 | ||||||||||||||||||
- 48 -
Table of Contents
Small Cap Stock Fund
The following table summarizes the net realized gains/(losses) and Statement of Operations location, for the period ended October 31, 2014, for Small Cap Stock Fund’s investments in financial derivative instruments by primary risk exposure.
Derivatives by risk category | Statement of Operations Location | Realized Gains/(Losses) recognized in Income | ||||
| Equity Contracts | ||||||
Futures | Net realized gains/(losses) on Futures contracts | 847,682 | ||||
Total Equity Contracts | 847,682 | |||||
|
| |||||
Total | $ | 847,682 | ||||
|
| |||||
The following table summarizes the change in net unrealized appreciation/(depreciation) and Statement of Operations location, for the period ended October 31, 2014, for Small Cap Stock Fund’s investments in financial derivative instruments by primary risk exposure.
Derivatives by risk category | Statement of Operations Location | Change in unrealized appreciation/(depreciation) recognized in Income | ||||
| Equity Contracts | ||||||
Futures | Change in net unrealized appreciation/(depreciation) on Futures contracts | (870,806 | ) | |||
Total Equity Contracts | (870,806 | ) | ||||
|
| |||||
Total | (870,806 | ) | ||||
|
| |||||
The following table presents Small Cap Stock Fund’s average volume of derivative activity during the period ended October 31, 2014.
Derivative Risk Category | Futures (Notional)* | Futures (Percentage of Average Net Assets) | ||||||
Equity Contracts | $ | 10,060,362 | 2.90 | % | ||||
| * | Notional amount represents long or short, or both, derivative positions held by the Fund. |
- 49 -
Table of Contents
Pro Forma Combined Schedule of Investments—October 31, 2014
Thrivent Mid Cap Growth Fund and Thrivent Mid Cap Stock Fund
Common Stock (95.7%) | Mid Cap Growth Fund Shares | Mid Cap Stock Fund Shares | Combined Pro Forma Shares (assuming merger with one Target Fund) | Combined Pro Forma Shares (assuming merger with two Target Funds) | Mid Cap Growth Fund Value | Mid Cap Stock Fund Value | Combined Pro Forma Value (assuming merger with one Target Fund) | Combined Pro Forma Value (assuming merger with two Target Funds) | ||||||||||||||||||||||||
| Consumer Discretionary (12.5%) | ||||||||||||||||||||||||||||||||
AMC Networks, Inc.b | — | — | — | 29,657 | — | — | — | 1,798,697 | ||||||||||||||||||||||||
Cheesecake Factory, Inc.a | — | 245,800 | 245,800 | 245,800 | — | 11,292,052 | 11,292,052 | 11,292,052 | ||||||||||||||||||||||||
Delphi Automotive plc | 64,840 | — | 64,840 | 64,840 | 4,472,663 | — | 4,472,663 | 4,472,663 | ||||||||||||||||||||||||
Discovery Communications, Inc., Class Ab | 40,890 | — | 40,890 | 40,890 | 1,445,462 | — | 1,445,462 | 1,445,462 | ||||||||||||||||||||||||
DISH Network Corporationb | — | 321,300 | 321,300 | 321,300 | — | 20,450,745 | 20,450,745 | 20,450,745 | ||||||||||||||||||||||||
Dollar Tree, Inc.b | 119,990 | — | 119,990 | 119,990 | 7,267,794 | — | 7,267,794 | 7,267,794 | ||||||||||||||||||||||||
Dunkin’ Brands Group, Inc. | 83,340 | — | 83,340 | 83,340 | 3,790,303 | — | 3,790,303 | 3,790,303 | ||||||||||||||||||||||||
Expedia, Inc. | — | — | — | 12,145 | — | — | — | 1,031,961 | ||||||||||||||||||||||||
Fossil, Inc. b | — | — | — | 14,782 | — | — | — | 1,502,738 | ||||||||||||||||||||||||
Gap, Inc. | — | — | — | 68,062 | — | — | — | 2,578,869 | ||||||||||||||||||||||||
GNC Holdings, Inc. | — | — | — | 24,350 | — | — | — | 1,012,230 | ||||||||||||||||||||||||
Harman International Industries, Inc. | — | 107,350 | 107,350 | 107,350 | — | 11,522,949 | 11,522,949 | 11,522,949 | ||||||||||||||||||||||||
HomeAway, Inc.b | 86,310 | — | 86,310 | 86,310 | 3,012,219 | — | 3,012,219 | 3,012,219 | ||||||||||||||||||||||||
Jarden Corporationb | 104,920 | — | 104,920 | 104,920 | 6,829,243 | — | 6,829,243 | 6,829,243 | ||||||||||||||||||||||||
Liberty Interactive Corporationb | — | — | — | 46,316 | — | — | — | 1,210,700 | ||||||||||||||||||||||||
Liberty Media Corporation, Class Ab | — | — | — | 17,079 | — | — | — | 820,134 | ||||||||||||||||||||||||
Liberty Media Corporation, Class Cb | — | — | — | 35,403 | — | — | — | 1,696,866 | ||||||||||||||||||||||||
Liberty Venturesb | — | — | — | 6,584 | — | — | — | 231,098 | ||||||||||||||||||||||||
Limited Brands, Inc. | 87,860 | — | 87,860 | 87,860 | 6,336,463 | — | 6,336,463 | 6,336,463 | ||||||||||||||||||||||||
Marriott International, Inc. | 98,210 | — | 98,210 | 98,210 | 7,439,408 | — | 7,439,408 | 7,439,408 | ||||||||||||||||||||||||
MGM Resorts Internationalb | — | — | — | 80,322 | — | — | — | 1,867,486 | ||||||||||||||||||||||||
Michael Kors Holdings, Ltd.b | — | 11,100 | 11,100 | 11,100 | — | 872,349 | 872,349 | 872,349 | ||||||||||||||||||||||||
Mohawk Industries, Inc.b | — | — | — | 11,875 | — | — | — | 1,686,725 | ||||||||||||||||||||||||
Omnicom Group, Inc. | — | 217,350 | 217,350 | 217,350 | — | 15,618,771 | 15,618,771 | 15,618,771 | ||||||||||||||||||||||||
O’Reilly Automotive, Inc.b | 39,150 | — | 39,150 | 39,150 | 6,885,702 | — | 6,885,702 | 6,885,702 | ||||||||||||||||||||||||
PVH Corporation | 50,220 | — | 50,220 | 65,103 | 5,742,657 | — | 5,742,657 | 7,444,528 | ||||||||||||||||||||||||
Ralph Lauren Corporation | 17,820 | — | 17,820 | 17,820 | 2,937,449 | — | 2,937,449 | 2,937,449 | ||||||||||||||||||||||||
Ross Stores, Inc. | 80,140 | — | 80,140 | 80,140 | 6,468,901 | — | 6,468,901 | 6,468,901 | ||||||||||||||||||||||||
Scripps Networks Interactive, Inc. | — | 179,350 | 179,350 | 189,363 | — | 13,852,994 | 13,852,994 | 14,626,398 | ||||||||||||||||||||||||
Staples, Inc. | — | — | — | 135,429 | — | — | — | 1,717,240 | ||||||||||||||||||||||||
Starwood Hotels & Resorts Worldwide, Inc. | 77,990 | — | 77,990 | 105,434 | 5,978,713 | — | 5,978,713 | 8,082,570 | ||||||||||||||||||||||||
Toll Brothers, Inc.b | 62,940 | 379,750 | 442,690 | 497,217 | 2,010,933 | 12,133,012 | 14,143,945 | 15,886,083 | ||||||||||||||||||||||||
Tractor Supply Company | 47,360 | — | 47,360 | 47,360 | 3,467,699 | — | 3,467,699 | 3,467,699 | ||||||||||||||||||||||||
Ulta Salon Cosmetics & Fragrance, Inc.b | 17,840 | — | 17,840 | 17,840 | 2,155,250 | — | 2,155,250 | 2,155,250 | ||||||||||||||||||||||||
Under Armour, Inc.b | 53,070 | — | 53,070 | 53,070 | 3,480,331 | — | 3,480,331 | 3,480,331 | ||||||||||||||||||||||||
VF Corporation | 72,200 | — | 72,200 | 72,200 | 4,886,496 | — | 4,886,496 | 4,886,496 | ||||||||||||||||||||||||
Wynn Resorts, Ltd. | 14,160 | — | 14,160 | 14,160 | 2,690,542 | — | 2,690,542 | 2,690,542 | ||||||||||||||||||||||||
|
|
|
|
|
|
|
|
|
|
|
|
|
|
|
| |||||||||||||||||
Total Consumer Discretionary | 87,298,228 | 85,742,872 | 173,041,100 | 196,517,114 | ||||||||||||||||||||||||||||
|
|
|
|
|
|
|
|
|
|
|
|
|
|
|
| |||||||||||||||||
Consumer Staples (4.9%) | ||||||||||||||||||||||||||||||||
ConAgra Foods, Inc. | — | — | — | 54,514 | — | — | — | 1,872,556 | ||||||||||||||||||||||||
Constellation Brands, Inc.b | — | — | — | 8,657 | — | — | — | 792,462 | ||||||||||||||||||||||||
Energizer Holdings, Inc. | — | — | — | 10,795 | — | — | — | 1,324,007 | ||||||||||||||||||||||||
Green Mountain Coffee Roasters, Inc. | — | 107,950 | 107,950 | 107,950 | — | 16,381,412 | 16,381,412 | 16,381,412 | ||||||||||||||||||||||||
Hain Celestial Group, Inc.b | 68,520 | — | 68,520 | 68,520 | 7,417,290 | — | 7,417,290 | 7,417,290 | ||||||||||||||||||||||||
Ingredion, Inc. | — | 143,950 | 143,950 | 143,950 | — | 11,120,137 | 11,120,137 | 11,120,137 | ||||||||||||||||||||||||
Kroger Company | — | — | — | 34,872 | — | — | — | 1,942,719 | ||||||||||||||||||||||||
Molson Coors Brewing Company | — | 128,550 | 128,550 | 139,214 | — | 9,561,549 | 9,561,549 | 10,354,737 | ||||||||||||||||||||||||
Monster Beverage Corporationb | 83,560 | — | 83,560 | 83,560 | 8,429,533 | — | 8,429,533 | 8,429,533 | ||||||||||||||||||||||||
Tyson Foods, Inc. | — | — | — | 64,643 | — | — | — | 2,608,345 | ||||||||||||||||||||||||
United Natural Foods, Inc.b | 67,790 | — | 67,790 | 67,790 | 4,611,075 | — | 4,611,075 | 4,611,075 | ||||||||||||||||||||||||
WhiteWave Foods Companyb | — | 262,650 | 262,650 | 262,650 | — | 9,778,460 | 9,778,460 | 9,778,460 | ||||||||||||||||||||||||
Whole Foods Market, Inc. | 23,048 | — | 23,048 | 56,748 | 906,478 | — | 906,478 | 2,231,899 | ||||||||||||||||||||||||
|
|
|
|
|
|
|
|
|
|
|
|
|
|
|
| |||||||||||||||||
Total Consumer Staples | 21,364,376 | 46,841,558 | 68,205,934 | 78,864,632 | ||||||||||||||||||||||||||||
|
|
|
|
|
|
|
|
|
|
|
|
|
|
|
| |||||||||||||||||
Energy (5.0%) | ||||||||||||||||||||||||||||||||
Atwood Oceanics, Inc.b | — | 56,250 | 56,250 | 56,250 | — | 2,286,562 | 2,286,562 | 2,286,562 | ||||||||||||||||||||||||
Cameron International Corporationb | 78,287 | 38,150 | 116,437 | 136,760 | 4,661,991 | 2,271,832 | 6,933,823 | 8,144,058 | ||||||||||||||||||||||||
Cimarex Energy Company | — | 27,200 | 27,200 | 43,242 | — | 3,091,824 | 3,091,824 | 4,915,318 | ||||||||||||||||||||||||
Concho Resources, Inc.b | 33,260 | 21,450 | 54,710 | 54,710 | 3,626,338 | 2,338,694 | 5,965,032 | 5,965,032 | ||||||||||||||||||||||||
Denbury Resources, Inc. | — | 159,200 | 159,200 | 159,200 | — | 1,974,080 | 1,974,080 | 1,974,080 | ||||||||||||||||||||||||
- 50 -
Table of Contents
Energen Corporation | — | 20,550 | 20,550 | 20,550 | — | 1,391,235 | 1,391,235 | 1,391,235 | ||||||||||||||||||||||||
Ensco plc | — | 37,950 | 37,950 | 37,950 | — | 1,540,390 | 1,540,390 | 1,540,390 | ||||||||||||||||||||||||
EQT Corporation | — | 22,850 | 22,850 | 22,850 | — | 2,148,814 | 2,148,814 | 2,148,814 | ||||||||||||||||||||||||
Gulfport Energy Corporationb | — | 22,650 | 22,650 | 22,650 | — | 1,136,577 | 1,136,577 | 1,136,577 | ||||||||||||||||||||||||
Helix Energy Solutions Group, Inc.b | — | 95,750 | 95,750 | 95,750 | — | 2,550,780 | 2,550,780 | 2,550,780 | ||||||||||||||||||||||||
Helmerich & Payne, Inc.a | — | 38,900 | 38,900 | 38,900 | — | 3,377,298 | 3,377,298 | 3,377,298 | ||||||||||||||||||||||||
HollyFrontier Corporation | 33,670 | 61,750 | 95,420 | 95,420 | 1,527,944 | 2,802,215 | 4,330,159 | 4,330,159 | ||||||||||||||||||||||||
National Oilwell Varco, Inc. | — | 33,450 | 33,450 | 33,450 | — | 2,429,808 | 2,429,808 | 2,429,808 | ||||||||||||||||||||||||
Newfield Exploration Companyb | — | 55,350 | 55,350 | 55,350 | — | 1,804,964 | 1,804,964 | 1,804,964 | ||||||||||||||||||||||||
Noble Corporation | — | 63,750 | 63,750 | 63,750 | — | 1,333,650 | 1,333,650 | 1,333,650 | ||||||||||||||||||||||||
Noble Energy, Inc. | — | 43,550 | 43,550 | 43,550 | — | 2,509,787 | 2,509,787 | 2,509,787 | ||||||||||||||||||||||||
Oasis Petroleum, Inc.b | — | 38,750 | 38,750 | 38,750 | — | 1,160,950 | 1,160,950 | 1,160,950 | ||||||||||||||||||||||||
Oceaneering International, Inc. | — | 41,300 | 41,300 | 41,300 | — | 2,902,151 | 2,902,151 | 2,902,151 | ||||||||||||||||||||||||
Oil States International, Inc.b | — | 36,800 | 36,800 | 67,668 | — | 2,198,432 | 2,198,432 | 4,042,486 | ||||||||||||||||||||||||
Pioneer Natural Resources Company | — | 13,300 | 13,300 | 13,300 | — | 2,514,498 | 2,514,498 | 2,514,498 | ||||||||||||||||||||||||
QEP Resources, Inc. | — | — | — | 53,708 | — | — | — | 1,346,460 | ||||||||||||||||||||||||
Rowan Companies plc | — | 59,850 | 59,850 | 59,850 | — | 1,452,559 | 1,452,559 | 1,452,559 | ||||||||||||||||||||||||
SM Energy Company | 35,570 | 32,200 | 67,770 | 67,770 | 2,002,591 | 1,812,860 | 3,815,451 | 3,815,451 | ||||||||||||||||||||||||
Southwestern Energy Company b | 126,410 | — | 126,410 | 199,454 | 4,109,589 | — | 4,109,589 | 6,484,249 | ||||||||||||||||||||||||
Superior Energy Services, Inc. | — | 138,250 | 138,250 | 138,250 | — | 3,476,988 | 3,476,988 | 3,476,988 | ||||||||||||||||||||||||
Tesoro Corporation | — | — | — | 24,612 | — | — | — | 1,757,543 | ||||||||||||||||||||||||
Whiting Petroleum Corporationb | — | 37,000 | 37,000 | 37,000 | — | 2,265,880 | 2,265,880 | 2,265,880 | ||||||||||||||||||||||||
|
|
|
|
|
|
|
|
|
|
|
|
|
|
|
| |||||||||||||||||
Total Energy | 15,928,453 | 52,772,828 | 68,701,281 | 79,057,727 | ||||||||||||||||||||||||||||
|
|
|
|
|
|
|
|
|
|
|
|
|
|
|
| |||||||||||||||||
Financials (18.9%) | ||||||||||||||||||||||||||||||||
Affiliated Managers Group, Inc.b | 44,960 | — | 44,960 | 44,960 | 8,982,558 | — | 8,982,558 | 8,982,558 | ||||||||||||||||||||||||
Ameriprise Financial, Inc. | 57,150 | — | 57,150 | 57,150 | 7,210,616 | — | 7,210,616 | 7,210,616 | ||||||||||||||||||||||||
Arthur J. Gallagher & Company | — | — | — | 34,325 | — | — | — | 1,637,303 | ||||||||||||||||||||||||
AvalonBay Communities, Inc. | — | — | — | 14,930 | — | — | — | 2,326,691 | ||||||||||||||||||||||||
Brixmor Property Group, Inc. | — | — | — | 44,492 | — | — | — | 1,083,825 | ||||||||||||||||||||||||
Camden Property Trust | — | 157,550 | 157,550 | 177,061 | — | 12,079,359 | 12,079,359 | 13,575,267 | ||||||||||||||||||||||||
DDR Corporation | — | — | — | 86,038 | — | — | — | 1,560,729 | ||||||||||||||||||||||||
Digital Realty Trust, Inc. | — | 182,750 | 182,750 | 182,750 | — | 12,607,923 | 12,607,923 | 12,607,923 | ||||||||||||||||||||||||
Discover Financial Services | 105,790 | — | 105,790 | 105,790 | 6,747,286 | — | 6,747,286 | 6,747,286 | ||||||||||||||||||||||||
Duke Realty Corporation | — | 588,300 | 588,300 | 588,300 | — | 11,154,168 | 11,154,168 | 11,154,168 | ||||||||||||||||||||||||
Everest Re Group, Ltd. | — | — | — | 12,489 | — | — | — | 2,131,248 | ||||||||||||||||||||||||
Fifth Third Bancorp | — | — | — | 149,257 | — | — | — | 2,983,647 | ||||||||||||||||||||||||
First Republic Bank | 159,360 | 299,400 | 458,760 | 458,760 | 8,116,205 | 15,248,442 | 23,364,647 | 23,364,647 | ||||||||||||||||||||||||
Gaming and Leisure Properties, Inc. | — | 281,103 | 281,103 | 281,103 | — | 8,784,469 | 8,784,469 | 8,784,469 | ||||||||||||||||||||||||
HCC Insurance Holdings, Inc. | — | 319,076 | 319,076 | 319,076 | — | 16,652,576 | 16,652,576 | 16,652,576 | ||||||||||||||||||||||||
Host Hotels & Resorts, Inc. | — | 716,459 | 716,459 | 716,459 | — | 16,700,659 | 16,700,659 | 16,700,659 | ||||||||||||||||||||||||
Huntington Bancshares, Inc. | — | 2,101,850 | 2,101,850 | 2,312,941 | — | 20,829,333 | 20,829,333 | 22,921,245 | ||||||||||||||||||||||||
Intercontinental Exchange, Inc. | 24,820 | — | 24,820 | 24,820 | 5,169,758 | — | 5,169,758 | 5,169,758 | ||||||||||||||||||||||||
Invesco, Ltd. | — | — | — | 61,159 | — | — | — | 2,475,105 | ||||||||||||||||||||||||
KeyCorp | — | 939,400 | 939,400 | 939,400 | — | 12,400,080 | 12,400,080 | 12,400,080 | ||||||||||||||||||||||||
Lazard, Ltd. | — | 357,832 | 357,832 | 357,832 | — | 17,608,913 | 17,608,913 | 17,608,913 | ||||||||||||||||||||||||
Lincoln National Corporation | — | — | — | 57,681 | — | — | — | 3,158,612 | ||||||||||||||||||||||||
M&T Bank Corporationa | — | 117,550 | 117,550 | 140,279 | — | 14,362,259 | 14,362,259 | 17,139,288 | ||||||||||||||||||||||||
NASDAQ OMX Group, Inc. | — | 474,400 | 474,400 | 505,872 | — | 20,522,544 | 20,522,544 | 21,884,023 | ||||||||||||||||||||||||
Navient Corporation | — | — | — | 146,555 | — | — | — | 2,898,858 | ||||||||||||||||||||||||
Northern Trust Corporation | — | 259,890 | 259,890 | 259,890 | — | 17,230,707 | 17,230,707 | 17,230,707 | ||||||||||||||||||||||||
Principal Financial Group, Inc. | — | — | — | 58,358 | — | — | — | 3,056,209 | ||||||||||||||||||||||||
Raymond James Financial, Inc. | — | — | — | 35,862 | — | — | — | 2,012,934 | ||||||||||||||||||||||||
RLJ Lodging Trust | — | — | — | 42,430 | — | — | — | 1,367,095 | ||||||||||||||||||||||||
Signature Bankb | — | — | — | 10,967 | — | — | — | 1,328,433 | ||||||||||||||||||||||||
SLM Corporation | — | — | — | 205,482 | — | — | — | 1,962,353 | ||||||||||||||||||||||||
Starwood Property Trust, Inc. | — | — | — | 76,031 | — | — | — | 1,715,259 | ||||||||||||||||||||||||
SVB Financial Groupb | 17,570 | — | 17,570 | 17,570 | 1,967,664 | — | 1,967,664 | 1,967,664 | ||||||||||||||||||||||||
Taubman Centers, Inc. | — | — | — | 20,688 | — | — | — | 1,573,322 | ||||||||||||||||||||||||
TD Ameritrade Holding Corporation | 168,820 | — | 168,820 | 168,820 | 5,695,987 | — | 5,695,987 | 5,695,987 | ||||||||||||||||||||||||
Unum Group | — | — | — | 35,366 | — | — | — | 1,183,346 | ||||||||||||||||||||||||
Validus Holdings, Ltd. | — | — | — | 34,171 | — | — | — | 1,359,322 | ||||||||||||||||||||||||
Voya Financial, Inc. | — | — | — | 39,297 | — | — | — | 1,542,407 | ||||||||||||||||||||||||
XL Group plc | — | — | — | 68,711 | — | — | — | 2,327,929 | ||||||||||||||||||||||||
Zions Bancorporation | 94,730 | 609,602 | 704,332 | 704,332 | 2,744,328 | 17,660,170 | 20,404,498 | 20,404,498 | ||||||||||||||||||||||||
|
|
|
|
|
|
|
|
|
|
|
|
|
|
|
| |||||||||||||||||
Total Financials | 46,634,402 | 213,841,602 | 260,476,004 | 307,886,959 | ||||||||||||||||||||||||||||
|
|
|
|
|
|
|
|
|
|
|
|
|
|
|
|
- 51 -
Table of Contents
Health Care (15.0%) | ||||||||||||||||||||||||||||||||
Acorda Therapeutics, Inc.b | — | 306,700 | 306,700 | 306,700 | — | 10,679,294 | 10,679,294 | 10,679,294 | ||||||||||||||||||||||||
Actavis, Inc.b | 29,370 | — | 29,370 | 29,370 | 7,129,274 | — | 7,129,274 | 7,129,274 | ||||||||||||||||||||||||
Allscripts Healthcare Solutions, Inc.b | — | 985,050 | 985,050 | 985,050 | — | 13,514,886 | 13,514,886 | 13,514,886 | ||||||||||||||||||||||||
AmerisourceBergen Corporation | 67,277 | — | 67,277 | 67,277 | 5,746,128 | — | 5,746,128 | 5,746,128 | ||||||||||||||||||||||||
BioMarin Pharmaceutical, Inc.b | 89,250 | — | 89,250 | 89,250 | 7,363,125 | — | 7,363,125 | 7,363,125 | ||||||||||||||||||||||||
C.R. Bard, Inc. | — | 107,564 | 107,564 | 107,564 | — | 17,637,269 | 17,637,269 | 17,637,269 | ||||||||||||||||||||||||
Cardinal Health, Inc. | — | — | — | 27,091 | — | — | — | 2,126,102 | ||||||||||||||||||||||||
Catamaran Corporationb | 89,782 | — | 89,782 | 89,782 | 4,279,908 | — | 4,279,908 | 4,279,908 | ||||||||||||||||||||||||
Centene Corporationb | — | 156,000 | 156,000 | 156,000 | — | 14,456,520 | 14,456,520 | 14,456,520 | ||||||||||||||||||||||||
Cerner Corporationb | 101,350 | — | 101,350 | 101,350 | 6,419,509 | — | 6,419,509 | 6,419,509 | ||||||||||||||||||||||||
CIGNA Corporation | — | — | — | 41,492 | — | — | — | 4,131,358 | ||||||||||||||||||||||||
Cooper Companies, Inc. | 22,310 | — | 22,310 | 22,310 | 3,656,609 | — | 3,656,609 | 3,656,609 | ||||||||||||||||||||||||
Covance, Inc.b | 35,890 | — | 35,890 | 35,890 | 2,867,611 | — | 2,867,611 | 2,867,611 | ||||||||||||||||||||||||
Cubist Pharmaceuticals, Inc.b | 26,170 | — | 26,170 | 26,170 | 1,891,829 | — | 1,891,829 | 1,891,829 | ||||||||||||||||||||||||
Endo International plcb | — | — | — | 43,427 | — | — | — | 2,906,135 | ||||||||||||||||||||||||
Envision Healthcare Holdings, Inc.b | 78,310 | — | 78,310 | 103,106 | 2,736,934 | — | 2,736,934 | 3,603,554 | ||||||||||||||||||||||||
Hologic, Inc.b | — | 706,750 | 706,750 | 706,750 | — | 18,509,783 | 18,509,783 | 18,509,783 | ||||||||||||||||||||||||
Illumina, Inc.b | — | 117,200 | 117,200 | 117,200 | — | 22,570,376 | 22,570,376 | 22,570,376 | ||||||||||||||||||||||||
Laboratory Corporation of America Holdingsb | — | — | — | 17,996 | — | — | — | 1,966,783 | ||||||||||||||||||||||||
Mallinckrodt, LLCb | — | 100,400 | 100,400 | 100,400 | — | 9,254,872 | 9,254,872 | 9,254,872 | ||||||||||||||||||||||||
Mettler-Toledo International, Inc.b | 20,970 | — | 20,970 | 20,970 | 5,420,116 | — | 5,420,116 | 5,420,116 | ||||||||||||||||||||||||
Mylan, Inc.b | 42,980 | — | 42,980 | 76,141 | 2,301,579 | — | 2,301,579 | 4,077,351 | ||||||||||||||||||||||||
Perrigo Company plc | 63,260 | — | 63,260 | 63,260 | 10,213,327 | — | 10,213,327 | 10,213,327 | ||||||||||||||||||||||||
Team Health Holdings, Inc.b | 48,730 | — | 48,730 | 48,730 | 3,047,574 | — | 3,047,574 | 3,047,574 | ||||||||||||||||||||||||
Teleflex, Inc. | 42,880 | — | 42,880 | 42,880 | 4,893,466 | — | 4,893,466 | 4,893,466 | ||||||||||||||||||||||||
Universal Health Services, Inc. | 14,480 | 165,600 | 180,080 | 180,080 | 1,501,721 | 17,174,376 | 18,676,097 | 18,676,097 | ||||||||||||||||||||||||
Vertex Pharmaceuticals, Inc.b | 9,690 | — | 9,690 | 9,690 | 1,091,482 | — | 1,091,482 | 1,091,482 | ||||||||||||||||||||||||
Waters Corporationb | — | 116,250 | 116,250 | 116,250 | — | 12,880,500 | 12,880,500 | 12,880,500 | ||||||||||||||||||||||||
Zimmer Holdings, Inc. | — | — | — | 23,347 | — | — | — | 2,597,120 | ||||||||||||||||||||||||
|
|
|
|
|
|
|
|
|
|
|
|
|
|
|
| |||||||||||||||||
Total Health Care | 70,560,192 | 136,677,876 | 207,238,068 | 223,607,958 | ||||||||||||||||||||||||||||
|
|
|
|
|
|
|
|
|
|
|
|
|
|
|
| |||||||||||||||||
Industrials (15.3%) | ||||||||||||||||||||||||||||||||
ADT Corporationb | — | 612,241 | 612,241 | 612,241 | — | 21,942,717 | 21,942,717 | 21,942,717 | ||||||||||||||||||||||||
Alliant Techsystems, Inc. | — | — | 14,540 | — | — | — | 1,700,598 | |||||||||||||||||||||||||
AMETEK, Inc. | 47,157 | — | 47,157 | 47,157 | 2,459,238 | — | 2,459,238 | 2,459,238 | ||||||||||||||||||||||||
Armstrong World Industries, Inc.b | — | — | 27,326 | — | — | — | 1,323,125 | |||||||||||||||||||||||||
B/E Aerospace, Inc.b | 51,840 | — | 51,840 | 51,840 | 3,859,488 | — | 3,859,488 | 3,859,488 | ||||||||||||||||||||||||
Fastenal Company | 28,480 | — | 28,480 | 28,480 | 1,254,259 | — | 1,254,259 | 1,254,259 | ||||||||||||||||||||||||
Flowserve Corporation | 24,055 | 212,200 | 236,255 | 236,255 | 1,635,499 | 14,427,478 | 16,062,977 | 16,062,977 | ||||||||||||||||||||||||
Fortune Brands Home and Security, Inc. | 113,150 | — | 113,150 | 157,146 | 4,893,738 | — | 4,893,738 | 6,796,565 | ||||||||||||||||||||||||
GATX Corporation | 48,630 | — | 48,630 | 48,630 | 3,083,142 | — | 3,083,142 | 3,083,142 | ||||||||||||||||||||||||
Graco, Inc. | 61,880 | — | 61,880 | 61,880 | 4,857,580 | — | 4,857,580 | 4,857,580 | ||||||||||||||||||||||||
Hertz Global Holdings, Inc.b | — | — | — | 100,280 | — | — | — | 2,198,138 | ||||||||||||||||||||||||
Huntington Ingalls Industries, Inc. | — | 121,850 | 121,850 | 121,850 | — | 12,894,167 | 12,894,167 | 12,894,167 | ||||||||||||||||||||||||
JB Hunt Transport Services, Inc. | 42,100 | — | 42,100 | 42,100 | 3,358,317 | — | 3,358,317 | 3,358,317 | ||||||||||||||||||||||||
Kansas City Southern | — | — | — | 9,850 | — | — | — | 1,209,481 | ||||||||||||||||||||||||
Manpower, Inc. | — | 132,248 | 132,248 | 132,248 | — | 8,827,554 | 8,827,554 | 8,827,554 | ||||||||||||||||||||||||
Nielsen NV | 95,680 | — | 95,680 | 95,680 | 4,065,443 | — | 4,065,443 | 4,065,443 | ||||||||||||||||||||||||
Old Dominion Freight Line, Inc.b | 30,510 | — | 30,510 | 30,510 | 2,223,264 | — | 2,223,264 | 2,223,264 | ||||||||||||||||||||||||
Oshkosh Corporation | — | 469,644 | 469,644 | 469,644 | — | 21,021,265 | 21,021,265 | 21,021,265 | ||||||||||||||||||||||||
Parker Hannifin Corporation | — | 141,118 | 141,118 | 141,118 | — | 17,926,220 | 17,926,220 | 17,926,220 | ||||||||||||||||||||||||
Robert Half International, Inc. | 157,030 | — | 157,030 | 157,030 | 8,602,103 | — | 8,602,103 | 8,602,103 | ||||||||||||||||||||||||
Roper Industries, Inc. | 46,090 | — | 46,090 | 46,090 | 7,296,047 | — | 7,296,047 | 7,296,047 | ||||||||||||||||||||||||
Southwest Airlines Company | 136,100 | 896,550 | 1,032,650 | 1,032,650 | 4,692,728 | 30,913,044 | 35,605,772 | 35,605,772 | ||||||||||||||||||||||||
Stericycle, Inc.b | 76,520 | — | 76,520 | 76,520 | 9,641,520 | — | 9,641,520 | 9,641,520 | ||||||||||||||||||||||||
Terex Corporation | — | — | — | 40,867 | — | — | — | 1,175,744 | ||||||||||||||||||||||||
Textron, Inc. | — | — | — | 57,982 | — | — | — | 2,407,992 | ||||||||||||||||||||||||
Timken Company | — | — | — | 18,700 | — | — | — | 803,913 | ||||||||||||||||||||||||
Triumph Group, Inc. | — | — | — | 40,119 | — | — | — | 2,793,486 | ||||||||||||||||||||||||
United Continental Holdings, Inc.b | — | — | — | 30,843 | — | — | — | 1,628,819 | ||||||||||||||||||||||||
United Rentals, Inc.b | 86,830 | — | 86,830 | 86,830 | 9,556,510 | — | 9,556,510 | 9,556,510 | ||||||||||||||||||||||||
WABCO Holdings, Inc.b | — | 116,850 | 116,850 | 116,850 | — | 11,378,853 | 11,378,853 | 11,378,853 | ||||||||||||||||||||||||
|
|
|
|
|
|
|
|
|
|
|
|
|
|
|
| |||||||||||||||||
Total Industrials | 71,478,876 | 139,331,298 | 210,810,174 | 227,954,297 | ||||||||||||||||||||||||||||
|
|
|
|
|
|
|
|
|
|
|
|
|
|
|
|
- 52 -
Table of Contents
Information Technology (18.%) | ||||||||||||||||||||||||||||||||
Agilent Technologies, Inc. | 101,129 | — | 101,129 | 135,762 | 5,590,411 | — | 5,590,411 | 7,504,923 | ||||||||||||||||||||||||
Alliance Data Systems Corporationb | — | 115,300 | 115,300 | 115,300 | — | 32,670,255 | 32,670,255 | 32,670,255 | ||||||||||||||||||||||||
Altera Corporation | — | — | — | 56,674 | — | — | — | 1,947,885 | ||||||||||||||||||||||||
Amphenol Corporation | 147,990 | — | 147,990 | 147,990 | 7,485,334 | — | 7,485,334 | 7,485,334 | ||||||||||||||||||||||||
Analog Devices, Inc. | — | — | — | 43,597 | — | — | — | 2,163,283 | ||||||||||||||||||||||||
ANSYS, Inc.b | 56,630 | — | 56,630 | 56,630 | 4,448,853 | — | 4,448,853 | 4,448,853 | ||||||||||||||||||||||||
AOL, Inc.b | — | — | — | 20,166 | — | — | — | 877,826 | ||||||||||||||||||||||||
Applied Materials, Inc. | — | 1,208,640 | 1,208,640 | 1,208,640 | — | 26,698,858 | 26,698,858 | 26,698,858 | ||||||||||||||||||||||||
Atmel Corporationb | — | — | — | 216,048 | — | — | — | 1,603,076 | ||||||||||||||||||||||||
Autodesk, Inc.b | 36,536 | — | 36,536 | 36,536 | 2,102,281 | — | 2,102,281 | 2,102,281 | ||||||||||||||||||||||||
Brocade Communications Systems, Inc. | — | — | — | 118,355 | — | — | — | 1,269,949 | ||||||||||||||||||||||||
Check Point Software Technologies, Ltd.b | — | — | — | 16,685 | — | — | — | 1,238,861 | ||||||||||||||||||||||||
Ciena Corporationab | 129,913 | — | 129,913 | 129,913 | 2,177,342 | — | 2,177,342 | 2,177,342 | ||||||||||||||||||||||||
Citrix Systems, Inc.b | — | — | — | 30,235 | — | — | — | 1,941,994 | ||||||||||||||||||||||||
eBay, Inc.b | — | 220,853 | 220,853 | 220,853 | — | 11,594,783 | 11,594,783 | 11,594,783 | ||||||||||||||||||||||||
F5 Networks, Inc.b | 51,990 | — | 51,990 | 51,990 | 6,393,730 | — | 6,393,730 | 6,393,730 | ||||||||||||||||||||||||
Fortinet, Inc.b | 215,370 | — | 215,370 | 215,370 | 5,610,389 | — | 5,610,389 | 5,610,389 | ||||||||||||||||||||||||
Gartner, Inc.b | 80,400 | — | 80,400 | 80,400 | 6,489,084 | — | 6,489,084 | 6,489,084 | ||||||||||||||||||||||||
IAC InterActiveCorp | 20,310 | — | 20,310 | 20,310 | 1,374,784 | — | 1,374,784 | 1,374,784 | ||||||||||||||||||||||||
Imperva, Inc.ab | 57,250 | — | 57,250 | 57,250 | 2,345,533 | — | 2,345,533 | 2,345,533 | ||||||||||||||||||||||||
Informatica Corporationb | — | — | — | 32,704 | — | — | — | 1,166,225 | �� | |||||||||||||||||||||||
Juniper Networks, Inc. | — | 547,800 | 547,800 | 613,298 | — | 11,542,146 | 11,542,146 | 12,922,189 | ||||||||||||||||||||||||
LinkedIn Corporationb | 8,210 | — | 8,210 | 8,210 | 1,879,762 | — | 1,879,762 | 1,879,762 | ||||||||||||||||||||||||
Maxim Integrated Products, Inc. | — | — | — | 105,260 | — | — | — | 3,088,328 | ||||||||||||||||||||||||
NetApp, Inc. | — | 374,850 | 374,850 | 405,366 | — | 16,043,580 | 16,043,580 | 17,349,665 | ||||||||||||||||||||||||
Nice Systems, Ltd. ADR | 45,680 | — | 45,680 | 45,680 | 1,858,262 | — | 1,858,262 | 1,858,262 | ||||||||||||||||||||||||
Nuance Communications, Inc.b | 88,329 | — | 88,329 | 88,329 | 1,362,916 | — | 1,362,916 | 1,362,916 | ||||||||||||||||||||||||
NVIDIA Corporation | 154,460 | 1,480,412 | 1,634,872 | 1,634,872 | 3,018,148 | 28,927,250 | 31,945,398 | 31,945,398 | ||||||||||||||||||||||||
NXP Semiconductors NVb | 125,350 | — | 125,350 | 125,350 | 8,606,531 | — | 8,606,531 | 8,606,531 | ||||||||||||||||||||||||
QLIK Technologies, Inc.b | 196,950 | — | 196,950 | 196,950 | 5,583,533 | — | 5,583,533 | 5,583,533 | ||||||||||||||||||||||||
Red Hat, Inc.b | — | 286,150 | 286,150 | 301,143 | — | 16,859,958 | 16,859,958 | 17,743,346 | ||||||||||||||||||||||||
ServiceNow, Inc.b | 98,013 | — | 98,013 | 98,013 | 6,658,023 | — | 6,658,023 | 6,658,023 | ||||||||||||||||||||||||
Skyworks Solutions, Inc. | 40,750 | — | 40,750 | 40,750 | 2,373,280 | — | 2,373,280 | 2,373,280 | ||||||||||||||||||||||||
Synopsys, Inc.b | 50,940 | — | 50,940 | 50,940 | 2,087,521 | — | 2,087,521 | 2,087,521 | ||||||||||||||||||||||||
Teradyne, Inc. | — | 727,001 | 727,001 | 727,001 | — | 13,376,818 | 13,376,818 | 13,376,818 | ||||||||||||||||||||||||
Ubiquiti Networks, Inc.a | — | 241,300 | 241,300 | 241,300 | — | 8,631,301 | 8,631,301 | 8,631,301 | ||||||||||||||||||||||||
Ultimate Software Group, Inc.b | 9,410 | — | 9,410 | 9,410 | 1,416,299 | — | 1,416,299 | 1,416,299 | ||||||||||||||||||||||||
VeriFone Systems, Inc.b | 77,479 | — | 77,479 | 77,479 | 2,886,868 | — | 2,886,868 | 2,886,868 | ||||||||||||||||||||||||
Workday, Inc.b | — | 74,150 | 74,150 | 74,150 | — | 7,079,842 | 7,079,842 | 7,079,842 | ||||||||||||||||||||||||
Xerox Corporation | — | — | — | 124,159 | — | — | — | 1,648,832 | ||||||||||||||||||||||||
|
|
|
|
|
|
|
|
|
|
|
|
|
|
|
| |||||||||||||||||
Total Information Technology | 81,748,884 | 173,424,791 | 255,173,675 | 277,603,962 | ||||||||||||||||||||||||||||
|
|
|
|
|
|
|
|
|
|
|
|
|
|
|
| |||||||||||||||||
Materials (4.0%) | ||||||||||||||||||||||||||||||||
Airgas, Inc. | 44,100 | — | 44,100 | 44,100 | 4,918,914 | — | 4,918,914 | 4,918,914 | ||||||||||||||||||||||||
Albemarle Corporationa | 38,200 | — | 38,200 | 38,200 | 2,230,116 | — | 2,230,116 | 2,230,116 | ||||||||||||||||||||||||
Carpenter Technology Corporation | — | — | — | 18,881 | — | — | — | 944,994 | ||||||||||||||||||||||||
Celanese Corporation | 30,620 | — | 30,620 | 57,406 | 1,798,313 | — | 1,798,313 | 3,371,455 | ||||||||||||||||||||||||
CF Industries Holdings, Inc. | — | — | — | 6,216 | — | — | — | 1,616,160 | ||||||||||||||||||||||||
FMC Corporation | 84,300 | — | 84,300 | 84,300 | 4,834,605 | — | 4,834,605 | 4,834,605 | ||||||||||||||||||||||||
Owens-Illinois, Inc.b | — | 374,000 | 374,000 | 374,000 | — | 9,637,980 | 9,637,980 | 9,637,980 | ||||||||||||||||||||||||
Packaging Corporation of America | — | — | — | 28,649 | — | — | — | 2,065,020 | ||||||||||||||||||||||||
Reliance Steel & Aluminum Company | — | — | — | 15,583 | — | — | — | 1,051,541 | ||||||||||||||||||||||||
Silgan Holdings, Inc. | — | 212,914 | 212,914 | 212,914 | — | 10,466,852 | 10,466,852 | 10,466,852 | ||||||||||||||||||||||||
Silver Wheaton Corporation | 71,370 | — | 71,370 | 71,370 | 1,239,697 | — | 1,239,697 | 1,239,697 | ||||||||||||||||||||||||
Steel Dynamics, Inc. | — | 868,894 | 868,894 | 868,894 | — | 19,993,251 | 19,993,251 | 19,993,251 | ||||||||||||||||||||||||
Timkensteel Corporation | — | — | — | 22,231 | — | — | — | 902,134 | ||||||||||||||||||||||||
Valspar Corporation | — | — | — | 21,991 | — | — | — | 1,806,780 | ||||||||||||||||||||||||
|
|
|
|
|
|
|
|
|
|
|
|
|
|
|
| |||||||||||||||||
Total Materials | 15,021,645 | 40,098,083 | 55,119,728 | 65,079,499 | ||||||||||||||||||||||||||||
|
|
|
|
|
|
|
|
|
|
|
|
|
|
|
| |||||||||||||||||
Telecommunications Services (0.5%) | ||||||||||||||||||||||||||||||||
SBA Communications Corporationb | 51,240 | — | 51,240 | 51,240 | 5,755,789 | — | 5,755,789 | 5,755,789 | ||||||||||||||||||||||||
TW Telecom, Inc.b | 42,570 | — | 42,570 | 42,570 | 1,821,145 | — | 1,821,145 | 1,821,145 | ||||||||||||||||||||||||
|
|
|
|
|
|
|
|
|
|
|
|
|
|
|
| |||||||||||||||||
Total Telecommunication Services | 7,576,934 | — | 7,576,934 | 7,576,934 | ||||||||||||||||||||||||||||
|
|
|
|
|
|
|
|
|
|
|
|
|
|
|
|
- 53 -
Table of Contents
Utilities (1.0%) | ||||||||||||||||||||||||||||||||
FirstEnergy Corporation | — | — | — | 93,399 | — | — | — | 3,487,519 | ||||||||||||||||||||||||
NRG Energy, Inc. | — | — | — | 59,893 | — | — | — | 1,795,592 | ||||||||||||||||||||||||
PG&E Corporation | — | — | — | 39,541 | — | — | — | 1,989,703 | ||||||||||||||||||||||||
Public Service Enterprise Group, Inc. | — | 336,850 | 336,850 | 336,850 | — | 13,915,274 | 13,915,274 | 13,915,274 | ||||||||||||||||||||||||
SCANA Corporation | — | — | — | 23,382 | — | — | — | 1,283,438 | ||||||||||||||||||||||||
Sempra Energy | — | — | — | 31,989 | — | — | — | 3,518,790 | ||||||||||||||||||||||||
|
|
|
|
|
|
|
|
|
|
|
|
|
|
|
| |||||||||||||||||
Total Utilities | — | 13,915,274 | 13,915,274 | 25,990,316 | ||||||||||||||||||||||||||||
|
|
|
|
|
|
|
|
|
|
|
|
|
|
|
| |||||||||||||||||
Total Common Stock (Cost $296,543,523, Cost $646,445,543, Combined Fund $942,989,066, Combined Funds 1,089,823,841) | 417,611,990 | 902,646,182 | 1,320,258,172 | 1,490,139,398 | ||||||||||||||||||||||||||||
|
|
|
|
|
|
|
|
|
|
|
|
|
|
|
| |||||||||||||||||
Collateral Held for Securities Loaned (3.2%) | ||||||||||||||||||||||||||||||||
Thrivent Cash Management Trust | 1,575,210.00 | 42,247,150.00 | 43,822,360 | 43,822,360 | 1,575,210.00 | 42,247,150.00 | 43,822,360 | 43,822,360 | ||||||||||||||||||||||||
|
|
|
|
|
|
|
|
|
|
|
|
|
|
|
| |||||||||||||||||
Total Collateral Held for Securities Loaned (Cost $1,575,210, Cost $42,247,150, Combined Fund $43,822,360, Combined Funds $43,822,360) | 1,575,210 | 42,247,150 | 43,822,360 | 43,822,360 | ||||||||||||||||||||||||||||
|
|
|
|
|
|
|
|
|
|
|
|
|
|
|
| |||||||||||||||||
Short-Term Investments (4.2%)c | ||||||||||||||||||||||||||||||||
Thrivent Cash Management Trust | 16,400,100 | 40,850,015 | 57,250,115 | 62,891,873 | 16,400,100 | 40,850,015 | 57,250,115 | 62,891,873 | ||||||||||||||||||||||||
|
|
|
|
|
|
|
|
|
|
|
|
|
|
|
| |||||||||||||||||
Total Short-Term Investments (at amortized cost) | 16,400,100 | 40,850,015 | 57,250,115 | 62,891,873 | ||||||||||||||||||||||||||||
|
|
|
|
|
|
|
|
|
|
|
|
|
|
|
| |||||||||||||||||
Total Investments (Cost $314,518,833, Cost $729,542,708, Combined Fund $1,044,061,541, Combined Funds 1,196,538,074) 103.1% | 435,587,300 | 985,743,347 | 1,421,330,647 | 1,596,853,631 | ||||||||||||||||||||||||||||
|
|
|
|
|
|
|
|
|
|
|
|
|
|
|
| |||||||||||||||||
Other Assets and Liabilities, Net (3.1)% | 1,302,159 | (43,518,024 | ) | (42,215,865 | ) | (42,472,230 | ) | |||||||||||||||||||||||||
|
|
|
|
|
|
|
|
|
|
|
|
|
|
|
| |||||||||||||||||
Total Net Assets 100.0% | 436,889,459 | 942,225,323 | 1,379,114,782 | 1,554,381,401 | ||||||||||||||||||||||||||||
|
|
|
|
|
|
|
|
|
|
|
|
|
|
|
|
| (a) | All or a portion of the security is on loan. |
| (b) | Non-income producing security. |
| (c) | The interest rate shown reflects the yield, coupon rate or the discount rate at the date of purchase. |
Definitions:
ADR - American Depositary Receipt, which are certificates for an underlying foreign security’s shares held by an issuing U.S. depository bank.
- 54 -
Table of Contents
Mid Cap Growth Fund
Fair Valuation Measurements
The following table is a summary of the inputs used, as of October 31, 2014, in valuing Mid Cap Growth Fund’s assets carried at fair value.
Investments in Securities | Total | Level 1 | Level 2 | Level 3 | ||||||||||||
Common Stock | ||||||||||||||||
Consumer Discretionary | 87,298,228 | 87,298,228 | — | — | ||||||||||||
Consumer Staples | 21,364,376 | 21,364,376 | — | — | ||||||||||||
Energy | 15,928,453 | 15,928,453 | — | — | ||||||||||||
Financials | 46,634,402 | 46,634,402 | — | — | ||||||||||||
Health Care | 70,560,192 | 70,560,192 | — | — | ||||||||||||
Industrials | 71,478,876 | 71,478,876 | — | — | ||||||||||||
Information Technology | 81,748,884 | 81,748,884 | — | — | ||||||||||||
Materials | 15,021,645 | 15,021,645 | — | — | ||||||||||||
Telecommunications Services | 7,576,934 | 7,576,934 | — | — | ||||||||||||
Utilities | — | — | — | — | ||||||||||||
Collateral Held for Securities Loaned | 1,575,210 | 1,575,210 | — | — | ||||||||||||
Short-Term Investments | 16,400,100 | 16,400,100 | — | — | ||||||||||||
|
|
|
|
|
|
|
| |||||||||
Total | $ | 435,587,300 | $ | 435,587,300 | $ | — | $ | — | ||||||||
|
|
|
|
|
|
|
| |||||||||
There were no significant transfers between Levels during the period ended October 31, 2014. Transfers between Levels are identified as of the end of the period.
Mid Cap Stock Fund
Fair Valuation Measurements
The following table is a summary of the inputs used, as of October 31, 2014, in valuing Mid Cap Stock Fund’s assets carried at fair value.
Investments in Securities | Total | Level 1 | Level 2 | Level 3 | ||||||||||||
Common Stock | ||||||||||||||||
Consumer Discretionary | 85,742,872 | 85,742,872 | — | — | ||||||||||||
Consumer Staples | 46,841,558 | 46,841,558 | — | — | ||||||||||||
Energy | 52,772,828 | 52,772,828 | — | — | ||||||||||||
Financials | 213,841,602 | 213,841,602 | — | — | ||||||||||||
Health Care | 136,677,876 | 136,677,876 | — | — | ||||||||||||
Industrials | 139,331,298 | 139,331,298 | — | — | ||||||||||||
Information Technology | 173,424,791 | 173,424,791 | — | — | ||||||||||||
Materials | 40,098,083 | 40,098,083 | — | — | ||||||||||||
Telecommunications Services | — | — | — | — | ||||||||||||
Utilities | 13,915,274 | 13,915,274 | — | — | ||||||||||||
Collateral Held for Securities Loaned | 42,247,150 | 42,247,150 | — | — | ||||||||||||
Short-Term Investments | 40,850,015 | 40,850,015 | — | — | ||||||||||||
|
|
|
|
|
|
|
| |||||||||
Total | $ | 985,743,347 | $ | 985,743,347 | $ | — | $ | — | ||||||||
|
|
|
|
|
|
|
| |||||||||
There were no significant transfers between Levels during the period ended October 31, 2014. Transfers between Levels are identified as of the end of the period.
- 55 -
Table of Contents
Combined Pro Forma (assuming merger with Target Fund)
Fair Valuation Measurements
The following table is a summary of the inputs used, as of October 31, 2014, in valuing Mid Cap Stock Fund’s assets carried at fair value.
Investments in Securities | Total | Level 1 | Level 2 | Level 3 | ||||||||||||
Common Stock | ||||||||||||||||
Consumer Discretionary | 173,041,100 | 173,041,100 | — | — | ||||||||||||
Consumer Staples | 68,205,934 | 68,205,934 | — | — | ||||||||||||
Energy | 68,701,281 | 68,701,281 | — | — | ||||||||||||
Financials | 260,476,004 | 260,476,004 | — | — | ||||||||||||
Health Care | 207,238,068 | 207,238,068 | — | — | ||||||||||||
Industrials | 210,810,174 | 210,810,174 | — | — | ||||||||||||
Information Technology | 255,173,675 | 255,173,675 | — | — | ||||||||||||
Materials | 55,119,728 | 55,119,728 | — | — | ||||||||||||
Telecommunications Services | 7,576,934 | 7,576,934 | — | — | ||||||||||||
Utilities | 13,915,274 | 13,915,274 | — | — | ||||||||||||
Collateral Held for Securities Loaned | 43,822,360 | 43,822,360 | — | — | ||||||||||||
Short-Term Investments | 57,250,115 | 57,250,115 | — | — | ||||||||||||
|
|
|
|
|
|
|
| |||||||||
Total | $ | 1,421,330,647 | $ | 1,421,330,647 | $ | — | $ | — | ||||||||
|
|
|
|
|
|
|
| |||||||||
There were no significant transfers between Levels during the period ended October 31, 2014. Transfers between Levels are identified as of the end of the period.
Mid Cap Growth Fund
Investment in Affiliates
Affiliated issuers, as defined under the Investment Company Act of 1940, include those in which the Fund’s holdings of an issuer represent 5% or more of the outstanding voting securities of an issuer, or any affiliated mutual fund.
A summary of transactions for the fiscal year to date, in Mid Cap Growth Fund, is as follows:
| Income Earned | ||||||||||||||||||||||||
| Value | Gross | Gross | Shares Held at | Value | November 1, 2013 - | |||||||||||||||||||
Fund | October 31, 2013 | Purchases | Sales | October 31, 2014 | October 31, 2014 | October 31, 2014 | ||||||||||||||||||
Cash Management Trust- Collateral Investment | $ | 19,138,554 | $ | 121,916,092 | $ | 139,479,436 | 1,575,210 | $ | 1,575,210 | $ | 16,613 | |||||||||||||
Cash Management Trust-Short Term Investment | 18,686,520 | 101,397,345 | 103,683,765 | 16,400,100 | 16,400,100 | 9,481 | ||||||||||||||||||
Total Value and Income Earned | 37,825,074 | 17,975,310 | 26,094 | |||||||||||||||||||||
Mid Cap Stock Fund
Investment in Affiliates
Affiliated issuers, as defined under the Investment Company Act of 1940, include those in which the Fund’s holdings of an issuer represent 5% or more of the outstanding voting securities of an issuer, or any affiliated mutual fund.
A summary of transactions for the fiscal year to date, in Mid Cap Stock Fund, is as follows:
| Income Earned | ||||||||||||||||||||||||
| Value | Gross | Gross | Shares Held at | Value | November 1, 2013 - | |||||||||||||||||||
Fund | October 31, 2013 | Purchases | Sales | October 31, 2014 | October 31, 2014 | October 31, 2014 | ||||||||||||||||||
Cash Management Trust-Collateral Investment | $ | 96,425,470 | $ | 394,507,597 | $ | 448,685,917 | 42,247,150 | $ | 42,247,150 | $ | 347,781 | |||||||||||||
Cash Management Trust-Short Term Investment | 37,146,950 | 156,229,512 | 152,526,447 | 40,850,015 | 40,850,015 | 26,878 | ||||||||||||||||||
Total Value and Income Earned | 133,572,420 | 83,097,165 | 374,659 | |||||||||||||||||||||
- 56 -
Table of Contents
Combined Pro Forma (assuming merger with Target Fund)
Investment in Affiliates
Affiliated issuers, as defined under the Investment Company Act of 1940, include those in which the Fund’s holdings of an issuer represent 5% or more of the outstanding voting securities of an issuer, or any affiliated mutual fund.
A summary of transactions for the fiscal year to date, in Mid Cap Stock Fund, is as follows:
| Income Earned | ||||||||||||||||||||||||
| Value | Gross | Gross | Shares Held at | Value | November 1, 2013 - | |||||||||||||||||||
Fund | October 31, 2013 | Purchases | Sales | October 31, 2014 | October 31, 2014 | October 31, 2014 | ||||||||||||||||||
Cash Management Trust- Collateral Investment | $ | 115,564,024 | $ | 516,423,689 | $ | 588,165,353 | $ | 43,822,360 | $ | 43,822,360 | $ | 364,394 | ||||||||||||
Cash Management Trust- Short Term Investment | $ | 55,833,470 | $ | 257,626,857 | $ | 256,210,212 | $ | 57,250,115 | $ | 57,250,115 | $ | 36,359 | ||||||||||||
Total Value and Income Earned | $ | 171,397,494 | $ | 101,072,475 | $ | 400,753 | ||||||||||||||||||
- 57 -
Table of Contents
Pro Forma Combined Schedule of Investments—October 31, 2014
Thrivent Partner Mid Cap Value Fund and Thrivent Mid Cap Stock Fund
Common Stock (96.0%) | Parnter Mid Cap Value Fund Shares | Mid Cap Stock Fund Shares | Combined Pro Forma Shares (assuming merger with one Target Fund) | Combined Pro Forma Shares (assuming merger with two Target Funds) | Partner Mid Cap Value Fund Value | Mid Cap Stock Fund Value | Combined Pro Forma Value (assuming merger with one Target Fund) | Combined Pro Forma Value (assuming merger with two Target Funds) | ||||||||||||||||||||||||
Consumer Discretionary (10.0%) | ||||||||||||||||||||||||||||||||
AMC Networks, Inc.b | 29,657 | — | 29,657 | 29,657 | 1,798,697 | — | 1,798,697 | 1,798,697 | ||||||||||||||||||||||||
Cheesecake Factory, Inc.a | 0 | 245,800 | 245,800 | 245,800 | — | 11,292,052 | 11,292,052 | 11,292,052 | ||||||||||||||||||||||||
Delphi Automotive plc | 0 | — | — | 64,840 | — | — | — | 4,472,663 | ||||||||||||||||||||||||
Discovery Communications, Inc., Class Ab | 0 | — | — | 40,890 | — | — | — | 1,445,462 | ||||||||||||||||||||||||
DISH Network Corporationb | 0 | 321,300 | 321,300 | 321,300 | — | 20,450,745 | 20,450,745 | 20,450,745 | ||||||||||||||||||||||||
Dollar Tree, Inc.b | 0 | 0 | — | 119,990 | — | — | — | 7,267,794 | ||||||||||||||||||||||||
Dunkin’ Brands Group, Inc. | 0 | 0 | — | 83,340 | — | — | — | 3,790,303 | ||||||||||||||||||||||||
Expedia, Inc. | 12,145 | 0 | 12,145 | 12,145 | 1,031,961 | — | 1,031,961 | 1,031,961 | ||||||||||||||||||||||||
Fossil, Inc. b | 14,782 | 0 | 14,782 | 14,782 | 1,502,738 | — | 1,502,738 | 1,502,738 | ||||||||||||||||||||||||
Gap, Inc. | 68,062 | 0 | 68,062 | 68,062 | 2,578,869 | — | 2,578,869 | 2,578,869 | ||||||||||||||||||||||||
GNC Holdings, Inc. | 24,350 | 0 | 24,350 | 24,350 | 1,012,230 | — | 1,012,230 | 1,012,230 | ||||||||||||||||||||||||
Harman International Industries, Inc. | 0 | 107,350 | 107,350 | 107,350 | — | 11,522,949 | 11,522,949 | 11,522,949 | ||||||||||||||||||||||||
HomeAway, Inc.b | 0 | — | — | 86,310 | — | — | — | 3,012,219 | ||||||||||||||||||||||||
Jarden Corporationb | 0 | — | — | 104,920 | — | — | — | 6,829,243 | ||||||||||||||||||||||||
Liberty Interactive Corporationb | 46,316 | — | 46,316 | 46,316 | 1,210,700 | — | 1,210,700 | 1,210,700 | ||||||||||||||||||||||||
Liberty Media Corporation, Class Ab | 17,079 | — | 17,079 | 17,079 | 820,134 | — | 820,134 | 820,134 | ||||||||||||||||||||||||
Liberty Media Corporation, Class Cb | 35,403 | — | 35,403 | 35,403 | 1,696,866 | — | 1,696,866 | 1,696,866 | ||||||||||||||||||||||||
Liberty Venturesb | 6,584 | — | 6,584 | 6,584 | 231,098 | — | 231,098 | 231,098 | ||||||||||||||||||||||||
Limited Brands, Inc. | — | — | — | 87,860 | — | — | — | 6,336,463 | ||||||||||||||||||||||||
Marriott International, Inc. | — | — | — | 98,210 | — | — | — | 7,439,408 | ||||||||||||||||||||||||
MGM Resorts Internationalb | 80,322 | — | 80,322 | 80,322 | 1,867,486 | — | 1,867,486 | 1,867,486 | ||||||||||||||||||||||||
Michael Kors Holdings, Ltd.b | — | 11,100 | 11,100 | 11,100 | — | 872,349 | 872,349 | 872,349 | ||||||||||||||||||||||||
Mohawk Industries, Inc.b | 11,875 | — | 11,875 | 11,875 | 1,686,725 | — | 1,686,725 | 1,686,725 | ||||||||||||||||||||||||
Omnicom Group, Inc. | — | 217,350 | 217,350 | 217,350 | — | 15,618,771 | 15,618,771 | 15,618,771 | ||||||||||||||||||||||||
O’Reilly Automotive, Inc.b | — | — | — | 39,150 | — | — | — | 6,885,702 | ||||||||||||||||||||||||
PVH Corporation | 14,883 | — | 14,883 | 65,103 | 1,701,871 | — | 1,701,871 | 7,444,528 | ||||||||||||||||||||||||
Ralph Lauren Corporation | — | — | — | 17,820 | — | — | — | 2,937,449 | ||||||||||||||||||||||||
Ross Stores, Inc. | — | — | — | 80,140 | — | — | — | 6,468,901 | ||||||||||||||||||||||||
Scripps Networks Interactive, Inc. | 10,013 | 179,350 | 189,363 | 189,363 | 773,404 | 13,852,994 | 14,626,398 | 14,626,398 | ||||||||||||||||||||||||
Staples, Inc. | 135,429 | — | 135,429 | 135,429 | 1,717,240 | — | 1,717,240 | 1,717,240 | ||||||||||||||||||||||||
Starwood Hotels & Resorts Worldwide, Inc. | 27,444 | — | 27,444 | 105,434 | 2,103,857 | — | 2,103,857 | 8,082,570 | ||||||||||||||||||||||||
Toll Brothers, Inc.b | 54,527 | 379,750 | 434,277 | 497,217 | 1,742,138 | 12,133,012 | 13,875,150 | 15,886,083 | ||||||||||||||||||||||||
Tractor Supply Company | — | — | — | 47,360 | — | — | — | 3,467,699 | ||||||||||||||||||||||||
Ulta Salon Cosmetics & Fragrance, Inc.b | — | — | — | 17,840 | — | — | — | 2,155,250 | ||||||||||||||||||||||||
Under Armour, Inc.b | — | — | — | 53,070 | — | — | — | 3,480,331 | ||||||||||||||||||||||||
VF Corporation | — | — | — | 72,200 | — | — | — | 4,886,496 | ||||||||||||||||||||||||
Wynn Resorts, Ltd. | — | — | — | 14,160 | — | — | — | 2,690,542 | ||||||||||||||||||||||||
|
|
|
|
|
|
|
|
|
|
|
|
|
|
|
| |||||||||||||||||
Total Consumer Discretionary | 23,476,014 | 85,742,872 | 109,218,886 | 196,517,114 | ||||||||||||||||||||||||||||
|
|
|
|
|
|
|
|
|
|
|
|
|
|
|
| |||||||||||||||||
Consumer Staples (5.1%) | ||||||||||||||||||||||||||||||||
ConAgra Foods, Inc. | 54,514 | — | 54,514 | 54,514 | 1,872,556 | — | 1,872,556 | 1,872,556 | ||||||||||||||||||||||||
Constellation Brands, Inc.b | 8,657 | — | 8,657 | 8,657 | 792,462 | — | 792,462 | 792,462 | ||||||||||||||||||||||||
Energizer Holdings, Inc. | 10,795 | — | 10,795 | 10,795 | 1,324,007 | — | 1,324,007 | 1,324,007 | ||||||||||||||||||||||||
Green Mountain Coffee Roasters, Inc. | — | 107,950 | 107,950 | 107,950 | — | 16,381,412 | 16,381,412 | 16,381,412 | ||||||||||||||||||||||||
Hain Celestial Group, Inc.b | — | — | — | 68,520 | — | — | — | 7,417,290 | ||||||||||||||||||||||||
Ingredion, Inc. | — | 143,950 | 143,950 | 143,950 | — | 11,120,137 | 11,120,137 | 11,120,137 | ||||||||||||||||||||||||
Kroger Company | 34,872 | — | 34,872 | 34,872 | 1,942,719 | — | 1,942,719 | 1,942,719 | ||||||||||||||||||||||||
Molson Coors Brewing Company | 10,664 | 128,550 | 139,214 | 139,214 | 793,188 | 9,561,549 | 10,354,737 | 10,354,737 | ||||||||||||||||||||||||
Monster Beverage Corporationb | — | — | — | 83,560 | — | — | — | 8,429,533 | ||||||||||||||||||||||||
Tyson Foods, Inc. | 64,643 | — | 64,643 | 64,643 | 2,608,345 | — | 2,608,345 | 2,608,345 | ||||||||||||||||||||||||
United Natural Foods, Inc.b | — | — | — | 67,790 | — | — | — | 4,611,075 | ||||||||||||||||||||||||
WhiteWave Foods Companyb | — | 262,650 | 262,650 | 262,650 | — | 9,778,460 | 9,778,460 | 9,778,460 | ||||||||||||||||||||||||
Whole Foods Market, Inc. | 33,700 | — | 33,700 | 56,748 | 1,325,421 | — | 1,325,421 | 2,231,899 | ||||||||||||||||||||||||
|
|
|
|
|
|
|
|
|
|
|
|
|
|
|
| |||||||||||||||||
Total Consumer Staples | 10,658,698 | 46,841,558 | 57,500,256 | 78,864,632 | ||||||||||||||||||||||||||||
|
|
|
|
|
|
|
|
|
|
|
|
|
|
|
| |||||||||||||||||
- 58 -
Table of Contents
Energy (5.6%) | ||||||||||||||||||||||||||||||||
Atwood Oceanics, Inc.b | — | 56,250 | 56,250 | 56,250 | — | 2,286,562 | 2,286,562 | 2,286,562 | ||||||||||||||||||||||||
Cameron International Corporationb | 20,323 | 38,150 | 58,473 | 136,760 | 1,210,235 | 2,271,832 | 3,482,067 | 8,144,058 | ||||||||||||||||||||||||
Cimarex Energy Company | 16,042 | 27,200 | 43,242 | 43,242 | 1,823,494 | 3,091,824 | 4,915,318 | 4,915,318 | ||||||||||||||||||||||||
Concho Resources, Inc.b | — | 21,450 | 21,450 | 54,710 | — | 2,338,694 | 2,338,694 | 5,965,032 | ||||||||||||||||||||||||
Denbury Resources, Inc. | — | 159,200 | 159,200 | 159,200 | — | 1,974,080 | 1,974,080 | 1,974,080 | ||||||||||||||||||||||||
Energen Corporation | — | 20,550 | 20,550 | 20,550 | — | 1,391,235 | 1,391,235 | 1,391,235 | ||||||||||||||||||||||||
Ensco plc | — | 37,950 | 37,950 | 37,950 | — | 1,540,390 | 1,540,390 | 1,540,390 | ||||||||||||||||||||||||
EQT Corporation | — | 22,850 | 22,850 | 22,850 | — | 2,148,814 | 2,148,814 | 2,148,814 | ||||||||||||||||||||||||
Gulfport Energy Corporationb | — | 22,650 | 22,650 | 22,650 | — | 1,136,577 | 1,136,577 | 1,136,577 | ||||||||||||||||||||||||
Helix Energy Solutions Group, Inc.b | — | 95,750 | 95,750 | 95,750 | — | 2,550,780 | 2,550,780 | 2,550,780 | ||||||||||||||||||||||||
Helmerich & Payne, Inc.a | — | 38,900 | 38,900 | 38,900 | — | 3,377,298 | 3,377,298 | 3,377,298 | ||||||||||||||||||||||||
HollyFrontier Corporation | — | 61,750 | 61,750 | 95,420 | — | 2,802,215 | 2,802,215 | 4,330,159 | ||||||||||||||||||||||||
National Oilwell Varco, Inc. | — | 33,450 | 33,450 | 33,450 | — | 2,429,808 | 2,429,808 | 2,429,808 | ||||||||||||||||||||||||
Newfield Exploration Companyb | — | 55,350 | 55,350 | 55,350 | — | 1,804,964 | 1,804,964 | 1,804,964 | ||||||||||||||||||||||||
Noble Corporation | — | 63,750 | 63,750 | 63,750 | — | 1,333,650 | 1,333,650 | 1,333,650 | ||||||||||||||||||||||||
Noble Energy, Inc. | — | 43,550 | 43,550 | 43,550 | — | 2,509,787 | 2,509,787 | 2,509,787 | ||||||||||||||||||||||||
Oasis Petroleum, Inc.b | — | 38,750 | 38,750 | 38,750 | — | 1,160,950 | 1,160,950 | 1,160,950 | ||||||||||||||||||||||||
Oceaneering International, Inc. | — | 41,300 | 41,300 | 41,300 | — | 2,902,151 | 2,902,151 | 2,902,151 | ||||||||||||||||||||||||
Oil States International, Inc.b | 30,868 | 36,800 | 67,668 | 67,668 | 1,844,054 | 2,198,432 | 4,042,486 | 4,042,486 | ||||||||||||||||||||||||
Pioneer Natural Resources Company | — | 13,300 | 13,300 | 13,300 | — | 2,514,498 | 2,514,498 | 2,514,498 | ||||||||||||||||||||||||
QEP Resources, Inc. | 53,708 | — | 53,708 | 53,708 | 1,346,460 | — | 1,346,460 | 1,346,460 | ||||||||||||||||||||||||
Rowan Companies plc | — | 59,850 | 59,850 | 59,850 | — | 1,452,559 | 1,452,559 | 1,452,559 | ||||||||||||||||||||||||
SM Energy Company | — | 32,200 | 32,200 | 67,770 | — | 1,812,860 | 1,812,860 | 3,815,451 | ||||||||||||||||||||||||
Southwestern Energy Company b | 73,044 | — | 73,044 | 199,454 | 2,374,660 | — | 2,374,660 | 6,484,249 | ||||||||||||||||||||||||
Superior Energy Services, Inc. | — | 138,250 | 138,250 | 138,250 | — | 3,476,988 | 3,476,988 | 3,476,988 | ||||||||||||||||||||||||
Tesoro Corporation | 24,612 | — | 24,612 | 24,612 | 1,757,543 | — | 1,757,543 | 1,757,543 | ||||||||||||||||||||||||
Whiting Petroleum Corporationb | — | 37,000 | 37,000 | 37,000 | — | 2,265,880 | 2,265,880 | 2,265,880 | ||||||||||||||||||||||||
|
|
|
|
|
|
|
|
|
|
|
|
|
|
|
| |||||||||||||||||
Total Energy | 10,356,446 | 52,772,828 | 63,129,274 | 79,057,727 | ||||||||||||||||||||||||||||
|
|
|
|
|
|
|
|
|
|
|
|
|
|
|
| |||||||||||||||||
Financials (23.4%) | ||||||||||||||||||||||||||||||||
Affiliated Managers Group, Inc.b | — | — | — | 44,960 | — | — | — | 8,982,558 | ||||||||||||||||||||||||
Ameriprise Financial, Inc. | — | — | — | 57,150 | — | — | — | 7,210,616 | ||||||||||||||||||||||||
Arthur J. Gallagher & Company | 34,325 | — | 34,325 | 34,325 | 1,637,303 | — | 1,637,303 | 1,637,303 | ||||||||||||||||||||||||
AvalonBay Communities, Inc. | 14,930 | — | 14,930 | 14,930 | 2,326,691 | — | 2,326,691 | 2,326,691 | ||||||||||||||||||||||||
Brixmor Property Group, Inc. | 44,492 | — | 44,492 | 44,492 | 1,083,825 | — | 1,083,825 | 1,083,825 | ||||||||||||||||||||||||
Camden Property Trust | 19,511 | 157,550 | 177,061 | 177,061 | 1,495,908 | 12,079,359 | 13,575,267 | 13,575,267 | ||||||||||||||||||||||||
DDR Corporation | 86,038 | — | 86,038 | 86,038 | 1,560,729 | — | 1,560,729 | 1,560,729 | ||||||||||||||||||||||||
Digital Realty Trust, Inc. | — | 182,750 | 182,750 | 182,750 | — | 12,607,923 | 12,607,923 | 12,607,923 | ||||||||||||||||||||||||
Discover Financial Services | — | — | — | 105,790 | — | — | — | 6,747,286 | ||||||||||||||||||||||||
Duke Realty Corporation | — | 588,300 | 588,300 | 588,300 | — | 11,154,168 | 11,154,168 | 11,154,168 | ||||||||||||||||||||||||
Everest Re Group, Ltd. | 12,489 | — | 12,489 | 12,489 | 2,131,248 | — | 2,131,248 | 2,131,248 | ||||||||||||||||||||||||
Fifth Third Bancorp | 149,257 | — | 149,257 | 149,257 | 2,983,647 | — | 2,983,647 | 2,983,647 | ||||||||||||||||||||||||
First Republic Bank | — | 299,400 | 299,400 | 458,760 | — | 15,248,442 | 15,248,442 | 23,364,647 | ||||||||||||||||||||||||
Gaming and Leisure Properties, Inc. | — | 281,103 | 281,103 | 281,103 | — | 8,784,469 | 8,784,469 | 8,784,469 | ||||||||||||||||||||||||
HCC Insurance Holdings, Inc. | — | 319,076 | 319,076 | 319,076 | — | 16,652,576 | 16,652,576 | 16,652,576 | ||||||||||||||||||||||||
Host Hotels & Resorts, Inc. | — | �� | 716,459 | 716,459 | 716,459 | — | 16,700,659 | 16,700,659 | 16,700,659 | |||||||||||||||||||||||
Huntington Bancshares, Inc. | 211,091 | 2,101,850 | 2,312,941 | 2,312,941 | 2,091,912 | 20,829,333 | 22,921,245 | 22,921,245 | ||||||||||||||||||||||||
Intercontinental Exchange, Inc. | — | — | — | 24,820 | — | — | — | 5,169,758 | ||||||||||||||||||||||||
Invesco, Ltd. | 61,159 | — | 61,159 | 61,159 | 2,475,105 | — | 2,475,105 | 2,475,105 | ||||||||||||||||||||||||
KeyCorp | — | 939,400 | 939,400 | 939,400 | — | 12,400,080 | 12,400,080 | 12,400,080 | ||||||||||||||||||||||||
Lazard, Ltd. | — | 357,832 | 357,832 | 357,832 | — | 17,608,913 | 17,608,913 | 17,608,913 | ||||||||||||||||||||||||
Lincoln National Corporation | 57,681 | — | 57,681 | 57,681 | 3,158,612 | — | 3,158,612 | 3,158,612 | ||||||||||||||||||||||||
M&T Bank Corporationa | 22,729 | 117,550 | 140,279 | 140,279 | 2,777,029 | 14,362,259 | 17,139,288 | 17,139,288 | ||||||||||||||||||||||||
NASDAQ OMX Group, Inc. | 31,472 | 474,400 | 505,872 | 505,872 | 1,361,479 | 20,522,544 | 21,884,023 | 21,884,023 | ||||||||||||||||||||||||
Navient Corporation | 146,555 | — | 146,555 | 146,555 | 2,898,858 | — | 2,898,858 | 2,898,858 | ||||||||||||||||||||||||
Northern Trust Corporation | — | 259,890 | 259,890 | 259,890 | — | 17,230,707 | 17,230,707 | 17,230,707 | ||||||||||||||||||||||||
Principal Financial Group, Inc. | 58,358 | — | 58,358 | 58,358 | 3,056,209 | — | 3,056,209 | 3,056,209 | ||||||||||||||||||||||||
Raymond James Financial, Inc. | 35,862 | — | 35,862 | 35,862 | 2,012,934 | — | 2,012,934 | 2,012,934 |
- 59 -
Table of Contents
RLJ Lodging Trust | 42,430 | — | 42,430 | 42,430 | 1,367,095 | - | 1,367,095 | 1,367,095 | ||||||||||||||||||||||||
Signature Bankb | 10,967 | — | 10,967 | 10,967 | 1,328,433 | — | 1,328,433 | 1,328,433 | ||||||||||||||||||||||||
SLM Corporation | 205,482 | — | 205,482 | 205,482 | 1,962,353 | — | 1,962,353 | 1,962,353 | ||||||||||||||||||||||||
Starwood Property Trust, Inc. | 76,031 | — | 76,031 | 76,031 | 1,715,259 | — | 1,715,259 | 1,715,259 | ||||||||||||||||||||||||
SVB Financial Groupb | — | — | — | 17,570 | — | — | — | 1,967,664 | ||||||||||||||||||||||||
Taubman Centers, Inc. | 20,688 | — | 20,688 | 20,688 | 1,573,322 | — | 1,573,322 | 1,573,322 | ||||||||||||||||||||||||
TD Ameritrade Holding Corporation | — | — | — | 168,820 | — | — | — | 5,695,987 | ||||||||||||||||||||||||
Unum Group | 35,366 | — | 35,366 | 35,366 | 1,183,346 | — | 1,183,346 | 1,183,346 | ||||||||||||||||||||||||
Validus Holdings, Ltd. | 34,171 | — | 34,171 | 34,171 | 1,359,322 | — | 1,359,322 | 1,359,322 | ||||||||||||||||||||||||
Voya Financial, Inc. | 39,297 | — | 39,297 | 39,297 | 1,542,407 | — | 1,542,407 | 1,542,407 | ||||||||||||||||||||||||
XL Group plc | 68,711 | — | 68,711 | 68,711 | 2,327,929 | — | 2,327,929 | 2,327,929 | ||||||||||||||||||||||||
Zions Bancorporation | — | 609,602 | 609,602 | 704,332 | — | 17,660,170 | 17,660,170 | 20,404,498 | ||||||||||||||||||||||||
|
|
|
|
|
|
|
|
|
|
|
|
|
|
|
| |||||||||||||||||
Total Financials | 47,410,955 | 213,841,602 | 261,252,557 | 307,886,959 | ||||||||||||||||||||||||||||
|
|
|
|
|
|
|
|
|
|
|
|
|
|
|
| |||||||||||||||||
Health Care (13.7%) | ||||||||||||||||||||||||||||||||
Acorda Therapeutics, Inc.b | — | 306,700 | 306,700 | 306,700 | — | 10,679,294 | 10,679,294 | 10,679,294 | ||||||||||||||||||||||||
Actavis, Inc.b | — | — | — | 29,370 | — | — | — | 7,129,274 | ||||||||||||||||||||||||
Allscripts Healthcare Solutions, Inc.b | — | 985,050 | 985,050 | 985,050 | — | 13,514,886 | 13,514,886 | 13,514,886 | ||||||||||||||||||||||||
AmerisourceBergen Corporation | — | — | — | 67,277 | — | — | — | 5,746,128 | ||||||||||||||||||||||||
BioMarin Pharmaceutical, Inc.b | — | — | — | 89,250 | — | — | — | 7,363,125 | ||||||||||||||||||||||||
C.R. Bard, Inc. | — | 107,564 | 107,564 | 107,564 | — | 17,637,269 | 17,637,269 | 17,637,269 | ||||||||||||||||||||||||
Cardinal Health, Inc. | 27,091 | — | 27,091 | 27,091 | 2,126,102 | — | 2,126,102 | 2,126,102 | ||||||||||||||||||||||||
Catamaran Corporationb | — | — | — | 89,782 | — | — | — | 4,279,908 | ||||||||||||||||||||||||
Centene Corporationb | — | 156,000 | 156,000 | 156,000 | — | 14,456,520 | 14,456,520 | 14,456,520 | ||||||||||||||||||||||||
Cerner Corporationb | — | — | — | 101,350 | — | — | — | 6,419,509 | ||||||||||||||||||||||||
CIGNA Corporation | 41,492 | — | 41,492 | 41,492 | 4,131,358 | — | 4,131,358 | 4,131,358 | ||||||||||||||||||||||||
Cooper Companies, Inc. | — | — | — | 22,310 | — | — | — | 3,656,609 | ||||||||||||||||||||||||
Covance, Inc.b | — | — | — | 35,890 | — | — | — | 2,867,611 | ||||||||||||||||||||||||
Cubist Pharmaceuticals, Inc.b | — | — | — | 26,170 | — | — | — | 1,891,829 | ||||||||||||||||||||||||
Endo International plcb | 43,427 | — | 43,427 | 43,427 | 2,906,135 | — | 2,906,135 | 2,906,135 | ||||||||||||||||||||||||
Envision Healthcare Holdings, Inc.b | 24,796 | — | 24,796 | 103,106 | 866,620 | — | 866,620 | 3,603,554 | ||||||||||||||||||||||||
Hologic, Inc.b | — | 706,750 | 706,750 | 706,750 | — | 18,509,783 | 18,509,783 | 18,509,783 | ||||||||||||||||||||||||
Illumina, Inc.b | — | 117,200 | 117,200 | 117,200 | — | 22,570,376 | 22,570,376 | 22,570,376 | ||||||||||||||||||||||||
Laboratory Corporation of America Holdingsb | 17,996 | — | 17,996 | 17,996 | 1,966,783 | — | 1,966,783 | 1,966,783 | ||||||||||||||||||||||||
Mallinckrodt, LLCb | — | 100,400 | 100,400 | 100,400 | — | 9,254,872 | 9,254,872 | 9,254,872 | ||||||||||||||||||||||||
Mettler-Toledo International, Inc.b | — | — | — | 20,970 | — | — | — | 5,420,116 | ||||||||||||||||||||||||
Mylan, Inc.b | 33,161 | — | 33,161 | 76,141 | 1,775,772 | — | 1,775,772 | 4,077,351 | ||||||||||||||||||||||||
Perrigo Company plc | — | — | — | 63,260 | — | — | — | 10,213,327 | ||||||||||||||||||||||||
Team Health Holdings, Inc.b | — | — | — | 48,730 | — | — | — | 3,047,574 | ||||||||||||||||||||||||
Teleflex, Inc. | — | — | — | 42,880 | — | — | — | 4,893,466 | ||||||||||||||||||||||||
Universal Health Services, Inc. | — | 165,600 | 165,600 | 180,080 | — | 17,174,376 | 17,174,376 | 18,676,097 | ||||||||||||||||||||||||
Vertex Pharmaceuticals, Inc.b | — | — | — | 9,690 | — | — | — | 1,091,482 | ||||||||||||||||||||||||
Waters Corporationb | — | 116,250 | 116,250 | 116,250 | — | 12,880,500 | 12,880,500 | 12,880,500 | ||||||||||||||||||||||||
Zimmer Holdings, Inc. | 23,347 | — | 23,347 | 23,347 | 2,597,120 | — | 2,597,120 | 2,597,120 | ||||||||||||||||||||||||
|
|
|
|
|
|
|
|
|
|
|
|
|
|
|
| |||||||||||||||||
Total Health Care | 16,369,890 | 136,677,876 | 153,047,766 | 223,607,958 | ||||||||||||||||||||||||||||
|
|
|
|
|
|
|
|
|
|
|
|
|
|
|
|
- 60 -
Table of Contents
Industrials (14.0%) | ||||||||||||||||||||||||||||||||
ADT Corporationa | — | 612,241 | 612,241 | 612,241 | — | 21,942,717 | 21,942,717 | 21,942,717 | ||||||||||||||||||||||||
Alliant Techsystems, Inc. | 14,540 | — | 14,540 | 14,540 | 1,700,598 | — | 1,700,598 | 1,700,598 | ||||||||||||||||||||||||
AMETEK, Inc. | — | — | — | 47,157 | — | — | — | 2,459,238 | ||||||||||||||||||||||||
Armstrong World Industries, Inc.b | 27,326 | — | 27,326 | 27,326 | 1,323,125 | — | 1,323,125 | 1,323,125 | ||||||||||||||||||||||||
B/E Aerospace, Inc.b | — | — | — | 51,840 | — | — | — | 3,859,488 | ||||||||||||||||||||||||
Fastenal Company | — | — | — | 28,480 | — | — | — | 1,254,259 | ||||||||||||||||||||||||
Flowserve Corporation | — | 212,200 | 212,200 | 236,255 | — | 14,427,478 | 14,427,478 | 16,062,977 | ||||||||||||||||||||||||
Fortune Brands Home and Security, Inc. | 43,996 | — | 43,996 | 157,146 | 1,902,827 | — | 1,902,827 | 6,796,565 | ||||||||||||||||||||||||
GATX Corporation | — | — | — | 48,630 | — | — | — | 3,083,142 | ||||||||||||||||||||||||
Graco, Inc. | — | — | — | 61,880 | — | — | — | 4,857,580 | ||||||||||||||||||||||||
Hertz Global Holdings, Inc.b | 100,280 | — | 100,280 | 100,280 | 2,198,138 | — | 2,198,138 | 2,198,138 | ||||||||||||||||||||||||
Huntington Ingalls Industries, Inc. | — | 121,850 | 121,850 | 121,850 | — | 12,894,167 | 12,894,167 | 12,894,167 | ||||||||||||||||||||||||
JB Hunt Transport Services, Inc. | — | — | — | 42,100 | — | — | — | 3,358,317 | ||||||||||||||||||||||||
Kansas City Southern | 9,850 | — | 9,850 | 9,850 | 1,209,481 | — | 1,209,481 | 1,209,481 | ||||||||||||||||||||||||
Manpower, Inc. | — | 132,248 | 132,248 | 132,248 | — | 8,827,554 | 8,827,554 | 8,827,554 | ||||||||||||||||||||||||
Nielsen NV | — | — | — | 95,680 | — | — | — | 4,065,443 | ||||||||||||||||||||||||
Old Dominion Freight Line, Inc.b | — | — | — | 30,510 | — | — | — | 2,223,264 | ||||||||||||||||||||||||
Oshkosh Corporation | — | 469,644 | 469,644 | 469,644 | — | 21,021,265 | 21,021,265 | 21,021,265 | ||||||||||||||||||||||||
Parker Hannifin Corporation | — | 141,118 | 141,118 | 141,118 | — | 17,926,220 | 17,926,220 | 17,926,220 | ||||||||||||||||||||||||
Robert Half International, Inc. | — | — | — | 157,030 | — | — | — | 8,602,103 | ||||||||||||||||||||||||
Roper Industries, Inc. | — | — | — | 46,090 | — | — | — | 7,296,047 | ||||||||||||||||||||||||
Southwest Airlines Company | — | 896,550 | 896,550 | 1,032,650 | — | 30,913,044 | 30,913,044 | 35,605,772 | ||||||||||||||||||||||||
Stericycle, Inc.b | — | — | — | 76,520 | — | — | — | 9,641,520 | ||||||||||||||||||||||||
Terex Corporation | 40,867 | — | 40,867 | 40,867 | 1,175,744 | — | 1,175,744 | 1,175,744 | ||||||||||||||||||||||||
Textron, Inc. | 57,982 | — | 57,982 | 57,982 | 2,407,992 | — | 2,407,992 | 2,407,992 | ||||||||||||||||||||||||
Timken Company | 18,700 | — | 18,700 | 18,700 | 803,913 | — | 803,913 | 803,913 | ||||||||||||||||||||||||
Triumph Group, Inc. | 40,119 | — | 40,119 | 40,119 | 2,793,486 | — | 2,793,486 | 2,793,486 | ||||||||||||||||||||||||
United Continental Holdings, Inc.b | 30,843 | — | 30,843 | 30,843 | 1,628,819 | — | 1,628,819 | 1,628,819 | ||||||||||||||||||||||||
United Rentals, Inc.b | — | — | — | 86,830 | — | — | — | 9,556,510 | ||||||||||||||||||||||||
WABCO Holdings, Inc.b | — | 116,850 | 116,850 | 116,850 | — | 11,378,853 | 11,378,853 | 11,378,853 | ||||||||||||||||||||||||
|
|
|
|
|
|
|
|
|
|
|
|
|
|
|
| |||||||||||||||||
Total Industrials | 17,144,123 | 139,331,298 | 156,475,421 | 227,954,297 | ||||||||||||||||||||||||||||
|
|
|
|
|
|
|
|
|
|
|
|
|
|
|
| |||||||||||||||||
Information Technology (17.5%) | ||||||||||||||||||||||||||||||||
Agilent Technologies, Inc. | 34,633 | — | 34,633 | 135,762 | 1,914,512 | — | 1,914,512 | 7,504,923 | ||||||||||||||||||||||||
Alliance Data Systems Corporationb | — | 115,300 | 115,300 | 115,300 | — | 32,670,255 | 32,670,255 | 32,670,255 | ||||||||||||||||||||||||
Altera Corporation | 56,674 | — | 56,674 | 56,674 | 1,947,885 | — | 1,947,885 | 1,947,885 | ||||||||||||||||||||||||
Amphenol Corporation | — | — | — | 147,990 | — | — | — | 7,485,334 | ||||||||||||||||||||||||
Analog Devices, Inc. | 43,597 | — | 43,597 | 43,597 | 2,163,283 | — | 2,163,283 | 2,163,283 | ||||||||||||||||||||||||
ANSYS, Inc.b | — | — | — | 56,630 | — | — | — | 4,448,853 | ||||||||||||||||||||||||
AOL, Inc.b | 20,166 | — | 20,166 | 20,166 | 877,826 | — | 877,826 | 877,826 | ||||||||||||||||||||||||
Applied Materials, Inc. | — | 1,208,640 | 1,208,640 | 1,208,640 | — | 26,698,858 | 26,698,858 | 26,698,858 | ||||||||||||||||||||||||
Atmel Corporationb | 216,048 | — | 216,048 | 216,048 | 1,603,076 | — | 1,603,076 | 1,603,076 | ||||||||||||||||||||||||
Autodesk, Inc.b | — | — | — | 36,536 | — | — | — | 2,102,281 | ||||||||||||||||||||||||
Brocade Communications Systems, Inc. | 118,355 | — | 118,355 | 118,355 | 1,269,949 | — | 1,269,949 | 1,269,949 | ||||||||||||||||||||||||
Check Point Software Technologies, Ltd.b | 16,685 | — | 16,685 | 16,685 | 1,238,861 | — | 1,238,861 | 1,238,861 | ||||||||||||||||||||||||
Ciena Corporationab | — | — | — | 129,913 | — | — | — | 2,177,342 | ||||||||||||||||||||||||
Citrix Systems, Inc.b | 30,235 | — | 30,235 | 30,235 | 1,941,994 | — | 1,941,994 | 1,941,994 | ||||||||||||||||||||||||
eBay, Inc.b | — | 220,853 | 220,853 | 220,853 | — | 11,594,783 | 11,594,783 | 11,594,783 | ||||||||||||||||||||||||
F5 Networks, Inc.b | — | — | — | 51,990 | — | — | — | 6,393,730 | ||||||||||||||||||||||||
Fortinet, Inc.b | — | — | — | 215,370 | — | — | — | 5,610,389 | ||||||||||||||||||||||||
Gartner, Inc.b | — | — | — | 80,400 | — | — | — | 6,489,084 | ||||||||||||||||||||||||
IAC InterActiveCorp | — | — | — | 20,310 | — | — | — | 1,374,784 | ||||||||||||||||||||||||
Imperva, Inc.ab | — | — | — | 57,250 | — | — | — | 2,345,533 | ||||||||||||||||||||||||
Informatica Corporationb | 32,704 | — | 32,704 | 32,704 | 1,166,225 | — | 1,166,225 | 1,166,225 | ||||||||||||||||||||||||
Juniper Networks, Inc. | 65,498 | 547,800 | 613,298 | 613,298 | 1,380,043 | 11,542,146 | 12,922,189 | 12,922,189 | ||||||||||||||||||||||||
LinkedIn Corporationa | — | — | — | 8,210 | — | — | — | 1,879,762 | ||||||||||||||||||||||||
Maxim Integrated Products, Inc. | 105,260 | — | 105,260 | 105,260 | 3,088,328 | — | 3,088,328 | 3,088,328 | ||||||||||||||||||||||||
NetApp, Inc. | 30,516 | 374,850 | 405,366 | 405,366 | 1,306,085 | 16,043,580 | 17,349,665 | 17,349,665 | ||||||||||||||||||||||||
Nice Systems, Ltd. ADR | — | — | — | 45,680 | — | — | — | 1,858,262 |
- 61 -
Table of Contents
Nuance Communications, Inc.b | — | — | — | 88,329 | — | — | — | 1,362,916 | ||||||||||||||||||||||||
NVIDIA Corporation | — | 1,480,412 | 1,480,412 | 1,634,872 | — | 28,927,250 | 28,927,250 | 31,945,398 | ||||||||||||||||||||||||
NXP Semiconductors NVb | — | — | — | 125,350 | — | — | — | 8,606,531 | ||||||||||||||||||||||||
QLIK Technologies, Inc.b | — | — | — | 196,950 | — | — | — | 5,583,533 | ||||||||||||||||||||||||
Red Hat, Inc.b | 14,993 | 286,150 | 301,143 | 301,143 | 883,388 | 16,859,958 | 17,743,346 | 17,743,346 | ||||||||||||||||||||||||
ServiceNow, Inc.b | — | — | — | 98,013 | — | — | — | 6,658,023 | ||||||||||||||||||||||||
Skyworks Solutions, Inc. | — | — | — | 40,750 | — | — | — | 2,373,280 | ||||||||||||||||||||||||
Synopsys, Inc.b | — | — | — | 50,940 | — | — | — | 2,087,521 | ||||||||||||||||||||||||
Teradyne, Inc. | — | 727,001 | 727,001 | 727,001 | — | 13,376,818 | 13,376,818 | 13,376,818 | ||||||||||||||||||||||||
Ubiquiti Networks, Inc.b | — | 241,300 | 241,300 | 241,300 | — | 8,631,301 | 8,631,301 | 8,631,301 | ||||||||||||||||||||||||
Ultimate Software Group, Inc.b | — | — | — | 9,410 | — | — | — | 1,416,299 | ||||||||||||||||||||||||
VeriFone Systems, Inc.b | — | — | — | 77,479 | — | — | — | 2,886,868 | ||||||||||||||||||||||||
Workday, Inc.b | — | 74,150 | 74,150 | 74,150 | — | 7,079,842 | 7,079,842 | 7,079,842 | ||||||||||||||||||||||||
Xerox Corporation | 124,159 | — | 124,159 | 124,159 | 1,648,832 | — | 1,648,832 | 1,648,832 | ||||||||||||||||||||||||
|
|
|
|
|
|
|
|
|
|
|
|
|
|
|
| |||||||||||||||||
Total Information Technology | 22,430,287 | 173,424,791 | 195,855,078 | 277,603,962 | ||||||||||||||||||||||||||||
|
|
|
|
|
|
|
|
|
|
|
|
|
|
|
| |||||||||||||||||
Materials (4.5%) | ||||||||||||||||||||||||||||||||
Airgas, Inc. | — | — | — | 44,100 | — | — | — | 4,918,914 | ||||||||||||||||||||||||
Albemarle Corporationa | �� | — | — | — | 38,200 | — | — | — | 2,230,116 | |||||||||||||||||||||||
Carpenter Technology Corporation | 18,881 | — | 18,881 | 18,881 | 944,994 | — | 944,994 | 944,994 | ||||||||||||||||||||||||
Celanese Corporation | 26,786 | — | 26,786 | 57,406 | 1,573,142 | — | 1,573,142 | 3,371,455 | ||||||||||||||||||||||||
CF Industries Holdings, Inc. | 6,216 | — | 6,216 | 6,216 | 1,616,160 | — | 1,616,160 | 1,616,160 | ||||||||||||||||||||||||
FMC Corporation | — | — | — | 84,300 | — | — | — | 4,834,605 | ||||||||||||||||||||||||
Owens-Illinois, Inc.b | — | 374,000 | 374,000 | 374,000 | — | 9,637,980 | 9,637,980 | 9,637,980 | ||||||||||||||||||||||||
Packaging Corporation of America | 28,649 | — | 28,649 | 28,649 | 2,065,020 | — | 2,065,020 | 2,065,020 | ||||||||||||||||||||||||
Reliance Steel & Aluminum Company | 15,583 | — | 15,583 | 15,583 | 1,051,541 | — | 1,051,541 | 1,051,541 | ||||||||||||||||||||||||
Silgan Holdings, Inc. | — | 212,914 | 212,914 | 212,914 | — | 10,466,852 | 10,466,852 | 10,466,852 | ||||||||||||||||||||||||
Silver Wheaton Corporation | — | — | — | 71,370 | — | — | — | 1,239,697 | ||||||||||||||||||||||||
Steel Dynamics, Inc. | — | 868,894 | 868,894 | 868,894 | — | 19,993,251 | 19,993,251 | 19,993,251 | ||||||||||||||||||||||||
Timkensteel Corporation | 22,231 | — | 22,231 | 22,231 | 902,134 | — | 902,134 | 902,134 | ||||||||||||||||||||||||
Valspar Corporation | 21,991 | — | 21,991 | 21,991 | 1,806,780 | — | 1,806,780 | 1,806,780 | ||||||||||||||||||||||||
|
|
|
|
|
|
|
|
|
|
|
|
|
|
|
| |||||||||||||||||
Total Materials | 9,959,771 | 40,098,083 | 50,057,854 | 65,079,499 | ||||||||||||||||||||||||||||
|
|
|
|
|
|
|
|
|
|
|
|
|
|
|
| |||||||||||||||||
Telecommunications Services (0.5%) | ||||||||||||||||||||||||||||||||
SBA Communications Corporationb | — | — | — | 51,240 | — | — | — | 5,755,789 | ||||||||||||||||||||||||
TW Telecom, Inc.b | — | — | — | 42,570 | — | — | — | 1,821,145 | ||||||||||||||||||||||||
|
|
|
|
|
|
|
|
|
|
|
|
|
|
|
| |||||||||||||||||
Total Telecommunication Services | — | — | — | 7,576,934 | ||||||||||||||||||||||||||||
|
|
|
|
|
|
|
|
|
|
|
|
|
|
|
| |||||||||||||||||
Utilities (2.3%) | ||||||||||||||||||||||||||||||||
FirstEnergy Corporation | 93,399 | — | 93,399 | 93,399 | 3,487,519 | — | 3,487,519 | 3,487,519 | ||||||||||||||||||||||||
NRG Energy, Inc. | 59,893 | — | 59,893 | 59,893 | 1,795,592 | — | 1,795,592 | 1,795,592 | ||||||||||||||||||||||||
PG&E Corporation | 39,541 | — | 39,541 | 39,541 | 1,989,703 | — | 1,989,703 | 1,989,703 | ||||||||||||||||||||||||
Public Service Enterprise Group, Inc. | — | 336,850 | 336,850 | 336,850 | — | 13,915,274 | 13,915,274 | 13,915,274 | ||||||||||||||||||||||||
SCANA Corporation | 23,382 | — | 23,382 | 23,382 | 1,283,438 | — | 1,283,438 | 1,283,438 | ||||||||||||||||||||||||
Sempra Energy | 31,989 | — | 31,989 | 31,989 | 3,518,790 | — | 3,518,790 | 3,518,790 | ||||||||||||||||||||||||
|
|
|
|
|
|
|
|
|
|
|
|
|
|
|
| |||||||||||||||||
Total Utilities | 12,075,042 | 13,915,274 | 25,990,316 | 25,990,316 | ||||||||||||||||||||||||||||
|
|
|
|
|
|
|
|
|
|
|
|
|
|
|
| |||||||||||||||||
Total Common Stock (Cost $146,834,775, Cost $646,445,543, Combined Fund $793,280,318, Combined Funds $1,089,823,841) | 169,881,226 | 902,646,182 | 1,072,527,408 | 1,490,139,398 | ||||||||||||||||||||||||||||
|
|
|
|
|
|
|
|
|
|
|
|
|
|
|
| |||||||||||||||||
Collateral Held for Securities Loaned (3.8%) | ||||||||||||||||||||||||||||||||
Thrivent Cash Management Trust | — | 42,247,150.00 | 42,247,150 | 43,822,360 | — | 42,247,150.00 | 42,247,150 | 43,822,360 | ||||||||||||||||||||||||
|
|
|
|
|
|
|
|
|
|
|
|
|
|
|
| |||||||||||||||||
Total Collateral Held for Securities Loaned (Cost $0, Cost $42,247,150, Combined Fund $42,247,150, Combined Funds $43,822,360) | — | 42,247,150 | 42,247,150 | 43,822,360 | ||||||||||||||||||||||||||||
|
|
|
|
|
|
|
|
|
|
|
|
|
|
|
|
- 62 -
Table of Contents
Short-Term Investments (4.2%)c | ||||||||||||||||||||||||||||||||
Thrivent Cash Management Trust | 5,641,758 | 40,850,015 | 46,491,773 | 62,891,873 | 5,641,758 | 40,850,015 | 46,491,773 | 62,891,873 | ||||||||||||||||||||||||
|
|
|
|
|
|
|
|
|
|
|
|
|
|
|
| |||||||||||||||||
Total Short- Term Investments (at amortized cost) | 5,641,758 | 40,850,015 | 46,491,773 | 62,891,873 | ||||||||||||||||||||||||||||
|
|
|
|
|
|
|
|
|
|
|
|
|
|
|
| |||||||||||||||||
Total Investments (Cost $152,476,533, Cost $729,542,708, Combined Fund $882,019,241, Combined Funds $1,196,538,074) 103.9% | 175,522,984 | 985,743,347 | 1,161,266,331 | 1,596,853,631 | ||||||||||||||||||||||||||||
|
|
|
|
|
|
|
|
|
|
|
|
|
|
|
| |||||||||||||||||
Other Assets and Liabilities, Net (3.9%) | (256,365 | ) | (43,518,024 | ) | (43,774,389 | ) | (42,472,230 | ) | ||||||||||||||||||||||||
|
|
|
|
|
|
|
|
|
|
|
|
|
|
|
| |||||||||||||||||
Total Net Assets 100.0% | 175,266,619 | 942,225,323 | 1,117,491,942 | 1,554,381,401 | ||||||||||||||||||||||||||||
|
|
|
|
|
|
|
|
|
|
|
|
|
|
|
|
| (a) | All or a portion of the security is on loan. |
| (b) | Non-income producing security. |
| (c) | The interest rate shown reflects the yield, coupon rate or the discount rate at the date of purchase. |
Definitions:
ADR—American Depositary Receipt, which are certificates for an underlying foreign security’s shares held by an issuing U.S. depository bank.
- 63 -
Table of Contents
Partner Mid Cap Value Fund
Fair Valuation Measurements
The following table is a summary of the inputs used, as of October 31, 2014, in valuing Partner Mid Cap Value Fund’s assets carried at fair value.
Investments in Securities | Total | Level 1 | Level 2 | Level 3 | ||||||||||||
Common Stock | ||||||||||||||||
Consumer Discretionary | 23,476,014 | 23,476,014 | — | — | ||||||||||||
Consumer Staples | 10,658,698 | 10,658,698 | — | — | ||||||||||||
Energy | 10,356,446 | 10,356,446 | — | — | ||||||||||||
Financials | 47,410,955 | 47,410,955 | — | — | ||||||||||||
Health Care | 16,369,890 | 16,369,890 | — | — | ||||||||||||
Industrials | 17,144,123 | 17,144,123 | — | — | ||||||||||||
Information Technology | 22,430,287 | 22,430,287 | — | — | ||||||||||||
Materials | 9,959,771 | 9,959,771 | — | — | ||||||||||||
Utilities | 12,075,042 | 12,075,042 | — | — | ||||||||||||
Collateral Held for Securities Loaned | — | — | — | — | ||||||||||||
Short-Term Investments | 5,641,758 | 5,641,758 | — | — | ||||||||||||
|
|
|
|
|
|
|
| |||||||||
Total | $ | 175,522,984 | $ | 175,522,984 | $ | — | $ | — | ||||||||
|
|
|
|
|
|
|
| |||||||||
There were no significant transfers between Levels during the period ended October 31, 2014. Transfers between Levels are identified as of the end of the period.
Mid Cap Stock Fund
Fair Valuation Measurements
The following table is a summary of the inputs used, as of October 31, 2014, in valuing Mid Cap Stock Fund’s assets carried at fair value.
Investments in Securities | Total | Level 1 | Level 2 | Level 3 | ||||||||||||
Common Stock | ||||||||||||||||
Consumer Discretionary | 85,742,872 | 85,742,872 | — | — | ||||||||||||
Consumer Staples | 46,841,558 | 46,841,558 | — | — | ||||||||||||
Energy | 52,772,828 | 52,772,828 | — | — | ||||||||||||
Financials | 213,841,602 | 213,841,602 | — | — | ||||||||||||
Health Care | 136,677,876 | 136,677,876 | — | — | ||||||||||||
Industrials | 139,331,298 | 139,331,298 | — | — | ||||||||||||
Information Technology | 173,424,791 | 173,424,791 | — | — | ||||||||||||
Materials | 40,098,083 | 40,098,083 | — | — | ||||||||||||
Utilities | 13,915,274 | 13,915,274 | — | — | ||||||||||||
Collateral Held for Securities Loaned | 42,247,150 | 42,247,150 | — | — | ||||||||||||
Short-Term Investments | 40,850,015 | 40,850,015 | — | — | ||||||||||||
|
|
|
|
|
|
|
| |||||||||
Total | $ | 985,743,347 | $ | 985,743,347 | $ | — | $ | — | ||||||||
|
|
|
|
|
|
|
| |||||||||
There were no significant transfers between Levels during the period ended October 31, 2014. Transfers between Levels are identified as of the end of the period.
- 64 -
Table of Contents
Combined Pro Forma (assuming merger with Target Fund)
Fair Valuation Measurements
The following table is a summary of the inputs used, as of October 31, 2014, in valuing Mid Cap Stock Fund’s assets carried at fair value.
Investments in Securities | Total | Level 1 | Level 2 | Level 3 | ||||||||||||
Common Stock | ||||||||||||||||
Consumer Discretionary | 109,218,886 | 109,218,886 | — | — | ||||||||||||
Consumer Staples | 57,500,256 | 57,500,256 | — | — | ||||||||||||
Energy | 63,129,274 | 63,129,274 | — | — | ||||||||||||
Financials | 261,252,557 | 261,252,557 | — | — | ||||||||||||
Health Care | 153,047,766 | 153,047,766 | — | — | ||||||||||||
Industrials | 156,475,421 | 156,475,421 | — | — | ||||||||||||
Information Technology | 195,855,078 | 195,855,078 | — | — | ||||||||||||
Materials | 50,057,854 | 50,057,854 | — | — | ||||||||||||
Utilities | 25,990,316 | 25,990,316 | — | — | ||||||||||||
Collateral Held for Securities Loaned | 42,247,150 | 42,247,150 | — | — | ||||||||||||
Short-Term Investments | 46,491,773 | 46,491,773 | — | — | ||||||||||||
|
|
|
|
|
|
|
| |||||||||
Total | $ | 1,161,266,331 | $ | 1,161,266,331 | $ | — | $ | — | ||||||||
|
|
|
|
|
|
|
| |||||||||
There were no significant transfers between Levels during the period ended October 31, 2014. Transfers between Levels are identified as of the end of the period.
Partner Mid Cap Value Fund
Investment in Affiliates
Affiliated issuers, as defined under the Investment Company Act of 1940, include those in which the Fund’s holdings of an issuer represent 5% or more of the outstanding voting securities of an issuer, or any affiliated mutual fund.
A summary of transactions for the fiscal year to date, in Partner Mid Cap Value Fund, is as follows:
| Income Earned | ||||||||||||||||||||||||
| Value | Gross | Gross | Shares Held at | Value | November 1, 2013 - | |||||||||||||||||||
Fund | October 31, 2013 | Purchases | Sales | October 31, 2014 | October 31, 2014 | October 31, 2014 | ||||||||||||||||||
Cash Management Trust- Collateral Investment | — | — | — | — | — | — | ||||||||||||||||||
Cash Management Trust- Short Term Investment | $ | 2,568,093 | $ | 45,128,500 | $ | 42,054,835 | 5,641,758 | $ | 5,641,758 | $ | 1,448 | |||||||||||||
Total Value and Income Earned | 2,568,093 | 5,641,758 | 1,448 | |||||||||||||||||||||
Mid Cap Stock Fund
Investment in Affiliates
Affiliated issuers, as defined under the Investment Company Act of 1940, include those in which the Fund’s holdings of an issuer represent 5% or more of the outstanding voting securities of an issuer, or A summary of transactions for the fiscal year to date, in Mid Cap Stock Fund, is as follows:
| Income Earned | ||||||||||||||||||||||||
| Value | Gross | Gross | Shares Held at | Value | November 1, 2013 - | |||||||||||||||||||
Fund | October 31, 2013 | Purchases | Sales | October 31, 2014 | October 31, 2014 | October 31, 2014 | ||||||||||||||||||
Cash Management Trust- Collateral Investment | $ | 96,425,470 | $ | 394,507,597 | $ | 448,685,917 | $ | 42,247,150 | $ | 42,247,150 | $ | 347,781 | ||||||||||||
Cash Management Trust- Short Term Investment | 37,146,950 | 156,229,512 | 152,526,447 | 40,850,015 | 40,850,015 | 26,878 | ||||||||||||||||||
Total Value and Income Earned | 133,572,420 | 83,097,165 | 374,659 | |||||||||||||||||||||
- 65 -
Table of Contents
Combined Pro Forma (assuming merger with Target Fund)
Investment in Affiliates
Affiliated issuers, as defined under the Investment Company Act of 1940, include those in which the Fund’s holdings of an issuer represent 5% or more of the outstanding voting securities of an issuer, or A summary of transactions for the fiscal year to date, in Mid Cap Stock Fund, is as follows:
| Income Earned | ||||||||||||||||||||||||
| Value | Gross | Gross | Shares Held at | Value | November 1, 2013 - | |||||||||||||||||||
Fund | October 31, 2013 | Purchases | Sales | October 31, 2014 | October 31, 2014 | October 31, 2014 | ||||||||||||||||||
Cash Management Trust- Collateral Investment | $ | 96,425,470 | $ | 394,507,597 | $ | 448,685,917 | $ | 42,247,150 | $ | 42,247,150 | $ | 347,781 | ||||||||||||
Cash Management Trust- Short Term | $ | 39,715,043 | $ | 201,358,012 | $ | 194,581,282 | $ | 46,491,773 | $ | 46,491,773 | $ | 28,326 | ||||||||||||
Investment | ||||||||||||||||||||||||
Total Value and Income Earned | $ | 136,140,513 | $ | 88,738,923 | $ | 376,107 | ||||||||||||||||||
- 66 -
Table of Contents
Pro Forma Combined Schedule of Investments—October 31, 2014
Thrivent Mid Cap Growth Fund, Thrivent Partner Mid Cap Value Fund, and Thrivent Mid Cap Stock Fund
Common Stock (95.9%) | Mid Cap Growth Fund Shares | Parnter Mid Cap Value Fund Shares | Mid Cap Stock Fund Shares | Combined Pro Forma Shares (assuming merger with Target Funds) | Mid Cap Growth Fund Value | Parnter Mid Cap Value Fund Value | Mid Cap Stock Fund Value | Combined Pro Forma Value (assuming merger with Target Funds) | ||||||||||||||||||||||||
Consumer Discretionary (12.6%) | ||||||||||||||||||||||||||||||||
AMC Networks, Inc.b | — | 29,657 | — | 29,657 | — | $ | 1,798,697 | — | 1,798,697 | |||||||||||||||||||||||
Cheesecake Factory, Inc.a | — | — | 245,800 | 245,800 | — | — | $ | 11,292,052 | 11,292,052 | |||||||||||||||||||||||
Delphi Automotive plc | 64,840 | — | — | 64,840 | $ | 4,472,663 | — | — | 4,472,663 | |||||||||||||||||||||||
Discovery Communications, Inc., Class Ab | 40,890 | — | — | 40,890 | 1,445,462 | — | — | 1,445,462 | ||||||||||||||||||||||||
DISH Network Corporationb | — | — | 321,300 | 321,300 | — | — | 20,450,745 | 20,450,745 | ||||||||||||||||||||||||
Dollar Tree, Inc.b | 119,990 | — | — | 119,990 | 7,267,794 | — | — | 7,267,794 | ||||||||||||||||||||||||
Dunkin’ Brands Group, Inc. | 83,340 | — | — | 83,340 | 3,790,303 | — | — | 3,790,303 | ||||||||||||||||||||||||
Expedia, Inc. | — | 12,145 | — | 12,145 | — | 1,031,961 | — | 1,031,961 | ||||||||||||||||||||||||
Fossil, Inc. b | — | 14,782 | — | 14,782 | — | 1,502,738 | — | 1,502,738 | ||||||||||||||||||||||||
Gap, Inc. | — | 68,062 | — | 68,062 | — | 2,578,869 | — | 2,578,869 | ||||||||||||||||||||||||
GNC Holdings, Inc. | — | 24,350 | — | 24,350 | — | 1,012,230 | — | 1,012,230 | ||||||||||||||||||||||||
Harman International Industries, Inc. | — | — | 107,350 | 107,350 | — | — | 11,522,949 | 11,522,949 | ||||||||||||||||||||||||
HomeAway, Inc.b | 86,310 | — | — | 86,310 | 3,012,219 | — | — | 3,012,219 | ||||||||||||||||||||||||
Jarden Corporationb | 104,920 | — | — | 104,920 | 6,829,243 | — | — | 6,829,243 | ||||||||||||||||||||||||
Liberty Interactive Corporationb | — | 46,316 | — | 46,316 | — | 1,210,700 | — | 1,210,700 | ||||||||||||||||||||||||
Liberty Media Corporation, Class Ab | — | 17,079 | — | 17,079 | — | 820,134 | — | 820,134 | ||||||||||||||||||||||||
Liberty Media Corporation, Class Cb | — | 35,403 | — | 35,403 | — | 1,696,866 | — | 1,696,866 | ||||||||||||||||||||||||
Liberty Venturesb | — | 6,584 | — | 6,584 | — | 231,098 | — | 231,098 | ||||||||||||||||||||||||
Limited Brands, Inc. | 87,860 | — | — | 87,860 | 6,336,463 | — | — | 6,336,463 | ||||||||||||||||||||||||
Marriott International, Inc. | 98,210 | — | — | 98,210 | 7,439,408 | — | — | 7,439,408 | ||||||||||||||||||||||||
MGM Resorts Internationalb | — | 80,322 | — | 80,322 | — | 1,867,486 | — | 1,867,486 | ||||||||||||||||||||||||
Michael Kors Holdings, Ltd.b | — | — | 11,100 | 11,100 | — | — | 872,349 | 872,349 | ||||||||||||||||||||||||
Mohawk Industries, Inc.b | — | 11,875 | — | 11,875 | — | 1,686,725 | — | 1,686,725 | ||||||||||||||||||||||||
Omnicom Group, Inc. | — | — | 217,350 | 217,350 | — | 15,618,771 | 15,618,771 | |||||||||||||||||||||||||
O’Reilly Automotive, Inc.b | 39,150 | — | — | 39,150 | 6,885,702 | — | — | 6,885,702 | ||||||||||||||||||||||||
PVH Corporation | 50,220 | 14,883 | — | 65,103 | 5,742,657 | 1,701,871 | — | 7,444,528 | ||||||||||||||||||||||||
Ralph Lauren Corporation | 17,820 | — | — | 17,820 | 2,937,449 | — | — | 2,937,449 | ||||||||||||||||||||||||
Ross Stores, Inc. | 80,140 | — | — | 80,140 | 6,468,901 | — | — | 6,468,901 | ||||||||||||||||||||||||
Scripps Networks Interactive, Inc. | — | 10,013 | 179,350 | 189,363 | — | 773,404 | 13,852,994 | 14,626,398 | ||||||||||||||||||||||||
Staples, Inc. | — | 135,429 | — | 135,429 | — | 1,717,240 | — | 1,717,240 | ||||||||||||||||||||||||
Starwood Hotels & Resorts Worldwide, Inc. | 77,990 | 27,444 | — | 105,434 | 5,978,713 | 2,103,857 | — | 8,082,570 | ||||||||||||||||||||||||
Toll Brothers, Inc.b | 62,940 | 54,527 | 379,750 | 497,217 | 2,010,933 | 1,742,138 | 12,133,012 | 15,886,083 | ||||||||||||||||||||||||
Tractor Supply Company | 47,360 | — | — | 47,360 | 3,467,699 | — | — | 3,467,699 | ||||||||||||||||||||||||
Ulta Salon Cosmetics & Fragrance, Inc.b | 17,840 | — | — | 17,840 | 2,155,250 | — | — | 2,155,250 | ||||||||||||||||||||||||
Under Armour, Inc.b | 53,070 | — | — | 53,070 | 3,480,331 | — | — | 3,480,331 | ||||||||||||||||||||||||
VF Corporation | 72,200 | — | — | 72,200 | 4,886,496 | — | — | 4,886,496 | ||||||||||||||||||||||||
Wynn Resorts, Ltd. | 14,160 | — | — | 14,160 | 2,690,542 | — | — | 2,690,542 | ||||||||||||||||||||||||
|
|
|
|
|
|
|
|
|
|
|
|
|
|
|
| |||||||||||||||||
Total Consumer Discretionary | 87,298,228 | 23,476,014 | 85,742,872 | 196,517,114 | ||||||||||||||||||||||||||||
|
|
|
|
|
|
|
|
|
|
|
|
|
|
|
| |||||||||||||||||
- 67 -
Table of Contents
Consumer Staples (5.1%) | ||||||||||||||||||||||||||||||||
ConAgra Foods, Inc. | — | 54,514 | — | 54,514 | — | 1,872,556 | — | 1,872,556 | ||||||||||||||||||||||||
Constellation Brands, Inc.b | — | 8,657 | — | 8,657 | — | 792,462 | — | 792,462 | ||||||||||||||||||||||||
Energizer Holdings, Inc. | — | 10,795 | — | 10,795 | — | 1,324,007 | — | 1,324,007 | ||||||||||||||||||||||||
Green Mountain Coffee Roasters, Inc. | — | — | 107,950 | 107,950 | — | — | 16,381,412 | 16,381,412 | ||||||||||||||||||||||||
Hain Celestial Group, Inc.b | 68,520 | — | — | 68,520 | 7,417,290 | — | — | 7,417,290 | ||||||||||||||||||||||||
Ingredion, Inc. | — | — | 143,950 | 143,950 | — | — | 11,120,137 | 11,120,137 | ||||||||||||||||||||||||
Kroger Company | — | 34,872 | — | 34,872 | — | 1,942,719 | — | 1,942,719 | ||||||||||||||||||||||||
Molson Coors Brewing Company | — | 10,664 | 128,550 | 139,214 | — | 793,188 | 9,561,549 | 10,354,737 | ||||||||||||||||||||||||
Monster Beverage Corporationb | 83,560 | — | — | 83,560 | 8,429,533 | — | — | 8,429,533 | ||||||||||||||||||||||||
Tyson Foods, Inc. | — | 64,643 | — | 64,643 | — | 2,608,345 | — | 2,608,345 | ||||||||||||||||||||||||
United Natural Foods, Inc.b | 67,790 | — | — | 67,790 | 4,611,075 | — | — | 4,611,075 | ||||||||||||||||||||||||
WhiteWave Foods Companyb | — | — | 262,650 | 262,650 | — | — | 9,778,460 | 9,778,460 | ||||||||||||||||||||||||
Whole Foods Market, Inc. | 23,048 | 33,700 | — | 56,748 | 906,478 | 1,325,421 | — | 2,231,899 | ||||||||||||||||||||||||
|
|
|
|
|
|
|
|
|
|
|
|
|
|
|
| |||||||||||||||||
Total Consumer Staples | 21,364,376 | 10,658,698 | 46,841,558 | 78,864,632 | ||||||||||||||||||||||||||||
|
|
|
|
|
|
|
|
|
|
|
|
|
|
|
| |||||||||||||||||
Energy (5.1%) | ||||||||||||||||||||||||||||||||
Atwood Oceanics, Inc.b | — | — | 56,250 | 56,250 | — | — | 2,286,562 | 2,286,562 | ||||||||||||||||||||||||
Cameron International Corporationb | 78,287 | 20,323 | 38,150 | 136,760 | 4,661,991 | 1,210,235 | 2,271,832 | 8,144,058 | ||||||||||||||||||||||||
Cimarex Energy Company | — | 16,042 | 27,200 | 43,242 | — | 1,823,494 | 3,091,824 | 4,915,318 | ||||||||||||||||||||||||
Concho Resources, Inc.b | 33,260 | — | 21,450 | 54,710 | 3,626,338 | — | 2,338,694 | 5,965,032 | ||||||||||||||||||||||||
Denbury Resources, Inc. | — | — | 159,200 | 159,200 | — | — | 1,974,080 | 1,974,080 | ||||||||||||||||||||||||
Energen Corporation | — | — | 20,550 | 20,550 | — | — | 1,391,235 | 1,391,235 | ||||||||||||||||||||||||
Ensco plc | — | — | 37,950 | 37,950 | — | — | 1,540,390 | 1,540,390 | ||||||||||||||||||||||||
EQT Corporation | — | — | 22,850 | 22,850 | — | — | 2,148,814 | 2,148,814 | ||||||||||||||||||||||||
Gulfport Energy Corporationb | — | — | 22,650 | 22,650 | — | — | 1,136,577 | 1,136,577 | ||||||||||||||||||||||||
Helix Energy Solutions Group, Inc.b | — | — | 95,750 | 95,750 | — | — | 2,550,780 | 2,550,780 | ||||||||||||||||||||||||
Helmerich & Payne, Inc.a | — | — | 38,900 | 38,900 | — | — | 3,377,298 | 3,377,298 | ||||||||||||||||||||||||
HollyFrontier Corporation | 33,670 | — | 61,750 | 95,420 | 1,527,944 | — | 2,802,215 | 4,330,159 | ||||||||||||||||||||||||
National Oilwell Varco, Inc. | — | — | 33,450 | 33,450 | — | — | 2,429,808 | 2,429,808 | ||||||||||||||||||||||||
Newfield Exploration Companyb | — | — | 55,350 | 55,350 | — | — | 1,804,964 | 1,804,964 | ||||||||||||||||||||||||
Noble Corporation | — | — | 63,750 | 63,750 | — | — | 1,333,650 | 1,333,650 | ||||||||||||||||||||||||
Noble Energy, Inc. | — | — | 43,550 | 43,550 | — | — | 2,509,787 | 2,509,787 | ||||||||||||||||||||||||
Oasis Petroleum, Inc.b | — | — | 38,750 | 38,750 | — | — | 1,160,950 | 1,160,950 | ||||||||||||||||||||||||
Oceaneering International, Inc. | — | — | 41,300 | 41,300 | — | — | 2,902,151 | 2,902,151 | ||||||||||||||||||||||||
Oil States International, Inc.b | — | 30,868 | 36,800 | 67,668 | — | 1,844,054 | 2,198,432 | 4,042,486 | ||||||||||||||||||||||||
Pioneer Natural Resources Company | — | — | 13,300 | 13,300 | — | — | 2,514,498 | 2,514,498 | ||||||||||||||||||||||||
QEP Resources, Inc. | — | 53,708 | — | 53,708 | — | 1,346,460 | — | 1,346,460 | ||||||||||||||||||||||||
Rowan Companies plc | — | — | 59,850 | 59,850 | — | — | 1,452,559 | 1,452,559 | ||||||||||||||||||||||||
SM Energy Company | 35,570 | — | 32,200 | 67,770 | 2,002,591 | — | 1,812,860 | 3,815,451 | ||||||||||||||||||||||||
Southwestern Energy Company b | 126,410 | 73,044 | — | 199,454 | 4,109,589 | 2,374,660 | — | 6,484,249 | ||||||||||||||||||||||||
Superior Energy Services, Inc. | — | — | 138,250 | 138,250 | — | — | 3,476,988 | 3,476,988 | ||||||||||||||||||||||||
Tesoro Corporation | — | 24,612 | — | 24,612 | — | 1,757,543 | — | 1,757,543 | ||||||||||||||||||||||||
Whiting Petroleum Corporationb | — | — | 37,000 | 37,000 | — | — | 2,265,880 | 2,265,880 | ||||||||||||||||||||||||
|
|
|
|
|
|
|
|
|
|
|
|
|
|
|
| |||||||||||||||||
Total Energy | 15,928,453 | 10,356,446 | 52,772,828 | 79,057,727 | ||||||||||||||||||||||||||||
|
|
|
|
|
|
|
|
|
|
|
|
|
|
|
|
- 68 -
Table of Contents
Financials (19.8%) | ||||||||||||||||||||||||||||||||
Affiliated Managers Group, Inc.b | 44,960 | — | — | 44,960 | 8,982,558 | — | — | 8,982,558 | ||||||||||||||||||||||||
Ameriprise Financial, Inc. | 57,150 | — | — | 57,150 | 7,210,616 | — | — | 7,210,616 | ||||||||||||||||||||||||
Arthur J. Gallagher & Company | — | 34,325 | — | 34,325 | — | 1,637,303 | — | 1,637,303 | ||||||||||||||||||||||||
AvalonBay Communities, Inc. | — | 14,930 | — | 14,930 | — | 2,326,691 | — | 2,326,691 | ||||||||||||||||||||||||
Brixmor Property Group, Inc. | — | 44,492 | — | 44,492 | — | 1,083,825 | — | 1,083,825 | ||||||||||||||||||||||||
Camden Property Trust | — | 19,511 | 157,550 | 177,061 | — | 1,495,908 | 12,079,359 | 13,575,267 | ||||||||||||||||||||||||
DDR Corporation | — | 86,038 | — | 86,038 | — | 1,560,729 | — | 1,560,729 | ||||||||||||||||||||||||
Digital Realty Trust, Inc. | — | — | 182,750 | 182,750 | — | — | 12,607,923 | 12,607,923 | ||||||||||||||||||||||||
Discover Financial Services | 105,790 | — | — | 105,790 | 6,747,286 | — | — | 6,747,286 | ||||||||||||||||||||||||
Duke Realty Corporation | — | — | 588,300 | 588,300 | — | — | 11,154,168 | 11,154,168 | ||||||||||||||||||||||||
Everest Re Group, Ltd. | — | 12,489 | — | 12,489 | — | 2,131,248 | — | 2,131,248 | ||||||||||||||||||||||||
Fifth Third Bancorp | — | 149,257 | — | 149,257 | — | 2,983,647 | — | 2,983,647 | ||||||||||||||||||||||||
First Republic Bank | 159,360 | — | 299,400 | 458,760 | 8,116,205 | — | 15,248,442 | 23,364,647 | ||||||||||||||||||||||||
Gaming and Leisure Properties, Inc. | — | — | 281,103 | 281,103 | — | — | 8,784,469 | 8,784,469 | ||||||||||||||||||||||||
HCC Insurance Holdings, Inc. | — | — | 319,076 | 319,076 | — | — | 16,652,576 | 16,652,576 | ||||||||||||||||||||||||
Host Hotels & Resorts, Inc. | — | — | 716,459 | 716,459 | — | — | 16,700,659 | 16,700,659 | ||||||||||||||||||||||||
Huntington Bancshares, Inc. | — | 211,091 | 2,101,850 | 2,312,941 | — | 2,091,912 | 20,829,333 | 22,921,245 | ||||||||||||||||||||||||
Intercontinental Exchange, Inc. | 24,820 | — | — | 24,820 | 5,169,758 | — | — | 5,169,758 | ||||||||||||||||||||||||
Invesco, Ltd. | — | 61,159 | — | 61,159 | — | 2,475,105 | — | 2,475,105 | ||||||||||||||||||||||||
KeyCorp | — | — | 939,400 | 939,400 | — | — | 12,400,080 | 12,400,080 | ||||||||||||||||||||||||
Lazard, Ltd. | — | — | 357,832 | 357,832 | — | — | 17,608,913 | 17,608,913 | ||||||||||||||||||||||||
Lincoln National Corporation | — | 57,681 | — | 57,681 | — | 3,158,612 | — | 3,158,612 | ||||||||||||||||||||||||
M&T Bank Corporationa | — | 22,729 | 117,550 | 140,279 | — | 2,777,029 | 14,362,259 | 17,139,288 | ||||||||||||||||||||||||
NASDAQ OMX Group, Inc. | — | 31,472 | 474,400 | 505,872 | — | 1,361,479 | 20,522,544 | 21,884,023 | ||||||||||||||||||||||||
Navient Corporation | — | 146,555 | — | 146,555 | — | 2,898,858 | — | 2,898,858 | ||||||||||||||||||||||||
Northern Trust Corporation | — | — | 259,890 | 259,890 | — | — | 17,230,707 | 17,230,707 | ||||||||||||||||||||||||
Principal Financial Group, Inc. | — | 58,358 | — | 58,358 | — | 3,056,209 | — | 3,056,209 | ||||||||||||||||||||||||
Raymond James Financial, Inc. | — | 35,862 | — | 35,862 | — | 2,012,934 | — | 2,012,934 | ||||||||||||||||||||||||
RLJ Lodging Trust | — | 42,430 | — | 42,430 | — | 1,367,095 | — | 1,367,095 | ||||||||||||||||||||||||
Signature Bankb | — | 10,967 | — | 10,967 | — | 1,328,433 | — | 1,328,433 | ||||||||||||||||||||||||
SLM Corporation | — | 205,482 | — | 205,482 | — | 1,962,353 | — | 1,962,353 | ||||||||||||||||||||||||
Starwood Property Trust, Inc. | — | 76,031 | — | 76,031 | — | 1,715,259 | — | 1,715,259 | ||||||||||||||||||||||||
SVB Financial Groupb | 17,570 | — | — | 17,570 | 1,967,664 | — | — | 1,967,664 | ||||||||||||||||||||||||
Taubman Centers, Inc. | — | 20,688 | — | 20,688 | — | 1,573,322 | — | 1,573,322 | ||||||||||||||||||||||||
TD Ameritrade Holding Corporation | 168,820 | — | — | 168,820 | 5,695,987 | — | — | 5,695,987 | ||||||||||||||||||||||||
Unum Group | — | 35,366 | — | 35,366 | — | 1,183,346 | — | 1,183,346 | ||||||||||||||||||||||||
Validus Holdings, Ltd. | — | 34,171 | — | 34,171 | — | 1,359,322 | — | 1,359,322 | ||||||||||||||||||||||||
Voya Financial, Inc. | — | 39,297 | — | 39,297 | — | 1,542,407 | — | 1,542,407 | ||||||||||||||||||||||||
XL Group plc | — | 68,711 | — | 68,711 | — | 2,327,929 | — | 2,327,929 | ||||||||||||||||||||||||
Zions Bancorporation | 94,730 | — | 609,602 | 704,332 | 2,744,328 | — | 17,660,170 | 20,404,498 | ||||||||||||||||||||||||
|
|
|
|
|
|
|
|
|
|
|
|
|
|
|
| |||||||||||||||||
Total Financials | 46,634,402 | 47,410,955 | 213,841,602 | 307,886,959 | ||||||||||||||||||||||||||||
|
|
|
|
|
|
|
|
|
|
|
|
|
|
|
|
- 69 -
Table of Contents
Health Care (14.4%) | ||||||||||||||||||||||||||||||||
Acorda Therapeutics, Inc.b | — | — | 306,700 | 306,700 | — | — | 10,679,294 | 10,679,294 | ||||||||||||||||||||||||
Actavis, Inc.b | 29,370 | — | — | 29,370 | 7,129,274 | — | — | 7,129,274 | ||||||||||||||||||||||||
Allscripts Healthcare Solutions, Inc.b | — | — | 985,050 | 985,050 | — | — | 13,514,886 | 13,514,886 | ||||||||||||||||||||||||
AmerisourceBergen Corporation | 67,277 | — | — | 67,277 | 5,746,128 | — | — | 5,746,128 | ||||||||||||||||||||||||
BioMarin Pharmaceutical, Inc.b | 89,250 | — | — | 89,250 | 7,363,125 | — | — | 7,363,125 | ||||||||||||||||||||||||
C.R. Bard, Inc. | — | — | 107,564 | 107,564 | — | — | 17,637,269 | 17,637,269 | ||||||||||||||||||||||||
Cardinal Health, Inc. | — | 27,091 | — | 27,091 | — | 2,126,102 | — | 2,126,102 | ||||||||||||||||||||||||
Catamaran Corporationb | 89,782 | — | — | 89,782 | 4,279,908 | — | — | 4,279,908 | ||||||||||||||||||||||||
Centene Corporationb | — | — | 156,000 | 156,000 | — | — | 14,456,520 | 14,456,520 | ||||||||||||||||||||||||
Cerner Corporationb | 101,350 | — | — | 101,350 | 6,419,509 | — | — | 6,419,509 | ||||||||||||||||||||||||
CIGNA Corporation | — | 41,492 | — | 41,492 | — | 4,131,358 | — | 4,131,358 | ||||||||||||||||||||||||
Cooper Companies, Inc. | 22,310 | — | — | 22,310 | 3,656,609 | — | — | 3,656,609 | ||||||||||||||||||||||||
Covance, Inc.b | 35,890 | — | — | 35,890 | 2,867,611 | — | — | 2,867,611 | ||||||||||||||||||||||||
Cubist Pharmaceuticals, Inc.b | 26,170 | — | — | 26,170 | 1,891,829 | — | — | 1,891,829 | ||||||||||||||||||||||||
Endo International plcb | — | 43,427 | — | 43,427 | — | 2,906,135 | — | 2,906,135 | ||||||||||||||||||||||||
Envision Healthcare Holdings, Inc.b | 78,310 | 24,796 | — | 103,106 | 2,736,934 | 866,620 | — | 3,603,554 | ||||||||||||||||||||||||
Hologic, Inc.b | — | — | 706,750 | 706,750 | — | — | 18,509,783 | 18,509,783 | ||||||||||||||||||||||||
Illumina, Inc.b | — | — | 117,200 | 117,200 | — | — | 22,570,376 | 22,570,376 | ||||||||||||||||||||||||
Laboratory Corporation of America Holdingsb | — | 17,996 | — | 17,996 | — | 1,966,783 | — | 1,966,783 | ||||||||||||||||||||||||
Mallinckrodt, LLCb | — | — | 100,400 | 100,400 | — | — | 9,254,872 | 9,254,872 | ||||||||||||||||||||||||
Mettler-Toledo International, Inc.b | 20,970 | — | — | 20,970 | 5,420,116 | — | — | 5,420,116 | ||||||||||||||||||||||||
Mylan, Inc.b | 42,980 | 33,161 | — | 76,141 | 2,301,579 | 1,775,772 | — | 4,077,351 | ||||||||||||||||||||||||
Perrigo Company plc | 63,260 | — | — | 63,260 | 10,213,327 | — | — | 10,213,327 | ||||||||||||||||||||||||
Team Health Holdings, Inc.b | 48,730 | — | — | 48,730 | 3,047,574 | — | — | 3,047,574 | ||||||||||||||||||||||||
Teleflex, Inc. | 42,880 | — | — | 42,880 | 4,893,466 | — | — | 4,893,466 | ||||||||||||||||||||||||
Universal Health Services, Inc. | 14,480 | — | 165,600 | 180,080 | 1,501,721 | — | 17,174,376 | 18,676,097 | ||||||||||||||||||||||||
Vertex Pharmaceuticals, Inc.b | 9,690 | — | — | 9,690 | 1,091,482 | — | — | 1,091,482 | ||||||||||||||||||||||||
Waters Corporationb | — | — | 116,250 | 116,250 | — | — | 12,880,500 | 12,880,500 | ||||||||||||||||||||||||
Zimmer Holdings, Inc. | — | 23,347 | — | 23,347 | — | 2,597,120 | — | 2,597,120 | ||||||||||||||||||||||||
|
|
|
|
|
|
|
|
|
|
|
|
|
|
|
| |||||||||||||||||
Total Health Care | 70,560,192 | 16,369,890 | 136,677,876 | 223,607,958 | ||||||||||||||||||||||||||||
|
|
|
|
|
|
|
|
|
|
|
|
|
|
|
| |||||||||||||||||
Industrials (14.7%) | ||||||||||||||||||||||||||||||||
ADT Corporationa | — | — | 612,241 | 612,241 | — | — | 21,942,717 | 21,942,717 | ||||||||||||||||||||||||
Alliant Techsystems, Inc. | 14,540 | — | 14,540 | — | 1,700,598 | — | 1,700,598 | |||||||||||||||||||||||||
AMETEK, Inc. | 47,157 | — | — | 47,157 | 2,459,238 | — | — | 2,459,238 | ||||||||||||||||||||||||
Armstrong World Industries, Inc.b | — | 27,326 | 27,326 | — | 1,323,125 | — | 1,323,125 | |||||||||||||||||||||||||
B/E Aerospace, Inc.b | 51,840 | — | — | 51,840 | 3,859,488 | — | — | 3,859,488 | ||||||||||||||||||||||||
Fastenal Company | 28,480 | — | — | 28,480 | 1,254,259 | — | — | 1,254,259 | ||||||||||||||||||||||||
Flowserve Corporation | 24,055 | — | 212,200 | 236,255 | 1,635,499 | — | 14,427,478 | 16,062,977 | ||||||||||||||||||||||||
Fortune Brands Home and Security, Inc. | 113,150 | 43,996 | — | 157,146 | 4,893,738 | 1,902,827 | — | 6,796,565 | ||||||||||||||||||||||||
GATX Corporation | 48,630 | — | — | 48,630 | 3,083,142 | — | — | 3,083,142 | ||||||||||||||||||||||||
Graco, Inc. | 61,880 | — | — | 61,880 | 4,857,580 | — | — | 4,857,580 | ||||||||||||||||||||||||
Hertz Global Holdings, Inc.b | — | 100,280 | — | 100,280 | — | 2,198,138 | — | 2,198,138 | ||||||||||||||||||||||||
Huntington Ingalls Industries, Inc. | — | — | 121,850 | 121,850 | — | — | 12,894,167 | 12,894,167 |
- 70 -
Table of Contents
JB Hunt Transport Services, Inc. | 42,100 | — | — | 42,100 | 3,358,317 | — | — | 3,358,317 | ||||||||||||||||||||||||
Kansas City Southern | — | 9,850 | — | 9,850 | — | 1,209,481 | — | 1,209,481 | ||||||||||||||||||||||||
Manpower, Inc. | — | — | 132,248 | 132,248 | — | — | 8,827,554 | 8,827,554 | ||||||||||||||||||||||||
Nielsen NV | 95,680 | — | — | 95,680 | 4,065,443 | — | — | 4,065,443 | ||||||||||||||||||||||||
Old Dominion Freight Line, Inc.b | 30,510 | — | — | 30,510 | 2,223,264 | — | — | 2,223,264 | ||||||||||||||||||||||||
Oshkosh Corporation | — | — | 469,644 | 469,644 | — | — | 21,021,265 | 21,021,265 | ||||||||||||||||||||||||
Parker Hannifin Corporation | — | — | 141,118 | 141,118 | — | — | 17,926,220 | 17,926,220 | ||||||||||||||||||||||||
Robert Half International, Inc. | 157,030 | — | — | 157,030 | 8,602,103 | — | — | 8,602,103 | ||||||||||||||||||||||||
Roper Industries, Inc. | 46,090 | — | — | 46,090 | 7,296,047 | — | — | 7,296,047 | ||||||||||||||||||||||||
Southwest Airlines Company | 136,100 | — | 896,550 | 1,032,650 | 4,692,728 | — | 30,913,044 | 35,605,772 | ||||||||||||||||||||||||
Stericycle, Inc.b | 76,520 | — | — | 76,520 | 9,641,520 | — | — | 9,641,520 | ||||||||||||||||||||||||
Terex Corporation | — | 40,867 | — | 40,867 | — | 1,175,744 | — | 1,175,744 | ||||||||||||||||||||||||
Textron, Inc. | — | 57,982 | — | 57,982 | — | 2,407,992 | — | 2,407,992 | ||||||||||||||||||||||||
Timken Company | — | 18,700 | — | 18,700 | — | 803,913 | — | 803,913 | ||||||||||||||||||||||||
Triumph Group, Inc. | — | 40,119 | — | 40,119 | — | 2,793,486 | — | 2,793,486 | ||||||||||||||||||||||||
United Continental Holdings, Inc.b | — | 30,843 | — | 30,843 | — | 1,628,819 | — | 1,628,819 | ||||||||||||||||||||||||
United Rentals, Inc.b | 86,830 | — | — | 86,830 | 9,556,510 | — | — | 9,556,510 | ||||||||||||||||||||||||
WABCO Holdings, Inc.b | — | — | 116,850 | 116,850 | — | — | 11,378,853 | 11,378,853 | ||||||||||||||||||||||||
|
|
|
|
|
|
|
|
|
|
|
|
|
|
|
| |||||||||||||||||
Total Industrials | 71,478,876 | 17,144,123 | 139,331,298 | 227,954,297 | ||||||||||||||||||||||||||||
|
|
|
|
|
|
|
|
|
|
|
|
|
|
|
| |||||||||||||||||
Information Technology (17.9%) | ||||||||||||||||||||||||||||||||
Agilent Technologies, Inc. | 101,129 | 34,633 | — | 135,762 | 5,590,411 | 1,914,512 | — | 7,504,923 | ||||||||||||||||||||||||
Alliance Data Systems Corporationb | — | — | 115,300 | 115,300 | — | — | 32,670,255 | 32,670,255 | ||||||||||||||||||||||||
Altera Corporation | — | 56,674 | — | 56,674 | — | 1,947,885 | — | 1,947,885 | ||||||||||||||||||||||||
Amphenol Corporation | 147,990 | — | — | 147,990 | 7,485,334 | — | — | 7,485,334 | ||||||||||||||||||||||||
Analog Devices, Inc. | — | 43,597 | — | 43,597 | — | 2,163,283 | — | 2,163,283 | ||||||||||||||||||||||||
ANSYS, Inc.b | 56,630 | — | — | 56,630 | 4,448,853 | — | — | 4,448,853 | ||||||||||||||||||||||||
AOL, Inc.b | — | 20,166 | — | 20,166 | — | 877,826 | — | 877,826 | ||||||||||||||||||||||||
Applied Materials, Inc. | — | — | 1,208,640 | 1,208,640 | — | — | 26,698,858 | 26,698,858 | ||||||||||||||||||||||||
Atmel Corporationb | — | 216,048 | — | 216,048 | — | 1,603,076 | — | 1,603,076 | ||||||||||||||||||||||||
Autodesk, Inc.b | 36,536 | — | — | 36,536 | 2,102,281 | — | — | 2,102,281 | ||||||||||||||||||||||||
Brocade Communications Systems, Inc. | — | 118,355 | — | 118,355 | — | 1,269,949 | — | 1,269,949 | ||||||||||||||||||||||||
Check Point Software Technologies, Ltd.b | — | 16,685 | — | 16,685 | — | 1,238,861 | — | 1,238,861 | ||||||||||||||||||||||||
Ciena Corporationab | 129,913 | — | — | 129,913 | 2,177,342 | — | — | 2,177,342 | ||||||||||||||||||||||||
Citrix Systems, Inc.b | — | 30,235 | — | 30,235 | — | 1,941,994 | — | 1,941,994 | ||||||||||||||||||||||||
eBay, Inc.b | — | — | 220,853 | 220,853 | — | — | 11,594,783 | 11,594,783 | ||||||||||||||||||||||||
F5 Networks, Inc.b | 51,990 | — | — | 51,990 | 6,393,730 | — | — | 6,393,730 | ||||||||||||||||||||||||
Fortinet, Inc.b | 215,370 | — | — | 215,370 | 5,610,389 | — | — | 5,610,389 | ||||||||||||||||||||||||
Gartner, Inc.b | 80,400 | — | — | 80,400 | 6,489,084 | — | — | 6,489,084 | ||||||||||||||||||||||||
IAC InterActiveCorp | 20,310 | — | — | 20,310 | 1,374,784 | — | — | 1,374,784 | ||||||||||||||||||||||||
Imperva, Inc.ab | 57,250 | — | — | 57,250 | 2,345,533 | — | — | 2,345,533 | ||||||||||||||||||||||||
Informatica Corporationb | — | 32,704 | — | 32,704 | — | 1,166,225 | — | 1,166,225 | ||||||||||||||||||||||||
Juniper Networks, Inc. | — | 65,498 | 547,800 | 613,298 | — | 1,380,043 | 11,542,146 | 12,922,189 | ||||||||||||||||||||||||
LinkedIn Corporationa | 8,210 | — | — | 8,210 | 1,879,762 | — | — | 1,879,762 | ||||||||||||||||||||||||
Maxim Integrated Products, Inc. | — | 105,260 | — | 105,260 | — | 3,088,328 | — | 3,088,328 | ||||||||||||||||||||||||
NetApp, Inc. | — | 30,516 | 374,850 | 405,366 | — | 1,306,085 | 16,043,580 | 17,349,665 |
- 71 -
Table of Contents
Nice Systems, Ltd. ADR | 45,680 | — | — | 45,680 | 1,858,262 | — | — | 1,858,262 | ||||||||||||||||||||||||
Nuance Communications, Inc.b | 88,329 | — | — | 88,329 | 1,362,916 | — | — | 1,362,916 | ||||||||||||||||||||||||
NVIDIA Corporation | 154,460 | — | 1,480,412 | 1,634,872 | 3,018,148 | — | 28,927,250 | 31,945,398 | ||||||||||||||||||||||||
NXP Semiconductors NVb | 125,350 | — | — | 125,350 | 8,606,531 | — | — | 8,606,531 | ||||||||||||||||||||||||
QLIK Technologies, Inc.b | 196,950 | — | — | 196,950 | 5,583,533 | — | — | 5,583,533 | ||||||||||||||||||||||||
Red Hat, Inc.b | — | 14,993 | 286,150 | 301,143 | — | 883,388 | 16,859,958 | 17,743,346 | ||||||||||||||||||||||||
ServiceNow, Inc.b | 98,013 | — | — | 98,013 | 6,658,023 | — | — | 6,658,023 | ||||||||||||||||||||||||
Skyworks Solutions, Inc. | 40,750 | — | — | 40,750 | 2,373,280 | — | — | 2,373,280 | ||||||||||||||||||||||||
Synopsys, Inc.b | 50,940 | — | — | 50,940 | 2,087,521 | — | — | 2,087,521 | ||||||||||||||||||||||||
Teradyne, Inc. | — | — | 727,001 | 727,001 | — | — | 13,376,818 | 13,376,818 | ||||||||||||||||||||||||
Ubiquiti Networks, Inc.a | — | — | 241,300 | 241,300 | — | — | 8,631,301 | 8,631,301 | ||||||||||||||||||||||||
Ultimate Software Group, Inc.b | 9,410 | — | — | 9,410 | 1,416,299 | — | — | 1,416,299 | ||||||||||||||||||||||||
VeriFone Systems, Inc.b | 77,479 | — | — | 77,479 | 2,886,868 | — | — | 2,886,868 | ||||||||||||||||||||||||
Workday, Inc.b | — | — | 74,150 | 74,150 | — | — | 7,079,842 | 7,079,842 | ||||||||||||||||||||||||
Xerox Corporation | — | 124,159 | — | 124,159 | — | 1,648,832 | — | 1,648,832 | ||||||||||||||||||||||||
|
|
|
|
|
|
|
|
|
|
|
|
|
|
|
| |||||||||||||||||
Total Information Technology | 81,748,884 | 22,430,287 | 173,424,791 | 277,603,962 | ||||||||||||||||||||||||||||
|
|
|
|
|
|
|
|
|
|
|
|
|
|
|
| |||||||||||||||||
Materials (4.2%) | ||||||||||||||||||||||||||||||||
Airgas, Inc. | 44,100 | — | — | 44,100 | 4,918,914 | — | — | 4,918,914 | ||||||||||||||||||||||||
Albemarle Corporationa | 38,200 | — | — | 38,200 | 2,230,116 | — | — | 2,230,116 | ||||||||||||||||||||||||
Carpenter Technology Corporation | — | 18,881 | — | 18,881 | — | 944,994 | — | 944,994 | ||||||||||||||||||||||||
Celanese Corporation | 30,620 | 26,786 | — | 57,406 | 1,798,313 | 1,573,142 | — | 3,371,455 | ||||||||||||||||||||||||
CF Industries Holdings, Inc. | — | 6,216 | — | 6,216 | — | 1,616,160 | — | 1,616,160 | ||||||||||||||||||||||||
FMC Corporation | 84,300 | — | — | 84,300 | 4,834,605 | — | — | 4,834,605 | ||||||||||||||||||||||||
Owens-Illinois, Inc.b | — | — | 374,000 | 374,000 | — | — | 9,637,980 | 9,637,980 | ||||||||||||||||||||||||
Packaging Corporation of America | — | 28,649 | — | 28,649 | — | 2,065,020 | — | 2,065,020 | ||||||||||||||||||||||||
Reliance Steel & Aluminum Company | — | 15,583 | — | 15,583 | — | 1,051,541 | — | 1,051,541 | ||||||||||||||||||||||||
Silgan Holdings, Inc. | — | — | 212,914 | 212,914 | — | — | 10,466,852 | 10,466,852 | ||||||||||||||||||||||||
Silver Wheaton Corporation | 71,370 | — | — | 71,370 | 1,239,697 | — | — | 1,239,697 | ||||||||||||||||||||||||
Steel Dynamics, Inc. | — �� | — | 868,894 | 868,894 | — | — | 19,993,251 | 19,993,251 | ||||||||||||||||||||||||
Timkensteel Corporation | — | 22,231 | — | 22,231 | — | 902,134 | — | 902,134 | ||||||||||||||||||||||||
Valspar Corporation | — | 21,991 | — | 21,991 | — | 1,806,780 | — | 1,806,780 | ||||||||||||||||||||||||
|
|
|
|
|
|
|
|
|
|
|
|
|
|
|
| |||||||||||||||||
Total Materials | 15,021,645 | 9,959,771 | 40,098,083 | 65,079,499 | ||||||||||||||||||||||||||||
|
|
|
|
|
|
|
|
|
|
|
|
|
|
|
| |||||||||||||||||
Telecommunications Services (0.5%) | ||||||||||||||||||||||||||||||||
SBA Communications Corporationb | 51,240 | — | — | 51,240 | 5,755,789 | — | — | 5,755,789 | ||||||||||||||||||||||||
TW Telecom, Inc.b | 42,570 | — | — | 42,570 | 1,821,145 | — | — | 1,821,145 | ||||||||||||||||||||||||
|
|
|
|
|
|
|
|
|
|
|
|
|
|
|
| |||||||||||||||||
Total Telecommunication Services | 7,576,934 | — | — | 7,576,934 | ||||||||||||||||||||||||||||
|
|
|
|
|
|
|
|
|
|
|
|
|
|
|
| |||||||||||||||||
Utilities (1.7%) | ||||||||||||||||||||||||||||||||
FirstEnergy Corporation | — | 93,399 | — | 93,399 | — | 3,487,519 | — | 3,487,519 | ||||||||||||||||||||||||
NRG Energy, Inc. | — | 59,893 | — | 59,893 | — | 1,795,592 | — | 1,795,592 | ||||||||||||||||||||||||
PG&E Corporation | — | 39,541 | — | 39,541 | — | 1,989,703 | — | 1,989,703 | ||||||||||||||||||||||||
Public Service Enterprise Group, Inc. | — | — | 336,850 | 336,850 | — | — | 13,915,274 | 13,915,274 | ||||||||||||||||||||||||
SCANA Corporation | — | 23,382 | — | 23,382 | — | 1,283,438 | — | 1,283,438 | ||||||||||||||||||||||||
Sempra Energy | — | 31,989 | — | 31,989 | — | 3,518,790 | — | 3,518,790 | ||||||||||||||||||||||||
|
|
|
|
|
|
|
|
|
|
|
|
|
|
|
| |||||||||||||||||
Total Utilities | — | 12,075,042 | 13,915,274 | 25,990,316 | ||||||||||||||||||||||||||||
|
|
|
|
|
|
|
|
|
|
|
|
|
|
|
|
- 72 -
Table of Contents
Total Common Stock (Cost $296,543,523, Cost $146,834,775, Cost $646,445,543, Combined Funds $1,089,823,841) | 417,611,990 | 169,881,226 | 902,646,182 | 1,490,139,398 | ||||||||||||||||||||||||||||
|
|
|
|
|
|
|
|
|
|
|
|
|
|
|
| |||||||||||||||||
Collateral Held for Securities Loaned (2.8%) | ||||||||||||||||||||||||||||||||
Thrivent Cash Management Trust | 1,575,210 | — | 42,247,150 | 43,822,360 | 1,575,210 | — | 42,247,150 | 43,822,360 | ||||||||||||||||||||||||
|
|
|
|
|
|
|
|
|
|
|
|
|
|
|
| |||||||||||||||||
Total Collateral Held for Securities Loaned (Cost $1,575,210, Cost $0, Cost $42,247,150, Combined Funds $43,822,360) | 1,575,210 | — | 42,247,150 | 43,822,360 | ||||||||||||||||||||||||||||
|
|
|
|
|
|
|
|
|
|
|
|
|
|
|
| |||||||||||||||||
Short-Term Investments (4.0%)c | ||||||||||||||||||||||||||||||||
Thrivent Cash Management Trust | 16,400,100 | 5,641,758 | 40,850,015 | 62,891,873 | 16,400,100 | 5,641,758 | 40,850,015 | 62,891,873 | ||||||||||||||||||||||||
|
|
|
|
|
|
|
|
|
|
|
|
|
|
|
| |||||||||||||||||
Total Short-Term Investments (at amortized cost) | 16,400,100 | 5,641,758 | 40,850,015 | 62,891,873 | ||||||||||||||||||||||||||||
|
|
|
|
|
|
|
|
|
|
|
|
|
|
|
| |||||||||||||||||
Total Investments (Cost $314,518,833, Cost $152,476,533, Cost $729,542,708, Combined Funds $1,196,538,074) 102.7% | 435,587,300 | 175,522,984 | 985,743,347 | 1,596,853,631 | ||||||||||||||||||||||||||||
|
|
|
|
|
|
|
|
|
|
|
|
|
|
|
| |||||||||||||||||
Other Assets and Liabilities, Net (2.7%) | 1,302,159 | (256,365 | ) | (43,518,024 | ) | (42,472,230 | ) | |||||||||||||||||||||||||
|
|
|
|
|
|
|
|
|
|
|
|
|
|
|
| |||||||||||||||||
Total Net Assets 100.0% | 436,889,459 | 175,266,619 | 942,225,323 | 1,554,381,401 | ||||||||||||||||||||||||||||
|
|
|
|
|
|
|
|
|
|
|
|
|
|
|
|
| (a) | All or a portion of the security is on loan. |
| (b) | Non-income producing security. |
| (c) | The interest rate shown reflects the yield, coupon rate or the discount rate at the date of purchase. |
Definitions:
ADR - American Depositary Receipt, which are certificates for an underlying foreign security’s shares held by an issuing U.S. depository bank.
- 73 -
Table of Contents
Mid Cap Growth Fund
Fair Valuation Measurements
The following table is a summary of the inputs used, as of October 31, 2014, in valuing Mid Cap Growth Fund’s assets carried at fair value.
Investments in Securities | Total | Level 1 | Level 2 | Level 3 | ||||||||||||
Common Stock | ||||||||||||||||
Consumer Discretionary | 87,298,228 | 87,298,228 | — | — | ||||||||||||
Consumer Staples | 21,364,376 | 21,364,376 | — | — | ||||||||||||
Energy | 15,928,453 | 15,928,453 | — | — | ||||||||||||
Financials | 46,634,402 | 46,634,402 | — | — | ||||||||||||
Health Care | 70,560,192 | 70,560,192 | — | — | ||||||||||||
Industrials | 71,478,876 | 71,478,876 | — | — | ||||||||||||
Information Technology | 81,748,884 | 81,748,884 | — | — | ||||||||||||
Materials | 15,021,645 | 15,021,645 | — | — | ||||||||||||
Telecommunications Services | 7,576,934 | 7,576,934 | — | — | ||||||||||||
Utilities | — | — | — | — | ||||||||||||
Collateral Held for Securities Loaned | 1,575,210 | 1,575,210 | — | — | ||||||||||||
Short-Term Investments | 16,400,100 | 16,400,100 | — | — | ||||||||||||
|
|
|
|
|
|
|
| |||||||||
Total | $ | 435,587,300 | $ | 435,587,300 | $ | — | $ | — | ||||||||
|
|
|
|
|
|
|
| |||||||||
There were no significant transfers between Levels during the period ended October 31, 2014. Transfers between Levels are identified as of the end of the period.
Partner Mid Cap Value Fund
Fair Valuation Measurements
The following table is a summary of the inputs used, as of October 31, 2014, in valuing Partner Mid Cap Value Fund’s assets carried at fair value.
Investments in Securities | Total | Level 1 | Level 2 | Level 3 | ||||||||||||
Common Stock | ||||||||||||||||
Consumer Discretionary | 23,476,014 | 23,476,014 | — | — | ||||||||||||
Consumer Staples | 10,658,698 | 10,658,698 | — | — | ||||||||||||
Energy | 10,356,446 | 10,356,446 | — | — | ||||||||||||
Financials | 47,410,955 | 47,410,955 | — | — | ||||||||||||
Health Care | 16,369,890 | 16,369,890 | — | — | ||||||||||||
Industrials | 17,144,123 | 17,144,123 | — | — | ||||||||||||
Information Technology | 22,430,287 | 22,430,287 | — | — | ||||||||||||
Materials | 9,959,771 | 9,959,771 | — | — | ||||||||||||
Telecommunications Services | — | — | — | — | ||||||||||||
Utilities | 12,075,042 | 12,075,042 | — | — | ||||||||||||
Collateral Held for Securities Loaned | — | — | — | — | ||||||||||||
Short-Term Investments | 5,641,758 | 5,641,758 | — | — | ||||||||||||
|
|
|
|
|
|
|
| |||||||||
Total | $ | 175,522,984 | $ | 175,522,984 | $ | — | $ | — | ||||||||
|
|
|
|
|
|
|
| |||||||||
There were no significant transfers between Levels during the period ended October 31, 2014. Transfers between Levels are identified as of the end of the period.
- 74 -
Table of Contents
Mid Cap Stock Fund
Fair Valuation Measurements
The following table is a summary of the inputs used, as of October 31, 2014, in valuing Mid Cap Stock Fund’s assets carried at fair value.
Investments in Securities | Total | Level 1 | Level 2 | Level 3 | ||||||||||||
Common Stock | ||||||||||||||||
Consumer Discretionary | 85,742,872 | 85,742,872 | — | — | ||||||||||||
Consumer Staples | 46,841,558 | 46,841,558 | — | — | ||||||||||||
Energy | 52,772,828 | 52,772,828 | — | — | ||||||||||||
Financials | 213,841,602 | 213,841,602 | — | — | ||||||||||||
Health Care | 136,677,876 | 136,677,876 | — | — | ||||||||||||
Industrials | 139,331,298 | 139,331,298 | — | — | ||||||||||||
Information Technology | 173,424,791 | 173,424,791 | — | — | ||||||||||||
Materials | 40,098,083 | 40,098,083 | — | — | ||||||||||||
Telecommunications Services | — | — | — | — | ||||||||||||
Utilities | 13,915,274 | 13,915,274 | — | — | ||||||||||||
Collateral Held for Securities Loaned | 42,247,150 | 42,247,150 | — | — | ||||||||||||
Short-Term Investments | 40,850,015 | 40,850,015 | — | — | ||||||||||||
|
|
|
|
|
|
|
| |||||||||
Total | $ | 985,743,347 | $ | 985,743,347 | $ | — | $ | — | ||||||||
|
|
|
|
|
|
|
| |||||||||
There were no significant transfers between Levels during the period ended October 31, 2014. Transfers between Levels are identified as of the end of the period.
Combined Pro Forma (assuming merger with Target Funds)
Fair Valuation Measurements
The following table is a summary of the inputs used, as of October 31, 2014, in valuing Mid Cap Stock Fund’s assets carried at fair value.
Investments in Securities | Total | Level 1 | Level 2 | Level 3 | ||||||||||||
Common Stock | ||||||||||||||||
Consumer Discretionary | 196,517,114 | 196,517,114 | — | — | ||||||||||||
Consumer Staples | 78,864,632 | 78,864,632 | — | — | ||||||||||||
Energy | 79,057,727 | 79,057,727 | — | — | ||||||||||||
Financials | 307,886,959 | 307,886,959 | — | — | ||||||||||||
Health Care | 223,607,958 | 223,607,958 | — | — | ||||||||||||
Industrials | 227,954,297 | 227,954,297 | — | — | ||||||||||||
Information Technology | 277,603,962 | 277,603,962 | — | — | ||||||||||||
Materials | 65,079,499 | 65,079,499 | — | — | ||||||||||||
Telecommunications Services | 7,576,934 | 7,576,934 | — | — | ||||||||||||
Utilities | 25,990,316 | 25,990,316 | — | — | ||||||||||||
Collateral Held for Securities Loaned | 43,822,360 | 43,822,360 | — | — | ||||||||||||
Short-Term Investments | 62,891,873 | 62,891,873 | — | — | ||||||||||||
|
|
|
|
|
|
|
| |||||||||
Total | $ | 1,596,853,631 | $ | 1,596,853,631 | $ | — | $ | — | ||||||||
|
|
|
|
|
|
|
| |||||||||
There were no significant transfers between Levels during the period ended October 31, 2014. Transfers between Levels are identified as of the end of the period.
- 75 -
Table of Contents
Mid Cap Growth Fund
Investment in Affiliates
Affiliated issuers, as defined under the Investment Company Act of 1940, include those in which the Fund’s holdings of an issuer represent 5% or more of the outstanding voting securities of an issuer, or A summary of transactions for the fiscal year to date, in Mid Cap Growth Fund, is as follows:
Fund | Value October 31, 2013 | Gross Purchases | Gross Sales | Shares Held at October 31, 2014 | Value October 31, 2014 | Income Earned November 1, 2013 - October 31, 2014 | ||||||||||||||||||
Cash Management Trust- Collateral Investment | $ | 19,138,554 | $ | 121,916,092 | $ | 139,479,436 | 1,575,210 | $ | 1,575,210 | $ | 16,613 | |||||||||||||
Cash Management Trust- Short Term Investment | 18,686,520 | 101,397,345 | 103,683,765 | 16,400,100 | 16,400,100 | 9,481 | ||||||||||||||||||
Total Value and Income Earned | 37,825,074 | 17,975,310 | 26,094 | |||||||||||||||||||||
Partner Mid Cap Value Fund
Investment in Affiliates
Affiliated issuers, as defined under the Investment Company Act of 1940, include those in which the Fund’s holdings of an issuer represent 5% or more of the outstanding voting securities of an issuer, or A summary of transactions for the fiscal year to date, in Partner Mid Cap Value Fund, is as follows:
Fund | Value October 31, 2013 | Gross Purchases | Gross Sales | Shares Held at October 31, 2014 | Value October 31, 2014 | Income Earned November 1, 2013 - October 31, 2014 | ||||||||||||||||||
Cash Management Trust- Collateral Investment | — | — | — | — | — | — | ||||||||||||||||||
Cash Management Trust- Short Term Investment | $ | 2,568,093 | $ | 45,128,500 | $ | 42,054,835 | 5,641,758 | $ | 5,641,758 | $ | 1,448 | |||||||||||||
Total Value and Income Earned | 2,568,093 | 5,641,758 | 1,448 | |||||||||||||||||||||
Mid Cap Stock Fund
Investment in Affiliates
Affiliated issuers, as defined under the Investment Company Act of 1940, include those in which the Fund’s holdings of an issuer represent 5% or more of the outstanding voting securities of an issuer, or A summary of transactions for the fiscal year to date, in Mid Cap Stock Fund, is as follows:
Fund | Value October 31, 2013 | Gross Purchases | Gross Sales | Shares Held at October 31, 2014 | Value October 31, 2014 | Income Earned November 1, 2013 - October 31, 2014 | ||||||||||||||||||
Cash Management Trust- Collateral Investment | $ | 96,425,470 | $ | 394,507,597 | $ | 448,685,917 | 42,247,150 | $ | 42,247,150 | $ | 347,781 | |||||||||||||
Cash Management Trust- Short Term Investment | 37,146,950 | 156,229,512 | 152,526,447 | 40,850,015 | 40,850,015 | 26,878 | ||||||||||||||||||
Total Value and Income Earned | 133,572,420 | 83,097,165 | 374,659 | |||||||||||||||||||||
Combined Pro Forma (assuming merger with Target Funds)
Investment in Affiliates
Affiliated issuers, as defined under the Investment Company Act of 1940, include those in which the Fund’s holdings of an issuer represent 5% or more of the outstanding voting securities of an issuer, or A summary of transactions for the fiscal year to date, in Mid Cap Stock Fund, is as follows:
Fund | Value October 31, 2013 | Gross Purchases | Gross Sales | Shares Held at October 31, 2014 | Value October 31, 2014 | Income Earned November 1, 2013 - October 31, 2014 | ||||||||||||||||||
Cash Management Trust- Collateral Investment | $ | 115,564,024 | $ | 516,423,689 | $ | 588,165,353 | $ | 43,822,360 | $ | 43,822,360 | $ | 364,394 | ||||||||||||
Cash Management Trust- Short Term Investment | $ | 58,401,563 | $ | 302,755,357 | $ | 298,265,047 | $ | 62,891,873 | $ | 62,891,873 | $ | 37,807 | ||||||||||||
Total Value and Income Earned | $ | 173,965,587 | $ | 106,714,233 | $ | 402,201 | ||||||||||||||||||
- 76 -
Table of Contents
Notes to Pro Forma Financial Statements of Thrivent Partner Small Cap Growth Fund (Target Fund) and Thrivent Partner Small Cap Value Fund (Target Fund) and Thrivent Small Cap Stock Fund (Acquiring Fund) as of October 31, 2014
(1) ORGANIZATION
Thrivent Mutual Funds (the “Trust”) was organized as a Massachusetts Business Trust on March 10, 1987 and is registered as an open-end management investment company under the Investment Company Act of 1940 (the “1940 Act”). The Trust is divided into twenty-six separate series (each, a “Fund” and, collectively, the “Funds”), each with its own investment objective and policies. The Trust currently consists of four allocation funds, twelve equity funds, four hybrid funds, five fixed-income funds and one money market fund. Thrivent Natural Resources Fund, Thrivent Growth and Income Plus Fund and Thrivent Diversified Income Plus Fund have a fiscal year end on a calendar-year basis and are presented under a separate shareholder report.
The Funds are each investment companies that follow the accounting and reporting guidance of the Financial Accounting Standards Board (FASB) Accounting Standard Codification Topic 946—Financial Services—Investment Companies.
(A) Share Classes — As of October 31, 2014, the Trust includes two classes of shares: Class A and Institutional Class. The classes of shares differ principally in their respective distribution expenses and other class-specific expenses and arrangements. Class A shares have a 0.25% annual 12b-1 fee and a maximum front-end sales load of 5.50% for equity funds and 4.50% for fixed-income funds, although some of the fixed-income funds have lower 12b-1 fees and either a reduced or no front-end sales load. Institutional Class shares are offered at net asset value and have no annual 12b-1 fees. The share classes have identical rights to earnings, assets and voting privileges, except for class-specific expenses and exclusive rights to vote on matters affecting only individual classes. All 26 Funds of the Trust offer Class A and Institutional Class shares.
(B) Other —Under the Trust’s organizational documents, its officers and trustees are indemnified against certain liabilities arising out of the performance of their duties to the Trust. In addition, in the normal course of business, the Trust enters into contracts with vendors and others that provide general damage clauses. The Trust’s maximum exposure under these contracts is unknown, as this would involve future claims that may be made against the Trust. However, based on experience, the Trust expects the risk of loss to be remote.
(2) SIGNIFICANT ACCOUNTING POLICIES
(A) Valuation of Investments —Securities traded on U.S. or foreign securities exchanges or included in a national market system are valued at the official closing price at the close of each business day unless otherwise stated below. Over-the-counter securities and listed securities for which no price is readily available are valued at the current bid price considered best to represent the value at that time. Swap agreements are valued at the latest bid quotation of the contract as furnished by an independent pricing service. Security prices are based on quotes that are obtained from an independent pricing service approved by the Trust’s Board of Trustees (“Board”). The pricing service, in determining values of fixed-income securities, takes into consideration such factors as current quotations by broker/dealers, coupon, maturity, quality, type of issue, trading characteristics, and other yield and risk factors it deems relevant in determining valuations. Securities which cannot be valued by the approved pricing service are valued using valuations obtained from dealers that make markets in the securities. Exchange-listed options and futures contracts are valued at the last quoted sales price. Forward foreign currency exchange contracts are marked-to-market based upon foreign currency exchange rates provided by the pricing service. Investments in open-ended mutual funds are valued at the net asset value at the close of each business day. Short-term securities are valued at amortized cost (which approximates market value) to the extent it is not materially different than market value.
Table of Contents
Securities held by Money Market Fund are valued on the basis of amortized cost (which approximates market value), whereby a portfolio security is valued at its cost initially and thereafter valued to reflect a constant amortization to maturity of any discount or premium. Money Market Fund and the Trust’s investment adviser, Thrivent Asset Management, LLC (“Thrivent Asset Mgt.” or the “Adviser”), follow procedures designed to help maintain a constant net asset value of $1.00 per share.
The Board has delegated responsibility for daily valuation of the Funds’ securities to the Adviser. The Adviser has formed a Valuation Committee (“Committee”) that is responsible for overseeing the Fund valuation policies in accordance with Valuation Policies and Procedures. The Committee meets on a monthly and on an as-needed basis to review price challenges, price overrides, stale prices, shadow prices, manual prices, money market pricing, international fair valuation, and other securities requiring fair valuation.
The Committee monitors for significant events occurring prior to the close of trading on the New York Stock Exchange that could have a material impact on the value of any securities that are held by the Funds. Examples of such events include trading halts, national news/events, and issuer-specific developments. If the Committee decides that such events warrant using fair value estimates, the Committee will take such events into consideration in determining the fair value of such securities. If market quotations or prices are not readily available or determined to be unreliable, the securities will be valued at fair value as determined in good faith pursuant to procedures adopted by the Board.
Financial Accounting Standards Board (FASB) guidelines require increased fair value disclosure intended to improve the consistency and comparability of fair value measurements used in financial reporting. The guidelines define fair value, establish a framework for measuring fair value in U.S. Generally Accepted Accounting Principles (“GAAP”) and expand disclosures about fair value requirements. The various inputs used to determine the fair value of the Funds’ investments are summarized in three broad levels: Level 1 includes quoted prices in active markets for identical securities, typically included in this level are U.S. equity securities, futures, options and registered investment company funds; Level 2 includes other significant observable inputs such as quoted prices for similar securities, interest rates, prepayment speeds and credit risk, typically included in this level are fixed income securities, international securities, swaps and forward contracts; and Level 3 includes significant unobservable inputs such as the Adviser’s own assumptions and broker evaluations in determining the fair value of investments. Of the Level 3 securities, those for which market values were not readily available or were deemed unreliable were fair valued as determined in good faith under procedures established by the Board. The valuation levels are not necessarily an indication of the risk associated with investing in these securities or other investments.
Valuation of International Securities— Because many foreign markets close before the U.S. markets, events may occur between the close of the foreign markets and the close of the U.S. markets that could have a material impact on the valuation of foreign securities. The Funds, under the supervision of the Board, evaluate the impacts of these events and may adjust the valuation of foreign securities to reflect fair value as of the close of the U.S. markets. The Board has authorized the Adviser to make fair valuation determinations pursuant to policies approved by the Board.
(B) Foreign Currency Translation — The accounting records of each Fund are maintained in U.S. dollars. Securities and other assets and liabilities that are denominated in foreign currencies are translated into U.S. dollars at the daily closing rates of exchange.
Foreign currency amounts related to the purchase or sale of securities and income and expenses are translated at the exchange rate on the transaction date. Net realized and unrealized currency gains and losses are recorded from closed currency contracts, disposition of foreign currencies, exchange gains or losses between the trade date and settlement date on securities transactions, and other translation gains or losses on dividends, interest income and foreign withholding taxes. The Funds do not separately report the effect of changes in foreign exchange rates from changes in prices on securities held. Such changes are included in net realized and unrealized gain or loss from investments in the Statement of Operations.
For federal income tax purposes, the Funds treat the effect of changes in foreign exchange rates arising from actual foreign currency transactions and the changes in foreign exchange rates between the trade date and settlement date as ordinary income.
- 2 -
Table of Contents
(C) Foreign Denominated Investments — Foreign denominated assets and currency contracts may involve more risks than domestic transactions including currency risk, political and economic risk, regulatory risk, and market risk. Certain Funds may also invest in securities of companies located in emerging markets. Future economic or political developments could adversely affect the liquidity or value, or both, of such securities.
(D) Federal Income Taxes — No provision has been made for income taxes because each Fund’s policy is to qualify as a regulated investment company under the Internal Revenue Code and distribute substantially all investment company taxable income and net capital gain on a timely basis. It is also the intention of each Fund to distribute an amount sufficient to avoid imposition of any federal excise tax. The Funds, accordingly, anticipate paying no federal taxes and no federal tax provision was recorded. Each Fund is treated as a separate taxable entity for federal income tax purposes. Certain Funds may utilize earnings and profits distributed to shareholders on the redemption of shares as part of the dividends paid deduction.
Foreign Income Taxes — Certain Funds are subject to foreign income taxes imposed by certain countries in which they invest. Withholding taxes on foreign dividends have been provided for in accordance with the applicable country’s tax rules and rates. These amounts are shown as foreign tax withholding on the Statement of Operations. The Funds pay tax on foreign capital gains, where applicable.
GAAP requires management of the Funds (i.e., the Adviser) to make additional tax disclosures with respect to the tax effects of certain income tax positions, whether those positions were taken on previously filed tax returns or are expected to be taken on future returns. These positions must meet a “more likely than not” standard that, based on the technical merits of the position, would have a greater than 50 percent likelihood of being sustained upon examination. In evaluating whether a tax position has met the more-likely-than-not recognition threshold, the Adviser must presume that the position will be examined by the appropriate taxing authority that has full knowledge of all relevant information.
The Adviser analyzed all open tax years, as defined by the statute of limitations, for all major jurisdictions. Open tax years are those that are open for examination by taxing authorities. Major jurisdictions for the Funds include U.S. Federal, Minnesota, Wisconsin, and Massachusetts as well as certain foreign countries. As of October 31, 2014, open U.S. Federal, Minnesota, Wisconsin and Massachusetts tax years include the tax years ended October 31, 2011 through 2014. Additionally, as of October 31, 2014, the tax year ended October 31, 2010 is open for Wisconsin. The Funds have no examinations in progress and none are expected at this time.
As of October 31, 2014, the Adviser has reviewed all open tax years and major jurisdictions and concluded that there is no effect to the Funds’ tax liability, financial position or results of operations. There is no tax liability resulting from unrecognized tax benefits related to uncertain income tax positions taken or expected to be taken in future tax returns. The Funds are also not aware of any tax positions for which it is reasonably possible that the total amounts of unrecognized tax benefits will significantly change in the next 12 months.
(E) Expenses and Income — Estimated expenses are accrued daily. The Funds are charged for those expenses that are directly attributable to them. Expenses that are not directly attributable to a Fund are allocated among all appropriate Funds in proportion to their respective net assets, number of shareholder accounts or other reasonable basis. Net investment income, expenses which are not class-specific, and realized and unrealized gains and losses are allocated directly to each class based upon the relative net asset value of outstanding shares.
Interest income is recorded daily on all debt securities, as is accretion of market discount and original issue discount and amortization of premium. Paydown gains and losses on mortgage- and asset-backed securities are recorded as components of interest income. Dividend income is recorded on the ex-dividend date.
For certain securities, including real estate investment trusts, the Trust records distributions received in excess of income as a reduction of cost of investments and/or realized gain. Such amounts are based on estimates if actual amounts are not available. Actual amounts of income, realized gain and return of capital may differ from the estimated amounts. The Trust adjusts the estimated amounts of the components of distributions as adjustments to investment income, unrealized appreciation/depreciation and realized gain/loss on investments as necessary, once the issuers provide information about the actual composition of the distributions.
- 3 -
Table of Contents
(F) Distributions to Shareholders — Dividend and capital gain distributions are recorded on the ex-dividend date. With the exception of Money Market Fund, net realized gains from securities transactions, if any, are paid at least annually after the close of the fiscal year.
Fund | Dividends Declared | Dividends Paid | ||||||
Partner Small Cap Growth | Annually | Annually | ||||||
Partner Small Cap Value | Annually | Annually | ||||||
Small Cap Stock | Annually | Annually | ||||||
| * | Dividends are net of any short-term realized gains or losses on the sale of securities. |
(G) Derivative Financial Instruments — Each of the Funds, except Money Market Fund, may invest in derivatives. Derivatives, a category that includes options, futures, swaps and hybrid instruments, are financial instruments whose value derives from another security, an index or a currency. Each applicable Fund may use derivatives for hedging (attempting to offset a potential loss in one position by establishing an interest in an opposite position). This includes the use of currency-based derivatives for hedging its positions in foreign securities. Each applicable Fund may also use derivatives for replication of a certain asset class or speculation (investing for potential income or capital gain). These contracts may be transacted on an exchange or over-the-counter (OTC).
A derivative may incur a mark to market loss if the value of the derivative decreases due to an unfavorable change in the market rates or values of the underlying derivative. Losses can also occur if the counterparty does not perform under the derivative. A Fund’s risk of loss from the counterparty credit risk on OTC derivatives is generally limited to the aggregate unrealized gain netted against any collateral held by such Fund. With exchange traded futures and centrally cleared swaps, there is minimal counterparty credit risk to the Funds because the exchange’s clearinghouse, as counterparty to such derivatives, guarantees against a possible default. The clearinghouse stands between the buyer and the seller of the derivative; thus, the credit risk is limited to the failure of the clearinghouse. However, credit risk still exists in exchange traded futures and centrally cleared swaps with respect to initial and variation margin that is held in a broker’s customer accounts. While brokers are required to segregate customer margin from their own assets, in the event that a broker becomes insolvent or goes into bankruptcy and at that time there is a shortfall in the aggregate amount of margin held by the broker for all its clients, U.S. bankruptcy laws will typically allocate that shortfall on a pro-rata basis across all the broker’s customers, potentially resulting in losses to the Funds. Using derivatives to hedge can guard against potential risks, but it also adds to the Funds’ expenses and can eliminate some opportunities for gains. In addition, a derivative used for hedging or replication may not accurately track the value of the underlying asset. Another risk with derivatives is that some types can amplify a gain or loss, potentially earning or losing substantially more money than the actual cost of the derivative.
In order to define their contractual rights and to secure rights that will help the Funds mitigate their counterparty risk, the Funds may enter into an International Swaps and Derivatives Association, Inc. Master Agreement (“ISDA Master Agreement”) or similar agreement with its derivative contract counterparties. An ISDA Master Agreement is a bilateral agreement between a Fund and a counterparty that governs OTC derivatives and foreign exchange contracts and typically includes, among other things, collateral posting terms and netting provisions in the event of a default and/or termination event. Under an ISDA Master Agreement, each Fund may, under certain circumstances, offset with the counterparty certain derivative’s payables and/or receivables with collateral held and/or posted and create one single net payment. The provisions of the ISDA Master Agreement typically permit a single net payment in the event of a default (close-out netting) including the bankruptcy or insolvency of the counterparty. Note, however, that bankruptcy and insolvency laws of a particular jurisdiction may impose restrictions on or prohibitions against the right of offset in bankruptcy, insolvency or other events.
- 4 -
Table of Contents
Collateral and margin requirements vary by type of derivative. Margin requirements are established by the broker or clearinghouse for exchange traded and centrally cleared derivatives (futures, options, and centrally cleared swaps). Brokers can ask for margining in excess of the minimum in certain situations. Collateral terms are contract specific for OTC derivatives (foreign currency exchange contracts, options, swaps). For derivatives traded under an ISDA Master Agreement, the collateral requirements are typically calculated by netting the mark to market amount for each transaction under such agreement and comparing that amount to the value of any collateral currently pledged by the Fund and the counterparty. For financial reporting purposes, non-cash collateral that has been pledged to cover obligations of the Fund has been noted in the Schedule of Investments. To the extent amounts due to the Fund from its counterparties are not fully collateralized, contractually or otherwise, the Fund bears the risk of loss from counterparty nonperformance. The Funds attempt to mitigate counterparty risk by only entering into agreements with counterparties that they believe have the financial resources to honor their obligations and by monitoring the financial stability of those counterparties.
Options — All Funds, except Money Market Fund, may buy put and call options and write put and covered call options. The Funds intend to use such derivative instruments as hedges to facilitate buying or selling securities or to provide protection against adverse movements in security prices or interest rates. The Funds may also enter into options contracts to protect against adverse foreign exchange rate fluctuations. Option contracts are valued daily and unrealized appreciation or depreciation is recorded. A Fund will realize a gain or loss upon expiration or closing of the option transaction. When an option is exercised, the proceeds upon sale for a written call option or the cost of a security for purchased put and call options is adjusted by the amount of premium received or paid.
Buying put options tends to decrease a Fund’s exposure to the underlying security while buying call options tends to increase a Fund’s exposure to the underlying security. The risk associated with purchasing put and call options is limited to the premium paid. There is no significant counterparty risk on exchange-traded options as the exchange guarantees the contract against default. Writing put options tends to increase a Fund’s exposure to the underlying security while writing call options tends to decrease a Fund’s exposure to the underlying security. The writer of an option has no control over whether the underlying security may be bought or sold, and therefore bears the market risk of an unfavorable change in the price of the underlying security. The counterparty risk for purchased options arises when a Fund has purchased an option, exercises that option, and the counterparty doesn’t buy from the Fund or sell to the Fund the underlying asset as required. In the case where a Fund has written an option, the Fund doesn’t have counterparty risk. Counterparty risk on purchased over-the-counter options is partially mitigated by the Fund’s collateral posting requirements. As the option increases in value to the Fund, the Fund receives collateral from the counterparty. Risks of loss may exceed amounts recognized on the Statement of Assets and Liabilities.
Futures Contracts — Certain Funds may use futures contracts to manage the exposure to interest rate and market or currency fluctuations. Gains or losses on futures contracts can offset changes in the yield of securities. When a futures contract is opened, cash or other investments equal to the required “initial margin deposit” are held on deposit with and pledged to the broker. Additional securities held by the Funds may be earmarked to cover open futures contracts. The futures contract’s daily change in value (“variation margin”) is either paid to or received from the broker, and is recorded as an unrealized gain or loss. When the contract is closed, realized gain or loss is recorded equal to the difference between the value of the contract when opened and the value of the contract when closed. Futures contracts involve, to varying degrees, risk of loss in excess of the variation margin disclosed in the Statement of Assets and Liabilities. Exchange-traded futures have no significant counterparty risk as the exchange guarantees the contracts against default.
Foreign Currency Forward Contracts — In connection with purchases and sales of securities denominated in foreign currencies all Funds, except Money Market Fund, may enter into foreign currency contracts. Additionally, the Funds may enter into such contracts to hedge certain other foreign-currency-denominated investments. These contracts are recorded at value and the related realized and change in unrealized foreign exchange gains and losses are included in the Statement of Operations. In the event that counterparties fail to settle
- 5 -
Table of Contents
these currency contracts, the Funds could be exposed to foreign currency fluctuations. Foreign currency contracts are valued daily and unrealized appreciation or depreciation is recorded daily as the difference between the contract exchange rate and the closing forward rate applied to the face amount of the contract. A realized gain or loss is recorded at the time a forward contract is closed. These contracts are over-the-counter and the Fund is exposed to counterparty risk equal to the discounted net amount of payments to the Fund. This risk is partially mitigated by the Fund’s collateral posting requirements.
Swap Agreements — Certain Funds enter into swap transactions, which involve swapping one or more investment characteristics of a security or a basket of securities with another party. Such transactions include market risk, risk of default by the other party to the transaction, risk of imperfect correlation and manager risk and may involve commissions or other costs. Swap transactions generally do not involve delivery of securities, other underlying assets or principal. Accordingly, the risk of loss with respect to swap transactions is generally limited to the net amount of payments that the Fund is contractually obligated to make, or in the case of the counterparty defaulting, the net amount of payments that the Fund is contractually entitled to receive. Risks of loss may exceed amounts recognized on the Statement of Assets and Liabilities. If there is a default by the counterparty, the Fund may have contractual remedies pursuant to the agreements related to the transaction. The contracts are valued daily and unrealized appreciation or depreciation is recorded. Swap agreements are valued at fair value of the contract as provided by an independent pricing service. The pricing service takes into account such factors as swap curves, default probabilities, recent trades, recovery rates and other factors it deems relevant in determining valuations. Daily fluctuations in the value of the centrally cleared credit default contracts are recorded in variation margin in the Statement of Assets and Liabilities and recorded as unrealized gain or loss. The Fund accrues for the periodic payment and amortizes upfront payments, if any, on swap agreements on a daily basis with the net amount recorded as realized gains or losses in the Statement of Operations. Receipts and payments received or made as a result of a credit event or termination of the contract are also recognized as realized gains or losses in the Statement of Operations. Collateral, in the form of cash or securities, may be required to be held with the Fund’s custodian, or a third party, in connection with these agreements. Certain swap agreements are over-the-counter and the Fund is exposed to counterparty risk, which is the discounted net amount of payments owed to the Fund. This risk is partially mitigated by the Fund’s collateral posting requirements. As the swap increases in value to the Fund, the Fund receives collateral from the counterparty. Certain interest rate and credit default index swaps must be cleared through a clearinghouse or central counterparty (a “CCP”). A default or failure by a CCP or a futures commission merchant (a “FCM”), or the failure of a swap to be transferred from a swap execution facility or an executing dealer to the FCM for clearing, may expose the Fund to losses, increase its costs, or prevent the Fund from entering or exiting swap positions, accessing collateral or margin, or fully implementing its investment strategies.
Credit Default Swaps — A credit default swap is a swap agreement between two parties to exchange the credit risk of a particular issuer, basket of securities or reference entity. In a credit default swap transaction, a buyer pays periodic fees in return for payment by the seller which is contingent upon an adverse credit event occurring in the underlying issuer or reference entity. The seller collects periodic fees from the buyer and profits if the credit of the underlying issuer or reference entity remains stable or improves while the swap is outstanding, but the seller in a credit default swap contract would be required to pay the amount of credit loss, determined as specified in the agreement, to the buyer in the event of an adverse credit event in the reference entity. A buyer of a credit default swap is said to buy protection whereas a seller of a credit default swap is said to sell protection. The Funds may be either the protection seller or the protection buyer.
Certain Funds enter into credit default derivative contracts directly through credit default swaps (CDS) or through credit default swap indices (CDX Indices). CDX indices are static pools of equally weighted credit default swaps referencing corporate bonds and/or loans designed to provide diversified credit exposure to these asset classes. Funds sell default protection and assume long-risk positions in individual credits or indices. Index positions are entered into to gain exposure to the corporate bond and/or loan markets in a cost-efficient and diversified structure. In the event that a position defaults, by going into bankruptcy and failing to pay interest or principal on borrowed money, within any given CDX Index held, the maximum potential amount of future payments required would be equal to the pro-rata share of that position within the index based on the notional amount of the index. In the event of a default under a CDS contract the maximum potential amount of future payments would be the notional amount. For CDS, the default events could be bankruptcy and failing to pay interest or principal on borrowed money or a restructuring. A restructuring is a change in the underlying obligations which would include reduction in interest or principal, maturity extension and subordination to other obligations.
- 6 -
Table of Contents
For financial reporting purposes, the Funds do not offset derivative assets and derivative liabilities that are subject to netting arrangements in the Statement of Assets and Liabilities. The amounts presented in the tables below are offset first by financial instruments that have the right of offset under master netting or similar arrangements, then any remaining amount is reduced by cash and non-cash collateral pledged. The actual amounts of collateral may be greater than amounts presented in the tables.
| Gross Amounts Not Offset in the Statement of Assets and Liabilities | ||||||||||||||||||||||||||||
Portfolio | Gross Amounts of Recognized Liabilities | Gross Amounts Offset | Net Amounts of Recognized Liabilities | Financial Instruments | Cash Collateral Pledged | Non-Cash Collateral Pledged** | Net Amount | |||||||||||||||||||||
Partner Small Cap Growth | ||||||||||||||||||||||||||||
Securities Lending | 217,215 | — | 217,215 | 217,215 | — | — | — | |||||||||||||||||||||
Partner Small Cap Value | ||||||||||||||||||||||||||||
Securities Lending | 8,739,961 | — | 8,739,961 | 8,654,315 | — | — | 85,646 | ^ | ||||||||||||||||||||
Small Cap Stock | ||||||||||||||||||||||||||||
Securities Lending | 13,527,930 | — | 13,527,930 | 13,486,028 | — | — | 41,902 | ^ | ||||||||||||||||||||
| ** | Excess of collateral pledged to the counterparty may not be shown for financial reporting purposes. |
| ^ | Net securities lending amounts represent the net amount payable from the counterparty in the event of a default. |
(H) Securities Lending — The Trust has entered into a Securities Lending Agreement (the “Agreement”) with Deutsche Bank AG (“Deutsche”). The Agreement authorizes Deutsche to lend securities to authorized borrowers on behalf of the Funds. Pursuant to the Agreement, all loaned securities are initially collateralized by cash equal to at least 102% of the value of the loaned securities. All cash collateral received is invested in Thrivent Cash Management Trust. The Funds receive dividends and interest that would have been earned on the securities loaned while simultaneously seeking to earn income on the investment of cash collateral. Amounts earned on investments in Thrivent Cash Management Trust, net of rebates, fees paid to Deutsche for services provided and any other securities lending expenses, are included in Income from securities loaned on the Statement of Operations. By investing any cash collateral it receives in these transactions, a Fund could realize additional gains or losses. If the borrower fails to return the securities or the invested collateral has declined in value, the Fund could lose money.
As of October 31, 2014, the value of securities on loan is as follows:
Fund | Securities on Loan | |||
Partner Small Cap Growth | 221,244 | |||
Partner Small Cap Value | 8,654,315 | |||
Small Cap Stock | 13,486,028 | |||
- 7 -
Table of Contents
(I) When-Issued and Delayed Delivery Transactions — Each Fund may purchase or sell securities on a when-issued or delayed delivery basis. These transactions involve a commitment by a Fund to purchase or sell securities for a predetermined price or yield, with payment and delivery taking place beyond the customary settlement period. When delayed delivery purchases are outstanding, a Fund will designate liquid assets in an amount sufficient to meet the purchase price. When purchasing a security on a delayed delivery basis, a Fund assumes the rights and risks of ownership of the security, including the risk of price and yield fluctuations, and takes such fluctuations into account when determining its net asset value. A Fund may dispose of a delayed delivery transaction after it is entered into, and may sell when-issued securities before they are delivered, which may result in a capital gain or loss. When a Fund has sold a security on a delayed delivery basis, a Fund does not participate in future gains and losses with respect to the security.
(J) Treasury Inflation Protected Securities — Certain Funds may invest in treasury inflation protected securities (TIPS). These securities are fixed income securities whose principal value is periodically adjusted to the rate of inflation. The coupon interest rate is generally fixed at issuance. Interest is paid based on the principal value, which is adjusted for inflation. Any increase in the principal amount will be included as taxable interest in the Statement of Operations and received in cash upon maturity or sale of the security.
(K) Repurchase Agreements — Each Fund may engage in repurchase agreement transactions in pursuit of its investment objective. A repurchase agreement consists of a purchase and a simultaneous agreement to resell an investment for later delivery at an agreed upon price and rate of interest. The Fund uses a third-party custodian to maintain the collateral. If the original seller of a security subject to a repurchase agreement fails to repurchase the security at the agreed upon time, the Fund could incur a loss due to a drop in the value of the security during the time it takes the Fund to either sell the security or take action to enforce the original seller’s agreement to repurchase the security. Also, if a defaulting original seller filed for bankruptcy or became insolvent, disposition of such security might be delayed by pending legal action. The Fund may only enter into repurchase agreements with banks and other recognized financial institutions such as broker/dealers that are found by the Adviser or subadviser to be creditworthy. During the year ended October 31, 2014, none of the Funds engaged in these types of investments.
(L) Equity-Linked Structured Securities — Certain Funds may invest in equity-linked structured notes. Equity-linked structured notes are debt securities which combine the characteristics of common stock and the sale of an option. The return component is based upon the performance of a single equity security, a basket of equity securities, or an equity index and the sale of an option. There is no guaranteed return of principal with these securities. The appreciation potential of these securities may be limited by a maximum payment or call right and can be influenced by many unpredictable factors. In addition to the performance of the equity, the nature and credit of the issuer may also impact return.
(M) Stripped Securities — Certain Funds may invest in Interest Only and Principal Only stripped mortgage or asset backed securities. These securities represent a participation in securities that are structured in classes with rights to receive different portions of the interest and principal. Interest only securities receive all the interest and principal only securities receive all the principal. If the underlying pool of mortgages or assets experience greater than anticipated prepayments of principal, the Fund may not fully recoup its initial investment in an interest only security. Principal only securities increase in value if prepayments are greater than anticipated and decline if prepayments are slower than anticipated. The market value of these securities is highly sensitive to changes in interest rates.
(N) Credit Risk — The Funds may be susceptible to credit risk to the extent an issuer or counterparty defaults on its payment obligation. The Funds’ policy is to monitor the creditworthiness of issuers and counterparties. Interest receivable on defaulted securities is monitored for ability to collect payments in default and is adjusted accordingly.
(O) Accounting Estimates — The preparation of financial statements in conformity with GAAP requires management to make estimates and assumptions that affect the reported amounts of assets and liabilities and disclosure of contingent assets and liabilities at the date of the financial statements and the reported amounts of income and expenses during the reporting period. Actual results could differ from those estimates.
- 8 -
Table of Contents
(P) Loan Commitments — Certain Funds may enter into loan commitments, which generally have interest rates which are reset daily, monthly, quarterly or semi-annually by reference to a base lending rate, plus a premium. These base rates are primarily the London-Interbank Offered Rate (“LIBOR”), and secondarily the prime rate offered by one or more major United States banks (the “Prime Rate”) and the certificate of deposit (“CD”) rate or other base lending rates used by commercial lenders. Loan commitments often require prepayments from excess cash flows or allow the borrower to repay at its election. The rate at which the borrower repays cannot be predicted with accuracy. Therefore, the remaining maturity may be considerably less than the stated maturity shown in the Schedule of Investments.
All or a portion of these loan commitments may be unfunded. A Fund is obligated to fund these commitments at the borrower’s discretion. Therefore, the Fund must have funds sufficient to cover its contractual obligation. These unfunded loan commitments, which are marked to market daily, are presented in the Schedule of Investments.
(Q) Loss Contingencies — High Yield Fund and Thrivent Income Fund are defendants in an adversary action filed on July 31, 2009 by the Official Committee of Unsecured Creditors of Motors Liquidation Company, formerly known as General Motors Corporation (GM), against prior and current holders of term loan debt of GM. The suit seeks to determine whether GM’s term loan facility was secured at the time it entered bankruptcy. High Yield Fund at one time held term loans in an original principal amount of at least $4,723,994 and, if the plaintiffs are successful, it is reasonably possible that the Fund will be required to make payments in some amount. This loss contingency has not been accrued as a liability because the amount of potential damages and the likelihood of loss cannot be reasonably estimated. Thrivent Income Fund is named as a defendant in this action, but we do not expect that the Fund’s assets will be subject to a loss contingency.
(R) Litigation — Awards from class action litigation are recorded as realized gains on the payment date.
(S) In-kind Redemptions — During the year ended October 31, 2014, the Thrivent Asset Allocation Funds, as the shareholders of the underlying funds of Thrivent Mutual Funds, Inc., (the “underlying fund”), redeemed their shares in-kind (“in-kind redemption”) of Thrivent Partner Small Cap Growth Fund (the “underlying fund”). The underlying fund distributed fund securities and cash as payment for the redemption of these fund shares. For financial reporting purposes, the underlying fund recognizes gain on these transactions to the extent the value of the distributed securities on the date of redemption exceeds the cost of those securities; they recognize a loss if the cost exceeds the value. Gains or losses on in-kind redemptions are not recognized for tax purposes. The realized gains or losses below are included in the Statement of Operations of the underlying fund as net realized gains/losses on in-kind redemptions. The in-kind amounts and shares redeemed are included in the Capital Stock Transactions of the Statement of Changes in Net Assets of the underlying fund. These in-kind transactions were conducted at market value. The transactions were as follows:
Underlying Fund | Underlying Shares Redeemed | Date | In-kind Amount | Realized Gain/(Loss) | ||||||||||||||
Aggressive Allocation Fund | Partner Small Cap Growth | 3,871,291 | 9/29/2014 | $ | 58,769,679 | $ | 5,914,868 | |||||||||||
Moderately Aggressive Allocation Fund | Partner Small Cap Growth | 3,462,250 | 9/29/2014 | $ | 52,560,077 | $ | 12,227,004 | |||||||||||
Moderate Allocation Fund | Partner Small Cap Growth | 2,282,448 | 9/29/2014 | $ | 34,649,606 | $ | 6,525,180 | |||||||||||
- 9 -
Table of Contents
During the year ended October 31, 2014, Thrivent Financial for Lutherans redeemed their shares in-kind (“in-kind redemption”) of Thrivent Partner Mid Cap Value Fund and Thrivent Partner Small Cap Growth Fund (the “underlying funds”). The underlying funds distributed fund securities and cash as payment for the redemption of these fund shares. For financial reporting purposes, the underlying funds recognize gain on these transactions to the extent the value of the distributed securities on the date of redemption exceeds the cost of those securities; they recognize a loss if the cost exceeds the value. Gains or losses on in-kind redemptions are not recognized for tax purposes. The realized gains or losses below are included in the Statement of Operations of the underlying funds as net realized gains/losses on in-kind redemptions. The in-kind amounts and shares redeemed are included in the Capital Stock Transactions of the Statement of Changes in Net Assets of the underlying funds. These in-kind transactions were conducted at market value. The transactions were as follows:
| Underlying Fund | Underlying Shares Redeemed | Date | In-kind Amount | Realized Gain/(Loss) | ||||||||||||||
Thrivent Financial for Lutherans | Partner Small Cap Growth | 748,037 | 1/15/2014 | $ | 11,519,768 | $ | 4,068,066 | |||||||||||
(T) Other — For financial statement purposes, investment security transactions are accounted for on the trade date. Realized gains and losses from investment transactions are determined on a specific cost identification basis, which is the same basis used for federal income tax purposes.
(3) FEES AND COMPENSATION PAID TO AFFILIATES
(A) Investment Advisory Fees — The Trust has entered into an Investment Advisory Agreement with Thrivent Asset Mgt. Under the Investment Advisory Agreement, each of the Funds pays a fee for investment advisory services. The fees are accrued daily and paid monthly.
The four Asset Allocation Funds – Aggressive Allocation Fund, Moderately Aggressive Allocation Fund, Moderate Allocation Fund and Moderately Conservative Allocation Fund – pay investment advisory fees for asset allocation services. In addition, for investments (other than underlying Thrivent Funds) held directly by the Asset Allocation Funds, each Asset Allocation Fund will pay an additional advisory fee. The annual rates of fees as a percentage of average daily net assets under the Investment Advisory Agreement are as follows:
- 10 -
Table of Contents
For all other Funds, the annual rates of fees as a percent of average daily net assets under the Investment Advisory Agreement were as follows:
Fund (M - Millions) | $0 to $50M | Over $50 to $100M | Over $100 to $200M | Over $200 to $250M | Over $250 to $500M | Over $500 to $750M | Over $750 to $1,000M | Over $1,000 to $2,000M | Over $2,000 to $2,500M | Over $2,500 to $5,000M | Over $5,000M | |||||||||||||||||||||||||||||||||
Partner Small Cap Growth | 0.900 | % | 0.900 | % | 0.900 | % | 0.900 | % | 0.900 | % | 0.800 | % | 0.800 | % | 0.800 | % | 0.800 | % | 0.800 | % | 0.800 | % | ||||||||||||||||||||||
Partner Small Cap Value | 0.700 | % | 0.700 | % | 0.700 | % | 0.700 | % | 0.700 | % | 0.700 | % | 0.700 | % | 0.700 | % | 0.700 | % | 0.700 | % | 0.700 | % | ||||||||||||||||||||||
Small Cap Stock | 0.700 | % | 0.700 | % | 0.700 | % | 0.650 | % | 0.650 | % | 0.650 | % | 0.650 | % | 0.600 | % | 0.600 | % | 0.550 | % | 0.525 | % | ||||||||||||||||||||||
(B) Sub-Adviser Fees — The following subadviser fees are charged as part of the total investment advisory fees stated in the table above. The subadvisory fees are borne directly by the Adviser and do not increase the overall fees paid by the Fund.
Partner Small Cap Growth Fund
The Adviser had entered into a subadvisory agreement with Turner Investments, L.P. (“Turner”) for performance of subadvisory services. For assets that were defined as microcap assets, the fee payable was equal to 0.80% of the average daily net assets in that microcap portion. For all other assets, the fee payable was equal to 0.65% of the average daily net assets when the entire portfolio assets (including the microcap portion) were no greater than $100 million, 0.60% of the average daily net assets when the entire portfolio assets were greater than $100 million but no greater than $350 million, and 0.575% of the average daily net assets when the entire portfolio assets were greater than $350 million. Thrivent Partner Small Cap Growth Portfolio (including the microcap portion of that Portfolio) was included in determining breakpoints for the assets managed by Turner. This agreement was terminated on May 27, 2014.
Partner Small Cap Value Fund
The Adviser has entered into a subadvisory agreement with T. Rowe Price Associates, Inc. for performance of subadvisory services. The fee payable is equal to 0.60% of average daily net assets.
(C) Expense Reimbursements — For the period ended October 31, 2014, the following voluntary expense reimbursements to limit expenses to the following percentages were in effect:
Fund | Class A | Institutional Class | Expiration Date | |||||||||
Partner Small Cap Growth | 1.30 | %1 | 1.00 | % | N/A | |||||||
| 1 | The following voluntary expense caps became effective 9/29/2014. The class A voluntary expense cap replaced the contractual expense cap of 1.40% |
Thrivent does not recoup amounts previously reimbursed or waived in prior fiscal years.
Each equity, hybrid and fixed income fund may invest cash in High Yield Fund, Money Market Fund and Thrivent Cash Management Trust, subject to certain limitations. During the year ended October 31, 2014, no Funds invested in High Yield Fund. During the year ended October 31, 2014, no funds invested in Money Market Fund. During the year ended October 31, 2014, all funds except Municipal Bond Fund and Money Market Fund invested in Thrivent Cash Management Trust. These related-party transactions are subject to the same terms as non-related party transactions except that, to avoid duplicate investment advisory fees, Thrivent Asset Mgt. reimburses an amount equal to the advisory fee that is charged to the equity, hybrid or fixed income fund for its investment in High Yield Fund, Money Market Fund or Thrivent Cash Management Trust.
- 11 -
Table of Contents
(D) Distribution Plan — Thrivent Investment Management, Inc. (“Thrivent Investment Mgt.”) is the Trust’s distributor. The Trust has adopted a Distribution Plan pursuant to Rule 12b-1 under the 1940 Act. Class A shares have a Rule 12b-1 fee of up to 0.25% (up to 0.125% for Government Bond Fund, Limited Maturity Bond Fund and Money Market Fund) of average net assets.
(E) Sales Charges and Other Fees — For the year ended October 31, 2014, Thrivent Investment Mgt. received $11,781,760 of aggregate underwriting concessions from the sales of the Trust’s Class A shares. Sales charges are not an expense of the Trust and are not reflected in the financial statements of any of the Funds.
The Trust has entered into an accounting and administrative services agreement with Thrivent Asset Mgt. pursuant to which Thrivent Asset Mgt. provides certain accounting and administrative personnel and services to the Funds. For the year ended October 31, 2014, Thrivent Asset Mgt. received aggregate fees for accounting and administrative personnel and services of $4,635,726 from the Trust.
The Trust has entered into an agreement with Thrivent Financial Investor Services Inc. (“Thrivent Investor Services”) to provide the Funds with transfer agent services. For the year ended October 31, 2014, Thrivent Investor Services received $14,237,728 for transfer agent services from the Trust.
Each Trustee who is not affiliated with the Adviser receives an annual fee from the Trust for services as a Trustee and is eligible to participate in a deferred compensation plan with respect to fees received from the Funds. Participants in the plan may designate their deferred Trustee’s fees as if invested in a series of the Thrivent Mutual Funds. The value of each Trustee’s deferred compensation account will increase or decrease as if invested in shares of that series. Their fees as well as the change in value are included in Trustee fees in the Statement of Operations. The deferred fees remain in the appropriate Fund until distribution in accordance with the plan. The deferred fee liability, included in accrued expenses in the Statement of Assets and Liabilities, is unsecured.
Those Trustees not participating in the above plan received $257,499 in fees from the Trust for the year ended October 31, 2014. In addition, the Trust reimbursed independent Trustees for reasonable expenses incurred in relation to attendance at meetings and industry conferences.
Certain officers and non-independent Trustees of the Trust are officers and directors of Thrivent Asset Mgt., Thrivent Investment Mgt. and Thrivent Investor Services; however, they receive no compensation from the Trust.
(F) Indirect Expenses — Some Funds invest in other mutual funds. Fees and expenses of those underlying funds are not included in those Funds’ expense ratios. The Funds indirectly bear their proportionate share of the annualized weighted average expense ratio of the underlying funds in which they invest.
(4) TAX INFORMATION
Distributions are based on amounts calculated in accordance with the applicable federal income tax regulations, which may differ from GAAP. To the extent that these differences are permanent in nature, such amounts are reclassified within the capital accounts based on their federal tax-basis treatment; temporary differences do not require reclassifications.
- 12 -
Table of Contents
On the Statement of Assets and Liabilities, as a result of permanent book-to-tax differences, reclassification adjustments were made as follows [Increase/(Decrease)]:
Fund | Accumulated Undistributed Net Investment Income/(Loss) | Accumulated Undistributed Net Realized Gain/(Loss) | Capital Stock | |||||||||
Partner Small Cap Growth | 1,066,390 | (42,427,765 | ) | 41,361,375 | ||||||||
Partner Small Cap Value | 462,055 | (3,281,695 | ) | 2,819,640 | ||||||||
Small Cap Stock | 561,769 | (1,360,276 | ) | 798,507 | ||||||||
At October 31, 2014, the components of distributable earnings on a tax basis were as follows:
Fund | Undistributed Ordinary Incomea | Undistributed Long- Term Capital Gain | ||||||
Partner Small Cap Growth | 46,612 | 1,771,878 | ||||||
Partner Small Cap Value | 1,187,718 | 31,659,907 | ||||||
Small Cap Stock | 4,356,247 | 32,385,099 | ||||||
| a | Undistributed Ordinary Income includes income derived from Short-Term Capital Gains. |
The tax character of distributions paid during the years ended October 31, 2014 and 2013 was as follows:
| Tax-Exempt Income | Ordinary Income(a) | Long-Term Capital Gain | ||||||||||||||||||||||
Fund | 10/31/2014 | 10/31/2013 | 10/31/2014 | 10/31/2013 | 10/31/2014 | 10/31/2013 | ||||||||||||||||||
Partner Small Cap Growth | — | — | 4,393,398 | — | 18,902,748 | 3,845,472 | ||||||||||||||||||
Partner Small Cap Value | — | — | 673,907 | 4,735,626 | 7,840,214 | 3,760,790 | ||||||||||||||||||
Small Cap Stock | — | — | — | — | 2,535,087 | — | ||||||||||||||||||
| (a) | Ordinary income includes income derived from short-term capital gains. |
(5) SECURITY TRANSACTIONS
(A) Purchases and Sales of Investment Securities — For the year ended October 31, 2014, the cost of purchases and the proceeds from sales of investment securities, other than U.S. Government and short-term securities, were as follows:
| In thousands | ||||||||
Fund | Purchases | Sales | ||||||
Partner Small Cap Growth | 131,262 | 131,184 | ||||||
Partner Small Cap Value | 52,742 | 84,170 | ||||||
Small Cap Stock | 184,362 | 184,624 | ||||||
- 13 -
Table of Contents
(B) Investments in High-Yielding Securities — High Yield Fund invests primarily in high-yielding fixed-income securities. Each of the other Funds, except Money Market Fund, may also invest in high-yielding securities. These securities will typically be in the lower rating categories or will be non-rated and generally will involve more risk than securities in the higher rating categories. Lower rated or unrated securities (e.g., junk bonds) are more likely to react to developments affecting market risk and credit risk than are more highly rated securities, which react primarily to movements in the general level of interest rates.
(C) Investments in Options and Futures Contracts — The movement in the price of the security underlying an option or futures contract may not correlate perfectly with the movement in the prices of the portfolio securities being hedged. A lack of correlation could render a Fund’s hedging strategy unsuccessful and could result in a loss to the Fund. In the event that a liquid secondary market would not exist, the Fund could be prevented from entering into a closing transaction, which could result in additional losses to the Fund.
(6) SECURITY TRANSACTIONS WITH AFFILIATED FUNDS
The Funds are permitted to purchase or sell securities from or to certain other Funds under specified conditions outlined in procedures adopted by the Board. The procedures have been designed to ensure that any purchase or sale of securities by a Fund from or to another fund or portfolio that is or could be considered an affiliate by virtue of having a common investment adviser (or affiliated investment advisers), common Trustees and/or common officers complies with Rule 17a-7 of the 1940 Act. Further, as defined under the procedures, each transaction is executed at the current market price.
(7) SUBSEQUENT EVENTS
The Adviser of the Funds has evaluated the impact of subsequent events, and, except as already included in the Notes to Financial Statements and in the next paragraph, has determined that no additional items require disclosure.
On November 24, 2014, a single investor redeemed $36.8 million from Thrivent Partner Small Cap Value Fund. This amount represented approximately 14% of the net assets of the Fund as of that date.
- 14 -
Table of Contents
Notes to Pro Forma Financial Statements of Thrivent Mid Cap Growth Fund (Target Fund)
and Thrivent Partner Mid Cap Value Fund (Target Fund) and Thrivent Mid Cap Stock Fund (Acquiring Fund)
as of October 31, 2014
(1) ORGANIZATION
Thrivent Mutual Funds (the “Trust”) was organized as a Massachusetts Business Trust on March 10, 1987 and is registered as an open-end management investment company under the Investment Company Act of 1940 (the “1940 Act”). The Trust is divided into twenty-six separate series (each, a “Fund” and, collectively, the “Funds”), each with its own investment objective and policies. The Trust currently consists of four allocation funds, twelve equity funds, four hybrid funds, five fixed-income funds and one money market fund. Thrivent Natural Resources Fund, Thrivent Growth and Income Plus Fund and Thrivent Diversified Income Plus Fund have a fiscal year end on a calendar-year basis and are presented under a separate shareholder report.
The Funds are each investment companies that follow the accounting and reporting guidance of the Financial Accounting Standards Board (FASB) Accounting Standard Codification Topic 946—Financial Services—Investment Companies.
(A) Share Classes — As of October 31, 2014, the Trust includes two classes of shares: Class A and Institutional Class. The classes of shares differ principally in their respective distribution expenses and other class-specific expenses and arrangements. Class A shares have a 0.25% annual 12b-1 fee and a maximum front-end sales load of 5.50% for equity funds and 4.50% for fixed-income funds, although some of the fixed-income funds have lower 12b-1 fees and either a reduced or no front-end sales load. Institutional Class shares are offered at net asset value and have no annual 12b-1 fees. The share classes have identical rights to earnings, assets and voting privileges, except for class-specific expenses and exclusive rights to vote on matters affecting only individual classes. All 26 Funds of the Trust offer Class A and Institutional Class shares.
(B) Other —Under the Trust’s organizational documents, its officers and trustees are indemnified against certain liabilities arising out of the performance of their duties to the Trust. In addition, in the normal course of business, the Trust enters into contracts with vendors and others that provide general damage clauses. The Trust’s maximum exposure under these contracts is unknown, as this would involve future claims that may be made against the Trust. However, based on experience, the Trust expects the risk of loss to be remote.
(2) SIGNIFICANT ACCOUNTING POLICIES
(A) Valuation of Investments —Securities traded on U.S. or foreign securities exchanges or included in a national market system are valued at the official closing price at the close of each business day unless otherwise stated below. Over-the-counter securities and listed securities for which no price is readily available are valued at the current bid price considered best to represent the value at that time. Swap agreements are valued at the latest bid quotation of the contract as furnished by an independent pricing service. Security prices are based on quotes that are obtained from an independent pricing service approved by the Trust’s Board of Trustees (“Board”). The pricing service, in determining values of fixed-income securities, takes into consideration such factors as current quotations by broker/dealers, coupon, maturity, quality, type of issue, trading characteristics, and other yield and risk factors it deems relevant in determining valuations. Securities which cannot be valued by the approved pricing service are valued using valuations obtained from dealers that make markets in the securities. Exchange-listed options and futures contracts are valued at the last quoted sales price. Forward foreign currency exchange contracts are marked-to-market based upon foreign currency exchange rates provided by the pricing service. Investments in open-ended mutual funds are valued at the net asset value at the close of each business day. Short-term securities are valued at amortized cost (which approximates market value) to the extent it is not materially different than market value.
Securities held by Money Market Fund are valued on the basis of amortized cost (which approximates market value), whereby a portfolio security is valued at its cost initially and thereafter valued to reflect a constant amortization to maturity of any discount or premium. Money Market Fund and the Trust’s investment adviser, Thrivent Asset Management, LLC (“Thrivent Asset Mgt.” or the “Adviser”), follow procedures designed to help maintain a constant net asset value of $1.00 per share.
Table of Contents
The Board has delegated responsibility for daily valuation of the Funds’ securities to the Adviser. The Adviser has formed a Valuation Committee (“Committee”) that is responsible for overseeing the Fund valuation policies in accordance with Valuation Policies and Procedures. The Committee meets on a monthly and on an as-needed basis to review price challenges, price overrides, stale prices, shadow prices, manual prices, money market pricing, international fair valuation, and other securities requiring fair valuation.
The Committee monitors for significant events occurring prior to the close of trading on the New York Stock Exchange that could have a material impact on the value of any securities that are held by the Funds. Examples of such events include trading halts, national news/events, and issuer-specific developments. If the Committee decides that such events warrant using fair value estimates, the Committee will take such events into consideration in determining the fair value of such securities. If market quotations or prices are not readily available or determined to be unreliable, the securities will be valued at fair value as determined in good faith pursuant to procedures adopted by the Board.
Financial Accounting Standards Board (FASB) guidelines require increased fair value disclosure intended to improve the consistency and comparability of fair value measurements used in financial reporting. The guidelines define fair value, establish a framework for measuring fair value in U.S. Generally Accepted Accounting Principles (“GAAP”) and expand disclosures about fair value requirements. The various inputs used to determine the fair value of the Funds’ investments are summarized in three broad levels: Level 1 includes quoted prices in active markets for identical securities, typically included in this level are U.S. equity securities, futures, options and registered investment company funds; Level 2 includes other significant observable inputs such as quoted prices for similar securities, interest rates, prepayment speeds and credit risk, typically included in this level are fixed income securities, international securities, swaps and forward contracts; and Level 3 includes significant unobservable inputs such as the Adviser’s own assumptions and broker evaluations in determining the fair value of investments. Of the Level 3 securities, those for which market values were not readily available or were deemed unreliable were fair valued as determined in good faith under procedures established by the Board. The valuation levels are not necessarily an indication of the risk associated with investing in these securities or other investments.
Valuation of International Securities — Because many foreign markets close before the U.S. markets, events may occur between the close of the foreign markets and the close of the U.S. markets that could have a material impact on the valuation of foreign securities. The Funds, under the supervision of the Board, evaluate the impacts of these events and may adjust the valuation of foreign securities to reflect fair value as of the close of the U.S. markets. The Board has authorized the Adviser to make fair valuation determinations pursuant to policies approved by the Board.
(B) Foreign Currency Translation — The accounting records of each Fund are maintained in U.S. dollars. Securities and other assets and liabilities that are denominated in foreign currencies are translated into U.S. dollars at the daily closing rates of exchange.
Foreign currency amounts related to the purchase or sale of securities and income and expenses are translated at the exchange rate on the transaction date. Net realized and unrealized currency gains and losses are recorded from closed currency contracts, disposition of foreign currencies, exchange gains or losses between the trade date and settlement date on securities transactions, and other translation gains or losses on dividends, interest income and foreign withholding taxes. The Funds do not separately report the effect of changes in foreign exchange rates from changes in prices on securities held. Such changes are included in net realized and unrealized gain or loss from investments in the Statement of Operations.
For federal income tax purposes, the Funds treat the effect of changes in foreign exchange rates arising from actual foreign currency transactions and the changes in foreign exchange rates between the trade date and settlement date as ordinary income.
- 2 -
Table of Contents
(C) Foreign Denominated Investments — Foreign denominated assets and currency contracts may involve more risks than domestic transactions including currency risk, political and economic risk, regulatory risk, and market risk. Certain Funds may also invest in securities of companies located in emerging markets. Future economic or political developments could adversely affect the liquidity or value, or both, of such securities.
(D) Federal Income Taxes — No provision has been made for income taxes because each Fund’s policy is to qualify as a regulated investment company under the Internal Revenue Code and distribute substantially all investment company taxable income and net capital gain on a timely basis. It is also the intention of each Fund to distribute an amount sufficient to avoid imposition of any federal excise tax. The Funds, accordingly, anticipate paying no federal taxes and no federal tax provision was recorded. Each Fund is treated as a separate taxable entity for federal income tax purposes. Certain Funds may utilize earnings and profits distributed to shareholders on the redemption of shares as part of the dividends paid deduction.
Foreign Income Taxes — Certain Funds are subject to foreign income taxes imposed by certain countries in which they invest. Withholding taxes on foreign dividends have been provided for in accordance with the applicable country’s tax rules and rates. These amounts are shown as foreign tax withholding on the Statement of Operations. The Funds pay tax on foreign capital gains, where applicable.
GAAP requires management of the Funds (i.e., the Adviser) to make additional tax disclosures with respect to the tax effects of certain income tax positions, whether those positions were taken on previously filed tax returns or are expected to be taken on future returns. These positions must meet a “more likely than not” standard that, based on the technical merits of the position, would have a greater than 50 percent likelihood of being sustained upon examination. In evaluating whether a tax position has met the more-likely-than-not recognition threshold, the Adviser must presume that the position will be examined by the appropriate taxing authority that has full knowledge of all relevant information.
The Adviser analyzed all open tax years, as defined by the statute of limitations, for all major jurisdictions. Open tax years are those that are open for examination by taxing authorities. Major jurisdictions for the Funds include U.S. Federal, Minnesota, Wisconsin, and Massachusetts as well as certain foreign countries. As of October 31, 2014, open U.S. Federal, Minnesota, Wisconsin and Massachusetts tax years include the tax years ended October 31, 2011 through 2014. Additionally, as of October 31, 2014, the tax year ended October 31, 2010 is open for Wisconsin. The Funds have no examinations in progress and none are expected at this time.
As of October 31, 2014, the Adviser has reviewed all open tax years and major jurisdictions and concluded that there is no effect to the Funds’ tax liability, financial position or results of operations. There is no tax liability resulting from unrecognized tax benefits related to uncertain income tax positions taken or expected to be taken in future tax returns. The Funds are also not aware of any tax positions for which it is reasonably possible that the total amounts of unrecognized tax benefits will significantly change in the next 12 months.
(E) Expenses and Income — Estimated expenses are accrued daily. The Funds are charged for those expenses that are directly attributable to them. Expenses that are not directly attributable to a Fund are allocated among all appropriate Funds in proportion to their respective net assets, number of shareholder accounts or other reasonable basis. Net investment income, expenses which are not class-specific, and realized and unrealized gains and losses are allocated directly to each class based upon the relative net asset value of outstanding shares.
Interest income is recorded daily on all debt securities, as is accretion of market discount and original issue discount and amortization of premium. Paydown gains and losses on mortgage- and asset-backed securities are recorded as components of interest income. Dividend income is recorded on the ex-dividend date.
For certain securities, including real estate investment trusts, the Trust records distributions received in excess of income as a reduction of cost of investments and/or realized gain. Such amounts are based on estimates if actual amounts are not available. Actual amounts of income, realized gain and return of capital may differ from the estimated amounts. The Trust adjusts the estimated amounts of the components of distributions as adjustments to investment income, unrealized appreciation/depreciation and realized gain/loss on investments as necessary, once the issuers provide information about the actual composition of the distributions.
- 3 -
Table of Contents
(F) Distributions to Shareholders — Dividend and capital gain distributions are recorded on the ex-dividend date. With the exception of Money Market Fund, net realized gains from securities transactions, if any, are paid at least annually after the close of the fiscal year.
Fund | Dividends Declared | Dividends Paid | ||
Mid Cap Growth | Annually | Annually | ||
Partner Mid Cap Value | Annually | Annually | ||
Mid Cap Stock | Annually | Annually |
(G) Derivative Financial Instruments — Each of the Funds, except Money Market Fund, may invest in derivatives. Derivatives, a category that includes options, futures, swaps and hybrid instruments, are financial instruments whose value derives from another security, an index or a currency. Each applicable Fund may use derivatives for hedging (attempting to offset a potential loss in one position by establishing an interest in an opposite position). This includes the use of currency-based derivatives for hedging its positions in foreign securities. Each applicable Fund may also use derivatives for replication of a certain asset class or speculation (investing for potential income or capital gain). These contracts may be transacted on an exchange or over-the-counter (OTC).
A derivative may incur a mark to market loss if the value of the derivative decreases due to an unfavorable change in the market rates or values of the underlying derivative. Losses can also occur if the counterparty does not perform under the derivative. A Fund’s risk of loss from the counterparty credit risk on OTC derivatives is generally limited to the aggregate unrealized gain netted against any collateral held by such Fund. With exchange traded futures and centrally cleared swaps, there is minimal counterparty credit risk to the Funds because the exchange’s clearinghouse, as counterparty to such derivatives, guarantees against a possible default. The clearinghouse stands between the buyer and the seller of the derivative; thus, the credit risk is limited to the failure of the clearinghouse. However, credit risk still exists in exchange traded futures and centrally cleared swaps with respect to initial and variation margin that is held in a broker’s customer accounts. While brokers are required to segregate customer margin from their own assets, in the event that a broker becomes insolvent or goes into bankruptcy and at that time there is a shortfall in the aggregate amount of margin held by the broker for all its clients, U.S. bankruptcy laws will typically allocate that shortfall on a pro-rata basis across all the broker’s customers, potentially resulting in losses to the Funds. Using derivatives to hedge can guard against potential risks, but it also adds to the Funds’ expenses and can eliminate some opportunities for gains. In addition, a derivative used for hedging or replication may not accurately track the value of the underlying asset. Another risk with derivatives is that some types can amplify a gain or loss, potentially earning or losing substantially more money than the actual cost of the derivative.
In order to define their contractual rights and to secure rights that will help the Funds mitigate their counterparty risk, the Funds may enter into an International Swaps and Derivatives Association, Inc. Master Agreement (“ISDA Master Agreement”) or similar agreement with its derivative contract counterparties. An ISDA Master Agreement is a bilateral agreement between a Fund and a counterparty that governs OTC derivatives and foreign exchange contracts and typically includes, among other things, collateral posting terms and netting provisions in the event of a default and/or termination event. Under an ISDA Master Agreement, each Fund may, under certain circumstances, offset with the counterparty certain derivative’s payables and/or receivables with collateral held and/or posted and create one single net payment. The provisions of the ISDA Master Agreement typically permit a single net payment in the event of a default (close-out netting) including the bankruptcy or insolvency of the counterparty. Note, however, that bankruptcy and insolvency laws of a particular jurisdiction may impose restrictions on or prohibitions against the right of offset in bankruptcy, insolvency or other events.
- 4 -
Table of Contents
Collateral and margin requirements vary by type of derivative. Margin requirements are established by the broker or clearinghouse for exchange traded and centrally cleared derivatives (futures, options, and centrally cleared swaps). Brokers can ask for margining in excess of the minimum in certain situations. Collateral terms are contract specific for OTC derivatives (foreign currency exchange contracts, options, swaps). For derivatives traded under an ISDA Master Agreement, the collateral requirements are typically calculated by netting the mark to market amount for each transaction under such agreement and comparing that amount to the value of any collateral currently pledged by the Fund and the counterparty. For financial reporting purposes, non-cash collateral that has been pledged to cover obligations of the Fund has been noted in the Schedule of Investments. To the extent amounts due to the Fund from its counterparties are not fully collateralized, contractually or otherwise, the Fund bears the risk of loss from counterparty nonperformance. The Funds attempt to mitigate counterparty risk by only entering into agreements with counterparties that they believe have the financial resources to honor their obligations and by monitoring the financial stability of those counterparties.
Options — All Funds, except Money Market Fund, may buy put and call options and write put and covered call options. The Funds intend to use such derivative instruments as hedges to facilitate buying or selling securities or to provide protection against adverse movements in security prices or interest rates. The Funds may also enter into options contracts to protect against adverse foreign exchange rate fluctuations. Option contracts are valued daily and unrealized appreciation or depreciation is recorded. A Fund will realize a gain or loss upon expiration or closing of the option transaction. When an option is exercised, the proceeds upon sale for a written call option or the cost of a security for purchased put and call options is adjusted by the amount of premium received or paid.
Buying put options tends to decrease a Fund’s exposure to the underlying security while buying call options tends to increase a Fund’s exposure to the underlying security. The risk associated with purchasing put and call options is limited to the premium paid. There is no significant counterparty risk on exchange-traded options as the exchange guarantees the contract against default. Writing put options tends to increase a Fund’s exposure to the underlying security while writing call options tends to decrease a Fund’s exposure to the underlying security. The writer of an option has no control over whether the underlying security may be bought or sold, and therefore bears the market risk of an unfavorable change in the price of the underlying security. The counterparty risk for purchased options arises when a Fund has purchased an option, exercises that option, and the counterparty doesn’t buy from the Fund or sell to the Fund the underlying asset as required. In the case where a Fund has written an option, the Fund doesn’t have counterparty risk. Counterparty risk on purchased over-the-counter options is partially mitigated by the Fund’s collateral posting requirements. As the option increases in value to the Fund, the Fund receives collateral from the counterparty. Risks of loss may exceed amounts recognized on the Statement of Assets and Liabilities.
Futures Contracts — Certain Funds may use futures contracts to manage the exposure to interest rate and market or currency fluctuations. Gains or losses on futures contracts can offset changes in the yield of securities. When a futures contract is opened, cash or other investments equal to the required “initial margin deposit” are held on deposit with and pledged to the broker. Additional securities held by the Funds may be earmarked to cover open futures contracts. The futures contract’s daily change in value (“variation margin”) is either paid to or received from the broker, and is recorded as an unrealized gain or loss. When the contract is closed, realized gain or loss is recorded equal to the difference between the value of the contract when opened and the value of the contract when closed. Futures contracts involve, to varying degrees, risk of loss in excess of the variation margin disclosed in the Statement of Assets and Liabilities. Exchange-traded futures have no significant counterparty risk as the exchange guarantees the contracts against default.
Foreign Currency Forward Contracts — In connection with purchases and sales of securities denominated in foreign currencies all Funds, except Money Market Fund, may enter into foreign currency contracts. Additionally, the Funds may enter into such contracts to hedge certain other foreign-currency-denominated investments. These contracts are recorded at value and the related realized and change in unrealized foreign exchange gains and losses are included in the Statement of Operations. In the event that counterparties fail to settle these currency contracts, the Funds could be exposed to foreign currency fluctuations. Foreign currency contracts are valued daily and unrealized appreciation or depreciation is recorded daily as the difference between the contract exchange rate and the closing forward rate applied to the face amount of the contract. A realized gain or loss is recorded at the time a forward contract is closed. These contracts are over-the-counter and the Fund is exposed to counterparty risk equal to the discounted net amount of payments to the Fund. This risk is partially mitigated by the Fund’s collateral posting requirements.
- 5 -
Table of Contents
Swap Agreements — Certain Funds enter into swap transactions, which involve swapping one or more investment characteristics of a security or a basket of securities with another party. Such transactions include market risk, risk of default by the other party to the transaction, risk of imperfect correlation and manager risk and may involve commissions or other costs. Swap transactions generally do not involve delivery of securities, other underlying assets or principal. Accordingly, the risk of loss with respect to swap transactions is generally limited to the net amount of payments that the Fund is contractually obligated to make, or in the case of the counterparty defaulting, the net amount of payments that the Fund is contractually entitled to receive. Risks of loss may exceed amounts recognized on the Statement of Assets and Liabilities. If there is a default by the counterparty, the Fund may have contractual remedies pursuant to the agreements related to the transaction. The contracts are valued daily and unrealized appreciation or depreciation is recorded. Swap agreements are valued at fair value of the contract as provided by an independent pricing service. The pricing service takes into account such factors as swap curves, default probabilities, recent trades, recovery rates and other factors it deems relevant in determining valuations. Daily fluctuations in the value of the centrally cleared credit default contracts are recorded in variation margin in the Statement of Assets and Liabilities and recorded as unrealized gain or loss. The Fund accrues for the periodic payment and amortizes upfront payments, if any, on swap agreements on a daily basis with the net amount recorded as realized gains or losses in the Statement of Operations. Receipts and payments received or made as a result of a credit event or termination of the contract are also recognized as realized gains or losses in the Statement of Operations. Collateral, in the form of cash or securities, may be required to be held with the Fund’s custodian, or a third party, in connection with these agreements. Certain swap agreements are over-the-counter and the Fund is exposed to counterparty risk, which is the discounted net amount of payments owed to the Fund. This risk is partially mitigated by the Fund’s collateral posting requirements. As the swap increases in value to the Fund, the Fund receives collateral from the counterparty. Certain interest rate and credit default index swaps must be cleared through a clearinghouse or central counterparty (a “CCP”). A default or failure by a CCP or a futures commission merchant (a “FCM”), or the failure of a swap to be transferred from a swap execution facility or an executing dealer to the FCM for clearing, may expose the Fund to losses, increase its costs, or prevent the Fund from entering or exiting swap positions, accessing collateral or margin, or fully implementing its investment strategies.
Credit Default Swaps — A credit default swap is a swap agreement between two parties to exchange the credit risk of a particular issuer, basket of securities or reference entity. In a credit default swap transaction, a buyer pays periodic fees in return for payment by the seller which is contingent upon an adverse credit event occurring in the underlying issuer or reference entity. The seller collects periodic fees from the buyer and profits if the credit of the underlying issuer or reference entity remains stable or improves while the swap is outstanding, but the seller in a credit default swap contract would be required to pay the amount of credit loss, determined as specified in the agreement, to the buyer in the event of an adverse credit event in the reference entity. A buyer of a credit default swap is said to buy protection whereas a seller of a credit default swap is said to sell protection. The Funds may be either the protection seller or the protection buyer.
Certain Funds enter into credit default derivative contracts directly through credit default swaps (CDS) or through credit default swap indices (CDX Indices). CDX indices are static pools of equally weighted credit default swaps referencing corporate bonds and/or loans designed to provide diversified credit exposure to these asset classes. Funds sell default protection and assume long-risk positions in individual credits or indices. Index positions are entered into to gain exposure to the corporate bond and/or loan markets in a cost-efficient and diversified structure. In the event that a position defaults, by going into bankruptcy and failing to pay interest or principal on borrowed money, within any given CDX Index held, the maximum potential amount of future payments required would be equal to the pro-rata share of that position within the index based on the notional amount of the index. In the event of a default under a CDS contract the maximum potential amount of future payments would be the notional amount. For CDS, the default events could be bankruptcy and failing to pay interest or principal on borrowed money or a restructuring. A restructuring is a change in the underlying obligations which would include reduction in interest or principal, maturity extension and subordination to other obligations.
- 6 -
Table of Contents
For financial reporting purposes, the Funds do not offset derivative assets and derivative liabilities that are subject to netting arrangements in the Statement of Assets and Liabilities. The amounts presented in the tables below are offset first by financial instruments that have the right of offset under master netting or similar arrangements, then any remaining amount is reduced by cash and non-cash collateral pledged. The actual amounts of collateral may be greater than amounts presented in the tables.
The following table presents the gross and net information about assets subject to master netting arrangements, as presented in the Statement of Assets and Liabilities:
| Gross Amounts Not Offset in the Statement of Assets and Liabilities | ||||||||||||||||||||||||||||
Fund | Gross Amounts of Recognized Liabilities | Gross Amounts Offset | Net Amounts of Recognized Liabilities | Financial Instruments | Cash Collateral Pledged | Non-Cash Collateral Pledged** | Net Amount | |||||||||||||||||||||
Mid Cap Growth | ||||||||||||||||||||||||||||
Securities Lending | 1,575,210 | — | 1,575,210 | 1,575,210 | — | — | — | |||||||||||||||||||||
Mid Cap Stock | ||||||||||||||||||||||||||||
Securities Lending | 42,247,150 | — | 42,247,150 | 42,089,283 | — | — | 157,867 | ^ | ||||||||||||||||||||
| ** | Excess of collateral pledged to the counterparty may not be shown for financial reporting purposes. |
| ^ | Net securities lending amounts represent the net amount payable from the counterparty in the event of a default. |
(H) Securities Lending — The Trust has entered into a Securities Lending Agreement (the “Agreement”) with Deutsche Bank AG (“Deutsche”). The Agreement authorizes Deutsche to lend securities to authorized borrowers on behalf of the Funds. Pursuant to the Agreement, all loaned securities are initially collateralized by cash equal to at least 102% of the value of the loaned securities. All cash collateral received is invested in Thrivent Cash Management Trust. The Funds receive dividends and interest that would have been earned on the securities loaned while simultaneously seeking to earn income on the investment of cash collateral. Amounts earned on investments in Thrivent Cash Management Trust, net of rebates, fees paid to Deutsche for services provided and any other securities lending expenses, are included in Income from securities loaned on the Statement of Operations. By investing any cash collateral it receives in these transactions, a Fund could realize additional gains or losses. If the borrower fails to return the securities or the invested collateral has declined in value, the Fund could lose money.
As of October 31, 2014, the value of securities on loan is as follows:
Fund | Securities on Loan | |||
Mid Cap Growth | 1,861,913 | |||
Mid Cap Stock | 42,089,283 | |||
(I) When-Issued and Delayed Delivery Transactions — Each Fund may purchase or sell securities on a when-issued or delayed delivery basis. These transactions involve a commitment by a Fund to purchase or sell securities for a predetermined price or yield, with payment and delivery taking place beyond the customary settlement period. When delayed delivery purchases are outstanding, a Fund will designate liquid assets in an amount sufficient to meet the purchase price. When purchasing a security on a delayed delivery basis, a Fund assumes the rights and
- 7 -
Table of Contents
risks of ownership of the security, including the risk of price and yield fluctuations, and takes such fluctuations into account when determining its net asset value. A Fund may dispose of a delayed delivery transaction after it is entered into, and may sell when-issued securities before they are delivered, which may result in a capital gain or loss. When a Fund has sold a security on a delayed delivery basis, a Fund does not participate in future gains and losses with respect to the security.
(J) Treasury Inflation Protected Securities — Certain Funds may invest in treasury inflation protected securities (TIPS). These securities are fixed income securities whose principal value is periodically adjusted to the rate of inflation. The coupon interest rate is generally fixed at issuance. Interest is paid based on the principal value, which is adjusted for inflation. Any increase in the principal amount will be included as taxable interest in the Statement of Operations and received in cash upon maturity or sale of the security.
(K) Repurchase Agreements — Each Fund may engage in repurchase agreement transactions in pursuit of its investment objective. A repurchase agreement consists of a purchase and a simultaneous agreement to resell an investment for later delivery at an agreed upon price and rate of interest. The Fund uses a third-party custodian to maintain the collateral. If the original seller of a security subject to a repurchase agreement fails to repurchase the security at the agreed upon time, the Fund could incur a loss due to a drop in the value of the security during the time it takes the Fund to either sell the security or take action to enforce the original seller’s agreement to repurchase the security. Also, if a defaulting original seller filed for bankruptcy or became insolvent, disposition of such security might be delayed by pending legal action. The Fund may only enter into repurchase agreements with banks and other recognized financial institutions such as broker/dealers that are found by the Adviser or subadviser to be creditworthy. During the year ended October 31, 2014, none of the Funds engaged in these types of investments.
(L) Equity-Linked Structured Securities — Certain Funds may invest in equity-linked structured notes. Equity-linked structured notes are debt securities which combine the characteristics of common stock and the sale of an option. The return component is based upon the performance of a single equity security, a basket of equity securities, or an equity index and the sale of an option. There is no guaranteed return of principal with these securities. The appreciation potential of these securities may be limited by a maximum payment or call right and can be influenced by many unpredictable factors. In addition to the performance of the equity, the nature and credit of the issuer may also impact return.
(M) Stripped Securities — Certain Funds may invest in Interest Only and Principal Only stripped mortgage or asset backed securities. These securities represent a participation in securities that are structured in classes with rights to receive different portions of the interest and principal. Interest only securities receive all the interest and principal only securities receive all the principal. If the underlying pool of mortgages or assets experience greater than anticipated prepayments of principal, the Fund may not fully recoup its initial investment in an interest only security. Principal only securities increase in value if prepayments are greater than anticipated and decline if prepayments are slower than anticipated. The market value of these securities is highly sensitive to changes in interest rates.
(N) Credit Risk — The Funds may be susceptible to credit risk to the extent an issuer or counterparty defaults on its payment obligation. The Funds’ policy is to monitor the creditworthiness of issuers and counterparties. Interest receivable on defaulted securities is monitored for ability to collect payments in default and is adjusted accordingly.
(O) Accounting Estimates — The preparation of financial statements in conformity with GAAP requires management to make estimates and assumptions that affect the reported amounts of assets and liabilities and disclosure of contingent assets and liabilities at the date of the financial statements and the reported amounts of income and expenses during the reporting period. Actual results could differ from those estimates.
(P) Loan Commitments — Certain Funds may enter into loan commitments, which generally have interest rates which are reset daily, monthly, quarterly or semi-annually by reference to a base lending rate, plus a premium. These base rates are primarily the London-Interbank Offered Rate (“LIBOR”), and secondarily the prime rate offered by one or more major United States banks (the “Prime Rate”) and the certificate of deposit (“CD”) rate or
- 8 -
Table of Contents
other base lending rates used by commercial lenders. Loan commitments often require prepayments from excess cash flows or allow the borrower to repay at its election. The rate at which the borrower repays cannot be predicted with accuracy. Therefore, the remaining maturity may be considerably less than the stated maturity shown in the Schedule of Investments.
All or a portion of these loan commitments may be unfunded. A Fund is obligated to fund these commitments at the borrower’s discretion. Therefore, the Fund must have funds sufficient to cover its contractual obligation. These unfunded loan commitments, which are marked to market daily, are presented in the Schedule of Investments.
(Q) Loss Contingencies — High Yield Fund and Thrivent Income Fund are defendants in an adversary action filed on July 31, 2009 by the Official Committee of Unsecured Creditors of Motors Liquidation Company, formerly known as General Motors Corporation (GM), against prior and current holders of term loan debt of GM. The suit seeks to determine whether GM’s term loan facility was secured at the time it entered bankruptcy. High Yield Fund at one time held term loans in an original principal amount of at least $4,723,994 and, if the plaintiffs are successful, it is reasonably possible that the Fund will be required to make payments in some amount. This loss contingency has not been accrued as a liability because the amount of potential damages and the likelihood of loss cannot be reasonably estimated. Thrivent Income Fund is named as a defendant in this action, but we do not expect that the Fund’s assets will be subject to a loss contingency.
(R) Litigation — Awards from class action litigation are recorded as realized gains on the payment date.
(S) In-kind Redemptions — During the year ended October 31, 2014, Thrivent Financial for Lutherans redeemed their shares in-kind (“in-kind redemption”) of Thrivent Partner Mid Cap Value Fund and Thrivent Partner Small Cap Growth Fund (the “underlying funds”). The underlying funds distributed fund securities and cash as payment for the redemption of these fund shares. For financial reporting purposes, the underlying funds recognize gain on these transactions to the extent the value of the distributed securities on the date of redemption exceeds the cost of those securities; they recognize a loss if the cost exceeds the value. Gains or losses on in-kind redemptions are not recognized for tax purposes. The realized gains or losses below are included in the Statement of Operations of the underlying funds as net realized gains/losses on in-kind redemptions. The in-kind amounts and shares redeemed are included in the Capital Stock Transactions of the Statement of Changes in Net Assets of the underlying funds. These in-kind transactions were conducted at market value. The transactions were as follows:
| Underlying Fund | Underlying Shares Redeemed | Date | In-kind Amount | Realized Gain/(Loss) | ||||||||||||||
Thrivent Financial for Lutherans | Partner Mid Cap Value | 633,249 | 1/8/2014 | $ | 8,795,826 | $ | 2,285,789 | |||||||||||
(T) Other — For financial statement purposes, investment security transactions are accounted for on the trade date. Realized gains and losses from investment transactions are determined on a specific cost identification basis, which is the same basis used for federal income tax purposes.
- 9 -
Table of Contents
(3) FEES AND COMPENSATION PAID TO AFFILIATES
(A) Investment Advisory Fees��— The Trust has entered into an Investment Advisory Agreement with Thrivent Asset Mgt. Under the Investment Advisory Agreement, each of the Funds pays a fee for investment advisory services. The fees are accrued daily and paid monthly.
For all other Funds, the annual rates of fees as a percent of average daily net assets under the Investment Advisory Agreement were as follows:
Fund (M - Millions) | $0 to $50M | Over $50 to $100M | Over $100 to $200M | Over $200 to $250M | Over $250 to $500M | Over $500 to $750M | Over $750 to $1,000M | Over $1,000 to $2,000M | Over $2,000 to $2,500M | Over $2,500 to $5,000M | Over $5,000M | |||||||||||||||||||||||||||||||||
Mid Cap Growth | 0.450 | % | 0.450 | % | 0.400 | % | 0.400 | % | 0.350 | % | 0.300 | % | 0.300 | % | 0.250 | % | 0.250 | % | 0.250 | % | 0.250 | % | ||||||||||||||||||||||
Partner Mid Cap Value | 0.750 | % | 0.750 | % | 0.750 | % | 0.700 | % | 0.700 | % | 0.700 | % | 0.700 | % | 0.700 | % | 0.700 | % | 0.700 | % | 0.700 | % | ||||||||||||||||||||||
Mid Cap Stock | 0.700 | % | 0.700 | % | 0.700 | % | 0.650 | % | 0.650 | % | 0.650 | % | 0.650 | % | 0.600 | % | 0.600 | % | 0.550 | % | 0.525 | % | ||||||||||||||||||||||
(B) Sub-Adviser Fees — The following subadviser fees are charged as part of the total investment advisory fees stated in the table above. The subadvisory fees are borne directly by the Adviser and do not increase the overall fees paid by the Fund.
Partner Mid Cap Value Fund
The Adviser has entered into a subadvisory agreement with Goldman Sachs Asset Management, L.P. (“GSAM”) for the performance of subadvisory services. The fee payable is equal to 0.50% of the first $200 million of average daily net assets and 0.45% for assets over $200 million. Thrivent Partner Mid Cap Value Portfolio is included in determining breakpoints for the assets managed by GSAM.
(C) Expense Reimbursements — For the period ended October 31, 2014, contractual expense reimbursements to limit expenses to the following percentages were in effect:
Fund | Class A | Institutional Class | Expiration Date | |||||||||
Partner Mid Cap Value | 1.25 | % | N/A | 2/28/2015 | ||||||||
Thrivent does not recoup amounts previously reimbursed or waived in prior fiscal years.
Each equity, hybrid and fixed income fund may invest cash in High Yield Fund, Money Market Fund and Thrivent Cash Management Trust, subject to certain limitations. During the year ended October 31, 2014, no Funds invested in High Yield Fund. During the year ended October 31, 2014, no funds invested in Money Market Fund. During the year ended October 31, 2014, all funds except Municipal Bond Fund and Money Market Fund invested in Thrivent Cash Management Trust. These related-party transactions are subject to the same terms as non-related party transactions except that, to avoid duplicate investment advisory fees, Thrivent Asset Mgt. reimburses an amount equal to the advisory fee that is charged to the equity, hybrid or fixed income fund for its investment in High Yield Fund, Money Market Fund or Thrivent Cash Management Trust.
(D) Distribution Plan — Thrivent Investment Management, Inc. (“Thrivent Investment Mgt.”) is the Trust’s distributor. The Trust has adopted a Distribution Plan pursuant to Rule 12b-1 under the 1940 Act. Class A shares have a Rule 12b-1 fee of up to 0.25% (up to 0.125% for Government Bond Fund, Limited Maturity Bond Fund and Money Market Fund) of average net assets.
- 10 -
Table of Contents
(E) Sales Charges and Other Fees — For the year ended October 31, 2014, Thrivent Investment Mgt. received $11,781,760 of aggregate underwriting concessions from the sales of the Trust’s Class A shares. Sales charges are not an expense of the Trust and are not reflected in the financial statements of any of the Funds.
The Trust has entered into an accounting and administrative services agreement with Thrivent Asset Mgt. pursuant to which Thrivent Asset Mgt. provides certain accounting and administrative personnel and services to the Funds. For the year ended October 31, 2014, Thrivent Asset Mgt. received aggregate fees for accounting and administrative personnel and services of $4,635,726 from the Trust.
The Trust has entered into an agreement with Thrivent Financial Investor Services Inc. (“Thrivent Investor Services”) to provide the Funds with transfer agent services. For the year ended October 31, 2014, Thrivent Investor Services received $14,237,728 for transfer agent services from the Trust.
Each Trustee who is not affiliated with the Adviser receives an annual fee from the Trust for services as a Trustee and is eligible to participate in a deferred compensation plan with respect to fees received from the Funds. Participants in the plan may designate their deferred Trustee’s fees as if invested in a series of the Thrivent Mutual Funds. The value of each Trustee’s deferred compensation account will increase or decrease as if invested in shares of that series. Their fees as well as the change in value are included in Trustee fees in the Statement of Operations. The deferred fees remain in the appropriate Fund until distribution in accordance with the plan. The deferred fee liability, included in accrued expenses in the Statement of Assets and Liabilities, is unsecured.
Those Trustees not participating in the above plan received $257,499 in fees from the Trust for the year ended October 31, 2014. In addition, the Trust reimbursed independent Trustees for reasonable expenses incurred in relation to attendance at meetings and industry conferences.
Certain officers and non-independent Trustees of the Trust are officers and directors of Thrivent Asset Mgt., Thrivent Investment Mgt. and Thrivent Investor Services; however, they receive no compensation from the Trust.
(F) Indirect Expenses — Some Funds invest in other mutual funds. Fees and expenses of those underlying funds are not included in those Funds’ expense ratios. The Funds indirectly bear their proportionate share of the annualized weighted average expense ratio of the underlying funds in which they invest.
(4) TAX INFORMATION
Distributions are based on amounts calculated in accordance with the applicable federal income tax regulations, which may differ from GAAP. To the extent that these differences are permanent in nature, such amounts are reclassified within the capital accounts based on their federal tax-basis treatment; temporary differences do not require reclassifications.
On the Statement of Assets and Liabilities, as a result of permanent book-to-tax differences, reclassification adjustments were made as follows [Increase/(Decrease)]:
| Accumulated | ||||||||||||
| Undistributed | Accumulated | |||||||||||
| Net | Undistributed | |||||||||||
| Investment | Net Realized | |||||||||||
Fund | Income/(Loss) | Gain/(Loss) | Capital Stock | |||||||||
Mid Cap Growth | 264,390 | (1,064,390 | ) | 800,000 | ||||||||
Partner Mid Cap Value | (176,686 | ) | (2,171,549 | ) | 2,348,235 | |||||||
Mid Cap Stock | (653,787 | ) | (6,978,213 | ) | 7,632,000 | |||||||
- 11 -
Table of Contents
At October 31, 2014, the components of distributable earnings on a tax basis were as follows:
| Undistributed | Undistributed Long- | |||||||
Fund | Ordinary Incomea | Term Capital Gain | ||||||
Mid Cap Growth | — | 42,869,546 | ||||||
Partner Mid Cap Value | 8,463,970 | 14,058,786 | ||||||
Mid Cap Stock | 2,962,295 | 102,867,699 | ||||||
| a | Undistributed Ordinary Income includes income derived from Short-Term Capital Gains. |
During the fiscal year 2014, capital loss carryovers utilized by the Funds were as follows:
Fund | Capital Loss Carryover | |||
Mid Cap Stock | 18,032,887 | |||
The following funds deferred, on a tax basis, the following Late Year Ordinary Losses:
Fund | Ordinary Losses | |||
Mid Cap Growth | $ | 47,097 | ||
These amounts are deferred for tax purposes, and are deemed to occur on the first day of the following fiscal year.
- 12 -
Table of Contents
The tax character of distributions paid during the years ended October 31, 2014 and 2013 was as follows:
| Tax-Exempt Income | Ordinary Income(a) | Long-Term Capital Gain | ||||||||||||||||||||||
Fund | 10/31/2014 | 10/31/2013 | 10/31/2014 | 10/31/2013 | 10/31/2014 | 10/31/2013 | ||||||||||||||||||
Mid Cap Growth | — | — | 3,156,568 | 484,142 | 47,193,909 | 25,881,632 | ||||||||||||||||||
Partner Mid Cap Value | — | — | 9,912,782 | 1,365,016 | 20,424,078 | 2,834,459 | ||||||||||||||||||
Mid Cap Stock | — | — | 1,030,040 | 1,000,068 | — | — | ||||||||||||||||||
| (a) | Ordinary income includes income derived from short-term capital gains. |
(5) SECURITY TRANSACTIONS
(A) Purchases and Sales of Investment Securities — For the year ended October 31, 2014, the cost of purchases and the proceeds from sales of investment securities, other than U.S. Government and short-term securities, were as follows:
| In thousands | ||||||||
Fund | Purchases | Sales | ||||||
Mid Cap Growth | 184,647 | 206,567 | ||||||
Partner Mid Cap Value | 150,715 | 151,872 | ||||||
Mid Cap Stock | 247,957 | 361,674 | ||||||
(B) Investments in High-Yielding Securities — High Yield Fund invests primarily in high-yielding fixed-income securities. Each of the other Funds, except Money Market Fund, may also invest in high-yielding securities. These securities will typically be in the lower rating categories or will be non-rated and generally will involve more risk than securities in the higher rating categories. Lower rated or unrated securities (e.g., junk bonds) are more likely to react to developments affecting market risk and credit risk than are more highly rated securities, which react primarily to movements in the general level of interest rates.
(C) Investments in Options and Futures Contracts — The movement in the price of the security underlying an option or futures contract may not correlate perfectly with the movement in the prices of the portfolio securities being hedged. A lack of correlation could render a Fund’s hedging strategy unsuccessful and could result in a loss to the Fund. In the event that a liquid secondary market would not exist, the Fund could be prevented from entering into a closing transaction, which could result in additional losses to the Fund.
(6) SECURITY TRANSACTIONS WITH AFFILIATED FUNDS
The Funds are permitted to purchase or sell securities from or to certain other Funds under specified conditions outlined in procedures adopted by the Board. The procedures have been designed to ensure that any purchase or sale of securities by a Fund from or to another fund or portfolio that is or could be considered an affiliate by virtue of having a common investment adviser (or affiliated investment advisers), common Trustees and/or common officers complies with Rule 17a-7 of the 1940 Act. Further, as defined under the procedures, each transaction is executed at the current market price.
(7) SUBSEQUENT EVENTS
The Adviser of the Funds has evaluated the impact of subsequent events, and, except as already included in the Notes to Financial Statements, has determined that no additional items require disclosure.
- 13 -
Table of Contents
FORM OF AGREEMENT AND PLAN OF REORGANIZATION FOR USE WITH ALL TARGET AND ACQUIRING FUNDS—SECTION 3.F, AS NOTED BELOW, WILL VARY
AGREEMENT AND PLAN OF REORGANIZATION
This Agreement and Plan of Reorganization (the “Agreement”) is made as of , 2015 by Thrivent Mutual Funds (the “Trust”), a Massachusetts business trust, on behalf of its series, (the “Acquiring Fund”) and (the “Target Fund”).
W I T N E S S E T H:
WHEREAS, the Board of Directors of the Trust, on behalf of each of the Acquiring Fund and the Target Fund, has determined that entering into this Agreement whereby the Target Fund would transfer all of its assets and liabilities to the Acquiring Fund in exchange for shares of the Acquiring Fund, is in the best interests of the shareholders of their respective Trust; and
WHEREAS, the parties intend that this transaction qualify as a reorganization within the meaning of Section 368(a) of the Internal Revenue Code of 1986, as amended (the “Code”);
NOW, THEREFORE, in consideration of the mutual promises contained herein, and intending to be legally bound hereby, the parties hereto agree as follows:
| 1. | Plan of Transaction. |
A. Transfer of Assets. Upon satisfaction of the conditions precedent set forth in Sections 7 and 8 hereof, the Target Fund will convey, transfer and deliver to the Acquiring Fund at the closing, provided for in Section 2 hereof, all of the existing assets of the Target Fund (including accrued interest to the Closing Date) (as defined below), free and clear of all liens, encumbrances and claims whatsoever (the assets so transferred collectively being referred to as the “Assets”).
B. Consideration. In consideration thereof, the Acquiring Fund agrees that the Acquiring Fund at the closing will deliver to the Target Fund, full and fractional Class A and Institutional Class Shares of beneficial interest, par value $0.01 per share, of the Acquiring Fund having net asset values per share calculated as provided in Section 3(A) hereof, in an amount equal to the aggregate dollar value of the Assets determined pursuant to Section 3(A) hereof net of any liabilities of the Target Fund described in Section 3(E) hereof (the “Liabilities”) (collectively, the “Acquiring Fund Shares”). The calculation of full and fractional Acquiring Fund Shares to be exchanged shall be carried out to no less than two (2) decimal places. All Acquiring Fund Shares delivered to the Target Fund in exchange for such Assets shall be delivered at net asset value without sales load, commission or other transactional fees being imposed.
| 2. | Closing of the Transaction. |
A. Closing Date. The closing shall occur within thirty (30) business days after the later of the receipt of all necessary regulatory approvals and the final adjournment of the meeting of shareholders of the Target Fund at which this Agreement will be considered and approved, or such later date as soon as practicable thereafter, as the parties may mutually agree (the “Closing Date”). On the Closing Date, the Acquiring Fund shall deliver to the Target Fund the Acquiring Fund Shares in the amount determined pursuant to Section 1(B) hereof and the Target Fund thereafter shall, in order to effect the distribution of such shares to the Target Fund shareholders, instruct the Acquiring Fund to register the pro rata interest in the Acquiring Fund Shares (in full and fractional shares) of each of the holders of record of Class A and Institutional Class Shares of the Target Fund in accordance with their holdings of shares of the Target Fund and shall provide as part of such instruction a complete and updated list of such holders (including addresses and taxpayer identification numbers), and the Acquiring Fund agrees promptly to comply with said instruction. The Acquiring Fund shall have no obligation to inquire as to the validity, propriety or correctness of such instruction, but shall assume that such instruction is valid, proper and correct.
Table of Contents
| 3. | Procedure for Reorganization. |
A. Valuation. The value of the Assets and Liabilities of the Target Fund to be transferred and assumed, respectively, by the Acquiring Fund shall be computed as of the Closing Date, in the manner set forth in the most recent Prospectus and Statement of Additional Information of the Acquiring Fund (collectively, the “Acquiring Fund Prospectus”), copies of which have been delivered to the Target Fund.
B. Delivery of Fund Assets. The Assets shall be delivered to State Street Bank and Trust Company as Custodian for the Acquiring Fund or such other custodian as designated by the Acquiring Fund (collectively the “Custodian”) for the benefit of the Acquiring Fund, duly endorsed in proper form for transfer in such condition as to constitute a good delivery thereof, free and clear of all liens, encumbrances and claims whatsoever, in accordance with the custom of brokers, and shall be accompanied by all necessary state stock transfer stamps, if any, the cost of which shall be borne by the Target Fund and the Acquiring Fund, in proportion to their respective declines in total operating expenses, if any.
C. Failure to Deliver Securities. If the Target Fund is unable to make delivery pursuant to Section 3(B) hereof to the Custodian of any of the securities of the Target Fund for the reason that any such securities purchased by the Target Fund have not yet been delivered it by the Target Fund’s broker or brokers, then, in lieu of such delivery, the Target Fund shall deliver to the Custodian, with respect to said securities, executed copies of an agreement of assignment and due bills executed on behalf of such broker or brokers, together with such other documents as may be required by the Acquiring Fund or Custodian, including brokers’ confirmation slips.
D. Shareholder Accounts. The Acquiring Fund, in order to assist the Target Fund in the distribution of the Acquiring Fund Shares to the Target Fund shareholders after delivery of the Acquiring Fund Shares to the Target Fund, will establish pursuant to the request of the Target Fund an open account with the Acquiring Fund for each shareholder of the Target Fund and, upon request by the Target Fund, shall transfer to such accounts, the exact number of Acquiring Fund Shares then held by the Target Fund specified in the instruction provided pursuant to Section 2 hereof.
E. Liabilities. The Liabilities shall include all of the Target Fund’s liabilities, debts, obligations, and duties of whatever kind or nature, whether absolute, accrued, contingent, or otherwise, whether or not arising in the ordinary course of business, whether or not determinable at the Closing Date, and whether or not specifically referred to in this Agreement. The Target Fund will discharge all of its Liabilities prior to or on the Closing Date.
[PARAGRAPH F—FOR THE AGREEMENT AND PLAN OF REORGANIZATION SOLELY IN RESPECT OF THE REORGANIZATIONS OF THRIVENT PARTNER SMALL CAP GROWTH FUND AND THRIVENT PARTNER SMALL CAP VALUE FUND INTO THRIVENT SMALL CAP STOCK FUND]
F. Expenses. In the event that the transactions contemplated herein are consummated, Thrivent Financial for Lutherans (or an affiliate thereof) shall pay the expenses of the Reorganization, including the costs of the special meeting of shareholders of the Target Fund. In addition, as part of the Reorganization, the Target Fund will write off its remaining unamortized organizational expenses, if any, which shall be reimbursed by Thrivent Financial for Lutherans (or an affiliate thereof). The Acquiring Fund shall bear expenses associated with the qualification of shares of the Acquiring Fund for sale in the various states. In addition, to the extent that any transition of Fund securities is required in connection with the Reorganization, the respective Fund may incur transaction expenses associated with the sale and purchase of Fund securities. In the event that the transactions contemplated herein are not consummated for any reason, then all reasonable outside expenses incurred to the date of termination of this Agreement shall be borne by Thrivent Financial for Lutherans (or an affiliate thereof).
[PARAGRAPH F—FOR EVERY AGREEMENT AND PLAN OF REORGANIZATION OTHER THAN THE FORMS OF AGREEMENT FOR USE IN RESPECT OF THE REORGANIZATIONS OF THRIVENT PARTNER SMALL CAP GROWTH FUND AND THRIVENT PARTNER SMALL CAP VALUE FUND INTO THRIVENT SMALL CAP STOCK FUND]
F. Expenses. In the event that the transactions contemplated herein are consummated, Thrivent Financial for Lutherans (or an affiliate thereof) shall pay the expenses of the Reorganization, including the costs of the special meeting of shareholders of the Target Fund. In addition, as part of the Reorganization, the Target Fund will write off its remaining unamortized organizational expenses, if any, which shall be reimbursed by Thrivent Financial for
A- 2 -
Table of Contents
Lutherans (or an affiliate thereof). The Acquiring Fund shall bear expenses associated with the qualification of shares of the Acquiring Fund for sale in the various states. In addition, to the extent that any transition of Fund securities is required in connection with the Reorganization, the respective Fund may incur transaction expenses associated with the sale and purchase of Fund securities. Thrivent Financial for Lutherans (or an affiliate thereof) will provide a reimbursement of investment advisory fees to the Acquiring Portfolio in the amount of $[ ], which is the estimated brokerage costs that will be incurred by the Acquiring Portfolio and the Target Portfolio[s] as a result of the Reorganization. Such reimbursement will be accrued during the month following the closing of the Reorganization. In the event that the transactions contemplated herein are not consummated for any reason, then all reasonable outside expenses incurred to the date of termination of this Agreement shall be borne by Thrivent Financial for Lutherans (or an affiliate thereof).
G. Dissolution. As soon as practicable after the Closing Date but in no event later than one year after the Closing Date, the Target Fund shall voluntarily dissolve and completely liquidate by taking, in accordance with the laws of the Commonwealth of Massachusetts and federal securities laws, all steps as shall be necessary and proper to effect a complete liquidation and dissolution of the Target Fund. Immediately after the Closing Date, the share transfer books relating to the Target Fund shall be closed and no transfer of shares shall thereafter be made on such books.
| 4. | Representations and Warranties of the Target Fund. |
The Target Fund hereby represents and warrants to the Acquiring Fund, which representations and warranties are true and correct on the date hereof, and agrees with the Acquiring Fund that:
A. Organization. The Trust is a trust, with transferable shares, duly organized, validly existing and in good standing in conformity with the laws of its jurisdiction of organization. The Target Fund is a separate series of the Trust duly organized in accordance with the applicable provisions of the Articles of Incorporation of the Trust, as amended through the date hereof (the “Articles of Incorporation”). The Trust and the Target Fund are qualified to do business in all jurisdictions in which it is required to be so qualified, except jurisdictions in which the failure to so qualify would not have a material adverse effect on the Target Fund. The Trust and the Target Fund have all material federal, state and local authorizations necessary to own all of its properties and assets and to carry on its business as now being conducted, except authorizations which the failure to so obtain would not have a material adverse effect on the Target Fund.
B. Registration. The Trust is registered under the Investment Company Act of 1940, as amended (the “1940 Act”), as an open-end management investment company and such registration has not been revoked or rescinded. The Target Fund is in compliance in all material respects with the 1940 Act, and the rules and regulations thereunder with respect to its activities. All of the outstanding common shares of beneficial interest of the Target Fund have been duly authorized and are validly issued, fully paid and non-assessable and not subject to pre-emptive or dissenters’ rights.
C. Audited Financial Statements. The statement of assets and liabilities and the portfolio of investments and the related statements of operations and changes in net assets of the Target Fund audited as of and for the year ended October 31, 2014, true and complete copies of which have been heretofore furnished to the Acquiring Fund, fairly represent the financial condition and the results of operations of the Target Fund as of and for their respective dates and periods in conformity with generally accepted accounting principles applied on a consistent basis during the periods involved.
D. Unaudited Financial Statements. The Target Fund shall furnish to the Acquiring Fund within ten (10) business days after the Closing Date, an unaudited statement of assets and liabilities and the portfolio of investments and the related statements of operations and changes in net assets as of and for the interim period ending on the Closing Date; such financial statements will represent fairly the financial position and portfolio of investments and the results of the Target Fund’s operations as of, and for the periods ending on, the dates of such statements in conformity with generally accepted accounting principles applied on a consistent basis during the periods involved and the results of its operations and changes in financial position for the period then ended; and such financial statements shall be certified by the Treasurer of the Target Fund as complying with the requirements hereof.
A- 3 -
Table of Contents
E. Contingent Liabilities. There are, and as of the Closing Date will be, no contingent liabilities of the Target Fund not discharged pursuant to Section 3(E), and there are no legal, administrative, or other proceedings pending or, to its knowledge, threatened against the Target Fund which would, if adversely determined, materially affect the Target Fund’s financial condition. All liabilities were incurred by the Target Fund in the ordinary course of its business.
F. Material Agreements. The Target Fund is in compliance with all material agreements, rules, laws, statutes, regulations and administrative orders affecting its operations or its assets; and except as referred to in the most recent Prospectus and Statement of Additional Information of the Target Fund (collectively, the “Target Fund Prospectus”), there are no material agreements outstanding relating to the Target Fund to which the Target Fund is a party.
G. Statement of Earnings. As promptly as practicable, but in any case no later than 30 calendar days after the Closing Date, the Target Fund shall furnish the Acquiring Fund with a statement of the earnings and profits of the Target Fund within the meaning of the Code as of the Closing Date.
H. Tax Returns. At the date hereof and on the Closing Date, all federal and other material tax returns and reports of the Target Fund required by law to have been filed by such dates shall have been filed, and all federal and other taxes shown thereon shall have been paid so far as due, or provision shall have been made for the payment thereof, and to the best of the Target Fund’s knowledge no such return is currently under audit and no assessment has been asserted with respect to any such return.
I. Necessary Authority. The Trust on behalf of the Target Fund has the necessary power to enter into this Agreement and to consummate the transactions contemplated herein. The execution, delivery and performance of this Agreement and the consummation of the transactions contemplated herein have been duly authorized by the Board on behalf of the Target Fund, and except for obtaining approval of the Target Fund shareholders, no other corporate acts or proceedings by the Trust on behalf of the Target Fund are necessary to authorize this Agreement and the transactions contemplated herein. This Agreement has been duly executed and delivered by the Trust on behalf of the Target Fund and constitutes a valid and binding obligation of the Target Fund enforceable in accordance with its terms, except as such enforceability may be limited by bankruptcy, insolvency, fraudulent transfer, reorganization, moratorium or similar laws affecting creditors’ rights generally, or by general principles of equity (regardless of whether enforcement is sought in a proceeding at equity or law).
J. No Violation, Consents and Approvals. The execution, delivery and performance of this Agreement by the Trust on behalf of the Target Fund does not and will not (i) result in a material violation of any provision of the Trust’s or the Target Fund’s organizational documents, (ii) violate any statute, law, judgment, writ, decree, order, regulation or rule of any court or governmental authority applicable to the Target Fund, (iii) result in a material violation or breach of, or constitute a default under any material contract, indenture, mortgage, loan agreement, note, lease or other instrument or obligation to which the Target Fund is subject, or (iv) result in the creation or imposition of any lien, charge or encumbrance upon any property or assets of the Target Fund. Except as have been obtained, (i) no consent, approval, authorization, order or filing with or notice to any court or governmental authority or agency is required for the consummation by the Target Fund of the transactions contemplated by this Agreement and (ii) no consent of or notice to any third party or entity is required for the consummation by the Target Fund of the transactions contemplated by this Agreement.
K. Absence of Changes. From the date of this Agreement through the Closing Date, there shall not have been:
| i. | any change in the business, results of operations, assets, or financial condition or the manner of conducting the business of the Target Fund, other than changes in the ordinary course of its business, or any pending or threatened litigation, which has had or may have a material adverse effect on such business, results of operations, assets, financial condition or manner of conducting business; |
| ii. | issued by the Target Fund any option to purchase or other right to acquire shares of the Target Fund to any person other than subscriptions to purchase shares at net asset value in accordance with terms in the Target Fund Prospectus; |
| iii. | any entering into, amendment or termination of any contract or agreement by the Target Fund, except as otherwise contemplated by this Agreement; |
A- 4 -
Table of Contents
| iv. | any indebtedness incurred, other than in the ordinary course of business, by the Target Fund for borrowed money or any commitment to borrow money entered into by the Target Fund; |
| v. | any amendment of the Trust’s or the Target Fund’s organizational documents; or |
| vi. | any grant or imposition of any lien, claim, charge or encumbrance (other than encumbrances arising in the ordinary course of business with respect to covered options) upon any asset of the Target Fund other than a lien for taxes not yet due and payable. |
L. Title. On the Closing Date, the Target Fund will have good and marketable title to the Assets, free and clear of all liens, mortgages, pledges, encumbrances, charges, claims and equities whatsoever, other than a lien for taxes not yet due and payable, and full right, power and authority to sell, assign, transfer and deliver such Assets; upon delivery of such Assets, the Acquiring Fund will receive good and marketable title to such Assets, free and clear of all liens, mortgages, pledges, encumbrances, charges, claims and equities whatsoever, other than a lien for taxes not yet due and payable.
M. Prospectus/Proxy Statement. The Registration Statement on Form N-14 of the Trust (the “Registration Statement”) and the Prospectus/Proxy Statement contained therein (the “Prospectus/Proxy Statement”), as of the effective date of the Registration Statement, and at all times subsequent thereto up to and including the Closing Date, as amended or as supplemented if it shall have been amended or supplemented, conform and will conform as they relate to the Target Fund, in all material respects, to the applicable requirements of the applicable federal and state securities laws and the rules and regulations of the Securities and Exchange Commission (the “SEC”) thereunder, and do not and will not include any untrue statement of a material fact or omit to state any material fact required to be stated therein or necessary to make the statements therein, in light of the circumstances under which they were made, not misleading, except that no representations or warranties in this Section 4(M) apply to statements or omissions made in reliance upon and in conformity with written information concerning the Acquiring Fund furnished to the Target Fund by the Acquiring Fund.
N. Tax Qualification. The Target Fund has qualified as a regulated investment company within the meaning of Section 851 of the Code for each of its taxable years; and has satisfied the distribution requirements imposed by Section 852 of the Code for each of its taxable years.
| 5. | Representations and Warranties of the Acquiring Fund. |
The Acquiring Fund hereby represents and warrants to the Target Fund, which representations and warranties are true and correct on the date hereof, and agrees with the Target Fund that:
A. Organization. The Trust is duly formed and in good standing under the laws of the state of its organization and is duly authorized to transact business in the state of its organization. The Acquiring Fund is a separate series of the Trust duly organized in accordance with the applicable provisions of the Articles of Incorporation. The Trust and the Acquiring are qualified to do business in all jurisdictions in which it is required to be so qualified, except jurisdictions in which the failure to so qualify would not have a material adverse effect on the Acquiring Fund. The Trust and the Acquiring Fund have all material federal, state and local authorizations necessary to own all of its properties and assets and to carry on its business and the business thereof as now being conducted, except authorizations which the failure to so obtain would not have a material adverse effect on the Acquiring Fund.
B. Registration. The Trust is registered under the 1940 Act as an open-end management investment company and such registration has not been revoked or rescinded. The Acquiring Fund is in compliance in all material respects with the 1940 Act, and the rules and regulations thereunder with respect to its activities. All of the outstanding shares of common stock of the Acquiring Fund have been duly authorized and are validly issued, fully paid and non-assessable and not subject to pre-emptive or dissenters’ rights.
C. Audited Financial Statements. The statement of assets and liabilities and the portfolio of investments and the related statements of operations and changes in net assets of the Acquiring Fund audited as of and for the year ended October 31, 2014, true and complete copies of which have been heretofore furnished to the Target Fund, fairly represent the financial condition and the results of operations of the Acquiring Fund as of and for their respective dates and periods in conformity with generally accepted accounting principles applied on a consistent basis during the periods involved.
A- 5 -
Table of Contents
D. Unaudited Financial Statements. The Acquiring Fund shall furnish to the Target Fund within ten (10) business days after the Closing Date, an unaudited statement of assets and liabilities and the portfolio of investments and the related statements of operations and changes in net assets as of and for the interim period ending on the Closing Date; such financial statements will represent fairly the financial position and portfolio of investments and the results of its operations as of, and for the period ending on, the dates of such statements in conformity with generally accepted accounting principles applied on a consistent basis during the period involved and the results of its operations and changes in financial position for the periods then ended; and such financial statements shall be certified by the Treasurer of the Acquiring Fund as complying with the requirements hereof.
E. Contingent Liabilities. There are, and as of the Closing Date will be, no contingent liabilities of the Acquiring Fund not disclosed in the financial statements delivered pursuant to Sections 5(C) and 5(D) hereof which would materially affect the Acquiring Fund’s financial condition, and there are no legal, administrative, or other proceedings pending or, to its knowledge, threatened against the Acquiring Fund which would, if adversely determined, materially affect the Acquiring Fund’s financial condition. All liabilities were incurred by the Acquiring Fund in the ordinary course of its business.
F. Material Agreements. The Acquiring Fund is in compliance with all material agreements, rules, laws, statutes, regulations and administrative orders affecting its operations or its assets; and, except as referred to in the Acquiring Fund Prospectus there are no material agreements outstanding relating to the Acquiring Fund to which the Acquiring Fund is a party.
G. Tax Returns. At the date hereof and on the Closing Date, all federal and other material tax returns and reports of the Acquiring Fund required by law to have been filed by such dates shall have been filed, and all federal and other taxes shown thereon shall have been paid so far as due, or provision shall have been made for the payment thereof, and to the best of the Acquiring Fund’s knowledge no such return is currently under audit and no assessment has been asserted with respect to any such return.
H. Necessary Authority. The Trust on behalf of the Acquiring Fund has the necessary power to enter into this Agreement and to consummate the transactions contemplated herein. The execution, delivery and performance of this Agreement and the consummation of the transactions contemplated herein have been duly authorized by the Board on behalf of the Acquiring Fund, no other corporate acts or proceedings by the Acquiring Fund are necessary to authorize this Agreement and the transactions contemplated herein. This Agreement has been duly executed and delivered by the Trust on behalf of the Acquiring Fund and constitutes a valid and binding obligation of the Acquiring Fund enforceable in accordance with its terms, except as such enforceability may be limited by bankruptcy, insolvency, fraudulent transfer, reorganization, moratorium or similar laws affecting creditors’ rights generally, or by general principals of equity (regardless of whether enforcement is sought in a proceeding at equity or law).
I. No Violation; Consents and Approvals. The execution, delivery and performance of this Agreement by Trust on behalf of the Acquiring Fund does not and will not (i) result in a material violation of any provision of Trust’s or the Acquiring Fund’s organizational documents, (ii) violate any statute, law, judgment, writ, decree, order, regulation or rule of any court or governmental authority applicable to the Acquiring Fund, (iii) result in a material violation or breach of, or constitute a default under any material contract, indenture, mortgage, loan agreement, note, lease or other instrument or obligation to which the Acquiring Fund is subject, or (iv) result in the creation or imposition or any lien, charge or encumbrance upon any property or assets of the Acquiring Fund. Except as have been obtained, (i) no consent, approval, authorization, order or filing with or notice to any court or governmental authority or agency is required for the consummation by the Acquiring Fund of the transactions contemplated by this Agreement and (ii) no consent of or notice to any third party or entity is required for the consummation by the Acquiring Fund of the transactions contemplated by this Agreement.
J. Absence of Proceedings. There are no legal, administrative or other proceedings pending or, to its knowledge, threatened against the Acquiring Fund which would materially affect its financial condition.
K. Acquiring Fund Shares: Registration. The Acquiring Fund Shares to be issued pursuant to Section 1 hereof will be duly registered under the Securities Act of 1933, as amended (the “Securities Act”), and all applicable state securities laws.
L. Acquiring Fund Shares: Authorization. The Acquiring Fund Shares to be issued pursuant to Section 1 hereof have been duly authorized and, when issued in accordance with this Agreement, will be validly issued, fully paid and non-assessable, will not be subject to pre-emptive or dissenters’ rights and will conform in all material respects to the description thereof contained in the Acquiring Fund’s Prospectus furnished to the Target Fund.
A- 6 -
Table of Contents
M. Absence of Changes. From the date hereof through the Closing Date, there shall not have been any change in the business, results of operations, assets or financial condition or the manner of conducting the business of the Acquiring Fund, other than changes in the ordinary course of its business, which has had a material adverse effect on such business, results of operations, assets, financial condition or manner of conducting business.
N. Registration Statement. The Registration Statement and the Prospectus/Proxy Statement as of the effective date of the Registration Statement, and at all times subsequent thereto up to and including the Closing Date, as amended or as supplemented if they shall have been amended or supplemented, conforms and will conform, as they relate to the Acquiring Fund, in all material respects, to the applicable requirements of the applicable federal securities laws and the rules and regulations of the SEC thereunder, and do not and will not include any untrue statement of a material fact or omit to state any material fact required to be stated therein or necessary to make the statements therein, in light of the circumstances under which they were made, not misleading, except that no representations or warranties in this Section 5 apply to statements or omissions made in reliance upon and in conformity with written information concerning the Target Fund furnished to the Acquiring Fund by the Target Fund.
O. Tax Qualification. The Acquiring Fund has qualified as a regulated investment company within the meaning of Section 851 of the Code for each of its taxable years; and has satisfied the distribution requirements imposed by Section 852 of the Code for each of its taxable years.
| 6. | Covenants. |
During the period from the date of this Agreement and continuing until the Closing Date, the Target Fund and Acquiring Fund agree as follows (except as expressly contemplated or permitted by this Agreement):
A. Other Actions. The Target Fund and Acquiring Fund shall operate only in the ordinary course of business consistent with prior practice. No party shall take any action that would, or reasonably would be expected to, result in any of its representations and warranties set forth in this Agreement being or becoming untrue in any material respect.
B. Government Filings; Consents. The Trust shall file all reports required to be filed by the Target Fund and Acquiring Fund with the SEC between the date of this Agreement and the Closing Date and the Target Fund and Acquiring Fund shall deliver to the other party copies of all such reports promptly after the same are filed. Except where prohibited by applicable statutes and regulations, each party shall promptly provide the other (or its counsel) with copies of all other filings made by such party with any state, local or federal government agency or entity in connection with this Agreement or the transactions contemplated hereby. Each of the Target Fund and the Acquiring Fund shall use all reasonable efforts to obtain all consents, approvals and authorizations required in connection with the consummation of the transactions contemplated by this Agreement and to make all necessary filings with the appropriate federal and state officials.
C. Preparation of the Registration Statement and the Prospectus/Proxy Statement. In connection with the Registration Statement and the Prospectus/Proxy Statement, each party hereto will cooperate with the other and furnish to the other the information relating to the Target Fund or Acquiring Fund, as the case may be, required by the Securities Act or the Securities Exchange Act of 1934 and the rules and regulations thereunder, to be set forth in the Registration Statement or the Prospectus/Proxy Statement. The Target Fund shall promptly prepare the Prospectus/Proxy Statement and the Acquiring Fund shall promptly prepare and file with the SEC the Registration Statement, in which the Prospectus/Proxy Statement will be included as a prospectus. In connection with the Registration Statement, insofar as it relates to the Target Fund and its affiliated persons, the Acquiring Fund shall only include such information as is approved by the Target Fund for use in the Registration Statement. The Acquiring Fund shall not amend or supplement any such information regarding the Target Fund and such affiliates without the prior written consent of the Target Fund which consent shall not be unreasonably withheld or delayed. The Acquiring Fund shall promptly notify and provide the Target Fund with copies of all amendments or supplements filed with respect to the Registration Statement. The Acquiring Fund shall use all reasonable efforts to have the Registration Statement declared effective under the Securities Act as promptly as practicable after such filing. The Acquiring Fund shall also take any action (other than qualifying to do business in any jurisdiction in
A- 7 -
Table of Contents
which it is now not so qualified) required to be taken under any applicable state securities laws in connection with the issuance of the Acquiring Fund Shares in the transactions contemplated by this Agreement, and the Target Fund shall furnish all information concerning the Target Fund and the holders of the Target Fund’s shares as may be reasonably requested in connection with any such action.
D. Access to Information. During the period prior to the Closing Date, the Target Fund shall make available to the Acquiring Fund a copy of each report, schedule, registration statement and other document (the “Documents”) filed or received by it during such period pursuant to the requirements of federal or state securities laws (other than Documents which such party is not permitted to disclose under applicable law). During the period prior to the Closing Date, the Acquiring Fund shall make available to the Target Fund each Document pertaining to the transactions contemplated hereby filed or received by it during such period pursuant to federal or state securities laws (other than Documents which such party is not permitted to disclose under applicable law).
E. Shareholder Meetings. The Target Fund shall call a meeting of the Target Fund shareholders to be held as promptly as practicable for the purpose of voting upon the approval of this Agreement and the transactions contemplated herein, and shall furnish a copy of the Prospectus/Proxy Statement and proxy card to each shareholder of the Target Fund as of the record date for such meeting of shareholders. The Board shall recommend to the Target Fund shareholders approval of this Agreement and the transactions contemplated herein, subject to fiduciary obligations under applicable law.
F. Portfolios. The Target Fund and Acquiring Fund covenant and agree to dispose of certain assets prior to the Closing Date, but only if and to the extent necessary, so that at Closing, when the Assets are added to the Acquiring Fund’s portfolio, the resulting portfolio will meet the Acquiring Fund’s investment objective, policies and restrictions, as set forth in the Acquiring Fund’s Prospectus, a copy of which has been delivered to the Target Fund. Notwithstanding the foregoing, nothing herein will require the Target Fund to dispose of any portion of the Assets if, in the reasonable judgment of the Target Fund’s Directors or investment adviser, such disposition would create more than an insignificant risk that the Reorganization would not be treated as a “reorganization” described in Section 368(a) of the Code.
G. Distribution of Shares. The Target Fund covenants that at closing it shall cause to be distributed the Acquiring Fund Shares in the proper pro rata amount for the benefit of Target Fund’s shareholders and that the Target Fund shall not continue to hold amounts of said shares so as to cause a violation of Section 12(d)(1) of the 1940 Act. The Target Fund covenants to use all reasonable efforts to cooperate with the Acquiring Fund and the Acquiring Fund’s transfer agent in the distribution of said shares. The Target Fund covenants further that, pursuant to Section 3(G) hereof, it shall liquidate and dissolve as promptly as practicable after the Closing Date.
H. Brokers or Finders. Except as disclosed in writing to the other party prior to the date hereof, each of the Target Fund and the Acquiring Fund represents that no agent, broker, investment banker, financial advisor or other firm or person is or will be entitled to any broker’s or finder’s fee or any other commission or similar fee in connection with any of the transactions contemplated by this Agreement, and each party shall hold the other harmless from and against any and all claims, liabilities or obligations with respect to any such fees, commissions or expenses asserted by any person to be due or payable in connection with any of the transactions contemplated by this Agreement on the basis of any act or statement alleged to have been made by such first party or its affiliate.
I. Additional Agreements. In case at any time after the Closing Date any further action is necessary or desirable in order to carry out the purposes of this Agreement, the proper directors and officers of each party to this Agreement shall take all such necessary action.
J. Public Announcements. For a period of time from the date of this Agreement to the Closing Date, the Target Fund and the Acquiring Fund will consult with each other before issuing any press releases or otherwise making any public statements with respect to this Agreement or the transactions contemplated herein and shall not issue any press release or make any public statement prior to such consultation, except as may be required by law.
K. Tax Status of Reorganization. The intention of the parties is that the transactions contemplated by this Agreement will qualify as a reorganization within the meaning of Section 368(a) of the Code. Neither the Acquiring Fund nor the Target Fund shall take any action, or cause any action to be taken (including, without limitation, the filing of any tax return) that is inconsistent with such treatment or results in the failure of the transaction to qualify
A- 8 -
Table of Contents
as a reorganization within the meaning of Section 368(a) of the Code. At or prior to the Closing Date, the Acquiring Fund and the Target Fund will take such action, or cause such action to be taken, as is reasonably necessary to enable Reed Smith LLP (“Reed Smith”), special counsel to the Acquiring Fund and the Target Fund, to render the tax opinion required herein (including, without limitation, each party’s execution of representations reasonably requested by Reed Smith).
L. Declaration of Dividend. At or immediately prior to the Closing Date, the Target Fund shall declare and pay to its stockholders a dividend or other distribution in an amount large enough so that it will have distributed substantially all (and in any event not less than 98%) of its investment company taxable income (computed without regard to any deduction for dividends paid) and realized net capital gain, if any, for the current taxable year through the Closing Date.
| 7. | Conditions to Obligations of the Target Fund. |
The obligations of the Target Fund hereunder with respect to the consummation of the Reorganization are subject to the satisfaction of the following conditions, unless waived in writing by the Target Fund:
A. Shareholder Approval. This Agreement and the transactions contemplated herein shall have been approved by the affirmative vote of a “Majority of the Outstanding Voting Securities” (as defined in the Articles of Incorporation) of the Target Fund.
B. Representations, Warranties and Agreements. Each of the representations and warranties of the Acquiring Fund contained herein shall be true in all material respects as of the Closing Date, there shall have been no material adverse change in the financial condition, results of operations, business properties or assets of the Acquiring Fund as of the Closing Date, and the Target Fund shall have received a certificate of an authorized officer of the Acquiring Fund satisfactory in form and substance to the Target Fund so stating. The Acquiring Fund shall have performed and complied in all material respects with all agreements, obligations and covenants required by this Agreement to be so performed or complied with by it on or prior to the Closing Date.
C. Registration Statement Effective. The Registration Statement shall have become effective and no stop orders under the Securities Act pertaining thereto shall have been issued.
D. Regulatory Approval. All necessary approvals, registrations, and exemptions under federal and state securities laws shall have been obtained.
E. No Injunctions or Restraints; Illegality. No temporary restraining order, preliminary or permanent injunction or other order issued by any court of competent jurisdiction or other legal restraint or prohibition (an “Injunction”) preventing the consummation of the transactions contemplated by this Agreement shall be in effect, nor shall any proceeding by any state, local or federal government agency or entity seeking any of the foregoing be pending. There shall not have been any action taken or any statute, rule, regulation or order enacted, entered, enforced or deemed applicable to the transactions contemplated by this Agreement, which makes the consummation of the transactions contemplated by this Agreement illegal or which has a material adverse effect on business operations of the Acquiring Fund.
F. Tax Opinion. The Target Fund shall have obtained an opinion from Reed Smith, special counsel for the Target Fund, dated as of the Closing Date, addressed to the Target Fund, that the consummation of the transactions set forth in this Agreement comply with the requirements of a reorganization as described in Section 368(a) of the Code. Such opinion shall be based on customary assumptions and such representations as Reed Smith may reasonably request and the Target Fund and the Acquiring Fund will cooperate to make and certify the accuracy of such representations.
G. Officer Certificates. The Target Fund shall have received a certificate of an authorized officer of the Acquiring Fund, dated as of the Closing Date, certifying that the representations and warranties set forth in Section 5 are true and correct on the Closing Date, together with certified copies of the resolutions adopted by the Board on behalf of the Acquiring Fund.
A- 9 -
Table of Contents
| 8. | Conditions to Obligations of the Acquiring Fund. |
The obligations of the Acquiring Fund hereunder with respect to the consummation of the Reorganization are subject to the satisfaction of the following conditions, unless waived in writing by the Acquiring Fund:
A. Representations, Warranties, and Agreements. Each of the representations and warranties of the Target Fund contained herein shall be true in all material respects as of the Closing Date, there shall have been no material adverse change in the financial condition, results of operations, business, properties or assets of the Target Fund as of the Closing Date, and the Acquiring Fund shall have received a certificate of an authorized officer of the Target Fund satisfactory in form and substance to the Acquiring Fund so stating. The Target Fund shall have performed and complied in all material respects with all agreements, obligations and covenants required by this Agreement to be so performed or complied with by them on or prior to the Closing Date.
B. Registration Statement Effective. The Registration Statement shall have become effective and no stop orders under the Securities Act pertaining thereto shall have been issued.
C. Regulatory Approval. All necessary approvals, registrations, and exemptions under federal and state securities laws shall have been obtained.
D. No Injunctions or Restrains; Illegality. No Injunction preventing the consummation of the transactions contemplated by this Agreement shall be in effect, nor shall any proceeding by any state, local or federal government agency or entity seeking any of the foregoing be pending. There shall not have been any action taken, or any statute, rule, regulation or order enacted, entered, enforced or deemed applicable to the transactions contemplated by this Agreement, which makes the consummation of the transactions contemplated by this Agreement illegal.
E. Tax Opinion. The Acquiring Fund shall have obtained an opinion from Reed Smith, special counsel for the Acquiring Fund, dated as of the Closing Date, addressed to the Acquiring Fund, that the consummation of the transactions set forth in this Agreement comply with the requirements of a reorganization as described in Section 368(a) of the Code. Such opinion shall be based on customary assumptions and such representations as Reed Smith may reasonably request and the Target Fund and the Acquiring Fund will cooperate to make and certify the accuracy of such representations.
F. Shareholder List. The Target Fund shall have delivered to the Acquiring Fund an updated list of all shareholders of the Target Fund, as reported by the Target Fund’s transfer agent, as of one (1) business day prior to the Closing Date with each shareholder’s respective holdings in the Target Fund, taxpayer identification numbers, Form W9 and last known address.
G. Officer Certificates. The Acquiring Fund shall have received a certificate of an authorized officer of the Target Fund, dated as of the Closing Date, certifying that the representations and warranties set forth in Section 4 hereof are true and correct on the Closing Date, together with certified copies of the resolutions adopted by the Board on behalf of the Target Fund and by Target Fund shareholders.
| 9. | Amendment, Waiver and Termination. |
A. The parties hereto may, by agreement in writing authorized by the Board on behalf of each of the Target Fund and the Acquiring Fund, amend this Agreement at any time before or after approval thereof by the shareholders of the Target Fund; provided, however, that after receipt of Target Fund shareholder approval, no amendment shall be made by the parties hereto which substantially changes the terms of Sections 1, 2 and 3 hereof without obtaining Target Fund’s shareholder approval thereof.
B. At any time prior to the Closing Date, either of the parties may by written instrument signed by it (i) waive any inaccuracies in the representations and warranties made to it contained herein and (ii) waive compliance with any of the covenants or conditions made for its benefit contained herein. No delay on the part of either party in exercising any right, power or privilege hereunder shall operate as a waiver thereof, nor shall any waiver on the part of any party of any such right, power or privilege, or any single or partial exercise of any such right, power or privilege, preclude any further exercise thereof or the exercise of any other such right, power or privilege.
A- 10 -
Table of Contents
C. This Agreement may be terminated, and the transactions contemplated herein may be abandoned at any time prior to the Closing Date:
| i. | by the consent of the Board on behalf of each of the Target Fund and the Acquiring Fund; |
| ii. | by the Target Fund, if the Acquiring Fund breaches in any material respect any of its representations, warranties, covenants or agreements contained in this Agreement; |
| iii. | by the Acquiring Fund, if the Target Fund breaches in any material respect any of its representations, warranties, covenants or agreements contained in this Agreement; |
| iv. | by either the Target Fund or the Acquiring Fund, if the Closing has not occurred on or prior to December 31, 2015 (provided that the rights to terminate this Agreement pursuant to this subsection (C)(iv) shall not be available to any party whose failure to fulfill any of its obligations under this Agreement has been the cause of or resulted in the failure of the closing to occur on or before such date); |
| v. | by the Acquiring Fund in the event that: (a) all the conditions precedent to the Target Fund’s obligation to close, as set forth in Section 7 hereof, have been fully satisfied (or can be fully satisfied at the Closing); (b) the Acquiring Fund gives the Target Fund written assurance of its intent to close irrespective of the satisfaction or non-satisfaction of all conditions precedent to the Acquiring Fund’s obligation to close, as set forth in Section 8 hereof; and (c) the Target Fund then fails or refuses to close within the earlier of ten (10) business days or December 31, 2015; or |
| vi. | by the Target Fund in the event that: (a) all the conditions precedent to the Acquiring Fund’s obligation to close, as set forth in Section 8 hereof have been fully satisfied (or can be fully satisfied at the Closing); (b) the Target Fund gives the Acquiring Fund written assurance of its intent to close irrespective of the satisfaction or non-satisfaction of all the conditions precedent to the Target Fund’s obligation to close, as set forth in Section 7 hereof; and (c) the Acquiring Fund then fails or refuses to close within the earlier of ten (10) business days or December 31, 2015. |
| 10. | Remedies. |
In the event of termination of this Agreement by either or both of the Target Fund and Acquiring Fund pursuant to Section 9(C) hereof, written notice thereof shall forthwith be given by the terminating party to the other party hereto, and this Agreement shall therefore terminate and become void and have no effect, and the transactions contemplated herein and thereby shall be abandoned, without further action by the parties hereto.
| 11. | Survival of Warranties and Indemnification. |
A. Survival. The representations and warranties included or provided for herein, or in the schedules or other instruments delivered or to be delivered pursuant hereto, shall survive the Closing Date for a three (3) year period except that any representation or warranty with respect to taxes shall survive for the expiration of the statutory period of limitations for assessments of tax deficiencies as the same may be extended from time to time by the taxpayer. The covenants and agreements included or provided for herein shall survive and be continuing obligations in accordance with their terms. The period for which a representation, warranty, covenant or agreement survives shall be referred to hereinafter as the “Survival Period.” Notwithstanding anything set forth in the immediately preceding sentence, the right of the Acquiring Fund and the Target Fund to seek indemnity pursuant to this Agreement shall survive for a period of ninety (90) days beyond the expiration of the Survival Period of the representation, warranty, covenant or agreement upon which indemnity is sought. In no event shall the Acquiring Fund or the Target Fund be obligated to indemnify the other if indemnity is not sought within ninety (90) days of the expiration of the applicable Survival Period.
B. Indemnification. Each party (an “Indemnitor”) shall indemnify and hold the other and its directors, officers, agents and persons controlled by or controlling any of them (each an “Indemnified Party”) harmless from and against any and all losses, damages, liabilities, claims, demands, judgments, settlements, deficiencies, taxes, assessments, charges, costs and expenses of any nature whatsoever (including reasonable attorneys’ fees), including amounts paid in satisfaction of judgments, in compromise or as fines and penalties, and counsel fees reasonably incurred by such Indemnified Party in connection with the defense or disposition of any claim, action, suit or other proceeding, whether civil or criminal, before any court or administrative or investigative body in which such Indemnified Party may be or may have been involved as a party or otherwise or with which such Indemnified Party
A- 11 -
Table of Contents
may be or may have been threatened (collectively, the “Losses”) arising out of or related to any claim of a breach of any representation, warranty or covenant made herein by the Indemnitor, provided, however, that no Indemnified Party shall be indemnified hereunder against any Losses arising directly from such Indemnified Party’s (i) willful misfeasance, (ii) bad faith, (iii) gross negligence or (iv) reckless disregard of the duties involved in the conduct of such Indemnified Party’s position.
C. Indemnification Procedure. The Indemnified Party shall use its best efforts to minimize any liabilities, damages, deficiencies, claims, judgments, assessments, costs and expenses in respect of which indemnity may be sought hereunder. The Indemnified Party shall give written notice to the Indemnitor within the earlier of ten (10) days of receipt of written notice to the Indemnified Party or thirty (30) days from discovery by the Indemnified Party of any matters which may give rise to a claim for indemnification or reimbursement under this Agreement. The failure to give such notice shall not affect the right of the Indemnified Party to indemnity hereunder unless such failure has materially and adversely affected the rights of the Indemnitor; provided that in any event such notice shall have been given prior to the expiration of the Survival Period. At any time after ten (10) days from the giving of such notice, the Indemnified Party may, at its option, resist, settle or otherwise compromise, or pay such claim unless it shall have received notice from the Indemnitor that the Indemnitor intends, at the Indemnitor’s sole cost and expense, to assume the defense of any such matter, in which case the Indemnified Party shall have the right, at no cost or expense to the Indemnitor, to participate in such defense. If the Indemnitor does not assume the defense of such matter, and in any event until the Indemnitor states in writing that it will assume the defense, the Indemnitor shall pay all costs of the Indemnified Party arising out of the defense until the defense is assumed; provided, however, that the Indemnified Party shall consult with the Indemnitor and obtain the Indemnitor’s prior written consent to any payment or settlement of any such claim. The Indemnitor shall keep the Indemnified Party fully apprised at all times as to the status of the defense. If the Indemnitor does not assume the defense, the Indemnified Party shall keep Indemnitor apprised at all times as to the status of the defense. Following indemnification as provided for hereunder, the Indemnitor shall be subrogated to all rights of the Indemnified Party with respect to all third parties, firms or corporations relating to the matter for which indemnification has been made.
| 12. | Survival. |
The provisions set forth in Sections 10, 11 and 16 hereof shall survive the termination of this Agreement for any cause whatsoever.
| 13. | Notices. |
All notices hereunder shall be sufficiently given for all purposes hereunder if in writing and delivered personally or sent by registered mail or certified mail, postage prepaid. Notice to the Target Fund shall be addressed to the Target Fund c/o Thrivent Mutual Funds, 625 Fourth Avenue South, Minneapolis, Minnesota 55415, Attention: Chief Legal Officer, or at such other address as the Target Fund may designate by written notice to the Acquiring Fund. Notice to the Acquiring Fund shall be addressed to the Acquiring Fund c/o Thrivent Mutual Funds, 625 Fourth Avenue South, Minneapolis, Minnesota 55415, Attention: Chief Legal Officer, or at such other address and to the attention of such other person as the Acquiring Fund may designate by written notice to the Target Fund. Any notice shall be deemed to have been served or given as of the date such notice is delivered personally or mailed.
| 14. | Successors and Assigns. |
This Agreement shall be binding upon and inure to the benefit of the parties hereto and their successors and assigns. This Agreement shall not be assigned by any party without the prior written consent of the other party hereto.
| 15. | Books and Records. |
All books and records of the Target Fund, including all books and records required to be maintained under the Investment Company Act of 1940, as amended (the “1940 Act”), and the rules and regulations thereunder, shall be available to the Acquiring Fund from and after the Closing Date and shall be turned over to the Acquiring Fund as soon as practicable following the Closing Date.
A- 12 -
Table of Contents
| 16. | General. |
This Agreement supersedes all prior agreements between the parties (written or oral), is intended as a complete and exclusive statement of the terms of the Agreement between the parties and may not be amended, modified or changed, or terminated orally. This Agreement may be executed in one or more counterparts, all of which shall be considered one and the same agreement, and shall become effective when one or more counterparts have been executed by the Trust on behalf of the Target Fund and by the Trust on behalf of the Acquiring Fund and delivered to each of the parties hereto. The headings contained in this Agreement are for reference purposes only and shall not affect in any way the meaning or interpretation of this Agreement. This Agreement is for the sole benefit of the parties hereto, and nothing in this Agreement, expressed or implied, is intended to confer upon any other person any rights or remedies under or by reason of this Agreement. This Agreement shall be governed by and construed in accordance with the laws of the State of Minnesota without regard to principles of conflicts or choice of law.
| 17. | Limitation of Liability. |
It is expressly agreed that the obligations of the Trust hereunder shall not be binding upon any of the Directors, shareholders, nominees, officers, agents or employees of the Trust personally, but shall bind only the property of the Trust, as provided in the Articles of Incorporation. The execution and delivery of this Agreement have been authorized by the Directors and signed by an authorized officer of the Trust, acting as such, and neither such authorization by such Directors nor such execution and delivery by such officer shall be deemed to have been made by any of them personally, but shall bind only the property of the Trust as provided in the Articles of Incorporation. The obligations of any series of the Trust hereunder shall be the exclusive obligation of that series and the parties hereto can only look to the assets of that series to satisfy any debt or obligation incurred by that series hereunder.
A- 13 -
Table of Contents
IN WITNESS WHEREOF, the parties have hereunto caused this Agreement to be executed and delivered by their duly authorized officers as of the day and year first written above.
Thrivent Mutual Funds On Behalf of Its Series, [Target Fund] | ||
| ||
Name: Title: | David S. Royal President | |
| Attest: |
|
Name: Michael W. Kremenak Title: Secretary |
Thrivent Mutual Funds On Behalf of Its Series, [Acquiring Fund] |
|
Name: David S. Royal Title: President |
| Attest: |
|
Name: Michael W. Kremenak Title: Secretary |
A- 14 -
Table of Contents
Fund | Class A | Institutional | ||
Thrivent Aggressive Allocation Fund | TAAAX | TAAIX | ||
Thrivent Moderately Aggressive Allocation Fund | TMAAX | TMAFX | ||
Thrivent Moderate Allocation Fund | THMAX | TMAIX | ||
Thrivent Moderately Conservative Allocation Fund | TCAAX | TCAIX | ||
Thrivent Growth and Income Plus Fund | TEIAX | TEIIX | ||
Thrivent Balanced Income Plus Fund | AABFX | IBBFX | ||
Thrivent Diversified Income Plus Fund | AAHYX | THYFX | ||
Thrivent Opportunity Income Plus Fund | AAINX | IIINX | ||
Thrivent Natural Resources Fund | TREFX | TREIX | ||
Thrivent Partner Emerging Markets Equity Fund | TPEAX | TPEIX | ||
Thrivent Partner Small Cap Growth Fund | TPSAX | TPGIX | ||
Thrivent Partner Small Cap Value Fund | AALVX | TPSIX | ||
Thrivent Small Cap Stock Fund | AASMX | TSCSX | ||
Thrivent Mid Cap Growth Fund | LBMGX | LBMIX | ||
Thrivent Partner Mid Cap Value Fund | TPMAX | TPMIX | ||
Thrivent Mid Cap Stock Fund | AASCX | TMSIX | ||
Thrivent Partner Worldwide Allocation Fund | TWAAX | TWAIX | ||
Thrivent Large Cap Growth Fund | AAAGX | THLCX | ||
Thrivent Large Cap Value Fund | AAUTX | TLVIX | ||
Thrivent Large Cap Stock Fund | AALGX | IILGX | ||
Thrivent High Yield Fund | LBHYX | LBHIX | ||
Thrivent Income Fund | LUBIX | LBIIX | ||
Thrivent Municipal Bond Fund | AAMBX | TMBIX | ||
Thrivent Government Bond Fund | TBFAX | TBFIX | ||
Thrivent Limited Maturity Bond Fund | LBLAX | THLIX | ||
Thrivent Money Market Fund | AMMXX | AALXX |
Series of
Thrivent Mutual Funds
Statement of Additional Information
Dated February 27, 2015
Each of the above-referenced mutual funds (each a “Fund” and collectively the “Funds”) are series of Thrivent Mutual Funds (the “Trust”). Class A and Institutional Class shares are offered through separate prospectuses. Each such prospectus is referred to hereinafter as a “Prospectus.” This Statement of Additional Information (“SAI”) is not a prospectus but should be read in conjunction with the Prospectus dated February 27, 2015 for the applicable class of the above-referenced series of the Trust. The Reports of the Independent Registered Public Accounting Firm and financial statements included in the Annual Reports for the Trust for the fiscal year ended October 31, 2014 (for all series except Thrivent Natural Resources Fund, Thrivent Growth and Income Plus Fund and Thrivent Diversified Income Plus Fund) and December 31, 2014 (for Thrivent Natural Resources Fund, Thrivent Growth and Income Plus Fund and Thrivent Diversified Income Plus Fund) are separate reports furnished with this SAI and are incorporated herein by reference. To receive a copy of a Prospectus or the Annual Reports, write to Thrivent Mutual Funds, 625 Fourth Avenue South, Minneapolis, Minnesota 55415 or call toll-free (800) THRIVENT (847-4836). The Prospectus and the Annual Reports are also available on the Thrivent Financial for Lutherans website (www.thrivent.com).
B-1
Table of Contents
| PAGE | ||||
| B-3 | ||||
| B-5 | ||||
| B-30 | ||||
| B-46 | ||||
INVESTMENT ADVISER, INVESTMENT SUBADVISERS AND PORTFOLIO MANAGERS | B-49 | |||
| B-74 | ||||
| B-77 | ||||
| B-79 | ||||
| B-86 | ||||
| B-90 | ||||
| B-91 | ||||
REPORT OF INDEPENDENT REGISTERED PUBLIC ACCOUNTING FIRM AND FINANCIAL STATEMENTS | B-97 | |||
| B-98 | ||||
B-2
Table of Contents
GENERAL INFORMATION ABOUT THE TRUST
The Trust was organized as a Massachusetts Business Trust on March 10, 1987 and is registered as an open-end management investment company under the Investment Company Act of 1940 (“1940 Act”). The Trust is authorized to issue shares of beneficial interest, par value $.01 per share, divisible into an indefinite number of different series and classes and operates as a “series company” as provided by Rule 18f-2 under the 1940 Act. The Trust commenced operations on July 16, 1987 and currently consists of 26 series (each a “Fund” and collectively the “Funds”). Each Fund other than the Thrivent Asset Allocation Funds, as defined below, and Thrivent Natural Resources Fund is diversified.
The following table provides the inception date and the available classes of shares of the Funds described in this SAI.
Fund Name | Class A Inception Date | Institutional Class Inception Date | ||||||
Thrivent Aggressive Allocation Fund | 6/30/05 | 6/30/05 | ||||||
Thrivent Moderately Aggressive Allocation Fund | 6/30/05 | 6/30/05 | ||||||
Thrivent Moderate Allocation Fund | 6/30/05 | 6/30/05 | ||||||
Thrivent Moderately Conservative Allocation Fund | 6/30/05 | 6/30/05 | ||||||
Thrivent Growth and Income Plus Fund | 2/29/08 | 2/29/08 | ||||||
Thrivent Balanced Income Plus Fund | 12/29/97 | 12/29/97 | ||||||
Thrivent Diversified Income Plus Fund | 1/08/97 | 12/29/97 | ||||||
Thrivent Opportunity Income Plus Fund | 7/16/87 | 12/29/97 | ||||||
Thrivent Natural Resources Fund | 6/30/05 | 6/30/05 | ||||||
Thrivent Partner Emerging Markets Equity Fund | 8/31/12 | 8/31/12 | ||||||
Thrivent Partner Small Cap Growth Fund | 6/30/05 | 6/30/05 | ||||||
Thrivent Partner Small Cap Value Fund | 7/17/01 | 7/17/01 | ||||||
Thrivent Small Cap Stock Fund | 7/01/96 | 12/29/97 | ||||||
Thrivent Mid Cap Growth Fund | 5/30/97 | 10/31/97 | ||||||
Thrivent Partner Mid Cap Value Fund | 6/30/05 | 6/30/05 | ||||||
Thrivent Mid Cap Stock Fund | 6/30/93 | 12/29/97 | ||||||
Thrivent Partner Worldwide Allocation Fund | 2/29/08 | 2/29/08 | ||||||
Thrivent Large Cap Growth Fund | 10/29/99 | 10/29/99 | ||||||
Thrivent Large Cap Value Fund | 10/29/99 | 10/29/99 | ||||||
Thrivent Large Cap Stock Fund | 7/16/87 | 12/29/97 | ||||||
Thrivent High Yield Fund | 4/3/87 | 10/31/97 | ||||||
Thrivent Income Fund | 6/1/72 | 10/31/97 | ||||||
Thrivent Municipal Bond Fund | 12/3/76 | 10/31/97 | ||||||
Thrivent Government Bond Fund | 2/26/2010 | 2/26/2010 | ||||||
Thrivent Limited Maturity Bond Fund | 10/29/99 | 10/29/99 | ||||||
Thrivent Money Market Fund | 3/10/88 | 12/29/97 | ||||||
The Declaration of Trust provides that each shareholder shall be deemed to have agreed to be bound by its terms. A vote of shareholders and the Board of Trustees may amend the Declaration of Trust. The Trust may issue an unlimited number of shares in one or more series as the Board of Trustees may authorize.
Each class is subject to such investment minimums and other conditions as set forth in the Trust’s prospectuses as from time to time is in effect. Differences in expenses among classes are described in the Trust’s Amended and Restated Plan Pursuant to Rule 18f-3 under the Investment Company Act of 1940. Class A and Institutional Class shares pay the expenses associated with their different distribution arrangements. Each class may, at the Trustees’ discretion, also pay a different share of other expenses, not including advisory or custodial fees or other expenses related to the management of the Trust’s assets, if these expenses are actually incurred in a different amount by that class, or if the class receives services of a different kind or to a different degree than the other class. All other expenses will be allocated to each class on the basis of the net asset value of the particular Fund.
B-3
Table of Contents
Each class of shares has identical voting rights except that each class has exclusive voting rights on any matter submitted to shareholders relating solely to the class or where the interests of one class differ from the interests of the other class. Class A shares have exclusive voting rights on matters involving the Rule 12b-1 Distribution Plan as applied to that class. Matters submitted to shareholder vote must be approved by each Fund separately except:
| 1. | when required otherwise by the 1940 Act; or |
| 2. | when the Trustees determine that the matter does not affect all Funds; then, only the shareholders of the affected Funds may vote. |
Shares are freely transferable, and holders thereof are entitled to receive dividends declared by the Trustees, and receive the assets of their respective Fund in the event of liquidation. The Trust generally holds shareholder meetings only when required by law or at the written request of shareholders owning at least 10% of the Trust’s outstanding shares. Shareholders may remove the Trustees from office by votes cast in person or by proxy at a shareholder meeting.
At the request of shareholders holding 10% or more of the outstanding shares of the Trust, the Trust will hold a special meeting for the purpose of considering the removal of a Trustee(s) from office, and the Trust will cooperate with and assist shareholders of record who notify the Trust that they wish to communicate with other shareholders for the purpose of obtaining signatures to request such a meeting, all pursuant to and in accordance with Section 16(c) of the 1940 Act, as amended.
Under Massachusetts law, shareholders of a business trust may be held personally liable, under certain circumstances, for the obligations of the Trust. However, the Declaration of Trust disclaims shareholder, Trustee and/or officer liability for acts performed on behalf of the Trust or for Trust obligations that are binding only on the assets and property of the Trust. The Funds include this disclaimer in each agreement, obligation, or contract entered into or executed by the Trust or the Board. The Declaration of Trust provides for indemnification out of the Trust’s assets for all losses and expenses of any shareholder held personally liable for the obligations of the Trust. The risk of a shareholder incurring financial loss on account of shareholder liability is remote because it is limited to circumstances where the Trust itself is unable to meet its obligations.
B-4
Table of Contents
INVESTMENT POLICIES AND RESTRICTIONS
Additional Investment Practices
In addition to those practices stated in the Prospectuses, various Funds may purchase the following securities or may engage in the following transactions. Each of these investment practices are non-principal investment strategies except as otherwise noted.
Investments of Thrivent Asset Allocation Funds
Each of the Thrivent Aggressive Allocation Fund, Thrivent Moderately Aggressive Allocation Fund, Thrivent Moderate Allocation Fund and Thrivent Moderately Conservative Allocation Fund (each, a “Thrivent Asset Allocation Fund” and collectively, the “Thrivent Asset Allocation Funds”) seeks to achieve its investment objective by investing in a combination of other series of the Trust and directly held financial instruments. Each of the Thrivent Asset Allocation Funds may also invest in (i) Government Securities and Short-Term Paper (as such terms are defined in the 1940 Act), (ii) unaffiliated mutual funds or other unaffiliated investment companies, to the extent permitted under Section 12(d)(1) of the 1940 Act, and (iii) other investments, as permitted by Rule 12d1-2 under the 1940 Act or by exemptive order.
None of the Thrivent Asset Allocation Funds is “diversified” within the meaning of the 1940 Act. A mutual fund is diversified if at least 75% of the value of its total assets is represented by Government Securities (as defined in the 1940 Act), cash and cash items, securities of other investment companies and other securities, excluding investments of more than 5% of the fund’s total assets in any one issuer and investments representing more than 10% of the outstanding voting securities of any one issuer.
Other Securities
Thrivent Natural Resources Fund, Thrivent Partner Emerging Markets Equity Fund, Thrivent Partner Small Cap Growth Fund, Thrivent Partner Small Cap Value Fund, Thrivent Small Cap Stock Fund, Thrivent Mid Cap Growth Fund, Thrivent Partner Mid Cap Value Fund, Thrivent Mid Cap Stock Fund, Thrivent Partner Worldwide Allocation Fund, Thrivent Large Cap Growth Fund, Thrivent Large Cap Value Fund, Thrivent Large Cap Stock Fund, Thrivent Growth and Income Plus Fund, Thrivent Balanced Income Plus Fund, and, to the extent set forth above, Thrivent Asset Allocation Funds may invest in other types of securities, including bonds, preferred stocks, convertible bonds, convertible preferred stocks, warrants, American Depository Receipts (ADRs), and other debt or equity securities. In addition, each of these Funds may invest in U.S. Government securities or cash, European Depository Receipts (EDRs) and the securities of foreign investment trusts.
Thrivent Growth and Income Plus Fund, Thrivent Balanced Income Plus Fund, Thrivent Natural Resources Fund, Thrivent Partner Emerging Markets Equity Fund, Thrivent Partner Small Cap Growth Fund, Thrivent Partner Small Cap Value Fund, Thrivent Small Cap Stock Fund, Thrivent Mid Cap Growth Fund, Thrivent Partner Mid Cap Value Fund, Thrivent Mid Cap Stock Fund, Thrivent Partner Worldwide Allocation Fund, Thrivent Large Cap Growth Fund, Thrivent Large Cap Value Fund, and Thrivent Large Cap Stock Fund will not use any minimum level of credit quality. Debt obligations may be rated less than investment grade, which is defined as having a quality rating below “Baa,” as rated by Moody’s Investors Service, Inc. (“Moody’s”), or below “BBB,” as rated by Standard & Poor’s Corporation (“S&P”). For a description of Moody’s and S&P’s ratings, see “Description of Debt Ratings.” Securities rated below investment grade (sometimes referred to as “high yield bonds” or “junk bonds”) are considered to be speculative and involve certain risks, including a higher risk of default and greater sensitivity to economic changes.
Thrivent Diversified Income Plus Fund, Thrivent Opportunity Income Plus Fund, Thrivent High Yield Fund, Thrivent Income Fund, Thrivent Government Bond Fund and Thrivent Limited Maturity Bond Fund also may invest in common stocks, warrants to purchase stocks, bonds or preferred stocks convertible into common stock, and other equity securities.
B-5
Table of Contents
Thrivent Municipal Bond Fund does not generally intend to purchase any securities that would cause 25% or more of the value of its total assets to be invested in the securities of governmental subdivisions located in any one state, territory or possession of the United States. The Fund may invest 25% or more of the value of its total assets in industrial development bonds. The Fund also may invest up to 25% of its total assets in securities issued in connection with the financing of projects with similar characteristics, such as toll road revenue bonds, housing revenue bonds or electric power project revenue bonds, or in industrial development revenue bonds which are based, directly or indirectly, on the credit of private entities in any one industry. Thrivent Municipal Bond Fund may invest up to 5% of its assets in high yield securities.
Bank Instruments
Each Fund may invest in bank instruments in pursuit of its investment objective. These instruments include, but are not limited to, certificates of deposit, bankers’ acceptances and time deposits. Certificates of deposit are generally short-term (i.e., less than one year), interest-bearing negotiable certificates issued by commercial banks or savings and loan associations against funds deposited in the issuing institution. A banker’s acceptance is a time draft drawn on a commercial bank by a borrower, usually in connection with an international commercial transaction (to finance the import, export, transfer or storage of goods). A banker’s acceptance may be obtained from a domestic or foreign bank including an U.S. branch or agency of a foreign bank. The borrower is liable for payment as well as the bank, which unconditionally guarantees to pay the draft at its face amount on the maturity date. Most acceptances have maturities of six months or less and are traded in secondary markets prior to maturity. Time deposits are non-negotiable deposits for a fixed period of time at a stated interest rate.
U.S. branches of foreign banks are offices of foreign banks and are not separately incorporated entities. They are chartered and regulated under federal or state law. U.S. federal branches of foreign banks are chartered and regulated by the Comptroller of the Currency, while state branches and agencies are chartered and regulated by authorities of the respective state or the District of Columbia. U.S. branches of foreign banks may accept deposits and thus are eligible for FDIC insurance; however, not all such branches elect FDIC insurance. U.S. branches of foreign banks can maintain credit balances, which are funds received by the office incidental to or arising out of the exercise of their banking powers and can exercise other commercial functions, such as lending activities.
Investing in foreign branches of U.S. banks and U.S. branches of foreign banks may involve risks. These risks may include future unfavorable political and economic developments, possible withholding or confiscatory taxes, seizure of foreign deposits, currency controls, interest limitations and other governmental restrictions that might affect payment of principal or interest, and possible difficulties pursuing or enforcing claims against banks located outside the U.S. Additionally, foreign issuers are not generally subject to uniform accounting, auditing and financial reporting standards or other regulatory requirements and practices comparable to U.S. issuers, and there may be less public information available about foreign banks and their branches and agencies.
Repurchase Agreements
Each Fund may engage in repurchase agreement transactions in pursuit of its investment objective. A repurchase agreement consists of a purchase and a simultaneous agreement to resell an investment for later delivery at an agreed upon price and rate of interest. The Fund must take possession of collateral either directly or through a third-party custodian. If the original seller of a security subject to a repurchase agreement fails to repurchase the security at the agreed upon time, the Fund could incur a loss due to a drop in the market value of the security during the time it takes the Fund to either sell the security or take action to enforce the original seller’s agreement to repurchase the security. Also, if a defaulting original seller filed for bankruptcy or became insolvent, disposition of such security might be delayed by pending court action. The Fund may only enter into repurchase agreements with banks and other recognized financial institutions such as broker/dealers that are found by the Funds’ investment adviser, Thrivent Asset Management, LLC (“Thrivent Asset Mgt.” or the “Adviser”), (or a subadviser) to be creditworthy. The Thrivent Money Market Fund may enter into repurchase agreements that are collateralized by equity securities, high-yield bonds and other non-traditional forms of collateral provided that the repurchase agreement is an eligible security under Rule 2a-7.
B-6
Table of Contents
Restricted Securities
The Funds may buy or sell restricted securities, including securities that meet the requirements of Rule 144A under the Securities Act of 1933 (“Rule 144A Securities”). Rule 144A Securities may be resold pursuant to Rule 144A under certain circumstances only to qualified institutional buyers as defined in the rule. Rule 144A Securities may be deemed to be liquid as determined by or in accordance with methods adopted by the Trustees. Under such methods the following factors are considered, among others: the frequency of trades and quotes for the security, the number of dealers and potential purchasers in the market, market making activity, and the nature of the security and marketplace trades. Investments in Rule 144A Securities could have the effect of increasing the level of a Fund’s illiquidity to the extent that qualified institutional buyers become, for a time, uninterested in purchasing such securities. Also, a Fund may be adversely impacted by the subjective valuation of such securities in the absence of an active market for them. Restricted securities that are not resalable under Rule 144A may be subject to risks of illiquidity and subjective valuations to a greater degree than Rule 144A securities. None of the Funds will invest more than 15% of its net assets in illiquid securities (5% in the case of Thrivent Money Market Fund).
Reverse Repurchase Agreements
Each Fund also may enter into reverse repurchase agreements, which may be viewed as borrowings made by a Fund. A reverse repurchase agreement is a transaction in which the Fund transfers possession of a portfolio instrument to another person, such as a financial institution, broker or dealer, in return for a percentage of the instrument’s market value in cash, with an agreement that at a stipulated date in the future the Fund will repurchase the portfolio instrument by remitting the original consideration plus interest at an agreed upon rate. The use of reverse repurchase agreements may enable the Fund to avoid selling portfolio instruments at a time when a sale may be deemed to be disadvantageous. However, the ability to enter into reverse repurchase agreements does not assure that the Fund will be able to avoid selling portfolio instruments at a disadvantageous time.
The Funds will engage in reverse repurchase agreements that are not in excess of 60 days to maturity and will do so to avoid borrowing cash and not for the purpose of investment leverage or to speculate on interest rate changes. When effecting reverse repurchase agreements, assets of the Fund in a dollar amount sufficient to make payment of the obligations to be purchased are segregated on the Fund’s records at the trade date and maintained until the transaction is settled.
When-Issued and Delayed Delivery Transactions
Each Fund may purchase securities on a when-issued and delayed delivery basis. When-issued and delayed delivery transactions arise when U.S. Government obligations and other types of securities are bought by the Fund with payment and delivery taking place in the future. The settlement dates of these transactions, which may be a month or more after entering into the transaction, are determined by mutual agreement of the parties. There are no fees or other expenses associated with these types of transactions other than normal transaction costs.
To the extent a Fund engages in when-issued and delayed delivery transactions, it will do so for the purpose of acquiring portfolio instruments consistent with its investment objective and policies and not for the purpose of investment leverage. On the settlement date, the value of such instruments may be less than the cost thereof. When effecting when-issued and delayed delivery transactions, a Fund will maintain liquid securities, cash, or cash equivalents of a dollar amount sufficient to make payment for the obligations to be purchased until the transaction has been settled.
Dollar Roll Transactions
The Funds may enter into dollar roll transactions with respect to securities issued or to be issued by the Government National Mortgage Association, Federal National Mortgage Association and Federal Home Loan Mortgage Corporation in which the Funds sell mortgage securities and simultaneously agree to repurchase
B-7
Table of Contents
similar (same type, coupon and maturity) securities at a later date at an agreed upon price. During the period between the sale and repurchase, the Funds forgo principal and interest paid on the mortgage securities sold. The Funds are compensated by the interest earned on the cash proceeds of the initial sale and from negotiated fees paid by brokers offered as an inducement to the Funds to “roll over” their purchase commitments. While the dollar roll transactions may result in higher transaction costs or higher taxes for the Funds, the Adviser believes that the benefits of investing in such a program will outweigh the potential for such increased costs.
Collateralized Mortgage Obligations and Multi-Class Pass-Through Securities
The principal strategies of Thrivent Growth and Income Plus Fund, Thrivent Balanced Income Plus Fund, Thrivent Diversified Income Plus Fund, Thrivent Income Fund, Thrivent Opportunity Income Plus Fund, and Thrivent Limited Maturity Bond Fund include investing in mortgage-backed securities, including collateralized mortgage obligations (“CMOs”) and Multi-Class Pass-Through Securities (“MCPTS”), and the other Funds may invest in such instruments as a non-principal strategy. CMOs and MCPTS are debt instruments issued by special purpose entities secured by pools of mortgage loans or other mortgage-backed securities. MCPTS are interests in a trust composed of mortgage loans or other mortgage-backed securities. Payments of principal and interest on the underlying collateral provide the money to pay debt service on the CMO or make scheduled distributions on the multi-class pass-through security. MCPTS, CMOs, and classes thereof (including those discussed below) are examples of the types of financial instruments commonly referred to as “derivatives.”
A CMO contains a series of bonds or certificates issued in multiple classes. Each CMO class (referred to as “tranche”) has a specified coupon rate and stated maturity or final distribution date. When people start prepaying the principal on the collateral underlying a CMO (such as mortgages underlying a CMO), some classes may retire substantially earlier than the stated maturity or final distribution dates. The issuer structures a CMO to pay or accrue interest on all classes on a monthly, quarterly or semi-annual basis. The issuer may allocate the principal and interest on the underlying mortgages among the classes in many ways. In a common structure, the issuer applies the principal payments on the underlying mortgages to the classes according to scheduled cash flow priorities.
There are many classes of CMOs. Interest only classes (“IOs”) entitle the class shareholders to receive distributions consisting solely or primarily of all or a portion of the interest in an underlying pool of mortgages or mortgage-backed securities (mortgage assets). Principal only classes (“POs”) entitle the class shareholders to receive distributions consisting solely or primarily of all or a portion of the underlying pool of mortgage assets. In addition, there are “inverse floaters,” which have coupon rates that move in the reverse direction to an applicable index, and accrual (or Z) bonds (described below).
Inverse floating CMO classes are typically more volatile than fixed or adjustable rate CMO classes. We would only invest in inverse floating CMOs to protect against a reduction in the income earned on investments due to a predicted decline in interest rates. In the event interest rates increased, we would lose money on investments in inverse floating CMO classes. An interest rate increase would cause the coupon rate on an inverse CMO class to decrease.
Cash flow and yields on IO and PO classes are extremely sensitive to principal payment rates (including prepayments) on the underlying mortgage loans or mortgage-backed securities. For example, rapid or slow principal payment rates may adversely affect the yield to maturity of IO or PO bonds, respectively. If the underlying mortgage assets experience greater than anticipated prepayments of principal, the holder of an IO bond may incur a complete loss in value due to the lost interest stream even if the IO bond has a AAA rating. If the underlying mortgage assets experience slower than anticipated prepayments of principal, the PO bond will incur substantial losses in value due to lost prepayments. Rapid or slow principal payment rates may cause IO and PO bond holders to incur substantially more losses in market value than if they had invested in traditional mortgage-backed securities. On the other hand, if interest rates rise, the value of an IO might increase and partially offset other bond value declines in a Fund’s portfolio. If interest rates fall, the value of a PO might increase offsetting lower reinvestment rates in a Fund’s portfolio.
B-8
Table of Contents
An accrual or Z bondholder does not receive cash payments until one or more of the other classes have received their full payments on the mortgage loans underlying the CMO. During the period when the Z bondholders do not receive cash payments, interest accrues on the Z class at a stated rate. The accrued interest is added to the amount of principal due to the Z class. After the other classes have received their payments in full, the Z class begins receiving cash payments until it receives its full amount of principal (including the accrued interest added to the principal amount) and interest at the stated rate.
Generally, the date when cash payments begin on the Z class depends on the prepayment rate of the mortgage loans underlying the CMO. A faster prepayment rate results in an earlier commencement of cash payments on the Z class. Like a zero coupon bond, during its accrual period the Z class has the advantage of eliminating the risk of reinvesting interest payments at lower rates during a period of declining interest rates. Like a zero coupon bond, the market value of a Z class bond fluctuates more widely with changes in interest rates than would the market value of a bond from a class that pays interest currently. Changing interest rates influence prepayment rates. As noted above, such changes in prepayment rates affect the date at which cash payments begin on a Z tranche, which in turn influences its market value.
Collateralized Debt Obligations
The Funds may invest in collateralized debt obligations (“CDOs”), which include collateralized loan obligations (“CLOs”), collateralized bond obligations (“CBOs”), and other similarly structured securities. CDOs are types of asset-backed securities. A CLO is ordinarily issued by a trust or other special purpose entity (“SPE”) and is typically collateralized by a pool of loans, which may include, among others, domestic and nonU.S. senior secured loans, senior unsecured loans, and subordinate corporate loans, including loans that may be rated below investment grade or equivalent unrated loans, held by such issuer. A CBO is ordinarily issued by a trust or other SPE and is typically backed by a diversified pool of fixed income securities (which may include high risk, below investment grade securities) held by such issuer. Although certain CDOs may benefit from credit enhancement in the form of a senior-subordinate structure, overcollateralization or bond insurance, such enhancement may not always be present, and may fail to protect a Fund against the risk of loss on default of the collateral. Certain CDO issuers may use derivatives contracts to create “synthetic” exposure to assets rather than holding such assets directly, which entails the risks of derivative instruments described elsewhere in this SAl. CDOs may charge management fees and administrative expenses, which are in addition to those of a Fund.
For both CLOs and CBOs, the cash flows from the SPE are split into two or more portions, called tranches, varying in risk and yield. The riskiest portion is the “equity” tranche, which bears the first loss from defaults from the bonds or loans in the SPE and serves to protect the other, more senior tranches from default (though such protection is not complete). Since it is partially protected from defaults, a senior tranche from a CLO or CBO typically has higher ratings and lower yields than its underlying securities, and may be rated investment grade. Despite the protection from the equity tranche, CLO or CBO tranches can experience substantial losses due to actual defaults, downgrades of the underlying collateral by rating agencies, forced liquidation of the collateral pool due to a failure of coverage tests, increased sensitivity to defaults due to collateral default and disappearance of protecting tranches, market anticipation of defaults as well as investor aversion to CLO or CBO securities as a class. Interest on certain tranches of a CDO may be paid in kind or deferred and capitalized (paid in the form of obligations of the same type rather than cash), which involves continued exposure to default risk with respect to such payments.
The risks of an investment in a CDO depend largely on the type of the collateral securities and the class of the CDO in which a Fund invests. Normally, CLOs, CBOs and other CDOs are privately offered and sold, and thus are not registered under the securities laws. As a result, investments in CDOs may be characterized by a Fund as illiquid securities. However, an active dealer market may exist for CDOs, allowing a CDO to qualify for Rule 144A transactions. In addition to the normal risks associated with fixed income securities and asset-backed securities generally discussed elsewhere in this SAI, CDOs carry additional risks including, but not limited to: (i) the possibility that distributions from collateral securities will not be adequate to make interest or other
B-9
Table of Contents
payments; (ii) the risk that the collateral may default or decline in value or be downgraded, if rated by a nationally recognized statistical rating organization (“NRSRO”); (iii) a Fund may invest in tranches of CDOs that are subordinate to other tranches; (iv) the structure and complexity of the transaction and the legal documents could lead to disputes among investors regarding the characterization of proceeds; (v) the investment return achieved by the Fund could be significantly different than those predicted by financial models; (vi) the lack of a readily available secondary market for CDOs; (vii) risk of forced “fire sale” liquidation due to technical defaults such as coverage test failures; and (viii) the CDO’s manager may perform poorly.
Senior Loans (All Funds except Thrivent Money Market Fund)
The Funds may invest in senior loans. Senior loans hold the most senior position in the capital structure of a business entity, are typically secured with specific collateral and have a claim on the general assets of the borrower that is senior to that held by subordinated debtholders and stockholders of the borrower. The proceeds of senior loans primarily are used to finance leveraged buyouts, recapitalizations, mergers, acquisitions, stock repurchases, and, to a lesser extent, to finance internal growth and for other corporate purposes. Senior loans typically have rates of interest which are redetermined either daily, monthly, quarterly or semi-annually by reference to a base lending rate, plus a premium. These base lending rates generally are LIBOR, the prime rate offered by one or more major United States banks or the certificate of deposit rate or other base lending rates used by commercial lenders.
Senior loans may not be rated by a rating organization, will not be registered with the Securities and Exchange Commission (SEC) or any state securities commission and generally will not be listed or traded on any national securities exchange. Therefore, the amount of public information available about senior loans will be limited, and the performance of investments in senior loans will be more dependent on the analytical abilities of the Adviser than would be the case for investments in more widely-rated, registered or exchange-listed or traded securities. In evaluating the creditworthiness of borrowers, the Adviser will consider, and may rely in part, on analyses performed by others. Moreover, certain senior loans will be subject to contractual restrictions on resale and, therefore, will be illiquid.
Structured Securities
The Funds may invest in structured securities. The issuer of a structured security links the security’s coupon, dividend or redemption amount at maturity to some sort of financial indicator. Such financial indicators can include currencies, interest rates, individual securities, commodities and indexes. The coupon, dividend and/or redemption amount at maturity may increase or decrease depending on the value of the linked or underlying instrument.
Investments in structured securities involve certain risks. In addition to the normal credit and interest rate risks inherent with a debt security, the redemption amount may increase or decrease as a result of price changes in the underlying instrument. Depending on how the issuer links the coupon and/or dividend to the underlying instrument, the amount of the dividend may be reduced to zero. Any further declines in the value of the underlying instrument may then reduce the redemption amount at maturity. Structured securities may have more volatility than the price of the underlying instrument.
In addition, structured securities include equity linked notes. An equity linked note is a note whose performance is tied to a single stock, a stock index or a basket of stocks. Equity linked notes can combine the principal protection normally associated with fixed income investments with the potential for capital appreciation normally associated with equity investments. Not all equity linked notes, however, provide principal protection. Upon the maturity of the note, the holder receives, but is not guaranteed, a return of principal based on the capital appreciation of the linked securities. Depending on the terms of the note, equity linked notes may also have a “cap” or “floor” on the maximum principal amount to be repaid to holders, irrespective of the performance of the underlying linked securities. The secondary market for equity linked notes may be limited, and the lack of
B-10
Table of Contents
liquidity in the secondary market may make these securities difficult to dispose of and to value. Equity linked notes will be considered equity securities for purposes of a Fund’s investment objective and policies.
The Thrivent Municipal Bond Fund may invest in derivative variable rate municipal securities such as inverse floaters whose rates vary inversely with changes in market rates of interest or range floaters or capped floaters whose rates are subject to periodic or lifetime caps. Derivative variable rate securities may pay a rate of interest determined by applying a multiple to the variable rate. The extent of increases and decreases in the value of derivative variable rate securities in response to changes in market rates of interest generally will be larger than comparable changes in the value of an equal principal amount of a fixed rate municipal security having similar credit quality, redemption provisions and maturity.
Variable Rate Demand Notes
The Funds may purchase variable rate master demand notes. Variable rate master demand notes are unsecured instruments that permit the indebtedness thereunder to vary and provide for periodic adjustments in the interest rate. These notes are normally not traded, and there is no secondary market for the notes. However, a Fund may demand payment of the principal for such Fund at any time. If an issuer of a variable rate master demand note defaulted on its payment obligation, a Fund might not be able to dispose of the note due to the absence of a secondary market. A Fund might suffer a loss to the extent of the default.
The extent to which the Thrivent Money Market Fund can purchase these securities is subject to Rule 2a-7 under the 1940 Act. The Money Market Fund’s purchases of variable rate master demand notes are limited to those: (1) rated in one of the two highest rating categories by a designated NRSRO; or (2) that have been issued by an issuer that has received a rating from a designated NRSRO in the top two categories with respect to a class of short-term debt obligations that is comparable in priority and security with the instrument. The Money Market Fund only invests in variable rate master demand notes when it deems them to involve minimal credit risk.
Lending Securities (All Funds except Thrivent Money Market Fund)
Consistent with applicable regulatory requirements, each of the Funds may from time to time lend the securities it holds to broker-dealers, provided that such loans are made pursuant to written agreements and are initially secured by collateral in the form of cash, U.S. Government securities, irrevocable standby letters of credit or other liquid securities in an amount equal to at least 102% of the market value of the loaned domestic securities and international fixed income securities and 105% of the market value of the loaned international equity securities. In electing to engage in securities lending for a Fund, the Adviser will take into account the investment objective and principal strategies of the Fund. For the period during which the securities are on loan, the lending Fund will be entitled to receive the interest and dividends, or amounts equivalent thereto, on the loaned securities and a fee from the borrower or interest on the investment of the cash collateral. The right to terminate the loan will be given to either party subject to appropriate notice. Upon termination of the loan, the borrower will return to the Fund securities identical to the loaned securities.
The primary risk in lending securities is that the borrower may become insolvent on a day on which the loaned security is rapidly increasing in value. In such event, if the borrower fails to return the loaned security, the existing collateral might be insufficient to purchase back the full amount of the security loaned, and the borrower would be unable to furnish additional collateral. The borrower would be liable for any shortage, but the lending Fund would be an unsecured creditor with respect to such shortage and might not be able to recover all or any portion thereof. However, this risk may be minimized by carefully selecting borrowers and securities to be lent and by monitoring collateral.
No Fund may lend any security or make any other loan if, as a result, more than one-third of its total assets would be lent to other parties.
B-11
Table of Contents
Non-Standard Warrants (all Funds Except Thrivent Money Market Fund)
A Fund may use non-standard warrants, including low exercise price warrants or low exercise price options and participatory notes, to gain indirect exposure to issuers in certain countries. Non-standard warrants are different from standard warrants in that they do not give their holders the right to receive a security of the issuer upon exercise. Rather, they pay the holder the difference in price of the underlying security between the date the non-standard warrant was purchased and the date it is sold. Non-standard warrants are generally a type of equity-linked derivative that are traded over-the-counter and constitute general unsecured contractual obligations of the banks or broker-dealers that issue them. Generally, banks and broker-dealers associated with non-U.S.-based brokerage firms buy securities listed on certain foreign exchanges and then issue non-standard warrants that are designed to replicate the performance of certain issuers and markets. The performance results of non-standard warrants will not replicate exactly the performance of the issuers or markets that they seek to replicate due to transaction costs and other expenses. The holder of a non-standard warrant typically does not receive voting or other rights as it would if it directly owned the underlying security, and non-standard warrants present similar risks to investing directly in the underlying security. Additionally, non-standard warrants entail the same risks as other over-the-counter derivatives. These include the risk that the counterparty or issuer of the non-standard warrant may not be able to fulfill its obligations, that the holder and counterparty or issuer may disagree as to the meaning or application of contractual terms, or that the instrument may not perform as expected. Additionally, there is no guarantee that a liquid market will exist for a particular non-standard warrant or that the counterparty or issuer of a non-standard warrant will be willing to repurchase such instrument when the Fund wishes to sell it.
Put and Call Options (All Funds except Thrivent Money Market Fund)
As described below, each of the Funds may invest in options on another security, an index, a currency, or a futures contract. If the option is described as “covered,” the applicable Fund holds the investment underlying the option or has the right to obtain it at no additional cost. If the option is not covered, the Fund will earmark cash or liquid securities. To ensure that the Fund has sufficient assets to meet its obligations in respect of the option. When a Fund sells put options, the earmarked assets must be equal to the purchase obligation of the Fund, less any amount maintained as margin. When a Fund sells a call option, earmarked assets must be equal to the market value of the instruments underlying the call options less any amount maintained as margin.
Selling (“Writing”) Covered Call Options: The Funds may from time to time sell (“write”) covered call options on any portion of their portfolios as a hedge to provide partial protection against adverse movements in prices of securities in those Funds and, subject to the limitations described below, for the non-hedging purpose of attempting to create additional income. A call option gives the buyer of the option, upon payment of a premium, the right to call upon the writer to deliver a specified amount of a security on or before a fixed date at a predetermined (“strike”) price. As the writer of a call option, a Fund assumes the obligation to deliver the underlying security to the holder of the option on demand at the strike price. This obligation is held by the Fund until either the option expires or an offsetting transaction is entered into by the Fund.
If the price of a security hedged by a call option falls below or remains below the strike price of the option, a Fund will generally not be called upon to deliver the security. A Fund will, however, retain the premium received for the option as additional income, offsetting all or part of any decline in the value of the security. If the price of a hedged security rises above or remains above the strike price of the option, the Fund will generally be called upon to deliver the security. In this event, a Fund limits its potential gain by limiting the value it can receive from the security to the strike price of the option plus the option premium.
Buying Call Options: The Funds may also from time to time purchase call options on securities in which those Funds may invest. As the holder of a call option, a Fund has the right (but not the obligation) to purchase the underlying security or currency at the exercise price at any time during the option period (American style) or at the expiration of the option (European style). A Fund generally will purchase such options as a hedge to
B-12
Table of Contents
provide protection against adverse movements in the prices of securities that the Fund intends to purchase. In purchasing a call option, a Fund would realize a gain if, during the option period, the price of the underlying security increased by more than the amount of the premium paid. A Fund would realize a loss equal to all or a portion of the premium paid if the price of the underlying security decreased, remained the same, or did not increase by more than the premium paid.
Selling Put Options: The Funds may from time to time sell (“write”) put options. As the writer of a put option, the Fund assumes the obligation to pay a predetermined (“strike”) price for the option’s underlying security if the holder of the option chooses to exercise it. Until the option expires or a closing transaction is made, the Fund must continue to be prepared to pay the strike price, regardless of price movements in the underlying security.
If the price of the underlying security remains the same or rises above the strike price, the Fund generally will not be called upon to purchase the security. The Fund will, however, retain the premium received for the option as additional income. If the price of the underlying security falls below the strike price, the Fund may be called upon to purchase the security at the strike price.
When a Fund writes a put option on a security, the option must be covered by segregating liquid assets on the Fund’s books with a value equal to or greater than the strike price of the underlying security to secure the Fund’s obligation.
Buying Put Options: The Funds may from time to time purchase put options on any portion of their portfolios. A put option gives the buyer of the option, upon payment of a premium, the right (but not the obligation) to deliver a specified amount of a security to the writer of the option on or before a fixed date at a predetermined (“strike”) price. A Fund generally will purchase such options as a hedge to provide protection against adverse movements in the prices of securities in the Fund. In purchasing a put option, a Fund would realize a gain if, during the option period, the price of the security declined by an amount in excess of the premium paid. A Fund would realize a loss equal to all or a portion of the premium paid if the price of the security increased, remained the same, or did not decrease by more than the premium paid.
Options on Foreign Currencies: The Funds may also write covered call options and purchase put and call options on foreign currencies as a hedge against changes in prevailing levels of currency exchange rates.
Index Options: The Funds may also purchase and sell call options and put options on stock and bond indices. Options on securities indices are similar to options on a security except that, upon the exercise of an option on a securities index, settlement is made in cash rather than in specific securities.
Negotiated Transactions: The Funds will generally purchase and sell options traded on a national securities or options exchange. Where options are not readily available on such exchanges, a Fund may purchase and sell options in negotiated transactions. A Fund effects negotiated transactions only with investment dealers and other financial institutions deemed creditworthy by its Adviser or subadviser. Despite the Adviser’s or subadviser’s best efforts to enter into negotiated options transactions with only creditworthy parties, there is always a risk that the opposite party to the transaction may default in its obligation to either purchase or sell the underlying security at the agreed upon time and price, resulting in a possible loss by the Fund. This risk is described more completely in the section of this Statement of Additional Information entitled, “Risks of Transactions in Options and Futures.”
Options written or purchased by a Fund in negotiated transactions are illiquid and there is no assurance that a Fund will be able to effect a closing purchase or closing sale transaction at a time when the Adviser or subadviser believes it would be advantageous to do so. In the event the Fund is unable to effect a closing transaction with the holder of a call option written by the Fund, the Fund may not sell the security underlying the option until the call written by the Fund expires or is exercised.
B-13
Table of Contents
Closing Transactions: The Funds may dispose of options that they have written by entering into “closing purchase transactions.” Those Funds may dispose of options that they have purchased by entering into “closing sale transactions.” A closing transaction terminates the rights of a holder, or the obligation of a writer, of an option and does not result in the ownership of an option.
A Fund realizes a profit from a closing purchase transaction if the premium paid to close the option is less than the premium received by the Fund from writing the option. The Fund realizes a loss if the premium paid is more than the premium received. The Fund may not enter into a closing purchase transaction with respect to an option it has written after it has been notified of the exercise of such option.
A Fund realizes a profit from a closing sale transaction if the premium received to close out the option is more than the premium paid for the option. A Fund realizes a loss if the premium received is less than the premium paid.
Financial Futures and Options on Futures (All Funds except Thrivent Money Market Fund)
Selling Futures Contracts: The Funds may sell financial futures contracts (“futures contracts”) as a hedge against adverse movements in the prices of securities in those Funds. Such contracts may involve futures on items such as U.S. Government Treasury bonds, notes and bills; specified interest rates; mortgage-backed securities; corporate and municipal bonds; stocks; and indices of any of the foregoing. A futures contract sale creates an obligation for the Fund, as seller, to deliver the specific type of instrument called for in the contract (or cash) at a specified future time for a specified price. In selling a futures contract, the Fund would realize a gain on the contract if, during the contract period, the price of the securities underlying the futures contract decreased. Such a gain would be expected to approximately offset the decrease in value of the same or similar securities in the Fund. The Fund would realize a loss if the price of the securities underlying the contract increased. Such a loss would be expected to approximately offset the increase in value of the same or similar securities in the Fund.
Futures contracts have been designed by and are traded on boards of trade that have been designated “contract markets” by the Commodity Futures Trading Commission (“CFTC”). These boards of trade, through their clearing corporations, guarantee performance of the contracts. Although the terms of some financial futures contracts specify actual delivery or receipt of securities, in most instances these contracts are closed out before the settlement due date without the making or taking of delivery of the securities. Other financial futures contracts, such as futures contracts on a securities index, by their terms call for cash settlements. The closing out of a futures contract is effected by entering into an offsetting purchase or sale transaction.
When a Fund sells a futures contract, or a call option on a futures contract, it is required to make payments to the commodities broker which are called “margin” by commodities exchanges and brokers.
The payment of “margin” in these transactions is different than purchasing securities “on margin.” In purchasing securities “on margin” an investor pays part of the purchase price in cash and receives an extension of credit from the broker, in the form of a loan secured by the securities, for the unpaid balance. There are two categories of “margin” involved in these transactions: initial margin and variation margin. Initial margin does not represent a loan between a Fund and its broker, but rather is a “good faith deposit” by a Fund to secure its obligations under a futures contract or an option. Each day during the term of certain futures transactions, a Fund will receive or pay “variation margin” equal to the daily change in the value of the position held by the Fund.
Buying Futures Contracts: The Funds may purchase financial futures contracts as a hedge against adverse movements in the prices of securities they intend to purchase. The Funds may buy futures contracts for a number of reasons, including: (1) to manage their exposure to changes in securities prices and foreign currencies as an efficient means of adjusting their overall exposure to certain markets in an effort to enhance income; and (2) to protect the value of portfolio securities.
B-14
Table of Contents
A futures contract purchase creates an obligation by a Fund, as buyer, to take delivery of the specific type of instrument called for in the contract (or cash) at a specified future time for a specified price. In purchasing a futures contract, a Fund would realize a gain if, during the contract period, the price of the investments underlying the futures contract increased. Such a gain would approximately offset the increase in cost of the same or similar investments that a Fund intends to purchase. A Fund would realize a loss if the price of the investments underlying the contract decreased. Such a loss would approximately offset the decrease in cost of the same or similar investments that a Fund intends to purchase.
Options on Futures Contracts: The Funds may also sell (“write”) and purchase covered call and put options on futures contracts in connection with the above strategies. An option on a futures contract gives the buyer of the option, in return for the premium paid for the option, the right to assume a position in the underlying futures contract (a long position if the option is a call and a short position if the option is a put). The writing of a call option on a futures contract constitutes a partial hedge against declining prices of securities underlying the futures contract to the extent of the premium received for the option. The purchase of a put option on a futures contract constitutes a hedge against price declines below the exercise price of the option and net of the premium paid for the option. The purchase of a call option constitutes a hedge, net of the premium, against an increase in cost of securities that a Fund intends to purchase.
Currency Futures Contracts and Options: The Funds may also sell and purchase currency futures contracts (or options thereon) as a hedge against changes in prevailing levels of currency exchange rates. Such contracts may be traded on U.S. or foreign exchanges. The Fund will not use such contracts or options for leveraging purposes.
Limitations: The Funds may engage in futures transactions, and transactions involving options on futures, only on regulated commodity exchanges or boards of trade. In instances involving the purchase of futures contracts or call options thereon, a Fund will maintain liquid securities, cash, or cash equivalents in an amount equal to the market value of such contracts.
Swap Transactions (All Funds except Thrivent Money Market Fund)
The Funds may enter into swap transactions, including, but not limited to, credit default, total return and interest rate swap agreements, and may purchase or sell caps, floors and collars. A credit default swap is an agreement between two parties to exchange the credit risk of a particular issuer or reference entity. In a credit default swap transaction, a buyer pays periodic fees in return for payment by the seller which is contingent upon an adverse credit event occurring in the underlying issuer or reference entity. The seller collects periodic fees from the buyer and profits if the credit of the underlying issuer or reference entity remains stable or improves while the swap is outstanding, but the seller in a credit default swap contract would be required to pay an agreed upon amount to the buyer in the event of an adverse credit event in the reference entity. A buyer of a credit default swap is said to buy protection whereas a seller of a credit default swap is said to sell protection. There may be times, however, when a Fund buys a credit default swap, without owning the underlying reference entity or entities, as a potential means of enhancing the Fund’s investment returns. A total return swap is an agreement in which one party makes payments based on a set rate, either fixed or variable, while the other party makes payments based on the return of an underlying asset plus any capital gains and losses over the payment period. The underlying asset is typically an index, loan or a basket of assets. Total return swaps provide the Funds with the additional flexibility of gaining exposure to a market or securities index by using the most cost-effective vehicle available. An interest rate swap involves the exchange by a Fund with another party of their respective commitments to pay or receive interest. The purchase of an interest rate cap entitles the purchaser, to the extent that a specified index exceeds a predetermined interest rate, to receive payments of interest on a contractually-based principal amount from the party selling the interest rate cap. The purchase of an interest rate floor entitles the purchaser, to the extent that a specified index falls below a predetermined interest rate, to receive payments of interest on a contractually-based principal amount from the party selling the interest rate floor. An interest rate collar combines the elements of purchasing a cap and selling a floor. The collar protects against an interest rate rise above the maximum amount but foregoes the benefit of an interest rate decline below the minimum amount.
B-15
Table of Contents
Such transactions include market risk, risk of default by the other party to the transaction, risk of imperfect correlation and manager risk and may involve commissions or other costs. Swaps generally do not involve delivery of securities, other underlying assets or principal. Accordingly, the risk of loss with respect to swaps generally is limited to the net amount of payments that the Fund is contractually obligated to make, or in the case of the other party to a swap defaulting, the net amount of payments that the Fund is contractually entitled to receive. If there is a default by the counterparty, the Fund may have contractual remedies pursuant to the agreements related to the transaction. Caps, floors and collars are more recent innovations for which standardized documentation has not yet been fully developed and, accordingly, they are less liquid than swaps.
Currency Forward Contracts (All Funds except Thrivent Money Market Fund)
The Funds may also sell and purchase currency forward contracts as a hedge against changes in prevailing levels of currency exchange rates. A currency forward contract is an OTC derivative that represents an obligation to purchase or sell a specific currency at a future date, at a price set at the time of the contract and for a period agreed upon by the parties which may be either a window of time or a fixed number of days from the date of the contract. A Fund may lose money on currency forward contracts if changes in currency rates do not occur as anticipated or if the Fund’s counterparty to the contract were to default. A Fund will not use such forward contracts for leveraging purposes.
Central Clearing and Trade Execution Regulations
The Commodity Exchange Act (the “CEA”) and related regulations enacted by the CFTC may require the Fund to clear certain derivative contracts (including swaps) through a clearinghouse or central counterparty (a “CCP”). At the present time, only certain interest rate swaps and credit default index swaps are subject to mandatory clearing. To clear a derivative with the CCP, the Funds submit the derivative to, and post margin with a futures commission merchant (“FCM”) that is a clearinghouse member. If a Fund must centrally clear a derivative transaction, the CFTC’s regulations may also require that the Fund enter into (or “execute”) that derivative over a market facility known as a swap execution facility (or “SEF”). The Funds may enter into the swap or other derivative with a financial institution other than the FCM (the “Executing Dealer”) and arrange for the transaction to be transferred to the FCM for clearing. It may also enter into the trade with the FCM itself. The CCP, the FCM, SEF and the Executing Dealer are all subject to regulatory oversight by the CFTC. A default or failure by a CCP or an FCM, or the failure of a swap to be transferred from a SEF or an Executing Dealer to the FCM for clearing, may expose the Fund to losses, increase its costs, or prevent the Fund from entering or exiting swap positions, accessing collateral or margin, or fully implementing its investment strategies. It is likely that in the future the CFTC will require additional types of derivatives to be traded on a SEF. The regulatory requirement to clear certain contracts or execute the contracts over a SEF could, either temporarily or permanently, reduce the liquidity of the derivatives or increase the costs of entering into those derivatives.
Exclusion from Regulation as a Commodity Pool Operator
Pursuant to a notice of eligibility claiming exclusion from the definition of commodity pool operator filed with the CFTC and the National Futures Association, neither the Trust nor any of the individual Funds is deemed to be a “commodity pool operator” under the Commodity Exchange Act (the “CEA”), which, through the CFTC, regulates investments in futures, options on futures and swaps. The Funds are, therefore, not subject to registration or regulation as such under the CEA. Under CFTC Rule 4.5 as currently in effect, each Fund will limit its trading activity in futures, option on futures and swaps (excluding activity for “bona fide hedging purposes,” as defined by the CFTC) such that it meets one of the following tests:
| • | Aggregate initial margin and premiums required to establish its futures, options on futures and swap positions do not exceed 5% of the liquidation value of the Fund’s portfolio, after taking into account unrealized profits and losses on such positions; or |
| • | Aggregate net notional value of its futures, options on futures and swap positions does not exceed 100% of the liquidation value of the Fund’s portfolio, after taking into account unrealized profits and losses on such positions. |
B-16
Table of Contents
Hybrid Investments (All Funds except Thrivent Money Market Fund)
As part of their investment program and to maintain greater flexibility, the Funds may invest in hybrid instruments (a potentially high-risk derivative) which have the characteristics of futures, options and securities. Such instruments may take a variety of forms, such as debt instruments with interest or principal payments determined by reference to the value of a currency, security index or commodity at a future point in time. The risks of such investments would reflect both the risks of investing in futures, options, currencies and securities, including volatility and illiquidity. Under certain conditions, the redemption value of a hybrid instrument could be zero.
In addition, because the purchase and sale of hybrid instruments could take place in an over-the-counter market or in a private transaction between a Fund and the seller of the hybrid instrument, the creditworthiness of the counterparty to the transaction would be a risk factor which a Fund would have to consider. Hybrid instruments also may not be subject to regulation of the CFTC, which generally regulates the trading of commodity futures by U.S. persons, the SEC, which regulates the offer and sale of securities by and to U.S. persons, or any other governmental regulatory authority.
Risks of Transactions in Options and Futures
There are certain risks involved in the use of futures contracts, options on securities and securities index options, and options on futures contracts, as hedging devices. There is a risk that the movement in the prices of the index or instrument underlying an option or futures contract may not correlate perfectly with the movement in the prices of the assets being hedged. The lack of correlation could render a Fund’s hedging strategy unsuccessful and could result in losses. The loss from investing in futures transactions is potentially unlimited.
There is a risk that Thrivent Asset Mgt. or a subadviser could be incorrect in their expectations about the direction or extent of market factors such as interest rate movements. In such a case, a Fund would have been better off without the hedge. In addition, while the principal purpose of hedging is to limit the effects of adverse market movements, the attendant expense may cause a Fund’s return to be less than if hedging had not taken place. The overall effectiveness of hedging, therefore, depends on the expense of hedging and Thrivent Asset Mgt.’s or a subadviser’s accuracy in predicting the future market factors, such as changes in interest rate levels and securities price movements.
A Fund will generally purchase and sell options traded on a national securities or options exchange. Where options are not readily available on such exchanges, a Fund may purchase and sell options in negotiated transactions. When a Fund uses negotiated options transactions, it will seek to enter into such transactions involving only those options and futures contracts for which there appears to be an active secondary market.
There is, nonetheless, no assurance that a liquid secondary market, such as an exchange or board of trade, will exist for any particular option or futures contract at any particular time. If a futures market were to become unavailable, in the event of an adverse movement, a Fund would be required to continue to make daily cash payments of maintenance margin if it could not close a futures position. If an options market were to become unavailable and a closing transaction could not be entered into, an option holder would be able to realize profits or limit losses only by exercising an option, and an option writer would remain obligated until exercise or expiration.
In addition, exchanges may establish daily price fluctuation limits for options and futures contracts, and may halt trading if a contract’s price moves upward or downward more than the limit in a given day. On volatile trading days when the price fluctuation limit is reached or a trading halt is imposed, it may be impossible for a Fund to enter into new positions or close out existing positions. If the secondary market for a contract is not liquid because of price fluctuation limits or otherwise, it could prevent prompt liquidation of unfavorable positions, and potentially could require a Fund to continue to hold a position until delivery or expiration regardless of changes in its value. As a result, a Fund’s access to other assets held to cover its options or futures positions could also be impaired.
B-17
Table of Contents
When conducting negotiated options transactions there is a risk that the opposite party to the transaction may default in its obligation to either purchase or sell the underlying security at the agreed upon time and price. In the event of such a default, a Fund could lose all or part of the benefit it would otherwise have realized from the transaction, including the ability to sell securities it holds at a price above the current market price or to purchase a security from another party at a price below the current market price.
Finally, if a broker or clearing member of an options or futures clearing corporation were to become insolvent, a Fund could experience delays and might not be able to trade or exercise options or futures purchased through that broker or clearing member. In addition, a Fund could have some or all of its positions closed out without its consent. If substantial and widespread, these insolvencies could ultimately impair the ability of the clearing corporations themselves.
Leverage Risks
Leverage risk is created when an investment, (which includes, for example, an investment in a futures contract, option, or swap) exposes the Fund to a level of risk that exceeds the amount invested. Changes in the value of such an investment magnify the Fund’s risk of loss and potential for gain. Investments can have these same results if their returns are based on a multiple of a specified index, security, currency, or other benchmark.
Foreign Securities
Foreign securities may include debt, equity and derivative securities that the Adviser determines are “foreign” based on the consideration of an issuer’s domicile, its principal place of business, its primary stock exchange listing, the source of its revenue or other factors. Foreign securities may also include depositary receipts, such as American Depositary Receipts (ADRs), European Depositary Receipts (EDRs) and Global Depositary Receipts (GDRs). ADRs are U.S. dollar-denominated receipts issued in registered form by a domestic bank or trust company that evidence ownership of underlying securities issued by a foreign issuer. EDRs are foreign currency denominated receipts issued in Europe, typically by foreign banks or trust companies and foreign branches of domestic banks, that evidence ownership of foreign or domestic securities. GDRs are receipts structured similarly to ADRs and EDRs and are marketed globally. Depositary receipts will not necessarily be denominated in the same currency as their underlying securities. In general, ADRs, in registered form, are designed for use in the U.S. securities markets, and EDRs, in bearer form, are designed for use in European securities markets. GDRs are tradable both in the United States and in Europe and are designed for use throughout the world. A Fund may invest in depositary receipts through “sponsored” or “unsponsored” facilities. A sponsored facility is established jointly by the issuer of the underlying security and a depositary, whereas a depositary may establish an unsponsored facility without participation by the issuer of the deposited security. Holders of unsponsored depositary receipts generally bear all the costs of such facilities and the depositary of an unsponsored facility frequently is under no obligation to distribute interest-holder communications received from the issuer of the deposited security or to pass through voting rights to the holders of such receipts in respect of the deposited securities. The issuers of unsponsored depositary receipts are not obligated to disclose material information in the United States, and, therefore, there may be limited information available regarding such issuers and/or limited correlation between available information and the market value of the depositary receipts.
Investing in foreign securities is subject to certain risks. For example, foreign markets can be extremely volatile. Fluctuations in currency exchange rates also may impact the value of foreign securities denominated in foreign currencies or U.S. dollars, without a change in the intrinsic value of those securities. Additionally, the U.S. dollar value of a foreign security tends to decrease when the value of the U.S. dollar rises against the foreign currency in which the security is denominated and tends to increase when the value of the U.S. dollar falls against such currency. The Fund may attempt to minimize the risk from adverse changes in the relationship between the U.S. dollar and foreign currencies by purchasing and selling forward foreign currency exchange contracts and foreign currency futures contracts and related options. Foreign securities may be less liquid than domestic securities so that a Fund may, at times, be unable to sell foreign securities at desirable prices. Brokerage
B-18
Table of Contents
commissions, custodial fees and other fees also are generally higher for foreign securities. In addition, foreign governments may impose potentially confiscatory withholding or other taxes, which would reduce a Fund’s return on these securities. Other risks include: possible delays in the settlement of transactions or in the notification of income; generally less publicly available information about companies; adverse impact of political, social or diplomatic events; possible seizure, expropriation or nationalization of a company or its assets; possible imposition of currency exchange controls; and that foreign companies generally are not subject to accounting, auditing and financial reporting standards comparable to those mandated for domestic companies.
Risks associated with investments in foreign securities are increased with respect to investments in emerging market countries. Political and economic structures in many emerging market countries, especially those in Eastern Europe, the Pacific Basin and the Far East, are undergoing significant evolutionary changes and rapid development, and may lack the social, political and economic stability of more developed countries. Investing in emerging market securities also involves risks beyond the risks applicable to foreign investments. For example, some emerging market countries may have fixed or managed currencies that are not free-floating against the U.S. dollar. Further, certain currencies may not be traded internationally, and some countries with emerging securities markets have sustained long periods of very high inflation or rapid fluctuation in inflation rates which can have negative effects on a country’s economy and securities markets.
Foreign Futures and Options
Participation in foreign futures and foreign options transactions involves the execution and clearing of trades on or subject to the rules of a foreign board of trade. Neither the National Futures Association nor any domestic exchange regulates activities of any foreign boards of trade, including the execution, delivery and clearing of transactions, or has the power to compel enforcement of the rules of a foreign board of trade or any applicable foreign law. This is true even if the exchange is formally linked to a domestic market so that a position taken on the market may be liquidated by a transaction on another market. Moreover, such laws or regulations will vary depending on the foreign country in which the foreign futures or foreign options transaction occurs.
For these reasons, customers who trade foreign futures or foreign options contracts may not be afforded certain of the protective measures provided by the Commodity Exchange Act, the CFTC’s regulations and the rules of the National Futures Association and any domestic exchange, including the right to use reparations proceedings before the Commission and arbitration proceedings provided by the National Futures Association or any domestic futures exchange. In particular, funds received from customers for foreign futures or foreign options transactions may not be provided the same protections as funds received in respect of transactions on United States futures exchanges.
In addition, the price of any foreign futures or foreign options contract and, therefore, the potential profit and loss thereon may be affected by any variance in the foreign exchange rate between the time an order is placed and the time it is liquidated, offset or exercised.
Short Sales Against the Box (All Funds except Thrivent Money Market Fund)
The Funds may effect short sales, but only if such transactions are short sale transactions known as short sales “against the box.” A short sale is a transaction in which a Fund sells a security it does not own by borrowing it from a broker, and consequently becomes obligated to replace that security. A short sale against the box is a short sale where a Fund owns the security sold short or has an immediate and unconditional right to acquire that security without additional cash consideration upon conversion, exercise or exchange of options with respect to securities held in its portfolio. The effect of selling a security short against the box is to insulate that security against any future gain or loss. The Funds will incur transaction costs, including interest, in connection with opening, maintaining, and closing short sales against the box.
B-19
Table of Contents
Foreign Currency Exchange-Related Securities and Foreign Currency Transactions
The Funds may invest in foreign currency exchange-related securities or engage in foreign currency transactions.
Foreign Currency Warrants. Foreign currency warrants are warrants which entitle the holder to receive from their issuer an amount of cash (generally, for warrants issued in the United States, in U.S. dollars). The cash amount is calculated pursuant to a predetermined formula and based on the exchange rate between a specified foreign currency and the U.S. dollar as of the exercise date of the warrant. Foreign currency warrants generally are exercisable upon their issuance and expire as of a specified date and time.
Foreign currency warrants have been issued in connection with U.S. dollar-denominated debt offerings by major corporate issuers in an attempt to reduce the foreign currency exchange risk that, from the point of view of prospective purchasers of the securities, is inherent in the international fixed-income marketplace. Foreign currency warrants may attempt to reduce the foreign exchange risk assumed by purchasers of a security by, for example, providing for a supplemental payment in the event that the U.S. dollar depreciates against the value of a major foreign currency such as the Japanese Yen or German Deutschmark. The formula used to determine the amount payable upon exercise of a foreign currency warrant may make the warrant worthless unless the applicable foreign currency exchange rate moves in a particular direction (e.g., unless the U.S. dollar appreciates or depreciates against the particular foreign currency to which the warrant is linked or indexed). Foreign currency warrants are severable from the debt obligations with which they may be offered and may be listed on exchanges.
Foreign currency warrants may be exercisable only in certain minimum amounts, and an investor wishing to exercise warrants who possesses less than the minimum number required for exercise may be required either to sell the warrants or to purchase additional warrants, thereby incurring additional transaction costs. In the case of any exercise of warrants, there may be a time delay between the time a holder of warrants gives instructions to exercise and the time the exchange rate relating to exercise is determined. During this time the exchange rate could change significantly, thereby affecting both the market and cash settlement values of the warrants being exercised.
The expiration date of the warrants may be accelerated if the warrants should be delisted from an exchange or if their trading should be suspended permanently. This would result in the loss of any remaining “time value” of the warrants (i.e., the difference between the current market value and the exercise value of the warrants), and, in the case the warrants were “out-of-the-money,” in a total loss of the purchase price of the warrants.
Warrants are generally unsecured obligations of their issuers and are not standardized foreign currency options issued by the Options Clearing Corporation (“OCC”). Unlike foreign currency options issued by OCC, the terms of foreign currency warrants generally will not be amended in the event of governmental or regulatory actions affecting exchange rates or in the event of the imposition of other regulatory controls affecting the international currency markets.
The initial public offering price of foreign currency warrants is generally considerably in excess of the price that a commercial user of foreign currencies might pay in the interbank market for a comparable option involving significantly larger amounts of foreign currencies.
Foreign currency warrants are subject to significant foreign exchange risk, including risks arising from complex political or economic factors.
Foreign Currency Transactions. A forward foreign currency exchange contract involves an obligation to purchase or sell a specific currency at a future date, which may be any fixed number of days from the date of the contract agreed upon by the parties at a price set at the time of the contract. These contracts are principally traded in the interbank market conducted directly between currency traders (usually large, commercial banks) and their customers. A forward contract generally has no deposit requirement, and no commissions are charged at any stage for trades.
B-20
Table of Contents
A Fund may enter into forward contracts for a variety of purposes in connection with the management of the foreign securities portion of its portfolio. A Fund’s use of such contracts would include, but not be limited to, the following:
| • | When the Fund enters into a contract for the purchase or sale of a security denominated in a foreign currency, it may desire to “lock in” the U.S. dollar price of the security. By entering into a forward contract for the purchase or sale, for a fixed amount of dollars, of the amount of foreign currency involved in the underlying security transactions, the Fund will be able to protect itself against a possible loss resulting from an adverse change in the relationship between the U.S. dollar and the subject foreign currency during the period between the date the security is purchased or sold and the date on which payment is made or received. |
| • | When a Fund determines that one currency may experience a substantial movement against another currency, including the U.S. dollar, a Fund may enter into a forward contract to sell or buy the amount of the former foreign currency, approximating the value of some or all of a Fund’s portfolio securities denominated in such foreign currency. |
Alternatively, where appropriate, a Fund may hedge all or part of its foreign currency exposure through the use of a basket of currencies or a proxy currency where such currency or currencies act as an effective proxy for other currencies. In such a case, a Fund may enter into a forward contract where the amount of the foreign currency to be sold exceeds the value of the securities denominated in such currency. The use of this basket hedging technique may be more efficient and economical than entering into separate forward contracts for each currency held in a Fund.
The precise matching of the forward contract amounts and the value of the securities involved will not generally be possible since the future value of such securities in foreign currencies will change as a consequence of market movements in the value of those securities between the date the forward contract is entered into and the date it matures. The projection of short-term currency market movement is extremely difficult, and the successful execution of a short-term hedging strategy is highly uncertain.
Under normal circumstances, currency risk will be considered when deciding whether to buy or sell a security and as part of the overall diversification strategies. However, Thrivent Asset Mgt. or a subadviser have the flexibility to enter into such forward contracts when it determines that the best interests of the Fund will be served.
A Fund may enter into forward contracts for any other purpose consistent with the Fund’s investment objective and program. However, a Fund will not enter into a forward contract, or maintain exposure to any such contract(s), if the amount of foreign currency required to be delivered thereunder would exceed the Fund’s holdings of cash or liquid securities available for cover of the forward contract(s), or other suitable cover as permitted by the SEC. In determining the amount to be delivered under a contract, the Fund may net offsetting positions.
At the maturity of a forward contract, a Fund may sell the portfolio security and make delivery of the foreign currency, or it may retain the security and either extend the maturity of the forward contract (by “rolling” that contract forward) or may initiate a new forward contract.
If a Fund retains the portfolio security and engages in an offsetting transaction, the Fund will incur a gain or a loss (as described below) to the extent that there has been movement in forward contract prices. If a Fund engages in an offsetting transaction, it may subsequently enter into a new forward contract to sell the foreign currency. Should forward prices decline during the period between a Fund’s entering into a forward contract for the sale of a foreign currency and the date it enters into an offsetting contract for the purchase of the foreign currency, the Fund will realize a gain to the extent the price of the currency it has agreed to sell exceeds the price of the currency it has agreed to purchase. Should forward prices increase, the Fund will suffer a loss to the extent of the price of the currency it has agreed to purchase exceeds the price of the currency it has agreed to sell.
B-21
Table of Contents
A Fund’s dealing in forward foreign currency exchange contracts will generally be limited to the transactions described above. However, the Funds reserve the right to enter into forward foreign currency contracts for different purposes and under different circumstances. Of course, the Funds are not required to enter into forward contracts with regard to foreign currency-denominated securities and will not do so unless deemed appropriate. It also should be realized that this method of hedging against a decline in the value of a currency does not eliminate fluctuations in the underlying prices of the securities. It simply establishes a rate of exchange at a future date. Additionally, although such contracts tend to minimize the risk of loss due to a decline in the value of the hedged currency, at the same time, they tend to limit any potential gain that might result from an increase in the value of that currency.
The use of forward contracts involves the risk that a loss may be sustained as a result of the insolvency or bankruptcy of the other party to the contract or the failure of that party to make required payments or otherwise comply with the terms of the contract. Accordingly, the adviser must assess the creditworthiness of the other party to determine the likelihood that the terms of the contract will be satisfied. In addition, as a general matter, forward contracts are not currently entered into or traded on exchanges and there is currently no central clearing function for these contracts; therefore, a Fund to a forward contract may find it difficult to exit the position.
Although a Fund values its assets daily in terms of U.S. dollars, it does not intend to convert its holdings of foreign currencies into U.S. dollars on a daily basis. It will do so from time to time, and there are costs associated with currency conversion. Although foreign exchange dealers do not charge a fee for conversion, they do realize a profit based on the difference (the “spread”) between the prices at which they are buying and selling various currencies. Thus, a dealer may offer to sell a foreign currency to the fund at one rate, while offering a lesser rate of exchange should the fund desire to resell that currency to the dealer.
Principal Exchange Rate Linked Securities. Principal exchange rate linked securities are debt obligations the principal on which is payable at maturity in an amount that may vary based on the exchange rate between the U.S. dollar and a particular foreign currency at or about that time. The return on “standard” principal exchange rate linked securities is enhanced if the foreign currency to which the security is linked appreciates against the U.S. dollar, and is adversely affected by increases in the foreign exchange value of the U.S. dollar. “Reverse” principal exchange rate linked securities are like the “standard” securities, except that their return is enhanced by increases in the value of the U.S. dollar and adversely impacted by increases in the value of foreign currency.
Interest payments on the securities are generally made in U.S. dollars at rates that reflect the degree of foreign currency risk assumed or given up by the purchaser of the notes (i.e., at relatively higher interest rates if the purchaser has assumed some of the foreign exchange risk, or relatively lower interest rates if the issuer has assumed some of the foreign exchange risk, based on the expectations of the current market).
Principal exchange rate linked securities may in limited cases be subject to acceleration of maturity (generally, not without the consent of the holders of the securities), which may have an adverse impact on the value of the principal payment to be made at maturity.
Performance Indexed Paper. Performance indexed paper is U.S. dollar-denominated commercial paper the yield of which is linked to certain foreign exchange rate movements. The yield to the investor on performance indexed paper is established at maturity as a function of spot exchange rates between the U.S. dollar and a designated currency as of or about that time (generally, the index maturity two days prior to maturity). The yield to the investor will be within a range stipulated at the time of purchase of the obligation. Generally, the guaranteed minimum rate of return is below, and a potential maximum rate of return that is above, market yields on U.S. dollar-denominated commercial paper. In addition, both the minimum and maximum rates of return on the investment generally correspond to the minimum and maximum values of the spot exchange rate two business days prior to maturity.
B-22
Table of Contents
U.S. Government Securities
Certain Funds may invest in U.S. government securities. U.S. government securities refer to a variety of debt securities that are issued or guaranteed by the U.S. Treasury, by various agencies of the U.S. government and by various instrumentalities that have been established or sponsored by the U.S. government. The term also refers to repurchase agreements collateralized by such securities.
U.S. Treasury securities are backed by the full faith and credit of the U.S. government. Other types of securities issued or guaranteed by Federal agencies and U.S. government-sponsored instrumentalities may or may not be backed by the full faith and credit of the U.S. government. The U.S. government, however, does not guarantee the market price of any U.S. government securities. In addition, the value of U.S. government securities may be affected by changes in the credit rating of the U.S. government.
In the case of securities not backed by the full faith and credit of the U.S. government, the investor must look principally to the agency or instrumentality issuing or guaranteeing the obligation for ultimate repayment. The investor may not be able to assert a claim against the U.S. itself in the event the agency or instrumentality does not meet its commitment.
Foreign Government Securities
Certain Funds may invest in foreign government securities. Foreign government securities generally consist of fixed-income securities supported by national, state or provincial governments or similar political subdivisions. Foreign government securities also include debt obligations of supranational entities, such as international organizations designed or supported by governmental entities to promote economic reconstruction or development, international banking institutions and related government agencies. Examples of these include, but are not limited to, the International Bank for Reconstruction and Development (the World Bank), the Asian Development Bank, the European Investment Bank and the Inter-American Development Bank.
Foreign government securities also include fixed-income securities of quasi-governmental agencies that are either issued by entities owned by a national, state or equivalent government or are obligations of a political unit that are not backed by the national government’s full faith and credit. Further, foreign government securities include mortgage-related securities issued or guaranteed by national, state or provincial governmental instrumentalities, including quasi-governmental agencies.
These investments are subject to the risk that a governmental entity may delay or refuse to pay interest or repay principal on its sovereign debt, due, for example, to cash flow problems, insufficient foreign currency reserves, political considerations, the relative size of the governmental entity’s debt position in relation to the economy or the failure to put in place economic reforms required by the International Monetary Fund or other multilateral agencies. If a governmental entity defaults, it may ask for more time in which to pay or for further loans. There is no legal process for collecting sovereign debts that a government does not pay nor are there bankruptcy proceedings through which all or part of the sovereign debt that a governmental entity has not repaid may be collected.
Other Investment Companies
Each Fund may invest in securities of other investment companies, including shares of closed-end investment companies, unit investment trusts, open-end investment companies and exchange-traded funds, which represent interests in professionally managed portfolios that may invest in any type of instrument. Investing in other investment companies involves substantially the same risks as investing directly in the underlying instruments, but may involve additional expenses at the investment company-level, such as portfolio management fees and operating expenses which would result in the Fund paying its proportionate share. Certain other investment companies may utilize financial leverage. Certain types of investment companies, such as closed-end investment companies, issue a fixed number of shares that trade on a stock exchange or over-the-counter at a premium or a
B-23
Table of Contents
discount to their net asset value. Others are continuously offered at net asset value, but may also be traded in the secondary market. None of the Funds will invest in other investment companies for the purpose of gaining control of the investment company. The extent to which a Fund can invest in other investment companies is limited by federal securities laws.
Exchange Traded Funds (ETFs) (All Funds except Thrivent Money Market Fund)
Each Fund may purchase the securities of ETFs. ETFs are a type of index fund bought and sold on a securities exchange. An ETF trades like common stock and represents a fixed portfolio of securities designed to track a particular market index. Each Fund could purchase shares of an ETF to temporarily gain exposure to a portion of the U.S. or a foreign market while awaiting purchase of underlying securities. The risks of owning shares in an ETF generally reflect the risks of owning the underlying securities they are designed to track, although lack of liquidity in an ETF could result in it being more volatile and ETFs have management fees which increase their costs. Certain ETFs may utilize financial leverage.
Exchange-Traded Notes
Certain Funds may invest in exchange-traded notes (“ETNs”). ETNs are generally notes representing debt of the issuer, usually a financial institution. ETNs combine both aspects of bonds and ETFs. An ETN’s returns are based on the performance of one or more underlying assets, reference rates or indexes, minus fees and expenses. Similar to ETFs, ETNs are listed on an exchange and traded in the secondary market. However, unlike an ETF, an ETN can be held until the ETN’s maturity, at which time the issuer will pay a return linked to the performance of the specific asset, index or rate (“reference instrument”) to which the ETN is linked minus certain fees and expenses. Unlike regular bonds, ETNs do not make periodic interest payments, and principal is not protected.
The value of an ETN may be influenced by, among other things, time to maturity, level of supply and demand for the ETN, volatility and lack of liquidity in underlying markets, changes in the applicable interest rates, the performance of the reference instrument, changes in the issuer’s credit rating and economic, legal, political or geographic events that affect the reference instrument. An ETN that is tied to a reference instrument may not replicate the performance of the reference instrument. ETNs also incur certain expenses not incurred by their applicable reference instrument. Some ETNs that use leverage can, at times, be relatively illiquid and, thus, they may be difficult to purchase or sell at a fair price. Levered ETNs are subject to the same risk as other instruments that use leverage in any form. While leverage allows for greater potential return, the potential for loss is also greater. Additional losses may be incurred if the investment loses value because, in addition to the money lost on the investment, the loan still needs to be repaid.
Because the return on the ETN is dependent on the issuer’s ability or willingness to meet its obligations, the value of the ETN may change due to a change in the issuer’s credit rating, despite no change in the underlying reference instrument. The market value of ETN shares may differ from the value of the reference instrument. This difference in price may be due to the fact that the supply and demand in the market for ETN shares at any point in time is not always identical to the supply and demand in the market for the assets underlying the reference instrument that the ETN seeks to track.
There may be restrictions on a Fund’s right to redeem its investment in an ETN, which are generally meant to be held until maturity. A Fund’s decision to sell its ETN holdings may be limited by the availability of a secondary market. An investor in an ETN could lose some or all of the amount invested.
Passive Foreign Investment Companies (All Funds except Thrivent Money Market Fund)
Each Fund may purchase the securities of certain foreign entities and foreign investment funds or trusts, treated as passive foreign investment companies for U.S. federal income tax purposes. Such trusts have been the only or primary way to invest in certain countries. In addition to bearing their proportionate share of the trust’s
B-24
Table of Contents
expenses (management fees and operating expenses), shareholders will also indirectly bear similar expenses of such trusts. Capital gains on the sale of such holdings are considered ordinary income regardless of how long the Funds hold their investments.
In addition, the Funds may be subject to corporate income tax and an interest charge on certain dividends and capital gains earned from these investments, regardless of whether such income and gains are distributed to shareholders.
To avoid such tax and interest, the Funds intend to treat these securities as sold on the last day of its fiscal year and recognize any gains for tax purposes at that time; deductions for losses are allowable only to the extent of any gains resulting from these deemed sales for prior taxable years. Such gains and losses will be treated as ordinary income. The Funds will be required to distribute any resulting income even though it has not sold the security and received cash to pay such distributions.
Inflation-Linked Debt Securities
The Funds may invest in inflation linked securities. Inflation-linked securities include fixed and floating rate debt securities of varying maturities issued by the U.S. government, its agencies and instrumentalities, such as Treasury Inflation-Protected Securities (“TIPS”), as well as securities issued by other entities such as corporations, municipalities, foreign governments and foreign issuers, including foreign issuers from emerging markets. Typically, such securities are structured as fixed income investments whose principal value is periodically adjusted according to the rate of inflation. The following two structures are common: (i) the U.S. Treasury and some other issuers issue inflation-linked securities that accrue inflation into the principal value of the security and (ii) other issuers may pay out the Consumer Price Index (“CPI”) accruals as part of a semi-annual coupon. Other types of inflation-linked securities exist which use an inflation index other than the CPI.
Inflation-linked securities issued by the U.S. Treasury, such as TIPS, have maturities of varying years. Typically, TIPS pay interest on a semi-annual basis equal to a fixed percentage of the inflation adjusted principal amount. For example, if a Fund purchased an inflation-indexed bond with a par value of $1,000 and a 3% real rate of return coupon (payable 1.5% semi-annually), and the rate of inflation over the first six months was 1%, the mid-year par value of the bond would be $1,010 and the first semi annual interest payment would be $15.15 ($1,010 times 1.5%). If inflation during the second half of the year resulted in the whole year’s inflation of 3%, the end-of-year par value of the bond would be $1,030 and the second semi-annual interest payment would be $15.45 ($1,030 times 1.5%).
If the periodic adjustment rate measuring inflation falls, the principal value of inflation indexed bonds will be adjusted downward, and consequently the interest payable on these securities (calculated with respect to a smaller principal amount) will be reduced. Repayment of the original bond principal upon maturity (as adjusted for inflation) is guaranteed in the case of TIPS, even during a period of deflation, although the inflation-adjusted principal received could be less than the inflation-adjusted principal that had accrued to the bond at the time of purchase. However, the current market value of the bonds is not guaranteed and will fluctuate. Other inflation-related bonds exist that may or may not provide a similar guarantee. If a guarantee of principal is not provided, the adjusted principal value of the bond repaid at maturity may be less than the original principal.
The value of inflation-linked securities is expected to change in response to changes in real interest rates. Real interest rates in turn are tied to the relationship between nominal interest rates and the rate of inflation. Therefore, if the rate of inflation rises at a faster rate than nominal interest rates, real interest rates might decline, leading to an increase in value of inflation-linked securities.
While inflation-linked securities are expected to be protected from long-term inflationary trends, short-term increases in inflation may lead to a decline in value. If interest rates rise due to reasons other than inflation (for example, due to changes in currency exchange rates), investors in these securities may not be protected to the extent that the increase is not reflected in the bond’s inflation measure.
B-25
Table of Contents
The periodic adjustment of U.S. inflation-linked securities is tied to the Consumer Price Index for All Urban Consumers (“CPI-U”), which is not seasonably adjusted and which is calculated monthly by the U.S. Bureau of Labor Statistics. The CPI-U is a measurement of changes in the cost of living, made up of components such as housing, food, transportation and energy. Inflation-linked securities issued by a foreign government are generally adjusted to reflect a comparable inflation index calculated by that government. There can be no assurance that the CPI-U or a foreign inflation index will accurately measure the real rate of inflation in the prices of goods and services. Moreover, there can be no assurance that the rate of inflation in a foreign country will be correlated to the rate of inflation in the U.S.
Any increase in the principal amount of an inflation-linked security will be considered taxable ordinary income, even though the Fund does not receive their principal until maturity.
Funding Agreements
The Funds may invest in funding agreements, which are contracts issued by insurance companies that provide investors the right to receive a rate of interest and the full return of principal at maturity. Funding agreements often include a put option that allows a fund to terminate the agreement at a specified time prior to maturity. Funding agreements generally offer a higher yield than other securities with similar credit ratings. The primary risks of a funding agreement are the credit quality of the insurance company that issues it and its general lack of liquidity.
Taxable Municipal Bonds
The Funds may invest in taxable municipal bonds. States, local governments and municipalities issue municipal bonds to raise money for certain purposes. Municipal bonds issued to finance activities with a broad public purpose are generally exempt from federal income tax. Taxable municipal bonds are most often used to finance private development projects but can be issued whenever the municipality exhausts its allowed limits of tax-exempt bonds. As such, the interest paid to holders of such bonds is taxable as ordinary income. Many taxable municipal bonds offer yields comparable to those of other taxable bonds, such as corporate and agency bonds. Taxable municipal bonds may be rated investment-grade or below investment-grade and pay interest based on fixed or floating rate coupons. Maturities may range from long-term to short-term. Taxable municipal bonds are subject to much of the same risks to which municipal bonds are subject. These risks include, among others, market risk, credit risk and interest rate risk.
Disclosure of Portfolio Holdings
The Trust has adopted, on behalf of the Funds, policies and procedures relating to disclosure of the Funds’ portfolio securities. These policies and procedures are designed to allow disclosure of portfolio holdings information where necessary to the operation of the Funds or useful to the Funds’ shareholders without compromising the integrity or performance of the Funds. Except when there are legitimate business purposes for selective disclosure and other conditions (designed to protect the Funds and their shareholders) are met, the Funds do not provide or permit others to provide information about a Fund’s portfolio holdings on a selective basis.
The Funds include portfolio holdings information as required in regulatory filings and shareholder reports, disclose portfolio holdings information as required by federal or state securities laws and may disclose portfolio holdings information in response to requests by governmental authorities. In addition, Thrivent Asset Mgt. may post portfolio holdings information on its website (www.thrivent.com). For each portfolio security, the posted information includes its name, the number of shares held by a Fund, the market value of the Fund’s holdings, and the percentage of the Fund’s assets represented by each industry sector. The day after portfolio holdings information is publicly available on the website, it may be mailed, e-mailed or otherwise transmitted to any person.
B-26
Table of Contents
Thrivent Asset Mgt. may distribute or authorize the distribution of information about a Fund’s portfolio holdings that is not publicly available, on the website or otherwise, to its employees and affiliates that provide services to the Fund. Thrivent Asset Mgt. may also distribute or authorize distribution of information about a Fund’s portfolio holdings that is not publicly available to the Fund’s service providers who require access to the information in order to fulfill their contractual duties relating to the Funds, including the custodian, auditor, proxy voting service provider, pricing service vendors, securities lending agent, subadvisers, publisher, printer and mailing agent, or to facilitate the review of the Funds by rating agencies. In addition, the Fund may provide early disclosure of portfolio holdings information to certain other parties, such as third-party consultants. A Fund may also disclose portfolio holdings information to broker/dealers and certain other entities in order to assist the Fund with potential transactions and management of the Fund.
Information may be disclosed with any frequency and any time lag, as appropriate. Thrivent Asset Mgt. does not expect to disclose information about a Fund’s holdings that is not publicly available to the Fund’s individual or institutional investors or to intermediaries that distribute the Fund’s shares.
Before any non-public disclosure of information about a Fund’s portfolio holdings is permitted, however, the Trust’s Chief Compliance Officer or a designated attorney in the Asset Management Law Department of Thrivent Financial for Lutherans (“Thrivent Financial”) must determine that the Fund has a legitimate business purpose for providing the portfolio holdings information, that the disclosure is in the best interests of the Fund’s shareholders, and that the recipient agrees or has a duty to keep the information confidential and agrees not to trade directly or indirectly based on the information or to use the information to form a specific recommendation about whether to invest in the Fund or any other security. Accordingly, all of the persons with whom an arrangement is made for non-public disclosure will have satisfied the aforementioned requirements. Under no circumstances may the Trust, Thrivent Asset Mgt. or their affiliates receive any consideration or compensation for disclosing the information.
In accordance with these policies and procedures, the Funds have ongoing arrangements to provide the Funds’ portfolio holdings information to the custodian, proxy voting agent, pricing service vendors, accounting vendor and securities lending agent at the end of each day; to Lipper on a monthly basis one day after the end of the month; to Morningstar on a monthly basis 60 days after the end of the month; to Wolters Kluwer on a monthly basis on the third day after the end of the month; to Callan Associates on a quarterly basis one day after the end of a calendar quarter; to Cambridge Associates on a quarterly basis 14 days after the end of a calendar quarter; to Bloomberg on a quarterly basis 60 days after the end of the quarter; and to the financial printer on a quarterly basis (monthly for Thrivent Money Market Fund).
As part of the annual review of the compliance policies and procedures of the Funds, the Chief Compliance Officer will discuss the operation and effectiveness of this policy and any changes to the Policy that have been made or recommended with the Board.
Investment Limitations
The fundamental investment restrictions for the Funds are set forth below. These fundamental investment restrictions may not be changed by a Fund except by the affirmative vote of a majority of the outstanding voting securities of that Fund as defined in the 1940 Act. (Under the 1940 Act, a “vote of the majority of the outstanding voting securities” means the vote, at a meeting of security holders duly called, (i) of 67% or more of the voting securities present at a meeting if the holders of more than 50% of the outstanding voting securities are present or represented by proxy or (ii) of more than 50% of the outstanding voting securities, whichever is less (a “1940 Act Majority Vote”).) Under these restrictions, with respect to each Fund:
| 1. | None of the Funds may borrow money, except that a Fund may borrow money (through the issuance of debt securities or otherwise) in an amount not exceeding one-third of the Fund’s total assets immediately after the time of such borrowing. |
B-27
Table of Contents
| 2. | None of the Funds may issue senior securities, except as permitted under the 1940 Act or any exemptive order or rule issued by the SEC. |
| 3. | None of the Funds will, with respect to 75% of its total assets, purchase securities of an issuer (other than the U.S. Government, its agencies, instrumentalities or authorities or repurchase agreements fully collateralized by U.S. Government securities, and other investment companies) if (a) such purchase would, at the time, cause more than 5% of the Fund’s total assets taken at market value to be invested in the securities of such issuer; or (b) such purchase would, at the time, result in more than 10% of the outstanding voting securities of such issuer being held by the Fund. This restriction does not apply to the Thrivent Asset Allocation Funds and the Thrivent Natural Resources Fund, which are “non-diversified” within the meaning of the 1940 Act. |
| 4. | None of the Funds may buy or sell real estate, except that any Fund may (i) acquire or lease office space for its own use, (ii) invest in securities of issuers that invest in real estate or interests therein, (iii) invest in mortgage-related securities and other securities that are secured by real estate or interests therein, and (iv) hold and sell real estate acquired by the Fund as a result of the ownership of securities. |
| 5. | None of the Funds may purchase or sell commodities or commodity contracts, except that any Fund may purchase and sell derivatives (including but not limited to options, futures contracts and options on futures contracts) whose value is tied to the value of a financial index or a financial instrument or other asset (including, but not limited to, securities indexes, interest rates, securities, currencies and physical commodities). |
| 6. | None of the Funds may make loans, except that any Fund may (i) lend portfolio securities, (ii) enter into repurchase agreements, (iii) purchase all or a portion of an issue of debt securities, bank loan participation interests, bank certificates of deposit, bankers’ acceptances, debentures or other securities, whether or not the purchase is made upon the original issuance of the securities, and (iv) participate in an interfund lending program with other registered investment companies. |
| 7. | None of the Funds will underwrite the securities of other issuers, except where the Fund may be deemed to be an underwriter for purposes of certain federal securities laws in connection with the disposition of portfolio securities; with investments in other investment companies; and with loans that a Fund may make pursuant to its fundamental investment restriction on lending. |
| 8. | None of the Funds will purchase a security if, after giving effect to the purchase, more than 25% of its total assets would be invested in the securities of one or more issuers conducting their principal business activities in the same industry, except that this restriction does not apply to Government Securities (as such term is defined in the 1940 Act). This restriction does not apply to the Thrivent Asset Allocation Funds, which primarily invest in other Funds of the Trust that could be considered to be in the same industry, and the Thrivent Natural Resources Fund, which concentrates its investments in one or more natural resource-related sectors or in one or more issuers in the natural resources-related industries. In addition, with respect to the Thrivent Money Market Fund, this restriction does not apply to instruments issued by domestic banks. |
The following nonfundamental investment restriction may be changed without shareholder approval. Under this restriction:
| 1. | None of the Funds will purchase any security while borrowings, including reverse repurchase agreements, representing more than 5% of the Fund’s total assets are outstanding. The Funds intend to limit borrowings to amounts borrowed from a bank, reverse repurchase agreements (insofar as they are considered borrowings), or an interfund lending agreement. |
| 2. | The fundamental investment restriction with respect to industry concentration (number 8 above) will be applied pursuant to SEC policy at 25% (instead of “more than 25%”) of a Fund’s total assets. |
B-28
Table of Contents
| 3. | None of the Funds currently intend to purchase securities on margin, except that a Fund may obtain such short-term credits as are necessary for the clearance of transactions, and provided that margin payments in connection with futures contracts and options on futures contracts shall not constitute purchasing securities on margin. |
| 4. | The fundamental investment restriction with respect to diversification (number 3 above) will be applied so securities issued by U.S. Government agencies, instrumentalities, or authorities will be eligible for the exception only if those securities qualify as a “Government Security” under the 1940 Act. |
| 5. | The exception for exemptive orders in the fundamental investment restriction with respect to senior securities (number 2 above) will be applied only for exemptive orders issued to the Funds. |
The Trust has received an exemptive order from the SEC that allows the Funds to engage in an interfund lending program. In an interfund lending arrangement, the Funds directly lend to and borrow money from each other for temporary purposes. This arrangement allows the borrowing Funds to borrow at a lower interest rate than banks offer, allows lending Funds to earn extra income, and reduces the need for bank lines of credit. Section 17(a) of the 1940 Act makes it unlawful for an affiliated person of a registered investment company, and underwriter, or a promoter (or any affiliated person thereof), acting as principal, to engage in “self-dealing,” i.e., knowingly sell any security (other than securities the buyer or seller issues) or other property to the company or to buy any security (other than securities the investment company issues) or other property from the company. Because an interfund lending arrangement raises issues under Section 17(a), along with other sections of the 1940 Act, its use requires an order for exemptive relief from the SEC. The Funds’ interfund lending arrangement is designed to ensure that each Fund has an equal opportunity to borrow and lend on equal terms consistent with its investment policies and limitations.
Section 18(g) of the 1940 Act defines a “senior security” as any bond, debenture, note, or similar obligation constituting a security and evidencing indebtedness. Section 18(f)(1) of the 1940 Act prohibits an open-end investment company from issuing senior securities but permits borrowings from a bank if immediately after the borrowing there is asset coverage of at least 300% and provided further that, in the event that such asset coverage falls below 300%, the investment company will, within 3 days (not including Sundays and holidays), reduce the amount of its borrowings to an extent that the asset coverage of such borrowings shall be at least 300%. The SEC staff has taken the position that a fund may engage in certain leveraged transactions, such as short sales and financial futures contracts, without violating Section 18(f)(1) if it segregates fund assets.
Each of the Funds, other than the Thrivent Asset Allocation Funds, has adopted a non-fundamental policy that prohibits it from acquiring any securities of registered open-end investment companies or registered unit investment trusts in reliance on Section 12(d)(1)(F) or 12(d)(1)(G) of the 1940 Act. This policy is required as a condition for the ability of the Thrivent Asset Allocation Funds to invest in other Funds of the Trust.
B-29
Table of Contents
Board of Trustees and Executive Officers
The Board of Trustees is responsible for the management and supervision of the Funds’ business affairs and for exercising all powers except those reserved to the shareholders. Each Trustee oversees each of 26 series of the Trust and also serves as:
| • | Director of Thrivent Series Fund, Inc., a registered investment company consisting of 33 Portfolios that serve as underlying funds for variable contracts issued by Thrivent Financial and Thrivent Life Insurance Company (“TLIC”) and investment options in the retirement plan offered by Thrivent Financial. |
| • | Trustee of Thrivent Cash Management Trust, a registered investment company consisting of one Fund that serves as a cash collateral fund for a securities lending program sponsored by Thrivent Financial. |
The Trust, Thrivent Series Fund, Inc. and Thrivent Cash Management Trust are collectively referred to as the “Fund Complex.”
Leadership Structure and Oversight Responsibilities
Overall responsibility for oversight of the Trust and its Funds rests with the Board of Trustees (the “Board”). The Board has engaged Thrivent Asset Mgt. to manage the Funds on a day-to-day basis. The Board is responsible for overseeing Thrivent Asset Mgt. and other service providers in the operation of the Trust in accordance with the provisions of the 1940 Act, applicable provisions of Massachusetts law, other applicable laws and the Trust’s charter. The Board is currently composed of nine members, including eight independent trustees and one interested trustee. The Board conducts regular meetings four times a year. In addition, the Board holds special in-person or telephonic meetings or informal conference calls to discuss specific matters that may arise or require action between regular meetings. The Independent Trustees have engaged independent legal counsel and an industry consultant to assist them in performance of their oversight responsibilities.
The Board has appointed an Independent Trustee to serve in the role of Chairperson. The Chairperson’s role is to preside at all meetings of the Board and to act as a liaison with service providers, officers, attorneys, and other Trustees generally between meetings. The Chairperson may also perform such other functions as may be delegated by the Board from time to time. Except for duties specified herein or pursuant to the Trust’s charter documents, the designation of Chairperson does not impose on such Independent Trustee any duties, obligations or liability that are greater than the duties, obligations or liability imposed on such person as a member of the Board generally. The Board has established five standing committees (described in more detail below) to assist the Board in the oversight and direction of the business and affairs of the Trust, and from time to time may establish informal working groups to review and address the policies and practices of the Trust with respect to certain specified matters. The Board believes that the Board’s current leadership structure is appropriate because it allows the Board to exercise informed and independent judgment over matters under its purview, and it allocates areas of responsibility among committees of the Trustees and the full Board in a manner that enhances effective oversight. The leadership structure of the Board may be changed at any time and in the discretion of the Board, including in response to changes in circumstances or the characteristics of the Trust.
The Trust and the Funds are subject to a number of risks, including investment, compliance, operational, and valuation risks, among others. Day-to-day risk management functions are subsumed within the responsibilities of Thrivent Asset Mgt., the sub-advisers and other service providers (depending on the nature of the risk), which carry out the Funds’ investment management and business affairs. Each of Thrivent Asset Mgt., the sub-advisers and other service providers have their own, independent interest in risk management, and their policies and methods of carrying out risk management functions will depend, in part, on their individual priorities, resources and controls.
B-30
Table of Contents
Risk oversight forms part of the Board’s general oversight of the Trust and Funds and is addressed as part of various Board and committee activities. The Board recognizes that it is not possible to identify all of the risks that may affect a Fund or to develop processes and controls to eliminate or mitigate their occurrence or effects. As part of its regular oversight of the Trust, the Board, directly or through a committee, interacts with and reviews reports from, among others, Thrivent Asset Mgt., sub-advisers, the Chief Compliance Officer of the Trust, the independent registered public accounting firm for the Trust, and internal auditors for Thrivent Asset Mgt., as appropriate, regarding risks faced by the Trust and its Funds, and Thrivent Asset Mgt.’s risk functions.
The Audit Committee of the Board, which is composed of all Independent Trustees, oversees management of financial risks and controls. The Audit Committee serves as the channel of communication between the independent auditors of the Trust and the Board with respect to financial statements and financial reporting processes, systems of internal control, and the audit process. A representative of business risk management, which functions as the Adviser’s internal audit group, meets with the Audit Committee and provides reports to the Committee in writing and in person on an as-needed basis (but at least annually). Although the Audit Committee is responsible for overseeing the management of financial risks, the entire Board is regularly informed of these risks through Committee reports.
The Ethics and Compliance Committee of the Board, which is composed of all Independent Trustees, monitors ethical risks and oversees the legal and regulatory compliance matters of the Funds. A representative of business risk management meets with the Ethics and Compliance Committee and provides reports to the Committee in writing and in person on an as-needed basis (but at least annually). In addition, the Trust’s Anti-Money Laundering Officer meets with the Ethics and Compliance Committee and provides reports to the Committee in writing and in person on a regular basis. The Anti-Money Laundering Officer’s reports relate to privacy and anti-money laundering concerns. The Committee also meets with a representative from the Business Continuity Plan area to learn more about that program. Although the Ethics and Compliance Committee is responsible for overseeing ethical and compliance risks, the entire Board is regularly informed of these risks through Committee reports.
The Investment Committee of the Board, which is composed of all Independent Trustees, is designed to review investment policies and risks in conjunction with its review of the Funds’ performance. Although the Investment Committee is responsible for oversight of investment risks, the entire Board will be regularly informed of these risks through Committee reports.
The Contracts Committee and the Governance Committee, each of which is comprised of all of the Independent Trustees, oversee matters relating to annual contract review and corporate governance, respectively, and related risks.
The Board has appointed a Chief Compliance Officer who oversees the implementation and testing of the Funds’ compliance program and reports to the Board regarding compliance matters for the Funds and their principal service providers. In addition, as part of the Board’s annual review of the Trust’s advisory, sub-advisory and other service provider agreements, the Board considers risk management aspects of these entities’ operations and the functions for which they are responsible. The Board may, at any time and in its discretion, change the manner in which it conducts its risk oversight role.
The Trust’s charter documents do not set forth any specific qualifications to serve as a Trustee. The charter of the Governance Committee also does not set forth any specific qualification. However, the Governance Committee has adopted qualification guidelines that the Committee may take into account in considering Trustee candidates and a process for evaluating potential candidates. The qualifications that the Committee takes into consideration include, but are not limited to, a candidate’s connections to the Lutheran community, experience on other boards, occupation, business experience, education, knowledge regarding investment matters, diversity of experience, personal integrity and reputation and willingness to devote time to attend and prepare for Board and Committee meetings. No one factor is controlling, either with respect to the group or any individual.
B-31
Table of Contents
The Board has concluded, based on each Trustee’s experience, qualifications, attributes or skills, on an individual basis and in combination with those of other Trustees, that each Trustee is qualified to serve on the Board of Trustees. Among the attributes or skills common to all Trustees are their ability to review critically, evaluate, question and discuss information provided to them, to interact effectively with each of the other Trustees, the Adviser, the sub-advisers, counsel, the Trust’s independent registered public accounting firm and other service providers, and to exercise effective and independent business judgment in the performance of their duties as Trustees. Each Trustee’s ability to perform his or her duties effectively has been attained through the Trustee’s business, consulting, public service or academic positions and through experience from service as a board member of the Trust and the other funds in the Fund Complex, another fund complex, public companies, or non-profit entities or other organizations as set forth below. Each Trustee’s ability to perform his or her duties effectively has been enhanced by his or her educational background, professional training, and/or other experiences. The following is a summary of each Trustee’s particular professional and other experience that qualifies each person to serve as a Trustee of the Trust as of the date of this SAI. Additional details regarding the background of each Trustee are included in the table below this section.
Janice B. Case. Ms. Case has served as a Trustee on the Board of the Fund Complex since 2011 and as Chair of the Governance Committee since 2012. She has nearly 25 years of experience in the electric utilities industry, including ten years as an executive officer of a Florida-based electric utility and holding company. Since leaving full-time corporate employment, Ms. Case gained mutual fund industry experience as a former director on the board of another fund complex. While a director on that board, she served on board committees, including as chair of the compensation and proxy voting committees, and as a member of the governance/nominating, contract review and audit committees. Ms. Case has also served as a director on several corporate and non-profit boards.
Richard L. Gady. Mr. Gady has served as a Trustee on the Board of the Fund Complex since 1987. He has experience as an executive officer and economist for a large public company in the agribusiness. Mr. Gady also has experience as a director as a former board member of the International Agricultural Marketing Association.
Richard A. Hauser. Mr. Hauser has served as a Trustee on the Board of the Fund Complex since 2004, as Chair of the Board since 2012 and as Chair of the Ethics and Compliance Committee from 2005 through 2011. He is a licensed attorney and is currently Vice President and Assistant General Counsel for a large publicly traded aerospace company. Mr. Hauser was formerly a partner in a large national law firm and has held senior positions in government, including as deputy White House counsel to President Ronald Reagan and as general counsel for the U.S. Department of Housing and Urban Development. He has experience as a director as a former board member and chairman of The Luther Institute and the Pennsylvania Avenue Development Corporation and a former director on the board of the Washington Hospital Center.
Marc S. Joseph. Mr. Joseph has served as a Trustee on the Board of the Fund Complex since 2011 and as Chair of the Ethics and Compliance Committee since 2012. He has more than 20 years of experience in the investment industry, including over five years as a portfolio manager for mutual funds and institutional accounts and three years as a chief investment officer. Mr. Joseph is the co-founder of a consulting and advisory firm registered with the Financial Conduct Authority, the regulator of financial service providers in the United Kingdom. As the founder and Managing Director of another private investing and consulting company, he has provided services as a mediator or arbitrator for cases involving disputes with broker-dealers.
Paul R. Laubscher. Mr. Laubscher has served as a Trustee on the Board of the Fund Complex since 2009 and as Chair of the Investment Committee since 2010. He is a holder of the Chartered Financial Analyst designation and has over 20 years of experience as a portfolio manager. Mr. Laubscher has for the last 13 years served as a senior investment manager of the retirement fund of a large public technology company.
James A. Nussle. Mr. Nussle has served as a Trustee on the Board of the Fund Complex since 2011. He has more than 20 years of public service experience, including serving as a Representative from Iowa in the House of Representatives from 1991 through 2007 and as Director of the U.S. Office of Management and Budget.
B-32
Table of Contents
Mr. Nussle is a founding member, president and chief executive officer of the Nussle Group, a public affairs media and strategic consulting firm, and he also serves as an executive officer of a trade association of renewable energy companies. Mr. Nussle has gained experience as a director on the advisory board of a private equity firm and on the board of several non-profit organizations.
Douglas D. Sims. Mr. Sims has served as a Trustee on the Board of the Fund Complex since 2006 and as Chair of the Audit Committee since 2009. Mr. Sims has over 37 years of experience in the financial services industry, including experience gained as the former chief executive officer of CoBank, a cooperative bank that provided financing to agribusinesses and rural-based customers.
Constance L. Souders. Ms. Souders has served as a Trustee on the Board of the Fund Complex since 2007 and as Chair of the Contracts Committee since 2010. She also serves as the Audit Committee financial expert. Ms. Souders has over 20 years of experience in the mutual fund industry, including eight years as the former Treasurer of a mutual fund complex and registered investment adviser and the Financial and Operations General Securities Principal of a mutual fund distributor.
Russell W. Swansen. Mr. Swansen has served as a Trustee on the Board of the Fund Complex since 2009. He has over 25 years of experience as a portfolio manager and has served as a Senior Vice President and Chief Investment Officer of Thrivent Financial since 2003. Mr. Swansen has executive and business experience as a former managing director of an investment bank and as a former president of another registered investment adviser. He has gained experience as a director on the board of several companies (both public and private) and a non-profit organization that supports medical research for the treatment and cure of childhood cancers. Mr. Swansen was formerly a director on the board of a mining equipment manufacturer and has been a board member of several private companies.
The following tables provide additional information about the Trustees and officers of the Trust.
Interested Trustees (1)
Name, Address and | Position | Number of Portfolios in Fund Complex Overseen by Trustee | Principal Occupation | Other | ||||
Russell W. Swansen 625 Fourth Avenue South Minneapolis, MN (1957) | Chief Investment Officer since 2015; Trustee since 2009 | 60 | Senior Vice President, Chief Investment Officer, Thrivent Financial since 2003 | None |
B-33
Table of Contents
Independent Trustees (3)
Name, Address and | Position | Number of Portfolios in Fund Complex Overseen by Trustee | Principal Occupation | Other | ||||
Janice B. Case 625 Fourth Avenue South Minneapolis, MN (1952) | Trustee since 2011 | 60 | Independent Trustee of North American Electric Reliability Corporation (self-regulatory organization) since 2008. | Please see principal occupation during the past 5 years | ||||
Richard L. Gady 625 Fourth Avenue South Minneapolis, MN (1943) | Trustee since 1987 | 60 | Retired | None | ||||
Richard A. Hauser 625 Fourth Avenue South Minneapolis, MN (1943) | Trustee since 2004 | 60 | Vice President and Assistant General Counsel, The Boeing Company since 2007. | None | ||||
Marc S. Joseph 625 Fourth Avenue South Minneapolis, MN (1960) | Trustee since 2011 | 60 | Managing Director of Granite Ridge LLP (consulting and advisory firm) since 2009; Managing Director of Triangle Crest (private investing and consulting firm) since 2004. | None | ||||
Paul R. Laubscher 625 Fourth Avenue South Minneapolis, MN (1956) | Trustee since 2009 | 60 | Portfolio Manager for U.S. private real estate portfolios of IBM Retirement Funds. | None | ||||
James A. Nussle 625 Fourth Avenue South Minneapolis, MN (1960) | Trustee since 2011 | 60 | President and Chief Executive Officer of Credit Union National Association since September 2014; President and Chief Operating Officer of Growth Energy (trade association) from 2010 through August 2014; Advisory Board member of AVISTA Capital Partners (private equity firm) since 2010; Contributor on CNBC (media) since 2010; CEO of The Nussle Group LLC (consulting firm) since 2009. | Currently, Advisory Board member of AVISTA Capital Partners and Director of Portfolio Recovery Associates (PRAA) | ||||
B-34
Table of Contents
Name, Address and | Position | Number of Portfolios in Fund Complex Overseen by Trustee | Principal Occupation | Other | ||||
Douglas D. Sims 625 Fourth Avenue South Minneapolis, MN (1946) | Trustee since 2006 | 60 | Retired | Currently, Director of Keystone Science School. Previously, Director of the Center for Corporate Excellence | ||||
Constance L. Souders 625 Fourth Avenue South Minneapolis, MN (1950) | Trustee since 2007 | 60 | Retired | None | ||||
Officers
Name, Address and | Position with Trust | Principal Occupation During the Past 5 Years | ||
Russell W. Swansen 625 Fourth Avenue South Minneapolis, MN (1957) | Chief Investment Officer since 2015; Trustee since 2009 | Senior Vice President and Chief Investment Officer, Thrivent Financial since 2003 | ||
David S. Royal 625 Fourth Avenue South Minneapolis, MN (1971) | President since 2015 | Vice President, Mutual Funds, Thrivent Financial since 2015; Vice President and Deputy General Counsel from 2006 to 2015; Interim Investment Company and Investment Adviser Chief Compliance Officer from May 2010 until December 2010 | ||
Gerard V. Vaillancourt 625 Fourth Avenue South Minneapolis, MN (1967) | Treasurer and Principal Accounting Officer since 2005 | Vice President, Mutual Fund Accounting since 2006 | ||
Michael W. Kremenak 625 Fourth Avenue South Minneapolis, MN (1978) | Secretary and Chief Legal Officer since 2015 | Senior Counsel, Thrivent Financial since 2013; Vice President and Assistant General Counsel at Nuveen Investments from 2011 to 2013; Attorney at FAF Advisors from 2009 to 2010 | ||
Ted S. Dryden 625 Fourth Avenue South Minneapolis, MN (1965) | Chief Compliance Officer since 2010 | Investment Company and Investment Adviser Chief Compliance Officer, Thrivent Financial since December 2010; Chief Compliance Officer, OptumHealth Financial Services from 2009 to 2010; Vice President, Asset Management Compliance, Ameriprise Financial from 2006 to 2009 | ||
Janice M. Guimond 625 Fourth Avenue South Minneapolis, MN (1964) | Vice President since 2005 | Vice President, Investment Operations, Thrivent Financial since 2004 | ||
B-35
Table of Contents
Name, Address and | Position with Trust | Principal Occupation During the Past 5 Years | ||
Kathleen M. Koelling 4321 North Ballard Road Appleton, WI (1977) | Anti-Money Laundering Officer since 2011 | Privacy and Anti-Money Laundering Officer, Thrivent Financial since 2011; Senior Counsel, Thrivent Financial since 2002 | ||
Mark D. Anema 625 Fourth Avenue South Minneapolis, MN (1961) | Vice President since 2012 | Vice President, New Product Management and Development, Thrivent Financial since 2007 | ||
Kathryn A. Stelter 625 Fourth Avenue South Minneapolis, MN (1962) | Vice President since 2015 | Director, Mutual Fund Operations, Thrivent Financial since 2014; Director, Mutual Fund Operations at Hartford Funds from 2006 to 2014 | ||
James M. Odland 625 Fourth Avenue South Minneapolis, MN (1955) | Assistant Secretary since 2006 | Vice President, Managing Counsel, Thrivent Financial since 2005 | ||
Todd J. Kelly 4321 North Ballard Road Appleton, WI (1969) | Assistant Treasurer since 1999 | Director, Fund Accounting Operations, Thrivent Financial since 2002 | ||
Sarah L. Bergstrom 625 Fourth Avenue South Minneapolis, MN (1977) | Assistant Treasurer since 2007 | Director, Fund Accounting Administration, Thrivent Financial since 2007 | ||
| (1) | “Interested person” of the Trust as defined in the 1940 Act by virtue of a position with Thrivent Financial. Mr. Swansen is considered an interested person because of his principal occupation with Thrivent Financial. |
| (2) | Each Trustee generally serves an indefinite term until her or his successor is duly elected and qualified. Officers generally serve at the discretion of the board until their successors are duly appointed and qualified. |
| (3) | The Trustees, other than Mr. Swansen, are not “interested persons” of the Trust and are referred to as “Independent Trustees.” |
B-36
Table of Contents
Committees of the Board of Trustees
Committee | Members (1) | Function | Meetings Held During Last Fiscal Year | |||
| Audit | Janice B. Case Richard L. Gady Richard A. Hauser Marc S. Joseph Paul R. Laubscher James A. Nussle Douglas D. Sims Constance L. Souders | The 1940 Act requires that the Trusts’ independent auditors be selected by a majority of those Trustees who are not “interested persons” (as defined in the 1940 Act) of the Trust. The Audit Committee is responsible for recommending the engagement or retention of the Trust’s independent accountants, reviewing with the independent accountants the plan and the results of the auditing engagement, approving professional services, including permitted non-audit services, provided by the independent accountants prior to the performance of such services, considering the range of audit and non-audit fees, reviewing the independence of the independent accountants, reviewing the scope and results of procedures of internal auditing, and reviewing the system of internal accounting control. | 6 | |||
| Contracts | Janice B. Case Richard L. Gady Richard A. Hauser Marc S. Joseph Paul R. Laubscher James A. Nussle Douglas D. Sims Constance L. Souders | The function of the Contracts Committee is to assist the Board of Trustees in fulfilling its duties with respect to the review and approval of contracts between the Trust and other entities, including entering into new contracts and the renewal of existing contracts. The Contracts Committee considers investment advisory, distribution, transfer agency, administrative service and custodial contracts, and such other contracts as the Board of Trustees deems necessary or appropriate for the continuation of operations of each Fund. | 6 | |||
| Ethics and Compliance | Janice B. Case Richard L. Gady Richard A. Hauser Marc S. Joseph Paul R. Laubscher James A. Nussle Douglas D. Sims Constance L. Souders | The function of the Ethics and Compliance Committee is to monitor the ethics of the Adviser and oversee the legal and regulatory compliance matters of the Funds. | 4 | |||
B-37
Table of Contents
Committee | Members (1) | Function | Meetings Held During Last Fiscal Year | |||
| Governance | Janice B. Case Richard L. Gady Richard A. Hauser Marc S. Joseph Paul R. Laubscher James A. Nussle Dougles D. Sims Constance L. Souders | The Governance Committee assists the Board of Trustees in fulfilling its duties with respect to the governance of the Trust, including recommendations regarding evaluation of the Board of Trustees, compensation of the Trustees and composition of the committees and the Board’s membership. The Governance Committee makes recommendations regarding nominations for Trustees and will consider nominees suggested by shareholders sent to the attention of the President of the Trust. | 4 | |||
| Investments | Janice B. Case Richard L. Gady Richard A. Hauser Marc S. Joseph Paul R. Laubscher James A. Nussle Dougles D. Sims Constance L. Souders | The Investment Committee assists the Board of Trustees in its oversight of the investment performance of the Funds; the Funds’ consistency with their investment objectives and styles; management’s selection of benchmarks, peer groups and other performance measures for the Funds; and the range of investment options offered to investors in the Funds. In addition, the Committee assists the Board in its review of investment-related aspects of management’s proposals such as new Funds or Fund reorganizations. | 4 | |||
| (1) | The Independent Trustees serve as members of each Committee. |
Beneficial Interest in the Funds by Trustees
The following tables provide information, as of December 31, 2014, regarding the dollar range of beneficial ownership by each Trustee in each series of the Trust. The dollar range shown in the third column reflects the aggregate amount of each Trustee’s beneficial ownership in all registered investment companies, not including ownership through deferred compensation, within the investment company complex that are overseen by the Trustee. For Independent Trustees only, the last column sets forth the dollar range of each Trustee’s deferred compensation, which is effectively invested in the Thrivent Mutual Funds and allocated among individual Funds as determined by the Trustee. For more information on the deferred compensation plan and for the aggregate amount of each Trustee’s deferred compensation, see “Compensation of Trustees” below.
B-38
Table of Contents
Interested Trustee
Name of Trustee | Dollar Range of Beneficial Ownership in the Funds | Aggregate Dollar Range of Beneficial Ownership in All Registered Investment Companies Overseen by the Trustee in the Family of Investment Companies | ||||
Russell W. Swansen | Thrivent Aggressive Allocation Fund | Over $100,000 | Over $100,000 | |||
| Thrivent Moderately Aggressive Allocation Fund | None | |||||
| Thrivent Moderate Allocation Fund | None | |||||
| Thrivent Moderately Conservative Allocation Fund | None | |||||
| Thrivent Natural Resources Fund | None | |||||
| Thrivent Partner Emerging Markets Equity Fund | None | |||||
| Thrivent Partner Small Cap Growth Fund | None | |||||
| Thrivent Partner Small Cap Value Fund | None | |||||
| Thrivent Small Cap Stock Fund | None | |||||
| Thrivent Mid Cap Growth Fund | None | |||||
| Thrivent Partner Mid Cap Value Fund | None | |||||
| Thrivent Mid Cap Stock Fund | None | |||||
| Thrivent Partner Worldwide Allocation Fund | None | |||||
| Thrivent Large Cap Growth Fund | None | |||||
| Thrivent Large Cap Value Fund | None | |||||
| Thrivent Large Cap Stock Fund | None | |||||
| Thrivent Growth and Income Plus Fund | None | |||||
| Thrivent Balanced Income Plus Fund | None | |||||
| Thrivent High Yield Fund | None | |||||
| Thrivent Diversified Income Plus Fund | None | |||||
| Thrivent Municipal Bond Fund | None | |||||
| Thrivent Income Fund | None | |||||
| Thrivent Opportunity Income Plus Fund | None | |||||
| Thrivent Government Bond Fund | None | |||||
| Thrivent Limited Maturity Bond Fund | None | |||||
| Thrivent Money Market Fund | None | |||||
Independent Trustees
Name of Trustee | Dollar Range of Beneficial Ownership in the Funds | Aggregate Dollar Range of Beneficial Ownership in All Registered Investment Companies Overseen by the Trustee in the Family of Investment Companies | Dollar Range through Deferred Compensation | |||||
Janice B. Case | Thrivent Aggressive Allocation Fund | $50,001-$100,000 | Over $100,000 | None | ||||
| Thrivent Moderately Aggressive Allocation Fund | None | None | ||||||
| Thrivent Moderate Allocation Fund | $10,001-$50,000 | None | ||||||
| Thrivent Moderately Conservative Allocation Fund | None | None | ||||||
| Thrivent Natural Resources Fund | None | None | ||||||
| Thrivent Partner Emerging Markets Equity Fund | $1-$10,000 | None | ||||||
| Thrivent Partner Small Cap Growth Fund | None | None | ||||||
| Thrivent Partner Small Cap Value Fund | None | None | ||||||
B-39
Table of Contents
Name of Trustee | Dollar Range of Beneficial Ownership in the Funds | Aggregate Dollar Range of Beneficial Ownership in All Registered Investment Companies Overseen by the Trustee in the Family of Investment Companies | Dollar Range through Deferred Compensation | |||||||
| Thrivent Small Cap Stock Fund | None | None | ||||||||
| Thrivent Mid Cap Growth Fund | None | None | ||||||||
| Thrivent Partner Mid Cap Value Fund | None | None | ||||||||
| Thrivent Mid Cap Stock Fund | None | None | ||||||||
| Thrivent Partner Worldwide Allocation Fund | None | None | ||||||||
| Thrivent Large Cap Growth Fund | None | None | ||||||||
| Thrivent Large Cap Value Fund | None | None | ||||||||
| Thrivent Large Cap Stock Fund | None | None | ||||||||
| Thrivent Growth and Income Plus Fund | None | None | ||||||||
| Thrivent Balanced Income Plus Fund | None | None | ||||||||
| Thrivent High Yield Fund | $10,001-$50,000 | None | ||||||||
| Thrivent Diversified Income Plus Fund | $10,001-$50,000 | None | ||||||||
| Thrivent Municipal Bond Fund | $10,001-$50,000 | None | ||||||||
| Thrivent Income Fund | None | None | ||||||||
| Thrivent Opportunity Income Plus Fund | None | None | ||||||||
| Thrivent Government Bond Fund | None | None | ||||||||
| Thrivent Limited Maturity Bond Fund | None | None | ||||||||
| Thrivent Money Market Fund | None | None | ||||||||
Richard L. Gady | Thrivent Aggressive Allocation Fund | $10,001-$50,000 | Over $100,000 | $50,001-$100,000 | ||||||
| Thrivent Moderately Aggressive Allocation Fund | None | $10,001-$50,000 | ||||||||
| Thrivent Moderate Allocation Fund | $10,001-$50,000 | $50,001-$100,000 | ||||||||
| Thrivent Moderately Conservative Allocation Fund | None | Over $100,000 | ||||||||
| Thrivent Natural Resources Fund | None | None | ||||||||
| Thrivent Partner Emerging Markets Equity Fund | None | $1-$10,000 | ||||||||
| Thrivent Partner Small Cap Growth Fund | None | None | ||||||||
| Thrivent Partner Small Cap Value Fund | None | None | ||||||||
| Thrivent Small Cap Stock Fund | None | $1-$10,000 | ||||||||
| Thrivent Mid Cap Growth Fund | None | None | ||||||||
| Thrivent Partner Mid Cap Value Fund | None | None | ||||||||
| Thrivent Mid Cap Stock Fund | None | None | ||||||||
| Thrivent Partner Worldwide Allocation Fund | None | None | ||||||||
| Thrivent Large Cap Growth Fund | None | $1-$10,000 | ||||||||
| Thrivent Large Cap Value Fund | None | None | ||||||||
| Thrivent Large Cap Stock Fund | None | None | ||||||||
| Thrivent Growth and Income Plus Fund | $10,001-$50,000 | Over $100,000 | ||||||||
| Thrivent Balanced Income Plus Fund | None | None | ||||||||
| Thrivent High Yield Fund | None | None | ||||||||
| Thrivent Diversified Income Plus Fund | $10,001-$50,000 | Over $100,000 | ||||||||
| Thrivent Municipal Bond Fund | $50,001-$100,000 | None | ||||||||
| Thrivent Income Fund | None | None | ||||||||
| Thrivent Opportunity Income Plus Fund | $10,001-$50,000 | None | ||||||||
| Thrivent Government Bond Fund | None | None | ||||||||
| Thrivent Limited Maturity Bond Fund | $1-$10,000 | Over $100,000 | ||||||||
| Thrivent Money Market Fund | $1-$10,000 | None | ||||||||
B-40
Table of Contents
Name of Trustee | Dollar Range of Beneficial Ownership in the Funds | Aggregate Dollar Range of Beneficial Ownership in All Registered Investment Companies Overseen by the Trustee in the Family of Investment Companies | Dollar Range through Deferred Compensation | |||||
Richard A. Hauser | Thrivent Aggressive Allocation Fund | None | Over $100,000 | None | ||||
| Thrivent Moderately Aggressive Allocation Fund | Over $100,000 | None | ||||||
| Thrivent Moderate Allocation Fund | Over $100,000 | None | ||||||
| Thrivent Moderately Conservative Allocation Fund | None | None | ||||||
| Thrivent Natural Resources Fund | None | None | ||||||
| Thrivent Partner Emerging Markets Equity Fund | None | |||||||
| Thrivent Partner Small Cap Growth Fund | None | None | ||||||
| Thrivent Partner Small Cap Value Fund | $10,001-$50,000 | None | ||||||
| Thrivent Small Cap Stock Fund | None | None | ||||||
| Thrivent Mid Cap Growth Fund | None | None | ||||||
| Thrivent Partner Mid Cap Value Fund | $10,001-$50,000 | None | ||||||
| Thrivent Mid Cap Stock Fund | None | None | ||||||
| Thrivent Partner Worldwide Allocation Fund | $10,001-$50,000 | None | ||||||
| Thrivent Large Cap Growth Fund | None | None | ||||||
| Thrivent Large Cap Value Fund | None | None | ||||||
| Thrivent Large Cap Stock Fund | None | None | ||||||
| Thrivent Growth and Income Plus Fund | None | None | ||||||
| Thrivent Balanced Income Plus Fund | None | None | ||||||
| Thrivent High Yield Fund | $10,001-$50,000 | None | ||||||
| Thrivent Diversified Income Plus Fund | Over $100,000 | Over $100,000 | ||||||
| Thrivent Municipal Bond Fund | Over $100,000 | None | ||||||
| Thrivent Income Fund | None | None | ||||||
| Thrivent Opportunity Income Plus Fund | $50,001-$100,000 | None | ||||||
| Thrivent Government Bond Fund | None | None | ||||||
| Thrivent Limited Maturity Bond Fund | Over $100,000 | None | ||||||
| Thrivent Money Market Fund | $10,001-$50,000 | None | ||||||
Marc S. Joseph | Thrivent Aggressive Allocation Fund | $1-$10,000 | $10,001-$50,000 | $10,001-$50,000 | ||||
| Thrivent Moderately Aggressive Allocation Fund | $1-$10,000 | $10,001-$50,000 | ||||||
| Thrivent Moderate Allocation Fund | None | None | ||||||
| Thrivent Moderately Conservative Allocation Fund | None | None | ||||||
| Thrivent Natural Resources Fund | None | None | ||||||
| Thrivent Partner Emerging Markets Equity Fund | ||||||||
| Thrivent Partner Small Cap Growth Fund | $1-$10,000 | None | ||||||
| Thrivent Partner Small Cap Value Fund | $1-$10,000 | $10,001-$50,000 | ||||||
| Thrivent Small Cap Stock Fund | $1-$10,000 | None | ||||||
| Thrivent Mid Cap Growth Fund | $1-$10,000 | None | ||||||
| Thrivent Partner Mid Cap Value Fund | $1-$10,000 | None | ||||||
| Thrivent Mid Cap Stock Fund | $1-$10,000 | None | ||||||
| Thrivent Partner Worldwide Allocation Fund | $1-$10,000 | None | ||||||
| Thrivent Large Cap Growth Fund | $1-$10,000 | None | ||||||
| Thrivent Large Cap Value Fund | $1-$10,000 | None | ||||||
B-41
Table of Contents
Name of Trustee | Dollar Range of Beneficial Ownership in the Funds | Aggregate Dollar Range of Beneficial Ownership in All Registered Investment Companies Overseen by the Trustee in the Family of Investment Companies | Dollar Range through Deferred Compensation | |||||
| Thrivent Large Cap Stock Fund | $1-$10,000 | None | ||||||
| Thrivent Growth and Income Plus Fund | $1-$10,000 | None | ||||||
| Thrivent Balanced Income Plus Fund | None | None | ||||||
| Thrivent High Yield Fund | $1-$10,000 | None | ||||||
| Thrivent Diversified Income Plus Fund | Over $100,000 | $10,001-$50,000 | ||||||
| Thrivent Municipal Bond Fund | None | None | ||||||
| Thrivent Income Fund | None | None | ||||||
| Thrivent Opportunity Income Plus Fund | None | None | ||||||
| Thrivent Government Bond Fund | None | None | ||||||
| Thrivent Limited Maturity Bond Fund | None | None | ||||||
| Thrivent Money Market Fund | None | None | ||||||
Paul R. Laubscher | Thrivent Aggressive Allocation Fund | None | None | None | ||||
| Thrivent Moderately Aggressive Allocation Fund | None | Over $100,000 | ||||||
| Thrivent Moderate Allocation Fund | None | None | ||||||
| Thrivent Moderately Conservative Allocation Fund | None | None | ||||||
| Thrivent Natural Resources Fund | None | None | ||||||
| Thrivent Partner Emerging Markets Equity Fund | None | |||||||
| Thrivent Partner Small Cap Growth Fund | None | None | ||||||
| Thrivent Partner Small Cap Value Fund | None | None | ||||||
| Thrivent Small Cap Stock Fund | None | None | ||||||
| Thrivent Mid Cap Growth Fund | None | None | ||||||
| Thrivent Partner Mid Cap Value Fund | None | None | ||||||
| Thrivent Mid Cap Stock Fund | None | None | ||||||
| Thrivent Partner Worldwide Allocation Fund | None | None | ||||||
| Thrivent Large Cap Growth Fund | None | None | ||||||
| Thrivent Large Cap Value Fund | None | None | ||||||
| Thrivent Large Cap Stock Fund | None | None | ||||||
| Thrivent Growth and Income Plus Fund | None | None | ||||||
| Thrivent Balanced Income Plus Fund | None | None | ||||||
| Thrivent High Yield Fund | None | None | ||||||
| Thrivent Diversified Income Plus Fund | None | None | ||||||
| Thrivent Municipal Bond Fund | None | None | ||||||
| Thrivent Income Fund | None | None | ||||||
| Thrivent Opportunity Income Plus Fund | None | None | ||||||
| Thrivent Government Bond Fund | None | None | ||||||
| Thrivent Limited Maturity Bond Fund | None | None | ||||||
| Thrivent Money Market Fund | None | None | ||||||
James A. Nussle | Thrivent Aggressive Allocation Fund | None | Over $100,000 | None | ||||
| Thrivent Moderately Aggressive Allocation Fund | None | None | ||||||
| Thrivent Moderate Allocation Fund | None | None | ||||||
| Thrivent Moderately Conservative Allocation Fund | None | None | ||||||
| Thrivent Natural Resources Fund | None | None | ||||||
B-42
Table of Contents
Name of Trustee | Dollar Range of Beneficial Ownership in the Funds | Aggregate Dollar Range of Beneficial Ownership in All Registered Investment Companies Overseen by the Trustee in the Family of Investment Companies | Dollar Range through Deferred Compensation | |||||
| Thrivent Partner Emerging Markets Equity Fund | $10,001-$50,000 | None | ||||||
| Thrivent Partner Small Cap Growth Fund | None | None | ||||||
| Thrivent Partner Small Cap Value Fund | $10,001-$50,000 | None | ||||||
| Thrivent Small Cap Stock Fund | None | None | ||||||
| Thrivent Mid Cap Growth Fund | Over $100,000 | None | ||||||
| Thrivent Partner Mid Cap Value Fund | None | None | ||||||
| Thrivent Mid Cap Stock Fund | None | None | ||||||
| Thrivent Partner Worldwide Allocation Fund | None | None | ||||||
| Thrivent Large Cap Growth Fund | None | None | ||||||
| Thrivent Large Cap Value Fund | $10,001-$50,000 | None | ||||||
| Thrivent Large Cap Stock Fund | None | None | ||||||
| Thrivent Growth and Income Plus Fund | None | None | ||||||
| Thrivent Balanced Income Plus Fund | None | None | ||||||
| Thrivent High Yield Fund | None | None | ||||||
| Thrivent Diversified Income Plus Fund | Over $100,000 | None | ||||||
| Thrivent Municipal Bond Fund | $0 | None | ||||||
| Thrivent Income Fund | None | None | ||||||
| Thrivent Opportunity Income Plus Fund | None | None | ||||||
| Thrivent Government Bond Fund | None | None | ||||||
| Thrivent Limited Maturity Bond Fund | $10,001-$50,000 | None | ||||||
| Thrivent Money Market Fund | None | None | ||||||
Douglas D. Sims | Thrivent Aggressive Allocation Fund | None | None | None | ||||
| Thrivent Moderately Aggressive Allocation Fund | None | Over $100,000 | ||||||
| Thrivent Moderate Allocation Fund | None | Over $100,000 | ||||||
| Thrivent Moderately Conservative Allocation Fund | None | None | ||||||
| Thrivent Natural Resources Fund | None | None | ||||||
| Thrivent Partner Emerging Markets Equity Fund | None | None | ||||||
| Thrivent Partner Small Cap Growth Fund | None | None | ||||||
| Thrivent Partner Small Cap Value Fund | None | None | ||||||
| Thrivent Small Cap Stock Fund | None | None | ||||||
| Thrivent Mid Cap Growth Fund | None | None | ||||||
| Thrivent Partner Mid Cap Value Fund | None | None | ||||||
| Thrivent Mid Cap Stock Fund | None | None | ||||||
| Thrivent Partner Worldwide Allocation Fund | None | None | ||||||
| Thrivent Large Cap Growth Fund | None | None | ||||||
| Thrivent Large Cap Value Fund | None | None | ||||||
| Thrivent Large Cap Stock Fund | None | None | ||||||
| Thrivent Growth and Income Plus Fund | None | None | ||||||
| Thrivent Balanced Income Plus Fund | None | None | ||||||
| Thrivent High Yield Fund | None | None | ||||||
| Thrivent Diversified Income Plus Fund | None | None | ||||||
| Thrivent Municipal Bond Fund | None | None | ||||||
| Thrivent Income Fund | None | None | ||||||
| Thrivent Opportunity Income Plus Fund | None | None | ||||||
B-43
Table of Contents
Name of Trustee | Dollar Range of Beneficial Ownership in the Funds | Aggregate Dollar Range of Beneficial Ownership in All Registered Investment Companies Overseen by the Trustee in the Family of Investment Companies | Dollar Range through Deferred Compensation | |||||
| Thrivent Government Bond Fund | None | None | ||||||
| Thrivent Limited Maturity Bond Fund | None | None | ||||||
| Thrivent Money Market Fund | None | None | ||||||
Constance L. Souders | Thrivent Aggressive Allocation Fund | None | None | None | ||||
| Thrivent Moderately Aggressive Allocation Fund | None | Over $100,000 | ||||||
| Thrivent Moderate Allocation Fund | None | None | ||||||
| Thrivent Moderately Conservative Allocation Fund | None | None | ||||||
| Thrivent Natural Resources Fund | None | None | ||||||
| Thrivent Partner Emerging Markets Equity Fund | None | None | ||||||
| Thrivent Partner Small Cap Growth Fund | None | None | ||||||
| Thrivent Partner Small Cap Value Fund | None | None | ||||||
| Thrivent Small Cap Stock Fund | None | None | ||||||
| Thrivent Mid Cap Growth Fund | None | None | ||||||
| Thrivent Partner Mid Cap Value Fund | None | None | ||||||
| Thrivent Mid Cap Stock Fund | None | None | ||||||
| Thrivent Partner Worldwide Allocation Fund | None | None | ||||||
| Thrivent Large Cap Growth Fund | None | None | ||||||
| Thrivent Large Cap Value Fund | None | None | ||||||
| Thrivent Large Cap Stock Fund | None | None | ||||||
| Thrivent Growth and Income Plus Fund | None | None | ||||||
| Thrivent Balanced Income Plus Fund | None | None | ||||||
| Thrivent High Yield Fund | None | None | ||||||
| Thrivent Diversified Income Plus Fund | None | None | ||||||
| Thrivent Municipal Bond Fund | None | None | ||||||
| Thrivent Income Fund | None | None | ||||||
| Thrivent Opportunity Income Plus Fund | None | None | ||||||
| Thrivent Government Bond Fund | None | None | ||||||
| Thrivent Limited Maturity Bond Fund | None | None | ||||||
| Thrivent Money Market Fund | None | None | ||||||
Compensation of Trustees
The Trust makes no payments to any of its officers for services performed for the Trust. The Independent Trustees are paid an annual base compensation of $135,000 to serve on the Board of Trustees of the Trust, the Board of Directors of Thrivent Series Fund, Inc., and the Board of Trustees of Thrivent Mutual Funds. Each
Trustee also receives $5,000 for each in-person meeting attended and $1,000 for each telephonic meeting (up to four telephonic meetings per year). The Board Chair is compensated an additional $55,000 per year; the Chair of the Contracts Committee, who also serves as the Audit Committee Financial Expert, is compensated an additional $40,000 per year; the Chair of the Audit Committee and the Chair of the Investments Committee are each compensated an additional $20,000 per year; and the Chair of the Governance Committee and the Chair of the Ethics and Compliance Committee are each compensated an additional $10,000 per year. Independent
B-44
Table of Contents
Trustees are reimbursed by the Trust for any expenses they may incur by reason of attending Board meetings or in connection with other services they may perform in connection with their duties as Trustees of the Trust. The Trustees receive no pension or retirement benefits in connection with their service to the Trust.
The following table provides the amounts of compensation paid to the Trustees either directly or in the form of payments made into a deferred compensation plan for the fiscal year ended October 31, 2014:
Name, Position | Aggregate Compensation from Trust for One Year Ending October 31, 2014 | Total Compensation Paid by Trust and the Investment Company Complex for One Year Ending October 31, 2014 | ||||||
Janice B. Case Trustee | $ | 65,616 | $ | 165,000 | ||||
Richard L. Gady (1) Trustee | $ | 61,249 | $ | 154,000 | ||||
Richard A. Hauser (1) Trustee | $ | 83,500 | $ | 210,000 | ||||
Marc S. Joseph Trustee | $ | 65,616 | $ | 165,000 | ||||
Paul R. Laubscher (1) Trustee | $ | 69,591 | $ | 175,000 | ||||
James A. Nussle Trustee | $ | 61,642 | $ | 155,000 | ||||
Douglas D. Sims (1) Trustee | $ | 69,197 | $ | 174,000 | ||||
Constance L. Souders (1) Trustee | $ | 77,539 | $ | 195,000 | ||||
| (1) | The Trust has adopted a deferred compensation plan for the benefit of the Independent Trustees of the Trust who wish to defer receipt of a percentage of eligible compensation which they otherwise are entitled to receive from the Trust. Compensation deferred is effectively invested in the Thrivent Mutual Funds, the allocation of which is determined by the individual Trustee. The Trustees participating in the deferred compensation plan do not actually own shares of the Thrivent Mutual Funds through the plan, since deferred compensation is a general liability of the Thrivent Mutual Funds. However, a Trustee’s return on compensation deferred is economically equivalent to an investment in the applicable Thrivent Mutual Funds. As of October 31, 2014, the total amount of deferred compensation payable to Mr. Gady was $1,196,865; the total amount of deferred compensation payable to Mr. Hauser was $863,916; the total amount of deferred compensation payable to Mr. Laubscher was $192,899; the total amount of deferred compensation payable to Mr. Sims was $1,476,367; the total amount of deferred compensation payable to Ms. Souders was $190,775; and the total amount of deferred compensation payable to Mr. Joseph was $174,688. |
B-45
Table of Contents
As of January 29, 2015, the following were significant shareholders of a Fund’s securities. This list of shareholders includes affiliates of the Funds and the Funds themselves.
Name | Fund | Percent | ||||
Thrivent Moderate Allocation Fund | Thrivent Mid Cap Stock Fund — Institutional Class | 6.90 | % | |||
Thrivent Large Cap Growth Fund — Institutional Class | 19.54 | % | ||||
Thrivent Large Cap Value Fund — Institutional Class | 21.45 | % | ||||
Thrivent Partner Mid Cap Value Fund — Institutional Class | 22.67 | % | ||||
Thrivent Partner Small Cap Value Fund — Institutional Class | 18.02 | % | ||||
Thrivent Income Fund — Institutional Class | 23.13 | % | ||||
Thrivent Natural Resources Fund — Institutional Class | 27.39 | % | ||||
Thrivent High Yield Fund — Institutional Class | 6.92 | % | ||||
Thrivent Limited Maturity Bond Fund — Institutional Class | 18.67 | % | ||||
Thrivent Partner Worldwide Allocation Fund — Institutional Class | 19.52 | % | ||||
Thrivent Government Bond Fund — Institutional Class | 23.67 | % | ||||
Thrivent Small Cap Stock Fund — Institutional Class |
| 5.38 | % | |||
Thrivent Moderately Aggressive Allocation Fund | Thrivent Mid Cap Stock Fund — Institutional Class | 10.59 | % | |||
Thrivent Large Cap Growth Fund — Institutional Class | 24.82 | % | ||||
Thrivent Large Cap Value Fund — Institutional Class | 25.19 | % | ||||
Thrivent Large Cap Stock Fund — Institutional Class | 5.65 | % | ||||
Thrivent Small Cap Stock Fund — Institutional Class | 8.20 | % | ||||
Thrivent Partner Small Cap Value Fund — Institutional Class | 18.94 | % | ||||
Thrivent Income Fund — Institutional Class | 9.74 | % | ||||
Thrivent Mid Cap Growth Fund — Institutional Class | 12.21 | % | ||||
Thrivent Partner Worldwide Allocation Fund — Institutional Class | 25.54 | % | ||||
Thrivent Natural Resources Fund — Institutional Class | 30.41 | % | ||||
Thrivent High Yield Fund — Institutional Class | 8.17 | % | ||||
Thrivent Partner Mid Cap Value Fund — Institutional Class | 34.33 | % | ||||
B-46
Table of Contents
Name | Fund | Percent | ||||
Thrivent Government Bond Fund — Institutional Class | 23.15 | % | ||||
Thrivent Aggressive Allocation Fund | ||||||
Thrivent Partner Worldwide Allocation Fund — Institutional Class | 13.27 | % | ||||
Thrivent Natural Resources Fund — Institutional Class | 15.06 | % | ||||
Thrivent Large Cap Value Fund — Institutional Class | 7.71 | % | ||||
Thrivent Small Cap Stock Fund — Institutional Class | 6.12 | % | ||||
Thrivent Partner Small Cap Value Fund — Institutional Class | 8.12 | % | ||||
Thrivent Mid Cap Growth Fund — Institutional Class | 9.24 | % | ||||
Thrivent Partner Mid Cap Value Fund — Institutional Class | 16.61 | % | ||||
Thrivent Large Cap Growth Fund — Institutional Class | 11.61 | % | ||||
| Thrivent Moderately Conservative Allocation Fund | ||||||
Thrivent Large Cap Value Fund — Institutional Class | 7.24 | % | ||||
Thrivent Natural Resources Fund — Institutional Class | 11.97 | % | ||||
Thrivent Limited Maturity Bond Fund — Institutional Class | 13.10 | % | ||||
Thrivent Partner Worldwide Allocation Fund — Institutional Class | 5.78 | % | ||||
Thrivent Partner Mid Cap Value Fund — Institutional Class | 12.37 | % | ||||
Thrivent Government Bond Fund — Institutional Class | 10.77 | % | ||||
Thrivent Income Fund — Institutional Class | 8.34 | % | ||||
Thrivent Financial for Lutherans 625 Fourth Ave. So. Mpls, MN 55415-1624 | ||||||
Thrivent Partner Worldwide Allocation — Institutional Class | 13.49 | % | ||||
Thrivent Partner Emerging Markets Equity Fund — Institutional Class | 59.14 | % | ||||
Interfaith Community Foundation 625 Fourth Avenue South, Suite 1500 Minneapolis, MN 55415-1624 | Thrivent Government Bond Fund — Institutional Class |
| 33.92 | % | ||
Thrivent Large Cap Growth Fund — Institutional Class | 5.01 | % | ||||
Fox Cities Performing Arts Center 400 W. College Ave Appleton, WI 54911-5931 | Thrivent Opportunity Income Fund — Institutional Class | 8.83 | % | |||
B-47
Table of Contents
Management Ownership
As of February 1, 2015, the officers and Trustees as a group owned less than 1% of a Fund’s share class.
Material Transactions with Independent Trustees.
No Independent Trustee of the Trust or any immediate family member of an Independent Trustee has had, during the two most recently completed calendar years, a direct or indirect interest in the investment adviser, the principal underwriter, or a subadviser for the Funds, or in any person directly or indirectly controlling, controlled by or under common control with the investment adviser, the principal underwriter, or a subadviser for the Funds exceeding $120,000. In addition, no Independent Trustee of the Trust or any of their immediate family members has had, during the two most recently completed calendar years, a direct or indirect material interest in any transaction or series of similar transactions in which the amount involved exceeds $120,000 and to which one of the parties was the Trust; an officer of the Trust; an investment company or an officer of any investment company having the same investment adviser, subadviser or principal underwriter as the Funds as its investment adviser or principal underwriter or having an investment adviser or principal underwriter that directly or indirectly controls, is controlled by or under common control with the investment adviser, subadviser or principal underwriter of the Funds; the Funds’ investment adviser or principal underwriter; an officer of the Funds’ investment adviser or principal underwriter; or a person or an officer of a person directly or indirectly controlling, controlled by or under common control with the investment adviser or the principal underwriter of the Funds (an “Associated Person”). No Independent Trustee of the Trust or a member of the immediate family of an Independent Trustee has had, in the two most recently completed calendar years, a direct or indirect relationship with any Associated Person involving an amount in excess of $120,000 and which involved: payments for property or services to or from any Associated Person; provision of legal services to any Associated Person; provision of investment banking services to any Associated Person, other than as a participating underwriter in a syndicate; or, any consulting or other relationship that is substantially similar in nature and scope to these types of relationships.
B-48
Table of Contents
INVESTMENT ADVISER, INVESTMENT SUBADVISERS AND PORTFOLIO MANAGERS
Investment Adviser
The Funds’ investment adviser Thrivent Asset Mgt. was organized as a Delaware limited liability company on September 23, 2005. Thrivent Asset Mgt. is a subsidiary of both Thrivent Investment Management Inc. (“Thrivent Investment Mgt.”) and TLIC, both of which are wholly owned subsidiaries of Thrivent Financial. Thrivent Financial Holdings, Inc. and TLIC own respectively 80% and 20% of Thrivent Asset Mgt.’s membership interests.
Thrivent Asset Mgt., 625 Fourth Avenue South, Minneapolis, Minnesota 55415 is the investment adviser for each of the Funds. The officers and directors of Thrivent Asset Mgt. who are affiliated with the Trust are set forth below under “Affiliated Persons.”
Investment decisions for each of the Funds (except for Thrivent Partner Small Cap Value Fund, Thrivent Partner Mid Cap Value Fund, Thrivent Partner Worldwide Allocation Fund (excluding the portion invested in U.S. securities), and Thrivent Partner Emerging Markets Equity Fund (collectively, the “Subadvised Funds”)) are made by Thrivent Asset Mgt., subject to the overall direction of the Board of Trustees. Thrivent Asset Mgt. also provides investment research and supervision of each of the Fund’s investments (except for the investments of the Subadvised Funds that are not managed, as noted above, by Thrivent Asset Mgt.) and conducts a continuous program of investment evaluation and appropriate disposition and reinvestment of these assets.
Thrivent Asset Mgt. Portfolio Managers
Other Accounts Managed by the Thrivent Asset Mgt. Portfolio Managers
The following table provides information relating to other accounts managed by Thrivent Asset Mgt. portfolio managers as of October 31, 2014:
| Other Registered Investment Companies1 | Other Accounts | |||||||||||||||
Portfolio Manager | # of Accounts Managed | Assets Managed | # of Accounts Managed | Assets Managed | ||||||||||||
Russell W. Swansen | 4 | $ | 17,728,171,687 | 0 | $ | 0 | ||||||||||
David C. Francis | 8 | $ | 19,619,597,828 | 2 | 3 | $ | 426,805,956 | 2 | ||||||||
Mark L. Simenstad | 5 | $ | 18,038,172,459 | 3 | 0 | $ | 0 | |||||||||
Darren M. Bagwell | 3 | $ | 1,192,657,435 | 4 | 2 | $ | 146,756,673 | 4 | ||||||||
Kurt J. Lauber | 2 | $ | 2,025,472,352 | 2 | $ | 224,315,614 | ||||||||||
Andrea J. Thomas | 1 | $ | 412,142,428 | 1 | $ | 7,940,583 | ||||||||||
Brian J. Flanagan | 1 | $ | 735,897,782 | 2 | $ | 109,687,554 | ||||||||||
David J. Lettenberger | 1 | $ | 61,811,903 | 0 | $ | 0 | ||||||||||
Matthew D. Finn | 1 | $ | 301,794,700 | 2 | $ | 96,087,072 | ||||||||||
James M. Tinucci | 1 | $ | 301,794,700 | 0 | $ | 0 | ||||||||||
Lettenberger, David J. | 1 | $ | 61,811,903 | 0 | $ | 0 | ||||||||||
Michael G. Landreville | 4 | $ | 1,427,032,893 | 3 | $ | 411,606,083 | ||||||||||
Gregory R. Anderson | 2 | $ | 1,123,697,075 | 3 | $ | 6,602,862,968 | ||||||||||
Paul J. Ocenasek | 2 | $ | 1,209,493,292 | 5 | 0 | $ | 0 | |||||||||
Conrad E. Smith | 1 | $ | 67,368,500 | 2 | $ | 533,702,089 | ||||||||||
David R. Spangler | 2 | $ | 174,840,668 | 6 | 3 | $ | 250,975,358 | 6 | ||||||||
Stephen D. Lowe | 3 | $ | 1,608,256,010 | 7 | 3 | $ | 1,442,392,392 | 7 | ||||||||
Janet I. Grangaard | 0 | $ | 0 | 0 | $ | 0 | ||||||||||
William D. Stouten | 2 | $ | 1,860,785,705 | 3 | $ | 2,125,168,446 | ||||||||||
| 1 | The “Other Registered Investment Companies” represent (a) series of Thrivent Series Fund, Inc., which have substantially similar investment objectives and policies as the Fund(s) managed by the portfolio manager listed and (b) Thrivent Cash Management Trust, in the case of William D. Stouten. |
| 2 | As of December 31, 2014, the Assets Managed totaled $20,262,400,314. |
B-49
Table of Contents
| 3 | As of December 31, 2014, the Assets Managed totaled $18,270,128,945. |
| 4 | As of December 31, 2014, the Assets Managed totaled $1,350,295,228. |
| 5 | As of December 31, 2014, the Assets Managed totaled $1,162,719,363. |
| 6 | # of Accounts Managed and Assets Managed are as of December 31, 2014. |
| 7 | As of December 31, 2014, the Assets Managed totaled $3,067,586,417. |
Compensation
Each portfolio manager of Thrivent Asset Mgt. is compensated by an annual base salary and an annual bonus, in addition to the various benefits that are available to all employees of Thrivent Financial. The annual base salary for each portfolio manager is a fixed amount that is determined annually according to the level of responsibility and performance. The annual bonus provides for a variable payment that is attributable to the relative pre-tax performance of each fund or account managed by the portfolio manager measured for one- and three-year periods against the median performance of other funds in the same peer group, as classified by Lipper, Inc., or an index constructed with comparable criteria. Some portfolio managers also participate in Thrivent Financial’s long-term incentive plan, which provides for an additional variable payment based on the extent to which Thrivent Financial met corporate goals related to the value of new business during the previous three-year period.
Conflicts of Interest
Portfolio managers at Thrivent Asset Mgt. typically manage multiple accounts. These accounts may include, among others, mutual funds, proprietary accounts and separate accounts (assets managed on behalf of pension funds, foundations and other investment accounts). The management of multiple funds and accounts may give rise to potential conflicts of interest if the funds and accounts have different objectives, benchmarks, time horizons, and fees. In addition, the side-by-side management of these funds and accounts may raise potential conflicts of interest relating to cross trading, the allocation of investment opportunities and the aggregation and allocation of trades. Thrivent Asset Mgt. seeks to provide best execution of all securities transactions and aggregate and then allocate securities to client accounts in a fair and timely manner. To this end, Thrivent Asset Mgt. has developed policies and procedures designed to mitigate and manage the potential conflicts of interest that may arise from side-by-side management.
Ownership in the Funds
The following table provides information as of October 31, 2014 on the dollar range of beneficial ownership by each portfolio manager for each Fund he or she manages. Dollar values disclosed with respect to the Thrivent Natural Resources Fund, the Thrivent Growth and Income Plus Fund, the Thrivent Diversified Income Plus Fund and each listed Portfolio are as of December 31, 2014.
Portfolio Manager | Fund | Fund Ownership | Portfolio1 | Portfolio Ownership | Ownership in Fund Complex2 | |||||
| Russell W. Swansen | Thrivent Aggressive Allocation Fund | Over $1,000,000 | Thrivent Aggressive Allocation Portfolio | $10,001-$50,000 | Over $1,000,000 | |||||
| Thrivent Moderately Aggressive Allocation Fund | $0 | Thrivent Moderately Aggressive Allocation Portfolio | $0 | |||||||
| Thrivent Moderate Allocation Fund | $0 | Thrivent Moderate Allocation Portfolio | $0 | |||||||
| Thrivent Moderately Conservative Allocation Fund | $0 | Thrivent Moderately Conservative Allocation Portfolio | $0 | |||||||
| David C. Francis | Thrivent Aggressive Allocation Fund | $100,001-$500,000 | Thrivent Aggressive Allocation Portfolio | $0 | $100,001-$500,000 | |||||
| Thrivent Moderately Aggressive Allocation Fund | $100,001-$500,000 | Thrivent Moderately Aggressive Allocation Portfolio | $0 | |||||||
B-50
Table of Contents
Portfolio Manager | Fund | Fund Ownership | Portfolio1 | Portfolio Ownership | Ownership in Fund Complex2 | |||||
| Thrivent Moderate Allocation Fund | $0 | Thrivent Moderate Allocation Portfolio | $0 | |||||||
| Thrivent Moderately Conservative Allocation Fund | $0 | Thrivent Moderately Conservative Allocation Portfolio | $0 | |||||||
| Thrivent Partner Worldwide Allocation Fund | $0 | Thrivent Partner Worldwide Allocation Portfolio | $0 | |||||||
| Thrivent Natural Resources Fund | $0 | Thrivent Natural Resources Portfolio | $0 | |||||||
| Thrivent Large Cap Growth Fund | $0 | Thrivent Large Cap Growth Portfolio | $0 | |||||||
| Thrivent Large Cap Stock Fund | $0 | Thrivent Large Cap Stock Portfolio | $0 | |||||||
| Mark L. Simenstad | Thrivent Aggressive Allocation Fund | $0 | Thrivent Aggressive Allocation Portfolio | $0 | $10,001-$50,000 | |||||
| Thrivent Moderately Aggressive Allocation Fund | $0 | Thrivent Moderately Aggressive Allocation Portfolio | $0 | |||||||
| Thrivent Moderate Allocation Fund | $0 | Thrivent Moderate Allocation Portfolio | $0 | |||||||
| Thrivent Moderately Conservative Allocation Fund | $0 | Thrivent Moderately Conservative Allocation Portfolio | $0 | |||||||
| Thrivent Diversified Income Plus Fund | $0 | Thrivent Diversified Income Plus Portfolio | $1-$10,000 | |||||||
| Darren M. Bagwell | Thrivent Balanced Income Plus Fund | $0 | Thrivent Natural Resources Portfolio | $0 | $0 | |||||
| Thrivent Natural Resources Fund | $0 | Thrivent Balanced Income Plus Portfolio | $0 | |||||||
| Thrivent Large Cap Growth Fund | $0 | Thrivent Large Cap Growth Portfolio | $0 | |||||||
| Andrea J. Thomas | Thrivent Mid Cap Growth Fund | $1-$10,000 | Thrivent Mid Cap Growth Portfolio | $0 | $1-$10,000 | |||||
| Brian J. Flanagan | Thrivent Mid Cap Stock Fund | $0 | Thrivent Mid Cap Stock Portfolio | $1-$10,000 | $1-$10,000 | |||||
| Matthew D. Finn | Thrivent Small Cap Stock Fund | $100,001-$500,000 | Thrivent Small Cap Stock Portfolio | $0 | $100,001-$500,000 | |||||
| James M. Tinucci | Thrivent Small Cap Stock Fund | $0 | Thrivent Small Cap Stock Portfolio | $0 | $1-$10,000 | |||||
| Michael G. Landreville | Thrivent Balanced Income Plus Fund | $0 | Thrivent Balanced Income Plus Portfolio | $0 | $100,001-$500,000 | |||||
| Thrivent Opportunity Income Plus Fund | $0 | Thrivent Bond Index Portfolio | $0 | |||||||
| Thrivent Government Bond Fund | $0 | Thrivent Opportunity Income Plus Portfolio | $0 | |||||||
| Thrivent Limited Maturity Bond Fund | $50,001-$100,000 | Thrivent Limited Maturity Bond Portfolio | $0 | |||||||
| Gregory R. Anderson | Thrivent Opportunity Income Plus Fund | $0 | Thrivent Opportunity Income Plus Portfolio | $0 | $100,001-$500,000 | |||||
B-51
Table of Contents
Portfolio Manager | Fund | Fund Ownership | Portfolio1 | Portfolio Ownership | Ownership in Fund Complex2 | |||||
| Thrivent Limited Maturity Bond Fund | $0 | Thrivent Limited Maturity Bond Portfolio | $0 | |||||||
| Paul J. Ocenasek | Thrivent High Yield Fund | $0 | Thrivent High Yield Portfolio | $0 | $10,001-$100,000 | |||||
| Thrivent Diversified Income Plus Fund | $0 | Thrivent Diversified Income Plus Portfolio | $0 | |||||||
| David R. Spangler | Thrivent Diversified Income Plus Fund | $0 | Thrivent Diversified Income Plus Portfolio | $0 | $100,001- $500,000 | |||||
| Thrivent Growth and Income Plus Fund | $0 | Thrivent Growth and Income Plus Portfolio | $0 | |||||||
| Stephen D. Lowe | Thrivent Income Fund | $100,001-$500,000 | Thrivent Income Portfolio | $0 | $500,001- $1,000,000 | |||||
| Thrivent Growth and Income Plus Fund | $0 | Thrivent Growth and Income Plus Portfolio | $0 | |||||||
| Thrivent Balanced Income Plus Fund | $0 | Thrivent Balanced Income Plus Portfolio | $0 | |||||||
| Janet I. Grangaard | Thrivent Municipal Bond Fund | Over $1,000,000 | Over $1,000,000 | |||||||
| William D. Stouten | Thrivent Money Market Fund | $1-$10,000 | Thrivent Money Market Portfolio | $0 | $1-$10,000 | |||||
| Conrad E. Smith | Thrivent Opportunity Income Plus Fund | $0 | Thrivent Opportunity Income Plus Portfolio | $0 | $100,001-$500,000 | |||||
| Kurt J. Lauber | Thrivent Large Cap Value Fund | $0 | Thrivent Large Cap Value Portfolio | $0 | $0 | |||||
| Thrivent Large Cap Stock Fund | $0 | Thrivent Large Cap Stock Portfolio | $0 | |||||||
| David J. Lettenberger | Thrivent Partner Small Cap Growth Fund | $0 | Thrivent Partner Small Cap Growth Portfolio | $0 | $0 | |||||
| (1) | Each Portfolio listed is a series of Thrivent Series Fund, Inc., is managed by the same portfolio manager(s) and has substantially similar investment objectives and policies to the corresponding Fund listed. |
| (2) | Ownership in Fund Complex includes investments in Thrivent Mutual Funds and Thrivent Series Fund, Inc. |
Investment Subadvisers
Thrivent Asset Mgt. has engaged the following subadvisers for Thrivent Partner Emerging Markets Equity Fund, Thrivent Partner Small Cap Value Fund, Thrivent Partner Mid Cap Value Fund and, to the extent invested in non-U.S. securities, Thrivent Partner Worldwide Allocation Fund. Investment decisions for those Funds are made by the subadvisers, subject to the overall direction of the Board of Trustees and Thrivent Asset Mgt.
Thrivent Partner Emerging Markets Equity Fund
Investment decisions for Thrivent Partner Emerging Markets Equity Fund are made by Aberdeen Asset Managers Limited (“Aberdeen”). Aberdeen is located at 10 Queens Terrace, Aberdeen, United Kingdom AB10 1YG. Aberdeen is a subsidiary of Aberdeen Asset Management PLC (“Aberdeen PLC”), which was organized in
B-52
Table of Contents
1983. Aberdeen PLC is the parent company of an asset management group managing approximately $504 billion in assets as of December 31, 2014 for a range of pension funds, financial institutions, investment trusts, unit trusts, offshore funds, charities and private clients.
Aberdeen Portfolio Managers
Other Accounts Managed by Aberdeen Portfolio Managers
The following table provides information about the other accounts managed by Aberdeen team members as of October 31, 2014.
Portfolio Manager | Type of Accounts | Total # of Accounts Managed | Total Assets in the Accounts (in millions) | # of Accounts Managed with Advisory Fee Based On Performance | Total Assets with Advisory Fee Based on Performance (in millions) | |||||||||||||
Devan Kaloo | Registered Investment Companies: | 11 | $ | 10,816.25 | 0 | $ | 0 | |||||||||||
| Other Pooled Investment Vehicles: | 25 | $ | 24,206.52 | 0 | $ | 0 | ||||||||||||
| Other Accounts: | 55 | $ | 20,114.20 | 4 | $ | 713.24 | ||||||||||||
Joanne Irvine | Registered Investment Companies: | 11 | $ | 10,816.25 | 0 | $ | 0 | |||||||||||
| Other Pooled Investment Vehicles: | 25 | $ | 24,206.52 | 0 | $ | 0 | ||||||||||||
| Other Accounts: | 55 | $ | 20,114.20 | 4 | $ | 713.24 | ||||||||||||
Mark Gordon-James | Registered Investment Companies: | 11 | $ | 10,816.25 | 0 | $ | 0 | |||||||||||
| Other Pooled Investment Vehicles: | 25 | $ | 24,206.52 | 0 | $ | 0 | ||||||||||||
| Other Accounts: | 55 | $ | 20,114.20 | 4 | $ | 713.24 | ||||||||||||
Fiona Manning | Registered Investment Companies: | 11 | $ | 10,816.25 | 0 | $ | 0 | |||||||||||
| Other Pooled Investment Vehicles: | 25 | $ | 24,206.52 | 0 | $ | 0 | ||||||||||||
| Other Accounts: | 55 | $ | 20,114.20 | 4 | $ | 713.24 | ||||||||||||
Hugh Young | Registered Investment Companies: | 21 | $ | 13,518 | 0 | $ | 0 | |||||||||||
| Other Pooled Investment Vehicles: | 82 | $ | 58,553 | 2 | $ | 398.26 | ||||||||||||
| Other Accounts: | 132 | $ | 46,938.58 | 16 | $ | 5,415.62 | ||||||||||||
Compensation
Aberdeen’s remuneration policies are designed to support our business strategy, as a leading international asset manager. The objective is to attract, retain and reward talented individuals for the delivery of sustained, superior returns for our clients and shareholders. Aberdeen operates in a highly competitive international employment market, and aims to maintain its strong track record of success in developing and retaining talent.
The policy is to recognise corporate and individual achievements each year through an appropriate annual bonus scheme. The aggregate value of awards in any year is dependent on the Group’s overall performance and profitability. Consideration is also given to the levels of bonuses paid in the market. Individual awards which are payable to all members of staff are determined by a rigorous assessment of achievement against defined objectives.
A long-term incentive plan for key staff and senior employees comprises of a mixture of cash and deferred shares in Aberdeen PLC or select Aberdeen funds (where applicable). Overall compensation packages are designed to be competitive relative to the investment management industry.
Base Salary
Any increase is to reflect inflation and is applied in a manner consistent with other Group employees; any other increases must be justified by reference to promotion or changes in responsibilities. The Policy is to pay a
B-53
Table of Contents
fair salary commensurate with the individual’s role, responsibilities and experience, and having regard to the market rates being offered for similar roles in the asset management sector and other comparable companies.
Annual Bonus
The Policy is to recognise corporate and individual achievements each year through an appropriate annual bonus scheme. The Remuneration Committee determines the KPI’s that will be applied in considering the overall size of the bonus pool. In line with practice amongst other asset management companies, individual bonuses are not subject to an absolute cap. However, the aggregate size of the bonus pool is dependent on the group’s overall performance and profitability. Consideration is also given to the levels of bonuses paid in the market. Individual awards are determined by a rigorous assessment of achievement against defined objectives, and are reviewed and approved by the Remuneration Committee.
The deferral policy is intended to assist in the retention of talent and to create additional alignment of executives’ interests with Aberdeen’s sustained performance and, in respect of the deferral into funds, managed by Aberdeen, to align the interest of asset managers with our clients.
Staff performance is reviewed formally at least once a year. The review process looks at all of the ways in which an individual has contributed to the Aberdeen Group, and specifically, in the case of portfolio managers, to the relevant investment team. Discretionary bonuses are based on client service, asset growth and the performance of the respective portfolio manager. Overall participation in team meetings, generation of original research ideas and contribution to presenting the team externally are also evaluated.
In the calculation of a portfolio management team’s bonus, the Aberdeen Group takes into consideration investment matters (which include the performance of funds, adherence to the company investment process, and quality of company meetings) as well as more subjective issues such as team participation and effectiveness at client presentations. To the extent performance is factored in, such performance is not judged against any specific benchmark and is evaluated over the period of a year - January to December. The pre- or after-tax performance of an individual account is not considered in the determination of a portfolio manager’s discretionary bonus; rather the review process evaluates the overall performance of the team for all of the accounts they manage.
Portfolio manager performance on investment matters is judged over all of the accounts the portfolio manager contributes to and is documented in the appraisal process. A combination of the team’s and individual’s performance is considered and evaluated.
Although performance is not a substantial portion of a portfolio manager’s compensation, the Aberdeen Group also recognizes that fund performance can often be driven by factors outside one’s control, such as (irrational) markets, and as such pays attention to the effort by portfolio managers to ensure integrity of our core process by sticking to disciplines and processes set, regardless of momentum and ‘hot’ themes. Short-terming is thus discouraged and trading-oriented managers will thus find it difficult to thrive in the Aberdeen Group’s environment. Additionally, if any of the aforementioned undue risks were to be taken by a portfolio manager, such trend would be identified via Aberdeen’s dynamic compliance monitoring system.
Conflicts of Interest
An Aberdeen portfolio manager’s management of other accounts may give rise to potential conflicts of interest in connection with their management of the Fund’s investments, on the one hand, and the investments of the other accounts, on the other. The other accounts may have the same investment objective as the Fund. A potential conflict of interest may therefore arise as a result of the identical investment objectives, whereby the portfolio manager could favor one account over another. Aberdeen believes, however, that these risks are mitigated by the fact that: (i) accounts with like investment strategies managed by a particular portfolio manager are generally managed in a similar fashion, subject to exceptions to account for particular investment restrictions or policies applicable only to certain accounts, differences in cash flows and account sizes, and similar factors; and (ii) portfolio manager personal trading is monitored to avoid potential conflicts. In addition, Aberdeen has adopted trade allocation procedures that require equitable allocation of trade orders for a particular security among participating accounts.
B-54
Table of Contents
In some cases, another account managed by the same portfolio manager may compensate Aberdeen based on the performance of the portfolio held by that account. The existence of such a performance-based fee may create additional conflicts of interest for the portfolio manager in the allocation of management time, resources and investment opportunities.
Another potential conflict could include instances in which securities considered as investments for the Fund also may be appropriate for other investment accounts managed by the Aberdeen or its affiliates. Whenever decisions are made to buy or sell securities by the Fund and one or more of the other accounts simultaneously, Aberdeen may aggregate the purchases and sales of the securities and will allocate the securities transactions in a manner that it believes to be equitable under the circumstances. As a result of the allocations, there may be instances where the Fund will not participate in a transaction that is allocated among other accounts. While these aggregation and allocation policies could have a detrimental effect on the price or amount of the securities available to the Fund from time to time, it is the opinion of Aberdeen that the benefits outweigh any disadvantage that may arise from exposure to simultaneous transactions. Aberdeen has adopted policies that are designed to eliminate or minimize conflicts of interest, although there is no guarantee that procedures adopted under such policies will detect each and every situation in which a conflict arises.
Ownership of the Fund
None of the portfolio managers own shares of the subadvised Fund.
Thrivent Partner Small Cap Value Fund
Investment decisions for Thrivent Partner Small Cap Value Fund are made by T. Rowe Price Associates, Inc. (“T. Rowe Price”) which Thrivent Financial has engaged as investment subadviser for the Fund. T. Rowe Price is located at 100 East Pratt Street, Baltimore, Maryland 21202. T. Rowe Price has over 70 years of investment management experience and approximately $746.8 billion of total assets under management as of December 31, 2014.
T. Rowe Price Portfolio Managers
Thrivent Partner Small Cap Value Fund is managed by an Investment Advisory Committee chaired by J. David Wagner, CFA.
Other Accounts Managed by Mr. Wagner.
The following table provides information relating to other accounts managed by J. David Wagner as of January 31, 2015.
| Total # of Accounts Managed | Total Assets | |||
J. David Wagner | ||||
• Registered Investment Companies | 7 | $11,185.15 | ||
• Other Pooled Investment Vehicles: | 1 | $813.14 | ||
• Other Accounts: | 4 | $251.54 |
None of the accounts listed above have performance-based advisory fees.
Compensation
Portfolio manager compensation consists primarily of a base salary, a cash bonus, and an equity incentive that usually comes in the form of a stock option grant or restricted stock grant. Compensation is variable and is determined based on the following factors.
B-55
Table of Contents
Investment performance over 1-, 3-, 5-, and 10-year periods is the most important input. The weightings for these time periods are generally balanced and are applied consistently across similar strategies. T. Rowe Price (and Price Hong Kong, Price Singapore, and T. Rowe Price International, as appropriate), evaluate performance in absolute, relative, and risk-adjusted terms. Relative performance and risk-adjusted performance are determined with reference to the broad-based index (e.g., S&P 500) and the Lipper index set forth in the total returns table in the fund’s prospectus, although other benchmarks may be used as well. Investment results are also measured against comparably managed funds of competitive investment management firms. The selection of comparable funds is approved by the applicable investment steering committee (as described under the “Disclosure of Fund Portfolio Information” section) and are the same as those presented to the directors of the Price Funds in their regular review of fund performance. Performance is primarily measured on a pretax basis though tax efficiency is considered and is especially important for the Tax-Efficient Equity Fund.
Compensation is viewed with a long-term time horizon. The more consistent a manager’s performance over time, the higher the compensation opportunity. The increase or decrease in a fund’s assets due to the purchase or sale of fund shares is not considered a material factor. In reviewing relative performance for fixed-income funds, a fund’s expense ratio is usually taken into account. Contribution to T. Rowe Price’s overall investment process is an important consideration as well. Leveraging ideas and investment insights across the global investment platform; working effectively with and mentoring others; and other contributions to our clients, the firm or our culture, are important components of T. Rowe Price’s long-term success and are highly valued.
All employees of T. Rowe Price, including portfolio managers, participate in a 401(k) plan sponsored by T. Rowe Price Group. In addition, all employees are eligible to purchase T. Rowe Price common stock through an employee stock purchase plan that features a limited corporate matching contribution. Eligibility for and participation in these plans is on the same basis as for all employees. Finally, all vice presidents of T. Rowe Price Group, including all portfolio managers, receive supplemental medical/hospital reimbursement benefits.
The compensation structure is as used for all portfolios managed by the portfolio manager.
Conflicts of Interest
Portfolio managers at T. Rowe Price and its affiliates typically manage multiple accounts. These accounts may include, among others, mutual funds, separate accounts (assets managed on behalf of institutions such as pension funds, colleges and universities, and foundations), offshore funds and common trust funds. Portfolio managers make investment decisions for each portfolio based on the investment objectives, policies, practices, and other relevant investment considerations that the managers believe are applicable to that portfolio.
Consequently, portfolio managers may purchase (or sell) securities for one portfolio and not another portfolio. T. Rowe Price and its affiliates have adopted brokerage and trade allocation policies and procedures which they believe are reasonably designed to address any potential conflicts associated with managing multiple accounts for multiple clients.
Ownership in the Portfolios
Mr. Wagner does not own shares of the subadvised Fund.
Thrivent Partner Mid Cap Value Fund
Investment decisions for Thrivent Partner Mid Cap Value Fund are made by Goldman Sachs Asset Management, L.P. (“GSAM”), 200 West Street, New York, New York 10282-2198, which Thrivent Financial has engaged as investment subadviser for the Fund. GSAM has been registered as an investment adviser since 1990 and is an affiliate of Goldman, Sachs & Co. (“Goldman Sachs”). As of December 31, 2014, GSAM, including its investment advisory affiliates, had assets under management of approximately $1,023,922.3 million.
B-56
Table of Contents
GSAM Portfolio Managers
Other Accounts Managed by the GSAM Portfolio Managers
The following table provides information relating to other accounts managed by the members of the Value Team as of October 31, 2014.
Name Team Member | Type of Accounts | Total # of Accounts Managed | Total Assets in the Accounts (in $ millions) | |||||||
Dolores Bamford | Registered Investment Companies | 10 | $ | 13,838 | ||||||
| Other Pooled Investment Vehicles | 0 | $ | 0 | |||||||
| Other Accounts | 7 | $ | 515 | |||||||
Andrew Braun | Registered Investment Companies | 17 | $ | 19,556 | ||||||
| Other Pooled Investment Vehicles | 4 | $ | 267 | |||||||
| Other Accounts | 37 | $ | 2,551 | |||||||
Sean Gallagher | Registered Investment Companies | 16 | $ | 18,903 | ||||||
| Other Pooled Investment Vehicles | 2 | $ | 483 | |||||||
| Other Accounts | 39 | $ | 2,402 | |||||||
None of the accounts listed above have performance-based advisory fees.
Compensation
Compensation for GSAM portfolio managers is comprised of a base salary and year-end discretionary variable compensation. The base salary is fixed from year to year. Year-end discretionary variable compensation is primarily a function of each portfolio manager’s individual performance and his or her contribution to overall team performance; the performance of GSAM and Goldman Sachs; the team’s net revenues for the past year which in part is derived from advisory fees, and for certain accounts, performance-based fees; and anticipated compensation levels among competitor firms. Portfolio managers are rewarded, in part, for their delivery of investment performance, measured on a pre-tax basis, which is reasonably expected to meet or exceed the expectations of clients and fund shareholders in terms of: excess return over an applicable benchmark, peer group ranking, risk management and factors specific to certain funds such as yield or regional focus. Performance is judged over 1-, 3- and 5-year time horizons.
The benchmark for this Fund is the Russell Midcap® Value Index.
The discretionary variable compensation for portfolio managers is also significantly influenced by: (1) effective participation in team research discussions and process; and (2) management of risk in alignment with the targeted risk parameter and investment objective of the fund. Other factors may also be considered including: (1) general client/shareholder orientation and (2) teamwork and leadership. Portfolio managers may receive equity-based awards as part of their discretionary variable compensation.
In addition to base salary and discretionary variable compensation, GSAM has a number of additional benefits in place including (1) a 401k program that enables employees to direct a percentage of their pretax salary and bonus income into a tax-qualified retirement plan; and (2) investment opportunity programs in which certain professionals may participate subject to certain eligibility requirements.
Conflicts of Interest
GSAM is part of The Goldman Sachs Group, Inc. (together with its affiliates, directors, partners, trustees, managers, members, officers and employees, “Goldman Sachs”) a bank holding company. The involvement of GSAM, Goldman Sachs and their affiliates in the management of, or their interest in, other accounts and other
B-57
Table of Contents
activities of Goldman Sachs may present conflicts of interest with respect to your Fund or limit your Fund’s investment activities. Goldman Sachs is a worldwide full service investment banking, broker dealer, asset management and financial services organization and a major participant in global financial markets that provides a wide range of financial services to a substantial and diversified client base that includes corporations, financial institutions, governments, and high-net-worth individuals. As such, it acts as an investor, investment banker, research provider, investment manager, financier, adviser, market maker, trader, prime broker, lender, agent and principal. In those and other capacities, Goldman Sachs advises clients in all markets and transactions and purchases, sells, holds and recommends a broad array of investments, including securities, derivatives, loans, commodities, currencies, credit default swaps, indices, baskets and other financial instruments and products for its own account or for the accounts of its customers, and has other direct and indirect interests, in the global fixed income, currency, commodity, equity and other markets and the securities and issuers in which your Fund may directly and indirectly invest. Thus, it is likely that your Fund will have multiple business relationships with and will invest in, engage in transactions with, make voting decisions with respect to, or obtain services from entities for which Goldman Sachs performs or seeks to perform investment banking or other services. As manager of your Fund, GSAM receives management fees from the Fund. In addition, GSAM’s affiliates may earn fees from relationships with your Fund. Although these fees are generally based on asset levels, the fees are not directly contingent on Fund performance, Goldman Sachs may still receive significant compensation from your Fund even if shareholders lose money. Goldman Sachs and its affiliates engage in trading and advise accounts and funds which have investment objectives similar to those of your Fund and/or which engage in and compete for transactions in the same types of securities, currencies and instruments as your Fund. Goldman Sachs and its affiliates will not have any obligation to make available any information regarding their activities or strategies, or the activities or strategies used for other accounts managed by them, for the benefit of the management of your Fund. The results of your Fund’s investment activities, therefore, may differ from those of Goldman Sachs, its affiliates, and other accounts managed by Goldman Sachs, and it is possible that your Fund could sustain losses during periods in which Goldman Sachs and its affiliates and other accounts achieve significant profits on their trading for Goldman Sachs or other accounts. In addition, your Fund may enter into transactions in which Goldman Sachs or its other clients have an adverse interest. For example, your Fund may take a long position in a security at the same time that Goldman Sachs or other accounts managed by GSAM take a short position in the same security (or vice versa). These and other transactions undertaken by Goldman Sachs, its affiliates or Goldman Sachs-advised clients may, individually or in the aggregate, adversely impact your Fund. Transactions by one or more Goldman Sachs-advised clients or GSAM may have the effect of diluting or otherwise disadvantaging the values, prices or investment strategies of your Fund. Your Fund’s activities may be limited because of regulatory restrictions applicable to Goldman Sachs and its affiliates, and/or their internal policies designed to comply with such restrictions. As a global financial services firm, Goldman Sachs also provides a wide range of investment banking and financial services to issuers of securities and investors in securities. Goldman Sachs, its affiliates and others associated with it may create markets or specialize in, have positions in and effect transactions in, securities of issuers held by your Fund, and may also perform or seek to perform investment banking and financial services for those issuers. Goldman Sachs and its affiliates may have business relationships with and purchase or distribute or sell services or products from or to, distributors, consultants and others who recommend your Fund or who engage in transactions with or for your Fund.
For a more detailed description of potential conflicts of interest, please refer to the language from GSAM’s ADV Part 2.
Ownership of the Portfolio
None of the Value Team members own shares of the subadvised Fund.
Thrivent Partner Worldwide Allocation Fund
Investment decisions for Thrivent Partner Worldwide Allocation Fund are made by Mercator Asset Management LP (“Mercator”), Principal Global Investors, LLC (“Principal”), Aberdeen Asset Managers Limited
B-58
Table of Contents
(“Aberdeen”), and Goldman Sachs Asset Management, L.P. (“GSAM”). Mercator is located at 5200 Town Center Circle, Suite 550, Boca Raton, Florida 33486, and was founded in 1984. Mercator manages international equity funds for institutional clients, including corporate and public retirement plans, endowments, and foundations. As of December 31, 2014, Mercator managed approximately $3.7 billion in assets including separate accounts, commingled funds and a mutual fund. Principal is located at 801 Grand Avenue, Des Moines, Iowa 50392. Principal is a direct wholly owned subsidiary of Principal Life Insurance Company. Principal and its predecessor firms have subadvised mutual fund assets since 1969. Principal, together with its affiliated asset management companies, had approximately $333.1 billion in assets under management as of December 31, 2014. Aberdeen is located at 10 Queens Terrace, Aberdeen, United Kingdom AB10 1YG and is a subsidiary of Aberdeen Asset Management PLC (“Aberdeen PLC”), which was organized in 1983. Aberdeen PLC is the parent company of an asset management group managing approximately $504 billion in assets as of December 31, 2014 for a range of pension funds, financial institutions, investment trusts, unit trusts, offshore funds, charities and private clients. GSAM is located at 200 West Street, New York, New York 10282-2198. GSAM has been registered as an investment adviser with the SEC since 1990 and is an affiliate of Goldman Sachs. As of December 31, 2014, GSAM, including its investment advisory affiliates, had assets under management of approximately $1,023,922.3 million.
Mercator Portfolio Managers
Other Accounts Managed by Mercator Portfolio Manager
The following table provides information about the other accounts managed by James E. Chaney, the portfolio manager of the Mercator portion of the Fund, as of October 31, 2014.
| Total # of Accounts Managed | Total Assets | |||||
• Registered Investment Companies: | 2 | $ | 674,618,873 | |||
• Other Pooled Investment Vehicles: | 2 | $ | 654,615,876 | |||
• Other Accounts: | 14 | $ | 2,179,769,849 | |||
One of the “other accounts” listed above has a performance-based advisory fee and has assets of $195,111,456.
Compensation
Mr. Chaney receives compensation that is equal to a pre-determined pro-rata share of Mercator’s net profitability. This pre-determined pro-rata share is dependent upon his length of tenure with the firm, his level of responsibility and overall contribution. It is the only form of compensation that he receives and is very dependent upon the firm’s asset performance. He receives no base salary, is not part of a bonus system and receives no deferred compensation. Mr. Chaney is also offered an attractive retirement plan.
Conflicts of Interest
Mercator, as a fiduciary, has an affirmative duty of care, loyalty, honesty, and good faith to act in the best interests of its clients. In order to comply with this duty, Mercator has a written Code of Ethics that requires that all Access Persons avoid conflicts of interest and avoid situations that have even the appearance of conflict or impropriety. If any conflict may arise with respect to a client, all material facts concerning such conflict must be fully disclosed.
Ownership of the Fund
Mr. Chaney does not own shares of the subadvised Fund.
B-59
Table of Contents
Principal Portfolio Managers
Other Accounts Managed by Principal Portfolio Managers
The following table provides information about other accounts managed by the Principal portfolio managers as of October 31, 2014.
Portfolio Manager | Type of Accounts | Total # of Accounts Managed | Total Assets | |||||
John Pihlblad | Registered Investment Companies: | 1 | $ | 506.3 million | ||||
| Other Pooled Investment Vehicles: | 1 | $ | 93.8 million | |||||
| Other Accounts: | 5 | $ | 684.8 million | |||||
Mark Nebelung | Registered Investment Companies: | 1 | $ | 506.3 million | ||||
| Other Pooled Investment Vehicles: | 1 | $ | 93.8 million | |||||
| Other Accounts: | 6 | $ | 866.9 million | |||||
None of the accounts listed above has a performance-based advisory fee.
Compensation
Principal Global Equities offers investment professionals a competitive compensation structure that is evaluated annually relative to other global asset management firms. The objectives are to align individual and team contributions with client performance objectives in a manner that is consistent with industry standards and business results.
Compensation for investment professionals at all levels is comprised of base salary and variable incentive components. As team members advance in their careers, the variable component increases in its proportion commensurate with responsibility levels. The incentive component is well aligned with client objectives, with the largest determinant being investment performance, which generally comprises 60% or more of total variable compensation.
Relative performance metrics are measured over rolling one-year, three-year and five-year periods, calculated quarterly. Emphasis is placed on longer term results, with the five year and three year results each comprising 40% weights, with the remaining 20% based on one year results. Quarterly measurement of rolling period results reinforces the longer term orientation, avoiding undue attention to seasonal or calendar year considerations.
The remaining portion of variable compensation is discretionary, in the form of a Profit Sharing Plan based on individual contributions and the overall results of Principal Global Equities. This structure was introduced in 2009, to better align with the longer term interests of clients and team members. Under this structure, business metrics are aligned specifically with the results of Principal Global Equities rather than the broader parent organization.
For portfolio managers and other senior professionals, a portion of variable compensation is deferred, with three year vesting. Deferred compensation takes the form of a combination of deferred cash, investment in our equity funds and PFG restricted stock.
The benefits of this structure are three fold. First, the emphasis on investment performance as the largest driver of variable compensation provides strong alignment of interests with client objectives. Second, the discretionary Profit Sharing element allows flexibility to reward individual and team contributions at times when our investment strategies may be temporarily out of favor. Third, the overall measurement framework and the deferred component for senior professionals is well aligned with our desired focus on longer term results, co-investment alongside clients, collaboration and team development.
B-60
Table of Contents
Conflicts of Interest
Principal provides investment advisory services to numerous clients other than the Fund. The investment objectives and policies of these accounts may differ from those of the Fund. Based on these differing circumstances, potential conflicts of interest may arise because Principal may be required to pursue different investment strategies on behalf of the Fund and other client accounts. For example, Principal may be required to consider an individual client’s existing positions, personal tax situation, suitability, personal biases and investment time horizon, which considerations would not affect his investment decisions on behalf of the Fund. This means that research on securities to determine the merits of including them in the Fund’s portfolio are similar, but not identical, to those employed in building private client portfolios. As a result, there may be instances in which Principal purchases or sells an investment for one or more private accounts and not for the Fund, or vice versa. To the extent the Fund and other clients seek to acquire the same security at about the same time, the Fund may not be able to acquire as large a position in such security as it desires or it may have to pay a higher price for the security. Similarly, the Fund may not be able to obtain as large an execution of an order to sell or as high a price for any particular security if the Portfolio Managers desire to sell the same portfolio security at the same time on behalf of other clients. On the other hand, if the same securities are bought or sold at the same time by more than one client, the resulting participation in volume transactions could produce better executions for the Fund.
Ownership of the Fund
Neither Mr. Pihlblad nor Mr. Nebelung own shares of the subadvised Fund.
Aberdeen Portfolio Managers
Other Accounts Managed by Aberdeen Portfolio Managers
The following table provides information about the other accounts managed by Aberdeen team members as of October 31, 2014.
Portfolio Manager | Type of Accounts | Total # of Accounts Managed | Total Assets in the Accounts (in millions) | # of Accounts Managed with Advisory Fee Based On Performance | Total Assets with Advisory Fee Based on Performance (in millions) | |||||||||||||
Devan Kaloo | Registered Investment Companies: | 11 | $ | 10,816.25 | 0 | $ | 0 | |||||||||||
| Other Pooled Investment Vehicles: | 25 | $ | 24,206.52 | 0 | $ | 0 | ||||||||||||
| Other Accounts: | 55 | $ | 20,114.20 | 4 | $ | 713.24 | ||||||||||||
Joanne Irvine | Registered Investment Companies: | 11 | $ | 10,816.25 | 0 | $ | 0 | |||||||||||
| Other Pooled Investment Vehicles: | 25 | $ | 24,206.52 | 0 | $ | 0 | ||||||||||||
| Other Accounts: | 55 | $ | 20,114.20 | 4 | $ | 713.24 | ||||||||||||
Mark Gordon-James | Registered Investment Companies: | 11 | $ | 10,816.25 | 0 | $ | 0 | |||||||||||
| Other Pooled Investment Vehicles: | 25 | $ | 24,206.52 | 0 | $ | 0 | ||||||||||||
| Other Accounts: | 55 | $ | 20,114.20 | 4 | $ | 713.24 | ||||||||||||
Fiona Manning | Registered Investment Companies: | 11 | $ | 10,816.25 | 0 | $ | 0 | |||||||||||
| Other Pooled Investment Vehicles: | 25 | $ | 24,206.52 | 0 | $ | 0 | ||||||||||||
| Other Accounts: | 55 | $ | 20,114.20 | 4 | $ | 713.24 | ||||||||||||
Hugh Young | Registered Investment Companies: | 21 | $ | 13,518 | 0 | $ | 0 | |||||||||||
| Other Pooled Investment Vehicles: | 82 | $ | 58,553 | 2 | $ | 398.26 | ||||||||||||
| Other Accounts: | 132 | $ | 46,938.58 | 16 | $ | 5,415.62 | ||||||||||||
B-61
Table of Contents
Compensation
Aberdeen’s remuneration policies are designed to support our business strategy, as a leading international asset manager. The objective is to attract, retain and reward talented individuals for the delivery of sustained, superior returns for our clients and shareholders. Aberdeen operates in a highly competitive international employment market, and aims to maintain its strong track record of success in developing and retaining talent.
The policy is to recognise corporate and individual achievements each year through an appropriate annual bonus scheme. The aggregate value of awards in any year is dependent on the Group’s overall performance and profitability. Consideration is also given to the levels of bonuses paid in the market. Individual awards which are payable to all members of staff are determined by a rigorous assessment of achievement against defined objectives.
A long-term incentive plan for key staff and senior employees comprises of a mixture of cash and deferred shares in Aberdeen PLC or select Aberdeen funds (where applicable). Overall compensation packages are designed to be competitive relative to the investment management industry.
Base Salary
Any increase is to reflect inflation and is applied in a manner consistent with other Group employees; any other increases must be justified by reference to promotion or changes in responsibilities. The Policy is to pay a fair salary commensurate with the individual’s role, responsibilities and experience, and having regard to the market rates being offered for similar roles in the asset management sector and other comparable companies.
Annual Bonus
The Policy is to recognise corporate and individual achievements each year through an appropriate annual bonus scheme. The Remuneration Committee determines the KPI’s that will be applied in considering the overall size of the bonus pool. In line with practice amongst other asset management companies, individual bonuses are not subject to an absolute cap. However, the aggregate size of the bonus pool is dependent on the group’s overall performance and profitability. Consideration is also given to the levels of bonuses paid in the market. Individual awards are determined by a rigorous assessment of achievement against defined objectives, and are reviewed and approved by the Remuneration Committee.
The deferral policy is intended to assist in the retention of talent and to create additional alignment of executives’ interests with Aberdeen’s sustained performance and, in respect of the deferral into funds, managed by Aberdeen, to align the interest of asset managers with our clients.
Staff performance is reviewed formally at least once a year. The review process looks at all of the ways in which an individual has contributed to the Aberdeen Group, and specifically, in the case of portfolio managers, to the relevant investment team. Discretionary bonuses are based on client service, asset growth and the performance of the respective portfolio manager. Overall participation in team meetings, generation of original research ideas and contribution to presenting the team externally are also evaluated.
In the calculation of a portfolio management team’s bonus, the Aberdeen Group takes into consideration investment matters (which include the performance of funds, adherence to the company investment process, and quality of company meetings) as well as more subjective issues such as team participation and effectiveness at client presentations. To the extent performance is factored in, such performance is not judged against any specific benchmark and is evaluated over the period of a year - January to December. The pre- or after-tax performance of an individual account is not considered in the determination of a portfolio manager’s discretionary bonus; rather the review process evaluates the overall performance of the team for all of the accounts they manage.
B-62
Table of Contents
Portfolio manager performance on investment matters is judged over all of the accounts the portfolio manager contributes to and is documented in the appraisal process. A combination of the team’s and individual’s performance is considered and evaluated.
Although performance is not a substantial portion of a portfolio manager’s compensation, the Aberdeen Group also recognizes that fund performance can often be driven by factors outside one’s control, such as (irrational) markets, and as such pays attention to the effort by portfolio managers to ensure integrity of our core process by sticking to disciplines and processes set, regardless of momentum and ‘hot’ themes. Short-terming is thus discouraged and trading-oriented managers will thus find it difficult to thrive in the Aberdeen Group’s environment. Additionally, if any of the aforementioned undue risks were to be taken by a portfolio manager, such trend would be identified via Aberdeen’s dynamic compliance monitoring system.
Conflicts of Interest
An Aberdeen portfolio manager’s management of other accounts may give rise to potential conflicts of interest in connection with their management of the Fund’s investments, on the one hand, and the investments of the other accounts, on the other. The other accounts may have the same investment objective as the Fund. A potential conflict of interest may therefore arise as a result of the identical investment objectives, whereby the portfolio manager could favor one account over another. Aberdeen believes, however, that these risks are mitigated by the fact that: (i) accounts with like investment strategies managed by a particular portfolio manager are generally managed in a similar fashion, subject to exceptions to account for particular investment restrictions or policies applicable only to certain accounts, differences in cash flows and account sizes, and similar factors; and (ii) portfolio manager personal trading is monitored to avoid potential conflicts. In addition, Aberdeen has adopted trade allocation procedures that require equitable allocation of trade orders for a particular security among participating accounts.
In some cases, another account managed by the same portfolio manager may compensate Aberdeen based on the performance of the portfolio held by that account. The existence of such a performance-based fee may create additional conflicts of interest for the portfolio manager in the allocation of management time, resources and investment opportunities.
Another potential conflict could include instances in which securities considered as investments for the Fund also may be appropriate for other investment accounts managed by the Aberdeen or its affiliates. Whenever decisions are made to buy or sell securities by the Fund and one or more of the other accounts simultaneously, Aberdeen may aggregate the purchases and sales of the securities and will allocate the securities transactions in a manner that it believes to be equitable under the circumstances. As a result of the allocations, there may be instances where the Fund will not participate in a transaction that is allocated among other accounts. While these aggregation and allocation policies could have a detrimental effect on the price or amount of the securities available to the Fund from time to time, it is the opinion of Aberdeen that the benefits outweigh any disadvantage that may arise from exposure to simultaneous transactions. Aberdeen has adopted policies that are designed to eliminate or minimize conflicts of interest, although there is no guarantee that procedures adopted under such policies will detect each and every situation in which a conflict arises.
Ownership of the Fund
None of the portfolio managers own shares of the subadvised Fund.
B-63
Table of Contents
GSAM Portfolio Managers
Other Accounts Managed by GSAM Portfolio Managers
The following table provides information about the other accounts managed by the GSAM portfolio managers as of October 31, 2014.
Portfolio Manager | Type of Accounts | Total # of Accounts Managed | Total Assets (in millions) | # of Accounts Managed with Advisory Fee Based on Performance | Total Assets with Advisory Fee Based on Performance (in millions) | |||||||||||||
Samuel Finkelstein | Registered Investment Companies: | 62 | $ | 195,348 | 0 | $ | 0 | |||||||||||
| Other Pooled Investment Vehicles: | 298 | $ | 166,848 | 28 | $ | 4,537 | ||||||||||||
| Other Accounts: | 3,301 | $ | 290,972 | 60 | $ | 21,225 | ||||||||||||
Ricardo Penfold | Registered Investment Companies: | 35 | $ | 40,346 | 0 | $ | 0 | |||||||||||
| Other Pooled Investment Vehicles: | 216 | $ | 54,486 | 28 | $ | 4,537 | ||||||||||||
| Other Accounts: | 1,067 | $ | 194,364 | 34 | $ | 14,837 | ||||||||||||
Ron Hua | Registered Investment Companies: | 13 | $ | 3,000 | 0 | $ | 0 | |||||||||||
| Other Pooled Investment Vehicles: | 15 | $ | 3,673 | 0 | $ | 0 | ||||||||||||
| Other Accounts: | 19 | $ | 6,694 | 4 | $ | 1,420 | ||||||||||||
Len Ioffe | Registered Investment Companies: | 11 | $ | 2,846 | 0 | $ | 0 | |||||||||||
| Other Pooled Investment Vehicles: | 15 | $ | 3,673 | 0 | $ | 0 | ||||||||||||
| Other Accounts: | 19 | $ | 6,694 | 4 | $ | 1,420 | ||||||||||||
Osman Ali | Registered Investment Companies: | 12 | $ | 3,367 | 0 | $ | 0 | |||||||||||
| Other Pooled Investment Vehicles: | 15 | $ | 3,367 | 0 | $ | 0 | ||||||||||||
| Other Accounts: | 19 | $ | 6,694 | 4 | $ | 1,420 | ||||||||||||
Takashi Suwabe | Registered Investment Companies: | 3 | $ | 1,253 | 0 | $ | 0 | |||||||||||
| Other Pooled Investment Vehicles: | 11 | $ | 2,865 | 0 | $ | 0 | ||||||||||||
| Other Accounts: | 12 | $ | 4,889 | 3 | $ | 1,318 | ||||||||||||
Denis Suvorov | Registered Investment Companies: | 3 | $ | 1,253 | 0 | $ | 0 | |||||||||||
| Other Pooled Investment Vehicles: | 8 | $ | 1,965 | 0 | $ | 0 | ||||||||||||
| Other Accounts: | 9 | $ | 2,763 | 3 | $ | 1,318 | ||||||||||||
Please note that all of GSAM’s fixed income portfolios are managed on a team basis. While lead portfolio managers may be associated with accounts in their specific strategy, the entire team is familiar with the general strategies and objectives and multiple individuals are involved in the management of a portfolio. GSAM believes this approach ensures a high degree of continuity of portfolio management style and knowledge.
For each portfolio manager listed above, the total number of accounts managed is a reflection of accounts within the strategy they oversee or manage, as well as accounts which participate in the sector they manage. There are multiple portfolio managers involved with each account.
Compensation
Compensation for GSAM portfolio managers is comprised of a base salary and year-end discretionary variable compensation. The base salary is fixed from year to year. Year-end discretionary variable compensation is primarily a function of each portfolio manager’s individual performance and his or her contribution to overall team performance; the performance of GSAM and Goldman Sachs; the team’s net revenues for the past year which in part is derived from advisory fees, and for certain accounts, performance-based fees; and anticipated compensation levels among competitor firms. Portfolio managers are rewarded, in part, for their delivery of investment performance, measured on a pre-tax basis, which is reasonably expected to meet or exceed the expectations of clients and fund shareholders in terms of: excess return over an applicable benchmark, peer group ranking, risk management and factors specific to certain funds such as yield or regional focus. Performance is judged over 1-, 3- and 5-year time horizons.
B-64
Table of Contents
The benchmark for this Fund is the MSCI All Country World Index ex-USA.
The discretionary variable compensation for portfolio managers is also significantly influenced by: (1) effective participation in team research discussions and process; and (2) management of risk in alignment with the targeted risk parameter and investment objective of the fund. Other factors may also be considered including: (1) general client/shareholder orientation and (2) teamwork and leadership. Portfolio managers may receive equity-based awards as part of their discretionary variable compensation.
In addition to base salary and discretionary variable compensation, GSAM has a number of additional benefits in place including (1) a 401k program that enables employees to direct a percentage of their pretax salary and bonus income into a tax-qualified retirement plan; and (2) investment opportunity programs in which certain professionals may participate subject to certain eligibility requirements.
Conflicts of Interest
GSAM is part of The Goldman Sachs Group, Inc. (together with its affiliates, directors, partners, trustees, managers, members, officers and employees, “Goldman Sachs”) a bank holding company. The involvement of GSAM, Goldman Sachs and their affiliates in the management of, or their interest in, other accounts and other activities of Goldman Sachs may present conflicts of interest with respect to your Fund or limit your Fund’s investment activities. Goldman Sachs is a worldwide full service investment banking, broker dealer, asset management and financial services organization and a major participant in global financial markets that provides a wide range of financial services to a substantial and diversified client base that includes corporations, financial institutions, governments, and high-net-worth individuals. As such, it acts as an investor, investment banker, research provider, investment manager, financier, adviser, market maker, trader, prime broker, lender, agent and principal. In those and other capacities, Goldman Sachs advises clients in all markets and transactions and purchases, sells, holds and recommends a broad array of investments, including securities, derivatives, loans, commodities, currencies, credit default swaps, indices, baskets and other financial instruments and products for its own account or for the accounts of its customers, and has other direct and indirect interests, in the global fixed income, currency, commodity, equity and other markets and the securities and issuers in which your Fund may directly and indirectly invest. Thus, it is likely that your Fund will have multiple business relationships with and will invest in, engage in transactions with, make voting decisions with respect to, or obtain services from entities for which Goldman Sachs performs or seeks to perform investment banking or other services. As manager of your Fund, GSAM receives management fees from the Fund. In addition, GSAM’s affiliates may earn fees from relationships with your Fund. Although these fees are generally based on asset levels, the fees are not directly contingent on Fund performance, Goldman Sachs may still receive significant compensation from your Fund even if shareholders lose money. Goldman Sachs and its affiliates engage in trading and advise accounts and funds which have investment objectives similar to those of your Fund and/or which engage in and compete for transactions in the same types of securities, currencies and instruments as your Fund. Goldman Sachs and its affiliates will not have any obligation to make available any information regarding their activities or strategies, or the activities or strategies used for other accounts managed by them, for the benefit of the management of your Fund. The results of your Fund’s investment activities, therefore, may differ from those of Goldman Sachs, its affiliates, and other accounts managed by Goldman Sachs, and it is possible that your Fund could sustain losses during periods in which Goldman Sachs and its affiliates and other accounts achieve significant profits on their trading for Goldman Sachs or other accounts. In addition, your Fund may enter into transactions in which Goldman Sachs or its other clients have an adverse interest. For example, your Fund may take a long position in a security at the same time that Goldman Sachs or other accounts managed by GSAM take a short position in the same security (or vice versa). These and other transactions undertaken by Goldman Sachs, its affiliates or Goldman Sachs-advised clients may, individually or in the aggregate, adversely impact your Fund. Transactions by one or more Goldman Sachs-advised clients or GSAM may have the effect of diluting or otherwise disadvantaging the values, prices or investment strategies of your Fund. Your Fund’s activities may be limited because of regulatory restrictions applicable to Goldman Sachs and its affiliates, and/or their internal policies designed to comply with such restrictions. As a global financial services firm, Goldman Sachs also provides a
B-65
Table of Contents
wide range of investment banking and financial services to issuers of securities and investors in securities. Goldman Sachs, its affiliates and others associated with it may create markets or specialize in, have positions in and effect transactions in, securities of issuers held by your Fund, and may also perform or seek to perform investment banking and financial services for those issuers. Goldman Sachs and its affiliates may have business relationships with and purchase or distribute or sell services or products from or to, distributors, consultants and others who recommend your Fund or who engage in transactions with or for your Fund.
For a more detailed description of potential conflicts of interest, please refer to the language from GSAM’s ADV Part 2.
Ownership of the Fund
None of the portfolio managers own shares of the subadvised Fund.
Affiliated Persons
The following officers of Thrivent Asset Mgt., the Funds’ investment adviser, are affiliated with the Trust:
Affiliated Person | Position with Trust | Position with Thrivent Asset Mgt. | ||
Russell W. Swansen | Chief Investment Officer | Elected Manager and President | ||
David S. Royal | President | Vice President | ||
Gerard V. Vaillancourt | Treasurer and Principal Accounting Officer | Chief Financial Officer | ||
Ted S. Dryden | Chief Compliance Officer | Chief Compliance Officer | ||
Janice M. Guimond | Vice President | Elected Manager and Vice President and Chief Operating Officer | ||
Kathleen M. Koelling | Anti-Money Laundering Officer | Privacy Officer | ||
Michael W. Kremenak | Secretary and Chief Legal Officer | Assistant Secretary |
The Advisory and Subadvisory Agreements
The advisory agreement provides that Thrivent Asset Mgt. will provide overall investment supervision of the assets of each Fund. Thrivent Asset Mgt. furnishes and pays for all office space and facilities, equipment and clerical personnel necessary for carrying out the adviser’s duties under the advisory agreement. The adviser also pays all compensation of Trustees, officers and employees of the Trust who are the adviser’s affiliated persons. All costs and expenses not expressly assumed by the adviser under the advisory agreement are paid by the Funds, including, but not limited to: (a) interest and taxes; (b) brokerage commissions; (c) insurance premiums; (d) compensation and expenses of the Funds’ Trustees other than those affiliated with the adviser; (e) legal and audit expenses; (f) fees and expenses of the Trust’s custodian and transfer agent; (g) expenses incident to the issuance of the Trust’s shares, including stock certificates and issuance of shares on the payment of, or reinvestment of, dividends; (h) fees and expenses incident to the registration under Federal or state securities laws of the Trust or its shares; (i) expenses of preparing, printing and mailing reports and notices and proxy material to the Trust’s shareholders; (j) all other expenses incidental to holding meetings of the Trust’s shareholders; (k) dues or assessments of or contributions to the Investment Company Institute or its successor, or other industry organizations; (l) such non-recurring expenses as may arise, including litigation affecting the Trust and the legal obligations that the Trust may have to indemnify its officers and Trustees with respect thereto; and (m) all expenses that the Trust agrees to bear in any distribution agreement or in any plan adopted by the Trust pursuant to Rule 12b-1 under the Act.
The advisory agreement and subadvisory agreements will continue in effect from year to year only so long as such continuances are specifically approved at least annually by the Board of Trustees. The vote for approval
B-66
Table of Contents
must include the approval of a majority of the Trustees who are not interested persons (as defined in the Act). The advisory and subadvisory agreements terminate automatically upon assignment. With respect to a particular Fund, the advisory or subadvisory agreement, if any, is terminable at any time without penalty by the Board of Trustees or by the vote of a majority of the outstanding shares of such Fund. The adviser may terminate the agreement on 60 days written notice to the Trust.
Advisory Fees
The advisory contract between Thrivent Asset Mgt. and the Trust provides for the following advisory fees for each class of shares of a Fund, expressed as an annual rate of average daily net assets:
Thrivent Aggressive Allocation Fund | ||||
Fund assets invested in all asset types (including Thrivent mutual funds) | ||||
First $500 million: | 0.150 | % | ||
Next $1.5 billion: | 0.125 | % | ||
Over $2 billion: | 0.100 | % | ||
Fund assets invested in assets other than Thrivent mutual funds: | 0.600 | % | ||
Thrivent Moderately Aggressive Allocation Fund | ||||
Fund assets invested in all asset types (including Thrivent mutual funds) | ||||
First $500 million: | 0.150 | % | ||
Next $1.5 billion: | 0.125 | % | ||
Over $2 billion: | 0.100 | % | ||
Fund assets invested in assets other than Thrivent mutual funds: | 0.550 | % | ||
Thrivent Moderate Allocation Fund | ||||
Fund assets invested in all asset types (including Thrivent mutual funds) | ||||
First $500 million: | 0.150 | % | ||
Next $1.5 billion: | 0.125 | % | ||
Over $2 billion: | 0.100 | % | ||
Fund assets invested in assets other than Thrivent mutual funds: | 0.500 | % | ||
Thrivent Moderately Conservative Allocation Fund | ||||
Fund assets invested in all asset types (including Thrivent mutual funds) | ||||
First $500 million: | 0.150 | % | ||
Next $1.5 billion: | 0.125 | % | ||
Over $2 billion: | 0.100 | % | ||
Fund assets invested in assets other than Thrivent mutual funds: | 0.450 | % | ||
Thrivent Growth and Income Plus Fund | ||||
First $250 million: | 0.650 | % | ||
Over $250 million: | 0.600 | % | ||
Thrivent Balanced Income Plus Fund | ||||
First $500 million: | 0.550 | % | ||
Next $500 million: | 0.500 | % | ||
Next $1.5 billion: | 0.475 | % | ||
Next $2.5 billion: | 0.450 | % | ||
Over $5 billion: | 0.425 | % | ||
B-67
Table of Contents
Thrivent Diversified Income Plus Fund | ||||
All assets: | 0.550 | % | ||
Thrivent Opportunity Income Plus Fund | ||||
First $500 million: | 0.450 | % | ||
Next $500 million: | 0.400 | % | ||
Next $1.5 billion: | 0.375 | % | ||
Next $2.5 billion: | 0.350 | % | ||
Over $5 billion: | 0.325 | % | ||
Thrivent Natural Resources Fund | ||||
First $500 million: | 0.800 | % | ||
Over $500 million: | 0.750 | % | ||
Thrivent Partner Emerging Markets Equity Fund | ||||
First $50 million | 1.020 | % | ||
Over $50 million | 1.070 | % | ||
Thrivent Partner Small Cap Growth Fund | ||||
First $500 million | 0.900 | % | ||
Over $500 million | 0.800 | % | ||
Thrivent Partner Small Cap Value Fund | ||||
All assets: | 0.700 | % | ||
Thrivent Small Cap Stock Fund | ||||
First $200 million: | 0.700 | % | ||
Next $800 million: | 0.650 | % | ||
Next $1.5 billion: | 0.600 | % | ||
Next $2.5 billion: | 0.550 | % | ||
Over $5 billion: | 0.525 | % | ||
Thrivent Mid Cap Growth Fund | ||||
First $100 million: | 0.450 | % | ||
Next $150 million: | 0.400 | % | ||
Next $250 million: | 0.350 | % | ||
Next $500 million: | 0.300 | % | ||
Over $1 billion: | 0.250 | % | ||
Thrivent Partner Mid Cap Value Fund | ||||
First $200 million: | 0.750 | % | ||
Over $200 million: | 0.700 | % | ||
Thrivent Mid Cap Stock Fund | ||||
First $200 million: | 0.700 | % | ||
Next $800 million: | 0.650 | % | ||
Next $1.5 billion: | 0.600 | % | ||
Next $2.5 billion: | 0.550 | % | ||
Over $5 billion: | 0.525 | % | ||
Thrivent Partner Worldwide Allocation Fund | ||||
First $250 million: | 0.900 | % | ||
Next $750 million: | 0.850 | % | ||
Over $1 billion: | 0.800 | % | ||
B-68
Table of Contents
Thrivent Large Cap Growth Fund | ||||
First $500 million: | 0.750 | % | ||
Next $500 million: | 0.700 | % | ||
Next $1.5 billion: | 0.650 | % | ||
Next $2.5 billion: | 0.600 | % | ||
Over $5 billion: | 0.575 | % | ||
Thrivent Large Cap Value Fund | ||||
All assets: | 0.450 | % | ||
Thrivent Large Cap Stock Fund | ||||
First $500 million: | 0.650 | % | ||
Next $500 million: | 0.575 | % | ||
Next $1 billion: | 0.500 | % | ||
Next $500 million: | 0.475 | % | ||
Next $2.5 billion: | 0.450 | % | ||
Over $5 billion: | 0.425 | % | ||
Thrivent High Yield Fund | ||||
First $500 million: | 0.400 | % | ||
Next $500 million: | 0.350 | % | ||
Over $1 billion: | 0.300 | % | ||
Thrivent Income Fund | ||||
First $500 million: | 0.350 | % | ||
Next $500 million: | 0.325 | % | ||
Over $1 billion: | 0.300 | % | ||
Thrivent Municipal Bond Fund | ||||
First $500 million: | 0.450 | % | ||
Next $500 million: | 0.400 | % | ||
Next $1.5 billion: | 0.350 | % | ||
Next $2.5 billion: | 0.325 | % | ||
Over $5 billion: | 0.300 | % | ||
Thrivent Government Bond Fund | ||||
First $500 million: | 0.400 | % | ||
Over $500 million: | 0.350 | % | ||
Thrivent Limited Maturity Bond Fund | ||||
First $500 million: | 0.300 | % | ||
Next $500 million: | 0.275 | % | ||
Over $1 billion: | 0.250 | % | ||
Thrivent Money Market Fund | ||||
First $500 million: | 0.500 | % | ||
Next $250 million: | 0.400 | % | ||
Next $250 million: | 0.350 | % | ||
Next $1.5 billion: | 0.325 | % | ||
Next $2.5 billion: | 0.300 | % | ||
Over $5 billion: | 0.275 | % | ||
B-69
Table of Contents
As of February 27, 2015, the following contractual expense reimbursements, as a percentage of net assets, were in effect:
Fund | Class A | Institutional Class | Expiration Date | |||||||||
Thrivent Money Market Fund | 0.20 | % | 0.10 | % | 2/28/2016 | |||||||
As of February 27, 2015, contractual expense reimbursements to limit expenses to the following percentages were in effect:
Fund | Class A | Institutional Class | Expiration Date | |||||||||
Thrivent Growth and Income Plus Fund | 1.15 | % | 0.80 | % | 2/28/2016 | |||||||
Thrivent Diversified Income Plus Fund | 1.00 | % | — | 2/28/2016 | ||||||||
Thrivent Opportunity Income Plus Fund | 0.85 | % | — | 2/28/2016 | ||||||||
Thrivent Natural Resources Fund | 1.30 | % | — | 2/28/2016 | ||||||||
Thrivent Partner Emerging Markets Equity Fund | 1.65 | % | 1.32 | % | 2/28/2016 | |||||||
Thrivent Partner Small Cap Growth Fund | 1.30 | % | 1.00 | % | 2/28/2016 | |||||||
Thrivent Partner Mid Cap Value Fund | 1.25 | % | — | 2/28/2016 | ||||||||
Thrivent Partner Worldwide Allocation Fund | 1.40 | % | — | 2/28/2016 | ||||||||
Thrivent Large Cap Growth Fund | 1.20 | % | — | 2/28/2016 | ||||||||
Thrivent Government Bond Fund | 0.90 | % | — | 2/28/2016 | ||||||||
The following table shows the total dollar amounts for investment advisory services each Fund paid during its past three fiscal years to its investment adviser (before giving effect to any expense reimbursements).
Fund | 10/31/2014 | 10/31/2013 | 10/31/2012 | |||||||||
Thrivent Aggressive Allocation Fund | $ | 2,695,497 | $ | 2,137,155 | $ | 1,991,428 | ||||||
Thrivent Moderately Aggressive Allocation Fund | $ | 6,082,869 | $ | 4,641,363 | $ | 4,239,154 | ||||||
Thrivent Moderate Allocation Fund | $ | 5,695,940 | $ | 4,479,723 | $ | 4,071,435 | ||||||
Thrivent Moderately Conservative Allocation Fund | $ | 2,828,144 | $ | 2,407,393 | $ | 2,131,159 | ||||||
Thrivent Growth and Income Plus Fund1 | $ | 423,313 | $ | 397,276 | $ | 378,890 | ||||||
Thrivent Balanced Income Plus Fund | $ | 1,347,555 | $ | 1,113,777 | $ | 1,067,454 | ||||||
Thrivent Diversified Income Plus Fund1 | $ | 3,518,024 | $ | 2,571,918 | $ | 1,505,487 | ||||||
Thrivent Opportunity Income Plus Fund | $ | 1,443,894 | $ | 1,234,878 | $ | 1,293,319 | ||||||
Thrivent Natural Resources Fund1 | $ | 837,463 | $ | 791,402 | $ | 769,258 | ||||||
Thrivent Partner Emerging Markets Equity Fund2 | $ | 175,728 | $ | 185,557 | $ | 31,077 | ||||||
Thrivent Partner Small Cap Growth Fund | $ | 1,384,909 | $ | 1,348,618 | $ | 1,169,461 | ||||||
Thrivent Partner Small Cap Value Fund | $ | 1,927,947 | $ | 1,727,169 | $ | 1,536,985 | ||||||
Thrivent Small Cap Stock Fund | $ | 2,339,711 | $ | 2,081,844 | $ | 1,968,623 | ||||||
Thrivent Mid Cap Growth Fund | $ | 1,670,547 | $ | 1,563,157 | $ | 1,540,882 | ||||||
Thrivent Partner Mid Cap Value Fund | $1,254,796 | $ | 1,086,347 | $ | 930,388 | |||||||
Thrivent Mid Cap Stock Fund | $6,377,149 | $ | 5,435,901 | $ | 4,975,969 | |||||||
Thrivent Partner Worldwide Allocation Fund | $7,531,394 | $ | 6,768,652 | $ | 5,787,051 | |||||||
Thrivent Large Cap Growth Fund | $3,637,495 | $ | 2,905,759 | $ | 2,546,408 | |||||||
Thrivent Large Cap Value Fund | $3,511,773 | $ | 2,935,324 | $ | 2,466,317 | |||||||
Thrivent Large Cap Stock Fund | $10,116,482 | $ | 9,326,270 | $ | 8,928,623 | |||||||
Thrivent High Yield Fund | $3,020,777 | $ | 3,078,876 | $ | 2,812,360 | |||||||
Thrivent Income Fund | $2,795,949 | $ | 2,920,815 | $ | 2,836,635 | |||||||
Thrivent Municipal Bond Fund | $5,927,406 | $ | 6,345,754 | $ | 6,136,576 | |||||||
Thrivent Government Bond Fund | $ 416,546 | $ | 413,609 | $ | 438,799 | |||||||
Thrivent Limited Maturity Bond Fund | $2,485,438 | $ | 2,583,223 | $ | 2,611,845 | |||||||
Thrivent Money Market Fund | $2,275,281 | $ | 2,416,802 | $ | 2,699,925 | |||||||
| 1 | For the fiscal years ended December 31, 2014, December 31, 2013 and December 31, 2012. |
| 2 | The Fund commenced operations on August 31, 2012. |
B-70
Table of Contents
The next table shows the total expenses reimbursed with respect to the Funds for the last three fiscal years.
Fund | 10/31/2014 | 10/31/2013 | 10/31/2012 | |||||||||
Thrivent Aggressive Allocation Fund | $ | — | $ | 55,087 | $ | 201,525 | ||||||
Thrivent Moderately Aggressive Allocation Fund | $ | — | $ | 256,008 | $ | — | ||||||
Thrivent Moderate Allocation Fund | $ | — | $ | 314,446 | $ | — | ||||||
Thrivent Moderately Conservative Allocation Fund | $ | — | $ | 229,090 | $ | — | ||||||
Thrivent Growth and Income Plus Fund1 | $ | 175,555 | $ | 159,881 | $ | 125,637 | ||||||
Thrivent Balanced Income Plus Fund | $ | — | $ | 5,192 | $ | 6,818 | ||||||
Thrivent Diversified Income Plus Fund1 | $ | — | $ | 7,961 | $ | 93,859 | ||||||
Thrivent Opportunity Income Plus Fund | $ | 238,288 | $ | 228,387 | $ | 223,497 | ||||||
Thrivent Natural Resources Fund1 | $ | 88,835 | $ | 78,370 | $ | 72,151 | ||||||
Thrivent Partner Emerging Markets Equity Fund2 | $ | 228,989 | $ | 274,212 | $ | 36,566 | ||||||
Thrivent Partner Small Cap Growth Fund | $ | 62,881 | $ | 29,975 | $ | 22,002 | ||||||
Thrivent Partner Small Cap Value Fund | $ | — | $ | 101 | $ | 943 | ||||||
Thrivent Small Cap Stock Fund | $ | — | $ | — | $ | — | ||||||
Thrivent Mid Cap Growth Fund | $ | — | $ | — | $ | — | ||||||
Thrivent Partner Mid Cap Value Fund | $ | 56,212 | $ | 44,671 | $ | 38,797 | ||||||
Thrivent Mid Cap Stock Fund | $ | — | $ | — | $ | — | ||||||
Thrivent Partner Worldwide Allocation Fund | $ | 401,211 | $ | 384,635 | $ | 525,126 | ||||||
Thrivent Large Cap Growth Fund | $ | 231,787 | $ | 292,474 | $ | 340,919 | ||||||
Thrivent Large Cap Value Fund | $ | — | $ | — | $ | — | ||||||
Thrivent Large Cap Stock Fund | $ | — | $ | — | $ | — | ||||||
Thrivent High Yield Fund | $ | — | $ | — | $ | — | ||||||
Thrivent Municipal Bond Fund | $ | — | $ | — | $ | — | ||||||
Thrivent Income Fund | $ | — | $ | — | $ | 20 | ||||||
Thrivent Government Bond Fund | $ | 23,235 | $ | 18,311 | $ | 10,693 | ||||||
Thrivent Limited Maturity Bond Fund | $ | — | $ | 26,622 | $ | 41,844 | ||||||
Thrivent Money Market Fund | $ | 3,400,392 | $ | 3,414,439 | $ | 3,462,992 | ||||||
| 1 | For the fiscal years ended December 31, 2014, December 31, 2013, and December 31, 2012. |
| 2 | The Fund commenced operations on August 31, 2012. |
Subadvisory Fees
Thrivent Asset Mgt. pays T. Rowe Price an annual subadvisory fee for the performance of subadvisory services for Thrivent Partner Small Cap Value Fund. The fee payable is equal to 0.60% of Thrivent Partner Small Cap Value Fund’s average daily net assets. T. Rowe Price was paid $1,314,128 for its subadvisory services for the year ended October 31, 2012, $1,479,525 for the year ended October 31, 2013, and $1,651,721 for the year ended October 31, 2014.
Thrivent Asset Mgt. pays GSAM an annual subadvisory fee for the performance of subadvisory services for Thrivent Partner Mid Cap Value Fund. The fee payable is equal to 0.50% of the first $200 million of the average daily net assets managed by GSAM and 0.45% of average daily net assets managed by GSAM in excess of $200 million. GSAM was paid $591,289 for its subadvisory services for the year ended October 31, 2012, $684,653 for the year ended October 31, 2013, and $784,266 for the year ended October 31, 2014.1
Thrivent Asset Mgt. pays Mercator an annual subadvisory fee for the performance of subadvisory services for Thrivent Partner Worldwide Allocation Fund. The fee payable is equal to 0.75% of the first $25 million of average daily net assets managed by Mercator, 0.60% of the next $25 million of average daily net assets, 0.55% of the next $25 million of average daily net assets, 0.50% of the next $225 million of average daily net assets,
| 1 | For purposes of calculating this breakpoint, the average daily net assets of the Thrivent Partner Mid Cap Value Fund are aggregated with the average daily net assets of the Thrivent Partner Mid Cap Value Portfolio, a series of the Thrivent Series Fund, Inc. for which GSAM also acts as subadviser. |
B-71
Table of Contents
0.40% of the next $200 million of average daily net assets and 0.20% of average daily net assets over $500 million. Thrivent Asset Mgt. paid Mercator the following amounts for its subadvisory services during the last three years: $777,511 for the year ended October 31, 2012, $929,029 for the year ended October 31, 2013, and $989,827 for the year ended October 31, 2014.2
Thrivent Asset Mgt. pays Principal an annual subadvisory fee for the performance of subadvisory services for Thrivent Partner Worldwide Allocation Fund. The fee payable is equal to 0.35% of the first $500 million of average daily net assets managed by Principal, 0.30% of the next $500 million of average daily net assets and 0.25% of the average daily net assets over $1.0 billion. Principal was paid the following amounts for the last three years: $662,763 for the year ended October 31, 2012, $780,562 for the year ended October 31, 2013, and $884,113 for the year ended October 31, 2014.
Thrivent Asset Mgt. pays Aberdeen an annual subadvisory fee for the performance of subadvisory services for Thrivent Partner Worldwide Allocation Fund and for Thrivent Partner Emerging Markets Equity Fund. The fee payable is equal to 0.85% of the first $50 million of average daily net assets managed by Aberdeen; 0.72% of the next $50 million of average daily net assets managed by Aberdeen; and 0.68% of all of average daily net assets managed by Aberdeen in excess of $100 million. Aberdeen was paid $753,182 for its subadvisory services for the year ended October 31, 2012, $734,107 for the year ended October 31, 2013 and $725,741 for the year ended October 31, 2014.3
Until February 26, 2015, Thrivent Asset Mgt. paid DuPont Capital Management Corporation (“DuPont Capital”) an annual subadvisory fee for the performance of subadvisory services to Thrivent Partner Emerging Markets Equity Fund and Thrivent Partner Worldwide Allocation Portfolio. The fee payable for services rendered to Thrivent Partner Emerging Markets Equity Fund and Thrivent Partner Worldwide Allocation Fund was equal to 0.72% of the first $50 million of average daily net assets and 0.68% for assets over $50 million. For purposes of calculating these breakpoints, the average daily net asset managed by DuPont Capital was aggregated with the portion of the average daily net assets of Thrivent Partner Worldwide Allocation Portfolio managed by DuPont Capital. Thrivent Partner Worldwide Allocation Portfolio is a series of Thrivent Series Fund, Inc. DuPont Capital was paid $20,628 for its subadvisory services for the year ended October 31, 2012, $210,599 for the year ended October 31, 2013 and $250,485 for the year ended October 31, 2014.
Thrivent Asset Mgt. pays GSAM an annual subadvisory fee for the performance of subadvisory services for Thrivent Partner Worldwide Allocation Fund. The fee payable for GSAM managing the emerging markets debt portion is equal to 0.50% of the first $200 million of average daily net assets, 0.45% of the next $200 million, and 0.40% of average daily net assets over $400 million. The fee payable for GSAM managing the international small- and mid-cap equities portion is equal to 0.58% of the first $250 million of average daily net assets and 0.54% of average daily net assets over $250 million. GSAM was paid $360,206 for its subadvisory services for the year ended October 31, 2012, $448,504 for the year ended October 31, 2013 and $1,145,072 for the year ended October 31, 2014.4
| 2 | For purposes of determining breakpoints, assets invested in Thrivent Partner Worldwide Allocation Portfolio, a series of Thrivent Series Fund, Inc. and managed by subadviser, will be included in determining average daily net assets. |
| 3 | For purposes of determining breakpoints, assets invested in Thrivent Partner Worldwide Allocation Portfolio and Thrivent Partner Emerging Markets Portfolio, both series of Thrivent Series Fund, Inc. and managed by subadviser, will be included in determining average daily net assets. Aberdeen began managing the Thrivent Partner Emerging Markets Equity Fund on February 26, 2015. |
| 4 | For purposes of determining breakpoints, assets invested in Thrivent Partner Worldwide Allocation Portfolio, a series of Thrivent Series Fund, Inc. and managed by subadviser, will be included in determining average daily net assets. GSAM began managing the international small- and mid-cap equities portion of the Thrivent Partner Worldwide Allocation Fund on September 25, 2013. |
B-72
Table of Contents
Code of Ethics
The Trust, Thrivent Asset Mgt. and the subadvisers have each adopted a code of ethics pursuant to the requirements of the 1940 Act. Under the Codes of Ethics, personnel are only permitted to engage in personal securities transactions in accordance with certain conditions relating to such person's position, the identity of the security, the timing of the transaction, and similar factors. Transactions in securities that may be held by the Funds are permitted, subject to compliance with applicable provisions of the Code. Personal securities transactions must be reported quarterly and broker confirmations of such transactions must be provided for review.
Proxy Voting Policies
The Trust has adopted the proxy voting policies of Thrivent Financial and Thrivent Asset Mgt. Those policies, and the proxy voting policies of each subadviser, are included in Appendix A. Information regarding how the Trust voted proxies relating to portfolio securities during the most recent twelve-month period ended June 30 is available without charge at the Thrivent Financial website (www.thrivent.com) or the SEC website (www.sec.gov).
B-73
Table of Contents
UNDERWRITING AND DISTRIBUTION SERVICES
The Funds’ principal underwriter and distributor, Thrivent Investment Mgt., is a Delaware corporation organized in 1986. Thrivent Investment Mgt. is an indirect wholly owned subsidiary of Thrivent Financial and is located at 625 Fourth Avenue South, Minneapolis, Minnesota 55415. The officers and directors of Thrivent Investment Mgt. who are affiliated with the Trust are set forth below under “Affiliated Persons.” Under an amended Distribution Contract (the “Distribution Contract”), Thrivent Investment Mgt. is granted the right to sell shares of the Funds as agent for the Trust. Thrivent Investment Mgt. offers the Funds’ shares for sale on a continuous basis through its sales force and has agreed to use its best efforts to secure purchasers for the shares of the Funds.
The Distribution Contract was initially approved by the Board of Trustees, including a majority of the Independent Trustees, on June 15, 1987 and will continue in effect from year to year so long as its continuance is approved at least annually by the Board of Trustees, including the Independent Trustees.
Underwriting Commissions
The Table below provides the total dollar amount of underwriting commissions received by Thrivent Investment Mgt. for the past three fiscal years of the Funds. Thrivent Investment Mgt. does not retain any of these amounts, which are used to pay commissions to financial representatives and other expenses. Thrivent Investment Mgt. does not receive compensation in connection with redemptions and repurchases or brokerage commissions.
Underwriting Commissions
Fund | 10/31/2014 | 10/31/2013 | 10/31/2012 | |||||||||
Thrivent Aggressive Allocation Fund | $ | 2,538,852 | $ | 2,041,211 | $ | 1,863,202 | ||||||
Thrivent Moderately Aggressive Allocation Fund | $ | 6,106,716 | $ | 5,083,573 | $ | 4,312,354 | ||||||
Thrivent Moderate Allocation Fund | $ | 4,977,683 | $ | 4,382,357 | $ | 3,599,900 | ||||||
Thrivent Moderately Conservative Allocation Fund | $ | 1,929,795 | $ | 2,162,810 | $ | 1,987,881 | ||||||
Thrivent Growth and Income Plus Fund1 | $ | 410,560 | $ | 364,282 | $ | 126,628 | ||||||
Thrivent Balanced Income Plus Fund | $ | 694,100 | $ | 301,096 | $ | 174,047 | ||||||
Thrivent Diversified Income Plus Fund1 | $ | 2,750,512 | $ | 3,666,120 | $ | 1,943,428 | ||||||
Thrivent Opportunity Income Plus Fund | $ | 582,494 | $ | 500,448 | $ | 543,970 | ||||||
Thrivent Natural Resources Fund1 | $ | 56,379 | $ | 49,483 | $ | 62,956 | ||||||
Thrivent Partner Emerging Markets Equity Fund2 | $ | 49,870 | $ | 63,307 | $ | 3,333 | ||||||
Thrivent Partner Small Cap Growth Fund | $ | 63,235 | $ | 34,996 | $ | 23,471 | ||||||
Thrivent Partner Small Cap Value Fund | $ | 174,615 | $ | 176,473 | $ | 114,208 | ||||||
Thrivent Small Cap Stock Fund | $ | 213,782 | $ | 199,782 | $ | 212,228 | ||||||
Thrivent Mid Cap Growth Fund | $ | 385,175 | $ | 253,897 | $ | 269,078 | ||||||
Thrivent Partner Mid Cap Value Fund | $ | 60,103 | $ | 72,861 | $ | 22,807 | ||||||
Thrivent Mid Cap Stock Fund | $ | 285,171 | $ | 435,980 | $ | 408,063 | ||||||
Thrivent Partner Worldwide Allocation Fund | $ | 236,462 | $ | 200,701 | $ | 159,045 | ||||||
Thrivent Large Cap Growth Fund | $ | 289,732 | $ | 217,840 | $ | 200,476 | ||||||
Thrivent Large Cap Value Fund | $ | 238,324 | $ | 235,152 | $ | 133,451 | ||||||
Thrivent Large Cap Stock Fund | $ | 1,111,223 | $ | 1,063,587 | $ | 1,012,941 | ||||||
Thrivent High Yield Fund | $ | 1,147,115 | $ | 1,563,526 | $ | 1,678,591 | ||||||
Thrivent Income Fund | $ | 417,807 | $ | 989,910 | $ | 1,089,388 | ||||||
Thrivent Municipal Bond Fund | $ | 1,947,382 | $ | 4,002,019 | $ | 5,350,294 | ||||||
Thrivent Government Bond Fund | $ | 15,841 | $ | 40,598 | $ | 75,161 | ||||||
Thrivent Limited Maturity Bond Fund | $ | 113,987 | $ | 1,089 | $ | 686 | ||||||
Thrivent Money Market Fund | $ | 1,517 | $ | 19,327 | $ | 30 | ||||||
| 1 | For the fiscal years ended December 31, 2014, December 31, 2013 and December 31, 2012. |
| 2 | The Fund commenced operations on August 31, 2012. |
B-74
Table of Contents
12b-1 Distribution Plan
The Trust has adopted a Distribution Plan and Agreement pursuant to Rule 12b-1 under the 1940 Act (the “12b-1 Plan”) with respect to the Class A shares of each Fund. The 12b-1 Plan permits, among other things, payment by each such Fund for the purpose of:
| • | paying compensation to registered representatives or other employees of the Thrivent Investment Mgt. who engage in or support distribution of the Funds; making payment of sales commissions, ongoing commissions and other payments to brokers, dealers, financial institutions or others who sell shares pursuant to Selling Agreements; |
| • | reimbursing expenses (including overhead and telephone expenses) of Thrivent Investment Mgt.; |
| • | providing training, marketing and support to dealers and others with respect to the sale of Fund shares; preparation, printing, and distribution of prospectuses, statements of additional information, and shareholder reports; organizing and conducting sales seminars and making payments in the form of transactional compensation or promotional incentives; receiving and answering correspondence from prospective shareholders, including distributing prospectuses, statements of additional information, and shareholder reports; providing facilities to answer questions from prospective investors about the Funds, assisting investors in completing application forms and selecting dividend and other account options, and providing other reasonable assistance in connection with the distribution of the Funds; and |
| • | providing payment of expenses relating to the formulation and implementation of marketing strategies and promotional activities such as direct mail promotions and television, radio, newspaper, magazine and other mass media advertising; the preparation, printing and distribution of sales literature; the preparation, printing and distribution of prospectuses of the Trust and reports for recipients other than existing shareholders of the Trust; and obtaining such information, analyses and reports with respect to marketing and promotional activities and investor accounts as the Trust may, from time to time, deem advisable. |
The Trust and the Funds are authorized to engage in the activities listed above, and in other distribution and services activities, either directly or through other persons with which the Trust has entered into agreements pursuant to the 12b-1 Plan.
The 12b-1 Plan provides that it may not be amended to increase materially the costs which a Fund may bear pursuant to the 12b-1 Plan without approval by a 1940 Act Majority Vote of the applicable Class A shareholders. The 12b-1 Plan also provides that other material amendments of the 12b-1 Plan must be approved by the Trustees, and by the Independent Trustees, by vote cast in person at a meeting called for the purpose of considering such amendments.
While the 12b-1 Plan is in effect, the selection and nomination of the Independent Trustees of the Trust has been committed to the discretion of the Independent Trustees, and any person who acts as legal counsel for the Independent Trustees must be an independent legal counsel. The 12b-1 Plan was approved by the initial shareholders of the Trust on September 13, 1988. It is subject to annual approval, by the Board of Trustees and by the Independent Trustees by vote cast in person at a meeting called for the purpose of voting on the 12b-1 Plan. The 12b-1 Plan is terminable with respect to the either the Class A shares of any Fund at any time by a vote of a majority of the Independent Trustees or by 1940 Act Majority Vote of the applicable Class A shareholders of such Fund. A quarterly report of the amounts expended under the 12b-1 Plan and the purposes for which such expenditures were incurred must be made to the Trustees for their review.
In connection with the services to be provided by Thrivent Investment Mgt. under the Rule 12b-1 Plan, Class A shares of the Funds pay Thrivent Investment Mgt. an aggregate fee for distribution and shareholder servicing equal to an annual rate of no more than 0.25% (0.125% for Thrivent Government Bond Fund, Thrivent Limited Maturity Bond Fund and Thrivent Money Market Fund) of the average daily net asset value represented
B-75
Table of Contents
by such shares. The fee is accrued daily and paid monthly. For the most recent fiscal year, the Funds paid $29,986,835 to the distributor under the 12b-1 Plan. Of the total 12b-1 fees paid to the distributor, $22,668,097 was used to compensate registered representatives, and $6,415,434 was used for other expenses.
Affiliated Persons
The following officer of Thrivent Investment Mgt., the Funds’ principal underwriter and distributor, is affiliated with the Trust.
Affiliated Person | Position with Trust | Position with Thrivent Investment Mgt. | ||
Kathryn A. Stelter | Vice President | Director, President |
B-76
Table of Contents
Custodian
The custodian for the Funds is State Street Bank and Trust Company, 225 Franklin Street, Suite 2700, Boston, Massachusetts 02110. The custodian is responsible for holding the Funds’ assets held in the United States and for serving as the Funds’ foreign custody manager.
Transfer Agent
Thrivent Financial Investor Services Inc. (“Thrivent Financial Investor Services”), 625 Fourth Avenue South, Minneapolis, Minnesota 55415, provides transfer agency and dividend payment services necessary to the Funds on a per-account basis.
Administration Contract
Thrivent Asset Mgt. provides both administrative and accounting services to the Funds under an Administrative Services Agreement. Under this Agreement, each Fund pays Thrivent Asset Mgt. an annual fee equal to the sum of $70,000 plus 0.02 percent of the Fund’s average daily net assets. Payments made under the Agreement for the past three fiscal years are as follows:
Fund | 10/31/2014 | 10/31/2013 | 10/31/2012 | |||||||||
Thrivent Aggressive Allocation Fund | $ | 210,236 | $ | 187,835 | $ | 182,705 | ||||||
Thrivent Moderately Aggressive Allocation Fund | $ | 399,692 | $ | 349,722 | $ | 331,850 | ||||||
Thrivent Moderate Allocation Fund | $ | 385,444 | $ | 349,091 | $ | 334,548 | ||||||
Thrivent Moderately Conservative Allocation Fund | $ | 208,640 | $ | 200,950 | $ | 193,996 | ||||||
Thrivent Growth and Income Plus Fund1 | $ | 82,048 | $ | 81,307 | $ | 81,658 | ||||||
Thrivent Balanced Income Plus Fund | $ | 115,327 | $ | 107,939 | $ | 108,817 | ||||||
Thrivent Diversified Income Plus Fund1 | $ | 188,334 | $ | 156,510 | $ | 124,745 | ||||||
Thrivent Opportunity Income Plus Fund | $ | 129,360 | $ | 121,484 | $ | 127,481 | ||||||
Thrivent Natural Resources Fund1 | $ | 89,366 | $ | 88,301 | $ | 89,231 | ||||||
Thrivent Partner Emerging Markets Equity Fund2 | $ | 72,709 | $ | 72,900 | $ | 12,186 | ||||||
Thrivent Partner Small Cap Growth Fund | $ | 98,468 | $ | 98,051 | $ | 95,988 | ||||||
Thrivent Partner Small Cap Value Fund | $ | 120,953 | $ | 116,196 | $ | 113,914 | ||||||
Thrivent Small Cap Stock Fund | $ | 133,746 | $ | 127,100 | $ | 127,496 | ||||||
Thrivent Mid Cap Growth Fund | $ | 149,050 | $ | 144,318 | $ | 148,051 | ||||||
Thrivent Partner Mid Cap Value Fund | $ | 100,952 | $ | 97,127 | $ | 94,810 | ||||||
Thrivent Mid Cap Stock Fund | $ | 248,725 | $ | 223,715 | $ | 220,030 | ||||||
Thrivent Partner Worldwide Allocation Fund | $ | 231,198 | $ | 216,406 | $ | 203,225 | ||||||
Thrivent Large Cap Growth Fund | $ | 159,768 | $ | 142,557 | $ | 137,904 | ||||||
Thrivent Large Cap Value Fund | $ | 214,373 | $ | 192,114 | $ | 179,614 | ||||||
Thrivent Large Cap Stock Fund | $ | 402,685 | $ | 377,285 | $ | 382,145 | ||||||
Thrivent High Yield Fund | $ | 216,455 | $ | 221,547 | $ | 216,421 | ||||||
Thrivent Income Fund | $ | 222,039 | $ | 231,378 | $ | 236,870 | ||||||
Thrivent Municipal Bond Fund | $ | 343,663 | $ | 369,907 | $ | 377,804 | ||||||
Thrivent Government Bond Fund | $ | 89,265 | $ | 89,391 | $ | 91,940 | ||||||
Thrivent Limited Maturity Bond Fund | $ | 228,793 | $ | 237,585 | $ | 250,862 | ||||||
Thrivent Money Market Fund | $ | 154,186 | $ | 160,731 | $ | 179,996 | ||||||
| 1 | For fiscal years ended December 31, 2014, December 31, 2013 and December 31, 2012. |
| 2 | The Fund commenced operations on August 31, 2012. |
B-77
Table of Contents
Independent Registered Public Accounting Firm
PricewaterhouseCoopers LLP, 225 South Sixth Street, Suite 1400, Minneapolis, MN 55402, serves as the Trust’s independent registered public accounting firm, providing professional services including audits of the Funds’ annual financial statements, assistance and consultation in connection with Securities and Exchange Commission filings, and preparation, review and signing of the annual income tax returns filed on behalf of the Funds.
B-78
Table of Contents
BROKERAGE ALLOCATION AND OTHER PRACTICES
Brokerage Transactions
In connection with the management of the investment and reinvestment of the assets of the Funds, the Advisory Contract authorizes Thrivent Asset Mgt., acting by its own officers, directors or employees or by a subadviser to select the brokers or dealers that will execute purchase and sale transactions for the Funds. In executing portfolio transactions and selecting brokers or dealers, if any, Thrivent Asset Mgt. and the subadvisers will use reasonable efforts to seek on behalf of the Funds the best overall terms available.
In assessing the best overall terms available for any transaction, Thrivent Asset Mgt. and the subadvisers will consider all factors it deems relevant, including:
| (1) | the breadth of the market in and the price of the security, |
| (2) | the financial condition and execution capability of the broker or dealer, and |
| (3) | the reasonableness of the commission, if any (for the specific transaction and on a continuing basis). |
In evaluating the best overall terms available, and in selecting the broker or dealer, if any, to execute a particular transaction, Thrivent Asset Mgt. and the subadvisers may also consider the brokerage and research services (as those terms are defined in Section 28(e) of the Securities Exchange Act of 1934) provided to any other accounts over which Thrivent Asset Mgt., the subadvisers, or an affiliate of Thrivent Asset Mgt. or the subadvisers, exercises investment discretion. Thrivent Asset Mgt. and the subadvisers may pay to a broker or dealer who provides such brokerage and research services a commission for executing a portfolio transaction which is in excess of the amount of commission another broker or dealer would have charged for effecting that transaction if, but only if, Thrivent Asset Mgt. or the subadviser determines in good faith that such commission was reasonable in relation to the value of the brokerage and research services provided.
To the extent that the receipt of the above-described services may supplant services for which Thrivent Asset Mgt. or the subadviser might otherwise have paid, it would, of course, tend to reduce the expenses of Thrivent Asset Mgt.
In certain cases, Thrivent Asset Mgt. or the subadviser may obtain products or services from a broker that have both research and non-research uses. Examples of non-research uses are administrative and marketing functions. These are referred to as “mixed use” products. In each case, Thrivent Asset Mgt. or the subadviser makes a good faith effort to determine the proportion of such products or services that may be used for research and non-research purposes. The portion of the costs of such products or services attributable to research usage may be defrayed by Thrivent Asset Mgt. or the subadviser, as the case may be, through brokerage commissions generated by transactions of its clients, including the Funds. Thrivent Asset Mgt. or the subadviser pays the provider in cash for the non-research portion of its use of these products or services.
Certain subadvisers may obtain third-party research from broker-dealers or non-broker dealers by entering into a commission sharing arrangement (a “CSA”). Under a CSA, the executing broker-dealer agrees that part of the commissions it earns on certain equity trades will be allocated to one or more research providers as payment for research. CSAs allow a subadviser to direct broker-dealers to pool commissions that are generated from orders executed at that broker-dealer, and then periodically direct the broker-dealer to pay third-party research providers for research.
The Trust’s Board has approved procedures in conformity with Rule 10f-3 under the 1940 Act whereby a Fund may purchase securities that are offered in underwritings in which an affiliate of a subadviser participates. These procedures prohibit a Fund from directly or indirectly benefiting a subadviser affiliate in connection with such underwritings. In addition, for underwritings where a subadviser affiliate participates as a principal underwriter, certain restrictions may apply that could, among other things, limit the amount of securities that a Fund could purchase in the underwritings.
B-79
Table of Contents
The investment decisions for a Fund are and will continue to be made independently from those of other investment companies and accounts managed by Thrivent Asset Mgt., a subadviser, or their affiliates. Such other investment companies and accounts may also invest in the same securities as a Fund. When purchases and sales of the same security are made at substantially the same time on behalf of such other investment companies and accounts, transactions may be averaged as to the price and available investments allocated as to the amount in a manner which Thrivent Asset Mgt. and its affiliates believe to be equitable to each investment company or account, including the Fund. In some instances, this investment procedure may affect the price paid or received by a Fund or the size of the position obtainable or sold by a Fund.
Affiliated Transactions
GSAM may place trades with certain brokers with which it is under common control, including Goldman Sachs, provided it determines that these affiliates’ products, services, and costs are comparable to those of non-affiliated, qualified brokerage firms. GSAM may trade with its affiliated brokers in exchange for brokerage and research products and services of the type sometimes known as “soft dollars.” GSAM also may trade with its affiliated brokers on an execution-only basis.
Brokerage Commissions
The following table shows the amount of brokerage commissions the Funds paid in each of the past three fiscal years:
Fund | 10/31/2014 | 10/31/2013 | 10/31/2012 | |||||||||
Thrivent Aggressive Allocation Fund | $ | 313,596 | $ | 378,219 | $ | 338,047 | ||||||
Thrivent Moderately Aggressive Allocation Fund | $ | 607,115 | $ | 649,371 | $ | 564,107 | ||||||
Thrivent Moderate Allocation Fund | $ | 483,468 | $ | 502,304 | $ | 422,113 | ||||||
Thrivent Moderately Conservative Allocation Fund | $ | 154,741 | $ | 175,887 | $ | 152,802 | ||||||
Thrivent Growth and Income Plus Fund1 | $ | 186,436 | $ | 135,771 | $ | 160,275 | ||||||
Thrivent Balanced Income Plus Fund | $ | 138,753 | $ | 169,480 | $ | 189,733 | ||||||
Thrivent Diversified Income Plus Fund1 | $ | 892,587 | $ | 490,145 | $ | 317,568 | ||||||
Thrivent Opportunity Income Plus Fund | $ | 44,724 | $ | 12,004 | $ | 12,681 | ||||||
Thrivent Natural Resources Fund1 | $ | 92,557 | $ | 54,841 | $ | 64,709 | ||||||
Thrivent Partner Emerging Markets Equity Fund2 | $ | 35,353 | $ | 44,616 | $ | 17,665 | ||||||
Thrivent Partner Small Cap Growth Fund | $ | 244,312 | $ | 263,329 | $ | 303,756 | ||||||
Thrivent Partner Small Cap Value Fund | $ | 123,110 | $ | 37,938 | $ | 68,612 | ||||||
Thrivent Small Cap Stock Fund | $ | 289,291 | $ | 348,088 | $ | 507,350 | ||||||
Thrivent Mid Cap Growth Fund | $ | 227,354 | $ | 251,869 | $ | 307,380 | ||||||
Thrivent Partner Mid Cap Value Fund3 | $ | 216,688 | $ | 223,831 | $ | 174,357 | ||||||
Thrivent Mid Cap Stock Fund | $ | 425,145 | $ | 643,281 | $ | 596,702 | ||||||
Thrivent Partner Worldwide Allocation Fund | $ | 1,120,807 | $ | 1,169,112 | $ | 817,812 | ||||||
Thrivent Large Cap Growth Fund | $ | 212,993 | $ | 273,677 | $ | 420,320 | ||||||
Thrivent Large Cap Value Fund | $ | 285,892 | $ | 429,935 | $ | 860,516 | ||||||
Thrivent Large Cap Stock Fund | $ | 2,050,375 | $ | 1,516,011 | $ | 2,782,317 | ||||||
Thrivent High Yield Fund | $ | 1,331 | $ | 3,462 | $ | 2,487 | ||||||
Thrivent Income Fund | $ | 33,801 | $ | 40,429 | $ | 44,912 | ||||||
Thrivent Municipal Bond Fund | $ | — | $ | — | $ | — | ||||||
Thrivent Government Bond Fund | $ | 1,080 | $ | — | $ | — | ||||||
Thrivent Limited Maturity Bond Fund | $ | 38,542 | $ | 36,212 | $ | 35,573 | ||||||
Thrivent Money Market Fund | $ | — | $ | — | $ | — | ||||||
| 1 | For the fiscal years ended December 31, 2014, December 31, 2013 and December 31, 2012. |
| 2 | The Fund commenced operations on August 31, 2012. |
B-80
Table of Contents
| 3 | Amount paid to affiliated broker-dealer was $6,812, $9,366, and $7,346 for the respective fiscal years ended October 31, 2014, October 31, 2013 and October 31, 2012. The percentage of the Fund’s aggregate brokerage commissions paid to affiliated broker-dealer during the most recent fiscal year was 3%. In addition, the percentage of the Fund’s aggregate dollar amount of transactions involving the payment of commissions effected through this affiliated broker-dealer during the most recent fiscal year was 4%. |
The table below indicates the total amount of brokerage commissions paid by each Fund to firms that provided research services and the aggregate amount of transactions relating to such commissions for the most recent fiscal year ended October 31, 2014. The provision of research services was not necessarily a factor in the placement of brokerage business with these firms.
Fund Name | Commissions | Aggregate Transactions | ||||||
Thrivent Aggressive Allocation Fund | $ | 303,759 | $ | 291,402,287 | ||||
Thrivent Moderately Aggressive Allocation Fund | $ | 592,112 | $ | 535,382,768 | ||||
Thrivent Moderate Allocation Fund | $ | 472,509 | $ | 413,905,742 | ||||
Thrivent Moderately Conservative Allocation Fund | $ | 151,340 | $ | 131,611,543 | ||||
Thrivent Growth and Income Plus Fund1 | $ | 185,217 | $ | 163,509,793 | ||||
Thrivent Balanced Income Plus Fund | $ | 136,614 | $ | 188,823,425 | ||||
Thrivent Diversified Income Plus Fund1 | $ | 886,236 | $ | 763,539,848 | ||||
Thrivent Opportunity Income Plus Fund | $ | 44,260 | $ | 34,023,856 | ||||
Thrivent Natural Resources Fund1 | $ | 90,626 | $ | 121,094,479 | ||||
Thrivent Partner Emerging Markets Equity Fund | $ | 35,353 | $ | 20,532,868 | ||||
Thrivent Partner Small Cap Growth Fund | $ | 220,993 | $ | 219,816,020 | ||||
Thrivent Partner Small Cap Value Fund | $ | 96,168 | $ | 69,188,743 | ||||
Thrivent Small Cap Stock Fund | $ | 259,804 | $ | 312,472,174 | ||||
Thrivent Mid Cap Growth Fund | $ | 215,513 | $ | 344,234,156 | ||||
Thrivent Partner Mid Cap Value Fund | $ | 207,934 | $ | 272,868,184 | ||||
Thrivent Mid Cap Stock Fund | $ | 422,024 | $ | 595,621,529 | ||||
Thrivent Partner Worldwide Allocation Fund | $ | 741,389 | $ | 619,869,850 | ||||
Thrivent Large Cap Growth Fund | $ | 207,521 | $ | 368,638,692 | ||||
Thrivent Large Cap Value Fund | $ | 280,868 | $ | 357,545,034 | ||||
Thrivent Large Cap Stock Fund | $ | 2,036,590 | $ | 2,198,598,339 | ||||
Thrivent High Yield Fund | $ | 1,331 | $ | 112,399 | ||||
Thrivent Income Fund | $ | 33,801 | $ | 33,801 | ||||
Thrivent Municipal Bond Fund | $ | — | $ | — | ||||
Thrivent Government Bond Fund | $ | 1,080 | $ | 110,361 | ||||
Thrivent Limited Maturity Bond Fund | $ | 38,542 | $ | 2,532,272 | ||||
Thrivent Money Market Fund | $ | — | $ | — | ||||
| 1 | For the fiscal year ended December 31, 2014. |
Portfolio Turnover Rates
The rate of portfolio turnover in the Funds will not be a limiting factor when Thrivent Asset Mgt. or the subadviser deems changes in a Fund’s portfolio appropriate in view of its investment objectives. As a result, while a Fund will not purchase or sell securities solely to achieve short term trading profits, a Fund may sell portfolio securities without regard to the length of time held if consistent with the Fund’s investment objective. A higher degree of equity portfolio activity will increase brokerage costs to a Fund. The portfolio turnover rate is computed by dividing the dollar amount of securities purchased or sold (whichever is smaller) by the average value of securities owned during the year. Short-term investments such as commercial paper and short-term U.S. Government securities are not considered when computing the turnover rate.
B-81
Table of Contents
Portfolio Turnover Rates
The following table shows the portfolio turnover rates for the Funds for the last three fiscal years:
Fund | 10/31/2014 | 10/31/2013 | 10/31/2012 | |||||||||
Thrivent Aggressive Allocation Fund | 51 | % | 44 | % | 66 | % | ||||||
Thrivent Moderately Aggressive Allocation Fund | 61 | % | 51 | % | 78 | % | ||||||
Thrivent Moderate Allocation Fund | 73 | % | 85 | % | 94 | % | ||||||
Thrivent Moderately Conservative Allocation Fund | 140 | % | 166 | % | 145 | % | ||||||
Thrivent Growth and Income Plus Fund1 | 167 | % | 162 | % | 164 | % | ||||||
Thrivent Balanced Income Plus Fund2 | 124 | % | 236 | % | 197 | % | ||||||
Thrivent Diversified Income Plus Fund1 | 137 | % | 153 | % | 153 | % | ||||||
Thrivent Opportunity Income Plus Fund3 | 169 | % | 387 | % | 355 | % | ||||||
Thrivent Natural Resources Fund1 | 58 | % | 36 | % | 30 | % | ||||||
Thrivent Partner Emerging Markets Equity Fund4 | 69 | % | 103 | % | 33 | % | ||||||
Thrivent Partner Small Cap Growth Fund5 | 438 | % | 84 | % | 100 | % | ||||||
Thrivent Partner Small Cap Value Fund | 20 | % | 6 | % | 11 | % | ||||||
Thrivent Small Cap Stock Fund | 56 | % | 66 | % | 91 | % | ||||||
Thrivent Mid Cap Growth Fund | 45 | % | 37 | % | 46 | % | ||||||
Thrivent Partner Mid Cap Value Fund | 92 | % | 109 | % | 83 | % | ||||||
Thrivent Mid Cap Stock Fund | 27 | % | 39 | % | 36 | % | ||||||
Thrivent Partner Worldwide Allocation Fund | 77 | % | 74 | % | 57 | % | ||||||
Thrivent Large Cap Growth Fund | 45 | % | 63 | % | 101 | % | ||||||
Thrivent Large Cap Value Fund | 24 | % | 39 | % | 92 | % | ||||||
Thrivent Large Cap Stock Fund | 65 | % | 66 | % | 124 | % | ||||||
Thrivent High Yield Fund | 43 | % | 61 | % | 52 | % | ||||||
Thrivent Income Fund | 97 | % | 121 | % | 117 | % | ||||||
Thrivent Municipal Bond Fund | 8 | % | 24 | % | 13 | % | ||||||
Thrivent Government Bond Fund | 130 | % | 184 | % | 191 | % | ||||||
Thrivent Limited Maturity Bond Fund | 102 | % | 121 | % | 113 | % | ||||||
| 1 | For the fiscal years ended December 31, 2014, December 31, 2013 and December 31, 2012. |
| 2 | The portfolio turnover rate for the fiscal year ended October 31, 2014 was lower than the previous fiscal year primarily because the Fund had a change in principal strategies during the previous fiscal year which caused increased portfolio turnover. |
| 3 | The portfolio turnover rate for the fiscal year ended October 31, 2014 was lower than the previous fiscal year primarily because the Fund had a change in principal strategies during the previous fiscal year which caused increased portfolio turnover. |
| 4 | The Fund commenced operations on August 31, 2012. |
| 5 | The portfolio turnover rate for the fiscal year ended October 31, 2014 was higher than the previous fiscal year primarily because the Fund changed portfolio managers and certain principal strategies during the year ended October 31, 2014. |
B-82
Table of Contents
Regular Broker or Dealers
Each of the Funds listed below held securities of its “regular broker or dealers,” as that term is defined in Rule 10b-1 under the 1940 Act, as of October 31, 2014 (December 31, 2014 in the case of Thrivent Natural Resources Fund, Thrivent Growth and Income Plus Fund and Thrivent Diversified Income Plus Fund) as follows:
Funds | Regular Broker or Dealer (or Parent) | Aggregate Holdings | ||||
Thrivent Aggressive Allocation Fund | Citigroup, Inc. | $ | 1,708,677.60 | |||
| Bank of America Corporation | $ | 1,209,436.80 | ||||
| J.P. Morgan | $ | 961,692.48 | ||||
| Morgan Stanley Dean Witter & Company | $ | 836,004.00 | ||||
| Credit Suisse Group AG | $ | 267,006.00 | ||||
| Deutsche Bank | $ | 208,090.08 | ||||
Thrivent Moderately Aggressive Allocation Fund | Bank of America Corporation | $ | 10,110,918.22 | |||
| Citigroup, Inc. | $ | 4,583,650.01 | ||||
| J.P. Morgan | $ | 4,185,866.43 | ||||
| Morgan Stanley Dean Witter & Company | $ | 3,282,782.04 | ||||
| Credit Suisse Group AG | $ | 1,817,297.03 | ||||
| Deutsche Bank | $ | 1,061,981.67 | ||||
| Goldman, Sachs & Company | $ | 874,427.22 | ||||
| Barclays | $ | 621,303.48 | ||||
| The Royal Bank of Scotland | $ | 323,131.50 | ||||
| Nomura Securities International, Inc. | $ | 75,814.73 | ||||
Thrivent Moderate Allocation Fund | Bank of America Corporation | $ | 14,033,843.22 | |||
| J.P. Morgan | $ | 6,377,911.15 | ||||
| Citigroup, Inc. | $ | 6,205,876.15 | ||||
| Morgan Stanley Dean Witter & Company | $ | 4,709,904.03 | ||||
| Credit Suisse Group AG | $ | 3,410,147.03 | ||||
| Goldman, Sachs & Company | $ | 1,676,905.95 | ||||
| Deutsche Bank | $ | 1,498,918.42 | ||||
| Barclays | $ | 996,036.04 | ||||
| The Royal Bank of Scotland | $ | 636,920.20 | ||||
| Nomura Securities International, Inc. | $ | 181,955.34 | ||||
Thrivent Moderately Conservative Allocation Fund | Bank of America Corporation | $ | 10,495,786.55 | |||
| J.P. Morgan | $ | 4,077,175.52 | ||||
| Citigroup, Inc. | $ | 3,266,655.26 | ||||
| Morgan Stanley Dean Witter & Company | $ | 2,984,045.04 | ||||
| Credit Suisse Group AG | $ | 2,101,281.38 | ||||
| Goldman, Sachs & Company | $ | 1,332,137.46 | ||||
| Deutsche Bank | $ | 1,030,436.16 | ||||
| The Royal Bank of Scotland | $ | 459,959.57 | ||||
| Barclays | $ | 190,659.42 | ||||
| Nomura Securities International, Inc. | $ | 126,357.88 | ||||
Thrivent Growth and Income Plus Fund | Bank of America Corporation | $ | 1,154,972 | |||
| Citigroup, Inc. | $ | 720,519 | ||||
| J.P. Morgan | $ | 568,420 | ||||
| Deutsche Bank | $ | 82,617 | ||||
| Morgan Stanley Dean Witter & Company | $ | 64,842 | ||||
| Goldman, Sachs & Company | $ | 52,826 | ||||
| The Royal Bank of Scotland | $ | 16,023 | ||||
| Nomura Securities International, Inc. | $ | 15,138 | ||||
B-83
Table of Contents
Funds | Regular Broker or Dealer (or Parent) | Aggregate Holdings | ||||
Thrivent Balanced Income Plus Fund | Bank of America Corporation | $ | 3,699,491.54 | |||
| J.P. Morgan | $ | 2,856,493.88 | ||||
| Citigroup, Inc. | $ | 2,175,015.04 | ||||
| Deutsche Bank | $ | 1,186,012.80 | ||||
| The Royal Bank of Scotland | $ | 701,558.85 | ||||
| Morgan Stanley Dean Witter & Company | $ | 699,951.87 | ||||
| Goldman, Sachs & Company | $ | 671,271.87 | ||||
| Credit Suisse Group AG | $ | 281,642.00 | ||||
| Nomura Securities International, Inc. | $ | 108,259.22 | ||||
| Barclays | $ | 63,033.82 | ||||
| BNY Mellon | $ | 37,850.00 | ||||
Thrivent Diversified Income Plus Fund | Bank of America Corporation | $ | 16,212,535 | |||
| J.P. Morgan | $ | 10,987,197 | ||||
| Citigroup, Inc. | $ | 7,714,468 | ||||
| Morgan Stanley Dean Witter & Company | $ | 4,192,715 | ||||
| Deutsche Bank | $ | 2,931,424 | ||||
| The Royal Bank of Scotland | $ | 2,923,366 | ||||
| Goldman, Sachs & Company | $ | 2,443,371 | ||||
| Credit Suisse Group AG | $ | 2,345,358 | ||||
| BNY Mellon | $ | 663,750 | ||||
Thrivent Opportunity Income Plus Fund | Bank of America Corporation | $ | 8,531,101.37 | |||
| J.P. Morgan | $ | 5,243,024.11 | ||||
| Citigroup, Inc. | $ | 2,126,258.07 | ||||
| Goldman, Sachs & Company | $ | 1,583,064.48 | ||||
| Morgan Stanley Dean Witter & Company | $ | 1,445,356.42 | ||||
| Deutsche Bank | $ | 1,328,175.11 | ||||
| The Royal Bank of Scotland | $ | 1,142,703.30 | ||||
| Credit Suisse Group AG | $ | 380,482.40 | ||||
| Nomura Securities International, Inc. | $ | 346,055.05 | ||||
| UBS AG | $ | 250,461.00 | ||||
| Barclays | $ | 152,150.60 | ||||
| BNY Mellon | $ | 151,400.00 | ||||
Thrivent Partner Emerging Markets Equity Fund | Citigroup, Inc. | $ | 156,209.16 | |||
| Barclays | $ | 99,803.88 | ||||
Thrivent Partner Small Cap Value Fund | Piper Jafray Inc. | $ | 762,210.00 | |||
Thrivent Partner Worldwide Allocation Fund | HSBC Securities | $ | 5,324,227.09 | |||
| Credit Suisse Group AG | $ | 4,735,349.81 | ||||
| Macquarie Group | $ | 2,387,023.87 | ||||
| Deutsche Bank | $ | 2,031,056.76 | ||||
| Citigroup, Inc. | $ | 225,455.12 | ||||
| Barclays | $ | 205,676.60 | ||||
| Nomura Securities International, Inc. | $ | 195,013.21 | ||||
Thrivent Large Cap Growth Fund | J.P. Morgan | $ | 9,543,078.72 | |||
Thrivent Large Cap Value Fund | Morgan Stanley Dean Witter & Company | $ | 17,792,346.00 | |||
| Deutsche Bank | $ | 5,913,028.08 | ||||
B-84
Table of Contents
Funds | Regular Broker or Dealer (or Parent) | Aggregate Holdings | ||||
Thrivent Large Cap Stock Fund | J.P. Morgan | $ | 47,172,827.52 | |||
| Citigroup, Inc. | $ | 35,573,361.50 | ||||
| Bank of America Corporation | $ | 8,570,853.72 | ||||
Thrivent High Yield Fund | Jefferies & Company, Inc. | $ | 2,338,250.00 | |||
| Goldman, Sachs & Company | $ | 1,794,247.47 | ||||
| Citigroup, Inc. | $ | 1,409,422.44 | ||||
| Morgan Stanley Dean Witter & Company | $ | 450,415.68 | ||||
Thrivent Income Fund | Bank of America Corporation | $ | 18,965,011.33 | |||
| Morgan Stanley Dean Witter & Company | $ | 15,372,191.74 | ||||
| Goldman, Sachs & Company | $ | 14,205,198.12 | ||||
| Citigroup, Inc. | $ | 13,680,522.60 | ||||
| J.P. Morgan | $ | 12,144,443.73 | ||||
| Barclays | $ | 2,540,267.98 | ||||
| The Royal Bank of Scotland | $ | 2,473,129.51 | ||||
| Credit Suisse Group AG | $ | 2,010,247.00 | ||||
| Nomura Securities International, Inc. | $ | 1,829,662.03 | ||||
Thrivent Limited Maturity Bond Fund | J.P. Morgan | $ | 19,652,923.12 | |||
| Bank of America Corporation | $ | 12,045,149.77 | ||||
| Morgan Stanley Dean Witter & Company | $ | 10,170,588.75 | ||||
| Goldman, Sachs & Company | $ | 6,307,958.20 | ||||
| Credit Suisse Group AG | $ | 5,147,875.06 | ||||
| Citigroup, Inc. | $ | 3,740,834.13 | ||||
Thrivent Money Market Fund | US Bank N.A. | $ | 21,115,801.24 | |||
B-85
Table of Contents
PURCHASE, REDEMPTION AND PRICING OF SHARES
Purchasing Shares
Initial and subsequent purchases of Fund shares may be made by:
| • | check; |
| • | Federal Reserve or bank wire; |
| • | telephone; |
| • | Internet; |
| • | Automatic Bank Withdrawal Plan; and |
| • | automatic payroll deduction. |
Complete and submit your new account application for each different account registration. If you do not complete the application properly, your purchase may be delayed or rejected.
Sales Charges
Purchases of Class A Fund shares (other than shares of Thrivent Money Market Fund or Thrivent Limited Maturity Bond Fund) carry either an initial sales charge or, in certain limited cases, a deferred sales charge. This is explained in the section of the Funds’ prospectus relating to such shares entitled “ Class A Shares,” which also lists ways to reduce or avoid sales charges on subsequent purchases.
In addition to the situations described in the prospectus, sales charges are waived when shares are purchased by:
| • | directors and regular full-time and regular part-time employees of Thrivent Financial and its subsidiaries and affiliates or their family members that share the same residential address as the director or employee; |
| • | members of Thrivent Financial’s sales force and their family members that share the same residential address as the sales force member; and |
| • | any trust, pension, profit-sharing or other benefit plan for such persons. |
Thrivent Investment Mgt. may also, from time to time, waive or reduce the initial sales charge on certain Class A shares offered uniformly to the public for specific time periods as specified in the disclosure documents of the applicable Fund (e.g., prospectus or supplement to the prospectus).
Employees
Regular part- and full-time employees of Thrivent Financial are persons who are defined as such by the Thrivent Financial Human Resources Policy Manual.
Restriction on Sale of Shares Purchased
Sales to any of the persons or groups mentioned in this section are made only with the purchaser’s written promise that the shares will not be resold, except through redemption or repurchase by or on behalf of a Fund.
Redeeming Shares
Shares may be redeemed with requests made:
| • | in writing; |
| • | through telephone or the Internet; or |
| • | through the systematic withdrawal plan. |
B-86
Table of Contents
All methods of redemptions are described in the Funds’ prospectus under “Redeeming Shares.”
Net Asset Value of Shares
The net asset value per share of each class is determined at the close of each day the New York Stock Exchange is open, or any other day as provided by Rule 22c-1 under the 1940 Act. Determination of net asset value may be suspended when the Exchange is closed or if certain emergencies have been determined to exist by the Securities and Exchange Commission, as allowed by the 1940 Act.
Net asset value per share is determined by adding the market or appraised value of all portfolio securities and other assets attributable to each class of shares; subtracting liabilities attributable to such class; and dividing the result by the number of shares of such class outstanding.
The market value of each Fund’s portfolio securities is determined at the close of regular trading of the New York Stock Exchange (the “Exchange”) on each day the Exchange is open. The value of portfolio securities is determined in the following manner:
| • | Equity securities traded on the Exchange or any other national securities exchange are valued at the last sale price. If there has been no sale on that day or if the security is unlisted, it is valued at the current bid price considered best to represent value in the circumstances. |
| • | Equity securities not traded on a national securities exchange are valued at the current bid price considered best to represent the value in the circumstances, except that securities for which quotations are furnished through the nationwide automated quotation system approved by the NASDAQ will be valued at their last sales prices so furnished on the date of valuation, if such quotations are available for sales occurring on that day. |
| • | Bonds and other income securities traded on a national securities exchange will be valued at the last sale price on such national securities exchange that day. Thrivent Asset Mgt. may value such securities on the basis of prices provided by an independent pricing service or within the range of the current bid and asked prices considered best to represent the value in the circumstances, if those prices are believed to better reflect the fair market value of such exchange listed securities. |
| • | Bonds and other income securities not traded on a national securities exchange will be valued at the current bid price considered best to represent the value in the circumstances. Such securities may also be valued on the basis of prices provided by an independent pricing service if those prices are believed to reflect the fair market value of such securities. |
For all Funds other than the Thrivent Money Market Fund, short-term debt securities are valued at acquisition cost, plus or minus any amortized discount or premium (amortized cost). Other debt securities with maturities of 60 days or less are valued at amortized cost, if appropriate.
Prices provided by independent pricing services may be determined without relying exclusively on quoted prices and may consider institutional trading in similar groups of securities, yield, quality, coupon rate, maturity, type of issue, trading characteristics and other market data employed in determining valuation for such securities.
All other securities and assets will be appraised at fair value as determined by the Board of Trustees.
Generally, trading in foreign securities, as well as U.S. Government securities, money market instruments and repurchase agreements, is substantially completed each day at various times prior to the close of the Exchange. The values of such securities used in computing the net asset value of shares of a Fund are determined as of such times. Foreign currency exchange rates are also generally determined prior to the close of the Exchange. Occasionally, events affecting the value of such securities and exchange rates may occur between the times at which they are determined and the close of the Exchange, which will not be reflected in the computation
B-87
Table of Contents
of net asset values. If during such periods events occur which materially affect the value of such securities, the securities will be valued at their fair market value as determined in good faith by the Trustees of the Fund.
For purposes of determining the net asset value of shares of a Fund all assets and liabilities initially expressed in foreign currencies will be converted into U.S. dollars based upon an exchange rate quoted by a major bank that is a regular participant in the foreign exchange market. Foreign securities may also be priced on the basis of a pricing service that takes into account the quotes provided by a number of such major banks.
The Funds may permit frequent trading by the InFaith Community Foundation, Thrivent Aggressive Allocation Fund, Thrivent Moderately Aggressive Allocation Fund, Thrivent Moderate Allocation Fund, and Thrivent Moderately Conservative Allocation Fund if each trade and the frequency of trading does not materially increase costs to shareholders and does not materially affect or disrupt portfolio management. Thrivent Aggressive Allocation Fund, Thrivent Moderately Aggressive Allocation Fund, Thrivent Moderate Allocation Fund, and Thrivent Moderately Conservative Allocation Fund are series of Thrivent Mutual Funds. The InFaith Community Foundation is a national public charity that accepts gifts from individuals and organizations, invests these gifts, and then distributes grants to support the charities and causes designated by the donating individuals and organizations. The Funds have no formal or written arrangements with any shareholder, including those mentioned in the previous sentence, to permit frequent trading. The Adviser closely monitors frequent trading. Neither the Funds, the Adviser, nor any other party receives any consideration for permitting frequent trading.
Thrivent Money Market Fund
Securities held by Thrivent Money Market Fund are valued on the basis of amortized cost, which involves a constant amortization of premium or accretion of discount to maturity regardless of the impact of fluctuating interest rates on the market value of the security. Amortized cost approximates market value. While this method provides certainty in valuation, it may result in periods in which the value as determined by amortized cost is higher or lower than the price Thrivent Money Market Fund would receive if it sold the security.
Thrivent Money Market Fund anticipates that under ordinary and usual circumstances it will be able to maintain a constant net asset value of $1.00 per share and Thrivent Money Market Fund will use its best efforts to do so. However, such maintenance at $1.00 might not be possible if (1) there are changes in short-term interest rates or other factors such as unfavorable changes in the credit of issuers affecting the values of the securities held by Thrivent Money Market Fund and Thrivent Money Market Fund is compelled to sell such securities at a time when the prices which it is able to realize vary significantly from the values determined on the amortized cost basis or (2) Thrivent Money Market Fund should have negative net income.
The utilization of the amortized cost method of valuation requires compliance with the requirements of Rule 2a-7 under the 1940 Act. Such compliance requires, among other things, the following:
| (1) | The Trustees must adopt procedures whereby the extent of deviation, if any, of the current net asset value per share calculated using available market quotations (or an appropriate substitute which reflects current market conditions) from Thrivent Money Market Fund’s net asset value per share under the amortized cost valuation method will be determined at such intervals as the Trustees deem appropriate and reasonable in light of current market conditions, and the Trustees must review periodically the amount of the deviation as well as the methods used to calculate the deviation; |
| (2) | In the event such deviation from Thrivent Money Market Fund’s net asset value under the amortized cost valuation method exceeds 1/2 of 1%, the Trustees must promptly consider what action should be initiated by them, and when the Trustees believe the extent of any deviation from Thrivent Money Market Fund’s net asset value per share under the amortized cost valuation method may result in material dilution or any other unfair results to investors or existing shareholders, they must take such action as they deem appropriate to eliminate or reduce to the extent reasonably practicable such dilution or unfair results (shareholders will be notified in the event any such corrective action is taken by the Trustees); |
B-88
Table of Contents
| (3) | Thrivent Money Market Fund may not purchase any instrument with a remaining maturity greater than 397 calendar days. In addition, the Fund must maintain a weighted average maturity (WAM) of not more than 60 days and a weighted average life (WAL) of not more than 120 days. When calculating its WAM, the Fund may shorten its maturity by using the interest rate resets of certain adjustable rate securities. Generally, the Fund may not take into account these resets when calculating its WAL; |
| (4) | Thrivent Money Market Fund must limit its portfolio investments, including repurchase agreements, to those United States dollar-denominated instruments that the Trustees determine present minimal credit risks and which are “eligible securities” as defined in Rule 2a-7; and |
| (5) | Thrivent Money Market Fund must record, maintain and preserve certain records and observe certain reporting obligations in accordance with Rule 2a-7. |
Securities in which Thrivent Money Market Fund invests must be U.S. dollar-denominated Eligible Securities (as defined in Rule 2a-7 under the 1940 Act) that are determined to present minimal credit risks. In general, the term “Eligible Security” is limited to any security that:
(1) (a) either (i) has received a short-term rating from a designated nationally recognized statistical rating organization (“NRSRO”) or has been issued by an issuer that has received a short-term rating from a designated NRSRO with respect to a class of debt obligations (or any debt obligation within that class) that is comparable in priority and security with the security or (ii) is subject to a guarantee that has received a short-term rating from a designated NRSRO, or a guarantee issued by a guarantor that has received a short-term rating from a designated NRSRO with respect to a class of debt obligations (or any debt obligation within that class) that is comparable in priority and security with the guarantee, (b) has a remaining maturity of 397 calendar days or less and (c) has received a rating from the requisite number of NRSROs (i.e. two, if two organizations have issued ratings and one, if only one has issued a rating) in one of the two highest short-term major rating categories; or
(2) is unrated but is of comparable quality to a rated security as described in (1) above, and which at the time of issuance (a) had a remaining maturity of more than 397 calendar days and now has a remaining maturity of 397 calendar days or less, and (b) has not received a long-term rating from any designated NRSRO in the NRSRO’s three highest long-term rating categories, unless the security has received a long-term rating from the requisite number of NRSROs (i.e., two, if two organizations have issued ratings and one if only one has issued a rating) in one of the three highest long-term rating categories.
Conversion to Federal Funds
It is Thrivent Money Market Fund’s policy to be as fully invested as possible so that maximum interest may be earned on money market instruments in the Fund’s portfolio. To that end, all payments from investors must be in federal funds or be converted into federal funds when deposited to State Street Bank’s account at the Boston Federal Reserve Bank. This conversion must be made before shares are purchased. State Street Bank will act as the investor’s agent in depositing checks and converting them to federal funds. State Street will convert the funds and enter the investor’s order for shares within two days of receipt of the check.
B-89
Table of Contents
The Funds’ Tax Status
The Funds expect to pay no federal income tax because they intend to meet requirements of Subchapter M of the Internal Revenue Code applicable to regulated investment companies and to receive the special tax treatment afforded to such companies. To qualify for this treatment, each Fund must, among other requirements:
| • | derive at least 90% of its gross income from dividends, interest, gains from the sale of securities, and certain other investments; |
| • | comply with applicable asset diversification requirements; and |
| • | distribute at least 90% of its ordinary income to shareholders. |
It is each Fund’s policy to distribute substantially all of its income on a timely basis, including any net realized gains on investments each year.
To avoid payment of a 4% excise tax, each Fund is also generally required to distribute to shareholders at least 98% of its ordinary income earned during the calendar year and 98.2% of its net capital gains realized during the 12-month period ending October 31.
Shareholders’ Tax Status
Information on a shareholder’s tax status is described in the Fund’s Prospectus under “Taxes.”
Capital Gains
While the Funds do not intend to engage in short-term trading, they may dispose of securities held for only a short time if Thrivent Asset Mgt. believes it to be advisable. Such changes may result in the realization of capital gains. Each Fund distributes its realized gains in accordance with federal tax regulations. Distributions from any net realized capital gains will usually be declared in December.
B-90
Table of Contents
A Fund’s investments may range in quality from securities rated in the lowest category in which the Fund is permitted to invest to securities rated in the highest category (as rated by Moody’s, S&P or Fitch, or, if unrated, determined by Thrivent Asset Mgt. to be of comparable quality). The percentage of a Fund’s assets invested in securities in a particular rating category will vary. The following terms are generally used to describe the credit quality of fixed income securities:
High Quality Debt Securities are those rated in one of the two highest rating categories (the highest category for commercial paper) or, if unrated, deemed comparable by Thrivent Asset Mgt.
Investment Grade Debt Securities are those rated in one of the four highest rating categories or, if unrated, deemed comparable by Thrivent Asset Mgt.
Below Investment Grade, High Yield Securities (“Junk Bonds”) are those rated lower than Baa by Moody’s, BBB by S&P or Fitch and comparable securities. They are deemed predominately speculative with respect to the issuer’s ability to repay principal and interest.
The following is a description of Moody’s, S&P’s and Fitch’s rating categories applicable to fixed income securities.
Moody’s Investors Service, Inc.
Long-Term Obligation Ratings
Moody’s long-term obligation ratings are opinions of the relative credit risk of fixed-income obligations with an original maturity of one year or more. They address the possibility that a financial obligation will not be honored as promised. Such ratings reflect both the likelihood of default and any financial loss suffered in the event of default.
Aaa: | Obligations rated Aaa are judged to be of the highest quality, with minimal credit risk. | |
Aa: | Obligations rated Aa are judged to be of high quality and are subject to very low credit risk. | |
A: | Obligations rated A are considered upper-medium grade and are subject to low credit risk. | |
Baa: | Obligations rated Baa are subject to moderate credit risk. They are considered medium-grade and as such may possess certain speculative characteristics. | |
Ba: | Obligations rated Ba are judged to have speculative elements and are subject to substantial credit risk. | |
B: | Obligations rated B are considered speculative and are subject to high credit risk. | |
Caa: | Obligations rated Caa are judged to be of poor standing and are subject to very high credit risk. | |
Ca: | Obligations rated Ca are highly speculative and are likely in, or very near, default, with some prospect of recovery of principal and interest. | |
C: | Obligations rated C are the lowest rated and are typically in default, with little prospect for recovery of principal or interest. | |
Moody’s appends numerical modifiers 1, 2, and 3 to each generic rating classification from Aa through Caa. The modifier 1 indicates that the obligation ranks in the higher end of its generic rating category; the modifier 2 indicates a mid-range ranking; and the modifier 3 indicates a ranking in the lower end of that generic rating category.
B-91
Table of Contents
Short-Term Ratings
Moody’s short-term ratings are opinions of the ability of issuers to honor short-term financial obligations. Ratings may be assigned to issuers, short-term programs or to individual short-term debt instruments. Such obligations generally have an original maturity not exceeding thirteen months, unless explicitly noted.
Moody’s employs the following designations to indicate the relative repayment ability of rated issuers:
P-1: | Issuers (or supporting institutions) rated Prime-1 have a superior ability to repay short-term debt obligations. | |
P-2: | Issuers (or supporting institutions) rated Prime-2 have a strong ability to repay short-term debt obligations. | |
P-3: | Issuers (or supporting institutions) rated Prime-3 have an acceptable ability to repay short-term obligations. | |
NP: | Issuers (or supporting institutions) rated Not Prime do not fall within any of the Prime rating categories. | |
US Municipal Short-Term Debt and Demand Obligation Ratings
Short-Term Obligation Ratings
There are three rating categories for short-term municipal obligations that are considered investment grade. These ratings are designated as Municipal Investment Grade (MIG) and are divided into three levels — MIG 1 through MIG 3. In addition, those short-term obligations that are of speculative quality are designated SG, or speculative grade. MIG ratings expire at the maturity of the obligation.
MIG 1: | This designation denotes superior credit quality. Excellent protection is afforded by established cash flows, highly reliable liquidity support, or demonstrated broad-based access to the market for refinancing. | |
MIG 2: | This designation denotes strong credit quality. Margins of protection are ample, although not as large as in the preceding group. | |
MIG 3: | This designation denotes acceptable credit quality. Liquidity and cash-flow protection may be narrow, and market access for refinancing is likely to be less well-established. | |
SG: | This designation denotes speculative-grade credit quality. Debt instruments in this category may lack sufficient margins of protection. | |
Demand Obligation Ratings
In the case of variable rate demand obligations (VRDOs), a two-component rating is assigned; a long or short-term debt rating and a demand obligation rating. The first element represents Moody’s evaluation of risk associated with scheduled principal and interest payments. The second element represents Moody’s evaluation of risk associated with the ability to receive purchase price upon demand (“demand feature”), using a variation of the MIG rating scale, the Variable Municipal Investment Grade or VMIG rating.
VMIG 1: | This designation denotes superior credit quality. Excellent protection is afforded by the superior short-term credit strength of the liquidity provider and structural and legal protections that ensure the timely payment of purchase price upon demand. | |
VMIG 2: | This designation denotes strong credit quality. Good protection is afforded by the strong short-term credit strength of the liquidity provider and structural and legal protections that ensure the timely payment of purchase price upon demand. | |
B-92
Table of Contents
VMIG 3: | This designation denotes acceptable credit quality. Adequate protection is afforded by the satisfactory short-term credit strength of the liquidity provider and structural and legal protections that ensure the timely payment of purchase price upon demand. | |
SG: | This designation denotes speculative-grade credit quality. Demand features rated in this category may be supported by a liquidity provider that does not have an investment grade short-term rating or may lack the structural and/or legal protections necessary to ensure the timely payment of purchase price upon demand. | |
Standard & Poor’s Ratings Services
Long-Term Issue Credit Ratings
Issue credit ratings are based, in varying degrees, on the following considerations:
| • | Likelihood of payment — capacity and willingness of the obligor to meet its financial commitment on an obligation in accordance with the terms of the obligation; |
| • | Nature of and provisions of the obligation; |
| • | Protection afforded by, and relative position of, the obligation in the event of bankruptcy, reorganization, or other arrangement under the laws of bankruptcy and other laws affecting creditors’ rights. |
Issue ratings are an assessment of default risk, but may incorporate an assessment of relative seniority or ultimate recovery in the event of default. Junior obligations are typically rated lower than senior obligations, to reflect the lower priority in bankruptcy, as noted above. (Such differentiation may apply when an entity has both senior and subordinated obligations, secured and unsecured obligations, or operating company and holding company obligations.)
Investment Grade
AAA: | An obligation rated ‘AAA’ has the highest rating assigned by Standard & Poor’s. The obligor’s capacity to meet its financial commitment on the obligation is extremely strong. | |
AA: | An obligation rated ‘AA’ differs from the highest-rated obligations only to a small degree. The obligor’s capacity to meet its financial commitment on the obligation is very strong. | |
A: | An obligation rated ‘A’ is somewhat more susceptible to the adverse effects of changes in circumstances and economic conditions than obligations in higher-rated categories. However, the obligor’s capacity to meet its financial commitment on the obligation is still strong. | |
BBB: | An obligation rated ‘BBB’ exhibits adequate protection parameters. However, adverse economic conditions or changing circumstances are more likely to lead to a weakened capacity of the obligor to meet its financial commitment on the obligation. | |
B-93
Table of Contents
Speculative Grade
Obligations rated ‘BB’, ‘B’, ‘CCC’, ‘CC’, and ‘C’ are regarded as having significant speculative characteristics. ‘BB’ indicates the least degree of speculation and ‘C’ the highest. While such obligations will likely have some quality and protective characteristics, these may be outweighed by large uncertainties or major exposures to adverse conditions.
BB: | An obligation rated ‘BB’ is less vulnerable to nonpayment than other speculative issues. However, it faces major ongoing uncertainties or exposure to adverse business, financial, or economic conditions which could lead to the obligor’s inadequate capacity to meet its financial commitment on the obligation. | |
B: | An obligation rated ‘B’ is more vulnerable to nonpayment than obligations rated ‘BB’, but the obligor currently has the capacity to meet its financial commitment on the obligation. Adverse business, financial, or economic conditions will likely impair the obligor’s capacity or willingness to meet its financial commitment on the obligation. | |
CCC: | An obligation rated ‘CCC’ is currently vulnerable to nonpayment, and is dependent upon favorable business, financial, and economic conditions for the obligor to meet its financial commitment on the obligation. In the event of adverse business, financial, or economic conditions, the obligor is not likely to have the capacity to meet its financial commitment on the obligation. | |
CC: | An obligation rated ‘CC’ is currently highly vulnerable to nonpayment. | |
R: | An obligor rated ‘R’ is under regulatory supervision owing to its financial condition. During the pendency of the regulatory Supervision, the regulators may have to power to favor one class of obligations over others or pay some obligations and not other. Please see standard & Poor’s issue credit ratings for a more detailed description of the effects of regulatory supervision on specific issues or classes of obligations. | |
SD and D: | An obligor rated ‘SD’ (selective default) or ‘D’ has failed to pay one or more of its financial obligations (rated or unrated) when it came due. A ‘D’ rating is assigned when standard & Poor’s believes that the default will be a general default and that the obligor will fail to pay all or substantially all of its obligations as they come due. An ‘SD’ rating is assigned when Standard & Poor’s believes that the obligor has selectively defaulted on a specific issue or Class of obligations but it will continue to meet its payment obligations on other issues or classes of obligations in a timely manner. A selective default includes the completion of a distressed exchange offer, whereby one or more financial obligation is either repurchased for an amount of cash or replaced by other instruments having a total value that is less per. Please see Standard & Poor’s issue credit ratings for a more detailed description of the effects of a default on specific issues or classes of obligations. | |
NR: | This indicates that no rating has been requested, that there is insufficient information on which to base a rating, or that Standard & Poor’s does not rate a particular obligation as a matter of policy. | |
Plus (+) or minus (-): | The ratings from ‘AA’ to ‘CCC’ may be modified by the addition of a plus (+) or minus (-) sign to show relative standing within the major rating categories. | |
Short-Term Issue Credit Ratings
A-1: | A short-term obligation rated ‘A-1’ is rated in the highest category by Standard & Poor’s. The obligor’s capacity to meet its financial commitment on the obligation is strong. Within this category, certain obligations are designated with a plus sign (+). This indicates that the obligor’s capacity to meet its financial commitment on these obligations is extremely strong. | |
A-2: | A short-term obligation rated ‘A-2’ is somewhat more susceptible to the adverse effects of changes in circumstances and economic conditions than obligations in higher rating categories. However, the obligor’s capacity to meet its financial commitment on the obligation is satisfactory. | |
B-94
Table of Contents
A-3: | A short-term obligation rated ‘A-3’ exhibits adequate protection parameters. However, adverse economic conditions or changing circumstances are more likely to lead to a weakened capacity of the obligor to meet its financial commitment on the obligation. | |
B: | A short-term obligation rated ‘B’ is regarded as vulnerable and has significant speculative characteristics. The obligor currently has the capacity to meet its financial commitments; however, it faces major ongoing uncertainties which could lead to the obligor’s inadequate capacity to meet its financial commitments. | |
C: | A short-term obligation rated ‘C’ is currently vulnerable to nonpayment and is dependent upon favorable business, financial, and economic conditions for the obligor to meet its financial commitment on the obligation. | |
D: | A short-term obligation rated ‘D’ is in default or in breach of an imputed promise. For non-hybrid capital instruments, the ‘D’ rating category is used when payments on an obligation are not made on the date due, unless Standard & Poor’s believes that such payments will be made within any stated grace period. However, any stated grace period longer than five business days will be treated as five business days. The ‘D’ rating also will be used upon the filing of a bankruptcy petition or the taking of a similar action and where default on an obligation is a virtual certainty, for example due to automatic stay provisions. An obligation’s rating is lowered to ‘D’ if it is subject to a distressed exchange offer. | |
Fitch, Inc.
Long-Term Credit Ratings
Investment Grade
AAA: | Highest credit quality. ‘AAA’ ratings denote the lowest expectation of credit risk. They are assigned only in case of exceptionally strong capacity for payment of financial commitments. This capacity is highly unlikely to be adversely affected by foreseeable events. | |
AA: | Very high credit quality. “AA” ratings denote expectations of very low credit risk. They indicate very strong capacity for timely payment of financial commitments. This capacity is not significantly vulnerable to foreseeable events. | |
A: | High credit quality. “A” ratings denote low expectation of credit risk. The capacity for timely payment of financial commitments is considered strong. This capacity may, nevertheless, be more vulnerable to adverse business or economic conditions than is the case for higher ratings. | |
BBB: | Good credit quality. “BBB” ratings indicate that expectations of credit risk are currently low. The capacity for payment of financial commitments is considered adequate, but adverse business or economic conditions are more likely to impair this capacity. | |
Speculative Grade
BB: | Speculative. ‘BB’ ratings indicate an elevated vulnerability to credit risk, particularly in the event of adverse changes in business or economic conditions over time; however, business or financial alternatives may be available to allow financial commitments to be met. | |
B: | Highly speculative. ‘B’ ratings indicate that material credit risk is present, but a limited margin of safety remains, financial commitments are currently being met; however, capacity for continued payment is vulnerable to deterioration in the business and economic environment. | |
CCC: | Substantial credit risk. Default is a real possibility. | |
CC: | Very high levels of credit risk. Default of some kind appears probable. | |
B-95
Table of Contents
C: | Exceptionally high levels of credit risk. Default is imminent or inevitable, or the issuer is in standstill. Conditions that are indicative of a “C” category rating for an issuer include: | |
| • | a. The issuer has entered into a grace or cure period following non-payment of a material financial obligation; |
| • | b. The issuer has entered into a temporary negotiated waiver or standstill agreement following a payment default on a material financial obligation; or |
| • | c. Fitch ratings otherwise believes a condition of ‘RD’ or ‘D’ to be imminent or inevitable, including through the formal announcement of a distressed debt exchange. |
D: | “Indicates an issuer that in Fitch Ratings’ opinion has entered into bankruptcy filings, administration receivorship, liquidation or other formal winding-up procedure, or which has otherwise ceased business. |
Default ratings are not assigned prospectively to entities or their obligations; within this context, non-payment on an instrument that contains a deferral feature or grace period will generally not be considered a default until after the deferral or grace period, unless a default is otherwise driven by bankruptcy or other similar circumstance, or by a distressed debt exchange.
“Imminent” default typically refers to the occasion where a payment default has been intimated by the issuer, and is all but inevitable. This may, for example, be where an issuer has missed a scheduled payment, but (as is typical) has a grace period during which it may cure the payment default. Another alternative would be where an issuer has formally announced a distressed debt exchange, but the date of the exchange still lies several days or weeks in the immediate future.
In all cases, the assignment of a default rating reflects the agency’s opinion as to the most appropriate rating category consistent with the rest of its universe of ratings, and may differ from the definition of default under the terms of an issuer’s financial obligations or local commercial practice.
Short-Term Credit Ratings
A short-term issuer or obligation rating is based in all cases on the short-term vulnerability to default of the rated entity or security stream, and relates to the capacity to meet financial obligations in accordance with the documentation governing the relevant obligation. Short-Term Ratings are assigned to obligations whose initial maturity is viewed as “short term” based on market convention. Typically, this means up to 13 months for corporate, structured and sovereign obligations, and up to 36 months for obligations in US public finance markets.
F1: | Highest short-term credit quality. Indicates the strongest intrinsic capacity for timely payment of financial commitments; may have an added “+” to denote any exceptionally strong credit feature. | |
F2: | Good short-term credit quality. Good intrinsic capacity for timely payment of financial commitments. | |
F3: | Fair short-term credit quality. The intrinsic capacity for timely payment of financial commitments is adequate. | |
B: | Speculative short-term credit quality. Minimal capacity for timely payment of financial commitments, plus heightened vulnerability to near term adverse changes in financial and economic conditions. | |
C: | High short-term default risk. Default is a real possibility. | |
RD: | Restricted default. Indicates an entity that has defaulted on one or more of its financial commitments, although it continues to meet other financial obligations. Applicable to entity ratings only. | |
D: | Default. Indicates a broad-based default event for an entity, or the default of a specific short-term obligation. | |
B-96
Table of Contents
REPORT OF INDEPENDENT REGISTERED PUBLIC ACCOUNTING FIRM AND FINANCIAL STATEMENTS
The Report of Independent Registered Public Accounting Firm and financial statements in the Annual Report of the Funds for the fiscal year ended October 31, 2014 (for all series except Thrivent Natural Resources Fund, Thrivent Growth and Income Plus Fund, and Thrivent Diversified Income Plus Fund) and December 31, 2014 (for Thrivent Natural Resources Fund, Thrivent Growth and Income Plus Fund, and Thrivent Diversified Income Plus Fund) are separate reports furnished with this SAI and are incorporated herein by reference.
B-97
Table of Contents
THRIVENT FINANCIAL FOR LUTHERANS and
THRIVENT ASSET MANAGEMENT, LLC
PROXY VOTING PROCESS AND POLICIES SUMMARY
| • | RESPONSIBILITY TO VOTE PROXIES |
Overview. Thrivent Financial for Lutherans and Thrivent Asset Management, LLC (“Thrivent Financial”) recognize and adhere to the principle that one of the privileges of owning stock in a company is the right to vote in the election of the company’s directors and on matters affecting certain important aspects of the company’s structure and operations that are submitted to shareholder vote. As an investment adviser with a fiduciary responsibility to its clients, Thrivent Financial analyzes the proxy statements of issuers whose stock is owned by the investment companies which it sponsors and serves as investment adviser (“Thrivent Funds”) and by institutional accounts who have requested that Thrivent Financial be involved in the proxy process.
Thrivent Financial has adopted Proxy Voting Policies and Procedures (“Policies and Procedures”) for the purpose of establishing formal policies and procedures for performing and documenting its fiduciary duty with regard to the voting of client proxies.
Fiduciary Considerations. It is the policy of Thrivent Financial that decisions with respect to proxy issues will be made in light of the anticipated impact of the issue on the desirability of investing in the portfolio company from the viewpoint of the particular client or Thrivent Fund. Proxies are voted solely in the interests of the client, Thrivent Fund shareholders or, where employee benefit plan assets are involved, in the interests of plan participants and beneficiaries. Thrivent Financial votes proxies, where possible to do so, in a manner consistent with its fiduciary obligations and responsibilities. Logistics involved may make it impossible at times, and at other times disadvantageous, to vote proxies in every instance.
Consideration Given Management Recommendations. One of the primary factors Thrivent Financial considers when determining the desirability of investing in a particular company is the quality and depth of its management. The Policies and Procedures were developed with the recognition that a company’s management is entrusted with the day-to-day operations of the company, as well as its long-term direction and strategic planning, subject to the oversight of the company’s board of directors. Accordingly, Thrivent Financial believes that the recommendation of management on most issues should be given weight in determining how proxy issues should be voted. However, the position of the company’s management will not be supported in any situation where it is found to be not in the best interests of the client, and Thrivent Financial reserves the right to vote contrary to management when it believes a particular proxy proposal may adversely affect the investment merits of owning stock in a portfolio company.
| • | ADMINISTRATION OF POLICIES AND PROCEDURES |
Thrivent Financial’s Compliance and Governance Committee (“Committee”) is responsible for establishing positions with respect to corporate governance and other proxy issues, including those involving social responsibility issues. Annually, the Committee reviews the proxy voting policies and procedures. As discussed below, Thrivent Financial portfolio management may, with the approval of the Committee, vote proxies other than in accordance with the proxy voting policies and procedures.
| • | HOW PROXIES ARE REVIEWED, PROCESSED AND VOTED |
In order to facilitate the proxy voting process, Thrivent Financial has retained Institutional Shareholder Services Inc. (“ISS”), an expert in the proxy voting area. ISS specializes in providing a variety of fiduciary-level proxy advisory and voting services. These services include in-depth research, analysis, and voting recommendations as well as vote execution, reporting, auditing and consulting assistance for the handling of
B-98
Table of Contents
proxy voting responsibilities. While the Committee relies upon ISS research in helping to establish Thrivent Financial’s proxy voting guidelines, Thrivent Financial may deviate from ISS recommendations on general policy issues or specific proxy proposals.
Summary of Thrivent Financial’s Voting Policies
Voting guidelines have been adopted by the Committee for routine anti-takeover, executive compensation and corporate governance proposals, as well as other common shareholder proposals. The voting guidelines are available to shareholders upon request. The following is a summary of the significant Thrivent Financial policies:
Board Structure and Composition Issues — Thrivent Financial believes boards are expected to have a majority of directors independent of management. The independent directors are expected to organize much of the board’s work, even if the chief executive officer also serves as chairman of the board. Key committees (audit, compensation, and nominating/corporate governance) of the board are expected to be entirely independent of management. It is expected that boards will engage in critical self-evaluation of themselves and of individual members. Individual directors, in turn, are expected to devote significant amounts of time to their duties, to limit the number of directorships they accept, and to own a meaningful amount of stock in companies on whose boards they serve. As such, Thrivent Financial withholds votes for directors who miss more than one-fourth of the scheduled board meetings. Thrivent Financial votes against management efforts to stagger board member terms because a staggered board may act as a deterrent to takeover proposals. For the same reasons, Thrivent Financial votes for proposals that seek to fix the size of the board.
Executive and Director Compensation — Non-salary compensation remains one of the most sensitive and visible corporate governance issues. Although shareholders have little say about how much the CEO is paid in salary and bonus, they do have a major voice in approving stock option and incentive plans. Stock option plans transfer significant amounts of wealth from shareholders to employees, and in particular to executives and directors. Rightly, the cost of these plans must be in line with the anticipated benefits to shareholders. Clearly, reasonable limits must be set on dilution as well as administrative authority. In addition, shareholders must consider the necessity of the various pay programs and examine the appropriateness of award types. Consequently, the pros and cons of these proposals necessitate a case-by-case evaluation. Generally, Thrivent Financial opposes compensation packages that provide what we view as excessive awards to a few senior executives or that contain excessively dilutive stock option grants based on a number of criteria such as the costs associated with the plan, plan features, and dilution to shareholders.
Ratification of Auditors — Annual election of the outside accountants is standard practice. While it is recognized that the company is in the best position to evaluate the competence of the outside accountants, we believe that outside accountants must ultimately be accountable to shareholders. Given the rash of accounting irregularities that were not detected by audit panels or auditors, shareholder ratification is an essential step in restoring investor confidence. In line with this, Thrivent Financial votes for proposals to ratify auditors, unless an auditor has a financial interest in or association with the company, and is therefore not independent; or there is reason to believe that the independent auditor has rendered an opinion that is neither accurate nor indicative of the company’s financial position.
Mergers and Acquisitions, Anti-Takeover and Corporate Governance Issues — Thrivent Financial votes on mergers and acquisitions on a case-by-case basis, taking the following into account: anticipated financial and operating benefits; offer price (cost vs. premium); prospects of the combined companies; how the deal was negotiated; the opinion of the financial advisor; potential conflicts of interest between management’s interests and shareholders’ interests; and changes in corporate governance and their impact on shareholder rights. Thrivent Financial generally opposes anti-takeover measures since they adversely impact shareholder rights. Also, Thrivent Financial will consider the dilutive impact to shareholders and the effect on shareholder rights when voting on corporate governance proposals.
B-99
Table of Contents
Social, Environmental and Corporate Responsibility Issues — In addition to moral and ethical considerations intrinsic to many of these proposals, Thrivent Financial recognizes their potential for impact on the economic performance of the company. Thrivent Financial balances these considerations carefully. On proposals which are primarily social, moral or ethical, Thrivent Financial believes it is impossible to vote in a manner that would accurately reflect the views of the beneficial owners of the portfolios that it manages. As such, on these items Thrivent Financial abstains. When voting on matters with apparent economic or operational impacts on the company, Thrivent Financial realizes that the precise economic effect of such proposals is often unclear. Where this is the case, Thrivent Financial relies on management’s assessment, and generally votes with company management.
Shareblocking — Shareblocking is the practice in certain foreign countries of “freezing” shares for trading purposes in order to vote proxies relating to those shares. In markets where shareblocking applies, the custodian or sub-custodian automatically freezes shares prior to a shareholder meeting once a proxy has been voted. Shareblocking typically takes place between one and fifteen (15) days before the shareholder meeting, depending on the market. In markets where shareblocking applies, there is a potential for a pending trade to fail if trade settlement takes place during the blocking period. Thrivent Financial generally abstains from voting shares in shareblocking countries unless the matter has compelling economic consequences that outweigh the loss of liquidity in the blocked shares.
Meeting Notification
Thrivent Financial utilizes ISS’ voting agent services to notify us of upcoming shareholder meetings for portfolio companies held in client accounts and to transmit votes on behalf of our clients. ISS tracks and reconciles Thrivent Financial holdings against incoming proxy ballots. If ballots do not arrive on time, ISS procures them from the appropriate custodian or proxy distribution agent. Meeting and record date information is updated daily in ProxyExchange, ISS’ web-based application. ISS is also responsible for maintaining copies of all proxy statements received by issuers and to promptly provide such materials to Thrivent Financial upon request.
Vote Determination
ISS provides comprehensive summaries of proxy proposals, publications discussing key proxy voting issues, and specific vote recommendations regarding portfolio company proxies to assist in the proxy research process. Upon request, portfolio managers may receive any or all of the above-mentioned research materials to assist in the vote determination process. The final authority and responsibility for proxy voting decisions remains with Thrivent Financial. Decisions with respect to proxy matters are made primarily in light of the anticipated impact of the issue on the desirability of investing in the company from the viewpoint of our clients.
Portfolio managers, executive officers, and directors (or persons holding equivalent positions) of Thrivent Financial and its affiliates may on any particular proxy vote request to diverge from Policies and Procedures. In such cases, the person requesting to diverge from the Policies and Procedures is required to document in writing the rationale for their vote and submit all written documentation to the Committee for review and approval. In determining whether to approve any particular request, the Committee will determine that the request is not influenced by any conflict of interest and is in the best interests of its clients.
Monitoring and Resolving Conflicts of Interest
The Committee is responsible for monitoring and resolving possible material conflicts between the interests of Thrivent Financial and those of its clients with respect to proxy voting.
Application of the Thrivent Financial guidelines to vote client proxies should in most instances adequately address any possible conflicts of interest since the voting guidelines are pre-determined by the Committee using recommendations from ISS.
B-100
Table of Contents
However, for proxy votes inconsistent with Thrivent Financial guidelines, Investment Operations gathers the documentation with respect to the portfolio manager’s voting rationale and brings it to the Committee for review for possible conflicts of interest. The Committee assesses whether any business or other relationships between Thrivent Financial and a portfolio company could have influenced an inconsistent vote on that company’s proxy.
Securities Lending
Thrivent Financial will generally not vote nor seek to recall in order to vote shares on loan, unless it determines that a vote is particularly significant. Seeking to recall securities in order to vote them even in these limited circumstances may nevertheless not result in Thrivent Financial voting the shares because the securities are unable to be recalled in time from the party with custody of the securities, or for other reasons beyond Thrivent Financial’s control.
| • | REPORTING AND RECORD RETENTION |
Proxy statements and solicitation materials received from issuers (other than those which are available on the SEC’s EDGAR database) are kept by ISS in its capacity as voting agent and are available upon request. Thrivent Financial retains documentation on shares voted differently than the Thrivent Financial voting guidelines, and any document which is material to a proxy voting decision such as the Thrivent Financial voting guidelines and the Committee meeting materials. In addition, all SEC filings with regard to proxy voting, such as Form N-PX, will be kept. All proxy voting materials and supporting documentation are retained for five years.
ISS provides Vote Summary Reports for each Thrivent Fund. The report specifies the company, ticker, cusip, meeting dates, proxy proposals, and votes which have been cast for the Thrivent Fund during the period, the position taken with respect to each issue and whether the fund voted with or against company management. Information on how each Thrivent Fund voted proxies during the most recent 12-month period ending June 30 is available at the Thrivent Financial web site or the SEC web site.
B-101
Table of Contents
Aberdeen U.S. Registered Advisers
Policy Summary on Proxy Voting
Aberdeen and its affiliated U.S. registered advisers (the “Aberdeen Advisers”) have adopted a proxy voting policy. The proxy voting policy is designed and implemented in a way that is reasonably expected to ensure that proxies are voted in the economic best interests of clients, that is, the common interest that all clients share in seeing the value of a common investment increase over time. Proxies are voted with the aim of furthering the best economic interests of clients, promoting high levels of corporate governance and adequate disclosure of company policies, activities and returns, including fair and equal treatment of stockholders.
The Aberdeen Advisers seek to develop relationships with the management of portfolio companies to encourage transparency and improvements in the treatment of employees, owners and stakeholders. Thus, the Aberdeen Advisers may engage in dialogue with the management of portfolio companies with respect to pending proxy voting issues. In voting proxies, the Adviser may conduct research internally and/or use the resources of an independent research consultant. The Aberdeen Adviser may consider legislative materials, studies of corporate governance and other proxy voting issues, and/or analyses of shareholder and management proposals by a certain sector of companies, e.g., Fortune 500 companies.
The proxy voting policy is a guideline. Each vote is ultimately cast on a case-by-case basis, taking into consideration the contractual obligations under the advisory agreement or comparable document, and all other relevant facts and circumstances at the time of the vote. The Aberdeen Advisers may cast proxy votes in favor of management proposals or seek to change the views of management, considering specific issues as they arise on their merits. The Aberdeen Advisers may also join with other investment managers in seeking to submit a shareholder proposal to a company or to oppose a proposal submitted by the company. Such action may be based on fundamental, social, environmental or human rights grounds.
Material conflicts are resolved in the best interest of clients. A material conflict of interest includes those circumstances when the Adviser or any member of senior management, portfolio manager or portfolio analyst knowingly does business with a particular proxy issuer or closely affiliated entity, which may appear to create a material conflict between the interests of the Adviser and the interests of its clients in how proxies of that issuer are voted. A material conflict of interest might also exist in unusual circumstances when the Adviser has actual knowledge of a material business arrangement between a particular proxy issuer or closely affiliated entity and an affiliate of the Adviser.
When a material conflict of interest between the Aberdeen Adviser and its client(s) is identified, the Aberdeen Adviser may choose among the following options to eliminate such conflict: (1) vote in accordance with the proxy voting policy if it involves little or no discretion; (2) vote as recommended by a third party service if the Aberdeen Adviser utilizes such a service; (3) “echo vote” or “mirror vote” the proxies in the same proportion as the votes of other proxy holders that are not the Aberdeen Adviser’s clients; (4) if possible, erect information barriers around the person or persons making voting decisions sufficient to insulate the decision from the conflict; (5) if practical, notify affected clients of the conflict of interest and seek a waiver of the conflict; or (6) if agreed upon in writing with the client, forward the proxies to affected clients allowing them to vote their own proxies.
In certain circumstances, the Aberdeen Advisers may take a limited role in voting proxies. Some of these circumstances may include when the effect on shareholders’ economic interests or the value of the portfolio holding is indeterminable or insignificant; for cost reasons (e.g., non-U.S. securities); if the securities are on loan; or if a jurisdictions has imposed share-blocking restrictions that prevents the Aberdeen Adviser from exercising its voting authority.
B-102
Table of Contents
April 2014
Goldman Sachs Asset Management
(“GSAM”)*
POLICY ON PROXY VOTING
FOR INVESTMENT ADVISORY CLIENTS
A. Objective
GSAM has adopted the policies and procedures set out below regarding the voting of proxies on securities held in client accounts (the “Policy”). These policies and procedures are designed to ensure that where GSAM has the authority to vote proxies, GSAM complies with its legal, fiduciary and contractual obligations.
B. Guiding Principles
Proxy voting and the analysis of corporate governance issues in general are important elements of the portfolio management services we provide to our advisory clients who have authorized us to address these matters on their behalf. Our guiding principles in performing proxy voting are to make decisions that favor proposals that in GSAM’s view tend to maximize a company’s shareholder value and are not influenced by conflicts of interest. These principles reflect GSAM’s belief that sound corporate governance will create a framework within which a company can be managed in the interests of its shareholders.
GSAM periodically reviews this Policy, including our use of the GSAM Guidelines (as defined below), to ensure it continues to be consistent with our guiding principles.
C. Implementation and the Proxy Voting Process
Public Equity Investments
To implement these guiding principles for investments in publicly-traded equities for which we have voting power on any record date, we follow customized proxy voting guidelines that have been developed by GSAM portfolio management (the “GSAM Guidelines”). The GSAM Guidelines embody the positions and factors GSAM generally considers important in casting proxy votes. They address a wide variety of individual topics, including, among other matters, shareholder voting rights, anti-takeover defenses, board structures, the election of directors, executive and director compensation, reorganizations, mergers, issues of corporate social responsibility and various shareholder proposals. Recognizing the complexity and fact-specific nature of many corporate governance issues, the GSAM Guidelines identify factors we consider in determining how the vote should be cast. A summary of the GSAM Guidelines is attached as Part II.
| * | For purposes of this Policy, “GSAM” refers, collectively, to the following legal entities: Goldman Sachs Asset Management, L.P.; Goldman Sachs Asset Management International; Goldman Sachs Hedge Fund Strategies LLC; GS Investment Strategies, LLC; GSAM Stable Value, LLC; Goldman Sachs (Singapore) Pte.; Goldman Sachs (Asia) L.L.C.; Goldman Sachs Asset Management Korea Co., Ltd.; Goldman Sachs Asset Management Co. Ltd.; Beijing Gao Hua Securities Company Limited; Goldman Sachs (China) L.L.C.; Goldman Sachs (India) Securities Private Limited; Goldman Sachs Asset Management (India) Private Limited; Goldman Sachs Representacoes Ltda.; Goldman Sachs Asset Management Brasil LTDA; GS Investment Strategies Canada Inc.; Goldman Sachs Management (Ireland) Ltd.; Goldman Sachs Asset Management Company Private Limited; Goldman Sachs Asset Management Australia Pty Ltd.; Goldman Sachs Australia Managed Funds Limited; Goldman Sachs Trustee Company (India) Private Limited; Goldman Sachs Global Advisory Products LLC. |
B-103
Table of Contents
The principles and positions reflected in this Policy are designed to guide us in voting proxies, and not necessarily in making investment decisions. Portfolio management teams base their determinations of whether to invest in a particular company on a variety of factors, and while corporate governance may be one such factor, it may not be the primary consideration.
Implementation by GSAM Portfolio Management Teams
General Overview
GSAM seeks to fulfill its proxy voting obligations through the implementation of this Policy and the oversight and maintenance of the GSAM Guidelines. In this connection, GSAM has retained a third-party proxy voting service (“Proxy Service”)1 to assist in the implementation of certain proxy voting-related functions, including, without limitation, operational, recordkeeping and reporting services. Among its responsibilities, the Proxy Service prepares a written analysis and recommendation (a “Recommendation”) of each proxy vote that reflects the Proxy Service’s application of the GSAM Guidelines to the particular proxy issues. GSAM retains the responsibility for proxy voting decisions.
GSAM’s portfolio management teams (each, a “Portfolio Management Team”) generally cast proxy votes consistently with the GSAM Guidelines and the Recommendations. Each Portfolio Management Team, however, may on certain proxy votes seek approval to diverge from the GSAM Guidelines or a Recommendation by following an “override” process. The override process requires: (i) the requesting Portfolio Management Team to set forth the reasons for their decision; (ii) the approval of the Chief Investment Officer for the requesting Portfolio Management Team; (iii) notification to senior management of GSAM and/or other appropriate GSAM personnel; (iv) an attestation that the decision is not influenced by any conflict of interest; and (v) the creation of a written record reflecting the process.
A Portfolio Management Team that receives approval through the override process to cast a proxy vote that diverges from the GSAM Guidelines and/or a Recommendation may vote differently than other Portfolio Management Teams that did not seek an override for that particular vote for that particular company.
Fundamental Equity and GS Investment Strategies Portfolio Management Teams
The Fundamental Equity and GS Investment Strategies Portfolio Management Teams view the analysis of corporate governance practices as an integral part of the investment research and stock valuation process. On a case-by-case basis, and subject to the approval process described above, each Fundamental Equity Portfolio Management Team and the GS Investment Strategies Portfolio Management Team may vote differently than the GSAM Guidelines or a particular Recommendation. In forming their views on particular matters, these Portfolio Management Teams may consider applicable regional rules and practices, including codes of conduct and other guides, regarding proxy voting, in addition to the GSAM Guidelines and Recommendations.
Quantitative Investment Strategies Portfolio Management Teams
The Quantitative Investment Strategies Portfolio Management Teams have decided to follow the GSAM Guidelines and Recommendations exclusively, based on such Portfolio Management Teams’ investment philosophy and approach to portfolio construction, as well as their participation in the creation of the GSAM Guidelines and their evaluation of the Proxy Service’s process of preparing Recommendations. The Quantitative Investment Strategies Portfolio Management Teams may from time to time, however, review and individually assess any specific shareholder vote.
| 1 | The third-party proxy voting service currently retained by GSAM is Institutional Shareholder Services. |
B-104
Table of Contents
Potential Limitations on GSAM’s Ability to Vote Proxies
In certain circumstances, such as if a security is on loan through a securities lending program or held by a prime broker, the Portfolio Management Teams may not be able to participate in certain proxy votes unless the shares of the particular issuer are recalled in time to cast a vote. A determination of whether to seek a recall will be based on whether the applicable Portfolio Management Team determines that the benefit of voting outweighs the costs, lost revenue, and/or other detriments of retrieving the securities, recognizing that the handling of such recall requests is beyond GSAM’s control and may not be satisfied in time for GSAM to vote the shares in question.
From time to time, GSAM may face regulatory, compliance, legal or logistical limits with respect to voting securities that it may purchase or hold for client accounts which can affect GSAM’s ability to vote such proxies, as well as the desirability of voting such proxies. As a result, GSAM, from time to time, may determine that it is not desirable to vote proxies in certain circumstances. Among other limits, federal, state, foreign regulatory restrictions, or company-specific ownership limits, as well as legal matters related to consolidated groups, may restrict the total percentage of an issuer’s voting securities that GSAM can hold for clients and the nature of GSAM’s voting in such securities. GSAM’s ability to vote proxies may also be affected by, among other things: (i) meeting notices received too late; (ii) requirements to vote proxies in person; (iii) restrictions on a foreigner’s ability to exercise votes; (iv) potential difficulties in translating the proxy; (v) requirements to provide local agents with unrestricted powers of attorney to facilitate voting instructions; and (vi) requirements that investors who exercise their voting rights surrender the right to dispose of their holdings for some specified period in proximity to the shareholder meeting.
GSAM clients who have delegated voting responsibility to GSAM with respect to their account may from time to time contact their client representative if they would like to direct GSAM to vote in a particular manner for a particular solicitation. GSAM will use commercially reasonable efforts to vote according to the client’s request in these circumstances, however, GSAM’s ability to implement such voting instruction will be dependent on operational matters such as the timing of the request.
Use of a Proxy Service
As discussed above, GSAM utilizes a Proxy Service to assist in the implementation and administration of GSAM’s proxy voting function. The Proxy Service assists GSAM in the proxy voting process by providing operational, recordkeeping and reporting services. In addition, the Proxy Service produces Recommendations as previously discussed under this Policy and provides assistance in the development and maintenance of the GSAM Guidelines. GSAM conducts periodic due diligence meetings with the Proxy Service which include, but are not limited to, a review of the Proxy Service’s general organizational structure, new developments with respect to research and technology, work flow improvements and internal due diligence with respect to conflicts of interest.
GSAM may hire other service providers to replace or supplement the Proxy Service with respect to any of the services GSAM currently receives from the Proxy Service. In addition, individual Portfolio Management Teams may supplement the information and analyses the Proxy Service provides from other sources.
Fixed Income and Private Investments
Voting decisions with respect to client investments in fixed income securities and the securities of privately-held issuers generally will be made by the relevant Portfolio Management Teams based on their assessment of the particular transactions or other matters at issue. Such Portfolio Management Teams may also adopt policies related to the fixed income or private investments they make that supplement this Policy.
B-105
Table of Contents
Alternative Investment and Manager Selection (“AIMS”) and Externally Managed Strategies
Where GSAM places client assets with managers outside of GSAM, which function occurs primarily within GSAM’s AIMS business unit, such external managers generally will be responsible for voting proxies in accordance with the managers’ own policies. AIMS may, however, retain proxy voting responsibilities where it deems appropriate or necessary under prevailing circumstances. To the extent AIMS portfolio managers assume proxy voting responsibility with respect to publicly-traded equity securities they will follow the GSAM Guidelines and Recommendations as discussed above unless an override is requested. Any other voting decision will be conducted in accordance with AIMS’ policies governing voting decisions with respect to non-publicly traded equity securities held by their clients.
D. Conflicts of Interest
Pursuant to this Policy, GSAM has implemented processes designed to prevent conflicts of interest from influencing its proxy voting decisions. These processes include the use of the GSAM Guidelines and Recommendations and the override process described above in instances when a Portfolio Management Team is interested in voting in a manner that diverges from the GSAM Guidelines and/or a Recommendation.
B-106
Table of Contents
Part II
GSAM Proxy Voting Guidelines Summary
The following is a summary of the material GSAM Proxy Voting Guidelines (the “Guidelines”), which form the substantive basis of GSAM’s Policy on Proxy Voting for Client Accounts (“Policy”). As described in the main body of the Policy, one or more GSAM portfolio management teams may diverge from the Guidelines and a related Recommendation on any particular proxy vote or in connection with any individual investment decision in accordance with the Policy.
| A. US proxy items: | ||||
1. Operational Items | page 4 | |||
2. Board of Directors | page 5 | |||
3. Executive Compensation | page 7 | |||
4. Proxy Contests and Access | page 10 | |||
5. Shareholder Rights and Defenses | page 10 | |||
6. Mergers and Corporate Restructurings | page 11 | |||
7. State of Incorporation | page 11 | |||
8. Capital Structure | page 12 | |||
9. Corporate Social Responsibility (CSR)/Environmental, Social, Governance (ESG) Issues | page 12 | |||
| B. Non-U.S. proxy items: | ||||
1. Operational Items | page 14 | |||
2. Board of Directors | page 15 | |||
3. Compensation | page 17 | |||
4. Board Structure | page 18 | |||
5. Capital Structure | page 18 | |||
6. Mergers and Corporate Restructurings & Other | page 20 | |||
7. Corporate Social Responsibility (CSR)/Environmental, Social, Governance (ESG) Issues | page 21 | |||
U.S. Proxy Items
The following section is a summary of the Guidelines, which form the substantive basis of the Policy with respect to U.S. public equity investments.
1. Operational Items
Auditor Ratification
Vote FOR proposals to ratify auditors, unless any of the following apply within the last year:
| • | An auditor has a financial interest in or association with the company, and is therefore not independent; |
| • | There is reason to believe that the independent auditor has rendered an opinion which is neither accurate nor indicative of the company’s financial position; |
| • | Poor accounting practices are identified that rise to a serious level of concern, such as: fraud; misapplication of GAAP; or material weaknesses identified in Section 404 disclosures; or |
| • | Fees for non-audit services are excessive (generally over 50% or more of the audit fees). |
Vote CASE-BY-CASE on shareholder proposals asking companies to prohibit or limit their auditors from engaging in non-audit services or asking for audit firm rotation.
B-107
Table of Contents
2. Board of Directors
The Board of Directors should promote the interests of shareholders by acting in an oversight and/or advisory role; the board should consist of a majority of independent directors and should be held accountable for actions and results related to their responsibilities. When evaluating board composition, GSAM believes a diversity of ethnicity, gender and experience is an important consideration.
Classification of Directors
Where applicable, the New York Stock Exchange or NASDAQ Listing Standards definition is to be used to classify directors as insiders or affiliated outsiders. General definitions are as follows:
| • | Inside Director |
| • | Employee of the company or one of its affiliates |
| • | Among the five most highly paid individuals (excluding interim CEO) |
| • | Listed as an officer as defined under Section 16 of the Securities and Exchange Act of 1934 |
| • | Current interim CEO |
| • | Beneficial owner of more than 50 percent of the company’s voting power (this may be aggregated if voting power is distributed among more than one member of a defined group) |
| • | Affiliated Outside Director |
| • | Board attestation that an outside director is not independent |
| • | Former CEO or other executive of the company within the last 3 years |
| • | Former CEO or other executive of an acquired company within the past three years |
| • | Independent Outside Director |
| • | No material connection to the company other than a board seat |
Additionally, GSAM will consider compensation committee interlocking directors to be affiliated (defined as CEOs who sit on each other’s compensation committees).
Voting on Director Nominees in Uncontested Elections
Vote on director nominees should be determined on a CASE-BY-CASE basis.
Vote AGAINST or WITHHOLD from individual directors who:
| • | Attend less than 75 percent of the board and committee meetings without a disclosed valid excuse for each of the last two years; |
| • | Sit on more than six public operating and/or holding company boards; |
| • | Are CEOs of public companies who sit on the boards of more than two public companies besides their own — withhold only at their outside boards. |
Other items considered for an AGAINST vote include specific concerns about the individual or the company, such as criminal wrongdoing or breach of fiduciary responsibilities, sanctions from government or authority, violations of laws and regulations, or other issues related to improper business practice.
Vote AGAINST or WITHHOLD from Inside Directors and Affiliated Outside Directors (per the Classification of Directors above) in the case of operating and/or holding companies when:
| • | The Inside Director or Affiliated Outside Director serves on the Audit, Compensation, or Nominating Committees (vote against Affiliated Outside Directors only for nominating committee); |
B-108
Table of Contents
| • | The company lacks an Audit or Compensation Committee so that the full board functions as such committees and Insider Directors are participating in voting on matters that independent committees should be voting on; |
| • | The full board is less than majority independent (in this case withhold from Affiliated Outside Directors); at controlled companies, GSAM will first vote against the election of an Inside Director, other than the CEO or chairperson or second, against a nominee that is affiliated with the controlling shareholder or third, vote against a nominee affiliated with the company for any other reason. |
Vote AGAINST or WITHHOLD from members of the appropriate committee for the following reasons (or independent chairman or lead director in cases of a classified board and members of appropriate committee are not up for reelection). Extreme cases may warrant a vote against the entire board.
| • | Material failures of governance, stewardship, or fiduciary responsibilities at the company; |
| • | Egregious actions related to the director(s)’ service on other boards that raise substantial doubt about his or her ability to effectively oversee management and serve the best interests of shareholders at any company; |
| • | At the previous board election, any director received more than 50 percent withhold/against votes of the shares cast and the company has failed to address the underlying issue(s) that caused the high withhold/against vote (members of the Nominating or Governance Committees); |
| • | The board failed to act on a shareholder proposal that received approval of the majority of shares cast for the previous two consecutive years (a management proposal with other than a FOR recommendation by management will not be considered as sufficient action taken); an adopted proposal that is substantially similar to the original shareholder proposal will be deemed sufficient; (vote against members of the committee of the board that is responsible for the issue under consideration). If GSAM did not support the shareholder proposal in both years, GSAM will still vote against the committee member(s). |
Vote AGAINST or WITHHOLD from the members of the Audit Committee if:
| • | The non-audit fees paid to the auditor are excessive (generally over 50% or more of the audit fees); |
| • | The company receives an adverse opinion on the company’s financial statements from its auditor and there is not clear evidence that the situation has been remedied; or |
| • | There is persuasive evidence that the Audit Committee entered into an inappropriate indemnification agreement with its auditor that limits the ability of the company, or its shareholders, to pursue legitimate legal recourse against the audit firm. |
Vote CASE-BY-CASE on members of the Audit Committee and/or the full board if poor accounting practices, which rise to a level of serious concern are identified, such as fraud, misapplication of GAAP and material weaknesses identified in Section 404 disclosures.
Examine the severity, breadth, chronological sequence and duration, as well as the company’s efforts at remediation or corrective actions, in determining whether negative vote recommendations are warranted against the members of the Audit Committee who are responsible for the poor accounting practices, or the entire board.
See section 3 on executive and director compensation for reasons to withhold from members of the Compensation Committee.
B-109
Table of Contents
In limited circumstances, GSAM may vote AGAINST or WITHHOLD from all nominees of the board of directors (except from new nominees who should be considered on a CASE-BY-CASE basis and except as discussed below) if:
| • | The company’s poison pill has a dead-hand or modified dead-hand feature for two or more years. Vote against/withhold every year until this feature is removed; however, vote against the poison pill if there is one on the ballot with this feature rather than the director; |
| • | The board adopts or renews a poison pill without shareholder approval, does not commit to putting it to shareholder vote within 12 months of adoption (or in the case of an newly public company, does not commit to put the pill to a shareholder vote within 12 months following the IPO), or reneges on a commitment to put the pill to a vote, and has not yet received a withhold/against recommendation for this issue; |
| • | The board failed to act on takeover offers where the majority of the shareholders tendered their shares; |
| • | If in an extreme situation the board lacks accountability and oversight, coupled with sustained poor performance relative to peers. |
Shareholder proposal regarding Independent Chair (Separate Chair/CEO)
Vote on a CASE-BY-CASE basis.
GSAM will generally recommend a vote AGAINST shareholder proposals requiring that the chairman’s position be filled by an independent director, if the company satisfies 3 of the 4 following criteria:
| • | Designated lead director, elected by and from the independent board members with clearly delineated and comprehensive duties; |
| • | Two-thirds independent board; |
| • | All independent “key” committees (audit, compensation and nominating committees); or |
| • | Established, disclosed governance guidelines. |
Shareholder proposal regarding board declassification
GSAM will generally vote FOR proposals requesting that the board adopt a declassified structure in the case of operating and holding companies.
Majority Vote Shareholder Proposals
GSAM will vote FOR proposals requesting that the board adopt majority voting in the election of directors provided it does not conflict with the state law where the company is incorporated.
GSAM also looks for companies to adopt a post-election policy outlining how the company will address the situation of a holdover director.
Cumulative Vote Shareholder Proposals
GSAM will generally support shareholder proposals to restore or provide cumulative voting in the case of operating and holding companies unless:
| • | The company has adopted (i) majority vote standard with a carve-out for plurality voting in situations where there are more nominees than seats and (ii) a director resignation policy to address failed elections. |
B-110
Table of Contents
3. Executive Compensation
Pay Practices
Good pay practices should align management’s interests with long-term shareholder value creation. Detailed disclosure of compensation criteria is preferred; proof that companies follow the criteria should be evident and retroactive performance target changes without proper disclosure is not viewed favorably. Compensation practices should allow a company to attract and retain proven talent. Some examples of poor pay practices include: abnormally large bonus payouts without justifiable performance linkage or proper disclosure, egregious employment contracts, excessive severance and/or change in control provisions, repricing or replacing of underwater stock options/stock appreciation rights without prior shareholder approval, and excessive perquisites. A company should also have an appropriate balance of short-term vs. long-term metrics and the metrics should be aligned with business goals and objectives.
If the company maintains problematic or poor pay practices, generally vote:
| • | AGAINST Management Say on Pay (MSOP) Proposals; or |
| • | AGAINST an equity-based incentive plan proposal if excessive non-performance-based equity awards are the major contributor to a pay-for-performance misalignment. |
| • | If no MSOP or equity-based incentive plan proposal item is on the ballot, vote AGAINST/WITHHOLD from compensation committee members. |
Equity Compensation Plans
Vote CASE-BY-CASE on equity-based compensation plans. Reasons to vote AGAINST the equity plan could include the following factors:
| • | The plan permits the repricing of stock options/stock appreciation rights (SARs) without prior shareholder approval; |
| • | The plan is a vehicle for poor pay practices; or |
| • | There is more than one problematic feature of the plan, which could include one of the following calculations materially exceeding industry group metrics (i) the company’s three year burn rate or (ii) Shareholder Value Transfer (SVT). |
Advisory Vote on Executive Compensation (Say-on-Pay, MSOP) Management Proposals
Vote FOR annual frequency and AGAINST shareholder or management proposals asking for any frequency less than annual.
Vote CASE-BY-CASE on management proposals for an advisory vote on executive compensation. For U.S. companies, consider the following factors in the context of each company’s specific circumstances and the board’s disclosed rationale for its practices. In general more than one factor will need to be present in order to warrant a vote AGAINST.
Pay-for-Performance Disconnect:
| • | GSAM will consider there to be a disconnect based on a quantitative assessment of the following: CEO pay vs. TSR and peers, CEO pay as a percentage of the median peer group or CEO pay vs. shareholder return over time. |
B-111
Table of Contents
Additional Factors Considered Include:
| • | Boards responsiveness if company received 70% or less shareholder support in the previous year’s MSOP vote; |
| • | Abnormally large bonus payouts without justifiable performance linkage or proper disclosure; |
| • | Egregious employment contracts; |
| • | Excessive perquisites or excessive severance and/or change in control provisions; |
| • | Repricing or replacing of underwater stock options without prior shareholder approval; |
| • | Excessive pledging or hedging of stock by executives; |
| • | Egregious pension/SERP (supplemental executive retirement plan) payouts; |
| • | Extraordinary relocation benefits; |
| • | Internal pay disparity; |
| • | Lack of transparent disclosure of compensation philosophy and goals and targets, including details on short-term and long-term performance incentives; and |
| • | Long-term equity-based compensation is 100% time-based. |
Other Compensation Proposals and Policies
Employee Stock Purchase Plans — Non-Qualified Plans
Vote CASE-BY-CASE on nonqualified employee stock purchase plans taking into account the following factors:
| • | Broad-based participation; |
| • | Limits on employee contributions; |
| • | Company matching contributions; and |
| • | Presence of a discount on the stock price on the date of purchase. |
Option Exchange Programs/Repricing Options
Vote CASE-BY-CASE on management proposals seeking approval to exchange/reprice options, taking into consideration:
| • | Historic trading patterns — the stock price should not be so volatile that the options are likely to be back “in-the-money” over the near term; |
| • | Rationale for the re-pricing; |
| • | If it is a value-for-value exchange; |
| • | If surrendered stock options are added back to the plan reserve; |
| • | Option vesting; |
| • | Term of the option — the term should remain the same as that of the replaced option; |
| • | Exercise price — should be set at fair market or a premium to market; |
| • | Participants — executive officers and directors should be excluded. |
Vote FOR shareholder proposals to put option repricings to a shareholder vote.
B-112
Table of Contents
Other Shareholder Proposals on Compensation
Advisory Vote on Executive Compensation (Frequency on Pay)
Vote FOR annual frequency.
Stock retention holding period
Vote FOR shareholder proposals asking for a policy requiring that senior executives retain a significant percentage of shares acquired through equity compensation programs if the policy requests retention for two years or less following the termination of their employment (through retirement or otherwise) and a holding threshold percentage of 50% or less.
Also consider:
| • | Whether the company has any holding period, retention ratio, or officer ownership requirements in place and the terms/provisions of awards already granted. |
Elimination of accelerated vesting in the event of a change in control
Vote AGAINST shareholder proposals seeking a policy eliminating the accelerated vesting of time-based equity awards in the event of a change-in-control.
Performance-based equity awards and pay-for-superior-performance proposals
Generally support unless there is sufficient evidence that the current compensation structure is already substantially performance-based. GSAM considers performance-based awards to include awards that are tied to shareholder return or other metrics that are relevant to the business.
Say on Supplemental Executive Retirement Plans (SERP)
Generally vote AGAINST proposals asking for shareholder votes on SERP.
4. Proxy Contests and Access
Voting for Director Nominees in Contested Elections
Vote CASE-BY-CASE on the election of directors of operating and holding companies in contested elections, considering the following factors:
| • | Long-term financial performance of the target company relative to its industry; |
| • | Management’s track record; |
| • | Background to the proxy contest; |
| • | Qualifications of director nominees (both slates); |
| • | Strategic plan of dissident slate and quality of critique against management; |
| • | Likelihood that the proposed goals and objectives can be achieved (both slates); |
| • | Likelihood that the Board will be productive as a result; |
| • | Stock ownership positions. |
Proxy Access
Vote CASE-BY-CASE on shareholder or management proposals asking for proxy access.
B-113
Table of Contents
GSAM may support proxy access as an important right for shareholders of operating and holding companies and as an alternative to costly proxy contests and as a method for GSAM to vote for directors on an individual basis, as appropriate, rather than voting on one slate or the other. While this could be an important shareholder right, the following will be taken into account when evaluating the shareholder proposals:
| • | The ownership thresholds, percentage and duration proposed (GSAM will not support if the ownership threshold is less than 3%); |
| • | The maximum proportion of directors that shareholders may nominate each year (GSAM will not support if the proportion of directors is greater than 25%); |
| • | The method of determining which nominations should appear on the ballot if multiple shareholders submit nominations; and |
| • | The governance of the company in question. |
Reimbursing Proxy Solicitation Expenses
Vote CASE-BY-CASE on proposals to reimburse proxy solicitation expenses. When voting in conjunction with support of a dissident slate, vote FOR the reimbursement of all appropriate proxy solicitation expenses associated with the election.
5. Shareholders Rights & Defenses
Shareholder Ability to Act by Written Consent
In the case of operating and holding companies, generally vote FOR shareholder proposals that provide shareholders with the ability to act by written consent, unless:
| • | The company already gives shareholders the right to call special meetings at a threshold of 25% or lower; and |
| • | The company has a history of strong governance practices. |
Shareholder Ability to Call Special Meetings
In the case of operating and holding companies, generally vote FOR management proposals that provide shareholders with the ability to call special meetings.
In the case of operating and holding companies, generally vote FOR shareholder proposals that provide shareholders with the ability to call special meetings at a threshold of 25% or lower if the company currently does not give shareholders the right to call special meetings. However, if a company already gives shareholders the right to call special meetings at a threshold of at least 25%, do not support shareholder proposals to further reduce the threshold.
Advance Notice Requirements for Shareholder Proposals/Nominations
In the case of operating and holding companies, vote CASE-BY-CASE on advance notice proposals, giving support to proposals that allow shareholders to submit proposals/nominations reasonably close to the meeting date and within the broadest window possible, recognizing the need to allow sufficient notice for company, regulatory and shareholder review.
Poison Pills
Vote FOR shareholder proposals requesting that the company submit its poison pill to a shareholder vote or redeem it UNLESS the company has: (1) A shareholder-approved poison pill in place; or (2) the company has
B-114
Table of Contents
adopted a policy concerning the adoption of a pill in the future specifying certain shareholder friendly provisions.
Vote FOR shareholder proposals calling for poison pills to be put to a vote within a time period of less than one year after adoption.
Vote CASE-BY-CASE on management proposals on poison pill ratification, focusing on the features of the shareholder rights plan.
In addition, the rationale for adopting the pill should be thoroughly explained by the company. In examining the request for the pill, take into consideration the company’s existing governance structure, including: board independence, existing takeover defenses, and any problematic governance concerns.
6. Mergers and Corporate Restructurings
Vote CASE-BY-CASE on mergers and acquisitions taking into account the following based on publicly available information:
| • | Valuation; |
| • | Market reaction; |
| • | Strategic rationale; |
| • | Management’s track record of successful integration of historical acquisitions; |
| • | Presence of conflicts of interest; and |
| • | Governance profile of the combined company. |
7. State of Incorporation
Reincorporation Proposals
GSAM may support management proposals to reincorporate as long as the reincorporation would not substantially diminish shareholder rights. GSAM may not support shareholder proposals for reincorporation unless the current state of incorporation is substantially less shareholder friendly than the proposed reincorporation, there is a strong economic case to reincorporate or the company has a history of making decisions that are not shareholder friendly.
Exclusive venue for shareholder lawsuits
Generally vote FOR on exclusive venue proposals, taking into account:
| • | Whether the company has been materially harmed by shareholder litigation outside its jurisdiction of incorporation, based on disclosure in the company’s proxy statement; |
| • | Whether the company has the following good governance features: |
| • | Majority independent board; |
| • | Independent key committees; |
| • | An annually elected board; |
| • | A majority vote standard in uncontested director elections; |
| • | The absence of a poison pill, unless the pill was approved by shareholder; and/or |
| • | Separate Chairman CEO role or, if combined, an independent chairman with clearly delineated duties. |
B-115
Table of Contents
8. Capital Structure
Common Stock Authorization
Votes on proposals to increase the number of shares of common stock authorized for issuance are determined on a CASE-BY-CASE basis. We consider company-specific factors that include, at a minimum, the following:
| • | Past Board performance; |
| • | The company’s use of authorized shares during the last three years; |
| • | One- and three-year total shareholder return; |
| • | The board’s governance structure and practices; |
| • | The current request; |
| • | Disclosure in the proxy statement of specific reasons for the proposed increase; |
| • | The dilutive impact of the request as determined through an allowable increase, which examines the company’s need for shares and total shareholder returns; and |
| • | Risks to shareholders of not approving the request. |
9. Corporate Social Responsibility (CSR)/Environmental, Social, Governance (ESG) Issues
Overall Approach
GSAM recognizes that Environmental, Social and Governance (ESG) factors can affect investment performance, expose potential investment risks and provide an indication of management excellence and leadership. When evaluating ESG proxy issues, GSAM balances the purpose of a proposal with the overall benefit to shareholders.
Shareholder proposals considered under this category could include, among others, reports asking for details on 1) employee labor and safety policies; 2) impact on the environment of the company’s oil sands or fracturing operations; 3) water-related risks or 4) societal impact of products manufactured.
When evaluating social and environmental shareholder proposals the following factors are generally considered:
| • | Whether adoption of the proposal is likely to enhance or protect shareholder value; |
| • | Whether the information requested concerns business issues that relate to a meaningful percentage of the company’s business; |
| • | The degree to which the company’s stated position on the issues raised in the proposal could affect its reputation or sales, or leave it vulnerable to a boycott or selective purchasing; |
| • | Whether the company has already responded in some appropriate manner to the request embodied in the proposal; |
| • | What other companies in the relevant industry have done in response to the issue addressed in the proposal; |
| • | Whether the proposal itself is well framed and the cost of preparing the report is reasonable; |
| • | Whether the subject of the proposal is best left to the discretion of the board; |
| • | Whether the company has material fines or violations in the area and if so, if appropriate actions have already been taken to remedy going forward; |
| • | Whether the requested information is available to shareholders either from the company or from a publicly available source; and |
B-116
Table of Contents
| • | Whether providing this information would reveal proprietary or confidential information that would place the company at a competitive disadvantage. |
Sustainability, climate change reporting
Generally vote FOR proposals requesting the company to report on its policies, initiatives and oversight mechanisms related to social, economic, and environmental sustainability, or how the company may be impacted by climate change. The following factors will be considered:
| • | The company’s current level of publicly-available disclosure including if the company already discloses similar information through existing reports or policies |
| • | If the company has formally committed to the implementation of a reporting program based on Global Reporting Initiative (GRI) guidelines or a similar standard within a specified time frame; |
| • | If the company’s current level of disclosure is comparable to that of its industry peers; and |
| • | If there are significant controversies, fines, penalties, or litigation associated with the company’s environmental performance. |
Establishing goals or targets for emissions reduction
Vote CASE-BY-CASE on proposals that call for the adoption of Greenhouse Gas (“GHG”) reduction goals from products and operations, taking into account:
| • | Overly prescriptive requests for the reduction in GHG emissions by specific amounts or within a specific time frame; |
| • | Whether company disclosure lags behind industry peers; |
| • | Whether the company has been the subject of recent, significant violations, fines, litigation, or controversy related to GHG emissions; |
| • | The feasibility of reduction of GHGs given the company’s product line and current technology and; |
| • | Whether the company already provides meaningful disclosure on GHG emissions from its products and operations. |
Political Contributions and Trade Association Spending/Lobbying Expenditures and Initiatives
Generally vote AGAINST proposals asking the company to affirm political nonpartisanship in the workplace so long as:
| • | There are no recent, significant controversies, fines or litigation regarding the company’s political contributions or trade association spending; and |
| • | The company has procedures in place to ensure that employee contributions to company-sponsored political action committees (PACs) are strictly voluntary and prohibits coercion. |
Vote CASE-BY-CASE on proposals to improve the disclosure of a company’s political contributions and trade association spending, considering:
| • | Recent significant controversy or litigation related to the company’s political contributions or governmental affairs; |
| • | The public availability of a company policy on political contributions and trade association spending including information on the types of organizations supported, the business rationale for supporting these organizations, and the oversight and compliance procedures related to such expenditures of corporate assets. |
B-117
Table of Contents
GSAM will not necessarily vote for the proposal merely to encourage further disclosure of trade association or lobbying spending.
Vote AGAINST proposals barring the company from making political contributions. Businesses are affected by legislation at the federal, state, and local level and barring political contributions can put the company at a competitive disadvantage.
Gender Identity and Sexual Orientation
A company should have a clear, public Equal Employment Opportunity (EEO) statement and/or diversity policy. Generally vote FOR proposals seeking to amend a company’s EEO statement or diversity policies to additionally prohibit discrimination based on sexual orientation and/or gender identity.
Labor and Human Rights Standards
Generally vote FOR proposals requesting a report or implementation of a policy on company or company supplier labor and/or human rights standards and policies unless such information is already publicly disclosed considering:
| • | The degree to which existing relevant policies and practices are disclosed; |
| • | Whether or not existing relevant policies are consistent with internationally recognized standards; |
| • | Whether company facilities and those of its suppliers are monitored and how; |
| • | Company participation in fair labor organizations or other internationally recognized human rights initiatives; |
| • | Scope and nature of business conducted in markets known to have higher risk of workplace labor/human rights abuse; |
| • | Recent, significant company controversies, fines, or litigation regarding human rights at the company or its suppliers; |
| • | The scope of the request; and |
| • | Deviation from industry sector peer company standards and practices. |
Non-U.S. Proxy Items
The following section is a broad summary of the Guidelines, which form the basis of the Policy with respect to non-U.S. public equity investments. Applying these guidelines is subject to certain regional and country-specific exceptions and modifications and is not inclusive of all considerations in each market.
1. Operational Items
Financial Results/Director and Auditor Reports
Vote FOR approval of financial statements and director and auditor reports, unless:
| • | There are concerns about the accounts presented or audit procedures used; or |
| • | The company is not responsive to shareholder questions about specific items that should be publicly disclosed. |
B-118
Table of Contents
Appointment of Auditors and Auditor Fees
Vote FOR the re-election of auditors and proposals authorizing the board to fix auditor fees, unless:
| • | There are serious concerns about the accounts presented, audit procedures used or audit opinion rendered; |
| • | There is reason to believe that the auditor has rendered an opinion, which is neither accurate nor indicative of the company’s financial position; |
| • | Name of the proposed auditor has not been published; |
| • | The auditors are being changed without explanation; non-audit-related fees are substantial or are in excess of standard annual audit-related fees; or the appointment of external auditors if they have previously served the company in an executive capacity or can otherwise be considered affiliated with the company. |
Appointment of Statutory Auditors
Vote FOR the appointment or reelection of statutory auditors, unless:
| • | There are serious concerns about the statutory reports presented or the audit procedures used; |
| • | Questions exist concerning any of the statutory auditors being appointed; or |
| • | The auditors have previously served the company in an executive capacity or can otherwise be considered affiliated with the company. |
Allocation of Income
Vote FOR approval of the allocation of income, unless:
| • | The dividend payout ratio has been consistently low without adequate explanation; or |
| • | The payout is excessive given the company’s financial position. |
Stock (Scrip) Dividend Alternative
Vote FOR most stock (scrip) dividend proposals.
Vote AGAINST proposals that do not allow for a cash option unless management demonstrates that the cash option is harmful to shareholder value.
Amendments to Articles of Association
Vote amendments to the articles of association on a CASE-BY-CASE basis.
Change in Company Fiscal Term
Vote FOR resolutions to change a company’s fiscal term unless a company’s motivation for the change is to postpone its AGM.
Lower Disclosure Threshold for Stock Ownership
Vote AGAINST resolutions to lower the stock ownership disclosure threshold below 5 percent unless specific reasons exist to implement a lower threshold.
Amend Quorum Requirements
Vote proposals to amend quorum requirements for shareholder meetings on a CASE-BY-CASE basis.
B-119
Table of Contents
Transact Other Business
Vote AGAINST other business when it appears as a voting item.
2. Board of Directors
Director Elections
Vote FOR management nominees taking into consideration the following:
| • | Adequate disclosure has not been provided in a timely manner; or |
| • | There are clear concerns over questionable finances or restatements; or |
| • | There have been questionable transactions or conflicts of interest; or |
| • | There are any records of abuses against minority shareholder interests; or |
| • | The board fails to meet minimum corporate governance standards. or |
| • | There are reservations about: |
| • | Director terms |
| • | Bundling of proposals to elect directors |
| • | Board independence |
| • | Disclosure of named nominees |
| • | Combined Chairman/CEO |
| • | Election of former CEO as Chairman of the Board |
| • | Overboarded directors |
| • | Composition of committees |
| • | Director independence |
| • | Specific concerns about the individual or company, such as criminal wrongdoing or breach of fiduciary responsibilities; or |
| • | Repeated absences at board meetings have not been explained (in countries where this information is disclosed); or |
| • | Unless there are other considerations which may include sanctions from government or authority, violations of laws and regulations, or other issues related to improper business practice, failure to replace management, or egregious actions related to service on other boards. |
Vote on a CASE-BY-CASE basis in contested elections of directors, e.g., the election of shareholder nominees or the dismissal of incumbent directors, determining which directors are best suited to add value for shareholders.
The analysis will generally be based on, but not limited to, the following major decision factors:
| • | Company performance relative to its peers; |
| • | Strategy of the incumbents versus the dissidents; |
| • | Independence of board candidates; |
| • | Experience and skills of board candidates; |
| • | Governance profile of the company; |
| • | Evidence of management entrenchment; |
B-120
Table of Contents
| • | Responsiveness to shareholders; |
| • | Whether a takeover offer has been rebuffed; |
| • | Whether minority or majority representation is being sought. |
Vote FOR employee and/or labor representatives if they sit on either the audit or compensation committee and are required by law to be on those committees.
Vote AGAINST employee and/or labor representatives if they sit on either the audit or compensation committee, if they are not required to be on those committees.
Classification of directors
Executive Director
| • | Employee or executive of the company; |
| • | Any director who is classified as a non-executive, but receives salary, fees, bonus, and/or other benefits that are in line with the highest-paid executives of the company. |
Non-Independent Non-Executive Director (NED)
| • | Any director who is attested by the board to be a non-independent NED; |
| • | Any director specifically designated as a representative of a significant shareholder of the company; |
| • | Any director who is also an employee or executive of a significant shareholder of the company; |
| • | Beneficial owner (direct or indirect) of at least 10% of the company’s stock, either in economic terms or in voting rights (this may be aggregated if voting power is distributed among more than one member of a defined group, e.g., family members who beneficially own less than 10% individually, but collectively own more than 10%), unless market best practice dictates a lower ownership and/or disclosure threshold (and in other special market-specific circumstances); |
| • | Government representative; |
| • | Currently provides (or a relative provides) professional services to the company, to an affiliate of the company, or to an individual officer of the company or of one of its affiliates in excess of $10,000 per year; |
| • | Represents customer, supplier, creditor, banker, or other entity with which company maintains transactional/commercial relationship (unless company discloses information to apply a materiality test); |
| • | Any director who has conflicting or cross-directorships with executive directors or the chairman of the company; |
| • | Relative of a current employee of the company or its affiliates; |
| • | Relative of a former executive of the company or its affiliates; |
| • | A new appointee elected other than by a formal process through the General Meeting (such as a contractual appointment by a substantial shareholder); |
| • | Founder/co-founder/member of founding family but not currently an employee; |
| • | Former executive (5 year cooling off period); |
| • | Years of service is generally not a determining factor unless it is recommended best practice in a market and/or in extreme circumstances, in which case it may be considered; and |
| • | Any additional relationship or principle considered to compromise independence under local corporate governance best practice guidance. |
B-121
Table of Contents
Independent NED
| • | No material connection, either directly or indirectly, to the company other than a board seat. |
Employee Representative
| • | Represents employees or employee shareholders of the company (classified as “employee representative” but considered a non-independent NED). |
Discharge of Directors
Generally vote FOR the discharge of directors, including members of the management board and/or supervisory board, unless there is reliable information about significant and compelling controversies that the board is not fulfilling its fiduciary duties warranted by:
| • | A lack of oversight or actions by board members which invoke shareholder distrust related to malfeasance or poor supervision, such as operating in private or company interest rather than in shareholder interest; or |
| • | Any legal issues (e.g., civil/criminal) aiming to hold the board responsible for breach of trust in the past or related to currently alleged actions yet to be confirmed (and not only the fiscal year in question), such as price fixing, insider trading, bribery, fraud, and other illegal actions; or |
| • | Other egregious governance issues where shareholders may bring legal action against the company or its directors; or |
| • | Vote on a CASE-BY-CASE basis where a vote against other agenda items are deemed inappropriate. |
3. Compensation
Good pay practices should align management’s interests with long-term shareholder value creation. Detailed disclosure of compensation criteria is preferred; proof that companies follow the criteria should be evident and retroactive performance target changes without proper disclosure is not viewed favorably. Compensation practices should allow a company to attract and retain proven talent. Some examples of poor pay practices include: abnormally large bonus payouts without justifiable performance linkage or proper disclosure, egregious employment contracts, excessive severance and/or change in control provisions, repricing or replacing of underwater stock options/stock appreciation rights without prior shareholder approval, and excessive perquisites. A company should also have an appropriate balance of short-term vs. long-term metrics and the metrics should be aligned with business goals and objectives.
Director Compensation
Vote FOR proposals to award cash fees to non-executive directors unless the amounts are excessive relative to other companies in the country or industry.
Vote non-executive director compensation proposals that include both cash and share-based components on a CASE-BY-CASE basis.
Vote proposals that bundle compensation for both non-executive and executive directors into a single resolution on a CASE-BY-CASE basis.
Vote AGAINST proposals to introduce retirement benefits for non-executive directors.
Compensation Plans
Vote compensation plans on a CASE-BY-CASE basis.
B-122
Table of Contents
Director, Officer, and Auditor Indemnification and Liability Provisions
Vote proposals seeking indemnification and liability protection for directors and officers on a CASE-BY-CASE basis.
Vote AGAINST proposals to indemnify auditors.
4. Board Structure
Vote AGAINST the introduction of classified boards and mandatory retirement ages for directors.
Vote AGAINST proposals to alter board structure or size in the context of a fight for control of the company or the board.
Chairman CEO combined role (for applicable markets)
GSAM will generally recommend a vote AGAINST shareholder proposals requiring that the chairman’s position be filled by an independent director, if the company satisfies 3 of the 4 following criteria:
| • | 2/3 independent board, or majority in countries where employee representation is common practice; |
| • | A designated, or a rotating, lead director, elected by and from the independent board members with clearly delineated and comprehensive duties; |
| • | Fully independent key committees; and/or |
| • | Established, publicly disclosed, governance guidelines and director biographies/profiles. |
5. Capital Structure
Share Issuance Requests
General Issuances:
Vote FOR issuance requests with preemptive rights to a maximum of 100 percent over currently issued capital.
Vote FOR issuance requests without preemptive rights to a maximum of 20 percent of currently issued capital.
Specific Issuances:
Vote on a CASE-BY-CASE basis on all requests, with or without preemptive rights.
Increases in Authorized Capital
Vote FOR non-specific proposals to increase authorized capital up to 100 percent over the current authorization unless the increase would leave the company with less than 30 percent of its new authorization outstanding.
Vote FOR specific proposals to increase authorized capital to any amount, unless:
| • | The specific purpose of the increase (such as a share-based acquisition or merger) does not meet guidelines for the purpose being proposed; or |
| • | The increase would leave the company with less than 30 percent of its new authorization outstanding after adjusting for all proposed issuances. |
Vote AGAINST proposals to adopt unlimited capital authorizations.
B-123
Table of Contents
Reduction of Capital
Vote FOR proposals to reduce capital for routine accounting purposes unless the terms are unfavorable to shareholders.
Vote proposals to reduce capital in connection with corporate restructuring on a CASE-BY-CASE basis.
Capital Structures
Vote FOR resolutions that seek to maintain or convert to a one-share, one-vote capital structure.
Vote AGAINST requests for the creation or continuation of dual-class capital structures or the creation of new or additional super voting shares.
Preferred Stock
Vote FOR the creation of a new class of preferred stock or for issuances of preferred stock up to 50 percent of issued capital unless the terms of the preferred stock would adversely affect the rights of existing shareholders.
Vote FOR the creation/issuance of convertible preferred stock as long as the maximum number of common shares that could be issued upon conversion meets guidelines on equity issuance requests.
Vote AGAINST the creation of a new class of preference shares that would carry superior voting rights to the common shares.
Vote AGAINST the creation of blank check preferred stock unless the board clearly states that the authorization will not be used to thwart a takeover bid.
Vote proposals to increase blank check preferred authorizations on a CASE-BY-CASE basis.
Debt Issuance Requests
Vote non-convertible debt issuance requests on a CASE-BY-CASE basis, with or without preemptive rights.
Vote FOR the creation/issuance of convertible debt instruments as long as the maximum number of common shares that could be issued upon conversion meets guidelines on equity issuance requests.
Vote FOR proposals to restructure existing debt arrangements unless the terms of the restructuring would adversely affect the rights of shareholders.
Increase in Borrowing Powers
Vote proposals to approve increases in a company’s borrowing powers on a CASE-BY-CASE basis.
Share Repurchase Plans
GSAM will generally recommend FOR share repurchase programs taking into account whether:
| • | The share repurchase program can be used as a takeover defense; |
| • | There is clear evidence of historical abuse; |
| • | There is no safeguard in the share repurchase program against selective buybacks; |
| • | Pricing provisions and safeguards in the share repurchase program are deemed to be unreasonable in light of market practice. |
B-124
Table of Contents
Reissuance of Repurchased Shares
Vote FOR requests to reissue any repurchased shares unless there is clear evidence of abuse of this authority in the past.
Capitalization of Reserves for Bonus Issues/Increase in Par Value
Vote FOR requests to capitalize reserves for bonus issues of shares or to increase par value.
6. Mergers and Corporate Restructuring & Other
Reorganizations/Restructurings
Vote reorganizations and restructurings on a CASE-BY-CASE basis.
Mergers and Acquisitions
Vote CASE-BY-CASE on mergers and acquisitions taking into account the following based on publicly available information:
| • | Valuation; |
| • | Market reaction; |
| • | Strategic rationale; |
| • | Management’s track record of successful integration of historical acquisitions; |
| • | Presence of conflicts of interest; and |
| • | Governance profile of the combined company. |
Antitakeover Mechanisms
Generally vote AGAINST all antitakeover proposals, unless they are structured in such a way that they give shareholders the ultimate decision on any proposal or offer.
Reincorporation Proposals
Vote reincorporation proposals on a CASE-BY-CASE basis.
Related-Party Transactions
Vote related-party transactions on a CASE-BY-CASE basis, considering factors including, but not limited to, the following:
| • | The parties on either side of the transaction; |
| • | The nature of the asset to be transferred/service to be provided; |
| • | The pricing of the transaction (and any associated professional valuation); |
| • | The views of independent directors (where provided); |
| • | The views of an independent financial adviser (where appointed); |
| • | Whether any entities party to the transaction (including advisers) is conflicted; and |
| • | The stated rationale for the transaction, including discussions of timing. |
B-125
Table of Contents
Shareholder Proposals
Vote all shareholder proposals on a CASE-BY-CASE basis.
Vote FOR proposals that would improve the company’s corporate governance or business profile at a reasonable cost.
Vote AGAINST proposals that limit the company’s business activities or capabilities or result in significant costs being incurred with little or no benefit.
7. Corporate Social Responsibility (CSR)/Environmental, Social, Governance (ESG) Issues
Please refer to page 9 for our current approach to these important topics.
B-126
Table of Contents
Mercator Asset Management, L.P. (“MAM”)
MAM has adopted the following Proxy Policies and Procedures in accordance with the relevant rules. Proxy votes will be periodically spot checked by the CCO for adherence to these rules.
MAM Proxy Voting Policies:
| • | Proxies are voted in a way that is consistent with the best interests of our clients. MAM accepts the fact that, under ERISA, voting proxies is a fiduciary act of MAM. As a fiduciary, it may be appropriate for us to engage in active monitoring and communications with the issuer and, if appropriate, a translation service will be used. |
| • | MAM votes proxies for all clients that have delegated to MAM full authority and responsibility to cast said votes, except that when voting on proxy proposals involving foreign securities will involve unusual costs, MAM will weigh those costs against the benefits of voting in determining whether to vote on a particular proposal. If MAM should inadvertently receive voting materials for a client who HAS NOT delegated voting authority to MAM, then MAM would promptly forward all proxy materials to said client. In addition, if for any client account MAM receives notice of legal proceedings involving client securities, including without limitation bankruptcies and class actions, MAM would promptly forward such notices to the client. |
| • | MAM receives company meeting information and proxy materials from RiskMetrics Group. MAM also refers to RiskMetrics Group International Proxy Voting Guidelines Summary RiskMetrics Group International Proxy Voting Guidelines Summary1, for informational purposes. |
Proxy Voting Procedures:
| • | The Research Analyst for each security’s corresponding market is responsible for client proxy voting. Many issues are relatively routine i.e. approval of annual report, auditors, uncontested election of directors, financial reports etc., and require no further assessment. Any issue in the judgment of the Research Analyst that requires special consideration will be presented to MAM’s investment committee for a decision. |
| • | MAM will cast votes in accordance with specific client guidelines if applicable, subject to consultation with the client if MAM believes that such vote would not be in the client’s best interest. In the absence of applicable client guidelines, MAM will vote in accordance with its judgment as to the client’s best interest, except that any vote involving a MAM conflict of interest will be cast in accordance with the specific RiskMetrics Group recommendation if available, or, if not, then in accordance with the RiskMetrics Group International Proxy Voting Guidelines Summary. |
| • | Full documentation is kept on each vote cast in every client account and procedures are in place to assure that voting is done in a timely manner. |
Proxy Voting Reporting:
Reporting of proxy voting is available to all of our clients upon request.
| 1 | RiskMetrics Group International Proxy Voting Guidelines Summary |
B-127
Table of Contents
Principal Global Investors, LLC
Proxy Voting and Class Action Monitoring
Background
Rule 206(4)-6 under the Advisers Act requires every investment adviser who exercises voting authority with respect to client securities to adopt and implement written policies and procedures, reasonably designed to ensure that the adviser votes proxies in the best interest of its clients. The procedures must address material conflicts that may arise in connection with proxy voting. The Rule further requires the adviser to provide a concise summary of the adviser’s proxy voting process and offer to provide copies of the complete proxy voting policy and procedures to clients upon request. Lastly, the Rule requires that the adviser disclose to clients how they may obtain information on how the adviser voted their proxies.
Risks
In developing this policy and procedures, the Advisers considered numerous risks associated with their voting of client proxies. This analysis includes risks such as:
| • | The Advisers do not maintain a written proxy voting policy as required by Rule 206(4)-6. |
| • | Proxies are not voted in Clients’ best interests. |
| • | Proxies are not identified and voted in a timely manner. |
| • | Conflicts between the Advisers’ interests and the Client are not identified; therefore, proxies are not voted appropriately. |
| • | The third-party proxy voting services utilized by the Advisers are not independent. |
| • | Proxy voting records and Client requests to review proxy votes are not maintained. |
The Advisers have established the following guidelines as an attempt to mitigate these risks.
Policy
The Advisers believe that proxy voting and the analysis of corporate governance issues, in general, are important elements of the portfolio management services provided to advisory clients. The Advisers’ guiding principles in performing proxy voting are to make decisions that (i) favor proposals that tend to maximize a company’s shareholder value and (ii) are not influenced by conflicts of interest. These principles reflect the Advisers’ belief that sound corporate governance creates a framework within which a company can be managed in the interests of its shareholders.
In addition, as a fiduciary, the Advisers also monitor Clients’ ability to participate in class action events through the regular portfolio management process. Accordingly, the Advisers have adopted the policies and procedures set out below, which are designed to ensure that the Advisers comply with legal, fiduciary, and contractual obligations with respect to proxy voting and class actions.
Proxy Voting Procedures
The Advisers have implemented these procedures with the premise that portfolio management personnel base their determinations of whether to invest in a particular company on a variety of factors, and while corporate governance is one such factor, it may not be the primary consideration. As such, the principles and positions reflected in the procedures are designed to guide in the voting of proxies, and not necessarily in making investment decisions.
The Investment Accounting Department has assigned a Proxy Voting Team to manage the proxy voting process. The Investment Accounting Department has delegated the handling of class action activities to a Senior Investment Accounting Leader.
B-128
Table of Contents
Institutional Shareholder Services
Based on the Advisers’ investment philosophy and approach to portfolio construction, and given the complexity of the issues that may be raised in connection with proxy votes, the Advisers have retained the services of Institutional Shareholder Services (“ISS”). ISS is a wholly owned subsidiary MSCI, Inc. which is a leading global provider of investment decision support tools. ISS offers proxy voting solutions to institutional clients globally. The services provided to the Advisers include in-depth research, voting recommendations, vote execution, recordkeeping, and reporting.
The Advisers have elected to follow the ISS Standard Proxy Voting Guidelines (the “Guidelines”), which embody the positions and factors that the Advisers’ Portfolio Management Teams (“PM Teams”) generally consider important in casting proxy votes.1 The Guidelines address a wide variety of individual topics, including, among other matters, shareholder voting rights, anti-takeover defenses, board structures, the election of directors, executive and director compensation, reorganizations, mergers, and various shareholder proposals. In connection with each proxy vote, ISS prepares a written analysis and recommendation (“ISS Recommendation”) that reflects ISS’s application of the Guidelines to the particular proxy issues. ISS Proxy Voting Guidelines Summaries are accessible to all PM Teams on the ISS system. They are also available from the Proxy Voting Team.
Voting Against ISS Recommendations
On any particular proxy vote, Portfolio Managers may decide to diverge from the Guidelines. Where the Guidelines do not direct a particular response and instead list relevant factors, the ISS Recommendation will reflect ISS’s own evaluation of the factors.
If the Portfolio Manager’s judgment differs from that of ISS, a written record is created reflecting the process (See Appendix titled “Report for Proxy Vote(s) Against the ISS Recommendation(s)”), including:
| 1. | The requesting PM Team’s reasons for the decision; |
| 2. | The approval of the lead Portfolio Manager for the requesting PM Team; |
| 3. | Notification to the Proxy Voting Team and other appropriate personnel (including other Advisers Portfolio Managers who may own the particular security); |
| 4. | A determination that the decision is not influenced by any conflict of interest; and Review and approval by the Compliance Department. |
Conflicts of Interest
The Advisers have implemented procedures designed to prevent conflicts of interest from influencing proxy voting decisions. These procedures include our use of the Guidelines and ISS Recommendations. Proxy votes cast by the Advisers in accordance with the Guidelines and ISS Recommendations are generally not viewed as being the product of any conflicts of interest because the Advisers cast such votes pursuant to a pre-determined policy based upon the recommendations of an independent third party.
Our procedures also prohibit the influence of conflicts of interest where a PM Team decides to vote against an ISS Recommendation, as described above. In exceptional circumstances, the approval process may also include consultation with the Advisers’ senior management, the Law Department, Outside Counsel, and/or the Client whose account may be affected by the conflict. The Advisers maintain records of the resolution of any proxy voting conflict of interest.
| 1 | The Advisers have various Portfolio Manager Teams organized by asset classes and investment strategies. |
B-129
Table of Contents
Proxy Voting Instructions and New Accounts
Institutional Accounts
As part of the new account opening process for discretionary institutional Clients, the Advisers’ Investment Accounting Department is responsible for sending a proxy letter to the Client’s custodian. This letter instructs the custodian to send the Client’s proxy materials to ISS for voting. The custodian must complete the letter and fax it to ISS, with a copy to the Advisers’ Investment Accounting Department. This process is designed to ensure and document that the custodian is aware of its responsibility to send proxies to ISS.
The Investment Accounting Department is responsible for maintaining this proxy instruction letter in the Client’s file and for scanning it into the Advisers’ OnBase system. These steps are part of the Advisers’ Account Opening Process.
SMA — Wrap Accounts
The Advisers’ SMA Operations Department is responsible for servicing wrap accounts, which includes providing instructions to the relevant wrap sponsor for setting up accounts with ISS.
Fixed Income and Private Investments
Voting decisions with respect to Client investments in fixed income securities and the securities of privately-held issuers will generally be made by the relevant Portfolio Managers based on their assessment of the particular transactions or other matters at issue.
Client Direction
Clients may choose to vote proxies themselves, in which case they must arrange for their custodians to send proxy materials directly to them. Upon request, the Advisers can accommodate individual Clients that have developed their own guidelines with ISS or another proxy service. Clients may also discuss with the Advisers the possibility of receiving individualized reports or other individualized services regarding proxy voting conducted on their behalf. Such requests should be centralized through the Advisers’ Proxy Voting Team.
Securities Lending
At times, neither the Advisers nor ISS will be allowed to vote proxies on behalf of Clients when those Clients have adopted a securities lending program. Typically, Clients who have adopted securities lending programs have made a general determination that the lending program provides a greater economic benefit than retaining the ability to vote proxies. Notwithstanding this fact, in the event that a proxy voting matter has the potential to materially enhance the economic value of the Client’s position and that position is lent out, the Advisers will make reasonable efforts to inform the Client that neither the Advisers nor ISS is able to vote the proxy until the lent security is recalled.
B-130
Table of Contents
Abstaining from Voting Certain Proxies
The Advisers shall at no time ignore or neglect their proxy voting responsibilities. However, there may be times when refraining from voting is in the Client’s best interest, such as when the Advisers’ analysis of a particular proxy issue reveals that the cost of voting the proxy may exceed the expected benefit to the Client. Such proxies may be voted on a best-efforts basis. These issues may include, but are not limited to:
| — | Restrictions for share blocking countries;2 |
| — | Casting a vote on a foreign security may require that the adviser engage a translator; |
| — | Restrictions on foreigners’ ability to exercise votes; |
| — | Requirements to vote proxies in person; |
| — | Requirements to provide local agents with power of attorney to facilitate the voting instructions; |
| — | Untimely notice of shareholder meeting; |
| — | Restrictions on the sale of securities for a period of time in proximity to the shareholder meeting. |
Proxy Solicitation
Employees must promptly inform the Advisers’ Proxy Voting Team of the receipt of any solicitation from any person related to Clients’ proxies. As a matter of practice, the Advisers do not reveal or disclose to any third party how the Advisers may have voted (or intend to vote) on a particular proxy until after such proxies have been counted at a shareholder’s meeting. However, the Proxy Voting Team may disclose that it is the Advisers’ general policy to follow the ISS Guidelines. At no time may any Employee accept any remuneration in the solicitation of proxies.
Handling of Information Requests Regarding Proxies
Employees may be contacted by various entities that request or provide information related to particular proxy issues. Specifically, investor relations, proxy solicitation, and corporate/financial communications firms (e.g., Ipreo, Richard Davies, DF King, Georgeson Shareholder) may contact the Advisers to ask questions regarding total holdings of a particular stock across advisory Clients, or how the Advisers intends to vote on a particular proxy. In addition, issuers may call (or hire third parties to call) with intentions to influence the Advisers’ votes (i.e., to vote against ISS).
Employees that receive information requests related to proxy votes should forward such communications (e.g., calls, e-mails, etc.) to the Advisers’ Proxy Voting Team. The Proxy Voting Team will take steps to verify the identity of the caller and his/her firm prior to exchanging any information. In addition, the Proxy Voting Team may consult with the appropriate Portfolio Manager(s) and/or the CCO or CCO NA with respect to the type of information that can be disclosed. Certain information may have to be provided pursuant to foreign legal requirements (e.g., Section 793 of the UK Companies Act).
External Managers
Where Client assets are placed with managers outside of the Advisers, whether through separate accounts, funds-of-funds or other structures, such external managers are responsible for voting proxies in accordance with the managers’ own policies. The Advisers may, however, retain such responsibilities where deemed appropriate.
| 2 | In certain markets where share blocking occurs, shares must be “frozen” for trading purposes at the custodian or sub-custodian in order to vote. During the time that shares are blocked, any pending trades will not settle. Depending on the market, this period can last from one day to three weeks. Any sales that must be executed will settle late and potentially be subject to interest charges or other punitive fees. |
B-131
Table of Contents
Proxy Voting Errors
In the event that any Employee becomes aware of an error related to proxy voting, he/she must promptly report that matter to the Advisers’ Proxy Voting Team. The Proxy Voting Team will take immediate steps to determine whether the impact of the error is material and to address the matter. The Proxy Voting Team, with the assistance of the CCO or CCO NA (or their designee), will generally prepare a memo describing the analysis and the resolution of the matter. Supporting documentation (e.g., correspondence with ISS, Client, Portfolio Managers/ analysts, etc.) will be maintained by the Compliance Department. Depending on the severity of the issue, the Law Department, Outside Counsel, and/or affected Clients may be contacted. However, the Advisers may opt to refrain from notifying non-material de minimis errors to Clients.
Recordkeeping
The Advisers must maintain the documentation described in the following section for a period of not less than five (5) years, the first two (2) years at the principal place of business. The Proxy Voting Team, in coordination with ISS, is responsible for the following procedures and for ensuring that the required documentation is retained.
Client request to review proxy votes:
| • | Any request, whether written (including e-mail) or oral, received by any Employee of the Advisers, must be promptly reported to the Proxy Voting Team. All written requests must be retained in the Client’s permanent file. |
| • | The Proxy Voting Team records the identity of the Client, the date of the request, and the disposition (e.g., provided a written or oral response to Client’s request, referred to third party, not a proxy voting client, other dispositions, etc.) in a suitable place. |
| • | The Proxy Voting Team furnishes the information requested to the Client within a reasonable time period (generally within 10 business days). The Advisers maintain a copy of the written record provided in response to Client’s written (including e-mail) or oral request. A copy of the written response should be attached and maintained with the Client’s written request, if applicable and maintained in the permanent file. |
| • | Clients are permitted to request the proxy voting record for the 5 year period prior to their request. |
Proxy statements received regarding client securities:
| • | Upon inadvertent receipt of a proxy, the Advisers forward the proxy to ISS for voting, unless the client has instructed otherwise. |
Note: The Advisers are permitted to rely on proxy statements filed on the SEC’s EDGAR system instead of keeping their own copies.
Proxy voting records:
| • | The Advisers’ proxy voting record is maintained by ISS. The Proxy Voting Team, with the assistance of the Investment Accounting and SMA Operations Departments, periodically ensures that ISS has complete, accurate, and current records of Clients who have instructed the Advisers to vote proxies on their behalf. |
| • | The Advisers maintain documentation to support the decision to vote against the ISS recommendation. |
B-132
Table of Contents
| • | The Advisers maintain documentation or any communications received from third parties, other industry analysts, third party service providers, company’s management discussions, etc. that were material in the basis for any voting decision. |
Procedures for Class Actions
In general, it is the Advisers’ policy not to file class action claims on behalf of Clients. The Advisers specifically do not act on behalf of former Clients who may have owned the affected security but subsequently terminated their relationship with the Advisers. The Advisers only file class actions on behalf of Clients if that responsibility is specifically stated in the advisory contract, as it is the Advisers’ general policy not to act as lead plaintiff in class actions.
The process of g class action claims is carried out by the Investment Accounting Department. In the event the Advisers opt out of a class action settlement, the Advisers will maintain documentation of any cost/benefit analysis to support that decision.
The Advisers are mindful that they have a duty to avoid and detect conflicts of interest that may arise in the class action claim process. Where actual, potential or apparent conflicts are identified regarding any material matter, the Advisers manage the conflict by seeking instruction from the Law Department and/or outside counsel.
Disclosure
The Advisers ensure that Part 2A of Form ADV is updated as necessary to reflect: (i) all material changes to this policy; and (ii) regulatory requirements.
Responsibility
Various individuals and departments are responsible for carrying out the Advisers’ proxy voting and class action practices, as mentioned throughout these policies and procedures. The Investment Accounting Department has assigned a Proxy Voting Team to manage the proxy voting process. The Investment Accounting Department has delegated the handling of class action activities to a Senior Investment Accounting Leader.
In general, the Advisers’ CCO or CCO NA (or their designee) oversees the decisions related to proxy voting, class actions, conflicts of interest, and applicable record keeping and disclosures. In addition, the Compliance Department periodically reviews the voting of proxies to ensure that all such votes — particularly those diverging from the judgment of ISS — were voted in a manner consistent with the Advisers’ fiduciary duties.
B-133
Table of Contents
T. ROWE PRICE ASSOCIATES, INC.
T. ROWE PRICE INTERNATIONAL LTD
T. ROWE PRICE (CANADA), INC
T. ROWE PRICE HONG KONG LIMITED
T. ROWE PRICE SINGAPORE PRIVATE LTD.
PROXY VOTING POLICIES AND PROCEDURES
RESPONSIBILITY TO VOTE PROXIES
T. Rowe Price Associates, Inc., T. Rowe Price International Ltd, T. Rowe Price (Canada), Inc., T. Rowe Price Hong Kong Limited, and T. Rowe Price Singapore Private Ltd. (“T. Rowe Price”) recognize and adhere to the principle that one of the privileges of owning stock in a company is the right to vote in the election of the company’s directors and on matters affecting certain important aspects of the company’s structure and operations that are submitted to shareholder vote. As an investment adviser with a fiduciary responsibility to its clients, T. Rowe Price analyzes the proxy statements of issuers whose stock is owned by the U.S.-registered investment companies which it sponsors and serves as investment adviser (“T. Rowe Price Funds”) and by common trust funds, offshore funds, institutional and private counsel clients who have requested that T. Rowe Price be involved in the proxy process. T. Rowe Price has assumed the responsibility for voting proxies on behalf of the T. Rowe Price Funds and certain counsel clients who have delegated such responsibility to T. Rowe Price. In addition, T. Rowe Price makes recommendations regarding proxy voting to counsel clients who have not delegated the voting responsibility but who have requested voting advice. T. Rowe Price reserves the right to decline to vote proxies in accordance with client-specific voting guidelines.
T. Rowe Price has adopted these Proxy Voting Policies and Procedures (“Policies and Procedures”) for the purpose of establishing formal policies and procedures for performing and documenting its fiduciary duty with regard to the voting of client proxies. This document is updated annually.
Fiduciary Considerations. It is the policy of T. Rowe Price that decisions with respect to proxy issues will be made in light of the anticipated impact of the issue on the desirability of investing in the portfolio company from the viewpoint of the particular client or Price Fund. Proxies are voted solely in the interests of the client, Price Fund shareholders or, where employee benefit plan assets are involved, in the interests of plan participants and beneficiaries. Our intent has always been to vote proxies, where possible to do so, in a manner consistent with our fiduciary obligations and responsibilities. Practicalities and costs involved with international investing may make it impossible at times, and at other times disadvantageous, to vote proxies in every instance.
Other Considerations. One of the primary factors T. Rowe Price considers when determining the desirability of investing in a particular company is the quality and depth of its management. We recognize that a company’s management is entrusted with the day-to-day operations of the company, as well as its long-term direction and strategic planning, subject to the oversight of the company’s board of directors. Accordingly, our proxy voting guidelines are not intended to substitute our judgment for management’s with respect to the company’s day-to-day operations. Rather, our voting guidelines are designed to promote accountability of a company’s management and board of directors to its shareholders; to align the interests of management with those of shareholders; and to encourage companies to adopt best practices in terms of their corporate governance. In addition to our voting guidelines, we rely on a company’s disclosures, its board’s recommendations, a company’s track record, country-specific best practices codes, our research providers and, most importantly, our investment professionals’ views, in making voting decisions.
ADMINISTRATION OF POLICIES AND PROCEDURES
Proxy Committee. T. Rowe Price’s Proxy Committee (“Proxy Committee”) is responsible for establishing positions with respect to corporate governance and other proxy issues, including those involving corporate social
B-134
Table of Contents
responsibility issues. Certain delegated members of the Proxy Committee also review questions and respond to inquiries from clients and mutual fund shareholders pertaining to proxy issues. While the Proxy Committee sets voting guidelines and serves as a resource for T. Rowe Price portfolio management, it does not have proxy voting authority for any Price Fund or counsel client. Rather, this responsibility is held by the Chairperson of the Fund’s Investment Advisory Committee or counsel client’s portfolio manager.
Global Proxy Services Group. The Global Proxy Services Group is responsible for administering the proxy voting process as set forth in the Policies and Procedures.
Proxy Administrator. The Global Proxy Services Group will assign a Proxy Administrator who will be responsible for ensuring that all meeting notices are reviewed and important proxy matters are communicated to the portfolio managers for consideration.
Global Corporate Governance Analyst. Our Global Corporate Governance Analyst is responsible for reviewing the proxy agendas for all upcoming meetings and making company-specific recommendations to our global industry analysts and portfolio managers with regard to the voting decisions in their portfolios.
HOW PROXIES ARE REVIEWED, PROCESSED AND VOTED
In order to facilitate the proxy voting process, T. Rowe Price has retained ISS as an expert in the proxy voting and corporate governance area. ISS specializes in providing a variety of fiduciary-level proxy advisory and voting services. These services include voting recommendations as well as vote execution, reporting, auditing and consulting assistance for the handling of proxy voting responsibility. In order to reflect T. Rowe Price’s issue-by-issue voting guidelines as approved each year by the Proxy Committee, ISS maintains and implements a custom voting policy for the Price Funds and other client accounts.
Meeting Notification
T. Rowe Price utilizes ISS’s voting agent services to notify us of upcoming shareholder meetings for portfolio companies held in client accounts and to transmit votes to the various custodian banks of our clients. ISS tracks and reconciles T. Rowe Price holdings against incoming proxy ballots. If ballots do not arrive on time, ISS procures them from the appropriate custodian or proxy distribution agent. Meeting and record date information is updated daily, and transmitted to T. Rowe Price through Proxy Exchange, ISS’s web-based application.
Vote Determination
Each day, ISS delivers into T. Rowe Price’s proprietary proxy research platform a comprehensive summary of upcoming meetings, proxy proposals, publications discussing key proxy voting issues, and custom vote recommendations to assist us with proxy research and processing. The final authority and responsibility for proxy voting decisions remains with T. Rowe Price. Decisions with respect to proxy matters are made primarily in light of the anticipated impact of the issue on the desirability of investing in the company from the perspective of our clients.
Portfolio managers may decide to vote their proxies consistent with T. Rowe Price’s policies as set by the Proxy Committee and instruct our Proxy Administrator to vote all proxies accordingly. Alternatively, portfolio managers may request to review the vote recommendations and sign off on all proxies before the votes are cast, or they may choose only to sign off on those votes cast against management. The portfolio managers are also given the option of reviewing and determining the votes on all proxies without utilizing the vote guidelines of the Proxy Committee. In all cases, the portfolio managers may elect to receive current reports summarizing all proxy votes in their client accounts. Portfolio managers who vote their proxies inconsistent with T. Rowe Price guidelines are required to document the rationale for their votes. The Proxy Administrator is responsible for
B-135
Table of Contents
maintaining this documentation and assuring that it adequately reflects the basis for any vote which is cast contrary to T. Rowe Price guidelines.
T. Rowe Price Voting Policies
Specific voting guidelines have been adopted by the Proxy Committee for all regularly occurring categories of management and shareholder proposals. A detailed set of voting guidelines is available on the T. Rowe Price web site, www.troweprice.com. The following is a summary of our guidelines on the most significant proxy voting topics:
Election of Directors — For U.S. companies, T. Rowe Price generally supports slates with a majority of independent directors. However, T. Rowe Price may vote against outside directors who do not meet our criteria relating to their independence, particularly when they serve on key board committees, such as compensation and nominating committees, for which we believe that all directors should be independent. Outside the U.S., we expect companies to adhere to the minimum independence standard established by regional corporate governance codes. At a minimum, however, we believe boards in all regions should include a blend of executive and non-executive members, and we are likely to vote against senior executives at companies without any independent directors. We also vote against directors who are unable to dedicate sufficient time to their board duties due to their commitments to other boards. We may vote against certain directors who have served on company boards where we believe there has been a gross failure in governance or oversight. Additionally, we may vote against compensation committee members who approve excessive executive compensation or severance arrangements. We support efforts to elect all board members annually because boards with staggered terms lessen directors’ accountability to shareholders and act as deterrents to takeover proposals. To strengthen boards’ accountability, T. Rowe Price supports proposals calling for a majority vote threshold for the election of directors and we may withhold votes from an entire board if they fail to implement shareholder proposals that receive majority support.
Anti-takeover, Capital Structure and Corporate Governance Issues — T. Rowe Price generally opposes anti-takeover measures since they adversely impact shareholder rights and limit the ability of shareholders to act on potential value-enhancing transactions. Such anti-takeover mechanisms include classified boards, supermajority voting requirements, dual share classes, and poison pills. When voting on capital structure proposals, T. Rowe Price will consider the dilutive impact to shareholders and the effect on shareholder rights. We may support shareholder proposals that call for the separation of the Chairman and CEO positions if we determine that insufficient governance safeguards are in place at the company.
Executive Compensation Issues — T. Rowe Price’s goal is to assure that a company’s equity-based compensation plan is aligned with shareholders’ long-term interests. We evaluate plans on a case-by-case basis, using a proprietary, scorecard-based approach that employs a number of factors, including dilution to shareholders, problematic plan features, burn rate, and the equity compensation mix. Plans that are constructed to effectively and fairly align executives’ and shareholders’ incentives generally earn our approval. Conversely, we oppose compensation packages that provide what we view as excessive awards to few senior executives, contain the potential for excessive dilution relative to the company’s peers, or rely on an inappropriate mix of options and full-value awards. We also may oppose equity plans at any company where we deem the overall compensation practices to be problematic. We generally oppose efforts to reprice options in the event of a decline in value of the underlying stock unless such plans appropriately balance shareholder and employee interests. For companies with particularly egregious pay practices such as excessive severance packages, executives with outsized pledged/hedged stock positions, executive perks, and bonuses that are not adequately linked to performance, we may vote against compensation committee members. We analyze management proposals requesting ratification of a company’s executive compensation practices (“Say-on-Pay” proposals) on a case-by-case basis, using a proprietary scorecard-based approach that assesses the long-term linkage between executive compensation and company performance as well as the presence of objectionable structural features in compensation plans. With respect to the frequency in which companies should seek advisory votes on compensation, we believe shareholders should be offered the opportunity to vote annually. Finally, we may
B-136
Table of Contents
withhold votes from compensation committee members or even the entire board if we have cast votes against a company’s “Say-on-Pay” vote in consecutive years.
Mergers and Acquisitions — T. Rowe Price considers takeover offers, mergers, and other extraordinary corporate transactions on a case-by-case basis to determine if they are beneficial to shareholders’ current and future earnings stream and to ensure that our Price Funds and clients are receiving fair consideration for their securities. We generally oppose proposals for the ratification of executive severance packages (“Say on Golden Parachute” proposals) in conjunction with merger transactions because we believe these arrangements are, by and large, unnecessary, and they reduce the alignment of executives’ incentives with shareholders’ interests.
Corporate Social Responsibility Issues — Vote recommendations for corporate responsibility issues are generated by the Global Corporate Governance Analyst using ISS’s proxy research and company reports. T. Rowe Price generally votes with a company’s management on social, environmental and corporate responsibility issues unless the issue has substantial investment implications for the company’s business or operations which have not been adequately addressed by management. T. Rowe Price supports well-targeted shareholder proposals on environmental and other public policy issues that are particularly relevant to a company’s businesses.
Global Portfolio Companies — ISS applies a two-tier approach to determining and applying global proxy voting policies. The first tier establishes baseline policy guidelines for the most fundamental issues, which span the corporate governance spectrum without regard to a company’s domicile. The second tier takes into account various idiosyncrasies of different countries, making allowances for standard market practices, as long as they do not violate the fundamental goals of good corporate governance. The goal is to enhance shareholder value through effective use of the shareholder franchise, recognizing that application of policies developed for U.S. corporate governance issues are not appropriate for all markets. The Proxy Committee has reviewed ISS’s general global policies and has developed international proxy voting guidelines which in most instances are consistent with ISS recommendations.
Fixed Income, Index and Passively Managed Accounts — Proxy voting for fixed income, index and other passively-managed portfolios is administered by the Proxy Services Group using T. Rowe Price’s policies as set by the Proxy Committee. If a portfolio company is held in both an actively managed account and an index account, the index account will default to the vote as determined by the actively managed proxy voting process. In addition, fixed income accounts will generally follow the proxy vote determinations on security holdings held by our equity accounts unless the matter is specific to a particular fixed income security (i.e., consents, restructurings, reorganization proposals).
Divided Votes — In situations where a decision is made which is contrary to the policies established by the Proxy Committee, or differs from the vote for any other client or T. Rowe Price Fund, the Proxy Services Group advises the portfolio managers involved of the divided vote. The persons representing opposing views may wish to confer to discuss their positions. In such instances, it is the normal practice for the portfolio manager to document the reasons for the vote if it is against T. Rowe Price policy. The Proxy Administrator is responsible for assuring that adequate documentation is maintained to reflect the basis for any vote which is cast in opposition to T. Rowe Price policy.
Shareblocking — Shareblocking is the practice in certain foreign countries of “freezing” shares for trading purposes in order to vote proxies relating to those shares. In markets where shareblocking applies, the custodian or sub-custodian automatically freezes shares prior to a shareholder meeting once a proxy has been voted. Shareblocking typically takes place between one and fifteen (15) days before the shareholder meeting, depending on the market. In markets where shareblocking applies, there is a potential for a pending trade to fail if trade settlement takes place during the blocking period. T. Rowe Price’s policy is generally to abstain from voting shares in shareblocking countries unless the matter has compelling economic consequences that outweigh the loss of liquidity in the blocked shares.
B-137
Table of Contents
Securities on Loan — The T. Rowe Price Funds and our institutional clients may participate in securities lending programs to generate income. Generally, the voting rights pass with the securities on loan; however, lending agreements give the lender the right to terminate the loan and pull back the loaned shares provided sufficient notice is given to the custodian bank in advance of the voting deadline. T. Rowe Price’s policy is generally not to vote securities on loan unless the portfolio manager has knowledge of a material voting event that could affect the value of the loaned securities. In this event, the portfolio manager has the discretion to instruct the Proxy Administrator to pull back the loaned securities in order to cast a vote at an upcoming shareholder meeting.
Monitoring and Resolving Conflicts of Interest
The Proxy Committee is also responsible for monitoring and resolving potential conflicts between the interests of T. Rowe Price and those of its clients with respect to proxy voting. We have adopted safeguards to ensure that our proxy voting is not influenced by interests other than those of our fund shareholders. While membership on the Proxy Committee is diverse, it does not include individuals whose primary duties relate to client relationship management, marketing, or sales. Since T. Rowe Price’s voting guidelines are pre-determined by the Proxy Committee, application of the guidelines by fund portfolio managers to vote fund proxies should in most instances adequately address any potential conflicts of interest. However, the Proxy Committee conducts a post-vote review of all proxy votes that are inconsistent with the guidelines to determine whether the portfolio manager’s voting rationale appears reasonable. The Proxy Committee also assesses whether any business or other material relationships between T. Rowe Price and a portfolio company (unrelated to the ownership of the portfolio company’s securities) could have influenced an inconsistent vote on that company’s proxy. Issues raising potential conflicts of interest are referred to designated members of the Proxy Committee for immediate resolution prior to the time T. Rowe Price casts its vote. With respect to personal conflicts of interest, T. Rowe Price’s Code of Ethics and Conduct requires all employees to avoid placing themselves in a “compromising position” in which their interests may conflict with those of our clients and restrict their ability to engage in certain outside business activities. Portfolio managers or Proxy Committee members with a personal conflict of interest regarding a particular proxy vote must recuse themselves and not participate in the voting decisions with respect to that proxy.
Specific Conflict of Interest Situations — Voting of T. Rowe Price Group, Inc. common stock (sym: TROW) by certain T. Rowe Price Index Funds will be done in all instances in accordance with T. Rowe Price policy, and votes inconsistent with policy will not be permitted. In addition, T. Rowe Price has voting authority for proxies of the holdings of certain T. Rowe Price funds that invest in other T. Rowe Price funds. In cases where the underlying fund of an investing T. Rowe Price fund, including a fund-of-funds, holds a proxy vote, T. Rowe Price will mirror vote the fund shares held by the upper-tier fund in the same proportion as the votes cast by the shareholders of the underlying funds (other than the TRP Reserve Investment Funds).
REPORTING AND RECORD RETENTION
Vote Summary Reports will be generated for each client that requests T. Rowe Price to furnish proxy voting records. The report specifies the portfolio companies, meeting dates, proxy proposals, and votes which have been cast for the client during the period and the position taken with respect to each issue. Reports normally cover quarterly or annual periods and are provided to clients upon request.
T. Rowe Price retains proxy solicitation materials, memoranda regarding votes cast in opposition to the position of a company’s management, and documentation on shares voted differently. In addition, any document which is material to a proxy voting decision such as the T. Rowe Price voting guidelines, Proxy Committee meeting materials, and other internal research relating to voting decisions will be kept. All proxy voting materials and supporting documentation are retained for six years (except for proxy statements available on the SEC’s EDGAR database).
B-138
Table of Contents
PART C
OTHER INFORMATION
Item 15. Indemnification
Under Section 12 of Article Seven of Registrant’s Declaration of Trust, Registrant may not indemnify any trustee, officer or employee for expenses (e.g. attorney’s fees, judgements, fines and settlement amounts) incurred in any threatened, pending or completed action, if there has been an adjudication of liability against such person based on a finding of willful misfeasance, bad faith, gross negligence or reckless disregard of such person’s duties of office (“disabling conduct”). Registrant shall indemnify its trustees, officers or employees for such expenses whether or not there is an adjudication of liability, if, pursuant to Investment Company act Release 11330, a determination is made that such person was not liable by reason of disability conduct by: (i) final decision of the court before which the proceeding was brought; or (ii) in the absence of such a decision, a reasonable determination, based on factual review, that the person was not liable for reasons of such conduct is made by: (a) a majority vote of disinterested, independent trustees; or (b) independent legal counsel in a written opinion.
Advancement of expenses incurred in defending such actions may be made pursuant to Release 11330, provided that the person undertakes to repay the advance unless it is ultimately determined that such person is entitled to indemnification and one or more of the following conditions is met: (1) the person provides security for the undertaking; (2) Registrant is insured against losses arising by reason of any lawful advances; or (3) a majority of disinterested non-party trustees or independent legal counsel in a written opinion determines, based on review of readily available facts, that there is reason to believe the person ultimately will be found entitled to indemnification.
Insofar as indemnification for liability arising under the Securities Act of 1933 may be permitted to trustees, officers and controlling persons of Registrant pursuant to the foregoing provision, or otherwise, Registrant has been advised that in the opinion of the Securities and Exchange Commission such indemnification is against public policy as expressed in that Act and is, therefore, unenforceable. In the event that a claim for indemnification against such liabilities (other than the payment by Registrant of expenses incurred or paid by a trustee, officer or controlling person of Registrant in the successful defense of any action, suit or will, unless in the opinion of its counsel the matter has been settled by controlling precedent, submit to a court of appropriate jurisdiction the question whether such indemnification by it is against public policy as expressed in the Act and will be governed by the final adjudication of such issue.
Registrant and its officers, employees, and agents are insured under the fidelity bond required by Rule 17g-1 of the Investment Company Act of 1940.
Item 16. Exhibits
| 1.1 | Declaration of Trust (1) | |
| 1.2 | Amendment No. 1 to Declaration of Trust (5) | |
| 2. | Amended and Restated By-Laws (11) | |
| 3. | Not applicable | |
| 4. | Form of Agreement and Plan of Reorganization** | |
| 5. | Not Applicable | |
| 6.1 | Investment Advisory Agreement with Thrivent Asset Management, LLC (7) | |
| 6.2 | Amendment No. 1 to Investment Advisory Agreement (9) | |
| 6.3 | Amendment No. 2 to Investment Advisory Agreement (12) | |
| 6.4 | Amendment No. 3 to Investment Advisory Agreement (12) | |
| 6.5 | Amendment No. 4 to Investment Advisory Agreement (12) | |
| 6.6 | Amendment No. 5 to Investment Advisory Agreement (14) | |
| 6.7 | Amendment No. 6 to Investment Advisory Agreement (15) | |
| 6.8 | Amendment No. 7 to Investment Advisory Agreement (16) | |
| 6.9 | Investment Subadvisory Agreement with T. Rowe Price Associates with respect to Thrivent Partner Small Cap Value Fund (7) |
Table of Contents
| 6.10 | Amendment No. 1 to Investment Subadvisory Agreement with T. Rowe Price Associates, Inc. with respect to Thrivent Partner Small Cap Value Fund (15) | |
| 6.11 | Amended and Restated Investment Subadvisory Agreement with Mercator Asset Management, LP with respect to Thrivent Partner International Stock Fund (8) | |
| 6.12 | Amendment to Investment Subadvisory Agreement with Mercator Asset Management, LP with respect to Thrivent Partner International Stock Fund and Thrivent Partner Worldwide Allocation Fund (10) | |
| 6.13 | Amendment No. 2 to Investment Subadvisory Agreement with Mercator Asset Management, LP with respect to Thrivent Partner Worldwide Allocation Fund (13) | |
| 6.14 | Investment Subadvisory Agreement with Principal Global Investors, LLC with respect to Thrivent Partner International Stock Fund (8) | |
| 6.15 | Amendment to Investment Subadvisory Agreement with Principal Global Investors, LLC with respect to Thrivent Partner International Stock Fund and Thrivent Partner Worldwide Allocation Fund (10) | |
| 6.16 | Amendment No. 2 to Investment Subadvisory Agreement with Principal Global Investors, LLC with respect to Thrivent Partner Worldwide Allocation Fund (13) | |
| 6.17 | Investment Subadvisory Agreement with Goldman Sachs Asset Management, L.P. with respect to Thrivent Partner Mid Cap Value Fund (7) | |
| 6.18 | Amendment No. 1 to Investment Subadvisory Agreement with Goldman Sachs Asset Management, L.P. with respect to Thrivent Partner Mid Cap Value Fund (12) | |
| 6.19 | Investment Subadvisory Agreement with Goldman Sachs Asset Management, L.P. with respect to Thrivent Partner Worldwide Allocation Fund (10) | |
| 6.20 | Amendment No. 1 to Investment Subadvisory Agreement with Goldman Sachs Asset Management, L.P. with respect to Thrivent Partner Worldwide Allocation Fund (16) | |
| 6.21 | Investment Subadvisory Agreement with Aberdeen Asset Management Investment Services Limited with respect to Thrivent Partner Worldwide Allocation Fund (10) | |
| 6.22 | Amendment No. 1 to Investment Subadvisory Agreement with Aberdeen Asset Managers Limited with respect to Thrivent Partner Worldwide Allocation Fund (15) | |
| 6.23 | Form of Amendment No. 2 to Investment Subadvisory Agreement with Aberdeen Asset Managers Limited with respect to Thrivent Partner Worldwide Allocation Fund and Thrivent Partner Emerging Markets Equity Fund (17) | |
| 7.1 | Distribution Agreement with Thrivent Investment Management Inc. (2) | |
| 7.2 | Amendment No. 14 to Distribution Agreement (9) | |
| 7.3 | Amendment No. 15 to Distribution Agreement (12) | |
| 7.4 | Amendment No. 16 to Distribution Agreement (15) | |
| 8. | Not Applicable | |
| 9. | Custodian Agreement with State Street Bank and Trust (3) | |
| 10.1 | Rule 12b-1 Plan (4) | |
| 10.2 | Rule 18f-3 Plan (6) | |
| 11. | Opinion and Consent of Counsel * | |
| 12. | Opinion of Counsel supporting tax matters and consequences + | |
| 13.1 | Accounting Services Agreement between Registrant and Thrivent Asset Management, LLC (7) | |
| 13.2 | Amendment No. 1 to Accounting Services Agreement (9) | |
| 13.3 | Administration Contract between Registrant and Thrivent Asset Management, LLC (11) | |
| 13.4 | Letter Agreement to Administration Contract, dated November 16, 2007 (9) | |
| 13.5 | Administrative Services Agreement, effective as of January 1, 2009, between Registrant and | |
| Thrivent Asset Management, LLC (13) | ||
| 13.6 | Amendment No. 1 to Administrative Services Agreement (12) | |
| 13.7 | Amendment No. 2 to Administrative Services Agreement (15) | |
| 13.8 | Amendment No. 3 to Administrative Services Agreement (16) | |
| 13.9 | Transfer Agency Agreement with Thrivent Financial Investor Services Inc. (5) | |
| 13.10 | Amendment No. 1 to Transfer Agency Agreement between Registrant and Thrivent Financial Investor Services Inc. (11) | |
| 13.11 | Amendment No. 2 to Transfer Agency Agreement between Registrant and Thrivent Financial Investor Services Inc. (11) | |
| 13.12 | Expense Reimbursement Letter Agreement (17) | |
| 14. | Consent of Independent Registered Public Accounting Firm * | |
| 15. | Not Applicable |
Table of Contents
| 16. | Powers of Attorney (18) | |
| 17. | Form of Proxy Card * |
| * | Filed herewith |
| ** | Included in Appendix A to the Statement of Additional Information |
| + | To be filed by further amendment |
Table of Contents
| (1) | Incorporated by reference from Post-Effective Amendment No. 26 to the registration statement of Registrant, file no. 33-12911, filed on June 25, 1998. | |
| (2) | Incorporated by reference from Post-Effective Amendment No. 36 to the registration statement of Registrant, file no. 33-12911, filed on December 29, 1999. | |
| (3) | Incorporated by reference from Post-Effective Amendment No. 47 to the registration statement of Registrant, file no. 33-12911, filed on June 27, 2003. | |
| (4) | Incorporated by reference from the initial registration statement of Registrant on Form N-14, file no. 333-113514, filed on March 11, 2004. | |
| (5) | Incorporated by reference from Post-Effective Amendment No. 52 to the registration statement of Registrant, file no. 33-12911, filed on July 14, 2004. | |
| (6) | Incorporated by reference from Post-Effective Amendment No. 58 to the registration statement of Registrant, file no. 33-12911, filed on December 15, 2005. | |
| (7) | Incorporated by reference from Post-Effective Amendment No. 59 to the registration statement of Registrant, file no. 33-12911, filed on February 22, 2006. | |
| (8) | Incorporated by reference from Post-Effective Amendment No. 61 to the registration statement of Registrant, file no. 33-12911, filed on February 26, 2007. | |
| (9) | Incorporated by reference from Post-Effective Amendment No. 62 to the registration statement of Registrant, file no. 33-12911, filed on November 29, 2007. | |
| (10) | Incorporated by reference from Post-Effective Amendment No. 63 to the registration statement of Registrant, file no. 33-12911, filed on February 21, 2008. | |
| (11) | Incorporated by reference from Post-Effective Amendment No. 64 to the registration statement of Registrant, file no. 33-12911, filed on February 27, 2009. | |
| (12) | Incorporated by reference from Post-Effective Amendment No. 65 to the registration statement of Registrant, file no. 33-12911, filed on December 7, 2009. | |
| (13) | Incorporated by reference from Post-Effective Amendment No. 1 of Registrant on Form N-14, file no. 333-175210, filed on September 16, 2011. | |
| (14) | Incorporated by reference from Post-Effective Amendment No. 69 to the registration statement of Registrant, file no. 33-12911, filed on February 27, 2012. | |
| (15) | Incorporated by reference from Post-Effective Amendment No. 74 to the registration statement of Registrant, file no. 33-12911, filed on February 28, 2013. | |
| (16) | Incorporated by reference from Post-Effective Amendment No. 76 to the registration statement of Registrant, file no. 33-12911, filed on February 27, 2014. | |
| (17) | Incorporated by reference from Post-Effective Amendment No. 78 to the registration statement of Registrant, file no. 33-12911, filed on February 27, 2015. | |
| (18) | Incorporated by reference from initial N-14 registration statement of Registrant, file no. 333-175210, filed on June 29, 2011. |
Table of Contents
Item 17. Undertakings
| (1) | The undersigned registrant agrees that prior to any public reoffering of the securities registered through the use of a prospectus which is a part of this registration statement by any person or party who is deemed to be an underwriter within the meaning of Rule 145(c) of the Securities Act [17 CFR 230.145c], the reoffering prospectus will contain the information called for by the applicable registration form for the reofferings by persons who may be deemed underwriters, in addition to the information called for by the other items of the applicable form. |
| (2) | The undersigned registrant agrees that every prospectus that is filed under paragraph (1) above will be filed as a part of an amendment to the registration statement and will not be used until the amendment is effective, and that, in determining any liability under the 1933 Act, each post-effective amendment shall be deemed to be a new registration statement for the securities offered therein, and the offering of the securities at that time shall be deemed to be the initial bona fide offering of them. |
| (3) | The undersigned registrant agrees to file, by post-effective amendment to the registration statement, an opinion of counsel supporting the tax consequences of the proposed reorganization as soon as practicable after the closing of the reorganization. |
Table of Contents
SIGNATURES
Pursuant to the requirements of the Securities Act of 1933, the Registrant has duly caused this Registration Statement to be signed on its behalf by the undersigned, thereunto duly authorized, in the City of Minneapolis, State of Minnesota, on this 15th day of May 2015.
| THRIVENT MUTUAL FUNDS |
/s/ Michael W. Kremenak |
| Michael W. Kremenak |
| Secretary and Chief Legal Officer |
Pursuant to the requirements of the Securities Act of 1933, this Registration Statement has been signed below by the following persons in the capacities indicated and on this 15th day of May 2015.
Signature | Title | |
/s/ David S. Royal | President (Principal Executive Officer) | |
| David S. Royal | ||
/s/ Gerard V. Vaillancourt | Treasurer (Principal Financial and Accounting Officer) | |
| Gerard V. Vaillancourt | ||
* | Trustee | |
| Janice B. Case | ||
* | Trustee | |
| Richard L. Gady | ||
* | Trustee | |
| Richard A. Hauser | ||
* | Trustee | |
| Marc S. Joseph | ||
* | Trustee | |
| Paul R. Laubscher | ||
* | Trustee | |
| James A. Nussle | ||
* | Trustee | |
| Douglas D. Sims | ||
* | Trustee | |
| Constance L. Souders | ||
/s/ Russell W. Swansen | Trustee | |
Russell W. Swansen | ||
| * | David S. Royal, by signing his name hereto, does hereby sign this document on behalf of each of the above-named Trustees of Thrivent Mutual Funds pursuant to the powers of attorney duly executed by such persons. |
Dated: May 15, 2015
/s/ David S. Royal |
| David S. Royal |
| Attorney-in-Fact |
Table of Contents
INDEX TO EXHIBITS
| Exhibit 11. | Opinion and Consent of Counsel | |
| Exhibit 14. | Consent of Independent Registered Public Accounting Firm | |