UNITED STATES
SECURITIES AND EXCHANGE COMMISSION
Washington, D.C. 20549
FORM N-CSR
CERTIFIED SHAREHOLDER REPORT OF REGISTERED
MANAGEMENT INVESTMENT COMPANIES
Investment Company Act file number: 811-05075
Thrivent Mutual Funds
(Exact name of registrant as specified in charter)
625 Fourth Avenue South
Minneapolis, Minnesota 55415
(Address of principal executive offices) (Zip code)
John D. Jackson
Assistant Secretary
625 Fourth Avenue South
Minneapolis, Minnesota 55415
(Name and address of agent for service)
Registrant’s telephone number, including area code: (612) 844-7190
Date of fiscal year end: October 31
Date of reporting period: October 31, 2018
| Item 1. | Report to Stockholders |

TABLEOF CONTENTS
Dear Shareholder:
We’ve often stated that Thrivent’s mission is to help people be wise with money. But I thought it might be helpful to go a step further and delve into the story behind that slogan—how we manage your money at Thrivent. Please bear with me; managing money may seem complicated and difficult to understand, but it can also be made very simple. In fact, that’s the whole point of much of what we do as an investment team at Thrivent.
Within the investment area, we do our best to offer low-cost, high-value products that are easy to understand. Although Thrivent offers a variety of funds, today I’d like to focus on some funds that we view as especially important in helping folks be wise with money: our Asset Allocation Funds and Income Plus Funds.
Our Asset Allocation Funds are intended to be a simple solution for investors seeking accumulation of assets for retirement or other purposes. We offer four funds—from Moderately Conservative to Aggressive—to suit the risk tolerance and objectives of a wide range of investors. Higher risk, of course, offers the potential for greater returns but also carries greater risk of loss.
We also offer three Income Plus funds—from our Balanced Income Plus Fund (which has approximately 50% in stocks and 50% in fixed-income) to our Diversified Income Plus Fund (which has approximately 30% in stocks and 70% in fixed-income) to our Opportunity Income Plus Fund (which normally holds only fixed-income securities). Our Income Plus funds seek to provide greater income than our Asset Allocation funds and could be appropriate, for example, for someone looking for income in retirement.
We use the same process to manage both our Asset Allocation funds and Income Plus funds. We sometimes refer to these funds collectively as our “mixed-asset funds,” since each holds a variety of different types of securities. We also sometimes refer to our Asset Allocation funds and Income Plus funds as “solution-oriented funds.” We call them that because, unlike our single-strategy funds (such as our Mid Cap Stock Fund or our Large Cap Growth Fund), our primary goal isn’t just to beat a particular investment benchmark. We’re seeking a particular outcome for investors, namely, some combination of capital appreciation and income with a certain level of risk (depending on the fund).
Our mixed-asset funds are designed to be as simple as possible for an investor to understand. But within these funds, there’s a whole lot “going on under the hood,” so to speak. Our process starts with an in-depth, quantitative review of the historical risk, return and other characteristics of more than two dozen types of assets—stocks, bonds and hybrid securities, both domestic and international. We have a group of five investment professionals, led by David Spangler, CFA, whose primary job is to analyze our allocations across asset classes for our mixed-asset funds. They compile the best historical data available for each type of asset and run an optimization algorithm to predict which allocations should produce the best risk-adjusted returns, based on that historical data.
But the future doesn’t always look like the past, so we don’t simply set our asset allocations based on algorithms running on historical information. When we set what we refer to as our “strategic allocations” for each asset class, we take into account the quantitative models and data, but we also apply a layer of judgment. Some periods in the market—think of the tech bubble in 1999-2000 or the credit crisis of 2008-09—can be so extreme as to distort long-term historical data. Our team of investment professionals uses its many years of experience to set what we believe to be the best strategic asset allocation for each fund based on its investment objective and its risk/ return profile. We redo this strategic allocation process about every 24 months to incorporate new and better historical information as it becomes available.
But while we view our strategic allocations as an important starting point—our “north star,” as we’ve termed it in our asset allocation meetings—our mixed-asset funds are rarely at their exact strategic allocations across all asset classes. There is nearly always something going on in the markets or in the world that gives us reason to believe we should over- or under-weight certain asset classes for some period of time. For instance, over the past year or so, we’ve been modestly below our strategic weightings for stocks because stocks seemed fully valued (but not over-valued), and we’ve been in a bull market for nearly 10 years. We refer to any departure from our strategic weightings as a “tactical allocation.”
Tactical allocations can be short- to intermediate-term trades. We may for example believe one asset class is significantly over-valued as compared to another. We may then buy the asset we view as cheap and sell the one we believe is too expensive. Such a trade could play out over a period of months or sometimes just weeks. We’re long-term investors, not market timers, but in our mixed-asset funds, part of our mandate is to continually seek to optimize our asset allocations, and that can sometimes involve being nimble and making some shorter-term trades to seek to add to shareholder returns.
A mutual fund may seem like an old and stodgy vehicle. After all, mutual funds have been around for more than 75 years. There are newer vehicles, such as managed accounts and even so-called “robo-advisors.” But a mutual fund has some significant advantages, and these advantages are a big part of the reason why mutual funds have withstood the test of time.
Mutual funds are called mutual funds because of the mutuality among shareholders. Expenses are allocated across all fund shareholders, which can give smaller investors access to economies of scale. But this mutuality is important from an investment management perspective as well. Since we’re managing pools of assets in our mixed-asset funds that belong to tens or hundreds of thousands of shareholders, we can use investment tools and techniques that would be difficult or impossible to utilize for an individual investor.
2
When we make tactical asset allocations, we typically do so using futures contracts or other derivative instruments, both to reduce transaction costs and to avoid disturbing our underlying portfolio managers by forcing them to buy or sell portfolio securities. We have in the past, for example, purchased an overweight position in foreign securities we believed to be undervalued, but hedged the relevant currency risk (because we thought the underlying currency might go down). I believe that, paradoxically, the fact that we’re managing large pools of assets actually allows us to be more nimble from an investment perspective.
The goal of this letter—and thank you for staying with me—is to help investors like you understand that when you invest in one of our Asset Allocation or Income Plus funds, there’s a lot going on within your fund in terms of investment management. Yet the whole point of the funds is to make things simple from an investor’s perspective.
We recognize that most of our shareholders have a long list of things they’d rather be doing than thinking about asset allocation and worrying about what might be going on in the markets. At Thrivent, we have a team of 116 investment professionals who are committed to helping you be wise with money and achieve your financial goals. I know that I sometimes wake up at night thinking about markets and asset allocation. I suspect others on our team do so as well. We’re continually thinking about how best to allocate our shareholders’ assets—so that you don’t have to.
Sincerely,

David S. Royal
President and Chief Investment Officer
Thrivent Mutual Funds
Before investing, consider the fund’s investment objectives, risks, charges and expenses. Go to ThriventFunds.com for a prospectus containing this information and read it carefully.
3
Dear Shareholder:
After a rocky final month of the Funds’ fiscal year, the S&P 500 Index still posted a total return of 7.35% for the 12-month period ended October 31, 2018.
Yields on 10-year U.S. Treasuries continued to move up over the past 12 months, ending the fiscal year at 3.15% after closing at 2.38% a year earlier. The yield increase was spurred by three rate hikes of 0.25% each by the Federal Reserve (Fed) during 2018—and a total of eight hikes since the Fed began raising rates in December 2016.
Economic Review
The U.S. economy has been solid over the past 12 months. Gross domestic product (GDP), which is the broadest measure of economic output, grew at an annualized rate of 3.5% in the third quarter of 2018 following a 4.2% growth rate in the second quarter, according to the U.S. Department of Commerce.
Several factors contributed to the solid GDP growth rate. Disposable personal income increased at an annualized rate of 4.1% in the third quarter of 2018, compared with a 4.5% increase in the second quarter, and real disposable personal income increased 2.5%, according to the Bureau of Economic Analysis.
Employment has also continued to rise, with positive job growth for 97 consecutive months through October, according to the Bureau of Labor Statistics. The unemployment rate is at just 3.7%, and wages have increased at an annualized rate of 3.1%.
Oil prices have been volatile recently but ended the period at $65.31 per barrel (West Texas Intermediate is a grade of crude oil used as a benchmark in oil pricing.), well above the $54.38 per barrel price of a year earlier.
Market Review
This year, stock market gains have been driven largely by strong corporate earnings, with S&P 500 earnings growth of about 20% in 2018. But much of those gains were the result of corporate tax cuts and improved margins. With no additional tax cuts planned for 2019, corporate profit growth will have to depend on continued margin improvement and organic revenue growth.
Sector performance has varied widely, with the S&P 500 Technology, Healthcare and Consumer Discretionary sectors all rising over 7% through the first 10 months of 2018, while Consumer Staples, Materials and Industrials all posted significant declines during the same period.
International equity markets have been weak throughout the past few months. The MSCI EAFE Index, which tracks developed markets in Europe, Asia and Australia, was down 6.85% over the past 12 months.
The MSCI Emerging Markets Index, which tracks stocks in developing economies, dropped 12.52% over the past 12 months. The MSCI World All Country Index (non-U.S.) declined 8.24% during the one-year period.
As interest rates have risen, bond prices have provided mixed results. The Bloomberg Barclays U.S. Aggregate Bond Index, which tracks a broad range of investment-grade bonds, was down 2.05% for the 12-month period ended October 31, 2018. The Bloomberg Barclays U.S. Corporate High Yield Bond Index gained 0.97%, while the Bloomberg Barclays 1-3 Year Government/Credit Bond Index gained 0.34% for the 12-month period.
Our Outlook
We expect GDP growth to ease back down closer to 3% in the coming quarters, which is still a healthy level that would support broad corporate earnings growth.
We expect to see one more interest rate hike before the end of 2018, with more rate increases expected in 2019. We don’t expect these rate hikes to have a significant effect on the equity market near-term as long as the Fed moves slowly.
Higher risk assets, particularly equities, will remain more volatile as the Fed pursues its tightening policy. This should not be surprising—this is what usually happens when the Fed raises interest rates. However, we think market valuation is now fairly reasonable, with the forward price-to-earnings ratio for the S&P 500 at about 15.5. This is slightly below longer-term valuation levels.
Corporate earnings are now decelerating as the effects of tax policy diminish over time. Rising interest rates will continue to temper the equity market. However, with short-term interest rates now approaching what the Fed may consider the “neutral rate,” we believe the Fed may be closer to stopping, or at least pausing, its tightening monetary policy.
We continue to expect modestly positive equity market returns over the next six to 12 months and believe fixed-income returns will remain relatively low over this same timeframe.
However, with bond yields meaningfully higher (particularly short-term yields) relative to rates in recent years, and with inflation still hovering around 2% with little sign of accelerating, bonds and other fixed-income and interest-bearing investments should provide some modicum of return for investors and a better diversification component for portfolios.
Sincerely,
David S. Royal
President and Chief Investment Officer
Thrivent Mutual Funds
4
(This page intentionally left blank)
5
THRIVENT AGGRESSIVE ALLOCATION FUND
David S. Royal, David C. Francis, CFA, Mark L. Simenstad, CFA, Darren M. Bagwell, CFA, and Stephen D. Lowe, CFA, Portfolio Co-Managers
The Fund seeks long-term capital growth.
Investment in Thrivent Aggressive Allocation Fund involves allocation, credit, derivatives, emerging markets, equity security, foreign securities, growth investing, high yield, interest rate, investment adviser, issuer, large cap, leveraged loan, liquidity, market, mid cap, non-diversified, other funds, small cap, and value investing risks. A detailed description of each risk can be found in the significant risks section of the accompanying notes to financial statements.
How did the Fund perform during the 12-month period ended October 31, 2018?
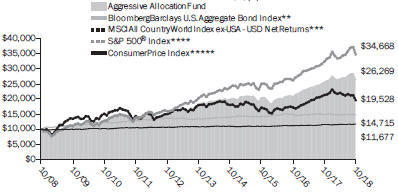
Thrivent Aggressive Allocation Fund earned a return of 2.89%, compared with the median return of its peer group, the Lipper Mixed-Asset Target Allocation Aggressive Growth Funds category, of -0.82%. The Fund’s market benchmarks, the S&P 500® Index, the Bloomberg Barclays U.S. Aggregate Bond Index, and the MSCI All Country World Index ex-USA–USD Net Returns, earned returns of 7.35%, -2.05% and -8.24%, respectively.
What factors affected the Fund’s performance?
After an exceptionally quiet 2017, market volatility returned this year in the form of two swift equity market drawdowns of approximately 10%. Typically, excessive market volatility presents a more challenging environment for our asset allocation funds because of their procyclical positioning. However, during this reporting period, the Aggressive Allocation Fund outperformed its peer group median, primarily due to favorable results from our asset allocation decisions and the relative outperformance of several of the underlying Fund managers. Additionally, as part of the management process, we employed derivatives for the purpose of adjusting the Fund’s exposures to various asset classes when deemed appropriate. In 2018, the Fund benefited from several of these tactics. First, an underweighting to international equities that we instituted in March added value because domestic equities materially outperformed. Second, in September, we eliminated an existing overweighting to domestic small-cap stocks, which allowed the Fund to capture the relative year-to-date outperformance of the position just prior to the small-cap segment’s material underperformance during the October decline. Beyond these tactical adjustments, we employed several risk-mitigating strategies, such as the extension of a NASDAQ 100 short position and the initiation of a low volatility strategy. These also proved successful in hedging the Fund’s overweighting to risk assets, including mega-cap technology stocks.
Broadly speaking, stock selection also provided strong contributions to relative performance, led by material outperformance in the large-cap growth and value spaces and smaller relative gains in the mid-cap core, small-cap core and growth areas. Only the international and mid-cap growth managers underperformed their benchmarks. Although no sectors represented more than 25% of net assets for the period, the Fund benefited from strong performance in information technology, industrials and health care, with modest underperformance from energy, consumer staples and utilities.
In the fixed-income market, we saw the Treasury yield curve flatten significantly as yields on shorter-term Treasuries rose more than yields on longer-term Treasuries. The Federal Reserve (Fed) increased the federal funds rate four times, which had the most impact on short-term rates. Intermediate-and long-term rates also rose, but less than short rates. Higher interest rates weighed on much of the fixed-income market with corporate bond returns ranging from slightly positive to moderately negative. Also, yield spreads over Treasuries, a form of risk premium, increased for investment-grade and high-yield corporate bonds as well as emerging markets debt, which negatively impacted returns. However, securities with floating rates that increase as interest rates rise produced the strongest returns, including leveraged loans and some securitized assets. The fixed-income portion of the Fund outperformed in part because it was positioned for the Treasury curve to flatten. Additionally, this segment of the Fund benefited from its overweighting in securitized assets, including nonagency mortgage-backed securities. Leveraged loan holdings also boosted relative performance, while high-yield holdings underperformed. Treasury futures were used in the fixed-income portfolio to help manage interest rate exposure.
What is your outlook?
At the beginning of the period, valuations were elevated. However, after the swift market decline in October 2018, valuations across asset classes appeared in line with their long-term averages and, in some cases such as international, they appeared cheap. Economically, the U.S. remains strong with historically low unemployment, strong business sentiment and robust manufacturing activity. Internationally, however, we see a different story with Europe and Asia showing marked weakness. We expect economic growth to moderate in the U.S. as the Fed continues raising rates at a measured pace into 2019, while trade tensions and market volatility will likely persist. As a result, we have positioned the Fund with a modest underweighting in equities, while maintaining diversifying strategies to hedge more volatile assets such as technology and emerging markets sectors, and growth and momentum investments. Within fixed income, the Fund has a roughly neutral position in corporate credit, along with an underweighting to emerging markets debt, and an overweighting to securitized assets such as nonagency mortgage-backed securities.
Quoted Fund performance is for Class A shares and does not reflect a sales charge.
The returns shown do not reflect taxes a shareholder would pay on distributions or redemptions.
6
| | | | |
| Portfolio Composition | | | | |
| (% of Portfolio) | | | | |
Large Cap | | | 40.0 | % |
International | | | 18.8 | % |
Short-Term Investments | | | 14.9 | % |
Small Cap | | | 13.6 | % |
Mid Cap | | | 5.8 | % |
Investment Grade Debt | | | 3.3 | % |
Multi-Cap | | | 3.2 | % |
High Yield | | | 0.4 | % |
| | | | |
Total | | | 100.0 | % |
Top 10 Holdings | | | | |
| (% of Net Assets) | | | | |
Thrivent Partner Worldwide Allocation Fund, Class S | | | 9.4 | % |
Thrivent Large Cap Growth Fund, Class S | | | 7.2 | % |
Thrivent Mid Cap Stock Fund, Class S | | | 5.9 | % |
Thrivent Large Cap Value Fund, Class S | | | 5.4 | % |
Thrivent Core International Equity Fund | | | 4.2 | % |
Thrivent Core Low Volatility Equity Fund | | | 3.7 | % |
Thrivent Large Cap Stock Fund, Class S | | | 2.9 | % |
Thrivent Small Cap Stock Fund, Class S | | | 2.6 | % |
Thrivent Limited Maturity Bond Fund, Class S | | | 0.6 | % |
Thrivent High Yield Fund, Class S | | | 0.5 | % |
| |
These securities represent 42.4% of the total net assets of the Fund. | | | | |
Portfolio Composition illustrates market exposure of all asset classes, including long and short derivatives. Portfolio composition does not look-through other mutual funds held to their underlying assets, but rather each fund is assigned an asset class.
The Portfolio Composition chart excludes collateral held for securities loaned.
The lists of Top 10 Holdings exclude short-term investments and collateral held for securities loaned.
Quoted Portfolio Composition and Top 10 Holdings are subject to change.
Average Annual Total Returns1
As of October 31, 2018
| | | | | | | | | | | | |
| Class A2 | | 1-Year | | | 5 Years | | | 10 Years | |
without sales charge | | | 2.89 | % | | | 7.64 | % | | | 10.65 | % |
with sales charge | | | -1.72 | % | | | 6.65 | % | | | 10.14 | % |
| | | |
| Class S | | 1-Year | | | 5 Years | | | 10 Years | |
Net Asset Value | | | 3.20 | % | | | 8.02 | % | | | 11.06 | % |
Value of a $10,000 Investment
Class A Shares *,1,(a )
| | Past performance is not an indication of future results. The prospectus contains more complete information on the investment objectives, risks, charges and expenses of the investment company, which investors should read and consider carefully before investing. To obtain a prospectus, contact a registered representative or visit ThriventFunds.com. Total investment return and principal value of your investment will fluctuate, and your shares, when redeemed, may be worth more or less than their original cost. Current performance may be higher or lower than the performance data quoted. Call 800-847-4836 or visit ThriventFunds.com for performance results current to the most recent month-end. |
| 1 | Average annual total returns represent past performance and reflect changes in share prices, the reinvestment of all dividends and capital gains, and the effects of compounding. Periods of less than one year are not annualized. At various times, the Fund’s adviser may have waived its management fee and/ or reimbursed Fund expenses, without which the Fund’s total returns would have been lower. The returns shown do not reflect taxes a shareholder would pay on distributions or redemptions. Unless otherwise noted, the Index results shown do not reflect deductions for fees, expenses, or taxes. Index results shown reflect reinvestment of dividends. It is not possible to invest directly in an Index. |
| 2 | Class A performance with sales charge reflects the maximum sales charge of 4.5%. |
| (a) | Performance of other classes will be greater or less than the line shown based on the differences in loads and fees paid by shareholders investing in the different classes. |
| * | As you compare performance, please note that the Fund’s performance reflects the maximum 4.5% sales charge, while the benchmark indices do not reflect any such charges, deductions for fees, expenses or taxes. If you were to purchase any of the above individual securities represented in those Indexes, any charges you would pay would reduce your total return as well. |
| ** | The Bloomberg Barclays U.S. Aggregate Bond Index is an index that measures the performance of U.S. investment grade bonds. |
| *** | The MSCI All Country World Index ex-USA -USD Net Returns is an unmanaged market capitalization-weighted index that is designed to represent the performance of developed and emerging stock markets throughout the world. The performance of the Index reflects dividends reinvested after the deduction of withholding taxes. |
| **** | The S&P 500® Index is an index that represents the average performance of a group of 500 widely held, publicly traded stocks. “S&P 500®” is a trademark of The McGraw-Hill Companies, Inc. and has been licensed for use by Thrivent Financial for Lutherans. The product is not sponsored, endorsed or promoted by Standard & Poor’s and Standard & Poor’s makes no representation regarding the advisability of investing in the product. |
| ***** | The Consumer Price Index is an inflationary indicator that measures the change in the cost of a fixed basket of products and services, including housing, electricity, food and transportation. |
7
THRIVENT BALANCED INCOME PLUS FUND
Mark L. Simenstad, CFA, Noah J. Monsen, CFA, Reginald L. Pfeifer, CFA, Stephen D. Lowe, CFA, and John T. Groton, Jr., CFA, Portfolio Co-Managers*
The Fund seeks long-term total return through a balance between income and the potential for long-term capital growth.
Investment in Thrivent Balanced Income Plus Fund involves risks including allocation, convertible securities, credit, derivatives, emerging markets, equity securities, ETF, foreign securities, high yield, interest rate, investment adviser, issuer, leveraged loan, liquidity, market, mortgage-backed and other asset-backed securities, other funds, portfolio turnover rate, preferred securities, and sovereign debt risks. A detailed description of each risk can be found in the significant risks section of the accompanying notes to financial statements.
*Effective October 31, 2018, Gregory R. Anderson, CFA and Matthew D. Finn, CFA were named as portfolio managers of the Fund, and Reginald L. Pfeifer, CFA and John T. Groton, Jr., CFA no longer serve as portfolio managers of the Fund.
How did the Fund perform during the 12-month period ended October 31, 2018?
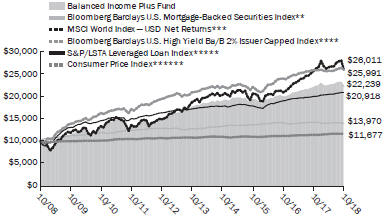
Thrivent Balanced Income Plus Fund earned a return of 0.99%, compared with the median return of its peer group, the Lipper Mixed-Asset Target Allocation Moderate Funds category, of -0.76%. The Fund’s market benchmarks, the S&P/LSTA Leveraged Loan Index, the MSCI World Index–USD Net Returns, the Bloomberg Barclays U.S. Mortgage-Backed Securities Index, and the Bloomberg Barclays U.S. High Yield Ba/B 2% Issuer Capped Index, earned returns of 4.54%, 1.16%, -1.52% and 0.30%, respectively.
What factors affected the Fund’s performance?
Despite increasing trade war tensions, the U.S. economy strengthened during the period while other economies across the globe slowed. The U.S. was spurred on by the late-2017 corporate tax cuts, improved trade policies, significant deregulation and a raft of positive economic data. These factors led the Federal Reserve (Fed) to keep raising the target federal funds rate with four hikes totaling 1.00%. The Treasury yield curve continued to flatten as rates moved higher for shorter-maturity securities than they did for longer-maturity Treasuries. As a result, returns for most fixed-income sectors were relatively flat to negative over the period. U.S. equity markets, which benefited significantly from corporate tax reform, produced positive returns and significantly outperformed international equities, which were sharply negative. The real estate investment trust (REIT) sector, which is fairly rate-sensitive, produced low single-digit returns and underperformed U.S. equities, but outperformed investment-grade and high-yield credit, as well as international equities.
The Fund’s portfolio continued to be split 50/50 between fixed-income and equity exposure. Within domestic equity, our large-capitalization and mid-/small-cap portfolios are managed separately, and both contributed positively. Strong stock selection drove favorable returns, particularly in the heavily weighted information technology and consumer discretionary sectors. We benefited from overweighted positions in outperforming mega-cap companies, including Amazon and Apple, and security selection among small-cap communications equipment and software companies. Stock selection detracted in energy, health care and materials. Outperforming REIT sectors included retail, cell tower, storage, health care, industrial and hotel REITs, while multifamily, office, diversified, data center and timber REITs lagged.
In the international equity portfolio, we use a quantitative approach that emphasizes certain factors in the markets. Results benefited from our emphasis on low volatility and high quality; however, a tilt toward smaller-cap stocks detracted. Country allocations aided performance including an underweighting to Hong Kong and overweighting to Japan. However, sector allocations modestly detracted, particularly our emphasis on the two consumer sectors and, in particular, the automotive industry. Although currency exposure in the portfolio was small, an underweighting to the euro proved beneficial.
The fixed-income portfolio outperformed in part due to our shorter duration stance, which dampened sensitivity to rising rates, and our positioning for a flatter yield curve. We used Treasury futures to aid in this interest rate positioning. In the securitized area, performance was aided by an overweighting in nonagency residential mortgage-backed securities, which experienced outsized gains versus the overall market and especially relative to agency mortgage-backed securities. In the corporate area, we had heavy exposure to floating-rate leveraged bank loans, one of the strongest areas of the fixed-income market that significantly outperformed both investment-grade and high-yield credit. The Fund’s alternative holdings underperformed, as did emerging market debt. We hedged some of our portfolio’s alternative equity exposure with a short position in S&P 500® futures, which had a modestly negative impact on overall portfolio performance.
What is your outlook?
In the fixed-income market, we believe the coming year will be a more difficult return environment because spreads remain tight by historical standards, the Fed is likely to continue rate hikes and the economy is likely to slow as the impact of tax reform subsides. We are emphasizing securitized debt due to better fundamentals supporting these securities and are more cautious regarding high-yield credit and leveraged loans as we get closer to the end of this economic cycle. In the international equity portfolio, we are focused on finding profitable companies with attractive valuations, positive price momentum, low volatility and high earnings quality. In the U.S. equity portfolio, we continue to implement our bottom-up stock selection process searching for the best ideas regardless of the macroeconomic backdrop. We plan to increase the number of holdings in the U.S. equity portfolio to help reduce volatility.
Quoted Fund performance is for Class A shares and does not reflect a sales charge.
The returns shown do not reflect taxes a shareholder would pay on distributions or redemptions.
8
| | | | |
| Portfolio Composition | | | | |
| (% of Portfolio) | | | | |
Common Stock | | | 43.0 | % |
Long-Term Fixed Income | | | 22.8 | % |
Bank Loans | | | 15.5 | % |
Short-Term Investments | | | 11.1 | % |
Registered Investment Companies | | | 6.9 | % |
Preferred Stock | | | 0.7 | % |
| | | | |
Total | | | 100.0 | % |
| | | | |
| Major Market Sectors | | | | |
| (% of Net Assets) | | | | |
Financials | | | 14.0 | % |
Information Technology | | | 10.4 | % |
Communications Services | | | 8.6 | % |
Consumer Discretionary | | | 7.8 | % |
Consumer Staples | | | 6.8 | % |
Health Care | | | 6.5 | % |
Affiliated Fixed Income Holdings | | | 6.4 | % |
Industrials | | | 6.3 | % |
Mortgage-Backed Securities | | | 6.3 | % |
Materials | | | 6.2 | % |
| | | | |
| Top 10 Holdings | | | | |
| (% of Net Assets) | | | | |
Thrivent Core Emerging Markets Debt Fund | | | 6.4 | % |
Federal National Mortgage Association Conventional 30-Yr. Pass Through | | | 2.1 | % |
Federal National Mortgage Association Conventional 30-Yr. Pass Through | | | 1.1 | % |
Federal National Mortgage Association Conventional 30-Yr. Pass Through | | | 1.1 | % |
Federal Home Loan Mortgage Corporation Gold 30-Yr. Pass Through | | | 0.8 | % |
Cisco Systems, Inc. | | | 0.8 | % |
Microsoft Corporation | | | 0.7 | % |
Citigroup, Inc. | | | 0.6 | % |
Apple, Inc. | | | 0.6 | % |
Bank of America Corporation | | | 0.6 | % |
| |
These securities represent 14.8% of the total net assets of the Fund. | | | | |
Quoted Portfolio Composition, Major Market Sectors and Top 10 Holdings are subject to change.
The lists of Major Market Sectors and Top 10 Holdings exclude short-term investments and collateral held for securities loaned.
The Portfolio Composition chart excludes collateral held for securities loaned.
Average Annual Total Returns1
As of October 31, 2018
| | | | | | | | | | | | |
| Class A2 | | 1-Year | | | 5 Years | | | 10 Years | |
without sales charge | | | 0.99 | % | | | 4.81 | % | | | 8.82 | % |
with sales charge | | | -3.52 | % | | | 3.85 | % | | | 8.32 | % |
| | | |
| Class S | | 1-Year | | | 5 Years | | | 10 Years | |
Net Asset Value | | | 1.31 | % | | | 5.18 | % | | | 9.28 | % |
Value of a $10,000 Investment
Class A Shares *,1,(a )
| | Past performance is not an indication of future results. The prospectus contains more complete information on the investment objectives, risks, charges and expenses of the investment company, which investors should read and consider carefully before investing. To obtain a prospectus, contact a registered representative or visit ThriventFunds.com. Total investment return and principal value of your investment will fluctuate, and your shares, when redeemed, may be worth more or less than their original cost. Current performance may be higher or lower than the performance data quoted. Call 800-847-4836 or visit ThriventFunds.com for performance results current to the most recent month-end. |
| 1 | Average annual total returns represent past performance and reflect changes in share prices, the reinvestment of all dividends and capital gains, and the effects of compounding. Periods of less than one year are not annualized. At various times, the Fund’s adviser may have waived its management fee and/ or reimbursed Fund expenses, without which the Fund’s total returns would have been lower. The returns shown do not reflect taxes a shareholder would pay on distributions or redemptions. Unless otherwise noted, the Index results shown do not reflect deductions for fees, expenses, or taxes. Index results shown reflect reinvestment of dividends. It is not possible to invest directly in an Index. |
| 2 | Class A performance with sales charge reflects the maximum sales charge of 4.5%. |
| (a) | Performance of other classes will be greater or less than the line shown based on the differences in loads and fees paid by shareholders investing in the different classes. |
| * | As you compare performance, please note that the Fund’s performance reflects the maximum 4.5% sales charge, while the benchmark indices do not reflect any such charges. If you were to purchase any of the above individual securities represented in those Indexes, any charges you would pay would reduce your total return as well. |
| ** | The Bloomberg Barclays U.S. Mortgage-Backed Securities Index (MBS) is formed by grouping the universe of over 600,000 individual fixed-rate U.S. government agency MBS pools into approximately 3,500 generic types of securities. |
| *** | The MSCI World Index – USD Net Returns is an unmanaged market-capitalization-weighted index that represents the performance of large and mid-cap stock across 23 developed market countries. The performance of the Index reflects dividends reinvested after the deduction of withholding taxes. |
| **** | The Bloomberg Barclays U.S. High-Yield Ba/B 2% Issuer Capped Index covers the USD denominated, non-investment grade, Ba or B rated, fixed-rate, taxable corporate bond market. The index limits issuer exposures to a maximum 2%, redistributing excess market value index-wide on a pro-rata basis. |
| ***** | The S&P/LSTA Leveraged Loan Index is a market-value weighted index representing the performance of the universe of U.S. dollar-denominated, senior secured, syndicated term loans. |
| ****** | The Consumer Price Index is an inflationary indicator that measures the change in the cost of a fixed basket of products and services, including housing, electricity, food and transportation. |
9
THRIVENT GOVERNMENT BOND FUND
Michael G. Landreville, CFA and CPA (inactive) and Gregory R. Anderson, CFA, Portfolio Co-Managers
The Fund seeks total return, consistent with preservation of capital. The Fund’s investment objective may be changed without shareholder approval.
Investment in Thrivent Government Bond Fund involves risks including derivatives, government securities, inflation-linked security, interest rate, investment adviser, liquidity, market, mortgage-backed and other asset-backed securities, other funds, portfolio turnover rate, and sovereign debt risks. A detailed description of each risk can be found in the significant risks section of the accompanying notes to financial statements.
How did the Fund perform during the 12-month period ended October 31, 2018?
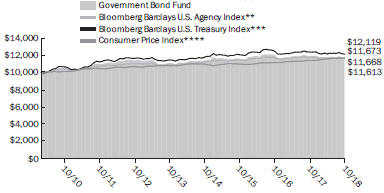
Thrivent Government Bond Fund earned a return of -1.99%, compared with the median return of its peer group, the Lipper General U.S. Government Funds category, of -2.35%. The Fund’s market benchmarks, the Bloomberg Barclays U.S. Agency Index, and the Bloomberg Barclays U.S. Treasury Index, earned returns of -0.72% and -1.97%, respectively.
What factors affected the Fund’s performance?
During the first few months of the period, the world enjoyed a synchronized global economic recovery led by the U.S. with surprising strength also seen in Japan and Europe. As we moved into 2018, however, world economies began to diverge, with the U.S. continuing to gain traction while other economies slowed. Despite increasing trade war tensions, the U.S. economy was spurred on by the late-2017 corporate tax cuts, significant deregulation and a raft of positive economic data including falling unemployment, increased consumer spending, stronger manufacturing and rising business investment. U.S. gross domestic product (GDP) exhibited its strongest growth rate since the recovery began, reaching 4.2% in second quarter 2018. Oil prices rose for most of the reporting period to reach four-year highs in early October before dropping sharply in the final weeks due to a supply glut and falling demand because of the global economic slowdown.
Stronger economic growth and falling unemployment led the Federal Reserve (Fed) to continue tightening monetary policy by raising the target federal funds rate by a total of 1.00% through four hikes. These moves contributed to further flattening of the U.S. Treasury yield curve and strengthening of the U.S. dollar versus other currencies. The flatter curve resulted from rates moving much higher for shorter-maturity securities than they did for longer-maturity Treasuries. For example, two-year Treasury rates rose by 1.27%, while 10-year and 30-year Treasuries increased by 0.76% and 0.54%, respectively. Additionally, the Fed continued to reduce its balance sheet by scaling back reinvestments into U.S. Treasuries and mortgage-backed securities (MBS).
Rising interest rates pressured bond prices, causing most segments of the fixed-income market to produce negative total returns over the period, including Treasuries. MBS and Treasury Inflation Protected Securities (TIPS) performed better than nominal Treasuries, but still fell into negative territory as measured by their respective Bloomberg Barclays indexes. TIPS did well through March, but then gave back most of the gains as oil prices weakened. The asset-backed securities (ABS) segment was one of the few areas to produce positive returns during the period, advancing 0.52% (Bloomberg Barclays Asset-Backed Securities Index).
The Fund’s outperformance versus the Lipper peer group was driven in part by our strategic underweighting and security selection in pass-through MBS. Our TIPS, ABS and commercial mortgage-backed securities (CMBS) allocations also proved beneficial because of these segments’ outperformance versus comparable-duration Treasuries. We used Treasury futures primarily to position the Fund for a flatter yield curve and for duration (interest rate sensitivity) management, which aided performance. In addition, security selection was favorable in the high-quality sovereign and supranational debt segment due in part to our avoidance of Italian bonds. The Fund underperformed the Bloomberg Barclays U.S. Agency Index due to its exposure to longer-duration agencies, which hindered performance in the rising rate environment.
What is your outlook?
In the coming year, we expect to see U.S. economic growth in the 2.5% to 3% range, low unemployment, modest upward wage pressure and inflation hitting the Fed’s target. We expect policymakers to continue rate hikes in December and more in 2019. While we will likely see continued market volatility, we do not believe we will see a meaningful increase in longer-term Treasury rates in the next 12 months. We are reducing the Fund’s duration and curve flattening bias closer to a neutral stance. We are also in the process of raising the Fund’s overall U.S. Treasury weighting slightly to approximately 28% of the portfolio by increasing nominal coupon Treasuries to 20%, while reducing TIPS to 8%. We intend to lower the Fund’s securitized exposure to 50% of the overall portfolio through a 10% reduction in the MBS sector to 35% of assets, while maintaining 10% in CMBS and 5% in ABS. In other government-related debt, we plan to slightly lower the Fund’s exposure to around 5% in sovereign and supranational debt, while maintaining around 5% in U.S. agency debt. Finally, we are looking for opportunities to further diversify the Fund by investing up to 5% of the portfolio in investment-grade corporate green bonds and other bonds supporting environmental, social and governance causes (ESG bonds). We are also planning to add up to 5% in high-quality covered bonds that are typically issued by banks and are collateralized by a pool of home mortgages. These securities have a set interest rate with no pass-through characteristics and no early paydowns. As always, we continue to maintain the Fund’s stance as a conservative and defensive investment vehicle in case the market experiences another sell off among risk assets.
Quoted Fund performance is for Class A shares and does not reflect a sales charge.
The returns shown do not reflect taxes a shareholder would pay on distributions or redemptions.
10
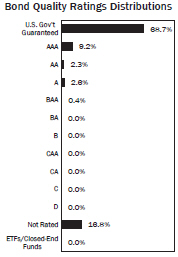
Bond Quality Ratings Distributions
| | | | |
| Major Market Sectors | | | | |
| (% of Net Assets) | | | | |
U.S. Government and Agencies | | | 49.2 | % |
Mortgage-Backed Securities | | | 18.8 | % |
Foreign Government | | | 8.8 | % |
Commercial Mortgage-Backed Securities | | | 8.0 | % |
Asset-Backed Securities | | | 6.0 | % |
Financials | | | 3.4 | % |
Collateralized Mortgage Obligations | | | 2.2 | % |
Consumer Cyclical | | | 1.0 | % |
Energy | | | 0.6 | % |
| | | | |
| Top 10 Holdings | | | | |
| (% of Net Assets) | | | | |
U.S. Treasury Notes | | | 9.8 | % |
U.S. Treasury Notes | | | 6.3 | % |
Federal National Mortgage Association Conventional 30-Yr. Pass Through | | | 6.0 | % |
Federal National Mortgage Association | | | 5.5 | % |
U.S. Treasury Bonds, TIPS | | | 5.5 | % |
Federal National Mortgage Association Conventional 30-Yr. Pass Through | | | 4.4 | % |
U.S. Treasury Notes | | | 3.5 | % |
Federal National Mortgage Association | | | 2.7 | % |
U.S. Treasury Bonds, TIPS | | | 2.6 | % |
Tennessee Valley Authority | | | 2.5 | % |
| |
These securities represent 48.8% of the total net assets of the Fund. | | | | |
Bond quality ratings are obtained from Moody’s Investors Service, Inc. (“Moody’s”) and Standard & Poor’s Ratings Services (“S&P”). Ratings from S&P, when used, are converted into their equivalent Moody’s ratings. If Moody’s and S&P have assigned different ratings to a security, the lowest rating for the security is used. Not rated may include cash. Investments in derivatives and short-term investments are not reflected in the table.
Quoted Bond Quality Ratings Distributions, Major Market Sectors and Top 10 Holdings are subject to change.
The lists of Major Market Sectors and Top 10 Holdings exclude short-term investments and collateral held for securities loaned.
Bond Quality Ratings Distributions exclude collateral held for securities loaned.
Average Annual Total Returns1
As of October 31, 2018
| | | | | | | | | | | | |
| Class A2 | | 1-Year | | | 5 Years | | | From
Inception
2/26/2010 | |
without sales charge | | | -1.99 | % | | | 1.02 | % | | | 1.97 | % |
with sales charge | | | -3.92 | % | | | 0.62 | % | | | 1.74 | % |
| | | |
| | | | | | | | | From | |
| Class S | | 1-Year | | | 5 Years | | | Inception
2/26/2010 | |
Net Asset Value | | | -1.89 | % | | | 1.20 | % | | | 2.22 | % |
Value of a $10,000 Investment
Class A Shares*,1,(a )
| | Past performance is not an indication of future results. The prospectus contains more complete information on the investment objectives, risks, charges and expenses of the investment company, which investors should read and consider carefully before investing. To obtain a prospectus, contact a registered representative or visit ThriventFunds.com. Total investment return and principal value of your investment will fluctuate, and your shares, when redeemed, may be worth more or less than their original cost. Current performance may be higher or lower than the performance data quoted. Call 800-847-4836 or visit ThriventFunds.com for performance results current to the most recent month-end. |
| 1 | Average annual total returns represent past performance and reflect changes in share prices, the reinvestment of all dividends and capital gains, and the effects of compounding. Periods of less than one year are not annualized. At various times, the Fund’s adviser may have waived its management fee and/ or reimbursed Fund expenses, without which the Fund’s total returns would have been lower. The returns shown do not reflect taxes a shareholder would pay on distributions or redemptions. Unless otherwise noted, the Index results shown do not reflect deductions for fees, expenses, or taxes. Index results shown reflect reinvestment of dividends. It is not possible to invest directly in an Index. |
| 2 | Class A performance with sales charge reflects the maximum sales charge of 2%. |
| (a) | Performance of other classes will be greater or less than the line shown based on the differences in loads and fees paid by shareholders investing in the different classes. |
| * | As you compare performance, please note that the Fund’s performance reflects the maximum 2.0% sales charge, while the benchmark indices do not reflect any such charges, deductions for fees, expenses or taxes. If you were to purchase any of the above individual securities represented in the Index, any charges you would pay would reduce your total return as well. |
| ** | The Bloomberg Barclays U.S. Agency Index is an index that measures the performance of the U.S. investment-grade fixed-income securities market. |
| *** | The Bloomberg Barclays U.S. Treasury Index is an index that measures the performance of the U.S. Treasury bond market. |
| **** | The Consumer Price Index is an inflationary indicator that measures the change in the cost of a fixed basket of products and services, including housing, electricity, food and transportation. |
11
THRIVENT HIGH INCOME MUNICIPAL BOND FUND
Janet I. Grangaard, CFA and Johan A. Akesson, CFA, Co-Portfolio Managers
The Fund seeks a high level of current income exempt from federal income taxes. The Fund’s investment objective may be changed without shareholder approval.
Investment in the Thrivent High Income Municipal Bond Fund involves risks including credit, futures contract, high yield, interest rate, investment adviser, liquidity, market, municipal bond, portfolio turnover rate and tax risks. A detailed description of each risk can be found in the significant risks section of the accompanying notes to financial statements.
How did the Fund perform during the since-inception period from February 28, 2018, through October 31, 2018?
Thrivent High Income Municipal Bond Fund earned a since-inception return of 0.79%. The Fund’s market benchmark, the Bloomberg Barclays High Yield Municipal Bond Index, earned a return of 4.04% over the same period.
What factors affected the Fund’s performance?
Right before the Fund launched, the U.S. passed the largest piece of tax reform legislation in more than three decades. The new law left the tax-exempt status of municipal bonds intact, including private activity bonds, quelling the market’s late-2017 concerns. However, several changes were implemented that are having a significant impact on the muni market. First, the new law greatly reduces or caps deductions previously allowed for investors, including a new $10,000 limit on state and local tax (SALT) deductibility. The SALT deduction cap has contributed to demand for muni bonds in certain high-tax states like California. Second, issuers are now prohibited from advanced refunding of outstanding municipal debt. Although pre-refunded bonds that are already outstanding will still be available until their call dates, no more will be created in the future. This will greatly decrease the amount of new supply issuance, while eventually removing an important market segment that is attractive to risk-averse investors. Third, the bill sharply lowered corporate tax rates, which means that banks and insurance companies do not have the same incentive to own muni bonds, particularly longer maturities. This selling pressure contributed to the cheapening of longer-maturity muni bonds. Following the flood of muni bond issuance at the end of 2017, the first few months of 2018 saw dramatically lower levels than normal with year-to-date issuance down 20%. Despite the decrease in new issuance, yields increased across all maturities as the Fed continued to raise short-term rates. However, short-term munis were able to outperform in this environment.
During the abbreviated reporting period, we focused on investing the Fund’s assets with an eye toward fulfilling its objective of providing a high level of current income exempt from federal income taxes. We purchased many of the Fund’s bonds at the longer end of the maturity spectrum because the steepness of the municipal yield curve allowed us to earn more income the farther out we went on the curve.
In terms of credit quality, the sweet spots for this Fund are the BBB- and BB-rated segments, where our goal is to invest approximately 55% of net assets. Our intent is for below BB- and non-rated exposure to average around 15% of the Fund’s assets. As of period end, the Fund was diversified across 21 states and 12 sectors, with significant exposure to retirement communities, infrastructure projects, hospitals and nursing homes.
One of the reasons the Fund underperformed the Bloomberg Barclays benchmark was because of our portfolio’s longer overall duration (i.e., interest rate sensitivity) in a rising rate environment. Also, our portfolio did not own bonds from Puerto Rico, which represent more than 4% of the index, because these securities were not providing income due to bankruptcy. Nevertheless, the price of Puerto Rico’s general obligation (GO) bonds and Cofina bonds, which are backed by sales taxes, rebounded sharply in August and September after a federal oversight board reached agreements with bond holders regarding the commonwealth’s debt restructuring efforts. This development marked a significant milestone in resolving Puerto Rico’s debt crisis.
On the other hand, our position in a Buckeye Tobacco Settlement Financing Authority revenue bond benefited from credit spread tightening. We took profits from that position and redeployed the assets. The Fund also experienced favorable results from our exposures to Illinois GO and New Jersey appropriation bonds, which benefited from tighter spreads. In addition, we shorted 30-year Treasury futures contracts to help manage the Fund’s duration and dampen net asset value (NAV) volatility.
What is your outlook?
Based on the strength of the economy and job market, we believe the Federal Reserve will likely increase the federal funds rate again in December 2018 and at least two more times in 2019. Although the passage of tax reform removed a great deal of uncertainty, we will continue to closely monitor trade policy and other developments coming out of Washington and the states that could affect the market. Two areas of greater concern are the impacts of pension reform and the expansion of Medicaid on state budgets. In terms of the latter, states are now required to cover a portion of the Medicaid expansion costs as part of the Affordable Care Act. Also, we may see new issuance increase if the current administration is successful with plans to increase infrastructure spending. We will continue to focus on rigorous, bottom-up security selection as we build out the Fund’s portfolio by diversifying across geographies, sectors and credit ratings with a focus on the BBB-rated and BB-rated segments of the market.
*Investors may be subject to state taxes, the federal alternative minimum tax and capital gains taxes.
The returns shown do not reflect taxes a shareholder would pay on distributions or redemptions.
12
Bond Quality Ratings Distributions
| | | | |
| Major Market Sectors | | | | |
| (% of Net Assets) | | | | |
Health Care | | | 20.7 | % |
Education | | | 20.2 | % |
Transportation | | | 18.1 | % |
Housing Finance | | | 10.6 | % |
Other Revenue | | | 7.2 | % |
General Obligation | | | 6.7 | % |
Electric Revenue | | | 6.7 | % |
Water & Sewer | | | 3.8 | % |
Industrial Development Revenue | | | 3.3 | % |
| | | | |
| Top 10 States | | | | |
| (% of Net Assets) | | | | |
Colorado | | | 10.6 | % |
Illinois | | | 7.3 | % |
Nevada | | | 7.3 | % |
Texas | | | 7.3 | % |
New Jersey | | | 7.1 | % |
Michigan | | | 3.8 | % |
Utah | | | 3.7 | % |
Kansas | | | 3.7 | % |
Wisconsin | | | 3.7 | % |
North Dakota | | | 3.7 | % |
| |
Investments in securities in these States represent 58.2% of the total net assets of the Fund. | | | | |
Bond quality ratings are obtained from Moody’s Investors Service, Inc. (“Moody’s”) and Standard & Poor’s Ratings Services (“S&P”). Ratings from S&P, when used, are converted into their equivalent Moody’s ratings. If Moody’s and S&P have assigned different ratings to a security, the lowest rating for the security is used. Not rated may include cash. Investments in derivatives and short-term investments are not reflected in the table.
Quoted Bond Quality Ratings Distributions, Major Market Sectors, and Top 10 States are subject to change.
The lists of Major Market Sectors and Top 10 States exclude short-term investments and collateral held for securities loaned.
Bond Quality Ratings Distributions exclude collateral held for securities loaned.
Average Annual Total Returns1
As of October 31, 2018
| | | | |
| Class S | | From Inception 2/28/2018 | |
Net Asset Value | | | 0.79 | % |
Value of a $10,000 Investment
Class S Shares1

| | Past performance is not an indication of future results. The prospectus contains more complete information on the investment objectives, risks, charges and expenses of the investment company, which investors should read and consider carefully before investing. To obtain a prospectus, contact a registered representative or visit ThriventFunds.com. Total investment return and principal value of your investment will fluctuate, and your shares, when redeemed, may be worth more or less than their original cost. Current performance may be higher or lower than the performance data quoted. Call 800-847-4836 or visit ThriventFunds.com for performance results current to the most recent month-end. |
| 1 | Average annual total returns represent past performance and reflect changes in share prices, the reinvestment of all dividends and capital gains, and the effects of compounding. Periods of less than one year are not annualized. At various times, the Fund’s adviser may have waived its management fee and/ or reimbursed Fund expenses, without which the Fund’s total returns would have been lower. The returns shown do not reflect taxes a shareholder would pay on distributions or redemptions. Unless otherwise noted, the Index results shown do not reflect deductions for fees, expenses, or taxes. Index results shown reflect reinvestment of dividends. It is not possible to invest directly in an Index. |
| * | The Bloomberg Barclays High Yield Municipal Bond Index is an index which measures the non-investment grade and non-rated U.S. tax-exempt bond market. |
| ** | The Consumer Price Index is an inflationary indicator that measures the change in the cost of a fixed basket of products and services, including housing, electricity, food and transportation. |
13
THRIVENT HIGH YIELD FUND
Paul J. Ocenasek, CFA, Portfolio Manager
The Fund seeks high current income and, secondarily, growth of capital.
Investment in Thrivent High Yield Fund involves risks including convertible securities, credit, derivatives, foreign securities, high yield, interest rate, investment adviser, issuer, leveraged loan, liquidity, market, other funds, and preferred securities risks. A detailed description of each risk can be found in the significant risks section of the accompanying notes to financial statements.
How did the Fund perform during the 12-month period ended October 31, 2018?
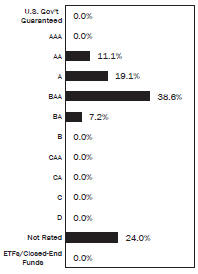
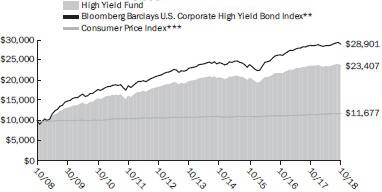
Thrivent High Yield Fund earned a return of -0.29%, compared with the median return of its peer group, the Lipper U.S. High Current Yield Funds category, of 0.29%. The Fund’s market benchmark, the Bloomberg Barclays U.S. Corporate High Yield Bond Index, earned a return of 0.97%.
What factors affected the Fund’s performance?
Stronger U.S. economic growth and falling unemployment led the Federal Reserve (Fed) to continue raising the target federal funds rate with four hikes in December, March, June and September totaling 1.00%. Rates rose from 2.02% to 2.98% in the five-year segment of the Treasury market, which is most closely aligned to the high-yield market in terms of its duration (i.e., interest rate sensitivity). High-yield spreads versus Treasuries remained in a fairly tight range for much of the reporting period, but did widen out after hitting the low point of 3.03% for this cycle in early October. From the beginning to the end of the period, spreads widened by 33 basis points to 3.71%. Although the overall return for the high-yield segment was only modestly positive, the segment was able to absorb the negative impact of rising rates better than most other areas within the fixed-income market.
Defaults remained low in the U.S. high-yield market with the trailing U.S. dollar-weighted 12-month default rate falling to 2.2%, as measured by Moody’s Investors Service. Continuing last year’s trend, lower-quality, CCC-rated bonds outpaced their higher-quality counterparts by a solid margin. Because spreads are tighter for BB-rated bonds, the segment was more negatively affected by the increase in interest rates. Over the 12-month period, CCC-rated bonds advanced 4.07% versus returns of 1.54% and -0.85% for B-rated and BB-rated bonds, respectively (source: Bloomberg Barclays High Yield Index). In terms of sectors, health care and energy performed best, while the biggest laggards were cyclical sectors that were negatively impacted by rising rates and tariff issues such as automotive, homebuilding, building materials and restaurants. Although rising rates pushed bond prices lower, they also led to a significant increase in the average overall yield for the high-yield market from 5.43% to 6.86% during the period (source: Bloomberg Barclays High Yield Index).
The high-yield market continued to experience outflows from mutual funds and exchange-traded funds (ETFs), which totaled approximately $40 billion during the period. However, the decreasing demand did not cause spreads to widen much because new issuance supply also fell fairly substantially. As yields approached 7% in the high-yield market, fewer companies refinanced their debt, and those that did often chose to use bank loans instead because they have floating rates and more flexibility in terms of repayment.
The most significant driver of the Fund’s underperformance was its more conservative posture, which included less CCC-rated bond exposure. Our portfolio was underweighted in CCC-rated securities by between 2% and 3% throughout the period. In terms of sector exposure, our avoidance of riskier names within the health care and cable industries also hindered performance. On the other hand, the Fund’s overweighted exposure to the energy sector proved beneficial, as did our credit selection within the exploration and production and oilfield services areas within energy.
What is your outlook?
Our outlook for the high-yield market continues to be somewhat cautious because there is not much room for further spread tightening in the segment. However, we are not necessarily bearish because the U.S. economy and job market remain strong, which indicates a recession is not likely anytime soon. Also, corporate earnings are robust, defaults are projected to stay low, business and consumer confidence is still fairly high and the high-yield market is fairly insulated from some of the issues affecting overseas markets and China. That said, the Fed has indicated its intent to continue raising interest rates, which puts pressure on the entire fixed-income market as well as high-yield companies because they have more leverage. We anticipate the trends of lower demand and lower supply will continue in the high-yield market next year as higher rates discourage issuers from refinancing and also lead investors to seek out other, more attractive fixed-income alternatives.
During the period, we decreased the Fund’s cyclical exposure by lowering its weights in the shipping and technology areas. We also shifted out of some high-quality pipeline names that are more interest-rate sensitive and into banking and finance names that underperformed over the past year. We are continuing this trend going forward by de-emphasizing cyclical industries such as building materials, homebuilding and metals and mining, while increasing the Fund’s exposure to more defensive industries such as health care and cable. Additionally, in light of significant increases in the federal funds rate and the London Interbank Offered Rate (LIBOR), we have increased the Fund’s exposure to bank loans from 2% to approximately 5%. We will look to increase this exposure even more in the coming months because bank loans float off of short-term rates. Higher exposure to these securities has modestly shortened our portfolio’s duration, which also helps insulate the Fund somewhat from further rate increases.
Quoted Fund performance is for Class A shares and does not reflect a sales charge.
The returns shown do not reflect taxes a shareholder would pay on distributions or redemptions.
14
Bond Quality Ratings Distributions

| | | | |
| Major Market Sectors | | | | |
| (% of Net Assets) | | | | |
Energy | | | 16.9 | % |
Communications Services | | | 15.5 | % |
Consumer Cyclical | | | 13.7 | % |
Consumer Non-Cyclical | | | 10.9 | % |
Capital Goods | | | 10.1 | % |
Financials | | | 9.7 | % |
Basic Materials | | | 9.1 | % |
Technology | | | 5.5 | % |
Utilities | | | 3.3 | % |
Transportation | | | 1.2 | % |
| | | | |
| Top 10 Holdings | | | | |
| (% of Net Assets) | | | | |
Sprint Corporation | | | 2.0 | % |
Intelsat Jackson Holdings SA | | | 0.9 | % |
Valeant Pharmaceuticals International, Inc. | | | 0.9 | % |
Cheniere Corpus Christi Holdings, LLC | | | 0.9 | % |
Contura Energy, Inc., Term Loan | | | 0.9 | % |
Alliance Data Systems Corporation | | | 0.9 | % |
Berry Plastics Corporation | | | 0.8 | % |
Neptune Finco Corporation | | | 0.7 | % |
Six Flags Entertainment Corporation | | | 0.7 | % |
Albertsons Companies, LLC | | | 0.7 | % |
| |
These securities represent 9.4% of the total net assets of the Fund. | | | | |
Bond quality ratings are obtained from Moody’s Investors Service, Inc. (“Moody’s”) and Standard & Poor’s Ratings Services (“S&P”). Ratings from S&P, when used, are converted into their equivalent Moody’s ratings. If Moody’s and S&P have assigned different ratings to a security, the lowest rating for the security is used. Not rated may include cash. Investments in derivatives and short-term investments are not reflected in the table.
Quoted Major Market Sectors, Bond Quality Ratings Distributions and Top 10 Holdings are subject to change.
The lists of Major Market Sectors and Top 10 Holdings exclude short-term investments and collateral held for securities loaned.
Bond Quality Ratings Distributions exclude collateral held for securities loaned.
Average Annual Total Returns1
As of October 31, 2018
| | | | | | | | | | | | |
| Class A2 | | 1-Year | | | 5 Years | | | 10 Years | |
without sales charge | | | -0.29 | % | | | 3.56 | % | | | 9.38 | % |
with sales charge | | | -4.76 | % | | | 2.61 | % | | | 8.87 | % |
| | | |
| Class S | | 1-Year | | | 5 Years | | | 10 Years | |
Net Asset Value | | | 0.14 | % | | | 3.85 | % | | | 9.76 | % |
Value of a $10,000 Investment
Class A Shares *,1,(a )
| | Past performance is not an indication of future results. The prospectus contains more complete information on the investment objectives, risks, charges and expenses of the investment company, which investors should read and consider carefully before investing. To obtain a prospectus, contact a registered representative or visit ThriventFunds.com. Total investment return and principal value of your investment will fluctuate, and your shares, when redeemed, may be worth more or less than their original cost. Current performance may be higher or lower than the performance data quoted. Call 800-847-4836 or visit ThriventFunds.com for performance results current to the most recent month-end. |
| 1 | Average annual total returns represent past performance and reflect changes in share prices, the reinvestment of all dividends and capital gains, and the effects of compounding. Periods of less than one year are not annualized. At various times, the Fund’s adviser may have waived its management fee and/ or reimbursed Fund expenses, without which the Fund’s total returns would have been lower. The returns shown do not reflect taxes a shareholder would pay on distributions or redemptions. Unless otherwise noted, the Index results shown do not reflect deductions for fees, expenses, or taxes. Index results shown reflect reinvestment of dividends. It is not possible to invest directly in an Index. |
| 2 | Class A performance with sales charge reflects the maximum sales charge of 4.5%. |
| (a) | Performance of other classes will be greater or less than the line shown based on the differences in loads and fees paid by shareholders investing in the different classes. |
| * | As you compare performance, please note that the Fund’s performance reflects the maximum 4.5% sales charge, while the benchmark indices do not reflect any such charges, deductions for fees, expenses or taxes. If you were to purchase any of the above individual securities represented in the Index, any charges you would pay would reduce your total return as well. |
| ** | The Bloomberg Barclays U.S. Corporate High Yield Bond Index is an index which measures the performance of fixed-rate non-investment grade bonds. |
| *** | The Consumer Price Index is an inflationary indicator that measures the change in the cost of a fixed basket of products and services, including housing, electricity, food and transportation. |
15
THRIVENT INCOME FUND
Stephen D. Lowe, CFA, and Kent L. White, CFA, Portfolio Co-Managers
The Fund seeks high current income while preserving principal and, secondarily, long-term growth of capital in order to maintain investors’ purchasing power.
Investment in Thrivent Income Fund involves risks including credit, derivatives, emerging markets, financial sector, foreign securities, high yield, interest rate, investment adviser, issuer, leveraged loan, liquidity, market, mortgage-backed and other asset-backed securities, other funds, portfolio turnover rate, and preferred securities risks. A detailed description of each risk can be found in the significant risks section of the accompanying notes to financial statements.
How did the Fund perform during the 12-month period ended October 31, 2018?
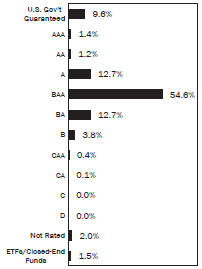
Thrivent Income Fund earned a return of -2.71%, compared with the median return of its peer group, the Lipper Corporate Debt Funds BBB-Rated category, of -2.88%. The Fund’s market benchmark, the Bloomberg Barclays U.S. Aggregate Bond Index, earned a return of -2.05%.
What factors affected the Fund’s performance?
Despite increasing trade war tensions, the U.S. economy strengthened during the period while other economies across the globe slowed. The U.S. was spurred on by the late-2017 corporate tax cuts, improved trade policies, significant deregulation and a raft of positive economic data including falling unemployment, increased consumer spending, stronger manufacturing and rising business investment. These factors led the Federal Reserve (Fed) to keep raising the target federal funds rate with four hikes totaling 1.00%. Following last year’s trend, the Treasury yield curve flattened further as rates moved higher for shorter-maturity securities than they did for longer-maturity Treasuries. Rates for 10-year Treasuries, for example, rose 76 basis points to end the period at 3.15%.
Investment-grade credit, which makes up the majority of this Fund’s portfolio, was one of the worst-performing asset classes during the reporting period. Much of the underperformance was because of the segment’s long duration (i.e., interest rate sensitivity), especially compared to other investment-grade sectors. The segment was also hindered by some technical issues, including elevated supply and much lower demand from foreign buyers due to the strength of the U.S. dollar. At the beginning of the reporting period, investment-grade credit spreads versus Treasuries were near their tightest levels since before the 2008 financial crisis began. Spreads reached a low of 0.85% in February before widening out to end the period at 1.18%. The Fund’s exposure to investment-grade credit averaged 71% during the year. In the high-yield credit market, spreads remained in a fairly tight range for much of the reporting period, but did widen to end the period at 3.71% after hitting a low point of 3.03% for this cycle in early October. Returns for the high-yield segment were modestly positive because the segment was able to absorb the negative impact of rising rates better than most other areas within the fixed-income market. Approximately 7% of the Fund’s portfolio was composed of high-yield credit.
The Fund’s interest rate positioning was the most significant contributor to performance, helping us outpace our Lipper peers. More specifically, the Fund benefited from our shorter duration stance versus the index, which dampened its interest rate sensitivity, and our positioning for a flatter yield curve, which we accomplished through the use of Treasury futures. The futures helped us lower the Fund’s exposure at the front end of the yield curve and dampen the impact from longer-maturity investment-grade corporate bonds. Performance was also aided by our favorable security selection in investment-grade credit, particularly among the midstream and exploration and production areas of the energy sector. We also steered away from the automotive industry, which was hindered by trade rhetoric, falling sales and a large restructuring announcement by Ford Motor Company. In the securitized space, the Fund benefited from increasing exposure in collateralized loan obligations (CLOs), which are typically floating-rate securities. An underweighting to U.S. Treasury securities also proved helpful.
On the other hand, the Fund’s shortfall versus the Bloomberg Barclays U.S. Aggregate Bond Index was caused in part by security selection in the metals and mining area of high yield. Also, our overweighting to emerging market (EM) bonds proved detrimental. The segment was negatively impacted by its longer duration and the Fed’s rate increases, which strengthened the dollar and led to increased market volatility and stress in EM countries. We also emphasized the wrong EM countries during part of the year.
What is your outlook?
We believe the Fed will continue to increase rates in the coming year, although policymakers may need to dial back the pace if U.S. economic growth falters or inflation does not increase from current levels. A relatively strong U.S. economy should be supportive of the corporate credit market and fundamentals. However, the absolute amount of leverage in the market remains relatively high, especially since we are likely later in the credit cycle, mainly due to the increased amount of merger and acquisition activity we saw in the higher-quality sectors of the corporate market. This factor could become problematic if the economy experiences a dramatic slowdown. We continue to see limited upside for further tightening of credit spreads, which means that bondholders are not getting paid as much to take risk. Therefore, although the Fund remains overweighted in corporate bonds, we are moving up the credit quality spectrum in both the high-yield and investment-grade sectors, while lessening our portfolio’s Treasury underweight. Although we are continuing to position the Fund to benefit from a flatter yield curve, we are keeping its duration closer to neutral because we do not see a meaningful increase in longer-term Treasury rates in the coming year.
Quoted Fund performance is for Class A shares and does not reflect a sales charge.
The returns shown do not reflect taxes a shareholder would pay on distributions or redemptions.
16
Bond Quality Ratings Distributions
| | | | |
| Major Market Sectors | | | | |
| (% of Net Assets) | | | | |
Financials | | | 27.4 | % |
Consumer Non-Cyclical | | | 10.9 | % |
Energy | | | 10.2 | % |
Communications Services | | | 10.1 | % |
Utilities | | | 7.2 | % |
U.S. Government and Agencies | | | 5.1 | % |
Consumer Cyclical | | | 4.8 | % |
Basic Materials | | | 4.8 | % |
Mortgage-Backed Securities | | | 4.4 | % |
Technology | | | 4.0 | % |
| | | | |
| Top 10 Holdings | | | | |
| (% of Net Assets) | | | | |
U.S. Treasury Bonds | | | 1.5 | % |
Federal National Mortgage Association Conventional 30-Yr. Pass Through | | | 1.4 | % |
Federal National Mortgage Association Conventional 30-Yr. Pass Through | | | 1.0 | % |
iShares J.P. Morgan USD Emerging Markets Bond ETF | | | 0.9 | % |
Federal National Mortgage Association Conventional 30-Yr. Pass Through | | | 0.9 | % |
U.S. Treasury Bonds | | | 0.8 | % |
U.S. Treasury Bonds | | | 0.7 | % |
Federal Home Loan Mortgage Corporation Gold 30-Yr. Pass Through | | | 0.7 | % |
SPDR Bloomberg Barclays High Yield Bond ETF | | | 0.6 | % |
U.S. Treasury Bonds | | | 0.6 | % |
| |
These securities represent 9.1% of the total net assets of the Fund. | | | | |
Bond quality ratings are obtained from Moody’s Investors Service, Inc. (“Moody’s”) and Standard & Poor’s Ratings Services (“S&P”). Ratings from S&P, when used, are converted into their equivalent Moody’s ratings. If Moody’s and S&P have assigned different ratings to a security, the lowest rating for the security is used. Not rated may include cash. Investments in derivatives and short-term investments are not reflected in the table.
Quoted Bond Quality Ratings Distributions, Major Market Sectors and Top 10 Holdings are subject to change.
The lists of Major Market Sectors and Top 10 Holdings exclude short-term investments and collateral held for securities loaned.
Bond Quality Ratings Distributions exclude collateral held for securities loaned.
Average Annual Total Returns1
As of October 31, 2018
| | | | | | | | | | | | |
| Class A2 | | 1-Year | | | 5 Years | | | 10 Years | |
without sales charge | | | -2.71 | % | | | 2.68 | % | | | 6.42 | % |
with sales charge | | | -7.12 | % | | | 1.73 | % | | | 5.92 | % |
| | | |
| Class S | | 1-Year | | | 5 Years | | | 10 Years | |
Net Asset Value | | | -2.30 | % | | | 3.05 | % | | | 6.82 | % |
Value of a $10,000 Investment
Class A Shares *,1,(a )
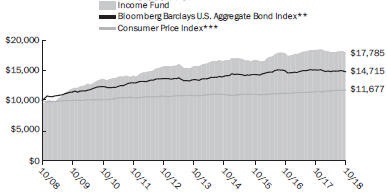
| | Past performance is not an indication of future results. The prospectus contains more complete information on the investment objectives, risks, charges and expenses of the investment company, which investors should read and consider carefully before investing. To obtain a prospectus, contact a registered representative or visit ThriventFunds.com. Total investment return and principal value of your investment will fluctuate, and your shares, when redeemed, may be worth more or less than their original cost. Current performance may be higher or lower than the performance data quoted. Call 800-847-4836 or visit ThriventFunds.com for performance results current to the most recent month-end. |
| 1 | Average annual total returns represent past performance and reflect changes in share prices, the reinvestment of all dividends and capital gains, and the effects of compounding. Periods of less than one year are not annualized. At various times, the Fund’s adviser may have waived its management fee and/ or reimbursed Fund expenses, without which the Fund’s total returns would have been lower. The returns shown do not reflect taxes a shareholder would pay on distributions or redemptions. Unless otherwise noted, the Index results shown do not reflect deductions for fees, expenses, or taxes. Index results shown reflect reinvestment of dividends. It is not possible to invest directly in an Index. |
| 2 | Class A performance with sales charge reflects the maximum sales charge of 4.5%. |
| (a) | Performance of other classes will be greater or less than the line shown based on the differences in loads and fees paid by shareholders investing in the different classes. |
| * | As you compare performance, please note that the Fund’s performance reflects the maximum 4.5% sales charge, while the benchmark indices do not reflect any such charges, deductions for fees, expenses or taxes. If you were to purchase any of the above individual securities represented in the Index, any charges you would pay would reduce your total return as well. |
| ** | The Bloomberg Barclays U.S. Aggregate Bond Index is an index that measures the performance of U.S. investment grade bonds. |
| *** | The Consumer Price Index is an inflationary indicator that measures the change in the cost of a fixed basket of products and services, including housing, electricity, food and transportation. |
17
THRIVENT LARGE CAP GROWTH FUND
Lauri Brunner, Portfolio Manager*
The Fund seeks long-term capital appreciation.
Investment in Thrivent Large Cap Growth Fund involves risks including equity security, foreign securities, growth investing, investment adviser, issuer, large cap, market, and technology-oriented companies risks. A detailed description of each risk can be found in the significant risks section of the accompanying notes to financial statements.
*Effective September 30, 2018, Lauri Brunner replaced Darren M. Bagwell, CFA as the portfolio manager of the Fund.
How did the Fund perform during the 12-month period ended October 31, 2018?
Thrivent Large Cap Growth Fund earned a return of 13.37%, compared with the median return for its peer group, the Lipper Large Cap Growth Funds category, of 9.74%. The Fund’s market benchmark, the S&P 500® Growth Index, earned returns of 11.44%.
What factors affected the Fund’s performance?
The Fund outperformed its benchmark and peer group due to strong security selection in the consumer discretionary, software and financial technology (payment processors) sectors. The proposed acquisition of holding Red Hat by IBM in October also benefited the Fund’s results.
In consumer discretionary, the Fund experienced strong performance from positions in Amazon.com and Netflix. Both companies benefited from the ongoing shift of physical to digital in shopping and video consumption. More importantly, Amazon and Netflix are data-led organizations whose offerings reflect the dynamic pull of consumers’ preferences rather than the push of corporate merchandising or content choices down to the consumer. The companies also have membership-driven models, which translate to management teams that are highly focused on constantly enriching the services or content provided on each platform in return for a monthly fee paid by consumers for unlimited usage. In addition, Amazon.com has multiple growth initiatives across large global markets to exploit over the next several years.
Performance in the software industry continued to be led by cloud native companies such as Salesforce.com, which we view as a long-term beneficiary of enterprise cloud migration for sales force automation functions. In the payment processor area, the Fund continued to see strong results from Mastercard, Visa and PayPal. The digital payment landscape is evolving rapidly and competition for consumer mindshare is intensifying. eCommerce transactions are shifting from desktop to mobile devices in business-to-consumer (B2C) transactions, while multiple companies are attempting to monetize peer-to-peer (P2P) transactions among consumers. Also, large technology companies with hardware or software in the hands of consumers every day, such as Apple, Amazon and Google, are developing payment solutions. Ultimately, the companies that have years and therefore billions of consumers’ transactions within their ecosystems appear best suited to win because they can sell data analytics to merchants to create value.
On the other hand, the Fund’s performance was pressured by ownership of Las Vegas Sands, Facebook and Caterpillar. Las Vegas Sands suffered from U.S. and China trade tensions at a high level and negative revisions for growth of Macau gaming operations at an industry and company level. While Facebook’s social media platform dominance remained unchecked, operations and expectations were pressured by increased spending to bolster security and controls following hacks and other unauthorized uses of consumers’ data. This has limited visibility into the long-term margins of the company. In the industrials sector, Caterpillar shares were hurt by late economic cycle fears supported by slowing construction segment operating metrics in the second half of 2018. Uncertainty over China and large machinery markets also weighed in the stock.
What is your outlook?
While U.S. gross domestic product (GDP) growth likely peaked in 2018 at 2.9%, the growth outlook remains strong for 2019 at 2.6% at the end of the reporting period. The backdrop for U.S. consumers in 2019 also appears positive due to the outlook for slowing inflation growth (2.3% in 2019 versus 2.5% in 2018) and expectations for an even lower unemployment rate in 2019 (3.6% in 2019 versus 3.9% in 2018).
Many large-cap growth companies have benefited from several years of strong top-line growth and investors’ appetite for companies that are building to exploit the largest global market opportunities. However, we believe the focus may be transitioning to short-term metrics, profits and margins as a few of the leading technology companies undergo shifts, such as Apple from units to services and Facebook due to implementing controls. We anticipate investors will increase their scrutiny of valuations if a shift toward short-term metrics over long-term opportunities occurs.
Capitalizing on long-term trends in technology remains at the forefront of our investment process for the Fund. We remain focused on understanding the opportunities created as enterprises shift to the cloud and as new technologies such as Internet of Things (IoT), machine learning and autonomous driving change how industries come to market with new products and how consumers adopt new technologies. We believe a key long-term revenue growth opportunity for large-cap companies is the ability to monetize technology platforms through machine learning and data analytics, which benefits both enterprises and consumers.
Quoted Fund performance is for Class A shares and does not reflect a sales charge.
The returns shown do not reflect taxes a shareholder would pay on distributions or redemptions.
18
| | | | |
| Portfolio Composition | | | |
| (% of Portfolio) | | | | |
Common Stock | | | 95.5 | % |
Short-Term Investments | | | 2.5 | % |
Registered Investment Companies | | | 2.0 | % |
| | | | |
Total | | | 100.0 | % |
| |
| Major Market Sectors | | | |
| (% of Net Assets) | | | | |
Information Technology | | | 36.9 | % |
Consumer Discretionary | | | 15.3 | % |
Health Care | | | 13.7 | % |
Communications Services | | | 12.2 | % |
Industrials | | | 8.3 | % |
Financials | | | 5.4 | % |
Consumer Staples | | | 2.1 | % |
Equity Funds/ETFs | | | 2.0 | % |
Energy | | | 1.6 | % |
| |
| Top 10 Holdings | | | |
| (% of Net Assets) | | | | |
Amazon.com, Inc. | | | 7.8 | % |
Alphabet, Inc., Class A | | | 5.2 | % |
Apple, Inc. | | | 5.1 | % |
Visa, Inc. | | | 4.8 | % |
Salesforce.com, Inc. | | | 4.7 | % |
Microsoft Corporation | | | 4.7 | % |
Facebook, Inc. | | | 4.1 | % |
MasterCard, Inc. | | | 4.1 | % |
PayPal Holdings, Inc. | | | 3.9 | % |
UnitedHealth Group, Inc. | | | 3.0 | % |
| |
These securities represent 47.4% of the total net assets of the Fund. | | | | |
Quoted Portfolio Composition, Major Market Sectors and Top 10 Holdings are subject to change.
The lists of Major Market Sectors and Top 10 Holdings exclude short-term investments and collateral held for securities loaned.
The Portfolio Composition chart excludes collateral held for securities loaned.
Average Annual Total Returns1
As of October 31, 2018
| | | | | | | | | | | | |
| Class A2 | | 1-Year | | | 5 Years | | | 10 Years | |
without sales charge | | | 13.37 | % | | | 12.08 | % | | | 13.09 | % |
with sales charge | | | 8.29 | % | | | 11.07 | % | | | 12.59 | % |
| | | |
| Class S | | 1-Year | | | 5 Years | | | 10 Years | |
Net Asset Value | | | 13.70 | % | | | 12.49 | % | | | 13.52 | % |
Value of a $10,000 Investment
Class A Shares *,1,(a )
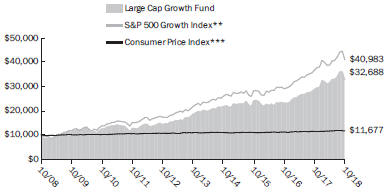
| | Past performance is not an indication of future results. The prospectus contains more complete information on the investment objectives, risks, charges and expenses of the investment company, which investors should read and consider carefully before investing. To obtain a prospectus, contact a registered representative or visit ThriventFunds.com. Total investment return and principal value of your investment will fluctuate, and your shares, when redeemed, may be worth more or less than their original cost. Current performance may be higher or lower than the performance data quoted. Call 800-847-4836 or visit ThriventFunds.com for performance results current to the most recent month-end. |
| 1 | Average annual total returns represent past performance and reflect changes in share prices, the reinvestment of all dividends and capital gains, and the effects of compounding. Periods of less than one year are not annualized. At various times, the Fund’s adviser may have waived its management fee and/ or reimbursed Fund expenses, without which the Fund’s total returns would have been lower. The returns shown do not reflect taxes a shareholder would pay on distributions or redemptions. Unless otherwise noted, the Index results shown do not reflect deductions for fees, expenses, or taxes. Index results shown reflect reinvestment of dividends. It is not possible to invest directly in an Index. |
| 2 | Class A performance with sales charge reflects the maximum sales charge of 4.5%. |
| (a) | Performance of other classes will be greater or less than the line shown based on the differences in loads and fees paid by shareholders investing in the different classes. |
| * | As you compare performance, please note that the Fund’s performance reflects the maximum 4.5% sales charge, while the benchmark indices do not reflect any such charges, deductions for fees, expenses or taxes. If you were to purchase any of the above individual securities represented in the Index, any charges you would pay would reduce your total return as well. |
| ** | The S&P 500® Growth Index is a market capitalization-weighted index developed by Standard and Poor’s consisting of those stocks within the S&P 500® Index that exhibit strong growth characteristics. |
| *** | The Consumer Price Index is an inflationary indicator that measures the change in the cost of a fixed basket of products and services, including housing, electricity, food and transportation. |
19
THRIVENT LARGE CAP STOCK FUND
Kurt J. Lauber, CFA, Lauri Brunner, and Noah J. Monsen, CFA, Portfolio Co-Managers*
The Fund seeks long-term capital growth.
Investment in Thrivent Large Cap Stock Fund involves risks including emerging markets, foreign securities, futures contract, investment adviser, issuer, large cap, market, and other funds risks. A detailed description of each risk can be found in the significant risks section of the accompanying notes to financial statements.
*Effective September 30, 2018, Lauri Brunner replaced Darren M. Bagwell, CFA as a portfolio manager of the Fund.
How did the Fund perform during the 12-month period ended October 31, 2018?
Thrivent Large Cap Stock Fund earned a return of 0.22%, compared with the median return of its peer group, the Lipper Global Large Cap Core Funds category, of -2.73%. The Fund’s market benchmark, the MSCI World Large Cap Index–USD Net Returns, earned a return of 1.98%.
What factors affected the Fund’s performance?
Relative to its peer group, the Fund’s outperformance was driven by strong stock selection within the technology, industrial and consumer discretionary sectors. Health care was a smaller, but also notable contributor. Within technology, bellwether cloud and networking names benefited from strong buildout spending and an expansion of valuation multiples to reflect the expected secular underpinnings of their businesses. The primary contributors were Apple, Red Hat (which entered a merger agreement with IBM at a significant premium), Microsoft, Salesforce.com and Cisco Systems. In the industrials sector, the Fund’s results were boosted by our stock selection within the transportation industry, where Boeing and railroads CSX and Norfolk Southern benefited from real and expected profitability gains in a cyclically favorable economic backdrop. Outperformance in the consumer discretionary sector resulted from a large overweighting in Amazon.com, which was also a significant beneficiary of the above-mentioned trends in technology.
The Fund’s worst relative performers were commodity-related areas within the energy and materials sectors. Within energy, the Fund’s focus on oil services and exploration was not successful since refiners and alternative energy companies performed better. Holdings in Weatherford International, Halliburton, Pioneer Natural Resources and Anadarko Petroleum dragged on results. Underperformance in materials was caused by poor market conditions and stock selection within chemicals, including positions in German company BASF and Japanese producer Kuraray. Additionally, holdings in Norwegian aluminum producer Norsk Hydro and North American packaging maker WestRock detracted from relative results.
Despite the peer group outperformance, the Fund underperformed its benchmark due to better results from the health care and financial sectors within the MSCI World Large Cap Index. Both sectors generated stronger returns than the peer group and negatively impacted the Fund’s relative returns versus the benchmark.
What is your outlook?
Our outlook for 2019 has moderated somewhat, both from the point of view of corporate performance and profitability, as well as the potential returns from risky assets like equities. On the positive side, the S&P 500 did generate better-than-expected aggregate profit and revenue growth in excess of 25% and 9%, respectively, in the third calendar quarter. However, the declining pace of earnings beats by aggressively priced market leaders and a moderation in the magnitude of upward revisions to earnings per share (EPS) estimates contributed to a dramatic sell off in U.S. stocks in October. Other factors also led to the broader sell off in stocks globally, including the continuation of U.S. and China trade tensions, slowing global trade, plummeting oil prices, fears of overly aggressive Federal Reserve (Fed) tightening and U.S. political turmoil post-midterm elections.
That said, we believe U.S. economic fundamentals will remain strong into 2020 with corporate profits anticipated to grow around 10%, while cost inflation and wages are expected to rise in a controlled manner. This should allow the Fed to continue normalizing monetary policy with three to four more rate hikes expected in the coming year. Although margins will likely fall from record levels, we believe they will remain resilient in part due to the productivity benefits of strong capital spending. Markets would also likely lift if world trade stabilized in conjunction with less-hostile China-U.S. rhetoric. A strong U.S. job market and wage gains are expected to keep the consumer healthy, which should minimize the downside risks to the U.S. economy. All considered, we believe the risk/reward backdrop for equities is skewed positively, but with foreign markets holding perhaps the greatest upside potential by the end of 2019 because of increasing stability in developed market economic and profitability trends.
Quoted Fund performance is for Class A shares and does not reflect a sales charge.
The returns shown do not reflect taxes a shareholder would pay on distributions or redemptions.
20
| | | | |
Portfolio Composition | | | | |
(% of Portfolio) | | | | |
Common Stock | | | 93.4 | % |
Short-Term Investments | | | 6.6 | % |
| | | | |
Total | | | 100.0 | % |
| |
Major Market Sectors | | | | |
(% of Net Assets) | | | | |
Information Technology | | | 17.5 | % |
Financials | | | 13.1 | % |
Consumer Discretionary | | | 12.1 | % |
Health Care | | | 12.0 | % |
Industrials | | | 11.4 | % |
Communications Services | | | 8.6 | % |
Materials | | | 5.5 | % |
Consumer Staples | | | 5.4 | % |
Energy | | | 4.6 | % |
Utilities | | | 2.2 | % |
| |
Top 10 Holdings | | | | |
(% of Net Assets) | | | | |
Amazon.com, Inc. | | | 3.9 | % |
Microsoft Corporation | | | 2.8 | % |
Apple, Inc. | | | 2.7 | % |
Alphabet, Inc., Class A | | | 2.0 | % |
Cisco Systems, Inc. | | | 1.9 | % |
Citigroup, Inc. | | | 1.7 | % |
Bank of America Corporation | | | 1.6 | % |
Visa, Inc. | | | 1.5 | % |
Goldman Sachs Group, Inc. | | | 1.4 | % |
Salesforce.com, Inc. | | | 1.4 | % |
| |
These securities represent 20.9% of the total net assets of the Fund. | | | | |
Quoted Portfolio Composition, Major Market Sectors and Top 10 Holdings are subject to change.
The lists of Major Market Sectors and Top 10 Holdings exclude short-term investments and collateral held for securities loaned.
The Portfolio Composition chart excludes collateral held for securities loaned.
Average Annual Total Returns1
As of October 31, 2018
| | | | | | | | | | | | |
| Class A2 | | 1-Year | | | 5 Years | | | 10 Years | |
without sales charge | | | 0.22 | % | | | 7.06 | % | | | 9.23 | % |
with sales charge | | | -4.30 | % | | | 6.07 | % | | | 8.73 | % |
| | | |
| Class S | | 1-Year | | | 5 Years | | | 10 Years | |
Net Asset Value | | | 0.56 | % | | | 7.47 | % | | | 9.72 | % |
Value of a $10,000 Investment
Class A Shares *,1,(a )
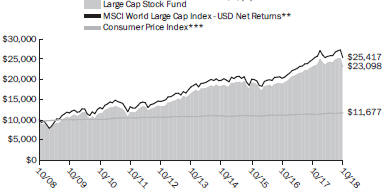
| | Past performance is not an indication of future results. The prospectus contains more complete information on the investment objectives, risks, charges and expenses of the investment company, which investors should read and consider carefully before investing. To obtain a prospectus, contact a registered representative or visit ThriventFunds.com. Total investment return and principal value of your investment will fluctuate, and your shares, when redeemed, may be worth more or less than their original cost. Current performance may be higher or lower than the performance data quoted. Call 800-847-4836 or visit ThriventFunds.com for performance results current to the most recent month-end. |
| 1 | Average annual total returns represent past performance and reflect changes in share prices, the reinvestment of all dividends and capital gains, and the effects of compounding. Periods of less than one year are not annualized. At various times, the Fund’s adviser may have waived its management fee and/ or reimbursed Fund expenses, without which the Fund’s total returns would have been lower. The returns shown do not reflect taxes a shareholder would pay on distributions or redemptions. Unless otherwise noted, the Index results shown do not reflect deductions for fees, expenses, or taxes. Index results shown reflect reinvestment of dividends. It is not possible to invest directly in an Index. |
| 2 | Class A performance with sales charge reflects the maximum sales charge of 4.5%. |
| (a) | Performance of other classes will be greater or less than the line shown based on the differences in loads and fees paid by shareholders investing in the different classes. |
| * | As you compare performance, please note that the Fund’s performance reflects the maximum 4.5% sales charge, while the benchmark indices do not reflect any such charges, deductions for fees, expenses or taxes. If you were to purchase any of the above individual securities represented in the Index, any charges you would pay would reduce your total return as well. |
| ** | The MSCI World Large Cap Index - USD Net Returns is an index that represents large cap stocks in 23 developed market countries. The performance of the Index reflects dividends reinvested after the deduction of withholding taxes. |
| *** | The Consumer Price Index is an inflationary indicator that measures the change in the cost of a fixed basket of products and services, including housing, electricity, food and transportation. |
21
THRIVENT LARGE CAP VALUE FUND
Kurt J. Lauber, CFA, Portfolio Manager
The Fund seeks to achieve long-term growth of capital.
Investment in Thrivent Large Cap Value Fund involves risks including equity securities, foreign securities, investment adviser, issuer, large cap, market, and value investing risks. A detailed description of each risk can be found in the significant risks section of the accompanying notes to financial statements.
How did the Fund perform during the 12-month period ended October 31, 2018?
Thrivent Large Cap Value Fund earned a return of 5.42%, compared with the median return of its peer group, the Lipper Large Cap Value Funds category, of 2.62%. The Fund’s market benchmark, the S&P 500® Value Index, earned a return of 3.02%.
What factors affected the Fund’s performance?
Security selection drove the Fund’s outperformance relative to the market benchmark and peer group, while results from sector allocations were flat. Strong stock selection in industrials continued to benefit performance led by positions in Boeing, CSX and Norfolk Southern, while lack of exposure to General Electric and its troubles also contributed. Technology was another area of consistent stock selection with Cisco Systems and Microsoft outperforming. Cisco Systems benefited from a new enterprise switching product cycle, as well as the transition of its business model to more recurring software revenue. The Fund also saw strong results in health care where Merck continued to show better outcomes in the fiercely competitive area of immunotherapy cancer drug research. Our position in Express Scripts benefited from the company’s acquisition by Cigna. In the communication services sector, the Fund’s position in Verizon Communications and lack of exposure to AT&T was beneficial. Verizon’s focus on its core wireless business started showing improvement versus AT&T’s media acquisition strategy. In consumer discretionary, Lowe’s benefited from strength in the home refurbishment market and the announcement of a new CEO, who has a plan to close the company’s large operating gap with Home Depot.
On the other hand, stock selection remained challenging in the energy sector. The Fund’s results were hurt by our lack of exposure to refining and an overweighting in energy services, especially Halliburton and Weatherford International. In utilities, the California fires negatively impacted our position in PG&E Corporation. In the financial sector, we continued to struggle with poor stock selection in the consumer finance and insurance industries. Although Synchrony Financial started to recover from credit issues that plagued it last year, the large contract loss of Walmart hurt performance. MetLife took a large charge related to its group annuity business at the beginning of the year that weighed on its shares.
What is your outlook?
Last year at this time, the world was entering a period of synchronized global growth. However, while the rate of improvement continued for the United States, it decelerated for many other large economies. The cooling of the global economy has not led to the type of overly optimistic behavior by consumers or corporations that usually precedes the economy overheating. Furthermore, the recent sharp market pullback as earnings outperform has put valuations more in line with historical averages. As a result, we have made no major changes to Fund’s allocations, and cash remains less than 5% of the portfolio.
Although traditional value sectors have underperformed, valuation as a factor has been a good guide in aiding stock selection within sectors over the past year. The Fund remains well overweighted in cheap valuation stocks through our process of ranking companies based on valuation, operating performance and catalysts. With that said, the Fund also remains overweighted in traditional value sectors like financials, materials and energy, where we believe some of the best opportunities based on low valuations can be found.
We have added more stocks to the portfolio due to strong relative performance during the past three years, which has forced us to sell some names based on valuation while adding new names. We cut back some of the Fund’s positions in industrials and technology throughout the year to buy pharmaceuticals Gilead Sciences and Johnson & Johnson. We sold Scripps Networks Interactive, which benefited from a takeover offer, and added to existing positions in Verizon Communications and Lowe’s. Early in the year, we trimmed our positions in Comerica and Zions Bancorporation because expectations for higher interest rates pushed them closer to price targets. We added U.S. Bancorp, Huntington Bancshares and Aflac because we believe they have more valuation upside and are less interest-rate sensitive.
We also reduced some the Fund’s names due to violation of our investment thesis. A lack of takeaway pipeline capacity hit energy companies to the benefit of refiners’ margins. Therefore, we sold Devon Energy due to persisting takeaway issues and bought Marathon Petroleum, which we believe should benefit from its Andeavor acquisition and the improved secular position of U.S. refining. We also sold Synchrony Financial because the firm was entering a risky renewal period for many large contracts.
We continued to hold PG&E and added Edison International after the California legislature passed a wildfire bill to address some of the fire liability issues. We also added Aetna based on its deal with CVS Health and held onto Express Scripts, which is merging with Cigna, because of our belief that the combined companies will be better able to lower overall health care costs for consumers and be more competitive in a consolidating health care landscape.
Quoted Fund performance is for Class A shares and does not reflect a sales charge.
The returns shown do not reflect taxes a shareholder would pay on distributions or redemptions.
22
| | | | |
Portfolio Composition | | | | |
(% of Portfolio) | | | | |
Common Stock | | | 97.3 | % |
Short-Term Investments | | | 2.7 | % |
| | | | |
Total | | | 100.0 | % |
| |
Major Market Sectors | | | | |
(% of Net Assets) | | | | |
Financials | | | 24.6 | % |
Health Care | | | 15.9 | % |
Information Technology | | | 12.7 | % |
Industrials | | | 10.7 | % |
Energy | | | 9.4 | % |
Communications Services | | | 8.4 | % |
Consumer Discretionary | | | 4.9 | % |
Consumer Staples | | | 4.0 | % |
Materials | | | 3.6 | % |
Utilities | | | 3.0 | % |
| |
Top 10 Holdings | | | | |
(% of Net Assets) | | | | |
Cisco Systems, Inc. | | | 5.1 | % |
Bank of America Corporation | | | 4.5 | % |
Verizon Communications, Inc. | | | 4.0 | % |
Citigroup, Inc. | | | 3.9 | % |
Microsoft Corporation | | | 3.6 | % |
Merck & Company, Inc. | | | 3.3 | % |
Chevron Corporation | | | 3.2 | % |
Lowe’s Companies, Inc. | | | 3.1 | % |
Comcast Corporation | | | 2.4 | % |
PG&E Corporation | | | 2.2 | % |
| |
These securities represent 35.3% of the total net assets of the Fund. | | | | |
Quoted Portfolio Composition, Major Market Sectors and Top 10 Holdings are subject to change.
The lists of Major Market Sectors and Top 10 Holdings exclude short-term investments and collateral held for securities loaned.
The Portfolio Composition chart excludes collateral held for securities loaned.
Average Annual Total Returns1
As of October 31, 2018
| | | | | | | | | | | | |
| Class A2 | | 1-Year | | | 5 Years | | | 10 Years | |
without sales charge | | | 5.42 | % | | | 8.60 | % | | | 10.53 | % |
with sales charge | | | 0.67 | % | | | 7.60 | % | | | 10.03 | % |
| | | |
| Class S | | 1-Year | | | 5 Years | | | 10 Years | |
Net Asset Value | | | 5.85 | % | | | 9.03 | % | | | 11.07 | % |
Value of a $10,000 Investment
Class A Shares *,1,(a )
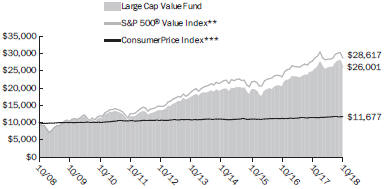
| | Past performance is not an indication of future results. The prospectus contains more complete information on the investment objectives, risks, charges and expenses of the investment company, which investors should read and consider carefully before investing. To obtain a prospectus, contact a registered representative or visit ThriventFunds.com. Total investment return and principal value of your investment will fluctuate, and your shares, when redeemed, may be worth more or less than their original cost. Current performance may be higher or lower than the performance data quoted. Call 800-847-4836 or visit ThriventFunds.com for performance results current to the most recent month-end. |
| 1 | Average annual total returns represent past performance and reflect changes in share prices, the reinvestment of all dividends and capital gains, and the effects of compounding. Periods of less than one year are not annualized. At various times, the Fund’s adviser may have waived its management fee and/ or reimbursed Fund expenses, without which the Fund’s total returns would have been lower. The returns shown do not reflect taxes a shareholder would pay on distributions or redemptions. Unless otherwise noted, the Index results shown do not reflect deductions for fees, expenses, or taxes. Index results shown reflect reinvestment of dividends. It is not possible to invest directly in an Index. |
| 2 | Class A performance with sales charge reflects the maximum sales charge of 4.5%. |
| (a) | Performance of other classes will be greater or less than the line shown based on the differences in loads and fees paid by shareholders investing in the different classes. |
| * | As you compare performance, please note that the Fund’s performance reflects the maximum 4.5% sales charge, while the benchmark indices do not reflect any such charges, deductions for fees, expenses or taxes. If you were to purchase any of the above individual securities represented in the Index, any charges you would pay would reduce your total return as well. |
| ** | The S&P 500® Value Index is a market capitalization-weighted index developed by Standard and Poor’s consisting of those stocks within the S&P 500® Index that exhibit strong value characteristics. |
| *** | The Consumer Price Index is an inflationary indicator that measures the change in the cost of a fixed basket of products and services, including housing electricity, food and transportation. |
23
THRIVENT LIMITED MATURITY BOND FUND
Michael G. Landreville, CFA and CPA (inactive) and Gregory R. Anderson, CFA, Portfolio Co-Managers
The Fund seeks a high level of current income consistent with stability of principal.
Investment in Thrivent Limited Maturity Bond Fund involves risks including collateralized debt obligations (“CDO”), credit, derivatives, foreign securities, futures contract, high yield, interest rate, investment adviser, issuer, leveraged loan, liquidity, market, mortgage-backed and other asset-backed securities, other funds and preferred securities risks. A detailed description of each risk can be found in the significant risks section of the accompanying notes to financial statements.
How did the Fund perform during the 12-month period ended October 31, 2018?
Thrivent Limited Maturity Bond Fund earned a return of 0.67%, compared with the median return of its peer group, the Lipper Short Investment Grade Debt Funds category, of 0.48%. The Fund’s market benchmark, the Bloomberg Barclays Government/ Credit 1-3 Year Bond Index, earned a return of 0.34%.
What factors affected the Fund’s performance?
Despite increasing trade war tensions, the U.S. economy strengthened while other economies across the globe slowed. The U.S. was spurred on by the late-2017 corporate tax cuts, improved trade policies, significant deregulation and a raft of positive economic data including falling unemployment, increased consumer spending, stronger manufacturing and rising business investment. U.S. gross domestic product (GDP) exhibited its strongest growth rate since the recovery began, reaching 4.2% in second quarter 2018. Oil prices rose for the majority of the reporting period to reach four-year highs in early October before dropping sharply in the final weeks due to a supply glut and falling demand because of the global economic slowdown.
Stronger U.S. economic growth and falling unemployment led the Federal Reserve (Fed) to continue raising the target federal funds rate with four hikes in December, March, June and September totaling 1.00%. As a result, the U.S. dollar strengthened versus most major currencies, contributing to increased market volatility and stress in emerging market countries. Following last year’s trend, the Treasury yield curve flattened further as rates moved higher for shorter-maturity securities than they did for longer-maturity Treasuries. Rates rose the most in the two-year segment of the Treasury curve, which was up 127 basis points to end at 2.87%, while 10-year Treasuries increased by 76 basis points to end at 3.15%. Yield spreads for risk assets versus Treasuries widened modestly from last year’s tight levels, but still remained quite narrow by historical standards.
The primary drivers of the Fund’s outperformance versus the Bloomberg Barclays benchmark and Lipper peer group were its security selection in the securitized sectors and its exposure to floating-rate securities. In the securitized area, the Fund benefited from exposure to nonagency residential mortgage-backed securities (RMBS), which experienced outsized gains versus the market. We invested approximately 6% of the portfolio in nonagency RMBS, which advanced around 4.6%. We also had approximately 25% of the portfolio invested in floating-rate securities, split fairly evenly between the securitized and investment-grade corporate sectors. Coupons on these securities reset upward as the Fed raised rates, helping the floating-rate portion of our portfolio to collectively return around 2.5%, significantly outpacing fixed-rate securities. The Fund’s modest 4% allocation to Treasury Inflation Protected Securities (TIPS) also proved beneficial because these securities outperformed nominal Treasuries. Additionally, the Fund benefited from a short duration versus the index, which lessened its interest rate sensitivity, and our positioning for a flatter yield curve through more exposure to modestly longer-maturity investment-grade credit. We used Treasury futures to lessen exposure at the front end of the curve and to dampen the interest rate impact from our longer-maturity investment-grade corporate bonds. The only detractor of note was exposure to foreign banks in our investment-grade credit allocation.
What is your outlook?
We believe the coming year will continue to be a more difficult return environment in the fixed-income market for several reasons. First, although spreads widened modestly during this period, they still remain tight by historical standards. Second, consensus estimates call for four more Fed rate hikes over the next 12 months. Third, the U.S. economy is likely to slow as the positive impact from corporate tax reform subsides somewhat and the Fed removes fiscal stimulus. While this remains a challenging backdrop for a fund focused on shorter-maturity, spread-related assets, we continue to believe our portfolio is well positioned.
We are maintaining the Fund’s high-quality focus with more than half of the portfolio invested in AAA-rated and AA-rated securities. We are also allocating approximately one-fourth of our portfolio to floating-rate securities, which tend to perform better than fixed-rate bonds when rates rise because their coupons reset monthly or quarterly. In an effort to further mitigate the impact of additional rate increases, we are keeping the Fund’s duration at its shortest level since pre-crisis at 1.6 years versus 1.8 years for our benchmark. Although a significant amount of yield curve compression has already taken place, we believe the trend will likely continue; therefore, we have maintained a curve-flattening bias. We are remaining neutral in terms of investment-grade credit exposure and underweight in both high-yield credit and leveraged loans as a precaution as we get closer to the end of the current economic cycle. In the event of significant spread widening or market distress, these asset classes would likely experience more volatility. At the same time, we continue to overweight high-quality, securitized debt because of better fundamentals supporting these securities. We also continue to overweight nonagency RMBS and AAA-rated, floating-rate collateralized loan obligations.
Quoted Fund performance is for Class A shares.
The returns shown do not reflect taxes a shareholder would pay on distributions or redemptions.
24
Bond Quality Ratings Distributions

| | | | |
Major Market Sectors | | | | |
(% of Net Assets) | | | | |
Asset-Backed Securities | | | 26.4 | % |
U.S. Government and Agencies | | | 18.5 | % |
Financials | | | 17.5 | % |
Collateralized Mortgage Obligations | | | 5.6 | % |
Consumer Non-Cyclical | | | 5.2 | % |
Energy | | | 3.9 | % |
Commercial Mortgage-Backed Securities | | | 3.6 | % |
Mortgage-Backed Securities | | | 3.5 | % |
Communications Services | | | 2.6 | % |
Utilities | | | 2.3 | % |
| |
Top 10 Holdings | | | | |
(% of Net Assets) | | | | |
U.S. Treasury Notes | | | 6.6 | % |
U.S. Treasury Notes | | | 2.2 | % |
U.S. Treasury Notes, TIPS | | | 1.9 | % |
Federal National Mortgage Association | | | 1.6 | % |
Federal National Mortgage Association Conventional 15-yr. Pass Through | | | 1.2 | % |
Federal National Mortgage Association Conventional 30-Yr. Pass Through | | | 1.2 | % |
U.S. Treasury Bonds | | | 0.9 | % |
U.S. Treasury Notes | | | 0.7 | % |
U.S. Treasury Bonds, TIPS | | | 0.7 | % |
Cedar Funding VI CLO, Ltd. | | | 0.6 | % |
| |
These securities represent 17.6% of the total net assets of the Fund. | | | | |
Bond quality ratings are obtained from Moody’s Investors Service, Inc. (“Moody’s”) and Standard & Poor’s Ratings Services (“S&P”). Ratings from S&P, when used, are converted into their equivalent Moody’s ratings. If Moody’s and S&P have assigned different ratings to a security, the lowest rating for the security is used. Not rated may include cash. Investments in derivatives and short-term investments are not reflected in the table.
Quoted Bond Quality Ratings Distributions, Major Market Sectors and Top 10 Holdings are subject to change.
The lists of Major Market Sectors and Top 10 Holdings exclude short-term investments and collateral held for securities loaned.
Bond Quality Ratings Distributions exclude collateral held for securities loaned.
Average Annual Total Returns1
As of October 31, 2018
| | | | | | | | | | | | |
| Class A2 | | 1-Year | | | 5 Years | | | 10 Years | |
Net Asset Value | | | 0.67 | % | | | 1.41 | % | | | 2.86 | % |
| | | |
| Class S2 | | 1-Year | | | 5 Years | | | 10 Years | |
Net Asset Value | | | 0.94 | % | | | 1.63 | % | | | 3.12 | % |
Value of a $10,000 Investment
Class A Shares 1,(a )
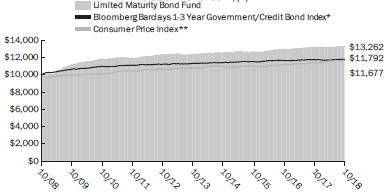
| | Past performance is not an indication of future results. The prospectus contains more complete information on the investment objectives, risks, charges and expenses of the investment company, which investors should read and consider carefully before investing. To obtain a prospectus, contact a registered representative or visit ThriventFunds.com. Total investment return and principal value of your investment will fluctuate, and your shares, when redeemed, may be worth more or less than their original cost. Current performance may be higher or lower than the performance data quoted. Call 800-847-4836 or visit ThriventFunds.com for performance results current to the most recent month-end. |
| 1 | Average annual total returns represent past performance and reflect changes in share prices, the reinvestment of all dividends and capital gains, and the effects of compounding. Periods of less than one year are not annualized. At various times, the Fund’s adviser may have waived its management fee and/ or reimbursed Fund expenses, without which the Fund’s total returns would have been lower. The returns shown do not reflect taxes a shareholder would pay on distributions or redemptions. Unless otherwise noted, the Index results shown do not reflect deductions for fees, expenses, or taxes. Index results shown reflect reinvestment of dividends. It is not possible to invest directly in an Index. |
| 2 | Class A shares and Class S shares have no sales load. |
| (a) | Performance of other classes will be greater or less than the line shown based on the differences in loads and fees paid by shareholders investing in the different classes. |
| * | The Bloomberg Barclays Government/Credit 1-3 Year Bond Index is an index that measures the performance of government and fixed-rate debt securities with maturities of 1-3 years. |
| ** | The Consumer Price Index is an inflationary indicator that measures the change in the cost of a fixed basket of products and services, including housing, electricity, food and transportation. |
25
THRIVENT LOW VOLATILITY EQUITY FUND
Noah J. Monsen, CFA and Brian W. Bomgren, CQF, Portfolio Co-Managers
The Fund seeks long-term capital appreciation with lower volatility relative to the global equity markets. The Fund’s investment objective may be changed without shareholder approval.
Investment in Thrivent Low Volatility Equity Fund involves risks including equity security, foreign securities, futures contract, investment adviser, issuer, large cap, market, mid cap, quantitative investing, and small cap risks. A detailed description of each risk can be found in the significant risks section of the accompanying notes to financial statements.
How did the Fund perform during the 12-month period ended October 31, 2018?
Thrivent Low Volatility Equity Fund earned a return of 1.92%. Its benchmark, the MSCI World Minimum Volatility Index–USD Net Returns, earned a return of 3.84%.
What factors affected the Fund’s performance?
The low volatility strategy provided some protection during periods of elevated market volatility and falling stock prices in February and October, allowing the Fund to outperform the broad market, as represented by the MSCI World Index, which returned 1.72% during the reporting period. At the same time, the Fund delivered lower volatility than the broad market index, with realized volatility of 8.7%, versus 10.9% realized volatility for the MSCI World Index.
In managing the Fund, our investment team uses a quantitative factor model to identify stock characteristics that have historically been associated with higher stock returns. Throughout this period, many of these factors underperformed, making this a challenging year to outperform our benchmark index. In particular, value factors (buying stocks that have low prices relative to earnings, cash flows or assets) performed poorly in most global regions. Value factors are an important input into the Fund’s investment process, and therefore contributed negatively to its relative performance.
Momentum factors (buying stocks with recent price increases), which are another important input to our investment process, had marginally positive returns during the year. Therefore, momentum factors only contributed slightly to the Fund’s return. Quality and profitability factors made the greatest positive contribution to the Fund’s return because these factors generally performed well in most regions.
Industry and country allocations provided positive contributions for the year, while currency exposures offset some of those gains. In terms of country exposures, the Fund benefited the most from its above-benchmark allocations to Japan and the U.K., although the latter was mostly offset by depreciation of the British pound.
The Fund experienced outperformance from its overweighting to technology stocks, especially in the software industry. However, results from the health care sector were negative because underweightings to both the health care equipment and health care services industries were drags on performance.
What is your outlook?
We anticipate the various factors we track will revert closer to historical norms in terms of their performance in the coming year. In particular, valuation dispersion has reached levels where we expect value factors to begin outperforming after a prolonged period of underperformance versus growth factors. We also believe political and economic risks globally will continue to be a source of uncertainty that will benefit the low volatility strategy relative to the market overall. As we witnessed this year, this often manifests itself in short bursts of volatility during which low volatility stocks provide some degree of downside protection to the portfolio.
On the other hand, we do see some risks to the Fund related to the expected continuation of interest rate hikes in the U.S. Many of the Fund’s low volatility stocks from the U.S. are sensitive to interest rate increases due to their higher dividend yields. The valuations of these high dividend stocks may be hurt by rising rates because their dividend yields become less attractive relative to fixed-income securities.
In addition, rising U.S. interest rates may cause continued appreciation of the U.S. dollar relative to foreign currencies because we do not expect rates in foreign markets to increase at the same pace. As the U.S. dollar appreciates, the value of foreign assets will fall for U.S. investors. This risk is exacerbated for stocks in the U.K. because uncertainty related to the country’s exit from the European Union could lead to further depreciation of the pound.
The returns shown do not reflect taxes a shareholder would pay on distributions or redemptions.
26
| | | | |
Portfolio Composition | | | | |
(% of Portfolio) | | | | |
Common Stock | | | 95.4 | % |
Short-Term Investments | | | 4.6 | % |
| | | | |
Total | | | 100.0 | % |
| |
Major Market Sectors | | | | |
(% of Net Assets) | | | | |
Health Care | | | 15.4 | % |
Consumer Staples | | | 13.7 | % |
Financials | | | 13.5 | % |
Information Technology | | | 13.4 | % |
Consumer Discretionary | | | 10.8 | % |
Utilities | | | 8.6 | % |
Industrials | | | 8.1 | % |
Communications Services | | | 5.0 | % |
Real Estate | | | 4.3 | % |
Materials | | | 1.9 | % |
| |
Top 10 Holdings | | | | |
(% of Net Assets) | | | | |
PepsiCo, Inc. | | | 2.0 | % |
Pfizer, Inc. | | | 2.0 | % |
CLP Holdings, Ltd. | | | 1.9 | % |
CGI Group, Inc. | | | 1.9 | % |
Japan Tobacco, Inc. | | | 1.9 | % |
SmartCentres Real Estate Investment Trust | | | 1.8 | % |
Allstate Corporation | | | 1.8 | % |
Lawson, Inc. | | | 1.8 | % |
Sekisui House, Ltd. | | | 1.7 | % |
Roche Holding AG | | | 1.6 | % |
| |
These securities represent 18.4% of the total net assets of the Fund. | | | | |
Quoted Major Market Sectors, Portfolio Composition and Top 10 Holdings are subject to change.
The lists of Major Market Sectors and Top 10 Holdings exclude short-term investments and collateral held for securities loaned.
The Portfolio Composition chart excludes collateral held for securities loaned.
Average Annual Total Returns1
As of October 31, 2018
| | | | | | | | |
| Class S | | 1-Year | | | From
Inception
2/28/2017 | |
Net Asset Value | | | 1.92 | % | | | 6.32 | % |
Value of a $10,000 Investment
Class S Shares 1

| | Past performance is not an indication of future results. The prospectus contains more complete information on the investment objectives, risks, charges and expenses of the investment company, which investors should read and consider carefully before investing. To obtain a prospectus, contact a registered representative or visit ThriventFunds.com. Total investment return and principal value of your investment will fluctuate, and your shares, when redeemed, may be worth more or less than their original cost. Current performance may be higher or lower than the performance data quoted. Call 800-847-4836 or visit ThriventFunds.com for performance results current to the most recent month-end. |
| 1 | Average annual total returns represent past performance and reflect changes in share prices, the reinvestment of all dividends and capital gains, and the effects of compounding. Periods of less than one year are not annualized. At various times, the Fund’s adviser may have waived its management fee and/ or reimbursed Fund expenses, without which the Fund’s total returns would have been lower. The returns shown do not reflect taxes a shareholder would pay on distributions or redemptions. Unless otherwise noted, the Index results shown do not reflect deductions for fees, expenses, or taxes. Index results shown reflect reinvestment of dividends. It is not possible to invest directly in an Index. |
| * | Morgan Stanley Capital International (MSCI) World Minimum Volatility Index - USD Net Returns measures the performance characteristics of a minimum variance strategy applied to a universe of large- and mid-cap stocks in 23 developed market countries. It is an optimized version of the MSCI World Index. It is not possible to invest directly in the Index. The performance of the Index reflects dividends reinvested after the deduction of withholding taxes. |
| ** | The Consumer Price Index is an inflationary indicator that measures the change in the cost of a fixed basket of products and services, including housing, electricity, food and transportation. |
27
THRIVENT MID CAP STOCK FUND
Brian J. Flanagan, CFA, Portfolio Manager
The Fund seeks long-term capital growth.
Investment in Thrivent Mid Cap Stock Fund involves risks including equity security, investment adviser, issuer, market, mid cap and other funds risks. A detailed description of each risk can be found in the significant risks section of the accompanying notes to financial statements.
How did the Fund perform during the 12-month period ended October 31, 2018?
Thrivent Mid Cap Stock Fund earned a return of 4.07%, compared with the median return of its peer group, the Lipper Mid Cap Core Funds category, of 0.02%. The Fund’s market benchmark, the S&P MidCap 400® Index, earned 1.02%.
What factors affected the Fund’s performance?
Thrivent Mid Cap Stock Fund significantly outperformed its peer group and benchmark due to strong security selection across a diverse group of sectors including financials, materials, communication services, information technology and energy. Favorable results in the financial sector were led by Interactive Brokers Group and a plethora of regional banks. Interactive Brokers benefited from growing market share within its customer base, while our regional bank holdings saw their valuations improve from historically low levels after the economy improved and interest rates increased. In the materials sector, shares of Steel Dynamics advanced due to higher steel prices driven by an improving economy and tariffs on imported steel. Within the communication services sector, Twitter’s management focused on execution by improving the company’s platform and engagement with advertisers, which drove revenue, earnings, cash flow and ultimately the stock price. Red Hat was acquired by IBM during the period and buoyed results in the information technology sector. Finally, increasing oil prices and the takeover of refining company Andeavor by Marathon Petroleum contributed to solid performance across the energy sector.
These positive contributors were slightly offset by underperformance within the consumer staples and consumer discretionary sectors. Poor execution, lost market share and a bloated product base caused problems for Hain Celestial within the consumer staples sector. In the consumer discretionary sector, shares of Toll Brothers suffered after new limits on interest deductibility and rising mortgage rates negatively impacted housing affordability. Lastly, increasing raw material costs and integration challenges in Europe battered Whirlpool.
What is your outlook?
Investors continue to analyze an increasing number of crosscurrents to determine the future direction of the market. On the positive side, low unemployment, high business and consumer confidence, improving average hourly earnings and restrained inflation are giving investors comfort that the economy is on a solid foundation. However, the level at which the Federal Reserve will stop raising the target federal funds rate and the trade conflict with China remain unresolved topics that may increase market volatility moving forward. At the same time, valuation spreads between the most expensive and average stocks across the mid-cap universe remain at average levels relative to history. Given this backdrop, we are focused on finding companies that can achieve superior growth even in a potentially slowing economy, as well as attractively priced stocks that may help protect capital if an all-out trade war with China ensues.
An improving economy, attractive valuations and company-specific attributes are providing many opportunities across the industrial universe. Airlines trade at attractive valuations and should benefit if the economic expansion continues, capacity grows at a reasonable rate and costs are kept under control. An increasing defense spending environment has also created attractive opportunities within the aerospace and defense industry. The Fund remains over weighted in the financial sector with a focus on regional banks because we believe that rising interest rates, increasing profitability and the return of excess capital to shareholders should improve valuations.
The consumer sectors, both discretionary and staples, represented the Fund’s largest under weightings. Both industries suffered from increasing competition, a lack of pricing power and potentially increasing costs. Amazon has clearly increased the competitive landscape across both industries and continues to take market share in a growing list of consumer categories. At the same time, higher tariffs are creating cost headwinds. The combination of a difficult sales environment and increasing costs will potentially lower returns throughout the consumer industries, which is typically not a good backdrop for improving stock prices.
Overall, we continue to focus on security selection to drive the Fund’s long-term performance. We continue to seek out companies that are improving their return on invested capital (ROIC) through a combination of increasing sales, improving margins and effectively managing capital.
Quoted Fund performance is for Class A shares and does not reflect a sales charge.
The returns shown do not reflect taxes a shareholder would pay on distributions or redemptions.
28
| | | | |
| Portfolio Composition | |
| (% of Portfolio) | |
Common Stock | | | 91.2 | % |
Short-Term Investments | | | 8.8 | % |
| | | | |
Total | | | 100.0 | % |
| | | | |
| Major Market Sectors | |
| (% of Net Assets) | |
Industrials | | | 18.7 | % |
Financials | | | 17.7 | % |
Information Technology | | | 14.6 | % |
Health Care | | | 8.1 | % |
Consumer Discretionary | | | 7.8 | % |
Real Estate | | | 6.2 | % |
Energy | | | 5.0 | % |
Materials | | | 4.2 | % |
Communications Services | | | 3.9 | % |
Utilities | | | 3.2 | % |
| | | | |
| Top 10 Holdings | |
| (% of Net Assets) | |
Red Hat, Inc. | | | 4.5 | % |
Zions Bancorporations NA | | | 3.7 | % |
Southwest Airlines Company | | | 3.1 | % |
Huntington Ingalls Industries, Inc. | | | 2.9 | % |
Akamai Technologies, Inc. | | | 2.7 | % |
Alliance Data Systems Corporation | | | 2.7 | % |
Twitter, Inc. | | | 2.5 | % |
Assured Guaranty, Ltd. | | | 2.4 | % |
KeyCorp | | | 2.4 | % |
Markel Corporation | | | 2.1 | % |
| |
These securities represent 29.0% of the total net assets of the Fund. | | | | |
Quoted Portfolio Composition, Major Market Sectors and Top 10 Holdings are subject to change.
The lists of Major Market Sectors and Top 10 Holdings exclude short-term investments and collateral held for securities loaned.
The Portfolio Composition chart excludes collateral held for securities loaned.
Average Annual Total Returns1
As of October 31, 2018
| | | | | | | | | | | | |
| Class A2 | | 1-Year | | | 5 Years | | | 10 Years | |
without sales charge | | | 4.07 | % | | | 12.07 | % | | | 14.86 | % |
with sales charge | | | -0.62 | % | | | 11.04 | % | | | 14.33 | % |
| | | |
| Class S | | 1-Year | | | 5 Years | | | 10 Years | |
Net Asset Value | | | 4.36 | % | | | 12.47 | % | | | 15.36 | % |
Value of a $10,000 Investment
Class A Shares *,1,(a )
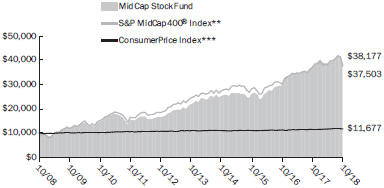
| | Past performance is not an indication of future results. The prospectus contains more complete information on the investment objectives, risks, charges and expenses of the investment company, which investors should read and consider carefully before investing. To obtain a prospectus, contact a registered representative or visit ThriventFunds.com. Total investment return and principal value of your investment will fluctuate, and your shares, when redeemed, may be worth more or less than their original cost. Current performance may be higher or lower than the performance data quoted. Call 800-847-4836 or visit ThriventFunds.com for performance results current to the most recent month-end. |
| 1 | Average annual total returns represent past performance and reflect changes in share prices, the reinvestment of all dividends and capital gains, and the effects of compounding. Periods of less than one year are not annualized. At various times, the Fund’s adviser may have waived its management fee and/ or reimbursed Fund expenses, without which the Fund’s total returns would have been lower. The returns shown do not reflect taxes a shareholder would pay on distributions or redemptions. Unless otherwise noted, the Index results shown do not reflect deductions for fees, expenses, or taxes. Index results shown reflect reinvestment of dividends. It is not possible to invest directly in an Index. |
| 2 | Class A performance with sales charge reflects the maximum sales charge of 4.5%. |
| (a) | Performance of other classes will be greater or less than the line shown based on the differences in loads and fees paid by shareholders investing in the different classes. |
| * | As you compare performance, please note that the Fund’s performance reflects the maximum 4.5% sales charge, while the benchmark indices do not reflect any such charges, deductions for fees, expenses or taxes. If you were to purchase any of the above individual securities represented in the Index, any charges you would pay would reduce your total return as well. |
| ** | S&P MidCap 400® Index represents the average performance of a group of 400 medium capitalization stocks. |
| *** | The Consumer Price Index is an inflationary indicator that measures the change in the cost of a fixed basket of products and services, including housing, electricity, food and transportation. |
29
THRIVENT MODERATE ALLOCATION FUND
David S. Royal, David C. Francis, CFA, Mark L. Simenstad, CFA, Darren M. Bagwell, CFA, and Stephen D. Lowe, CFA, Portfolio Co-Managers
The Fund seeks long-term capital growth while providing reasonable stability of principal.
Investment in Thrivent Moderate Allocation Fund involves risks including allocation, credit, derivatives, emerging markets, equity security, foreign securities, growth investing, high yield, interest rate, investment adviser, issuer, large cap, leveraged loan, liquidity, market, mid cap, non-diversified, other funds, portfolio turnover rate, small cap and value investing risks. A detailed description of each risk can be found in the significant risks section of the accompanying notes to financial statements.
How did the Fund perform during the 12-month period ended October 31, 2018?
Thrivent Moderate Allocation Fund earned a return of 0.50%, compared with the median return of its peer group, the Lipper Mixed-Asset Target Allocation Moderate Funds category, of -0.76%. The Fund’s market benchmarks, the S&P 500® Index, the Bloomberg Barclays U.S. Aggregate Bond Index, and the MSCI All Country World Index ex-USA–USD Net Returns, earned returns of 7.35%, -2.05% and -8.24%, respectively.
What factors affected the Fund’s performance?
After an exceptionally quiet 2017, market volatility returned this year in the form of two swift equity market drawdowns of approximately 10%. Typically, excessive market volatility presents a more challenging environment for our asset allocation funds because of their procyclical positioning. However, during this reporting period, the Moderate Allocation Fund outperformed its peer group median, primarily due to favorable results from our asset allocation decisions and the relative outperformance of several of the underlying Fund managers. Additionally, as part of the management process, we employed derivatives for the purpose of adjusting the Fund’s exposures to various asset classes when deemed appropriate. In 2018, the Fund benefited from several of these tactics. First, an underweighting to international equities that we instituted in March added value because domestic equities materially outperformed. Second, in September, we eliminated an existing overweighting to domestic small-cap stocks, which allowed the Fund to capture the relative year-to-date outperformance of the position just prior to the small-cap segment’s material underperformance during the October decline. Beyond these tactical adjustments, we employed several risk-mitigating strategies, such as the extension of a NASDAQ 100 short position and the initiation of a low volatility strategy. These also proved successful in hedging the Fund’s overweighting to risk assets, including mega-cap technology stocks.
Broadly speaking, stock selection also provided strong contributions to relative performance, led by material outperformance in the large-cap growth and value spaces and smaller relative gains in the mid-cap core, small-cap core and growth areas. Only the international and mid-cap growth managers underperformed their benchmarks. Although no sectors represented more than 25% of net assets for the period, the Fund benefited from strong performance in information technology, industrials and health care, with modest underperformance from energy, consumer staples and utilities.
In the fixed-income market, we saw the Treasury yield curve flatten significantly as yields on shorter-term Treasuries rose more than yields on longer-term Treasuries. The Federal Reserve (Fed) increased the federal funds rate four times, which had the most impact on short-term rates. Intermediate- and long-term rates also rose, but less than short rates. Higher interest rates weighed on much of the fixed-income market with corporate bond returns ranging from slightly positive to moderately negative. Also, yield spreads over Treasuries—a form of risk premium—increased for investment-grade and high-yield corporate bonds as well as emerging markets debt, which negatively impacted returns. However, securities with floating rates that increase as interest rates rise produced the strongest returns, including leveraged loans and some securitized assets. The fixed-income portion of the Fund outperformed in part because it was positioned for the Treasury curve to flatten. Additionally, this segment of the Fund benefited from its overweighting in securitized assets, including nonagency mortgage-backed securities. Leveraged loan holdings also boosted relative performance, while high-yield holdings underperformed. Treasury futures were used in the fixed-income portfolio to help manage interest rate exposure.
What is your outlook?
At the beginning of the period, valuations were elevated. However, after the swift market decline in October 2018, valuations across asset classes appeared in line with their long-term averages and, in some cases such as international, they appeared cheap. Economically, the U.S. remains strong with historically low unemployment, strong business sentiment and robust manufacturing activity. Internationally, however, we see a different story with Europe and Asia showing marked weakness. We expect economic growth to moderate in the U.S. as the Fed continues raising rates at a measured pace into 2019, while trade tensions and market volatility will likely persist. As a result, we have positioned the Fund with a modest underweighting in equities, while maintaining diversifying strategies to hedge more volatile risk assets such as technology, emerging markets, growth and momentum. Within fixed income, the Fund has a roughly neutral position in corporate credit, along with an underweighting to emerging markets debt, and an overweighting to securitized assets such as nonagency mortgage-backed securities.
Quoted Fund performance is for Class A shares and does not reflect a sales charge.
The returns shown do not reflect taxes a shareholder would pay on distributions or redemptions.
30
| | | | |
| Portfolio Composition | |
| (% of Portfolio) | |
Investment Grade Debt | | | 30.5 | % |
Large Cap | | | 26.5 | % |
Short-Term Investments | | | 12.0 | % |
International | | | 10.6 | % |
Small Cap | | | 5.3 | % |
Mid Cap | | | 4.1 | % |
Floating Rate Debt | | | 3.6 | % |
High Yield | | | 3.4 | % |
Multi-Cap | | | 2.5 | % |
Emerging Markets Debt | | | 1.5 | % |
| | | | |
Total | | | 100.0 | % |
| | | | |
| Top 10 Holdings | |
| (% of Net Assets) | |
Thrivent Large Cap Value Fund, Class S | | | 8.1 | % |
Thrivent Large Cap Growth Fund, Class S | | | 6.7 | % |
Thrivent Partner Worldwide Allocation Fund, Class S | | | 5.1 | % |
Thrivent Income Fund, Class S | | | 4.7 | % |
Thrivent Mid Cap Stock Fund, Class S | | | 4.5 | % |
Thrivent Core Low Volatility Equity Fund | | | 2.9 | % |
Thrivent Limited Maturity Bond Fund, Class S | | | 2.7 | % |
Federal National Mortgage Association Conventional 30-Yr. Pass Through | | | 2.3 | % |
Federal National Mortgage Association Conventional 30-Yr. Pass Through | | | 2.3 | % |
Federal National Mortgage Association Conventional 30-Yr. Pass Through | | | 2.2 | % |
| |
These securities represent 41.5% of the total net assets of the Fund. | | | | |
Portfolio Composition illustrates market exposure of all asset classes, including long and short derivatives. Portfolio composition does not look-through other mutual funds held to their underlying assets, but rather each fund is assigned an asset class.
The Portfolio Composition char excludes collateral held for securities loaned.
The lists of Top 10 Holdings exclude short-term investments and collateral held for securities loaned.
Quoted Portfolio Composition and Top 10 Holdings are subject to change.
Average Annual Total Returns1
As of October 31, 2018
| | | | | | | | | | | | |
| Class A2 | | 1-Year | | | 5 Years | | | 10 Years | |
without sales charge | | | 0.50 | % | | | 5.06 | % | | | 8.31 | % |
with sales charge | | | -3.99 | % | | | 4.09 | % | | | 7.81 | % |
| | | |
| Class S | | 1-Year | | | 5 Years | | | 10 Years | |
Net Asset Value | | | 0.77 | % | | | 5.39 | % | | | 8.67 | % |
Value of a $10,000 Investment
Class A Shares *,1,(a )
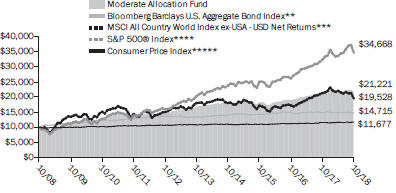
| | Past performance is not an indication of future results. The prospectus contains more complete information on the investment objectives, risks, charges and expenses of the investment company, which investors should read and consider carefully before investing. To obtain a prospectus, contact a registered representative or visit ThriventFunds.com. Total investment return and principal value of your investment will fluctuate, and your shares, when redeemed, may be worth more or less than their original cost. Current performance may be higher or lower than the performance data quoted. Call 800-847-4836 or visit ThriventFunds.com for performance results current to the most recent month-end. |
| 1 | Average annual total returns represent past performance and reflect changes in share prices, the reinvestment of all dividends and capital gains, and the effects of compounding. Periods of less than one year are not annualized. At various times, the Fund’s adviser may have waived its management fee and/ or reimbursed Fund expenses, without which the Fund’s total returns would have been lower. The returns shown do not reflect taxes a shareholder would pay on distributions or redemptions. Unless otherwise noted, the Index results shown do not reflect deductions for fees, expenses, or taxes. Index results shown reflect reinvestment of dividends. It is not possible to invest directly in an Index. |
| 2 | Class A performance with sales charge reflects the maximum sales charge of 4.5%. |
| (a) | Performance of other classes will be greater or less than the line shown based on the differences in loads and fees paid by shareholders investing in the different classes. |
| * | As you compare performance, please note that the Fund’s performance reflects the maximum 4.5% sales charge, while the benchmark indices do not reflect any such charges, deductions for fees, expenses or taxes. If you were to purchase any of the above individual securities represented in those Indexes, any charges you would pay would reduce your total return as well. |
| ** | The Bloomberg Barclays U.S. Aggregate Bond Index is an index that measures the performance of U.S. investment grade bonds. |
| *** | The MSCI All Country World Index ex-USA - USD Net Returns is an unmanaged market capitalization-weighted index that is designed to represent the performance of developed and emerging stock markets throughout the world. The performance of the Index reflects dividends reinvested after the deduction of withholding taxes. |
| **** | The S&P 500® Index is an index that represents the average performance of a group of 500 widely held, publicly traded stocks. “S&P 500®” is a trademark of The McGraw-Hill Companies, Inc. and has been licensed for use by Thrivent Financial for Lutherans. The product is not sponsored, endorsed or promoted by Standard & Poor’s and Standard & Poor’s makes no representation regarding the advisability of investing in the product. |
| ***** | The Consumer Price Index is an inflationary indicator that measures the change in the cost of a fixed basket of products and services, including housing, electricity, food and transportation.. |
31
THRIVENT MODERATELY AGGRESSIVE ALLOCATION FUND
David S. Royal, David C. Francis, CFA, Mark L. Simenstad, CFA, Darren M. Bagwell, CFA, and Stephen D. Lowe, CFA, Portfolio Co-Managers
The Fund seeks long-term capital growth.
Investment in Thrivent Moderately Aggressive Allocation Fund involves risks including allocation, credit, derivatives, emerging markets, equity security, foreign securities, growth investing, high yield, interest rate, investment adviser, issuer, large cap, leveraged loan, liquidity, market, mid cap, non-diversified, other funds, small cap and value investing risks. A detailed description of each risk can be found in the significant risks section of the accompanying notes to financial statements.
How did the Fund perform during the 12-month period ended October 31, 2018?
Thrivent Moderately Aggressive Allocation Fund earned a return of 1.37%, compared with the median return of its peer group, the Lipper Mixed-Asset Target Allocation Growth Funds category, of 0.03%. The Fund’s market benchmarks, the S&P 500® Index, the Bloomberg Barclays U.S. Aggregate Bond Index, and the MSCI All Country World Index ex-USA–USD Net Returns, earned returns of 7.35%, -2.05% and -8.24%, respectively.
What factors affected the Fund’s performance?
After an exceptionally quiet 2017, market volatility returned this year in the form of two swift equity market drawdowns of approximately 10%. Typically, excessive market volatility presents a more challenging environment for our asset allocation funds because of their procyclical positioning. However, during this reporting period, the Moderately Aggressive Allocation Fund outperformed its peer group median, primarily due to favorable results from our asset allocation decisions and the relative outperformance of several of the underlying Fund managers. Additionally, as part of the management process, we employed derivatives for the purpose of adjusting the Fund’s exposures to various asset classes when deemed appropriate. In 2018, the Fund benefited from several of these tactics. First, an underweighting to international equities that we instituted in March added value because domestic equities materially outperformed. Second, in September, we eliminated an existing overweighting to domestic small-cap stocks, which allowed the Fund to capture the relative year-to-date outperformance of the position just prior to the small-cap segment’s material underperformance during the October decline. Beyond these tactical adjustments, we employed several risk-mitigating strategies, such as the extension of a NASDAQ 100 short position and the initiation of a low volatility strategy. These also proved successful in hedging the Fund’s overweighting to risk assets, including mega-cap technology stocks.
Broadly speaking, stock selection also provided strong contributions to relative performance, led by material outperformance in the large-cap growth and value spaces and smaller relative gains in the mid-cap core, small-cap core and growth areas. Only the international and mid-cap growth managers underperformed their benchmarks. Although no sectors represented more than 25% of net assets for the period, the Fund benefited from strong performance in information technology, industrials and health care, with modest underperformance from energy, consumer staples and utilities.
In the fixed-income market, we saw the Treasury yield curve flatten significantly as yields on shorter-term Treasuries rose more than yields on longer-term Treasuries. The Federal Reserve (Fed) increased the federal funds rate four times, which had the most impact on short-term rates. Intermediate- and long-term rates also rose, but less than short-term rates. Higher interest rates weighed on much of the fixed-income market with corporate bond returns ranging from slightly positive to moderately negative. Also, yield spreads over Treasuries, a form of risk premium, increased for investment-grade and high-yield corporate bonds as well as emerging markets debt, which negatively impacted returns. However, securities with floating rates that increase as interest rates rise produced the strongest returns, including leveraged loans and some securitized assets. The fixed-income portion of the Fund outperformed in part because it was positioned for the Treasury curve to flatten. Additionally, this segment of the Fund benefited from its overweighting in securitized assets, including nonagency mortgage-backed securities. Leveraged loan holdings also boosted relative performance, while high-yield holdings underperformed. Treasury futures were used in the fixed-income portfolio to help manage interest rate exposure.
What is your outlook?
At the beginning of the period, valuations were elevated. However, after the swift market decline in October 2018, valuations across asset classes appeared in line with their long-term averages and, in some cases such as international, they appeared cheap. Economically, the U.S. remains strong with historically low unemployment, strong business sentiment and robust manufacturing activity. Internationally, however, we see a different story with Europe and Asia showing marked weakness. We expect economic growth to moderate in the U.S. as the Fed continues raising rates at a measured pace into 2019, while trade tensions and market volatility will likely persist. As a result, we have positioned the Fund with a modest underweighting in equities, while maintaining diversifying strategies to hedge more volatile risk assets such as technology, emerging markets, growth and momentum. Within fixed income, the Fund has a roughly neutral position in corporate credit, along with an underweighting to emerging markets debt, and an overweighting to securitized assets such as nonagency mortgage-backed securities.
Quoted Fund performance is for Class A shares and does not reflect a sales charge.
The returns shown do not reflect taxes a shareholder would pay on distributions or redemptions.
32
| | | | |
| Portfolio Composition | |
| (% of Portfolio) | |
Large Cap | | | 36.1 | % |
Investment Grade Debt | | | 16.5 | % |
International | | | 14.7 | % |
Short-Term Investments | | | 12.1 | % |
Small Cap | | | 8.5 | % |
Mid Cap | | | 4.9 | % |
Multi-Cap | | | 2.7 | % |
High Yield | | | 1.8 | % |
Floating Rate Debt | | | 1.8 | % |
Emerging Markets Debt | | | 0.9 | % |
| | | | |
Total | | | 100.0 | % |
| | | | |
| Top 10 Holdings | |
| (% of Net Assets) | |
Thrivent Partner Worldwide Allocation Fund, Class S | | | 8.3 | % |
Thrivent Large Cap Value Fund, Class S | | | 8.1 | % |
Thrivent Large Cap Growth Fund, Class S | | | 7.3 | % |
Thrivent Mid Cap Stock Fund, Class S | | | 5.9 | % |
Thrivent Large Cap Stock Fund, Class S | | | 4.7 | % |
Thrivent Core Low Volatility Equity Fund | | | 3.0 | % |
Thrivent Core International Equity Fund | | | 2.9 | % |
Thrivent Income Fund, Class S | | | 2.2 | % |
Thrivent Small Cap Stock Fund, Class S | | | 1.5 | % |
Federal National Mortgage Association Conventional 30-Yr. Pass Through | | | 1.4 | % |
| |
These securities represent 45.3% of the total net assets of the Fund. | | | | |
Portfolio Composition illustrates market exposure of all asset classes, including long and short derivatives. Portfolio composition does not look-through other mutual funds held to their underlying assets, but rather each fund is assigned an asset class.
The Portfolio Composition chart excludes collateral held for securities loaned.
The lists of Top 10 Holdings exclude short-term investments and collateral held for securities loaned.
Quoted Portfolio Composition and Top 10 Holdings are subject to change.
Average Annual Total Returns1
As of October 31, 2018
| | | | | | | | | | | | |
| Class A2 | | 1-Year | | | 5 Years | | | 10 Years | |
without sales charge | | | 1.37 | % | | | 6.33 | % | | | 9.62 | % |
with sales charge | | | -3.22 | % | | | 5.35 | % | | | 9.12 | % |
| | | |
| Class S | | 1-Year | | | 5 Years | | | 10 Years | |
Net Asset Value | | | 1.61 | % | | | 6.65 | % | | | 9.99 | % |
Value of a $10,000 Investment
Class A Shares *,1,(a )
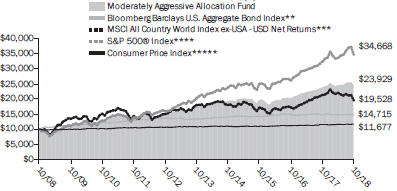
| | Past performance is not an indication of future results. The prospectus contains more complete information on the investment objectives, risks, charges and expenses of the investment company, which investors should read and consider carefully before investing. To obtain a prospectus, contact a registered representative or visit ThriventFunds.com. Total investment return and principal value of your investment will fluctuate, and your shares, when redeemed, may be worth more or less than their original cost. Current performance may be higher or lower than the performance data quoted. Call 800-847-4836 or visit ThriventFunds.com for performance results current to the most recent month-end. |
| 1 | Average annual total returns represent past performance and reflect changes in share prices, the reinvestment of all dividends and capital gains, and the effects of compounding. Periods of less than one year are not annualized. At various times, the Fund’s adviser may have waived its management fee and/ or reimbursed Fund expenses, without which the Fund’s total returns would have been lower. The returns shown do not reflect taxes a shareholder would pay on distributions or redemptions. Unless otherwise noted, the Index results shown do not reflect deductions for fees, expenses, or taxes. Index results shown reflect reinvestment of dividends. It is not possible to invest directly in an Index. |
| 2 | Class A performance with sales charge reflects the maximum sales charge of 4.5%. |
| (a) | Performance of other classes will be greater or less than the line shown based on the differences in loads and fees paid by shareholders investing in the different classes. |
| * | As you compare performance, please note that the Fund’s performance reflects the maximum 4.5% sales charge, while the benchmark indices do not reflect any such charges, deductions for fees, expenses or taxes. If you were to purchase any of the above individual securities represented in those Indexes, any charges you would pay would reduce your total return as well. |
| ** | The Bloomberg Barclays U.S. Aggregate Bond Index is an index that measures the performance of U.S. investment grade bonds. |
| *** | The MSCI All Country World Index ex-USA - USD Net Returns is an unmanaged market capitalization-weighted index that is designed to represent the performance of developed and emerging stock markets throughout the world. The performance of the Index reflects dividends reinvested after the deduction of withholding taxes. |
| **** | The S&P 500® Index is an index that represents the average performance of a group of 500 widely held, publicly traded stocks. “S&P 500®” is a trademark of The McGraw-Hill Companies, Inc. and has been licensed for use by Thrivent Financial for Lutherans. The product is not sponsored, endorsed or promoted by Standard & Poor’s and Standard & Poor’s makes no representation regarding the advisability of investing in the product.. |
| ***** | The Consumer Price Index is an inflationary indicator that measures the change in the cost of a fixed basket of products and services, including housing, electricity, food and transportation. |
33
THRIVENT MODERATELY CONSERVATIVE ALLOCATION FUND
David S. Royal, David C. Francis, CFA, Mark L. Simenstad, CFA, Darren M. Bagwell, CFA, and Stephen D. Lowe, CFA, Portfolio Co-Managers
The Fund seeks long-term capital growth while providing reasonable stability of principal.
Investment in Thrivent Moderately Conservative Allocation Fund involves risks including allocation, credit, derivatives, emerging markets, equity security, foreign securities, growth investing, high yield, interest rate, investment adviser, issuer, large cap, leveraged loan, liquidity, market, mid cap, non-diversified, other funds, portfolio turnover rate, small cap and value investing risks. A detailed description of each risk can be found in the significant risks section of the accompanying notes to financial statements.
How did the Fund perform during the 12-month period ended October 31, 2018?
Thrivent Moderately Conservative Allocation Fund earned a return of -0.45%, compared with the median return of its peer group, the Lipper Mixed-Asset Target Allocation Conservative Funds category, of -1.07%. The Fund’s market benchmarks, the S&P 500® Index, the Bloomberg Barclays U.S. Aggregate Bond Index, and the MSCI All Country World Index ex-USA–USD Net Returns, earned returns of 7.35%, -2.05% and -8.24%, respectively.
What factors affected the Fund’s performance?
After an exceptionally quiet 2017, market volatility returned this year in the form of two swift equity market drawdowns of approximately 10%. Typically, excessive market volatility presents a more challenging environment for our asset allocation funds because of their procyclical positioning. However, during this reporting period, the Moderately Conservative Allocation Fund outperformed its peer group median, primarily due to favorable results from our asset allocation decisions and the relative outperformance of several of the underlying Fund managers. Additionally, as part of the management process, we employed derivatives for the purpose of adjusting the Fund’s exposures to various asset classes when deemed appropriate. In 2018, the Fund benefited from several of these tactics. First, an underweighting to international equities that we instituted in March added value because domestic equities materially outperformed. Second, in September, we eliminated an existing overweighting to domestic small-cap stocks, which allowed the Fund to capture the relative year-to-date outperformance of the position just prior to the small-cap segment’s material underperformance during the October decline. Beyond these tactical adjustments, we employed several risk-mitigating strategies, such as the extension of a NASDAQ 100 short position and the initiation of a low volatility strategy. These also proved successful in hedging the Fund’s overweighting to risk assets, including mega-cap technology stocks.
Broadly speaking, stock selection also provided strong contributions to relative performance, led by material outperformance in the large-cap growth and value spaces and smaller relative gains in the mid-cap core, small-cap core and growth areas. Only the international and mid-cap growth managers underperformed their benchmarks. Although no sectors represented more than 25% of net assets for the period, the Fund benefited from strong performance in information technology, industrials and health care, with modest underperformance from energy, consumer staples and utilities.
In the fixed-income market, we saw the Treasury yield curve flatten significantly as yields on shorter-term Treasuries rose more than yields on longer-term Treasuries. The Federal Reserve (Fed) increased the federal funds rate four times, which had the most impact on short-term rates. Intermediate- and long-term rates also rose, but less than short-term rates. Higher interest rates weighed on much of the fixed-income market with corporate bond returns ranging from slightly positive to moderately negative. Also, yield spreads over Treasuries, a form of risk premium, increased for investment-grade and high-yield corporate bonds as well as emerging markets debt, which negatively impacted returns. However, securities with floating rates that increase as interest rates rise produced the strongest returns, including leveraged loans and some securitized assets. The fixed-income portion of the Fund outperformed in part because it was positioned for the Treasury curve to flatten. Additionally, this segment of the Fund benefited from its overweighting in securitized assets, including nonagency mortgage-backed securities. Leveraged loan holdings also boosted relative performance, while high-yield holdings underperformed. Treasury futures were used in the fixed-income portfolio to help manage interest rate exposure.
What is your outlook?
At the beginning of the period, valuations were elevated. However, after the swift market decline in October 2018, valuations across asset classes appeared in line with their long-term averages and, in some cases such as international, they appeared cheap. Economically, the U.S. remains strong with historically low unemployment, strong business sentiment and robust manufacturing activity. Internationally, however, we see a different story with Europe and Asia showing marked weakness. We expect economic growth to moderate in the U.S. as the Fed continues raising rates at a measured pace into 2019, while trade tensions and market volatility will likely persist. As a result, we have positioned the Fund with a modest underweighting in equities, while maintaining diversifying strategies to hedge more volatile risk assets such as technology, emerging markets, growth and momentum. Within fixed income, the Fund has a roughly neutral position in corporate credit, along with an underweighting to emerging markets debt, and an overweighting to securitized assets such as nonagency mortgage-backed securities.
Quoted Fund performance is for Class A shares and does not reflect a sales charge.
The returns shown do not reflect taxes a shareholder would pay on distributions or redemptions.
34
| | | | |
Portfolio Composition | | | | |
(% of Portfolio) | | | | |
Investment Grade Debt | | | 43.3 | % |
Large Cap | | | 17.6 | % |
Short-Term Investments | | | 12.2 | % |
International | | | 6.4 | % |
Floating Rate Debt | | | 5.8 | % |
High Yield | | | 5.1 | % |
Small Cap | | | 2.9 | % |
Mid Cap | | | 2.9 | % |
Emerging Markets Debt | | | 2.2 | % |
Multi-Cap | | | 1.6 | % |
| | | | |
Total | | | 100.0 | % |
| |
Top 10 Holdings | | | | |
(% of Net Assets) | | | | |
Thrivent Income Fund, Class S | | | 7.7 | % |
Thrivent Large Cap Value Fund, Class S | | | 7.3 | % |
Thrivent Limited Maturity Bond Fund, Class S | | | 4.4 | % |
Thrivent Partner Worldwide Allocation Fund, Class S | | | 4.1 | % |
Thrivent Large Cap Growth Fund, Class S | | | 3.6 | % |
Federal National Mortgage Association Conventional 30-Yr. Pass Through | | | 3.4 | % |
Federal National Mortgage Association Conventional 30-Yr. Pass Through | | | 2.9 | % |
Federal National Mortgage Association Conventional 30-Yr. Pass Through | | | 2.8 | % |
Thrivent High Yield Fund, Class S | | | 2.5 | % |
U.S. Treasury Notes | | | 2.5 | % |
| |
These securities represent 41.2% of the total net assets of the Fund. | | | | |
Portfolio Composition illustrates market exposure of all asset classes, including long and short derivatives. Portfolio composition does not look-through other mutual funds held to their underlying assets, but rather each fund is assigned an asset class.
The Portfolio Composition char excludes collateral held for securities loaned.
The lists of Top 10 Holdings exclude short-term investments and collateral held for securities loaned.
Quoted Portfolio Composition and Top 10 Holdings are subject to change.
Average Annual Total Returns1
As of October 31, 2018
| | | | | | | | | | | | |
| Class A2 | | 1-Year | | | 5 Years | | | 10 Years | |
without sales charge | | | -0.45 | % | | | 3.76 | % | | | 6.59 | % |
with sales charge | | | -4.94 | % | | | 2.82 | % | | | 6.10 | % |
| | | |
| Class S | | 1-Year | | | 5 Years | | | 10 Years | |
Net Asset Value | | | -0.18 | % | | | 4.09 | % | | | 6.91 | % |
Value of a $10,000 Investment
Class A Shares*,1,(a )
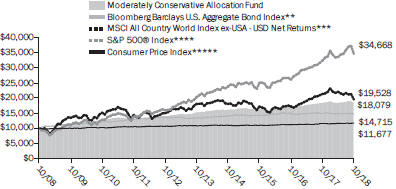
| | Past performance is not an indication of future results. The prospectus contains more complete information on the investment objectives, risks, charges and expenses of the investment company, which investors should read and consider carefully before investing. To obtain a prospectus, contact a registered representative or visit ThriventFunds.com. Total investment return and principal value of your investment will fluctuate, and your shares, when redeemed, may be worth more or less than their original cost. Current performance may be higher or lower than the performance data quoted. Call 800-847-4836 or visit ThriventFunds.com for performance results current to the most recent month-end. |
| 1 | Average annual total returns represent past performance and reflect changes in share prices, the reinvestment of all dividends and capital gains, and the effects of compounding. Periods of less than one year are not annualized. At various times, the Fund’s adviser may have waived its management fee and/ or reimbursed Fund expenses, without which the Fund’s total returns would have been lower. The returns shown do not reflect taxes a shareholder would pay on distributions or redemptions. Unless otherwise noted, the Index results shown do not reflect deductions for fees, expenses, or taxes. Index results shown reflect reinvestment of dividends. It is not possible to invest directly in an Index. |
| 2 | Class A performance with sales charge reflects the maximum sales charge of 4.5%. |
| (a) | Performance of other classes will be greater or less than the line shown based on the differences in loads and fees paid by shareholders investing in the different classes. |
| * | As you compare performance, please note that the Fund’s performance reflects the maximum 4.5% sales charge, while the benchmark indices do not reflect any such charges, deductions for fees, expenses or taxes. If you were to purchase any of the above individual securities represented in those Indexes, any charges you would pay would reduce your total return as well. |
| ** | The Bloomberg Barclays U.S. Aggregate Bond Index is an index that measures the performance of U.S. investment grade bonds. |
| *** | The MSCI All Country World Index ex-USA - USD Net Returns is an unmanaged market capitalization-weighted index that is designed to represent the performance of developed and emerging stock markets throughout the world. The performance of the Index reflects dividends reinvested after the deduction of withholding taxes. |
| **** | The S&P 500® Index is an index that represents the average performance of a group of 500 widely held, publicly traded stocks. “S&P 500®” is a trademark of The McGraw-Hill Companies, Inc. and has been licensed for use by Thrivent Financial for Lutherans. The product is not sponsored, endorsed or promoted by Standard & Poor’s and Standard & Poor’s makes no representation regarding the advisability of investing in the product. |
| ***** | The Consumer Price Index is an inflationary indicator that measures the change in the cost of a fixed basket of products and services, including housing, electricity, food and transportation. |
35
THRIVENT MONEY MARKET FUND
William D. Stouten, Portfolio Manager
The Fund seeks a high level of current income, while maintaining liquidity and a constant net asset value of $1.00 per share. Investment in Thrivent Money Market Fund involves risks including credit, government securities, interest rate, money market fund and redemption risks. A detailed description of each risk can be found in the significant risks section of the accompanying notes to financial statements.
The Fund invests at least 99.5% of its total assets in government securities, cash and repurchase agreements collateralized fully by government securities or cash.
How did the Fund perform during the 12-month period ended October 31, 2018?
Thrivent Money Market Fund earned a return of 1.13%, compared with the median net return of its peer group, the Lipper U.S. Government Money Market Funds category, of 1.10%.
What factors affected the Fund’s performance?
During the first few months of the period, the world enjoyed a synchronized global economic recovery led by the U.S. with surprising strength also seen in Japan and Europe. As we moved into 2018, however, world economies began to diverge with the U.S. continuing to gain traction while other economies slowed, particularly in Europe and Asia. Despite increasing trade war tensions with its major trading partners, the U.S. economy was spurred on by the late-2017 corporate tax cuts, improved trade policies, significant deregulation, oil independence and a raft of positive economic data including falling unemployment, increased consumer spending, stronger manufacturing and rising business investment. U.S. gross domestic product (GDP) exhibited its strongest growth rate since the recovery began, reaching 4.2% in second quarter 2018.
Stronger economic growth and falling unemployment led the Federal Reserve (Fed) to continue raising the target federal funds rate with four hikes in December, March, June and September totaling 1.00%. Following last year’s trend, the Treasury yield curve flattened further as rates moved higher for shorter-maturity securities than they did for longer-maturity Treasuries. Three-month Treasury bill rates, for example, rose 117 basis points to end at 2.33%. The three-month London Interbank Offered Rate (LIBOR) also rose significantly over the period by 118 basis points, reaching 2.56% as of October 31, 2018. LIBOR is the most widely used global benchmark for short-term rates.
Thrivent Money Market Fund continues to operate as a government money market fund, and as such, offers a stable $1.00 share price and is not required to impose redemption gates or liquidity fees. However, it must invest at least 99.5% of its total assets in government securities, cash and repurchase agreements collateralized by government securities. As of October 31, 2018, net assets in the Fund totaled approximately $476 million and 100% of the portfolio was invested in U.S. government obligations or U.S. government-supported securities. Within the portfolio, we continued to invest heavily in variable-rate demand notes (VRDNs), which represented approximately 25% of net assets at fiscal year-end, to lessen the Fund’s sensitivity to rising interest rates. We favor VRDNs because they typically have weekly interest rate resets, ensuring that their yields reflect the current rate environment.
As a government money market fund, the Fund is also required to maintain a weighted average maturity (WAM) of not more than 60 days and a weighted average life (WAL) of not more than 120 days. During the period, the Fund’s WAM and WAL remained well within these guidelines, ending at 34 days and 100 days, respectively. We continued to emphasize a conservative posture for the Fund, while remaining focused on our primary goals of liquidity, safety and a stable $1.00 share price.
What is your outlook?
At period end, the market consensus was calling for another federal funds rate increase in December 2018 and two to three more increases in 2019, based on the strength of the U.S. economy and job market. As a result, short-term yields will continue to rise. We remain focused on maintaining safety and liquidity as we look to capitalize on the potential for higher rates in the coming year. We will continue to monitor Fed guidance as well as market and regulatory developments that may impact our market going forward. That said, we believe the current administration has made a number of positive structural changes that will continue to support U.S. economic growth, including deregulation, updated trade policies and lower corporate taxes, which have resulted in a large amount of cash being repatriated by U.S. corporations.
An investment in the Thrivent Money Market Fund is not insured or guaranteed by the FDIC or any other government agency.
Although the Fund seeks to preserve the value of your investment at $1.00 per share, it is possible to lose money by investing in the Fund.
Quoted Fund performance is for Class A shares.
The returns shown do not reflect taxes a shareholder would pay on distributions or redemptions.
36
| | | | |
| Portfolio Composition | | | | |
| (% of Portfolio) | | | | |
U.S. Government Agency Debt | | | 77.6 | % |
U.S. Treasury Debt | | | 22.4 | % |
| | | | |
Total | | | 100.0 | % |
Quoted Portfolio Composition is subject to change.
Average Annual Total Returns1
As of October 31, 2018
| | | | | | | | | | | | |
Class A2 | | | 1-Year | | | | 5 Years | | | | 10 Years | |
Net Asset Value | | | 1.13 | % | | | 0.23 | % | | | 0.18 | % |
| | | |
Class S2 | | | 1-Year | | | | 5 Years | | | | 10 Years | |
Net Asset Value | | | 1.29 | % | | | 0.32 | % | | | 0.24 | % |
Money Market Fund Yields*
As of October 31, 2018
| | | | | | | | |
| | | Class A | | | Class S | |
7-Day Yield | | | 1.73 | % | | | 1.81 | % |
7-Day Yield Gross of Waivers | | | 1.63 | % | | | 1.71 | % |
| | |
7-Day Effective Yield | | | 1.75 | % | | | 1.83 | % |
7-Day Effective Yield Gross of Waivers | | | 1.65 | % | | | 1.73 | % |
| | Past performance is not an indication of future results. The prospectus contains more complete information on the investment objectives, risks, charges and expenses of the investment company, which investors should read and consider carefully before investing. To obtain a prospectus, contact a registered representative or visit ThriventFunds.com. Total investment return and principal value of your investment will fluctuate, and your shares, when redeemed, may be worth more or less than their original cost. Current performance may be higher or lower than the performance data quoted. Call 800-847-4836 or visit ThriventFunds.com for performance results current to the most recent month-end. |
| 1 | Average annual total returns represent past performance and reflect changes in share prices, the reinvestment of all dividends and capital gains, and the effects of compounding. Periods of less than one year are not annualized. At various times, the Fund’s adviser may have waived its management fee and/ or reimbursed Fund expenses, without which the Fund’s total returns would have been lower. The returns shown do not reflect taxes a shareholder would pay on distributions or redemptions. Unless otherwise noted, the Index results shown do not reflect deductions for fees, expenses, or taxes. Index results shown reflect reinvestment of dividends. It is not possible to invest directly in an Index. |
| 2 | Class A shares and Class S shares have no sales load. |
| * | Seven-day yields of Thrivent Money Market Fund refer to the income generated by an investment in the Fund over a specified seven-day period. Effective yields reflect the reinvestment of income. A yield gross of waivers represents what the yield would have been if the Adviser were not waiving or reimbursing certain expenses associated with the Fund. Yields are subject to daily fluctuation and should not be considered an indication of future results. The yield quotation more closely reflects the current earnings of the Thrivent Money Market Fund than the total return quotations. |
37
THRIVENT MUNICIPAL BOND FUND
Janet I. Grangaard, CFA, Portfolio Manager
The Fund seeks a high level of current income exempt from federal income taxes, consistent with capital preservation.
Investment in Thrivent Municipal Bond Fund involves risks including credit, futures contract, interest rate, investment adviser, liquidity, market, municipal bond, and tax risks. A detailed description of each risk can be found in the significant risks section of the accompanying notes to financial statements.
How did the Fund perform during the 12-month period ended October 31, 2018?
Thrivent Municipal Bond Fund earned a return of -1.08%, compared with the median return of its peer group, the Lipper General Municipal Debt Funds category, of -0.51%. The Fund’s market benchmark, the Bloomberg Barclays Municipal Bond Index, earned a return of -0.51%.
What factors affected the Fund’s performance?
At the end of 2017, the municipal bond market was overshadowed by uncertainty as investors awaited the outcome of proposed tax law changes. Muni bond issuance hit a record high in December as deals were rushed to the market and bonds were readily snapped up by investors due to fears that the future tax-exempt status of part or all of the market was in jeopardy. In late December, the U.S. passed the largest piece of U.S. tax reform legislation in more than three decades. Although the tax-exempt status of all muni bonds—including private activity bonds—was left intact, the bill made several other changes that impact the market. First, the new law greatly reduces or caps deductions previously allowed for investors, including a new $10,000 limit on state and local tax (SALT) deductibility. The SALT deduction cap has contributed to demand for muni bonds in certain high-tax states like California. Second, issuers are now prohibited from advanced refunding of outstanding municipal debt. Although pre-refunded bonds that are already outstanding will still be available until their call dates, no more will be created in the future. This will greatly decrease the amount of new supply issuance, while eventually removing an important market segment that is attractive to risk-averse investors. Third, the bill sharply lowered corporate tax rates, which means that banks and insurance companies do not have the same incentive to own muni bonds, particularly longer maturities. This selling pressure contributed to the cheapening of longer-maturity muni bonds. Following the flood of muni bond issuance at the end of 2017, the first few months of 2018 saw dramatically lower levels than normal with year-to-date issuance down 20%. Despite the decrease, yields increased across all maturities as the Fed continued to raise short-term rates. However, short-term munis were able to outperform in this environment. Also worth noting, the price of Puerto Rico’s general obligation (GO) bonds and Cofina bonds, which are backed by sales taxes, rallied in August and September after a federal oversight board reached agreements with bond holders regarding the commonwealth’s debt restructuring efforts. This development marked a significant milestone in resolving Puerto Rico’s debt crisis.
The Fund underperformed the peer group and benchmark primarily because of our portfolio’s higher-quality bias. Credit spreads generally tightened causing lower-quality, high-yield muni securities to outperform higher-quality, investment-grade bonds in 11 of the 12 months during the period. We also saw weaker results from two holdings in the hospital and continuing care retirement community (CCRC) areas. The first, Mission Health, was a well-run hospital system in North Carolina that agreed to merge with for-profit hospital chain HCA Healthcare, which will result in a bond call at par. The second was non-profit CCRC provider Lifespace Communities, which was downgraded by Fitch due to capital expenditure plans. Also, several of the Fund’s larger positions were non-callable bonds, which did not perform well due to their longer durations (i.e., interest rate sensitivity). Additionally, we did not own bonds from Puerto Rico, which detracted from relative performance after they rebounded sharply.
On the positive side, the Fund continued to generate a significantly higher level of tax-exempt income than its peers, as measured by its 12-month distribution yield. Also, performance was aided by our portfolio’s shorter overall duration. Our best-performing position was a Buckeye Tobacco Settlement Financing Authority revenue bond that benefited from credit-spread tightening. We also successfully shorted two-year Treasury futures to lessen exposure to rising rates at the front end of the curve because of our portfolio’s heavy weighting in short-duration, pre-refunded bonds. In addition, we saw favorable results from our exposure to Illinois GO bonds and the Illinois Metropolitan Pier and Exposition Authority tax revenue bond. Finally, we held a small short position in 30-year Treasury futures to hedge some of the duration risk from one of the Fund’s longer maturity bonds.
What is your outlook?
Based on the strength of the economy and job market, we expect the Federal Reserve to increase the federal funds rate again in December 2018 and at least two more times in 2019. Although tax reform passage removed a great deal of uncertainty, we will continue to closely monitor trade policy and other developments coming out of Washington and the states that could affect the market. Two areas of greater concern are the impacts of pension reform and the expansion of Medicaid on state budgets. In terms of the latter, states are now required to cover a portion of the Medicaid expansion costs as part of the Affordable Care Act. Also, we may see new issuance increase if the current administration is successful with plans to increase infrastructure spending.
*Investors may be subject to state taxes, the federal alternative minimum tax and capital gains taxes.
Quoted Fund performance is for Class A shares and does not reflect a sales charge.
The returns shown do not reflect taxes a shareholder would pay on distributions or redemptions.
38
Bond Quality Ratings Distributions

| | | | |
| Major Market Sectors | | | | |
| (% of Net Assets) | | | | |
Escrowed/Pre-refunded | | | 19.1 | % |
Transportation | | | 17.0 | % |
Health Care | | | 15.1 | % |
Education | | | 13.0 | % |
General Obligation | | | 10.1 | % |
Other Revenue | | | 6.9 | % |
Water & Sewer | | | 5.9 | % |
Tax Revenue | | | 5.0 | % |
Electric Revenue | | | 3.4 | % |
Housing Finance | | | 2.9 | % |
| | | | |
| Top 10 States | | | | |
| (% of Net Assets) | | | | |
California | | | 11.4 | % |
Texas | | | 9.3 | % |
New York | | | 7.6 | % |
Illinois | | | 6.6 | % |
Florida | | | 5.7 | % |
Ohio | | | 5.3 | % |
Colorado | | | 4.0 | % |
Minnesota | | | 3.6 | % |
Massachusetts | | | 3.5 | % |
Washington | | | 3.4 | % |
| |
Investments in securities in these States represent 60.4% of the total net assets of the Fund. | | | | |
Bond quality ratings are obtained from Moody’s Investors Service, Inc. (“Moody’s”) and Standard & Poor’s Ratings Services (“S&P”). Ratings from S&P, when
used, are converted into their equivalent Moody’s ratings. If Moody’s and S&P have assigned different ratings to a security, the lowest rating for the security is
used. Not rated may include cash. Investments in derivatives and short-term investments are not reflected in the table.
Quoted Bond Quality Ratings Distributions, Major Market Sectors, and Top 10 States are subject to change.
The lists of Major Market Sectors and Top 10 States exclude short-term investments and collateral held for securities loaned.
Bond Quality Ratings Distributions exclude collateral held for securities loaned.
Average Annual Total Returns1
As of October 31, 2018
| | | | | | | | | | | | |
| Class A2 | | 1-Year | | | 5 Years | | | 10 Years | |
without sales charge | | | -1.08 | % | | | 2.94 | % | | | 4.35 | % |
with sales charge | | | -5.56 | % | | | 1.99 | % | | | 3.86 | % |
| | | |
| Class S | | 1-Year | | | 5 Years | | | 10 Years | |
Net Asset Value | | | -0.85 | % | | | 3.19 | % | | | 4.62 | % |
Value of a $10,000 Investment
Class A Shares*,1,(a )
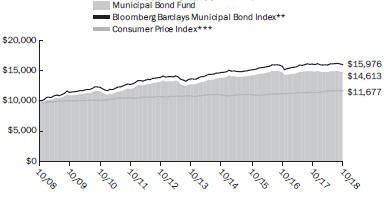
| | Past performance is not an indication of future results. The prospectus contains more complete information on the investment objectives, risks, charges and expenses of the investment company, which investors should read and consider carefully before investing. To obtain a prospectus, contact a registered representative or visit ThriventFunds.com. Total investment return and principal value of your investment will fluctuate, and your shares, when redeemed, may be worth more or less than their original cost. Current performance may be higher or lower than the performance data quoted. Call 800-847-4836 or visit ThriventFunds.com for performance results current to the most recent month-end. |
| 1 | Average annual total returns represent past performance and reflect changes in share prices, the reinvestment of all dividends and capital gains, and the effects of compounding. Periods of less than one year are not annualized. At various times, the Fund’s adviser may have waived its management fee and/ or reimbursed Fund expenses, without which the Fund’s total returns would have been lower. The returns shown do not reflect taxes a shareholder would pay on distributions or redemptions. Unless otherwise noted, the Index results shown do not reflect deductions for fees, expenses, or taxes. Index results shown reflect reinvestment of dividends. It is not possible to invest directly in an Index. |
| 2 | Class A performance with sales charge reflects the maximum sales charge of 4.5%. |
| (a) | Performance of other classes will be greater or less than the line shown based on the differences in loads and fees paid by shareholders investing in the different classes. |
| * | As you compare performance, please note that the Fund’s performance reflects the maximum 4.5% sales charge, while the benchmark indices do not reflect any such charges, deductions for fees, expenses or taxes. If you were to purchase any of the above individual securities represented in the Index, any charges you would pay would reduce your total return as well. |
| ** | The Bloomberg Barclays Municipal Bond Index is a market-value-weighted index of investment-grade municipal bonds with maturities of one year or more. |
| *** | The Consumer Price Index is an inflationary indicator that measures the change in the cost of a fixed basket of products and services, including housing, electricity, food and transportation. |
39
THRIVENT OPPORTUNITY INCOME PLUS FUND
Stephen D. Lowe, CFA, Gregory R. Anderson, CFA, Conrad E. Smith, CFA, Paul J. Ocenasek, CFA, and Kent L. White, CFA, Portfolio Co- Managers
The Fund seeks a high level of current income consistent with capital preservation.
Investment in Thrivent Opportunity Income Plus Fund involves risks including allocation, convertible securities, credit, derivatives, emerging markets, equity security, ETF, foreign securities, high yield, interest rate, investment adviser, issuer, leveraged loan, liquidity, market, mortgage-backed and other asset-backed securities, other funds, portfolio turnover rate, real estate investment trust (“REIT”), and sovereign debt risks. A detailed description of each risk can be found in the significant risks section of the accompanying notes to financial statements.
How did the Fund perform during the 12-month period ended October 31, 2018?
Thrivent Opportunity Income Plus Fund earned a return of 0.31%, compared with the median return of its peer group, the Lipper Multi-Sector Income Funds category, of -0.87%. The Fund’s market benchmarks, the Bloomberg Barclays U.S. High Yield Ba/B 2% Issuer Capped Index, the S&P/LSTA Leveraged Loan Index, and the Bloomberg Barclays U.S. Mortgage-Backed Securities Index, earned returns of 0.30%, 4.54% and -1.52%, respectively.
What factors affected the Fund’s performance?
During the first few months of the period, the world enjoyed a synchronized global economic recovery led by the U.S. However, world economies began to diverge in 2018 as the U.S. gained traction while other economies slowed, particularly in Europe and Asia. Despite increasing trade war tensions with its major trading partners, the U.S. economy was spurred on by the late-2017 corporate tax cuts, improved trade policies, significant deregulation and a raft of positive economic data, including falling unemployment, increased consumer spending, stronger manufacturing and rising business investment. U.S. gross domestic product (GDP) exhibited its strongest growth rate since the recovery began, reaching 4.2% in second quarter 2018. Stronger U.S. economic growth and falling unemployment led the Federal Reserve (Fed) to continue raising the target federal funds rate with four hikes in December, March, June and September totaling 1.00%. Following last year’s trend, the Treasury yield curve flattened further as rates moved higher for shorter-maturity securities than they did for longer-maturity Treasuries. In the 10- year segment of the Treasury market, rates rose 76 basis points to end the period at 3.15%.
We continued to invest a significant portion of the Fund in the corporate credit sectors, including approximately 33% in floating-rate leveraged bank loans, 14% in high-yield corporate bonds and 10% in investment-grade corporate bonds. We allocated approximately 24% of the Fund to securitized assets, split fairly evenly between agency mortgage-backed securities and nonagency residential mortgage-backed securities (RMBS). The Fund’s emerging market (EM) exposure represented approximately 14% of net assets, while approximately 5% of the portfolio was invested in preferred securities, alternative equity products and cash.
The Fund’s outperformance versus its Lipper peers was primarily the result of two factors. First, our portfolio had heavy exposure to floating-rate leveraged bank loans, which was one of the strongest-performing areas of the fixed-income market and significantly outperformed both investment-grade and high-yield credit. The Fund’s leveraged loans generated a 4.4% return, which was slightly below the S&P/LSTA Leveraged Loan Index, but we had more allocated to the sector versus our peers. Second, within the Fund’s securitized exposure, our performance was enhanced by an overweighting in nonagency RMBS. The Fund’s nonagency RMBS holdings experienced outsized gains of 4.7% versus the overall market and especially relative to the negative return of the Bloomberg Barclays U.S. Mortgage-Backed Securities Index. The Fund also modestly benefited from a short duration, which lessened its interest rate sensitivity, and our positioning for a flatter yield curve. On the negative side, we hedged some of the alternative equity exposure with a short position in S&P 500® futures, which offset the positive results from this segment.
What is your outlook?
We believe the coming year will continue to be a more difficult return environment in the fixed-income market for several reasons. First, although spreads widened modestly during this period, they still remain tight by historical standards. Second, consensus estimates call for four more Fed rate hikes over the next 12 months. Third, the U.S. economy is likely to slow as the positive impact from corporate tax reform subsides somewhat and the Fed removes fiscal stimulus.
In an effort to further mitigate the impact of additional rate increases, we are keeping the Fund’s duration short versus its peers. Although a significant amount of yield-curve compression has already taken place, we believe the trend will likely continue; therefore, we are also maintaining a bias to benefit from a flatter Treasury curve. We plan to continue to overweight securitized debt because of better fundamentals supporting these securities versus the corporate credit sectors. We remain neutral regarding investment-grade credit, but more cautious in terms of high-yield credit and leveraged loans as we get closer to the end of the current economic cycle. These asset classes are likely to experience more volatility in the event of significant spread widening or market distress. We will also continue to diversify the portfolio somewhat away from the U.S. through its EM exposure. That being said, the EM segment will likely continue to be negatively impacted in the short term by Fed rate increases, which typically strengthen the U.S. dollar and contribute to increased market volatility and stress in EM countries.
Quoted Fund performance is for Class A shares and does not reflect a sales charge.
The returns shown do not reflect taxes a shareholder would pay on distributions or redemptions.
40
Bond Quality Ratings Distributions
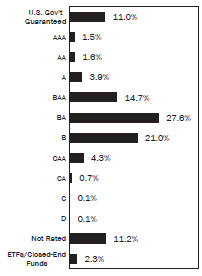
| | | | |
| Major Market Sectors | | | | |
| (% of Net Assets) | | | | |
Affiliated Fixed Income Holdings | | | 14.1 | % |
Mortgage-Backed Securities | | | 11.2 | % |
Communications Services | | | 11.1 | % |
Financials | | | 11.1 | % |
Consumer Non-Cyclical | | | 8.5 | % |
Consumer Cyclical | | | 7.2 | % |
Asset-Backed Securities | | | 7.1 | % |
Energy | | | 6.3 | % |
Collateralized Mortgage Obligations | | | 5.7 | % |
Basic Materials | | | 4.2 | % |
| | | | |
| Top 10 Holdings | | | | |
| (% of Net Assets) | | | | |
Thrivent Core Emerging Markets Debt Fund | | | 14.1 | % |
Federal National Mortgage Association Conventional 30-Yr. Pass Through | | | 4.2 | % |
Federal National Mortgage Association Conventional 30-Yr. Pass Through | | | 1.9 | % |
Federal Home Loan Mortgage Corporation Gold 30-Yr. Pass Through | | | 1.9 | % |
Federal National Mortgage Association Conventional 30-Yr. Pass Through | | | 1.6 | % |
Sable International Finance, Ltd., Term Loan | | | 0.8 | % |
Scientific Games International, Inc., Term Loan | | | 0.7 | % |
Air Medical Group Holdings, Inc., Term Loan | | | 0.7 | % |
First Data Corporation, Term Loan | | | 0.7 | % |
Radiate Holdco, LLC, Term Loan | | | 0.7 | % |
| |
These securities represent 27.3% of the total net assets of the Fund. | | | | |
Bond quality ratings are obtained from Moody’s Investors Service, Inc. (“Moody’s”) and Standard & Poor’s Ratings Services (“S&P”). Ratings from S&P, when
used, are converted into their equivalent Moody’s ratings. If Moody’s and S&P have assigned different ratings to a security, the lowest rating for the security is
used. Not rated may include cash. Investments in derivatives and short-term investments are not reflected in the table.
Quoted Bond Quality Ratings Distributions, Major Market Sectors and Top 10 Holdings are subject to change.
The lists of Major Market Sectors and Top 10 Holdings exclude short-term investments and collateral held for securities loaned.
Bond Quality Ratings Distributions exclude collateral held for securities loaned.
Average Annual Total Returns1
As of October 31, 2018
| | | | | | | | | | | | |
| Class A2 | | 1-Year | | | 5 Years | | | 10 Years | |
without sales charge | | | 0.31 | % | | | 2.91 | % | | | 5.37 | % |
with sales charge | | | -4.25 | % | | | 1.96 | % | | | 4.89 | % |
| | | |
| Class S | | 1-Year | | | 5 Years | | | 10 Years | |
Net Asset Value | | | 0.55 | % | | | 3.15 | % | | | 5.67 | % |
Value of a $10,000 Investment
Class A Shares *,1,(a )
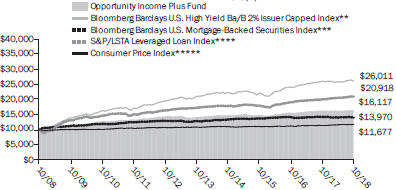
| | Past performance is not an indication of future results. The prospectus contains more complete information on the investment objectives, risks, charges and expenses of the investment company, which investors should read and consider carefully before investing. To obtain a prospectus, contact a registered representative or visit ThriventFunds.com. Total investment return and principal value of your investment will fluctuate, and your shares, when redeemed, may be worth more or less than their original cost. Current performance may be higher or lower than the performance data quoted. Call 800-847-4836 or visit ThriventFunds.com for performance results current to the most recent month-end. |
| 1 | Average annual total returns represent past performance and reflect changes in share prices, the reinvestment of all dividends and capital gains, and the effects of compounding. Periods of less than one year are not annualized. At various times, the Fund’s adviser may have waived its management fee and/ or reimbursed Fund expenses, without which the Fund’s total returns would have been lower. The returns shown do not reflect taxes a shareholder would pay on distributions or redemptions. Unless otherwise noted, the Index results shown do not reflect deductions for fees, expenses, or taxes. Index results shown reflect reinvestment of dividends. It is not possible to invest directly in an Index. |
| 2 | Class A performance with sales charge reflects the maximum sales charge of 4.5%. |
| (a) | Performance of other classes will be greater or less than the line shown based on the differences in loads and fees paid by shareholders investing in the different classes. |
| * | As you compare performance, please note that the Fund’s performance reflects the maximum 4.5% sales charge, while the benchmark indices do not reflect any such charges, deductions for fees, expenses or taxes. If you were to purchase any of the above individual securities represented in those indices, any charges you would pay would reduce your total return as well. |
| ** | The Bloomberg Barclays U.S. High-Yield Ba/B 2% Issuer Capped Index covers the USD denominated, non-investment grade, Ba or B rated, fixed-rate, taxable corporate bond market. The Index limits issuer exposures to a maximum 2%, redistributing excess market value index-wide on a pro-rata basis. |
| *** | The Bloomberg Barclays U.S. Mortgage-Backed Securities Index (MBS) is formed by grouping the universe of over 600,000 individual fixed-rate U.S. government agency MBS pools into approximately 3,500 generic types of securities. |
| **** | The S&P/LSTA U.S. Leveraged Loan Index is a market-value weighted index representing the performance of the universe of U.S. dollar-denominated, senior secured, syndicated term loans. |
| ***** | The Consumer Price Index is an inflationary indicator that measures the change in the cost of a fixed basket of products and services, including housing, electricity, food and transportation. |
41
THRIVENT PARTNER EMERGING MARKETS EQUITY FUND

Managed by Thrivent Asset Management, LLC and subadvised by Aberdeen Asset Managers Limited
The Fund seeks long-term capital growth.
Investment in the Thrivent Partner Emerging Markets Equity Fund involves risks including emerging markets, equity security, financial sector, foreign currency, foreign securities, investment adviser, issuer, large cap, market, mid cap, preferred securities and small cap risks. A detailed description of each risk can be found in the significant risks section of the accompanying notes to financial statements.
How did the Fund perform during the 12-month period ended October 31, 2018?
Thrivent Partner Emerging Markets Equity Fund earned a return of -15.71%, compared with the median return of its peer group, the Lipper Emerging Markets Funds category, of -14.09%. The Fund’s market benchmark, the MSCI Emerging Markets Index– USD Net Returns, earned a return of -12.52%.
What factors affected the Fund’s performance?
A large bulk of the Fund’s underperformance came from Brazil, which saw its currency tumble on the back of election jitters and fiscal concerns, before staging a solid recovery in October following right-wing Jair Bolsonaro’s presidential victory. While our relatively large exposure aided performance, further gains were capped by negative stock selection in Brazilian companies. For example, fuel distributor Ultrapar sold off based on expectations of weaker quarterly profits amid intensifying competition. Meanwhile, food producer BRF was hampered by weak earnings, leadership uncertainty and ongoing investigations into the alleged provision of substandard meat. However, we were heartened by the new CEO’s appointment at BRF, which should bring much-needed leadership to steer the company forward. On the positive side, mining company Vale remained a bright spot with consistently good results, owing to higher iron ore prices.
In EMEA (Europe, Middle East and Africa), an underweighting to Russia hampered performance because the market was buoyed by firming energy prices. The negative impact was compounded by our lack of exposure to several state-owned oil companies, such as Gazprom and Novatek. We prefer to hold Lukoil for its integrated business model, strategic consistency and focus on cash generation and shareholder returns. For food retailer Magnit, shares were pressured by a weak retail environment, while its extended store-refurbishment program dented like-for-like sales. Investors were additionally caught off guard by the resignation of founder and CEO Sergey Galitsky and the subsequent sale of most of his stake. Elsewhere, our position in Turkey proved costly due to the sharp lira depreciation and worries about the central bank’s unorthodox economic policies.
Mexico mitigated some of the underperformance where our positions in Asur and Banorte rebounded based on improving economic conditions and easing political uncertainty. In Hong Kong, insurer AIA fared well on the back of healthy results, while China Resources Land was buoyed by steady returns from its portfolio of investment properties. In India, Tata Consultancy Services bucked the general downtrend, thanks to improving demand for IT services, its capital management efforts and rupee weakness that amplified the company’s foreign-denominated revenues. Our preference for companies that benefit from rural consumption also added to performance, with Hindustan Unilever advancing on good results and better demand.
Meanwhile, an underweighting to technology companies proved beneficial because the sector succumbed to bouts of sell offs during a volatile period. Our lack of exposure to Taiwanese chipmaker Hon Hai Precision and Internet giant Alibaba aided performance; however, our holding Tencent detracted because it was pressured by a lower earnings forecast for its gaming segment and stricter regulations for online games.
What is your outlook?
The outlook for emerging markets remains cautious, given the contagion risks that could afflict the asset class and trigger further sell offs. While global trade relations improved in some areas, tensions between the U.S. and China persist, threatening to upend the integrated global supply chain. Tightening monetary conditions in major economies and the rising U.S. dollar, coupled with domestic political developments, could add to the uncertainty. Nevertheless, recovery across markets is expected as central banks tread lightly to keep inflation in check and ease currency pressures, while still supporting economic expansion. China’s shifting focus toward sustainable growth and recent loosening policies should bolster its ability to weather external shocks and avoid a hard landing. Meanwhile, rebounding domestic consumption remains a key driver for Brazil and India. Against this backdrop, corporate earnings appear resilient, with many of our holdings boasting healthier balance sheets and intact long-term drivers. Looking beyond the short-term volatility, we stay confident in our holdings’ potential, believing that their solid fundamentals will allow them to withstand future challenges and sustain their earnings momentum.
Quoted Fund performance is for Class A shares and does not reflect a sales charge.
The returns shown do not reflect taxes a shareholder would pay on distributions or redemptions.
42
| | | | |
Portfolio Composition | | | | |
(% of Portfolio) | | | | |
Common Stock | | | 93.2 | % |
Preferred Stock | | | 6.2 | % |
Short-Term Investments | | | 0.6 | % |
| | | | |
Total | | | 100.0 | % |
| | | | |
Major Market Sectors | | | | |
(% of Net Assets) | | | | |
Financials | | | 25.7 | % |
Information Technology | | | 19.8 | % |
Consumer Staples | | | 12.3 | % |
Consumer Discretionary | | | 12.3 | % |
Materials | | | 10.6 | % |
Communications Services | | | 5.4 | % |
Industrials | | | 4.8 | % |
Energy | | | 4.1 | % |
Real Estate | | | 3.6 | % |
Health Care | | | 0.9 | % |
| | | | |
Top 10 Countries | | | | |
(% of Net Assets) | | | | |
India | | | 13.9 | % |
Brazil | | | 12.5 | % |
China | | | 10.8 | % |
Cayman Islands | | | 10.8 | % |
South Korea | | | 9.3 | % |
Hong Kong | | | 6.2 | % |
Indonesia | | | 5.7 | % |
Mexico | | | 5.0 | % |
Taiwan | | | 4.8 | % |
Philippines | | | 3.6 | % |
Investments in securities in these countries represent 82.6% of the total net assets of the Fund. | | | | |
Quoted Portfolio Composition, Major Market Sectors and Top 10 Countries are subject to change.
The lists of Major Market Sectors and Top 10 Countries exclude short-term investments and collateral held for securities loaned.
The Portfolio Composition chart excludes collateral held for securities loaned.
Average Annual Total Returns1
As of October 31, 2018
| | | | | | | | | | | | |
| Class A2 | | 1-Year | | | 5 Years | | | From
Inception
8/31/2012 | |
without sales charge | | | -15.71 | % | | | -4.25 | % | | | -2.53 | % |
with sales charge | | | -19.47 | % | | | -5.13 | % | | | -3.26 | % |
| | | |
| Class S | | 1-Year | | | 5 Years | | | From
Inception
8/31/2012 | |
Net Asset Value | | | -15.39 | % | | | -3.92 | % | | | -2.21 | % |
Value of a $10,000 Investment
Class A Shares *,1,(a )
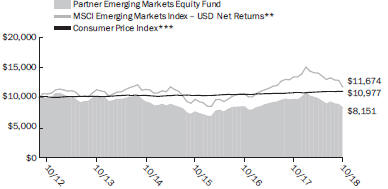
| | Past performance is not an indication of future results. The prospectus contains more complete information on the investment objectives, risks, charges and expenses of the investment company, which investors should read and consider carefully before investing. To obtain a prospectus, contact a registered representative or visit ThriventFunds.com. Total investment return and principal value of your investment will fluctuate, and your shares, when redeemed, may be worth more or less than their original cost. Current performance may be higher or lower than the performance data quoted. Call 800-847-4836 or visit ThriventFunds.com for performance results current to the most recent month-end. |
| 1 | Average annual total returns represent past performance and reflect changes in share prices, the reinvestment of all dividends and capital gains, and the effects of compounding. Periods of less than one year are not annualized. At various times, the Fund’s adviser may have waived its management fee and/ or reimbursed Fund expenses, without which the Fund’s total returns would have been lower. The returns shown do not reflect taxes a shareholder would pay on distributions or redemptions. Unless otherwise noted, the Index results shown do not reflect deductions for fees, expenses, or taxes. Index results shown reflect reinvestment of dividends. It is not possible to invest directly in an Index. |
| 2 | Class A performance with sales charge reflects the maximum sales charge of 4.5%. |
| (a) | Performance of other classes will be greater or less than the line shown based on the differences in loads and fees paid by shareholders investing in the different classes. |
| * | As you compare performance, please note that the Fund’s performance reflects the maximum 4.5% sales charge, while the benchmark indices do not reflect any such charges, deductions for fees, expenses or taxes. If you were to purchase any of the above individual securities represented in the Index, any charges you would pay would reduce your total return as well. |
| ** | The MSCI Emerging Markets Index - USD Net Returns is a modified capitalization-weighted index of selected emerging economies from around the world. The performance of the Index reflects dividends reinvested after the deduction of withholding taxes. |
| *** | The Consumer Price Index is an inflationary indicator that measures the change in the cost of a fixed basket of products and services, including housing, electricity, food and transportation. |
43
THRIVENT PARTNER WORLDWIDE ALLOCATION FUND

Managed by Thrivent Asset Management, LLC, and subadvised by Principal Global Investors, LLC, Aberdeen Asset Managers Limited and Goldman Sachs Asset Management, L.P.
The Fund seeks long-term capital growth.
Investment in Thrivent Partner Worldwide Allocation Fund involves risks including allocation, credit, emerging markets, equity security, foreign currency, foreign securities, growth investing, high yield, interest rate, investment adviser, issuer, large cap, liquidity, market, mid cap, multi-manager, small cap, sovereign debt, and value investing risks. A detailed description of each risk can be found in the significant risks section of the accompanying notes to financial statements.
How did the Fund perform during the 12-month period ended October 31, 2018?
Thrivent Partner Worldwide Allocation Fund earned a return of -10.52%, compared with the median return of its peer group, the Lipper International Multi-Cap Core Funds category, of -8.46%. The Fund’s market benchmark, the MSCI All Country World Index ex-USA–USD Net Returns, earned a return of -8.24%.
What factors affected the Fund’s performance?
Three portfolios within Thrivent Partner Worldwide Allocation Fund—emerging market debt, emerging market equities and international large-cap growth—accounted for its significant underperformance during the reporting period. The majority of the Fund’s underperformance relative to its peers and benchmark resulted from its heavy exposure to emerging market sovereign debt, particularly of Mexico, Argentina and South Africa. Mexico’s economy slowed while debt has increased, which made investors nervous about the country’s debt ratings. Argentina continues to suffer from a post-bubble economic implosion and currency crisis that has exceeded expectations in terms of its depth and duration. South Africa has dipped into a recession while its currency recently reached record lows. The emerging market equity portfolio was also a drag on the Fund’s relative performance, especially its exposures in technology and consumer staples. In technology, a large position in Chinese Internet and artificial intelligence conglomerate Tencent was a meaningful underperformer. Higher multiple stocks like Tencent were disproportionately punished by a market concerned about slowing economic growth. In consumer staples, struggling Russian food retailer Magnit saw its founding CEO sell his stake in the company, while Brazilian food company BRF struggled with costs and margins as the country’s economy slowed. The Fund’s international large-cap growth portfolio detracted from relative performance due to poor security selection in health care, consumer staples and energy, which overwhelmed favorable results in financials. Finally, the Fund’s international small-cap portfolio slightly underperformed because the positive contributions from its highly diversified exposures in technology and real estate failed to offset negative contributions from industrial and consumer staples holdings.
International large-cap value provided a positive contribution to the Fund’s overall performance due to strong security selection in technology, materials and real estate that more than offset weakness in financials. Although international large-cap value represents the largest weighting in Thrivent Partner Worldwide Allocation Fund, the portfolio’s outperformance was too marginal to significantly alter the Fund’s disappointing overall results.
What is your outlook?
We believe current conditions favor investments with low-volatility and high-quality characteristics, all else being equal, as well as improving earnings outlooks. The outlook for emerging markets remains cautious, given the contagion risks that could affect the asset class and trigger further sell offs. While global trade relations improved in some areas, tensions between the U.S. and China persist and are threatening to upend the integrated global supply chain. Tightening monetary conditions in major economies and the rising U.S. dollar, coupled with domestic political developments, could add to the uncertainty. Nevertheless, recovery across markets is expected to steady as central banks tread lightly to keep inflation in check and ease currency pressures, while still supporting economic expansion. China’s shifting focus toward sustainable growth and recent loosening policies should bolster its ability to weather external shocks and avoid a hard landing. Also, signs of stabilization in China and emerging markets would likely be a catalyst for developed markets outside the U.S., especially Europe, because these markets have been more negatively impacted by tariffs and slowing trade due to their greater reliance on exports for economic growth and corporate profitability. As a result, developed markets outside the U.S. are trading at deeper discounts, so improvement on these fronts could unlock significant value and spark a sharp reversal in relative performance versus the U.S. market. In the meantime, a surging dollar and geopolitical tensions warrant a more conservative positioning for the Fund that emphasizes liquidity and flexibility.
Quoted Fund performance is for Class A shares and does not reflect a sales charge.
The returns shown do not reflect taxes a shareholder would pay on distributions or redemptions.
44
| | | | |
| Portfolio Composition | | | | |
| (% of Portfolio) | | | | |
Common Stock | | | 86.9 | % |
Long-Term Fixed Income | | | 9.1 | % |
Short-Term Investments | | | 3.1 | % |
Preferred Stock | | | 0.9 | % |
| | | | |
Total | | | 100.0 | % |
| | | | |
| Major Market Sectors | | | | |
| (% of Net Assets) | | | | |
Financials | | | 15.5 | % |
Consumer Discretionary | | | 12.9 | % |
Industrials | | | 11.4 | % |
Consumer Staples | | | 9.5 | % |
Information Technology | | | 9.2 | % |
Health Care | | | 8.7 | % |
Materials | | | 8.5 | % |
Foreign Government | | | 6.3 | % |
Energy | | | 5.4 | % |
Communications Services | | | 3.8 | % |
| | | | |
Top 10 Countries | | | | |
(% of Net Assets) | | | | |
Japan | | | 19.8 | % |
United Kingdom | | | 12.9 | % |
Switzerland | | | 5.8 | % |
France | | | 5.0 | % |
Australia | | | 4.8 | % |
Germany | | | 4.3 | % |
Netherlands | | | 3.1 | % |
Spain | | | 2.7 | % |
Sweden | | | 2.6 | % |
Canada | | | 2.1 | % |
| |
Investments in securities in these countries represent 63.1% of the total net assets of the Fund. | | | | |
Quoted Portfolio Composition, Major Market Sectors and Top 10 Countries are subject to change.
The lists of Major Market Sectors and Top 10 Countries exclude short-term investments and collateral held for securities loaned.
The Portfolio Composition chart excludes collateral held for securities loaned.
Average Annual Total Returns1
As of October 31, 2018
| | | | | | | | | | | | |
| Class A2 | | 1-Year | | | 5 Years | | | 10 Years | |
without sales charge | | | -10.52 | % | | | 1.22 | % | | | 6.79 | % |
with sales charge | | | -14.52 | % | | | 0.30 | % | | | 6.30 | % |
| | | |
| Class S | | 1-Year | | | 5 Years | | | 10 Years | |
Net Asset Value | | | -10.13 | % | | | 1.64 | % | | | 7.20 | % |
Value of a $10,000 Investment
Class A Shares *,1,(a )

| | Past performance is not an indication of future results. The prospectus contains more complete information on the investment objectives, risks, charges and expenses of the investment company, which investors should read and consider carefully before investing. To obtain a prospectus, contact a registered representative or visit ThriventFunds.com. Total investment return and principal value of your investment will fluctuate, and your shares, when redeemed, may be worth more or less than their original cost. Current performance may be higher or lower than the performance data quoted. Call 800-847-4836 or visit ThriventFunds.com for performance results current to the most recent month-end. |
| 1 | Average annual total returns represent past performance and reflect changes in share prices, the reinvestment of all dividends and capital gains, and the effects of compounding. Periods of less than one year are not annualized. At various times, the Fund’s adviser may have waived its management fee and/ or reimbursed Fund expenses, without which the Fund’s total returns would have been lower. The returns shown do not reflect taxes a shareholder would pay on distributions or redemptions. Unless otherwise noted, the Index results shown do not reflect deductions for fees, expenses, or taxes. Index results shown reflect reinvestment of dividends. It is not possible to invest directly in an Index. |
| 2 | Class A performance with sales charge reflects the maximum sales charge of 4.5%. |
| (a) | Performance of other classes will be greater or less than the line shown based on the differences in loads and fees paid by shareholders investing in the different classes. |
| * | As you compare performance, please note that the Fund’s performance reflects the maximum 4.5% sales charge, while the benchmark indices do not reflect any such charges, deductions for fees, expenses or taxes. If you were to purchase any of the above individual securities represented in the Index, any charges you would pay would reduce your total return as well. |
| ** | The MSCI All Country World Index ex-USA- USD Net Returns is an unmanaged market capitalization-weighted index that is designed to represent the performance of developed and emerging stock markets throughout the world. The performance of the Index reflects dividends reinvested after the deduction of withholding taxes. |
| *** | The Consumer Price Index is an inflationary indicator that measures the change in the cost of a fixed basket of products and services, including housing, electricity, food and transportation. |
45
THRIVENT SMALL CAP GROWTH FUND
David J. Lettenberger, CFA, Portfolio Manager
The Fund seeks long-term capital growth. The Fund’s investment objective may be changed without shareholder approval. Investment in Thrivent Small Cap Growth Fund involves risks including equity security, investment adviser, issuer, market, small cap, and technology-oriented companies risks. A detailed description of each risk can be found in the significant risks section of the accompanying notes to financial statements.
How did the Fund perform during the since-inception period from February 28, 2018, through October 31, 2018?
Thrivent Small Cap Growth Fund earned a return of 5.70%, compared with the median return of its peer group, the Lipper Small Cap Growth Core Funds category, of 20.60%. The Fund’s market benchmark, the S&P SmallCap 600® Growth Index, earned a return of 19.40%.
What factors affected the Fund’s performance?
Our investment process is focused on individual stock selection, which is the main driver of the Fund’s relative performance. While this was clearly the case since inception, the Fund’s results were also influenced by some noteworthy industry exposures. For example, the most notable drag on performance versus the benchmark was stock selection and a significant underweighting in the biotechnology segment of health care. The small-cap biotechnology industry is difficult to analyze and invest in because most of the companies do not generate revenues. Instead, their share price performance is often pinned to the results of a clinical trial or a Food and Drug Administration (FDA) review, which is why we typically maintain a large underweight to the segment. Two of the biotechnology names we did own, Intersect ENT and OptiNose, underperformed during the period after their product launches fell short of expectations. That said, ongoing innovation in other areas of the health care industry provided ample opportunities for new investment ideas in small-cap growth. For example, as a partial offset to the poor performance from biotechnology, the Fund benefited from its sizeable exposure to medical device companies, including Inogen, Tactile Systems Technology and Abiomed.
A significant underweighting to real estate investment trusts (REITs) also detracted from the Fund’s relative results because that sector outperformed the broader market during the abbreviated reporting period. In addition, performance was hindered by our underweighted position and poor stock selection in the consumer staples sector. Shares of e.l.f. Beauty were pressured after growth fell short of expectations.
On the other hand, we have over weighted the retail industry since the Fund’s inception and several of these holdings were key contributors to performance. The Fund experienced strong results from Burlington Stores, Duluth Holdings and Five Below, which we invested in because we believed each company had a unique, specific growth opportunity. Our bottom-up stock selection process also led to an over weighted position in the aerospace and defense group where we saw strong returns from HEICO, Aerojet Rocketdyne Holdings and Mercury Systems. While aerospace and defense on the surface may seem more cyclical than growthy, we found pockets of secular growth within this space. For example, Mercury Systems, which provides components, modules and integrated subsystems to the defense industry, benefited from the secular, sustainable trend of the large tier-one defense contractors outsourcing some of the building blocks of their systems. Other individual stocks that contributed favorably to the Fund’s performance included Core-Mark Holding, Wingstop and Vail Resorts in the consumer discretionary sector, TPI Composites in the industrial sector and Nine Energy Service in the energy sector.
The Fund’s largest sector overweighting was in technology because of the tremendous innovation that is driving rapid growth for many companies in this space. Nowhere was this more apparent than in the software space, which is going through transformations both in product delivery (on premise to cloud) and in business model (legacy sales model to subscription model). The Fund had significant exposure to the software industry where results from stock selection were mixed. Strong returns in New Relic, Q2 Holdings and SailPoint Technologies were partially offset by the decline in shares of Proofpoint.
What is your outlook?
Small-cap growth has been one of the strongest-performing segments of the domestic equity market for most of 2018, in part because investors perceived that domestic growth companies would be more insulated from escalating trade war rhetoric and actions. This has led to elevated valuations in some industry groups such as software and medical devices. Nevertheless, innovation and secular drivers will continue to provide ample investment opportunities for small-cap growth investors.
The returns shown do not reflect taxes a shareholder would pay on distributions or redemptions.
46
| | | | |
| Portfolio Composition | | | | |
| (% of Portfolio) | | | | |
Common Stock | | | 94.9 | % |
Short-Term Investments | | | 3.1 | % |
Registered Investment Companies | | | 2.0 | % |
| | | | |
Total | | | 100.0 | % |
| | | | |
| Major Market Sectors | | | | |
| (% of Net Assets) | | | | |
Information Technology | | | 27.8 | % |
Health Care | | | 19.5 | % |
Industrials | | | 15.7 | % |
Consumer Discretionary | | | 15.4 | % |
Financials | | | 10.5 | % |
Energy | | | 2.8 | % |
Equity Funds/ETFs | | | 2.0 | % |
Consumer Staples | | | 1.6 | % |
Communications Services | | | 0.7 | % |
Real Estate | | | 0.3 | % |
| | | | |
| Top 10 Holdings | | | | |
| (% of Net Assets) | | | | |
Monolithic Power Systems, Inc. | | | 2.9 | % |
Tactile Systems Technology, Inc. | | | 2.7 | % |
Proofpoint, Inc. | | | 2.5 | % |
New Relic, Inc. | | | 2.2 | % |
Dolby Laboratories, Inc. | | | 2.2 | % |
Burlington Stores, Inc. | | | 1.9 | % |
Q2 Holdings, Inc. | | | 1.9 | % |
Blackline, Inc. | | | 1.9 | % |
Guidewire Software, Inc. | | | 1.8 | % |
Heico Corporation | | | 1.7 | % |
| |
These securities represent 21.7% of the total net assets of the Fund. | | | | |
Quoted Major Market Sectors, Portfolio Composition and Top 10 Holdings are subject to change.
The lists of Major Market Sectors and Top 10 Holdings exclude short-term investments and collateral held for securities loaned.
The Portfolio Composition chart excludes collateral held for securities loaned.
Average Annual Total Returns1
As of October 31, 2018
| | |
| Class S | | From Inception 2/28/2018 |
Net Asset Value | | 5.70% |
Value of a $10,000 Investment
Class A Shares 1
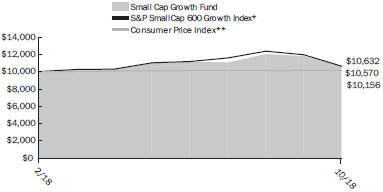
| | Past performance is not an indication of future results. The prospectus contains more complete information on the investment objectives, risks, charges and expenses of the investment company, which investors should read and consider carefully before investing. To obtain a prospectus, contact a registered representative or visit ThriventFunds.com. Total investment return and principal value of your investment will fluctuate, and your shares, when redeemed, may be worth more or less than their original cost. Current performance may be higher or lower than the performance data quoted. Call 800-847-4836 or visit ThriventFunds.com for performance results current to the most recent month-end. |
| 1 | Average annual total returns represent past performance and reflect changes in share prices, the reinvestment of all dividends and capital gains, and the effects of compounding. Periods of less than one year are not annualized. At various times, the Fund’s adviser may have waived its management fee and/ or reimbursed Fund expenses, without which the Fund’s total returns would have been lower. The returns shown do not reflect taxes a shareholder would pay on distributions or redemptions. Unless otherwise noted, the Index results shown do not reflect deductions for fees, expenses, or taxes. Index results shown reflect reinvestment of dividends. It is not possible to invest directly in an Index. |
| * | S&P SmallCap 600 Growth Index measures growth stocks through: sales growth, ratio of earnings to change in price, and momentum. The constituents are drawn from the S&P 600. |
| ** | The Consumer Price Index is an inflationary indicator that measures the change in the cost of a fixed basket of products and services, including housing, electricity, food and transportation. |
47
THRIVENT SMALL CAP STOCK FUND
Matthew D. Finn, CFA, and James M. Tinucci, CFA, Portfolio Co-Managers
The Fund seeks long-term capital growth.
Investment in Thrivent Small Cap Stock Fund involves risks including equity security, investment adviser, issuer, market, and small cap risks. A detailed description of each risk can be found in the significant risks section of the accompanying notes to financial statements.
How did the Fund perform during the 12-month period ended October 31, 2018?
Thrivent Small Cap Stock Fund earned a return of 4.48%, compared with the median return of its peer group, the Lipper Small Cap Core Funds category, of 0.27%. The Fund’s market benchmark, the S&P SmallCap 600® Index, earned a return of 5.60%.
What factors affected the Fund’s performance?
The Fund outperformed versus the Lipper Small Cap Core Funds category due to stock selection, while the impact from sector selection was relatively neutral. Compared to the peer group, security selection was strong in nine of the 11 sectors led by technology and financials, while only two sectors detracted—consumer staples and utilities. In technology, standout performers included systems software company SailPoint Technologies and communications equipment company Arista Networks. SailPoint Technologies is the market leader in developing enterprise identity governance software that empowers customers to efficiently and securely govern the digital identities of employees, contractors, business partners and other users, and manage their constantly changing access rights to enterprise applications and data. Arista Networks competes with Cisco Systems and other data center switch and router companies. The company’s advantages are that its switches contain computer chips and software that can be programmed by the customer, and its products are cheaper and faster. As Internet titans have emerged, they have developed very application-specific data centers (e.g., search, eCommerce, web hosting). Therefore, the customization feature offered by Arista Networks has enabled the company to gain market share. In financials, Infinity Property and Casualty, a low-cost provider of nonstandard auto insurance, outperformed after it was taken over by Kemper during the year. Additionally, shares of Hamilton Lane, a global private markets investment solutions provider, advanced strongly during the year. The company’s advantage relative to public investment managers is that its fees are based primarily on invested capital, which significantly reduces revenue volatility. All these companies are still held in the portfolio; however, we have reduced some position sizes to help manage portfolio risk.
The Fund’s sector weightings result from our security selection based on bottom-up industry and company research. Financials remained the largest overweighting in the portfolio, while the health care sector increased in weight because our holdings outperformed and we added a few positions during the year. Also, during the period, S&P Dow Jones changed the way it classifies certain industries within the Global Industry Classification Standard (GICS®) and, as a result, weights in certain sectors shifted slightly. At period end, the Fund was no longer underweighted in consumer discretionary, but was underweighted in technology and the newly added communication services sector. The Fund continued to be underweighted in the real estate investment trust (REIT) and material sectors because it was difficult for us to find our favored combination of valuation, quality and a promising future in these areas. The Fund’s performance benefited from our underweighted positions because REITs and materials were two of the weaker sectors of the market during the year.
The Fund underperformed versus the S&P SmallCap 600® Index because of both sector allocation and stock selection, mainly in the health care and industrial sectors. The Fund was underweighted in the health care sector and did not own a few companies that represent large weights in the index that significantly outperformed. Additionally, in the industrials sector, the Fund held positions in two agricultural companies that are not in the index, Valmont Industries and AGCO, which detracted from performance.
What is your outlook?
Valuations in many areas of the market are extended. Companies continue to benefit from a global synchronized economic expansion, and it has become more difficult to find undervalued companies. Energy and consumer staples have been areas of increasing weights in the portfolio. The U.S. economy is clearly late in its cycle, with the Federal Reserve accelerating the pace of interest rate increases and lower corporate tax rates. However, given the still relatively low level of short-term interest rates, it is unclear how soon rate increases will affect the economy.
Quoted Fund performance is for Class A shares and does not reflect a sales charge.
The returns shown do not reflect taxes a shareholder would pay on distributions or redemptions.
48
| | | | |
Portfolio Composition | | | | |
(% of Portfolio) | | | | |
Common Stock | | | 97.0 | % |
Registered Investment Companies | | | 2.2 | % |
Short-Term Investments | | | 0.8 | % |
| | | | |
Total | | | 100.0 | % |
| | | | |
Major Market Sectors | | | | |
(% of Net Assets) | | | | |
Financials | | | 22.4 | % |
Industrials | | | 17.5 | % |
Information Technology | | | 14.3 | % |
Health Care | | | 13.2 | % |
Consumer Discretionary | | | 10.1 | % |
Consumer Staples | | | 6.5 | % |
Energy | | | 4.3 | % |
Materials | | | 4.0 | % |
Real Estate | | | 2.4 | % |
Utilities | | | 2.4 | % |
| | | | |
Top 10 Holdings | | | | |
(% of Net Assets) | | | | |
Children’s Place, Inc. | | | 2.5 | % |
Omnicell, Inc. | | | 2.2 | % |
Dolby Laboratories, Inc. | | | 2.2 | % |
Virtusa Corporation | | | 1.8 | % |
Assured Guaranty, Ltd. | | | 1.7 | % |
MRC Global, Inc. | | | 1.7 | % |
Transocean, Ltd. | | | 1.6 | % |
Cott Corporation | | | 1.6 | % |
National Instruments Corporation | | | 1.6 | % |
Sensient Technologies Corporation | | | 1.6 | % |
| |
These securities represent 18.5% of the total net assets of the Fund. | | | | |
Quoted Portfolio Composition, Major Market Sectors and Top 10 Holdings are subject to change.
The lists of Major Market Sectors and Top 10 Holdings exclude short-term investments and collateral held for securities loaned.
The Portfolio Composition chart excludes collateral held for securities loaned.
Average Annual Total Returns1
As of October 31, 2018
| | | | | | | | | | | | |
| Class A2 | | 1-Year | | | 5 Years | | | 10 Years | |
without sales charge | | | 4.48 | % | | | 10.56 | % | | | 11.49 | % |
with sales charge | | | -0.20 | % | | | 9.55 | % | | | 10.97 | % |
| | | |
| Class S | | 1-Year | | | 5 Years | | | 10 Years | |
Net Asset Value | | | 4.75 | % | | | 11.01 | % | | | 12.07 | % |
Value of a $10,000 Investment
Class A Shares *,1,(a )
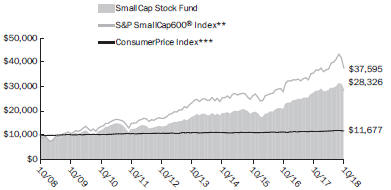
| | Past performance is not an indication of future results. The prospectus contains more complete information on the investment objectives, risks, charges and expenses of the investment company, which investors should read and consider carefully before investing. To obtain a prospectus, contact a registered representative or visit ThriventFunds.com. Total investment return and principal value of your investment will fluctuate, and your shares, when redeemed, may be worth more or less than their original cost. Current performance may be higher or lower than the performance data quoted. Call 800-847-4836 or visit ThriventFunds.com for performance results current to the most recent month-end. |
| 1 | Average annual total returns represent past performance and reflect changes in share prices, the reinvestment of all dividends and capital gains, and the effects of compounding. Periods of less than one year are not annualized. At various times, the Fund’s adviser may have waived its management fee and/ or reimbursed Fund expenses, without which the Fund’s total returns would have been lower. The returns shown do not reflect taxes a shareholder would pay on distributions or redemptions. Unless otherwise noted, the Index results shown do not reflect deductions for fees, expenses, or taxes. Index results shown reflect reinvestment of dividends. It is not possible to invest directly in an Index. |
| 2 | Class A performance with sales charge reflects the maximum sales charge of 4.5%. |
| (a) | Performance of other classes will be greater or less than the line shown based on the differences in loads and fees paid by shareholders investing in the different classes. |
| * | As you compare performance, please note that the Fund’s performance reflects the maximum 4.5% sales charge, while the benchmark indices do not reflect any such charges, deductions for fees, expenses or taxes. If you were to purchase any of the above individual securities represented in the Index, any charges you would pay would reduce your total return as well. |
| ** | The S&P SmallCap 600® Index represents the average performance of a group of 600 small capitalization stocks. |
| *** | The Consumer Price Index is an inflationary indicator that measures the change in the cost of a fixed basket of products and services, including housing, electricity, food and transportation. |
49
SHAREHOLDER EXPENSE EXAMPLE
(unaudited)
As a shareholder of a Fund, you incur, depending on the Fund and share class, two types of costs: (1) transaction costs, including sales charges (loads) on purchase payments; and (2) ongoing costs, including management fees, distribution (12b-1) fees and other Fund expenses. This Example is intended to help you understand your ongoing costs (in dollars) of investing in your Fund and to compare these costs with the ongoing costs of investing in other mutual funds. The Example is based on an investment of $1,000 invested at the beginning of the period and held for the entire period from May 1, 2018 through October 31, 2018.
Actual Expenses
In the table below, the first section, labeled “Actual,” provides information about actual account values and actual expenses. You may use the information in this section, together with the amount you invested, to estimate the expenses that you paid over the period. Simply divide your account value by $1,000 (for example, an $8,600 account value divided by $1,000 = 8.6), then multiply the result by the number from the appropriate Class line under the heading entitled “Expenses Paid During Period” to estimate the expenses you paid. A small account fee of $12 may be charged to Class A shareholder accounts if the value falls to an amount of $2,000 or less, in the case of a non-qualified account, and $1,000 or less, in the case of a qualified account. This fee is not included in the table below. If it were and you were assessed such a fee, the expenses you paid during the period would have been higher and the ending account value would have been lower.
Hypothetical Example for Comparison Purposes
In the table below, the second section, labeled “Hypothetical,” provides information about hypothetical account values and hypothetical expenses based on the Fund’s actual expense ratio and an assumed rate of return of 5% per year before expenses, which is not the Fund’s actual return. The hypothetical account values and expenses may not be used to estimate the actual ending account balance or expenses you paid for the period. You may use this information to compare the ongoing costs of investing in the Fund and other funds. To do so, compare this 5% hypothetical example with the 5% hypothetical examples that appear in the shareholder reports of the other funds. A small account fee of $12 may be charged to Class A shareholder accounts if the value falls to an amount of $2,000 or less, in the case of a non-qualified account, and $1,000 or less, in the case of a qualified account. This fee is not included in the table below. If it were and you were assessed such a fee, the expenses you paid during the period would have been higher and the ending account value would have been lower.
Please note that the expenses shown in the table are meant to highlight your ongoing costs only and do not reflect any transactional costs, such as sales charges (loads). Therefore, the second section of the table is useful in comparing ongoing costs only, and will not help you determine the relative total costs of owning different funds. In addition, if these transactional costs were included, your costs would have been higher.
| | | | | | | | | | | | | | | | |
| | | Beginning Account
Value 5/1/2018 | | | Ending Account Value
10/31/2018 | | | Expenses Paid During
Period 5/1/2018-
10/31/2018* | | | Annualized Expense
Ratio | |
Thrivent Aggressive Allocation Fund | | | | | | | | | | | | | |
| | | | |
Actual | | | | | | | | | | | | | | | | |
Class A | | | $1,000 | | | | $987 | | | | $4.55 | | | | 0.91% | |
Class S | | | $1,000 | | | | $988 | | | | $3.32 | | | | 0.66% | |
| | | | |
Hypothetical** | | | | | | | | | | | | | | | | |
Class A | | | $1,000 | | | | $1,021 | | | | $4.62 | | | | 0.91% | |
Class S | | | $1,000 | | | | $1,022 | | | | $3.38 | | | | 0.66% | |
Thrivent Balanced Income Plus Fund | | | | | | | | | | | | | |
| | | | |
Actual | | | | | | | | | | | | | | | | |
Class A | | | $1,000 | | | | $989 | | | | $5.09 | | | | 1.01% | |
Class S | | | $1,000 | | | | $991 | | | | $3.56 | | | | 0.71% | |
| | | | |
Hypothetical** | | | | | | | | | | | | | | | | |
Class A | | | $1,000 | | | | $1,020 | | | | $5.16 | | | | 1.01% | |
Class S | | | $1,000 | | | | $1,022 | | | | $3.61 | | | | 0.71% | |
Thrivent Government Bond Fund | | | | | | | | | | | | | |
| | | | |
Actual | | | | | | | | | | | | | | | | |
Class A | | | $1,000 | | | | $996 | | | | $4.28 | | | | 0.85% | |
Class S | | | $1,000 | | | | $996 | | | | $3.77 | | | | 0.75% | |
| | | | |
Hypothetical** | | | | | | | | | | | | | | | | |
Class A | | | $1,000 | | | | $1,021 | | | | $4.33 | | | | 0.85% | |
Class S | | | $1,000 | | | | $1,021 | | | | $3.82 | | | | 0.75% | |
50
| | | | | | | | | | | | | | | | |
| | | Beginning Account
Value 5/1/2018 | | | Ending Account Value
10/31/2018 | | | Expenses Paid During
Period 5/1/2018-
10/31/2018* | | | Annualized Expense
Ratio | |
Thrivent High Income Municipal Bond Fund | | | | | | | | | | | | | | | | |
| | | | |
Actual | | | | | | | | | | | | | | | | |
Class S | | | $1,000 | | | | $1,001 | | | | $1.85 | | | | 0.37% | |
| | | | |
Hypothetical** | | | | | | | | | | | | | | | | |
Class S | | | $1,000 | | | | $1,023 | | | | $1.87 | | | | 0.37% | |
Thrivent High Yield Fund | | | | | | | | | | | | | | | | |
| | | | |
Actual | | | | | | | | | | | | | | | | |
Class A | | | $1,000 | | | | $1,003 | | | | $4.03 | | | | 0.80% | |
Class S | | | $1,000 | | | | $1,005 | | | | $2.93 | | | | 0.58% | |
| | | | |
Hypothetical** | | | | | | | | | | | | | | | | |
Class A | | | $1,000 | | | | $1,021 | | | | $4.07 | | | | 0.80% | |
Class S | | | $1,000 | | | | $1,022 | | | | $2.95 | | | | 0.58% | |
Thrivent Income Fund | | | | | | | | | | | | | | | | |
| | | | |
Actual | | | | | | | | | | | | | | | | |
Class A | | | $1,000 | | | | $995 | | | | $3.83 | | | | 0.76% | |
Class S | | | $1,000 | | | | $998 | | | | $2.29 | | | | 0.45% | |
| | | | |
Hypothetical** | | | | | | | | | | | | | | | | |
Class A | | | $1,000 | | | | $1,021 | | | | $3.88 | | | | 0.76% | |
Class S | | | $1,000 | | | | $1,023 | | | | $2.32 | | | | 0.45% | |
Thrivent Large Cap Growth Fund | | | | | | | | | | | | | | | | |
| | | | |
Actual | | | | | | | | | | | | | | | | |
Class A | | | $1,000 | | | | $1,035 | | | | $5.90 | | | | 1.15% | |
Class S | | | $1,000 | | | | $1,036 | | | | $4.15 | | | | 0.81% | |
| | | | |
Hypothetical** | | | | | | | | | | | | | | | | |
Class A | | | $1,000 | | | | $1,019 | | | | $5.85 | | | | 1.15% | |
Class S | | | $1,000 | | | | $1,021 | | | | $4.12 | | | | 0.81% | |
Thrivent Large Cap Stock Fund | | | | | | | | | | | | | | | | |
| | | | |
Actual | | | | | | | | | | | | | | | | |
Class A | | | $1,000 | | | | $959 | | | | $4.84 | | | | 0.98% | |
Class S | | | $1,000 | | | | $961 | | | | $3.15 | | | | 0.64% | |
| | | | |
Hypothetical** | | | | | | | | | | | | | | | | |
Class A | | | $1,000 | | | | $1,020 | | | | $4.99 | | | | 0.98% | |
Class S | | | $1,000 | | | | $1,022 | | | | $3.25 | | | | 0.64% | |
Thrivent Large Cap Value Fund | | | | | | | | | | | | | | | | |
| | | | |
Actual | | | | | | | | | | | | | | | | |
Class A | | | $1,000 | | | | $1,011 | | | | $4.49 | | | | 0.89% | |
Class S | | | $1,000 | | | | $1,013 | | | | $2.68 | | | | 0.53% | |
| | | | |
Hypothetical** | | | | | | | | | | | | | | | | |
Class A | | | $1,000 | | | | $1,021 | | | | $4.52 | | | | 0.89% | |
Class S | | | $1,000 | | | | $1,023 | | | | $2.69 | | | | 0.53% | |
Thrivent Limited Maturity Bond Fund | | | | | | | | | | | | | | | | |
| | | | |
Actual | | | | | | | | | | | | | | | | |
Class A | | | $1,000 | | | | $1,007 | | | | $3.06 | | | | 0.61% | |
Class S | | | $1,000 | | | | $1,009 | | | | $2.11 | | | | 0.42% | |
| | | | |
Hypothetical** | | | | | | | | | | | | | | | | |
Class A | | | $1,000 | | | | $1,022 | | | | $3.09 | | | | 0.61% | |
Class S | | | $1,000 | | | | $1,023 | | | | $2.13 | | | | 0.42% | |
Thrivent Low Volatility Equity Fund | | | | | | | | | | | | | | | | |
Actual | | | | | | | | | | | | | | | | |
Class S | | | $1,000 | | | | $1,000 | | | | $6.05 | | | | 1.20% | |
| | | | |
Hypothetical** | | | | | | | | | | | | | | | | |
Class S | | | $1,000 | | | | $1,019 | | | | $6.11 | | | | 1.20% | |
51
| | | | | | | | | | | | | | | | |
| | | Beginning Account
Value 5/1/2018 | | | Ending Account Value
10/31/2018 | | | Expenses Paid During Period 5/1/2018-
10/31/2018* | | | Annualized Expense
Ratio | |
Thrivent Mid Cap Stock Fund | | | | | | | | | | | | | |
| | | | |
Actual | | | | | | | | | | | | | | | | |
Class A | | | $1,000 | | | | $991 | | | | $5.16 | | | | 1.03% | |
Class S | | | $1,000 | | | | $992 | | | | $3.72 | | | | 0.74% | |
| | | | |
Hypothetical** | | | | | | | | | | | | | | | | |
Class A | | | $1,000 | | | | $1,020 | | | | $5.24 | | | | 1.03% | |
Class S | | | $1,000 | | | | $1,021 | | | | $3.77 | | | | 0.74% | |
Thrivent Moderate Allocation Fund | | | | | | | | | | | | | |
| | | | |
Actual | | | | | | | | | | | | | | | | |
Class A | | | $1,000 | | | | $990 | | | | $3.93 | | | | 0.78% | |
Class S | | | $1,000 | | | | $991 | | | | $2.65 | | | | 0.53% | |
| | | | |
Hypothetical** | | | | | | | | | | | | | | | | |
Class A | | | $1,000 | | | | $1,021 | | | | $3.99 | | | | 0.78% | |
Class S | | | $1,000 | | | | $1,023 | | | | $2.69 | | | | 0.53% | |
Thrivent Moderately Aggressive Allocation Fund | | | | | | | | | | | | | |
| | | | |
Actual | | | | | | | | | | | | | | | | |
Class A | | | $1,000 | | | | $986 | | | | $4.00 | | | | 0.80% | |
Class S | | | $1,000 | | | | $987 | | | | $2.85 | | | | 0.57% | |
| | | | |
Hypothetical** | | | | | | | | | | | | | | | | |
Class A | | | $1,000 | | | | $1,021 | | | | $4.07 | | | | 0.80% | |
Class S | | | $1,000 | | | | $1,022 | | | | $2.90 | | | | 0.57% | |
Thrivent Moderately Conservative Allocation Fund | | | | | | | | | | | | | |
| | | | |
Actual | | | | | | | | | | | | | | | | |
Class A | | | $1,000 | | | | $993 | | | | $4.06 | | | | 0.81% | |
Class S | | | $1,000 | | | | $994 | | | | $2.75 | | | | 0.55% | |
| | | | |
Hypothetical** | | | | | | | | | | | | | | | | |
Class A | | | $1,000 | | | | $1,021 | | | | $4.12 | | | | 0.81% | |
Class S | | | $1,000 | | | | $1,022 | | | | $2.79 | | | | 0.55% | |
Thrivent Money Market Fund | | | | | | | | | | | | | |
| | | | |
Actual | | | | | | | | | | | | | | | | |
Class A | | | $1,000 | | | | $1,007 | | | | $2.87 | | | | 0.57% | |
Class S | | | $1,000 | | | | $1,008 | | | | $2.12 | | | | 0.42% | |
| | | | |
Hypothetical** | | | | | | | | | | | | | | | | |
Class A | | | $1,000 | | | | $1,022 | | | | $2.89 | | | | 0.57% | |
Class S | | | $1,000 | | | | $1,023 | | | | $2.14 | | | | 0.42% | |
Thrivent Municipal Bond Fund | | | | | | | | | | | | | |
| | | | |
Actual | | | | | | | | | | | | | | | | |
Class A | | | $1,000 | | | | $1,000 | | | | $3.74 | | | | 0.74% | |
Class S | | | $1,000 | | | | $1,001 | | | | $2.57 | | | | 0.51% | |
| | | | |
Hypothetical** | | | | | | | | | | | | | | | | |
Class A | | | $1,000 | | | | $1,021 | | | | $3.79 | | | | 0.74% | |
Class S | | | $1,000 | | | | $1,023 | | | | $2.60 | | | | 0.51% | |
Thrivent Opportunity Income Plus Fund | | | | | | | | | | | | | |
| | | | |
Actual | | | | | | | | | | | | | | | | |
Class A | | | $1,000 | | | | $1,005 | | | | $4.49 | | | | 0.89% | |
Class S | | | $1,000 | | | | $1,006 | | | | $3.25 | | | | 0.64% | |
| | | | |
Hypothetical** | | | | | | | | | | | | | | | | |
Class A | | | $1,000 | | | | $1,021 | | | | $4.52 | | | | 0.89% | |
Class S | | | $1,000 | | | | $1,022 | | | | $3.28 | | | | 0.64% | |
52
| | | | | | | | | | | | | | | | |
| | | Beginning Account
Value 5/1/2018 | | | Ending Account Value
10/31/2018 | | | Expenses Paid During
Period 5/1/2018-
10/31/2018* | | | Annualized Expense
Ratio | |
Thrivent Partner Emerging Markets Equity Fund | | | | | | | | | | | | | |
| | | | |
Actual | | | | | | | | | | | | | | | | |
Class A | | | $1,000 | | | | $836 | | | | $7.64 | | | | 1.65% | |
Class S | | | $1,000 | | | | $838 | | | | $6.11 | | | | 1.32% | |
| | | | |
Hypothetical** | | | | | | | | | | | | | | | | |
Class A | | | $1,000 | | | | $1,017 | | | | $8.39 | | | | 1.65% | |
Class S | | | $1,000 | | | | $1,019 | | | | $6.72 | | | | 1.32% | |
Thrivent Partner Worldwide Allocation Fund | | | | | | | | | | | | | |
| | | | |
Actual | | | | | | | | | | | | | | | | |
Class A | | | $1,000 | | | | $877 | | | | $6.39 | | | | 1.35% | |
Class S | | | $1,000 | | | | $879 | | | | $4.44 | | | | 0.94% | |
| | | | |
Hypothetical** | | | | | | | | | | | | | | | | |
Class A | | | $1,000 | | | | $1,018 | | | | $6.87 | | | | 1.35% | |
Class S | | | $1,000 | | | | $1,020 | | | | $4.78 | | | | 0.94% | |
Thrivent Small Cap Growth Fund | | | | | | | | | | | | | |
| | | | |
Actual | | | | | | | | | | | | | | | | |
Class S | | | $1,000 | | | | $1,034 | | | | $6.36 | | | | 1.24% | |
| | | | |
Hypothetical** | | | | | | | | | | | | | | | | |
Class S | | | $1,000 | | | | $1,019 | | | | $6.31 | | | | 1.24% | |
Thrivent Small Cap Stock Fund | | | | | | | | | | | | | |
| | | | |
Actual | | | | | | | | | | | | | | | | |
Class A | | | $1,000 | | | | $1,000 | | | | $5.63 | | | | 1.12% | |
Class S | | | $1,000 | | | | $1,002 | | | | $4.46 | | | | 0.88% | |
| | | | |
Hypothetical** | | | | | | | | | | | | | | | | |
Class A | | | $1,000 | | | | $1,020 | | | | $5.68 | | | | 1.12% | |
Class S | | | $1,000 | | | | $1,021 | | | | $4.50 | | | | 0.88% | |
| * | Expenses are equal to the Fund’s annualized expense ratio, multiplied by the average account value over the period, multiplied by 184/365 to reflect the one-half year period. |
| ** | Assuming 5% annualized total return before expenses. |
53

Report of Independent Registered Public Accounting Firm
To the Board of Trustees of Thrivent Mutual Funds and Shareholders of each of the twenty-two funds listed in the table below
Opinions on the Financial Statements
We have audited the accompanying statements of assets and liabilities, including the schedules of investments or summary schedules of investments of each of the funds listed in the table below (twenty-two of the funds constituting Thrivent Mutual Funds, hereafter collectively referred to as the “Funds”) as of October 31, 2018, the related statements of operations for the periods listed in the table below, the statements of changes in net assets for the periods listed in the table below, including the related notes, and the financial highlights for each of the periods indicated therein (collectively referred to as the “financial statements”). In our opinion, the financial statements present fairly, in all material respects, the financial position of each of the Funds as of October 31, 2018, the results of each of their operations for the periods listed in the table below, the changes in each of their net assets for the periods listed in the table below, and each of the financial highlights for each of the periods indicated therein in conformity with accounting principles generally accepted in the United States of America.
| | |
| |
| Thrivent Aggressive Allocation Fund (2) | | Thrivent Mid Cap Stock Fund (1) |
| |
| Thrivent Balanced Income Plus Fund (2) | | Thrivent Moderate Allocation Fund (2) |
| |
| Thrivent Government Bond Fund (1) | | Thrivent Moderately Aggressive Allocation Fund (2) |
| |
| Thrivent High Income Municipal Bond Fund (3) | | Thrivent Moderately Conservative Allocation Fund (2) |
| |
| Thrivent High Yield Fund (2) | | Thrivent Money Market Fund (1) |
| |
| Thrivent Income Fund (2) | | Thrivent Municipal Bond Fund (2) |
| |
| Thrivent Large Cap Growth Fund (1) | | Thrivent Opportunity Income Plus Fund (2) |
| |
| Thrivent Large Cap Stock Fund (2) | | Thrivent Partner Emerging Markets Equity Fund (1) |
| |
| Thrivent Large Cap Value Fund (1) | | Thrivent Partner Worldwide Allocation Fund (2) |
| |
| Thrivent Limited Maturity Bond Fund (2) | | Thrivent Small Cap Growth Fund (3) |
| |
| Thrivent Low Volatility Equity Fund (4) | | Thrivent Small Cap Stock Fund (1) |
| (1) | Schedule of investments, statement of operations for the year ended October 31, 2018 and statement of changes in net assets for each of the two years in the period ended October 31, 2018 |
| (2) | Summary schedule of investments, statement of operations for the year ended October 31, 2018 and statement of changes in net assets for each of the two years in the period ended October 31, 2018 |
| (3) | Schedule of investments, statements of operations and changes in net assets for the period February 28, 2018 (commencement of operations) through October 31, 2018 |
| (4) | Schedule of investments, statement of operations for the year ended October 31, 2018 and statement of changes in net assets for the year ended October 31, 2018 and for the period February 28, 2017 (commencement of operations) through October 31, 2017 |
|
PricewaterhouseCoopers LLP, 45 South Seventh Street, Suite 3400, Minneapolis, MN 55402 |
T: (612) 596 6000, F: (612) 373 7160, www.pwc.com/us |
54
Basis for Opinions
These financial statements are the responsibility of the Funds’ management. Our responsibility is to express an opinion on the Funds’ financial statements based on our audits. We are a public accounting firm registered with the Public Company Accounting Oversight Board (United States) (“PCAOB”) and are required to be independent with respect to the Funds in accordance with the U.S. federal securities laws and the applicable rules and regulations of the Securities and Exchange Commission and the PCAOB.
We conducted our audits of these financial statements in accordance with the standards of the PCAOB. Those standards require that we plan and perform the audit to obtain reasonable assurance about whether the financial statements are free of material misstatement, whether due to error or fraud.
Our audits included performing procedures to assess the risks of material misstatement of the financial statements, whether due to error or fraud, and performing procedures that respond to those risks. Such procedures included examining, on a test basis, evidence regarding the amounts and disclosures in the financial statements. Our audits also included evaluating the accounting principles used and significant estimates made by management, as well as evaluating the overall presentation of the financial statements. Our procedures included confirmation of securities owned as of October 31, 2018 by correspondence with the custodian, agent banks, transfer agent, and brokers; when replies were not received from brokers and agent banks, we performed other auditing procedures. We believe that our audits provide a reasonable basis for our opinions.

December 17, 2018
We have served as the auditor of one or more investment companies in Thrivent Financial for Lutherans investment company complex since 1987.
55
AGGRESSIVE ALLOCATION FUND
Summary Schedule of Investments as of October 31, 2018
| | | | | | | | | | | | |
| Shares | | | Registered Investment Companies (43.8%) | | Value | | | % of Net
Assets | |
| | Affiliated Equity Holdings (41.3%) | | | | | | | | |
| | 5,607,856 | | | Thrivent Core International Equity Fund | | | $52,040,901 | | | | 4.2 | % |
| | 4,318,979 | | | Thrivent Core Low Volatility Equity Funda | | | 45,522,035 | | | | 3.7 | % |
| | 7,132,168 | | | Thrivent Large Cap Growth Fund, Class S | | | 88,938,129 | | | | 7.2 | % |
| | 1,309,878 | | | Thrivent Large Cap Stock Fund, Class S | | | 35,209,517 | | | | 2.9 | % |
| | 2,928,782 | | | Thrivent Large Cap Value Fund, Class S | | | 67,069,097 | | | | 5.4 | % |
| | 2,601,035 | | | Thrivent Mid Cap Stock Fund, Class S | | | 72,985,049 | | | | 5.9 | % |
| | 11,758,230 | | | Thrivent Partner Worldwide Allocation Fund, Class S | | | 116,053,728 | | | | 9.4 | % |
| | 1,201,969 | | | Thrivent Small Cap Stock Fund, Class S | | | 31,671,889 | | | | 2.6 | % |
| | | | | |
| | | | Total | | | 509,490,345 | | | | | |
| | | | | |
| | |
| | Affiliated Fixed Income Holdings (1.4%) | | | | | | | | |
| | 1,334,731 | | | Thrivent High Yield Fund, Class S | | | 6,193,152 | | | | 0.5 | % |
| | 459,914 | | | Thrivent Income Fund, Class S | | | 4,001,251 | | | | 0.3 | % |
| | 559,454 | | | Thrivent Limited Maturity Bond Fund, Class S | | | 6,881,281 | | | | 0.6 | % |
| | | | | |
| | | | Total | | | 17,075,684 | | | | | |
| | | | | |
| | |
| | Equity Funds/Exchange Traded Funds (1.1%) | | | | | | | | |
| | 22,806 | | | SPDR S&P 500 ETF Trust | | | 6,171,988 | | | | 0.5 | % |
| | | | Other Securities^ | | | 7,155,853 | | | | 0.6 | % |
| | | | | |
| | | | Total | | | 13,327,841 | | | | | |
| | | | | |
| | | | | | | | | | | | |
| | | | | |
| | | | Total Registered Investment Companies (cost $420,967,208) | | | 539,893,870 | | | | | |
| | | | | |
| | | |
| Shares | | | Common Stock (37.2%) | | Value | | | % of Net Assets | |
| | Communications Services (1.3%) | | | | | | | | |
| | 1,944 | | | Alphabet, Inc., Class Aa | | | 2,120,088 | | | | 0.2 | % |
| | 46,914 | | | Verizon Communications, Inc. | | | 2,678,320 | | | | 0.2 | % |
| | | | Other Securities^ | | | 10,830,225 | | | | 0.9 | % |
| | | | | |
| | | | Total | | | 15,628,633 | | | | | |
| | | | | |
| | |
| | Consumer Discretionary (3.9%) | | | | | | | | |
| | 2,160 | | | Amazon.com, Inc.a | | | 3,451,702 | | | | 0.3 | % |
| | 13,184 | | | Burlington Stores, Inc.a | | | 2,260,924 | | | | 0.2 | % |
| | 22,105 | | | Children’s Place, Inc. | | | 3,302,487 | | | | 0.3 | % |
| | 56,314 | | | Core-Mark Holding Company, Inc. | | | 2,163,021 | | | | 0.2 | % |
| | 22,190 | | | Lowe’s Companies, Inc. | | | 2,112,932 | | | | 0.2 | % |
| | 60,341 | | | Nutrisystem, Inc. | | | 2,145,726 | | | | 0.2 | % |
| | | | Other Securities^ | | | 33,015,379 | | | | 2.5 | % |
| | | | | |
| | | | Total | | | 48,452,171 | | | | | |
| | | | | |
| | |
| | Consumer Staples (1.3%) | | | | | | | | |
| | 17,315 | | | Casey’s General Stores, Inc. | | | 2,183,595 | | | | 0.2 | % |
| | | | Other Securities^ | | | 14,001,736 | | | | 1.1 | % |
| | | | | |
| | | | Total | | | 16,185,331 | | | | | |
| | | | | |
| | |
| | Energy (1.7%) | | | | | | | | |
| | 19,271 | | | Chevron Corporation | | | 2,151,607 | | | | 0.2 | % |
| | | | Other Securities^ | | | 19,246,971 | | | | 1.5 | % |
| | | | | |
| | | | Total | | | 21,398,578 | | | | | |
| | | | | |
| | |
| | Financials (6.8%) | | | | | | | | |
| | 57,119 | | | Assured Guaranty, Ltd. | | | 2,283,618 | | | | 0.2 | % |
| | 123,399 | | | Bank of America Corporation | | | 3,393,473 | | | | 0.3 | % |
| | 65,194 | | | Citigroup, Inc. | | | 4,267,599 | | | | 0.4 | % |
| | 81,082 | | | Investment Technology Group, Inc. | | | 2,228,133 | | | | 0.2 | % |
| | 135,205 | | | KeyCorp | | | 2,455,323 | | | | 0.2 | % |
| | 49,140 | | | Zions Bancorporations NA | | | 2,312,037 | | | | 0.2 | % |
| | | | Other Securities^ | | | 66,848,348 | | | | 5.3 | % |
| | | | | |
| | | | Total | | | 83,788,531 | | | | | |
| | | | | |
| | |
| | Health Care (5.5%) | | | | | | | | |
| | 19,511 | | | Johnson & Johnson | | | 2,731,345 | | | | 0.2 | % |
| | 27,379 | | | LHC Group, Inc.a | | | 2,503,262 | | | | 0.2 | % |
| | 28,457 | | | Medtronic plc | | | 2,556,008 | | | | 0.2 | % |
| | 29,630 | | | Merck & Company, Inc. | | | 2,181,064 | | | | 0.2 | % |
| | 29,843 | | | Omnicell, Inc.a | | | 2,109,900 | | | | 0.2 | % |
| | 62,617 | | | Pfizer, Inc. | | | 2,696,288 | | | | 0.2 | % |
| | 12,147 | | | Teleflex, Inc. | | | 2,924,269 | | | | 0.3 | % |
| | 14,087 | | | UnitedHealth Group, Inc. | | | 3,681,637 | | | | 0.3 | % |
| | | | Other Securities^ | | | 46,060,158 | | | | 3.7 | % |
| | | | | |
| | | | Total | | | 67,443,931 | | | | | |
| | | | | |
| | |
| | Industrials (5.6%) | | | | | | | | |
| | 20,353 | | | Honeywell International, Inc. | | | 2,947,521 | | | | 0.2 | % |
| | 139,604 | | | MRC Global, Inc.a | | | 2,209,931 | | | | 0.2 | % |
| | 42,420 | | | Southwest Airlines Company | | | 2,082,822 | | | | 0.2 | % |
| | 40,662 | | | Waste Connections, Inc. | | | 3,108,203 | | | | 0.3 | % |
| | | | Other Securities^ | | | 59,233,384 | | | | 4.7 | % |
| | | | | |
| | | | Total | | | 69,581,861 | | | | | |
| | | | | |
| | |
| | Information Technology (7.9%) | | | | | | | | |
| | 33,163 | | | Amphenol Corporation | | | 2,968,089 | | | | 0.3 | % |
| | 18,983 | | | Apple, Inc. | | | 4,154,619 | | | | 0.3 | % |
| | 74,078 | | | Ciena Corporationa | | | 2,315,678 | | | | 0.2 | % |
| | 121,427 | | | Cisco Systems, Inc. | | | 5,555,285 | | | | 0.5 | % |
| | 52,992 | | | Dolby Laboratories, Inc. | | | 3,646,380 | | | | 0.3 | % |
| | 14,828 | | | MasterCard, Inc. | | | 2,931,051 | | | | 0.2 | % |
| | 48,261 | | | Microsoft Corporation | | | 5,154,757 | | | | 0.4 | % |
| | 21,164 | | | Monolithic Power Systems, Inc. | | | 2,499,892 | | | | 0.2 | % |
| | 46,536 | | | Oracle Corporation | | | 2,272,818 | | | | 0.2 | % |
| | 24,601 | | | Synopsys, Inc.a | | | 2,202,528 | | | | 0.2 | % |
| | 48,833 | | | Virtusa Corporationa | | | 2,421,629 | | | | 0.2 | % |
| | 25,110 | | | Xilinx, Inc. | | | 2,143,641 | | | | 0.2 | % |
| | | | Other Securities^ | | | 58,749,726 | | | | 4.7 | % |
| | | | | |
| | | | Total | | | 97,016,093 | | | | | |
| | | | | |
The accompanying Notes to Financial Statements are an integral part of this schedule.
56
AGGRESSIVE ALLOCATION FUND
Summary Schedule of Investments as of October 31, 2018
| | | | | | | | | | | | |
| Shares | | | Common Stock (37.2%) | | Value | | | % of Net
Assets | |
| | Materials (1.3%) | | | | | | | | |
| | | | Other Securities^ | | | $15,782,928 | | | | 1.3 | % |
| | | | | |
| | | | Total | | | 15,782,928 | | | | | |
| | | | | |
| | |
| | Real Estate (1.2%) | | | | | | | | |
| | | | Other Securities^ | | | 14,500,184 | | | | 1.2 | % |
| | | | | |
| | | | Total | | | 14,500,184 | | | | | |
| | | | | |
| | |
| | Utilities (0.7%) | | | | | | | | |
| | | | Other Securities^ | | | 8,294,030 | | | | 0.7 | % |
| | | | | |
| | | | Total | | | 8,294,030 | | | | | |
| | | | | |
| | | | | | | | | | | | |
| | | | | |
| | | | Total Common Stock (cost $ 397,868,594) | | | 458,072,271 | | | | | |
| | | | | |
| | | |
Principal
Amount | | | Long-Term Fixed Income (2.9%) | | Value | | | % of Net
Assets | |
| | Collateralized Mortgage Obligations (<0.1%) | | | | | | | | |
| | | | Other Securities^ | | | 158,032 | | | | <0.1 | % |
| | | | | |
| | | | Total | | | 158,032 | | | | | |
| | | | | |
| | |
| | Mortgage-Backed Securities (1.3%) | | | | | | | | |
| | | | Federal National Mortgage Association Conventional 30- Yr. Pass Through | | | | | | | | |
| | $5,325,000 | | | 3.500%, 11/1/2048b | | | 5,183,763 | | | | 0.4 | % |
| | 4,900,000 | | | 4.000%, 11/1/2048b | | | 4,899,979 | | | | 0.4 | % |
| | 3,945,000 | | | 4.500%, 11/1/2048b | | | 4,039,079 | | | | 0.3 | % |
| | 475,000 | | | 5.000%, 11/1/2048b | | | 495,670 | | | | 0.1 | % |
| | | | Other Securities^ | | | 1,685,584 | | | | 0.1 | % |
| | | | | |
| | | | Total | | | 16,304,075 | | | | | |
| | | | | |
| | |
| | U.S. Government and Agencies (1.6%) | | | | | | | | |
| | | | U.S. Treasury Bonds | | | | | | | | |
| | 4,500,000 | | | 2.875%, 5/15/2028 | | | 4,400,156 | | | | 0.4 | % |
| | 3,241,000 | | | 2.250% - 2.500%, | | | | | | | | |
| | | | 11/15/2027 - 5/15/2046 | | | 2,808,333 | | | | 0.3 | % |
| | | | U.S. Treasury Bonds, TIPS | | | | | | | | |
| | 1,700,737 | | | 0.375%, 7/15/2027 | | | 1,600,487 | | | | 0.1 | % |
| | | | U.S. Treasury Notes | | | | | | | | |
| | 3,100,000 | | | 0.750%, 2/15/2019 | | | 3,085,688 | | | | 0.3 | % |
| | 3,000,000 | | | 2.250%, 11/15/2024 | | | 2,869,453 | | | | 0.2 | % |
| | 5,670,000 | | | 1.000% - 2.125%, | | | | | | | | |
| | | | 10/15/2019 - 11/30/2024 | | | 5,454,013 | | | | 0.3 | % |
| | | | | |
| | | | Total | | | 20,218,130 | | | | | |
| | | | | |
| | | | | | | | | | | | |
| | | | | |
| | | | Total Long-Term Fixed Income (cost $37,485,454) | | | 36,680,237 | | | | | |
| | | | | |
| | | |
| Shares | | | Collateral Held for Securities Loaned (0.7%) | | Value | | | % of Net
Assets | |
| | 9,152,537 | | | Thrivent Cash Management Trust | | | $9,152,537 | | | | 0.7 | % |
| | | | | |
| | | | Total Collateral Held for Securities Loaned (cost $9,152,537) | | | 9,152,537 | | | | | |
| | | | | |
| | | |
Shares or
Principal
Amount | | | Short-Term Investments (17.4%) | | Value | | | % of Net
Assets | |
| | | | Federal Home Loan Bank Discount Notes | | | | | | | | |
| | 6,500,000 | | | 2.100%, 11/28/2018c,d | | | 6,489,372 | | | | 0.5 | % |
| | 8,700,000 | | | 2.240%, 1/16/2019c,d | | | 8,657,753 | | | | 0.7 | % |
| | 2,250,000 | | | 2.285%, 1/18/2019c,d | | | 2,238,788 | | | | 0.2 | % |
| | | | Federal Home Loan Bank Discount Notes | | | | | | | | |
| | 3,050,000 | | | 2.030% - 2.270%, 11/2/2018 - 1/11/2019c,d | | | 3,043,165 | | | | 0.3 | % |
| | | | Thrivent Core Short-Term Reserve Fund | | | | | | | | |
| | 19,361,484 | | | 2.430% | | | 193,614,838 | | | | 15.7 | % |
| | | | | |
| | | | Total Short-Term Investments (cost $214,045,659) | | | 214,043,916 | | | | | |
| | | | | |
| | | | Total Investments (cost $1,079,519,452) 102.0% | | | $1,257,842,831 | | | | | |
| | | | | |
| | | | Other Assets and Liabilities, Net (2.0%) | | | (24,802,532 | ) | | | | |
| | | | | |
| | | | Total Net Assets 100.0% | | | $1,233,040,299 | | | | | |
| | | | | |
| ^ | The Summary Schedule of Investments shows the 50 largest holdings in unaffiliated issuers, any holding or issuer that exceeds 1% of net assets and all affiliated holdings as of the report date. The remaining securities held are grouped by category as “Other securities”. |
| a | Non-income producing security. |
| b | Denotes investments purchased on a when-issued or delayed delivery basis. |
| c | The interest rate shown reflects the yield, coupon rate or the discount rate at the date of purchase. |
| d | All or a portion of the security is held on deposit with the counterparty and pledged as the initial margin deposit for open futures contracts. |
The following table presents the total amount of securities loaned with continuous maturity, by type, offset by the gross payable upon return of collateral for securities loaned by Thrivent Aggressive Allocation Fund as of October 31, 2018:
| | | | |
Securities Lending Transactions | | | | |
Common Stock | | | $8,979,336 | |
| | | | |
Total lending | | | $8,979,336 | |
Gross amount payable upon return of collateral for securities loaned | | | $9,152,537 | |
| | | | |
Net amounts due to counterparty | | | $173,201 | |
| | | | |
The accompanying Notes to Financial Statements are an integral part of this schedule.
57
AGGRESSIVE ALLOCATION FUND
Summary Schedule of Investments as of October 31, 2018
Definitions:
| | | | |
ETF | | - | | Exchange Traded Fund |
SPDR | | - | | S&P Depository Receipts, which are a family of exchange-traded funds traded in the U.S., Europe, and Asia-Pacific and managed by State Street Global Advisors. |
TIPS | | - | | Treasury Inflation Protected Security |
Unrealized Appreciation (Depreciation)
Gross unrealized appreciation and depreciation of investments of the portfolio as a whole (including derivatives), based on cost for federal income tax purposes, were as follows:
| | | | |
Gross unrealized appreciation | | | $228,161,994 | |
Gross unrealized depreciation | | | (53,962,874 | ) |
| | | | |
Net unrealized appreciation (depreciation) | | | $174,199,120 | |
| |
Cost for federal income tax purposes | | | $1,269,333,262 | |
Fair Valuation Measurements
The following table is a summary of the inputs used, as of October 31, 2018, in valuing Aggressive Allocation Fund’s assets carried at fair value.
| | | | | | | | | | | | | | | | |
| Investments in Securities | | Total | | | Level 1 | | | Level 2 | | | Level 3 | |
| | | | |
Common Stock | | | | | | | | | | | | | | | | |
Communications Services | | | 15,628,633 | | | | 15,216,449 | | | | 412,184 | | | | – | |
Consumer Discretionary | | | 48,452,171 | | | | 47,195,140 | | | | 1,257,031 | | | | – | |
Consumer Staples | | | 16,185,331 | | | | 15,119,595 | | | | 1,065,736 | | | | – | |
Energy | | | 21,398,578 | | | | 21,035,355 | | | | 363,223 | | | | – | |
Financials | | | 83,788,531 | | | | 82,753,081 | | | | 1,035,450 | | | | – | |
Health Care | | | 67,443,931 | | | | 66,539,431 | | | | 904,500 | | | | – | |
Industrials | | | 69,581,861 | | | | 68,184,742 | | | | 1,397,119 | | | | – | |
Information Technology | | | 97,016,093 | | | | 96,302,494 | | | | 713,599 | | | | – | |
Materials | | | 15,782,928 | | | | 14,676,710 | | | | 1,106,217 | | | | 1 | |
Real Estate | | | 14,500,184 | | | | 14,269,377 | | | | 230,807 | | | | – | |
Utilities | | | 8,294,030 | | | | 8,078,012 | | | | 216,018 | | | | – | |
Registered Investment Companies | | | | | | | | | | | | | | | | |
Affiliated Equity Holdings | | | 411,927,409 | | | | 411,927,409 | | | | – | | | | – | |
Equity Funds/Exchange Traded Funds | | | 13,327,841 | | | | 13,327,841 | | | | – | | | | – | |
Affiliated Fixed Income Holdings | | | 17,075,684 | | | | 17,075,684 | | | | – | | | | – | |
Long-Term Fixed Income | | | | | | | | | | | | | | | | |
Collateralized Mortgage Obligations | | | 158,032 | | | | – | | | | 158,032 | | | | – | |
Mortgage-Backed Securities | | | 16,304,075 | | | | – | | | | 16,304,075 | | | | – | |
U.S. Government and Agencies | | | 20,218,130 | | | | – | | | | 20,218,130 | | | | – | |
Short-Term Investments | | | 20,429,078 | | | | – | | | | 20,429,078 | | | | – | |
| |
Subtotal Investments in Securities | | | $957,512,520 | | | | $891,701,320 | | | | $65,811,199 | | | | $1 | |
| |
| |
| | | | |
| Other Investments* | | Total | | | | | | | | | | |
Affiliated Registered Investment Companies | | | 97,562,936 | | | | | | | | | | | | | |
Short-Term Investments | | | 193,614,838 | | | | | | | | | | | | | |
Collateral Held for Securities Loaned | | | 9,152,537 | | | | | | | | | | | | | |
| | | | | | | | | | | | | |
Subtotal Other Investments | | | $300,330,311 | | | | | | | | | | | | | |
| | | | | | | | | | | | | |
| | | | | | | | | | | | | |
| | | | | | | | | | | | | | | | |
| | | | | | | | | | | | | |
Total Investments at Value | | | $1,257,842,831 | | | | | | | | | | | | | |
| | | | | | | | | | | | | |
| | | | | | | | | | | | | |
| * | Certain investments are measured at fair value using a net asset value per share that is not publicly available (practical expedient). According to disclosure requirements of Accounting Standards Codification (ASC) 820, Fair Value Measurement, securities valued using the practical expedient are not classified in the fair value hierarchy. The fair value amounts presented in this table are intended to permit reconciliation of the fair value hierarchy to the amounts presented in the Statement of Assets and Liabilities. |
| | | | | | | | | | | | | | | | |
| Other Financial Instruments | | Total | | | Level 1 | | | Level 2 | | | Level 3 | |
| | | | |
Asset Derivatives | | | | | | | | | | | | | | | | |
Futures Contracts | | | 23,549,857 | | | | 23,549,857 | | | | – | | | | – | |
| |
Total Asset Derivatives | | | $23,549,857 | | | | $23,549,857 | | | | $– | | | | $– | |
| |
| |
| | | | |
Liability Derivatives | | | | | | | | | | | | | | | | |
Futures Contracts | | | 26,392,420 | | | | 26,392,420 | | | | – | | | | – | |
| |
Total Liability Derivatives | | | $26,392,420 | | | | $26,392,420 | | | | $– | | | | $– | |
| |
| |
There were no significant transfers between Levels during the period ended October 31, 2018. Transfers between Levels are identified as of the end of the period.
The accompanying Notes to Financial Statements are an integral part of this schedule.
58
AGGRESSIVE ALLOCATION FUND
Summary Schedule of Investments as of October 31, 2018
The following table presents Aggressive Allocation Fund’s futures contracts held as of October 31, 2018. Investments and/or cash totaling $20,429,078 were pledged as the initial margin deposit for these contracts.
| | | | | | | | | | | | | | | | |
| Futures Contracts Description | | Number of
Contracts Long/(Short) | | | Expiration Date | | | Notional
Principal Amount | | | Value and
Unrealized | |
CBOT 5-Yr. U.S. Treasury Note | | | 31 | | | | December 2018 | | | | $3,517,627 | | | | ($33,760) | |
CBOT U.S. Long Bond | | | 4 | | | | December 2018 | | | | 556,466 | | | | (3,966) | |
CME E-mini S&P 500 Index | | | 2,267 | | | | December 2018 | | | | 326,720,011 | | | | (19,416,826) | |
CME Ultra Long Term U.S. Treasury Bond | | | 13 | | | | December 2018 | | | | 2,084,106 | | | | (144,262) | |
ICE mini MSCI EAFE Index | | | 570 | | | | December 2018 | | | | 55,536,017 | | | | (3,879,766) | |
ICE US mini MSCI Emerging Markets Index | | | 850 | | | | December 2018 | | | | 43,573,590 | | | | (2,913,840) | |
| |
Total Futures Long Contracts | | | | | | | | | | | $431,987,817 | | | | ($26,392,420) | |
| |
CBOT 10-Yr. U.S. Treasury Note | | | (24 | ) | | | December 2018 | | | | ($2,892,861 | ) | | | $50,361 | |
CBOT 2-Yr. U.S. Treasury Note | | | (11 | ) | | | December 2018 | | | | (2,325,951 | ) | | | 8,732 | |
CME E-mini NASDAQ 100 Index | | | (621 | ) | | | December 2018 | | | | (94,137,277 | ) | | | 7,501,567 | |
CME E-mini Russell 2000 Index | | | (226 | ) | | | December 2018 | | | | (19,440,529 | ) | | | 2,356,059 | |
CME E-mini S&P Mid-Cap 400 Index | | | (605 | ) | | | December 2018 | | | | (124,017,265 | ) | | | 13,616,865 | |
Ultra 10-Yr. U.S. Treasury Note | | | (5 | ) | | | December 2018 | | | | (641,820 | ) | | | 16,273 | |
| |
Total Futures Short Contracts | | | | | | | | | | | ($243,455,703 | ) | | | $23,549,857 | |
| |
Total Futures Contracts | | | | | | | | | | | $188,532,114 | | | | ($2,842,563) | |
| |
Reference Description:
| | | | |
| CBOT | | - | | Chicago Board of Trade |
| CME | | - | | Chicago Mercantile Exchange |
| EAFE | | - | | Europe, Australasia and Far East |
| ICE | | - | | Intercontinental Exchange |
| MSCI | | - | | Morgan Stanley Capital International |
| NASDAQ | | - | | National Association of Securities Dealers Automated Quotations |
| S&P | | - | | Standard & Poor’s |
The following table summarizes the fair value and Statement of Assets and Liabilities location, as of October 31, 2018, for Aggressive Allocation Fund’s investments in financial derivative instruments by primary risk exposure as discussed under item (2) Significant Accounting Policies of the Notes to Financial Statements.
| | | | | | |
| Derivatives by risk category | | Statement of Assets and Liabilities Location | | Fair Value | |
| | |
Asset Derivatives | | | | | | |
| | |
Interest Rate Contracts | | | | | | |
Futures* | | Net Assets - Accumulated undistributed earnings/(loss) | | | $75,366 | |
Total Interest Rate Contracts | | | | | 75,366 | |
| | |
Equity Contracts | | | | | | |
Futures* | | Net Assets - Accumulated undistributed earnings/(loss) | | | 23,474,491 | |
Total Equity Contracts | | | | | 23,474,491 | |
| |
Total Asset Derivatives | | | | | $23,549,857 | |
| |
| | |
Liability Derivatives | | | | | | |
| | |
Interest Rate Contracts | | | | | | |
Futures* | | Net Assets - Accumulated undistributed earnings/(loss) | | | 181,988 | |
Total Interest Rate Contracts | | | | | 181,988 | |
| | |
Equity Contracts | | | | | | |
Futures* | | Net Assets - Accumulated undistributed earnings/(loss) | | | 26,210,432 | |
Total Equity Contracts | | | | | 26,210,432 | |
| |
Total Liability Derivatives | | | | | $26,392,420 | |
| |
| * | Includes cumulative appreciation/depreciation of futures contracts as reported in the Schedule of Investments. Only current day’s variation margin is reported within the Statement of Assets and Liabilities. |
The accompanying Notes to Financial Statements are an integral part of this schedule.
59
AGGRESSIVE ALLOCATION FUND
Summary Schedule of Investments as of October 31, 2018
The following table summarizes the net realized gains/(losses) and Statement of Operations location, for the period ended October 31, 2018, for Aggressive Allocation Fund’s investments in financial derivative instruments by primary risk exposure.
| | | | |
| Derivatives by risk category | | Statement of Operations Location | | Realized Gains/(Losses)
recognized in Income |
| | |
Interest Rate Contracts | | | | |
Futures | | Net realized gains/(losses) on Futures contracts | | (42,037) |
Total Interest Rate Contracts | | | | (42,037) |
| | |
Equity Contracts | | | | |
Futures | | Net realized gains/(losses) on Futures contracts | | (4,390,244) |
| | |
Total Equity Contracts | | | | (4,390,244) |
|
Total | | | | ($4,432,281) |
|
|
The following table summarizes the change in net unrealized appreciation/(depreciation) and Statement of Operations location, for the period ended October 31, 2018, for Aggressive Allocation Fund’s investments in financial derivative instruments by primary risk exposure.
| | | | |
| Derivatives by risk category | | Statement of Operations Location | | Change in unrealized
appreciation/
(depreciation)
recognized in Income |
| | |
Interest Rate Contracts | | | | |
Futures | | Change in net unrealized appreciation/(depreciation) on Futures contracts | | (73,187) |
| | |
Total Interest Rate Contracts | | | | (73,187) |
| | |
Equity Contracts | | | | |
Futures | | Change in net unrealized appreciation/(depreciation) on Futures contracts | | (1,569,897) |
| |
Total Equity Contracts | | (1,569,897) |
|
Total | | | | ($1,643,084) |
|
|
The following table presents Aggressive Allocation Fund’s average volume of derivative activity during the period ended October 31, 2018.
| | | | |
| Derivative Risk Category | | Average Notional Value | |
Equity Contracts | | | | |
Futures - Long | | | $355,065,725 | |
Futures - Short | | | (213,286,787 | ) |
Interest Rate Contracts | | | | |
Futures - Long | | | 5,903,963 | |
Futures - Short | | | (6,252,847 | ) |
The accompanying Notes to Financial Statements are an integral part of this schedule.
60
AGGRESSIVE ALLOCATION FUND
Summary Schedule of Investments as of October 31, 2018
Investment in Affiliates
Affiliated issuers, as defined under the Investment Company Act of 1940, include those in which the Fund’s holdings of an issuer represent 5% or more of the outstanding voting securities of an issuer, any affiliated mutual fund, or a company which is under common ownership or control with the Fund. The Fund owns shares of Thrivent Cash Management Trust for the purpose of securities lending and Thrivent Core Short-Term Reserve Fund primarily to serve as a cash sweep vehicle for the Fund. Thrivent Cash Management Trust and Thrivent Core Funds are established solely for investment by Thrivent entities.
A summary of transactions (in thousands) for the fiscal year to date, in Aggressive Allocation Fund, is as follows:
| | | | | | | | | | | | | | | | | | | | | | | | |
| Fund | | Value 10/31/2017 | | | Gross Purchases | | | Gross Sales | | | Shares Held at 10/31/2018 | | | Value 10/31/2018 | | | % of Net Assets | |
Affiliated Equity Holdings | | | | | | | | | | | | | | | | | | | | | | | | |
Core International Equity | | | $ – | | | | $56,074 | | | | $ – | | | | 5,608 | | | | $52,041 | | | | 4.2 | % |
Core Low Volatility Equity* | | | – | | | | 43,000 | | | | – | | | | 4,319 | | | | 45,522 | | | | 3.7 | |
Large Cap Growth, Class S | | | 78,222 | | | | 1,877 | | | | – | | | | 7,132 | | | | 88,938 | | | | 7.2 | |
Large Cap Stock, Class S | | | 35,014 | | | | 3,385 | | | | – | | | | 1,310 | | | | 35,210 | | | | 2.9 | |
Large Cap Value, Class S | | | 63,365 | | | | 3,524 | | | | – | | | | 2,929 | | | | 67,069 | | | | 5.4 | |
Mid Cap Stock, Class S | | | 69,939 | | | | 5,377 | | | | – | | | | 2,601 | | | | 72,985 | | | | 5.9 | |
Partner Worldwide Allocation, Class S | | | 129,130 | | | | 4,827 | | | | – | | | | 11,758 | | | | 116,054 | | | | 9.4 | |
Small Cap Stock, Class S | | | 33,910 | | | | 2,192 | | | | 3,710 | | | | 1,202 | | | | 31,672 | | | | 2.6 | |
| |
Total Affiliated Equity Holdings | | | 409,580 | | | | | | | | | | | | | | | | 509,491 | | | | 41.3 | |
| |
Affiliated Fixed Income Holdings | | | | | | | | | | | | | | | | | | | | | | | | |
High Yield, Class S | | | 6,184 | | | | 346 | | | | – | | | | 1,335 | | | | 6,193 | | | | 0.5 | |
Income, Class S | | | 4,096 | | | | 158 | | | | – | | | | 460 | | | | 4,001 | | | | 0.3 | |
Limited Maturity Bond, Class S | | | 6,817 | | | | 163 | | | | – | | | | 559 | | | | 6,881 | | | | 0.6 | |
| |
Total Affiliated Fixed Income Holdings | | | 17,097 | | | | | | | | | | | | | | | | 17,075 | | | | 1.4 | |
| |
Affiliated Short-Term Investments | | | | | | | | | | | | | | | | | | | | | | | | |
Core Short-Term Reserve, 2.430% | | | 182,392 | | | | 229,027 | | | | 217,804 | | | | 19,361 | | | | 193,615 | | | | 15.7 | |
| |
Total Affiliated Short-Term Investments | | | 182,392 | | | | | | | | | | | | | | | | 193,615 | | | | 15.7 | |
| |
Collateral Held for Securities Loaned | | | | | | | | | | | | | | | | | | | | | | | | |
Cash Management Trust- Collateral Investment | | | – | | | | 114,191 | | | | 105,038 | | | | 9,153 | | | | 9,153 | | | | 0.7 | |
| |
Total Collateral Held for Securities Loaned | | | – | | | | | | | | | | | | | | | | 9,153 | | | | 0.7 | |
| |
Total Value | | | $609,069 | | | | | | | | | | | | | | | | $729,334 | | | | | |
| |
| |
| * | Non-income producing security. |
| | | | | | | | | | | | | | | | |
| Fund | | Net Realized Gain/(Loss) | | | Change in
Unrealized Appreciation/ (Depreciation) | | | Distributions of Realized Capital Gains | | | Income Earned
11/1/2017
- 10/31/2018 | |
Affiliated Equity Holdings | | | | | | | | | | | | | | | | |
Core International Equity | | | $ – | | | | $(4,033) | | | | $ – | | | | $74 | |
Core Low Volatility Equity Fund* | | | – | | | | 2,522 | | | | – | | | | – | |
Large Cap Growth, Class S | | | – | | | | 8,839 | | | | 1,877 | | | | – | |
Large Cap Stock, Class S | | | – | | | | (3,189 | ) | | | 2,910 | | | | 475 | |
Large Cap Value, Class S | | | – | | | | 181 | | | | 2,579 | | | | 945 | |
Mid Cap Stock, Class S | | | – | | | | (2,331 | ) | | | 5,377 | | | | – | |
Partner Worldwide Allocation, Class S | | | – | | | | (17,903 | ) | | | 1,688 | | | | 3,140 | |
Small Cap Stock, Class S | | | 151 | | | | (871 | ) | | | 2,192 | | | | – | |
Affiliated Fixed Income Holdings | | | | | | | | | | | | | | | | |
High Yield, Class S | | | – | | | | (337 | ) | | | – | | | | 346 | |
Income, Class S | | | – | | | | (253 | ) | | | 14 | | | | 144 | |
Limited Maturity Bond, Class S | | | – | | | | (99 | ) | | | – | | | | 163 | |
Affiliated Short-Term Investments | | | | | | | | | | | | | | | | |
Core Short-Term Reserve, 2.430% | | | – | | | | – | | | | 2 | | | | 3,516 | |
| |
Total Income from Affiliated Investments | | | | | | | | | | | | | | | $8,803 | |
| |
Collateral Held for Securities Loaned | | | | | | | | | | | | | | | | |
Cash Management Trust-Collateral Investment | | | – | | | | – | | | | – | | | | 157 | |
| |
Total Affiliated Income from Securities Loaned, Net | | | | | | | | | | | | | | | $157 | |
| |
Total | | | $151 | | | | $(17,474) | | | | $16,639 | | | | | |
| |
| * | Non-income producing security. |
The accompanying Notes to Financial Statements are an integral part of this schedule.
61
BALANCED INCOME PLUS FUND
Summary Schedule of Investments as of October 31, 2018
| | | | | | | | | | | | |
Principal
Amount | | | Bank Loans (16.6%) | | Value | | | % of Net
Assets | |
| | Basic Materials (1.1%) | | | | | | | | |
| | | | Other Securities^ | | | $3,902,758 | | | | 1.1 | % |
| | | | | |
| | | | Total | | | 3,902,758 | | | | | |
| | | | | |
|
| | Capital Goods (0.9%) | |
| | | | Other Securities^ | | | 3,220,187 | | | | 0.9 | % |
| | | | | |
| | | | Total | | | 3,220,187 | | | | | |
| | | | | |
|
| | Communications Services (4.6%) | |
| | | | Altice France SA, Term Loan | | | | | | | | |
| | $1,040,000 | | | 6.280%, (LIBOR 1M + 4.000%), 1/31/2026a,b | | | 1,017,255 | | | | 0.3 | % |
| | | | CenturyLink, Inc., Term Loan | | | | | | | | |
| | 1,486,107 | | | 5.052%, (LIBOR 1M + 2.750%), 1/31/2025a,b | | | 1,469,388 | | | | 0.4 | % |
| | | | McGraw-Hill Global Education Holdings, LLC, Term Loan | | | | | | | | |
| | 1,249,904 | | | 6.302%, (LIBOR 1M + 4.000%), 5/4/2022a,b,c,d | | | 1,197,570 | | | | 0.3 | % |
| | | | Sable International Finance, Ltd., Term Loan | | | | | | | | |
| | 1,440,000 | | | 5.547%, (LIBOR 1M + 3.250%), 1/31/2026a,b | | | 1,438,387 | | | | 0.4 | % |
| | | | Sprint Communications, Inc., Term Loan | | | | | | | | |
| | 1,157,375 | | | 4.813%, (LIBOR 1M + 2.500%), 2/2/2024a,b | | | 1,156,287 | | | | 0.3 | % |
| | | | Other Securities^ | | | 10,549,385 | | | | 2.9 | % |
| | | | | |
| | | | Total | | | 16,828,272 | | | | | |
| | | | | |
|
| | Consumer Cyclical (1.9%) | |
| | | | Scientific Games International, Inc., Term Loan | | | | | | | | |
| | 1,343,250 | | | 5.046%, (LIBOR 1M + 2.750%), 8/14/2024a,b | | | 1,329,334 | | | | 0.4 | % |
| | | | Other Securities^ | | | 5,834,511 | | | | 1.5 | % |
| | | | | |
| | | | Total | | | 7,163,845 | | | | | |
| | | | | |
|
| | Consumer Non-Cyclical (3.0%) | |
| | | | Air Medical Group Holdings, Inc., Term Loan | | | | | | | | |
| | 1,508,600 | | | 5.534%, (LIBOR 3M + 3.250%), 4/28/2022a,b | | | 1,462,588 | | | | 0.4 | % |
| | | | Albertson’s, LLC, Term Loan | | | | | | | | |
| | 1,195,000 | | | 0.000%, (LIBOR 3M + 3.000%), 10/29/2025a,b,c,d | | | 1,184,795 | | | | 0.3 | % |
| | | | Ortho-Clinical Diagnostics SA, Term Loan | | | | | | | | |
| | 1,093,950 | | | 5.544%, (LIBOR 1M + 3.250%), 6/1/2025a,b | | | 1,089,848 | | | | 0.3 | % |
| | | | Other Securities^ | | | 7,412,689 | | | | 2.0 | % |
| | | | | |
| | | | Total | | | 11,149,920 | | | | | |
| | | | | |
|
| | Energy (1.1%) | |
| | | | Radiate Holdco, LLC, Term Loan | | | | | | | | |
| | 1,300,101 | | | 5.302%, (LIBOR 1M + 3.000%), 2/1/2024a,b | | | 1,288,959 | | | | 0.4 | % |
| | | | Other Securities^ | | | 2,775,219 | | | | 0.7 | % |
| | | | | |
| | | | Total | | | 4,064,178 | | | | | |
| | | | | |
|
| | Financials (1.7%) | |
| | | | INEOS U.S. Finance, LLC, Term Loan | | | | | | | | |
| | 1,101,675 | | | 4.302%, (LIBOR 1M + 2.000%), 3/31/2024a,b | | | 1,099,097 | | | | 0.3 | % |
| | | | Other Securities^ | | | 5,039,708 | | | | 1.4 | % |
| | | | | |
| | | | Total | | | 6,138,805 | | | | | |
| | | | | |
|
| | Technology (1.4%) | |
| | | | First Data Corporation, Term Loan | | | | | | | | |
| | 1,345,000 | | | 4.287%, (LIBOR 1M + 2.000%), 4/26/2024a,b | | | 1,337,159 | | | | 0.4 | % |
| | | | Rackspace Hosting, Inc., Term Loan | | | | | | | | |
| | 1,040,264 | | | 5.348%, (LIBOR 3M + 3.000%), 11/3/2023a,b | | | 1,007,974 | | | | 0.3 | % |
| | | | Other Securities^ | | | 2,886,888 | | | | 0.7 | % |
| | | | | |
| | | | Total | | | 5,232,021 | | | | | |
| | | | | |
|
| | Transportation (0.3%) | |
| | | | Arctic LNG Carriers, Ltd., Term Loan | | | | | | | | |
| | 1,012,188 | | | 6.802%, (LIBOR 1M + 4.500%), 5/18/2023a,b | | | 1,012,187 | | | | 0.3 | % |
| | | | Other Securities^ | | | 91,695 | | | | <0.1 | % |
| | | | | |
| | | | Total | | | 1,103,882 | | | | | |
| | | | | |
|
| | Utilities (0.6%) | |
| | | | Other Securities^ | | | 2,213,196 | | | | 0.6 | % |
| | | | | |
| | | | Total | | | 2,213,196 | | | | | |
| | | | | |
| | | | | | | | | | | | |
| | | | | |
| | | | Total Bank Loans (cost $61,833,495) | | | 61,017,064 | | | | | |
| | | | | |
| | | |
| Shares | | | Common Stock (46.1%) | | Value | | | % of Net
Assets | |
| | Communications Services (2.5%) | | | | | | | | |
| | 962 | | | Alphabet, Inc., Class Ae | | | 1,049,138 | | | | 0.3 | % |
| | 24,240 | | | Verizon Communications, Inc. | | | 1,383,862 | | | | 0.4 | % |
| | | | Other Securities^ | | | 6,875,606 | | | | 1.8 | % |
| | | | | |
| | | | Total | | | 9,308,606 | | | | | |
| | | | | |
|
| | Consumer Discretionary (4.5%) | |
| | 1,082 | | | Amazon.com, Inc.e | | | 1,729,047 | | | | 0.5 | % |
| | 11,590 | | | Lowe’s Companies, Inc. | | | 1,103,600 | | | | 0.3 | % |
| | | | Other Securities^ | | | 13,495,561 | | | | 3.7 | % |
| | | | | |
| | | | Total | | | 16,328,208 | | | | | |
| | | | | |
|
| | Consumer Staples (2.7%) | |
| | 47,300 | | | Japan Tobacco, Inc. | | | 1,215,389 | | | | 0.3 | % |
| | 9,841 | | | PepsiCo, Inc. | | | 1,105,932 | | | | 0.3 | % |
The accompanying Notes to Financial Statements are an integral part of this schedule.
62
BALANCED INCOME PLUS FUND
Summary Schedule of Investments as of October 31, 2018
| | | | | | | | | | | | |
| Shares | | | Common Stock (46.1%) | | Value | | | % of Net
Assets | |
| | Consumer Staples (2.7%) - continued | | | | | | | | |
| | 19,297 | | | Unilever plc | | | $1,022,155 | | | | 0.3 | % |
| | | | Other Securities^ | | | 6,423,073 | | | | 1.8 | % |
| | | | | |
| | | | Total | | | 9,766,549 | | | | | |
| | | | | |
|
| | Energy (2.3%) | |
| | 10,056 | | | Chevron Corporation | | | 1,122,752 | | | | 0.3 | % |
| | 32,492 | | | Royal Dutch Shell plc, Class B | | | 1,059,660 | | | | 0.3 | % |
| | | | Other Securities^ | | | 6,387,158 | | | | 1.7 | % |
| | | | | |
| | | | Total | | | 8,569,570 | | | | | |
| | | | | |
|
| | Financials (8.4%) | |
| | 74,619 | | | Bank of America Corporation | | | 2,052,022 | | | | 0.6 | % |
| | 11,231 | | | Capital One Financial Corporation | | | 1,002,928 | | | | 0.3 | % |
| | 35,353 | | | Citigroup, Inc. | | | 2,314,207 | | | | 0.6 | % |
| | 56,164 | | | KeyCorp | | | 1,019,938 | | | | 0.3 | % |
| | 24,038 | | | Zions Bancorporations NA | | | 1,130,988 | | | | 0.3 | % |
| | | | Other Securities^ | | | 23,139,852 | | | | 6.3 | % |
| | | | | |
| | | | Total | | | 30,659,935 | | | | | |
| | | | | |
|
| | Health Care (6.5%) | |
| | 10,945 | | | Johnson & Johnson | | | 1,532,190 | | | | 0.4 | % |
| | 15,854 | | | Medtronic plc | | | 1,424,006 | | | | 0.4 | % |
| | 15,460 | | | Merck & Company, Inc. | | | 1,138,011 | | | | 0.3 | % |
| | 13,013 | | | Novartis AG | | | 1,139,579 | | | | 0.3 | % |
| | 28,880 | | | Novo Nordisk AS | | | 1,247,228 | | | | 0.3 | % |
| | 35,604 | | | Pfizer, Inc. | | | 1,533,108 | | | | 0.4 | % |
| | 4,542 | | | Roche Holding AG | | | 1,105,352 | | | | 0.3 | % |
| | 7,633 | | | UnitedHealth Group, Inc. | | | 1,994,885 | | | | 0.5 | % |
| | | | Other Securities^ | | | 12,860,848 | | | | 3.6 | % |
| | | | | |
| | | | Total | | | 23,975,207 | | | | | |
| | | | | |
|
| | Industrials (6.3%) | |
| | 14,890 | | | CSX Corporation | | | 1,025,325 | | | | 0.3 | % |
| | 10,969 | | | Honeywell International, Inc. | | | 1,588,531 | | | | 0.4 | % |
| | | | Other Securities^ | | | 20,422,550 | | | | 5.6 | % |
| | | | | |
| | | | Total | | | 23,036,406 | | | | | |
| | | | | |
|
| | Information Technology (8.0%) | |
| | 10,087 | | | Apple, Inc. | | | 2,207,641 | | | | 0.6 | % |
| | 65,403 | | | Cisco Systems, Inc. | | | 2,992,187 | | | | 0.8 | % |
| | 7,979 | | | MasterCard, Inc. | | | 1,577,209 | | | | 0.4 | % |
| | 25,010 | | | Microsoft Corporation | | | 2,671,318 | | | | 0.7 | % |
| | 26,417 | | | Oracle Corporation | | | 1,290,206 | | | | 0.4 | % |
| | 8,227 | | | Red Hat, Inc.e | | | 1,412,082 | | | | 0.4 | % |
| | | | Other Securities^ | | | 17,341,634 | | | | 4.7 | % |
| | | | | |
| | | | Total | | | 29,492,277 | | | | | |
| | | | | |
|
| | Materials (2.7%) | |
| | | | Other Securities^ | | | 9,706,560 | | | | 2.7 | % |
| | | | | |
| | | | Total | | | 9,706,560 | | | | | |
| | | | | |
|
| | Real Estate (1.2%) | |
| | | | Other Securities^ | | | 4,431,453 | | | | 1.2 | % |
| | | | | |
| | | | Total | | | 4,431,453 | | | | | |
| | | | | |
|
| | Utilities (1.0%) | |
| | | | Other Securities^ | | | 3,570,488 | | | | 1.0 | % |
| | | | | |
| | | | Total | | | 3,570,488 | | | | | |
| | | | | |
| | | | | | | | | | | | |
| | | | | |
| | | | Total Common Stock (cost $165,300,268) | | | 168,845,259 | | | | | |
| | | | | |
| | | |
Principal
Amount | | | Long-Term Fixed Income (24.4%) | | Value | | | % of Net
Assets | |
| | Asset-Backed Securities (3.1%) | |
| | | | THL Credit Wind River CLO, Ltd. | | | | | | | | |
| | 1,075,000 | | | 3.860%, (LIBOR 3M + 1.450%), 10/22/2031, Ser. 2014-3A, Class A2R2*,b | | | 1,074,970 | | | | 0.3 | % |
| | | | Other Securities^ | | | 10,263,467 | | | | 2.8 | % |
| | | | | |
| | | | Total | | | 11,338,437 | | | | | |
| | | | | |
|
| | Basic Materials (0.6%) | |
| | | | Other Securities^ | | | 2,003,376 | | | | 0.6 | % |
| | | | | |
| | | | Total | | | 2,003,376 | | | | | |
| | | | | |
|
| | Capital Goods (0.9%) | |
| | | | Other Securities^ | | | 3,075,382 | | | | 0.9 | % |
| | | | | |
| | | | Total | | | 3,075,382 | | | | | |
| | | | | |
|
| | Collateralized Mortgage Obligations (2.7%) | |
| | | | Banc of America Mortgage Securities, Inc. | | | | | | | | |
| | 74,947 | | | 4.368%, 9/25/2035, Ser. 2005-H, Class 2A1b | | | 72,622 | | | | <0.1 | % |
| | | | CHL Mortgage Pass-Through Trust | | | | | | | | |
| | 319,348 | | | 3.610%, 11/20/2035, Ser. 2005-HYB7, Class 6A1b | | | 298,249 | | | | 0.1 | % |
| | 207,651 | | | 4.109%, 12/20/2035, Ser. 2005-HYB8, Class 3A1b | | | 198,967 | | | | 0.1 | % |
| | | | Countrywide Home Loan Mortgage Pass Through Trust | | | | | | | | |
| | 198,146 | | | 4.060%, 11/25/2035, Ser. 2005-22, Class 2A1b | | | 176,778 | | | | 0.1 | % |
| | | | Federal National Mortgage Association - REMIC | | | | | | | | |
| | 10,426,488 | | | 2.500% - 3.000%, 7/25/2027 - 6/25/2028, Ser. 2012-147, Class EIf | | | 833,853 | | | | 0.1 | % |
| | | | Other Securities^ | | | 8,618,676 | | | | 2.3 | % |
| | | | | |
| | | | Total | | | 10,199,145 | | | | | |
| | | | | |
The accompanying Notes to Financial Statements are an integral part of this schedule.
63
BALANCED INCOME PLUS FUND
Summary Schedule of Investments as of October 31, 2018
| | | | | | | | | | | | |
Principal
Amount | | | Long-Term Fixed Income (24.4%) | | Value | | | % of Net
Assets | |
| | Commercial Mortgage-Backed Securities (0.1%) | | | | | | | | |
| | | | Other Securities^ | | | $387,650 | | | | 0.1 | % |
| | | | | |
| | | | Total | | | 387,650 | | | | | |
| | | | | |
| | |
| | Communications Services (1.5%) | | | | | | | | |
| | | | Other Securities^ | | | 5,597,256 | | | | 1.5 | % |
| | | | | |
| | | | Total | | | 5,597,256 | | | | | |
| | | | | |
| | |
| | Consumer Cyclical (1.4%) | | | | | | | | |
| | | | Other Securities^ | | | 5,057,535 | | | | 1.4 | % |
| | | | | |
| | | | Total | | | 5,057,535 | | | | | |
| | | | | |
| | |
| | Consumer Non-Cyclical (1.0%) | | | | | | | | |
| | | | Other Securities^ | | | 3,608,419 | | | | 1.0 | % |
| | | | | |
| | | | Total | | | 3,608,419 | | | | | |
| | | | | |
| | |
| | Energy (1.7%) | | | | | | | | |
| | | | Other Securities^ | | | 6,365,153 | | | | 1.7 | % |
| | | | | |
| | | | Total | | | 6,365,153 | | | | | |
| | | | | |
| | |
| | Financials (3.4%) | | | | | | | | |
| | | | Bank of America Corporation | | | | | | | | |
| | 76,000 | | | 2.328%, 10/1/2021b | | | 74,193 | | | | <0.1 | % |
| | 74,000 | | | 3.499%, 5/17/2022b | | | 73,677 | | | | <0.1 | % |
| | 74,000 | | | 2.738%, 1/23/2022b | | | 72,524 | | | | <0.1 | % |
| | 71,000 | | | 3.550%, 3/5/2024b | | | 69,680 | | | | <0.1 | % |
| | 37,000 | | | 2.369%, 7/21/2021b | | | 36,291 | | | | <0.1 | % |
| | 33,000 | | | 3.864%, 7/23/2024b | | | 32,763 | | | | <0.1 | % |
| | | | Other Securities^ | | | 12,154,856 | | | | 3.4 | % |
| | | | | |
| | | | Total | | | 12,513,984 | | | | | |
| | | | | |
| | |
| | Mortgage-Backed Securities (6.3%) | | | | | | | | |
| | | | Federal Home Loan Mortgage Corporation Gold 30-Yr. Pass Through | | | | | | | | |
| | 3,025,000 | | | 4.000%, 11/1/2048d | | | 3,026,049 | | | | 0.8 | % |
| | | | Federal National Mortgage Association Conventional 30- Yr. Pass Through | | | | | | | | |
| | 4,050,000 | | | 3.500%, 11/1/2048d | | | 3,942,580 | | | | 1.1 | % |
| | 3,850,000 | | | 4.000%, 11/1/2048d | | | 3,849,984 | | | | 1.1 | % |
| | 7,550,000 | | | 4.500%, 11/1/2048d | | | 7,730,050 | | | | 2.1 | % |
| | 1,775,000 | | | 5.000%, 11/1/2048d | | | 1,852,240 | | | | 0.5 | % |
| | | | Merrill Lynch Alternative Note Asset Trust | | | | | | | | |
| | 654,708 | | | 2.431%, (LIBOR 1M + 0.150%), 1/25/2037, Ser. 2007-A1, Class A2Bb | | | 290,871 | | | | 0.1 | % |
| | | | Other Securities^ | | | 2,130,318 | | | | 0.6 | % |
| | | | | |
| | | | Total | | | 22,822,092 | | | | | |
| | | | | |
| | |
| | Technology (1.0%) | | | | | | | | |
| | | | Other Securities^ | | | 3,776,433 | | | | 1.0 | % |
| | | | | |
| | | | Total | | | 3,776,433 | | | | | |
| | | | | |
| | |
| | Transportation (0.2%) | | | | | | | | |
| | | | Other Securities^ | | | 804,243 | | | | 0.2 | % |
| | | | | |
| | | | Total | | | 804,243 | | | | | |
| | | | | |
| | |
| | Utilities (0.5%) | | | | | | | | |
| | | | Other Securities^ | | | 1,782,676 | | | | 0.5 | % |
| | | | | |
| | | | Total | | | 1,782,676 | | | | | |
| | | | | |
| | | | | | | | | | | | |
| | | | | |
| | | | Total Long-Term Fixed Income (cost $89,894,468) | | | 89,331,781 | | | | | |
| | | | | |
| | | |
| Shares | | | Registered Investment Companies (7.3%) | | Value | | | % of Net
Assets | |
| | Affiliated Fixed Income Holdings (6.4%) | | | | | | | | |
| | 2,592,289 | | | Thrivent Core Emerging Markets Debt Fund | | | 23,434,295 | | | | 6.4 | % |
| | | | | |
| | | | Total | | | 23,434,295 | | | | | |
| | | | | |
| | |
| | Equity Funds/Exchange Traded Funds (0.3%) | | | | | | | | |
| | | | Other Securities^ | | | 948,332 | | | | 0.3 | % |
| | | | | |
| | | | Total | | | 948,332 | | | | | |
| | | | | |
| | |
| | Fixed Income Funds/Exchange Traded Funds (0.6%) | | | | | | | | |
| | | | Other Securities^ | | | 2,330,888 | | | | 0.6 | % |
| | | | | |
| | | | Total | | | 2,330,888 | | | | | |
| | | | | |
| | | | | | | | | | | | |
| | | | | |
| | | | Total Registered Investment Companies (cost $28,925,062) | | | 26,713,515 | | | | | |
| | | | | |
| | | |
| Shares | | | Preferred Stock (0.8%) | | Value | | | % of Net
Assets | |
| | Consumer Staples (0.1%) | | | | | | | | |
| | | | Other Securities^ | | | 272,844 | | | | 0.1 | % |
| | | | | |
| | | | Total | | | 272,844 | | | | | |
| | | | | |
| | |
| | Energy (0.2%) | | | | | | | | |
| | | | Other Securities^ | | | 682,561 | | | | 0.2 | % |
| | | | | |
| | | | Total | | | 682,561 | | | | | |
| | | | | |
| | |
| | Financials (0.5%) | | | | | | | | |
| | 5,944 | | | Federal National Mortgage Association, 0.000%e,g | | | 35,545 | | | | <0.1 | % |
| | | | Other Securities^ | | | 1,685,697 | | | | 0.5 | % |
| | | | | |
| | | | Total | | | 1,721,242 | | | | | |
| | | | | |
| | |
| | Real Estate (<0.1%) | | | | | | | | |
| | | | Other Securities^ | | | 197,523 | | | | <0.1 | % |
| | | | | |
| | | �� | Total | | | 197,523 | | | | | |
| | | | | |
| | | | | | | | | | | | |
| | | | | |
| | | | Total Preferred Stock (cost $2,819,864) | | | 2,874,170 | | | | | |
| | | | | |
The accompanying Notes to Financial Statements are an integral part of this schedule.
64
BALANCED INCOME PLUS FUND
Summary Schedule of Investments as of October 31, 2018
| | | | | | | | | | | | |
| Shares | | | Collateral Held for Securities Loaned (0.6%) | | Value | | | % of Net
Assets | |
| | 2,305,594 | | | Thrivent Cash Management Trust | | | $2,305,594 | | | | 0.6 | % |
| | | | | |
| | | | Total Collateral Held for Securities Loaned (cost $2,305,594) | | | 2,305,594 | | | | | |
| | | | | |
| | | |
Shares or
Principal
Amount | | | Short-Term Investments (11.8%) | | Value | | | % of Net
Assets | |
| | | | Thrivent Core Short-Term Reserve Fund | | | | | | | | |
| | 4,188,960 | | | 2.430% | | | 41,889,597 | | | | 11.4 | % |
| | | | Other Securities^ | | | 1,547,366 | | | | 0.4 | % |
| | | | | |
| | | | Total Short-Term Investments (cost $43,437,052) | | | 43,436,963 | | | | | |
| | | | | |
| | | | Total Investments (cost $394,515,803) 107.6% | | | $394,524,346 | | | | | |
| | | | | |
| | | | Other Assets and Liabilities, Net (7.6%) | | | (27,989,068 | ) | | | | |
| | | | | |
| | | | Total Net Assets 100.0% | | | $366,535,278 | | | | | |
| | | | | |
| ^ | The Summary Schedule of Investments shows the 50 largest holdings in unaffiliated issuers, any holding or issuer that exceeds 1% of net assets and all affiliated holdings as of the report date. The remaining securities held are grouped by category as “Other securities”. |
| a | The stated interest rate represents the weighted average of all contracts within the bank loan facility. |
| b | Denotes variable rate securities. The rate shown is as of October 31, 2018. The rates of certain variable rate securities are based on a published reference rate and spread; these may vary by security and the reference rate and spread are indicated in their description. The rates of other variable rate securities are determined by the issuer or agent and are based on current market conditions. These securities do not indicate a reference rate and spread in their description. |
| c | All or a portion of the loan is unfunded. |
| d | Denotes investments purchased on a when-issued or delayed delivery basis. |
| e | Non-income producing security. |
| f | Denotes interest only security. Interest only securities represent the right to receive monthly interest payments on an underlying pool of mortgages or assets. The principal shown is the outstanding par amount of the pool as of the end of the period. The actual effective yield of the security is different than the stated coupon rate. |
| g | Denotes perpetual securities. Perpetual securities pay an indefinite stream of interest and have no contractual maturity date. Date shown, if applicable, is next call date. |
| * | Denotes restricted securities. Restricted securities are investment securities which cannot be offered for public sale without first being registered under the Securities Act of 1933. The value of all restricted securities held in Balanced Income Plus Fund as of October 31, 2018 was $10,903,723 or 3.0% of total net assets. The following table indicates the acquisition date and cost of restricted securities shown in the schedule as of October 31, 2018. |
| | | | | | | | |
Security | | Acquisition
Date | | | Cost | |
THL Credit Wind River CLO, Ltd., 10/22/2031 | | | 9/21/2018 | | | $ | 1,075,000 | |
The following table presents the total amount of securities loaned with continuous maturity, by type, offset by the gross payable upon return of collateral for securities loaned by Thrivent Balanced Income Plus Fund as of October 31, 2018:
| | | | |
| Securities Lending Transactions | | | | |
Common Stock | | | $1,581,195 | |
Taxable Debt Security | | | 632,431 | |
| | | | |
Total lending | | | $2,213,626 | |
Gross amount payable upon return of collateral for securities loaned | | | $2,305,594 | |
| | | | |
Net amounts due to counterparty | | | $91,968 | |
| | | | |
Definitions:
| | | | |
| CLO | | - | | Collateralized Loan Obligation |
| REMIC | | - | | Real Estate Mortgage Investment Conduit |
| Ser. | | - | | Series |
Reference Rate Index:
| | | | |
LIBOR 1M | | - | | ICE Libor USD Rate 1 Month |
LIBOR 3M | | - | | ICE Libor USD Rate 3 Month |
| | | | |
| Unrealized Appreciation (Depreciation) | | | | |
| Gross unrealized appreciation and depreciation of investments of the portfolio as a whole (including derivatives), based on cost for federal income tax purposes, were as follows: | |
Gross unrealized appreciation | | | $16,144,462 | |
Gross unrealized depreciation | | | (16,236,392 | ) |
| | | | |
Net unrealized appreciation (depreciation) | | | ($91,930 | ) |
| |
Cost for federal income tax purposes | | | $398,017,158 | |
The accompanying Notes to Financial Statements are an integral part of this schedule.
65
BALANCED INCOME PLUS FUND
Summary Schedule of Investments as of October 31, 2018
Fair Valuation Measurements
The following table is a summary of the inputs used, as of October 31, 2018, in valuing Balanced Income Plus Fund’s assets carried at fair value.
| | | | | | | | | | | | | | | | |
| Investments in Securities | | Total | | | Level 1 | | | Level 2 | | | Level 3 | |
| | | | |
Bank Loans | | | | | | | | | | | | | | | | |
Basic Materials | | | 3,902,758 | | | | – | | | | 3,902,758 | | | | – | |
Capital Goods | | | 3,220,187 | | | | – | | | | 3,220,187 | | | | – | |
Communications Services | | | 16,828,272 | | | | – | | | | 16,681,072 | | | | 147,200 | |
Consumer Cyclical | | | 7,163,845 | | | | – | | | | 7,163,845 | | | | – | |
Consumer Non-Cyclical | | | 11,149,920 | | | | – | | | | 11,149,920 | | | | – | |
Energy | | | 4,064,178 | | | | – | | | | 3,364,461 | | | | 699,717 | |
Financials | | | 6,138,805 | | | | – | | | | 5,625,856 | | | | 512,949 | |
Technology | | | 5,232,021 | | | | – | | | | 5,232,021 | | | | – | |
Transportation | | | 1,103,882 | | | | – | | | | 1,103,882 | | | | – | |
Utilities | | | 2,213,196 | | | | – | | | | 1,812,747 | | | | 400,449 | |
| | | | |
Common Stock | | | | | | | | | | | | | | | | |
Communications Services | | | 9,308,606 | | | | 7,230,072 | | | | 2,078,534 | | | | – | |
Consumer Discretionary | | | 16,328,208 | | | | 9,928,906 | | | | 6,399,302 | | | | – | |
Consumer Staples | | | 9,766,549 | | | | 4,358,757 | | | | 5,407,792 | | | | – | |
Energy | | | 8,569,570 | | | | 6,603,056 | | | | 1,849,239 | | | | 117,275 | |
Financials | | | 30,659,935 | | | | 25,418,678 | | | | 5,241,257 | | | | – | |
Health Care | | | 23,975,207 | | | | 19,370,927 | | | | 4,604,280 | | | | – | |
Industrials | | | 23,036,406 | | | | 15,937,882 | | | | 7,098,524 | | | | – | |
Information Technology | | | 29,492,277 | | | | 25,851,896 | | | | 3,640,381 | | | | – | |
Materials | | | 9,706,560 | | | | 4,066,100 | | | | 5,640,460 | | | | – | |
Real Estate | | | 4,431,453 | | | | 3,268,675 | | | | 1,162,778 | | | | – | |
Utilities | | | 3,570,488 | | | | 2,485,658 | | | | 1,084,830 | | | | – | |
| | | | |
Long-Term Fixed Income | | | | | | | | | | | | | | | | |
Asset-Backed Securities | | | 11,338,437 | | | | – | | | | 9,663,437 | | | | 1,675,000 | |
Basic Materials | | | 2,003,376 | | | | – | | | | 2,003,376 | | | | – | |
Capital Goods | | | 3,075,382 | | | | – | | | | 3,075,382 | | | | – | |
Collateralized Mortgage Obligations | | | 10,199,145 | | | | – | | | | 10,199,145 | | | | – | |
Commercial Mortgage-Backed Securities | | | 387,650 | | | | – | | | | 387,650 | | | | – | |
Communications Services | | | 5,597,256 | | | | – | | | | 5,597,256 | | | | – | |
Consumer Cyclical | | | 5,057,535 | | | | – | | | | 5,057,535 | | | | – | |
Consumer Non-Cyclical | | | 3,608,419 | | | | – | | | | 3,608,419 | | | | – | |
Energy | | | 6,365,153 | | | | – | | | | 6,365,153 | | | | – | |
Financials | | | 12,513,984 | | | | – | | | | 11,723,184 | | | | 790,800 | |
Mortgage-Backed Securities | | | 22,822,092 | | | | – | | | | 22,086,777 | | | | 735,315 | |
Technology | | | 3,776,433 | | | | – | | | | 3,776,433 | | | | – | |
Transportation | | | 804,243 | | | | – | | | | 804,243 | | | | – | |
Utilities | | | 1,782,676 | | | | – | | | | 1,782,676 | | | | – | |
| | | | |
Registered Investment Companies | | | | | | | | | | | | | | | | |
Fixed Income Funds/Exchange Traded Funds | | | 2,330,888 | | | | 2,330,888 | | | | – | | | | – | |
Equity Funds/Exchange Traded Funds | | | 948,332 | | | | 948,332 | | | | – | | | | – | |
| | | | |
Preferred Stock | | | | | | | | | | | | | | | | |
Consumer Staples | | | 272,844 | | | | 272,844 | | | | – | | | | – | |
Energy | | | 682,561 | | | | 294,606 | | | | 387,955 | | | | – | |
Financials | | | 1,721,242 | | | | 937,453 | | | | 783,789 | | | | – | |
Real Estate | | | 197,523 | | | | 197,523 | | | | – | | | | – | |
Options Purchased | | | – | | | | – | | | | – | | | | – | |
Short-Term Investments | | | 1,547,366 | | | | – | | | | 1,547,366 | | | | – | |
| |
Subtotal Investments in Securities | | | $326,894,860 | | | | $129,502,253 | | | | $192,313,902 | | | | $5,078,705 | |
| |
| |
| | | | |
| Other Investments* | | Total | | | | | | | | | | |
| | | | | | | | | | | | | |
Affiliated Registered Investment Companies | | | 23,434,295 | | | | | | | | | | | | | |
Short-Term Investments | | | 41,889,597 | | | | | | | | | | | | | |
Collateral Held for Securities Loaned | | | 2,305,594 | | | | | | | | | | | | | |
| | | | | | | | | | | | | |
Subtotal Other Investments | | | $67,629,486 | | | | | | | | | | | | | |
| | | | | | | | | | | | | |
| | | | | | | | | | | | | | | | |
| | | | | | | | | | | | | |
Total Investments at Value | | | $394,524,346 | | | | | | | | | | | | | |
| | | | | | | | | | | | | |
| * | Certain investments are measured at fair value using a net asset value per share that is not publicly available (practical expedient). According to disclosure requirements of Accounting Standards Codification (ASC) 820, Fair Value Measurement, securities valued using the practical expedient are not classified in the fair value hierarchy. The fair value amounts presented in this table are intended to permit reconciliation of the fair value hierarchy to the amounts presented in the Statement of Assets and Liabilities. |
The accompanying Notes to Financial Statements are an integral part of this schedule.
66
BALANCED INCOME PLUS FUND
Summary Schedule of Investments as of October 31, 2018
| | | | | | | | | | | | | | | | |
| | | | |
| Other Financial Instruments | | Total | | | Level 1 | | | Level 2 | | | Level 3 | |
Asset Derivatives | | | | | | | | | | | | | | | | |
Futures Contracts | | | 117,440 | | | | 117,440 | | | | – | | | | – | |
| |
Total Asset Derivatives | | | $117,440 | | | | $117,440 | | | | $– | | | | $– | |
| |
| |
Liability Derivatives | | | | | | | | | | | | | | | | |
Futures Contracts | | | 286,549 | | | | 286,549 | | | | – | | | | – | |
| |
Total Liability Derivatives | | | $286,549 | | | | $286,549 | | | | $– | | | | $– | |
| |
| |
There were no significant transfers between Levels during the period ended October 31, 2018. Transfers between Levels are identified as of the end of the period.
The following table presents Balanced Income Plus Fund’s futures contracts held as of October 31, 2018. Investments and/or cash totaling $1,547,366 were pledged as the initial margin deposit for these contracts.
| | | | | | | | | | | | | | | | |
| Futures Contracts Description | | Number of
Contracts
Long/(Short) | | | Expiration
Date | | | Notional
Principal
Amount | | | Value and
Unrealized | |
CBOT 10-Yr. U.S. Treasury Note | | | 81 | | | | December 2018 | | | | $9,729,189 | | | | ($135,752) | |
CBOT 5-Yr. U.S. Treasury Note | | | 8 | | | | December 2018 | | | | 907,775 | | | | (8,712) | |
CBOT U.S. Long Bond | | | 14 | | | | December 2018 | | | | 1,942,670 | | | | (8,920) | |
CME Ultra Long Term U.S. Treasury Bond | | | 12 | | | | December 2018 | | | | 1,923,790 | | | | (133,165) | |
| |
Total Futures Long Contracts | | | | | | | | | | | $14,503,424 | | | | ($286,549) | |
| |
CBOT 2-Yr. U.S. Treasury Note | | | (41 | ) | | | December 2018 | | | | ($8,669,453 | ) | | | $32,547 | |
CME E-mini S&P 500 Index | | | (5 | ) | | | December 2018 | | | | (723,612 | ) | | | 45,837 | |
Ultra 10-Yr. U.S. Treasury Note | | | (12 | ) | | | December 2018 | | | | (1,540,368 | ) | | | 39,056 | |
| |
Total Futures Short Contracts | | | | | | | | | | | ($10,933,433 | ) | | | $117,440 | |
| |
Total Futures Contracts | | | | | | | | | | | $3,569,991 | | | | ($169,109) | |
| |
Reference Description:
| | | | |
| CBOT | | - | | Chicago Board of Trade |
| CME | | - | | Chicago Mercantile Exchange |
| S&P | | - | | Standard & Poor’s |
The following table summarizes the fair value and Statement of Assets and Liabilities location, as of October 31, 2018, for Balanced Income Plus Fund’s investments in financial derivative instruments by primary risk exposure as discussed under item (2) Significant Accounting Policies of the Notes to Financial Statements.
| | | | | | |
| Derivatives by risk category | | Statement of Assets and Liabilities Location | | Fair Value | |
| | |
Asset Derivatives | | | | | | |
| | |
Interest Rate Contracts | | | | | | |
Futures* | | Net Assets - Accumulated undistributed earnings/(loss) | | | $71,603 | |
Total Interest Rate Contracts | | | | | 71,603 | |
| | |
Equity Contracts | | | | | | |
Futures* | | Net Assets - Accumulated undistributed earnings/(loss) | | | 45,837 | |
Total Equity Contracts | | | | | 45,837 | |
Total Asset Derivatives | | | | | $117,440 | |
| | | | | | | |
| | |
Liability Derivatives | | | | | | |
| | |
Interest Rate Contracts | | | | | | |
Futures* | | Net Assets - Accumulated undistributed earnings/(loss) | | | 286,549 | |
Total Interest Rate Contracts | | | | | 286,549 | |
Total Liability Derivatives | | | | | $286,549 | |
| | | | | | | |
| * | Includes cumulative appreciation/depreciation of futures contracts as reported in the Schedule of Investments. Only current day’s variation margin is reported within the Statement of Assets and Liabilities. |
The accompanying Notes to Financial Statements are an integral part of this schedule.
67
BALANCED INCOME PLUS FUND
Summary Schedule of Investments as of October 31, 2018
The following table summarizes the net realized gains/(losses) and Statement of Operations location, for the period ended October 31, 2018, for Balanced Income Plus Fund’s investments in financial derivative instruments by primary risk exposure.
| | | | | | |
| Derivatives by risk category | | Statement of Operations Location | | Realized Gains/(Losses)
recognized in Income | |
| | |
Interest Rate Contracts | | | | | | |
Options Written | | Net realized gains/(losses) on Written option contracts | | | 4,765 | |
Futures | | Net realized gains/(losses) on Futures contracts | | | 101,536 | |
Total Interest Rate Contracts | | | | | 106,301 | |
| | |
Equity Contracts | | | | | | |
Futures | | Net realized gains/(losses) on Futures contracts | | | (433,920 | ) |
Total Equity Contracts | | | | | (433,920 | ) |
Total | | | | | ($327,619 | ) |
| | | | | | | |
The following table summarizes the change in net unrealized appreciation/(depreciation) and Statement of Operations location, for the period ended October 31, 2018, for Balanced Income Plus Fund’s investments in financial derivative instruments by primary risk exposure.
| | | | | | |
| Derivatives by risk category | | Statement of Operations Location | | Change in unrealized
appreciation/(depreciation)
recognized in Income | |
| | |
Interest Rate Contracts | | | | | | |
Options Written | | Change in net unrealized appreciation/(depreciation) on Written option contracts | | | (6,529 | ) |
Futures | | Change in net unrealized appreciation/(depreciation) on Futures contracts | | | (211,502 | ) |
Total Interest Rate Contracts | | | | | (218,031 | ) |
| | |
Equity Contracts | | | | | | |
Futures | | Change in net unrealized appreciation/(depreciation) on Futures contracts | | | 338,039 | |
Total Equity Contracts | | | | | 338,039 | |
| |
Total | | | | | $120,008 | |
| |
| |
The following table presents Balanced Income Plus Fund’s average volume of derivative activity during the period ended October 31, 2018.
| | | | |
| Derivative Risk Category | | Average Notional Value | |
Equity Contracts | | | | |
Futures - Long | | | $5,731,734 | |
Futures - Short | | | (7,427,548 | ) |
Interest Rate Contracts | | | | |
Futures - Long | | | 10,462,928 | |
Futures - Short | | | (12,284,163 | ) |
Written Options | | | (303,399 | ) |
Investment in Affiliates
Affiliated issuers, as defined under the Investment Company Act of 1940, include those in which the Fund’s holdings of an issuer represent 5% or more of the outstanding voting securities of an issuer, any affiliated mutual fund, or a company which is under common ownership or control with the Fund. The Fund owns shares of Thrivent Cash Management Trust for the purpose of securities lending and Thrivent Core Short-Term Reserve Fund primarily to serve as a cash sweep vehicle for the Fund. Thrivent Cash Management Trust and Thrivent Core Funds are established solely for investment by Thrivent entities.
A summary of transactions (in thousands) for the fiscal year to date, in Balanced Income Plus Fund, is as follows:
| | | | | | | | | | | | | | | | | | | | | | | | |
| Fund | | Value
10/31/2017 | | | Gross
Purchases | | | Gross
Sales | | | Shares Held at
10/31/2018 | | | Value
10/31/2018 | | | % of Net
Assets | |
Affiliated Fixed Income Holdings | | | | | | | | | | | | | | | | | | | | | | | | |
Core Emerging Markets Debt | | | $242 | | | | $24,822 | | | | $– | | | | 2,592 | | | | $23,434 | | | | 6.4 | % |
Total Affiliated Fixed Income Holdings | | | 242 | | | | | | | | | | | | | | | | 23,434 | | | | 6.4 | |
Affiliated Short-Term Investments | | | | | | | | | | | | | | | | | | | | | | | | |
Core Short-Term Reserve, 2.430% | | | 32,549 | | | | 130,728 | | | | 121,387 | | | | 4,189 | | | | 41,890 | | | | 11.4 | |
Total Affiliated Short-Term Investments | | | 32,549 | | | | | | | | | | | | | | | | 41,890 | | | | 11.4 | |
Collateral Held for Securities Loaned | | | | | | | | | | | | | | | | | | | | | | | | |
Cash Management Trust-Collateral Investment | | | 4,119 | | | | 61,402 | | | | 63,215 | | | | 2,306 | | | | 2,306 | | | | 0.6 | |
Total Collateral Held for Securities Loaned | | | 4,119 | | | | | | | | | | | | | | | | 2,306 | | | | 0.6 | |
Total Value | | | $36,910 | | | | | | | | | | | | | | | | $67,630 | | | | | |
The accompanying Notes to Financial Statements are an integral part of this schedule.
68
BALANCED INCOME PLUS FUND
Summary Schedule of Investments as of October 31, 2018
| | | | | | | | | | | | | | | | |
| Fund | | Net Realized
Gain/(Loss) | | | Change in
Unrealized
Appreciation/
(Depreciation) | | | Distributions of
Realized Capital
Gains | | | Income Earned
11/1/2017
- 10/31/2018 | |
Affiliated Fixed Income Holdings | | | | | | | | | | | | | | | | |
Core Emerging Markets Debt | | | $– | | | | $(1,630 | ) | | | $– | | | | $798 | |
Affiliated Short-Term Investments | | | | | | | | | | | | | | | | |
Core Short-Term Reserve, 2.430% | | | – | | | | – | | | | 0 | | | | 748 | |
Total Income from Affiliated Investments | | | | | | | | | | | | | | | $1,546 | |
Collateral Held for Securities Loaned | | | | | | | | | | | | | | | | |
Cash Management Trust- Collateral Investment | | | – | | | | – | | | | – | | | | 32 | |
Total Affiliated Income from Securities Loaned, Net | | | | | | | | | | | | | | | $32 | |
Total | | | $– | | | | $(1,630 | ) | | | $0 | | | | | |
The accompanying Notes to Financial Statements are an integral part of this schedule.
69
GOVERNMENT BOND FUND
Schedule of Investments as of October 31, 2018
| | | | | | | | |
Principal Amount | | | Long-Term Fixed Income (98.0%) | | Value | |
| | Asset-Backed Securities (6.0%) | | | | |
| | | | Federal Home Loan Mortgage Corporation Multifamily Structured Pass Through Certificates | | | | |
| | | | 3.900%, 8/25/2028, Ser. | | | | |
| | $550,000 | | | K081, Class A2a | | | $553,877 | |
| | | | Navient Student Loan Trust | | | | |
| | | | 3.031%, (LIBOR 1M + 0.750%), 7/25/2066, Ser. | | | | |
| | 489,451 | | | 2017-1A, Class A2a,b | | | 491,676 | |
| | | | 2.881%, (LIBOR 1M + 0.600%), 7/26/2066, Ser. | | | | |
| | 500,000 | | | 2017-3A, Class A2a,b | | | 502,681 | |
| | | | Northstar Education Finance, Inc. | | | | |
| | | | 2.981%, (LIBOR 1M + 0.700%), 12/26/2031, Ser. | | | | |
| | 275,561 | | | 2012-1, Class Aa,b | | | 276,824 | |
| | | | SBA Small Business Investment Companies | | | | |
| | | | 3.548%, 9/11/2028, Ser. | | | | |
| | 1,000,000 | | | 2018-10B, Class 1 | | | 993,031 | |
| | | | SLM Student Loan Trust | | | | |
| | | | 2.681%, (LIBOR 1M + 0.400%), 3/25/2025, Ser. | | | | |
| | 210,625 | | | 2010-1, Class Aa | | | 207,522 | |
| | | | U.S. Small Business Administration | | | | |
| | | | 3.191%, 3/10/2024, Ser. | | | | |
| | 421,545 | | | 2014-10A, Class 1 | | | 418,049 | |
| | | | | |
| | | | Total | | | 3,443,660 | |
| | | | | |
| |
| | Collateralized Mortgage Obligations (2.2%) | | | | |
| | | | Federal Home Loan Mortgage Corporation Whole Loan Securities Trust | | | | |
| | | | 3.000%, 7/25/2046, Ser. | | | | |
| | 431,793 | | | 2016-SC01, Class 1Ac | | | 405,909 | |
| | | | NCUA Guaranteed Notes | | | | |
| | | | 2.729%, (LIBOR 1M + 0.450%), 10/7/2020, Ser. | | | | |
| | 173,723 | | | 2010-R1, Class 1Aa,c | | | 173,953 | |
| | | | Seasoned Credit Risk Transfer Trust | | | | |
| | | | 2.500%, 8/25/2056, Ser. | | | | |
| | 710,614 | | | 2017-2, Class HAc,d | | | 683,759 | |
| | | | | |
| | | | Total | | | 1,263,621 | |
| | | | | |
| |
| | Commercial Mortgage-Backed Securities (8.0%) | | | | |
| | | | Federal Home Loan Mortgage Corporation Multifamily Structured Pass Through Certificates | | | | |
| | | | 3.650%, 2/25/2028, Ser. | | | | |
| | 250,000 | | | K075, Class A2a | | | 248,167 | |
| | | | Federal Home Loan Mortgage Corporation Multifamily Structured Pass Through Certificates | | | | |
| | | | 2.776%, 3/25/2023, Ser. | | | | |
| | 392,552 | | | K724, Class A1c | | | 386,465 | |
| | | | 2.561%, (LIBOR 1M + 0.300%), 11/25/2024, Ser. | | | | |
| | 362,849 | | | KF41, Class Aa,c | | | 361,148 | |
| | | | 3.430%, 1/25/2027, Ser. | | | | |
| | 500,000 | | | K063, Class A2a | | | 493,174 | |
| | | | 3.444%, 12/25/2027, Ser. | | | | |
| | 664,000 | | | K072, Class A2c | | | 649,477 | |
| | | | 3.900%, 4/25/2028, Ser. | | | | |
| | 500,000 | | | K076, Class A2c | | | 505,642 | |
| | | | Federal National Mortgage Association - ACES | | | | |
| | | | 3.560%, 9/25/2021, Ser. | | | | |
| | 450,548 | | | 2018-M5, Class A2a | | | 451,682 | |
| | | | 3.346%, 3/25/2024, Ser. | | | | |
| | 415,000 | | | 2014-M4, Class A2a | | | 412,549 | |
| | | | 2.565%, (LIBOR 1M + 0.400%), 10/25/2024, Ser. | | | | |
| | 442,495 | | | 2017-M13, Class FAa | | | 441,939 | |
| | | | 2.961%, 2/25/2027, Ser. | | | | |
| | 160,000 | | | 2017-M7, Class A2a | | | 151,252 | |
| | | | FRESB Multifamily Mortgage Pass- Through Trust | | | | |
| | | | 2.950%, 8/25/2027, Ser. | | | | |
| | 489,363 | | | 2017-SB40, Class A10Fa,c | | | 469,004 | |
| | | | | |
| | | | Total | | | 4,570,499 | |
| | | | | |
| |
| | Consumer Cyclical (1.0%) | | | | |
| | | | Board of Trustees of The Leland Stanford Junior University | | | | |
| | 125,000 | | | 3.563%, 6/1/2044 | | | 114,103 | |
| | | | California Institute of Technology | | | | |
| | 75,000 | | | 4.700%, 11/1/2111 | | | 73,451 | |
| | | | Dartmouth College | | | | |
| | 125,000 | | | 3.760%, 6/1/2043 | | | 115,816 | |
| | | | Massachusetts Institute of Technology | | | | |
| | 125,000 | | | 4.678%, 7/1/2114 | | | 128,371 | |
| | | | President and Fellows of Harvard College | | | | |
| | 125,000 | | | 3.619%, 10/1/2037 | | | 118,488 | |
| | | | | |
| | | | Total | | | 550,229 | |
| | | | | |
| |
| | Energy (0.6%) | | | | |
| | | | Petroleos Mexicanos | | | | |
| | 325,000 | | | 2.378%, 4/15/2025 | | | 315,902 | |
| | | | | |
| | | | Total | | | 315,902 | |
| | | | | |
| |
| | Financials (3.4%) | | | | |
| | | | Bank Nederlandse Gemeenten NV | | | | |
| | 500,000 | | | 2.401%, (LIBOR 3M + 0.070%), 3/11/2022a,b | | | 500,650 | |
| | | | Korea Development Bank | | | | |
| | 500,000 | | | 3.016%, (LIBOR 3M + 0.705%), 5/27/2022a | | | 500,859 | |
| | | | Private Export Funding Corporation | | | | |
| | 1,000,000 | | | 2.050%, 11/15/2022 | | | 960,105 | |
| | | | | |
| | | | Total | | | 1,961,614 | |
| | | | | |
| |
| | Foreign Government (8.8%) | | | | |
| | | | CPPIB Capital, Inc. | | | | |
| | 500,000 | | | 2.250%, 1/25/2022b | | | 485,339 | |
| | | | Development Bank of Japan, Inc. | | | | |
| | 250,000 | | | 2.125%, 9/1/2022b | | | 238,648 | |
| | | | Export Development Canada | | | | |
| | 500,000 | | | 2.500%, 1/24/2023 | | | 487,330 | |
| | | | Inter-American Development Bank | | | | |
| | 600,000 | | | 4.375%, 1/24/2044 | | | 675,206 | |
The accompanying Notes to Financial Statements are an integral part of this schedule.
70
GOVERNMENT BOND FUND
Schedule of Investments as of October 31, 2018
| | | | | | | | |
Principal
Amount | | | Long-Term Fixed Income (98.0%) | | Value | |
| | Foreign Government (8.8%) - continued | | | | |
| | | | Japan Bank for International Cooperation | | | | |
| | $500,000 | | | 2.882%, (LIBOR 3M + 0.570%), 2/24/2020a | | | $502,834 | |
| | | | Jordan Government International Bond | | | | |
| | 500,000 | | | 2.503%, 10/30/2020 | | | 494,898 | |
| | | | Kommunalbanken AS | | | | |
| | 500,000 | | | 2.500%, 1/11/2023b | | | 486,998 | |
| | | | Province of Manitoba Canada | | | | |
| | 500,000 | | | 2.125%, 5/4/2022 | | | 479,835 | |
| | | | Province of Ontario Canada | | | | |
| | 250,000 | | | 3.400%, 10/17/2023 | | | 250,490 | |
| | | | Province of Quebec Canada | | | | |
| | 500,000 | | | 2.750%, 4/12/2027 | | | 472,088 | |
| | | | Sweden Government International Bond | | | | |
| | 500,000 | | | 2.375%, 2/15/2023b | | | 485,366 | |
| | | | | |
| | | | Total | | | 5,059,032 | |
| | | | | |
| |
| | Mortgage-Backed Securities (18.8%) | | | | |
| | | | Federal Home Loan Mortgage Corporation - REMIC | | | | |
| | | | 3.000%, 5/15/2045, Ser. | | | | |
| | 420,066 | | | 4631, Class PA | | | 408,991 | |
| | | | 3.000%, 3/15/2047, Ser. | | | | |
| | 427,923 | | | 4734, Class JA | | | 416,419 | |
| | | | Federal Home Loan Mortgage Corporation Gold 30-Yr. Pass Through | | | | |
| | 1,000,000 | | | 4.000%, 11/1/2048e | | | 1,000,347 | |
| | | | Federal Home Loan Mortgage Corporation Multifamily Structured Pass Through Certificates | | | | |
| | | | 3.000%, 3/15/2045, Ser. | | | | |
| | 474,549 | | | 4741, Class GA | | | 463,473 | |
| | | | Federal National Mortgage Association | | | | |
| | 275,000 | | | 3.640%, 6/1/2028 | | | 270,693 | |
| | 125,000 | | | 3.710%, 7/1/2028 | | | 123,111 | |
| | | | Federal National Mortgage Association - REMIC | | | | |
| | | | 3.000%, 6/25/2046, Ser. | | | | |
| | 228,784 | | | 2017-58, Class P | | | 222,445 | |
| | | | 3.500%, 12/25/2047, Ser. | | | | |
| | 490,532 | | | 2018-41, Class PB | | | 484,461 | |
| | | | Federal National Mortgage Association Conventional 30-Yr. Pass Through | | | | |
| | 975,000 | | | 3.500%, 11/1/2048e | | | 949,140 | |
| | 2,500,000 | | | 4.000%, 11/1/2048e | | | 2,499,989 | |
| | 3,350,000 | | | 4.500%, 11/1/2048e | | | 3,429,890 | |
| | 450,000 | | | 5.000%, 11/1/2048e | | | 469,582 | |
| | | | | |
| | | | Total | | | 10,738,541 | |
| | | | | |
| |
| | U.S. Government and Agencies (49.2%) | | | | |
| | | | Federal Farm Credit Bank | | | | |
| | 500,000 | | | 2.210%, 8/1/2024 | | | 474,788 | |
| | | | Federal National Mortgage Association | | | | |
| | 350,000 | | | 2.500%, 4/13/2021 | | | 346,121 | |
| | 3,500,000 | | | 1.875%, 9/24/2026 | | | 3,163,255 | |
| | 1,250,000 | | | 6.250%, 5/15/2029 | | | 1,558,776 | |
| | | | Tennessee Valley Authority | | | | |
| | 1,225,000 | | | 5.250%, 9/15/2039 | | | 1,457,507 | |
| | | | U.S. Treasury Bonds | | | | |
| | 1,000,000 | | | 2.250%, 11/15/2027 | | | 930,508 | |
| | 115,000 | | | 5.500%, 8/15/2028 | | | 137,591 | |
| | 500,000 | | | 4.750%, 2/15/2037 | | | 602,910 | |
| | 1,105,000 | | | 2.500%, 5/15/2046 | | | 928,157 | |
| | | | U.S. Treasury Bonds, TIPS | | | | |
| | 3,271,618 | | | 0.125%, 1/15/2023 | | | 3,148,658 | |
| | 367,851 | | | 2.375%, 1/15/2025 | | | 396,376 | |
| | 469,715 | | | 0.375%, 1/15/2027 | | | 442,131 | |
| | 379,135 | | | 2.125%, 2/15/2040 | | | 437,847 | |
| | 1,673,790 | | | 0.750%, 2/15/2042 | | | 1,487,428 | |
| | 783,398 | | | 0.875%, 2/15/2047 | | | 702,579 | |
| | | | U.S. Treasury Notes | | | | |
| | 750,000 | | | 1.875%, 12/15/2020 | | | 734,531 | |
| | 2,000,000 | | | 2.750%, 7/31/2023 | | | 1,979,766 | |
| | 5,925,000 | | | 2.125%, 11/30/2024 | | | 5,625,278 | |
| | 3,650,000 | | | 2.875%, 7/31/2025 | | | 3,607,797 | |
| | | | | |
| | | | Total | | | 28,162,004 | |
| | | | | |
| | | | | | | | |
| | | | | |
| | | | Total Long-Term Fixed Income (cost $57,063,991) | | | 56,065,102 | |
| | | | | |
| | |
Shares or
Principal
Amount | | | Short-Term Investments (16.2%) | | Value | |
| | | | Federal Home Loan Bank Discount Notes | | | | |
| | 300,000 | | | 2.110%, 11/30/2018f,g | | | 299,473 | |
| | | | Thrivent Core Short-Term Reserve Fund | | | | |
| | 897,114 | | | 2.430% | | | 8,971,143 | |
| | | | | |
| | | | Total Short-Term Investments (cost $9,270,634) | | | 9,270,616 | |
| | | | | |
| | | | Total Investments (cost $66,334,625) 114.2% | | | $65,335,718 | |
| | | | | |
| | | | Other Assets and Liabilities, Net (14.2%) | | | (8,106,364 | ) |
| | | | | |
| | | | Total Net Assets 100.0% | | | $57,229,354 | |
| | | | | |
| a | Denotes variable rate securities. The rate shown is as of October 31, 2018. The rates of certain variable rate securities are based on a published reference rate and spread; these may vary by security and the reference rate and spread are indicated in their description. The rates of other variable rate securities are determined by the issuer or agent and are based on current market conditions. These securities do not indicate a reference rate and spread in their description. |
| b | Denotes securities sold under Rule 144A of the Securities Act of 1933, which exempts them from registration. These securities may be resold to other dealers in the program or to other qualified institutional buyers. As of October 31, 2018, the value of these investments was $3,468,182 or 6.1% of total net assets. |
| c | All or a portion of the security is insured or guaranteed. |
| d | Denotes step coupon securities. Step coupon securities pay an initial coupon rate for the first period and then different coupon rates for following periods. The rate shown is as of October 31, 2018. |
| e | Denotes investments purchased on a when-issued or delayed delivery basis. |
| f | The interest rate shown reflects the yield, coupon rate or the discount rate at the date of purchase. |
| g | All or a portion of the security is held on deposit with the counterparty and pledged as the initial margin deposit for open futures contracts. |
The accompanying Notes to Financial Statements are an integral part of this schedule.
71
GOVERNMENT BOND FUND
Schedule of Investments as of October 31, 2018
Definitions:
| | | | |
| Ser. | | - | | Series |
| TIPS | | - | | Treasury Inflation Protected Security |
Reference Rate Index:
| | | | |
| LIBOR 1M | | - | | ICE Libor USD Rate 1 Month |
| LIBOR 3M | | - | | ICE Libor USD Rate 3 Month |
Unrealized Appreciation (Depreciation)
Gross unrealized appreciation and depreciation of investments of the portfolio as a whole (including derivatives), based on cost for federal income tax purposes, were as follows:
| | | | |
Gross unrealized appreciation | | | $707,104 | |
Gross unrealized depreciation | | | (1,683,043 | ) |
| | | | |
Net unrealized appreciation (depreciation) | | | ($975,939 | ) |
Cost for federal income tax purposes | | | $62,922,071 | |
Fair Valuation Measurements
The following table is a summary of the inputs used, as of October 31, 2018, in valuing Government Bond Fund’s assets carried at fair value.
| | | | | | | | | | | | | | | | |
| Investments in Securities | | Total | | | Level 1 | | | Level 2 | | | Level 3 | |
| | | | |
Long-Term Fixed Income | | | | | | | | | | | | | | | | |
Asset-Backed Securities | | | 3,443,660 | | | | – | | | | 3,443,660 | | | | – | |
Collateralized Mortgage Obligations | | | 1,263,621 | | | | – | | | | 1,263,621 | | | | – | |
Commercial Mortgage-Backed Securities | | | 4,570,499 | | | | – | | | | 4,570,499 | | | | – | |
Consumer Cyclical | | | 550,229 | | | | – | | | | 550,229 | | | | – | |
Energy | | | 315,902 | | | | – | | | | 315,902 | | | | – | |
Financials | | | 1,961,614 | | | | – | | | | 1,961,614 | | | | – | |
Foreign Government | | | 5,059,032 | | | | – | | | | 5,059,032 | | | | – | |
Mortgage-Backed Securities | | | 10,738,541 | | | | – | | | | 10,738,541 | | | | – | |
U.S. Government and Agencies | | | 28,162,004 | | | | – | | | | 28,162,004 | | | | – | |
Short-Term Investments | | | 299,473 | | | | – | | | | 299,473 | | | | – | |
| |
Subtotal Investments in Securities | | | $56,364,575 | | | | $– | | | | $56,364,575 | | | | $– | |
| |
| | | | |
| Other Investments* | | Total | | | | | | | | | | |
| | | | | | | | | | | | | |
Short-Term Investments | | | 8,971,143 | | | | | | | | | | | | | |
| | | | | | | | | | | | | |
Subtotal Other Investments | | | $8,971,143 | | | | | | | | | | | | | |
| | | | | | | | | | | | | |
| | | | | | | | | | | | | | | | |
| | | | | | | | | | | | | |
Total Investments at Value | | | $65,335,718 | | | | | | | | | | | | | |
| | | | | | | | | | | | | |
| * | Certain investments are measured at fair value using a net asset value per share that is not publicly available (practical expedient). According to disclosure requirements of Accounting Standards Codification (ASC) 820, Fair Value Measurement, securities valued using the practical expedient are not classified in the fair value hierarchy. The fair value amounts presented in this table are intended to permit reconciliation of the fair value hierarchy to the amounts presented in the Statement of Assets and Liabilities. |
| | | | | | | | | | | | | | | | |
| Other Financial Instruments | | Total | | | Level 1 | | | Level 2 | | | Level 3 | |
| | | | |
Asset Derivatives | | | | | | | | | | | | | | | | |
Futures Contracts | | | 182,707 | | | | 182,707 | | | | – | | | | – | |
| |
Total Asset Derivatives | | | $182,707 | | | | $182,707 | | | | $– | | | | $– | |
| |
| | | | |
Liability Derivatives | | | | | | | | | | | | | | | | |
Futures Contracts | | | 54,112 | | | | 54,112 | | | | – | | | | – | |
| |
Total Liability Derivatives | | | $54,112 | | | | $54,112 | | | | $– | | | | $– | |
| |
There were no significant transfers between Levels during the period ended October 31, 2018. Transfers between Levels are identified as of the end of the period.
The accompanying Notes to Financial Statements are an integral part of this schedule.
72
GOVERNMENT BOND FUND
Schedule of Investments as of October 31, 2018
The following table presents Government Bond Fund’s futures contracts held as of October 31, 2018. Investments and/or cash totaling $299,473 were pledged as the initial margin deposit for these contracts.
| | | | | | | | | | | | | | | | |
| Futures Contracts Description | | Number of
Contracts
Long/(Short) | | | Expiration
Date | | | Notional
Principal
Amount | | | Value and
Unrealized | |
CBOT 2-Yr. U.S. Treasury Note | | | 9 | | | | December 2018 | | | | $1,901,559 | | | | ($5,653 | ) |
CBOT U.S. Long Bond | | | 1 | | | | December 2018 | | | | 144,800 | | | | (6,675 | ) |
Ultra 10-Yr. U.S. Treasury Note | | | 13 | | | | December 2018 | | | | 1,668,206 | | | | (41,784 | ) |
| |
Total Futures Long Contracts | | | | | | | | | | | $3,714,565 | | | | ($54,112 | ) |
| |
CBOT 10-Yr. U.S. Treasury Note | | | (27 | ) | | | December 2018 | | | | ($3,254,468 | ) | | | $56,656 | |
CBOT 5-Yr. U.S. Treasury Note | | | (21 | ) | | | December 2018 | | | | (2,382,451 | ) | | | 22,412 | |
CME Ultra Long Term U.S. Treasury Bond | | | (10 | ) | | | December 2018 | | | | (1,595,827 | ) | | | 103,639 | |
| |
Total Futures Short Contracts | | | | | | | | | | | ($7,232,746 | ) | | | $182,707 | |
| |
Total Futures Contracts | | | | | | | | | | | ($3,518,181 | ) | | | $128,595 | |
| |
Reference Description:
| | | | |
| CBOT | | - | | Chicago Board of Trade |
| CME | | - | | Chicago Mercantile Exchange |
The following table summarizes the fair value and Statement of Assets and Liabilities location, as of October 31, 2018, for Government Bond Fund’s investments in financial derivative instruments by primary risk exposure as discussed under item (2) Significant Accounting Policies of the Notes to Financial Statements.
| | | | | | |
| Derivatives by risk category | | Statement of Assets and Liabilities Location | | Fair Value | |
| | |
Asset Derivatives | | | | | | |
| | |
Interest Rate Contracts | | | | | | |
Futures* | | Net Assets - Accumulated undistributed earnings/(loss) | | | $182,707 | |
Total Interest Rate Contracts | | | | | 182,707 | |
| |
Total Asset Derivatives | | | | | $182,707 | |
| |
| | |
Liability Derivatives | | | | | | |
| | |
Interest Rate Contracts | | | | | | |
Futures* | | Net Assets - Accumulated undistributed earnings/(loss) | | | 54,112 | |
Total Interest Rate Contracts | | | | | 54,112 | |
| |
Total Liability Derivatives | | | | | $54,112 | |
| |
| * | Includes cumulative appreciation/depreciation of futures contracts as reported in the Schedule of Investments. Only current day’s variation margin is reported within the Statement of Assets and Liabilities. |
The following table summarizes the net realized gains/(losses) and Statement of Operations location, for the period ended October 31, 2018, for Government Bond Fund’s investments in financial derivative instruments by primary risk exposure.
| | | | |
| Derivatives by risk category | | Statement of Operations Location | | Realized Gains/(Losses)
recognized in Income |
Interest Rate Contracts | | | | |
Options Written | | Net realized gains/(losses) on Written option contracts | | 1,172 |
Futures | | Net realized gains/(losses) on Futures contracts | | 282,123 |
Total Interest Rate Contracts | | | | 283,295 |
|
Total | | | | $283,295 |
|
The following table summarizes the change in net unrealized appreciation/(depreciation) and Statement of Operations location, for the period ended October 31, 2018, for Government Bond Fund’s investments in financial derivative instruments by primary risk exposure.
| | | | |
| Derivatives by risk category | | Statement of Operations Location | | Change in unrealized
appreciation/(depreciation)
recognized in Income |
Interest Rate Contracts | | | | |
Futures | | Change in net unrealized appreciation/(depreciation) on Futures contracts | | 50,237 |
Total Interest Rate Contracts | | | | 50,237 |
|
Total | | | | $50,237 |
|
The accompanying Notes to Financial Statements are an integral part of this schedule.
73
GOVERNMENT BOND FUND
Schedule of Investments as of October 31, 2018
The following table presents Government Bond Fund’s average volume of derivative activity during the period ended October 31, 2018.
| | | | |
| Derivative Risk Category | | Average Notional Value | |
Interest Rate Contracts | | | | |
Futures - Long | | | $4,004,970 | |
Futures - Short | | | (9,955,825 | ) |
Written Options | | | (37,816 | ) |
Investment in Affiliates
Affiliated issuers, as defined under the Investment Company Act of 1940, include those in which the Fund’s holdings of an issuer represent 5% or more of the outstanding voting securities of an issuer, any affiliated mutual fund, or a company which is under common ownership or control with the Fund. The Fund owns shares of Thrivent Core Short-Term Reserve Fund primarily to serve as a cash sweep vehicle for the Fund. Thrivent Core Funds are established solely for investment by Thrivent entities.
A summary of transactions (in thousands) for the fiscal year to date, in Government Bond Fund, is as follows:
| | | | | | | | | | | | | | | | | | | | | | | | |
| Fund | | Value
10/31/2017 | | | Gross
Purchases | | | Gross
Sales | | | Shares Held at
10/31/2018 | | | Value
10/31/2018 | | | % of Net
Assets | |
Affiliated Short-Term Investments
Core Short-Term Reserve, 2.430% | | | $2,905 | | | | $48,992 | | | | $42,926 | | | | 897 | | | | $8,971 | | | | 15.7 | % |
| |
Total Affiliated Short-Term Investments | | | 2,905 | | | | | | | | | | | | | | | | 8,971 | | | | 15.7 | |
| |
Total Value | | | $2,905 | | | | | | | | | | | | | | | | $8,971 | | | | | |
| |
| | | | | | | | | | | | | | | | |
| Fund | | Net Realized
Gain/(Loss) | | | Change in
Unrealized
Appreciation/
(Depreciation) | | | Distributions of
Realized Capital Gains | | | Income Earned
11/1/2017 -
10/31/2018 | |
Affiliated Short-Term Investments
Core Short-Term Reserve, 2.430% | | | $– | | | | $– | | | | $0 | | | | $166 | |
| |
Total Income from Affiliated Investments | | | | | | | | | | | | | | | $166 | |
| |
Total | | | $– | | | | $– | | | | $0 | | | | | |
| |
The accompanying Notes to Financial Statements are an integral part of this schedule.
74
HIGH INCOME MUNICIPAL BOND FUND
Schedule of Investments as of October 31, 2018
| | | | | | | | |
Principal
Amount | | | Long-Term Fixed Income (97.3%) | | Value | |
| | California (3.0%) | | | | |
| | | | California Kindergarten - University Public Education Fac. G.O. | | | | |
| | $200,000 | | | 1.130%, 5/1/2034a | | | $200,000 | |
| | | | | |
| | | | Total | | | 200,000 | |
| | | | | |
| |
| | Colorado (10.6%) | | | | |
| | | | Colorado Educational and Cultural Fac. Auth. Charter School Rev. Refg. (Union Colony School) | | | | |
| | 225,000 | | | 5.000%, 4/1/2048 | | | 241,038 | |
| | | | Denver, CO Health and Hospital Auth. Healthcare Rev. | | | | |
| | 230,000 | | | 5.000%, 12/1/2039, Ser. A | | | 239,292 | |
| | | | Denver, CO Urban Renewal Auth. Rev. (9th and Colorado Urban Redevelopment Area) | | | | |
| | 225,000 | | | 5.250%, 12/1/2039b | | | 222,727 | |
| | | | | |
| | | | Total | | | 703,057 | |
| | | | | |
| |
| | Delaware (3.6%) | | | | |
| | | | Kent County, DE Student Housing and Dining Fac. Rev. (CHF-Dover, LLC - Delaware State University) | | | | |
| | 230,000 | | | 5.000%, 7/1/2040, Ser. A | | | 239,773 | |
| | | | | |
| | | | Total | | | 239,773 | |
| | | | | |
| |
| | Florida (3.0%) | | | | |
| | | | Florida Municipal Power Agency Rev. | | | | |
| | 200,000 | | | 1.720%, 10/1/2035a | | | 200,000 | |
| | | | | |
| | | | Total | | | 200,000 | |
| | | | | |
| |
| | Illinois (7.3%) | | | | |
| | | | Illinois State G.O. | | | | |
| | 235,000 | | | 5.000%, 12/1/2025, Ser. B | | | 244,506 | |
| | | | Metropolitan Pier and Exposition Auth., IL Rev. Refg. (McCormick Place Expansion) (NATL-RE Insured) | | | | |
| | 220,000 | | | 5.500%, 6/15/2029, Ser. Ac | | | 240,737 | |
| | | | | |
| | | | Total | | | 485,243 | |
| | | | | |
| |
| | Kansas (3.7%) | | | | |
| | | | City of Wichita, KS Health Care Fac. Rev. Refg. (Presbyterian Manors, Inc.) | | | | |
| | 240,000 | | | 5.000%, 5/15/2038, Ser. I | | | 244,738 | |
| | | | | |
| | | | Total | | | 244,738 | |
| | | | | |
| |
| | Michigan (3.8%) | | | | |
| | | | Downriver Utility Wastewater Auth. Rev. Refg. (AGM Insured) | | | | |
| | 225,000 | | | 5.000%, 4/1/2031c | | | 249,010 | |
| | | | | |
| | | | Total | | | 249,010 | |
| | | | | |
| |
| | Minnesota (0.8%) | | | | |
| | | | Duluth, MN Economic Development Auth. Health Care Fac. Rev. Refg. (Essentia Health Obligated Group) | | | | |
| | 50,000 | | | 5.000%, 2/15/2033, Ser. Ad | | | 54,696 | |
| | | | | |
| | | | Total | | | 54,696 | |
| | | | | |
| |
| | Missouri (3.3%) | | | | |
| | | | Lee’s Summit, MO Industrial Development Auth. Senior Living Fac. Rev. Refg. (John Knox Village) | | | | |
| | 225,000 | | | 5.000%, 8/15/2042, Ser. A | | | 220,081 | |
| | | | | |
| | | | Total | | | 220,081 | |
| | | | | |
| |
| | Nebraska (3.6%) | | | | |
| | | | Douglas County, NE Hospital Auth. No. 2 Health Fac. Rev. (Childrens Hospital Obligated Group) | | | | |
| | 225,000 | | | 5.000%, 11/15/2047 | | | 240,964 | |
| | | | | |
| | | | Total | | | 240,964 | |
| | | | | |
| |
| | Nevada (7.3%) | | | | |
| | | | Carson City, NV Hospital Rev. Refg. (Carson Tahoe Regional Medical Center) | | | | |
| | 225,000 | | | 5.000%, 9/1/2042, Ser. A | | | 238,153 | |
| | | | Director of the State of Nevada Department of Business & Industry Rev. (Somerset Academy of Las Vegas) | | | | |
| | 250,000 | | | 5.000%, 12/15/2048, Ser. Ab | | | 246,538 | |
| | | | | |
| | | | Total | | | 484,691 | |
| | | | | |
| |
| | New Hampshire (1.9%) | | | | |
| | | | New Hampshire Health and Education Fac. Auth. Rev. Refg. (Dartmouth College) | | | | |
| | 125,000 | | | 1.660%, 6/1/2041, Ser. Ba | | | 125,000 | |
| | | | | |
| | | | Total | | | 125,000 | |
| | | | | |
| |
| | New Jersey (7.1%) | | | | |
| | | | New Jersey Transportation Trust Fund Auth. Rev. | | | | |
| | 225,000 | | | 5.000%, 6/15/2045, Ser. AA | | | 231,757 | |
| | | | Tobacco Settlement Financing Corporation Rev. Refg. | | | | |
| | 225,000 | | | 5.250%, 6/1/2046, Ser. A | | | 237,827 | |
| | | | | |
| | | | Total | | | 469,584 | |
| | | | | |
| |
| | New York (3.6%) | | | | |
| | | | New York Transportation Development Corporation Special Fac. Rev. (LaGuardia Airport) | | | | |
| | 225,000 | | | 5.000%, 1/1/2036, AMT | | | 240,682 | |
| | | | | |
| | | | Total | | | 240,682 | |
| | | | | |
| |
| | North Carolina (3.6%) | | | | |
| | | | North Carolina Capital Fac. Finance Agency Educational Fac. Rev. Refg. (Meredith College) | | | | |
| | 225,000 | | | 5.000%, 6/1/2038 | | | 238,374 | |
| | | | | |
| | | | Total | | | 238,374 | |
| | | | | |
The accompanying Notes to Financial Statements are an integral part of this schedule.
75
HIGH INCOME MUNICIPAL BOND FUND
Schedule of Investments as of October 31, 2018
| | | | | | | | |
Principal
Amount | | | Long-Term Fixed Income (97.3%) | | Value | |
| | North Dakota (3.7%) | | | | |
| | | | University of North Dakota C.O.P. (Infrastructure Energy Improvement) | | | | |
| | $225,000 | | | 5.000%, 4/1/2048, Ser. A | | | $243,416 | |
| | | | | |
| | | | Total | | | 243,416 | |
| | | | | |
| |
| | Oregon (1.7%) | | | | |
| | | | Salem, OR Hospital Fac. Auth. Rev (Capital Manor) | | | | |
| | 100,000 | | | 5.000%, 5/15/2026 | | | 110,908 | |
| | | | | |
| | | | Total | | | 110,908 | |
| | | | �� | |
| |
| | Pennsylvania (3.6%) | | | | |
| | | | Pennsylvania Economic Development Financing Auth. Rev. Refg. (Tapestry Moon Senior Housing) | | | | |
| | 245,000 | | | 6.750%, 12/1/2053, Ser. Ab | | | 235,472 | |
| | | | | |
| | | | Total | | | 235,472 | |
| | | | | |
| |
| | Texas (7.3%) | | | | |
| | | | Houston, TX Airport System Rev. | | | | |
| | 220,000 | | | 5.000%, 7/1/2036, Ser. A, AMT | | | 239,503 | |
| | | | Tarrant County Cultural Education Fac. Finance Corporation Rev. Refg. (Trinity Terrace) | | | | |
| | 235,000 | | | 5.000%, 10/1/2044, Ser. A-1 | | | 244,872 | |
| | | | | |
| | | | Total | | | 484,375 | |
| | | | | |
| |
| | Utah (3.7%) | | | | |
| | | | Salt Lake City, UT Airport Rev. | | | | |
| | 225,000 | | | 5.000%, 7/1/2036, Ser. A, AMT | | | 246,276 | |
| | | | | |
| | | | Total | | | 246,276 | |
| | | | | |
| |
| | Virginia (3.7%) | | | | |
| | | | Virginia Small Business Financing Auth. Rev. (Transform 66 P3) | | | | |
| | 230,000 | | | 5.000%, 12/31/2047, AMT | | | 241,528 | |
| | | | | |
| | | | Total | | | 241,528 | |
| | | | | |
| |
| | Washington (3.7%) | | | | |
| | | | Pend Oreille Cty, WA Public Utility District No. 1 Rev. Refg. (Box Canyon Production System) | | | | |
| | 225,000 | | | 5.000%, 1/1/2023 | | | 241,115 | |
| | | | | |
| | | | Total | | | 241,115 | |
| | | | | |
| |
| | Wisconsin (3.7%) | | | | |
| | | | Wisconsin Health & Educational Fac. Auth. Rev. | | | | |
| | 250,000 | | | 5.125%, 10/1/2048 | | | 243,460 | |
| | | | | |
| | | | Total | | | 243,460 | |
| | | | | |
| | | | | | | | |
| | | | | |
| | | | Total Long-Term Fixed Income (cost $6,545,471) | | | 6,442,443 | |
| | | | | |
| | |
Principal
Amount | | | Short-Term Investments (1.5%)e | | Value | |
| | | | Federal Home Loan Bank Discount Notes | | | | |
| | $100,000 | | | 2.240%, 1/4/2019f | | | $99,591 | |
| | | | | |
| | | | Total Short-Term Investments (cost $99,602) | | | 99,591 | |
| | | | | |
| | | | Total Investments (cost $6,645,073) 98.8% | | | $6,542,034 | |
| | | | | |
| | | | Other Assets and Liabilities, Net 1.2% | | | 82,133 | |
| | | | | |
| | | | Total Net Assets 100.0% | | | $6,624,167 | |
| | | | | |
| a | Denotes variable rate securities. The rate shown is as of October 31, 2018. The rates of certain variable rate securities are based on a published reference rate and spread; these may vary by security and the reference rate and spread are indicated in their description. The rates of other variable rate securities are determined by the issuer or agent and are based on current market conditions. These securities do not indicate a reference rate and spread in their description. |
| b | Denotes securities sold under Rule 144A of the Securities Act of 1933, which exempts them from registration. These securities may be resold to other dealers in the program or to other qualified institutional buyers. As of October 31, 2018, the value of these investments was $704,737 or 10.6% of total net assets. |
| c | To reduce certain risks associated with securities issued by municipalities, which may include but are not limited to economic development in a specific industry or municipality, the principal and/or interest payments are guaranteed by the bond insurance company or government agency identified. |
| d | Denotes investments purchased on a when-issued or delayed delivery basis. |
| e | The interest rate shown reflects the yield, coupon rate or the discount rate at the date of purchase. |
| f | All or a portion of the security is held on deposit with the counterparty and pledged as the initial margin deposit for open futures contracts. |
Definitions:
| | | | |
| AGM | | - | | Assured Guaranty Municipal Corporation |
| AMT | | - | | Subject to Alternative Minimum Tax |
| Auth. | | - | | Authority |
| C.O.P. | | - | | Certificate of Participation |
| Fac. | | - | | Facility/Facilities |
| G.O. | | - | | General Obligation |
| NATL-RE | | - | | National Public Finance Guarantee Corporation |
| Refg. | | - | | Refunding |
| Rev. | | - | | Revenue |
Ser. | | - | | Series |
Unrealized Appreciation (Depreciation)
Gross unrealized appreciation and depreciation of investments of the portfolio as a whole (including derivatives), based on cost for federal income tax purposes, were as follows:
| | | | |
Gross unrealized appreciation | | | $715 | |
Gross unrealized depreciation | | | (103,611 | ) |
| | | | |
Net unrealized appreciation (depreciation) | | | ($102,896 | ) |
| |
Cost for federal income tax purposes | | | $6,092,430 | |
The accompanying Notes to Financial Statements are an integral part of this schedule.
76
HIGH INCOME MUNICIPAL BOND FUND
Schedule of Investments as of October 31, 2018
Fair Valuation Measurements
The following table is a summary of the inputs used, as of October 31, 2018, in valuing High Income Municipal Bond Fund’s assets carried at fair value.
| | | | | | | | | | | | | | | | |
| Investments in Securities | | Total | | | Level 1 | | | Level 2 | | | Level 3 | |
Long-Term Fixed Income | | | | | | | | | | | | | | | | |
Education | | | 1,339,238 | | | | – | | | | 1,339,238 | | | | – | |
Electric Revenue | | | 441,115 | | | | – | | | | 441,115 | | | | – | |
General Obligation | | | 444,506 | | | | – | | | | 444,506 | | | | – | |
Health Care | | | 1,372,211 | | | | – | | | | 1,372,211 | | | | – | |
Housing Finance | | | 697,972 | | | | – | | | | 697,972 | | | | – | |
Industrial Development Revenue | | | 220,081 | | | | – | | | | 220,081 | | | | – | |
Other Revenue | | | 479,355 | | | | – | | | | 479,355 | | | | – | |
Transportation | | | 1,198,955 | | | | – | | | | 1,198,955 | | | | – | |
Water & Sewer | | | 249,010 | | | | – | | | | 249,010 | | | | – | |
Short-Term Investments | | | 99,591 | | | | – | | | | 99,591 | | | | – | |
| |
Total Investments at Value | | | $6,542,034 | | | | $– | | | | $6,542,034 | | | | $– | |
| |
| | | | |
Other Financial Instruments | | | Total | | | | Level 1 | | | | Level 2 | | | | Level 3 | |
| |
Asset Derivatives | | | | | | | | | | | | | | | | |
Futures Contracts | | | 143 | | | | 143 | | | | – | | | | – | |
| |
Total Asset Derivatives | | | $143 | | | | $143 | | | | $– | | | | $– | |
| |
There were no significant transfers between Levels during the period ended October 31, 2018. Transfers between Levels are identified as of the end of the period.
The following table presents High Income Municipal Bond Fund’s futures contracts held as of October 31, 2018. Investments and/or cash totaling $99,591 were pledged as the initial margin deposit for these contracts.
| | | | | | | | | | | | | | | | |
| Futures Contracts Description | | Number of
Contracts
Long/(Short) | | | Expiration Date | | | Notional Principal
Amount | | | Value and
Unrealized | |
CBOT U.S. Long Bond | | | (4 | ) | | | December 2018 | | | | ($552,643 | ) | | | $143 | |
| |
Total Futures Short Contracts | | | | | | | | | | | ($552,643 | ) | | | $143 | |
| |
Total Futures Contracts | | | | | | | | | | | ($552,643 | ) | | | $143 | |
| |
Reference Description:
| | | | |
CBOT | | - | | Chicago Board of Trade |
The following table summarizes the fair value and Statement of Assets and Liabilities location, as of October 31, 2018, for High Income Municipal Bond Fund’s investments in financial derivative instruments by primary risk exposure as discussed under item (2) Significant Accounting Policies of the Notes to Financial Statements.
| | | | |
| Derivatives by risk category | | Statement of Assets and Liabilities Location | | Fair Value |
| | |
Asset Derivatives | | | | |
| | |
Interest Rate Contracts | | | | |
Futures* | | Net Assets - Accumulated undistributed earnings/(loss) | | $143 |
Total Interest Rate Contracts | | | | 143 |
|
Total Asset Derivatives | | | | $143 |
|
| * | Includes cumulative appreciation/depreciation of futures contracts as reported in the Schedule of Investments. Only current day’s variation margin is reported within the Statement of Assets and Liabilities. |
The accompanying Notes to Financial Statements are an integral part of this schedule.
77
HIGH INCOME MUNICIPAL BOND FUND
Schedule of Investments as of October 31, 2018
The following table summarizes the change in net unrealized appreciation/(depreciation) and Statement of Operations location, for the period ended October 31, 2018, for High Income Municipal Bond Fund’s investments in financial derivative instruments by primary risk exposure.
| | | | |
| Derivatives by risk category | | Statement of Operations Location | | Change in unrealized
appreciation/(depreciation)
recognized in Income |
Interest Rate Contracts | | | | |
Futures | | Change in net unrealized appreciation/(depreciation) on Futures contracts | | 143 |
Total Interest Rate Contracts | | | | 143 |
|
Total | | | | $143 |
|
The following table presents High Income Municipal Bond Fund’s average volume of derivative activity during the period ended October 31, 2018.
| | | | |
| Derivative Risk Category | | Average Notional Value | |
Interest Rate Contracts | | | | |
Futures - Short | | | ($47,966 | ) |
The accompanying Notes to Financial Statements are an integral part of this schedule.
78
HIGH YIELD FUND
Summary Schedule of Investments as of October 31, 2018
| | | | | | | | | | | | |
Principal
Amount | | | Bank Loans (4.1%) | | Value | | | % of Net
Assets | |
| | Basic Materials (1.5%) | | | | | | | | |
| | | | Contura Energy, Inc., Term Loan | | | | | | | | |
| | $6,205,000 | | | 0.000%, (LIBOR 3M + 5.000%), 10/3/2025a,b,c,d | | | $6,173,975 | | | | 0.9 | % |
| | 2,940,730 | | | 7.300%, (LIBOR 2M + 5.000%), 3/17/2024b,d | | | 2,926,026 | | | | 0.4 | % |
| | | | Other Securities^ | | | 1,390,765 | | | | 0.2 | % |
| | | | | |
| | | | Total | | | 10,490,766 | | | | | |
| | | | | |
| | |
| | Communications Services (1.3%) | | | | | | | | |
| | | | Frontier Communications Corporation, Term Loan | | | | | | | | |
| | 3,678,437 | | | 6.060%, (LIBOR 1M + 3.750%), 6/15/2024b,d | | | 3,553,371 | | | | 0.5 | % |
| | | | Other Securities^ | | | 6,080,769 | | | | 0.8 | % |
| | | | | |
| | | | Total | | | 9,634,140 | | | | | |
| | | | | |
| | |
| | Consumer Non-Cyclical (0.7%) | | | | | | | | |
| | | | Northriver Midstream Finance LP, Term Loan | | | | | | | | |
| | 3,700,000 | | | 5.646%, (LIBOR 3M + 3.250%), 10/1/2025a,b,c,d | | | 3,715,429 | | | | 0.5 | % |
| | | | Other Securities^ | | | 1,475,117 | | | | 0.2 | % |
| | | | | |
| | | | Total | | | 5,190,546 | | | | | |
| | | | | |
| | |
| | Financials (0.3%) | | | | | | | | |
| | | | Other Securities^ | | | 2,337,759 | | | | 0.3 | % |
| | | | | |
| | | | Total | | | 2,337,759 | | | | | |
| | | | | |
| | |
| | Utilities (0.3%) | | | | | | | | |
| | | | Other Securities^ | | | 2,007,972 | | | | 0.3 | % |
| | | | | |
| | | | Total | | | 2,007,972 | | | | | |
| | | | | |
| | | | | | | | | | | | |
| | | | | |
| | | | Total Bank Loans (cost $30,004,291) | | | 29,661,183 | | | | | |
| | | | | |
| | | |
Principal
Amount | | | Long-Term Fixed Income (91.5%) | | Value | | | % of Net Assets | |
| | Asset-Backed Securities (0.1%) | | | | | | | | |
| | | | Other Securities^ | | | 954,911 | | | | 0.1 | % |
| | | | | |
| | | | Total | | | 954,911 | | | | | |
| | | | | |
| | |
| | Basic Materials (7.6%) | | | | | | | | |
| | | | Other Securities^ | | | 54,783,830 | | | | 7.6 | % |
| | | | | |
| | | | Total | | | 54,783,830 | | | | | |
| | | | | |
| | |
| | Capital Goods (10.1%) | | | | | | | | |
| | | | Ardagh Packaging Finance plc | | | | | | | | |
| | 3,810,000 | | | 7.250%, 5/15/2024e | | | 3,829,050 | | | | 0.5 | % |
| | | | Berry Global, Inc. | | | | | | | | |
| | 1,510,000 | | | 4.500%, 2/15/2026e | | | 1,411,850 | | | | 0.2 | % |
| | | | Berry Plastics Corporation | | | | | | | | |
| | 5,630,000 | | | 5.125%, 7/15/2023 | | | 5,601,850 | | | | 0.8 | % |
| | | | H&E Equipment Services, Inc. | | | | | | | | |
| | 4,140,000 | | | 5.625%, 9/1/2025 | | | 3,943,350 | | | | 0.5 | % |
| | | | Other Securities^ | | | 57,723,754 | | | | 8.1 | % |
| | | | | |
| | | | Total | | | 72,509,854 | | | | | |
| | | | | |
| | |
| | Communications Services (14.2%) | | | | | | | | |
| | | | CCO Holdings, LLC | | | | | | | | |
| | 4,500,000 | | | 5.875%, 4/1/2024e | | | 4,539,375 | | | | 0.6 | % |
| | | | CenturyLink, Inc. | | | | | | | | |
| | 1,855,000 | | | 7.500%, 4/1/2024f | | | 1,947,750 | | | | 0.3 | % |
| | | | Digicel, Ltd. | | | | | | | | |
| | 5,000,000 | | | 6.000%, 4/15/2021*,f | | | 4,537,500 | | | | 0.6 | % |
| | | | Embarq Corporation | | | | | | | | |
| | 2,330,000 | | | 7.995%, 6/1/2036 | | | 2,219,325 | | | | 0.3 | % |
| | | | Intelsat Jackson Holdings SA | | | | | | | | |
| | 7,430,000 | | | 5.500%, 8/1/2023 | | | 6,649,850 | | | | 0.9 | % |
| | | | Level 3 Financing, Inc. | | | | | | | | |
| | 4,780,000 | | | 5.375%, 5/1/2025 | | | 4,666,475 | | | | 0.7 | % |
| | 1,500,000 | | | 5.250%, 3/15/2026 | | | 1,440,000 | | | | 0.2 | % |
| | | | Meredith Corporation | | | | | | | | |
| | 3,610,000 | | | 6.875%, 2/1/2026e | | | 3,610,000 | | | | 0.5 | % |
| | | | Neptune Finco Corporation | | | | | | | | |
| | 4,245,000 | | | 10.875%, 10/15/2025e | | | 4,897,669 | | | | 0.7 | % |
| | | | Sprint Communications, Inc. | | | | | | | | |
| | 4,640,000 | | | 6.000%, 11/15/2022 | | | 4,683,500 | | | | 0.7 | % |
| | | | Sprint Corporation | | | | | | | | |
| | 13,505,000 | | | 7.625%, 2/15/2025 | | | 14,028,319 | | | | 2.0 | % |
| | | | Zayo Group, LLC | | | | | | | | |
| | 3,575,000 | | | 6.375%, 5/15/2025 | | | 3,655,438 | | | | 0.5 | % |
| | | | Other Securities^ | | | 45,394,384 | | | | 6.2 | % |
| | | | | |
| | | | Total | | | 102,269,585 | | | | | |
| | | | | |
| | |
| | Consumer Cyclical (13.7%) | | | | | | | | |
| | | | AMC Entertainment Holdings, Inc. | | | | | | | | |
| | 4,057,000 | | | 5.750%, 6/15/2025f | | | 3,752,725 | | | | 0.5 | % |
| | | | American Axle & Manufacturing, Inc. | | | | | | | | |
| | 3,732,000 | | | 6.250%, 4/1/2025f | | | 3,522,075 | | | | 0.5 | % |
| | | | Brookfield Residential Properties, Inc. | | | | | | | | |
| | 3,570,000 | | | 6.125%, 7/1/2022e | | | 3,498,600 | | | | 0.5 | % |
| | | | Cinemark USA, Inc. | | | | | | | | |
| | 4,205,000 | | | 4.875%, 6/1/2023 | | | 4,105,131 | | | | 0.6 | % |
| | | | Dana Financing Luxembourg SARL | | | | | | | | |
| | 3,575,000 | | | 6.500%, 6/1/2026e | | | 3,516,906 | | | | 0.5 | % |
| | | | Hilton Escrow Issuer, LLC | | | | | | | | |
| | 4,655,000 | | | 4.250%, 9/1/2024 | | | 4,470,196 | | | | 0.6 | % |
| | | | Six Flags Entertainment Corporation | | | | | | | | |
| | 5,120,000 | | | 4.875%, 7/31/2024e | | | 4,838,400 | | | | 0.7 | % |
| | | | Other Securities^ | | | 71,041,828 | | | | 9.8 | % |
| | | | | |
| | | | Total | | | 98,745,861 | | | | | |
| | | | | |
| | |
| | Consumer Non-Cyclical (10.2%) | | | | | | | | |
| | | | Albertsons Companies, LLC | | | | | | | | |
| | 4,970,000 | | | 6.625%, 6/15/2024 | | | 4,696,650 | | | | 0.7 | % |
The accompanying Notes to Financial Statements are an integral part of this schedule.
79
HIGH YIELD FUND
Summary Schedule of Investments as of October 31, 2018
| | | | | | | | | | | | |
| | | |
Principal
Amount | | | Long-Term Fixed Income (91.5%) | | Value | | | % of Net
Assets | |
| | Consumer Non-Cyclical (10.2%) - continued | | | | | | | | |
| | | | Bausch Health Co. Inc. | | | | | | | | |
| $ | 2,612,000 | | | 7.500%, 7/15/2021e | | | $2,651,180 | | | | 0.4 | % |
| | | | Energizer Holdings, Inc. | | | | | | | | |
| | 3,760,000 | | | 5.500%, 6/15/2025e | | | 3,656,600 | | | | 0.5 | % |
| | | | HCA, Inc. | | | | | | | | |
| | 4,190,000 | | | 5.875%, 3/15/2022 | | | 4,383,787 | | | | 0.6 | % |
| | 7,290,000 | | | 4.750% - 6.500%, 2/15/2020 - 2/1/2025 | | | 7,403,531 | | | | 1.0 | % |
| | | | MPH Acquisition Holdings, LLC | | | | | | | | |
| | 3,810,000 | | | 7.125%, 6/1/2024e | | | 3,870,274 | | | | 0.5 | % |
| | | | Spectrum Brands, Inc. | | | | | | | | |
| | 3,720,000 | | | 5.750%, 7/15/2025 | | | 3,608,400 | | | | 0.5 | % |
| | | | Valeant Pharmaceuticals International, Inc. | | | | | | | | |
| | 6,890,000 | | | 5.500%, 3/1/2023e | | | 6,528,275 | | | | 0.9 | % |
| | 6,055,000 | | | 5.625% - 8.500%, 12/1/2021 - 1/31/2027e | | | 5,972,731 | | | | 0.8 | % |
| | | | Other Securities^ | | | 30,647,058 | | | | 4.3 | % |
| | | | | |
| | | | Total | | | 73,418,486 | | | | | |
| | | | | |
| | |
| | Energy (16.6%) | | | | | | | | |
| | | | California Resources Corporation | | | | | | | | |
| | 5,110,000 | | | 8.000%, 12/15/2022e,f | | | 4,547,900 | | | | 0.6 | % |
| | | | Centennial Resource Production, LLC | | | | | | | | |
| | 4,415,000 | | | 5.375%, 1/15/2026e | | | 4,315,662 | | | | 0.6 | % |
| | | | Cheniere Corpus Christi Holdings, LLC | | | | | | | | |
| | 5,990,000 | | | 7.000%, 6/30/2024 | | | 6,476,687 | | | | 0.9 | % |
| | | | Cheniere Energy Partners, LP | | | | | | | | |
| | 3,285,000 | | | 5.625%, 10/1/2026e | | | 3,235,725 | | | | 0.5 | % |
| | | | Chesapeake Energy Corporation | | | | | | | | |
| | 3,719,000 | | | 8.000%, 1/15/2025f | | | 3,772,461 | | | | 0.5 | % |
| | | | Energy Transfer Equity, LP | | | | | | | | |
| | 3,755,000 | | | 5.500%, 6/1/2027 | | | 3,817,145 | | | | 0.5 | % |
| | | | Pacific Drilling First Lien Escrow Issuer, Ltd. | | | | | | | | |
| | 3,500,000 | | | 8.375%, 10/1/2023e | | | 3,548,125 | | | | 0.5 | % |
| | | | SESI, LLC | | | | | | | | |
| | 3,720,000 | | | 7.750%, 9/15/2024 | | | 3,654,900 | | | | 0.5 | % |
| | | | Southwestern Energy Company | | | | | | | | |
| | 3,715,000 | | | 7.500%, 4/1/2026f | | | 3,780,013 | | | | 0.5 | % |
| | | | Tallgrass Energy Partners, LP | | | | | | | | |
| | 3,755,000 | | | 5.500%, 1/15/2028e | | | 3,712,043 | | | | 0.5 | % |
| | | | Targa Resources Partners, LP | | | | | | | | |
| | 3,725,000 | | | 5.125%, 2/1/2025 | | | 3,622,563 | | | | 0.5 | % |
| | | | W&T Offshore, Inc. | | | | | | | | |
| | 4,300,000 | | | 9.750%, 11/1/2023e | | | 4,161,110 | | | | 0.6 | % |
| | | | Other Securities^ | | | 71,379,258 | | | | 9.9 | % |
| | | | | |
| | | | Total | | | 120,023,592 | | | | | |
| | | | | |
| | |
| | Financials (9.0%) | | | | | | | | |
| | | | Ally Financial, Inc. | | | | | | | | |
| | 3,630,000 | | | 4.125%, 3/30/2020 | | | 3,625,462 | | | | 0.5 | % |
| | 3,500,000 | | | 5.750%, 11/20/2025f | | | 3,587,500 | | | | 0.5 | % |
| | 1,340,000 | | | 4.625%, 5/19/2022 | | | 1,340,000 | | | | 0.2 | % |
| | | | ASP AMC Merger Sub, Inc. | | | | | | | | |
| $ | 4,800,000 | | | 8.000%, 5/15/2025e | | | 3,600,000 | | | | 0.5 | % |
| | | | Centene Escrow Corporation | | | | | | | | |
| | 4,060,000 | | | 6.125%, 2/15/2024 | | | 4,242,700 | | | | 0.6 | % |
| | | | Park Aerospace Holdings, Ltd. | | | | | | | | |
| | 3,715,000 | | | 4.500%, 3/15/2023e | | | 3,534,377 | | | | 0.5 | % |
| | | | Other Securities^ | | | 45,035,165 | | | | 6.2 | % |
| | | | | |
| | | | Total | | | 64,965,204 | | | | | |
| | | | | |
| | |
| | Foreign Government (0.3%) | | | | | | | | |
| | | | Other Securities^ | | | 2,358,930 | | | | 0.3 | % |
| | | | | |
| | | | Total | | | 2,358,930 | | | | | |
| | | | | |
| | |
| | Technology (5.5%) | | | | | | | | |
| | | | Alliance Data Systems Corporation | | | | | | | | |
| | 6,120,000 | | | 5.375%, 8/1/2022e | | | 6,142,950 | | | | 0.9 | % |
| | | | CommScope Technologies Finance, LLC | | | | | | | | |
| | 4,225,000 | | | 6.000%, 6/15/2025e | | | 4,108,812 | | | | 0.6 | % |
| | | | Inception Merger Sub, Inc. | | | | | | | | |
| | 4,655,000 | | | 8.625%, 11/15/2024e,f | | | 4,375,700 | | | | 0.6 | % |
| | | | Seagate HDD Cayman | | | | | | | | |
| | 3,885,000 | | | 4.750%, 1/1/2025 | | | 3,555,403 | | | | 0.5 | % |
| | | | Western Digital Corporation | | | | | | | | |
| | 4,600,000 | | | 4.750%, 2/15/2026 | | | 4,249,250 | | | | 0.6 | % |
| | | | Other Securities^ | | | 17,126,195 | | | | 2.3 | % |
| | | | | |
| | | | Total | | | 39,558,310 | | | | | |
| | | | | |
| | |
| | Transportation (1.2%) | | | | | | | | |
| | | | Other Securities^ | | | 8,512,133 | | | | 1.2 | % |
| | | | | |
| | | | Total | | | 8,512,133 | | | | | |
| | | | | |
| | |
| | Utilities (3.0%) | | | | | | | | |
| | | | Dynegy, Inc. | | | | | | | | |
| | 3,255,000 | | | 8.125%, 1/30/2026e | | | 3,523,538 | | | | 0.5 | % |
| | | | Other Securities^ | | | 17,828,785 | | | | 2.5 | % |
| | | | | |
| | | | Total | | | 21,352,323 | | | | | |
| | | | | |
| | | | | | | | | | | | |
| | | | | |
| | | | Total Long-Term Fixed Income (cost $683,044,054) | | | 659,453,019 | | | | | |
| | | | | |
| | | | | | | |
| Shares | | | Preferred Stock (0.7%) | | Value | | | % of Net Assets | |
| | Energy (0.3%) | |
| | | | Other Securities^ | | | 1,854,384 | | | | 0.3 | % |
| | | | | |
| | | | Total | | | 1,854,384 | | | | | |
| | | | | |
| | |
| | Financials (0.4%) | | | | | | | | |
| | | | Other Securities^ | | | 3,240,981 | | | | 0.4 | % |
| | | | | |
| | | | Total | | | 3,240,981 | | | | | |
| | | | | |
| | | | | | | | | | | | |
| | | | | |
| | | | Total Preferred Stock (cost $5,327,202) | | | 5,095,365 | | | | | |
| | | | | |
The accompanying Notes to Financial Statements are an integral part of this schedule.
80
HIGH YIELD FUND
Summary Schedule of Investments as of October 31, 2018
| | | | | | | | | | | | |
| | | |
| Shares | | | Registered Investment Companies (0.5%) | | Value | | | % of Net
Assets | |
| | Equity Funds/Exchange Traded Funds (0.5%) | |
| | | | Other Securities^ | | | $3,631,275 | | | | 0.5 | % |
| | | | | |
| | | | Total | | | 3,631,275 | | | | | |
| | | | | |
| | | | | | | | | | | | |
| | | | | |
| | | | Total Registered Investment Companies (cost $3,360,650) | | | 3,631,275 | | | | | |
| | | | | |
| | | |
| Shares | | | Common Stock (<0.1%) | | Value | | | % of Net
Assets | |
| | Consumer Discretionary (<0.1%) | |
| | | | Other Securities^ | | | 48,774 | | | | <0.1 | % |
| | | | | |
| | | | Total | | | 48,774 | | | | | |
| | | | | |
| | |
| | Industrials (<0.1%) | | | | | | | | |
| | | | Other Securities^ | | | 42,614 | | | | <0.1 | % |
| | | | | |
| | | | Total | | | 42,614 | | | | | |
| | | | | |
| | |
| | Materials (<0.1%) | | | | | | | | |
| | | | Other Securities^ | | | 10,098 | | | | <0.1 | % |
| | | | | |
| | | | Total | | | 10,098 | | | | | |
| | | | | |
| | | | Total Common Stock (cost $320,645) | | | 101,486 | | | | | |
| | | | | |
| | | |
| Shares | | | Collateral Held for Securities Loaned (7.5%) | | Value | | | % of Net
Assets | |
| | 53,926,806 | | | Thrivent Cash Management Trust | | | 53,926,806 | | | | 7.5 | % |
| | | | | |
| | | | Total Collateral Held for Securities Loaned (cost $53,926,806) | | | 53,926,806 | | | | | |
| | | | | |
| | | |
Shares or Principal Amount | | | Short-Term Investments (3.6%) | | Value | | | % of Net
Assets | |
| | | | Thrivent Core Short-Term Reserve Fund | | | | | | | | |
| | 2,580,952 | | | 2.430% | | | 25,809,518 | | | | 3.6 | % |
| | | | | |
| | | | Total Short-Term Investments (cost $25,809,518) | | | 25,809,518 | | | | | |
| | | | | |
| | | | Total Investments (cost $801,793,166) 107.9% | | | $777,678,652 | | | | | |
| | | | | |
| | | | Other Assets and Liabilities, Net (7.9%) | | | (56,933,960 | ) | | | | |
| | | | | |
| | | | Total Net Assets 100.0% | | | $720,744,692 | | | | | |
| | | | | |
| ^ | The Summary Schedule of Investments shows the 50 largest holdings in unaffiliated issuers, any holding or issuer that exceeds 1% of net assets and all affiliated holdings as of the report date. The remaining securities held are grouped by category as “Other securities”. |
| a | All or a portion of the loan is unfunded. |
| b | The stated interest rate represents the weighted average of all contracts within the bank loan facility. |
| c | Denotes investments purchased on a when-issued or delayed delivery basis. |
| d | Denotes variable rate securities. The rate shown is as of October 31, 2018. The rates of certain variable rate securities are based on a published reference rate and spread; these may vary by security and the reference rate and spread are indicated in their description. The rates of other variable rate securities are determined by the issuer or agent and are based on current market conditions. These securities do not indicate a reference rate and spread in their description. |
| e | Denotes securities sold under Rule 144A of the Securities Act of 1933, which exempts them from registration. These securities may be resold to other dealers in the program or to other qualified institutional buyers. As of October 31, 2018, the value of these investments was $353,823,544 or 49.1% of total net assets. |
| f | All or a portion of the security is on loan. |
| * | Denotes restricted securities. Restricted securities are investment securities which cannot be offered for public sale without first being registered under the Securities Act of 1933. The value of all restricted securities held in High Yield Fund as of October 31, 2018 was $6,068,519 or 0.8% of total net assets. The following table indicates the acquisition date and cost of restricted securities shown in the schedule as of October 31, 2018. |
| | | | | | | | |
Security | | Acquisition
Date | | | Cost | |
Digicel, Ltd., 4/15/2021 | | | 3/19/2013 | | | $ | 4,950,858 | |
The following table presents the total amount of securities loaned with continuous maturity, by type, offset by the gross payable upon return of collateral for securities loaned by Thrivent High Yield Fund as of October 31, 2018:
| | | | |
Securities Lending Transactions | | | |
Common Stock | | $ | 1,803,500 | |
Taxable Debt Security | | | 50,247,936 | |
| | | | |
Total lending | | $ | 52,051,436 | |
Gross amount payable upon return of collateral for securities loaned | | $ | 53,926,806 | |
| | | | |
Net amounts due to counterparty | | $ | 1,875,370 | |
| | | | |
Reference Rate Index:
| | | | | | |
LIBOR 1M | | | - | | | ICE Libor USD Rate 1 Month |
LIBOR 2M | | | - | | | ICE Libor USD Rate 2 Month |
LIBOR 3M | | | - | | | ICE Libor USD Rate 3 Month |
Unrealized Appreciation (Depreciation)
Gross unrealized appreciation and depreciation of investments of the portfolio as a whole (including derivatives), based on cost for federal income tax purposes, were as follows:
| | | | |
Gross unrealized appreciation | | | $5,445,951 | |
Gross unrealized depreciation | | | (29,521,835 | ) |
| | | | |
Net unrealized appreciation (depreciation) | | | ($24,075,884 | ) |
| |
Cost for federal income tax purposes | | | $801,754,536 | |
The accompanying Notes to Financial Statements are an integral part of this schedule.
81
HIGH YIELD FUND
Summary Schedule of Investments as of October 31, 2018
Fair Valuation Measurements
The following table is a summary of the inputs used, as of October 31, 2018, in valuing High Yield Fund’s assets carried at fair value.
| | | | | | | | | | | | | | | | |
| Investments in Securities | | Total | | | Level 1 | | | Level 2 | | | Level 3 | |
| | | | |
Bank Loans | | | | | | | | | | | | | | | | |
Basic Materials | | | 10,490,766 | | | | – | | | | 10,490,766 | | | | – | |
Communications Services | | | 9,634,140 | | | | – | | | | 9,634,140 | | | | – | |
Consumer Non-Cyclical | | | 5,190,546 | | | | – | | | | 5,190,546 | | | | – | |
Financials | | | 2,337,759 | | | | – | | | | 2,337,759 | | | | – | |
Utilities | | | 2,007,972 | | | | – | | | | 2,007,972 | | | | – | |
| | | | |
Long-Term Fixed Income | | | | | | | | | | | | | | | | |
Asset-Backed Securities | | | 954,911 | | | | – | | | | 954,911 | | | | – | |
Basic Materials | | | 54,783,830 | | | | – | | | | 54,774,986 | | | | 8,844 | |
Capital Goods | | | 72,509,854 | | | | – | | | | 72,509,854 | | | | – | |
Communications Services | | | 102,269,585 | | | | – | | | | 102,269,585 | | | | – | |
Consumer Cyclical | | | 98,745,861 | | | | – | | | | 98,745,861 | | | | – | |
Consumer Non-Cyclical | | | 73,418,486 | | | | – | | | | 73,418,486 | | | | – | |
Energy | | | 120,023,592 | | | | – | | | | 120,023,592 | | | | – | |
Financials | | | 64,965,204 | | | | – | | | | 64,965,204 | | | | – | |
Foreign Government | | | 2,358,930 | | | | – | | | | 2,358,930 | | | | – | |
Technology | | | 39,558,310 | | | | – | | | | 39,558,310 | | | | – | |
Transportation | | | 8,512,133 | | | | – | | | | 8,512,133 | | | | – | |
Utilities | | | 21,352,323 | | | | – | | | | 21,352,323 | | | | – | |
| | | | |
Preferred Stock | | | | | | | | | | | | | | | | |
Energy | | | 1,854,384 | | | | – | | | | 1,854,384 | | | | – | |
Financials | | | 3,240,981 | | | | 3,240,981 | | | | – | | | | – | |
| | | | |
Registered Investment Companies | | | | | | | | | | | | | | | | |
Equity Funds/Exchange Traded Funds | | | 3,631,275 | | | | 3,631,275 | | | | – | | | | – | |
| | | | |
Common Stock | | | | | | | | | | | | | | | | |
Communications Services^ | | | 0 | | | | – | | | | – | | | | 0 | |
Consumer Discretionary | | | 48,774 | | | | 48,774 | | | | – | | | | – | |
Industrials | | | 42,614 | | | | – | | | | 42,614 | | | | – | |
Materials | | | 10,098 | | | | 10,098 | | | | – | | | | – | |
| |
Subtotal Investments in Securities | | | $697,942,328 | | | | $6,931,128 | | | | $691,002,356 | | | | $8,844 | |
| |
| | | | |
Other Investments* | | | Total | | | | | | | | | | | | | |
| | | | | | | | | | | | | |
Short-Term Investments | | | 25,809,518 | | | | | | | | | | | | | |
Collateral Held for Securities Loaned | | | 53,926,806 | | | | | | | | | | | | | |
| | | | | | | | | | | | | |
Subtotal Other Investments | | | $79,736,324 | | | | | | | | | | | | | |
| | | | | | | | | | | | | |
| | | | | | | | | | | | | | | | |
| | | | | | | | | | | | | |
Total Investments at Value | | | $777,678,652 | | | | | | | | | | | | | |
| | | | | | | | | | | | | |
| * | Certain investments are measured at fair value using a net asset value per share that is not publicly available (practical expedient). According to disclosure requirements of Accounting Standards Codification (ASC) 820, Fair Value Measurement, securities valued using the practical expedient are not classified in the fair value hierarchy. The fair value amounts presented in this table are intended to permit reconciliation of the fair value hierarchy to the amounts presented in the Statement of Assets and Liabilities. |
| ^ | Level 3 Security in this section is fair valued at <$1 |
There were no significant transfers between Levels during the period ended October 31, 2018. Transfers between Levels are identified as of the end of the period.
The following table summarizes the net realized gains/(losses) and Statement of Operations location, for the period ended October 31, 2018, for High Yield Fund’s investments in financial derivative instruments by primary risk exposure.
| | | | |
| Derivatives by risk category | | Statement of Operations Location | | Realized Gains/(Losses)
recognized in Income |
| | |
Credit Contracts | | | | |
Credit Default Swaps | | Net realized gains/(losses) on Swap agreements | | 10,422 |
Total Credit Contracts | | | | 10,422 |
|
Total | | | | $10,422 |
|
The following table presents High Yield Fund’s average volume of derivative activity during the period ended October 31, 2018.
| | | | |
| Derivative Risk Category | | Average Notional Value | |
Credit Contracts | | | | |
Credit Default Swaps - Buy Protection | | | ($11,316 | ) |
The accompanying Notes to Financial Statements are an integral part of this schedule.
82
HIGH YIELD FUND
Summary Schedule of Investments as of October 31, 2018
Investment in Affiliates
Affiliated issuers, as defined under the Investment Company Act of 1940, include those in which the Fund’s holdings of an issuer represent 5% or more of the outstanding voting securities of an issuer, any affiliated mutual fund, or a company which is under common ownership or control with the Fund. The Fund owns shares of Thrivent Cash Management Trust for the purpose of securities lending and Thrivent Core Short-Term Reserve Fund primarily to serve as a cash sweep vehicle for the Fund. Thrivent Cash Management Trust and Thrivent Core Funds are established solely for investment by Thrivent entities.
A summary of transactions (in thousands) for the fiscal year to date, in High Yield Fund, is as follows:
| | | | | | | | | | | | | | | | | | | | | | | | |
| Fund | | Value
10/31/2017 | | | Gross
Purchases | | | Gross
Sales | | | Shares Held at
10/31/2018 | | | Value
10/31/2018 | | | % of Net
Assets | |
Affiliated Short-Term Investments | | | | | | | | | | | | | | | | | | | | | | | | |
Core Short-Term Reserve, 2.430% | | | $17,220 | | | | $188,299 | | | | $179,709 | | | | 2,581 | | | | $25,810 | | | | 3.6 | % |
Total Affiliated Short-Term Investments | | | 17,220 | | | | | | | | | | | | | | | | 25,810 | | | | 3.6 | |
Collateral Held for Securities Loaned | | | | | | | | | | | | | | | | | | | | | | | | |
Cash Management Trust-Collateral Investment | | | 60,706 | | | | 217,143 | | | | 223,922 | | | | 53,927 | | | | 53,927 | | | | 7.5 | |
Total Collateral Held for Securities Loaned | | | 60,706 | | | | | | | | | | | | | | | | 53,927 | | | | 7.5 | |
Total Value | | | $77,926 | | | | | | | | | | | | | | | | $79,737 | | | | | |
| | | | | | | | | | | | | | | | |
| Fund | | Net Realized
Gain/(Loss) | | | Change in
Unrealized
Appreciation/
(Depreciation) | | | Distributions of
Realized Capital
Gains | | | Income Earned
11/1/2017 -
10/31/2018 | |
Affiliated Short-Term Investments | | | | | | | | | | | | | | | | |
Core Short-Term Reserve, 2.430% | | | $– | | | | $– | | | | $0 | | | | $481 | |
Total Income from Affiliated Investments | | | | | | | | | | | | | | | $481 | |
Collateral Held for Securities Loaned | | | | | | | | | | | | | | | | |
Cash Management Trust-Collateral Investment | | | – | | | | – | | | | – | | | | 494 | |
Total Affiliated Income from Securities Loaned, Net | | | | | | | | | | | | | | | $494 | |
Total | | | $– | | | | $– | | | | $0 | | | | | |
The accompanying Notes to Financial Statements are an integral part of this schedule.
83
INCOME FUND
Summary Schedule of Investments as of October 31, 2018
| | | | | | | | | | | | |
| | | |
Principal
Amount | | | Bank Loans (2.3%) | | Value | | | % of Net
Assets | |
| | Basic Materials (0.2%) | | | | | | | | |
| | | | Other Securities^ | | | $1,236,448 | | | | 0.2 | % |
| | | | | |
| | | | Total | | | 1,236,448 | | | | | |
| | | | | |
| | |
| | Capital Goods (0.1%) | | | | | | | | |
| | | | Other Securities^ | | | 899,345 | | | | 0.1 | % |
| | | | | |
| | | | Total | | | 899,345 | | | | | |
| | | | | |
| | |
| | Communications Services (0.8%) | | | | | | | | |
| | | | Other Securities^ | | | 6,408,582 | | | | 0.8 | % |
| | | | | |
| | | | Total | | | 6,408,582 | | | | | |
| | | | | |
| | |
| | Consumer Cyclical (0.2%) | | | | | | | | |
| | | | Other Securities^ | | | 1,858,402 | | | | 0.2 | % |
| | | | | |
| | | | Total | | | 1,858,402 | | | | | |
| | | | | |
| | |
| | Consumer Non-Cyclical (0.4%) | | | | | | | | |
| | | | Other Securities^ | | | 3,230,954 | | | | 0.4 | % |
| | | | | |
| | | | Total | | | 3,230,954 | | | | | |
| | | | | |
| | |
| | Energy (0.1%) | | | | | | | | |
| | | | Other Securities^ | | | 1,030,262 | | | | 0.1 | % |
| | | | | |
| | | | Total | | | 1,030,262 | | | | | |
| | | | | |
| | |
| | Financials (0.2%) | | | | | | | | |
| | | | Other Securities^ | | | 1,230,288 | | | | 0.2 | % |
| | | | | |
| | | | Total | | | 1,230,288 | | | | | |
| | | | | |
| | |
| | Technology (0.2%) | | | | | | | | |
| | | | Other Securities^ | | | 1,799,650 | | | | 0.2 | % |
| | | | | |
| | | | Total | | | 1,799,650 | | | | | |
| | | | | |
| | |
| | Transportation (0.1%) | | | | | | | | |
| | | | Other Securities^ | | | 454,250 | | | | 0.1 | % |
| | | | | |
| | | | Total | | | 454,250 | | | | | |
| | | | | |
| | |
| | Utilities (<0.1%) | | | | | | | | |
| | | | Other Securities^ | | | 399,640 | | | | <0.1 | % |
| | | | | |
| | | | Total | | | 399,640 | | | | | |
| | | | | |
| | | | | | | | | | | | |
| | | | | |
| | | | Total Bank Loans (cost $18,771,585) | | | 18,547,821 | | | | | |
| | | | | |
| | | |
Principal Amount | | | Long-Term Fixed Income (93.9%) | | Value | | | % of Net
Assets | |
| | Asset-Backed Securities (2.3%) | | | | | | | | |
| | | | Other Securities^ | | | 18,615,281 | | | | 2.3 | % |
| | | | | |
| | | | Total | | | 18,615,281 | | | | | |
| | | | | |
| | Basic Materials (4.6%) | | | | | | | | |
| | | | Anglo American Capital plc | | | | | | | | |
| $ | 2,900,000 | | | 4.750%, 4/10/2027a | | | 2,792,551 | | | | 0.4 | % |
| | | | Braskem Netherlands Finance BV | | | | | | | | |
| | 3,000,000 | | | 4.500%, 1/10/2028a | | | 2,771,250 | | | | 0.4 | % |
| | | | Kinross Gold Corporation | | | | | | | | |
| | 2,950,000 | | | 4.500%, 7/15/2027 | | | 2,640,250 | | | | 0.3 | % |
| | | | Teck Resources, Ltd. | | | | | | | | |
| | 3,580,000 | | | 6.125%, 10/1/2035 | | | 3,624,750 | | | | 0.5 | % |
| | | | Other Securities^ | | | 25,172,804 | | | | 3.0 | % |
| | | | | |
| | | | Total | | | 37,001,605 | | | | | |
| | | | | |
| | |
| | Capital Goods (2.8%) | | | | | | | | |
| | | | Other Securities^ | | | 22,852,099 | | | | 2.8 | % |
| | | | | |
| | | | Total | | | 22,852,099 | | | | | |
| | | | | |
| | |
| | Collateralized Mortgage Obligations (0.2%) | | | | | | | | |
| | | | Other Securities^ | | | 1,149,531 | | | | 0.2 | % |
| | | | | |
| | | | Total | | | 1,149,531 | | | | | |
| | | | | |
| | |
| | Communications Services (9.3%) | | | | | | | | |
| | | | AT&T, Inc. | | | | | | | | |
| | 2,880,000 | | | 4.250%, 3/1/2027 | | | 2,793,283 | | | | 0.4 | % |
| | 5,899,000 | | | 3.400% - 4.450%, 4/1/2024 - 12/15/2042 a | | | 5,453,871 | | | | 0.7 | % |
| | 2,150,000 | | | 3.514%, (LIBOR 3M + 1.180%), 6/12/2024b | | | 2,155,964 | | | | 0.3 | % |
| | | | Charter Communications Operating, LLC | | | | | | | | |
| | 3,325,000 | | | 6.484%, 10/23/2045 | | | 3,398,354 | | | | 0.4 | % |
| | | | Comcast Corporation | | | | | | | | |
| | 3,400,000 | | | 4.950%, 10/15/2058 | | | 3,330,940 | | | | 0.4 | % |
| | | | Crown Castle International Corporation | | | | | | | | |
| | 2,340,000 | | | 5.250%, 1/15/2023 | | | 2,440,457 | | | | 0.3 | % |
| | | | Omnicom Group, Inc. | | | | | | | | |
| | 2,380,000 | | | 4.450%, 8/15/2020 | | | 2,421,222 | | | | 0.3 | % |
| | | | Time Warner, Inc. | | | | | | | | |
| | 790,000 | | | 4.750%, 3/29/2021 | | | 810,735 | | | | 0.1 | % |
| | | | Verizon Communications, Inc. | | | | | | | | |
| | 2,600,000 | | | 3.414%, (LIBOR 3M + 1.100%), 5/15/2025b | | | 2,613,396 | | | | 0.3 | % |
| | 2,747,000 | | | 4.522%, 9/15/2048 | | | 2,491,562 | | | | 0.3 | % |
| | 4,510,000 | | | 3.500% - 5.250%, 11/1/2024 - 8/21/2046 | | | 4,419,112 | | | | 0.6 | % |
| | | | Viacom, Inc. | | | | | | | | |
| | 2,500,000 | | | 6.875%, 4/30/2036 | | | 2,760,683 | | | | 0.3 | % |
| | | | Other Securities^ | | | 39,474,713 | | | | 4.9 | % |
| | | | | |
| | | | Total | | | 74,564,292 | | | | | |
| | | | | |
| | |
| | Consumer Cyclical (4.6%) | | | | | | | | |
| | | | Amazon.com, Inc. | | | | | | | | |
| | 2,520,000 | | | 4.050%, 8/22/2047 | | | 2,360,582 | | | | 0.3 | % |
| | | | General Motors Company | | | | | | | | |
| | 2,870,000 | | | 5.000% - 5.000%, 10/1/2028 - 4/1/2035 | | | 2,685,777 | | | | 0.4 | % |
The accompanying Notes to Financial Statements are an integral part of this schedule.
84
INCOME FUND
Summary Schedule of Investments as of October 31, 2018
| | | | | | | | | | | | |
| | | |
Principal
Amount | | | Long-Term Fixed Income (93.9%) | | Value | | | % of Net
Assets | |
| | Consumer Cyclical (4.6%) - continued | | | | | | | | |
| $ | 1,800,000 | | | 3.227%, (LIBOR 3M + 0.900%), 9/10/2021b | | | $1,797,397 | | | | 0.2 | % |
| | | | General Motors Financial Company, Inc. | | | | | | | | |
| | 3,390,000 | | | 3.450% - 4.000%, 4/10/2022 - 1/15/2025 | | | 3,259,252 | | | | 0.4 | % |
| | | | Other Securities^ | | | 27,293,609 | | | | 3.3 | % |
| | | | | |
| | | | Total | | | 37,396,617 | | | | | |
| | | | | |
| | |
| | Consumer Non-Cyclical (10.5%) | | | | | | | | |
| | | | Anheuser-Busch InBev Finance, Inc. | | | | | | | | |
| | 3,700,000 | | | 3.650%, 2/1/2026 | | | 3,511,595 | | | | 0.4 | % |
| | 1,790,000 | | | 4.700%, 2/1/2036 | | | 1,706,959 | | | | 0.2 | % |
| | | | Anheuser-Busch InBev Worldwide, Inc. | | | | | | | | |
| | 2,900,000 | | | 4.600%, 4/15/2048 | | | 2,610,870 | | | | 0.3 | % |
| | 2,900,000 | | | 3.500% - 4.000%, 1/12/2024 - 4/13/2028 | | | 2,791,806 | | | | 0.4 | % |
| | | | Bayer U.S. Finance II, LLC | | | | | | | | |
| | 2,520,000 | | | 4.875%, 6/25/2048a | | | 2,349,665 | | | | 0.3 | % |
| | | | CVS Health Corporation | | | | | | | | |
| | 3,000,000 | | | 4.780%, 3/25/2038 | | | 2,873,864 | | | | 0.4 | % |
| | | | Smithfield Foods, Inc. | | | | | | | | |
| | 4,500,000 | | | 2.650%, 10/3/2021a | | | 4,282,599 | | | | 0.5 | % |
| | | | Other Securities^ | | | 64,464,889 | | | | 8.0 | % |
| | | | | |
| | | | Total | | | 84,592,247 | | | | | |
| | | | | |
| | |
| | Energy (10.1%) | | | | | | | | |
| | | | Energy Transfer Partners, LP | | | | | | | | |
| | 2,520,000 | | | 4.200%, 4/15/2027 | | | 2,377,780 | | | | 0.3 | % |
| | | | EQT Corporation | | | | | | | | |
| | 2,600,000 | | | 3.900%, 10/1/2027 | | | 2,366,004 | | | | 0.3 | % |
| | | | Petrobras Global Finance BV | | | | | | | | |
| | 2,520,000 | | | 5.299%, 1/27/2025 | | | 2,403,450 | | | | 0.3 | % |
| | | | Regency Energy Partners, LP | | | | | | | | |
| | 2,360,000 | | | 5.000%, 10/1/2022 | | | 2,431,698 | | | | 0.3 | % |
| | | | Other Securities^ | | | 71,447,385 | | | | 8.9 | % |
| | | | | |
| | | | Total | | | 81,026,317 | | | | | |
| | | | | |
| | |
| | Financials (26.9%) | | | | | | | | |
| | | | Bank of America Corporation | | | | | | | | |
| | 7,340,000 | | | 3.875% - 4.750%, 8/26/2024 - 4/21/2045 | | | 7,186,710 | | | | 0.9 | % |
| | 1,857,000 | | | 3.004%, 12/20/2023b | | | 1,787,954 | | | | 0.2 | % |
| | 1,800,000 | | | 3.705%, 4/24/2028b | | | 1,708,718 | | | | 0.2 | % |
| | 1,800,000 | | | 3.093%, 10/1/2025b | | | 1,704,469 | | | | 0.2 | % |
| | 1,640,000 | | | 6.500%, 10/23/2024b,c | | | 1,739,138 | | | | 0.2 | % |
| | 1,450,000 | | | 4.271%, 7/23/2029b | | | 1,430,066 | | | | 0.2 | % |
| | 1,100,000 | | | 3.499%, 5/17/2022b | | | 1,095,200 | | | | 0.1 | % |
| | 1,080,000 | | | 2.328%, 10/1/2021b | | | 1,054,323 | | | | 0.1 | % |
| | 730,000 | | | 6.300%, 3/10/2026b,c | | | 769,238 | | | | 0.1 | % |
| | | | Citigroup, Inc. | | | | | | | | |
| | 2,630,000 | | | 4.400%, 6/10/2025 | | | 2,605,425 | | | | 0.3 | % |
| | 5,745,000 | | | 3.700% - 5.500%, 9/13/2025 - 7/23/2048 | | | 5,691,238 | | | | 0.7 | % |
| | 1,440,000 | | | 3.887%, 1/10/2028b | | | 1,375,170 | | | | 0.2 | % |
| | 1,440,000 | | | 3.751%, (LIBOR 3M + 1.430%), 9/1/2023b | | | 1,470,312 | | | | 0.2 | % |
| | 1,100,000 | | | 3.142%, 1/24/2023b | | | 1,073,919 | | | | 0.1 | % |
| | | | Credit Suisse Group Funding, Ltd. | | | | | | | | |
| | 2,600,000 | | | 3.750%, 3/26/2025 | | | 2,488,942 | | | | 0.3 | % |
| | | | Discover Bank | | | | | | | | |
| | 2,510,000 | | | 4.682%, 8/9/2028b | | | 2,480,081 | | | | 0.3 | % |
| | | | Five Corners Funding Trust | | | | | | | | |
| | 2,890,000 | | | 4.419%, 11/15/2023a | | | 2,951,732 | | | | 0.4 | % |
| | | | Goldman Sachs Group, Inc. | | | | | | | | |
| | 2,550,000 | | | 3.850%, 7/8/2024 | | | 2,501,902 | | | | 0.3 | % |
| | 7,750,000 | | | 3.500% - 5.250%, 7/27/2021 - 5/22/2045 | | | 7,632,140 | | | | 1.0 | % |
| | 1,150,000 | | | 2.876%, 10/31/2022b | | | 1,118,536 | | | | 0.1 | % |
| | 1,080,000 | | | 5.300%, 11/10/2026b,c | | | 1,053,000 | | | | 0.1 | % |
| | 1,080,000 | | | 2.908%, 6/5/2023b | | | 1,040,491 | | | | 0.1 | % |
| | | | ING Groep NV | | | | | | | | |
| | 2,500,000 | | | 4.100%, 10/2/2023 | | | 2,481,087 | | | | 0.3 | % |
| | | | J.P. Morgan Chase & Company | | | | | | | | |
| | 7,570,000 | | | 2.295% - 5.500%, 8/15/2021 - 10/15/2040 | | | 7,517,418 | | | | 1.0 | % |
| | 1,810,000 | | | 3.717%, (LIBOR 3M + 1.230%), 10/24/2023b | | | 1,841,870 | | | | 0.2 | % |
| | 1,440,000 | | | 6.000%, 8/1/2023b,c | | | 1,447,200 | | | | 0.2 | % |
| | 1,400,000 | | | 3.882%, 7/24/2038b | | | 1,262,081 | | | | 0.2 | % |
| | 730,000 | | | 6.750%, 2/1/2024b,c | | | 778,545 | | | | 0.1 | % |
| | | | Kimco Realty Corporation | | | | | | | | |
| | 2,900,000 | | | 3.300%, 2/1/2025 | | | 2,740,079 | | | | 0.3 | % |
| | | | Morgan Stanley | | | | | | | | |
| | 10,555,000 | | | 2.500% - 5.500%, 1/26/2020 - 1/27/2045 | | | 10,376,568 | | | | 1.3 | % |
| | 1,810,000 | | | 3.887%, (LIBOR 3M + 1.400%), 10/24/2023b | | | 1,843,058 | | | | 0.2 | % |
| | | | Other Securities^ | | | 135,040,196 | | | | 16.8 | % |
| | | | | |
| | | | Total | | | 217,286,806 | | | | | |
| | | | | |
| | |
| | Foreign Government (1.5%) | | | | | | | | |
| | | | Other Securities^ | | | 11,766,400 | | | | 1.5 | % |
| | | | | |
| | | | Total | | | 11,766,400 | | | | | |
| | | | | |
| | |
| | Mortgage-Backed Securities (4.4%) | | | | | | | | |
| | | | Federal Home Loan Mortgage Corporation Gold 30-Yr. Pass Through | | | | | | | | |
| | 5,525,000 | | | 4.000%, 11/1/2048d | | | 5,526,915 | | | | 0.7 | % |
| | | | Federal National Mortgage Association Conventional 15- Yr. Pass Through | | | | | | | | |
| | 2,425,000 | | | 3.500%, 11/1/2033d | | | 2,422,963 | | | | 0.3 | % |
| | | | Federal National Mortgage Association Conventional 30- Yr. Pass Through | | | | | | | | |
| | 11,750,000 | | | 3.500%, 11/1/2048d | | | 11,438,350 | | | | 1.4 | % |
| | 6,900,000 | | | 4.000%, 11/1/2048d | | | 6,899,971 | | | | 0.9 | % |
| | 8,160,000 | | | 4.500%, 11/1/2048d | | | 8,354,597 | | | | 1.0 | % |
| | 1,000,000 | | | 5.000%, 11/1/2048d | | | 1,043,516 | | | | 0.1 | % |
| | | | | |
| | | | Total | | | 35,686,312 | | | | | |
| | | | | |
The accompanying Notes to Financial Statements are an integral part of this schedule.
85
INCOME FUND
Summary Schedule of Investments as of October 31, 2018
| | | | | | | | | | | | |
| | | |
Principal Amount | | | Long-Term Fixed Income (93.9%) | | Value | | | % of Net
Assets | |
| | Technology (3.8%) | | | | | | | | |
| | | | Apple, Inc. | | | | | | | | |
| $ | 2,550,000 | | | 3.250%, 2/23/2026 | | | $2,455,178 | | | | 0.3 | % |
| | | | Other Securities^ | | | 28,496,441 | | | | 3.5 | % |
| | | | | |
| | | | Total | | | 30,951,619 | | | | | |
| | | | | |
| | |
| | Transportation (0.6%) | | | | | | | | |
| | | | Other Securities^ | | | 5,090,528 | | | | 0.6 | % |
| | | | | |
| | | | Total | | | 5,090,528 | | | | | |
| | | | | |
| | |
| | U.S. Government and Agencies (5.1%) | | | | | | | | |
| | | | U.S. Treasury Bonds | | | | | | | | |
| | 3,600,000 | | | 2.250%, 11/15/2027 | | | 3,349,828 | | | | 0.4 | % |
| | 6,000,000 | | | 2.750%, 2/15/2028 | | | 5,810,625 | | | | 0.7 | % |
| | 4,500,000 | | | 2.875%, 5/15/2028 | | | 4,400,156 | | | | 0.6 | % |
| | 5,000,000 | | | 2.875%, 8/15/2028 | | | 4,884,961 | | | | 0.6 | % |
| | 13,900,000 | | | 2.750%, 11/15/2047 | | | 12,254,262 | | | | 1.5 | % |
| | 7,000,000 | | | 3.000%, 8/15/2048 | | | 6,491,406 | | | | 0.8 | % |
| | | | U.S. Treasury Notes | | | | | | | | |
| | 3,870,000 | | | 2.125%, 12/31/2022 | | | 3,741,504 | | | | 0.5 | % |
| | | | | |
| | | | Total | | | 40,932,742 | | | | | |
| | | | | |
| |
| | Utilities (7.2%) | | | | | |
| | | | AEP Transmission Company, LLC | | | | | | | | |
| | 2,520,000 | | | 3.100%, 12/1/2026 | | | 2,381,183 | | | | 0.3 | % |
| | | | ITC Holdings Corporation | | | | | | | | |
| | 2,920,000 | | | 4.050%, 7/1/2023 | | | 2,903,615 | | | | 0.4 | % |
| | | | Pennsylvania Electric Company | | | | | | | | |
| | 2,300,000 | | | 5.200%, 4/1/2020 | | | 2,353,166 | | | | 0.3 | % |
| | | | South Carolina Electric & Gas Company | | | | | | | | |
| | 4,300,000 | | | 5.100%, 6/1/2065 | | | 4,133,225 | | | | 0.5 | % |
| | | | Southern California Edison Company | | | | | | | | |
| | 3,150,000 | | | 4.125%, 3/1/2048 | | | 2,920,247 | | | | 0.4 | % |
| | | | Southern Company | | | | | | | | |
| | 4,370,000 | | | 3.250%, 7/1/2026 | | | 4,052,523 | | | | 0.5 | % |
| | | | Other Securities^ | | | 39,534,693 | | | | 4.8 | % |
| | | | | |
| | | | Total | | | 58,278,652 | | | | | |
| | | | | |
| | | | | | | | | | | | |
| | | | | |
| | | | Total Long-Term Fixed Income (cost $780,339,855) | | | 757,191,048 | | | | | |
| | | | | |
| | | |
| Shares | | | Registered Investment Companies (1.5%) | | Value | | | % of Net Assets | |
| | Fixed Income Funds/Exchange Traded Funds (1.5%) | | | | | | | | |
| | 67,000 | | | iShares J.P. Morgan USD Emerging Markets Bond ETF | | | 7,012,220 | | | | 0.9 | % |
| | 150,000 | | | SPDR Bloomberg Barclays High Yield Bond ETF | | | 5,274,000 | | | | 0.6 | % |
| | | | | |
| | | | Total | | | 12,286,220 | | | | | |
| | | | | |
| | | | | | | | | | | | |
| | | | | |
| | | | Total Registered Investment Companies (cost $12,566,863) | | | 12,286,220 | | | | | |
| | | | | |
| | | |
| Shares | | | Preferred Stock (0.3%) | | Value | | | % of Net
Assets | |
| | Financials (0.3%) | | | | | | | | |
| | 51,800 | | | Morgan Stanley, 7.125%b,c | | | 1,412,586 | | | | 0.2 | % |
| | | | Other Securities^ | | | 1,287,500 | | | | 0.1 | % |
| | | | | |
| | | | Total | | | 2,700,086 | | | | | |
| | | | | |
| | | | | | | | | | | | |
| | | | | |
| | | | Total Preferred Stock (cost $2,543,644) | | | 2,700,086 | | | | | |
| | | | | |
| | | |
| Shares | | | Collateral Held for Securities Loaned (1.0%) | | Value | | | % of Net
Assets | |
| | 8,347,519 | | | Thrivent Cash Management Trust | | | 8,347,519 | | | | 1.0 | % |
| | | | | |
| | | | Total Collateral Held for Securities Loaned (cost $ 8,347,519) | | | 8,347,519 | | | | | |
| | | | | |
| | | |
Shares or Principal Amount | | | Short-Term Investments (6.5%) | | Value | | | % of Net
Assets | |
| | | | Thrivent Core Short-Term Reserve Fund | |
| | 5,147,370 | | | 2.430% | | | 51,473,698 | | | | 6.4 | % |
| | | | Other Securities^ | | | 698,179 | | | | 0.1 | % |
| | | | | |
| | | | Total Short-Term Investments (cost $52,171,905) | | | 52,171,877 | | | | | |
| | | | | |
| | | | Total Investments (cost $874,741,371)105.5% | | $ | 851,244,571 | | | | | |
| | | | | |
| | | | Other Assets and Liabilities, Net (5.5%) | | | (44,406,249 | ) | | | | |
| | | | | |
| | | | Total Net Assets 100.0% | | $ | 806,838,322 | | | | | |
| | | | | |
| ^ | The Summary Schedule of Investments shows the 50 largest holdings in unaffiliated issuers, any holding or issuer that exceeds 1% of net assets and all affiliated holdings as of the report date. The remaining securities held are grouped by category as “Other securities”. |
| a | Denotes securities sold under Rule 144A of the Securities Act of 1933, which exempts them from registration. These securities may be resold to other dealers in the program or to other qualified institutional buyers. As of October 31, 2018, the value of these investments was $123,581,872 or 15.3% of total net assets. |
| b | Denotes variable rate securities. The rate shown is as of October 31, 2018. The rates of certain variable rate securities are based on a published reference rate and spread; these may vary by security and the reference rate and spread are indicated in their description. The rates of other variable rate securities are determined by the issuer or agent and are based on current market conditions. These securities do not indicate a reference rate and spread in their description. |
| c | Denotes perpetual securities. Perpetual securities pay an indefinite stream of interest and have no contractual maturity date. Date shown, if applicable, is next call date. |
| d | Denotes investments purchased on a when-issued or delayed delivery basis. |
Income Fund held restricted securities as of October 31, 2018. Restricted securities are investment securities which cannot be offered for public sale without first being registered under the Securities Act of 1933. As of October 31, 2018, the value of these investments was $15,863,546 or 2.0% of total net assets.
The accompanying Notes to Financial Statements are an integral part of this schedule.
86
INCOME FUND
Summary Schedule of Investments as of October 31, 2018
The following table presents the total amount of securities loaned with continuous maturity, by type, offset by the gross payable upon return of collateral for securities loaned by Thrivent Income Fund as of October 31, 2018:
| | | | |
| Securities Lending Transactions | | | |
Taxable Debt Security | | | $8,056,513 | |
| | | | |
Total lending | | | $8,056,513 | |
Gross amount payable upon return of collateral for securities loaned | | | $8,347,519 | |
| | | | |
Net amounts due to counterparty | | | $291,006 | |
Definitions:
| | | | |
| ETF | | - | | Exchange Traded Fund |
| SPDR | | - | | S&P Depository Receipts, which are a family of exchange-traded funds traded in the U.S., Europe, and Asia-Pacific and managed by State Street Global Advisors. |
Reference Rate Index:
| | | | |
LIBOR 3M | | - | | ICE Libor USD Rate 3 Month |
Unrealized Appreciation (Depreciation)
Gross unrealized appreciation and depreciation of investments of the portfolio as a whole (including derivatives), based on cost for federal income tax purposes, were as follows:
| | | | |
Gross unrealized appreciation | | | $4,751,521 | |
Gross unrealized depreciation | | | (27,982,581 | ) |
| | | | |
Net unrealized appreciation (depreciation) | | | ($23,231,060 | ) |
| |
Cost for federal income tax purposes | | | $831,472,702 | |
The accompanying Notes to Financial Statements are an integral part of this schedule.
87
INCOME FUND
Summary Schedule of Investments as of October 31, 2018
Fair Valuation Measurements
The following table is a summary of the inputs used, as of October 31, 2018, in valuing Income Fund’s assets carried at fair value.
| | | | | | | | | | | | | | | | |
| Investments in Securities | | Total | | | Level 1 | | | Level 2 | | | Level 3 | |
| | | | |
Bank Loans | | | | | | | | | | | | | | | | |
Basic Materials | | | 1,236,448 | | | | – | | | | 1,072,275 | | | | 164,173 | |
Capital Goods | | | 899,345 | | | | – | | | | 899,345 | | | | – | |
Communications Services | | | 6,408,582 | | | | – | | | | 6,408,582 | | | | – | |
Consumer Cyclical | | | 1,858,402 | | | | – | | | | 1,858,402 | | | | – | |
Consumer Non-Cyclical | | | 3,230,954 | | | | – | | | | 3,230,954 | | | | – | |
Energy | | | 1,030,262 | | | | – | | | | 1,030,262 | | | | – | |
Financials | | | 1,230,288 | | | | – | | | | 1,230,288 | | | | – | |
Technology | | | 1,799,650 | | | | – | | | | 1,799,650 | | | | – | |
Transportation | | | 454,250 | | | | – | | | | 454,250 | | | | – | |
Utilities | | | 399,640 | | | | – | | | | 399,640 | | | | – | |
| | | | |
Long-Term Fixed Income | | | | | | | | | | | | | | | | |
Asset-Backed Securities | | | 18,615,281 | | | | – | | | | 18,615,281 | | | | – | |
Basic Materials | | | 37,001,605 | | | | – | | | | 37,001,605 | | | | – | |
Capital Goods | | | 22,852,099 | | | | – | | | | 22,852,099 | | | | – | |
Collateralized Mortgage Obligations | | | 1,149,531 | | | | – | | | | 1,149,531 | | | | – | |
Communications Services | | | 74,564,292 | | | | – | | | | 74,564,292 | | | | – | |
Consumer Cyclical | | | 37,396,617 | | | | – | | | | 37,396,617 | | | | – | |
Consumer Non-Cyclical | | | 84,592,247 | | | | – | | | | 84,592,247 | | | | – | |
Energy | | | 81,026,317 | | | | – | | | | 81,026,317 | | | | – | |
Financials | | | 217,286,806 | | | | – | | | | 217,286,806 | | | | – | |
Foreign Government | | | 11,766,400 | | | | – | | | | 11,766,400 | | | | – | |
Mortgage-Backed Securities | | | 35,686,312 | | | | – | | | | 35,686,312 | | | | – | |
Technology | | | 30,951,619 | | | | – | | | | 30,951,619 | | | | – | |
Transportation | | | 5,090,528 | | | | – | | | | 5,090,528 | | | | – | |
U.S. Government and Agencies | | | 40,932,742 | | | | – | | | | 40,932,742 | | | | – | |
Utilities | | | 58,278,652 | | | | – | | | | 58,278,652 | | | | – | |
| | | | |
Registered Investment Companies | | | | | | | | | | | | | | | | |
Fixed Income Funds/Exchange Traded Funds | | | 12,286,220 | | | | 12,286,220 | | | | – | | | | – | |
| | | | |
Preferred Stock | | | | | | | | | | | | | | | | |
Financials | | | 2,700,086 | | | | 1,412,586 | | | | 1,287,500 | | | | – | |
Short-Term Investments | | | 698,179 | | | | – | | | | 698,179 | | | | – | |
Subtotal Investments in Securities | | | $791,423,354 | | | | $13,698,806 | | | | $777,560,375 | | | | $164,173 | |
| |
| | | | |
| Other Investments* | | Total | | | | | | | | | | |
Short-Term Investments | | | 51,473,698 | | | | | | | | | | | | | |
Collateral Held for Securities Loaned | | | 8,347,519 | | | | | | | | | | | | | |
| | | | | | | | | | | | | |
Subtotal Other Investments | | | $59,821,217 | | | | | | | | | | | | | |
| | | | | | | | | | | | | |
| | | | | | | | | | | | | | | | |
| | | | | | | | | | | | | |
Total Investments at Value | | | $851,244,571 | | | | | | | | | | | | | |
| | | | | | | | | | | | | |
| * | Certain investments are measured at fair value using a net asset value per share that is not publicly available (practical expedient). According to disclosure requirements of Accounting Standards Codification (ASC) 820, Fair Value Measurement, securities valued using the practical expedient are not classified in the fair value hierarchy. The fair value amounts presented in this table are intended to permit reconciliation of the fair value hierarchy to the amounts presented in the Statement of Assets and Liabilities. |
| | | | | | | | | | | | | | | | |
| | | | |
| Other Financial Instruments | | Total | | | Level 1 | | | Level 2 | | | Level 3 | |
| | | | |
Asset Derivatives | | | | | | | | | | | | | | | | |
Futures Contracts | | | 627,647 | | | | 627,647 | | | | – | | | | – | |
| |
Total Asset Derivatives | | | $627,647 | | | | $627,647 | | | | $– | | | | $– | |
| |
| | | | |
Liability Derivatives | | | | | | | | | | | | | | | | |
Futures Contracts | | | 694,214 | | | | 694,214 | | | | – | | | | – | |
| |
Total Liability Derivatives | | | $694,214 | | | | $694,214 | | | | $– | | | | $– | |
| |
There were no significant transfers between Levels during the period ended October 31, 2018. Transfers between Levels are identified as of the end of the
period.
The accompanying Notes to Financial Statements are an integral part of this schedule.
88
INCOME FUND
Summary Schedule of Investments as of October 31, 2018
The following table presents Income Fund’s futures contracts held as of October 31, 2018. Investments and/or cash totaling $698,179 were pledged as the initial margin deposit for these contracts.
| | | | | | | | | | | | | | | | | | | | |
| Futures Contracts Description | | Number of
Contracts
Long/(Short) | | | Expiration
Date | | | Notional Principal
Amount | | | | | | Value and
Unrealized | |
CBOT U.S. Long Bond | | | 104 | | | | December 2018 | | | | $15,059,214 | | | | | | | | ($694,214 | ) |
| |
Total Futures Long Contracts | | | | | | | | | | | $15,059,214 | | | | | | | | ($694,214 | ) |
| |
CBOT 10-Yr. U.S. Treasury Note | | | (250 | ) | | | December 2018 | | | | ($29,973,419 | ) | | | | | | | $364,044 | |
CBOT 5-Yr. U.S. Treasury Note | | | (247 | ) | | | December 2018 | | | | (28,022,157 | ) | | | | | | | 263,603 | |
| |
Total Futures Short Contracts | | | | | | | | | | | ($57,995,576 | ) | | | | | | | $627,647 | |
| |
Total Futures Contracts | | | | | | | | | | | ($42,936,362 | ) | | | | | | | ($66,567 | ) |
| |
| | |
| Reference Description: |
| CBOT | | - Chicago Board of Trade |
The following table summarizes the fair value and Statement of Assets and Liabilities location, as of October 31, 2018, for Income Fund’s investments in financial derivative instruments by primary risk exposure as discussed under item (2) Significant Accounting Policies of the Notes to Financial Statements.
| | | | | | |
| Derivatives by risk category | | Statement of Assets and Liabilities Location | | Fair Value | |
| | |
Asset Derivatives | | | | | | |
| | |
Interest Rate Contracts | | | | | | |
Futures* | | Net Assets - Accumulated undistributed earnings/(loss) | | $ | 627,647 | |
Total Interest Rate Contracts | | | | | 627,647 | |
| |
Total Asset Derivatives | | | | $ | 627,647 | |
| |
| | |
Liability Derivatives | | | | | | |
| | |
Interest Rate Contracts | | | | | | |
Futures* | | Net Assets - Accumulated undistributed earnings/(loss) | | | 694,214 | |
Total Interest Rate Contracts | | | | | 694,214 | |
| |
Total Liability Derivatives | | | | $ | 694,214 | |
| |
| * | Includes cumulative appreciation/depreciation of futures contracts as reported in the Schedule of Investments. Only current day’s variation margin is reported within the Statement of Assets and Liabilities. |
The following table summarizes the net realized gains/(losses) and Statement of Operations location, for the period ended October 31, 2018, for Income Fund’s investments in financial derivative instruments by primary risk exposure.
| | | | |
| Derivatives by risk category | | Statement of Operations Location | | Realized Gains/(Losses)
recognized in Income |
| | |
Interest Rate Contracts | | | | |
Futures | | Net realized gains/(losses) on Futures contracts | | 2,493,879 |
| | |
Total Interest Rate Contracts | | | | 2,493,879 |
|
Total | | | | $2,493,879 |
|
The following table summarizes the change in net unrealized appreciation/(depreciation) and Statement of Operations location, for the period ended October 31, 2018, for Income Fund’s investments in financial derivative instruments by primary risk exposure.
| | | | |
| Derivatives by risk category | | Statement of Operations Location | | Change in unrealized
appreciation/(depreciation)
recognized in Income |
| | |
Interest Rate Contracts | | | | |
Futures | | Change in net unrealized appreciation/(depreciation) on Futures contracts | | (393,181) |
| | |
Total Interest Rate Contracts | | | | (393,181) |
|
Total | | | | ($393,181) |
|
The accompanying Notes to Financial Statements are an integral part of this schedule.
89
INCOME FUND
Summary Schedule of Investments as of October 31, 2018
The following table presents Income Fund’s average volume of derivative activity during the period ended October 31, 2018.
| | | | |
| Derivative Risk Category | | Average Notional Value | |
Interest Rate Contracts | | | | |
Futures - Long | | | $19,239,451 | |
Futures - Short | | | (79,899,093 | ) |
Investment in Affiliates
Affiliated issuers, as defined under the Investment Company Act of 1940, include those in which the Fund’s holdings of an issuer represent 5% or more of the outstanding voting securities of an issuer, any affiliated mutual fund, or a company which is under common ownership or control with the Fund. The Fund owns shares of Thrivent Cash Management Trust for the purpose of securities lending and Thrivent Core Short-Term Reserve Fund primarily to serve as a cash sweep vehicle for the Fund. Thrivent Cash Management Trust and Thrivent Core Funds are established solely for investment by Thrivent entities.
A summary of transactions (in thousands) for the fiscal year to date, in Income Fund, is as follows:
| | | | | | | | | | | | | | | | | | | | | | | | |
| Fund | | Value
10/31/2017 | | | Gross
Purchases | | | Gross
Sales | | | Shares Held at
10/31/2018 | | | Value
10/31/2018 | | | % of Net
Assets | |
Affiliated Short-Term Investments | | | | | | | | | | | | | | | | | | | | | | | | |
Core Short-Term Reserve, 2.430% | | | $42,410 | | | | $263,187 | | | | $254,123 | | | | 5,147 | | | | $51,474 | | | | 6.4 | % |
Total Affiliated Short-Term Investments | | | 42,410 | | | | | | | | | | | | | | | | 51,474 | | | | 6.4 | |
Collateral Held for Securities Loaned | | | | | | | | | | | | | | | | | | | | | | | | |
Cash Management Trust-Collateral Investment | | | 19,443 | | | | 74,584 | | | | 85,679 | | | | 8,348 | | | | 8,348 | | | | 1.0 | |
Total Collateral Held for Securities Loaned | | | 19,443 | | | | | | | | | | | | | | | | 8,348 | | | | 1.0 | |
Total Value | | | $61,853 | | | | | | | | | | | | | | | | $59,822 | | | | | |
| | | | | | | | | | | | | | | | |
| Fund | | Net Realized
Gain/(Loss) | | | Change in
Unrealized
Appreciation/
(Depreciation) | | | Distributions of
Realized Capital
Gains | | | Income Earned
11/1/2017 -
10/31/2018 | |
Affiliated Short-Term Investments | | | | | | | | | | | | | | | | |
Core Short-Term Reserve, 2.430% | | | $– | | | | $– | | | | $1 | | | | $1,072 | |
Total Income from Affiliated Investments | | | | | | | | | | | | | | | $1,072 | |
Collateral Held for Securities Loaned | | | | | | | | | | | | | | | | |
Cash Management Trust-Collateral Investment | | | – | | | | – | | | | – | | | | 66 | |
Total Affiliated Income from Securities Loaned, Net | | | | | | | | | | | | | | | $66 | |
Total | | | $– | | | | $– | | | | $1 | | | | | |
The accompanying Notes to Financial Statements are an integral part of this schedule.
90
LARGE CAP GROWTH FUND
Summary Schedule of Investments as of October 31, 2018
| | | | | | | | |
| Shares | | | Common Stock (95.5%) | | Value | |
| | Communications Services (12.2%) | | | | |
| | 47,604 | | | Alphabet, Inc., Class Aa | | | $51,915,970 | |
| | 9,344 | | | Alphabet, Inc., Class Ca | | | 10,061,339 | |
| | 272,185 | | | Facebook, Inc.a | | | 41,314,961 | |
| | 65,370 | | | Netflix, Inc.a | | | 19,727,359 | |
| | | | | |
| | | | Total | | | 123,019,629 | |
| | | | | |
| |
| | Consumer Discretionary (15.3%) | | | | |
| | 49,198 | | | Amazon.com, Inc.a | | | 78,618,896 | |
| | 11,331 | | | Booking Holdings, Inc.a | | | 21,240,866 | |
| | 200,802 | | | Las Vegas Sands Corporation | | | 10,246,926 | |
| | 83,737 | | | McDonald’s Corporation | | | 14,813,075 | |
| | 380,676 | | | NIKE, Inc. | | | 28,565,927 | |
| | | | | |
| | | | Total | | | 153,485,690 | |
| | | | | |
| |
| | Consumer Staples (2.1%) | | | | |
| | 184,427 | | | Altria Group, Inc. | | | 11,995,132 | |
| | 321,122 | | | Kroger Company | | | 9,556,591 | |
| | | | | |
| | | | Total | | | 21,551,723 | |
| | | | | |
| |
| | Energy (1.6%) | | | | |
| | 143,157 | | | Anadarko Petroleum Corporation | | | 7,615,952 | |
| | 54,810 | | | Pioneer Natural Resources Company | | | 8,071,869 | |
| | | | | |
| | | | Total | | | 15,687,821 | |
| | | | | |
| |
| | Financials (5.4%) | | | | |
| | 432,596 | | | Bank of America Corporation | | | 11,896,390 | |
| | 176,376 | | | Citigroup, Inc. | | | 11,545,573 | |
| | 65,388 | | | Goldman Sachs Group, Inc. | | | 14,736,494 | |
| | 208,535 | | | Intercontinental Exchange, Inc. | | | 16,065,536 | |
| | | | | |
| | | | Total | | | 54,243,993 | |
| | | | | |
| |
| | Health Care (13.7%) | | | | |
| | 62,916 | | | Becton, Dickinson and Company | | | 14,502,138 | |
| | 28,461 | | | Biogen, Inc.a | | | 8,659,828 | |
| | 135,296 | | | BioMarin Pharmaceutical, Inc.a | | | 12,470,232 | |
| | 86,951 | | | Edwards Lifesciences Corporationa | | | 12,833,968 | |
| | 30,682 | | | Illumina, Inc.a | | | 9,546,704 | |
| | 28,253 | | | Intuitive Surgical, Inc.a | | | 14,724,899 | |
| | 36,962 | | | Thermo Fisher Scientific, Inc. | | | 8,636,171 | |
| | 116,062 | | | UnitedHealth Group, Inc. | | | 30,332,804 | |
| | 93,201 | | | Vertex Pharmaceuticals, Inc.a | | | 15,793,841 | |
| | 110,934 | | | Zoetis, Inc. | | | 10,000,701 | |
| | | | | |
| | | | Total | | | 137,501,286 | |
| | | | | |
| |
| | Industrials (8.3%) | | | | |
| | 73,239 | | | Boeing Company | | | 25,989,592 | |
| | 250,341 | | | CSX Corporation | | | 17,238,481 | |
| | 128,523 | | | Honeywell International, Inc. | | | 18,612,701 | |
| | 76,283 | | | Norfolk Southern Corporation | | | 12,802,576 | |
| | 21,420 | | | Resideo Technologies, Inc.a | | | 450,891 | |
| | 88,542 | | | XPO Logistics, Inc.a | | | 7,913,884 | |
| | | | | |
| | | | Total | | | 83,008,125 | |
| | | | | |
| |
| | Information Technology (36.9%) | | | | |
| | 219,169 | | | Activision Blizzard, Inc. | | | 15,133,620 | |
| | 233,501 | | | Apple, Inc. | | | 51,104,029 | |
| | 126,641 | | | Autodesk, Inc.a | | | 16,368,349 | |
| | 251,318 | | | Cisco Systems, Inc. | | | 11,497,799 | |
| | 206,793 | | | MasterCard, Inc. | | | 40,876,772 | |
| | 438,105 | | | Microsoft Corporation | | | 46,793,995 | |
| | 88,086 | | | NVIDIA Corporation | | | 18,571,171 | |
| | 463,500 | | | PayPal Holdings, Inc.a | | | 39,022,065 | |
| | 101,714 | | | Red Hat, Inc.a | | | 17,458,191 | |
| | 341,514 | | | Salesforce.com, Inc.a | | | 46,869,381 | |
| | 349,178 | | | Visa, Inc. | | | 48,134,187 | |
| | 213,435 | | | Xilinx, Inc. | | | 18,220,946 | |
| | | | | |
| | | | Total | | | 370,050,505 | |
| | | | | |
| | | | Total Common Stock (cost $658,679,209) | | | 958,548,772 | |
| | | | | |
| | | | | | | | |
| | |
| Shares | | | Registered Investment Companies (2.0%) | | Value | |
| | Equity Funds/Exchange Traded Funds (2.0%) | | | | |
| | 141,769 | | | iShares Russell 1000 Growth Index Fund | | | 20,142,540 | |
| | | | | |
| | | | Total | | | 20,142,540 | |
| | | | | |
| | | | Total Registered Investment Companies (cost $19,780,575) | | | 20,142,540 | |
| | | | | |
| | |
Shares or
Principal
Amount | | | Short-Term Investments (2.6%) | | Value | |
| | | | Federal Home Loan Bank Discount Notes | | | | |
| | 500,000 | | | 2.195%, 12/13/2018b,c | | | 498,699 | |
| | | | Thrivent Core Short-Term Reserve Fund | | | | |
| | 2,502,625 | | | 2.430% | | | 25,026,249 | |
| | | | | |
| | | | Total Short-Term Investments (cost $25,524,969) | | | 25,524,948 | |
| | | | | |
| | | | Total Investments (cost $703,984,753) 100.1% | | | $1,004,216,260 | |
| | | | | |
| | | | Other Assets and Liabilities, Net (0.1%) | | | (610,711 | ) |
| | | | | |
| | | | Total Net Assets 100.0% | | | $1,003,605,549 | |
| | | | | |
| a | Non-income producing security. |
| b | The interest rate shown reflects the yield, coupon rate or the discount rate at the date of purchase. |
| c | All or a portion of the security is held on deposit with the counterparty and pledged as the initial margin deposit for open futures contracts. |
Unrealized Appreciation (Depreciation)
Gross unrealized appreciation and depreciation of investments of the portfolio as a whole (including derivatives), based on cost for federal income tax purposes, were as follows:
| | | | |
Gross unrealized appreciation | | $ | 318,609,787 | |
Gross unrealized depreciation | | | (18,746,826 | ) |
| | | | |
Net unrealized appreciation (depreciation) | | $ | 299,862,961 | |
| |
Cost for federal income tax purposes | | $ | 704,353,299 | |
The accompanying Notes to Financial Statements are an integral part of this schedule.
91
LARGE CAP GROWTH FUND
Schedule of Investments as of October 31, 2018
Fair Valuation Measurements
The following table is a summary of the inputs used, as of October 31, 2018, in valuing Large Cap Growth Fund’s assets carried at fair value.
| | | | | | | | | | | | | | | | |
| Investments in Securities | | Total | | | Level 1 | | | Level 2 | | | Level 3 | |
| | | | |
Common Stock | | | | | | | | | | | | | | | | |
Communications Services | | | 123,019,629 | | | | 123,019,629 | | | | – | | | | – | |
Consumer Discretionary | | | 153,485,690 | | | | 153,485,690 | | | | – | | | | – | |
Consumer Staples | | | 21,551,723 | | | | 21,551,723 | | | | – | | | | – | |
Energy | | | 15,687,821 | | | | 15,687,821 | | | | – | | | | – | |
Financials | | | 54,243,993 | | | | 54,243,993 | | | | – | | | | – | |
Health Care | | | 137,501,286 | | | | 137,501,286 | | | | – | | | | – | |
Industrials | | | 83,008,125 | | | | 83,008,125 | | | | – | | | | – | |
Information Technology | | | 370,050,505 | | | | 370,050,505 | | | | – | | | | – | |
| | | | |
Registered Investment Companies | | | | | | | | | | | | | | | | |
Equity Funds/Exchange Traded Funds | | | 20,142,540 | | | | 20,142,540 | | | | – | | | | – | |
Short-Term Investments | | | 498,699 | | | | – | | | | 498,699 | | | | – | |
| |
Subtotal Investments in Securities | | | $979,190,011 | | | | $978,691,312 | | | | $498,699 | | | | $– | |
| |
| | | | |
| Other Investments * | | Total | | | | | | | | | | |
Short-Term Investments | | | 25,026,249 | | | | | | | | | | | | | |
| | | | | | | | | | | | | |
Subtotal Other Investments | | | $25,026,249 | | | | | | | | | | | | | |
| | | | | | | | | | | | | |
| | | | | | | | | | | | | | | | |
| | | | | | | | | | | | | |
Total Investments at Value | | | $1,004,216,260 | | | | | | | | | | | | | |
| | | | | | | | | | | | | |
| * | Certain investments are measured at fair value using a net asset value per share that is not publicly available (practical expedient). According to disclosure requirements of Accounting Standards Codification (ASC) 820, Fair Value Measurement, securities valued using the practical expedient are not classified in the fair value hierarchy. The fair value amounts presented in this table are intended to permit reconciliation of the fair value hierarchy to the amounts presented in the Statement of Assets and Liabilities. |
There were no significant transfers between Levels during the period ended October 31, 2018. Transfers between Levels are identified as of the end of the period.
The following table summarizes the net realized gains/(losses) and Statement of Operations location, for the period ended October 31, 2018, for Large Cap Growth Fund’s investments in financial derivative instruments by primary risk exposure.
| | | | | | |
| Derivatives by risk category | | Statement of Operations Location | | Realized Gains/(Losses)
recognized in Income | |
Equity Contracts | | | | | | |
Futures | | Net realized gains/(losses) on Futures contracts | | | (4,473,558 | ) |
Total Equity Contracts | | | | | (4,473,558 | ) |
| |
Total | | | | | ($4,473,558 | ) |
| |
The following table summarizes the change in net unrealized appreciation/(depreciation) and Statement of Operations location, for the period ended October 31, 2018, for Large Cap Growth Fund’s investments in financial derivative instruments by primary risk exposure.
| | | | |
| Derivatives by risk category | | Statement of Operations Location | | Change in unrealized
appreciation/(depreciation)
recognized in Income |
Equity Contracts | | | | |
Futures | | Change in net unrealized appreciation/(depreciation) on Futures contracts | | 3,693,646 |
Total Equity Contracts | | | | 3,693,646 |
|
Total | | | | $3,693,646 |
|
The following table presents Large Cap Growth Fund’s average volume of derivative activity during the period ended October 31, 2018.
| | | | |
| Derivative Risk Category | | Average Notional Value | |
Equity Contracts | | | | |
Futures - Long | | | $2,405,706 | |
The accompanying Notes to Financial Statements are an integral part of this schedule.
92
LARGE CAP GROWTH FUND
Schedule of Investments as of October 31, 2018
Investment in Affiliates
Affiliated issuers, as defined under the Investment Company Act of 1940, include those in which the Fund’s holdings of an issuer represent 5% or more of the outstanding voting securities of an issuer, any affiliated mutual fund, or a company which is under common ownership or control with the Fund. The Fund owns shares of Thrivent Cash Management Trust for the purpose of securities lending and Thrivent Core Short-Term Reserve Fund primarily to serve as a cash sweep vehicle for the Fund. Thrivent Cash Management Trust and Thrivent Core Funds are established solely for investment by Thrivent entities.
A summary of transactions (in thousands) for the fiscal year to date, in Large Cap Growth Fund, is as follows:
| | | | | | | | | | | | | | | | | | | | | | | | |
| Fund | | Value
10/31/2017 | | | Gross
Purchases | | | Gross
Sales | | | Shares Held at
10/31/2018 | | | Value
10/31/2018 | | | % of Net
Assets | |
Affiliated Short-Term Investments | | | | | | | | | | | | | | | | | | | | | | | | |
Core Short-Term Reserve, 2.430% | | | $31,679 | | | | $163,411 | | | | $170,064 | | | | 2,503 | | | | $25,026 | | | | 2.5 | % |
Total Affiliated Short-Term Investments | | | 31,679 | | | | | | | | | | | | | | | | 25,026 | | | | 2.5 | |
Collateral Held for Securities Loaned | | | | | | | | | | | | | | | | | | | | | | | | |
Cash Management Trust-Collateral Investment | | | — | | | | 58,282 | | | | 58,282 | | | | – | | | | – | | | | – | |
Total Value | | | $31,679 | | | | | | | | | | | | | | | | $25,026 | | | | | |
| | | | | | | | | | | | | | | | |
| Fund | | Net Realized
Gain/(Loss) | | | Change in
Unrealized
Appreciation/
(Depreciation) | | | Distributions of
Realized Capital
Gains | | | Income Earned
11/1/2017 -
10/31/2018 | |
Affiliated Short-Term Investments | | | | | | | | | | | | | | | | |
Core Short-Term Reserve, 2.430% | | | $– | | | | $– | | | | $1 | | | | $718 | |
Total Income from Affiliated Investments | | | | | | | | | | | | | | | $718 | |
Total | | | $– | | | | $– | | | | $1 | | | | | |
The accompanying Notes to Financial Statements are an integral part of this schedule
93
LARGE CAP STOCK FUND
Schedule of Investments as of October 31, 2018
| | | | | | | | | | | | |
| Shares | | | Common Stock (93.2%) | | Value | | | % of Net
Assets | |
| | Communications Services (8.6%) | |
| | 32,908 | | | Alphabet, Inc., Class Aa | | | $35,888,807 | | | | 2.0 | % |
| | 21,338 | | | Alphabet, Inc., Class Ca | | | 22,976,118 | | | | 1.3 | % |
| | 397,589 | | | Comcast Corporation | | | 15,164,045 | | | | 0.9 | % |
| | 156,931 | | | Facebook, Inc.a | | | 23,820,557 | | | | 1.3 | % |
| | 41,371 | | | Netflix, Inc.a | | | 12,484,940 | | | | 0.7 | % |
| | 215,802 | | | Verizon Communications, Inc. | | | 12,320,136 | | | | 0.7 | % |
| | | | Other Securities^ | | | 29,727,904 | | | | 1.7 | % |
| | | | | |
| | | | Total | | | 152,382,507 | | | | | |
| | | | | |
| | |
| | Consumer Discretionary (12.1%) | | | | | | | | |
| | 42,916 | | | Amazon.com, Inc.a | | | 68,580,197 | | | | 3.9 | % |
| | 7,287 | | | Booking Holdings, Inc.a | | | 13,660,065 | | | | 0.8 | % |
| | 279,900 | | | Bridgestone Corporation | | | 10,792,748 | | | | 0.6 | % |
| | 354,600 | | | Honda Motor Company, Ltd. | | | 10,122,245 | | | | 0.6 | % |
| | 164,941 | | | Lowe’s Companies, Inc. | | | 15,705,682 | | | | 0.9 | % |
| | 154,978 | | | NIKE, Inc. | | | 11,629,549 | | | | 0.7 | % |
| | 1,308,900 | | | Nissan Motor Company, Ltd. | | | 11,908,062 | | | | 0.7 | % |
| | 737,100 | | | Sekisui House, Ltd. | | | 10,818,435 | | | | 0.6 | % |
| | | | Other Securities^ | | | 61,349,786 | | | | 3.3 | % |
| | | | | |
| | | | Total | | | 214,566,769 | | | | | |
| | | | | |
| | |
| | Consumer Staples (5.4%) | | | | | | | | |
| | 144,280 | | | CVS Health Corporation | | | 10,444,429 | | | | 0.6 | % |
| | 581,900 | | | Japan Tobacco, Inc. | | | 14,952,111 | | | | 0.9 | % |
| | 237,674 | | | Unilever plc | | | 12,589,508 | | | | 0.7 | % |
| | | | Other Securities^ | | | 57,403,445 | | | | 3.2 | % |
| | | | | |
| | | | Total | | | 95,389,493 | | | | | |
| | | | | |
| | |
| | Energy (4.6%) | | | | | | | | |
| | 157,357 | | | Chevron Corporation | | | 17,568,909 | | | | 1.0 | % |
| | 299,050 | | | Halliburton Company | | | 10,371,054 | | | | 0.6 | % |
| | 398,083 | | | Royal Dutch Shell plc, Class B | | | 12,982,655 | | | | 0.8 | % |
| | | | Other Securities^ | | | 39,540,174 | | | | 2.2 | % |
| | | | | |
| | | | Total | | | 80,462,792 | | | | | |
| | | | | |
| | |
| | Financials (13.1%) | | | | | | | | |
| | 1,047,187 | | | Bank of America Corporation | | | 28,797,643 | | | | 1.6 | % |
| | 449,406 | | | Citigroup, Inc. | | | 29,418,117 | | | | 1.7 | % |
| | 110,541 | | | Goldman Sachs Group, Inc. | | | 24,912,625 | | | | 1.4 | % |
| | | | Other Securities^ | | | 149,280,527 | | | | 8.4 | % |
| | | | | |
| | | | Total | | | 232,408,912 | | | | | |
| | | | | |
| | |
| | Health Care (12.0%) | | | | | | | | |
| | 43,434 | | | Biogen, Inc.a | | | 13,215,663 | | | | 0.7 | % |
| | 589,550 | | | GlaxoSmithKline plc | | | 11,418,267 | | | | 0.6 | % |
| | 97,206 | | | Johnson & Johnson | | | 13,607,868 | | | | 0.8 | % |
| | 306,992 | | | Merck & Company, Inc. | | | 22,597,681 | | | | 1.3 | % |
| | 159,973 | | | Novartis AG | | | 14,009,214 | | | | 0.8 | % |
| | 353,235 | | | Novo Nordisk AS | | | 15,255,003 | | | | 0.9 | % |
| | 375,750 | | | Pfizer, Inc. | | | 16,179,795 | | | | 0.9 | % |
| | 55,967 | | | Roche Holding AG | | | 13,620,264 | | | | 0.8 | % |
| | 92,905 | | | UnitedHealth Group, Inc. | | | 24,280,722 | | | | 1.4 | % |
| | | | Other Securities^ | | | 67,842,741 | | | | 3.8 | % |
| | | | | |
| | | | Total | | | 212,027,218 | | | | | |
| | | | | |
| | |
| | Industrials (11.4%) | | | | | | | | |
| | 63,335 | | | Boeing Company | | | 22,475,058 | | | | 1.3 | % |
| | 250,136 | | | CSX Corporation | | | 17,224,365 | | | | 1.0 | % |
| | 249,799 | | | Delta Air Lines, Inc. | | | 13,671,499 | | | | 0.8 | % |
| | 129,012 | | | Honeywell International, Inc. | | | 18,683,518 | | | | 1.1 | % |
| | 135,705 | | | Norfolk Southern Corporation | | | 22,775,370 | | | | 1.3 | % |
| | | | Other Securities^ | | | 106,893,941 | | | | 5.9 | % |
| | | | | |
| | | | Total | | | 201,723,751 | | | | | |
| | | | | |
| | |
| | Information Technology (17.5%) | | | | | | | | |
| | 220,440 | | | Apple, Inc. | | | 48,245,498 | | | | 2.7 | % |
| | 198,847 | | | CGI Group, Inc.a | | | 12,280,194 | | | | 0.7 | % |
| | 750,593 | | | Cisco Systems, Inc. | | | 34,339,630 | | | | 1.9 | % |
| | 67,353 | | | MasterCard, Inc. | | | 13,313,668 | | | | 0.8 | % |
| | 461,808 | | | Microsoft Corporation | | | 49,325,713 | | | | 2.8 | % |
| | 188,421 | | | PayPal Holdings, Inc.a | | | 15,863,164 | | | | 0.9 | % |
| | 97,620 | | | Red Hat, Inc.a | | | 16,755,497 | | | | 1.0 | % |
| | 181,042 | | | Salesforce.com, Inc.a | | | 24,846,204 | | | | 1.4 | % |
| | 188,292 | | | Visa, Inc. | | | 25,956,052 | | | | 1.5 | % |
| | 118,130 | | | Xilinx, Inc. | | | 10,084,758 | | | | 0.6 | % |
| | | | Other Securities^ | | | 58,257,514 | | | | 3.2 | % |
| | | | | |
| | | | Total | | | 309,267,892 | | | | | |
| | | | | |
| | |
| | Materials (5.5%) | | | | | | | | |
| | 148,181 | | | BASF SE | | | 11,371,135 | | | | 0.6 | % |
| | 306,029 | | | UPM-Kymmene Oyj | | | 9,838,398 | | | | 0.6 | % |
| | | | Other Securities^ | | | 76,565,816 | | | | 4.3 | % |
| | | | | |
| | | | Total | | | 97,775,349 | | | | | |
| | | | | |
| | |
| | Real Estate (0.8%) | | | | | | | | |
| | | | Other Securities^ | | | 14,296,420 | | | | 0.8 | % |
| | | | | |
| | | | Total | | | 14,296,420 | | | | | |
| | | | | |
| | |
| | Utilities (2.2%) | | | | | | | | |
| | 405,657 | | | PG&E Corporationa | | | 18,988,804 | | | | 1.1 | % |
| | | | Other Securities^ | | | 20,254,136 | | | | 1.1 | % |
| | | | | |
| | | | Total | | | 39,242,940 | | | | | |
| | | | | |
| | | | | | | | | | | | |
| | | | | |
| | | | Total Common Stock (cost $1,334,624,723) | | | 1,649,544,043 | | | | | |
| | | | | |
| | | |
| Shares | | | Collateral Held for Securities Loaned (1.3%) | | Value | | | % of Net
Assets | |
| | 22,091,756 | | | Thrivent Cash Management Trust | | | 22,091,756 | | | | 1.3 | % |
| | | | | |
| | | | Total Collateral Held for Securities Loaned (cost $22,091,756) | | | 22,091,756 | | | | | |
| | | | | |
| | | |
Shares or Principal Amount | | | Short-Term Investments (6.6%) | | Value | | | % of Net
Assets | |
| | | | Federal Home Loan Bank Discount Notes | | | | | | | | |
| | 27,700,000 | | | 2.020% - 2.255%, 11/6/2018 - 1/16/2019b,c | | | 27,616,640 | | | | 1.6 | % |
The accompanying Notes to Financial Statements are an integral part of this schedule.
94
LARGE CAP STOCK FUND
Summary Schedule of Investments as of October 31, 2018
| | | | | | | | | | | | |
Shares or
Principal
Amount | | | Short-Term Investments (6.6%) | | Value | | | % of Net
Assets | |
| | | | Thrivent Core Short-Term Reserve Fund | | | | | | | | |
| | 8,918,435 | | | 2.430% | | | $89,184,347 | | | | 5.0 | % |
| | | | | |
| | | | Total Short-Term Investments (cost $116,802,956) | | | 116,800,987 | | | | | |
| | | | | |
| | | | Total Investments (cost $1,473,519,435) 101.1% | | | $1,788,436,786 | | | | | |
| | | | | |
| | | | Other Assets and Liabilities, Net (1.1%) | | | (19,321,069 | ) | | | | |
| | | | | |
| | | | Total Net Assets 100.0% | | | $1,769,115,717 | | | | | |
| | | | | |
| ^ | The Summary Schedule of Investments shows the 50 largest holdings in unaffiliated issuers, any holding or issuer that exceeds 1% of net assets and all affiliated holdings as of the report date. The remaining securities held are grouped by category as “Other securities”. |
| a | Non-income producing security. |
| b | The interest rate shown reflects the yield, coupon rate or the discount rate at the date of purchase. |
| c | All or a portion of the security is held on deposit with the counterparty and pledged as the initial margin deposit for open futures contracts. |
The following table presents the total amount of securities loaned with continuous maturity, by type, offset by the gross payable upon return of collateral for securities loaned by Thrivent Large Cap Stock Fund as of October 31, 2018:
Securities Lending Transactions
| | | | |
Common Stock | | | $20,843,498 | |
| | | | |
Total lending | | | $20,843,498 | |
Gross amount payable upon return of collateral for securities loaned | | | $22,091,756 | |
| | | | |
Net amounts due to counterparty | | | $1,248,258 | |
| | | | |
Unrealized Appreciation (Depreciation)
Gross unrealized appreciation and depreciation of investments of the portfolio as a whole (including derivatives), based on cost for federal income tax purposes, were as follows:
| | | | |
Gross unrealized appreciation | | | $409,256,746 | |
Gross unrealized depreciation | | | (97,118,996 | ) |
| | | | |
Net unrealized appreciation (depreciation) | | | $312,137,750 | |
| |
Cost for federal income tax purposes | | | $1,582,785,031 | |
The accompanying Notes to Financial Statements are an integral part of this schedule.
95
LARGE CAP STOCK FUND
Summary Schedule of Investments as of October 31, 2018
Fair Valuation Measurements
The following table is a summary of the inputs used, as of October 31, 2018, in valuing Large Cap Stock Fund’s assets carried at fair value.
| | | | | | | | | | | | | | | | |
| Investments in Securities | | Total | | | Level 1 | | | Level 2 | | | Level 3 | |
| | | | |
Common Stock | | | | | | | | | | | | | | | | |
Communications Services | | | 152,382,507 | | | | 126,916,454 | | | | 25,466,053 | | | | – | |
Consumer Discretionary | | | 214,566,769 | | | | 135,751,923 | | | | 78,814,846 | | | | – | |
Consumer Staples | | | 95,389,493 | | | | 28,901,362 | | | | 66,488,131 | | | | – | |
Energy | | | 80,462,792 | | | | 57,891,896 | | | | 22,570,896 | | | | – | |
Financials | | | 232,408,912 | | | | 168,026,354 | | | | 64,382,558 | | | | – | |
Health Care | | | 212,027,218 | | | | 155,600,021 | | | | 56,427,197 | | | | – | |
Industrials | | | 201,723,751 | | | | 114,606,572 | | | | 87,117,179 | | | | – | |
Information Technology | | | 309,267,892 | | | | 264,661,743 | | | | 44,606,149 | | | | – | |
Materials | | | 97,775,349 | | | | 28,550,628 | | | | 69,224,721 | | | | – | |
Real Estate | | | 14,296,420 | | | | – | | | | 14,296,420 | | | | – | |
Utilities | | | 39,242,940 | | | | 25,848,144 | | | | 13,394,796 | | | | – | |
Short-Term Investments | | | 27,616,640 | | | | – | | | | 27,616,640 | | | | – | |
| |
Subtotal Investments in Securities | | | $1,677,160,683 | | | | $1,106,755,097 | | | | $570,405,586 | | | | $– | |
| |
| | | | |
| Other Investments* | | Total | | | | | | | | | | |
Short-Term Investments | | | 89,184,347 | | | | | | | | | | | | | |
Collateral Held for Securities Loaned | | | 22,091,756 | | | | | | | | | | | | | |
| | | | | | | | | | | | | |
Subtotal Other Investments | | | $111,276,103 | | | | | | | | | | | | | |
| | | | | | | | | | | | | |
| | | | | | | | | | | | | | | | |
| | | | | | | | | | | | | |
Total Investments at Value | | | $1,788,436,786 | | | | | | | | | | | | | |
| | | | | | | | | | | | | |
| * | Certain investments are measured at fair value using a net asset value per share that is not publicly available (practical expedient). According to disclosure requirements of Accounting Standards Codification (ASC) 820, Fair Value Measurement, securities valued using the practical expedient are not classified in the fair value hierarchy. The fair value amounts presented in this table are intended to permit reconciliation of the fair value hierarchy to the amounts presented in the Statement of Assets and Liabilities. |
| | | | | | | | | | | | | | | | |
| Other Financial Instruments | | Total | | | Level 1 | | | Level 2 | | | Level 3 | |
| | | | |
Asset Derivatives | | | | | | | | | | | | | | | | |
Futures Contracts | | | 7,219,349 | | | | 7,219,349 | | | | – | | | | – | |
| |
Total Asset Derivatives | | | $7,219,349 | | | | $7,219,349 | | | | $– | | | | $– | |
| |
| | | | |
Liability Derivatives | | | | | | | | | | | | | | | | |
Futures Contracts | | | 15,753,567 | | | | 15,753,567 | | | | – | | | | – | |
| |
Total Liability Derivatives | | | $15,753,567 | | | | $15,753,567 | | | | $– | | | | $– | |
| |
There were no significant transfers between Levels during the period ended October 31, 2018. Transfers between Levels are identified as of the end of the period.
The following table presents Large Cap Stock Fund’s futures contracts held as of October 31, 2018. Investments and/or cash totaling $27,616,640 were pledged as the initial margin deposit for these contracts.
| | | | | | | | | | | | | | | | |
| Futures Contracts Description | | Number of
Contracts Long/(Short) | | | Expiration
Date | | | Notional
Principal
Amount | | | Value and
Unrealized | |
ICE mini MSCI EAFE Index | | | 1,247 | | | | December 2018 | | | | $121,536,687 | | | | ($8,527,312 | ) |
ICE US mini MSCI Emerging Markets Index | | | 2,108 | | | | December 2018 | | | | 108,062,435 | | | | (7,226,255 | ) |
| |
Total Futures Long Contracts | | | | | | | | | | | $229,599,122 | | | | ($15,753,567 | ) |
| |
CME E-mini S&P 500 Index | | | (792 | ) | | | December 2018 | | | | ($114,578,909 | ) | | | $7,219,349 | |
| |
Total Futures Short Contracts | | | | | | | | | | | ($114,578,909 | ) | | | $7,219,349 | |
| |
Total Futures Contracts | | | | | | | | | | | $115,020,213 | | | | ($8,534,218 | ) |
| |
Reference Description:
| | | | |
| CME | | - | | Chicago Mercantile Exchange |
| EAFE | | - | | Europe, Australasia and Far East |
| ICE | | - | | Intercontinental Exchange |
| MSCI | | - | | Morgan Stanley Capital International |
| S&P | | - | | Standard & Poor’s |
The accompanying Notes to Financial Statements are an integral part of this schedule.
96
LARGE CAP STOCK FUND
Summary Schedule of Investments as of October 31, 2018
The following table summarizes the fair value and Statement of Assets and Liabilities location, as of October 31, 2018, for Large Cap Stock Fund’s investments in financial derivative instruments by primary risk exposure as discussed under item (2) Significant Accounting Policies of the Notes to Financial Statements.
| | | | | | |
| Derivatives by risk category | | Statement of Assets and Liabilities Location | | Fair Value | |
| | |
Asset Derivatives | | | | | | |
Equity Contracts | | | | | | |
Futures* | | Net Assets - Accumulated undistributed earnings/(loss) | | $ | 7,219,349 | |
Total Equity Contracts | | | | | 7,219,349 | |
Total Asset Derivatives | | | | $ | 7,219,349 | |
| |
| | |
Liability Derivatives | | | | | | |
Equity Contracts | | | | | | |
Futures* | | Net Assets - Accumulated undistributed earnings/(loss) | | | 15,753,567 | |
Total Equity Contracts | | | | | 15,753,567 | |
Total Liability Derivatives | | | | $ | 15,753,567 | |
| |
| * | Includes cumulative appreciation/depreciation of futures contracts as reported in the Schedule of Investments. Only current day’s variation margin is reported within the Statement of Assets and Liabilities. |
The following table summarizes the net realized gains/(losses) and Statement of Operations location, for the period ended October 31, 2018, for Large Cap Stock Fund’s investments in financial derivative instruments by primary risk exposure.
| | | | | | |
| Derivatives by risk category | | Statement of Operations Location | | Realized Gains/(Losses)
recognized in Income | |
| | |
Equity Contracts | | | | | | |
Futures | | Net realized gains/(losses) on Futures contracts | | | (20,957,332 | ) |
Total Equity Contracts | | | | | (20,957,332 | ) |
| |
Total | | | | | ($20,957,332 | ) |
| |
The following table summarizes the change in net unrealized appreciation/(depreciation) and Statement of Operations location, for the period ended October 31, 2018, for Large Cap Stock Fund’s investments in financial derivative instruments by primary risk exposure.
| | | | | | |
| Derivatives by risk category | | Statement of Operations Location | | Change in unrealized
appreciation/(depreciation)
recognized in Income | |
| | |
Equity Contracts | | | | | | |
Futures | | Change in net unrealized appreciation/(depreciation) on Futures contracts | | | (19,419,503 | ) |
Total Equity Contracts | | | | | (19,419,503 | ) |
| |
Total | | | | | ($19,419,503 | ) |
| |
The following table presents Large Cap Stock Fund’s average volume of derivative activity during the period ended October 31, 2018.
| | | | |
| Derivative Risk Category | | Average Notional Value | |
Equity Contracts | | | | |
Futures - Long | | | $233,471,671 | |
Futures - Short | | | (53,292,150 | ) |
The accompanying Notes to Financial Statements are an integral part of this schedule.
97
LARGE CAP STOCK FUND
Summary Schedule of Investments as of October 31, 2018
Investment in Affiliates
Affiliated issuers, as defined under the Investment Company Act of 1940, include those in which the Fund’s holdings of an issuer represent 5% or more of the outstanding voting securities of an issuer, any affiliated mutual fund, or a company which is under common ownership or control with the Fund. The Fund owns shares of Thrivent Cash Management Trust for the purpose of securities lending and Thrivent Core Short-Term Reserve Fund primarily to serve as a cash sweep vehicle for the Fund. Thrivent Cash Management Trust and Thrivent Core Funds are established solely for investment by Thrivent entities.
A summary of transactions (in thousands) for the fiscal year to date, in Large Cap Stock Fund, is as follows:
| | | | | | | | | | | | | | | | | | | | | | | | |
| Fund | | Value
10/31/2017 | | | Gross
Purchases | | | Gross
Sales | | | Shares Held at
10/31/2018 | | | Value
10/31/2018 | | | % of Net
Assets | |
Affiliated Short-Term Investments | | | | | | | | | | | | | | | | | | | | | | | | |
Core Short-Term Reserve, 2.430% | | | $85,818 | | | | $594,281 | | | | $590,915 | | | | 8,918 | | | | $89,184 | | | | 5.0 | % |
| |
Total Affiliated Short-Term Investments | | | 85,818 | | | | | | | | | | | | | | | | 89,184 | | | | 5.0 | |
| |
Collateral Held for Securities Loaned | | | | | | | | | | | | | | | | | | | | | | | | |
Cash Management Trust-Collateral Investment | | | 31,320 | | | | 291,084 | | | | 300,312 | | | | 22,092 | | | | 22,092 | | | | 1.3 | |
| |
Total Collateral Held for Securities Loaned | | | 31,320 | | | | | | | | | | | | | | | | 22,092 | | | | 1.3 | |
| |
Total Value | | | $117,138 | | | | | | | | | | | | | | | | $111,276 | | | | | |
| |
| | | | | | | | | | | | | | | | |
| Fund | | Net Realized
Gain/(Loss) | | | Change in
Unrealized
Appreciation/
(Depreciation) | | | Distributions of
Realized Capital
Gains | | | Income Earned
11/1/2017 -
10/31/2018 | |
Affiliated Short-Term Investments | | | | | | | | | | | | | | | | |
Core Short-Term Reserve, 2.430% | | | $– | | | | $– | | | | $1 | | | | $2,937 | |
| |
Total Income from Affiliated Investments | | | | | | | | | | | | | | | $2,937 | |
| |
Collateral Held for Securities Loaned | | | | | | | | | | | | | | | | |
Cash Management Trust-Collateral Investment | | | – | | | | – | | | | – | | | | 326 | |
| |
Total Affiliated Income from Securities Loaned, Net | | | | | | | | | | | | | | | $326 | |
| |
Total | | | $– | | | | $– | | | | $1 | | | | | |
| |
The accompanying Notes to Financial Statements are an integral part of this schedule.
98
LARGE CAP VALUE FUND
Schedule of Investments as of October 31, 2018
| | | | | | | | |
| Shares | | | Common Stock (97.2%) | | Value | |
| | Communications Services (8.4%) | |
| | 12,640 | | | Alphabet, Inc.a | | | $13,610,373 | |
| | 135,839 | | | CBS Corporation | | | 7,790,367 | |
| | 681,860 | | | Comcast Corporation | | | 26,006,140 | |
| | 741,889 | | | Verizon Communications, Inc. | | | 42,354,443 | |
| | | | | |
| | | | Total | | | 89,761,323 | |
| | | | | |
| |
| | Consumer Discretionary (4.9%) | | | | |
| | 70,914 | | | Aptiv plc | | | 5,446,195 | |
| | 363,079 | | | Harley-Davidson, Inc. | | | 13,876,879 | |
| | 346,321 | | | Lowe’s Companies, Inc. | | | 32,976,686 | |
| | | | | |
| | | | Total | | | 52,299,760 | |
| | | | | |
| |
| | Consumer Staples (4.0%) | | | | |
| | 280,740 | | | CVS Health Corporation | | | 20,322,768 | |
| | 56,540 | | | Kimberly-Clark Corporation | | | 5,897,122 | |
| | 164,353 | | | Wal-Mart Stores, Inc. | | | 16,481,319 | |
| | | | | |
| | | | Total | | | 42,701,209 | |
| | | | | |
| |
| | Energy (9.4%) | | | | |
| | 179,250 | | | Anadarko Petroleum Corporation | | | 9,536,100 | |
| | 302,434 | | | Chevron Corporation | | | 33,766,756 | |
| | 124,812 | | | EQT Corporation | | | 4,239,864 | |
| | 304,380 | | | Halliburton Company | | | 10,555,898 | |
| | 937,701 | | | Marathon Oil Corporation | | | 17,806,942 | |
| | 121,080 | | | Marathon Petroleum Corporation | | | 8,530,086 | |
| | 45,100 | | | Phillips 66 | | | 4,637,182 | |
| | 56,190 | | | Pioneer Natural Resources Company | | | 8,275,101 | |
| | 1,673,040 | | | Weatherford International plca,b | | | 2,258,604 | |
| | | | | |
| | | | Total | | | 99,606,533 | |
| | | | | |
| |
| | Financials (24.6%) | | | | |
| | 247,170 | | | Aflac, Inc. | | | 10,645,612 | |
| | 134,050 | | | American International Group, Inc. | | | 5,534,924 | |
| | 1,734,506 | | | Bank of America Corporation | | | 47,698,915 | |
| | 319,350 | | | Blackstone Group, LP | | | 10,334,166 | |
| | 206,172 | | | Capital One Financial Corporation | | | 18,411,160 | |
| | 73,697 | | | Chubb, Ltd. | | | 9,205,492 | |
| | 635,210 | | | Citigroup, Inc. | | | 41,580,847 | |
| | 143,059 | | | Comerica, Inc. | | | 11,667,892 | |
| | 727,843 | | | Fifth Third Bancorp | | | 19,644,483 | |
| | 93,480 | | | Goldman Sachs Group, Inc. | | | 21,067,588 | |
| | 512,180 | | | Huntington Bancshares, Inc. | | | 7,339,539 | |
| | 136,820 | | | J.P. Morgan Chase & Company | | | 14,916,116 | |
| | 215,080 | | | MetLife, Inc. | | | 8,859,145 | |
| | 70,000 | | | Prudential Financial, Inc. | | | 6,564,600 | |
| | 13,342 | | | Raymond James Financial, Inc. | | | 1,023,198 | |
| | 131,719 | | | State Street Corporation | | | 9,055,681 | |
| | 209,610 | | | U.S. Bancorp | | | 10,956,315 | |
| | 157,360 | | | Zions Bancorporations NA | | | 7,403,788 | |
| | | | | |
| | | | Total | | | 261,909,461 | |
| | | | | |
| |
| | Health Care (15.9%) | | | | |
| | 64,910 | | | Aetna, Inc. | | | 12,878,144 | |
| | 58,210 | | | Biogen, Inc.a | | | 17,711,557 | |
| | 157,257 | | | Express Scripts Holding Companya | | | 15,249,211 | |
| | 194,460 | | | Gilead Sciences, Inc. | | | 13,258,283 | |
| | 222,740 | | | GlaxoSmithKline plc ADR | | | 8,700,224 | |
| | 128,250 | | | Johnson & Johnson | | | 17,953,718 | |
| | 211,483 | | | Medtronic plc | | | 18,995,403 | |
| | 473,610 | | | Merck & Company, Inc. | | | 34,862,432 | |
| | 338,120 | | | Pfizer, Inc. | | | 14,559,447 | |
| | 56,693 | | | UnitedHealth Group, Inc. | | | 14,816,716 | |
| | | | | |
| | | | Total | | | 168,985,135 | |
| | | | | |
| |
| | Industrials (10.7%) | | | | |
| | 45,200 | | | Boeing Company | | | 16,039,672 | |
| | 133,140 | | | CSX Corporation | | | 9,168,020 | |
| | 294,620 | | | Delta Air Lines, Inc. | | | 16,124,553 | |
| | 116,863 | | | Honeywell International, Inc. | | | 16,924,100 | |
| | 141,410 | | | Ingersoll-Rand plc | | | 13,566,875 | |
| | 64,040 | | | Norfolk Southern Corporation | | | 10,747,833 | |
| | 19,477 | | | Resideo Technologies, Inc.a | | | 409,991 | |
| | 82,641 | | | United Parcel Service, Inc. | | | 8,804,572 | |
| | 179,960 | | | United Technologies Corporation | | | 22,352,832 | |
| | | | | |
| | | | Total | | | 114,138,448 | |
| | | | | |
| |
| | Information Technology (12.7%) | | | | |
| | 62,190 | | | Apple, Inc. | | | 13,610,903 | |
| | 1,190,040 | | | Cisco Systems, Inc. | | | 54,444,330 | |
| | 360,751 | | | Microsoft Corporation | | | 38,531,814 | |
| | 257,840 | | | Oracle Corporation | | | 12,592,906 | |
| | 164,620 | | | Texas Instruments, Inc. | | | 15,281,675 | |
| | | | | |
| | | | Total | | | 134,461,628 | |
| | | | | |
| |
| | Materials (3.6%) | | | | |
| | 181,530 | | | Alcoa Corporationa | | | 6,351,735 | |
| | 199,710 | | | CF Industries Holdings, Inc. | | | 9,592,071 | |
| | 131,416 | | | Eastman Chemical Company | | | 10,296,444 | |
| | 269,860 | | | WestRock Company | | | 11,595,884 | |
| | | | | |
| | | | Total | | | 37,836,134 | |
| | | | | |
| |
| | Utilities (3.0%) | | | | |
| | 128,760 | | | Edison International, Inc. | | | 8,934,657 | |
| | 499,062 | | | PG&E Corporationa | | | 23,361,092 | |
| | | | | |
| | | | Total | | | 32,295,749 | |
| | | | | |
| | | | Total Common Stock (cost $761,732,772) | | | 1,033,995,380 | |
| | | | | |
| | |
| Shares | | | Collateral Held for Securities Loaned (0.2%) | | Value | |
| | 1,804,350 | | | Thrivent Cash Management Trust | | | 1,804,350 | |
| | | | | |
| | | | Total Collateral Held for Securities Loaned (cost $1,804,350) | | | 1,804,350 | |
| | | | | |
| | |
Shares or
Principal
Amount | | | Short-Term Investments (2.7%) | | Value | |
| | | | Thrivent Core Short-Term Reserve Fund | | | | |
| | 2,887,466 | | | 2.430% | | | 28,874,661 | |
| | | | | |
| | | | Total Short-Term Investments (cost $28,874,661) | | | 28,874,661 | |
| | | | | |
| | | | Total Investments (cost $792,411,783) 100.1% | | | $1,064,674,391 | |
| | | | | |
| | | | Other Assets and Liabilities, Net (0.1%) | | | (1,107,567 | ) |
| | | | | |
| | | | Total Net Assets 100.0% | | | $1,063,566,824 | |
| | | | | |
| a | Non-income producing security. |
| b | All or a portion of the security is on loan. |
The accompanying Notes to Financial Statements are an integral part of this schedule.
99
LARGE CAP VALUE FUND
Schedule of Investments as of October 31, 2018
The following table presents the total amount of securities loaned with continuous maturity, by type, offset by the gross payable upon return of collateral for securities loaned by Thrivent Large Cap Value Fund as of October 31, 2018:
| | | | |
| Securities Lending Transactions | | | | |
Common Stock | | | $1,623,915 | |
| | | | |
Total lending | | | $1,623,915 | |
Gross amount payable upon return of collateral for securities loaned | | | $1,804,350 | |
| | | | |
Net amounts due to counterparty | | | $180,435 | |
| | | | |
Unrealized Appreciation (Depreciation)
Gross unrealized appreciation and depreciation of investments of the portfolio as a whole (including derivatives), based on cost for federal income tax purposes, were as follows:
| | | | |
Gross unrealized appreciation | | $ | 316,699,204 | |
Gross unrealized depreciation | | | (43,864,891 | ) |
| | | | |
Net unrealized appreciation (depreciation) | | $ | 272,834,313 | |
| |
Cost for federal income tax purposes | | $ | 791,840,078 | |
Definitions:
| | | | |
| ADR | | - | | American Depositary Receipt, which are certificates for an underlying foreign security’s shares held by an issuing U.S. depository bank. |
Fair Valuation Measurements
The following table is a summary of the inputs used, as of October 31, 2018, in valuing Large Cap Value Fund’s assets carried at fair value.
| | | | | | | | | | | | | | | | |
| Investments in Securities | | Total | | | Level 1 | | | Level 2 | | | Level 3 | |
| | | | |
Common Stock | | | | | | | | | | | | | | | | |
Communications Services | | | 89,761,323 | | | | 89,761,323 | | | | – | | | | – | |
Consumer Discretionary | | | 52,299,760 | | | | 52,299,760 | | | | – | | | | – | |
Consumer Staples | | | 42,701,209 | | | | 42,701,209 | | | | – | | | | – | |
Energy | | | 99,606,533 | | | | 99,606,533 | | | | – | | | | – | |
Financials | | | 261,909,461 | | | | 261,909,461 | | | | – | | | | – | |
Health Care | | | 168,985,135 | | | | 168,985,135 | | | | – | | | | – | |
Industrials | | | 114,138,448 | | | | 114,138,448 | | | | – | | | | – | |
Information Technology | | | 134,461,628 | | | | 134,461,628 | | | | – | | | | – | |
Materials | | | 37,836,134 | | | | 37,836,134 | | | | – | | | | – | |
Utilities | | | 32,295,749 | | | | 32,295,749 | | | | – | | | | – | |
| |
Subtotal Investments in Securities | | | $1,033,995,380 | | | | $1,033,995,380 | | | | $– | | | | $– | |
| |
| | | | |
| Other Investments* | | Total | | | | | | | | | | |
Short-Term Investments | | | 28,874,661 | | | | | | | | | | | | | |
Collateral Held for Securities Loaned | | | 1,804,350 | | | | | | | | | | | | | |
| | | | | | | | | | | | | |
Subtotal Other Investments | | | $30,679,011 | | | | | | | | | | | | | |
| | | | | | | | | | | | | |
| | | | | | | | | | | | | | | | |
| | | | | | | | | | | | | |
Total Investments at Value | | | $1,064,674,391 | | | | | | | | | | | | | |
| | | | | | | | | | | | | |
| * | Certain investments are measured at fair value using a net asset value per share that is not publicly available (practical expedient). According to disclosure requirements of Accounting Standards Codification (ASC) 820, Fair Value Measurement, securities valued using the practical expedient are not classified in the fair value hierarchy. The fair value amounts presented in this table are intended to permit reconciliation of the fair value hierarchy to the amounts presented in the Statement of Assets and Liabilities. |
There were no significant transfers between Levels during the period ended October 31, 2018. Transfers between Levels are identified as of the end of the period.
The accompanying Notes to Financial Statements are an integral part of this schedule.
100
LARGE CAP VALUE FUND
Schedule of Investments as of October 31, 2018
Investment in Affiliates
Affiliated issuers, as defined under the Investment Company Act of 1940, include those in which the Fund’s holdings of an issuer represent 5% or more of the outstanding voting securities of an issuer, any affiliated mutual fund, or a company which is under common ownership or control with the Fund. The Fund owns shares of Thrivent Cash Management Trust for the purpose of securities lending and Thrivent Core Short-Term Reserve Fund primarily to serve as a cash sweep vehicle for the Fund. Thrivent Cash Management Trust and Thrivent Core Funds are established solely for investment by Thrivent entities.
A summary of transactions (in thousands) for the fiscal year to date, in Large Cap Value Fund, is as follows:
| | | | | | | | | | | | | | | | | | | | | | | | |
| Fund | | Value
10/31/2017 | | | Gross
Purchases | | | Gross
Sales | | | Shares Held at
10/31/2018 | | | Value
10/31/2018 | | | % of Net
Assets | |
Affiliated Short-Term Investments | | | | | | | | | | | | | | | | | | | | | | | | |
Core Short-Term Reserve, 2.430% | | | $39,609 | | | | $57,930 | | | | $68,664 | | | | 2,887 | | | | $28,875 | | | | 2.7 | % |
| |
Total Affiliated Short-Term Investments | | | 39,609 | | | | | | | | | | | | | | | | 28,875 | | | | 2.7 | |
| |
Collateral Held for Securities Loaned | | | | | | | | | | | | | | | | | | | | | | | | |
Cash Management Trust-Collateral Investment | | | 13,370 | | | | 113,446 | | | | 125,012 | | | | 1,804 | | | | 1,804 | | | | 0.2 | |
| |
Total Collateral Held for Securities Loaned | | | 13,370 | | | | | | | | | | | | | | | | 1,804 | | | | 0.2 | |
| |
Total Value | | | $52,979 | | | | | | | | | | | | | | | | $30,679 | | | | | |
| |
| | | | | | | | | | | | | | | | |
| Fund | | Net Realized
Gain/(Loss) | | | Change in
Unrealized
Appreciation/
(Depreciation) | | | Distributions of
Realized Capital
Gains | | | Income Earned
11/1/2017 -
10/31/2018 | |
Affiliated Short-Term Investments | | | | | | | | | | | | | | | | |
Core Short-Term Reserve, 2.430% | | | $– | | | | $– | | | | $0 | | | | $535 | |
| |
Total Income from Affiliated Investments | | | | | | | | | | | | | | | $535 | |
| |
Collateral Held for Securities Loaned | | | | | | | | | | | | | | | | |
Cash Management Trust-Collateral Investment | | | – | | | | – | | | | – | | | | 37 | |
| |
Total Affiliated Income from Securities Loaned, Net | | | | | | | | | | | | | | | $37 | |
| |
Total | | | $– | | | | $– | | | | $0 | | | | | |
| |
The accompanying Notes to Financial Statements are an integral part of this schedule.
101
LIMITED MATURITY BOND FUND
Summary Schedule of Investments as of October 31, 2018
| | | | | | | | | | | | |
Principal Amount | | | Bank Loans (0.5%) | | Value | | | % of Net
Assets | |
| | Basic Materials (<0.1%) | | | | | | | | |
| | | | Other Securities^ | | | $214,194 | | | | <0.1 | % |
| | | | | |
| | | | Total | | | 214,194 | | | | | |
| | | | | |
| | |
| | Capital Goods (<0.1%) | | | | | | | | |
| | | | Other Securities^ | | | 198,113 | | | | <0.1 | % |
| | | | | |
| | | | Total | | | 198,113 | | | | | |
| | | | | |
| | |
| | Communications Services (0.2%) | | | | | | | | |
| | | | Other Securities^ | | | 1,899,268 | | | | 0.2 | % |
| | | | | |
| | | | Total | | | 1,899,268 | | | | | |
| | | | | |
| | |
| | Consumer Cyclical (<0.1%) | | | | | | | | |
| | | | Other Securities^ | | | 561,804 | | | | <0.1 | % |
| | | | | |
| | | | Total | | | 561,804 | | | | | |
| | | | | |
| | |
| | Consumer Non-Cyclical (0.1%) | | | | | | | | |
| | | | Other Securities^ | | | 820,074 | | | | 0.1 | % |
| | | | | |
| | | | Total | | | 820,074 | | | | | |
| | | | | |
| | |
| | Energy (0.1%) | | | | | | | | |
| | | | Other Securities^ | | | 612,027 | | | | 0.1 | % |
| | | | | |
| | | | Total | | | 612,027 | | | | | |
| | | | | |
| | |
| | Financials (<0.1%) | | | | | | | | |
| | | | Other Securities^ | | | 93,389 | | | | <0.1 | % |
| | | | | |
| | | | Total | | | 93,389 | | | | | |
| | | | | |
| | |
| | Technology (0.1%) | | | | | | | | |
| | | | Other Securities^ | | | 588,177 | | | | 0.1 | % |
| | | | | |
| | | | Total | | | 588,177 | | | | | |
| | | | | |
| | | | | | | | | | | | |
| | | | | |
| | | | Total Bank Loans (cost $5,552,639) | | | 4,987,046 | | | | | |
| | | | | |
| | | |
Principal Amount | | | Long-Term Fixed Income (95.9%) | | Value | | | % of Net
Assets | |
Asset-Backed Securities (26.4%) | | | | | | |
| | | | Ares XXXVII CLO, Ltd. | | | | | | | | |
| $ | 4,000,000 | | | 3.606%, (LIBOR 3M + 1.170%), 10/15/2030, Ser. 2015-4A, Class A1R*,a | | | 4,001,464 | | | | 0.4 | % |
| | | | Assurant CLO III, Ltd. | | | | | | | | |
| | 4,700,000 | | | 3.389%, (LIBOR 3M + 1.230%), 10/20/2031, Ser. 2018-2A, Class A*,a | | | 4,699,756 | | | | 0.5 | % |
| | | | CBAM CLO, Ltd. | | | | | | | | |
| | 4,000,000 | | | 3.563%, (LIBOR 3M + 1.120%), 10/20/2029, Ser. 2018-8A, Class A1*,a | | | 3,999,848 | | | | 0.4 | % |
| | | | CCG Receivables Trust | | | | | | | | |
| | 3,500,000 | | | 2.500%, 6/16/2025, Ser. 2018-1, Class A2b | | | 3,476,864 | | | | 0.4 | % |
| | | | Cedar Funding VI CLO, Ltd. | | | | | | | | |
| | 6,000,000 | | | 3.559%, (LIBOR 3M + 1.090%), 10/20/2028, Ser. 2016-6A, Class AR*,a | | | 5,999,952 | | | | 0.6 | % |
| | | | Citibank Credit Card Issuance Trust | | | | | | | | |
| | 4,900,000 | | | 2.647%, (LIBOR 1M + 0.370%), 8/8/2024, Ser. 2017-A7, Class A7a | | | 4,904,589 | | | | 0.5 | % |
| | | | Commonbond Student Loan Trust | | | | | | | | |
| | 4,148,902 | | | 2.781%, (LIBOR 1M + 0.500%), 2/25/2044, Ser. 2018-AGS, Class A2a,b | | | 4,105,666 | | | | 0.4 | % |
| | | | Finance of America Structured Securities Trust | | | | | | | | |
| | 3,614,513 | | | 3.375%, 9/25/2028, Ser. 2018-HB1, Class A*,a,c | | | 3,610,899 | | | | 0.4 | % |
| | | | Garrison BSL CLO, Ltd. | | | | | | | | |
| | 6,000,000 | | | 3.341%, (LIBOR 3M + 0.970%), 7/17/2028, Ser. 2018-1A, Class A1*,a | | | 5,962,632 | | | | 0.6 | % |
| | | | GM Financial Consumer Automobile Receivables Trust | | | | | | | | |
| | 4,230,691 | | | 2.080%, 1/19/2021, Ser. 2018-1, Class A2A | | | 4,214,219 | | | | 0.5 | % |
| | | | Golub Capital Partners, Ltd. | | | | | | | | |
| | 6,000,000 | | | 3.610%, (LIBOR 3M + 1.150%), 10/20/2028, Ser. 2018-39A, Class A1*,a | | | 5,999,856 | | | | 0.6 | % |
| | | | Invitation Homes Trust | | | | | | | | |
| | 4,500,000 | | | 3.350%, (LIBOR 1M + 1.100%), 1/17/2038, Ser. 2018-SFR4, Class Aa,b,d | | | 4,500,000 | | | | 0.5 | % |
| | | | Magnetite XVIII Ltd | | | | | | | | |
| | 4,500,000 | | | 3.490%, (LIBOR 3M + 1.080%), 11/15/2028, Ser. 2016-18A, Class AR*,a,d | | | 4,500,000 | | | | 0.5 | % |
| | | | Marlette Funding Trust | | | | | | | | |
| | 3,382,322 | | | 2.610%, 3/15/2028, Ser. 2018-1A, Class Ab | | | 3,370,204 | | | | 0.4 | % |
| | 5,375,909 | | | 3.200%, 9/15/2028, Ser. 2018-3A, Class Ab | | | 5,364,744 | | | | 0.6 | % |
| | | | Mercedes-Benz Auto Lease Trust | | | | | | | | |
| | 3,808,625 | | | 2.200%, 4/15/2020, Ser. 2018-A, Class A2 | | | 3,800,969 | | | | 0.4 | % |
| | | | Mill City Mortgage Loan Trust | | | | | | | | |
| | 3,563,077 | | | 3.500%, 5/25/2058, Ser. 2018-2, Class A1a,b | | | 3,524,789 | | | | 0.4 | % |
| | | | Navient Student Loan Trust | | | | | | | | |
| | 5,139,233 | | | 3.031%, (LIBOR 1M + 0.750%), 7/25/2066, Ser. 2017-1A, Class A2a,b | | | 5,162,601 | | | | 0.6 | % |
| | | | Octagon Investment Partners XX, Ltd. | | | | | | | | |
| | 3,350,000 | | | 3.468%, (LIBOR 3M + 1.130%), 8/12/2026, Ser. 2014-1A, Class AR*,a | | | 3,350,951 | | | | 0.4 | % |
The accompanying Notes to Financial Statements are an integral part of this schedule.
102
LIMITED MATURITY BOND FUND
Summary Schedule of Investments as of October 31, 2018
| | | | | | | | | | | | |
Principal
Amount | | | Long-Term Fixed Income (95.9%) | | Value | | | % of Net
Assets | |
| | Asset-Backed Securities (26.4%) - continued | | | | | | | | |
| | | | Prosper Marketplace Issuance Trust | | | | | | | | |
| $ | 4,715,131 | | | 3.350%, 10/15/2024, Ser. 2018-2A, Class Ab | | | $4,707,688 | | | | 0.5 | % |
| | | | Santander Retail Auto Lease Trust | | | | | | | | |
| | 3,450,000 | | | 2.220%, 1/20/2021, Ser. 2017-A, Class A3b | | | 3,414,884 | | | | 0.4 | % |
| | | | Securitized Term Auto Receivables Trust | | | | | | | | |
| | 3,575,783 | | | 1.890%, 8/25/2020, Ser. 2017-1A, Class A3b | | | 3,559,697 | | | | 0.4 | % |
| | | | SLM Student Loan Trust | | | | | | | | |
| | 3,709,304 | | | 2.681%, (LIBOR 1M + 0.400%), 3/25/2025, Ser. 2010-1, Class Aa | | | 3,654,650 | | | | 0.4 | % |
| | | | Springleaf Funding Trust | | | | | | | | |
| | 3,350,000 | | | 2.900%, 11/15/2029, Ser. 2016-AA, Class Ab | | | 3,336,894 | | | | 0.4 | % |
| | | | Upstart Securitization Trust | | | | | | | | |
| | 4,439,587 | | | 3.330%, 12/22/2025, Ser. 2018-2, Class Ab | | | 4,437,358 | | | | 0.5 | % |
| | | | Verizon Owner Trust | | | | | | | | |
| | 4,500,000 | | | 2.060%, 4/20/2022, Ser. 2017-3A, Class A1Ab | | | 4,428,473 | | | | 0.5 | % |
| | | | World Financial Network Credit Card Master Trust | | | | | | | | |
| | 3,900,000 | | | 1.980%, 6/15/2023, Ser. 2017-B, Class A | | | 3,867,870 | | | | 0.4 | % |
| | | | Other Securities^ | | | 128,140,815 | | | | 13.8 | % |
| | | | | |
| | | | Total | | | 244,098,332 | | | | | |
| | | | | |
| | |
| | Basic Materials (0.5%) | | | | | | | | |
| | | | Other Securities^ | | | 4,436,741 | | | | 0.5 | % |
| | | | | |
| | | | Total | | | 4,436,741 | | | | | |
| | | | | |
| | |
| | Capital Goods (0.7%) | | | | | | | | |
| | | | Other Securities^ | | | 6,897,107 | | | | 0.7 | % |
| | | | | |
| | | | Total | | | 6,897,107 | | | | | |
| | | | | |
| | |
| | Collateralized Mortgage Obligations (5.6%) | | | | | | | | |
| | | | Angel Oak Mortgage Trust I, LLC | | | | | | | | |
| | 4,522,128 | | | 3.674%, 7/27/2048, Ser. 2018-2, Class A1a,b | | | 4,513,113 | | | | 0.5 | % |
| | | | Bellemeade Re, Ltd. | | | | | | | | |
| | 4,000,000 | | | 3.231%, (LIBOR 1M + 0.950%), 8/25/2028, Ser. 2018-2A, Class M1Aa,b | | | 4,004,907 | | | | 0.4 | % |
| | | | Civic Mortgage, LLC | | | | | | | | |
| | 5,000,000 | | | 4.349%, 11/25/2022, Ser. 2018-2, Class A1b,c,e | | | 4,950,000 | | | | 0.5 | % |
| | | | Countrywide Alternative Loan Trust | | | | | | | | |
| | 411,082 | | | 5.500% - 5.500%, 11/25/2035 - 2/25/2036, Ser. 2005- 49CB, Class A1 | | | 395,263 | | | | <0.1 | % |
| | | | Federal National Mortgage Association Conventional 15- Yr. Pass Through | | | | | | | | |
| | 500,257 | | | 2.250%, 6/25/2025, Ser. 2010-58, Class PT | | | 496,968 | | | | 0.1 | % |
| | | | Radnor RE, Ltd. | | | | | | | | |
| | 3,300,000 | | | 3.681%, (LIBOR 1M + 1.400%), 3/25/2028, Ser. 2018-1, Class M1*,a | | | 3,305,229 | | | | 0.4 | % |
| | | | Towd Point Mortgage Trust | | | | | | | | |
| | 3,559,539 | | | 2.887%, (LIBOR 1M + 0.600%), 2/25/2057, Ser. 2017-5, Class A1a,b | | | 3,555,574 | | | | 0.4 | % |
| | | | Other Securities^ | | | 31,061,067 | | | | 3.3 | % |
| | | | | |
| | | | Total | | | 52,282,121 | | | | | |
| | | | | |
| | |
| | Commercial Mortgage-Backed Securities (3.6%) | | | | | | | | |
| | | | Cold Storage Trust | | | | | | | | |
| | 4,850,000 | | | 3.280%, (LIBOR 1M + 1.000%), 4/15/2024, Ser. 2017-ICE3, Class A*,a | | | 4,851,374 | | | | 0.5 | % |
| | | | Federal Home Loan Mortgage Corporation Multifamily Structured Pass Through Certificates | | | | | | | | |
| | 5,150,000 | | | 2.481%, (LIBOR 1M + 0.220%), 7/25/2020, Ser. KP04, Class AG1a,f | | | 5,149,996 | | | | 0.6 | % |
| | 5,805,591 | | | 2.561%, (LIBOR 1M + 0.300%), 11/25/2024, Ser. KF41, Class Aa,f | | | 5,778,366 | | | | 0.6 | % |
| | | | Federal National Mortgage Association - ACES | | | | | | | | |
| | 3,097,463 | | | 2.565%, (LIBOR 1M + 0.400%), 10/25/2024, Ser. 2017-M13, Class FAa | | | 3,093,576 | | | | 0.3 | % |
| | 2,928,559 | | | 3.560%, 9/25/2021, Ser. 2018-M5, Class A2a | | | 2,935,936 | | | | 0.3 | % |
| | | | Federal National Mortgage Association - Connecticut Avenue Securities | | | | | | | | |
| | 3,172,457 | | | 3.031%, (LIBOR 1M + 0.750%), 12/25/2030, Ser. 2018-C04, Class 2M1a | | | 3,172,906 | | | | 0.4 | % |
| | | | Wells Fargo Commercial Mortgage Trust | | | | | | | | |
| | 5,276,659 | | | 2.819%, 8/15/2050, Ser. 2014-LC16, Class A2 | | | 5,268,149 | | | | 0.6 | % |
| | | | Other Securities^ | | | 2,907,760 | | | | 0.3 | % |
| | | | | |
| | | | Total | | | 33,158,063 | | | | | |
| | | | | |
| | |
| | Communications Services (2.4%) | | | | | | | | |
| | | | Other Securities^ | | | 21,974,892 | | | | 2.4 | % |
| | | | | |
| | | | Total | | | 21,974,892 | | | | | |
| | | | | |
The accompanying Notes to Financial Statements are an integral part of this schedule.
103
LIMITED MATURITY BOND FUND
Summary Schedule of Investments as of October 31, 2018
| | | | | | | | | | | | |
Principal
Amount | | | Long-Term Fixed Income (95.9%) | | Value | | | % of Net
Assets | |
| | Consumer Cyclical (2.0%) | | | | | | | | |
| | | | General Motors Financial Company, Inc. | | | | | | | | |
| | $3,500,000 | | | 3.696%, (LIBOR 3M + 1.310%), 6/30/2022a | | | $3,525,305 | | | | 0.4 | % |
| | | | Other Securities^ | | | 15,317,390 | | | | 1.6 | % |
| | | | | |
| | | | Total | | | 18,842,695 | | | | | |
| | | | | |
| | |
| | Consumer Non-Cyclical (5.1%) | | | | | | | | |
| | | | Other Securities^ | | | 46,950,608 | | | | 5.1 | % |
| | | | | |
| | | | Total | | | 46,950,608 | | | | | |
| | | | | |
| | |
| | Energy (3.8%) | | | | | | | | |
| | | | Other Securities^ | | | 35,649,619 | | | | 3.8 | % |
| | | | | |
| | | | Total | | | 35,649,619 | | | | | |
| | | | | |
| | |
| | Financials (17.3%) | | | | | | | | |
| | | | Bank of America Corporation | | | | | | | | |
| | 1,775,000 | | | 3.266%, (LIBOR 3M + 0.870%), 4/1/2019a | | | 1,780,190 | | | | 0.2 | % |
| | 1,500,000 | | | 3.046%, (LIBOR 3M + 0.650%), 10/1/2021a | | | 1,505,239 | | | | 0.2 | % |
| | 1,500,000 | | | 3.111%, (LIBOR 3M + 0.770%), 2/5/2026a | | | 1,466,774 | | | | 0.2 | % |
| | 1,500,000 | | | 3.487%, (LIBOR 3M + 1.000%), 4/24/2023a | | | 1,514,820 | | | | 0.2 | % |
| | 1,500,000 | | | 2.816%, 7/21/2023a | | | 1,444,039 | | | | 0.1 | % |
| | 1,065,000 | | | 3.629%, (LIBOR 3M + 1.160%), 1/20/2023a | | | 1,081,652 | | | | 0.1 | % |
| | 900,000 | | | 6.100%, 3/17/2025a,g | | | 923,625 | | | | 0.1 | % |
| | | | Goldman Sachs Group, Inc. | | | | | | | | |
| | 2,000,000 | | | 3.487%, (LIBOR 3M + 1.000%), 7/24/2023a | | | 2,013,335 | | | | 0.2 | % |
| | 1,755,000 | | | 3.637%, (LIBOR 3M + 1.160%), 4/23/2020a | | | 1,774,401 | | | | 0.2 | % |
| | 1,530,000 | | | 3.484%, (LIBOR 3M + 1.170%), 11/15/2021a | | | 1,548,635 | | | | 0.2 | % |
| | 1,500,000 | | | 3.414%, (LIBOR 3M + 1.100%), 11/15/2018a | | | 1,500,618 | | | | 0.2 | % |
| | 1,125,000 | | | 3.917%, (LIBOR 3M + 1.600%), 11/29/2023a | | | 1,163,181 | | | | 0.1 | % |
| | 1,000,000 | | | 3.060%, (LIBOR 3M + 0.750%), 2/23/2023a | | | 998,991 | | | | 0.1 | % |
| | | | Morgan Stanley | | | | | | | | |
| | 1,425,000 | | | 5.000%, 11/24/2025 | | | 1,459,073 | | | | 0.2 | % |
| | 2,000,000 | | | 3.649%, (LIBOR 3M + 1.180%), 1/20/2022a | | | 2,022,514 | | | | 0.2 | % |
| | 1,950,000 | | | 3.119%, (LIBOR 3M + 0.800%), 2/14/2020a | | | 1,952,535 | | | | 0.2 | % |
| | 1,400,000 | | | 3.887%, (LIBOR 3M + 1.400%), 10/24/2023a | | | 1,425,570 | | | | 0.1 | % |
| | 1,000,000 | | | 5.450%, 7/15/2019a,g | | | 1,008,880 | | | | 0.1 | % |
| | 1,000,000 | | | 2.891%, (LIBOR 3M + 0.550%), 2/10/2021a | | | 1,000,500 | | | | 0.1 | % |
| | 900,000 | | | 5.550%, 7/15/2020a,g | | | 909,000 | | | | 0.1 | % |
| | | | Other Securities^ | | | 131,491,648 | | | | 14.2 | % |
| | | | | |
| | | | Total | | | 159,985,220 | | | | | |
| | | | | |
| | Foreign Government (0.7%) | | | | | | | | |
| | | | Other Securities^ | | | 6,380,572 | | | | 0.7 | % |
| | | | | |
| | | | Total | | | 6,380,572 | | | | | |
| | | | | |
| | |
| | Mortgage-Backed Securities (3.5%) | | | | | | | | |
| | | | Federal National Mortgage Association Conventional 15- Yr. Pass Through | | | | | | | | |
| | 11,570,000 | | | 3.500%, 11/1/2033d | | | 11,560,283 | | | | 1.2 | % |
| | | | Federal National Mortgage Association Conventional 30- Yr. Pass Through | | | | | | | | |
| | 10,750,000 | | | 4.500%, 11/1/2048d | | | 11,006,363 | | | | 1.2 | % |
| | 250,000 | | | 5.000%, 11/1/2048d | | | 260,879 | | | | <0.1 | % |
| | 642,519 | | | 4.281%, (LIBOR 12M + 1.550%), 7/1/2043a | | | 662,447 | | | | 0.1 | % |
| | 504,470 | | | 3.727%, (LIBOR 12M + 1.515%), 1/1/2043a | | | 518,393 | | | | 0.1 | % |
| | | | GSAA Home Equity Trust | | | | | | | | |
| | 920,880 | | | 4.564%, 8/25/2034, Ser. 2004-10, Class M2e | | | 916,316 | | | | 0.1 | % |
| | | | Towd Point Mortgage Trust | | | | | | | | |
| | 4,943,757 | | | 3.250%, 8/25/2058, Ser. 2018-5, Class A1Aa,b | | | 4,871,429 | | | | 0.5 | % |
| | | | Other Securities^ | | | 2,416,251 | | | | 0.3 | % |
| | | | | |
| | | | Total | | | 32,212,361 | | | | | |
| | | | | |
| | |
| | Technology (2.1%) | | | | | | | | |
| | | | Other Securities^ | | | 19,175,856 | | | | 2.1 | % |
| | | | | |
| | | | Total | | | 19,175,856 | | | | | |
| | | | | |
| | |
| | Transportation (1.4%) | | | | | | | | |
| | | | Other Securities^ | | | 12,880,051 | | | | 1.4 | % |
| | | | | |
| | | | Total | | | 12,880,051 | | | | | |
| | | | | |
| | |
| | U.S. Government and Agencies (18.5%) | | | | | | | | |
| | | | Federal National Mortgage Association | | | | | | | | |
| | 15,000,000 | | | 2.875%, 9/12/2023 | | | 14,852,235 | | | | 1.6 | % |
| | 3,000,000 | | | 2.500%, 4/13/2021 | | | 2,966,748 | | | | 0.3 | % |
| | | | U.S. Treasury Bonds | | | | | | | | |
| | 6,750,000 | | | 5.500%, 8/15/2028 | | | 8,076,006 | | | | 0.9 | % |
| | 5,220,000 | | | 2.250% - 3.000%, 11/15/2027 - 5/15/2046 | | | 4,604,804 | | | | 0.6 | % |
| | | | U.S. Treasury Bonds, TIPS | | | | | | | | |
| | 5,461,800 | | | 0.125%, 1/15/2023 | | | 5,256,525 | | | | 0.6 | % |
| | 6,315,050 | | | 0.375%, 1/15/2027 | | | 5,944,206 | | | | 0.6 | % |
| | 6,699,875 | | | 0.375%, 7/15/2027 | | | 6,304,949 | | | | 0.7 | % |
| | 5,852,770 | | | 1.000%, 2/15/2046 | | | 5,432,407 | | | | 0.6 | % |
| | | | U.S. Treasury Notes | | | | | | | | |
| | 62,000,000 | | | 1.750%, 11/30/2019 | | | 61,350,937 | | | | 6.6 | % |
| | 6,500,000 | | | 1.875%, 12/15/2020 | | | 6,365,937 | | | | 0.7 | % |
| | 21,345,000 | | | 2.000%, 11/30/2022 | | | 20,554,568 | | | | 2.2 | % |
| | 12,125,000 | | | 1.125% - 2.875%, 10/31/2019 - 7/31/2025 | | | 11,751,146 | | | | 1.2 | % |
The accompanying Notes to Financial Statements are an integral part of this schedule.
104
LIMITED MATURITY BOND FUND
Summary Schedule of Investments as of October 31, 2018
| | | | | | | | | | | | |
Principal
Amount | | | Long-Term Fixed Income (95.9%) | | Value | | | % of Net
Assets | |
| | U.S. Government and Agencies (18.5%) - continued | | | | | | | | |
| | | | U.S. Treasury Notes, TIPS | | | | | | | | |
| | $18,085,620 | | | 0.125%, 4/15/2021 | | | $17,621,470 | | | | 1.9 | % |
| | | | | |
| | | | Total | | | 171,081,938 | | | | | |
| | | | | |
|
| | Utilities (2.3%) | |
| | | | Other Securities^ | | | 21,145,255 | | | | 2.3 | % |
| | | | | |
| | | | Total | | | 21,145,255 | | | | | |
| | | | | |
| | | | | | | | | | | | |
| | | | | |
| | | | Total Long-Term Fixed Income (cost $896,822,126) | | | 887,151,431 | | | | | |
| | | | | |
| | | |
| Shares | | | Preferred Stock (0.2%) | | Value | | | % of Net
Assets | |
| | Financials (0.2%) | | | | | | | | |
| | | | Other Securities^ | | | 2,208,480 | | | | 0.2 | % |
| | | | | |
| | | | Total | | | 2,208,480 | | | | | |
| | | | | |
| | | | | | | | | | | | |
| | | | | |
| | | | Total Preferred Stock (cost $2,225,400) | | | 2,208,480 | | | | | |
| | | | | |
| | | |
| Shares | | | Common Stock (<0.1%) | | Value | | | % of Net
Assets | |
| | Energy (<0.1%) | | | | | | | | |
| | | | Other Securities^ | | | 195,812 | | | | <0.1 | % |
| | | | | |
| | | | Total | | | 195,812 | | | | | |
| | | | | |
| | | | | | | | | | | | |
| | | | | |
| | | | Total Common Stock (cost $195,812) | | | 195,812 | | | | | |
| | | | | |
| | | |
Shares or
Principal
Amount | | | Short-Term Investments (6.5%) | | Value | | | % of Net
Assets | |
| | | | U.S. Treasury Bills | | | | | | | | |
| | 250,000 | | | 2.181%, 12/27/2018h,i | | | 249,141 | | | | <0.1 | % |
| | | | Thrivent Core Short-Term Reserve Fund | | | | | | | | |
| | 5,915,209 | | | 2.430% | | | 59,152,095 | | | | 6.4 | % |
| | | | Other Securities^ | | | 897,174 | | | | 0.1 | % |
| | | | | |
| | | | Total Short-Term Investments (cost $60,298,487) | | | 60,298,410 | | | | | |
| | | | | |
| | | | Total Investments (cost $965,094,464) 103.1% | | | $954,841,179 | | | | | |
| | | | | |
| | | | Other Assets and Liabilities, Net (3.1%) | | | (29,134,118 | ) | | | | |
| | | | | |
| | | | Total Net Assets 100.0% | | | $925,707,061 | | | | | |
| | | | | |
| ^ | The Summary Schedule of Investments shows the 50 largest holdings in unaffiliated issuers, any holding or issuer that exceeds 1% of net assets and all affiliated holdings as of the report date. The remaining securities held are grouped by category as “Other securities”. |
| a | Denotes variable rate securities. The rate shown is as of October 31, 2018. The rates of certain variable rate securities are based on a published reference rate and spread; these may vary by security and the reference rate and spread are indicated in their description. The rates of other variable rate securities are determined by the issuer or agent and are based on current market conditions. These securities do not indicate a reference rate and spread in their description. |
| b | Denotes securities sold under Rule 144A of the Securities Act of 1933, which exempts them from registration. These securities may be resold to other dealers in the program or to other qualified institutional buyers. As of October 31, 2018, the value of these investments was $252,328,802 or 27.3% of total net assets. |
| c | Security is valued using significant unobservable inputs. Further information on valuation can be found in the Notes to Financial Statements. |
| d | Denotes investments purchased on a when-issued or delayed delivery basis. |
| e | Denotes step coupon securities. Step coupon securities pay an initial coupon rate for the first period and then different coupon rates for following periods. The rate shown is as of October 31, 2018. |
| f | All or a portion of the security is insured or guaranteed. |
| g | Denotes perpetual securities. Perpetual securities pay an indefinite stream of interest and have no contractual maturity date. Date shown, if applicable, is next call date. |
| h | The interest rate shown reflects the yield, coupon rate or the discount rate at the date of purchase. |
| i | At October 31, 2018, $249,142 of investments were segregated to cover exposure to a counterparty for margin on open mortgage-backed security transactions. |
| * | Denotes restricted securities. Restricted securities are investment securities which cannot be offered for public sale without first being registered under the Securities Act of 1933. The value of all restricted securities held in Limited Maturity Bond Fund as of October 31, 2018 was $93,448,822 or 10.1% of total net assets. The following table indicates the acquisition date and cost of restricted securities shown in the schedule as of October 31, 2018. |
| | | | | | | | |
Security | | Acquisition
Date | | | Cost | |
Ares XXXVII CLO, Ltd., 10/15/2030 | | | 5/18/2018 | | | $ | 4,007,286 | |
Assurant CLO III, Ltd., 10/20/2031 | | | 7/27/2018 | | | | 4,700,000 | |
CBAM CLO, Ltd., 10/20/2029 | | | 8/29/2018 | | | | 4,000,000 | |
Cedar Funding VI CLO, Ltd., 10/20/2028 | | | 10/2/2018 | | | | 6,000,000 | |
Cold Storage Trust, 4/15/2036 | | | 4/20/2017 | | | | 4,850,000 | |
Finance of America Structured Securities Trust, 9/25/2028 | | | 10/2/2018 | | | | 3,614,371 | |
Garrison BSL CLO, Ltd., 7/17/2028 | | | 5/18/2018 | | | | 6,000,000 | |
Golub Capital Partners, Ltd., 10/20/2028 | | | 9/17/2018 | | | | 6,000,000 | |
Magnetite XVIII Ltd, 11/15/2028 | | | 10/31/2018 | | | | 4,500,000 | |
Octagon Investment Partners XX, Ltd., 8/12/2026 | | | 4/21/2017 | | | | 3,350,000 | |
Radnor RE, Ltd., 3/25/2028 | | | 3/13/2018 | | | | 3,300,000 | |
The accompanying Notes to Financial Statements are an integral part of this schedule.
105
LIMITED MATURITY BOND FUND
Summary Schedule of Investments as of October 31, 2018
Definitions:
| | | | |
| ACES | | - | | Alternative Credit Enhancement Securities |
| CLO | | - | | Collateralized Loan Obligation |
| Ser. | | - | | Series |
| TIPS | | - | | Treasury Inflation Protected Security |
Reference Rate Index:
| | | | |
| LIBOR 1M | | - | | ICE Libor USD Rate 1 Month |
| LIBOR 3M | | - | | ICE Libor USD Rate 3 Month |
| LIBOR 12M | | - | | ICE Libor USD Rate 12 Month |
Unrealized Appreciation (Depreciation)
Gross unrealized appreciation and depreciation of investments of the portfolio as a whole (including derivatives), based on cost for federal income tax purposes, were as follows:
| | | | |
Gross unrealized appreciation | | | $3,450,587 | |
Gross unrealized depreciation | | | (12,413,538 | ) |
| | | | |
Net unrealized appreciation (depreciation) | | | ($8,962,951 | ) |
| |
Cost for federal income tax purposes | | | $921,255,616 | |
The accompanying Notes to Financial Statements are an integral part of this schedule.
106
LIMITED MATURITY BOND FUND
Summary Schedule of Investments as of October 31, 2018
Fair Valuation Measurements
The following table is a summary of the inputs used, as of October 31, 2018, in valuing Limited Maturity Bond Fund’s assets carried at fair value.
| | | | | | | | | | | | | | | | |
| Investments in Securities | | Total | | | Level 1 | | | Level 2 | | | Level 3 | |
| | | | |
Bank Loans | | | | | | | | | | | | | | | | |
Basic Materials | | | 214,194 | | | | – | | | | 154,495 | | | | 59,699 | |
Capital Goods | | | 198,113 | | | | – | | | | 198,113 | | | | – | |
Communications Services | | | 1,899,268 | | | | – | | | | 1,899,268 | | | | – | |
Consumer Cyclical | | | 561,804 | | | | – | | | | 561,804 | | | | – | |
Consumer Non-Cyclical | | | 820,074 | | | | – | | | | 820,074 | | | | – | |
Energy | | | 612,027 | | | | – | | | | 612,027 | | | | – | |
Financials | | | 93,389 | | | | – | | | | 93,389 | | | | – | |
Technology | | | 588,177 | | | | – | | | | 588,177 | | | | – | |
| | | | |
Long-Term Fixed Income | | | | | | | | | | | | | | | | |
Asset-Backed Securities | | | 244,098,332 | | | | – | | | | 235,276,920 | | | | 8,821,412 | |
Basic Materials | | | 4,436,741 | | | | – | | | | 4,436,741 | | | | – | |
Capital Goods | | | 6,897,107 | | | | – | | | | 6,897,107 | | | | – | |
Collateralized Mortgage Obligations | | | 52,282,121 | | | | – | | | | 47,332,121 | | | | 4,950,000 | |
Commercial Mortgage-Backed Securities | | | 33,158,063 | | | | – | | | | 33,158,063 | | | | – | |
Communications Services | | | 21,974,892 | | | | – | | | | 21,974,892 | | | | – | |
Consumer Cyclical | | | 18,842,695 | | | | – | | | | 18,842,695 | | | | – | |
Consumer Non-Cyclical | | | 46,950,608 | | | | – | | | | 46,950,608 | | | | – | |
Energy | | | 35,649,619 | | | | – | | | | 35,649,619 | | | | – | |
Financials | | | 159,985,220 | | | | – | | | | 159,985,220 | | | | – | |
Foreign Government | | | 6,380,572 | | | | – | | | | 6,380,572 | | | | – | |
Mortgage-Backed Securities | | | 32,212,361 | | | | – | | | | 32,212,361 | | | | – | |
Technology | | | 19,175,856 | | | | – | | | | 19,175,856 | | | | – | |
Transportation | | | 12,880,051 | | | | – | | | | 12,880,051 | | | | – | |
U.S. Government and Agencies | | | 171,081,938 | | | | – | | | | 171,081,938 | | | | – | |
Utilities | | | 21,145,255 | | | | – | | | | 21,145,255 | | | | – | |
| | | | |
Preferred Stock | | | | | | | | | | | | | | | | |
Financials | | | 2,208,480 | | | | 1,429,380 | | | | 779,100 | | | | – | |
| | | | |
Common Stock | | | | | | | | | | | | | | | | |
Energy | | | 195,812 | | | | – | | | | – | | | | 195,812 | |
Short-Term Investments | | | 1,146,315 | | | | – | | | | 1,146,315 | | | | – | |
| |
Subtotal Investments in Securities | | | $895,689,084 | | | | $1,429,380 | | | | $880,232,781 | | | | $14,026,923 | |
| |
| | | | |
| Other Investments * | | Total | | | | | | | | | | |
| | | | | | | | | | | | | |
Short-Term Investments | | | 59,152,095 | | | | | | | | | | | | | |
| | | | | | | | | | | | | |
Subtotal Other Investments | | | $59,152,095 | | | | | | | | | | | | | |
| | | | | | | | | | | | | |
| | | | | | | | | | | | | | | | |
| | | | | | | | | | | | | |
Total Investments at Value | | | $954,841,179 | | | | | | | | | | | | | |
| | | | | | | | | | | | | |
| * | Certain investments are measured at fair value using a net asset value per share that is not publicly available (practical expedient). According to disclosure requirements of Accounting Standards Codification (ASC) 820, Fair Value Measurement, securities valued using the practical expedient are not classified in the fair value hierarchy. The fair value amounts presented in this table are intended to permit reconciliation of the fair value hierarchy to the amounts presented in the Statement of Assets and Liabilities. |
| | | | | | | | | | | | | | | | |
| | | | |
| Other Financial Instruments | | Total | | | Level 1 | | | Level 2 | | | Level 3 | |
Asset Derivatives | | | | | | | | | | | | | | | | |
Futures Contracts | | | 1,669,223 | | | | 1,669,223 | | | | – | | | | – | |
| |
Total Asset Derivatives | | | $1,669,223 | | | | $1,669,223 | | | | $– | | | | $ – | |
| |
| | | | |
Liability Derivatives | | | | | | | | | | | | | | | | |
Futures Contracts | | | 341,363 | | | | 341,363 | | | | – | | | | – | |
| |
Total Liability Derivatives | | | $341,363 | | | | $341,363 | | | | $– | | | | $– | |
| |
There were no significant transfers between Levels during the period ended October 31, 2018. Transfers between Levels are identified as of the end of the period.
The accompanying Notes to Financial Statements are an integral part of this schedule.
107
LIMITED MATURITY BOND FUND
Summary Schedule of Investments as of October 31, 2018
The following table presents Limited Maturity Bond Fund’s futures contracts held as of October 31, 2018. Investments and/or cash totaling $897,174 were pledged as the initial margin deposit for these contracts.
| | | | | | | | | | | | | | | | |
| Futures Contracts Description | | Number of
Contracts
Long/(Short) | | | Expiration
Date | | | Notional
Principal
Amount | | | Value and
Unrealized | |
CBOT 2-Yr. U.S. Treasury Note | | | 216 | | | | December 2018 | | | | $45,637,409 | | | | ($135,659 | ) |
Ultra 10-Yr. U.S. Treasury Note | | | 64 | | | | December 2018 | | | | 8,212,704 | | | | (205,704 | ) |
| |
Total Futures Long Contracts | | | | | | | | | | | $53,850,113 | | | | ($341,363 | ) |
| |
CBOT 10-Yr. U.S. Treasury Note | | | (305 | ) | | | December 2018 | | | | ($36,763,437 | ) | | | $640,000 | |
CBOT 5-Yr. U.S. Treasury Note | | | (442 | ) | | | December 2018 | | | | (50,144,913 | ) | | | 471,711 | |
CBOT U.S. Long Bond | | | (57 | ) | | | December 2018 | | | | (8,264,815 | ) | | | 391,690 | |
CME Ultra Long Term U.S. Treasury Bond | | | (16 | ) | | | December 2018 | | | | (2,553,322 | ) | | | 165,822 | |
| |
Total Futures Short Contracts | | | | | | | | | | | ($97,726,487 | ) | | | $1,669,223 | |
| |
Total Futures Contracts | | | | | | | | | | | ($43,876,374 | ) | | | $1,327,860 | |
| |
Reference Description:
| | | | |
CBOT | | - | | Chicago Board of Trade |
CME | | - | | Chicago Mercantile Exchange |
The following table summarizes the fair value and Statement of Assets and Liabilities location, as of October 31, 2018, for Limited Maturity Bond Fund’s investments in financial derivative instruments by primary risk exposure as discussed under item (2) Significant Accounting Policies of the Notes to Financial Statements.
| | | | | | |
| Derivatives by risk category | | Statement of Assets and Liabilities Location | | Fair Value | |
| | |
Asset Derivatives | | | | | | |
| | |
Interest Rate Contracts | | | | | | |
Futures* | | Net Assets - Accumulated undistributed earnings/(loss) | | | $1,669,223 | |
Total Interest Rate Contracts | | | | | 1,669,223 | |
| |
Total Asset Derivatives | | | | | $1,669,223 | |
| |
| | |
Liability Derivatives | | | | | | |
| | |
Interest Rate Contracts | | | | | | |
Futures* | | Net Assets - Accumulated undistributed earnings/(loss) | | | 341,363 | |
Total Interest Rate Contracts | | | | | 341,363 | |
| |
Total Liability Derivatives | | | | | $341,363 | |
| |
| * | Includes cumulative appreciation/depreciation of futures contracts as reported in the Schedule of Investments. Only current day’s variation margin is reported within the Statement of Assets and Liabilities. |
The following table summarizes the net realized gains/(losses) and Statement of Operations location, for the period ended October 31, 2018, for Limited Maturity Bond Fund’s investments in financial derivative instruments by primary risk exposure.
| | | | |
| Derivatives by risk category | | Statement of Operations Location | | Realized Gains/(Losses)
recognized in Income |
| | |
Interest Rate Contracts | | | | |
Futures | | Net realized gains/(losses) on Futures contracts | | 2,589,504 |
Total Interest Rate Contracts | | | | 2,589,504 |
|
Total | | | | $2,589,504 |
|
The following table summarizes the change in net unrealized appreciation/(depreciation) and Statement of Operations location, for the period ended October 31, 2018, for Limited Maturity Bond Fund’s investments in financial derivative instruments by primary risk exposure.
| | | | |
| Derivatives by risk category | | Statement of Operations Location | | Change in unrealized
appreciation/(depreciation) recognized in Income |
| | |
Interest Rate Contracts | | | | |
Futures | | Change in net unrealized appreciation/(depreciation) on Futures contracts | | 415,042 |
Total Interest Rate Contracts | | | | 415,042 |
|
Total | | | | $415,042 |
|
The accompanying Notes to Financial Statements are an integral part of this schedule.
108
LIMITED MATURITY BOND FUND
Summary Schedule of Investments as of October 31, 2018
The following table presents Limited Maturity Bond Fund’s average volume of derivative activity during the period ended October 31, 2018.
| | | | |
| Derivative Risk Category | | Average
Notional
Value | |
Interest Rate Contracts | | | | |
Futures - Long | | | $86,274,751 | |
Futures - Short | | | (115,169,258 | ) |
Investment in Affiliates
Affiliated issuers, as defined under the Investment Company Act of 1940, include those in which the Fund’s holdings of an issuer represent 5% or more of the outstanding voting securities of an issuer, any affiliated mutual fund, or a company which is under common ownership or control with the Fund. The Fund owns shares of Thrivent Cash Management Trust for the purpose of securities lending and Thrivent Core Short-Term Reserve Fund primarily to serve as a cash sweep vehicle for the Fund. Thrivent Cash Management Trust and Thrivent Core Funds are established solely for investment by Thrivent entities.
A summary of transactions (in thousands) for the fiscal year to date, in Limited Maturity Bond Fund, is as follows:
| | | | | | | | | | | | | | | | | | | | | | | | | | | | |
| Fund | | Value
10/31/2017 | | | Gross Purchases | | | Gross
Sales | | | Shares Held at
10/31/2018 | | | Value
10/31/2018 | | | % of Net
Assets | |
Affiliated Short-Term Investments | | | | | | | | | | | | | | | | | | | | | | | | | | | | |
Core Short-Term Reserve, 2.430% | | | $42,477 | | | | $308,646 | | | | $291,971 | | | | | | | | 5,915 | | | | $59,152 | | | | 6.4 | % |
| |
Total Affiliated Short-Term Investments | | | 42,477 | | | | | | | | | | | | | | | | | | | | 59,152 | | | | 6.4 | |
| |
Collateral Held for Securities Loaned | | | | | | | | | | | | | | | | | | | | | | | | | | | | |
Cash Management Trust- Collateral Investment | | | 3,467 | | | | 14,331 | | | | 17,798 | | | | | | | | – | | | | – | | | | – | |
| |
Total Collateral Held for Securities Loaned | | | 3,467 | | | | | | | | | | | | | | | | | | | | – | | | | – | |
| |
Total Value | | | $45,944 | | | | | | | | | | | | | | | | | | | | $59,152 | | | | | |
| |
| | | | | | | | | | | | | | | | |
| Fund | | Net Realized
Gain/(Loss) | | | Change in
Unrealized
Appreciation/
(Depreciation) | | | Distributions
of Realized
Capital Gains | | | Income Earned
11/1/2017 -
10/31/2018 | |
Affiliated Short-Term Investments | | | | | | | | | | | | | | | | |
Core Short-Term Reserve, 2.430% | | | $– | | | | $– | | | | $1 | | | | $1,030 | |
| |
Total Income from Affiliated Investments | | | | | | | | | | | | | | | $1,030 | |
| |
Collateral Held for Securities Loaned | | | | | | | | | | | | | | | | |
Cash Management Trust- Collateral Investment | | | – | | | | – | | | | – | | | | 3 | |
| |
Total Affiliated Income from Securities Loaned, Net | | | | | | | | | | | | | | | $3 | |
| |
Total | | | $– | | | | $– | | | | $1 | | | | | |
| |
The accompanying Notes to Financial Statements are an integral part of this schedule.
109
LOW VOLATILITY EQUITY FUND
Schedule of Investments as of October 31, 2018
| | | | | | | | |
| Shares | | | Common Stock (95.7%) | | Value | |
| | Communications Services (5.0%) | | | | |
| | 56,000 | | | HKT Trust and HKT, Ltd. | | | $77,233 | |
| | 5,200 | | | KDDI Corporation | | | 125,839 | |
| | 5,600 | | | NTT DOCOMO, Inc. | | | 138,874 | |
| | 257,000 | | | PCCW, Ltd. | | | 141,111 | |
| | 321 | | | RTL Group SA | | | 20,603 | |
| | 826 | | | TELUS Corporation | | | 28,285 | |
| | | | | |
| | | | Total | | | 531,945 | |
| | | | | |
| |
| | Consumer Discretionary (10.8%) | | | | |
| | 600 | | | ABC-MART, Inc. | | | 35,079 | |
| | 2,900 | | | Bridgestone Corporation | | | 111,822 | |
| | 1,829 | | | Bunzl plc | | | 53,955 | |
| | 663 | | | Burberry Group plc | | | 15,341 | |
| | 256 | | | Canadian Tire Corporation, Ltd. | | | 28,808 | |
| | 165 | | | Carnival Corporation | | | 9,247 | |
| | 61 | | | Garrett Motion, Inc.a | | | 925 | |
| | 45 | | | Hermes International | | | 25,691 | |
| | 672 | | | Home Depot, Inc. | | | 118,191 | |
| | 260 | | | McDonald’s Corporation | | | 45,994 | |
| | 10,800 | | | Nissan Motor Company, Ltd. | | | 98,256 | |
| | 900 | | | Park24 Company, Ltd. | | | 23,677 | |
| | 1,300 | | | Sankyo Company, Ltd. | | | 49,635 | |
| | 12,100 | | | Sekisui House, Ltd. | | | 177,592 | |
| | 900 | | | SHIMAMURA Company, Ltd. | | | 75,703 | |
| | 8,624 | | | SmartCentres Real Estate Investment Trust | | | 197,053 | |
| | 766 | | | TJX Companies, Inc. | | | 84,168 | |
| | | | | |
| | | | Total | | | 1,151,137 | |
| | | | | |
| |
| | Consumer Staples (13.7%) | | | | |
| | 2,083 | | | Altria Group, Inc. | | | 135,478 | |
| | 111 | | | Beiersdorf AG | | | 11,477 | |
| | 374 | | | Carlsberg AS | | | 41,258 | |
| | 2,485 | | | Coca-Cola Company | | | 118,982 | |
| | 758 | | | Colgate-Palmolive Company | | | 45,139 | |
| | 4,676 | | | Empire Company, Ltd. | | | 85,070 | |
| | 7,800 | | | Japan Tobacco, Inc. | | | 200,424 | |
| | 3,857 | | | Koninklijke Ahold Delhaize NV | | | 88,288 | |
| | 3,000 | | | Lawson, Inc. | | | 190,433 | |
| | 539 | | | Loblaw Companies, Ltd. | | | 26,957 | |
| | 730 | | | Mondelez International, Inc. | | | 30,645 | |
| | 272 | | | Nestle SA | | | 22,963 | |
| | 1,150 | | | NH Foods, Ltd. | | | 39,659 | |
| | 1,928 | | | PepsiCo, Inc. | | | 216,669 | |
| | 87 | | | Unilever NV | | | 4,675 | |
| | 1,975 | | | Unilever plc | | | 104,615 | |
| | 1,087 | | | Wal-Mart Stores, Inc. | | | 109,004 | |
| | | | | |
| | | | Total | | | 1,471,736 | |
| | | | | |
| |
| | Energy (1.0%) | | | | |
| | 410 | | | Chevron Corporation | | | 45,777 | |
| | 783 | | | Exxon Mobil Corporation | | | 62,389 | |
| | | | | |
| | | | Total | | | 108,166 | |
| | | | | |
| |
| | Financials (13.5%) | | | | |
| | 13 | | | Alleghany Corporation | | | 7,809 | |
| | 2,014 | | | Allstate Corporation | | | 192,780 | |
| | 297 | | | American Express Company | | | 30,511 | |
| | 1,713 | | | American Financial Group, Inc. | | | 171,351 | |
| | 742 | | | Aon plc | | | 115,886 | |
| | 689 | | | Arch Capital Group, Ltd.a | | | 19,547 | |
| | 694 | | | Berkshire Hathaway, Inc.a | | | 142,464 | |
| | 693 | | | Chubb, Ltd. | | | 86,563 | |
| | 2,201 | | | CI Financial Corporation | | | 32,552 | |
| | 1,759 | | | Direct Line Insurance Group plc | | | 7,392 | |
| | 2,201 | | | Hartford Financial Services Group, Inc. | | | 99,969 | |
| | 3,325 | | | KeyCorp | | | 60,382 | |
| | 1,062 | | | Loews Corporation | | | 49,447 | |
| | 71 | | | Markel Corporationa | | | 77,620 | |
| | 1,342 | | | Marsh & McLennan Companies, Inc. | | | 113,735 | |
| | 24,758 | | | Medibank Private, Ltd. | | | 49,089 | |
| | 575 | | | Nasdaq, Inc. | | | 49,858 | |
| | 419 | | | Pargesa Holding SA | | | 30,759 | |
| | 1,596 | | | U.S. Bancorp | | | 83,423 | |
| | 381 | | | W.R. Berkley Corporation | | | 28,918 | |
| | | | | |
| | | | Total | | | 1,450,055 | |
| | | | | |
| |
| | Health Care (15.4%) | | | | |
| | 1,613 | | | Abbott Laboratories | | | 111,200 | |
| | 444 | | | Amgen, Inc. | | | 85,599 | |
| | 3,000 | | | Astellas Pharmaceutical, Inc. | | | 46,351 | |
| | 1,471 | | | Baxter International, Inc. | | | 91,952 | |
| | 1,464 | | | Danaher Corporation | | | 145,522 | |
| | 1,280 | | | Eli Lilly and Company | | | 138,803 | |
| | 2,224 | | | GlaxoSmithKline plc | | | 43,074 | |
| | 1,001 | | | Johnson & Johnson | | | 140,130 | |
| | 1,123 | | | Medtronic plc | | | 100,868 | |
| | 2,500 | | | Mitsubishi Tanabe Pharma Corporation | | | 36,927 | |
| | 3,038 | | | Novo Nordisk AS | | | 131,201 | |
| | 4,915 | | | Pfizer, Inc. | | | 211,640 | |
| | 708 | | | Roche Holding AG | | | 172,300 | |
| | 194 | | | Sonova Holding AG | | | 31,638 | |
| | 615 | | | Stryker Corporation | | | 99,765 | |
| | 228 | | | UnitedHealth Group, Inc. | | | 59,588 | |
| | | | | |
| | | | Total | | | 1,646,558 | |
| | | | | |
| |
| | Industrials (8.1%) | | | | |
| | 663 | | | AMETEK, Inc. | | | 44,474 | |
| | 224 | | | General Dynamics Corporation | | | 38,658 | |
| | 602 | | | Honeywell International, Inc. | | | 87,182 | |
| | 395 | | | Lockheed Martin Corporation | | | 116,071 | |
| | 317 | | | Northrop Grumman Corporation | | | 83,038 | |
| | 653 | | | Raytheon Company | | | 114,301 | |
| | 4,420 | | | RELX plc | | | 87,413 | |
| | 100 | | | Resideo Technologies, Inc.a | | | 2,105 | |
| | 6,301 | | | Royal Mail plc | | | 28,927 | |
| | 99 | | | Schindler Holding AG | | | 20,558 | |
| | 199 | | | Schindler Holding AG, Participation Certificate | | | 41,962 | |
| | 22 | | | SGS SA | | | 52,251 | |
| | 10,400 | | | Singapore Airport Terminal Services, Ltd. | | | 37,429 | |
| | 3,500 | | | Sumitomo Electric Industries, Ltd. | | | 47,732 | |
| | 883 | | | Waste Connections, Inc. | | | 67,497 | |
| | | | | |
| | | | Total | | | 869,598 | |
| | | | | |
| |
| | Information Technology (13.4%) | | | | |
| | 147 | | | Accenture plc | | | 23,170 | |
| | 936 | | | Amphenol Corporation | | | 83,772 | |
| | 1,167 | | | Automatic Data Processing, Inc. | | | 168,141 | |
| | 4,200 | | | Canon, Inc. | | | 119,630 | |
| | 3,261 | | | CGI Group, Inc.a | | | 201,390 | |
| | 3,164 | | | Cisco Systems, Inc. | | | 144,753 | |
| | 1,330 | | | Fidelity National Information Services, Inc. | | | 138,453 | |
| | 935 | | | Fiserv, Inc.a | | | 74,146 | |
The accompanying Notes to Financial Statements are an integral part of this schedule.
110
LOW VOLATILITY EQUITY FUND
Schedule of Investments as of October 31, 2018
| | | | | | | | |
| Shares | | | Common Stock (95.7%) | | Value | |
| | Information Technology (13.4%) - continued | |
| | 179 | | | International Business Machines Corporation | | | $20,662 | |
| | 829 | | | MasterCard, Inc. | | | 163,868 | |
| | 989 | | | Microsoft Corporation | | | 105,635 | |
| | 3,007 | | | Oracle Corporation | | | 146,862 | |
| | 517 | | | Synopsys, Inc.a | | | 46,287 | |
| | | | | |
| | | | Total | | | 1,436,769 | |
| | | | | |
| |
| | Materials (1.9%) | | | | |
| | 40 | | | Givaudan SA | | | 96,957 | |
| | 1,300 | | | Kuraray Company, Ltd. | | | 17,856 | |
| | 2,873 | | | Newmont Mining Corporation | | | 88,833 | |
| | | | | |
| | | | Total | | | 203,646 | |
| | | | | |
| |
| | Real Estate (4.3%) | | | | |
| | 710 | | | AvalonBay Communities, Inc. | | | 124,520 | |
| | 128 | | | Crown Castle International Corporation | | | 13,919 | |
| | 800 | | | Daito Trust Construction Company, Ltd. | | | 105,471 | |
| | 1,073 | | | Duke Realty Corporation | | | 29,582 | |
| | 809 | | | Equity Residential | | | 52,553 | |
| | 6,000 | | | Hysan Development Company, Ltd. | | | 28,138 | |
| | 1,113 | | | Klepierre SA | | | 37,716 | |
| | 2,500 | | | Link REIT | | | 22,218 | |
| | 148 | | | Regency Centers Corporation | | | 9,377 | |
| | 472 | | | Swiss Prime Site AG | | | 38,300 | |
| | | | | |
| | | | Total | | | 461,794 | |
| | | | | |
| |
| | Utilities (8.6%) | | | | |
| | 792 | | | Ameren Corporation | | | 51,147 | |
| | 1,190 | | | American Electric Power Company, Inc. | | | 87,298 | |
| | 3,600 | | | Chugoku Electric Power Company, Inc. | | | 46,306 | |
| | 18,000 | | | CLP Holdings, Ltd. | | | 201,698 | |
| | 2,108 | | | CMS Energy Corporation | | | 104,388 | |
| | 694 | | | Duke Energy Corporation | | | 57,345 | |
| | 438 | | | Edison International, Inc. | | | 30,393 | |
| | 1,319 | | | Enagas SA | | | 34,971 | |
| | 151 | | | NextEra Energy, Inc. | | | 26,047 | |
| | 4,300 | | | Osaka Gas Company, Ltd. | | | 78,630 | |
| | 296 | | | Southern Company | | | 13,329 | |
| | 2,000 | | | Tokyo Gas Company, Ltd. | | | 49,186 | |
| | 864 | | | WEC Energy Group, Inc. | | | 59,098 | |
| | 1,671 | | | Xcel Energy, Inc. | | | 81,896 | |
| | | | | |
| | | | Total | | | 921,732 | |
| | | | | |
| | | | | | | | |
| | | | | |
| | | | Total Common Stock (cost $10,092,763) | | | 10,253,136 | |
| | | | | |
Shares or
Principal
Amount | | | Short-Term Investments (4.6%) | | Value | |
| | | | Federal Home Loan Bank Discount Notes | | | | |
| | 200,000 | | | 2.255%, 1/8/2019b,c | | | 199,131 | |
| | 300,000 | | | 2.281%, 1/16/2019b,c | | | 298,544 | |
| | | | | | |
| | |
Shares or
Principal
Amount | | | Short-Term Investments (4.6%) | | Value |
| | | | Thrivent Core Short-Term Reserve Fund | | |
| | <1 | | | 2.430% | | 1 |
| | | | |
| | | | Total Short-Term Investments (cost $497,705) | | 497,676 |
| | | | |
| | | | Total Investments (cost $10,590,468) 100.3% | | $10,750,812 |
| | | | |
| | | | Other Assets and Liabilities, Net (0.3%) | | (33,028) |
| | | | |
| | | | Total Net Assets 100.0% | | $10,717,784 |
| | | | |
| a | Non-income producing security. |
| b | The interest rate shown reflects the yield, coupon rate or the discount rate at the date of purchase. |
| c | All or a portion of the security is held on deposit with the counterparty and pledged as the initial margin deposit for open futures contracts. |
Definitions:
| | | | |
| REIT | | - | | Real Estate Investment Trust is a company that buys, develops, manages and/or sells real estate assets. |
Unrealized Appreciation (Depreciation)
Gross unrealized appreciation and depreciation of investments of the portfolio as a whole (including derivatives), based on cost for federal income tax purposes, were as follows:
| | | | |
Gross unrealized appreciation | | | $570,863 | |
Gross unrealized depreciation | | | (453,411 | ) |
| | | | |
Net unrealized appreciation (depreciation) | | | $117,452 | |
| |
Cost for federal income tax purposes | | | $10,981,960 | |
The accompanying Notes to Financial Statements are an integral part of this schedule.
111
LOW VOLATILITY EQUITY FUND
Schedule of Investments as of October 31, 2018
Fair Valuation Measurements
The following table is a summary of the inputs used, as of October 31, 2018, in valuing Low Volatility Equity Fund’s assets carried at fair value.
| | | | | | | | | | | | | | | | |
| Investments in Securities | | Total | | | Level 1 | | | Level 2 | | | Level 3 | |
|
Common Stock | |
Communications Services | | | 531,945 | | | | – | | | | 531,945 | | | | – | |
Consumer Discretionary | | | 1,151,137 | | | | 258,525 | | | | 892,612 | | | | – | |
Consumer Staples | | | 1,471,736 | | | | 655,917 | | | | 815,819 | | | | – | |
Energy | | | 108,166 | | | | 108,166 | | | | – | | | | – | |
Financials | | | 1,450,055 | | | | 1,330,263 | | | | 119,792 | | | | – | |
Health Care | | | 1,646,558 | | | | 1,185,067 | | | | 461,491 | | | | – | |
Industrials | | | 869,598 | | | | 553,326 | | | | 316,272 | | | | – | |
Information Technology | | | 1,436,769 | | | | 1,115,749 | | | | 321,020 | | | | – | |
Materials | | | 203,646 | | | | 88,833 | | | | 114,813 | | | | – | |
Real Estate | | | 461,794 | | | | 229,951 | | | | 231,843 | | | | – | |
Utilities | | | 921,732 | | | | 510,941 | | | | 410,791 | | | | – | |
Short-Term Investments | | | 497,675 | | | | – | | | | 497,675 | | | | – | |
| |
Subtotal Investments in Securities | | | $10,750,811 | | | | $6,036,738 | | | | $4,714,073 | | | | $– | |
| |
| | | | |
Other Investments * | | | Total | | | | | | | | | | | | | |
| | | | | | | | | | | | | |
Short-Term Investments | | | 1 | | | | | | | | | | | | | |
| | | | | | | | | | | | | |
Subtotal Other Investments | | | $1 | | | | | | | | | | | | | |
| | | | | | | | | | | | | |
| | | | | | | | | | | | | |
| | | | | | | | | | | | | |
Total Investments at Value | | | $10,750,812 | | | | | | | | | | | | | |
| | | | | | | | | | | | | |
| | | | | | | | | | | | | |
| * | Certain investments are measured at fair value using a net asset value per share that is not publicly available (practical expedient). According to disclosure requirements of Accounting Standards Codification (ASC) 820, Fair Value Measurement, securities valued using the practical expedient are not classified in the fair value hierarchy. The fair value amounts presented in this table are intended to permit reconciliation of the fair value hierarchy to the amounts presented in the Statement of Assets and Liabilities. |
| | | | | | | | | | | | | | | | |
| Other Financial Instruments | | Total | | | Level 1 | | | Level 2 | | | Level 3 | |
Liability Derivatives | | | | | | | | | | | | | | | | |
Futures Contracts | | | 4,640 | | | | 4,640 | | | | – | | | | – | |
| |
Total Liability Derivatives | | | $4,640 | | | | $4,640 | | | | $– | | | | $– | |
| |
There were no significant transfers between Levels during the period ended October 31, 2018. Transfers between Levels are identified as of the end of the period.
The following table presents Low Volatility Equity Fund’s futures contracts held as of October 31, 2018. Investments and/or cash totaling $497,675 were pledged as the initial margin deposit for these contracts.
| | | | | | | | | | | | | | | | |
| Futures Contracts Description | | Number of
Contracts
Long/(Short) | | | Expiration
Date | | | Notional
Principal
Amount | | | Value and
Unrealized | |
Eurex MSCI World Index | | | 6 | | | | December 2018 | | | | $353,240 | | | | ($4,640 | ) |
| |
Total Futures Long Contracts | | | | | | | | | | | $353,240 | | | | ($4,640 | ) |
| |
Total Futures Contracts | | | | | | | | | | | $353,240 | | | | ($4,640 | ) |
| |
| | |
Reference Description: |
MSCI | | - Morgan Stanley Capital International |
The following table summarizes the fair value and Statement of Assets and Liabilities location, as of October 31, 2018, for Low Volatility Equity Fund’s investments in financial derivative instruments by primary risk exposure as discussed under item (2) Significant Accounting Policies of the Notes to Financial Statements.
| | | | |
| Derivatives by risk category | | Statement of Assets and Liabilities Location | | Fair Value |
| | |
Liability Derivatives | | | | |
| | |
Equity Contracts | | | | |
Futures* | | Net Assets - Accumulated undistributed earnings/(loss) | | $4,640 |
Total Equity Contracts | | | | 4,640 |
|
Total Liability Derivatives | | | | $4,640 |
|
| * | Includes cumulative appreciation/depreciation of futures contracts as reported in the Schedule of Investments. Only current day’s variation margin is reported within the Statement of Assets and Liabilities. |
The accompanying Notes to Financial Statements are an integral part of this schedule.
112
LOW VOLATILITY EQUITY FUND
Schedule of Investments as of October 31, 2018
The following table summarizes the net realized gains/(losses) and Statement of Operations location, for the period ended October 31, 2018, for Low Volatility Equity Fund’s investments in financial derivative instruments by primary risk exposure.
| | | | |
| Derivatives by risk category | | Statement of Operations Location | | Realized Gains/(Losses)
recognized in Income |
| | |
Equity Contracts | | | | |
Futures | | Net realized gains/(losses) on Futures contracts | | (3,963) |
Total Equity Contracts | | | | (3,963) |
|
Total | | | | ($3,963) |
|
The following table summarizes the change in net unrealized appreciation/(depreciation) and Statement of Operations location, for the period ended October 31, 2018, for Low Volatility Equity Fund’s investments in financial derivative instruments by primary risk exposure.
| | | | |
| Derivatives by risk category | | Statement of Operations Location | | Change in unrealized
appreciation/(depreciation)
recognized in Income |
| | |
Equity Contracts | | | | |
Futures | | Change in net unrealized appreciation/(depreciation) on Futures contracts | | (9,513) |
Total Equity Contracts | | | | (9,513) |
|
Total | | | | ($9,513) |
|
The following table presents Low Volatility Equity Fund’s average volume of derivative activity during the period ended October 31, 2018.
| | | | |
| Derivative Risk Category | | Average Notional Value | |
Equity Contracts | | | | |
Futures - Long | | | $280,928 | |
Futures - Short | | | (3,236 | ) |
Investment in Affiliates
Affiliated issuers, as defined under the Investment Company Act of 1940, include those in which the Fund’s holdings of an issuer represent 5% or more of the outstanding voting securities of an issuer, any affiliated mutual fund, or a company which is under common ownership or control with the Fund. The Fund owns shares of Thrivent Cash Management Trust for the purpose of securities lending and Thrivent Core Short-Term Reserve Fund primarily to serve as a cash sweep vehicle for the Fund. Thrivent Cash Management Trust and Thrivent Core Funds are established solely for investment by Thrivent entities.
A summary of transactions (in thousands) for the fiscal year to date, in Low Volatility Equity Fund, is as follows:
| | | | | | | | | | | | | | | | | | | | | | | | |
| Fund | | Value
10/31/2017 | | | Gross
Purchases | | | Gross
Sales | | | Shares Held at
10/31/2018 | | | Value
10/31/2018 | | | % of Net
Assets | |
Affiliated Short-Term Investments | | | | | | | | | | | | | | | | | | | | | | | | |
Core Short-Term Reserve, 2.430% | | | $266 | | | | $5,939 | | | | $6,205 | | | | – | | | | $0 | | | | <0.1 | % |
| |
Total Affiliated Short-Term Investments | | | 266 | | | | | | | | | | | | | | | | – | | | | – | |
| |
Collateral Held for Securities Loaned | | | | | | | | | | | | | | | | | | | | | | | | |
Cash Management Trust- Collateral Investment | | | — | | | | 236 | | | | 236 | | | | – | | | | – | | | | – | |
| |
Total Value | | | $266 | | | | | | | | | | | | | | | | $– | | | | | |
| |
| | | | | | | | | | | | | | | | |
| Fund | | Net Realized
Gain/(Loss) | | | Change in
Unrealized
Appreciation/
(Depreciation) | | | Distributions of
Realized Capital
Gains | | | Income Earned
11/1/2017 -
10/31/2018 | |
Affiliated Short-Term Investments | | | | | | | | | | | | | | | | |
Core Short-Term Reserve, 2.430% | | | $– | | | | $– | | | | $0 | | | | $5 | |
| |
Total Income from Affiliated Investments | | | | | | | | | | | | | | | $5 | |
| |
Cash Management Trust-Collateral Investment | | | – | | | | – | | | | – | | | | 0 | |
| |
Total Affiliated Income from Securities Loaned, Net | | | | | | | | | | | | | | | $0 | |
| |
Total | | | $– | | | | $– | | | | $0 | | | | | |
| |
The accompanying Notes to Financial Statements are an integral part of this schedule.
113
MID CAP STOCK FUND
Schedule of Investments as of October 31, 2018
| | | | | | | | |
| Shares | | | Common Stock (90.6%) | | Value | |
| | Communications Services (3.9%) | | | | |
| | 878,050 | | | DISH Network Corporationa | | | $26,991,257 | |
| | 1,383,275 | | | Twitter, Inc.a | | | 48,068,806 | |
| | | | | |
| | | | Total | | | 75,060,063 | |
| | | | | |
| |
| | Consumer Discretionary (7.8%) | | | | |
| | 1,333,825 | | | American Axle & Manufacturing Holdings, Inc.a | | | 20,234,125 | |
| | 245,725 | | | Dollar Tree, Inc.a | | | 20,714,617 | |
| | 187,025 | | | Expedia Group, Inc. | | | 23,458,546 | |
| | 185,125 | | | Lululemon Athletica, Inc.a | | | 26,052,641 | |
| | 249,850 | | | RHa,b | | | 28,910,144 | |
| | 909,926 | | | Toll Brothers, Inc. | | | 30,628,109 | |
| | | | | |
| | | | Total | | | 149,998,182 | |
| | | | | |
| |
| | Consumer Staples (1.2%) | | | | |
| | 961,525 | | | Hain Celestial Group, Inc.a | | | 23,922,742 | |
| | | | | |
| | | | Total | | | 23,922,742 | |
| | | | | |
| |
| | Energy (5.0%) | | | | |
| | 782,600 | | | Callon Petroleum Companya | | | 7,802,522 | |
| | 142,475 | | | Diamondback Energy, Inc. | | | 16,008,491 | |
| | 185,255 | | | Marathon Petroleum Corporation | | | 13,051,215 | |
| | 346,638 | | | Parsley Energy, Inc.a | | | 8,118,262 | |
| | 1,467,400 | | | Patterson-UTI Energy, Inc. | | | 24,417,536 | |
| | 1,596,765 | | | WPX Energy, Inc.a | | | 25,612,110 | |
| | | | | |
| | | | Total | | | 95,010,136 | |
| | | | | |
| |
| | Financials (17.7%) | | | | |
| | 1,127,100 | | | Ally Financial, Inc. | | | 28,639,611 | |
| | 1,145,200 | | | Assured Guaranty, Ltd. | | | 45,785,096 | |
| | 531,450 | | | E*TRADE Financial Corporation | | | 26,264,259 | |
| | 336,200 | | | First Republic Bank | | | 30,590,838 | |
| | 1,986,876 | | | Huntington Bancshares, Inc. | | | 28,471,933 | |
| | 2,497,550 | | | KeyCorp | | | 45,355,508 | |
| | 36,210 | | | Markel Corporationa | | | 39,586,220 | |
| | 1,207,000 | | | Radian Group, Inc. | | | 23,162,330 | |
| | 1,507,850 | | | Zions Bancorporations NA | | | 70,944,343 | |
| | | | | |
| | | | Total | | | 338,800,138 | |
| | | | | |
| |
| | Health Care (8.1%) | | | | |
| | 245,525 | | | Edwards Lifesciences Corporationa | | | 36,239,490 | |
| | 1,138,877 | | | Halozyme Therapeutics, Inc.a | | | 17,686,760 | |
| | 573,425 | | | Myriad Genetics, Inc.a | | | 25,821,327 | |
| | 226,000 | | | Neurocrine Biosciences, Inc.a | | | 24,215,900 | |
| | 230,589 | | | Universal Health Services, Inc. | | | 28,030,399 | |
| | 977,950 | | | Valeant Pharmaceuticals International, Inc.a | | | 22,375,496 | |
| | | | | |
| | | | Total | | | 154,369,372 | |
| | | | | |
| |
| | Industrials (18.7%) | | | | |
| | 161,175 | | | Acuity Brands, Inc. | | | 20,250,027 | |
| | 450,275 | | | AGCO Corporation | | | 25,233,411 | |
| | 342,650 | | | Brink’s Company | | | 22,724,548 | |
| | 556,325 | | | CSX Corporation | | | 38,308,539 | |
| | 257,925 | | | Huntington Ingalls Industries, Inc. | | | 56,351,454 | |
| | 260,712 | | | Oshkosh Corporation | | | 14,636,372 | |
| | 337,750 | | | SiteOne Landscape Supply, Inc.a | | | 22,980,510 | |
| | 1,206,440 | | | Southwest Airlines Company | | | 59,236,204 | |
| | 439,150 | | | United Continental Holdings, Inc.a | | | 37,551,717 | |
| | 255,355 | | | Verisk Analytics, Inc.a | | | 30,601,743 | |
| | 289,500 | | | WABCO Holdings, Inc.a | | | 31,106,775 | |
| | | | | |
| | | | Total | | | 358,981,300 | |
| | | | | |
| |
| | Information Technology (14.6%) | | | | |
| | 1,100,145 | | | Advanced Micro Devices, Inc.a | | | 20,033,640 | |
| | 724,950 | | | Akamai Technologies, Inc.a | | | 52,377,638 | |
| | 246,750 | | | Alliance Data Systems Corporation | | | 50,874,915 | |
| | 781,750 | | | Ciena Corporationa | | | 24,437,505 | |
| | 504,350 | | | Red Hat, Inc.a | | | 86,566,634 | |
| | 605,363 | | | Teradata Corporationa | | | 22,035,213 | |
| | 678,126 | | | Teradyne, Inc. | | | 23,361,441 | |
| | | | | |
| | | | Total | | | 279,686,986 | |
| | | | | |
| |
| | Materials (4.2%) | | | | |
| | 530,150 | | | Ball Corporation | | | 23,750,720 | |
| | 1,388,525 | | | Owens-Illinois, Inc.a | | | 21,758,187 | |
| | 860,433 | | | Steel Dynamics, Inc. | | | 34,073,147 | |
| | | | | |
| | | | Total | | | 79,582,054 | |
| | | | | |
| |
| | Real Estate (6.2%) | | | | |
| | 203,750 | | | Alexandria Real Estate Equities, Inc. | | | 24,904,362 | |
| | 274,200 | | | Camden Property Trust | | | 24,752,034 | |
| | 203,650 | | | Digital Realty Trust, Inc. | | | 21,028,899 | |
| | 873,550 | | | Duke Realty Corporation | | | 24,083,774 | |
| | 1,264,309 | | | Host Hotels & Resorts, Inc. | | | 24,160,945 | |
| | | | | |
| | | | Total | | | 118,930,014 | |
| | | | | |
| |
| | Utilities (3.2%) | | | | |
| | 347,650 | | | Entergy Corporation | | | 29,185,218 | |
| | 594,000 | | | Public Service Enterprise Group, Inc. | | | 31,737,420 | |
| | | | | |
| | | | Total | | | 60,922,638 | |
| | | | | |
| | | | | | | | |
| | | | | |
| | | | Total Common Stock (cost $1,346,187,790) | | | 1,735,263,625 | |
| | | | | |
| | |
| Shares | | | Collateral Held for Securities Loaned (1.1%) | | Value | |
| | 21,669,050 | | | Thrivent Cash Management Trust | | | 21,669,050 | |
| | | | | |
| | | | Total Collateral Held for Securities Loaned (cost $21,669,050) | | | 21,669,050 | |
| | | | | |
| | |
Shares or
Principal
Amount | | | Short-Term Investments (8.7%) | | Value | |
| | 16,723,089 | | | Thrivent Core Short-Term Reserve Fund 2.430% | | | 167,230,890 | |
| | | | | |
| | | | Total Short-Term Investments (cost $167,230,890) | | | 167,230,890 | |
| | | | | |
| | | | Total Investments (cost $1,535,087,730) 100.4% | | $ | 1,924,163,565 | |
| | | | | |
| | | | Other Assets and Liabilities, Net (0.4%) | | | (8,417,077 | ) |
| | | | | |
| | | | Total Net Assets 100.0% | | $ | 1,915,746,488 | |
| | | | | |
| a | Non-income producing security. |
| b | All or a portion of the security is on loan. |
The accompanying Notes to Financial Statements are an integral part of this schedule.
114
MID CAP STOCK FUND
Schedule of Investments as of October 31, 2018
The following table presents the total amount of securities loaned with continuous maturity, by type, offset by the gross payable upon return of collateral for securities loaned by Thrivent Mid Cap Stock Fund as of October 31, 2018:
Securities Lending Transactions
| | | | |
Common Stock | | $ | 20,850,942 | |
| | | | |
Total lending | | $ | 20,850,942 | |
Gross amount payable upon return of collateral for securities loaned | | $ | 21,669,050 | |
| | | | |
Net amounts due to counterparty | | | $818,108 | |
| | | | |
Unrealized Appreciation (Depreciation)
Gross unrealized appreciation and depreciation of investments of the portfolio as a whole (including derivatives), based on cost for federal income tax purposes, were as follows:
| | | | |
Gross unrealized appreciation | | | $442,937,184 | |
Gross unrealized depreciation | | | (54,719,434 | ) |
| | | | |
Net unrealized appreciation (depreciation) | | | $388,217,750 | |
| |
Cost for federal income tax purposes | | | $1,535,945,815 | |
Fair Valuation Measurements
The following table is a summary of the inputs used, as of October 31, 2018, in valuing Mid Cap Stock Fund’s assets carried at fair value.
| | | | | | | | | | | | | | | | |
| Investments in Securities | | Total | | | Level 1 | | | Level 2 | | | Level 3 | |
| | | | |
Common Stock | | | | | | | | | | | | | | | | |
Communications Services | | | 75,060,063 | | | | 75,060,063 | | | | – | | | | – | |
Consumer Discretionary | | | 149,998,182 | | | | 149,998,182 | | | | – | | | | – | |
Consumer Staples | | | 23,922,742 | | | | 23,922,742 | | | | – | | | | – | |
Energy | | | 95,010,136 | | | | 95,010,136 | | | | – | | | | – | |
Financials | | | 338,800,138 | | | | 338,800,138 | | | | – | | | | – | |
Health Care | | | 154,369,372 | | | | 154,369,372 | | | | – | | | | – | |
Industrials | | | 358,981,300 | | | | 358,981,300 | | | | – | | | | – | |
Information Technology | | | 279,686,986 | | | | 279,686,986 | | | | – | | | | – | |
Materials | | | 79,582,054 | | | | 79,582,054 | | | | – | | | | – | |
Real Estate | | | 118,930,014 | | | | 118,930,014 | | | | – | | | | – | |
Utilities | | | 60,922,638 | | | | 60,922,638 | | | | – | | | | – | |
| |
Subtotal Investments in Securities | | | $1,735,263,625 | | | | $1,735,263,625 | | | | $– | | | | $– | |
| |
| |
| | | | |
Other Investments * | | | Total | | | | | | | | | | | | | |
| | | | | | | | | | | | | |
Short-Term Investments | | | 167,230,890 | | | | | | | | | | | | | |
Collateral Held for Securities Loaned | | | 21,669,050 | | | | | | | | | | | | | |
| | | | | | | | | | | | | |
Subtotal Other Investments | | | $188,899,940 | | | | | | | | | | | | | |
| | | | | | | | | | | | | |
| | | | | | | | | | | | | |
| | | | | | | | | | | | | |
| | | | | | | | | | | | | |
Total Investments at Value | | | $1,924,163,565 | | | | | | | | | | | | | |
| | | | | | | | | | | | | |
| | | | | | | | | | | | | |
| * | Certain investments are measured at fair value using a net asset value per share that is not publicly available (practical expedient). According to disclosure requirements of Accounting Standards Codification (ASC) 820, Fair Value Measurement, securities valued using the practical expedient are not classified in the fair value hierarchy. The fair value amounts presented in this table are intended to permit reconciliation of the fair value hierarchy to the amounts presented in the Statement of Assets and Liabilities. |
There were no significant transfers between Levels during the period ended October 31, 2018. Transfers between Levels are identified as of the end of the period.
Investment in Affiliates
Affiliated issuers, as defined under the Investment Company Act of 1940, include those in which the Fund’s holdings of an issuer represent 5% or more of the outstanding voting securities of an issuer, any affiliated mutual fund, or a company which is under common ownership or control with the Fund. The Fund owns shares of Thrivent Cash Management Trust for the purpose of securities lending and Thrivent Core Short-Term Reserve Fund primarily to serve as a cash sweep vehicle for the Fund. Thrivent Cash Management Trust and Thrivent Core Funds are established solely for investment by Thrivent entities.
A summary of transactions (in thousands) for the fiscal year to date, in Mid Cap Stock Fund, is as follows:
| | | | | | | | | | | | | | | | | | | | | | | | |
| Fund | | Value
10/31/2017 | | | Gross
Purchases | | | Gross
Sales | | | Shares Held at
10/31/2018 | | | Value
10/31/2018 | | | % of Net
Assets | |
Affiliated Short-Term Investments | | | | | | | | | | | | | | | | | | | | | | | | |
Core Short-Term Reserve, 2.430% | | | $85,301 | | | | $324,061 | | | | $242,131 | | | | 16,723 | | | | $167,231 | | | | 8.7% | |
| |
Total Affiliated Short-Term Investments | | | 85,301 | | | | | | | | | | | | | | | | 167,231 | | | | 8.7 | |
| |
Collateral Held for Securities Loaned | | | | | | | | | | | | | | | | | | | | | | | | |
Cash Management Trust- Collateral Investment | | | 661 | | | | 354,987 | | | | 333,979 | | | | 21,669 | | | | 21,669 | | | | 1.1 | |
| |
Total Collateral Held for Securities Loaned | | | 661 | | | | | | | | | | | | | | | | 21,669 | | | | 1.1 | |
| |
Total Value | | | $85,962 | | | | | | | | | | | | | | | | $188,900 | | | | | |
| |
The accompanying Notes to Financial Statements are an integral part of this schedule.
115
MID CAP STOCK FUND
Schedule of Investments as of October 31, 2018
| | | | | | | | | | | | | | | | |
| Fund | | Net Realized Gain/(Loss) | | | Change in Unrealized Appreciation/ (Depreciation) | | | Distributions of Realized Capital Gains | | | Income Earned 11/1/2017 - 10/31/2018 | |
Affiliated Short-Term Investments | | | | | | | | | | | | | | | | |
Core Short-Term Reserve, 2.430% | | | $– | | | | $– | | | | $1 | | | | $3,074 | |
| |
Total Income from Affiliated Investments | | | | | | | | | | | | | | | $3,074 | |
| |
Collateral Held for Securities Loaned | | | | | | | | | | | | | | | | |
Cash Management Trust- Collateral Investment | | | – | | | | – | | | | – | | | | 92 | |
| |
Total Affiliated Income from Securities Loaned, Net | | | | | | | | | | | | | | | $92 | |
| |
Total | | | $– | | | | $– | | | | $1 | | | | | |
| |
The accompanying Notes to Financial Statements are an integral part of this schedule.
116
MODERATE ALLOCATION FUND
Summary Schedule of Investments as of October 31, 2018
| | | | | | | | | | | | |
Principal
Amount | | | Bank Loans (2.1%) | | Value | | | % of Net
Assets | |
| | Basic Materials (0.2%) | | | | | | | | |
| | | | Other Securities^ | | | $4,572,759 | | | | 0.2 | % |
| | | | | |
| | | | Total | | | 4,572,759 | | | | | |
| | | | | |
| | |
| | Capital Goods (0.1%) | | | | | | | | |
| | | | Other Securities^ | | | 2,582,608 | | | | 0.1 | % |
| | | | | |
| | | | Total | | | 2,582,608 | | | | | |
| | | | | |
| | |
| | Communications Services (0.5%) | | | | | | | | |
| | | | Other Securities^ | | | 11,442,297 | | | | 0.5 | % |
| | | | | |
| | | | Total | | | 11,442,297 | | | | | |
| | | | | |
| | |
| | Consumer Cyclical (0.3%) | | | | | | | | |
| | | | Other Securities^ | | | 5,615,429 | | | | 0.3 | % |
| | | | | |
| | | | Total | | | 5,615,429 | | | | | |
| | | | | |
| | |
| | Consumer Non-Cyclical (0.3%) | | | | | | | | |
| | | | Other Securities^ | | | 7,756,919 | | | | 0.3 | % |
| | | | | |
| | | | Total | | | 7,756,919 | | | | | |
| | | | | |
| | |
| | Energy (0.2%) | | | | | | | | |
| | | | Other Securities^ | | | 3,794,834 | | | | 0.2 | % |
| | | | | |
| | | | Total | | | 3,794,834 | | | | | |
| | | | | |
| | |
| | Financials (0.2%) | | | | | | | | |
| | | | Other Securities^ | | | 4,274,638 | | | | 0.2 | % |
| | | | | |
| | | | Total | | | 4,274,638 | | | | | |
| | | | | |
| | |
| | Technology (0.2%) | | | | | | | | |
| | | | Other Securities^ | | | 5,096,272 | | | | 0.2 | % |
| | | | | |
| | | | Total | | | 5,096,272 | | | | | |
| | | | | |
| | |
| | Transportation (<0.1%) | | | | | | | | |
| | | | Other Securities^ | | | 829,676 | | | | <0.1 | % |
| | | | | |
| | | | Total | | | 829,676 | | | | | |
| | | | | |
| | |
| | Utilities (0.1%) | | | | | | | | |
| | | | Other Securities^ | | | 1,660,724 | | | | 0.1 | % |
| | | | | |
| | | | Total | | | 1,660,724 | | | | | |
| | | | | |
| | | | | | | | | | | | |
| | | | | |
| | | | Total Bank Loans (cost $48,299,707) | | | 47,626,156 | | | | | |
| | | | | |
| | | |
| Shares | | | Registered Investment Companies (43.3%) | | Value | | | % of Net
Assets | |
| | Affiliated Equity Holdings (31.5%) | | | | | | | | |
| | 2,203,086 | | | Thrivent Core International Equity Fund | | | 20,444,642 | | | | 0.9 | % |
| | 6,327,806 | | | Thrivent Core Low Volatility Equity Funda | | | 66,695,075 | | | | 2.9 | % |
| | 12,490,426 | | | Thrivent Large Cap Growth Fund, Class S | | | 155,755,609 | | | | 6.7 | % |
| | 1,828,360 | | | Thrivent Large Cap Stock Fund, Class S | | | 49,146,306 | | | | 2.1 | % |
| | 8,148,795 | | | Thrivent Large Cap Value Fund, Class S | | | 186,607,417 | | | | 8.1 | % |
| | 3,723,782 | | | Thrivent Mid Cap Stock Fund, Class S | | | 104,489,316 | | | | 4.5 | % |
| | 12,134,999 | | | Thrivent Partner Worldwide Allocation Fund, Class S | | | 119,772,442 | | | | 5.1 | % |
| | 1,034,330 | | | Thrivent Small Cap Stock Fund, Class S | | | 27,254,589 | | | | 1.2 | % |
| | | | | |
| | | | Total | | | 730,165,396 | | | | | |
| | | | | |
| | |
| | Affiliated Fixed Income Holdings (10.7%) | | | | | | | | |
| | 4,379,939 | | | Thrivent Core Emerging Markets Debt Fund | | | 39,594,649 | | | | 1.7 | % |
| | 7,885,546 | | | Thrivent High Yield Fund, Class S | | | 36,588,934 | | | | 1.6 | % |
| | 12,489,865 | | | Thrivent Income Fund, Class S | | | 108,661,822 | | | | 4.7 | % |
| | 5,183,865 | | | Thrivent Limited Maturity Bond Fund, Class S | | | 63,761,546 | | | | 2.7 | % |
| | | | | |
| | | | Total | | | 248,606,951 | | | | | |
| | | | | |
| | |
| | Equity Funds/Exchange Traded Funds (0.6%) | | | | | | | | |
| | 28,521 | | | SPDR S&P 500 ETF Trust | | | 7,718,638 | | | | 0.3 | % |
| | | | Other Securities^ | | | 5,395,721 | | | | 0.3 | % |
| | | | | |
| | | | Total | | | 13,114,359 | | | | | |
| | | | | |
| | |
| | Fixed Income Funds/Exchange Traded Funds (0.5%) | | | | | | | | |
| | 110,900 | | | Vanguard Short-Term Corporate Bond ETF | | | 8,642,437 | | | | 0.4 | % |
| | | | Other Securities^ | | | 2,767,405 | | | | 0.1 | % |
| | | | | |
| | | | Total | | | 11,409,842 | | | | | |
| | | | | |
| | | | | | | | | | | | |
| | | | | |
| | | | Total Registered Investment Companies (cost $771,972,521) | | | 1,003,296,548 | | | | | |
| | | | | |
| | | |
Principal Amount | | | Long-Term Fixed Income (30.5%) | | Value | | | % of Net
Assets | |
| | Asset-Backed Securities (1.1%) | | | | | | | | |
| | | | Federal Home Loan Mortgage Corporation Multifamily Structured Pass Through Certificates | | | | | | | | |
| $ | 1,975,000 | | | 3.900%, 8/25/2028, Ser. K081, Class A2b | | | 1,988,920 | | | | 0.1 | % |
| | | | SBA Small Business Investment Companies | | | | | | | | |
| | 1,700,000 | | | 3.548%, 9/11/2028, Ser. 2018-10B, Class 1 | | | 1,688,152 | | | | 0.1 | % |
| | | | Other Securities^ | | | 21,316,355 | | | | 0.9 | % |
| | | | | |
| | | | Total | | | 24,993,427 | | | | | |
| | | | | |
| | |
| | Basic Materials (0.5%) | | | | | | | | |
| | | | Other Securities^ | | | 11,192,362 | | | | 0.5 | % |
| | | | | |
| | | | Total | | | 11,192,362 | | | | | |
| | | | | |
The accompanying Notes to Financial Statements are an integral part of this schedule.
117
MODERATE ALLOCATION FUND
Summary Schedule of Investments as of October 31, 2018
| | | | | | | | | | | | |
Principal
Amount | | | Long-Term Fixed Income (30.5%) | | Value | | | % of Net Assets | |
| | Capital Goods (0.6%) | | | | | | | | |
| | | | Other Securities^ | | | $13,583,858 | | | | 0.6 | % |
| | | | | |
| | | | Total | | | 13,583,858 | | | | | |
| | | | | |
| | |
| | Collateralized Mortgage Obligations ( 1.0%) | | | | | | | | |
| | | | CHL Mortgage Pass-Through Trust | | | | | | | | |
| | 2,910,447 | | | 6.000%, 11/25/2037, Ser. 2007-18, Class 1A2 | | | 2,480,286 | | | | 0.1 | % |
| | | | Federal Home Loan Mortgage Corporation | | | | | | | | |
| | 1,607,764 | | | 3.000% - 4.000%, 7/15/2031 - 2/15/2033, Ser. 4104, Class KIc | | | 184,227 | | | | <0.1 | % |
| | | | Federal National Mortgage Association | | | | | | | | |
| | 1,289,667 | | | 3.500%, 1/25/2033, Ser. 2012-150, Class YIc | | | 164,634 | | | | <0.1 | % |
| | | | Other Securities^ | | | 19,574,183 | | | | 0.9 | % |
| | | | | |
| | | | Total | | | 22,403,330 | | | | | |
| | | | | |
| | |
| | Commercial Mortgage-Backed Securities (0.9%) | | | | | | | | |
| | | | Federal Home Loan Mortgage Corporation Multifamily Structured Pass Through Certificates | | | | | | | | |
| | 700,000 | | | 3.900%, 4/25/2028, Ser. K076, Class A2d | | | 707,899 | | | | <0.1 | % |
| | | | Federal National Mortgage Association - ACES | | | | | | | | |
| | 1,600,000 | | | 2.961%, 2/25/2027, Ser. 2017-M7, Class A2b | | | 1,512,517 | | | | 0.1 | % |
| | 1,350,000 | | | 3.052%, 3/25/2028, Ser. 2018-M7, Class A2b | | | 1,272,938 | | | | 0.1 | % |
| | 1,225,000 | | | 2.785%, 2/25/2027, Ser. 2017-M2, Class A2b | | | 1,151,659 | | | | <0.1 | % |
| | 800,000 | | | 2.485%, 12/25/2026, Ser. 2017-M3, Class A2b | | | 735,411 | | | | <0.1 | % |
| | | | Federal National Mortgage Association Grantor Trust | | | | | | | | |
| | 1,573,252 | | | 2.898%, 6/25/2027, Ser. 2017-T1, Class Ad | | | 1,464,752 | | | | 0.1 | % |
| | | | Other Securities^ | | | 14,465,590 | | | | 0.6 | % |
| | | | | |
| | | | Total | | | 21,310,766 | | | | | |
| | | | | |
| | |
| | Communications Services (1.1%) | | | | | | | | |
| | | | Other Securities^ | | | 25,884,899 | | | | 1.1 | % |
| | | | | |
| | | | Total | | | 25,884,899 | | | | | |
| | | | | |
| | |
| | Consumer Cyclical (0.8%) | | | | | | | | |
| | | | Other Securities^ | | | 19,888,614 | | | | 0.8 | % |
| | | | | |
| | | | Total | | | 19,888,614 | | | | | |
| | | | | |
| | |
| | Consumer Non-Cyclical (1.5%) | | | | | | | | |
| | | | Other Securities^ | | | 34,411,312 | | | | 1.5 | % |
| | | | | |
| | | | Total | | | 34,411,312 | | | | | |
| | | | | |
| | |
| | Energy (1.3%) | | | | | | | | |
| | | | Other Securities^ | | | 30,593,204 | | | | 1.3 | % |
| | | | | |
| | | | Total | | | 30,593,204 | | | | | |
| | | | | |
| | |
| | Financials (3.5%) | | | | | | | | |
| | | | Other Securities^ | | | 80,710,008 | | | | 3.5 | % |
| | | | | |
| | | | Total | | | 80,710,008 | | | | | |
| | | | | |
| | |
| | Foreign Government (<0.1%) | | | | | | | | |
| | | | Other Securities^ | | | 301,184 | | | | <0.1 | % |
| | | | | |
| | | | Total | | | 301,184 | | | | | |
| | | | | |
| | |
| | Mortgage-Backed Securities (8.6%) | | | | | | | | |
| | | | Federal Home Loan Mortgage Corporation Gold 30-Yr. Pass Through | | | | | | | | |
| | 20,012,500 | | | 4.000%, 11/1/2048e | | | 20,019,436 | | | | 0.9 | % |
| | | | Federal Home Loan Mortgage Corporation Multifamily Structured Pass Through Certificates | | | | | | | | |
| | 949,099 | | | 3.000%, 3/15/2045, Ser. 4741, Class GA | | | 926,946 | | | | <0.1 | % |
| | | | Federal National Mortgage Association | | | | | | | | |
| | 1,650,000 | | | 3.640% - 3.710%, 6/1/2028 - 7/1/2028 | | | 1,624,351 | | | | 0.1 | % |
| | | | Federal National Mortgage Association Conventional 15- Yr. Pass Through | | | | | | | | |
| | 13,337,500 | | | 3.500%, 11/1/2033e | | | 13,326,299 | | | | 0.6 | % |
| | | | Federal National Mortgage Association Conventional 30- Yr. Pass Through | | | | | | | | |
| | 54,850,000 | | | 3.500%, 11/1/2048e | | | 53,395,192 | | | | 2.3 | % |
| | 51,180,000 | | | 4.000%, 11/1/2048e | | | 51,179,785 | | | | 2.2 | % |
| | 51,964,000 | | | 4.500%, 11/1/2048e | | | 53,203,222 | | | | 2.3 | % |
| | 5,475,000 | | | 5.000%, 11/1/2048e | | | 5,713,248 | | | | 0.2 | % |
| | 280,464 | | | 4.288%, (LIBOR 12M + 1.540%), 7/1/2043b | | | 289,019 | | | | <0.1 | % |
| | 105,143 | | | 4.280%, (LIBOR 12M + 1.530%), 8/1/2043b | | | 108,357 | | | | <0.1 | % |
| | 93,119 | | | 4.281%, (LIBOR 12M + 1.550%), 7/1/2043b | | | 96,007 | | | | <0.1 | % |
| | | | | |
| | | | Total | | | 199,881,862 | | | | | |
| | | | | |
| | |
| | Technology (0.8%) | | | | | | | | |
| | | | Other Securities^ | | | 17,668,323 | | | | 0.8 | % |
| | | | | |
| | | | Total | | | 17,668,323 | | | | | |
| | | | | |
| | |
| | Transportation (0.1%) | | | | | | | | |
| | | | Other Securities^ | | | 3,326,081 | | | | 0.1 | % |
| | | | | |
| | | | Total | | | 3,326,081 | | | | | |
| | | | | |
The accompanying Notes to Financial Statements are an integral part of this schedule.
118
MODERATE ALLOCATION FUND
Summary Schedule of Investments as of October 31, 2018
| | | | | | | | | | | | |
Principal
Amount | | | Long-Term Fixed Income (30.5%) | | Value | | | % of Net Assets | |
| | U.S. Government and Agencies (7.8%) | | | | | | | | |
| | | | Federal National Mortgage Association - ACES | | | | | | | | |
| | $2,225,000 | | | 3.639%, 8/25/2030, Ser. 2018-M12, Class A2b | | | $2,176,434 | | | | 0.1 | % |
| | | | U.S. Treasury Bonds | | | | | | | | |
| | 3,005,000 | | | 2.250%, 11/15/2027 | | | 2,796,176 | | | | 0.1 | % |
| | 22,500,000 | | | 2.875%, 5/15/2028 | | | 22,000,781 | | | | 1.0 | % |
| | 14,321,000 | | | 2.500%, 5/15/2046 | | | 12,029,081 | | | | 0.5 | % |
| | 3,000,000 | | | 2.750%, 8/15/2047 | | | 2,646,680 | | | | 0.1 | % |
| | 3,302,000 | | | 2.750% - 5.250%, 11/15/2028 - 11/15/2047 | | | 3,432,741 | | | | 0.1 | % |
| | | | U.S. Treasury Bonds, TIPS | | | | | | | | |
| | 10,268,184 | | | 0.125%, 1/15/2023 | | | 9,882,267 | | | | 0.4 | % |
| | 7,097,908 | | | 0.375%, 1/15/2027 | | | 6,681,091 | | | | 0.3 | % |
| | 6,081,425 | | | 0.375%, 7/15/2027 | | | 5,722,954 | | | | 0.2 | % |
| | | | U.S. Treasury Notes | | | | | | | | |
| | 13,530,000 | | | 1.500%, 10/31/2019 | | | 13,367,217 | | | | 0.6 | % |
| | 10,845,000 | | | 1.750%, 11/30/2019 | | | 10,731,466 | | | | 0.5 | % |
| | 21,500,000 | | | 1.375%, 9/30/2020 | | | 20,907,070 | | | | 0.9 | % |
| | 4,773,000 | | | 1.125%, 8/31/2021 | | | 4,540,503 | | | | 0.2 | % |
| | 11,250,000 | | | 1.875%, 7/31/2022 | | | 10,818,457 | | | | 0.5 | % |
| | 32,440,000 | | | 2.000%, 11/30/2022 | | | 31,238,706 | | | | 1.4 | % |
| | 5,270,000 | | | 2.500%, 3/31/2023 | | | 5,167,276 | | | | 0.2 | % |
| | 6,640,000 | | | 2.125%, 7/31/2024 | | | 6,325,119 | | | | 0.3 | % |
| | 2,900,000 | | | 2.250%, 11/15/2024 | | | 2,773,805 | | | | 0.1 | % |
| | 4,000,000 | | | 2.125%, 11/30/2024 | | | 3,797,656 | | | | 0.2 | % |
| | 2,444,000 | | | 1.375% - 2.250%, 3/31/2020 - 9/30/2023 | | | 2,356,805 | | | | 0.1 | % |
| | | | | |
| | | | Total | | | 179,392,285 | | | | | |
| | | | | |
| | |
| | Utilities (0.9%) | | | | | | | | |
| | | | Other Securities^ | | | 19,907,131 | | | | 0.9 | % |
| | | | | |
| | | | Total | | | 19,907,131 | | | | | |
| | | | | |
| | | | | | | | | | | | |
| | | | | |
| | | | Total Long-Term Fixed Income (cost $721,972,910) | | | 705,448,646 | | | | | |
| | | | | |
| | | |
| Shares | | | Common Stock (18.8%) | | Value | | | % of Net Assets | |
| | Communications Services (0.7%) | | | | | | | | |
| | | | Other Securities^ | | | 15,016,081 | | | | 0.7 | % |
| | | | | |
| | | | Total | | | 15,016,081 | | | | | |
| | | | | |
| | |
| | Consumer Discretionary (1.8%) | | | | | | | | |
| | 2,103 | | | Amazon.com, Inc.a | | | 3,360,615 | | | | 0.2 | % |
| | | | Other Securities^ | | | 37,369,776 | | | | 1.6 | % |
| | | | | |
| | | | Total | | | 40,730,391 | | | | | |
| | | | | |
| | |
| | Consumer Staples (0.5%) | | | | | | | | |
| | 22,194 | | | PepsiCo, Inc. | | | 2,494,162 | | | | 0.1 | % |
| | | | Other Securities^ | | | 9,817,135 | | | | 0.4 | % |
| | | | | |
| | | | Total | | | 12,311,297 | | | | | |
| | | | | |
| | |
| | Energy (0.8%) | | | | | | | | |
| | | | Other Securities^ | | | 19,508,616 | | | | 0.8 | % |
| | | | | |
| | | | Total | | | 19,508,616 | | | | | |
| | | | | |
| | |
| | Financials (3.6%) | | | | | | | | |
| | 33,619 | | | American Financial Group, Inc. | | | 3,362,909 | | | | 0.2 | % |
| | 59,278 | | | Citigroup, Inc. | | | 3,880,338 | | | | 0.2 | % |
| | 110,800 | | | First Hawaiian, Inc. | | | 2,745,624 | | | | 0.1 | % |
| | 147,084 | | | KeyCorp | | | 2,671,045 | | | | 0.1 | % |
| | | | Other Securities^ | | | 71,214,445 | | | | 3.0 | % |
| | | | | |
| | | | Total | | | 83,874,361 | | | | | |
| | | | | |
| | |
| | Health Care (2.5%) | | | | | | | | |
| | 20,792 | | | Johnson & Johnson | | | 2,910,672 | | | | 0.1 | % |
| | 29,340 | | | Medtronic plc | | | 2,635,319 | | | | 0.1 | % |
| | 70,058 | | | Pfizer, Inc. | | | 3,016,697 | | | | 0.1 | % |
| | 14,729 | | | UnitedHealth Group, Inc. | | | 3,849,424 | | | | 0.2 | % |
| | | | Other Securities^ | | | 44,509,974 | | | | 2.0 | % |
| | | | | |
| | | | Total | | | 56,922,086 | | | | | |
| | | | | |
| | |
| | Industrials (2.8%) | | | | | | | | |
| | 20,262 | | | Honeywell International, Inc. | | | 2,934,343 | | | | 0.1 | % |
| | | | Other Securities^ | | | 62,404,851 | | | | 2.7 | % |
| | | | | |
| | | | Total | | | 65,339,194 | | | | | |
| | | | | |
| | |
| | Information Technology (3.9%) | | | | | | | | |
| | 37,625 | | | Amphenol Corporation | | | 3,367,438 | | | | 0.2 | % |
| | 19,269 | | | Apple, Inc. | | | 4,217,213 | | | | 0.2 | % |
| | 108,890 | | | Cisco Systems, Inc. | | | 4,981,718 | | | | 0.2 | % |
| | 53,538 | | | Keysight Technologies, Inc.a | | | 3,055,949 | | | | 0.1 | % |
| | 16,499 | | | MasterCard, Inc. | | | 3,261,357 | | | | 0.1 | % |
| | 42,533 | | | Microsoft Corporation | | | 4,542,950 | | | | 0.2 | % |
| | 51,776 | | | Oracle Corporation | | | 2,528,740 | | | | 0.1 | % |
| | 29,555 | | | Synopsys, Inc.a | | | 2,646,059 | | | | 0.1 | % |
| | | | Other Securities^ | | | 60,917,552 | | | | 2.7 | % |
| | | | | |
| | | | Total | | | 89,518,976 | | | | | |
| | | | | |
| | |
| | Materials (0.8%) | | | | | �� | | | |
| | | | Other Securities^ | | | 18,457,581 | | | | 0.8 | % |
| | | | | |
| | | | Total | | | 18,457,581 | | | | | |
| | | | | |
| | |
| | Real Estate (1.0%) | | | | | | | | |
| | 109,216 | | | Hudson Pacific Properties, Inc. | | | 3,309,245 | | | | 0.2 | % |
| | | | Other Securities^ | | | 20,168,501 | | | | 0.8 | % |
| | | | | |
| | | | Total | | | 23,477,746 | | | | | |
| | | | | |
| | |
| | Utilities (0.4%) | | | | | | | | |
| | 47,794 | | | UGI Corporation | | | 2,535,950 | | | | 0.1 | % |
| | | | Other Securities^ | | | 6,663,465 | | | | 0.3 | % |
| | | | | |
| | | | Total | | | 9,199,415 | | | | | |
| | | | | |
| | | | | | | | | | | | |
| | | | | |
| | | | Total Common Stock (cost $376,321,952) | | | 434,355,744 | | | | | |
| | | | | |
The accompanying Notes to Financial Statements are an integral part of this schedule.
119
MODERATE ALLOCATION FUND
Summary Schedule of Investments as of October 31, 2018
| | | | | | | | | | | | |
| Shares | | | Collateral Held for Securities Loaned (0.5%) | | Value | | | % of Net
Assets | |
| | 10,899,857 | | | Thrivent Cash Management Trust | | | $10,899,857 | | | | 0.5 | % |
| | | | | |
| | | | Total Collateral Held for Securities Loaned (cost $10,899,857) | | | 10,899,857 | | | | | |
| | | | | |
| | | |
Shares or
Principal
Amount | | | Short-Term Investments (13.7%) | | Value | | | % of Net Assets | |
| | | | Federal Home Loan Bank Discount Notes | | | | | | | | |
| | 5,700,000 | | | 2.100%, 11/28/2018f,g | | | 5,690,680 | | | | 0.3 | % |
| | 2,900,000 | | | 2.100%, 11/29/2018f,g | | | 2,895,081 | | | | 0.1 | % |
| | 9,610,000 | | | 2.240%, 1/16/2019f,g | | | 9,563,334 | | | | 0.4 | % |
| | | | U.S. Treasury Bills | | | | | | | | |
| | 560,000 | | | 2.116% - 2.161%, 11/29/2018 - 12/27/2018f,h | | | 558,532 | | | | <0.1 | % |
| | | | Thrivent Core Short-Term Reserve Fund | | | | | | | | |
| | 29,623,767 | | | 2.430% | | | 296,237,666 | | | | 12.8 | % |
| | | | Other Securities^ | | | 1,745,036 | | | | 0.1 | % |
| | | | | |
| | | | Total Short-Term Investments (cost $316,692,175) | | | 316,690,329 | | | | | |
| | | | | |
| | | | Total Investments (cost $2,246,159,122) 108.9% | | $ | 2,518,317,280 | | | | | |
| | | | | |
| | | | Other Assets and Liabilities, Net (8.9%) | | | (204,814,433 | ) | | | | |
| | | | | |
| | | | Total Net Assets 100.0% | | $ | 2,313,502,847 | | | | | |
| | | | | |
| ^ | The Summary Schedule of Investments shows the 50 largest holdings in unaffiliated issuers, any holding or issuer that exceeds 1% of net assets and all affiliated holdings as of the report date. The remaining securities held are grouped by category as “Other securities”. |
| a | Non-income producing security. |
| b | Denotes variable rate securities. The rate shown is as of October 31, 2018. The rates of certain variable rate securities are based on a published reference rate and spread; these may vary by security and the reference rate and spread are indicated in their description. The rates of other variable rate securities are determined by the issuer or agent and are based on current market conditions. These securities do not indicate a reference rate and spread in their description. |
| c | Denotes interest only security. Interest only securities represent the right to receive monthly interest payments on an underlying pool of mortgages or assets. The principal shown is the outstanding par amount of the pool as of the end of the period. The actual effective yield of the security is different than the stated coupon rate. |
| d | All or a portion of the security is insured or guaranteed. |
| e | Denotes investments purchased on a when-issued or delayed delivery basis. |
| f | The interest rate shown reflects the yield, coupon rate or the discount rate at the date of purchase. |
| g | All or a portion of the security is held on deposit with the counterparty and pledged as the initial margin deposit for open futures contracts. |
| h | At October 31, 2018, $99,657 of investments were segregated to cover exposure to a counterparty for margin on open mortgage-backed security transactions. |
Moderate Allocation Fund held restricted securities as of October 31, 2018. Restricted securities are investment securities which cannot be offered for public sale without first being registered under the Securities Act of 1933. As of October 31, 2018, the value of these investments was $22,260,167 or 1.0% of total net assets.
The following table presents the total amount of securities loaned with continuous maturity, by type, offset by the gross payable upon return of collateral for securities loaned by Thrivent Moderate Allocation Fund as of October 31, 2018:
Securities Lending Transactions
| | | | |
Taxable Debt Security | | | $5,147,162 | |
Common Stock | | | 5,479,690 | |
| | | | |
Total lending | | | $10,626,852 | |
Gross amount payable upon return of collateral for securities loaned | | | $10,899,857 | |
| | | | |
Net amounts due to counterparty | | | $273,005 | |
| | | | |
Definitions:
| | | | |
ACES | | - | | Alternative Credit Enhancement Securities |
ETF | | - | | Exchange Traded Fund |
Ser. | | - | | Series |
SPDR | | - | | S&P Depository Receipts, which are a family of exchange-traded funds traded in the U.S., Europe, and Asia-Pacific and managed by State Street Global Advisors. |
TIPS | | - | | Treasury Inflation Protected Security |
Reference Rate Index:
LIBOR 12M - ICE Libor USD Rate 12 Month
Unrealized Appreciation (Depreciation)
Gross unrealized appreciation and depreciation of investments of the portfolio as a whole (including derivatives), based on cost for federal income tax purposes, were as follows:
| | | | |
Gross unrealized appreciation | | | $331,808,055 | |
Gross unrealized depreciation | | | (71,227,668 | ) |
| | | | |
Net unrealized appreciation (depreciation) | | | $260,580,387 | |
| |
Cost for federal income tax purposes | | | $2,383,585,513 | |
The accompanying Notes to Financial Statements are an integral part of this schedule.
120
MODERATE ALLOCATION FUND
Summary Schedule of Investments as of October 31, 2018
Fair Valuation Measurements
The following table is a summary of the inputs used, as of October 31, 2018, in valuing Moderate Allocation Fund’s assets carried at fair value.
| | | | | | | | | | | | | | | | |
| Investments in Securities | | Total | | | Level 1 | | | Level 2 | | | Level 3 | |
| | | | |
Bank Loans | | | | | | | | | | | | | | | | |
Basic Materials | | | 4,572,759 | | | | – | | | | 4,202,126 | | | | 370,633 | |
Capital Goods | | | 2,582,608 | | | | – | | | | 2,582,608 | | | | – | |
Communications Services | | | 11,442,297 | | | | – | | | | 11,340,644 | | | | 101,653 | |
Consumer Cyclical | | | 5,615,429 | | | | – | | | | 5,615,429 | | | | – | |
Consumer Non-Cyclical | | | 7,756,919 | | | | – | | | | 7,756,919 | | | | – | |
Energy | | | 3,794,834 | | | | – | | | | 3,293,619 | | | | 501,215 | |
Financials | | | 4,274,638 | | | | – | | | | 3,700,380 | | | | 574,258 | |
Technology | | | 5,096,272 | | | | – | | | | 5,096,272 | | | | – | |
Transportation | | | 829,676 | | | | – | | | | 829,676 | | | | – | |
Utilities | | | 1,660,724 | | | | – | | | | 1,349,264 | | | | 311,460 | |
| | | | |
Registered Investment Companies | | | | | | | | | | | | | | | | |
Affiliated Equity Holdings | | | 643,025,679 | | | | 643,025,679 | | | | – | | | | – | |
Affiliated Fixed Income Holdings | | | 209,012,302 | | | | 209,012,302 | | | | – | | | | – | |
Fixed Income Funds/Exchange Traded Funds | | | 11,409,842 | | | | 11,409,842 | | | | – | | | | – | |
Equity Funds/Exchange Traded Funds | | | 13,114,359 | | | | 13,114,359 | | | | – | | | | – | |
| | | | |
Long-Term Fixed Income | | | | | | | | | | | | | | | | |
Asset-Backed Securities | | | 24,993,427 | | | | – | | | | 24,993,427 | | | | – | |
Basic Materials | | | 11,192,362 | | | | – | | | | 11,192,362 | | | | – | |
Capital Goods | | | 13,583,858 | | | | – | | | | 13,583,858 | | | | – | |
Collateralized Mortgage Obligations | | | 22,403,330 | | | | – | | | | 22,403,330 | | | | – | |
Commercial Mortgage-Backed Securities | | | 21,310,766 | | | | – | | | | 21,310,766 | | | | – | |
Communications Services | | | 25,884,899 | | | | – | | | | 25,884,899 | | | | – | |
Consumer Cyclical | | | 19,888,614 | | | | – | | | | 19,888,614 | | | | – | |
Consumer Non-Cyclical | | | 34,411,312 | | | | – | | | | 34,411,312 | | | | – | |
Energy | | | 30,593,204 | | | | – | | | | 30,593,204 | | | | – | |
Financials | | | 80,710,008 | | | | – | | | | 80,710,008 | | | | – | |
Foreign Government | | | 301,184 | | | | – | | | | 301,184 | | | | – | |
Mortgage-Backed Securities | | | 199,881,862 | | | | – | | | | 199,881,862 | | | | – | |
Technology | | | 17,668,323 | | | | – | | | | 17,668,323 | | | | – | |
Transportation | | | 3,326,081 | | | | – | | | | 3,326,081 | | | | – | |
U.S. Government and Agencies | | | 179,392,285 | | | | – | | | | 179,392,285 | | | | – | |
Utilities | | | 19,907,131 | | | | – | | | | 19,907,131 | | | | – | |
| | | | |
Common Stock | | | | | | | | | | | | | | | | |
Communications Services | | | 15,016,081 | | | | 14,269,705 | | | | 746,376 | | | | – | |
Consumer Discretionary | | | 40,730,391 | | | | 38,453,852 | | | | 2,276,539 | | | | – | |
Consumer Staples | | | 12,311,297 | | | | 10,383,964 | | | | 1,927,333 | | | | – | |
Energy | | | 19,508,616 | | | | 18,757,628 | | | | 657,383 | | | | 93,605 | |
Financials | | | 83,874,361 | | | | 82,005,319 | | | | 1,869,042 | | | | – | |
Health Care | | | 56,922,086 | | | | 55,288,895 | | | | 1,633,191 | | | | – | |
Industrials | | | 65,339,194 | | | | 62,804,105 | | | | 2,535,089 | | | | – | |
Information Technology | | | 89,518,976 | | | | 88,224,504 | | | | 1,294,472 | | | | – | |
Materials | | | 18,457,581 | | | | 16,451,740 | | | | 2,005,839 | | | | 2 | |
Real Estate | | | 23,477,746 | | | | 23,063,753 | | | | 413,993 | | | | – | |
Utilities | | | 9,199,415 | | | | 8,811,623 | | | | 387,792 | | | | – | |
Short-Term Investments | | | 20,452,663 | | | | – | | | | 20,452,663 | | | | – | |
| |
Subtotal Investments in Securities | | | $2,084,445,391 | | | | $1,295,077,270 | | | | $787,415,295 | | | | $1,952,826 | |
| |
| | | | |
| Other Investments * | | Total | | | | | | | | | | |
Affiliated Registered Investment Companies | | | 126,734,366 | | | | | | | | | | | | | |
Short-Term Investments | | | 296,237,666 | | | | | | | | | | | | | |
Collateral Held for Securities Loaned | | | 10,899,857 | | | | | | | | | | | | | |
| | | | | | | | | | | | | |
Subtotal Other Investments | | | $433,871,889 | | | | | | | | | | | | | |
| | | | | | | | | | | | | |
| | | | | | | | | | | | | | | | |
| | | | | | | | | | | | | |
Total Investments at Value | | | $2,518,317,280 | | | | | | | | | | | | | |
| | | | | | | | | | | | | |
| * | Certain investments are measured at fair value using a net asset value per share that is not publicly available (practical expedient). According to disclosure requirements of Accounting Standards Codification (ASC) 820, Fair Value Measurement, securities valued using the practical expedient are not classified in the fair value hierarchy. The fair value amounts presented in this table are intended to permit reconciliation of the fair value hierarchy to the amounts presented in the Statement of Assets and Liabilities. |
The accompanying Notes to Financial Statements are an integral part of this schedule.
121
MODERATE ALLOCATION FUND
Summary Schedule of Investments as of October 31, 2018
| | | | | | | | | | | | | | | | |
| Other Financial Instruments | | Total | | | Level 1 | | | Level 2 | | | Level 3 | |
| | | | |
Asset Derivatives | | | | | | | | | | | | | | | | |
Futures Contracts | | | 29,084,734 | | | | 29,084,734 | | | | – | | | | – | |
| |
Total Asset Derivatives | | | $29,084,734 | | | | $29,084,734 | | | | $– | | | | $– | |
| |
| | | | |
Liability Derivatives | | | | | | | | | | | | | | | | |
Futures Contracts | | | 25,200,019 | | | | 25,200,019 | | | | – | | | | – | |
| |
Total Liability Derivatives | | | $25,200,019 | | | | $25,200,019 | | | | $– | | | | $– | |
| |
There were no significant transfers between Levels during the period ended October 31, 2018. Transfers between Levels are identified as of the end of the period.
The following table presents Moderate Allocation Fund’s futures contracts held as of October 31, 2018. Investments and/or cash totaling $19,195,318 were pledged as the initial margin deposit for these contracts.
| | | | | | | | | | | | | | | | |
| Futures Contracts Description | | Number of
Contracts
Long/(Short) | | | Expiration Date | | | Notional Principal Amount | | | Value and Unrealized | |
CBOT 10-Yr. U.S. Treasury Note | | | 196 | | | | December 2018 | | | | $23,409,760 | | | | ($196,010 | ) |
CBOT 5-Yr. U.S. Treasury Note | | | 6 | | | | December 2018 | | | | 680,831 | | | | (6,534 | ) |
CBOT U.S. Long Bond | | | 432 | | | | December 2018 | | | | 62,106,547 | | | | (2,436,547 | ) |
CME E-mini S&P 500 Index | | | 1,772 | | | | December 2018 | | | | 253,616,642 | | | | (13,413,182 | ) |
ICE mini MSCI EAFE Index | | | 1,274 | | | | December 2018 | | | | 124,127,306 | | | | (8,671,056 | ) |
ICE US mini MSCI Emerging Markets Index | | | 139 | | | | December 2018 | | | | 7,125,756 | | | | (476,690 | ) |
| |
Total Futures Long Contracts | | | | | | | | | | | $471,066,842 | | | | ($25,200,019 | ) |
| |
CBOT 2-Yr. U.S. Treasury Note | | | (286 | ) | | | December 2018 | | | | ($60,474,723 | ) | | | $227,035 | |
CME E-mini NASDAQ 100 Index | | | (630 | ) | | | December 2018 | | | | (95,500,866 | ) | | | 7,609,566 | |
CME E-mini Russell 2000 Index | | | (857 | ) | | | December 2018 | | | | (73,721,741 | ) | | | 8,936,826 | |
CME E-mini S&P Mid-Cap 400 Index | | | (521 | ) | | | December 2018 | | | | (106,798,392 | ) | | | 11,726,312 | |
CME Ultra Long Term U.S. Treasury Bond | | | (42 | ) | | | December 2018 | | | | (6,702,471 | ) | | | 435,283 | |
Ultra 10-Yr. U.S. Treasury Note | | | (46 | ) | | | December 2018 | | | | (5,904,744 | ) | | | 149,712 | |
| |
Total Futures Short Contracts | | | | | | | | | | | ($349,102,937 | ) | | | $29,084,734 | |
| |
Total Futures Contracts | | | | | | | | | | | $121,963,905 | | | | $3,884,715 | |
| |
| | | | |
Reference Description: |
| CBOT | | - | | Chicago Board of Trade |
| CME | | - | | Chicago Mercantile Exchange |
| EAFE | | - | | Europe, Australasia and Far East |
| ICE | | - | | Intercontinental Exchange |
| MSCI | | - | | Morgan Stanley Capital International |
| NASDAQ | | - | | National Association of Securities Dealers Automated Quotations |
| S&P | | - | | Standard & Poor’s |
The accompanying Notes to Financial Statements are an integral part of this schedule.
122
MODERATE ALLOCATION FUND
Summary Schedule of Investments as of October 31, 2018
The following table summarizes the fair value and Statement of Assets and Liabilities location, as of October 31, 2018, for Moderate Allocation Fund’s investments in financial derivative instruments by primary risk exposure as discussed under item (2) Significant Accounting Policies of the Notes to Financial Statements.
| | | | | | |
| Derivatives by risk category | | Statement of Assets and Liabilities Location | | Fair Value | |
| | |
Asset Derivatives | | | | | | |
| | |
Interest Rate Contracts | | | | | | |
Futures* | | Net Assets - Accumulated undistributed earnings/(loss) | | | $812,030 | |
Total Interest Rate Contracts | | | | | 812,030 | |
| | |
Equity Contracts | | | | | | |
Futures* | | Net Assets - Accumulated undistributed earnings/(loss) | | | 28,272,704 | |
Total Equity Contracts | | | | | 28,272,704 | |
| |
Total Asset Derivatives | | | | | $29,084,734 | |
| |
| |
| | |
Liability Derivatives | | | | | | |
| | |
Interest Rate Contracts | | | | | | |
Futures* | | Net Assets - Accumulated undistributed earnings/(loss) | | | 2,639,091 | |
Total Interest Rate Contracts | | | | | 2,639,091 | |
| | |
Equity Contracts | | | | | | |
Futures* | | Net Assets - Accumulated undistributed earnings/(loss) | | | 22,560,928 | |
Total Equity Contracts | | | | | 22,560,928 | |
| |
Total Liability Derivatives | | | | | $25,200,019 | |
| |
| |
| * | Includes cumulative appreciation/depreciation of futures contracts as reported in the Schedule of Investments. Only current day’s variation margin is reported within the Statement of Assets and Liabilities. |
The following table summarizes the net realized gains/(losses) and Statement of Operations location, for the period ended October 31, 2018, for Moderate Allocation Fund’s investments in financial derivative instruments by primary risk exposure.
| | | | | | |
| Derivatives by risk category | | Statement of Operations Location | | Realized Gains/(Losses)
recognized in Income | |
| | |
Interest Rate Contracts | | | | | | |
Options Written | | Net realized gains/(losses) on Written option contracts | | | 92,734 | |
Futures | | Net realized gains/(losses) on Futures contracts | | | (1,921,672 | ) |
Total Interest Rate Contracts | | | | | (1,828,938 | ) |
| | |
Equity Contracts | | | | | | |
Futures | | Net realized gains/(losses) on Futures contracts | | | (16,891,400 | ) |
Total Equity Contracts | | | | | (16,891,400 | ) |
| |
Total | | | | | ($18,720,338 | ) |
| |
| |
The following table summarizes the change in net unrealized appreciation/(depreciation) and Statement of Operations location, for the period ended October 31, 2018, for Moderate Allocation Fund’s investments in financial derivative instruments by primary risk exposure.
| | | | |
| Derivatives by risk category | | Statement of Operations Location | | Change in unrealized
appreciation/(depreciation)
recognized in Income |
| | |
Interest Rate Contracts | | | | |
Futures | | Change in net unrealized appreciation/(depreciation) on Futures contracts | | (1,005,680) |
Total Interest Rate Contracts | | | | (1,005,680) |
| | |
Equity Contracts | | | | |
Futures | | Change in net unrealized appreciation/(depreciation) on Futures contracts | | 10,149,187 |
Total Equity Contracts | | | | 10,149,187 |
|
Total | | | | $9,143,507 |
|
|
The accompanying Notes to Financial Statements are an integral part of this schedule.
123
MODERATE ALLOCATION FUND
Summary Schedule of Investments as of October 31, 2018
The following table presents Moderate Allocation Fund’s average volume of derivative activity during the period ended October 31, 2018.
| | | | |
| Derivative Risk Category | | Average
Notional
Value | |
Equity Contracts | | | | |
Futures - Long | | | $289,087,162 | |
Futures - Short | | | (220,784,729 | ) |
Interest Rate Contracts | | | | |
Futures - Long | | | 68,685,390 | |
Futures - Short | | | (74,010,063 | ) |
Purchased Options | | | 3,724,957 | |
Written Options | | | (3,253,466 | ) |
Investment in Affiliates
Affiliated issuers, as defined under the Investment Company Act of 1940, include those in which the Fund’s holdings of an issuer represent 5% or more of the outstanding voting securities of an issuer, any affiliated mutual fund, or a company which is under common ownership or control with the Fund. The Fund owns shares of Thrivent Cash Management Trust for the purpose of securities lending and Thrivent Core Short-Term Reserve Fund primarily to serve as a cash sweep vehicle for the Fund. Thrivent Cash Management Trust and Thrivent Core Funds are established solely for investment by Thrivent entities.
A summary of transactions (in thousands) for the fiscal year to date, in Moderate Allocation Fund, is as follows:
| | | | | | | | | | | | | | | | | | | | | | | | |
| Fund | | Value
10/31/2017 | | | Gross
Purchases | | | Gross
Sales | | | Shares Held at
10/31/2018 | | | Value
10/31/2018 | | | % of Net
Assets | |
Affiliated Equity Holdings | | | | | | | | | | | | | | | | | | | | | | | | |
Core International Equity | | | $– | | | | $22,029 | | | | $– | | | | 2,203 | | | | $20,445 | | | | 0.9 | % |
Core Low Volatility Equity* | | | – | | | | 63,000 | | | | – | | | | 6,328 | | | | 66,695 | | | | 2.9 | |
Large Cap Growth, Class S | | | 136,988 | | | | 3,288 | | | | – | | | | 12,490 | | | | 155,756 | | | | 6.7 | |
Large Cap Stock, Class S | | | 48,873 | | | | 4,725 | | | | – | | | | 1,828 | | | | 49,146 | | | | 2.1 | |
Large Cap Value, Class S | | | 176,300 | | | | 9,804 | | | | – | | | | 8,149 | | | | 186,607 | | | | 8.1 | |
Mid Cap Stock, Class S | | | 100,128 | | | | 7,699 | | | | – | | | | 3,724 | | | | 104,489 | | | | 4.5 | |
Partner Worldwide Allocation, Class S | | | 133,267 | | | | 4,982 | | | | – | | | | 12,135 | | | | 119,772 | | | | 5.1 | |
Small Cap Stock, Class S | | | 29,796 | | | | 1,926 | | | | 3,814 | | | | 1,034 | | | | 27,255 | | | | 1.2 | |
| |
Total Affiliated Equity Holdings | | | 625,352 | | | | | | | | | | | | | | | | 730,165 | | | | 31.5 | |
| |
Affiliated Fixed Income Holdings | | | | | | | | | | | | | | | | | | | | | | | | |
Core Emerging Markets Debt | | | 34,027 | | | | 8,718 | | | | – | | | | 4,380 | | | | 39,595 | | | | 1.7 | |
High Yield, Class S | | | 36,537 | | | | 2,043 | | | | – | | | | 7,886 | | | | 36,589 | | | | 1.6 | |
Income, Class S | | | 111,222 | | | | 4,295 | | | | – | | | | 12,490 | | | | 108,662 | | | | 4.7 | |
Limited Maturity Bond, Class S | | | 63,167 | | | | 1,514 | | | | – | | | | 5,184 | | | | 63,762 | | | | 2.7 | |
| |
Total Affiliated Fixed Income Holdings | | | 244,953 | | | | | | | | | | | | | | | | 248,608 | | | | 10.7 | |
| |
Affiliated Short-Term Investments | | | | | | | | | | | | | | | | | | | | | | | | |
Core Short-Term Reserve, 2.430% | | | 320,859 | | | | 363,730 | | | | 388,351 | | | | 29,624 | | | | 296,238 | | | | 12.8 | |
| |
Total Affiliated Short-Term Investments | | | 320,859 | | | | | | | | | | | | | | | | 296,238 | | | | 12.8 | |
| |
Collateral Held for Securities Loaned | | | | | | | | | | | | | | | | | | | | | | | | |
Cash Management Trust- Collateral Investment | | | 5,342 | | | | 115,276 | | | | 109,718 | | | | 10,900 | | | | 10,900 | | | | 0.5 | |
| |
Total Collateral Held for Securities Loaned | | | 5,342 | | | | | | | | | | | | | | | | 10,900 | | | | 0.5 | |
| |
Total Value | | | $1,196,506 | | | | | | | | | | | | | | | | $1,285,911 | | | | | |
| |
| * | Non-income producing security. |
The accompanying Notes to Financial Statements are an integral part of this schedule.
124
MODERATE ALLOCATION FUND
Summary Schedule of Investments as of October 31, 2018
| | | | | | | | | | | | | | | | |
| Fund | | Net Realized
Gain/(Loss) | | | Change in Unrealized Appreciation/ (Depreciation) | | | Distributions of Realized Capital Gains | | | Income Earned 11/1/2017 - 10/31/2018 | |
Affiliated Equity Holdings | | | | | | | | | | | | | | | | |
Core International Equity | | | $– | | | | $(1,584 | ) | | | $– | | | | $29 | |
Core Low Volatility Equity Fund* | | | – | | | | 3,695 | | | | – | | | | – | |
Large Cap Growth, Class S | | | – | | | | 15,479 | | | | 3,288 | | | | – | |
Large Cap Stock, Class S | | | – | | | | (4,452 | ) | | | 4,061 | | | | 663 | |
Large Cap Value, Class S | | | – | | | | 503 | | | | 7,176 | | | | 2,628 | |
Mid Cap Stock, Class S | | | – | | | | (3,338 | ) | | | 7,699 | | | | – | |
Partner Worldwide Allocation, Class S | | | – | | | | (18,476 | ) | | | 1,742 | | | | 3,240 | |
Small Cap Stock, Class S | | | 237 | | | | (891 | ) | | | 1,926 | | | | – | |
| |
Affiliated Fixed Income Holdings | | | | | | | | | | | | | | | | |
| |
Core Emerging Markets Debt | | | – | | | | (3,151 | ) | | | – | | | | 1,584 | |
High Yield, Class S | | | – | | | | (1,991 | ) | | | – | | | | 2,043 | |
Income, Class S | | | – | | | | (6,855 | ) | | | 373 | | | | 3,922 | |
Limited Maturity Bond, Class S | | | – | | | | (919 | ) | | | – | | | | 1,513 | |
Affiliated Short-Term Investments | | | | | | | | | | | | | | | | |
Core Short-Term Reserve, 2.430% | | | – | | | | – | | | | 4 | | | | 6,268 | |
| |
Total Income from Affiliated Investments | | | | | | | | | | | | | | | $21,890 | |
| |
Collateral Held for Securities Loaned | | | | | | | | | | | | | | | | |
Cash Management Trust- Collateral Investment | | | – | | | | – | | | | – | | | | 108 | |
| |
Total Affiliated Income from Securities Loaned, Net | | | | | | | | | | | | | | | $108 | |
| |
Total | | | $237 | | | | $(21,980 | ) | | | $26,269 | | | | | |
| |
| * | Non-income producing security. |
The accompanying Notes to Financial Statements are an integral part of this schedule.
125
MODERATELY AGGRESSIVE ALLOCATION FUND
Summary Schedule of Investments as of October 31, 2018
| | | | | | | | | | | | |
Principal
Amount | | | Bank Loans (1.1%) | | Value | | | % of Net Assets | |
| | Basic Materials (0.1%) | | | | | | | | |
| | | | Other Securities^ | | | $3,746,712 | | | | 0.1 | % |
| | | | | |
| | | | Total | | | 3,746,712 | | | | | |
| | | | | |
| | |
| | Capital Goods (<0.1%) | | | | | | | | |
| | | | Other Securities^ | | | 769,997 | | | | <0.1 | % |
| | | | | |
| | | | Total | | | 769,997 | | | | | |
| | | | | |
| | |
| | Communications Services (0.3%) | | | | | | | | |
| | | | Other Securities^ | | | 7,936,386 | | | | 0.3 | % |
| | | | | |
| | | | Total | | | 7,936,386 | | | | | |
| | | | | |
| | |
| | Consumer Cyclical (0.1%) | | | | | | | | |
| | | | Other Securities^ | | | 3,600,841 | | | | 0.1 | % |
| | | | | |
| | | | Total | | | 3,600,841 | | | | | |
| | | | | |
| | |
| | Consumer Non-Cyclical (0.2%) | | | | | | | | |
| | | | Other Securities^ | | | 5,388,765 | | | | 0.2 | % |
| | | | | |
| | | | Total | | | 5,388,765 | | | | | |
| | | | | |
| | |
| | Energy (0.1%) | | | | | | | | |
| | | | Other Securities^ | | | 2,009,592 | | | | 0.1 | % |
| | | | | |
| | | | Total | | | 2,009,592 | | | | | |
| | | | | |
| | |
| | Financials (0.1%) | | | | | | | | |
| | | | Other Securities^ | | | 3,570,214 | | | | 0.1 | % |
| | | | | |
| | | | Total | | | 3,570,214 | | | | | |
| | | | | |
| | |
| | Technology (0.1%) | | | | | | | | |
| | | | Other Securities^ | | | 1,796,779 | | | | 0.1 | % |
| | | | | |
| | | | Total | | | 1,796,779 | | | | | |
| | | | | |
| | |
| | Transportation (<0.1%) | | | | | | | | |
| | | | Other Securities^ | | | 715,831 | | | | <0.1 | % |
| | | | | |
| | | | Total | | | 715,831 | | | | | |
| | | | | |
| | |
| | Utilities (0.1%) | | | | | | | | |
| | | | Other Securities^ | | | 1,046,534 | | | | 0.1 | % |
| | | | | |
| | | | Total | | | 1,046,534 | | | | | |
| | | | | |
| | | | | | | | | | | | |
| | | | | |
| | | | Total Bank Loans (cost $31,033,201) | | | 30,581,651 | | | | | |
| | | | | |
| | | |
| Shares | | | Registered Investment Companies (48.3%) | | Value | | | % of Net
Assets | |
| | Affiliated Equity Holdings (41.7%) | | | | | | | | |
| | 8,612,063 | | | Thrivent Core International Equity Fund | | | 79,919,949 | | | | 2.9 | % |
| | 7,733,985 | | | Thrivent Core Low Volatility Equity Funda | | | 81,516,203 | | | | 3.0 | % |
| | 15,867,571 | | | Thrivent Large Cap Growth Fund, Class S | | | 197,868,608 | | | | 7.3 | % |
| | 4,674,604 | | | Thrivent Large Cap Stock Fund, Class S | | | 125,653,356 | | | | 4.7 | % |
| | 9,571,559 | | | Thrivent Large Cap Value Fund, Class S | | | 219,188,710 | | | | 8.1 | % |
| | 5,715,256 | | | Thrivent Mid Cap Stock Fund, Class S | | | 160,370,082 | | | | 5.9 | % |
| | 22,634,732 | | | Thrivent Partner Worldwide Allocation Fund, Class S | | | 223,404,800 | | | | 8.3 | % |
| | 1,593,213 | | | Thrivent Small Cap Stock Fund, Class S | | | 41,981,166 | | | | 1.5 | % |
| | | | | |
| | | | Total | | | 1,129,902,874 | | | | | |
| | | | | |
| | |
| | Affiliated Fixed Income Holdings (5.3%) | | | | | | | | |
| | 2,921,208 | | | Thrivent Core Emerging Markets Debt Fund | | | 26,407,721 | | | | 1.0 | % |
| | 4,507,340 | | | Thrivent High Yield Fund, Class S | | | 20,914,056 | | | | 0.8 | % |
| | 6,910,015 | | | Thrivent Income Fund, Class S | | | 60,117,134 | | | | 2.2 | % |
| | 2,888,091 | | | Thrivent Limited Maturity Bond Fund, Class S | | | 35,523,517 | | | | 1.3 | % |
| | | | | |
| | | | Total | | | 142,962,428 | | | | | |
| | | | | |
| | |
| | Equity Funds/Exchange Traded Funds (0.8%) | | | | | | | | |
| | 39,914 | | | SPDR S&P 500 ETF Trust | | | 10,801,926 | | | | 0.4 | % |
| | | | Other Securities^ | | | 10,000,532 | | | | 0.4 | % |
| | | | | |
| | | | Total | | | 20,802,458 | | | | | |
| | | | | |
| | |
| | Fixed Income Funds/Exchange Traded Funds (0.5%) | | | | | | | | |
| | 50,395 | | | iShares iBoxx $ Investment Grade Corporate Bond ETF | | | 5,655,831 | | | | 0.2 | % |
| | 71,850 | | | Vanguard Short-Term Corporate Bond ETF | | | 5,599,271 | | | | 0.2 | % |
| | | | Other Securities^ | | | 2,171,000 | | | | 0.1 | % |
| | | | | |
| | | | Total | | | 13,426,102 | | | | | |
| | | | | |
| | | | | | | | | | | | |
| | | | | |
| | | | Total Registered Investment Companies (cost $1,032,751,128) | | | 1,307,093,862 | | | | | |
| | | | | |
| | | |
| Shares | | | Common Stock (24.5%) | | Value | | | % of Net Assets | |
| | Communications Services (0.8%) | | | | | | | | |
| | 3,818 | | | Alphabet, Inc., Class Aa | | | 4,163,834 | | | | 0.2 | % |
| | 21,288 | | | Facebook, Inc.a | | | 3,231,306 | | | | 0.1 | % |
| | | | Other Securities^ | | | 14,479,416 | | | | 0.5 | % |
| | | | | |
| | | | Total | | | 21,874,556 | | | | | |
| | | | | |
| | |
| | Consumer Discretionary (2.6%) | | | | | | | | |
| | 4,191 | | | Amazon.com, Inc.a | | | 6,697,260 | | | | 0.3 | % |
| | 19,187 | | | Burlington Stores, Inc.a | | | 3,290,379 | | | | 0.1 | % |
| | 23,397 | | | Children’s Place, Inc. | | | 3,495,512 | | | | 0.1 | % |
| | | | Other Securities^ | | | 56,649,959 | | | | 2.1 | % |
| | | | | |
| | | | Total | | | 70,133,110 | | | | | |
| | | | | |
The accompanying Notes to Financial Statements are an integral part of this schedule.
126
MODERATELY AGGRESSIVE ALLOCATION FUND
Summary Schedule of Investments as of October 31, 2018
| | | | | | | | | | | | |
| Shares | | | Common Stock (24.5%) | | Value | | | % of Net
Assets | |
| | Consumer Staples (0.8%) | | | | | | | | |
| | | | Other Securities^ | | | $21,181,197 | | | | 0.8 | % |
| | | | | |
| | | | Total | | | 21,181,197 | | | | | |
| | | | | |
| | |
| | Energy (1.0%) | | | | | | | | |
| | | | Other Securities^ | | | 27,215,327 | | | | 1.0 | % |
| | | | | |
| | | | Total | | | 27,215,327 | | | | | |
| | | | | |
| | |
| | Financials (4.4%) | | | | | | | | |
| | 40,576 | | | American Financial Group, Inc. | | | 4,058,817 | | | | 0.2 | % |
| | 65,159 | | | Citigroup, Inc. | | | 4,265,308 | | | | 0.2 | % |
| | 131,545 | | | First Hawaiian, Inc. | | | 3,259,685 | | | | 0.1 | % |
| | 200,472 | | | KeyCorp | | | 3,640,571 | | | | 0.1 | % |
| | | | Other Securities^ | | | 103,220,430 | | | | 3.8 | % |
| | | | | |
| | | | Total | | | 118,444,811 | | | | | |
| | | | | |
| | |
| | Health Care (3.3%) | | | | | | | | |
| | 78,752 | | | Pfizer, Inc. | | | 3,391,061 | | | | 0.1 | % |
| | 15,228 | | | Teleflex, Inc. | | | 3,665,989 | | | | 0.1 | % |
| | 20,629 | | | UnitedHealth Group, Inc. | | | 5,391,389 | | | | 0.2 | % |
| | | | Other Securities^ | | | 77,182,976 | | | | 2.9 | % |
| | | | | |
| | | | Total | | | 89,631,415 | | | | | |
| | | | | |
| | |
| | Industrials (3.7%) | | | | | | | | |
| | 26,612 | | | Honeywell International, Inc. | | | 3,853,950 | | | | 0.2 | % |
| | 49,181 | | | Waste Connections, Inc. | | | 3,759,396 | | | | 0.2 | % |
| | | | Other Securities^ | | | 93,564,449 | | | | 3.3 | % |
| | | | | |
| | | | Total | | | 101,177,795 | | | | | |
| | | | | |
| | |
| | Information Technology (5.3%) | | | | | | | | |
| | 50,436 | | | Amphenol Corporation | | | 4,514,022 | | | | 0.2 | % |
| | 29,928 | | | Apple, Inc. | | | 6,550,042 | | | | 0.3 | % |
| | 66,412 | | | Booz Allen Hamilton Holding Corporation | | | 3,290,050 | | | | 0.1 | % |
| | 116,270 | | | Cisco Systems, Inc. | | | 5,319,352 | | | | 0.2 | % |
| | 65,263 | | | Dolby Laboratories, Inc. | | | 4,490,747 | | | | 0.2 | % |
| | 62,624 | | | Keysight Technologies, Inc.a | | | 3,574,578 | | | | 0.1 | % |
| | 27,013 | | | MasterCard, Inc. | | | 5,339,660 | | | | 0.2 | % |
| | 59,137 | | | Microsoft Corporation | | | 6,316,423 | | | | 0.2 | % |
| | 31,668 | | | Monolithic Power Systems, Inc. | | | 3,740,624 | | | | 0.1 | % |
| | 39,020 | | | Synopsys, Inc.a | | | 3,493,461 | | | | 0.1 | % |
| | 40,920 | | | Xilinx, Inc. | | | 3,493,340 | | | | 0.1 | % |
| | | | Other Securities^ | | | 93,107,939 | | | | 3.5 | % |
| | | | | |
| | | | Total | | | 143,230,238 | | | | | |
| | | | | |
| | |
| | Materials (1.0%) | | | | | | | | |
| | | | Other Securities^ | | | 26,176,728 | | | | 1.0 | % |
| | | | | |
| | | | Total | | | 26,176,728 | | | | | |
| | | | | |
| | |
| | Real Estate (1.1%) | | | | | | | | |
| | 129,488 | | | Hudson Pacific Properties, Inc. | | | 3,923,486 | | | | 0.2 | % |
| | | | Other Securities^ | | | 26,385,160 | | | | 0.9 | % |
| | | | | |
| | | | Total | | | 30,308,646 | | | | | |
| | | | | |
| | |
| | Utilities (0.5%) | | | | | | | | |
| | | | Other Securities^ | | | 12,422,040 | | | | 0.5 | % |
| | | | | |
| | | | Total | | | 12,422,040 | | | | | |
| | | | | |
| | | | | | | | | | | | |
| | | | | |
| | | | Total Common Stock (cost $565,710,685) | | | 661,795,863 | | | | | |
| | | | | |
| | | |
Principal
Amount | | | Long-Term Fixed Income (17.0%) | | Value | | | % of Net Assets | |
| | Asset-Backed Securities (0.7%) | | | | | | | | |
| | | | SBA Small Business Investment Companies | | | | | | | | |
| $ | 1,300,000 | | | 3.548%, 9/11/2028, Ser. 2018-10B, Class 1 | | | 1,290,940 | | | | 0.1 | % |
| | | | Other Securities^ | | | 17,161,776 | | | | 0.6 | % |
| | | | | |
| | | | Total | | | 18,452,716 | | | | | |
| | | | | |
| | |
| | Basic Materials (0.2%) | | | | | | | | |
| | | |
| | | | Other Securities^ | | | 6,906,019 | | | | 0.2 | % |
| | | | | |
| | | | Total | | | 6,906,019 | | | | | |
| | | | | |
| | |
| | Capital Goods (0.3%) | | | | | | | | |
| | | | Other Securities^ | | | 8,807,585 | | | | 0.3 | % |
| | | | | |
| | | | Total | | | 8,807,585 | | | | | |
| | | | | |
| | |
| | Collateralized Mortgage Obligations (0.6%) | | | | | | | | |
| | | | Federal National Mortgage Association | | | | | | | | |
| | 580,350 | | | 3.500%, 1/25/2033, Ser. 2012-150, Class YIb | | | 74,085 | | | | <0.1 | % |
| | | | Other Securities^ | | | 14,816,663 | | | | 0.6 | % |
| | | | | |
| | | | Total | | | 14,890,748 | | | | | |
| | | | | |
| | |
| | Commercial Mortgage-Backed Securities (0.5%) | | | | | | | | |
| | | | Federal National Mortgage Association - ACES | | | | | | | | |
| | 950,000 | | | 2.961%, 2/25/2027, Ser. 2017-M7, Class A2c | | | 898,057 | | | | 0.1 | % |
| | 825,000 | | | 3.052%, 3/25/2028, Ser. 2018-M7, Class A2c | | | 777,906 | | | | <0.1 | % |
| | 700,000 | | | 2.785%, 2/25/2027, Ser. 2017-M2, Class A2c | | | 658,091 | | | | <0.1 | % |
| | 475,000 | | | 2.485%, 12/25/2026, Ser. 2017-M3, Class A2c | | | 436,650 | | | | <0.1 | % |
| | | | Federal National Mortgage Association Grantor Trust | | | | | | | | |
| | 923,973 | | | 2.898%, 6/25/2027, Ser. 2017-T1, Class Ad | | | 860,251 | | | | <0.1 | % |
| | | | Other Securities^ | | | 10,120,702 | | | | 0.4 | % |
| | | | | |
| | | | Total | | | 13,751,657 | | | | | |
| | | | | |
| | |
| | Communications Services (0.6%) | | | | | | | | |
| | | | Other Securities^ | | | 15,897,251 | | | | 0.6 | % |
| | | | | |
| | | | Total | | | 15,897,251 | | | | | |
| | | | | |
The accompanying Notes to Financial Statements are an integral part of this schedule.
127
MODERATELY AGGRESSIVE ALLOCATION FUND
Summary Schedule of Investments as of October 31, 2018
| | | | | | | | | | | | |
Principal
Amount | | | Long-Term Fixed Income (17.0%) | | Value | | | % of Net
Assets | |
| | Consumer Cyclical (0.5%) | | | | | | | | |
| | | | Other Securities^ | | | $13,054,574 | | | | 0.5 | % |
| | | | | |
| | | | Total | | | 13,054,574 | | | | | |
| | | | | |
| | |
| | Consumer Non-Cyclical (0.8%) | | | | | | | | |
| | | | Other Securities^ | | | 21,020,609 | | | | 0.8 | % |
| | | | | |
| | | | Total | | | 21,020,609 | | | | | |
| | | | | |
| | |
| | Energy (0.7%) | | | | | | | | |
| | | | Other Securities^ | | | 18,838,331 | | | | 0.7 | % |
| | | | | |
| | | | Total | | | 18,838,331 | | | | | |
| | | | | |
| | |
| | Financials (1.8%) | | | | | | | | |
| | | | Other Securities^ | | | 48,042,249 | | | | 1.8 | % |
| | | | | |
| | | | Total | | | 48,042,249 | | | | | |
| | | | | |
| | |
| | Foreign Government (<0.1%) | | | | | | | | |
| | | | Other Securities^ | | | 197,497 | | | | <0.1 | % |
| | | | | |
| | | | Total | | | 197,497 | | | | | |
| | | | | |
| | |
| | Mortgage-Backed Securities (4.8%) | | | | | | | | |
| | | | Federal Home Loan Mortgage Corporation Gold 30-Yr. Pass Through | | | | | | | | |
| | 11,125,000 | | | 4.000%, 11/1/2048e | | | 11,128,856 | | | | 0.4 | % |
| | | | Federal National Mortgage Association | | | | | | | | |
| | 1,075,000 | | | 3.640% - 3.710%, 6/1/2028 - 7/1/2028 | | | 1,058,288 | | | | <0.1 | % |
| | | | Federal National Mortgage Association Conventional 15-Yr. Pass Through | | | | | | | | |
| | 9,475,000 | | | 3.500%, 11/1/2033e | | | 9,467,043 | | | | 0.3 | % |
| | | | Federal National Mortgage Association Conventional 30-Yr. Pass Through | | | | | | | | |
| | 37,975,000 | | | 3.500%, 11/1/2048e | | | 36,967,774 | | | | 1.4 | % |
| | 31,685,000 | | | 4.000%, 11/1/2048e | | | 31,684,867 | | | | 1.2 | % |
| | 34,590,000 | | | 4.500%, 11/1/2048e | | | 35,414,892 | | | | 1.3 | % |
| | 4,075,000 | | | 5.000%, 11/1/2048e | | | 4,252,326 | | | | 0.2 | % |
| | 65,183 | | | 4.281%, (LIBOR 12M + 1.550%), 7/1/2043c | | | 67,205 | | | | <0.1 | % |
| | 58,897 | | | 4.288%, (LIBOR 12M + 1.540%), 7/1/2043c | | | 60,694 | | | | <0.1 | % |
| | 22,531 | | | 4.280%, (LIBOR 12M + 1.530%), 8/1/2043c | | | 23,219 | | | | <0.1 | % |
| | | | Other Securities^ | | | 556,167 | | | | <0.1 | % |
| | | | | |
| | | | Total | | | 130,681,331 | | | | | |
| | | | | |
| | |
| | Technology (0.4%) | | | | | | | | |
| | | | Other Securities^ | | | 10,953,675 | | | | 0.4 | % |
| | | | | |
| | | | Total | | | 10,953,675 | | | | | |
| | | | | |
| | |
| | Transportation (0.1%) | | | | | | | | |
| | | | Other Securities^ | | | 1,940,598 | | | | 0.1 | % |
| | | | | |
| | | | Total | | | 1,940,598 | | | | | |
| | | | | |
| | |
| | U.S. Government and Agencies (4.6%) | | | | | | | | |
| | | | Federal National Mortgage Association - ACES | | | | | | | | |
| | 1,500,000 | | | 3.639%, 8/25/2030, Ser. 2018-M12, Class A2c | | | 1,467,259 | | | | 0.1 | % |
| | | | U.S. Treasury Bonds | | | | | | | | |
| | 5,135,000 | | | 2.250%, 11/15/2027 | | | 4,778,158 | | | | 0.2 | % |
| | 10,250,000 | | | 2.875%, 5/15/2028 | | | 10,022,578 | | | | 0.4 | % |
| | 6,780,000 | | | 3.000%, 5/15/2042 | | | 6,368,433 | | | | 0.2 | % |
| | 11,118,000 | | | 2.500%, 5/15/2046 | | | 9,338,686 | | | | 0.3 | % |
| | 5,371,000 | | | 2.750% - 5.250%, 11/15/2028 - 5/15/2048 | | | 5,427,179 | | | | 0.2 | % |
| | | | U.S. Treasury Bonds, TIPS | | | | | | | | |
| | 6,554,160 | | | 0.125%, 1/15/2023 | | | 6,307,830 | | | | 0.2 | % |
| | 12,265,925 | | | 0.375%, 7/15/2027 | | | 11,542,906 | | | | 0.4 | % |
| | | | U.S. Treasury Notes | | | | | | | | |
| | 7,984,000 | | | 1.125%, 8/31/2021 | | | 7,595,092 | | | | 0.3 | % |
| | 9,000,000 | | | 1.875%, 7/31/2022 | | | 8,654,766 | | | | 0.3 | % |
| | 14,155,000 | | | 2.000%, 11/30/2022 | | | 13,630,823 | | | | 0.5 | % |
| | 4,750,000 | | | 2.500%, 3/31/2023 | | | 4,657,412 | | | | 0.2 | % |
| | 4,800,000 | | | 2.125%, 11/30/2024 | | | 4,557,187 | | | | 0.2 | % |
| | 18,500,000 | | | 2.875%, 5/31/2025 | | | 18,297,656 | | | | 0.7 | % |
| | 10,078,000 | | | 1.375% - 2.250%, 10/31/2019 - 11/15/2024 | | | 9,688,715 | | | | 0.4 | % |
| | | | | |
| | | | Total | | | 122,334,680 | | | | | |
| | | | | |
| | |
| | Utilities (0.4%) | | | | | | | | |
| | | | Other Securities^ | | | 11,759,832 | | | | 0.4 | % |
| | | | | |
| | | | Total | | | 11,759,832 | | | | | |
| | | | | |
| | | | | | | | | | | | |
| | | | | |
| | | | Total Long-Term Fixed Income (cost $467,939,317) | | | 457,529,352 | | | | | |
| | | | | |
| | | |
| Shares | | | Collateral Held for Securities Loaned (0.5%) | | Value | | | % of Net Assets | |
| | 14,805,419 | | | Thrivent Cash Management Trust | | | 14,805,419 | | | | 0.5 | % |
| | | | | |
| | | | Total Collateral Held for Securities Loaned (cost $14,805,419) | | | 14,805,419 | | | | | |
| | | | | |
| | | |
Shares or Principal Amount | | | Short-Term Investments (13.8%) | | Value | | | % of Net
Assets | |
| | | | Federal Home Loan Bank Discount Notes | | | | | | | | |
| | 3,300,000 | | | 2.100%, 11/28/2018f,g | | | 3,294,604 | | | | 0.1 | % |
| | 8,000,000 | | | 2.170%, 12/12/2018f,g | | | 7,979,680 | | | | 0.3 | % |
| | 6,700,000 | | | 2.240%, 1/16/2019f,g | | | 6,667,465 | | | | 0.3 | % |
| | | | U.S. Treasury Bills | | | | | | | | |
| | 460,000 | | | 2.090% - 2.161%, 11/23/2018 - 12/27/2018f,h | | | 458,844 | | | | <0.1 | % |
| | | | Thrivent Core Short-Term Reserve Fund | | | | | | | | |
| | 35,005,356 | | | 2.430% | | | 350,053,555 | | | | 13.0 | % |
The accompanying Notes to Financial Statements are an integral part of this schedule.
128
MODERATELY AGGRESSIVE ALLOCATION FUND
Summary Schedule of Investments as of October 31, 2018
| | | | | | | | | | | | |
Shares or Principal Amount | | | Short-Term Investments (13.8%) | | Value | | | % of Net Assets | |
| | | | Other Securities^ | | | $4,332,961 | | | | 0.1 | % |
| | | | | |
| | | | Total Short-Term Investments (cost $372,788,911) | | | 372,787,109 | | | | | |
| | | | | |
| | | | Total Investments (cost $2,485,028,661) 105.2% | | | $2,844,593,256 | | | | | |
| | | | | |
| | | | Other Assets and Liabilities, Net (5.2%) | | | (140,426,271 | ) | | | | |
| | | | | |
| | | | Total Net Assets 100.0% | | | $2,704,166,985 | | | | | |
| | | | | |
| ^ | The Summary Schedule of Investments shows the 50 largest holdings in unaffiliated issuers, any holding or issuer that exceeds 1% of net assets and all affiliated holdings as of the report date. The remaining securities held are grouped by category as “Other securities”. |
| a | Non-income producing security. |
| b | Denotes interest only security. Interest only securities represent the right to receive monthly interest payments on an underlying pool of mortgages or assets. The principal shown is the outstanding par amount of the pool as of the end of the period. The actual effective yield of the security is different than the stated coupon rate. |
| c | Denotes variable rate securities. The rate shown is as of October 31, 2018. The rates of certain variable rate securities are based on a published reference rate and spread; these may vary by security and the reference rate and spread are indicated in their description. The rates of other variable rate securities are determined by the issuer or agent and are based on current market conditions. These securities do not indicate a reference rate and spread in their description. |
| d | All or a portion of the security is insured or guaranteed. |
| e | Denotes investments purchased on a when-issued or delayed delivery basis. |
| f | The interest rate shown reflects the yield, coupon rate or the discount rate at the date of purchase. |
| g | All or a portion of the security is held on deposit with the counterparty and pledged as the initial margin deposit for open futures contracts. |
| h | At October 31, 2018, $199,737 of investments were segregated to cover exposure to a counterparty for margin on open mortgage-backed security transactions. |
Moderately Aggressive Allocation Fund held restricted securities as of October 31, 2018. Restricted securities are investment securities which cannot be offered for public sale without first being registered under the Securities Act of 1933. As of October 31, 2018, the value of these investments was $13,899,490 or 0.5% of total net assets.
The following table presents the total amount of securities loaned with continuous maturity, by type, offset by the gross payable upon return of collateral for securities loaned by Thrivent Moderately Aggressive Allocation Fund as of October 31, 2018:
Securities Lending Transactions
| | |
Taxable Debt Security | | $3,368,259 |
Common Stock | | 11,100,467 |
| | |
Total lending | | $14,468,726 |
Gross amount payable upon return of collateral for securities loaned | | $14,805,419 |
| | |
Net amounts due to counterparty | | $336,693 |
| | |
Definitions:
| | | | |
| ACES | | - | | Alternative Credit Enhancement Securities |
| ETF | | - | | Exchange Traded Fund |
| Ser. | | - | | Series |
| SPDR | | - | | S&P Depository Receipts, which are a family of exchange-traded funds traded in the U.S., Europe, and Asia-Pacific and managed by State Street Global Advisors. |
| TIPS | | - | | Treasury Inflation Protected Security |
Reference Rate Index:
| | | | |
| LIBOR 12M | | - | | ICE Libor USD Rate 12 Month |
Unrealized Appreciation (Depreciation)
Gross unrealized appreciation and depreciation of investments of the portfolio as a whole (including derivatives), based on cost for federal income tax purposes, were as follows:
| | | | |
Gross unrealized appreciation | | | $439,356,434 | |
Gross unrealized depreciation | | | (94,199,393 | ) |
| | | | |
Net unrealized appreciation (depreciation) | | | $345,157,041 | |
| |
Cost for federal income tax purposes | | | $2,743,836,086 | |
The accompanying Notes to Financial Statements are an integral part of this schedule.
129
MODERATELY AGGRESSIVE ALLOCATION FUND
Summary Schedule of Investments as of October 31, 2018
Fair Valuation Measurements
The following table is a summary of the inputs used, as of October 31, 2018, in valuing Moderately Aggressive Allocation Fund’s assets carried at fair value.
| | | | | | | | | | | | | | | | |
| Investments in Securities | | Total | | | Level 1 | | | Level 2 | | | Level 3 | |
| | | | |
Bank Loans | | | | | | | | | | | | | | | | |
Basic Materials | | | 3,746,712 | | | | – | | | | 2,751,725 | | | | 994,987 | |
Capital Goods | | | 769,997 | | | | – | | | | 769,997 | | | | – | |
Communications Services | | | 7,936,386 | | | | – | | | | 7,876,586 | | | | 59,800 | |
Consumer Cyclical | | | 3,600,841 | | | | – | | | | 3,600,841 | | | | – | |
Consumer Non-Cyclical | | | 5,388,765 | | | | – | | | | 5,388,765 | | | | – | |
Energy | | | 2,009,592 | | | | – | | | | 1,816,054 | | | | 193,538 | |
Financials | | | 3,570,214 | | | | – | | | | 3,174,233 | | | | 395,981 | |
Technology | | | 1,796,779 | | | | – | | | | 1,796,779 | | | | – | |
Transportation | | | 715,831 | | | | – | | | | 715,831 | | | | – | |
Utilities | | | 1,046,534 | | | | – | | | | 794,400 | | | | 252,134 | |
| | | | |
Registered Investment Companies | | | | | | | | | | | | | | | | |
Affiliated Equity Holdings | | | 968,466,722 | | | | 968,466,722 | | | | – | | | | – | |
Affiliated Fixed Income Holdings | | | 116,554,707 | | | | 116,554,707 | | | | – | | | | – | |
Fixed Income Funds/Exchange Traded Funds | | | 13,426,102 | | | | 13,426,102 | | | | – | | | | – | |
Equity Funds/Exchange Traded Funds | | | 20,802,458 | | | | 20,802,458 | | | | – | | | | – | |
| | | | |
Common Stock | | | | | | | | | | | | | | | | |
Communications Services | | | 21,874,556 | | | | 20,429,206 | | | | 1,445,350 | | | | – | |
Consumer Discretionary | | | 70,133,110 | | | | 65,694,678 | | | | 4,438,432 | | | | – | |
Consumer Staples | | | 21,181,197 | | | | 17,431,316 | | | | 3,749,881 | | | | – | |
Energy | | | 27,215,327 | | | | 25,878,855 | | | | 1,275,367 | | | | 61,105 | |
Financials | | | 118,444,811 | | | | 114,802,473 | | | | 3,642,338 | | | | – | |
Health Care | | | 89,631,415 | | | | 86,448,131 | | | | 3,183,284 | | | | – | |
Industrials | | | 101,177,795 | | | | 96,266,729 | | | | 4,911,066 | | | | – | |
Information Technology | | | 143,230,238 | | | | 140,715,910 | | | | 2,514,328 | | | | – | |
Materials | | | 26,176,728 | | | | 22,269,133 | | | | 3,907,593 | | | | 2 | |
Real Estate | | | 30,308,646 | | | | 29,499,515 | | | | 809,131 | | | | – | |
Utilities | | | 12,422,040 | | | | 11,665,861 | | | | 756,179 | | | | – | |
| | | | |
Long-Term Fixed Income | | | | | | | | | | | | | | | | |
Asset-Backed Securities | | | 18,452,716 | | | | – | | | | 18,452,716 | | | | – | |
Basic Materials | | | 6,906,019 | | | | – | | | | 6,906,019 | | | | – | |
Capital Goods | | | 8,807,585 | | | | – | | | | 8,807,585 | | | | – | |
Collateralized Mortgage Obligations | | | 14,890,748 | | | | – | | | | 14,890,748 | | | | – | |
Commercial Mortgage-Backed Securities | | | 13,751,657 | | | | – | | | | 13,751,657 | | | | – | |
Communications Services | | | 15,897,251 | | | | – | | | | 15,897,251 | | | | – | |
Consumer Cyclical | | | 13,054,574 | | | | – | | | | 13,054,574 | | | | – | |
Consumer Non-Cyclical | | | 21,020,609 | | | | – | | | | 21,020,609 | | | | – | |
Energy | | | 18,838,331 | | | | – | | | | 18,838,331 | | | | – | |
Financials | | | 48,042,249 | | | | – | | | | 48,042,249 | | | | – | |
Foreign Government | | | 197,497 | | | | – | | | | 197,497 | | | | – | |
Mortgage-Backed Securities | | | 130,681,331 | | | | – | | | | 130,681,331 | | | | – | |
Technology | | | 10,953,675 | | | | – | | | | 10,953,675 | | | | – | |
Transportation | | | 1,940,598 | | | | – | | | | 1,940,598 | | | | – | |
U.S. Government and Agencies | | | 122,334,680 | | | | – | | | | 122,334,680 | | | | – | |
Utilities | | | 11,759,832 | | | | – | | | | 11,759,832 | | | | – | |
Short-Term Investments | | | 22,733,554 | | | | – | | | | 22,733,554 | | | | – | |
| |
Subtotal Investments in Securities | | | $2,291,890,409 | | | | $1,750,351,796 | | | | $539,581,066 | | | | $1,957,547 | |
| |
| | | | |
| Other Investments* | | Total | | | | | | | | | | |
Affiliated Registered Investment Companies | | | 187,843,873 | | | | | | | | | | | | | |
Short-Term Investments | | | 350,053,555 | | | | | | | | | | | | | |
Collateral Held for Securities Loaned | | | 14,805,419 | | | | | | | | | | | | | |
| | | | | | | | | | | | | |
Subtotal Other Investments | | | $552,702,847 | | | | | | | | | | | | | |
| | | | | | | | | | | | | |
| | | | | | | | | | | | | | | | |
| | | | | | | | | | | | | |
Total Investments at Value | | | $2,844,593,256 | | | | | | | | | | | | | |
| | | | | | | | | | | | | |
| * | Certain investments are measured at fair value using a net asset value per share that is not publicly available (practical expedient). According to disclosure requirements of Accounting Standards Codification (ASC) 820, Fair Value Measurement, securities valued using the practical expedient are not classified in the fair value hierarchy. The fair value amounts presented in this table are intended to permit reconciliation of the fair value hierarchy to the amounts presented in the Statement of Assets and Liabilities. |
The accompanying Notes to Financial Statements are an integral part of this schedule.
130
MODERATELY AGGRESSIVE ALLOCATION FUND
Summary Schedule of Investments as of October 31, 2018
| | | | | | | | | | | | | | | | |
| | | | |
| Other Financial Instruments | | Total | | | Level 1 | | | Level 2 | | | Level 3 | |
| | | | |
Asset Derivatives | | | | | | | | | | | | | | | | |
Futures Contracts | | | 43,889,420 | | | | 43,889,420 | | | | – | | | | – | |
| |
Total Asset Derivatives | | | $43,889,420 | | | | $43,889,420 | | | | $– | | | | $– | |
| |
| |
Liability Derivatives | |
Futures Contracts | | | 41,284,059 | | | | 41,284,059 | | | | – | | | | – | |
| |
Total Liability Derivatives | | | $41,284,059 | | | | $41,284,059 | | | | $– | | | | $– | |
| |
| |
There were no significant transfers between Levels during the period ended October 31, 2018. Transfers between Levels are identified as of the end of the period.
The following table presents Moderately Aggressive Allocation Fund’s futures contracts held as of October 31, 2018. Investments and/or cash totaling $22,274,710 were pledged as the initial margin deposit for these contracts.
| | | | | | | | | | | | | | | | |
| Futures Contracts Description | | Number of
Contracts Long/(Short) | | | Expiration Date | | | Notional Principal Amount | | | Value and
Unrealized | |
CBOT U.S. Long Bond | | | 173 | | | | December 2018 | | | | $24,762,453 | | | | ($866,829 | ) |
CME E-mini S&P 500 Index | | | 3,747 | | | | December 2018 | | | | 539,533,788 | | | | (31,609,203 | ) |
ICE mini MSCI EAFE Index | | | 1,143 | | | | December 2018 | | | | 111,363,988 | | | | (7,779,613 | ) |
ICE US mini MSCI Emerging Markets Index | | | 300 | | | | December 2018 | | | | 15,378,914 | | | | (1,028,414 | ) |
| |
Total Futures Long Contracts | | | | | | | | | | | $691,039,143 | | | | ($41,284,059 | ) |
| |
CBOT 10-Yr. U.S. Treasury Note | | | (5 | ) | | | December 2018 | | | | ($602,679 | ) | | | $10,492 | |
CBOT 2-Yr. U.S. Treasury Note | | | (48 | ) | | | December 2018 | | | | (10,149,604 | ) | | | 38,104 | |
CBOT 5-Yr. U.S. Treasury Note | | | (8 | ) | | | December 2018 | | | | (907,600 | ) | | | 8,538 | |
CME E-mini NASDAQ 100 Index | | | (999 | ) | | | December 2018 | | | | (151,439,385 | ) | | | 12,068,895 | |
CME E-mini Russell 2000 Index | | | (1,181 | ) | | | December 2018 | | | | (101,593,148 | ) | | | 12,315,453 | |
CME E-mini S&P Mid-Cap 400 Index | | | (847 | ) | | | December 2018 | | | | (173,624,017 | ) | | | 19,063,457 | |
CME Ultra Long Term U.S. Treasury Bond | | | (17 | ) | | | December 2018 | | | | (2,712,905 | ) | | | 176,186 | |
Ultra 10-Yr. U.S. Treasury Note | | | (64 | ) | | | December 2018 | | | | (8,215,295 | ) | | | 208,295 | |
| |
Total Futures Short Contracts | | | | | | | | | | | ($449,244,633 | ) | | | $43,889,420 | |
| |
Total Futures Contracts | | | | | | | | | | | $241,794,510 | | | | $2,605,361 | |
| |
| | | | |
| Reference Description: |
| CBOT | | - | | Chicago Board of Trade |
| CME | | - | | Chicago Mercantile Exchange |
| EAFE | | - | | Europe, Australasia and Far East |
| ICE | | - | | Intercontinental Exchange |
| MSCI | | - | | Morgan Stanley Capital International |
| NASDAQ | | - | | National Association of Securities Dealers Automated Quotations |
| S&P | | - | | Standard & Poor’s |
The accompanying Notes to Financial Statements are an integral part of this schedule.
131
MODERATELY AGGRESSIVE ALLOCATION FUND
Summary Schedule of Investments as of October 31, 2018
The following table summarizes the fair value and Statement of Assets and Liabilities location, as of October 31, 2018, for Moderately Aggressive Allocation Fund’s investments in financial derivative instruments by primary risk exposure as discussed under item (2) Significant Accounting Policies of the Notes to Financial Statements.
| | | | | | |
| Derivatives by risk category | | Statement of Assets and Liabilities Location | | Fair Value | |
| | |
Asset Derivatives | | | | | | |
| | |
Interest Rate Contracts | | | | | | |
Futures* | | Net Assets - Accumulated undistributed earnings/(loss) | | | $441,615 | |
Total Interest Rate Contracts | | | | | 441,615 | |
| | |
Equity Contracts | | | | | | |
Futures* | | Net Assets - Accumulated undistributed earnings/(loss) | | | 43,447,805 | |
Total Equity Contracts | | | | | 43,447,805 | |
Total Asset Derivatives | | | | | $43,889,420 | |
| | |
| | |
Liability Derivatives | | | | | | |
| | |
Interest Rate Contracts | | | | | | |
Futures* | | Net Assets - Accumulated undistributed earnings/(loss) | | | 866,829 | |
Total Interest Rate Contracts | | | | | 866,829 | |
| | |
Equity Contracts | | | | | | |
Futures* | | Net Assets - Accumulated undistributed earnings/(loss) | | | 40,417,230 | |
Total Equity Contracts | | | | | 40,417,230 | |
Total Liability Derivatives | | | | | $41,284,059 | |
| | |
| * | Includes cumulative appreciation/depreciation of futures contracts as reported in the Schedule of Investments. Only current day’s variation margin is reported within the Statement of Assets and Liabilities. |
The following table summarizes the net realized gains/(losses) and Statement of Operations location, for the period ended October 31, 2018, for Moderately Aggressive Allocation Fund’s investments in financial derivative instruments by primary risk exposure.
| | | | | | |
| Derivatives by risk category | | Statement of Operations Location | | Realized Gains/(Losses) recognized in Income | |
| | |
Interest Rate Contracts | | | | | | |
Options Written | | Net realized gains/(losses) on Written option contracts | | | 63,281 | |
Options Purchased | | Net realized gains/(losses) on Investments | | | 177,891 | |
Futures | | Net realized gains/(losses) on Futures contracts | | | (156,476 | ) |
Total Interest Rate Contracts | | | | | 84,696 | |
| | |
Equity Contracts | | | | | | |
Futures | | Net realized gains/(losses) on Futures contracts | | | (9,380,801 | ) |
Total Equity Contracts | | | | | (9,380,801 | ) |
Total | | | | | ($9,296,105 | ) |
| | |
The following table summarizes the change in net unrealized appreciation/(depreciation) and Statement of Operations location, for the period ended October 31, 2018, for Moderately Aggressive Allocation Fund’s investments in financial derivative instruments by primary risk exposure.
| | | | | | |
| Derivatives by risk category | | Statement of Operations Location | | Change in unrealized appreciation/(depreciation) recognized in Income | |
| | |
Interest Rate Contracts | | | | | | |
Futures | | Change in net unrealized appreciation/(depreciation) on Futures contracts | | | (295,447 | ) |
Total Interest Rate Contracts | | | | | (295,447 | ) |
| | |
Equity Contracts | | | | | | |
Futures | | Change in net unrealized appreciation/(depreciation) on Futures contracts | | | 6,979,032 | |
Total Equity Contracts | | | | | 6,979,032 | |
Total | | | | | $6,683,585 | |
| | |
The accompanying Notes to Financial Statements are an integral part of this schedule.
132
MODERATELY AGGRESSIVE ALLOCATION FUND
Summary Schedule of Investments as of October 31, 2018
The following table presents Moderately Aggressive Allocation Fund’s average volume of derivative activity during the period ended October 31, 2018.
| | | | |
| Derivative Risk Category | | Average Notional Value | |
Equity Contracts | | | | |
Futures - Long | | $ | 528,973,094 | |
Futures - Short | | | (380,528,485 | ) |
Interest Rate Contracts | | | | |
Futures - Long | | | 17,354,666 | |
Futures - Short | | | (24,889,768 | ) |
Purchased Options | | | 2,731,635 | |
Written Options | | | (2,176,335 | ) |
Investment in Affiliates
Affiliated issuers, as defined under the Investment Company Act of 1940, include those in which the Fund’s holdings of an issuer represent 5% or more of the outstanding voting securities of an issuer, any affiliated mutual fund, or a company which is under common ownership or control with the Fund. The Fund owns shares of Thrivent Cash Management Trust for the purpose of securities lending and Thrivent Core Short-Term Reserve Fund primarily to serve as a cash sweep vehicle for the Fund. Thrivent Cash Management Trust and Thrivent Core Funds are established solely for investment by Thrivent entities.
A summary of transactions (in thousands) for the fiscal year to date, in Moderately Aggressive Allocation Fund, is as follows:
| | | | | | | | | | | | | | | | | | | | | | | | |
| Fund | | Value 10/31/2017 | | | Gross Purchases | | | Gross Sales | | | Shares Held at 10/31/2018 | | | Value
10/31/2018 | | | % of Net Assets | |
Affiliated Equity Holdings | | | | | | | | | | | | | | | | | | | | | | | | |
Core International Equity | | | $– | | | | $86,113 | | | | $– | | | | 8,612 | | | | $79,920 | | | | 2.9 | % |
Core Low Volatility Equity* | | | – | | | | 77,000 | | | | – | | | | 7,734 | | | | 81,516 | | | | 3.0 | |
Large Cap Growth, Class S | | | 174,027 | | | | 4,177 | | | | – | | | | 15,868 | | | | 197,869 | | | | 7.3 | |
Large Cap Stock, Class S | | | 124,955 | | | | 12,080 | | | | – | | | | 4,675 | | | | 125,653 | | | | 4.7 | |
Large Cap Value, Class S | | | 207,082 | | | | 11,516 | | | | – | | | | 9,572 | | | | 219,189 | | | | 8.1 | |
Mid Cap Stock, Class S | | | 153,677 | | | | 11,816 | | | | – | | | | 5,715 | | | | 160,370 | | | | 5.9 | |
Partner Worldwide Allocation, Class S | | | 248,576 | | | | 9,292 | | | | – | | | | 22,635 | | | | 223,405 | | | | 8.3 | |
Small Cap Stock, Class S | | | 45,398 | | | | 2,935 | | | | 5,372 | | | | 1,593 | | | | 41,981 | | | | 1.5 | |
Total Affiliated Equity Holdings | | | 953,715 | | | | | | | | | | | | | | | | 1,129,903 | | | | 41.7 | |
Affiliated Fixed Income Holdings | | | | | | | | | | | | | | | | | | | | | | | | |
Core Emerging Markets Debt | | | 19,710 | | | | 8,710 | | | | – | | | | 2,921 | | | | 26,408 | | | | 1.0 | |
High Yield, Class S | | | 20,885 | | | | 1,168 | | | | – | | | | 4,507 | | | | 20,914 | | | | 0.8 | |
Income, Class S | | | 61,534 | | | | 2,376 | | | | – | | | | 6,910 | | | | 60,117 | | | | 2.2 | |
Limited Maturity Bond, Class S | | | 35,192 | | | | 843 | | | | – | | | | 2,888 | | | | 35,524 | | | | 1.3 | |
Total Affiliated Fixed Income Holdings | | | 137,321 | | | | | | | | | | | | | | | | 142,963 | | | | 5.3 | |
Affiliated Short-Term Investments | | | | | | | | | | | | | | | | | | | | | | | | |
Core Short-Term Reserve, 2.430% | | | 357,318 | | | | 550,210 | | | | 557,474 | | | | 35,005 | | | | 350,054 | | | | 13.0 | |
Total Affiliated Short-Term Investments | | | 357,318 | | | | | | | | | | | | | | | | 350,054 | | | | 13.0 | |
Collateral Held for Securities Loaned | | | | | | | | | | | | | | | | | | | | | | | | |
Cash Management Trust- Collateral Investment | | | 2,793 | | | | 155,676 | | | | 143,664 | | | | 14,805 | | | | 14,805 | | | | 0.5 | |
Total Collateral Held for Securities Loaned | | | 2,793 | | | | | | | | | | | | | | | | 14,805 | | | | 0.5 | |
Total Value | | | $1,451,147 | | | | | | | | | | | | | | | | $1,637,725 | | | | | |
| * | Non-income producing security. |
The accompanying Notes to Financial Statements are an integral part of this schedule.
133
MODERATELY AGGRESSIVE ALLOCATION FUND
Summary Schedule of Investments as of October 31, 2018
| | | | | | | | | | | | | | | | |
| Fund | | Net Realized
Gain/(Loss) | | | Change in Unrealized Appreciation/ (Depreciation) | | | Distributions of
Realized Capital Gains | | | Income Earned
11/1/2017 - 10/31/2018 | |
Affiliated Equity Holdings | | | | | | | | | | | | | | | | |
Core International Equity | | | $– | | | | $(6,193 | ) | | | $– | | | | $113 | |
Core Low Volatility Equity Fund* | | | – | | | | 4,516 | | | | – | | | | – | |
Large Cap Growth, Class S | | | – | | | | 19,665 | | | | 4,177 | | | | – | |
Large Cap Stock, Class S | | | – | | | | (11,381 | ) | | | 10,384 | | | | 1,696 | |
Large Cap Value, Class S | | | – | | | | 591 | | | | 8,429 | | | | 3,087 | |
Mid Cap Stock, Class S | | | – | | | | (5,123 | ) | | | 11,816 | | | | – | |
Partner Worldwide Allocation, Class S | | | – | | | | (34,463 | ) | | | 3,249 | | | | 6,043 | |
Small Cap Stock, Class S | | | 278 | | | | (1,259 | ) | | | 2,935 | | | | – | |
Affiliated Fixed Income Holdings | | | | | | | | | | | | | | | | |
Core Emerging Markets Debt | | | – | | | | (2,061 | ) | | | – | | | | 978 | |
High Yield, Class S | | | – | | | | (1,138 | ) | | | – | | | | 1,168 | |
Income, Class S | | | – | | | | (3,792 | ) | | | 206 | | | | 2,170 | |
Limited Maturity Bond, Class S | | | – | | | | (512 | ) | | | – | | | | 843 | |
Affiliated Short-Term Investments | | | | | | | | | | | | | | | | |
Core Short-Term Reserve, 2.430% | | | – | | | | – | | | | 4 | | | | 6,406 | |
Total Income from Affiliated Investments | | | | | | | | | | | | | | | $22,504 | |
Collateral Held for Securities Loaned | | | | | | | | | | | | | | | | |
Cash Management Trust-Collateral Investment | | | – | | | | – | | | | – | | | | 171 | |
Total Affiliated Income from Securities Loaned, Net | | | | | | | | | | | | | | | $171 | |
Total | | | $278 | | | | $(41,150 | ) | | | $41,200 | | | | | |
| * | Non-income producing security. |
The accompanying Notes to Financial Statements are an integral part of this schedule.
134
MODERATELY CONSERVATIVE ALLOCATION FUND
Summary Schedule of Investments as of October 31, 2018
| | | | | | | | | | | | |
Principal
Amount | | | Bank Loans (2.9%) | | Value | | | % of Net
Assets | |
| | Basic Materials (0.2%) | | | | | | | | |
| | | | Other Securities^ | | | $2,269,211 | | | | 0.2 | % |
| | | | | |
| | | | Total | | | 2,269,211 | | | | | |
| | | | | |
| | |
| | Capital Goods (0.2%) | | | | | | | | |
| | | | Other Securities^ | | | 1,431,024 | | | | 0.2 | % |
| | | | | |
| | | | Total | | | 1,431,024 | | | | | |
| | | | | |
| | |
| | Communications Services (0.7%) | | | | | | | | |
| | | | Other Securities^ | | | 5,928,937 | | | | 0.7 | % |
| | | | | |
| | | | Total | | | 5,928,937 | | | | | |
| | | | | |
| | |
| | Consumer Cyclical (0.4%) | | | | | | | | |
| | | | Other Securities^ | | | 3,157,342 | | | | 0.4 | % |
| | | | | |
| | | | Total | | | 3,157,342 | | | | | |
| | | | | |
| | |
| | Consumer Non-Cyclical (0.5%) | | | | | | | | |
| | | | Other Securities^ | | | 4,359,872 | | | | 0.5 | % |
| | | | | |
| | | | Total | | | 4,359,872 | | | | | |
| | | | | |
| | |
| | Energy (0.2%) | | | | | | | | |
| | | | Other Securities^ | | | 2,158,062 | | | | 0.2 | % |
| | | | | |
| | | | Total | | | 2,158,062 | | | | | |
| | | | | |
| | |
| | Financials (0.3%) | | | | | | | | |
| | | | Other Securities^ | | | 2,298,654 | | | | 0.3 | % |
| | | | | |
| | | | Total | | | 2,298,654 | | | | | |
| | | | | |
| | |
| | Technology (0.3%) | | | | | | | | |
| | | | Other Securities^ | | | 2,449,379 | | | | 0.3 | % |
| | | | | |
| | | | Total | | | 2,449,379 | | | | | |
| | | | | |
| | |
| | Transportation (<0.1%) | | | | | | | | |
| | | | Other Securities^ | | | 497,115 | | | | <0.1 | % |
| | | | | |
| | | | Total | �� | | 497,115 | | | | | |
| | | | | |
| | |
| | Utilities (0.1%) | | | | | | | | |
| | | | Other Securities^ | | | 964,830 | | | | 0.1 | % |
| | | | | |
| | | | Total | | | 964,830 | | | | | |
| | | | | |
| | | | | | | | | | | | |
| | | | | |
| | | | Total Bank Loans (cost $25,868,806) | | | 25,514,426 | | | | | |
| | | | | |
| | | |
Principal
Amount | | | Long-Term Fixed Income (42.9%) | | Value | | | % of Net
Assets | |
| | Asset-Backed Securities (1.8%) | | | | | | | | |
| | | | Buttermilk Park CLO, Ltd. | | | | | | | | |
| | $925,000 | | | 3.738%, (LIBOR 3M + 1.400%), 10/15/2031, Ser. 2018-1A, Class A2*,a | | | 924,969 | | | | 0.1 | % |
| | | | Federal Home Loan Mortgage Corporation Multifamily Structured Pass Through Certificates | | | | | | | | |
| | 1,050,000 | | | 3.900%, 8/25/2028, Ser. K081, Class A2a | | | 1,057,401 | | | | 0.1 | % |
| | | | Harley Marine Financing, LLC | | | | | | | | |
| | 1,283,750 | | | 5.682%, 5/15/2043, Ser. 2018-1A, Class A2* | | | 1,187,469 | | | | 0.1 | % |
| | | | Renaissance Home Equity Loan Trust | | | | | | | | |
| | 1,543,698 | | | 6.011%, 5/25/2036, Ser. 2006-1, Class AF4b | | | 1,126,931 | | | | 0.1 | % |
| | | | Other Securities^ | | | 11,321,131 | | | | 1.4 | % |
| | | | | |
| | | | Total | | | 15,617,901 | | | | | |
| | | | | |
| | |
| | Basic Materials (0.6%) | | | | | | | | |
| | | | Other Securities^ | | | 5,443,408 | | | | 0.6 | % |
| | | | | |
| | | | Total | | | 5,443,408 | | | | | |
| | | | | |
| | |
| | Capital Goods (0.8%) | | | | | | | | |
| | | | Other Securities^ | | | 7,161,736 | | | | 0.8 | % |
| | | | | |
| | | | Total | | | 7,161,736 | | | | | |
| | | | | |
| | |
| | Collateralized Mortgage Obligations (1.7%) | | | | | | | | |
| | | | Angel Oak Mortgage Trust I, LLC | | | | | | | | |
| | 1,318,954 | | | 3.674%, 7/27/2048, Ser. 2018-2, Class A1a,c | | | 1,316,324 | | | | 0.2 | % |
| | | | CHL Mortgage Pass-Through Trust | | | | | | | | |
| | 1,455,224 | | | 6.000%, 11/25/2037, Ser. 2007-18, Class 1A2 | | | 1,240,143 | | | | 0.2 | % |
| | | | CIM Trust | | | | | | | | |
| | 1,090,965 | | | 5.000%, 12/25/2057, Ser. 2018-R3, Class A1*,a | | | 1,128,929 | | | | 0.1 | % |
| | | | Federal Home Loan Mortgage Corporation | | | | | | | | |
| | 1,455,982 | | | 3.000% - 3.000%, 4/15/2028 - 2/15/2033, Ser. 4170, Class IGd | | | 139,699 | | | | <0.1 | % |
| | | | Federal National Mortgage Association | | | | | | | | |
| | 1,332,656 | | | 3.500%, 1/25/2033, Ser. 2012-150, Class YId | | | 170,122 | | | | <0.1 | % |
| | | | Other Securities^ | | | 10,354,011 | | | | 1.2 | % |
| | | | | |
| | | | Total | | | 14,349,228 | | | | | |
| | | | | |
| | |
| | Commercial Mortgage-Backed Securities (1.5%) | | | | | | | | |
| | | | Benchmark 2018-B5 Mortgage Trust | | | | | | | | |
| | 950,000 | | | 4.208%, 7/15/2051, Ser. 2018-B5, Class A4 | | | 961,501 | | | | 0.1 | % |
| | | | Federal Home Loan Mortgage Corporation Multifamily Structured Pass Through Certificates | | | | | | | | |
| | 700,000 | | | 3.900%, 4/25/2028, Ser. K076, Class A2e | | | 707,899 | | | | 0.1 | % |
The accompanying Notes to Financial Statements are an integral part of this schedule.
135
MODERATELY CONSERVATIVE ALLOCATION FUND
Summary Schedule of Investments as of October 31, 2018
| | | | | | | | | | | | |
Principal
Amount | | | Long-Term Fixed Income (42.9%) | | Value | | | % of Net
Assets | |
| | Commercial Mortgage-Backed Securities (1.5%) - continued | | | | | | | | |
| | | | Federal National Mortgage Association - ACES | | | | | | | | |
| | $900,000 | | | 2.961%, 2/25/2027, Ser. 2017-M7, Class A2a | | | $850,791 | | | | 0.1 | % |
| | 775,000 | | | 3.052%, 3/25/2028, Ser. 2018-M7, Class A2a | | | 730,761 | | | | 0.1 | % |
| | 700,000 | | | 2.785%, 2/25/2027, Ser. 2017-M2, Class A2a | | | 658,091 | | | | 0.1 | % |
| | 475,000 | | | 2.485%, 12/25/2026, Ser. 2017-M3, Class A2a | | | 436,650 | | | | <0.1 | % |
| | | | Federal National Mortgage Association Grantor Trust | | | | | | | | |
| | 923,973 | | | 2.898%, 6/25/2027, Ser. 2017-T1, Class Ae | | | 860,251 | | | | 0.1 | % |
| | | | Morgan Stanley Capital I, Inc. | | | | | | | | |
| | 1,000,000 | | | 4.177%, 7/15/2051, Ser. 2018-H3, Class A5 | | | 1,008,157 | | | | 0.1 | % |
| | | | UBS Commercial Mortgage Trust | | | | | | | | |
| | 972,626 | | | 3.400%, 5/10/2045, Ser. 2012-C1, Class A3 | | | 969,198 | | | | 0.1 | % |
| | | | Other Securities^ | | | 5,569,801 | | | | 0.7 | % |
| | | | | |
| | | | Total | | | 12,753,100 | | | | | |
| | | | | |
| | |
| | Communications Services (1.7%) | | | | | | | | |
| | | | Other Securities^ | | | 14,911,755 | | | | 1.7 | % |
| | | | | |
| | | | Total | | | 14,911,755 | | | | | |
| | | | | |
| | |
| | Consumer Cyclical (1.3%) | | | | | | | | |
| | | | Other Securities^ | | | 11,042,850 | | | | 1.3 | % |
| | | | | |
| | | | Total | | | 11,042,850 | | | | | |
| | | | | |
| | |
| | Consumer Non-Cyclical (2.1%) | | | | | | | | |
| | | | Other Securities^ | | | 18,490,702 | | | | 2.1 | % |
| | | | | |
| | | | Total | | | 18,490,702 | | | | | |
| | | | | |
| | |
| | Energy (1.9%) | | | | | | | | |
| | | | Other Securities^ | | | 16,467,127 | | | | 1.9 | % |
| | | | | |
| | | | Total | | | 16,467,127 | | | | | |
| | | | | |
| | |
| | Financials (5.1%) | | | | | | | | |
| | | | Other Securities^ | | | 44,552,285 | | | | 5.1 | % |
| | | | | |
| | | | Total | | | 44,552,285 | | | | | |
| | | | | |
| | |
| | Foreign Government (<0.1%) | | | | | | | | |
| | | | Other Securities^ | | | 236,997 | | | | <0.1 | % |
| | | | | |
| | | | Total | | | 236,997 | | | | | |
| | | | | |
| | |
| | Mortgage-Backed Securities (11.7%) | | | | | | | | |
| | | | Federal Home Loan Mortgage Corporation Gold 30-Yr. Pass Through | | | | | | | | |
| | 11,770,000 | | | 4.000%, 11/1/2048f | | | 11,774,079 | | | | 1.4 | % |
| | | | Federal Home Loan Mortgage Corporation Multifamily Structured Pass Through Certificates | | | | | | | | |
| | 474,549 | | | 3.000%, 3/15/2045, Ser. 4741, Class GA | | | 463,473 | | | | 0.1 | % |
| | | | Federal National Mortgage Association | | | | | | | | |
| | 999,000 | | | 3.640% - 3.710%, 6/1/2028-7/1/2028 | | | 983,520 | | | | 0.1 | % |
| | | | Federal National Mortgage Association Conventional 15- Yr. Pass Through | | | | | | | | |
| | 5,670,000 | | | 3.500%, 11/1/2033f | | | 5,665,238 | | | | 0.6 | % |
| | | | Federal National Mortgage Association Conventional 30- Yr. Pass Through | | | | | | | | |
| | 26,250,000 | | | 3.500%, 11/1/2048f | | | 25,553,761 | | | | 2.9 | % |
| | 23,905,000 | | | 4.000%, 11/1/2048f | | | 23,904,900 | | | | 2.8 | % |
| | 28,675,000 | | | 4.500%, 11/1/2048f | | | 29,358,833 | | | | 3.4 | % |
| | 3,450,000 | | | 5.000%, 11/1/2048f | | | 3,600,129 | | | | 0.4 | % |
| | 256,076 | | | 4.281%, (LIBOR 12M + 1.550%), 7/1/2043a | | | 264,018 | | | | <0.1 | % |
| | | | | |
| | | | Total | | | 101,567,951 | | | | | |
| | | | | |
| | |
| | Technology (1.1%) | | | | | | | | |
| | | | Other Securities^ | | | 9,492,370 | | | | 1.1 | % |
| | | | | |
| | | | Total | | | 9,492,370 | | | | | |
| | | | | |
| | |
| | Transportation (0.2%) | | | | | | | | |
| | | | Other Securities^ | | | 2,020,714 | | | | 0.2 | % |
| | | | | |
| | | | Total | | | 2,020,714 | | | | | |
| | | | | |
| | |
| | U.S. Government and Agencies (10.1%) | | | | | | | | |
| | | | Federal National Mortgage Association - ACES | | | | | | | | |
| | 1,200,000 | | | 3.639%, 8/25/2030, Ser. 2018-M12, Class A2a | | | 1,173,807 | | | | 0.1 | % |
| | | | U.S. Treasury Bonds | | | | | | | | |
| | 6,000,000 | | | 2.875%, 5/15/2028 | | | 5,866,875 | | | | 0.7 | % |
| | 2,000,000 | | | 3.000%, 5/15/2042 | | | 1,878,594 | | | | 0.2 | % |
| | 4,999,000 | | | 2.500%, 5/15/2046 | | | 4,198,965 | | | | 0.5 | % |
| | 1,005.000 | | | 3.000%, 5/15/2047 | | | 933,472 | | | | 0.1 | % |
| | 799,000 | | | 2.250% - 4.375%, 11/15/2027 - 11/15/2047 | | | 864,339 | | | | 0.1 | % |
| | | | U.S. Treasury Bonds, TIPS | | | | | | | | |
| | 3,823,260 | | | 0.125%, 1/15/2023 | | | 3,679,567 | | | | 0.4 | % |
| | 3,914,287 | | | 0.375%, 1/15/2027 | | | 3,684,425 | | | | 0.4 | % |
| | 5,978,350 | | | 0.375%, 7/15/2027 | | | 5,625,954 | | | | 0.7 | % |
| | | | U.S. Treasury Notes | | | | | | | | |
| | 1,900,000 | | | 1.000%, 10/15/2019 | | | 1,869,645 | | | | 0.2 | % |
| | 5,400,000 | | | 1.500%, 10/31/2019 | | | 5,335,032 | | | | 0.6 | % |
| | 4,450,000 | | | 1.750%, 11/30/2019 | | | 4,403,414 | | | | 0.5 | % |
| | 1,170,000 | | | 2.250%, 3/31/2020 | | | 1,160,814 | | | | 0.2 | % |
| | 5,500,000 | | | 1.375%, 9/30/2020 | | | 5,348,320 | | | | 0.6 | % |
| | 1,000,000 | | | 1.375%, 5/31/2021 | | | 961,953 | | | | 0.1 | % |
| | 9,210,000 | | | 1.125%, 8/31/2021 | | | 8,761,372 | | | | 1.0 | % |
| | 6,250,000 | | | 1.875%, 7/31/2022 | | | 6,010,254 | | | | 0.7 | % |
The accompanying Notes to Financial Statements are an integral part of this schedule.
136
MODERATELY CONSERVATIVE ALLOCATION FUND
Summary Schedule of Investments as of October 31, 2018
| | | | | | | | | | | | |
Principal
Amount | | | Long-Term Fixed Income (42.9%) | | Value | | | % of Net
Assets | |
| | U.S. Government and Agencies (10.1%) - continued | | | | | | | | |
| $ | 22,765,000 | | | 2.000%, 11/30/2022 | | | $21,921,984 | | | | 2.5 | % |
| | 1,700,000 | | | 2.500%, 3/31/2023 | | | 1,666,863 | | | | 0.2 | % |
| | 1,350,000 | | | 2.125%, 7/31/2024 | | | 1,285,980 | | | | 0.2 | % |
| | 930,000 | | | 1.875% - 2.250%, 12/15/2020 -11/15/2024 | | | 892,507 | | | | 0.1 | % |
| | | | | |
| | | | Total | | | 87,524,136 | | | | | |
| | | | | |
| | |
| | Utilities (1.3%) | | | | | | | | |
| | | | Other Securities^ | | | 10,777,389 | | | | 1.3 | % |
| | | | | |
| | | | Total | | | 10,777,389 | | | | | |
| | | | | |
| | | | | |
| | | | | |
| | | | Total Long-Term Fixed Income (cost $381,263,892) | | | 372,409,649 | | | | | |
| | | | | |
| | | |
| Shares | | | Registered Investment Companies (38.3%) | | Value | | | % of Net
Assets | |
| | Affiliated Equity Holdings (20.4%) | | | | | | | | |
| | 901,262 | | | Thrivent Core International Equity Fund | | | 8,363,712 | | | | 1.0 | % |
| | 1,506,620 | | | Thrivent Core Low Volatility Equity Fundg | | | 15,879,780 | | | | 1.8 | % |
| | 2,500,175 | | | Thrivent Large Cap Growth Fund, Class S | | | 31,177,183 | | | | 3.6 | % |
| | 47,463 | | | Thrivent Large Cap Stock Fund, Class S | | | 1,275,816 | | | | 0.1 | % |
| | 2,752,709 | | | Thrivent Large Cap Value Fund, Class S | | | 63,037,043 | | | | 7.3 | % |
| | 606,458 | | | Thrivent Mid Cap Stock Fund, Class S | | | 17,017,212 | | | | 2.0 | % |
| | 3,627,422 | | | Thrivent Partner Worldwide Allocation Fund, Class S | | | 35,802,660 | | | | 4.1 | % |
| | 171,214 | | | Thrivent Small Cap Stock Fund, Class S | | | 4,511,488 | | | | 0.5 | % |
| | | | | |
| | | | Total | | | 177,064,894 | | | | | |
| | | | | |
| | |
| | Affiliated Fixed Income Holdings (17.1%) | | | | | | | | |
| | 2,423,815 | | | Thrivent Core Emerging Markets Debt Fund | | | 21,911,292 | | | | 2.5 | % |
| | 4,748,326 | | | Thrivent High Yield Fund, Class S | | | 22,032,233 | | | | 2.5 | % |
| | 7,626,300 | | | Thrivent Income Fund, Class S | | | 66,348,810 | | | | 7.7 | % |
| | 3,110,740 | | | Thrivent Limited Maturity Bond Fund, Class S | | | 38,262,097 | | | | 4.4 | % |
| | | | | |
| | | | Total | | | 148,554,432 | | | | | |
| | | | | |
| | |
| | Equity Funds/Exchange Traded Funds (0.5%) | | | | | | | | |
| | 11,372 | | | SPDR S&P 500 ETF Trust | | | 3,077,604 | | | | 0.4 | % |
| | | | Other Securities^ | | | 1,772,805 | | | | 0.1 | % |
| | | | | |
| | | | Total | | | 4,850,409 | | | | | |
| | | | | |
| | |
| | Fixed Income Funds/Exchange Traded Funds (0.3%) | | | | | | | | |
| | 32,000 | | | iShares Short-Term Corporate Bond ETF | | | 1,652,480 | | | | 0.2 | % |
| | | | Other Securities^ | | | 862,875 | | | | 0.1 | % |
| | | | | |
| | | | Total | | | 2,515,355 | | | | | |
| | | | | |
| | | | | |
| | | | | |
| | | | Total Registered Investment Companies (cost $272,961,090) | | | 332,985,090 | | | | | |
| | | | | |
| | | |
| Shares | | | Common Stock (13.1%) | | Value | | | % of Net Assets | |
| | Communications Services (0.6%) | | | | | | | | |
| | 870 | | | Alphabet, Inc., Class Ag | | | 948,805 | | | | 0.1 | % |
| | | | Other Securities^ | | | 3,894,516 | | | | 0.5 | % |
| | | | | |
| | | | Total | | | 4,843,321 | | | | | |
| | | | | |
| | |
| | Consumer Discretionary (1.2%) | | | | | | | | |
| | 967 | | | Amazon.com, Inc.g | | | 1,545,276 | | | | 0.2 | % |
| | | | Other Securities^ | | | 8,757,810 | | | | 1.0 | % |
| | | | | |
| | | | Total | | | 10,303,086 | | | | | |
| | | | | |
| | |
| | Consumer Staples (0.4%) | | | | | | | | |
| | | | Other Securities^ | | | 3,340,992 | | | | 0.4 | % |
| | | | | |
| | | | Total | | | 3,340,992 | | | | | |
| | | | | |
| | |
| | Energy (0.6%) | | | | | | | | |
| | | | Other Securities^ | | | 5,185,938 | | | | 0.6 | % |
| | | | | |
| | | | Total | | | 5,185,938 | | | | | |
| | | | | |
| | |
| | Financials (2.5%) | | | | | | | | |
| | 20,131 | | | Citigroup, Inc. | | | 1,317,775 | | | | 0.2 | % |
| | | | Other Securities^ | | | 20,397,840 | | | | 2.3 | % |
| | | | | |
| | | | Total | | | 21,715,615 | | | | | |
| | | | | |
| | |
| | Health Care (1.8%) | | | | | | | | |
| | 6,818 | | | Johnson & Johnson | | | 954,452 | | | | 0.1 | % |
| | 23,160 | | | Pfizer, Inc. | | | 997,270 | | | | 0.1 | % |
| | 5,519 | | | UnitedHealth Group, Inc. | | | 1,442,391 | | | | 0.2 | % |
| | | | Other Securities^ | | | 12,234,615 | | | | 1.4 | % |
| | | | | |
| | | | Total | | | 15,628,728 | | | | | |
| | | | | |
| | |
| | Industrials (1.8%) | | | | | | | | |
| | 7,329 | | | Honeywell International, Inc. | | | 1,061,386 | | | | 0.1 | % |
| | | | Other Securities^ | | | 15,066,663 | | | | 1.7 | % |
| | | | | |
| | | | Total | | | 16,128,049 | | | | | |
| | | | | |
| | |
| | Information Technology (2.9%) | | | | | | | | |
| | 10,406 | | | Amphenol Corporation | | | 931,337 | | | | 0.1 | % |
| | 7,648 | | | Apple, Inc. | | | 1,673,841 | | | | 0.2 | % |
| | 36,627 | | | Cisco Systems, Inc. | | | 1,675,685 | | | | 0.2 | % |
| | 6,626 | | | MasterCard, Inc. | | | 1,309,761 | | | | 0.2 | % |
The accompanying Notes to Financial Statements are an integral part of this schedule.
137
MODERATELY CONSERVATIVE ALLOCATION FUND
Summary Schedule of Investments as of October 31, 2018
| | | | | | | | | | | | |
| Shares | | | Common Stock (13.1%) | | Value | | | % of Net
Assets | |
| | Information Technology (2.9%) - continued | | | | | | | | |
| | 16,292 | | | Microsoft Corporation | | $ | 1,740,149 | | | | 0.2 | % |
| | | | Other Securities^ | | | 17,776,294 | | | | 2.0 | % |
| | | | | |
| | | | Total | | | 25,107,067 | | | | | |
| | | | | |
| | |
| | Materials (0.4%) | | | | | | | | |
| | | | Other Securities^ | | | 3,956,225 | | | | 0.4 | % |
| | | | | |
| | | | Total | | | 3,956,225 | | | | | |
| | | | | |
| | |
| | Real Estate (0.6%) | | | | | | | | |
| | | | Other Securities^ | | | 5,178,579 | | | | 0.6 | % |
| | | | | |
| | | | Total | | | 5,178,579 | | | | | |
| | | | | |
| | |
| | Utilities (0.3%) | | | | | | | | |
| | | | Other Securities^ | | | 2,236,386 | | | | 0.3 | % |
| | | | | |
| | | | Total | | | 2,236,386 | | | | | |
| | | | | |
| | | | | |
| | | | | |
| | | | Total Common Stock (cost $95,931,012) | | | 113,623,986 | | | | | |
| | | | | |
| | | |
| Shares | | | Collateral Held for Securities Loaned (0.5%) | | Value | | | % of Net
Assets | |
| | 4,038,165 | | | Thrivent Cash Management Trust | | | 4,038,165 | | | | 0.5 | % |
| | | | | |
| | | | Total Collateral Held for Securities Loaned (cost $4,038,165) | | | 4,038,165 | | | | | |
| | | | | |
| | | |
Shares or
Principal
Amount | | | Short-Term Investments (14.2%) | | Value | | | % of Net
Assets | |
| | | | Federal Home Loan Bank Discount Notes | | | | | | | | |
| | 3,460,000 | | | 2.240%, 1/16/2019h,i | | | 3,443,198 | | | | 0.4 | % |
| | | | U.S. Treasury Bills | | | | | | | | |
| | 400,000 | | | 2.126% - 2.181%, 12/13/2018 - 12/27/2018h,j | | | 398,728 | | | | <0.1 | % |
| | | | Thrivent Core Short-Term Reserve Fund | | | | | | | | |
| | 11,763,211 | | | 2.430% | | | 117,632,110 | | | | 13.6 | % |
| | | | Other Securities^ | | | 1,696,020 | | | | 0.2 | % |
| | | | | |
| | | | Total Short-Term Investments (cost $123,170,602) | | | 123,170,056 | | | | | |
| | | | | |
| | | | Total Investments (cost $903,233,567)111.9% | | $ | 971,741,372 | | | | | |
| | | | | |
| | | | Other Assets and Liabilities, Net (11.9%) | | | (103,222,170 | ) | | | | |
| | | | | |
| | | | Total Net Assets 100.0% | | $ | 868,519,202 | | | | | |
| | | | | |
| ^ | The Summary Schedule of Investments shows the 50 largest holdings in unaffiliated issuers, any holding or issuer that exceeds 1% of net assets and all affiliated holdings as of the report date. The remaining securities held are grouped by category as “Other securities”. |
| a | Denotes variable rate securities. The rate shown is as of October 31, 2018. The rates of certain variable rate securities are based on a published reference rate and spread; these may vary by security and the reference rate and spread are indicated in their description. The rates of other variable rate securities are determined by the issuer or agent and are based on current market conditions. These securities do not indicate a reference rate and spread in their description. |
| b | Denotes step coupon securities. Step coupon securities pay an initial coupon rate for the first period and then different coupon rates for following periods. The rate shown is as of October 31, 2018. |
| c | Denotes securities sold under Rule 144A of the Securities Act of 1933, which exempts them from registration. These securities may be resold to other dealers in the program or to other qualified institutional buyers. As of October 31, 2018, the value of these investments was $34,910,560 or 4.0% of total net assets. |
| d | Denotes interest only security. Interest only securities represent the right to receive monthly interest payments on an underlying pool of mortgages or assets. The principal shown is the outstanding par amount of the pool as of the end of the period. The actual effective yield of the security is different than the stated coupon rate. |
| e | All or a portion of the security is insured or guaranteed. |
| f | Denotes investments purchased on a when-issued or delayed delivery basis. |
| g | Non-income producing security. |
| h | The interest rate shown reflects the yield, coupon rate or the discount rate at the date of purchase. |
| i | All or a portion of the security is held on deposit with the counterparty and pledged as the initial margin deposit for open futures contracts. |
| j | At October 31, 2018, $126,657 of investments were segregated to cover exposure to a counterparty for margin on open mortgage-backed security transactions. |
| * | Denotes restricted securities. Restricted securities are investment securities which cannot be offered for public sale without first being registered under the Securities Act of 1933. The value of all restricted securities held in Moderately Conservative Allocation Fund as of October 31, 2018 was $13,844,456 or 1.6% of total net assets. The following table indicates the acquisition date and cost of restricted securities shown in the schedule as of October 31, 2018. |
| | | | | | | | |
| Security | | Acquisition Date | | | Cost | |
Buttermilk Park CLO, Ltd., | | | | | | | | |
10/15/2031 | | | 8/27/2018 | | | | $925,000 | |
CIM Trust, 12/25/2057 | | | 4/23/2018 | | | | 1,131,920 | |
Harley Marine Financing, LLC, | | | | |
5/15/2043 | | | 5/9/2018 | | | | 1,283,736 | |
The accompanying Notes to Financial Statements are an integral part of this schedule.
138
MODERATELY CONSERVATIVE ALLOCATION FUND
Summary Schedule of Investments as of October 31, 2018
The following table presents the total amount of securities loaned with continuous maturity, by type, offset by the gross payable upon return of collateral for securities loaned by Thrivent Moderately Conservative Allocation Fund as of October 31, 2018:
| | | | |
Securities Lending Transactions | | | | |
Taxable Debt Security | | | $2,787,795 | |
Common Stock | | | 1,138,470 | |
| | | | |
Total lending | | | $3,926,265 | |
Gross amount payable upon return of collateral for securities loaned | | | $4,038,165 | |
| | | | |
Net amounts due to counterparty | | | $111,900 | |
| | | | |
Definitions:
| | | | |
| ACES | | - | | Alternative Credit Enhancement Securities |
| ETF | | - | | Exchange Traded Fund |
| Ser. | | - | | Series |
| SPDR | | - | | S&P Depository Receipts, which are a family of exchange-traded funds traded in the U.S., Europe, and Asia-Pacific and managed by State Street Global Advisors. |
| TIPS | | - | | Treasury Inflation Protected Security |
Reference Rate Index:
| | | | |
| LIBOR 3M | | - | | ICE Libor USD Rate 3 Month |
| LIBOR 12M | | - | | ICE Libor USD Rate 12 Month |
Unrealized Appreciation (Depreciation)
Gross unrealized appreciation and depreciation of investments of the portfolio as a whole (including derivatives), based on cost for federal income tax purposes, were as follows:
| | | | |
Gross unrealized appreciation | | | $86,270,993 | |
Gross unrealized depreciation | | | (22,933,947 | ) |
| | | | |
Net unrealized appreciation (depreciation) | | | $63,337,046 | |
Cost for federal income tax purposes | | | $949,520,953 | |
The accompanying Notes to Financial Statements are an integral part of this schedule.
139
MODERATELY CONSERVATIVE ALLOCATION FUND
Summary Schedule of Investments as of October 31, 2018
Fair Valuation Measurements
The following table is a summary of the inputs used, as of October 31, 2018, in valuing Moderately Conservative Allocation Fund’s assets carried at fair value.
| | | | | | | | | | | | | | | | |
| Investments in Securities | | Total | | | Level 1 | | | Level 2 | | | Level 3 | |
Bank Loans | | | | | | | | | | | | | | | | |
Basic Materials | | | 2,269,211 | | | | – | | | | 2,060,264 | | | | 208,947 | |
Capital Goods | | | 1,431,024 | | | | – | | | | 1,431,024 | | | | – | |
Communications Services | | | 5,928,937 | | | | – | | | | 5,869,137 | | | | 59,800 | |
Consumer Cyclical | | | 3,157,342 | | | | – | | | | 3,157,342 | | | | – | |
Consumer Non-Cyclical | | | 4,359,872 | | | | – | | | | 4,359,872 | | | | – | |
Energy | | | 2,158,062 | | | | – | | | | 1,870,236 | | | | 287,826 | |
Financials | | | 2,298,654 | | | | – | | | | 2,001,872 | | | | 296,782 | |
Technology | | | 2,449,379 | | | | – | | | | 2,449,379 | | | | – | |
Transportation | | | 497,115 | | | | – | | | | 497,115 | | | | – | |
Utilities | | | 964,830 | | | | – | | | | 786,853 | | | | 177,977 | |
| | | | |
Long-Term Fixed Income | | | | | | | | | | | | | | | | |
Asset-Backed Securities | | | 15,617,901 | | | | – | | | | 15,617,901 | | | | – | |
Basic Materials | | | 5,443,408 | | | | – | | | | 5,443,408 | | | | – | |
Capital Goods | | | 7,161,736 | | | | – | | | | 7,161,736 | | | | – | |
Collateralized Mortgage Obligations | | | 14,349,228 | | | | – | | | | 14,349,228 | | | | – | |
Commercial Mortgage-Backed Securities | | | 12,753,100 | | | | – | | | | 12,753,100 | | | | – | |
Communications Services | | | 14,911,755 | | | | – | | | | 14,911,755 | | | | – | |
Consumer Cyclical | | | 11,042,850 | | | | – | | | | 11,042,850 | | | | – | |
Consumer Non-Cyclical | | | 18,490,702 | | | | – | | | | 18,490,702 | | | | – | |
Energy | | | 16,467,127 | | | | – | | | | 16,467,127 | | | | – | |
Financials | | | 44,552,285 | | | | – | | | | 44,552,285 | | | | – | |
Foreign Government | | | 236,997 | | | | – | | | | 236,997 | | | | – | |
Mortgage-Backed Securities | | | 101,567,951 | | | | – | | | | 101,567,951 | | | | – | |
Technology | | | 9,492,370 | | | | – | | | | 9,492,370 | | | | – | |
Transportation | | | 2,020,714 | | | | – | | | | 2,020,714 | | | | – | |
U.S. Government and Agencies | | | 87,524,136 | | | | – | | | | 87,524,136 | | | | – | |
Utilities | | | 10,777,389 | | | | – | | | | 10,777,389 | | | | – | |
| | | | |
Registered Investment Companies | | | | | | | | | | | | | | | | |
Affiliated Fixed Income Holdings | | | 126,643,140 | | | | 126,643,140 | | | | – | | | | – | |
Affiliated Equity Holdings | | | 152,821,402 | | | | 152,821,402 | | | | – | | | | – | |
Equity Funds/Exchange Traded Funds | | | 4,850,409 | | | | 4,850,409 | | | | – | | | | – | |
Fixed Income Funds/Exchange Traded Funds | | | 2,515,355 | | | | 2,515,355 | | | | – | | | | – | |
| | | | |
Common Stock | | | | | | | | | | | | | | | | |
Communications Services | | | 4,843,321 | | | | 4,843,321 | | | | – | | | | – | |
Consumer Discretionary | | | 10,303,086 | | | | 10,303,086 | | | | – | | | | – | |
Consumer Staples | | | 3,340,992 | | | | 3,340,992 | | | | – | | | | – | |
Energy | | | 5,185,938 | | | | 5,141,827 | | | | – | | | | 44,111 | |
Financials | | | 21,715,615 | | | | 21,715,615 | | | | – | | | | – | |
Health Care | | | 15,628,728 | | | | 15,628,728 | | | | – | | | | – | |
Industrials | | | 16,128,049 | | | | 16,128,049 | | | | – | | | | – | |
Information Technology | | | 25,107,067 | | | | 25,107,067 | | | | – | | | | – | |
Materials^ | | | 3,956,225 | | | | 3,956,225 | | | | – | | | | 0 | |
Real Estate | | | 5,178,579 | | | | 5,178,579 | | | | – | | | | – | |
Utilities | | | 2,236,386 | | | | 2,236,386 | | | | – | | | | – | |
| | | | |
Short-Term Investments | | | 5,537,946 | | | | – | | | | 5,537,946 | | | | – | |
| |
Subtotal Investments in Securities | | $ | 803,916,313 | | | $ | 400,410,181 | | | $ | 402,430,689 | | | $ | 1,075,443 | |
| |
| |
| | | | |
Other Investments* | | | Total | | | | | | | | | | | | | |
| | | | | | | | | | | | | |
Affiliated Registered Investment Companies | | | 46,154,784 | | | | | | | | | | | | | |
Short-Term Investments | | | 117,632,110 | | | | | | | | | | | | | |
Collateral Held for Securities Loaned | | | 4,038,165 | | | | | | | | | | | | | |
| | | | | | | | | | | | | |
Subtotal Other Investments | | $ | 167,825,059 | | | | | | | | | | | | | |
| | | | | | | | | | | | | |
| | | | | | | | | | | | | | | | |
| | | | | | | | | | | | | |
Total Investments at Value | | $ | 971,741,372 | | | | | | | | | | | | | |
| | | | | | | | | | | | | |
| * | Certain investments are measured at fair value using a net asset value per share that is not publicly available (practical expedient). According to disclosure requirements of Accounting Standards Codification (ASC) 820, Fair Value Measurement, securities valued using the practical expedient are not classified in the fair value hierarchy. The fair value amounts presented in this table are intended to permit reconciliation of the fair value hierarchy to the amounts presented in the Statement of Assets and Liabilities. |
| ^ | Level 3 security in this section is fair valued at <$1. |
The accompanying Notes to Financial Statements are an integral part of this schedule.
140
MODERATELY CONSERVATIVE ALLOCATION FUND
Summary Schedule of Investments as of October 31, 2018
| | | | | | | | | | | | | | | | |
| | | | |
| Other Financial Instruments | | Total | | | Level 1 | | | Level 2 | | | Level 3 | |
| | | | |
Asset Derivatives | | | | | | | | | | | | | | | | |
Futures Contracts | | | 4,986,233 | | | | 4,986,233 | | | | – | | | | – | |
| |
Total Asset Derivatives | | | $4,986,233 | | | | $4,986,233 | | | | $– | | | | $– | |
| |
| |
Liability Derivatives | | | | | | | | | | | | | | | | |
Futures Contracts | | | 5,040,742 | | | | 5,040,742 | | | | – | | | | – | |
| |
Total Liability Derivatives | | | $5,040,742 | | | | $5,040,742 | | | | $– | | | | $– | |
| |
| |
There were no significant transfers between Levels during the period ended October 31, 2018. Transfers between Levels are identified as of the end of the period.
The following table presents Moderately Conservative Allocation Fund’s futures contracts held as of October 31, 2018. Investments and/or cash totaling $5,139,218 were pledged as the initial margin deposit for these contracts.
| | | | | | | | | | | | | | | | |
| Futures Contracts Description | | Number of Contracts Long/(Short) | | | Expiration Date | | | Notional Principal Amount | | | Value and Unrealized | |
CBOT 10-Yr. U.S. Treasury Note | | | 90 | | | | December 2018 | | | | $10,697,374 | | | | ($37,999 | ) |
CBOT U.S. Long Bond | | | 247 | | | | December 2018 | | | | 35,523,132 | | | | (1,406,257 | ) |
CME E-mini S&P 500 Index | | | 317 | | | | December 2018 | | | | 45,034,802 | | | | (2,063,867 | ) |
ICE mini MSCI EAFE Index | | | 205 | | | | December 2018 | | | | 19,973,622 | | | | (1,395,497 | ) |
ICE US mini MSCI Emerging Markets Index | | | 40 | | | | December 2018 | | | | 2,050,522 | | | | (137,122 | ) |
| |
Total Futures Long Contracts | | | | | | | | | | | $113,279,452 | | | | ($5,040,742 | ) |
| |
CBOT 2-Yr. U.S. Treasury Note | | | (85 | ) | | | December 2018 | | | | ($17,973,257 | ) | | | $67,476 | |
CBOT 5-Yr. U.S. Treasury Note | | | (32 | ) | | | December 2018 | | | | (3,630,401 | ) | | | 34,151 | |
CME E-mini NASDAQ 100 Index | | | (143 | ) | | | December 2018 | | | | (21,677,076 | ) | | | 1,727,146 | |
CME E-mini Russell 2000 Index | | | (123 | ) | | | December 2018 | | | | (10,580,718 | ) | | | 1,282,533 | |
CME E-mini S&P Mid-Cap 400 Index | | | (75 | ) | | | December 2018 | | | | (15,374,377 | ) | | | 1,688,377 | |
CME Ultra Long Term U.S. Treasury Bond | | | (18 | ) | | | December 2018 | | | | (2,872,487 | ) | | | 186,550 | |
| |
Total Futures Short Contracts | | | | | | | | | | | ($72,108,316 | ) | | | $4,986,233 | |
| |
Total Futures Contracts | | | | | | | | | | | $41,171,136 | | | | ($54,509 | ) |
| |
| | | | |
Reference Description: |
| CBOT | | - | | Chicago Board of Trade |
| CME | | - | | Chicago Mercantile Exchange |
| EAFE | | - | | Europe, Australasia and Far East |
| ICE | | - | | Intercontinental Exchange |
| MSCI | | - | | Morgan Stanley Capital International |
| NASDAQ | | - | | National Association of Securities Dealers Automated Quotations |
| S&P | | - | | Standard & Poor’s |
The accompanying Notes to Financial Statements are an integral part of this schedule.
141
MODERATELY CONSERVATIVE ALLOCATION FUND
Summary Schedule of Investments as of October 31, 2018
The following table summarizes the fair value and Statement of Assets and Liabilities location, as of October 31, 2018, for Moderately Conservative Allocation Fund’s investments in financial derivative instruments by primary risk exposure as discussed under item (2) Significant Accounting Policies of the Notes to Financial Statements.
| | | | | | |
| Derivatives by risk category | | Statement of Assets and Liabilities Location | | Fair Value | |
| | |
Asset Derivatives | | | | | | |
| | |
Interest Rate Contracts | | | | | | |
Futures* | | Net Assets - Accumulated undistributed earnings/(loss) | | | $288,177 | |
Total Interest Rate Contracts | | | 288,177 | |
| | |
Equity Contracts | | | | | | |
Futures* | | Net Assets - Accumulated undistributed earnings/(loss) | | | 4,698,056 | |
Total Equity Contracts | | | 4,698,056 | |
| |
Total Asset Derivatives | | | $4,986,233 | |
| |
| |
| | |
Liability Derivatives | | | | | | |
| | |
Interest Rate Contracts | | | | | | |
Futures* | | Net Assets - Accumulated undistributed earnings/(loss) | | | 1,444,256 | |
Total Interest Rate Contracts | | | 1,444,256 | |
| | |
Equity Contracts | | | | | | |
Futures* | | Net Assets - Accumulated undistributed earnings/(loss) | | | 3,596,486 | |
Total Equity Contracts | | | | | 3,596,486 | |
| |
Total Liability Derivatives | | | | | $5,040,742 | |
| |
| * | Includes cumulative appreciation/depreciation of futures contracts as reported in the Schedule of Investments. Only current day’s variation margin is reported within the Statement of Assets and Liabilities. |
The following table summarizes the net realized gains/(losses) and Statement of Operations location, for the period ended October 31, 2018, for Moderately Conservative Allocation Fund’s investments in financial derivative instruments by primary risk exposure.
| | | | | | |
| Derivatives by risk category | | Statement of Operations Location | | Realized Gains/(Losses) recognized in Income | |
| | |
Interest Rate Contracts | | | | | | |
Options Written | | Net realized gains/(losses) on Written option contracts | | | 51,524 | |
Options Purchased | | Net realized gains/(losses) on Investments | | | 113,203 | |
Futures | | Net realized gains/(losses) on Futures contracts | | | (1,305,409 | ) |
Total Interest Rate Contracts | | | | | (1,140,682 | ) |
| | |
Equity Contracts | | | | | | |
Futures | | Net realized gains/(losses) on Futures contracts | | | (4,742,965 | ) |
Total Equity Contracts | | | | | (4,742,965 | ) |
| |
Total | | | | | ($5,883,647 | ) |
| |
The following table summarizes the change in net unrealized appreciation/(depreciation) and Statement of Operations location, for the period ended October 31, 2018, for Moderately Conservative Allocation Fund’s investments in financial derivative instruments by primary risk exposure.
| | | | |
| Derivatives by risk category | | Statement of Operations Location | | Change in unrealized appreciation/(depreciation) recognized in Income |
| | |
Interest Rate Contracts | | | | |
Futures | | Change in net unrealized appreciation/(depreciation) on Futures contracts | | (620,597) |
Total Interest Rate Contracts | | | | (620,597) |
| | |
Equity Contracts | | | | |
Futures | | Change in net unrealized appreciation/(depreciation) on Futures contracts | | 2,598,436 |
Total Equity Contracts | | | | 2,598,436 |
| | | | | |
Total | | | | $1,977,839 |
|
The accompanying Notes to Financial Statements are an integral part of this schedule.
142
MODERATELY CONSERVATIVE ALLOCATION FUND
Summary Schedule of Investments as of October 31, 2018
The following table presents Moderately Conservative Allocation Fund’s average volume of derivative activity during the period ended October 31, 2018.
| | | | |
| Derivative Risk Category | | Average Notional Value | |
Equity Contracts | | | | |
Futures - Long | | | $48,255,460 | |
Futures - Short | | | (42,578,879 | ) |
Interest Rate Contracts | | | | |
Futures - Long | | | 36,311,115 | |
Futures - Short | | | (25,829,700 | ) |
Purchased Options | | | 1,738,313 | |
Written Options | | | (1,920,035 | ) |
Investment in Affiliates
Affiliated issuers, as defined under the Investment Company Act of 1940, include those in which the Fund’s holdings of an issuer represent 5% or more of the outstanding voting securities of an issuer, any affiliated mutual fund, or a company which is under common ownership or control with the Fund. The Fund owns shares of Thrivent Cash Management Trust for the purpose of securities lending and Thrivent Core Short-Term Reserve Fund primarily to serve as a cash sweep vehicle for the Fund. Thrivent Cash Management Trust and Thrivent Core Funds are established solely for investment by Thrivent entities.
A summary of transactions (in thousands) for the fiscal year to date, in Moderately Conservative Allocation Fund, is as follows:
| | | | | | | | | | | | | | | | | | | | | | | | |
| Fund | | Value
10/31/2017 | | | Gross Purchases | | | Gross Sales | | | Shares Held at 10/31/2018 | | | Value 10/31/2018 | | | % of Net
Assets | |
Affiliated Equity Holdings | | | | | | | | | | | | | | | | | | | | | | | | |
Core International Equity | | | $– | | | | $9,012 | | | | $– | | | | 901 | | | | $8,364 | | | | 1.0 | % |
Core Low Volatility Equity* | | | – | | | | 15,000 | | | | – | | | | 1,507 | | | | 15,880 | | | | 1.8 | |
Large Cap Growth, Class S | | | 27,421 | | | | 658 | | | | – | | | | 2,500 | | | | 31,177 | | | | 3.6 | |
Large Cap Stock, Class S | | | 1,269 | | | | 123 | | | | – | | | | 47 | | | | 1,276 | | | | 0.1 | |
Large Cap Value, Class S | | | 59,555 | | | | 3,312 | | | | – | | | | 2,753 | | | | 63,037 | | | | 7.3 | |
Mid Cap Stock, Class S | | | 16,307 | | | | 1,254 | | | | – | | | | 606 | | | | 17,017 | | | | 2.0 | |
Partner Worldwide Allocation, Class S | | | 39,837 | | | | 1,489 | | | | – | | | | 3,627 | | | | 35,803 | | | | 4.1 | |
Small Cap Stock, Class S | | | 5,666 | | | | 366 | | | | 1,372 | | | | 171 | | | | 4,511 | | | | 0.5 | |
| |
Total Affiliated Equity Holdings | | | 150,055 | | | | | | | | | | | | | | | | 177,065 | | | | 20.4 | |
| |
Affiliated Fixed Income Holdings | | | | | | | | | | | | | | | | | | | | | | | | |
Core Emerging Markets Debt | | | 19,460 | | | | 4,220 | | | | – | | | | 2,424 | | | | 21,911 | | | | 2.5 | |
High Yield, Class S | | | 22,001 | | | | 1,230 | | | | – | | | | 4,748 | | | | 22,032 | | | | 2.5 | |
Income, Class S | | | 67,912 | | | | 2,622 | | | | – | | | | 7,626 | | | | 66,349 | | | | 7.7 | |
Limited Maturity Bond, Class S | | | 37,906 | | | | 908 | | | | – | | | | 3,111 | | | | 38,262 | | | | 4.4 | |
| |
Total Affiliated Fixed Income Holdings | | | 147,279 | | | | | | | | | | | | | | | | 148,554 | | | | 17.1 | |
| |
Affiliated Short-Term Investments | | | | | | | | | | | | | | | | | | | | | | | | |
Core Short-Term Reserve, 2.430% | | | 133,154 | | | | 136,406 | | | | 151,928 | | | | 11,763 | | | | 117,632 | | | | 13.6 | |
| |
Total Affiliated Short-Term Investments | | | 133,154 | | | | | | | | | | | | | | | | 117,632 | | | | 13.6 | |
| |
Collateral Held for Securities Loaned | | | | | | | | | | | | | | | | | | | | | | | | |
Cash Management Trust-Collateral Investment | | | 2,075 | | | | 36,987 | | | | 35,024 | | | | 4,038 | | | | 4,038 | | | | 0.5 | |
| |
Total Collateral Held for Securities Loaned | | | 2,075 | | | | | | | | | | | | | | | | 4,038 | | | | 0.5 | |
| |
Total Value | | | $432,563 | | | | | | | | | | | | | | | | $447,289 | | | | | |
| |
| * | Non-income producing security. |
The accompanying Notes to Financial Statements are an integral part of this schedule.
143
MODERATELY CONSERVATIVE ALLOCATION FUND
Summary Schedule of Investments as of October 31, 2018
| | | | | | | | | | | | | | | | |
| Fund | | Net Realized Gain/(Loss) | | | Change in Unrealized Appreciation/ (Depreciation) | | | Distributions of Realized Capital Gains | | | Income Earned 11/1/2017
-10/31/2018 | |
Affiliated Equity Holdings | | | | | | | | | | | | | | | | |
Core International Equity | | | $– | | | | $(648 | ) | | | $– | | | | $12 | |
Core Low Volatility Equity Fund* | | | – | | | | 880 | | | | – | | | | – | |
Large Cap Growth, Class S | | | – | | | | 3,099 | | | | 658 | | | | – | |
Large Cap Stock, Class S | | | – | | | | (116 | ) | | | 105 | | | | 17 | |
Large Cap Value, Class S | | | – | | | | 170 | | | | 2,424 | | | | 888 | |
Mid Cap Stock, Class S | | | – | | | | (544 | ) | | | 1,254 | | | | – | |
Partner Worldwide Allocation, Class S | | | – | | | | (5,523 | ) | | | 521 | | | | 969 | |
Small Cap Stock, Class S | | | 185 | | | | (333 | ) | | | 366 | | | | – | |
Affiliated Fixed Income Holdings | | | | | | | | | | | | | | | | |
Core Emerging Markets Debt | | | – | | | | (1,769 | ) | | | – | | | | 887 | |
High Yield, Class S | | | – | | | | (1,199 | ) | | | – | | | | 1,230 | |
Income, Class S | | | – | | | | (4,185 | ) | | | 228 | | | | 2,394 | |
Limited Maturity Bond, Class S | | | – | | | | (552 | ) | | | – | | | | 908 | |
Affiliated Short-Term Investments | | | | | | | | | | | | | | | | |
Core Short-Term Reserve, 2.430% | | | – | | | | – | | | | 2 | | | | 2,579 | |
| |
Total Income from Affiliated Investments | | | | | | | | | | | | | | | $9,884 | |
| |
Collateral Held for Securities Loaned | | | | | | | | | | | | | | | | |
Cash Management Trust- Collateral Investment | | | – | | | | – | | | | – | | | | 21 | |
| |
Total Affiliated Income from Securities Loaned, Net | | | | | | | | | | | | | | | $21 | |
| |
Total | | | $185 | | | | $(10,720 | ) | | | $5,558 | | | | | |
| |
| * | Non-income producing security. |
The accompanying Notes to Financial Statements are an integral part of this schedule.
144
MONEY MARKET FUND
Schedule of Investments as of October 31, 2018
| | | | | | | | |
Principal
Amount | | | U.S. Government Agency Debt (75.5%)a | | Value | |
| | | | Federal Agricultural Mortgage Corporation | | | | |
| | $8,460,000 | | | 2.300% (FEDL 1M + 0.100%), 11/30/2018b | | | $8,460,000 | |
| | 7,275,000 | | | 2.185% (LIBOR 1M + -0.080%), 12/3/2018b | | | 7,275,162 | |
| | 3,980,000 | | | 2.186% (LIBOR 1M + -0.070%), 3/1/2019b | | | 3,980,000 | |
| | 3,640,000 | | | 2.231% (LIBOR 1M + -0.050%), 6/25/2019b | | | 3,640,000 | |
| | 4,470,000 | | | 2.320% (FEDL 1M + 0.120%), 2/26/2020b | | | 4,470,000 | |
| | | | Federal Farm Credit Bank | | | | |
| | 3,520,000 | | | 2.369% (USBMMY 3M + 0.050%), 12/5/2018b | | | 3,519,984 | |
| | 4,380,000 | | | 2.399% (USBMMY 3M + 0.080%), 3/25/2019b | | | 4,379,914 | |
| | 4,300,000 | | | 2.210% (FEDL 1M + 0.010%), 4/24/2019b | | | 4,299,796 | |
| | 2,145,000 | | | 2.419% (USBMMY 3M + 0.100%), 7/3/2019b | | | 2,144,928 | |
| | 10,525,000 | | | 2.193% (LIBOR 1M + -0.090%), 7/12/2019b | | | 10,523,539 | |
| | 5,180,000 | | | 2.200% (FEDL 1M FLAT), 8/8/2019b | | | 5,177,584 | |
| | 4,580,000 | | | 2.185% (LIBOR 1M + -0.095%), 9/13/2019b | | | 4,579,802 | |
| | 4,060,000 | | | 2.320% (FEDL 1M + 0.120%), 2/18/2020b | | | 4,059,738 | |
| | 4,430,000 | | | 2.340% (FEDL 1M + 0.140%), 3/23/2020b | | | 4,431,170 | |
| | | | Federal Home Loan Bank | | | | |
| | 1,500,000 | | | 2.150%, 11/2/2018 | | | 1,499,911 | |
| | 1,000,000 | | | 2.170%, 11/5/2018 | | | 999,759 | |
| | 940,000 | | | 2.150%, 11/6/2018 | | | 939,719 | |
| | 3,665,000 | | | 2.119%, 11/7/2018 | | | 3,663,705 | |
| | 6,370,000 | | | 2.077%, 11/9/2018 | | | 6,367,059 | |
| | 5,080,000 | | | 2.042%, 11/14/2018 | | | 5,076,254 | |
| | 6,490,000 | | | 2.099%, 11/16/2018 | | | 6,484,325 | |
| | 6,370,000 | | | 2.075%, 11/21/2018 | | | 6,362,657 | |
| | 5,255,000 | | | 2.177%, 11/23/2018 | | | 5,248,009 | |
| | 5,000,000 | | | 2.185%, 11/26/2018 | | | 4,992,413 | |
| | 2,490,000 | | | 2.168%, 11/28/2018 | | | 2,485,951 | |
| | 2,500,000 | | | 2.190%, 12/3/2018 | | | 2,495,133 | |
| | 4,000,000 | | | 1.625%, 12/7/2018 | | | 3,997,219 | |
| | 5,770,000 | | | 2.145%, 12/7/2018 | | | 5,757,626 | |
| | 7,000,000 | | | 2.180% (LIBOR 1M + -0.100%), 12/14/2018b | | | 7,000,000 | |
| | 2,929,000 | | | 2.184%, 12/14/2018 | | | 2,921,358 | |
| | 4,640,000 | | | 2.197%, 12/19/2018 | | | 4,626,408 | |
| | 575,000 | | | 2.180%, 12/20/2018 | | | 573,294 | |
| | 4,290,000 | | | 2.180% (LIBOR 1M + -0.100%), 12/21/2018b | | | 4,290,000 | |
| | 6,175,000 | | | 2.221%, 12/26/2018 | | | 6,154,049 | |
| | 9,180,000 | | | 2.000%, 2/7/2019c | | | 9,178,156 | |
| | 2,230,000 | | | 2.280%, 2/7/2019 | | | 2,216,159 | |
| | 255,000 | | | 2.300%, 2/15/2019 | | | 253,273 | |
| | 4,640,000 | | | 2.350%, 3/5/2019 | | | 4,602,442 | |
| | 1,700,000 | | | 2.195% (LIBOR 1M + -0.085%), 3/13/2019b | | | 1,699,921 | |
| | 750,000 | | | 2.192% (LIBOR 1M + -0.095%), 4/18/2019b | | | 749,917 | |
| | 2,320,000 | | | 2.425%, 4/26/2019 | | | 2,292,495 | |
| | 7,250,000 | | | 2.193% (LIBOR 1M + -0.090%), 8/12/2019b | | | 7,248,408 | |
| | 4,580,000 | | | 2.196% (LIBOR 1M + -0.085%), 9/9/2019b | | | 4,580,000 | |
| | 9,160,000 | | | 2.280%, 9/20/2019c | | | 9,160,000 | |
| | 1,000,000 | | | 2.222% (LIBOR 1M + -0.060%), 11/19/2019b | | | 999,842 | |
| | 4,640,000 | | | 2.294% (LIBOR 1M FLAT), 10/26/2020b | | | 4,640,000 | |
| | | | Federal Home Loan Mortgage Corporation | | | | |
| | 950,000 | | | 2.050%, 11/20/2018 | | | 948,972 | |
| | 4,740,000 | | | 2.187% (LIBOR 1M + -0.095%), 6/19/2019b | | | 4,740,000 | |
| | | | Federal National Mortgage Association | | | | |
| | 3,750,000 | | | 2.280% (SOFRRATE + 0.100%), 4/30/2020b | | | 3,750,000 | |
| | | | Overseas Private Investment Corporation | | | | |
| | 2,200,000 | | | 2.290% (T-BILL 3M FLAT), 11/7/2018b | | | 2,200,000 | |
| | 4,500,000 | | | 2.290% (T-BILL 3M FLAT), 11/7/2018b | | | 4,500,000 | |
| | 4,394,400 | | | 2.290% (T-BILL 3M FLAT), 11/7/2018b | | | 4,394,400 | |
| | 1,000,000 | | | 2.290% (T-BILL 3M FLAT), 11/7/2018b | | | 1,000,000 | |
| | 5,017,544 | | | 2.290% (T-BILL 3M FLAT), 11/7/2018b | | | 5,017,544 | |
| | 4,284,211 | | | 2.290% (T-BILL 3M FLAT), 11/7/2018b | | | 4,284,211 | |
| | 2,017,554 | | | 2.290% (T-BILL 3M FLAT), 11/7/2018b | | | 2,017,554 | |
| | 1,867,620 | | | 2.290% (T-BILL 3M FLAT), 11/7/2018b | | | 1,867,620 | |
| | 3,230,000 | | | 2.290% (T-BILL 3M FLAT), 11/7/2018b | | | 3,230,000 | |
| | 7,385,000 | | | 2.290% (T-BILL 3M FLAT), 11/7/2018b | | | 7,385,000 | |
| | 8,720,000 | | | 2.290% (T-BILL 3M FLAT), 11/7/2018b | | | 8,720,000 | |
| | 3,570,000 | | | 2.300% (T-BILL 3M FLAT), 11/7/2018b | | | 3,570,000 | |
| | 6,205,000 | | | 2.300% (T-BILL 3M FLAT), 11/7/2018b | | | 6,205,000 | |
| | 6,300,000 | | | 2.300% (T-BILL 3M FLAT), 11/7/2018b | | | 6,300,000 | |
| | 4,700,000 | | | 2.300% (T-BILL 3M FLAT), 11/7/2018b | | | 4,700,000 | |
| | 3,557,167 | | | 2.300% (T-BILL 3M FLAT), 11/7/2018b | | | 3,557,167 | |
| | 4,100,000 | | | 2.300% (T-BILL 3M + 0.070%), 11/7/2018b | | | 4,100,000 | |
| | 7,400,000 | | | 2.300% (T-BILL 3M FLAT), 11/7/2018b | | | 7,400,000 | |
| | 6,872,400 | | | 2.300% (T-BILL 3M FLAT), 11/7/2018b | | | 6,872,400 | |
| | 3,620,000 | | | 2.300% (T-BILL 3M FLAT), 11/7/2018b | | | 3,620,000 | |
| | 6,000,000 | | | 2.300% (T-BILL 3M FLAT), 11/7/2018b | | | 6,000,000 | |
| | 5,057,400 | | | 2.300% (T-BILL 3M FLAT), 11/7/2018b | | | 5,057,400 | |
| | 1,153,851 | | | 2.320% (T-BILL 3M FLAT), 11/7/2018b | | | 1,153,851 | |
| | 3,650,090 | | | 2.320% (T-BILL 3M FLAT), 11/7/2018b | | | 3,650,090 | |
The accompanying Notes to Financial Statements are an integral part of this schedule.
145
MONEY MARKET FUND
Schedule of Investments as of October 31, 2018
| | | | | | | | |
Principal
Amount | | | U.S. Government Agency Debt (75.5%)a | | Value | |
| | $6,070,755 | | | 2.320% (T-BILL 3M FLAT), 11/7/2018b | | | $6,070,755 | |
| | 3,990,566 | | | 2.320% (T-BILL 3M FLAT), 11/7/2018b | | | 3,990,566 | |
| | 7,590,985 | | | 2.320% (T-BILL 3M FLAT), 11/7/2018b | | | 7,590,985 | |
| | 4,500,000 | | | 2.340% (T-BILL 3M FLAT), 11/7/2018b | | | 4,500,000 | |
| | 3,520,000 | | | 1.700%, 11/13/2018 | | | 3,578,078 | |
| | 6,150,000 | | | 1.770%, 11/20/2018 | | | 6,253,559 | |
| | 3,567,407 | | | 2.270%, 2/19/2019 | | | 3,623,690 | |
| | 3,630,000 | | | 2.260%, 3/17/2019 | | | 3,680,874 | |
| | 4,140,000 | | | 2.570%, 5/17/2019 | | | 4,188,608 | |
| | 2,965,000 | | | 2.660%, 7/7/2019 | | | 2,989,565 | |
| | | | State of Israel | | | | |
| | 7,480,000 | | | 2.247%, 11/15/2018 | | | 7,473,463 | |
| | | | U.S. Department of Housing and Urban Development | | | | |
| | 1,880,000 | | | 1.880%, 8/1/2019 | | | 1,871,406 | |
| | | | | |
| | | | Total | | | 372,549,837 | |
| | | | | |
| | |
Principal
Amount | | | U.S. Treasury Debt (21.5%)a | | Value | |
| | | | U.S. Treasury Bills | | | | |
| | 4,470,000 | | | 1.990%, 11/1/2018 | | | 4,470,000 | |
| | 5,525,000 | | | 2.011%, 11/15/2018 | | | 5,520,661 | |
| | 4,580,000 | | | 2.086%, 11/23/2018 | | | 4,574,161 | |
| | 9,090,000 | | | 2.080%, 11/29/2018 | | | 9,075,298 | |
| | 4,530,000 | | | 2.098%, 12/6/2018 | | | 4,520,762 | |
| | 4,580,000 | | | 2.112%, 12/13/2018 | | | 4,568,715 | |
| | 4,580,000 | | | 2.116%, 12/20/2018 | | | 4,566,809 | |
| | 9,170,000 | | | 2.340%, 3/21/2019 | | | 9,086,562 | |
| | 3,740,000 | | | 2.356%, 3/28/2019 | | | 3,704,020 | |
| | 4,610,000 | | | 2.351%, 4/4/2019 | | | 4,563,637 | |
| | 4,475,000 | | | 2.380%, 4/11/2019 | | | 4,427,369 | |
| | | | U.S. Treasury Notes | | | | |
| | 7,390,000 | | | 1.250%, 11/30/2018 | | | 7,384,831 | |
| | 9,230,000 | | | 1.250%, 12/31/2018 | | | 9,215,527 | |
| | 4,740,000 | | | 1.125%, 1/31/2019 | | | 4,725,921 | |
| | 9,480,000 | | | 1.250%, 1/31/2019 | | | 9,455,463 | |
| | 4,580,000 | | | 1.500%, 1/31/2019 | | | 4,571,623 | |
| | 4,500,000 | | | 2.453% (USBMMY 3M + 0.140%), 1/31/2019b | | | 4,500,214 | |
| | 4,640,000 | | | 2.750%, 2/15/2019 | | | 4,644,805 | |
| | 3,690,000 | | | 2.346% (USBMMY 3M + 0.033%), 4/30/2020b | | | 3,689,597 | |
| | | | | |
| | | | Total | | | 107,265,975 | |
| | | | | |
| | | | | | | | |
| | | | | |
| | | | Total Investments (at amortized cost) 97.0% | | $ | 479,815,812 | |
| | | | | |
| | | | Other Assets and Liabilities, Net 3.0% | | | 15,069,103 | |
| | | | | |
| | | | Total Net Assets 100.0% | | $ | 494,884,915 | |
| | | | | |
| a | The interest rate shown reflects the yield, coupon rate or the discount rate at the date of purchase. |
| b | Denotes variable rate securities. The rate shown is as of October 31, 2018. The rates of certain variable rate securities are based on a published reference rate and spread; these may vary by security and the reference rate and spread are indicated in their description. The rates of other variable rate securities are determined by the issuer or agent and are based on current market conditions. These securities do not indicate a reference rate and spread in their description. |
| c | Denotes step coupon securities. Step coupon securities pay an initial coupon rate for the first period and then different coupon rates for following periods. The rate shown is as of October 31, 2018. |
Reference Rate Index:
| | | | |
| FEDL 1M | | - | | Federal Funds 1 Month Rate |
| LIBOR 1M | | - | | ICE Libor USD Rate 1 Month |
| SOFRRATE | | - | | Secured Overnight Financing Rate |
| T-BILL 3M | | - | | U. S. Treasury Bill Rate 3 Month |
| USBMMY 3M | | - | | U. S. Treasury Bill Rate 3 Month Money Market Yield |
| | | | |
Cost for federal income tax purposes | | $ | 479,815,812 | |
The accompanying Notes to Financial Statements are an integral part of this schedule.
146
MONEY MARKET FUND
Schedule of Investments as of October 31, 2018
Fair Valuation Measurements
The following table is a summary of the inputs used, as of October 31, 2018, in valuing Money Market Fund’s assets carried at fair value or amortized cost, which approximates fair value.
| | | | | | | | | | | | | | | | |
| Investments in Securities | | Total | | | Level 1 | | | Level 2 | | | Level 3 | |
U.S. Government Agency Debt | | | 372,549,837 | | | | – | | | | 372,549,837 | | | | – | |
U.S. Treasury Debt | | | 107,265,975 | | | | – | | | | 107,265,975 | | | | – | |
| |
Total Investments at Amortized Cost | | | $479,815,812 | | | | $– | | | | $479,815,812 | | | | $– | |
| |
There were no significant transfers between Levels during the period ended October 31, 2018. Transfers between Levels are identified as of the end of the period.
The accompanying Notes to Financial Statements are an integral part of this schedule.
147
MUNICIPAL BOND FUND
Summary Schedule of Investments as of October 31, 2018
| | | | | | | | | | | | |
Principal
Amount | | | Long-Term Fixed Income (98.8%) | | Value | | | % of Net Assets | |
| | Alabama (0.4%) | | | | | | | | |
| | | | Other Securities^ | | | $6,209,515 | | | | 0.4 | % |
| | | | | |
| | | | Total | | | 6,209,515 | | | | | |
| | | | | |
| | |
| | Alaska (<0.1%) | | | | | | | | |
| | | | Other Securities^ | | | 125,000 | | | | <0.1 | % |
| | | | | |
| | | | Total | | | 125,000 | | | | | |
| | | | | |
| | |
| | Arizona (1.2%) | | | | | | | | |
| | | | Other Securities^ | | | 18,021,320 | | | | 1.2 | % |
| | | | | |
| | | | Total | | | 18,021,320 | | | | | |
| | | | | |
| | |
| | Arkansas (0.5%) | | | | | | | | |
| | | | Other Securities^ | | | 7,127,921 | | | | 0.5 | % |
| | | | | |
| | | | Total | | | 7,127,921 | | | | | |
| | | | | |
| | |
| | California (11.4%) | | | | | | | | |
| | | | California Department of Water Resources Rev. Refg. (Central Valley) | | | | | | | | |
| | $2,500,000 | | | 5.000% - 5.000%, 12/1/2031 - 12/1/2032, Ser. AX | | | 2,930,810 | | | | 0.2 | % |
| | | | California Educational Fac. Auth. Rev. (Stanford University) | | | | | | | | |
| | 6,000,000 | | | 5.250%, 4/1/2040 | | | 7,468,920 | | | | 0.5 | % |
| | 8,300,000 | | | 5.000%, 5/1/2045, Ser. U-6 | | | 10,160,362 | | | | 0.7 | % |
| | | | California Infrastructure and Economic Development Bank Rev. (Bay Area Toll Bridges Seismic Retrofit Rev.) (FGIC Insured) | | | | | | | | |
| | 5,000,000 | | | 5.000%, 7/1/2025, Ser. Aa,b | | | 5,836,250 | | | | 0.4 | % |
| | | | California Kindergarten - University Public Education Fac. G.O. | | | | | | | | |
| | 3,850,000 | | | 1.130%, 5/1/2034c | | | 3,850,000 | | | | 0.3 | % |
| | | | California Various Purpose G.O. | | | | | | | | |
| | 11,805,000 | | | 5.250% - 6.000%, 4/1/2024 - 11/1/2039 | | | 12,103,427 | | | | 0.8 | % |
| | | | Los Angeles, CA Department of Airports Rev. (Los Angeles International Airport) | | | | | | | | |
| | 8,000,000 | | | 5.000%, 5/15/2040, Ser. A | | | 8,290,880 | | | | 0.6 | % |
| | | | Los Angeles, CA Department of Water & Power System Rev. | | | | | | | | |
| | 7,000,000 | | | 5.000%, 7/1/2044, Ser. D | | | 7,689,570 | | | | 0.5 | % |
| | | | San Diego Unified School District G.O. | | | | | | | | |
| | 10,000,000 | | | Zero Coupon, 7/1/2033, Ser. Ab,d | | | 11,450,900 | | | | 0.8 | % |
| | | | San Francisco, CA City & County Airport Commission Rev. (San Francisco International Airport) | | | | | | | | |
| | 7,825,000 | | | 5.000%, 5/1/2044, Ser. A, AMT | | | 8,423,534 | | | | 0.6 | % |
| | 16,730,000 | | | 5.000% - 6.000%, 5/1/2028 - 5/1/2047, Ser. Bb | | | 17,898,743 | | | | 1.2 | % |
| | | | San Jose, CA Redevelopment Agency Successor Agency Tax Allocation Refg. | | | | | | | | |
| | 6,000,000 | | | 5.000%, 8/1/2035, Ser. A | | | 6,867,300 | | | | 0.5 | % |
| | | | University of California Limited Rev. Refg. | | | | | | | | |
| | 8,000,000 | | | 5.000%, 5/15/2032, Ser. I | | | 9,019,040 | | | | 0.6 | % |
| | | | University of California Rev. | | | | | | | | |
| | 5,000,000 | | | 5.250% - 5.250%, 5/15/2039, Ser. Ob | | | 5,095,650 | | | | 0.4 | % |
| | | | Other Securities^ | | | 50,749,913 | | | | 3.3 | % |
| | | | | |
| | | | Total | | | 167,835,299 | | | | | |
| | | | | |
| | |
| | Colorado (4.0%) | | | | | | | | |
| | | | University of Colorado University Enterprise Rev. | | | | | | | | |
| | 9,790,000 | | | 5.000%, 6/1/2033b | | | 10,486,559 | | | | 0.7 | % |
| | 7,500,000 | | | 5.000% - 5.375%, 6/1/2032 - 6/1/2034, Ser. Ab | | | 8,351,225 | | | | 0.6 | % |
| | | | Other Securities^ | | | 40,269,984 | | | | 2.7 | % |
| | | | | |
| | | | Total | | | 59,107,768 | | | | | |
| | | | | |
| | |
| | Connecticut (<0.1%) | | | | | | | | |
| | | | Other Securities^ | | | 643,992 | | | | <0.1 | % |
| | | | | |
| | | | Total | | | 643,992 | | | | | |
| | | | | |
| | |
| | Delaware (0.1%) | | | | | | | | |
| | | | Other Securities^ | | | 1,425,161 | | | | 0.1 | % |
| | | | | |
| | | | Total | | | 1,425,161 | | | | | |
| | | | | |
| | |
| | District of Columbia (0.8%) | | | | | | | | |
| | | | Other Securities^ | | | 11,825,823 | | | | 0.8 | % |
| | | | | |
| | | | Total | | | 11,825,823 | | | | | |
| | | | | |
| | |
| | Florida (5.7%) | | | | | | | | |
| | | | Higher Educational Fac. Financing Auth. Rev. (Ringling College) | | | | | | | | |
| | 7,225,000 | | | 5.000%, 3/1/2042 | | | 7,580,687 | | | | 0.5 | % |
| | | | Miami-Dade County, FL Aviation Rev. (Miami International Airport-Hub of the Americas) | | | | | | | | |
| | 7,500,000 | | | 5.500%, 10/1/2036, Ser. Bb | | | 7,739,175 | | | | 0.5 | % |
The accompanying Notes to Financial Statements are an integral part of this schedule.
148
MUNICIPAL BOND FUND
Summary Schedule of Investments as of October 31, 2018
| | | | | | | | | | | | |
Principal
Amount | | | Long-Term Fixed Income (98.8%) | | Value | | | % of Net Assets | |
| | Florida (5.7%)- continued | | | | | | | | |
| | $8,000,000 | | | 5.500%, 10/1/2041, Ser. Ab | | | $8,255,120 | | | | 0.6 | % |
| | | | Miami-Dade County, FL Public Fac. Rev. (Jackson Health System) | | | | | | | | |
| | 5,000,000 | | | 5.000%, 6/1/2035, Ser. A | | | 5,418,950 | | | | 0.4 | % |
| | | | Miami-Dade County, FL Public Fac. Rev. (Jackson Health System) (AGC Insured) | | | | | | | | |
| | 2,000,000 | | | 5.625%, 6/1/2034a,b | | | 2,042,540 | | | | 0.1 | % |
| | | | St. Johns County Industrial Development Auth. Rev. (Presbyterian Retirement Communities) | | | | | | | | |
| | 6,490,000 | | | 5.875%, 8/1/2040, Ser. Ab | | | 6,890,628 | | | | 0.5 | % |
| | | | Other Securities^ | | | 46,514,751 | | | | 3.1 | % |
| | | | | |
| | | | Total | | | 84,441,851 | | | | | |
| | | | | |
| | |
| | Georgia (0.5%) | | | | | | | | |
| | | | Other Securities^ | | | 7,426,886 | | | | 0.5 | % |
| | | | | |
| | | | Total | | | 7,426,886 | | | | | |
| | | | | |
| | |
| | Guam (<0.1%) | | | | | | | | |
| | | | Other Securities^ | | | 264,110 | | | | <0.1 | % |
| | | | | |
| | | | Total | | | 264,110 | | | | | |
| | | | | |
| | |
| | Hawaii (1.6%) | | | | | | | | |
| | | | Hawaii Airports System Rev. | | | | | | | | |
| | 3,040,000 | | | 5.250%, 7/1/2030, Ser. A | | | 3,189,051 | | | | 0.2 | % |
| | | | Hawaii Department of Budget and Finance Special Purpose Senior Living Rev. Refg. | | | | | | | | |
| | 6,395,000 | | | 5.125% - 5.250%, 11/15/2032 - 11/15/2037 | | | 6,902,195 | | | | 0.5 | % |
| | | | Hawaii Department of Transportation Airport Division Lease Rev. C.O.P. | | | | | | | | |
| | 1,600,000 | | | 5.000%, 8/1/2028, AMT | | | 1,717,808 | | | | 0.1 | % |
| | | | Hawaii Harbor System Rev. | | | | | | | | |
| | 6,000,000 | | | 5.250%, 7/1/2030, Ser. A | | | 6,276,060 | | | | 0.4 | % |
| | | | Other Securities^ | | | 5,413,131 | | | | 0.4 | % |
| | | | | |
| | | | Total | | | 23,498,245 | | | | | |
| | | | | |
| | |
| | Illinois (6.6%) | | | | | | | | |
| | | | Chicago Metropolitan Water Reclamation District G.O. Refg. | | | | | | | | |
| | 8,700,000 | | | 5.250%, 12/1/2032, Ser. C | | | 10,169,343 | | | | 0.7 | % |
| | | | Illinois Finance Auth. Multifamily Housing Rev. (Better Housing Foundation Blue Station) | | | | | | | | |
| | 1,750,000 | | | 5.000%, 12/1/2043, Ser. A-1 | | | 1,688,190 | | | | 0.1 | % |
| | | | Illinois Finance Auth. Rev. (DePaul University) | | | | | | | | |
| | 5,075,000 | | | 5.000% - 6.000%, 10/1/2032 - 10/1/2041b | | | 5,509,605 | | | | 0.4 | % |
| | | | Illinois Finance Auth. Rev. (Rosalind Franklin University) | | | | | | | | |
| | 1,750,000 | | | 5.000%, 8/1/2042, Ser. A | | | 1,841,018 | | | | 0.1 | % |
| | | | Illinois Finance Auth. Rev. (Rush University Medical Center) | | | | | | | | |
| | 4,000,000 | | | 5.000% - 7.250%, 11/15/2027 - 11/1/2038, Ser. Ab | | | 4,112,250 | | | | 0.3 | % |
| | | | Illinois Finance Auth. Rev. (The Art Institute of Chicago) | | | | | | | | |
| | 3,530,000 | | | 5.000% - 5.000%, 3/1/2034b | | | 3,761,703 | | | | 0.2 | % |
| | | | Illinois Finance Auth. Rev. Refg. (Northwestern Memorial Healthcare) | | | | | | | | |
| | 4,000,000 | | | 5.000%, 7/15/2042, Ser. A | | | 4,343,720 | | | | 0.3 | % |
| | | | Illinois Finance Auth. Rev. Refg. (Rosalind Franklin University) | | | | | | | | |
| | 2,100,000 | | | 5.000%, 8/1/2047, Ser. A | | | 2,199,855 | | | | 0.1 | % |
| | | | Illinois Finance Auth. Rev. Refg. (Rush University Medical Center) (NATL-RE Insured) | | | | | | | | |
| | 2,020,000 | | | 5.250%, 11/1/2035, Ser. Ba,b | | | 2,020,000 | | | | 0.1 | % |
| | | | Illinois Finance Auth. Student Housing & Academic Fac. Rev. (CHF - Chicago, LLC - University of IL at Chicago) | | | | | | | | |
| | 1,000,000 | | | 5.000%, 2/15/2047, Ser. A | | | 1,049,960 | | | | 0.1 | % |
| | | | Illinois G.O. | | | | | | | | |
| | 7,000,000 | | | 5.000%, 11/1/2023, Ser. D | | | 7,298,130 | | | | 0.5 | % |
| | 7,000,000 | | | 5.000%, 6/1/2024 | | | 7,282,870 | | | | 0.5 | % |
| | 8,250,000 | | | 5.000% - 5.500%, 3/1/2027 - 7/1/2038 | | | 8,532,473 | | | | 0.6 | % |
| | | | Illinois G.O. Refg. | | | | | | | | |
| | 1,500,000 | | | 5.000%, 10/1/2021, Ser. B | | | 1,553,355 | | | | 0.1 | % |
| | | | Metropolitan Pier and Exposition Auth., IL Refg. (McCormick Place Expansion) (NATL-RE Insured) | | | | | | | | |
| | 17,605,000 | | | Zero Coupon, 6/15/2020, Ser. Aa | | | 16,682,850 | | | | 1.1 | % |
| | 5,100,000 | | | 0.000% - 0.000%, 6/15/2024 - 12/15/2024, Ser. Aa | | | 4,041,689 | | | | 0.3 | % |
| | | | Metropolitan Pier and Exposition Auth., IL Rev. Refg. (McCormick Place Expansion) | | | | | | | | |
| | 2,000,000 | | | Zero Coupon, 12/15/2047, Ser. Bd | | | 1,061,460 | | | | 0.1 | % |
| | | | Metropolitan Pier and Exposition Auth., IL Rev. Refg. (McCormick Place Expansion) (NATL-RE Insured) | | | | | | | | |
| | 920,000 | | | 5.500%, 6/15/2020a | | | 926,550 | | | | 0.1 | % |
| | | | Other Securities^ | | | 13,763,213 | | | | 0.9 | % |
| | | | | |
| | | | Total | | | 97,838,234 | | | | | |
| | | | | |
The accompanying Notes to Financial Statements are an integral part of this schedule.
149
MUNICIPAL BOND FUND
Summary Schedule of Investments as of October 31, 2018
| | | | | | | | | | | | |
Principal Amount | | | Long-Term Fixed Income (98.8%) | | Value | | | % of Net Assets | |
| | Indiana (2.6%) | | | | | | | | |
| | | | Indiana Bond Bank Special Program Rev. (Clark Memorial Hospital) | | | | | | | | |
| | $7,000,000 | | | 5.500%, 8/1/2029, Ser. Db | | | $7,063,140 | | | | 0.5 | % |
| | | | Knox County, IN Economic Development Rev. Refg. (Good Samaritan Hospital) | | | | | | | | |
| | 6,965,000 | | | 5.000%, 4/1/2042, Ser. A | | | 7,091,415 | | | | 0.5 | % |
| | | | Other Securities^ | | | 24,145,953 | | | | 1.6 | % |
| | | | | |
| | | | Total | | | 38,300,508 | | | | | |
| | | | | |
| | |
| | Iowa (2.2%) | | | | | | | | |
| | | | Iowa Finance Auth. Rev. (Lifespace Communities, Inc.) | | | | | | | | |
| | 5,500,000 | | | 5.000% - 5.000%, 5/15/2041 - 5/15/2043, Ser. A | | | 5,633,400 | | | | 0.4 | % |
| | | | Iowa Finance Auth. Rev. Refg. | | | | | | | | |
| | 8,100,000 | | | 5.000%, 8/1/2036 | | | 9,197,712 | | | | 0.6 | % |
| | 3,000,000 | | | 5.000%, 8/1/2042 | | | 3,345,990 | | | | 0.3 | % |
| | | | Iowa Finance Auth. Senior Housing Rev. (PHS Council Bluffs, Inc.) | | | | | | | | |
| | 1,355,000 | | | 5.125%, 8/1/2048 | | | 1,319,580 | | | | 0.1 | % |
| | | | Other Securities^ | | | 12,999,816 | | | | 0.8 | % |
| | | | | |
| | | | Total | | | 32,496,498 | | | | | |
| | | | | |
| | |
| | Kansas (0.8%) | | | | | | | | |
| | | | Other Securities^ | | | 11,509,304 | | | | 0.8 | % |
| | | | | |
| | | | Total | | | 11,509,304 | | | | | |
| | | | | |
| | |
| | Kentucky (1.3%) | | | | | | | | |
| | | | Other Securities^ | | | 18,855,710 | | | | 1.3 | % |
| | | | | |
| | | | Total | | | 18,855,710 | | | | | |
| | | | | |
| | |
| | Louisiana (2.8%) | | | | | | | | |
| | | | Louisiana Gas and Fuels Tax Rev. | | | | | | | | |
| | 7,000,000 | | | 5.000%, 5/1/2045, Ser. Bb | | | 7,294,490 | | | | 0.5 | % |
| | | | Other Securities^ | | | 33,268,669 | | | | 2.3 | % |
| | | | | |
| | | | Total | | | 40,563,159 | | | | | |
| | | | | |
| | |
| | Maryland (0.1%) | | | | | | | | |
| | | | Other Securities^ | | | 1,088,390 | | | | 0.1 | % |
| | | | | |
| | | | Total | | | 1,088,390 | | | | | |
| | | | | |
| | |
| | Massachusetts (3.5%) | | | | | | | | |
| | | | Massachusetts Development Finance Agency Rev. (Dana-Farber Cancer Institute) | | | | | | | | |
| | 6,500,000 | | | 5.000%, 12/1/2046, Ser. N | | | 6,963,385 | | | | 0.5 | % |
| | | | Massachusetts Health & Educational Fac. Auth. Rev. (Massachusetts Institute of Technology) | | | | | | | | |
| | | | 5.250%, 7/1/2033, Ser. L | | | 18,900,643 | | | | 1.3 | % |
| | | | Massachusetts Port Auth. Rev. | | | | | | | | |
| | 8,300,000 | | | 5.000%, 7/1/2042, Ser. A, AMT | | | 8,785,799 | | | | 0.6 | % |
| | | | Other Securities^ | | | 16,498,378 | | | | 1.1 | % |
| | | | | |
| | | | Total | | | 51,148,205 | | | | | |
| | | | | |
| | |
| | Michigan (2.3%) | | | | | | | | |
| | | | Great Lakes, MI Water Auth. Water Supply System Rev. | | | | | | | | |
| | 10,000,000 | | | 5.000%, 7/1/2046, Ser. A | | | 10,908,900 | | | | 0.7 | % |
| | | | Other Securities^ | | | 22,537,092 | | | | 1.6 | % |
| | | | | |
| | | | Total | | | 33,445,992 | | | | | |
| | | | | |
| | |
| | Minnesota (3.6%) | | | | | | | | |
| | | | St. Paul, MN Housing & Redevelopment Auth. Health Care Rev. Refg. (Fairview Health Services) | | | | | | | | |
| | 6,945,000 | | | 5.000%, 11/15/2047, Ser. A | | | 7,412,885 | | | | 0.5 | % |
| | | | Other Securities^ | | | 44,962,615 | | | | 3.1 | % |
| | | | | |
| | | | Total | | | 52,375,500 | | | | | |
| | | | | |
| | |
| | Mississippi (0.4%) | | | | | | | | |
| | | | Other Securities^ | | | 5,260,657 | | | | 0.4 | % |
| | | | | |
| | | | Total | | | 5,260,657 | | | | | |
| | | | | |
| | |
| | Missouri (0.4%) | | | | | | | | |
| | | | Other Securities^ | | | 5,699,954 | | | | 0.4 | % |
| | | | | |
| | | | Total | | | 5,699,954 | | | | | |
| | | | | |
| | |
| | Nebraska (1.9%) | | | | | | | | |
| | | | Omaha, NE Public Power District Electric Rev. | | | | | | | | |
| | 8,150,000 | | | 5.000%, 2/1/2045, Ser. A | | | 8,905,179 | | | | 0.6 | % |
| | | | Other Securities^ | | | 18,503,409 | | | | 1.3 | % |
| | | | | |
| | | | Total | | | 27,408,588 | | | | | |
| | | | | |
| | |
| | Nevada (0.4%) | | | | | | | | |
| | | | Other Securities^ | | | 5,508,475 | | | | 0.4 | % |
| | | | | |
| | | | Total | | | 5,508,475 | | | | | |
| | | | | |
The accompanying Notes to Financial Statements are an integral part of this schedule.
150
MUNICIPAL BOND FUND
Summary Schedule of Investments as of October 31, 2018
| | | | | | | | | | | | |
Principal
Amount | | | Long-Term Fixed Income (98.8%) | | Value | | | % of Net Assets | |
| | New Hampshire (0.2%) | | | | | | | | |
| | | | Other Securities^ | | | $2,554,400 | | | | 0.2 | % |
| | | | | |
| | | | Total | | | 2,554,400 | | | | | |
| | | | | |
| | |
| | New Jersey (1.5%) | | | | | | | | |
| | | | Tobacco Settlement Financing Corporation Rev. Refg. | | | | | | | | |
| | 8,275,000 | | | 5.250%, 6/1/2046, Ser. A | | | 8,746,758 | | | | 0.6 | % |
| | | | Other Securities^ | | | 13,567,454 | | | | 0.9 | % |
| | | | | |
| | | | Total | | | 22,314,212 | | | | | |
| | | | | |
| | |
| | New York (7.6%) | | | | | | | | |
| | | | New York City Transitional Finance Auth. Future Tax Secured Rev. | | | | | | | | |
| | 15,000,000 | | | 5.000%, 11/1/2033, Ser. D-1 | | | 16,080,900 | | | | 1.1 | % |
| | 19,000,000 | | | 5.000%, 2/1/2043, Ser. A | | | 20,839,770 | | | | 1.4 | % |
| | | | New York State Dormitory Auth. State Personal Income Tax Rev. | | | | | | | | |
| | 10,125,000 | | | 5.000% - 5.000%, 2/15/2029 - 3/15/2039, Ser. Cb | | | 10,630,130 | | | | 0.7 | % |
| | | | New York State Dormitory Auth. State Personal Income Tax Rev. Refg. | | | | | | | | |
| | 8,330,000 | | | 5.000%, 2/15/2043, Ser. B | | | 9,194,737 | | | | 0.6 | % |
| | | | New York State Liberty Development Corporation Liberty Rev. | | | | | | | | |
| | 10,000,000 | | | 5.250%, 12/15/2043 | | | 10,791,900 | | | | 0.7 | % |
| | | | Port Auth. of New York & New Jersey Rev. | | | | | | | | |
| | 11,125,000 | | | 5.000% - 5.000%, 12/1/2024 - 9/1/2039, Ser. 178, AMT | | | 12,276,926 | | | | 0.8 | % |
| | | | Port Auth. of New York & New Jersey Rev. Refg. | | | | | | | | |
| | 6,715,000 | | | 5.000% - 5.000%, 9/15/2034 - 9/15/2048, Ser. 207, AMT | | | 7,400,146 | | | | 0.5 | % |
| | | | Other Securities^ | | | 24,826,640 | | | | 1.8 | % |
| | | | | |
| | | | Total | | | 112,041,149 | | | | | |
| | | | | |
| | |
| | North Carolina (1.3%) | | | | | | | | |
| | | | Other Securities^ | | | 19,512,240 | | | | 1.3 | % |
| | | | | |
| | | | Total | | | 19,512,240 | | | | | |
| | | | | |
| | |
| | North Dakota (0.7%) | | | | | | | | |
| | | | Other Securities^ | | | 9,820,029 | | | | 0.7 | % |
| | | | | |
| | | | Total | | | 9,820,029 | | | | | |
| | | | | |
| | |
| | Ohio (5.3%) | | | | | | | | |
| | | | Buckeye, OH Tobacco Settlement Financing Auth. Rev. | | | | | | | | |
| | 14,505,000 | | | 5.125%, 6/1/2024, Ser. A-2 | | | 14,015,021 | | | | 0.9 | % |
| | | | Ohio Higher Educational Fac. Commission Rev. (Case Western Reserve University) | | | | | | | | |
| | 750,000 | | | 6.500%, 10/1/2020, Ser. B | | | 788,850 | | | | 0.1 | % |
| | 2,745,000 | | | 5.000%, 12/1/2028 | | | 3,069,047 | | | | 0.2 | % |
| | | | Ohio Higher Educational Fac. Commission Rev. (Dayton University) | | | | | | | | |
| | 2,565,000 | | | 5.000%, 12/1/2035, Ser. A | | | 2,794,055 | | | | 0.2 | % |
| | | | Ohio Higher Educational Fac. Commission Rev. (Kenyon College) | | | | | | | | |
| | 3,025,000 | | | 5.000%, 7/1/2042 | | | 3,295,344 | | | | 0.2 | % |
| | | | Ohio Higher Educational Fac. Commission Rev. Refg. (Kenyon College) | | | | | | | | |
| | 4,740,000 | | | 5.250% - 5.250%, 7/1/2044b | | | 4,968,264 | | | | 0.3 | % |
| | | | Ohio Hospital Rev. (Cleveland Clinic Health System Obligated Group) | | | | | | | | |
| | 5,000,000 | | | 5.000%, 1/1/2034 | | | 5,344,750 | | | | 0.4 | % |
| | | | Ohio State Turnpike Commission Rev. | | | | | | | | |
| | 8,570,000 | | | Zero Coupon, 2/15/2034, Ser. A-4d | | | 8,136,015 | | | | 0.6 | % |
| | | | Ohio State Turnpike Commission Rev. Refg. (NATL-RE Insured) | | | | | | | | |
| | 10,000,000 | | | 5.500%, 2/15/2026, Ser. Aa | | | 11,633,900 | | | | 0.8 | % |
| | | | Other Securities^ | | | 23,650,375 | | | | 1.6 | % |
| | | | | |
| | | | Total | | | 77,695,621 | | | | | |
| | | | | |
| | |
| | Oklahoma (1.9%) | | | | | | | | |
| | | | Grand River, OK Dam Authority Rev. | | | | | | | | |
| | 7,815,000 | | | 5.000%, 6/1/2039, Ser. A | | | 8,595,562 | | | | 0.6 | % |
| | | | Other Securities^ | | | 19,485,961 | | | | 1.3 | % |
| | | | | |
| | | | Total | | | 28,081,523 | | | | | |
| | | | | |
| | |
| | Oregon (0.3%) | | | | | | | | |
| | | | Other Securities^ | | | 5,073,470 | | | | 0.3 | % |
| | | | | |
| | | | Total | | | 5,073,470 | | | | | |
| | | | | |
| | |
| | Pennsylvania (2.4%) | | | | | | | | |
| | | | Lycoming County, PA Auth. Health System Rev. (Susquehanna Health System) | | | | | | | | |
| | 7,075,000 | | | 5.750%, 7/1/2039, Ser. A | | | 7,250,318 | | | | 0.5 | % |
| | | | Pennsylvania Turnpike Commission Turnpike Rev. | | | | | | | | |
| | 7,950,000 | | | 5.000% - 5.000%, 12/1/2040 - 12/1/2046, Ser. B | | | 8,564,814 | | | | 0.6 | % |
The accompanying Notes to Financial Statements are an integral part of this schedule.
151
MUNICIPAL BOND FUND
Summary Schedule of Investments as of October 31, 2018
| | | | | | | | | | | | |
Principal
Amount | | | Long-Term Fixed Income (98.8%) | | Value | | | % of Net Assets | |
| | Pennsylvania (2.4%)- continued | | | | | | | | |
| | | | Pennsylvania Turnpike Commission Turnpike Rev. (AGM Insured) | | | | | | | | |
| | $10,440,000 | | | 6.250%, 6/1/2033, Ser. Ca | | | $12,467,135 | | | | 0.9 | % |
| | | | Other Securities^ | | | 6,556,059 | | | | 0.4 | % |
| | | | | |
| | | | Total | | | 34,838,326 | | | | | |
| | | | | |
| | |
| | South Carolina (1.4%) | | | | | | | | |
| | | | Charleston County, SC Airport System Rev. | | | | | | | | |
| | 6,215,000 | | | 5.500%, 7/1/2031, Ser. A, AMT | | | 6,892,000 | | | | 0.5 | % |
| | | | Other Securities^ | | | 13,536,613 | | | | 0.9 | % |
| | | | | |
| | | | Total | | | 20,428,613 | | | | | |
| | | | | |
| | |
| | South Dakota (0.3%) | | | | | | | | |
| | | | Other Securities^ | | | 4,301,303 | | | | 0.3 | % |
| | | | | |
| | | | Total | | | 4,301,303 | | | | | |
| | | | | |
| | |
| | Tennessee (0.3%) | | | | | | | | |
| | | | Other Securities^ | | | 4,228,026 | | | | 0.3 | % |
| | | | | |
| | | | Total | | | 4,228,026 | | | | | |
| | | | | |
| | |
| | Texas (9.3%) | | | | | | | | |
| | | | Clifton, TX Higher Education Finance Corporation Education Rev. (IDEA Public Schools) | | | | | | | | |
| | 3,000,000 | | | 5.000% - 6.000%, 8/15/2042 - 8/15/2043 | | | 3,214,340 | | | | 0.2 | % |
| | | | Clifton, TX Higher Education Finance Corporation Education Rev. (IDEA Public Schools) (PSF-GTD Insured) | | | | | | | | |
| | 7,605,000 | | | 5.000% - 5.000%, 8/15/2036 - 8/15/2046, Ser. Aa | | | 8,251,256 | | | | 0.6 | % |
| | | | Clifton, TX Higher Education Finance Corporation Education Rev. (Uplift Education) | | | | | | | | |
| | 4,000,000 | | | 6.250%, 12/1/2045, Ser. Ab | | | 4,321,640 | | | | 0.3 | % |
| | | | Houston, TX Water and Sewer System Rev. Refg. (AGM Insured) | | | | | | | | |
| | 10,000,000 | | | 5.750%, 12/1/2032, Ser. Aa,b | | | 12,872,100 | | | | 0.9 | % |
| | | | North Texas Tollway Auth. System Rev. | | | | | | | | |
| | 15,000,000 | | | 5.000%, 9/1/2030, Ser. Db | | | 16,094,700 | | | | 1.1 | % |
| | | | North Texas Tollway Auth. System Rev. Refg. | | | | | | | | |
| | 5,000,000 | | | 5.000%, 1/1/2042, Ser. B | | | 5,302,600 | | | | 0.4 | % |
| | | | North Texas Tollway Auth. System Rev. Refg. (AGC Insured) | | | | | | | | |
| | 5,000,000 | | | Zero Coupon, 1/1/2028, Ser. Da | | | 3,651,300 | | | | 0.2 | % |
| | | | San Antonio Water System Rev. | | | | | | | | |
| | 7,875,000 | | | 5.000%, 5/15/2039, Ser. A | | | 8,785,035 | | | | 0.6 | % |
| | | | Texas G.O. Refg. | | | | | | | | |
| | 13,940,000 | | | 5.000%, 10/1/2044, Ser. A | | | 15,305,423 | | | | 1.0 | % |
| | | | Other Securities^ | | | 59,332,543 | | | | 4.0 | % |
| | | | | |
| | | | Total | | | 137,130,937 | | | | | |
| | | | | |
| | |
| | Utah (1.7%) | | | | | | | | |
| | | | Utah County, UT Hospital Rev. (IHC Health Services, Inc.) | | | | | | | | |
| | 7,500,000 | | | 5.000%, 5/15/2046, Ser. B | | | 8,187,525 | | | | 0.6 | % |
| | 5,870,000 | | | 5.000% - 5.000%, 5/15/2023 - 5/15/2045, Ser. A | | | 6,302,286 | | | | 0.4 | % |
| | | | Other Securities^ | | | 10,282,708 | | | | 0.7 | % |
| | | | | |
| | | | Total | | | 24,772,519 | | | | | |
| | | | | |
| | |
| | Vermont (0.3%) | | | | | | | | |
| | | | Other Securities^ | | | 4,395,670 | | | | 0.3 | % |
| | | | | |
| | | | Total | | | 4,395,670 | | | | | |
| | | | | |
| | |
| | Virginia (2.9%) | | | | | | | | |
| | | | Virginia Commonwealth Transportation Board Rev. | | | | | | | | |
| | 10,000,000 | | | 5.000%, 5/15/2034b | | | 10,692,000 | | | | 0.7 | % |
| | | | Virginia Small Business Financing Auth. Rev. (Elizabeth River Crossings Opco, LLC) | | | | | | | | |
| | 8,910,000 | | | 6.000%, 1/1/2037, AMT | | | 9,694,793 | | | | 0.7 | % |
| | | | Virginia Small Business Financing Auth. Rev. (Transform 66 P3) | | | | | | | | |
| | 11,010,000 | | | 5.000%, 12/31/2052, AMT | | | 11,505,010 | | | | 0.8 | % |
| | 6,785,000 | | | 5.000% - 5.000%, 12/31/2047 - 12/31/2049, AMT | | | 7,111,355 | | | | 0.5 | % |
| | | | Other Securities^ | | | 4,296,115 | | | | 0.2 | % |
| | | | | |
| | | | Total | | | 43,299,273 | | | | | |
| | | | | |
| | |
| | Washington (3.4%) | | | | | | | | |
| | | | Washington Health Care Fac. Auth. Rev. (Kadlec Regional Medical Center) | | | | | | | | |
| | 2,625,000 | | | 5.250%, 12/1/2030b | | | 2,785,808 | | | | 0.2 | % |
| | | | Washington Health Care Fac. Auth. Rev. (Providence Health & Services) | | | | | | | | |
| | 5,000,000 | | | 5.250%, 10/1/2032, Ser. A | | | 5,198,250 | | | | 0.3 | % |
The accompanying Notes to Financial Statements are an integral part of this schedule.
152
MUNICIPAL BOND FUND
Summary Schedule of Investments as of October 31, 2018
| | | | | | | | | | | | |
Principal
Amount | | | Long-Term Fixed Income (98.8%) | | Value | | | % of Net Assets | |
| | Washington (3.4%)- continued | | | | | | | | |
| | | | Washington Health Care Fac. Auth. Rev. (Seattle Cancer Care Alliance) | | | | | | | | |
| | $5,010,000 | | | 7.375%, 3/1/2038b | | | $5,098,527 | | | | 0.3 | % |
| | | | Washington State Housing Finance Commission Refg. (Hearthstone) | | | | | | | | |
| | 825,000 | | | 5.000%, 7/1/2038, Ser. Ae | | | 835,676 | | | | <0.1 | % |
| | | | Washington Various Purpose G.O. | | | | | | | | |
| | 12,095,000 | | | 5.000%, 8/1/2030, Ser. A | | | 13,348,888 | | | | 0.9 | % |
| | 5,310,000 | | | 5.000%, 8/1/2042, Ser. A | | | 5,880,135 | | | | 0.4 | % |
| | | | Other Securities^ | | | 17,232,002 | | | | 1.3 | % |
| | | | | |
| | | | Total | | | 50,379,286 | | | | | |
| | | | | |
| | |
| | Wisconsin (2.8%) | | | | | | | | |
| | | | Wisconsin Health & Educational Fac. Auth. Rev. | | | | | | | | |
| | 1,750,000 | | | 5.125%, 10/1/2048 | | | 1,704,220 | | | | 0.1 | % |
| | | | Wisconsin Health & Educational Fac. Auth. Rev. (Thedacare, Inc.) | | | | | | | | |
| | 9,030,000 | | | 5.000% - 5.500%, 12/15/2038 - 12/15/2044 | | | 9,366,213 | | | | 0.6 | % |
| | | | Wisconsin Health & Educational Fac. Auth. Rev. Refg. (Ascension Health Credit Group) | | | | | | | | |
| | 9,275,000 | | | 5.000%, 11/15/2039, Ser. A | | | 10,074,227 | | | | 0.7 | % |
| | | | Wisconsin Health & Educational Fac. Auth. Rev. Refg. (Marquette University) | | | | | | | | |
| | 8,000,000 | | | 5.000%, 10/1/2041 | | | 8,594,000 | | | | 0.6 | % |
| | | | Wisconsin Health & Educational Fac. Auth. Rev. Refg. (Marshfield Clinic Health Systems, Inc.) | | | | | | | | |
| | 2,000,000 | | | 5.000%, 2/15/2047, Ser. C | | | 2,115,180 | | | | 0.2 | % |
| | | | Other Securities^ | | | 9,441,007 | | | | 0.6 | % |
| | | | | |
| | | | Total | | | 41,294,847 | | | | | |
| | | | | |
| | |
| | Wyoming (0.1%) | | | | | | | | |
| | | | Other Securities^ | | | 1,360,003 | | | | 0.1 | % |
| | | | | |
| | | | Total | | | 1,360,003 | | | | | |
| | | | | |
| | | | | | | | | | | | |
| | | | | |
| | | | Total Long-Term Fixed Income (cost $1,437,112,780) | | | 1,452,973,512 | | | | | |
| | | | | |
| | | |
Principal Amount | | | Short-Term Investments (<0.1%)f | | Value | | | % of Net Assets | |
| | | | Other Securities^ | | | $298,543 | | | | <0.1 | % |
| | | | | |
| | | | Total Short-Term Investments (cost $298,581) | | | 298,543 | | | | | |
| | | | | |
| | | | Total Investments (cost $1,437,411,361) 98.8% | | | $1,453,272,055 | | | | | |
| | | | | |
| | | | Other Assets and Liabilities, Net 1.2% | | | 17,763,839 | | | | | |
| | | | | |
| | | | Total Net Assets 100.0% | | | $1,471,035,894 | | | | | |
| | | | | |
| ^ | The Summary Schedule of Investments shows the 50 largest holdings in unaffiliated issuers, any holding or issuer that exceeds 1% of net assets and all affiliated holdings as of the report date. The remaining securities held are grouped by category as “Other securities”. |
| a | To reduce certain risks associated with securities issued by municipalities, which may include but are not limited to economic development in a specific industry or municipality, the principal and/or interest payments are guaranteed by the bond insurance company or government agency identified. |
| b | Denotes securities that have been pre-refunded or escrowed to maturity. Under such an arrangement, money is deposited into an irrevocable escrow account and is used to purchase U.S. Treasury securities or government agency securities with maturing principal and interest earnings sufficient to pay all debt service requirements of the pre-refunded bonds. |
| c | Denotes variable rate securities. The rate shown is as of October 31, 2018. The rates of certain variable rate securities are based on a published reference rate and spread; these may vary by security and the reference rate and spread are indicated in their description. The rates of other variable rate securities are determined by the issuer or agent and are based on current market conditions. These securities do not indicate a reference rate and spread in their description. |
| d | Denotes step coupon securities. Step coupon securities pay an initial coupon rate for the first period and then different coupon rates for following periods. The rate shown is as of October 31, 2018. |
| e | Denotes securities sold under Rule 144A of the Securities Act of 1933, which exempts them from registration. These securities may be resold to other dealers in the program or to other qualified institutional buyers. As of October 31, 2018, the value of these investments was $1,832,226 or 0.1% of total net assets. |
| f | The interest rate shown reflects the yield, coupon rate or the discount rate at the date of purchase. |
Municipal Bond Fund held restricted securities as of October 31, 2018. Restricted securities are investment securities which cannot be offered for public sale without first being registered under the Securities Act of 1933. As of October 31, 2018, the value of these investments was $4,984,350 or 0.3% of total net assets.
The accompanying Notes to Financial Statements are an integral part of this schedule.
153
MUNICIPAL BOND FUND
Summary Schedule of Investments as of October 31, 2018
Definitions:
| | | | |
| AGC | | - | | Assured Guaranty, Ltd |
| AGM | | - | | Assured Guaranty Municipal Corporation |
| AMT | | - | | Subject to Alternative Minimum Tax |
| Auth. | | - | | Authority |
| C.O.P. | | - | | Certificate of Participation |
| Fac. | | - | | Facility/Facilities |
| FGIC | | - | | Federal Guaranty Insurance Company |
| G.O. | | - | | General Obligation |
| NATL-RE | | - | | National Public Finance Guarantee Corporation |
| PSF-GTD | | - | | Permanent School Fund Guarantee Program |
| Refg. | | - | | Refunding |
| Rev. | | - | | Revenue |
| Ser. | | - | | Series |
Unrealized Appreciation (Depreciation)
Gross unrealized appreciation and depreciation of investments of the portfolio as a whole (including derivatives), based on cost for federal income tax purposes, were as follows:
| | | | |
| Gross unrealized appreciation | | | $43,175,128 | |
| Gross unrealized depreciation | | | (26,504,140 | ) |
| | | | |
| Net unrealized appreciation (depreciation) | | | $16,670,988 | |
| |
| Cost for federal income tax purposes | | | $1,356,476,004 | |
Fair Valuation Measurements
The following table is a summary of the inputs used, as of October 31, 2018, in valuing Municipal Bond Fund’s assets carried at fair value.
| | | | | | | | | | | | | | | | |
| Investments in Securities | | Total | | | Level 1 | | | Level 2 | | | Level 3 | |
| | | | |
Long-Term Fixed Income | | | | | | | | | | | | | | | | |
Education | | | 191,571,955 | | | | – | | | | 191,571,955 | | | | – | |
Electric Revenue | | | 49,777,972 | | | | – | | | | 49,777,972 | | | | – | |
Escrowed/Pre-refunded | | | 280,232,868 | | | | – | | | | 280,232,868 | | | | – | |
General Obligation | | | 148,905,569 | | | | – | | | | 148,905,569 | | | | – | |
Health Care | | | 222,427,690 | | | | – | | | | 222,427,690 | | | | – | |
Housing Finance | | | 42,670,509 | | | | – | | | | 42,670,509 | | | | – | |
Industrial Development Revenue | | | 5,885,441 | | | | – | | | | 5,885,441 | | | | – | |
Other Revenue | | | 101,296,618 | | | | – | | | | 101,296,618 | | | | – | |
Tax Revenue | | | 72,914,245 | | | | – | | | | 72,914,245 | | | | – | |
Transportation | | | 249,864,292 | | | | – | | | | 249,864,292 | | | | – | |
Water & Sewer | | | 87,426,353 | | | | – | | | | 87,426,353 | | | | – | |
Short-Term Investments | | | 298,543 | | | | – | | | | 298,543 | | | | – | |
| |
Total Investments at Value | | | $1,453,272,055 | | | | $– | | | | $1,453,272,055 | | | | $– | |
| |
| | | | | | | | | | | | | | | | |
| Other Financial Instruments | | Total | | | Level 1 | | | Level 2 | | | Level 3 | |
| | | | |
Asset Derivatives | | | | | | | | | | | | | | | | |
Futures Contracts | | | 287,366 | | | | 287,366 | | | | – | | | | – | |
| |
Total Asset Derivatives | | | $287,366 | | | | $287,366 | | | | $– | | | | $– | |
| |
Liability Derivatives | |
Futures Contracts | | | 1,841 | | | | 1,841 | | | | – | | | | – | |
| |
Total Liability Derivatives | | | $1,841 | | | | $1,841 | | | | $– | | | | $– | |
| |
There were no significant transfers between Levels during the period ended October 31, 2018. Transfers between Levels are identified as of the end of the period.
The following table presents Municipal Bond Fund’s futures contracts held as of October 31, 2018. Investments and/or cash totaling $298,543 were pledged as the initial margin deposit for these contracts.
| | | | | | | | | | | | | | | | |
| Futures Contracts Description | | Number of Contracts
Long/(Short) | | | Expiration Date | | | Notional Principal Amount | | | Value and Unrealized | |
CBOT 2-Yr. U.S. Treasury Note | | | (362 | ) | | | December 2018 | | | | ($76,544,929 | ) | | | $287,366 | |
CBOT U.S. Long Bond | | | (28 | ) | | | December 2018 | | | | (3,865,659 | ) | | | (1,841 | ) |
| |
Total Futures Short Contracts | | | | | | | | | | | ($80,410,588 | ) | | | $285,525 | |
| |
Total Futures Contracts | | | | | | | | | | | ($80,410,588 | ) | | | $285,525 | |
| |
The accompanying Notes to Financial Statements are an integral part of this schedule.
154
MUNICIPAL BOND FUND
Summary Schedule of Investments as of October 31, 2018
The following table summarizes the fair value and Statement of Assets and Liabilities location, as of October 31, 2018, for Municipal Bond Fund’s investments in financial derivative instruments by primary risk exposure as discussed under item (2) Significant Accounting Policies of the Notes to Financial Statements.
| | | | | | |
| Derivatives by risk category | | Statement of Assets and Liabilities Location | | Fair Value | |
| | |
Asset Derivatives | | | | | | |
| | |
Interest Rate Contracts | | | | | | |
Futures* | | Net Assets - Accumulated undistributed earnings/(loss) | | | $287,366 | |
Total Interest Rate Contracts | | | | | 287,366 | |
Total Asset Derivatives | | | | | $287,366 | |
| | |
Liability Derivatives | | | | | | |
| | |
Interest Rate Contracts | | | | | | |
Futures* | | Net Assets - Accumulated undistributed earnings/(loss) | | | 1,841 | |
Total Interest Rate Contracts | | | | | 1,841 | |
Total Liability Derivatives | | | | | $1,841 | |
| | |
The following table summarizes the net realized gains/(losses) and Statement of Operations location, for the period ended October 31, 2018, for Municipal Bond Fund’s investments in financial derivative instruments by primary risk exposure.
| | | | | | |
| Derivatives by risk category | | Statement of Operations Location | | Realized Gains/(Losses) recognized in Income | |
| | |
Interest Rate Contracts | | | | | | |
Futures | | Net realized gains/(losses) on Futures contracts | | | 120,021 | |
Total Interest Rate Contracts | | | | | 120,021 | |
Total | | | | | $120,021 | |
| | |
The following table summarizes the change in net unrealized appreciation/(depreciation) and Statement of Operations location, for the period ended October 31, 2018, for Municipal Bond Fund’s investments in financial derivative instruments by primary risk exposure.
| | | | | | |
| Derivatives by risk category | | Statement of Operations Location | | Change in unrealized appreciation/(depreciation) recognized in Income | |
| | |
Interest Rate Contracts | | | | | | |
Futures | | Change in net unrealized appreciation/(depreciation) on Futures contracts | | | 285,525 | |
Total Interest Rate Contracts | | | | | 285,525 | |
Total | | | | | $285,525 | |
| | |
The following table presents Municipal Bond Fund’s average volume of derivative activity during the period ended October 31, 2018.
| | | | |
| Derivative Risk Category | | Average Notional Value | |
| |
Interest Rate Contracts | | | | |
Futures - Short | | | ($50,036,587) | |
The accompanying Notes to Financial Statements are an integral part of this schedule.
155
OPPORTUNITY INCOME PLUS FUND
Summary Schedule of Investments as of October 31, 2018
| | | | | | | | | | | | |
Principal
Amount | | | Bank Loans (32.9%) | | Value | | | % of Net Assets | |
| | Basic Materials (2.7%) | | | | | | | | |
| | | | Contura Energy, Inc., Term Loan | | | | | | | | |
| | $2,760,000 | | | 0.000%, (LIBOR 3M + 5.000%), 10/3/2025a,b,c,d | | | $2,746,200 | | | | 0.5 | % |
| | | | Other Securities^ | | | 12,210,263 | | | | 2.2 | % |
| | | | | |
| | | | Total | | | 14,956,463 | | | | | |
| | | | | |
| | |
| | Capital Goods (1.4%) | | | | | | | | |
| | | | GFL Environmental, Inc., Term Loan | | | | | | | | |
| | 2,170,000 | | | 0.000%, (LIBOR 3M + 3.000%), 5/31/2025a,b,c,d | | | 2,134,737 | | | | 0.4 | % |
| | | | Navistar, Inc., Term Loan | | | | | | | | |
| | 1,930,413 | | | 5.780%, (LIBOR 1M + 3.500%), 11/6/2024b,d | | | 1,932,015 | | | | 0.4 | % |
| | | | Other Securities^ | | | 3,671,600 | | | | 0.6 | % |
| | | | | |
| | | | Total | | | 7,738,352 | | | | | |
| | | | | |
| | |
| | Communications Services (8.8%) | | | | | | | | |
| | | | Altice France SA, Term Loan | | | | | | | | |
| | 3,435,000 | | | 6.280%, (LIBOR 1M + 4.000%), 1/31/2026b,d | | | 3,359,877 | | | | 0.6 | % |
| | | | Cengage Learning, Inc., Term Loan | | | | | | | | |
| | 2,186,793 | | | 6.530%, (LIBOR 1M + 4.250%), 6/7/2023b,d | | | 2,023,462 | | | | 0.4 | % |
| | | | CenturyLink, Inc., Term Loan | | | | | | | | |
| | 3,176,000 | | | 5.052%, (LIBOR 1M + 2.750%), 1/31/2025b,d | | | 3,140,270 | | | | 0.6 | % |
| | | | Charter Communications Operating, LLC, Term Loan | | | | | | | | |
| | 1,890,713 | | | 4.310%, (LIBOR 1M + 2.000%), 4/30/2025b,d | | | 1,890,486 | | | | 0.3 | % |
| | | | Level 3 Parent, LLC, Term Loan | | | | | | | | |
| | 2,765,000 | | | 4.530%, (LIBOR 1M + 2.250%), 2/22/2024b,d | | | 2,766,300 | | | | 0.5 | % |
| | | | Liberty Cablevision of Puerto Rico, LLC, Term Loan | | | | | | | | |
| | 2,275,000 | | | 5.936%, (LIBOR 3M + 3.500%), 1/7/2022b,d | | | 2,229,909 | | | | 0.4 | % |
| | | | McGraw-Hill Global Education Holdings, LLC, Term Loan | | | | | | | | |
| | 3,851,220 | | | 6.302%, (LIBOR 1M + 4.000%), 5/4/2022a,b,c,d | | | 3,689,970 | | | | 0.7 | % |
| | | | Sable International Finance, Ltd., Term Loan | | | | | | | | |
| | 4,780,000 | | | 5.547%, (LIBOR 1M + 3.250%), 1/31/2026b,d | | | 4,774,646 | | | | 0.8 | % |
| | | | Sprint Communications, Inc., Term Loan | | | | | | | | |
| | 3,240,650 | | | 4.813%, (LIBOR 1M + 2.500%), 2/2/2024b,d | | | 3,237,604 | | | | 0.6 | % |
| | | | Univision Communications, Inc., Term Loan | | | | | | | | |
| | 2,752,783 | | | 5.052%, (LIBOR 1M + 2.750%), 3/15/2024b,d | | | 2,638,790 | | | | 0.5 | % |
| | | | Virgin Media Bristol, LLC, Term Loan | | | | | | | | |
| | 2,410,000 | | | 4.780%, (LIBOR 1M + 2.500%), 1/15/2026b,d | | | 2,407,229 | | | | 0.4 | % |
| | | | Other Securities^ | | | 16,785,098 | | | | 3.0 | % |
| | | | | |
| | | | Total | | | 48,943,641 | | | | | |
| | | | | |
| | |
| | Consumer Cyclical (4.2%) | | | | | | | | |
| | | | Golden Entertainment, Inc., Term Loan | | | | | | | | |
| | 2,605,312 | | | 5.300%, (LIBOR 1M + 3.000%), 10/20/2024b,d | | | 2,605,312 | | | | 0.5 | % |
| | | | Golden Nugget, LLC, Term Loan | | | | | | | | |
| | 2,072,634 | | | 5.230%, (LIBOR 1M + 2.750%), 10/4/2023b,d | | | 2,073,609 | | | | 0.4 | % |
| | | | Mohegan Gaming and Entertainment, Term Loan | | | | | | | | |
| | 2,063,778 | | | 6.302%, (LIBOR 1M + 4.000%), 10/13/2023b,d | | | 1,933,326 | | | | 0.3 | % |
| | | | Scientific Games International, Inc., Term Loan | | | | | | | | |
| | 4,278,500 | | | 5.046%, (LIBOR 1M + 2.750%), 8/14/2024b,d | | | 4,234,175 | | | | 0.7 | % |
| | | | Stars Group Holdings BV, Term Loan | | | | | | | | |
| | 2,817,938 | | | 5.886%, (LIBOR 3M + 3.500%), 7/10/2025b,d | | | 2,828,110 | | | | 0.5 | % |
| | | | Other Securities^ | | | 9,589,179 | | | | 1.8 | % |
| | | | | |
| | | | Total | | | 23,263,711 | | | | | |
| | | | | |
| | |
| | Consumer Non-Cyclical (6.0%) | | | | | | | | |
| | | | Air Medical Group Holdings, Inc., Term Loan | | | | | | | | |
| | 4,203,238 | | | 5.534%, (LIBOR 3M + 3.250%), 4/28/2022b,d | | | 4,075,039 | | | | 0.7 | % |
| | | | Albertson’s, LLC, Term Loan | | | | | | | | |
| | 2,250,000 | | | 0.000%, (LIBOR 3M + 3.000%), 10/29/2025a,b,c,d | | | 2,230,785 | | | | 0.4 | % |
| | 1,710,368 | | | 5.052%, (LIBOR 1M + 2.750%), 8/25/2021b,d | | | 1,707,067 | | | | 0.3 | % |
| | 1,668,171 | | | 5.311%, (LIBOR 3M + 3.000%), 6/22/2023b,d | | | 1,659,830 | | | | 0.3 | % |
| | 1,391,524 | | | 5.381%, (LIBOR 3M + 3.000%), 12/21/2022b,d | | | 1,387,265 | | | | 0.2 | % |
| | | | Bausch Health Companies, Inc., Term Loan | | | | | | | | |
| | 3,266,250 | | | 5.274%, (LIBOR 1M + 3.000%), 6/1/2025b,d | | | 3,265,499 | | | | 0.6 | % |
| | | | Endo International plc, Term Loan | | | | | | | | |
| | 2,569,311 | | | 6.563%, (LIBOR 1M + 4.250%), 4/27/2024b,d | | | 2,578,407 | | | | 0.5 | % |
| | | | JBS USA LUX SA, Term Loan | | | | | | | | |
| | 3,166,775 | | | 4.844%, (LIBOR 3M + 2.500%), 10/30/2022b,d | | | 3,165,192 | | | | 0.6 | % |
| | | | Mallinckrodt International Finance SA, Term Loan | | | | | | | | |
| | 3,129,275 | | | 5.517%, (LIBOR 3M + 3.000%), 2/24/2025b,d | | | 3,105,305 | | | | 0.5 | % |
| | | | Other Securities^ | | | 10,277,210 | | | | 1.9 | % |
| | | | | |
| | | | Total | | | 33,451,599 | | | | | |
| | | | | |
The accompanying Notes to Financial Statements are an integral part of this schedule.
156
OPPORTUNITY INCOME PLUS FUND
Summary Schedule of Investments as of October 31, 2018
| | | | | | | | | | | | |
Principal
Amount | | | Bank Loans (32.9%) | | Value | | | % of Net
Assets | |
| | Energy (2.4%) | | | | | | | | |
| | | | HFOTCO, LLC, Term Loan | | | | | | | | |
| | $2,693,250 | | | 5.060%, (LIBOR 1M + 2.750%), 6/26/2025b,d | | | $2,698,852 | | | | 0.5 | % |
| | | | McDermott Technology (Americas), Inc., Term Loan | | | | | | | | |
| | 2,440,237 | | | 7.302%, (LIBOR 1M + 5.000%), 5/10/2025b,d | | | 2,406,684 | | | | 0.4 | % |
| | | | Radiate Holdco, LLC, Term Loan | | | | | | | | |
| | 3,989,622 | | | 5.302%, (LIBOR 1M + 3.000%), 2/1/2024b,d | | | 3,955,431 | | | | 0.7 | % |
| | | | Other Securities^ | | | 4,694,439 | | | | 0.8 | % |
| | | | | |
| | | | Total | | | 13,755,406 | | | | | |
| | | | | |
| | |
| | Financials (3.2%) | | | | | | | | |
| | | | Air Methods Corporation, Term Loan | | | | | | | | |
| | 2,635,619 | | | 5.886%, (LIBOR 3M + 3.500%), 4/21/2024b,d | | | 2,375,351 | | | | 0.4 | % |
| | | | Avolon TLB Borrower 1 US, LLC, Term Loan | | | | | | | | |
| | 2,997,487 | | | 4.280%, (LIBOR 1M + 2.000%), 1/15/2025b,d | | | 2,987,985 | | | | 0.5 | % |
| | | | Digicel International Finance, Ltd., Term Loan | | | | | | | | |
| | 2,560,606 | | | 5.570%, (LIBOR 3M + 3.250%), 5/10/2024b,d | | | 2,449,655 | | | | 0.4 | % |
| | | | GGP Nimbus LP, Term Loan | | | | | | | | |
| | 2,715,000 | | | 4.795%, (LIBOR 1M + 2.500%), 8/24/2025b,d | | | 2,668,954 | | | | 0.5 | % |
| | | | INEOS U.S. Finance, LLC, Term Loan | | | | | | | | |
| | 3,295,100 | | | 4.302%, (LIBOR 1M + 2.000%), 3/31/2024b,d | | | 3,287,390 | | | | 0.6 | % |
| | | | Other Securities^ | | | 4,090,615 | | | | 0.8 | % |
| | | | | |
| | | | Total | | | 17,859,950 | | | | | |
| | | | | |
| | |
| | Technology (2.4%) | | | | | | | | |
| | | | First Data Corporation, Term Loan | | | | | | | | |
| | 4,065,000 | | | 4.287%, (LIBOR 1M + 2.000%), 4/26/2024b,d | | | 4,041,301 | | | | 0.7 | % |
| | | | Harland Clarke Holdings Corporation, Term Loan | | | | | | | | |
| | 2,317,277 | | | 7.136%, (LIBOR 3M + 4.750%), 11/3/2023b,d | | | 2,166,654 | | | | 0.4 | % |
| | | | Rackspace Hosting, Inc., Term Loan | | | | | | | | |
| | 2,218,002 | | | 5.348%, (LIBOR 3M + 3.000%), 11/3/2023b,d | | | 2,149,155 | | | | 0.4 | % |
| | | | Other Securities^ | | | 5,190,552 | | | | 0.9 | % |
| | | | | |
| | | | Total | | | 13,547,662 | | | | | |
| | | | | |
| | |
| | Transportation (0.6%) | | | | | | | | |
| | | | Arctic LNG Carriers, Ltd., Term Loan | | | | | | | | |
| | 2,952,625 | | | 6.802%, (LIBOR 1M + 4.500%), 5/18/2023b,d | | | 2,952,625 | | | | 0.5 | % |
| | | | Other Securities^ | | | 443,707 | | | | 0.1 | % |
| | | | | |
| | | | Total | | | 3,396,332 | | | | | |
| | | | | |
| | |
| | Utilities (1.2%) | | | | | | | | |
| | | | Vertiv Group Corporation, Term Loan | | | | | | | | |
| | 2,710,557 | | | 6.313%, (LIBOR 3M + 4.000%), 11/15/2023b,d | | | 2,680,063 | | | | 0.5 | % |
| | | | Other Securities^ | | | 3,871,157 | | | | 0.7 | % |
| | | | | |
| | | | Total | | | 6,551,220 | | | | | |
| | | | | |
| | | | | | | | | | | | |
| | | | | |
| | | | Total Bank Loans (cost $186,300,565) | | | 183,464,336 | | | | | |
| | | | | |
| | | |
Principal
Amount | | | Long-Term Fixed Income (48.1%) | | Value | | | % of Net
Assets | |
| | Asset-Backed Securities (7.1%) | | | | | | | | |
| | | | OZLM Funding II, Ltd. | | | | | | | | |
| | 2,170,000 | | | 4.020%, (LIBOR 3M + 1.500%), 7/15/2031, Ser. 2012-2A, Class A1BR*,d | | | 2,169,996 | | | | 0.4 | % |
| | | | OZLM IX, Ltd. | | | | | | | | |
| | 2,000,000 | | | 4.019%, (LIBOR 3M + 1.550%), 10/20/2031, Ser. 2014-9A, Class A1BR*,c,d,e | | | 2,000,000 | | | | 0.4 | % |
| | | | Park Avenue Institutional Advisers CLO, Ltd. | | | | | | | | |
| | 2,200,000 | | | 3.910%, (LIBOR 3M + 1.500%), 10/20/2031, Ser. 2018-1A, Class A1B*,c,d,e | | | 2,200,000 | | | | 0.4 | % |
| | | | Sound Point CLO XXI, Ltd. | | | | | | | | |
| | 2,200,000 | | | 3.864%, (LIBOR 3M + 1.450%), 10/26/2031, Ser. 2018-3A, Class A1B*,d | | | 2,199,905 | | | | 0.4 | % |
| | | | THL Credit Wind River CLO, Ltd. | | | | | | | | |
| | 3,350,000 | | | 3.860%, (LIBOR 3M + 1.450%), 10/22/2031, Ser. 2014-3A, Class A2R2*,d | | | 3,349,906 | | | | 0.6 | % |
| | | | Other Securities^ | | | 27,953,764 | | | | 4.9 | % |
| | | | | |
| | | | Total | | | 39,873,571 | | | | | |
| | | | | |
| | |
| | Basic Materials (1.4%) | | | | | | | | |
| | | | Other Securities^ | | | 7,561,948 | | | | 1.4 | % |
| | | | | |
| | | | Total | | | 7,561,948 | | | | | |
| | | | | |
| | |
| | Capital Goods (1.6%) | | | | | | | | |
| | | | Other Securities^ | | | 8,893,614 | | | | 1.6 | % |
| | | | | |
| | | | Total | | | 8,893,614 | | | | | |
| | | | | |
| | |
| | Collateralized Mortgage Obligations (5.7%) | | | | | | | | |
| | | | Banc of America Mortgage Securities, Inc. | | | | | | | | |
| | 168,256 | | | 4.368%, 9/25/2035, Ser. 2005-H, Class 2A1d | | | 163,037 | | | | <0.1 | % |
The accompanying Notes to Financial Statements are an integral part of this schedule.
157
OPPORTUNITY INCOME PLUS FUND
Summary Schedule of Investments as of October 31, 2018
| | | | | | | | | | | | |
Principal Amount | | | Long-Term Fixed Income (48.1%) | | Value | | | % of Net Assets | |
| | Collateralized Mortgage Obligations (5.7%) - continued | | | | | | | | |
| | | | Banc of America Mortgage Trust | | | | | | | | |
| | $131,078 | | | 4.249%, 7/25/2035, Ser. 2005-F, Class 2A2d | | | $122,025 | | | | <0.1 | % |
| | | | CHL Mortgage Pass-Through Trust | | | | | | | | |
| | 800,938 | | | 4.109%, 12/20/2035, Ser. 2005-HYB8, Class 3A1d | | | 767,445 | | | | 0.1 | % |
| | | | Countrywide Alternative Loan Trust | | | | | | | | |
| | 1,543,249 | | | 5.500% - 5.500%, 5/25/2035 - 10/25/2035, Ser. 2005- 46CB, Class A8 | | | 1,420,500 | | | | 0.3 | % |
| | | | Countrywide Home Loan Mortgage Pass Through Trust | | | | | | | | |
| | 376,478 | | | 4.060%, 11/25/2035, Ser. 2005-22, Class 2A1d | | | 335,879 | | | | 0.1 | % |
| | | | Federal Home Loan Mortgage Corporation - REMIC | | | | | | | | |
| | 5,733,943 | | | 3.000% - 3.000%, 5/15/2027 - 4/15/2033, Ser. 4046, Class GIf | | | 462,015 | | | | 0.1 | % |
| | | | Federal National Mortgage Association - REMIC | | | | | | | | |
| | 30,437,188 | | | 2.500% - 3.000%, 7/25/2027 - 6/25/2028, Ser. 2012-74, Class AIf | | | 2,421,680 | | | | 0.4 | % |
| | | | Other Securities^ | | | 25,919,090 | | | | 4.7 | % |
| | | | | |
| | | | Total | | | 31,611,671 | | | | | |
| | | | | |
| | |
| | Commercial Mortgage-Backed Securities (0.4%) | | | | | | | | |
| | | | Other Securities^ | | | 2,008,849 | | | | 0.4 | % |
| | | | | |
| | | | Total | | | 2,008,849 | | | | | |
| | | | | |
| | |
| | Communications Services (2.3%) | | | | | | | | |
| | | | Other Securities^ | | | 12,638,533 | | | | 2.3 | % |
| | | | | |
| | | | Total | | | 12,638,533 | | | | | |
| | | | | |
| | |
| | Consumer Cyclical (3.0%) | | | | | | | | |
| | | | Other Securities^ | | | 16,873,421 | | | | 3.0 | % |
| | | | | |
| | | | Total | | | 16,873,421 | | | | | |
| | | | | |
| | |
| | Consumer Non-Cyclical (2.4%) | | | | | | | | |
| | | | Albertsons Companies, LLC | | | | | | | | |
| | 750,000 | | | 6.625%, 6/15/2024 | | | 708,750 | | | | 0.1 | % |
| | | | Other Securities^ | | | 12,385,141 | | | | 2.3 | % |
| | | | | |
| | | | Total | | | 13,093,891 | | | | | |
| | | | | |
| | |
| | Energy (3.4%) | | | | | | | | |
| | | | Other Securities^ | | | 19,080,763 | | | | 3.4 | % |
| | | | | |
| | | | Total | | | 19,080,763 | | | | | |
| | | | | |
| | |
| | Financials (6.8%) | | | | | | | | |
| | | | Bank of America Corporation | | | | | | | | |
| | 254,000 | | | 2.328%, 10/1/2021d | | | 247,961 | | | | 0.1 | % |
| | 252,000 | | | 3.499%, 5/17/2022d | | | 250,900 | | | | 0.1 | % |
| | 250,000 | | | 2.738%, 1/23/2022d | | | 245,013 | | | | 0.1 | % |
| | 247,000 | | | 3.550%, 3/5/2024d | | | 242,407 | | | | 0.1 | % |
| | 119,000 | | | 3.864%, 7/23/2024d | | | 118,147 | | | | <0.1 | % |
| | 116,000 | | | 2.369%, 7/21/2021d | | | 113,778 | | | | <0.1 | % |
| | | | Other Securities^ | | | 36,431,960 | | | | 6.4 | % |
| | | | | |
| | | | Total | | | 37,650,166 | | | | | |
| | | | | |
| | |
| | Mortgage-Backed Securities (11.2%) | | | | | | | | |
| | | | Antler Mortgage Trust | | | | | | | | |
| | 2,257,676 | | | 4.335%, 7/25/2022, Ser. 2018-RTL1, Class A1*,e | | | 2,254,967 | | | | 0.4 | % |
| | | | Federal Home Loan Mortgage Corporation | | | | | | | | |
| | 3,665,889 | | | 3.500%, 8/15/2035, Ser. 345, Class C8f | | | 580,346 | | | | 0.1 | % |
| | | | Federal Home Loan Mortgage Corporation Gold 30-Yr. Pass Through | | | | | | | | |
| | 10,475,000 | | | 4.000%, 11/1/2048c | | | 10,478,631 | | | | 1.9 | % |
| | | | Federal National Mortgage Association Conventional 30- Yr. Pass Through | | | | | | | | |
| | 9,025,000 | | | 3.500%, 11/1/2048c | | | 8,785,626 | | | | 1.6 | % |
| | 10,787,500 | | | 4.000%, 11/1/2048c | | | 10,787,455 | | | | 1.9 | % |
| | 22,850,000 | | | 4.500%, 11/1/2048c | | | 23,394,920 | | | | 4.2 | % |
| | 3,675,000 | | | 5.000%, 11/1/2048c | | | 3,834,920 | | | | 0.7 | % |
| | | | Merrill Lynch Alternative Note Asset Trust | | | | | | | | |
| | 2,073,242 | | | 2.431%, (LIBOR 1M + 0.150%), 1/25/2037, Ser. 2007-A1, Class A2Bd | | | 921,090 | | | | 0.2 | % |
| | | | Other Securities^ | | | 1,138,213 | | | | 0.2 | % |
| | | | | |
| | | | Total | | | 62,176,168 | | | | | |
| | | | | |
| | |
| | Technology (1.3%) | | | | | | | | |
| | | | Other Securities^ | | | 7,448,387 | | | | 1.3 | % |
| | | | | |
| | | | Total | | | 7,448,387 | | | | | |
| | | | | |
| | |
| | Transportation (0.4%) | | | | | | | | |
| | | | Other Securities^ | | | 2,429,476 | | | | 0.4 | % |
| | | | | |
| | | | Total | | | 2,429,476 | | | | | |
| | | | | |
| | |
| | Utilities (1.1%) | | | | | | | | |
| | | | Other Securities^ | | | 6,381,540 | | | | 1.1 | % |
| | | | | |
| | | | Total | | | 6,381,540 | | | | | |
| | | | | |
| | | | | | | | | | | | |
| | | | | |
| | | | Total Long-Term Fixed Income (cost $270,588,757) | | | 267,721,998 | | | | | |
| | | | | |
The accompanying Notes to Financial Statements are an integral part of this schedule.
158
OPPORTUNITY INCOME PLUS FUND
Summary Schedule of Investments as of October 31, 2018
| | | | | | | | | | | | |
| Shares | | | Registered Investment Companies (15.6%) | | Value | | | % of Net
Assets | |
| | Affiliated Fixed Income Holdings (14.1%) | | | | | | | | |
| | 8,667,585 | | | Thrivent Core Emerging Markets Debt Fund | | | $78,354,969 | | | | 14.1 | % |
| | | | | |
| | | | Total | | | 78,354,969 | | | | | |
| | | | | |
| | |
| | Equity Funds/Exchange Traded Funds (<0.1%) | | | | | | | | |
| | | | Other Securities^ | | | 750,303 | | | | 0.1 | % |
| | | | | |
| | | | Total | | | 750,303 | | | | | |
| | | | | |
| | |
| | Fixed Income Funds/Exchange Traded | | | | | | | | |
| | Funds (1.4%) | | | | | | | | |
| | 131,500 | | | Invesco Senior Loan ETF | | | 3,025,815 | | | | 0.5 | % |
| | | | Other Securities^ | | | 4,871,360 | | | | 0.9 | % |
| | | | | |
| | | | Total | | | 7,897,175 | | | | | |
| | | | | |
| | | | | | | | | | | | |
| | | | | |
| | | | Total Registered Investment Companies (cost $93,084,810) | | | 87,002,447 | | | | | |
| | | | | |
| | | |
| Shares | | | Preferred Stock (1.1%) | | Value | | | % of Net
Assets | |
| | Consumer Staples (0.1%) | | | | | | | | |
| | | | Other Securities^ | | | 368,597 | | | | 0.1 | % |
| | | | | |
| | | | Total | | | 368,597 | | | | | |
| | | | | |
| | |
| | Energy (0.3%) | | | | | | | | |
| | | | Other Securities^ | | | 1,461,091 | | | | 0.3 | % |
| | | | | |
| | | | Total | | | 1,461,091 | | | | | |
| | | | | |
| | |
| | Financials (0.7%) | | | | | | | | |
| | | | Other Securities^ | | | 3,933,452 | | | | 0.7 | % |
| | | | | |
| | | | Total | | | 3,933,452 | | | | | |
| | | | | |
| | |
| | Real Estate (<0.1%) | | | | | | | | |
| | | | Other Securities^ | | | 175,085 | | | | <0.1 | % |
| | | | | |
| | | | Total | | | 175,085 | | | | | |
| | | | | |
| | | | | | | | | | | | |
| | | | | |
| | | | Total Preferred Stock (cost $5,825,167) | | | 5,938,225 | | | | | |
| | | | | |
| | | |
| Shares | | | Common Stock (0.8%) | | Value | | | % of Net
Assets | |
| | Energy (0.2%) | | | | | | | | |
| | | | Other Securities^ | | | 1,398,028 | | | | 0.2 | % |
| | | | | |
| | | | Total | | | 1,398,028 | | | | | |
| | | | | |
| | |
| | Financials (0.4%) | | | | | | | | |
| | | | Other Securities^ | | | 1,975,113 | | | | 0.4 | % |
| | | | | |
| | | | Total | | | 1,975,113 | | | | | |
| | | | | |
| | |
| | Materials (0.1%) | | | | | | | | |
| | | | Other Securities^ | | | 669,580 | | | | 0.1 | % |
| | | | | |
| | | | Total | | | 669,580 | | | | | |
| | | | | |
| | |
| | Utilities (0.1%) | | | | | | | | |
| | | | Other Securities^ | | | 529,060 | | | | 0.1 | % |
| | | | | |
| | | | Total | | | 529,060 | | | | | |
| | | | | |
| | | | | | | | | | | | |
| | | | | |
| | | | Total Common Stock (cost $2,681,047) | | | 4,571,781 | | | | | |
| | | | | |
| | | |
| Shares | | | Collateral Held for Securities Loaned (1.0%) | | Value | | | % of Net
Assets | |
| | 5,373,892 | | | Thrivent Cash Management Trust | | | 5,373,892 | | | | 1.0 | % |
| | | | | |
| | | | Total Collateral Held for Securities Loaned (cost $5,373,892) | | | 5,373,892 | | | | | |
| | | | | |
| | | |
Shares or Principal Amount | | | Short-Term Investments (14.1%) | | Value | | | % of Net
Assets | |
| | | | Thrivent Core Short-Term Reserve Fund | | | | | | | | |
| | 7,769,239 | | | 2.430% | | | 77,692,386 | | | | 13.9 | % |
| | | | Other Securities^ | | | 998,317 | | | | 0.2 | % |
| | | | | |
| | | | Total Short-Term Investments (cost $78,690,761) | | | 78,690,703 | | | | | |
| | | | | |
| | | | Total Investments (cost $642,544,999) 113.6% | | $ | 632,763,382 | | | | | |
| | | | | |
| | | | Other Assets and Liabilities, Net (13.6%) | | | (75,539,883 | ) | | | | |
| | | | | |
| | | | Total Net Assets 100.0% | | $ | 557,223,499 | | | | | |
| | | | | |
The accompanying Notes to Financial Statements are an integral part of this schedule.
159
OPPORTUNITY INCOME PLUS FUND
Summary Schedule of Investments as of October 31, 2018
| ^ | The Summary Schedule of Investments shows the 50 largest holdings in unaffiliated issuers, any holding or issuer that exceeds 1% of net assets and all affiliated holdings as of the report date. The remaining securities held are grouped by category as “Other securities”. |
| a | All or a portion of the loan is unfunded. |
| b | The stated interest rate represents the weighted average of all contracts within the bank loan facility. |
| c | Denotes investments purchased on a when-issued or delayed delivery basis. |
| d | Denotes variable rate securities. The rate shown is as of October 31, 2018. The rates of certain variable rate securities are based on a published reference rate and spread; these may vary by security and the reference rate and spread are indicated in their description. The rates of other variable rate securities are determined by the issuer or agent and are based on current market conditions. These securities do not indicate a reference rate and spread in their description. |
| e | Security is valued using significant unobservable inputs. Further information on valuation can be found in the Notes to Financial Statements. |
| f | Denotes interest only security. Interest only securities represent the right to receive monthly interest payments on an underlying pool of mortgages or assets. The principal shown is the outstanding par amount of the pool as of the end of the period. The actual effective yield of the security is different than the stated coupon rate. |
| * | Denotes restricted securities. Restricted securities are investment securities which cannot be offered for public sale without first being registered under the Securities Act of 1933. The value of all restricted securities held in Opportunity Income Plus Fund as of October 31, 2018 was $39,864,446 or 7.2% of total net assets. The following table indicates the acquisition date and cost of restricted securities shown in the schedule as of October 31, 2018. |
| | | | | | | | |
| Security | | Acquisition Date | | | Cost | |
Antler Mortgage Trust, 7/25/2022 | | | 9/21/2018 | | | $ | 2,257,649 | |
OZLM Funding II, Ltd., 7/30/2031 | | | 8/17/2018 | | | | 2,170,000 | |
OZLM IX, Ltd., 10/20/2031 | | | 10/29/2018 | | | | 2,000,000 | |
Park Avenue Institutional Advisers CLO, Ltd., 10/20/2031 | | | 10/5/2018 | | | | 2,200,000 | |
Sound Point CLO XXI, Ltd., 10/26/2031 | | | 8/29/2018 | | | | 2,200,000 | |
THL Credit Wind River CLO, Ltd., 10/22/2031 | | | 9/21/2018 | | | | 3,350,000 | |
The following table presents the total amount of securities loaned with continuous maturity, by type, offset by the gross payable upon return of collateral for securities loaned by Thrivent Opportunity Income Plus Fund as of October 31, 2018:
| | | | |
Securities Lending Transactions | | | | |
Taxable Debt Security | | $ | 4,381,735 | |
Common Stock | | | 860,810 | |
| | | | |
Total lending | | $ | 5,242,545 | |
Gross amount payable upon return of collateral for securities loaned | | $ | 5,373,892 | |
| | | | |
Net amounts due to counterparty | | $ | 131,347 | |
| | | | |
Definitions:
| | | | |
CLO | | - | | Collateralized Loan Obligation |
ETF | | - | | Exchange Traded Fund |
REMIC | | - | | Real Estate Mortgage Investment Conduit |
Ser. | | - | | Series |
Reference Rate Index:
| | | | |
LIBOR 1M | | - | | ICE Libor USD Rate 1 Month |
LIBOR 3M | | - | | ICE Libor USD Rate 3 Month |
Unrealized Appreciation (Depreciation)
Gross unrealized appreciation and depreciation of investments of the portfolio as a whole (including derivatives), based on cost for federal income tax purposes, were as follows:
| | | | |
Gross unrealized appreciation | | | $5,585,822 | |
Gross unrealized depreciation | | | (15,337,889 | ) |
| | | | |
Net unrealized appreciation (depreciation) | | | ($9,752,067 | ) |
Cost for federal income tax purposes | | | $637,570,422 | |
The accompanying Notes to Financial Statements are an integral part of this schedule.
160
OPPORTUNITY INCOME PLUS FUND
Summary Schedule of Investments as of October 31, 2018
Fair Valuation Measurements
The following table is a summary of the inputs used, as of October 31, 2018, in valuing Opportunity Income Plus Fund’s assets carried at fair value.
| | | | | | | | | | | | | | | | |
| Investments in Securities | | Total | | | Level 1 | | | Level 2 | | | Level 3 | |
| | | | |
Bank Loans | | | | | | | | | | | | | | | | |
Basic Materials | | | 14,956,463 | | | | – | | | | 14,956,463 | | | | – | |
Capital Goods | | | 7,738,352 | | | | – | | | | 7,738,352 | | | | – | |
Communications Services | | | 48,943,641 | | | | – | | | | 48,534,241 | | | | 409,400 | |
Consumer Cyclical | | | 23,263,711 | | | | – | | | | 23,263,711 | | | | – | |
Consumer Non-Cyclical | | | 33,451,599 | | | | – | | | | 33,451,599 | | | | – | |
Energy | | | 13,755,406 | | | | – | | | | 12,326,193 | | | | 1,429,213 | |
Financials | | | 17,859,950 | | | | – | | | | 16,407,352 | | | | 1,452,598 | |
Technology | | | 13,547,662 | | | | – | | | | 13,547,662 | | | | – | |
Transportation | | | 3,396,332 | | | | – | | | | 3,396,332 | | | | – | |
Utilities | | | 6,551,220 | | | | – | | | | 5,349,874 | | | | 1,201,346 | |
| | | | |
Long-Term Fixed Income | | | | | | | | | | | | | | | | |
Asset-Backed Securities | | | 39,873,571 | | | | – | | | | 33,923,571 | | | | 5,950,000 | |
Basic Materials | | | 7,561,948 | | | | – | | | | 7,561,948 | | | | – | |
Capital Goods | | | 8,893,614 | | | | – | | | | 8,893,614 | | | | – | |
Collateralized Mortgage Obligations | | | 31,611,671 | | | | – | | | | 31,611,671 | | | | – | |
Commercial Mortgage-Backed Securities | | | 2,008,849 | | | | – | | | | 1,119,339 | | | | 889,510 | |
Communications Services | | | 12,638,533 | | | | – | | | | 12,638,533 | | | | – | |
Consumer Cyclical | | | 16,873,421 | | | | – | | | | 16,873,421 | | | | – | |
Consumer Non-Cyclical | | | 13,093,891 | | | | – | | | | 13,093,891 | | | | – | |
Energy | | | 19,080,763 | | | | – | | | | 19,080,763 | | | | – | |
Financials | | | 37,650,166 | | | | – | | | | 37,650,166 | | | | – | |
Mortgage-Backed Securities | | | 62,176,168 | | | | – | | | | 59,921,201 | | | | 2,254,967 | |
Technology | | | 7,448,387 | | | | – | | | | 7,448,387 | | | | – | |
Transportation | | | 2,429,476 | | | | – | | | | 2,429,476 | | | | – | |
Utilities | | | 6,381,540 | | | | – | | | | 6,381,540 | | | | – | |
| | | | |
Registered Investment Companies | | | | | | | | | | | | | | | | |
Fixed Income Funds/Exchange Traded Funds | | | 7,897,175 | | | | 7,897,175 | | | | – | | | | – | |
Equity Funds/Exchange Traded Funds | | | 750,303 | | | | 750,303 | | | | – | | | | – | |
| | | | |
Preferred Stock | | | | | | | | | | | | | | | | |
Consumer Staples | | | 368,597 | | | | 368,597 | | | | – | | | | – | |
Energy | | | 1,461,091 | | | | 897,667 | | | | 563,424 | | | | – | |
Financials | | | 3,933,452 | | | | 1,906,782 | | | | 2,026,670 | | | | – | |
| | | | |
Real Estate | | | 175,085 | | | | 175,085 | | | | – | | | | – | |
Common Stock | | | | | | | | | | | | | | | | |
Energy | | | 1,398,028 | | | | 906,331 | | | | – | | | | 491,697 | |
Financials | | | 1,975,113 | | | | 1,975,113 | | | | – | | | | – | |
Materials | | | 669,580 | | | | 669,580 | | | | – | | | | – | |
Utilities | | | 529,060 | | | | 529,060 | | | | – | | | | – | |
Options Purchased | | | – | | | | – | | | | – | | | | – | |
Short-Term Investments | | | 998,317 | | | | – | | | | 998,317 | | | | – | |
| |
Subtotal Investments in Securities | | $ | 471,342,135 | | | $ | 16,075,693 | | | $ | 441,187,711 | | | $ | 14,078,731 | |
| |
| | | | |
Other Investments* | | | Total | | | | | | | | | | | | | |
| | | | | | | | | | | | | |
Affiliated Registered Investment Companies | | | 78,354,969 | | | | | | | | | | | | | |
Short-Term Investments | | | 77,692,386 | | | | | | | | | | | | | |
Collateral Held for Securities Loaned | | | 5,373,892 | | | | | | | | | | | | | |
| | | | | | | | | | | | | |
Subtotal Other Investments | | $ | 161,421,247 | | | | | | | | | | | | | |
| | | | | | | | | | | | | |
| | | | | | | | | | | | | | | | |
| | | | | | | | | | | | | |
Total Investments at Value | | $ | 632,763,382 | | | | | | | | | | | | | |
| | | | | | | | | | | | | |
| * | Certain investments are measured at fair value using a net asset value per share that is not publicly available (practical expedient). According to disclosure requirements of Accounting Standards Codification (ASC) 820, Fair Value Measurement, securities valued using the practical expedient are not classified in the fair value hierarchy. The fair value amounts presented in this table are intended to permit reconciliation of the fair value hierarchy to the amounts presented in the Statement of Assets and Liabilities. |
The accompanying Notes to Financial Statements are an integral part of this schedule.
161
OPPORTUNITY INCOME PLUS FUND
Summary Schedule of Investments as of October 31, 2018
| | | | | | | | | | | | | | | | | | | | |
| Other Financial Instruments | | Total | | | Level 1 | | | Level 2 | | | | | | Level 3 | |
Asset Derivatives | | | | | | | | | | | | | | | | | | | | |
Futures Contracts | | | 728,388 | | | | 728,388 | | | | | | | | – | | | | – | |
| |
Total Asset Derivatives | | | $728,388 | | | | $728,388 | | | | | | | | $– | | | | $– | |
| |
Liability Derivatives | | | | | | | | | | | | | | | | | | | | |
Futures Contracts | | | 678,234 | | | | 678,234 | | | | | | | | – | | | | – | |
| |
Total Liability Derivatives | | | $678,234 | | | | $678,234 | | | | | | | | $– | | | | $– | |
| |
There were no significant transfers between Levels during the period ended October 31, 2018. Transfers between Levels are identified as of the end of the period.
The following table presents Opportunity Income Plus Fund’s futures contracts held as of October 31, 2018. Investments and/or cash totaling $998,317 were pledged as the initial margin deposit for these contracts.
| | | | | | | | | | | | | | | | |
| Futures Contracts Description | | Number of
Contracts
Long/(Short) | | | Expiration
Date | | | Notional
Principal
Amount | | | Value and
Unrealized | |
CBOT 10-Yr. U.S. Treasury Note | | | 194 | | | | December 2018 | | | | $23,142,348 | | | | ($165,473 | ) |
CBOT 5-Yr. U.S. Treasury Note | | | 39 | | | | December 2018 | | | | 4,388,535 | | | | (5,605 | ) |
CBOT U.S. Long Bond | | | 60 | | | | December 2018 | | | | 8,506,133 | | | | (218,633 | ) |
CME Ultra Long Term U.S. Treasury Bond | | | 26 | | | | December 2018 | | | | 4,168,211 | | | | (288,523 | ) |
| |
Total Futures Long Contracts | | | | | | | | | | | $40,205,227 | | | | ($678,234 | ) |
| |
CBOT 2-Yr. U.S. Treasury Note | | | (163 | ) | | | December 2018 | | | | ($34,466,363 | ) | | | $129,394 | |
CME E-mini S&P 500 Index | | | (60 | ) | | | December 2018 | | | | (8,680,221 | ) | | | 546,920 | |
Ultra 10-Yr. U.S. Treasury Note | | | (16 | ) | | | December 2018 | | | | (2,053,824 | ) | | | 52,074 | |
| |
Total Futures Short Contracts | | | | | | | | | | | ($45,200,408 | ) | | | $728,388 | |
| |
Total Futures Contracts | | | | | | | | | | | ($4,995,181 | ) | | | $50,154 | |
| |
Reference Description:
| | | | |
CBOT | | - | | Chicago Board of Trade |
CME | | - | | Chicago Mercantile Exchange |
S&P | | - | | Standard & Poor’s |
The following table summarizes the fair value and Statement of Assets and Liabilities location, as of October 31, 2018, for Opportunity Income Plus Fund’s investments in financial derivative instruments by primary risk exposure as discussed under item (2) Significant Accounting Policies of the Notes to Financial Statements.
| | | | | | |
| Derivatives by risk category | | Statement of Assets and Liabilities Location | | Fair Value | |
Asset Derivatives | | | | | | |
| | |
Interest Rate Contracts | | | | | | |
Futures* | | Net Assets - Accumulated undistributed earnings/(loss) | | | $181,468 | |
Total Interest Rate Contracts | | | | | 181,468 | |
| | |
Equity Contracts | | | | | | |
Futures* | | Net Assets - Accumulated undistributed earnings/(loss) | | | 546,920 | |
Total Equity Contracts | | | | | 546,920 | |
| |
Total Asset Derivatives | | | | | $728,388 | |
| |
Liability Derivatives | | | | | | |
| | |
Interest Rate Contracts | | | | | | |
Futures* | | Net Assets - Accumulated undistributed earnings/(loss) | | | 678,234 | |
Total Interest Rate Contracts | | | | | 678,234 | |
| |
Total Liability Derivatives | | | | | $678,234 | |
| |
| * | Includes cumulative appreciation/depreciation of futures contracts as reported in the Schedule of Investments. Only current day’s variation margin is reported within the Statement of Assets and Liabilities. |
The accompanying Notes to Financial Statements are an integral part of this schedule.
162
OPPORTUNITY INCOME PLUS FUND
Summary Schedule of Investments as of October 31, 2018
The following table summarizes the net realized gains/(losses) and Statement of Operations location, for the period ended October 31, 2018, for Opportunity Income Plus Fund’s investments in financial derivative instruments by primary risk exposure.
| | | | |
| Derivatives by risk category | | Statement of Operations Location | | Realized Gains/(Losses)
recognized in Income |
| | |
Interest Rate Contracts | | | | |
Options Written | | Net realized gains/(losses) on Written option contracts | | 17,188 |
Futures | | Net realized gains/(losses) on Futures contracts | | 266,583 |
Total Interest Rate Contracts | | | | 283,771 |
| | |
Equity Contracts | | | | |
Futures | | Net realized gains/(losses) on Futures contracts | | (1,814,106) |
Total Equity Contracts | | | | (1,814,106) |
|
Total | | | | ($1,530,335) |
|
The following table summarizes the change in net unrealized appreciation/(depreciation) and Statement of Operations location, for the period ended October 31, 2018, for Opportunity Income Plus Fund’s investments in financial derivative instruments by primary risk exposure.
| | | | |
| Derivatives by risk category | | Statement of Operations Location | | Change in unrealized
appreciation/(depreciation)
recognized in Income |
| | |
Interest Rate Contracts | | | | |
Options Written | | Change in net unrealized appreciation/(depreciation) on Written option contracts | | (18,956) |
Futures | | Change in net unrealized appreciation/(depreciation) on Futures contracts | | (507,315) |
Total Interest Rate Contracts | | | | (526,271) |
| | |
Equity Contracts | | | | |
Futures | | Change in net unrealized appreciation/(depreciation) on Futures contracts | | 1,200,420 |
Total Equity Contracts | | | | 1,200,420 |
|
Total | | | | $674,149 |
|
The following table presents Opportunity Income Plus Fund’s average volume of derivative activity during the period ended October 31, 2018.
| | | | |
| Derivative Risk Category | | Average Notional Value | |
Equity Contracts | | | | |
Futures - Short | | | ($10,371,545 | ) |
Interest Rate Contracts | | | | |
Futures - Long | | | 22,401,088 | |
Futures - Short | | | (40,209,541 | ) |
Written Options | | | (1,035,046 | ) |
Investment in Affiliates
Affiliated issuers, as defined under the Investment Company Act of 1940, include those in which the Fund’s holdings of an issuer represent 5% or more of the outstanding voting securities of an issuer, any affiliated mutual fund, or a company which is under common ownership or control with the Fund. The Fund owns shares of Thrivent Cash Management Trust for the purpose of securities lending and Thrivent Core Short-Term Reserve Fund primarily to serve as a cash sweep vehicle for the Fund. Thrivent Cash Management Trust and Thrivent Core Funds are established solely for investment by Thrivent entities.
A summary of transactions (in thousands) for the fiscal year to date, in Opportunity Income Plus Fund, is as follows:
| | | | | | | | | | | | | | | | | | | | | | | | |
| Fund | | Value
10/31/2017 | | | Gross
Purchases | | | Gross
Sales | | | Shares Held at
10/31/2018 | | | Value
10/31/2018 | | | % of Net
Assets | |
Affiliated Fixed Income Holdings | | | | | | | | | | | | | | | | | | | | | | | | |
Core Emerging Markets Debt | | | $1,106 | | | | $81,774 | | | | $– | | | | 8,668 | | | | $78,355 | | | | 14.1 | % |
| |
Total Affiliated Fixed Income Holdings | | | 1,106 | | | | | | | | | | | | | | | | 78,355 | | | | 14.1 | |
| |
Affiliated Short-Term Investments | | | | | | | | | | | | | | | | | | | | | | | | |
Core Short-Term Reserve, 2.430% | | | 88,217 | | | | 238,475 | | | | 249,000 | | | | 7,769 | | | | 77,692 | | | | 13.9 | |
| |
Total Affiliated Short-Term Investments | | | 88,217 | | | | | | | | | | | | | | | | 77,692 | | | | 13.9 | |
| |
Collateral Held for Securities Loaned | | | | | | | | | | | | | | | | | | | | | | | | |
Cash Management Trust- Collateral Investment | | | 5,427 | | | | 44,924 | | | | 44,977 | | | | 5,374 | | | | 5,374 | | | | 1.0 | |
| |
Total Collateral Held for Securities Loaned | | | 5,427 | | | | | | | | | | | | | | | | 5,374 | | | | 1.0 | |
| |
Total Value | | | $94,750 | | | | | | | | | | | | | | | | $161,421 | | | | | |
| |
The accompanying Notes to Financial Statements are an integral part of this schedule.
163
OPPORTUNITY INCOME PLUS FUND
Summary Schedule of Investments as of October 31, 2018
| | | | | | | | | | | | | | | | |
| Fund | | Net Realized
Gain/(Loss) | | | Change in
Unrealized
Appreciation/
(Depreciation) | | | Distributions of
Realized Capital Gains | | | Income
Earned
11/1/2017 -
10/31/2018 | |
Affiliated Fixed Income Holdings | | | | | | | | | | | | | | | | |
Core Emerging Markets Debt | | | $– | | | | $(4,525 | ) | | | $– | | | | $2,427 | |
Affiliated Short-Term Investments | | | | | | | | | | | | | | | | |
Core Short-Term Reserve, 2.430% | | | – | | | | – | | | | 1 | | | | 1,756 | |
| |
Total Income from Affiliated Investments | | | | | | | | | | | | | | | $4,183 | |
| |
Collateral Held for Securities Loaned | | | | | | | | | | | | | | | | |
Cash Management Trust- Collateral Investment | | | – | | | | – | | | | – | | | | 19 | |
| |
Total Affiliated Income from Securities Loaned, Net | | | | | | | | | | | | | | | $19 | |
| |
Total | | | $– | | | | $(4,525 | ) | | | $1 | | | | | |
| |
The accompanying Notes to Financial Statements are an integral part of this schedule.
164
PARTNER EMERGING MARKETS EQUITY FUND
Schedule of Investments as of October 31, 2018
| | | | | | | | |
| Shares | | | Common Stock (93.3%) | | Value | |
| | Brazil (12.5%) | | | | |
| | 45,550 | | | Ambev SA | | | $198,773 | |
| | 46,760 | | | Banco Bradesco SA ADR | | | 428,789 | |
| | 15,300 | | | BRF SAa | | | 89,707 | |
| | 18,378 | | | Lojas Renner SA | | | 186,076 | |
| | 23,600 | | | Multiplan Empreendimentos Imobiliarios SA | | | 146,046 | |
| | 14,026 | | | Ultrapar Participacoes SA | | | 165,832 | |
| | 24,920 | | | Vale SA ADR | | | 376,292 | |
| | | | | |
| | | | Total | | | 1,591,515 | |
| | | | | |
| |
| | Cayman Islands (10.8%) | | | | |
| | 1,944 | | | Autohome, Inc. ADRb | | | 140,707 | |
| | 72,000 | | | China Resources Land, Ltd. | | | 244,886 | |
| | 4,108 | | | Huazhu Group, Ltd. ADRa | | | 107,465 | |
| | 5,800 | | | Sunny Optical Technology Group Company, Ltd. | | | 50,639 | |
| | 22,400 | | | Tencent Holdings, Ltd. | | | 767,408 | |
| | 9,000 | | | Wuxi Biologics (Cayman), Inc.a,c | | | 64,394 | |
| | | | | |
| | | | Total | | | 1,375,499 | |
| | | | | |
| |
| | Chile (2.0%) | | | | |
| | 4,500 | | | Banco Santander Chile SA ADR | | | 132,570 | |
| | 16,700 | | | S.A.C.I. Falabella | | | 125,863 | |
| | | | | |
| | | | Total | | | 258,433 | |
| | | | | |
| |
| | China (10.8%) | | | | |
| | 1,958 | | | 58.com, Inc. ADRa | | | 128,425 | |
| | 22,500 | | | China International Travel Service Corporation, Ltd. | | | 174,215 | |
| | 41,696 | | | Hangzhou Hikvision Digital Technology Company, Ltd. | | | 145,831 | |
| | 3,099 | | | Kweichow Moutai Company, Ltd. | | | 245,475 | |
| | 24,600 | | | Midea Group Company, Ltd. | | | 131,693 | |
| | 39,500 | | | Ping An Insurance Company of China, Ltd. | | | 373,434 | |
| | 24,697 | | | Shanghai International Airport Company, Ltd. | | | 176,448 | |
| | | | | |
| | | | Total | | | 1,375,521 | |
| | | | | |
| |
| | Hong Kong (6.2%) | | | | |
| | 39,400 | | | AIA Group, Ltd. | | | 299,718 | |
| | 18,500 | | | China Mobile, Ltd. | | | 173,306 | |
| | 52,000 | | | Hang Lung Group, Ltd. | | | 128,021 | |
| | 7,123 | | | Hong Kong Exchanges & Clearing, Ltd. | | | 189,662 | |
| | | | | |
| | | | Total | | | 790,707 | |
| | | | | |
| |
| | Hungary (0.4%) | | | | |
| | 2,900 | | | Richter Gedeon Nyrt | | | 53,869 | |
| | | | | |
| | | | Total | | | 53,869 | |
| | | | | |
| |
| | India (13.9%) | | | | |
| | 12,000 | | | Aditya Birla Capital, Ltd.a | | | 16,970 | |
| | 10,000 | | | Aditya Birla Capital, Ltd. GDRa | | | 14,139 | |
| | 2,000 | | | Grasim Industries, Ltd. | | | 22,565 | |
| | 8,600 | | | Grasim Industries, Ltd. GDR | | | 96,046 | |
| | 3,600 | | | Hero Motocorp, Ltd. | | | 134,402 | |
| | 8,334 | | | Hindustan Unilever, Ltd. | | | 182,969 | |
| | 19,220 | | | Housing Development Finance Corporation | | | 459,811 | |
| | 38,000 | | | ITC, Ltd. | | | 144,002 | |
| | 23,420 | | | ITC, Ltd. GDR | | | 88,528 | |
| | 14,429 | | | Kotak Mahindra Bank, Ltd. | | | 218,349 | |
| | 7,672 | | | Tata Consultancy Services, Ltd. | | | 201,125 | |
| | 1,600 | | | Ultra Tech Cement, Ltd. | | | 75,711 | |
| | 2,300 | | | Ultra Tech Cement, Ltd. GDR | | | 108,846 | |
| | | | | |
| | | | Total | | | 1,763,463 | |
| | | | | |
| |
| | Indonesia (5.7%) | | | | |
| | 652,700 | | | Astra International Tbk PT | | | 339,512 | |
| | 98,700 | | | Indocement Tunggal Prakarsa Tbk PT | | | 112,619 | |
| | 177,100 | | | PT Bank Central Asia Tbk | | | 275,755 | |
| | | | | |
| | | | Total | | | 727,886 | |
| | | | | |
| |
| | Luxembourg (0.5%) | | | | |
| | 2,000 | | | Tenaris SA ADR | | | 58,460 | |
| | | | | |
| | | | Total | | | 58,460 | |
| | | | | |
| |
| | Malaysia (1.5%) | | | | |
| | 31,700 | | | Public Bank Berhad | | | 186,473 | |
| | | | | |
| | | | Total | | | 186,473 | |
| | | | | |
| |
| | Mexico (5.0%) | | | | |
| | 2,740 | | | Fomento Economico Mexicano SAB de CV ADR | | | 233,092 | |
| | 11,600 | | | Grupo Aeroportuario del Sureste, SAB de CV | | | 191,367 | |
| | 37,600 | | | Grupo Financiero Banorte SAB de CV ADR | | | 207,294 | |
| | | | | |
| | | | Total | | | 631,753 | |
| | | | | |
| |
| | Philippines (3.6%) | | | | |
| | 5,400 | | | Ayala Corporation | | | 92,962 | |
| | 255,000 | | | Ayala Land, Inc. | | | 189,211 | |
| | 110,754 | | | Bank of the Philippine Islands | | | 170,292 | |
| | | | | |
| | | | Total | | | 452,465 | |
| | | | | |
| |
| | Poland (0.8%) | | | | |
| | 3,900 | | | Bank Pekao SA | | | 106,323 | |
| | | | | |
| | | | Total | | | 106,323 | |
| | | | | |
| |
| | Russia (2.6%) | | | | |
| | 4,058 | | | Lukoil ADR | | | 302,560 | |
| | 527 | | | Magnit PJSC | | | 28,741 | |
| | | | | |
| | | | Total | | | 331,301 | |
| | | | | |
| |
| | South Africa (3.5%) | | | | |
| | 13,600 | | | Massmart Holdings, Ltd. | | | 88,537 | |
| | 18,700 | | | MTN Group, Ltd. | | | 108,589 | |
| | 740 | | | Naspers, Ltd. | | | 129,797 | |
| | 22,500 | | | Truworths International, Ltd. | | | 123,250 | |
| | | | | |
| | | | Total | | | 450,173 | |
| | | | | |
| |
| | South Korea (3.1%) | | | | |
| | 329 | | | Amorepacific Corporation | | | 26,121 | |
| | 666 | | | Amorepacific Group | | | 36,504 | |
| | 585 | | | LG Chem, Ltd. | | | 178,762 | |
| | 1,505 | | | NAVER Corporation | | | 151,560 | |
| | | | | |
| | | | Total | | | 392,947 | |
| | | | | |
The accompanying Notes to Financial Statements are an integral part of this schedule.
165
PARTNER EMERGING MARKETS EQUITY FUND
Schedule of Investments as of October 31, 2018
| | | | | | | | |
| Shares | | | Common Stock (93.3%) | | Value | |
| | Taiwan (4.8%) | | | | |
| | 82,000 | | | Taiwan Semiconductor Manufacturing Company, Ltd. | | | $615,605 | |
| | | | | |
| | | | Total | | | 615,605 | |
| | | | | |
| |
| | Thailand (2.5%) | | | | |
| | 18,300 | | | Siam Cement pcl | | | 227,304 | |
| | 22,500 | | | Siam Commercial Bank pcl | | | 93,374 | |
| | | | | |
| | | | Total | | | 320,678 | |
| | | | | |
| |
| | Turkey (1.2%) | | | | |
| | 10,300 | | | BIM Birlesik Magazalar AS | | | 146,419 | |
| | | | | |
| | | | Total | | | 146,419 | |
| | | | | |
| |
| | United Kingdom (<0.1%) | | | | |
| | 636 | | | Standard Chartered plc | | | 4,458 | |
| | | | | |
| | | | Total | | | 4,458 | |
| | | | | |
| |
| | United States (1.9%) | | | | |
| | 6,540 | | | Yum China Holding, Inc. | | | 235,963 | |
| | | | | |
| | | | Total | | | 235,963 | |
| | | | | |
| | | | | | | | |
| | | | | |
| | | | Total Common Stock (cost $12,715,487) | | | 11,869,911 | |
| | | | | |
| | |
| Shares | | | Preferred Stock (6.2%) | | | |
| | South Korea (6.2%) | | | | |
| | 24,830 | | | Samsung Electronics Company, Ltd. | | | 783,405 | |
| | | | | |
| | | | Total | | | 783,405 | |
| | | | | |
| | | | | | | | |
| | | | | |
| | | | Total Preferred Stock (cost $623,819) | | | 783,405 | |
| | | | | |
| | |
| Shares | | | Collateral Held for Securities Loaned (0.9%) | | | |
| | 110,800 | | | Thrivent Cash Management Trust | | | 110,800 | |
| | | | | |
| | | | Total Collateral Held for Securities Loaned (cost $110,800) | | | 110,800 | |
| | | | | |
| | |
Shares or Principal Amount | | | Short-Term Investments (0.6%) | | | |
| | | | Thrivent Core Short-Term Reserve Fund | | | | |
| | 8,163 | | | 2.430% | | | 81,631 | |
| | | | | |
| | | | Total Short-Term Investments (cost $81,631) | | | 81,631 | |
| | | | | |
| | | | Total Investments (cost $13,531,737) 101.0% | | | $12,845,747 | |
| | | | | |
| | | | Other Assets and Liabilities, Net (1.0%) | | | (126,418 | ) |
| | | | | |
| | | | Total Net Assets 100.0% | | | $12,719,329 | |
| | | | | |
| a | Non-income producing security. |
| b | All or a portion of the security is on loan. |
| c | Denotes securities sold under Rule 144A of the Securities Act of 1933, which exempts them from registration. These securities may be resold to other dealers in the program or to other qualified institutional buyers. As of October 31, 2018, the value of these investments was $64,394 or 0.5% of total net assets. |
The following table presents the total amount of securities loaned with continuous maturity, by type, offset by the gross payable upon return of collateral for securities loaned by Thrivent Partner Emerging Markets Equity Fund as of October 31, 2018:
Securities Lending Transactions
| | | | |
Common Stock | | | $115,808 | |
| | | | |
Total lending | | | $115,808 | |
Gross amount payable upon return of collateral for securities loaned | | | $110,800 | |
| | | | |
Net amounts due to counterparty | | | $(5,008 | ) |
| | | | |
Definitions:
| | | | |
ADR | | - | | American Depositary Receipt, which are certificates for an underlying foreign security’s shares held by an issuing U.S. depository bank. |
GDR | | - | | Global Depository Receipts, which are certificates for shares of an underlying foreign security’s shares held by an issuing depository bank from more than one country. |
Unrealized Appreciation (Depreciation)
Gross unrealized appreciation and depreciation of investments of the portfolio as a whole (including derivatives), based on cost for federal income tax purposes, were as follows:
| | | | |
Gross unrealized appreciation | | | $1,326,632 | |
Gross unrealized depreciation | | | (2,085,180 | ) |
| | | | |
Net unrealized appreciation (depreciation) | | | ($758,548 | ) |
| |
Cost for federal income tax purposes | | | $13,604,295 | |
The accompanying Notes to Financial Statements are an integral part of this schedule.
166
PARTNER EMERGING MARKETS EQUITY FUND
Schedule of Investments as of October 31, 2018
Fair Valuation Measurements
The following table is a summary of the inputs used, as of October 31, 2018, in valuing Partner Emerging Markets Equity Fund’s assets carried at fair value.
| | | | | | | | | | | | | | | | |
| Investments in Securities | | Total | | | Level 1 | | | Level 2 | | | Level 3 | |
| | | | |
Common Stock | | | | | | | | | | | | | | | | |
Communications Services | | | 680,824 | | | | 269,132 | | | | 411,692 | | | | – | |
Consumer Discretionary | | | 1,558,439 | | | | 343,428 | | | | 1,215,011 | | | | – | |
Consumer Staples | | | 1,559,507 | | | | 233,092 | | | | 1,326,415 | | | | – | |
Energy | | | 526,852 | | | | 58,460 | | | | 468,392 | | | | – | |
Financials | | | 3,270,373 | | | | 575,498 | | | | 2,694,875 | | | | – | |
Health Care | | | 118,263 | | | | – | | | | 118,263 | | | | – | |
Industrials | | | 612,701 | | | | – | | | | 612,701 | | | | – | |
Information Technology | | | 1,735,698 | | | | – | | | | 1,735,698 | | | | – | |
Materials | | | 1,343,976 | | | | 485,138 | | | | 858,838 | | | | – | |
Real Estate | | | 463,278 | | | | – | | | | 463,278 | | | | – | |
| | | | |
Preferred Stock | | | | | | | | | | | | | | | | |
Information Technology | | | 783,405 | | | | – | | | | 783,405 | | | | – | |
| |
Subtotal Investments in Securities | | | $12,653,316 | | | | $1,964,748 | | | | $10,688,568 | | | | $– | |
| |
| | | | |
| Other Investments * | | Total | | | | | | | | | | |
Short-Term Investments | | | 81,631 | | | | | | | | | | | | | |
Collateral Held for Securities Loaned | | | 110,800 | | | | | | | | | | | | | |
| | | | | | | | | | | | | |
Subtotal Other Investments | | | $192,431 | | | | | | | | | | | | | |
| | | | | | | | | | | | | |
| | | | | | | | | | | | | | | | |
| | | | | | | | | | | | | |
Total Investments at Value | | | $12,845,747 | | | | | | | | | | | | | |
| | | | | | | | | | | | | |
| * | Certain investments are measured at fair value using a net asset value per share that is not publicly available (practical expedient). According to disclosure requirements of Accounting Standards Codification (ASC) 820, Fair Value Measurement, securities valued using the practical expedient are not classified in the fair value hierarchy. The fair value amounts presented in this table are intended to permit reconciliation of the fair value hierarchy to the amounts presented in the Statement of Assets and Liabilities. |
There were no significant transfers between Levels during the period ended October 31, 2018. Transfers between Levels are identified as of the end of the period.
Investment in Affiliates
Affiliated issuers, as defined under the Investment Company Act of 1940, include those in which the Fund’s holdings of an issuer represent 5% or more of the outstanding voting securities of an issuer, any affiliated mutual fund, or a company which is under common ownership or control with the Fund. The Fund owns shares of Thrivent Cash Management Trust for the purpose of securities lending and Thrivent Core Short-Term Reserve Fund primarily to serve as a cash sweep vehicle for the Fund. Thrivent Cash Management Trust and Thrivent Core Funds are established solely for investment by Thrivent entities.
A summary of transactions (in thousands) for the fiscal year to date, in Partner Emerging Markets Equity Fund, is as follows:
| | | | | | | | | | | | | | | | | | | | | | | | |
| Fund | | Value 10/31/2017 | | | Gross Purchases | | | Gross Sales | | | Shares Held at 10/31/2018 | | | Value 10/31/2018 | | | % of Net Assets | |
Affiliated Short-Term Investments | | | | | | | | | | | | | | | | | | | | | | | | |
Core Short-Term Reserve, 2.430% | | | $289 | | | | $4,634 | | | | $4,841 | | | | 8 | | | | $82 | | | | 0.6 | % |
Total Affiliated Short-Term Investments | | | 289 | | | | | | | | | | | | | | | | 82 | | | | 0.6 | |
Collateral Held for Securities Loaned | | | | | | | | | | | | | | | | | | | | | | | | |
Cash Management Trust- Collateral Investment | | | – | | | | 1,262 | | | | 1,151 | | | | 111 | | | | 111 | | | | 0.9 | |
Total Collateral Held for Securities Loaned | | | – | | | | | | | | | | | | | | | | 111 | | | | 0.9 | |
Total Value | | | $289 | | | | | | | | | | | | | | | | $193 | | | | | |
| | | | | | | | | | | | | | | | |
| Fund | | Net Realized Gain/(Loss) | | | Change in Unrealized Appreciation/ (Depreciation) | | | Distributions of Realized Capital Gains | | | Income Earned 11/1/2017 -10/31/2018 | |
Affiliated Short-Term Investments | | | | | | | | | | | | | | | | |
Core Short-Term Reserve, 2.430% | | | $– | | | | $– | | | | $0 | | | | $5 | |
Total Income from Affiliated Investments | | | | | | | | | | | | | | | $5 | |
Cash Management Trust- Collateral Investment | | | – | | | | – | | | | – | | | | 0 | |
Total Affiliated Income from Securities Loaned, Net | | | | | | | | | | | | | | | $0 | |
Total | | | $– | | | | $– | | | | $0 | | | | | |
The accompanying Notes to Financial Statements are an integral part of this schedule.
167
PARTNER WORLDWIDE ALLOCATION FUND
Summary Schedule of Investments as of October 31, 2018
| | | | | | | | | | |
| Shares | | Common Stock (86.3%) | | Value | | | % of Net
Assets | |
Australia (4.8%) | | | | | | | | |
| 314,559 | | Australia and New Zealand Banking Group, Ltd. | | | $5,789,982 | | | | 0.7 | % |
| 27,956 | | CSL, Ltd. | | | 3,732,047 | | | | 0.5 | % |
| 1,834,068 | | Medibank Private, Ltd. | | | 3,636,530 | | | | 0.5 | % |
| | Other Securities^ | | | 25,958,680 | | | | 3.1 | % |
| | | |
| | Total | | | 39,117,239 | | | | | |
| | | |
| | |
Austria (0.8%) | | | | | | | | |
| 60,123 | | OMV AG | | | 3,338,767 | | | | 0.4 | % |
| | Other Securities^ | | | 2,881,114 | | | | 0.4 | % |
| | | |
| | Total | | | 6,219,881 | | | | | |
| | | |
| | |
Belgium (0.1%) | | | | | | | | |
| | Other Securities^ | | | 954,503 | | | | 0.1 | % |
| | | |
| | Total | | | 954,503 | | | | | |
| | | |
| | |
Brazil (1.7%) | | | | | | | | |
| 408,046 | | Banco Bradesco SA ADR | | | 3,741,785 | | | | 0.4 | % |
| 224,696 | | Vale SA ADR | | | 3,392,910 | | | | 0.4 | % |
| | Other Securities^ | | | 6,881,629 | | | | 0.9 | % |
| | | |
| | Total | | | 14,016,324 | | | | | |
| | | |
| | |
Canada (2.1%) | | | | | | | | |
| 39,948 | | Canadian National Railway Company | | | 3,415,054 | | | | 0.4 | % |
| | Other Securities^ | | | 13,947,853 | | | | 1.7 | % |
| | | |
| | Total | | | 17,362,907 | | | | | |
| | | |
| | |
Cayman Islands (1.8%) | | | | | | | | |
| 183,300 | | Tencent Holdings, Ltd. | | | 6,279,723 | | | | 0.8 | % |
| | Other Securities^ | | | 8,177,283 | | | | 1.0 | % |
| | | |
| | Total | | | 14,457,006 | | | | | |
| | | |
| | |
Chile (0.3%) | | | | | | | | |
| | Other Securities^ | | | 2,200,035 | | | | 0.3 | % |
| | | |
| | Total | | | 2,200,035 | | | | | |
| | | |
| | |
China (1.5%) | | | | | | | | |
| | Other Securities^ | | | 12,266,122 | | | | 1.5 | % |
| | | |
| | Total | | | 12,266,122 | | | | | |
| | | |
| | |
Denmark (1.8%) | | | | | | | | |
| 175,241 | | Novo Nordisk AS | | | 7,568,055 | | | | 0.9 | % |
| | Other Securities^ | | | 7,423,456 | | | | 0.9 | % |
| | | |
| | Total | | | 14,991,511 | | | | | |
| | | |
| | |
Faroe Islands (0.1%) | | | | | | | | |
| | Other Securities^ | | | 570,675 | | | | 0.1 | % |
| | | |
| | Total | | | 570,675 | | | | | |
| | | |
| | |
Finland (1.5%) | | | | | | | | |
| 239,832 | | UPM-Kymmene Oyj | | | 7,710,258 | | | | 1.0 | % |
| | Other Securities^ | | | 4,317,660 | | | | 0.5 | % |
| | | |
| | Total | | | 12,027,918 | | | | | |
| | | |
| | |
France (5.0%) | | | | | | | | |
| 26,382 | | Capgemini SA | | | 3,221,351 | | | | 0.4 | % |
| 14,090 | | LVMH Moet Hennessy Louis Vuitton SE | | | 4,274,960 | | | | 0.5 | % |
| 29,343 | | Safran SA | | | 3,791,912 | | | | 0.5 | % |
| | Other Securities^ | | | 29,678,361 | | | | 3.6 | % |
| | | |
| | Total | | | 40,966,584 | | | | | |
| | | |
| | |
Germany (4.3%) | | | | | | | | |
| 24,141 | | Allianz SE | | | 5,029,025 | | | | 0.6 | % |
| 52,436 | | BASF SE | | | 4,023,841 | | | | 0.5 | % |
| 24,362 | | Hannover Rueckversicherung SE | | | 3,276,204 | | | | 0.4 | % |
| | Other Securities^ | | | 22,803,425 | | | | 2.8 | % |
| | | |
| | Total | | | 35,132,495 | | | | | |
| | | |
| | |
Hong Kong (1.2%) | | | | | | | | |
| | Other Securities^ | | | 9,451,116 | | | | 1.2 | % |
| | | |
| | Total | | | 9,451,116 | | | | | |
| | | |
| | |
Hungary (0.1%) | | | | | | | | |
| | Other Securities^ | | | 468,418 | | | | 0.1 | % |
| | | |
| | Total | | | 468,418 | | | | | |
| | | |
| | |
India (1.8%) | | | | | | | | |
| 157,848 | | Housing Development Finance Corporation | | | 3,776,284 | | | | 0.5 | % |
| | Other Securities^ | | | 11,266,830 | | | | 1.3 | % |
| | | |
| | Total | | | 15,043,114 | | | | | |
| | | |
| | |
Indonesia (0.8%) | | | | | | | | |
| | Other Securities^ | | | 6,289,180 | | | | 0.8 | % |
| | | |
| | Total | | | 6,289,180 | | | | | |
| | | |
| | |
Ireland (0.3%) | | | | | | | | |
| | Other Securities^ | | | 2,417,015 | | | | 0.3 | % |
| | | |
| | Total | | | 2,417,015 | | | | | |
| | | |
| | |
Isle of Man (0.2%) | | | | | | | | |
| | Other Securities^ | | | 1,412,586 | | | | 0.2 | % |
| | | |
| | Total | | | 1,412,586 | | | | | |
| | | |
| | |
Israel (0.3%) | | | | | | | | |
| | Other Securities^ | | | 2,176,229 | | | | 0.3 | % |
| | | |
| | Total | | | 2,176,229 | | | | | |
| | | |
| | |
Italy (1.9%) | | | | | | | | |
| | Other Securities^ | | | 15,382,631 | | | | 1.9 | % |
| | | |
| | Total | | | 15,382,631 | | | | | |
| | | |
| | |
Japan (19.8%) | | | | | | | | |
| 32,800 | | Daito Trust Construction Company, Ltd. | | | 4,324,299 | | | | 0.5 | % |
| 253,400 | | Honda Motor Company, Ltd. | | | 7,233,438 | | | | 0.9 | % |
| 284,500 | | Japan Tobacco, Inc. | | | 7,310,321 | | | | 0.9 | % |
| 6,900 | | Keyence Corporation | | | 3,370,787 | | | | 0.4 | % |
| 2,189,600 | | Mizuho Financial Group, Inc. | | | 3,760,339 | | | | 0.5 | % |
| 192,200 | | Nippon Steel & Sumitomo Metal Corporation | | | 3,545,354 | | | | 0.4 | % |
| 829,978 | | Nissan Motor Company, Ltd. | | | 7,550,943 | | | | 0.9 | % |
| 183,500 | | Osaka Gas Company, Ltd. | | | 3,355,481 | | | | 0.4 | % |
The accompanying Notes to Financial Statements are an integral part of this schedule.
168
PARTNER WORLDWIDE ALLOCATION FUND
Summary Schedule of Investments as of October 31, 2018
| | | | | | | | | | | | |
| Shares | | | Common Stock (86.3%) | | Value | | | % of Net
Assets | |
| | Japan (19.8%) - continued | | | | | | | | |
| | 330,200 | | | Sekisui House, Ltd. | | | $4,846,354 | | | | 0.6 | % |
| | 50,100 | | | SoftBank Group Corporation | | | 3,964,855 | | | | 0.5 | % |
| | 65,800 | | | Sony Corporation | | | 3,560,882 | | | | 0.5 | % |
| | 388,500 | | | Sumitomo Electric Industries, Ltd. | | | 5,298,204 | | | | 0.7 | % |
| | | | Other Securities^ | | | 103,742,563 | | | | 12.6 | % |
| | | | | |
| | | | Total | | | 161,863,820 | | | | | |
| | | | | |
| | |
| | Jersey (<0.1%) | | | | | | | | |
| | | | Other Securities^ | | | 302,600 | | | | <0.1 | % |
| | | | | |
| | | | Total | | | 302,600 | | | | | |
| | | | | |
| | |
| | Luxembourg (0.2%) | | | | | | | | |
| | | | Other Securities^ | | | 1,561,812 | | | | 0.2 | % |
| | | | | |
| | | | Total | | | 1,561,812 | | | | | |
| | | | | |
| | |
| | Malaysia (0.2%) | | | | | | | | |
| | | | Other Securities^ | | | 1,585,315 | | | | 0.2 | % |
| | | | | |
| | | | Total | | | 1,585,315 | | | | | |
| | | | | |
| | |
| | Mexico (0.7%) | | | | | | | | |
| | | | Other Securities^ | | | 5,670,170 | | | | 0.7 | % |
| | | | | |
| | | | Total | | | 5,670,170 | | | | | |
| | | | | |
| | |
| | Netherlands (2.8%) | | | | | | | | |
| | 119,610 | | | Unilever NV | | | 6,427,209 | | | | 0.8 | % |
| | | | Other Securities^ | | | 16,539,508 | | | | 2.0 | % |
| | | | | |
| | | | Total | | | 22,966,717 | | | | | |
| | | | | |
| | |
| | New Zealand (<0.1%) | | | | | | | | |
| | | | Other Securities^ | | | 263,799 | | | | <0.1 | % |
| | | | | |
| | | | Total | | | 263,799 | | | | | |
| | | | | |
| | |
| | Norway (2.1%) | | | | | | | | |
| | 325,027 | | | DnB ASA | | | 5,872,068 | | | | 0.7 | % |
| | 248,636 | | | Telenor ASA | | | 4,558,832 | | | | 0.6 | % |
| | | | Other Securities^ | | | 6,508,289 | | | | 0.8 | % |
| | | | | |
| | | | Total | | | 16,939,189 | | | | | |
| | | | | |
| | |
| | Philippines (0.5%) | | | | | | | | |
| | | | Other Securities^ | | | 4,170,963 | | | | 0.5 | % |
| | | | | |
| | | | Total | | | 4,170,963 | | | | | |
| | | | | |
| | |
| | Poland (0.1%) | | | | | | | | |
| | | | Other Securities^ | | | 951,399 | | | | 0.1 | % |
| | | | | |
| | | | Total | | | 951,399 | | | | | |
| | | | | |
| | |
| | Portugal (0.2%) | | | | | | | | |
| | | | Other Securities^ | | | 1,703,970 | | | | 0.2 | % |
| | | | | |
| | | | Total | | | 1,703,970 | | | | | |
| | | | | |
| | |
| | Russia (0.4%) | | | | | | | | |
| | | | Other Securities^ | | | 3,164,142 | | | | 0.4 | % |
| | | | | |
| | | | Total | | | 3,164,142 | | | | | |
| | | | | |
| | |
| | Singapore (0.4%) | | | | | | | | |
| | | | Other Securities^ | | | 3,665,344 | | | | 0.4 | % |
| | | | | |
| | | | Total | | | 3,665,344 | | | | | |
| | | | | |
| | |
| | South Africa (0.5%) | | | | | | | | |
| | | | Other Securities^ | | | 4,040,222 | | | | 0.5 | % |
| | | | | |
| | | | Total | | | 4,040,222 | | | | | |
| | | | | |
| | |
| | South Korea (0.4%) | | | | | | | | |
| | | | Other Securities^ | | | 3,619,628 | | | | 0.4 | % |
| | | | | |
| | | | Total | | | 3,619,628 | | | | | |
| | | | | |
| | |
| | Spain (2.7%) | | | | | | | | |
| | 107,288 | | | ACS Actividades de Construccion y Servicios, SAa | | | 4,016,998 | | | | 0.5 | % |
| | 136,583 | | | Enagas SA | | | 3,621,270 | | | | 0.4 | % |
| | | | Other Securities^ | | | 14,854,374 | | | | 1.8 | % |
| | | | | |
| | | | Total | | | 22,492,642 | | | | | |
| | | | | |
| | |
| | Sweden (2.6%) | | | | | | | | |
| | | | Other Securities^ | | | 21,171,422 | | | | 2.6 | % |
| | | | | |
| | | | Total | | | 21,171,422 | | | | | |
| | | | | |
| | |
| | Switzerland (5.8%) | | | | | | | | |
| | 10,268 | | | Lonza Group AG | | | 3,228,664 | | | | 0.4 | % |
| | 86,458 | | | Nestle SA | | | 7,299,053 | | | | 0.9 | % |
| | 59,226 | | | Novartis AG | | | 5,186,561 | | | | 0.6 | % |
| | 52,735 | | | Roche Holding AG | | | 12,833,717 | | | | 1.6 | % |
| | 5,839 | | | Roche Holding AG-BR | | | 1,421,548 | | | | 0.2 | % |
| | | | Other Securities^ | | | 17,126,706 | | | | 2.1 | % |
| | | | | |
| | | | Total | | | 47,096,249 | | | | | |
| | | | | |
| | |
| | Taiwan (0.7%) | | | | | | | | |
| | 764,362 | | | Taiwan Semiconductor | | | | | | | | |
| | | | Manufacturing Company, Ltd. | | | 5,738,358 | | | | 0.7 | % |
| | | | | |
| | | | Total | | | 5,738,358 | | | | | |
| | | | | |
| | |
| | Thailand (0.4%) | | | | | | | | |
| | | | Other Securities^ | | | 3,057,383 | | | | 0.4 | % |
| | | | | |
| | | | Total | | | 3,057,383 | | | | | |
| | | | | |
| | |
| | Turkey (0.1%) | | | | | | | | |
| | | | Other Securities^ | | | 1,198,303 | | | | 0.1 | % |
| | | | | |
| | | | Total | | | 1,198,303 | | | | | |
| | | | | |
| | |
| | United Kingdom (12.9%) | | | | | | | | |
| | 258,590 | | | BHP Billiton plc | | | 5,158,533 | | | | 0.6 | % |
| | 482,432 | | | BP plc | | | 3,484,955 | | | | 0.4 | % |
| | 135,111 | | | Diageo plc | | | 4,670,993 | | | | 0.6 | % |
| | 367,903 | | | GlaxoSmithKline plc | | | 7,125,459 | | | | 0.9 | % |
| | 1,258,764 | | | HSBC Holdings plc | | | 10,359,128 | | | | 1.3 | % |
| | 1,770,627 | | | ITV plc | | | 3,361,134 | | | | 0.4 | % |
| | 135,930 | | | Mondi plc | | | 3,200,996 | | | | 0.4 | % |
| | 66,627 | | | Royal Dutch Shell plc, Class A | | | 2,122,611 | | | | 0.3 | % |
| | 245,856 | | | Royal Dutch Shell plc, Class B | | | 8,018,086 | | | | 1.0 | % |
| | 74,531 | | | Unilever plc | | | 3,947,881 | | | | 0.5 | % |
| | | | Other Securities^ | | | 54,221,587 | | | | 6.5 | % |
| | | | | |
| | | | Total | | | 105,671,363 | | | | | |
| | | | | |
The accompanying Notes to Financial Statements are an integral part of this schedule.
169
PARTNER WORLDWIDE ALLOCATION FUND
Summary Schedule of Investments as of October 31, 2018
| | | | | | | | | | |
| Shares | | Common Stock (86.3%) | | Value | | | % of Net Assets | |
United States (0.4%) | | | | | | | | |
| | Other Securities^ | | | $3,339,522 | | | | 0.4 | % |
| | | |
| | Total | | | 3,339,522 | | | | | |
| | | |
| | Total Common Stock (cost $717,933,814) | | | 705,157,821 | | | | | |
| | | |
| | | |
Principal
Amount | | Long-Term Fixed Income (9.0%) | | | | | % of Net Assets | |
Albania (<0.1%) | | | | | | | | |
| | Other Securities^ | | | 191,683 | | | | < 0.1 | % |
| | | |
| | Total | | | 191,683 | | | | | |
| | | |
| | |
Angola (0.1%) | | | | | | | | |
| | Other Securities^ | | | 759,232 | | | | 0.1 | % |
| | | |
| | Total | | | 759,232 | | | | | |
| | | |
| | |
Argentina (0.7%) | | | | | | | | |
| | Other Securities^ | | | 5,687,771 | | | | 0.7 | % |
| | | |
| | Total | | | 5,687,771 | | | | | |
| | | |
| | |
Azerbaijan (<0.1%) | | | | | | | | |
| | Other Securities^ | | | 122,928 | | | | < 0.1 | % |
| | | |
| | Total | | | 122,928 | | | | | |
| | | |
| | |
Belize (<0.1%) | | | | | | | | |
| | Other Securities^ | | | 76,783 | | | | < 0.1 | % |
| | | |
| | Total | | | 76,783 | | | | | |
| | | |
| | |
Bermuda (<0.1%) | | | | | | | | |
| | Other Securities^ | | | 446,738 | | | | < 0.1 | % |
| | | |
| | Total | | | 446,738 | | | | | |
| | | |
| | |
Brazil (0.2%) | | | | | | | | |
| | Other Securities^ | | | 1,186,474 | | | | 0.2 | % |
| | | |
| | Total | | | 1,186,474 | | | | | |
| | | |
| | |
Cayman Islands (0.1%) | | | | | | | | |
| | Other Securities^ | | | 928,304 | | | | 0.1 | % |
| | | |
| | Total | | | 928,304 | | | | | |
| | | |
| | |
Chile (0.1%) | | | | | | | | |
| | Other Securities^ | | | 1,060,330 | | | | 0.1 | % |
| | | |
| | Total | | | 1,060,330 | | | | | |
| | | |
| | |
Colombia (0.1%) | | | | | | | | |
| | Other Securities^ | | | 896,529 | | | | 0.1 | % |
| | | |
| | Total | | | 896,529 | | | | | |
| | | |
| | |
Costa Rica (0.1%) | | | | | | | | |
| | Other Securities^ | | | 811,195 | | | | 0.1 | % |
| | | |
| | Total | | | 811,195 | | | | | |
| | | |
| | |
Dominican Republic (0.3%) | | | | | | | | |
| | Other Securities^ | | | 2,547,110 | | | | 0.3 | % |
| | | |
| | Total | | | 2,547,110 | | | | | |
| | | |
| | |
Ecuador (0.3%) | | | | | | | | |
| | Other Securities^ | | | 2,697,360 | | | | 0.3 | % |
| | | |
| | Total | | | 2,697,360 | | | | | |
| | | |
| | |
Egypt (0.1%) | | | | | | | | |
| | Other Securities^ | | | 1,105,774 | | | | 0.1 | % |
| | | |
| | Total | | | 1,105,774 | | | | | |
| | | |
| | |
El Salvador (<0.1%) | | | | | | | | |
| | Other Securities^ | | | 306,983 | | | | <0.1 | % |
| | | |
| | Total | | | 306,983 | | | | | |
| | | |
| | |
France (<0.1%) | | | | | | | | |
| | Other Securities^ | | | 95,821 | | | | <0.1 | % |
| | | |
| | Total | | | 95,821 | | | | | |
| | | |
| | |
Gabon (0.1%) | | | | | | | | |
| | Other Securities^ | | | 381,587 | | | | 0.1 | % |
| | | |
| | Total | | | 381,587 | | | | | |
| | | |
| | |
Guatemala (0.3%) | | | | | | | | |
| | Other Securities^ | | | 2,189,711 | | | | 0.3 | % |
| | | |
| | Total | | | 2,189,711 | | | | | |
| | | |
| | |
Honduras (0.1%) | | | | | | | | |
| | Other Securities^ | | | 742,985 | | | | 0.1 | % |
| | | |
| | Total | | | 742,985 | | | | | |
| | | |
| | |
India (0.1%) | | | | | | | | |
| | Other Securities^ | | | 1,355,153 | | | | 0.1 | % |
| | | |
| | Total | | | 1,355,153 | | | | | |
| | | |
| | |
Indonesia (0.7%) | | | | | | | | |
| | Other Securities^ | | | 5,521,095 | | | | 0.7 | % |
| | | |
| | Total | | | 5,521,095 | | | | | |
| | | |
| | |
Ireland (<0.1%) | | | | | | | | |
| | Other Securities^ | | | 206,448 | | | | <0.1 | % |
| | | |
| | Total | | | 206,448 | | | | | |
| | | |
| | |
Isle of Man (<0.1%) | | | | | | | | |
| | Other Securities^ | | | 187,016 | | | | <0.1 | % |
| | | |
| | Total | | | 187,016 | | | | | |
| | | |
| | |
Italy (0.1%) | | | | | | | | |
| | Other Securities^ | | | 710,535 | | | | 0.1 | % |
| | | |
| | Total | | | 710,535 | | | | | |
| | | |
| | |
Ivory Coast (0.1%) | | | | | | | | |
| | Other Securities^ | | | 416,574 | | | | 0.1 | % |
| | | |
| | Total | | | 416,574 | | | | | |
| | | |
| | |
Japan (<0.1%) | | | | | | | | |
| | Other Securities^ | | | 231,811 | | | | <0.1 | % |
| | | |
| | Total | | | 231,811 | | | | | |
| | | |
The accompanying Notes to Financial Statements are an integral part of this schedule.
170
PARTNER WORLDWIDE ALLOCATION FUND
Summary Schedule of Investments as of October 31, 2018
| | | | | | | | | | |
Principal
Amount | | Long-Term Fixed Income (9.0%) | | Value | | | % of Net Assets | |
Kenya (0.1%) | | | | | | | | |
| | Other Securities^ | | | $421,522 | | | | 0.1 | % |
| | | |
| | Total | | | 421,522 | | | | | |
| | | |
| | |
Kuwait (0.1%) | | | | | | | | |
| | Other Securities^ | | | 330,225 | | | | 0.1 | % |
| | | |
| | Total | | | 330,225 | | | | | |
| | | |
| | |
Lebanon (<0.1%) | | | | | | | | |
| | Other Securities^ | | | 56,816 | | | | < 0.1 | % |
| | | |
| | Total | | | 56,816 | | | | | |
| | | |
| | |
Luxembourg (0.2%) | | | | | | | | |
| | Other Securities^ | | | 1,381,046 | | | | 0.2 | % |
| | | |
| | Total | | | 1,381,046 | | | | | |
| | | |
| | |
Macedonia, The Former Yugoslav Republic Of (0.1%) | | | | | | | | |
| | Other Securities^ | | | 989,903 | | | | 0.1 | % |
| | | |
| | Total | | | 989,903 | | | | | |
| | | |
| | |
Mauritius (0.1%) | | | | | | | | |
| | Other Securities^ | | | 558,474 | | | | 0.1 | % |
| | | |
| | Total | | | 558,474 | | | | | |
| | | |
| | |
Mexico (0.4%) | | | | | | | | |
| | Other Securities^ | | | 3,702,708 | | | | 0.4 | % |
| | | |
| | Total | | | 3,702,708 | | | | | |
| | | |
| | |
Netherlands (0.3%) | | | | | | | | |
| | Other Securities^ | | | 2,215,333 | | | | 0.3 | % |
| | | |
| | Total | | | 2,215,333 | | | | | |
| | | |
| | |
Nigeria (0.2%) | | | | | | | | |
| | Other Securities^ | | | 1,946,983 | | | | 0.2 | % |
| | | |
| | Total | | | 1,946,983 | | | | | |
| | | |
| | |
Oman (0.1%) | | | | | | | | |
| | Other Securities^ | | | 1,040,250 | | | | 0.1 | % |
| | | |
| | Total | | | 1,040,250 | | | | | |
| | | |
| | |
Pakistan (0.1%) | | | | | | | | |
| | Other Securities^ | | | 932,113 | | | | 0.1 | % |
| | | |
| | Total | | | 932,113 | | | | | |
| | | |
| | |
Panama (<0.1%) | | | | | | | | |
| | Other Securities^ | | | 236,175 | | | | < 0.1 | % |
| | | |
| | Total | | | 236,175 | | | | | |
| | | |
| | |
Papua New Guinea (<0.1%) | | | | | | | | |
| | Other Securities^ | | | 198,250 | | | | < 0.1 | % |
| | | |
| | Total | | | 198,250 | | | | | |
| | | |
| | |
Paraguay (0.2%) | | | | | | | | |
| | Other Securities^ | | | 1,891,803 | | | | 0.2 | % |
| | | |
| | Total | | | 1,891,803 | | | | | |
| | | |
| | |
Peru (0.1%) | | | | | | | | |
| | Other Securities^ | | | 827,204 | | | | 0.1 | % |
| | | |
| | Total | | | 827,204 | | | | | |
| | | |
| | |
Qatar (0.1%) | | | | | | | | |
| | Other Securities^ | | | 780,040 | | | | 0.1 | % |
| | | |
| | Total | | | 780,040 | | | | | |
| | | |
| | |
Romania (0.2%) | | | | | | | | |
| | Other Securities^ | | | 1,277,646 | | |
| 0.2
|
% |
| | | |
| | Total | | | 1,277,646 | | | | | |
| | | |
| | |
Russia (0.3%) | | | | | | | | |
| | Other Securities^ | | | 2,346,368 | | | | 0.3 | % |
| | | |
| | Total | | | 2,346,368 | | | | | |
| | | |
| | |
Senegal (<0.1%) | | | | | | | | |
| | Other Securities^ | | | 200,590 | | | | < 0.1 | % |
| | | |
| | Total | | | 200,590 | | | | | |
| | | |
| | |
Singapore (<0.1%) | | | | | | | | |
| | Other Securities^ | | | 172,327 | | | | < 0.1 | % |
| | | |
| | Total | | | 172,327 | | | | | |
| | | |
| | |
South Africa (0.4%) | | | | | | | | |
| | Other Securities^ | | | 2,800,352 | | | | 0.4 | % |
| | | |
| | Total | | | 2,800,352 | | | | | |
| | | |
| | |
South Korea (<0.1%) | | | | | | | | |
| | Other Securities^ | | | 193,541 | | | | < 0.1 | % |
| | | |
| | Total | | | 193,541 | | | | | |
| | | |
| | |
Sri Lanka (0.4%) | | | | | | | | |
| | Other Securities^ | | | 2,727,470 | | | | 0.4 | % |
| | | |
| | Total | | | 2,727,470 | | | | | |
| | | |
| | |
Supranational (<0.1%) | | | | | | | | |
| | Other Securities^ | | | 198,460 | | | | < 0.1 | % |
| | | |
| | Total | | | 198,460 | | | | | |
| | | |
| | |
Suriname (<0.1%) | | | | | | | | |
| | Other Securities^ | | | 275,100 | | | | < 0.1 | % |
| | | |
| | Total | | | 275,100 | | | | | |
| | | |
| | |
Tunisia (<0.1%) | | | | | | | | |
| | Other Securities^ | | | 233,990 | | | | < 0.1 | % |
| | | |
| | Total | | | 233,990 | | | | | |
| | | |
| | |
Turkey (0.7%) | | | | | | | | |
| | Other Securities^ | | | 5,566,613 | | | | 0.7 | % |
| | | |
| | Total | | | 5,566,613 | | | | | |
| | | |
| | |
Ukraine (0.4%) | | | | | | | | |
| | Other Securities^ | | | 2,884,148 | | | | 0.4 | % |
| | | |
| | Total | | | 2,884,148 | | | | | |
| | | |
The accompanying Notes to Financial Statements are an integral part of this schedule.
171
PARTNER WORLDWIDE ALLOCATION FUND
Summary Schedule of Investments as of October 31, 2018
| | | | | | | | | | | | |
Principal
Amount | | | Long-Term Fixed Income (9.0%) | | Value | | | % of Net
Assets | |
| | United Arab Emirates (0.3%) | | | | | | | | |
| | | | Other Securities^ | | $ | 2,010,694 | | | | 0.3 | % |
| | | | | |
| | | | Total | | | 2,010,694 | | | | | |
| | | | | |
| | |
| | United States (0.2%) | | | | | | | | |
| | | | Other Securities^ | | | 1,342,912 | | | | 0.2 | % |
| | | | | |
| | | | Total | | | 1,342,912 | | | | | |
| | | | | |
| | |
| | Uruguay (<0.1%) | | | | | | | | |
| | | | Other Securities^ | | | 166,950 | | | | <0.1 | % |
| | | | | |
| | | | Total | | | 166,950 | | | | | |
| | | | | |
| | |
| | Venezuela (0.2%) | | | | | | | | |
| | | | Other Securities^ | | | 1,574,237 | | | | 0.2 | % |
| | | | | |
| | | | Total | | | 1,574,237 | | | | | |
| | | | | |
| | |
| | Virgin Islands, British (0.1%) | | | | | | | | |
| | | | Other Securities^ | | | 472,974 | | | | 0.1 | % |
| | | | | |
| | | | Total | | | 472,974 | | | | | |
| | | | | |
| | |
| | Zambia (0.1%) | | | | | | | | |
| | | | Other Securities^ | | | 664,943 | | | | 0.1 | % |
| | | | | |
| | | | Total | | | 664,943 | | | | | |
| | | | | |
| | | | | | | | | | | | |
| | | | | |
| | | | Total Long-Term Fixed Income (cost $81,286,698) | | | 73,482,090 | | | | | |
| | | | | |
| | | |
| Shares | | | Preferred Stock (0.9%) | | | | | % of Net
Assets | |
| | South Korea (0.9%) | | | | | | | | |
| | 223,270 | | | Samsung Electronics Company, Ltd. | | | 7,044,336 | | | | 0.9 | % |
| | | | | |
| | | | Total | | | 7,044,336 | | | | | |
| | | | | |
| | | | | | | | | | | | |
| | | | | |
| | | | Total Preferred Stock (cost $4,079,764) | | | 7,044,336 | | | | | |
| | | | | |
| | | |
| Shares | | | Collateral Held for Securities Loaned (0.3%) | | Value | | | % of Net
Assets | |
| | 2,491,545 | | | Thrivent Cash Management Trust | | | 2,491,545 | | | | 0.3 | % |
| | | | | |
| | | | Total Collateral Held for Securities Loaned (cost $2,491,545) | | | 2,491,545 | | | | | |
| | | | | |
| | | |
Shares or
Principal
Amount | | | Short-Term Investments (3.1%) | | | | | % of Net Assets | |
| | | | Federal Home Loan Bank Discount Notes | | | | | | | | |
| | 5,200,000 | | | 2.150%, 12/4/2018b,c | | | 5,189,371 | | | | 0.6 | % |
| | | | Thrivent Core Short-Term Reserve Fund | | | | | | | | |
| | 7,095,753 | | | 2.430 %c | | | 18,957,525 | | | | 2.3 | % |
| | | | Other Securities^ | | | 1,243,944 | | | | 0.2 | % |
| | | | | |
| | | | Total Short-Term Investments ($25,391,420) | | | 25,390,840 | | | | | |
| | | | | |
| | | | Total Investments (cost $831,183,241) 99.6% | | $ | 813,566,632 | | | | | |
| | | | | |
| | | | Other Assets and Liabilities, Net 0.4% | | | 3,220,261 | | | | | |
| | | | | |
| | | | Total Net Assets 100.0% | | $ | 816,786,893 | | | | | |
| | | | | |
| ^ | The Summary Schedule of Investments shows the 50 largest holdings in unaffiliated issuers, any holding or issuer that exceeds 1% of net assets and all affiliated holdings as of the report date. The remaining securities held are grouped by category as “Other securities”. |
| a | Non-income producing security. |
| b | The interest rate shown reflects the yield, coupon rate or the discount rate at the date of purchase. |
| c | All or a portion of the security is held on deposit with the counterparty and pledged as the initial margin deposit for open futures contracts. |
Partner Worldwide Allocation Fund held restricted securities as of October 31, 2018. Restricted securities are investment securities which cannot be offered for public sale without first being registered under the Securities Act of 1933. As of October 31, 2018, the value of these investments was $2,052,181 or 0.3% of total net assets.
The following table presents the total amount of securities loaned with continuous maturity, by type, offset by the gross payable upon return of collateral for securities loaned by Thrivent Partner Worldwide Allocation Fund as of October 31, 2018:
Securities Lending Transactions
| | | | |
Common Stock | | $ | 2,476,946 | |
| | | | |
Total lending | | $ | 2,476,946 | |
Gross amount payable upon return of collateral for securities loaned | | $ | 2,491,545 | |
| | | | |
Net amounts due to counterparty | | $ | 14,599 | |
| | | | |
Definitions:
| | | | |
| ADR | | - | | American Depositary Receipt, which are certificates for an underlying foreign security’s shares held by an issuing U.S. depository bank. |
Unrealized Appreciation (Depreciation)
Gross unrealized appreciation and depreciation of investments of the portfolio as a whole (including derivatives), based on cost for federal income tax purposes, were as follows:
| | | | |
Gross unrealized appreciation | | $ | 65,577,165 | |
Gross unrealized depreciation | | | (86,571,082 | ) |
| | | | |
Net unrealized appreciation (depreciation) | | ($ | 20,993,917 | ) |
| |
Cost for federal income tax purposes | | $ | 834,197,048 | |
The accompanying Notes to Financial Statements are an integral part of this schedule.
172
PARTNER WORLDWIDE ALLOCATION FUND
Summary Schedule of Investments as of October 31, 2018
Fair Valuation Measurements
The following table is a summary of the inputs used, as of October 31, 2018, in valuing Partner Worldwide Allocation Fund’s assets carried at fair value.
| | | | | | | | | | | | | | | | |
| Investments in Securities | | Total | | | Level 1 | | | Level 2 | | | Level 3 | |
| | | | |
Common Stock | | | | | | | | | | | | | | | | |
Communications Services^ | | | 28,964,413 | | | | 2,445,710 | | | | 26,518,703 | | | | 0 | |
Consumer Discretionary | | | 104,956,768 | | | | 2,899,961 | | | | 102,056,807 | | | | – | |
Consumer Staples | | | 76,581,263 | | | | 2,135,257 | | | | 74,446,006 | | | | – | |
Energy | | | 38,581,236 | | | | 502,756 | | | | 38,078,480 | | | | – | |
Financials | | | 120,566,274 | | | | 4,921,540 | | | | 115,644,397 | | | | 337 | |
Health Care | | | 70,722,711 | | | | 1,280,830 | | | | 69,441,881 | | | | – | |
Industrials | | | 93,366,212 | | | | – | | | | 93,366,212 | | | | – | |
Information Technology | | | 68,226,281 | | | | 1,492,695 | | | | 66,733,586 | | | | – | |
Materials | | | 65,992,058 | | | | 3,392,910 | | | | 62,599,148 | | | | – | |
Real Estate | | | 26,671,228 | | | | – | | | | 26,671,221 | | | | 7 | |
Utilities | | | 10,529,377 | | | | – | | | | 10,529,377 | | | | – | |
| | | | |
Long-Term Fixed Income | | | | | | | | | | | | | | | | |
Basic Materials | | | 2,999,063 | | | | – | | | | 2,999,063 | | | | – | |
Capital Goods | | | 228,947 | | | | – | | | | 228,947 | | | | – | |
Communications Services | | | 2,806,130 | | | | – | | | | 2,806,130 | | | | – | |
Consumer Cyclical | | | 380,557 | | | | – | | | | 380,557 | | | | – | |
Consumer Non-Cyclical | | | 786,420 | | | | – | | | | 786,420 | | | | – | |
Energy | | | 6,072,209 | | | | – | | | | 6,072,209 | | | | – | |
Financials | | | 5,883,646 | | | | – | | | | 5,883,646 | | | | – | |
Foreign Government | | | 51,423,474 | | | | – | | | | 51,423,474 | | | | – | |
Transportation | | | 365,146 | | | | – | | | | 365,146 | | | | – | |
U.S. Municipals | | | 458,569 | | | | – | | | | 458,569 | | | | – | |
Utilities | | | 2,077,929 | | | | – | | | | 2,077,929 | | | | – | |
| | | | |
Preferred Stock | | | | | | | | | | | | | | | | |
Information Technology | | | 7,044,336 | | | | – | | | | 7,044,336 | | | | – | |
Short-Term Investments | | | 6,433,315 | | | | – | | | | 6,433,315 | | | | – | |
| |
Subtotal Investments in Securities | | | $792,117,562 | | | | $19,071,659 | | | | $773,045,559 | | | | $344 | |
| |
| | | | |
Other Investments * | | | Total | | | | | | | | | | | | | |
| | | | | | | | | | | | | |
Short-Term Investments | | | 18,957,525 | | | | | | | | | | | | | |
Collateral Held for Securities Loaned | | | 2,491,545 | | | | | | | | | | | | | |
| | | | | | | | | | | | | |
Subtotal Other Investments | | | $21,449,070 | | | | | | | | | | | | | |
| | | | | | | | | | | | | |
| | | | | | | | | | | | | | | | |
| | | | | | | | | | | | | |
Total Investments at Value | | | $813,566,632 | | | | | | | | | | | | | |
| | | | | | | | | | | | | |
| * | Certain investments are measured at fair value using a net asset value per share that is not publicly available (practical expedient). According to disclosure requirements of Accounting Standards Codification (ASC) 820, Fair Value Measurement, securities valued using the practical expedient are not classified in the fair value hierarchy. The fair value amounts presented in this table are intended to permit reconciliation of the fair value hierarchy to the amounts presented in the Statement of Assets and Liabilities. |
| | | | | | | | | | | | | | | | |
| | | | |
| Other Financial Instruments | | Total | | | Level 1 | | | Level 2 | | | Level 3 | |
| | | | |
Asset Derivatives | | | | | | | | | | | | | | | | |
Futures Contracts | | | 2,490,686 | | | | 2,490,686 | | | | – | | | | – | |
Foreign Currency Forward Contracts | | | 671,031 | | | | – | | | | 671,031 | | | | – | |
| |
Total Asset Derivatives | | $ | 3,161,717 | | | $ | 2,490,686 | | | $ | 671,031 | | | $ | – | |
| |
Liability Derivatives | | | | | | | | | | | | | | | | |
Futures Contracts | | | 3,520,904 | | | | 3,520,904 | | | | – | | | | – | |
Foreign Currency Forward Contracts | | | 284,241 | | | | – | | | | 284,241 | | | | – | |
| |
Total Liability Derivatives | | $ | 3,805,145 | | | $ | 3,520,904 | | | $ | 284,241 | | | $ | – | |
| |
There were no significant transfers between Levels during the period ended October 31, 2018. Transfers between Levels are identified as of the end of the period.
| ^ | Level 3 security in this section is fair valued at <$1. |
The accompanying Notes to Financial Statements are an integral part of this schedule.
173
PARTNER WORLDWIDE ALLOCATION FUND
Summary Schedule of Investments as of October 31, 2018
The following table presents Partner Worldwide Allocation Fund’s foreign currency forward contracts held as of October 31, 2018.
| | | | | | | | | | | | | | | | | | | | |
| Foreign Currency Forward Contracts | |
| Currency to Receive | | Counterparty | | Contracts to Receive | | | Currency to Deliver | | Settlement Date | | | Value | | | Unrealized
Appreciation/ (Depreciation) | |
Argentina Peso | | MSC | | | 8,381,465 | | | USD | | | 11/13/2018 | | | | $ 229,725 | | | | $ 8,122 | |
Argentina Peso | | MSC | | | 2,476,776 | | | USD | | | 11/20/2018 | | | | 67,290 | | | | 4,026 | |
Argentina Peso | | MSC | | | 3,364,976 | | | USD | | | 11/23/2018 | | | | 91,074 | | | | 2,382 | |
Brazilian Real | | MSC | | | 4,242,936 | | | USD | | | 11/5/2018 | | | | 1,139,594 | | | | 14,629 | |
Brazilian Real | | MSC | | | 1,232,996 | | | USD | | | 12/4/2018 | | | | 330,315 | | | | (1,786 | ) |
Chilean Peso | | MSC | | | 37,047,960 | | | USD | | | 11/21/2018 | | | | 53,266 | | | | (1,701 | ) |
Chinese Yuan Offshore | | MSC | | | 5,918,332 | | | USD | | | 12/19/2018 | | | | 846,684 | | | | (6,171 | ) |
Chinese Yuan Offshore | | MSC | | | 879,701 | | | USD | | | 12/19/2018 | | | | 125,851 | | | | (1,031 | ) |
Colombian Peso | | MSC | | | 865,025,531 | | | USD | | | 11/30/2018 | | | | 268,697 | | | | (10,047 | ) |
Czech Republic Koruna | | MSC | | | 5,876,886 | | | EUR | | | 11/19/2018 | | | | 256,851 | | | | (6,949 | ) |
Czech Republic Koruna | | MSC | | | 3,229,858 | | | USD | | | 12/19/2018 | | | | 141,860 | | | | (3,958 | ) |
Czech Republic Koruna | | MSC | | | 6,247,447 | | | EUR | | | 12/19/2018 | | | | 274,396 | | | | (5,696 | ) |
Euro | | MSC | | | 50,670 | | | USD | | | 11/21/2018 | | | | 57,478 | | | | (788 | ) |
Euro | | MSC | | | 197,294 | | | PLN | | | 12/19/2018 | | | | 224,430 | | | | (4,499 | ) |
Euro | | MSC | | | 836,107 | | | HUF | | | 12/19/2018 | | | | 951,104 | | | | (16,085 | ) |
Euro | | MSC | | | 180,465 | | | CZK | | | 12/19/2018 | | | | 205,286 | | | | (2,601 | ) |
Euro | | MSC | | | 227,339 | | | RON | | | 12/19/2018 | | | | 258,607 | | | | (4,936 | ) |
Hungarian Forint | | MSC | | | 306,636,218 | | | EUR | | | 12/19/2018 | | | | 1,075,221 | | | | (11,160 | ) |
Indian Rupee | | MSC | | | 8,459,727 | | | USD | | | 11/26/2018 | | | | 114,055 | | | | 51 | |
Indonesian Rupiah | | MSC | | | 4,286,628,044 | | | USD | | | 11/5/2018 | | | | 281,803 | | | | 56 | |
Indonesian Rupiah | | MSC | | | 7,401,146,155 | | | USD | | | 11/19/2018 | | | | 485,738 | | | | 881 | |
Indonesian Rupiah | | MSC | | | 9,153,102,980 | | | USD | | | 12/5/2018 | | | | 599,510 | | | | 642 | |
Mexican Peso | | MSC | | | 18,243,812 | | | USD | | | 12/19/2018 | | | | 890,907 | | | | (47,687 | ) |
New Taiwan Dollar | | MSC | | | 9,641,411 | | | USD | | | 12/14/2018 | | | | 312,659 | | | | (1,223 | ) |
Polish Zloty | | MSC | | | 244,725 | | | USD | | | 12/19/2018 | | | | 63,903 | | | | (2,190 | ) |
Polish Zloty | | MSC | | | 2,346,308 | | | EUR | | | 12/19/2018 | | | | 612,673 | | | | (21,862 | ) |
Russian Ruble | | MSC | | | 94,599,407 | | | USD | | | 11/21/2018 | | | | 1,432,389 | | | | 27,096 | |
Singapore Dollar | | MSC | | | 527,553 | | | USD | | | 12/19/2018 | | | | 381,370 | | | | (3,615 | ) |
Singapore Dollar | | MSC | | | 174,198 | | | USD | | | 12/19/2018 | | | | 125,928 | | | | (954 | ) |
South African Rand | | MSC | | | 7,053,687 | | | USD | | | 12/19/2018 | | | | 475,321 | | | | (3,309 | ) |
South Korean Won | | MSC | | | 157,082,588 | | | USD | | | 11/13/2018 | | | | 137,938 | | | | (84 | ) |
South Korean Won | | MSC | | | 207,552,096 | | | USD | | | 11/19/2018 | | | | 182,313 | | | | (503 | ) |
Turkish Lira | | MSC | | | 3,534,228 | | | USD | | | 12/19/2018 | | | | 614,434 | | | | 54,761 | |
Total | | | | | | | | | | | | | | | $13,308,670 | | | | ($46,189 | ) |
| | | | | | |
| Currency to Deliver | | Counterparty | | Contracts to Deliver | | | Currency to Receive | | Settlement Date | | | Value | | | Unrealized Appreciation/ (Depreciation) | |
Brazilian Real | | MSC | | | 4,242,936 | | | USD | | | 11/5/2018 | | | | $1,139,593 | | | | ($32,223 | ) |
Brazilian Real | | MSC | | | 256,897 | | | USD | | | 12/4/2018 | | | | 68,822 | | | | 1,350 | |
Chilean Peso | | MSC | | | 48,669,059 | | | USD | | | 11/21/2018 | | | | 69,974 | | | | 653 | |
Chinese Yuan Offshore | | MSC | | | 20,235,463 | | | USD | | | 12/19/2018 | | | | 2,894,906 | | | | 37,796 | |
Czech Republic Koruna | | MSC | | | 4,656,441 | | | EUR | | | 12/19/2018 | | | | 204,517 | | | | 3,370 | |
Euro | | MSC | | | 227,339 | | | CZK | | | 11/19/2018 | | | | 257,848 | | | | 5,952 | |
Euro | | MSC | | | 6,814,661 | | | USD | | | 11/21/2018 | | | | 7,730,298 | | | | 253,833 | |
Euro | | MSC | | | 542,473 | | | PLN | | | 12/19/2018 | | | | 617,084 | | | | 17,451 | |
Euro | | MSC | | | 1,016,460 | | | USD | | | 12/19/2018 | | | | 1,156,264 | | | | 38,461 | |
Euro | | MSC | | | 933,842 | | | HUF | | | 12/19/2018 | | | | 1,062,282 | | | | 24,099 | |
Euro | | MSC | | | 242,000 | | | CZK | | | 12/19/2018 | | | | 275,285 | | | | 4,807 | |
Hungarian Forint | | MSC | | | 270,973,498 | | | EUR | | | 12/19/2018 | | | | 950,168 | | | | 17,021 | |
Indian Rupee | | MSC | | | 87,997,467 | | | USD | | | 11/26/2018 | | | | 1,186,392 | | | | 2,339 | |
Indonesian Rupiah | | MSC | | | 4,286,628,045 | | | USD | | | 11/5/2018 | | | | 281,803 | | | | (3,126 | ) |
Indonesian Rupiah | | MSC | | | 2,154,906,649 | | | USD | | | 11/19/2018 | | | | 141,427 | | | | (29 | ) |
Mexican Peso | | MSC | | | 10,678,765 | | | USD | | | 11/16/2018 | | | | 524,374 | | | | 35,384 | |
Mexican Peso | | MSC | | | 13,471,592 | | | USD | | | 12/19/2018 | | | | 657,864 | | | | 46,360 | |
New Taiwan Dollar | | MSC | | | 28,221,785 | | | USD | | | 12/14/2018 | | | | 915,200 | | | | 5,382 | |
Philippines Peso | | MSC | | | 22,354,830 | | | USD | | | 11/13/2018 | | | | 417,640 | | | | (4,537 | ) |
Polish Zloty | | MSC | | | 849,476 | | | EUR | | | 12/19/2018 | | | | 221,817 | | | | 7,112 | |
Polish Zloty | | MSC | | | 515,702 | | | USD | | | 12/19/2018 | | | | 134,661 | | | | 5,285 | |
Romanian New Leu | | MSC | | | 1,068,676 | | | EUR | | | 12/19/2018 | | | | 259,601 | | | | 3,942 | |
Russian Ruble | | MSC | | | 130,374,398 | | | USD | | | 11/21/2018 | | | | 1,974,084 | | | | (25,124 | ) |
Singapore Dollar | | MSC | | | 1,004,016 | | | USD | | | 12/19/2018 | | | | 725,807 | | | | 4,462 | |
South African Rand | | MSC | | | 8,493,747 | | | USD | | | 12/19/2018 | | | | 572,361 | | | | 3,168 | |
The accompanying Notes to Financial Statements are an integral part of this schedule.
174
PARTNER WORLDWIDE ALLOCATION FUND
Summary Schedule of Investments as of October 31, 2018
| | | | | | | | | | | | | | | | | | | | | | | | |
| Foreign Currency Forward Contracts | |
| Currency to Deliver | | Counterparty | | | Contracts to Deliver | | | Currency to Receive | | | Settlement Date | | | Value | | | Unrealized
Appreciation/
(Depreciation) | |
South African Rand | | | MSC | | | | 9,888,661 | | | | USD | | | | 1/15/2019 | | | | $663,908 | | | | $20,305 | |
South Korean Won | | | MSC | | | | 580,630,980 | | | | USD | | | | 11/13/2018 | | | | 509,866 | | | | 1,787 | |
South Korean Won | | | MSC | | | | 254,008,291 | | | | USD | | | | 11/19/2018 | | | | 223,119 | | | | 1,799 | |
South Korean Won | | | MSC | | | | 311,626,916 | | | | USD | | | | 12/19/2018 | | | | 274,130 | | | | (1,089 | ) |
Turkish Lira | | | MSC | | | | 357,097 | | | | USD | | | | 11/19/2018 | | | | 63,190 | | | | (444 | ) |
Turkish Lira | | | MSC | | | | 2,640,202 | | | | USD | | | | 12/19/2018 | | | | 459,004 | | | | (42,567 | ) |
Total | | | | | | | | | | | | | | | | | | | $26,633,289 | | | | $432,979 | |
Net Unrealized Appreciation/(Depreciation) on Foreign Currency Forward Contracts | | | | | | | | $386,790 | |
Counterparty:
| | | | |
MSC | | - | | Morgan Stanley & Company |
|
| Currency: |
CNH | | - | | Chinese Yuan Offshore |
CZK | | - | | Czech Republic Koruna |
EUR | | - | | Euro |
HUF | | - | | Hungarian Forint |
PLN | | - | | Polish Zloty |
RON | | - | | Romanian New Leu |
SGD | | - | | Singapore Dollar |
USD | | - | | United States Dollar |
The accompanying Notes to Financial Statements are an integral part of this schedule.
175
PARTNER WORLDWIDE ALLOCATION FUND
Summary Schedule of Investments as of October 31, 2018
The following table presents Partner Worldwide Allocation Fund’s futures contracts held as of October 31, 2018. Investments and/or cash totaling $6,367,296 were pledged as the initial margin deposit for these contracts.
| | | | | | | | | | | | | | | | |
| Futures Contracts Description | | Number of Contracts Long/(Short) | | | Expiration
Date | | | Notional
Principal
Amount | | | Value and
Unrealized | |
CBOT 10-Yr. U.S. Treasury Note | | | 7 | | | | December 2018 | | | | $ 832,560 | | | | ($3,497 | ) |
CBOT 2-Yr. U.S. Treasury Note | | | 46 | | | | December 2018 | | | | 9,706,297 | | | | (16,109 | ) |
CBOT 5-Yr. U.S. Treasury Note | | | 59 | | | | December 2018 | | | | 6,645,782 | | | | (15,197 | ) |
CBOT U.S. Long Bond | | | 22 | | | | December 2018 | | | | 3,141,301 | | | | (102,551 | ) |
CME Ultra Long Term U.S. Treasury Bond | | | 31 | | | | December 2018 | | | | 4,851,264 | | | | (225,483 | ) |
Eurex Euro STOXX 50 Index | | | 25 | | | | December 2018 | | | | 944,876 | | | | (44,424 | ) |
FTSE 100 Index | | | 5 | | | | December 2018 | | | | 464,248 | | | | (11,573 | ) |
ICE mini MSCI EAFE Index | | | 447 | | | | December 2018 | | | | 43,580,386 | | | | (3,071,011 | ) |
SFE S&P ASX Share Price Index 200 | | | 2 | | | | December 2018 | | | | 218,126 | | | | (12,833 | ) |
SGX MSCI Singapore Index | | | 2 | | | | November 2018 | | | | 48,824 | | | | 701 | |
TSE Tokyo Price Index | | | 4 | | | | December 2018 | | | | 593,315 | | | | (11,581 | ) |
Total Futures Long Contracts | | | | | | | | | | | $71,026,979 | | | | ($3,513,558 | ) |
CME 3 Month Eurodollar | | | (14 | ) | | | December 2019 | | | | ($3,395,087 | ) | | | $ 7,262 | |
CME 3 Month Eurodollar | | | (13 | ) | | | December 2020 | | | | (3,144,446 | ) | | | (1,392 | ) |
CME 3 Month Eurodollar | | | (5 | ) | | | June 2019 | | | | (1,214,071 | ) | | | 2,070 | |
Eurex 10-Yr. Euro BUND | | | (14 | ) | | | December 2018 | | | | (2,540,019 | ) | | | (909 | ) |
Eurex 2-Yr. Euro SCHATZ | | | (2 | ) | | | December 2018 | | | | (253,576 | ) | | | (91 | ) |
Eurex 30-Yr. Euro BUXL | | | (2 | ) | | | December 2018 | | | | (396,295 | ) | | | (4,253 | ) |
Eurex 5-Yr. Euro BOBL | | | (20 | ) | | | December 2018 | | | | (2,982,348 | ) | | | 4,854 | |
ICE US mini MSCI Emerging Markets Index | | | (839 | ) | | | December 2018 | | | | (42,598,174 | ) | | | 2,464,609 | |
Ultra 10-Yr. U.S. Treasury Note | | | (4 | ) | | | December 2018 | | | | (511,627 | ) | | | 11,190 | |
Total Futures Short Contracts | | | | | | | | | | | ($57,035,643 | ) | | | $ 2,483,340 | |
Total Futures Contracts | | | | | | | | | | | $13,991,336 | | | | ($1,030,218 | ) |
| | | | | | |
| Reference Description: |
ASX | | | - | | | Australian Securities Exchange |
CBOT | | | - | | | Chicago Board of Trade |
CME | | | - | | | Chicago Mercantile Exchange |
EAFE | | | - | | | Europe, Australasia and Far East |
FTSE | | | - | | | Financial Times Stock Exchange |
ICE | | | - | | | Intercontinental Exchange |
MSCI | | | - | | | Morgan Stanley Capital International |
S&P | | | - | | | Standard & Poor’s |
SFE | | | - | | | Sydney Futures Exchange |
SGX | | | - | | | Singapore Stock Exchange |
TSE | | | - | | | Tokyo Stock Exchange |
The accompanying Notes to Financial Statements are an integral part of this schedule.
176
PARTNER WORLDWIDE ALLOCATION FUND
Summary Schedule of Investments as of October 31, 2018
The following table summarizes the fair value and Statement of Assets and Liabilities location, as of October 31, 2018, for Partner Worldwide Allocation Fund’s investments in financial derivative instruments by primary risk exposure as discussed under item (2) Significant Accounting Policies of the Notes to Financial Statements.
| | | | | | |
| Derivatives by risk category | | Statement of Assets and Liabilities Location | | Fair Value | |
| | |
Asset Derivatives | | | | | | |
| | |
Interest Rate Contracts | | | | | | |
Futures* | | Net Assets - Accumulated undistributed earnings/(loss) | | | $25,376 | |
Total Interest Rate Contracts | | | | | 25,376 | |
| | |
Equity Contracts | | | | | | |
Futures* | | Net Assets - Accumulated undistributed earnings/(loss) | | | 2,465,310 | |
Total Equity Contracts | | | | | 2,465,310 | |
| | |
Foreign Exchange Contracts | | | | | | |
Forward Contracts | | Net Assets - Accumulated undistributed earnings/(loss) | | | 671,031 | |
Total Foreign Exchange Contracts | | | | | 671,031 | |
| |
Total Asset Derivatives | | | | | $3,161,717 | |
| |
| | |
Liability Derivatives | | | | | | |
| | |
Interest Rate Contracts | | | | | | |
Futures* | | Net Assets - Accumulated undistributed earnings/(loss) | | | 369,482 | |
Total Interest Rate Contracts | | | | | 369,482 | |
| | |
Equity Contracts | | | | | | |
Futures* | | Net Assets - Accumulated undistributed earnings/(loss) | | | 3,151,422 | |
Total Equity Contracts | | | | | 3,151,422 | |
| | |
Foreign Exchange Contracts | | | | | | |
Forward Contracts | | Net Assets - Accumulated undistributed earnings/(loss) | | | 284,241 | |
Total Foreign Exchange Contracts | | | | | 284,241 | |
| |
Total Liability Derivatives | | | | | $3,805,145 | |
| |
| * | Includes cumulative appreciation/depreciation of futures contracts as reported in the Schedule of Investments. Only current day’s variation margin is reported within the Statement of Assets and Liabilities. |
The following table summarizes the net realized gains/(losses) and Statement of Operations location, for the period ended October 31, 2018, for Partner Worldwide Allocation Fund’s investments in financial derivative instruments by primary risk exposure.
| | | | | | |
| Derivatives by risk category | | Statement of Operations Location | | Realized Gains/(Losses) recognized in Income | |
| | |
Interest Rate Contracts | | | | | | |
Futures | | Net realized gains/(losses) on Futures contracts | | | (643,541 | ) |
Total Interest Rate Contracts | | | | | (643,541 | ) |
| | |
Equity Contracts | | | | | | |
Futures | | Net realized gains/(losses) on Futures contracts | | | 569,161 | |
Total Equity Contracts | | | | | 569,161 | |
| | |
Foreign Exchange Contracts | | | | | | |
Forward Contracts | | Net realized gains/(losses) on Foreign currency transactions | | | (316,926 | ) |
Total Foreign Exchange Contracts | | | | | (316,926 | ) |
| |
Total | | | | | ($391,306 | ) |
| |
The accompanying Notes to Financial Statements are an integral part of this schedule.
177
PARTNER WORLDWIDE ALLOCATION FUND
Summary Schedule of Investments as of October 31, 2018
The following table summarizes the change in net unrealized appreciation/(depreciation) and Statement of Operations location, for the period ended October 31, 2018, for Partner Worldwide Allocation Fund’s investments in financial derivative instruments by primary risk exposure.
| | | | | | |
| Derivatives by risk category | | Statement of Operations Location | | Change in unrealized appreciation/(depreciation)
recognized in Income | |
| | |
Interest Rate Contracts | | | | | | |
Futures | | Change in net unrealized appreciation/(depreciation) on Futures contracts | | | (230,724 | ) |
Total Interest Rate Contracts | | | | | (230,724 | ) |
| | |
Equity Contracts | | | | | | |
Futures | | Change in net unrealized appreciation/(depreciation) on Futures contracts | | | (843,606 | ) |
Total Equity Contracts | | | | | (843,606 | ) |
| | |
Foreign Exchange Contracts | | | | | | |
Forward Contracts | | Change in net unrealized appreciation/(depreciation) on Foreign currency forward contracts | | | 241,379 | |
Total Foreign Exchange Contracts | | | | | 241,379 | |
| |
Total | | | | | ($832,951 | ) |
| |
The following table presents Partner Worldwide Allocation Fund’s average volume of derivative activity during the period ended October 31, 2018.
| | | | |
| Derivative Risk Category | | Average Notional Value | |
Equity Contracts | | | | |
Futures - Long | | | $20,477,857 | |
Futures - Short | | | (14,139,053 | ) |
Interest Rate Contracts | | | | |
Futures - Long | | | 20,099,852 | |
Futures - Short | | | (16,023,798 | ) |
Foreign Exchange Contracts | | | | |
Contracts Purchased | | | 41,732,949 | |
Contracts Sold | | | (48,067,376 | ) |
Investment in Affiliates
Affiliated issuers, as defined under the Investment Company Act of 1940, include those in which the Fund’s holdings of an issuer represent 5% or more of the outstanding voting securities of an issuer, any affiliated mutual fund, or a company which is under common ownership or control with the Fund. The Fund owns shares of Thrivent Cash Management Trust for the purpose of securities lending and Thrivent Core Short-Term Reserve Fund primarily to serve as a cash sweep vehicle for the Fund. Thrivent Cash Management Trust and Thrivent Core Funds are established solely for investment by Thrivent entities.
A summary of transactions (in thousands) for the fiscal year to date, in Partner Worldwide Allocation Fund, is as follows:
| | | | | | | | | | | | | | | | | | | | | | | | |
| Fund | | Value
10/31/2017 | | | Gross
Purchases | | | Gross
Sales | | | Shares Held at
10/31/2018 | | | Value
10/31/2018 | | | % of Net
Assets | |
Affiliated Short-Term Investments | | | | | | | | | | | | | | | | | | | | | | | | |
Core Short-Term Reserve, 2.430% | | | $11,779 | | | | $232,529 | | | | $225,350 | | | | 1,896 | | | | $18,958 | | | | 2.3 | % |
Total Affiliated Short-Term Investments | | | 11,779 | | | | | | | | | | | | | | | | 18,958 | | | | 2.3 | |
Collateral Held for Securities Loaned | | | | | | | | | | | | | | | | | | | | | | | | |
Cash Management Trust- Collateral Investment | | | – | | | | 31,936 | | | | 29,444 | | | | 2,492 | | | | 2,492 | | | | 0.3 | |
Total Collateral Held for Securities Loaned | | | – | | | | | | | | | | | | | | | | 2,492 | | | | 0.3 | |
Total Value | | | $11,779 | | | | | | | | | | | | | | | | $21,450 | | | | | |
| | | | | | | | | | | | | | | | |
| Fund | | Net Realized
Gain/(Loss) | | | Change in
Unrealized
Appreciation/
(Depreciation) | | | Distributions of
Realized Capital
Gains | | | Income Earned
11/1/2017
- 10/31/2018 | |
Affiliated Short-Term Investments | | | | | | | | | | | | | | | | |
Core Short-Term Reserve, 2.430% | | | $– | | | | $– | | | | $0 | | | | $275 | |
Total Income from Affiliated Investments | | | | | | | | | | | | | | | $275 | |
Collateral Held for Securities Loaned | | | | | | | | | | | | | | | | |
Cash Management Trust- Collateral Investment | | | – | | | | – | | | | – | | | | 82 | |
Total Affiliated Income from Securities Loaned, Net | | | | | | | | | | | | | | | $82 | |
Total | | | $– | | | | $– | | | | $0 | | | | | |
The accompanying Notes to Financial Statements are an integral part of this schedule.
178
SMALL CAP GROWTH FUND
Schedule of Investments as of October 31, 2018
| | | | | | | | |
| Shares | | | Common Stock (94.3%) | | Value | |
| | Communications Services (0.7%) | | | | |
| | 3,893 | | | ORBCOMM, Inc.a | | | $37,100 | |
| | | | | |
| | | | Total | | | 37,100 | |
| | | | | |
| |
| | Consumer Discretionary (15.4%) | | | | |
| | 379 | | | Bright Horizons Family Solutions, Inc.a | | | 43,551 | |
| | 581 | | | Burlington Stores, Inc.a | | | 99,636 | |
| | 445 | | | Children’s Place, Inc. | | | 66,483 | |
| | 1,732 | | | Core-Mark Holding Company, Inc. | | | 66,526 | |
| | 1,992 | | | Duluth Holdings, Inc.a | | | 61,214 | |
| | 778 | | | Five Below, Inc.a | | | 88,552 | |
| | 717 | | | G-III Apparel Group, Ltd.a | | | 28,580 | |
| | 1,363 | | | Habit Restaurants, Inc.a | | | 17,310 | |
| | 1,751 | | | Nutrisystem, Inc. | | | 62,266 | |
| | 494 | | | Oxford Industries, Inc. | | | 43,956 | |
| | 1,459 | | | Planet Fitness, Inc.a | | | 71,622 | |
| | 818 | | | Six Flags Entertainment Corporation | | | 44,057 | |
| | 241 | | | Vail Resorts, Inc. | | | 60,568 | |
| | 731 | | | Wingstop, Inc. | | | 45,775 | |
| | | | | |
| | | | Total | | | 800,096 | |
| | | | | |
| |
| | Consumer Staples (1.6%) | | | | |
| | 535 | | | Casey’s General Stores, Inc. | | | 67,469 | |
| | 284 | | | e.l.f. Beauty, Inc.a | | | 3,013 | |
| | 189 | | | MGP Ingredients, Inc. | | | 13,451 | |
| | | | | |
| | | | Total | | | 83,933 | |
| | | | | |
| |
| | Energy (2.8%) | | | | |
| | 3,151 | | | Callon Petroleum Companya | | | 31,415 | |
| | 1,286 | | | Nine Energy Service, Inc.a | | | 47,621 | |
| | 625 | | | Parsley Energy, Inc.a | | | 14,638 | |
| | 1,170 | | | Talos Energy, Inc.a | | | 30,490 | |
| | 2,224 | | | Transocean, Ltd.a | | | 24,486 | |
| | | | | |
| | | | Total | | | 148,650 | |
| | | | | |
| |
| | Financials (10.5%) | | | | |
| | 641 | | | Ameris Bancorp | | | 27,493 | |
| | 748 | | | Axos Financial, Inc.a | | | 22,709 | |
| | 943 | | | Descartes Systems Group, Inc.a | | | 28,847 | |
| | 1,117 | | | Essent Group, Ltd.a | | | 44,032 | |
| | 1,435 | | | Hamilton Lane, Inc. | | | 55,075 | |
| | 335 | | | Interactive Brokers Group, Inc. | | | 16,552 | |
| | 2,201 | | | Investment Technology Group, Inc. | | | 60,484 | |
| | 261 | | | MarketAxess Holdings, Inc. | | | 54,724 | |
| | 692 | | | PacWest Bancorp | | | 28,109 | |
| | 1,596 | | | Santander Consumer USA Holdings Inc. | | | 29,925 | |
| | 1,329 | | | Seacoast Banking Corporation of Floridaa | | | 34,966 | |
| | 6,215 | | | SLM Corporationa | | | 63,020 | |
| | 710 | | | Stifel Financial Corporation | | | 32,461 | |
| | 143 | | | SVB Financial Groupa | | | 33,924 | |
| | 288 | | | Western Alliance Bancorpa | | | 13,893 | |
| | | | | |
| | | | Total | | | 546,214 | |
| | | | | |
| |
| | Health Care (19.5%) | | | | |
| | 63 | | | ABIOMED, Inc.a | | | 21,496 | |
| | 646 | | | Aerie Pharmaceuticals, Inc.a | | | 34,354 | |
| | 343 | | | Arena Pharmaceuticals, Inc.a | | | 12,231 | |
| | 856 | | | Cardiovascular Systems, Inc.a | | | 24,011 | |
| | 1,225 | | | Catalent, Inc.a | | | 49,416 | |
| | 624 | | | Concert Pharmaceuticals, Inc.a | | | 9,310 | |
| | 1,222 | | | Evolent Health, Inc.a | | | 27,128 | |
| | 3,015 | | | GenMark Diagnostics, Inc.a | | | 16,070 | |
| | 1,526 | | | Halozyme Therapeutics, Inc.a | | | 23,699 | |
| | 719 | | | Immunomedics, Inc.a | | | 16,199 | |
| | 329 | | | Inogen, Inc.a | | | 62,369 | |
| | 996 | | | Intersect ENT, Inc.a | | | 27,948 | |
| | 276 | | | Intra-Cellular Therapies, Inc.a | | | 4,686 | |
| | 813 | | | LHC Group, Inc.a | | | 74,333 | |
| | 819 | | | Merit Medical Systems, Inc.a | | | 46,781 | |
| | 1,281 | | | Natera, Inc.a | | | 28,131 | |
| | 452 | | | Neurocrine Biosciences, Inc.a | | | 48,432 | |
| | 1,004 | | | Nevro Corporationa | | | 48,955 | |
| | 827 | | | Novocure, Ltd.a | | | 27,407 | |
| | 1,087 | | | NuVasive, Inc.a | | | 61,057 | |
| | 3,181 | | | Optinose, Inc.a | | | 33,655 | |
| | 520 | | | Ra Medical Systems, Inc.a | | | 5,564 | |
| | 158 | | | Sage Therapeutics, Inc.a | | | 20,331 | |
| | 2,108 | | | Tactile Systems Technology, Inc.a | | | 138,032 | |
| | 319 | | | Teleflex, Inc. | | | 76,796 | |
| | 830 | | | Veeva Systems, Inc.a | | | 75,820 | |
| | | | | |
| | | | Total | | | 1,014,211 | |
| | | | | |
| |
| | Industrials (15.7%) | | | | |
| | 1,415 | | | Aerojet Rocketdyne Holdings, Inc.a | | | 49,978 | |
| | 676 | | | ASGN, Inc.a | | | 45,346 | |
| | 1,809 | | | Casella Waste Systems, Inc.a | | | 58,901 | |
| | 617 | | | Dycom Industries, Inc.a | | | 41,882 | |
| | 430 | | | Granite Construction, Inc. | | | 19,660 | |
| | 1,429 | | | Healthcare Services Group, Inc. | | | 58,003 | |
| | 1,086 | | | Heico Corporation | | | 91,039 | |
| | 384 | | | Kirby Corporationa | | | 27,625 | |
| | 1,228 | | | Mercury Systems, Inc.a | | | 57,544 | |
| | 2,915 | | | MRC Global, Inc.a | | | 46,145 | |
| | 950 | | | Ritchie Brothers Auctioneers, Inc. | | | 31,930 | |
| | 1,193 | | | SiteOne Landscape Supply, Inc.a | | | 81,172 | |
| | 2,619 | | | TPI Composites, Inc.a | | | 66,156 | |
| | 91 | | | Valmont Industries, Inc. | | | 11,312 | |
| | 1,126 | | | WageWorks, Inc.a | | | 44,826 | |
| | 213 | | | Watsco, Inc. | | | 31,562 | |
| | 1,751 | | | Willdan Group, Inc.a | | | 52,880 | |
| | | | | |
| | | | Total | | | 815,961 | |
| | | | | |
| |
| | Information Technology (27.8%) | | | | |
| | 353 | | | 2U, Inc.a | | | 22,207 | |
| | 534 | | | Ambarella, Inc.a | | | 18,573 | |
| | 180 | | | Arista Networks, Inc.a | | | 41,463 | |
| | 2,079 | | | Blackline, Inc.a | | | 96,424 | |
| | 493 | | | CEVA, Inc.a | | | 12,148 | |
| | 580 | | | Cognex Corporation | | | 24,847 | |
| | 1,676 | | | Dolby Laboratories, Inc. | | | 115,326 | |
| | 391 | | | Envestnet, Inc.a | | | 20,340 | |
| | 1,073 | | | Guidewire Software, Inc.a | | | 95,465 | |
| | 1,266 | | | M/A-COM Technology Solutions Holdings, Inc.a | | | 17,813 | |
| | 1,294 | | | Monolithic Power Systems, Inc. | | | 152,847 | |
| | 1,307 | | | New Relic, Inc.a | | | 116,650 | |
| | 450 | | | Novanta, Inc.a | | | 26,194 | |
| | 1,410 | | | Proofpoint, Inc.a | | | 128,239 | |
| | 1,840 | | | Q2 Holdings, Inc.a | | | 97,943 | |
| | 4,444 | | | Quantenna Communications, Inc.a | | | 79,814 | |
| | 502 | | | Rogers Corporationa | | | 61,776 | |
| | 2,104 | | | SailPoint Technologies Holdings, Inc.a | | | 54,788 | |
| | 5,438 | | | Sequans Communications SA ADRa | | | 5,710 | |
| | 472 | | | SS&C Technologies Holdings, Inc. | | | 24,148 | |
| | 413 | | | Tyler Technologies, Inc.a | | | 87,416 | |
| | 99 | | | Ultimate Software Group, Inc.a | | | 26,396 | |
| | 315 | | | Universal Display Corporation | | | 38,748 | |
| | 1,132 | | | Virtusa Corporationa | | | 56,136 | |
| | 1,189 | | | Zuora, Inc.a | | | 24,279 | |
| | | | | |
| | | | Total | | | 1,445,690 | |
| | | | | |
The accompanying Notes to Financial Statements are an integral part of this schedule.
179
SMALL CAP GROWTH FUND
Schedule of Investments as of October 31, 2018
| | | | | | |
| Shares | | Common Stock (94.3%) | | Value | |
Real Estate (0.3%) | | | | |
| 280 | | CyrusOne,Inc. | | | $14,904 | |
| | | |
| | Total | | | 14,904 | |
| | | |
| | | | | | |
| | | |
| | Total Common Stock (cost $4,665,617) | | | 4,906,759 | |
| | | |
| | |
| Shares | | Registered Investment Companies (2.0%) | | Value | |
Equity Funds/Exchange Traded Funds (2.0%) | | | | |
| 78 | | iShares Russell 2000 Growth Index Fund | | | 14,655 | |
| 1,143 | | SPDR S&P Biotech ETF | | | 90,423 | |
| | | |
| | Total | | | 105,078 | |
| | | |
| | | | | | |
| | | |
| | Total Registered Investment Companies (cost $121,649) | | | 105,078 | |
| | | |
| | |
Shares or
Principal
Amount | | Short-Term Investments (3.0%) | | Value | |
| | Thrivent Core Short-Term Reserve Fund | | | | |
| 15,778 | | 2.430% | | | 157,784 | |
| | | |
| | Total Short-Term Investments (cost $157,784 ) | | | 157,784 | |
| | | |
| | Total Investments (cost $4,945,050) 99.3% | | | $5,169,621 | |
| | | |
| | Other Assets and Liabilities, Net 0.7% | | | 34,311 | |
| | | |
| | Total Net Assets 100.0% | | | $5,203,932 | |
| | | |
| | |
| a | | Non-income producing security. |
Definitions:
| | | | |
| ADR | | - | | American Depositary Receipt, which are certificates for an underlying foreign security’s shares held by an issuing U.S. depository bank. |
| ETF | | - | | Exchange Traded Fund |
| SPDR | | - | | S&P Depository Receipts, which are exchange-traded funds traded in the U.S., Europe, and Asia-Pacific and managed by State Street Global Advisors. |
Unrealized Appreciation (Depreciation)
Gross unrealized appreciation and depreciation of investments of the portfolio as a whole (including derivatives), based on cost for federal income tax purposes, were as follows:
| | | | |
Gross unrealized appreciation | | $ | 549,672 | |
Gross unrealized depreciation | | | (341,182 | ) |
| | | | |
Net unrealized appreciation (depreciation) | | $ | 208,490 | |
| |
Cost for federal income tax purposes | | $ | 4,961,131 | |
The accompanying Notes to Financial Statements are an integral part of this schedule.
180
SMALL CAP GROWTH FUND
Schedule of Investments as of October 31, 2018
Fair Valuation Measurements
The following table is a summary of the inputs used, as of October 31, 2018, in valuing Small Cap Growth Fund’s assets carried at fair value.
| | | | | | | | | | | | | | | | |
| Investments in Securities | | Total | | | Level 1 | | | Level 2 | | | Level 3 | |
| | | | |
Common Stock | | | | | | | | | | | | | | | | |
Communications Services | | | 37,100 | | | | 37,100 | | | | – | | | | – | |
Consumer Discretionary | | | 800,096 | | | | 800,096 | | | | – | | | | – | |
Consumer Staples | | | 83,933 | | | | 83,933 | | | | – | | | | – | |
Energy | | | 148,650 | | | | 148,650 | | | | – | | | | – | |
Financials | | | 546,214 | | | | 546,214 | | | | – | | | | – | |
Health Care | | | 1,014,211 | | | | 1,014,211 | | | | – | | | | – | |
Industrials | | | 815,961 | | | | 815,961 | | | | – | | | | – | |
Information Technology | | | 1,445,690 | | | | 1,445,690 | | | | – | | | | – | |
Real Estate | | | 14,904 | | | | 14,904 | | | | – | | | | – | |
Registered Investment Companies | | | | | | | | | | | | | | | | |
Equity Funds/Exchange Traded Funds | | | 105,078 | | | | 105,078 | | | | – | | | | – | |
| |
Subtotal Investments in Securities | | | $5,011,837 | | | | $5,011,837 | | | | $– | | | | $– | |
| |
| | | | |
Other Investments * | | | Total | | | | | | | | | | | | | |
| | | | | | | | | | | | | |
Short-Term Investments | | | 157,784 | | | | | | | | | | | | | |
| | | | | | | | | | | | | |
Subtotal Other Investments | | | $ 157,784 | | | | | | | | | | | | | |
| | | | | | | | | | | | | |
| | | | | | | | | | | | | | | | |
| | | | | | | | | | | | | |
Total Investments at Value | | | $5,169,621 | | | | | | | | | | | | | |
| | | | | | | | | | | | | |
| * | Certain investments are measured at fair value using a net asset value per share that is not publicly available (practical expedient). According to disclosure requirements of Accounting Standards Codification (ASC) 820, Fair Value Measurement, securities valued using the practical expedient are not classified in the fair value hierarchy. The fair value amounts presented in this table are intended to permit reconciliation of the fair value hierarchy to the amounts presented in the Statement of Assets and Liabilities. |
There were no significant transfers between Levels during the period ended October 31, 2018. Transfers between Levels are identified as of the end of the period.
Investment in Affiliates
Affiliated issuers, as defined under the Investment Company Act of 1940, include those in which the Fund’s holdings of an issuer represent 5% or more of the outstanding voting securities of an issuer, any affiliated mutual fund, or a company which is under common ownership or control with the Fund. The Fund owns shares of Thrivent Core Short-Term Reserve Fund primarily to serve as a cash sweep vehicle for the Fund. Thrivent Core Funds are established solely for investment by Thrivent entities.
A summary of transactions (in thousands) for the fiscal year to date, in Small Cap Growth Fund, is as follows:
| | | | | | | | | | | | | | | | | | | | | | | | |
| Fund | | Value
2/28/2018
(inception) | | | Gross
Purchases | | | Gross
Sales | | | Shares Held at
10/31/2018 | | | Value
10/31/2018 | | | % of Net
Assets | |
Affiliated Short-Term Investments | | | | | | | | | | | | | | | | | | | | | | | | |
Core Short-Term Reserve, 2.430% | | | $– | | | | $3,635 | | | | $3,477 | | | | 16 | | | | $158 | | | | 3.0 | % |
| |
Total Affiliated Short-Term Investments | | | – | | | | | | | | | | | | | | | | 158 | | | | 3.0 | |
| |
Total Value | | | $– | | | | | | | | | | | | | | | | $158 | | | | | |
| |
| | | | | | | | | | | | | | | | |
| Fund | | Net Realized
Gain/(Loss) | | | Change in
Unrealized
Appreciation/
(Depreciation) | | | Distributions of
Realized Capital
Gains | | | Income Earned
2/28/2018 - 10/31/2018 | |
Affiliated Short-Term Investments | | | | | | | | | | | | | | | | |
Core Short-Term Reserve, 2.430% | | | $– | | | | $– | | | | $– | | | | $3 | |
| |
Total Income from Affiliated Investments | | | | | | | | | | | | | | | $3 | |
| |
Total | | | $– | | | | $– | | | | $– | | | | | |
| |
The accompanying Notes to Financial Statements are an integral part of this schedule.
181
SMALL CAP STOCK FUND
Schedule of Investments as of October 31, 2018
| | | | | | | | |
| Shares | | | Common Stock (97.1%) | | Value | |
| | Consumer Discretionary (10.1%) | | | | |
| | 113,241 | | | Children’s Place, Inc. | | | $16,918,205 | |
| | 234,204 | | | Core-Mark Holding Company, Inc. | | | 8,995,776 | |
| | 498,899 | | | Crocs, Inc.a | | | 10,247,386 | |
| | 87,440 | | | G-III Apparel Group, Ltd.a | | | 3,485,358 | |
| | 263,373 | | | Michaels Companies, Inc.a | | | 4,174,462 | |
| | 260,372 | | | Nutrisystem, Inc. | | | 9,258,828 | |
| | 55,573 | | | Oxford Industries, Inc. | | | 4,944,886 | |
| | 31,151 | | | Stamps.com, Inc.a | | | 6,297,798 | |
| | 136,459 | | | Zumiez, Inc.a | | | 3,174,036 | |
| | | | | |
| | | | Total | | | 67,496,735 | |
| | | | | |
| |
| | Consumer Staples (6.5%) | | | | |
| | 71,502 | | | Casey’s General Stores, Inc. | | | 9,017,117 | |
| | 704,314 | | | Cott Corporation | | | 10,592,883 | |
| | 265,648 | | | Hain Celestial Group, Inc.a | | | 6,609,322 | |
| | 74,400 | | | John B. Sanfilippo & Son, Inc. | | | 4,691,664 | |
| | 563,340 | | | SunOpta, Inc.a | | | 4,179,983 | |
| | 192,924 | | | Turning Point Brands, Inc. | | | 7,929,176 | |
| | | | | |
| | | | Total | | | 43,020,145 | |
| | | | | |
| |
| | Energy (4.3%) | | | | |
| | 655,177 | | | Callon Petroleum Companya | | | 6,532,115 | |
| | 222,982 | | | Nine Energy Service, Inc.a | | | 8,257,023 | |
| | 116,500 | | | Talos Energy, Inc.a | | | 3,035,990 | |
| | 963,451 | | | Transocean, Ltd.a,b | | | 10,607,596 | |
| | | | | |
| | | | Total | | | 28,432,724 | |
| | | | | |
| |
| | Financials (22.4%) | | | | |
| | 123,823 | | | Argo Group International Holdings, Ltd. | | | 7,628,735 | |
| | 285,648 | | | Assured Guaranty, Ltd. | | | 11,420,207 | |
| | 252,961 | | | BancorpSouth Bank | | | 7,259,981 | |
| | 51,592 | | | BOK Financial Corporation | | | 4,422,982 | |
| | 163,299 | | | First Interstate BancSystem, Inc. | | | 6,770,376 | |
| | 132,793 | | | Hamilton Lane, Inc. | | | 5,096,595 | |
| | 201,372 | | | Hancock Whitney Corporation | | | 8,449,569 | |
| | 567,570 | | | Heritage Commerce Corporation | | | 8,235,441 | |
| | 123,979 | | | Horace Mann Educators Corporation | | | 4,869,895 | |
| | 127,177 | | | Houlihan Lokey, Inc. | | | 5,237,149 | |
| | 114,467 | | | IBERIABANK Corporation | | | 8,526,647 | |
| | 359,486 | | | Investment Technology Group, Inc. | | | 9,878,675 | |
| | 121,791 | | | Kemper Corporation | | | 9,157,465 | |
| | 52,822 | | | National Bank Holdings Corporation | | | 1,783,271 | |
| | 365,626 | | | PCSB Financial Corporation | | | 6,844,519 | |
| | 85,186 | | | Primerica, Inc. | | | 9,348,312 | |
| | 279,995 | | | Santander Consumer USA Holdings Inc. | | | 5,249,906 | |
| | 273,179 | | | Seacoast Banking Corporation of Floridaa | | | 7,187,339 | |
| | 114,091 | | | State Auto Financial Corporation | | | 3,626,953 | |
| | 89,880 | | | Stifel Financial Corporation | | | 4,109,314 | |
| | 258,389 | | | Synovus Financial Corporation | | | 9,705,091 | |
| | 158,910 | | | United Community Banks, Inc. | | | 3,952,092 | |
| | | | | |
| | | | Total | | | 148,760,514 | |
| | | | | |
| |
| | Health Care (13.2%) | | | | |
| | 169,734 | | | Catalent, Inc.a | | | 6,847,070 | |
| | 212,424 | | | Halozyme Therapeutics, Inc.a | | | 3,298,945 | |
| | 34,094 | | | Heska Corporationa | | | 3,416,901 | |
| | 111,008 | | | LHC Group, Inc.a | | | 10,149,461 | |
| | 178,077 | | | Myriad Genetics, Inc.a | | | 8,018,807 | |
| | 33,236 | | | Neurocrine Biosciences, Inc.a | | | 3,561,237 | |
| | 108,881 | | | NuVasive, Inc.a | | | 6,115,846 | |
| | 206,357 | | | Omnicell, Inc.a | | | 14,589,440 | |
| | 254,925 | | | Optinose, Inc.a,b | | | 2,697,107 | |
| | 95,198 | | | PerkinElmer, Inc. | | | 8,232,723 | |
| | 205,437 | | | Syneos Health, Inc.a | | | 9,374,090 | |
| | 28,865 | | | Teleflex, Inc. | | | 6,948,960 | |
| | 42,370 | | | West Pharmaceutical Services, Inc. | | | 4,487,830 | |
| | | | | |
| | | | Total | | | 87,738,417 | |
| | | | | |
| |
| | Industrials (17.5%) | | | | |
| | 68,132 | | | AGCO Corporation | | | 3,818,117 | |
| | 56,375 | | | BWX Technologies, Inc. | | | 3,295,683 | |
| | 38,464 | | | Curtiss-Wright Corporation | | | 4,210,269 | |
| | 154,888 | | | Encore Wire Corporation | | | 6,846,050 | |
| | 894,117 | | | Euronav NV | | | 8,225,876 | |
| | 95,513 | | | Genesee & Wyoming, Inc.a | | | 7,567,495 | |
| | 54,937 | | | Granite Construction, Inc. | | | 2,511,720 | |
| | 592,962 | | | KeyW Holding Corporationa,b | | | 4,642,892 | |
| | 25,378 | | | Kirby Corporationa | | | 1,825,693 | |
| | 75,587 | | | Lindsay Corporation | | | 7,227,629 | |
| | 704,256 | | | MRC Global, Inc.a | | | 11,148,372 | |
| | 703,209 | | | Nexeo Solutions, Inc.a | | | 7,348,534 | |
| | 101,959 | | | Oshkosh Corporation | | | 5,723,978 | |
| | 452,050 | | | Primoris Services Corporation | | | 9,569,899 | |
| | 72,735 | | | Raven Industries, Inc. | | | 3,162,518 | |
| | 159,397 | | | Terex Corporation | | | 5,322,266 | |
| | 53,341 | | | TransUnion | | | 3,507,171 | |
| | 271,260 | | | Univar, Inc.a | | | 6,678,421 | |
| | 42,192 | | | Valmont Industries, Inc. | | | 5,244,888 | |
| | 107,961 | | | Waste Connections, Inc. | | | 8,252,539 | |
| | | | | |
| | | | Total | | | 116,130,010 | |
| | | | | |
| |
| | Information Technology (14.3%) | | | | |
| | 29,897 | | | Arista Networks, Inc.a | | | 6,886,774 | |
| | 81,345 | | | Belden, Inc. | | | 4,396,697 | |
| | 81,298 | | | Blackline, Inc.a | | | 3,770,601 | |
| | 62,314 | | | Booz Allen Hamilton Holding Corporation | | | 3,087,036 | |
| | 268,509 | | | Ciena Corporationa | | | 8,393,591 | |
| | 208,568 | | | Dolby Laboratories, Inc. | | | 14,351,564 | |
| | 61,294 | | | Guidewire Software, Inc.a | | | 5,453,327 | |
| | 144,748 | | | M/A-COM Technology Solutions Holdings, Inc.a,b | | | 2,036,604 | |
| | 215,937 | | | National Instruments Corporation | | | 10,574,435 | |
| | 61,678 | | | Pegasystems, Inc. | | | 3,301,007 | |
| | 176,821 | | | Plexus Corporationa | | | 10,326,346 | |
| | 32,605 | | | Q2 Holdings, Inc.a | | | 1,735,564 | |
| | 39,881 | | | Rogers Corporationa | | | 4,907,756 | |
| | 159,893 | | | SailPoint Technologies Holdings, Inc.a | | | 4,163,614 | |
| | 236,290 | | | Virtusa Corporationa | | | 11,717,621 | |
| | | | | |
| | | | Total | | | 95,102,537 | |
| | | | | |
| |
| | Materials (4.0%) | | | | |
| | 42,037 | | | Balchem Corporation | | | 3,936,765 | |
| | 139,365 | | | Scotts Miracle-Gro Company | | | 9,301,220 | |
| | 159,385 | | | Sensient Technologies Corporation | | | 10,337,711 | |
| | 45,989 | | | United States Lime & Minerals, Inc. | | | 3,449,635 | |
| | | | | |
| | | | Total | | | 27,025,331 | |
| | | | | |
| |
| | Real Estate (2.4%) | | | | |
| | 41,243 | | | Americold Realty Trust | | | 1,020,764 | |
| | 330,810 | | | Cousins Properties, Inc. | | | 2,749,031 | |
| | 66,062 | | | CyrusOne, Inc. | | | 3,516,481 | |
| | 176,983 | | | Physicians Realty Trust | | | 2,934,378 | |
The accompanying Notes to Financial Statements are an integral part of this schedule.
182
SMALL CAP STOCK FUND
Schedule of Investments as of October 31, 2018
| | | | | | | | |
| Shares | | | Common Stock (97.1%) | | Value | |
| | Real Estate (2.4%) - continued | | | | |
| | 160,319 | | | Terreno Realty Corporation | | | $6,000,740 | |
| | | | | |
| | | | Total | | | 16,221,394 | |
| | | | | |
| |
| | Utilities (2.4%) | | | | |
| | 115,423 | | | MDU Resources Group, Inc. | | | 2,880,958 | |
| | 81,405 | | | New Jersey Resources Corporation | | | 3,671,366 | |
| | 138,539 | | | PNM Resources, Inc. | | | 5,321,283 | |
| | 53,016 | | | Southwest Gas Holdings, Inc. | | | 4,096,546 | |
| | | | | |
| | | | Total | | | 15,970,153 | |
| | | | | |
| | | | | | | | |
| | | | | |
| | | | Total Common Stock (cost $548,839,720) | | | 645,897,960 | |
| | | | | |
| | |
| Shares | | | Registered Investment Companies (2.2%) | | Value | |
| | Equity Funds/Exchange Traded Funds (2.2%) | | | | |
| | 28,263 | | | iShares Russell 2000 Value Index Fund | | | 3,424,063 | |
| | 111,365 | | | SPDR S&P Retail ETFb | | | 5,249,746 | |
| | 80,685 | | | Vanguard REIT ETF | | | 6,319,249 | |
| | | | | |
| | | | Total | | | 14,993,058 | |
| | | | | |
| | | | | | | | |
| | | | | |
| | | | Total Registered Investment Companies (cost $15,836,104) | | | 14,993,058 | |
| | | | | |
| | |
| Shares | | | Collateral Held for Securities Loaned (3.0%) | | Value | |
| | 19,754,035 | | | Thrivent Cash Management Trust | | | 19,754,035 | |
| | | | | |
| | | | Total Collateral Held for Securities Loaned (cost $19,754,035) | | | 19,754,035 | |
| | | | | |
| | |
Shares or
Principal
Amount | | | Short-Term Investments (0.8%) | | Value | |
| | | | Thrivent Core Short-Term Reserve Fund | | | | |
| | 511,329 | | | 2.430% | | | 5,113,292 | |
| | | | | |
| | | | Total Short-Term Investments (cost $5,113,292) | | | 5,113,292 | |
| | | | | |
| | | | Total Investments (cost $589,543,151) 103.1% | | | $685,758,345 | |
| | | | | |
| | | | Other Assets and Liabilities, Net (3.1%) | | | (20,930,889 | ) |
| | | | | |
| | | | Total Net Assets 100.0% | | | $664,827,456 | |
| | | | | |
| a | Non-income producing security. |
| b | All or a portion of the security is on loan. |
The following table presents the total amount of securities loaned with continuous maturity, by type, offset by the gross payable upon return of collateral for securities loaned by Thrivent Small Cap Stock Fund as of October 31, 2018:
| | | | |
Securities Lending Transactions | | | | |
Common Stock | | | $19,282,807 | |
| | | | |
Total lending | | | $19,282,807 | |
Gross amount payable upon return of collateral for securities loaned | | | $19,754,035 | |
| | | | |
Net amounts due to counterparty | | | $ 471,228 | |
| | | | |
Definitions:
| | | | |
| ETF | | - | | Exchange Traded Fund |
| REIT | | - | | Real Estate Investment Trust is a company that buys, develops, manages and/or sells real estate assets. |
| SPDR | | - | | S&P Depository Receipts, which are exchange-traded funds traded in the U.S., Europe, and Asia-Pacific and managed by State Street Global Advisors. |
Unrealized Appreciation (Depreciation)
Gross unrealized appreciation and depreciation of investments of the portfolio as a whole (including derivatives), based on cost for federal income tax purposes, were as follows:
| | | | |
Gross unrealized appreciation | | | $122,611,898 | |
Gross unrealized depreciation | | | (26,593,832 | ) |
| | | | |
Net unrealized appreciation (depreciation) | | | $ 96,018,066 | |
| |
Cost for federal income tax purposes | | | $589,740,279 | |
The accompanying Notes to Financial Statements are an integral part of this schedule.
183
SMALL CAP STOCK FUND
Schedule of Investments as of October 31, 2018
Fair Valuation Measurements
The following table is a summary of the inputs used, as of October 31, 2018, in valuing Small Cap Stock Fund’s assets carried at fair value.
| | | | | | | | | | | | | | | | |
| Investments in Securities | | Total | | | Level 1 | | | Level 2 | | | Level 3 | |
| | | | |
Common Stock | | | | | | | | | | | | | | | | |
Consumer Discretionary | | | 67,496,735 | | | | 67,496,735 | | | | – | | | | – | |
Consumer Staples | | | 43,020,145 | | | | 43,020,145 | | | | – | | | | – | |
Energy | | | 28,432,724 | | | | 28,432,724 | | | | – | | | | – | |
Financials | | | 148,760,514 | | | | 148,760,514 | | | | – | | | | – | |
Health Care | | | 87,738,417 | | | | 87,738,417 | | | | – | | | | – | |
Industrials | | | 116,130,010 | | | | 116,130,010 | | | | – | | | | – | |
Information Technology | | | 95,102,537 | | | | 95,102,537 | | | | – | | | | – | |
Materials | | | 27,025,331 | | | | 27,025,331 | | | | – | | | | – | |
Real Estate | | | 16,221,394 | | | | 16,221,394 | | | | – | | | | – | |
Utilities | | | 15,970,153 | | | | 15,970,153 | | | | – | | | | – | |
Registered Investment Companies | | | | | | | | | | | | | | | | |
Equity Funds/Exchange Traded Funds | | | 14,993,058 | | | | 14,993,058 | | | | – | | | | – | |
| |
Subtotal Investments in Securities | | | $660,891,018 | | | | $660,891,018 | | | | $– | | | | $– | |
| |
| | | | |
Other Investments * | | | Total | | | | | | | | | | | | | |
| | | | | | | | | | | | | |
Short-Term Investments | | | 5,113,292 | | | | | | | | | | | | | |
Collateral Held for Securities Loaned | | | 19,754,035 | | | | | | | | | | | | | |
| | | | | | | | | | | | | |
Subtotal Other Investments | | | $ 24,867,327 | | | | | | | | | | | | | |
| | | | | | | | | | | | | |
| | | | | | | | | | | | | | | | |
| | | | | | | | | | | | | |
Total Investments at Value | | | $685,758,345 | | | | | | | | | | | | | |
| | | | | | | | | | | | | |
| * | Certain investments are measured at fair value using a net asset value per share that is not publicly available (practical expedient). According to disclosure requirements of Accounting Standards Codification (ASC) 820, Fair Value Measurement, securities valued using the practical expedient are not classified in the fair value hierarchy. The fair value amounts presented in this table are intended to permit reconciliation of the fair value hierarchy to the amounts presented in the Statement of Assets and Liabilities. |
There were no significant transfers between Levels during the period ended October 31, 2018. Transfers between Levels are identified as of the end of the period.
Investment in Affiliates
Affiliated issuers, as defined under the Investment Company Act of 1940, include those in which the Fund’s holdings of an issuer represent 5% or more of the outstanding voting securities of an issuer, any affiliated mutual fund, or a company which is under common ownership or control with the Fund. The Fund owns shares of Thrivent Cash Management Trust for the purpose of securities lending and Thrivent Core Short-Term Reserve Fund primarily to serve as a cash sweep vehicle for the Fund. Thrivent Cash Management Trust and Thrivent Core Funds are established solely for investment by Thrivent entities.
A summary of transactions (in thousands) for the fiscal year to date, in Small Cap Stock Fund, is as follows:
| | | | | | | | | | | | | | | | | | | | | | | | |
| Fund | | Value 10/31/2017 | | | Gross Purchases | | | Gross Sales | | | Shares Held at 10/31/2018 | | | Value 10/31/2018 | | | % of Net Assets | |
Affiliated Short-Term Investments | | | | | | | | | | | | | | | | | | | | | | | | |
Core Short-Term Reserve, 2.430% | | | $ 4,653 | | | | $179,602 | | | | $179,142 | | | | 511 | | | | $ 5,113 | | | | 0.8 | % |
Total Affiliated Short-Term Investments | | | 4,653 | | | | | | | | | | | | | | | | 5,113 | | | | 0.8 | |
Collateral Held for Securities Loaned | | | | | | | | | | | | | | | | | | | | | | | | |
Cash Management Trust- Collateral Investment | | | 41,758 | | | | 272,041 | | | | 294,045 | | | | 19,754 | | | | 19,754 | | | | 3.0 | |
Total Collateral Held for Securities Loaned | | | 41,758 | | | | | | | | | | | | | | | | 19,754 | | | | 3.0 | |
Total Value | | | $46,411 | | | | | | | | | | | | | | | | $24,867 | | | | | |
| | | | | | | | | | | | | | | | |
| Fund | | Net Realized Gain/(Loss) | | | Change in Unrealized Appreciation/ (Depreciation) | | | Distributions of Realized Capital Gains | | | Income Earned 11/1/2017
-10/31/2018 | |
Affiliated Short-Term Investments | | | | | | | | | | | | | | | | |
Core Short-Term Reserve, 2.430% | | | $– | | | | $– | | | | $0 | | | | $284 | |
Total Income from Affiliated Investments | | | | | | | | | | | | | | | $284 | |
Collateral Held for Securities Loaned | | | | | | | | | | | | | | | | |
Cash Management Trust- Collateral Investment | | | – | | | | – | | | | – | | | | 140 | |
Total Affiliated Income from Securities Loaned, Net | | | | | | | | | | | | | | | $140 | |
Total | | | $– | | | | $– | | | | $0 | | | | | |
The accompanying Notes to Financial Statements are an integral part of this schedule.
184
(This page intentionally left blank)
185
THRIVENT MUTUAL FUNDS
STATEMENTOF ASSETSAND LIABILITIES
| | | | | | | | | | | | | | | | |
| As of October 31, 2018 | | Aggressive Allocation Fund | | | Balanced Income Plus Fund | | | Government Bond Fund | | | High Income Municipal Bond Fund | |
Assets | | | | | | | | | | | | | | | | |
Investments at cost | | | $1,079,519,452 | | | | $394,515,803 | | | | $66,334,625 | | | | $6,645,073 | |
Investments in unaffiliated securities at value (#) | | | 528,509,427 | | | | 326,894,860 | | | | 56,364,575 | | | | 6,542,034 | |
Investments in affiliated securities at value | | | 729,333,404 | | | | 67,629,486 | | | | 8,971,143 | | | | – | |
Cash | | | 4,138 | (a) | | | 16,897 | (b) | | | – | | | | 49,374 | |
Dividends and interest receivable | | | 768,952 | | | | 1,092,686 | | | | 292,516 | | | | 84,357 | |
Prepaid expenses | | | 7,045 | | | | 2,550 | | | | 6,121 | | | | 10,305 | |
Prepaid trustee fees | | | 3,848 | | | | 1,645 | | | | 1,091 | | | | 1,091 | |
Receivable for: | | | | | | | | | | | | | | | | |
Investments sold | | | 3,405,202 | | | | 2,416,382 | | | | – | | | | – | |
Investments sold on a delayed delivery basis | | | 651,074 | | | | 1,372,465 | | | | 208,719 | | | | – | |
Fund shares sold | | | 269,521 | | | | 328,603 | | | | 14,296 | | | | 1,601 | |
Expense reimbursements | | | 262,190 | | | | – | | | | 2,799 | | | | 14,535 | |
Variation margin on open future contracts | | | 3,815,429 | | | | 10,749 | | | | 25,750 | | | | 6,809 | |
Total Assets | | | 1,267,030,230 | | | | 399,766,323 | | | | 65,887,010 | | | | 6,710,106 | |
| | | | |
Liabilities | | | | | | | | | | | | | | | | |
Distributions payable | | | – | | | | – | | | | 535 | | | | 6,073 | |
Accrued expenses | | | 82,623 | | | | 52,374 | | | | 17,160 | | | | 16,293 | |
Cash overdraft | | | – | | | | – | | | | – | | | | – | |
Payable for: | | | | | | | | | | | | | | | | |
Investments purchased | | | 3,248,650 | | | | 2,066,583 | | | | – | | | | – | |
Investments purchased on a delayed delivery basis | | | 16,991,440 | | | | 28,178,755 | | | | 8,576,429 | | | | 54,738 | |
Return of collateral for securities loaned | | | 9,152,537 | | | | 2,305,594 | | | | – | | | | – | |
Fund shares redeemed | | | 949,878 | | | | 212,842 | | | | 10,872 | | | | 4,768 | |
Variation margin on open future contracts | | | 2,342,349 | | | | 61,231 | | | | 8,000 | | | | – | |
Investment advisory fees | | | 839,160 | | | | 184,144 | | | | 20,712 | | | | 2,889 | |
Administrative fees | | | 21,696 | | | | 6,361 | | | | 984 | | | | 110 | |
Distribution fees | | | 208,355 | | | | 56,459 | | | | 567 | | | | – | |
Transfer agent fees | | | 97,281 | | | | 23,781 | | | | 987 | | | | 203 | |
Trustee deferred compensation | | | 49,648 | | | | 75,174 | | | | 18,542 | | | | 865 | |
Commitments and contingent liabilities^ | | | – | | | | – | | | | – | | | | – | |
Mortgage dollar roll deferred revenue | | | 6,314 | | | | 7,747 | | | | 2,868 | | | | – | |
Total Liabilities | | | 33,989,931 | | | | 33,231,045 | | | | 8,657,656 | | | | 85,939 | |
| | | | |
Net Assets | | | | | | | | | | | | | | | | |
Capital stock (beneficial interest) | | | 968,412,003 | | | | 343,136,237 | | | | 58,980,966 | | | | 6,710,054 | |
Distributable earnings/(accumulated loss) | | | 264,628,296 | | | | 23,399,041 | | | | (1,751,612 | ) | | | (85,887 | ) |
Total Net Assets | | | $1,233,040,299 | | | | $366,535,278 | | | | $57,229,354 | | | | $6,624,167 | |
| | | | |
Class A Share Capital | | | $ 896,604,725 | | | | $246,260,302 | | | | $4,941,544 | | | | $– | |
Shares of beneficial interest outstanding (Class A) | | | 57,804,860 | | | | 19,051,305 | | | | 522,015 | | | | – | |
Net asset value per share | | | $ 15.51 | | | | $12.93 | | | | $9.47 | | | | $– | |
Maximum public offering price | | | $ 16.24 | | | | $13.54 | | | | $9.66 | | | | $– | |
| | | | |
Class S Share Capital | | | $ 336,435,574 | | | | $120,274,976 | | | | $52,287,810 | | | | $6,624,167 | |
Shares of beneficial interest outstanding (Class S) | | | 21,459,377 | | | | 9,324,111 | | | | 5,521,814 | | | | 671,937 | |
Net asset value per share | | | $ 15.68 | | | | $12.90 | | | | $9.47 | | | | $ 9.86 | |
(#) Includes securities on loan of | | | 8,979,336 | | | | 2,213,626 | | | | – | | | | – | |
| (a) | Includes foreign currency holdings of $711 (cost $713). |
| (b) | Includes foreign currency holdings of $753 (cost $756). |
| (c) | Includes foreign currency holdings of $651 (cost $653). |
| (d) | Includes foreign currency holdings of $187 (cost $190). |
| ^ | Commitments and contingent liabilities accrual. Additional information can be found in the accompanying Notes to Financial Statements. |
The accompanying Notes to Financial Statements are an integral part of this statement.
186
THRIVENT MUTUAL FUNDS
STATEMENTOF ASSETSAND LIABILITIES –CONTINUED
| | | | | | | | | | | | | | | | | | | | | | | | | | |
| High Yield Fund | | | Income Fund | | | Large Cap Growth Fund | | | Large Cap Stock Fund | | | Large Cap Value Fund | | | Limited Maturity Bond Fund | | | Low Volatility Equity Fund | |
| | | | | | |
| | | | | | | | | | | | | | | | | | | | | | | | | | | |
| | $801,793,166 | | | | $874,741,371 | | | | $703,984,753 | | | | $1,473,519,435 | | | | $792,411,783 | | | | $965,094,464 | | | | $10,590,468 | |
| | 697,942,328 | | | | 791,423,354 | | | | 979,190,011 | | | | 1,677,160,683 | | | | 1,033,995,380 | | | | 895,689,084 | | | | 10,750,811 | |
| | 79,736,324 | | | | 59,821,217 | | | | 25,026,249 | | | | 111,276,103 | | | | 30,679,011 | | | | 59,152,095 | | | | 1 | |
| | – | | | | 15 | | | | 4,009 | | | | 651 | (c) | | | – | | | | 7,902 | | | | – | |
| | 11,439,167 | | | | 7,541,131 | | | | 189,297 | | | | 3,650,072 | | | | 1,220,223 | | | | 4,280,773 | | | | 24,842 | |
| | 13,035 | | | | 14,744 | | | | 13,886 | | | | 11,768 | | | | 4,254 | | | | 18,839 | | | | 3,519 | |
| | 3,314 | | | | 3,701 | | | | 5,004 | | | | 8,863 | | | | 5,176 | | | | 4,179 | | | | 1,091 | |
| | 3,134,771 | | | | 689,624 | | | | 17,565,216 | | | | 7,069,705 | | | | 7,117,961 | | | | 1,629,463 | | | | – | |
| | – | | | | 1,302,148 | | | | – | | | | – | | | | – | | | | 10,273,209 | | | | – | |
| | 380,288 | | | | 159,812 | | | | 406,819 | | | | 510,676 | | | | 507,372 | | | | 1,077,839 | | | | – | |
| | – | | | | – | | | | 5,246 | | | | – | | | | – | | | | – | | | | 10,702 | |
| | – | | | | 139,969 | | | | – | | | | 2,057,240 | | | | – | | | | 265,062 | | | | 6,120 | |
| | 792,649,227 | | | | 861,095,715 | | | | 1,022,405,737 | | | | 1,801,745,761 | | | | 1,073,529,377 | | | | 972,398,445 | | | | 10,797,086 | |
| | 654,188 | | | | 174,593 | | | | – | | | | – | | | | – | | | | 55,179 | | | | – | |
| | 67,382 | | | | 69,479 | | | | 57,096 | | | | 127,752 | | | | 60,504 | | | | 81,224 | | | | 18,584 | |
| | – | | | | – | | | | – | | | | – | | | | – | | | | – | | | | 49,229 | (d) |
| | 3,548,854 | | | | 5,640,935 | | | | 17,585,937 | | | | 6,804,330 | | | | 7,135,794 | | | | 2,073,971 | | | | – | |
| | 12,202,963 | | | | 38,847,269 | | | | – | | | | – | | | | – | | | | 42,348,809 | | | | – | |
| | 53,926,806 | | | | 8,347,519 | | | | – | | | | 22,091,756 | | | | 1,804,350 | | | | – | | | | – | |
| | 971,891 | | | | 580,577 | | | | 270,706 | | | | 651,005 | | | | 287,094 | | | | 1,618,343 | | | | 3,426 | |
| | – | | | | 81,250 | | | | – | | | | 1,021,680 | | | | – | | | | 57,000 | | | | – | |
| | 253,358 | | | | 250,093 | | | | 678,033 | | | | 930,208 | | | | 447,226 | | | | 241,108 | | | | 5,810 | |
| | 12,527 | | | | 13,960 | | | | 17,843 | | | | 31,483 | | | | 18,883 | | | | 15,878 | | | | 184 | |
| | 100,164 | | | | 68,274 | | | | 55,864 | | | | 349,803 | | | | 53,251 | | | | 33,943 | | | | – | |
| | 33,675 | | | | 24,504 | | | | 33,962 | | | | 117,056 | | | | 26,330 | | | | 34,497 | | | | 1,189 | |
| | 132,727 | | | | 145,378 | | | | 100,747 | | | | 504,971 | | | | 129,121 | | | | 123,210 | | | | 880 | |
| | – | | | | – | | | | – | | | | – | | | | – | | | | – | | | | – | |
| | – | | | | 13,562 | | | | – | | | | – | | | | – | | | | 8,222 | | | | – | |
| | 71,904,535 | | | | 54,257,393 | | | | 18,800,188 | | | | 32,630,044 | | | | 9,962,553 | | | | 46,691,384 | | | | 79,302 | |
| | 772,763,959 | | | | 834,640,227 | | | | 609,968,822 | | | | 1,321,164,858 | | | | 724,528,948 | | | | 940,301,054 | | | | 10,309,957 | |
| | (52,019,267) | | | | (27,801,905 | ) | | | 393,636,727 | | | | 447,950,859 | | | | 339,037,876 | | | | (14,593,993 | ) | | | 407,827 | |
| | $720,744,692 | | | | $806,838,322 | | | | $1,003,605,549 | | | | $1,769,115,717 | | | | $1,063,566,824 | | | | $925,707,061 | | | | $10,717,784 | |
| | $437,367,354 | | | | $298,541,021 | | | | $237,778,668 | | | | $1,492,485,739 | | | | $227,110,849 | | | | $298,027,893 | | | | $– | |
| | 94,397,446 | | | | 34,295,873 | | | | 21,045,629 | | | | 56,130,042 | | | | 9,999,213 | | | | 24,220,199 | | | | – | |
| | $4.63 | | | | $8.70 | | | | $11.30 | | | | $26.59 | | | | $22.71 | | | | $12.30 | | | | $– | |
| | $4.85 | | | | $9.11 | | | | $11.83 | | | | $27.84 | | | | $23.78 | | | | $12.30 | | | | $– | |
| | $283,377,338 | | | | $508,297,301 | | | | $765,826,881 | | | | $276,629,978 | | | | $836,455,975 | | | | $627,679,168 | | | | $10,717,784 | |
| | 61,118,694 | | | | 58,436,380 | | | | 61,392,684 | | | | 10,290,609 | | | | 36,525,751 | | | | 51,022,658 | | | | 987,428 | |
| | $4.64 | | | | $8.70 | | | | $12.47 | | | | $26.88 | | | | $22.90 | | | | $12.30 | | | | $10.85 | |
| | 52,051,436 | | | | 8,056,513 | | | | – | | | | 20,843,498 | | | | 1,623,915 | | | | – | | | | – | |
The accompanying Notes to Financial Statements are an integral part of this statement.
187
THRIVENT MUTUAL FUNDS
STATEMENTOF ASSETSAND LIABILITIES –CONTINUED
| | | | | | | | | | | | |
| As of October 31, 2018 | | Mid Cap
Stock Fund | | | Moderate
Allocation
Fund | | | Moderately
Aggressive
Allocation
Fund | |
Assets | | | | | | | | | | | | |
Investments at cost | | | $1,535,087,730 | | | | $2,246,159,122 | | | | $2,485,028,661 | |
Investments in unaffiliated securities at value (#) | | | 1,735,263,625 | | | | 1,232,407,410 | | | | 1,206,868,980 | |
Investments in affiliated securities at value | | | 188,899,940 | | | | 1,285,909,869 | | | | 1,637,724,276 | |
Cash | | | 818 | | | | 10,525 | (a) | | | 14,142 | (b) |
Initial margin deposit on open future contracts | | | – | | | | – | | | | – | |
Initial margin deposit on open currency contracts | | | – | | | | – | | | | – | |
Dividends and interest receivable | | | 681,064 | | | | 5,214,114 | | | | 4,097,725 | |
Prepaid expenses | | | 4,147 | | | | 11,458 | | | | 7,923 | |
Prepaid trustee fees | | | 9,361 | | | | 6,857 | | | | 7,735 | |
Receivable for: | | | | | | | | | | | | |
Investments sold | | | 27,860,299 | | | | 6,536,567 | | | | 6,574,638 | |
Investments sold on a delayed delivery basis | | | – | | | | 6,354,485 | | | | 4,401,262 | |
Fund shares sold | | | 2,890,752 | | | | 954,338 | | | | 626,975 | |
Expense reimbursements | | | – | | | | 441,183 | | | | 615,951 | |
Variation margin on open future contracts | | | – | | | | 3,391,083 | | | | 5,887,151 | |
Unrealized gain on forward contracts | | | – | | | | – | | | | – | |
Total Assets | | | 1,955,610,006 | | | | 2,541,237,889 | | | | 2,866,826,758 | |
| | | |
Liabilities | | | | | | | | | | | | |
Distributions payable | | | – | | | | – | | | | – | |
Accrued expenses | | | 127,649 | | | | 107,692 | | | | 141,779 | |
Payable for: | | | | | | | | | | | | |
Investments purchased | | | 15,915,583 | | | | 3,421,289 | | | | 5,030,523 | |
Investments purchased on a delayed delivery basis | | | – | | | | 207,428,081 | | | | 135,889,891 | |
Return of collateral for securities loaned | | | 21,669,050 | | | | 10,899,857 | | | | 14,805,419 | |
Foreign capital gain tax liability | | | – | | | | – | | | | – | |
Fund shares redeemed | | | 345,977 | | | | 1,113,244 | | | | 450,739 | |
Variation margin on open future contracts | | | – | | | | 2,706,678 | | | | 3,794,331 | |
Investment advisory fees | | | 1,105,635 | | | | 1,331,602 | | | | 1,678,038 | |
Administrative fees | | | 33,294 | | | | 40,378 | | | | 47,399 | |
Distribution fees | | | 270,044 | | | | 409,763 | | | | 491,253 | |
Transfer agent fees | | | 102,693 | | | | 123,745 | | | | 182,787 | |
Trustee deferred compensation | | | 293,593 | | | | 79,382 | | | | 99,784 | |
Unrealized loss on forward contracts | | | – | | | | – | | | | – | |
Commitments and contingent liabilities^ | | | – | | | | – | | | | – | |
Mortgage dollar roll deferred revenue | | | – | | | | 73,331 | | | | 47,830 | |
Total Liabilities | | | 39,863,518 | | | | 227,735,042 | | | | 162,659,773 | |
| | | |
Net Assets | | | | | | | | | | | | |
Capital stock (beneficial interest) | | | 1,332,029,137 | | | | 1,998,596,390 | | | | 2,237,274,592 | |
Distributable earnings/(accumulated loss) | | | 583,717,351 | | | | 314,906,457 | | | | 466,892,393 | |
Total Net Assets | | | $1,915,746,488 | | | | $2,313,502,847 | | | | $2,704,166,985 | |
| | | |
Class A Share Capital | | | $1,171,777,006 | | | | $1,777,996,913 | | | | $2,123,349,328 | |
Shares of beneficial interest outstanding (Class A) | | | 47,124,261 | | | | 132,962,534 | | | | 145,265,366 | |
Net asset value per share | | | $24.87 | | | | $13.37 | | | | $14.62 | |
Maximum public offering price | | | $26.04 | | | | $14.00 | | | | $15.31 | |
Class S Share Capital | | | $743,969,482 | | | | $535,505,934 | | | | $580,817,657 | |
Shares of beneficial interest outstanding (Class S) | | | 26,509,944 | | | | 39,935,658 | | | | 39,367,346 | |
Net asset value per share | | | $28.06 | | | | $13.41 | | | | $14.75 | |
(#) Includes securities on loan of | | | 20,850,942 | | | | 10,626,852 | | | | 14,468,726 | |
| 1 | Securities held by this fund are valued on the basis of amortized cost, which approximates market value. |
| (a) | Includes foreign currency holdings of $724 (cost $727). |
| (b) | Includes foreign currency holdings of $1,534 (cost $1,538). |
| (c) | Includes foreign currency holdings of $16 (cost $15). |
| (d) | Includes foreign currency holdings of $16,159 (cost $14,874). |
| (e) | Includes foreign currency holdings of $2,657,023 (cost $2,691,305). |
| ^ | Commitments and contingent liabilities accrual. Additional information can be found in the accompanying Notes to Financial Statements. |
The accompanying Notes to Financial Statements are an integral part of this statement.
188
THRIVENT MUTUAL FUNDS
STATEMENTOF ASSETSAND LIABILITIES –CONTINUED
| | | | | | | | | | | | | | | | | | | | | | | | | | | | | | |
Moderately Conservative Allocation Fund | | | Money Market Fund | | | Municipal Bond Fund | | | Opportunity Income Plus Fund | | | Partner Emerging Markets Equity Fund | | | Partner Worldwide Allocation Fund | | | Small Cap Growth Fund | | | Small Cap Stock Fund | |
| | | | | | | | | | | | | | | | | | | | | | | | | | | | | | |
| | $903,233,567 | | | | $479,815,812 | | | | $1,437,411,361 | | | | $642,544,999 | | | | $13,531,737 | | | | $831,183,241 | | | | $4,945,050 | | | | $589,543,151 | |
| | 524,451,770 | | | | 479,815,812 | 1 | | | 1,453,272,056 | | | | 471,342,135 | | | | 12,653,316 | | | | 792,117,562 | | | | 5,011,838 | | | | 660,891,018 | |
| | 447,289,601 | | | | – | | | | – | | | | 161,421,247 | | | | 192,431 | | | | 21,449,070 | | | | 157,784 | | | | 24,867,327 | |
| | 5,192 | (c) | | | 30,841 | | | | 5,830 | | | | 35,502 | | | | 16,159 | (d) | | | 2,658,134 | (e) | | | – | | | | 268 | |
| | – | | | | – | | | | – | | | | – | | | | – | | | | 431,471 | | | | – | | | | – | |
| | – | | | | – | | | | – | | | | – | | | | – | | | | 530,000 | | | | – | | | | – | |
| | 2,563,992 | | | | 777,163 | | | | 21,105,967 | | | | 2,542,634 | | | | 13,276 | | | | 4,131,892 | | | | 643 | | | | 78,953 | |
| | 14,341 | | | | 5,377 | | | | 17,425 | | | | 6,396 | | | | 14,478 | | | | 5,707 | | | | 10,072 | | | | 2,455 | |
| | 2,694 | | | | 2,022 | | | | 6,843 | | | | 2,488 | | | | 1,091 | | | | 4,026 | | | | 1,091 | | | | 3,246 | |
| | 2,475,780 | | | | – | | | | – | | | | 1,207,812 | | | | 12,754 | | | | 2,587,616 | | | | 35,890 | | | | – | |
| | 4,114,789 | | | | – | | | | – | | | | 3,881,166 | | | | – | | | | – | | | | – | | | | – | |
| | 341,973 | | | | 19,259,786 | | | | 56,427 | | | | 178,804 | | | | 60 | | | | 32,453 | | | | 572 | | | | 212,877 | |
| | 126,335 | | | | 42,020 | | | | – | | | | – | | | | 21,208 | | | | 13,694 | | | | 12,549 | | | | – | |
| | 618,145 | | | | – | | | | 67,125 | | | | 27,875 | | | | – | | | | 885,300 | | | | – | | | | – | |
| | – | | | | – | | | | – | | | | – | | | | – | | | | 671,031 | | | | – | | | | – | |
| | 982,004,612 | | | | 499,933,021 | | | | 1,474,531,673 | | | | 640,646,059 | | | | 12,924,773 | | | | 825,517,956 | | | | 5,230,439 | | | | 686,056,144 | |
| | | | | | | |
| | | | | | | | | | | | | | | | | | | | | | | | | | | | | | | |
| | – | | | | 3,667 | | | | 580,800 | | | | 145,460 | | | | – | | | | – | | | | – | | | | – | |
| | 57,648 | | | | 44,316 | | | | 84,515 | | | | 72,350 | | | | 39,596 | | | | 147,471 | | | | 15,056 | | | | 67,111 | |
| | 1,080,602 | | | | 3,704,020 | | | | – | | | | 579,452 | | | | – | | | | 2,335,888 | | | | 1,900 | | | | 422,776 | |
| | 106,330,115 | | | | – | | | | – | | | | 75,827,524 | | | | – | | | | 1,240,000 | | | | – | | | | – | |
| | 4,038,165 | | | | – | | | | – | | | | 5,373,892 | | | | 110,800 | | | | 2,491,545 | | | | – | | | | 19,754,035 | |
| | – | | | | – | | | | – | | | | – | | | | 15,646 | | | | 194,623 | | | | – | | | | – | |
| | 484,167 | | | | 1,108,126 | | | | 1,673,583 | | | | 763,281 | | | | 7,547 | | | | 135,462 | | | | 3,748 | | | | 248,225 | |
| | 722,721 | | | | – | | | | – | | | | 230,369 | | | | – | | | | 1,068,675 | | | | – | | | | – | |
| | 469,255 | | | | 147,069 | | | | 537,632 | | | | 224,410 | | | | 14,270 | | | | 621,426 | | | | 3,909 | | | | 411,213 | |
| | 15,132 | | | | 7,984 | | | | 25,505 | | | | 9,586 | | | | 226 | | | | 14,490 | | | | 93 | | | | 11,756 | |
| | 154,621 | | | | – | | | | 282,541 | | | | 55,747 | | | | 1,817 | | | | 32,476 | | | | – | | | | 98,403 | |
| | 44,172 | | | | 32,924 | | | | 40,638 | | | | 24,781 | | | | 3,208 | | | | 23,926 | | | | 936 | | | | 50,492 | |
| | 51,097 | | | | – | | | | 270,565 | | | | 92,599 | | | | 12,334 | | | | 140,840 | | | | 865 | | | | 164,677 | |
| | – | | | | – | | | | – | | | | – | | | | – | | | | 284,241 | | | | – | | | | – | |
| | – | | | | – | | | | – | | | | – | | | | – | | | | – | | | | – | | | | – | |
| | 37,715 | | | | – | | | | – | | | | 23,109 | | | | – | | | | – | | | | – | | | | – | |
| | 113,485,410 | | | | 5,048,106 | | | | 3,495,779 | | | | 83,422,560 | | | | 205,444 | | | | 8,731,063 | | | | 26,507 | | | | 21,228,688 | |
| | | | | | | |
| | | | | | | | | | | | | | | | | | | | | | | | | | | | | | | |
| | 790,106,042 | | | | 494,892,910 | | | | 1,464,675,788 | | | | 579,440,232 | | | | 15,911,253 | | | | 795,445,264 | | | | 4,894,683 | | | | 478,067,206 | |
| | 78,413,160 | | | | (7,995 | ) | | | 6,360,106 | | | | (22,216,733 | ) | | | (3,191,924 | ) | | | 21,341,629 | | | | 309,249 | | | | 186,760,250 | |
| | $868,519,202 | | | | $494,884,915 | | | | $1,471,035,894 | | | | $557,223,499 | | | | $12,719,329 | | | | $816,786,893 | | | | $5,203,932 | | | | $664,827,456 | |
| | | | | | | |
| | | | | | | | | | | | | | | | | | | | | | | | | | | | | | | |
| | $672,651,443 | | | | $322,944,277 | | | | $1,238,862,856 | | | | $244,618,525 | | | | $7,777,368 | | | | $138,498,530 | | | | $– | | | | $421,815,793 | |
| | 56,132,428 | | | | 322,952,016 | | | | 113,758,934 | | | | 24,568,579 | | | | 965,821 | | | | 14,132,005 | | | | – | | | | 19,332,451 | |
| | $11.98 | | | | $1.00 | | | | $10.89 | | | | $9.96 | | | | $8.05 | | | | $9.80 | | | | $– | | | | $21.82 | |
| | $12.54 | | | | $1.00 | | | | $11.40 | | | | $10.43 | | | | $8.43 | | | | $10.26 | | | | $– | | | | $22.85 | |
| | $195,867,759 | | | | $171,940,638 | | | | $232,173,038 | | | | $312,604,974 | | | | $4,941,961 | | | | $678,288,363 | | | | $5,203,932 | | | | $243,011,663 | |
| | 16,295,382 | | | | 171,940,896 | | | | 21,319,186 | | | | 31,397,211 | | | | 617,841 | | | | 68,723,011 | | | | 492,329 | | | | 9,222,695 | |
| | $12.02 | | | | $1.00 | | | | $10.89 | | | | $9.96 | | | | $8.00 | | | | $9.87 | | | | $10.57 | | | | $26.35 | |
| | 3,926,265 | | | | – | | | | – | | | | 5,242,545 | | | | 115,808 | | | | 2,476,946 | | | | – | | | | 19,282,807 | |
The accompanying Notes to Financial Statements are an integral part of this statement.
189
THRIVENT MUTUAL FUNDS
STATEMENTOF OPERATIONS
| | | | | | | | | | | | | | | | |
| For the year ended October 31, 2018 | | Aggressive
Allocation
Fund | | | Balanced Income
Plus Fund | | | Government Bond Fund | | | High Income Municipal Bond Fund(a) | |
Investment Income | | | | | | | | | | | | | | | | |
Dividends | | | $6,122,050 | | | | $4,627,941 | | | | $– | | | | $– | |
Taxable interest | | | 647,556 | | | | 6,033,592 | | | | 1,334,798 | | | | 706 | |
Tax-Exempt interest | | | – | | | | – | | | | – | | | | 136,639 | |
Income from mortgage dollar rolls | | | 224,040 | | | | 333,848 | | | | 145,727 | | | | – | |
Affiliated income from securities loaned, net | | | 156,926 | | | | 31,804 | | | | – | | | | – | |
Income from affiliated investments | | | 8,802,547 | | | | 1,545,514 | | | | 165,554 | | | | – | |
Non cash income | | | – | | | | – | | | | – | | | | – | |
Foreign tax withholding | | | (41,638 | ) | | | (182,197 | ) | | | – | | | | – | |
Total Investment Income | | | 15,911,481 | | | | 12,390,502 | | | | 1,646,079 | | | | 137,345 | |
| | | | |
Expenses | | | | | | | | | | | | | | | | |
Adviser fees | | | 9,018,445 | | | | 1,990,757 | | | | 237,889 | | | | 18,528 | |
Administrative service fees | | | 303,070 | | | | 138,771 | | | | 81,300 | | | | 47,371 | |
Amortization of offering costs | | | – | | | | – | | | | – | | | | 17,396 | |
Audit and legal fees | | | 48,185 | | | | 41,263 | | | | 33,939 | | | | 27,086 | |
Custody fees | | | 65,782 | | | | 71,960 | | | | 5,943 | | | | 1,662 | |
Distribution expenses Class A | | | 2,316,834 | | | | 633,431 | | | | 7,070 | | | | – | |
Insurance expenses | | | 7,919 | | | | 5,187 | | | | 4,187 | | | | 2,563 | |
Printing and postage expenses Class A | | | 185,873 | | | | 48,405 | | | | 2,790 | | | | – | |
Printing and postage expenses Class S | | | 75,735 | | | | 11,877 | | | | 7,934 | | | | 693 | |
SEC and state registration expenses | | | 94,992 | | | | 50,396 | | | | 30,195 | | | | 2,087 | |
Transfer agent fees Class A | | | 919,779 | | | | 253,994 | | | | 9,065 | | | | – | |
Transfer agent fees Class S | | | 279,171 | | | | 52,806 | | | | 40,732 | | | | 4,534 | |
Trustees’ fees | | | 25,408 | | | | 16,755 | | | | 8,678 | | | | 5,081 | |
Other expenses | | | 36,461 | | | | 62,722 | | | | 15,145 | | | | 11,210 | |
Total Expenses Before Reimbursement | | | 13,377,654 | | | | 3,378,324 | | | | 484,867 | | | | 138,211 | |
Less: | | | | | | | | | | | | | | | | |
Reimbursement from adviser | | | (2,967,190 | ) | | | – | | | | (33,169 | ) | | | (122,056 | ) |
Total Net Expenses | | | 10,410,464 | | | | 3,378,324 | | | | 451,698 | | | | 16,155 | |
| | | | | | | | | | | | | | | | |
Net Investment Income/(Loss) | | | 5,501,017 | | | | 9,012,178 | | | | 1,194,381 | | | | 121,190 | |
Realized and Unrealized Gains/(Losses) | | | | | | | | | | | | | | | | |
Net realized gains/(losses) on: | | | | | | | | | | | | | | | | |
Investments | | | 83,233,736 | | | | 23,637,817 | | | | (1,194,889 | ) | | | 917 | |
Affiliated investments | | | 150,607 | | | | – | | | | – | | | | – | |
In-kind contributions | | | – | | | | (261,061 | ) | | | – | | | | – | |
Distributions of realized capital gains from affiliated investments | | | 16,639,320 | | | | 468 | | | | 53 | | | | – | |
Written option contracts | | | – | | | | 4,765 | | | | 1,172 | | | | – | |
Futures contracts | | | (4,432,281 | ) | | | (332,384 | ) | | | 282,123 | | | | – | |
Foreign currency transactions | | | (1,986 | ) | | | (11,273 | ) | | | – | | | | – | |
Swap agreements | | | – | | | | – | | | | – | | | | – | |
Change in net unrealized appreciation/(depreciation) on: | | | | | | | | | | | | | | | | |
Investments | | | (50,902,419 | ) | | | (27,214,988 | ) | | | (1,596,844 | ) | | | (103,039 | ) |
Affiliated investments | | | (17,474,438 | ) | | | (1,629,517 | ) | | | – | | | | – | |
Written option contracts | | | – | | | | (6,529 | ) | | | – | | | | – | |
Futures contracts | | | (1,643,084 | ) | | | 126,537 | | | | 50,237 | | | | 143 | |
Foreign currency transactions | | | (408 | ) | | | (2,969 | ) | | | – | | | | – | |
Net Realized and Unrealized Gains/(Losses) | | | 25,569,047 | | | | (5,689,134 | ) | | | (2,458,148 | ) | | | (101,979 | ) |
| | | | | | | | | | | | | | | | |
Net Increase/(Decrease) in Net Assets Resulting From Operations | | | $31,070,064 | | | | $3,323,044 | | | | $(1,263,767 | ) | | | $19,211 | |
| (a) | For the period from February 28, 2018 (inception) through October 31, 2018 |
The accompanying Notes to Financial Statements are an integral part of this statement.
190
THRIVENT MUTUAL FUNDS
STATEMENTOF OPERATIONS –CONTINUED
| | | | | | | | | | | | | | | | | | | | | | | | | | |
| High Yield Fund | | | Income Fund | | | Large Cap
Growth Fund | | | Large Cap Stock Fund | | | Large Cap Value Fund | | | Limited Maturity Bond Fund | | | Low Volatility Equity Fund | |
| | | | | | | | | | | | | | | | | | | | | | | | | | |
| | $438,308 | | | | $649,083 | | | | $7,053,989 | | | | $35,991,339 | | | | $22,476,566 | | | | $178,419 | | | | $226,144 | |
| | 44,000,045 | | | | 31,361,404 | | | | 11,377 | | | | 766,426 | | | | 299 | | | | 24,082,263 | | | | 2,481 | |
| | – | | | | – | | | | – | | | | – | | | | – | | | | – | | | | – | |
| | – | | | | 581,220 | | | | – | | | | – | | | | – | | | | 329,534 | | | | – | |
| | 493,626 | | | | 65,862 | | | | – | | | | 325,726 | | | | 37,115 | | | | 2,924 | | | | 13 | |
| | 481,020 | | | | 1,071,710 | | | | 717,990 | | | | 2,936,873 | | | | 535,021 | | | | 1,029,651 | | | | 5,406 | |
| | – | | | | – | | | | – | | | | 2,700,434 | | | | – | | | | – | | | | – | |
| | – | | | | – | | | | – | | | | (2,099,939 | ) | | | – | | | | – | | | | (9,743 | ) |
| | 45,412,999 | | | | 33,729,279 | | | | 7,783,356 | | | | 40,620,859 | | | | 23,049,001 | | | | 25,622,791 | | | | 224,301 | |
| | | | | | |
| | | | | | | | | | | | | | | | | | | | | | | | | | | |
| | 2,803,133 | | | | 2,850,231 | | | | 7,130,465 | | | | 10,619,155 | | | | 4,779,277 | | | | 2,650,480 | | | | 54,545 | |
| | 208,599 | | | | 229,321 | | | | 257,041 | | | | 430,780 | | | | 271,792 | | | | 244,488 | | | | 71,727 | |
| | – | | | | – | | | | – | | | | – | | | | – | | | | – | | | | 8,671 | |
| | 41,723 | | | | 42,598 | | | | 39,924 | | | | 48,681 | | | | 45,712 | | | | 42,846 | | | | 31,867 | |
| | 12,089 | | | | 18,076 | | | | 12,020 | | | | 144,113 | | | | 11,438 | | | | 14,182 | | | | 14,164 | |
| | 1,144,336 | | | | 804,251 | | | | 589,996 | | | | 4,039,724 | | | | 590,760 | | | | 398,142 | | | | – | |
| | 6,536 | | | | 6,963 | | | | 7,042 | | | | 10,445 | | | | 7,478 | | | | 7,146 | | | | 4,002 | |
| | 94,193 | | | | 70,418 | | | | 58,602 | | | | 361,387 | | | | 48,162 | | | | 82,998 | | | | – | |
| | 50,443 | | | | 38,126 | | | | 40,526 | | | | 14,754 | | | | 35,762 | | | | 63,085 | | | | 3,136 | |
| | 59,140 | | | | 58,126 | | | | 66,411 | | | | 76,351 | | | | 62,277 | | | | 115,450 | | | | 17,665 | |
| | 412,877 | | | | 321,703 | | | | 364,577 | | | | 1,808,549 | | | | 302,985 | | | | 361,289 | | | | – | |
| | 312,171 | | | | 273,373 | | | | 278,938 | | | | 90,649 | | | | 259,682 | | | | 373,575 | | | | 11,969 | |
| | 34,944 | | | | 38,737 | | | | 39,130 | | | | 94,475 | | | | 44,435 | | | | 39,971 | | | | 7,342 | |
| | 36,055 | | | | 44,430 | | | | 18,363 | | | | 43,090 | | | | 20,049 | | | | 48,837 | | | | 14,926 | |
| | 5,216,239 | | | | 4,796,353 | | | | 8,903,035 | | | | 17,782,153 | | | | 6,479,809 | | | | 4,442,489 | | | | 240,014 | |
| | – | | | | – | | | | (78,088 | ) | | | – | | | | – | | | | – | | | | (130,924 | ) |
| | 5,216,239 | | | | 4,796,353 | | | | 8,824,947 | | | | 17,782,153 | | | | 6,479,809 | | | | 4,442,489 | | | | 109,090 | |
| | | | | | | | | | | | | | | | | | | | | | | | | | |
| | 40,196,760 | | | | 28,932,926 | | | | (1,041,591 | ) | | | 22,838,706 | | | | 16,569,192 | | | | 21,180,302 | | | | 115,211 | |
| | | | | | |
| | | | | | | | | | | | | | | | | | | | | | | | | | | |
| | 2,220,011 | | | | (5,776,293 | ) | | | 99,089,306 | | | | 170,981,308 | | | | 54,798,272 | | | | (3,473,337 | ) | | | 160,615 | |
| | – | | | | – | | | | – | | | | – | | | | – | | | | – | | | | – | |
| | – | | | | – | | | | – | | | | – | | | | – | | | | – | | | | – | |
| | 334 | | | | 536 | | | | 541 | | | | 1,277 | | | | 401 | | | | 560 | | | | 4 | |
| | – | | | | – | | | | – | | | | – | | | | – | | | | – | | | | – | |
| | – | | | | 2,493,879 | | | | (4,473,558 | ) | | | (20,957,332 | ) | | | – | | | | 2,589,504 | | | | (3,963 | ) |
| | – | | | | – | | | | – | | | | (18,189 | ) | | | – | | | | – | | | | (882 | ) |
| | 10,422 | | | | – | | | | – | | | | – | | | | – | | | | – | | | | – | |
| | (43,508,872 | ) | | | (46,321,861 | ) | | | 20,162,884 | | | | (143,943,263 | ) | | | (15,202,464 | ) | | | (12,756,888 | ) | | | (191,114 | ) |
| | – | | | | – | | | | – | | | | – | | | | – | | | | – | | | | – | |
| | – | | | | – | | | | – | | | | – | | | | – | | | | – | | | | – | |
| | – | | | | (393,181 | ) | | | 3,693,646 | | | | (19,419,503 | ) | | | – | | | | 415,042 | | | | (9,513 | ) |
| | – | | | | – | | | | – | | | | (27,322 | ) | | | – | | | | – | | | | (181 | ) |
| | (41,278,105 | ) | | | (49,996,920 | ) | | | 118,472,819 | | | | (13,383,024 | ) | | | 39,596,209 | | | | (13,225,119 | ) | | | (45,034 | ) |
| | | | | | | | | | | | | | | | | | | | | | | | | | |
| | $(1,081,345 | ) | | | $(21,063,994 | ) | | | $117,431,228 | | | | $9,455,682 | | | | $56,165,401 | | | | $7,955,183 | | | | $70,177 | |
The accompanying Notes to Financial Statements are an integral part of this statement.
191
THRIVENT MUTUAL FUNDS
STATEMENTOF OPERATIONS –CONTINUED
| | | | | | | | | | | | | | | | |
| For the year ended October 31, 2018 | | Mid Cap Stock Fund | | | Moderate Allocation Fund | | | Moderately Aggressive Allocation Fund | | | Moderately Conservative Allocation Fund | |
Investment Income | | | | | | | | | | | | | | | | |
Dividends | | | $20,470,076 | | | | $8,396,856 | | | | $10,751,501 | | | | $2,281,670 | |
Taxable interest | | | 245,171 | | | | 18,797,190 | | | | 12,126,661 | | | | 10,383,485 | |
Tax-Exempt interest | | | – | | | | – | | | | – | | | | – | |
Income from mortgage dollar rolls | | | – | | | | 3,035,107 | | | | 1,855,762 | | | | 1,666,545 | |
Affiliated income from securities loaned, net | | | 92,291 | | | | 107,581 | | | | 170,860 | | | | 20,659 | |
Income from affiliated investments | | | 3,073,909 | | | | 21,889,924 | | | | 22,504,132 | | | | 9,884,158 | |
Foreign tax withholding | | | – | | | | (66,794 | ) | | | (77,738 | ) | | | (1,202 | ) |
Total Investment Income | | | 23,881,447 | | | | 52,159,864 | | | | 47,331,178 | | | | 24,235,315 | |
| | | | |
Expenses | | | | | | | | | | | | | | | | |
Adviser fees | | | 12,013,564 | | | | 14,587,144 | | | | 17,943,062 | | | | 5,201,083 | |
Sub-Adviser fees | | | – | | | | – | | | | – | | | | – | |
Administrative service fees | | | 431,429 | | | | 512,135 | | | | 576,220 | | | | 237,731 | |
Amortization of offering costs | | | – | | | | – | | | | – | | | | – | |
Audit and legal fees | | | 46,087 | | | | 56,197 | | | | 59,299 | | | | 46,461 | |
Custody fees | | | 19,470 | | | | 73,296 | | | | 83,407 | | | | 36,681 | |
Distribution expenses Class A | | | 3,111,717 | | | | 4,641,259 | | | | 5,410,572 | | | | 1,770,873 | |
Insurance expenses | | | 10,132 | | | | 11,745 | | | | 12,758 | | | | 7,004 | |
Printing and postage expenses Class A | | | 213,364 | | | | 267,087 | | | | 354,232 | | | | 105,567 | |
Printing and postage expenses Class S | | | 61,725 | | | | 75,891 | | | | 121,942 | | | | 26,753 | |
SEC and state registration expenses | | | 124,925 | | | | 150,698 | | | | 156,776 | | | | 77,458 | |
Transfer agent fees Class A | | | 1,220,800 | | | | 1,265,510 | | | | 1,758,323 | | | | 467,940 | |
Transfer agent fees Class S | | | 384,150 | | | | 281,491 | | | | 455,269 | | | | 92,375 | |
Trustees’ fees | | | 82,135 | | | | 46,746 | | | | 49,540 | | | | 20,925 | |
Other expenses | | | 27,573 | | | | 85,683 | | | | 90,328 | | | | 63,299 | |
Total Expenses Before Reimbursement | | | 17,747,071 | | | | 22,054,882 | | | | 27,071,728 | | | | 8,154,150 | |
Less: | | | | | | | | | | | | | | | | |
Reimbursement from adviser | | | – | | | | (4,921,316 | ) | | | (6,943,729 | ) | | | (1,412,195 | ) |
Total Net Expenses | | | 17,747,071 | | | | 17,133,566 | | | | 20,127,999 | | | | 6,741,955 | |
| | | | | | | | | | | | | | | | |
Net Investment Income/(Loss) | | | 6,134,376 | | | | 35,026,298 | | | | 27,203,179 | | | | 17,493,360 | |
Realized and Unrealized Gains/(Losses) | | | | | | | | | | | | | | | | |
Net realized gains/(losses) on: | | | | | | | | | | | | | | | | |
Investments | | | 196,222,598 | | | | 41,356,391 | | | | 82,441,233 | | | | 13,240,915 | |
Affiliated investments | | | – | | | | 237,116 | | | | 278,227 | | | | 184,500 | |
In-kind contributions | | | – | | | | – | | | | – | | | | – | |
Distributions of realized capital gains from affiliated investments | | | 1,214 | | | | 26,269,241 | | | | 41,199,641 | | | | 5,557,802 | |
Written option contracts | | | – | | | | 92,734 | | | | 63,281 | | | | 51,524 | |
Futures contracts | | | – | | | | (18,813,072 | ) | | | (9,537,277 | ) | | | (6,048,374 | ) |
Foreign currency forward contracts | | | – | | | | – | | | | – | | | | – | |
Foreign currency transactions | | | – | | | | (3,682 | ) | | | (5,157 | ) | | | – | |
Change in net unrealized appreciation/(depreciation) on: | | | | | | | | | | | | | | | | |
Investments | | | (136,225,333 | ) | | | (60,538,359 | ) | | | (76,246,451 | ) | | | (25,428,965 | ) |
Affiliated investments | | | – | | | | (21,979,743 | ) | | | (40,959,969 | ) | | | (10,720,398 | ) |
Written option contracts | | | – | | | | – | | | | – | | | | – | |
Futures contracts | | | – | | | | 9,143,507 | | | | 6,683,585 | | | | 1,977,839 | |
Foreign currency forward contracts | | | – | | | | – | | | | – | | | | – | |
Foreign currency transactions | | | – | | | | (966 | ) | | | (671 | ) | | | (1 | ) |
Net Realized and Unrealized Gains/(Losses) | | | 59,998,479 | | | | (24,236,833 | ) | | | 3,916,442 | | | | (21,185,158 | ) |
| | | | | | | | | | | | | | | | |
Net Increase/(Decrease) in Net Assets Resulting From Operations | | | $66,132,855 | | | | $10,789,465 | | | | $31,119,621 | | | | $(3,691,798 | ) |
| (a) | For the period from February 28, 2018 (inception) through October 31, 2018 |
The accompanying Notes to Financial Statements are an integral part of this statement.
192
THRIVENT MUTUAL FUNDS
STATEMENTOF OPERATIONS –CONTINUED
| | | | | | | | | | | | |
Money Market Fund | | Municipal Bond Fund | | Opportunity Income
Plus Fund | | Partner Emerging
Markets Equity Fund | | Partner Worldwide
Allocation Fund | | Small Cap
Growth Fund(a) | | Small Cap
Stock Fund |
| | | | | | | | | | | | |
$– | | $– | | $1,000,035 | | $357,392 | | $25,661,912 | | $14,840 | | $6,898,312 |
7,421,922 | | 381,493 | | 18,654,088 | | 4 | | 4,633,190 | | 131 | | 185 |
– | | 64,054,625 | | – | | – | | – | | – | | – |
– | | – | | 1,047,658 | | – | | – | | – | | – |
– | | – | | 18,527 | | 164 | | 81,905 | | – | | 139,831 |
– | | – | | 4,182,724 | | 5,491 | | 275,026 | | 2,502 | | 284,156 |
– | | – | | – | | (39,796) | | (2,447,445) | | – | | (38,403) |
7,421,922 | | 64,436,118 | | 24,903,032 | | 323,255 | | 28,204,588 | | 17,473 | | 7,284,081 |
| | | | | | |
| | | | | | | | | | | | |
1,481,491 | | 6,163,943 | | 2,428,670 | | 75,017 | | 4,499,629 | | 29,492 | | 4,369,201 |
– | | – | | – | | 105,417 | | 3,015,341 | | – | | – |
150,424 | | 363,900 | | 173,487 | | 72,857 | | 243,706 | | 47,367 | | 194,792 |
– | | – | | – | | – | | – | | 16,929 | | – |
36,035 | | 48,324 | | 40,143 | | 57,420 | | 74,988 | | 27,081 | | 37,995 |
8,761 | | 23,777 | | 37,419 | | 45,025 | | 528,013 | | 2,957 | | 14,444 |
66,983 | | 3,291,982 | | 640,491 | | 24,175 | | 400,096 | | – | | 1,102,571 |
5,487 | | 9,614 | | 5,808 | | 4,028 | | 7,111 | | 2,563 | | 6,056 |
170,742 | | 124,817 | | 51,628 | | 4,457 | | 67,623 | | – | | 95,388 |
25,024 | | 23,741 | | 48,408 | | 3,666 | | 18,215 | | 1,223 | | 24,991 |
146,908 | | 82,344 | | 65,693 | | 29,408 | | 49,537 | | 883 | | 64,593 |
563,815 | | 495,856 | | 269,563 | | 26,731 | | 380,828 | | – | | 590,937 |
72,418 | | 119,629 | | 316,914 | | 20,208 | | 79,536 | | 3,874 | | 259,800 |
15,521 | | 73,078 | | 22,320 | | 8,235 | | 41,804 | | 5,081 | | 33,703 |
15,330 | | 152,663 | | 51,455 | | 14,055 | | 110,474 | | 7,148 | | 15,942 |
2,758,939 | | 10,973,668 | | 4,151,999 | | 490,699 | | 9,516,901 | | 144,598 | | 6,810,413 |
| | | | | | | | | | | | |
(355,837) | | – | | (2,304) | | (260,310) | | (250,969) | | (98,699) | | – |
2,403,102 | | 10,973,668 | | 4,149,695 | | 230,389 | | 9,265,932 | | 45,899 | | 6,810,413 |
| | | | | | | | | | | | |
5,018,820 | | 53,462,450 | | 20,753,337 | | 92,866 | | 18,938,656 | | (28,426) | | 473,668 |
| | | | | | |
| | | | | | | | | | | | |
(1,389) | | 1,966,084 | | (1,439,453) | | (528,809) | | 26,751,248 | | 97,687 | | 93,974,293 |
– | | – | | – | | – | | – | | – | | – |
– | | – | | (1,226,852) | | – | | – | | – | | – |
– | | – | | 1,337 | | 5 | | 157 | | – | | 240 |
– | | – | | 17,188 | | – | | – | | – | | – |
– | | 120,021 | | (1,547,523) | | – | | (74,380) | | – | | – |
– | | – | | – | | – | | (316,926) | | – | | – |
– | | – | | – | | (7,325) | | (357,317) | | – | | – |
– | | (72,310,044) | | (10,339,745) | | (2,194,361) | | (137,552,498) | | 224,571 | | (69,178,400) |
– | | – | | (4,525,145) | | – | | – | | – | | – |
– | | – | | (18,956) | | – | | – | | – | | – |
– | | 285,525 | | 693,105 | | – | | (1,074,330) | | – | | – |
– | | – | | – | | – | | 241,379 | | – | | – |
– | | – | | – | | 375 | | (71,113) | | – | | – |
(1,389) | | (69,938,414) | | (18,386,044) | | (2,730,115) | | (112,453,780) | | 322,258 | | 24,796,133 |
| | | | | | | | | | | | |
$5,017,431 | | $(16,475,964) | | $2,367,293 | | $(2,637,249) | | $(93,515,124) | | $293,832 | | $25,269,801 |
The accompanying Notes to Financial Statements are an integral part of this statement.
193
THRIVENT MUTUAL FUNDS
STATEMENTOF CHANGESIN NET ASSETS
| | | | | | | | | | | | | | | | |
| | | Aggressive Allocation Fund | | | Balanced Income Plus Fund | |
| For the periods ended | | 10/31/2018 | | | 10/31/2017 | | | 10/31/2018 | | | 10/31/2017 | |
Operations | | | | | | | | | | | | | | | | |
Net investment income/(loss) | | | $5,501,017 | | | | $3,630,710 | | | | $9,012,178 | | | | $7,530,281 | |
Net realized gains/(losses) | | | 95,589,396 | | | | 65,719,835 | | | | 23,038,332 | | | | 6,753,079 | |
Change in net unrealized appreciation/(depreciation) | | | (70,020,349 | ) | | | 136,769,894 | | | | (28,727,466 | ) | | | 18,793,036 | |
Net Change in Net Assets Resulting From Operations | | | 31,070,064 | | | | 206,120,439 | | | | 3,323,044 | | | | 33,076,396 | |
Distributions to Shareholders (%) | | | | | | | | | | | | | | | | |
From income/realized gains Class A | | | (52,296,766 | ) | | | N/A | | | | (8,849,405 | ) | | | N/A | |
From income/realized gains Class S | | | (15,257,299 | ) | | | N/A | | | | (4,045,458 | ) | | | N/A | |
Total from income/realized gains | | | (67,554,065 | ) | | | N/A | | | | (12,894,863 | ) | | | N/A | |
From net investment income Class A | | | N/A | | | | (3,922,298 | ) | | | N/A | | | | (5,005,083 | ) |
From net investment income Class S | | | N/A | | | | (1,303,852 | ) | | | N/A | | | | (1,950,929 | ) |
Total From Net Investment Income | | | N/A | | | | (5,226,150 | ) | | | N/A | | | | (6,956,012 | ) |
From net realized gains Class A | | | N/A | | | | (3,460,323 | ) | | | N/A | | | | – | |
From net realized gains Class S | | | N/A | | | | (677,607 | ) | | | N/A | | | | – | |
Total From Net Realized Gains | | | N/A | | | | (4,137,930 | ) | | | N/A | | | | – | |
Total Distributions to Shareholders | | | (67,554,065 | ) | | | (9,364,080 | ) | | | (12,894,863 | ) | | | (6,956,012 | ) |
Capital Stock Transactions | | | | | | | | | | | | | | | | |
| | | | |
Class A | | | | | | | | | | | | | | | | |
Sold | | | 67,789,115 | | | | 59,916,555 | | | | 20,641,005 | | | | 19,742,869 | |
Distributions reinvested | | | 52,192,965 | | | | 7,368,935 | | | | 8,639,622 | | | | 4,866,187 | |
Redeemed | | | (76,590,317 | ) | | | (78,329,678 | ) | | | (27,500,931 | ) | | | (25,337,083 | ) |
Total Class A Capital Stock Transactions | | | 43,391,763 | | | | (11,044,188 | ) | | | 1,779,696 | | | | (728,027 | ) |
| | | | |
Class S | | | | | | | | | | | | | | | | |
Sold | | | 128,883,050 | | | | 83,716,329 | | | | 42,381,031 | | | | 34,718,914 | |
Distributions reinvested | | | 15,252,657 | | | | 1,981,486 | | | | 3,970,080 | | | | 1,923,847 | |
Redeemed | | | (35,746,111 | ) | | | (24,559,875 | ) | | | (17,268,090 | ) | | | (14,208,823 | ) |
Total Class S Capital Stock Transactions | | | 108,389,596 | | | | 61,137,940 | | | | 29,083,021 | | | | 22,433,938 | |
Capital Stock Transactions | | | 151,781,359 | | | | 50,093,752 | | | | 30,862,717 | | | | 21,705,911 | |
| | | | | | | | | | | | | | | | |
Net Increase/(Decrease) in Net Assets | | | 115,297,358 | | | | 246,850,111 | | | | 21,290,898 | | | | 47,826,295 | |
Net Assets, Beginning of Period | | | 1,117,742,941 | | | | 870,892,830 | | | | 345,244,380 | | | | 297,418,085 | |
Net Assets, End of Period | | | $1,233,040,299 | | | | $1,117,742,941 | | | | $366,535,278 | | | | $345,244,380 | |
| | | | |
Capital Stock Share Transactions | | | | | | | | | | | | | | | | |
| | | | |
Class A shares | | | | | | | | | | | | | | | | |
Sold | | | 4,234,798 | | | | 4,120,843 | | | | 1,548,878 | | | | 1,551,546 | |
Distributions reinvested | | | 3,393,431 | | | | 537,082 | | | | 649,902 | | | | 381,746 | |
Redeemed | | | (4,775,202 | ) | | | (5,378,857 | ) | | | (2,059,375 | ) | | | (1,988,652 | ) |
Total Class A shares | | | 2,853,027 | | | | (720,932 | ) | | | 139,405 | | | | (55,360 | ) |
| | | | |
Class S shares | | | | | | | | | | | | | | | | |
Sold | | | 7,965,429 | | | | 5,624,457 | | | | 3,178,979 | | | | 2,725,464 | |
Distributions reinvested | | | 980,114 | | | | 143,352 | | | | 299,160 | | | | 150,976 | |
Redeemed | | | (2,210,657 | ) | | | (1,678,374 | ) | | | (1,296,752 | ) | | | (1,114,314 | ) |
Total Class S shares | | | 6,734,886 | | | | 4,089,435 | | | | 2,181,387 | | | | 1,762,126 | |
| (a) | For the period from February 28, 2018 (inception) through October 31, 2018 |
| (%) | Distributions to Shareholders. Additional information can be found in the accompanying Notes to Financial Statements – Recent Accounting Pronouncements – Disclosure Update and Simplification. |
The accompanying Notes to Financial Statements are an integral part of this statement.
194
THRIVENT MUTUAL FUNDS
STATEMENTOF CHANGESIN NET ASSETS –CONTINUED
| | | | | | | | | | | | |
| Government Bond Fund | | High Income Municipal Bond Fund | | High Yield Fund | | Income Fund |
| 10/31/2018 | | 10/31/2017 | | 10/31/2018(a) | | 10/31/2018 | | 10/31/2017 | | 10/31/2018 | | 10/31/2017 |
| | | | | | | | | | | | | |
$1,194,381 | | $894,096 | | $121,190 | | $40,196,760 | | $38,044,552 | | $28,932,926 | | $26,449,259 |
(911,541) | | 571,593 | | 917 | | 2,230,767 | | (4,045,383) | | (3,281,878) | | 3,000,693 |
(1,546,607) | | (1,565,684) | | (102,896) | | (43,508,872) | | 25,061,059 | | (46,715,042) | | (861,018) |
(1,263,767) | | (99,995) | | 19,211 | | (1,081,345) | | 59,060,228 | | (21,063,994) | | 28,588,934 |
| | | | | | | | | | | | |
(152,134) | | N/A | | – | | (24,596,676) | | N/A | | (11,611,202) | | N/A |
(1,480,475) | | N/A | | (120,982) | | (15,210,738) | | N/A | | (20,174,750) | | N/A |
(1,632,609) | | N/A | | (120,982) | | (39,807,414) | | N/A | | (31,785,952) | | N/A |
N/A | | (103,897) | | N/A | | N/A | | (24,741,149) | | N/A | | (10,481,565) |
N/A | | (790,204) | | N/A | | N/A | | (13,015,769) | | N/A | | (15,918,379) |
N/A | | (894,101) | | N/A | | N/A | | (37,756,918) | | N/A | | (26,399,944) |
N/A | | (18,490) | | N/A | | N/A | | – | | N/A | | (514,974) |
N/A | | (115,788) | | N/A | | N/A | | – | | N/A | | (671,791) |
N/A | | (134,278) | | N/A | | N/A | | – | | N/A | | (1,186,765) |
(1,632,609) | | (1,028,379) | | (120,982) | | (39,807,414) | | (37,756,918) | | (31,785,952) | | (27,586,709) |
| | | | | | |
| | | | | | | | | | | | |
– | | 256 | | – | | 22,135,897 | | 26,387,862 | | 11,998,972 | | 15,436,924 |
147,564 | | 118,161 | | – | | 18,171,820 | | 18,115,009 | | 10,247,253 | | 9,631,830 |
(1,431,230) | | (2,103,166) | | – | | (55,027,620) | | (52,552,778) | | (46,000,068) | | (41,879,717) |
(1,283,666) | | (1,984,749) | | – | | (14,719,903) | | (8,049,907) | | (23,753,843) | | (16,810,963) |
47,363,965 | | 42,078,400 | | 12,115,876 | | 71,940,838 | | 64,615,291 | | 88,204,619 | | 72,600,671 |
1,475,306 | | 904,632 | | 104,578 | | 13,596,829 | | 11,766,507 | | 19,423,828 | | 15,881,059 |
(45,876,685) | | (36,978,754) | | (5,494,516) | | (46,763,164) | | (55,774,488) | | (71,413,206) | | (47,549,505) |
2,962,586 | | 6,004,278 | | 6,725,938 | | 38,774,503 | | 20,607,310 | | 36,215,241 | | 40,932,225 |
1,678,920 | | 4,019,529 | | 6,725,938 | | 24,054,600 | | 12,557,403 | | 12,461,398 | | 24,121,262 |
| | | | | | | | | | | | |
(1,217,456) | | 2,891,155 | | 6,624,167 | | (16,834,159) | | 33,860,713 | | (40,388,548) | | 25,123,487 |
58,446,810 | | 55,555,655 | | – | | 737,578,851 | | 703,718,138 | | 847,226,870 | | 822,103,383 |
$57,229,354 | | $58,446,810 | | $6,624,167 | | $720,744,692 | | $737,578,851 | | $806,838,322 | | $847,226,870 |
| | | | | | |
| | | | | | | | | | | | |
| | | | | | |
| | | | | | | | | | | | |
– | | – | | – | | 4,638,510 | | 5,461,710 | | 1,332,876 | | 1,689,866 |
15,186 | | 11,957 | | – | | 3,819,628 | | 3,737,122 | | 1,140,691 | | 1,053,891 |
(147,761) | | (212,569) | | – | | (11,545,661) | | (10,874,389) | | (5,133,757) | | (4,586,721) |
(132,575) | | (200,612) | | – | | (3,087,523) | | (1,675,557) | | (2,660,190) | | (1,842,964) |
| | | | | | |
| | | | | | | | | | | | |
4,880,202 | | 4,248,887 | | 1,204,176 | | 15,092,374 | | 13,355,849 | | 9,763,820 | | 7,937,719 |
151,905 | | 91,428 | | 10,373 | | 2,856,031 | | 2,425,343 | | 2,166,091 | | 1,737,733 |
(4,746,018) | | (3,727,620) | | (542,612) | | (9,829,122) | | (11,578,738) | | (7,989,951) | | (5,205,893) |
286,089 | | 612,695 | | 671,937 | | 8,119,283 | | 4,202,454 | | 3,939,960 | | 4,469,559 |
The accompanying Notes to Financial Statements are an integral part of this statement.
195
THRIVENT MUTUAL FUNDS
STATEMENTOF CHANGESIN NET ASSETS –CONTINUED
| | | | | | | | | | | | | | | | |
| | | Large Cap Growth Fund | | | Large Cap Stock Fund | |
| For the periods ended | | 10/31/2018 | | | 10/31/2017 | | | 10/31/2018 | | | 10/31/2017 | |
Operations | | | | | | | | | | | | | | | | |
Net investment income/(loss) | | | $(1,041,591 | ) | | | $(335,499 | ) | | | $22,838,706 | | | | $20,118,806 | |
Net realized gains/(losses) | | | 94,616,289 | | | | 25,550,376 | | | | 150,007,064 | | | | 155,300,629 | |
Change in net unrealized appreciation/(depreciation) | | | 23,856,530 | | | | 149,756,945 | | | | (163,390,088 | ) | | | 177,525,104 | |
Net Change in Net Assets Resulting From Operations | | | 117,431,228 | | | | 174,971,822 | | | | 9,455,682 | | | | 352,944,539 | |
Distributions to Shareholders (%) | | | | | | | | | | | | | | | | |
From income/realized gains Class A | | | (5,523,376 | ) | | | N/A | | | | (148,627,514 | ) | | | N/A | |
From income/realized gains Class S | | | (15,772,711 | ) | | | N/A | | | | (25,616,989 | ) | | | N/A | |
Total from income/realized gains | | | (21,296,087 | ) | | | N/A | | | | (174,244,503 | ) | | | N/A | |
From net investment income Class A | | | N/A | | | | – | | | | N/A | | | | (16,304,694 | ) |
From net investment income Class S | | | N/A | | | | – | | | | N/A | | | | (3,184,851 | ) |
Total From Net Investment Income | | | N/A | | | | – | | | | N/A | | | | (19,489,545 | ) |
From net realized gains Class A | | | N/A | | | | (1,047,717 | ) | | | N/A | | | | (39,292,274 | ) |
From net realized gains Class S | | | N/A | | | | (2,793,431 | ) | | | N/A | | | | (5,737,774 | ) |
Total From Net Realized Gains | | | N/A | | | | (3,841,148 | ) | | | N/A | | | | (45,030,048 | ) |
Total Distributions to Shareholders | | | (21,296,087 | ) | | | (3,841,148 | ) | | | (174,244,503 | ) | | | (64,519,593 | ) |
Capital Stock Transactions | | | | | | | | | | | | | | | | |
| | | | |
Class A | | | | | | | | | | | | | | | | |
Sold | | | 25,938,692 | | | | 11,883,120 | | | | 38,904,773 | | | | 33,353,493 | |
Distributions reinvested | | | 5,451,030 | | | | 1,035,081 | | | | 146,608,939 | | | | 54,836,892 | |
Redeemed | | | (25,958,777 | ) | | | (23,432,774 | ) | | | (147,672,238 | ) | | | (142,560,074 | ) |
Total Class A Capital Stock Transactions | | | 5,430,945 | | | | (10,514,573 | ) | | | 37,841,474 | | | | (54,369,689 | ) |
| | | | |
Class S | | | | | | | | | | | | | | | | |
Sold | | | 82,438,282 | | | | 50,551,798 | | | | 21,795,799 | | | | 17,811,346 | |
Distributions reinvested | | | 15,586,954 | | | | 2,758,773 | | | | 25,533,377 | | | | 8,881,786 | |
Redeemed | | | (60,267,204 | ) | | | (38,536,081 | ) | | | (9,352,714 | ) | | | (6,133,364 | ) |
Total Class S Capital Stock Transactions | | | 37,758,032 | | | | 14,774,490 | | | | 37,976,462 | | | | 20,559,768 | |
Capital Stock Transactions | | | 43,188,977 | | | | 4,259,917 | | | | 75,817,936 | | | | (33,809,921 | ) |
| | | | | | | | | | | | | | | | |
Net Increase/(Decrease) in Net Assets | | | 139,324,118 | | | | 175,390,591 | | | | (88,970,885 | ) | | | 254,615,025 | |
Net Assets, Beginning of Period | | | 864,281,431 | | | | 688,890,840 | | | | 1,858,086,602 | | | | 1,603,471,577 | |
Net Assets, End of Period | | | $1,003,605,549 | | | | $864,281,431 | | | | $1,769,115,717 | | | | $1,858,086,602 | |
| | | | |
Capital Stock Share Transactions | | | | | | | | | | | | | | | | |
| | | | |
Class A shares | | | | | | | | | | | | | | | | |
Sold | | | 2,293,419 | | | | 1,300,628 | | | | 1,386,450 | | | | 1,248,652 | |
Distributions reinvested | | | 532,848 | | | | 124,260 | | | | 5,384,309 | | | | 2,188,622 | |
Redeemed | | | (2,331,739 | ) | | | (2,611,919 | ) | | | (5,244,190 | ) | | | (5,338,090 | ) |
Total Class A shares | | | 494,528 | | | | (1,187,031 | ) | | | 1,526,569 | | | | (1,900,816 | ) |
| | | | |
Class S shares | | | | | | | | | | | | | | | | |
Sold | | | 6,600,115 | | | | 5,057,925 | | | | 767,735 | | | | 656,444 | |
Distributions reinvested | | | 1,384,277 | | | | 302,497 | | | | 927,611 | | | | 351,674 | |
Redeemed | | | (4,857,467 | ) | | | (3,834,081 | ) | | | (330,079 | ) | | | (227,803 | ) |
Total Class S shares | | | 3,126,925 | | | | 1,526,341 | | | | 1,365,267 | | | | 780,315 | |
| (a) | For the period from February 28, 2017 (inception) through October 31, 2017 |
| (%) | Distributions to Shareholders. Additional information can be found in the accompanying Notes to Financial Statements – Recent Accounting Pronouncements – Disclosure Update and Simplification. |
The accompanying Notes to Financial Statements are an integral part of this statement.
196
THRIVENT MUTUAL FUNDS
STATEMENTOF CHANGESIN NET ASSETS –CONTINUED
| | | | | | | | | | | | | | |
| Large Cap Value Fund | | Limited Maturity Bond Fund | | Low Volatility Equity Fund | | Mid Cap Stock Fund |
| 10/31/2018 | | 10/31/2017 | | 10/31/2018 | | 10/31/2017 | | 10/31/2018 | | 10/31/2017(a) | | 10/31/2018 | | 10/31/2017 |
$16,569,192 | | $14,798,508 | | $21,180,302 | | $15,227,279 | | $115,211 | | $49,030 | | $6,134,376 | | $287,148 |
54,798,673 | | 41,071,898 | | (883,273) | | 2,014,911 | | 155,774 | | 60,030 | | 196,223,812 | | 147,608,187 |
(15,202,464) | | 123,563,706 | | (12,341,846) | | (1,277,975) | | (200,808) | | 356,267 | | (136,225,333) | | 198,260,839 |
56,165,401 | | 179,434,112 | | 7,955,183 | | 15,964,215 | | 70,177 | | 465,327 | | 66,132,855 | | 346,156,174 |
| | | | | | | |
| | | | | | | | | | | | | | | |
(11,805,946) | | N/A | | (6,987,172) | | N/A | | – | | N/A | | (100,901,096) | | N/A |
(42,215,595) | | N/A | | (14,385,604) | | N/A | | (150,621) | | N/A | | (40,796,467) | | N/A |
(54,021,541) | | N/A | | (21,372,776) | | N/A | | (150,621) | | N/A | | (141,697,563) | | N/A |
N/A | | (2,498,405) | | N/A | | (5,853,396) | | N/A | | – | | N/A | | (1,114,640) |
N/A | | (10,134,973) | | N/A | | (9,450,197) | | N/A | | – | | N/A | | (1,451,583) |
N/A | | (12,633,378) | | N/A | | (15,303,593) | | N/A | | – | | N/A | | (2,566,223) |
N/A | | (6,612,772) | | N/A | | – | | N/A | | – | | N/A | | (45,485,701) |
N/A | | (20,389,278) | | N/A | | – | | N/A | | – | | N/A | | (14,137,670) |
N/A | | (27,002,050) | | N/A | | – | | N/A | | – | | N/A | | (59,623,371) |
(54,021,541) | | (39,635,428) | | (21,372,776) | | (15,303,593) | | (150,621) | | – | | (141,697,563) | | (62,189,594) |
| | | | | | | |
| | | | | | | | | | | | | | |
| | | | | | | |
| | | | | | | | | | | | | | |
10,691,613 | | 9,867,809 | | 82,762,424 | | 109,724,610 | | – | | – | | 55,972,099 | | 40,574,176 |
11,542,402 | | 8,898,845 | | 6,810,261 | | 5,696,364 | | – | | – | | 99,893,043 | | 46,164,912 |
(23,897,900) | | (22,624,841) | | (122,808,652) | | (130,841,777) | | – | | – | | (121,254,888) | | (109,152,643) |
(1,663,885) | | (3,858,187) | | (33,235,967) | | (15,420,803) | | – | | – | | 34,610,254 | | (22,413,555) |
| | | | | | | |
| | | | | | | | | | | | | | |
72,514,640 | | 54,381,213 | | 276,984,212 | | 252,488,756 | | 6,811,353 | | 10,881,943 | | 268,661,312 | | 112,514,293 |
41,726,604 | | 30,138,195 | | 13,903,121 | | 9,132,707 | | 150,391 | | – | | 40,601,775 | | 15,547,509 |
(36,408,488) | | (52,567,106) | | (204,552,633) | | (153,003,567) | | (1,953,935) | | (5,556,851) | | (56,858,767) | | (28,096,039) |
77,832,756 | | 31,952,302 | | 86,334,700 | | 108,617,896 | | 5,007,809 | | 5,325,092 | | 252,404,320 | | 99,965,763 |
76,168,871 | | 28,094,115 | | 53,098,733 | | 93,197,093 | | 5,007,809 | | 5,325,092 | | 287,014,574 | | 77,552,208 |
| | | | | | | |
| | | | | | | | | | | | | | |
78,312,731 | | 167,892,799 | | 39,681,140 | | 93,857,715 | | 4,927,365 | | 5,790,419 | | 211,449,866 | | 361,518,788 |
985,254,093 | | 817,361,294 | | 886,025,921 | | 792,168,206 | | 5,790,419 | | – | | 1,704,296,622 | | 1,342,777,834 |
$1,063,566,824 | | $985,254,093 | | $925,707,061 | | $886,025,921 | | $10,717,784 | | $5,790,419 | | $1,915,746,488 | | $1,704,296,622 |
| | | | | | | |
| | | | | | | | | | | | | | |
| | | | | | | |
| | | | | | | | | | | | | | |
461,052 | | 466,683 | | 6,681,525 | | 8,809,633 | | – | | – | | 2,160,173 | | 1,673,929 |
510,300 | | 427,191 | | 550,463 | | 457,048 | | – | | – | | 4,029,571 | | 1,967,719 |
(1,030,275) | | (1,062,617) | | (9,917,512) | | (10,502,904) | | – | | – | | (4,676,740) | | (4,494,570) |
(58,923) | | (168,743) | | (2,685,524) | | (1,236,223) | | – | | – | | 1,513,004 | | (852,922) |
| | | | | | | |
| | | | | | | | | | | | | | |
3,101,811 | | 2,535,555 | | 22,359,342 | | 20,271,039 | | 617,498 | | 1,067,583 | | 9,230,223 | | 4,140,559 |
1,829,525 | | 1,439,714 | | 1,124,278 | | 732,886 | | 13,677 | | – | | 1,454,739 | | 594,767 |
(1,555,601) | | (2,453,229) | | (16,525,085) | | (12,284,091) | | (176,314) | | (535,016) | | (1,953,962) | | (1,026,902) |
3,375,735 | | 1,522,040 | | 6,958,535 | | 8,719,834 | | 454,861 | | 532,567 | | 8,731,000 | | 3,708,424 |
The accompanying Notes to Financial Statements are an integral part of this statement.
197
THRIVENT MUTUAL FUNDS
STATEMENTOF CHANGESIN NET ASSETS –CONTINUED
| | | | | | | | | | | | | | | | |
| | | Moderate Allocation Fund | | | Moderately Aggressive Allocation Fund | |
| For the periods ended | | 10/31/2018 | | | 10/31/2017 | | | 10/31/2018 | | | 10/31/2017 | |
Operations | | | | | | | | | | | | | | | | |
Net investment income/(loss) | | | $35,026,298 | | | | $27,284,231 | | | | $27,203,179 | | | | $20,953,962 | |
Net realized gains/(losses) | | | 49,138,728 | | | | 66,255,995 | | | | 114,439,948 | | | | 106,935,099 | |
Change in net unrealized appreciation/(depreciation) | | | (73,375,561 | ) | | | 156,641,742 | | | | (110,523,506 | ) | | | 244,088,288 | |
Net Change in Net Assets Resulting From Operations | | | 10,789,465 | | | | 250,181,968 | | | | 31,119,621 | | | | 371,977,349 | |
Distributions to Shareholders (%) | | | | | | | | | | | | | | | | |
From income/realized gains Class A | | | (79,254,963 | ) | | | N/A | | | | (107,601,075 | ) | | | N/A | |
From income/realized gains Class S | | | (19,041,501 | ) | | | N/A | | | | (22,138,952 | ) | | | N/A | |
Total from income/realized gains | | | (98,296,464 | ) | | | N/A | | | | (129,740,027 | ) | | | N/A | |
From net investment income Class A | | | N/A | | | | (22,395,069 | ) | | | N/A | | | | (18,331,418 | ) |
From net investment income Class S | | | N/A | | | | (4,040,733 | ) | | | N/A | | | | (2,778,458 | ) |
Total From Net Investment Income | | | N/A | | | | (26,435,802 | ) | | | N/A | | | | (21,109,876 | ) |
From net realized gains Class A | | | N/A | | | | (10,806,762 | ) | | | N/A | | | | (19,091,905 | ) |
From net realized gains Class S | | | N/A | | | | (1,269,080 | ) | | | N/A | | | | (2,132,912 | ) |
Total From Net Realized Gains | | | N/A | | | | (12,075,842 | ) | | | N/A | | | | (21,224,817 | ) |
Total Distributions to Shareholders | | | (98,296,464 | ) | | | (38,511,644 | ) | | | (129,740,027 | ) | | | (42,334,693 | ) |
Capital Stock Transactions | | | | | | | | | | | | | | | | |
| | | | |
Class A | | | | | | | | | | | | | | | | |
Sold | | | 126,258,661 | | | | 123,690,529 | | | | 133,964,457 | | | | 130,958,458 | |
Issued in connection with merger | | | – | | | | – | | | | 74,061,895 | | | | – | |
Distributions reinvested | | | 78,848,691 | | | | 33,016,918 | | | | 107,357,417 | | | | 37,341,146 | |
Redeemed | | | (198,309,359 | ) | | | (184,286,242 | ) | | | (200,417,063 | ) | | | (179,194,579 | ) |
Total Class A Capital Stock Transactions | | | 6,797,993 | | | | (27,578,795 | ) | | | 114,966,706 | | | | (10,894,975 | ) |
Class S | | | | | | | | | | | | | | | | |
Sold | | | 242,415,972 | | | | 196,010,995 | | | | 242,632,763 | | | | 186,898,013 | |
Issued in connection with merger | | | – | | | | – | | | | 16,793,771 | | | | – | |
Distributions reinvested | | | 18,942,946 | | | | 5,266,892 | | | | 22,129,583 | | | | 4,906,429 | |
Redeemed | | | (76,055,816 | ) | | | (38,302,803 | ) | | | (70,510,035 | ) | | | (34,392,768 | ) |
Total Class S Capital Stock Transactions | | | 185,303,102 | | | | 162,975,084 | | | | 211,046,082 | | | | 157,411,674 | |
Capital Stock Transactions | | | 192,101,095 | | | | 135,396,289 | | | | 326,012,788 | | | | 146,516,699 | |
| | | | | | | | | | | | | | | | |
Net Increase/(Decrease) in Net Assets | | | 104,594,096 | | | | 347,066,613 | | | | 227,392,382 | | | | 476,159,355 | |
Net Assets, Beginning of Period | | | 2,208,908,751 | | | | 1,861,842,138 | | | | 2,476,774,603 | | | | 2,000,615,248 | |
Net Assets, End of Period | | $ | 2,313,502,847 | | | $ | 2,208,908,751 | | | $ | 2,704,166,985 | | | $ | 2,476,774,603 | |
| | | | |
Capital Stock Share Transactions | | | | | | | | | | | | | | | | |
| | | | |
Class A shares | | | | | | | | | | | | | | | | |
Sold | | | 9,156,424 | | | | 9,385,511 | | | | 7,016,183 | | | | 9,290,259 | |
Issued in connection with merger | | | – | | | | – | | | | 6,842,773 | | | | – | |
Distributions reinvested | | | 5,761,473 | | | | 2,539,036 | | | | 7,258,783 | | | | 2,765,753 | |
Redeemed | | | (14,366,827 | ) | | | (13,954,431 | ) | | | (13,273,634 | ) | | | (12,681,789 | ) |
Total Class A shares | | | 551,070 | | | | (2,029,884 | ) | | | 7,844,105 | | | | (625,777 | ) |
| | | | |
Class S shares | | | | | | | | | | | | | | | | |
Sold | | | 17,539,101 | | | | 14,738,716 | | | | 15,522,328 | | | | 13,055,685 | |
Issued in connection with merger | | | – | | | | – | | | | 1,548,689 | | | | – | |
Distributions reinvested | | | 1,379,704 | | | | 400,777 | | | | 1,482,248 | | | | 360,908 | |
Redeemed | | | (5,500,513 | ) | | | (2,880,429 | ) | | | (4,631,775 | ) | | | (2,407,454 | ) |
Total Class S shares | | | 13,418,292 | | | | 12,259,064 | | | | 13,921,490 | | | | 11,009,139 | |
| (%) | Distributions to Shareholders. Additional information can be found in the accompanying Notes to Financial Statements – Recent Accounting Pronouncements – Disclosure Update and Simplification. |
The accompanying Notes to Financial Statements are an integral part of this statement.
198
THRIVENT MUTUAL FUNDS
STATEMENTOF CHANGESIN NET ASSETS –CONTINUED
| | | | | | | | | | | | | | |
Moderately Conservative Allocation Fund | | Money Market Fund | | Municipal Bond Fund | | Opportunity Income Plus Fund |
| 10/31/2018 | | 10/31/2017 | | 10/31/2018 | | 10/31/2017 | | 10/31/2018 | | 10/31/2017 | | 10/31/2018 | | 10/31/2017 |
| | | | | | | | | | | | | | |
$17,493,360 | | $14,106,905 | | $5,018,820 | | $355,446 | | $53,462,450 | | $55,034,126 | | $20,753,337 | | $16,236,157 |
12,986,367 | | 15,387,696 | | (1,389) | | 268 | | 2,086,105 | | (2,962,342) | | (4,195,303) | | (340,739) |
(34,171,525) | | 38,868,489 | | – | | – | | (72,024,519) | | (33,697,180) | | (14,190,741) | | 4,149,200 |
(3,691,798) | | 68,363,090 | | 5,017,431 | | 355,714 | | (16,475,964) | | 18,374,604 | | 2,367,293 | | 20,044,618 |
| | | | | | | | | | | | | | |
(25,886,454) | | N/A | | (3,537,659) | | N/A | | (44,782,468) | | N/A | | (9,617,228) | | N/A |
(6,332,358) | | N/A | | (1,481,161) | | N/A | | (8,358,636) | | N/A | | (11,613,221) | | N/A |
(32,218,812) | | N/A | | (5,018,820) | | N/A | | (53,141,104) | | N/A | | (21,230,449) | | N/A |
N/A | | (11,993,068) | | N/A | | (105,838) | | N/A | | (47,790,355) | | N/A | | (8,603,782) |
N/A | | (2,021,189) | | N/A | | (249,608) | | N/A | | (7,173,455) | | N/A | | (7,670,388) |
N/A | | (14,014,257) | | N/A | | (355,446) | | N/A | | (54,963,810) | | N/A | | (16,274,170) |
N/A | | (6,110,766) | | N/A | | – | | N/A | | – | | N/A | | – |
N/A | | (666,362) | | N/A | | – | | N/A | | – | | N/A | | – |
N/A | | (6,777,128) | | N/A | | – | | N/A | | – | | N/A | | – |
(32,218,812) | | (20,791,385) | | (5,018,820) | | (355,446) | | (53,141,104) | | (54,963,810) | | (21,230,449) | | (16,274,170) |
| | | | | | | | | | | | | | |
| | | | | | | | | | | | | | |
51,154,138 | | 51,797,504 | | 257,426,802 | | 242,067,940 | | 46,895,802 | | 62,763,886 | | 23,167,113 | | 30,780,063 |
– | | – | | – | | – | | – | | – | | – | | – |
25,614,993 | | 17,912,686 | | 3,479,170 | | 104,043 | | 38,288,903 | | 40,787,705 | | 8,790,242 | | 7,849,810 |
(95,307,190) | | (94,734,303) | | (263,030,923) | | (298,443,722) | | (169,486,624) | | (159,920,611) | | (43,228,005) | | (34,136,345) |
(18,538,059) | | (25,024,113) | | (2,124,951) | | (56,271,739) | | (84,301,919) | | (56,369,020) | | (11,270,650) | | 4,493,528 |
| | | | | | | | | | | | | | |
92,446,453 | | 87,125,201 | | 392,696,839 | | 311,645,006 | | 87,560,779 | | 77,982,660 | | 116,374,426 | | 112,255,199 |
– | | – | | – | | – | | – | | – | | – | | – |
6,302,897 | | 2,660,827 | | 1,425,035 | | 234,521 | | 7,680,464 | | 6,591,809 | | 10,922,207 | | 7,301,476 |
(37,353,996) | | (23,461,067) | | (300,301,334) | | (290,387,221) | | (66,500,295) | | (59,476,151) | | (64,934,970) | | (39,395,609) |
61,395,354 | | 66,324,961 | | 93,820,540 | | 21,492,306 | | 28,740,948 | | 25,098,318 | | 62,361,663 | | 80,161,066 |
42,857,295 | | 41,300,848 | | 91,695,589 | | (34,779,433) | | (55,560,971) | | (31,270,702) | | 51,091,013 | | 84,654,594 |
| | | | | | | | | | | | | | |
6,946,685 | | 88,872,553 | | 91,694,200 | | (34,779,165) | | (125,178,039) | | (67,859,908) | | 32,227,857 | | 88,425,042 |
861,572,517 | | 772,699,964 | | 403,190,715 | | 437,969,880 | | 1,596,213,933 | | 1,664,073,841 | | 524,995,642 | | 436,570,600 |
$868,519,202 | | $861,572,517 | | $494,884,915 | | $403,190,715 | | $1,471,035,894 | | $1,596,213,933 | | $557,223,499 | | $524,995,642 |
| | | | | | | | | | | | | | |
| | | | | | | | | | | | | | |
4,143,052 | | 4,294,425 | | 257,426,801 | | 242,067,938 | | 4,195,592 | | 5,516,312 | | 2,281,228 | | 3,010,351 |
– | | – | | – | | – | | – | | – | | – | | – |
2,076,098 | | 1,500,225 | | 3,479,170 | | 104,044 | | 3,436,432 | | 3,590,615 | | 868,971 | | 766,512 |
(7,729,477) | | (7,847,375) | | (263,030,919) | | (298,443,721) | | (15,205,735) | | (14,078,488) | | (4,269,546) | | (3,338,561) |
(1,510,327) | | (2,052,725) | | (2,124,948) | | (56,271,739) | | (7,573,711) | | (4,971,561) | | (1,119,347) | | 438,302 |
| | | | | | | | | | | | | | |
7,471,591 | | 7,173,390 | | 392,696,838 | | 311,645,006 | | 7,824,501 | | 6,861,019 | | 11,490,016 | | 10,970,324 |
– | | – | | – | | – | | – | | – | | – | | – |
509,835 | | 220,948 | | 1,425,035 | | 234,521 | | 689,687 | | 580,167 | | 1,080,479 | | 712,559 |
(3,018,866) | | (1,935,863) | | (300,301,333) | | (290,387,221) | | (5,967,065) | | (5,243,365) | | (6,418,295) | | (3,850,457) |
4,962,560 | | 5,458,475 | | 93,820,540 | | 21,492,306 | | 2,547,123 | | 2,197,821 | | 6,152,200 | | 7,832,426 |
The accompanying Notes to Financial Statements are an integral part of this statement.
199
THRIVENT MUTUAL FUNDS
STATEMENTOF CHANGESIN NET ASSETS –CONTINUED
| | | | | | | | |
| | | Partner Emerging Markets Equity Fund | |
| For the periods ended | | 10/31/2018 | | | 10/31/2017 | |
Operations | | | | | | | | |
Net investment income/(loss) | | | $ 92,866 | | | | $ 159,490 | |
Net realized gains/(losses) | | | (536,129 | ) | | | (188,126 | ) |
Change in net unrealized appreciation/(depreciation) | | | (2,193,986 | ) | | | 1,926,188 | |
Net Change in Net Assets Resulting From Operations | | | (2,637,249 | ) | | | 1,897,552 | |
Distributions to Shareholders (%) | | | | | | | | |
From income/realized gains Class A | | | (89,722 | ) | | | N/A | |
From income/realized gains Class S | | | (55,491 | ) | | | N/A | |
Total from income/realized gains | | | (145,213 | ) | | | N/A | |
From net investment income Class A | | | N/A | | | | (43,554 | ) |
From net investment income Class S | | | N/A | | | | (28,818 | ) |
Total From Net Investment Income | | | N/A | | | | (72,372 | ) |
From net realized gains Class A | | | N/A | | | | – | |
From net realized gains Class S | | | N/A | | | | – | |
Total From Net Realized Gains | | | N/A | | | | – | |
Total Distributions to Shareholders | | | (145,213 | ) | | | (72,372 | ) |
Capital Stock Transactions | | | | | | | | |
| | |
Class A | | | | | | | | |
Sold | | | 2,563,626 | | | | 4,582,653 | |
Distributions reinvested | | | 89,154 | | | | 43,506 | |
Redeemed | | | (2,454,117 | ) | | | (6,292,638 | ) |
Total Class A Capital Stock Transactions | | | 198,663 | | | | (1,666,479 | ) |
| | |
Class S | | | | | | | | |
Sold | | | 4,382,623 | | | | 5,285,566 | |
Distributions reinvested | | | 55,493 | | | | 28,824 | |
Redeemed | | | (2,217,261 | ) | | | (3,126,799 | ) |
Total Class S Capital Stock Transactions | | | 2,220,855 | | | | 2,187,591 | |
Capital Stock Transactions | | | 2,419,518 | | | | 521,112 | |
| | | | | | | | |
Net Increase/(Decrease) in Net Assets | | | (362,944 | ) | | | 2,346,292 | |
Net Assets, Beginning of Period | | | 13,082,273 | | | | 10,735,981 | |
Net Assets, End of Period | | $ | 12,719,329 | | | $ | 13,082,273 | |
| | |
Capital Stock Share Transactions | | | | | | | | |
| | |
Class A shares | | | | | | | | |
Sold | | | 264,993 | | | | 541,497 | |
Distributions reinvested | | | 9,103 | | | | 5,535 | |
Redeemed | | | (270,366 | ) | | | (742,483 | ) |
Total Class A shares | | | 3,730 | | | | (195,451 | ) |
| | |
Class S shares | | | | | | | | |
Sold | | | 462,363 | | | | 613,775 | |
Distributions reinvested | | | 5,721 | | | | 3,705 | |
Redeemed | | | (248,252 | ) | | | (335,143 | ) |
Total Class S shares | | | 219,832 | | | | 282,337 | |
| (a) | For the period from February 28, 2018 (inception) through October 31, 2018 |
| (%) | Distributions to Shareholders. Additional information can be found in the accompanying Notes to Financial Statements – Recent Accounting Pronouncements – Disclosure Update and Simplification. |
The accompanying Notes to Financial Statements are an integral part of this statement.
200
THRIVENT MUTUAL FUNDS
STATEMENTOF CHANGESIN NET ASSETS –CONTINUED
| | | | | | | | | | | | | | | | |
| Partner Worldwide Allocation Fund | | | Small Cap Growth Fund | | | Small Cap Stock Fund | |
| 10/31/2018 | | 10/31/2017 | | | 10/31/2018(a) | | | 10/31/2018 | | | 10/31/2017 | |
| | | | | | | | | | | | | | | | |
$18,938,656 | | | $17,999,510 | | | | $(28,426) | | | | $473,668 | | | | $164,960 | |
26,002,782 | | | 36,589,905 | | | | 97,687 | | | | 93,974,533 | | | | 47,168,618 | |
(138,456,562) | | | 97,227,066 | | | | 224,571 | | | | (69,178,400) | | | | 107,637,046 | |
(93,515,124) | | | 151,816,481 | | | | 293,832 | | | | 25,269,801 | | | | 154,970,624 | |
| | | | | | | | | | | | | | | | |
(5,479,150) | | | N/A | | | | – | | | | (32,369,402) | | | | N/A | |
(27,991,413) | | | N/A | | | | – | | | | (11,696,047) | | | | N/A | |
(33,470,563) | | | N/A | | | | – | | | | (44,065,449) | | | | N/A | |
N/A | | | (2,695,343) | | | | N/A | | | | N/A | | | | (647,301) | |
N/A | | | (14,277,535) | | | | N/A | | | | N/A | | | | (570,250) | |
N/A | | | (16,972,878) | | | | N/A | | | | N/A | | | | (1,217,551) | |
N/A | | | – | | | | N/A | | | | N/A | | | | (16,107,310) | |
N/A | | | – | | | | N/A | | | | N/A | | | | (4,745,724) | |
N/A | | | – | | | | N/A | | | | N/A | | | | (20,853,034) | |
(33,470,563) | | | (16,972,878) | | | | – | | | | (44,065,449) | | | | (22,070,585) | |
| | | | | | | | | | | | | | | | |
| | | | | | | | | | | | | | | | |
9,527,706 | | | 8,497,908 | | | | – | | | | 19,310,756 | | | | 16,280,602 | |
5,400,053 | | | 2,655,104 | | | | – | | | | 32,141,102 | | | | 16,642,749 | |
(15,937,749) | | | (15,037,016) | | | | – | | | | (40,598,142) | | | | (36,724,668) | |
(1,009,990) | | | (3,884,004) | | | | – | | | | 10,853,716 | | | | (3,801,317) | |
| | | | | | | | | | | | | | | | |
20,386,542 | | | 15,581,089 | | | | 8,849,413 | | | | 100,305,514 | | | | 28,686,730 | |
27,982,435 | | | 14,222,488 | | | | – | | | | 11,693,746 | | | | 5,313,787 | |
(12,432,988) | | | (9,168,091) | | | | (3,939,313) | | | | (34,286,689) | | | | (14,505,758) | |
35,935,989 | | | 20,635,486 | | | | 4,910,100 | | | | 77,712,571 | | | | 19,494,759 | |
34,925,999 | | | 16,751,482 | | | | 4,910,100 | | | | 88,566,287 | | | | 15,693,442 | |
| | | | | | | | | | | | | | | | |
(92,059,688) | | | 151,595,085 | | | | 5,203,932 | | | | 69,770,639 | | | | 148,593,481 | |
908,846,581 | | | 757,251,496 | | | | – | | | | 595,056,817 | | | | 446,463,336 | |
$816,786,893 | | | $908,846,581 | | | | $5,203,932 | | | | $664,827,456 | | | | $595,056,817 | |
| | | | | | | | | | | | | | | | |
855,386 | | | 815,695 | | | | – | | | | 857,576 | | | | 807,090 | |
484,576 | | | 284,272 | | | | – | | | | 1,520,393 | | | | 855,788 | |
(1,461,407) | | | (1,487,744) | | | | – | | | | (1,805,691) | | | | (1,804,658) | |
(121,445) | | | (387,777) | | | | – | | | | 572,278 | | | | (141,780) | |
| | | | | | | | | | | | | | | | |
1,799,586 | | | 1,497,545 | | | | 845,482 | | | | 3,701,582 | | | | 1,165,084 | |
2,499,006 | | | 1,517,875 | | | | – | | | | 459,118 | | | | 230,084 | |
(1,135,188) | | | (862,706) | | | | (353,153) | | | | (1,302,714) | | | | (596,037) | |
3,163,404 | | | 2,152,714 | | | | 492,329 | | | | 2,857,986 | | | | 799,131 | |
The accompanying Notes to Financial Statements are an integral part of this statement.
201
THRIVENT MUTUAL FUNDS
NOTES TO FINANCIAL STATEMENTS
October 31, 2018
(1) ORGANIZATION
Thrivent Mutual Funds (the “Trust”) was organized as a Massachusetts Business Trust on March 10, 1987 and is registered as an open-end management investment company under the Investment Company Act of 1940 (the “1940 Act”). The Trust is divided into 24 separate series (each, a “Fund” and, collectively, the “Funds”), each with its own investment objective and policies. The Trust currently consists of four asset allocation Funds, three income plus Funds, nine equity Funds, seven fixed-income Funds and one money market Fund. This report includes 22 of the Funds while Thrivent Diversified Income Plus Fund and Thrivent Multidimensional Income Fund have a fiscal year end on a calendar-year basis and are presented under a separate shareholder report.
The Funds are each investment companies that follow the accounting and reporting guidance of the Financial Accounting Standards Board (“FASB”) Accounting Standard Codification Topic 946 - Financial Services - Investment Companies.
Mergers – At a meeting held on June 21, 2018, shareholders of Thrivent Growth and Income Plus Fund (the “Target Fund”) approved the merger of the Target Fund into Thrivent Moderately Aggressive Allocation Fund (the “Acquiring Fund”). The merger occurred at the close of business on June 28, 2018. Acquisition of the assets and liabilities of the Target Fund by the Acquiring Fund were followed by the distribution of the Acquiring Fund’s shares to the Target Fund’s shareholders. The shares issued of the Acquiring Fund are disclosed in the Statement of Changes in Net Assets.
The merger was accomplished by a tax free exchange as detailed below:
| | | | | | |
| Fund | | Description | | Net Assets as of June 28, 2018 | |
Moderately Aggressive Allocation | | Acquiring Fund | | $ | 2,637,303,574 | |
Growth and Income Plus | | Target Fund | | $ | 90,855,666 | |
Moderately Aggressive Allocation | | After Acquisition | | $ | 2,728,159,240 | |
As of June 28, 2018, the net assets of the Target Fund were comprised of the following:
| | | | | | | | | | | | | | | | |
| Target Fund | | Unrealized Appreciation/ (Depreciation) | | | Undistributed Net Investment Income | | | Accumulated Net Realized
Gains/ (Losses) | | | Capital Stock | |
Growth and Income Plus | | $ | 7,642,332 | | | $ | (252,078 | ) | | $ | 106,645 | | | $ | 83,358,767 | |
In the event of a capital loss carryover, the Target Fund’s capital loss carryover is carried over to the Acquiring Fund. The amount, if any, and applicable limitations are disclosed in Note (4) Tax Information.
Assuming the merger had been completed on November 1, 2017, the Acquiring Fund’s pro-forma results of operations for the year ended October 31, 2018 would be the following:
| | | | | | | | | | | | | | | | |
| Acquiring Fund | | Net Change in Unrealized Appreciation/ (Depreciation) | | | Net Investment
Income | | | Net Gains/(Losses) on
Investments | | | Net Increase in
Net Assets from
Operations | |
Moderately Aggressive Allocation | | $ | (112,408,098 | ) | | $ | 27,542,641 | | | $ | 116,530,520 | | | $ | 31,665,063 | |
The financial statements reflect the operations of the Acquiring Fund for the period prior to the merger and the combined Funds for the period subsequent to the merger. Because the combined investment funds have been managed as a single integrated fund since the merger was completed, it is not practicable to separate the amounts of revenue and earnings of Thrivent Growth and Income Plus Fund that have been included in the Acquiring Fund’s Statement of Operations since the merger was completed.
Share Classes – The Trust includes two classes of shares: Class A and Class S shares. The classes of shares differ principally in their respective distribution expenses and other class-specific expenses and arrangements. Class A shares have an annual 12b-1 fee of 0.25% for all Funds other than Government Bond Fund and Limited Maturity Bond Fund, which have a 12b-1 fee of 0.125%, and Money Market Fund, which does not have a 12b-1 fee. Effective January 1, 2018, the 12b-1 fee of 0.125% was removed from the Money Market Fund Class A shares. Class A shares have a maximum front-end sales load of 4.50%, although some Funds have a reduced or no front-end sales load. Class S shares are offered at net asset value and have no annual 12b-1 fees. The share classes have identical rights to earnings, assets and voting privileges, except for class-specific expenses and exclusive rights to vote on matters affecting only individual classes. Thrivent High Income Municipal Bond Fund, Thrivent Low Volatility Equity Fund, Thrivent Multidimensional Income
202
THRIVENT MUTUAL FUNDS
NOTESTO FINANCIAL STATEMENTS
October 31, 2018
Fund, and Thrivent Small Cap Growth Fund offer only Class S Shares, all other of the 20 Funds of the Trust offer Class A and Class S shares. Class A shares of Government Bond Fund are closed to all purchases and exchanges into the Fund, other than reinvestment of dividends by current shareholders of the Fund.
Other – Under the Trust’s organizational documents, its officers and trustees are indemnified against certain liabilities arising out of the performance of their duties to the Trust. In addition, in the normal course of business, the Trust enters into contracts with vendors and others that provide general damage clauses. The Trust’s maximum exposure under these contracts is unknown, as this would involve future claims that may be made against the Trust. However, based on experience, the Trust expects the risk of loss to be remote.
(2) SIGNIFICANT ACCOUNTING POLICIES
Valuation of Investments – Securities traded on U.S. or foreign securities exchanges or included in a national market system are valued at the last sale price on the principal exchange as of the close of regular trading on such exchange or the official closing price of the national market system. Over-the-counter securities and listed securities for which no price is readily available are valued at the current bid price considered best to represent the value at that time. Security prices are based on quotes that are obtained from an independent pricing service approved by the Trust’s Board of Trustees (“Board”). The pricing service, in determining values of fixed-income securities, takes into consideration such factors as current quotations by broker/dealers, coupon, maturity, quality, type of issue, trading characteristics, and other yield and risk factors it deems relevant in determining valuations. Securities which cannot be valued by the approved pricing service are valued using valuations obtained from dealers that make markets in the securities. Exchange-listed options and futures contracts are valued at the primary exchange settle price. Exchange cleared swap agreements are valued using the clearinghouse end of day price. Swap agreements not cleared on exchanges will be valued using the mid-price from the primary approved pricing service. Forward foreign currency exchange contracts are marked-to-market based upon foreign currency exchange rates provided by the pricing service. Investments in open-ended mutual funds are valued at the net asset value at the close of each business day.
Securities held by the Money Market Fund are valued on the basis of amortized cost (which approximates market value), whereby a portfolio security is valued at its cost initially and thereafter valued to reflect a constant amortization to maturity of any discount or premium. The Money Market Fund and the Trust’s investment adviser, Thrivent Asset Management, LLC (“Thrivent Asset Mgt.” or the “Adviser”), follow procedures designed to help maintain a constant net asset value of $1.00 per share.
The Board has delegated responsibility for daily valuation of the Funds’ securities to the Funds’ investment Adviser. The Adviser has formed a Valuation Committee (“Committee”) that is responsible for overseeing the Funds’ valuation policies in accordance with Valuation Policies and Procedures. The Committee meets on a monthly and on an as-needed basis to review price challenges, price overrides, stale prices, shadow prices, manual prices, money market pricing, international fair valuation, and other securities requiring fair valuation.
The Committee monitors for significant events occurring prior to the close of trading on the New York Stock Exchange that could have a material impact on the value of any securities that are held by the Funds. Examples of such events include trading halts, national news/events, and issuer-specific developments. If the Committee decides that such events warrant using fair value estimates, the Committee will take such events into consideration in determining the fair value of such securities. If market quotations or prices are not readily available or determined to be unreliable, the securities will be valued at fair value as determined in good faith pursuant to procedures adopted by the Board.
In accordance with U.S. Generally Accepted Accounting Principles (“GAAP”), the various inputs used to determine the fair value of the Funds’ investments are summarized in three broad levels. Level 1 includes quoted prices in active markets for identical securities, typically included in this level are U.S. equity securities, futures, options and registered investment company funds. Level 2 includes other significant observable inputs such as quoted prices for similar securities, interest rates, prepayment speeds and credit risk, typically included in this level are fixed income securities, international securities, swaps and forward contracts. Level 3 includes significant unobservable inputs such as the Adviser’s own assumptions and broker evaluations in determining the fair value of investments. Of the Level 3 securities, those for which market values were not readily available or were deemed unreliable were fair valued as determined in good faith pursuant to procedures established by the Board. The valuation levels are not necessarily an indication of the risk associated with investing in these securities or other investments. Investments measured using net asset value per share as a practical expedient for fair value and that are not publicly available for sale are not categorized within the fair value hierarchy.
Valuation of International Securities – The Funds value certain foreign securities traded on foreign exchanges that close prior to the close of the New York Stock Exchange using a fair value pricing service. The fair value pricing service uses a multi-factor model that may take into account the local close, relevant general and sector indices, currency fluctuation, prices of other securities (including ADRs, New
203
THRIVENT MUTUAL FUNDS
NOTESTO FINANCIAL STATEMENTS
October 31, 2018
York registered shares, and ETFs), and futures, as applicable, to determine price adjustments for each security in order to reflect the effects of post-closing events. The Board has authorized the Adviser to make fair valuation determinations pursuant to policies approved by the Board.
Foreign Currency Translation – The accounting records of each Fund are maintained in U.S. dollars. Securities and other assets and liabilities that are denominated in foreign currencies are translated into U.S. dollars at the daily closing rates of exchange.
Foreign currency amounts related to the purchase or sale of securities and income and expenses are translated at the exchange rate on the transaction date. Net realized and unrealized currency gains and losses are recorded from closed currency contracts, disposition of foreign currencies, exchange gains or losses between the trade date and settlement date on securities transactions, and other translation gains or losses on dividends, interest income and foreign withholding taxes. The Funds do not separately report the effect of changes in foreign exchange rates from changes in prices on securities held. Such changes are included in net realized and unrealized gain or loss from investments in the Statement of Operations.
For federal income tax purposes, the Funds treat the effect of changes in foreign exchange rates arising from actual foreign currency transactions and the changes in foreign exchange rates between the trade date and settlement date as ordinary income.
Federal Income Taxes – No provision has been made for income taxes because each Fund’s policy is to qualify as a regulated investment company under the Internal Revenue Code and distribute substantially all investment company taxable income and net capital gain on a timely basis. It is also the intention of each Fund to distribute an amount sufficient to avoid imposition of any federal excise tax. The Funds, accordingly, anticipate paying no federal taxes and no federal tax provision was recorded. Each Fund is treated as a separate taxable entity for federal income tax purposes. Funds may utilize earnings and profits distributed to shareholders on the redemption of shares as part of the dividends paid deduction.
GAAP requires management of the Funds (i.e., the Adviser) to make additional tax disclosures with respect to the tax effects of certain income tax positions, whether those positions were taken on previously filed tax returns or are expected to be taken on future returns. These positions must meet a “more likely than not” standard that, based on the technical merits of the position, would have a greater than 50 percent likelihood of being sustained upon examination. In evaluating whether a tax position has met the more-likely-than-not recognition threshold, the Adviser must presume that the position will be examined by the appropriate taxing authority that has full knowledge of all relevant information.
The Adviser analyzed all open tax years, as defined by the statute of limitations, for all major jurisdictions. Open tax years are those that are open for examination by taxing authorities. Major jurisdictions for the Funds include U.S. Federal, Minnesota, Wisconsin, and Massachusetts as well as certain foreign countries. As of October 31, 2018, open U.S. Federal, Minnesota, Wisconsin and Massachusetts tax years include the tax years ended October 31, 2015 through 2018. Additionally, as of October 31, 2018, the tax year ended October 31, 2014 is open for Wisconsin. The Funds have no examinations in progress and none are expected at this time.
As of October 31, 2018, the Adviser has reviewed all open tax years and major jurisdictions and concluded that there is no effect to the Funds’ tax liability, financial position or results of operations. There is no tax liability resulting from unrecognized tax benefits related to uncertain income tax positions taken or expected to be taken in future tax returns. The Funds are also not aware of any tax positions for which it is reasonably possible that the total amounts of unrecognized tax benefits will significantly change in the next 12 months.
Foreign Income Taxes – Funds are subject to foreign income taxes imposed by certain countries in which they invest. Withholding taxes on foreign dividends have been provided for in accordance with the applicable country’s tax rules and rates. These amounts are shown as foreign tax withholding on the Statement of Operations. The Funds pay tax on foreign capital gains, where applicable.
Expenses and Income – Estimated expenses are accrued daily. The Funds are charged for those expenses that are directly attributable to them. Expenses that are not directly attributable to a Fund are allocated among all appropriate Funds in proportion to their respective net assets or number of shareholder accounts, or other reasonable basis. Net investment income, expenses which are not class-specific, and realized and unrealized gains and losses are allocated directly to each class based upon the relative net asset value of outstanding shares.
Interest income is recorded daily on all debt securities, as is accretion of market discount and original issue discount and amortization of premium. Paydown gains and losses on mortgage-backed and asset-backed securities are recorded as components of interest income. Dividend income and capital gain distributions are recorded on the ex-dividend date. However, certain dividends from foreign securities are recorded as soon as the information is available to the Funds. Non-cash income, if any, is recorded at the fair market value of the securities received.
For certain securities, including real estate investment trusts, the Funds record distributions received in excess of
204
THRIVENT MUTUAL FUNDS
NOTESTO FINANCIAL STATEMENTS
October 31, 2018
income as a reduction of cost of investments and/or realized gain. Such amounts are based on estimates if actual amounts are not available. Actual amounts of income, realized gain and return of capital may differ from the estimated amounts. The Funds adjust the estimated amounts of the components of distributions as adjustments to investment income, unrealized appreciation/depreciation and realized gain/ loss on investments as necessary, once the issuers provide information about the actual composition of the distributions.
Distributions to Shareholders – Dividend and capital gain distributions are recorded on the ex-dividend date. With the exception of the Money Market Fund, net realized gains from securities transactions, if any, are paid at least annually after the close of the fiscal year.
| | | | | | | | |
| Fund | | Dividends
Declared | | | Dividends
Paid | |
Aggressive Allocation | | | Annually | | | | Annually | |
Balanced Income Plus | | | Quarterly | | | | Quarterly | |
Government Bond | | | Daily | | | | Monthly | |
High Income Municipal Bond | | | Daily | | | | Monthly | |
High Yield | | | Daily | | | | Monthly | |
Income | | | Daily | | | | Monthly | |
Large Cap Growth | | | Annually | | | | Annually | |
Large Cap Stock | | | Annually | | | | Annually | |
Large Cap Value | | | Annually | | | | Annually | |
Limited Maturity Bond | | | Daily | | | | Monthly | |
Low Volatility Equity | | | Annually | | | | Annually | |
Mid Cap Stock | | | Annually | | | | Annually | |
Moderate Allocation | | | Quarterly | | | | Quarterly | |
Moderately Aggressive Allocation | | | Annually | | | | Annually | |
Moderately Conservative Allocation | | | Quarterly | | | | Quarterly | |
Money Market* | | | Daily | | | | Monthly | |
Municipal Bond | | | Daily | | | | Monthly | |
Opportunity Income Plus | | | Daily | | | | Monthly | |
Partner Emerging Markets Equity | | | Annually | | | | Annually | |
Partner Worldwide Allocation | | | Annually | | | | Annually | |
Small Cap Growth | | | Annually | | | | Annually | |
Small Cap Stock | | | Annually | | | | Annually | |
| * | Dividends are net of any short-term realized gains or losses on the sale of securities. |
Derivative Financial Instruments – Each of the Funds, with the exception of the Money Market Fund, may invest in derivatives. Derivatives, a category that includes options, futures, swaps, foreign currency forward contracts and hybrid instruments, are financial instruments whose value is derived from another security, an index or a currency. Each applicable Fund may use derivatives for hedging (attempting to offset a potential loss in one position by establishing an interest in an opposite position). This includes the use of currency-based derivatives to manage the risk of its positions in foreign securities. Each applicable Fund may also use derivatives for replication of a certain asset class or speculation (investing for potential income or capital gain). These contracts may be transacted on an exchange or over-the-counter (“OTC”).
A derivative may incur a mark to market loss if the value of the derivative decreases due to an unfavorable change in the market rates or values of the underlying derivative. Losses can also occur if the counterparty does not perform under the derivative. A Fund’s risk of loss from the counterparty credit risk on OTC derivatives is generally limited to the aggregate unrealized gain netted against any collateral held by such Fund. With exchange traded futures and centrally cleared swaps, there is minimal counterparty credit risk to the Funds because the exchange’s clearinghouse, as counterparty to such derivatives, guarantees against a possible default. The clearinghouse stands between the buyer and the seller of the derivative; thus, the credit risk is limited to the failure of the clearinghouse. However, credit risk still exists in exchange traded futures and centrally cleared swaps with respect to initial and variation margin that is held in a broker’s customer accounts. While brokers are required to segregate customer margin from their own assets, in the event that a broker becomes insolvent or goes into bankruptcy and at that time there is a shortfall in the aggregate amount of margin held by the broker for all its clients, U.S. bankruptcy laws will typically allocate that shortfall on a pro-rata basis across all the broker’s customers, potentially resulting in losses to the Funds. Using derivatives to hedge can guard against potential risks, but it also adds to the Funds’ expenses and can eliminate some opportunities for gains. In addition, a derivative used for mitigating exposure or replication may not accurately track the value of the underlying asset. Another risk with derivatives is that some types can amplify a gain or loss, potentially earning or losing substantially more money than the actual cost of the derivative.
In order to define their contractual rights and to secure rights that will help the Funds mitigate their counterparty risk, the Funds may enter into an International Swaps and Derivatives Association, Inc. Master Agreement (“ISDA Master Agreement”) or similar agreement with derivative contract counterparties. An ISDA Master Agreement is a bilateral agreement between a Fund and a counterparty that governs OTC derivatives and foreign exchange contracts and typically includes, among other things, collateral posting terms and netting provisions in the event of a default and/or termination event. Under an ISDA Master Agreement, each Fund may, under certain circumstances, offset with the counterparty certain derivatives’ payables and/or receivables with collateral held and/or posted and create one single net payment. The provisions of the ISDA Master Agreement typically permit a single net payment in the event of a default (close-out netting) including the bankruptcy or insolvency of the counterparty. Note, however, that bankruptcy and insolvency laws of a particular jurisdiction may impose restrictions on or prohibitions against the right of offset in bankruptcy, insolvency or other events.
Collateral and margin requirements vary by type of derivative. Margin requirements are established by the broker or clearinghouse for exchange traded and centrally cleared derivatives (futures, options, and centrally cleared swaps). Brokers can ask for margining in excess of the minimum in certain situations. Collateral terms are contract specific
205
THRIVENT MUTUAL FUNDS
NOTESTO FINANCIAL STATEMENTS
October 31, 2018
for OTC derivatives (foreign currency exchange contracts, options, swaps). For derivatives traded under an ISDA Master Agreement, the collateral requirements are typically calculated by netting the mark to market amount for each transaction under such agreement and comparing that amount to the value of any collateral currently pledged by the Fund and the counterparty. For financial reporting purposes, non-cash collateral that has been pledged to cover obligations of the Fund has been noted in the Schedule of Investments. To the extent amounts due to a Fund from its counterparties are not fully collateralized, contractually or otherwise, the Fund bears the risk of loss from counterparty nonperformance. The Funds attempt to mitigate counterparty risk by only entering into agreements with counterparties that they believe have the financial resources to honor their obligations and by monitoring the financial stability of those counterparties.
Options – All Funds, with the exception of the Money Market Fund, may buy put and call options and write put and covered call options. The Funds intend to use such derivative instruments as hedges to facilitate buying or selling securities or to provide protection against adverse movements in security prices or interest rates. The Funds may also enter into options contracts to protect against adverse foreign exchange rate fluctuations. Option contracts are valued daily and unrealized appreciation or depreciation is recorded. A Fund will realize a gain or loss upon expiration or closing of the option transaction. When an option is exercised, the proceeds upon sale for a written call option or the cost of a security for purchased put and call options is adjusted by the amount of premium received or paid.
Buying put options tends to decrease a Fund’s exposure to the underlying security while buying call options tends to increase a Fund’s exposure to the underlying security. The risk associated with purchasing put and call options is limited to the premium paid. There is no significant counterparty risk on exchange-traded options as the exchange guarantees the contract against default. Writing put options tends to increase a Fund’s exposure to the underlying security while writing call options tends to decrease a Fund’s exposure to the underlying security. The writer of an option has no control over whether the underlying security may be bought or sold, and therefore bears the market risk of an unfavorable change in the price of the underlying security. The counterparty risk for purchased options arises when a Fund has purchased an option, exercises that option, and the counterparty doesn’t buy from the Fund or sell to the Fund the underlying asset as required. In the case where a Fund has written an option, the Fund doesn’t have counterparty risk. Counterparty risk on purchased over-the-counter options is partially mitigated by the Fund’s collateral posting requirements. As the option increases in value to the Fund, the Fund receives collateral from the counterparty. Risks of loss may exceed amounts recognized on the Statement of Assets and Liabilities.
During the year ended October 31, 2018, Balanced Income Plus Fund, Government Bond Fund, Moderate Allocation Fund, Moderately Aggressive Allocation Fund, Moderately Conservative Allocation Fund and Opportunity Income Plus Fund used treasury options to manage the duration of the Fund versus the benchmark. Options on mortgage-backed securities were used to generate income.
Futures Contracts – All Funds, with the exception of the Money Market Fund, may use futures contracts to manage the exposure to interest rate and market or currency fluctuations. Gains or losses on futures contracts can offset changes in the yield of securities. When a futures contract is opened, cash or other investments equal to the required “initial margin deposit” are held on deposit with and pledged to the broker. Additional securities held by the Funds may be earmarked to cover open futures contracts. A futures contract’s daily change in value (“variation margin”) is either paid to or received from the broker, and is recorded as an unrealized gain or loss. When the contract is closed, realized gain or loss is recorded equal to the difference between the value of the contract when opened and the value of the contract when closed. Futures contracts involve, to varying degrees, risk of loss in excess of the variation margin disclosed in the Statement of Assets and Liabilities. Exchange-traded futures have no significant counterparty risk as the exchange guarantees the contracts against default.
During the year ended October 31, 2018, Aggressive Allocation Fund, Balanced Income Plus Fund, Government Bond Fund, High Income Municipal Bond Fund, Income Fund, Limited Maturity Bond Fund, Moderate Allocation Fund, Moderately Aggressive Allocation Fund, Moderately Conservative Allocation Fund, Municipal Bond Fund, Opportunity Income Plus Fund and Partner Worldwide Allocation Fund used treasury futures to manage the duration and yield curve exposure of the Fund versus the benchmark.
During the year ended October 31, 2018, Aggressive Allocation Fund, Balanced Income Plus Fund, Large Cap Growth, Large Cap Stock Fund, Low Volatility Equity Fund, Moderate Allocation Fund, Moderately Aggressive Allocation Fund, Moderately Conservative Allocation Fund, Opportunity Income Plus Fund and Partner Worldwide Allocation Fund used equity futures to manage exposure to the equities markets.
Foreign Currency Forward Contracts – In connection with purchases and sales of securities denominated in foreign currencies, all Funds, with the exception of the Money Market Fund, may enter into foreign currency forward contracts. Additionally, the Funds may enter into such contracts to mitigate currency and counterparty exposure to other foreign-currency-denominated investments. These contracts are recorded at value and the related realized and change in unrealized foreign exchange gains and losses are included in the Statement of Operations. In the event that counterparties
206
THRIVENT MUTUAL FUNDS
NOTESTO FINANCIAL STATEMENTS
October 31, 2018
fail to settle these forward contracts, the Funds could be exposed to foreign currency fluctuations. Foreign currency contracts are valued daily and unrealized appreciation or depreciation is recorded daily as the difference between the contract exchange rate and the closing forward rate applied to the face amount of the contract. A realized gain or loss is recorded at the time a forward contract is closed. These contracts are over-the-counter and a Fund is exposed to counterparty risk equal to the discounted net amount of payments to the Fund.
During the year ended October 31, 2018, Partner Worldwide Allocation Fund used foreign currency forward contracts in order to gain active currency exposure and to hedge unwanted currency exposure.
Swap Agreements – All Funds, with the exception of the Money Market Fund, may enter into swap transactions, which involve swapping one or more investment characteristics of a security or a basket of securities with another party. Such transactions include market risk, risk of default by the other party to the transaction, risk of imperfect correlation and manager risk and may involve commissions or other costs. Swap transactions generally do not involve delivery of securities, other underlying assets or principal. Accordingly, the risk of loss with respect to swap transactions is generally limited to the net amount of payments that the Fund is contractually obligated to make, or in the case of the counterparty defaulting, the net amount of payments that the Fund is contractually entitled to receive. Risks of loss may exceed amounts recognized on the Statement of Assets and Liabilities. If there is a default by the counterparty, the Fund may have contractual remedies pursuant to the agreements related to the transaction. The contracts are valued daily and unrealized appreciation or depreciation is recorded. Swap agreements are valued at the clearinghouse end of day prices as furnished by an independent pricing service. The pricing service takes into account such factors as swap curves, default probabilities, recent trades, recovery rates and other factors it deems relevant in determining valuations. Daily fluctuations in the value of the centrally cleared credit default contracts are recorded in variation margin in the Statement of Assets and Liabilities and recorded as unrealized gain or loss. The Fund accrues for the periodic payment and amortizes upfront payments, if any, on swap agreements on a daily basis with the net amount recorded as realized gains or losses in the Statement of Operations. Receipts and payments received or made as a result of a credit event or termination of the contract are also recognized as realized gains or losses in the Statement of Operations. Collateral, in the form of cash or securities, may be required to be held with the Fund’s custodian, or a third party, in connection with these agreements. Certain swap agreements are over-the-counter. In these types of transactions, the Fund is exposed to counterparty risk, which is the discounted net amount of payments owed to the Fund. This risk is partially mitigated by the Fund’s collateral posting requirements. As the swap increases in value to the Fund, the Fund receives collateral from the counterparty. Certain interest rate and credit default index swaps must be cleared through a clearinghouse or central counterparty.
Credit Default Swaps – A credit default swap is a swap agreement between two parties to exchange the credit risk of a particular issuer, basket of securities or reference entity. In a credit default swap transaction, a buyer pays periodic fees in return for payment by the seller which is contingent upon an adverse credit event occurring in the underlying issuer or reference entity. The seller collects periodic fees from the buyer and profits if the credit of the underlying issuer or reference entity remains stable or improves while the swap is outstanding, but the seller in a credit default swap contract would be required to pay the amount of credit loss, determined as specified in the agreement, to the buyer in the event of an adverse credit event in the reference entity. A buyer of a credit default swap is said to buy protection whereas a seller of a credit default swap is said to sell protection. The Funds may be either the protection seller or the protection buyer.
Certain Funds enter into credit default derivative contracts directly through credit default swaps (CDS) or through credit default swap indices (“CDX Indices”). CDX indices are static pools of equally weighted credit default swaps referencing corporate bonds and/or loans designed to provide diversified credit exposure to these asset classes. Funds sell default protection and assume long-risk positions in individual credits or indices. Index positions are entered into to gain exposure to the corporate bond and/or loan markets in a cost-efficient and diversified structure. In the event that a position defaults, by going into bankruptcy and failing to pay interest or principal on borrowed money, within any given CDX Index held, the maximum potential amount of future payments required would be equal to the pro-rata share of that position within the index based on the notional amount of the index. In the event of a default under a CDS contract the maximum potential amount of future payments would be the notional amount. For CDS, the default events could be bankruptcy and failing to pay interest or principal on borrowed money or a restructuring. A restructuring is a change in the underlying obligations which would include reduction in interest or principal, maturity extension and subordination to other obligations.
During the year ended October 31, 2018, High Yield Fund used CDX indexes (comprised of credit default swaps) to help manage credit risk exposures within the fund.
For financial reporting purposes, the Funds do not offset derivative assets and derivative liabilities that are subject to netting arrangements in the Statement of Assets and Liabilities.
207
THRIVENT MUTUAL FUNDS
NOTESTO FINANCIAL STATEMENTS
October 31, 2018
The amounts presented in the tables below are offset first by financial instruments that have the right to offset under master netting or similar arrangements, then any remaining amount is reduced by cash and non-cash collateral received/pledged. The actual amounts of collateral may be greater than the amounts presented in the tables.
The following table presents the gross and net information about assets subject to master netting arrangements, as presented in the Statement of Assets and Liabilities:
| | | | | | | | | | | | | | | | | | | | | | | | | | | | |
| | | | | | | | | | | | Gross Amounts Not Offset in the
Statement of Assets and Liabilities | | | | |
| Fund | | Gross Amounts
of Recognized
Assets | | | Gross
Amounts
Offset | | | Net
Amounts
of
Recognized
Assets | | | Financial
Instruments | | | Cash
Collateral
Received | | | Non-Cash
Collateral
Received | | | Net Amount | |
Aggressive Allocation | | | | | | | | | | | | | | | | | | | | | | | | | | | | |
Futures Contracts | | | 3,815,429 | | | | – | | | | 3,815,429 | | | | 2,342,349 | | | | – | | | | – | | | | 1,473,080 | (*) |
Balanced Income Plus | | | | | | | | | | | | | | | | | | | | | | | | | | | | |
Futures Contracts | | | 10,749 | | | | – | | | | 10,749 | | | | 10,749 | | | | – | | | | – | | | | – | |
Government Bond | | | | | | | | | | | | | | | | | | | | | | | | | | | | |
Futures Contracts | | | 25,750 | | | | – | | | | 25,750 | | | | 8,000 | | | | – | | | | – | | | | 17,750 | (*) |
High Income Municipal Bond | | | | | | | | | | | | | | | | | | | | | | | | | | | | |
Futures Contracts | | | 6,809 | | | | – | | | | 6,809 | | | | – | | | | – | | | | – | | | | 6,809 | (*) |
Income | | | | | | | | | | | | | | | | | | | | | | | | | | | | |
Futures Contracts | | | 139,969 | | | | – | | | | 139,969 | | | | 81,250 | | | | – | | | | – | | | | 58,719 | (*) |
Large Cap Stock | | | | | | | | | | | | | | | | | | | | | | | | | | | | |
Futures Contracts | | | 2,057,240 | | | | – | | | | 2,057,240 | | | | 1,021,680 | | | | – | | | | – | | | | 1,035,560 | (*) |
Limited Maturity Bond | | | | | | | | | | | | | | | | | | | | | | | | | | | | |
Futures Contracts | | | 265,062 | | | | – | | | | 265,062 | | | | 57,000 | | | | – | | | | – | | | | 208,062 | (*) |
Low Volatility Equity | | | | | | | | | | | | | | | | | | | | | | | | | | | | |
Futures Contracts | | | 6,120 | | | | – | | | | 6,120 | | | | – | | | | – | | | | – | | | | 6,120 | (*) |
Moderate Allocation | | | | | | | | | | | | | | | | | | | | | | | | | | | | |
Futures Contracts | | | 3,391,083 | | | | – | | | | 3,391,083 | | | | 2,706,678 | | | | – | | | | – | | | | 684,405 | (*) |
Moderately Aggressive Allocation | | | | | | | | | | | | | | | | | | | | | | | | | | | | |
Futures Contracts | | | 5,887,151 | | | | – | | | | 5,887,151 | | | | 3,794,331 | | | | – | | | | – | | | | 2,092,820 | (*) |
Moderately Conservative Allocation | | | | | | | | | | | | | | | | | | | | | | | | | | | | |
Futures Contracts | | | 618,145 | | | | – | | | | 618,145 | | | | 618,145 | | | | – | | | | – | | | | – | |
Municipal Bond | | | | | | | | | | | | | | | | | | | | | | | | | | | | |
Futures Contracts | | | 67,125 | | | | – | | | | 67,125 | | | | – | | | | – | | | | – | | | | 67,125 | (*) |
Opportunity Income Plus | | | | | | | | | | | | | | | | | | | | | | | | | | | | |
Futures Contracts | | | 27,875 | | | | – | | | | 27,875 | | | | 27,875 | | | | – | | | | – | | | | – | |
Partner Worldwide Allocation | | | | | | | | | | | | | | | | | | | | | | | | | | | | |
Futures Contracts | | | 885,300 | | | | – | | | | 885,300 | | | | 885,300 | | | | – | | | | – | | | | – | |
Exchange Contracts | | | 671,031 | | | | – | | | | 671,031 | | | | 284,241 | | | | – | | | | – | | | | 386,790 | (†) |
| (*) | Net futures amount represents the net amount receivable from the counterparty in the event of a default. |
| (†) | Net exchange contract amount represents the net amount receivable from the counterparty in the event of a default. |
208
THRIVENT MUTUAL FUNDS
NOTESTO FINANCIAL STATEMENTS
October 31, 2018
The following table presents the gross and net information about liabilities subject to master netting arrangements, as presented in the Statement of Assets and Liabilities:
| | | | | | | | | | | | | | | | | | | | | | | | | | | | |
| | | | | | | | | | | | Gross Amounts Not Offset in the
Statement of Assets and Liabilities | | | | |
| Fund | | Gross Amounts
of Recognized
Liabilities | | | Gross
Amounts
Offset | | | Net
Amounts of
Recognized
Liabilities | | | Financial
Instruments | | | Cash
Collateral
Pledged | | | Non-Cash
Collateral
Pledged(**) | | | Net
Amount | |
Aggressive Allocation | | | | | | | | | | | | | | | | | | | | | | | | | | | | |
Futures Contracts | | | 2,342,349 | | | | – | | | | 2,342,349 | | | | 2,342,349 | | | | – | | | | – | | | | – | |
Securities Lending | | | 9,152,537 | | | | – | | | | 9,152,537 | | | | 8,979,336 | | | | – | | | | – | | | | 173,201 | (^) |
Balanced Income Plus | | | | | | | | | | | | | | | | | | | | | | | | | | | | |
Futures Contracts | | | 61,231 | | | | – | | | | 61,231 | | | | 10,749 | | | | – | | | | 50,482 | | | | – | |
Securities Lending | | | 2,305,594 | | | | – | | | | 2,305,594 | | | | 2,213,626 | | | | – | | | | – | | | | 91,968 | (^) |
Government Bond | | | | | | | | | | | | | | | | | | | | | | | | | | | | |
Futures Contracts | | | 8,000 | | | | – | | | | 8,000 | | | | 8,000 | | | | – | | | | – | | | | – | |
High Yield | | | | | | | | | | | | | | | | | | | | | | | | | | | | |
Securities Lending | | | 53,926,806 | | | | – | | | | 53,926,806 | | | | 52,051,436 | | | | – | | | | – | | | | 1,875,370 | (^) |
Income | | | | | | | | | | | | | | | | | | | | | | | | | | | | |
Futures Contracts | | | 81,250 | | | | – | | | | 81,250 | | | | 81,250 | | | | – | | | | – | | | | – | |
Securities Lending | | | 8,347,519 | | | | – | | | | 8,347,519 | | | | 8,056,513 | | | | – | | | | – | | | | 291,006 | (^) |
Large Cap Stock | | | | | | | | | | | | | | | | | | | | | | | | | | | | |
Futures Contracts | | | 1,021,680 | | | | – | | | | 1,021,680 | | | | 1,021,680 | | | | – | | | | – | | | | – | |
Securities Lending | | | 22,091,756 | | | | – | | | | 22,091,756 | | | | 20,843,498 | | | | – | | | | – | | | | 1,248,258 | (^) |
Large Cap Value | | | | | | | | | | | | | | | | | | | | | | | | | | | | |
Securities Lending | | | 1,804,350 | | | | – | | | | 1,804,350 | | | | 1,623,915 | | | | – | | | | – | | | | 180,435 | (^) |
Limited Maturity Bond | | | | | | | | | | | | | | | | | | | | | | | | | | | | |
Futures Contracts | | | 57,000 | | | | – | | | | 57,000 | | | | 57,000 | | | | – | | | | – | | | | – | |
Mid Cap Stock | | | | | | | | | | | | | | | | | | | | | | | | | | | | |
Securities Lending | | | 21,669,050 | | | | – | | | | 21,669,050 | | | | 20,850,942 | | | | – | | | | – | | | | 818,108 | (^) |
Moderate Allocation | | | | | | | | | | | | | | | | | | | | | | | | | | | | |
Futures Contracts | | | 2,706,678 | | | | – | | | | 2,706,678 | | | | 2,706,678 | | | | – | | | | – | | | | – | |
Securities Lending | | | 10,899,857 | | | | – | | | | 10,899,857 | | | | 10,626,852 | | | | – | | | | – | | | | 273,005 | (^) |
Moderately Aggressive Allocation | | | | | | | | | | | | | | | | | | | | | | | | | | | | |
Futures Contracts | | | 3,794,331 | | | | – | | | | 3,794,331 | | | | 3,794,331 | | | | – | | | | – | | | | – | |
Securities Lending | | | 14,805,419 | | | | – | | | | 14,805,419 | | | | 14,468,726 | | | | – | | | | – | | | | 336,693 | (^) |
Moderately Conservative Allocation | | | | | | | | | | | | | | | | | | | | | | | | | | | | |
Futures Contracts | | | 722,721 | | | | – | | | | 722,721 | | | | 618,145 | | | | – | | | | 104,576 | | | | – | |
Securities Lending | | | 4,038,165 | | | | – | | | | 4,038,165 | | | | 3,926,265 | | | | – | | | | – | | | | 111,900 | (^) |
Opportunity Income Plus | | | | | | | | | | | | | | | | | | | | | | | | | | | | |
Futures Contracts | | | 230,369 | | | | – | | | | 230,369 | | | | 27,875 | | | | – | | | | 202,494 | | | | – | |
Securities Lending | | | 5,373,892 | | | | – | | | | 5,373,892 | | | | 5,242,545 | | | | – | | | | – | | | | 131,347 | (^) |
Partner Emerging Markets Equity | | | | | | | | | | | | | | | | | | | | | | | | | | | | |
Securities Lending | | | 110,800 | | | | – | | | | 110,800 | | | | 110,800 | | | | – | | | | – | | | | – | |
Partner Worldwide Allocation | | | | | | | | | | | | | | | | | | | | | | | | | | | | |
Futures Contracts | | | 1,068,675 | | | | – | | | | 1,068,675 | | | | 885,300 | | | | 183,375 | | | | – | | | | – | |
Exchange Contracts | | | 284,241 | | | | – | | | | 284,241 | | | | 284,241 | | | | – | | | | – | | | | – | |
Securities Lending | | | 2,491,545 | | | | – | | | | 2,491,545 | | | | 2,476,946 | | | | – | | | | – | | | | 14,599 | (^) |
Small Cap Stock | | | | | | | | | | | | | | | | | | | | | | | | | | | | |
Securities Lending | | | 19,754,035 | | | | – | | | | 19,754,035 | | | | 19,282,807 | | | | – | | | | – | | | | 471,228 | (^) |
| (**) | Excess of collateral pledged to the counterparty may not be shown for financial reporting purposes. |
| (^) | Net securities lending amounts represent the net amount payable to the counterparty in the event of a default. |
209
THRIVENT MUTUAL FUNDS
NOTESTO FINANCIAL STATEMENTS
October 31, 2018
Mortgage Dollar Roll Transactions – Certain Funds enter into dollar roll transactions on securities issued or to be issued by the Government National Mortgage Association, Federal National Mortgage Association and Federal Home Loan Mortgage Corporation, in which the Funds sell mortgage securities and simultaneously agree to repurchase similar (same type and coupon) securities at a later date at an agreed upon price. The Funds must maintain liquid securities having a value at least equal to the repurchase price (including accrued interest) for such dollar rolls. In addition, the Funds are required to segregate collateral with the fund custodian - depending on market movements - on their mortgage dollar rolls. The value of the securities that the Funds are required to purchase may decline below the agreed upon repurchase price of those securities.
During the period between the sale and repurchase, the Funds forgo principal and interest paid on the mortgage securities sold. The Funds are compensated from negotiated fees paid by brokers offered as an inducement to the Funds to “roll over” their purchase commitments, thus enhancing the yield. Mortgage dollar rolls may be renewed with a new purchase and repurchase price and a cash settlement made on settlement date without physical delivery of the securities subject to the contract. The fees received are recognized over the roll period and are included in Income from mortgage dollar rolls in the Statement of Operations.
Securities Lending – Effective December 16, 2017, the Trust terminated its Securities Lending Agreement with Deutsche Bank AG (the “Prior Agreement”). The Trust has entered into a Securities Lending Agreement (the “Agreement”) with Goldman Sachs Bank USA, doing business as Goldman Sachs Agency Lending (“GSAL”), pursuant to which GSAL provides substantially the same securities lending services as were provided under the Prior Agreement. The Agreement authorizes GSAL to lend securities to authorized borrowers on behalf of the Funds. Pursuant to the Agreement, loaned securities are typically initially collateralized equal to at least 102% for U.S. securities and 105% for non-U.S. securities of the market value of the loaned securities. Daily market fluctuations could cause the value of loaned securities to be more or less that the value of the collateral received. Any additional collateral is adjusted and settled on the next business day. The Trust has the ability to recall the loans at any time and could do so in order to vote proxies or sell the loaned securities. All cash collateral received is invested in Thrivent Cash Management Trust. The Funds receive dividends and interest that would have been earned on the securities loaned while simultaneously seeking to earn income on the investment of cash collateral. Amounts earned on investments in Thrivent Cash Management Trust, net of rebates, fees paid to GSAL for services provided and any other securities lending expenses, are included in income from securities loaned on the Statement of Operations. By investing any cash collateral it receives in these transactions, a Fund could realize additional gains or losses. If the borrower fails to return the securities or the invested collateral has declined in value, the Fund could lose money. Generally, in the event of borrower default, the Fund has the right to use the collateral to offset any losses incurred. However, in the event the Fund is delayed or prevented from exercising its right to dispose of the collateral, there may be a potential loss. Some of these losses may be indemnified by the lending agent.
As of October 31, 2018, the value of securities on loan is as follows:
| | | | |
| Fund | | Securities
on Loan | |
Aggressive Allocation | | $ | 8,979,336 | |
Balanced Income Plus | | | 2,213,626 | |
High Yield | | | 52,051,436 | |
Income | | | 8,056,513 | |
Large Cap Stock | | | 20,843,498 | |
Large Cap Value | | | 1,623,915 | |
Mid Cap Stock | | | 20,850,942 | |
Moderate Allocation | | | 10,626,852 | |
Moderately Aggressive Allocation | | | 14,468,726 | |
Moderately Conservative Allocation | | | 3,926,265 | |
Opportunity Income Plus | | | 5,242,545 | |
Partner Emerging Markets Equity | | | 115,808 | |
Partner Worldwide Allocation | | | 2,476,946 | |
Small Cap Stock | | | 19,282,807 | |
When-Issued and Delayed Delivery Transactions – Each Fund may purchase or sell securities on a when-issued or delayed delivery basis. These transactions involve a commitment by a Fund to purchase or sell securities for a predetermined price or yield, with payment and delivery taking place beyond the customary settlement period. When delayed delivery purchases are outstanding, a Fund will designate liquid assets in an amount sufficient to meet the purchase price. When purchasing a security on a delayed delivery basis, a Fund assumes the rights and risks of ownership of the security, including the risk of price and yield fluctuations, and takes such fluctuations into account when determining its net asset value. A Fund may dispose of a delayed delivery transaction after it is entered into, and may sell when-issued securities before they are delivered, which may result in a capital gain or loss. When a Fund has sold a security on a delayed delivery basis, a Fund does not participate in future gains and losses with respect to the security.
Treasury Inflation Protected Securities – Certain Funds may invest in treasury inflation protected securities (TIPS). These securities are fixed income securities whose principal value is periodically adjusted to the rate of inflation. The coupon interest rate is generally fixed at issuance. Interest is paid based on the principal value, which is adjusted for inflation.
210
THRIVENT MUTUAL FUNDS
NOTESTO FINANCIAL STATEMENTS
October 31, 2018
Any increase in the principal amount will be included as taxable interest in the Statement of Operations and received in cash upon maturity or sale of the security.
Repurchase Agreements – Each Fund may engage in repurchase agreement transactions in pursuit of its investment objective. A repurchase agreement consists of a purchase and a simultaneous agreement to resell an investment for later delivery at an agreed upon price and rate of interest. The Funds use a third-party custodian to maintain the collateral. If the original seller of a security subject to a repurchase agreement fails to repurchase the security at the agreed upon time, a Fund could incur a loss due to a drop in the value of the security during the time it takes the Fund to either sell the security or take action to enforce the original seller’s agreement to repurchase the security. Also, if a defaulting original seller filed for bankruptcy or became insolvent, disposition of such security might be delayed by pending legal action. The Funds may only enter into repurchase agreements with banks and other recognized financial institutions such as broker/dealers that are found by the Adviser or subadviser to be creditworthy. During the year ended October 31, 2018, none of the Funds engaged in these types of investments.
Equity-Linked Structured Securities – Certain Funds may invest in equity-linked structured notes. Equity-linked structured notes are debt securities which combine the characteristics of common stock and the sale of an option. The return component is based upon the performance of a single equity security, a basket of equity securities, or an equity index and the sale of an option. There is no guaranteed return of principal with these securities. The appreciation potential of these securities may be limited by a maximum payment or call right and can be influenced by many unpredictable factors. In addition to the performance of the equity, the nature and credit of the issuer may also impact return. During the year ended October 31, 2018, none of the Funds engaged in these types of transactions.
Stripped Securities – Certain Funds may invest in Interest Only and Principal Only stripped mortgage or asset backed securities. These securities represent a participation in securities that are structured in classes with rights to receive different portions of the interest and principal. Interest only securities receive all the interest, and principal only securities receive all the principal. If the underlying pool of mortgages or assets experience greater than anticipated prepayments of principal, a Fund may not fully recoup its initial investment in an interest only security. Principal only securities increase in value if prepayments are greater than anticipated and decline if prepayments are slower than anticipated. The market value of these securities is highly sensitive to changes in interest rates. As interest rates increase, the price of the principal only security decreases. Similarly, as interest rates decrease, the price of the principal only security increases.
The principal only security represents the payment with the longest maturity, therefore making it the most sensitive to interest rate changes.
Credit Risk – The Funds may be susceptible to credit risk to the extent an issuer or counterparty defaults on its payment obligation. The Funds’ policy is to monitor the creditworthiness of issuers and counterparties. Interest receivable on defaulted securities is monitored for ability to collect payments in default and is adjusted accordingly.
Accounting Estimates – The preparation of financial statements in conformity with GAAP requires management to make estimates and assumptions that affect the reported amounts of assets and liabilities and disclosure of contingent assets and liabilities at the date of the financial statements and the reported amounts of income and expenses during the reporting period. Actual results could differ from those estimates.
Loan Commitments – Certain Funds may enter into loan commitments, which generally have interest rates which are reset daily, monthly, quarterly or semi-annually by reference to a base lending rate, plus a premium. These base rates are primarily the London-Interbank Offered Rate (“LIBOR”), and secondarily the prime rate offered by one or more major United States banks (the “Prime Rate”) and the certificate of deposit (“CD”) rate or other base lending rates used by commercial lenders. Loan commitments often require prepayments from excess cash flows or allow the borrower to repay at its election. The rate at which the borrower repays cannot be predicted with accuracy. Therefore, the remaining maturity may be considerably less than the stated maturity shown in the Schedule of Investments.
All or a portion of these loan commitments may be unfunded. A Fund is obligated to fund these commitments at the borrower’s discretion. Therefore, the Fund must have funds sufficient to cover its contractual obligation. These unfunded loan commitments, which are marked to market daily, are presented in the Schedule of Investments. During the six months ended October 31, 2018, none of the Funds engaged in these types of investments.
Loss Contingencies – High Yield Fund and Income Fund are defendants in an adversary action filed on July 31, 2009 by the Official Committee of Unsecured Creditors of Motors Liquidation Company, formerly known as General Motors Corporation (GM), against prior and current holders of term loan debt of GM. The suit seeks to determine whether GM’s term loan facility was secured at the time it entered bankruptcy. High Yield Fund at one time held term loans in an original principal amount of at least $4,723,994 and, if the plaintiffs are successful, it is reasonably possible that the Fund will be required to make payments in some amount. This loss contingency has not been accrued as a liability
211
THRIVENT MUTUAL FUNDS
NOTESTO FINANCIAL STATEMENTS
October 31, 2018
because the amount of potential damages and the likelihood of loss cannot be reasonably estimated. Income Fund is also named as a defendant in this action, but management does not expect that the Fund’s assets will be subject to a loss contingency.
Litigation – Awards from class action litigation are recorded as a reduction of cost if the Fund still owns the applicable securities on the payment date. If the Fund no longer owns the applicable securities, the proceeds are recorded as realized gains.
Bank Loans (Leveraged Loans) – Certain Funds may invest in bank loans, which are senior secured loans that are made by banks or other lending institutions to companies that are typically rated below investment grade. A fund may invest in multiple series or tranches of a bank loan, with varying terms and different associated risks. Transactions in bank loan securities may settle on a delayed basis, which may result in the proceeds of the sale to not be readily available for a fund to make additional investments. Interest rates of bank loan securities typically reset periodically, as the rates are tied to a reference index, such as the London Interbank Offered Rate (“LIBOR”), plus a premium. Income is recorded daily on bank loan securities. On an ongoing basis, a fund may receive a commitment fee based on the undrawn portion of the underlying line of credit of the bank loan. This commitment fee is accrued as income over the term of the bank loan. A fund may receive consent and amendment fees for accepting an amendment to the current terms of a bank loan. Consent and amendment fees are accrued as income when the changes to the bank loan are immaterial and to capital when the changes are material.
Amortization of Offering Costs – The offering costs referenced in the Statement of Operations for High Income Municipal Bond Fund, Low Volatility Equity Fund and Small Cap Growth Fund are costs incurred by the Fund in order to establish it for sale. These costs generally include any legal costs associated with registering the Fund. These costs are amortized over a period of 12 months from inception.
Line of Credit – On January 3, 2018, each Fund (except High Income Municipal Bond Fund and Small Cap Growth Fund) along with other portfolios managed by the investment adviser or an affiliate, agreed to participate in a $100 million ($50 million committed, $50 million uncommitted) credit facility (the “line of credit”) to be utilized for temporary or emergency purposes to fund shareholder redemptions or for other short-term liquidity purposes. Interest is charged to each participating fund based on its borrowings at the higher of the Federal Funds Rate or the One-Month LIBOR rate plus 1.25%. Each borrowing under the credit facility matures no later than 30 calendar days after the date of the borrowing. Each participating Fund paid commitment fees during the year ended October 31, 2018 in proportion to their respective net assets.
Recent Accounting Pronouncements –
Premium Amortization on Purchased Callable Debt Securities
In March 2017, the Financial Accounting Standards Board (FASB) issued Accounting Standards Update (ASU) No. 2017-08 Premium Amortization on Purchased Callable Debt Securities. ASU No. 2017-08 updates the accounting standards to shorten the amortization period for certain purchased callable debt securities, held at a premium, to be amortized to the earliest call date. The update applies to securities with explicit, non-contingent call features that are callable at fixed prices and on preset dates. The amendments are effective for fiscal years, and interim periods within those fiscal years, beginning after December 15, 2018. At this time management is evaluating the implications of this guidance and the impact it will have to financial statement amounts and footnote disclosures.
Fair Value Measurement (Topic 820)
In August 2018, the Financial Accounting Standards Board (FASB) issued Accounting Standards Update (ASU) No. 2018-13 Fair Value Measurement (Topic 820). ASU No. 2018-13 updates the disclosure requirements on fair value measurements by modifying or removing certain disclosures and adding certain new disclosures. The amendments are effective for fiscal years, and the interim periods within those fiscal years, beginning after December 15, 2019. At this time, management is evaluating the implications of this guidance and the impact it will have to financial statements amounts and footnote disclosures.
Disclosure Update and Simplification
In September 2018, the Securities and Exchange Commission released Final Rule 33-10532, Disclosure Update and Simplification, which amends certain disclosure requirements that the Commission has determined to be redundant, duplicative, overlapping, outdated, or superseded in light of other Commission disclosure requirements, GAAP, or changes in the information environment. The amendments are effective for filings subsequent to November 5, 2018. Management has evaluated the impact of these amendments and has implemented disclosure changes to the Statement of Assets and Liabilities and the Statement of Changes in Net Assets. The components of distributable earnings are no longer required to be presented on the Statement of Assets and Liabilities. Additionally, the source of distributions to shareholders and the amount of undistributed net investment income is no longer required to be presented on the Statement of Changes in Net Assets.
212
THRIVENT MUTUAL FUNDS
NOTESTO FINANCIAL STATEMENTS
October 31, 2018
In-kind Contributions – During March 2018, Balanced Income Plus Fund and Opportunity Income Plus Fund contributed securities in-kind to Thrivent Core Emerging Markets Debt Fund in the amount of $71,231,243. As a result of the in-kind contribution, Thrivent Core Emerging Markets Debt Fund issued 7,482,273 shares at a $9.52/share net asset value. For financial reporting purposes, the contributing fund/portfolio recognizes a gain on these transactions to the extent the value of the distributed securities on the date of contribution exceeds the cost of those securities; they recognize a loss if the cost exceeds the value. Gains or losses on these in-kind contributions are recognized for tax purposes. The realized gains or losses below are included in the Statement of Operations of the contributing fund/portfolio as net realized gains/losses on in-kind contributions. These in-kind transactions were conducted at market value. The transactions were as follows:
| | | | | | | | | | | | |
| Contributing Fund | | Shares
Received | | | In-kind
Amount | | | Realized
Gain/(Loss) | |
Balanced Income Plus Fund | | | 1,120,664 | | | $ | 10,668,722 | | | $ | (261,061 | ) |
Opportunity Income Plus Fund | | | 6,361,609 | | | $ | 60,562,521 | | | $ | (1,226,852 | ) |
Totals | | | 7,482,273 | | | $ | 71,231,243 | | | $ | (1,487,913 | ) |
Other – For financial statement purposes, investment security transactions are accounted for on the trade date.
Realized gains and losses from investment transactions are determined on a specific cost identification basis, which is the same basis used for federal income tax purposes.
(3) FEES AND COMPENSATION PAID TO AFFILIATES
Investment Advisory Fees – The Trust has entered into an Investment Advisory Agreement with Thrivent Asset Mgt. Under the Investment Advisory Agreement, each of the Funds pays a fee for investment advisory services. The fees are accrued daily and paid monthly.
The annual rates of fees as a percent of average daily net assets under the Investment Advisory Agreement were as follows:
| | | | | | | | | | | | | | | | | | | | |
| Fund (M - Millions) | | $0 to $500M | | | Over $500 to $2,000M | | | Over $2,000 to
$5,000M | | | Over $5,000 to
$10,000M | | | Over $10,000M | |
Aggressive Allocation | | | 0.750 | % | | | 0.725 | % | | | 0.700 | % | | | 0.675 | % | | | 0.650 | % |
Moderate Allocation | | | 0.650 | % | | | 0.625 | % | | | 0.600 | % | | | 0.575 | % | | | 0.550 | % |
Moderately Aggressive Allocation | | | 0.700 | % | | | 0.675 | % | | | 0.650 | % | | | 0.625 | % | | | 0.600 | % |
Moderately Conservative Allocation | | | 0.600 | % | | | 0.575 | % | | | 0.550 | % | | | 0.525 | % | | | 0.500 | % |
| | | | | | | | | | | | | | | | |
| Fund (M - Millions) | | $0 to $250M | | | Over $250 to
$1,000M | | | Over $1,000 to
$1,500M | | | Over $1,500M | |
Partner Worldwide Allocation | | | 0.850 | % | | | 0.800 | % | | | 0.775 | % | | | 0.750 | % |
| | | | | | | | | | | | | | | | | | | | | | | | | | | | | | | | | | | | | | | | | | | | |
| Fund (M - Millions) | | $0 to $50M | | | Over $50 to $100M | | | Over
$100 to
$200M | | | Over
$200 to
$250M | | | Over
$250 to
$500M | | | Over
$500 to
$750M | | | Over
$750 to
$1,000M | | | Over
$1,000 to
$2,000M | | | Over
$2,000 to
$2,500M | | | Over
$2,500 to
$5,000M | | | Over
$5,000M | |
Balanced Income Plus | | | 0.550 | % | | | 0.550 | % | | | 0.550 | % | | | 0.550 | % | | | 0.550 | % | | | 0.500 | % | | | 0.500 | % | | | 0.475 | % | | | 0.475 | % | | | 0.450 | % | | | 0.425 | % |
Government Bond | | | 0.400 | % | | | 0.400 | % | | | 0.400 | % | | | 0.400 | % | | | 0.400 | % | | | 0.350 | % | | | 0.350 | % | | | 0.350 | % | | | 0.350 | % | | | 0.350 | % | | | 0.350 | % |
High Income Municipal Bond | | | 0.500 | % | | | 0.500 | % | | | 0.500 | % | | | 0.500 | % | | | 0.500 | % | | | 0.450 | % | | | 0.450 | % | | | 0.450 | % | | | 0.450 | % | | | 0.450 | % | | | 0.450 | % |
High Yield | | | 0.400 | % | | | 0.400 | % | | | 0.400 | % | | | 0.400 | % | | | 0.400 | % | | | 0.350 | % | | | 0.350 | % | | | 0.300 | % | | | 0.300 | % | | | 0.300 | % | | | 0.300 | % |
Income | | | 0.350 | % | | | 0.350 | % | | | 0.350 | % | | | 0.350 | % | | | 0.350 | % | | | 0.325 | % | | | 0.325 | % | | | 0.300 | % | | | 0.300 | % | | | 0.300 | % | | | 0.300 | % |
Large Cap Growth | | | 0.750 | % | | | 0.750 | % | | | 0.750 | % | | | 0.750 | % | | | 0.750 | % | | | 0.700 | % | | | 0.700 | % | | | 0.650 | % | | | 0.650 | % | | | 0.600 | % | | | 0.575 | % |
Large Cap Stock | | | 0.650 | % | | | 0.650 | % | | | 0.650 | % | | | 0.650 | % | | | 0.650 | % | | | 0.575 | % | | | 0.575 | % | | | 0.500 | % | | | 0.475 | % | | | 0.450 | % | | | 0.425 | % |
Large Cap Value | | | 0.450 | % | | | 0.450 | % | | | 0.450 | % | | | 0.450 | % | | | 0.450 | % | | | 0.450 | % | | | 0.450 | % | | | 0.450 | % | | | 0.450 | % | | | 0.450 | % | | | 0.450 | % |
Limited Maturity Bond | | | 0.300 | % | | | 0.300 | % | | | 0.300 | % | | | 0.300 | % | | | 0.300 | % | | | 0.275 | % | | | 0.275 | % | | | 0.250 | % | | | 0.250 | % | | | 0.250 | % | | | 0.250 | % |
Low Volatility Equity | | | 0.600 | % | | | 0.600 | % | | | 0.500 | % | | | 0.500 | % | | | 0.500 | % | | | 0.500 | % | | | 0.500 | % | | | 0.500 | % | | | 0.500 | % | | | 0.500 | % | | | 0.500 | % |
Mid Cap Stock | | | 0.700 | % | | | 0.700 | % | | | 0.700 | % | | | 0.650 | % | | | 0.650 | % | | | 0.650 | % | | | 0.650 | % | | | 0.600 | % | | | 0.600 | % | | | 0.550 | % | | | 0.525 | % |
Money Market | | | 0.350 | % | | | 0.350 | % | | | 0.350 | % | | | 0.350 | % | | | 0.350 | % | | | 0.350 | % | | | 0.350 | % | | | 0.350 | % | | | 0.350 | % | | | 0.350 | % | | | 0.350 | % |
Municipal Bond | | | 0.450 | % | | | 0.450 | % | | | 0.450 | % | | | 0.450 | % | | | 0.450 | % | | | 0.400 | % | | | 0.400 | % | | | 0.350 | % | | | 0.350 | % | | | 0.325 | % | | | 0.300 | % |
213
THRIVENT MUTUAL FUNDS
NOTESTO FINANCIAL STATEMENTS
October 31, 2018
| | | | | | | | | | | | | | | | | | | | | | | | | | | | | | | | | | | | | | | | | | | | |
| Fund (M - Millions) | | $0 to
$50M | | | Over $50 to
$100M | | | Over
$100 to $200M | | | Over
$200 to $250M | | | Over
$250 to
$500M | | | Over
$500 to
$750M | | | Over
$750 to
$1,000M | | | Over
$1,000 to $2,000M | | | Over
$2,000 to
$2,500M | | | Over
$2,500 to
$5,000M | | | Over
$5,000M | |
Opportunity Income Plus | | | 0.450 | % | | | 0.450 | % | | | 0.450 | % | | | 0.450 | % | | | 0.450 | % | | | 0.400 | % | | | 0.400 | % | | | 0.375 | % | | | 0.375 | % | | | 0.350 | % | | | 0.325 | % |
Partner Emerging Markets Equity | | | 1.200 | % | | | 1.070 | % | | | 1.070 | % | | | 1.070 | % | | | 1.070 | % | | | 1.070 | % | | | 1.070 | % | | | 1.070 | % | | | 1.070 | % | | | 1.070 | % | | | 1.070 | % |
Small Cap Growth | | | 0.800 | % | | | 0.800 | % | | | 0.800 | % | | | 0.750 | % | | | 0.750 | % | | | 0.750 | % | | | 0.750 | % | | | 0.750 | % | | | 0.750 | % | | | 0.750 | % | | | 0.750 | % |
Small Cap Stock | | | 0.700 | % | | | 0.700 | % | | | 0.700 | % | | | 0.650 | % | | | 0.650 | % | | | 0.650 | % | | | 0.650 | % | | | 0.600 | % | | | 0.600 | % | | | 0.550 | % | | | 0.525 | % |
Sub-Adviser Fees – The following subadviser fees are charged as part of the total investment advisory fees stated in the table above. The subadvisory fees are borne directly by the Adviser and do not increase the overall fees paid by the Fund. The amounts listed as subadviser fees in the Statement of Operations is the portion of the investment advisory fee that is paid to the subadviser. The amount listed as adviser fees in the Statement of Operations is the portion of the investment advisory fee that is retained by the investment adviser.
Partner Emerging Markets Equity Fund
The Adviser has entered into a subadvisory agreement for the performance of subadvisory services with Aberdeen Asset Managers Limited (“Aberdeen”). The fee payable for Aberdeen is equal to 0.85% of the first $50 million of average daily net assets, 0.72% for the next $50 million and 0.68% for assets over $100 million. Thrivent Partner Emerging Markets Equity Portfolio, Thrivent Partner Worldwide Allocation Portfolio; each a series of Thrivent Series Fund, Inc., the shares of which are only available for purchase by separate accounts of and retirement plans sponsored by Thrivent Financial, and Thrivent Partner Worldwide Allocation Fund are included in determining breakpoints for the assets managed by Aberdeen.
Partner Worldwide Allocation Fund
The adviser has entered into subadvisory agreements with Principal Global Investors, LLC (“Principal”), Aberdeen Asset Managers Limited (“Aberdeen”) and Goldman Sachs Asset Management, L.P. (“GSAM”) for the performance of subadvisory services.
The fee payable for Principal is equal to 0.35% of the first $500 million of average daily net assets, 0.30% of the next $500 million and 0.25% of average daily net assets over $1 billion. Thrivent Partner Worldwide Allocation Portfolio is included in determining breakpoints for the assets managed by Principal.
The fee payable for Aberdeen is equal to 0.85% of the first $50 million of average daily net assets, 0.72% of the next $50 million and 0.68% of average daily net assets over $100 million. Thrivent Partner Worldwide Allocation Portfolio, Thrivent Partner Emerging Markets Equity Fund, and Thrivent Partner Emerging Markets Equity Portfolio are included in determining breakpoints for the assets managed by Aberdeen.
The fee payable for GSAM for managing the emerging markets debt portion is equal to 0.50% of the first $200 million of average daily net assets, 0.45% of the next $200 million and 0.40% of average daily net assets over $400 million. The fee payable for GSAM for managing the international small- and mid-cap equities portion is equal to 0.58% of the first $250 million of average daily net assets; and 0.54% of average daily net assets in excess of $250 million. Thrivent Partner Worldwide Allocation Portfolio is included in determining breakpoints for the assets managed by GSAM.
Expense Reimbursements – For the period ended October 31, 2018, contractual expense reimbursements, as a percentage of net assets, were in effect:
| | | | | | | | | | | | |
| Fund | | Class A | | | Class S | | | Expiration Date | |
Money Market* | | | 0.10 | % | | | 0.10 | % | | | 2/28/2019 | |
| * | Expense waiver in effect on January 1, 2018 |
For the period ended October 31, 2018, contractual expense reimbursements to limit expenses to the following percentages were in effect:
| | | | | | | | | | | | |
| Fund | | Class A | | | Class S | | | Expiration Date | |
Government Bond | | | 0.85 | % | | | 0.75 | % | | | 2/28/2019 | |
High Income Municipal Bond | | | N/A | | | | 0.66 | % | | | 2/28/2019 | |
Large Cap Growth* | | | 1.15 | % | | | N/A | | | | 2/28/2019 | |
Low Volatility Equity | | | N/A | | | | 1.20 | % | | | 2/28/2019 | |
Partner Emerging Markets Equity | | | 1.65 | % | | | 1.32 | % | | | 2/28/2019 | |
Partner Worldwide Allocation | | | 1.35 | % | | | N/A | | | | 2/28/2019 | |
Small Cap Growth | | | N/A | | | | 1.24 | % | | | 2/28/2019 | |
| * | Prior expense cap of 1.20% expired on February 28, 2018. |
For the period ended October 31, 2018, Partner Worldwide Allocation Fund class S shares had a contractual expense reimbursement of 0.05% as a percentage of net assets in effect that expired on January 1, 2018. This expense reimbursement was effective beginning January 1, 2017.
Each of the four Asset Allocation Funds paid a fee for investment advisory services. The Adviser has contractually agreed, for as long as the current fee structure is in place and through at least February 28, 2019, to waive an amount equal to any investment advisory fees indirectly incurred by the Asset Allocation Funds as a result of their investment in any other mutual fund for which the Adviser or an affiliate serves as investment adviser, other than Thrivent Cash Management Trust. This contractual provision may be terminated upon the mutual agreement between the Independent Trustees of
214
THRIVENT MUTUAL FUNDS
NOTESTO FINANCIAL STATEMENTS
October 31, 2018
the Fund and the Adviser. For the period ended October 31, 2018, the following expense reimbursements, as a percentage of net assets, were in effect:
| | | | | | | | | | | | |
| Fund | | Class A | | | Class S | | | Expiration Date | |
Aggressive Allocation* | | | 0.24 | % | | | 0.24 | % | | | N/A | |
Moderate Allocation* | | | 0.21 | % | | | 0.21 | % | | | N/A | |
Moderately Aggressive Allocation* | | | 0.26 | % | | | 0.26 | % | | | N/A | |
Moderately Conservative Allocation* | | | 0.16 | % | | | 0.16 | % | | | N/A | |
| * | Expense reimbursements are accrued daily and paid by Thrivent Asset Mgt. monthly. Thrivent does not recoup amounts previously reimbursed or waived in prior fiscal years. |
Subject to certain limitations, all Funds in the Trust except for Money Market Fund may invest cash in other Funds in the Trust, Thrivent Cash Management Trust, and Thrivent Core Funds. These related-party transactions are subject to the same terms as non-related party transactions. To avoid duplicate investment advisory fees, Thrivent Asset Mgt. reimburses an amount equal to any investment advisory fees indirectly incurred by the asset allocation, income plus, equity and fixed income funds as a result of their investment in any other mutual fund for which the Adviser or an affiliate serves as investment adviser, other than Thrivent Cash Management.
Distribution Plan – Thrivent Distributors, LLC is the Trust’s distributor. The Trust has adopted a Distribution Plan pursuant to Rule 12b-1 under the 1940 Act. Class A shares have an annual 12b-1 fee of 0.25% for all Funds other than Government Bond Fund and Limited Maturity Bond Fund, which have a 12b-1 fee of 0.125%, and Money Market Fund, which does not have a 12b-1 fee. Effective January 1, 2018, the 12b-1 fee of 0.125% was removed from Money Market Fund Class A shares.
Sales Charges and Other Fees – For the year ended October 31, 2018, Thrivent Investment Management Inc. (“Thrivent Investment Mgt.”) and Thrivent Distributors, LLC received $1,415,796 of aggregate underwriting concessions from the sales of the Trust’s Class A shares. Sales charges are not an expense of the Trust and are not reflected in the financial statements of any of the Funds.
The Trust has entered into an accounting and administrative services agreement with Thrivent Asset Mgt. pursuant to which Thrivent Asset Mgt. provides certain accounting and administrative personnel and services to the Funds. The Funds pay an annual fee equal to the sum of $70,000 per fund plus 0.019% of net assets to Thrivent Asset Mgt. These fees are accrued daily and paid monthly. For the year ended October 31, 2018, Thrivent Asset Mgt. received aggregate fees for accounting and administrative personnel and services of $5,288,307 from the Trust.
The Trust has entered into an agreement with Thrivent Financial Investor Services Inc. (“Thrivent Investor Services”) to provide transfer agency, sub transfer agency, and dividend payment services necessary to the Funds on a per-account basis. These fees are accrued daily and paid monthly. For the year ended October 31, 2018, Thrivent Investor Services received $16,272,456 for transfer agent services from the Trust.
Each Trustee who is not affiliated with the Adviser receives an annual fee from the Trust for services as a Trustee and is eligible to participate in a deferred compensation plan with respect to fees received from the Trust. Participants in the plan may designate their deferred Trustee’s fees as if invested in a series of the Thrivent Mutual Funds, except for Money Market Fund as it is not eligible for the deferral plan. The value of each Trustee’s deferred compensation account will increase or decrease as if invested in shares of a particular series of Thrivent Mutual Funds. Their fees as well as the change in value are included in Trustee fees in the Statement of Operations. The deferred fees remain in the appropriate series of Thrivent Mutual Funds until distribution in accordance with the plan. The Payable for trustee deferred compensation, located in the Statement of Assets and Liabilities, is unsecured.
Those Trustees not participating in the above plan received $511,999 in fees from the Trust for the Funds covered in this shareholder report for the year ended October 31, 2018. In addition, the Trust reimbursed independent Trustees for reasonable expenses incurred in relation to attendance at meetings and industry conferences.
Certain officers and non-independent Trustees of the Trust are officers, managers or directors of Thrivent Asset Mgt., Thrivent Investment Mgt., Thrivent Investor Services and Thrivent Distributors, LLC.; however, they receive no compensation from the Trust. Affiliated employees and board consultants are reimbursed for reasonable expenses incurred in relation to board meeting attendance.
Indirect Expenses – Some Funds invest in other open-ended funds. Fees and expenses of those underlying funds are not included in those Funds’ expense ratios reported in the Financial Highlights. The Funds indirectly bear their proportionate share of the annualized weighted average expense ratio of the underlying funds in which they invest. The Adviser has contractually agreed, for as long as the current fee structure is in place, to waive an amount equal to any investment advisory fees indirectly incurred by the Asset Allocation Funds as a result of their investment in any other mutual fund for which the Adviser or an affiliate serves as investment adviser, other than Thrivent Cash Management Trust. There are no advisory fees for Thrivent Core Funds, and therefore no reimbursement is made for investments in these funds. This contractual provision may be terminated upon the mutual agreement between the Independent Trustees of the Trust and the Adviser.
Interfund Lending – The Funds may participate in an interfund lending program (the “Program”) pursuant to an exemptive order issued by the SEC. The Program permits the
215
THRIVENT MUTUAL FUNDS
NOTESTO FINANCIAL STATEMENTS
October 31, 2018
Funds to borrow cash for temporary purposes from Thrivent Core Short-Term Reserve Fund. Interest is charged to each participating Fund based on its borrowings at the average of the repo rate and bank loan rate, each as defined in the Program. Each borrowing made under the Program matures no later than seven calendar days after the date of the borrowing, and each borrowing must be securitized by a pledge of segregated collateral with a market value at least equal to 102% of the outstanding principal value of the loan. For the year ended October 31, 2018, none of the Funds borrowed cash through the Program.
TAX INFORMATION
Distributions are based on amounts calculated in accordance with the applicable federal income tax regulations, which may differ from GAAP. At the end of the fiscal year, reclassifications between net asset accounts are made for differences that are permanent in nature. These permanent differences primarily relate to the tax treatment of partnerships or utilization of earnings and profits distributed to shareholders on redemption of shares.
On the Statement of Assets and Liabilities, as a result of permanent book-to-tax differences, reclassification adjustments were made as increases or decreases as applicable in the table below:
| | | | | | | | |
| Fund | | Distributable earnings/ (accumulated loss) | | | Capital Stock | |
Aggressive Allocation | | | ($2,600,409 | ) | | | $2,600,409 | |
Balanced Income Plus | | | (65,991 | ) | | | 65,991 | |
High Income Municipal Bond | | | 15,884 | | | | (15,884 | ) |
Large Cap Growth | | | (2,700,000 | ) | | | 2,700,000 | |
Large Cap Stock | | | (4,899,801 | ) | | | 4,899,801 | |
Large Cap Value | | | (1,499,833 | ) | | | 1,499,833 | |
Low Volatility Equity | | | 7,305 | | | | (7,305 | ) |
Mid Cap Stock | | | (6,502,816 | ) | | | 6,502,816 | |
Moderate Allocation | | | (1,999,730 | ) | | | 1,999,730 | |
Moderately Aggressive Allocation | | | (6,257,674 | ) | | | 6,257,674 | |
Moderately Conservative Allocation | | | (45,040 | ) | | | 45,040 | |
Partner Worldwide Allocation | | | (21,344 | ) | | | 21,344 | |
Small Cap Growth | | | 15,417 | | | | (15,417 | ) |
Small Cap Stock | | | (4,061,505 | ) | | | 4,061,505 | |
At October 31, 2018, the components of distributable earnings on a tax basis were as follows:
| | | | | | | | |
| Fund | | Undistributed Ordinary Incomea | | | Undistributed Long- Term Capital Gain | |
Aggressive Allocation | | | $9,576,498 | | | | $80,902,936 | |
Balanced Income Plus | | | 3,833,354 | | | | 19,735,849 | |
Government Bond | | | 12,940 | | | | – | |
High Income Municipal Bondb | | | 17,118 | | | | – | |
High Yield | | | 168,616 | | | | – | |
Income | | | 6,404 | | | | – | |
Large Cap Growth | | | 14,711,170 | | | | 79,163,344 | |
Large Cap Stock | | | 17,776,780 | | | | 126,292,351 | |
Large Cap Value | | | 13,854,333 | | | | 52,478,351 | |
Limited Maturity Bond | | | 200,389 | | | | – | |
Low Volatility Equity | | | 182,904 | | | | 108,596 | |
Mid Cap Stock | | | 24,189,314 | | | | 171,603,880 | |
Moderate Allocation | | | 1,686,772 | | | | 52,719,999 | |
Moderately Aggressive Allocation | | | 18,935,048 | | | | 102,890,117 | |
Moderately Conservative Allocation | | | 1,399,057 | | | | 13,728,154 | |
Municipal Bondb | | | 141,468 | | | | – | |
Partner Emerging Markets Equity | | | 66,405 | | | | – | |
Partner Worldwide Allocation | | | 16,700,143 | | | | 25,991,555 | |
Small Cap Growth | | | 100,868 | | | | – | |
Small Cap Stock | | | 8,364,793 | | | | 82,542,068 | |
| a | Undistributed Ordinary Income includes income derived from Short-Term Capital Gains. |
| b | High Income Municipal Bond Fund and Municipal Bond Fund undistributed ordinary income are primarily exempt from federal income taxes. |
At October 31, 2018, the following Funds had accumulated net realized capital loss carryovers expiring as follows:
| | | | | | | | |
| Fund | | Capital Loss Carryover | | | Expiration | |
Government Bond | | $ | 770,070 | | | | Unlimited | |
High Yield | | | 27,979,272 | | | | Unlimited | |
Income | | | 4,431,827 | | | | Unlimited | |
Large Cap Stock | | | 7,722,816 | * | | | Unlimited | |
Limited Maturity Bond | | | 5,708,223 | | | | Unlimited | |
Money Market | | | 7,995 | | | | Unlimited | |
Municipal Bond | | | 10,181,782 | | | | Unlimited | |
Opportunity Income Plus | | | 12,275,188 | | | | Unlimited | |
Partner Emerging Markets Equity | | | 2,489,477 | * | | | Unlimited | |
| * | These capital loss carryovers are limited under the Internal Revenue Code as to future utilization |
To the extent that these Funds realize future net capital gains, taxable distributions will be reduced by any unused capital loss carryovers as permitted by the Internal Revenue Code.
During the fiscal year 2018, capital loss carryovers utilized by the Funds were as follows:
| | | | |
| Fund | | Capital Loss
Carryover | |
High Yield | | | 2,226,602 | |
Large Cap Stock | | | 320,623 | |
Municipal Bond | | | 2,036,901 | |
216
THRIVENT MUTUAL FUNDS
NOTESTO FINANCIAL STATEMENTS
October 31, 2018
The tax character of distributions paid during the years ended October 31, 2018 and 2017 was as follows:
| | | | | | | | | | | | | | | | | | | | | | | | |
| | | Tax-Exempt Income | | | Ordinary Income a | | | Long-Term Capital Gain | |
| Fund | | 10/31/2018 | | | 10/31/2017 | | | 10/31/2018 | | | 10/31/2017 | | | 10/31/2018 | | | 10/31/2017 | |
Aggressive Allocation | | | $– | | | | $– | | | | $25,049,146 | | | | $5,226,150 | | | | $42,504,919 | | | | $4,137,930 | |
Balanced Income Plus | | | – | | | | – | | | | 9,117,358 | | | | 6,956,012 | | | | 3,777,505 | | | | – | |
Government Bond | | | – | | | | – | | | | 1,457,395 | | | | 912,659 | | | | 175,213 | | | | 115,720 | |
High Income Municipal Bond | | | 120,355 | | | | – | | | | 627 | | | | – | | | | – | | | | – | |
High Yield | | | – | | | | – | | | | 39,807,414 | | | | 37,756,918 | | | | – | | | | – | |
Income | | | – | | | | – | | | | 28,950,740 | | | | 27,516,639 | | | | 2,835,212 | | | | 70,070 | |
Large Cap Growth | | | – | | | | – | | | | 7,307,023 | | | | – | | | | 13,989,064 | | | | 3,841,148 | |
Large Cap Stock | | | – | | | | – | | | | 57,172,400 | | | | 19,489,545 | | | | 117,072,103 | | | | 45,030,048 | |
Large Cap Value | | | – | | | | – | | | | 16,343,737 | | | | 12,633,378 | | | | 37,677,804 | | | | 27,002,050 | |
Limited Maturity Bond | | | – | | | | – | | | | 21,372,776 | | | | 15,303,593 | | | | – | | | | – | |
Low Volatility Equity | | | – | | | | – | | | | 130,395 | | | | – | | | | 20,226 | | | | – | |
Mid Cap Stock | | | – | | | | – | | | | 686,657 | | | | 2,566,223 | | | | 141,010,906 | | | | 59,623,371 | |
Moderate Allocation | | | – | | | | – | | | | 53,203,629 | | | | 28,709,427 | | | | 45,092,835 | | | | 9,802,217 | |
Moderately Aggressive Allocation | | | – | | | | – | | | | 58,640,304 | | | | 21,109,876 | | | | 71,099,723 | | | | 21,224,817 | |
Moderately Conservative Allocation | | | – | | | | – | | | | 19,988,413 | | | | 15,557,498 | | | | 12,230,399 | | | | 5,233,887 | |
Money Market | | | – | | | | – | | | | 5,018,820 | | | | 355,446 | | | | – | | | | – | |
Municipal Bond | | | 52,816,067 | | | | 54,640,708 | | | | 325,037 | | | | 323,102 | | | | – | | | | – | |
Opportunity Income Plus | | | – | | | | – | | | | 21,230,449 | | | | 16,274,170 | | | | – | | | | – | |
Partner Emerging Markets Equity | | | – | | | | – | | | | 145,213 | | | | 72,372 | | | | – | | | | – | |
Partner Worldwide Allocation | | | – | | | | – | | | | 27,934,231 | | | | 16,972,878 | | | | 5,536,332 | | | | – | |
Small Cap Stock | | | – | | | | – | | | | 2,363,503 | | | | 1,217,551 | | | | 41,701,946 | | | | 20,853,034 | |
| (a) | Ordinary income includes income derived from short-term capital gains. |
(5) SECURITY TRANSACTIONS
Purchases and Sales of Investment Securities – For the year ended October 31, 2018, the cost of purchases and the proceeds from sales of investment securities, other than U.S. Government and short-term securities, were as follows:
| | | | | | | | |
| | | In thousands | |
| Fund | | Purchases | | | Sales | |
Aggressive Allocation | | | $450,755 | | | | $372,281 | |
Balanced Income Plus | | | 275,604 | | | | 258,648 | |
Government Bond | | | 9,553 | | | | 5,645 | |
High Income Municipal Bond | | | 16,676 | | | | 10,114 | |
High Yield | | | 293,511 | | | | 266,979 | |
Income | | | 390,278 | | | | 396,655 | |
Large Cap Growth | | | 612,648 | | | | 582,276 | |
Large Cap Stock | | | 908,920 | | | | 876,483 | |
Large Cap Value | | | 230,408 | | | | 181,187 | |
Limited Maturity Bond | | | 340,297 | | | | 311,404 | |
Low Volatility Equity | | | 9,837 | | | | 4,944 | |
Mid Cap Stock | | | 683,493 | | | | 590,777 | |
Moderate Allocation | | | 609,946 | | | | 483,925 | |
Moderately Aggressive Allocation | | | 822,145 | | | | 614,506 | |
Moderately Conservative Allocation | | | 216,803 | | | | 187,377 | |
Municipal Bond | | | 543,386 | | | | 608,122 | |
Opportunity Income Plus | | | 251,327 | | | | 194,120 | |
Partner Emerging Markets Equity | | | 6,430 | | | | 3,796 | |
Partner Worldwide Allocation | | | 645,379 | | | | 640,116 | |
Small Cap Growth | | | 6,208 | | | | 1,518 | |
Small Cap Stock | | | 445,811 | | | | 401,108 | |
Purchases and sales of U.S. Government securities were:
| | | | | | | | |
| | | In thousands | |
| Fund | | Purchases | | | Sales | |
Aggressive Allocation | | | $184,153 | | | | $175,105 | |
Balanced Income Plus | | | 260,086 | | | | 259,649 | |
Government Bond | | | 154,243 | | | | 156,746 | |
Income | | | 510,423 | | | | 494,684 | |
Limited Maturity Bond | | | 441,005 | | | | 413,177 | |
Moderate Allocation | | | 2,457,767 | | | | 2,409,560 | |
Moderately Aggressive Allocation | | | 1,556,405 | | | | 1,489,699 | |
Moderately Conservative Allocation | | | 1,312,606 | | | | 1,304,767 | |
Opportunity Income Plus | | | 812,580 | | | | 817,130 | |
Partner Worldwide Allocation | | | 24,883 | | | | 24,893 | |
Investments in Restricted Securities – Certain Funds may own restricted securities which were purchased in private placement transactions without registration under the Securities Act of 1933. Unless such securities subsequently become registered, they generally may be resold only in privately negotiated transactions with a limited number of purchasers. As of October 31, 2018, the following Funds held restricted securities:
| | | | | | | | |
| Fund | | Number of
Securities | | | Percent of Fund’s
Net Assets | |
Balanced Income Plus | | | 26 | | | | 2.97 | % |
High Yield | | | 3 | | | | 0.84 | % |
Income | | | 11 | | | | 1.97 | % |
Limited Maturity Bond | | | 34 | | | | 10.09 | % |
Moderate Allocation | | | 32 | | | | 0.96 | % |
Moderately Aggressive Allocation | | | 32 | | | | 0.51 | % |
Moderately Conservative Allocation | | | 32 | | | | 1.59 | % |
Municipal Bond | | | 5 | | | | 0.34 | % |
Opportunity Income Plus | | | 31 | | | | 7.15 | % |
Partner Worldwide Allocation | | | 10 | | | | 0.25 | % |
217
THRIVENT MUTUAL FUNDS
NOTESTO FINANCIAL STATEMENTS
October 31, 2018
The Funds have no right to require registration of unregistered securities.
(6) SECURITY TRANSACTIONS WITH AFFILIATED FUNDS
The Funds are permitted to purchase or sell securities from or to certain other Funds under specified conditions outlined in procedures adopted by the Board. The procedures have been designed to ensure that any purchase or sale of securities by a Fund from or to another fund or portfolio that is or could be considered an affiliate by virtue of having a common investment adviser (or affiliated investment advisers), common Trustees and/or common officers complies with Rule 17a-7 of the 1940 Act. Further, as defined under the procedures, each transaction is executed at the current market price.
During the year ended October 31, 2018, Mid Cap Stock Fund and Small Cap Stock Fund engaged in purchase transactions in the amounts of $86,761,226 and $25,505,513, respectively, that complied with Rule 17a-7 of the 1940 Act. Aggressive Allocation Fund engaged in sale transactions in the amount of $7,462,467 that complied with Rule 17a-7 of the 1940 Act. These sale transactions resulted in a realized gain of $1,754,094 in Aggressive Allocation Fund.
(7) RELATED PARTY TRANSACTIONS
As of October 31, 2018, related parties (other than the Thrivent Asset Allocation Funds) held the following shares in excess of 5% of Thrivent Mutual Funds:
| | | | | | | | |
| Fund | | Shares | | | Percent of Fund’s
Outstanding
Shares | |
Government Bond | | | 4,380,641 | | | | 72.5 | % |
High Income Municipal Bond | | | 185,848 | | | | 27.7 | % |
Opportunity Income Plus | | | 2,814,174 | | | | 5.0 | % |
Partner Worldwide Allocation | | | 11,934,084 | | | | 14.4 | % |
Small Cap Growth | | | 163,037 | | | | 33.1 | % |
As of October 31, 2018, retirement plans sponsored by Thrivent Financial for Lutherans held the following shares in excess of 5% of Thrivent Mutual Funds:
| | | | | | | | |
| Fund | | Shares | | | Percent of Fund’s Outstanding Shares | |
Aggressive Allocation | | | 9,817,513 | | | | 12.4 | % |
Balanced Income Plus | | | 2,997,323 | | | | 10.6 | % |
Income | | | 6,458,672 | | | | 7.0 | % |
Subscription and redemption activity by concentrated accounts may have a significant effect on the operation of these funds. In the case of a large redemption, these funds may be forced to sell investments at inopportune times, resulting in additional losses for the funds.
(8) SUBSEQUENT EVENTS
The Adviser of the Funds has evaluated the impact of subsequent events through the date the financial statements were issued, and, except as already included in the Notes to Financial Statements, has determined that no additional items require disclosure.
(9) MARKET RISK
Over time, securities markets generally tend to move in cycles with periods when security prices rise and periods when security prices decline. The value of a Fund’s investments may move with these cycles and, in some instances, increase or decrease more than the applicable market(s) as measured by the Fund’s benchmark index(es). The securities markets may also decline because of factors that affect a particular industry. As of October 31, 2018, the following Funds had portfolio concentration greater than 25% in certain sectors.
| | | | | | | | |
| Fund | | Sector | | | % of Total Net Assets | |
Government Bond | | | U.S. Govt. & Agencies | | | | 49.2 | % |
Income | | | Financials | | | | 27.4 | % |
Large Cap Growth | | | Information Technology | | | | 36.9 | % |
Limited Maturity Bond | | | Asset-Backed Securities | | | | 26.4 | % |
Partner Emerging Markets Equity | | | Financials | | | | 25.7 | % |
Small Cap Growth | | | Information Technology | | | | 27.8 | % |
(10) SIGNIFICANT RISKS
Allocation Risk – The Fund’s investment performance depends upon how its assets are allocated across broad asset categories and applicable sub-classes within such categories. Some broad asset categories and sub-classes may perform below expectations or the securities markets generally over short and extended periods. Therefore, a principal risk of investing in the Fund is that the allocation strategies used and the allocation decisions made will not produce the desired results.
Collateralized Debt Obligations (“CDO”) Risk – The risks of an investment in a collateralized debt obligation (“CDO”) depend largely on the quality and type of the collateral and the tranche of the CDO in which the Fund invests. In addition to the typical risks associated with fixed income securities and asset-backed securities, CDOs carry additional risks including, but not limited to: (i) the possibility that distributions from collateral securities will not be adequate to make interest or other payments; (ii) the risk that the collateral may default, decline in value, and/or be downgraded; (iii) the Fund may invest in tranches of CDOs that are subordinate to other tranches; (iv) the structure and complexity of the transaction and the legal documents could lead to disputes among investors regarding the characterization of proceeds; (v) the investment return achieved by the Fund could be significantly different than those predicted by financial models; (vi) the lack of a readily available secondary market
218
THRIVENT MUTUAL FUNDS
NOTESTO FINANCIAL STATEMENTS
October 31, 2018
for CDOs; (vii) risk of forced “fire sale” liquidation due to technical defaults such as coverage test failures; and (viii) the CDO’s manager may perform poorly.
Convertible Securities Risk – Convertible securities are subject to the usual risks associated with debt securities, such as interest rate risk and credit risk. Convertible securities also react to changes in the value of the common stock into which they convert, and are thus subject to market risk. The Fund may also be forced to convert a convertible security at an inopportune time, which may decrease the Fund’s return.
Credit Risk – Credit risk is the risk that an issuer of a debt security to which the Fund is exposed may no longer be able or willing to pay its debt. As a result of such an event, the debt security may decline in price and affect the value of the Fund.
Derivatives Risk – The use of derivatives (such as credit default swaps) involves additional risks and transaction costs which could leave the Fund in a worse position than if it had not used these instruments. The use of derivatives can lead to losses because of adverse movements in the price or value of the underlying asset, index or rate, which may be magnified by certain features of the contract. Changes in the value of the derivative may not correlate as intended with the underlying asset, rate or index, and the Fund could lose much more than the original amount invested. Derivatives can be highly volatile, illiquid and difficult to value. Certain derivatives may also be subject to counterparty risk, which is that the other party in the transaction will not fulfill its contractual obligations due to its financial condition, market events, or other reasons.
Emerging Markets Risk – The economic and political structures of developing countries, in most cases, do not compare favorably with the U.S. or other developed countries in terms of wealth and stability, and their financial markets often lack liquidity. Fund performance will likely be negatively affected by portfolio exposure to countries in the midst of, among other things, hyperinflation, currency devaluation, trade disagreements, sudden political upheaval, or interventionist government policies. Significant buying or selling actions by a few major investors may also heighten the volatility of emerging markets. These factors make investing in emerging market countries significantly riskier than in other countries, and events in any one country could cause the Fund’s share price to decline.
Equity Securities Risk – Equity securities held by the Fund may decline significantly in price over short or extended periods of time, and such declines may occur because of declines in the equity market as a whole, or because of declines in only a particular country, company, industry, or sector of the market. From time to time, the Fund may invest a significant portion of its assets in companies in one or more related sectors or industries which would make the Fund more vulnerable to adverse developments affecting such sectors or industries. Equity securities are generally more volatile than most debt securities.
ETF Risk – An ETF is subject to the risks of the underlying investments that it holds. In addition, for index-based ETFs, the performance of an ETF may diverge from the performance of such index (commonly known as tracking error). ETFs are subject to fees and expenses (like management fees and operating expenses) that do not apply to an index, and the Fund will indirectly bear its proportionate share of any such fees and expenses paid by the ETFs in which it invests.
Financial Sector Risk – To the extent that the financials sector continues to represent a significant portion of the Fund, the Fund will be sensitive to changes in, and its performance may depend to a greater extent on, factors impacting this sector. Performance of companies in the financials sector may be adversely impacted by many factors, including, among others, government regulations, economic conditions, credit rating downgrades, changes in interest rates, and decreased liquidity in credit markets. The impact of more stringent capital requirements, recent or future regulation of any individual financial company or recent or future regulation of the financials sector as a whole cannot be predicted. In recent years, cyber attacks and technology malfunctions and failures have become increasingly frequent in this sector and have caused significant losses.
Foreign Currency Risk – The value of a foreign currency may decline against the U.S. dollar, which would reduce the dollar value of securities denominated in that currency. The overall impact of such a decline of foreign currency can be significant, unpredictable, and long lasting, depending on the currencies represented, how each one appreciates or depreciates in relation to the U.S. dollar, and whether currency positions are hedged. Under normal conditions, the Fund does not engage in extensive foreign currency hedging programs. Further, exchange rate movements are volatile, and it is not possible to effectively hedge the currency risks of many developing countries.
Foreign Securities Risk – Foreign securities generally carry more risk and are more volatile than their domestic counterparts, in part because of higher political and economic risks, lack of reliable information and fluctuations in currency exchange rates. The Fund’s investment in any country could be subject to governmental actions such as capital or currency controls, nationalizing a company or industry, expropriating assets, or imposing punitive taxes that would have an adverse effect on security prices, and impair the Fund’s ability to repatriate capital or income. Foreign securities may also be more difficult to resell than comparable U.S. securities because the markets for foreign securities are often less liquid. Even when a foreign security
219
THRIVENT MUTUAL FUNDS
NOTESTO FINANCIAL STATEMENTS
October 31, 2018
increases in price in its local currency, the appreciation may be diluted by adverse changes in exchange rates when the security’s value is converted to U.S. dollars. Foreign withholding taxes also may apply and errors and delays may occur in the settlement process for foreign securities.
Futures Contract Risk – The value of a futures contract tends to increase and decrease in tandem with the value of the underlying instrument. The price of futures can be highly volatile; using them could lower total return, and the potential loss from futures can exceed the Fund’s initial investment in such contracts. In addition, the value of the futures contract may not accurately track the value of the underlying instrument.
Government Securities Risk – The Fund invests in securities issued or guaranteed by the U.S. government or its agencies and instrumentalities (such as Federal Home Loan Bank, Ginnie Mae, Fannie Mae or Freddie Mac securities). Securities issued or guaranteed by Federal Home Loan Banks, Ginnie Mae, Fannie Mae or Freddie Mac are not issued directly by the U.S. government. Ginnie Mae is a wholly owned U.S. corporation that is authorized to guarantee, with the full faith and credit of the U.S. government, the timely payment of principal and interest of its securities. By contrast, securities issued or guaranteed by U.S. government-related organizations such as Federal Home Loan Banks, Fannie Mae and Freddie Mac are not backed by the full faith and credit of the U.S. government. No assurance can be given that the U.S. government would provide financial support to its agencies and instrumentalities if not required to do so by law. In addition, the value of U.S. government securities may be affected by changes in the credit rating of the U.S. government.
Growth Investing Risk – Growth style investing includes the risk of investing in securities whose prices historically have been more volatile than other securities, especially over the short term. Growth stock prices reflect projections of future earnings or revenues and, if a company’s earnings or revenues fall short of expectations, its stock price may fall dramatically.
High Yield Risk – High yield securities – commonly known as “junk bonds” – to which the Fund is exposed are considered predominantly speculative with respect to the issuer’s continuing ability to make principal and interest payments. If the issuer of the security is in default with respect to interest or principal payments, the value of the Fund may be negatively affected. High yield securities generally have a less liquid resale market.
Inflation-Linked Security Risk – Inflation-linked debt securities, such as TIPS, are subject to the effects of changes in market interest rates caused by factors other than inflation (real interest rates). In general, the price of an inflation-linked security tends to decrease when real interest rates increase and can increase when real interest rates decrease. Interest payments on inflation-linked securities are unpredictable and will fluctuate as the principal and interest are adjusted for inflation. Any increase in the principal amount of an inflation-linked debt security will be considered taxable ordinary income, even though the Fund will not receive the principal until maturity.
There can also be no assurance that the inflation index used will accurately measure the real rate of inflation in the prices of goods and services. The Fund’s investments in inflation-linked securities may lose value in the event that the actual rate of inflation is different than the rate of the inflation index. In addition, inflation-linked securities are subject to the risk that the Consumer Price Index for All Urban Consumers (CPI-U) or other relevant pricing index may be discontinued, fundamentally altered in a manner materially adverse to the interests of an investor in the securities, altered by legislation or Executive Order in a materially adverse manner to the interests of an investor in the securities or substituted with an alternative index.
Interest Rate Risk – Interest rate risk is the risk that prices of debt securities decline in value when interest rates rise for debt securities that pay a fixed rate of interest. Debt securities with longer durations (a measure of price sensitivity of a bond or bond fund to changes in interest rates) or maturities (i.e., the amount of time until a bond’s issuer must pay its principal or face value) tend to be more sensitive to changes in interest rates than debt securities with shorter durations or maturities. Changes by the Federal Reserve to monetary policies could affect interest rates and the value of some securities.
Investment Adviser Risk – The Fund is actively managed and the success of its investment strategy depends significantly on the skills of the adviser in assessing the potential of the investments in which the Fund invests. This assessment of investments may prove incorrect, resulting in losses or poor performance, even in rising markets.
Issuer Risk – Issuer risk is the possibility that factors specific to an issuer to which the Fund is exposed will affect the market prices of the issuer’s securities and therefore the value of the Fund.
Large Cap Risk – Large-sized companies may be unable to respond quickly to new competitive challenges such as changes in technology. They may also not be able to attain the high growth rate of successful smaller companies, especially during extended periods of economic expansion.
Leveraged Loan Risk – Leveraged loans (also known as bank loans) are subject to the risks typically associated with debt securities. In addition, leveraged loans, which typically hold a senior position in the capital structure of a borrower,
220
THRIVENT MUTUAL FUNDS
NOTESTO FINANCIAL STATEMENTS
October 31, 2018
are subject to the risk that a court could subordinate such loans to presently existing or future indebtedness or take other action detrimental to the holders of leveraged loans. Leveraged loans are also subject to the risk that the value of the collateral, if any, securing a loan may decline, be insufficient to meet the obligations of the borrower, or be difficult to liquidate. Some leveraged loans are not as easily purchased or sold as publicly-traded securities and others are illiquid, which may make it more difficult for the Fund to value them or dispose of them at an acceptable price. Below investment-grade leveraged loans are typically more credit sensitive. In the event of fraud or misrepresentation, the Fund may not be protected under federal securities laws with respect to leveraged loans that may not be in the form of “securities.” The settlement period for some leveraged loans may be more than seven days.
Liquidity Risk – Liquidity is the ability to sell a security relatively quickly for a price that most closely reflects the actual value of the security. Dealer inventories of bonds are at or near historic lows in relation to market size, which has the potential to decrease liquidity and increase price volatility in the fixed income markets, particularly during periods of economic or market stress. As a result of this decreased liquidity, the Fund may have to accept a lower price to sell a security, sell other securities to raise cash, or give up an investment opportunity, any of which could have a negative effect on performance.
Market Risk – Over time, securities markets generally tend to move in cycles with periods when security prices rise and periods when security prices decline. The value of the Fund’s investments may move with these cycles and, in some instances, increase or decrease more than the applicable market(s) as measured by the Fund’s benchmark index(es). The securities markets may also decline because of factors that affect a particular industry.
Mid Cap Risk – Medium-sized companies often have greater price volatility, lower trading volume, and less liquidity than larger, more-established companies. These companies tend to have smaller revenues, narrower product lines, less management depth and experience, smaller shares of their product or service markets, fewer financial resources, and less competitive strength than larger companies.
Money Market Fund Risk – You could lose money by investing in the Fund. Although the Fund seeks to preserve the value of your investment at $1.00 per share, it cannot guarantee it will do so. An investment in the Fund is not insured or guaranteed by the Federal Deposit Insurance Corporation or any other government agency. The Fund’s sponsor has no legal obligation to provide financial support to the Fund, and you should not expect that the sponsor will provide financial support to the Fund at any time.
Mortgage-Backed and Other Asset-Backed Securities Risk – The value of mortgage-backed and asset-backed securities will be influenced by the factors affecting the housing market and the assets underlying such securities. As a result, during periods of declining asset value, difficult or frozen credit markets, swings in interest rates, or deteriorating economic conditions, mortgage-related and asset-backed securities may decline in value, face valuation difficulties, become more volatile and/or become illiquid. In addition, both mortgage-backed and asset-backed securities are sensitive to changes in the repayment patterns of the underlying security. If the principal payment on the underlying asset is repaid faster or slower than the holder of the asset-backed or mortgage-backed security anticipates, the price of the security may fall, particularly if the holder must reinvest the repaid principal at lower rates or must continue to hold the security when interest rates rise. This effect may cause the value of the Fund to decline and reduce the overall return of the Fund.
Multi-Manager Risk – The investment styles employed by the subadvisers may not be complementary. The interplay of the various strategies employed by the subadvisers may result in the Fund indirectly holding positions in certain types of securities, industries or sectors. These positions may be detrimental to a Fund’s performance depending upon the performance of those securities and the overall economic environment. The multi-manager approach could result in a high level of portfolio turnover, resulting in higher brokerage expenses and increased tax liability from a Fund’s realization of capital gains. It is also possible that one subadviser could be selling a particular security or security from a certain country while another subadviser could be purchasing the same security or a security from that same country.
Municipal Bond Risk – The Fund’s performance may be affected by political and economic conditions at the state, regional or federal level. These may include budgetary problems, decline in the tax base and other factors that may cause rating agencies to downgrade the credit ratings on certain issues. Bonds may also exhibit price fluctuations due to changes in interest rate or bond yield levels. Some municipal bonds may be repaid prior to maturity if interest rates decrease. As a result, the value of the Fund’s shares may fluctuate significantly in the short term.
Non-Diversified Risk – The Fund is not “diversified” within the meaning of the 1940 Act. That means the Fund may invest a greater percentage of its assets in the securities of any single issuer compared to other funds. A non-diversified portfolio is generally more susceptible than a diversified portfolio to the risk that events or developments affecting a particular issuer or industry will significantly affect the Fund’s performance.
221
THRIVENT MUTUAL FUNDS
NOTESTO FINANCIAL STATEMENTS
October 31, 2018
Other Funds Risk – The performance of the Fund is dependent, in part, upon the performance of other funds managed by the Adviser or an affiliate (“Other Funds”) in which the Fund may invest. As a result, the Fund is subject to the same risks as those faced by the Other Funds.
Portfolio Turnover Rate Risk – The Fund may engage in active and frequent trading of portfolio securities in implementing its principal investment strategies. A high rate of portfolio turnover (100% or more) involves correspondingly greater expenses which are borne by the Fund and its shareholders and may also result in short-term capital gains taxable to shareholders.
Preferred Securities Risk – There are certain additional risks associated with investing in preferred securities, including, but not limited to, preferred securities may include provisions that permit the issuer, at its discretion, to defer or omit distributions for a stated period without any adverse consequences to the issuer; preferred securities are generally subordinated to bonds and other debt instruments in a company’s capital structure in terms of having priority to corporate income and liquidation payments, and therefore will be subject to greater credit risk than more senior debt instruments; preferred securities may be substantially less liquid than many other securities, such as common stocks or U.S. Government securities; generally, traditional preferred securities offer no voting rights with respect to the issuing company unless preferred dividends have been in arrears for a specified number of periods, at which time the preferred security holders may elect a number of directors to the issuer’s board; and in certain varying circumstances, an issuer of preferred securities may redeem the securities prior to a specified date.
Quantitative Investing Risk – The risk that securities selected according to a quantitative analysis methodology can perform differently from the market as a whole based on the model and the factors used in the analysis, the weight placed on each factor and changes in the factor’s historical trends. Such models are based on assumptions of these and other market factors, and the models may not take into account certain factors, or perform as intended, and may result in a decline in the value of the Fund’s portfolio.
Real Estate Investment Trust (“REIT”) Risk – REITs generally can be divided into three types: equity REITs, mortgage REITs, and hybrid REITs (which combine the characteristics of equity REITs and mortgage REITs). Equity REITs will be affected by changes in the values of, and income from, the properties they own, while mortgage REITs may be affected by the credit quality of the mortgage loans they hold. All REIT types may be affected by changes in interest rates. The effect of rising interest rates is generally more pronounced for high dividend paying stock than for stocks that pay little or no dividends. This may cause the value of real estate securities to decline during periods of rising interest rates, which would reduce the overall return of the Fund. REITs are subject to additional risks, including the fact that they are dependent on specialized management skills that may affect the REITs’ abilities to generate cash flows for operating purposes and for making investor distributions. REITs may have limited diversification and are subject to the risks associated with obtaining financing for real property. As with any investment, there is a risk that REIT securities and other real estate industry investments may be overvalued at the time of purchase. In addition, a REIT can pass its income through to its investors without any tax at the entity level if it complies with various requirements under the Internal Revenue Code. There is the risk, however, that a REIT held by the Fund will fail to qualify for this tax-free pass-through treatment of its income. In addition, due to recent changes in the tax laws, certain tax benefits of REITs may not be passed through to mutual fund shareholders. By investing in REITs indirectly through the Fund, in addition to bearing a proportionate share of the expenses of the Fund, you will also indirectly bear similar expenses of the REITs in which the Fund invests.
Redemption Risk – The Fund may need to sell portfolio securities to meet redemption requests. The Fund could experience a loss when selling portfolio securities to meet redemption requests if there is (i) significant redemption activity by shareholders, including, for example, when a single investor or few large investors make a significant redemption of Fund shares, (ii) a disruption in the normal operation of the markets in which the Fund buys and sells portfolio securities or (iii) the inability of the Fund to sell portfolio securities because such securities are illiquid. In such events, the Fund could be forced to sell portfolio securities at unfavorable prices in an effort to generate sufficient cash to pay redeeming shareholders. Although the Fund generally does not have the ability to impose liquidity fees or temporarily suspend redemptions, the payment of redemption proceeds could be delayed or denied if the Fund is liquidated, to the extent permitted by applicable regulations.
Small Cap Risk – Smaller, less seasoned companies often have greater price volatility, lower trading volume, and less liquidity than larger, more established companies. These companies tend to have small revenues, narrower product lines, less management depth and experience, small shares of their product or service markets, fewer financial resources,
222
THRIVENT MUTUAL FUNDS
NOTESTO FINANCIAL STATEMENTS
October 31, 2018
and less competitive strength than larger companies. Such companies seldom pay significant dividends that could cushion returns in a falling market.
Sovereign Debt Risk – Sovereign debt securities are issued or guaranteed by foreign governmental entities. These investments are subject to the risk that a governmental entity may delay or refuse to pay interest or repay principal on its sovereign debt, due, for example, to cash flow problems, insufficient foreign currency reserves, political considerations, the relative size of the governmental entity’s debt position in relation to the economy or the failure to put in place economic reforms required by the International Monetary Fund or other multilateral agencies. If a governmental entity defaults, it may ask for more time in which to pay or for further loans. There is no legal process for collecting sovereign debts that a government does not pay nor are there bankruptcy proceedings through which all or part of the sovereign debt that a governmental entity has not repaid may be collected.
Tax Risk – Changes in federal income tax laws or rates may affect both the net asset value of the Fund and the taxable equivalent interest generated from securities in the Fund. Since the Fund may invest in municipal securities subject to the federal alternative minimum tax without limitation, the Fund may not be suitable for investors who already are or could be subject to the federal alternative minimum tax.
Technology-Oriented Companies Risk – Common stocks of companies that rely extensively on technology, science or communications in their product development or operations may be more volatile than the overall stock market and may or may not move in tandem with the overall stock market. Technology, science and communications are rapidly changing fields, and stocks of these companies, especially of smaller or unseasoned companies, may be subject to more abrupt or erratic market movements than the stock market in general. There are significant competitive pressures among technology-oriented companies and the products or operations of such companies may become obsolete quickly. In addition, these companies may have limited product lines, markets or financial resources and the management of such companies may be more dependent upon one or a few key people.
Value Investing Risk – Value style investing includes the risk that stocks of undervalued companies may not rise as quickly as anticipated if the market doesn’t recognize their intrinsic value or if value stocks are out of favor.
223
THRIVENT MUTUAL FUNDS
FINANCIAL HIGHLIGHTS
| | | | | | | | | | | | | | | | | | | | | | | | |
| | | FOR A SHARE OUTSTANDING THROUGHOUT EACH PERIOD* | |
| | | | | | Income from Investment Operations | | | Less Distributions From | |
| | | Net Asset
Value,
Beginning of
Period | | | Net
Investment
Income/(Loss) | | |
Net Realized
and
Unrealized
Gain/(Loss) on
Investments(a) | | | Total from
Investment
Operations | | | Net
Investment
Income | | | Net Realized
Gain on
Investments | |
AGGRESSIVE ALLOCATION FUND | | | | | | | | | | | | | | | | | | | | | | | | |
Class A Shares | | | | | | | | | | | | | | | | | | | | | | | | |
Year Ended 10/31/2018 | | | $16.01 | | | | $0.06 | | | | $0.39 | | | | $0.45 | | | | $(0.06) | | | | $(0.89) | |
Year Ended 10/31/2017 | | | 13.11 | | | | 0.05 | | | | 2.98 | | | | 3.03 | | | | (0.07) | | | | (0.06) | �� |
Year Ended 10/31/2016 | | | 14.05 | | | | 0.07 | | | | 0.08 | | | | 0.15 | | | | (0.03) | | | | (1.06) | |
Year Ended 10/31/2015 | | | 14.77 | | | | 0.04 | | | | 0.33 | | | | 0.37 | | | | (0.07) | | | | (1.02) | |
Year Ended 10/31/2014 | | | 14.15 | | | | 0.05 | | | | 1.21 | | | | 1.26 | | | | (0.10) | | | | (0.54) | |
| | | | | | |
Class S Shares | | | | | | | | | | | | | | | | | | | | | | | | |
Year Ended 10/31/2018 | | | 16.17 | | | | 0.10 | | | | 0.40 | | | | 0.50 | | | | (0.10) | | | | (0.89) | |
Year Ended 10/31/2017 | | | 13.25 | | | | 0.08 | | | | 3.02 | | | | 3.10 | | | | (0.12) | | | | (0.06) | |
Year Ended 10/31/2016 | | | 14.19 | | | | 0.10 | | | | 0.11 | | | | 0.21 | | | | (0.09) | | | | (1.06) | |
Year Ended 10/31/2015 | | | 14.90 | | | | 0.09 | | | | 0.35 | | | | 0.44 | | | | (0.13) | | | | (1.02) | |
Year Ended 10/31/2014 | | | 14.27 | | | | 0.10 | | | | 1.23 | | | | 1.33 | | | | (0.16) | | | | (0.54) | |
BALANCED INCOME PLUS FUND | | | | | | | | | | | | | | | | | | | | | | | | |
Class A Shares | | | | | | | | | | | | | | | | | | | | | | | | |
Year Ended 10/31/2018 | | | 13.26 | | | | 0.32 | | | | (0.18) | | | | 0.14 | | | | (0.31) | | | | (0.16) | |
Year Ended 10/31/2017 | | | 12.22 | | | | 0.29 | | | | 1.01 | | | | 1.30 | | | | (0.26) | | | | – | |
Year Ended 10/31/2016 | | | 12.80 | | | | 0.30 | | | | 0.03 | | | | 0.33 | | | | (0.29) | | | | (0.62) | |
Year Ended 10/31/2015 | | | 13.43 | | | | 0.31 | | | | (0.04) | | | | 0.27 | | | | (0.29) | | | | (0.61) | |
Year Ended 10/31/2014 | | | 14.21 | | | | 0.24 | | | | 0.72 | | | | 0.96 | | | | (0.22) | | | | (1.52) | |
| | | | | | |
Class S Shares | | | | | | | | | | | | | | | | | | | | | | | | |
Year Ended 10/31/2018 | | | 13.23 | | | | 0.36 | | | | (0.18) | | | | 0.18 | | | | (0.35) | | | | (0.16) | |
Year Ended 10/31/2017 | | | 12.20 | | | | 0.32 | | | | 1.02 | | | | 1.34 | | | | (0.31) | | | | – | |
Year Ended 10/31/2016 | | | 12.77 | | | | 0.34 | | | | 0.04 | | | | 0.38 | | | | (0.33) | | | | (0.62) | |
Year Ended 10/31/2015 | | | 13.40 | | | | 0.36 | | | | (0.03) | | | | 0.33 | | | | (0.35) | | | | (0.61) | |
Year Ended 10/31/2014 | | | 14.19 | | | | 0.30 | | | | 0.70 | | | | 1.00 | | | | (0.27) | | | | (1.52) | |
GOVERNMENT BOND FUND | | | | | | | | | | | | | | | | | | | | | | | | |
Class A Shares | | | | | | | | | | | | | | | | | | | | | | | | |
Year Ended 10/31/2018 | | | 9.92 | | | | 0.19 | | | | (0.38) | | | | (0.19) | | | | (0.19) | | | | (0.07) | |
Year Ended 10/31/2017 | | | 10.14 | | | | 0.14 | | | | (0.20) | | | | (0.06) | | | | (0.14) | | | | (0.02) | |
Year Ended 10/31/2016 | | | 10.12 | | | | 0.12 | | | | 0.21 | | | | 0.33 | | | | (0.12) | | | | (0.19) | |
Year Ended 10/31/2015 | | | 10.05 | | | | 0.09 | | | | 0.09 | | | | 0.18 | | | | (0.08) | | | | (0.03) | |
Year Ended 10/31/2014 | | | 10.02 | | | | 0.11 | | | | 0.14 | | | | 0.25 | | | | (0.11) | | | | (0.11) | |
| | | | | | |
Class S Shares | | | | | | | | | | | | | | | | | | | | | | | | |
Year Ended 10/31/2018 | | | 9.92 | | | | 0.20 | | | | (0.38) | | | | (0.18) | | | | (0.20) | | | | (0.07) | |
Year Ended 10/31/2017 | | | 10.14 | | | | 0.15 | | | | (0.20) | | | | (0.05) | | | | (0.15) | | | | (0.02) | |
Year Ended 10/31/2016 | | | 10.12 | | | | 0.12 | | | | 0.22 | | | | 0.34 | | | | (0.13) | | | | (0.19) | |
Year Ended 10/31/2015 | | | 10.05 | | | | 0.12 | | | | 0.10 | | | | 0.22 | | | | (0.12) | | | | (0.03) | |
Year Ended 10/31/2014 | | | 10.02 | | | | 0.14 | | | | 0.14 | | | | 0.28 | | | | (0.14) | | | | (0.11) | |
| (a) | The amount shown may not correlate with the change in aggregate gains and losses of portfolio securities due to the timing of sales and redemptions of fund shares. |
| (b) | Total investment return assumes dividend reinvestment and does not reflect any deduction for applicable sales charges. Not annualized for periods less than one year. |
| * | All per share amounts have been rounded to the nearest cent. |
| ** | Computed on an annualized basis for periods less than one year. |
| *** | Management identified an error in the calculation of the 10/31/2016 Portfolio Turnover Rates. The market value of a short term security was incorrectly included in the calculation. The impact of the revised calculation was evaluated, and Management concluded that the error did not result in a material misstatement of the Financial Statements or the Financial Highlights. Management determined that a revision of the 10/31/2016 Portfolio Turnover Rates was appropriate and the revisions are reflected in the Financial Highlights. The previously stated 10/31/2016 Portfolio Turnover Rate for Aggressive Allocation Fund was 57%, for Balanced Income Plus Fund was 120%, and for Government Bond Fund was 149%. |
The accompanying Notes to Financial Statements are an integral part of this statement.
224
THRIVENT MUTUAL FUNDS
FINANCIAL HIGHLIGHTS –CONTINUED
| | | | | | | | | | | | | | | | | | | | | | | | | | | | | | | | |
| | | RATIOS/SUPPLEMENTAL DATA | |
| | | | | | | | | | | Ratio to Average Net
Assets** | | | Ratios to Average Net
Assets Before Expenses
Waived, Credited or Paid
Indirectly** | | | | |
Total
Distributions | | Net Asset
Value, End of
Period | | Total
Return(b) | | | Net Assets,
End of Period
(in millions) | | | Expenses | | | Net Investment
Income/(Loss) | | | Expenses | | | Net Investment
Income/(Loss) | | | Portfolio
Turnover Rate | |
| | | | | | | | | | | | | | | | | | | | | | | | | | | | | | | | |
| | | | | | | | | | | | | | | | | | | | | | | | | | | | | | | | |
$(0.95) | | | $15.51 | | | | 2.89 | % | | | $896.6 | | | | 0.91% | | | | 0.40% | | | | 1.15% | | | | 0.15% | | | | 52% | |
(0.13) | | | 16.01 | | | | 23.31 | % | | | 879.6 | | | | 0.92% | | | | 0.32% | | | | 1.19% | | | | 0.05% | | | | 59% | |
(1.09) | | | 13.11 | | | | 1.34 | % | | | 730.0 | | | | 0.94% | | | | 0.50% | | | | 1.21% | | | | 0.23% | | | | 58%*** | |
(1.09) | | | 14.05 | | | | 2.78 | % | | | 732.0 | | | | 0.92% | | | | 0.23% | | | | 0.96% | | | | 0.19% | | | | 51% | |
(0.64) | | | 14.77 | | | | 9.34 | % | | | 687.6 | | | | 0.81% | | | | 0.30% | | | | 0.81% | | | | 0.30% | | | | 51% | |
| | | | | | | | |
| | | | | | | | | | | | | | | | | | | | | | | | | | | | | | | | |
(0.99) | | | 15.68 | | | | 3.20 | % | | | 336.4 | | | | 0.66% | | | | 0.61% | | | | 0.90% | | | | 0.37% | | | | 52% | |
(0.18) | | | 16.17 | | | | 23.64 | % | | | 238.1 | | | | 0.63% | | | | 0.56% | | | | 0.89% | | | | 0.29% | | | | 59% | |
(1.15) | | | 13.25 | | | | 1.76 | % | | | 140.9 | | | | 0.56% | | | | 0.86% | | | | 0.83% | | | | 0.59% | | | | 58%*** | |
(1.15) | | | 14.19 | | | | 3.21 | % | | | 120.3 | | | | 0.49% | | | | 0.65% | | | | 0.54% | | | | 0.61% | | | | 51% | |
(0.70) | | | 14.90 | | | | 9.73 | % | | | 112.3 | | | | 0.41% | | | | 0.70% | | | | 0.41% | | | | 0.70% | | | | 51% | |
| | | | | | | | | | | | | | | | | | | | | | | | | | | | | | | | |
| | | | | | | | | | | | | | | | | | | | | | | | | | | | | | | | |
(0.47) | | | 12.93 | | | | 0.99 | % | | | 246.3 | | | | 1.03% | | | | 2.38% | | | | 1.03% | | | | 2.38% | | | | 149% | |
(0.26) | | | 13.26 | | | | 10.78 | % | | | 250.7 | | | | 1.06% | | | | 2.26% | | | | 1.06% | | | | 2.26% | | | | 145% | |
(0.91) | | | 12.22 | | | | 2.83 | % | | | 231.8 | | | | 1.07% | | | | 2.52% | | | | 1.07% | | | | 2.52% | | | | 125%*** | |
(0.90) | | | 12.80 | | | | 2.18 | % | | | 232.8 | | | | 1.06% | | | | 2.38% | | | | 1.06% | | | | 2.38% | | | | 148% | |
(1.74) | | | 13.43 | | | | 7.60 | % | | | 222.1 | | | | 1.06% | | | | 1.85% | | | | 1.06% | | | | 1.85% | | | | 124% | |
| | | | | | | | |
| | | | | | | | | | | | | | | | | | | | | | | | | | | | | | | | |
(0.51) | | | 12.90 | | | | 1.31 | % | | | 120.3 | | | | 0.72% | | | | 2.74% | | | | 0.72% | | | | 2.74% | | | | 149% | |
(0.31) | | | 13.23 | | | | 11.09 | % | | | 94.5 | | | | 0.73% | | | | 2.58% | | | | 0.73% | | | | 2.58% | | | | 145% | |
(0.95) | | | 12.20 | | | | 3.30 | % | | | 65.6 | | | | 0.70% | | | | 2.88% | | | | 0.70% | | | | 2.88% | | | | 125%*** | |
(0.96) | | | 12.77 | | | | 2.58 | % | | | 54.4 | | | | 0.67% | | | | 2.77% | | | | 0.67% | | | | 2.77% | | | | 148% | |
(1.79) | | | 13.40 | | | | 7.95 | % | | | 54.9 | | | | 0.66% | | | | 2.24% | | | | 0.66% | | | | 2.24% | | | | 124% | |
| | | | | | | | | | | | | | | | | | | | | | | | | | | | | | | | |
| | | | | | | | | | | | | | | | | | | | | | | | | | | | | | | | |
(0.26) | | | 9.47 | | | | (1.99 | )% | | | 4.9 | | | | 0.85% | | | | 1.92% | | | | 1.04% | | | | 1.73% | | | | 280% | |
(0.16) | | | 9.92 | | | | (0.56 | )% | | | 6.5 | | | | 0.85% | | | | 1.40% | | | | 1.00% | | | | 1.25% | | | | 193% | |
(0.31) | | | 10.14 | | | | 3.36 | % | | | 8.7 | | | | 0.87% | | | | 1.16% | | | | 1.04% | | | | 0.98% | | | | 152%*** | |
(0.11) | | | 10.12 | | | | 1.83 | % | | | 18.7 | | | | 0.90% | | | | 0.86% | | | | 1.12% | | | | 0.65% | | | | 145% | |
(0.22) | | | 10.05 | | | | 2.56 | % | | | 14.1 | | | | 0.90% | | | | 1.08% | | | | 1.07% | | | | 0.90% | | | | 130% | |
| | | | | | | | |
| | | | | | | | | | | | | | | | | | | | | | | | | | | | | | | | |
(0.27) | | | 9.47 | | | | (1.89 | )% | | | 52.3 | | | | 0.75% | | | | 2.02% | | | | 0.79% | | | | 1.98% | | | | 280% | |
(0.17) | | | 9.92 | | | | (0.47 | )% | | | 52.0 | | | | 0.76% | | | | 1.49% | | | | 0.79% | | | | 1.46% | | | | 193% | |
(0.32) | | | 10.14 | | | | 3.41 | % | | | 46.9 | | | | 0.81% | | | | 1.22% | | | | 0.81% | | | | 1.22% | | | | 152%*** | |
(0.15) | | | 10.12 | | | | 2.17 | % | | | 73.9 | | | | 0.57% | | | | 1.18% | | | | 0.57% | | | | 1.18% | | | | 145% | |
(0.25) | | | 10.05 | | | | 2.90 | % | | | 88.7 | | | | 0.57% | | | | 1.41% | | | | 0.57% | | | | 1.41% | | | | 130% | |
The accompanying Notes to Financial Statements are an integral part of this statement.
225
THRIVENT MUTUAL FUNDS
FINANCIAL HIGHLIGHTS –CONTINUED
| | | | | | | | | | | | | | | | | | | | | | | | |
| | | FOR A SHARE OUTSTANDING THROUGHOUT EACH PERIOD* | |
| | | | | | Income from Investment Operations | | | Less Distributions From | |
| | | Net Asset
Value,
Beginning of
Period | | | Net
Investment
Income/(Loss) | | |
Net Realized
and Unrealized
Gain/(Loss) on
Investments(a) | | | Total from
Investment
Operations | | | Net
Investment
Income | | | Net Realized
Gain on Investments | |
HIGH INCOME MUNICIPAL BOND FUND | | | | | | | | | | | | | | | | | |
Class S Shares | | | | | | | | | | | | | | | | | |
Year Ended 10/31/2018(c) | | $ | 10.00 | | | $ | 0.22 | | | $ | (0.14 | ) | | $ | 0.08 | | | $ | (0.22 | ) | | $ | – | |
HIGH YIELD FUND | | | | | | | | | | | | | | | | | |
Class A Shares | | | | | | | | | | | | | | | | | | | | | | | | |
Year Ended 10/31/2018 | | | 4.90 | | | | 0.26 | | | | (0.27 | ) | | | (0.01 | ) | | | (0.26 | ) | | | – | |
Year Ended 10/31/2017 | | | 4.76 | | | | 0.25 | | | | 0.14 | | | | 0.39 | | | | (0.25 | ) | | | – | |
Year Ended 10/31/2016 | | | 4.74 | | | | 0.25 | | | | 0.02 | | | | 0.27 | | | | (0.25 | ) | | | – | |
Year Ended 10/31/2015 | | | 5.04 | | | | 0.26 | | | | (0.30 | ) | | | (0.04 | ) | | | (0.26 | ) | | | – | |
Year Ended 10/31/2014 | | | 5.09 | | | | 0.29 | | | | (0.05 | ) | | | 0.24 | | | | (0.29 | ) | | | – | |
| | | | | | |
Class S Shares | | | | | | | | | | | | | | | | | | | | | | | | |
Year Ended 10/31/2018 | | | 4.90 | | | | 0.27 | | | | (0.26 | ) | | | 0.01 | | | | (0.27 | ) | | | – | |
Year Ended 10/31/2017 | | | 4.76 | | | | 0.27 | | | | 0.13 | | | | 0.40 | | | | (0.26 | ) | | | – | |
Year Ended 10/31/2016 | | | 4.74 | | | | 0.26 | | | | 0.03 | | | | 0.29 | | | | (0.27 | ) | | | – | |
Year Ended 10/31/2015 | | | 5.05 | | | | 0.28 | | | | (0.31 | ) | | | (0.03 | ) | | | (0.28 | ) | | | – | |
Year Ended 10/31/2014 | | | 5.10 | | | | 0.30 | | | | (0.05 | ) | | | 0.25 | | | | (0.30 | ) | | | – | |
INCOME FUND | | | | | | | | | | | | | | | | | |
Class A Shares | | | | | | | | | | | | | | | | | | | | | | | | |
Year Ended 10/31/2018 | | | 9.27 | | | | 0.29 | | | | (0.54 | ) | | | (0.25 | ) | | | (0.29 | ) | | | (0.03 | ) |
Year Ended 10/31/2017 | | | 9.26 | | | | 0.28 | | | | 0.02 | | | | 0.30 | | | | (0.28 | ) | | | (0.01 | ) |
Year Ended 10/31/2016 | | | 9.01 | | | | 0.29 | | | | 0.29 | | | | 0.58 | | | | (0.29 | ) | | | (0.04 | ) |
Year Ended 10/31/2015 | | | 9.29 | | | | 0.30 | | | | (0.24 | ) | | | 0.06 | | | | (0.30 | ) | | | (0.04 | ) |
Year Ended 10/31/2014 | | | 9.09 | | | | 0.32 | | | | 0.20 | | | | 0.52 | | | | (0.32 | ) | | | – | |
| | | | | | |
Class S Shares | | | | | | | | | | | | | | | | | | | | | | | | |
Year Ended 10/31/2018 | | | 9.26 | | | | 0.32 | | | | (0.53 | ) | | | (0.21 | ) | | | (0.32 | ) | | | (0.03 | ) |
Year Ended 10/31/2017 | | | 9.25 | | | | 0.31 | | | | 0.02 | | | | 0.33 | | | | (0.31 | ) | | | (0.01 | ) |
Year Ended 10/31/2016 | | | 9.00 | | | | 0.32 | | | | 0.29 | | | | 0.61 | | | | (0.32 | ) | | | (0.04 | ) |
Year Ended 10/31/2015 | | | 9.29 | | | | 0.34 | | | | (0.26 | ) | | | 0.08 | | | | (0.33 | ) | | | (0.04 | ) |
Year Ended 10/31/2014 | | | 9.08 | | | | 0.35 | | | | 0.21 | | | | 0.56 | | | | (0.35 | ) | | | – | |
| (a) | The amount shown may not correlate with the change in aggregate gains and losses of portfolio securities due to the timing of sales and redemptions of fund shares. |
| (b) | Total investment return assumes dividend reinvestment and does not reflect any deduction for applicable sales charges. Not annualized for periods less than one year. |
| (c) | Since fund inception, February 28, 2018. |
| * | All per share amounts have been rounded to the nearest cent. |
| ** | Computed on an annualized basis for periods less than one year. |
| *** | Management identified an error in the calculation of the 10/31/2016 Portfolio Turnover Rates. The market value of a short term security was incorrectly included in the calculation. The impact of the revised calculation was evaluated, and Management concluded that the error did not result in a material misstatement of the Financial Statements or the Financial Highlights. Management determined that a revision of the 10/31/2016 Portfolio Turnover Rates was appropriate and the revisions are reflected in the Financial Highlights. The previously stated 10/31/2016 Portfolio Turnover Rate for High Yield Fund was 42% and for Income Fund was 104%. |
The accompanying Notes to Financial Statements are an integral part of this statement.
226
THRIVENT MUTUAL FUNDS
FINANCIAL HIGHLIGHTS –CONTINUED
| | | | | | | | | | | | | | | | | | | | | | | | | | | | | | | | |
| | | RATIOS/SUPPLEMENTAL DATA | |
| | | | | | | | | | | Ratio to Average Net
Assets** | | | Ratios to Average Net
Assets Before Expenses
Waived, Credited or Paid
Indirectly** | | | | |
Total
Distributions | | Net Asset Value, End of Period | | Total Return(b) | | |
Net Assets, End of Period (in millions) | | | Expenses | | | Net Investment Income/(Loss) | | | Expenses | | | Net Investment Income/(Loss) | | | Portfolio Turnover Rate | |
| | | | | | | | | | | | | | | | | | | | | | | | | | | | | | | | | |
| | | | | | | | | | | | | | | | | | | | | | | | | | | | | | | | | |
$(0.22) | | | $9.86 | | | | 0.79 | % | | | $6.6 | | | | 0.43 | % | | | 3.26 | % | | | 3.71 | % | | | (0.02 | )% | | | 201 | % |
| | | | | | | | | | | | | | | | | | | | | | | | | | | | | | | | |
| | | | | | | | | | | | | | | | | | | | | | | | | | | | | | | | |
(0.26) | | | 4.63 | | | | (0.29 | )% | | | 437.4 | | | | 0.80 | % | | | 5.42 | % | | | 0.80 | % | | | 5.42 | % | | | 38 | % |
(0.25) | | | 4.90 | | | | 8.42 | % | | | 477.7 | | | | 0.80 | % | | | 5.25 | % | | | 0.80 | % | | | 5.25 | % | | | 48 | % |
(0.25) | | | 4.76 | | | | 6.05 | % | | | 471.5 | | | | 0.81 | % | | | 5.42 | % | | | 0.81 | % | | | 5.42 | % | | | 43 | %*** |
(0.26) | | | 4.74 | | | | (0.77 | )% | | | 489.2 | | | | 0.81 | % | | | 5.39 | % | | | 0.81 | % | | | 5.39 | % | | | 38 | % |
(0.29) | | | 5.04 | | | | 4.72 | % | | | 540.1 | | | | 0.80 | % | | | 5.59 | % | | | 0.80 | % | | | 5.59 | % | | | 43 | % |
| | | | | | | | | | | | | | | | | | | | | | | | | | | | | | | | |
| | | | | | | | | | | | | | | | | | | | | | | | | | | | | | | | |
(0.27) | | | 4.64 | | | | 0.14 | % | | | 283.4 | | | | 0.57 | % | | | 5.65 | % | | | 0.57 | % | | | 5.65 | % | | | 38 | % |
(0.26) | | | 4.90 | | | | 8.68 | % | | | 259.9 | | | | 0.57 | % | | | 5.49 | % | | | 0.57 | % | | | 5.49 | % | | | 48 | % |
(0.27) | | | 4.76 | | | | 6.34 | % | | | 232.2 | | | | 0.55 | % | | | 5.68 | % | | | 0.55 | % | | | 5.68 | % | | | 43 | %*** |
(0.28) | | | 4.74 | | | | (0.66 | )% | | | 235.9 | | | | 0.50 | % | | | 5.69 | % | | | 0.50 | % | | | 5.69 | % | | | 38 | % |
(0.30) | | | 5.05 | | | | 5.05 | % | | | 246.2 | | | | 0.49 | % | | | 5.90 | % | | | 0.49 | % | | | 5.90 | % | | | 43 | % |
| | | | | | | | | | | | | | | | | | | | | | | | | | | | | | | | |
| | | | | | | | | | | | | | | | | | | | | | | | | | | | | | | | |
(0.32) | | | 8.70 | | | | (2.71 | )% | | | 298.5 | | | | 0.76 | % | | | 3.25 | % | | | 0.76 | % | | | 3.25 | % | | | 109 | % |
(0.29) | | | 9.27 | | | | 3.34 | % | | | 342.5 | | | | 0.77 | % | | | 3.04 | % | | | 0.77 | % | | | 3.04 | % | | | 100 | % |
(0.33) | | | 9.26 | | | | 6.62 | % | | | 359.3 | | | | 0.77 | % | | | 3.20 | % | | | 0.77 | % | | | 3.20 | % | | | 107 | %*** |
(0.34) | | | 9.01 | | | | 0.65 | % | | | 370.0 | | | | 0.77 | % | | | 3.29 | % | | | 0.77 | % | | | 3.29 | % | | | 92 | % |
(0.32) | | | 9.29 | | | | 5.79 | % | | | 400.5 | | | | 0.77 | % | | | 3.47 | % | | | 0.77 | % | | | 3.47 | % | | | 97 | % |
| | | | | | | | | | | | | | | | | | | | | | | | | | | | | | | | |
| | | | | | | | | | | | | | | | | | | | | | | | | | | | | | | | |
(0.35) | | | 8.70 | | | | (2.30 | )% | | | 508.3 | | | | 0.45 | % | | | 3.57 | % | | | 0.45 | % | | | 3.57 | % | | | 109 | % |
(0.32) | | | 9.26 | | | | 3.66 | % | | | 504.7 | | | | 0.45 | % | | | 3.35 | % | | | 0.45 | % | | | 3.35 | % | | | 100 | % |
(0.36) | | | 9.25 | | | | 6.97 | % | | | 462.9 | | | | 0.44 | % | | | 3.53 | % | | | 0.44 | % | | | 3.53 | % | | | 107 | %*** |
(0.37) | | | 9.00 | | | | 0.90 | % | | | 429.9 | | | | 0.41 | % | | | 3.66 | % | | | 0.41 | % | | | 3.66 | % | | | 92 | % |
(0.35) | | | 9.29 | | | | 6.29 | % | | | 438.1 | | | | 0.40 | % | | | 3.83 | % | | | 0.40 | % | | | 3.83 | % | | | 97 | % |
The accompanying Notes to Financial Statements are an integral part of this statement.
227
THRIVENT MUTUAL FUNDS
FINANCIAL HIGHLIGHTS –CONTINUED
| | | | | | | | | | | | | | | | | | | | | | | | |
| | | FOR A SHARE OUTSTANDING THROUGHOUT EACH PERIOD * | |
| | | | | | Income from Investment Operations | | | Less Distributions From | |
| | | Net Asset Value, Beginning of Period | | | Net Investment Income/(Loss) | | |
Net Realized and Unrealized Gain/(Loss) on Investments(a) | | | Total from Investment Operations | | | Net Investment Income | | | Net Realized Gain on Investments | |
LARGE CAP GROWTH FUND | | | | | | | | | | | | | | | | | | | | | | | | |
Class A Shares | | | | | | | | | | | | | | | | | | | | | | | | |
Year Ended 10/31/2018 | | $ | 10.23 | | | $ | (0.04 | ) | | $ | 1.38 | | | $ | 1.34 | | | $ | – | | | $ | (0.27 | ) |
Year Ended 10/31/2017 | | | 8.23 | | | | (0.04 | ) | | | 2.09 | | | | 2.05 | | | | – | | | | (0.05 | ) |
Year Ended 10/31/2016 | | | 9.12 | | | | (0.03 | ) | | | (0.36 | ) | | | (0.39 | ) | | | – | | | | (0.50 | ) |
Year Ended 10/31/2015 | | | 8.31 | | | | (0.02 | ) | | | 0.97 | | | | 0.95 | | | | – | | | | (0.14 | ) |
Year Ended 10/31/2014 | | | 7.10 | | | | (0.02 | ) | | | 1.23 | | | | 1.21 | | | | – | | | | – | |
| | | | | | |
Class S Shares | | | | | | | | | | | | | | | | | | | | | | | | |
Year Ended 10/31/2018 | | | 11.23 | | | | – | | | | 1.51 | | | | 1.51 | | | | – | | | | (0.27 | ) |
Year Ended 10/31/2017 | | | 8.99 | | | | – | | | | 2.29 | | | | 2.29 | | | | – | | | | (0.05 | ) |
Year Ended 10/31/2016 | | | 9.89 | | | | 0.01 | | | | (0.41 | ) | | | (0.40 | ) | | | – | | | | (0.50 | ) |
Year Ended 10/31/2015 | | | 8.96 | | | | – | | | | 1.07 | | | | 1.07 | | | | – | | | | (0.14 | ) |
Year Ended 10/31/2014 | | | 7.65 | | | | 0.01 | | | | 1.33 | | | | 1.34 | | | | (0.03 | ) | | | – | |
LARGE CAP STOCK FUND | | | | | | | | | | | | | | | | | | | | | | | | |
Class A Shares | | | | | | | | | | | | | | | | | | | | | | | | |
Year Ended 10/31/2018 | | | 29.21 | | | | 0.31 | | | | (0.21 | ) | | | 0.10 | | | | (0.27 | ) | | | (2.45 | ) |
Year Ended 10/31/2017 | | | 24.77 | | | | 0.30 | | | | 5.13 | | | | 5.43 | | | | (0.29 | ) | | | (0.70 | ) |
Year Ended 10/31/2016 | | | 26.32 | | | | 0.26 | | | | (0.66 | ) | | | (0.40 | ) | | | (0.24 | ) | | | (0.91 | ) |
Year Ended 10/31/2015 | | | 27.75 | | | | 0.24 | | | | 0.90 | | | | 1.14 | | | | (0.24 | ) | | | (2.33 | ) |
Year Ended 10/31/2014 | | | 27.54 | | | | 0.22 | | | | 2.57 | | | | 2.79 | | | | (0.10 | ) | | | (2.48 | ) |
| | | | | | |
Class S Shares | | | | | | | | | | | | | | | | | | | | | | | | |
Year Ended 10/31/2018 | | | 29.50 | | | | 0.41 | | | | (0.21 | ) | | | 0.20 | | | | (0.37 | ) | | | (2.45 | ) |
Year Ended 10/31/2017 | | | 25.01 | | | | 0.40 | | | | 5.17 | | | | 5.57 | | | | (0.38 | ) | | | (0.70 | ) |
Year Ended 10/31/2016 | | | 26.57 | | | | 0.32 | | | | (0.62 | ) | | | (0.30 | ) | | | (0.35 | ) | | | (0.91 | ) |
Year Ended 10/31/2015 | | | 27.99 | | | | 0.39 | | | | 0.86 | | | | 1.25 | | | | (0.34 | ) | | | (2.33 | ) |
Year Ended 10/31/2014 | | | 27.75 | | | | 0.35 | | | | 2.58 | | | | 2.93 | | | | (0.21 | ) | | | (2.48 | ) |
LARGE CAP VALUE FUND | | | | | | | | | | | | | | | | | | | | | | | | |
Class A Shares | | | | | | | | | | | | | | | | | | | | | | | | |
Year Ended 10/31/2018 | | | 22.67 | | | | 0.30 | | | | 0.91 | | | | 1.21 | | | | (0.24 | ) | | | (0.93 | ) |
Year Ended 10/31/2017 | | | 19.42 | | | | 0.29 | | | | 3.85 | | | | 4.14 | | | | (0.24 | ) | | | (0.65 | ) |
Year Ended 10/31/2016 | | | 19.99 | | | | 0.30 | | | | 0.39 | | | | 0.69 | | | | (0.19 | ) | | | (1.07 | ) |
Year Ended 10/31/2015 | | | 20.65 | | | | 0.22 | | | | 0.01 | | | | 0.23 | | | | (0.19 | ) | | | (0.70 | ) |
Year Ended 10/31/2014 | | | 18.60 | | | | 0.20 | | | | 2.02 | | | | 2.22 | | | | (0.17 | ) | | | – | |
| | | | | | |
Class S Shares | | | | | | | | | | | | | | | | | | | | | | | | |
Year Ended 10/31/2018 | | | 22.84 | | | | 0.37 | | | | 0.95 | | | | 1.32 | | | | (0.33 | ) | | | (0.93 | ) |
Year Ended 10/31/2017 | | | 19.56 | | | | 0.36 | | | | 3.89 | | | | 4.25 | | | | (0.32 | ) | | | (0.65 | ) |
Year Ended 10/31/2016 | | | 20.14 | | | | 0.32 | | | | 0.46 | | | | 0.78 | | | | (0.29 | ) | | | (1.07 | ) |
Year Ended 10/31/2015 | | | 20.80 | | | | 0.30 | | | | 0.01 | | | | 0.31 | | | | (0.27 | ) | | | (0.70 | ) |
Year Ended 10/31/2014 | | | 18.73 | | | | 0.29 | | | | 2.03 | | | | 2.32 | | | | (0.25 | ) | | | – | |
| (a) | The amount shown may not correlate with the change in aggregate gains and losses of portfolio securities due to the timing of sales and redemptions of fund shares. |
| (b) | Total investment return assumes dividend reinvestment and does not reflect any deduction for applicable sales charges. Not annualized for periods less than one year. |
| * | All per share amounts have been rounded to the nearest cent. |
| ** | Computed on an annualized basis for periods less than one year. |
| *** | Management identified an error in the calculation of the 10/31/2016 Portfolio Turnover Rates. The market value of a short term security was incorrectly included in the calculation. The impact of the revised calculation was evaluated, and Management concluded that the error did not result in a material misstatement of the Financial Statements or the Financial Highlights. Management determined that a revision of the 10/31/2016 Portfolio Turnover Rates was appropriate and the revisions are reflected in the Financial Highlights. The previously stated 10/31/2016 Portfolio Turnover Rate for Large Cap Growth Fund was 67% and for Large Cap Stock Fund was 62%. |
The accompanying Notes to Financial Statements are an integral part of this statement.
228
THRIVENT MUTUAL FUNDS
FINANCIAL HIGHLIGHTS –CONTINUED
| | | | | | | | | | | | | | | | | | | | | | | | | | | | | | | | |
| | | RATIOS/SUPPLEMENTAL DATA | |
| | | | | | | | | | | | Ratio to Average Net
Assets** | | | Ratios to Average Net
Assets Before Expenses
Waived, Credited or Paid
Indirectly** | | | | |
Total
Distributions | | Net Asset Value, End of Period | | | Total Return(b) | | | Net Assets, End of Period (in millions) | | | Expenses | | | Net Investment Income/(Loss) | | | Expenses | | | Net Investment Income/(Loss) | | | Portfolio Turnover Rate | |
| | | | | | | | | | | | | | | | | | | | | | | | | | | | | | | | |
| | | | | | | | | | | | | | | | | | | | | | | | | | | | | | | | |
$(0.27) | | $ | 11.30 | | | | 13.37 | % | | $ | 237.8 | | | | 1.17 | % | | | (0.37)% | | | | 1.20% | | | | (0.41)% | | | | 62 | % |
(0.05) | | | 10.23 | | | | 25.03 | % | | | 210.2 | | | | 1.20 | % | | | (0.32)% | | | | 1.26% | | | | (0.38)% | | | | 65 | % |
(0.50) | | | 8.23 | | | | (4.52 | )% | | | 178.8 | | | | 1.20 | % | | | (0.25)% | | | | 1.28% | | | | (0.33)% | | | | 68 | %*** |
(0.14) | | | 9.12 | | | | 11.61 | % | | | 218.8 | | | | 1.20 | % | | | (0.35)% | | | | 1.30% | | | | (0.45)% | | | | 64 | % |
– | | | 8.31 | | | | 17.10 | % | | | 183.6 | | | | 1.20 | % | | | (0.25)% | | | | 1.34% | | | | (0.38)% | | | | 45 | % |
| | | | | | | | |
| | | | | | | | | | | | | | | | | | | | | | | | | | | | | | | | |
(0.27) | | | 12.47 | | | | 13.70 | % | | | 765.8 | | | | 0.81 | % | | | (0.02)% | | | | 0.81% | | | | (0.02)% | | | | 62 | % |
(0.05) | | | 11.23 | | | | 25.59 | % | | | 654.1 | | | | 0.82 | % | | | 0.05% | | | | 0.82% | | | | 0.05% | | | | 65 | % |
(0.50) | | | 8.99 | | | | (4.26 | )% | | | 510.1 | | | | 0.82 | % | | | 0.12% | | | | 0.82% | | | | 0.12% | | | | 68 | %*** |
(0.14) | | | 9.89 | | | | 12.12 | % | | | 509.3 | | | | 0.81 | % | | | 0.03% | | | | 0.81% | | | | 0.03% | | | | 64 | % |
(0.03) | | | 8.96 | | | | 17.53 | % | | | 338.3 | | | | 0.81 | % | | | 0.14% | | | | 0.81% | | | | 0.14% | | | | 45 | % |
| | | | | | | | | | | | | | | | | | | | | | | | | | | | | | | | |
| | | | | | | | | | | | | | | | | | | | | | | | | | | | | | | | |
(2.72) | | | 26.59 | | | | 0.22 | % | | | 1,492.5 | | | | 0.99 | % | | | 1.15% | | | | 0.99% | | | | 1.15% | | | | 52 | % |
(0.99) | | | 29.21 | | | | 22.61 | % | | | 1,594.8 | | | | 1.01 | % | | | 1.11% | | | | 1.01% | | | | 1.11% | | | | 73 | % |
(1.15) | | | 24.77 | | | | (1.48 | )% | | | 1,399.8 | | | | 1.03 | % | | | 1.03% | | | | 1.03% | | | | 1.03% | | | | 64 | %*** |
(2.57) | | | 26.32 | | | | 4.59 | % | | | 1,560.0 | | | | 1.02 | % | | | 0.99% | | | | 1.02% | | | | 0.99% | | | | 52 | % |
(2.58) | | | 27.75 | | | | 11.06 | % | | | 1,594.0 | | | | 1.02 | % | | | 0.82% | | | | 1.02% | | | | 0.82% | | | | 65 | % |
| | | | | | | | |
| | | | | | | | | | | | | | | | | | | | | | | | | | | | | | | | |
(2.82) | | | 26.88 | | | | 0.56 | % | | | 276.6 | | | | 0.64 | % | | | 1.50% | | | | 0.64% | | | | 1.50% | | | | 52 | % |
(1.08) | | | 29.50 | | | | 23.06 | % | | | 263.3 | | | | 0.65 | % | | | 1.47% | | | | 0.65% | | | | 1.47% | | | | 73 | % |
(1.26) | | | 25.01 | | | | (1.08 | )% | | | 203.7 | | | | 0.64 | % | | | 1.42% | | | | 0.64% | | | | 1.42% | | | | 64 | %*** |
(2.67) | | | 26.57 | | | | 5.02 | % | | | 187.8 | | | | 0.61 | % | | | 1.40% | | | | 0.61% | | | | 1.40% | | | | 52 | % |
(2.69) | | | 27.99 | | | | 11.53 | % | | | 174.2 | | | | 0.61 | % | | | 1.24% | | | | 0.61% | | | | 1.24% | | | | 65 | % |
| | | | | | | | | | | | | | | | | | | | | | | | | | | | | | | | |
| | | | | | | | | | | | | | | | | | | | | | | | | | | | | | | | |
(1.17) | | | 22.71 | | | | 5.42 | % | | | 227.1 | | | | 0.89 | % | | | 1.28% | | | | 0.89% | | | | 1.28% | | | | 18 | % |
(0.89) | | | 22.67 | | | | 21.77 | % | | | 228.0 | | | | 0.91 | % | | | 1.31% | | | | 0.91% | | | | 1.31% | | | | 17 | % |
(1.26) | | | 19.42 | | | | 3.86 | % | | | 198.6 | | | | 0.93 | % | | | 1.34% | | | | 0.93% | | | | 1.34% | | | | 22 | % |
(0.89) | | | 19.99 | | | | 1.14 | % | | | 231.1 | | | | 0.94 | % | | | 1.08% | | | | 0.94% | | | | 1.08% | | | | 31 | % |
(0.17) | | | 20.65 | | | | 12.00 | % | | | 237.1 | | | | 0.94 | % | | | 1.00% | | | | 0.94% | | | | 1.00% | | | | 24 | % |
| | | | | | | | |
| | | | | | | | | | | | | | | | | | | | | | | | | | | | | | | | |
(1.26) | | | 22.90 | | | | 5.85 | % | | | 836.5 | | | | 0.53 | % | | | 1.64% | | | | 0.53% | | | | 1.64% | | | | 18 | % |
(0.97) | | | 22.84 | | | | 22.21 | % | | | 757.3 | | | | 0.53 | % | | | 1.69% | | | | 0.53% | | | | 1.69% | | | | 17 | % |
(1.36) | | | 19.56 | | | | 4.29 | % | | | 618.7 | | | | 0.53 | % | | | 1.73% | | | | 0.53% | | | | 1.73% | | | | 22 | % |
(0.97) | | | 20.14 | | | | 1.55 | % | | | 580.9 | | | | 0.52 | % | | | 1.50% | | | | 0.52% | | | | 1.50% | | | | 31 | % |
(0.25) | | | 20.80 | | | | 12.47 | % | | | 562.0 | | | | 0.52 | % | | | 1.42% | | | | 0.52% | | | | 1.42% | | | | 24 | % |
The accompanying Notes to Financial Statements are an integral part of this statement.
229
THRIVENT MUTUAL FUNDS
FINANCIAL HIGHLIGHTS –CONTINUED
| | | | | | | | | | | | | | | | | | | | | | | | |
| | | FOR A SHARE OUTSTANDING THROUGHOUT EACH PERIOD * | |
| | | | | | Income from Investment Operations | | | Less Distributions From | |
| | | Net Asset
Value,
Beginning of Period | | | Net
Investment Income/(Loss) | | | Net Realized
and Unrealized
Gain/(Loss) on
Investments(a) | | | Total from
Investment
Operations | | | Net
Investment
Income | | | Net Realized
Gain on
Investments | |
LIMITED MATURITY BOND FUND | | | | | | | | | | | | | | | | | | | | | | | | |
Class A Shares | | | | | | | | | | | | | | | | | | | | | | | | |
Year Ended 10/31/2018 | | $ | 12.49 | | | $ | 0.27 | | | $ | (0.19 | ) | | $ | 0.08 | | | $ | (0.27 | ) | | $ | – | |
Year Ended 10/31/2017 | | | 12.48 | | | | 0.21 | | | | 0.01 | | | | 0.22 | | | | (0.21 | ) | | | – | |
Year Ended 10/31/2016 | | | 12.38 | | | | 0.20 | | | | 0.10 | | | | 0.30 | | | | (0.20 | ) | | | – | |
Year Ended 10/31/2015 | | | 12.44 | | | | 0.17 | | | | (0.06 | ) | | | 0.11 | | | | (0.17 | ) | | | – | |
Year Ended 10/31/2014 | | | 12.53 | | | | 0.18 | | | | (0.02 | ) | | | 0.16 | | | | (0.18 | ) | | | (0.07 | ) |
| | | | | | |
Class S Shares | | | | | | | | | | | | | | | | | | | | | | | | |
Year Ended 10/31/2018 | | | 12.48 | | | | 0.29 | | | | (0.17 | ) | | | 0.12 | | | | (0.30 | ) | | | – | |
Year Ended 10/31/2017 | | | 12.48 | | | | 0.23 | | | | 0.01 | | | | 0.24 | | | | (0.24 | ) | | | – | |
Year Ended 10/31/2016 | | | 12.37 | | | | 0.22 | | | | 0.11 | | | | 0.33 | | | | (0.22 | ) | | | – | |
Year Ended 10/31/2015 | | | 12.44 | | | | 0.20 | | | | (0.07 | ) | | | 0.13 | | | | (0.20 | ) | | | – | |
Year Ended 10/31/2014 | | | 12.53 | | | | 0.21 | | | | (0.02 | ) | | | 0.19 | | | | (0.21 | ) | | | (0.07 | ) |
LOW VOLATILITY EQUITY FUND | | | | | | | | | | | | | | | | | | | | | | | | |
Class S Shares | | | | | | | | | | | | | | | | | | | | | | | | |
Year Ended 10/31/2018 | | | 10.87 | | | | 0.10 | | | | 0.11 | | | | 0.21 | | | | (0.13 | ) | | | (0.10 | ) |
Year Ended 10/31/2017 (c) | | | 10.00 | | | | 0.09 | | | | 0.78 | | | | 0.87 | | | | – | | | | – | |
MID CAP STOCK FUND | | | | | | | | | | | | | | | | | | | | | | | | |
| | | | | | |
Class A Shares | | | | | | | | | | | | | | | | | | | | | | | | |
Year Ended 10/31/2018 | | | 26.05 | | | | 0.05 | | | | 1.00 | | | | 1.05 | | | | – | | | | (2.23 | ) |
Year Ended 10/31/2017 | | | 21.63 | | | | (0.02 | ) | | | 5.45 | | | | 5.43 | | | | (0.02 | ) | | | (0.99 | ) |
Year Ended 10/31/2016 | | | 21.61 | | | | 0.02 | | | | 2.44 | | | | 2.46 | | | | (0.03 | ) | | | (2.41 | ) |
Year Ended 10/31/2015 | | | 23.55 | | | | (0.07 | ) | | | 0.82 | | | | 0.75 | | | | (0.05 | ) | | | (2.64 | ) |
Year Ended 10/31/2014 | | | 20.38 | | | | 0.07 | | | | 3.10 | | | | 3.17 | | | | – | | | | – | |
| | | | | | |
Class S Shares | | | | | | | | | | | | | | | | | | | | | | | | |
Year Ended 10/31/2018 | | | 29.04 | | | | 0.02 | | | | 1.23 | | | | 1.25 | | | | – | | | | (2.23 | ) |
Year Ended 10/31/2017 | | | 24.00 | | | | (0.03 | ) | | | 6.15 | | | | 6.12 | | | | (0.10 | ) | | | (0.98 | ) |
Year Ended 10/31/2016 | | | 23.69 | | | | 0.02 | | | | 2.79 | | | | 2.81 | | | | (0.09 | ) | | | (2.41 | ) |
Year Ended 10/31/2015 | | | 25.54 | | | | 0.47 | | | | 0.45 | | | | 0.92 | | | | (0.13 | ) | | | (2.64 | ) |
Year Ended 10/31/2014 | | | 22.09 | | | | 0.22 | | | | 3.31 | | | | 3.53 | | | | (0.08 | ) | | | – | |
| (a) | The amount shown may not correlate with the change in aggregate gains and losses of portfolio securities due to the timing of sales and redemptions of fund shares. |
| (b) | Total investment return assumes dividend reinvestment and does not reflect any deduction for applicable sales charges. Not annualized for periods less than one year. |
| (c) | Since fund inception, February 28, 2017. |
| * | All per share amounts have been rounded to the nearest cent. |
| ** | Computed on an annualized basis for periods less than one year. |
| *** | Management identified an error in the calculation of the 10/31/2016 Portfolio Turnover Rates. The market value of a short term security was incorrectly included in the calculation. The impact of the revised calculation was evaluated, and Management concluded that the error did not result in a material misstatement of the Financial Statements or the Financial Highlights. Management determined that a revision of the 10/31/2016 Portfolio Turnover Rates was appropriate and the revisions are reflected in the Financial Highlights. The previously stated 10/31/2016 Portfolio Turnover Rate for Limited Maturity Bond Fund was 81% and for Mid Cap Stock Fund was 21%. |
The accompanying Notes to Financial Statements are an integral part of this statement.
230
THRIVENT MUTUAL FUNDS
FINANCIAL HIGHLIGHTS –CONTINUED
| | | | | | | | | | | | | | | | | | | | | | | | | | | | | | | | | | | | | | | | |
| | RATIOS/SUPPLEMENTAL DATA |
| | | | | | | | | Ratio to Average Net
Assets** | | Ratios to Average Net
Assets Before Expenses
Waived, Credited or Paid
Indirectly** | | |
Total
Distributions | | Net Asset Value, End of Period | | Total
Return(b) | | Net Assets, End of Period
(in millions) | | Expenses | | Net Investment
Income/(Loss) | | Expenses | | Net Investment
Income/(Loss) | | Portfolio Turnover Rate |
| | | | | | | | | | | | | | | | | | | | | | | | | | | | | | | | | | | | | | | | |
| | | | | | | | | | | | | | | | | | | | | | | | | | | | | | | | | | | | | | | | |
$(0.27) | | | | $12.30 | | | | | 0.67% | | | | | $298.0 | | | | | 0.61% | | | | | 2.17% | | | | | 0.61% | | | | | 2.17% | | | | | 82% | |
(0.21) | | | | 12.49 | | | | | 1.79% | | | | | 336.0 | | | | | 0.61% | | | | | 1.69% | | | | | 0.61% | | | | | 1.69% | | | | | 79% | |
(0.20) | | | | 12.48 | | | | | 2.42% | | | | | 351.2 | | | | | 0.62% | | | | | 1.58% | | | | | 0.62% | | | | | 1.58% | | | | | 83% | *** |
(0.17) | | | | 12.38 | | | | | 0.89% | | | | | 374.4 | | | | | 0.62% | | | | | 1.37% | | | | | 0.62% | | | | | 1.37% | | | | | 89% | |
(0.25) | | | | 12.44 | | | | | 1.27% | | | | | 360.2 | | | | | 0.62% | | | | | 1.44% | | | | | 0.62% | | | | | 1.44% | | | | | 102% | |
| | | | | | | | |
| | | | | | | | | | | | | | | | | | | | | | | | | | | | | | | | | | | | | | | | |
(0.30) | | | | 12.30 | | | | | 0.94% | | | | | 627.7 | | | | | 0.42% | | | | | 2.38% | | | | | 0.42% | | | | | 2.38% | | | | | 82% | |
(0.24) | | | | 12.48 | | | | | 1.91% | | | | | 550.1 | | | | | 0.42% | | | | | 1.89% | | | | | 0.42% | | | | | 1.89% | | | | | 79% | |
(0.22) | | | | 12.48 | | | | | 2.72% | | | | | 441.0 | | | | | 0.41% | | | | | 1.80% | | | | | 0.41% | | | | | 1.80% | | | | | 83% | *** |
(0.20) | | | | 12.37 | | | | | 1.05% | | | | | 356.4 | | | | | 0.38% | | | | | 1.62% | | | | | 0.38% | | | | | 1.62% | | | | | 89% | |
(0.28) | | | | 12.44 | | | | | 1.52% | | | | | 467.3 | | | | | 0.37% | | | | | 1.69% | | | | | 0.37% | | | | | 1.69% | | | | | 102% | |
| | | | | | | | | | | | | | | | | | | | | | | | | | | | | | | | | | | | | | | | |
| | | | | | | | | | | | | | | | | | | | | | | | | | | | | | | | | | | | | | | | |
(0.23) | | | | 10.85 | | | | | 1.92% | | | | | 10.7 | | | | | 1.20% | | | | | 1.27% | | | | | 2.64% | | | | | (0.17)% | | | | | 58% | |
– | | | | 10.87 | | | | | 8.70% | | | | | 5.8 | | | | | 1.20% | | | | | 1.31% | | | | | 4.22% | | | | | (1.71)% | | | | | 77% | |
| | | | | | | | | | | | | | | | | | | | | | | | | | | | | | | | | | | | | | | | |
| | | | | | | | | | | | | | | | | | | | | | | | | | | | | | | | | | | | | | | | |
(2.23) | | | | 24.87 | | | | | 4.07% | | | | | 1,171.8 | | | | | 1.04% | | | | | 0.17% | | | | | 1.04% | | | | | 0.17% | | | | | 34% | |
(1.01) | | | | 26.05 | | | | | 25.63% | | | | | 1,188.0 | | | | | 1.06% | | | | | (0.07)% | | | | | 1.06% | | | | | (0.07)% | | | | | 29% | |
(2.44) | | | | 21.63 | | | | | 12.93% | | | | | 1,005.1 | | | | | 1.09% | | | | | 0.09% | | | | | 1.09% | | | | | 0.09% | | | | | 22% | *** |
(2.69) | | | | 21.61 | | | | | 3.60% | | | | | 963.3 | | | | | 1.09% | | | | | 0.10% | | | | | 1.11% | | | | | 0.09% | | | | | 56% | |
– | | | | 23.55 | | | | | 15.55% | | | | | 678.2 | | | | | 1.11% | | | | | 0.30% | | | | | 1.11% | | | | | 0.30% | | | | | 27% | |
| | | | | | | | |
| | | | | | | | | | | | | | | | | | | | | | | | | | | | | | | | | | | | | | | | |
(2.23) | | | | 28.06 | | | | | 4.36% | | | | | 744.0 | | | | | 0.74% | | | | | 0.61% | | | | | 0.74% | | | | | 0.61% | | | | | 34% | |
(1.08) | | | | 29.04 | | | | | 26.04% | | | | | 516.3 | | | | | 0.72% | | | | | 0.26% | | | | | 0.72% | | | | | 0.26% | | | | | 29% | |
(2.50) | | | | 24.00 | | | | | 13.36% | | | | | 337.7 | | | | | 0.72% | | | | | 0.47% | | | | | 0.72% | | | | | 0.47% | | | | | 22% | *** |
(2.77) | | | | 23.69 | | | | | 4.05% | | | | | 286.6 | | | | | 0.69% | | | | | 0.51% | | | | | 0.70% | | | | | 0.50% | | | | | 56% | |
(0.08) | | | | 25.54 | | | | | 16.01% | | | | | 264.0 | | | | | 0.71% | | | | | 0.70% | | | | | 0.71% | | | | | 0.70% | | | | | 27% | |
The accompanying Notes to Financial Statements are an integral part of this statement.
231
THRIVENT MUTUAL FUNDS
FINANCIAL HIGHLIGHTS –CONTINUED
| | | | | | | | | | | | | | | | | | | | | | | | |
| | | FOR A SHARE OUTSTANDING THROUGHOUT EACH PERIOD * | |
| | | | | | Income from Investment Operations | | | Less Distributions From | |
| | | Net Asset Value, Beginning of Period | | | Net Investment Income/(Loss) | | | Net Realized and Unrealized Gain/(Loss) on Investments(a) | | | Total from Investment Operations | | | Net Investment Income | | | Net Realized Gain on Investments | |
MODERATE ALLOCATION FUND | | | | | | | | | | | | | | | | | | | | | |
Class A Shares | | | | | | | | | | | | | | | | | | | | | | | | |
Year Ended 10/31/2018 | | | $13.89 | | | | $0.20 | | | | $(0.12 | ) | | | $0.08 | | | | $(0.22 | ) | | | $(0.38 | ) |
Year Ended 10/31/2017 | | | 12.52 | | | | 0.17 | | | | 1.45 | | | | 1.62 | | | | (0.17 | ) | | | (0.08 | ) |
Year Ended 10/31/2016 | | | 12.90 | | | | 0.16 | | | | 0.20 | | | | 0.36 | | | | (0.15 | ) | | | (0.59 | ) |
Year Ended 10/31/2015 | | | 13.26 | | | | 0.16 | | | | 0.08 | | | | 0.24 | | | | (0.18 | ) | | | (0.42 | ) |
Year Ended 10/31/2014 | | | 12.88 | | | | 0.17 | | | | 0.73 | | | | 0.90 | | | | (0.20 | ) | | | (0.32 | ) |
| | | | | | |
Class S Shares | | | | | | | | | | | | | | | | | | | | | | | | |
Year Ended 10/31/2018 | | | 13.93 | | | | 0.24 | | | | (0.13 | ) | | | 0.11 | | | | (0.25 | ) | | | (0.38 | ) |
Year Ended 10/31/2017 | | | 12.55 | | | | 0.20 | | | | 1.46 | | | | 1.66 | | | | (0.20 | ) | | | (0.08 | ) |
Year Ended 10/31/2016 | | | 12.94 | | | | 0.19 | | | | 0.20 | | | | 0.39 | | | | (0.19 | ) | | | (0.59 | ) |
Year Ended 10/31/2015 | | | 13.29 | | | | 0.21 | | | | 0.08 | | | | 0.29 | | | | (0.22 | ) | | | (0.42 | ) |
Year Ended 10/31/2014 | | | 12.91 | | | | 0.21 | | | | 0.73 | | | | 0.94 | | | | (0.24 | ) | | | (0.32 | ) |
MODERATELY AGGRESSIVE ALLOCATION FUND | | | | | | | | | | | | | | | | | |
Class A Shares | | | | | | | | | | | | | | | | | | | | | | | | |
Year Ended 10/31/2018 | | | 15.19 | | | | 0.15 | | | | 0.06 | | | | 0.21 | | | | (0.16 | ) | | | (0.62 | ) |
Year Ended 10/31/2017 | | | 13.11 | | | | 0.13 | | | | 2.22 | | | | 2.35 | | | | (0.13 | ) | | | (0.14 | ) |
Year Ended 10/31/2016 | | | 13.73 | | | | 0.13 | | | | 0.15 | | | | 0.28 | | | | (0.09 | ) | | | (0.81 | ) |
Year Ended 10/31/2015 | | | 14.17 | | | | 0.11 | | | | 0.20 | | | | 0.31 | | | | (0.15 | ) | | | (0.60 | ) |
Year Ended 10/31/2014 | | | 13.69 | | | | 0.12 | | | | 0.97 | | | | 1.09 | | | | (0.16 | ) | | | (0.45 | ) |
| | | | | | |
Class S Shares | | | | | | | | | | | | | | | | | | | | | | | | |
Year Ended 10/31/2018 | | | 15.32 | | | | 0.18 | | | | 0.07 | | | | 0.25 | | | | (0.20 | ) | | | (0.62 | ) |
Year Ended 10/31/2017 | | | 13.23 | | | | 0.15 | | | | 2.25 | | | | 2.40 | | | | (0.17 | ) | | | (0.14 | ) |
Year Ended 10/31/2016 | | | 13.86 | | | | 0.14 | | | | 0.18 | | | | 0.32 | | | | (0.14 | ) | | | (0.81 | ) |
Year Ended 10/31/2015 | | | 14.29 | | | | 0.16 | | | | 0.21 | | | | 0.37 | | | | (0.20 | ) | | | (0.60 | ) |
Year Ended 10/31/2014 | | | 13.79 | | | | 0.17 | | | | 0.98 | | | | 1.15 | | | | (0.20 | ) | | | (0.45 | ) |
MODERATELY CONSERVATIVE ALLOCATION FUND | | | | | | | | | | | | | | | | | |
Class A Shares | | | | | | | | | | | | | | | | | | | | | | | | |
Year Ended 10/31/2018 | | | 12.48 | | | | 0.24 | | | | (0.29 | ) | | | (0.05 | ) | | | (0.24 | ) | | | (0.21 | ) |
Year Ended 10/31/2017 | | | 11.78 | | | | 0.21 | | | | 0.80 | | | | 1.01 | | | | (0.21 | ) | | | (0.10 | ) |
Year Ended 10/31/2016 | | | 11.88 | | | | 0.20 | | | | 0.21 | | | | 0.41 | | | | (0.18 | ) | | | (0.33 | ) |
Year Ended 10/31/2015 | | | 12.19 | | | | 0.18 | | | | (0.03 | ) | | | 0.15 | | | | (0.20 | ) | | | (0.26 | ) |
Year Ended 10/31/2014 | | | 11.98 | | | | 0.20 | | | | 0.48 | | | | 0.68 | | | | (0.21 | ) | | | (0.26 | ) |
| | | | | | |
Class S Shares | | | | | | | | | | | | | | | | | | | | | | | | |
Year Ended 10/31/2018 | | | 12.52 | | | | 0.27 | | | | (0.29 | ) | | | (0.02 | ) | | | (0.27 | ) | | | (0.21 | ) |
Year Ended 10/31/2017 | | | 11.82 | | | | 0.23 | | | | 0.81 | | | | 1.04 | | | | (0.24 | ) | | | (0.10 | ) |
Year Ended 10/31/2016 | | | 11.91 | | | | 0.22 | | | | 0.24 | | | | 0.46 | | | | (0.22 | ) | | | (0.33 | ) |
Year Ended 10/31/2015 | | | 12.22 | | | | 0.23 | | | | (0.04 | ) | | | 0.19 | | | | (0.24 | ) | | | (0.26 | ) |
Year Ended 10/31/2014 | | | 12.01 | | | | 0.24 | | | | 0.48 | | | | 0.72 | | | | (0.25 | ) | | | (0.26 | ) |
| (a) | The amount shown may not correlate with the change in aggregate gains and losses of portfolio securities due to the timing of sales and redemptions of fund shares. |
| (b) | Total investment return assumes dividend reinvestment and does not reflect any deduction for applicable sales charges. Not annualized for periods less than one year. |
| * | All per share amounts have been rounded to the nearest cent. |
| ** | Computed on an annualized basis for periods less than one year. |
| *** | Management identified an error in the calculation of the 10/31/2016 Portfolio Turnover Rates. The market value of a short term security was incorrectly included in the calculation. The impact of the revised calculation was evaluated, and Management concluded that the error did not result in a material misstatement of the Financial Statements or the Financial Highlights. Management determined that a revision of the 10/31/2016 Portfolio Turnover Rates was appropriate and the revisions are reflected in the Financial Highlights. The previously stated 10/31/2016 Portfolio Turnover Rate for Moderate Allocation Fund was 138%, for Moderately Aggressive Allocation Fund was 90%, and for Moderately Conservative Allocation Fund was 181%. |
The accompanying Notes to Financial Statements are an integral part of this statement.
232
THRIVENT MUTUAL FUNDS
FINANCIAL HIGHLIGHTS –CONTINUED
| | | | | | | | | | | | | | | | | | | | | | | | |
| | | RATIOS/SUPPLEMENTAL DATA | |
| | | | | | | | | | | | Ratio to Average Net
Assets** | | Ratios to Average
Net Assets Before Expenses
Waived, Credited or Paid
Indirectly ** | | | |
Total Distributions | | Net Asset Value, End of Period | | | Total Return(b) | | | Net Assets, End of Period (in millions) | | | Expenses | | Net Investment Income/(Loss) | | Expenses | | Net Investment Income/(Loss) | | Portfolio Turnover Rate | |
| | | | | | | | | | | | | | | | | | | | | | | | |
| | | | | | | | | | | | | | | | | | | | | | | | |
$(0.60) | | | $13.37 | | | | 0.50% | | | | $1,778.0 | | | 0.79% | | 1.46% | | 1.00% | | 1.25% | | | 133% | |
(0.25) | | | 13.89 | | | | 13.08% | | | | 1,839.5 | | | 0.80% | | 1.31% | | 1.02% | | 1.09% | | | 158% | |
(0.74) | | | 12.52 | | | | 3.06% | | | | 1,682.9 | | | 0.81% | | 1.31% | | 1.02% | | 1.10% | | | 147%*** | |
(0.60) | | | 12.90 | | | | 1.93% | | | | 1,706.5 | | | 0.76% | | 1.25% | | 0.81% | | 1.21% | | | 107% | |
(0.52) | | | 13.26 | | | | 7.22% | | | | 1,683.8 | | | 0.72% | | 1.29% | | 0.72% | | 1.29% | | | 73% | |
| | | | | | | | |
| | | | | | | | | | | | | | | | | | | | | | | | |
(0.63) | | | 13.41 | | | | 0.77% | | | | 535.5 | | | 0.53% | | 1.69% | | 0.74% | | 1.47% | | | 133% | |
(0.28) | | | 13.93 | | | | 13.44% | | | | 369.4 | | | 0.53% | | 1.51% | | 0.75% | | 1.30% | | | 158% | |
(0.78) | | | 12.55 | | | | 3.31% | | | | 179.0 | | | 0.49% | | 1.56% | | 0.71% | | 1.35% | | | 147%*** | |
(0.64) | | | 12.94 | | | | 2.36% | | | | 108.3 | | | 0.41% | | 1.60% | | 0.46% | | 1.55% | | | 107% | |
(0.56) | | | 13.29 | | | | 7.56% | | | | 89.0 | | | 0.38% | | 1.62% | | 0.38% | | 1.62% | | | 73% | |
| | | | | | | | | | | | | | | | | | | | | | | | |
| | | | | | | | | | | | | | | | | | | | | | | | |
(0.78) | | | 14.62 | | | | 1.37% | | | | 2,123.3 | | | 0.80% | | 0.99% | | 1.06% | | 0.73% | | | 86% | |
(0.27) | | | 15.19 | | | | 18.21% | | | | 2,086.9 | | | 0.81% | | 0.91% | | 1.08% | | 0.64% | | | 103% | |
(0.90) | | | 13.11 | | | | 2.36% | | | | 1,809.6 | | | 0.82% | | 1.01% | | 1.10% | | 0.73% | | | 94%*** | |
(0.75) | | | 13.73 | | | | 2.34% | | | | 1,814.6 | | | 0.81% | | 0.81% | | 0.85% | | 0.76% | | | 66% | |
(0.61) | | | 14.17 | | | | 8.29% | | | | 1,746.7 | | | 0.76% | | 0.85% | | 0.76% | | 0.85% | | | 61% | |
| | | | | | | | |
| | | | | | | | | | | | | | | | | | | | | | | | |
(0.82) | | | 14.75 | | | | 1.61% | | | | 580.8 | | | 0.57% | | 1.17% | | 0.83% | | 0.91% | | | 86% | |
(0.31) | | | 15.32 | | | | 18.48% | | | | 389.9 | | | 0.55% | | 1.07% | | 0.83% | | 0.79% | | | 103% | |
(0.95) | | | 13.23 | | | | 2.66% | | | | 191.0 | | | 0.49% | | 1.28% | | 0.77% | | 1.00% | | | 94%*** | |
(0.80) | | | 13.86 | | | | 2.75% | | | | 125.5 | | | 0.42% | | 1.19% | | 0.47% | | 1.14% | | | 66% | |
(0.65) | | | 14.29 | | | | 8.73% | | | | 120.3 | | | 0.39% | | 1.22% | | 0.39% | | 1.22% | | | 61% | |
| | | | | | | | | | | | | | | | | | | | | | | | |
| | | | | | | | | | | | | | | | | | | | | | | | |
(0.45) | | | 11.98 | | | | (0.45)% | | | | 672.7 | | | 0.82% | | 1.93% | | 0.98% | | 1.77% | | | 175% | |
(0.31) | | | 12.48 | | | | 8.70% | | | | 719.7 | | | 0.83% | | 1.70% | | 0.99% | | 1.54% | | | 208% | |
(0.51) | | | 11.78 | | | | 3.65% | | | | 703.3 | | | 0.84% | | 1.69% | | 0.99% | | 1.54% | | | 196%*** | |
(0.46) | | | 11.88 | | | | 1.32% | | | | 716.6 | | | 0.80% | | 1.54% | | 0.83% | | 1.52% | | | 187% | |
(0.47) | | | 12.19 | | | | 5.86% | | | | 731.4 | | | 0.77% | | 1.64% | | 0.77% | | 1.64% | | | 140% | |
| | | | | | | | |
| | | | | | | | | | | | | | | | | | | | | | | | |
(0.48) | | | 12.02 | | | | (0.18)% | | | | 195.9 | | | 0.55% | | 2.18% | | 0.71% | | 2.02% | | | 175% | |
(0.34) | | | 12.52 | | | | 8.97% | | | | 141.9 | | | 0.56% | | 1.93% | | 0.72% | | 1.77% | | | 208% | |
(0.55) | | | 11.82 | | | | 4.05% | | | | 69.4 | | | 0.53% | | 1.95% | | 0.69% | | 1.80% | | | 196%*** | |
(0.50) | | | 11.91 | | | | 1.66% | | | | 37.5 | | | 0.46% | | 1.87% | | 0.49% | | 1.84% | | | 187% | |
(0.51) | | | 12.22 | | | | 6.20% | | | | 32.3 | | | 0.44% | | 1.97% | | 0.44% | | 1.97% | | | 140% | |
The accompanying Notes to Financial Statements are an integral part of this statement.
233
THRIVENT MUTUAL FUNDS
FINANCIAL HIGHLIGHTS –CONTINUED
| | | | | | | | | | | | | | | | | | | | | | | | |
| | | FOR A SHARE OUTSTANDING THROUGHOUT EACH PERIOD * | |
| | | | | | Income from Investment Operations | | | Less Distributions From | |
| | | Net Asset Value, Beginning of Period | | | Net Investment Income/(Loss) | | | Net Realized and Unrealized Gain/(Loss) on Investments(a) | | | Total from Investment Operations | | | Net Investment Income | | | Net Realized Gain on Investments | |
MONEY MARKET FUND | | | | | | | | | | | | | | | | | | | | | | | | |
Class A Shares | | | | | | | | | | | | | | | | | | | | | | | | |
Year Ended 10/31/2018 | | | $1.00 | | | | $0.01 | | | | $– | | | | $0.01 | | | | $(0.01) | | | | $– | |
Year Ended 10/31/2017 | | | 1.00 | | | | – | | | | – | | | | – | | | | – | | | | – | |
Year Ended 10/31/2016 | | | 1.00 | | | | – | | | | – | | | | – | | | | – | | | | – | |
Year Ended 10/31/2015 | | | 1.00 | | | | – | | | | – | | | | – | | | | – | | | | – | |
Year Ended 10/31/2014 | | | 1.00 | | | | – | | | | – | | | | – | | | | – | | | | – | |
| | | | | | |
Class S Shares | | | | | | | | | | | | | | | | | | | | | | | | |
Year Ended 10/31/2018 | | | 1.00 | | | | 0.01 | | | | – | | | | 0.01 | | | | (0.01 | ) | | | – | |
Year Ended 10/31/2017 | | | 1.00 | | | | – | | | | – | | | | – | | | | – | | | | – | |
Year Ended 10/31/2016 | | | 1.00 | | | | – | | | | – | | | | – | | | | – | | | | – | |
Year Ended 10/31/2015 | | | 1.00 | | | | – | | | | – | | | | – | | | | – | | | | – | |
Year Ended 10/31/2014 | | | 1.00 | | | | – | | | | – | | | | – | | | | – | | | | – | |
MUNICIPAL BOND FUND | | | | | | | | | | | | | | | | | | | | | | | | |
Class A Shares | | | | | | | | | | | | | | | | | | | | | | | | |
Year Ended 10/31/2018 | | | 11.39 | | | | 0.38 | | | | (0.50 | ) | | | (0.12 | ) | | | (0.38 | ) | | | – | |
Year Ended 10/31/2017 | | | 11.65 | | | | 0.39 | | | | (0.26 | ) | | | 0.13 | | | | (0.39 | ) | | | – | |
Year Ended 10/31/2016 | | | 11.60 | | | | 0.39 | | | | 0.05 | | | | 0.44 | | | | (0.39 | ) | | | – | |
Year Ended 10/31/2015 | | | 11.68 | | | | 0.40 | | | | (0.08 | ) | | | 0.32 | | | | (0.40 | ) | | | – | |
Year Ended 10/31/2014 | | | 11.18 | | | | 0.42 | | | | 0.50 | | | | 0.92 | | | | (0.42 | ) | | | – | |
| | | | | | |
Class S Shares | | | | | | | | | | | | | | | | | | | | | | | | |
Year Ended 10/31/2018 | | | 11.39 | | | | 0.41 | | | | (0.50 | ) | | | (0.09 | ) | | | (0.41 | ) | | | – | |
Year Ended 10/31/2017 | | | 11.65 | | | | 0.41 | | | | (0.26 | ) | | | 0.15 | | | | (0.41 | ) | | | – | |
Year Ended 10/31/2016 | | | 11.60 | | | | 0.41 | | | | 0.06 | | | | 0.47 | | | | (0.42 | ) | | | – | |
Year Ended 10/31/2015 | | | 11.68 | | | | 0.43 | | | | (0.08 | ) | | | 0.35 | | | | (0.43 | ) | | | – | |
Year Ended 10/31/2014 | | | 11.18 | | | | 0.44 | | | | 0.50 | | | | 0.94 | | | | (0.44 | ) | | | – | |
OPPORTUNITY INCOME PLUS FUND | | | | | | | | | | | | | | | | | | | | | |
Class A Shares | | | | | | | | | | | | | | | | | | | | | | | | |
Year Ended 10/31/2018 | | | 10.31 | | | | 0.37 | | | | (0.34 | ) | | | 0.03 | | | | (0.38 | ) | | | – | |
Year Ended 10/31/2017 | | | 10.23 | | | | 0.34 | | | | 0.08 | | | | 0.42 | | | | (0.34 | ) | | | – | |
Year Ended 10/31/2016 | | | 10.05 | | | | 0.36 | | | | 0.19 | | | | 0.55 | | | | (0.37 | ) | | | – | |
Year Ended 10/31/2015 | | | 10.38 | | | | 0.38 | | | | (0.33 | ) | | | 0.05 | | | | (0.38 | ) | | | – | |
Year Ended 10/31/2014 | | | 10.32 | | | | 0.36 | | | | 0.06 | | | | 0.42 | | | | (0.36 | ) | | | – | |
| | | | | | |
Class S Shares | | | | | | | | | | | | | | | | | | | | | | | | |
Year Ended 10/31/2018 | | | 10.31 | | | | 0.40 | | | | (0.34 | ) | | | 0.06 | | | | (0.41 | ) | | | – | |
Year Ended 10/31/2017 | | | 10.23 | | | | 0.36 | | | | 0.08 | | | | 0.44 | | | | (0.36 | ) | | | – | |
Year Ended 10/31/2016 | | | 10.05 | | | | 0.39 | | | | 0.18 | | | | 0.57 | | | | (0.39 | ) | | | – | |
Year Ended 10/31/2015 | | | 10.38 | | | | 0.40 | | | | (0.33 | ) | | | 0.07 | | | | (0.40 | ) | | | – | |
Year Ended 10/31/2014 | | | 10.32 | | | | 0.39 | | | | 0.05 | | | | 0.44 | | | | (0.38 | ) | | | – | |
| (a) | The amount shown may not correlate with the change in aggregate gains and losses of portfolio securities due to the timing of sales and redemptions of fund shares. |
| (b) | Total investment return assumes dividend reinvestment and does not reflect any deduction for applicable sales charges. Not annualized for periods less than one year. |
| * | All per share amounts have been rounded to the nearest cent. |
| ** | Computed on an annualized basis for periods less than one year. |
| *** | Management identified an error in the calculation of the 10/31/2016 Portfolio Turnover Rates. The market value of a short term security was incorrectly included in the calculation. The impact of the revised calculation was evaluated, and Management concluded that the error did not result in a material misstatement of the Financial Statements or the Financial Highlights. Management determined that a revision of the 10/31/2016 Portfolio Turnover Rates was appropriate and the revisions are reflected in the Financial Highlights. The previously stated 10/31/2016 Portfolio Turnover Rate for Opportunity Income Plus Fund was 147%. |
The accompanying Notes to Financial Statements are an integral part of this statement.
234
THRIVENT MUTUAL FUNDS
FINANCIAL HIGHLIGHTS –CONTINUED
| | | | | | | | | | | | | | | | | | | | |
| | | RATIOS/SUPPLEMENTAL DATA |
| | | | | | | | | | | Ratio to Average Net
Assets** | | Ratios to Average Net
Assets Before Expenses
Waived, Credited or Paid
Indirectly ** | | |
Total
Distributions | | Net Asset Value, End of Period | | | Total Return(b) | | Net Assets, End of Period (in millions) | | | Expenses | | Net Investment Income/(Loss) | | Expenses | | Net Investment Income/(Loss) | | Portfolio Turnover Rate |
| | | | | | | | | | | | | | | | | | | | |
| | | | | | | | | | | | | | | | | | | | |
$(0.01) | | | $1.00 | | | 1.13% | | | $322.9 | | | 0.61% | | 1.12% | | 0.69% | | 1.04% | | N/A |
– | | | 1.00 | | | 0.03% | | | 325.1 | | | 0.80% | | 0.03% | | 0.80% | | 0.03% | | N/A |
– | | | 1.00 | | | 0.00% | | | 381.3 | | | 0.41% | | 0.00% | | 0.85% | | (0.43)% | | N/A |
– | | | 1.00 | | | 0.00% | | | 409.5 | | | 0.20% | | 0.00% | | 0.95% | | (0.75)% | | N/A |
– | | | 1.00 | | | 0.00% | | | 422.7 | | | 0.19% | | 0.00% | | 0.94% | | (0.75)% | | N/A |
| | | | | | | | |
| | | | | | | | | | | | | | | | | | | | |
(0.01) | | | 1.00 | | | 1.29% | | | 171.9 | | | 0.44% | | 1.36% | | 0.53% | | 1.28% | | N/A |
– | | | 1.00 | | | 0.31% | | | 78.1 | | | 0.53% | | 0.32% | | 0.53% | | 0.32% | | N/A |
– | | | 1.00 | | | 0.00% | | | 56.6 | | | 0.44% | | 0.00% | | 0.53% | | (0.09)% | | N/A |
– | | | 1.00 | | | 0.00% | | | 10.4 | | | 0.20% | | 0.00% | | 0.61% | | (0.41)% | | N/A |
– | | | 1.00 | | | 0.00% | | | 6.2 | | | 0.19% | | 0.00% | | 0.61% | | (0.42)% | | N/A |
| | | | | | | | | | | | | | | | | | | | |
| | | | | | | | | | | | | | | | | | | | |
(0.38) | | | 10.89 | | | (1.08)% | | | 1,238.9 | | | 0.74% | | 3.42% | | 0.74% | | 3.42% | | 35% |
(0.39) | | | 11.39 | | | 1.15% | | | 1,382.3 | | | 0.74% | | 3.41% | | 0.74% | | 3.41% | | 18% |
(0.39) | | | 11.65 | | | 3.79% | | | 1,471.0 | | | 0.74% | | 3.29% | | 0.74% | | 3.29% | | 10% |
(0.40) | | | 11.60 | | | 2.75% | | | 1,463.5 | | | 0.74% | | 3.42% | | 0.74% | | 3.42% | | 8% |
(0.42) | | | 11.68 | | | 8.33% | | | 1,446.3 | | | 0.75% | | 3.65% | | 0.75% | | 3.65% | | 8% |
| | | | | | | | |
| | | | | | | | | | | | | | | | | | | | |
(0.41) | | | 10.89 | | | (0.85)% | | | 232.2 | | | 0.51% | | 3.66% | | 0.51% | | 3.66% | | 35% |
(0.41) | | | 11.39 | | | 1.39% | | | 213.9 | | | 0.50% | | 3.64% | | 0.50% | | 3.64% | | 18% |
(0.42) | | | 11.65 | | | 4.04% | | | 193.0 | | | 0.49% | | 3.53% | | 0.49% | | 3.53% | | 10% |
(0.43) | | | 11.60 | | | 3.01% | | | 108.5 | | | 0.48% | | 3.68% | | 0.48% | | 3.68% | | 8% |
(0.44) | | | 11.68 | | | 8.61% | | | 97.2 | | | 0.49% | | 3.90% | | 0.49% | | 3.90% | | 8% |
| | | | | | | | |
| | | | | | | | | | | | | | | | | | | | |
| | | | | | | | | | | | | | | | | | | | |
(0.38) | | | 9.96 | | | 0.31% | | | 244.6 | | | 0.89% | | 3.67% | | 0.89% | | 3.67% | | 190% |
(0.34) | | | 10.31 | | | 4.16% | | | 264.8 | | | 0.90% | | 3.29% | | 0.91% | | 3.28% | | 186% |
(0.37) | | | 10.23 | | | 5.60% | | | 258.4 | | | 0.89% | | 3.65% | | 0.92% | | 3.62% | | 156%*** |
(0.38) | | | 10.05 | | | 0.47% | | | 265.3 | | | 0.85% | | 3.70% | | 0.94% | | 3.61% | | 165% |
(0.36) | | | 10.38 | | | 4.13% | | | 271.1 | | | 0.85% | | 3.48% | | 0.95% | | 3.38% | | 169% |
| | | | | | | | |
| | | | | | | | | | | | | | | | | | | | |
(0.41) | | | 9.96 | | | 0.55% | | | 312.6 | | | 0.65% | | 3.94% | | 0.65% | | 3.94% | | 190% |
(0.36) | | | 10.31 | | | 4.40% | | | 260.2 | | | 0.66% | | 3.53% | | 0.66% | | 3.53% | | 186% |
(0.39) | | | 10.23 | | | 5.84% | | | 178.2 | | | 0.66% | | 3.88% | | 0.66% | | 3.88% | | 156%*** |
(0.40) | | | 10.05 | | | 0.69% | | | 142.0 | | | 0.63% | | 3.92% | | 0.63% | | 3.92% | | 165% |
(0.38) | | | 10.38 | | | 4.35% | | | 113.1 | | | 0.64% | | 3.72% | | 0.64% | | 3.72% | | 169% |
The accompanying Notes to Financial Statements are an integral part of this statement.
235
THRIVENT MUTUAL FUNDS
FINANCIAL HIGHLIGHTS –CONTINUED
| | | | | | | | | | | | | | | | | | | | | | | | |
| | | FOR A SHARE OUTSTANDING THROUGHOUT EACH PERIOD * | |
| | | | | | Income from Investment Operations | | | Less Distributions From | |
| | | Net Asset Value, Beginning of Period | | | Net Investment Income/(Loss) | | | Net Realized and Unrealized Gain/(Loss) on Investments(a) | | | Total from Investment Operations | | | Net Investment Income | | | Net Realized Gain on Investments | |
PARTNER EMERGING MARKETS EQUITY FUND | | | | | | | | | | | | | | | | | |
Class A Shares | | | | | | | | | | | | | | | | | | | | | | | | |
Year Ended 10/31/2018 | | | $9.64 | | | | $0.05 | | | | $(1.55 | ) | | | $(1.50 | ) | | | $(0.09 | ) | | | $– | |
Year Ended 10/31/2017 | | | 8.44 | | | | 0.10 | | | | 1.14 | | | | 1.24 | | | | (0.04 | ) | | | – | |
Year Ended 10/31/2016 | | | 7.66 | | | | 0.06 | | | | 0.80 | | | | 0.86 | | | | (0.08 | ) | | | – | |
Year Ended 10/31/2015 | | | 9.45 | | | | 0.08 | | | | (1.74 | ) | | | (1.66 | ) | | | (0.13 | ) | | | – | |
Year Ended 10/31/2014 | | | 10.51 | | | | 0.14 | | | | (1.10 | ) | | | (0.96 | ) | | | (0.10 | ) | | | – | |
| | | | | | |
Class S Shares | | | | | | | | | | | | | | | | | | | | | | | | |
Year Ended 10/31/2018 | | | 9.57 | | | | 0.07 | | | | (1.52 | ) | | | (1.45 | ) | | | (0.12 | ) | | | – | |
Year Ended 10/31/2017 | | | 8.39 | | | | 0.14 | | | | 1.12 | | | | 1.26 | | | | (0.08 | ) | | | – | |
Year Ended 10/31/2016 | | | 7.63 | | | | 0.03 | | | | 0.84 | | | | 0.87 | | | | (0.11 | ) | | | – | |
Year Ended 10/31/2015 | | | 9.47 | | | | 0.12 | | | | (1.75 | ) | | | (1.63 | ) | | | (0.21 | ) | | | – | |
Year Ended 10/31/2014 | | | 10.55 | | | | 0.23 | | | | (1.16 | ) | | | (0.93 | ) | | | (0.15 | ) | | | – | |
PARTNER WORLDWIDE ALLOCATION FUND | | | | | | | | | | | | | | | | | |
Class A Shares | | | | | | | | | | | | | | | | | | | | | | | | |
Year Ended 10/31/2018 | | | 11.33 | | | | 0.19 | | | | (1.34 | ) | | | (1.15 | ) | | | (0.23 | ) | | | (0.15 | ) |
Year Ended 10/31/2017 | | | 9.65 | | | | 0.20 | | | | 1.67 | | | | 1.87 | | | | (0.19 | ) | | | – | |
Year Ended 10/31/2016 | | | 9.62 | | | | 0.21 | | | | – | | | | 0.21 | | | | (0.18 | ) | | | – | |
Year Ended 10/31/2015 | | | 10.03 | | | | 0.16 | | | | (0.37 | ) | | | (0.21 | ) | | | (0.20 | ) | | | – | |
Year Ended 10/31/2014 | | | 10.29 | | | | 0.16 | | | | (0.25 | ) | | | (0.09 | ) | | | (0.17 | ) | | | – | |
| | | | | | |
Class S Shares | | | | | | | | | | | | | | | | | | | | | | | | |
Year Ended 10/31/2018 | | | 11.40 | | | | 0.23 | | | | (1.34 | ) | | | (1.11 | ) | | | (0.27 | ) | | | (0.15 | ) |
Year Ended 10/31/2017 | | | 9.71 | | | | 0.23 | | | | 1.69 | | | | 1.92 | | | | (0.23 | ) | | | – | |
Year Ended 10/31/2016 | | | 9.69 | | | | 0.22 | | | | 0.02 | | | | 0.24 | | | | (0.22 | ) | | | – | |
Year Ended 10/31/2015 | | | 10.11 | | | | 0.20 | | | | (0.38 | ) | | | (0.18 | ) | | | (0.24 | ) | | | – | |
Year Ended 10/31/2014 | | | 10.36 | | | | 0.21 | | | | (0.25 | ) | | | (0.04 | ) | | | (0.21 | ) | | | – | |
SMALL CAP GROWTH FUND | | | | | | | | | | | | | | | | | | | | | |
Class S Shares | | | | | | | | | | | | | | | | | | | | | | | | |
Year Ended 10/31/2018 (c) | | | 10.00 | | | | (0.06 | ) | | | 0.63 | | | | 0.57 | | | | – | | | | – | |
SMALL CAP STOCK FUND | | | | | | | | | | | | | | | | | | | | | |
Class A Shares | | | | | | | | | | | | | | | | | | | | | | | | |
Year Ended 10/31/2018 | | | 22.60 | | | | – | | | | 0.96 | | | | 0.96 | | | | – | | | | (1.74 | ) |
Year Ended 10/31/2017 | | | 17.53 | | | | (0.02 | ) | | | 5.98 | | | | 5.96 | | | | (0.03 | ) | | | (0.86 | ) |
Year Ended 10/31/2016 | | | 18.15 | | | | 0.04 | | | | 0.88 | | | | 0.92 | | | | – | | | | (1.54 | ) |
Year Ended 10/31/2015 | | | 20.12 | | | | 0.08 | | | | 0.14 | | | | 0.22 | | | | – | | | | (2.19 | ) |
Year Ended 10/31/2014 | | | 18.52 | | | | (0.05 | ) | | | 1.80 | | | | 1.75 | | | | – | | | | (0.15 | ) |
| | | | | | |
Class S Shares | | | | | | | | | | | | | | | | | | | | | | | | |
Year Ended 10/31/2018 (d) | | | 26.87 | | | | 0.07 | | | | 1.15 | | | | 1.22 | | | | – | | | | (1.74 | ) |
Year Ended 10/31/2017 | | | 20.68 | | | | (0.01 | ) | | | 7.16 | | | | 7.15 | | | | (0.10 | ) | | | (0.86 | ) |
Year Ended 10/31/2016 | | | 21.10 | | | | 0.01 | | | | 1.15 | | | | 1.16 | | | | (0.04 | ) | | | (1.54 | ) |
Year Ended 10/31/2015 | | | 22.92 | | | | 0.01 | | | | 0.36 | | | | 0.37 | | | | – | | | | (2.19 | ) |
Year Ended 10/31/2014 | | | 20.98 | | | | 0.05 | | | | 2.04 | | | | 2.09 | | | | – | | | | (0.15 | ) |
| (a) | The amount shown may not correlate with the change in aggregate gains and losses of portfolio securities due to the timing of sales and redemptions of fund shares. |
| (b) | Total investment return assumes dividend reinvestment and does not reflect any deduction for applicable sales charges. Not annualized for periods less than one year. |
| (c) | Since fund inception, February 28, 2018. |
| (d) | Per share amounts have been calculated using the average shares outstanding method. |
| * | All per share amounts have been rounded to the nearest cent. |
| ** | Computed on an annualized basis for periods less than one year. |
The accompanying Notes to Financial Statements are an integral part of this statement.
236
THRIVENT MUTUAL FUNDS
FINANCIAL HIGHLIGHTS –CONTINUED
| | | | | | | | | | | | | | | | | | | | | | |
| | | RATIOS/SUPPLEMENTAL DATA |
| | | | | | | | | | | | Ratio to Average Net
Assets** | | Ratios to Average Net
Assets Before Expenses
Waived, Credited or Paid
Indirectly ** | | |
Total Distributions | | Net Asset Value, End of Period | | | Total Return(b) | | | Net Assets, End of Period (in millions) | | | Expenses | | Net Investment Income/(Loss) | | Expenses | | Net Investment Income/(Loss) | | Portfolio
Turnover Rate |
| | | | | | | | | | | | | | | | | | | | | | |
| | | | | | | | | | | | | | | | | | | | | | |
$(0.09) | | | $8.05 | | | | (15.71)% | | | | $7.8 | | | 1.65% | | 0.48% | | 3.31% | | (1.18)% | | 26% |
(0.04) | | | 9.64 | | | | 14.79% | | | | 9.3 | | | 1.65% | | 1.10% | | 3.39% | | (0.64)% | | 42% |
(0.08) | | | 8.44 | | | | 11.36% | | | | 9.8 | | | 1.65% | | 0.75% | | 3.57% | | (1.17)% | | 11% |
(0.13) | | | 7.66 | | | | (17.75)% | | | | 9.6 | | | 1.65% | | 0.85% | | 3.46% | | (0.95)% | | 117% |
(0.10) | | | 9.45 | | | | (9.17)% | | | | 12.8 | | | 1.67% | | 1.32% | | 3.23% | | (0.25)% | | 69% |
| | | | | | | | |
| | | | | | | | | | | | | | | | | | | | | | |
(0.12) | | | 8.00 | | | | (15.39)% | | | | 4.9 | | | 1.32% | | 0.87% | | 3.18% | | (0.99)% | | 26% |
(0.08) | | | 9.57 | | | | 15.19% | | | | 3.8 | | | 1.32% | | 1.61% | | 3.24% | | (0.31)% | | 42% |
(0.11) | | | 8.39 | | | | 11.67% | | | | 1.0 | | | 1.32% | | 0.94% | | 3.56% | | (1.30)% | | 11% |
(0.21) | | | 7.63 | | | | (17.53)% | | | | 0.3 | | | 1.32% | | 1.14% | | 3.05% | | (0.58)% | | 117% |
(0.15) | | | 9.47 | | | | (8.90)% | | | | 0.6 | | | 1.32% | | 1.64% | | 2.90% | | 0.06% | | 69% |
| | | | | | | | | | | | | | | | | | | | | | |
| | | | | | | | | | | | | | | | | | | | | | |
(0.38) | | | 9.80 | | | | (10.52)% | | | | 138.5 | | | 1.35% | | 1.73% | | 1.47% | | 1.62% | | 75% |
(0.19) | | | 11.33 | | | | 19.76% | | | | 161.4 | | | 1.36% | | 1.86% | | 1.56% | | 1.65% | | 94% |
(0.18) | | | 9.65 | | | | 2.21% | | | | 141.3 | | | 1.40% | | 1.82% | | 1.58% | | 1.64% | | 108%*** |
(0.20) | | | 9.62 | | | | (2.14)% | | | | 167.3 | | | 1.40% | | 1.61% | | 1.57% | | 1.44% | | 68% |
(0.17) | | | 10.03 | | | | (0.89)% | | | | 178.2 | | | 1.40% | | 1.57% | | 1.55% | | 1.41% | | 77% |
| | | | | | | | |
| | | | | | | | | | | | | | | | | | | | | | |
(0.42) | | | 9.87 | | | | (10.13)% | | | | 678.3 | | | 0.94% | | 2.14% | | 0.95% | | 2.14% | | 75% |
(0.23) | | | 11.40 | | | | 20.22% | | | | 747.4 | | | 0.96% | | 2.26% | | 1.01% | | 2.22% | | 94% |
(0.22) | | | 9.71 | | | | 2.60% | | | | 615.9 | | | 1.00% | | 2.24% | | 1.00% | | 2.24% | | 108%*** |
(0.24) | | | 9.69 | | | | (1.77)% | | | | 640.3 | | | 0.98% | | 2.04% | | 0.99% | | 2.03% | | 68% |
(0.21) | | | 10.11 | | | | (0.40)% | | | | 651.9 | | | 0.97% | | 1.99% | | 0.99% | | 1.98% | | 77% |
| | | | | | | | |
| | | | | | | | | | | | | | | | | | | | | | |
– | | | 10.57 | | | | 5.70% | | | | 5.2 | | | 1.24% | | (0.77)% | | 3.91% | | (3.43)% | | 32% |
| | | | | | | | |
| | | | | | | | | | | | | | | | | | | | | | |
(1.74) | | | 21.82 | | | | 4.48% | | | | 421.8 | | | 1.13% | | (0.02)% | | 1.13% | | (0.02)% | | 63% |
(0.89) | | | 22.60 | | | | 34.84% | | | | 424.0 | | | 1.16% | | (0.07)% | | 1.16% | | (0.07)% | | 47% |
(1.54) | | | 17.53 | | | | 5.72% | | | | 331.4 | | | 1.21% | | 0.23% | | 1.21% | | 0.23% | | 58% |
(2.19) | | | 18.15 | | | | 1.32% | | | | 342.6 | | | 1.23% | | (0.01)% | | 1.23% | | (0.01)% | | 70% |
(0.15) | | | 20.12 | | | | 9.48% | | | | 259.8 | | | 1.25% | | (0.15)% | | 1.25% | | (0.15)% | | 56% |
| | | | | | | | |
| | | | | | | | | | | | | | | | | | | | | | |
(1.74) | | | 26.35 | | | | 4.75% | | | | 243.0 | | | 0.85% | | 0.25% | | 0.85% | | 0.25% | | 63% |
(0.96) | | | 26.87 | | | | 35.34% | | | | 171.0 | | | 0.80% | | 0.30% | | 0.80% | | 0.30% | | 47% |
(1.58) | | | 20.68 | | | | 6.12% | | | | 115.1 | | | 0.80% | | 0.64% | | 0.80% | | 0.64% | | 58% |
(2.19) | | | 21.10 | | | | 1.86% | | | | 100.4 | | | 0.75% | | 0.47% | | 0.75% | | 0.47% | | 70% |
(0.15) | | | 22.92 | | | | 10.00% | | | | 90.8 | | | 0.75% | | 0.35% | | 0.75% | | 0.35% | | 56% |
| *** | Management identified an error in the calculation of the 10/31/2016 Portfolio Turnover Rates. The market value of a short term security was incorrectly included in the calculation. The impact of the revised calculation was evaluated, and Management concluded that the error did not result in a material misstatement of the Financial Statements or the Financial Highlights. Management determined that a revision of the 10/31/2016 Portfolio Turnover Rates was appropriate and the revisions are reflected in the Financial Highlights. The previously stated 10/31/2016 Portfolio Turnover Rate for Partner Worldwide Allocation Fund was 107%. |
The accompanying Notes to Financial Statements are an integral part of this statement.
237
ADDITIONAL INFORMATION
(unaudited)
Shareholder Notification of Federal Tax Information
The following information is provided solely to satisfy the requirements set forth by the Internal Revenue Code. Shareholders will be provided information regarding their distributions in January 2019.
The Funds designate the following percentages of dividends declared from net investment income as dividends qualifying for the 70% dividends received deduction for corporations or as qualified dividend income for individuals under the Jobs and Growth Tax Relief Reconciliation Act of 2003 for the tax period ending October 31, 2018:
| | | | | | | | |
| Fund | | Dividends Received Deduction for Corporations | | | Qualified Dividend Income for Individuals | |
Aggressive Allocation | | | 26 | % | | | 40 | % |
Balanced Income Plus | | | 10 | % | | | 26 | % |
High Yield | | | 1 | % | | | 1 | % |
Income | | | 1 | % | | | 1 | % |
Large Cap Growth | | | 82 | % | | | 87 | % |
Large Cap Stock | | | 26 | % | | | 56 | % |
Large Cap Value | | | 100 | % | | | 100 | % |
Low Volatility Equity | | | 39 | % | | | 72 | % |
Mid Cap Stock | | | 80 | % | | | 80 | % |
Moderate Allocation | | | 22 | % | | | 30 | % |
Moderately Aggressive Allocation | | | 25 | % | | | 38 | % |
Moderately Conservative Allocation | | | 15 | % | | | 20 | % |
Opportunity Income Plus | | | 1 | % | | | 1 | % |
Partner Emerging Markets Equity | | | 0 | % | | | 100 | % |
Partner Worldwide Allocation | | | 0 | % | | | 77 | % |
Small Cap Stock | | | 100 | % | | | 100 | % |
The Municipal Bond Fund and High Income Municipal Bond Fund designate 99.39% and 99.47% of the dividends declared from net investment income, respectively, as exempt from federal income tax for the tax period ended October 31, 2018.
Pursuant to IRC 852(b)(3) of the Internal Revenue Code, the Funds hereby designate the following amounts as long-term capital gains distributed during the year ended October 31, 2018, or if subsequently determined to be different, the net capital gain of such year:
| | | | |
| Fund | | Distributions of Long-Term Capital Gains | |
Aggressive Allocation | | | $44,619,346 | |
Balanced Income Plus | | | 3,777,505 | |
Government Bond | | | 175,213 | |
Income | | | 2,835,212 | |
Large Cap Growth | | | 16,265,929 | |
Large Cap Stock | | | 121,265,652 | |
Large Cap Value | | | 38,803,449 | |
Low Volatility Equity | | | 20,226 | |
Mid Cap Stock | | | 146,010,906 | |
Moderate Allocation | | | 46,257,170 | |
Moderately Aggressive Allocation | | | 75,442,756 | |
Moderately Conservative Allocation | | | 12,230,399 | |
Partner Worldwide Allocation | | | 5,536,332 | |
Small Cap Stock | | | 45,333,886 | |
These amounts may include earnings and profits distributed to shareholders on the redemption of shares as part of the dividend paid deduction.
Proxy Voting
The policies and procedures that the Trust uses to determine how to vote proxies relating to portfolio securities are attached to the Trust’s Statement of Additional Information. You may request a free copy of the Statement of Additional Information by calling 800-847-4836, or visit ThriventFunds.com to access it online. In addition, you may review a report of how the Trust voted proxies relating to portfolio securities during the most recent 12-month period ended June 29 by clicking on the tab for each Fund and navigating to “Related Documents” under Fund Details - Holdings at ThriventFunds.com or SEC.gov where it is filed on Form N-PX.
Quarterly Schedule of Portfolio Holdings
The Trust files its Schedule of Portfolio Holdings on Form N-Q with the SEC for the first and third quarters of each fiscal year. You may request a free copy of the Trust’s Forms N-Q by calling 800-847-4836. The Trust’s most recent Form N-Q Schedule of Investments also is at ThriventFunds.com or SEC. gov. You also may review and copy the Forms N-Q for the Trust at the SEC’s Public Reference Room in Washington, DC. You may get information about the operation of the Public Reference Room by calling 800-SEC-0330.
Summary Schedule of Investments
The summary schedule of investments is designed to streamline the report and help investors better focus on a fund’s principal holdings. A complete listing of holdings for a fund in which the summary is included in the shareholder report is available free of charge by calling 800-847-4836. It is also available at ThriventFunds.com or SEC.gov where it is part of form N-CSR.
238
BOARDOF TRUSTEESAND OFFICERS
The following table provides information about the Trustees and Officers of the Trust. The Board is responsible for the management and supervision of the Funds’ business affairs and for exercising all powers except those reserved to the shareholders. Each Trustee oversees each of 24 series of the Trust and also serves as:
| | • | | Director of Thrivent Series Fund, Inc., a registered investment company consisting of 29 funds that serve as underlying funds for variable contracts issued by Thrivent Financial and Thrivent Life Insurance Company and separate accounts of insurance companies not affiliated with Thrivent Financial. |
| | • | | Trustee of Thrivent Cash Management Trust, a registered investment company consisting of one fund that serves as a cash collateral fund for a securities lending program sponsored by Thrivent Financial. |
| | • | | Trustee of Thrivent Core Funds, a registered investment company consisting of four funds that are established solely for investment by Thrivent entities. |
David Royal also serves as Trustee of Thrivent Church Loan and Income Fund, a closed-end registered investment company.
The Trust, Thrivent Series Fund, Inc., Thrivent Cash Management Trust, Thrivent Core Funds, and Thrivent Church Loan and Income Fund are collectively referred to as the “Fund Complex.” The Statement of Additional Information includes additional information about the Trustees and is available, without charge, by calling 800-847-4836.
Interested Trustees (1)(2)(3)(4)
| | |
Name (Year of Birth) Year Elected | | Principal Occupation(s) and Directorships of Public Companies and Other Investment Companies During the Past Five Years |
David S. Royal (1971) 2015 | | Chief Investment Officer, Thrivent Financial since 2017; VP, President, Mutual Funds, Thrivent Financial from 2015 to 2017; Vice President and Deputy General Counsel from 2006 to 2015. Currently, Director of Children’s Cancer Research Fund and Advisory Board member of Twin Bridge Capital Partners; Director of Fairview Hospital Foundation until 2017. |
Russell W. Swansen (1957) 2009 | | Retired; Chief Investment Officer, Thrivent Financial from 2003 to 2017. Currently, Advisory Board member of Twin Bridge Capital Partners, Advisory Board member of Invenshure LLC, and Director of Intellectual Takeout; Director of Children’s Cancer Research Fund until 2017. |
|
| Independent Trustees (2)(3)(4)(5) |
| |
Name (Year of Birth) Year Elected | | Principal Occupation(s) and Directorships of Public Companies and Other Investment Companies During the Past Five Years |
Janice B. Case (1952) 2011 | | Retired. Independent Trustee of North American Electric Reliability Corporation (the electric reliability organization (“ERD”) for North America) since 2008. |
Robert J. Chersi (1961) 2017 | | Founder of Chersi Services LLC (consulting firm) since 2012; Executive Director of Center for Global Governance, Reporting & Regulation and Adjunct Professor of Finance and Economics at Pace University since 2013; Helpful Executive in Research (counseling) in the Department of Accounting & Information Systems at Rutgers University since 2013. Director and Chairman of the Audit Committee of Brightsphere Investment Group plc since 2016; Advisory Board member of the Pace University Lubin School of Business. |
Richard A. Hauser (1943) 2004 | | Retired; Member, PowerHaus Advisors LLC since 2016; Vice President and Assistant General Counsel, The Boeing Company from 2007 to 2016. |
Marc S. Joseph (1960) 2011 | | Managing Director of Granite Ridge LLP (consulting and advisory firm) since 2009; Managing Director of Triangle Crest (private investing and consulting firm) since 2004. |
Paul R. Laubscher (1956) 2009 | | Portfolio Manager for U.S. private real estate portfolios of IBM Retirement Funds. |
James A. Nussle (1960) 2011 | | President and Chief Executive Officer of Credit Union National Association since September 2014; President and Chief Operating Officer of Growth Energy (trade association) from 2010 through August 2014; Advisory Board member of AVISTA Capital Partners (private equity firm) from 2010 to 2015; CEO of The Nussle Group LLC (consulting firm) since 2009. Advisory Board member of AVISTA Capital Partners and Director of Portfolio Recovery Associates (PRAA) since 2010. |
239
BOARDOF TRUSTEESAND OFFICERS
| | |
| Independent Trustees (2)(3)(4)(5) |
| |
Name (Year of Birth) Year Elected | | Principal Occupation(s) and Directorships of Public Companies and Other Investment Companies During the Past Five Years |
Verne O. Sedlacek (1954) 2017 | | Chief Executive Officer of E&F Advisors LLC (consulting) since 2015; President & Chief Executive Officer of the Commonfund from 2003 to 2015. Director of Association of Governing Boards of Universities and Colleges since 2007; Trustee of Valparaiso University since 2015; Trustee of Museum of American Finance since 2015; Chairman of the Board of Directors of AGB Institutional Strategies since 2016. |
Constance L. Souders (1950) 2007 | | Retired. |
240
BOARDOF TRUSTEESAND OFFICERS
Executive Officers (2)(4)
| | |
Name (Year of Birth) Position Held With Trust | | Principal Occupation(s) During the Past Five Years |
David S. Royal (1971) Trustee, President and Chief Investment Officer | | Chief Investment Officer, Thrivent Financial since 2017; VP, President, Mutual Funds, Thrivent Financial from 2015 to 2017; Vice President and Deputy General Counsel from 2006 to 2015. |
Gerard V. Vaillancourt (1967) Treasurer and Principal Accounting Officer | | Vice President, Mutual Fund Accounting since 2006. |
Michael W. Kremenak (1978) Secretary and Chief Legal Officer | | Vice President, Thrivent Financial since 2015; Senior Counsel, Thrivent Financial from 2013 to 2015; Vice President and Assistant General Counsel at Nuveen Investments from 2011 to 2013. |
Ted S. Dryden (1965) Chief Compliance Officer | | Vice President, Chief Compliance Officer - Thrivent Funds, Thrivent Financial since 2018; Director, Chief Compliance Officer - Thrivent Funds, Thrivent Financial from 2010 to 2018. |
Janice M. Guimond (1964) Vice President | | Vice President, Investment Operations, Thrivent Financial since 2004. |
Kathleen M. Koelling (1977) Privacy and Identity Theft and Anti-Money Laundering Officer (6) | | Vice President, Deputy General Counsel, Thrivent Financial since 2018; Vice President, Managing Counsel, Thrivent Financial from 2016 to 2018; Privacy and Identity Theft and Anti-Money Laundering Officer, Thrivent Financial since 2011; Senior Counsel, Thrivent Financial from 2002 to 2016. |
Kathryn A. Stelter (1962) Vice President | | Vice President, Mutual Funds Chief Operations Officer, Thrivent Financial since 2017; Director, Mutual Fund Operations, Thrivent Financial from 2014 to 2017; Director, Mutual Fund Operations at Hartford Funds from 2006 to 2014. |
Troy A. Beaver (1967) Vice President | | Vice President, Mutual Funds Marketing & Distribution, Thrivent Financial since 2015; Vice President, Marketing, American Century Investments from 2006 to 2015. |
James M. Odland (1955) Assistant Secretary | | Vice President, Managing Counsel, Thrivent Financial since 2005. |
Jill M. Forte (1974) Assistant Secretary | | Senior Counsel, Thrivent Financial since 2017; Counsel, Thrivent Financial from 2015 to 2017; Associate Counsel, Ameriprise Financial, Inc. from 2013 to 2015; Manager - Legal Affairs, Ameriprise Financial, Inc. from 2010 to 2013. |
John D. Jackson (1977) Assistant Secretary | | Senior Counsel, Thrivent Financial since 2017; Associate General Counsel, RBC Global Asset Management (US) Inc. from 2011 to 2017. |
Sarah L. Bergstrom (1977) Assistant Treasurer | | Head of Mutual Fund Accounting, Thrivent Financial since 2017; Director, Fund Accounting Administration, Thrivent Financial from 2007 to 2017. |
| (1) | “Interested person” of the Trust as defined in the 1940 Act by virtue of a position with Thrivent Financial. Mr. Royal is considered an interested person because of his principal occupation with Thrivent Financial. Mr. Swansen is considered an interested person because of his past occupation with Thrivent Financial. |
| (2) | Each Trustee generally serves an indefinite term until her or his successor is duly elected and qualified. Officers serve at the discretion of the Board until their successors are duly appointed and qualified. |
| (3) | Each Trustee, other than Mr. Royal, oversees 58 portfolios. Mr. Royal oversees 59 portfolios. |
| (4) | The address for each Trustee and Officer unless otherwise noted is 625 Fourth Avenue South, Minneapolis, MN 55415. |
| (5) | The Trustees other than Mr. Royal and Mr. Swansen are not “interested persons” of the Trust and are referred to as “Independent Trustees.” |
| (6) | The address for this Officer is 4321 North Ballard Road, Appleton, WI 54913. |
241
(This page intentionally left blank)
(This page intentionally left blank)
(This page intentionally left blank)

4321 North Ballard Road, Appleton, WI 54919-0001
We’re listening to you!
In response to concerns regarding multiple mailings, we send one copy of a shareholder report and one copy of a prospectus for Thrivent Mutual Funds to each household. This process is known as householding. This consolidation helps reduce printing and postage costs, thereby saving money.
| | • | | If you purchased shares of Thrivent Mutual Funds through Thrivent Financial or online at ThriventFunds.com |
If you wish to receive an additional copy of this report, call us toll-free at 800-847-4836. If you wish to revoke householding in the future, you may write to us at 4321 North Ballard Road, Appleton, WI, 54919-0001, or by calling us at 800-847-4836. We will begin to mail separate regulatory mailings within 30 days of receiving your request. This report is also available by visiting ThriventFunds.com.
| | • | | If you purchased shares of Thrivent Mutual Funds from a firm other than Thrivent |
If you wish to receive an additional copy of this report or wish to revoke householding in the future, please contact your financial advisor. This report is also available by visiting ThriventFunds.com.
The principal underwriter for Thrivent Mutual Funds is Thrivent Distributors, a registered broker/dealer and member of FINRA and SIPC., and a wholly owned subsidiary of Thrivent, the marketing name for Thrivent Financial for Lutherans, Appleton, WI.
23459AR R12-18
As of the end of the period covered by this report, registrant has adopted a code of ethics (as defined in Item 2 of Form N-CSR) applicable to registrant’s Principal Executive Officer, Principal Financial Officer and Principal Accounting Officer. No waivers were granted to such code of ethics during the period covered by this report. A copy of this code of ethics is filed as an exhibit to this Form N-CSR.
| Item 3. | Audit Committee Financial Expert |
Registrant’s Board of Trustees has determined that Robert J. Chersi, an independent trustee, is the Audit Committee Financial Expert.
| Item 4. | Principal Accountant Fees and Services |
The aggregate fees billed by registrant’s independent public accountants, PricewaterhouseCoopers LLP (“PwC”), for the fiscal year ended October 31, 2017 and the fiscal year ended October 31, 2018, for professional services rendered in connection with the audit of registrant’s annual financial statements or services that are normally provided by the accountant in connection with statutory and regulatory filings or engagements were $421,705 and $486,374, respectively.
The aggregate fees PwC billed to registrant for the fiscal year ended October 31, 2017 and the fiscal year ended October 31, 2018, for assurance and other services that are reasonably related to the performance of registrant’s audit and are not reported under Item 4(a), were $1,000 and $3,515, respectively. The 2017 payments were for corporate action consultation services. The 2018 payments were for the review of SEC comment letter. The aggregate fees PwC billed to registrant’s investment adviser and any entity controlling, controlled by, or under common control with registrant’s investment adviser for the fiscal year ended October 31, 2017 and the fiscal year ended October 31, 2018, for assurance and other services directly related to the operations and financial reporting of registrant, were $0 for each respective period.
The aggregate tax fees PwC billed to registrant for the fiscal year ended October 31, 2017 and for the fiscal year ended October 31, 2018, for tax compliance, tax advice and tax planning services, were $181,489 and $53,293, respectively. These fees include payments for tax return compliance services, excise distribution review services, and other tax related matters. The aggregate tax fees PwC billed to registrant’s investment adviser and any entity controlling, controlled by, or under common control with registrant’s investment adviser for the fiscal year ended October 31, 2017 and the fiscal year ended October 31, 2018, for services directly related to the operations and financial reporting of registrant, were $0 for each respective period.
The aggregate fees PwC billed to registrant for the last two fiscal years for products and services provided, other than the services reported in paragraphs (a) through (c) of this item, were $0 for each respective period. The aggregate fees PwC billed to the registrant’s investment adviser and any entity controlling, controlled by, or under common control with the registrant’s investment adviser for the fiscal year ended October 31, 2017 and the fiscal year ended October 31, 2018, for products and services provided, other than the services reported in paragraphs (a) through (c) of this item, were $3,600 and $23,550, respectively. The 2017 payments were for access to a PwC-sponsored online library that provides interpretive guidance regarding U.S. and foreign accounting standards. The 2018 payments were for access to a PwC-sponsored online library that provides interpretive guidance regarding U.S. and foreign accounting standards and for fees related to the merger of certain series of Thrivent Mutual Funds and certain series of Thrivent Series Fund, Inc. These figures are also reported in response to Item 4(g) below.
| | (e) | Registrant’s audit committee charter provides that the audit committee (comprised of the independent Trustees of registrant) is responsible for pre-approval of all auditing services performed for the registrant. The audit committee also is responsible for pre-approval (subject to the de minimis exceptions for non-audit services described in Section 10A(i)(1)(B) of the Securities Exchange Act of 1934) of all non-auditing services performed for the registrant or an affiliate of registrant. In addition, registrant’s audit committee charter permits a designated member of the audit committee to pre-approve, between meetings, one or more audit or non-audit service projects, subject to an expense limit and notification to the audit committee at the next committee meeting. Registrant’s audit committee pre-approved all fees described above that PwC billed to registrant. |
| | (f) | Less than 50% of the hours billed by PwC for auditing services to registrant for the fiscal year ended October 31, 2017 were for work performed by persons other than full-time permanent employees of PwC. |
| | (g) | The aggregate non-audit fees billed by PwC to registrant and to registrant’s investment adviser and any entity controlling, controlled by, or under common control with registrant’s investment adviser for the fiscal year ended October 31, 2017 and the fiscal year ended October 31, 2018 were $3,600 and $23,550 for each respective period. These figures are also reported in response to Item 4(d) above. |
| | (h) | Registrant’s audit committee has considered the non-audit services provided to the registrant and registrant’s investment adviser and any entity controlling, controlled by, or under common control with registrant’s investment adviser as described above and determined that these services do not compromise PwC’s independence. |
| Item 5. | Audit Committee of Listed Registrants |
Not applicable.
| | (a) | Registrant’s Schedule of Investments/Summary Schedule of Investments is included in the report to shareholders filed under Item 1. Where the registrant included a Summary Schedule of Investments in the report to shareholders filed under Item 1, the registrant has filed a Schedule of Investments under this item. |

Report of Independent Registered Public Accounting Firm
To the Board of Trustees of Thrivent Mutual Funds and Shareholders of Thrivent Aggressive Allocation Fund, Thrivent Balanced Income Plus Fund, Thrivent High Yield Fund, Thrivent Income Fund, Thrivent Large Cap Stock Fund, Thrivent Limited Maturity Bond Fund, Thrivent Moderate Allocation Fund, Thrivent Moderately Aggressive Allocation Fund, Thrivent Moderately Conservative Allocation Fund, Thrivent Municipal Bond Fund, Thrivent Opportunity Income Plus Fund, and Thrivent Partner Worldwide Allocation Fund
Opinions on the Financial Statements
We have audited the accompanying statements of assets and liabilities, including the summary schedules of investments, of Thrivent Aggressive Allocation Fund, Thrivent Balanced Income Plus Fund, Thrivent High Yield Fund, Thrivent Income Fund, Thrivent Large Cap Stock Fund, Thrivent Limited Maturity Bond Fund, Thrivent Moderate Allocation Fund, Thrivent Moderately Aggressive Allocation Fund, Thrivent Moderately Conservative Allocation Fund, Thrivent Municipal Bond Fund, Thrivent Opportunity Income Plus Fund, and Thrivent Partner Worldwide Allocation Fund (twelve of the funds constituting Thrivent Mutual Funds, hereafter collectively referred to as the “Funds”) as of October 31, 2018, the related statements of operations for the year ended October 31, 2018, the statements of changes in net assets for each of the two years in the period ended October 31, 2018, including the related notes, and the financial highlights for each of the periods indicated therein (included in Item 1 of this Form N-CSR) and the schedules of investments (included in Item 6 of this Form N-CSR) as of October 31, 2018 (collectively referred to as the “financial statements”). In our opinion, the financial statements present fairly, in all material respects, the financial position of each of the Funds as of October 31, 2018, the results of each of their operations for the year then ended, the changes in each of their net assets for each of the two years in the period ended October 31, 2018 and each of the financial highlights for each of the periods indicated therein in conformity with accounting principles generally accepted in the United States of America.
Basis for Opinions
These financial statements are the responsibility of the Funds’ management. Our responsibility is to express an opinion on the Funds’ financial statements based on our audits. We are a public accounting firm registered with the Public Company Accounting Oversight Board (United States) (“PCAOB”) and are required to be independent with respect to the Funds in accordance with the U.S. federal securities laws and the applicable rules and regulations of the Securities and Exchange Commission and the PCAOB.
We conducted our audits of these financial statements in accordance with the standards of the PCAOB. Those standards require that we plan and perform the audit to obtain reasonable assurance about whether the financial statements are free of material misstatement, whether due to error or fraud.
Our audits included performing procedures to assess the risks of material misstatement of the financial statements, whether due to error or fraud, and performing procedures that respond to those risks. Such procedures included examining, on a test basis, evidence regarding the amounts and disclosures in the financial statements. Our audits also included evaluating the accounting principles used and significant estimates made by management, as well as evaluating the overall presentation of the financial statements. Our procedures included confirmation of securities owned as of October 31, 2018 by correspondence with the custodian, agent banks, transfer agent and brokers; when replies were not received from brokers and agent banks, we performed other auditing procedures. We believe that our audits provide a reasonable basis for our opinions.
|
PricewaterhouseCoopers LLP, 45 South Seventh Street, Suite 3400, Minneapolis, MN 55402 |
T: (612) 596 6000, F: (612) 373 7160, www.pwc.com/us |

December 17, 2018
We have served as the auditor of one or more investment companies in Thrivent Financial for Lutherans investment company complex since 1987.
2
AGGRESSIVE ALLOCATION FUND
Schedule of Investments as of October 31, 2018
| | | | | | | | |
| Shares | | | Registered Investment Companies (43.8%) | | Value | |
| | Affiliated Equity Holdings (41.3%) | | | | |
| | 5,607,856 | | | Thrivent Core International Equity Fund | | | $52,040,901 | |
| | 4,318,979 | | | Thrivent Core Low Volatility Equity Funda | | | 45,522,035 | |
| | 7,132,168 | | | Thrivent Large Cap Growth Fund, Class S | | | 88,938,129 | |
| | 1,309,878 | | | Thrivent Large Cap Stock Fund, Class S | | | 35,209,517 | |
| | 2,928,782 | | | Thrivent Large Cap Value Fund, Class S | | | 67,069,097 | |
| | 2,601,035 | | | Thrivent Mid Cap Stock Fund, Class S | | | 72,985,049 | |
| | 11,758,230 | | | Thrivent Partner Worldwide Allocation Fund, Class S | | | 116,053,728 | |
| | 1,201,969 | | | Thrivent Small Cap Stock Fund, Class S | | | 31,671,889 | |
| | | | | |
| | | | Total | | | 509,490,345 | |
| | | | | |
| |
| | Affiliated Fixed Income Holdings (1.4%) | | | | |
| | 1,334,731 | | | Thrivent High Yield Fund, Class S | | | 6,193,152 | |
| | 459,914 | | | Thrivent Income Fund, Class S | | | 4,001,251 | |
| | 559,454 | | | Thrivent Limited Maturity Bond Fund, Class S | | | 6,881,281 | |
| | | | | |
| | | | Total | | | 17,075,684 | |
| | | | | |
| |
| | Equity Funds/Exchange Traded Funds (1.1%) | | | | |
| | 4,499 | | | iShares Russell 1000 Growth Index Fund | | | 639,218 | |
| | 6,977 | | | iShares Russell 2000 Growth Index Fundb | | | 1,310,908 | |
| | 4,088 | | | iShares Russell 2000 Value Index Fund | | | 495,261 | |
| | 14,015 | | | ProShares Ultra S&P 500b | | | 1,536,745 | |
| | 894 | | | ProShares UltraPro S&P 500 | | | 40,561 | |
| | 22,806 | | | SPDR S&P 500 ETF Trust | | | 6,171,988 | |
| | 18,456 | | | SPDR S&P Biotech ETFb | | | 1,460,054 | |
| | 16,105 | | | SPDR S&P Retail ETFb | | | 759,190 | |
| | 11,669 | | | Vanguard REIT ETF | | | 913,916 | |
| | | | | |
| | | | Total | | | 13,327,841 | |
| | | | | |
| | | | | | | | |
| | | | | |
| | | | Total Registered Investment Companies (cost $420,967,208) | | | 539,893,870 | |
| | | | | |
| | |
| Shares | | | Common Stock (37.2%) | | Value | |
| | Communications Services (1.3%) | |
| | 1,944 | | | Alphabet, Inc., Class Aa | | | 2,120,088 | |
| | 1,558 | | | Alphabet, Inc., Class Ca | | | 1,677,608 | |
| | 22,065 | | | AT&T, Inc. | | | 676,954 | |
| | 558 | | | Carsales.com, Ltd. | | | 4,836 | |
| | 8,605 | | | CBS Corporation | | | 493,497 | |
| | 43,010 | | | Comcast Corporation | | | 1,640,401 | |
| | 12,879 | | | DISH Network Corporationa | | | 395,900 | |
| | 10,783 | | | Facebook, Inc.a | | | 1,636,752 | |
| | 610 | | | Hemisphere Media Group, Inc.a | | | 8,217 | |
| | 4,852 | | | IAC/InterActiveCorporationa | | | 953,855 | |
| | 253 | | | Ipsos SA | | | 6,737 | |
| | 41,994 | | | ITV plc | | | 79,716 | |
| | 22,194 | | | KCOM Group plc | | | 26,127 | |
| | 11,251 | | | Liberty Media Corporation - Liberty SiriusXMa | | | 464,329 | |
| | 2,550 | | | Liberty SiriusXM Groupa | | | 105,162 | |
| | 4,177 | | | Liberty Tripadvisor Holdings, Inc.a | | | 60,232 | |
| | 285 | | | Lions Gate Entertainment Corporation | | | 5,070 | |
| | 1,984 | | | Mediaset Espana Comunicacion SA | | | 13,491 | |
| | 2,086 | | | Netflix, Inc.a | | | 629,513 | |
| | 28,483 | | | News Corporation, Class A | | | 375,691 | |
| | 11,959 | | | News Corporation, Class B | | | 159,533 | |
| | 1,800 | | | NTT DOCOMO, Inc. | | | 44,638 | |
| | 52,312 | | | ORBCOMM, Inc.a | | | 498,533 | |
| | 1,035 | | | ProSiebenSat.1 Media AG | | | 23,900 | |
| | 35 | | | RTL Group SA | | | 2,246 | |
| | 3,229 | | | Seven West Media, Ltd.a | | | 1,790 | |
| | 6,996 | | | Telenor ASA | | | 128,274 | |
| | 2,500 | | | TV Asahi Holdings Corporation | | | 46,672 | |
| | 18,325 | | | Twitter, Inc.a | | | 636,794 | |
| | 46,914 | | | Verizon Communications, Inc. | | | 2,678,320 | |
| | 595 | | | Wolters Kluwer NV | | | 33,757 | |
| | | | | |
| | | | Total | | | 15,628,633 | |
| | | | | |
|
| | Consumer Discretionary (3.9%) | |
| | 2,160 | | | Amazon.com, Inc.a | | | 3,451,702 | |
| | 18,275 | | | American Axle & Manufacturing Holdings, Inc.a | | | 277,232 | |
| | 300 | | | AOKI Holdings, Inc. | | | 3,951 | |
| | 200 | | | Aoyama Trading Company, Ltd. | | | 6,051 | |
| | 4,543 | | | Aptiv plc | | | 348,902 | |
| | 1,090 | | | Ascent Capital Group, Inc.a | | | 1,046 | |
| | 500 | | | Autobacs Seven Company, Ltd. | | | 8,047 | |
| | 300 | | | Benesse Holdings, Inc. | | | 8,367 | |
| | 390 | | | Berkeley Group Holdings plc | | | 17,430 | |
| | 362 | | | Booking Holdings, Inc.a | | | 678,598 | |
| | 17,560 | | | BorgWarner, Inc. | | | 692,040 | |
| | 4,500 | | | Bridgestone Corporation | | | 173,517 | |
| | 10,212 | | | Bright Horizons Family Solutions, Inc.a | | | 1,173,461 | |
| | 4,675 | | | Bunzl plc | | | 137,912 | |
| | 13,184 | | | Burlington Stores, Inc.a | | | 2,260,924 | |
| | 1,823 | | | Century Casinos, Inc.a | | | 11,376 | |
| | 22,749 | | | Chico’s FAS, Inc. | | | 174,485 | |
| | 22,105 | | | Children’s Place, Inc. | | | 3,302,487 | |
| | 1,710 | | | Chipotle Mexican Grill, Inc.a | | | 787,164 | |
| | 400 | | | Chiyoda Company, Ltd. | | | 7,711 | |
| | 169 | | | Cie Generale des Etablissements Michelin | | | 17,301 | |
| | 56,314 | | | Core-Mark Holding Company, Inc. | | | 2,163,021 | |
| | 72,148 | | | Crocs, Inc.a | | | 1,481,920 | |
| | 2,629 | | | CSS Industries, Inc. | | | 34,545 | |
| | 2,407 | | | Culp, Inc. | | | 55,722 | |
| | 600 | | | DCM Holdings Company, Ltd. | | | 5,834 | |
| | 600 | | | Denso Corporation | | | 26,763 | |
| | 20,702 | | | Dollar Tree, Inc.a | | | 1,745,179 | |
| | 25,699 | | | Duluth Holdings, Inc.a,b | | | 789,730 | |
| | 1,735 | | | Emerald Expositions Events, Inc. | | | 25,366 | |
| | 8,855 | | | Expedia Group, Inc. | | | 1,110,683 | |
| | 17,783 | | | Extended Stay America, Inc. | | | 289,507 | |
| | 10,032 | | | Five Below, Inc.a | | | 1,141,842 | |
| | 83 | | | Genuine Parts Company | | | 8,127 | |
| | 21,938 | | | G-III Apparel Group, Ltd.a | | | 874,449 | |
| | 17,676 | | | Habit Restaurants, Inc.a | | | 224,485 | |
| | 23,114 | | | Harley-Davidson, Inc. | | | 883,417 | |
| | 871 | | | Haverty Furniture Companies, Inc. | | | 17,664 | |
| | 7,741 | | | Home Depot, Inc. | | | 1,361,487 | |
| | 5,700 | | | Honda Motor Company, Ltd. | | | 162,710 | |
| | 1,978 | | | Inchcape plc | | | 13,661 | |
| | 4,686 | | | International Speedway Corporation | | | 175,772 | |
| | 6,406 | | | Las Vegas Sands Corporation | | | 326,898 | |
| | 1,066 | | | Laureate Education, Inc.a | | | 15,873 | |
| | 434 | | | Liberty Latin America, Ltd.a | | | 7,803 | |
| | 7,696 | | | LKQ Corporationa | | | 209,870 | |
The accompanying Notes to Financial Statements are an integral part of this schedule.
1
AGGRESSIVE ALLOCATION FUND
Schedule of Investments as of October 31, 2018
| | | | | | | | |
| Shares | | | Common Stock (37.2%) | | Value | |
| | Consumer Discretionary (3.9%) - continued | | | | |
| | 22,190 | | | Lowe’s Companies, Inc. | | | $2,112,932 | |
| | 2,475 | | | Lululemon Athletica, Inc.a | | | 348,307 | |
| | 2,252 | | | Magna International, Inc. | | | 110,888 | |
| | 3,150 | | | McDonald’s Corporation | | | 557,235 | |
| | 38,088 | | | Michaels Companies, Inc.a | | | 603,695 | |
| | 5,371 | | | Modine Manufacturing Companya | | | 69,877 | |
| | 449 | | | Next plc | | | 29,828 | |
| | 2,100 | | | NHK Spring Company, Ltd. | | | 17,982 | |
| | 12,131 | | | NIKE, Inc. | | | 910,310 | |
| | 20,900 | | | Nissan Motor Company, Ltd. | | | 190,143 | |
| | 22,920 | | | Norwegian Cruise Line Holdings, Ltd.a | | | 1,010,084 | |
| | 60,341 | | | Nutrisystem, Inc. | | | 2,145,726 | |
| | 1,434 | | | O’Reilly Automotive, Inc.a | | | 459,955 | |
| | 14,385 | | | Oxford Industries, Inc. | | | 1,279,977 | |
| | 2,484 | | | Peugeot SA | | | 59,046 | |
| | 26,339 | | | Planet Fitness, Inc.a | | | 1,292,982 | |
| | 623 | | | Playa Hotels and Resorts NVa | | | 5,352 | |
| | 200 | | | Plenus Company, Ltd.b | | | 3,201 | |
| | 7,710 | | | Polaris Industries, Inc. | | | 686,036 | |
| | 4,390 | | | PVH Corporation | | | 530,268 | |
| | 3,175 | | | RHa | | | 367,379 | |
| | 12,567 | | | Ross Stores, Inc. | | | 1,244,133 | |
| | 800 | | | Sangetsu Company, Ltd. | | | 15,387 | |
| | 900 | | | Sankyo Company, Ltd. | | | 34,363 | |
| | 11,800 | | | Sekisui House, Ltd. | | | 173,189 | |
| | 500 | | | SHIMAMURA Company, Ltd. | | | 42,057 | |
| | 20,839 | | | Six Flags Entertainment Corporation | | | 1,122,389 | |
| | 306 | | | SmartCentres Real Estate Investment Trust | | | 6,992 | |
| | 4,505 | | | Stamps.com, Inc.a | | | 910,776 | |
| | 1,600 | | | Sumitomo Rubber Industries, Ltd. | | | 22,951 | |
| | 1,246 | | | Super Retail Group, Ltd. | | | 6,390 | |
| | 100 | | | Takara Standard Company, Ltd. | | | 1,544 | |
| | 7,650 | | | Tapestry, Inc. | | | 323,672 | |
| | 31,513 | | | Toll Brothers, Inc. | | | 1,060,728 | |
| | 9,328 | | | Tower International, Inc. | | | 276,948 | |
| | 3,000 | | | Toyoda Gosei Company, Ltd. | | | 64,703 | |
| | 3,579 | | | Ulta Beauty, Inc.a | | | 982,507 | |
| | 5,267 | | | Vail Resorts, Inc. | | | 1,323,702 | |
| | 3,707 | | | VF Corporation | | | 307,236 | |
| | 9,426 | | | Wingstop, Inc. | | | 590,256 | |
| | 19,734 | | | Zumiez, Inc.a | | | 459,013 | |
| | | | | |
| | | | Total | | | 48,452,171 | |
| | | | | |
| |
| | Consumer Staples (1.3%) | | | | |
| | 5,884 | | | Altria Group, Inc. | | | 382,695 | |
| | 14,113 | | | Archer-Daniels-Midland Company | | | 666,839 | |
| | 500 | | | Arcs Company, Ltd. | | | 12,082 | |
| | 17,315 | | | Casey’s General Stores, Inc. | | | 2,183,595 | |
| | 101,854 | | | Cott Corporation | | | 1,531,884 | |
| | 17,400 | | | CVS Health Corporation | | | 1,259,586 | |
| | 3,672 | | | e.l.f. Beauty, Inc.a,b | | | 38,960 | |
| | 3,521 | | | Empire Company, Ltd. | | | 64,057 | |
| | 605 | | | ForFarmers BV | | | 6,814 | |
| | 144 | | | Glanbia plc | | | 2,555 | |
| | 69,624 | | | Hain Celestial Group, Inc.a | | | 1,732,245 | |
| | 3,914 | | | Imperial Brands plc | | | 132,578 | |
| | 2,358 | | | Inter Parfums, Inc. | | | 139,098 | |
| | 9,400 | | | Japan Tobacco, Inc. | | | 241,536 | |
| | 10,760 | | | John B. Sanfilippo & Son, Inc. | | | 678,526 | |
| | 3,690 | | | Kimberly-Clark Corporation | | | 384,867 | |
| | 3,588 | | | Koninklijke Ahold Delhaize NV | | | 82,131 | |
| | 10,244 | | | Kroger Company | | | 304,861 | |
| | 156 | | | Loblaw Companies, Ltd. | | | 7,802 | |
| | 2,443 | | | MGP Ingredients, Inc. | | | 173,868 | |
| | 100 | | | Ministop Company, Ltd. | | | 1,846 | |
| | 5,440 | | | Molson Coors Brewing Company | | | 348,160 | |
| | 10,437 | | | Monster Beverage Corporationa | | | 551,595 | |
| | 100 | | | NH Foods, Ltd. | | | 3,449 | |
| | 16,684 | | | PepsiCo, Inc. | | | 1,874,948 | |
| | 676 | | | Seneca Foods Corporationa | | | 21,382 | |
| | 2,035 | | | SpartanNash Company | | | 36,325 | |
| | 200 | | | Sugi Holdings Company, Ltd. | | | 9,157 | |
| | 81,187 | | | SunOpta, Inc.a | | | 602,408 | |
| | 1,446 | | | Swedish Match AB | | | 73,657 | |
| | 27,900 | | | Turning Point Brands, Inc. | | | 1,146,690 | |
| | 2,579 | | | Unilever NV | | | 138,582 | |
| | 3,809 | | | Unilever plc | | | 201,761 | |
| | 10,581 | | | Wal-Mart Stores, Inc. | | | 1,061,063 | |
| | 2,649 | | | Wesfarmers, Ltd. | | | 87,729 | |
| | | | | |
| | | | Total | | | 16,185,331 | |
| | | | | |
| |
| | Energy (1.7%) | | | | |
| | 7,001 | | | Abraxas Petroleum Corporationa | | | 12,882 | |
| | 15,936 | | | Anadarko Petroleum Corporation | | | 847,795 | |
| | 46,600 | | | Archrock, Inc. | | | 478,116 | |
| | 1,519 | | | California Resources Corporationa | | | 47,605 | |
| | 145,481 | | | Callon Petroleum Companya | | | 1,450,446 | |
| | 19,271 | | | Chevron Corporation | | | 2,151,607 | |
| | 4,249 | | | Comstock Resources, Inc.a | | | 30,805 | |
| | 4,429 | | | Concho Resources, Inc.a | | | 616,030 | |
| | 13,408 | | | Denbury Resources, Inc.a | | | 46,258 | |
| | 6,230 | | | Diamondback Energy, Inc. | | | 700,003 | |
| | 314 | | | Eni SPA | | | 5,577 | |
| | 8,000 | | | EQT Corporation | | | 271,760 | |
| | 2,170 | | | Era Group, Inc.a | | | 24,564 | |
| | 547 | | | Evolution Petroleum Corporation | | | 5,634 | |
| | 5,288 | | | Exterran Corporationa | | | 110,466 | |
| | 19,437 | | | Exxon Mobil Corporation | | | 1,548,740 | |
| | 16,420 | | | Forum Energy Technologies, Inc.a | | | 147,123 | |
| | 95 | | | Gaztransport Et Technigaz SA | | | 7,021 | |
| | 60,891 | | | Gran Tierra Energy, Inc.a | | | 185,718 | |
| | 19,475 | | | Halliburton Company | | | 675,393 | |
| | 13,614 | | | Helix Energy Solutions Group, Inc.a | | | 115,991 | |
| | 1,076 | | | Keane Group, Inc.a | | | 13,525 | |
| | 80,355 | | | Marathon Oil Corporation | | | 1,525,941 | |
| | 9,989 | | | Marathon Petroleum Corporation | | | 703,725 | |
| | 4,812 | | | Nabors Industries, Ltd. | | | 23,916 | |
| | 4,764 | | | Newpark Resources, Inc.a | | | 39,112 | |
| | 49,097 | | | Nine Energy Service, Inc.a | | | 1,818,062 | |
| | 10,922 | | | Northern Oil and Gas, Inc.a | | | 32,111 | |
| | 1,175 | | | OMV AG | | | 65,250 | |
| | 5,189 | | | ONEOK, Inc. | | | 340,398 | |
| | 13,031 | | | Parsley Energy, Inc.a | | | 305,186 | |
| | 64,906 | | | Patterson-UTI Energy, Inc. | | | 1,080,036 | |
| | 1,145 | | | Petrofac, Ltd. | | | 8,420 | |
| | 4,194 | | | Phillips 66 | | | 431,227 | |
| | 3,635 | | | Pioneer Energy Services Corporationa | | | 10,796 | |
| | 5,348 | | | Pioneer Natural Resources Company | | | 787,600 | |
| | 284 | | | Royal Dutch Shell plc, Class A | | | 9,048 | |
| | 6,412 | | | Royal Dutch Shell plc, Class B | | | 209,114 | |
| | 8,967 | | | SM Energy Company | | | 218,257 | |
| | 32,017 | | | Talos Energy, Inc.a | | | 834,363 | |
| | 27,090 | | | TechnipFMC plc | | | 712,467 | |
| | 6,374 | | | Teekay Tankers, Ltd. | | | 7,075 | |
| | 1,002 | | | Total SAb | | | 58,793 | |
| | 168,372 | | | Transocean, Ltd.a,b | | | 1,853,776 | |
| | 14,377 | | | Unit Corporationa | | | 332,540 | |
| | 107,010 | | | Weatherford International plca,b | | | 144,464 | |
| | 22,060 | | | WPX Energy, Inc.a | | | 353,842 | |
| | | | | |
| | | | Total | | | 21,398,578 | |
| | | | | |
The accompanying Notes to Financial Statements are an integral part of this schedule.
2
AGGRESSIVE ALLOCATION FUND
Schedule of Investments as of October 31, 2018
| | | | | | | | |
| Shares | | | Common Stock (37.2%) | | Value | |
| | Financials (6.8%) | | | | |
| | 585 | | | Aareal Bank AG | | | $ 21,763 | |
| | 4,902 | | | Affiliated Managers Group, Inc. | | | 557,161 | |
| | 15,510 | | | Aflac, Inc. | | | 668,015 | |
| | 814 | | | AG Mortgage Investment Trust, Inc. | | | 14,082 | |
| | 277 | | | Aircastle, Ltd. | | | 5,382 | |
| | 42 | | | Allianz SE | | | 8,749 | |
| | 11,326 | | | Allstate Corporation | | | 1,084,125 | |
| | 15,450 | | | Ally Financial, Inc. | | | 392,585 | |
| | 4,747 | | | American Express Company | | | 487,659 | |
| | 17,061 | | | American Financial Group, Inc. | | | 1,706,612 | |
| | 8,550 | | | American International Group, Inc. | | | 353,030 | |
| | 8,269 | | | Ameris Bancorp | | | 354,657 | |
| | 85 | | | Anima Holding SPAc | | | 355 | |
| | 7,000 | | | Arch Capital Group, Ltd.a | | | 198,590 | |
| | 17,907 | | | Argo Group International Holdings, Ltd. | | | 1,103,250 | |
| | 9,950 | | | Arthur J. Gallagher & Company | | | 736,400 | |
| | 57,119 | | | Assured Guaranty, Ltd. | | | 2,283,618 | |
| | 420 | | | ASX, Ltd. | | | 17,640 | |
| | 5,096 | | | Australia and New Zealand Banking Group, Ltd. | | | 93,800 | |
| | 9,802 | | | Axos Financial, Inc.a | | | 297,589 | |
| | 3,490 | | | Banca Monte dei Paschi di Siena SPAa,b | | | 5,730 | |
| | 102 | | | BancFirst Corporation | | | 5,853 | |
| | 36,582 | | | BancorpSouth Bank | | | 1,049,903 | |
| | 123,399 | | | Bank of America Corporation | | | 3,393,473 | |
| | 637 | | | Bank of Marin Bancorp | | | 54,139 | |
| | 457 | | | Bank of New York Mellon Corporation | | | 21,630 | |
| | 2,420 | | | BankFinancial Corporation | | | 34,170 | |
| | 2,050 | | | Bankinter SA | | | 16,796 | |
| | 5,116 | | | Berkshire Hathaway, Inc.a | | | 1,050,213 | |
| | 781 | | | BGC Partners, Inc. | | | 8,271 | |
| | 20,670 | | | Blackstone Group, LP | | | 668,881 | |
| | 7,461 | | | BOK Financial Corporation | | | 639,632 | |
| | 12,812 | | | Boston Private Financial Holdings, Inc. | | | 172,962 | |
| | 41,505 | | | BrightSphere Investment Group | | | 473,157 | |
| | 15,532 | | | Brown & Brown, Inc. | | | 437,692 | |
| | 10,504 | | | CaixaBank SA | | | 42,506 | |
| | 20,559 | | | Capital One Financial Corporation | | | 1,835,919 | |
| | 10,172 | | | Cathay General Bancorp | | | 383,179 | |
| | 13,105 | | | Central Pacific Financial Corporation | | | 354,359 | |
| | 1,584 | | | Cherry Hill Mortgage Investment Corporation | | | 28,369 | |
| | 4,790 | | | Chubb, Ltd. | | | 598,319 | |
| | 4,676 | | | CI Financial Corporation | | | 69,157 | |
| | 4,272 | | | Cincinnati Financial Corporation | | | 335,950 | |
| | 65,194 | | | Citigroup, Inc. | | | 4,267,599 | |
| | 3,155 | | | CNP Assurances | | | 70,317 | |
| | 9,206 | | | Comerica, Inc. | | | 750,841 | |
| | 7,226 | | | Community Trust Bancorp, Inc. | | | 328,855 | |
| | 12,171 | | | Descartes Systems Group, Inc.a | | | 372,311 | |
| | 6,665 | | | Direct Line Insurance Group plc | | | 28,008 | |
| | 16,638 | | | Discover Financial Services | | | 1,159,169 | |
| | 6,325 | | | DnB ASA | | | 114,270 | |
| | 27,517 | | | Dynex Capital, Inc. | | | 159,323 | |
| | 20,489 | | | E*TRADE Financial Corporation | | | 1,012,566 | |
| | 15,051 | | | East West Bancorp, Inc. | | | 789,274 | |
| | 3,120 | | | Ellington Residential Mortgage REIT | | | 32,947 | |
| | 5,663 | | | Employers Holdings, Inc. | | | 260,272 | |
| | 12,390 | | | Enterprise Financial Services Corporation | | | 538,346 | |
| | 14,418 | | | Essent Group, Ltd.a | | | 568,358 | |
| | 1,230 | | | Euronext NVc | | | 75,685 | |
| | 1,096 | | | FBL Financial Group, Inc. | | | 75,602 | |
| | 46,730 | | | Fifth Third Bancorp | | | 1,261,243 | |
| | 3,391 | | | Financial Institutions, Inc. | | | 96,813 | |
| | 3,878 | | | Finecobank Banca Fineco SPA | | | 40,531 | |
| | 7,338 | | | First American Financial Corporation | | | 325,294 | |
| | 6,148 | | | First Busey Corporation | | | 171,652 | |
| | 8,921 | | | First Commonwealth Financial Corporation | | | 120,434 | |
| | 9,943 | | | First Defiance Financial Corporation | | | 270,648 | |
| | 1,451 | | | First Financial Corporation | | | 66,543 | |
| | 53,734 | | | First Hawaiian, Inc. | | | 1,331,529 | |
| | 27,695 | | | First Interstate BancSystem, Inc. | | | 1,148,235 | |
| | 580 | | | First Merchants Corporation | | | 24,134 | |
| | 360 | | | First Mid-Illinois Bancshares, Inc. | | | 13,421 | |
| | 2,864 | | | First Midwest Bancorp, Inc. | | | 65,757 | |
| | 802 | | | First of Long Island Corporation | | | 16,208 | |
| | 4,585 | | | First Republic Bank | | | 417,189 | |
| | 12,273 | | | FlexiGroup, Ltd. | | | 13,374 | |
| | 1,146 | | | Genworth MI Canada, Inc.b | | | 37,615 | |
| | 8,093 | | | Goldman Sachs Group, Inc. | | | 1,823,919 | |
| | 6,999 | | | Great Southern Bancorp, Inc. | | | 378,996 | |
| | 37,626 | | | Hamilton Lane, Inc. | | | 1,444,086 | |
| | 29,562 | | | Hancock Whitney Corporation | | | 1,240,422 | |
| | 886 | | | Hanmi Financial Corporation | | | 18,588 | |
| | 786 | | | Hannover Rueckversicherung SE | | | 105,701 | |
| | 881 | | | Hanover Insurance Group, Inc. | | | 98,126 | |
| | 25,760 | | | Hartford Financial Services Group, Inc. | | | 1,170,019 | |
| | 302 | | | Heartland Financial USA, Inc. | | | 16,048 | |
| | 88,223 | | | Heritage Commerce Corporation | | | 1,280,116 | |
| | 4,851 | | | Hometrust Bancshares, Inc.a | | | 132,238 | |
| | 17,930 | | | Horace Mann Educators Corporation | | | 704,290 | |
| | 4,951 | | | Horizon Bancorp, Inc. | | | 82,979 | |
| | 18,392 | | | Houlihan Lokey, Inc. | | | 757,383 | |
| | 82,889 | | | Huntington Bancshares, Inc. | | | 1,187,799 | |
| | 16,554 | | | IBERIABANK Corporation | | | 1,233,107 | |
| | 6,189 | | | Independent Bank Corporation | | | 136,963 | |
| | 4,315 | | | Interactive Brokers Group, Inc. | | | 213,204 | |
| | 25,302 | | | Intercontinental Exchange, Inc. | | | 1,949,266 | |
| | 831 | | | Invesco, Ltd. | | | 18,041 | |
| | 81,082 | | | Investment Technology Group, Inc. | | | 2,228,133 | |
| | 10,072 | | | J.P. Morgan Chase & Company | | | 1,098,049 | |
| | 17,192 | | | Jefferies Financial Group, Inc. | | | 369,112 | |
| | 17,613 | | | Kemper Corporation | | | 1,324,321 | |
| | 135,205 | | | KeyCorp | | | 2,455,323 | |
| | 1,368 | | | Ladder Capital Corporation | | | 23,037 | |
| | 2,639 | | | Lakeland Bancorp, Inc. | | | 43,464 | |
| | 20,282 | | | Loews Corporation | | | 944,330 | |
| | 500 | | | Markel Corporationa | | | 546,620 | |
| | 3,388 | | | MarketAxess Holdings, Inc. | | | 710,362 | |
| | 800 | | | Matsui Securities Company, Ltd. | | | 8,154 | |
| | 67,166 | | | Medibank Private, Ltd. | | | 133,175 | |
| | 933 | | | Mercantile Bank Corporation | | | 29,632 | |
| | 27,723 | | | Meridian Bancorp, Inc. | | | 439,132 | |
| | 13,640 | | | MetLife, Inc. | | | 561,832 | |
| | 8,688 | | | MidWestOne Financial Group, Inc. | | | 250,301 | |
| | 7,370 | | | Morgan Stanley | | | 336,514 | |
| | 7,639 | | | National Bank Holdings Corporation | | | 257,893 | |
| | 1,350 | | | National Bank of Canada | | | 61,283 | |
| | 30 | | | National Western Life Group, Inc. | | | 8,078 | |
| | 481 | | | NBT Bancorp, Inc. | | | 17,552 | |
| | 2,133 | | | Old Second Bancorp, Inc. | | | 30,331 | |
The accompanying Notes to Financial Statements are an integral part of this schedule.
3
AGGRESSIVE ALLOCATION FUND
Schedule of Investments as of October 31, 2018
| | | | | | | | |
| Shares | | | Common Stock (37.2%) | | Value | |
| | Financials (6.8%) - continued | | | | |
| | 8,997 | | | PacWest Bancorp | | | $365,458 | |
| | 370 | | | Paragon Banking Group plc | | | 2,011 | |
| | 563 | | | Pargesa Holding SA | | | 41,330 | |
| | 78 | | | Park National Corporation | | | 7,129 | |
| | 52,875 | | | PCSB Financial Corporation | | | 989,820 | |
| | 1,913 | | | Peapack-Gladstone Financial Corporation | | | 51,632 | |
| | 590 | | | Peoples Bancorp, Inc. | | | 20,196 | |
| | 12,320 | | | Primerica, Inc. | | | 1,351,997 | |
| | 724 | | | Principal Financial Group, Inc. | | | 34,079 | |
| | 23,011 | | | Provident Financial Services, Inc. | | | 561,468 | |
| | 4,455 | | | Prudential Financial, Inc. | | | 417,790 | |
| | 4,534 | | | QCR Holdings, Inc. | | | 165,174 | |
| | 16,100 | | | Radian Group, Inc. | | | 308,959 | |
| | 1,667 | | | Raymond James Financial, Inc. | | | 127,842 | |
| | 9,949 | | | Sandy Spring Bancorp, Inc. | | | 353,687 | |
| | 61,178 | | | Santander Consumer USA Holdings Inc. | | | 1,147,088 | |
| | 56,744 | | | Seacoast Banking Corporation of Floridaa | | | 1,492,935 | |
| | 500 | | | Senshu Ikeda Holdings, Inc. | | | 1,537 | |
| | 80,132 | | | SLM Corporationa | | | 812,538 | |
| | 16,500 | | | State Auto Financial Corporation | | | 524,535 | |
| | 8,491 | | | State Street Corporation | | | 583,756 | |
| | 22,110 | | | Stifel Financial Corporation | | | 1,010,869 | |
| | 426 | | | Sun Life Financial, Inc. | | | 15,601 | |
| | 6,714 | | | SVB Financial Groupa | | | 1,592,762 | |
| | 48,115 | | | Synovus Financial Corporation | | | 1,807,199 | |
| | 920 | | | Territorial Bancorp, Inc. | | | 25,061 | |
| | 218 | | | Topdanmark AS | | | 10,362 | |
| | 2,798 | | | TriCo Bancshares | | | 100,784 | |
| | 23,879 | | | TrustCo Bank Corporation | | | 178,854 | |
| | 13,290 | | | U.S. Bancorp | | | 694,668 | |
| | 22,981 | | | United Community Banks, Inc. | | | 571,537 | |
| | 8,002 | | | United Financial Bancorp, Inc. | | | 123,631 | |
| | 460 | | | United Fire Group, Inc. | | | 24,762 | |
| | 200 | | | Univest Corporation of Pennsylvania | | | 4,992 | |
| | 5,649 | | | Unum Group | | | 204,833 | |
| | 1,932 | | | Washington Trust Bancorp, Inc. | | | 99,208 | |
| | 9,604 | | | Wells Fargo & Company | | | 511,221 | |
| | 3,750 | | | Western Alliance Bancorpa | | | 180,900 | |
| | 6,604 | | | Wintrust Financial Corporation | | | 502,829 | |
| | 11,706 | | | WSFS Financial Corporation | | | 497,856 | |
| | 49,140 | | | Zions Bancorporations NA | | | 2,312,037 | |
| | | | | |
| | | | Total | | | 83,788,531 | |
| | | | | |
| |
| | Health Care (5.5%) | | | | |
| | 811 | | | ABIOMED, Inc.a | | | 276,713 | |
| | 8,457 | | | Aerie Pharmaceuticals, Inc.a | | | 449,743 | |
| | 4,115 | | | Aetna, Inc. | | | 816,416 | |
| | 4,902 | | | AmerisourceBergen Corporation | | | 431,376 | |
| | 7,040 | | | Amgen, Inc. | | | 1,357,242 | |
| | 487 | | | Amplifon SPA | | | 8,627 | |
| | 1,681 | | | Ardelyx, Inc.a | | | 4,623 | |
| | 4,417 | | | Arena Pharmaceuticals, Inc.a | | | 157,510 | |
| | 6,075 | | | Asterias Biotherapeutics, Inc.a | | | 6,865 | |
| | 107 | | | Atrion Corporation | | | 72,993 | |
| | 9,000 | | | Baxter International, Inc. | | | 562,590 | |
| | 2,007 | | | Becton, Dickinson and Company | | | 462,614 | |
| | 4,641 | | | Biogen, Inc.a | | | 1,412,117 | |
| | 17,208 | | | BioMarin Pharmaceutical, Inc.a | | | 1,586,061 | |
| | 1,250 | | | Bio-Techne Corporation | | | 209,650 | |
| | 601 | | | Bruker Corporation | | | 18,829 | |
| | 2,706 | | | Cardinal Health, Inc. | | | 136,924 | |
| | 11,096 | | | Cardiovascular Systems, Inc.a | | | 311,243 | |
| | 41,324 | | | Catalent, Inc.a | | | 1,667,010 | |
| | 1,861 | | | Charles River Laboratories International, Inc.a | | | 226,707 | |
| | 8,096 | | | Concert Pharmaceuticals, Inc.a | | | 120,792 | |
| | 10,377 | | | Danaher Corporation | | | 1,031,474 | |
| | 10,780 | | | Dexcom, Inc.a | | | 1,431,261 | |
| | 6,138 | | | Edwards Lifesciences Corporationa | | | 905,969 | |
| | 2,127 | | | Epizyme, Inc.a | | | 17,122 | |
| | 15,793 | | | Evolent Health, Inc.a | | | 350,605 | |
| | 10,070 | | | Express Scripts Holding Companya | | | 976,488 | |
| | 39,095 | | | GenMark Diagnostics, Inc.a | | | 208,376 | |
| | 347 | | | Genomic Health, Inc.a | | | 24,883 | |
| | 14,113 | | | Gilead Sciences, Inc. | | | 962,224 | |
| | 9,449 | | | GlaxoSmithKline plc | | | 183,006 | |
| | 14,310 | | | GlaxoSmithKline plc ADR | | | 558,949 | |
| | 65,345 | | | Halozyme Therapeutics, Inc.a | | | 1,014,808 | |
| | 4,930 | | | Heska Corporationa | | | 494,085 | |
| | 3,117 | | | Hill-Rom Holdings, Inc. | | | 262,077 | |
| | 979 | | | Illumina, Inc.a | | | 304,616 | |
| | 9,296 | | | Immunomedics, Inc.a | | | 209,439 | |
| | 4,235 | | | Inogen, Inc.a | | | 802,829 | |
| | 12,863 | | | Intersect ENT, Inc.a | | | 360,936 | |
| | 3,572 | | | Intra-Cellular Therapies, Inc.a | | | 60,653 | |
| | 901 | | | Intuitive Surgical, Inc.a | | | 469,583 | |
| | 5,980 | | | Jazz Pharmaceuticals, Inc.a | | | 949,744 | |
| | 19,511 | | | Johnson & Johnson | | | 2,731,345 | |
| | 600 | | | KYORIN Holdings, Inc. | | | 13,104 | |
| | 27,379 | | | LHC Group, Inc.a | | | 2,503,262 | |
| | 65 | | | LNA Sante | | | 3,437 | |
| | 2,111 | | | Magellan Health Services, Inc.a | | | 137,342 | |
| | 1,512 | | | Medpace Holdings, Inc.a | | | 78,775 | |
| | 28,457 | | | Medtronic plc | | | 2,556,008 | |
| | 29,630 | | | Merck & Company, Inc. | | | 2,181,064 | |
| | 10,820 | | | Merit Medical Systems, Inc.a | | | 618,038 | |
| | 300 | | | Miraca Holdings, Inc. | | | 7,303 | |
| | 19,308 | | | Mylan NVa | | | 603,375 | |
| | 33,227 | | | Myriad Genetics, Inc.a | | | 1,496,212 | |
| | 16,800 | | | Natera, Inc.a | | | 368,928 | |
| | 1,952 | | | National Healthcare Corporation | | | 155,243 | |
| | 13,438 | | | Neurocrine Biosciences, Inc.a | | | 1,439,882 | |
| | 12,934 | | | Nevro Corporationa | | | 630,662 | |
| | 2,565 | | | Novartis AG | | | 224,623 | |
| | 5,693 | | | Novo Nordisk AS | | | 245,861 | |
| | 11,130 | | | Novocure, Ltd.a | | | 368,848 | |
| | 29,844 | | | NuVasive, Inc.a | | | 1,676,337 | |
| | 29,843 | | | Omnicell, Inc.a | | | 2,109,900 | |
| | 78,006 | | | Optinose, Inc.a,b | | | 825,303 | |
| | 13,767 | | | PerkinElmer, Inc. | | | 1,190,570 | |
| | 8,328 | | | Perrigo Company plc | | | 585,458 | |
| | 62,617 | | | Pfizer, Inc. | | | 2,696,288 | |
| | 6,873 | | | Ra Medical Systems, Inc.a | | | 73,541 | |
| | 898 | | | Roche Holding AG | | | 218,539 | |
| | 3,434 | | | Sage Therapeutics, Inc.a | | | 441,887 | |
| | 29,585 | | | Syneos Health, Inc.a | | | 1,349,964 | |
| | 26,953 | | | Tactile Systems Technology, Inc.a | | | 1,764,882 | |
| | 12,147 | | | Teleflex, Inc. | | | 2,924,269 | |
| | 7,236 | | | Thermo Fisher Scientific, Inc. | | | 1,690,691 | |
| | 14,087 | | | UnitedHealth Group, Inc. | | | 3,681,637 | |
| | 12,410 | | | Universal Health Services, Inc. | | | 1,508,560 | |
| | 12,875 | | | Valeant Pharmaceuticals International, Inc.a | | | 294,580 | |
| | 16,728 | | | Veeva Systems, Inc.a | | | 1,528,103 | |
| | 9,219 | | | Vertex Pharmaceuticals, Inc.a | | | 1,562,252 | |
| | 6,128 | | | West Pharmaceutical Services, Inc. | | | 649,078 | |
| | 35,450 | | | Wright Medical Group NVa | | | 956,441 | |
| | 16,379 | | | Zoetis, Inc. | | | 1,476,567 | |
| | | | | |
| | | | Total | | | 67,443,931 | |
| | | | | |
The accompanying Notes to Financial Statements are an integral part of this schedule.
4
AGGRESSIVE ALLOCATION FUND
Schedule of Investments as of October 31, 2018
| | | | | | | | |
| Shares | | | Common Stock (37.2%) | | Value | |
| | Industrials (5.6%) | | | | |
| | 4,947 | | | Acco Brands Corporation | | | $39,922 | |
| | 2,503 | | | ACS Actividades de Construccion y Servicios, SAa | | | 93,716 | |
| | 2,125 | | | Acuity Brands, Inc. | | | 266,985 | |
| | 8,070 | | | Advanced Disposal Services, Inc.a | | | 218,616 | |
| | 6,228 | | | AECOMa | | | 181,484 | |
| | 2,433 | | | Aegion Corporationa | | | 47,103 | |
| | 18,651 | | | Aerojet Rocketdyne Holdings, Inc.a | | | 658,753 | |
| | 16,028 | | | AGCO Corporation | | | 898,209 | |
| | 16,342 | | | AMETEK, Inc. | | | 1,096,221 | |
| | 8,769 | | | ASGN, Inc.a | | | 588,225 | |
| | 4,132 | | | Atlas Copco AB, Class A | | | 102,150 | |
| | 3,728 | | | Atlas Copco AB, Class B | | | 85,384 | |
| | 3,106 | | | AZZ, Inc. | | | 137,751 | |
| | 5,216 | | | Boeing Company | | | 1,850,950 | |
| | 1,148 | | | Brady Corporation | | | 46,253 | |
| | 4,675 | | | Brink’s Company | | | 310,046 | |
| | 8,153 | | | BWX Technologies, Inc. | | | 476,624 | |
| | 23,624 | | | Casella Waste Systems, Inc.a | | | 769,197 | |
| | 8,402 | | | CBIZ, Inc.a | | | 186,356 | |
| | 344 | | | CIA De Distribucion Integral | | | 8,305 | |
| | 3,782 | | | Colfax Corporationa | | | 106,009 | |
| | 5,676 | | | Comfort Systems USA, Inc. | | | 303,553 | |
| | 10,116 | | | Costamare, Inc. | | | 53,615 | |
| | 8,358 | | | Crane Company | | | 727,480 | |
| | 246 | | | CSW Industrials, Inc.a | | | 11,323 | |
| | 24,017 | | | CSX Corporation | | | 1,653,811 | |
| | 197 | | | Cummins, Inc. | | | 26,928 | |
| | 5,563 | | | Curtiss-Wright Corporation | | | 608,926 | |
| | 18,650 | | | Delta Air Lines, Inc. | | | 1,020,715 | |
| | 7,930 | | | Dycom Industries, Inc.a | | | 538,288 | |
| | 14,155 | | | EMCOR Group, Inc. | | | 1,004,722 | |
| | 11,202 | | | Emerson Electric Company | | | 760,392 | |
| | 22,531 | | | Encore Wire Corporation | | | 995,870 | |
| | 275 | | | Ennis, Inc. | | | 5,324 | |
| | 1,042 | | | ESCO Technologies, Inc. | | | 63,791 | |
| | 129,303 | | | Euronav NV | | | 1,189,588 | |
| | 5,987 | | | Federal Signal Corporation | | | 131,654 | |
| | 209 | | | Ferguson plc | | | 14,091 | |
| | 3,178 | | | Forrester Research, Inc. | | | 128,010 | |
| | 7,820 | | | Fortune Brands Home and Security, Inc. | | | 350,571 | |
| | 750 | | | Franklin Electric Company, Inc. | | | 31,815 | |
| | 4,916 | | | General Dynamics Corporation | | | 848,403 | |
| | 13,813 | | | Genesee & Wyoming, Inc.a | | | 1,094,404 | |
| | 661 | | | Global Brass and Copper Holdings, Inc. | | | 20,901 | |
| | 440 | | | GMS, Inc.a | | | 7,234 | |
| | 2,852 | | | Gorman-Rupp Company | | | 98,394 | |
| | 13,523 | | | Granite Construction, Inc. | | | 618,272 | |
| | 5,692 | | | GWA Group, Ltd. | | | 11,131 | |
| | 18,530 | | | Healthcare Services Group, Inc.b | | | 752,133 | |
| | 13,240 | | | Heico Corporation | | | 1,109,909 | |
| | 1,800 | | | Hino Motors, Ltd. | | | 17,230 | |
| | 500 | | | Hitachi Zosen Corporation | | | 1,900 | |
| | 145 | | | Hochtief AG | | | 21,487 | |
| | 20,353 | | | Honeywell International, Inc. | | | 2,947,521 | |
| | 2,929 | | | Hubbell, Inc. | | | 297,879 | |
| | 3,435 | | | Huntington Ingalls Industries, Inc. | | | 750,479 | |
| | 796 | | | Hyster-Yale Materials Handling, Inc. | | | 48,118 | |
| | 936 | | | ICF International, Inc. | | | 68,927 | |
| | 1,848 | | | Illinois Tool Works, Inc. | | | 235,749 | |
| | 700 | | | Inaba Denki Sangyo Company, Ltd. | | | 28,184 | |
| | 15,309 | | | Ingersoll-Rand plc | | | 1,468,745 | |
| | 16,866 | | | Interface, Inc. | | | 274,747 | |
| | 1,789 | | | Jacobs Engineering Group, Inc. | | | 134,336 | |
| | 8,789 | | | JB Hunt Transport Services, Inc. | | | 972,151 | |
| | 2,533 | | | Kadant, Inc. | | | 250,007 | |
| | 7,193 | | | KAR Auction Services, Inc. | | | 409,569 | |
| | 85,751 | | | KeyW Holding Corporationa | | | 671,430 | |
| | 4,260 | | | Kforce, Inc. | | | 131,293 | |
| | 8,801 | | | Kirby Corporationa | | | 633,144 | |
| | 7,737 | | | Korn/Ferry International | | | 349,248 | |
| | 5,260 | | | L3 Technologies, Inc. | | | 996,612 | |
| | 11,186 | | | Lincoln Electric Holdings, Inc. | | | 905,059 | |
| | 10,931 | | | Lindsay Corporation | | | 1,045,222 | |
| | 1,595 | | | Lockheed Martin Corporation | | | 468,691 | |
| | 13,490 | | | Masco Corporation | | | 404,700 | |
| | 3,689 | | | Masonite International Corporationa | | | 204,334 | |
| | 15,720 | | | Mercury Systems, Inc.a | | | 736,639 | |
| | 8,088 | | | Milacron Holdings Corporationa | | | 113,232 | |
| | 500 | | | Mitsuboshi Belting, Ltd. | | | 12,283 | |
| | 451 | | | Monadelphous Group, Ltd. | | | 4,615 | |
| | 2,971 | | | Moog, Inc. | | | 212,575 | |
| | 139,604 | | | MRC Global, Inc.a | | | 2,209,931 | |
| | 3,603 | | | Mueller Industries, Inc. | | | 87,733 | |
| | 2,215 | | | National Express Group plc | | | 11,318 | |
| | 20,231 | | | NCI Building Systems, Inc.a | | | 247,830 | |
| | 101,296 | | | Nexeo Solutions, Inc.a | | | 1,058,543 | |
| | 1,800 | | | Nitto Kogyo Corporation | | | 31,349 | |
| | 905 | | | Nobina ABc | | | 6,039 | |
| | 6,444 | | | Norfolk Southern Corporation | | | 1,081,497 | |
| | 667 | | | Northgate plc | | | 3,212 | |
| | 6,226 | | | Old Dominion Freight Line, Inc. | | | 811,995 | |
| | 104 | | | Orion Group Holdings, Inc.a | | | 491 | |
| | 18,232 | | | Oshkosh Corporation | | | 1,023,545 | |
| | 5,130 | | | PageGroup plc | | | 32,883 | |
| | 1,740 | | | Parker Hannifin Corporation | | | 263,836 | |
| | 65,683 | | | Primoris Services Corporation | | | 1,390,509 | |
| | 1,282 | | | Radiant Logistics, Inc.a | | | 6,974 | |
| | 10,519 | | | Raven Industries, Inc. | | | 457,366 | |
| | 3,215 | | | Regal-Beloit Corporation | | | 230,516 | |
| | 5,937 | | | RELX plc | | | 117,414 | |
| | 4,275 | | | RELX plc | | | 84,591 | |
| | 3,392 | | | Resideo Technologies, Inc.a | | | 71,402 | |
| | 1,028 | | | Resources Connection, Inc. | | | 16,777 | |
| | 12,294 | | | Ritchie Brothers Auctioneers, Inc. | | | 413,201 | |
| | 158 | | | Rockwool International AS | | | 53,982 | |
| | 5,287 | | | Roper Industries, Inc. | | | 1,495,692 | |
| | 732 | | | Rush Enterprises, Inc. | | | 25,906 | |
| | 1,077 | | | Sandvik AB | | | 17,026 | |
| | 475 | | | Schindler Holding AG, Participation Certificate | | | 100,161 | |
| | 729 | | | Schneider Electric SE | | | 52,715 | |
| | 6 | | | SGS SA | | | 14,250 | |
| | 300 | | | ShinMaywa Industries, Ltd. | | | 3,693 | |
| | 19,790 | | | SiteOne Landscape Supply, Inc.a | | | 1,346,512 | |
| | 4,613 | | | SKF AB | | | 73,956 | |
| | 675 | | | Smiths Group plc | | | 12,032 | |
| | 42,420 | | | Southwest Airlines Company | | | 2,082,822 | |
| | 1,790 | | | SP Plus Corporationa | | | 57,208 | |
| | 289 | | | Spirax-Sarco Engineering plc | | | 23,871 | |
| | 5,162 | | | SPX Corporationa | | | 151,350 | |
| | 1,577 | | | SPX FLOW, Inc.a | | | 53,981 | |
| | 3,479 | | | Standex International Corporation | | | 282,217 | |
| | 9,300 | | | Sumitomo Electric Industries, Ltd. | | | 126,830 | |
| | 200 | | | Taikisha, Ltd. | | | 5,644 | |
| | 23,052 | | | Terex Corporation | | | 769,706 | |
The accompanying Notes to Financial Statements are an integral part of this schedule.
5
AGGRESSIVE ALLOCATION FUND
Schedule of Investments as of October 31, 2018
| | | | | | | | |
| Shares | | | Common Stock (37.2%) | | Value | |
| | Industrials (5.6%) - continued | | | | |
| | 700 | | | Toppan Forms Company, Ltd. | | | $6,363 | |
| | 3,300 | | | Toppan Printing Company, Ltd. | | | 46,654 | |
| | 33,591 | | | TPI Composites, Inc.a | | | 848,509 | |
| | 1,086 | | | Transcontinental, Inc. | | | 17,877 | |
| | 1,230 | | | TransDigm Group, Inc.a | | | 406,208 | |
| | 7,714 | | | TransUnion | | | 507,196 | |
| | 9,771 | | | TriMas Corporationa | | | 287,756 | |
| | 500 | | | Tsubakimoto Chain Company | | | 19,198 | |
| | 360 | | | UniFirst Corporation | | | 53,748 | |
| | 12,880 | | | United Continental Holdings, Inc.a | | | 1,101,369 | |
| | 5,228 | | | United Parcel Service, Inc. | | | 556,991 | |
| | 7,881 | | | United Rentals, Inc.a | | | 946,272 | |
| | 11,420 | | | United Technologies Corporation | | | 1,418,478 | |
| | 39,229 | | | Univar, Inc.a | | | 965,818 | |
| | 2,896 | | | Universal Truckload Services, Inc. | | | 78,684 | |
| | 7,281 | | | Valmont Industries, Inc. | | | 905,101 | |
| | 16,715 | | | Verisk Analytics, Inc.a | | | 2,003,126 | |
| | 1,376 | | | Vinci SAb | | | 122,463 | |
| | 6,158 | | | WABCO Holdings, Inc.a | | | 661,677 | |
| | 14,595 | | | WageWorks, Inc.a | | | 581,027 | |
| | 40,662 | | | Waste Connections, Inc. | | | 3,108,203 | |
| | 2,763 | | | Watsco, Inc. | | | 409,421 | |
| | 22,853 | | | Willdan Group, Inc.a | | | 690,161 | |
| | 2,823 | | | XPO Logistics, Inc.a | | | 252,320 | |
| | 400 | | | Yuasa Trading Company, Ltd. | | | 13,122 | |
| | | | | |
| | | | Total | | | 69,581,861 | |
| | | | | |
| |
| | Information Technology (7.9%) | | | | |
| | 3,668 | | | 2U, Inc.a | | | 230,754 | |
| | 6,954 | | | Activision Blizzard, Inc. | | | 480,174 | |
| | 1,307 | | | Adobe, Inc.a | | | 321,208 | |
| | 52,966 | | | Advanced Micro Devices, Inc.a | | | 964,510 | |
| | 30,130 | | | Agilent Technologies, Inc. | | | 1,952,123 | |
| | 19,457 | | | Akamai Technologies, Inc.a | | | 1,405,768 | |
| | 3,370 | | | Alliance Data Systems Corporation | | | 694,827 | |
| | 1,487 | | | Amadeus IT Holding SA | | | 119,739 | |
| | 6,907 | | | Ambarella, Inc.a,b | | | 240,225 | |
| | 1,626 | | | American Software, Inc. | | | 18,715 | |
| | 33,163 | | | Amphenol Corporation | | | 2,968,089 | |
| | 944 | | | ANSYS, Inc.a | | | 141,175 | |
| | 18,983 | | | Apple, Inc. | | | 4,154,619 | |
| | 9,324 | | | Applied Materials, Inc. | | | 306,573 | |
| | 6,654 | | | Arista Networks, Inc.a | | | 1,532,749 | |
| | 9,401 | | | Arrow Electronics, Inc.a | | | 636,542 | |
| | 2,001 | | | Atkore International Group, Inc.a | | | 38,539 | |
| | 5,290 | | | Atlassian Corporation plca | | | 401,564 | |
| | 4,040 | | | Autodesk, Inc.a | | | 522,170 | |
| | 7,084 | | | Automatic Data Processing, Inc. | | | 1,020,663 | |
| | 11,764 | | | Belden, Inc. | | | 635,844 | |
| | 9,735 | | | Benchmark Electronics, Inc. | | | 212,515 | |
| | 38,579 | | | Blackline, Inc.a | | | 1,789,294 | |
| | 41,636 | | | Booz Allen Hamilton Holding Corporation | | | 2,062,647 | |
| | 3,300 | | | Canon, Inc. | | | 93,995 | |
| | 1,264 | | | Capgemini SA | | | 154,340 | |
| | 3,947 | | | CDW Corporation | | | 355,270 | |
| | 7,600 | | | CEVA, Inc.a | | | 187,264 | |
| | 3,187 | | | CGI Group, Inc.a | | | 196,820 | |
| | 74,078 | | | Ciena Corporationa | | | 2,315,678 | |
| | 121,427 | | | Cisco Systems, Inc. | | | 5,555,285 | |
| | 7,509 | | | Cognex Corporation | | | 321,686 | |
| | 1,158 | | | Cognizant Technology Solutions Corporation | | | 79,937 | |
| | 8,699 | | | CoreLogic, Inc.a | | | 353,353 | |
| | 223 | | | CSG Systems International, Inc. | | | 7,827 | |
| | 52,992 | | | Dolby Laboratories, Inc. | | | 3,646,380 | |
| | 1,444 | | | Endurance International Group Holdings, Inc.a | | | 14,252 | |
| | 5,028 | | | Envestnet, Inc.a | | | 261,557 | |
| | 3,640 | | | Euronet Worldwide, Inc.a | | | 404,695 | |
| | 18,071 | | | EVERTEC, Inc. | | | 471,292 | |
| | 495 | | | ExlService Holdings, Inc.a | | | 31,730 | |
| | 1,446 | | | Fidelity National Information Services, Inc. | | | 150,529 | |
| | 12,988 | | | Fiserv, Inc.a | | | 1,029,948 | |
| | 31,783 | | | Flextronics International, Ltd.a | | | 249,814 | |
| | 30,450 | | | FLIR Systems, Inc. | | | 1,410,140 | |
| | 17,167 | | | Fortinet, Inc.a | | | 1,410,784 | |
| | 15,470 | | | Global Payments, Inc. | | | 1,767,138 | |
| | 22,681 | | | Guidewire Software, Inc.a | | | 2,017,929 | |
| | 868 | | | Halma plc | | | 14,730 | |
| | 21,486 | | | Keysight Technologies, Inc.a | | | 1,226,421 | |
| | 6,800 | | | Konica Minolta Holdings, Inc. | | | 67,309 | |
| | 84 | | | Kulicke and Soffa Industries, Inc. | | | 1,708 | |
| | 5,270 | | | Lam Research Corporation | | | 746,917 | |
| | 37,358 | | | M/A-COM Technology Solutions Holdings, Inc.a | | | 525,627 | |
| | 1,004 | | | ManTech International Corporation | | | 57,509 | |
| | 14,828 | | | MasterCard, Inc. | | | 2,931,051 | |
| | 6,790 | | | Maxim Integrated Products, Inc. | | | 339,636 | |
| | 48,261 | | | Microsoft Corporation | | | 5,154,757 | |
| | 514 | | | MicroStrategy, Inc.a | | | 64,749 | |
| | 2,344 | | | MoneyGram International, Inc.a | | | 9,939 | |
| | 21,164 | | | Monolithic Power Systems, Inc. | | | 2,499,892 | |
| | 1,895 | | | Monotype Imaging Holdings, Inc. | | | 33,219 | |
| | 34,630 | | | National Instruments Corporation | | | 1,695,831 | |
| | 1,000 | | | NEC Networks & System Integration Corporation | | | 21,796 | |
| | 16,745 | | | New Relic, Inc.a | | | 1,494,491 | |
| | 7,452 | | | Nice, Ltd. ADRa | | | 789,465 | |
| | 5,831 | | | Novanta, Inc.a | | | 339,423 | |
| | 2,810 | | | NVIDIA Corporation | | | 592,432 | |
| | 46,536 | | | Oracle Corporation | | | 2,272,818 | |
| | 6,090 | | | Palo Alto Networks, Inc.a | | | 1,114,714 | |
| | 14,786 | | | PayPal Holdings, Inc.a | | | 1,244,833 | |
| | 8,920 | | | Pegasystems, Inc. | | | 477,398 | |
| | 25,571 | | | Plexus Corporationa | | | 1,493,346 | |
| | 18,076 | | | Proofpoint, Inc.a | | | 1,644,012 | |
| | 28,506 | | | Q2 Holdings, Inc.a | | | 1,517,374 | |
| | 57,632 | | | Quantenna Communications, Inc.a | | | 1,035,071 | |
| | 10,115 | | | Red Hat, Inc.a | | | 1,736,139 | |
| | 12,276 | | | Rogers Corporationa | | | 1,510,685 | |
| | 5,604 | | | Rudolph Technologies, Inc.a | | | 116,507 | |
| | 300 | | | Ryoyo Electro Corporation | | | 4,302 | |
| | 50,284 | | | SailPoint Technologies Holdings, Inc.a | | | 1,309,395 | |
| | 10,895 | | | Salesforce.com, Inc.a | | | 1,495,230 | |
| | 1,831 | | | ScanSource, Inc.a | | | 71,189 | |
| | 72,094 | | | Sequans Communications SA ADRa,b | | | 75,699 | |
| | 7,729 | | | ServiceNow, Inc.a | | | 1,399,258 | |
| | 5,100 | | | Shinko Electric Industries Company, Ltd. | | | 35,507 | |
| | 515 | | | Silicon Laboratories, Inc.a | | | 41,988 | |
| | 29 | | | Siltronic AG | | | 2,656 | |
| | 5,807 | | | SS&C Technologies Holdings, Inc. | | | 297,086 | |
| | 24,601 | | | Synopsys, Inc.a | | | 2,202,528 | |
| | 8,048 | | | Teradata Corporationa | | | 292,947 | |
| | 9,234 | | | Teradyne, Inc. | | | 318,111 | |
| | 18,790 | | | Texas Instruments, Inc. | | | 1,744,276 | |
| | 100 | | | Tokyo Seimitsu Company, Ltd. | | | 2,405 | |
| | 317 | | | Trimble, Inc.a | | | 11,849 | |
| | 7,890 | | | Tyler Technologies, Inc.a | | | 1,669,997 | |
| | 1,269 | | | Ultimate Software Group, Inc.a | | | 338,354 | |
The accompanying Notes to Financial Statements are an integral part of this schedule.
6
AGGRESSIVE ALLOCATION FUND
Schedule of Investments as of October 31, 2018
| | | | | | | | |
| Shares | | | Common Stock (37.2%) | | Value | |
| | Information Technology (7.9%) - continued | | | | |
| | 4,127 | | | Universal Display Corporationb | | | $507,662 | |
| | 9,354 | | | Verint Systems, Inc.a | | | 427,197 | |
| | 969 | | | VeriSign, Inc.a | | | 138,121 | |
| | 48,833 | | | Virtusa Corporationa | | | 2,421,629 | |
| | 11,139 | | | Visa, Inc. | | | 1,535,511 | |
| | 25,110 | | | Xilinx, Inc. | | | 2,143,641 | |
| | 15,722 | | | Zix Corporationa | | | 105,966 | |
| | 15,432 | | | Zuora, Inc.a | | | 315,121 | |
| | | | | |
| | | | Total | | | 97,016,093 | |
| | | | | |
| |
| | Materials (1.3%) | | | | |
| | 11,490 | | | Alcoa Corporationa | | | 402,035 | |
| | 6,080 | | | Balchem Corporation | | | 569,392 | |
| | 7,075 | | | Ball Corporation | | | 316,960 | |
| | 2,384 | | | BASF SE | | | 182,944 | |
| | 6,994 | | | BHP Billiton plc | | | 139,521 | |
| | 4,019 | | | BHP Billiton, Ltd. | | | 92,733 | |
| | 164 | | | Canfor Corporationa | | | 2,356 | |
| | 15,375 | | | Celanese Corporation | | | 1,490,452 | |
| | 12,820 | | | CF Industries Holdings, Inc. | | | 615,745 | |
| | 685 | | | Coeur Mining, Inc.a | | | 3,274 | |
| | 4,417 | | | Continental Building Products, Inc.a | | | 122,837 | |
| | 4,000 | | | Daicel Corporation | | | 42,316 | |
| | 8,325 | | | Eastman Chemical Company | | | 652,264 | |
| | 2,530 | | | Evonik Industries AG | | | 78,267 | |
| | 6,790 | | | Ferroglobe Representation & Warranty Insurance Trusta,d | | | 1 | |
| | 9,406 | | | Freeport-McMoRan, Inc. | | | 109,580 | |
| | 137 | | | Fuchs Petrolub SE | | | 6,342 | |
| | 1,861 | | | Granges AB | | | 19,675 | |
| | 242 | | | Hexpol AB | | | 2,239 | |
| | 300 | | | Hitachi Chemical Company, Ltd. | | | 4,729 | |
| | 400 | | | Hokuetsu Corporation | | | 1,911 | |
| | 4,915 | | | Innospec, Inc. | | | 328,912 | |
| | 2,987 | | | International Paper Company | | | 135,490 | |
| | 700 | | | JSR Corporation | | | 10,432 | |
| | 177 | | | Koppers Holdings, Inc.a | | | 4,735 | |
| | 4,100 | | | Kuraray Company, Ltd. | | | 56,316 | |
| | 1,800 | | | Kyoei Steel, Ltd. | | | 32,607 | |
| | 5,600 | | | Martin Marietta Materials, Inc. | | | 959,168 | |
| | 8,470 | | | Mercer International, Inc. | | | 128,829 | |
| | 1,445 | | | Methanex Corporation | | | 93,535 | |
| | 3,050 | | | Minerals Technologies, Inc. | | | 166,987 | |
| | 2,733 | | | Mondi plc | | | 64,359 | |
| | 4,577 | | | Myers Industries, Inc. | | | 72,591 | |
| | 7,846 | | | Newmont Mining Corporation | | | 242,598 | |
| | 1,800 | | | Nippon Kayaku Company, Ltd. | | | 21,422 | |
| | 1,300 | | | Nippon Light Metal Holdings Company, Ltd. | | | 2,741 | |
| | 6,300 | | | Nippon Steel & Sumitomo Metal Corporation | | | 116,211 | |
| | 6,533 | | | Nucor Corporation | | | 386,231 | |
| | 588 | | | Olympic Steel, Inc. | | | 11,090 | |
| | 19,688 | | | OMNOVA Solutions, Inc.a | | | 145,494 | |
| | 18,320 | | | Owens-Illinois, Inc.a | | | 287,074 | |
| | 1,706 | | | Packaging Corporation of America | | | 156,628 | |
| | 10,907 | | | Reliance Steel & Aluminum Company | | | 860,780 | |
| | 12 | | | Rio Tinto, Ltd. | | | 653 | |
| | 13,940 | | | RPM International, Inc. | | | 852,710 | |
| | 2,803 | | | Ryerson Holding Corporationa | | | 25,732 | |
| | 4,912 | | | Sandfire Resources NL | | | 23,226 | |
| | 6,857 | | | Schweitzer-Mauduit International, Inc. | | | 218,875 | |
| | 20,155 | | | Scotts Miracle-Gro Company | | | 1,345,145 | |
| | 23,050 | | | Sensient Technologies Corporation | | | 1,495,023 | |
| | 2,310 | | | Sonoco Products Company | | | 126,080 | |
| | 729 | | | SSAB AB, Class A | | | 2,910 | |
| | 12,244 | | | Steel Dynamics, Inc. | | | 484,862 | |
| | 478 | | | Stepan Company | | | 39,478 | |
| | 500 | | | Taiheiyo Cement Corporation | | | 14,713 | |
| | 200 | | | Taiyo Holdings Company, Ltd. | | | 7,146 | |
| | 1,200 | | | Toagosei Company, Ltd. | | | 12,322 | |
| | 4,756 | | | Trinseo SA | | | 256,253 | |
| | 100 | | | Ube Industries, Ltd. | | | 2,178 | |
| | 6,654 | | | United States Lime & Minerals, Inc. | | | 499,117 | |
| | 4,916 | | | UPM-Kymmene Oyj | | | 158,042 | |
| | 20,563 | | | WestRock Company | | | 883,592 | |
| | 4,469 | | | Worthington Industries, Inc. | | | 187,162 | |
| | 300 | | | Yamato Kogyo Company, Ltd. | | | 7,906 | |
| | | | | |
| | | | Total | | | 15,782,928 | |
| | | | | |
| |
| | Real Estate (1.2%) | | | | |
| | 2,650 | | | Alexandria Real Estate Equities, Inc. | | | 323,909 | |
| | 5,965 | | | Americold Realty Trust | | | 147,634 | |
| | 4,396 | | | Ares Commercial Real Estate Corporation | | | 63,610 | |
| | 23,377 | | | Armada Hoffler Properties, Inc. | | | 350,187 | |
| | 482 | | | Artis Real Estate Investment Trust | | | 4,101 | |
| | 5,742 | | | Ashford Hospitality Trust, Inc. | | | 29,571 | |
| | 1,014 | | | Bluerock Residential Growth REIT, Inc. | | | 9,603 | |
| | 43,886 | | | Brixmor Property Group, Inc. | | | 710,953 | |
| | 3,760 | | | Camden Property Trust | | | 339,415 | |
| | 12,688 | | | Catchmark Timber Trust, Inc. | | | 112,289 | |
| | 35,826 | | | Cedar Realty Trust, Inc. | | | 135,064 | |
| | 8,339 | | | Chatham Lodging Trust | | | 162,610 | |
| | 2,525 | | | City Office REIT, Inc. | | | 27,825 | |
| | 47,839 | | | Cousins Properties, Inc. | | | 397,542 | |
| | 1,932 | | | Crown Castle International Corporation | | | 210,086 | |
| | 13,179 | | | CyrusOne, Inc. | | | 701,518 | |
| | 900 | | | Daito Trust Construction Company, Ltd. | | | 118,655 | |
| | 2,790 | | | Digital Realty Trust, Inc. | | | 288,095 | |
| | 30,230 | | | Douglas Emmett, Inc. | | | 1,094,024 | |
| | 11,980 | | | Duke Realty Corporation | | | 330,289 | |
| | 9,541 | | | Empire State Realty Trust, Inc. | | | 151,320 | |
| | 3,360 | | | Franklin Street Properties Corporation | | | 23,386 | |
| | 494 | | | Gaming and Leisure Properties, Inc. | | | 16,643 | |
| | 1,024 | | | Getty Realty Corporation | | | 27,474 | |
| | 683 | | | Gladstone Commercial Corporation | | | 12,970 | |
| | 1,000 | | | Hang Lung Properties, Ltd. | | | 1,813 | |
| | 19,139 | | | Highwoods Properties, Inc. | | | 816,087 | |
| | 200 | | | Hitachi High-Technologies Corporation | | | 7,506 | |
| | 9,405 | | | Hospitality Properties Trust | | | 240,956 | |
| | 17,248 | | | Host Hotels & Resorts, Inc. | | | 329,609 | |
| | 53,309 | | | Hudson Pacific Properties, Inc. | | | 1,615,263 | |
| | 11,000 | | | Hysan Development Company, Ltd. | | | 51,587 | |
| | 37,295 | | | Monmouth Real Estate Investment Corporation | | | 557,933 | |
| | 10,792 | | | National Storage Affiliates Trust | | | 287,391 | |
| | 2,887 | | | One Liberty Properties, Inc. | | | 74,860 | |
| | 741 | | | Outfront Media, Inc. | | | 13,130 | |
| | 3,663 | | | Paramount Group, Inc. | | | 52,344 | |
| | 25,594 | | | Physicians Realty Trust | | | 424,349 | |
| | 1,083 | | | Quebecor, Inc. | | | 21,241 | |
| | 777 | | | RE/MAX Holdings, Inc. | | | 29,052 | |
| | 34,451 | | | Retail Properties of America, Inc. | | | 422,714 | |
| | 3,000 | | | Road King Infrastructure, Ltd. | | | 4,644 | |
| | 1,000 | | | Saul Centers, Inc. | | | 47,760 | |
The accompanying Notes to Financial Statements are an integral part of this schedule.
7
AGGRESSIVE ALLOCATION FUND
Schedule of Investments as of October 31, 2018
| | | | | | | | |
| Shares | | | Common Stock (37.2%) | | Value | |
| | Real Estate (1.2%) - continued | | | | |
| | 7,759 | | | SBA Communications Corporationa | | | $1,258,277 | |
| | 30,470 | | | Spirit Realty Capital, Inc. | | | 238,275 | |
| | 346 | | | St. Joe Companya | | | 5,256 | |
| | 1,000 | | | Swire Pacific, Ltd. | | | 10,389 | |
| | 23,185 | | | Terreno Realty Corporation | | | 867,815 | |
| | 11,991 | | | Urstadt Biddle Properties, Inc. | | | 238,741 | |
| | 40,689 | | | Weyerhaeuser Company | | | 1,083,548 | |
| | 7,800 | | | Wing Tai Holdings, Ltd. | | | 10,871 | |
| | | | | |
| | | | Total | | | 14,500,184 | |
| | | | | |
| |
| | Utilities (0.7%) | | | | |
| | 1,166 | | | ALLETE, Inc. | | | 86,284 | |
| | 1,675 | | | Artesian Resources Corporation | | | 61,288 | |
| | 35,792 | | | Clearway Energy, Inc., Class A | | | 695,081 | |
| | 4,054 | | | Clearway Energy, Inc., Class C | | | 79,499 | |
| | 1,310 | | | Consolidated Water Company, Ltd. | | | 16,113 | |
| | 8,200 | | | Edison International, Inc. | | | 568,998 | |
| | 4,768 | | | Enagas SA | | | 126,416 | |
| | 4,550 | | | Entergy Corporation | | | 381,973 | |
| | 180 | | | IDACORP, Inc. | | | 16,787 | |
| | 24,692 | | | MDU Resources Group, Inc. | | | 616,312 | |
| | 899 | | | Middlesex Water Company | | | 40,455 | |
| | 11,773 | | | New Jersey Resources Corporation | | | 530,962 | |
| | 3,205 | | | NorthWestern Corporation | | | 188,326 | |
| | 4,900 | | | Osaka Gas Company, Ltd. | | | 89,602 | |
| | 31,456 | | | PG&E Corporationa | | | 1,472,455 | |
| | 20,035 | | | PNM Resources, Inc. | | | 769,544 | |
| | 5,126 | | | Portland General Electric Company | | | 231,080 | |
| | 8,120 | | | Public Service Enterprise Group, Inc. | | | 433,852 | |
| | 7,667 | | | Southwest Gas Holdings, Inc. | | | 592,429 | |
| | 840 | | | Spire, Inc. | | | 60,967 | |
| | 22,739 | | | UGI Corporation | | | 1,206,531 | |
| | 612 | | | Unitil Corporation | | | 29,076 | |
| | | | | |
| | | | Total | | | 8,294,030 | |
| | | | | |
| | | | | | | | |
| | | | | |
| | | | Total Common Stock (cost $397,868,594) | | | 458,072,271 | |
| | | | | |
| | |
Principal
Amount | | | Long-Term Fixed Income (2.9%) | | Value | |
| | Collateralized Mortgage Obligations (<0.1%) | | | | |
| | | | MASTR Alternative Loans Trust | | | | |
| | $31,867 | | | 2.731%, (LIBOR 1M + 0.450%), 12/25/2035, Ser. 2005-6, Class 2A1e | | | 15,628 | |
| | | | Sequoia Mortgage Trust | | | | |
| | 74,598 | | | 3.984%, 9/20/2046, Ser. 2007-1, Class 4A1e | | | 61,824 | |
| | | | WaMu Mortgage Pass Through Certificates | | | | |
| | 32,756 | | | 3.867%, 9/25/2036, Ser. 2006-AR10, Class 1A2e | | | 31,664 | |
| | 50,515 | | | 3.876%, 10/25/2036, Ser. 2006-AR12, Class 1A1e | | | 48,916 | |
| | | | | |
| | | | Total | | | 158,032 | |
| | | | | |
| |
| | Mortgage-Backed Securities (1.3%) | | | | |
| | | | Federal Home Loan Mortgage Corporation Gold 30-Yr. Pass Through | | | | |
| | 1,685,000 | | | 4.000%, 11/1/2048f | | | 1,685,584 | |
| | | | Federal National Mortgage Association Conventional 30-Yr. Pass Through | | | | |
| | 5,325,000 | | | 3.500%, 11/1/2048f | | | 5,183,763 | |
| | 4,900,000 | | | 4.000%, 11/1/2048f | | | 4,899,979 | |
| | 3,945,000 | | | 4.500%, 11/1/2048f | | | 4,039,079 | |
| | 475,000 | | | 5.000%, 11/1/2048f | | | 495,670 | |
| | | | | |
| | | | Total | | | 16,304,075 | |
| | | | | |
| |
| | U.S. Government and Agencies (1.6%) | | | | |
| | | | U.S. Treasury Bonds | | | | |
| | 950,000 | | | 2.250%, 11/15/2027 | | | 883,982 | |
| | 4,500,000 | | | 2.875%, 5/15/2028 | | | 4,400,156 | |
| | 2,291,000 | | | 2.500%, 5/15/2046 | | | 1,924,351 | |
| | | | U.S. Treasury Bonds, TIPS | | | | |
| | 1,700,737 | | | 0.375%, 7/15/2027 | | | 1,600,487 | |
| | | | U.S. Treasury Notes | | | | |
| | 3,100,000 | | | 0.750%, 2/15/2019 | | | 3,085,688 | |
| | 340,000 | | | 1.000%, 10/15/2019 | | | 334,568 | |
| | 575,000 | | | 1.500%, 10/31/2019 | | | 568,082 | |
| | 675,000 | | | 1.750%, 11/30/2019 | | | 667,934 | |
| | 1,430,000 | | | 1.125%, 8/31/2021 | | | 1,360,343 | |
| | 410,000 | | | 2.000%, 11/30/2022 | | | 394,817 | |
| | 500,000 | | | 2.125%, 7/31/2024 | | | 476,289 | |
| | 3,000,000 | | | 2.250%, 11/15/2024 | | | 2,869,453 | |
| | 1,740,000 | | | 2.125%, 11/30/2024 | | | 1,651,980 | |
| | | | | |
| | | | Total | | | 20,218,130 | |
| | | | | |
| | | | | | | | |
| | | | | |
| | | | Total Long-Term Fixed Income (cost $37,485,454) | | | 36,680,237 | |
| | | | | |
| | |
| Shares | | | Collateral Held for Securities Loaned (0.7%) | | Value | |
| | 9,152,537 | | | Thrivent Cash Management Trust | | | 9,152,537 | |
| | | | | |
| | | | Total Collateral Held for Securities Loaned (cost $9,152,537) | | | 9,152,537 | |
| | | | | |
| | |
Shares or
Principal
Amount | | | Short-Term Investments (17.4%) | | Value | |
| | | | Federal Home Loan Bank Discount Notes | | | | |
| | 150,000 | | | 2.030%, 11/2/2018g,h | | | 149,991 | |
| | 1,600,000 | | | 2.085%, 11/23/2018g,h | | | 1,597,869 | |
| | 6,500,000 | | | 2.100%, 11/28/2018g,h | | | 6,489,372 | |
| | 400,000 | | | 2.110%, 11/30/2018g,h | | | 399,298 | |
| | 200,000 | | | 2.250%, 1/4/2019g,h | | | 199,182 | |
| | 700,000 | | | 2.270%, 1/11/2019g,h | | | 696,825 | |
| | 8,700,000 | | | 2.240%, 1/16/2019g,h | | | 8,657,753 | |
| | 2,250,000 | | | 2.285%, 1/18/2019g,h | | | 2,238,788 | |
| | | | Thrivent Core Short-Term Reserve Fund | | | | |
| | 19,361,484 | | | 2.430% | | | 193,614,838 | |
| | | | | |
| | | | Total Short-Term Investments (cost $214,045,659) | | | 214,043,916 | |
| | | | | |
| | | | Total Investments (cost $1,079,519,452) 102.0% | | | $1,257,842,831 | |
| | | | | |
| | | | Other Assets and Liabilities, Net (2.0%) | | | (24,802,532 | ) |
| | | | | |
| | | | Total Net Assets 100.0% | | | $1,233,040,299 | |
| | | | | |
The accompanying Notes to Financial Statements are an integral part of this schedule.
8
AGGRESSIVE ALLOCATION FUND
Schedule of Investments as of October 31, 2018
a | Non-income producing security. |
b | All or a portion of the security is on loan. |
c | Denotes securities sold under Rule 144A of the Securities Act of 1933, which exempts them from registration. These securities may be resold to other dealers in the program or to other qualified institutional buyers. As of October 31, 2018, the value of these investments was $82,079 or 0.0% of total net assets. |
d | Security is valued using significant unobservable inputs. Further information on valuation can be found in the Notes to Financial Statements. |
e | Denotes variable rate securities. The rate shown is as of October 31, 2018. The rates of certain variable rate securities are based on a published reference rate and spread; these may vary by security and the reference rate and spread are indicated in their description. The rates of other variable rate securities are determined by the issuer or agent and are based on current market conditions. These securities do not indicate a reference rate and spread in their description. |
f | Denotes investments purchased on a when-issued or delayed delivery basis. |
g | The interest rate shown reflects the yield, coupon rate or the discount rate at the date of purchase. |
h | All or a portion of the security is held on deposit with the counterparty and pledged as the initial margin deposit for open futures contracts. |
The following table presents the total amount of securities loaned with continuous maturity, by type, offset by the gross payable upon return of collateral for securities loaned by Thrivent Aggressive Allocation Fund as of October 31, 2018:
| | | | |
Securities Lending Transactions | | | |
Common Stock | | $ | 8,979,336 | |
| | | | |
Total lending | | $ | 8,979,336 | |
Gross amount payable upon return of collateral for securities loaned | | $ | 9,152,537 | |
| | | | |
Net amounts due to counterparty | | $ | 173,201 | |
| | | | |
Definitions:
| | | | |
ADR | | - | | American Depositary Receipt, which are certificates for an underlying foreign security’s shares held by an issuing U.S. depository bank. |
ETF | | - | | Exchange Traded Fund |
REIT | | - | | Real Estate Investment Trust is a company that buys, develops, manages and/or sells real estate assets. |
Ser. | | - | | Series |
SPDR | | - | | S&P Depository Receipts, which are exchange-traded funds traded in the U.S., Europe, and Asia-Pacific and managed by State Street Global Advisors. |
TIPS | | - | | Treasury Inflation Protected Security |
Reference Rate Index:
| | | | |
LIBOR 1M | | - | | ICE Libor USD Rate 1 Month |
The accompanying Notes to Financial Statements are an integral part of this schedule.
9
BALANCED INCOME PLUS FUND
Schedule of Investments as of October 31, 2018
| | | | | | | | |
Principal
Amount | | | Bank Loans (16.6%)a | | Value | |
| | Basic Materials (1.1%) | | | | |
| | | | Ball Metalpack Finco, LLC, Term Loan | | | | |
| | $179,550 | | | 6.802%, (LIBOR 1M + 4.500%), 7/31/2025b | | | $180,448 | |
| | | | Big River Steel, LLC, Term Loan | | | | |
| | 341,550 | | | 7.386%, (LIBOR 3M + 5.000%), 8/23/2023b | | | 344,965 | |
| | | | CONSOL Energy, Inc., Term Loan | | | | |
| | 337,450 | | | 8.310%, (LIBOR 1M + 6.000%), 11/28/2022b | | | 344,763 | |
| | | | Contura Energy, Inc., Term Loan | | | | |
| | 599,566 | | | 7.300%, (LIBOR 2M + 5.000%), 3/17/2024b | | | 596,568 | |
| | 895,000 | | | 0.000%, (LIBOR 3M + 5.000%), 10/3/2025b,c,d | | | 890,525 | |
| | | | Pixelle Specialty Solutions, LLC, Term Loan | | | | |
| | 480,000 | | | 0.000%, (LIBOR 3M + 6.000%), 10/31/2024b,c,d | | | 468,600 | |
| | | | Starfruit US Holdco, LLC, Term Loan | | | | |
| | 300,000 | | | 5.506%, (LIBOR 1M + 3.250%), 10/1/2025b | | | 298,875 | |
| | | | Tronox Blocked Borrower, LLC, Term Loan | | | | |
| | 235,546 | | | 5.302%, (LIBOR 1M + 3.000%), 9/22/2024b | | | 235,214 | |
| | | | Tronox Finance, LLC, Term Loan | | | | |
| | 543,567 | | | 5.302%, (LIBOR 1M + 3.000%), 9/22/2024b | | | 542,800 | |
| | | | | |
| | | | Total | | | 3,902,758 | |
| | | | | |
| |
| | Capital Goods (0.9%) | | | | |
| | | | Advanced Disposal Services, Inc., Term Loan | | | | |
| | 308,903 | | | 4.460%, (LIBOR 1W + 2.250%), 11/10/2023b | | | 308,711 | |
| | | | Flex Acquisition Company, Inc. Term Loan | | | | |
| | 743,137 | | | 5.506%, (LIBOR 1M + 3.250%), 6/22/2025b | | | 743,539 | |
| | | | GFL Environmental, Inc., Term Loan | | | | |
| | 735,000 | | | 0.000%, (LIBOR 3M + 3.000%), 5/31/2025b,c,d | | | 723,056 | |
| | 27,072 | | | 5.136%, (LIBOR 3M + 2.750%), 5/31/2025b | | | 26,632 | |
| | 217,383 | | | 5.136%, (LIBOR 3M + 2.750%), 5/31/2025b | | | 213,851 | |
| | | | Navistar, Inc., Term Loan | | | | |
| | 645,125 | | | 5.780%, (LIBOR 1M + 3.500%), 11/6/2024b | | | 645,660 | |
| | | | Sotera Health Holdings, LLC, Term Loan | | | | |
| | 558,275 | | | 5.302%, (LIBOR 1M + 3.000%), 5/15/2022b | | | 558,738 | |
| | | | | |
| | | | Total | | | 3,220,187 | |
| | | | | |
| |
| | Communications Services (4.6%) | | | | |
| | | | Altice France SA, Term Loan | | | | |
| | 280,725 | | | 5.052%, (LIBOR 1M + 2.750%), 7/31/2025b | | | 270,462 | |
| | 1,040,000 | | | 6.280%, (LIBOR 1M + 4.000%), 1/31/2026b | | | 1,017,255 | |
| | | | Altice US Finance I Corporation, Term Loan | | | | |
| | 390,062 | | | 4.552%, (LIBOR 1M + 2.250%), 7/28/2025b | | | 389,169 | |
| | | | CBS Radio, Inc., Term Loan | | | | |
| | 104,213 | | | 5.037%, (LIBOR 1M + 2.750%), 11/17/2024b | | | 103,639 | |
| | | | Cengage Learning, Inc., Term Loan | | | | |
| | 771,235 | | | 6.530%, (LIBOR 1M + 4.250%), 6/7/2023b | | | 713,632 | |
| | | | CenturyLink, Inc., Term Loan | | | | |
| | 1,486,107 | | | 5.052%, (LIBOR 1M + 2.750%), 1/31/2025b | | | 1,469,388 | |
| | | | Charter Communications Operating, LLC, Term Loan | | | | |
| | 625,275 | | | 4.310%, (LIBOR 1M + 2.000%), 4/30/2025b | | | 625,200 | |
| | | | CSC Holdings, LLC, Term Loan | | | | |
| | 517,125 | | | 4.530%, (LIBOR 1M + 2.250%), 7/17/2025b | | | 515,465 | |
| | | | Frontier Communications Corporation, Term Loan | | | | |
| | 756,684 | | | 6.060%, (LIBOR 1M + 3.750%), 6/15/2024b | | | 730,957 | |
| | | | Gray Television, Inc., Term Loan | | | | |
| | 301,384 | | | 4.515%, (LIBOR 1M + 2.250%), 2/7/2024b | | | 301,170 | |
| | | | HCP Acquisition, LLC, Term Loan | | | | |
| | 519,604 | | | 5.302%, (LIBOR 1M + 3.000%), 5/16/2024b | | | 518,565 | |
| | | | Intelsat Jackson Holdings SA, Term Loan | | | | |
| | 505,000 | | | 6.045%, (LIBOR 1M + 3.750%), 11/27/2023b | | | 505,000 | |
| | | | Level 3 Parent, LLC, Term Loan | | | | |
| | 1,000,000 | | | 4.530%, (LIBOR 1M + 2.250%), 2/22/2024b | | | 1,000,470 | |
| | | | Liberty Cablevision of Puerto Rico, LLC, Term Loan | | | | |
| | 785,000 | | | 5.936%, (LIBOR 3M + 3.500%), 1/7/2022b | | | 769,441 | |
| | 160,000 | | | 9.186%, (LIBOR 3M + 6.750%), 7/7/2023b,e | | | 147,200 | |
| | | | McGraw-Hill Global Education Holdings, LLC, Term Loan | | | | |
| | 1,249,904 | | | 6.302%, (LIBOR 1M + 4.000%), 5/4/2022b,c,d | | | 1,197,570 | |
| | | | Mediacom Illinois, LLC, Term Loan | | | | |
| | 288,550 | | | 3.970%, (LIBOR 1W + 1.750%), 2/15/2024b | | | 287,650 | |
| | | | NEP/NCP Holdco, Inc., Term Loan | | | | |
| | 375,000 | | | 0.000%, (LIBOR 3M + 3.250%), 10/22/2025b,c,d | | | 376,313 | |
| | | | Sable International Finance, Ltd., Term Loan | | | | |
| | 1,440,000 | | | 5.547%, (LIBOR 1M + 3.250%), 1/31/2026b | | | 1,438,387 | |
| | | | Sprint Communications, Inc., Term Loan | | | | |
| | 1,157,375 | | | 4.813%, (LIBOR 1M + 2.500%), 2/2/2024b | | | 1,156,287 | |
The accompanying Notes to Financial Statements are an integral part of this schedule.
10
BALANCED INCOME PLUS FUND
Schedule of Investments as of October 31, 2018
| | | | | | | | |
Principal
Amount | | | Bank Loans (16.6%)a | | Value | |
| | Communications Services (4.6%) - continued | | | | |
| | | | Syniverse Holdings, Inc., Term Loan | | | | |
| | $174,125 | | | 7.280%, (LIBOR 1M + 5.000%), 3/9/2023b | | | $174,996 | |
| | | | Unitymedia Finance, LLC, Term Loan | | | | |
| | 630,000 | | | 4.530%, (LIBOR 1M + 2.250%), 1/15/2026b | | | 628,778 | |
| | | | Univision Communications, Inc., Term Loan | | | | |
| | 889,502 | | | 5.052%, (LIBOR 1M + 2.750%), 3/15/2024b | | | 852,667 | |
| | | | Virgin Media Bristol, LLC, Term Loan | | | | |
| | 800,000 | | | 4.780%, (LIBOR 1M + 2.500%), 1/15/2026b | | | 799,080 | |
| | | | WideOpenWest Finance, LLC, Term Loan | | | | |
| | 485,100 | | | 5.540%, (LIBOR 1M + 3.250%), 8/19/2023b | | | 466,909 | |
| | | | Windstream Services, LLC, Term Loan | | | | |
| | 398,071 | | | 6.290%, (LIBOR 1M + 4.000%), 3/30/2021b | | | 372,622 | |
| | | | | |
| | | | Total | | | 16,828,272 | |
| | | | | |
| |
| | Consumer Cyclical (1.9%) | | | | |
| | | | Boyd Gaming Corporation, Term Loan | | | | |
| | 241,566 | | | 4.467%, (LIBOR 1W + 2.250%), 9/15/2023b | | | 241,658 | |
| | | | Burlington Coat Factory Warehouse Corporation, Term Loan | | | | |
| | 529,338 | | | 4.790%, (LIBOR 1M + 2.500%), 11/17/2024b | | | 529,338 | |
| | | | Eldorado Resorts, Inc., Term Loan | | | | |
| | 174,854 | | | 4.563%, (LIBOR 1M + 2.250%), 4/17/2024b | | | 174,800 | |
| | | | Four Seasons Hotels, Ltd., Term Loan | | | | |
| | 481,326 | | | 4.302%, (LIBOR 1M + 2.000%), 11/30/2023b | | | 481,066 | |
| | | | Golden Entertainment, Inc., Term Loan | | | | |
| | 863,475 | | | 5.300%, (LIBOR 1M + 3.000%), 10/20/2024b | | | 863,475 | |
| | 135,000 | | | 9.310%, (LIBOR 1M + 7.000%), 10/20/2025b | | | 135,675 | |
| | | | Men’s Warehouse, Inc., Term Loan | | | | |
| | 390,000 | | | 5.506%, (LIBOR 3M + 3.250%), 4/9/2025b | | | 391,708 | |
| | | | Mohegan Gaming and Entertainment, Term Loan | | | | |
| | 732,608 | | | 6.302%, (LIBOR 1M + 4.000%), 10/13/2023b | | | 686,300 | |
| | | | Neiman Marcus Group, Ltd., LLC, Term Loan | | | | |
| | 282,773 | | | 5.531%, (LIBOR 1M + 3.250%), 10/25/2020b | | | 257,165 | |
| | | | Scientific Games International, Inc., Term Loan | | | | |
| | 1,343,250 | | | 5.046%, (LIBOR 1M + 2.750%), 8/14/2024b | | | 1,329,334 | |
| | | | Seminole Hard Rock Entertainment, Inc., Term Loan | | | | |
| | 583,526 | | | 5.146%, (LIBOR 3M + 2.750%), 5/14/2020b | | | 584,255 | |
| | | | Stars Group Holdings BV, Term Loan | | | | |
| | 907,725 | | | 5.886%, (LIBOR 3M + 3.500%), 7/10/2025b | | | 911,002 | |
| | | | Tenneco, Inc., Term Loan | | | | |
| | 580,000 | | | 5.052%, (LIBOR 1M + 2.750%), 10/1/2025b | | | 578,069 | |
| | | | | |
| | | | Total | | | 7,163,845 | |
| | | | | |
| |
| | Consumer Non-Cyclical (3.0%) | | | | |
| | | | Air Medical Group Holdings, Inc., Term Loan | | | | |
| | 1,508,600 | | | 5.534%, (LIBOR 3M + 3.250%), 4/28/2022b | | | 1,462,588 | |
| | | | Albertson’s, LLC, Term Loan | | | | |
| | 911,461 | | | 5.052%, (LIBOR 1M + 2.750%), 8/25/2021b | | | 909,702 | |
| | 593,679 | | | 5.311%, (LIBOR 3M + 3.000%), 6/22/2023b | | | 590,711 | |
| | 1,195,000 | | | 0.000%, (LIBOR 3M + 3.000%), 10/29/2025b,c,d | | | 1,184,795 | |
| | | | Amneal Pharmaceuticals, LLC, Term Loan | | | | |
| | 543,512 | | | 5.813%, (LIBOR 1M + 3.500%), 5/4/2025b | | | 546,093 | |
| | | | Bausch Health Companies, Inc., Term Loan | | | | |
| | 999,375 | | | 5.274%, (LIBOR 1M + 3.000%), 6/1/2025b | | | 999,145 | |
| | | | CHS/Community Health Systems, Inc., Term Loan | | | | |
| | 468,895 | | | 5.563%, (LIBOR 3M + 3.250%), 1/27/2021b | | | 458,453 | |
| | | | Endo International plc, Term Loan | | | | |
| | 836,472 | | | 6.563%, (LIBOR 1M + 4.250%), 4/27/2024b | | | 839,433 | |
| | | | Energizer Holdings, Inc., Term Loan | | | | |
| | 570,000 | | | 0.000%, (LIBOR 3M + 2.250%), 6/21/2025b,c,d | | | 570,359 | |
| | | | Grifols Worldwide Operations USA, Inc., Term Loan | | | | |
| | 482,650 | | | 4.467%, (LIBOR 1W + 2.250%), 1/31/2025b | | | 482,867 | |
| | | | JBS USA LUX SA, Term Loan | | | | |
| | 970,225 | | | 4.844%, (LIBOR 3M + 2.500%), 10/30/2022b | | | 969,740 | |
| | | | Libbey Glass, Inc., Term Loan | | | | |
| | 242,645 | | | 5.281%, (LIBOR 1M + 3.000%), 4/9/2021b | | | 241,735 | |
| | | | Northriver Midstream Finance LP, Term Loan | | | | |
| | 480,000 | | | 5.646%, (LIBOR 3M + 3.250%), 10/1/2025b,c,d | | | 482,002 | |
| | | | Ortho-Clinical Diagnostics SA, Term Loan | | | | |
| | 1,093,950 | | | 5.544%, (LIBOR 1M + 3.250%), 6/1/2025b | | | 1,089,848 | |
| | | | Revlon Consumer Products Corporation, Term Loan | | | | |
| | 441,542 | | | 5.813%, (LIBOR 3M + 3.500%), 9/7/2023b | | | 322,449 | |
| | | | | |
| | | | Total | | | 11,149,920 | |
| | | | | |
The accompanying Notes to Financial Statements are an integral part of this schedule.
11
BALANCED INCOME PLUS FUND
Schedule of Investments as of October 31, 2018
| | | | | | | | |
Principal
Amount | | | Bank Loans (16.6%)a | | Value | |
| | Energy (1.1%) | | | | |
| | | | BCP Raptor II, LLC, Term Loan | | | | |
| | $360,000 | | | 0.000%, (LIBOR 3M + 4.750%), 10/22/2025b,c,d,e | | | $357,300 | |
| | | | Calpine Corporation, Term Loan | | | | |
| | 489,936 | | | 4.890%, (LIBOR 3M + 2.500%), 1/15/2024b | | | 488,050 | |
| | | | Consolidated Energy Finance SA, Term Loan | | | | |
| | 344,137 | | | 4.784%, (LIBOR 1M + 2.500%), 5/7/2025b,e | | | 342,417 | |
| | | | GIP III Stetson I, LP, Term Loan | | | | |
| | 425,000 | | | 6.695%, (LIBOR 3M + 4.250%), 7/18/2025b | | | 425,531 | |
| | | | HFOTCO, LLC, Term Loan | | | | |
| | 867,825 | | | 5.060%, (LIBOR 1M + 2.750%), 6/26/2025b | | | 869,630 | |
| | | | MEG Energy Corporation, Term Loan | | | | |
| | 58,275 | | | 5.810%, (LIBOR 1M + 3.500%), 12/31/2023b | | | 58,336 | |
| | | | Pacific Drilling SA, Term Loan | | | | |
| | 521,838 | | | 0.000%, (PRIME + 4.500%), 6/3/2018b,f,g | | | 233,955 | |
| | | | Radiate Holdco, LLC, Term Loan | | | | |
| | 1,300,101 | | | 5.302%, (LIBOR 1M + 3.000%), 2/1/2024b | | | 1,288,959 | |
| | | | | |
| | | | Total | | | 4,064,178 | |
| | | | | |
| |
| | Financials (1.7%) | | | | |
| | | | Air Methods Corporation, Term Loan | | | | |
| | 919,516 | | | 5.886%, (LIBOR 3M + 3.500%), 4/21/2024b | | | 828,714 | |
| | | | Avolon TLB Borrower 1 US, LLC, Term Loan | | | | |
| | 997,500 | | | 4.280%, (LIBOR 1M + 2.000%), 1/15/2025b | | | 994,338 | |
| | | | Cyxtera DC Holdings, Inc., Term Loan | | | | |
| | 158,000 | | | 5.280%, (LIBOR 1M + 3.000%), 5/1/2024b | | | 157,407 | |
| | 85,000 | | | 9.530%, (LIBOR 1M + 7.250%), 5/1/2025b | | | 84,044 | |
| | | | Digicel International Finance, Ltd., Term Loan | | | | |
| | 808,874 | | | 5.570%, (LIBOR 3M + 3.250%), 5/10/2024b | | | 773,825 | |
| | | | DJO Finance, LLC, Term Loan | | | | |
| | 128,424 | | | 5.599%, (LIBOR 1M + 3.250%), 6/7/2020b | | | 128,130 | |
| | | | Genworth Holdings, Inc., Term Loan | | | | |
| | 149,250 | | | 6.831%, (LIBOR 2M + 4.500%), 3/7/2023b | | | 152,142 | |
| | | | GGP Nimbus LP, Term Loan | | | | |
| | 905,000 | | | 4.795%, (LIBOR 1M + 2.500%), 8/24/2025b | | | 889,651 | |
| | | | INEOS U.S. Finance, LLC, Term Loan | | | | |
| | 1,101,675 | | | 4.302%, (LIBOR 1M + 2.000%), 3/31/2024b | | | 1,099,097 | |
| | | | MoneyGram International, Inc., Term Loan | | | | |
| | 539,946 | | | 5.552%, (LIBOR 1M + 3.250%), 3/28/2020b,e | | | 512,949 | |
| | | | Trans Union, LLC, Term Loan | | | | |
| | 519,750 | | | 4.302%, (LIBOR 1M + 2.000%), 4/9/2023b | | | 518,508 | |
| | | | | |
| | | | Total | | | 6,138,805 | |
| | | | | |
| |
| | Technology (1.4%) | | | | |
| | | | First Data Corporation, Term Loan | | | | |
| | 1,345,000 | | | 4.287%, (LIBOR 1M + 2.000%), 4/26/2024b | | | 1,337,159 | |
| | | | Harland Clarke Holdings Corporation, Term Loan | | | | |
| | 725,876 | | | 7.136%, (LIBOR 3M + 4.750%), 11/3/2023b | | | 678,695 | |
| | | | Micron Technology, Inc., Term Loan | | | | |
| | 706,387 | | | 4.060%, (LIBOR 1M + 1.750%), 4/26/2022b | | | 706,238 | |
| | | | Plantronics, Inc., Term Loan | | | | |
| | 555,000 | | | 4.802%, (LIBOR 1M + 2.500%), 7/2/2025b | | | 552,919 | |
| | | | Rackspace Hosting, Inc., Term Loan | | | | |
| | 1,040,264 | | | 5.348%, (LIBOR 3M + 3.000%), 11/3/2023b | | | 1,007,974 | |
| | | | SS&C Technologies Holdings Europe SARL, Term Loan | | | | |
| | 198,995 | | | 4.552%, (LIBOR 1M + 2.250%), 4/16/2025b | | | 197,888 | |
| | | | SS&C Technologies, Inc., Term Loan | | | | |
| | 513,402 | | | 4.552%, (LIBOR 1M + 2.250%), 4/16/2025b | | | 510,547 | |
| | | | TNS, Inc., Term Loan | | | | |
| | 239,601 | | | 6.320%, (LIBOR 3M + 4.000%), 8/14/2022b | | | 240,601 | |
| | | | | |
| | | | Total | | | 5,232,021 | |
| | | | | |
| |
| | Transportation (0.3%) | | | | |
| | | | Arctic LNG Carriers, Ltd., Term Loan | | | | |
| | 1,012,188 | | | 6.802%, (LIBOR 1M + 4.500%), 5/18/2023b | | | 1,012,187 | |
| | | | OSG Bulk Ships, Inc., Term Loan | | | | |
| | 92,698 | | | 6.770%, (LIBOR 1M + 4.250%), 8/5/2019b | | | 91,695 | |
| | | | | |
| | | | Total | | | 1,103,882 | |
| | | | | |
| |
| | Utilities (0.6%) | | | | |
| | | | Core and Main, LP, Term Loan | | | | |
| | 400,950 | | | 5.317%, (LIBOR 3M + 3.000%), 8/1/2024b,e | | | 400,449 | |
| | | | EnergySolutions, LLC, Term Loan | | | | |
| | 299,250 | | | 6.136%, (LIBOR 3M + 3.750%), 5/11/2025b | | | 300,935 | |
| | | | Talen Energy Supply, LLC, Term Loan | | | | |
| | 334,740 | | | 6.302%, (LIBOR 1M + 4.000%), 7/6/2023b | | | 335,158 | |
| | | | TerraForm Power Operating, LLC, Term Loan | | | | |
| | 273,622 | | | 4.302%, (LIBOR 1M + 2.000%), 11/8/2022b | | | 273,621 | |
The accompanying Notes to Financial Statements are an integral part of this schedule.
12
BALANCED INCOME PLUS FUND
Schedule of Investments as of October 31, 2018
| | | | | | | | |
Principal
Amount | | | Bank Loans (16.6%)a | | Value | |
| | Utilities (0.6%) - continued | | | | |
| | | | Vertiv Group Corporation, Term Loan | | | | |
| | $913,307 | | | 6.313%, (LIBOR 3M + 4.000%), 11/15/2023b | | | $ 903,033 | |
| | | | | |
| | | | Total | | | 2,213,196 | |
| | | | | |
| | | | | | | | |
| | | | | |
| | | | Total Bank Loans (cost $61,833,495) | | | 61,017,064 | |
| | | | | |
| | |
| Shares | | | Common Stock (46.1%) | | Value | |
| | Communications Services (2.5%) | | | | |
| | 962 | | | Alphabet, Inc., Class Ah | | | 1,049,138 | |
| | 827 | | | Alphabet, Inc., Class Ch | | | 890,489 | |
| | 13,070 | | | AT&T, Inc. | | | 400,987 | |
| | 2,835 | | | Carsales.com, Ltd. | | | 24,572 | |
| | 4,450 | | | CBS Corporation | | | 255,207 | |
| | 578 | | | Charter Communications, Inc.h | | | 185,174 | |
| | 22,220 | | | Comcast Corporation | | | 847,471 | |
| | 12,108 | | | DISH Network Corporationh | | | 372,200 | |
| | 5,301 | | | Facebook, Inc.h | | | 804,639 | |
| | 1,290 | | | Ipsos SA | | | 34,351 | |
| | 211,873 | | | ITV plc | | | 402,193 | |
| | 114,933 | | | KCOM Group plc | | | 135,302 | |
| | 2,572 | | | Liberty Media Corporation - Liberty SiriusXMh | | | 106,146 | |
| | 10,464 | | | Mediaset Espana Comunicacion SA | | | 71,153 | |
| | 974 | | | Netflix, Inc.h | | | 293,934 | |
| | 9,100 | | | NTT DOCOMO, Inc. | | | 225,669 | |
| | 5,218 | | | ProSiebenSat.1 Media AG | | | 120,491 | |
| | 189 | | | RTL Group SA | | | 12,131 | |
| | 17,254 | | | Seven West Media, Ltd.h | | | 9,562 | |
| | 35,202 | | | Telenor ASA | | | 645,441 | |
| | 12,400 | | | TV Asahi Holdings Corporation | | | 231,494 | |
| | 18,441 | | | Twitter, Inc.h | | | 640,825 | |
| | 24,240 | | | Verizon Communications, Inc. | | | 1,383,862 | |
| | 2,929 | | | Wolters Kluwer NV | | | 166,175 | |
| | | | | |
| | | | Total | | | 9,308,606 | |
| | | | | |
| |
| | Consumer Discretionary (4.5%) | | | | |
| | 1,082 | | | Amazon.com, Inc.h | | | 1,729,047 | |
| | 16,309 | | | American Axle & Manufacturing Holdings, Inc.h | | | 247,407 | |
| | 1,600 | | | AOKI Holdings, Inc. | | | 21,074 | |
| | 1,400 | | | Aoyama Trading Company, Ltd. | | | 42,355 | |
| | 2,360 | | | Aptiv plc | | | 181,248 | |
| | 2,600 | | | Autobacs Seven Company, Ltd. | | | 41,845 | |
| | 1,900 | | | Benesse Holdings, Inc. | | | 52,988 | |
| | 1,965 | | | Berkeley Group Holdings plc | | | 87,822 | |
| | 251 | | | Booking Holdings, Inc.h | | | 470,520 | |
| | 22,700 | | | Bridgestone Corporation | | | 875,296 | |
| | 1,712 | | | Bright Horizons Family Solutions, Inc.h | | | 196,726 | |
| | 23,491 | | | Bunzl plc | | | 692,983 | |
| | 9,796 | | | Caesars Entertainment Corporationh,i | | | 84,148 | |
| | 1,066 | | | Century Casinos, Inc.h | | | 6,652 | |
| | 2,825 | | | Children’s Place, Inc. | | | 422,055 | |
| | 2,100 | | | Chiyoda Company, Ltd. | | | 40,483 | |
| | 832 | | | Cie Generale des Etablissements Michelin | | | 85,175 | |
| | 5,843 | | | Core-Mark Holding Company, Inc. | | | 224,430 | |
| | 12,446 | | | Crocs, Inc.h | | | 255,641 | |
| | 3,400 | | | DCM Holdings Company, Ltd. | | | 33,062 | |
| | 3,500 | | | Denso Corporation | | | 156,120 | |
| | 3,030 | | | Dollar Tree, Inc.h | | | 255,429 | |
| | 2,300 | | | Expedia Group, Inc. | | | 288,489 | |
| | 2,181 | | | G-III Apparel Group, Ltd.h | | | 86,935 | |
| | 12,150 | | | Harley-Davidson, Inc. | | | 464,373 | |
| | 4,571 | | | Home Depot, Inc. | | | 803,947 | |
| | 28,800 | | | Honda Motor Company, Ltd. | | | 822,111 | |
| | 10,566 | | | Inchcape plc | | | 72,976 | |
| | 2,993 | | | Las Vegas Sands Corporation | | | 152,733 | |
| | 11,590 | | | Lowe’s Companies, Inc. | | | 1,103,600 | |
| | 2,250 | | | Lululemon Athletica, Inc.h | | | 316,642 | |
| | 11,369 | | | Magna International, Inc. | | | 559,810 | |
| | 1,532 | | | McDonald’s Corporation | | | 271,011 | |
| | 6,570 | | | Michaels Companies, Inc.h | | | 104,134 | |
| | 2,170 | | | Next plc | | | 144,159 | |
| | 10,900 | | | NHK Spring Company, Ltd. | | | 93,333 | |
| | 5,668 | | | NIKE, Inc. | | | 425,327 | |
| | 105,400 | | | Nissan Motor Company, Ltd. | | | 958,904 | |
| | 6,495 | | | Nutrisystem, Inc. | | | 230,962 | |
| | 1,386 | | | Oxford Industries, Inc. | | | 123,326 | |
| | 12,400 | | | Peugeot SA | | | 294,756 | |
| | 1,400 | | | Plenus Company, Ltd.i | | | 22,406 | |
| | 2,850 | | | RHh | | | 329,773 | |
| | 3,800 | | | Sangetsu Company, Ltd. | | | 73,087 | |
| | 4,500 | | | Sankyo Company, Ltd. | | | 171,813 | |
| | 59,900 | | | Sekisui House, Ltd. | | | 879,154 | |
| | 2,600 | | | SHIMAMURA Company, Ltd. | | | 218,698 | |
| | 1,552 | | | SmartCentres Real Estate Investment Trust | | | 35,462 | |
| | 777 | | | Stamps.com, Inc.h | | | 157,086 | |
| | 8,000 | | | Sumitomo Rubber Industries, Ltd. | | | 114,758 | |
| | 6,661 | | | Super Retail Group, Ltd. | | | 34,159 | |
| | 700 | | | Takara Standard Company, Ltd. | | | 10,808 | |
| | 10,360 | | | Toll Brothers, Inc. | | | 348,718 | |
| | 322 | | | Tower International, Inc. | | | 9,560 | |
| | 15,000 | | | Toyoda Gosei Company, Ltd. | | | 323,515 | |
| | 3,404 | | | Zumiez, Inc.h | | | 79,177 | |
| | | | | |
| | | | Total | | | 16,328,208 | |
| | | | | |
| |
| | Consumer Staples (2.7%) | | | | |
| | 2,749 | | | Altria Group, Inc. | | | 178,795 | |
| | 2,300 | | | Arcs Company, Ltd. | | | 55,578 | |
| | 2,369 | | | Bunge, Ltd. | | | 146,404 | |
| | 1,784 | | | Casey’s General Stores, Inc. | | | 224,980 | |
| | 17,570 | | | Cott Corporation | | | 264,253 | |
| | 9,210 | | | CVS Health Corporation | | | 666,712 | |
| | 17,741 | | | Empire Company, Ltd. | | | 322,760 | |
| | 3,138 | | | ForFarmers BV | | | 35,340 | |
| | 734 | | | Glanbia plc | | | 13,022 | |
| | 18,377 | | | Hain Celestial Group, Inc.h | | | 457,220 | |
| | 19,810 | | | Imperial Brands plc | | | 671,017 | |
| | 47,300 | | | Japan Tobacco, Inc. | | | 1,215,389 | |
| | 1,856 | | | John B. Sanfilippo & Son, Inc. | | | 117,039 | |
| | 1,970 | | | Kimberly-Clark Corporation | | | 205,471 | |
| | 18,080 | | | Koninklijke Ahold Delhaize NV | | | 413,858 | |
| | 4,786 | | | Kroger Company | | | 142,431 | |
| | 835 | | | Loblaw Companies, Ltd. | | | 41,761 | |
| | 700 | | | Ministop Company, Ltd. | | | 12,925 | |
| | 800 | | | NH Foods, Ltd. | | | 27,589 | |
| | 9,841 | | | PepsiCo, Inc. | | | 1,105,932 | |
| | 1,200 | | | Sugi Holdings Company, Ltd. | | | 54,943 | |
| | 14,040 | | | SunOpta, Inc.h | | | 104,177 | |
| | 7,343 | | | Swedish Match AB | | | 374,043 | |
| | 4,813 | | | Turning Point Brands, Inc. | | | 197,814 | |
| | 13,147 | | | Unilever NVi | | | 706,450 | |
| | 19,297 | | | Unilever plc | | | 1,022,155 | |
| | 5,460 | | | Wal-Mart Stores, Inc. | | | 547,529 | |
| | 13,315 | | | Wesfarmers, Ltd. | | | 440,962 | |
| | | | | |
| | | | Total | | | 9,766,549 | |
| | | | | |
The accompanying Notes to Financial Statements are an integral part of this schedule.
13
BALANCED INCOME PLUS FUND
Schedule of Investments as of October 31, 2018
| | | | | | | | |
| Shares | | | Common Stock (46.1%) | | Value | |
| | Energy (2.3%) | | | | |
| | 8,014 | | | Anadarko Petroleum Corporation | | $ | 426,345 | |
| | 25,219 | | | Callon Petroleum Companyh | | | 251,433 | |
| | 10,056 | | | Chevron Corporation | | | 1,122,752 | |
| | 3,229 | | | Contura Energy, Inc.h,i | | | 235,556 | |
| | 1,600 | | | Diamondback Energy, Inc. | | | 179,776 | |
| | 1,680 | | | Eni SPA | | | 29,836 | |
| | 4,260 | | | EQT Corporation | | | 144,712 | |
| | 11,514 | | | Exxon Mobil Corporation | | | 917,436 | |
| | 504 | | | Gaztransport Et Technigaz SA | | | 37,250 | |
| | 10,094 | | | Halliburton Company | | | 350,060 | |
| | 30,760 | | | Marathon Oil Corporation | | | 584,132 | |
| | 6,102 | | | Marathon Petroleum Corporation | | | 429,886 | |
| | 5,563 | | | Nine Energy Service, Inc.h | | | 205,998 | |
| | 5,969 | | | OMV AG | | | 331,472 | |
| | 11,262 | | | Pacific Drilling, Inc. Rightse,h | | | 117,275 | |
| | 4,019 | | | Parsley Energy, Inc.h | | | 94,125 | |
| | 16,750 | | | Patterson-UTI Energy, Inc. | | | 278,720 | |
| | 6,116 | | | Petrofac, Ltd. | | | 44,974 | |
| | 2,266 | | | Phillips 66 | | | 232,990 | |
| | 2,671 | | | Pioneer Natural Resources Company | | | 393,358 | |
| | 1,517 | | | Royal Dutch Shell plc, Class A | | | 48,329 | |
| | 32,492 | | | Royal Dutch Shell plc, Class B | | | 1,059,660 | |
| | 2,906 | | | Talos Energy, Inc.h | | | 75,730 | |
| | 5,074 | | | Total SAi | | | 297,718 | |
| | 24,035 | | | Transocean, Ltd.h | | | 264,625 | |
| | 55,670 | | | Weatherford International plch | | | 75,155 | |
| | 721 | | | Whiting Petroleum Corporationh | | | 26,893 | |
| | 19,537 | | | WPX Energy, Inc.h | | | 313,374 | |
| | | | | |
| | | | Total | | | 8,569,570 | |
| | | | | |
| |
| | Financials (8.4%) | | | | |
| | 2,965 | | | Aareal Bank AG | | | 110,301 | |
| | 8,040 | | | Aflac, Inc. | | | 346,283 | |
| | 229 | | | Allianz SE | | | 47,705 | |
| | 6,708 | | | Allstate Corporation | | | 642,090 | |
| | 13,800 | | | Ally Financial, Inc. | | | 350,658 | |
| | 2,811 | | | American Express Company | | | 288,774 | |
| | 3,256 | | | American Financial Group, Inc. | | | 325,698 | |
| | 4,520 | | | American International Group, Inc. | | | 186,631 | |
| | 429 | | | Anima Holding SPAj | | | 1,794 | |
| | 56,128 | | | Apollo Investment Corporation | | | 290,182 | |
| | 25,486 | | | Ares Capital Corporation | | | 437,340 | |
| | 3,089 | | | Argo Group International Holdings, Ltd. | | | 190,313 | |
| | 21,126 | | | Assured Guaranty, Ltd. | | | 844,617 | |
| | 2,177 | | | ASX, Ltd. | | | 91,435 | |
| | 25,639 | | | Australia and New Zealand Banking Group, Ltd. | | | 471,929 | |
| | 17,730 | | | Banca Monte dei Paschi di Siena SPAh,i | | | 29,108 | |
| | 6,310 | | | BancorpSouth Bank | | | 181,097 | |
| | 74,619 | | | Bank of America Corporation | | | 2,052,022 | |
| | 138 | | | Bank of Marin Bancorp | | | 11,729 | |
| | 271 | | | Bank of New York Mellon Corporation | | | 12,826 | |
| | 10,235 | | | Bankinter SA | | | 83,855 | |
| | 3,029 | | | Berkshire Hathaway, Inc.h | | | 621,793 | |
| | 10,930 | | | Blackstone Group, LP | | | 353,695 | |
| | 1,287 | | | BOK Financial Corporation | | | 110,335 | |
| | 7,751 | | | BrightSphere Investment Group | | | 88,361 | |
| | 53,369 | | | CaixaBank SAi | | | 215,968 | |
| | 11,231 | | | Capital One Financial Corporation | | | 1,002,928 | |
| | 2,103 | | | Central Pacific Financial Corporation | | | 56,865 | |
| | 561 | | | Cherry Hill Mortgage Investment Corporation | | | 10,048 | |
| | 2,540 | | | Chubb, Ltd. | | | 317,271 | |
| | 23,182 | | | CI Financial Corporation | | | 342,857 | |
| | 35,353 | | | Citigroup, Inc. | | | 2,314,207 | |
| | 15,969 | | | CNP Assurances | | | 355,907 | |
| | 4,791 | | | Comerica, Inc. | | | 390,754 | |
| | 1,122 | | | Community Trust Bancorp, Inc. | | | 51,062 | |
| | 33,731 | | | Direct Line Insurance Group plc | | | 141,747 | |
| | 5,955 | | | Discover Financial Services | | | 414,885 | |
| | 31,888 | | | DnB ASA | | | 576,101 | |
| | 2,790 | | | Dynex Capital, Inc. | | | 16,154 | |
| | 6,520 | | | E*TRADE Financial Corporation | | | 322,218 | |
| | 1,831 | | | Ellington Residential Mortgage REIT | | | 19,335 | |
| | 3,327 | | | Enterprise Financial Services Corporation | | | 144,558 | |
| | 6,194 | | | Euronext NVj | | | 381,130 | |
| | 282 | | | FBL Financial Group, Inc. | | | 19,452 | |
| | 24,210 | | | Fifth Third Bancorp | | | 653,428 | |
| | 333 | | | Financial Institutions, Inc. | | | 9,507 | |
| | 19,541 | | | Finecobank Banca Fineco SPA | | | 204,234 | |
| | 1,164 | | | First American Financial Corporation | | | 51,600 | |
| | 2,315 | | | First Busey Corporation | | | 64,635 | |
| | 302 | | | First Defiance Financial Corporation | | | 8,220 | |
| | 126 | | | First Financial Corporation | | | 5,778 | |
| | 12,008 | | | First Hawaiian, Inc. | | | 297,558 | |
| | 4,074 | | | First Interstate BancSystem, Inc. | | | 168,908 | |
| | 213 | | | First Mid-Illinois Bancshares, Inc. | | | 7,941 | |
| | 4,100 | | | First Republic Bank | | | 373,059 | |
| | 57,827 | | | FlexiGroup, Ltd. | | | 63,014 | |
| | 5,936 | | | Genworth MI Canada, Inc.i | | | 194,838 | |
| | 4,073 | | | Goldman Sachs Group, Inc. | | | 917,932 | |
| | 1,502 | | | Great Southern Bancorp, Inc. | | | 81,333 | |
| | 3,313 | | | Hamilton Lane, Inc. | | | 127,153 | |
| | 5,015 | | | Hancock Whitney Corporation | | | 210,429 | |
| | 3,991 | | | Hannover Rueckversicherung SE | | | 536,710 | |
| | 11,396 | | | Hartford Financial Services Group, Inc. | | | 517,606 | |
| | 14,146 | | | Heritage Commerce Corporation | | | 205,258 | |
| | 862 | | | Hometrust Bancshares, Inc.h | | | 23,498 | |
| | 3,093 | | | Horace Mann Educators Corporation | | | 121,493 | |
| | 3,173 | | | Houlihan Lokey, Inc. | | | 130,664 | |
| | 41,170 | | | Huntington Bancshares, Inc. | | | 589,966 | |
| | 2,856 | | | IBERIABANK Corporation | | | 212,743 | |
| | 389 | | | Independent Bank Corporation | | | 8,609 | |
| | 3,101 | | | Intercontinental Exchange, Inc. | | | 238,901 | |
| | 8,968 | | | Investment Technology Group, Inc. | | | 246,441 | |
| | 5,313 | | | J.P. Morgan Chase & Company | | | 579,223 | |
| | 3,038 | | | Kemper Corporation | | | 228,427 | |
| | 56,164 | | | KeyCorp | | | 1,019,938 | |
| | 582 | | | Lakeland Bancorp, Inc. | | | 9,586 | |
| | 6,781 | | | Loews Corporation | | | 315,723 | |
| | 448 | | | Markel Corporationh | | | 489,772 | |
| | 4,600 | | | Matsui Securities Company, Ltd. | | | 46,883 | |
| | 338,519 | | | Medibank Private, Ltd. | | | 671,204 | |
| | 7,740 | | | Meridian Bancorp, Inc. | | | 122,602 | |
| | 7,040 | | | MetLife, Inc. | | | 289,978 | |
| | 2,907 | | | MidWestOne Financial Group, Inc. | | | 83,751 | |
| | 4,365 | | | Morgan Stanley | | | 199,306 | |
| | 1,318 | | | National Bank Holdings Corporation | | | 44,496 | |
| | 6,933 | | | National Bank of Canada | | | 314,722 | |
| | 1,981 | | | Paragon Banking Group plc | | | 10,766 | |
| | 2,875 | | | Pargesa Holding SA | | | 211,054 | |
| | 9,121 | | | PCSB Financial Corporation | | | 170,745 | |
The accompanying Notes to Financial Statements are an integral part of this schedule.
14
BALANCED INCOME PLUS FUND
Schedule of Investments as of October 31, 2018
| | | | | | | | |
| Shares | | | Common Stock (46.1%) | | Value | |
| | Financials (8.4%) - continued | | | | |
| | 239 | | | Peapack-Gladstone Financial Corporation | | $ | 6,451 | |
| | 2,125 | | | Primerica, Inc. | | | 233,198 | |
| | 5,988 | | | Provident Financial Services, Inc. | | | 146,107 | |
| | 2,310 | | | Prudential Financial, Inc. | | | 216,632 | |
| | 193 | | | QCR Holdings, Inc. | | | 7,031 | |
| | 14,800 | | | Radian Group, Inc. | | | 284,012 | |
| | 432 | | | Raymond James Financial, Inc. | | | 33,130 | |
| | 2,767 | | | Sandy Spring Bancorp, Inc. | | | 98,367 | |
| | 6,985 | | | Santander Consumer USA Holdings Inc. | | | 130,969 | |
| | 6,815 | | | Seacoast Banking Corporation of Floridah | | | 179,303 | |
| | 2,300 | | | Senshu Ikeda Holdings, Inc. | | | 7,068 | |
| | 2,846 | | | State Auto Financial Corporation | | | 90,474 | |
| | 4,388 | | | State Street Corporation | | | 301,675 | |
| | 2,242 | | | Stifel Financial Corporation | | | 102,504 | |
| | 2,137 | | | Sun Life Financial, Inc. | | | 78,260 | |
| | 6,446 | | | Synovus Financial Corporation | | | 242,112 | |
| | 1,108 | | | Topdanmark AS | | | 52,667 | |
| | 4,042 | | | TrustCo Bank Corporation | | | 30,275 | |
| | 6,870 | | | U.S. Bancorp | | | 359,095 | |
| | 3,964 | | | United Community Banks, Inc. | | | 98,585 | |
| | 196 | | | Washington Trust Bancorp, Inc. | | | 10,065 | |
| | 8,069 | | | Wells Fargo & Company | | | 429,513 | |
| | 1,124 | | | WSFS Financial Corporation | | | 47,804 | |
| | 24,038 | | | Zions Bancorporations NA | | | 1,130,988 | |
| | | | | |
| | | | Total | | | 30,659,935 | |
| | | | | |
| |
| | Health Care (6.5%) | | | | |
| | 2,120 | | | Aetna, Inc. | | | 420,608 | |
| | 4,172 | | | Amgen, Inc. | | | 804,320 | |
| | 2,594 | | | Amplifon SPA | | | 45,951 | |
| | 2,019 | | | Anthem, Inc. | | | 556,376 | |
| | 5,332 | | | Baxter International, Inc. | | | 333,303 | |
| | 938 | | | Becton, Dickinson and Company | | | 216,209 | |
| | 2,354 | | | Biogen, Inc.h | | | 716,252 | |
| | 2,017 | | | BioMarin Pharmaceutical, Inc.h | | | 185,907 | |
| | 4,234 | | | Catalent, Inc.h | | | 170,800 | |
| | 8,142 | | | Danaher Corporation | | | 809,315 | |
| | 4,296 | | | Edwards Lifesciences Corporationh | | | 634,090 | |
| | 5,220 | | | Express Scripts Holding Companyh | | | 506,183 | |
| | 7,505 | | | Gilead Sciences, Inc. | | | 511,691 | |
| | 48,009 | | | GlaxoSmithKline plc | | | 929,827 | |
| | 7,423 | | | GlaxoSmithKline plc ADR | | | 289,942 | |
| | 18,299 | | | Halozyme Therapeutics, Inc.h | | | 284,183 | |
| | 851 | | | Heska Corporationh | | | 85,287 | |
| | 1,279 | | | Illumina, Inc.h | | | 397,961 | |
| | 421 | | | Intuitive Surgical, Inc.h | | | 219,417 | |
| | 10,945 | | | Johnson & Johnson | | | 1,532,190 | |
| | 3,200 | | | KYORIN Holdings, Inc. | | | 69,886 | |
| | 2,769 | | | LHC Group, Inc.h | | | 253,170 | |
| | 336 | | | LNA Sante | | | 17,769 | |
| | 15,854 | | | Medtronic plc | | | 1,424,006 | |
| | 15,460 | | | Merck & Company, Inc. | | | 1,138,011 | |
| | 2,000 | | | Miraca Holdings, Inc. | | | 48,688 | |
| | 11,442 | | | Myriad Genetics, Inc.h | | | 515,233 | |
| | 3,379 | | | Neurocrine Biosciences, Inc.h | | | 362,060 | |
| | 13,013 | | | Novartis AG | | | 1,139,579 | |
| | 28,880 | | | Novo Nordisk AS | | | 1,247,228 | |
| | 2,716 | | | NuVasive, Inc.h | | | 152,558 | |
| | 5,148 | | | Omnicell, Inc.h | | | 363,964 | |
| | 6,359 | | | Optinose, Inc.h | | | 67,278 | |
| | 2,375 | | | PerkinElmer, Inc. | | | 205,390 | |
| | 35,604 | | | Pfizer, Inc. | | | 1,533,108 | |
| | 4,542 | | | Roche Holding AG | | | 1,105,352 | |
| | 5,115 | | | Syneos Health, Inc.h | | | 233,397 | |
| | 720 | | | Teleflex, Inc. | | | 173,333 | |
| | 10,088 | | | Teva Pharmaceutical Industries, Ltd. ADR | | | 201,558 | |
| | 4,146 | | | Thermo Fisher Scientific, Inc. | | | 968,713 | |
| | 7,633 | | | UnitedHealth Group, Inc. | | | 1,994,885 | |
| | 2,800 | | | Universal Health Services, Inc. | | | 340,368 | |
| | 11,950 | | | Valeant Pharmaceuticals International, Inc.h | | | 273,416 | |
| | 1,389 | | | Vertex Pharmaceuticals, Inc.h | | | 235,380 | |
| | 1,057 | | | West Pharmaceutical Services, Inc. | | | 111,957 | |
| | 1,654 | | | Zoetis, Inc. | | | 149,108 | |
| | | | | |
| | | | Total | | | 23,975,207 | |
| | | | | |
| |
| | Industrials (6.3%) | | | | |
| | 12,614 | | | ACS Actividades de Construccion y Servicios, SAh | | | 472,284 | |
| | 1,950 | | | Acuity Brands, Inc. | | | 244,998 | |
| | 7,200 | | | AGCO Corporation | | | 403,488 | |
| | 6,204 | | | AMETEK, Inc. | | | 416,164 | |
| | 20,864 | | | Atlas Copco AB, Class A | | | 515,795 | |
| | 18,613 | | | Atlas Copco AB, Class B | | | 426,300 | |
| | 2,599 | | | Boeing Company | | | 922,281 | |
| | 405 | | | Brady Corporation | | | 16,318 | |
| | 4,196 | | | Brink’s Company | | | 278,279 | |
| | 1,406 | | | BWX Technologies, Inc. | | | 82,195 | |
| | 1,748 | | | CIA De Distribucion Integral | | | 42,203 | |
| | 1,761 | | | Crane Company | | | 153,277 | |
| | 14,890 | | | CSX Corporation | | | 1,025,325 | |
| | 960 | | | Curtiss-Wright Corporation | | | 105,082 | |
| | 9,640 | | | Delta Air Lines, Inc. | | | 527,597 | |
| | 1,551 | | | Dycom Industries, Inc.h | | | 105,282 | |
| | 3,893 | | | EMCOR Group, Inc. | | | 276,325 | |
| | 6,631 | | | Emerson Electric Company | | | 450,112 | |
| | 3,864 | | | Encore Wire Corporation | | | 170,789 | |
| | 22,305 | | | Euronav NV | | | 205,206 | |
| | 1,061 | | | Ferguson plc | | | 71,532 | |
| | 2,910 | | | General Dynamics Corporation | | | 502,208 | |
| | 2,383 | | | Genesee & Wyoming, Inc.h | | | 188,805 | |
| | 500 | | | Glory, Ltd. | | | 11,643 | |
| | 260 | | | Gorman-Rupp Company | | | 8,970 | |
| | 1,370 | | | Granite Construction, Inc. | | | 62,636 | |
| | 29,111 | | | GWA Group, Ltd. | | | 56,930 | |
| | 9,500 | | | Hino Motors, Ltd. | | | 90,937 | |
| | 3,100 | | | Hitachi Zosen Corporation | | | 11,781 | |
| | 740 | | | Hochtief AG | | | 109,659 | |
| | 10,969 | | | Honeywell International, Inc. | | | 1,588,531 | |
| | 3,150 | | | Huntington Ingalls Industries, Inc. | | | 688,212 | |
| | 554 | | | ICF International, Inc. | | | 40,797 | |
| | 1,092 | | | Illinois Tool Works, Inc. | | | 139,306 | |
| | 3,500 | | | Inaba Denki Sangyo Company, Ltd. | | | 140,920 | |
| | 5,688 | | | Ingersoll-Rand plc | | | 545,707 | |
| | 1,033 | | | Interface, Inc. | | | 16,828 | |
| | 819 | | | Kadant, Inc. | | | 80,835 | |
| | 14,792 | | | KeyW Holding Corporationh | | | 115,821 | |
| | 633 | | | Kirby Corporationh | | | 45,538 | |
| | 304 | | | Korn/Ferry International | | | 13,723 | |
| | 1,627 | | | Lincoln Electric Holdings, Inc. | | | 131,641 | |
| | 1,886 | | | Lindsay Corporation | | | 180,339 | |
| | 945 | | | Lockheed Martin Corporation | | | 277,688 | |
| | 630 | | | Masonite International Corporationh | | | 34,896 | |
| | 2,700 | | | Mitsuboshi Belting, Ltd. | | | 66,330 | |
| | 2,406 | | | Monadelphous Group, Ltd. | | | 24,621 | |
| | 17,569 | | | MRC Global, Inc.h | | | 278,117 | |
| | 365 | | | Mueller Industries, Inc. | | | 8,888 | |
| | 11,312 | | | National Express Group plc | | | 57,801 | |
The accompanying Notes to Financial Statements are an integral part of this schedule.
15
BALANCED INCOME PLUS FUND
Schedule of Investments as of October 31, 2018
| | | | | | | | |
| Shares | | | Common Stock (46.1%) | | Value | |
| | Industrials (6.3%) - continued | | | | |
| | 4,824 | | | NCI Building Systems, Inc.h | | | $59,094 | |
| | 17,519 | | | Nexeo Solutions, Inc.h | | | 183,074 | |
| | 8,900 | | | Nitto Kogyo Corporation | | | 155,005 | |
| | 4,827 | | | Nobina ABj | | | 32,209 | |
| | 3,227 | | | Norfolk Southern Corporation | | | 541,587 | |
| | 3,448 | | | Northgate plc | | | 16,606 | |
| | 5,746 | | | Oshkosh Corporation | | | 322,580 | |
| | 25,295 | | | PageGroup plc | | | 162,140 | |
| | 11,277 | | | Primoris Services Corporation | | | 238,734 | |
| | 1,647 | | | Raven Industries, Inc. | | | 71,612 | |
| | 479 | | | Regal-Beloit Corporation | | | 34,344 | |
| | 21,720 | | | RELX plc | | | 429,780 | |
| | 30,194 | | | RELX plc | | | 597,137 | |
| | 1,827 | | | Resideo Technologies, Inc.h | | | 38,458 | |
| | 793 | | | Rockwool International AS | | | 270,935 | |
| | 372 | | | Rush Enterprises, Inc. | | | 13,165 | |
| | 5,360 | | | Sandvik AB | | | 84,735 | |
| | 2,419 | | | Schindler Holding AG, Participation Certificate | | | 510,081 | |
| | 3,679 | | | Schneider Electric SE | | | 266,031 | |
| | 34 | | | SGS SA | | | 80,752 | |
| | 1,100 | | | ShinMaywa Industries, Ltd. | | | 13,543 | |
| | 3,850 | | | SiteOne Landscape Supply, Inc.h | | | 261,954 | |
| | 23,461 | | | SKF AB | | | 376,130 | |
| | 3,427 | | | Smiths Group plc | | | 61,088 | |
| | 14,750 | | | Southwest Airlines Company | | | 724,225 | |
| | 1,416 | | | Spirax-Sarco Engineering plc | | | 116,962 | |
| | 310 | | | Standex International Corporation | | | 25,147 | |
| | 47,200 | | | Sumitomo Electric Industries, Ltd. | | | 643,694 | |
| | 1,300 | | | Taikisha, Ltd. | | | 36,684 | |
| | 3,976 | | | Terex Corporation | | | 132,759 | |
| | 3,700 | | | Toppan Forms Company, Ltd. | | | 33,634 | |
| | 16,800 | | | Toppan Printing Company, Ltd. | | | 237,509 | |
| | 400 | | | Toshiba Machine Company, Ltd. | | | 7,575 | |
| | 5,516 | | | Transcontinental, Inc. | | | 90,799 | |
| | 1,331 | | | TransUnion | | | 87,513 | |
| | 2,800 | | | Tsubakimoto Chain Company | | | 107,510 | |
| | 64 | | | UniFirst Corporation | | | 9,555 | |
| | 5,400 | | | United Continental Holdings, Inc.h | | | 461,754 | |
| | 2,710 | | | United Parcel Service, Inc. | | | 288,723 | |
| | 5,900 | | | United Technologies Corporation | | | 732,839 | |
| | 6,767 | | | Univar, Inc.h | | | 166,604 | |
| | 1,053 | | | Valmont Industries, Inc. | | | 130,898 | |
| | 3,150 | | | Verisk Analytics, Inc.h | | | 377,496 | |
| | 6,930 | | | Vinci SA | | | 616,762 | |
| | 3,534 | | | WABCO Holdings, Inc.h | | | 379,728 | |
| | 2,693 | | | Waste Connections, Inc. | | | 205,853 | |
| | 1,320 | | | XPO Logistics, Inc.h | | | 117,982 | |
| | 1,600 | | | Yuasa Trading Company, Ltd. | | | 52,487 | |
| | | | | |
| | | | Total | | | 23,036,406 | |
| | | | | |
| |
| | Information Technology (8.0%) | | | | |
| | 3,251 | | | Activision Blizzard, Inc. | | | 224,482 | |
| | 774 | | | Adobe, Inc.h | | | 190,218 | |
| | 20,180 | | | Advanced Micro Devices, Inc.h | | | 367,478 | |
| | 6,783 | | | Agilent Technologies, Inc. | | | 439,471 | |
| | 8,850 | | | Akamai Technologies, Inc.h | | | 639,413 | |
| | 3,000 | | | Alliance Data Systems Corporation | | | 618,540 | |
| | 7,494 | | | Amadeus IT Holding SA | | | 603,448 | |
| | 5,709 | | | Amphenol Corporation | | | 510,956 | |
| | 559 | | | ANSYS, Inc.h | | | 83,598 | |
| | 10,087 | | | Apple, Inc. | | | 2,207,641 | |
| | 5,522 | | | Applied Materials, Inc. | | | 181,563 | |
| | 746 | | | Arista Networks, Inc.h | | | 171,841 | |
| | 1,888 | | | Autodesk, Inc.h | | | 244,024 | |
| | 4,189 | | | Automatic Data Processing, Inc. | | | 603,551 | |
| | 2,029 | | | Belden, Inc. | | | 109,667 | |
| | 2,028 | | | Blackline, Inc.h | | | 94,059 | |
| | 1,555 | | | Booz Allen Hamilton Holding Corporation | | | 77,035 | |
| | 17,000 | | | Canon, Inc. | | | 484,218 | |
| | 6,429 | | | Capgemini SA | | | 785,007 | |
| | 16,170 | | | CGI Group, Inc.h | | | 998,611 | |
| | 16,250 | | | Ciena Corporationh | | | 507,975 | |
| | 65,403 | | | Cisco Systems, Inc. | | | 2,992,187 | |
| | 686 | | | Cognizant Technology Solutions Corporation | | | 47,355 | |
| | 5,203 | | | Dolby Laboratories, Inc. | | | 358,018 | |
| | 857 | | | Fidelity National Information Services, Inc. | | | 89,214 | |
| | 7,693 | | | Fiserv, Inc.h | | | 610,055 | |
| | 8,912 | | | Flextronics International, Ltd.h | | | 70,048 | |
| | 1,529 | | | Guidewire Software, Inc.h | | | 136,035 | |
| | 4,646 | | | Halma plc | | | 78,844 | |
| | 100 | | | Hirose Electric Company, Ltd. | | | 9,531 | |
| | 1,163 | | | Intel Corporation | | | 54,521 | |
| | 1,569 | | | Keysight Technologies, Inc.h | | | 89,559 | |
| | 34,300 | | | Konica Minolta Holdings, Inc. | | | 339,515 | |
| | 424 | | | Kulicke and Soffa Industries, Inc. | | | 8,620 | |
| | 547 | | | Lam Research Corporation | | | 77,526 | |
| | 3,611 | | | M/A-COM Technology Solutions Holdings, Inc.h | | | 50,807 | |
| | 7,979 | | | MasterCard, Inc. | | | 1,577,209 | |
| | 11,700 | | | Micron Technology, Inc.h | | | 441,324 | |
| | 25,010 | | | Microsoft Corporation | | | 2,671,318 | |
| | 6,978 | | | National Instruments Corporation | | | 341,713 | |
| | 4,600 | | | NEC Networks & System Integration Corporation | | | 100,262 | |
| | 1,966 | | | NVIDIA Corporation | | | 414,492 | |
| | 1,788 | | | NXP Semiconductors NV | | | 134,082 | |
| | 26,417 | | | Oracle Corporation | | | 1,290,206 | |
| | 6,908 | | | PayPal Holdings, Inc.h | | | 581,585 | |
| | 1,539 | | | Pegasystems, Inc. | | | 82,367 | |
| | 4,411 | | | Plexus Corporationh | | | 257,602 | |
| | 813 | | | Q2 Holdings, Inc.h | | | 43,276 | |
| | 8,227 | | | Red Hat, Inc.h | | | 1,412,082 | |
| | 995 | | | Rogers Corporationh | | | 122,445 | |
| | 1,800 | | | Ryoyo Electro Corporation | | | 25,813 | |
| | 3,989 | | | SailPoint Technologies Holdings, Inc.h | | | 103,874 | |
| | 5,090 | | | Salesforce.com, Inc.h | | | 698,552 | |
| | 25,700 | | | Shinko Electric Industries Company, Ltd. | | | 178,928 | |
| | 159 | | | Siltronic AG | | | 14,562 | |
| | 5,463 | | | Synopsys, Inc.h | | | 489,102 | |
| | 7,400 | | | Teradata Corporationh | | | 269,360 | |
| | 8,300 | | | Teradyne, Inc. | | | 285,935 | |
| | 10,403 | | | Texas Instruments, Inc. | | | 965,710 | |
| | 900 | | | Tokyo Seimitsu Company, Ltd. | | | 21,642 | |
| | 574 | | | VeriSign, Inc.h | | | 81,818 | |
| | 5,895 | | | Virtusa Corporationh | | | 292,333 | |
| | 5,204 | | | Visa, Inc. | | | 717,371 | |
| | 8,004 | | | Xilinx, Inc. | | | 683,301 | |
| | 5,843 | | | Zix Corporationh | | | 39,382 | |
| | | | | |
| | | | Total | | | 29,492,277 | |
| | | | | |
| |
| | Materials (2.7%) | | | | |
| | 5,970 | | | Alcoa Corporationh | | | 208,890 | |
| | 1,049 | | | Balchem Corporation | | | 98,239 | |
| | 6,500 | | | Ball Corporation | | | 291,200 | |
| | 12,067 | | | BASF SE | | | 925,999 | |
| | 35,571 | | | BHP Billiton plc | | | 709,595 | |
| | 20,454 | | | BHP Billiton, Ltd. | | | 471,949 | |
The accompanying Notes to Financial Statements are an integral part of this schedule.
16
BALANCED INCOME PLUS FUND
Schedule of Investments as of October 31, 2018
| | | | | | | | |
| Shares | | | Common Stock (46.1%) | | Value | |
| | Materials (2.7%) - continued | | | | |
| | 830 | | | Canfor Corporationh | | $ | 11,923 | |
| | 4,337 | | | Celanese Corporation | | | 420,429 | |
| | 6,660 | | | CF Industries Holdings, Inc. | | | 319,880 | |
| | 20,100 | | | Daicel Corporation | | | 212,638 | |
| | 4,310 | | | Eastman Chemical Company | | | 337,689 | |
| | 12,854 | | | Evonik Industries AG | | | 397,646 | |
| | 734 | | | Fuchs Petrolub SE | | | 33,977 | |
| | 9,032 | | | Granges AB | | | 95,487 | |
| | 1,297 | | | Hexpol AB | | | 12,003 | |
| | 2,000 | | | Hitachi Chemical Company, Ltd. | | | 31,524 | |
| | 2,400 | | | Hokuetsu Corporation | | | 11,464 | |
| | 3,900 | | | JSR Corporation | | | 58,122 | |
| | 20,900 | | | Kuraray Company, Ltd. | | | 287,072 | |
| | 8,800 | | | Kyoei Steel, Ltd.i | | | 159,410 | |
| | 852 | | | Mercer International, Inc. | | | 12,959 | |
| | 7,347 | | | Methanex Corporation | | | 475,571 | |
| | 13,804 | | | Mondi plc | | | 325,068 | |
| | 9,400 | | | Nippon Kayaku Company, Ltd. | | | 111,871 | |
| | 6,900 | | | Nippon Light Metal Holdings Company, Ltd. | | | 14,549 | |
| | 31,700 | | | Nippon Steel & Sumitomo Metal Corporation | | | 584,744 | |
| | 2,312 | | | OMNOVA Solutions, Inc.h | | | 17,086 | |
| | 17,000 | | | Owens-Illinois, Inc.h | | | 266,390 | |
| | 65 | | | Rio Tinto, Ltd. | | | 3,537 | |
| | 24,525 | | | Sandfire Resources NL | | | 115,963 | |
| | 500 | | | Sanyo Special Steel Company, Ltd. | | | 11,497 | |
| | 3,477 | | | Scotts Miracle-Gro Company | | | 232,055 | |
| | 3,976 | | | Sensient Technologies Corporation | | | 257,883 | |
| | 3,700 | | | SSAB AB, Class A | | | 14,771 | |
| | 10,550 | | | Steel Dynamics, Inc. | | | 417,780 | |
| | 2,700 | | | Taiheiyo Cement Corporation | | | 79,452 | |
| | 1,300 | | | Taiyo Holdings Company, Ltd. | | | 46,448 | |
| | 5,900 | | | Toagosei Company, Ltd. | | | 60,583 | |
| | 1,000 | | | Ube Industries, Ltd. | | | 21,783 | |
| | 1,208 | | | United States Lime & Minerals, Inc. | | | 90,612 | |
| | 24,877 | | | UPM-Kymmene Oyj | | | 799,760 | |
| | 8,309 | | | Verso Corporationh | | | 233,566 | |
| | 8,980 | | | WestRock Company | | | 385,871 | |
| | 1,200 | | | Yamato Kogyo Company, Ltd. | | | 31,625 | |
| | | | | |
| | | | Total | | | 9,706,560 | |
| | | | | |
| |
| | Real Estate (1.2%) | | | | |
| | 2,496 | | | Alexandria Real Estate Equities, Inc. | | | 305,086 | |
| | 1,029 | | | Americold Realty Trust | | | 25,468 | |
| | 7,391 | | | Armada Hoffler Properties, Inc. | | | 110,717 | |
| | 2,499 | | | Artis Real Estate Investment Trust | | | 21,261 | |
| | 3,357 | | | Camden Property Trust | | | 303,036 | |
| | 2,313 | | | Catchmark Timber Trust, Inc. | | | 20,470 | |
| | 8,252 | | | Cousins Properties, Inc. | | | 68,574 | |
| | 1,141 | | | Crown Castle International Corporation | | | 124,072 | |
| | 1,648 | | | CyrusOne, Inc. | | | 87,723 | |
| | 4,600 | | | Daito Trust Construction Company, Ltd. | | | 606,457 | |
| | 2,495 | | | Digital Realty Trust, Inc. | | | 257,634 | |
| | 6,226 | | | Douglas Emmett, Inc. | | | 225,319 | |
| | 10,709 | | | Duke Realty Corporation | | | 295,247 | |
| | 5,000 | | | Hang Lung Properties, Ltd. | | | 9,063 | |
| | 1,492 | | | Highwoods Properties, Inc. | | | 63,619 | |
| | 1,200 | | | Hitachi High-Technologies Corporation | | | 45,035 | |
| | 15,458 | | | Host Hotels & Resorts, Inc. | | | 295,402 | |
| | 13,308 | | | Hudson Pacific Properties, Inc. | | | 403,232 | |
| | 51,000 | | | Hysan Development Company, Ltd. | | | 239,175 | |
| | 5,713 | | | Monmouth Real Estate Investment Corporation | | | 85,467 | |
| | 4,415 | | | Physicians Realty Trust | | | 73,201 | |
| | 5,481 | | | Quebecor, Inc. | | | 107,501 | |
| | 17,000 | | | Road King Infrastructure, Ltd. | | | 26,315 | |
| | 346 | | | Saul Centers, Inc. | | | 16,525 | |
| | 5,000 | | | Swire Pacific, Ltd. | | | 51,943 | |
| | 3,999 | | | Terreno Realty Corporation | | | 149,683 | |
| | 13,451 | | | Weyerhaeuser Company | | | 358,200 | |
| | 40,200 | | | Wing Tai Holdings, Ltd. | | | 56,028 | |
| | | | | |
| | | | Total | | | 4,431,453 | |
| | | | | |
| |
| | Utilities (1.0%) | | | | |
| | 825 | | | Alpha Natural Resources Holdings, Inc.h | | | 28,875 | |
| | 3,104 | | | ANR, Inc.h | | | 108,640 | |
| | 6,040 | | | Clearway Energy, Inc., Class A | | | 117,297 | |
| | 4,250 | | | Edison International, Inc. | | | 294,907 | |
| | 23,950 | | | Enagas SA | | | 634,994 | |
| | 4,250 | | | Entergy Corporation | | | 356,787 | |
| | 2,879 | | | MDU Resources Group, Inc. | | | 71,860 | |
| | 2,031 | | | New Jersey Resources Corporation | | | 91,598 | |
| | 24,600 | | | Osaka Gas Company, Ltd. | | | 449,836 | |
| | 16,585 | | | PG&E Corporationh | | | 776,344 | |
| | 3,456 | | | PNM Resources, Inc. | | | 132,745 | |
| | 7,250 | | | Public Service Enterprise Group, Inc. | | | 387,368 | |
| | 1,323 | | | Southwest Gas Holdings, Inc. | | | 102,228 | |
| | 358 | | | Unitil Corporation | | | 17,009 | |
| | | | | |
| | | | Total | | | 3,570,488 | |
| | | | | |
| | | | | | | | |
| | | | | |
| | | | Total Common Stock (cost $165,300,268) | | | 168,845,259 | |
| | | | | |
| | |
Principal
Amount | | | Long-Term Fixed Income (24.4%) | | Value | |
| | Asset-Backed Securities (3.1%) | | | | |
| | | | Babson CLO, Ltd. | | | | |
| | | | 5.369%, (LIBOR 3M + 2.900%), 7/20/2029, Ser. | | | | |
| | 425,000 | | | 2018-3A, Class D*,b | | | 422,434 | |
| | | | Bellemeade Re 2018-1, Ltd. | | | | |
| | | | 3.881%, (LIBOR 1M + 1.600%), 4/25/2028, Ser. | | | | |
| | 350,000 | | | 2018-1A, Class M1Bb,j | | | 351,826 | |
| | | | Business Jet Securities, LLC | | | | |
| | | | 4.447%, 6/15/2033, Ser. | | | | |
| | 461,534 | | | 2018-2, Class Aj | | | 461,263 | |
| | | | Cent CLO, LP | | | | |
| | | | 4.790%, (LIBOR 3M + 2.300%), 10/25/2028, Ser. | | | | |
| | 575,000 | | | 2018-27A, Class B*,b,e | | | 575,000 | |
| | | | College Ave Student Loans, LLC | | | | |
| | | | 3.931%, (LIBOR 1M + 1.650%), 11/26/2046, Ser. | | | | |
| | 244,590 | | | 2017-A, Class A1*,b | | | 249,560 | |
| | | | Foundation Finance Trust | | | | |
| | | | 3.300%, 7/15/2033, Ser. | | | | |
| | 252,803 | | | 2017-1A, Class A* | | | 250,234 | |
| | | | GMAC Mortgage Corporation Loan Trust | | | | |
| | | | 2.781%, (LIBOR 1M + 0.500%), 8/25/2035, Ser. | | | | |
| | 47,903 | | | 2005-HE1, Class A2b,k | | | 52,291 | |
The accompanying Notes to Financial Statements are an integral part of this schedule.
17
BALANCED INCOME PLUS FUND
Schedule of Investments as of October 31, 2018
| | | | | | | | |
Principal
Amount | | | Long-Term Fixed Income (24.4%) | | Value | |
| | Asset-Backed Securities (3.1%) - continued | | | | |
| | | | Harley Marine Financing, LLC | | | | |
| | | | 5.682%, 5/15/2043, Ser. | | | | |
| | $419,687 | | | 2018-1A, Class A2* | | | $388,211 | |
| | | | J.P. Morgan Mortgage Acquisition Trust | | | | |
| | | | 4.263%, 3/25/2047, Ser. | | | | |
| | 148,788 | | | 2007-HE1, Class AF4l | | | 106,125 | |
| | | | Lehman XS Trust | | | | |
| | | | 5.440%, 8/25/2035, Ser. | | | | |
| | 131,837 | | | 2005-2, Class 2A3Bl | | | 120,776 | |
| | | | Lendmark Funding Trust | | | | |
| | | | 2.830%, 12/22/2025, Ser. | | | | |
| | 300,000 | | | 2017-1A, Class Aj | | | 296,063 | |
| | | | Madison Park Funding XIV, Ltd. | | | | |
| | | | 3.869%, (LIBOR 3M + 1.400%), 10/22/2030, Ser. | | | | |
| | 425,000 | | | 2014-14A, Class A2RR*,b | | | 424,996 | |
| | | | Merrill Lynch Mortgage Investors Trust | | | | |
| | | | 4.004%, 6/25/2035, Ser. | | | | |
| | 264,682 | | | 2005-A5, Class M1b | | | 263,549 | |
| | | | Oak Hill Advisors Residential Loan Trust | | | | |
| | | | 3.000%, 6/25/2057, Ser. | | | | |
| | 296,191 | | | 2017-NPL1, Class A1*,l | | | 291,663 | |
| | | | Octagon Investment Partners XX, Ltd. | | | | |
| | | | 5.888%, (LIBOR 3M + 3.550%), 8/12/2026, Ser. | | | | |
| | 300,000 | | | 2014-1A, Class DR*,b | | | 300,025 | |
| | | | OHA Credit Funding 1, Ltd. | | | | |
| | | | 4.089%, (LIBOR 3M + 1.450%), 10/20/2030, Ser. | | | | |
| | 350,000 | | | 2018-1A, Class A2*,b | | | 349,981 | |
| | | | OZLM Funding II, Ltd. | | | | |
| | | | 4.020%, (LIBOR 3M + 1.500%), 7/15/2031, Ser. | | | | |
| | 700,000 | | | 2012-2A, Class A1BR*,b | | | 699,999 | |
| | | | OZLM IX, Ltd. | | | | |
| | | | 4.019%, (LIBOR 3M + 1.550%), 10/20/2031, Ser. | | | | |
| | 400,000 | | | 2014-9A, Class A1BR*,b,d,e | | | 400,000 | |
| | | | Park Avenue Institutional Advisers CLO, Ltd. | | | | |
| | | | 3.910%, (LIBOR 3M + 1.500%), 10/20/2031, Ser. | | | | |
| | 700,000 | | | 2018-1A, Class A1B*,b,d,e | | | 700,000 | |
| | | | Preston Ridge Partners Mortgage Trust, LLC | | | | |
| | | | 4.250%, 1/25/2022, Ser. | | | | |
| | 83,231 | | | 2017-1A, Class A1*,l | | | 83,117 | |
| | | | Pretium Mortgage Credit Partners, LLC | | | | |
| | | | 3.250%, 3/28/2057, Ser. | | | | |
| | 99,381 | | | 2017-NPL2, Class A1j,l | | | 98,684 | |
| | | | Renaissance Home Equity Loan Trust | | | | |
| | | | 5.608%, 5/25/2036, Ser. | | | | |
| | 293,945 | | | 2006-1, Class AF3l | | | 202,879 | |
| | | | 5.285%, 1/25/2037, Ser. | | | | |
| | 459,695 | | | 2006-4, Class AF2l | | | 245,072 | |
| | | | Sound Point CLO X, Ltd. | | | | |
| | | | 5.169%, (LIBOR 3M + 2.700%), 1/20/2028, Ser. | | | | |
| | 350,000 | | | 2015-3A, Class DR*,b | | | 349,994 | |
| | | | Sound Point CLO XXI, Ltd. | | | | |
| | | | 3.864%, (LIBOR 3M + 1.450%), 10/26/2031, Ser. | | | | |
| | 700,000 | | | 2018-3A, Class A1B*,b | | | 699,970 | |
| | | | Spirit Master Funding, LLC | | | | |
| | | | 4.360%, 12/20/2047, Ser. | | | | |
| | 596,250 | | | 2017-1A, Class A* | | | 591,431 | |
| | | | THL Credit Wind River CLO, Ltd. | | | | |
| | | | 5.286%, (LIBOR 3M + 2.850%), 7/15/2028, Ser. | | | | |
| | 350,000 | | | 2016-1A, Class DRb | | | 349,996 | |
| | | | 3.860%, (LIBOR 3M + 1.450%), 10/22/2031, Ser. | | | | |
| | 1,075,000 | | | 2014-3A, Class A2R2*,b | | | 1,074,970 | |
| | | | Vericrest Opportunity Loan Trust | | | | |
| | | | 3.250%, 6/25/2047, Ser. | | | | |
| | 128,982 | | | 2017-NPL7, Class A1j,l | | | 127,948 | |
| | | | Vericrest Opportunity Loan Trust | | | | |
| | | | LXV, LLC | | | | |
| | | | 3.750%, 4/25/2048, Ser. | | | | |
| | 356,720 | | | 2018-NPL1, Class A1j,l | | | 354,999 | |
| | | | Wachovia Asset Securitization, Inc. | | | | |
| | | | 2.421%, (LIBOR 1M + 0.140%), | | | | |
| | | | 7/25/2037, Ser. 2007-HE1, | | | | |
| | 236,854 | | | Class A*,b,k | | | 227,391 | |
| | | | Wells Fargo Home Equity Trust | | | | |
| | | | 2.781%, (LIBOR 1M + 0.500%), 4/25/2034, Ser. | | | | |
| | 232,033 | | | 2004-1, Class M1b | | | 227,990 | |
| | | | | |
| | | | Total | | | 11,338,437 | |
| | | | | |
| | Basic Materials (0.6%) | | | | |
| | | | Alcoa Nederland Holding BV | | | | |
| | 80,000 | | | 6.750%, 9/30/2024j | | | 84,000 | |
| | | | Anglo American Capital plc | | | | |
| | 76,000 | | | 4.125%, 9/27/2022j | | | 75,783 | |
| | | | ArcelorMittal SA | | | | |
| | 78,000 | | | 6.125%, 6/1/2025 | | | 83,384 | |
| | | | CF Industries, Inc. | | | | |
| | 190,000 | | | 3.450%, 6/1/2023i | | | 180,500 | |
| | | | E.I. du Pont de Nemours and | | | | |
| | | | Company | | | | |
| | 76,000 | | | 2.200%, 5/1/2020 | | | 75,066 | |
| | | | First Quantum Minerals, Ltd. | | | | |
| | 310,000 | | | 7.000%, 2/15/2021j | | | 303,219 | |
| | | | FMG Resources Property, Ltd. | | | | |
| | 175,000 | | | 5.125%, 5/15/2024j | | | 166,250 | |
| | | | Kinross Gold Corporation | | | | |
| | 38,000 | | | 5.125%, 9/1/2021 | | | 38,817 | |
| | | | LyondellBasell Industries NV | | | | |
| | 62,000 | | | 5.000%, 4/15/2019 | | | 62,234 | |
| | | | Packaging Corporation of America | | | | |
| | 55,000 | | | 2.450%, 12/15/2020 | | | 53,830 | |
| | | | Peabody Securities Finance Corporation | | | | |
| | 170,000 | | | 6.375%, 3/31/2025j | | | 170,000 | |
| | | | Platform Specialty Products Corporation | | | | |
| | 120,000 | | | 5.875%, 12/1/2025j | | | 113,700 | |
| | | | Sherwin-Williams Company | | | | |
| | 75,000 | | | 2.250%, 5/15/2020 | | | 73,721 | |
The accompanying Notes to Financial Statements are an integral part of this schedule.
18
BALANCED INCOME PLUS FUND
Schedule of Investments as of October 31, 2018
| | | | | | | | |
| | |
Principal
Amount | | | Long-Term Fixed Income (24.4%) | | Value | |
| | Basic Materials (0.6%) - continued | | | | |
| | | | Syngenta Finance NV | | | | |
| | $64,000 | | | 3.933%, 4/23/2021j | | | $63,678 | |
| | | | Trinseo Materials Operating SCA | | | | |
| | 180,000 | | | 5.375%, 9/1/2025j | | | 166,950 | |
| | | | United States Steel Corporation | | | | |
| | 200,000 | | | 6.250%, 3/15/2026 | | | 188,500 | |
| | | | Vale Overseas, Ltd. | | | | |
| | 45,000 | | | 4.375%, 1/11/2022 | | | 45,252 | |
| | | | Xstrata Finance Canada, Ltd. | | | | |
| | 57,000 | | | 4.950%, 11/15/2021j | | | 58,492 | |
| | | | | |
| | | | Total | | | 2,003,376 | |
| | | | | |
| |
| | Capital Goods (0.9%) | | | | |
| | | | AECOM | | | | |
| | 235,000 | | | 5.875%, 10/15/2024 | | | 239,112 | |
| | | | Ashtead Capital, Inc. | | | | |
| | 150,000 | | | 4.125%, 8/15/2025j | | | 139,125 | |
| | | | Bombardier, Inc. | | | | |
| | 210,000 | | | 7.500%, 3/15/2025j | | | 209,937 | |
| | | | Building Materials Corporation of America | | | | |
| | 285,000 | | | 6.000%, 10/15/2025j | | | 280,369 | |
| | | | Caterpillar Financial Services Corporation | | | | |
| | 55,000 | | | 1.850%, 9/4/2020 | | | 53,780 | |
| | | | Cemex SAB de CV | | | | |
| | 310,000 | | | 5.700%, 1/11/2025j | | | 302,932 | |
| | | | Cintas Corporation No. 2 | | | | |
| | 57,000 | | | 2.900%, 4/1/2022 | | | 55,519 | |
| | | | CNH Industrial Capital, LLC | | | | |
| | 56,000 | | | 4.875%, 4/1/2021 | | | 57,212 | |
| | | | Covanta Holding Corporation | | | | |
| | 200,000 | | | 6.000%, 1/1/2027 | | | 193,000 | |
| | | | Crown Americas Capital Corporation IV | | | | |
| | 260,000 | | | 4.500%, 1/15/2023 | | | 254,800 | |
| | | | General Electric Company | | | | |
| | 259,000 | | | 5.000%, 1/21/2021b,m | | | 238,928 | |
| | | | H&E Equipment Services, Inc. | | | | |
| | 190,000 | | | 5.625%, 9/1/2025 | | | 180,975 | |
| | | | L3 Technologies, Inc. | | | | |
| | 65,000 | | | 4.950%, 2/15/2021 | | | 66,652 | |
| | | | Lockheed Martin Corporation | | | | |
| | 60,000 | | | 2.500%, 11/23/2020 | | | 58,917 | |
| | | | Owens-Brockway Glass Container, Inc. | | | | |
| | 230,000 | | | 5.000%, 1/15/2022j | | | 227,125 | |
| | | | Rockwell Collins, Inc. | | | | |
| | 37,000 | | | 2.800%, 3/15/2022 | | | 35,865 | |
| | | | Textron Financial Corporation | | | | |
| | | | 4.049%, (LIBOR 3M + | | | | |
| | 140,000 | | | 1.735%), 2/15/2042b,j | | | 119,700 | |
| | | | United Rentals North America, Inc. | | | | |
| | 300,000 | | | 5.500%, 7/15/2025 | | | 292,313 | |
| | | | United Technologies Corporation | | | | |
| | 70,000 | | | 3.950%, 8/16/2025 | | | 69,121 | |
| | | | | |
| | | | Total | | | 3,075,382 | |
| | | | | |
| |
| | Collateralized Mortgage Obligations (2.7%) | | | | |
| | | | Alternative Loan Trust 2007-6 | | | | |
| | 187,449 | | | 5.750%, 4/25/2047, Ser. 2007-6, Class A4 | | | 160,300 | |
| | | | Banc of America Alternative Loan Trust | | | | |
| | 282,970 | | | 6.000%, 11/25/2035, Ser. 2005-10, Class 3CB1 | | | 252,374 | |
| | | | Banc of America Mortgage Securities, Inc. | | | | |
| | 74,947 | | | 4.368%, 9/25/2035, Ser. 2005-H, Class 2A1b | | | 72,622 | |
| | | | CHL Mortgage Pass-Through Trust | | | | |
| | 319,348 | | | 3.610%, 11/20/2035, Ser. 2005-HYB7, Class 6A1b | | | 298,249 | |
| | 207,651 | | | 4.109%, 12/20/2035, Ser. 2005-HYB8, Class 3A1b | | | 198,967 | |
| | 463,026 | | | 6.000%, 11/25/2037, Ser. 2007-18, Class 1A2 | | | 394,591 | |
| | | | CIM Trust | | | | |
| | 345,472 | | | 5.000%, 12/25/2057, Ser. 2018-R3, Class A1*,b | | | 357,494 | |
| | | | COLT Mortgage Loan Trust | | | | |
| | 57,965 | | | 2.750%, 9/25/2046, Ser. 2016-2, Class A1*,b | | | 57,678 | |
| | | | Countrywide Alternative Loan Trust | | | | |
| | 323,094 | | | 6.500%, 8/25/2036, Ser. 2006-23CB, Class 2A3 | | | 205,602 | |
| | | | Countrywide Home Loan Mortgage Pass Through Trust | | | | |
| | 198,146 | | | 4.060%, 11/25/2035, Ser. 2005-22, Class 2A1b | | | 176,778 | |
| | | | Credit Suisse First Boston Mortgage Securities Corporation | | | | |
| | 157,871 | | | 5.250%, 10/25/2035, Ser. 2005-9, Class 1A3 | | | 155,394 | |
| | | | Deutsche Alt-A Securities, Inc., Mortgage Loan Trust | | | | |
| | 323,917 | | | 5.500%, 11/25/2035, Ser. 2005-5, Class 1A4b | | | 344,391 | |
| | | | Federal Home Loan Mortgage Corporation - REMIC | | | | |
| | 1,125,852 | | | 3.000%, 5/15/2027, Ser. 4046, Class GIn | | | 87,267 | |
| | 687,279 | | | 3.000%, 4/15/2033, Ser. 4203, Class DIn | | | 58,396 | |
| | | | Federal National Mortgage Association - REMIC | | | | |
| | 1,487,488 | | | 3.000%, 7/25/2027, Ser. 2012-73, Class DIn | | | 128,710 | |
| | 1,218,399 | | | 3.000%, 7/25/2027, Ser. 2012-74, Class AIn | | | 96,518 | |
| | 1,915,458 | | | 3.000%, 8/25/2027, Ser. 2012-95, Class HIn | | | 147,252 | |
| | 1,602,992 | | | 3.000%, 12/25/2027, Ser. 2012-139, Class DIn | | | 131,085 | |
| | 899,537 | | | 2.500%, 1/25/2028, Ser. 2012-152, Class AIn | | | 65,838 | |
| | 2,169,247 | | | 3.000%, 1/25/2028, Ser. 2012-147, Class EIn | | | 180,283 | |
| | 1,133,367 | | | 2.500%, 6/25/2028, Ser. 2013-87, Class IWn | | | 84,167 | |
The accompanying Notes to Financial Statements are an integral part of this schedule.
19
BALANCED INCOME PLUS FUND
Schedule of Investments as of October 31, 2018
| | | | | | | | |
Principal
Amount | | | Long-Term Fixed Income (24.4%) | | Value | |
| | Collateralized Mortgage Obligations (2.7%) - continued | | | | |
| | | | GMAC Mortgage Corporation Loan Trust | | | | |
| | $185,734 | | | 3.801%, 5/25/2035, Ser. 2005-AR2, Class 4Ab | | | $177,605 | |
| | | | Impac Secured Assets Trust | | | | |
| | 393,585 | | | 2.521%, (LIBOR 1M + 0.240%), 9/25/2037, Ser. 2007-3, Class A1Bb | | | 330,732 | |
| | | | IndyMac INDA Mortgage Loan Trust | | | | |
| | 180,246 | | | 3.897%, 8/25/2036, Ser. 2006-AR1, Class A1b | | | 178,109 | |
| | | | IndyMac INDX Mortgage Loan Trust | | | | |
| | 354,123 | | | 3.746%, 10/25/2035, Ser. 2005-AR19, Class A1b | | | 319,284 | |
| | | | 2.491%, (LIBOR 1M + 0.210%), | | | | |
| | 370,567 | | | 4/25/2046, Ser. 2006-AR2, Class 1A1Bb | | | 347,985 | |
| | | | J.P. Morgan Alternative Loan Trust | | | | |
| | 170,255 | | | 3.734%, 3/25/2036, Ser. 2006-A1, Class 2A1b | | | 154,276 | |
| | 439,501 | | | 6.500%, 3/25/2036, Ser. 2006-S1, Class 1A19 | | | 381,920 | |
| | | | Lehman Mortgage Trust | | | | |
| | 38,297 | | | 6.000%, 1/25/2036, Ser. 2005-3, Class 2A7 | | | 38,035 | |
| | | | Master Asset Securitization Trust | | | | |
| | | | 2.781%, (LIBOR 1M + | | | | |
| | 385,430 | | | 0.500%), 6/25/2036, Ser. 2006-2, Class 2A2b | | | 182,868 | |
| | | | MortgageIT Trust | | | | |
| | 465,194 | | | 2.481%, (LIBOR 1M + 0.200%), 4/25/2036, Ser. 2006-1, Class 1A2b | | | 413,056 | |
| | | | Preston Ridge Partners Mortgage Trust, LLC | | | | |
| | 156,848 | | | 3.470%, 9/25/2022, Ser. 2017-2A, Class A1*,l | | | 155,075 | |
| | | | RCO 2017-INV1 Trust | | | | |
| | 322,499 | | | 3.197%, 11/25/2052, Ser. 2017-INV1, Class A*,b | | | 325,703 | |
| | | | Residential Accredit Loans, Inc. Trust | | | | |
| | 218,303 | | | 5.750%, 9/25/2035, Ser. 2005-QS13, Class 2A3 | | | 210,642 | |
| | 271,859 | | | 2.831%, (LIBOR 1M + 0.550%), 1/25/2037, Ser. 2007-QS1, Class 1A5b | | | 215,554 | |
| | 145,843 | | | 6.000%, 1/25/2037, Ser. 2007-QS1, Class 1A1 | | | 134,901 | |
| | | | Residential Asset Securitization Trust | | | | |
| | 214,066 | | | 3.159%, 1/25/2034, Ser. 2004-IP1, Class A1b | | | 210,214 | |
| | | | Residential Funding Mortgage Security I Trust | | | | |
| | 358,417 | | | 6.000%, 7/25/2037, Ser. 2007-S7, Class A20 | | | 337,503 | |
| | | | Structured Adjustable Rate Mortgage Loan Trust | | | | |
| | 140,906 | | | 4.201%, 7/25/2035, Ser. 2005-15, Class 4A1b | | | 130,220 | |
| | 232,521 | | | 4.268%, 9/25/2035, Ser. 2005-18, Class 1A1b | | | 186,794 | |
| | | | Structured Asset Mortgage Investments, Inc. | | | | |
| | | | 2.591%, (LIBOR 1M + 0.310%), | | | | |
| | 554,098 | | | 12/25/2035, Ser. 2005-AR4, Class A1b | | | 530,552 | |
| | | | Toorak Mortgage Corporation 2018- 1, Ltd. | | | | |
| | 450,000 | | | 4.336%, 8/25/2021, Ser. 2018-1, Class A1*,l | | | 450,864 | |
| | | | WaMu Mortgage Pass Through Certificates | | | | |
| | 115,527 | | | 2.903%, 1/25/2037, Ser. 2006-AR18, Class 1A1b | | | 108,727 | |
| | | | 2.826%, (12 MTA + 0.880%), | | | | |
| | 302,375 | | | 10/25/2046, Ser. 2006-AR13, Class 1Ab | | | 284,274 | |
| | | | 2.686%, (12 MTA + 0.740%), | | | | |
| | 180,598 | | | 1/25/2047, Ser. 2006-AR19, Class 1Ab | | | 170,952 | |
| | | | Wells Fargo Mortgage Backed Securities Trust | | | | |
| | 125,284 | | | 4.083%, 3/25/2036, Ser. 2006-AR2, Class 2A1b | | | 127,503 | |
| | 200,133 | | | 4.219%, 7/25/2036, Ser. 2006-AR10, Class 2A1b | | | 199,484 | |
| | 138,519 | | | 6.000%, 7/25/2037, Ser. 2007-8, Class 1A16 | | | 137,470 | |
| | 105,679 | | | 6.000%, 7/25/2037, Ser. 2007-10, Class 1A1 | | | 104,887 | |
| | | | | |
| | | | Total | | | 10,199,145 | |
| | | | | |
| |
| | Commercial Mortgage-Backed Securities (0.1%) | | | | |
| | | | Wells Fargo Commercial Mortgage Trust | | | | |
| | 400,000 | | | 3.290%, 5/15/2048, Ser. 2015-C28, Class A3 | | | 387,650 | |
| | | | | |
| | | | Total | | | 387,650 | |
| | | | | |
| |
| | Communications Services (1.5%) | | | | |
| | | | Altice US Finance I Corporation | | | | |
| | 200,000 | | | 5.500%, 5/15/2026j | | | 194,812 | |
| | | | AMC Networks, Inc. | | | | |
| | 305,000 | | | 5.000%, 4/1/2024 | | | 291,717 | |
| | | | America Movil SAB de CV | | | | |
| | 56,000 | | | 5.000%, 10/16/2019 | | | 56,840 | |
| | | | American Tower Corporation | | | | |
| | 60,000 | | | 2.800%, 6/1/2020 | | | 59,369 | |
| | | | AT&T, Inc. | | | | |
| | 66,000 | | | 5.875%, 10/1/2019 | | | 67,593 | |
| | 38,000 | | | 5.200%, 3/15/2020 | | | 38,923 | |
| | | | British Sky Broadcasting Group plc | | | | |
| | 47,000 | | | 2.625%, 9/16/2019j | | | 46,738 | |
| | | | CCOH Safari, LLC | | | | |
| | 310,000 | | | 5.750%, 2/15/2026j | | | 306,900 | |
| | | | CenturyLink, Inc. | | | | |
| | 200,000 | | | 6.450%, 6/15/2021 | | | 204,500 | |
| | | | Charter Communications Operating, LLC | | | | |
| | 68,000 | | | 3.579%, 7/23/2020 | | | 67,910 | |
| | 29,000 | | | 4.464%, 7/23/2022 | | | 29,324 | |
| | 32,000 | | | 4.500%, 2/1/2024 | | | 32,039 | |
The accompanying Notes to Financial Statements are an integral part of this schedule.
20
BALANCED INCOME PLUS FUND
Schedule of Investments as of October 31, 2018
| | | | | | | | |
Principal
Amount | | | Long-Term Fixed Income (24.4%) | | Value | |
| | Communications Services (1.5%) - continued | | | | |
| | | | Clear Channel Worldwide Holdings, Inc. | | | | |
| | $265,000 | | | 6.500%, 11/15/2022 | | | $269,028 | |
| | | | Comcast Corporation | | | | |
| | 76,000 | | | 1.625%, 1/15/2022 | | | 71,581 | |
| | 35,000 | | | 3.700%, 4/15/2024 | | | 34,880 | |
| | 35,000 | | | 3.950%, 10/15/2025 | | | 34,902 | |
| | | | Crown Castle International Corporation | | | | |
| | 25,000 | | | 3.400%, 2/15/2021 | | | 24,843 | |
| | 39,000 | | | 3.150%, 7/15/2023 | | | 37,434 | |
| | | | CSC Holdings, LLC | | | | |
| | 20,000 | | | 5.500%, 4/15/2027j | | | 19,200 | |
| | | | Digicel, Ltd. | | | | |
| | 287,750 | | | 6.000%, 4/15/2021*,i | | | 261,133 | |
| | | | Discovery Communications, LLC | | | | |
| | 37,000 | | | 2.200%, 9/20/2019 | | | 36,666 | |
| | 75,000 | | | 2.950%, 3/20/2023 | | | 71,289 | |
| | | | DISH Network Corporation, Convertible | | | | |
| | 403,000 | | | 3.375%, 8/15/2026 | | | 359,053 | |
| | | | GCI Liberty, Inc., Convertible | | | | |
| | 241,000 | | | 1.750%, 9/30/2046j | | | 259,350 | |
| | | | IAC FinanceCo, Inc., Convertible | | | | |
| | 286,000 | | | 0.875%, 10/1/2022j | | | 399,606 | |
| | | | Intelsat Jackson Holdings SA | | | | |
| | 105,000 | | | 8.500%, 10/15/2024j | | | 103,163 | |
| | | | Level 3 Financing, Inc. | | | | |
| | 190,000 | | | 5.250%, 3/15/2026 | | | 182,400 | |
| | | | Liberty Media Corporation, Convertible | | | | |
| | 357,000 | | | 1.000%, 1/30/2023 | | | 385,078 | |
| | | | Meredith Corporation | | | | |
| | 55,000 | | | 6.875%, 2/1/2026j | | | 55,000 | |
| | | | Moody’s Corporation | | | | |
| | 38,000 | | | 2.750%, 12/15/2021 | | | 37,067 | |
| | | | Neptune Finco Corporation | | | | |
| | 95,000 | | | 10.875%, 10/15/2025j | | | 109,606 | |
| | | | Netflix, Inc. | | | | |
| | 200,000 | | | 4.875%, 4/15/2028j | | | 183,500 | |
| | | | Sprint Corporation | | | | |
| | 295,000 | | | 7.625%, 2/15/2025 | | | 306,431 | |
| | | | Twitter, Inc., Convertible | | | | |
| | 213,000 | | | 0.250%, 6/15/2024j | | | 199,715 | |
| | | | Verizon Communications, Inc. | | | | |
| | 91,000 | | | 2.946%, 3/15/2022 | | | 89,045 | |
| | 73,000 | | | 3.414%, (LIBOR 3M + 1.100%), 5/15/2025b | | | 73,376 | |
| | | | Viacom, Inc. | | | | |
| | 55,000 | | | 4.250%, 9/1/2023 | | | 54,920 | |
| | 85,000 | | | 5.875%, 2/28/2057b | | | 81,170 | |
| | | | World Wrestling Entertainment, Inc., Convertible | | | | |
| | 157,000 | | | 3.375%, 12/15/2023j | | | 461,155 | |
| | | | | |
| | | | Total | | | 5,597,256 | |
| | | | | |
| |
| | Consumer Cyclical (1.4%) | | | | |
| | | | Allison Transmission, Inc. | | | | |
| | 280,000 | | | 5.000%, 10/1/2024j | | | 271,774 | |
| | | | American Honda Finance Corporation | | | | |
| | 57,000 | | | 2.000%, 2/14/2020 | | | 56,194 | |
| | | | BMW US Capital, LLC | | | | |
| | 75,000 | | | 1.500%, 4/11/2019j | | | 74,547 | |
| | | | Brookfield Residential Properties, Inc. | | | | |
| | 125,000 | | | 6.125%, 7/1/2022j | | | 122,500 | |
| | | | Caesars Entertainment Corporation, Convertible | | | | |
| | 72,000 | | | 5.000%, 10/1/2024 | | | 102,822 | |
| | | | Cinemark USA, Inc. | | | | |
| | 204,000 | | | 4.875%, 6/1/2023 | | | 199,155 | |
| | | | D.R. Horton, Inc. | | | | |
| | 53,000 | | | 2.550%, 12/1/2020 | | | 51,763 | |
| | | | Delphi Jersey Holdings plc | | | | |
| | 205,000 | | | 5.000%, 10/1/2025j | | | 185,012 | |
| | | | Ford Motor Credit Company, LLC | | | | |
| | 76,000 | | | 2.262%, 3/28/2019 | | | 75,740 | |
| | 85,000 | | | 2.597%, 11/4/2019 | | | 83,991 | |
| | 57,000 | | | 3.336%, 3/18/2021 | | | 55,686 | |
| | | | General Motors Financial Company, Inc. | | | | |
| | 57,000 | | | 2.650%, 4/13/2020 | | | 56,393 | |
| | 36,000 | | | 3.258%, (LIBOR 3M + 0.850%), 4/9/2021b | | | 35,997 | |
| | 57,000 | | | 4.375%, 9/25/2021 | | | 57,494 | |
| | 37,000 | | | 3.150%, 6/30/2022 | | | 35,518 | |
| | | | Home Depot, Inc. | | | | |
| | 60,000 | | | 2.625%, 6/1/2022 | | | 58,582 | |
| | | | Hyundai Capital America | | | | |
| | 37,000 | | | 2.550%, 4/3/2020j | | | 36,326 | |
| | 37,000 | | | 2.750%, 9/18/2020j | | | 36,254 | |
| | | | Jaguar Land Rover Automotive plc | | | | |
| | 75,000 | | | 4.125%, 12/15/2018j | | | 74,925 | |
| | 211,000 | | | 5.625%, 2/1/2023j | | | 200,978 | |
| | | | KB Home | | | | |
| | 160,000 | | | 4.750%, 5/15/2019 | | | 160,528 | |
| | | | L Brands, Inc. | | | | |
| | 189,000 | | | 6.694%, 1/15/2027 | | | 177,660 | |
| | | | Landry’s, Inc. | | | | |
| | 160,000 | | | 6.750%, 10/15/2024j | | | 159,600 | |
| | | | Lennar Corporation | | | | |
| | 55,000 | | | 2.950%, 11/29/2020 | | | 53,488 | |
| | 18,000 | | | 4.125%, 1/15/2022 | | | 17,573 | |
| | 17,000 | | | 4.875%, 12/15/2023 | | | 16,596 | |
| | 265,000 | | | 4.500%, 4/30/2024 | | | 253,241 | |
| | | | Live Nation Entertainment, Inc. | | | | |
| | 70,000 | | | 5.375%, 6/15/2022j | | | 70,525 | |
| | 100,000 | | | 5.625%, 3/15/2026j | | | 100,000 | |
| | | | Macy’s Retail Holdings, Inc. | | | | |
| | 15,000 | | | 3.875%, 1/15/2022 | | | 14,899 | |
| | 22,000 | | | 2.875%, 2/15/2023 | | | 20,548 | |
| | | | McDonald’s Corporation | | | | |
| | 76,000 | | | 2.625%, 1/15/2022 | | | 73,919 | |
| | | | MGM Resorts International | | | | |
| | 175,000 | | | 6.000%, 3/15/2023 | | | 177,625 | |
| | 190,000 | | | 5.750%, 6/15/2025 | | | 185,250 | |
| | | | Navistar International Corporation | | | | |
| | 185,000 | | | 6.625%, 11/1/2025j | | | 188,700 | |
| | | | New Red Finance, Inc. | | | | |
| | 180,000 | | | 4.250%, 5/15/2024j | | | 168,750 | |
The accompanying Notes to Financial Statements are an integral part of this schedule.
21
BALANCED INCOME PLUS FUND
Schedule of Investments as of October 31, 2018
| | | | | | | | |
Principal
Amount | | | Long-Term Fixed Income (24.4%) | | Value | |
| | Consumer Cyclical (1.4%) - continued | | | | |
| | | | Nissan Motor Acceptance Corporation | | | | |
| | $57,000 | | | 2.000%, 3/8/2019j | | | $56,831 | |
| | | | Prime Security Services Borrower, LLC | | | | |
| | 187,000 | | | 9.250%, 5/15/2023j | | | 197,603 | |
| | | | Ralph Lauren Corporation | | | | |
| | 60,000 | | | 2.625%, 8/18/2020 | | | 59,315 | |
| | | | Royal Caribbean Cruises, Ltd. | | | | |
| | 287,750 | | | 5.250%, 11/15/2022 | | | 300,421 | |
| | | | Six Flags Entertainment Corporation | | | | |
| | 150,000 | | | 4.875%, 7/31/2024j | | | 141,750 | |
| | | | Visa, Inc. | | | | |
| | 60,000 | | | 2.200%, 12/14/2020 | | | 58,774 | |
| | | | Volkswagen Group of America Finance, LLC | | | | |
| | 52,000 | | | 2.450%, 11/20/2019j | | | 51,482 | |
| | | | Wabash National Corporation | | | | |
| | 200,000 | | | 5.500%, 10/1/2025j | | | 180,000 | |
| | | | Yum! Brands, Inc. | | | | |
| | 305,000 | | | 5.000%, 6/1/2024j | | | 300,806 | |
| | | | | |
| | | | Total | | | 5,057,535 | |
| | | | | |
| |
| | Consumer Non-Cyclical (1.0%) | | | | |
| | | | Abbott Laboratories | | | | |
| | 76,000 | | | 2.550%, 3/15/2022 | | | 73,519 | |
| | 40,000 | | | 3.400%, 11/30/2023 | | | 39,571 | |
| | | | AbbVie, Inc. | | | | |
| | 76,000 | | | 2.500%, 5/14/2020 | | | 75,007 | |
| | 38,000 | | | 2.900%, 11/6/2022 | | | 36,788 | |
| | | | Albertsons Companies, LLC | | | | |
| | 220,000 | | | 6.625%, 6/15/2024 | | | 207,900 | |
| | | | Amgen, Inc. | | | | |
| | 74,000 | | | 3.875%, 11/15/2021 | | | 74,684 | |
| | 75,000 | | | 2.650%, 5/11/2022 | | | 72,464 | |
| | | | Anheuser-Busch InBev Finance, Inc. | | | | |
| | 55,000 | | | 2.650%, 2/1/2021 | | | 53,916 | |
| | 80,000 | | | 3.603%, (LIBOR 3M + 1.260%), 2/1/2021b | | | 81,703 | |
| | 38,000 | | | 3.300%, 2/1/2023 | | | 37,045 | |
| | | | Anheuser-Busch InBev Worldwide, Inc. | | | | |
| | 73,000 | | | 3.500%, 1/12/2024 | | | 71,057 | |
| | | | BAT Capital Corporation | | | | |
| | 37,000 | | | 2.297%, 8/14/2020j | | | 36,206 | |
| | 38,000 | | | 2.764%, 8/15/2022j | | | 36,376 | |
| | | | Bayer U.S. Finance II, LLC | | | | |
| | 71,000 | | | 3.500%, 6/25/2021j | | | 70,551 | |
| | | | Becton, Dickinson and Company | | | | |
| | 76,000 | | | 3.125%, 11/8/2021 | | | 74,749 | |
| | | | Boston Scientific Corporation | | | | |
| | 40,000 | | | 6.000%, 1/15/2020 | | | 41,232 | |
| | | | Bunge, Ltd. Finance Corporation | | | | |
| | 60,000 | | | 3.500%, 11/24/2020 | | | 59,871 | |
| | | | Cardinal Health, Inc. | | | | |
| | 38,000 | | | 1.948%, 6/14/2019 | | | 37,756 | |
| | 38,000 | | | 2.616%, 6/15/2022 | | | 36,328 | |
| | | | Conagra Brands, Inc. | | | | |
| | 34,000 | | | 3.800%, 10/22/2021 | | | 34,079 | |
| | 34,000 | | | 4.300%, 5/1/2024 | | | 34,052 | |
| | | | CVS Health Corporation | | | | |
| | 74,000 | | | 3.350%, 3/9/2021 | | | 73,675 | |
| | 38,000 | | | 2.750%, 12/1/2022 | | | 36,322 | |
| | 111,000 | | | 3.700%, 3/9/2023 | | | 109,669 | |
| | | | Express Scripts Holding Company | | | | |
| | 38,000 | | | 4.750%, 11/15/2021 | | | 39,104 | |
| | | | Forest Laboratories, LLC | | | | |
| | 19,000 | | | 4.875%, 2/15/2021j | | | 19,411 | |
| | | | Halfmoon Parent, Inc. | | | | |
| | 69,000 | | | 4.125%, 11/15/2025j | | | 68,210 | |
| | | | HCA, Inc. | | | | |
| | 187,750 | | | 4.750%, 5/1/2023 | | | 189,627 | |
| | | | J.M. Smucker Company | | | | |
| | 37,000 | | | 2.200%, 12/6/2019 | | | 36,597 | |
| | | | JBS USA, LLC | | | | |
| | 300,000 | | | 5.750%, 6/15/2025j | | | 290,250 | |
| | | | Kellogg Company | | | | |
| | 70,000 | | | 3.125%, 5/17/2022 | | | 68,489 | |
| | | | Kraft Heinz Foods Company | | | | |
| | 75,000 | | | 5.375%, 2/10/2020 | | | 76,967 | |
| | 37,000 | | | 4.000%, 6/15/2023 | | | 36,807 | |
| | | | Kroger Company | | | | |
| | 37,000 | | | 2.800%, 8/1/2022 | | | 35,818 | |
| | | | Maple Escrow Subsidiary, Inc. | | | | |
| | 74,000 | | | 3.551%, 5/25/2021j | | | 73,655 | |
| | | | Mead Johnson Nutrition Company | | | | |
| | 60,000 | | | 3.000%, 11/15/2020 | | | 59,580 | |
| | | | Medtronic Global Holdings SCA | | | | |
| | 76,000 | | | 1.700%, 3/28/2019 | | | 75,698 | |
| | | | Mondelez International Holdings Netherlands BV | | | | |
| | 55,000 | | | 2.000%, 10/28/2021j | | | 52,353 | |
| | | | Mylan NV | | | | |
| | 37,000 | | | 3.150%, 6/15/2021 | | | 36,129 | |
| | | | Mylan, Inc. | | | | |
| | 33,000 | | | 3.125%, 1/15/2023j | | | 31,124 | |
| | | | Newell Rubbermaid, Inc. | | | | |
| | 6,000 | | | 3.150%, 4/1/2021 | | | 5,877 | |
| | | | Pernod Ricard SA | | | | |
| | 30,000 | | | 5.750%, 4/7/2021j | | | 31,416 | |
| | | | Perrigo Finance Unlimited Company | | | | |
| | 70,000 | | | 4.375%, 3/15/2026 | | | 67,632 | |
| | | | Reynolds American, Inc. | | | | |
| | 33,000 | | | 3.250%, 6/12/2020 | | | 32,892 | |
| | | | Shire Acquisitions Investments Ireland Designated Activity Company | | | | |
| | 74,000 | | | 2.400%, 9/23/2021 | | | 71,119 | |
| | | | Smithfield Foods, Inc. | | | | |
| | 57,000 | | | 2.700%, 1/31/2020j | | | 56,021 | |
| | | | Tenet Healthcare Corporation | | | | |
| | 260,000 | | | 8.125%, 4/1/2022 | | | 270,725 | |
| | | | Teva Pharmaceutical Finance IV, LLC | | | | |
| | 19,000 | | | 2.250%, 3/18/2020 | | | 18,453 | |
| | | | Teva Pharmaceutical Finance Netherlands III BV | | | | |
| | 55,000 | | | 2.200%, 7/21/2021 | | | 51,353 | |
| | | | TreeHouse Foods, Inc. | | | | |
| | 200,000 | | | 4.875%, 3/15/2022 | | | 197,500 | |
The accompanying Notes to Financial Statements are an integral part of this schedule.
22
BALANCED INCOME PLUS FUND
Schedule of Investments as of October 31, 2018
| | | | | | | | |
Principal
Amount | | | Long-Term Fixed Income (24.4%) | | Value | |
| | Consumer Non-Cyclical (1.0%) - continued | | | | |
| | | | Zimmer Biomet Holdings, Inc. | | | | |
| | $56,000 | | | 3.089%, (LIBOR 3M + 0.750%), 3/19/2021b | | | $56,029 | |
| | | | Zoetis, Inc. | | | | |
| | 55,000 | | | 3.450%, 11/13/2020 | | | 55,063 | |
| | | | | |
| | | | Total | | | 3,608,419 | |
| | | | | |
| |
| | Energy (1.7%) | | | | |
| | | | Alliance Resource Operating Partners, LP | | | | |
| | 170,000 | | | 7.500%, 5/1/2025j | | | 176,375 | |
| | | | Anadarko Petroleum Corporation | | | | |
| | 55,000 | | | 8.700%, 3/15/2019 | | | 56,092 | |
| | 15,000 | | | 4.850%, 3/15/2021 | | | 15,325 | |
| | 15,000 | | | 3.450%, 7/15/2024 | | | 14,251 | |
| | | | Antero Resources Corporation | | | | |
| | 200,000 | | | 5.125%, 12/1/2022 | | | 198,625 | |
| | | | BP Capital Markets plc | | | | |
| | 38,000 | | | 2.315%, 2/13/2020 | | | 37,604 | |
| | 152,000 | | | 2.520%, 9/19/2022 | | | 145,890 | |
| | | | Buckeye Partners, LP | | | | |
| | 80,000 | | | 2.650%, 11/15/2018 | | | 79,983 | |
| | | | Canadian Natural Resources, Ltd. | | | | |
| | 38,000 | | | 2.950%, 1/15/2023 | | | 36,582 | |
| | | | Canadian Oil Sands, Ltd. | | | | |
| | 37,000 | | | 9.400%, 9/1/2021j | | | 41,717 | |
| | | | Cenovus Energy, Inc. | | | | |
| | 38,000 | | | 3.800%, 9/15/2023 | | | 37,146 | |
| | | | Cheniere Corpus Christi Holdings, LLC | | | | |
| | 175,000 | | | 7.000%, 6/30/2024 | | | 189,219 | |
| | | | Cheniere Energy Partners, LP | | | | |
| | 245,000 | | | 5.625%, 10/1/2026j | | | 241,325 | |
| | | | Chesapeake Energy Corporation | | | | |
| | 100,000 | | | 7.000%, 10/1/2024 | | | 97,750 | |
| | | | Continental Resources, Inc. | | | | |
| | 30,000 | | | 5.000%, 9/15/2022 | | | 30,270 | |
| | | | Crestwood Midstream Partners, LP | | | | |
| | 200,000 | | | 6.250%, 4/1/2023 | | | 204,000 | |
| | | | Diamondback Energy, Inc. | | | | |
| | 225,000 | | | 4.750%, 11/1/2024 | | | 218,812 | |
| | | | Enbridge, Inc. | | | | |
| | 38,000 | | | 2.900%, 7/15/2022 | | | 36,683 | |
| | 200,000 | | | 6.250%, 3/1/2078b | | | 187,234 | |
| | | | Encana Corporation | | | | |
| | 58,000 | | | 3.900%, 11/15/2021 | | | 57,940 | |
| | | | Energy Transfer Equity, LP | | | | |
| | 300,000 | | | 5.500%, 6/1/2027 | | | 304,965 | |
| | | | Energy Transfer Operating, LP | | | | |
| | 37,000 | | | 4.200%, 9/15/2023 | | | 36,835 | |
| | | | Energy Transfer Partners, LP | | | | |
| | 60,000 | | | 4.150%, 10/1/2020 | | | 60,507 | |
| | | | Enterprise Products Operating, LLC | | | | |
| | 170,000 | | | 5.250%, 8/16/2077b | | | 152,253 | |
| | | | EOG Resources, Inc. | | | | |
| | 60,000 | | | 2.625%, 3/15/2023 | | | 57,478 | |
| | | | EQM Midstream Partners LP | | | | |
| | 51,000 | | | 4.750%, 7/15/2023 | | | 51,427 | |
| | | | EQT Corporation | | | | |
| | 68,000 | | | 8.125%, 6/1/2019 | | | 69,873 | |
| | 37,000 | | | 3.000%, 10/1/2022 | | | 35,498 | |
| | | | Exxon Mobil Corporation | | | | |
| | 70,000 | | | 1.708%, 3/1/2019 | | | 69,786 | |
| | | | Hess Corporation | | | | |
| | 37,000 | | | 3.500%, 7/15/2024 | | | 34,885 | |
| | | | Kinder Morgan Energy Partners, LP | | | | |
| | 37,000 | | | 9.000%, 2/1/2019 | | | 37,534 | |
| | 76,000 | | | 3.450%, 2/15/2023 | | | 74,120 | |
| | | | Marathon Oil Corporation | | | | |
| | 38,000 | | | 2.700%, 6/1/2020 | | | 37,485 | |
| | | | Marathon Petroleum Corporation | | | | |
| | 60,000 | | | 3.400%, 12/15/2020 | | | 59,979 | |
| | | | MEG Energy Corporation | | | | |
| | 41,000 | | | 6.375%, 1/30/2023j | | | 39,514 | |
| | | | MPLX, LP | | | | |
| | 57,000 | | | 4.500%, 7/15/2023 | | | 57,859 | |
| | | | Nabors Industries, Inc., Convertible | | | | |
| | 110,000 | | | 0.750%, 1/15/2024 | | | 81,987 | |
| | | | ONEOK Partners, LP | | | | |
| | 35,000 | | | 3.800%, 3/15/2020 | | | 35,106 | |
| | | | Parsley Energy, LLC | | | | |
| | 80,000 | | | 5.625%, 10/15/2027j | | | 78,862 | |
| | | | PBF Holding Company, LLC | | | | |
| | 140,000 | | | 7.250%, 6/15/2025 | | | 144,200 | |
| | | | Petrobras Global Finance BV | | | | |
| | 20,000 | | | 8.375%, 5/23/2021 | | | 21,817 | |
| | | | Petroleos Mexicanos | | | | |
| | 36,000 | | | 6.375%, 2/4/2021 | | | 36,834 | |
| | | | Plains All American Pipeline, LP | | | | |
| | 83,000 | | | 5.000%, 2/1/2021 | | | 84,704 | |
| | 200,000 | | | 6.125%, 11/15/2022b,m | | | 188,000 | |
| | | | Regency Energy Partners, LP | | | | |
| | 260,000 | | | 5.000%, 10/1/2022 | | | 267,899 | |
| | | | Sabine Pass Liquefaction, LLC | | | | |
| | 38,000 | | | 6.250%, 3/15/2022 | | | 40,489 | |
| | 38,000 | | | 5.625%, 4/15/2023 | | | 40,008 | |
| | 310,000 | | | 5.625%, 3/1/2025 | | | 323,660 | |
| | | | Schlumberger Holdings Corporation | | | | |
| | 60,000 | | | 3.000%, 12/21/2020j | | | 59,355 | |
| | | | Southwestern Energy Company | | | | |
| | 185,000 | | | 7.500%, 4/1/2026 | | | 188,238 | |
| | | | Sunoco Logistics Partners Operations, LP | | | | |
| | 60,000 | | | 4.400%, 4/1/2021 | | | 60,696 | |
| | | | Sunoco, LP | | | | |
| | 100,000 | | | 5.875%, 3/15/2028j | | | 93,250 | |
| | | | Tallgrass Energy Partners, LP | | | | |
| | 275,000 | | | 5.500%, 1/15/2028j | | | 271,854 | |
| | | | TransCanada Trust | | | | |
| | 225,000 | | | 5.875%, 8/15/2076b | | | 221,490 | |
| | | | Transocean Guardian, Ltd. | | | | |
| | 200,000 | | | 5.875%, 1/15/2024j | | | 198,000 | |
| | | | W&T Offshore, Inc. | | | | |
| | 200,000 | | | 9.750%, 11/1/2023j | | | 193,540 | |
| | | | Weatherford International, Ltd. | | | | |
| | 52,000 | | | 4.500%, 4/15/2022 | | | 39,000 | |
| | | | Western Gas Partners, LP | | | | |
| | 38,000 | | | 4.000%, 7/1/2022 | | | 37,678 | |
The accompanying Notes to Financial Statements are an integral part of this schedule.
23
BALANCED INCOME PLUS FUND
Schedule of Investments as of October 31, 2018
| | | | | | | | |
Principal
Amount | | | Long-Term Fixed Income (24.4%) | | Value | |
| | Energy (1.7%) - continued | | | | |
| | | | Whiting Petroleum Corporation, Convertible | | | | |
| | $171,000 | | | 1.250%, 4/1/2020 | | | $163,961 | |
| | | | Williams Partners, LP | | | | |
| | 77,000 | | | 4.000%, 11/15/2021 | | | 77,379 | |
| | | | WPX Energy, Inc. | | | | |
| | 135,000 | | | 5.750%, 6/1/2026 | | | 134,325 | |
| | | | | |
| | | | Total | | | 6,365,153 | |
| | | | | |
| |
| | Financials (3.4%) | | | | |
| | | | ACE INA Holdings, Inc. | | | | |
| | 60,000 | | | 2.875%, 11/3/2022 | | | 58,597 | |
| | | | AIG Global Funding | | | | |
| | 74,000 | | | 2.150%, 7/2/2020j | | | 72,444 | |
| | | | Air Lease Corporation | | | | |
| | 73,000 | | | 2.500%, 3/1/2021 | | | 71,168 | |
| | | | Aircastle, Ltd. | | | | |
| | 46,000 | | | 5.000%, 4/1/2023 | | | 46,643 | |
| | | | American Express Company | | | | |
| | 36,000 | | | 3.375%, 5/17/2021 | | | 35,922 | |
| | | | American Express Credit Corporation | | | | |
| | 38,000 | | | 2.678%, (LIBOR 3M + 0.330%), 5/3/2019b | | | 38,031 | |
| | 38,000 | | | 2.200%, 3/3/2020 | | | 37,497 | |
| | 60,000 | | | 3.382%, (LIBOR 3M + 1.050%), 9/14/2020b | | | 60,866 | |
| | | | Ares Capital Corporation | | | | |
| | 76,000 | | | 3.875%, 1/15/2020 | | | 76,244 | |
| | | | Athene Global Funding | | | | |
| | 53,000 | | | 4.000%, 1/25/2022j | | | 53,185 | |
| | | | Australia and New Zealand Banking Group, Ltd. | | | | |
| | 90,000 | | | 6.750%, 6/15/2026b,j,m | | | 92,362 | |
| | | | Bank of America Corporation | | | | |
| | 37,000 | | | 2.369%, 7/21/2021b | | | 36,291 | |
| | 76,000 | | | 2.328%, 10/1/2021b | | | 74,193 | |
| | 74,000 | | | 2.738%, 1/23/2022b | | | 72,524 | |
| | 74,000 | | | 3.499%, 5/17/2022b | | | 73,677 | |
| | 71,000 | | | 3.550%, 3/5/2024b | | | 69,680 | |
| | 33,000 | | | 3.864%, 7/23/2024b | | | 32,763 | |
| | | | Bank of Montreal | | | | |
| | 50,000 | | | 1.500%, 7/18/2019 | | | 49,493 | |
| | 58,000 | | | 2.100%, 6/15/2020 | | | 56,979 | |
| | | | Bank of New York Mellon Corporation | | | | |
| | 76,000 | | | 2.600%, 2/7/2022 | | | 73,953 | |
| | | | Bank of Nova Scotia | | | | |
| | 37,000 | | | 2.909%, (LIBOR 3M + 0.440%), 4/20/2021b | | | 37,090 | |
| | 57,000 | | | 2.700%, 3/7/2022 | | | 55,479 | |
| | | | Barclays plc | | | | |
| | 56,000 | | | 4.338%, 5/16/2024b | | | 55,018 | |
| | | | BB&T Corporation | | | | |
| | 74,000 | | | 2.150%, 2/1/2021 | | | 72,089 | |
| | | | BNP Paribas SA | | | | |
| | 270,000 | | | 7.625%, 3/30/2021b,j,m | | | 280,462 | |
| | | | Capital One Financial Corporation | | | | |
| | 37,000 | | | 2.500%, 5/12/2020 | | | 36,473 | |
| | 111,000 | | | 3.050%, 3/9/2022 | | | 108,293 | |
| | | | Cboe Global Markets, Inc. | | | | |
| | 57,000 | | | 1.950%, 6/28/2019 | | | 56,594 | |
| | | | Central Fidelity Capital Trust I | | | | |
| | 125,000 | | | 3.436%, (LIBOR 3M + 1.000%), 4/15/2027b | | | 116,875 | |
| | | | CIT Group, Inc. | | | | |
| | 190,000 | | | 4.750%, 2/16/2024 | | | 187,150 | |
| | | | Citigroup, Inc. | | | | |
| | 76,000 | | | 2.450%, 1/10/2020 | | | 75,308 | |
| | 76,000 | | | 2.650%, 10/26/2020 | | | 74,839 | |
| | 114,000 | | | 2.350%, 8/2/2021 | | | 110,120 | |
| | 38,000 | | | 2.750%, 4/25/2022 | | | 36,710 | |
| | 37,000 | | | 3.199%, (LIBOR 3M + 0.690%), 10/27/2022b | | | 36,985 | |
| | 73,000 | | | 3.142%, 1/24/2023b | | | 71,269 | |
| | 260,000 | | | 5.950%, 1/30/2023b,m | | | 260,325 | |
| | | | CNA Financial Corporation | | | | |
| | 65,000 | | | 5.750%, 8/15/2021 | | | 68,482 | |
| | | | Commonwealth Bank of Australia | | | | |
| | 76,000 | | | 2.250%, 3/10/2020j | | | 74,952 | |
| | | | Cooperatieve Centrale Raiffeisen-Boerenleenbank BA | | | | |
| | 74,000 | | | 3.950%, 11/9/2022 | | | 73,311 | |
| | | | Credit Agricole SA | | | | |
| | 38,000 | | | 3.375%, 1/10/2022j | | | 37,201 | |
| | 80,000 | | | 8.125%, 12/23/2025b,j,m | | | 85,805 | |
| | | | Credit Suisse Group AG | | | | |
| | 51,000 | | | 7.500%, 7/17/2023b,j,m | | | 51,892 | |
| | 227,000 | | | 7.500%, 12/11/2023b,j,m | | | 236,343 | |
| | | | Credit Suisse Group Funding Guernsey, Ltd. | | | | |
| | 114,000 | | | 3.800%, 9/15/2022 | | | 112,751 | |
| | | | Credit Suisse Group Funding, Ltd. | | | | |
| | 76,000 | | | 3.125%, 12/10/2020 | | | 75,133 | |
| | | | Deutsche Bank AG | | | | |
| | 37,000 | | | 2.700%, 7/13/2020 | | | 36,152 | |
| | 114,000 | | | 4.250%, 10/14/2021 | | | 113,091 | |
| | | | Digital Realty Trust, LP | | | | |
| | 55,000 | | | 2.750%, 2/1/2023 | | | 52,541 | |
| | | | Discover Bank | | | | |
| | 24,000 | | | 8.700%, 11/18/2019 | | | 25,198 | |
| | 72,000 | | | 3.100%, 6/4/2020 | | | 71,458 | |
| | | | Energizer Gamma Acquisition, Inc. | | | | |
| | 210,000 | | | 6.375%, 7/15/2026j | | | 210,000 | |
| | | | Fidelity National Financial, Inc. | | | | |
| | 52,000 | | | 5.500%, 9/1/2022 | | | 54,789 | |
| | | | Fifth Third Bancorp | | | | |
| | 57,000 | | | 2.600%, 6/15/2022 | | | 54,794 | |
| | | | Goldman Sachs Group, Inc. | | | | |
| | 74,000 | | | 5.375%, 5/10/2020b,m | | | 74,832 | |
| | 57,000 | | | 2.600%, 12/27/2020 | | | 55,899 | |
| | 76,000 | | | 5.250%, 7/27/2021 | | | 79,033 | |
| | 55,000 | | | 3.484%, (LIBOR 3M + 1.170%), 11/15/2021b | | | 55,670 | |
| | 76,000 | | | 3.000%, 4/26/2022 | | | 73,984 | |
| | 51,000 | | | 2.876%, 10/31/2022b | | | 49,605 | |
| | 37,000 | | | 3.366%, (LIBOR 3M + 1.050%), 6/5/2023b | | | 37,246 | |
| | | | GS Finance Corporation, Convertible | | | | |
| | 794,000 | | | 0.500%, 6/23/2025e | | | 790,800 | |
| | | | Hartford Financial Services Group, Inc. | | | | |
| | 50,000 | | | 4.439%, (LIBOR 3M + 2.125%), 2/12/2047b,j | | | 46,000 | |
The accompanying Notes to Financial Statements are an integral part of this schedule.
24
BALANCED INCOME PLUS FUND
Schedule of Investments as of October 31, 2018
| | | | | | | | |
Principal
Amount | | | Long-Term Fixed Income (24.4%) | | Value | |
| | Financials (3.4%) - continued | | | | |
| | | | HCP, Inc. | | | | |
| | $68,000 | | | 3.750%, 2/1/2019 | | | $68,005 | |
| | | | Hospitality Properties Trust | | | | |
| | 55,000 | | | 4.250%, 2/15/2021 | | | 55,188 | |
| | | | HSBC Holdings plc | | | | |
| | 114,000 | | | 3.400%, 3/8/2021 | | | 113,442 | |
| | 76,000 | | | 6.875%, 6/1/2021b,m | | | 78,755 | |
| | 100,000 | | | 6.375%, 9/17/2024b,m | | | 96,900 | |
| | | | Huntington Bancshares, Inc. | | | | |
| | 70,000 | | | 3.150%, 3/14/2021 | | | 69,207 | |
| | | | Icahn Enterprises, LP | | | | |
| | 75,000 | | | 6.750%, 2/1/2024 | | | 75,562 | |
| | 90,000 | | | 6.375%, 12/15/2025 | | | 89,437 | |
| | | | ILFC E-Capital Trust II 5.030%, (H15T30Y + 1.800%), | | | | |
| | 415,000 | | | 12/21/2065b,j | | | 369,350 | |
| | | | International Lease Finance Corporation | | | | |
| | 76,000 | | | 4.625%, 4/15/2021 | | | 77,042 | |
| | 76,000 | | | 5.875%, 8/15/2022 | | | 80,043 | |
| | | | Iron Mountain, Inc. | | | | |
| | 127,750 | | | 6.000%, 8/15/2023 | | | 130,784 | |
| | 55,000 | | | J.P. Morgan Chase & Company 3.001%, (LIBOR 3M + 0.680%), 6/1/2021b | | | 55,083 | |
| | 90,000 | | | 4.625%, 11/1/2022b,m | | | 83,304 | |
| | 145,000 | | | 2.972%, 1/15/2023 | | | 140,308 | |
| | 57,000 | | | 2.776%, 4/25/2023b | | | 55,162 | |
| | 78,000 | | | 3.717%, (LIBOR 3M + 1.230%), 10/24/2023b | | | 79,373 | |
| | | | KeyCorp | | | | |
| | 58,000 | | | 2.300%, 12/13/2018 | | | 57,976 | |
| | | | Liberty Mutual Group, Inc. | | | | |
| | 27,000 | | | 5.000%, 6/1/2021j | | | 27,688 | |
| | | | Lincoln National Corporation | | | | |
| | 50,000 | | | 6.250%, 2/15/2020 | | | 51,729 | |
| | 40,000 | | | 4.669%, (LIBOR 3M + 2.358%), 5/17/2066b | | | 36,600 | |
| | | | Lloyds Banking Group plc | | | | |
| | 70,000 | | | 6.657%, 5/21/2037b,j,m | | | 70,918 | |
| | | | Macquarie Bank, Ltd. | | | | |
| | 200,000 | | | 6.125%, 3/8/2027b,j,m | | | 179,500 | |
| | | | MGIC Investment Corporation, Convertible | | | | |
| | 150,000 | | | 9.000%, 4/1/2063j | | | 200,464 | |
| | | | Mitsubishi UFJ Financial Group, Inc. | | | | |
| | 38,000 | | | 2.998%, 2/22/2022 | | | 37,246 | |
| | 73,000 | | | 3.455%, 3/2/2023 | | | 71,980 | |
| | | | Morgan Stanley | | | | |
| | 76,000 | | | 2.800%, 6/16/2020 | | | 75,318 | |
| | 74,000 | | | 5.500%, 7/28/2021 | | | 77,514 | |
| | 77,000 | | | 3.649%, (LIBOR 3M + 1.180%), 1/20/2022b | | | 77,867 | |
| | 37,000 | | | 2.750%, 5/19/2022 | | | 35,769 | |
| | 40,000 | | | 4.875%, 11/1/2022 | | | 41,159 | |
| | 74,000 | | | 3.125%, 1/23/2023 | | | 71,615 | |
| | | | MPT Operating Partnership, LP | | | | |
| | 200,000 | | | 5.500%, 5/1/2024 | | | 202,000 | |
| | | | National City Corporation | | | | |
| | 48,000 | | | 6.875%, 5/15/2019 | | | 48,992 | |
| | | | Nomura Holdings, Inc. | | | | |
| | 48,000 | | | 2.750%, 3/19/2019 | | | 47,980 | |
| | | | Park Aerospace Holdings, Ltd. | | | | |
| | 190,000 | | | 5.500%, 2/15/2024j | | | 188,148 | |
| | | | PNC Bank NA | | | | |
| | 74,000 | | | 2.450%, 11/5/2020 | | | 72,691 | |
| | | | Quicken Loans, Inc. | | | | |
| | 295,000 | | | 5.750%, 5/1/2025j | | | 284,306 | |
| | | | Realty Income Corporation | | | | |
| | 57,000 | | | 5.750%, 1/15/2021 | | | 59,420 | |
| | | | Regions Financial Corporation | | | | |
| | 50,000 | | | 3.200%, 2/8/2021 | | | 49,568 | |
| | 37,000 | | | 3.800%, 8/14/2023 | | | 36,624 | |
| | | | Reinsurance Group of America, Inc. | | | | |
| | 56,000 | | | 4.700%, 9/15/2023 | | | 57,532 | |
| | | | Royal Bank of Canada | | | | |
| | 76,000 | | | 2.125%, 3/2/2020 | | | 74,992 | |
| | | | Royal Bank of Scotland Group plc | | | | |
| | 210,000 | | | 7.500%, 8/10/2020b,m | | | 213,465 | |
| | 55,000 | | | 8.625%, 8/15/2021b,m | | | 57,819 | |
| | 195,000 | | | 5.125%, 5/28/2024 | | | 193,050 | |
| | 265,000 | | | 7.648%, 9/30/2031b,m | | | 330,588 | |
| | | | Santander UK Group Holdings plc | | | | |
| | 76,000 | | | 2.875%, 8/5/2021 | | | 73,628 | |
| | | | Simon Property Group, LP | | | | |
| | 60,000 | | | 2.500%, 9/1/2020 | | | 59,161 | |
| | 80,000 | | | 2.500%, 7/15/2021 | | | 78,049 | |
| | | | SITE Centers Corporation | | | | |
| | 53,000 | | | 4.625%, 7/15/2022 | | | 53,922 | |
| | | | Societe Generale SA | | | | |
| | 250,000 | | | 8.000%, 9/29/2025b,j,m | | | 253,750 | |
| | | | Standard Chartered plc | | | | |
| | 11,000 | | | 2.100%, 8/19/2019j | | | 10,908 | |
| | | | State Street Capital Trust IV | | | | |
| | 440,000 | | | 3.334%, (LIBOR 3M + 1.000%), 6/15/2047b | | | 386,390 | |
| | | | State Street Corporation | | | | |
| | 60,000 | | | 3.222%, (LIBOR 3M + 0.900%), 8/18/2020b | | | 60,746 | |
| | | | Sumitomo Mitsui Financial Group, Inc. | | | | |
| | 74,000 | | | 2.934%, 3/9/2021 | | | 73,007 | |
| | 37,000 | | | 2.784%, 7/12/2022 | | | 35,765 | |
| | | | SunTrust Banks, Inc. | | | | |
| | 50,000 | | | 2.900%, 3/3/2021 | | | 49,265 | |
| | | | Synchrony Financial | | | | |
| | 37,000 | | | 3.000%, 8/15/2019 | | | 36,849 | |
| | 25,000 | | | 3.578%, (LIBOR 3M + 1.230%), 2/3/2020b | | | 25,152 | |
| | | | Toronto-Dominion Bank | | | | |
| | 60,000 | | | 3.262%, (LIBOR 3M + 0.930%), 12/14/2020b | | | 60,859 | |
| | 45,000 | | | 2.550%, 1/25/2021 | | | 44,273 | |
| | | | UBS Group Funding Jersey, Ltd. | | | | |
| | 74,000 | | | 3.000%, 4/15/2021j | | | 72,831 | |
| | | | UnitedHealth Group, Inc. | | | | |
| | 60,000 | | | 3.350%, 7/15/2022 | | | 59,572 | |
| | | | USB Realty Corporation | | | | |
| | | | 3.583%, (LIBOR 3M + 1.147%), | | | | |
| | 211,000 | | | 1/15/2022b,j,m | | | 189,373 | |
| | | | Vantiv, LLC | | | | |
| | 200,000 | | | 4.375%, 11/15/2025j | | | 188,750 | |
The accompanying Notes to Financial Statements are an integral part of this schedule.
25
BALANCED INCOME PLUS FUND
Schedule of Investments as of October 31, 2018
| | | | | | | | |
Principal
Amount | | | Long-Term Fixed Income (24.4%) | | Value | |
| | Financials (3.4%) - continued | | | | |
| | | | Ventas Realty, LP | | | | |
| | $37,000 | | | 3.100%, 1/15/2023 | | | $35,844 | |
| | | | Wachovia Capital Trust II | | | | |
| | 40,000 | | | 2.936%, (LIBOR 3M + 0.500%), 1/15/2027b | | | 36,400 | |
| | | | Wells Fargo & Company | | | | |
| | 45,000 | | | 2.100%, 7/26/2021 | | | 43,202 | |
| | 37,000 | | | 2.625%, 7/22/2022 | | | 35,531 | |
| | 77,000 | | | 3.597%, (LIBOR 3M + 1.110%), 1/24/2023b | | | 77,876 | |
| | 50,000 | | | 3.757%, (LIBOR 3M + 1.230%), 10/31/2023b | | | 50,703 | |
| | | | Welltower, Inc. | | | | |
| | 57,000 | | | 4.950%, 1/15/2021 | | | 58,296 | |
| | | | Westpac Banking Corporation | | | | |
| | 65,000 | | | 3.172%, (LIBOR 3M + 0.850%), 8/19/2021b | | | 65,866 | |
| | | | | |
| | | | Total | | | 12,513,984 | |
| | | | | |
| |
| | Mortgage-Backed Securities (6.3%) | | | | |
| | | | Antler Mortgage Trust | | | | |
| | 736,199 | | | 4.335%, 7/25/2022, Ser. 2018-RTL1, Class A1*,e | | | 735,315 | |
| | | | Banc of America Funding | | | | |
| | 455,752 | | | 2.440%, (LIBOR 1M + 0.160%), 2/20/2047, Ser. 2007-A, Class 2A1b | | | 435,516 | |
| | | | Deutsche Alt-A Securities, Inc., Mortgage Loan Trust | | | | |
| | 281,400 | | | 5.250%, 6/25/2035, Ser. 2005-3, Class 4A6 | | | 284,553 | |
| | | | Federal Home Loan Mortgage Corporation | | | | |
| | 1,221,963 | | | 3.500%, 8/15/2035, Ser. 345, Class C8n | | | 193,449 | |
| | | | Federal Home Loan Mortgage Corporation Gold 30-Yr. Pass Through | | | | |
| | 3,025,000 | | | 4.000%, 11/1/2048d | | | 3,026,049 | |
| | | | Federal National Mortgage Association Conventional 30-Yr. Pass Through | | | | |
| | 4,050,000 | | | 3.500%, 11/1/2048d | | | 3,942,580 | |
| | 3,850,000 | | | 4.000%, 11/1/2048d | | | 3,849,984 | |
| | 7,550,000 | | | 4.500%, 11/1/2048d | | | 7,730,050 | |
| | 1,775,000 | | | 5.000%, 11/1/2048d | | | 1,852,240 | |
| | 654,708 | | | Merrill Lynch Alternative Note Asset Trust 2.431%, (LIBOR 1M + 0.150%), 1/25/2037, Ser. 2007-A1, Class A2Bb | | | 290,871 | |
| | | | Radnor RE, Ltd. | | | | |
| | 475,000 | | | 4.981%, (LIBOR 1M + 2.700%), 3/25/2028, Ser. 2018-1, Class M2*,b | | | 481,485 | |
| | | | | |
| | | | Total | | | 22,822,092 | |
| | | | | |
|
| Technology (1.0%) | |
| | | | Alliance Data Systems Corporation | | | | |
| | 165,000 | | | 5.375%, 8/1/2022j | | | 165,619 | |
| | | | Apple, Inc. | | | | |
| | 76,000 | | | 2.850%, 5/6/2021 | | | 75,321 | |
| | 74,000 | | | 2.688%, (LIBOR 3M + 0.350%), 5/11/2022b | | | 74,555 | |
| | 74,000 | | | 2.400%, 1/13/2023 | | | 70,845 | |
| | | | Baidu, Inc. | | | | |
| | 37,000 | | | 3.000%, 6/30/2020 | | | 36,665 | |
| | | | Broadcom Corporation | | | | |
| | 75,000 | | | 2.650%, 1/15/2023 | | | 70,351 | |
| | 75,000 | | | 3.625%, 1/15/2024 | | | 71,810 | |
| | | | Carbonite, Inc., Convertible | | | | |
| | 144,000 | | | 2.500%, 4/1/2022 | | | 209,145 | |
| | | | Citrix Systems, Inc., Convertible | | | | |
| | 173,000 | | | 0.500%, 4/15/2019 | | | 245,100 | |
| | | | Cypress Semiconductor Corporation, Convertible | | | | |
| | 44,000 | | | 4.500%, 1/15/2022 | | | 51,953 | |
| | | | Diamond 1 Finance Corporation | | | | |
| | 50,000 | | | 3.480%, 6/1/2019j | | | 50,062 | |
| | 76,000 | | | 5.450%, 6/15/2023j | | | 78,715 | |
| | | | Equinix, Inc. | | | | |
| | 200,000 | | | 5.750%, 1/1/2025 | | | 203,750 | |
| | | | Fidelity National Information Services, Inc. | | | | |
| | 34,000 | | | 3.625%, 10/15/2020 | | | 34,067 | |
| | 65,000 | | | 2.250%, 8/15/2021 | | | 62,526 | |
| | | | Harland Clarke Holdings Corporation | | | | |
| | 175,000 | | | 8.375%, 8/15/2022j | | | 157,938 | |
| | | | Hewlett Packard Enterprise Company | | | | |
| | 95,000 | | | 3.600%, 10/15/2020 | | | 95,149 | |
| | | | Intel Corporation | | | | |
| | 60,000 | | | 3.100%, 7/29/2022 | | | 59,308 | |
| | | | Intel Corporation, Convertible | | | | |
| | 191,000 | | | 3.250%, 8/1/2039 | | | 433,320 | |
| | | | Marvell Technology Group, Ltd. | | | | |
| | 37,000 | | | 4.200%, 6/22/2023 | | | 36,580 | |
| | | | Microchip Technology, Inc., Convertible | | | | |
| | 105,000 | | | 1.625%, 2/15/2027 | | | 99,387 | |
| | | | Micron Technology, Inc., Convertible | | | | |
| | 180,000 | | | 3.000%, 11/15/2043 | | | 234,539 | |
| | | | Microsoft Corporation | | | | |
| | 76,000 | | | 2.400%, 2/6/2022 | | | 74,015 | |
| | | | NetApp, Inc. | | | | |
| | 55,000 | | | 2.000%, 9/27/2019 | | | 54,452 | |
| | | | NXP BV | | | | |
| | 215,000 | | | 3.875%, 9/1/2022j | | | 207,475 | |
| | | | ON Semiconductor Corporation, Convertible | | | | |
| | 87,000 | | | 1.625%, 10/15/2023 | | | 94,646 | |
| | | | Oracle Corporation | | | | |
| | 60,000 | | | 2.500%, 5/15/2022 | | | 58,079 | |
| | | | Red Hat, Inc., Convertible | | | | |
| | 37,000 | | | 0.250%, 10/1/2019 | | | 86,038 | |
| | | | Seagate HDD Cayman | | | | |
| | 95,000 | | | 4.750%, 1/1/2025 | | | 86,940 | |
| | | | Splunk, Inc., Convertible | | | | |
| | 195,000 | | | 0.500%, 9/15/2023j | | | 186,627 | |
| | | | Verint Systems, Inc., Convertible | | | | |
| | 54,000 | | | 1.500%, 6/1/2021 | | | 53,580 | |
| | | | Vishay Intertechnology, Inc., Convertible | | | | |
| | 247,000 | | | 2.250%, 6/15/2025j | | | 221,757 | |
The accompanying Notes to Financial Statements are an integral part of this schedule.
26
BALANCED INCOME PLUS FUND
Schedule of Investments as of October 31, 2018
| | | | | | | | |
Principal Amount | | | Long-Term Fixed Income (24.4%) | | Value | |
| | Technology (1.0%) - continued | | | | |
| | | | VMware, Inc. | | | | |
| | $37,000 | | | 2.300%, 8/21/2020 | | | $36,119 | |
| | | | | |
| | | | Total | | | 3,776,433 | |
| | | | | |
| |
| | Transportation (0.2%) | | | | |
| | | | Air Canada Pass Through Trust | | | | |
| | 15,558 | | | 3.875%, 3/15/2023j | | | 15,227 | |
| | | | American Airlines Pass Through Trust | | | | |
| | 31,987 | | | 4.950%, 1/15/2023 | | | 32,680 | |
| | | | Avis Budget Car Rental, LLC | | | | |
| | 90,000 | | | 5.125%, 6/1/2022j | | | 92,307 | |
| | | | Delta Air Lines, Inc. | | | | |
| | 57,000 | | | 2.875%, 3/13/2020 | | | 56,471 | |
| | 31,339 | | | 4.950%, 11/23/2020 | | | 31,463 | |
| | | | J.B. Hunt Transport Services, Inc. | | | | |
| | 60,000 | | | 3.300%, 8/15/2022 | | | 59,286 | |
| | | | Ryder System, Inc. | | | | |
| | 68,000 | | | 3.500%, 6/1/2021 | | | 67,704 | |
| | | | Union Pacific Corporation | | | | |
| | 55,000 | | | 3.750%, 7/15/2025 | | | 54,580 | |
| | | | United Airlines Pass Through Trust | | | | |
| | 60,000 | | | 3.700%, 12/1/2022 | | | 59,244 | |
| | | | United Continental Holdings, Inc. | | | | |
| | 185,000 | | | 4.250%, 10/1/2022 | | | 181,531 | |
| | | | XPO Logistics, Inc. | | | | |
| | 150,000 | | | 6.500%, 6/15/2022j | | | 153,750 | |
| | | | | |
| | | | Total | | | 804,243 | |
| | | | | |
| |
| | Utilities (0.5%) | | | | |
| | | | Alabama Power Company | | | | |
| | 38,000 | | | 2.450%, 3/30/2022 | | | 36,679 | |
| | | | Ameren Corporation | | | | |
| | 60,000 | | | 2.700%, 11/15/2020 | | | 59,114 | |
| | | | Berkshire Hathaway Energy Company | | | | |
| | 88,000 | | | 2.400%, 2/1/2020 | | | 87,131 | |
| | | | Calpine Corporation | | | | |
| | 95,000 | | | 5.375%, 1/15/2023 | | | 90,012 | |
| | | | CenterPoint Energy, Inc. | | | | |
| | 37,000 | | | 2.500%, 9/1/2022 | | | 35,327 | |
| | | | Consolidated Edison, Inc. | | | | |
| | 38,000 | | | 2.000%, 3/15/2020 | | | 37,381 | |
| | | | Dominion Energy, Inc. | | | | |
| | 74,000 | | | 2.579%, 7/1/2020 | | | 72,868 | |
| | | | DTE Energy Company | | | | |
| | 88,000 | | | 2.400%, 12/1/2019 | | | 87,092 | |
| | | | Duke Energy Corporation | | | | |
| | 74,000 | | | 2.400%, 8/15/2022 | | | 70,818 | |
| | | | Dynegy, Inc. | | | | |
| | 160,000 | | | 7.375%, 11/1/2022 | | | 166,000 | |
| | | | Edison International | | | | |
| | 38,000 | | | 2.125%, 4/15/2020 | | | 37,270 | |
| | | | Emera U.S. Finance, LP | | | | |
| | 25,000 | | | 2.150%, 6/15/2019 | | | 24,822 | |
| | | | Eversource Energy | | | | |
| | 37,000 | | | 2.500%, 3/15/2021 | | | 36,303 | |
| | | | Exelon Generation Company, LLC | | | | |
| | 44,000 | | | 5.200%, 10/1/2019 | | | 44,782 | |
| | 57,000 | | | 2.950%, 1/15/2020 | | | 56,638 | |
| | | | FirstEnergy Corporation | | | | |
| | 56,000 | | | 2.850%, 7/15/2022 | | | 53,974 | |
| | | | Fortis, Inc. | | | | |
| | 30,000 | | | 2.100%, 10/4/2021 | | | 28,632 | |
| | | | NextEra Energy Capital Holdings, Inc. | | | | |
| | 50,000 | | | 2.300%, 4/1/2019 | | | 49,891 | |
| | | | NiSource, Inc. | | | | |
| | 50,000 | | | 3.650%, 6/15/2023j | | | 49,211 | |
| | 230,000 | | | 5.650%, 6/15/2023b,i,j,m | | | 225,446 | |
| | | | Pinnacle West Capital Corporation | | | | |
| | 37,000 | | | 2.250%, 11/30/2020 | | | 36,160 | |
| | | | PPL Capital Funding, Inc. | | | | |
| | 50,000 | | | 3.500%, 12/1/2022 | | | 49,364 | |
| | | | PSEG Power, LLC | | | | |
| | 50,000 | | | 3.000%, 6/15/2021 | | | 49,178 | |
| | | | Sempra Energy | | | | |
| | 25,000 | | | 2.400%, 3/15/2020 | | | 24,674 | |
| | | | Southern California Edison Company | | | | |
| | 20,000 | | | 2.400%, 2/1/2022 | | | 19,222 | |
| | | | Southern Company | | | | |
| | 45,000 | | | 1.850%, 7/1/2019 | | | 44,613 | |
| | 37,000 | | | 2.350%, 7/1/2021 | | | 35,793 | |
| | | | TerraForm Power Operating, LLC | | | | |
| | 195,000 | | | 5.000%, 1/31/2028j | | | 174,281 | |
| | | | | |
| | | | Total | | | 1,782,676 | |
| | | | | |
| | | | | | | | |
| | | | | |
| | | | Total Long-Term Fixed Income (cost $89,894,468) | | | 89,331,781 | |
| | | | | |
| | |
| Shares | | | Registered Investment Companies (7.3%) | | Value | |
| | Affiliated Fixed Income Holdings (6.4%) | | | | |
| | 2,592,289 | | | Thrivent Core Emerging Markets Debt Fund | | | 23,434,295 | |
| | | | | |
| | | | Total | | | 23,434,295 | |
| | | | | |
| |
| | Equity Funds/Exchange Traded Funds (0.3%) | | | | |
| | 12,700 | | | AllianzGI NFJ Dividend Interest & Premium Strategy Fund | | | 152,400 | |
| | 15,525 | | | BlackRock Resources & Commodities Strategy Trust | | | 123,114 | |
| | 2,103 | | | iShares Russell 1000 Growth Index Fund | | | 298,794 | |
| | 705 | | | iShares Russell 2000 Value Index Fund | | | 85,411 | |
| | 2,778 | | | SPDR S&P Retail ETF | | | 130,955 | |
| | 2,013 | | | Vanguard REIT ETF | | | 157,658 | |
| | | | | |
| | | | Total | | | 948,332 | |
| | | | | |
| |
| | Fixed Income Funds/Exchange Traded Funds (0.6%) | | | | |
| | 70,773 | | | Aberdeen Asia-Pacific Income Fund, Inc. | | | 278,138 | |
| | 35,000 | | | Invesco Senior Loan ETF | | | 805,350 | |
| | 50,149 | | | MFS Intermediate Income Trust | | | 185,050 | |
| | 46,783 | | | Templeton Global Income Fund | | | 284,908 | |
| | 3,000 | | | Vanguard Short-Term Corporate Bond ETF | | | 233,790 | |
| | 28,049 | | | Western Asset Emerging Markets Debt Fund, Inc. | | | 349,771 | |
The accompanying Notes to Financial Statements are an integral part of this schedule.
27
BALANCED INCOME PLUS FUND
Schedule of Investments as of October 31, 2018
| | | | | | | | |
| Shares | | | Registered Investment Companies (7.3%) | | Value | |
| | Fixed Income Funds/Exchange Traded Funds (0.6%)- continued | | | | |
| | 42,705 | | | Western Asset High Income | | | | |
| | | | Opportunity Fund, Inc. | | | $193,881 | |
| | | | | |
| | | | Total | | | 2,330,888 | |
| | | | | |
| | | | | | | | |
| | | | | |
| | | | Total Registered Investment Companies (cost $28,925,062) | | | 26,713,515 | |
| | | | | |
| | |
| Shares | | | Preferred Stock (0.8%) | | Value | |
| | Consumer Staples (0.1%) | | | | |
| | 10,600 | | | CHS, Inc., 7.100%b,m | | | 272,844 | |
| | | | | |
| | | | Total | | | 272,844 | |
| | | | | |
| |
| | Energy (0.2%) | | | | |
| | 40,412 | | | Crestwood Equity Partners, LP, 9.250%m | | | 387,955 | |
| | 11,700 | | | NuStar Logistics, LP, 9.170%b | | | 294,606 | |
| | | | | |
| | | | Total | | | 682,561 | |
| | | | | |
| |
| | Financials (0.5%) | | | | |
| | 2,826 | | | Agribank FCB, 6.875%b,m | | | 303,089 | |
| | 2,200 | | | CoBank ACB, 6.250%b,m | | | 226,600 | |
| | 5,944 | | | Federal National Mortgage Association, 0.000%h,m | | | 35,545 | |
| | 330 | | | First Tennessee Bank NA, 3.750%b,j,m | | | 254,100 | |
| | 7,100 | | | GMAC Capital Trust I, 8.099%b | | | 186,446 | |
| | 6,425 | | | Hartford Financial Services Group, Inc., 7.875%b | | | 176,623 | |
| | 4,600 | | | Morgan Stanley, 7.125%b,m | | | 125,442 | |
| | 325 | | | Wells Fargo & Company, Convertible, 7.500%m | | | 413,397 | |
| | | | | |
| | | | Total | | | 1,721,242 | |
| | | | | |
| |
| | Real Estate (<0.1%) | | | | |
| | 7,650 | | | Colony Capital, Inc., 8.75%m | | | 197,523 | |
| | | | | |
| | | | Total | | | 197,523 | |
| | | | | |
| | | | Total Preferred Stock (cost $2,819,864) | | | 2,874,170 | |
| | | | | |
| | |
| Shares | | | Collateral Held for Securities Loaned (0.6%) | | Value | |
| | 2,305,594 | | | Thrivent Cash Management Trust | | | 2,305,594 | |
| | | | | |
| | | | Total Collateral Held for Securities Loaned (cost $2,305,594) | | | 2,305,594 | |
| | | | | |
| | |
Shares or
Principal
Amount | | | Short-Term Investments (11.8%) | | Value | |
| | | | Federal Home Loan Bank Discount Notes | | | | |
| | 400,000 | | | 2.090%, 11/14/2018o,p | | | $399,685 | |
| | 300,000 | | | 2.100%, 11/28/2018o,p | | | 299,509 | |
| | 200,000 | | | 2.110%, 11/30/2018o,p | | | 199,649 | |
| | 350,000 | | | 2.150%, 12/4/2018o,p | | | 349,285 | |
| | 300,000 | | | 2.170%, 12/12/2018o,p | | | 299,238 | |
| | | | Thrivent Core Short-Term Reserve Fund | | | | |
| | 4,188,960 | | | 2.430% | | | 41,889,597 | |
| | | | | |
| | | | Total Short-Term Investments (cost $43,437,052) | | | 43,436,963 | |
| | | | | |
| | | | Total Investments (cost $394,515,803) 107.6% | | | $394,524,346 | |
| | | | | |
| | | | Other Assets and Liabilities, Net (7.6%) | | | (27,989,068 | ) |
| | | | | |
| | | | Total Net Assets 100.0% | | | $366,535,278 | |
| | | | | |
a | The stated interest rate represents the weighted average of all contracts within the bank loan facility. |
b | Denotes variable rate securities. The rate shown is as of October 31, 2018. The rates of certain variable rate securities are based on a published reference rate and spread; these may vary by security and the reference rate and spread are indicated in their description. The rates of other variable rate securities are determined by the issuer or agent and are based on current market conditions. These securities do not indicate a reference rate and spread in their description. |
c | All or a portion of the loan is unfunded. |
d | Denotes investments purchased on a when-issued or delayed delivery basis. |
e | Security is valued using significant unobservable inputs. Further information on valuation can be found in the Notes to Financial Statements. |
f | Defaulted security. Interest is not being accrued. |
g | In bankruptcy. Interest is not being accrued. |
h | Non-income producing security. |
i | All or a portion of the security is on loan. |
j | Denotes securities sold under Rule 144A of the Securities Act of 1933, which exempts them from registration. These securities may be resold to other dealers in the program or to other qualified institutional buyers. As of October 31, 2018, the value of these investments was $17,012,796 or 4.6% of total net assets. |
k | All or a portion of the security is insured or guaranteed. |
l | Denotes step coupon securities. Step coupon securities pay an initial coupon rate for the first period and then different coupon rates for following periods. The rate shown is as of October 31, 2018. |
m | Denotes perpetual securities. Perpetual securities pay an indefinite stream of interest and have no contractual maturity date. Date shown, if applicable, is next call date. |
n | Denotes interest only security. Interest only securities represent the right to receive monthly interest payments on an underlying pool of mortgages or assets. The principal shown is the outstanding par amount of the pool as of the end of the period. The actual effective yield of the security is different than the stated coupon rate. |
o | The interest rate shown reflects the yield, coupon rate or the discount rate at the date of purchase. |
p | All or a portion of the security is held on deposit with the counterparty and pledged as the initial margin deposit for open futures contracts. |
* | Denotes restricted securities. Restricted securities are investment securities which cannot be offered for public sale without first being registered under the Securities Act of 1933. The value of all restricted securities held in Balanced Income Plus Fund as of October 31, 2018 was $10,903,723 or 3.0% of total net assets. The following table indicates the acquisition date and cost of restricted securities shown in the schedule as of October 31, 2018. |
The accompanying Notes to Financial Statements are an integral part of this schedule.
28
BALANCED INCOME PLUS FUND
Schedule of Investments as of October 31, 2018
| | | | | | | | |
Security | | Acquisition
Date | | | Cost | |
Antler Mortgage Trust, 7/25/2022 | | | 9/21/2018 | | | | $736,190 | |
Babson CLO, Ltd., 7/20/2029 | | | 5/18/2018 | | | | 425,000 | |
Cent CLO, LP, 10/25/2028 | | | 10/11/2018 | | | | 575,000 | |
CIM Trust, 12/25/2057 | | | 4/23/2018 | | | | 358,441 | |
College Ave Student Loans, LLC, 11/26/2046 | | | 7/11/2017 | | | | 244,590 | |
COLT Mortgage Loan Trust, 9/25/2046 | | | 9/9/2016 | | | | 58,284 | |
Digicel, Ltd., 4/15/2021 | | | 8/19/2013 | | | | 286,109 | |
Foundation Finance Trust, 7/15/2033 | | | 12/6/2017 | | | | 252,766 | |
Harley Marine Financing, LLC, 5/15/2043 | | | 5/9/2018 | | | | 419,683 | |
Madison Park Funding XIV, Ltd., 10/22/2030 | | | 10/12/2018 | | | | 425,000 | |
Oak Hill Advisors Residential Loan Trust, 6/25/2057 | | | 8/8/2017 | | | | 296,191 | |
Octagon Investment Partners XX, Ltd., 8/12/2026 | | | 4/21/2017 | | | | 300,000 | |
OHA Credit Funding 1, Ltd., 10/20/2030 | | | 8/24/2018 | | | | 350,000 | |
OZLM Funding II, Ltd., 7/30/2031 | | | 8/17/2018 | | | | 700,000 | |
OZLM IX, Ltd., 10/20/2031 | | | 10/29/2018 | | | | 400,000 | |
Park Avenue Institutional Advisers CLO, Ltd., 10/20/2031 | | | 10/5/2018 | | | | 700,000 | |
Preston Ridge Partners Mortgage Trust, LLC, 1/25/2022 | | | 1/24/2017 | | | | 83,231 | |
Preston Ridge Partners Mortgage Trust, LLC, 9/25/2022 | | | 9/27/2017 | | | | 156,833 | |
Radnor RE, Ltd., 3/25/2028 | | | 3/13/2018 | | | | 475,000 | |
RCO 2017-INV1 Trust, 11/25/2052 | | | 11/6/2017 | | | | 322,494 | |
Sound Point CLO X, Ltd., 1/20/2028 | | | 6/5/2018 | | | | 350,000 | |
Sound Point CLO XXI, Ltd., 10/26/2031 | | | 8/29/2018 | | | | 700,000 | |
Spirit Master Funding, LLC, 12/20/2047 | | | 1/23/2018 | | | | 599,125 | |
THL Credit Wind River CLO, Ltd., 10/22/2031 | | | 9/21/2018 | | | | 1,075,000 | |
Toorak Mortgage Corporation 2018-1, Ltd., 8/25/2021 | | | 8/3/2018 | | | | 450,000 | |
Wachovia Asset Securitization, Inc., 7/25/2037 | | | 3/16/2007 | | | | 233,540 | |
The following table presents the total amount of securities loaned with continuous maturity, by type, offset by the gross payable upon return of collateral for securities loaned by Thrivent Balanced Income Plus Fund as of October 31, 2018:
| | | | |
Securities Lending Transactions | | | | |
Common Stock | | | $1,581,195 | |
Taxable Debt Security | | | 632,431 | |
| | | | |
Total lending | | | $2,213,626 | |
Gross amount payable upon return of collateral for securities loaned | | | $2,305,594 | |
| | | | |
Net amounts due to counterparty | | | $ 91,968 | |
| | | | |
Definitions:
| | | | |
ADR | | - | | American Depositary Receipt, which are certificates for an underlying foreign security’s shares held by an issuing U.S. depository bank. |
CLO | | - | | Collateralized Loan Obligation |
ETF | | - | | Exchange Traded Fund |
REMIC | | - | | Real Estate Mortgage Investment Conduit |
REIT | | - | | Real Estate Investment Trust is a company that buys, develops, manages and/or sells real estate assets. |
Ser. | | - | | Series |
SPDR | | - | | S&P Depository Receipts, which are exchange-traded funds traded in the U.S., Europe, and Asia-Pacific and managed by State Street Global Advisors. |
Reference Rate Index:
| | | | |
12 MTA | | - | | 12 Month Treasury Average |
H15T30Y | | - | | U. S. Treasury Yield Curve Rate Treasury |
| | | | Note Constant Maturity 30 Year |
LIBOR 1W | | - | | ICE Libor USD Rate 1 Week |
LIBOR 1M | | - | | ICE Libor USD Rate 1 Month |
LIBOR 2M | | - | | ICE Libor USD Rate 2 Month |
LIBOR 3M | | - | | ICE Libor USD Rate 3 Month |
PRIME | | - | | Federal Reserve Prime Loan Rate |
The accompanying Notes to Financial Statements are an integral part of this schedule.
29
HIGH YIELD FUND
Schedule of Investments as of October 31, 2018
| | | | | | | | |
Principal Amount | | | Bank Loans (4.1%)a | | Value | |
| | Basic Materials (1.5%) | | | | |
| | | | Contura Energy, Inc., Term Loan | | | | |
| | $2,940,730 | | | 7.300%, (LIBOR 2M + 5.000%), 3/17/2024b | | | $2,926,026 | |
| | 6,205,000 | | | 0.000%, (LIBOR 3M + 5.000%), 10/3/2025b,c,d | | | 6,173,975 | |
| | | | Starfruit US Holdco, LLC, Term Loan | | | | |
| | 1,396,000 | | | 5.506%, (LIBOR 1M + 3.250%), 10/1/2025b | | | 1,390,765 | |
| | | | | |
| | | | Total | | | 10,490,766 | |
| | | | | |
| |
| | Communications Services (1.3%) | | | | |
| | | | Cengage Learning, Inc., Term Loan | | | | |
| | 3,689,135 | | | 6.530%, (LIBOR 1M + 4.250%), 6/7/2023b | | | 3,413,593 | |
| | | | Frontier Communications Corporation, Term Loan | | | | |
| | 3,678,437 | | | 6.060%, (LIBOR 1M + 3.750%), 6/15/2024b | | | 3,553,371 | |
| | | | Univision Communications, Inc., Term Loan | | | | |
| | 2,782,395 | | | 5.052%, (LIBOR 1M + 2.750%), 3/15/2024b | | | 2,667,176 | |
| | | | | |
| | | | Total | | | 9,634,140 | |
| | | | | |
| |
| | Consumer Non-Cyclical (0.7%) | | | | |
| | | | Northriver Midstream Finance LP, Term Loan | | | | |
| | 3,700,000 | | | 5.646%, (LIBOR 3M + 3.250%), 10/1/2025b,c,d | | | 3,715,429 | |
| | | | Revlon Consumer Products Corporation, Term Loan | | | | |
| | 2,019,933 | | | 5.813%, (LIBOR 3M + 3.500%), 9/7/2023b | | | 1,475,117 | |
| | | | | |
| | | | Total | | | 5,190,546 | |
| | | | | |
| |
| | Financials (0.3%) | | | | |
| | | | Forest City Enterprises, LP, Term Loan | | | | |
| | 2,330,000 | | | 0.000%, (LIBOR 3M + 4.000%), 10/26/2025b | | | 2,337,759 | |
| | | | | |
| | | | Total | | | 2,337,759 | |
| | | | | |
| |
| | Utilities (0.3%) | | | | |
| | | | Vertiv Group Corporation, Term Loan | | | | |
| | 2,030,819 | | | 6.313%, (LIBOR 3M + 4.000%), 11/15/2023b | | | 2,007,972 | |
| | | | | |
| | | | Total | | | 2,007,972 | |
| | | | | |
| | | | | | | | |
| | | | | |
| | | | Total Bank Loans (cost $30,004,291) | | | 29,661,183 | |
| | | | | |
| | |
Principal Amount | | | Long-Term Fixed Income (91.5%) | | Value | |
| | Asset-Backed Securities (0.1%) | | | | |
| | | | Renaissance Home Equity Loan Trust | | | | |
| | 1,356,751 | | | 5.746%, 5/25/2036, Ser. 2006-1, Class AF6e | | | 954,911 | |
| | | | | |
| | | | Total | | | 954,911 | |
| | | | | |
| |
| | Basic Materials (7.6%) | | | | |
| | | | Alcoa, Inc. | | | | |
| | 1,395,000 | | | 5.125%, 10/1/2024 | | | 1,368,844 | |
| | | | ArcelorMittal SA | | | | |
| | 498,000 | | | 6.125%, 6/1/2025f | | | 532,377 | |
| | | | Big River Steel, LLC | | | | |
| | 3,140,000 | | | 7.250%, 9/1/2025g | | | 3,297,000 | |
| | | | BWAY Holding Company | | | | |
| | 2,330,000 | | | 5.500%, 4/15/2024g | | | 2,236,800 | |
| | | | Cleveland-Cliffs, Inc. | | | | |
| | 2,795,000 | | | 5.750%, 3/1/2025 | | | 2,641,275 | |
| | | | Consolidated Energy Finance SA | | | | |
| | 2,330,000 | | | 6.875%, 6/15/2025g | | | 2,373,687 | |
| | | | First Quantum Minerals, Ltd. | | | | |
| | 1,901,000 | | | 7.000%, 2/15/2021g | | | 1,859,416 | |
| | 2,325,000 | | | 7.250%, 4/1/2023g | | | 2,147,719 | |
| | 1,860,000 | | | 6.875%, 3/1/2026g | | | 1,606,575 | |
| | | | Grinding Media, Inc. | | | | |
| | 3,380,000 | | | 7.375%, 12/15/2023g | | | 3,472,950 | |
| | | | Hexion, Inc. | | | | |
| | 2,235,000 | | | 6.625%, 4/15/2020 | | | 1,977,975 | |
| | 1,400,000 | | | 10.375%, 2/1/2022g | | | 1,258,250 | |
| | | | Hudbay Minerals, Inc. | | | | |
| | 375,000 | | | 7.250%, 1/15/2023g | | | 373,125 | |
| | 750,000 | | | 7.625%, 1/15/2025g | | | 751,875 | |
| | | | Krayton Polymers, LLC | | | | |
| | 2,325,000 | | | 7.000%, 4/15/2025g | | | 2,179,687 | |
| | | | Mercer International, Inc. | | | | |
| | 2,785,000 | | | 5.500%, 1/15/2026 | | | 2,700,614 | |
| | | | Midwest Vanadium, Pty. Ltd. | | | | |
| | 2,862,131 | | | 11.500%, 2/15/2018*,h,i | | | 8,844 | |
| | | | Novelis Corporation | | | | |
| | 1,430,000 | | | 6.250%, 8/15/2024g | | | 1,415,700 | |
| | 2,030,000 | | | 5.875%, 9/30/2026g | | | 1,913,275 | |
| | | | OCI NV | | | | |
| | 750,000 | | | 6.625%, 4/15/2023g | | | 768,750 | |
| | | | Olin Corporation | | | | |
| | 3,725,000 | | | 5.000%, 2/1/2030 | | | 3,344,417 | |
| | | | Peabody Securities Finance Corporation | | | | |
| | 2,820,000 | | | 6.000%, 3/31/2022g | | | 2,817,265 | |
| | | | Platform Specialty Products Corporation | | | | |
| | 3,000,000 | | | 5.875%, 12/1/2025g | | | 2,842,500 | |
| | | | Starfruit US Holdco, LLC | | | | |
| | 1,863,000 | | | 8.000%, 10/1/2026f,g | | | 1,807,110 | |
| | | | Trinseo Materials Operating SCA | | | | |
| | 2,800,000 | | | 5.375%, 9/1/2025g | | | 2,597,000 | |
| | | | Tronox Finance plc | | | | |
| | 2,790,000 | | | 5.750%, 10/1/2025g | | | 2,448,225 | |
| | | | United States Steel Corporation | | | | |
| | 1,865,000 | | | 6.875%, 8/15/2025 | | | 1,827,700 | |
| | 2,350,000 | | | 6.250%, 3/15/2026 | | | 2,214,875 | |
| | | | | |
| | | | Total | | | 54,783,830 | |
| | | | | |
| |
| | Capital Goods (10.1%) | | | | |
| | | | Abengoa Abnewco 2 SAU | | | | |
| | 3,338,469 | | | 0.236%,PIK 1.264%, 9/29/2022g,j | | | 434,001 | |
The accompanying Notes to Financial Statements are an integral part of this schedule.
30
HIGH YIELD FUND
Schedule of Investments as of October 31, 2018
| | | | | | | | |
Principal
Amount | | | Long-Term Fixed Income (91.5%) | | Value | |
| | Capital Goods (10.1%) - continued | | | | |
| | | | ABG Orphan Holdco SARL | | | | |
| | $254,752 | | | 2.712%,PIK 11.289%, 2/28/2021g,j | | | $266,726 | |
| | 241,997 | | | 4.900%,PIK 9.100%, 2/28/2021g,j | | | 254,062 | |
| | | | Advanced Disposal Services, Inc. | | | | |
| | 2,845,000 | | | 5.625%, 11/15/2024g | | | 2,773,875 | |
| | | | AECOM | | | | |
| | 935,000 | | | 5.875%, 10/15/2024 | | | 951,362 | |
| | 1,410,000 | | | 5.125%, 3/15/2027 | | | 1,311,300 | |
| | | | Arconic, Inc. | | | | |
| | 1,395,000 | | | 5.900%, 2/1/2027 | | | 1,377,562 | |
| | | | Ardagh Packaging Finance plc | | | | |
| | 3,810,000 | | | 7.250%, 5/15/2024g | | | 3,829,050 | |
| | 3,280,000 | | | 6.000%, 2/15/2025g | | | 3,075,000 | |
| | | | BBA US Holdings, Inc. | | | | |
| | 460,000 | | | 5.375%, 5/1/2026g | | | 454,825 | |
| | | | Berry Global, Inc. | | | | |
| | 1,510,000 | | | 4.500%, 2/15/2026g | | | 1,411,850 | |
| | | | Berry Plastics Corporation | | | | |
| | 5,630,000 | | | 5.125%, 7/15/2023 | | | 5,601,850 | |
| | | | Bombardier, Inc. | | | | |
| | 2,555,000 | | | 7.500%, 3/15/2025g | | | 2,554,234 | |
| | | | BWAY Holding Company | | | | |
| | 2,795,000 | | | 7.250%, 4/15/2025g | | | 2,648,263 | |
| | | | Cemex SAB de CV | | | | |
| | 2,000,000 | | | 6.125%, 5/5/2025g | | | 1,985,000 | |
| | | | Cemex SAB de CV | | | | |
| | 2,500,000 | | | 5.700%, 1/11/2025g | | | 2,443,000 | |
| | | | Covanta Holding Corporation | | | | |
| | 1,400,000 | | | 5.875%, 7/1/2025 | | | 1,358,000 | |
| | 2,190,000 | | | 6.000%, 1/1/2027 | | | 2,113,350 | |
| | | | Crown Cork & Seal Company, Inc. | | | | |
| | 2,790,000 | | | 7.375%, 12/15/2026 | | | 2,985,300 | |
| | | | Flex Acquisition Company, Inc. | | | | |
| | 2,795,000 | | | 6.875%, 1/15/2025g | | | 2,613,325 | |
| | 700,000 | | | 7.875%, 7/15/2026g | | | 675,710 | |
| | | | GFL Environmental, Inc. | | | | |
| | 2,790,000 | | | 7.000%, 6/1/2026g | | | 2,566,800 | |
| | | | H&E Equipment Services, Inc. | | | | |
| | 4,140,000 | | | 5.625%, 9/1/2025 | | | 3,943,350 | |
| | | | Herc Rentals, Inc. | | | | |
| | 3,133,000 | | | 7.750%, 6/1/2024f,g | | | 3,305,315 | |
| | | | James Hardie International Finance Designated Activity Company | | | | |
| | 500,000 | | | 4.750%, 1/15/2025g | | | 464,375 | |
| | 1,400,000 | | | 5.000%, 1/15/2028g | | | 1,270,500 | |
| | | | Jeld-Wen, Inc. | | | | |
| | 2,330,000 | | | 4.875%, 12/15/2027f,g | | | 2,027,100 | |
| | | | New Enterprise Stone & Lime Company, Inc. | | | | |
| | 1,855,000 | | | 6.250%, 3/15/2026g | | | 1,808,625 | |
| | | | Owens-Brockway Glass Container, Inc. | | | | |
| | 2,680,000 | | | 5.875%, 8/15/2023g | | | 2,669,950 | |
| | | | Reynolds Group Issuer, Inc. | | | | |
| | 1,995,000 | | | 5.125%, 7/15/2023g | | | 1,952,606 | |
| | | | Ritchie Bros. Auctioneers, Inc. | | | | |
| | 1,295,000 | | | 5.375%, 1/15/2025g | | | 1,275,575 | |
| | | | Summit Materials, LLC | | | | |
| | 2,350,000 | | | 6.125%, 7/15/2023 | | | 2,273,625 | |
| | 1,865,000 | | | 5.125%, 6/1/2025g | | | 1,669,175 | |
| | | | U.S. Concrete, Inc. | | | | |
| | 2,620,000 | | | 6.375%, 6/1/2024 | | | 2,443,150 | |
| | | | United Rentals North America, Inc. | | | | |
| | 940,000 | | | 5.500%, 7/15/2025 | | | 915,913 | |
| | 2,380,000 | | | 5.875%, 9/15/2026 | | | 2,332,400 | |
| | | | Waste Pro USA, Inc. | | | | |
| | 500,000 | | | 5.500%, 2/15/2026g | | | 473,750 | |
| | | | | |
| | | | Total | | | 72,509,854 | |
| | | | | |
| |
| | Communications Services (14.2%) | | | | |
| | | | AMC Networks, Inc. | | | | |
| | 2,400,000 | | | 5.000%, 4/1/2024 | | | 2,295,480 | |
| | | | Block Communications, Inc. | | | | |
| | 3,280,000 | | | 6.875%, 2/15/2025g | | | 3,325,100 | |
| | | | CBS Radio, Inc. | | | | |
| | 1,665,000 | | | 7.250%, 11/1/2024f,g | | | 1,567,181 | |
| | | | CCO Holdings, LLC | | | | |
| | 4,500,000 | | | 5.875%, 4/1/2024g | | | 4,539,375 | |
| | | | CCOH Safari, LLC | | | | |
| | 2,750,000 | | | 5.750%, 2/15/2026g | | | 2,722,500 | |
| | | | Cengage Learning, Inc. | | | | |
| | 1,495,000 | | | 9.500%, 6/15/2024g | | | 1,283,831 | |
| | | | CenturyLink, Inc. | | | | |
| | 1,855,000 | | | 7.500%, 4/1/2024f | | | 1,947,750 | |
| | | | Clear Channel Worldwide Holdings, Inc. | | | | |
| | 3,005,000 | | | 6.500%, 11/15/2022 | | | 3,050,676 | |
| | | | Digicel Group, Ltd. | | | | |
| | 1,535,000 | | | 8.250%, 9/30/2020g | | | 1,097,525 | |
| | | | Digicel, Ltd. | | | | |
| | 5,000,000 | | | 6.000%, 4/15/2021*,f | | | 4,537,500 | |
| | | | Embarq Corporation | | | | |
| | 2,330,000 | | | 7.995%, 6/1/2036 | | | 2,219,325 | |
| | | | Frontier Communications Corporation | | | | |
| | 1,625,000 | | | 10.500%, 9/15/2022 | | | 1,352,812 | |
| | | | Gray Television, Inc. | | | | |
| | 3,190,000 | | | 5.875%, 7/15/2026g | | | 3,061,411 | |
| | | | Intelsat Jackson Holdings SA | | | | |
| | 7,430,000 | | | 5.500%, 8/1/2023 | | | 6,649,850 | |
| | | | Level 3 Financing, Inc. | | | | |
| | 4,780,000 | | | 5.375%, 5/1/2025 | | | 4,666,475 | |
| | 1,500,000 | | | 5.250%, 3/15/2026 | | | 1,440,000 | |
| | | | McGraw-Hill Global Education Holdings, LLC | | | | |
| | 2,855,000 | | | 7.875%, 5/15/2024f,g | | | 2,430,319 | |
| | | | Meredith Corporation | | | | |
| | 3,610,000 | | | 6.875%, 2/1/2026g | | | 3,610,000 | |
| | | | Neptune Finco Corporation | | | | |
| | 4,245,000 | | | 10.875%, 10/15/2025g | | | 4,897,669 | |
| | | | Qualitytech, LP | | | | |
| | 3,260,000 | | | 4.750%, 11/15/2025g | | | 3,039,950 | |
| | | | SFR Group SA | | | | |
| | 2,290,000 | | | 6.250%, 5/15/2024g | | | 2,198,400 | |
| | 2,380,000 | | | 7.375%, 5/1/2026g | | | 2,284,800 | |
| | | | Sinclair Television Group, Inc. | | | | |
| | 1,430,000 | | | 5.875%, 3/15/2026g | | | 1,362,075 | |
| | 1,860,000 | | | 5.125%, 2/15/2027f,g | | | 1,674,000 | |
The accompanying Notes to Financial Statements are an integral part of this schedule.
31
HIGH YIELD FUND
Schedule of Investments as of October 31, 2018
| | | | | | | | |
Principal
Amount | | | Long-Term Fixed Income (91.5%) | | Value | |
| | Communications Services (14.2%) - continued | | | | |
| | | | Sprint Communications, Inc. | | | | |
| | $4,640,000 | | | 6.000%, 11/15/2022 | | | $4,683,500 | |
| | | | Sprint Corporation | | | | |
| | 13,505,000 | | | 7.625%, 2/15/2025 | | | 14,028,319 | |
| | | | T-Mobile USA, Inc. | | | | |
| | 3,140,000 | | | 6.000%, 4/15/2024 | | | 3,218,500 | |
| | | | VeriSign, Inc. | | | | |
| | 2,290,000 | | | 4.750%, 7/15/2027 | | | 2,156,149 | |
| | | | Virgin Media Secured Finance plc | | | | |
| | 1,030,000 | | | 5.250%, 1/15/2026g | | | 960,475 | |
| | 950,000 | | | 5.500%, 8/15/2026g | | | 895,375 | |
| | | | Windstream Services, LLC | | | | |
| | 3,370,000 | | | 8.625%, 10/31/2025g | | | 3,150,950 | |
| | | | WMG Acquisition Corporation | | | | |
| | 2,325,000 | | | 5.500%, 4/15/2026g | | | 2,266,875 | |
| | | | Zayo Group, LLC | | | | |
| | 3,575,000 | | | 6.375%, 5/15/2025 | | | 3,655,438 | |
| | | | | |
| | | | Total | | | 102,269,585 | |
| | | | | |
| |
| | Consumer Cyclical (13.7%) | | | | |
| | | | Allison Transmission, Inc. | | | | |
| | 3,480,000 | | | 5.000%, 10/1/2024g | | | 3,377,758 | |
| | | | AMC Entertainment Holdings, Inc. | | | | |
| | 4,057,000 | | | 5.750%, 6/15/2025f | | | 3,752,725 | |
| | | | American Axle & Manufacturing, Inc. | | | | |
| | 3,732,000 | | | 6.250%, 4/1/2025f | | | 3,522,075 | |
| | | | Brookfield Residential Properties, Inc. | | | | |
| | 3,570,000 | | | 6.125%, 7/1/2022g | | | 3,498,600 | |
| | | | Choice Hotels International, Inc. | | | | |
| | 3,026,000 | | | 5.750%, 7/1/2022 | | | 3,177,300 | |
| | | | Cinemark USA, Inc. | | | | |
| | 4,205,000 | | | 4.875%, 6/1/2023 | | | 4,105,131 | |
| | | | Dana Financing Luxembourg SARL | | | | |
| | 3,575,000 | | | 6.500%, 6/1/2026g | | | 3,516,906 | |
| | | | Delphi Jersey Holdings plc | | | | |
| | 3,800,000 | | | 5.000%, 10/1/2025g | | | 3,429,500 | |
| | | | Hanesbrands, Inc. | | | | |
| | 3,605,000 | | | 4.875%, 5/15/2026g | | | 3,415,737 | |
| | | | Hilton Escrow Issuer, LLC | | | | |
| | 4,655,000 | | | 4.250%, 9/1/2024 | | | 4,470,196 | |
| | | | KAR Auction Services, Inc. | | | | |
| | 2,330,000 | | | 5.125%, 6/1/2025g | | | 2,207,675 | |
| | | | KB Home | | | | |
| | 1,750,000 | | | 8.000%, 3/15/2020 | | | 1,830,937 | |
| | | | L Brands, Inc. | | | | |
| | 1,640,000 | | | 5.625%, 2/15/2022 | | | 1,664,600 | |
| | 1,287,000 | | | 6.694%, 1/15/2027 | | | 1,209,780 | |
| | | | Landry’s, Inc. | | | | |
| | 3,045,000 | | | 6.750%, 10/15/2024g | | | 3,037,388 | |
| | | | Lennar Corporation | | | | |
| | 3,290,000 | | | 4.125%, 1/15/2022 | | | 3,212,027 | |
| | 1,270,000 | | | 4.500%, 4/30/2024 | | | 1,213,644 | |
| | 1,410,000 | | | 4.750%, 5/30/2025 | | | 1,343,025 | |
| | | | Live Nation Entertainment, Inc. | | | | |
| | 2,935,000 | | | 4.875%, 11/1/2024g | | | 2,810,263 | |
| | 470,000 | | | 5.625%, 3/15/2026g | | | 470,000 | |
| | | | Mattamy Group Corporation | | | | |
| | 2,820,000 | | | 6.875%, 12/15/2023g | | | 2,745,975 | |
| | 930,000 | | | 6.500%, 10/1/2025g | | | 874,200 | |
| | | | MGM Resorts International | | | | |
| | 3,000,000 | | | 5.750%, 6/15/2025 | | | 2,925,000 | |
| | | | Navistar International Corporation | | | | |
| | 3,000,000 | | | 6.625%, 11/1/2025g | | | 3,060,000 | |
| | | | New Red Finance, Inc. | | | | |
| | 2,090,000 | | | 5.000%, 10/15/2025g | | | 1,959,375 | |
| | | | PGT Escrow Issuer, Inc. | | | | |
| | 2,325,000 | | | 6.750%, 8/1/2026g | | | 2,394,750 | |
| | | | Prime Security Services Borrower, LLC | | | | |
| | 2,433,000 | | | 9.250%, 5/15/2023g | | | 2,570,951 | |
| | | | RHP Hotel Properties, LP | | | | |
| | 710,000 | | | 5.000%, 4/15/2021 | | | 709,113 | |
| | 840,000 | | | 5.000%, 4/15/2023 | | | 831,600 | |
| | | | Scientific Games International, Inc. | | | | |
| | 2,060,000 | | | 6.625%, 5/15/2021 | | | 1,993,050 | |
| | 2,350,000 | | | 10.000%, 12/1/2022 | | | 2,455,750 | |
| | | | ServiceMaster Company, LLC | | | | |
| | 2,330,000 | | | 5.125%, 11/15/2024g | | | 2,242,625 | |
| | | | Six Flags Entertainment Corporation | | | | |
| | 5,120,000 | | | 4.875%, 7/31/2024g | | | 4,838,400 | |
| | | | Stars Group Holdings BV | | | | |
| | 2,200,000 | | | 7.000%, 7/15/2026g | | | 2,233,000 | |
| | | | Station Casinos, LLC | | | | |
| | 470,000 | | | 5.000%, 10/1/2025g | | | 436,517 | |
| | | | Studio City Finance, Ltd. | | | | |
| | 2,335,000 | | | 8.500%, 12/1/2020g | | | 2,335,000 | |
| | | | Tesla, Inc. | | | | |
| | 1,860,000 | | | 5.300%, 8/15/2025g | | | 1,653,075 | |
| | | | Tunica-Biloxi Gaming Authority | | | | |
| | 5,535,183 | | | 3.780%, 12/15/2020* | | | 1,522,175 | |
| | | | Wabash National Corporation | | | | |
| | 3,250,000 | | | 5.500%, 10/1/2025g | | | 2,925,000 | |
| | | | Wyndham Destinations, Inc. | | | | |
| | 970,000 | | | 4.500%, 4/1/2027 | | | 898,463 | |
| | | | Yum! Brands, Inc. | | | | |
| | 1,910,000 | | | 5.250%, 6/1/2026g | | | 1,876,575 | |
| | | | | |
| | | | Total | | | 98,745,861 | |
| | | | | |
| |
| | Consumer Non-Cyclical (10.2%) | | | | |
| | | | Air Medical Merger Sub Corporation | | | | |
| | 2,810,000 | | | 6.375%, 5/15/2023f,g | | | 2,525,487 | |
| | | | Albertsons Companies, LLC | | | | |
| | 4,970,000 | | | 6.625%, 6/15/2024 | | | 4,696,650 | |
| | | | Alliance One International, Inc. | | | | |
| | 2,700,000 | | | 9.875%, 7/15/2021 | | | 2,585,250 | |
| | | | Bausch Health Co. Inc. | | | | |
| | 2,612,000 | | | 7.500%, 7/15/2021g | | | 2,651,180 | |
| | | | Cott Holdings, Inc. | | | | |
| | 1,862,000 | | | 5.500%, 4/1/2025g | | | 1,773,555 | |
| | | | Energizer Holdings, Inc. | | | | |
| | 3,760,000 | | | 5.500%, 6/15/2025g | | | 3,656,600 | |
| | | | HCA, Inc. | | | | |
| | 2,355,000 | | | 6.500%, 2/15/2020 | | | 2,431,537 | |
| | 4,190,000 | | | 5.875%, 3/15/2022 | | | 4,383,787 | |
| | 1,640,000 | | | 4.750%, 5/1/2023 | | | 1,656,400 | |
| | 3,295,000 | | | 5.375%, 2/1/2025 | | | 3,315,594 | |
| | | | JBS USA, LLC | | | | |
| | 2,750,000 | | | 5.875%, 7/15/2024g | | | 2,699,125 | |
| | 3,030,000 | | | 5.750%, 6/15/2025g | | | 2,931,525 | |
The accompanying Notes to Financial Statements are an integral part of this schedule.
32
HIGH YIELD FUND
Schedule of Investments as of October 31, 2018
| | | | | | | | |
Principal
Amount | | | Long-Term Fixed Income (91.5%) | | Value | |
| | Consumer Non-Cyclical (10.2%) - continued | | | | |
| | | | Mallinckrodt International Finance SA | | | | |
| | $1,745,000 | | | 5.625%, 10/15/2023f,g | | | $1,496,338 | |
| | | | MPH Acquisition Holdings, LLC | | | | |
| | 3,810,000 | | | 7.125%, 6/1/2024g | | | 3,870,274 | |
| | | | Pilgrim’s Pride Corporation | | | | |
| | 2,785,000 | | | 5.750%, 3/15/2025g | | | 2,597,013 | |
| | | | Post Holdings, Inc. | | | | |
| | 1,410,000 | | | 5.500%, 3/1/2025g | | | 1,363,294 | |
| | 2,775,000 | | | 5.000%, 8/15/2026g | | | 2,559,938 | |
| | | | Simmons Foods, Inc. | | | | |
| | 3,375,000 | | | 5.750%, 11/1/2024g | | | 2,480,625 | |
| | | | Spectrum Brands, Inc. | | | | |
| | 3,720,000 | | | 5.750%, 7/15/2025 | | | 3,608,400 | |
| | | | Teleflex, Inc. | | | | |
| | 2,225,000 | | | 5.250%, 6/15/2024 | | | 2,247,250 | |
| | | | Tenet Healthcare Corporation | | | | |
| | 2,750,000 | | | 6.000%, 10/1/2020 | | | 2,816,138 | |
| | 470,000 | | | 7.500%, 1/1/2022g | | | 489,975 | |
| | | | Teva Pharmaceutical Finance Netherlands III BV | | | | |
| | 2,555,000 | | | 3.150%, 10/1/2026 | | | 2,081,545 | |
| | | | Valeant Pharmaceuticals International, Inc. | | | | |
| | 1,410,000 | | | 5.625%, 12/1/2021g | | | 1,388,850 | |
| | 6,890,000 | | | 5.500%, 3/1/2023g | | | 6,528,275 | |
| | 2,325,000 | | | 5.875%, 5/15/2023g | | | 2,223,281 | |
| | 2,320,000 | | | 8.500%, 1/31/2027g | | | 2,360,600 | |
| | | | | |
| | | | Total | | | 73,418,486 | |
| | | | | |
| |
| | Energy (16.6%) | | | | |
| | | | Alliance Resource Operating Partners, LP | | | | |
| | 2,330,000 | | | 7.500%, 5/1/2025g | | | 2,417,375 | |
| | | | Antero Resources Corporation | | | | |
| | 1,415,000 | | | 5.125%, 12/1/2022 | | | 1,405,272 | |
| | 2,360,000 | | | 5.625%, 6/1/2023 | | | 2,360,000 | |
| | | | California Resources Corporation | | | | |
| | 5,110,000 | | | 8.000%, 12/15/2022f,g | | | 4,547,900 | |
| | | | Centennial Resource Production, LLC | | | | |
| | 4,415,000 | | | 5.375%, 1/15/2026g | | | 4,315,662 | |
| | | | Cheniere Corpus Christi Holdings, LLC | | | | |
| | 5,990,000 | | | 7.000%, 6/30/2024 | | | 6,476,687 | |
| | | | Cheniere Energy Partners, LP | | | | |
| | 3,285,000 | | | 5.625%, 10/1/2026g | | | 3,235,725 | |
| | | | Chesapeake Energy Corporation | | | | |
| | 900,000 | | | 7.000%, 10/1/2024 | | | 879,750 | |
| | 3,719,000 | | | 8.000%, 1/15/2025f | | | 3,772,461 | |
| | | | CrownRock Finance, Inc. | | | | |
| | 3,250,000 | | | 5.625%, 10/15/2025g | | | 3,091,562 | |
| | | | Diamondback Energy, Inc. | | | | |
| | 2,790,000 | | | 4.750%, 11/1/2024 | | | 2,713,275 | |
| | | | Endeavor Energy Resources, LP | | | | |
| | 600,000 | | | 5.500%, 1/30/2026g | | | 616,500 | |
| | 2,325,000 | | | 5.750%, 1/30/2028g | | | 2,400,562 | |
| | | | Energy Transfer Equity, LP | | | | |
| | 1,970,000 | | | 4.250%, 3/15/2023 | | | 1,950,300 | |
| | 3,755,000 | | | 5.500%, 6/1/2027 | | | 3,817,145 | |
| | | | EnLink Midstream Partners, LP | | | | |
| | 2,325,000 | | | 4.150%, 6/1/2025 | | | 2,161,328 | |
| | | | Ensco plc | | | | |
| | 3,260,000 | | | 4.500%, 10/1/2024 | | | 2,648,750 | |
| | | | Genesis Energy, LP | | | | |
| | 2,320,000 | | | 6.750%, 8/1/2022 | | | 2,331,600 | |
| | | | MEG Energy Corporation | | | | |
| | 720,000 | | | 6.375%, 1/30/2023g | | | 693,900 | |
| | | | Murphy Oil Corporation | | | | |
| | 1,190,000 | | | 6.875%, 8/15/2024 | | | 1,242,932 | |
| | 1,630,000 | | | 5.750%, 8/15/2025 | | | 1,621,364 | |
| | | | Nabors Industries, Inc. | | | | |
| | 2,800,000 | | | 5.750%, 2/1/2025 | | | 2,584,357 | |
| | | | NGPL Pipeco, LLC | | | | |
| | 2,790,000 | | | 4.875%, 8/15/2027g | | | 2,685,375 | |
| | | | Noble Holding International, Ltd. | | | | |
| | 2,790,000 | | | 7.750%, 1/15/2024 | | | 2,605,162 | |
| | | | Pacific Drilling First Lien Escrow Issuer, Ltd. | | | | |
| | 3,500,000 | | | 8.375%, 10/1/2023g | | | 3,548,125 | |
| | | | Pacific Drilling Second Lien Escrow Issuer, Ltd. | | | | |
| | 500,000 | | | 11.000%, PIK 12.000%, 4/1/2024g,j | | | 527,500 | |
| | | | Parsley Energy, LLC | | | | |
| | 2,800,000 | | | 5.625%, 10/15/2027g | | | 2,760,156 | |
| | | | Precision Drilling Corporation | | | | |
| | 1,060,000 | | | 7.750%, 12/15/2023 | | | 1,102,400 | |
| | 1,150,000 | | | 5.250%, 11/15/2024f | | | 1,066,625 | |
| | 930,000 | | | 7.125%, 1/15/2026g | | | 923,025 | |
| | | | Rowan Companies, Inc. | | | | |
| | 3,025,000 | | | 4.875%, 6/1/2022 | | | 2,896,437 | |
| | | | Sanchez Energy Corporation | | | | |
| | 3,260,000 | | | 7.250%, 2/15/2023f,g | | | 2,974,750 | |
| | | | SESI, LLC | | | | |
| | 3,720,000 | | | 7.750%, 9/15/2024 | | | 3,654,900 | |
| | | | SM Energy Company | | | | |
| | 2,325,000 | | | 5.000%, 1/15/2024f | | | 2,214,562 | |
| | 465,000 | | | 6.625%, 1/15/2027 | | | 467,325 | |
| | | | Southwestern Energy Company | | | | |
| | 3,715,000 | | | 7.500%, 4/1/2026f | | | 3,780,013 | |
| | | | Sunoco, LP | | | | |
| | 2,325,000 | | | 4.875%, 1/15/2023g | | | 2,240,719 | |
| | 910,000 | | | 5.500%, 2/15/2026g | | | 866,775 | |
| | | | Tallgrass Energy Partners, LP | | | | |
| | 2,500,000 | | | 4.750%, 10/1/2023g | | | 2,473,438 | |
| | 3,755,000 | | | 5.500%, 1/15/2028g | | | 3,712,043 | |
| | | | Targa Resources Partners, LP | | | | |
| | 3,725,000 | | | 5.125%, 2/1/2025 | | | 3,622,563 | |
| | | | Transocean Pontus, Ltd. | | | | |
| | 465,000 | | | 6.125%, 8/1/2025g | | | 462,094 | |
| | | | Transocean, Inc. | | | | |
| | 2,600,000 | | | 7.250%, 11/1/2025g | | | 2,528,500 | |
| | 930,000 | | | 7.500%, 1/15/2026g | | | 913,725 | |
| | 3,255,000 | | | 7.500%, 4/15/2031 | | | 3,010,875 | |
| | | | W&T Offshore, Inc. | | | | |
| | 4,300,000 | | | 9.750%, 11/1/2023g | | | 4,161,110 | |
| | | | Weatherford International, Ltd. | | | | |
| | 2,145,000 | | | 4.500%, 4/15/2022f | | | 1,608,750 | |
| | | | Whiting Petroleum Corporation | | | | |
| | 2,790,000 | | | 6.625%, 1/15/2026 | | | 2,796,975 | |
The accompanying Notes to Financial Statements are an integral part of this schedule.
33
HIGH YIELD FUND
Schedule of Investments as of October 31, 2018
| | | | | | | | |
Principal
Amount | | | Long-Term Fixed Income (91.5%) | | Value | |
| | Energy (16.6%) - continued | | | | |
| | | | WPX Energy, Inc. | | | | |
| | $2,790,000 | | | 8.250%, 8/1/2023 | | | $3,135,263 | |
| | | | | |
| | | | Total | | | 120,023,592 | |
| | | | | |
| |
| | Financials (9.0%) | | | | |
| | | | Ally Financial, Inc. | | | | |
| | 3,630,000 | | | 4.125%, 3/30/2020 | | | 3,625,462 | |
| | 1,340,000 | | | 4.625%, 5/19/2022 | | | 1,340,000 | |
| | 3,500,000 | | | 5.750%, 11/20/2025f | | | 3,587,500 | |
| | | | ASP AMC Merger Sub, Inc. | | | | |
| | 4,800,000 | | | 8.000%, 5/15/2025g | | | 3,600,000 | |
| | | | Avolon Holdings Funding, Ltd. | | | | |
| | 930,000 | | | 5.500%, 1/15/2023g | | | 925,350 | |
| | 2,330,000 | | | 5.125%, 10/1/2023g | | | 2,286,312 | |
| | | | Barclays plc | | | | |
| | 700,000 | | | 7.750%, 9/15/2023b,k | | | 698,390 | |
| | | | Centene Escrow Corporation | | | | |
| | 4,060,000 | | | 6.125%, 2/15/2024 | | | 4,242,700 | |
| | | | Chobani, LLC | | | | |
| | 1,395,000 | | | 7.500%, 4/15/2025f,g | | | 1,192,725 | |
| | | | CIT Group, Inc. | | | | |
| | 1,237,000 | | | 5.000%, 8/15/2022 | | | 1,246,277 | |
| | 1,083,000 | | | 5.000%, 8/1/2023 | | | 1,085,707 | |
| | 1,510,000 | | | 4.750%, 2/16/2024 | | | 1,487,350 | |
| | | | Drawbridge Special Opportunities Fund, LP | | | | |
| | 3,215,000 | | | 5.000%, 8/1/2021g | | | 3,215,341 | |
| | | | Genworth Holdings, Inc. | | | | |
| | 930,000 | | | 4.900%, 8/15/2023 | | | 818,400 | |
| | 2,055,000 | | | 4.900%, 8/15/2023 | | | 1,808,400 | |
| | | | Icahn Enterprises, LP | | | | |
| | 1,850,000 | | | 6.000%, 8/1/2020 | | | 1,866,188 | |
| | 1,630,000 | | | 6.250%, 2/1/2022 | | | 1,645,583 | |
| | | | Iron Mountain, Inc. | | | | |
| | 1,860,000 | | | 5.750%, 8/15/2024 | | | 1,825,125 | |
| | | | MPT Operating Partnership, LP | | | | |
| | 2,640,000 | | | 5.500%, 5/1/2024 | | | 2,666,400 | |
| | 1,160,000 | | | 5.000%, 10/15/2027 | | | 1,090,052 | |
| | | | Navient Corporation | | | | |
| | 2,500,000 | | | 5.500%, 1/25/2023 | | | 2,454,925 | |
| | | | Park Aerospace Holdings, Ltd. | | | | |
| | 1,395,000 | | | 5.250%, 8/15/2022g | | | 1,384,538 | |
| | 3,715,000 | | | 4.500%, 3/15/2023g | | | 3,534,377 | |
| | 1,370,000 | | | 5.500%, 2/15/2024g | | | 1,356,643 | |
| | | | Quicken Loans, Inc. | | | | |
| | 3,485,000 | | | 5.750%, 5/1/2025g | | | 3,358,669 | |
| | | | Royal Bank of Scotland Group plc | | | | |
| | 2,585,000 | | | 5.125%, 5/28/2024 | | | 2,559,151 | |
| | | | SemGroup Corporation / Rose Rock Finance Corporation | | | | |
| | 1,960,000 | | | 5.625%, 7/15/2022 | | | 1,881,600 | |
| | | | Springleaf Finance Corporation | | | | |
| | 2,330,000 | | | 6.875%, 3/15/2025 | | | 2,230,975 | |
| | | | Synchrony Financial | | | | |
| | 3,720,000 | | | 3.950%, 12/1/2027 | | | 3,280,126 | |
| | | | Wand Merger Corporation | | | | |
| | 2,625,000 | | | 8.125%, 7/15/2023g | | | 2,670,938 | |
| | | | | |
| | | | Total | | | 64,965,204 | |
| | | | | |
| |
| | Foreign Government (0.3%) | | | | |
| | | | Argentina Government International Bond | | | | |
| | 2,820,000 | | | 6.875%, 1/26/2027 | | | 2,358,930 | |
| | | | | |
| | | | Total | | | 2,358,930 | |
| | | | | |
| |
| | Technology (5.5%) | | | | |
| | | | Alliance Data Systems Corporation | | | | |
| | 6,120,000 | | | 5.375%, 8/1/2022g | | | 6,142,950 | |
| | | | Anixter, Inc. | | | | |
| | 2,045,000 | | | 5.125%, 10/1/2021 | | | 2,055,225 | |
| | | | CommScope Technologies Finance, LLC | | | | |
| | 4,225,000 | | | 6.000%, 6/15/2025g | | | 4,108,812 | |
| | | | Diamond Finance Corporation | | | | |
| | 2,320,000 | | | 7.125%, 6/15/2024g | | | 2,455,289 | |
| | | | First Data Corporation | | | | |
| | 1,690,000 | | | 7.000%, 12/1/2023g | | | 1,752,530 | |
| | | | Harland Clarke Holdings Corporation | | | | |
| | 3,510,000 | | | 8.375%, 8/15/2022g | | | 3,167,775 | |
| | | | Inception Merger Sub, Inc. | | | | |
| | 4,655,000 | | | 8.625%, 11/15/2024f,g | | | 4,375,700 | |
| | | | Iron Mountain, Inc. | | | | |
| | 3,255,000 | | | 5.250%, 3/15/2028g | | | 2,921,363 | |
| | | | Nielsen Company SARL | | | | |
| | 2,790,000 | | | 5.000%, 2/1/2025f,g | | | 2,716,763 | |
| | | | Plantronics, Inc. | | | | |
| | 2,110,000 | | | 5.500%, 5/31/2023g | | | 2,057,250 | |
| | | | Seagate HDD Cayman | | | | |
| | 3,885,000 | | | 4.750%, 1/1/2025 | | | 3,555,403 | |
| | | | Western Digital Corporation | | | | |
| | 4,600,000 | | | 4.750%, 2/15/2026 | | | 4,249,250 | |
| | | | | |
| | | | Total | | | 39,558,310 | |
| | | | | |
| |
| | Transportation (1.2%) | | | | |
| | | | Hertz Corporation | | | | |
| | 1,865,000 | | | 7.625%, 6/1/2022g | | | 1,786,577 | |
| | | | United Continental Holdings, Inc. | | | | |
| | 2,000,000 | | | 4.250%, 10/1/2022 | | | 1,962,500 | |
| | | | XPO Logistics, Inc. | | | | |
| | 3,218,000 | | | 6.500%, 6/15/2022g | | | 3,298,450 | |
| | 1,430,000 | | | 6.125%, 9/1/2023g | | | 1,464,606 | |
| | | | | |
| | | | Total | | | 8,512,133 | |
| | | | | |
| |
| | Utilities (3.0%) | | | | |
| | | | AES Corporation | | | | |
| | 2,325,000 | | | 4.500%, 3/15/2023 | | | 2,293,031 | |
| | 2,140,000 | | | 5.500%, 4/15/2025 | | | 2,145,350 | |
| | | | Covanta Holding Corporation | | | | |
| | 1,650,000 | | | 6.375%, 10/1/2022 | | | 1,685,062 | |
| | | | Dynegy, Inc. | | | | |
| | 3,255,000 | | | 8.125%, 1/30/2026g | | | 3,523,538 | |
| | | | Electricite de France SA | | | | |
| | 2,500,000 | | | 5.250%, 1/29/2023b,g,k | | | 2,407,250 | |
| | | | NRG Energy, Inc. | | | | |
| | 1,400,000 | | | 6.250%, 5/1/2024 | | | 1,429,232 | |
| | 1,320,000 | | | 7.250%, 5/15/2026 | | | 1,402,500 | |
| | | | Talen Energy Supply, LLC | | | | |
| | 1,860,000 | | | 6.500%, 6/1/2025 | | | 1,385,700 | |
The accompanying Notes to Financial Statements are an integral part of this schedule.
34
HIGH YIELD FUND
Schedule of Investments as of October 31, 2018
| | | | | | | | |
Principal Amount | | | Long-Term Fixed Income (91.5%) | | Value | |
| | Utilities (3.0%) - continued | | | | |
| | | | TerraForm Power Operating, LLC | | | | |
| | $1,860,000 | | | 4.250%, 1/31/2023g | | | $1,762,350 | |
| | 2,560,000 | | | 5.000%, 1/31/2028g | | | 2,288,000 | |
| | | | Vistra Operations Company, LLC | | | | |
| | 1,046,000 | | | 5.500%, 9/1/2026g | | | 1,030,310 | |
| | | | | |
| | | | Total | | | 21,352,323 | |
| | | | | |
| | | | | | | | |
| | | | | |
| | | | Total Long-Term Fixed Income (cost $683,044,054) | | | 659,453,019 | |
| | | | | |
| | |
| Shares | | | Preferred Stock (0.7%) | | Value | |
| | Energy (0.3%) | | | | |
| | 193,165 | | | Crestwood Equity Partners, LP, 9.250%k | | | 1,854,384 | |
| | | | | |
| | | | Total | | | 1,854,384 | |
| | | | | |
| | Financials (0.4%) | | | | |
| | 47,000 | | | Federal National Mortgage Association, 0.000%k,l | | | 281,060 | |
| | 2,327 | | | Wells Fargo & Company, Convertible, 7.500%k | | | 2,959,921 | |
| | | | | |
| | | | Total | | | 3,240,981 | |
| | | | | |
| | | | | | | | |
| | | | | |
| | | | Total Preferred Stock (cost $5,327,202) | | | 5,095,365 | |
| | |
| Shares | | | Registered Investment Companies (0.5%) | | Value | |
| | Equity Funds/Exchange Traded Funds (0.5%) | | | | |
| | 25,604 | | | Energy Select Sector SPDR Fund | | | 1,719,565 | |
| | 53,000 | | | SPDR S&P Oil & Gas Exploration & Production ETFf | | | 1,911,710 | |
| | | | | |
| | | | Total | | | 3,631,275 | |
| | | | | |
| | | | | | | | |
| | | | | |
| | | | Total Registered Investment Companies (cost $3,360,650) | | | 3,631,275 | |
| | | | | |
| | |
| Shares | | | Common Stock (<0.1%) | | Value | |
| | Communications Services (<0.1%) | | | | |
| | 3,140,000 | | | T-Mobile USA, Inc. Rightsm | | | 0 | |
| | | | | |
| | | | Total | | | 0 | |
| | | | | |
| |
| | Consumer Discretionary (<0.1%) | | | | |
| | 367 | | | Lear Corporation | | | 48,774 | |
| | | | | |
| | | | Total | | | 48,774 | |
| | | | | |
| |
| | Industrials (<0.1%) | | | | |
| | 917,195 | | | Abengoa SA, Class Al | | | 11,427 | |
| | 9,178,073 | | | Abengoa SA, Class Bl | | | 31,187 | |
| | | | | |
| | | | Total | | | 42,614 | |
| | | | | |
| |
| | Materials (<0.1%) | | | | |
| | 235 | | | WestRock Company | | | 10,098 | |
| | | | | |
| | | | Total | | | 10,098 | |
| | | | | |
| | | | | | | | |
| | | | | |
| | | | Total Common Stock (cost $320,645) | | | 101,486 | |
| | | | | |
| | |
| Shares | | | Collateral Held for Securities Loaned (7.5%) | | Value | |
| | 53,926,806 | | | Thrivent Cash Management Trust | | | 53,926,806 | |
| | | | | |
| | | | Total Collateral Held for Securities Loaned (cost $53,926,806) | | | 53,926,806 | |
| | | | | |
| | |
Shares or
Principal
Amount | | | Short-Term Investments (3.6%) | | Value | |
| | 2,580,952 | | | Thrivent Core Short-Term Reserve Fund 2.430% | | | 25,809,518 | |
| | | | | |
| | | | Total Short-Term Investments (cost $25,809,518) | | | 25,809,518 | |
| | | | | |
| | | | Total Investments (cost $801,793,166) 107.9% | | $ | 777,678,652 | |
| | | | | |
| | | | Other Assets and Liabilities, Net (7.9%) | | | (56,933,960 | ) |
| | | | | |
| | | | Total Net Assets 100.0% | | $ | 720,744,692 | |
| | | | | |
a | The stated interest rate represents the weighted average of all contracts within the bank loan facility. |
b | Denotes variable rate securities. The rate shown is as of October 31, 2018. The rates of certain variable rate securities are based on a published reference rate and spread; these may vary by security and the reference rate and spread are indicated in their description. The rates of other variable rate securities are determined by the issuer or agent and are based on current market conditions. These securities do not indicate a reference rate and spread in their description. |
c | All or a portion of the loan is unfunded. |
d | Denotes investments purchased on a when-issued or delayed delivery basis. |
e | Denotes step coupon securities. Step coupon securities pay an initial coupon rate for the first period and then different coupon rates for following periods. The rate shown is as of October 31, 2018. |
f | All or a portion of the security is on loan. |
g | Denotes securities sold under Rule 144A of the Securities Act of 1933, which exempts them from registration. These securities may be resold to other dealers in the program or to other qualified institutional buyers. As of October 31, 2018, the value of these investments was $353,823,544 or 49.1% of total net assets. |
h | Defaulted security. Interest is not being accrued. |
i | In bankruptcy. Interest is not being accrued. |
j | Denotes payment-in-kind security. The security paid an interest or dividend payment with additional fixed income or equity securities in lieu of, or in addition to a cash payment. The cash rate and/or payment-in-kind rate shown are as of October 31, 2018. |
k | Denotes perpetual securities. Perpetual securities pay an indefinite stream of interest and have no contractual maturity date. Date shown, if applicable, is next call date. |
l | Non-income producing security. |
m | Security is valued using significant unobservable inputs. Further information on valuation can be found in the Notes to Financial Statements. |
* | Denotes restricted securities. Restricted securities are investment securities which cannot be offered for public sale without first being registered under the Securities Act of 1933. The value of all restricted securities held in High Yield Fund as of October 31, 2018 was $6,068,519 or 0.8% of total net assets. The following table indicates the acquisition date and cost of restricted securities shown in the schedule as of October 31, 2018. |
The accompanying Notes to Financial Statements are an integral part of this schedule.
35
HIGH YIELD FUND
Schedule of Investments as of October 31, 2018
| | | | | | | | |
Security | | Acquisition
Date | | | Cost | |
Digicel, Ltd., 4/15/2021 | | | 3/19/2013 | | | $ | 4,950,858 | |
Midwest Vanadium, Pty. Ltd., 2/15/2019 | | | 2/9/2011 | | | | 2,714,489 | |
Tunica-Biloxi Gaming Authority, 12/15/2020 | | | 11/8/2005 | | | | 4,649,602 | |
The following table presents the total amount of securities loaned with continuous maturity, by type, offset by the gross payable upon return of collateral for securities loaned by Thrivent High Yield Fund as of October 31, 2018:
| | | | |
Securities Lending Transactions | | | | |
Common Stock | | | $1,803,500 | |
Taxable Debt Security | | | 50,247,936 | |
| | | | |
Total lending | | | $52,051,436 | |
Gross amount payable upon return of collateral for securities loaned | | | $53,926,806 | |
| | | | |
Net amounts due to counterparty | | | $1,875,370 | |
| | | | |
Definitions:
| | | | |
ETF | | - | | Exchange Traded Fund |
PIK | | - | | Payment-In-Kind |
Ser. | | - | | Series |
SPDR | | - | | S&P Depository Receipts, which are exchange-traded funds traded in the U.S., Europe, and Asia-Pacific and managed by State Street Global Advisors. |
Reference Rate Index:
| | | | |
LIBOR 1M | | - | | ICE Libor USD Rate 1 Month |
LIBOR 2M | | - | | ICE Libor USD Rate 2 Month |
LIBOR 3M | | - | | ICE Libor USD Rate 3 Month |
The accompanying Notes to Financial Statements are an integral part of this schedule.
36
INCOME FUND
Schedule of Investments as of October 31, 2018
| | | | | | | | |
Principal
Amount | | | Bank Loans (2.3%)a | | Value | |
| | Basic Materials (0.2%) | | | | |
| | | | Ball Metalpack Finco, LLC, Term Loan | | | | |
| | $59,850 | | | 6.802%, (LIBOR 1M + 4.500%), 7/31/2025b | | | $60,149 | |
| | | | Big River Steel, LLC, Term Loan | | | | |
| | 148,500 | | | 7.386%, (LIBOR 3M + 5.000%), 8/23/2023b | | | 149,985 | |
| | | | Contura Energy, Inc., Term Loan | | | | |
| | 133,237 | | | 7.300%, (LIBOR 2M + 5.000%), 3/17/2024b | | | 132,571 | |
| | 285,000 | | | 0.000%, (LIBOR 3M + 5.000%), 10/3/2025b,c,d | | | 283,575 | |
| | | | MRC Global (US), Inc., Term Loan | | | | |
| | 164,173 | | | 5.302%, (LIBOR 1M + 3.000%), 9/20/2024b,e | | | 164,173 | |
| | | | Tronox Blocked Borrower, LLC, Term Loan | | | | |
| | 135,026 | | | 5.302%, (LIBOR 1M + 3.000%), 9/22/2024b | | | 134,836 | |
| | | | Tronox Finance, LLC, Term Loan | | | | |
| | 311,599 | | | 5.302%, (LIBOR 1M + 3.000%), 9/22/2024b | | | 311,159 | |
| | | | | |
| | | | Total | | | 1,236,448 | |
| | | | | |
| |
| | Capital Goods (0.1%) | | | | |
| | | | Advanced Disposal Services, Inc., Term Loan | | | | |
| | 275,636 | | | 4.460%, (LIBOR 1W + 2.250%), 11/10/2023b | | | 275,465 | |
| | | | GFL Environmental, Inc., Term Loan | | | | |
| | 430,000 | | | 0.000%, (LIBOR 3M + 3.000%), 5/31/2025b,c,d | | | 423,013 | |
| | | | Sotera Health Holdings, LLC, Term Loan | | | | |
| | 200,700 | | | 5.302%, (LIBOR 1M + 3.000%), 5/15/2022b,c,d | | | 200,867 | |
| | | | | |
| | | | Total | | | 899,345 | |
| | | | | |
| |
| | Communications Services (0.8%) | | | | |
| | | | Altice France SA, Term Loan | | | | |
| | 128,050 | | | 5.052%, (LIBOR 1M + 2.750%), 7/31/2025b | | | 123,368 | |
| | 320,000 | | | 6.280%, (LIBOR 1M + 4.000%), 1/31/2026b | | | 313,002 | |
| | | | Cengage Learning, Inc., Term Loan | | | | |
| | 493,005 | | | 6.530%, (LIBOR 1M + 4.250%), 6/7/2023b | | | 456,182 | |
| | | | CenturyLink, Inc., Term Loan | | | | |
| | 476,749 | | | 5.052%, (LIBOR 1M + 2.750%), 1/31/2025b | | | 471,386 | |
| | | | Frontier Communications Corporation, Term Loan | | | | |
| | 271,563 | | | 6.060%, (LIBOR 1M + 3.750%), 6/15/2024b | | | 262,329 | |
| | | | HCP Acquisition, LLC, Term Loan | | | | |
| | 217,684 | | | 5.302%, (LIBOR 1M + 3.000%), 5/16/2024b | | | 217,249 | |
| | | | Intelsat Jackson Holdings SA, Term Loan | | | | |
| | 185,000 | | | 6.045%, (LIBOR 1M + 3.750%), 11/27/2023b | | | 185,000 | |
| | | | Level 3 Parent, LLC, Term Loan | | | | |
| | 515,000 | | | 4.530%, (LIBOR 1M + 2.250%), 2/22/2024b | | | 515,242 | |
| | | | Liberty Cablevision of Puerto Rico, LLC, Term Loan | | | | |
| | 430,000 | | | 5.936%, (LIBOR 3M + 3.500%), 1/7/2022b | | | 421,477 | |
| | | | McGraw-Hill Global Education Holdings, LLC, Term Loan | | | | |
| | 708,630 | | | 6.302%, (LIBOR 1M + 4.000%), 5/4/2022b | | | 678,959 | |
| | | | Sable International Finance, Ltd., Term Loan | | | | |
| | 595,000 | | | 5.547%, (LIBOR 1M + 3.250%), 1/31/2026b | | | 594,334 | |
| | | | Sprint Communications, Inc., Term Loan | | | | |
| | 620,550 | | | 4.813%, (LIBOR 1M + 2.500%), 2/2/2024b | | | 619,967 | |
| | | | Univision Communications, Inc., Term Loan | | | | |
| | 883,055 | | | 5.052%, (LIBOR 1M + 2.750%), 3/15/2024b | | | 846,488 | |
| | | | Virgin Media Bristol, LLC, Term Loan | | | | |
| | 355,000 | | | 4.780%, (LIBOR 1M + 2.500%), 1/15/2026b | | | 354,592 | |
| | | | WideOpenWest Finance, LLC, Term Loan | | | | |
| | 202,950 | | | 5.540%, (LIBOR 1M + 3.250%), 8/19/2023b | | | 195,339 | |
| | | | Windstream Services, LLC, Term Loan | | | | |
| | 164,162 | | | 6.290%, (LIBOR 1M + 4.000%), 3/30/2021b | | | 153,668 | |
| | | | | |
| | | | Total | | | 6,408,582 | |
| | | | | |
| |
| | Consumer Cyclical (0.2%) | | | | |
| | | | Burlington Coat Factory Warehouse Corporation, Term Loan | | | | |
| | 236,696 | | | 4.790%, (LIBOR 1M + 2.500%), 11/17/2024b | | | 236,696 | |
| | | | Golden Entertainment, Inc., Term Loan | | | | |
| | 377,150 | | | 5.300%, (LIBOR 1M + 3.000%), 10/20/2024b | | | 377,150 | |
| | | | Golden Nugget, LLC, Term Loan | | | | |
| | 307,237 | | | 5.230%, (LIBOR 1M + 2.750%), 10/4/2023b | | | 307,382 | |
| | | | Scientific Games International, Inc., Term Loan | | | | |
| | 547,250 | | | 5.046%, (LIBOR 1M + 2.750%), 8/14/2024b | | | 541,580 | |
| | | | Stars Group Holdings BV, Term Loan | | | | |
| | 205,485 | | | 5.886%, (LIBOR 3M + 3.500%), 7/10/2025b | | | 206,227 | |
| | | | Tenneco, Inc., Term Loan | | | | |
| | 190,000 | | | 5.052%, (LIBOR 1M + 2.750%), 10/1/2025b | | | 189,367 | |
| | | | | |
| | | | Total | | | 1,858,402 | |
| | | | | |
The accompanying Notes to Financial Statements are an integral part of this schedule.
37
INCOME FUND
Schedule of Investments as of October 31, 2018
| | | | | | |
Principal
Amount | | | Bank Loans (2.3%)a | | Value |
| | Consumer Non-Cyclical (0.4%) | | |
| | | | Air Medical Group Holdings, Inc., Term Loan | | |
| | $501,212 | | | 5.534%, (LIBOR 3M + 3.250%), 4/28/2022b | | $485,926 |
| | 99,250 | | | 6.530%, (LIBOR 1M + 4.250%), 3/14/2025b | | 97,265 |
| | | | Albertson’s, LLC, Term Loan | | |
| | 89,322 | | | 5.052%, (LIBOR 1M + 2.750%), 8/25/2021b | | 89,149 |
| | 182,041 | | | 5.381%, (LIBOR 3M + 3.000%), 12/21/2022b | | 181,485 |
| | 330,175 | | | 5.311%, (LIBOR 3M + 3.000%), 6/22/2023b | | 328,524 |
| | 30,000 | | | 0.000%, (LIBOR 3M + 3.000%), 10/29/2025b,c,d | | 29,744 |
| | | | Amneal Pharmaceuticals, LLC, Term Loan | | |
| | 214,413 | | | 5.813%, (LIBOR 1M + 3.500%), 5/4/2025b | | 215,431 |
| | | | Bausch Health Companies, Inc., Term Loan | | |
| | 365,625 | | | 5.274%, (LIBOR 1M + 3.000%), 6/1/2025b | | 365,541 |
| | | | CHS/Community Health Systems, Inc., Term Loan | | |
| | 227,254 | | | 5.563%, (LIBOR 3M + 3.250%), 1/27/2021b | | 222,193 |
| | | | Endo International plc, Term Loan | | |
| | 327,512 | | | 6.563%, (LIBOR 1M + 4.250%), 4/27/2024b | | 328,672 |
| | | | JBS USA LUX SA, Term Loan | | |
| | 507,275 | | | 4.844%, (LIBOR 3M + 2.500%), 10/30/2022b | | 507,021 |
| | | | MPH Acquisition Holdings, LLC, Term Loan | | |
| | 244,155 | | | 5.136%, (LIBOR 3M + 2.750%), 6/7/2023b | | 243,342 |
| | | | Revlon Consumer Products Corporation, Term Loan | | |
| | 187,136 | | | 5.813%, (LIBOR 3M + 3.500%), 9/7/2023b | | 136,661 |
| | | | |
| | | | Total | | 3,230,954 |
| | | | |
| |
| | Energy (0.1%) | | |
| | | | GIP III Stetson I, LP, Term Loan | | |
| | 145,000 | | | 6.695%, (LIBOR 3M + 4.250%), 7/18/2025b | | 145,181 |
| | | | HFOTCO, LLC, Term Loan | | |
| | 284,288 | | | 5.060%, (LIBOR 1M + 2.750%), 6/26/2025b | | 284,879 |
| | | | Radiate Holdco, LLC, Term Loan | | |
| | 605,390 | | | 5.302%, (LIBOR 1M + 3.000%), 2/1/2024b | | 600,202 |
| | | | |
| | | | Total | | 1,030,262 |
| | | | |
| |
| | Financials (0.2%) | | |
| | | | Air Methods Corporation, Term Loan | | |
| | 408,128 | | | 5.886%, (LIBOR 3M + 3.500%), 4/21/2024b | | 367,825 |
| | | | Avolon TLB Borrower 1 US, LLC, Term Loan | | |
| | 299,250 | | | 4.280%, (LIBOR 1M + 2.000%), 1/15/2025b | | 298,301 |
| | | | DTZ U.S. Borrower, LLC, Term Loan | | |
| | 190,000 | | | 5.552%, (LIBOR 1M + 3.250%), 8/21/2025b | | 189,821 |
| | | | GGP Nimbus LP, Term Loan | | |
| | 270,000 | | | 4.795%, (LIBOR 1M + 2.500%), 8/24/2025b | | 265,421 |
| | | | INEOS U.S. Finance, LLC, Term Loan | | |
| | 109,175 | | | 4.302%, (LIBOR 1M + 2.000%), 3/31/2024b | | 108,920 |
| | | | |
| | | | Total | | 1,230,288 |
| | | | |
| |
| | Technology (0.2%) | | |
| | | | First Data Corporation, Term Loan | | |
| | 595,000 | | | 4.287%, (LIBOR 1M + 2.000%), 4/26/2024b | | 591,531 |
| | | | Harland Clarke Holdings Corporation, Term Loan | | |
| | 313,123 | | | 7.136%, (LIBOR 3M + 4.750%), 11/3/2023b | | 292,770 |
| | | | Plantronics, Inc., Term Loan | | |
| | 380,000 | | | 4.802%, (LIBOR 1M + 2.500%), 7/2/2025b | | 378,575 |
| | | | Rackspace Hosting, Inc., Term Loan | | |
| | 330,998 | | | 5.348%, (LIBOR 3M + 3.000%), 11/3/2023b | | 320,724 |
| | | | TNS, Inc., Term Loan | | |
| | 215,153 | | | 6.320%, (LIBOR 3M + 4.000%), 8/14/2022b | | 216,050 |
| | | | |
| | | | Total | | 1,799,650 |
| | | | |
| |
| | Transportation (0.1%) | | |
| | | | Arctic LNG Carriers, Ltd., Term Loan | | |
| | 454,250 | | | 6.802%, (LIBOR 1M + 4.500%), 5/18/2023b | | 454,250 |
| | | | |
| | | | Total | | 454,250 |
| | | | |
| |
| | Utilities (<0.1%) | | |
| | | | Vertiv Group Corporation, Term Loan | | |
| | 404,187 | | | 6.313%, (LIBOR 3M + 4.000%), 11/15/2023b | | 399,640 |
| | | | |
| | | | Total | | 399,640 |
| | | | |
| | | | | | |
| | | | Total Bank Loans (cost $18,771,585) | | 18,547,821 |
| | | | |
| | |
Principal
Amount | | | Long-Term Fixed Income (93.9%) | | Value |
| |
| | Asset-Backed Securities (2.3%) | | |
| | | | Babson CLO, Ltd. | | |
| | 1,496,050 | | | 3.599%, (LIBOR 3M + 1.150%), 10/17/2026, Ser. 2014-IIA, Class AR*,b | | 1,496,355 |
| | 2,100,000 | | | 5.369%, (LIBOR 3M + 2.900%), 7/20/2029, Ser. 2018-3A, Class D*,b | | 2,087,320 |
| | | | Cent CLO 22, Ltd. | | |
| | 1,800,000 | | | 3.753%, (LIBOR 3M + 1.410%), 11/7/2026, Ser. 2014-22A, Class A1R*,b | | 1,800,362 |
The accompanying Notes to Financial Statements are an integral part of this schedule.
38
INCOME FUND
Schedule of Investments as of October 31, 2018
| | | | | | | | |
Principal
Amount | | | Long-Term Fixed Income (93.9%) | | Value | |
| | Asset-Backed Securities (2.3%) - continued | | | | |
| | | | Delta Air Lines, Inc. | | | | |
| | $904,626 | | | 4.250%, 7/30/2023 | | | $898,688 | |
| | | | First Horizon ABS Trust | | | | |
| | 7,547 | | | 2.441%, (LIBOR 1M + 0.160%), 10/25/2034, Ser. 2006-HE1, Class Ab,f | | | 7,508 | |
| | | | GMAC Mortgage Corporation Loan Trust | | | | |
| | 261,287 | | | 2.781%, (LIBOR 1M + 0.500%), 8/25/2035, Ser. 2005-HE1, Class A2b,f | | | 285,226 | |
| | | | IndyMac Seconds Asset-Backed Trust | | | | |
| | 704,832 | | | 2.621%, (LIBOR 1M + 0.340%), 10/25/2036, Ser. 2006-2B, Class Ab,f | | | 402,785 | |
| | | | Magnetite XII, Ltd. | | | | |
| | 1,800,000 | | | 3.536%, (LIBOR 3M + 1.100%), 10/15/2031, Ser. 2015-12A, Class ARR*,b | | | 1,799,977 | |
| | | | Octagon Investment Partners XVI, Ltd. | | | | |
| | 1,400,000 | | | 3.736%, (LIBOR 3M + 1.400%), 7/17/2030, Ser. 2013-1A, Class A2R*,b | | | 1,395,359 | |
| | | | PPM CLO, Ltd. | | | | |
| | 1,200,000 | | | 3.643%, (LIBOR 3M + 1.150%), 7/15/2031, Ser. 2018-1A, Class A*,b | | | 1,198,628 | |
| | | | Renaissance Home Equity Loan Trust | | | | |
| | 1,187,157 | | | 5.746%, 5/25/2036, Ser. 2006-1, Class AF6g | | | 835,547 | |
| | | | Shackleton CLO, Ltd. | | | | |
| | 1,200,000 | | | 3.509%, (LIBOR 3M + 1.170%), 7/15/2031, Ser. 2015-7RA, Class A1*,b | | | 1,199,908 | |
| | | | Sound Point CLO X, Ltd. | | | | |
| | 1,800,000 | | | 5.169%, (LIBOR 3M + 2.700%), 1/20/2028, Ser. 2015-3A, Class DR*,b | | | 1,799,971 | |
| | | | Symphony CLO XV, Ltd. | | | | |
| | 1,606,956 | | | 3.629%, (LIBOR 3M + 1.180%), 10/17/2026, Ser. 2014-15A, Class AR*,b | | | 1,607,665 | |
| | | | THL Credit Wind River CLO, Ltd. | | | | |
| | 1,800,000 | | | 5.286%, (LIBOR 3M + 2.850%), 7/15/2028, Ser. 2016-1A, Class DRb | | | 1,799,982 | |
| | | | | |
| | | | Total | | | 18,615,281 | |
| | | | | |
| |
| | Basic Materials (4.6%) | | | | |
| | | | Alcoa, Inc. | | | | |
| | 360,000 | | | 5.125%, 10/1/2024 | | | 353,250 | |
| | | | Anglo American Capital plc | | | | |
| | 1,800,000 | | | 3.625%, 9/11/2024h | | | 1,699,913 | |
| | 2,900,000 | | | 4.750%, 4/10/2027h | | | 2,792,551 | |
| | | | ArcelorMittal SA | | | | |
| | 1,820,000 | | | 6.125%, 6/1/2025i | | | 1,945,635 | |
| | | | Braskem America Finance Company | | | | |
| | 550,000 | | | 7.125%, 7/22/2041h | | | 611,188 | |
| | | | Braskem Netherlands Finance BV | | | | |
| | 3,000,000 | | | 4.500%, 1/10/2028h | | | 2,771,250 | |
| | | | Cleveland-Cliffs, Inc. | | | | |
| | 360,000 | | | 5.750%, 3/1/2025 | | | 340,200 | |
| | | | Dow Chemical Company | | | | |
| | 1,430,000 | | | 4.250%, 11/15/2020 | | | 1,447,946 | |
| | 1,080,000 | | | 3.000%, 11/15/2022 | | | 1,048,879 | |
| | | | First Quantum Minerals, Ltd. | | | | |
| | 360,000 | | | 6.500%, 3/1/2024h | | | 314,100 | |
| | | | Glencore Funding, LLC | | | | |
| | 1,820,000 | | | 4.125%, 5/30/2023h | | | 1,798,251 | |
| | 1,620,000 | | | 4.000%, 3/27/2027h | | | 1,489,885 | |
| | | | International Paper Company | | | | |
| | 1,260,000 | | | 3.000%, 2/15/2027 | | | 1,134,472 | |
| | | | Kinross Gold Corporation | | | | |
| | 360,000 | | | 5.950%, 3/15/2024 | | | 368,100 | |
| | 2,950,000 | | | 4.500%, 7/15/2027 | | | 2,640,250 | |
| | | | Krayton Polymers, LLC | | | | |
| | 360,000 | | | 7.000%, 4/15/2025h | | | 337,500 | |
| | | | LyondellBasell Industries NV | | | | |
| | 600,000 | | | 6.000%, 11/15/2021 | | | 632,716 | |
| | | | Novelis Corporation | | | | |
| | 360,000 | | | 5.875%, 9/30/2026h | | | 339,300 | |
| | | | Packaging Corporation of America | | | | |
| | 1,550,000 | | | 2.450%, 12/15/2020 | | | 1,517,032 | |
| | | | Syngenta Finance NV | | | | |
| | 1,825,000 | | | 4.441%, 4/24/2023h | | | 1,795,951 | |
| | | | Teck Resources, Ltd. | | | | |
| | 3,580,000 | | | 6.125%, 10/1/2035 | | | 3,624,750 | |
| | | | Tronox Finance plc | | | | |
| | 360,000 | | | 5.750%, 10/1/2025h | | | 315,900 | |
| | | | Vale Overseas, Ltd. | | | | |
| | 1,179,000 | | | 4.375%, 1/11/2022 | | | 1,185,602 | |
| | 1,080,000 | | | 6.250%, 8/10/2026 | | | 1,152,900 | |
| | 1,100,000 | | | 6.875%, 11/21/2036 | | | 1,221,319 | |
| | | | Westlake Chemical Corporation | | | | |
| | 1,800,000 | | | 3.600%, 8/15/2026 | | | 1,665,407 | |
| | | | WestRock Company | | | | |
| | 730,000 | | | 3.750%, 3/15/2025h | | | 702,577 | |
| | | | Weyerhaeuser Company | | | | |
| | 1,430,000 | | | 7.375%, 3/15/2032 | | | 1,754,781 | |
| | | | | |
| | | | Total | | | 37,001,605 | |
| | | | | |
| |
| | Capital Goods (2.8%) | | | | |
| | | | AECOM | | | | |
| | 385,000 | | | 5.875%, 10/15/2024 | | | 391,737 | |
| | 385,000 | | | 5.125%, 3/15/2027 | | | 358,050 | |
| | | | Ashtead Capital, Inc. | | | | |
| | 360,000 | | | 4.125%, 8/15/2025h | | | 333,900 | |
| | | | BAE Systems plc | | | | |
| | 1,030,000 | | | 4.750%, 10/11/2021h | | | 1,059,044 | |
| | | | Berry Global, Inc. | | | | |
| | 540,000 | | | 4.500%, 2/15/2026h | | | 504,900 | |
| | | | CNH Industrial Capital, LLC | | | | |
| | 1,440,000 | | | 4.875%, 4/1/2021 | | | 1,471,175 | |
| | | | CNH Industrial NV | | | | |
| | 1,795,000 | | | 3.850%, 11/15/2027 | | | 1,658,674 | |
| | | | Covanta Holding Corporation | | | | |
| | 360,000 | | | 5.875%, 7/1/2025 | | | 349,200 | |
| | | | Crown Cork & Seal Company, Inc. | | | | |
| | 360,000 | | | 7.375%, 12/15/2026 | | | 385,200 | |
The accompanying Notes to Financial Statements are an integral part of this schedule.
39
INCOME FUND
Schedule of Investments as of October 31, 2018
| | | | | | | | |
Principal
Amount | | | Long-Term Fixed Income (93.9%) | | Value | |
| | Capital Goods (2.8%) - continued | | | | |
| | | | General Electric Capital Corporation | | | | |
| | $1,800,000 | | | 3.334%, (LIBOR 3M + 1.000%), 3/15/2023b | | | $1,778,868 | |
| | | | Jeld-Wen, Inc. | | | | |
| | 360,000 | | | 4.625%, 12/15/2025h | | | 323,550 | |
| | | | L3 Technologies, Inc. | | | | |
| | 720,000 | | | 4.950%, 2/15/2021 | | | 738,295 | |
| | | | Northrop Grumman Corporation | | | | |
| | 1,250,000 | | | 3.250%, 1/15/2028 | | | 1,153,772 | |
| | | | Owens-Brockway Glass Container, Inc. | | | | |
| | 500,000 | | | 5.875%, 8/15/2023h | | | 498,125 | |
| | | | Republic Services, Inc. | | | | |
| | 1,830,000 | | | 3.550%, 6/1/2022 | | | 1,824,024 | |
| | | | Roper Technologies, Inc. | | | | |
| | 1,080,000 | | | 3.125%, 11/15/2022 | | | 1,052,014 | |
| | 1,260,000 | | | 3.800%, 12/15/2026 | | | 1,209,786 | |
| | | | Spirit AeroSystems, Inc. | | | | |
| | 1,800,000 | | | 3.134%, (LIBOR 3M + 0.800%), 6/15/2021b | | | 1,802,363 | |
| | | | Textron, Inc. | | | | |
| | 720,000 | | | 4.300%, 3/1/2024 | | | 724,183 | |
| | 370,000 | | | 3.875%, 3/1/2025 | | | 358,685 | |
| | 1,440,000 | | | 3.650%, 3/15/2027 | | | 1,348,798 | |
| | | | United Rentals North America, Inc. | | | | |
| | 375,000 | | | 5.500%, 7/15/2025 | | | 365,391 | |
| | | | United Technologies Corporation | | | | |
| | 1,075,000 | | | 3.950%, 8/16/2025 | | | 1,061,500 | |
| | 2,175,000 | | | 4.450%, 11/16/2038 | | | 2,100,865 | |
| | | | | |
| | | | Total | | | 22,852,099 | |
| | | | | |
| |
| | Collateralized Mortgage Obligations (0.2%) | | | | |
| | | | Countrywide Alternative Loan Trust | | | | |
| | 792,628 | | | 6.000%, 1/25/2037, Ser. 2006-39CB, Class 1A16 | | | 753,740 | |
| | | | Wachovia Mortgage Loan Trust, LLC | | | | |
| | 435,702 | | | 4.027%, 5/20/2036, Ser. 2006-A, Class 2A1b | | | 395,791 | |
| | | | | |
| | | | Total | | | 1,149,531 | |
| | | | | |
| |
| | Communications Services (9.3%) | | | | |
| | | | 21st Century Fox America, Inc. | | | | |
| | 1,100,000 | | | 7.625%, 11/30/2028 | | | 1,373,915 | |
| | 1,190,000 | | | 6.400%, 12/15/2035 | | | 1,450,087 | |
| | 1,300,000 | | | 6.150%, 2/15/2041 | | | 1,576,090 | |
| | | | American Tower Corporation | | | | |
| | 2,000,000 | | | 3.450%, 9/15/2021 | | | 1,987,620 | |
| | 1,440,000 | | | 3.125%, 1/15/2027 | | | 1,293,163 | |
| | | | AT&T, Inc. | | | | |
| | 1,810,000 | | | 4.450%, 4/1/2024 | | | 1,827,819 | |
| | 2,150,000 | | | 3.514%, (LIBOR 3M + 1.180%), 6/12/2024b | | | 2,155,964 | |
| | 760,000 | | | 3.400%, 5/15/2025 | | | 713,590 | |
| | 2,880,000 | | | 4.250%, 3/1/2027 | | | 2,793,283 | |
| | 1,519,000 | | | 4.300%, 2/15/2030h | | | 1,427,470 | |
| | 1,810,000 | | | 4.300%, 12/15/2042 | | | 1,484,992 | |
| | | | Block Communications, Inc. | | | | |
| | 360,000 | | | 6.875%, 2/15/2025h | | | 364,950 | |
| | | | CCO Holdings, LLC | | | | |
| | 360,000 | | | 5.500%, 5/1/2026h | | | 350,550 | |
| | | | Charter Communications Operating, LLC | | | | |
| | 1,080,000 | | | 4.464%, 7/23/2022 | | | 1,092,045 | |
| | 3,325,000 | | | 6.484%, 10/23/2045 | | | 3,398,354 | |
| | | | Comcast Corporation | | | | |
| | 3,400,000 | | | 4.950%, 10/15/2058 | | | 3,330,940 | |
| | 1,080,000 | | | 3.375%, 8/15/2025 | | | 1,039,007 | |
| | 292,000 | | | 6.400%, 5/15/2038 | | | 343,669 | |
| | 1,600,000 | | | 4.600%, 10/15/2038 | | | 1,565,706 | |
| | 1,800,000 | | | 4.650%, 7/15/2042 | | | 1,718,125 | |
| | | | Cox Communications, Inc. | | | | |
| | 1,800,000 | | | 3.350%, 9/15/2026h | | | 1,656,068 | |
| | 315,000 | | | 4.800%, 2/1/2035h | | | 283,494 | |
| | 1,400,000 | | | 4.700%, 12/15/2042h | | | 1,185,142 | |
| | | | Crown Castle International Corporation | | | | |
| | 540,000 | | | 3.400%, 2/15/2021 | | | 536,607 | |
| | 2,340,000 | | | 5.250%, 1/15/2023 | | | 2,440,457 | |
| | 1,300,000 | | | 3.150%, 7/15/2023 | | | 1,247,806 | |
| | | | Digicel, Ltd. | | | | |
| | 360,000 | | | 6.000%, 4/15/2021*,i | | | 326,700 | |
| | | | Discovery Communications, LLC | | | | |
| | 1,170,000 | | | 3.500%, 6/15/2022h | | | 1,146,471 | |
| | 900,000 | | | 4.900%, 3/11/2026 | | | 910,282 | |
| | 2,160,000 | | | 5.200%, 9/20/2047 | | | 1,994,962 | |
| | | | Gray Television, Inc. | | | | |
| | 360,000 | | | 5.125%, 10/15/2024h | | | 342,450 | |
| | | | Interpublic Group of Companies, Inc. | | | | |
| | 1,800,000 | | | 3.750%, 10/1/2021 | | | 1,799,146 | |
| | | | Level 3 Financing, Inc. | | | | |
| | 360,000 | | | 5.250%, 3/15/2026 | | | 345,600 | |
| | | | Omnicom Group, Inc. | | | | |
| | 2,380,000 | | | 4.450%, 8/15/2020 | | | 2,421,222 | |
| | 560,000 | | | 3.650%, 11/1/2024 | | | 539,371 | |
| | | | Outdoor Americas Capital, LLC | | | | |
| | 360,000 | | | 5.625%, 2/15/2024 | | | 360,450 | |
| | | | SES Global Americas Holdings GP | | | | |
| | 1,820,000 | | | 2.500%, 3/25/2019h | | | 1,814,917 | |
| | | | Sinclair Television Group, Inc. | | | | |
| | 360,000 | | | 5.875%, 3/15/2026h | | | 342,900 | |
| | | | Sprint Communications, Inc. | | | | |
| | 355,000 | | | 7.000%, 3/1/2020h | | | 367,869 | |
| | | | Sprint Corporation | | | | |
| | 540,000 | | | 7.125%, 6/15/2024 | | | 552,150 | |
| | | | Telecom Italia Capital SA | | | | |
| | 845,000 | | | 7.721%, 6/4/2038 | | | 855,563 | |
| | | | Telecom Italia SPA | | | | |
| | 1,800,000 | | | 5.303%, 5/30/2024h | | | 1,696,500 | |
| | | | Telefonica Emisiones SAU | | | | |
| | 1,800,000 | | | 4.665%, 3/6/2038 | | | 1,613,548 | |
| | | | Time Warner Cable, Inc. | | | | |
| | 2,200,000 | | | 4.125%, 2/15/2021 | | | 2,207,405 | |
| | | | Time Warner Entertainment Company, LP | | | | |
| | 780,000 | | | 8.375%, 3/15/2023 | | | 899,041 | |
| | | | Time Warner, Inc. | | | | |
| | 790,000 | | | 4.750%, 3/29/2021 | | | 810,735 | |
| | | | Verizon Communications, Inc. | | | | |
| | 1,260,000 | | | 3.500%, 11/1/2024 | | | 1,232,384 | |
| | 2,600,000 | | | 3.414%, (LIBOR 3M + 1.100%), 5/15/2025b | | | 2,613,396 | |
| | 1,080,000 | | | 5.250%, 3/16/2037 | | | 1,110,409 | |
The accompanying Notes to Financial Statements are an integral part of this schedule.
40
INCOME FUND
Schedule of Investments as of October 31, 2018
| | | | | | | | |
Principal
Amount | | | Long-Term Fixed Income (93.9%) | | Value | |
| | Communications Services (9.3%) - continued | | | | |
| | $2,170,000 | | | 4.862%, 8/21/2046 | | | $2,076,319 | |
| | 2,747,000 | | | 4.522%, 9/15/2048 | | | 2,491,562 | |
| | | | Viacom, Inc. | | | | |
| | 2,500,000 | | | 6.875%, 4/30/2036 | | | 2,760,683 | |
| | | | Virgin Media Secured Finance plc | | | | |
| | 360,000 | | | 5.250%, 1/15/2026h | | | 335,700 | |
| | | | Vodafone Group plc | | | | |
| | 1,350,000 | | | 5.000%, 5/30/2038 | | | 1,270,172 | |
| | | | Windstream Services, LLC | | | | |
| | 360,000 | | | 8.625%, 10/31/2025h | | | 336,600 | |
| | | | Zayo Group, LLC | | | | |
| | 360,000 | | | 5.750%, 1/15/2027h | | | 352,872 | |
| | | | | |
| | | | Total | | | 74,564,292 | |
| | | | | |
| |
| | Consumer Cyclical (4.6%) | | | | |
| | | | Amazon.com, Inc. | | | | |
| | 2,520,000 | | | 4.050%, 8/22/2047 | | | 2,360,582 | |
| | | | American Axle & Manufacturing, Inc. | | | | |
| | 360,000 | | | 6.250%, 4/1/2025i | | | 339,750 | |
| | | | Cinemark USA, Inc. | | | | |
| | 360,000 | | | 4.875%, 6/1/2023 | | | 351,450 | |
| | | | Daimler Finance North America, LLC | | | | |
| | 1,100,000 | | | 2.891%, (LIBOR 3M + 0.550%), 5/4/2021b,h | | | 1,100,528 | |
| | | | Dana, Inc. | | | | |
| | 360,000 | | | 6.000%, 9/15/2023 | | | 365,400 | |
| | | | Ford Motor Credit Company, LLC | | | | |
| | 800,000 | | | 2.597%, 11/4/2019 | | | 790,503 | |
| | 1,100,000 | | | 3.470%, 4/5/2021 | | | 1,073,895 | |
| | 1,800,000 | | | 2.979%, 8/3/2022 | | | 1,688,446 | |
| | 1,425,000 | | | 4.250%, 9/20/2022 | | | 1,400,281 | |
| | 1,150,000 | | | 3.096%, 5/4/2023 | | | 1,061,669 | |
| | | | General Motors Company | | | | |
| | 1,800,000 | | | 3.227%, (LIBOR 3M + 0.900%), 9/10/2021b | | | 1,797,397 | |
| | 2,100,000 | | | 5.000%, 10/1/2028 | | | 2,009,410 | |
| | 770,000 | | | 5.000%, 4/1/2035 | | | 676,367 | |
| | | | General Motors Financial Company, Inc. | | | | |
| | 1,900,000 | | | 3.450%, 4/10/2022 | | | 1,848,459 | |
| | 1,490,000 | | | 4.000%, 1/15/2025 | | | 1,410,793 | |
| | | | Hanesbrands, Inc. | | | | |
| | 360,000 | | | 4.625%, 5/15/2024h | | | 344,700 | |
| | | | Hilton Escrow Issuer, LLC | | | | |
| | 360,000 | | | 4.250%, 9/1/2024 | | | 345,708 | |
| | | | Home Depot, Inc. | | | | |
| | 540,000 | | | 2.125%, 9/15/2026 | | | 480,682 | |
| | 1,820,000 | | | 4.250%, 4/1/2046 | | | 1,750,013 | |
| | | | Hyundai Capital America | | | | |
| | 1,050,000 | | | 3.000%, 3/18/2021h | | | 1,024,732 | |
| | 2,150,000 | | | 2.450%, 6/15/2021h | | | 2,065,604 | |
| | | | Hyundai Capital Services, Inc. | | | | |
| | 1,080,000 | | | 3.000%, 3/6/2022h | | | 1,039,593 | |
| | | | L Brands, Inc. | | | | |
| | 380,000 | | | 5.625%, 2/15/2022 | | | 385,700 | |
| | | | Lennar Corporation | | | | |
| | 1,270,000 | | | 2.950%, 11/29/2020 | | | 1,235,075 | |
| | 1,100,000 | | | 4.125%, 1/15/2022 | | | 1,073,930 | |
| | 1,100,000 | | | 4.500%, 4/30/2024 | | | 1,051,188 | |
| | | | Live Nation Entertainment, Inc. | | | | |
| | 720,000 | | | 4.875%, 11/1/2024h | | | 689,400 | |
| | | | Macy’s Retail Holdings, Inc. | | | | |
| | 300,000 | | | 3.875%, 1/15/2022 | | | 297,978 | |
| | 475,000 | | | 2.875%, 2/15/2023i | | | 443,639 | |
| | 1,100,000 | | | 6.790%, 7/15/2027 | | | 1,161,887 | |
| | 725,000 | | | 6.700%, 9/15/2028 | | | 754,047 | |
| | | | Mattamy Group Corporation | | | | |
| | 360,000 | | | 6.500%, 10/1/2025h | | | 338,400 | |
| | | | McDonald’s Corporation | | | | |
| | 1,825,000 | | | 4.450%, 3/1/2047 | | | 1,706,656 | |
| | | | MGM Growth Properties Operating Partnership, LP | | | | |
| | 360,000 | | | 4.500%, 9/1/2026 | | | 325,800 | |
| | | | Scientific Games International, Inc. | | | | |
| | 360,000 | | | 5.000%, 10/15/2025h | | | 334,800 | |
| | | | Six Flags Entertainment Corporation | | | | |
| | 360,000 | | | 4.875%, 7/31/2024h | | | 340,200 | |
| | | | Visa, Inc. | | | | |
| | 1,640,000 | | | 3.150%, 12/14/2025 | | | 1,576,905 | |
| | | | Yum! Brands, Inc. | | | | |
| | 360,000 | | | 5.000%, 6/1/2024h | | | 355,050 | |
| | | | | |
| | | | Total | | | 37,396,617 | |
| | | | | |
| |
| | Consumer Non-Cyclical (10.5%) | | | | |
| | | | Abbott Laboratories | | | | |
| | 1,632,000 | | | 3.750%, 11/30/2026 | | | 1,606,941 | |
| | 810,000 | | | 4.750%, 11/30/2036 | | | 823,354 | |
| | 1,500,000 | | | 6.000%, 4/1/2039 | | | 1,727,188 | |
| | 1,080,000 | | | 4.900%, 11/30/2046 | | | 1,113,934 | |
| | | | AbbVie, Inc. | | | | |
| | 2,540,000 | | | 3.200%, 5/14/2026 | | | 2,324,820 | |
| | | | Albertsons Companies, LLC | | | | |
| | 360,000 | | | 6.625%, 6/15/2024 | | | 340,200 | |
| | | | Anheuser-Busch InBev Finance, Inc. | | | | |
| | 3,700,000 | | | 3.650%, 2/1/2026 | | | 3,511,595 | |
| | 1,790,000 | | | 4.700%, 2/1/2036 | | | 1,706,959 | |
| | | | Anheuser-Busch InBev Worldwide, Inc. | | | | |
| | 725,000 | | | 3.500%, 1/12/2024 | | | 705,699 | |
| | 2,175,000 | | | 4.000%, 4/13/2028 | | | 2,086,107 | |
| | 2,900,000 | | | 4.600%, 4/15/2048 | | | 2,610,870 | |
| | | | BAT Capital Corporation | | | | |
| | 540,000 | | | 2.297%, 8/14/2020h | | | 528,409 | |
| | 1,800,000 | | | 3.222%, 8/15/2024h | | | 1,698,756 | |
| | | | Bausch Health Co. Inc. | | | | |
| | 332,000 | | | 7.500%, 7/15/2021h | | | 336,980 | |
| | | | Baxalta, Inc. | | | | |
| | 871,000 | | | 4.000%, 6/23/2025 | | | 849,002 | |
| | | | Bayer U.S. Finance II, LLC | | | | |
| | 720,000 | | | 4.250%, 12/15/2025h | | | 707,332 | |
| | 2,520,000 | | | 4.875%, 6/25/2048h | | | 2,349,665 | |
| | | | Becton, Dickinson and Company | | | | |
| | 1,880,000 | | | 3.125%, 11/8/2021 | | | 1,849,062 | |
| | 1,080,000 | | | 3.363%, 6/6/2024 | | | 1,032,049 | |
| | 1,080,000 | | | 3.734%, 12/15/2024 | | | 1,046,962 | |
| | 2,150,000 | | | 3.700%, 6/6/2027 | | | 2,019,338 | |
| | 1,700,000 | | | 4.669%, 6/6/2047 | | | 1,593,207 | |
| | | | Boston Scientific Corporation | | | | |
| | 1,340,000 | | | 3.375%, 5/15/2022 | | | 1,322,111 | |
| | 700,000 | | | 4.000%, 3/1/2028 | | | 683,425 | |
| | 928,000 | | | 7.375%, 1/15/2040 | | | 1,188,933 | |
The accompanying Notes to Financial Statements are an integral part of this schedule.
41
INCOME FUND
Schedule of Investments as of October 31, 2018
| | | | | | | | |
Principal
Amount | | | Long-Term Fixed Income (93.9%) | | Value | |
| | Consumer Non-Cyclical (10.5%) - continued | | | | |
| | | | Bunge, Ltd. Finance Corporation | | | | |
| | $1,080,000 | | | 3.500%, 11/24/2020 | | | $1,077,681 | |
| | | | Celgene Corporation | | | | |
| | 1,090,000 | | | 3.250%, 8/15/2022 | | | 1,066,179 | |
| | | | Conagra Brands, Inc. | | | | |
| | 500,000 | | | 4.600%, 11/1/2025 | | | 500,387 | |
| | | | Constellation Brands, Inc. | | | | |
| | 800,000 | | | 4.400%, 11/15/2025 | | | 801,512 | |
| | 360,000 | | | 3.500%, 5/9/2027 | | | 332,795 | |
| | 1,700,000 | | | 5.250%, 11/15/2048 | | | 1,701,517 | |
| | | | CVS Health Corporation | | | | |
| | 630,000 | | | 4.750%, 12/1/2022 | | | 649,738 | |
| | 1,825,000 | | | 4.100%, 3/25/2025 | | | 1,803,765 | |
| | 900,000 | | | 3.875%, 7/20/2025 | | | 875,949 | |
| | 3,000,000 | | | 4.780%, 3/25/2038 | | | 2,873,864 | |
| | | | Forest Laboratories, Inc. | | | | |
| | 1,450,000 | | | 5.000%, 12/15/2021h | | | 1,495,613 | |
| | | | H. J. Heinz Company | | | | |
| | 1,140,000 | | | 5.200%, 7/15/2045 | | | 1,070,419 | |
| | | | Halfmoon Parent, Inc. | | | | |
| | 1,800,000 | | | 4.125%, 11/15/2025h | | | 1,779,380 | |
| | 1,800,000 | | | 4.800%, 8/15/2038h | | | 1,737,699 | |
| | | | HCA, Inc. | | | | |
| | 360,000 | | | 4.750%, 5/1/2023 | | | 363,600 | |
| | | | Imperial Tobacco Finance plc | | | | |
| | 1,310,000 | | | 3.750%, 7/21/2022h | | | 1,294,879 | |
| | | | Kellogg Company | | | | |
| | 1,450,000 | | | 3.125%, 5/17/2022 | | | 1,418,708 | |
| | | | Kraft Heinz Foods Company | | | | |
| | 720,000 | | | 3.000%, 6/1/2026 | | | 642,681 | |
| | | | Kroger Company | | | | |
| | 1,800,000 | | | 2.650%, 10/15/2026i | | | 1,575,506 | |
| | | | Maple Escrow Subsidiary, Inc. | | | | |
| | 750,000 | | | 3.551%, 5/25/2021h | | | 746,504 | |
| | | | Mylan, Inc. | | | | |
| | 1,080,000 | | | 3.125%, 1/15/2023h | | | 1,018,592 | |
| | 1,260,000 | | | 4.550%, 4/15/2028h | | | 1,166,072 | |
| | | | Nestle Holdings, Inc. | | | | |
| | 2,150,000 | | | 3.900%, 9/24/2038h | | | 2,035,537 | |
| | | | Newell Rubbermaid, Inc. | | | | |
| | 1,550,000 | | | 3.850%, 4/1/2023 | | | 1,502,252 | |
| | | | Pernod Ricard SA | | | | |
| | 1,620,000 | | | 5.750%, 4/7/2021h | | | 1,696,454 | |
| | | | Perrigo Finance Unlimited Company | �� | | | |
| | 800,000 | | | 4.375%, 3/15/2026 | | | 772,936 | |
| | 1,800,000 | | | 4.900%, 12/15/2044 | | | 1,582,215 | |
| | | | Pilgrim’s Pride Corporation | | | | |
| | 540,000 | | | 5.875%, 9/30/2027h | | | 490,050 | |
| | | | Reckitt Benckiser Treasury Services plc | | | | |
| | 1,620,000 | | | 2.750%, 6/26/2024h | | | 1,520,452 | |
| | | | Reynolds American, Inc. | | | | |
| | 940,000 | | | 5.850%, 8/15/2045 | | | 963,668 | |
| | | | Shire Acquisitions Investments Ireland Designated Activity Company | | | | |
| | 1,800,000 | | | 2.875%, 9/23/2023 | | | 1,695,221 | |
| | | | Smithfield Foods, Inc. | | | | |
| | 4,500,000 | | | 2.650%, 10/3/2021h | | | 4,282,599 | |
| | | | Tenet Healthcare Corporation | | | | |
| | 360,000 | | | 4.500%, 4/1/2021 | | | 358,200 | |
| | | | Teva Pharmaceutical Finance Netherlands III BV | | | | |
| | 1,850,000 | | | 6.000%, 4/15/2024 | | | 1,841,073 | |
| | | | Thermo Fisher Scientific, Inc. | | | | |
| | 2,170,000 | | | 3.000%, 4/15/2023 | | | 2,091,551 | |
| | 720,000 | | | 2.950%, 9/19/2026 | | | 657,570 | |
| | | | Tyson Foods, Inc. | | | | |
| | 720,000 | | | 3.550%, 6/2/2027 | | | 671,189 | |
| | | | Valeant Pharmaceuticals International, Inc. | | | | |
| | 360,000 | | | 5.875%, 5/15/2023h | | | 344,250 | |
| | | | VRX Escrow Corporation | | | | |
| | 360,000 | | | 6.125%, 4/15/2025h | | | 331,092 | |
| | | | | |
| | | | Total | | | 84,592,247 | |
| | | | | |
| |
| | Energy (10.1%) | | | | |
| | | | Anadarko Petroleum Corporation | | | | |
| | 1,700,000 | | | 3.450%, 7/15/2024 | | | 1,615,106 | |
| | 1,800,000 | | | 5.550%, 3/15/2026 | | | 1,872,887 | |
| | | | Andeavor Logistics, LP | | | | |
| | 1,450,000 | | | 3.500%, 12/1/2022 | | | 1,415,799 | |
| | | | BP Capital Markets plc | | | | |
| | 1,510,000 | | | 3.814%, 2/10/2024 | | | 1,513,534 | |
| | 910,000 | | | 3.119%, 5/4/2026 | | | 856,373 | |
| | 1,440,000 | | | 3.017%, 1/16/2027 | | | 1,333,059 | |
| | | | California Resources Corporation | | | | |
| | 360,000 | | | 8.000%, 12/15/2022h,i | | | 320,400 | |
| | | | Canadian Natural Resources, Ltd. | | | | |
| | 900,000 | | | 6.250%, 3/15/2038 | | | 1,013,835 | |
| | | | Centennial Resource Production, LLC | | | | |
| | 360,000 | | | 5.375%, 1/15/2026h | | | 351,900 | |
| | | | Cheniere Corpus Christi Holdings, LLC | | | | |
| | 540,000 | | | 5.125%, 6/30/2027 | | | 529,200 | |
| | | | Continental Resources, Inc. | | | | |
| | 1,800,000 | | | 4.375%, 1/15/2028 | | | 1,740,445 | |
| | | | Diamondback Energy, Inc. | | | | |
| | 710,000 | | | 4.750%, 11/1/2024 | | | 690,475 | |
| | | | El Paso Pipeline Partners Operating Company, LLC | | | | |
| | 1,650,000 | | | 5.000%, 10/1/2021 | | | 1,701,515 | |
| | 720,000 | | | 4.700%, 11/1/2042 | | | 639,233 | |
| | | | Enbridge Energy Partners, LP | | | | |
| | 1,450,000 | | | 5.200%, 3/15/2020 | | | 1,480,751 | |
| | 1,080,000 | | | 7.375%, 10/15/2045 | | | 1,340,335 | |
| | | | Enbridge, Inc. | | | | |
| | 900,000 | | | 3.700%, 7/15/2027i | | | 845,811 | |
| | | | Energy Transfer Equity, LP | | | | |
| | 565,000 | | | 5.500%, 6/1/2027 | | | 574,351 | |
| | | | Energy Transfer Operating, LP | | | | |
| | 1,800,000 | | | 6.000%, 6/15/2048 | | | 1,773,424 | |
| | | | Energy Transfer Partners, LP | | | | |
| | 2,520,000 | | | 4.200%, 4/15/2027 | | | 2,377,780 | |
| | | | Eni SPA | | | | |
| | 1,450,000 | | | 4.000%, 9/12/2023h | | | 1,419,302 | |
| | | | EnLink Midstream Partners, LP | | | | |
| | 720,000 | | | 4.150%, 6/1/2025 | | | 669,314 | |
| | 540,000 | | | 4.850%, 7/15/2026 | | | 511,620 | |
| | | | Ensco plc | | | | |
| | 360,000 | | | 7.750%, 2/1/2026 | | | 335,700 | |
The accompanying Notes to Financial Statements are an integral part of this schedule.
42
INCOME FUND
Schedule of Investments as of October 31, 2018
| | | | | | | | |
Principal
Amount | | | Long-Term Fixed Income (93.9%) | | Value | |
| | Energy (10.1%) - continued | | | | |
| | | | Enterprise Products Operating, LLC | | | | |
| | $1,010,000 | | | 3.700%, 2/15/2026 | | | $974,855 | |
| | 1,800,000 | | | 4.875%, 8/16/2077b | | | 1,669,433 | |
| | | | EQM Midstream Partners LP | | | | |
| | 1,550,000 | | | 4.750%, 7/15/2023 | | | 1,562,982 | |
| | | | EQT Corporation | | | | |
| | 720,000 | | | 3.000%, 10/1/2022 | | | 690,768 | |
| | 2,600,000 | | | 3.900%, 10/1/2027 | | | 2,366,004 | |
| | | | Hess Corporation | | | | |
| | 720,000 | | | 3.500%, 7/15/2024 | | | 678,847 | |
| | | | Kerr-McGee Corporation | | | | |
| | 1,800,000 | | | 6.950%, 7/1/2024 | | | 2,015,077 | |
| | | | Kinder Morgan Energy Partners, LP | | | | |
| | 1,825,000 | | | 5.000%, 8/15/2042 | | | 1,676,740 | |
| | | | Kinder Morgan, Inc. | | | | |
| | 720,000 | | | 5.000%, 2/15/2021h | | | 738,527 | |
| | 1,825,000 | | | 5.200%, 3/1/2048 | | | 1,762,204 | |
| | | | Marathon Oil Corporation | | | | |
| | 1,800,000 | | | 4.400%, 7/15/2027 | | | 1,754,274 | |
| | | | Marathon Petroleum Corporation | | | | |
| | 1,440,000 | | | 4.750%, 12/15/2023h | | | 1,483,455 | |
| | 1,780,000 | | | 6.500%, 3/1/2041 | | | 1,997,380 | |
| | | | MPLX, LP | | | | |
| | 1,450,000 | | | 4.875%, 6/1/2025 | | | 1,478,371 | |
| | 1,080,000 | | | 5.200%, 3/1/2047 | | | 1,021,137 | |
| | | | Murphy Oil Corporation | | | | |
| | 360,000 | | | 5.750%, 8/15/2025 | | | 358,093 | |
| | | | Nabors Industries, Inc. | | | | |
| | 360,000 | | | 5.750%, 2/1/2025 | | | 332,274 | |
| | | | NiSource Finance Corporation | | | | |
| | 1,080,000 | | | 4.375%, 5/15/2047 | | | 988,970 | |
| | | | Noble Energy, Inc. | | | | |
| | 720,000 | | | 5.050%, 11/15/2044 | | | 660,231 | |
| | | | ONEOK Partners, LP | | | | |
| | 2,000,000 | | | 3.800%, 3/15/2020 | | | 2,006,039 | |
| | | | Petrobras Global Finance BV | | | | |
| | 2,520,000 | | | 5.299%, 1/27/2025 | | | 2,403,450 | |
| | | | Petroleos Mexicanos | | | | |
| | 540,000 | | | 5.375%, 3/13/2022 | | | 539,892 | |
| | 1,080,000 | | | 4.625%, 9/21/2023 | | | 1,029,769 | |
| | | | Phillips 66 | | | | |
| | 1,050,000 | | | 3.900%, 3/15/2028 | | | 1,005,921 | |
| | | | Plains All American Pipeline, LP | | | | |
| | 1,550,000 | | | 5.000%, 2/1/2021 | | | 1,581,830 | |
| | 1,800,000 | | | 3.650%, 6/1/2022 | | | 1,764,279 | |
| | | | Precision Drilling Corporation | | | | |
| | 360,000 | | | 7.125%, 1/15/2026h | | | 357,300 | |
| | | | Regency Energy Partners, LP | | | | |
| | 2,360,000 | | | 5.000%, 10/1/2022 | | | 2,431,698 | |
| | | | Sabine Pass Liquefaction, LLC | | | | |
| | 1,090,000 | | | 5.750%, 5/15/2024 | | | 1,154,439 | |
| | | | Schlumberger Holdings Corporation | | | | |
| | 1,080,000 | | | 4.000%, 12/21/2025h | | | 1,068,283 | |
| | | | Sempra Energy | | | | |
| | 1,800,000 | | | 3.250%, 6/15/2027 | | | 1,657,528 | |
| | | | SM Energy Company | | | | |
| | 720,000 | | | 5.000%, 1/15/2024i | | | 685,800 | |
| | | | Southwestern Energy Company | | | | |
| | 360,000 | | | 7.750%, 10/1/2027i | | | 367,200 | |
| | | | Suncor Energy, Inc. | | | | |
| | 1,080,000 | | | 3.600%, 12/1/2024 | | | 1,060,643 | |
| | | | Sunoco Logistics Partners Operations, LP | | | | |
| | 1,800,000 | | | 3.450%, 1/15/2023 | | | 1,738,184 | |
| | | | Sunoco, LP | | | | |
| | 360,000 | | | 5.500%, 2/15/2026h | | | 342,900 | |
| | | | Tallgrass Energy Partners, LP | | | | |
| | 360,000 | | | 5.500%, 1/15/2028h | | | 355,882 | |
| | | | Targa Resources Partners, LP | | | | |
| | 360,000 | | | 5.125%, 2/1/2025 | | | 350,100 | |
| | | | Tesoro Logistics, LP | | | | |
| | 1,120,000 | | | 5.500%, 10/15/2019 | | | 1,141,213 | |
| | | | TransCanada Trust | | | | |
| | 720,000 | | | 5.300%, 3/15/2077b | | | 658,800 | |
| | | | Transocean, Inc. | | | | |
| | 360,000 | | | 7.500%, 1/15/2026h | | | 353,700 | |
| | | | Williams Companies, Inc. | | | | |
| | 1,800,000 | | | 7.500%, 1/15/2031 | | | 2,130,284 | |
| | | | Williams Partners, LP | | | | |
| | 1,070,000 | | | 4.500%, 11/15/2023 | | | 1,085,046 | |
| | 900,000 | | | 3.750%, 6/15/2027 | | | 838,082 | |
| | | | Woodside Finance, Ltd. | | | | |
| | 1,870,000 | | | 3.650%, 3/5/2025h | | | 1,786,284 | |
| | | | | |
| | | | Total | | | 81,026,317 | |
| | | | | |
| |
| | Financials (26.9%) | | | | |
| | | | Aegon NV | | | | |
| | 1,400,000 | | | 3.313%, (USISDA 10Y + 0.100%), 1/15/2019b,j | | | 1,092,168 | |
| | | | AerCap Ireland Capital, Ltd. | | | | |
| | 1,800,000 | | | 5.000%, 10/1/2021 | | | 1,848,294 | |
| | 540,000 | | | 3.950%, 2/1/2022 | | | 534,585 | |
| | | | Aflac, Inc. | | | | |
| | 1,440,000 | | | 4.000%, 10/15/2046 | | | 1,285,243 | |
| | | | Air Lease Corporation | | | | |
| | 1,490,000 | | | 3.750%, 2/1/2022 | | | 1,481,626 | |
| | 740,000 | | | 4.250%, 9/15/2024 | | | 729,755 | |
| | | | Aircastle, Ltd. | | | | |
| | 1,785,000 | | | 4.400%, 9/25/2023 | | | 1,767,739 | |
| | | | Ally Financial, Inc. | | | | |
| | 360,000 | | | 4.125%, 2/13/2022 | | | 354,600 | |
| | | | American International Group, Inc. | | | | |
| | 1,800,000 | | | 4.200%, 4/1/2028 | | | 1,728,593 | |
| | 1,370,000 | | | 4.500%, 7/16/2044 | | | 1,215,740 | |
| | | | Ares Capital Corporation | | | | |
| | 1,810,000 | | | 4.875%, 11/30/2018 | | | 1,812,552 | |
| | 1,850,000 | | | 3.875%, 1/15/2020 | | | 1,855,931 | |
| | | | Associated Banc-Corporation | | | | |
| | 1,850,000 | | | 4.250%, 1/15/2025 | | | 1,821,715 | |
| | | | Athene Holding, Ltd. | | | | |
| | 2,500,000 | | | 4.125%, 1/12/2028 | | | 2,293,172 | |
| | | | Avolon Holdings Funding, Ltd. | | | | |
| | 360,000 | | | 5.500%, 1/15/2023h | | | 358,200 | |
| | 360,000 | | | 5.125%, 10/1/2023h | | | 353,250 | |
| | | | AXA SA | | | | |
| | 1,420,000 | | | 8.600%, 12/15/2030 | | | 1,803,400 | |
| | | | Banco Bilbao Vizcaya Argentaria SA | | | | |
| | 2,200,000 | | | 6.125%, 11/16/2027b,i,j | | | 1,894,750 | |
The accompanying Notes to Financial Statements are an integral part of this schedule.
43
INCOME FUND
Schedule of Investments as of October 31, 2018
| | | | | | | | |
Principal
Amount | | | Long-Term Fixed Income (93.9%) | | Value | |
| | Financials (26.9%) - continued | | | | |
| | | | Banco Santander SA | | | | |
| | $1,000,000 | | | 6.375%, 5/19/2019b,j | | | $986,250 | |
| | 1,200,000 | | | 4.379%, 4/12/2028 | | | 1,118,272 | |
| | | | Bank of America Corporation | | | | |
| | 1,080,000 | | | 2.328%, 10/1/2021b | | | 1,054,323 | |
| | 1,100,000 | | | 3.499%, 5/17/2022b | | | 1,095,200 | |
| | 1,857,000 | | | 3.004%, 12/20/2023b | | | 1,787,954 | |
| | 1,670,000 | | | 4.200%, 8/26/2024 | | | 1,658,450 | |
| | 1,640,000 | | | 6.500%, 10/23/2024b,j | | | 1,739,138 | |
| | 1,800,000 | | | 4.000%, 1/22/2025 | | | 1,751,373 | |
| | 1,250,000 | | | 3.950%, 4/21/2025 | | | 1,212,306 | |
| | 730,000 | | | 3.875%, 8/1/2025 | | | 719,528 | |
| | 1,800,000 | | | 3.093%, 10/1/2025b | | | 1,704,469 | |
| | 730,000 | | | 6.300%, 3/10/2026b,j | | | 769,238 | |
| | 1,800,000 | | | 3.705%, 4/24/2028b | | | 1,708,718 | |
| | 1,450,000 | | | 4.271%, 7/23/2029b | | | 1,430,066 | |
| | 1,890,000 | | | 4.750%, 4/21/2045 | | | 1,845,053 | |
| | | | Bank of Montreal | | | | |
| | 1,100,000 | | | 2.896%, (LIBOR 3M + 0.460%), 4/13/2021b | | | 1,102,499 | |
| | | | Bank of Nova Scotia | | | | |
| | 1,800,000 | | | 3.125%, 4/20/2021 | | | 1,786,652 | |
| | | | Barclays Bank plc | | | | |
| | 1,090,000 | | | 10.179%, 6/12/2021h | | | 1,239,570 | |
| | | | Barclays plc | | | | |
| | 1,600,000 | | | 4.338%, 5/16/2024b | | | 1,571,934 | |
| | 720,000 | | | 4.836%, 5/9/2028 | | | 664,777 | |
| | | | Boston Properties, LP | | | | |
| | 1,800,000 | | | 2.750%, 10/1/2026 | | | 1,613,686 | |
| | | | BPCE SA | | | | |
| | 1,080,000 | | | 3.000%, 5/22/2022h | | | 1,040,244 | |
| | 735,000 | | | 5.700%, 10/22/2023h | | | 760,820 | |
| | 810,000 | | | 5.150%, 7/21/2024h | | | 815,271 | |
| | | | Capital One Financial Corporation | | | | |
| | 2,200,000 | | | 3.450%, 4/30/2021 | | | 2,190,449 | |
| | 1,810,000 | | | 4.200%, 10/29/2025 | | | 1,747,678 | |
| | | | Centene Escrow Corporation | | | | |
| | 360,000 | | | 6.125%, 2/15/2024 | | | 376,200 | |
| | | | CIT Group, Inc. | | | | |
| | 180,000 | | | 4.125%, 3/9/2021 | | | 179,550 | |
| | 180,000 | | | 5.250%, 3/7/2025 | | | 180,900 | |
| | | | Citigroup, Inc. | | | | |
| | 1,100,000 | | | 3.142%, 1/24/2023b | | | 1,073,919 | |
| | 1,440,000 | | | 3.751%, (LIBOR 3M + 1.430%), 9/1/2023b | | | 1,470,312 | |
| | 2,630,000 | | | 4.400%, 6/10/2025 | | | 2,605,425 | |
| | 1,695,000 | | | 5.500%, 9/13/2025 | | | 1,777,864 | |
| | 1,090,000 | | | 3.700%, 1/12/2026 | | | 1,042,429 | |
| | 1,510,000 | | | 4.450%, 9/29/2027 | | | 1,469,795 | |
| | 1,440,000 | | | 3.887%, 1/10/2028b | | | 1,375,170 | |
| | 1,450,000 | | | 4.650%, 7/23/2048 | | | 1,401,150 | |
| | | | Citizens Bank NA | | | | |
| | 1,440,000 | | | 2.550%, 5/13/2021 | | | 1,401,274 | |
| | 720,000 | | | 2.650%, 5/26/2022 | | | 691,409 | |
| | | | Citizens Financial Group, Inc. | | | | |
| | 720,000 | | | 2.375%, 7/28/2021 | | | 694,101 | |
| | | | CNA Financial Corporation | | | | |
| | 1,130,000 | | | 7.250%, 11/15/2023 | | | 1,272,155 | |
| | | | Commerzbank AG | | | | |
| | 1,800,000 | | | 8.125%, 9/19/2023h | | | 2,027,422 | |
| | | | Cooperatieve Centrale Raiffeisen- Boerenleenbank BA | | | | |
| | 710,000 | | | 11.000%, 6/30/2019b,h,j | | | 742,660 | |
| | | | CoreStates Capital III | | | | |
| | 1,360,000 | | | 2.884%, (LIBOR 3M + 0.570%), 2/15/2027b,h | | | 1,251,200 | |
| | | | Credit Agricole SA | | | | |
| | 720,000 | | | 3.375%, 1/10/2022h | | | 704,859 | |
| | | | Credit Suisse Group AG | | | | |
| | 1,800,000 | | | 3.574%, 1/9/2023h | | | 1,757,941 | |
| | 2,300,000 | | | 7.500%, 7/17/2023b,h,j | | | 2,340,250 | |
| | | | Credit Suisse Group Funding, Ltd. | | | | |
| | 2,600,000 | | | 3.750%, 3/26/2025 | | | 2,488,942 | |
| | | | Deutsche Bank AG | | | | |
| | 1,440,000 | | | 2.700%, 7/13/2020 | | | 1,407,000 | |
| | 2,200,000 | | | 4.875%, 12/1/2032b | | | 1,874,334 | |
| | | | Digital Realty Trust, LP | | | | |
| | 1,550,000 | | | 2.750%, 2/1/2023 | | | 1,480,694 | |
| | | | Discover Bank | | | | |
| | 1,460,000 | | | 3.100%, 6/4/2020 | | | 1,449,017 | |
| | 2,510,000 | | | 4.682%, 8/9/2028b | | | 2,480,081 | |
| | | | Discover Bank of Greenwood Delaware | | | | |
| | 865,000 | | | 4.200%, 8/8/2023 | | | 862,916 | |
| | | | Duke Realty, LP | | | | |
| | 1,780,000 | | | 3.875%, 10/15/2022 | | | 1,788,734 | |
| | | | Fidelity National Financial, Inc. | | | | |
| | 730,000 | | | 5.500%, 9/1/2022 | | | 769,156 | |
| | | | Five Corners Funding Trust | | | | |
| | 2,890,000 | | | 4.419%, 11/15/2023h | | | 2,951,732 | |
| | | | Goldman Sachs Group, Inc. | | | | |
| | 1,750,000 | | | 5.250%, 7/27/2021 | | | 1,819,831 | |
| | 1,150,000 | | | 2.876%, 10/31/2022b | | | 1,118,536 | |
| | 1,080,000 | | | 2.908%, 6/5/2023b | | | 1,040,491 | |
| | 810,000 | | | 4.000%, 3/3/2024 | | | 804,724 | |
| | 2,550,000 | | | 3.850%, 7/8/2024 | | | 2,501,902 | |
| | 1,510,000 | | | 4.250%, 10/21/2025 | | | 1,468,850 | |
| | 1,080,000 | | | 5.300%, 11/10/2026b,j | | | 1,053,000 | |
| | 1,440,000 | | | 3.500%, 11/16/2026 | | | 1,345,627 | |
| | 2,240,000 | | | 5.150%, 5/22/2045 | | | 2,193,108 | |
| | | | Hartford Financial Services Group, Inc. | | | | |
| | 1,770,000 | | | 5.125%, 4/15/2022 | | | 1,846,797 | |
| | | | HCP, Inc. | | | | |
| | 1,600,000 | | | 4.250%, 11/15/2023 | | | 1,590,482 | |
| | | | Host Hotels & Resorts, LP | | | | |
| | 760,000 | | | 4.000%, 6/15/2025 | | | 730,594 | |
| | | | HSBC Holdings plc | | | | |
| | 720,000 | | | 6.875%, 6/1/2021b,j | | | 746,100 | |
| | 1,800,000 | | | 3.322%, (LIBOR 3M + 1.000%), 5/18/2024b | | | 1,795,032 | |
| | 1,440,000 | | | 4.300%, 3/8/2026 | | | 1,420,477 | |
| | 900,000 | | | 6.000%, 5/22/2027b,j | | | 828,000 | |
| | 1,080,000 | | | 4.041%, 3/13/2028b | | | 1,032,401 | |
| | | | Huntington Bancshares, Inc. | | | | |
| | 1,650,000 | | | 7.000%, 12/15/2020 | | | 1,763,920 | |
| | | | Icahn Enterprises, LP | | | | |
| | 360,000 | | | 6.375%, 12/15/2025 | | | 357,750 | |
| | | | ILFC E-Capital Trust II | | | | |
| | 1,270,000 | | | 5.030%, (H15T30Y + 1.800%), 12/21/2065b,h | | | 1,130,300 | |
The accompanying Notes to Financial Statements are an integral part of this schedule.
44
INCOME FUND
Schedule of Investments as of October 31, 2018
| | | | | | | | |
Principal
Amount | | | Long-Term Fixed Income (93.9%) | | Value | |
| | Financials (26.9%) - continued | | | | |
| | | | ING Groep NV | | | | |
| | $2,500,000 | | | 4.100%, 10/2/2023 | | | $2,481,087 | |
| | | | International Lease Finance Corporation | | | | |
| | 1,440,000 | | | 5.875%, 8/15/2022 | | | 1,516,613 | |
| | | | J.P. Morgan Chase & Company | | | | |
| | 220,000 | | | 2.295%, 8/15/2021 | | | 212,916 | |
| | 1,500,000 | | | 2.972%, 1/15/2023 | | | 1,451,465 | |
| | 1,440,000 | | | 6.000%, 8/1/2023b,j | | | 1,447,200 | |
| | 1,810,000 | | | 3.717%, (LIBOR 3M + 1.230%), 10/24/2023b | | | 1,841,870 | |
| | 730,000 | | | 6.750%, 2/1/2024b,j | | | 778,545 | |
| | 2,200,000 | | | 3.900%, 7/15/2025 | | | 2,169,648 | |
| | 1,800,000 | | | 2.950%, 10/1/2026 | | | 1,653,248 | |
| | 1,400,000 | | | 3.882%, 7/24/2038b | | | 1,262,081 | |
| | 1,850,000 | | | 5.500%, 10/15/2040 | | | 2,030,141 | |
| | | | Kilroy Realty, LP | | | | |
| | 1,450,000 | | | 4.250%, 8/15/2029 | | | 1,386,781 | |
| | | | Kimco Realty Corporation | | | | |
| | 2,900,000 | | | 3.300%, 2/1/2025 | | | 2,740,079 | |
| | | | Liberty Mutual Group, Inc. | | | | |
| | 1,065,000 | | | 4.950%, 5/1/2022h | | | 1,096,465 | |
| | 1,090,000 | | | 4.850%, 8/1/2044h | | | 1,051,050 | |
| | | | Liberty Property, LP | | | | |
| | 1,125,000 | | | 4.750%, 10/1/2020 | | | 1,147,741 | |
| | | | Lincoln National Corporation | | | | |
| | 1,850,000 | | | 4.000%, 9/1/2023 | | | 1,863,462 | |
| | | | Lloyds Bank plc | | | | |
| | 1,090,000 | | | 4.650%, 3/24/2026 | | | 1,055,026 | |
| | | | Lloyds Banking Group plc | | | | |
| | 2,200,000 | | | 4.375%, 3/22/2028 | | | 2,102,612 | |
| | | | MetLife Capital Trust IV | | | | |
| | 300,000 | | | 7.875%, 12/15/2037h | | | 363,000 | |
| | | | MetLife, Inc. | | | | |
| | 750,000 | | | 9.250%, 4/8/2038h | | | 993,750 | |
| | | | Mitsubishi UFJ Financial Group, Inc. | | | | |
| | 1,050,000 | | | 3.455%, 3/2/2023 | | | 1,035,336 | |
| | | | Mizuho Financial Group, Inc. | | | | |
| | 1,440,000 | | | 3.663%, 2/28/2027 | | | 1,379,108 | |
| | | | Morgan Stanley | | | | |
| | 1,600,000 | | | 5.500%, 1/26/2020 | | | 1,642,152 | |
| | 1,450,000 | | | 2.500%, 4/21/2021 | | | 1,412,840 | |
| | 1,440,000 | | | 2.625%, 11/17/2021 | | | 1,396,685 | |
| | 1,795,000 | | | 4.875%, 11/1/2022 | | | 1,847,010 | |
| | 1,810,000 | | | 3.887%, (LIBOR 3M + 1.400%), 10/24/2023b | | | 1,843,058 | |
| | 1,130,000 | | | 4.000%, 7/23/2025 | | | 1,109,806 | |
| | 720,000 | | | 3.125%, 7/27/2026 | | | 660,680 | |
| | 1,490,000 | | | 4.350%, 9/8/2026 | | | 1,451,170 | |
| | 930,000 | | | 4.300%, 1/27/2045 | | | 856,225 | |
| | | | MPT Operating Partnership, LP | | | | |
| | 360,000 | | | 5.000%, 10/15/2027 | | | 338,292 | |
| | | | Nationwide Building Society | | | | |
| | 1,510,000 | | | 3.900%, 7/21/2025h | | | 1,474,897 | |
| | 1,080,000 | | | 4.000%, 9/14/2026h | | | 996,994 | |
| | | | Nordea Bank AB | | | | |
| | 1,110,000 | | | 5.500%, 9/23/2019b,h,j | | | 1,098,900 | |
| | | | Peachtree Corners Funding Trust | | | | |
| | 1,700,000 | | | 3.976%, 2/15/2025h | | | 1,649,841 | |
| | | | Preferred Term Securities XXIII, Ltd. | | | | |
| | 1,218,404 | | | 2.534%, (LIBOR 3M + 0.200%), 12/22/2036*,b | | | 1,151,301 | |
| | | | Prudential Financial, Inc. | | | | |
| | 1,133,000 | | | 3.935%, 12/7/2049 | | | 979,575 | |
| | | | Realty Income Corporation | | | | |
| | 2,170,000 | | | 3.875%, 7/15/2024 | | | 2,156,067 | |
| | | | Regency Centers, LP | | | | |
| | 1,440,000 | | | 3.600%, 2/1/2027 | | | 1,352,816 | |
| | | | Reinsurance Group of America, Inc. | | | | |
| | 1,070,000 | | | 6.450%, 11/15/2019 | | | 1,102,089 | |
| | | | Royal Bank of Scotland Group plc | | | | |
| | 1,510,000 | | | 7.500%, 8/10/2020b,j | | | 1,534,915 | |
| | 1,080,000 | | | 8.625%, 8/15/2021b,j | | | 1,135,350 | |
| | 1,440,000 | | | 3.498%, 5/15/2023b | | | 1,385,028 | |
| | 1,440,000 | | | 3.875%, 9/12/2023 | | | 1,385,401 | |
| | | | Santander UK Group Holdings plc | | | | |
| | 1,500,000 | | | 4.750%, 9/15/2025h | | | 1,440,422 | |
| | | | Santander UK plc | | | | |
| | 800,000 | | | 3.125%, 1/8/2021 | | | 788,522 | |
| | | | SITE Centers Corporation | | | | |
| | 1,825,000 | | | 4.625%, 7/15/2022 | | | 1,856,764 | |
| | | | Standard Chartered plc | | | | |
| | 1,750,000 | | | 3.558%, (LIBOR 3M + 1.150%), 1/20/2023b,h | | | 1,751,286 | |
| | | | State Street Capital Trust IV | | | | |
| | 1,080,000 | | | 3.334%, (LIBOR 3M + 1.000%), 6/15/2047b | | | 948,413 | |
| | | | SunTrust Banks, Inc. | | | | |
| | 1,090,000 | | | 2.900%, 3/3/2021 | | | 1,073,967 | |
| | | | Synchrony Financial | | | | |
| | 2,150,000 | | | 3.950%, 12/1/2027 | | | 1,895,772 | |
| | | | UBS Group Funding Jersey, Ltd. | | | | |
| | 900,000 | | | 2.650%, 2/1/2022h | | | 868,244 | |
| | 1,510,000 | | | 4.125%, 9/24/2025h | | | 1,485,707 | |
| | | | UBS Group Funding Switzerland AG | | | | |
| | 1,440,000 | | | 4.253%, 3/23/2028h | | | 1,411,866 | |
| | | | UnionBanCal Corporation | | | | |
| | 1,420,000 | | | 3.500%, 6/18/2022 | | | 1,408,847 | |
| | | | UnitedHealth Group, Inc. | | | | |
| | 1,800,000 | | | 2.950%, 10/15/2027 | | | 1,663,302 | |
| | 760,000 | | | 4.750%, 7/15/2045 | | | 775,583 | |
| | | | USB Realty Corporation | | | | |
| | 1,100,000 | | | 3.583%, (LIBOR 3M + 1.147%), 1/15/2022b,h,j | | | 987,250 | |
| | | | Ventas Realty, LP | | | | |
| | 720,000 | | | 3.500%, 2/1/2025 | | | 683,992 | |
| | 1,080,000 | | | 3.850%, 4/1/2027 | | | 1,026,800 | |
| | 1,800,000 | | | 4.000%, 3/1/2028 | | | 1,720,211 | |
| | | | Wells Fargo & Company | | | | |
| | 1,440,000 | | | 3.000%, 4/22/2026 | | | 1,327,251 | |
| | | | Welltower, Inc. | | | | |
| | 550,000 | | | 4.950%, 1/15/2021 | | | 562,506 | |
| | 1,300,000 | | | 4.000%, 6/1/2025 | | | 1,268,041 | |
| | | | | |
| | | | Total | | | 217,286,806 | |
| | | | | |
| |
| | Foreign Government (1.5%) | | | | |
| | | | Argentina Government International Bond | | | | |
| | 1,850,000 | | | 5.625%, 1/26/2022 | | | 1,665,000 | |
| | 1,825,000 | | | 7.500%, 4/22/2026 | | | 1,602,350 | |
| | 1,080,000 | | | 6.875%, 1/26/2027 | | | 903,420 | |
The accompanying Notes to Financial Statements are an integral part of this schedule.
45
INCOME FUND
Schedule of Investments as of October 31, 2018
| | | | | | | | |
Principal
Amount | | | Long-Term Fixed Income (93.9%) | | Value | |
| | Foreign Government (1.5%) - continued | | | | |
| | | | Dominican Republic Government International Bond | | | | |
| | $550,000 | | | 6.000%, 7/19/2028h | | | $545,188 | |
| | | | Mexico Government International Bond | | | | |
| | 2,200,000 | | | 4.600%, 1/23/2046 | | | 1,899,722 | |
| | | | Qatar Government International Bond | | | | |
| | 1,100,000 | | | 4.500%, 4/23/2028h | | | 1,122,000 | |
| | 1,500,000 | | | 5.103%, 4/23/2048h | | | 1,522,500 | |
| | | | Saudi Arabia Government International Bond | | | | |
| | 1,800,000 | | | 4.000%, 4/17/2025h | | | 1,767,470 | |
| | 750,000 | | | 4.500%, 4/17/2030h | | | 738,750 | |
| | | | | |
| | | | Total | | | 11,766,400 | |
| | | | | |
| |
| | Mortgage-Backed Securities (4.4%) | | | | |
| | | | Federal Home Loan Mortgage Corporation Gold 30-Yr. Pass Through | | | | |
| | 5,525,000 | | | 4.000%, 11/1/2048d | | | 5,526,915 | |
| | | | Federal National Mortgage Association Conventional 15-yr. Pass Through | | | | |
| | 2,425,000 | | | 3.500%, 11/1/2033d | | | 2,422,963 | |
| | | | Federal National Mortgage Association Conventional 30-Yr. Pass Through | | | | |
| | 11,750,000 | | | 3.500%, 11/1/2048d | | | 11,438,350 | |
| | 6,900,000 | | | 4.000%, 11/1/2048d | | | 6,899,971 | |
| | 8,160,000 | | | 4.500%, 11/1/2048d | | | 8,354,597 | |
| | 1,000,000 | | | 5.000%, 11/1/2048d | | | 1,043,516 | |
| | | | | |
| | | | Total | | | 35,686,312 | |
| | | | | |
| |
| | Technology (3.8%) | | | | |
| | | | Apple, Inc. | | | | |
| | 2,550,000 | | | 3.250%, 2/23/2026 | | | 2,455,178 | |
| | 1,800,000 | | | 4.500%, 2/23/2036 | | | 1,869,968 | |
| | 1,080,000 | | | 3.750%, 9/12/2047 | | | 968,695 | |
| | | | Applied Materials, Inc. | | | | |
| | 720,000 | | | 3.300%, 4/1/2027 | | | 679,421 | |
| | | | Broadcom Corporation | | | | |
| | 900,000 | | | 3.625%, 1/15/2024 | | | 861,725 | |
| | 1,450,000 | | | 3.875%, 1/15/2027 | | | 1,329,706 | |
| | 1,070,000 | | | 3.500%, 1/15/2028 | | | 942,004 | |
| | | | Diamond 1 Finance Corporation | | | | |
| | 1,440,000 | | | 4.420%, 6/15/2021h | | | 1,451,995 | |
| | 1,080,000 | | | 5.450%, 6/15/2023h | | | 1,118,577 | |
| | 2,200,000 | | | 6.020%, 6/15/2026h | | | 2,281,254 | |
| | | | DXC Technology Company | | | | |
| | 1,440,000 | | | 4.750%, 4/15/2027 | | | 1,430,730 | |
| | | | Harland Clarke Holdings Corporation | | | | |
| | 360,000 | | | 8.375%, 8/15/2022h | | | 324,900 | |
| | | | Hewlett Packard Enterprise Company | | | | |
| | 1,440,000 | | | 4.400%, 10/15/2022 | | | 1,467,922 | |
| | | | Intel Corporation | | | | |
| | 1,630,000 | | | 4.100%, 5/19/2046 | | | 1,551,183 | |
| | | | Iron Mountain, Inc. | | | | |
| | 720,000 | | | 5.250%, 3/15/2028h | | | 646,200 | |
| | | | Marvell Technology Group, Ltd. | | | | |
| | 900,000 | | | 4.200%, 6/22/2023 | | | 889,793 | |
| | 1,100,000 | | | 4.875%, 6/22/2028 | | | 1,079,140 | |
| | | | Microsoft Corporation | | | | |
| | 1,440,000 | | | 3.450%, 8/8/2036 | | | 1,325,447 | |
| | 1,080,000 | | | 4.250%, 2/6/2047 | | | 1,086,042 | |
| | | | Oracle Corporation | | | | |
| | 1,800,000 | | | 4.300%, 7/8/2034 | | | 1,763,557 | |
| | 1,800,000 | | | 4.000%, 7/15/2046 | | | 1,621,751 | |
| | | | Texas Instruments, Inc. | | | | |
| | 1,800,000 | | | 4.150%, 5/15/2048 | | | 1,726,184 | |
| | | | VMware, Inc. | | | | |
| | 1,620,000 | | | 2.300%, 8/21/2020 | | | 1,581,422 | |
| | | | Western Digital Corporation | | | | |
| | 540,000 | | | 4.750%, 2/15/2026 | | | 498,825 | |
| | | | | |
| | | | Total | | | 30,951,619 | |
| | | | | |
| |
| | Transportation (0.6%) | | | | |
| | | | Burlington Northern Santa Fe, LLC | | | | |
| | 1,500,000 | | | 4.700%, 9/1/2045 | | | 1,521,422 | |
| | 1,800,000 | | | 4.050%, 6/15/2048 | | | 1,666,963 | |
| | | | Delta Air Lines, Inc. | | | | |
| | 438,746 | | | 4.950%, 11/23/2020 | | | 440,488 | |
| | | | Hertz Corporation | | | | |
| | 360,000 | | | 7.625%, 6/1/2022h | | | 344,862 | |
| | | | United Airlines Pass Through Trust | | | | |
| | 754,700 | | | 3.750%, 9/3/2026 | | | 748,081 | |
| | | | XPO Logistics, Inc. | | | | |
| | 360,000 | | | 6.125%, 9/1/2023h | | | 368,712 | |
| | | | | |
| | | | Total | | | 5,090,528 | |
| | | | | |
| |
| | U.S. Government and Agencies (5.1%) | | | | |
| | | | U.S. Treasury Bonds | | | | |
| | 3,600,000 | | | 2.250%, 11/15/2027 | | | 3,349,828 | |
| | 6,000,000 | | | 2.750%, 2/15/2028 | | | 5,810,625 | |
| | 4,500,000 | | | 2.875%, 5/15/2028 | | | 4,400,156 | |
| | 5,000,000 | | | 2.875%, 8/15/2028 | | | 4,884,961 | |
| | 13,900,000 | | | 2.750%, 11/15/2047 | | | 12,254,262 | |
| | 7,000,000 | | | 3.000%, 8/15/2048 | | | 6,491,406 | |
| | | | U.S. Treasury Notes | | | | |
| | 3,870,000 | | | 2.125%, 12/31/2022 | | | 3,741,504 | |
| | | | | |
| | | | Total | | | 40,932,742 | |
| | | | | |
| |
| | Utilities (7.2%) | | | | |
| | | | AEP Transmission Company, LLC | | | | |
| | 2,520,000 | | | 3.100%, 12/1/2026 | | | 2,381,183 | |
| | | | American Electric Power Company, Inc. | | | | |
| | 1,435,000 | | | 2.950%, 12/15/2022 | | | 1,397,184 | |
| | | | Baltimore Gas and Electric Company | | | | |
| | 1,440,000 | | | 2.400%, 8/15/2026 | | | 1,291,671 | |
| | | | Berkshire Hathaway Energy Company | | | | |
| | 1,425,000 | | | 4.450%, 1/15/2049h | | | 1,368,965 | |
| | | | CenterPoint Energy, Inc. | | | | |
| | 2,340,000 | | | 2.500%, 9/1/2022 | | | 2,234,223 | |
| | | | CMS Energy Corporation | | | | |
| | 1,440,000 | | | 3.450%, 8/15/2027 | | | 1,367,444 | |
| | | | Consolidated Edison Company of New York, Inc. | | | | |
| | 720,000 | | | 2.900%, 12/1/2026 | | | 665,362 | |
| | | | Consumers Energy Company | | | | |
| | 1,050,000 | | | 4.350%, 4/15/2049d | | | 1,043,025 | |
The accompanying Notes to Financial Statements are an integral part of this schedule.
46
INCOME FUND
Schedule of Investments as of October 31, 2018
| | | | | | | | |
Principal
Amount | | | Long-Term Fixed Income (93.9%) | | Value | |
| | Utilities (7.2%) - continued | | | | |
| | | | Duke Energy Corporation | | | | |
| | $2,160,000 | | | 2.650%, 9/1/2026 | | | $1,932,833 | |
| | 2,160,000 | | | 3.150%, 8/15/2027 | | | 1,981,144 | |
| | 1,800,000 | | | 3.750%, 9/1/2046 | | | 1,527,384 | |
| | | | Electricite de France SA | | | | |
| | 1,800,000 | | | 5.250%, 1/29/2023b,h,j | | | 1,733,220 | |
| | | | Exelon Corporation | | | | |
| | 900,000 | | | 3.497%, 6/1/2022 | | | 877,778 | |
| | 1,880,000 | | | 3.950%, 6/15/2025 | | | 1,850,530 | |
| | 1,090,000 | | | 3.400%, 4/15/2026 | | | 1,025,288 | |
| | | | Exelon Generation Company, LLC | | | | |
| | 1,440,000 | | | 4.250%, 6/15/2022 | | | 1,456,461 | |
| | | | FirstEnergy Corporation | | | | |
| | 720,000 | | | 3.900%, 7/15/2027 | | | 687,705 | |
| | 700,000 | | | 4.850%, 7/15/2047 | | | 682,659 | |
| | | | FirstEnergy Transmission, LLC | | | | |
| | 1,850,000 | | | 5.450%, 7/15/2044h | | | 1,964,445 | |
| | | | ITC Holdings Corporation | | | | |
| | 2,920,000 | | | 4.050%, 7/1/2023 | | | 2,903,615 | |
| | | | National Rural Utilities Cooperative Finance Corporation | | | | |
| | 1,400,000 | | | 4.400%, 11/1/2048 | | | 1,387,818 | |
| | | | Nevada Power Company | | | | |
| | 1,700,000 | | | 6.750%, 7/1/2037 | | | 2,153,494 | |
| | | | Oncor Electric Delivery Company, LLC | | | | |
| | 1,510,000 | | | 3.750%, 4/1/2045 | | | 1,369,615 | |
| | | | Pacific Gas and Electric Company | | | | |
| | 730,000 | | | 2.950%, 3/1/2026 | | | 647,858 | |
| | 1,100,000 | | | 3.300%, 12/1/2027 | | | 979,592 | |
| | 1,100,000 | | | 3.950%, 12/1/2047 | | | 887,909 | |
| | | | Pennsylvania Electric Company | | | | |
| | 2,300,000 | | | 5.200%, 4/1/2020 | | | 2,353,166 | |
| | | | PPL Capital Funding, Inc. | | | | |
| | 1,795,000 | | | 3.500%, 12/1/2022 | | | 1,772,182 | |
| | 1,810,000 | | | 3.950%, 3/15/2024 | | | 1,797,780 | |
| | | | San Diego Gas and Electric Company | | | | |
| | 1,800,000 | | | 4.150%, 5/15/2048 | | | 1,698,804 | |
| | | | South Carolina Electric & Gas Company | | | | |
| | 4,300,000 | | | 5.100%, 6/1/2065 | | | 4,133,225 | |
| | | | Southern California Edison Company | | | | |
| | 3,150,000 | | | 4.125%, 3/1/2048 | | | 2,920,247 | |
| | | | Southern Company | | | | |
| | 4,370,000 | | | 3.250%, 7/1/2026 | | | 4,052,523 | |
| | 1,080,000 | | | 5.500%, 3/15/2057b | | | 1,075,970 | |
| | | | TerraForm Power Operating, LLC | | | | |
| | 360,000 | | | 5.000%, 1/31/2028h | | | 321,750 | |
| | | | Vistra Operations Company, LLC | | | | |
| | 360,000 | | | 5.500%, 9/1/2026h | | | 354,600 | |
| | | | | |
| | | | Total | | | 58,278,652 | |
| | | | | |
| | | | | | | | |
| | | | | |
| | | | Total Long-Term Fixed Income (cost $780,339,855) | | | 757,191,048 | |
| | | | | |
| | |
| Shares | | | Registered Investment Companies (1.5%) | | Value | |
| | Fixed Income Funds/Exchange Traded Funds (1.5%) | | | | |
| | 67,000 | | | iShares J.P. Morgan USD Emerging Markets Bond ETF | | | 7,012,220 | |
| | 150,000 | | | SPDR Bloomberg Barclays High Yield Bond ETF | | | 5,274,000 | |
| | | | | |
| | | | Total | | | 12,286,220 | |
| | | | | |
| | | | | | | | |
| | | | | |
| | | | Total Registered Investment Companies (cost $12,566,863) | | | 12,286,220 | |
| | | | | |
| | |
| Shares | | | Preferred Stock (0.3%) | | Value | |
| | Financials (0.3%) | | | | |
| | 12,500 | | | CoBank ACB, 6.250%b,j | | | 1,287,500 | |
| | 51,800 | | | Morgan Stanley, 7.125%b,j | | | 1,412,586 | |
| | | | | |
| | | | Total | | | 2,700,086 | |
| | | | | |
| | | | | | | | |
| | | | | |
| | | | Total Preferred Stock (cost $2,543,644) | | | 2,700,086 | |
| | | | | |
| | |
| Shares | | | Collateral Held for Securities Loaned (1.0%) | | Value | |
| | 8,347,519 | | | Thrivent Cash Management Trust | | | 8,347,519 | |
| | | | | |
| | | | Total Collateral Held for Securities Loaned (cost $8,347,519) | | | 8,347,519 | |
| | | | | |
| | |
Shares or
Principal
Amount | | | Short-Term Investments (6.5%) | | Value | |
| | | | Federal Home Loan Bank Discount Notes | | | | |
| | 700,000 | | | 2.195%, 12/13/2018k,l | | | 698,179 | |
| | | | Thrivent Core Short-Term Reserve Fund | | | | |
| | 5,147,370 | | | 2.430% | | | 51,473,698 | |
| | | | | |
| | | | Total Short-Term Investments (cost $52,171,905) | | | 52,171,877 | |
| | | | | |
| | | | Total Investments (cost $874,741,371) 105.5% | | | $851,244,571 | |
| | | | | |
| | | | Other Assets and Liabilities, Net (5.5%) | | | (44,406,249 | ) |
| | | | | |
| | | | Total Net Assets 100.0% | | | $806,838,322 | |
| | | | | |
The accompanying Notes to Financial Statements are an integral part of this schedule.
47
INCOME FUND
Schedule of Investments as of October 31, 2018
a | The stated interest rate represents the weighted average of all contracts within the bank loan facility. |
b | Denotes variable rate securities. The rate shown is as of October 31, 2018. The rates of certain variable rate securities are based on a published reference rate and spread; these may vary by security and the reference rate and spread are indicated in their description. The rates of other variable rate securities are determined by the issuer or agent and are based on current market conditions. These securities do not indicate a reference rate and spread in their description. |
c | All or a portion of the loan is unfunded. |
d | Denotes investments purchased on a when-issued or delayed delivery basis. |
e | Security is valued using significant unobservable inputs. Further information on valuation can be found in the Notes to Financial Statements. |
f | All or a portion of the security is insured or guaranteed. |
g | Denotes step coupon securities. Step coupon securities pay an initial coupon rate for the first period and then different coupon rates for following periods. The rate shown is as of October 31, 2018. |
h | Denotes securities sold under Rule 144A of the Securities Act of 1933, which exempts them from registration. These securities may be resold to other dealers in the program or to other qualified institutional buyers. As of October 31, 2018, the value of these investments was $123,581,872 or 15.3% of total net assets. |
i | All or a portion of the security is on loan. |
j | Denotes perpetual securities. Perpetual securities pay an indefinite stream of interest and have no contractual maturity date. Date shown, if applicable, is next call date. |
k | The interest rate shown reflects the yield, coupon rate or the discount rate at the date of purchase. |
l | All or a portion of the security is held on deposit with the counterparty and pledged as the initial margin deposit for open futures contracts. |
* | Denotes restricted securities. Restricted securities are investment securities which cannot be offered for public sale without first being registered under the Securities Act of 1933. The value of all restricted securities held in Income Fund as of October 31, 2018 was $15,863,546 or 2.0% of total net assets. The following table indicates the acquisition date and cost of restricted securities shown in the schedule as of October 31, 2018. |
| | | | | | | | |
Security | | Acquisition
Date | | | Cost | |
Babson CLO, Ltd., 10/17/2026 | | | 3/10/2017 | | | $ | 1,496,050 | |
Babson CLO, Ltd., 7/20/2029 | | | 5/18/2018 | | | | 2,100,000 | |
Cent CLO 22, Ltd., 11/7/2026 | | | 11/1/2016 | | | | 1,800,000 | |
Digicel, Ltd., 4/15/2021 | | | 9/26/2017 | | | | 356,136 | |
Magnetite XII, Ltd., 10/15/2031 | | | 8/14/2018 | | | | 1,800,000 | |
Octagon Investment Partners XVI, Ltd., 7/17/2030 | | | 6/15/2018 | | | | 1,400,000 | |
PPM CLO, Ltd., 7/15/2031 | | | 7/2/2018 | | | | 1,198,560 | |
Preferred Term Securities XXIII, Ltd., 12/22/2036 | | | 9/14/2006 | | | | 1,218,404 | |
Shackleton CLO, Ltd., 7/15/2031 | | | 7/12/2018 | | | | 1,200,000 | |
Sound Point CLO X, Ltd., 1/20/2028 | | | 6/5/2018 | | | | 1,800,000 | |
Symphony CLO XV, Ltd., 10/17/2026 | | | 2/16/2017 | | | | 1,606,956 | |
The following table presents the total amount of securities loaned with continuous maturity, by type, offset by the gross payable upon return of collateral for securities loaned by Thrivent Income Fund as of October 31, 2018:
| | | | |
Securities Lending Transactions | | | | |
Taxable Debt Security | | | $8,056,513 | |
| | | | |
Total lending | | | $8,056,513 | |
Gross amount payable upon return of collateral for securities loaned | | | $8,347,519 | |
| | | | |
Net amounts due to counterparty | | | $291,006 | |
| | | | |
Definitions:
| | | | |
CLO | | - | | Collateralized Loan Obligation |
ETF | | - | | Exchange Traded Fund |
Ser. | | - | | Series |
SPDR | | - | | S&P Depository Receipts, which are exchange-traded funds traded in the U.S., Europe, and Asia-Pacific and managed by State Street Global Advisors. |
Reference Rate Index:
| | | | |
H15T30Y | | - | | U. S. Treasury Yield Curve Rate Treasury Note Constant Maturity 30 Year |
LIBOR 1W | | - | | ICE Libor USD Rate 1 Week |
LIBOR 1M | | - | | ICE Libor USD Rate 1 Month |
LIBOR 2M | | - | | ICE Libor USD Rate 2 Month |
LIBOR 3M | | - | | ICE Libor USD Rate 3 Month |
USISDA 10Y | | - | | ICE Swap USD Rate 10 Year |
The accompanying Notes to Financial Statements are an integral part of this schedule.
48
LARGE CAP STOCK FUND
Schedule of Investments as of October 31, 2018
| | | | | | | | |
| Shares | | | Common Stock (93.2%) | | Value | |
| | Communications Services (8.6%) | | | | |
| | 32,908 | | | Alphabet, Inc., Class Aa | | | $35,888,807 | |
| | 21,338 | | | Alphabet, Inc., Class Ca | | | 22,976,118 | |
| | 34,811 | | | Carsales.com, Ltd. | | | 301,726 | |
| | 74,313 | | | CBS Corporation | | | 4,261,851 | |
| | 397,589 | | | Comcast Corporation | | | 15,164,045 | |
| | 156,931 | | | Facebook, Inc.a | | | 23,820,557 | |
| | 14,982 | | | Ipsos SA | | | 398,947 | |
| | 2,610,067 | | | ITV plc | | | 4,954,620 | |
| | 1,391,702 | | | KCOM Group plc | | | 1,638,343 | |
| | 121,355 | | | Mediaset Espana Comunicacion SA | | | 825,190 | |
| | 41,371 | | | Netflix, Inc.a | | | 12,484,940 | |
| | 112,200 | | | NTT DOCOMO, Inc. | | | 2,782,430 | |
| | 64,237 | | | ProSiebenSat.1 Media AG | | | 1,483,320 | |
| | 2,198 | | | RTL Group SA | | | 141,076 | |
| | 200,053 | | | Seven West Media, Ltd.a | | | 110,874 | |
| | 433,252 | | | Telenor ASA | | | 7,943,834 | |
| | 152,500 | | | TV Asahi Holdings Corporation | | | 2,847,004 | |
| | 215,802 | | | Verizon Communications, Inc. | | | 12,320,136 | |
| | 35,934 | | | Wolters Kluwer NV | | | 2,038,689 | |
| | | | | |
| | | | Total | | | 152,382,507 | |
| | | | | |
| |
| | Consumer Discretionary (12.1%) | | | | |
| | 42,916 | | | Amazon.com, Inc.a | | | 68,580,197 | |
| | 19,700 | | | AOKI Holdings, Inc. | | | 259,470 | |
| | 17,000 | | | Aoyama Trading Company, Ltd. | | | 514,309 | |
| | 19,264 | | | Aptiv plc | | | 1,479,475 | |
| | 30,700 | | | Autobacs Seven Company, Ltd. | | | 494,091 | |
| | 24,500 | | | Benesse Holdings, Inc. | | | 683,271 | |
| | 24,226 | | | Berkeley Group Holdings plc | | | 1,082,740 | |
| | 7,287 | | | Booking Holdings, Inc.a | | | 13,660,065 | |
| | 279,900 | | | Bridgestone Corporation | | | 10,792,748 | |
| | 291,655 | | | Bunzl plc | | | 8,603,801 | |
| | 25,000 | | | Chiyoda Company, Ltd. | | | 481,942 | |
| | 10,222 | | | Cie Generale des Etablissements Michelin | | | 1,046,467 | |
| | 39,700 | | | DCM Holdings Company, Ltd. | | | 386,043 | |
| | 43,000 | | | Denso Corporation | | | 1,918,048 | |
| | 98,654 | | | Harley-Davidson, Inc. | | | 3,770,556 | |
| | 354,600 | | | Honda Motor Company, Ltd. | | | 10,122,245 | |
| | 122,749 | | | Inchcape plc | | | 847,789 | |
| | 112,241 | | | Las Vegas Sands Corporation | | | 5,727,658 | |
| | 164,941 | | | Lowe’s Companies, Inc. | | | 15,705,682 | |
| | 139,814 | | | Magna International, Inc. | | | 6,884,441 | |
| | 47,000 | | | McDonald’s Corporation | | | 8,314,300 | |
| | 26,575 | | | Next plc | | | 1,765,452 | |
| | 134,200 | | | NHK Spring Company, Ltd. | | | 1,149,111 | |
| | 154,978 | | | NIKE, Inc. | | | 11,629,549 | |
| | 1,308,900 | | | Nissan Motor Company, Ltd. | | | 11,908,062 | |
| | 152,222 | | | Peugeot SA | | | 3,618,416 | |
| | 17,400 | | | Plenus Company, Ltd.b | | | 278,472 | |
| | 46,600 | | | Sangetsu Company, Ltd. | | | 896,272 | |
| | 55,000 | | | Sankyo Company, Ltd. | | | 2,099,941 | |
| | 737,100 | | | Sekisui House, Ltd. | | | 10,818,435 | |
| | 32,000 | | | SHIMAMURA Company, Ltd. | | | 2,691,666 | |
| | 19,055 | | | SmartCentres Real Estate Investment Trust | | | 435,394 | |
| | 97,800 | | | Sumitomo Rubber Industries, Ltd. | | | 1,402,911 | |
| | 77,190 | | | Super Retail Group, Ltd. | | | 395,848 | |
| | 9,100 | | | Takara Standard Company, Ltd. | | | 140,510 | |
| | 184,600 | | | Toyoda Gosei Company, Ltd. | | | 3,981,392 | |
| | | | | |
| | | | Total | | | 214,566,769 | |
| | | | | |
| |
| | Consumer Staples (5.4%) | | | | |
| | 61,000 | | | Altria Group, Inc. | | | 3,967,440 | |
| | 27,900 | | | Arcs Company, Ltd. | | | 674,184 | |
| | 144,280 | | | CVS Health Corporation | | | 10,444,429 | |
| | 218,475 | | | Empire Company, Ltd. | | | 3,974,687 | |
| | 36,465 | | | ForFarmers BV | | | 410,668 | |
| | 9,003 | | | Glanbia plc | | | 159,726 | |
| | 243,261 | | | Imperial Brands plc | | | 8,239,891 | |
| | 581,900 | | | Japan Tobacco, Inc. | | | 14,952,111 | |
| | 46,337 | | | Kimberly-Clark Corporation | | | 4,832,949 | |
| | 222,610 | | | Koninklijke Ahold Delhaize NV | | | 5,095,630 | |
| | 174,000 | | | Kroger Company | | | 5,178,240 | |
| | 9,662 | | | Loblaw Companies, Ltd. | | | 483,229 | |
| | 9,000 | | | Ministop Company, Ltd. | | | 166,177 | |
| | 9,800 | | | NH Foods, Ltd. | | | 337,962 | |
| | 15,100 | | | Sugi Holdings Company, Ltd. | | | 691,365 | |
| | 90,171 | | | Swedish Match AB | | | 4,593,193 | |
| | 161,738 | | | Unilever NVb | | | 8,690,945 | |
| | 237,674 | | | Unilever plc | | | 12,589,508 | |
| | 44,658 | | | Wal-Mart Stores, Inc. | | | 4,478,304 | |
| | 163,926 | | | Wesfarmers, Ltd. | | | 5,428,855 | |
| | | | | |
| | | | Total | | | 95,389,493 | |
| | | | | |
| |
| | Energy (4.6%) | | | | |
| | 178,660 | | | Anadarko Petroleum Corporation | | | 9,504,712 | |
| | 157,357 | | | Chevron Corporation | | | 17,568,909 | |
| | 19,524 | | | Eni SPA | | | 346,740 | |
| | 33,917 | | | EQT Corporation | | | 1,152,160 | |
| | 5,851 | | | Gaztransport Et Technigaz SA | | | 432,445 | |
| | 299,050 | | | Halliburton Company | | | 10,371,054 | |
| | 289,117 | | | Marathon Oil Corporation | | | 5,490,332 | |
| | 56,600 | | | Marathon Petroleum Corporation | | | 3,987,470 | |
| | 73,289 | | | OMV AG | | | 4,069,905 | |
| | 71,057 | | | Petrofac, Ltd. | | | 522,519 | |
| | 22,800 | | | Phillips 66 | | | 2,344,296 | |
| | 29,446 | | | Pioneer Natural Resources Company | | | 4,336,512 | |
| | 17,600 | | | Royal Dutch Shell plc, Class A | | | 560,703 | |
| | 398,083 | | | Royal Dutch Shell plc, Class B | | | 12,982,655 | |
| | 62,308 | | | Total SAb | | | 3,655,929 | |
| | 2,323,297 | | | Weatherford International plca,b | | | 3,136,451 | |
| | | | | |
| | | | Total | | | 80,462,792 | |
| | | | | |
| |
| | Financials (13.1%) | | | | |
| | 36,403 | | | Aareal Bank AG | | | 1,354,231 | |
| | 66,000 | | | Aflac, Inc. | | | 2,842,620 | |
| | 2,666 | | | Allianz SE | | | 555,378 | |
| | 36,426 | | | American International Group, Inc. | | | 1,504,030 | |
| | 5,257 | | | Anima Holding SPAc | | | 21,982 | |
| | 25,286 | | | ASX, Ltd. | | | 1,062,029 | |
| | 315,655 | | | Australia and New Zealand Banking Group, Ltd. | | | 5,810,156 | |
| | 217,714 | | | Banca Monte dei Paschi di Siena SPAa,b | | | 357,430 | |
| | 1,047,187 | | | Bank of America Corporation | | | 28,797,643 | |
| | 125,650 | | | Bankinter SA | | | 1,029,445 | |
| | 282,595 | | | Blackstone Group, LP | | | 9,144,774 | |
| | 655,365 | | | CaixaBank SAb | | | 2,652,059 | |
| | 71,269 | | | Capital One Financial Corporation | | | 6,364,322 | |
| | 63,960 | | | Chubb, Ltd. | | | 7,989,244 | |
| | 285,299 | | | CI Financial Corporation | | | 4,219,508 | |
| | 449,406 | | | Citigroup, Inc. | | | 29,418,117 | |
| | 196,089 | | | CNP Assurances | | | 4,370,307 | |
| | 55,120 | | | Comerica, Inc. | | | 4,495,587 | |
| | 414,220 | | | Direct Line Insurance Group plc | | | 1,740,669 | |
| | 392,421 | | | DnB ASA | | | 7,089,636 | |
| | 76,255 | | | Euronext NVc | | | 4,692,132 | |
| | 197,798 | | | Fifth Third Bancorp | | | 5,338,568 | |
| | 240,790 | | | Finecobank Banca Fineco SPA | | | 2,516,634 | |
The accompanying Notes to Financial Statements are an integral part of this schedule.
49
LARGE CAP STOCK FUND
Schedule of Investments as of October 31, 2018
| | | | | | | | |
| Shares | | | Common Stock (93.2%) | | Value | |
| | Financials (13.1%) - continued | | | | |
| | 737,856 | | | FlexiGroup, Ltd. | | | $804,040 | |
| | 73,121 | | | Genworth MI Canada, Inc.b | | | 2,400,060 | |
| | 110,541 | | | Goldman Sachs Group, Inc. | | | 24,912,625 | |
| | 49,220 | | | Hannover Rueckversicherung SE | | | 6,619,111 | |
| | 408,136 | | | Huntington Bancshares, Inc. | | | 5,848,589 | |
| | 60,000 | | | Intercontinental Exchange, Inc. | | | 4,622,400 | |
| | 70,678 | | | J.P. Morgan Chase & Company | | | 7,705,316 | |
| | 53,200 | | | Matsui Securities Company, Ltd. | | | 542,209 | |
| | 4,167,558 | | | Medibank Private, Ltd. | | | 8,263,297 | |
| | 210,176 | | | MetLife, Inc. | | | 8,657,149 | |
| | 85,358 | | | National Bank of Canada | | | 3,874,810 | |
| | 22,970 | | | Paragon Banking Group plc | | | 124,830 | |
| | 35,342 | | | Pargesa Holding SA | | | 2,594,458 | |
| | 19,017 | | | Prudential Financial, Inc. | | | 1,783,414 | |
| | 2,154 | | | Raymond James Financial, Inc. | | | 165,190 | |
| | 25,700 | | | Senshu Ikeda Holdings, Inc. | | | 78,977 | |
| | 105,533 | | | State Street Corporation | | | 7,255,394 | |
| | 26,291 | | | Sun Life Financial, Inc. | | | 962,808 | |
| | 13,598 | | | Topdanmark AS | | | 646,362 | |
| | 108,600 | | | U.S. Bancorp | | | 5,676,522 | |
| | 117,000 | | | Zions Bancorporations NA | | | 5,504,850 | |
| | | | | |
| | | | Total | | | 232,408,912 | |
| | | | | |
| |
| | Health Care (12.0%) | | | | |
| | 34,048 | | | Aetna, Inc. | | | 6,755,123 | |
| | 30,138 | | | Amplifon SPA | | | 533,871 | |
| | 30,500 | | | Becton, Dickinson and Company | | | 7,030,250 | |
| | 43,434 | | | Biogen, Inc.a | | | 13,215,663 | |
| | 73,000 | | | BioMarin Pharmaceutical, Inc.a | | | 6,728,410 | |
| | 41,689 | | | Edwards Lifesciences Corporationa | | | 6,153,296 | |
| | 42,734 | | | Express Scripts Holding Companya | | | 4,143,916 | |
| | 37,300 | | | Gilead Sciences, Inc. | | | 2,543,114 | |
| | 589,550 | | | GlaxoSmithKline plc | | | 11,418,267 | |
| | 136,670 | | | GlaxoSmithKline plc ADR | | | 5,338,330 | |
| | 8,894 | | | Illumina, Inc.a | | | 2,767,368 | |
| | 13,643 | | | Intuitive Surgical, Inc.a | | | 7,110,459 | |
| | 97,206 | | | Johnson & Johnson | | | 13,607,868 | |
| | 37,400 | | | KYORIN Holdings, Inc. | | | 816,797 | |
| | 3,906 | | | LNA Sante | | | 206,565 | |
| | 57,465 | | | Medtronic plc | | | 5,161,506 | |
| | 306,992 | | | Merck & Company, Inc. | | | 22,597,681 | |
| | 23,300 | | | Miraca Holdings, Inc. | | | 567,216 | |
| | 159,973 | | | Novartis AG | | | 14,009,214 | |
| | 353,235 | | | Novo Nordisk AS | | | 15,255,003 | |
| | 375,750 | | | Pfizer, Inc. | | | 16,179,795 | |
| | 55,967 | | | Roche Holding AG | | | 13,620,264 | |
| | 10,713 | | | Thermo Fisher Scientific, Inc. | | | 2,503,093 | |
| | 92,905 | | | UnitedHealth Group, Inc. | | | 24,280,722 | |
| | 38,862 | | | Vertex Pharmaceuticals, Inc.a | | | 6,585,555 | |
| | 32,145 | | | Zoetis, Inc. | | | 2,897,872 | |
| | | | | |
| | | | Total | | | 212,027,218 | |
| | | | | |
| |
| | Industrials (11.4%) | | | | |
| | 155,439 | | | ACS Actividades de Construccion y Servicios, SAa | | | 5,819,832 | |
| | 257,021 | | | Atlas Copco AB, Class A | | | 6,354,013 | |
| | 228,956 | | | Atlas Copco AB, Class B | | | 5,243,855 | |
| | 63,335 | | | Boeing Company | | | 22,475,058 | |
| | 21,469 | | | CIA De Distribucion Integral | | | 518,336 | |
| | 250,136 | | | CSX Corporation | | | 17,224,365 | |
| | 249,799 | | | Delta Air Lines, Inc. | | | 13,671,499 | |
| | 13,022 | | | Ferguson plc | | | 877,937 | |
| | 5,900 | | | Glory, Ltd. | | | 137,390 | |
| | 338,127 | | | GWA Group, Ltd. | | | 661,245 | |
| | 117,000 | | | Hino Motors, Ltd. | | | 1,119,957 | |
| | 35,900 | | | Hitachi Zosen Corporation | | | 136,435 | |
| | 9,078 | | | Hochtief AG | | | 1,345,246 | |
| | 129,012 | | | Honeywell International, Inc. | | | 18,683,518 | |
| | 42,800 | | | Inaba Denki Sangyo Company, Ltd. | | | 1,723,254 | |
| | 33,515 | | | Ingersoll-Rand plc | | | 3,215,429 | |
| | 32,500 | | | Mitsuboshi Belting, Ltd. | | | 798,417 | |
| | 27,878 | | | Monadelphous Group, Ltd. | | | 285,280 | |
| | 131,393 | | | National Express Group plc | | | 671,376 | |
| | 108,600 | | | Nitto Kogyo Corporation | | | 1,891,410 | |
| | 56,084 | | | Nobina ABc | | | 374,226 | |
| | 135,705 | | | Norfolk Southern Corporation | | | 22,775,370 | |
| | 40,052 | | | Northgate plc | | | 192,901 | |
| | 310,339 | | | PageGroup plc | | | 1,989,267 | |
| | 266,710 | | | RELX plc | | | 5,277,468 | |
| | 371,470 | | | RELX plc | | | 7,346,437 | |
| | 21,502 | | | Resideo Technologies, Inc.a | | | 452,617 | |
| | 9,760 | | | Rockwool International AS | | | 3,334,586 | |
| | 65,883 | | | Sandvik AB | | | 1,041,531 | |
| | 29,806 | | | Schindler Holding AG, Participation Certificate | | | 6,285,028 | |
| | 45,327 | | | Schneider Electric SE | | | 3,277,628 | |
| | 402 | | | SGS SA | | | 954,770 | |
| | 13,100 | | | ShinMaywa Industries, Ltd. | | | 161,279 | |
| | 288,357 | | | SKF AB | | | 4,622,976 | |
| | 42,073 | | | Smiths Group plc | | | 749,974 | |
| | 17,360 | | | Spirax-Sarco Engineering plc | | | 1,433,935 | |
| | 580,800 | | | Sumitomo Electric Industries, Ltd. | | | 7,920,713 | |
| | 15,900 | | | Taikisha, Ltd. | | | 448,676 | |
| | 43,400 | | | Toppan Forms Company, Ltd. | | | 394,521 | |
| | 207,500 | | | Toppan Printing Company, Ltd. | | | 2,933,516 | |
| | 6,400 | | | Toshiba Machine Company, Ltd. | | | 121,199 | |
| | 67,734 | | | Transcontinental, Inc. | | | 1,114,965 | |
| | 34,000 | | | Tsubakimoto Chain Company | | | 1,305,478 | |
| | 61,297 | | | United Parcel Service, Inc. | | | 6,530,582 | |
| | 42,932 | | | United Technologies Corporation | | | 5,332,584 | |
| | 85,276 | | | Vinci SAb | | | 7,589,470 | |
| | 47,500 | | | XPO Logistics, Inc.a | | | 4,245,550 | |
| | 20,200 | | | Yuasa Trading Company, Ltd. | | | 662,652 | |
| | | | | |
| | | | Total | | | 201,723,751 | |
| | | | | |
| |
| | Information Technology (17.5%) | | | | |
| | 41,200 | | | Activision Blizzard, Inc. | | | 2,844,860 | |
| | 92,345 | | | Amadeus IT Holding SA | | | 7,436,002 | |
| | 220,440 | | | Apple, Inc. | | | 48,245,498 | |
| | 46,920 | | | Autodesk, Inc.a | | | 6,064,410 | |
| | 208,700 | | | Canon, Inc. | | | 5,944,488 | |
| | 79,066 | | | Capgemini SA | | | 9,654,285 | |
| | 198,847 | | | CGI Group, Inc.a | | | 12,280,194 | |
| | 750,593 | | | Cisco Systems, Inc. | | | 34,339,630 | |
| | 53,991 | | | Halma plc | | | 916,248 | |
| | 300 | | | Hirose Electric Company, Ltd. | | | 28,592 | |
| | 420,700 | | | Konica Minolta Holdings, Inc. | | | 4,164,253 | |
| | 5,198 | | | Kulicke and Soffa Industries, Inc. | | | 105,675 | |
| | 67,353 | | | MasterCard, Inc. | | | 13,313,668 | |
| | 461,808 | | | Microsoft Corporation | | | 49,325,713 | |
| | 56,500 | | | NEC Networks & System Integration Corporation | | | 1,231,476 | |
| | 25,533 | | | NVIDIA Corporation | | | 5,383,122 | |
| | 165,722 | | | Oracle Corporation | | | 8,093,862 | |
| | 188,421 | | | PayPal Holdings, Inc.a | | | 15,863,164 | |
| | 97,620 | | | Red Hat, Inc.a | | | 16,755,497 | |
| | 21,600 | | | Ryoyo Electro Corporation | | | 309,754 | |
| | 181,042 | | | Salesforce.com, Inc.a | | | 24,846,204 | |
| | 316,600 | | | Shinko Electric Industries Company, Ltd. | | | 2,204,228 | |
| | 1,853 | | | Siltronic AG | | | 169,706 | |
The accompanying Notes to Financial Statements are an integral part of this schedule.
50
LARGE CAP STOCK FUND
Schedule of Investments as of October 31, 2018
| | | | | | | | |
| Shares | | | Common Stock (93.2%) | | Value | |
| | Information Technology (17.5%) - continued | | | | |
| | 37,053 | | | Texas Instruments, Inc. | | | $3,439,630 | |
| | 11,100 | | | Tokyo Seimitsu Company, Ltd. | | | 266,923 | |
| | 188,292 | | | Visa, Inc. | | | 25,956,052 | |
| | 118,130 | | | Xilinx, Inc. | | | 10,084,758 | |
| | | | | |
| | | | Total | | | 309,267,892 | |
| | | | | |
| |
| | Materials (5.5%) | | | | |
| | 81,227 | | | Alcoa Corporationa | | | 2,842,133 | |
| | 148,181 | | | BASF SE | | | 11,371,135 | |
| | 438,094 | | | BHP Billiton plc | | | 8,739,404 | |
| | 251,572 | | | BHP Billiton, Ltd. | | | 5,804,686 | |
| | 10,184 | | | Canfor Corporationa | | | 146,287 | |
| | 54,257 | | | CF Industries Holdings, Inc. | | | 2,605,964 | |
| | 247,400 | | | Daicel Corporation | | | 2,617,249 | |
| | 118,910 | | | Eastman Chemical Company | | | 9,316,599 | |
| | 157,845 | | | Evonik Industries AG | | | 4,883,033 | |
| | 8,535 | | | Fuchs Petrolub SE | | | 395,080 | |
| | 110,548 | | | Granges AB | | | 1,168,725 | |
| | 15,084 | | | Hexpol AB | | | 139,588 | |
| | 23,600 | | | Hitachi Chemical Company, Ltd. | | | 371,984 | |
| | 27,800 | | | Hokuetsu Corporation | | | 132,794 | |
| | 47,300 | | | JSR Corporation | | | 704,920 | |
| | 257,400 | | | Kuraray Company, Ltd. | | | 3,535,523 | |
| | 108,200 | | | Kyoei Steel, Ltd.b | | | 1,960,023 | |
| | 90,458 | | | Methanex Corporation | | | 5,855,346 | |
| | 169,737 | | | Mondi plc | | | 3,997,113 | |
| | 116,000 | | | Nippon Kayaku Company, Ltd. | | | 1,380,537 | |
| | 81,100 | | | Nippon Light Metal Holdings Company, Ltd. | | | 171,007 | |
| | 390,900 | | | Nippon Steel & Sumitomo Metal Corporation | | | 7,210,608 | |
| | 760 | | | Rio Tinto, Ltd. | | | 41,353 | |
| | 301,651 | | | Sandfire Resources NL | | | 1,426,315 | |
| | 6,000 | | | Sanyo Special Steel Company, Ltd. | | | 137,966 | |
| | 45,434 | | | SSAB AB, Class A | | | 181,385 | |
| | 31,600 | | | Taiheiyo Cement Corporation | | | 929,883 | |
| | 16,100 | | | Taiyo Holdings Company, Ltd. | | | 575,241 | |
| | 75,000 | | | Toagosei Company, Ltd. | | | 770,119 | |
| | 11,800 | | | Ube Industries, Ltd. | | | 257,036 | |
| | 306,029 | | | UPM-Kymmene Oyj | | | 9,838,398 | |
| | 184,561 | | | WestRock Company | | | 7,930,586 | |
| | 12,800 | | | Yamato Kogyo Company, Ltd. | | | 337,329 | |
| | | | | |
| | | | Total | | | 97,775,349 | |
| | | | | |
| |
| | Real Estate (0.8%) | | | | |
| | 29,042 | | | Artis Real Estate Investment Trust | | | 247,081 | |
| | 57,200 | | | Daito Trust Construction Company, Ltd. | | | 7,541,156 | |
| | 53,000 | | | Hang Lung Properties, Ltd. | | | 96,072 | |
| | 14,900 | | | Hitachi High-Technologies Corporation | | | 559,188 | |
| | 632,000 | | | Hysan Development Company, Ltd. | | | 2,963,889 | |
| | 67,304 | | | Quebecor, Inc. | | | 1,320,057 | |
| | 198,000 | | | Road King Infrastructure, Ltd. | | | 306,486 | |
| | 60,000 | | | Swire Pacific, Ltd. | | | 623,322 | |
| | 458,600 | | | Wing Tai Holdings, Ltd. | | | 639,169 | |
| | | | | |
| | | | Total | | | 14,296,420 | |
| | | | | |
| |
| | Utilities (2.2%) | | | | |
| | 98,852 | | | Edison International, Inc. | | | 6,859,340 | |
| | 297,475 | | | Enagas SA | | | 7,887,052 | |
| | 301,200 | | | Osaka Gas Company, Ltd. | | | 5,507,744 | |
| | 405,657 | | | PG&E Corporationa | | | 18,988,804 | |
| | | | | |
| | | | Total | | | 39,242,940 | |
| | | | | |
| | | | | | | | |
| | | | | |
| | | | Total Common Stock (cost $1,334,624,723) | | | 1,649,544,043 | |
| | | | | |
| | |
| Shares | | | Collateral Held for Securities Loaned (1.3%) | | Value | |
| | 22,091,756 | | | Thrivent Cash Management Trust | | | 22,091,756 | |
| | | | | |
| | | | Total Collateral Held for Securities Loaned (cost $22,091,756) | | | 22,091,756 | |
| | | | | |
| | |
Shares or
Principal
Amount | | | Short-Term Investments (6.6%) | | Value | |
| | | | Federal Home Loan Bank Discount Notes | | | | |
| | 4,300,000 | | | 2.020%, 11/6/2018d,e | | | 4,298,697 | |
| | 4,300,000 | | | 2.100%, 11/28/2018d,e | | | 4,292,970 | |
| | 6,500,000 | | | 2.195%, 12/13/2018d,e | | | 6,483,087 | |
| | 6,000,000 | | | 2.255%, 1/8/2019d,e | | | 5,973,936 | |
| | 6,600,000 | | | 2.240%, 1/16/2019d,e | | | 6,567,950 | |
| | | | Thrivent Core Short-Term Reserve Fund | | | | |
| | 8,918,435 | | | 2.430% | | | 89,184,347 | |
| | | | | |
| | | | Total Short-Term Investments (cost $116,802,956) | | | 116,800,987 | |
| | | | | |
| | | | Total Investments (cost $1,473,519,435) 101.1% | | | $1,788,436,786 | |
| | | | | |
| | | | Other Assets and Liabilities, Net (1.1%) | | | (19,321,069 | ) |
| | | | | |
| | | | Total Net Assets 100.0% | | | $1,769,115,717 | |
| | | | | |
a | Non-income producing security. |
b | All or a portion of the security is on loan. |
c | Denotes securities sold under Rule 144A of the Securities Act of 1933, which exempts them from registration. These securities may be resold to other dealers in the program or to other qualified institutional buyers. As of October 31, 2018, the value of these investments was $5,088,340 or 0.3% of total net assets. |
d | The interest rate shown reflects the yield, coupon rate or the discount rate at the date of purchase. |
e | All or a portion of the security is held on deposit with the counterparty and pledged as the initial margin deposit for open futures contracts. |
The following table presents the total amount of securities loaned with continuous maturity, by type, offset by the gross payable upon return of collateral for securities loaned by Thrivent Large Cap Stock Fund as of October 31, 2018:
| | | | |
Securities Lending Transactions | | | |
Common Stock | | | $20,843,498 | |
| | | | |
Total lending | | | $20,843,498 | |
Gross amount payable upon return of collateral for securities loaned | | | $22,091,756 | |
| | | | |
Net amounts due to counterparty | | | $1,248,258 | |
| | | | |
The accompanying Notes to Financial Statements are an integral part of this schedule.
51
LARGE CAP STOCK FUND
Schedule of Investments as of October 31, 2018
Definitions:
| | | | |
ADR | | - | | American Depositary Receipt, which are certificates for an underlying foreign security’s shares held by an issuing U.S. depository bank. |
The accompanying Notes to Financial Statements are an integral part of this schedule.
52
LIMITED MATURITY BOND FUND
Schedule of Investments as of October 31, 2018
| | | | | | | | |
Principal Amount | | | Bank Loans (0.5%)a | | Value | |
| | Basic Materials (<0.1%) | | | | |
| | | | Big River Steel, LLC, Term Loan | | | | |
| | $54,450 | | | 7.386%, (LIBOR 3M + 5.000%), 8/23/2023b | | | $54,995 | |
| | | | Contura Energy, Inc., Term Loan | | | | |
| | 100,000 | | | 0.000%, (LIBOR 3M + 5.000%), 10/3/2025b,c,d | | | 99,500 | |
| | | | MRC Global (US), Inc., Term Loan | | | | |
| | 59,699 | | | 5.302%, (LIBOR 1M + 3.000%), 9/20/2024b,e | | | 59,699 | |
| | | | | |
| | | | Total | | | 214,194 | |
| | | | | |
| |
| | Capital Goods (<0.1%) | | | | |
| | | | Advanced Disposal Services, Inc., Term Loan | | | | |
| | 99,799 | | | 4.460%, (LIBOR 1W + 2.250%), 11/10/2023b | | | 99,738 | |
| | | | GFL Environmental, Inc., Term Loan | | | | |
| | 100,000 | | | 0.000%, (LIBOR 3M + 3.000%), 5/31/2025b,c,d | | | 98,375 | |
| | | | | |
| | | | Total | | | 198,113 | |
| | | | | |
| |
| | Communications Services (0.2%) | | | | |
| | | | Cengage Learning, Inc., Term Loan | | | | |
| | 341,687 | | | 6.530%, (LIBOR 1M + 4.250%), 6/7/2023b | | | 316,166 | |
| | | | Frontier Communications Corporation, Term Loan | | | | |
| | 98,750 | | | 6.060%, (LIBOR 1M + 3.750%), 6/15/2024b | | | 95,392 | |
| | | | Intelsat Jackson Holdings SA, Term Loan | | | | |
| | 70,000 | | | 6.045%, (LIBOR 1M + 3.750%), 11/27/2023b | | | 70,000 | |
| | | | Liberty Cablevision of Puerto Rico, LLC, Term Loan | | | | |
| | 150,000 | | | 5.936%, (LIBOR 3M + 3.500%), 1/7/2022b | | | 147,027 | |
| | | | McGraw-Hill Global Education Holdings, LLC, Term Loan | | | | |
| | 162,493 | | | 6.302%, (LIBOR 1M + 4.000%), 5/4/2022b | | | 155,689 | |
| | | | Sable International Finance, Ltd., Term Loan | | | | |
| | 220,000 | | | 5.547%, (LIBOR 1M + 3.250%), 1/31/2026b | | | 219,754 | |
| | | | Univision Communications, Inc., Term Loan | | | | |
| | 859,360 | | | 5.052%, (LIBOR 1M + 2.750%), 3/15/2024b | | | 823,774 | |
| | | | WideOpenWest Finance, LLC, Term Loan | | | | |
| | 74,250 | | | 5.540%, (LIBOR 1M + 3.250%), 8/19/2023b | | | 71,466 | |
| | | | | |
| | | | Total | | | 1,899,268 | |
| | | | | |
| |
| | Consumer Cyclical (<0.1%) | | | | |
| | | | Burlington Coat Factory Warehouse Corporation, Term Loan | | | | |
| | 86,071 | | | 4.790%, (LIBOR 1M + 2.500%), 11/17/2024b | | | 86,071 | |
| | | | Golden Entertainment, Inc., Term Loan | | | | |
| | 138,950 | | | 5.300%, (LIBOR 1M + 3.000%), 10/20/2024b | | | 138,950 | |
| | | | Seminole Hard Rock Entertainment, Inc., Term Loan | | | | |
| | 336,363 | | | 5.146%, (LIBOR 3M + 2.750%), 5/14/2020b | | | 336,783 | |
| | | | | |
| | | | Total | | | 561,804 | |
| | | | | |
| |
| | Consumer Non-Cyclical (0.1%) | | | | |
| | | | Air Medical Group Holdings, Inc., Term Loan | | | | |
| | 173,688 | | | 5.534%, (LIBOR 3M + 3.250%), 4/28/2022b | | | 168,390 | |
| | 44,662 | | | 6.530%, (LIBOR 1M + 4.250%), 3/14/2025b | | | 43,769 | |
| | | | Bausch Health Companies, Inc., Term Loan | | | | |
| | 126,750 | | | 5.274%, (LIBOR 1M + 3.000%), 6/1/2025b | | | 126,721 | |
| | | | Endo International plc, Term Loan | | | | |
| | 119,095 | | | 6.563%, (LIBOR 1M + 4.250%), 4/27/2024b | | | 119,517 | |
| | | | JBS USA LUX SA, Term Loan | | | | |
| | 226,550 | | | 4.844%, (LIBOR 3M + 2.500%), 10/30/2022b | | | 226,437 | |
| | | | MPH Acquisition Holdings, LLC, Term Loan | | | | |
| | 88,784 | | | 5.136%, (LIBOR 3M + 2.750%), 6/7/2023b | | | 88,488 | |
| | | | Revlon Consumer Products Corporation, Term Loan | | | | |
| | 64,020 | | | 5.813%, (LIBOR 3M + 3.500%), 9/7/2023b | | | 46,752 | |
| | | | | |
| | | | Total | | | 820,074 | |
| | | | | |
| |
| | Energy (0.1%) | | | | |
| | | | Pacific Drilling SA, Term Loan | | | | |
| | 871,325 | | | 0.000%, (PRIME + 4.500%), 6/3/2018b,f,g | | | 390,641 | |
| | | | Radiate Holdco, LLC, Term Loan | | | | |
| | 223,300 | | | 5.302%, (LIBOR 1M + 3.000%), 2/1/2024b | | | 221,386 | |
| | | | | |
| | | | Total | | | 612,027 | |
| | | | | |
| |
| | Financials (<0.1%) | | | | |
| | | | GGP Nimbus LP, Term Loan | | | | |
| | 95,000 | | | 4.795%, (LIBOR 1M + 2.500%), 8/24/2025b | | | 93,389 | |
| | | | | |
| | | | Total | | | 93,389 | |
| | | | | |
| |
| | Technology (0.1%) | | | | |
| | | | First Data Corporation, Term Loan | | | | |
| | 220,000 | | | 4.287%, (LIBOR 1M + 2.000%), 4/26/2024b | | | 218,717 | |
| | | | Harland Clarke Holdings Corporation, Term Loan | | | | |
| | 113,863 | | | 7.136%, (LIBOR 3M + 4.750%), 11/3/2023b | | | 106,462 | |
The accompanying Notes to Financial Statements are an integral part of this schedule.
53
LIMITED MATURITY BOND FUND
Schedule of Investments as of October 31, 2018
| | | | | | | | |
Principal Amount | | | Bank Loans (0.5%)a | | Value | |
| | Technology (0.1%) - continued | | | | |
| | | | Plantronics, Inc., Term Loan | | | | |
| | $65,000 | | | 4.802%, (LIBOR 1M + 2.500%), 7/2/2025b | | | $64,756 | |
| | | | Rackspace Hosting, Inc., Term Loan | | | | |
| | 123,512 | | | 5.348%, (LIBOR 3M + 3.000%), 11/3/2023b | | | 119,678 | |
| | | | TNS, Inc., Term Loan | | | | |
| | 78,237 | | | 6.320%, (LIBOR 3M + 4.000%), 8/14/2022b | | | 78,564 | |
| | | | | |
| | | | Total | | | 588,177 | |
| | | | | |
| | | | | | | | |
| | | | | |
| | | | Total Bank Loans (cost $5,552,639) | | | 4,987,046 | |
| | | | | |
| | |
Principal
Amount | | | Long-Term Fixed Income (95.9%) | | Value | |
| | Asset-Backed Securities (26.4%) | | | | |
| | | | Ares XXXVII CLO, Ltd. | | | | |
| | 4,000,000 | | | 3.606%, (LIBOR 3M + 1.170%), 10/15/2030, Ser. 2015-4A, Class A1R*,b | | | 4,001,464 | |
| | | | ARI Fleet Lease Trust | | | | |
| | 2,323,991 | | | 1.910%, 4/15/2026, Ser. 2017-A, Class A2h | | | 2,307,391 | |
| | | | Ascentium Equipment Receivables, LLC | | | | |
| | 2,250,000 | | | 3.210%, 9/11/2023, Ser. 2018-1A, Class A3h | | | 2,241,932 | |
| | | | Assurant CLO III, Ltd. | | | | |
| | 4,700,000 | | | 3.389%, (LIBOR 3M + 1.230%), 10/20/2031, Ser. 2018-2A, Class A*,b | | | 4,699,756 | |
| | | | Babson CLO, Ltd. | | | | |
| | 2,607,402 | | | 3.599%, (LIBOR 3M + 1.150%), 10/17/2026, Ser. 2014-IIA, Class AR*,b | | | 2,607,934 | |
| | | | Bank of the West Auto Trust | | | | |
| | 2,000,000 | | | 2.110%, 1/15/2023, Ser. 2017-1, Class A3h | | | 1,964,162 | |
| | | | Barclays Dryrock Issuance Trust | | | | |
| | 2,750,000 | | | 1.520%, 5/16/2022, Ser. 2016-1, Class A | | | 2,723,110 | |
| | | | Bayview Opportunity Master Fund IVa Trust | | | | |
| | 2,872,335 | | | 3.500%, 6/28/2057, Ser. 2017-SPL5, Class Ab,h | | | 2,845,420 | |
| | | | BCC Funding XIV, LLC | | | | |
| | 859,811 | | | 2.200%, 2/20/2019, Ser. 2018-1A, Class A1h | | | 859,640 | |
| | 2,600,000 | | | 2.960%, 6/20/2023, Ser. 2018-1A, Class A2h | | | 2,585,465 | |
| | | | Betony CLO, Ltd. | | | | |
| | 2,750,000 | | | 3.600%, (LIBOR 3M + 1.080%), 4/30/2031, Ser. 2018-1A, Class A1*,b | | | 2,747,101 | |
| | | | Brazos Higher Education Authority, Inc. | | | | |
| | 1,642,492 | | | 3.111%, (LIBOR 3M + 0.800%), 2/25/2030, Ser. 2011-1, Class A2b | | | 1,654,067 | |
| | | | Business Jet Securities, LLC | | | | |
| | 1,683,860 | | | 4.335%, 2/15/2033, Ser. 2018-1, Class Ah | | | 1,678,336 | |
| | | | CBAM CLO, Ltd. | | | | |
| | 4,000,000 | | | 3.563%, (LIBOR 3M + 1.120%), 10/20/2029, Ser. 2018-8A, Class A1*,b | | | 3,999,848 | |
| | | | CCG Receivables Trust | | | | |
| | 3,500,000 | | | 2.500%, 6/16/2025, Ser. 2018-1, Class A2h | | | 3,476,864 | |
| | | | Cedar Funding VI CLO, Ltd. | | | | |
| | 6,000,000 | | | 3.559%, (LIBOR 3M + 1.090%), 10/20/2028, Ser. 2016-6A, Class AR*,b | | | 5,999,952 | |
| | | | Cent CLO 22, Ltd. | | | | |
| | 3,250,000 | | | 3.753%, (LIBOR 3M + 1.410%), 11/7/2026, Ser. 2014-22A, Class A1R*,b | | | 3,250,653 | |
| | | | Chesapeake Funding II, LLC | | | | |
| | 1,220,631 | | | 1.880%, 6/15/2028, Ser. 2016-2A, Class A1h | | | 1,214,518 | |
| | | | Citibank Credit Card Issuance Trust | | | | |
| | 4,900,000 | | | 2.647%, (LIBOR 1M + 0.370%), 8/8/2024, Ser. 2017-A7, Class A7b | | | 4,904,589 | |
| | | | Commonbond Student Loan Trust | | | | |
| | 274,028 | | | 3.200%, 6/25/2032, Ser. 2015-A, Class A* | | | 271,617 | |
| | 1,283,955 | | | 2.550%, 5/25/2041, Ser. 2017-AGS, Class A1h | | | 1,239,422 | |
| | 4,148,902 | | | 2.781%, (LIBOR 1M + 0.500%), 2/25/2044, Ser. 2018-AGS, Class A2b,h | | | 4,105,666 | |
| | | | Conn Funding II, LP | | | | |
| | 180,529 | | | 2.730%, 7/15/2020, Ser. 2017-B, Class Ah | | | 180,491 | |
| | 1,766,735 | | | 3.250%, 1/15/2023, Ser. 2018-A, Class Ah | | | 1,766,523 | |
| | | | CoreVest American Finance Trust | | | | |
| | 2,580,936 | | | 3.804%, 6/15/2051, Ser. 2018-1, Class Ah | | | 2,574,035 | |
| | | | CPS Auto Receivables Trust | | | | |
| | 2,802,393 | | | 2.160%, 5/17/2021, Ser. 2018-A, Class Ah | | | 2,791,378 | |
| | | | Credit Acceptance Auto Loan Trust | | | | |
| | 2,800,000 | | | 3.470%, 5/17/2027, Ser. 2018-2A, Class Ah | | | 2,795,241 | |
| | | | DRB Prime Student Loan Trust | | | | |
| | 1,156,983 | | | 4.187%, (LIBOR 1M + 1.900%), 10/27/2031, Ser. 2015-B, Class A1*,b | | | 1,174,188 | |
| | 309,521 | | | 1.750%, 5/27/2042, Ser. 2017-A, Class A2Ah | | | 308,780 | |
| | | | Earnest Student Loan Program, LLC | | | | |
| | 2,091,471 | | | 2.650%, 1/25/2041, Ser. 2017-A, Class A2h | | | 2,043,377 | |
| | | | Edlinc Student Loan Funding Trust | | | | |
| | 552,461 | | | 5.330%, (CMT 3M + 3.150%), 10/1/2025, Ser. 2012-A, Class AT*,b | | | 558,858 | |
The accompanying Notes to Financial Statements are an integral part of this schedule.
54
LIMITED MATURITY BOND FUND
Schedule of Investments as of October 31, 2018
| | | | | | | | |
Principal
Amount | | | Long-Term Fixed Income (95.9%) | | Value | |
| | Asset-Backed Securities (26.4%) - continued | | | | |
| | | | Fifth Third Auto Trust | | | | |
| | $1,375,000 | | | 1.800%, 2/15/2022, Ser. 2017-1, Class A3 | | | $1,357,265 | |
| | | | Finance of America Structured Securities Trust | | | | |
| | 3,614,513 | | | 3.375%, 9/25/2028, Ser. 2018-HB1, Class A*,b,e | | | 3,610,899 | |
| | | | Ford Credit Auto Owner Trust | | | | |
| | 2,875,000 | | | 2.260%, 11/15/2025, Ser. 2014-1, Class Ah | | | 2,864,980 | |
| | | | FRS, LLC | | | | |
| | 317,221 | | | 1.800%, 4/15/2043, Ser. 2013-1A, Class A1* | | | 315,821 | |
| | | | Garrison BSL CLO, Ltd. | | | | |
| | 6,000,000 | | | 3.341%, (LIBOR 3M + 0.970%), 7/17/2028, Ser. 2018-1A, Class A1*,b | | | 5,962,632 | |
| | | | GM Financial Consumer Automobile Receivables Trust | | | | |
| | 4,230,691 | | | 2.080%, 1/19/2021, Ser. 2018-1, Class A2A | | | 4,214,219 | |
| | | | GMAC Mortgage Corporation Loan Trust | | | | |
| | 65,322 | | | 2.781%, (LIBOR 1M + 0.500%), 8/25/2035, Ser. 2005-HE1, Class A2b,i | | | 71,307 | |
| | 198,783 | | | 5.750%, 10/25/2036, Ser. 2006-HE3, Class A2b | | | 200,792 | |
| | | | GoldenTree Loan Opportunities, Ltd. | | | | |
| | 3,000,000 | | | 3.809%, (LIBOR 3M + 1.300%), 10/29/2029, Ser. 2014-9A, Class AJR2*,b | | | 3,000,000 | |
| | | | Golub Capital Partners, Ltd. | | | | |
| | 6,000,000 | | | 3.610%, (LIBOR 3M + 1.150%), 10/20/2028, Ser. 2018-39A, Class A1*,b | | | 5,999,856 | |
| | | | GreatAmerica Leasing Receivables Funding, LLC | | | | |
| | 2,964,266 | | | 2.060%, 6/22/2020, Ser. 2017-1, Class A3h | | | 2,949,584 | |
| | | | Home Partners of America Trust | | | | |
| | 2,732,464 | | | 3.107%, (LIBOR 1M + 0.817%), 7/17/2034, Ser. 2017-1, Class Ab,h | | | 2,733,822 | |
| | | | Invitation Homes Trust | | | | |
| | 4,500,000 | | | 3.350%, (LIBOR 1M + 1.100%), 1/17/2038, Ser. 2018-SFR4, Class Ab,d,h | | | 4,500,000 | |
| | | | Lendmark Funding Trust | | | | |
| | 1,200,000 | | | 2.800%, 5/20/2026, Ser. 2017-2A, Class Ah | | | 1,181,643 | |
| | | | Magnetite XVIII Ltd | | | | |
| | 4,500,000 | | | 3.490%, (LIBOR 3M + 1.080%), 11/15/2028, Ser. 2016-18A, Class AR*,b,d | | | 4,500,000 | |
| | | | Marlette Funding Trust | | | | |
| | 401,193 | | | 2.827%, 3/15/2024, Ser. 2017-1A, Class Ah | | | 401,046 | |
| | 3,382,322 | | | 2.610%, 3/15/2028, Ser. 2018-1A, Class Ah | | | 3,370,204 | |
| | 2,633,531 | | | 3.060%, 7/17/2028, Ser. 2018-2A, Class Ah | | | 2,628,709 | |
| | 5,375,909 | | | 3.200%, 9/15/2028, Ser. 2018-3A, Class Ah | | | 5,364,744 | |
| | | | Mercedes-Benz Auto Lease Trust | | | | |
| | 3,808,625 | | | 2.200%, 4/15/2020, Ser. 2018-A, Class A2 | | | 3,800,969 | |
| | | | Mill City Mortgage Loan Trust | | | | |
| | 3,563,077 | | | 3.500%, 5/25/2058, Ser. 2018-2, Class A1b,h | | | 3,524,789 | |
| | | | MMAF Equipment Finance, LLC | | | | |
| | 582,422 | | | 1.730%, 5/18/2020, Ser. 2017-AA, Class A2h | | | 580,851 | |
| | | | Mortgage Equity Conversion Asset Trust | | | | |
| | 1,469,232 | | | 3.160%, (CMT 1Y + 0.490%), 1/25/2042, Ser. 2007-FF1, Class A*,b,e | | | 1,372,409 | |
| | 1,435,580 | | | 3.130%, (CMT 1Y + 0.470%), 2/25/2042, Ser. 2007-FF2, Class A*,b,e | | | 1,338,104 | |
| | | | Nationstar HECM Loan Trust | | | | |
| | 1,538,097 | | | 2.038%, 9/25/2027, Ser. 2017-2A, Class A1b,h | | | 1,527,042 | |
| | | | Navient Student Loan Trust | | | | |
| | 5,139,233 | | | 3.031%, (LIBOR 1M + 0.750%), 7/25/2066, Ser. 2017-1A, Class A2b,h | | | 5,162,601 | |
| | 2,700,000 | | | 2.881%, (LIBOR 1M + 0.600%), 7/26/2066, Ser. 2017-3A, Class A2b,h | | | 2,714,476 | |
| | | | NCUA Guaranteed Notes | | | | |
| | 802,114 | | | 2.633%, (LIBOR 1M + 0.350%), 12/7/2020, Ser. 2010-A1, Class Ab | | | 802,775 | |
| | | | Neuberger Berman CLO, Ltd. | | | | |
| | 2,800,000 | | | 3.649%, (LIBOR 3M + 1.180%), 4/22/2029, Ser. 2014-17A, Class AR*,b | | | 2,803,433 | |
| | | | NextGear Floorplan Master Owner Trust | | | | |
| | 3,000,000 | | | 2.560%, 10/17/2022, Ser. 2017-2A, Class A2h | | | 2,943,931 | |
| | | | Northstar Education Finance, Inc. | | | | |
| | 1,102,243 | | | 2.981%, (LIBOR 1M + 0.700%), 12/26/2031, Ser. 2012-1, Class Ab,h | | | 1,107,297 | |
| | | | NRZ Excess Spread-Collateralized Notes Series | | | | |
| | 2,081,558 | | | 3.193%, 1/25/2023, Ser. 2018-PLS1, Class A* | | | 2,067,532 | |
| | | | Octagon Investment Partners XX, Ltd. | | | | |
| | 3,350,000 | | | 3.468%, (LIBOR 3M + 1.130%), 8/12/2026, Ser. 2014-1A, Class AR*,b | | | 3,350,951 | |
| | | | OZLM VIII, Ltd. | | | | |
| | 3,300,000 | | | 3.579%, (LIBOR 3M + 1.130%), 10/17/2026, Ser. 2014-8A, Class A1AR*,b | | | 3,301,597 | |
| | | | PFS Financing Corporation | | | | |
| | 3,300,000 | | | 2.680%, (LIBOR 1M + 0.400%), 2/15/2022, Ser. 2018-A, Class Ab,h | | | 3,300,445 | |
The accompanying Notes to Financial Statements are an integral part of this schedule.
55
LIMITED MATURITY BOND FUND
Schedule of Investments as of October 31, 2018
| | | | | | | | |
Principal
Amount | | | Long-Term Fixed Income (95.9%) | | Value | |
| | Asset-Backed Securities (26.4%) - continued | | | | |
| | | | Prestige Auto Receivables Trust | | | | |
| | $9,191 | | | 1.460%, 7/15/2020, Ser. 2016-2A, Class A2h | | | $9,186 | |
| | | | Pretium Mortgage Credit Partners, LLC | | | | |
| | 2,929,130 | | | 4.125%, 8/27/2033, Ser. 2018-NPL3, Class A1h,j | | | 2,920,853 | |
| | | | Progress Residential Trust | | | | |
| | 2,990,393 | | | 2.768%, 8/17/2034, Ser. 2017-SFR1, Class Ah | | | 2,878,496 | |
| | | | Prosper Marketplace Issuance Trust | | | | |
| | 549,478 | | | 2.410%, 9/15/2023, Ser. 2017-2A, Class Ah | | | 548,845 | |
| | 2,070,140 | | | 3.110%, 6/17/2024, Ser. 2018-1A, Class Ah | | | 2,067,644 | |
| | 4,715,131 | | | 3.350%, 10/15/2024, Ser. 2018-2A, Class Ah | | | 4,707,688 | |
| | | | Race Point IX CLO, Ltd. | | | | |
| | 1,325,000 | | | 3.646%, (LIBOR 3M + 1.210%), 10/15/2030, Ser. 2015-9A, Class A1AR*,b | | | 1,328,628 | |
| | | | Renaissance Home Equity Loan Trust | | | | |
| | 1,306,420 | | | 5.608%, 5/25/2036, Ser. 2006-1, Class AF3j | | | 901,687 | |
| | 689,543 | | | 5.285%, 1/25/2037, Ser. 2006-4, Class AF2j | | | 367,608 | |
| | | | Santander Retail Auto Lease Trust | | | | |
| | 3,450,000 | | | 2.220%, 1/20/2021, Ser. 2017-A, Class A3h | | | 3,414,884 | |
| | | | Securitized Term Auto Receivables Trust | | | | |
| | 3,575,783 | | | 1.890%, 8/25/2020, Ser. 2017-1A, Class A3h | | | 3,559,697 | |
| | | | SLM Student Loan Trust | | | | |
| | 3,709,304 | | | 2.681%, (LIBOR 1M + 0.400%), 3/25/2025, Ser. 2010-1, Class Ab | | | 3,654,650 | |
| | 1,104,737 | | | 2.801%, (LIBOR 1M + 0.520%), 3/25/2026, Ser. 2011-1, Class A1b | | | 1,107,231 | |
| | | | SoFi Consumer Loan Program Trust | | | | |
| | 2,476,190 | | | 2.930%, 4/26/2027, Ser. 2018-2, Class A1h | | | 2,468,465 | |
| | | | Sofi Consumer Loan Program, LLC | | | | |
| | 1,389,830 | | | 2.770%, 5/25/2026, Ser. 2017-3, Class Ah | | | 1,376,228 | |
| | | | SoFi Professional Loan Program, LLC | | | | |
| | 722,432 | | | 2.420%, 3/25/2030, Ser. 2015-A, Class A2h | | | 711,445 | |
| | 102,049 | | | 1.480%, 5/26/2031, Ser. 2016-C, Class A2Ah | | | 101,880 | |
| | 640,758 | | | 2.510%, 8/25/2033, Ser. 2015-C, Class A2h | | | 628,016 | |
| | 649,612 | | | 3.131%, (LIBOR 1M + 0.850%), 7/25/2039, Ser. 2016-E, Class A1b,h | | | 652,592 | |
| | 1,180,980 | | | 1.550%, 3/26/2040, Ser. 2017-A, Class A2Ah | | | 1,171,586 | |
| | | | Sound Point CLO XX, Ltd. | | | | |
| | 3,000,000 | | | 3.436%, (LIBOR 3M + 1.100%), 7/26/2031, Ser. 2018-2A, Class A*,b | | | 2,999,658 | |
| | | | Springleaf Funding Trust | | | | |
| | 3,350,000 | | | 2.900%, 11/15/2029, Ser. 2016-AA, Class Ah | | | 3,336,894 | |
| | | | Stanwich Mortgage Loan Trust | | | | |
| | 2,500,000 | | | 4.500%, 10/18/2023, Ser. 2018-NPB2, Class A1*,e | | | 2,500,000 | |
| | | | Synchrony Credit Card Master Note Trust | | | | |
| | 2,500,000 | | | 3.470%, 5/15/2026, Ser. 2018-2, Class A | | | 2,491,323 | |
| | | | Tesla Auto Lease Trust | | | | |
| | 2,958,214 | | | 2.320%, 12/20/2019, Ser. 2018-A, Class Ah | | | 2,947,737 | |
| | | | Upstart Securitization Trust | | | | |
| | 1,045,193 | | | 3.015%, 8/20/2025, Ser. 2018-1, Class Ah | | | 1,044,586 | |
| | 4,439,587 | | | 3.330%, 12/22/2025, Ser. 2018-2, Class Ah | | | 4,437,358 | |
| | | | Vericrest Opportunity Loan Transferee | | | | |
| | 2,500,000 | | | 4.213%, 8/25/2048, Ser. 2018-NPL5, Class A1Ah,j | | | 2,495,810 | |
| | | | Vericrest Opportunity Loan Trust LXV, LLC | | | | |
| | 1,783,601 | | | 3.750%, 4/25/2048, Ser. 2018-NPL1, Class A1h,j | | | 1,774,993 | |
| | | | Verizon Owner Trust | | | | |
| | 4,500,000 | | | 2.060%, 4/20/2022, Ser. 2017-3A, Class A1Ah | | | 4,428,473 | |
| | | | Volvo Financial Equipment Master Owner Trust | | | | |
| | 2,500,000 | | | 2.780%, (LIBOR 1M + 0.500%), 11/15/2022, Ser. 2017-A, Class Ab,h | | | 2,507,173 | |
| | | | Voya CLO 3, Ltd. | | | | |
| | 2,732,209 | | | 3.210%, (LIBOR 3M + 0.720%), 7/25/2026, Ser. 2014-3A, Class A1R*,b | | | 2,732,507 | |
| | | | Wachovia Asset Securitization, Inc. | | | | |
| | 322,365 | | | 2.421%, (LIBOR 1M + 0.140%), 7/25/2037, Ser. 2007-HE1, Class A*,b,i | | | 309,485 | |
| | | | Wheels SPV 2, LLC | | | | |
| | 419,994 | | | 1.590%, 5/20/2025, Ser. 2016-1A, Class A2h | | | 418,727 | |
| | 736,315 | | | 1.880%, 4/20/2026, Ser. 2017-1A, Class A2h | | | 729,926 | |
| | | | World Financial Network Credit Card Master Trust | | | | |
| | 3,900,000 | | | 1.980%, 6/15/2023, Ser. 2017-B, Class A | | | 3,867,870 | |
| | | | | |
| | | | Total | | | 244,098,332 | |
| | | | | |
| |
| | Basic Materials (0.5%) | | | | |
| | | | Georgia-Pacific, LLC | | | | |
| | 1,995,000 | | | 2.539%, 11/15/2019h | | | 1,979,875 | |
| | | | Glencore Funding, LLC | | | | |
| | 1,500,000 | | | 3.000%, 10/27/2022h | | | 1,434,366 | |
| | | | Kinross Gold Corporation | | | | |
| | 1,000,000 | | | 5.950%, 3/15/2024 | | | 1,022,500 | |
| | | | | |
| | | | Total | | | 4,436,741 | |
| | | | | |
The accompanying Notes to Financial Statements are an integral part of this schedule.
56
LIMITED MATURITY BOND FUND
Schedule of Investments as of October 31, 2018
| | | | | | | | |
Principal
Amount | | | Long-Term Fixed Income (95.9%) | | Value | |
| | Capital Goods (0.7%) | | | | |
| | | | Lockheed Martin Corporation | | | | |
| | $1,250,000 | | | 2.500%, 11/23/2020 | | | $1,227,437 | |
| | | | Northrop Grumman Corporation | | | | |
| | 2,000,000 | | | 2.550%, 10/15/2022 | | | 1,922,861 | |
| | | | Roper Technologies, Inc. | | | | |
| | 500,000 | | | 2.800%, 12/15/2021 | | | 486,885 | |
| | 1,250,000 | | | 3.650%, 9/15/2023 | | | 1,238,855 | |
| | | | Siemens Financieringsmaatschappij NV | | | | |
| | 2,000,000 | | | 2.944%, (LIBOR 3M + 0.610%), 3/16/2022b,h | | | 2,021,069 | |
| | | | | |
| | | | Total | | | 6,897,107 | |
| | | | | |
| |
| | Collateralized Mortgage Obligations (5.6%) | | | | |
| | | | Angel Oak Mortgage Trust I, LLC | | | | |
| | 2,701,780 | | | 3.258%, 4/27/2048, Ser. 2018-1, Class A1b,h | | | 2,691,371 | |
| | 4,522,128 | | | 3.674%, 7/27/2048, Ser. 2018-2, Class A1b,h | | | 4,513,113 | |
| | | | Arroyo Mortgage Trust | | | | |
| | 3,283,987 | | | 3.763%, 4/25/2048, Ser. 2018-1, Class A1b,h | | | 3,278,147 | |
| | | | Bayview Opportunity Master Fund Trust | | | | |
| | 2,110,365 | | | 3.500%, 5/28/2069, Ser. 2017-RT5, Class Ab,h | | | 2,087,276 | |
| | | | Bear Stearns Adjustable Rate Mortgage Trust | | | | |
| | 195,382 | | | 4.730%, (CMT 1Y + 2.300%), 10/25/2035, Ser. 2005-9, Class A1b | | | 197,591 | |
| | | | Bellemeade Re, Ltd. | | | | |
| | 4,000,000 | | | 3.231%, (LIBOR 1M + 0.950%), 8/25/2028, Ser. 2018-2A, Class M1Ab,h | | | 4,004,907 | |
| | | | Civic Mortgage, LLC | | | | |
| | 2,334,854 | | | 3.892%, 6/25/2022, Ser. 2018-1, Class A1h | | | 2,333,589 | |
| | 5,000,000 | | | 4.349%, 11/25/2022, Ser. 2018-2, Class A1e,h,j | | | 4,950,000 | |
| | | | COLT Mortgage Loan Trust | | | | |
| | 1,301,767 | | | 2.614%, 5/27/2047, Ser. 2017-1, Class A1*,b | | | 1,289,615 | |
| | 1,792,694 | | | 2.930%, 2/25/2048, Ser. 2018-1, Class A1b,h | | | 1,781,864 | |
| | | | Countrywide Alternative Loan Trust | | | | |
| | 226,015 | | | 5.500%, 11/25/2035, Ser. 2005-49CB, Class A1 | | | 219,248 | |
| | 185,067 | | | 5.500%, 2/25/2036, Ser. 2005-85CB, Class 2A2 | | | 176,015 | |
| | 264,209 | | | 6.000%, 1/25/2037, Ser. 2006-39CB, Class 1A16 | | | 251,247 | |
| | | | Countrywide Home Loans, Inc. | | | | |
| | 375,196 | | | 3.826%, 9/20/2036, Ser. 2006-HYB5, Class 2A1b | | | 323,943 | |
| | | | Deephaven Residential Mortgage Trust | | | | |
| | 780,849 | | | 2.725%, 12/26/2046, Ser. 2017-1A, Class A1*,b | | | 776,491 | |
| | 1,149,535 | | | 2.577%, 10/25/2047, Ser. 2017-3A, Class A1b,h | | | 1,136,090 | |
| | | | Federal National Mortgage Association Conventional 15-Yr. Pass Through | | | | |
| | 500,257 | | | 2.250%, 6/25/2025, Ser. 2010-58, Class PT | | | 496,968 | |
| | | | Homeward Opportunities Fund Trust | | | | |
| | 3,264,182 | | | 3.766%, 6/25/2048, Ser. 2018-1, Class A1*,b | | | 3,263,830 | |
| | | | J.P. Morgan Alternative Loan Trust | | | | |
| | 637,604 | | | 3.734%, 3/25/2036, Ser. 2006-A1, Class 2A1b | | | 577,764 | |
| | | | J.P. Morgan Mortgage Trust | | | | |
| | 341,464 | | | 3.871%, 2/25/2036, Ser. 2006-A1, Class 2A2b | | | 310,212 | |
| | 209,903 | | | 4.225%, 10/25/2036, Ser. 2006-A6, Class 1A2b | | | 183,132 | |
| | | | Master Asset Securitization Trust | | | | |
| | 585,853 | | | 2.781%, (LIBOR 1M + 0.500%), 6/25/2036, Ser. 2006-2, Class 2A2b | | | 277,959 | |
| | | | NCUA Guaranteed Notes | | | | |
| | 1,056,236 | | | 2.729%, (LIBOR 1M + 0.450%), 10/7/2020, Ser. 2010-R1, Class 1Ab,i | | | 1,057,635 | |
| | | | Radnor RE, Ltd. | | | | |
| | 3,300,000 | | | 3.681%, (LIBOR 1M + 1.400%), 3/25/2028, Ser. 2018-1, Class M1*,b | | | 3,305,229 | |
| | | | Residential Accredit Loans, Inc. Trust | | | | |
| | 2,419,544 | | | 2.831%, (LIBOR 1M + 0.550%), 1/25/2037, Ser. 2007-QS1, Class 1A5b | | | 1,918,428 | |
| | | | Residential Asset Securitization Trust | | | | |
| | 307,617 | | | 5.750%, 2/25/2036, Ser. 2005-A15, Class 5A1 | | | 222,802 | |
| | | | Structured Asset Securities Corporation Trust | | | | |
| | 678,282 | | | 5.500%, 12/25/2034, Ser. 2005-10, Class 3A1 | | | 676,429 | |
| | | | Toorak Mortgage Corporation 2018- 1, Ltd. | | | | |
| | 2,500,000 | | | 4.336%, 8/25/2021, Ser. 2018-1, Class A1*,j | | | 2,504,797 | |
| | | | Towd Point Mortgage Trust | | | | |
| | 3,559,539 | | | 2.887%, (LIBOR 1M + 0.600%), 2/25/2057, Ser. 2017-5, Class A1b,h | | | 3,555,574 | |
| | | | Wachovia Mortgage Loan Trust, LLC | | | | |
| | 165,982 | | | 4.027%, 5/20/2036, Ser. 2006-A, Class 2A1b | | | 150,778 | |
| | | | WaMu Mortgage Pass Through Certificates | | | | |
| | 1,628,171 | | | 2.826%, (12 MTA + 0.880%), 10/25/2046, Ser. 2006-AR13, Class 1Ab | | | 1,530,706 | |
| | 1,122,773 | | | 2.686%, (12 MTA + 0.740%), 1/25/2047, Ser. 2006-AR19, Class 1Ab | | | 1,062,804 | |
| | | | Wells Fargo Mortgage Backed Securities Trust | | | | |
| | 603,876 | | | 5.500%, 8/25/2035, Ser. 2005-6, Class A12 | | | 614,188 | |
The accompanying Notes to Financial Statements are an integral part of this schedule.
57
LIMITED MATURITY BOND FUND
Schedule of Investments as of October 31, 2018
| | | | | | | | |
Principal
Amount | | | Long-Term Fixed Income (95.9%) | | Value | |
| | Collateralized Mortgage Obligations (5.6%) - continued | | | | |
| | $552,592 | | | 4.083%, 3/25/2036, Ser. 2006-AR2, Class 2A1b | | | $562,379 | |
| | | | | |
| | | | Total | | | 52,282,121 | |
| | | | | |
| |
| | Commercial Mortgage-Backed Securities (3.6%) | | | | |
| | | | Cold Storage Trust | | | | |
| | 4,850,000 | | | 3.280%, (LIBOR 1M + 1.000%), 4/15/2024, Ser. 2017-ICE3, Class A*,b | | | 4,851,374 | |
| | | | Federal Home Loan Mortgage Corporation Multifamily Structured Pass Through Certificates | | | | |
| | 5,150,000 | | | 2.481%, (LIBOR 1M + 0.220%), 7/25/2020, Ser. KP04, Class AG1b,i | | | 5,149,996 | |
| | 5,805,591 | | | 2.561%, (LIBOR 1M + 0.300%), 11/25/2024, Ser. KF41, Class Ab,i | | | 5,778,366 | |
| | | | Federal National Mortgage Association—ACES | | | | |
| | 2,928,559 | | | 3.560%, 9/25/2021, Ser. 2018-M5, Class A2b | | | 2,935,936 | |
| | 3,097,463 | | | 2.565%, (LIBOR 1M + 0.400%), 10/25/2024, Ser. 2017-M13, Class FAb | | | 3,093,576 | |
| | | | Federal National Mortgage Association—Connecticut Avenue Securities | | | | |
| | 3,172,457 | | | 3.031%, (LIBOR 1M + 0.750%), 12/25/2030, Ser. 2018-C04, Class 2M1b | | | 3,172,906 | |
| | | | Wells Fargo Commercial Mortgage Trust | | | | |
| | 5,276,659 | | | 2.819%, 8/15/2050, Ser. 2014-LC16, Class A2 | | | 5,268,149 | |
| | 2,925,000 | | | 2.632%, 5/15/2048, Ser. 2015-NXS1, Class A2 | | | 2,907,760 | |
| | | | | |
| | | | Total | | | 33,158,063 | |
| | | | | |
| |
| | Communications Services (2.4%) | | | | |
| | | | American Tower Corporation | | | | |
| | 1,800,000 | | | 3.450%, 9/15/2021 | | | 1,788,858 | |
| | | | AT&T, Inc. | | | | |
| | 1,400,000 | | | 3.316%, (LIBOR 3M + 0.930%), 6/30/2020b | | | 1,412,491 | |
| | 2,000,000 | | | 3.200%, 3/1/2022 3.209%, (LIBOR 3M + | | | 1,965,057 | |
| | 2,000,000 | | | 0.890%), 2/15/2023b,h | | | 1,989,734 | |
| | | | Charter Communications Operating, LLC | | | | |
| | 1,000,000 | | | 3.579%, 7/23/2020 | | | 998,670 | |
| | 1,000,000 | | | 4.464%, 7/23/2022 | | | 1,011,152 | |
| | | | Comcast Corporation | | | | |
| | 1,750,000 | | | 3.038%, (LIBOR 3M + 0.630%), 4/15/2024b | | | 1,740,181 | |
| | | | Cox Communications, Inc. | | | | |
| | 1,500,000 | | | 3.150%, 8/15/2024h | | | 1,417,910 | |
| | | | Crown Castle International Corporation | | | | |
| | 250,000 | | | 3.400%, 2/15/2021 | | | 248,429 | |
| | 1,000,000 | | | 2.250%, 9/1/2021 | | | 959,130 | |
| | 1,000,000 | | | 3.200%, 9/1/2024 | | | 944,494 | |
| | | | Discovery Communications, LLC | | | | |
| | 2,000,000 | | | 2.950%, 3/20/2023 | | | 1,901,031 | |
| | | | Moody’s Corporation | | | | |
| | 1,250,000 | | | 2.750%, 7/15/2019 | | | 1,247,477 | |
| | | | Omnicom Group, Inc. | | | | |
| | 1,250,000 | | | 3.625%, 5/1/2022 | | | 1,234,817 | |
| | | | SES Global Americas Holdings GP | | | | |
| | 1,125,000 | | | 2.500%, 3/25/2019h | | | 1,121,858 | |
| | | | Vodafone Group plc | | | | |
| | 2,000,000 | | | 3.426%, (LIBOR 3M + 0.990%), 1/16/2024b | | | 1,993,603 | |
| | | | | |
| | | | Total | | | 21,974,892 | |
| | | | | |
| |
| | Consumer Cyclical (2.0%) | | | | |
| | | | Alibaba Group Holding, Ltd. | | | | |
| | 500,000 | | | 2.800%, 6/6/2023 | | | 478,800 | |
| | | | BMW US Capital, LLC | | | | |
| | 1,450,000 | | | 1.500%, 4/11/2019h | | | 1,441,251 | |
| | 1,500,000 | | | 2.835%, (LIBOR 3M + 0.410%), 4/12/2021b,h | | | 1,498,660 | |
| | | | Daimler Finance North America, LLC | | | | |
| | 2,000,000 | | | 2.871%, (LIBOR 3M + 0.530%), 5/5/2020b,h | | | 2,004,198 | |
| | 1,000,000 | | | 3.181%, (LIBOR 3M + 0.840%), 5/4/2023b,h | | | 1,003,019 | |
| | | | Ford Motor Credit Company, LLC | | | | |
| | 1,000,000 | | | 3.656%, (LIBOR 3M + 1.270%), 3/28/2022b | | | 987,823 | |
| | 1,000,000 | | | 3.549%, (LIBOR 3M + 1.235%), 2/15/2023b | | | 974,559 | |
| | | | General Motors Financial Company, Inc. | | | | |
| | 1,700,000 | | | 3.366%, (LIBOR 3M + 0.930%), 4/13/2020b | | | 1,707,867 | |
| | 3,500,000 | | | 3.696%, (LIBOR 3M + 1.310%), 6/30/2022b | | | 3,525,305 | |
| | | | Home Depot, Inc. | | | | |
| | 1,600,000 | | | 4.400%, 4/1/2021 | | | 1,639,385 | |
| | | | Hyundai Capital Services, Inc. | | | | |
| | 2,000,000 | | | 3.000%, 3/6/2022h | | | 1,925,173 | |
| | 1,500,000 | | | 3.000%, 8/29/2022h | | | 1,434,223 | |
| | | | Ralph Lauren Corporation | | | | |
| | 225,000 | | | 2.625%, 8/18/2020 | | | 222,432 | |
| | | | | |
| | | | Total | | | 18,842,695 | |
| | | | | |
| |
| | Consumer Non-Cyclical (5.1%) | | | | |
| | | | Anheuser-Busch InBev Finance, Inc. | | | | |
| | 2,000,000 | | | 3.603%, (LIBOR 3M + 1.260%), 2/1/2021b | | | 2,042,577 | |
| | 1,335,000 | | | 3.300%, 2/1/2023 | | | 1,301,458 | |
| | | | Anheuser-Busch InBev Worldwide, Inc. | | | | |
| | 1,000,000 | | | 3.165%, (LIBOR 3M + 0.740%), 1/12/2024b | | | 999,449 | |
| | | | BAT Capital Corporation | | | | |
| | 2,000,000 | | | 3.194%, (LIBOR 3M + 0.880%), 8/15/2022b,h | | | 2,009,082 | |
| | | | Bayer US Finance, LLC | | | | |
| | 1,000,000 | | | 2.375%, 10/8/2019h | | | 992,078 | |
| | 2,000,000 | | | 3.344%, (LIBOR 3M + 1.010%), 12/15/2023b,h | | | 1,992,084 | |
The accompanying Notes to Financial Statements are an integral part of this schedule.
58
LIMITED MATURITY BOND FUND
Schedule of Investments as of October 31, 2018
| | | | | | | | |
Principal
Amount | | | Long-Term Fixed Income (95.9%) | | Value | |
| | Consumer Non-Cyclical (5.1%) - continued | | | | |
| | | | Becton, Dickinson and Company | | | | |
| | $1,000,000 | | | 3.261%, (LIBOR 3M + 0.875%), 12/29/2020b | | | $1,000,799 | |
| | 1,950,000 | | | 3.125%, 11/8/2021 | | | 1,917,910 | |
| | | | Boston Scientific Corporation | | | | |
| | 1,665,000 | | | 6.000%, 1/15/2020 | | | 1,716,272 | |
| | | | Cargill, Inc. | | | | |
| | 1,000,000 | | | 3.250%, 3/1/2023h | | | 983,976 | |
| | | | Church & Dwight Company, Inc. | | | | |
| | 1,155,000 | | | 2.450%, 12/15/2019 | | | 1,146,696 | |
| | | | CK Hutchison International, Ltd. | | | | |
| | 2,000,000 | | | 2.750%, 3/29/2023h | | | 1,901,934 | |
| | | | Conagra Brands, Inc. | | | | |
| | 1,750,000 | | | 4.300%, 5/1/2024 | | | 1,752,690 | |
| | | | Constellation Brands, Inc. | | | | |
| | 1,000,000 | | | 2.700%, 5/9/2022 | | | 960,804 | |
| | 1,500,000 | | | 3.200%, 2/15/2023 | | | 1,453,827 | |
| | | | CVS Caremark Corporation | | | | |
| | 1,050,000 | | | 4.000%, 12/5/2023 | | | 1,044,168 | |
| | | | CVS Health Corporation | | | | |
| | 1,750,000 | | | 3.700%, 3/9/2023 | | | 1,729,018 | |
| | | | General Mills, Inc. | | | | |
| | 1,500,000 | | | 3.459%, (LIBOR 3M + 1.010%), 10/17/2023b | | | 1,501,986 | |
| | | | Halfmoon Parent, Inc. | | | | |
| | 500,000 | | | 3.326%, (LIBOR 3M + 0.890%), 7/15/2023b,h | | | 499,601 | |
| | | | Howard Hughes Medical Institute | | | | |
| | 1,500,000 | | | 3.500%, 9/1/2023 | | | 1,506,654 | |
| | | | Imperial Tobacco Finance plc | | | | |
| | 1,500,000 | | | 3.750%, 7/21/2022h | | | 1,482,686 | |
| | | | Kraft Heinz Foods Company | | | | |
| | 1,500,000 | | | 3.161%, (LIBOR 3M + 0.820%), 8/10/2022b | | | 1,505,326 | |
| | | | Laboratory Corporation of America Holdings | | | | |
| | 1,390,000 | | | 2.625%, 2/1/2020 | | | 1,377,978 | |
| | | | Mead Johnson Nutrition Company | | | | |
| | 1,000,000 | | | 3.000%, 11/15/2020 | | | 993,001 | |
| | | | Merck & Company, Inc. | | | | |
| | 1,490,000 | | | 2.716%, (LIBOR 3M + 0.375%), 2/10/2020b | | | 1,493,896 | |
| | | | Mondelez International, Inc. | | | | |
| | 1,484,000 | | | 2.863%, (LIBOR 3M + 0.520%), 2/1/2019b | | | 1,485,358 | |
| | | | Mylan, Inc. | | | | |
| | 1,035,000 | | | 3.125%, 1/15/2023h | | | 976,151 | |
| | | | Newell Rubbermaid, Inc. | | | | |
| | 136,000 | | | 3.150%, 4/1/2021 | | | 133,209 | |
| | | | PepsiCo, Inc. | | | | |
| | 1,065,000 | | | 2.938%, (LIBOR 3M + 0.530%), 10/6/2021b | | | 1,077,727 | |
| | | | Pernod Ricard SA | | | | |
| | 1,915,000 | | | 4.250%, 7/15/2022h | | | 1,940,228 | |
| | | | Perrigo Finance Unlimited Company | | | | |
| | 500,000 | | | 3.900%, 12/15/2024 | | | 479,479 | |
| | | | Reynolds American, Inc. | | | | |
| | 447,000 | | | 3.250%, 6/12/2020 | | | 445,534 | |
| | | | Smithfield Foods, Inc. | | | | |
| | 720,000 | | | 2.700%, 1/31/2020h | | | 707,636 | |
| | 2,000,000 | | | 2.650%, 10/3/2021h | | | 1,903,377 | |
| | | | Teva Pharmaceutical Finance Netherlands III BV | | | | |
| | 1,000,000 | | | 6.000%, 4/15/2024 | | | 995,174 | |
| | | | Zimmer Biomet Holdings, Inc. | | | | |
| | 1,500,000 | | | 3.089%, (LIBOR 3M + 0.750%), 3/19/2021b | | | 1,500,785 | |
| | | | | |
| | | | Total | | | 46,950,608 | |
| | | | | |
| |
| | Energy (3.8%) | | | | |
| | | | Andeavor Logistics, LP | | | | |
| | 500,000 | | | 3.500%, 12/1/2022 | | | 488,207 | |
| | | | BP Capital Markets plc | | | | |
| | 1,400,000 | | | 1.676%, 5/3/2019 | | | 1,390,766 | |
| | 1,500,000 | | | 2.989%, (LIBOR 3M + 0.650%), 9/19/2022b | | | 1,514,944 | |
| | | | Canadian Natural Resources, Ltd. | | | | |
| | 1,500,000 | | | 2.950%, 1/15/2023 | | | 1,444,037 | |
| | | | Cenovus Energy, Inc. | | | | |
| | 1,000,000 | | | 3.000%, 8/15/2022 | | | 955,570 | |
| | | | Chevron Corporation | | | | |
| | 500,000 | | | 2.825%, (LIBOR 3M + 0.510%), 11/16/2018b | | | 500,099 | |
| | | | DCP Midstream Operating, LP | | | | |
| | 1,350,000 | | | 2.700%, 4/1/2019 | | | 1,339,875 | |
| | | | Enable Midstream Partners, LP | | | | |
| | 1,250,000 | | | 2.400%, 5/15/2019 | | | 1,243,356 | |
| | | | Enbridge, Inc. | | | | |
| | 2,000,000 | | | 2.900%, 7/15/2022 | | | 1,930,694 | |
| | | | Encana Corporation | | | | |
| | 1,000,000 | | | 3.900%, 11/15/2021 | | | 998,973 | |
| | | | Energy Transfer Operating, LP | | | | |
| | 1,675,000 | | | 4.200%, 9/15/2023 | | | 1,667,553 | |
| | | | EOG Resources, Inc. | | | | |
| | 975,000 | | | 2.625%, 3/15/2023 | | | 934,025 | |
| | | | EQM Midstream Partners LP | | | | |
| | 1,500,000 | | | 4.750%, 7/15/2023 | | | 1,512,564 | |
| | | | EQT Corporation | | | | |
| | 1,000,000 | | | 3.000%, 10/1/2022 | | | 959,399 | |
| | | | Exxon Mobil Corporation | | | | |
| | 1,900,000 | | | 1.708%, 3/1/2019 | | | 1,894,178 | |
| | 1,465,000 | | | 2.693%, (LIBOR 3M + 0.370%), 3/6/2022b | | | 1,471,519 | |
| | | | Hess Corporation | | | | |
| | 2,000,000 | | | 3.500%, 7/15/2024 | | | 1,885,687 | |
| | | | Marathon Oil Corporation | | | | |
| | 2,000,000 | | | 2.800%, 11/1/2022 | | | 1,906,270 | |
| | | | Marathon Petroleum Corporation | | | | |
| | 1,325,000 | | | 3.400%, 12/15/2020 | | | 1,324,525 | |
| | | | NiSource Finance Corporation | | | | |
| | 1,000,000 | | | 2.650%, 11/17/2022 | | | 950,665 | |
| | | | Petrobras Global Finance BV | | | | |
| | 408,000 | | | 6.125%, 1/17/2022 | | | 422,790 | |
| | | | Petroleos Mexicanos | | | | |
| | 1,200,000 | | | 5.981%, (LIBOR 3M + 3.650%), 3/11/2022b | | | 1,245,000 | |
| | 1,105,000 | | | 2.378%, 4/15/2025 | | | 1,074,065 | |
| | | | Plains All American Pipeline, LP | | | | |
| | 2,000,000 | | | 3.850%, 10/15/2023 | | | 1,944,326 | |
The accompanying Notes to Financial Statements are an integral part of this schedule.
59
LIMITED MATURITY BOND FUND
Schedule of Investments as of October 31, 2018
| | | | | | | | |
Principal
Amount | | | Long-Term Fixed Income (95.9%) | | Value | |
| | Energy (3.8%) - continued | | | | |
| | | | Shell International Finance BV | | | | |
| | $1,400,000 | | | 2.788%, (LIBOR 3M + 0.450%), 5/11/2020b | | | $1,408,524 | |
| | | | Sinopec Group Overseas Development, Ltd. | | | | |
| | 1,175,000 | | | 1.750%, 9/29/2019h | | | 1,157,471 | |
| | | | Transcontinental Gas Pipe Line Company, LLC | | | | |
| | 650,000 | | | 7.850%, 2/1/2026 | | | 780,292 | |
| | | | Williams Partners, LP | | | | |
| | 1,325,000 | | | 3.600%, 3/15/2022 | | | 1,304,245 | |
| | | | | |
| | | | Total | | | 35,649,619 | |
| | | | | |
| |
| | Financials (17.3%) | | | | |
| | | | ABN AMRO Bank NV | | | | |
| | 1,600,000 | | | 2.450%, 6/4/2020h | | | 1,575,271 | |
| | | | AerCap Ireland Capital Designated Activity Company and AerCap Global Aviation Trust | | | | |
| | 1,000,000 | | | 3.300%, 1/23/2023 | | | 960,759 | |
| | | | Air Lease Corporation | | | | |
| | 1,750,000 | | | 3.500%, 1/15/2022 | | | 1,730,401 | |
| | | | American Express Credit Corporation | | | | |
| | 2,080,000 | | | 2.887%, (LIBOR 3M + 0.550%), 3/18/2019b | | | 2,082,877 | |
| | 650,000 | | | 3.382%, (LIBOR 3M + 1.050%), 9/14/2020b | | | 659,385 | |
| | | | American International Group, Inc. | | | | |
| | 1,150,000 | | | 3.300%, 3/1/2021 | | | 1,138,358 | |
| | | | Ares Capital Corporation | | | | |
| | 1,100,000 | | | 4.875%, 11/30/2018 | | | 1,101,551 | |
| | 1,250,000 | | | 3.875%, 1/15/2020 | | | 1,254,007 | |
| | | | Athene Global Funding | | | | |
| | 2,000,000 | | | 3.628%, (LIBOR 3M + 1.230%), 7/1/2022b,h | | | 2,034,865 | |
| | | | Banco Santander SA | | | | |
| | 800,000 | | | 3.545%, (LIBOR 3M + 1.120%), 4/12/2023b | | | 802,146 | |
| | | | Bank of America Corporation | | | | |
| | 1,775,000 | | | 3.266%, (LIBOR 3M + 0.870%), 4/1/2019b | | | 1,780,190 | |
| | 1,500,000 | | | 3.046%, (LIBOR 3M + 0.650%), 10/1/2021b | | | 1,505,239 | |
| | 1,065,000 | | | 3.629%, (LIBOR 3M + 1.160%), 1/20/2023b | | | 1,081,652 | |
| | 1,500,000 | | | 3.487%, (LIBOR 3M + 1.000%), 4/24/2023b | | | 1,514,820 | |
| | 1,500,000 | | | 2.816%, 7/21/2023b | | | 1,444,039 | |
| | 900,000 | | | 6.100%, 3/17/2025b,k | | | 923,625 | |
| | 1,500,000 | | | 3.111%, (LIBOR 3M + 0.770%), 2/5/2026b | | | 1,466,774 | |
| | | | Bank of New York Mellon Corporation | | | | |
| | 500,000 | | | 4.500%, 6/20/2023b,k | | | 472,500 | |
| | | | Barclays plc | | | | |
| | 1,250,000 | | | 3.250%, 1/12/2021 | | | 1,231,323 | |
| | 2,000,000 | | | 3.684%, 1/10/2023 | | | 1,936,348 | |
| | 2,000,000 | | | 3.695%, (LIBOR 3M + 1.380%), 5/16/2024b | | | 1,983,040 | |
| | | | BB&T Corporation | | | | |
| | 1,220,000 | | | 3.151%, (LIBOR 3M + 0.715%), 1/15/2020b | | | 1,227,543 | |
| | | | BNZ International Funding, Ltd. | | | | |
| | 2,000,000 | | | 3.012%, (LIBOR 3M + 0.700%), 2/21/2020b,h | | | 2,009,932 | |
| | 1,175,000 | | | 3.312%, (LIBOR 3M + 0.980%), 9/14/2021b,h | | | 1,189,194 | |
| | | | BPCE SA | | | | |
| | 1,000,000 | | | 3.530%, (LIBOR 3M + 1.220%), 5/22/2022b,h | | | 1,008,180 | |
| | | | Capital One Financial Corporation | | | | |
| | 2,000,000 | | | 3.098%, (LIBOR 3M + 0.760%), 5/12/2020b | | | 2,009,640 | |
| | | | Capital One NA | | | | |
| | 2,000,000 | | | 3.163%, (LIBOR 3M + 0.820%), 8/8/2022b | | | 1,997,470 | |
| | 2,500,000 | | | 3.670%, (LIBOR 3M + 1.150%), 1/30/2023b | | | 2,512,000 | |
| | | | Citigroup, Inc. | | | | |
| | 1,475,000 | | | 3.180%, (LIBOR 3M + 0.770%), 4/8/2019b | | | 1,478,570 | |
| | 1,500,000 | | | 3.450%, (LIBOR 3M + 0.960%), 4/25/2022b | | | 1,515,446 | |
| | 2,275,000 | | | 3.751%, (LIBOR 3M + 1.430%), 9/1/2023b | | | 2,322,889 | |
| | 2,000,000 | | | 3.412%, (LIBOR 3M + 1.100%), 5/17/2024b | | | 2,011,954 | |
| | | | CNA Financial Corporation | | | | |
| | 2,000,000 | | | 5.875%, 8/15/2020 | | | 2,082,215 | |
| | 1,250,000 | | | 5.750%, 8/15/2021 | | | 1,316,952 | |
| | | | Comerica, Inc. | | | | |
| | 750,000 | | | 3.700%, 7/31/2023 | | | 743,088 | |
| | | | Compass Bank | | | | |
| | 1,500,000 | | | 2.875%, 6/29/2022 | | | 1,437,451 | |
| | | | Cooperatieve Centrale Raiffeisen- Boerenleenbank BA | | | | |
| | 1,500,000 | | | 11.000%, 6/30/2019b,h,k | | | 1,569,000 | |
| | 1,400,000 | | | 2.500%, 1/19/2021 | | | 1,369,482 | |
| | | | Credit Agricole SA | | | | |
| | 1,350,000 | | | 3.236%, (LIBOR 3M + 0.800%), 4/15/2019b,h | | | 1,353,854 | |
| | 1,450,000 | | | 3.297%, (LIBOR 3M + 0.970%), 6/10/2020b,h | | | 1,465,277 | |
| | 950,000 | | | 8.125%, 12/23/2025b,h,k | | | 1,018,938 | |
| | | | Credit Suisse Group AG | | | | |
| | 1,500,000 | | | 6.500%, 8/8/2023h | | | 1,584,576 | |
| | 810,000 | | | 7.500%, 12/11/2023b,h,k | | | 843,340 | |
| | | | Discover Bank | | | | |
| | 1,650,000 | | | 8.700%, 11/18/2019 | | | 1,732,348 | |
| | | | Discover Financial Services | | | | |
| | 2,250,000 | | | 2.600%, 11/13/2018 | | | 2,249,600 | |
| | | | Fifth Third Bancorp | | | | |
| | 1,100,000 | | | 2.875%, 10/1/2021 | | | 1,078,881 | |
| | | | Goldman Sachs Capital II | | | | |
| | 70,000 | | | 4.000%, (LIBOR 3M + 0.768%), 12/3/2018b,k | | | 56,000 | |
| | | | Goldman Sachs Group, Inc. | | | | |
| | 1,500,000 | | | 3.414%, (LIBOR 3M + 1.100%), 11/15/2018b | | | 1,500,618 | |
| | 1,755,000 | | | 3.637%, (LIBOR 3M + 1.160%), 4/23/2020b | | | 1,774,401 | |
| | 1,530,000 | | | 3.484%, (LIBOR 3M + 1.170%), 11/15/2021b | | | 1,548,635 | |
The accompanying Notes to Financial Statements are an integral part of this schedule.
60
LIMITED MATURITY BOND FUND
Schedule of Investments as of October 31, 2018
| | | | | | | | |
Principal
Amount | | | Long-Term Fixed Income (95.9%) | | Value | |
| | Financials (17.3%) - continued | | | | |
| | $1,000,000 | | | 3.060%, (LIBOR 3M + 0.750%), 2/23/2023b | | | $998,991 | |
| | 2,000,000 | | | 3.487%, (LIBOR 3M + 1.000%), 7/24/2023b | | | 2,013,335 | |
| | 1,125,000 | | | 3.917%, (LIBOR 3M + 1.600%), 11/29/2023b | | | 1,163,181 | |
| | | | HSBC Holdings plc | | | | |
| | 1,175,000 | | | 3.908%, (LIBOR 3M + 1.500%), 1/5/2022b | | | 1,203,075 | |
| | 2,000,000 | | | 3.262%, 3/13/2023b | | | 1,953,167 | |
| | 1,500,000 | | | 6.250%, 3/23/2023b,k | | | 1,456,875 | |
| | | | Huntington Bancshares, Inc. | | | | |
| | 1,450,000 | | | 3.150%, 3/14/2021 | | | 1,433,584 | |
| | | | ING Groep NV | | | | |
| | 1,350,000 | | | 6.000%, 4/16/2020b,k | | | 1,344,600 | |
| | 2,400,000 | | | 3.536%, (LIBOR 3M + 1.150%), 3/29/2022b | | | 2,435,814 | |
| | | | International Lease Finance Corporation | | | | |
| | 1,440,000 | | | 5.875%, 8/15/2022 | | | 1,516,613 | |
| | | | J.P. Morgan Chase & Company | | | | |
| | 1,400,000 | | | 2.250%, 1/23/2020 | | | 1,383,416 | |
| | 1,250,000 | | | 5.300%, 5/1/2020b,k | | | 1,268,750 | |
| | 1,250,000 | | | 3.875%, 9/10/2024 | | | 1,228,264 | |
| | 1,500,000 | | | 3.264%, (LIBOR 3M + 0.850%), 1/10/2025b | | | 1,488,116 | |
| | | | JPMorgan Chase Bank NA | | | | |
| | 1,150,000 | | | 2.956%, (LIBOR 3M + 0.590%), 9/23/2019b | | | 1,153,816 | |
| | | | Kilroy Realty, LP | | | | |
| | 700,000 | | | 3.800%, 1/15/2023 | | | 691,047 | |
| | | | Lincoln National Corporation | | | | |
| | 1,000,000 | | | 4.000%, 9/1/2023 | | | 1,007,277 | |
| | | | Lloyds Banking Group plc | | | | |
| | 2,000,000 | | | 2.907%, 11/7/2023b | | | 1,900,053 | |
| | 350,000 | | | 4.582%, 12/10/2025 | | | 337,610 | |
| | | | Macquarie Bank, Ltd. | | | | |
| | 500,000 | | | 3.616%, (LIBOR 3M + 1.180%), 1/15/2019b,h | | | 500,811 | |
| | | | Macquarie Group, Ltd. | | | | |
| | 1,500,000 | | | 3.331%, (LIBOR 3M + 1.020%), 11/28/2023b,h | | | 1,493,700 | |
| | | | Mitsubishi UFJ Financial Group, Inc. | | | | |
| | 1,175,000 | | | 3.394%, (LIBOR 3M + 1.060%), 9/13/2021b | | | 1,193,189 | |
| | 1,600,000 | | | 3.230%, (LIBOR 3M + 0.920%), 2/22/2022b | | | 1,613,754 | |
| | | | Mizuho Financial Group Cayman 3, Ltd. | | | | |
| | 675,000 | | | 4.600%, 3/27/2024h | | | 675,398 | |
| | | | Mizuho Financial Group, Inc. | | | | |
| | 1,175,000 | | | 3.474%, (LIBOR 3M + 1.140%), 9/13/2021b | | | 1,191,514 | |
| | 1,500,000 | | | 3.251%, (LIBOR 3M + 0.940%), 2/28/2022b | | | 1,514,541 | |
| | | | Morgan Stanley | | | | |
| | 1,000,000 | | | 5.450%, 7/15/2019b,k | | | 1,008,880 | |
| | 1,950,000 | | | 3.119%, (LIBOR 3M + 0.800%), 2/14/2020b | | | 1,952,535 | |
| | 900,000 | | | 5.550%, 7/15/2020b,k | | | 909,000 | |
| | 1,000,000 | | | 2.891%, (LIBOR 3M + 0.550%), 2/10/2021b | | | 1,000,500 | |
| | 2,000,000 | | | 3.649%, (LIBOR 3M + 1.180%), 1/20/2022b | | | 2,022,514 | |
| | 1,400,000 | | | 3.887%, (LIBOR 3M + 1.400%), 10/24/2023b | | | 1,425,570 | |
| | 1,425,000 | | | 5.000%, 11/24/2025 | | | 1,459,073 | |
| | | | Nationwide Building Society | | | | |
| | 2,000,000 | | | 3.766%, 3/8/2024b,h | | | 1,945,288 | |
| | | | Peachtree Corners Funding Trust | | | | |
| | 1,125,000 | | | 3.976%, 2/15/2025h | | | 1,091,806 | |
| | | | Prudential Financial, Inc. | | | | |
| | 1,150,000 | | | 2.350%, 8/15/2019 | | | 1,143,903 | |
| | | | Realty Income Corporation | | | | |
| | 2,000,000 | | | 3.250%, 10/15/2022 | | | 1,969,013 | |
| | | | Regions Financial Corporation | | | | |
| | 1,000,000 | | | 3.200%, 2/8/2021 | | | 991,352 | |
| | | | Reinsurance Group of America, Inc. | | | | |
| | 2,000,000 | | | 4.700%, 9/15/2023 | | | 2,054,711 | |
| | | | Reliance Standard Life Global Funding II | | | | |
| | 1,400,000 | | | 2.500%, 4/24/2019h | | | 1,397,047 | |
| | | | Royal Bank of Scotland Group plc | | | | |
| | 2,000,000 | | | 3.498%, 5/15/2023b | | | 1,923,650 | |
| | 2,000,000 | | | 3.784%, (LIBOR 3M + 1.470%), 5/15/2023b | | | 2,010,379 | |
| | | | Santander Holdings USA, Inc. | | | | |
| | 1,000,000 | | | 3.400%, 1/18/2023 | | | 954,599 | |
| | | | Santander UK plc | | | | |
| | 750,000 | | | 3.125%, 1/8/2021 | | | 739,239 | |
| | 500,000 | | | 5.000%, 11/7/2023h | | | 501,217 | |
| | | | Simon Property Group, LP | | | | |
| | 1,350,000 | | | 2.500%, 9/1/2020 | | | 1,331,127 | |
| | 1,400,000 | | | 2.500%, 7/15/2021 | | | 1,365,862 | |
| | | | Stadshypotek AB | | | | |
| | 2,000,000 | | | 1.875%, 10/2/2019h | | | 1,979,227 | |
| | 2,000,000 | | | 2.500%, 4/5/2022h | | | 1,943,598 | |
| | | | Standard Chartered plc | | | | |
| | 1,000,000 | | | 3.950%, 1/11/2023h | | | 981,186 | |
| | | | State Street Corporation | | | | |
| | 2,062,000 | | | 3.222%, (LIBOR 3M + 0.900%), 8/18/2020b | | | 2,087,647 | |
| | | | SunTrust Banks, Inc. | | | | |
| | 725,000 | | | 2.900%, 3/3/2021 | | | 714,336 | |
| | | | Svenska Handelsbanken AB | | | | |
| | 500,000 | | | 2.824%, (LIBOR 3M + 0.490%), 6/17/2019b | | | 501,074 | |
| | | | Synchrony Financial | | | | |
| | 1,175,000 | | | 3.578%, (LIBOR 3M + 1.230%), 2/3/2020b | | | 1,182,155 | |
| | 1,230,000 | | | 4.250%, 8/15/2024 | | | 1,168,205 | |
| | | | Toronto-Dominion Bank | | | | |
| | 1,400,000 | | | 3.262%, (LIBOR 3M + 0.930%), 12/14/2020b | | | 1,420,052 | |
| | | | USB Group Funding Jersey, Ltd. | | | | |
| | 1,750,000 | | | 3.806%, (LIBOR 3M + 1.440%), 9/24/2020b,h | | | 1,782,355 | |
| | | | USB Realty Corporation | | | | |
| | | | 3.583%, (LIBOR 3M + 1.147%), | | | | |
| | 1,200,000 | | | 1/15/2022b,h,k | | | 1,077,000 | |
| | | | Ventas Realty, LP | | | | |
| | 2,000,000 | | | 3.100%, 1/15/2023 | | | 1,937,506 | |
The accompanying Notes to Financial Statements are an integral part of this schedule.
61
LIMITED MATURITY BOND FUND
Schedule of Investments as of October 31, 2018
| | | | | | | | |
Principal
Amount | | | Long-Term Fixed Income (95.9%) | | Value | |
| | Financials (17.3%) - continued | | | | |
| | | | Voya Financial, Inc. | | | | |
| | $500,000 | | | 5.650%, 5/15/2053b | | | $492,500 | |
| | | | Wells Fargo & Company | | | | |
| | 1,000,000 | | | 6.104%, (LIBOR 3M + 3.770%), 12/15/2018b,k | | | 1,007,500 | |
| | 1,760,000 | | | 3.200%, (LIBOR 3M + 0.680%), 1/30/2020b | | | 1,768,347 | |
| | 750,000 | | | 3.450%, 2/13/2023 | | | 732,557 | |
| | 1,400,000 | | | 3.757%, (LIBOR 3M + 1.230%), 10/31/2023b | | | 1,419,694 | |
| | | | Welltower, Inc. | | | | |
| | 1,750,000 | | | 3.950%, 9/1/2023 | | | 1,745,881 | |
| | | | | |
| | | | Total | | | 159,985,220 | |
| | | | | |
| |
| | Foreign Government (0.7%) | | | | |
| | | | Argentina Government International Bond | | | | |
| | 1,440,000 | | | 5.625%, 1/26/2022 | | | 1,296,000 | |
| | | | Export-Import Bank of Korea | | | | |
| | 1,720,000 | | | 2.250%, 1/21/2020 | | | 1,700,156 | |
| | | | Kommunalbanken AS | | | | |
| | 2,540,000 | | | 1.500%, 10/22/2019h | | | 2,506,726 | |
| | | | Poland Government International Bond | | | | |
| | 125,000 | | | 4.000%, 1/22/2024 | | | 126,220 | |
| | | | Province of Ontario Canada | | | | |
| | 750,000 | | | 3.400%, 10/17/2023 | | | 751,470 | |
| | | | | |
| | | | Total | | | 6,380,572 | |
| | | | | |
| |
| | Mortgage-Backed Securities (3.5%) | | | | |
| | | | Federal National Mortgage Association Conventional 15-yr. Pass Through | | | | |
| | 11,570,000 | | | 3.500%, 11/1/2033d | | | 11,560,283 | |
| | | | Federal National Mortgage Association Conventional 30-Yr. Pass Through | | | | |
| | 504,470 | | | 3.727%, (LIBOR 12M + 1.515%), 1/1/2043b | | | 518,393 | |
| | 642,519 | | | 4.281%, (LIBOR 12M + 1.550%), 7/1/2043b | | | 662,447 | |
| | 10,750,000 | | | 4.500%, 11/1/2048d | | | 11,006,363 | |
| | 250,000 | | | 5.000%, 11/1/2048d | | | 260,879 | |
| | | | GSAA Home Equity Trust | | | | |
| | 920,880 | | | 4.564%, 8/25/2034, Ser. 2004-10, Class M2j | | | 916,316 | |
| | | | Towd Point Mortgage Trust | | | | |
| | 4,943,757 | | | 3.250%, 8/25/2058, Ser. 2018-5, Class A1Ab,h | | | 4,871,429 | |
| | | | Vericrest Opportunity Loan Transferee | | | | |
| | 2,420,667 | | | 4.115%, 9/25/2048, Ser. 2018-NPL6, Class A1Ah,j | | | 2,416,251 | |
| | | | | |
| | | | Total | | | 32,212,361 | |
| | | | | |
| |
| | Technology (2.1%) | | | | |
| | | | Amphenol Corporation | | | | |
| | 1,122,000 | | | 2.550%, 1/30/2019 | | | 1,121,040 | |
| | | | Apple, Inc. | | | | |
| | 2,450,000 | | | 2.641%, (LIBOR 3M + 0.300%), 5/6/2019b | | | 2,453,425 | |
| | 1,900,000 | | | 2.638%, (LIBOR 3M + 0.300%), 5/6/2020b | | | 1,907,543 | |
| | | | Broadcom Corporation | | | | |
| | 1,435,000 | | | 2.375%, 1/15/2020 | | | 1,416,995 | |
| | 2,000,000 | | | 2.650%, 1/15/2023 | | | 1,876,037 | |
| | | | Cisco Systems, Inc. | | | | |
| | 2,405,000 | | | 2.821%, (LIBOR 3M + 0.500%), 3/1/2019b | | | 2,408,645 | |
| | | | Diamond 1 Finance Corporation | | | | |
| | 865,000 | | | 3.480%, 6/1/2019h | | | 866,077 | |
| | | | Hewlett Packard Enterprise Company | | | | |
| | 1,750,000 | | | 3.500%, 10/5/2021 | | | 1,745,007 | |
| | | | Marvell Technology Group, Ltd. | | | | |
| | 1,000,000 | | | 4.200%, 6/22/2023 | | | 988,660 | |
| | | | Microsoft Corporation | | | | |
| | 2,000,000 | | | 1.850%, 2/6/2020 | | | 1,974,546 | |
| | | | Texas Instruments, Inc. | | | | |
| | 1,000,000 | | | 1.750%, 5/1/2020 | | | 980,121 | |
| | | | VMware, Inc. | | | | |
| | 1,500,000 | | | 2.950%, 8/21/2022 | | | 1,437,760 | |
| | | | | |
| | | | Total | | | 19,175,856 | |
| | | | | |
| |
| | Transportation (1.4%) | | | | |
| | | | Air Canada Pass Through Trust | | | | |
| | 933,467 | | | 3.875%, 3/15/2023h | | | 913,631 | |
| | | | American Airlines Pass Through Trust | | | | |
| | 999,598 | | | 4.950%, 1/15/2023 | | | 1,021,249 | |
| | 650,110 | | | 3.700%, 5/1/2023 | | | 635,528 | |
| | | | British Airways plc | | | | |
| | 1,192,970 | | | 4.625%, 6/20/2024h | | | 1,218,142 | |
| | | | Continental Airlines, Inc. | | | | |
| | 1,713,848 | | | 4.150%, 4/11/2024 | | | 1,722,417 | |
| | | | Delta Air Lines, Inc. | | | | |
| | 363,705 | | | 4.750%, 5/7/2020 | | | 368,921 | |
| | 94,017 | | | 4.950%, 11/23/2020 | | | 94,390 | |
| | | | ERAC USA Finance, LLC | | | | |
| | 1,400,000 | | | 2.600%, 12/1/2021h | | | 1,350,319 | |
| | | | J.B. Hunt Transport Services, Inc. | | | | |
| | 1,200,000 | | | 3.300%, 8/15/2022 | | | 1,185,720 | |
| | | | Ryder System, Inc. | | | | |
| | 1,000,000 | | | 3.400%, 3/1/2023 | | | 983,761 | |
| | | | TTX Company | | | | |
| | 2,000,000 | | | 2.250%, 2/1/2019h | | | 1,995,305 | |
| | 650,000 | | | 4.125%, 10/1/2023* | | | 652,603 | |
| | | | US Airways Pass Through Trust | | | | |
| | 743,675 | | | 3.950%, 11/15/2025 | | | 738,065 | |
| | | | | |
| | | | Total | | | 12,880,051 | |
| | | | | |
| |
| | U.S. Government and Agencies (18.5%) | | | | |
| | | | Federal National Mortgage Association | | | | |
| | 3,000,000 | | | 2.500%, 4/13/2021 | | | 2,966,748 | |
| | 15,000,000 | | | 2.875%, 9/12/2023 | | | 14,852,235 | |
| | | | U.S. Treasury Bonds | | | | |
| | 1,675,000 | | | 2.250%, 11/15/2027 | | | 1,558,601 | |
| | 6,750,000 | | | 5.500%, 8/15/2028 | | | 8,076,006 | |
| | 690,000 | | | 3.000%, 5/15/2042 | | | 648,115 | |
| | 2,855,000 | | | 2.500%, 5/15/2046 | | | 2,398,088 | |
| | | | U.S. Treasury Bonds, TIPS | | | | |
| | 5,461,800 | | | 0.125%, 1/15/2023 | | | 5,256,525 | |
The accompanying Notes to Financial Statements are an integral part of this schedule.
62
LIMITED MATURITY BOND FUND
Schedule of Investments as of October 31, 2018
| | | | | | | | |
Principal
Amount | | | Long-Term Fixed Income (95.9%) | | Value | |
| | U.S. Government and Agencies (18.5%) - continued | | | | |
| | $6,315,050 | | | 0.375%, 1/15/2027 | | | $5,944,206 | |
| | 6,699,875 | | | 0.375%, 7/15/2027 | | | 6,304,949 | |
| | 5,852,770 | | | 1.000%, 2/15/2046 | | | 5,432,407 | |
| | | | U.S. Treasury Notes | | | | |
| | 1,125,000 | | | 1.500%, 10/31/2019 | | | 1,111,465 | |
| | 62,000,000 | | | 1.750%, 11/30/2019 | | | 61,350,937 | |
| | 6,500,000 | | | 1.875%, 12/15/2020 | | | 6,365,937 | |
| | 1,450,000 | | | 1.375%, 5/31/2021 | | | 1,394,832 | |
| | 1,250,000 | | | 2.625%, 6/15/2021 | | | 1,240,918 | |
| | 2,800,000 | | | 1.125%, 8/31/2021 | | | 2,663,609 | |
| | 21,345,000 | | | 2.000%, 11/30/2022 | | | 20,554,568 | |
| | 1,750,000 | | | 2.750%, 7/31/2023 | | | 1,732,295 | |
| | 2,750,000 | | | 2.125%, 7/31/2024 | | | 2,619,590 | |
| | 1,000,000 | | | 2.875%, 7/31/2025 | | | 988,437 | |
| | | | U.S. Treasury Notes, TIPS | | | | |
| | 18,085,620 | | | 0.125%, 4/15/2021 | | | 17,621,470 | |
| | | | | |
| | | | Total | | | 171,081,938 | |
| | | | | |
| |
| | Utilities (2.3%) | | | | |
| | | | Ameren Corporation | | | | |
| | 1,100,000 | | | 2.700%, 11/15/2020 | | | 1,083,754 | |
| | | | CenterPoint Energy, Inc. | | | | |
| | 1,750,000 | | | 3.850%, 2/1/2024 | | | 1,748,810 | |
| | | | DTE Energy Company | | | | |
| | 570,000 | | | 2.400%, 12/1/2019 | | | 564,120 | |
| | 1,500,000 | | | 3.700%, 8/1/2023 | | | 1,489,260 | |
| | | | Edison International | | | | |
| | 1,000,000 | | | 2.950%, 3/15/2023 | | | 951,269 | |
| | | | Enel Finance International NV | | | | |
| | 2,000,000 | | | 2.750%, 4/6/2023h | | | 1,841,954 | |
| | | | Exelon Corporation | | | | |
| | 1,350,000 | | | 2.850%, 6/15/2020 | | | 1,334,993 | |
| | 1,250,000 | | | 3.497%, 6/1/2022 | | | 1,219,136 | |
| | | | Exelon Generation Company, LLC | | | | |
| | 1,125,000 | | | 2.950%, 1/15/2020 | | | 1,117,851 | |
| | | | ITC Holdings Corporation | | | | |
| | 1,500,000 | | | 2.700%, 11/15/2022 | | | 1,434,321 | |
| | | | National Rural Utilities Cooperative Finance Corporation | | | | |
| | 850,000 | | | 4.750%, 4/30/2043b | | | 843,819 | |
| | | | NiSource, Inc. | | | | |
| | 1,250,000 | | | 5.650%, 6/15/2023b,h,k | | | 1,225,250 | |
| | | | PPL Capital Funding, Inc. | | | | |
| | 1,420,000 | | | 3.500%, 12/1/2022 | | | 1,401,949 | |
| | | | Public Service Electric And Gas Company | | | | |
| | 2,070,000 | | | 1.800%, 6/1/2019 | | | 2,054,941 | |
| | | | Sempra Energy | | | | |
| | 1,420,000 | | | 2.400%, 3/15/2020 | | | 1,401,500 | |
| | | | Southern Company | | | | |
| | 1,500,000 | | | 2.950%, 7/1/2023 | | | 1,432,328 | |
| | | | | |
| | | | Total | | | 21,145,255 | |
| | | | | |
| | | | | | | | |
| | | | | |
| | | | Total Long-Term Fixed Income (cost $896,822,126) | | | 887,151,431 | |
| | | | | |
| | |
| Shares | | | Preferred Stock (0.2%) | | Value | |
| | Financials (0.2%) | | | | |
| | 54,000 | | | Citigroup Capital XIIIb | | | 1,429,380 | |
| | 7,350 | | | Farm Credit Bank of Texas, 6.750%b,h,k | | | 779,100 | |
| | | | | |
| | | | Total | | | 2,208,480 | |
| | | | | |
| | | | | | | | |
| | | | | |
| | | | Total Preferred Stock (cost $2,225,400) | | | 2,208,480 | |
| | | | | |
| | |
| Shares | | | Common Stock (<0.1%) | | Value | |
| | Energy (<0.1%) | | | | |
| | 18,804 | | | Pacific Drilling, Inc. Rightse,l | | | 195,812 | |
| | | | | |
| | | | Total | | | 195,812 | |
| | | | | |
| | | | | | | | |
| | | | | |
| | | | Total Common Stock (cost $195,812) | | | 195,812 | |
| | | | | |
Shares or
Principal
Amount | | | Short-Term Investments (6.5%) | | Value | |
| | | | Federal Home Loan Bank Discount Notes | | | | |
| | 400,000 | | | 2.100%, 11/28/2018m,n | | | 399,346 | |
| | 500,000 | | | 2.255%, 1/8/2019m,n | | | 497,828 | |
| | | | Thrivent Core Short-Term Reserve Fund | | | | |
| | 5,915,209 | | | 2.430% | | | 59,152,095 | |
| | | | U.S. Treasury Bills | | | | |
| | 250,000 | | | 2.181%, 12/27/2018m,o | | | 249,141 | |
| | | | | |
| | | | Total Short-Term Investments (cost $60,298,487) | | | 60,298,410 | |
| | | | | |
| | | | Total Investments (cost $965,094,464) 103.1% | | | $954,841,179 | |
| | | | | |
| | | | Other Assets and Liabilities, Net (3.1%) | | | (29,134,118 | ) |
| | | | | |
| | | | Total Net Assets 100.0% | | | $925,707,061 | |
| | | | | |
a | The stated interest rate represents the weighted average of all contracts within the bank loan facility. |
b | Denotes variable rate securities. The rate shown is as of October 31, 2018. The rates of certain variable rate securities are based on a published reference rate and spread; these may vary by security and the reference rate and spread are indicated in their description. The rates of other variable rate securities are determined by the issuer or agent and are based on current market conditions. These securities do not indicate a reference rate and spread in their description. |
c | All or a portion of the loan is unfunded. |
d | Denotes investments purchased on a when-issued or delayed delivery basis. |
e | Security is valued using significant unobservable inputs. Further information on valuation can be found in the Notes to Financial Statements. |
f | Defaulted security. Interest is not being accrued. |
g | In bankruptcy. Interest is not being accrued. |
h | Denotes securities sold under Rule 144A of the Securities Act of 1933, which exempts them from registration. These securities may be resold to other dealers in the program or to other qualified institutional buyers. As of October 31, 2018, the value of these investments was $252,328,802 or 27.3% of total net assets. |
i | All or a portion of the security is insured or guaranteed. |
j | Denotes step coupon securities. Step coupon securities pay an initial coupon rate for the first period and then different coupon rates for following periods. The rate shown is as of October 31, 2018. |
The accompanying Notes to Financial Statements are an integral part of this schedule.
63
LIMITED MATURITY BOND FUND
Schedule of Investments as of October 31, 2018
k | Denotes perpetual securities. Perpetual securities pay an indefinite stream of interest and have no contractual maturity date. Date shown, if applicable, is next call date. |
l | Non-income producing security. |
m | The interest rate shown reflects the yield, coupon rate or the discount rate at the date of purchase. |
n | All or a portion of the security is held on deposit with the counterparty and pledged as the initial margin deposit for open futures contracts. |
o | At October 31, 2018, $249,142 of investments were segregated to cover exposure to a counterparty for margin on open mortgage-backed security transactions. |
* | Denotes restricted securities. Restricted securities are investment securities which cannot be offered for public sale without first being registered under the Securities Act of 1933. The value of all restricted securities held in Limited Maturity Bond Fund as of October 31, 2018 was $93,448,822 or 10.1% of total net assets. The following table indicates the acquisition date and cost of restricted securities shown in the schedule as of October 31, 2018. |
| | | | | | | | |
Security | | Acquisition Date | | | Cost | |
Ares XXXVII CLO, Ltd., 10/15/2030 | | | 5/18/2018 | | | $ | 4,007,286 | |
Assurant CLO III, Ltd., 10/20/2031 | | | 7/27/2018 | | | | 4,700,000 | |
Babson CLO, Ltd., 10/17/2026 | | | 3/10/2017 | | | | 2,607,402 | |
Betony CLO, Ltd., 4/30/2031 | | | 6/5/2018 | | | | 2,750,000 | |
CBAM CLO, Ltd., 10/20/2029 | | | 8/29/2018 | | | | 4,000,000 | |
Cedar Funding VI CLO, Ltd., 10/20/2028 | | | 10/2/2018 | | | | 6,000,000 | |
Cent CLO 22, Ltd., 11/7/2026 | | | 11/1/2016 | | | | 3,250,100 | |
Cold Storage Trust, 4/15/2036 | | | 4/20/2017 | | | | 4,850,000 | |
COLT Mortgage Loan Trust, 5/27/2047 | | | 4/27/2017 | | | | 1,301,745 | |
Commonbond Student Loan Trust, 6/25/2032 | | | 6/17/2015 | | | | 273,958 | |
Deephaven Residential Mortgage Trust, 12/26/2046 | | | 4/7/2017 | | | | 780,847 | |
DRB Prime Student Loan Trust, 10/27/2031 | | | 9/23/2015 | | | | 1,164,785 | |
Edlinc Student Loan Funding Trust, 10/1/2025 | | | 11/29/2012 | | | | 555,523 | |
Finance of America Structured Securities Trust, 9/25/2028 | | | 10/2/2018 | | | | 3,614,371 | |
FRS, LLC, 4/15/2043 | | | 4/10/2013 | | | | 317,182 | |
Garrison BSL CLO, Ltd., 7/17/2028 | | | 5/18/2018 | | | | 6,000,000 | |
GoldenTree Loan Opportunities, Ltd., 10/29/2029 | | | 9/20/2018 | | | | 3,000,000 | |
Golub Capital Partners, Ltd., 10/20/2028 | | | 9/17/2018 | | | | 6,000,000 | |
Homeward Opportunities Fund Trust, 6/25/2048 | | | 7/31/2018 | | | | 3,264,166 | |
Magnetite XVIII Ltd, 11/15/2028 | | | 10/31/2018 | | | | 4,500,000 | |
Mortgage Equity Conversion Asset Trust, 2/25/2042 | | | 2/14/2007 | | | | 1,435,580 | |
Mortgage Equity Conversion Asset Trust, 1/25/2042 | | | 1/18/2007 | | | | 1,469,232 | |
Neuberger Berman CLO, Ltd., 4/22/2029 | | | 4/27/2017 | | | | 2,800,000 | |
NRZ Excess Spread-Collateralized Notes Series, 1/25/2023 | | | 1/24/2018 | | | | 2,081,531 | |
Octagon Investment Partners XX, Ltd., 8/12/2026 | | | 4/21/2017 | | | | 3,350,000 | |
OZLM VIII, Ltd., 10/17/2026 | | | 5/16/2017 | | | | 3,300,000 | |
Race Point IX CLO, Ltd., 10/15/2030 | | | 8/28/2017 | | | | 1,325,000 | |
Radnor RE, Ltd., 3/25/2028 | | | 3/13/2018 | | | | 3,300,000 | |
Sound Point CLO XX, Ltd., 7/26/2031 | | | 6/15/2018 | | | | 3,000,000 | |
Stanwich Mortgage Loan Trust, 10/18/2023 | | | 10/26/2018 | | | $ | 2,500,000 | |
Toorak Mortgage Corporation 2018-1, Ltd., 8/25/2021 | | | 8/3/2018 | | | | 2,499,997 | |
TTX Company, 10/1/2023 | | | 9/19/2013 | | | | 649,994 | |
Voya CLO 3, Ltd., 7/25/2026 | | | 12/13/2017 | | | | 2,732,209 | |
Wachovia Asset Securitization, Inc., 7/25/2037 | | | 3/16/2007 | | | | 322,365 | |
Definitions:
| | | | |
| ACES | | - | | Alternative Credit Enhancement Securities |
| CLO | | - | | Collateralized Loan Obligation |
| Ser. | | - | | Series |
| TIPS | | - | | Treasury Inflation Protected Security |
Reference Rate Index:
| | | | |
12 MTA | | - | | 12 Month Treasury Average |
CMT 1Y | | - | | Constant Maturity Treasury Yield 1 Year |
CMT 3M | | - | | Constant Maturity Treasury Yield 3 Month |
LIBOR 1W | | - | | ICE Libor USD Rate 1 Week |
LIBOR 1M | | - | | ICE Libor USD Rate 1 Month |
LIBOR 3M | | - | | ICE Libor USD Rate 3 Month |
LIBOR 12M | | - | | ICE Libor USD Rate 12 Month |
PRIME | | - | | Federal Reserve Prime Loan Rate |
The accompanying Notes to Financial Statements are an integral part of this schedule.
64
MODERATE ALLOCATION FUND
Schedule of Investments as of October 31, 2018
| | | | | | | | |
Principal
Amount | | | Bank Loans (2.1%)a | | Value | |
| | Basic Materials (0.2%) | | | | |
| | | | Arch Coal, Inc., Term Loan | | | | |
| | $422,854 | | | 5.052%, (LIBOR 1M + 2.750%), 3/7/2024b | | | $422,223 | |
| | | | Ball Metalpack Finco, LLC, Term Loan | | | | |
| | 164,587 | | | 6.802%, (LIBOR 1M + 4.500%), 7/31/2025b | | | 165,410 | |
| | | | Big River Steel, LLC, Term Loan | | | | |
| | 267,300 | | | 7.386%, (LIBOR 3M + 5.000%), 8/23/2023b | | | 269,973 | |
| | | | Chemours Company, Term Loan | | | | |
| | 497,500 | | | 4.050%, (LIBOR 1M + 1.750%), 4/3/2025b | | | 495,326 | |
| | | | CONSOL Energy, Inc., Term Loan | | | | |
| | 248,125 | | | 8.310%, (LIBOR 1M + 6.000%), 11/28/2022b | | | 253,502 | |
| | | | Contura Energy, Inc., Term Loan | | | | |
| | 409,228 | | | 7.300%, (LIBOR 2M + 5.000%), 3/17/2024b | | | 407,182 | |
| | 745,000 | | | 0.000%, (LIBOR 3M + 5.000%), 10/3/2025b,c,d | | | 741,275 | |
| | | | MRC Global (US), Inc., Term Loan | | | | |
| | 370,633 | | | 5.302%, (LIBOR 1M + 3.000%), 9/20/2024b,e | | | 370,633 | |
| | | | Peabody Energy Corporation, Term Loan | | | | |
| | 283,575 | | | 5.052%, (LIBOR 1M + 2.750%), 3/31/2025b | | | 282,775 | |
| | | | Pixelle Specialty Solutions, LLC, Term Loan | | | | |
| | 400,000 | | | 0.000%, (LIBOR 3M + 6.000%), 10/31/2024b,c,d | | | 390,500 | |
| | | | Starfruit US Holdco, LLC, Term Loan | | | | |
| | 175,000 | | | 5.506%, (LIBOR 1M + 3.250%), 10/1/2025b | | | 174,344 | |
| | | | Tronox Blocked Borrower, LLC, Term Loan | | | | |
| | 181,535 | | | 5.302%, (LIBOR 1M + 3.000%), 9/22/2024b | | | 181,279 | |
| | | | Tronox Finance, LLC, Term Loan | | | | |
| | 418,927 | | | 5.302%, (LIBOR 1M + 3.000%), 9/22/2024b | | | 418,337 | |
| | | | | |
| | | | Total | | | 4,572,759 | |
| | | | | |
| |
| | Capital Goods (0.1%) | | | | |
| | | | Advanced Disposal Services, Inc., Term Loan | | | | |
| | 228,113 | | | 4.460%, (LIBOR 1W + 2.250%), 11/10/2023b | | | 227,971 | |
| | | | Flex Acquisition Company, Inc. Term Loan | | | | |
| | 1,177,050 | | | 5.506%, (LIBOR 1M + 3.250%), 6/22/2025b | | | 1,177,686 | |
| | | | GFL Environmental, Inc., Term Loan | | | | |
| | 280,000 | | | 0.000%, (LIBOR 3M + 3.000%), 5/31/2025b,c,d | | | 275,450 | |
| | 141,965 | | | 5.136%, (LIBOR 3M + 2.750%), 5/31/2025b | | | 139,658 | |
| | 17,680 | | | 5.136%, (LIBOR 3M + 2.750%), 5/31/2025b | | | 17,392 | |
| | | | Navistar, Inc., Term Loan | | | | |
| | 466,475 | | | 5.780%, (LIBOR 1M + 3.500%), 11/6/2024b | | | 466,862 | |
| | | | Sotera Health Holdings, LLC, Term Loan | | | | |
| | 277,358 | | | 5.302%, (LIBOR 1M + 3.000%), 5/15/2022b | | | 277,589 | |
| | | | | |
| | | | Total | | | 2,582,608 | |
| | | | | |
| |
| | Communications Services (0.5%) | | | | |
| | | | Altice France SA, Term Loan | | | | |
| | 192,075 | | | 5.052%, (LIBOR 1M + 2.750%), 7/31/2025b | | | 185,053 | |
| | 1,015,000 | | | 6.280%, (LIBOR 1M + 4.000%), 1/31/2026b | | | 992,802 | |
| | | | Cengage Learning, Inc., Term Loan | | | | |
| | 698,373 | | | 6.530%, (LIBOR 1M + 4.250%), 6/7/2023b | | | 646,211 | |
| | | | CenturyLink, Inc., Term Loan | | | | |
| | 1,238,256 | | | 5.052%, (LIBOR 1M + 2.750%), 1/31/2025b | | | 1,224,326 | |
| | | | Charter Communications Operating, LLC, Term Loan | | | | |
| | 496,250 | | | 4.310%, (LIBOR 1M + 2.000%), 4/30/2025b | | | 496,190 | |
| | | | Frontier Communications Corporation, Term Loan | | | | |
| | 723,219 | | | 6.060%, (LIBOR 1M + 3.750%), 6/15/2024b | | | 698,630 | |
| | | | HCP Acquisition, LLC, Term Loan | | | | |
| | 366,169 | | | 5.302%, (LIBOR 1M + 3.000%), 5/16/2024b | | | 365,437 | |
| | | | Intelsat Jackson Holdings SA, Term Loan | | | | |
| | 400,000 | | | 6.045%, (LIBOR 1M + 3.750%), 11/27/2023b | | | 400,000 | |
| | | | Liberty Cablevision of Puerto Rico, LLC, Term Loan | | | | |
| | 1,120,000 | | | 5.936%, (LIBOR 3M + 3.500%), 1/7/2022b | | | 1,097,802 | |
| | 110,493 | | | 9.186%, (LIBOR 3M + 6.750%), 7/7/2023b,e | | | 101,653 | |
| | | | McGraw-Hill Global Education Holdings, LLC, Term Loan | | | | |
| | 1,042,460 | | | 6.302%, (LIBOR 1M + 4.000%), 5/4/2022b,c,d | | | 998,812 | |
| | | | Mediacom Illinois, LLC, Term Loan | | | | |
| | 208,950 | | | 3.970%, (LIBOR 1W + 1.750%), 2/15/2024b | | | 208,298 | |
| | | | NEP/NCP Holdco, Inc., Term Loan | | | | |
| | 315,000 | | | 0.000%, (LIBOR 3M + 3.250%), 10/22/2025b,c,d | | | 316,103 | |
| | 40,000 | | | 9.302%, (LIBOR 1M + 7.000%), 10/23/2026b | | | 40,000 | |
| | | | Sable International Finance, Ltd., Term Loan | | | | |
| | 1,005,000 | | | 5.547%, (LIBOR 1M + 3.250%), 1/31/2026b | | | 1,003,874 | |
| | | | SBA Senior Finance II, LLC, Term Loan | | | | |
| | 304,237 | | | 4.310%, (LIBOR 1M + 2.000%), 4/11/2025b | | | 303,443 | |
| | | | Sprint Communications, Inc., Term Loan | | | | |
| | 861,875 | | | 4.813%, (LIBOR 1M + 2.500%), 2/2/2024b | | | 861,065 | |
The accompanying Notes to Financial Statements are an integral part of this schedule.
65
MODERATE ALLOCATION FUND
Schedule of Investments as of October 31, 2018
| | | | | | | | |
Principal
Amount | | | Bank Loans (2.1%)a | | Value | |
| | Communications Services (0.5%) - continued | | | | |
| | | | Syniverse Holdings, Inc., Term Loan | | | | |
| | $119,400 | | | 7.280%, (LIBOR 1M + 5.000%), 3/9/2023b | | | $119,997 | |
| | | | Univision Communications, Inc., Term Loan | | | | |
| | 746,196 | | | 5.052%, (LIBOR 1M + 2.750%), 3/15/2024b | | | 715,296 | |
| | | | WideOpenWest Finance, LLC, Term Loan | | | | |
| | 359,370 | | | 5.540%, (LIBOR 1M + 3.250%), 8/19/2023b | | | 345,894 | |
| | | | Windstream Services, LLC, Term Loan | | | | |
| | 343,363 | | | 6.290%, (LIBOR 1M + 4.000%), 3/30/2021b | | | 321,411 | |
| | | | | |
| | | | Total | | | 11,442,297 | |
| | | | | |
| |
| | Consumer Cyclical (0.3%) | | | | |
| | | | Burlington Coat Factory Warehouse Corporation, Term Loan | | | | |
| | 365,802 | | | 4.790%, (LIBOR 1M + 2.500%), 11/17/2024b | | | 365,802 | |
| | | | Four Seasons Hotels, Ltd., Term Loan | | | | |
| | 347,348 | | | 4.302%, (LIBOR 1M + 2.000%), 11/30/2023b | | | 347,161 | |
| | | | Golden Entertainment, Inc., Term Loan | | | | |
| | 669,937 | | | 5.300%, (LIBOR 1M + 3.000%), 10/20/2024b | | | 669,938 | |
| | 105,000 | | | 9.310%, (LIBOR 1M + 7.000%), 10/20/2025b | | | 105,525 | |
| | | | Golden Nugget, LLC, Term Loan | | | | |
| | 521,816 | | | 5.230%, (LIBOR 1M + 2.750%), 10/4/2023b | | | 522,061 | |
| | | | KAR Auction Services, Inc., Term Loan | | | | |
| | 212,313 | | | 4.938%, (LIBOR 3M + 2.500%), 3/9/2023b | | | 212,402 | |
| | | | Mohegan Gaming and Entertainment, Term Loan | | | | |
| | 497,982 | | | 6.302%, (LIBOR 1M + 4.000%), 10/13/2023b | | | 466,504 | |
| | | | Neiman Marcus Group, Ltd., LLC, Term Loan | | | | |
| | 193,477 | | | 5.531%, (LIBOR 1M + 3.250%), 10/25/2020b | | | 175,955 | |
| | | | Penn National Gaming, Inc. Term Loan | | | | |
| | 250,000 | | | 0.000%, (LIBOR 3M + 2.250%), 10/15/2025b,c,d | | | 250,625 | |
| | | | Scientific Games International, Inc., Term Loan | | | | |
| | 940,275 | | | 5.046%, (LIBOR 1M + 2.750%), 8/14/2024b | | | 930,534 | |
| | | | Stars Group Holdings BV, Term Loan | | | | |
| | 807,975 | | | 5.886%, (LIBOR 3M + 3.500%), 7/10/2025b | | | 810,892 | |
| | | | Tenneco, Inc., Term Loan | | | | |
| | 515,000 | | | 5.052%, (LIBOR 1M + 2.750%), 10/1/2025b | | | 513,285 | |
| | | | Wyndham Hotels & Resorts, Inc., Term Loan | | | | |
| | 245,000 | | | 4.052%, (LIBOR 1M + 1.750%), 5/30/2025b | | | 244,745 | |
| | | | | |
| | | | Total | | | 5,615,429 | |
| | | | | |
| |
| | Consumer Non-Cyclical (0.3%) | | | | |
| | | | Air Medical Group Holdings, Inc., Term Loan | | | | |
| | 1,261,971 | | | 5.534%, (LIBOR 3M + 3.250%), 4/28/2022b | | | 1,223,481 | |
| | 104,213 | | | 6.530%, (LIBOR 1M + 4.250%), 3/14/2025b | | | 102,128 | |
| | | | Albertson’s, LLC, Term Loan | | | | |
| | 252,755 | | | 5.052%, (LIBOR 1M + 2.750%), 8/25/2021b | | | 252,267 | |
| | 348,743 | | | 5.381%, (LIBOR 3M + 3.000%), 12/21/2022b | | | 347,676 | |
| | 444,466 | | | 5.311%, (LIBOR 3M + 3.000%), 6/22/2023b | | | 442,244 | |
| | 250,000 | | | 0.000%, (LIBOR 3M + 3.000%), 10/29/2025b,c,d | | | 247,865 | |
| | | | Amneal Pharmaceuticals, LLC, Term Loan | | | | |
| | 393,921 | | | 5.813%, (LIBOR 1M + 3.500%), 5/4/2025b | | | 395,792 | |
| | | | Bausch Health Companies, Inc., Term Loan | | | | |
| | 799,500 | | | 5.274%, (LIBOR 1M + 3.000%), 6/1/2025b | | | 799,316 | |
| | | | CHS/Community Health Systems, Inc., Term Loan | | | | |
| | 497,795 | | | 5.563%, (LIBOR 3M + 3.250%), 1/27/2021b | | | 486,710 | |
| | | | Endo International plc, Term Loan | | | | |
| | 603,938 | | | 6.563%, (LIBOR 1M + 4.250%), 4/27/2024b | | | 606,076 | |
| | | | Energizer Holdings, Inc., Term Loan | | | | |
| | 510,000 | | | 0.000%, (LIBOR 3M + 2.250%), 6/21/2025b,c,d | | | 510,321 | |
| | | | JBS USA LUX SA, Term Loan | | | | |
| | 882,222 | | | 4.844%, (LIBOR 3M + 2.500%), 10/30/2022b | | | 881,781 | |
| | | | Northriver Midstream Finance LP, Term Loan | | | | |
| | 200,000 | | | 5.646%, (LIBOR 3M + 3.250%), 10/1/2025b,c,d | | | 200,834 | |
| | | | Ortho-Clinical Diagnostics SA, Term Loan | | | | |
| | 1,019,700 | | | 5.544%, (LIBOR 1M + 3.250%), 6/1/2025b | | | 1,015,876 | |
| | | | Revlon Consumer Products Corporation, Term Loan | | | | |
| | 334,874 | | | 5.813%, (LIBOR 3M + 3.500%), 9/7/2023b | | | 244,552 | |
| | | | | |
| | | | Total | | | 7,756,919 | |
| | | | | |
| |
| | Energy (0.2%) | | | | |
| | | | BCP Raptor II, LLC, Term Loan | | | | |
| | 300,000 | | | 0.000%, (LIBOR 3M + 4.750%), 10/22/2025b,c,d,e | | | 297,750 | |
The accompanying Notes to Financial Statements are an integral part of this schedule.
66
MODERATE ALLOCATION FUND
Schedule of Investments as of October 31, 2018
| | | | | | | | |
Principal
Amount | | | Bank Loans (2.1%)a | | Value | |
| | Energy (0.2%) - continued | | | | |
| | | | Calpine Corporation, Term Loan | | | | |
| | $361,266 | | | 4.890%, (LIBOR 3M + 2.500%), 1/15/2024b | | | $359,875 | |
| | | | Consolidated Energy Finance SA, Term Loan | | | | |
| | 204,487 | | | 4.784%, (LIBOR 1M + 2.500%), 5/7/2025b,e | | | 203,465 | |
| | | | GIP III Stetson I, LP, Term Loan | | | | |
| | 390,000 | | | 6.695%, (LIBOR 3M + 4.250%), 7/18/2025b | | | 390,488 | |
| | | | HFOTCO, LLC, Term Loan | | | | |
| | 773,063 | | | 5.060%, (LIBOR 1M + 2.750%), 6/26/2025b | | | 774,671 | |
| | | | McDermott Technology (Americas), Inc., Term Loan | | | | |
| | 582,075 | | | 7.302%, (LIBOR 1M + 5.000%), 5/10/2025b | | | 574,071 | |
| | | | MEG Energy Corporation, Term Loan | | | | |
| | 43,475 | | | 5.810%, (LIBOR 1M + 3.500%), 12/31/2023b | | | 43,520 | |
| | | | Pacific Drilling SA, Term Loan | | | | |
| | 416,513 | | | 0.000%, (PRIME + 4.500%), 6/3/2018b,f,g | | | 186,735 | |
| | | | Radiate Holdco, LLC, Term Loan | | | | |
| | 972,594 | | | 5.302%, (LIBOR 1M + 3.000%), 2/1/2024b | | | 964,259 | |
| | | | | |
| | | | Total | | | 3,794,834 | |
| | | | | |
| |
| | Financials (0.2%) | | | | |
| | | | Air Methods Corporation, Term Loan | | | | |
| | 629,401 | | | 5.886%, (LIBOR 3M + 3.500%), 4/21/2024b | | | 567,248 | |
| | | | Avolon TLB Borrower 1 US, LLC, Term Loan | | | | |
| | 628,425 | | | 4.280%, (LIBOR 1M + 2.000%), 1/15/2025b | | | 626,433 | |
| | | | Digicel International Finance, Ltd., Term Loan | | | | |
| | 745,287 | | | 5.570%, (LIBOR 3M + 3.250%), 5/10/2024b | | | 712,994 | |
| | | | DJO Finance, LLC, Term Loan | | | | |
| | 237,771 | | | 5.599%, (LIBOR 1M + 3.250%), 6/7/2020b | | | 237,227 | |
| | | | DTZ U.S. Borrower, LLC, Term Loan | | | | |
| | 500,000 | | | 5.552%, (LIBOR 1M + 3.250%), 8/21/2025b | | | 499,530 | |
| | | | Genworth Holdings, Inc., Term Loan | | | | |
| | 104,475 | | | 6.831%, (LIBOR 2M + 4.500%), 3/7/2023b | | | 106,500 | |
| | | | GGP Nimbus LP, Term Loan | | | | |
| | 570,000 | | | 4.795%, (LIBOR 1M + 2.500%), 8/24/2025b | | | 560,333 | |
| | | | MoneyGram International, Inc., Term Loan | | | | |
| | 604,483 | | | 5.552%, (LIBOR 1M + 3.250%), 3/28/2020b,e | | | 574,258 | |
| | | | Trans Union, LLC, Term Loan | | | | |
| | 391,050 | | | 4.302%, (LIBOR 1M + 2.000%), 4/9/2023b | | | 390,115 | |
| | | | | |
| | | | Total | | | 4,274,638 | |
| | | | | |
| |
| | Technology (0.2%) | | | | |
| | | | Harland Clarke Holdings Corporation, Term Loan | | | | |
| | 612,861 | | | 7.136%, (LIBOR 3M + 4.750%), 11/3/2023b | | | 573,025 | |
| | | | Micron Technology, Inc., Term Loan | | | | |
| | 482,532 | | | 4.060%, (LIBOR 1M + 1.750%), 4/26/2022b | | | 482,430 | |
| | | | Plantronics, Inc., Term Loan | | | | |
| | 1,030,000 | | | 4.802%, (LIBOR 1M + 2.500%), 7/2/2025b | | | 1,026,137 | |
| | | | Rackspace Hosting, Inc., Term Loan | | | | |
| | 868,202 | | | 5.348%, (LIBOR 3M + 3.000%), 11/3/2023b | | | 841,253 | |
| | | | SS&C Technologies Holdings Europe SARL, Term Loan | | | | |
| | 141,059 | | | 4.552%, (LIBOR 1M + 2.250%), 4/16/2025b | | | 140,275 | |
| | | | SS&C Technologies, Inc., Term Loan | | | | |
| | 150,000 | | | 4.552%, (LIBOR 3M + 2.250%), 4/16/2025b,c,d | | | 149,090 | |
| | 363,931 | | | 4.552%, (LIBOR 1M + 2.250%), 4/16/2025b | | | 361,907 | |
| | | | TNS, Inc., Term Loan | | | | |
| | 557,440 | | | 6.320%, (LIBOR 3M + 4.000%), 8/14/2022b | | | 559,765 | |
| | | | Vantiv, LLC, Term Loan | | | | |
| | 965,150 | | | 4.030%, (LIBOR 1M + 1.750%), 8/20/2024b | | | 962,390 | |
| | | | | |
| | | | Total | | | 5,096,272 | |
| | | | | |
| |
| | Transportation (<0.1%) | | | | |
| | | | Arctic LNG Carriers, Ltd., Term Loan | | | | |
| | 706,063 | | | 6.802%, (LIBOR 1M + 4.500%), 5/18/2023b | | | 706,062 | |
| | | | OSG Bulk Ships, Inc., Term Loan | | | | |
| | 124,967 | | | 6.770%, (LIBOR 1M + 4.250%), 8/5/2019b | | | 123,614 | |
| | | | | |
| | | | Total | | | 829,676 | |
| | | | | |
| |
| | Utilities (0.1)% | | | | |
| | | | Core and Main, LP, Term Loan | | | | |
| | 311,850 | | | 5.317%, (LIBOR 3M + 3.000%), 8/1/2024b,e | | | 311,460 | |
| | | | EnergySolutions, LLC, Term Loan | | | | |
| | 244,387 | | | 6.136%, (LIBOR 3M + 3.750%), 5/11/2025b | | | 245,763 | |
| | | | Talen Energy Supply, LLC, Term Loan | | | | |
| | 231,315 | | | 6.302%, (LIBOR 1M + 4.000%), 7/6/2023b | | | 231,604 | |
| | | | TerraForm Power Operating, LLC, Term Loan | | | | |
| | 174,123 | | | 4.302%, (LIBOR 1M + 2.000%), 11/8/2022b | | | 174,123 | |
| | | | Vertiv Group Corporation, Term Loan | | | | |
| | 705,713 | | | 6.313%, (LIBOR 3M + 4.000%), 11/15/2023b | | | 697,774 | |
| | | | | |
| | | | Total | | | 1,660,724 | |
| | | | | |
| | | | | | | | |
| | | | | |
| | | | Total Bank Loans (cost $48,299,707) | | | 47,626,156 | |
| | | | | |
The accompanying Notes to Financial Statements are an integral part of this schedule.
67
MODERATE ALLOCATION FUND
Schedule of Investments as of October 31, 2018
| | | | | | | | |
| Shares | | | Registered Investment Companies (43.3%) | | Value | |
| | Affiliated Equity Holdings (31.5%) | | | | |
| | 2,203,086 | | | Thrivent Core International Equity Fund | | | $20,444,642 | |
| | 6,327,806 | | | Thrivent Core Low Volatility Equity Fundh | | | 66,695,075 | |
| | 12,490,426 | | | Thrivent Large Cap Growth Fund, Class S | | | 155,755,609 | |
| | 1,828,360 | | | Thrivent Large Cap Stock Fund, Class S | | | 49,146,306 | |
| | 8,148,795 | | | Thrivent Large Cap Value Fund, Class S | | | 186,607,417 | |
| | 3,723,782 | | | Thrivent Mid Cap Stock Fund, Class S | | | 104,489,316 | |
| | 12,134,999 | | | Thrivent Partner Worldwide Allocation Fund, Class S | | | 119,772,442 | |
| | 1,034,330 | | | Thrivent Small Cap Stock Fund, Class S | | | 27,254,589 | |
| | | | | |
| | | | Total | | | 730,165,396 | |
| | | | | |
|
| | Affiliated Fixed Income Holdings (10.7%) | |
| | 4,379,939 | | | Thrivent Core Emerging Markets Debt Fund | | | 39,594,649 | |
| | 7,885,546 | | | Thrivent High Yield Fund, Class S | | | 36,588,934 | |
| | 12,489,865 | | | Thrivent Income Fund, Class S | | | 108,661,822 | |
| | 5,183,865 | | | Thrivent Limited Maturity Bond Fund, Class S | | | 63,761,546 | |
| | | | | |
| | | | Total | | | 248,606,951 | |
| | | | | |
|
| | Equity Funds/Exchange Traded Funds (0.6%) | |
| | 3,776 | | | iShares Russell 1000 Growth Index Fund | | | 536,494 | |
| | 6,423 | | | iShares Russell 2000 Growth Index Fundi | | | 1,206,817 | |
| | 940 | | | iShares Russell 2000 Value Index Fund | | | 113,881 | |
| | 17,532 | | | ProShares Ultra S&P 500 | | | 1,922,384 | |
| | 1,119 | | | ProShares UltraPro S&P 500 | | | 50,769 | |
| | 28,521 | | | SPDR S&P 500 ETF Trust | | | 7,718,638 | |
| | 14,923 | | | SPDR S&P Biotech ETFi | | | 1,180,558 | |
| | 3,704 | | | SPDR S&P Retail ETFi | | | 174,607 | |
| | 2,684 | | | Vanguard REIT ETF | | | 210,211 | |
| | | | | |
| | | | Total | | | 13,114,359 | |
| | | | | |
|
| | Fixed Income Funds/Exchange Traded Funds (0.5%) | |
| | 30,500 | | | Invesco Senior Loan ETF | | | 701,805 | |
| | 40,000 | | | iShares Short-Term Corporate Bond ETF | | | 2,065,600 | |
| | 110,900 | | | Vanguard Short-Term Corporate Bond ETF | | | 8,642,437 | |
| | | | | |
| | | | Total | | | 11,409,842 | |
| | | | | |
| | | | | | | | |
| | | | | |
| | | | Total Registered Investment Companies (cost $771,972,521) | | | 1,003,296,548 | |
| | | | | |
| | |
Principal
Amount | | | Long-Term Fixed Income (30.5%) | | Value | |
| | Asset-Backed Securities (1.1%) | |
| | | | Access Group, Inc. | | | | |
| | $81,397 | | | 2.781%, (LIBOR 1M + 0.500%), 2/25/2036, Ser. 2013-1, Class Ab,j | | | 80,422 | |
| | | | Ares CLO, Ltd. | | | | |
| | 1,000,000 | | | 3.821%, (LIBOR 3M + 1.400%), 10/17/2030, Ser. 2018-28RA, Class A2*,b | | | 999,960 | |
| | | | Babson CLO, Ltd. | | | | |
| | 179,526 | | | 3.599%, (LIBOR 3M + 1.150%), 10/17/2026, Ser. 2014-IIA, Class AR*,b | | | 179,563 | |
| | | | Betony CLO, Ltd. | | | | |
| | 940,000 | | | 3.600%, (LIBOR 3M + 1.080%), 4/30/2031, Ser. 2018-1A, Class A1*,b | | | 939,009 | |
| | | | Buttermilk Park CLO, Ltd. | | | | |
| | 1,750,000 | | | 3.738%, (LIBOR 3M + 1.400%), 10/15/2031, Ser. 2018-1A, Class A2*,b | | | 1,749,940 | |
| | | | Carlyle Global Market Strategies CLO, Ltd. | | | | |
| | 1,150,000 | | | 3.782%, (LIBOR 3M + 1.450%), 7/15/2031, Ser. 2014-5A, Class A2RR*,b | | | 1,149,954 | |
| | | | Cent CLO 22, Ltd. | | | | |
| | 200,000 | | | 3.753%, (LIBOR 3M + 1.410%), 11/7/2026, Ser. 2014-22A, Class A1R*,b | | | 200,040 | |
| | | | Commonbond Student Loan Trust | | | | |
| | 234,843 | | | 2.781%, (LIBOR 1M + 0.500%), 2/25/2044, Ser. 2018-AGS, Class A2b,j | | | 232,396 | |
| | | | Dryden Senior Loan Fund | | | | |
| | 950,000 | | | 3.810%, (LIBOR 3M + 1.400%), 7/18/2030, Ser. 2018-65A, Class A2*,b | | | 949,982 | |
| | | | Earnest Student Loan Program, LLC | | | | |
| | 406,233 | | | 3.020%, 5/25/2034, Ser. 2016-B, Class A2j | | | 401,634 | |
| | | | Edlinc Student Loan Funding Trust | | | | |
| | 18,152 | | | 5.330%, (CMT 3M + 3.150%), 10/1/2025, Ser. 2012-A, Class AT*,b | | | 18,362 | |
| | | | Federal Home Loan Mortgage Corporation Multifamily Structured Pass Through Certificates | | | | |
| | 1,975,000 | | | 3.900%, 8/25/2028, Ser. K081, Class A2b | | | 1,988,920 | |
| | | | Galaxy XX CLO, Ltd. | | | | |
| | 650,000 | | | 3.469%, (LIBOR 3M + 1.000%), 4/20/2031, Ser. 2015-20A, Class AR*,b | | | 647,336 | |
| | | | Golub Capital Partners, Ltd. | | | | |
| | 890,000 | | | 3.610%, (LIBOR 3M + 1.150%), 10/20/2028, Ser. 2018-39A, Class A1*,b | | | 889,979 | |
| | 769,000 | | | 3.669%, (LIBOR 3M + 1.200%), 1/20/2031, Ser. 2015-23A, Class AR*,b | | | 771,316 | |
| | | | Harley Marine Financing, LLC | | | | |
| | 2,295,937 | | | 5.682%, 5/15/2043, Ser. 2018-1A, Class A2* | | | 2,123,742 | |
| | | | Limerock CLO III, LLC | | | | |
| | 650,000 | | | 3.669%, (LIBOR 3M + 1.200%), 10/20/2026, Ser. 2014-3A, Class A1R*,b | | | 650,267 | |
The accompanying Notes to Financial Statements are an integral part of this schedule.
68
MODERATE ALLOCATION FUND
Schedule of Investments as of October 31, 2018
| | | | | | | | |
Principal
Amount | | | Long-Term Fixed Income (30.5%) | | Value | |
| | Asset-Backed Securities (1.1%) - continued | | | | |
| | | | Madison Park Funding XIV, Ltd. | | | | |
| | $500,000 | | | 3.869%, (LIBOR 3M + 1.400%), 10/22/2030, Ser. 2014-14A, Class A2RR*,b | | | $499,996 | |
| | | | Magnetite XII, Ltd. | | | | |
| | 650,000 | | | 3.536%, (LIBOR 3M + 1.100%), 10/15/2031, Ser. 2015-12A, Class ARR*,b | | | 649,992 | |
| | | | Morgan Stanley Capital I, Inc. | | | | |
| | 700,000 | | | 4.407%, 10/23/2051, Ser. 2018-L1, Class A4 | | | 723,078 | |
| | | | Mountain View CLO, Ltd. | | | | |
| | 475,000 | | | 3.556%, (LIBOR 3M + 1.120%), 7/15/2031, Ser. 2015-9A, Class A1R*,b | | | 474,495 | |
| | | | Neuberger Berman CLO XIV, Ltd. | | | | |
| | 850,000 | | | 3.759%, (LIBOR 3M + 1.250%), 1/28/2030, Ser. 2013-14A, Class AR*,b | | | 850,417 | |
| | | | Neuberger Berman CLO, Ltd. | | | | |
| | 180,000 | | | 3.649%, (LIBOR 3M + 1.180%), 4/22/2029, Ser. 2014-17A, Class AR*,b | | | 180,221 | |
| | | | Octagon Investment Partners XVI, Ltd. | | | | |
| | 200,000 | | | 3.736%, (LIBOR 3M + 1.400%), 7/17/2030, Ser. 2013-1A, Class A2R*,b | | | 199,337 | |
| | | | Octagon Investment Partners XX, Ltd. | | | | |
| | 675,000 | | | 3.468%, (LIBOR 3M + 1.130%), 8/12/2026, Ser. 2014-1A, Class AR*,b | | | 675,192 | |
| | | | OZLM VIII, Ltd. | | | | |
| | 210,000 | | | 3.579%, (LIBOR 3M + 1.130%), 10/17/2026, Ser. 2014-8A, Class A1AR*,b | | | 210,102 | |
| | | | PPM CLO, Ltd. | | | | |
| | 600,000 | | | 3.643%, (LIBOR 3M + 1.150%), 7/15/2031, Ser. 2018-1A, Class A*,b | | | 599,314 | |
| | | | Race Point IX CLO, Ltd. | | | | |
| | 600,000 | | | 3.646%, (LIBOR 3M + 1.210%), 10/15/2030, Ser. 2015-9A, Class A1AR*,b | | | 601,643 | |
| | | | Renaissance Home Equity Loan Trust | | | | |
| | 1,217,316 | | | 6.011%, 5/25/2036, Ser. 2006-1, Class AF4k | | | 888,666 | |
| | | | SBA Small Business Investment Companies | | | | |
| | 1,700,000 | | | 3.548%, 9/11/2028, Ser. 2018-10B, Class 1 | | | 1,688,152 | |
| | | | Shackleton CLO, Ltd. | | | | |
| | 450,000 | | | 3.509%, (LIBOR 3M + 1.170%), 7/15/2031, Ser. 2015-7RA, Class A1*,b | | | 449,965 | |
| | | | SLM Student Loan Trust | | | | |
| | 191,478 | | | 2.681%, (LIBOR 1M + 0.400%), 3/25/2025, Ser. 2010-1, Class Ab | | | 188,656 | |
| | | | SoFi Consumer Loan Program, LLC | | | | |
| | 288,800 | | | 2.140%, 9/25/2026, Ser. 2017-5, Class A1j | | | 287,442 | |
| | | | SoFi Professional Loan Program, LLC | | | | |
| | $161,597 | | | 2.420%, 3/25/2030, Ser. 2015-A, Class A2j | | | 159,139 | |
| | | | Symphony CLO XV, Ltd. | | | | |
| | 580,290 | | | 3.629%, (LIBOR 3M + 1.180%), 10/17/2026, Ser. 2014-15A, Class AR*,b | | | 580,546 | |
| | | | U.S. Residential Opportunity Fund Trust | | | | |
| | 103,788 | | | 3.352%, 11/27/2037, Ser. 2017-1III, Class Aj | | | 102,754 | |
| | | | Verus Securitization Trust | | | | |
| | 826,799 | | | 3.677%, 6/1/2058, Ser. 2018-2, Class A1b,j | | | 823,358 | |
| | | | Voya CLO 3, Ltd. | | | | |
| | 188,119 | | | 3.210%, (LIBOR 3M + 0.720%), 7/25/2026, Ser. 2014-3A, Class A1R*,b | | | 188,140 | |
| | | | | |
| | | | Total | | | 24,993,427 | |
| | | | | |
| |
| | Basic Materials (0.5%) | | | | |
| | | | Alcoa Nederland Holding BV | | | | |
| | 455,000 | | | 6.750%, 9/30/2024j | | | 477,750 | |
| | | | Anglo American Capital plc | | | | |
| | 550,000 | | | 4.875%, 5/14/2025j | | | 542,249 | |
| | | | ArcelorMittal SA | | | | |
| | 421,000 | | | 6.125%, 6/1/2025i | | | 450,062 | |
| | | | Braskem Netherlands Finance BV | | | | |
| | 804,000 | | | 4.500%, 1/10/2028j | | | 742,695 | |
| | | | BWAY Holding Company | | | | |
| | 475,000 | | | 5.500%, 4/15/2024j | | | 456,000 | |
| | | | CF Industries, Inc. | | | | |
| | 800,000 | | | 3.450%, 6/1/2023i | | | 760,000 | |
| | | | Chemours Company | | | | |
| | 460,000 | | | 5.375%, 5/15/2027 | | | 427,800 | |
| | | | First Quantum Minerals, Ltd. | | | | |
| | 320,000 | | | 7.500%, 4/1/2025j | | | 285,600 | |
| | | | Georgia-Pacific, LLC | | | | |
| | 135,000 | | | 2.539%, 11/15/2019j | | | 133,977 | |
| | | | Glencore Funding, LLC | | | | |
| | 152,000 | | | 4.125%, 5/30/2023j | | | 150,184 | |
| | 200,000 | | | 4.000%, 3/27/2027j | | | 183,936 | |
| | | | International Paper Company | | | | |
| | 390,000 | | | 4.350%, 8/15/2048 | | | 334,492 | |
| | | | Kinross Gold Corporation | | | | |
| | 304,000 | | | 5.950%, 3/15/2024 | | | 310,840 | |
| | 460,000 | | | 4.500%, 7/15/2027 | | | 411,700 | |
| | | | Novelis Corporation | | | | |
| | 175,000 | | | 5.875%, 9/30/2026j | | | 164,937 | |
| | | | Olin Corporation | | | | |
| | 560,000 | | | 5.125%, 9/15/2027i | | | 521,500 | |
| | | | Peabody Securities Finance Corporation | | | | |
| | 465,000 | | | 6.375%, 3/31/2025j | | | 465,000 | |
| | | | Platform Specialty Products Corporation | | | | |
| | 350,000 | | | 5.875%, 12/1/2025j | | | 331,625 | |
| | | | Sherwin-Williams Company | | | | |
| | 353,000 | | | 3.125%, 6/1/2024 | | | 335,000 | |
| | | | Steel Dynamics, Inc. | | | | |
| | 385,000 | | | 5.000%, 12/15/2026 | | | 376,338 | |
The accompanying Notes to Financial Statements are an integral part of this schedule.
69
MODERATE ALLOCATION FUND
Schedule of Investments as of October 31, 2018
| | | | | | | | |
Principal
Amount | | | Long-Term Fixed Income (30.5%) | | Value | |
| | Basic Materials (0.5%) - continued | | | | |
| | | | Syngenta Finance NV | | | | |
| | $475,000 | | | 3.933%, 4/23/2021j | | | $472,611 | |
| | | | Teck Resources, Ltd. | | | | |
| | 674,000 | | | 6.125%, 10/1/2035 | | | 682,425 | |
| | | | United States Steel Corporation | | | | |
| | 550,000 | | | 6.250%, 3/15/2026 | | | 518,375 | |
| | | | Vale Overseas, Ltd. | | | | |
| | 215,000 | | | 4.375%, 1/11/2022 | | | 216,204 | |
| | 225,000 | | | 6.250%, 8/10/2026 | | | 240,188 | |
| | 275,000 | | | 6.875%, 11/21/2036 | | | 305,330 | |
| | 230,000 | | | 6.875%, 11/10/2039 | | | 258,175 | |
| | | | Westlake Chemical Corporation | | | | |
| | 304,000 | | | 3.600%, 8/15/2026 | | | 281,269 | |
| | | | WestRock Company | | | | |
| | 370,000 | | | 3.750%, 3/15/2025j | | | 356,100 | |
| | | | | |
| | | | Total | | | 11,192,362 | |
| | | | | |
| |
| | Capital Goods (0.6%) | | | | |
| | | | AECOM | | | | |
| | 590,000 | | | 5.875%, 10/15/2024 | | | 600,325 | |
| | | | Ardagh Packaging Finance plc | | | | |
| | 480,000 | | | 6.000%, 2/15/2025j | | | 450,000 | |
| | | | Ashtead Capital, Inc. | | | | |
| | 435,000 | | | 4.125%, 8/15/2025j | | | 403,463 | |
| | | | Boeing Company | | | | |
| | 375,000 | | | 3.850%, 11/1/2048 | | | 347,018 | |
| | | | Bombardier, Inc. | | | | |
| | 580,000 | | | 7.500%, 3/15/2025j | | | 579,826 | |
| | | | Building Materials Corporation of America | | | | |
| | 460,000 | | | 6.000%, 10/15/2025j | | | 452,525 | |
| | | | Cemex SAB de CV | | | | |
| | 510,000 | | | 6.125%, 5/5/2025j | | | 506,175 | |
| | | | Cintas Corporation No. 2 | | | | |
| | 230,000 | | | 3.700%, 4/1/2027 | | | 221,830 | |
| | | | CNH Industrial Capital, LLC | | | | |
| | 336,000 | | | 4.875%, 4/1/2021 | | | 343,274 | |
| | | | CNH Industrial NV | | | | |
| | 420,000 | | | 3.850%, 11/15/2027 | | | 388,102 | |
| | | | Covanta Holding Corporation | | | | |
| | 500,000 | | | 6.000%, 1/1/2027 | | | 482,500 | |
| | | | Crown Americas Capital Corporation IV | | | | |
| | 325,000 | | | 4.500%, 1/15/2023 | | | 318,500 | |
| | | | Crown Cork & Seal Company, Inc. | | | | |
| | 450,000 | | | 7.375%, 12/15/2026 | | | 481,500 | |
| | | | H&E Equipment Services, Inc. | | | | |
| | 275,000 | | | 5.625%, 9/1/2025 | | | 261,938 | |
| | | | Huntington Ingalls Industries, Inc. | | | | |
| | 510,000 | | | 3.483%, 12/1/2027 | | | 472,250 | |
| | | | L3 Technologies, Inc. | | | | |
| | 507,000 | | | 3.950%, 5/28/2024 | | | 499,349 | |
| | | | Lockheed Martin Corporation | | | | |
| | 105,000 | | | 2.500%, 11/23/2020 | | | 103,105 | |
| | 312,000 | | | 3.600%, 3/1/2035 | | | 282,230 | |
| | 304,000 | | | 4.500%, 5/15/2036 | | | 306,765 | |
| | 78,000 | | | 6.150%, 9/1/2036 | | | 91,917 | |
| | | | Northrop Grumman Corporation | | | | |
| | 550,000 | | | 3.850%, 4/15/2045 | | | 480,429 | |
| | | | Owens-Brockway Glass Container, Inc. | | | | |
| | 675,000 | | | 5.000%, 1/15/2022j | | | 666,563 | |
| | | | Republic Services, Inc. | | | | |
| | 235,000 | | | 2.900%, 7/1/2026 | | | 217,028 | |
| | | | Reynolds Group Issuer, Inc. | | | | |
| | 570,000 | | | 5.125%, 7/15/2023j | | | 557,888 | |
| | | | Rockwell Collins, Inc. | | | | |
| | 580,000 | | | 2.800%, 3/15/2022 | | | 562,212 | |
| | | | Roper Technologies, Inc. | | | | |
| | 228,000 | | | 2.800%, 12/15/2021 | | | 222,020 | |
| | 130,000 | | | 3.650%, 9/15/2023 | | | 128,841 | |
| | 192,000 | | | 4.200%, 9/15/2028 | | | 188,466 | |
| | | | Siemens Financieringsmaatschappij NV | | | | |
| | 636,000 | | | 4.200%, 3/16/2047j | | | 612,783 | |
| | | | Standard Industries, Inc. | | | | |
| | 195,000 | | | 5.500%, 2/15/2023j | | | 191,100 | |
| | | | Textron, Inc. | | | | |
| | 250,000 | | | 7.250%, 10/1/2019 | | | 258,475 | |
| | 510,000 | | | 3.375%, 3/1/2028 | | | 464,063 | |
| | | | United Rentals North America, Inc. | | | | |
| | 435,000 | | | 5.500%, 7/15/2025 | | | 423,853 | |
| | | | United Technologies Corporation | | | | |
| | 700,000 | | | 4.450%, 11/16/2038 | | | 676,140 | |
| | 390,000 | | | 4.050%, 5/4/2047 | | | 341,405 | |
| | | | | |
| | | | Total | | | 13,583,858 | |
| | | | | |
| |
| | Collateralized Mortgage Obligations (1.0%) | | | | |
| | | | Ajax Mortgage Loan Trust | | | | |
| | 1,150,000 | | | 4.360%, 9/25/2065, Ser. 2018-C, Class Ab,j | | | 1,148,106 | |
| | | | Alternative Loan Trust | | | | |
| | 189,661 | | | 6.000%, 8/1/2036, Ser. 2006-24CB, Class A9 | | | 161,273 | |
| | | | Angel Oak Mortgage Trust I, LLC | | | | |
| | 121,417 | | | 3.500%, 7/25/2046, Ser. 2016-1, Class A1* | | | 121,513 | |
| | 2,449,486 | | | 3.674%, 7/27/2048, Ser. 2018-2, Class A1b,j | | | 2,444,603 | |
| | | | Bayview Opportunity Master Fund Trust | | | | |
| | 625,293 | | | 3.500%, 5/28/2069, Ser. 2017-RT5, Class Ab,j | | | 618,452 | |
| | | | CHL Mortgage Pass-Through Trust | | | | |
| | 2,910,447 | | | 6.000%, 11/25/2037, Ser. 2007-18, Class 1A2 | | | 2,480,286 | |
| | | | CIM Trust | | | | |
| | 1,954,646 | | | 5.000%, 12/25/2057, Ser. 2018-R3, Class A1*,b | | | 2,022,664 | |
| | | | Citigroup Mortgage Loan Trust, Inc. | | | | |
| | 254,093 | | | 5.500%, 11/25/2035, Ser. 2005-9, Class 21A2 | | | 253,311 | |
| | | | COLT Mortgage Loan Trust | | | | |
| | 585,604 | | | 2.415%, 10/25/2047, Ser. 2017-2, Class A1Ab,j | | | 581,651 | |
| | | | Countrywide Alternative Loan Trust | | | | |
| | 264,100 | | | 4.025%, 10/25/2035, Ser. 2005-43, Class 4A1b | | | 231,586 | |
| | 306,954 | | | 6.000%, 4/25/2036, Ser. 2006-4CB, Class 1A1 | | | 252,484 | |
The accompanying Notes to Financial Statements are an integral part of this schedule.
70
MODERATE ALLOCATION FUND
Schedule of Investments as of October 31, 2018
| | | | | | | | |
Principal
Amount | | | Long-Term Fixed Income (30.5%) | | Value | |
| | Collateralized Mortgage Obligations (1.0%) - continued | | | | |
| | $158,526 | | | 6.000%, 1/25/2037, Ser. 2006-39CB, Class 1A16 | | | $150,748 | |
| | 836,528 | | | 5.500%, 5/25/2037, Ser. 2007-8CB, Class A1 | | | 698,363 | |
| | 844,273 | | | 7.000%, 10/25/2037, Ser. 2007-24, Class A10 | | | 525,104 | |
| | | | Countrywide Home Loans, Inc. | | | | |
| | 295,100 | | | 5.750%, 4/25/2037, Ser. 2007-3, Class A27 | | | 237,215 | |
| | | | Credit Suisse Mortgage Trust | | | | |
| | 1,395,376 | | | 3.850%, 9/25/2057, Ser. 2018-RPL9, Class A1b,j | | | 1,393,555 | |
| | | | Deutsche Alt-A Securities Mortgage Loan Trust | | | | |
| | 204,949 | | | 6.000%, 10/25/2021, Ser. 2006-AR5, Class 23A | | | 185,457 | |
| | | | Federal Home Loan Mortgage Corporation | | | | |
| | 941,214 | | | 4.000%, 7/15/2031, Ser. 4104, Class KIl | | | 110,247 | |
| | 666,550 | | | 3.000%, 2/15/2033, Ser. 4170, Class IGl | | | 73,980 | |
| | | | Federal National Mortgage Association | | | | |
| | 1,289,667 | | | 3.500%, 1/25/2033, Ser. 2012-150, Class YIl | | | 164,634 | |
| | | | Impac Secured Assets Trust | | | | |
| | 1,118,610 | | | 2.521%, (LIBOR 1M + 0.240%), 9/25/2037, Ser. 2007-3, Class A1Bb | | | 939,974 | |
| | | | J.P. Morgan Mortgage Trust | | | | |
| | 137,465 | | | 4.154%, 6/25/2036, Ser. 2006-A4, Class 1A2b | | | 131,237 | |
| | 64,932 | | | 4.225%, 10/25/2036, Ser. 2006-A6, Class 1A2b | | | 56,651 | |
| | 633,608 | | | 2.661%, (LIBOR 1M + 0.380%), 1/25/2037, Ser. 2006-S4, Class A8b | | | 345,679 | |
| | 800,919 | | | 6.250%, 8/25/2037, Ser. 2007-S3, Class 1A10 | | | 467,889 | |
| | | | MASTR Alternative Loans Trust | | | | |
| | 220,918 | | | 6.500%, 7/25/2034, Ser. 2004-6, Class 6A1 | | | 222,924 | |
| | 424,897 | | | 2.731%, (LIBOR 1M + 0.450%), 12/25/2035, Ser. 2005-6, Class 2A1b | | | 208,366 | |
| | | | Merrill Lynch Alternative Note Asset Trust | | | | |
| | 217,510 | | | 6.000%, 3/25/2037, Ser. 2007-F1, Class 2A1 | | | 170,884 | |
| | | | Mill City Mortgage Loan Trust | | | | |
| | 1,088,422 | | | 3.500%, 8/25/2058, Ser. 2018-3, Class A1b,j | | | 1,080,291 | |
| | | | MortgageIT Trust | | | | |
| | 1,807,333 | | | 2.481%, (LIBOR 1M + 0.200%), 4/25/2036, Ser. 2006-1, Class 1A2b | | | 1,604,770 | |
| | | | Preston Ridge Partners Mortgage Trust, LLC | | | | |
| | 972,459 | | | 3.470%, 9/25/2022, Ser. 2017-2A, Class A1*,k | | | 961,464 | |
| | | | Pretium Mortgage Credit Partners, LLC | | | | |
| | 525,222 | | | 3.250%, 8/27/2032, Ser. 2017-NPL4, Class A1j,k | | | 519,525 | |
| | | | Towd Point Mortgage Trust | | | | |
| | 508,506 | | | 2.887%, (LIBOR 1M + 0.600%), 2/25/2057, Ser. 2017-5, Class A1b,j | | | 507,939 | |
| | | | Verus Securitization Trust | | | | |
| | 421,390 | | | 2.853%, 1/25/2047, Ser. 2017-1A, Class A1*,b | | | 417,834 | |
| | 619,583 | | | 2.485%, 7/25/2047, Ser. 2017-2A, Class A1*,b | | | 604,570 | |
| | | | WaMu Mortgage Pass Through Certificates | | | | |
| | 64,022 | | | 3.867%, 9/25/2036, Ser. 2006-AR10, Class 1A2b | | | 61,888 | |
| | 254,256 | | | 3.876%, 10/25/2036, Ser. 2006-AR12, Class 1A1b | | | 246,213 | |
| | | | | |
| | | | Total | | | 22,403,330 | |
| | | | | |
| |
| | Commercial Mortgage-Backed Securities (0.9%) | | | | |
| | | | BANK 2018-BNK13 | | | | |
| | 1,600,000 | | | 4.217%, 8/15/2061, Ser. 2018-BN13, Class A5 | | | 1,618,079 | |
| | | | Benchmark 2018-B5 Mortgage Trust | | | | |
| | 1,775,000 | | | 4.208%, 7/15/2051, Ser. 2018-B5, Class A4 | | | 1,796,489 | |
| | | | CSAIL Commercial Mortgage Trust | | | | |
| | 1,300,000 | | | 3.504%, 6/15/2057, Ser. 2015-C2, Class A4 | | | 1,272,705 | |
| | | | Federal Home Loan Mortgage Corporation Multifamily Structured Pass Through Certificates | | | | |
| | 700,000 | | | 3.900%, 4/25/2028, Ser. K076, Class A2m | | | 707,899 | |
| | | | Federal National Mortgage Association - ACES | | | | |
| | 800,000 | | | 2.485%, 12/25/2026, Ser. 2017-M3, Class A2b | | | 735,411 | |
| | 1,225,000 | | | 2.785%, 2/25/2027, Ser. 2017-M2, Class A2b | | | 1,151,659 | |
| | 1,600,000 | | | 2.961%, 2/25/2027, Ser. 2017-M7, Class A2b | | | 1,512,517 | |
| | 1,350,000 | | | 3.052%, 3/25/2028, Ser. 2018-M7, Class A2b | | | 1,272,938 | |
| | | | Federal National Mortgage Association Grantor Trust | | | | |
| | 1,573,252 | | | 2.898%, 6/25/2027, Ser. 2017-T1, Class Am | | | 1,464,752 | |
| | | | GS Mortgage Securities Trust | | | | |
| | 850,000 | | | 3.801%, 1/10/2047, Ser. 2014-GC18, Class A3 | | | 855,258 | |
| | 1,200,000 | | | 3.666%, 9/10/2047, Ser. 2014-GC24, Class A4 | | | 1,194,853 | |
| | 1,400,000 | | | 3.244%, 10/10/2048, Ser. 2015-GC34, Class A3 | | | 1,348,438 | |
| | | | Morgan Stanley Bank of America Merrill Lynch Trust | | | | |
| | 700,000 | | | 3.246%, 12/15/2047, Ser. 2014-C19, Class A3 | | | 679,751 | |
The accompanying Notes to Financial Statements are an integral part of this schedule.
71
MODERATE ALLOCATION FUND
Schedule of Investments as of October 31, 2018
| | | | | | | | |
Principal
Amount | | | Long-Term Fixed Income (30.5%) | | Value | |
| | Commercial Mortgage-Backed Securities (0.9%) - continued | | | | |
| | | | Morgan Stanley Capital I, Inc. | | | | |
| | $1,950,000 | | | 4.177%, 7/15/2051, Ser. 2018-H3, Class A5 | | | $1,965,906 | |
| | | | UBS Commercial Mortgage Trust | | | | |
| | 1,069,888 | | | 3.400%, 5/10/2045, Ser. 2012-C1, Class A3 | | | 1,066,118 | |
| | 1,350,000 | | | 4.241%, 6/15/2051, Ser. 2018-C11, Class A5b | | | 1,364,690 | |
| | | | Wells Fargo Commercial Mortgage Trust | | | | |
| | 500,000 | | | 3.617%, 9/15/2057, Ser. 2015-NXS3, Class A4 | | | 492,100 | |
| | | | WFRBS Commercial Mortgage Trust | | | | |
| | 830,301 | | | 2.870%, 11/15/2045, Ser. 2012-C9, Class A3 | | | 811,203 | |
| | | | | |
| | | | Total | | | 21,310,766 | |
| | | | | |
| |
| | Communications Services (1.1%) | | | | |
| | | | 21st Century Fox America, Inc. | | | | |
| | 325,000 | | | 6.900%, 3/1/2019 | | | 329,323 | |
| | 720,000 | | | 6.400%, 12/15/2035 | | | 877,363 | |
| | | | AMC Networks, Inc. | | | | |
| | 440,000 | | | 5.000%, 4/1/2024 | | | 420,838 | |
| | | | America Movil SAB de CV | | | | |
| | 252,000 | | | 5.000%, 10/16/2019 | | | 255,780 | |
| | | | American Tower Corporation | | | | |
| | 380,000 | | | 3.300%, 2/15/2021 | | | 376,831 | |
| | | | AT&T, Inc. | | | | |
| | 164,000 | | | 5.875%, 10/1/2019 | | | 167,957 | |
| | 90,000 | | | 3.316%, (LIBOR 3M + 0.930%), 6/30/2020b | | | 90,803 | |
| | 235,000 | | | 3.800%, 3/1/2024 | | | 230,659 | |
| | 244,000 | | | 4.100%, 2/15/2028j | | | 232,220 | |
| | 235,000 | | | 4.300%, 2/15/2030j | | | 220,840 | |
| | 315,000 | | | 5.250%, 3/1/2037 | | | 301,311 | |
| | 300,000 | | | 4.900%, 8/15/2037j | | | 275,173 | |
| | 228,000 | | | 6.350%, 3/15/2040 | | | 241,358 | |
| | 285,000 | | | 5.550%, 8/15/2041 | | | 275,154 | |
| | 152,000 | | | 4.750%, 5/15/2046 | | | 131,945 | |
| | 540,000 | | | 5.450%, 3/1/2047 | | | 512,244 | |
| | | | British Sky Broadcasting Group plc | | | | |
| | 315,000 | | | 3.125%, 11/26/2022j | | | 307,835 | |
| | | | CCO Holdings, LLC | | | | |
| | 600,000 | | | 5.875%, 4/1/2024j | | | 605,250 | |
| | | | CCOH Safari, LLC | | | | |
| | 200,000 | | | 5.750%, 2/15/2026j | | | 198,000 | |
| | | | CenturyLink, Inc. | | | | |
| | 465,000 | | | 6.450%, 6/15/2021 | | | 475,462 | |
| | | | Charter Communications Operating, LLC | | | | |
| | 149,000 | | | 6.834%, 10/23/2055 | | | 154,355 | |
| | 300,000 | | | 4.500%, 2/1/2024 | | | 300,362 | |
| | 430,000 | | | 4.200%, 3/15/2028 | | | 402,873 | |
| | 1,075,000 | | | 6.484%, 10/23/2045 | | | 1,098,716 | |
| | | | Clear Channel Worldwide Holdings, Inc. | | | | |
| | 570,000 | | | 6.500%, 11/15/2022 | | | 578,664 | |
| | | | Comcast Corporation | | | | |
| | 575,000 | | | 4.950%, 10/15/2058 | | | 563,321 | |
| | 370,000 | | | 4.049%, 11/1/2052 | | | 315,962 | |
| | 250,000 | | | 2.750%, 3/1/2023 | | | 241,024 | |
| | 130,000 | | | 3.038%, (LIBOR 3M + 0.630%), 4/15/2024b | | | 129,271 | |
| | 355,000 | | | 3.950%, 10/15/2025 | | | 354,006 | |
| | 575,000 | | | 4.250%, 10/15/2030 | | | 567,993 | |
| | 630,000 | | | 4.400%, 8/15/2035 | | | 598,874 | |
| | 410,000 | | | 4.750%, 3/1/2044 | | | 400,710 | |
| | 250,000 | | | 4.600%, 8/15/2045 | | | 239,003 | |
| | | | Cox Communications, Inc. | | | | |
| | 420,000 | | | 3.350%, 9/15/2026j | | | 386,416 | |
| | 156,000 | | | 4.600%, 8/15/2047j | | | 138,868 | |
| | | | Crown Castle International Corporation | | | | |
| | 358,000 | | | 3.400%, 2/15/2021 | | | 355,751 | |
| | 514,000 | | | 5.250%, 1/15/2023 | | | 536,066 | |
| | 312,000 | | | 3.200%, 9/1/2024 | | | 294,682 | |
| | | | CSC Holdings, LLC | | | | |
| | 65,000 | | | 5.500%, 4/15/2027j | | | 62,400 | |
| | | | Digicel, Ltd. | | | | |
| | 775,000 | | | 6.000%, 4/15/2021*,i | | | 703,312 | |
| | | | Discovery Communications, LLC | | | | |
| | 390,000 | | | 4.900%, 3/11/2026 | | | 394,456 | |
| | 640,000 | | | 5.000%, 9/20/2037 | | | 597,178 | |
| | | | Gray Television, Inc. | | | | |
| | 475,000 | | | 5.875%, 7/15/2026j | | | 455,853 | |
| | | | Intelsat Jackson Holdings SA | | | | |
| | 295,000 | | | 8.500%, 10/15/2024j | | | 289,837 | |
| | | | Level 3 Communications, Inc. | | | | |
| | 595,000 | | | 5.375%, 1/15/2024 | | | 589,050 | |
| | | | Level 3 Financing, Inc. | | | | |
| | 205,000 | | | 5.375%, 5/1/2025 | | | 200,131 | |
| | | | Moody’s Corporation | | | | |
| | 209,000 | | | 2.750%, 12/15/2021 | | | 203,869 | |
| | | | Neptune Finco Corporation | | | | |
| | 499,000 | | | 10.875%, 10/15/2025j | | | 575,721 | |
| | | | Netflix, Inc. | | | | |
| | 590,000 | | | 4.875%, 4/15/2028j | | | 541,325 | |
| | | | Nexstar Escrow Corporation | | | | |
| | 221,000 | | | 5.625%, 8/1/2024j | | | 211,055 | |
| | | | Omnicom Group, Inc. | | | | |
| | 156,000 | | | 3.600%, 4/15/2026 | | | 146,708 | |
| | | | SES Global Americas Holdings GP | | | | |
| | 175,000 | | | 2.500%, 3/25/2019j | | | 174,511 | |
| | | | Sprint Communications, Inc. | | | | |
| | 390,000 | | | 6.000%, 11/15/2022 | | | 393,656 | |
| | | | Sprint Corporation | | | | |
| | 305,000 | | | 7.625%, 2/15/2025 | | | 316,819 | |
| | | | Telecom Italia SPA | | | | |
| | 450,000 | | | 5.303%, 5/30/2024j | | | 424,125 | |
| | | | Telefonica Emisiones SAU | | | | |
| | 470,000 | | | 4.665%, 3/6/2038 | | | 421,315 | |
| | | | Time Warner Entertainment Company, LP | | | | |
| | 379,000 | | | 8.375%, 3/15/2023 | | | 436,842 | |
| | | | Verizon Communications, Inc. | | | | |
| | 480,000 | | | 3.500%, 11/1/2021 | | | 480,135 | |
| | 684,000 | | | 5.150%, 9/15/2023 | | | 725,877 | |
| | 298,000 | | | 3.376%, 2/15/2025 | | | 287,737 | |
| | 170,000 | | | 3.414%, (LIBOR 3M + 1.100%), 5/15/2025b | | | 170,876 | |
| | 242,000 | | | 4.272%, 1/15/2036 | | | 222,346 | |
| | 624,000 | | | 4.862%, 8/21/2046 | | | 597,061 | |
| | 543,000 | | | 4.522%, 9/15/2048 | | | 492,507 | |
The accompanying Notes to Financial Statements are an integral part of this schedule.
72
MODERATE ALLOCATION FUND
Schedule of Investments as of October 31, 2018
| | | | | | | | |
Principal
Amount | | | Long-Term Fixed Income (30.5%) | | Value | |
| | Communications Services (1.1%) - continued | | | | |
| | | | Viacom, Inc. | | | | |
| | $160,000 | | | 4.250%, 9/1/2023 | | | $159,767 | |
| | 338,000 | | | 6.875%, 4/30/2036 | | | 373,244 | |
| | 228,000 | | | 5.850%, 9/1/2043 | | | 227,610 | |
| | | | Virgin Media Secured Finance plc | | | | |
| | 465,000 | | | 5.250%, 1/15/2026j | | | 433,613 | |
| | | | Windstream Services, LLC | | | | |
| | 420,000 | | | 8.625%, 10/31/2025j | | | 392,700 | |
| | | | | |
| | | | Total | | | 25,884,899 | |
| | | | | |
| |
| | Consumer Cyclical (0.8%) | | | | |
| | | | Amazon.com, Inc. | | | | |
| | 195,000 | | | 3.150%, 8/22/2027 | | | 183,671 | |
| | 390,000 | | | 3.875%, 8/22/2037 | | | 367,252 | |
| | 234,000 | | | 4.050%, 8/22/2047 | | | 219,197 | |
| | | | American Honda Finance Corporation | | | | |
| | 330,000 | | | 2.000%, 2/14/2020 | | | 325,336 | |
| | | | Aptiv plc | | | | |
| | 380,000 | | | 3.150%, 11/19/2020 | | | 375,740 | |
| | | | Cinemark USA, Inc. | | | | |
| | 775,000 | | | 4.875%, 6/1/2023 | | | 756,594 | |
| | | | D.R. Horton, Inc. | | | | |
| | 365,000 | | | 2.550%, 12/1/2020 | | | 356,479 | |
| | | | Daimler Finance North America, LLC | | | | |
| | 304,000 | | | 3.140%, (LIBOR 3M + 0.620%), 10/30/2019b,j | | | 305,192 | |
| | 425,000 | | | 2.891%, (LIBOR 3M + 0.550%), 5/4/2021b,j | | | 425,204 | |
| | | | Delphi Jersey Holdings plc | | | | |
| | 580,000 | | | 5.000%, 10/1/2025j | | | 523,450 | |
| | | | Ford Motor Credit Company, LLC | | | | |
| | 300,000 | | | 2.943%, 1/8/2019 | | | 299,937 | |
| | 285,000 | | | 2.262%, 3/28/2019 | | | 284,025 | |
| | 152,000 | | | 2.459%, 3/27/2020 | | | 148,918 | |
| | 114,000 | | | 3.200%, 1/15/2021 | | | 111,249 | |
| | 115,000 | | | 3.656%, (LIBOR 3M + 1.270%), 3/28/2022b | | | 113,600 | |
| | 600,000 | | | 2.979%, 8/3/2022 | | | 562,815 | |
| | | | General Motors Company | | | | |
| | 560,000 | | | 3.227%, (LIBOR 3M + 0.900%), 9/10/2021b | | | 559,190 | |
| | 700,000 | | | 5.000%, 10/1/2028 | | | 669,803 | |
| | | | General Motors Financial Company, Inc. | | | | |
| | 125,000 | | | 3.366%, (LIBOR 3M + 0.930%), 4/13/2020b | | | 125,578 | |
| | 228,000 | | | 3.700%, 11/24/2020 | | | 227,564 | |
| | 152,000 | | | 4.200%, 3/1/2021 | | | 152,736 | |
| | 460,000 | | | 3.258%, (LIBOR 3M + 0.850%), 4/9/2021b | | | 459,968 | |
| | 400,000 | | | 3.150%, 6/30/2022 | | | 383,975 | |
| | 152,000 | | | 3.950%, 4/13/2024 | | | 146,050 | |
| | 360,000 | | | 4.300%, 7/13/2025 | | | 344,333 | |
| | | | Home Depot, Inc. | | | | |
| | 375,000 | | | 5.400%, 9/15/2040 | | | 421,687 | |
| | 228,000 | | | 4.250%, 4/1/2046 | | | 219,232 | |
| | 390,000 | | | 3.900%, 6/15/2047 | | | 354,836 | |
| | | | Hyundai Capital America | | | | |
| | 374,000 | | | 2.550%, 4/3/2020j | | | 367,185 | |
| | 228,000 | | | 3.000%, 10/30/2020j | | | 224,395 | |
| | | | Jaguar Land Rover Automotive plc | | | | |
| | 230,000 | | | 4.125%, 12/15/2018j | | | 229,770 | |
| | 270,000 | | | 5.625%, 2/1/2023j | | | 257,175 | |
| | | | KB Home | | | | |
| | 358,000 | | | 4.750%, 5/15/2019 | | | 359,181 | |
| | | | L Brands, Inc. | | | | |
| | 270,000 | | | 5.625%, 2/15/2022 | | | 274,050 | |
| | | | Landry’s, Inc. | | | | |
| | 480,000 | | | 6.750%, 10/15/2024j | | | 478,800 | |
| | | | Lear Corporation | | | | |
| | 325,000 | | | 5.250%, 1/15/2025 | | | 332,933 | |
| | | | Lennar Corporation | | | | |
| | 350,000 | | | 4.125%, 1/15/2022 | | | 341,705 | |
| | 620,000 | | | 4.875%, 12/15/2023 | | | 605,275 | |
| | 350,000 | | | 4.500%, 4/30/2024 | | | 334,469 | |
| | | | Live Nation Entertainment, Inc. | | | | |
| | 325,000 | | | 5.375%, 6/15/2022j | | | 327,438 | |
| | 295,000 | | | 5.625%, 3/15/2026i,j | | | 295,000 | |
| | | | Macy’s Retail Holdings, Inc. | | | | |
| | 580,000 | | | 2.875%, 2/15/2023i | | | 541,707 | |
| | | | Mastercard, Inc. | | | | |
| | 550,000 | | | 3.950%, 2/26/2048 | | | 519,381 | |
| | | | McDonald’s Corporation | | | | |
| | 225,000 | | | 2.750%, 12/9/2020 | | | 222,507 | |
| | 304,000 | | | 2.625%, 1/15/2022 | | | 295,677 | |
| | 470,000 | | | 4.450%, 3/1/2047 | | | 439,522 | |
| | | | MGM Resorts International | | | | |
| | 590,000 | | | 6.000%, 3/15/2023 | | | 598,850 | |
| | | | Navistar International Corporation | | | | |
| | 555,000 | | | 6.625%, 11/1/2025j | | | 566,100 | |
| | | | New Red Finance, Inc. | | | | |
| | 485,000 | | | 4.250%, 5/15/2024i,j | | | 454,688 | |
| | | | Nissan Motor Acceptance Corporation | | | | |
| | 252,000 | | | 2.150%, 9/28/2020j | | | 245,774 | |
| | | | Prime Security Services Borrower, LLC | | | | |
| | 515,000 | | | 9.250%, 5/15/2023j | | | 544,201 | |
| | | | Scientific Games International, Inc. | | | | |
| | 540,000 | | | 5.000%, 10/15/2025j | | | 502,200 | |
| | | | Six Flags Entertainment Corporation | | | | |
| | 490,000 | | | 4.875%, 7/31/2024j | | | 463,050 | |
| | | | Toll Brothers Finance Corporation | | | | |
| | 132,000 | | | 4.000%, 12/31/2018 | | | 131,670 | |
| | | | VOC Escrow, Ltd. | | | | |
| | 545,000 | | | 5.000%, 2/15/2028j | | | 512,300 | |
| | | | | |
| | | | Total | | | 19,888,614 | |
| | | | | |
| |
| | Consumer Non-Cyclical (1.5%) | | | | |
| | | | Abbott Laboratories | | | | |
| | 390,000 | | | 2.900%, 11/30/2021 | | | 383,019 | |
| | 133,000 | | | 3.400%, 11/30/2023 | | | 131,575 | |
| | 133,000 | | | 3.750%, 11/30/2026 | | | 130,958 | |
| | 643,000 | | | 4.750%, 11/30/2036 | | | 653,601 | |
| | 320,000 | | | 4.900%, 11/30/2046 | | | 330,055 | |
| | | | AbbVie, Inc. | | | | |
| | 575,000 | | | 2.500%, 5/14/2020 | | | 567,485 | |
| | 390,000 | | | 3.600%, 5/14/2025 | | | 372,127 | |
| | 175,000 | | | 4.700%, 5/14/2045 | | | 158,211 | |
| | | | Altria Group, Inc. | | | | |
| | 152,000 | | | 2.850%, 8/9/2022 | | | 147,725 | |
| | 190,000 | | | 2.625%, 9/16/2026 | | | 170,794 | |
The accompanying Notes to Financial Statements are an integral part of this schedule.
73
MODERATE ALLOCATION FUND
Schedule of Investments as of October 31, 2018
| | | | | | | | |
Principal
Amount | | | Long-Term Fixed Income (30.5%) | | Value | |
| | Consumer Non-Cyclical (1.5%) - continued | | | | |
| | | | Amgen, Inc. | | | | |
| | $468,000 | | | 2.200%, 5/11/2020 | | | $460,737 | |
| | 152,000 | | | 2.700%, 5/1/2022 | | | 147,345 | |
| | 150,000 | | | 3.125%, 5/1/2025 | | | 141,948 | |
| | | | Anheuser-Busch InBev Finance, Inc. | | | | |
| | 165,000 | | | 3.603%, (LIBOR 3M + 1.260%), 2/1/2021b | | | 168,513 | |
| | 800,000 | | | 3.650%, 2/1/2026 | | | 759,264 | |
| | 608,000 | | | 4.700%, 2/1/2036 | | | 579,794 | |
| | | | Anheuser-Busch InBev Worldwide, Inc. | | | | |
| | 950,000 | | | 4.750%, 4/15/2058 | | | 841,992 | |
| | 280,000 | | | 3.165%, (LIBOR 3M + 0.740%), 1/12/2024b | | | 279,846 | |
| | 495,000 | | | 4.375%, 4/15/2038 | | | 449,430 | |
| | 495,000 | | | 4.600%, 4/15/2048 | | | 445,649 | |
| | | | BAT Capital Corporation | | | | |
| | 156,000 | | | 2.297%, 8/14/2020j | | | 152,652 | |
| | 234,000 | | | 3.222%, 8/15/2024j | | | 220,838 | |
| | 312,000 | | | 4.540%, 8/15/2047j | | | 271,668 | |
| | | | Baxalta, Inc. | | | | |
| | 201,000 | | | 4.000%, 6/23/2025 | | | 195,924 | |
| | | | Bayer U.S. Finance II, LLC | | | | |
| | 540,000 | | | 4.250%, 12/15/2025j | | | 530,499 | |
| | 550,000 | | | 4.875%, 6/25/2048j | | | 512,824 | |
| | | | Becton, Dickinson and Company | | | | |
| | 341,000 | | | 3.734%, 12/15/2024 | | | 330,568 | |
| | 650,000 | | | 3.700%, 6/6/2027 | | | 610,498 | |
| | 234,000 | | | 4.669%, 6/6/2047 | | | 219,300 | |
| | | | Boston Scientific Corporation | | | | |
| | 110,000 | | | 6.000%, 1/15/2020 | | | 113,387 | |
| | 175,000 | | | 3.850%, 5/15/2025 | | | 172,595 | |
| | 375,000 | | | 4.000%, 3/1/2028 | | | 366,120 | |
| | 228,000 | | | 7.375%, 1/15/2040 | | | 292,109 | |
| | | | Bunge, Ltd. Finance Corporation | | | | |
| | 114,000 | | | 3.500%, 11/24/2020 | | | 113,755 | |
| | | | Celgene Corporation | | | | |
| | 630,000 | | | 2.875%, 8/15/2020 | | | 623,378 | |
| | | | Church & Dwight Company, Inc. | | | | |
| | 80,000 | | | 2.450%, 12/15/2019 | | | 79,425 | |
| | | | Clorox Company | | | | |
| | 505,000 | | | 3.100%, 10/1/2027 | | | 467,846 | |
| | | | Conagra Brands, Inc. | | | | |
| | 300,000 | | | 3.800%, 10/22/2021 | | | 300,696 | |
| | 380,000 | | | 4.300%, 5/1/2024 | | | 380,584 | |
| | | | Constellation Brands, Inc. | | | | |
| | 360,000 | | | 3.600%, 2/15/2028 | | | 332,195 | |
| | | | CVS Caremark Corporation | | | | |
| | 75,000 | | | 4.000%, 12/5/2023 | | | 74,583 | |
| | | | CVS Health Corporation | | | | |
| | 90,000 | | | 3.350%, 3/9/2021 | | | 89,605 | |
| | 180,000 | | | 3.700%, 3/9/2023 | | | 177,842 | |
| | 465,000 | | | 4.100%, 3/25/2025 | | | 459,589 | |
| | 935,000 | | | 4.875%, 7/20/2035 | | | 908,971 | |
| | 910,000 | | | 4.780%, 3/25/2038 | | | 871,739 | |
| | 540,000 | | | 5.050%, 3/25/2048 | | | 526,415 | |
| | | | EMD Finance, LLC | | | | |
| | 344,000 | | | 2.950%, 3/19/2022j | | | 334,586 | |
| | | | Energizer Holdings, Inc. | | | | |
| | 540,000 | | | 5.500%, 6/15/2025j | | | 525,150 | |
| | | | Express Scripts Holding Company | | | | |
| | 152,000 | | | 3.000%, 7/15/2023 | | | 145,809 | |
| | 690,000 | | | 4.800%, 7/15/2046 | | | 648,376 | |
| | | | Forest Laboratories, LLC | | | | |
| | 83,000 | | | 4.875%, 2/15/2021j | | | 84,794 | |
| | | | Grupo Bimbo SAB de CV | | | | |
| | 260,000 | | | 4.700%, 11/10/2047j | | | 228,085 | |
| | | | Halfmoon Parent, Inc. | | | | |
| | 90,000 | | | 3.326%, (LIBOR 3M + 0.890%), 7/15/2023b,j | | | 89,928 | |
| | 490,000 | | | 4.125%, 11/15/2025j | | | 484,387 | |
| | 605,000 | | | 4.800%, 8/15/2038j | | | 584,060 | |
| | | | HCA, Inc. | | | | |
| | 305,000 | | | 5.250%, 6/15/2026 | | | 310,337 | |
| | 270,000 | | | 4.500%, 2/15/2027 | | | 262,575 | |
| | | | Imperial Tobacco Finance plc | | | | |
| | 365,000 | | | 2.950%, 7/21/2020j | | | 360,294 | |
| | | | JBS USA, LLC | | | | |
| | 325,000 | | | 5.750%, 6/15/2025j | | | 314,437 | |
| | | | Kellogg Company | | | | |
| | 675,000 | | | 3.250%, 5/14/2021 | | | 670,263 | |
| | | | Kimberly-Clark Corporation | | | | |
| | 390,000 | | | 3.900%, 5/4/2047 | | | 361,360 | |
| | | | Kraft Foods Group, Inc. | | | | |
| | 312,000 | | | 5.000%, 6/4/2042 | | | 286,296 | |
| | | | Kraft Heinz Foods Company | | | | |
| | 650,000 | | | 3.375%, 6/15/2021 | | | 648,022 | |
| | | | Kroger Company | | | | |
| | 200,000 | | | 2.800%, 8/1/2022 | | | 193,611 | |
| | | | Laboratory Corporation of America Holdings | | | | |
| | 90,000 | | | 2.625%, 2/1/2020 | | | 89,222 | |
| | | | Maple Escrow Subsidiary, Inc. | | | | |
| | 450,000 | | | 3.551%, 5/25/2021j | | | 447,903 | |
| | | | Mead Johnson Nutrition Company | | | | |
| | 152,000 | | | 3.000%, 11/15/2020 | | | 150,936 | |
| | | | Medtronic, Inc. | | | | |
| | 1,185,000 | | | 4.375%, 3/15/2035 | | | 1,179,070 | |
| | 160,000 | | | 4.625%, 3/15/2045 | | | 161,801 | |
| | | | Merck & Company, Inc. | | | | |
| | 100,000 | | | 2.716%, (LIBOR 3M + 0.375%), 2/10/2020b | | | 100,261 | |
| | 70,000 | | | 3.700%, 2/10/2045 | | | 63,692 | |
| | | | Mondelez International Holdings Netherlands BV | | | | |
| | 335,000 | | | 2.000%, 10/28/2021j | | | 318,880 | |
| | | | Mondelez International, Inc. | | | | |
| | 118,000 | | | 2.863%, (LIBOR 3M + 0.520%), 2/1/2019b | | | 118,108 | |
| | | | Mylan NV | | | | |
| | 160,000 | | | 5.250%, 6/15/2046 | | | 137,788 | |
| | | | Mylan, Inc. | | | | |
| | 65,000 | | | 3.125%, 1/15/2023j | | | 61,304 | |
| | 295,000 | | | 4.550%, 4/15/2028j | | | 273,009 | |
| | | | Nestle Holdings, Inc. | | | | |
| | 1,000,000 | | | 3.900%, 9/24/2038j | | | 946,762 | |
| | | | Newell Rubbermaid, Inc. | | | | |
| | 234,000 | | | 5.500%, 4/1/2046 | | | 201,696 | |
| | | | PepsiCo, Inc. | | | | |
| | 300,000 | | | 2.850%, 2/24/2026 | | | 280,779 | |
The accompanying Notes to Financial Statements are an integral part of this schedule.
74
MODERATE ALLOCATION FUND
Schedule of Investments as of October 31, 2018
| | | | | | | | |
Principal
Amount | | | Long-Term Fixed Income (30.5%) | | Value | |
| | Consumer Non-Cyclical (1.5%) - continued | | | | |
| | | | Perrigo Finance Unlimited Company | | | | |
| | $560,000 | | | 4.900%, 12/15/2044 | | | $492,245 | |
| | | | Pilgrim’s Pride Corporation | | | | |
| | 535,000 | | | 5.750%, 3/15/2025j | | | 498,887 | |
| | | | Post Holdings, Inc. | | | | |
| | 475,000 | | | 5.500%, 3/1/2025j | | | 459,266 | |
| | | | Reynolds American, Inc. | | | | |
| | 481,000 | | | 5.700%, 8/15/2035 | | | 493,746 | |
| | | | Roche Holdings, Inc. | | | | |
| | 228,000 | | | 4.000%, 11/28/2044j | | | 219,848 | |
| | | | Shire Acquisitions Investments Ireland Designated Activity Company | | | | |
| | 462,000 | | | 2.400%, 9/23/2021 | | | 444,013 | |
| | | | Simmons Foods, Inc. | | | | |
| | 545,000 | | | 5.750%, 11/1/2024i,j | | | 400,575 | |
| | | | Smithfield Foods, Inc. | | | | |
| | 365,000 | | | 2.700%, 1/31/2020j | | | 358,732 | |
| | 275,000 | | | 2.650%, 10/3/2021j | | | 261,714 | |
| | | | Tenet Healthcare Corporation | | | | |
| | 600,000 | | | 8.125%, 4/1/2022 | | | 624,750 | |
| | | | Thermo Fisher Scientific, Inc. | | | | |
| | 117,000 | | | 3.000%, 4/15/2023 | | | 112,770 | |
| | | | TreeHouse Foods, Inc. | | | | |
| | 215,000 | | | 4.875%, 3/15/2022 | | | 212,312 | |
| | | | Tyson Foods, Inc. | | | | |
| | 156,000 | | | 3.550%, 6/2/2027 | | | 145,424 | |
| | | | VRX Escrow Corporation | | | | |
| | 905,000 | | | 6.125%, 4/15/2025j | | | 832,328 | |
| | | | Zimmer Biomet Holdings, Inc. | | | | |
| | 575,000 | | | 3.089%, (LIBOR 3M + 0.750%), 3/19/2021b | | | 575,301 | |
| | | | Zoetis, Inc. | | | | |
| | 509,000 | | | 4.700%, 2/1/2043 | | | 500,147 | |
| | | | | |
| | | | Total | | | 34,411,312 | |
| | | | | |
|
| | Energy (1.3%) | |
| | | | Alliance Resource Operating Partners, LP | | | | |
| | 470,000 | | | 7.500%, 5/1/2025j | | | 487,625 | |
| | | | Anadarko Petroleum Corporation | | | | |
| | 465,000 | | | 4.850%, 3/15/2021 | | | 475,081 | |
| | 550,000 | | | 5.550%, 3/15/2026 | | | 572,271 | |
| | | | Antero Resources Corporation | | | | |
| | 475,000 | | | 5.125%, 12/1/2022 | | | 471,734 | |
| | | | BP Capital Markets plc | | | | |
| | 463,000 | | | 3.535%, 11/4/2024 | | | 455,895 | |
| | 85,000 | | | 3.119%, 5/4/2026 | | | 79,991 | |
| | 588,000 | | | 3.279%, 9/19/2027 | | | 553,706 | |
| | | | Buckeye Partners, LP | | | | |
| | 226,000 | | | 2.650%, 11/15/2018 | | | 225,952 | |
| | | | Canadian Natural Resources, Ltd. | | | | |
| | 310,000 | | | 3.450%, 11/15/2021 | | | 307,073 | |
| | 150,000 | | | 6.250%, 3/15/2038 | | | 168,972 | |
| | | | Canadian Oil Sands, Ltd. | | | | |
| | 210,000 | | | 9.400%, 9/1/2021j | | | 236,775 | |
| | | | Cenovus Energy, Inc. | | | | |
| | 320,000 | | | 3.800%, 9/15/2023 | | | 312,808 | |
| | | | Cheniere Corpus Christi Holdings, LLC | | | | |
| | 500,000 | | | 7.000%, 6/30/2024 | | | 540,625 | |
| | 430,000 | | | 5.875%, 3/31/2025 | | | 441,825 | |
| | | | Cheniere Energy Partners, LP | | | | |
| | 695,000 | | | 5.625%, 10/1/2026j | | | 684,575 | |
| | | | Chesapeake Energy Corporation | | | | |
| | 290,000 | | | 7.000%, 10/1/2024 | | | 283,475 | |
| | | | ConocoPhillips | | | | |
| | 390,000 | | | 6.500%, 2/1/2039 | | | 487,474 | |
| | | | Continental Resources, Inc. | | | | |
| | 320,000 | | | 5.000%, 9/15/2022 | | | 322,881 | |
| | 550,000 | | | 4.375%, 1/15/2028 | | | 531,803 | |
| | | | El Paso Pipeline Partners Operating Company, LLC | | | | |
| | 230,000 | | | 4.300%, 5/1/2024 | | | 230,504 | |
| | | | Enbridge Energy Partners, LP | | | | |
| | 400,000 | | | 5.875%, 10/15/2025 | | | 435,286 | |
| | | | Enbridge, Inc. | | | | |
| | 300,000 | | | 2.900%, 7/15/2022 | | | 289,604 | |
| | | | Encana Corporation | | | | |
| | 70,000 | | | 3.900%, 11/15/2021 | | | 69,928 | |
| | | | Energy Transfer Equity, LP | | | | |
| | 325,000 | | | 5.500%, 6/1/2027 | | | 330,379 | |
| | | | Energy Transfer Operating, LP | | | | |
| | 125,000 | | | 4.200%, 9/15/2023 | | | 124,444 | |
| | 570,000 | | | 6.000%, 6/15/2048 | | | 561,584 | |
| | | | Energy Transfer Partners, LP | | | | |
| | 215,000 | | | 4.900%, 3/15/2035 | | | 193,434 | |
| | 175,000 | | | 5.150%, 2/1/2043 | | | 154,261 | |
| | | | Eni SPA | | | | |
| | 560,000 | | | 4.000%, 9/12/2023j | | | 548,144 | |
| | | | EnLink Midstream Partners, LP | | | | |
| | 155,000 | | | 4.150%, 6/1/2025 | | | 144,088 | |
| | 115,000 | | | 4.850%, 7/15/2026 | | | 108,956 | |
| | | | Enterprise Products Operating, LLC | | | | |
| | 198,000 | | | 5.100%, 2/15/2045 | | | 196,991 | |
| | | | EQM Midstream Partners LP | | | | |
| | 550,000 | | | 4.750%, 7/15/2023 | | | 554,607 | |
| | | | EQT Corporation | | | | |
| | 160,000 | | | 8.125%, 6/1/2019 | | | 164,407 | |
| | 175,000 | | | 4.875%, 11/15/2021 | | | 179,139 | |
| | 454,000 | | | 3.900%, 10/1/2027 | | | 413,141 | |
| | | | Exxon Mobil Corporation | | | | |
| | 125,000 | | | 4.114%, 3/1/2046 | | | 120,572 | |
| | | | Hess Corporation | | | | |
| | 710,000 | | | 3.500%, 7/15/2024 | | | 669,419 | |
| | 255,000 | | | 6.000%, 1/15/2040 | | | 251,164 | |
| | | | Kinder Morgan Energy Partners, LP | | | | |
| | 230,000 | | | 3.500%, 3/1/2021 | | | 228,955 | |
| | 380,000 | | | 6.500%, 9/1/2039 | | | 414,271 | |
| | | | Kinder Morgan, Inc. | | | | |
| | 440,000 | | | 6.500%, 9/15/2020 | | | 461,951 | |
| | | | Magellan Midstream Partners, LP | | | | |
| | 215,000 | | | 5.000%, 3/1/2026 | | | 224,791 | |
| | | | Marathon Oil Corporation | | | | |
| | 228,000 | | | 2.700%, 6/1/2020 | | | 224,908 | |
| | 555,000 | | | 6.600%, 10/1/2037 | | | 630,064 | |
| | | | Marathon Petroleum Corporation | | | | |
| | 115,000 | | | 3.400%, 12/15/2020 | | | 114,959 | |
| | 468,000 | | | 4.750%, 12/15/2023j | | | 482,123 | |
| | 312,000 | | | 6.500%, 3/1/2041 | | | 350,103 | |
| | | | MPLX, LP | | | | |
| | 468,000 | | | 4.875%, 6/1/2025 | | | 477,157 | |
| | 240,000 | | | 4.125%, 3/1/2027 | | | 228,995 | |
The accompanying Notes to Financial Statements are an integral part of this schedule.
75
MODERATE ALLOCATION FUND
Schedule of Investments as of October 31, 2018
| | | | | | | | |
Principal
Amount | | | Long-Term Fixed Income (30.5%) | | Value | |
| | Energy (1.3%) - continued | | | | |
| | | | Nabors Industries, Inc. | | | | |
| | $275,000 | | | 5.750%, 2/1/2025 | | | $253,821 | |
| | | | Newfield Exploration Company | | | | |
| | 410,000 | | | 5.625%, 7/1/2024 | | | 422,300 | |
| | | | ONEOK Partners, LP | | | | |
| | 270,000 | | | 3.800%, 3/15/2020 | | | 270,815 | |
| | | | Parsley Energy, LLC | | | | |
| | 230,000 | | | 5.625%, 10/15/2027j | | | 226,727 | |
| | | | PBF Holding Company, LLC | | | | |
| | 410,000 | | | 7.250%, 6/15/2025 | | | 422,300 | |
| | | | Petrobras Global Finance BV | | | | |
| | 242,000 | | | 8.375%, 5/23/2021 | | | 263,986 | |
| | | | Petroleos Mexicanos | | | | |
| | 299,000 | | | 6.000%, 3/5/2020 | | | 303,108 | |
| | 78,000 | | | 2.378%, 4/15/2025 | | | 75,816 | |
| | 205,000 | | | 6.750%, 9/21/2047 | | | 176,587 | |
| | | | Phillips 66 | | | | |
| | 350,000 | | | 3.900%, 3/15/2028 | | | 335,307 | |
| | | | Pioneer Natural Resources Company | | | | |
| | 150,000 | | | 4.450%, 1/15/2026 | | | 150,907 | |
| | | | Plains All American Pipeline, LP | | | | |
| | 390,000 | | | 5.000%, 2/1/2021 | | | 398,009 | |
| | | | Regency Energy Partners, LP | | | | |
| | 304,000 | | | 5.875%, 3/1/2022 | | | 320,010 | |
| | 325,000 | | | 5.000%, 10/1/2022 | | | 334,874 | |
| | | | Sabine Pass Liquefaction, LLC | | | | |
| | 230,000 | | | 6.250%, 3/15/2022 | | | 245,067 | |
| | 270,000 | | | 5.625%, 4/15/2023 | | | 284,264 | |
| | 320,000 | | | 5.750%, 5/15/2024 | | | 338,918 | |
| | 325,000 | | | 5.625%, 3/1/2025 | | | 339,321 | |
| | | | Schlumberger Holdings Corporation | | | | |
| | 540,000 | | | 4.000%, 12/21/2025j | | | 534,142 | |
| | | | Shell International Finance BV | | | | |
| | 90,000 | | | 2.788%, (LIBOR 3M + 0.450%), 5/11/2020b | | | 90,548 | |
| | | | Southwestern Energy Company | | | | |
| | 545,000 | | | 7.500%, 4/1/2026i | | | 554,537 | |
| | | | SRC Energy, Inc. | | | | |
| | 550,000 | | | 6.250%, 12/1/2025 | | | 512,187 | |
| | | | Suncor Energy, Inc. | | | | |
| | 210,000 | | | 3.600%, 12/1/2024 | | | 206,236 | |
| | | | Sunoco, LP | | | | |
| | 195,000 | | | 5.500%, 2/15/2026j | | | 185,738 | |
| | 290,000 | | | 5.875%, 3/15/2028j | | | 270,425 | |
| | | | Tallgrass Energy Partners, LP | | | | |
| | 820,000 | | | 5.500%, 1/15/2028j | | | 810,619 | |
| | | | Targa Resources Partners, LP | | | | |
| | 500,000 | | | 5.250%, 5/1/2023 | | | 498,750 | |
| | | | Transocean Guardian, Ltd. | | | | |
| | 550,000 | | | 5.875%, 1/15/2024j | | | 544,500 | |
| | | | W&T Offshore, Inc. | | | | |
| | 555,000 | | | 9.750%, 11/1/2023j | | | 537,074 | |
| | | | Weatherford International, Ltd. | | | | |
| | 148,000 | | | 4.500%, 4/15/2022i | | | 111,000 | |
| | 431,000 | | | 8.250%, 6/15/2023i | | | 329,715 | |
| | | | Western Gas Partners, LP | | | | |
| | 312,000 | | | 4.000%, 7/1/2022 | | | 309,360 | |
| | 175,000 | | | 4.500%, 3/1/2028 | | | 166,602 | |
| | | | Williams Companies, Inc. | | | | |
| | 420,000 | | | 7.500%, 1/15/2031 | | | 497,066 | |
| | | | Williams Partners, LP | | | | |
| | 190,000 | | | 4.000%, 11/15/2021 | | | 190,935 | |
| | 115,000 | | | 3.600%, 3/15/2022 | | | 113,199 | |
| | 195,000 | | | 4.500%, 11/15/2023 | | | 197,742 | |
| | 290,000 | | | 3.750%, 6/15/2027 | | | 270,049 | |
| | 320,000 | | | 6.300%, 4/15/2040 | | | 339,894 | |
| | | | Woodside Finance, Ltd. | | | | |
| | 420,000 | | | 3.650%, 3/5/2025j | | | 401,197 | |
| | 165,000 | | | 3.700%, 3/15/2028j | | | 152,632 | |
| | | | WPX Energy, Inc. | | | | |
| | 390,000 | | | 5.750%, 6/1/2026 | | | 388,050 | |
| | | | | |
| | | | Total | | | 30,593,204 | |
| | | | | |
| |
| | Financials (3.5%) | | | | |
| | | | ABN AMRO Bank NV | | | | |
| | 300,000 | | | 4.750%, 7/28/2025j | | | 297,870 | |
| | | | ACE INA Holdings, Inc. | | | | |
| | 225,000 | | | 4.350%, 11/3/2045 | | | 222,043 | |
| | | | AerCap Ireland Capital, Ltd. | | | | |
| | 150,000 | | | 3.750%, 5/15/2019 | | | 150,292 | |
| | 152,000 | | | 4.625%, 10/30/2020 | | | 154,242 | |
| | 390,000 | | | 5.000%, 10/1/2021 | | | 400,464 | |
| | 152,000 | | | 4.625%, 7/1/2022 | | | 153,988 | |
| | 275,000 | | | 3.500%, 1/15/2025 | | | 256,394 | |
| | | | Air Lease Corporation | | | | |
| | 390,000 | | | 3.375%, 1/15/2019 | | | 390,099 | |
| | 345,000 | | | 2.500%, 3/1/2021 | | | 336,342 | |
| | 130,000 | | | 3.500%, 1/15/2022 | | | 128,544 | |
| | | | Aircastle, Ltd. | | | | |
| | 650,000 | | | 5.000%, 4/1/2023 | | | 659,093 | |
| | | | Ally Financial, Inc. | | | | |
| | 210,000 | | | 3.750%, 11/18/2019 | | | 210,021 | |
| | 400,000 | | | 4.125%, 3/30/2020 | | | 399,500 | |
| | | | American Express Company | | | | |
| | 278,000 | | | 2.200%, 10/30/2020 | | | 271,456 | |
| | | | American Express Credit Corporation | | | | |
| | 165,000 | | | 2.887%, (LIBOR 3M + 0.550%), 3/18/2019b | | | 165,228 | |
| | 468,000 | | | 1.875%, 5/3/2019 | | | 465,458 | |
| | 730,000 | | | 2.200%, 3/3/2020 | | | 720,341 | |
| | | | American International Group, Inc. | | | | |
| | 80,000 | | | 3.300%, 3/1/2021 | | | 79,190 | |
| | 228,000 | | | 4.125%, 2/15/2024 | | | 226,627 | |
| | 475,000 | | | 3.750%, 7/10/2025 | | | 453,556 | |
| | 450,000 | | | 3.900%, 4/1/2026 | | | 428,737 | |
| | | | Anthem, Inc. | | | | |
| | 390,000 | | | 4.625%, 5/15/2042 | | | 369,559 | |
| | | | Ares Capital Corporation | | | | |
| | 750,000 | | | 3.875%, 1/15/2020 | | | 752,404 | |
| | | | ASP AMC Merger Sub, Inc. | | | | |
| | 550,000 | | | 8.000%, 5/15/2025j | | | 412,500 | |
| | | | Avalonbay Communities, Inc. | | | | |
| | 325,000 | | | 3.500%, 11/15/2025 | | | 315,095 | |
| | | | Aviation Capital Group, LLC | | | | |
| | 500,000 | | | 2.875%, 1/20/2022j | | | 483,295 | |
| | | | Banco Santander SA | | | | |
| | 600,000 | | | 6.375%, 5/19/2019b,n | | | 591,750 | |
| | 600,000 | | | 3.545%, (LIBOR 3M + 1.120%), 4/12/2023b | | | 601,609 | |
The accompanying Notes to Financial Statements are an integral part of this schedule.
76
MODERATE ALLOCATION FUND
Schedule of Investments as of October 31, 2018
| | | | | | | | |
Principal Amount | | | Long-Term Fixed Income (30.5%) | | Value | |
| | Financials (3.5%) - continued | | | | |
| | | | Bank of America Corporation | | | | |
| | $140,000 | | | 3.266%, (LIBOR 3M + 0.870%), 4/1/2019b | | | $140,409 | |
| | 200,000 | | | 2.369%, 7/21/2021b | | | 196,169 | |
| | 241,000 | | | 2.328%, 10/1/2021b | | | 235,270 | |
| | 450,000 | | | 3.499%, 5/17/2022b | | | 448,036 | |
| | 285,000 | | | 3.300%, 1/11/2023 | | | 278,658 | |
| | 320,000 | | | 2.881%, 4/24/2023b | | | 309,616 | |
| | 312,000 | | | 4.000%, 4/1/2024 | | | 311,517 | |
| | 900,000 | | | 4.000%, 1/22/2025 | | | 875,687 | |
| | 420,000 | | | 3.093%, 10/1/2025b | | | 397,709 | |
| | 230,000 | | | 3.500%, 4/19/2026 | | | 218,813 | |
| | 468,000 | | | 4.183%, 11/25/2027 | | | 449,448 | |
| | 325,000 | | | 3.824%, 1/20/2028b | | | 311,591 | |
| | 389,000 | | | 5.875%, 2/7/2042 | | | 443,744 | |
| | | | Bank of Montreal | | | | |
| | 390,000 | | | 2.896%, (LIBOR 3M + 0.460%), 4/13/2021b | | | 390,886 | |
| | | | Bank of New York Mellon Corporation | | | | |
| | 380,000 | | | 2.500%, 4/15/2021 | | | 372,398 | |
| | | | Bank of Nova Scotia | | | | |
| | 725,000 | | | 2.909%, (LIBOR 3M + 0.440%), 4/20/2021b | | | 726,755 | |
| | 325,000 | | | 2.700%, 3/7/2022 | | | 316,325 | |
| | | | Bank of Tokyo-Mitsubishi UFJ, Ltd. | | | | |
| | 70,000 | | | 2.850%, 9/8/2021j | | | 68,492 | |
| | | | Barclays Bank plc | | | | |
| | 78,000 | | | 10.179%, 6/12/2021j | | | 88,703 | |
| | | | Barclays plc | | | | |
| | 210,000 | | | 2.750%, 11/8/2019 | | | 208,535 | |
| | 555,000 | | | 3.250%, 1/12/2021 | | | 546,707 | |
| | 315,000 | | | 3.650%, 3/16/2025 | | | 292,986 | |
| | | | BB&T Corporation | | | | |
| | 85,000 | | | 3.151%, (LIBOR 3M + 0.715%), 1/15/2020b | | | 85,526 | |
| | | | BPCE SA | | | | |
| | 588,000 | | | 3.500%, 10/23/2027j | | | 528,389 | |
| | | | Capital One Financial Corporation | | | | |
| | 180,000 | | | 2.450%, 4/24/2019 | | | 179,604 | |
| | 273,000 | | | 2.500%, 5/12/2020 | | | 269,113 | |
| | 1,000,000 | | | 3.450%, 4/30/2021 | | | 995,659 | |
| | 304,000 | | | 3.050%, 3/9/2022 | | | 296,585 | |
| | | | Capital One NA | | | | |
| | 400,000 | | | 2.350%, 1/31/2020 | | | 394,952 | |
| | | | Cboe Global Markets, Inc. | | | | |
| | 175,000 | | | 1.950%, 6/28/2019 | | | 173,753 | |
| | | | Cigna Corporation | | | | |
| | 660,000 | | | 3.050%, 10/15/2027 | | | 588,838 | |
| | | | CIT Group, Inc. | | | | |
| | 580,000 | | | 5.000%, 8/15/2022 | | | 584,350 | |
| | | | Citigroup, Inc. | | | | |
| | 115,000 | | | 3.180%, (LIBOR 3M + 0.770%), 4/8/2019b | | | 115,278 | |
| | 315,000 | | | 2.700%, 3/30/2021 | | | 308,496 | |
| | 360,000 | | | 2.750%, 4/25/2022 | | | 347,775 | |
| | 188,000 | | | 4.050%, 7/30/2022 | | | 188,821 | |
| | 265,000 | | | 3.142%, 1/24/2023b | | | 258,717 | |
| | 655,000 | | | 4.400%, 6/10/2025 | | | 648,880 | |
| | 304,000 | | | 3.200%, 10/21/2026 | | | 278,583 | |
| | 468,000 | | | 3.668%, 7/24/2028b | | | 438,806 | |
| | 228,000 | | | 4.125%, 7/25/2028 | | | 216,453 | |
| | 425,000 | | | 3.520%, 10/27/2028b | | | 393,866 | |
| | 550,000 | | | 3.878%, 1/24/2039b | | | 488,023 | |
| | 324,000 | | | 4.650%, 7/23/2048 | | | 313,085 | |
| | | | Citizens Bank NA | | | | |
| | 325,000 | | | 2.200%, 5/26/2020 | | | 318,940 | |
| | | | Comerica, Inc. | | | | |
| | 130,000 | | | 3.700%, 7/31/2023 | | | 128,802 | |
| | | | Commerzbank AG | | | | |
| | 390,000 | | | 8.125%, 9/19/2023j | | | 439,275 | |
| | | | Commonwealth Bank of Australia | | | | |
| | 228,000 | | | 2.250%, 3/10/2020j | | | 224,856 | |
| | 540,000 | | | 3.034%, (LIBOR 3M + 0.700%), 3/16/2023b,j | | | 541,721 | |
| | | | Compass Bank | | | | |
| | 288,000 | | | 2.750%, 9/29/2019 | | | 286,704 | |
| | 425,000 | | | 3.500%, 6/11/2021 | | | 421,508 | |
| | | | Cooperatieve Centrale Raiffeisen- Boerenleenbank BA | | | | |
| | 432,000 | | | 3.950%, 11/9/2022 | | | 427,980 | |
| | 936,000 | | | 4.625%, 12/1/2023 | | | 944,048 | |
| | | | Credit Agricole SA | | | | |
| | 140,000 | | | 3.236%, (LIBOR 3M + 0.800%), 4/15/2019b,j | | | 140,400 | |
| | 500,000 | | | 3.375%, 1/10/2022j | | | 489,485 | |
| | | | Credit Suisse AG | | | | |
| | 152,000 | | | 5.400%, 1/14/2020 | | | 155,278 | |
| | | | Credit Suisse Group AG | | | | |
| | 420,000 | | | 2.997%, 12/14/2023b,j | | | 399,357 | |
| | 350,000 | | | 7.250%, 9/12/2025b,j,n | | | 346,062 | |
| | 350,000 | | | 3.869%, 1/12/2029b,j | | | 324,274 | |
| | | | Credit Suisse Group Funding, Ltd. | | | | |
| | 375,000 | | | 3.125%, 12/10/2020 | | | 370,721 | |
| | 304,000 | | | 3.750%, 3/26/2025 | | | 291,015 | |
| | | | Deutsche Bank AG | | | | |
| | 288,000 | | | 2.700%, 7/13/2020 | | | 281,400 | |
| | 468,000 | | | 3.375%, 5/12/2021 | | | 455,776 | |
| | 190,000 | | | 4.250%, 10/14/2021 | | | 188,484 | |
| | 570,000 | | | 4.875%, 12/1/2032b | | | 485,623 | |
| | | | Deutsche Bank AG of New York | | | | |
| | 100,000 | | | 3.950%, 2/27/2023 | | | 96,009 | |
| | | | Digital Realty Trust LP | | | | |
| | 340,000 | | | 3.400%, 10/1/2020 | | | 339,311 | |
| | | | Discover Bank | | | | |
| | 355,000 | | | 8.700%, 11/18/2019 | | | 372,717 | |
| | 280,000 | | | 3.100%, 6/4/2020 | | | 277,894 | |
| | 480,000 | | | 4.682%, 8/9/2028b | | | 474,278 | |
| | | | Duke Realty, LP | | | | |
| | 70,000 | | | 3.875%, 2/15/2021 | | | 70,443 | |
| | 210,000 | | | 4.375%, 6/15/2022 | | | 214,637 | |
| | | | ERP Operating, LP | | | | |
| | 75,000 | | | 3.375%, 6/1/2025 | | | 72,476 | |
| | | | European Investment Bank | | | | |
| | 215,000 | | | 1.875%, 3/15/2019 | | | 214,448 | |
| | | | Fidelity National Financial, Inc. | | | | |
| | 500,000 | | | 5.500%, 9/1/2022 | | | 526,819 | |
| | | | Fifth Third Bancorp | | | | |
| | 164,000 | | | 2.875%, 7/27/2020 | | | 162,511 | |
| | 80,000 | | | 2.875%, 10/1/2021 | | | 78,464 | |
| | 260,000 | | | 2.600%, 6/15/2022 | | | 249,939 | |
| | | | Five Corners Funding Trust | | | | |
| | 865,000 | | | 4.419%, 11/15/2023j | | | 883,477 | |
The accompanying Notes to Financial Statements are an integral part of this schedule.
77
MODERATE ALLOCATION FUND
Schedule of Investments as of October 31, 2018
| | | | | | | | |
Principal
Amount | | | Long-Term Fixed Income (30.5%) | | Value | |
| | Financials (3.5%) - continued | | | | |
| | | | GE Capital International Funding Company | | | | |
| | $1,260,000 | | | 4.418%, 11/15/2035 | | | $1,087,441 | |
| | | | Goldman Sachs Group, Inc. | | | | |
| | 911,000 | | | 5.375%, 3/15/2020 | | | 935,415 | |
| | 115,000 | | | 3.637%, (LIBOR 3M + 1.160%), 4/23/2020b | | | 116,271 | |
| | 550,000 | | | 5.375%, 5/10/2020b,n | | | 556,187 | |
| | 958,000 | | | 5.250%, 7/27/2021 | | | 996,227 | |
| | 540,000 | | | 2.876%, 10/31/2022b | | | 525,226 | |
| | 312,000 | | | 2.908%, 6/5/2023b | | | 300,586 | |
| | 550,000 | | | 3.691%, 6/5/2028b | | | 516,277 | |
| | 795,000 | | | 4.750%, 10/21/2045 | | | 773,518 | |
| | | | Hartford Financial Services Group, Inc. | | | | |
| | 618,000 | | | 5.125%, 4/15/2022 | | | 644,814 | |
| | | | HCP, Inc. | | | | |
| | 380,000 | | | 4.000%, 12/1/2022 | | | 377,271 | |
| | 140,000 | | | 3.400%, 2/1/2025 | | | 131,427 | |
| | | | HSBC Holdings plc | | | | |
| | 575,000 | | | 3.400%, 3/8/2021 | | | 572,188 | |
| | 300,000 | | | 6.875%, 6/1/2021b,n | | | 310,875 | |
| | 250,000 | | | 2.650%, 1/5/2022 | | | 241,755 | |
| | 230,000 | | | 3.600%, 5/25/2023 | | | 226,572 | |
| | 275,000 | | | 3.900%, 5/25/2026 | | | 264,256 | |
| | | | HSBC USA, Inc. | | | | |
| | 480,000 | | | 2.350%, 3/5/2020 | | | 474,288 | |
| | | | Huntington National Bank | | | | |
| | 250,000 | | | 2.200%, 11/6/2018 | | | 249,985 | |
| | | | Icahn Enterprises, LP | | | | |
| | 205,000 | | | 6.750%, 2/1/2024 | | | 206,538 | |
| | 275,000 | | | 6.375%, 12/15/2025 | | | 273,281 | |
| | | | ING Groep NV | | | | |
| | 245,000 | | | 3.150%, 3/29/2022 | | | 238,271 | |
| | 525,000 | | | 4.100%, 10/2/2023 | | | 521,028 | |
| | | | International Lease Finance Corporation | | | | |
| | 150,000 | | | 5.875%, 8/15/2022 | | | 157,981 | |
| | | | Intesa Sanpaolo SPA | | | | |
| | 290,000 | | | 3.125%, 7/14/2022j | | | 263,450 | |
| | | | Iron Mountain, Inc. | | | | |
| | 530,000 | | | 6.000%, 8/15/2023 | | | 542,588 | |
| | | | J.P. Morgan Chase & Company | | | | |
| | 90,000 | | | 2.250%, 1/23/2020 | | | 88,934 | |
| | 325,000 | | | 3.001%, (LIBOR 3M + 0.680%), 6/1/2021b | | | 325,488 | |
| | 180,000 | | | 2.295%, 8/15/2021 | | | 174,204 | |
| | 400,000 | | | 4.500%, 1/24/2022 | | | 411,106 | |
| | 350,000 | | | 2.972%, 1/15/2023 | | | 338,675 | |
| | 228,000 | | | 3.200%, 1/25/2023 | | | 223,191 | |
| | 385,000 | | | 2.700%, 5/18/2023 | | | 367,965 | |
| | 165,000 | | | 3.717%, (LIBOR 3M + 1.230%), 10/24/2023b | | | 167,905 | |
| | 280,000 | | | 3.625%, 5/13/2024 | | | 275,702 | |
| | 550,000 | | | 3.125%, 1/23/2025 | | | 521,543 | |
| | 800,000 | | | 3.900%, 7/15/2025 | | | 788,963 | |
| | 250,000 | | | 3.300%, 4/1/2026 | | | 236,125 | |
| | 575,000 | | | 4.203%, 7/23/2029b | | | 566,366 | |
| | 470,000 | | | 3.882%, 7/24/2038b | | | 423,699 | |
| | | | J.P. Morgan Chase Bank NA | | | | |
| | 650,000 | | | 3.086%, 4/26/2021b | | | 647,517 | |
| | | | KeyBank NA | | | | |
| | 250,000 | | | 2.350%, 3/8/2019 | | | 249,589 | |
| | | | KeyCorp | | | | |
| | 350,000 | | | 2.900%, 9/15/2020 | | | 346,776 | |
| | | | Kimco Realty Corporation | | | | |
| | 624,000 | | | 3.300%, 2/1/2025 | | | 589,589 | |
| | | | Kookmin Bank | | | | |
| | 250,000 | | | 1.625%, 8/1/2019j | | | 246,988 | |
| | | | Liberty Mutual Group, Inc. | | | | |
| | 152,000 | | | 4.950%, 5/1/2022j | | | 156,491 | |
| | | | Liberty Property, LP | | | | |
| | 435,000 | | | 3.750%, 4/1/2025 | | | 419,948 | |
| | | | Lloyds Bank plc | | | | |
| | 325,000 | | | 2.833%, (LIBOR 3M + 0.490%), 5/7/2021b | | | 325,422 | |
| | | | Lloyds Banking Group plc | | | | |
| | 425,000 | | | 2.907%, 11/7/2023b | | | 403,761 | |
| | | | MassMutual Global Funding | | | | |
| | 250,000 | | | 2.750%, 6/22/2024j | | | 238,169 | |
| | | | MetLife, Inc. | | | | |
| | 290,000 | | | 4.050%, 3/1/2045 | | | 258,973 | |
| | | | Mitsubishi UFJ Financial Group, Inc. | | | | |
| | 450,000 | | | 2.190%, 9/13/2021 | | | 432,964 | |
| | 525,000 | | | 3.455%, 3/2/2023 | | | 517,668 | |
| | 390,000 | | | 3.287%, 7/25/2027 | | | 364,536 | |
| | | | Morgan Stanley | | | | |
| | 152,000 | | | 5.550%, 7/15/2020b,n | | | 153,520 | |
| | 640,000 | | | 2.500%, 4/21/2021 | | | 623,598 | |
| | 380,000 | | | 2.625%, 11/17/2021 | | | 368,570 | |
| | 130,000 | | | 3.649%, (LIBOR 3M + 1.180%), 1/20/2022b | | | 131,463 | |
| | 351,000 | | | 2.750%, 5/19/2022 | | | 339,320 | |
| | 180,000 | | | 4.875%, 11/1/2022 | | | 185,215 | |
| | 355,000 | | | 3.125%, 1/23/2023 | | | 343,557 | |
| | 300,000 | | | 4.000%, 7/23/2025 | | | 294,639 | |
| | 450,000 | | | 4.350%, 9/8/2026 | | | 438,273 | |
| | 468,000 | | | 3.591%, 7/22/2028b | | | 438,380 | |
| | 420,000 | | | 3.772%, 1/24/2029b | | | 398,059 | |
| | | | MPT Operating Partnership, LP | | | | |
| | 440,000 | | | 6.375%, 3/1/2024 | | | 455,400 | |
| | | | Nasdaq, Inc. | | | | |
| | 180,000 | | | 3.850%, 6/30/2026 | | | 172,360 | |
| | | | National City Corporation | | | | |
| | 438,000 | | | 6.875%, 5/15/2019 | | | 447,054 | |
| | | | New York Life Global Funding | | | | |
| | 234,000 | | | 2.300%, 6/10/2022j | | | 224,323 | |
| | | | Park Aerospace Holdings, Ltd. | | | | |
| | 540,000 | | | 5.500%, 2/15/2024j | | | 534,735 | |
| | | | Prudential Financial, Inc. | | | | |
| | 80,000 | | | 2.350%, 8/15/2019 | | | 79,576 | |
| | | | Quicken Loans, Inc. | | | | |
| | 725,000 | | | 5.750%, 5/1/2025j | | | 698,719 | |
| | | | Realty Income Corporation | | | | |
| | 320,000 | | | 4.125%, 10/15/2026 | | | 317,496 | |
| | | | Regency Centers, LP | | | | |
| | 550,000 | | | 4.125%, 3/15/2028 | | | 534,997 | |
| | | | Regions Financial Corporation | | | | |
| | 112,000 | | | 3.200%, 2/8/2021 | | | 111,031 | |
| | | | Reinsurance Group of America, Inc. | | | | |
| | 459,000 | | | 5.000%, 6/1/2021 | | | 474,806 | |
| | | | Reliance Standard Life Global Funding II | | | | |
| | 110,000 | | | 2.500%, 4/24/2019j | | | 109,768 | |
The accompanying Notes to Financial Statements are an integral part of this schedule.
78
MODERATE ALLOCATION FUND
Schedule of Investments as of October 31, 2018
| | | | | | | | |
Principal
Amount | | | Long-Term Fixed Income (30.5%) | | Value | |
| | Financials (3.5%) - continued | | | | |
| | | | Royal Bank of Scotland Group plc | | | | |
| | $390,000 | | | 8.625%, 8/15/2021b,n | | | $409,988 | |
| | 300,000 | | | 3.875%, 9/12/2023 | | | 288,625 | |
| | 550,000 | | | 5.125%, 5/28/2024 | | | 544,500 | |
| | | | Santander UK Group Holdings plc | | | | |
| | 266,000 | | | 2.875%, 10/16/2020 | | | 262,107 | |
| | | | Simon Property Group, LP | | | | |
| | 85,000 | | | 2.500%, 9/1/2020 | | | 83,812 | |
| | 320,000 | | | 2.750%, 2/1/2023 | | | 308,326 | |
| | 304,000 | | | 4.250%, 11/30/2046 | | | 285,309 | |
| | | | SITE Centers Corporation | | | | |
| | 330,000 | | | 4.625%, 7/15/2022 | | | 335,744 | |
| | | | Skandinaviska Enskilda Banken AB | | | | |
| | 175,000 | | | 2.375%, 3/25/2019j | | | 174,547 | |
| | | | Societe Generale SA | | | | |
| | 234,000 | | | 4.750%, 11/24/2025j | | | 229,277 | |
| | | | Standard Chartered plc | | | | |
| | 551,000 | | | 2.100%, 8/19/2019j | | | 546,369 | |
| | | | State Street Corporation | | | | |
| | 129,000 | | | 3.222%, (LIBOR 3M + 0.900%), 8/18/2020b | | | 130,604 | |
| | | | Sumitomo Mitsui Financial Group, Inc. | | | | |
| | 295,000 | | | 2.784%, 7/12/2022 | | | 285,152 | |
| | 255,000 | | | 3.102%, 1/17/2023 | | | 248,204 | |
| | 228,000 | | | 3.010%, 10/19/2026 | | | 209,373 | |
| | | | Sumitomo Mitsui Trust Bank, Ltd. | | | | |
| | 420,000 | | | 1.950%, 9/19/2019j | | | 415,673 | |
| | | | SunTrust Banks, Inc. | | | | |
| | 310,000 | | | 2.250%, 1/31/2020 | | | 306,338 | |
| | | | Svenska Handelsbanken AB | | | | |
| | 180,000 | | | 2.824%, (LIBOR 3M + 0.490%), 6/17/2019b | | | 180,387 | |
| | | | Synchrony Financial | | | | |
| | 546,000 | | | 3.000%, 8/15/2019 | | | 543,767 | |
| | 75,000 | | | 3.578%, (LIBOR 3M + 1.230%), 2/3/2020b | | | 75,457 | |
| | 85,000 | | | 4.250%, 8/15/2024 | | | 80,730 | |
| | 675,000 | | | 3.950%, 12/1/2027 | | | 595,184 | |
| | | | Toronto-Dominion Bank | | | | |
| | 115,000 | | | 3.262%, (LIBOR 3M + 0.930%), 12/14/2020b | | | 116,647 | |
| | | | UBS Group Funding Jersey, Ltd. | | | | |
| | 228,000 | | | 4.125%, 9/24/2025j | | | 224,332 | |
| | | | UBS Group Funding Switzerland AG | | | | |
| | 300,000 | | | 3.491%, 5/23/2023j | | | 293,055 | |
| | | | UnitedHealth Group, Inc. | | | | |
| | 50,000 | | | 3.350%, 7/15/2022 | | | 49,643 | |
| | 420,000 | | | 2.950%, 10/15/2027 | | | 388,104 | |
| | 685,000 | | | 4.625%, 7/15/2035 | | | 704,891 | |
| | | | USB Realty Corporation | | | | |
| | 80,000 | | | 3.583%, (LIBOR 3M + 1.147%), 1/15/2022b,j,n | | | 71,800 | |
| | | | Ventas Realty, LP | | | | |
| | 340,000 | | | 3.100%, 1/15/2023 | | | 329,376 | |
| | 445,000 | | | 4.000%, 3/1/2028 | | | 425,274 | |
| | | | Voya Financial, Inc. | | | | |
| | 576,000 | | | 3.125%, 7/15/2024 | | | 542,449 | |
| | | | Wells Fargo & Company | | | | |
| | 115,000 | | | 3.200%, (LIBOR 3M + 0.680%), 1/30/2020b | | | 115,545 | |
| | 305,000 | | | 2.550%, 12/7/2020 | | | 298,828 | |
| | 355,000 | | | 2.625%, 7/22/2022 | | | 340,905 | |
| | 340,000 | | | 3.069%, 1/24/2023 | | | 329,331 | |
| | 304,000 | | | 3.450%, 2/13/2023 | | | 296,930 | |
| | 285,000 | | | 3.000%, 2/19/2025 | | | 266,682 | |
| | 325,000 | | | 3.000%, 4/22/2026 | | | 299,553 | |
| | 304,000 | | | 3.000%, 10/23/2026 | | | 278,297 | |
| | 550,000 | | | 4.900%, 11/17/2045 | | | 533,704 | |
| | | | Welltower, Inc. | | | | |
| | 130,000 | | | 3.950%, 9/1/2023 | | | 129,694 | |
| | 578,000 | | | 4.000%, 6/1/2025 | | | 563,791 | |
| | | | ZB NA | | | | |
| | 575,000 | | | 3.500%, 8/27/2021 | | | 572,037 | |
| | | | | |
| | | | Total | | | 80,710,008 | |
| | | | | |
| |
| | Foreign Government (<0.1%) | | | | |
| | | | Export-Import Bank of Korea | | | | |
| | 115,000 | | | 2.250%, 1/21/2020 | | | 113,673 | |
| | | | Kommunalbanken AS | | | | |
| | 190,000 | | | 1.500%, 10/22/2019j | | | 187,511 | |
| | | | | |
| | | | Total | | | 301,184 | |
| | | | | |
| |
| | Mortgage-Backed Securities (8.6%) | | | | |
| | | | Federal Home Loan Mortgage Corporation Gold 30-Yr. Pass Through | | | | |
| | 20,012,500 | | | 4.000%, 11/1/2048d | | | 20,019,436 | |
| | | | Federal Home Loan Mortgage Corporation Multifamily Structured Pass Through Certificates | | | | |
| | 949,099 | | | 3.000%, 3/15/2045, Ser. 4741, Class GA | | | 926,946 | |
| | | | Federal National Mortgage Association | | | | |
| | 1,300,000 | | | 3.640%, 6/1/2028 | | | 1,279,640 | |
| | 350,000 | | | 3.710%, 7/1/2028 | | | 344,711 | |
| | | | Federal National Mortgage Association Conventional 15-yr. Pass Through | | | | |
| | 13,337,500 | | | 3.500%, 11/1/2033d | | | 13,326,299 | |
| | | | Federal National Mortgage Association Conventional 30-Yr. Pass Through | | | | |
| | 93,119 | | | 4.281%, (LIBOR 12M + 1.550%), 7/1/2043b | | | 96,007 | |
| | 280,464 | | | 4.288%, (LIBOR 12M + 1.540%), 7/1/2043b | | | 289,019 | |
| | 105,143 | | | 4.280%, (LIBOR 12M + 1.530%), 8/1/2043b | | | 108,357 | |
| | 54,850,000 | | | 3.500%, 11/1/2048d | | | 53,395,192 | |
| | 51,180,000 | | | 4.000%, 11/1/2048d | | | 51,179,785 | |
| | 51,964,000 | | | 4.500%, 11/1/2048d | | | 53,203,222 | |
| | 5,475,000 | | | 5.000%, 11/1/2048d | | | 5,713,248 | |
| | | | | |
| | | | Total | | | 199,881,862 | |
| | | | | |
| |
| | Technology (0.8%) | | | | |
| | | | Amphenol Corporation | | | | |
| | 90,000 | | | 2.550%, 1/30/2019 | | | 89,923 | |
| | | | Apple, Inc. | | | | |
| | 90,000 | | | 2.638%, (LIBOR 3M + 0.300%), 5/6/2020b | | | 90,357 | |
| | 195,000 | | | 3.000%, 2/9/2024 | | | 189,312 | |
The accompanying Notes to Financial Statements are an integral part of this schedule.
79
MODERATE ALLOCATION FUND
Schedule of Investments as of October 31, 2018
| | | | | | | | |
Principal
Amount | | | Long-Term Fixed Income (30.5%) | | Value | |
| | Technology (0.8%) - continued | | | | |
| | $312,000 | | | 3.200%, 5/11/2027 | | | $296,663 | |
| | 430,000 | | | 3.000%, 6/20/2027 | | | 402,446 | |
| | 670,000 | | | 3.000%, 11/13/2027 | | | 625,528 | |
| | 410,000 | | | 4.500%, 2/23/2036 | | | 425,937 | |
| | 228,000 | | | 4.650%, 2/23/2046 | | | 235,203 | |
| | 380,000 | | | 4.250%, 2/9/2047 | | | 369,238 | |
| | 570,000 | | | 3.750%, 9/12/2047 | | | 511,256 | |
| | | | Applied Materials, Inc. | | | | |
| | 160,000 | | | 3.300%, 4/1/2027 | | | 150,982 | |
| | | | Avnet, Inc. | | | | |
| | 225,000 | | | 3.750%, 12/1/2021 | | | 224,433 | |
| | | | Baidu, Inc. | | | | |
| | 370,000 | | | 3.000%, 6/30/2020 | | | 366,655 | |
| | | | Broadcom Corporation | | | | |
| | 143,000 | | | 3.875%, 1/15/2027 | | | 131,137 | |
| | 755,000 | | | 3.500%, 1/15/2028 | | | 664,685 | |
| | | | CDK Global, Inc. | | | | |
| | 265,000 | | | 4.875%, 6/1/2027 | | | 248,106 | |
| | | | Cisco Systems, Inc. | | | | |
| | 120,000 | | | 2.821%, (LIBOR 3M + 0.500%), 3/1/2019b | | | 120,182 | |
| | | | CommScope Technologies Finance, LLC | | | | |
| | 500,000 | | | 6.000%, 6/15/2025j | | | 486,250 | |
| | | | Diamond 1 Finance Corporation | | | | |
| | 190,000 | | | 3.480%, 6/1/2019j | | | 190,237 | |
| | 650,000 | | | 4.420%, 6/15/2021j | | | 655,414 | |
| | 390,000 | | | 5.450%, 6/15/2023j | | | 403,931 | |
| | 560,000 | | | 6.020%, 6/15/2026j | | | 580,683 | |
| | | | Equinix, Inc. | | | | |
| | 540,000 | | | 5.750%, 1/1/2025 | | | 550,125 | |
| | | | Fidelity National Information Services, Inc. | | | | |
| | 173,000 | | | 3.625%, 10/15/2020 | | | 173,339 | |
| | | | Harland Clarke Holdings Corporation | | | | |
| | 520,000 | | | 8.375%, 8/15/2022j | | | 469,300 | |
| | | | Hewlett Packard Enterprise Company | | | | |
| | 550,000 | | | 3.059%, (LIBOR 3M + 0.720%), 10/5/2021b | | | 550,237 | |
| | 130,000 | | | 3.500%, 10/5/2021 | | | 129,629 | |
| | 172,000 | | | 4.400%, 10/15/2022 | | | 175,335 | |
| | | | Intel Corporation | | | | |
| | 205,000 | | | 3.700%, 7/29/2025 | | | 204,493 | |
| | 351,000 | | | 4.100%, 5/19/2046 | | | 334,028 | |
| | | | Marvell Technology Group, Ltd. | | | | |
| | 335,000 | | | 4.200%, 6/22/2023 | | | 331,201 | |
| | 450,000 | | | 4.875%, 6/22/2028 | | | 441,467 | |
| | | | Microsoft Corporation | | | | |
| | 475,000 | | | 4.750%, 11/3/2055 | | | 512,353 | |
| | 475,000 | | | 4.200%, 11/3/2035 | | | 481,612 | |
| | 1,360,000 | | | 3.700%, 8/8/2046 | | | 1,251,373 | |
| | 380,000 | | | 4.250%, 2/6/2047 | | | 382,126 | |
| | | | NetApp, Inc. | | | | |
| | 265,000 | | | 2.000%, 9/27/2019 | | | 262,361 | |
| | | | NXP BV | | | | |
| | 395,000 | | | 3.875%, 9/1/2022j | | | 381,175 | |
| | | | Oracle Corporation | | | | |
| | 312,000 | | | 2.400%, 9/15/2023 | | | 294,935 | |
| | 780,000 | | | 2.950%, 5/15/2025 | | | 739,895 | |
| | 420,000 | | | 3.850%, 7/15/2036 | | | 387,311 | |
| | | | Seagate HDD Cayman | | | | |
| | 280,000 | | | 4.750%, 1/1/2025 | | | 256,245 | |
| | | | Sensata Technologies UK Financing Company plc | | | | |
| | 325,000 | | | 6.250%, 2/15/2026j | | | 330,688 | |
| | | | Texas Instruments, Inc. | | | | |
| | 540,000 | | | 4.150%, 5/15/2048 | | | 517,855 | |
| | | | Tyco Electronics Group SA | | | | |
| | 78,000 | | | 3.450%, 8/1/2024 | | | 76,038 | |
| | 156,000 | | | 3.125%, 8/15/2027 | | | 143,010 | |
| | | | VMware, Inc. | | | | |
| | 65,000 | | | 2.950%, 8/21/2022 | | | 62,303 | |
| | | | Western Digital Corporation | | | | |
| | 835,000 | | | 4.750%, 2/15/2026 | | | 771,331 | |
| | | | | |
| | | | Total | | | 17,668,323 | |
| | | | | |
| |
| | Transportation (0.1%) | | | | |
| | | | Air Canada Pass Through Trust | | | | |
| | 62,231 | | | 3.875%, 3/15/2023j | | | 60,909 | |
| | | | American Airlines Pass Through Trust | | | | |
| | 302,940 | | | 3.375%, 5/1/2027 | | | 290,647 | |
| | | | Avis Budget Car Rental, LLC | | | | |
| | 305,000 | | | 6.375%, 4/1/2024i,j | | | 291,275 | |
| | | | Burlington Northern Santa Fe, LLC | | | | |
| | 235,000 | | | 5.750%, 5/1/2040 | | | 270,436 | |
| | 740,000 | | | 5.050%, 3/1/2041 | | | 782,020 | |
| | 260,000 | | | 4.450%, 3/15/2043 | | | 255,501 | |
| | | | CSX Corporation | | | | |
| | 126,000 | | | 3.700%, 11/1/2023 | | | 125,778 | |
| | | | Delta Air Lines, Inc. | | | | |
| | 175,000 | | | 2.875%, 3/13/2020 | | | 173,374 | |
| | 40,741 | | | 4.950%, 11/23/2020 | | | 40,902 | |
| | | | ERAC USA Finance, LLC | | | | |
| | 84,000 | | | 2.800%, 11/1/2018j | | | 84,000 | |
| | | | J.B. Hunt Transport Services, Inc. | | | | |
| | 75,000 | | | 3.300%, 8/15/2022 | | | 74,108 | |
| | | | United Continental Holdings, Inc. | | | | |
| | 545,000 | | | 4.250%, 10/1/2022 | | | 534,781 | |
| | | | XPO Logistics, Inc. | | | | |
| | 334,000 | | | 6.500%, 6/15/2022j | | | 342,350 | |
| | | | | |
| | | | Total | | | 3,326,081 | |
| | | | | |
| |
| | U.S. Government and Agencies (7.8%) | | | | |
| | | | Federal National Mortgage Association - ACES | | | | |
| | 2,225,000 | | | 3.639%, 8/25/2030, Ser. 2018-M12, Class A2b | | | 2,176,434 | |
| | | | U.S. Treasury Bonds | | | | |
| | 3,005,000 | | | 2.250%, 11/15/2027 | | | 2,796,176 | |
| | 22,500,000 | | | 2.875%, 5/15/2028 | | | 22,000,781 | |
| | 550,000 | | | 5.250%, 11/15/2028 | | | 648,248 | |
| | 1,175,000 | | | 4.375%, 5/15/2040 | | | 1,361,898 | |
| | 560,000 | | | 3.000%, 5/15/2042 | | | 526,006 | |
| | 14,321,000 | | | 2.500%, 5/15/2046 | | | 12,029,081 | |
| | 3,000,000 | | | 2.750%, 8/15/2047 | | | 2,646,680 | |
| | 1,017,000 | | | 2.750%, 11/15/2047 | | | 896,589 | |
| | | | U.S. Treasury Bonds, TIPS | | | | |
| | 10,268,184 | | | 0.125%, 1/15/2023 | | | 9,882,267 | |
| | 7,097,908 | | | 0.375%, 1/15/2027 | | | 6,681,091 | |
| | 6,081,425 | | | 0.375%, 7/15/2027 | | | 5,722,954 | |
| | | | U.S. Treasury Notes | | | | |
| | 13,530,000 | | | 1.500%, 10/31/2019 | | | 13,367,217 | |
| | 10,845,000 | | | 1.750%, 11/30/2019 | | | 10,731,466 | |
The accompanying Notes to Financial Statements are an integral part of this schedule.
80
MODERATE ALLOCATION FUND
Schedule of Investments as of October 31, 2018
| | | | | | | | |
Principal
Amount | | | Long-Term Fixed Income (30.5%) | | Value | |
| | U.S. Government and Agencies (7.8%) - continued | | | | |
| | $420,000 | | | 2.250%, 3/31/2020 | | | $416,702 | |
| | 21,500,000 | | | 1.375%, 9/30/2020 | | | 20,907,070 | |
| | 220,000 | | | 1.875%, 12/15/2020 | | | 215,462 | |
| | 1,500,000 | | | 1.375%, 5/31/2021 | | | 1,442,930 | |
| | 4,773,000 | | | 1.125%, 8/31/2021 | | | 4,540,503 | |
| | 11,250,000 | | | 1.875%, 7/31/2022 | | | 10,818,457 | |
| | 32,440,000 | | | 2.000%, 11/30/2022 | | | 31,238,706 | |
| | 5,270,000 | | | 2.500%, 3/31/2023 | | | 5,167,276 | |
| | 304,000 | | | 1.375%, 9/30/2023 | | | 281,711 | |
| | 6,640,000 | | | 2.125%, 7/31/2024 | | | 6,325,119 | |
| | 2,900,000 | | | 2.250%, 11/15/2024 | | | 2,773,805 | |
| | 4,000,000 | | | 2.125%, 11/30/2024 | | | 3,797,656 | |
| | | | | |
| | | | Total | | | 179,392,285 | |
| | | | | |
| |
| | Utilities (0.9%) | | | | |
| | | | American Electric Power Company, Inc. | | | | |
| | 479,000 | | | 2.950%, 12/15/2022 | | | 466,377 | |
| | | | Appalachian Power Company | | | | |
| | 155,000 | | | 3.300%, 6/1/2027 | | | 145,756 | |
| | | | Arizona Public Service Company | | | | |
| | 100,000 | | | 2.200%, 1/15/2020 | | | 98,841 | |
| | | | Atmos Energy Corporation | | | | |
| | 175,000 | | | 3.000%, 6/15/2027 | | | 163,588 | |
| | | | Berkshire Hathaway Energy Company | | | | |
| | 105,000 | | | 2.400%, 2/1/2020 | | | 103,963 | |
| | 265,000 | | | 4.500%, 2/1/2045 | | | 256,856 | |
| | | | Calpine Corporation | | | | |
| | 270,000 | | | 5.375%, 1/15/2023 | | | 255,825 | |
| | | | CenterPoint Energy, Inc. | | | | |
| | 130,000 | | | 3.850%, 2/1/2024 | | | 129,912 | |
| | 355,000 | | | 4.250%, 11/1/2028 | | | 351,572 | |
| | | | CMS Energy Corporation | | | | |
| | 228,000 | | | 2.950%, 2/15/2027 | | | 207,648 | |
| | | | Commonwealth Edison Company | | | | |
| | 290,000 | | | 3.700%, 3/1/2045 | | | 256,656 | |
| | 130,000 | | | 4.350%, 11/15/2045 | | | 126,995 | |
| | | | Consolidated Edison, Inc. | | | | |
| | 156,000 | | | 2.000%, 5/15/2021 | | | 150,485 | |
| | 114,000 | | | 4.500%, 12/1/2045 | | | 113,656 | |
| | | | Consumers Energy Company | | | | |
| | 475,000 | | | 4.350%, 4/15/2049d | | | 471,845 | |
| | | | Dominion Energy, Inc. | | | | |
| | 300,000 | | | 2.962%, 7/1/2019 | | | 298,735 | |
| | 312,000 | | | 2.579%, 7/1/2020 | | | 307,226 | |
| | | | Dominion Gas Holdings, LLC | | | | |
| | 480,000 | | | 2.500%, 12/15/2019 | | | 476,261 | |
| | | | DTE Electric Company | | | | |
| | 215,000 | | | 3.700%, 3/15/2045 | | | 192,421 | |
| | 245,000 | | | 3.700%, 6/1/2046 | | | 217,556 | |
| | | | DTE Energy Company | | | | |
| | 40,000 | | | 2.400%, 12/1/2019 | | | 39,587 | |
| | | | Duke Energy Carolinas, LLC | | | | |
| | 585,000 | | | 3.700%, 12/1/2047 | | | 512,581 | |
| | | | Duke Energy Corporation | | | | |
| | 304,000 | | | 3.750%, 9/1/2046 | | | 257,958 | |
| | | | Duke Energy Florida, LLC | | | | |
| | 210,000 | | | 3.200%, 1/15/2027 | | | 199,606 | |
| | | | Duke Energy Indiana, LLC | | | | |
| | 310,000 | | | 3.750%, 5/15/2046 | | | 274,358 | |
| | | | Dynegy, Inc. | | | | |
| | 395,000 | | | 7.375%, 11/1/2022 | | | 409,813 | |
| | | | Edison International | | | | |
| | 300,000 | | | 2.950%, 3/15/2023 | | | 285,381 | |
| | | | Emera U.S. Finance, LP | | | | |
| | 235,000 | | | 2.150%, 6/15/2019 | | | 233,328 | |
| | | | Energy Transfer Operating, LP | | | | |
| | 550,000 | | | 5.200%, 2/1/2022 | | | 568,593 | |
| | | | Eversource Energy | | | | |
| | 400,000 | | | 2.500%, 3/15/2021 | | | 392,469 | |
| | | | Exelon Corporation | | | | |
| | 165,000 | | | 5.100%, 6/15/2045 | | | 169,413 | |
| | 234,000 | | | 4.450%, 4/15/2046 | | | 220,092 | |
| | | | Exelon Generation Company, LLC | | | | |
| | 247,000 | | | 5.200%, 10/1/2019 | | | 251,387 | |
| | 265,000 | | | 2.950%, 1/15/2020 | | | 263,316 | |
| | | | FirstEnergy Corporation | | | | |
| | 100,000 | | | 2.850%, 7/15/2022 | | | 96,381 | |
| | 605,000 | | | 4.850%, 7/15/2047 | | | 590,013 | |
| | | | ITC Holdings Corporation | | | | |
| | 84,000 | | | 4.050%, 7/1/2023 | | | 83,529 | |
| | 152,000 | | | 5.300%, 7/1/2043 | | | 164,320 | |
| | | | MidAmerican Energy Holdings Company | | | | |
| | 468,000 | | | 6.500%, 9/15/2037 | | | 564,696 | |
| | | | Mississippi Power Company | | | | |
| | 310,000 | | | 3.031%, (LIBOR 3M + 0.650%), 3/27/2020b | | | 310,032 | |
| | 310,000 | | | 3.950%, 3/30/2028 | | | 300,439 | |
| | | | Monongahela Power Company | | | | |
| | 210,000 | | | 5.400%, 12/15/2043j | | | 236,650 | |
| | | | National Rural Utilities Cooperative Finance Corporation | | | | |
| | 300,000 | | | 2.300%, 11/1/2020 | | | 293,713 | |
| | 250,000 | | | 3.900%, 11/1/2028 | | | 248,953 | |
| | | | NextEra Energy Capital Holdings, Inc. | | | | |
| | 195,000 | | | 2.300%, 4/1/2019 | | | 194,574 | |
| | | | NextEra Energy Partners, LP | | | | |
| | 545,000 | | | 4.250%, 9/15/2024j | | | 517,750 | |
| | | | NiSource Finance Corporation | | | | |
| | 156,000 | | | 3.490%, 5/15/2027 | | | 146,477 | |
| | 435,000 | | | 5.650%, 2/1/2045 | | | 469,808 | |
| | | | NRG Energy, Inc. | | | | |
| | 250,000 | | | 7.250%, 5/15/2026 | | | 265,625 | |
| | | | Oncor Electric Delivery Company, LLC | | | | |
| | 624,000 | | | 3.750%, 4/1/2045 | | | 565,987 | |
| | | | Pacific Gas and Electric Company | | | | |
| | 390,000 | | | 3.300%, 3/15/2027 | | | 350,440 | |
| | 365,000 | | | 3.300%, 12/1/2027 | | | 325,046 | |
| | 365,000 | | | 3.950%, 12/1/2047 | | | 294,624 | |
| | | | PPL Capital Funding, Inc. | | | | |
| | 105,000 | | | 3.500%, 12/1/2022 | | | 103,665 | |
| | 156,000 | | | 3.400%, 6/1/2023 | | | 152,898 | |
| | 365,000 | | | 5.000%, 3/15/2044 | | | 367,301 | |
| | | | PPL Electric Utilities Corporation | | | | |
| | 234,000 | | | 3.950%, 6/1/2047 | | | 216,835 | |
| | | | Public Service Electric & Gas Company | | | | |
| | 390,000 | | | 3.000%, 5/15/2027 | | | 366,599 | |
| | | | San Diego Gas and Electric Company | | | | |
| | 540,000 | | | 4.150%, 5/15/2048 | | | 509,641 | |
The accompanying Notes to Financial Statements are an integral part of this schedule.
81
MODERATE ALLOCATION FUND
Schedule of Investments as of October 31, 2018
| | | | | | | | |
Principal
Amount | | | Long-Term Fixed Income (30.5%) | | Value | |
| | Utilities (0.9%) - continued | | | | |
| | | | Sempra Energy | | | | |
| | $95,000 | | | 2.400%, 3/15/2020 | | | $93,762 | |
| | | | South Carolina Electric & Gas Company | | | | |
| | 685,000 | | | 5.100%, 6/1/2065 | | | 658,432 | |
| | | | Southern California Edison Company | | | | |
| | 320,000 | | | 4.000%, 4/1/2047 | | | 291,696 | |
| | 350,000 | | | 4.125%, 3/1/2048 | | | 324,472 | |
| | | | Southern Company | | | | |
| | 315,000 | | | 2.950%, 7/1/2023 | | | 300,789 | |
| | 424,000 | | | 3.250%, 7/1/2026 | | | 393,197 | |
| | 300,000 | | | 4.400%, 7/1/2046 | | | 275,127 | |
| | | | Southern Company Gas Capital Corporation | | | | |
| | 390,000 | | | 4.400%, 5/30/2047 | | | 357,587 | |
| | | | Southwestern Electric Power Company | | | | |
| | 110,000 | | | 3.900%, 4/1/2045 | | | 96,579 | |
| | | | TerraForm Power Operating, LLC | | | | |
| | 570,000 | | | 5.000%, 1/31/2028j | | | 509,438 | |
| | | | | |
| | | | Total | | | 19,907,131 | |
| | | | | |
| | | | | | | | |
| | | | | |
| | | | Total Long-Term Fixed Income (cost $721,972,910) | | | 705,448,646 | |
| | | | | |
| | |
| Shares | | | Common Stock (18.8%) | | Value | |
| | Communications Services (0.7%) | | | | |
| | 1,841 | | | Alphabet, Inc., Class Ah | | | 2,007,758 | |
| | 1,423 | | | Alphabet, Inc., Class Ch | | | 1,532,244 | |
| | 29,382 | | | AT&T, Inc. | | | 901,440 | |
| | 1,011 | | | Carsales.com, Ltd. | | | 8,763 | |
| | 5,946 | | | CBS Corporation | | | 341,003 | |
| | 29,810 | | | Comcast Corporation | | | 1,136,953 | |
| | 9,668 | | | DISH Network Corporationh | | | 297,194 | |
| | 10,085 | | | Facebook, Inc.h | | | 1,530,802 | |
| | 2,450 | | | Hemisphere Media Group, Inc.h | | | 33,001 | |
| | 4,586 | | | IAC/InterActiveCorporationh | | | 901,562 | |
| | 457 | | | Ipsos SA | | | 12,169 | |
| | 75,811 | | | ITV plc | | | 143,910 | |
| | 42,345 | | | KCOM Group plc | | | 49,849 | |
| | 16,119 | | | Liberty Media Corporation - Liberty SiriusXMh | | | 665,231 | |
| | 3,819 | | | Liberty SiriusXM Grouph | | | 157,496 | |
| | 17,108 | | | Liberty Tripadvisor Holdings, Inc.h | | | 246,697 | |
| | 1,128 | | | Lions Gate Entertainment Corporation | | | 20,067 | |
| | 3,586 | | | Mediaset Espana Comunicacion SA | | | 24,384 | |
| | 1,751 | | | Netflix, Inc.h | | | 528,417 | |
| | 69,765 | | | News Corporation, Class A | | | 920,200 | |
| | 29,485 | | | News Corporation, Class B | | | 393,330 | |
| | 3,300 | | | NTT DOCOMO, Inc. | | | 81,836 | |
| | 40,452 | | | ORBCOMM, Inc.h | | | 385,508 | |
| | 1,869 | | | ProSiebenSat.1 Media AG | | | 43,158 | |
| | 64 | | | RTL Group SA | | | 4,108 | |
| | 5,835 | | | Seven West Media, Ltd.h | | | 3,234 | |
| | 12,536 | | | Telenor ASA | | | 229,852 | |
| | 4,500 | | | TV Asahi Holdings Corporation | | | 84,010 | |
| | 11,950 | | | Twitter, Inc.h | | | 415,263 | |
| | 32,502 | | | Verizon Communications, Inc. | | | 1,855,539 | |
| | 1,077 | | | Wolters Kluwer NV | | | 61,103 | |
| | | | | |
| | | | Total | | | 15,016,081 | |
| | | | | |
| |
| | Consumer Discretionary (1.8%) | | | | |
| | 2,103 | | | Amazon.com, Inc.h | | | 3,360,615 | |
| | 11,775 | | | American Axle & Manufacturing Holdings, Inc.h | | | 178,627 | |
| | 500 | | | AOKI Holdings, Inc. | | | 6,586 | |
| | 400 | | | Aoyama Trading Company, Ltd. | | | 12,101 | |
| | 3,182 | | | Aptiv plc | | | 244,378 | |
| | 4,338 | | | Ascent Capital Group, Inc.h | | | 4,164 | |
| | 900 | | | Autobacs Seven Company, Ltd. | | | 14,485 | |
| | 700 | | | Benesse Holdings, Inc. | | | 19,522 | |
| | 706 | | | Berkeley Group Holdings plc | | | 31,553 | |
| | 304 | | | Booking Holdings, Inc.h | | | 569,872 | |
| | 16,640 | | | BorgWarner, Inc. | | | 655,782 | |
| | 8,100 | | | Bridgestone Corporation | | | 312,330 | |
| | 17,368 | | | Bright Horizons Family Solutions, Inc.h | | | 1,995,757 | |
| | 8,390 | | | Bunzl plc | | | 247,504 | |
| | 11,210 | | | Burlington Stores, Inc.h | | | 1,922,403 | |
| | 2,427 | | | Century Casinos, Inc.h | | | 15,144 | |
| | 34,035 | | | Chico’s FAS, Inc. | | | 261,048 | |
| | 8,207 | | | Children’s Place, Inc. | | | 1,226,126 | |
| | 1,630 | | | Chipotle Mexican Grill, Inc.h | | | 750,338 | |
| | 700 | | | Chiyoda Company, Ltd. | | | 13,494 | |
| | 304 | | | Cie Generale des Etablissements Michelin | | | 31,122 | |
| | 25,192 | | | Core-Mark Holding Company, Inc. | | | 967,625 | |
| | 16,593 | | | Crocs, Inc.h | | | 340,820 | |
| | 10,462 | | | CSS Industries, Inc. | | | 137,471 | |
| | 9,545 | | | Culp, Inc. | | | 220,967 | |
| | 1,100 | | | DCM Holdings Company, Ltd. | | | 10,696 | |
| | 1,200 | | | Denso Corporation | | | 53,527 | |
| | 18,614 | | | Dollar Tree, Inc.h | | | 1,569,160 | |
| | 19,893 | | | Duluth Holdings, Inc.h,i | | | 611,312 | |
| | 3,409 | | | Emerald Expositions Events, Inc. | | | 49,840 | |
| | 7,655 | | | Expedia Group, Inc. | | | 960,167 | |
| | 65,274 | | | Extended Stay America, Inc. | | | 1,062,661 | |
| | 7,779 | | | Five Below, Inc.h | | | 885,406 | |
| | 125 | | | Genuine Parts Company | | | 12,240 | |
| | 10,106 | | | G-III Apparel Group, Ltd.h | | | 402,825 | |
| | 13,682 | | | Habit Restaurants, Inc.h | | | 173,761 | |
| | 16,331 | | | Harley-Davidson, Inc. | | | 624,171 | |
| | 3,424 | | | Haverty Furniture Companies, Inc. | | | 69,439 | |
| | 10,309 | | | Home Depot, Inc. | | | 1,813,147 | |
| | 10,300 | | | Honda Motor Company, Ltd. | | | 294,019 | |
| | 3,569 | | | Inchcape plc | | | 24,650 | |
| | 12,168 | | | International Speedway Corporation | | | 456,422 | |
| | 5,378 | | | Las Vegas Sands Corporation | | | 274,439 | |
| | 1,596 | | | Laureate Education, Inc.h | | | 23,764 | |
| | 1,717 | | | Liberty Latin America, Ltd.h | | | 30,872 | |
| | 11,514 | | | LKQ Corporationh | | | 313,987 | |
| | 15,560 | | | Lowe’s Companies, Inc. | | | 1,481,623 | |
| | 1,600 | | | Lululemon Athletica, Inc.h | | | 225,168 | |
| | 4,077 | | | Magna International, Inc. | | | 200,751 | |
| | 2,882 | | | McDonald’s Corporation | | | 509,826 | |
| | 8,760 | | | Michaels Companies, Inc.h | | | 138,846 | |
| | 21,471 | | | Modine Manufacturing Companyh | | | 279,338 | |
| | 811 | | | Next plc | | | 53,877 | |
| | 3,900 | | | NHK Spring Company, Ltd. | | | 33,394 | |
| | 10,183 | | | NIKE, Inc. | | | 764,132 | |
| | 37,600 | | | Nissan Motor Company, Ltd. | | | 342,076 | |
| | 21,700 | | | Norwegian Cruise Line Holdings, Ltd.h | | | 956,319 | |
| | 26,257 | | | Nutrisystem, Inc. | | | 933,699 | |
| | 1,368 | | | O’Reilly Automotive, Inc.h | | | 438,786 | |
| | 6,771 | | | Oxford Industries, Inc. | | | 602,484 | |
| | 4,516 | | | Peugeot SA | | | 107,348 | |
| | 21,707 | | | Planet Fitness, Inc.h | | | 1,065,597 | |
The accompanying Notes to Financial Statements are an integral part of this schedule.
82
MODERATE ALLOCATION FUND
Schedule of Investments as of October 31, 2018
| | | | | | | | |
| Shares | | | Common Stock (18.8%) | | Value | |
| | Consumer Discretionary (1.8%) - continued | |
| | 2,465 | | | Playa Hotels and Resorts NVh | | | $21,174 | |
| | 500 | | | Plenus Company, Ltd.i | | | 8,002 | |
| | 7,290 | | | Polaris Industries, Inc. | | | 648,664 | |
| | 5,127 | | | PVH Corporation | | | 619,290 | |
| | 2,050 | | | RHh,i | | | 237,206 | |
| | 11,897 | | | Ross Stores, Inc. | | | 1,177,803 | |
| | 1,400 | | | Sangetsu Company, Ltd. | | | 26,927 | |
| | 1,600 | | | Sankyo Company, Ltd. | | | 61,089 | |
| | 21,200 | | | Sekisui House, Ltd. | | | 311,153 | |
| | 900 | | | SHIMAMURA Company, Ltd. | | | 75,703 | |
| | 17,910 | | | Six Flags Entertainment Corporation | | | 964,633 | |
| | 554 | | | SmartCentres Real Estate Investment Trust | | | 12,659 | |
| | 1,037 | | | Stamps.com, Inc.h | | | 209,650 | |
| | 2,900 | | | Sumitomo Rubber Industries, Ltd. | | | 41,600 | |
| | 2,256 | | | Super Retail Group, Ltd. | | | 11,569 | |
| | 200 | | | Takara Standard Company, Ltd. | | | 3,088 | |
| | 7,250 | | | Tapestry, Inc. | | | 306,748 | |
| | 26,388 | | | Toll Brothers, Inc. | | | 888,220 | |
| | 23,755 | | | Tower International, Inc. | | | 705,286 | |
| | 5,400 | | | Toyoda Gosei Company, Ltd. | | | 116,465 | |
| | 3,369 | | | Ulta Beauty, Inc.h | | | 924,858 | |
| | 4,450 | | | Vail Resorts, Inc. | | | 1,118,374 | |
| | 3,477 | | | VF Corporation | | | 288,174 | |
| | 7,296 | | | Wingstop, Inc. | | | 456,876 | |
| | 4,539 | | | Zumiez, Inc.h | | | 105,577 | |
| | | | | |
| | | | Total | | | 40,730,391 | |
| | | | | |
| |
| | Consumer Staples (0.5%) | | | | |
| | 4,939 | | | Altria Group, Inc. | | | 321,232 | |
| | 21,114 | | | Archer-Daniels-Midland Company | | | 997,636 | |
| | 900 | | | Arcs Company, Ltd. | | | 21,748 | |
| | 7,791 | | | Casey’s General Stores, Inc. | | | 982,523 | |
| | 23,425 | | | Cott Corporation | | | 352,312 | |
| | 12,400 | | | CVS Health Corporation | | | 897,636 | |
| | 2,843 | | | e.l.f. Beauty, Inc.h,i | | | 30,164 | |
| | 6,368 | | | Empire Company, Ltd. | | | 115,852 | |
| | 1,094 | | | ForFarmers BV | | | 12,321 | |
| | 262 | | | Glanbia plc | | | 4,648 | |
| | 34,627 | | | Hain Celestial Group, Inc.h | | | 861,520 | |
| | 7,061 | | | Imperial Brands plc | | | 239,175 | |
| | 3,530 | | | Inter Parfums, Inc. | | | 208,235 | |
| | 16,900 | | | Japan Tobacco, Inc. | | | 434,251 | |
| | 2,475 | | | John B. Sanfilippo & Son, Inc. | | | 156,073 | |
| | 2,660 | | | Kimberly-Clark Corporation | | | 277,438 | |
| | 6,497 | | | Koninklijke Ahold Delhaize NV | | | 148,719 | |
| | 8,600 | | | Kroger Company | | | 255,936 | |
| | 282 | | | Loblaw Companies, Ltd. | | | 14,104 | |
| | 1,891 | | | MGP Ingredients, Inc. | | | 134,582 | |
| | 200 | | | Ministop Company, Ltd. | | | 3,693 | |
| | 8,140 | | | Molson Coors Brewing Company | | | 520,960 | |
| | 9,933 | | | Monster Beverage Corporationh | | | 524,959 | |
| | 200 | | | NH Foods, Ltd. | | | 6,897 | |
| | 22,194 | | | PepsiCo, Inc. | | | 2,494,162 | |
| | 2,693 | | | Seneca Foods Corporationh | | | 85,180 | |
| | 8,083 | | | SpartanNash Company | | | 144,281 | |
| | 400 | | | Sugi Holdings Company, Ltd. | | | 18,314 | |
| | 18,671 | | | SunOpta, Inc.h | | | 138,539 | |
| | 2,630 | | | Swedish Match AB | | | 133,969 | |
| | 6,417 | | | Turning Point Brands, Inc. | | | 263,739 | |
| | 4,652 | | | Unilever NV | | | 249,974 | |
| | 6,892 | | | Unilever plc | | | 365,067 | |
| | 7,348 | | | Wal-Mart Stores, Inc. | | | 736,857 | |
| | 4,789 | | | Wesfarmers, Ltd. | | | 158,601 | |
| | | | | |
| | | | Total | | | 12,311,297 | |
| | | | | |
| |
| | Energy (0.8%) | | | | |
| | 26,102 | | | Abraxas Petroleum Corporationh | | | 48,028 | |
| | 11,684 | | | Anadarko Petroleum Corporation | | | 621,589 | |
| | 118,231 | | | Archrock, Inc. | | | 1,213,050 | |
| | 2,272 | | | California Resources Corporationh | | | 71,204 | |
| | 59,800 | | | Callon Petroleum Companyh | | | 596,206 | |
| | 13,673 | | | Chevron Corporation | | | 1,526,590 | |
| | 9,152 | | | Comstock Resources, Inc.h | | | 66,352 | |
| | 4,196 | | | Concho Resources, Inc.h | | | 583,622 | |
| | 1,943 | | | Contura Energy, Inc.h,i | | | 141,742 | |
| | 19,999 | | | Denbury Resources, Inc.h | | | 68,997 | |
| | 5,347 | | | Diamondback Energy, Inc. | | | 600,789 | |
| | 567 | | | Eni SPA | | | 10,070 | |
| | 5,714 | | | EQT Corporation | | | 194,105 | |
| | 8,610 | | | Era Group, Inc.h | | | 97,465 | |
| | 2,152 | | | Evolution Petroleum Corporation | | | 22,166 | |
| | 17,902 | | | Exterran Corporationh | | | 373,973 | |
| | 25,883 | | | Exxon Mobil Corporation | | | 2,062,357 | |
| | 40,065 | | | Forum Energy Technologies, Inc.h | | | 358,982 | |
| | 173 | | | Gaztransport Et Technigaz SA | | | 12,786 | |
| | 157,879 | | | Gran Tierra Energy, Inc.h | | | 481,531 | |
| | 13,450 | | | Halliburton Company | | | 466,446 | |
| | 20,369 | | | Helix Energy Solutions Group, Inc.h | | | 173,544 | |
| | 1,610 | | | Keane Group, Inc.h | | | 20,238 | |
| | 72,570 | | | Marathon Oil Corporation | | | 1,378,104 | |
| | 6,873 | | | Marathon Petroleum Corporation | | | 484,203 | |
| | 7,199 | | | Nabors Industries, Ltd. | | | 35,779 | |
| | 18,844 | | | Newpark Resources, Inc.h | | | 154,709 | |
| | 20,460 | | | Nine Energy Service, Inc.h | | | 757,634 | |
| | 27,964 | | | Northern Oil and Gas, Inc.h | | | 82,214 | |
| | 2,128 | | | OMV AG | | | 118,173 | |
| | 7,763 | | | ONEOK, Inc. | | | 509,253 | |
| | 8,989 | | | Pacific Drilling, Inc. Rightse,h | | | 93,605 | |
| | 9,578 | | | Parsley Energy, Inc.h | | | 224,317 | |
| | 64,557 | | | Patterson-UTI Energy, Inc. | | | 1,074,228 | |
| | 2,067 | | | Petrofac, Ltd. | | | 15,200 | |
| | 3,740 | | | Phillips 66 | | | 384,547 | |
| | 14,380 | | | Pioneer Energy Services Corporationh | | | 42,709 | |
| | 3,978 | | | Pioneer Natural Resources Company | | | 585,840 | |
| | 514 | | | Royal Dutch Shell plc, Class A | | | 16,375 | |
| | 11,610 | | | Royal Dutch Shell plc, Class B | | | 378,636 | |
| | 13,415 | | | SM Energy Company | | | 326,521 | |
| | 15,616 | | | Talos Energy, Inc.h | | | 406,953 | |
| | 32,171 | | | TechnipFMC plc | | | 846,097 | |
| | 25,321 | | | Teekay Tankers, Ltd.i | | | 28,106 | |
| | 1,809 | | | Total SAi | | | 106,143 | |
| | 54,526 | | | Transocean, Ltd.h,i | | | 600,331 | |
| | 31,065 | | | Unit Corporationh | | | 718,533 | |
| | 74,730 | | | Weatherford International plch,i | | | 100,886 | |
| | 14,195 | | | WPX Energy, Inc.h | | | 227,688 | |
| | | | | |
| | | | Total | | | 19,508,616 | |
| | | | | |
| |
| | Financials (3.6%) | | | | |
| | 1,057 | | | Aareal Bank AG | | | 39,322 | |
| | 4,629 | | | Affiliated Managers Group, Inc. | | | 526,132 | |
| | 10,760 | | | Aflac, Inc. | | | 463,433 | |
| | 3,203 | | | AG Mortgage Investment Trust, Inc. | | | 55,412 | |
| | 1,099 | | | Aircastle, Ltd. | | | 21,354 | |
| | 77 | | | Allianz SE | | | 16,041 | |
| | 15,082 | | | Allstate Corporation | | | 1,443,649 | |
| | 9,950 | | | Ally Financial, Inc. | | | 252,829 | |
| | 6,321 | | | American Express Company | | | 649,356 | |
The accompanying Notes to Financial Statements are an integral part of this schedule.
83
MODERATE ALLOCATION FUND
Schedule of Investments as of October 31, 2018
| | | | | | | | |
| Shares | | | Common Stock (18.8%) | | Value | |
| | Financials (3.6%) - continued | | | | |
| | 33,619 | | | American Financial Group, Inc. | | | $3,362,909 | |
| | 6,050 | | | American International Group, Inc. | | | 249,804 | |
| | 6,345 | | | Ameris Bancorp | | | 272,137 | |
| | 153 | | | Anima Holding SPAj | | | 640 | |
| | 10,473 | | | Arch Capital Group, Ltd.h | | | 297,119 | |
| | 4,119 | | | Argo Group International Holdings, Ltd. | | | 253,772 | |
| | 9,440 | | | Arthur J. Gallagher & Company | | | 698,654 | |
| | 19,651 | | | Assured Guaranty, Ltd. | | | 785,647 | |
| | 759 | | | ASX, Ltd. | | | 31,879 | |
| | 9,228 | | | Australia and New Zealand Banking Group, Ltd. | | | 169,857 | |
| | 7,587 | | | Axos Financial, Inc.h | | | 230,341 | |
| | 6,319 | | | Banca Monte dei Paschi di Siena SPAh,i | | | 10,374 | |
| | 406 | | | BancFirst Corporation | | | 23,296 | |
| | 8,414 | | | BancorpSouth Bank | | | 241,482 | |
| | 89,198 | | | Bank of America Corporation | | | 2,452,945 | |
| | 911 | | | Bank of Marin Bancorp | | | 77,426 | |
| | 609 | | | Bank of New York Mellon Corporation | | | 28,824 | |
| | 9,616 | | | BankFinancial Corporation | | | 135,778 | |
| | 3,728 | | | Bankinter SA | | | 30,543 | |
| | 6,812 | | | Berkshire Hathaway, Inc.h | | | 1,398,367 | |
| | 3,072 | | | BGC Partners, Inc. | | | 32,532 | |
| | 14,700 | | | Blackstone Group, LP | | | 475,692 | |
| | 1,716 | | | BOK Financial Corporation | | | 147,113 | |
| | 38,465 | | | Boston Private Financial Holdings, Inc. | | | 519,277 | |
| | 93,934 | | | BrightSphere Investment Group | | | 1,070,848 | |
| | 46,958 | | | Brown & Brown, Inc. | | | 1,323,276 | |
| | 19,022 | | | CaixaBank SA | | | 76,976 | |
| | 18,925 | | | Capital One Financial Corporation | | | 1,690,002 | |
| | 28,763 | | | Cathay General Bancorp | | | 1,083,502 | |
| | 29,723 | | | Central Pacific Financial Corporation | | | 803,710 | |
| | 3,760 | | | Cherry Hill Mortgage Investment Corporation | | | 67,342 | |
| | 3,400 | | | Chubb, Ltd. | | | 424,694 | |
| | 8,435 | | | CI Financial Corporation | | | 124,752 | |
| | 6,391 | | | Cincinnati Financial Corporation | | | 502,588 | |
| | 59,278 | | | Citigroup, Inc. | | | 3,880,338 | |
| | 5,692 | | | CNP Assurances | | | 126,860 | |
| | 6,393 | | | Comerica, Inc. | | | 521,413 | |
| | 13,177 | | | Community Trust Bancorp, Inc. | | | 599,685 | |
| | 9,467 | | | Descartes Systems Group, Inc.h | | | 289,596 | |
| | 12,023 | | | Direct Line Insurance Group plc | | | 50,524 | |
| | 23,239 | | | Discover Financial Services | | | 1,619,061 | |
| | 11,278 | | | DnB ASA | | | 203,753 | |
| | 53,553 | | | Dynex Capital, Inc. | | | 310,072 | |
| | 41,684 | | | E*TRADE Financial Corporation | | | 2,060,023 | |
| | 32,523 | | | East West Bancorp, Inc. | | | 1,705,506 | |
| | 4,148 | | | Ellington Residential Mortgage REIT | | | 43,803 | |
| | 17,553 | | | Employers Holdings, Inc. | | | 806,736 | |
| | 25,117 | | | Enterprise Financial Services Corporation | | | 1,091,334 | |
| | 11,179 | | | Essent Group, Ltd.h | | | 440,676 | |
| | 2,224 | | | Euronext NVj | | | 136,847 | |
| | 3,096 | | | FBL Financial Group, Inc. | | | 213,562 | |
| | 32,606 | | | Fifth Third Bancorp | | | 880,036 | |
| | 9,799 | | | Financial Institutions, Inc. | | | 279,761 | |
| | 7,003 | | | Finecobank Banca Fineco SPA | | | 73,192 | |
| | 17,055 | | | First American Financial Corporation | | | 756,048 | |
| | 14,050 | | | First Busey Corporation | | | 392,276 | |
| | 13,360 | | | First Commonwealth Financial Corporation | | | 180,360 | |
| | 20,388 | | | First Defiance Financial Corporation | | | 554,961 | |
| | 5,193 | | | First Financial Corporation | | | 238,151 | |
| | 110,800 | | | First Hawaiian, Inc. | | | 2,745,624 | |
| | 15,007 | | | First Interstate BancSystem, Inc. | | | 622,190 | |
| | 864 | | | First Merchants Corporation | | | 35,951 | |
| | 486 | | | First Mid-Illinois Bancshares, Inc. | | | 18,118 | |
| | 4,285 | | | First Midwest Bancorp, Inc. | | | 98,384 | |
| | 2,665 | | | First of Long Island Corporation | | | 53,860 | |
| | 2,975 | | | First Republic Bank | | | 270,695 | |
| | 22,461 | | | FlexiGroup, Ltd. | | | 24,476 | |
| | 2,075 | | | Genworth MI Canada, Inc. | | | 68,108 | |
| | 5,857 | | | Goldman Sachs Group, Inc. | | | 1,319,992 | |
| | 14,979 | | | Great Southern Bancorp, Inc. | | | 811,113 | |
| | 18,701 | | | Hamilton Lane, Inc. | | | 717,744 | |
| | 8,852 | | | Hancock Whitney Corporation | | | 371,430 | |
| | 3,523 | | | Hanmi Financial Corporation | | | 73,913 | |
| | 1,416 | | | Hannover Rueckversicherung SE | | | 190,424 | |
| | 3,484 | | | Hanover Insurance Group, Inc. | | | 388,048 | |
| | 35,437 | | | Hartford Financial Services Group, Inc. | | | 1,609,549 | |
| | 1,193 | | | Heartland Financial USA, Inc. | | | 63,396 | |
| | 34,373 | | | Heritage Commerce Corporation | | | 498,752 | |
| | 12,368 | | | Hometrust Bancshares, Inc.h | | | 337,152 | |
| | 4,124 | | | Horace Mann Educators Corporation | | | 161,991 | |
| | 17,949 | | | Horizon Bancorp, Inc. | | | 300,825 | |
| | 4,230 | | | Houlihan Lokey, Inc. | | | 174,191 | |
| | 74,697 | | | Huntington Bancshares, Inc. | | | 1,070,408 | |
| | 3,808 | | | IBERIABANK Corporation | | | 283,658 | |
| | 16,163 | | | Independent Bank Corporation | | | 357,687 | |
| | 3,346 | | | Interactive Brokers Group, Inc. | | | 165,326 | |
| | 23,217 | | | Intercontinental Exchange, Inc. | | | 1,788,638 | |
| | 3,266 | | | Invesco, Ltd. | | | 70,905 | |
| | 35,033 | | | Investment Technology Group, Inc. | | | 962,707 | |
| | 7,811 | | | J.P. Morgan Chase & Company | | | 851,555 | |
| | 49,712 | | | Jefferies Financial Group, Inc. | | | 1,067,317 | |
| | 4,051 | | | Kemper Corporation | | | 304,595 | |
| | 147,084 | | | KeyCorp | | | 2,671,045 | |
| | 5,378 | | | Ladder Capital Corporation | | | 90,566 | |
| | 6,815 | | | Lakeland Bancorp, Inc. | | | 112,243 | |
| | 28,493 | | | Loews Corporation | | | 1,326,634 | |
| | 350 | | | Markel Corporationh | | | 382,634 | |
| | 2,627 | | | MarketAxess Holdings, Inc. | | | 550,803 | |
| | 1,500 | | | Matsui Securities Company, Ltd. | | | 15,288 | |
| | 121,204 | | | Medibank Private, Ltd. | | | 240,319 | |
| | 1,692 | | | Mercantile Bank Corporation | | | 53,738 | |
| | 55,308 | | | Meridian Bancorp, Inc. | | | 876,079 | |
| | 9,450 | | | MetLife, Inc. | | | 389,245 | |
| | 19,747 | | | MidWestOne Financial Group, Inc. | | | 568,911 | |
| | 9,814 | | | Morgan Stanley | | | 448,107 | |
| | 1,757 | | | National Bank Holdings Corporation | | | 59,316 | |
| | 2,440 | | | National Bank of Canada | | | 110,763 | |
| | 136 | | | National Western Life Group, Inc. | | | 36,622 | |
| | 721 | | | NBT Bancorp, Inc. | | | 26,309 | |
| | 8,475 | | | Old Second Bancorp, Inc. | | | 120,514 | |
| | 6,988 | | | PacWest Bancorp | | | 283,853 | |
| | 671 | | | Paragon Banking Group plc | | | 3,647 | |
| | 1,019 | | | Pargesa Holding SA | | | 74,805 | |
| | 309 | | | Park National Corporation | | | 28,243 | |
| | 12,161 | | | PCSB Financial Corporation | | | 227,654 | |
| | 3,627 | | | Peapack-Gladstone Financial Corporation | | | 97,893 | |
| | 2,356 | | | Peoples Bancorp, Inc. | | | 80,646 | |
| | 2,834 | | | Primerica, Inc. | | | 311,003 | |
| | 1,083 | | | Principal Financial Group, Inc. | | | 50,977 | |
| | 48,058 | | | Provident Financial Services, Inc. | | | 1,172,615 | |
| | 3,100 | | | Prudential Financial, Inc. | | | 290,718 | |
| | 9,809 | | | QCR Holdings, Inc. | | | 357,342 | |
| | 10,500 | | | Radian Group, Inc. | | | 201,495 | |
The accompanying Notes to Financial Statements are an integral part of this schedule.
84
MODERATE ALLOCATION FUND
Schedule of Investments as of October 31, 2018
| | | | | | | | |
| Shares | | | Common Stock (18.8%) | | Value | |
| | Financials (3.6%) - continued | |
| | 1,835 | | | Raymond James Financial, Inc. | | | $140,726 | |
| | 23,507 | | | Sandy Spring Bancorp, Inc. | | | 835,674 | |
| | 25,296 | | | Santander Consumer USA Holdings Inc. | | | 474,300 | |
| | 22,461 | | | Seacoast Banking Corporation of Floridah | | | 590,949 | |
| | 800 | | | Senshu Ikeda Holdings, Inc. | | | 2,458 | |
| | 62,026 | | | SLM Corporationh | | | 628,944 | |
| | 3,795 | | | State Auto Financial Corporation | | | 120,643 | |
| | 5,875 | | | State Street Corporation | | | 403,906 | |
| | 10,056 | | | Stifel Financial Corporation | | | 459,760 | |
| | 776 | | | Sun Life Financial, Inc. | | | 28,418 | |
| | 6,013 | | | SVB Financial Grouph | | | 1,426,464 | |
| | 41,119 | | | Synovus Financial Corporation | | | 1,544,430 | |
| | 3,672 | | | Territorial Bancorp, Inc. | | | 100,025 | |
| | 395 | | | Topdanmark AS | | | 18,776 | |
| | 10,336 | | | TriCo Bancshares | | | 372,303 | |
| | 66,599 | | | TrustCo Bank Corporation | | | 498,826 | |
| | 9,220 | | | U.S. Bancorp | | | 481,929 | |
| | 5,286 | | | United Community Banks, Inc. | | | 131,463 | |
| | 29,787 | | | United Financial Bancorp, Inc. | | | 460,209 | |
| | 1,826 | | | United Fire Group, Inc. | | | 98,294 | |
| | 791 | | | Univest Corporation of Pennsylvania | | | 19,743 | |
| | 8,461 | | | Unum Group | | | 306,796 | |
| | 5,996 | | | Washington Trust Bancorp, Inc. | | | 307,895 | |
| | 12,781 | | | Wells Fargo & Company | | | 680,333 | |
| | 2,933 | | | Western Alliance Bancorph | | | 141,488 | |
| | 18,981 | | | Wintrust Financial Corporation | | | 1,445,213 | |
| | 28,509 | | | WSFS Financial Corporation | | | 1,212,488 | |
| | 37,980 | | | Zions Bancorporations NA | | | 1,786,959 | |
| | | | | |
| | | | Total | | | 83,874,361 | |
| | | | | |
| |
| | Health Care (2.5%) | | | | |
| | 629 | | | ABIOMED, Inc.h | | | 214,615 | |
| | 6,546 | | | Aerie Pharmaceuticals, Inc.h | | | 348,116 | |
| | 2,850 | | | Aetna, Inc. | | | 565,440 | |
| | 7,335 | | | AmerisourceBergen Corporation | | | 645,480 | |
| | 9,374 | | | Amgen, Inc. | | | 1,807,213 | |
| | 878 | | | Amplifon SPA | | | 15,553 | |
| | 6,600 | | | Ardelyx, Inc.h | | | 18,150 | |
| | 3,425 | | | Arena Pharmaceuticals, Inc.h | | | 122,136 | |
| | 24,098 | | | Asterias Biotherapeutics, Inc.h,i | | | 27,231 | |
| | 419 | | | Atrion Corporation | | | 285,833 | |
| | 11,985 | | | Baxter International, Inc. | | | 749,182 | |
| | 1,684 | | | Becton, Dickinson and Company | | | 388,162 | |
| | 3,313 | | | Biogen, Inc.h | | | 1,008,047 | |
| | 15,821 | | | BioMarin Pharmaceutical, Inc.h | | | 1,458,222 | |
| | 1,190 | | | Bio-Techne Corporation | | | 199,587 | |
| | 2,380 | | | Bruker Corporation | | | 74,565 | |
| | 4,049 | | | Cardinal Health, Inc. | | | 204,879 | |
| | 8,612 | | | Cardiovascular Systems, Inc.h | | | 241,567 | |
| | 21,546 | | | Catalent, Inc.h | | | 869,166 | |
| | 7,363 | | | Charles River Laboratories International, Inc.h | | | 896,961 | |
| | 6,281 | | | Concert Pharmaceuticals, Inc.h | | | 93,713 | |
| | 13,818 | | | Danaher Corporation | | | 1,373,509 | |
| | 10,190 | | | Dexcom, Inc.h | | | 1,352,926 | |
| | 4,528 | | | Edwards Lifesciences Corporationh | | | 668,333 | |
| | 9,980 | | | Epizyme, Inc.h | | | 80,339 | |
| | 12,246 | | | Evolent Health, Inc.h | | | 271,861 | |
| | 7,040 | | | Express Scripts Holding Companyh | | | 682,669 | |
| | 30,261 | | | GenMark Diagnostics, Inc.h | | | 161,291 | |
| | 1,372 | | | Genomic Health, Inc.h | | | 98,386 | |
| | 11,130 | | | Gilead Sciences, Inc. | | | 758,843 | |
| | 17,111 | | | GlaxoSmithKline plc | | | 331,402 | |
| | 9,900 | | | GlaxoSmithKline plc ADR | | | 386,694 | |
| | 32,078 | | | Halozyme Therapeutics, Inc.h | | | 498,171 | |
| | 1,133 | | | Heska Corporationh | | | 113,549 | |
| | 12,331 | | | Hill-Rom Holdings, Inc. | | | 1,036,791 | |
| | 822 | | | Illumina, Inc.h | | | 255,765 | |
| | 7,195 | | | Immunomedics, Inc.h | | | 162,103 | |
| | 3,278 | | | Inogen, Inc.h | | | 621,410 | |
| | 9,957 | | | Intersect ENT, Inc.h | | | 279,393 | |
| | 2,769 | | | Intra-Cellular Therapies, Inc.h | | | 47,018 | |
| | 756 | | | Intuitive Surgical, Inc.h | | | 394,012 | |
| | 5,650 | | | Jazz Pharmaceuticals, Inc.h | | | 897,333 | |
| | 20,792 | | | Johnson & Johnson | | | 2,910,672 | |
| | 1,100 | | | KYORIN Holdings, Inc. | | | 24,023 | |
| | 12,517 | | | LHC Group, Inc.h | | | 1,144,429 | |
| | 117 | | | LNA Sante | | | 6,187 | |
| | 4,372 | | | Magellan Health Services, Inc.h | | | 284,442 | |
| | 5,955 | | | Medpace Holdings, Inc.h | | | 310,256 | |
| | 29,340 | | | Medtronic plc | | | 2,635,319 | |
| | 20,900 | | | Merck & Company, Inc. | | | 1,538,449 | |
| | 8,314 | | | Merit Medical Systems, Inc.h | | | 474,896 | |
| | 600 | | | Miraca Holdings, Inc. | | | 14,606 | |
| | 18,287 | | | Mylan NVh | | | 571,469 | |
| | 10,822 | | | Myriad Genetics, Inc.h | | | 487,315 | |
| | 13,000 | | | Natera, Inc.h | | | 285,480 | |
| | 7,080 | | | National Healthcare Corporation | | | 563,072 | |
| | 7,464 | | | Neurocrine Biosciences, Inc.h | | | 799,768 | |
| | 10,029 | | | Nevro Corporationh | | | 489,014 | |
| | 4,643 | | | Novartis AG | | | 406,599 | |
| | 10,258 | | | Novo Nordisk AS | | | 443,008 | |
| | 8,597 | | | Novocure, Ltd.h | | | 284,905 | |
| | 14,565 | | | NuVasive, Inc.h | | | 818,116 | |
| | 6,864 | | | Omnicell, Inc.h | | | 485,285 | |
| | 40,325 | | | Optinose, Inc.h,i | | | 426,639 | |
| | 3,167 | | | PerkinElmer, Inc. | | | 273,882 | |
| | 7,910 | | | Perrigo Company plc | | | 556,073 | |
| | 70,058 | | | Pfizer, Inc. | | | 3,016,697 | |
| | 5,320 | | | Ra Medical Systems, Inc.h | | | 56,924 | |
| | 1,610 | | | Roche Holding AG | | | 391,813 | |
| | 2,899 | | | Sage Therapeutics, Inc.h | | | 373,043 | |
| | 6,804 | | | Syneos Health, Inc.h | | | 310,467 | |
| | 20,864 | | | Tactile Systems Technology, Inc.h | | | 1,366,175 | |
| | 7,796 | | | Teleflex, Inc. | | | 1,876,809 | |
| | 9,055 | | | Thermo Fisher Scientific, Inc. | | | 2,115,701 | |
| | 14,729 | | | UnitedHealth Group, Inc. | | | 3,849,424 | |
| | 10,820 | | | Universal Health Services, Inc. | | | 1,315,279 | |
| | 8,375 | | | Valeant Pharmaceuticals International, Inc.h | | | 191,620 | |
| | 13,987 | | | Veeva Systems, Inc.h | | | 1,277,712 | |
| | 8,406 | | | Vertex Pharmaceuticals, Inc.h | | | 1,424,481 | |
| | 1,410 | | | West Pharmaceutical Services, Inc. | | | 149,347 | |
| | 33,570 | | | Wright Medical Group NVh | | | 905,719 | |
| | 15,101 | | | Zoetis, Inc. | | | 1,361,355 | |
| | | | | |
| | | | Total | | | 56,922,086 | |
| | | | | |
| |
| | Industrials (2.8%) | | | | |
| | 19,660 | | | Acco Brands Corporation | | | 158,656 | |
| | 4,520 | | | ACS Actividades de Construccion y Servicios, SAh | | | 169,234 | |
| | 1,375 | | | Acuity Brands, Inc. | | | 172,755 | |
| | 12,073 | | | Advanced Disposal Services, Inc.h | | | 327,058 | |
| | 9,328 | | | AECOMh | | | 271,818 | |
| | 9,857 | | | Aegion Corporationh | | | 190,832 | |
| | 14,407 | | | Aerojet Rocketdyne Holdings, Inc.h | | | 508,855 | |
| | 6,241 | | | AGCO Corporation | | | 349,746 | |
| | 22,727 | | | AMETEK, Inc. | | | 1,524,527 | |
| | 6,802 | | | ASGN, Inc.h | | | 456,278 | |
| | 7,504 | | | Atlas Copco AB, Class A | | | 185,512 | |
The accompanying Notes to Financial Statements are an integral part of this schedule.
85
MODERATE ALLOCATION FUND
Schedule of Investments as of October 31, 2018
| | | | | | | | |
| Shares | | | Common Stock (18.8%) | | Value | |
| | Industrials (2.8%) - continued | | | | |
| | 6,639 | | | Atlas Copco AB, Class B | | | $152,055 | |
| | 7,778 | | | AZZ, Inc. | | | 344,954 | |
| | 3,971 | | | Boeing Company | | | 1,409,149 | |
| | 2,749 | | | Brady Corporation | | | 110,757 | |
| | 3,025 | | | Brink’s Company | | | 200,618 | |
| | 1,875 | | | BWX Technologies, Inc. | | | 109,612 | |
| | 18,287 | | | Casella Waste Systems, Inc.h | | | 595,425 | |
| | 20,511 | | | CBIZ, Inc.h | | | 454,934 | |
| | 623 | | | CIA De Distribucion Integral | | | 15,041 | |
| | 15,027 | | | Colfax Corporationh | | | 421,207 | |
| | 16,638 | | | Comfort Systems USA, Inc. | | | 889,800 | |
| | 39,841 | | | Costamare, Inc. | | | 211,157 | |
| | 19,254 | | | Crane Company | | | 1,675,868 | |
| | 980 | | | CSW Industrials, Inc.h | | | 45,109 | |
| | 17,518 | | | CSX Corporation | | | 1,206,289 | |
| | 296 | | | Cummins, Inc. | | | 40,460 | |
| | 1,280 | | | Curtiss-Wright Corporation | | | 140,109 | |
| | 12,930 | | | Delta Air Lines, Inc. | | | 707,659 | |
| | 6,149 | | | Dycom Industries, Inc.h | | | 417,394 | |
| | 28,182 | | | EMCOR Group, Inc. | | | 2,000,358 | |
| | 14,917 | | | Emerson Electric Company | | | 1,012,566 | |
| | 5,409 | | | Encore Wire Corporation | | | 239,078 | |
| | 1,089 | | | Ennis, Inc. | | | 21,083 | |
| | 4,131 | | | ESCO Technologies, Inc. | | | 252,900 | |
| | 29,738 | | | Euronav NV | | | 273,590 | |
| | 17,783 | | | Federal Signal Corporation | | | 391,048 | |
| | 378 | | | Ferguson plc | | | 25,485 | |
| | 7,251 | | | Forrester Research, Inc. | | | 292,070 | |
| | 7,366 | | | Fortune Brands Home and Security, Inc. | | | 330,218 | |
| | 2,967 | | | Franklin Electric Company, Inc. | | | 125,860 | |
| | 6,546 | | | General Dynamics Corporation | | | 1,129,709 | |
| | 3,177 | | | Genesee & Wyoming, Inc.h | | | 251,714 | |
| | 2,011 | | | Global Brass and Copper Holdings, Inc. | | | 63,588 | |
| | 100 | | | Glory, Ltd. | | | 2,329 | |
| | 1,724 | | | GMS, Inc.h | | | 28,343 | |
| | 5,762 | | | Gorman-Rupp Company | | | 198,789 | |
| | 6,152 | | | Granite Construction, Inc. | | | 281,269 | |
| | 10,302 | | | GWA Group, Ltd. | | | 20,147 | |
| | 14,377 | | | Healthcare Services Group, Inc.i | | | 583,562 | |
| | 10,362 | | | Heico Corporation | | | 868,646 | |
| | 3,400 | | | Hino Motors, Ltd. | | | 32,546 | |
| | 1,000 | | | Hitachi Zosen Corporation | | | 3,800 | |
| | 264 | | | Hochtief AG | | | 39,122 | |
| | 20,262 | | | Honeywell International, Inc. | | | 2,934,343 | |
| | 5,720 | | | Hubbell, Inc. | | | 581,724 | |
| | 2,225 | | | Huntington Ingalls Industries, Inc. | | | 486,118 | |
| | 1,386 | | | Hyster-Yale Materials Handling, Inc. | | | 83,784 | |
| | 1,246 | | | ICF International, Inc. | | | 91,755 | |
| | 2,461 | | | Illinois Tool Works, Inc. | | | 313,950 | |
| | 1,300 | | | Inaba Denki Sangyo Company, Ltd. | | | 52,342 | |
| | 15,384 | | | Ingersoll-Rand plc | | | 1,475,941 | |
| | 40,716 | | | Interface, Inc. | | | 663,264 | |
| | 7,033 | | | Jacobs Engineering Group, Inc. | | | 528,108 | |
| | 8,300 | | | JB Hunt Transport Services, Inc. | | | 918,063 | |
| | 3,561 | | | Kadant, Inc. | | | 351,471 | |
| | 21,889 | | | KAR Auction Services, Inc. | | | 1,246,360 | |
| | 19,722 | | | KeyW Holding Corporationh | | | 154,423 | |
| | 16,921 | | | Kforce, Inc. | | | 521,505 | |
| | 4,822 | | | Kirby Corporationh | | | 346,895 | |
| | 19,918 | | | Korn/Ferry International | | | 899,099 | |
| | 4,980 | | | L3 Technologies, Inc. | | | 943,561 | |
| | 24,359 | | | Lincoln Electric Holdings, Inc. | | | 1,970,887 | |
| | 2,514 | | | Lindsay Corporation | | | 240,389 | |
| | 2,123 | | | Lockheed Martin Corporation | | | 623,844 | |
| | 12,780 | | | Masco Corporation | | | 383,400 | |
| | 7,593 | | | Masonite International Corporationh | | | 420,576 | |
| | 12,168 | | | Mercury Systems, Inc.h | | | 570,192 | |
| | 26,491 | | | Milacron Holdings Corporationh | | | 370,874 | |
| | 1,000 | | | Mitsuboshi Belting, Ltd. | | | 24,567 | |
| | 816 | | | Monadelphous Group, Ltd. | | | 8,350 | |
| | 6,814 | | | Moog, Inc. | | | 487,542 | |
| | 52,670 | | | MRC Global, Inc.h | | | 833,766 | |
| | 8,967 | | | Mueller Industries, Inc. | | | 218,346 | |
| | 4,009 | | | National Express Group plc | | | 20,485 | |
| | 43,847 | | | NCI Building Systems, Inc.h | | | 537,126 | |
| | 23,296 | | | Nexeo Solutions, Inc.h | | | 243,443 | |
| | 3,200 | | | Nitto Kogyo Corporation | | | 55,732 | |
| | 1,629 | | | Nobina ABj | | | 10,870 | |
| | 4,841 | | | Norfolk Southern Corporation | | | 812,465 | |
| | 1,208 | | | Northgate plc | | | 5,818 | |
| | 5,920 | | | Old Dominion Freight Line, Inc. | | | 772,086 | |
| | 412 | | | Orion Group Holdings, Inc.h | | | 1,945 | |
| | 5,660 | | | Oshkosh Corporation | | | 317,752 | |
| | 9,286 | | | PageGroup plc | | | 59,523 | |
| | 2,603 | | | Parker Hannifin Corporation | | | 394,693 | |
| | 16,253 | | | Primoris Services Corporation | | | 344,076 | |
| | 5,071 | | | Radiant Logistics, Inc.h | | | 27,586 | |
| | 2,420 | | | Raven Industries, Inc. | | | 105,222 | |
| | 9,544 | | | Regal-Beloit Corporation | | | 684,305 | |
| | 7,742 | | | RELX plc | | | 153,193 | |
| | 10,770 | | | RELX plc | | | 212,995 | |
| | 3,377 | | | Resideo Technologies, Inc.h | | | 71,086 | |
| | 4,067 | | | Resources Connection, Inc. | | | 66,373 | |
| | 9,515 | | | Ritchie Brothers Auctioneers, Inc. | | | 319,799 | |
| | 286 | | | Rockwool International AS | | | 97,714 | |
| | 4,999 | | | Roper Industries, Inc. | | | 1,414,217 | |
| | 1,255 | | | Rush Enterprises, Inc. | | | 44,414 | |
| | 1,947 | | | Sandvik AB | | | 30,780 | |
| | 856 | | | Schindler Holding AG, Participation Certificate | | | 180,500 | |
| | 1,317 | | | Schneider Electric SE | | | 95,233 | |
| | 11 | | | SGS SA | | | 26,126 | |
| | 400 | | | ShinMaywa Industries, Ltd. | | | 4,925 | |
| | 14,750 | | | SiteOne Landscape Supply, Inc.h | | | 1,003,590 | |
| | 8,345 | | | SKF AB | | | 133,788 | |
| | 1,222 | | | Smiths Group plc | | | 21,783 | |
| | 35,175 | | | Southwest Airlines Company | | | 1,727,092 | |
| | 7,090 | | | SP Plus Corporationh | | | 226,596 | |
| | 524 | | | Spirax-Sarco Engineering plc | | | 43,282 | |
| | 15,442 | | | SPX Corporationh | | | 452,759 | |
| | 6,237 | | | SPX FLOW, Inc.h | | | 213,493 | |
| | 7,179 | | | Standex International Corporation | | | 582,360 | |
| | 16,900 | | | Sumitomo Electric Industries, Ltd. | | | 230,475 | |
| | 400 | | | Taikisha, Ltd. | | | 11,287 | |
| | 5,302 | | | Terex Corporation | | | 177,034 | |
| | 1,300 | | | Toppan Forms Company, Ltd. | | | 11,817 | |
| | 6,000 | | | Toppan Printing Company, Ltd. | | | 84,825 | |
| | 100 | | | Toshiba Machine Company, Ltd. | | | 1,894 | |
| | 26,002 | | | TPI Composites, Inc.h | | | 656,811 | |
| | 1,966 | | | Transcontinental, Inc. | | | 32,362 | |
| | 1,170 | | | TransDigm Group, Inc.h | | | 386,393 | |
| | 1,775 | | | TransUnion | | | 116,706 | |
| | 25,566 | | | TriMas Corporationh | | | 752,919 | |
| | 1,000 | | | Tsubakimoto Chain Company | | | 38,396 | |
| | 1,141 | | | UniFirst Corporation | | | 170,351 | |
| | 10,400 | | | United Continental Holdings, Inc.h | | | 889,304 | |
| | 3,629 | | | United Parcel Service, Inc. | | | 386,634 | |
| | 7,446 | | | United Rentals, Inc.h | | | 894,041 | |
| | 7,900 | | | United Technologies Corporation | | | 981,259 | |
| | 9,022 | | | Univar, Inc.h | | | 222,122 | |
The accompanying Notes to Financial Statements are an integral part of this schedule.
86
MODERATE ALLOCATION FUND
Schedule of Investments as of October 31, 2018
| | | | | | | | |
| Shares | | | Common Stock (18.8%) | | Value | |
| | Industrials (2.8%) - continued | |
| | 11,550 | | | Universal Truckload Services, Inc. | | | $313,814 | |
| | 2,318 | | | Valmont Industries, Inc. | | | 288,151 | |
| | 14,785 | | | Verisk Analytics, Inc.h | | | 1,771,834 | |
| | 2,484 | | | Vinci SA | | | 221,073 | |
| | 7,381 | | | WABCO Holdings, Inc.h | | | 793,088 | |
| | 11,317 | | | WageWorks, Inc.h | | | 450,530 | |
| | 28,547 | | | Waste Connections, Inc. | | | 2,182,133 | |
| | 2,139 | | | Watsco, Inc. | | | 316,957 | |
| | 17,689 | | | Willdan Group, Inc.h | | | 534,208 | |
| | 2,369 | | | XPO Logistics, Inc.h | | | 211,741 | |
| | 600 | | | Yuasa Trading Company, Ltd. | | | 19,683 | |
| | | | | |
| | | | Total | | | 65,339,194 | |
| | | | | |
| |
| | Information Technology (3.9%) | | | | |
| | 2,858 | | | 2U, Inc.h | | | 179,797 | |
| | 5,838 | | | Activision Blizzard, Inc. | | | 403,114 | |
| | 1,741 | | | Adobe, Inc.h | | | 427,868 | |
| | 45,930 | | | Advanced Micro Devices, Inc.h | | | 836,385 | |
| | 36,513 | | | Agilent Technologies, Inc. | | | 2,365,677 | |
| | 15,442 | | | Akamai Technologies, Inc.h | | | 1,115,685 | |
| | 2,200 | | | Alliance Data Systems Corporation | | | 453,596 | |
| | 2,685 | | | Amadeus IT Holding SA | | | 216,207 | |
| | 5,356 | | | Ambarella, Inc.h,i | | | 186,282 | |
| | 2,433 | | | American Software, Inc. | | | 28,004 | |
| | 37,625 | | | Amphenol Corporation | | | 3,367,438 | |
| | 1,257 | | | ANSYS, Inc.h | | | 187,984 | |
| | 19,269 | | | Apple, Inc. | | | 4,217,213 | |
| | 12,416 | | | Applied Materials, Inc. | | | 408,238 | |
| | 2,804 | | | Arista Networks, Inc.h | | | 645,901 | |
| | 22,592 | | | Arrow Electronics, Inc.h | | | 1,529,704 | |
| | 2,990 | | | Atkore International Group, Inc.h | | | 57,587 | |
| | 5,020 | | | Atlassian Corporation plch | | | 381,068 | |
| | 3,392 | | | Autodesk, Inc.h | | | 438,416 | |
| | 9,415 | | | Automatic Data Processing, Inc. | | | 1,356,513 | |
| | 2,706 | | | Belden, Inc. | | | 146,259 | |
| | 27,330 | | | Benchmark Electronics, Inc. | | | 596,614 | |
| | 23,466 | | | Blackline, Inc.h | | | 1,088,353 | |
| | 46,875 | | | Booz Allen Hamilton Holding Corporation | | | 2,322,188 | |
| | 6,000 | | | Canon, Inc. | | | 170,901 | |
| | 2,291 | | | Capgemini SA | | | 279,741 | |
| | 5,910 | | | CDW Corporation | | | 531,959 | |
| | 5,900 | | | CEVA, Inc.h | | | 145,376 | |
| | 5,775 | | | CGI Group, Inc.h | | | 356,647 | |
| | 39,221 | | | Ciena Corporationh | | | 1,226,048 | |
| | 108,890 | | | Cisco Systems, Inc. | | | 4,981,718 | |
| | 5,843 | | | Cognex Corporation | | | 250,314 | |
| | 1,543 | | | Cognizant Technology Solutions Corporation | | | 106,513 | |
| | 22,167 | | | CoreLogic, Inc.h | | | 900,424 | |
| | 887 | | | CSG Systems International, Inc. | | | 31,134 | |
| | 28,439 | | | Dolby Laboratories, Inc. | | | 1,956,888 | |
| | 5,711 | | | Endurance International Group Holdings, Inc.h | | | 56,368 | |
| | 3,898 | | | Envestnet, Inc.h | | | 202,774 | |
| | 3,450 | | | Euronet Worldwide, Inc.h | | | 383,571 | |
| | 50,257 | | | EVERTEC, Inc. | | | 1,310,703 | |
| | 740 | | | ExlService Holdings, Inc.h | | | 47,434 | |
| | 1,926 | | | Fidelity National Information Services, Inc. | | | 200,497 | |
| | 17,294 | | | Fiserv, Inc.h | | | 1,371,414 | |
| | 87,452 | | | Flextronics International, Ltd.h | | | 687,373 | |
| | 28,830 | | | FLIR Systems, Inc. | | | 1,335,117 | |
| | 16,238 | | | Fortinet, Inc.h | | | 1,334,439 | |
| | 14,660 | | | Global Payments, Inc. | | | 1,674,612 | |
| | 12,753 | | | Guidewire Software, Inc.h | | | 1,134,634 | |
| | 1,571 | | | Halma plc | | | 26,661 | |
| | 53,538 | | | Keysight Technologies, Inc.h | | | 3,055,949 | |
| | 12,300 | | | Konica Minolta Holdings, Inc. | | | 121,750 | |
| | 151 | | | Kulicke and Soffa Industries, Inc. | | | 3,070 | |
| | 5,020 | | | Lam Research Corporation | | | 711,485 | |
| | 17,475 | | | M/A-COM Technology Solutions Holdings, Inc.h,i | | | 245,873 | |
| | 3,975 | | | ManTech International Corporation | | | 227,688 | |
| | 16,499 | | | MasterCard, Inc. | | | 3,261,357 | |
| | 6,410 | | | Maxim Integrated Products, Inc. | | | 320,628 | |
| | 42,533 | | | Microsoft Corporation | | | 4,542,950 | |
| | 766 | | | MicroStrategy, Inc.h | | | 96,493 | |
| | 9,275 | | | MoneyGram International, Inc.h | | | 39,326 | |
| | 17,153 | | | Monolithic Power Systems, Inc. | | | 2,026,112 | |
| | 4,827 | | | Monotype Imaging Holdings, Inc. | | | 84,617 | |
| | 13,589 | | | National Instruments Corporation | | | 665,453 | |
| | 1,700 | | | NEC Networks & System Integration Corporation | | | 37,053 | |
| | 12,984 | | | New Relic, Inc.h | | | 1,158,822 | |
| | 7,077 | | | Nice, Ltd. ADRh | | | 749,737 | |
| | 4,523 | | | Novanta, Inc.h | | | 263,284 | |
| | 2,359 | | | NVIDIA Corporation | | | 497,348 | |
| | 51,776 | | | Oracle Corporation | | | 2,528,740 | |
| | 5,760 | | | Palo Alto Networks, Inc.h | | | 1,054,310 | |
| | 12,412 | | | PayPal Holdings, Inc.h | | | 1,044,966 | |
| | 2,052 | | | Pegasystems, Inc. | | | 109,823 | |
| | 5,881 | | | Plexus Corporationh | | | 343,450 | |
| | 14,017 | | | Proofpoint, Inc.h | | | 1,274,846 | |
| | 19,525 | | | Q2 Holdings, Inc.h | | | 1,039,316 | |
| | 44,609 | | | Quantenna Communications, Inc.h | | | 801,178 | |
| | 7,174 | | | Red Hat, Inc.h | | | 1,231,345 | |
| | 6,364 | | | Rogers Corporationh | | | 783,154 | |
| | 18,717 | | | Rudolph Technologies, Inc.h | | | 389,126 | |
| | 600 | | | Ryoyo Electro Corporation | | | 8,604 | |
| | 26,340 | | | SailPoint Technologies Holdings, Inc.h | | | 685,894 | |
| | 9,146 | | | Salesforce.com, Inc.h | | | 1,255,197 | |
| | 5,795 | | | ScanSource, Inc.h | | | 225,310 | |
| | 55,883 | | | Sequans Communications SA ADRh | | | 58,677 | |
| | 7,298 | | | ServiceNow, Inc.h | | | 1,321,230 | |
| | 9,300 | | | Shinko Electric Industries Company, Ltd. | | | 64,748 | |
| | 2,039 | | | Silicon Laboratories, Inc.h | | | 166,240 | |
| | 54 | | | Siltronic AG | | | 4,946 | |
| | 4,495 | | | SS&C Technologies Holdings, Inc. | | | 229,964 | |
| | 29,555 | | | Synopsys, Inc.h | | | 2,646,059 | |
| | 5,224 | | | Teradata Corporationh | | | 190,154 | |
| | 5,955 | | | Teradyne, Inc. | | | 205,150 | |
| | 18,515 | | | Texas Instruments, Inc. | | | 1,718,747 | |
| | 300 | | | Tokyo Seimitsu Company, Ltd. | | | 7,214 | |
| | 475 | | | Trimble, Inc.h | | | 17,756 | |
| | 6,568 | | | Tyler Technologies, Inc.h | | | 1,390,183 | |
| | 982 | | | Ultimate Software Group, Inc.h | | | 261,831 | |
| | 3,194 | | | Universal Display Corporationi | | | 392,894 | |
| | 25,226 | | | Verint Systems, Inc.h | | | 1,152,071 | |
| | 1,291 | | | VeriSign, Inc.h | | | 184,019 | |
| | 19,226 | | | Virtusa Corporationh | | | 953,417 | |
| | 9,351 | | | Visa, Inc. | | | 1,289,035 | |
| | 26,166 | | | Xilinx, Inc. | | | 2,233,791 | |
| | 36,102 | | | Zix Corporationh | | | 243,328 | |
| | 11,945 | | | Zuora, Inc.h | | | 243,917 | |
| | | | | |
| | | | Total | | | 89,518,976 | |
| | | | | |
| |
| | Materials (0.8%) | | | | |
| | 7,980 | | | Alcoa Corporationh | | | 279,220 | |
| | 1,399 | | | Balchem Corporation | | | 131,016 | |
| | 4,600 | | | Ball Corporation | | | 206,080 | |
The accompanying Notes to Financial Statements are an integral part of this schedule.
87
MODERATE ALLOCATION FUND
Schedule of Investments as of October 31, 2018
| | | | | | | | |
| Shares | | | Common Stock (18.8%) | | Value | |
| | Materials (0.8%) - continued | | | | |
| | 4,301 | | | BASF SE | | | $330,051 | |
| | 12,665 | | | BHP Billiton plc | | | 252,650 | |
| | 7,241 | | | BHP Billiton, Ltd. | | | 167,076 | |
| | 296 | | | Canfor Corporationh | | | 4,252 | |
| | 19,572 | | | Celanese Corporation | | | 1,897,310 | |
| | 8,900 | | | CF Industries Holdings, Inc. | | | 427,467 | |
| | 2,714 | | | Coeur Mining, Inc.h | | | 12,973 | |
| | 16,314 | | | Continental Building Products, Inc.h | | | 453,692 | |
| | 7,300 | | | Daicel Corporation | | | 77,227 | |
| | 5,783 | | | Eastman Chemical Company | | | 453,098 | |
| | 4,582 | | | Evonik Industries AG | | | 141,747 | |
| | 18,780 | | | Ferroglobe Representation & Warranty Insurance Truste,h | | | 2 | |
| | 14,088 | | | Freeport-McMoRan, Inc. | | | 164,125 | |
| | 248 | | | Fuchs Petrolub SE | | | 11,480 | |
| | 3,368 | | | Granges AB | | | 35,607 | |
| | 439 | | | Hexpol AB | | | 4,063 | |
| | 600 | | | Hitachi Chemical Company, Ltd. | | | 9,457 | |
| | 800 | | | Hokuetsu Corporation | | | 3,821 | |
| | 13,324 | | | Innospec, Inc. | | | 891,642 | |
| | 4,468 | | | International Paper Company | | | 202,669 | |
| | 1,400 | | | JSR Corporation | | | 20,864 | |
| | 700 | | | Koppers Holdings, Inc.h | | | 18,725 | |
| | 7,500 | | | Kuraray Company, Ltd. | | | 103,016 | |
| | 3,200 | | | Kyoei Steel, Ltd. | | | 57,967 | |
| | 5,300 | | | Martin Marietta Materials, Inc. | | | 907,784 | |
| | 29,692 | | | Mercer International, Inc. | | | 451,615 | |
| | 2,613 | | | Methanex Corporation | | | 169,140 | |
| | 10,573 | | | Minerals Technologies, Inc. | | | 578,872 | |
| | 4,943 | | | Mondi plc | | | 116,402 | |
| | 17,994 | | | Myers Industries, Inc. | | | 285,385 | |
| | 11,739 | | | Newmont Mining Corporation | | | 362,970 | |
| | 3,300 | | | Nippon Kayaku Company, Ltd. | | | 39,274 | |
| | 2,300 | | | Nippon Light Metal Holdings Company, Ltd. | | | 4,850 | |
| | 11,300 | | | Nippon Steel & Sumitomo Metal Corporation | | | 208,442 | |
| | 9,774 | | | Nucor Corporation | | | 577,839 | |
| | 2,335 | | | Olympic Steel, Inc. | | | 44,038 | |
| | 44,890 | | | OMNOVA Solutions, Inc.h | | | 331,737 | |
| | 11,925 | | | Owens-Illinois, Inc.h | | | 186,865 | |
| | 2,548 | | | Packaging Corporation of America | | | 233,932 | |
| | 25,311 | | | Reliance Steel & Aluminum Company | | | 1,997,544 | |
| | 22 | | | Rio Tinto, Ltd. | | | 1,197 | |
| | 13,200 | | | RPM International, Inc. | | | 807,444 | |
| | 8,969 | | | Ryerson Holding Corporationh | | | 82,335 | |
| | 8,878 | | | Sandfire Resources NL | | | 41,978 | |
| | 100 | | | Sanyo Special Steel Company, Ltd. | | | 2,299 | |
| | 16,370 | | | Schweitzer-Mauduit International, Inc. | | | 522,530 | |
| | 4,636 | | | Scotts Miracle-Gro Company | | | 309,407 | |
| | 5,301 | | | Sensient Technologies Corporation | | | 343,823 | |
| | 9,138 | | | Sonoco Products Company | | | 498,752 | |
| | 1,319 | | | SSAB AB, Class A | | | 5,266 | |
| | 7,859 | | | Steel Dynamics, Inc. | | | 311,216 | |
| | 713 | | | Stepan Company | | | 58,887 | |
| | 900 | | | Taiheiyo Cement Corporation | | | 26,484 | |
| | 400 | | | Taiyo Holdings Company, Ltd. | | | 14,292 | |
| | 2,300 | | | Toagosei Company, Ltd. | | | 23,617 | |
| | 12,301 | | | Trinseo SA | | | 662,778 | |
| | 300 | | | Ube Industries, Ltd. | | | 6,535 | |
| | 1,530 | | | United States Lime & Minerals, Inc. | | | 114,765 | |
| | 8,877 | | | UPM-Kymmene Oyj | | | 285,383 | |
| | 8,771 | | | Verso Corporationh | | | 246,553 | |
| | 16,837 | | | WestRock Company | | | 723,486 | |
| | 12,035 | | | Worthington Industries, Inc. | | | 504,026 | |
| | 400 | | | Yamato Kogyo Company, Ltd. | | | 10,542 | |
| | | | | |
| | | | Total | | | 18,457,581 | |
| | | | | |
| |
| | Real Estate (1.0%) | | | | |
| | 1,700 | | | Alexandria Real Estate Equities, Inc. | | | 207,791 | |
| | 1,372 | | | Americold Realty Trust | | | 33,957 | |
| | 15,072 | | | Ares Commercial Real Estate Corporation | | | 218,092 | |
| | 59,663 | | | Armada Hoffler Properties, Inc. | | | 893,752 | |
| | 871 | | | Artis Real Estate Investment Trust | | | 7,410 | |
| | 17,216 | | | Ashford Hospitality Trust, Inc. | | | 88,662 | |
| | 4,030 | | | Bluerock Residential Growth REIT, Inc. | | | 38,164 | |
| | 105,717 | | | Brixmor Property Group, Inc. | | | 1,712,615 | |
| | 2,450 | | | Camden Property Trust | | | 221,162 | |
| | 29,072 | | | Catchmark Timber Trust, Inc. | | | 257,287 | |
| | 111,455 | | | Cedar Realty Trust, Inc. | | | 420,185 | |
| | 26,206 | | | Chatham Lodging Trust | | | 511,017 | |
| | 9,987 | | | City Office REIT, Inc. | | | 110,057 | |
| | 11,002 | | | Cousins Properties, Inc. | | | 91,427 | |
| | 2,572 | | | Crown Castle International Corporation | | | 279,679 | |
| | 5,007 | | | CyrusOne, Inc. | | | 266,523 | |
| | 1,600 | | | Daito Trust Construction Company, Ltd. | | | 210,941 | |
| | 1,800 | | | Digital Realty Trust, Inc. | | | 185,868 | |
| | 61,154 | | | Douglas Emmett, Inc. | | | 2,213,163 | |
| | 7,700 | | | Duke Realty Corporation | | | 212,289 | |
| | 37,748 | | | Empire State Realty Trust, Inc. | | | 598,683 | |
| | 13,353 | | | Franklin Street Properties Corporation | | | 92,937 | |
| | 1,951 | | | Gaming and Leisure Properties, Inc. | | | 65,729 | |
| | 4,054 | | | Getty Realty Corporation | | | 108,769 | |
| | 1,592 | | | Gladstone Commercial Corporation | | | 30,232 | |
| | 2,000 | | | Hang Lung Properties, Ltd. | | | 3,625 | |
| | 47,498 | | | Highwoods Properties, Inc. | | | 2,025,315 | |
| | 400 | | | Hitachi High-Technologies Corporation | | | 15,012 | |
| | 14,893 | | | Hospitality Properties Trust | | | 381,559 | |
| | 11,107 | | | Host Hotels & Resorts, Inc. | | | 212,255 | |
| | 109,216 | | | Hudson Pacific Properties, Inc. | | | 3,309,245 | |
| | 19,000 | | | Hysan Development Company, Ltd. | | | 89,104 | |
| | 82,873 | | | Monmouth Real Estate Investment Corporation | | | 1,239,780 | |
| | 27,176 | | | National Storage Affiliates Trust | | | 723,697 | |
| | 6,810 | | | One Liberty Properties, Inc. | | | 176,583 | |
| | 2,932 | | | Outfront Media, Inc. | | | 51,955 | |
| | 14,492 | | | Paramount Group, Inc. | | | 207,091 | |
| | 5,886 | | | Physicians Realty Trust | | | 97,590 | |
| | 1,954 | | | Quebecor, Inc. | | | 38,325 | |
| | 3,075 | | | RE/MAX Holdings, Inc. | | | 114,974 | |
| | 92,589 | | | Retail Properties of America, Inc. | | | 1,136,067 | |
| | 6,000 | | | Road King Infrastructure, Ltd. | | | 9,287 | |
| | 1,843 | | | Saul Centers, Inc. | | | 88,022 | |
| | 7,334 | | | SBA Communications Corporation | | | 1,189,355 | |
| | 119,801 | | | Spirit Realty Capital, Inc. | | | 936,844 | |
| | 1,368 | | | St. Joe Companyh | | | 20,780 | |
| | 2,000 | | | Swire Pacific, Ltd. | | | 20,777 | |
| | 5,333 | | | Terreno Realty Corporation | | | 199,614 | |
| | 28,793 | | | Urstadt Biddle Properties, Inc. | | | 573,269 | |
| | 57,143 | | | Weyerhaeuser Company | | | 1,521,718 | |
| | 14,000 | | | Wing Tai Holdings, Ltd. | | | 19,512 | |
| | | | | |
| | | | Total | | | 23,477,746 | |
| | | | | |
The accompanying Notes to Financial Statements are an integral part of this schedule.
88
MODERATE ALLOCATION FUND
Schedule of Investments as of October 31, 2018
| | | | | | | | |
| Shares | | | Common Stock (18.8%) | | Value | |
| | Utilities (0.4%) | | | | |
| | 1,744 | | | ALLETE, Inc. | | | $129,056 | |
| | 496 | | | Alpha Natural Resources Holdings, Inc.h | | | 17,360 | |
| | 1,867 | | | ANR, Inc.h | | | 65,345 | |
| | 6,650 | | | Artesian Resources Corporation | | | 243,324 | |
| | 75,670 | | | Clearway Energy, Inc., Class A | | | 1,469,511 | |
| | 15,907 | | | Clearway Energy, Inc., Class C | | | 311,936 | |
| | 5,220 | | | Consolidated Water Company, Ltd. | | | 64,206 | |
| | 5,700 | | | Edison International, Inc. | | | 395,523 | |
| | 8,557 | | | Enagas SA | | | 226,875 | |
| | 2,950 | | | Entergy Corporation | | | 247,653 | |
| | 270 | | | IDACORP, Inc. | | | 25,180 | |
| | 25,224 | | | MDU Resources Group, Inc. | | | 629,591 | |
| | 3,573 | | | Middlesex Water Company | | | 160,785 | |
| | 2,708 | | | New Jersey Resources Corporation | | | 122,131 | |
| | 4,794 | | | NorthWestern Corporation | | | 281,695 | |
| | 8,800 | | | Osaka Gas Company, Ltd. | | | 160,917 | |
| | 22,282 | | | PG&E Corporationh | | | 1,043,020 | |
| | 4,608 | | | PNM Resources, Inc. | | | 176,993 | |
| | 7,669 | | | Portland General Electric Company | | | 345,719 | |
| | 5,250 | | | Public Service Enterprise Group, Inc. | | | 280,508 | |
| | 1,764 | | | Southwest Gas Holdings, Inc. | | | 136,304 | |
| | 1,256 | | | Spire, Inc. | | | 91,160 | |
| | 47,794 | | | UGI Corporation | | | 2,535,950 | |
| | 814 | | | Unitil Corporation | | | 38,673 | |
| | | | | |
| | | | Total | | | 9,199,415 | |
| | | | | |
| | | | | | | | |
| | | | | |
| | | | Total Common Stock (cost $376,321,952) | | | 434,355,744 | |
| | | | | |
| | |
| Shares | | | Collateral Held for Securities Loaned (0.5%) | | Value | |
| | 10,899,857 | | | Thrivent Cash Management Trust | | | 10,899,857 | |
| | | | | |
| | | | Total Collateral Held for Securities Loaned (cost $10,899,857) | | | 10,899,857 | |
| | | | | |
| | |
Shares or
Principal
Amount | | | Short-Term Investments (13.7%) | | Value | |
| | | | Federal Home Loan Bank Discount Notes | | | | |
| | 5,700,000 | | | 2.100%, 11/28/2018o,p | | | 5,690,680 | |
| | 2,900,000 | | | 2.100%, 11/29/2018o,p | | | 2,895,081 | |
| | 700,000 | | | 2.110%, 11/30/2018o,p | | | 698,771 | |
| | 900,000 | | | 2.220%, 12/27/2018o,p | | | 896,878 | |
| | 150,000 | | | 2.245%, 1/4/2019o,p | | | 149,387 | |
| | 9,610,000 | | | 2.240%, 1/16/2019o,p | | | 9,563,334 | |
| | | | Thrivent Core Short-Term Reserve Fund | | | | |
| | 29,623,767 | | | 2.430% | | | 296,237,666 | |
| | | | U.S. Treasury Bills | | | | |
| | 260,000 | | | 2.116%, 11/29/2018o | | | 259,562 | |
| | 300,000 | | | 2.161%, 12/27/2018o,q | | | 298,970 | |
| | | | | |
| | | | Total Short-Term Investments (cost $316,692,175) | | | 316,690,329 | |
| | | | | |
| | | | Total Investments (cost $2,246,159,122) 108.9% | | | $2,518,317,280 | |
| | | | | |
| | | | Other Assets and Liabilities, Net (8.9%) | | | (204,814,433 | ) |
| | | | | |
| | | | Total Net Assets 100.0% | | | $2,313,502,847 | |
| | | | | |
a | The stated interest rate represents the weighted average of all contracts within the bank loan facility. |
b | Denotes variable rate securities. The rate shown is as of October 31, 2018. The rates of certain variable rate securities are based on a published reference rate and spread; these may vary by security and the reference rate and spread are indicated in their description. The rates of other variable rate securities are determined by the issuer or agent and are based on current market conditions. These securities do not indicate a reference rate and spread in their description. |
c | All or a portion of the loan is unfunded. |
d | Denotes investments purchased on a when-issued or delayed delivery basis. |
e | Security is valued using significant unobservable inputs. Further information on valuation can be found in the Notes to Financial Statements. |
f | Defaulted security. Interest is not being accrued. |
g | In bankruptcy. Interest is not being accrued. |
h | Non-income producing security. |
i | All or a portion of the security is on loan. |
j | Denotes securities sold under Rule 144A of the Securities Act of 1933, which exempts them from registration. These securities may be resold to other dealers in the program or to other qualified institutional buyers. As of October 31, 2018, the value of these investments was $64,059,394 or 2.8% of total net assets. |
k | Denotes step coupon securities. Step coupon securities pay an initial coupon rate for the first period and then different coupon rates for following periods. The rate shown is as of October 31, 2018. |
l | Denotes interest only security. Interest only securities represent the right to receive monthly interest payments on an underlying pool of mortgages or assets. The principal shown is the outstanding par amount of the pool as of the end of the period. The actual effective yield of the security is different than the stated coupon rate. |
m | All or a portion of the security is insured or guaranteed. |
n | Denotes perpetual securities. Perpetual securities pay an indefinite stream of interest and have no contractual maturity date. Date shown, if applicable, is next call date. |
o | The interest rate shown reflects the yield, coupon rate or the discount rate at the date of purchase. |
p | All or a portion of the security is held on deposit with the counterparty and pledged as the initial margin deposit for open futures contracts. |
q | At October 31, 2018, $99,657 of investments were segregated to cover exposure to a counterparty for margin on open mortgage-backed security transactions. |
* | Denotes restricted securities. Restricted securities are investment securities which cannot be offered for public sale without first being registered under the Securities Act of 1933. The value of all restricted securities held in Moderate Allocation Fund as of October 31, 2018 was $22,260,167 or 1.0% of total net assets. The following table indicates the acquisition date and cost of restricted securities shown in the schedule as of October 31, 2018. |
| | | | | | | | |
Security | | Acquisition
Date | | | Cost | |
Angel Oak Mortgage Trust I, LLC, 7/25/2046 | | | 8/15/2016 | | | $ | 121,202 | |
Ares CLO, Ltd., 10/17/2030 | | | 8/17/2018 | | | | 1,000,000 | |
Babson CLO, Ltd., 10/17/2026 | | | 3/10/2017 | | | | 179,526 | |
Betony CLO, Ltd., 4/30/2031 | | | 6/5/2018 | | | | 937,300 | |
Buttermilk Park CLO, Ltd., 10/15/2031 | | | 8/27/2018 | | | | 1,750,000 | |
Carlyle Global Market Strategies CLO, Ltd., 7/15/2031 | | | 8/24/2018 | | | | 1,150,000 | |
Cent CLO 22, Ltd., 11/7/2026 | | | 11/1/2016 | | | | 200,000 | |
CIM Trust, 12/25/2057 | | | 4/23/2018 | | | | 2,028,022 | |
Digicel, Ltd., 4/15/2021 | | | 8/18/2014 | | | | 746,488 | |
The accompanying Notes to Financial Statements are an integral part of this schedule.
89
MODERATE ALLOCATION FUND
Schedule of Investments as of October 31, 2018
| | | | | | | | |
Security | | Acquisition
Date | | | Cost | |
Dryden Senior Loan Fund, 7/18/2030 | | | 8/28/2018 | | | $ | 950,000 | |
Edlinc Student Loan Funding Trust, 10/1/2025 | | | 2/28/2013 | | | | 18,248 | |
Galaxy XX CLO, Ltd., 4/20/2031 | | | 2/23/2018 | | | | 650,000 | |
Golub Capital Partners, Ltd., 10/20/2028 | | | 10/30/2018 | | | | 889,288 | |
Golub Capital Partners, Ltd., 1/20/2031 | | | 11/20/2017 | | | | 769,000 | |
Harley Marine Financing, LLC, 5/15/2043 | | | 5/9/2018 | | | | 2,295,913 | |
Limerock CLO III, LLC, 10/20/2026 | | | 1/30/2017 | | | | 650,000 | |
Madison Park Funding XIV, Ltd., 10/22/2030 | | | 10/12/2018 | | | | 500,000 | |
Magnetite XII, Ltd., 10/15/2031 | | | 8/14/2018 | | | | 650,000 | |
Mountain View CLO, Ltd., 7/15/2031 | | | 5/31/2018 | | | | 475,000 | |
Neuberger Berman CLO XIV, Ltd., 1/28/2030 | | | 4/19/2017 | | | | 851,543 | |
Neuberger Berman CLO, Ltd., 4/22/2029 | | | 4/27/2017 | | | | 180,000 | |
Octagon Investment Partners XVI, Ltd., 7/17/2030 | | | 6/15/2018 | | | | 200,000 | |
Octagon Investment Partners XX, Ltd., 8/12/2026 | | | 4/21/2017 | | | | 675,000 | |
OZLM VIII, Ltd., 10/17/2026 | | | 5/16/2017 | | | | 210,000 | |
PPM CLO, Ltd., 7/15/2031 | | | 7/2/2018 | | | | 599,280 | |
Preston Ridge Partners Mortgage Trust, LLC, 9/25/2022 | | | 9/27/2017 | | | | 972,365 | |
Race Point IX CLO, Ltd., 10/15/2030 | | | 8/28/2017 | | | | 600,000 | |
Shackleton CLO, Ltd., 7/15/2031 | | | 7/12/2018 | | | | 450,000 | |
Symphony CLO XV, Ltd., 10/17/2026 | | | 2/16/2017 | | | | 580,290 | |
Verus Securitization Trust, 1/25/2047 | | | 2/16/2017 | | | | 421,381 | |
Verus Securitization Trust, 7/25/2047 | | | 7/24/2017 | | | | 619,544 | |
Voya CLO 3, Ltd., 7/25/2026 | | | 12/13/2017 | | | | 188,119 | |
The following table presents the total amount of securities loaned with continuous maturity, by type, offset by the gross payable upon return of collateral for securities loaned by Thrivent Moderate Allocation Fund as of October 31, 2018:
| | | | |
Securities Lending Transactions | | | |
Taxable Debt Security | | $ | 5,147,162 | |
Common Stock | | | 5,479,690 | |
| | | | |
Total lending | | $ | 10,626,852 | |
Gross amount payable upon return of collateral for securities loaned | | $ | 10,899,857 | |
| | | | |
Net amounts due to counterparty | | $ | 273,005 | |
| | | | |
Definitions:
| | | | |
ACES | | - | | Alternative Credit Enhancement Securities |
ADR | | - | | American Depositary Receipt, which are certificates for an underlying foreign security’s shares held by an issuing U.S. depository bank. |
CLO | | - | | Collateralized Loan Obligation |
ETF | | - | | Exchange Traded Fund |
REIT | | - | | Real Estate Investment Trust is a company that buys, develops, manages and/or sells real estate assets. |
Ser. | | - | | Series |
SPDR | | - | | S&P Depository Receipts, which are exchange-traded funds traded in the U.S., Europe, and Asia-Pacific and managed by State Street Global Advisors. |
TIPS | | - | | Treasury Inflation Protected Security |
| | | | |
Reference Rate Index: |
CMT 3M | | - | | Constant Maturity Treasury Yield 3 Month |
LIBOR 1W | | - | | ICE Libor USD Rate 1 Week |
LIBOR 1M | | - | | ICE Libor USD Rate 1 Month |
LIBOR 2M | | - | | ICE Libor USD Rate 2 Month |
LIBOR 3M | | - | | ICE Libor USD Rate 3 Month |
LIBOR 12M | | - | | ICE Libor USD Rate 12 Month |
PRIME | | - | | Federal Reserve Prime Loan Rate |
The accompanying Notes to Financial Statements are an integral part of this schedule.
90
MODERATELY AGGRESSIVE ALLOCATION FUND
Schedule of Investments as of October 31, 2018
| | | | | | | | |
Principal
Amount | | | Bank Loans (1.1%)a | | Value | |
| | Basic Materials (0.1%) | | | | |
| | | | Arch Coal, Inc., Term Loan | | | | |
| | $253,712 | | | 5.052%, (LIBOR 1M + 2.750%), 3/7/2024b | | | $253,334 | |
| | | | Big River Steel, LLC, Term Loan | | | | |
| | 222,750 | | | 7.386%, (LIBOR 3M + 5.000%), 8/23/2023b | | | 224,977 | |
| | | | Chemours Company, Term Loan | | | | |
| | 288,550 | | | 4.050%, (LIBOR 1M + 1.750%), 4/3/2025b | | | 287,289 | |
| | | | CONSOL Energy, Inc., Term Loan | | | | |
| | 69,475 | | | 8.310%, (LIBOR 1M + 6.000%), 11/28/2022b | | | 70,981 | |
| | | | Contura Energy, Inc., Term Loan | | | | |
| | 356,885 | | | 7.300%, (LIBOR 2M + 5.000%), 3/17/2024b | | | 355,100 | |
| | 485,000 | | | 0.000%, (LIBOR 3M + 5.000%), 10/3/2025b,c,d | | | 482,575 | |
| | | | MRC Global (US), Inc., Term Loan | | | | |
| | 994,987 | | | 5.302%, (LIBOR 1M + 3.000%), 9/20/2024b,e | | | 994,987 | |
| | | | Peabody Energy Corporation, Term Loan | | | | |
| | 164,175 | | | 5.052%, (LIBOR 1M + 2.750%), 3/31/2025b | | | 163,712 | |
| | | | Pixelle Specialty Solutions, LLC, Term Loan | | | | |
| | 260,000 | | | 0.000%, (LIBOR 3M + 6.000%), 10/31/2024b,c,d | | | 253,825 | |
| | | | Starfruit US Holdco, LLC, Term Loan | | | | |
| | 165,000 | | | 5.506%, (LIBOR 1M + 3.250%), 10/1/2025b | | | 164,381 | |
| | | | Tronox Blocked Borrower, LLC, Term Loan | | | | |
| | 150,029 | | | 5.302%, (LIBOR 1M + 3.000%), 9/22/2024b | | | 149,818 | |
| | | | Tronox Finance, LLC, Term Loan | | | | |
| | 346,221 | | | 5.302%, (LIBOR 1M + 3.000%), 9/22/2024b | | | 345,733 | |
| | | | | |
| | | | Total | | | 3,746,712 | |
| | | | | |
| |
Capital Goods (<0.1%) | | | |
| | | | Advanced Disposal Services, Inc., Term Loan | | | | |
| | 194,846 | | | 4.460%, (LIBOR 1W + 2.250%), 11/10/2023b | | | 194,726 | |
| | | | GFL Environmental, Inc., Term Loan | | | | |
| | 235,000 | | | 0.000%, (LIBOR 3M + 3.000%), 5/31/2025b,c,d | | | 231,181 | |
| | | | Navistar, Inc., Term Loan | | | | |
| | 114,138 | | | 5.780%, (LIBOR 1M + 3.500%), 11/6/2024b | | | 114,232 | |
| | | | Sotera Health Holdings, LLC, Term Loan | | | | |
| | 229,667 | | | 5.302%, (LIBOR 1M + 3.000%), 5/15/2022b | | | 229,858 | |
| | | | | |
| | | | Total | | | 769,997 | |
| | | | | |
| |
| | Communications Services (0.3%) | | | | |
| | | | Altice France SA, Term Loan | | | | |
| | 172,375 | | | 5.052%, (LIBOR 1M + 2.750%), 7/31/2025b | | | 166,073 | |
| | 260,000 | | | 6.280%, (LIBOR 1M + 4.000%), 1/31/2026b | | | 254,314 | |
| | | | Altice US Finance I Corporation, Term Loan | | | | |
| | 74,062 | | | 4.552%, (LIBOR 1M + 2.250%), 7/28/2025b | | | 73,893 | |
| | | | CBS Radio, Inc., Term Loan | | | | |
| | 24,813 | | | 5.037%, (LIBOR 1M + 2.750%), 11/17/2024b | | | 24,676 | |
| | | | Cengage Learning, Inc., Term Loan | | | | |
| | 483,242 | | | 6.530%, (LIBOR 1M + 4.250%), 6/7/2023b | | | 447,149 | |
| | | | CenturyLink, Inc., Term Loan | | | | |
| | 416,850 | | | 5.052%, (LIBOR 1M + 2.750%), 1/31/2025b | | | 412,160 | |
| | | | Charter Communications Operating, LLC, Term Loan | | | | |
| | 352,338 | | | 4.310%, (LIBOR 1M + 2.000%), 4/30/2025b | | | 352,295 | |
| | | | CSC Holdings, LLC, Term Loan | | | | |
| | 73,875 | | | 4.530%, (LIBOR 1M + 2.250%), 7/17/2025b | | | 73,638 | |
| | | | Frontier Communications Corporation, Term Loan | | | | |
| | 514,647 | | | 6.060%, (LIBOR 1M + 3.750%), 6/15/2024b | | | 497,149 | |
| | | | Gray Television, Inc., Term Loan | | | | |
| | 55,640 | | | 4.515%, (LIBOR 1M + 2.250%), 2/7/2024b | | | 55,601 | |
| | | | HCP Acquisition, LLC, Term Loan | | | | |
| | 301,795 | | | 5.302%, (LIBOR 1M + 3.000%), 5/16/2024b | | | 301,192 | |
| | | | Intelsat Jackson Holdings SA, Term Loan | | | | |
| | 310,000 | | | 6.045%, (LIBOR 1M + 3.750%), 11/27/2023b | | | 310,000 | |
| | | | Level 3 Parent, LLC, Term Loan | | | | |
| | 200,000 | | | 4.530%, (LIBOR 1M + 2.250%), 2/22/2024b | | | 200,094 | |
| | | | Liberty Cablevision of Puerto Rico, LLC, Term Loan | | | | |
| | 880,000 | | | 5.936%, (LIBOR 3M + 3.500%), 1/7/2022b | | | 862,558 | |
| | 65,000 | | | 9.186%, (LIBOR 3M + 6.750%), 7/7/2023b,e | | | 59,800 | |
| | | | McGraw-Hill Global Education Holdings, LLC, Term Loan | | | | |
| | 602,480 | | | 6.302%, (LIBOR 1M + 4.000%), 5/4/2022b | | | 577,254 | |
| | | | Mediacom Illinois, LLC, Term Loan | | | | |
| | 119,400 | | | 3.970%, (LIBOR 1W + 1.750%), 2/15/2024b | | | 119,028 | |
| | | | NEP/NCP Holdco, Inc., Term Loan | | | | |
| | 205,000 | | | 0.000%, (LIBOR 3M + 3.250%), 10/22/2025b,c,d | | | 205,718 | |
| | 30,000 | | | 9.302%, (LIBOR 1M + 7.000%), 10/23/2026b | | | 30,000 | |
| | | | Sable International Finance, Ltd., Term Loan | | | | |
| | 820,000 | | | 5.547%, (LIBOR 1M + 3.250%), 1/31/2026b | | | 819,082 | |
The accompanying Notes to Financial Statements are an integral part of this schedule.
91
MODERATELYAGGRESSIVEALLOCATION FUND
Schedule of Investments as of October 31, 2018
| | | | | | | | |
Principal
Amount | | | Bank Loans (1.1%)a | | Value | |
| | Communications Services (0.3%) - continued | | | | |
| | | | SBA Senior Finance II, LLC, Term Loan | | | | |
| | $184,538 | | | 4.310%, (LIBOR 1M + 2.000%), 4/11/2025b | | | $184,056 | |
| | | | Sprint Communications, Inc., Term Loan | | | | |
| | 723,975 | | | 4.813%, (LIBOR 1M + 2.500%), 2/2/2024b | | | 723,294 | |
| | | | Syniverse Holdings, Inc., Term Loan | | | | |
| | 69,650 | | | 7.280%, (LIBOR 1M + 5.000%), 3/9/2023b | | | 69,998 | |
| | | | Unitymedia Finance, LLC, Term Loan | | | | |
| | 135,000 | | | 4.530%, (LIBOR 1M + 2.250%), 1/15/2026b | | | 134,738 | |
| | | | Univision Communications, Inc., Term Loan | | | | |
| | 480,994 | | | 5.052%, (LIBOR 1M + 2.750%), 3/15/2024b | | | 461,076 | |
| | | | Virgin Media Bristol, LLC, Term Loan | | | | |
| | 140,000 | | | 4.780%, (LIBOR 1M + 2.500%), 1/15/2026b | | | 139,839 | |
| | | | WideOpenWest Finance, LLC, Term Loan | | | | |
| | 207,900 | | | 5.540%, (LIBOR 1M + 3.250%), 8/19/2023b | | | 200,104 | |
| | | | Windstream Services, LLC, Term Loan | | | | |
| | 194,010 | | | 6.290%, (LIBOR 1M + 4.000%), 3/30/2021b | | | 181,607 | |
| | | | | |
| | | | Total | | | 7,936,386 | |
| | | | | |
| |
| | Consumer Cyclical (0.1%) | | | | |
| | | | Boyd Gaming Corporation, Term Loan | | | | |
| | 45,578 | | | 4.467%, (LIBOR 1W + 2.250%), 9/15/2023b | | | 45,596 | |
| | | | Burlington Coat Factory Warehouse Corporation, Term Loan | | | | |
| | 305,553 | | | 4.790%, (LIBOR 1M + 2.500%), 11/17/2024b | | | 305,553 | |
| | | | Eldorado Resorts, Inc., Term Loan | | | | |
| | 32,991 | | | 4.563%, (LIBOR 1M + 2.250%), 4/17/2024b | | | 32,981 | |
| | | | Four Seasons Hotels, Ltd., Term Loan | | | | |
| | 203,447 | | | 4.302%, (LIBOR 1M + 2.000%), 11/30/2023b | | | 203,337 | |
| | | | Golden Entertainment, Inc., Term Loan | | | | |
| | 392,037 | | | 5.300%, (LIBOR 1M + 3.000%), 10/20/2024b | | | 392,037 | |
| | 65,000 | | | 9.310%, (LIBOR 1M + 7.000%), 10/20/2025b | | | 65,325 | |
| | | | Golden Nugget, LLC, Term Loan | | | | |
| | 434,034 | | | 5.230%, (LIBOR 1M + 2.750%), 10/4/2023b | | | 434,238 | |
| | | | KAR Auction Services, Inc., Term Loan | | | | |
| | 123,438 | | | 4.938%, (LIBOR 3M + 2.500%), 3/9/2023b | | | 123,489 | |
| | | | Men’s Warehouse, Inc., Term Loan | | | | |
| | 210,000 | | | 5.506%, (LIBOR 3M + 3.250%), 4/9/2025b | | | 210,920 | |
| | | | Mohegan Gaming and Entertainment, Term Loan | | | | |
| | 287,309 | | | 6.302%, (LIBOR 1M + 4.000%), 10/13/2023b | | | 269,149 | |
| | | | Neiman Marcus Group, Ltd., LLC, Term Loan | | | | |
| | 114,102 | | | 5.531%, (LIBOR 1M + 3.250%), 10/25/2020b | | | 103,769 | |
| | | | Penn National Gaming, Inc. Term Loan | | | | |
| | 165,000 | | | 0.000%, (LIBOR 3M + 2.250%), 10/15/2025b,c,d | | | 165,412 | |
| | | | Scientific Games International, Inc., Term Loan | | | | |
| | 766,150 | | | 5.046%, (LIBOR 1M + 2.750%), 8/14/2024b | | | 758,213 | |
| | | | Seminole Hard Rock Entertainment, Inc., Term Loan | | | | |
| | 143,561 | | | 5.146%, (LIBOR 3M + 2.750%), 5/14/2020b | | | 143,740 | |
| | | | Stars Group Holdings BV, Term Loan | | | | |
| | 206,483 | | | 5.886%, (LIBOR 3M + 3.500%), 7/10/2025b | | | 207,228 | |
| | | | Wyndham Hotels & Resorts, Inc., Term Loan | | | | |
| | 140,000 | | | 4.052%, (LIBOR 1M + 1.750%), 5/30/2025b | | | 139,854 | |
| | | | | |
| | | | Total | | | 3,600,841 | |
| | | | | |
| |
| | Consumer Non-Cyclical (0.2%) | | | | |
| | | | Air Medical Group Holdings, Inc., Term Loan | | | | |
| | 555,800 | | | 5.534%, (LIBOR 3M + 3.250%), 4/28/2022b | | | 538,848 | |
| | 99,250 | | | 6.530%, (LIBOR 1M + 4.250%), 3/14/2025b | | | 97,265 | |
| | | | Albertson’s, LLC, Term Loan | | | | |
| | 396,214 | | | 5.052%, (LIBOR 1M + 2.750%), 8/25/2021b | | | 395,449 | |
| | 202,783 | | | 5.381%, (LIBOR 3M + 3.000%), 12/21/2022b | | | 202,162 | |
| | 260,330 | | | 5.311%, (LIBOR 3M + 3.000%), 6/22/2023b | | | 259,028 | |
| | 390,000 | | | 0.000%, (LIBOR 3M + 3.000%), 10/29/2025b,c,d | | | 386,670 | |
| | | | Amneal Pharmaceuticals, LLC, Term Loan | | | | |
| | 224,385 | | | 5.813%, (LIBOR 1M + 3.500%), 5/4/2025b | | | 225,451 | |
| | | | Bausch Health Companies, Inc., Term Loan | | | | |
| | 1,116,375 | | | 5.274%, (LIBOR 1M + 3.000%), 6/1/2025b | | | 1,116,118 | |
| | | | CHS/Community Health Systems, Inc., Term Loan | | | | |
| | 304,917 | | | 5.563%, (LIBOR 3M + 3.250%), 1/27/2021b | | | 298,127 | |
| | | | Endo International plc, Term Loan | | | | |
| | 346,072 | | | 6.563%, (LIBOR 1M + 4.250%), 4/27/2024b | | | 347,297 | |
| | | | Grifols Worldwide Operations USA, Inc., Term Loan | | | | |
| | 300,425 | | | 4.467%, (LIBOR 1W + 2.250%), 1/31/2025b | | | 300,560 | |
The accompanying Notes to Financial Statements are an integral part of this schedule.
92
MODERATELYAGGRESSIVEALLOCATION FUND
Schedule of Investments as of October 31, 2018
| | | | | | | | |
Principal
Amount | | | Bank Loans (1.1%)a | | Value | |
| | Consumer Non-Cyclical (0.2%) - continued | | | | |
| | | | JBS USA LUX SA, Term Loan | | | | |
| | $655,025 | | | 4.844%, (LIBOR 3M + 2.500%), 10/30/2022b | | | $654,698 | |
| | | | Libbey Glass, Inc., Term Loan | | | | |
| | 108,324 | | | 5.281%, (LIBOR 1M + 3.000%), 4/9/2021b | | | 107,918 | |
| | | | Northriver Midstream Finance LP, Term Loan | | | | |
| | 260,000 | | | 5.646%, (LIBOR 3M + 3.250%), 10/1/2025b,c,d | | | 261,084 | |
| | | | Revlon Consumer Products Corporation, Term Loan | | | | |
| | 271,252 | | | 5.813%, (LIBOR 3M + 3.500%), 9/7/2023b | | | 198,090 | |
| | | | | |
| | | | Total | | | 5,388,765 | |
| | | | | |
| |
| | Energy (0.1%) | | | | |
| | | | BCP Raptor II, LLC, Term Loan | | | | |
| | 195,000 | | | 0.000%, (LIBOR 3M + 4.750%), 10/22/2025b,c,d,e | | | 193,538 | |
| | | | Calpine Corporation, Term Loan | | | | |
| | 222,698 | | | 4.890%, (LIBOR 3M + 2.500%), 1/15/2024b | | | 221,841 | |
| | | | HFOTCO, LLC, Term Loan | | | | |
| | 289,275 | | | 5.060%, (LIBOR 1M + 2.750%), 6/26/2025b | | | 289,877 | |
| | | | McDermott Technology (Americas), Inc., Term Loan | | | | |
| | 343,275 | | | 7.302%, (LIBOR 1M + 5.000%), 5/10/2025b | | | 338,555 | |
| | | | MEG Energy Corporation, Term Loan | | | | |
| | 37,000 | | | 5.810%, (LIBOR 1M + 3.500%), 12/31/2023b | | | 37,038 | |
| | | | Pacific Drilling SA, Term Loan | | | | |
| | 271,930 | | | 0.000%, (PRIME + 4.500%), 6/3/2018b,f,g | | | 121,914 | |
| | | | Radiate Holdco, LLC, Term Loan | | | | |
| | 813,804 | | | 5.302%, (LIBOR 1M + 3.000%), 2/1/2024b | | | 806,829 | |
| | | | | |
| | | | Total | | | 2,009,592 | |
| | | | | |
| |
| | Financials (0.1%) | | | | |
| | | | Air Methods Corporation, Term Loan | | | | |
| | 545,809 | | | 5.886%, (LIBOR 3M + 3.500%), 4/21/2024b | | | 491,910 | |
| | | | Cyxtera DC Holdings, Inc., Term Loan | | | | |
| | 93,812 | | | 5.280%, (LIBOR 1M + 3.000%), 5/1/2024b | | | 93,461 | |
| | 50,000 | | | 9.530%, (LIBOR 1M + 7.250%), 5/1/2025b | | | 49,437 | |
| | | | Digicel International Finance, Ltd., Term Loan | | | | |
| | 461,505 | | | 5.570%, (LIBOR 3M + 3.250%), 5/10/2024b | | | 441,508 | |
| | | | DJO Finance, LLC, Term Loan | | | | |
| | 185,379 | | | 5.599%, (LIBOR 1M + 3.250%), 6/7/2020b | | | 184,955 | |
| | | | DTZ U.S. Borrower, LLC, Term Loan | | | | |
| | 325,000 | | | 5.552%, (LIBOR 1M + 3.250%), 8/21/2025b | | | 324,695 | |
| | | | Genworth Holdings, Inc., Term Loan | | | | |
| | 99,500 | | | 6.831%, (LIBOR 2M + 4.500%), 3/7/2023b | | | 101,428 | |
| | | | GGP Nimbus LP, Term Loan | | | | |
| | 1,085,000 | | | 4.795%, (LIBOR 1M + 2.500%), 8/24/2025b | | | 1,066,598 | |
| | | | INEOS U.S. Finance, LLC, Term Loan | | | | |
| | 193,538 | | | 4.302%, (LIBOR 1M + 2.000%), 3/31/2024b | | | 193,085 | |
| | | | MoneyGram International, Inc., Term Loan | | | | |
| | 416,822 | | | 5.552%, (LIBOR 1M + 3.250%), 3/28/2020b,e | | | 395,981 | |
| | | | Trans Union, LLC, Term Loan | | | | |
| | 227,700 | | | 4.302%, (LIBOR 1M + 2.000%), 4/9/2023b | | | 227,156 | |
| | | | | |
| | | | Total | | | 3,570,214 | |
| | | | | |
| |
| | Technology (0.1%) | | | | |
| | | | First Data Corporation, Term Loan | | | | |
| | 235,000 | | | 4.287%, (LIBOR 1M + 2.000%), 4/26/2024b | | | 233,630 | |
| | | | Harland Clarke Holdings Corporation, Term Loan | | | | |
| | 165,062 | | | 7.136%, (LIBOR 3M + 4.750%), 11/3/2023b | | | 154,332 | |
| | | | Micron Technology, Inc., Term Loan | | | | |
| | 278,575 | | | 4.060%, (LIBOR 1M + 1.750%), 4/26/2022b | | | 278,517 | |
| | | | Rackspace Hosting, Inc., Term Loan | | | | |
| | 390,248 | | | 5.348%, (LIBOR 3M + 3.000%), 11/3/2023b | | | 378,135 | |
| | | | SS&C Technologies Holdings Europe SARL, Term Loan | | | | |
| | 113,351 | | | 4.552%, (LIBOR 1M + 2.250%), 4/16/2025b | | | 112,721 | |
| | | | SS&C Technologies, Inc., Term Loan | | | | |
| | 292,444 | | | 4.552%, (LIBOR 1M + 2.250%), 4/16/2025b | | | 290,818 | |
| | | | TNS, Inc., Term Loan | | | | |
| | 347,178 | | | 6.320%, (LIBOR 3M + 4.000%), 8/14/2022b | | | 348,626 | |
| | | | | |
| | | | Total | | | 1,796,779 | |
| | | | | |
| |
| | Transportation (<0.1%) | | | | |
| | | | Arctic LNG Carriers, Ltd., Term Loan | | | | |
| | 602,375 | | | 6.802%, (LIBOR 1M + 4.500%), 5/18/2023b | | | 602,375 | |
| | | | OSG Bulk Ships, Inc., Term Loan | | | | |
| | 114,699 | | | 6.770%, (LIBOR 1M + 4.250%), 8/5/2019b | | | 113,456 | |
| | | | | |
| | | | Total | | | 715,831 | |
| | | | | |
| |
| | Utilities (0.1%) | | | | |
| | | | Core and Main, LP, Term Loan | | | | |
| | 252,450 | | | 5.317%, (LIBOR 3M + 3.000%), 8/1/2024b,e | | | 252,134 | |
| | | | Talen Energy Supply, LLC, Term Loan | | | | |
| | 201,789 | | | 6.302%, (LIBOR 1M + 4.000%), 7/6/2023b | |
| 202,042
|
|
The accompanying Notes to Financial Statements are an integral part of this schedule.
93
MODERATELYAGGRESSIVEALLOCATION FUND
Schedule of Investments as of October 31, 2018
| | | | | | | | |
Principal
Amount | | | Bank Loans (1.1%)a | | Value | |
| | Utilities (0.1%) - continued | | | | |
| | | | Vertiv Group Corporation, Term Loan | | | | |
| | $599,098 | | | 6.313%, (LIBOR 3M + 4.000%), 11/15/2023b | | | $592,358 | |
| | | | | |
| | | | Total | | | 1,046,534 | |
| | | | | |
| | | | | |
| | | | | |
| | | | Total Bank Loans (cost $31,033,201) | | | 30,581,651 | |
| | | | | |
| | |
| Shares | | | Registered Investment Companies (48.3%) | | Value | |
| | Affiliated Equity Holdings (41.7%) | | | | |
| | 8,612,063 | | | Thrivent Core International Equity Fund | | | 79,919,949 | |
| | 7,733,985 | | | Thrivent Core Low Volatility Equity Fundh | | | 81,516,203 | |
| | 15,867,571 | | | Thrivent Large Cap Growth Fund, Class S | | | 197,868,608 | |
| | 4,674,604 | | | Thrivent Large Cap Stock Fund, Class S | | | 125,653,356 | |
| | 9,571,559 | | | Thrivent Large Cap Value Fund, Class S | | | 219,188,710 | |
| | 5,715,256 | | | Thrivent Mid Cap Stock Fund, Class S | | | 160,370,082 | |
| | 22,634,732 | | | Thrivent Partner Worldwide Allocation Fund, Class S | | | 223,404,800 | |
| | 1,593,213 | | | Thrivent Small Cap Stock Fund, Class S | | | 41,981,166 | |
| | | | | |
| | | | Total | | | 1,129,902,874 | |
| | | | | |
| |
| | Affiliated Fixed Income Holdings (5.3%) | | | | |
| | 2,921,208 | | | Thrivent Core Emerging Markets Debt Fund | | | 26,407,721 | |
| | 4,507,340 | | | Thrivent High Yield Fund, Class S | | | 20,914,056 | |
| | 6,910,015 | | | Thrivent Income Fund, Class S | | | 60,117,134 | |
| | 2,888,091 | | | Thrivent Limited Maturity Bond Fund, Class S | | | 35,523,517 | |
| | | | | |
| | | | Total | | | 142,962,428 | |
| | | | | |
| |
| | Equity Funds/Exchange Traded Funds (0.8%) | | | | |
| | 9,265 | | | iShares Russell 1000 Growth Index Fund | | | 1,316,371 | |
| | 9,613 | | | iShares Russell 2000 Growth Index Fundi | | | 1,806,187 | |
| | 3,641 | | | iShares Russell 2000 Value Index Fund | | | 441,107 | |
| | 24,520 | | | ProShares Ultra S&P 500i | | | 2,688,618 | |
| | 1,565 | | | ProShares UltraPro S&P 500 | | | 71,004 | |
| | 39,914 | | | SPDR S&P 500 ETF Trust | | | 10,801,926 | |
| | 27,644 | | | SPDR S&P Biotech ETFi | | | 2,186,917 | |
| | 14,346 | | | SPDR S&P Retail ETFi | | | 676,270 | |
| | 10,394 | | | Vanguard REIT ETF | | | 814,058 | |
| | | | | |
| | | | Total | | | 20,802,458 | |
| | | | | |
| |
| | Fixed Income Funds/Exchange Traded Funds (0.5%) | | | | |
| | 36,000 | | | Invesco Senior Loan ETF | | | 828,360 | |
| | 50,395 | | | iShares iBoxx $ Investment Grade Corporate Bond ETF | | | 5,655,831 | |
| | 26,000 | | | iShares Short-Term Corporate Bond ETF | | | 1,342,640 | |
| | 71,850 | | | Vanguard Short-Term Corporate Bond ETF | | | 5,599,271 | |
| | | | | |
| | | | Total | | | 13,426,102 | |
| | | | | |
| | | | | |
| | | | | |
| | | | Total Registered Investment Companies (cost $1,032,751,128) | | | 1,307,093,862 | |
| | | | | |
| | |
| Shares | | | Common Stock (24.5%) | | Value | |
| | Communications Services (0.8%) | | | | |
| | 3,818 | | | Alphabet, Inc., Class Ah | | | 4,163,834 | |
| | 1,768 | | | Alphabet, Inc., Class Ch | | | 1,903,729 | |
| | 35,800 | | | AT&T, Inc. | | | 1,098,344 | |
| | 1,969 | | | Carsales.com, Ltd. | | | 17,066 | |
| | 4,564 | | | CBS Corporation | | | 261,745 | |
| | 22,870 | | | Comcast Corporation | | | 872,262 | |
| | 15,464 | | | DISH Network Corporationh | | | 475,363 | |
| | 21,288 | | | Facebook, Inc.h | | | 3,231,306 | |
| | 2,640 | | | Hemisphere Media Group, Inc.h | | | 35,561 | |
| | 6,535 | | | IAC/InterActiveCorporationh | | | 1,284,716 | |
| | 842 | | | Ipsos SA | | | 22,421 | |
| | 147,424 | | | ITV plc | | | 279,851 | |
| | 78,828 | | | KCOM Group plc | | | 92,798 | |
| | 21,020 | | | Liberty Media Corporation - Liberty SiriusXMh | | | 867,495 | |
| | 5,155 | | | Liberty SiriusXM Grouph | | | 212,592 | |
| | 18,418 | | | Liberty Tripadvisor Holdings, Inc.h | | | 265,588 | |
| | 1,221 | | | Lions Gate Entertainment Corporation | | | 21,722 | |
| | 6,970 | | | Mediaset Espana Comunicacion SA | | | 47,395 | |
| | 4,295 | | | Netflix, Inc.h | | | 1,296,145 | |
| | 82,555 | | | News Corporation, Class A | | | 1,088,900 | |
| | 34,909 | | | News Corporation, Class B | | | 465,686 | |
| | 6,400 | | | NTT DOCOMO, Inc. | | | 158,713 | |
| | 80,356 | | | ORBCOMM, Inc.h | | | 765,793 | |
| | 3,645 | | | ProSiebenSat.1 Media AG | | | 84,168 | |
| | 124 | | | RTL Group SA | | | 7,959 | |
| | 11,349 | | | Seven West Media, Ltd.h | | | 6,290 | |
| | 24,374 | | | Telenor ASA | | | 446,906 | |
| | 8,800 | | | TV Asahi Holdings Corporation | | | 164,286 | |
| | 20,000 | | | Twitter, Inc.h | | | 695,000 | |
| | 24,933 | | | Verizon Communications, Inc. | | | 1,423,425 | |
| | 2,071 | | | Wolters Kluwer NV | | | 117,497 | |
| | | | | |
| | | | Total | | | 21,874,556 | |
| | | | | |
| |
| | Consumer Discretionary (2.6%) | | | | |
| | 4,191 | | | Amazon.com, Inc.h | | | 6,697,260 | |
| | 19,650 | | | American Axle & Manufacturing Holdings, Inc.h | | | 298,091 | |
| | 1,000 | | | AOKI Holdings, Inc. | | | 13,171 | |
| | 900 | | | Aoyama Trading Company, Ltd. | | | 27,228 | |
| | 2,442 | | | Aptiv plc | | | 187,546 | |
| | 4,678 | | | Ascent Capital Group, Inc.h | | | 4,491 | |
| | 1,700 | | | Autobacs Seven Company, Ltd. | | | 27,360 | |
| | 1,300 | | | Benesse Holdings, Inc. | | | 36,255 | |
| | 1,369 | | | Berkeley Group Holdings plc | | | 61,185 | |
| | 745 | | | Booking Holdings, Inc.h | | | 1,396,562 | |
| | 23,680 | | | BorgWarner, Inc. | | | 933,229 | |
| | 15,700 | | | Bridgestone Corporation | | | 605,381 | |
| | 22,711 | | | Bright Horizons Family Solutions, Inc.h | | | 2,609,721 | |
| | 16,400 | | | Bunzl plc | | | 483,799 | |
| | 19,187 | | | Burlington Stores, Inc.h | | | 3,290,379 | |
| | 2,960 | | | Century Casinos, Inc.h | | | 18,470 | |
The accompanying Notes to Financial Statements are an integral part of this schedule.
94
MODERATELY AGGRESSIVE ALLOCATION FUND
Schedule of Investments as of October 31, 2018
| | | | | | | | |
| Shares | | | Common Stock (24.5%) | | Value | |
| | Consumer Discretionary (2.6%) - continued | | | | |
| | 46,014 | | | Chico’s FAS, Inc. | | | $352,927 | |
| | 23,397 | | | Children’s Place, Inc. | | | 3,495,512 | |
| | 2,320 | | | Chipotle Mexican Grill, Inc.h | | | 1,067,966 | |
| | 1,300 | | | Chiyoda Company, Ltd. | | | 25,061 | |
| | 591 | | | Cie Generale des Etablissements Michelin | | | 60,503 | |
| | 64,464 | | | Core-Mark Holding Company, Inc. | | | 2,476,062 | |
| | 64,266 | | | Crocs, Inc.h | | | 1,320,024 | |
| | 11,267 | | | CSS Industries, Inc. | | | 148,048 | |
| | 10,281 | | | Culp, Inc. | | | 238,005 | |
| | 2,100 | | | DCM Holdings Company, Ltd. | | | 20,420 | |
| | 2,400 | | | Denso Corporation | | | 107,054 | |
| | 27,002 | | | Dollar Tree, Inc.h | | | 2,276,269 | |
| | 39,462 | | | Duluth Holdings, Inc.h,i | | | 1,212,667 | |
| | 4,245 | | | Emerald Expositions Events, Inc. | | | 62,062 | |
| | 11,302 | | | Expedia Group, Inc. | | | 1,417,610 | |
| | 71,750 | | | Extended Stay America, Inc. | | | 1,168,090 | |
| | 15,429 | | | Five Below, Inc.h | | | 1,756,129 | |
| | 169 | | | Genuine Parts Company | | | 16,549 | |
| | 25,464 | | | G-III Apparel Group, Ltd.h | | | 1,014,995 | |
| | 27,146 | | | Habit Restaurants, Inc.h | | | 344,754 | |
| | 12,508 | | | Harley-Davidson, Inc. | | | 478,056 | |
| | 3,731 | | | Haverty Furniture Companies, Inc. | | | 75,665 | |
| | 12,560 | | | Home Depot, Inc. | | | 2,209,053 | |
| | 19,900 | | | Honda Motor Company, Ltd. | | | 568,056 | |
| | 6,942 | | | Inchcape plc | | | 47,946 | |
| | 14,173 | | | International Speedway Corporation | | | 531,629 | |
| | 13,192 | | | Las Vegas Sands Corporation | | | 673,188 | |
| | 2,157 | | | Laureate Education, Inc.h | | | 32,118 | |
| | 1,858 | | | Liberty Latin America, Ltd.h | | | 33,407 | |
| | 15,566 | | | LKQ Corporationh | | | 424,485 | |
| | 11,990 | | | Lowe’s Companies, Inc. | | | 1,141,688 | |
| | 2,700 | | | Lululemon Athletica, Inc.h | | | 379,971 | |
| | 7,849 | | | Magna International, Inc. | | | 386,485 | |
| | 6,276 | | | McDonald’s Corporation | | | 1,110,224 | |
| | 33,927 | | | Michaels Companies, Inc.h | | | 537,743 | |
| | 23,117 | | | Modine Manufacturing Companyh | | | 300,752 | |
| | 1,544 | | | Next plc | | | 102,572 | |
| | 7,600 | | | NHK Spring Company, Ltd. | | | 65,076 | |
| | 24,981 | | | NIKE, Inc. | | | 1,874,574 | |
| | 73,600 | | | Nissan Motor Company, Ltd. | | | 669,595 | |
| | 30,900 | | | Norwegian Cruise Line Holdings, Ltd.h | | | 1,361,763 | |
| | 68,206 | | | Nutrisystem, Inc. | | | 2,425,405 | |
| | 1,940 | | | O’Reilly Automotive, Inc.h | | | 622,255 | |
| | 16,923 | | | Oxford Industries, Inc. | | | 1,505,809 | |
| | 8,737 | | | Peugeot SA | | | 207,684 | |
| | 39,020 | | | Planet Fitness, Inc.h | | | 1,915,492 | |
| | 2,668 | | | Playa Hotels and Resorts NVh | | | 22,918 | |
| | 900 | | | Plenus Company, Ltd.i | | | 14,404 | |
| | 10,390 | | | Polaris Industries, Inc. | | | 924,502 | |
| | 7,090 | | | PVH Corporation | | | 856,401 | |
| | 3,475 | | | RHh,i | | | 402,092 | |
| | 16,914 | | | Ross Stores, Inc. | | | 1,674,486 | |
| | 2,800 | | | Sangetsu Company, Ltd. | | | 53,853 | |
| | 3,200 | | | Sankyo Company, Ltd. | | | 122,178 | |
| | 41,300 | | | Sekisui House, Ltd. | | | 606,161 | |
| | 1,800 | | | SHIMAMURA Company, Ltd. | | | 151,406 | |
| | 30,080 | | | Six Flags Entertainment Corporation | | | 1,620,109 | |
| | 1,076 | | | SmartCentres Real Estate Investment Trust | | | 24,586 | |
| | 4,013 | | | Stamps.com, Inc.h | | | 811,308 | |
| | 5,600 | | | Sumitomo Rubber Industries, Ltd. | | | 80,330 | |
| | 4,363 | | | Super Retail Group, Ltd. | | | 22,375 | |
| | 400 | | | Takara Standard Company, Ltd. | | | 6,176 | |
| | 10,320 | | | Tapestry, Inc. | | | 436,639 | |
| | 39,495 | | | Toll Brothers, Inc. | | | 1,329,402 | |
| | 27,654 | | | Tower International, Inc. | | | 821,047 | |
| | 10,600 | | | Toyoda Gosei Company, Ltd. | | | 228,617 | |
| | 4,803 | | | Ulta Beauty, Inc.h | | | 1,318,520 | |
| | 7,660 | | | Vail Resorts, Inc. | | | 1,925,111 | |
| | 4,992 | | | VF Corporation | | | 413,737 | |
| | 14,474 | | | Wingstop, Inc. | | | 906,362 | |
| | 17,578 | | | Zumiez, Inc.h | | | 408,864 | |
| | | | | |
| | | | Total | | | 70,133,110 | |
| | | | | |
| |
| | Consumer Staples (0.8%) | | | | |
| | 12,116 | | | Altria Group, Inc. | | | 788,025 | |
| | 28,546 | | | Archer-Daniels-Midland Company | | | 1,348,799 | |
| | 1,700 | | | Arcs Company, Ltd. | | | 41,079 | |
| | 19,939 | | | Casey’s General Stores, Inc. | | | 2,514,507 | |
| | 90,727 | | | Cott Corporation | | | 1,364,534 | |
| | 9,550 | | | CVS Health Corporation | | | 691,325 | |
| | 5,640 | | | e.l.f. Beauty, Inc.h,i | | | 59,840 | |
| | 12,404 | | | Empire Company, Ltd. | | | 225,664 | |
| | 2,031 | | | ForFarmers BV | | | 22,873 | |
| | 509 | | | Glanbia plc | | | 9,030 | |
| | 73,044 | | | Hain Celestial Group, Inc.h | | | 1,817,335 | |
| | 13,731 | | | Imperial Brands plc | | | 465,105 | |
| | 4,768 | | | Inter Parfums, Inc. | | | 281,264 | |
| | 32,900 | | | Japan Tobacco, Inc. | | | 845,376 | |
| | 9,584 | | | John B. Sanfilippo & Son, Inc. | | | 604,367 | |
| | 2,060 | | | Kimberly-Clark Corporation | | | 214,858 | |
| | 12,635 | | | Koninklijke Ahold Delhaize NV | | | 289,220 | |
| | 21,096 | | | Kroger Company | | | 627,817 | |
| | 549 | | | Loblaw Companies, Ltd. | | | 27,457 | |
| | 3,751 | | | MGP Ingredients, Inc. | | | 266,959 | |
| | 400 | | | Ministop Company, Ltd. | | | 7,386 | |
| | 11,005 | | | Molson Coors Brewing Company | | | 704,320 | |
| | 14,008 | | | Monster Beverage Corporationh | | | 740,323 | |
| | 500 | | | NH Foods, Ltd. | | | 17,243 | |
| | 27,015 | | | PepsiCo, Inc. | | | 3,035,946 | |
| | 2,901 | | | Seneca Foods Corporationh | | | 91,759 | |
| | 8,703 | | | SpartanNash Company | | | 155,349 | |
| | 800 | | | Sugi Holdings Company, Ltd. | | | 36,629 | |
| | 72,317 | | | SunOpta, Inc.h | | | 536,592 | |
| | 5,130 | | | Swedish Match AB | | | 261,315 | |
| | 24,852 | | | Turning Point Brands, Inc. | | | 1,021,417 | |
| | 9,137 | | | Unilever NV | | | 490,974 | |
| | 13,323 | | | Unilever plc | | | 705,715 | |
| | 5,644 | | | Wal-Mart Stores, Inc. | | | 565,980 | |
| | 9,204 | | | Wesfarmers, Ltd. | | | 304,815 | |
| | | | | |
| | | | Total | | | 21,181,197 | |
| | | | | |
| |
| | Energy (1.0%) | | | | |
| | 28,518 | | | Abraxas Petroleum Corporationh | | | 52,473 | |
| | 15,455 | | | Anadarko Petroleum Corporation | | | 822,206 | |
| | 138,821 | | | Archrock, Inc. | | | 1,424,304 | |
| | 3,072 | | | California Resources Corporationh | | | 96,277 | |
| | 157,861 | | | Callon Petroleum Companyh | | | 1,573,874 | |
| | 10,719 | | | Chevron Corporation | | | 1,196,776 | |
| | 11,174 | | | Comstock Resources, Inc.h | | | 81,012 | |
| | 5,971 | | | Concho Resources, Inc.h | | | 830,506 | |
| | 1,412 | | | Contura Energy, Inc.h,i | | | 103,005 | |
| | 27,120 | | | Denbury Resources, Inc.h | | | 93,564 | |
| | 7,923 | | | Diamondback Energy, Inc. | | | 890,228 | |
| | 1,104 | | | Eni SPA | | | 19,607 | |
| | 4,422 | | | EQT Corporation | | | 150,215 | |
| | 9,280 | | | Era Group, Inc.h | | | 105,050 | |
| | 2,343 | | | Evolution Petroleum Corporation | | | 24,133 | |
| | 19,875 | | | Exterran Corporationh | | | 415,189 | |
The accompanying Notes to Financial Statements are an integral part of this schedule.
95
MODERATELY AGGRESSIVE ALLOCATION FUND
Schedule of Investments as of October 31, 2018
| | | | | | | | |
| Shares | | | Common Stock (24.5%) | | Value | |
| | Energy (1.0%) - continued | | | | |
| | 31,536 | | | Exxon Mobil Corporation | | | $2,512,789 | |
| | 47,543 | | | Forum Energy Technologies, Inc.h | | | 425,985 | |
| | 337 | | | Gaztransport Et Technigaz SA | | | 24,908 | |
| | 183,976 | | | Gran Tierra Energy, Inc.h | | | 561,127 | |
| | 10,300 | | | Halliburton Company | | | 357,204 | |
| | 27,539 | | | Helix Energy Solutions Group, Inc.h | | | 234,632 | |
| | 2,176 | | | Keane Group, Inc.h | | | 27,352 | |
| | 73,976 | | | Marathon Oil Corporation | | | 1,404,804 | |
| | 6,709 | | | Marathon Petroleum Corporation | | | 472,649 | |
| | 9,733 | | | Nabors Industries, Ltd. | | | 48,373 | |
| | 20,400 | | | Newpark Resources, Inc.h | | | 167,484 | |
| | 54,600 | | | Nine Energy Service, Inc.h | | | 2,021,838 | |
| | 32,678 | | | Northern Oil and Gas, Inc.h | | | 96,073 | |
| | 4,146 | | | OMV AG | | | 230,237 | |
| | 10,495 | | | ONEOK, Inc. | | | 688,472 | |
| | 5,868 | | | Pacific Drilling, Inc. Rightse,h | | | 61,105 | |
| | 17,983 | | | Parsley Energy, Inc.h | | | 421,162 | |
| | 91,082 | | | Patterson-UTI Energy, Inc. | | | 1,515,605 | |
| | 4,032 | | | Petrofac, Ltd. | | | 29,649 | |
| | 3,681 | | | Phillips 66 | | | 378,480 | |
| | 15,567 | | | Pioneer Energy Services Corporationh | | | 46,234 | |
| | 5,491 | | | Pioneer Natural Resources Company | | | 808,660 | |
| | 999 | | | Royal Dutch Shell plc, Class A | | | 31,826 | |
| | 22,469 | | | Royal Dutch Shell plc, Class B | | | 732,780 | |
| | 18,137 | | | SM Energy Company | | | 441,455 | |
| | 38,302 | | | Talos Energy, Inc.h | | | 998,150 | |
| | 44,523 | | | TechnipFMC plc | | | 1,170,955 | |
| | 27,264 | | | Teekay Tankers, Ltd.i | | | 30,263 | |
| | 3,517 | | | Total SAi | | | 206,360 | |
| | 168,705 | | | Transocean, Ltd.h,i | | | 1,857,442 | |
| | 37,857 | | | Unit Corporationh | | | 875,632 | |
| | 57,330 | | | Weatherford International plch,i | | | 77,396 | |
| | 23,680 | | | WPX Energy, Inc.h | | | 379,827 | |
| | | | | |
| | | | Total | | | 27,215,327 | |
| | | | | |
| |
| | Financials (4.4%) | | | | |
| | 2,055 | | | Aareal Bank AG | | | 76,448 | |
| | 6,618 | | | Affiliated Managers Group, Inc. | | | 752,202 | |
| | 8,250 | | | Aflac, Inc. | | | 355,327 | |
| | 3,488 | | | AG Mortgage Investment Trust, Inc. | | | 60,342 | |
| | 1,190 | | | Aircastle, Ltd. | | | 23,122 | |
| | 151 | | | Allianz SE | | | 31,456 | |
| | 18,376 | | | Allstate Corporation | | | 1,758,951 | |
| | 16,600 | | | Ally Financial, Inc. | | | 421,806 | |
| | 7,701 | | | American Express Company | | | 791,124 | |
| | 40,576 | | | American Financial Group, Inc. | | | 4,058,817 | |
| | 4,660 | | | American International Group, Inc. | | | 192,411 | |
| | 12,689 | | | Ameris Bancorp | | | 544,231 | |
| | 297 | | | Anima Holding SPAj | | | 1,242 | |
| | 14,159 | | | Arch Capital Group, Ltd.h | | | 401,691 | |
| | 15,951 | | | Argo Group International Holdings, Ltd. | | | 982,741 | |
| | 13,430 | | | Arthur J. Gallagher & Company | | | 993,954 | |
| | 53,806 | | | Assured Guaranty, Ltd. | | | 2,151,164 | |
| | 1,458 | | | ASX, Ltd. | | | 61,237 | |
| | 17,838 | | | Australia and New Zealand Banking Group, Ltd. | | | 328,338 | |
| | 15,053 | | | Axos Financial, Inc.h | | | 457,009 | |
| | 12,319 | | | Banca Monte dei Paschi di Siena SPAh,i | | | 20,225 | |
| | 439 | | | BancFirst Corporation | | | 25,190 | |
| | 32,586 | | | BancorpSouth Bank | | | 935,218 | |
| | 88,041 | | | Bank of America Corporation | | | 2,421,127 | |
| | 1,198 | | | Bank of Marin Bancorp | | | 101,818 | |
| | 742 | | | Bank of New York Mellon Corporation | | | 35,119 | |
| | 10,346 | | | BankFinancial Corporation | | | 146,085 | |
| | 7,212 | | | Bankinter SA | | | 59,088 | |
| | 8,300 | | | Berkshire Hathaway, Inc.h | | | 1,703,824 | |
| | 3,345 | | | BGC Partners, Inc. | | | 35,424 | |
| | 11,310 | | | Blackstone Group, LP | | | 365,992 | |
| | 6,646 | | | BOK Financial Corporation | | | 569,762 | |
| | 43,642 | | | Boston Private Financial Holdings, Inc. | | | 589,167 | |
| | 109,921 | | | BrightSphere Investment Group | | | 1,253,099 | |
| | 53,205 | | | Brown & Brown, Inc. | | | 1,499,317 | |
| | 37,083 | | | CaixaBank SA | | | 150,063 | |
| | 19,069 | | | Capital One Financial Corporation | | | 1,702,862 | |
| | 33,169 | | | Cathay General Bancorp | | | 1,249,476 | |
| | 34,822 | | | Central Pacific Financial Corporation | | | 941,587 | |
| | 4,240 | | | Cherry Hill Mortgage Investment Corporation | | | 75,938 | |
| | 2,610 | | | Chubb, Ltd. | | | 326,015 | |
| | 16,402 | | | CI Financial Corporation | | | 242,582 | |
| | 8,641 | | | Cincinnati Financial Corporation | | | 679,528 | |
| | 65,159 | | | Citigroup, Inc. | | | 4,265,308 | |
| | 11,068 | | | CNP Assurances | | | 246,677 | |
| | 4,933 | | | Comerica, Inc. | | | 402,335 | |
| | 16,376 | | | Community Trust Bancorp, Inc. | | | 745,272 | |
| | 18,663 | | | Descartes Systems Group, Inc.h | | | 570,901 | |
| | 23,380 | | | Direct Line Insurance Group plc | | | 98,249 | |
| | 29,630 | | | Discover Financial Services | | | 2,064,322 | |
| | 22,273 | | | DnB ASA | | | 402,393 | |
| | 65,756 | | | Dynex Capital, Inc. | | | 380,727 | |
| | 50,415 | | | E*TRADE Financial Corporation | | | 2,491,509 | |
| | 38,766 | | | East West Bancorp, Inc. | | | 2,032,889 | |
| | 5,065 | | | Ellington Residential Mortgage REIT | | | 53,486 | |
| | 19,720 | | | Employers Holdings, Inc. | | | 906,331 | |
| | 29,636 | | | Enterprise Financial Services Corporation | | | 1,287,684 | |
| | 22,175 | | | Essent Group, Ltd.h | | | 874,138 | |
| | 4,326 | | | Euronext NVj | | | 266,188 | |
| | 3,427 | | | FBL Financial Group, Inc. | | | 236,394 | |
| | 25,039 | | | Fifth Third Bancorp | | | 675,803 | |
| | 11,060 | | | Financial Institutions, Inc. | | | 315,763 | |
| | 13,619 | | | Finecobank Banca Fineco SPA | | | 142,340 | |
| | 19,935 | | | First American Financial Corporation | | | 883,719 | |
| | 15,976 | | | First Busey Corporation | | | 446,050 | |
| | 18,043 | | | First Commonwealth Financial Corporation | | | 243,580 | |
| | 25,049 | | | First Defiance Financial Corporation | | | 681,834 | |
| | 5,633 | | | First Financial Corporation | | | 258,329 | |
| | 131,545 | | | First Hawaiian, Inc. | | | 3,259,685 | |
| | 32,449 | | | First Interstate BancSystem, Inc. | | | 1,345,335 | |
| | 1,172 | | | First Merchants Corporation | | | 48,767 | |
| | 588 | | | First Mid-Illinois Bancshares, Inc. | | | 21,921 | |
| | 5,792 | | | First Midwest Bancorp, Inc. | | | 132,984 | |
| | 2,966 | | | First of Long Island Corporation | | | 59,943 | |
| | 4,985 | | | First Republic Bank | | | 453,585 | |
| | 42,740 | | | FlexiGroup, Ltd. | | | 46,574 | |
| | 4,011 | | | Genworth MI Canada, Inc.i | | | 131,654 | |
| | 7,488 | | | Goldman Sachs Group, Inc. | | | 1,687,571 | |
| | 17,628 | | | Great Southern Bancorp, Inc. | | | 954,556 | |
| | 45,442 | | | Hamilton Lane, Inc. | | | 1,744,064 | |
| | 28,199 | | | Hancock Whitney Corporation | | | 1,183,230 | |
| | 3,793 | | | Hanmi Financial Corporation | | | 79,577 | |
| | 2,755 | | | Hannover Rueckversicherung SE | | | 370,493 | |
| | 3,771 | | | Hanover Insurance Group, Inc. | | | 420,014 | |
| | 44,432 | | | Hartford Financial Services Group, Inc. | | | 2,018,101 | |
| | 1,292 | | | Heartland Financial USA, Inc. | | | 68,657 | |
| | 91,274 | | | Heritage Commerce Corporation | | | 1,324,386 | |
| | 14,107 | | | Hometrust Bancshares, Inc.h | | | 384,557 | |
The accompanying Notes to Financial Statements are an integral part of this schedule.
96
MODERATELY AGGRESSIVE ALLOCATION FUND
Schedule of Investments as of October 31, 2018
| | | | | | | | |
| Shares | | | Common Stock (24.5%) | | Value | |
| | Financials (4.4%) - continued | | | | |
| | 15,971 | | | Horace Mann Educators Corporation | | | $627,341 | |
| | 19,612 | | | Horizon Bancorp, Inc. | | | 328,697 | |
| | 16,383 | | | Houlihan Lokey, Inc. | | | 674,652 | |
| | 93,352 | | | Huntington Bancshares, Inc. | | | 1,337,734 | |
| | 14,746 | | | IBERIABANK Corporation | | | 1,098,430 | |
| | 19,025 | | | Independent Bank Corporation | | | 421,023 | |
| | 6,637 | | | Interactive Brokers Group, Inc. | | | 327,934 | |
| | 38,869 | | | Intercontinental Exchange, Inc. | | | 2,994,468 | |
| | 3,558 | | | Invesco, Ltd. | | | 77,244 | |
| | 91,385 | | | Investment Technology Group, Inc. | | | 2,511,260 | |
| | 6,796 | | | J.P. Morgan Chase & Company | | | 740,900 | |
| | 56,956 | | | Jefferies Financial Group, Inc. | | | 1,222,845 | |
| | 15,689 | | | Kemper Corporation | | | 1,179,656 | |
| | 200,472 | | | KeyCorp | | | 3,640,571 | |
| | 5,858 | | | Ladder Capital Corporation | | | 98,649 | |
| | 7,697 | | | Lakeland Bancorp, Inc. | | | 126,770 | |
| | 36,445 | | | Loews Corporation | | | 1,696,879 | |
| | 560 | | | Markel Corporationh | | | 612,214 | |
| | 5,179 | | | MarketAxess Holdings, Inc. | | | 1,085,881 | |
| | 3,000 | | | Matsui Securities Company, Ltd. | | | 30,576 | |
| | 233,217 | | | Medibank Private, Ltd. | | | 462,415 | |
| | 2,163 | | | Mercantile Bank Corporation | | | 68,697 | |
| | 65,607 | | | Meridian Bancorp, Inc. | | | 1,039,215 | |
| | 7,260 | | | MetLife, Inc. | | | 299,039 | |
| | 22,502 | | | MidWestOne Financial Group, Inc. | | | 648,283 | |
| | 11,958 | | | Morgan Stanley | | | 546,002 | |
| | 6,805 | | | National Bank Holdings Corporation | | | 229,737 | |
| | 4,873 | | | National Bank of Canada | | | 221,209 | |
| | 147 | | | National Western Life Group, Inc. | | | 39,584 | |
| | 973 | | | NBT Bancorp, Inc. | | | 35,505 | |
| | 9,126 | | | Old Second Bancorp, Inc. | | | 129,772 | |
| | 13,720 | | | PacWest Bancorp | | | 557,306 | |
| | 1,304 | | | Paragon Banking Group plc | | | 7,087 | |
| | 2,036 | | | Pargesa Holding SA | | | 149,463 | |
| | 334 | | | Park National Corporation | | | 30,528 | |
| | 47,099 | | | PCSB Financial Corporation | | | 881,693 | |
| | 4,461 | | | Peapack-Gladstone Financial Corporation | | | 120,402 | |
| | 2,546 | | | Peoples Bancorp, Inc. | | | 87,150 | |
| | 10,974 | | | Primerica, Inc. | | | 1,204,287 | |
| | 1,464 | | | Principal Financial Group, Inc. | | | 68,910 | |
| | 56,415 | | | Provident Financial Services, Inc. | | | 1,376,526 | |
| | 2,350 | | | Prudential Financial, Inc. | | | 220,383 | |
| | 11,949 | | | QCR Holdings, Inc. | | | 435,302 | |
| | 17,550 | | | Radian Group, Inc. | | | 336,784 | |
| | 2,140 | | | Raymond James Financial, Inc. | | | 164,117 | |
| | 26,782 | | | Sandy Spring Bancorp, Inc. | | | 952,100 | |
| | 67,619 | | | Santander Consumer USA Holdings Inc. | | | 1,267,856 | |
| | 61,903 | | | Seacoast Banking Corporation of Floridah | | | 1,628,668 | |
| | 1,500 | | | Senshu Ikeda Holdings, Inc. | | | 4,610 | |
| | 123,054 | | | SLM Corporationh | | | 1,247,768 | |
| | 14,697 | | | State Auto Financial Corporation | | | 467,218 | |
| | 4,522 | | | State Street Corporation | | | 310,887 | |
| | 25,594 | | | Stifel Financial Corporation | | | 1,170,158 | |
| | 1,508 | | | Sun Life Financial, Inc. | | | 55,225 | |
| | 9,308 | | | SVB Financial Grouph | | | 2,208,137 | |
| | 70,282 | | | Synovus Financial Corporation | | | 2,639,792 | |
| | 3,961 | | | Territorial Bancorp, Inc. | | | 107,898 | |
| | 768 | | | Topdanmark AS | | | 36,506 | |
| | 11,260 | | | TriCo Bancshares | | | 405,585 | |
| | 74,677 | | | TrustCo Bank Corporation | | | 559,331 | |
| | 7,070 | | | U.S. Bancorp | | | 369,549 | |
| | 20,470 | | | United Community Banks, Inc. | | | 509,089 | |
| | 32,406 | | | United Financial Bancorp, Inc. | | | 500,673 | |
| | 1,966 | | | United Fire Group, Inc. | | | 105,830 | |
| | 857 | | | Univest Corporation of Pennsylvania | | | 21,391 | |
| | 11,421 | | | Unum Group | | | 414,125 | |
| | 6,652 | | | Washington Trust Bancorp, Inc. | | | 341,580 | |
| | 15,588 | | | Wells Fargo & Company | | | 829,749 | |
| | 5,748 | | | Western Alliance Bancorph | | | 277,283 | |
| | 21,711 | | | Wintrust Financial Corporation | | | 1,653,076 | |
| | 33,307 | | | WSFS Financial Corporation | | | 1,416,547 | |
| | 52,520 | | | Zions Bancorporations NA | | | 2,471,066 | |
| | | | | |
| | | | Total | | | 118,444,811 | |
| | | | | |
| |
| | Health Care (3.3%) | | | | |
| | 1,248 | | | ABIOMED, Inc.h | | | 425,818 | |
| | 12,987 | | | Aerie Pharmaceuticals, Inc.h | | | 690,649 | |
| | 2,170 | | | Aetna, Inc. | | | 430,528 | |
| | 9,917 | | | AmerisourceBergen Corporation | | | 872,696 | |
| | 11,421 | | | Amgen, Inc. | | | 2,201,855 | |
| | 1,717 | | | Amplifon SPA | | | 30,415 | |
| | 7,201 | | | Ardelyx, Inc.h | | | 19,803 | |
| | 6,795 | | | Arena Pharmaceuticals, Inc.h | | | 242,310 | |
| | 25,957 | | | Asterias Biotherapeutics, Inc.h,i | | | 29,332 | |
| | 457 | | | Atrion Corporation | | | 311,756 | |
| | 14,603 | | | Baxter International, Inc. | | | 912,834 | |
| | 4,133 | | | Becton, Dickinson and Company | | | 952,657 | |
| | 3,820 | | | Biogen, Inc.h | | | 1,162,311 | |
| | 26,236 | | | BioMarin Pharmaceutical, Inc.h | | | 2,418,172 | |
| | 1,690 | | | Bio-Techne Corporation | | | 283,447 | |
| | 2,576 | | | Bruker Corporation | | | 80,706 | |
| | 5,474 | | | Cardinal Health, Inc. | | | 276,984 | |
| | 16,962 | | | Cardiovascular Systems, Inc.h | | | 475,784 | |
| | 50,007 | | | Catalent, Inc.h | | | 2,017,282 | |
| | 7,970 | | | Charles River Laboratories International, Inc.h | | | 970,905 | |
| | 12,547 | | | Concert Pharmaceuticals, Inc.h | | | 187,201 | |
| | 16,837 | | | Danaher Corporation | | | 1,673,598 | |
| | 14,490 | | | Dexcom, Inc.h | | | 1,923,837 | |
| | 9,327 | | | Edwards Lifesciences Corporationh | | | 1,376,665 | |
| | 9,108 | | | Epizyme, Inc.h | | | 73,319 | |
| | 24,282 | | | Evolent Health, Inc.h | | | 539,060 | |
| | 5,364 | | | Express Scripts Holding Companyh | | | 520,147 | |
| | 60,041 | | | GenMark Diagnostics, Inc.h | | | 320,019 | |
| | 1,486 | | | Genomic Health, Inc.h | | | 106,561 | |
| | 9,765 | | | Gilead Sciences, Inc. | | | 665,778 | |
| | 33,359 | | | GlaxoSmithKline plc | | | 646,089 | |
| | 7,650 | | | GlaxoSmithKline plc ADR | | | 298,809 | |
| | 74,045 | | | Halozyme Therapeutics, Inc.h | | | 1,149,919 | |
| | 4,391 | | | Heska Corporationh | | | 440,066 | |
| | 13,348 | | | Hill-Rom Holdings, Inc. | | | 1,122,300 | |
| | 2,016 | | | Illumina, Inc.h | | | 627,278 | |
| | 14,277 | | | Immunomedics, Inc.h | | | 321,661 | |
| | 6,503 | | | Inogen, Inc.h | | | 1,232,774 | |
| | 19,753 | | | Intersect ENT, Inc.h | | | 554,269 | |
| | 5,452 | | | Intra-Cellular Therapies, Inc.h | | | 92,575 | |
| | 1,856 | | | Intuitive Surgical, Inc.h | | | 967,310 | |
| | 8,080 | | | Jazz Pharmaceuticals, Inc.h | | | 1,283,266 | |
| | 22,749 | | | Johnson & Johnson | | | 3,184,633 | |
| | 2,000 | | | KYORIN Holdings, Inc. | | | 43,679 | |
| | 31,816 | | | LHC Group, Inc.h | | | 2,908,937 | |
| | 217 | | | LNA Sante | | | 11,476 | |
| | 5,385 | | | Magellan Health Services, Inc.h | | | 350,348 | |
| | 6,472 | | | Medpace Holdings, Inc.h | | | 337,191 | |
| | 31,510 | | | Medtronic plc | | | 2,830,228 | |
| | 15,960 | | | Merck & Company, Inc. | | | 1,174,816 | |
| | 16,613 | | | Merit Medical Systems, Inc.h | | | 948,935 | |
| | 1,300 | | | Miraca Holdings, Inc. | | | 31,647 | |
| | 25,997 | | | Mylan NVh | | | 812,406 | |
The accompanying Notes to Financial Statements are an integral part of this schedule.
97
MODERATELY AGGRESSIVE ALLOCATION FUND
Schedule of Investments as of October 31, 2018
| | | | | | | | |
| Shares | | | Common Stock (24.5%) | | Value | |
| | Health Care (3.3%) - continued | | | | |
| | 31,114 | | | Myriad Genetics, Inc.h | | | $1,401,064 | |
| | 25,800 | | | Natera, Inc.h | | | 566,568 | |
| | 7,743 | | | National Healthcare Corporation | | | 615,801 | |
| | 16,315 | | | Neurocrine Biosciences, Inc.h | | | 1,748,152 | |
| | 19,895 | | | Nevro Corporationh | | | 970,080 | |
| | 9,039 | | | Novartis AG | | | 791,567 | |
| | 19,967 | | | Novo Nordisk AS | | | 862,306 | |
| | 17,208 | | | Novocure, Ltd.h | | | 570,273 | |
| | 35,567 | | | NuVasive, Inc.h | | | 1,997,798 | |
| | 26,582 | | | Omnicell, Inc.h | | | 1,879,347 | |
| | 96,015 | | | Optinose, Inc.h,i | | | 1,015,839 | |
| | 12,263 | | | PerkinElmer, Inc. | | | 1,060,504 | |
| | 11,251 | | | Perrigo Company plc | | | 790,945 | |
| | 78,752 | | | Pfizer, Inc. | | | 3,391,061 | |
| | 10,555 | | | Ra Medical Systems, Inc.h | | | 112,939 | |
| | 3,148 | | | Roche Holding AG | | | 766,105 | |
| | 5,013 | | | Sage Therapeutics, Inc.h | | | 645,073 | |
| | 26,353 | | | Syneos Health, Inc.h | | | 1,202,487 | |
| | 41,388 | | | Tactile Systems Technology, Inc.h | | | 2,710,086 | |
| | 15,228 | | | Teleflex, Inc. | | | 3,665,989 | |
| | 12,255 | | | Thermo Fisher Scientific, Inc. | | | 2,863,381 | |
| | 20,629 | | | UnitedHealth Group, Inc. | | | 5,391,389 | |
| | 15,900 | | | Universal Health Services, Inc. | | | 1,932,804 | |
| | 14,050 | | | Valeant Pharmaceuticals International, Inc.h | | | 321,464 | |
| | 24,564 | | | Veeva Systems, Inc.h | | | 2,243,921 | |
| | 14,560 | | | Vertex Pharmaceuticals, Inc.h | | | 2,467,338 | |
| | 5,458 | | | West Pharmaceutical Services, Inc. | | | 578,111 | |
| | 47,790 | | | Wright Medical Group NVh | | | 1,289,374 | |
| | 24,588 | | | Zoetis, Inc. | | | 2,216,608 | |
| | | | | |
| | | | Total | | | 89,631,415 | |
| | | | | |
| |
| | Industrials (3.7%) | | | | |
| | 21,170 | | | Acco Brands Corporation | | | 170,842 | |
| | 8,791 | | | ACS Actividades de Construccion y Servicios, SAh | | | 329,146 | |
| | 2,300 | | | Acuity Brands, Inc. | | | 288,972 | |
| | 16,323 | | | Advanced Disposal Services, Inc.h | | | 442,190 | |
| | 12,591 | | | AECOMh | | | 366,902 | |
| | 10,670 | | | Aegion Corporationh | | | 206,571 | |
| | 28,599 | | | Aerojet Rocketdyne Holdings, Inc.h | | | 1,010,117 | |
| | 15,427 | | | AGCO Corporation | | | 864,529 | |
| | 28,864 | | | AMETEK, Inc. | | | 1,936,197 | |
| | 13,399 | | | ASGN, Inc.h | | | 898,805 | |
| | 14,594 | | | Atlas Copco AB, Class A | | | 360,789 | |
| | 13,067 | | | Atlas Copco AB, Class B | | | 299,278 | |
| | 9,186 | | | AZZ, Inc. | | | 407,399 | |
| | 6,351 | | | Boeing Company | | | 2,253,716 | |
| | 3,099 | | | Brady Corporation | | | 124,859 | |
| | 5,075 | | | Brink’s Company | | | 336,574 | |
| | 7,262 | | | BWX Technologies, Inc. | | | 424,537 | |
| | 36,277 | | | Casella Waste Systems, Inc.h | | | 1,181,179 | |
| | 24,206 | | | CBIZ, Inc.h | | | 536,889 | |
| | 1,214 | | | CIA De Distribucion Integral | | | 29,310 | |
| | 16,180 | | | Colfax Corporationh | | | 453,525 | |
| | 18,963 | | | Comfort Systems USA, Inc. | | | 1,014,141 | |
| | 43,322 | | | Costamare, Inc. | | | 229,607 | |
| | 22,350 | | | Crane Company | | | 1,945,344 | |
| | 1,056 | | | CSW Industrials, Inc.h | | | 48,608 | |
| | 29,200 | | | CSX Corporation | | | 2,010,712 | |
| | 400 | | | Cummins, Inc. | | | 54,676 | |
| | 4,955 | | | Curtiss-Wright Corporation | | | 542,374 | |
| | 9,920 | | | Delta Air Lines, Inc. | | | 542,922 | |
| | 12,198 | | | Dycom Industries, Inc.h | | | 828,000 | |
| | 33,420 | | | EMCOR Group, Inc. | | | 2,372,152 | |
| | 18,175 | | | Emerson Electric Company | | | 1,233,719 | |
| | 20,272 | | | Encore Wire Corporation | | | 896,022 | |
| | 1,179 | | | Ennis, Inc. | | | 22,825 | |
| | 4,449 | | | ESCO Technologies, Inc. | | | 272,368 | |
| | 115,176 | | | Euronav NV | | | 1,059,619 | |
| | 20,219 | | | Federal Signal Corporation | | | 444,616 | |
| | 736 | | | Ferguson plc | | | 49,621 | |
| | 8,704 | | | Forrester Research, Inc. | | | 350,597 | |
| | 10,496 | | | Fortune Brands Home and Security, Inc. | | | 470,536 | |
| | 3,212 | | | Franklin Electric Company, Inc. | | | 136,253 | |
| | 7,975 | | | General Dynamics Corporation | | | 1,376,325 | |
| | 12,304 | | | Genesee & Wyoming, Inc.h | | | 974,846 | |
| | 2,276 | | | Global Brass and Copper Holdings, Inc. | | | 71,967 | |
| | 300 | | | Glory, Ltd. | | | 6,986 | |
| | 1,882 | | | GMS, Inc.h | | | 30,940 | |
| | 7,043 | | | Gorman-Rupp Company | | | 242,983 | |
| | 15,602 | | | Granite Construction, Inc. | | | 713,323 | |
| | 18,969 | | | GWA Group, Ltd. | | | 37,096 | |
| | 28,724 | | | Healthcare Services Group, Inc.i | | | 1,165,907 | |
| | 20,475 | | | Heico Corporation | | | 1,716,419 | |
| | 6,600 | | | Hino Motors, Ltd. | | | 63,177 | |
| | 2,000 | | | Hitachi Zosen Corporation | | | 7,601 | |
| | 516 | | | Hochtief AG | | | 76,465 | |
| | 26,612 | | | Honeywell International, Inc. | | | 3,853,950 | |
| | 7,152 | | | Hubbell, Inc. | | | 727,358 | |
| | 3,735 | | | Huntington Ingalls Industries, Inc. | | | 816,023 | |
| | 1,794 | | | Hyster-Yale Materials Handling, Inc. | | | 108,447 | |
| | 1,518 | | | ICF International, Inc. | | | 111,786 | |
| | 2,999 | | | Illinois Tool Works, Inc. | | | 382,582 | |
| | 2,400 | | | Inaba Denki Sangyo Company, Ltd. | | | 96,631 | |
| | 16,876 | | | Ingersoll-Rand plc | | | 1,619,083 | |
| | 47,777 | | | Interface, Inc. | | | 778,287 | |
| | 7,660 | | | Jacobs Engineering Group, Inc. | | | 575,189 | |
| | 11,835 | | | JB Hunt Transport Services, Inc. | | | 1,309,069 | |
| | 4,559 | | | Kadant, Inc. | | | 449,973 | |
| | 24,771 | | | KAR Auction Services, Inc. | | | 1,410,461 | |
| | 76,383 | | | KeyW Holding Corporationh | | | 598,079 | |
| | 18,219 | | | Kforce, Inc. | | | 561,510 | |
| | 11,155 | | | Kirby Corporationh | | | 802,491 | |
| | 23,186 | | | Korn/Ferry International | | | 1,046,616 | |
| | 7,120 | | | L3 Technologies, Inc. | | | 1,349,026 | |
| | 28,945 | | | Lincoln Electric Holdings, Inc. | | | 2,341,940 | |
| | 9,737 | | | Lindsay Corporation | | | 931,052 | |
| | 2,589 | | | Lockheed Martin Corporation | | | 760,778 | |
| | 18,190 | | | Masco Corporation | | | 545,700 | |
| | 9,119 | | | Masonite International Corporationh | | | 505,101 | |
| | 24,140 | | | Mercury Systems, Inc.h | | | 1,131,200 | |
| | 29,578 | | | Milacron Holdings Corporationh | | | 414,092 | |
| | 2,000 | | | Mitsuboshi Belting, Ltd. | | | 49,133 | |
| | 1,576 | | | Monadelphous Group, Ltd. | | | 16,127 | |
| | 8,202 | | | Moog, Inc. | | | 586,853 | |
| | 149,243 | | | MRC Global, Inc.h | | | 2,362,517 | |
| | 10,420 | | | Mueller Industries, Inc. | | | 253,727 | |
| | 7,376 | | | National Express Group plc | | | 37,689 | |
| | 51,367 | | | NCI Building Systems, Inc.h | | | 629,246 | |
| | 90,228 | | | Nexeo Solutions, Inc.h | | | 942,883 | |
| | 6,300 | | | Nitto Kogyo Corporation | | | 109,723 | |
| | 3,178 | | | Nobina ABj | | | 21,206 | |
| | 7,162 | | | Norfolk Southern Corporation | | | 1,201,998 | |
| | 2,237 | | | Northgate plc | | | 10,774 | |
| | 8,396 | | | Old Dominion Freight Line, Inc. | | | 1,095,006 | |
| | 446 | | | Orion Group Holdings, Inc.h | | | 2,105 | |
| | 16,945 | | | Oshkosh Corporation | | | 951,292 | |
| | 17,862 | | | PageGroup plc | | | 114,495 | |
| | 3,519 | | | Parker Hannifin Corporation | | | 533,586 | |
The accompanying Notes to Financial Statements are an integral part of this schedule.
98
MODERATELY AGGRESSIVE ALLOCATION FUND
Schedule of Investments as of October 31, 2018
| | | | | | | | |
| Shares | | | Common Stock (24.5%) | | Value | |
| | Industrials (3.7%) - continued | | | | |
| | 59,559 | | | Primoris Services Corporation | | | $1,260,864 | |
| | 5,490 | | | Radiant Logistics, Inc.h | | | 29,866 | |
| | 9,370 | | | Raven Industries, Inc. | | | 407,408 | |
| | 10,693 | | | Regal-Beloit Corporation | | | 766,688 | |
| | 20,840 | | | RELX plc | | | 412,146 | |
| | 15,091 | | | RELX plc | | | 298,610 | |
| | 4,435 | | | Resideo Technologies, Inc.h | | | 93,357 | |
| | 4,402 | | | Resources Connection, Inc. | | | 71,841 | |
| | 18,880 | | | Ritchie Brothers Auctioneers, Inc. | | | 634,557 | |
| | 552 | | | Rockwool International AS | | | 188,595 | |
| | 7,124 | | | Roper Industries, Inc. | | | 2,015,380 | |
| | 1,470 | | | Rush Enterprises, Inc. | | | 52,023 | |
| | 3,784 | | | Sandvik AB | | | 59,820 | |
| | 1,666 | | | Schindler Holding AG, Participation Certificate | | | 351,300 | |
| | 2,561 | | | Schneider Electric SE | | | 185,188 | |
| | 22 | | | SGS SA | | | 52,251 | |
| | 800 | | | ShinMaywa Industries, Ltd. | | | 9,849 | |
| | 28,437 | | | SiteOne Landscape Supply, Inc.h | | | 1,934,853 | |
| | 16,497 | | | SKF AB | | | 264,482 | |
| | 2,380 | | | Smiths Group plc | | | 42,425 | |
| | 52,661 | | | Southwest Airlines Company | | | 2,585,655 | |
| | 7,640 | | | SP Plus Corporationh | | | 244,174 | |
| | 1,003 | | | Spirax-Sarco Engineering plc | | | 82,848 | |
| | 17,531 | | | SPX Corporationh | | | 514,009 | |
| | 6,751 | | | SPX FLOW, Inc.h | | | 231,087 | |
| | 8,747 | | | Standex International Corporation | | | 709,557 | |
| | 32,600 | | | Sumitomo Electric Industries, Ltd. | | | 444,585 | |
| | 800 | | | Taikisha, Ltd. | | | 22,575 | |
| | 20,533 | | | Terex Corporation | | | 685,597 | |
| | 2,300 | | | Toppan Forms Company, Ltd. | | | 20,908 | |
| | 11,500 | | | Toppan Printing Company, Ltd. | | | 162,580 | |
| | 200 | | | Toshiba Machine Company, Ltd. | | | 3,787 | |
| | 51,582 | | | TPI Composites, Inc.h | | | 1,302,961 | |
| | 3,832 | | | Transcontinental, Inc. | | | 63,078 | |
| | 1,670 | | | TransDigm Group, Inc.h | | | 551,517 | |
| | 6,872 | | | TransUnion | | | 451,834 | |
| | 29,733 | | | TriMas Corporationh | | | 875,637 | |
| | 1,800 | | | Tsubakimoto Chain Company | | | 69,114 | |
| | 1,255 | | | UniFirst Corporation | | | 187,372 | |
| | 15,760 | | | United Continental Holdings, Inc.h | | | 1,347,638 | |
| | 2,789 | | | United Parcel Service, Inc. | | | 297,140 | |
| | 10,608 | | | United Rentals, Inc.h | | | 1,273,703 | |
| | 6,050 | | | United Technologies Corporation | | | 751,471 | |
| | 34,943 | | | Univar, Inc.h | | | 860,297 | |
| | 12,429 | | | Universal Truckload Services, Inc. | | | 337,696 | |
| | 7,248 | | | Valmont Industries, Inc. | | | 900,999 | |
| | 21,600 | | | Verisk Analytics, Inc.h | | | 2,588,544 | |
| | 4,782 | | | Vinci SAi | | | 425,593 | |
| | 10,149 | | | WABCO Holdings, Inc.h | | | 1,090,510 | |
| | 22,300 | | | WageWorks, Inc.h | | | 887,763 | |
| | 49,181 | | | Waste Connections, Inc. | | | 3,759,396 | |
| | 4,220 | | | Watsco, Inc. | | | 625,320 | |
| | 35,094 | | | Willdan Group, Inc.h | | | 1,059,839 | |
| | 5,813 | | | XPO Logistics, Inc.h | | | 519,566 | |
| | 1,100 | | | Yuasa Trading Company, Ltd. | | | 36,085 | |
| | | | | |
| | | | Total | | | 101,177,795 | |
| | | | | |
| |
| | Information Technology (5.3%) | | | | |
| | 5,541 | | | 2U, Inc.h | | | 348,584 | |
| | 14,323 | | | Activision Blizzard, Inc. | | | 989,003 | |
| | 2,121 | | | Adobe, Inc.h | | | 521,257 | |
| | 67,740 | | | Advanced Micro Devices, Inc.h | | | 1,233,545 | |
| | 48,163 | | | Agilent Technologies, Inc. | | | 3,120,481 | |
| | 23,545 | | | Akamai Technologies, Inc.h | | | 1,701,126 | |
| | 3,670 | | | Alliance Data Systems Corporation | | | 756,681 | |
| | 5,223 | | | Amadeus IT Holding SA | | | 420,578 | |
| | 10,554 | | | Ambarella, Inc.h,i | | | 367,068 | |
| | 3,285 | | | American Software, Inc. | | | 37,810 | |
| | 50,436 | | | Amphenol Corporation | | | 4,514,022 | |
| | 1,532 | | | ANSYS, Inc.h | | | 229,111 | |
| | 29,928 | | | Apple, Inc. | | | 6,550,042 | |
| | 15,128 | | | Applied Materials, Inc. | | | 497,409 | |
| | 7,463 | | | Arista Networks, Inc.h | | | 1,719,102 | |
| | 26,862 | | | Arrow Electronics, Inc.h | | | 1,818,826 | |
| | 4,039 | | | Atkore International Group, Inc.h | | | 77,791 | |
| | 7,140 | | | Atlassian Corporation plch | | | 541,997 | |
| | 8,320 | | | Autodesk, Inc.h | | | 1,075,360 | |
| | 11,493 | | | Automatic Data Processing, Inc. | | | 1,655,911 | |
| | 10,479 | | | Belden, Inc. | | | 566,390 | |
| | 31,316 | | | Benchmark Electronics, Inc. | | | 683,628 | |
| | 51,662 | | | Blackline, Inc.h | | | 2,396,084 | |
| | 66,412 | | | Booz Allen Hamilton Holding Corporation | | | 3,290,050 | |
| | 11,800 | | | Canon, Inc. | | | 336,104 | |
| | 4,439 | | | Capgemini SA | | | 542,020 | |
| | 7,979 | | | CDW Corporation | | | 718,190 | |
| | 11,700 | | | CEVA, Inc.h | | | 288,288 | |
| | 11,181 | | | CGI Group, Inc.h | | | 690,505 | |
| | 79,328 | | | Ciena Corporationh | | | 2,479,793 | |
| | 116,270 | | | Cisco Systems, Inc. | | | 5,319,352 | |
| | 11,468 | | | Cognex Corporation | | | 491,289 | |
| | 1,880 | | | Cognizant Technology Solutions Corporation | | | 129,776 | |
| | 26,005 | | | CoreLogic, Inc.h | | | 1,056,323 | |
| | 955 | | | CSG Systems International, Inc. | | | 33,521 | |
| | 65,263 | | | Dolby Laboratories, Inc. | | | 4,490,747 | |
| | 6,183 | | | Endurance International Group Holdings, Inc.h | | | 61,026 | |
| | 7,733 | | | Envestnet, Inc.h | | | 402,271 | |
| | 4,890 | | | Euronet Worldwide, Inc.h | | | 543,670 | |
| | 58,070 | | | EVERTEC, Inc. | | | 1,514,466 | |
| | 1,000 | | | ExlService Holdings, Inc.h | | | 64,100 | |
| | 2,347 | | | Fidelity National Information Services, Inc. | | | 244,323 | |
| | 21,071 | | | Fiserv, Inc.h | | | 1,670,930 | |
| | 96,082 | | | Flextronics International, Ltd.h | | | 755,205 | |
| | 41,040 | | | FLIR Systems, Inc. | | | 1,900,562 | |
| | 23,044 | | | Fortinet, Inc.h | | | 1,893,756 | |
| | 20,870 | | | Global Payments, Inc. | | | 2,383,980 | |
| | 29,151 | | | Guidewire Software, Inc.h | | | 2,593,564 | |
| | 3,051 | | | Halma plc | | | 51,777 | |
| | 62,624 | | | Keysight Technologies, Inc.h | | | 3,574,578 | |
| | 23,800 | | | Konica Minolta Holdings, Inc. | | | 235,582 | |
| | 295 | | | Kulicke and Soffa Industries, Inc. | | | 5,997 | |
| | 7,100 | | | Lam Research Corporation | | | 1,006,283 | |
| | 43,737 | | | M/A-COM Technology Solutions Holdings, Inc.h,i | | | 615,380 | |
| | 4,299 | | | ManTech International Corporation | | | 246,247 | |
| | 27,013 | | | MasterCard, Inc. | | | 5,339,660 | |
| | 9,120 | | | Maxim Integrated Products, Inc. | | | 456,182 | |
| | 59,137 | | | Microsoft Corporation | | | 6,316,423 | |
| | 1,038 | | | MicroStrategy, Inc.h | | | 130,757 | |
| | 10,041 | | | MoneyGram International, Inc.h | | | 42,574 | |
| | 31,668 | | | Monolithic Power Systems, Inc. | | | 3,740,624 | |
| | 5,663 | | | Monotype Imaging Holdings, Inc. | | | 99,272 | |
| | 35,238 | | | National Instruments Corporation | | | 1,725,605 | |
| | 3,300 | | | NEC Networks & System Integration Corporation | | | 71,927 | |
| | 25,752 | | | New Relic, Inc.h | | | 2,298,366 | |
| | 10,056 | | | Nice, Ltd. ADRh | | | 1,065,333 | |
| | 9,033 | | | Novanta, Inc.h | | | 525,811 | |
The accompanying Notes to Financial Statements are an integral part of this schedule.
99
MODERATELY AGGRESSIVE ALLOCATION FUND
Schedule of Investments as of October 31, 2018
| | | | | | | | |
| Shares | | | Common Stock (24.5%) | | Value | |
| | Information Technology (5.3%) - continued | | | | |
| | 5,787 | | | NVIDIA Corporation | | | $1,220,073 | |
| | 58,042 | | | Oracle Corporation | | | 2,834,771 | |
| | 8,210 | | | Palo Alto Networks, Inc.h | | | 1,502,758 | |
| | 30,449 | | | PayPal Holdings, Inc.h | | | 2,563,501 | |
| | 7,946 | | | Pegasystems, Inc. | | | 425,270 | |
| | 22,778 | | | Plexus Corporationh | | | 1,330,235 | |
| | 27,806 | | | Proofpoint, Inc.h | | | 2,528,956 | |
| | 40,569 | | | Q2 Holdings, Inc.h | | | 2,159,488 | |
| | 88,509 | | | Quantenna Communications, Inc.h | | | 1,589,622 | |
| | 14,102 | | | Red Hat, Inc.h | | | 2,420,467 | |
| | 15,131 | | | Rogers Corporationh | | | 1,862,021 | |
| | 20,810 | | | Rudolph Technologies, Inc.h | | | 432,640 | |
| | 1,100 | | | Ryoyo Electro Corporation | | | 15,775 | |
| | 62,309 | | | SailPoint Technologies Holdings, Inc.h | | | 1,622,526 | |
| | 22,436 | | | Salesforce.com, Inc.h | | | 3,079,117 | |
| | 6,511 | | | ScanSource, Inc.h | | | 253,148 | |
| | 110,198 | | | Sequans Communications SA ADRh | | | 115,708 | |
| | 10,422 | | | ServiceNow, Inc.h | | | 1,886,799 | |
| | 18,100 | | | Shinko Electric Industries Company, Ltd. | | | 126,016 | |
| | 2,207 | | | Silicon Laboratories, Inc.h | | | 179,937 | |
| | 105 | | | Siltronic AG | | | 9,616 | |
| | 8,917 | | | SS&C Technologies Holdings, Inc. | | | 456,194 | |
| | 39,020 | | | Synopsys, Inc.h | | | 3,493,461 | |
| | 8,749 | | | Teradata Corporationh | | | 318,464 | |
| | 9,991 | | | Teradyne, Inc. | | | 344,190 | |
| | 19,342 | | | Texas Instruments, Inc. | | | 1,795,518 | |
| | 600 | | | Tokyo Seimitsu Company, Ltd. | | | 14,428 | |
| | 641 | | | Trimble, Inc.h | | | 23,961 | |
| | 11,648 | | | Tyler Technologies, Inc.h | | | 2,465,416 | |
| | 1,948 | | | Ultimate Software Group, Inc.h | | | 519,395 | |
| | 6,338 | | | Universal Display Corporationi | | | 779,637 | |
| | 29,305 | | | Verint Systems, Inc.h | | | 1,338,359 | |
| | 1,573 | | | VeriSign, Inc.h | | | 224,215 | |
| | 52,840 | | | Virtusa Corporationh | | | 2,620,336 | |
| | 22,939 | | | Visa, Inc. | | | 3,162,141 | |
| | 40,920 | | | Xilinx, Inc. | | | 3,493,340 | |
| | 40,770 | | | Zix Corporationh | | | 274,790 | |
| | 23,700 | | | Zuora, Inc.h | | | 483,954 | |
| | | | | |
| | | | Total | | | 143,230,238 | |
| | | | | |
| |
| | Materials (1.0%) | | | | |
| | 6,110 | | | Alcoa Corporationh | | | 213,789 | |
| | 5,415 | | | Balchem Corporation | | | 507,115 | |
| | 7,700 | | | Ball Corporation | | | 344,960 | |
| | 8,364 | | | BASF SE | | | 641,838 | |
| | 24,655 | | | BHP Billiton plc | | | 491,835 | |
| | 14,357 | | | BHP Billiton, Ltd. | | | 331,269 | |
| | 575 | | | Canfor Corporationh | | | 8,260 | |
| | 25,434 | | | Celanese Corporation | | | 2,465,572 | |
| | 6,850 | | | CF Industries Holdings, Inc. | | | 329,005 | |
| | 2,935 | | | Coeur Mining, Inc.h | | | 14,029 | |
| | 17,841 | | | Continental Building Products, Inc.h | | | 496,158 | |
| | 14,100 | | | Daicel Corporation | | | 149,164 | |
| | 4,440 | | | Eastman Chemical Company | | | 347,874 | |
| | 8,931 | | | Evonik Industries AG | | | 276,286 | |
| | 22,270 | | | Ferroglobe Representation & Warranty Insurance Truste,h | | | 2 | |
| | 19,017 | | | Freeport-McMoRan, Inc. | | | 221,548 | |
| | 483 | | | Fuchs Petrolub SE | | | 22,358 | |
| | 6,417 | | | Granges AB | | | 67,841 | |
| | 853 | | | Hexpol AB | | | 7,894 | |
| | 1,300 | | | Hitachi Chemical Company, Ltd. | | | 20,491 | |
| | 1,500 | | | Hokuetsu Corporation | | | 7,165 | |
| | 15,372 | | | Innospec, Inc. | | | 1,028,694 | |
| | 6,041 | | | International Paper Company | | | 274,020 | |
| | 2,700 | | | JSR Corporation | | | 40,239 | |
| | 758 | | | Koppers Holdings, Inc.h | | | 20,276 | |
| | 14,600 | | | Kuraray Company, Ltd. | | | 200,539 | |
| | 6,300 | | | Kyoei Steel, Ltd. | | | 114,123 | |
| | 7,540 | | | Martin Marietta Materials, Inc. | | | 1,291,451 | |
| | 32,407 | | | Mercer International, Inc. | | | 492,910 | |
| | 5,076 | | | Methanex Corporation | | | 328,569 | |
| | 11,691 | | | Minerals Technologies, Inc. | | | 640,082 | |
| | 9,647 | | | Mondi plc | | | 227,176 | |
| | 19,599 | | | Myers Industries, Inc. | | | 310,840 | |
| | 15,870 | | | Newmont Mining Corporation | | | 490,700 | |
| | 6,500 | | | Nippon Kayaku Company, Ltd. | | | 77,358 | |
| | 4,500 | | | Nippon Light Metal Holdings Company, Ltd. | | | 9,489 | |
| | 22,100 | | | Nippon Steel & Sumitomo Metal Corporation | | | 407,660 | |
| | 13,215 | | | Nucor Corporation | | | 781,271 | |
| | 2,515 | | | Olympic Steel, Inc. | | | 47,433 | |
| | 52,871 | | | OMNOVA Solutions, Inc.h | | | 390,717 | |
| | 19,945 | | | Owens-Illinois, Inc.h | | | 312,538 | |
| | 3,442 | | | Packaging Corporation of America | | | 316,010 | |
| | 30,395 | | | Reliance Steel & Aluminum Company | | | 2,398,773 | |
| | 43 | | | Rio Tinto, Ltd. | | | 2,340 | |
| | 18,810 | | | RPM International, Inc. | | | 1,150,608 | |
| | 11,893 | | | Ryerson Holding Corporationh | | | 109,178 | |
| | 17,216 | | | Sandfire Resources NL | | | 81,403 | |
| | 200 | | | Sanyo Special Steel Company, Ltd. | | | 4,599 | |
| | 19,436 | | | Schweitzer-Mauduit International, Inc. | | | 620,397 | |
| | 17,953 | | | Scotts Miracle-Gro Company | | | 1,198,183 | |
| | 20,532 | | | Sensient Technologies Corporation | | | 1,331,706 | |
| | 9,892 | | | Sonoco Products Company | | | 539,905 | |
| | 2,570 | | | SSAB AB, Class A | | | 10,260 | |
| | 13,038 | | | Steel Dynamics, Inc. | | | 516,305 | |
| | 964 | | | Stepan Company | | | 79,617 | |
| | 1,700 | | | Taiheiyo Cement Corporation | | | 50,025 | |
| | 800 | | | Taiyo Holdings Company, Ltd. | | | 28,583 | |
| | 4,300 | | | Toagosei Company, Ltd. | | | 44,154 | |
| | 14,378 | | | Trinseo SA | | | 774,687 | |
| | 600 | | | Ube Industries, Ltd. | | | 13,070 | |
| | 5,926 | | | United States Lime & Minerals, Inc. | | | 444,509 | |
| | 17,142 | | | UPM-Kymmene Oyj | | | 551,091 | |
| | 6,371 | | | Verso Corporationh | | | 179,089 | |
| | 15,739 | | | WestRock Company | | | 676,305 | |
| | 13,952 | | | Worthington Industries, Inc. | | | 584,310 | |
| | 800 | | | Yamato Kogyo Company, Ltd. | | | 21,083 | |
| | | | | |
| | | | Total | | | 26,176,728 | |
| | | | | |
| |
| | Real Estate (1.1%) | | | | |
| | 2,850 | | | Alexandria Real Estate Equities, Inc. | | | 348,356 | |
| | 5,313 | | | Americold Realty Trust | | | 131,497 | |
| | 16,609 | | | Ares Commercial Real Estate Corporation | | | 240,332 | |
| | 66,863 | | | Armada Hoffler Properties, Inc. | | | 1,001,608 | |
| | 1,618 | | | Artis Real Estate Investment Trust | | | 13,766 | |
| | 19,538 | | | Ashford Hospitality Trust, Inc. | | | 100,621 | |
| | 4,339 | | | Bluerock Residential Growth REIT, Inc. | | | 41,090 | |
| | 125,682 | | | Brixmor Property Group, Inc. | | | 2,036,048 | |
| | 4,060 | | | Camden Property Trust | | | 366,496 | |
| | 33,883 | | | Catchmark Timber Trust, Inc. | | | 299,865 | |
| | 125,994 | | | Cedar Realty Trust, Inc. | | | 474,997 | |
| | 29,362 | | | Chatham Lodging Trust | | | 572,559 | |
| | 10,811 | | | City Office REIT, Inc. | | | 119,137 | |
| | 42,613 | | | Cousins Properties, Inc. | | | 354,114 | |
The accompanying Notes to Financial Statements are an integral part of this schedule.
100
MODERATELY AGGRESSIVE ALLOCATION FUND
Schedule of Investments as of October 31, 2018
| | | | | | | | |
| Shares | | | Common Stock (24.5%) | | Value | |
| | Real Estate (1.1%) - continued | | | | |
| | 3,134 | | | Crown Castle International Corporation | | | $340,791 | |
| | 14,046 | | | CyrusOne, Inc. | | | 747,669 | |
| | 3,200 | | | Daito Trust Construction Company, Ltd. | | | 421,883 | |
| | 3,040 | | | Digital Realty Trust, Inc. | | | 313,910 | |
| | 73,308 | | | Douglas Emmett, Inc. | | | 2,653,017 | |
| | 12,880 | | | Duke Realty Corporation | | | 355,102 | |
| | 40,862 | | | Empire State Realty Trust, Inc. | | | 648,071 | |
| | 14,373 | | | Franklin Street Properties Corporation | | | 100,036 | |
| | 2,112 | | | Gaming and Leisure Properties, Inc. | | | 71,153 | |
| | 4,388 | | | Getty Realty Corporation | | | 117,730 | |
| | 1,911 | | | Gladstone Commercial Corporation | | | 36,290 | |
| | 3,000 | | | Hang Lung Properties, Ltd. | | | 5,438 | |
| | 55,626 | | | Highwoods Properties, Inc. | | | 2,371,893 | |
| | 800 | | | Hitachi High-Technologies Corporation | | | 30,024 | |
| | 19,787 | | | Hospitality Properties Trust | | | 506,943 | |
| | 18,565 | | | Host Hotels & Resorts, Inc. | | | 354,777 | |
| | 129,488 | | | Hudson Pacific Properties, Inc. | | | 3,923,486 | |
| | 36,000 | | | Hysan Development Company, Ltd. | | | 168,829 | |
| | 97,910 | | | Monmouth Real Estate Investment Corporation | | | 1,464,734 | |
| | 31,952 | | | National Storage Affiliates Trust | | | 850,882 | |
| | 8,108 | | | One Liberty Properties, Inc. | | | 210,240 | |
| | 3,173 | | | Outfront Media, Inc. | | | 56,226 | |
| | 15,687 | | | Paramount Group, Inc. | | | 224,167 | |
| | 22,798 | | | Physicians Realty Trust | | | 377,991 | |
| | 3,799 | | | Quebecor, Inc. | | | 74,511 | |
| | 3,328 | | | RE/MAX Holdings, Inc. | | | 124,434 | |
| | 107,637 | | | Retail Properties of America, Inc. | | | 1,320,706 | |
| | 11,000 | | | Road King Infrastructure, Ltd. | | | 17,027 | |
| | 2,195 | | | Saul Centers, Inc. | | | 104,833 | |
| | 10,425 | | | SBA Communications Corporationh | | | 1,690,622 | |
| | 130,483 | | | Spirit Realty Capital, Inc. | | | 1,020,377 | |
| | 1,481 | | | St. Joe Companyh | | | 22,496 | |
| | 4,000 | | | Swire Pacific, Ltd. | | | 41,555 | |
| | 20,652 | | | Terreno Realty Corporation | | | 773,004 | |
| | 34,225 | | | Urstadt Biddle Properties, Inc. | | | 681,420 | |
| | 73,218 | | | Weyerhaeuser Company | | | 1,949,795 | |
| | 25,900 | | | Wing Tai Holdings, Ltd. | | | 36,098 | |
| | | | | |
| | | | Total | | | 30,308,646 | |
| | | | | |
| |
| | Utilities (0.5%) | | | | |
| | 2,358 | | | ALLETE, Inc. | | | 174,492 | |
| | 360 | | | Alpha Natural Resources Holdings, Inc.h | | | 12,600 | |
| | 1,357 | | | ANR, Inc.h | | | 47,495 | |
| | 7,158 | | | Artesian Resources Corporation | | | 261,911 | |
| | 90,403 | | | Clearway Energy, Inc., Class A | | | 1,755,626 | |
| | 17,359 | | | Clearway Energy, Inc., Class C | | | 340,410 | |
| | 5,611 | | | Consolidated Water Company, Ltd. | | | 69,015 | |
| | 4,370 | | | Edison International, Inc. | | | 303,234 | |
| | 16,727 | | | Enagas SA | | | 443,488 | |
| | 4,950 | | | Entergy Corporation | | | 415,552 | |
| | 365 | | | IDACORP, Inc. | | | 34,040 | |
| | 39,787 | | | MDU Resources Group, Inc. | | | 993,084 | |
| | 3,848 | | | Middlesex Water Company | | | 173,160 | |
| | 10,487 | | | New Jersey Resources Corporation | | | 472,964 | |
| | 6,482 | | | NorthWestern Corporation | | | 380,882 | |
| | 17,100 | | | Osaka Gas Company, Ltd. | | | 312,691 | |
| | 17,146 | | | PG&E Corporationh | | | 802,604 | |
| | 17,846 | | | PNM Resources, Inc. | | | 685,465 | |
| | 10,369 | | | Portland General Electric Company | | | 467,435 | |
| | 8,720 | | | Public Service Enterprise Group, Inc. | | | 465,910 | |
| | 6,830 | | | Southwest Gas Holdings, Inc. | | | 527,754 | |
| | 1,698 | | | Spire, Inc. | | | 123,241 | |
| | 58,647 | | | UGI Corporation | | | 3,111,810 | |
| | 993 | | | Unitil Corporation | | | 47,177 | |
| | | | | |
| | | | Total | | | 12,422,040 | |
| | | | | |
| | | | | | | | |
| | | | | |
| | | | Total Common Stock (cost $565,710,685) | | | 661,795,863 | |
| | | | | |
| | |
Principal Amount | | | Long-Term Fixed Income (17.0%) | | Value | |
| | Asset-Backed Securities (0.7%) | | | | |
| | | | Access Group, Inc. | | | | |
| | 97,677 | | | 2.781%, (LIBOR 1M + 0.500%), 2/25/2036, Ser. 2013-1, Class Ab,j | | | 96,506 | |
| | | | Ares CLO, Ltd. | | | | |
| | 700,000 | | | 3.821%, (LIBOR 3M + 1.400%), 10/17/2030, Ser. 2018-28RA, Class A2*,b | | | 699,972 | |
| | | | Babson CLO, Ltd. | | | | |
| | 119,684 | | | 3.599%, (LIBOR 3M + 1.150%), 10/17/2026, Ser. 2014-IIA, Class AR*,b | | | 119,708 | |
| | | | Betony CLO, Ltd. | | | | |
| | 510,000 | | | 3.600%, (LIBOR 3M + 1.080%), 4/30/2031, Ser. 2018-1A, Class A1*,b | | | 509,462 | |
| | | | Buttermilk Park CLO, Ltd. | | | | |
| | 1,150,000 | | | 3.738%, (LIBOR 3M + 1.400%), 10/15/2031, Ser. 2018-1A, Class A2*,b | | | 1,149,961 | |
| | | | Carlyle Global Market Strategies CLO, Ltd. | | | | |
| | 750,000 | | | 3.782%, (LIBOR 3M + 1.450%), 7/15/2031, Ser. 2014-5A, Class A2RR*,b | | | 749,970 | |
| | | | Cent CLO 22, Ltd. | | | | |
| | 150,000 | | | 3.753%, (LIBOR 3M + 1.410%), 11/7/2026, Ser. 2014-22A, Class A1R*,b | | | 150,030 | |
| | | | Commonbond Student Loan Trust | | | | |
| | 234,844 | | | 2.781%, (LIBOR 1M + 0.500%), 2/25/2044, Ser. 2018-AGS, Class A2b,j | | | 232,396 | |
| | | | Dryden Senior Loan Fund | | | | |
| | 650,000 | | | 3.810%, (LIBOR 3M + 1.400%), 7/18/2030, Ser. 2018-65A, Class A2*,b | | | 649,988 | |
| | | | Earnest Student Loan Program, LLC | | | | |
| | 467,167 | | | 3.020%, 5/25/2034, Ser. 2016-B, Class A2j | | | 461,880 | |
| | | | Edlinc Student Loan Funding Trust | | | | |
| | 47,354 | | | 5.330%, (CMT 3M + 3.150%), 10/1/2025, Ser. 2012-A, Class AT*,b | | | 47,902 | |
| | | | Federal Home Loan Mortgage Corporation Multifamily Structured Pass Through Certificates | | | | |
| | 1,425,000 | | | 3.900%, 8/25/2028, Ser. K081, Class A2b | | | 1,435,044 | |
The accompanying Notes to Financial Statements are an integral part of this schedule.
101
MODERATELY AGGRESSIVE ALLOCATION FUND
Schedule of Investments as of October 31, 2018
| | | | | | | | |
Principal
Amount | | | Long-Term Fixed Income (17.0%) | | Value | |
| | Asset-Backed Securities (0.7%) - continued | | | | |
| | | | Galaxy XX CLO, Ltd. | | | | |
| | $450,000 | | | 3.469%, (LIBOR 3M + 1.000%), 4/20/2031, Ser. 2015-20A, Class AR*,b | | | $448,155 | |
| | | | Golub Capital Partners, Ltd. | | | | |
| | 500,000 | | | 3.610%, (LIBOR 3M + 1.150%), 10/20/2028, Ser. 2018-39A, Class A1*,b | | | 499,988 | |
| | 416,000 | | | 3.669%, (LIBOR 3M + 1.200%), 1/20/2031, Ser. 2015-23A, Class AR*,b | | | 417,253 | |
| | | | Harley Marine Financing, LLC | | | | |
| | 1,481,250 | | | 5.682%, 5/15/2043, Ser. 2018-1A, Class A2* | | | 1,370,156 | |
| | | | Limerock CLO III, LLC | | | | |
| | 450,000 | | | 3.669%, (LIBOR 3M + 1.200%), 10/20/2026, Ser. 2014-3A, Class A1R*,b | | | 450,184 | |
| | | | Madison Park Funding XIV, Ltd. | | | | |
| | 275,000 | | | 3.869%, (LIBOR 3M + 1.400%), 10/22/2030, Ser. 2014-14A, Class A2RR*,b | | | 274,998 | |
| | | | Magnetite XII, Ltd. | | | | |
| | 450,000 | | | 3.536%, (LIBOR 3M + 1.100%), 10/15/2031, Ser. 2015-12A, Class ARR*,b | | | 449,994 | |
| | | | Morgan Stanley Capital I, Inc. | | | | |
| | 400,000 | | | 4.407%, 10/23/2051, Ser. 2018-L1, Class A4 | | | 413,188 | |
| | | | Mountain View CLO, Ltd. | | | | |
| | 300,000 | | | 3.556%, (LIBOR 3M + 1.120%), 7/15/2031, Ser. 2015-9A, Class A1R*,b | | | 299,681 | |
| | | | Neuberger Berman CLO XIV, Ltd. | | | | |
| | 465,000 | | | 3.759%, (LIBOR 3M + 1.250%), 1/28/2030, Ser. 2013-14A, Class AR*,b | | | 465,228 | |
| | | | Neuberger Berman CLO, Ltd. | | | | |
| | 100,000 | | | 3.649%, (LIBOR 3M + 1.180%), 4/22/2029, Ser. 2014-17A, Class AR*,b | | | 100,123 | |
| | | | Octagon Investment Partners XVI, Ltd. | | | | |
| | 100,000 | | | 3.736%, (LIBOR 3M + 1.400%), 7/17/2030, Ser. 2013-1A, Class A2R*,b | | | 99,668 | |
| | | | Octagon Investment Partners XX, Ltd. | | | | |
| | 375,000 | | | 3.468%, (LIBOR 3M + 1.130%), 8/12/2026, Ser. 2014-1A, Class AR*,b | | | 375,107 | |
| | | | OZLM VIII, Ltd. | | | | |
| | 140,000 | | | 3.579%, (LIBOR 3M + 1.130%), 10/17/2026, Ser. 2014-8A, Class A1AR*,b | | | 140,068 | |
| | | | PPM CLO, Ltd. | | | | |
| | 300,000 | | | 3.643%, (LIBOR 3M + 1.150%), 7/15/2031, Ser. 2018-1A, Class A*,b | | | 299,657 | |
| | | | Race Point IX CLO, Ltd. | | | | |
| | 325,000 | | | 3.646%, (LIBOR 3M + 1.210%), 10/15/2030, Ser. 2015-9A, Class A1AR*,b | | | 325,890 | |
| | | | Renaissance Home Equity Loan Trust | | | | |
| | 2,035,126 | | | 5.746%, 5/25/2036, Ser. 2006-1, Class AF6k | | | 1,432,367 | |
| | 1,120,284 | | | 6.011%, 5/25/2036, Ser. 2006-1, Class AF4k | | | 817,830 | |
| | | | SBA Small Business Investment Companies | | | | |
| | 1,300,000 | | | 3.548%, 9/11/2028, Ser. 2018-10B, Class 1 | | | 1,290,940 | |
| | | | Shackleton CLO, Ltd. | | | | |
| | 300,000 | | | 3.509%, (LIBOR 3M + 1.170%), 7/15/2031, Ser. 2015-7RA, Class A1*,b | | | 299,977 | |
| | | | SLM Student Loan Trust | | | | |
| | 248,921 | | | 2.681%, (LIBOR 1M + 0.400%), 3/25/2025, Ser. 2010-1, Class Ab | | | 245,253 | |
| | 113,714 | | | 2.801%, (LIBOR 1M + 0.520%), 3/25/2026, Ser. 2011-1, Class A1b | | | 113,971 | |
| | | | SoFi Consumer Loan Program, LLC | | | | |
| | 169,882 | | | 2.140%, 9/25/2026, Ser. 2017-5, Class A1j | | | 169,084 | |
| | | | SoFi Professional Loan Program, LLC | | | | |
| | 90,304 | | | 2.420%, 3/25/2030, Ser. 2015-A, Class A2j | | | 88,931 | |
| | | | Symphony CLO XV, Ltd. | | | | |
| | 401,739 | | | 3.629%, (LIBOR 3M + 1.180%), 10/17/2026, Ser. 2014-15A, Class AR*,b | | | 401,916 | |
| | | | U.S. Residential Opportunity Fund Trust | | | | |
| | 234,031 | | | 3.352%, 11/27/2037, Ser. 2017-1III, Class Aj | | | 231,700 | |
| | | | Verus Securitization Trust | | | | |
| | 505,266 | | | 3.677%, 6/1/2058, Ser. 2018-2, Class A1b,j | | | 503,163 | |
| | | | Voya CLO 3, Ltd. | | | | |
| | 125,413 | | | 3.210%, (LIBOR 3M + 0.720%), 7/25/2026, Ser. 2014-3A, Class A1R*,b | | | 125,427 | |
| | | | | |
| | | | Total | | | 18,452,716 | |
| | | | | |
| |
| | Basic Materials (0.2%) | | | | |
| | | | Alcoa Nederland Holding BV | | | | |
| | 300,000 | | | 6.750%, 9/30/2024j | | | 315,000 | |
| | | | Anglo American Capital plc | | | | |
| | 12,000 | | | 4.125%, 9/27/2022j | | | 11,966 | |
| | 320,000 | | | 4.875%, 5/14/2025j | | | 315,491 | |
| | | | ArcelorMittal SA | | | | |
| | 247,000 | | | 6.125%, 6/1/2025i | | | 264,050 | |
| | | | Braskem Netherlands Finance BV | | | | |
| | 500,000 | | | 4.500%, 1/10/2028j | | | 461,875 | |
| | | | BWAY Holding Company | | | | |
| | 290,000 | | | 5.500%, 4/15/2024j | | | 278,400 | |
| | | | CF Industries, Inc. | | | | |
| | 500,000 | | | 3.450%, 6/1/2023i | | | 475,000 | |
| | | | Chemours Company | | | | |
| | 290,000 | | | 5.375%, 5/15/2027 | | | 269,700 | |
| | | | E.I. du Pont de Nemours and Company | | | | |
| | 12,000 | | | 2.200%, 5/1/2020 | | | 11,853 | |
The accompanying Notes to Financial Statements are an integral part of this schedule.
102
MODERATELY AGGRESSIVE ALLOCATION FUND
Schedule of Investments as of October 31, 2018
| | | | | | | | |
Principal
Amount | | | Long-Term Fixed Income (17.0%) | | Value | |
| | Basic Materials (0.2%) - continued | | | | |
| | | | First Quantum Minerals, Ltd. | | | | |
| | $60,000 | | | 7.000%, 2/15/2021j | | $ | 58,687 | |
| | 195,000 | | | 7.500%, 4/1/2025j | | | 174,037 | |
| | | | FMG Resources Property, Ltd. | | | | |
| | 30,000 | | | 5.125%, 5/15/2024j | | | 28,500 | |
| | | | Georgia-Pacific, LLC | | | | |
| | 90,000 | | | 2.539%, 11/15/2019j | | | 89,318 | |
| | | | Glencore Funding, LLC | | | | |
| | 84,000 | | | 4.125%, 5/30/2023j | | | 82,996 | |
| | 115,000 | | | 4.000%, 3/27/2027j | | | 105,763 | |
| | | | International Paper Company | | | | |
| | 230,000 | | | 4.350%, 8/15/2048 | | | 197,265 | |
| | | | Kinross Gold Corporation | | | | |
| | 6,000 | | | 5.125%, 9/1/2021 | | | 6,129 | |
| | 168,000 | | | 5.950%, 3/15/2024 | | | 171,780 | |
| | 265,000 | | | 4.500%, 7/15/2027 | | | 237,175 | |
| | | | LyondellBasell Industries NV | | | | |
| | 8,000 | | | 5.000%, 4/15/2019 | | | 8,030 | |
| | | | Novelis Corporation | | | | |
| | 100,000 | | | 5.875%, 9/30/2026j | | | 94,250 | |
| | | | Olin Corporation | | | | |
| | 340,000 | | | 5.125%, 9/15/2027i | | | 316,625 | |
| | | | Peabody Securities Finance Corporation | | | | |
| | 280,000 | | | 6.375%, 3/31/2025j | | | 280,000 | |
| | | | Platform Specialty Products Corporation | | | | |
| | 240,000 | | | 5.875%, 12/1/2025j | | | 227,400 | |
| | | | Sherwin-Williams Company | | | | |
| | 12,000 | | | 2.250%, 5/15/2020 | | | 11,795 | |
| | 207,000 | | | 3.125%, 6/1/2024 | | | 196,445 | |
| | | | Steel Dynamics, Inc. | | | | |
| | 230,000 | | | 5.000%, 12/15/2026 | | | 224,825 | |
| | | | Syngenta Finance NV | | | | |
| | 275,000 | | | 3.933%, 4/23/2021j | | | 273,617 | |
| | | | Teck Resources, Ltd. | | | | |
| | 395,000 | | | 6.125%, 10/1/2035 | | | 399,938 | |
| | | | United States Steel Corporation | | | | |
| | 375,000 | | | 6.250%, 3/15/2026 | | | 353,438 | |
| | | | Vale Overseas, Ltd. | | | | |
| | 130,000 | | | 4.375%, 1/11/2022 | | | 130,728 | |
| | 130,000 | | | 6.250%, 8/10/2026 | | | 138,775 | |
| | 160,000 | | | 6.875%, 11/21/2036 | | | 177,646 | |
| | 130,000 | | | 6.875%, 11/10/2039 | | | 145,925 | |
| | | | Westlake Chemical Corporation | | | | |
| | 168,000 | | | 3.600%, 8/15/2026 | | | 155,438 | |
| | | | WestRock Company | | | | |
| | 215,000 | | | 3.750%, 3/15/2025j | | | 206,923 | |
| | | | Xstrata Finance Canada, Ltd. | | | | |
| | 9,000 | | | 4.950%, 11/15/2021j | | | 9,236 | |
| | | | | |
| | | | Total | | | 6,906,019 | |
| | | | | |
| |
| | Capital Goods (0.3%) | | | | |
| | | | AECOM | | | | |
| | 415,000 | | | 5.875%, 10/15/2024 | | | 422,262 | |
| | | | Ardagh Packaging Finance plc | | | | |
| | 290,000 | | | 6.000%, 2/15/2025j | | | 271,875 | |
| | | | Ashtead Capital, Inc. | | | | |
| | 290,000 | | | 4.125%, 8/15/2025j | | | 268,975 | |
| | | | Boeing Company | | | | |
| | 250,000 | | | 3.850%, 11/1/2048 | | | 231,346 | |
| | | | Bombardier, Inc. | | | | |
| | 390,000 | | | 7.500%, 3/15/2025j | | | 389,883 | |
| | | | Building Materials Corporation of America | | | | |
| | 310,000 | | | 6.000%, 10/15/2025j | | | 304,962 | |
| | | | Cemex SAB de CV | | | | |
| | 320,000 | | | 6.125%, 5/5/2025j | | | 317,600 | |
| | | | Cemex SAB de CV | | | | |
| | 60,000 | | | 5.700%, 1/11/2025j | | | 58,632 | |
| | | | Cintas Corporation No. 2 | | | | |
| | 9,000 | | | 2.900%, 4/1/2022 | | | 8,766 | |
| | 135,000 | | | 3.700%, 4/1/2027 | | | 130,205 | |
| | | | CNH Industrial Capital, LLC | | | | |
| | 200,000 | | | 4.875%, 4/1/2021 | | | 204,330 | |
| | | | CNH Industrial NV | | | | |
| | 250,000 | | | 3.850%, 11/15/2027 | | | 231,013 | |
| | | | Covanta Holding Corporation | | | | |
| | 400,000 | | | 6.000%, 1/1/2027 | | | 386,000 | |
| | | | Crown Americas Capital Corporation IV | | | | |
| | 320,000 | | | 4.500%, 1/15/2023 | | | 313,600 | |
| | | | Crown Cork & Seal Company, Inc. | | | | |
| | 280,000 | | | 7.375%, 12/15/2026 | | | 299,600 | |
| | | | General Electric Company | | | | |
| | 16,000 | | | 5.000%, 1/21/2021b,l | | | 14,760 | |
| | | | H&E Equipment Services, Inc. | | | | |
| | 190,000 | | | 5.625%, 9/1/2025 | | | 180,975 | |
| | | | Huntington Ingalls Industries, Inc. | | | | |
| | 300,000 | | | 3.483%, 12/1/2027 | | | 277,794 | |
| | | | L3 Technologies, Inc. | | | | |
| | 333,000 | | | 3.950%, 5/28/2024 | | | 327,975 | |
| | | | Lockheed Martin Corporation | | | | |
| | 70,000 | | | 2.500%, 11/23/2020 | | | 68,736 | |
| | 184,000 | | | 3.600%, 3/1/2035 | | | 166,443 | |
| | 168,000 | | | 4.500%, 5/15/2036 | | | 169,528 | |
| | 46,000 | | | 6.150%, 9/1/2036 | | | 54,208 | |
| | | | Northrop Grumman Corporation | | | | |
| | 320,000 | | | 3.850%, 4/15/2045 | | | 279,523 | |
| | | | Owens-Brockway Glass Container, Inc. | | | | |
| | 425,000 | | | 5.000%, 1/15/2022j | | | 419,687 | |
| | | | Republic Services, Inc. | | | | |
| | 130,000 | | | 2.900%, 7/1/2026 | | | 120,058 | |
| | | | Reynolds Group Issuer, Inc. | | | | |
| | 390,000 | | | 5.125%, 7/15/2023j | | | 381,713 | |
| | | | Rockwell Collins, Inc. | | | | |
| | 345,000 | | | 2.800%, 3/15/2022 | | | 334,419 | |
| | | | Roper Technologies, Inc. | | | | |
| | 126,000 | | | 2.800%, 12/15/2021 | | | 122,695 | |
| | 70,000 | | | 3.650%, 9/15/2023 | | | 69,376 | |
| | 116,000 | | | 4.200%, 9/15/2028 | | | 113,865 | |
| | | | Siemens Financieringsmaatschappij NV | | | | |
| | 362,000 | | | 4.200%, 3/16/2047j | | | 348,786 | |
| | | | Standard Industries, Inc. | | | | |
| | 150,000 | | | 5.500%, 2/15/2023j | | | 147,000 | |
| | | | Textron, Inc. | | | | |
| | 150,000 | | | 7.250%, 10/1/2019 | | | 155,085 | |
| | 300,000 | | | 3.375%, 3/1/2028 | | | 272,978 | |
The accompanying Notes to Financial Statements are an integral part of this schedule.
103
MODERATELY AGGRESSIVE ALLOCATION FUND
Schedule of Investments as of October 31, 2018
| | | | | | | | |
Principal
Amount | | | Long-Term Fixed Income (17.0%) | | Value | |
| | Capital Goods (0.3%) - continued | | | | |
| | | | United Rentals North America, Inc. | | | | |
| | $315,000 | | | 5.500%, 7/15/2025 | | | $306,928 | |
| | | | United Technologies Corporation | | | | |
| | 450,000 | | | 4.450%, 11/16/2038 | | | 434,662 | |
| | 230,000 | | | 4.050%, 5/4/2047 | | | 201,342 | |
| | | | | |
| | | | Total | | | 8,807,585 | |
| | | | | |
| |
| | Collateralized Mortgage Obligations (0.6%) | | | | |
| | | | Ajax Mortgage Loan Trust | | | | |
| | 750,000 | | | 4.360%, 9/25/2065, Ser. 2018-C, Class Ab,j | | | 748,765 | |
| | | | Angel Oak Mortgage Trust I, LLC | | | | |
| | 75,885 | | | 3.500%, 7/25/2046, Ser. 2016-1, Class A1* | | | 75,946 | |
| | 1,601,587 | | | 3.674%, 7/27/2048, Ser. 2018-2, Class A1b,j | | | 1,598,394 | |
| | | | Banc of America Alternative Loan Trust | | | | |
| | 30,591 | | | 6.000%, 11/25/2035, Ser. 2005-10, Class 3CB1 | | | 27,284 | |
| | | | Bayview Opportunity Master Fund Trust | | | | |
| | 390,808 | | | 3.500%, 5/28/2069, Ser. 2017-RT5, Class Ab,j | | | 386,533 | |
| | | | CHL Mortgage Pass-Through Trust | | | | |
| | 1,852,103 | | | 6.000%, 11/25/2037, Ser. 2007-18, Class 1A2 | | | 1,578,364 | |
| | | | CIM Trust | | | | |
| | 1,181,879 | | | 5.000%, 12/25/2057, Ser. 2018-R3, Class A1*,b | | | 1,223,006 | |
| | | | Citigroup Mortgage Loan Trust, Inc. | | | | |
| | 135,516 | | | 5.500%, 11/25/2035, Ser. 2005-9, Class 21A2 | | | 135,099 | |
| | 15,427 | | | 3.902%, 3/25/2037, Ser. 2007-AR4, Class 2A1Ab | | | 13,009 | |
| | | | COLT Mortgage Loan Trust | | | | |
| | 343,724 | | | 2.415%, 10/25/2047, Ser. 2017-2, Class A1Ab,j | | | 341,404 | |
| | | | Countrywide Alternative Loan Trust | | | | |
| | 111,200 | | | 4.025%, 10/25/2035, Ser. 2005-43, Class 4A1b | | | 97,510 | |
| | 143,598 | | | 6.500%, 8/25/2036, Ser. 2006-23CB, Class 2A3 | | | 91,379 | |
| | 84,547 | | | 6.000%, 1/25/2037, Ser. 2006-39CB, Class 1A16 | | | 80,399 | |
| | 410,063 | | | 5.500%, 5/25/2037, Ser. 2007-8CB, Class A1 | | | 342,335 | |
| | 406,730 | | | 7.000%, 10/25/2037, Ser. 2007-24, Class A10 | | | 252,970 | |
| | | | Countrywide Home Loan Mortgage Pass Through Trust | | | | |
| | 68,030 | | | 4.060%, 11/25/2035, Ser. 2005-22, Class 2A1b | | | 60,694 | |
| | | | Countrywide Home Loans, Inc. | | | | |
| | 147,550 | | | 5.750%, 4/25/2037, Ser. 2007-3, Class A27 | | | 118,608 | |
| | | | Credit Suisse First Boston Mortgage Securities Corporation | | | | |
| | 26,312 | | | 5.250%, 10/25/2035, Ser. 2005-9, Class 1A3 | | | 25,899 | |
| | | | Credit Suisse Mortgage Trust | | | | |
| | 897,028 | | | 3.850%, 9/25/2057, Ser. 2018-RPL9, Class A1b,j | | | 895,857 | |
| | | | Deutsche Alt-A Securities Mortgage Loan Trust | | | | |
| | 102,474 | | | 6.000%, 10/25/2021, Ser. 2006-AR5, Class 23A | | | 92,729 | |
| | | | Deutsche Alt-A Securities, Inc., Mortgage Loan Trust | | | | |
| | 32,392 | | | 5.500%, 11/25/2035, Ser. 2005-5, Class 1A4b | | | 34,439 | |
| | | | Federal Home Loan Mortgage Corporation | | | | |
| | 535,768 | | | 4.000%, 7/15/2031, Ser. 4104, Class KIm | | | 62,756 | |
| | 296,244 | | | 3.000%, 2/15/2033, Ser. 4170, Class IGm | | | 32,880 | |
| | | | Federal National Mortgage Association | | | | |
| | 580,350 | | | 3.500%, 1/25/2033, Ser. 2012-150, Class YIm | | | 74,085 | |
| | | | Impac Secured Assets Trust | | | | |
| | 662,880 | | | 2.521%, (LIBOR 1M + 0.240%), 9/25/2037, Ser. 2007-3, Class A1Bb | | | 557,022 | |
| | | | J.P. Morgan Alternative Loan Trust | | | | |
| | 97,500 | | | 6.500%, 3/25/2036, Ser. 2006-S1, Class 1A19 | | | 84,726 | |
| | | | J.P. Morgan Mortgage Trust | | | | |
| | 207,782 | | | 4.225%, 10/25/2036, Ser. 2006-A6, Class 1A2b | | | 181,282 | |
| | 396,005 | | | 2.661%, (LIBOR 1M + 0.380%), 1/25/2037, Ser. 2006-S4, Class A8b | | | 216,049 | |
| | 453,854 | | | 6.250%, 8/25/2037, Ser. 2007-S3, Class 1A10 | | | 265,137 | |
| | | | MASTR Alternative Loans Trust | | | | |
| | 117,363 | | | 6.500%, 7/25/2034, Ser. 2004-6, Class 6A1 | | | 118,428 | |
| | 233,694 | | | 2.731%, (LIBOR 1M + 0.450%), 12/25/2035, Ser. 2005-6, Class 2A1b | | | 114,601 | |
| | | | Merrill Lynch Alternative Note Asset Trust | | | | |
| | 116,005 | | | 6.000%, 3/25/2037, Ser. 2007-F1, Class 2A1 | | | 91,138 | |
| | | | Mill City Mortgage Loan Trust | | | | |
| | 692,633 | | | 3.500%, 8/25/2058, Ser. 2018-3, Class A1b,j | | | 687,458 | |
| | | | MortgageIT Trust | | | | |
| | 1,190,896 | | | 2.481%, (LIBOR 1M + 0.200%), 4/25/2036, Ser. 2006-1, Class 1A2b | | | 1,057,422 | |
| | | | Preston Ridge Partners Mortgage Trust, LLC | | | | |
| | 596,023 | | | 3.470%, 9/25/2022, Ser. 2017-2A, Class A1*,k | | | 589,284 | |
| | | | Pretium Mortgage Credit Partners, LLC | | | | |
| | 321,910 | | | 3.250%, 8/27/2032, Ser. 2017-NPL4, Class A1j,k | | | 318,418 | |
| | | | Residential Accredit Loans, Inc. Trust | | | | |
| | 41,655 | | | 5.750%, 9/25/2035, Ser. 2005-QS13, Class 2A3 | | | 40,193 | |
The accompanying Notes to Financial Statements are an integral part of this schedule.
104
MODERATELY AGGRESSIVE ALLOCATION FUND
Schedule of Investments as of October 31, 2018
| | | | | | | | |
Principal
Amount | | | Long-Term Fixed Income (17.0%) | | Value | |
| | Collateralized Mortgage Obligations (0.6%) - continued | | | | |
| | $679,647 | | | 2.831%, (LIBOR 1M + 0.550%), 1/25/2037, Ser. 2007-QS1, Class 1A5b | | | $538,884 | |
| | | | Residential Funding Mortgage Security I Trust | | | | |
| | 44,802 | | | 6.000%, 7/25/2037, Ser. 2007-S7, Class A20 | | | 42,188 | |
| | | | Sequoia Mortgage Trust | | | | |
| | 263,707 | | | 3.984%, 9/20/2046, Ser. 2007-1, Class 4A1b | | | 218,551 | |
| | | | Structured Adjustable Rate Mortgage Loan Trust | | | | |
| | 53,044 | | | 4.268%, 9/25/2035, Ser. 2005-18, Class 1A1b | | | 42,612 | |
| | | | Structured Asset Mortgage Investments, Inc. | | | | |
| | 85,246 | | | 2.591%, (LIBOR 1M + 0.310%), 12/25/2035, Ser. 2005-AR4, Class A1b | | | 81,623 | |
| | | | Towd Point Mortgage Trust | | | | |
| | 290,575 | | | 2.887%, (LIBOR 1M + 0.600%), 2/25/2057, Ser. 2017-5, Class A1b,j | | | 290,251 | |
| | | | Verus Securitization Trust | | | | |
| | 245,811 | | | 2.853%, 1/25/2047, Ser. 2017-1A, Class A1*,b | | | 243,737 | |
| | 371,750 | | | 2.485%, 7/25/2047, Ser. 2017-2A, Class A1*,b | | | 362,742 | |
| | | | WaMu Mortgage Pass Through Certificates | | | | |
| | 64,023 | | | 3.867%, 9/25/2036, Ser. 2006-AR10, Class 1A2b | | | 61,888 | |
| | 138,073 | | | 3.876%, 10/25/2036, Ser. 2006-AR12, Class 1A1b | | | 133,705 | |
| | 76,617 | | | 2.686%, (12 MTA + 0.740%), 1/25/2047, Ser. 2006-AR19, Class 1Ab | | | 72,525 | |
| | | | Wells Fargo Mortgage Backed Securities Trust | | | | |
| | 17,973 | | | 5.500%, 11/25/2021, Ser. 2006-17, Class A1 | | | 17,950 | |
| | 26,847 | | | 4.083%, 3/25/2036, Ser. 2006-AR2, Class 2A1b | | | 27,322 | |
| | 24,727 | | | 4.219%, 7/25/2036, Ser. 2006-AR10, Class 2A1b | | | 24,647 | |
| | 20,778 | | | 6.000%, 7/25/2037, Ser. 2007-8, Class 1A16 | | | 20,621 | |
| | | | | |
| | | | Total | | | 14,890,748 | |
| | | | | |
| |
| | Commercial Mortgage-Backed Securities (0.5%) | | | | |
| | | | BANK 2018-BNK13 | | | | |
| | 1,050,000 | | | 4.217%, 8/15/2061, Ser. 2018-BN13, Class A5 | | | 1,061,865 | |
| | | | Benchmark 2018-B5 Mortgage Trust | | | | |
| | 1,150,000 | | | 4.208%, 7/15/2051, Ser. 2018-B5, Class A4 | | | 1,163,922 | |
| | | | CSAIL Commercial Mortgage Trust | | | | |
| | 750,000 | | | 3.504%, 6/15/2057, Ser. 2015-C2, Class A4 | | | 734,253 | |
| | | | Federal Home Loan Mortgage Corporation Multifamily Structured Pass Through Certificates | | | | |
| | 750,000 | | | 3.900%, 4/25/2028, Ser. K076, Class A2n | | | 758,464 | |
| | | | Federal National Mortgage Association - ACES | | | | |
| | 475,000 | | | 2.485%, 12/25/2026, Ser. 2017-M3, Class A2b | | | 436,650 | |
| | 700,000 | | | 2.785%, 2/25/2027, Ser. 2017-M2, Class A2b | | | 658,091 | |
| | 950,000 | | | 2.961%, 2/25/2027, Ser. 2017-M7, Class A2b | | | 898,057 | |
| | 825,000 | | | 3.052%, 3/25/2028, Ser. 2018-M7, Class A2b | | | 777,906 | |
| | | | Federal National Mortgage Association Grantor Trust | | | | |
| | 923,973 | | | 2.898%, 6/25/2027, Ser. 2017-T1, Class An | | | 860,251 | |
| | | | GS Mortgage Securities Trust | | | | |
| | 500,000 | | | 3.801%, 1/10/2047, Ser. 2014-GC18, Class A3 | | | 503,093 | |
| | 700,000 | | | 3.666%, 9/10/2047, Ser. 2014-GC24, Class A4 | | | 696,998 | |
| | 825,000 | | | 3.244%, 10/10/2048, Ser. 2015-GC34, Class A3 | | | 794,615 | |
| | 800,000 | | | 3.470%, 11/10/2048, Ser. 2015-GS1, Class A2 | | | 779,972 | |
| | | | Morgan Stanley Bank of America Merrill Lynch Trust | | | | |
| | 400,000 | | | 3.246%, 12/15/2047, Ser. 2014-C19, Class A3 | | | 388,429 | |
| | | | Morgan Stanley Capital I, Inc. | | | | |
| | 1,300,000 | | | 4.177%, 7/15/2051, Ser. 2018-H3, Class A5 | | | 1,310,604 | |
| | | | UBS Commercial Mortgage Trust | | | | |
| | 583,576 | | | 3.400%, 5/10/2045, Ser. 2012-C1, Class A3 | | | 581,519 | |
| | 900,000 | | | 4.241%, 6/15/2051, Ser. 2018-C11, Class A5b | | | 909,793 | |
| | | | WFRBS Commercial Mortgage Trust | | | | |
| | 447,468 | | | 2.870%, 11/15/2045, Ser. 2012-C9, Class A3 | | | 437,175 | |
| | | | | |
| | | | Total | | | 13,751,657 | |
| | | | | |
| |
| | Communications Services (0.6%) | | | | |
| | | | 21st Century Fox America, Inc. | | | | |
| | 190,000 | | | 6.900%, 3/1/2019 | | | 192,528 | |
| | 435,000 | | | 6.400%, 12/15/2035 | | | 530,074 | |
| | | | AMC Networks, Inc. | | | | |
| | 255,000 | | | 5.000%, 4/1/2024 | | | 243,895 | |
| | | | America Movil SAB de CV | | | | |
| | 98,000 | | | 5.000%, 10/16/2019 | | | 99,470 | |
| | | | American Tower Corporation | | | | |
| | 10,000 | | | 2.800%, 6/1/2020 | | | 9,895 | |
| | 210,000 | | | 3.300%, 2/15/2021 | | | 208,249 | |
| | | | AT&T, Inc. | | | | |
| | 73,000 | | | 5.875%, 10/1/2019 | | | 74,761 | |
| | 6,000 | | | 5.200%, 3/15/2020 | | | 6,146 | |
| | 60,000 | | | 3.316%, (LIBOR 3M + 0.930%), 6/30/2020b | | | 60,535 | |
| | 135,000 | | | 3.800%, 3/1/2024 | | | 132,506 | |
The accompanying Notes to Financial Statements are an integral part of this schedule.
105
MODERATELY AGGRESSIVE ALLOCATION FUND
Schedule of Investments as of October 31, 2018
| | | | | | | | |
Principal Amount | | | Long-Term Fixed Income (17.0%) | | Value | |
| | Communications Services (0.6%) - continued | | | | |
| | $118,000 | | | 4.100%, 2/15/2028j | | | $112,303 | |
| | 97,000 | | | 4.300%, 2/15/2030j | | | 91,155 | |
| | 180,000 | | | 5.250%, 3/1/2037 | | | 172,178 | |
| | 180,000 | | | 4.900%, 8/15/2037j | | | 165,104 | |
| | 126,000 | | | 6.350%, 3/15/2040 | | | 133,382 | |
| | 125,000 | | | 5.550%, 8/15/2041 | | | 120,681 | |
| | 95,000 | | | 4.750%, 5/15/2046 | | | 82,465 | |
| | 330,000 | | | 5.450%, 3/1/2047 | | | 313,038 | |
| | | | British Sky Broadcasting Group plc | | | | |
| | 184,000 | | | 3.125%, 11/26/2022j | | | 179,815 | |
| | | | CCO Holdings, LLC | | | | |
| | 400,000 | | | 5.875%, 4/1/2024j | | | 403,500 | |
| | | | CCOH Safari, LLC | | | | |
| | 60,000 | | | 5.750%, 2/15/2026j | | | 59,400 | |
| | | | CenturyLink, Inc. | | | | |
| | 315,000 | | | 6.450%, 6/15/2021 | | | 322,087 | |
| | | | Charter Communications Operating, LLC | | | | |
| | 77,000 | | | 6.834%, 10/23/2055 | | | 79,767 | |
| | 5,000 | | | 4.464%, 7/23/2022 | | | 5,056 | |
| | 200,000 | | | 4.500%, 2/1/2024 | | | 200,241 | |
| | 250,000 | | | 4.200%, 3/15/2028 | | | 234,228 | |
| | 640,000 | | | 6.484%, 10/23/2045 | | | 654,119 | |
| | | | Clear Channel Worldwide Holdings, Inc. | | | | |
| | 330,000 | | | 6.500%, 11/15/2022 | | | 335,016 | |
| | | | Comcast Corporation | | | | |
| | 400,000 | | | 4.950%, 10/15/2058 | | | 391,875 | |
| | 225,000 | | | 4.049%, 11/1/2052 | | | 192,139 | |
| | 12,000 | | | 1.625%, 1/15/2022 | | | 11,302 | |
| | 140,000 | | | 2.750%, 3/1/2023 | | | 134,973 | |
| | | | 3.038%, (LIBOR 3M + | | | | |
| | 70,000 | | | 0.630%), 4/15/2024b | | | 69,607 | |
| | 245,000 | | | 3.950%, 10/15/2025 | | | 244,314 | |
| | 400,000 | | | 4.250%, 10/15/2030 | | | 395,125 | |
| | 360,000 | | | 4.400%, 8/15/2035 | | | 342,214 | |
| | 243,000 | | | 4.750%, 3/1/2044 | | | 237,494 | |
| | 150,000 | | | 4.600%, 8/15/2045 | | | 143,402 | |
| | | | Cox Communications, Inc. | | | | |
| | 250,000 | | | 3.350%, 9/15/2026j | | | 230,009 | |
| | 92,000 | | | 4.600%, 8/15/2047j | | | 81,896 | |
| | | | Crown Castle International Corporation | | | | |
| | 201,000 | | | 3.400%, 2/15/2021 | | | 199,737 | |
| | 371,000 | | | 5.250%, 1/15/2023 | | | 386,927 | |
| | 184,000 | | | 3.200%, 9/1/2024 | | | 173,787 | |
| | | | CSC Holdings, LLC | | | | |
| | 40,000 | | | 5.500%, 4/15/2027j | | | 38,400 | |
| | | | Digicel, Ltd. | | | | |
| | 533,677 | | | 6.000%, 4/15/2021*,i | | | 484,312 | |
| | | | Discovery Communications, LLC | | | | |
| | 230,000 | | | 4.900%, 3/11/2026 | | | 232,628 | |
| | 380,000 | | | 5.000%, 9/20/2037 | | | 354,575 | |
| | | | Gray Television, Inc. | | | | |
| | 295,000 | | | 5.875%, 7/15/2026j | | | 283,109 | |
| | | | Intelsat Jackson Holdings SA | | | | |
| | 200,000 | | | 8.500%, 10/15/2024j | | | 196,500 | |
| | | | Level 3 Communications, Inc. | | | | |
| | 360,000 | | | 5.375%, 1/15/2024 | | | 356,400 | |
| | | | Level 3 Financing, Inc. | | | | |
| | 130,000 | | | 5.375%, 5/1/2025 | | | 126,913 | |
| | 30,000 | | | 5.250%, 3/15/2026 | | | 28,800 | |
| | | | Meredith Corporation | | | | |
| | 25,000 | | | 6.875%, 2/1/2026j | | | 25,000 | |
| | | | Moody’s Corporation | | | | |
| | 122,000 | | | 2.750%, 12/15/2021 | | | 119,005 | |
| | | | Neptune Finco Corporation | | | | |
| | 345,000 | | | 10.875%, 10/15/2025j | | | 398,044 | |
| | | | Netflix, Inc. | | | | |
| | 400,000 | | | 4.875%, 4/15/2028j | | | 367,000 | |
| | | | Nexstar Escrow Corporation | | | | |
| | 138,000 | | | 5.625%, 8/1/2024j | | | 131,790 | |
| | | | Omnicom Group, Inc. | | | | |
| | 85,000 | | | 3.600%, 4/15/2026 | | | 79,937 | |
| | | | Orange SA | | | | |
| | 10,000 | | | 1.625%, 11/3/2019 | | | 9,842 | |
| | | | SES Global Americas Holdings GP | | | | |
| | 135,000 | | | 2.500%, 3/25/2019j | | | 134,623 | |
| | | | Sprint Communications, Inc. | | | | |
| | 230,000 | | | 6.000%, 11/15/2022 | | | 232,156 | |
| | | | Sprint Corporation | | | | |
| | 325,000 | | | 7.625%, 2/15/2025 | | | 337,594 | |
| | | | Telecom Italia SPA | | | | |
| | 260,000 | | | 5.303%, 5/30/2024j | | | 245,050 | |
| | | | Telefonica Emisiones SAU | | | | |
| | 275,000 | | | 4.665%, 3/6/2038 | | | 246,514 | |
| | | | Time Warner Entertainment Company, LP | | | | |
| | 160,000 | | | 8.375%, 3/15/2023 | | | 184,419 | |
| | | | Verizon Communications, Inc. | | | | |
| | 280,000 | | | 3.500%, 11/1/2021 | | | 280,079 | |
| | 378,000 | | | 5.150%, 9/15/2023 | | | 401,143 | |
| | 385,000 | | | 3.376%, 2/15/2025 | | | 371,741 | |
| | | | 3.414%, (LIBOR 3M + 1.100%), | | | | |
| | 90,000 | | | 5/15/2025b | | | 90,464 | |
| | 117,000 | | | 4.272%, 1/15/2036 | | | 107,498 | |
| | 368,000 | | | 4.862%, 8/21/2046 | | | 352,113 | |
| | 278,000 | | | 4.522%, 9/15/2048 | | | 252,149 | |
| | | | Viacom, Inc. | | | | |
| | 99,000 | | | 4.250%, 9/1/2023 | | | 98,856 | |
| | 200,000 | | | 6.875%, 4/30/2036 | | | 220,855 | |
| | 126,000 | | | 5.850%, 9/1/2043 | | | 125,784 | |
| | | | Virgin Media Secured Finance plc | | | | |
| | 285,000 | | | 5.250%, 1/15/2026j | | | 265,763 | |
| | | | Windstream Services, LLC | | | | |
| | 280,000 | | | 8.625%, 10/31/2025j | | | 261,800 | |
| | | | | |
| | | | Total | | | 15,897,251 | |
| | | | | |
| |
| | Consumer Cyclical (0.5%) | | | | |
| | | | Allison Transmission, Inc. | | | | |
| | 50,000 | | | 5.000%, 10/1/2024j | | | 48,531 | |
| | | | Amazon.com, Inc. | | | | |
| | 115,000 | | | 3.150%, 8/22/2027 | | | 108,319 | |
| | 230,000 | | | 3.875%, 8/22/2037 | | | 216,584 | |
| | 138,000 | | | 4.050%, 8/22/2047 | | | 129,270 | |
| | | | American Honda Finance Corporation | | | | |
| | 204,000 | | | 2.000%, 2/14/2020 | | | 201,117 | |
| | | | Aptiv plc | | | | |
| | 210,000 | | | 3.150%, 11/19/2020 | | | 207,646 | |
| | | | Brookfield Residential Properties, Inc. | | | | |
| | 60,000 | | | 6.125%, 7/1/2022j | | | 58,800 | |
The accompanying Notes to Financial Statements are an integral part of this schedule.
106
MODERATELY AGGRESSIVE ALLOCATION FUND
Schedule of Investments as of October 31, 2018
| | | | | | | | |
Principal
Amount | | | Long-Term Fixed Income (17.0%) | | Value | |
| | Consumer Cyclical (0.5%) - continued | | | | |
| | | | Cinemark USA, Inc. | | | | |
| | $488,000 | | | 4.875%, 6/1/2023 | | | $476,410 | |
| | | | D.R. Horton, Inc. | | | | |
| | 228,000 | | | 2.550%, 12/1/2020 | | | 222,677 | |
| | | | Daimler Finance North America, LLC | | | | |
| | 168,000 | | | 3.140%, (LIBOR 3M + 0.620%), 10/30/2019b,j | | | 168,659 | |
| | 250,000 | | | 2.891%, (LIBOR 3M + 0.550%), 5/4/2021b,j | | | 250,120 | |
| | 395,000 | | | Delphi Jersey Holdings plc 5.000%, 10/1/2025j | | | 356,487 | |
| | | | Ford Motor Credit Company, LLC | | | | |
| | 200,000 | | | 2.943%, 1/8/2019 | | | 199,958 | |
| | 182,000 | | | 2.262%, 3/28/2019 | | | 181,377 | |
| | 14,000 | | | 2.597%, 11/4/2019 | | | 13,834 | |
| | 84,000 | | | 2.459%, 3/27/2020 | | | 82,297 | |
| | 63,000 | | | 3.200%, 1/15/2021 | | | 61,480 | |
| | 9,000 | | | 3.336%, 3/18/2021 | | | 8,792 | |
| | 130,000 | | | 3.656%, (LIBOR 3M + 1.270%), 3/28/2022b | | | 128,417 | |
| | 350,000 | | | 2.979%, 8/3/2022 | | | 328,309 | |
| | | | General Motors Company | | | | |
| | 375,000 | | | 3. 227%, ( LIBOR 3M + 0.900%), 9/10/2021b | | | 374,458 | |
| | 475,000 | | | 5.000%, 10/1/2028 | | | 454,509 | |
| | | | General Motors Financial Company, Inc. | | | | |
| | 9,000 | | | 2.650%, 4/13/2020 | | | 8,904 | |
| | 70,000 | | | 3. 366%, ( LIBOR 3M + 0.930%), 4/13/2020b | | | 70,324 | |
| | 126,000 | | | 3.700%, 11/24/2020 | | | 125,759 | |
| | 84,000 | | | 4.200%, 3/1/2021 | | | 84,407 | |
| | 275,000 | | | 3.258%, (LIBOR 3M + 0.850%), 4/9/2021b | | | 274,981 | |
| | 9,000 | | | 4.375%, 9/25/2021 | | | 9,078 | |
| | 235,000 | | | 3.150%, 6/30/2022 | | | 225,585 | |
| | 84,000 | | | 3.950%, 4/13/2024 | | | 80,712 | |
| | 135,000 | | | 4.300%, 7/13/2025 | | | 129,125 | |
| | | | Home Depot, Inc. | | | | |
| | 10,000 | | | 2.625%, 6/1/2022 | | | 9,764 | |
| | 215,000 | | | 5.400%, 9/15/2040 | | | 241,767 | |
| | 126,000 | | | 4.250%, 4/1/2046 | | | 121,155 | |
| | 230,000 | | | 3.900%, 6/15/2047 | | | 209,262 | |
| | | | Hyundai Capital America | | | | |
| | 226,000 | | | 2.550%, 4/3/2020j | | | 221,882 | |
| | 6,000 | | | 2.750%, 9/18/2020j | | | 5,879 | |
| | 126,000 | | | 3.000%, 10/30/2020j | | | 124,008 | |
| | | | Jaguar Land Rover Automotive plc | | | | |
| | 275,000 | | | 5.625%, 2/1/2023j | | | 261,937 | |
| | | | KB Home | | | | |
| | 162,000 | | | 4.750%, 5/15/2019 | | | 162,535 | |
| | | | L Brands, Inc. | | | | |
| | 275,000 | | | 5.625%, 2/15/2022 | | | 279,125 | |
| | 27,000 | | | 6.694%, 1/15/2027 | | | 25,380 | |
| | | | Landry’s, Inc. | | | | |
| | 300,000 | | | 6.750%, 10/15/2024j | | | 299,250 | |
| | | | Lear Corporation | | | | |
| | 175,000 | | | 5.250%, 1/15/2025 | | | 179,272 | |
| | | | Lennar Corporation | | | | |
| | 9,000 | | | 2.950%, 11/29/2020 | | | 8,752 | |
| | 215,000 | | | 4.125%, 1/15/2022 | | | 209,904 | |
| | 60,000 | | | 4.750%, 11/15/2022 | | | 59,412 | |
| | 475,000 | | | 4.875%, 12/15/2023 | | | 463,719 | |
| | 145,000 | | | 4.500%, 4/30/2024 | | | 138,566 | |
| | | | Live Nation Entertainment, Inc. | | | | |
| | 20,000 | | | 5.375%, 6/15/2022j | | | 20,150 | |
| | 210,000 | | | 4.875%, 11/1/2024j | | | 201,075 | |
| | 185,000 | | | 5.625%, 3/15/2026j | | | 185,000 | |
| | | | Macy’s Retail Holdings, Inc. | | | | |
| | 348,000 | | | 2.875%, 2/15/2023i | | | 325,024 | |
| | | | Mastercard, Inc. | | | | |
| | 320,000 | | | 3.950%, 2/26/2048 | | | 302,185 | |
| | | | McDonald’s Corporation | | | | |
| | 125,000 | | | 2.750%, 12/9/2020 | | | 123,615 | |
| | 180,000 | | | 2.625%, 1/15/2022 | | | 175,072 | |
| | 275,000 | | | 4.450%, 3/1/2047 | | | 257,167 | |
| | | | MGM Resorts International | | | | |
| | 390,000 | | | 6.000%, 3/15/2023 | | | 395,850 | |
| | 30,000 | | | 5.750%, 6/15/2025 | | | 29,250 | |
| | | | Navistar International Corporation | | | | |
| | 375,000 | | | 6.625%, 11/1/2025j | | | 382,500 | |
| | | | New Red Finance, Inc. | | | | |
| | 340,000 | | | 4.250%, 5/15/2024i,j | | | 318,750 | |
| | | | Nissan Motor Acceptance Corporation | | | | |
| | 9,000 | | | 2.000%, 3/8/2019j | | | 8,973 | |
| | 150,000 | | | 2.150%, 9/28/2020j | | | 146,294 | |
| | | | Prime Security Services Borrower, LLC | | | | |
| | 348,000 | | | 9.250%, 5/15/2023j | | | 367,732 | |
| | | | Ralph Lauren Corporation | | | | |
| | 10,000 | | | 2.625%, 8/18/2020 | | | 9,886 | |
| | | | Scientific Games International, Inc. | | | | |
| | 335,000 | | | 5.000%, 10/15/2025j | | | 311,550 | |
| | | | Six Flags Entertainment Corporation | | | | |
| | 300,000 | | | 4.875%, 7/31/2024j | | | 283,500 | |
| | | | Toll Brothers Finance Corporation | | | | |
| | 74,000 | | | 4.000%, 12/31/2018 | | | 73,815 | |
| | | | Visa, Inc. | | | | |
| | 10,000 | | | 2.200%, 12/14/2020 | | | 9,796 | |
| | | | VOC Escrow, Ltd. | | | | |
| | 345,000 | | | 5.000%, 2/15/2028j | | | 324,300 | |
| | | | Volkswagen Group of America Finance, LLC | | | | |
| | 8,000 | | | 2.450%, 11/20/2019j | | | 7,920 | |
| | | | Wabash National Corporation | | | | |
| | 475,000 | | | 5.500%, 10/1/2025j | | | 427,500 | |
| | | | Yum! Brands, Inc. | | | | |
| | 60,000 | | | 5.000%, 6/1/2024j | | | 59,175 | |
| | | | | |
| | | | Total | | | 13,054,574 | |
| | | | | |
| |
| | Consumer Non-Cyclical (0.8%) | | | | |
| | | | Abbott Laboratories | | | | |
| | 230,000 | | | 2.900%, 11/30/2021 | | | 225,883 | |
| | 12,000 | | | 2.550%, 3/15/2022 | | | 11,608 | |
| | 80,000 | | | 3.400%, 11/30/2023 | | | 79,143 | |
| | 79,000 | | | 3.750%, 11/30/2026 | | | 77,787 | |
| | 381,000 | | | 4.750%, 11/30/2036 | | | 387,281 | |
| | 185,000 | | | 4.900%, 11/30/2046 | | | 190,813 | |
| | | | AbbVie, Inc. | | | | |
| | 302,000 | | | 2.500%, 5/14/2020 | | | 298,053 | |
| | 6,000 | | | 2.900%, 11/6/2022 | | | 5,809 | |
| | 210,000 | | | 3.600%, 5/14/2025 | | | 200,376 | |
| | 105,000 | | | 4.700%, 5/14/2045 | | | 94,927 | |
The accompanying Notes to Financial Statements are an integral part of this schedule.
107
MODERATELY AGGRESSIVE ALLOCATION FUND
Schedule of Investments as of October 31, 2018
| | | | | | | | |
Principal
Amount | | | Long-Term Fixed Income (17.0%) | | Value | |
| | Consumer Non-Cyclical (0.8%) - continued | | | | |
| | | | Albertsons Companies, LLC | | | | |
| | $35,000 | | | 6.625%, 6/15/2024 | | | $33,075 | |
| | | | Altria Group, Inc. | | | | |
| | 84,000 | | | 2.850%, 8/9/2022 | | | 81,638 | |
| | 105,000 | | | 2.625%, 9/16/2026 | | | 94,386 | |
| | | | Amgen, Inc. | | | | |
| | 276,000 | | | 2.200%, 5/11/2020 | | | 271,716 | |
| | 84,000 | | | 2.700%, 5/1/2022 | | | 81,427 | |
| | 11,000 | | | 2.650%, 5/11/2022 | | | 10,628 | |
| | 125,000 | | | 3.125%, 5/1/2025 | | | 118,290 | |
| | | | Anheuser-Busch InBev Finance, Inc. | | | | |
| | 105,000 | | | 3.603%, (LIBOR 3M + 1.260%), 2/1/2021b | | | 107,235 | |
| | 6,000 | | | 3.300%, 2/1/2023 | | | 5,849 | |
| | 484,000 | | | 3.650%, 2/1/2026 | | | 459,355 | |
| | 336,000 | | | 4.700%, 2/1/2036 | | | 320,412 | |
| | | | Anheuser-Busch InBev Worldwide, Inc. | | | | |
| | 550,000 | | | 4.750%, 4/15/2058 | | | 487,469 | |
| | | | 3.165%, (LIBOR 3M + 0.740%), | | | | |
| | 170,000 | | | 1/12/2024b | | | 169,906 | |
| | 290,000 | | | 4.375%, 4/15/2038 | | | 263,303 | |
| | 290,000 | | | 4.600%, 4/15/2048 | | | 261,087 | |
| | | | BAT Capital Corporation | | | | |
| | 92,000 | | | 2.297%, 8/14/2020j | | | 90,025 | |
| | 138,000 | | | 3.222%, 8/15/2024j | | | 130,238 | |
| | 184,000 | | | 4.540%, 8/15/2047j | | | 160,215 | |
| | | | Baxalta, Inc. | | | | |
| | 118,000 | | | 4.000%, 6/23/2025 | | | 115,020 | |
| | | | Bayer U.S. Finance II, LLC | | | | |
| | 330,000 | | | 4.250%, 12/15/2025j | | | 324,194 | |
| | 375,000 | | | 4.875%, 6/25/2048j | | | 349,653 | |
| | | | Bayer US Finance, LLC | | | | |
| | 10,000 | | | 2.375%, 10/8/2019j | | | 9,921 | |
| | | | Becton, Dickinson and Company | | | | |
| | 12,000 | | | 3.125%, 11/8/2021 | | | 11,803 | |
| | 196,000 | | | 3.734%, 12/15/2024 | | | 190,004 | |
| | 425,000 | | | 3.700%, 6/6/2027 | | | 399,171 | |
| | 138,000 | | | 4.669%, 6/6/2047 | | | 129,331 | |
| | | | Boston Scientific Corporation | | | | |
| | 80,000 | | | 6.000%, 1/15/2020 | | | 82,464 | |
| | 125,000 | | | 3.850%, 5/15/2025 | | | 123,282 | |
| | 275,000 | | | 4.000%, 3/1/2028 | | | 268,488 | |
| | 126,000 | | | 7.375%, 1/15/2040 | | | 161,428 | |
| | | | Bunge, Ltd. Finance Corporation | | | | |
| | 80,000 | | | 3.500%, 11/24/2020 | | | 79,828 | |
| | | | Celgene Corporation | | | | |
| | 370,000 | | | 2.875%, 8/15/2020 | | | 366,111 | |
| | | | Church & Dwight Company, Inc. | | | | |
| | 50,000 | | | 2.450%, 12/15/2019 | | | 49,641 | |
| | | | Clorox Company | | | | |
| | 300,000 | | | 3.100%, 10/1/2027 | | | 277,929 | |
| | | | Conagra Brands, Inc. | | | | |
| | 215,000 | | | 3.800%, 10/22/2021 | | | 215,499 | |
| | 230,000 | | | 4.300%, 5/1/2024 | | | 230,354 | |
| | | | Constellation Brands, Inc. | | | | |
| | 210,000 | | | 3.600%, 2/15/2028 | | | 193,780 | |
| | | | CVS Caremark Corporation | | | | |
| | 40,000 | | | 4.000%, 12/5/2023 | | | 39,778 | |
| | | | CVS Health Corporation | | | | |
| | 52,000 | | | 3.350%, 3/9/2021 | | | 51,772 | |
| | 6,000 | | | 2.750%, 12/1/2022 | | | 5,735 | |
| | 104,000 | | | 3.700%, 3/9/2023 | | | $102,753 | |
| | 270,000 | | | 4.100%, 3/25/2025 | | | 266,858 | |
| | 550,000 | | | 4.875%, 7/20/2035 | | | 534,689 | |
| | 545,000 | | | 4.780%, 3/25/2038 | | | 522,085 | |
| | 330,000 | | | 5.050%, 3/25/2048 | | | 321,698 | |
| | | | EMD Finance, LLC | | | | |
| | 96,000 | | | 2.950%, 3/19/2022j | | | 93,373 | |
| | | | Energizer Holdings, Inc. | | | | |
| | 320,000 | | | 5.500%, 6/15/2025j | | | 311,200 | |
| | | | Express Scripts Holding Company | | | | |
| | 6,000 | | | 4.750%, 11/15/2021 | | | 6,174 | |
| | 84,000 | | | 3.000%, 7/15/2023 | | | 80,579 | |
| | 425,000 | | | 4.800%, 7/15/2046 | | | 399,362 | |
| | | | Forest Laboratories, LLC | | | | |
| | 52,000 | | | 4.875%, 2/15/2021j | | | 53,124 | |
| | | | Grupo Bimbo SAB de CV | | | | |
| | 200,000 | | | 4.700%, 11/10/2047j | | | 175,450 | |
| | | | Halfmoon Parent, Inc. | | | | |
| | | | 3. 326%, ( LIBOR 3M + | | | | |
| | 45,000 | | | 0.890%), 7/15/2023b,j | | | 44,964 | |
| | 320,000 | | | 4.125%, 11/15/2025j | | | 316,334 | |
| | 400,000 | | | 4.800%, 8/15/2038j | | | 386,155 | |
| | | | HCA, Inc. | | | | |
| | 23,677 | | | 4.750%, 5/1/2023 | | | 23,914 | |
| | 205,000 | | | 5.250%, 6/15/2026 | | | 208,587 | |
| | 125,000 | | | 4.500%, 2/15/2027 | | | 121,563 | |
| | | | Imperial Tobacco Finance plc | | | | |
| | 170,000 | | | 2.950%, 7/21/2020j | | | 167,808 | |
| | | | JBS USA, LLC | | | | |
| | 335,000 | | | 5.750%, 6/15/2025j | | | 324,113 | |
| | | | Kellogg Company | | | | |
| | 400,000 | | | 3.250%, 5/14/2021 | | | 397,193 | |
| | | | Kimberly-Clark Corporation | | | | |
| | 230,000 | | | 3.900%, 5/4/2047 | | | 213,110 | |
| | | | Kraft Foods Group, Inc. | | | | |
| | 168,000 | | | 5.000%, 6/4/2042 | | | 154,160 | |
| | | | Kraft Heinz Foods Company | | | | |
| | 10,000 | | | 5.375%, 2/10/2020 | | | 10,262 | |
| | 400,000 | | | 3.375%, 6/15/2021 | | | 398,783 | |
| | | | Kroger Company | | | | |
| | 115,000 | | | 2.800%, 8/1/2022 | | | 111,326 | |
| | | | Laboratory Corporation of America Holdings | | | | |
| | 60,000 | | | 2.625%, 2/1/2020 | | | 59,481 | |
| | | | Maple Escrow Subsidiary, Inc. | | | | |
| | 275,000 | | | 3.551%, 5/25/2021j | | | 273,718 | |
| | | | Mead Johnson Nutrition Company | | | | |
| | 94,000 | | | 3.000%, 11/15/2020 | | | 93,342 | |
| | | | Medtronic Global Holdings SCA | | | | |
| | 12,000 | | | 1.700%, 3/28/2019 | | | 11,952 | |
| | | | Medtronic, Inc. | | | | |
| | 665,000 | | | 4.375%, 3/15/2035 | | | 661,672 | |
| | 90,000 | | | 4.625%, 3/15/2045 | | | 91,013 | |
| | | | Merck & Company, Inc. | | | | |
| | | | 2.716%, (LIBOR 3M + 0.375%), | | | | |
| | 65,000 | | | 2/10/2020b | | | 65,170 | |
| | 30,000 | | | 3.700%, 2/10/2045 | | | 27,297 | |
| | | | Mondelez International Holdings Netherlands BV | | | | |
| | 200,000 | | | 2.000%, 10/28/2021j | | | 190,376 | |
The accompanying Notes to Financial Statements are an integral part of this schedule.
108
MODERATELY AGGRESSIVE ALLOCATION FUN
Schedule of Investments as of October 31, 2018
| | | | | | | | |
Principal
Amount | | | Long-Term Fixed Income (17.0%) | | Value | |
| | Consumer Non-Cyclical (0.8%) - continued | | | | |
| | | | Mondelez International, Inc. | | | | |
| | $91,000 | | | 2.863%, (LIBOR 3M + 0.520%), 2/1/2019b | | | $91,083 | |
| | | | Mylan NV | | | | |
| | 84,000 | | | 5.250%, 6/15/2046 | | | 72,339 | |
| | | | Mylan, Inc. | | | | |
| | 45,000 | | | 3.125%, 1/15/2023j | | | 42,441 | |
| | 175,000 | | | 4.550%, 4/15/2028j | | | 161,954 | |
| | | | Nestle Holdings, Inc. | | | | |
| | 650,000 | | | 3.900%, 9/24/2038j | | | 615,395 | |
| | | | Newell Rubbermaid, Inc. | | | | |
| | 2,000 | | | 3.150%, 4/1/2021 | | | 1,959 | |
| | 126,000 | | | 5.500%, 4/1/2046 | | | 108,606 | |
| | | | PepsiCo, Inc. | | | | |
| | 12,000 | | | 2.938%, (LIBOR 3M + 0.530%), 10/6/2021b | | | 12,143 | |
| | 168,000 | | | 2.850%, 2/24/2026 | | | 157,236 | |
| | | | Pernod Ricard SA | | | | |
| | 10,000 | | | 5.750%, 4/7/2021j | | | 10,472 | |
| | | | Perrigo Finance Unlimited Company | | | | |
| | 360,000 | | | 4.900%, 12/15/2044 | | | 316,443 | |
| | | | Pilgrim’s Pride Corporation | | | | |
| | 335,000 | | | 5.750%, 3/15/2025j | | | 312,388 | |
| | | | Post Holdings, Inc. | | | | |
| | 290,000 | | | 5.500%, 3/1/2025j | | | 280,394 | |
| | | | Reynolds American, Inc. | | | | |
| | 6,000 | | | 3.250%, 6/12/2020 | | | 5,980 | |
| | 257,000 | | | 5.700%, 8/15/2035 | | | 263,810 | |
| | | | Roche Holdings, Inc. | | | | |
| | 130,000 | | | 4.000%, 11/28/2044j | | | 125,352 | |
| | | | Shire Acquisitions Investments Ireland Designated Activity Company | | | | |
| | 10,000 | | | 1.900%, 9/23/2019 | | | 9,877 | |
| | 276,000 | | | 2.400%, 9/23/2021 | | | 265,254 | |
| | | | Simmons Foods, Inc. | | | | |
| | 365,000 | | | 5.750%, 11/1/2024i,j | | | 268,275 | |
| | | | Smithfield Foods, Inc. | | | | |
| | 224,000 | | | 2.700%, 1/31/2020j | | | 220,153 | |
| | 165,000 | | | 2.650%, 10/3/2021j | | | 157,029 | |
| | | | Tenet Healthcare Corporation | | | | |
| | 360,000 | | | 8.125%, 4/1/2022 | | | 374,850 | |
| | | | Teva Pharmaceutical Finance Netherlands III BV | | | | |
| | 10,000 | | | 2.200%, 7/21/2021 | | | 9,337 | |
| | | | Thermo Fisher Scientific, Inc. | | | | |
| | 63,000 | | | 3.000%, 4/15/2023 | | | 60,722 | |
| | | | TreeHouse Foods, Inc. | | | | |
| | 225,000 | | | 4.875%, 3/15/2022 | | | 222,188 | |
| | | | Tyson Foods, Inc. | | | | |
| | 92,000 | | | 3.550%, 6/2/2027 | | | 85,763 | |
| | | | VRX Escrow Corporation | | | | |
| | 570,000 | | | 6.125%, 4/15/2025j | | | 524,229 | |
| | | | Zimmer Biomet Holdings, Inc. | | | | |
| | 340,000 | | | 3.089%, (LIBOR 3M + 0.750%), 3/19/2021b | | | 340,178 | |
| | | | Zoetis, Inc. | | | | |
| | 9,000 | | | 3.450%, 11/13/2020 | | | 9,010 | |
| | 288,000 | | | 4.700%, 2/1/2043 | | | 282,991 | |
| | | | | |
| | | | Total | | | 21,020,609 | |
| | | | | |
| |
| | Energy (0.7%) | | | | |
| | | | Alliance Resource Operating Partners, LP | | | | |
| | 315,000 | | | 7.500%, 5/1/2025j | | | 326,812 | |
| | | | Anadarko Petroleum Corporation | | | | |
| | 9,000 | | | 8.700%, 3/15/2019 | | | 9,179 | |
| | 275,000 | | | 4.850%, 3/15/2021 | | | 280,962 | |
| | 330,000 | | | 5.550%, 3/15/2026 | | | 343,363 | |
| | | | Antero Resources Corporation | | | | |
| | 330,000 | | | 5.125%, 12/1/2022 | | | 327,731 | |
| | | | BP Capital Markets plc | | | | |
| | 6,000 | | | 2.315%, 2/13/2020 | | | 5,937 | |
| | 252,000 | | | 3.535%, 11/4/2024 | | | 248,133 | |
| | 45,000 | | | 3.119%, 5/4/2026 | | | 42,348 | |
| | 350,000 | | | 3.279%, 9/19/2027 | | | 329,587 | |
| | | | Buckeye Partners, LP | | | | |
| | 120,000 | | | 2.650%, 11/15/2018 | | | 119,975 | |
| | | | Canadian Natural Resources, Ltd. | | | | |
| | 200,000 | | | 3.450%, 11/15/2021 | | | 198,112 | |
| | 85,000 | | | 6.250%, 3/15/2038 | | | 95,751 | |
| | | | Canadian Oil Sands, Ltd. | | | | |
| | 125,000 | | | 9.400%, 9/1/2021j | | | 140,937 | |
| | | | Cenovus Energy, Inc. | | | | |
| | 191,000 | | | 3.800%, 9/15/2023 | | | 186,707 | |
| | | | Cheniere Corpus Christi Holdings, LLC | | | | |
| | 340,000 | | | 7.000%, 6/30/2024 | | | 367,625 | |
| | 255,000 | | | 5.875%, 3/31/2025 | | | 262,012 | |
| | | | Cheniere Energy Partners, LP | | | | |
| | 475,000 | | | 5.625%, 10/1/2026j | | | 467,875 | |
| | | | Chesapeake Energy Corporation | | | | |
| | 195,000 | | | 7.000%, 10/1/2024 | | | 190,612 | |
| | | | ConocoPhillips | | | | |
| | 230,000 | | | 6.500%, 2/1/2039 | | | 287,485 | |
| | | | Continental Resources, Inc. | | | | |
| | 189,000 | | | 5.000%, 9/15/2022 | | | 190,702 | |
| | 350,000 | | | 4.375%, 1/15/2028 | | | 338,420 | |
| | | | Crestwood Midstream Partners, LP | | | | |
| | 40,000 | | | 6.250%, 4/1/2023 | | | 40,800 | |
| | | | El Paso Pipeline Partners Operating Company, LLC | | | | |
| | 135,000 | | | 4.300%, 5/1/2024 | | | 135,296 | |
| | | | Enbridge Energy Partners, LP | | | | |
| | 230,000 | | | 5.875%, 10/15/2025 | | | 250,289 | |
| | | | Enbridge, Inc. | | | | |
| | 175,000 | | | 2.900%, 7/15/2022 | | | 168,936 | |
| | | | Encana Corporation | | | | |
| | 47,000 | | | 3.900%, 11/15/2021 | | | 46,952 | |
| | | | Energy Transfer Equity, LP | | | | |
| | 335,000 | | | 5.500%, 6/1/2027 | | | 340,544 | |
| | | | Energy Transfer Operating, LP | | | | |
| | 75,000 | | | 4.200%, 9/15/2023 | | | 74,667 | |
| | 330,000 | | | 6.000%, 6/15/2048 | | | 325,128 | |
| | | | Energy Transfer Partners, LP | | | | |
| | 10,000 | | | 4.150%, 10/1/2020 | | | 10,085 | |
| | | | Energy Transfer Partners, LP | | | | |
| | 90,000 | | | 4.900%, 3/15/2035 | | | 80,972 | |
| | 125,000 | | | 5.150%, 2/1/2043 | | | 110,187 | |
| | | | Eni SPA | | | | |
| | 375,000 | | | 4.000%, 9/12/2023j | | | 367,061 | |
| | | | EnLink Midstream Partners, LP | | | | |
| | 85,000 | | | 4.150%, 6/1/2025 | | | 79,016 | |
The accompanying Notes to Financial Statements are an integral part of this schedule.
109
MODERATELY AGGRESSIVE ALLOCATION FUND
Schedule of Investments as of October 31, 2018
| | | | | | | | |
Principal
Amount | | | Long-Term Fixed Income (17.0%) | | Value | |
| | Energy (0.7%) - continued | | | | |
| | $63,000 | | | 4.850%, 7/15/2026 | | | $59,689 | |
| | | | Enterprise Products Operating, LLC | | | | |
| | 48,000 | | | 5.100%, 2/15/2045 | | | 47,755 | |
| | | | EOG Resources, Inc. | | | | |
| | 10,000 | | | 2.625%, 3/15/2023 | | | 9,580 | |
| | | | EQM Midstream Partners LP | | | | |
| | 350,000 | | | 4.750%, 7/15/2023 | | | 352,931 | |
| | | | EQT Corporation | | | | |
| | 63,000 | | | 8.125%, 6/1/2019 | | | 64,735 | |
| | 150,000 | | | 4.875%, 11/15/2021 | | | 153,547 | |
| | 274,000 | | | 3.900%, 10/1/2027 | | | 249,340 | |
| | | | Exxon Mobil Corporation | | | | |
| | 10,000 | | | 1.708%, 3/1/2019 | | | 9,969 | |
| | 70,000 | | | 4.114%, 3/1/2046 | | | 67,520 | |
| | | | Hess Corporation | | | | |
| | 435,000 | | | 3.500%, 7/15/2024 | | | 410,137 | |
| | 150,000 | | | 6.000%, 1/15/2040 | | | 147,744 | |
| | | | Kinder Morgan Energy Partners, LP | | | | |
| | 130,000 | | | 3.500%, 3/1/2021 | | | 129,410 | |
| | 12,000 | | | 3.450%, 2/15/2023 | | | 11,703 | |
| | 225,000 | | | 6.500%, 9/1/2039 | | | 245,292 | |
| | | | Kinder Morgan, Inc. | | | | |
| | 255,000 | | | 6.500%, 9/15/2020 | | | 267,721 | |
| | | | Magellan Midstream Partners, LP | | | | |
| | 120,000 | | | 5.000%, 3/1/2026 | | | 125,464 | |
| | | | Marathon Oil Corporation | | | | |
| | 132,000 | | | 2.700%, 6/1/2020 | | | 130,210 | |
| | 325,000 | | | 6.600%, 10/1/2037 | | | 368,956 | |
| | | | Marathon Petroleum Corporation | | | | |
| | 75,000 | | | 3.400%, 12/15/2020 | | | 74,973 | |
| | 276,000 | | | 4.750%, 12/15/2023j | | | 284,329 | |
| | 184,000 | | | 6.500%, 3/1/2041 | | | 206,471 | |
| | | | MEG Energy Corporation | | | | |
| | 10,000 | | | 6.375%, 1/30/2023j | | | 9,638 | |
| | | | MPLX, LP | | | | |
| | 9,000 | | | 4.500%, 7/15/2023 | | | 9,136 | |
| | 276,000 | | | 4.875%, 6/1/2025 | | | 281,400 | |
| | 130,000 | | | 4.125%, 3/1/2027 | | | 124,039 | |
| | | | Nabors Industries, Inc. | | | | |
| | 300,000 | | | 5.750%, 2/1/2025 | | | 276,895 | |
| | | | Newfield Exploration Company | | | | |
| | 250,000 | | | 5.625%, 7/1/2024 | | | 257,500 | |
| | | | ONEOK Partners, LP | | | | |
| | 165,000 | | | 3.800%, 3/15/2020 | | | 165,498 | |
| | | | Parsley Energy, LLC | | | | |
| | 160,000 | | | 5.625%, 10/15/2027j | | | 157,723 | |
| | | | PBF Holding Company, LLC | | | | |
| | 285,000 | | | 7.250%, 6/15/2025 | | | 293,550 | |
| | | | Petrobras Global Finance BV | | | | |
| | 149,000 | | | 8.375%, 5/23/2021 | | | 162,537 | |
| | | | Petroleos Mexicanos | | | | |
| | 175,000 | | | 6.000%, 3/5/2020 | | | 177,405 | |
| | 10,000 | | | 6.375%, 2/4/2021 | | | 10,232 | |
| | 52,000 | | | 2.378%, 4/15/2025 | | | 50,544 | |
| | 110,000 | | | 6.750%, 9/21/2047 | | | 94,754 | |
| | | | Phillips 66 | | | | |
| | 205,000 | | | 3.900%, 3/15/2028 | | | 196,394 | |
| | | | Pioneer Natural Resources Company | | | | |
| | 85,000 | | | 4.450%, 1/15/2026 | | | 85,514 | |
| | | | Plains All American Pipeline, LP | | | | |
| | 225,000 | | | 5.000%, 2/1/2021 | | | 229,621 | |
| | | | Regency Energy Partners, LP | | | | |
| | 168,000 | | | 5.875%, 3/1/2022 | | | 176,848 | |
| | 320,000 | | | 5.000%, 10/1/2022 | | | 329,722 | |
| | | | Sabine Pass Liquefaction, LLC | | | | |
| | 141,000 | | | 6.250%, 3/15/2022 | | | 150,237 | |
| | 166,000 | | | 5.625%, 4/15/2023 | | | 174,770 | |
| | 185,000 | | | 5.750%, 5/15/2024 | | | 195,937 | |
| | 335,000 | | | 5.625%, 3/1/2025 | | | 349,762 | |
| | | | Schlumberger Holdings Corporation | | | | |
| | 10,000 | | | 3.000%, 12/21/2020j | | | 9,893 | |
| | 330,000 | | | 4.000%, 12/21/2025j | | | 326,420 | |
| | | | Shell International Finance BV | | | | |
| | 60,000 | | | 2.788%, (LIBOR 3M + 0.450%), 5/11/2020b | | | 60,365 | |
| | | | Southwestern Energy Company | | | | |
| | 340,000 | | | 7.500%, 4/1/2026i | | | 345,950 | |
| | | | SRC Energy, Inc. | | | | |
| | 235,000 | | | 6.250%, 12/1/2025 | | | 218,844 | |
| | | | Suncor Energy, Inc. | | | | |
| | 95,000 | | | 3.600%, 12/1/2024 | | | 93,297 | |
| | | | Sunoco Logistics Partners Operations, LP | | | | |
| | 10,000 | | | 4.400%, 4/1/2021 | | | 10,116 | |
| | | | Sunoco, LP | | | | |
| | 130,000 | | | 5.500%, 2/15/2026j | | | 123,825 | |
| | 200,000 | | | 5.875%, 3/15/2028j | | | 186,500 | |
| | | | Tallgrass Energy Partners, LP | | | | |
| | 515,000 | | | 5.500%, 1/15/2028j | | | 509,108 | |
| | | | Transocean Guardian, Ltd. | | | | |
| | 375,000 | | | 5.875%, 1/15/2024j | | | 371,250 | |
| | | | W&T Offshore, Inc. | | | | |
| | 380,000 | | | 9.750%, 11/1/2023j | | | 367,726 | |
| | | | Weatherford International, Ltd. | | | | |
| | 100,000 | | | 4.500%, 4/15/2022i | | | 75,000 | |
| | 236,000 | | | 8.250%, 6/15/2023i | | | 180,540 | |
| | | | Western Gas Partners, LP | | | | |
| | 184,000 | | | 4.000%, 7/1/2022 | | | 182,443 | |
| | 105,000 | | | 4.500%, 3/1/2028 | | | 99,961 | |
| | | | Williams Companies, Inc. | | | | |
| | 250,000 | | | 7.500%, 1/15/2031 | | | 295,873 | |
| | | | Williams Partners, LP | | | | |
| | 117,000 | | | 4.000%, 11/15/2021 | | | 117,576 | |
| | 65,000 | | | 3.600%, 3/15/2022 | | | 63,982 | |
| | 115,000 | | | 4.500%, 11/15/2023 | | | 116,617 | |
| | 170,000 | | | 3.750%, 6/15/2027 | | | 158,304 | |
| | 185,000 | | | 6.300%, 4/15/2040 | | | 196,501 | |
| | | | Woodside Finance, Ltd. | | | | |
| | 240,000 | | | 3.650%, 3/5/2025j | | | 229,256 | |
| | 95,000 | | | 3.700%, 3/15/2028j | | | 87,879 | |
| | | | WPX Energy, Inc. | | | | |
| | 245,000 | | | 5.750%, 6/1/2026 | | | 243,775 | |
| | | | | |
| | | | Total | | | 18,838,331 | |
| | | | | |
| |
| | Financials (1.8%) | | | | |
| | | | ABN AMRO Bank NV | | | | |
| | 200,000 | | | 4.750%, 7/28/2025j | | | 198,580 | |
| | | | ACE INA Holdings, Inc. | | | | |
| | 10,000 | | | 2.875%, 11/3/2022 | | | 9,766 | |
| | 125,000 | | | 4.350%, 11/3/2045 | | | 123,357 | |
| | | | AerCap Ireland Capital, Ltd. | | | | |
| | 80,000 | | | 3.750%, 5/15/2019 | | | 80,156 | |
The accompanying Notes to Financial Statements are an integral part of this schedule.
110
MODERATELY AGGRESSIVE ALLOCATION FUND
Schedule of Investments as of October 31, 2018
| | | | | | |
Principal
Amount | | Long-Term Fixed Income (17.0%) | | Value | |
Financials (1.8%) - continued | | | | |
| $84,000 | | 4.625%, 10/30/2020 | | | $85,239 | |
| 230,000 | | 5.000%, 10/1/2021 | | | 236,171 | |
| 84,000 | | 4.625%, 7/1/2022 | | | 85,098 | |
| 175,000 | | 3.500%, 1/15/2025 | | | 163,160 | |
| | Air Lease Corporation | | | | |
| 230,000 | | 3.375%, 1/15/2019 | | | 230,058 | |
| 215,000 | | 2.500%, 3/1/2021 | | | 209,604 | |
| 70,000 | | 3.500%, 1/15/2022 | | | 69,216 | |
| | Aircastle, Ltd. | | | | |
| 400,000 | | 5.000%, 4/1/2023 | | | 405,595 | |
| | Ally Financial, Inc. | | | | |
| 180,000 | | 3.750%, 11/18/2019 | | | 180,018 | |
| 200,000 | | 4.125%, 3/30/2020 | | | 199,750 | |
| | American Express Company | | | | |
| 162,000 | | 2.200%, 10/30/2020 | | | 158,187 | |
| | American Express Credit Corporation | | | | |
| 130,000 | | 2.887%, (LIBOR 3M + 0.550%), 3/18/2019b | | | 130,180 | |
| 276,000 | | 1.875%, 5/3/2019 | | | 274,501 | |
| 6,000 | | 2.678%, (LIBOR 3M + 0.330%), 5/3/2019b | | | 6,005 | |
| 431,000 | | 2.200%, 3/3/2020 | | | 425,297 | |
| 5,000 | | 3.382%, (LIBOR 3M + 1.050%), 9/14/2020b | | | 5,072 | |
| | American International Group, Inc. | | | | |
| 55,000 | | 3.300%, 3/1/2021 | | | 54,443 | |
| 126,000 | | 4.125%, 2/15/2024 | | | 125,241 | |
| 275,000 | | 3.750%, 7/10/2025 | | | 262,585 | |
| 255,000 | | 3.900%, 4/1/2026 | | | 242,951 | |
| | Anthem, Inc. | | | | |
| 230,000 | | 4.625%, 5/15/2042 | | | 217,945 | |
| | Ares Capital Corporation | | | | |
| 435,000 | | 3.875%, 1/15/2020 | | | 436,395 | |
| | ASP AMC Merger Sub, Inc. | | | | |
| 300,000 | | 8.000%, 5/15/2025j | | | 225,000 | |
| | Athene Global Funding | | | | |
| 5,000 | | 4.000%, 1/25/2022j | | | 5,017 | |
| | Avalonbay Communities, Inc. | | | | |
| 200,000 | | 3.500%, 11/15/2025 | | | 193,905 | |
| | Aviation Capital Group, LLC | | | | |
| 290,000 | | 2.875%, 1/20/2022j | | | 280,311 | |
| | Banco Santander SA | | | | |
| 200,000 | | 6.375%, 5/19/2019b,l | | | 197,250 | |
| 400,000 | | 3.545%, (LIBOR 3M + 1.120%), 4/12/2023b | | | 401,073 | |
| | Bank of America Corporation | | | | |
| 110,000 | | 3.266%, (LIBOR 3M + 0.870%), 4/1/2019b | | | 110,322 | |
| 126,000 | | 2.369%, 7/21/2021b | | | 123,586 | |
| 142,000 | | 2.328%, 10/1/2021b | | | 138,624 | |
| 5,000 | | 2.738%, 1/23/2022b | �� | | 4,900 | |
| 275,000 | | 3.499%, 5/17/2022b | | | 273,800 | |
| 200,000 | | 3.300%, 1/11/2023 | | | 195,549 | |
| 185,000 | | 2.881%, 4/24/2023b | | | 178,997 | |
| 9,000 | | 3.550%, 3/5/2024b | | | 8,833 | |
| 168,000 | | 4.000%, 4/1/2024 | | | 167,740 | |
| 515,000 | | 4.000%, 1/22/2025 | | | 501,087 | |
| 240,000 | | 3.093%, 10/1/2025b | | | 227,262 | |
| 126,000 | | 3.500%, 4/19/2026 | | | 119,871 | |
| 276,000 | | 4.183%, 11/25/2027 | | | 265,059 | |
| 185,000 | | 3.824%, 1/20/2028b | | | 177,367 | |
| 208,000 | | 5.875%, 2/7/2042 | | | 237,272 | |
| | Bank of Montreal | | | | |
| 7,000 | | 1.500%, 7/18/2019 | | | 6,929 | |
| 225,000 | | 2.896%, (LIBOR 3M + 0.460%), 4/13/2021b | | | 225,511 | |
| | Bank of New York Mellon Corporation | | | | |
| 210,000 | | 2.500%, 4/15/2021 | | | 205,799 | |
| 12,000 | | 2.600%, 2/7/2022 | | | 11,677 | |
| | Bank of Nova Scotia | | | | |
| 435,000 | | 2.909%, (LIBOR 3M + 0.440%), 4/20/2021b | | | 436,053 | |
| 199,000 | | 2.700%, 3/7/2022 | | | 193,688 | |
| | Bank of Tokyo-Mitsubishi UFJ, Ltd. | | | | |
| 50,000 | | 2.850%, 9/8/2021j | | | 48,923 | |
| | Barclays Bank plc | | | | |
| 42,000 | | 10.179%, 6/12/2021j | | | 47,763 | |
| | Barclays plc | | | | |
| 90,000 | | 2.750%, 11/8/2019 | | | 89,372 | |
| 330,000 | | 3.250%, 1/12/2021 | | | 325,069 | |
| 168,000 | | 3.650%, 3/16/2025 | | | 156,259 | |
| | BB&T Corporation | | | | |
| 55,000 | | 3.151%, (LIBOR 3M + 0.715%), 1/15/2020b | | | 55,340 | |
| | BPCE SA | | | | |
| 350,000 | | 3.500%, 10/23/2027j | | | 314,517 | |
| | Capital One Financial Corporation | | | | |
| 90,000 | | 2.450%, 4/24/2019 | | | 89,802 | |
| 166,000 | | 2.500%, 5/12/2020 | | | 163,636 | |
| 600,000 | | 3.450%, 4/30/2021 | | | 597,395 | |
| 186,000 | | 3.050%, 3/9/2022 | | | 181,463 | |
| | Capital One NA | | | | |
| 250,000 | | 2.350%, 1/31/2020 | | | 246,845 | |
| | Cboe Global Markets, Inc. | | | | |
| 110,000 | | 1.950%, 6/28/2019 | | | 109,216 | |
| | Cigna Corporation | | | | |
| 380,000 | | 3.050%, 10/15/2027 | | | 339,028 | |
| | CIT Group, Inc. | | | | |
| 355,000 | | 5.000%, 8/15/2022 | | | 357,662 | |
| | Citigroup, Inc. | | | | |
| 90,000 | | 3.180%, (LIBOR 3M + 0.770%), 4/8/2019b | | | 90,218 | |
| 12,000 | | 2.450%, 1/10/2020 | | | 11,891 | |
| 12,000 | | 2.650%, 10/26/2020 | | | 11,817 | |
| 170,000 | | 2.700%, 3/30/2021 | | | 166,490 | |
| 216,000 | | 2.750%, 4/25/2022 | | | 208,665 | |
| 89,000 | | 4.050%, 7/30/2022 | | | 89,388 | |
| 165,000 | | 3.142%, 1/24/2023b | | | 161,088 | |
| 435,000 | | 4.400%, 6/10/2025 | | | 430,935 | |
| 168,000 | | 3.200%, 10/21/2026 | | | 153,954 | |
| 276,000 | | 3.668%, 7/24/2028b | | | 258,783 | |
| 126,000 | | 4.125%, 7/25/2028 | | | 119,619 | |
| 250,000 | | 3.520%, 10/27/2028b | | | 231,686 | |
| 320,000 | | 3.878%, 1/24/2039b | | | 283,941 | |
| 198,000 | | 4.650%, 7/23/2048 | | | 191,329 | |
| | Citizens Bank NA | | | | |
| 250,000 | | 2.200%, 5/26/2020 | | | 245,339 | |
| | CNA Financial Corporation | | | | |
| 10,000 | | 5.750%, 8/15/2021 | | | 10,536 | |
| | Comerica, Inc. | | | | |
| 70,000 | | 3.700%, 7/31/2023 | | | 69,355 | |
| | Commerzbank AG | | | | |
| 230,000 | | 8.125%, 9/19/2023j | | | 259,059 | |
The accompanying Notes to Financial Statements are an integral part of this schedule.
111
MODERATELY AGGRESSIVE ALLOCATION FUND
Schedule of Investments as of October 31, 2018
| | | | | | | | |
Principal
Amount | | | Long-Term Fixed Income (17.0%) | | Value | |
| | Financials (1.8%) - continued | | | | |
| | | | Commonwealth Bank of Australia | | | | |
| | $138,000 | | | 2.250%, 3/10/2020j | | $ | 136,097 | |
| | 315,000 | | | 3.034%, (LIBOR 3M + 0.700%), 3/16/2023b,j | | | 316,004 | |
| | | | Compass Bank | | | | |
| | 180,000 | | | 2.750%, 9/29/2019 | | | 179,190 | |
| | 250,000 | | | 3.500%, 6/11/2021 | | | 247,946 | |
| | | | Cooperatieve Centrale Raiffeisen - Boerenleenbank BA | | | | |
| | 239,000 | | | 3.950%, 11/9/2022 | | | 236,776 | |
| | 552,000 | | | 4.625%, 12/1/2023 | | | 556,746 | |
| | | | Credit Agricole SA | | | | |
| | 110,000 | | | 3.236%, (LIBOR 3M + 0.800%), 4/15/2019b,j | | | 110,314 | |
| | 306,000 | | | 3.375%, 1/10/2022j | | | 299,565 | |
| | | | Credit Suisse AG | | | | |
| | 73,000 | | | 5.400%, 1/14/2020 | | | 74,574 | |
| | | | Credit Suisse Group AG | | | | |
| | 250,000 | | | 2.997%, 12/14/2023b,j | | | 237,713 | |
| | 225,000 | | | 7.250%, 9/12/2025b,j,l | | | 222,469 | |
| | 250,000 | | | 3.869%, 1/12/2029b,j | | | 231,624 | |
| | | | Credit Suisse Group Funding Guernsey, Ltd. | | | | |
| | 18,000 | | | 3.800%, 9/15/2022 | | | 17,803 | |
| | | | Credit Suisse Group Funding, Ltd. | | | | |
| | 222,000 | | | 3.125%, 12/10/2020 | | | 219,467 | |
| | 168,000 | | | 3.750%, 3/26/2025 | | | 160,824 | |
| | | | Deutsche Bank AG | | | | |
| | 174,000 | | | 2.700%, 7/13/2020 | | | 170,013 | |
| | 252,000 | | | 3.375%, 5/12/2021 | | | 245,418 | |
| | 123,000 | | | 4.250%, 10/14/2021 | | | 122,019 | |
| | 330,000 | | | 4.875%, 12/1/2032b | | | 281,150 | |
| | | | Deutsche Bank AG of New York | | | | |
| | 100,000 | | | 3.950%, 2/27/2023 | | | 96,009 | |
| | | | Digital Realty Trust LP | | | | |
| | 100,000 | | | 3.400%, 10/1/2020 | | | 99,797 | |
| | | | Discover Bank | | | | |
| | 193,000 | | | 8.700%, 11/18/2019 | | | 202,632 | |
| | 165,000 | | | 3.100%, 6/4/2020 | | | 163,759 | |
| | 290,000 | | | 4.682%, 8/9/2028b | | | 286,543 | |
| | | | Duke Realty, LP | | | | |
| | 30,000 | | | 3.875%, 2/15/2021 | | | 30,190 | |
| | 90,000 | | | 4.375%, 6/15/2022 | | | 91,987 | |
| | | | ERP Operating, LP | | | | |
| | 32,000 | | | 3.375%, 6/1/2025 | | | 30,923 | |
| | | | European Investment Bank | | | | |
| | 165,000 | | | 1.875%, 3/15/2019 | | | 164,577 | |
| | | | Fidelity National Financial, Inc. | | | | |
| | 325,000 | | | 5.500%, 9/1/2022 | | | 342,433 | |
| | | | Fifth Third Bancorp | | | | |
| | 52,000 | | | 2.875%, 7/27/2020 | | | 51,528 | |
| | 55,000 | | | 2.875%, 10/1/2021 | | | 53,944 | |
| | 155,000 | | | 2.600%, 6/15/2022 | | | 149,002 | |
| | | | Five Corners Funding Trust | | | | |
| | 555,000 | | | 4.419%, 11/15/2023j | | | 566,855 | |
| | | | GE Capital International Funding Company | | | | |
| | 750,000 | | | 4.418%, 11/15/2035 | | | 647,286 | |
| | | | Goldman Sachs Group, Inc. | | | | |
| | 442,000 | | | 5.375%, 3/15/2020 | | | 453,846 | |
| | 75,000 | | | 3.637%, (LIBOR 3M + 1.160%), 4/23/2020b | | | 75,829 | |
| | 337,000 | | | 5.375%, 5/10/2020b,l | | | 340,791 | |
| | 9,000 | | | 2.600%, 12/27/2020 | | | 8,826 | |
| | 578,000 | | | 5.250%, 7/27/2021 | | | 601,064 | |
| | 10,000 | | | 3.484%, (LIBOR 3M + 1.170%), 11/15/2021b | | | 10,122 | |
| | 12,000 | | | 3.000%, 4/26/2022 | | | 11,682 | |
| | 329,000 | | | 2.876%, 10/31/2022b | | | 319,999 | |
| | 184,000 | | | 2.908%, 6/5/2023b | | | 177,269 | |
| | 325,000 | | | 3.691%, 6/5/2028b | | | 305,073 | |
| | 465,000 | | | 4.750%, 10/21/2045 | | | 452,435 | |
| | | | Hartford Financial Services Group, Inc. | | | | |
| | 369,000 | | | 5.125%, 4/15/2022 | | | 385,010 | |
| | | | HCP, Inc. | | | | |
| | 9,000 | | | 3.750%, 2/1/2019 | | | 9,001 | |
| | 210,000 | | | 4.000%, 12/1/2022 | | | 208,492 | |
| | 60,000 | | | 3.400%, 2/1/2025 | | | 56,326 | |
| | | | Hospitality Properties Trust | | | | |
| | 10,000 | | | 4.250%, 2/15/2021 | | | 10,034 | |
| | | | HSBC Holdings plc | | | | |
| | 353,000 | | | 3.400%, 3/8/2021 | | | 351,273 | |
| | 212,000 | | | 6.875%, 6/1/2021b,l | | | 219,685 | |
| | 125,000 | | | 2.650%, 1/5/2022 | | | 120,878 | |
| | 200,000 | | | 3.600%, 5/25/2023 | | | 197,019 | |
| | 200,000 | | | 3.900%, 5/25/2026 | | | 192,186 | |
| | | | HSBC USA, Inc. | | | | |
| | 280,000 | | | 2.350%, 3/5/2020 | | | 276,668 | |
| | | | Huntington Bancshares, Inc. | | | | |
| | 10,000 | | | 3.150%, 3/14/2021 | | | 9,887 | |
| | | | Huntington National Bank | | | | |
| | 250,000 | | | 2.200%, 11/6/2018 | | | 249,985 | |
| | | | Icahn Enterprises, LP | | | | |
| | 140,000 | | | 6.750%, 2/1/2024 | | | 141,050 | |
| | 185,000 | | | 6.375%, 12/15/2025 | | | 183,844 | |
| | | | ING Groep NV | | | | |
| | 200,000 | | | 3.150%, 3/29/2022 | | | 194,507 | |
| | 350,000 | | | 4.100%, 10/2/2023 | | | 347,352 | |
| | | | International Lease Finance Corporation | | | | |
| | 12,000 | | | 4.625%, 4/15/2021 | | | 12,164 | |
| | 112,000 | | | 5.875%, 8/15/2022 | | | 117,959 | |
| | | | Intesa Sanpaolo SPA | | | | |
| | 198,000 | | | 3.125%, 7/14/2022j | | | 179,873 | |
| | | | Iron Mountain, Inc. | | | | |
| | 333,677 | | | 6.000%, 8/15/2023 | | | 341,602 | |
| | | | J.P. Morgan Chase & Company | | | | |
| | 60,000 | | | 2.250%, 1/23/2020 | | | 59,289 | |
| | 199,000 | | | 3.001%, (LIBOR 3M + 0.680%), 6/1/2021b | | | 199,299 | |
| | 95,000 | | | 2.295%, 8/15/2021 | | | 91,941 | |
| | 210,000 | | | 4.500%, 1/24/2022 | | | 215,831 | |
| | 215,000 | | | 2.972%, 1/15/2023 | | | 208,043 | |
| | 126,000 | | | 3.200%, 1/25/2023 | | | 123,342 | |
| | 9,000 | | | 2.776%, 4/25/2023b | | | 8,710 | |
| | 210,000 | | | 2.700%, 5/18/2023 | | | 200,708 | |
| | 108,000 | | | 3.717%, (LIBOR 3M + 1.230%), 10/24/2023b | | | 109,902 | |
| | 120,000 | | | 3.625%, 5/13/2024 | | | 118,158 | |
| | 240,000 | | | 3.125%, 1/23/2025 | | | 227,582 | |
| | 470,000 | | | 3.900%, 7/15/2025 | | | 463,516 | |
| | 135,000 | | | 3.300%, 4/1/2026 | | | 127,507 | |
| | 375,000 | | | 4.203%, 7/23/2029b | | | 369,369 | |
| | 275,000 | | | 3.882%, 7/24/2038b | | | 247,909 | |
The accompanying Notes to Financial Statements are an integral part of this schedule.
112
MODERATELY AGGRESSIVE ALLOCATION FUND
Schedule of Investments as of October 31, 2018
| | | | | | | | |
Principal
Amount | | | Long-Term Fixed Income (17.0%) | | Value | |
| | Financials (1.8%) - continued | | | | |
| | | | J.P. Morgan Chase Bank NA | | | | |
| $ | 650,000 | | | 3.086%, 4/26/2021b | | $ | 647,517 | |
| | | | KeyCorp | | | | |
| | 9,000 | | | 2.300%, 12/13/2018 | | | 8,996 | |
| | 100,000 | | | 2.900%, 9/15/2020 | | | 99,079 | |
| | | | Kimco Realty Corporation | | | | |
| | 368,000 | | | 3.300%, 2/1/2025 | | | 347,707 | |
| | | | Liberty Mutual Group, Inc. | | | | |
| | 3,000 | | | 5.000%, 6/1/2021j | | | 3,076 | |
| | 84,000 | | | 4.950%, 5/1/2022j | | | 86,482 | |
| | | | Liberty Property, LP | | | | |
| | 246,000 | | | 3.750%, 4/1/2025 | | | 237,488 | |
| | | | Lincoln National Corporation | | | | |
| | 7,000 | | | 6.250%, 2/15/2020 | | | 7,242 | |
| | | | Lloyds Bank plc | | | | |
| | 200,000 | | | 2.833%, (LIBOR 3M + 0.490%), 5/7/2021b | | | 200,260 | |
| | | | Lloyds Banking Group plc | | | | |
| | 250,000 | | | 2.907%, 11/7/2023b | | | 237,507 | |
| | | | MetLife, Inc. | | | | |
| | 125,000 | | | 4.050%, 3/1/2045 | | | 111,626 | |
| | | | Mitsubishi UFJ Financial Group, Inc. | | | | |
| | 200,000 | | | 2.190%, 9/13/2021 | | | 192,429 | |
| | 6,000 | | | 2.998%, 2/22/2022 | | | 5,881 | |
| | 315,000 | | | 3.455%, 3/2/2023 | | | 310,601 | |
| | 230,000 | | | 3.287%, 7/25/2027 | | | 214,983 | |
| | | | Morgan Stanley | | | | |
| | 12,000 | | | 2.800%, 6/16/2020 | | | 11,892 | |
| | 84,000 | | | 5.550%, 7/15/2020b,l | | | 84,840 | |
| | 555,000 | | | 2.500%, 4/21/2021 | | | 540,777 | |
| | 11,000 | | | 5.500%, 7/28/2021 | | | 11,522 | |
| | 210,000 | | | 2.625%, 11/17/2021 | | | 203,683 | |
| | 97,000 | | | 3.649%, (LIBOR 3M + 1.180%), 1/20/2022b | | | 98,092 | |
| | 213,000 | | | 2.750%, 5/19/2022 | | | 205,912 | |
| | 65,000 | | | 4.875%, 11/1/2022 | | | 66,883 | |
| | 215,000 | | | 3.125%, 1/23/2023 | | | 208,070 | |
| | 100,000 | | | 4.000%, 7/23/2025 | | | 98,213 | |
| | 210,000 | | | 4.350%, 9/8/2026 | | | 204,527 | |
| | 276,000 | | | 3.591%, 7/22/2028b | | | 258,532 | |
| | 250,000 | | | 3.772%, 1/24/2029b | | | 236,940 | |
| | | | MPT Operating Partnership, LP | | | | |
| | 275,000 | | | 6.375%, 3/1/2024 | | | 284,625 | |
| | 40,000 | | | 5.500%, 5/1/2024 | | | 40,400 | |
| | | | Nasdaq, Inc. | | | | |
| | 110,000 | | | 3.850%, 6/30/2026 | | | 105,331 | |
| | | | National City Corporation | | | | |
| | 209,000 | | | 6.875%, 5/15/2019 | | | 213,320 | |
| | | | New York Life Global Funding | | | | |
| | 138,000 | | | 2.300%, 6/10/2022j | | | 132,293 | |
| | | | Nomura Holdings, Inc. | | | | |
| | 6,000 | | | 2.750%, 3/19/2019 | | | 5,997 | |
| | | | Park Aerospace Holdings, Ltd. | | | | |
| | 355,000 | | | 5.500%, 2/15/2024j | | | 351,539 | |
| | | | PNC Bank NA | | | | |
| | 10,000 | | | 2.450%, 11/5/2020 | | | 9,823 | |
| | | | Prudential Financial, Inc. | | | | |
| | 55,000 | | | 2.350%, 8/15/2019 | | | 54,708 | |
| | | | Quicken Loans, Inc. | | | | |
| | 505,000 | | | 5.750%, 5/1/2025j | | | 486,694 | |
| | | | Realty Income Corporation | | | | |
| | 9,000 | | | 5.750%,1/15/2021 | | | 9,382 | |
| | 185,000 | | | 4.125%,10/15/2026 | | | 183,552 | |
| | | | Regency Centers, LP | | | | |
| | 320,000 | | | 4.125%,3/15/2028 | | | 311,271 | |
| | | | Regions Financial Corporation | | | | |
| | 136,000 | | | 3.200%,2/8/2021 | | | 134,824 | |
| | | | Reinsurance Group of America, Inc. | | | | |
| | 281,000 | | | 5.000%,6/1/2021 | | | 290,676 | |
| | 8,000 | | | 4.700%,9/15/2023 | | | 8,219 | |
| | | | Reliance Standard Life Global Funding II | | | | |
| | 85,000 | | | 2.500%,4/24/2019j | | | 84,821 | |
| | | | Royal Bank of Canada | | | | |
| | 12,000 | | | 2.125%,3/2/2020 | | | 11,841 | |
| | | | Royal Bank of Scotland Group plc | | | | |
| | 238,000 | | | 8.625%,8/15/2021b,l | | | 250,198 | |
| | 200,000 | | | 3.875%,9/12/2023 | | | 192,417 | |
| | 375,000 | | | 5.125%,5/28/2024 | | | 371,250 | |
| | | | Santander UK Group Holdings plc | | | | |
| | 147,000 | | | 2.875%,10/16/2020 | | | 144,849 | |
| | | | Simon Property Group, LP | | | | |
| | 65,000 | | | 2.500%,9/1/2020 | | | 64,091 | |
| | 15,000 | | | 2.500%,7/15/2021 | | | 14,634 | |
| | 140,000 | | | 2.750%,2/1/2023 | | | 134,892 | |
| | 168,000 | | | 4.250%,11/30/2046 | | | 157,671 | |
| | | | SITE Centers Corporation | | | | |
| | 220,000 | | | 4.625%,7/15/2022 | | | 223,829 | |
| | | | Skandinaviska Enskilda Banken AB | | | | |
| | 135,000 | | | 2.375%,3/25/2019j | | | 134,650 | |
| | | | Societe Generale SA | | | | |
| | 138,000 | | | 4.750%,11/24/2025j | | | 135,214 | |
| | | | Standard Chartered plc | | | | |
| | 164,000 | | | 2.100%,8/19/2019j | | | 162,622 | |
| | | | State Street Corporation | | | | |
| | 95,000 | | | 3.222%, (LIBOR 3M + 0.900%), 8/18/2020b | | | 96,182 | |
| | | | Sumitomo Mitsui Financial Group, Inc. | | | | |
| | 12,000 | | | 2.934%,3/9/2021 | | | 11,839 | |
| | 176,000 | | | 2.784%,7/12/2022 | | | 170,124 | |
| | 150,000 | | | 3.102%,1/17/2023 | | | 146,002 | |
| | 126,000 | | | 3.010%,10/19/2026 | | | 115,706 | |
| | | | Sumitomo Mitsui Trust Bank, Ltd. | | | | |
| | 240,000 | | | 1.950%,9/19/2019j | | | 237,527 | |
| | | | SunTrust Banks, Inc. | | | | |
| | 180,000 | | | 2.250%,1/31/2020 | | | 177,874 | |
| | 10,000 | | | 2.900%,3/3/2021 | | | 9,853 | |
| | | | Svenska Handelsbanken AB | | | | |
| | 120,000 | | | 2.824%, (LIBOR 3M + 0.490%), 6/17/2019b | | | 120,258 | |
| | | | Synchrony Financial | | | | |
| | 321,000 | | | 3.000%,8/15/2019 | | | 319,687 | |
| | 55,000 | | | 3.578%, (LIBOR 3M + 1.230%), 2/3/2020b | | | 55,335 | |
| | 55,000 | | | 4.250%,8/15/2024 | | | 52,237 | |
| | 425,000 | | | 3.950%,12/1/2027 | | | 374,746 | |
| | | | Toronto-Dominion Bank | | | | |
| | 75,000 | | | 3.262%, (LIBOR 3M + 0.930%), 12/14/2020b | | | 76,074 | |
| | | | UBS Group Funding Jersey, Ltd. | | | | |
| | 24,000 | | | 3.000%,4/15/2021j | | | 23,621 | |
The accompanying Notes to Financial Statements are an integral part of this schedule.
113
MODERATELY AGGRESSIVE ALLOCATION FUND
Schedule of Investments as of October 31, 2018
| | | | | | | | |
Principal
Amount | | | Long-Term Fixed Income (17.0%) | | Value | |
| | Financials (1.8%) - continued | | | | |
| $ | 126,000 | | | 4.125%,9/24/2025j | | $ | 123,973 | |
| | | | UBS Group Funding Switzerland AG | | | | |
| | 200,000 | | | 3.491%,5/23/2023j | | | 195,370 | |
| | | | UnitedHealth Group, Inc. | | | | |
| | 40,000 | | | 3.350%,7/15/2022 | | | 39,715 | |
| | 250,000 | | | 2.950%,10/15/2027 | | | 231,014 | |
| | 380,000 | | | 4.625%,7/15/2035 | | | 391,034 | |
| | | | USB Realty Corporation | | | | |
| | 50,000 | | | 3.583%, (LIBOR 3M + 1.147%), 1/15/2022b,j,l | | | 44,875 | |
| | | | Ventas Realty, LP | | | | |
| | 195,000 | | | 3.100%,1/15/2023 | | | 188,907 | |
| | 260,000 | | | 4.000%,3/1/2028 | | | 248,475 | |
| | | | Voya Financial, Inc. | | | | |
| | 342,000 | | | 3.125%,7/15/2024 | | | 322,079 | |
| | | | Wells Fargo & Company | | | | |
| | 75,000 | | | 3.200%, (LIBOR 3M + 0.680%), 1/30/2020b | | | 75,356 | |
| | 170,000 | | | 2.550%,12/7/2020 | | | 166,560 | |
| | 7,000 | | | 2.100%,7/26/2021 | | | 6,720 | |
| | 205,000 | | | 2.625%,7/22/2022 | | | 196,861 | |
| | 225,000 | | | 3.069%,1/24/2023 | | | 217,940 | |
| | 12,000 | | | 3.597%, (LIBOR 3M + 1.110%), 1/24/2023b | | | 12,137 | |
| | 168,000 | | | 3.450%,2/13/2023 | | | 164,093 | |
| | 15,000 | | | 3.757%, (LIBOR 3M + 1.230%), 10/31/2023b | | | 15,211 | |
| | 125,000 | | | 3.000%,2/19/2025 | | | 116,966 | |
| | 175,000 | | | 3.000%,4/22/2026 | | | 161,298 | |
| | 168,000 | | | 3.000%,10/23/2026 | | | 153,796 | |
| | 323,000 | | | 4.900%,11/17/2045 | | | 313,430 | |
| | | | Welltower, Inc. | | | | |
| | 9,000 | | | 4.950%,1/15/2021 | | | 9,205 | |
| | 70,000 | | | 3.950%,9/1/2023 | | | 69,835 | |
| | 360,000 | | | 4.000%,6/1/2025 | | | 351,150 | |
| | | | Westpac Banking Corporation | | | | |
| | 15,000 | | | 3.172%, (LIBOR 3M + 0.850%), 8/19/2021b | | | 15,200 | |
| | | | ZB NA | | | | |
| | 360,000 | | | 3.500%,8/27/2021 | | | 358,145 | |
| | | | | |
| | | | Total | | | 48,042,249 | |
| | | | | |
| |
| | Foreign Government (<0.1%) | | | | |
| | | | Export-Import Bank of Korea | | | | |
| | 75,000 | | | 2.250%,1/21/2020 | | | 74,135 | |
| | | | Kommunalbanken AS | | | | |
| | 125,000 | | | 1.500%,10/22/2019j | | | 123,362 | |
| | | | | |
| | | | Total | | | 197,497 | |
| | | | | |
| |
| | Mortgage-Backed Securities (4.8%) | | | | |
| | | | Federal Home Loan Mortgage Corporation Gold 30-Yr. Pass Through | | | | |
| | 11,125,000 | | | 4.000%,11/1/2048d | | | 11,128,856 | |
| | | | Federal Home Loan Mortgage Corporation Multifamily Structured Pass Through Certificates | | | | |
| | 569,459 | | | 3.000%, 3/15/2045, Ser. 4741, Class GA | | | 556,167 | |
| | | | Federal National Mortgage Association | | | | |
| | 850,000 | | | 3.640%,6/1/2028 | | | 836,688 | |
| | 225,000 | | | 3.710%,7/1/2028 | | | 221,600 | |
| | | | Federal National Mortgage Association Conventional 15-yr. Pass Through | | | | |
| | 9,475,000 | | | 3.500%,11/1/2033d | | | 9,467,043 | |
| | | | Federal National Mortgage Association Conventional 30-Yr. Pass Through | | | | |
| | 65,183 | | | 4.281%, (LIBOR 12M + 1.550%), 7/1/2043b | | | 67,205 | |
| | 58,897 | | | 4.288%, (LIBOR 12M + 1.540%), 7/1/2043b | | | 60,694 | |
| | 22,531 | | | 4.280%, (LIBOR 12M + 1.530%), 8/1/2043b | | | 23,219 | |
| | 37,975,000 | | | 3.500%,11/1/2048d | | | 36,967,774 | |
| | 31,685,000 | | | 4.000%,11/1/2048d | | | 31,684,867 | |
| | 34,590,000 | | | 4.500%,11/1/2048d | | | 35,414,892 | |
| | 4,075,000 | | | 5.000%,11/1/2048d | | | 4,252,326 | |
| | | | | |
| | | | Total | | | 130,681,331 | |
| | | | | |
| |
| | Technology (0.4%) | | | | |
| | | | Alliance Data Systems Corporation | | | | |
| | 25,000 | | | 5.375%,8/1/2022j | | | 25,094 | |
| | | | Amphenol Corporation | | | | |
| | 69,000 | | | 2.550%,1/30/2019 | | | 68,941 | |
| | | | Apple, Inc. | | | | |
| | 60,000 | | | 2.638%, (LIBOR 3M + 0.300%), 5/6/2020b | | | 60,238 | |
| | 12,000 | | | 2.850%,5/6/2021 | | | 11,893 | |
| | 12,000 | | | 2.688%, (LIBOR 3M + 0.350%), 5/11/2022b | | | 12,090 | |
| | 10,000 | | | 2.400%,1/13/2023 | | | 9,574 | |
| | 115,000 | | | 3.000%,2/9/2024 | | | 111,645 | |
| | 183,000 | | | 3.200%,5/11/2027 | | | 174,004 | |
| | 250,000 | | | 3.000%,6/20/2027 | | | 233,980 | |
| | 400,000 | | | 3.000%,11/13/2027 | | | 373,450 | |
| | 250,000 | | | 4.500%,2/23/2036 | | | 259,718 | |
| | 126,000 | | | 4.650%,2/23/2046 | | | 129,981 | |
| | 225,000 | | | 4.250%,2/9/2047 | | | 218,628 | |
| | 335,000 | | | 3.750%,9/12/2047 | | | 300,475 | |
| | | | Applied Materials, Inc. | | | | |
| | 92,000 | | | 3.300%,4/1/2027 | | | 86,815 | |
| | | | Avnet, Inc. | | | | |
| | 125,000 | | | 3.750%,12/1/2021 | | | 124,685 | |
| | | | Baidu, Inc. | | | | |
| | 225,000 | | | 3.000%,6/30/2020 | | | 222,966 | |
| | | | Broadcom Corporation | | | | |
| | 146,000 | | | 3.875%,1/15/2027 | | | 133,888 | |
| | 440,000 | | | 3.500%,1/15/2028 | | | 387,366 | |
| | | | CDK Global, Inc. | | | | |
| | 165,000 | | | 4.875%,6/1/2027 | | | 154,481 | |
| | | | Cisco Systems, Inc. | | | | |
| | 80,000 | | | 2.821%, (LIBOR 3M + 0.500%), 3/1/2019b | | | 80,121 | |
| | | | CommScope Technologies Finance, LLC | | | | |
| | 270,000 | | | 6.000%,6/15/2025j | | | 262,575 | |
| | | | Diamond 1 Finance Corporation | | | | |
| | 115,000 | | | 3.480%,6/1/2019j | | | 115,143 | |
| | 400,000 | | | 4.420%,6/15/2021j | | | 403,332 | |
| | 242,000 | | | 5.450%,6/15/2023j | | | 250,644 | |
| | 330,000 | | | 6.020%,6/15/2026j | | | 342,188 | |
The accompanying Notes to Financial Statements are an integral part of this schedule.
114
MODERATELY AGGRESSIVE ALLOCATION FUND
Schedule of Investments as of October 31, 2018
| | | | | | | | |
Principal
Amount | | | Long-Term Fixed Income (17.0%) | | Value | |
| | Technology (0.4%) - continued | | | | |
| | | | Equinix, Inc. | | | | |
| | $225,000 | | | 5.750%, 1/1/2025 | | | $229,219 | |
| | | | Fidelity National Information Services, Inc. | | | | |
| | 109,000 | | | 3.625%, 10/15/2020 | | | 109,213 | |
| | 15,000 | | | 2.250%, 8/15/2021 | | | 14,429 | |
| | | | Harland Clarke Holdings Corporation | | | | |
| | 350,000 | | | 8.375%, 8/15/2022j | | | 315,875 | |
| | | | Hewlett Packard Enterprise Company | | | | |
| | 15,000 | | | 3.600%, 10/15/2020 | | | 15,024 | |
| | 365,000 | | | 3.059%, (LIBOR 3M + 0.720%), 10/5/2021b | | | 365,157 | |
| | 70,000 | | | 3.500%, 10/5/2021 | | | 69,800 | |
| | 48,000 | | | 4.400%, 10/15/2022 | | | 48,931 | |
| | | | Inception Merger Sub, Inc. | | | | |
| | 380,000 | | | 8.625%, 11/15/2024i,j | | | 357,200 | |
| | | | Intel Corporation | | | | |
| | 10,000 | | | 3.100%, 7/29/2022 | | | 9,885 | |
| | 65,000 | | | 3.700%, 7/29/2025 | | | 64,839 | |
| | 189,000 | | | 4.100%, 5/19/2046 | | | 179,861 | |
| | | | Marvell Technology Group, Ltd. | | | | |
| | 205,000 | | | 4.200%, 6/22/2023 | | | 202,675 | |
| | 275,000 | | | 4.875%, 6/22/2028 | | | 269,785 | |
| | | | Microsoft Corporation | | | | |
| | 270,000 | | | 4.750%, 11/3/2055 | | | 291,232 | |
| | 12,000 | | | 2.400%, 2/6/2022 | | | 11,687 | |
| | 270,000 | | | 4.200%, 11/3/2035 | | | 273,758 | |
| | 975,000 | | | 3.700%, 8/8/2046 | | | 897,124 | |
| | 225,000 | | | 4.250%, 2/6/2047 | | | 226,259 | |
| | | | NetApp, Inc. | | | | |
| | 160,000 | | | 2.000%, 9/27/2019 | | | 158,407 | |
| | | | NXP BV | | | | |
| | 185,000 | | | 3.875%, 9/1/2022j | | | 178,525 | |
| | | | Oracle Corporation | | | | |
| | 10,000 | | | 2.500%, 5/15/2022 | | | 9,680 | |
| | 168,000 | | | 2.400%, 9/15/2023 | | | 158,811 | |
| | 390,000 | | | 2.950%, 5/15/2025 | | | 369,948 | |
| | 250,000 | | | 3.850%, 7/15/2036 | | | 230,542 | |
| | | | Seagate HDD Cayman | | | | |
| | 190,000 | | | 4.750%, 1/1/2025 | | | 173,881 | |
| | | | Sensata Technologies UK Financing Company plc | | | | |
| | 200,000 | | | 6.250%, 2/15/2026j | | | 203,500 | |
| | | | Texas Instruments, Inc. | | | | |
| | 330,000 | | | 4.150%, 5/15/2048 | | | 316,467 | |
| | | | Tyco Electronics Group SA | | | | |
| | 46,000 | | | 3.450%, 8/1/2024 | | | 44,843 | |
| | 92,000 | | | 3.125%, 8/15/2027 | | | 84,339 | |
| | | | VMware, Inc. | | | | |
| | 45,000 | | | 2.950%, 8/21/2022 | | | 43,133 | |
| | | | Western Digital Corporation | | | | |
| | 515,000 | | | 4.750%, 2/15/2026 | | | 475,731 | |
| | | | | |
| | | | Total | | | 10,953,675 | |
| | | | | |
| |
| | Transportation (0.1%) | | | | |
| | | | Air Canada Pass Through Trust | | | | |
| | 42,784 | | | 3.875%, 3/15/2023j | | | 41,875 | |
| | | | American Airlines Pass Through Trust | | | | |
| | 3,999 | | | 4.950%, 1/15/2023 | | | 4,085 | |
| | 89,602 | | | 3.375%, 5/1/2027 | | | 85,966 | |
| | | | Avis Budget Car Rental, LLC | | | | |
| | 20,000 | | | 5.125%, 6/1/2022j | | | 20,512 | |
| | 185,000 | | | 6.375%, 4/1/2024i,j | | | 176,675 | |
| | | | Burlington Northern Santa Fe, LLC | | | | |
| | 140,000 | | | 5.750%, 5/1/2040 | | | 161,111 | |
| | 430,000 | | | 5.050%, 3/1/2041 | | | 454,417 | |
| | 150,000 | | | 4.450%, 3/15/2043 | | | 147,404 | |
| | | | CSX Corporation | | | | |
| | 42,000 | | | 3.700%, 11/1/2023 | | | 41,926 | |
| | | | Delta Air Lines, Inc. | | | | |
| | 114,000 | | | 2.875%, 3/13/2020 | | | 112,941 | |
| | 19,430 | | | 4.950%, 11/23/2020 | | | 19,507 | |
| | | | ERAC USA Finance, LLC | | | | |
| | 30,000 | | | 2.800%, 11/1/2018j | | | 30,000 | |
| | | | J.B. Hunt Transport Services, Inc. | | | | |
| | 60,000 | | | 3.300%, 8/15/2022 | | | 59,286 | |
| | | | United Airlines Pass Through Trust | | | | |
| | 10,000 | | | 3.700%, 12/1/2022 | | | 9,874 | |
| | | | United Continental Holdings, Inc. | | | | |
| | 375,000 | | | 4.250%, 10/1/2022 | | | 367,969 | |
| | | | XPO Logistics, Inc. | | | | |
| | 202,000 | | | 6.500%, 6/15/2022j | | | 207,050 | |
| | | | | |
| | | | Total | | | 1,940,598 | |
| | | | | |
| |
| | U.S. Government and Agencies (4.6%) | | | | |
| | | | Federal National Mortgage Association - ACES | | | | |
| | 1,500,000 | | | 3.639%, 8/25/2030, Ser. 2018-M12, Class A2b | | | 1,467,259 | |
| | | | U.S. Treasury Bonds | | | | |
| | 5,135,000 | | | 2.250%, 11/15/2027 | | | 4,778,158 | |
| | 10,250,000 | | | 2.875%, 5/15/2028 | | | 10,022,578 | |
| | 550,000 | | | 5.250%, 11/15/2028 | | | 648,248 | |
| | 1,175,000 | | | 4.375%, 5/15/2040 | | | 1,361,898 | |
| | 6,780,000 | | | 3.000%, 5/15/2042 | | | 6,368,433 | |
| | 11,118,000 | | | 2.500%, 5/15/2046 | | | 9,338,686 | |
| | 995,000 | | | 3.000%, 5/15/2047 | | | 924,184 | |
| | 250,000 | | | 2.750%, 8/15/2047 | | | 220,557 | |
| | 151,000 | | | 2.750%, 11/15/2047 | | | 133,122 | |
| | 2,250,000 | | | 3.125%, 5/15/2048 | | | 2,139,170 | |
| | | | U.S. Treasury Bonds, TIPS | | | | |
| | 6,554,160 | | | 0.125%, 1/15/2023 | | | 6,307,830 | |
| | 12,265,925 | | | 0.375%, 7/15/2027 | | | 11,542,906 | |
| | | | U.S. Treasury Notes | | | | |
| | 2,210,000 | | | 1.500%, 10/31/2019 | | | 2,183,411 | |
| | 940,000 | | | 2.250%, 3/31/2020 | | | 932,619 | |
| | 120,000 | | | 1.875%, 12/15/2020 | | | 117,525 | |
| | 250,000 | | | 1.375%, 5/31/2021 | | | 240,488 | |
| | 7,984,000 | | | 1.125%, 8/31/2021 | | | 7,595,092 | |
| | 50,000 | | | 2.000%, 2/15/2022 | | | 48,527 | |
| | 9,000,000 | | | 1.875%, 7/31/2022 | | | 8,654,766 | |
| | 14,155,000 | | | 2.000%, 11/30/2022 | | | 13,630,823 | |
| | 4,750,000 | | | 2.500%, 3/31/2023 | | | 4,657,412 | |
| | 1,698,000 | | | 1.375%, 9/30/2023 | | | 1,573,502 | |
| | 2,060,000 | | | 2.125%, 7/31/2024 | | | 1,962,311 | |
| | 2,750,000 | | | 2.250%, 11/15/2024 | | | 2,630,332 | |
| | 4,800,000 | | | 2.125%, 11/30/2024 | | | 4,557,187 | |
| | 18,500,000 | | | 2.875%, 5/31/2025 | | | 18,297,656 | |
| | | | | |
| | | | Total | | | 122,334,680 | |
| | | | | |
The accompanying Notes to Financial Statements are an integral part of this schedule.
115
MODERATELY AGGRESSIVE ALLOCATION FUND
Schedule of Investments as of October 31, 2018
| | | | | | | | |
Principal
Amount | | | Long-Term Fixed Income (17.0%) | | Value | |
| | Utilities (0.4%) | | | | |
| | | | Alabama Power Company | | | | |
| | $6,000 | | | 2.450%, 3/30/2022 | | | $5,792 | |
| | | | Ameren Corporation | | | | |
| | 10,000 | | | 2.700%, 11/15/2020 | | | 9,852 | |
| | | | American Electric Power Company, Inc. | | | | |
| | 253,000 | | | 2.950%, 12/15/2022 | | | 246,333 | |
| | | | Appalachian Power Company | | | | |
| | 92,000 | | | 3.300%, 6/1/2027 | | | 86,514 | |
| | | | Arizona Public Service Company | | | | |
| | 65,000 | | | 2.200%, 1/15/2020 | | | 64,246 | |
| | | | Atmos Energy Corporation | | | | |
| | 100,000 | | | 3.000%, 6/15/2027 | | | 93,479 | |
| | | | Berkshire Hathaway Energy Company | | | | |
| | 59,000 | | | 2.400%, 2/1/2020 | | | 58,417 | |
| | 155,000 | | | 4.500%, 2/1/2045 | | | 150,236 | |
| | | | Calpine Corporation | | | | |
| | 195,000 | | | 5.375%, 1/15/2023 | | | 184,763 | |
| | | | CenterPoint Energy, Inc. | | | | |
| | 70,000 | | | 3.850%, 2/1/2024 | | | 69,952 | |
| | 245,000 | | | 4.250%, 11/1/2028 | | | 242,634 | |
| | | | CMS Energy Corporation | | | | |
| | 126,000 | | | 2.950%, 2/15/2027 | | | 114,753 | |
| | | | Commonwealth Edison Company | | | | |
| | 125,000 | | | 3.700%, 3/1/2045 | | | 110,627 | |
| | 70,000 | | | 4.350%, 11/15/2045 | | | 68,382 | |
| | | | Consolidated Edison, Inc. | | | | |
| | 6,000 | | | 2.000%, 3/15/2020 | | | 5,902 | |
| | 84,000 | | | 2.000%, 5/15/2021 | | | 81,030 | |
| | 63,000 | | | 4.500%, 12/1/2045 | | | 62,810 | |
| | | | Consumers Energy Company | | | | |
| | 325,000 | | | 4.350%, 4/15/2049d | | | 322,841 | |
| | | | Dominion Energy, Inc. | | | | |
| | 180,000 | | | 2.962%, 7/1/2019 | | | 179,241 | |
| | 196,000 | | | 2.579%, 7/1/2020 | | | 193,001 | |
| | | | Dominion Gas Holdings, LLC | | | | |
| | 280,000 | | | 2.500%, 12/15/2019 | | | 277,819 | |
| | | | DTE Electric Company | | | | |
| | 95,000 | | | 3.700%, 3/15/2045 | | | 85,023 | |
| | 135,000 | | | 3.700%, 6/1/2046 | | | 119,878 | |
| | | | DTE Energy Company | | | | |
| | 39,000 | | | 2.400%, 12/1/2019 | | | 38,598 | |
| | | | Duke Energy Carolinas, LLC | | | | |
| | 350,000 | | | 3.700%, 12/1/2047 | | | 306,672 | |
| | | | Duke Energy Corporation | | | | |
| | 168,000 | | | 3.750%, 9/1/2046 | | | 142,556 | |
| | | | Duke Energy Florida, LLC | | | | |
| | 120,000 | | | 3.200%, 1/15/2027 | | | 114,061 | |
| | | | Duke Energy Indiana, LLC | | | | |
| | 170,000 | | | 3.750%, 5/15/2046 | | | 150,454 | |
| | | | Dynegy, Inc. | | | | |
| | 380,000 | | | 7.375%, 11/1/2022 | | | 394,250 | |
| | | | Edison International | | | | |
| | 6,000 | | | 2.125%, 4/15/2020 | | | 5,885 | |
| | 170,000 | | | 2.950%, 3/15/2023 | | | 161,716 | |
| | | | Emera U.S. Finance, LP | | | | |
| | 134,000 | | | 2.150%, 6/15/2019 | | | 133,047 | |
| | | | Energy Transfer Operating, LP | | | | |
| | 330,000 | | | 5.200%, 2/1/2022 | | | 341,156 | |
| | | | Eversource Energy | | | | |
| | 225,000 | | | 2.500%, 3/15/2021 | | | 220,764 | |
| | | | Exelon Corporation | | | | |
| | 90,000 | | | 5.100%, 6/15/2045 | | | 92,407 | |
| | 126,000 | | | 4.450%, 4/15/2046 | | | 118,511 | |
| | | | Exelon Generation Company, LLC | | | | |
| | 129,000 | | | 5.200%, 10/1/2019 | | | 131,291 | |
| | 169,000 | | | 2.950%, 1/15/2020 | | | 167,926 | |
| | | | FirstEnergy Corporation | | | | |
| | 60,000 | | | 2.850%, 7/15/2022 | | | 57,829 | |
| | 350,000 | | | 4.850%, 7/15/2047 | | | 341,330 | |
| | | | Fortis, Inc. | | | | |
| | 10,000 | | | 2.100%, 10/4/2021 | | | 9,544 | |
| | | | ITC Holdings Corporation | | | | |
| | 30,000 | | | 4.050%, 7/1/2023 | | | 29,832 | |
| | 84,000 | | | 5.300%, 7/1/2043 | | | 90,809 | |
| | | | MidAmerican Energy Holdings Company | | | | |
| | 252,000 | | | 6.500%, 9/15/2037 | | | 304,067 | |
| | | | Mississippi Power Company | | | | |
| | 185,000 | | | 3.031%, (LIBOR 3M + 0.650%), 3/27/2020b | | | 185,019 | |
| | 185,000 | | | 3.950%, 3/30/2028 | | | 179,294 | |
| | | | Monongahela Power Company | | | | |
| | 95,000 | | | 5.400%, 12/15/2043j | | | 107,056 | |
| | | | National Rural Utilities Cooperative Finance Corporation | | | | |
| | 150,000 | | | 2.300%, 11/1/2020 | | | 146,856 | |
| | 175,000 | | | 3.900%, 11/1/2028 | | | 174,267 | |
| | | | NextEra Energy Capital Holdings, Inc. | | | | |
| | 115,000 | | | 2.300%, 4/1/2019 | | | 114,749 | |
| | | | NextEra Energy Partners, LP | | | | |
| | 340,000 | | | 4.250%, 9/15/2024j | | | 323,000 | |
| | | | NiSource Finance Corporation | | | | |
| | 92,000 | | | 3.490%, 5/15/2027 | | | 86,384 | |
| | 245,000 | | | 5.650%, 2/1/2045 | | | 264,604 | |
| | | | Oncor Electric Delivery Company, LLC | | | | |
| | 368,000 | | | 3.750%, 4/1/2045 | | | 333,787 | |
| | | | Pacific Gas and Electric Company | | | | |
| | 225,000 | | | 3.300%, 3/15/2027 | | | 202,177 | |
| | 235,000 | | | 3.300%, 12/1/2027 | | | 209,276 | |
| | 235,000 | | | 3.950%, 12/1/2047 | | | 189,690 | |
| | | | PPL Capital Funding, Inc. | | | | |
| | 69,000 | | | 3.500%, 12/1/2022 | | | 68,123 | |
| | 92,000 | | | 3.400%, 6/1/2023 | | | 90,171 | |
| | 195,000 | | | 5.000%, 3/15/2044 | | | 196,229 | |
| | | | PPL Electric Utilities Corporation | | | | |
| | 138,000 | | | 3.950%, 6/1/2047 | | | 127,877 | |
| | | | PSEG Power, LLC | | | | |
| | 8,000 | | | 3.000%, 6/15/2021 | | | 7,868 | |
| | | | Public Service Electric & Gas Company | | | | |
| | 230,000 | | | 3.000%, 5/15/2027 | | | 216,200 | |
| | | | San Diego Gas and Electric Company | | | | |
| | 330,000 | | | 4.150%, 5/15/2048 | | | 311,447 | |
| | | | Sempra Energy | | | | |
| | 65,000 | | | 2.400%, 3/15/2020 | | | 64,153 | |
| | | | South Carolina Electric & Gas Company | | | | |
| | 455,000 | | | 5.100%, 6/1/2065 | | | 437,353 | |
| | | | Southern California Edison Company | | | | |
| | 5,000 | | | 2.400%, 2/1/2022 | | | 4,805 | |
The accompanying Notes to Financial Statements are an integral part of this schedule.
116
MODERATELY AGGRESSIVE ALLOCATION FUND
Schedule of Investments as of October 31, 2018
| | | | | | | | |
Principal
Amount | | | Long-Term Fixed Income (17.0%) | | Value | |
| | Utilities (0.4%) - continued | | | | |
| | $185,000 | | | 4.000%, 4/1/2047 | | | $168,637 | |
| | 225,000 | | | 4.125%, 3/1/2048 | | | 208,589 | |
| | | | Southern Company | | | | |
| | 10,000 | | | 1.850%, 7/1/2019 | | | 9,914 | |
| | 6,000 | | | 2.350%, 7/1/2021 | | | 5,804 | |
| | 180,000 | | | 2.950%, 7/1/2023 | | | 171,879 | |
| | 250,000 | | | 3.250%, 7/1/2026 | | | 231,838 | |
| | 165,000 | | | 4.400%, 7/1/2046 | | | 151,320 | |
| | | | Southern Company Gas Capital Corporation | | | | |
| | 230,000 | | | 4.400%, 5/30/2047 | | | 210,885 | |
| | | | Southwestern Electric Power Company | | | | |
| | 65,000 | | | 3.900%, 4/1/2045 | | | 57,070 | |
| | | | TerraForm Power Operating, LLC | | | | |
| | 355,000 | | | 5.000%, 1/31/2028j | | | 317,281 | |
| | | | | |
| | | | Total | | | 11,759,832 | |
| | | | | |
| | | | | |
| | | | | |
| | | | Total Long-Term Fixed Income (cost $467,939,317) | | | 457,529,352 | |
| | | | | |
| | |
| Shares | | | Collateral Held for Securities Loaned (0.5%) | | Value | |
| | 14,805,419 | | | Thrivent Cash Management Trust | | | 14,805,419 | |
| | | | | |
| | | | Total Collateral Held for Securities Loaned (cost $14,805,419) | | | 14,805,419 | |
| | | | | |
| | |
Shares or
Principal
Amount | | | Short-Term Investments (13.8%) | | Value | |
| | | | Federal Home Loan Bank Discount Notes | | | | |
| | 400,000 | | | 2.130%, 11/21/2018o,p | | | 399,516 | |
| | 3,300,000 | | | 2.100%, 11/28/2018o,p | | | 3,294,604 | |
| | 400,000 | | | 2.110%, 11/30/2018o,p | | | 399,298 | |
| | 8,000,000 | | | 2.170%, 12/12/2018o,p | | | 7,979,680 | |
| | 800,000 | | | 2.220%, 12/27/2018o,p | | | 797,225 | |
| | 150,000 | | | 2.235%, 1/4/2019o,p | | | 149,387 | |
| | 1,100,000 | | | 2.270%, 1/11/2019o,p | | | 1,095,010 | |
| | 6,700,000 | | | 2.240%, 1/16/2019o,p | | | 6,667,465 | |
| | 1,500,000 | | | 2.285%, 1/18/2019o,p | | | 1,492,525 | |
| | | | Thrivent Core Short-Term Reserve Fund | | | | |
| | 35,005,356 | | | 2.430% | | | 350,053,555 | |
| | | | U.S. Treasury Bills | | | | |
| | 200,000 | | | 2.090%, 11/23/2018o,q | | | 199,737 | |
| | 260,000 | | | 2.161%, 12/27/2018o | | | 259,107 | |
| | | | | |
| | | | Total Short-Term Investments (cost $372,788,911) | | | 372,787,109 | |
| | | | | |
| | | | Total Investments (cost $2,485,028,661) 105.2% | | $ | 2,844,593,256 | |
| | | | | |
| | | | Other Assets and Liabilities, Net (5.2%) | | | (140,426,271 | ) |
| | | | | |
| | | | Total Net Assets 100.0% | | $ | 2,704,166,985 | |
| | | | | |
a | The stated interest rate represents the weighted average of all contracts within the bank loan facility. |
b | Denotes variable rate securities. The rate shown is as of October 31, 2018. The rates of certain variable rate securities are based on a published reference rate and spread; these may vary by security and the reference rate and spread are indicated in their description. The rates of other variable rate securities are determined by the issuer or agent and are based on current market conditions. These securities do not indicate a reference rate and spread in their description. |
c | All or a portion of the loan is unfunded. |
d | Denotes investments purchased on a when-issued or delayed delivery basis. |
e | Security is valued using significant unobservable inputs. Further information on valuation can be found in the Notes to Financial Statements. |
f | Defaulted security. Interest is not being accrued. |
g | In bankruptcy. Interest is not being accrued. |
h | Non-income producing security. |
i | All or a portion of the security is on loan. |
j | Denotes securities sold under Rule 144A of the Securities Act of 1933, which exempts them from registration. These securities may be resold to other dealers in the program or to other qualified institutional buyers. As of October 31, 2018, the value of these investments was $41,540,684 or 1.5% of total net assets. |
k | Denotes step coupon securities. Step coupon securities pay an initial coupon rate for the first period and then different coupon rates for following periods. The rate shown is as of October 31, 2018. |
l | Denotes perpetual securities. Perpetual securities pay an indefinite stream of interest and have no contractual maturity date. Date shown, if applicable, is next call date. |
m | Denotes interest only security. Interest only securities represent the right to receive monthly interest payments on an underlying pool of mortgages or assets. The principal shown is the outstanding par amount of the pool as of the end of the period. The actual effective yield of the security is different than the stated coupon rate. |
n | All or a portion of the security is insured or guaranteed. |
o | The interest rate shown reflects the yield, coupon rate or the discount rate at the date of purchase. |
p | All or a portion of the security is held on deposit with the counterparty and pledged as the initial margin deposit for open futures contracts. |
q | At October 31, 2018, $199,737 of investments were segregated to cover exposure to a counterparty for margin on open mortgage-backed security transactions. |
* | Denotes restricted securities. Restricted securities are investment securities which cannot be offered for public sale without first being registered under the Securities Act of 1933. The value of all restricted securities held in Moderately Aggressive Allocation Fund as of October 31, 2018 was $13,899,490 or 0.5% of total net assets. The following table indicates the acquisition date and cost of restricted securities shown in the schedule as of October 31, 2018. |
The accompanying Notes to Financial Statements are an integral part of this schedule.
117
MODERATELY AGGRESSIVE ALLOCATION FUND
Schedule of Investments as of October 31, 2018
| | | | | | | | |
Security | | Acquisition
Date | | | Cost | |
Angel Oak Mortgage Trust I, LLC, 7/25/2046 | | | 8/15/2016 | | | | $75,751 | |
Ares CLO, Ltd., 10/17/2030 | | | 8/17/2018 | | | | 700,000 | |
Babson CLO, Ltd., 10/17/2026 | | | 3/10/2017 | | | | 119,684 | |
Betony CLO, Ltd., 4/30/2031 | | | 6/5/2018 | | | | 508,614 | |
Buttermilk Park CLO, Ltd., 10/15/2031 | | | 8/27/2018 | | | | 1,150,000 | |
Carlyle Global Market Strategies CLO, Ltd., 7/15/2031 | | | 8/24/2018 | | | | 750,000 | |
Cent CLO 22, Ltd., 11/7/2026 | | | 11/1/2016 | | | | 150,000 | |
CIM Trust, 12/25/2057 | | | 4/23/2018 | | | | 1,226,246 | |
Digicel, Ltd., 4/15/2021 | | | 8/19/2013 | | | | 522,991 | |
Dryden Senior Loan Fund, 7/18/2030 | | | 8/28/2018 | | | | 650,000 | |
Edlinc Student Loan Funding Trust, 10/1/2025 | | | 2/28/2013 | | | | 47,602 | |
Galaxy XX CLO, Ltd., 4/20/2031 | | | 2/23/2018 | | | | 450,000 | |
Golub Capital Partners, Ltd., 10/20/2028 | | | 10/30/2018 | | | | 499,600 | |
Golub Capital Partners, Ltd., 1/20/2031 | | | 11/20/2017 | | | | 416,000 | |
Harley Marine Financing, LLC, 5/15/2043 | | | 5/9/2018 | | | | 1,481,234 | |
Limerock CLO III, LLC, 10/20/2026 | | | 1/30/2017 | | | | 450,000 | |
Madison Park Funding XIV, Ltd., 10/22/2030 | | | 10/12/2018 | | | | 275,000 | |
Magnetite XII, Ltd., 10/15/2031 | | | 8/14/2018 | | | | 450,000 | |
Mountain View CLO, Ltd., 7/15/2031 | | | 5/31/2018 | | | | 300,000 | |
Neuberger Berman CLO XIV, Ltd., 1/28/2030 | | | 4/19/2017 | | | | 465,871 | |
Neuberger Berman CLO, Ltd., 4/22/2029 | | | 4/27/2017 | | | | 100,000 | |
Octagon Investment Partners XVI, Ltd., 7/17/2030 | | | 6/15/2018 | | | | 100,000 | |
Octagon Investment Partners XX, Ltd., 8/12/2026 | | | 4/21/2017 | | | | 375,000 | |
OZLM VIII, Ltd., 10/17/2026 | | | 5/16/2017 | | | | 140,000 | |
PPM CLO, Ltd., 7/15/2031 | | | 7/2/2018 | | | | 299,640 | |
Preston Ridge Partners Mortgage Trust, LLC, 9/25/2022 | | | 9/27/2017 | | | | 595,966 | |
Race Point IX CLO, Ltd., 10/15/2030 | | | 8/28/2017 | | | | 325,000 | |
Shackleton CLO, Ltd., 7/15/2031 | | | 7/12/2018 | | | | 300,000 | |
Symphony CLO XV, Ltd., 10/17/2026 | | | 2/16/2017 | | | | 401,739 | |
Verus Securitization Trust, 7/25/2047 | | | 7/24/2017 | | | | 371,726 | |
Verus Securitization Trust, 1/25/2047 | | | 2/16/2017 | | | | 245,805 | |
Voya CLO 3, Ltd., 7/25/2026 | | | 12/13/2017 | | | | 125,413 | |
The following table presents the total amount of securities loaned with continuous maturity, by type, offset by the gross payable upon return of collateral for securities loaned by Thrivent Moderately Aggressive Allocation Fund as of October 31, 2018:
| | | | |
Securities Lending Transactions | | | | |
Taxable Debt Security | | | $3,368,259 | |
Common Stock | | | 11,100,467 | |
| | | | |
Total lending | | $ | 14,468,726 | |
Gross amount payable upon return of collateral for securities loaned | | $ | 14,805,419 | |
| | | | |
Net amounts due to counterparty | | | $336,693 | |
| | | | |
Definitions:
| | | | |
ACES | | - | | Alternative Credit Enhancement Securities |
ADR | | - | | American Depositary Receipt, which are certificates for an underlying foreign security’s shares held by an issuing U.S. depository bank. |
CLO | | - | | Collateralized Loan Obligation |
ETF | | - | | Exchange Traded Fund |
REIT | | - | | Real Estate Investment Trust is a company that buys, develops, manages and/or sells real estate assets. |
Ser. | | - | | Series |
SPDR | | - | | S&P Depository Receipts, which are exchange-traded funds traded in the U.S., Europe, and Asia-Pacific and managed by State Street Global Advisors. |
TIPS | | - | | Treasury Inflation Protected Security |
Reference Rate Index:
| | | | |
12 MTA | | - | | 12 Month Treasury Average |
CMT 3M | | - | | Constant Maturity Treasury Yield 3 Month |
LIBOR 1W | | - | | ICE Libor USD Rate 1 Week |
LIBOR 1M | | - | | ICE Libor USD Rate 1 Month |
LIBOR 2M | | - | | ICE Libor USD Rate 2 Month |
LIBOR 3M | | - | | ICE Libor USD Rate 3 Month |
LIBOR 12M | | - | | ICE Libor USD Rate 12 Month |
PRIME | | - | | Federal Reserve Prime Loan Rate |
The accompanying Notes to Financial Statements are an integral part of this schedule.
118
MODERATELY CONSERVATIVE ALLOCATION FUND
Schedule of Investments as of October 31, 2018
| | | | | | | | |
Principal
Amount | | | Bank Loans (2.9%)a | | Value | |
| | Basic Materials (0.2%) | | | | |
| | | | Arch Coal, Inc., Term Loan | | | | |
| | $223,864 | | | 5.052%, (LIBOR 1M + 2.750%), 3/7/2024b | | | $223,530 | |
| | | | Ball Metalpack Finco, LLC, Term Loan | | | | |
| | 94,762 | | | 6.802%, (LIBOR 1M + 4.500%), 7/31/2025b | | | 95,236 | |
| | | | Big River Steel, LLC, Term Loan | | | | |
| | 153,450 | | | 7.386%, (LIBOR 3M + 5.000%), 8/23/2023b | | | 154,984 | |
| | | | Chemours Company, Term Loan | | | | |
| | 283,575 | | | 4.050%, (LIBOR 1M + 1.750%), 4/3/2025b | | | 282,336 | |
| | | | CONSOL Energy, Inc., Term Loan | | | | |
| | 148,875 | | | 8.310%, (LIBOR 1M + 6.000%), 11/28/2022b | | | 152,101 | |
| | | | Contura Energy, Inc., Term Loan | | | | |
| | 252,199 | | | 7.300%, (LIBOR 2M + 5.000%), 3/17/2024b | | | 250,938 | |
| | 400,000 | | | 0.000%, (LIBOR 3M + 5.000%), 10/3/2025b,c,d | | | 398,000 | |
| | | | MRC Global (US), Inc., Term Loan | | | | |
| | 208,947 | | | 5.302%, (LIBOR 1M + 3.000%), 9/20/2024b,e | | | 208,947 | |
| | | | Peabody Energy Corporation, Term Loan | | | | |
| | 159,200 | | | 5.052%, (LIBOR 1M + 2.750%), 3/31/2025b | | | 158,751 | |
| | | | Pixelle Specialty Solutions, LLC, Term Loan | | | | |
| | 215,000 | | | 0.000%, (LIBOR 3M + 6.000%), 10/31/2024b,c,d | | | 209,894 | |
| | | | Starfruit US Holdco, LLC, Term Loan | | | | |
| | 135,000 | | | 5.506%, (LIBOR 1M + 3.250%), 10/1/2025b | | | 134,494 | |
| | | | | |
| | | | Total | | | 2,269,211 | |
| | | | | |
| |
| | Capital Goods (0.2%) | | | | |
| | | | Advanced Disposal Services, Inc., Term Loan | | | | |
| | 133,066 | | | 4.460%, (LIBOR 1W + 2.250%), 11/10/2023b | | | 132,983 | |
| | | | Flex Acquisition Company, Inc. Term Loan | | | | |
| | 463,837 | | | 5.506%, (LIBOR 1M + 3.250%), 6/22/2025b | | | 464,088 | |
| | | | GFL Environmental, Inc., Term Loan | | | | |
| | 310,000 | | | 0.000%, (LIBOR 3M + 3.000%), 5/31/2025b,c,d | | | 304,963 | |
| | 9,392 | | | 5.136%, (LIBOR 3M + 2.750%), 5/31/2025b | | | 9,240 | |
| | 75,419 | | | 5.136%, (LIBOR 3M + 2.750%), 5/31/2025b | | | 74,193 | |
| | | | Navistar, Inc., Term Loan | | | | |
| | 272,938 | | | 5.780%, (LIBOR 1M + 3.500%), 11/6/2024b | | | 273,164 | |
| | | | Sotera Health Holdings, LLC, Term Loan | | | | |
| | 172,250 | | | 5.302%, (LIBOR 1M + 3.000%), 5/15/2022b | | | 172,393 | |
| | | | | |
| | | | Total | | | 1,431,024 | |
| | | | | |
| |
| | Communications Services (0.7%) | | | | |
| | | | Altice France SA, Term Loan | | | | |
| | 118,200 | | | 5.052%, (LIBOR 1M + 2.750%), 7/31/2025b | | | 113,879 | |
| | 570,000 | | | 6.280%, (LIBOR 1M + 4.000%), 1/31/2026b | | | 557,534 | |
| | | | Cengage Learning, Inc., Term Loan | | | | |
| | 375,855 | | | 6.530%, (LIBOR 1M + 4.250%), 6/7/2023b | | | 347,783 | |
| | | | CenturyLink, Inc., Term Loan | | | | |
| | 401,963 | | | 5.052%, (LIBOR 1M + 2.750%), 1/31/2025b | | | 397,440 | |
| | | | Charter Communications Operating, LLC, Term Loan | | | | |
| | 287,825 | | | 4.310%, (LIBOR 1M + 2.000%), 4/30/2025b | | | 287,790 | |
| | | | Frontier Communications Corporation, Term Loan | | | | |
| | 406,122 | | | 6.060%, (LIBOR 1M + 3.750%), 6/15/2024b | | | 392,314 | |
| | | | HCP Acquisition, LLC, Term Loan | | | | |
| | 202,822 | | | 5.302%, (LIBOR 1M + 3.000%), 5/16/2024b | | | 202,416 | |
| | | | Intelsat Jackson Holdings SA, Term Loan | | | | |
| | 235,000 | | | 6.045%, (LIBOR 1M + 3.750%), 11/27/2023b | | | 235,000 | |
| | | | Liberty Cablevision of Puerto Rico, LLC, Term Loan | | | | |
| | 455,000 | | | 5.936%, (LIBOR 3M + 3.500%), 1/7/2022b | | | 445,982 | |
| | 65,000 | | | 9.186%, (LIBOR 3M + 6.750%), 7/7/2023b,e | | | 59,800 | |
| | | | McGraw-Hill Global Education Holdings, LLC, Term Loan | | | | |
| | 500,035 | | | 6.302%, (LIBOR 1M + 4.000%), 5/4/2022b | | | 479,099 | |
| | | | Mediacom Illinois, LLC, Term Loan | | | | |
| | 119,400 | | | 3.970%, (LIBOR 1W + 1.750%), 2/15/2024b | | | 119,027 | |
| | | | NEP/NCP Holdco, Inc., Term Loan | | | | |
| | 175,000 | | | 0.000%, (LIBOR 3M + 3.250%), 10/22/2025b,c,d | | | 175,613 | |
| | 25,000 | | | 9.302%, (LIBOR 1M + 7.000%), 10/23/2026b | | | 25,000 | |
| | | | Sable International Finance, Ltd., Term Loan | | | | |
| | 560,000 | | | 5.547%, (LIBOR 1M + 3.250%), 1/31/2026b | | | 559,373 | |
| | | | SBA Senior Finance II, LLC, Term Loan | | | | |
| | 174,563 | | | 4.310%, (LIBOR 1M + 2.000%), 4/11/2025b | | | 174,107 | |
| | | | Sprint Communications, Inc., Term Loan | | | | |
| | 531,900 | | | 4.813%, (LIBOR 1M + 2.500%), 2/2/2024b | | | 531,400 | |
| | | | Syniverse Holdings, Inc., Term Loan | | | | |
| | 69,650 | | | 7.280%, (LIBOR 1M + 5.000%), 3/9/2023b | | | 69,998 | |
| | | | Univision Communications, Inc., Term Loan | | | | |
| | 401,355 | | | 5.052%, (LIBOR 1M + 2.750%), 3/15/2024b | | | 384,735 | |
The accompanying Notes to Financial Statements are an integral part of this schedule.
119
MODERATELY CONSERVATIVE ALLOCATION FUND
Schedule of Investments as of October 31, 2018
| | | | | | | | |
Principal
Amount | | | Bank Loans (2.9%)a | | Value | |
| | Communications Services (0.7%) - continued | | | | |
| | | | WideOpenWest Finance, LLC, Term Loan | | | | |
| | $210,870 | | | 5.540%, (LIBOR 1M + 3.250%), 8/19/2023b | | | $202,962 | |
| | | | Windstream Services, LLC, Term Loan | | | | |
| | 179,137 | | | 6.290%, (LIBOR 1M + 4.000%), 3/30/2021b | | | 167,685 | |
| | | | | |
| | | | Total | | | 5,928,937 | |
| | | | | |
| |
| | Consumer Cyclical (0.4%) | | | | |
| | | | Burlington Coat Factory Warehouse Corporation, Term Loan | | | | |
| | 206,571 | | | 4.790%, (LIBOR 1M + 2.500%), 11/17/2024b | | | 206,571 | |
| | | | Four Seasons Hotels, Ltd., Term Loan | | | | |
| | 198,485 | | | 4.302%, (LIBOR 1M + 2.000%), 11/30/2023b | | | 198,378 | |
| | | | Golden Entertainment, Inc., Term Loan | | | | |
| | 387,075 | | | 5.300%, (LIBOR 1M + 3.000%), 10/20/2024b | | | 387,075 | |
| | 65,000 | | | 9.310%, (LIBOR 1M + 7.000%), 10/20/2025b | | | 65,325 | |
| | | | Golden Nugget, LLC, Term Loan | | | | |
| | 297,484 | | | 5.230%, (LIBOR 1M + 2.750%), 10/4/2023b | | | 297,624 | |
| | | | KAR Auction Services, Inc., Term Loan | | | | |
| | 128,375 | | | 4.938%, (LIBOR 3M + 2.500%), 3/9/2023b | | | 128,429 | |
| | | | Men’s Warehouse, Inc., Term Loan | | | | |
| | 175,000 | | | 5.506%, (LIBOR 3M + 3.250%), 4/9/2025b | | | 175,766 | |
| | | | Mohegan Gaming and Entertainment, Term Loan | | | | |
| | 320,812 | | | 6.302%, (LIBOR 1M + 4.000%), 10/13/2023b | | | 300,534 | |
| | | | Neiman Marcus Group, Ltd., LLC, Term Loan | | | | |
| | 109,141 | | | 5.531%, (LIBOR 1M + 3.250%), 10/25/2020b | | | 99,257 | |
| | | | Penn National Gaming, Inc. Term Loan | | | | |
| | 135,000 | | | 0.000%, (LIBOR 3M + 2.250%), 10/15/2025b,c,d | | | 135,337 | |
| | | | Scientific Games International, Inc., Term Loan | | | | |
| | 522,375 | | | 5.046%, (LIBOR 1M + 2.750%), 8/14/2024b | | | 516,963 | |
| | | | Stars Group Holdings BV, Term Loan | | | | |
| | 206,482 | | | 5.886%, (LIBOR 3M + 3.500%), 7/10/2025b | | | 207,228 | |
| | | | Tenneco, Inc., Term Loan | | | | |
| | 300,000 | | | 5.052%, (LIBOR 1M + 2.750%), 10/1/2025b | | | 299,001 | |
| | | | Wyndham Hotels & Resorts, Inc., Term Loan | | | | |
| | 140,000 | | | 4.052%, (LIBOR 1M + 1.750%), 5/30/2025b | | | 139,854 | |
| | | | | |
| | | | Total | | | 3,157,342 | |
| | | | | |
| |
| | Consumer Non-Cyclical (0.5%) | | | | |
| | | | Air Medical Group Holdings, Inc., Term Loan | | | | |
| | 565,725 | | | 5.534%, (LIBOR 3M + 3.250%), 4/28/2022b | | | 548,470 | |
| | 29,775 | | | 6.530%, (LIBOR 1M + 4.250%), 3/14/2025b | | | 29,180 | |
| | | | Albertson’s, LLC, Term Loan | | | | |
| | 99,085 | | | 5.052%, (LIBOR 1M + 2.750%), 8/25/2021b | | | 98,893 | |
| | 197,036 | | | 5.381%, (LIBOR 3M + 3.000%), 12/21/2022b | | | 196,433 | |
| | 285,728 | | | 5.311%, (LIBOR 3M + 3.000%), 6/22/2023b | | | 284,299 | |
| | 235,000 | | | 0.000%, (LIBOR 3M + 3.000%), 10/29/2025b,c,d | | | 232,993 | |
| | | | Amneal Pharmaceuticals, LLC, Term Loan | | | | |
| | 219,399 | | | 5.813%, (LIBOR 1M + 3.500%), 5/4/2025b | | | 220,441 | |
| | | | Bausch Health Companies, Inc., Term Loan | | | | |
| | 443,625 | | | 5.274%, (LIBOR 1M + 3.000%), 6/1/2025b | | | 443,523 | |
| | | | CHS/Community Health Systems, Inc., Term Loan | | | | |
| | 241,221 | | | 5.563%, (LIBOR 3M + 3.250%), 1/27/2021b | | | 235,849 | |
| | | | Endo International plc, Term Loan | | | | |
| | 341,481 | | | 6.563%, (LIBOR 1M + 4.250%), 4/27/2024b | | | 342,690 | |
| | | | Energizer Holdings, Inc., Term Loan | | | | |
| | 290,000 | | | 0.000%, (LIBOR 3M + 2.250%), 6/21/2025b,c,d | | | 290,183 | |
| | | | JBS USA LUX SA, Term Loan | | | | |
| | 492,500 | | | 4.844%, (LIBOR 3M + 2.500%), 10/30/2022b | | | 492,254 | |
| | | | Northriver Midstream Finance LP, Term Loan | | | | |
| | 215,000 | | | 5.646%, (LIBOR 3M + 3.250%), 10/1/2025b,c,d | | | 215,897 | |
| | | | Ortho-Clinical Diagnostics SA, Term Loan | | | | |
| | 584,100 | | | 5.544%, (LIBOR 1M + 3.250%), 6/1/2025b | | | 581,910 | |
| | | | Revlon Consumer Products Corporation, Term Loan | | | | |
| | 201,097 | | | 5.813%, (LIBOR 3M + 3.500%), 9/7/2023b | | | 146,857 | |
| | | | | |
| | | | Total | | | 4,359,872 | |
| | | | | |
| |
| | Energy (0.2%) | | | | |
| | | | BCP Raptor II, LLC, Term Loan | | | | |
| | 180,000 | | | 0.000%, (LIBOR 3M + 4.750%), 10/22/2025b,c,d,e | | | 178,650 | |
| | | | Calpine Corporation, Term Loan | | | | |
| | 207,852 | | | 4.890%, (LIBOR 3M + 2.500%), 1/15/2024b | | | 207,051 | |
| | | | Consolidated Energy Finance SA, Term Loan | | | | |
| | 109,725 | | | 4.784%, (LIBOR 1M + 2.500%), 5/7/2025b,e | | | 109,176 | |
The accompanying Notes to Financial Statements are an integral part of this schedule.
120
MODERATELY CONSERVATIVE ALLOCATION FUND
Schedule of Investments as of October 31, 2018
| | | | | | | | |
Principal
Amount | | | Bank Loans (2.9%)a | | Value | |
| | Energy (0.2%) - continued | | | | |
| | | | GIP III Stetson I, LP, Term Loan | | | | |
| | $220,000 | | | 6.695%, (LIBOR 3M + 4.250%), 7/18/2025b | | | $220,275 | |
| | | | HFOTCO, LLC, Term Loan | | | | |
| | 448,875 | | | 5.060%, (LIBOR 1M + 2.750%), 6/26/2025b | | | 449,809 | |
| | | | McDermott Technology (Americas), Inc., Term Loan | | | | |
| | 320,887 | | | 7.302%, (LIBOR 1M + 5.000%), 5/10/2025b | | | 316,475 | |
| | | | MEG Energy Corporation, Term Loan | | | | |
| | 27,750 | | | 5.810%, (LIBOR 1M + 3.500%), 12/31/2023b | | | 27,779 | |
| | | | Pacific Drilling SA, Term Loan | | | | |
| | 196,287 | | | 0.000%, (PRIME + 4.500%), 6/3/2018b,f,g | | | 88,002 | |
| | | | Radiate Holdco, LLC, Term Loan | | | | |
| | 565,693 | | | 5.302%, (LIBOR 1M + 3.000%), 2/1/2024b | | | 560,845 | |
| | | | | |
| | | | Total | | | 2,158,062 | |
| | | | | |
| |
| | Financials (0.3%) | | | | |
| | | | Air Methods Corporation, Term Loan | | | | |
| | 388,459 | | | 5.886%, (LIBOR 3M + 3.500%), 4/21/2024b | | | 350,098 | |
| | | | Avolon TLB Borrower 1 US, LLC, Term Loan | | | | |
| | 344,138 | | | 4.280%, (LIBOR 1M + 2.000%), 1/15/2025b | | | 343,047 | |
| | | | Digicel International Finance, Ltd., Term Loan | | | | |
| | 312,632 | | | 5.570%, (LIBOR 3M + 3.250%), 5/10/2024b | | | 299,086 | |
| | | | DJO Finance, LLC, Term Loan | | | | |
| | 147,500 | | | 5.599%, (LIBOR 1M + 3.250%), 6/7/2020b | | | 147,162 | |
| | | | DTZ U.S. Borrower, LLC, Term Loan | | | | |
| | 270,000 | | | 5.552%, (LIBOR 1M + 3.250%), 8/21/2025b | | | 269,746 | |
| | | | Genworth Holdings, Inc., Term Loan | | | | |
| | 59,700 | | | 6.831%, (LIBOR 2M + 4.500%), 3/7/2023b | | | 60,857 | |
| | | | GGP Nimbus LP, Term Loan | | | | |
| | 315,000 | | | 4.795%, (LIBOR 1M + 2.500%), 8/24/2025b | | | 309,658 | |
| | | | MoneyGram International, Inc., Term Loan | | | | |
| | 312,402 | | | 5.552%, (LIBOR 1M + 3.250%), 3/28/2020b,e | | | 296,782 | |
| | | | Trans Union, LLC, Term Loan | | | | |
| | 222,750 | | | 4.302%, (LIBOR 1M + 2.000%), 4/9/2023b | | | 222,218 | |
| | | | | |
| | | | Total | | | 2,298,654 | |
| | | | | |
| |
| | Technology (0.3%) | | | | |
| | | | Harland Clarke Holdings Corporation, Term Loan | | | | |
| | 320,701 | | | 7.136%, (LIBOR 3M + 4.750%), 11/3/2023b | | | 299,855 | |
| | | | Micron Technology, Inc., Term Loan | | | | |
| | 268,626 | | | 4.060%, (LIBOR 1M + 1.750%), 4/26/2022b | | | 268,570 | |
| | | | Plantronics, Inc., Term Loan | | | | |
| | 590,000 | | | 4.802%, (LIBOR 1M + 2.500%), 7/2/2025b | | | 587,788 | |
| | | | Rackspace Hosting, Inc., Term Loan | | | | |
| | 266,625 | | | 5.348%, (LIBOR 3M + 3.000%), 11/3/2023b | | | 258,349 | |
| | | | SS&C Technologies Holdings Europe SARL, Term Loan | | | | |
| | 78,086 | | | 4.552%, (LIBOR 1M + 2.250%), 4/16/2025b | | | 77,652 | |
| | | | SS&C Technologies, Inc., Term Loan | | | | |
| | 201,461 | | | 4.552%, (LIBOR 1M + 2.250%), 4/16/2025b | | | 200,341 | |
| | | | TNS, Inc., Term Loan | | | | |
| | 210,263 | | | 6.320%, (LIBOR 3M + 4.000%), 8/14/2022b | | | 211,139 | |
| | | | Vantiv, LLC, Term Loan | | | | |
| | 547,250 | | | 4.030%, (LIBOR 1M + 1.750%), 8/20/2024b | | | 545,685 | |
| | | | | |
| | | | Total | | | 2,449,379 | |
| | | | | |
| |
| | Transportation (<0.1%) | | | | |
| | | | Arctic LNG Carriers, Ltd., Term Loan | | | | |
| | 439,437 | | | 6.802%, (LIBOR 1M + 4.500%), 5/18/2023b | | | 439,437 | |
| | | | OSG Bulk Ships, Inc., Term Loan | | | | |
| | 58,309 | | | 6.770%, (LIBOR 1M + 4.250%), 8/5/2019b | | | 57,678 | |
| | | | | |
| | | | Total | | | 497,115 | |
| | | | | |
| |
| | Utilities (0.1%) | | | | |
| | | | Core and Main, LP, Term Loan | | | | |
| | 178,200 | | | 5.317%, (LIBOR 3M + 3.000%), 8/1/2024b,e | | | 177,977 | |
| | | | EnergySolutions, LLC, Term Loan | | | | |
| | 139,650 | | | 6.136%, (LIBOR 3M + 3.750%), 5/11/2025b | | | 140,436 | |
| | | | Talen Energy Supply, LLC, Term Loan | | | | |
| | 142,727 | | | 6.302%, (LIBOR 1M + 4.000%), 7/6/2023b | | | 142,905 | |
| | | | TerraForm Power Operating, LLC, Term Loan | | | | |
| | 94,524 | | | 4.302%, (LIBOR 1M + 2.000%), 11/8/2022b | | | 94,524 | |
| | | | Vertiv Group Corporation, Term Loan | | | | |
| | 413,641 | | | 6.313%, (LIBOR 3M + 4.000%), 11/15/2023b | | | 408,988 | |
| | | | | |
| | | | Total | | | 964,830 | |
| | | | | |
| | | | | | | | |
| | | | | |
| | | | Total Bank Loans (cost $25,868,806) | | | 25,514,426 | |
| | | | | |
| | |
Principal
Amount | | | Long-Term Fixed Income (42.9%) | | Value | |
| | Asset-Backed Securities (1.8%) | | | | |
| | | | Access Group, Inc. | | | | |
| | 146,515 | | | 2.781%, (LIBOR 1M + 0.500%), 2/25/2036, Ser. 2013-1, Class Ab,h | | | 144,759 | |
The accompanying Notes to Financial Statements are an integral part of this schedule.
121
MODERATELY CONSERVATIVE ALLOCATION FUND
Schedule of Investments as of October 31, 2018
| | | | | | | | |
Principal
Amount | | | Long-Term Fixed Income (42.9%) | | Value | |
| | Asset-Backed Securities (1.8%) - continued | | | | |
| | | | Ares CLO, Ltd. | | | | |
| | $550,000 | | | 3.821%, (LIBOR 3M + 1.400%), 10/17/2030, Ser. 2018-28RA, Class A2*,b | | | $549,978 | |
| | | | Babson CLO, Ltd. | | | | |
| | 145,330 | | | 3.599%, (LIBOR 3M + 1.150%), 10/17/2026, Ser. 2014-IIA, Class AR*,b | | | 145,360 | |
| | | | Betony CLO, Ltd. | | | | |
| | 550,000 | | | 3.600%, (LIBOR 3M + 1.080%), 4/30/2031, Ser. 2018-1A, Class A1*,b | | | 549,420 | |
| | | | Buttermilk Park CLO, Ltd. | | | | |
| | 925,000 | | | 3.738%, (LIBOR 3M + 1.400%), 10/15/2031, Ser. 2018-1A, Class A2*,b | | | 924,969 | |
| | | | Carlyle Global Market Strategies CLO, Ltd. | | | | |
| | 600,000 | | | 3.782%, (LIBOR 3M + 1.450%), 7/15/2031, Ser. 2014-5A, Class A2RR*,b | | | 599,976 | |
| | | | Cent CLO 22, Ltd. | | | | |
| | 175,000 | | | 3.753%, (LIBOR 3M + 1.410%), 11/7/2026, Ser. 2014-22A, Class A1R*,b | | | 175,035 | |
| | | | Commonbond Student Loan Trust | | | | |
| | 273,984 | | | 2.781%, (LIBOR 1M + 0.500%), 2/25/2044, Ser. 2018-AGS, Class A2b,h | | | 271,129 | |
| | | | Dryden Senior Loan Fund | | | | |
| | 500,000 | | | 3.810%, (LIBOR 3M + 1.400%), 7/18/2030, Ser. 2018-65A, Class A2*,b | | | 499,990 | |
| | | | Earnest Student Loan Program, LLC | | | | |
| | 324,986 | | | 3.020%, 5/25/2034, Ser. 2016-B, Class A2h | | | 321,308 | |
| | | | Edlinc Student Loan Funding Trust | | | | |
| | 72,609 | | | 5.330%, (CMT 3M + 3.150%), 10/1/2025, Ser. 2012-A, Class AT*,b | | | 73,450 | |
| | | | Federal Home Loan Mortgage Corporation Multifamily Structured Pass Through Certificates | | | | |
| | 1,050,000 | | | 3.900%, 8/25/2028, Ser. K081, Class A2b | | | 1,057,401 | |
| | | | Galaxy XX CLO, Ltd. | | | | |
| | 550,000 | | | 3.469%, (LIBOR 3M + 1.000%), 4/20/2031, Ser. 2015-20A, Class AR*,b | | | 547,746 | |
| | | | Golub Capital Partners, Ltd. | | | | |
| | 500,000 | | | 3.610%, (LIBOR 3M + 1.150%), 10/20/2028, Ser. 2018-39A, Class A1*,b | | | 499,988 | |
| | 468,000 | | | 3.669%, (LIBOR 3M + 1.200%), 1/20/2031, Ser. 2015-23A, Class AR*,b | | | 469,410 | |
| | | | Harley Marine Financing, LLC | | | | |
| | 1,283,750 | | | 5.682%, 5/15/2043, Ser. 2018-1A, Class A2* | | | 1,187,469 | |
| | | | Limerock CLO III, LLC | | | | |
| | 500,000 | | | 3.669%, (LIBOR 3M + 1.200%), 10/20/2026, Ser. 2014-3A, Class A1R*,b | | | 500,205 | |
| | | | Madison Park Funding XIV, Ltd. | | | | |
| | 300,000 | | | 3.869%, (LIBOR 3M + 1.400%), 10/22/2030, Ser. 2014-14A, Class A2RR*,b | | | 299,997 | |
| | | | Magnetite XII, Ltd. | | | | |
| | 525,000 | | | 3.536%, (LIBOR 3M + 1.100%), 10/15/2031, Ser. 2015-12A, Class ARR*,b | | | 524,993 | |
| | | | Morgan Stanley Capital I, Inc. | | | | |
| | 675,000 | | | 4.407%, 10/23/2051, Ser. 2018-L1, Class A4 | | | 697,254 | |
| | | | Mountain View CLO, Ltd. | | | | |
| | 375,000 | | | 3.556%, (LIBOR 3M + 1.120%), 7/15/2031, Ser. 2015-9A, Class A1R*,b | | | 374,601 | |
| | | | Neuberger Berman CLO XIV, Ltd. | | | | |
| | 525,000 | | | 3.759%, (LIBOR 3M + 1.250%), 1/28/2030, Ser. 2013-14A, Class AR*,b | | | 525,258 | |
| | | | Neuberger Berman CLO, Ltd. | | | | |
| | 110,000 | | | 3.649%, (LIBOR 3M + 1.180%), 4/22/2029, Ser. 2014-17A, Class AR*,b | | | 110,135 | |
| | | | Octagon Investment Partners XVI, Ltd. | | | | |
| | 100,000 | | | 3.736%, (LIBOR 3M + 1.400%), 7/17/2030, Ser. 2013-1A, Class A2R*,b | | | 99,668 | |
| | | | Octagon Investment Partners XX, Ltd. | | | | |
| | 425,000 | | | 3.468%, (LIBOR 3M + 1.130%), 8/12/2026, Ser. 2014-1A, Class AR*,b | | | 425,121 | |
| | | | OZLM VIII, Ltd. | | | | |
| | 170,000 | | | 3.579%, (LIBOR 3M + 1.130%), 10/17/2026, Ser. 2014-8A, Class A1AR*,b | | | 170,082 | |
| | | | PPM CLO, Ltd. | | | | |
| | 350,000 | | | 3.643%, (LIBOR 3M + 1.150%), 7/15/2031, Ser. 2018-1A, Class A*,b | | | 349,600 | |
| | | | Race Point IX CLO, Ltd. | | | | |
| | 375,000 | | | 3.646%, (LIBOR 3M + 1.210%), 10/15/2030, Ser. 2015-9A, Class A1AR*,b | | | 376,027 | |
| | | | Renaissance Home Equity Loan Trust | | | | |
| | 1,543,698 | | | 6.011%, 5/25/2036, Ser. 2006-1, Class AF4i | | | 1,126,931 | |
| | | | Shackleton CLO, Ltd. | | | | |
| | 350,000 | | | 3.509%, (LIBOR 3M + 1.170%), 7/15/2031, Ser. 2015-7RA, Class A1*,b | | | 349,973 | |
| | | | SLM Student Loan Trust | | | | |
| | 191,478 | | | 2.681%, (LIBOR 1M + 0.400%), 3/25/2025, Ser. 2010-1, Class Ab | | | 188,656 | |
| | 102,343 | | | 2.801%, (LIBOR 1M + 0.520%), 3/25/2026, Ser. 2011-1, Class A1b | | | 102,574 | |
| | | | SoFi Consumer Loan Program, LLC | | | | |
| | 169,882 | | | 2.140%, 9/25/2026, Ser. 2017-5, Class A1h | | | 169,084 | |
The accompanying Notes to Financial Statements are an integral part of this schedule.
122
MODERATELY CONSERVATIVE ALLOCATION FUND
Schedule of Investments as of October 31, 2018
| | | | | | | | |
Principal
Amount | | | Long-Term Fixed Income (42.9%) | | Value | |
| | Asset-Backed Securities (1.8%) - continued | | | | |
| | | | SoFi Professional Loan Program, LLC | | | | |
| | $95,057 | | | 2.420%, 3/25/2030, Ser. 2015-A, Class A2h | | | $93,611 | |
| | | | Symphony CLO XV, Ltd. | | | | |
| | 446,377 | | | 3.629%, (LIBOR 3M + 1.180%), 10/17/2026, Ser. 2014-15A, Class AR*,b | | | 446,574 | |
| | | | U.S. Residential Opportunity Fund Trust | | | | |
| | 61,052 | | | 3.352%, 11/27/2037, Ser. 2017-1III, Class Ah | | | 60,444 | |
| | | | Verus Securitization Trust | | | | |
| | 459,333 | | | 3.677%, 6/1/2058, Ser. 2018-2, Class A1b,h | | | 457,421 | |
| | | | Voya CLO 3, Ltd. | | | | |
| | 152,287 | | | 3.210%, (LIBOR 3M + 0.720%), 7/25/2026, Ser. 2014-3A, Class A1R*,b | | | 152,304 | |
| | | | | |
| | | | Total | | | 15,617,901 | |
| | | | | |
| |
| | Basic Materials (0.6%) | | | | |
| | | | Alcoa Nederland Holding BV | | | | |
| | 255,000 | | | 6.750%, 9/30/2024h | | | 267,750 | |
| | | | Anglo American Capital plc | | | | |
| | 300,000 | | | 4.875%, 5/14/2025h | | | 295,772 | |
| | | | ArcelorMittal SA | | | | |
| | 212,000 | | | 6.125%, 6/1/2025j | | | 226,634 | |
| | | | Braskem Netherlands Finance BV | | | | |
| | 470,000 | | | 4.500%, 1/10/2028h | | | 434,162 | |
| | | | BWAY Holding Company | | | | |
| | 265,000 | | | 5.500%, 4/15/2024h | | | 254,400 | |
| | | | CF Industries, Inc. | | | | |
| | 450,000 | | | 3.450%, 6/1/2023j | | | 427,500 | |
| | | | Chemours Company | | | | |
| | 250,000 | | | 5.375%, 5/15/2027 | | | 232,500 | |
| | | | First Quantum Minerals, Ltd. | | | | |
| | 180,000 | | | 7.500%, 4/1/2025h | | | 160,650 | |
| | | | Georgia-Pacific, LLC | | | | |
| | 110,000 | | | 2.539%, 11/15/2019h | | | 109,166 | |
| | | | Glencore Funding, LLC | | | | |
| | 80,000 | | | 4.125%, 5/30/2023h | | | 79,044 | |
| | 110,000 | | | 4.000%, 3/27/2027h | | | 101,165 | |
| | | | International Paper Company | | | | |
| | 222,000 | | | 4.350%, 8/15/2048 | | | 190,403 | |
| | | | Kinross Gold Corporation | | | | |
| | 160,000 | | | 5.950%, 3/15/2024 | | | 163,600 | |
| | 245,000 | | | 4.500%, 7/15/2027 | | | 219,275 | |
| | | | Novelis Corporation | | | | |
| | 105,000 | | | 5.875%, 9/30/2026h | | | 98,962 | |
| | | | Olin Corporation | | | | |
| | 315,000 | | | 5.125%, 9/15/2027j | | | 293,344 | |
| | | | Platform Specialty Products Corporation | | | | |
| | 190,000 | | | 5.875%, 12/1/2025h | | | 180,025 | |
| | | | Sherwin-Williams Company | | | | |
| | 180,000 | | | 3.125%, 6/1/2024 | | | 170,822 | |
| | | | Syngenta Finance NV | | | | |
| | 250,000 | | | 3.933%, 4/23/2021h | | | 248,743 | |
| | | | Teck Resources, Ltd. | | | | |
| | 355,000 | | | 6.125%, 10/1/2035 | | | 359,437 | |
| | | | United States Steel Corporation | | | | |
| | 175,000 | | | 6.250%, 3/15/2026 | | | 164,938 | |
| | | | Vale Overseas, Ltd. | | | | |
| | 120,000 | | | 6.250%, 8/10/2026 | | | 128,100 | |
| | 145,000 | | | 6.875%, 11/21/2036 | | | 160,992 | |
| | 125,000 | | | 6.875%, 11/10/2039 | | | 140,313 | |
| | | | Westlake Chemical Corporation | | | | |
| | 160,000 | | | 3.600%, 8/15/2026 | | | 148,036 | |
| | | | WestRock Company | | | | |
| | 195,000 | | | 3.750%, 3/15/2025h | | | 187,675 | |
| | | | | |
| | | | Total | | | 5,443,408 | |
| | | | | |
| |
| | Capital Goods (0.8%) | | | | |
| | | | AECOM | | | | |
| | 380,000 | | | 5.875%, 10/15/2024 | | | 386,650 | |
| | | | Ashtead Capital, Inc. | | | | |
| | 230,000 | | | 4.125%, 8/15/2025h | | | 213,325 | |
| | | | Boeing Company | | | | |
| | 125,000 | | | 3.850%, 11/1/2048 | | | 115,673 | |
| | | | Bombardier, Inc. | | | | |
| | 325,000 | | | 7.500%, 3/15/2025h | | | 324,902 | |
| | | | Building Materials Corporation of America | | | | |
| | 190,000 | | | 6.000%, 10/15/2025h | | | 186,912 | |
| | | | Cemex SAB de CV | | | | |
| | 275,000 | | | 6.125%, 5/5/2025h | | | 272,937 | |
| | | | Cintas Corporation No. 2 | | | | |
| | 125,000 | | | 3.700%, 4/1/2027 | | | 120,560 | |
| | | | CNH Industrial Capital, LLC | | | | |
| | 180,000 | | | 4.875%, 4/1/2021 | | | 183,897 | |
| | | | CNH Industrial NV | | | | |
| | 225,000 | | | 3.850%, 11/15/2027 | | | 207,912 | |
| | | | Crown Americas Capital Corporation IV | | | | |
| | 310,000 | | | 4.500%, 1/15/2023 | | | 303,800 | |
| | | | Crown Cork & Seal Company, Inc. | | | | |
| | 240,000 | | | 7.375%, 12/15/2026 | | | 256,800 | |
| | | | H&E Equipment Services, Inc. | | | | |
| | 145,000 | | | 5.625%, 9/1/2025 | | | 138,112 | |
| | | | Huntington Ingalls Industries, Inc. | | | | |
| | 270,000 | | | 3.483%, 12/1/2027 | | | 250,015 | |
| | | | L3 Technologies, Inc. | | | | |
| | 309,000 | | | 3.950%, 5/28/2024 | | | 304,337 | |
| | | | Lockheed Martin Corporation | | | | |
| | 70,000 | | | 2.500%, 11/23/2020 | | | 68,736 | |
| | 160,000 | | | 3.600%, 3/1/2035 | | | 144,733 | |
| | 184,000 | | | 4.500%, 5/15/2036 | | | 185,673 | |
| | 40,000 | | | 6.150%, 9/1/2036 | | | 47,137 | |
| | | | Northrop Grumman Corporation | | | | |
| | 300,000 | | | 3.850%, 4/15/2045 | | | 262,052 | |
| | | | Owens-Brockway Glass Container, Inc. | | | | |
| | 395,000 | | | 5.000%, 1/15/2022h | | | 390,063 | |
| | | | Republic Services, Inc. | | | | |
| | 125,000 | | | 2.900%, 7/1/2026 | | | 115,440 | |
| | | | Reynolds Group Issuer, Inc. | | | | |
| | 305,000 | | | 5.125%, 7/15/2023h | | | 298,519 | |
| | | | Rockwell Collins, Inc. | | | | |
| | 310,000 | | | 2.800%, 3/15/2022 | | | 300,493 | |
The accompanying Notes to Financial Statements are an integral part of this schedule.
123
MODERATELY CONSERVATIVE ALLOCATION FUND
Schedule of Investments as of October 31, 2018
| | | | | | | | |
Principal
Amount | | | Long-Term Fixed Income (42.9%) | | Value | |
| | Capital Goods (0.8%) - continued | | | | |
| | | | Roper Technologies, Inc. | | | | |
| | $120,000 | | | 2.800%, 12/15/2021 | | | $116,853 | |
| | 75,000 | | | 3.650%, 9/15/2023 | | | 74,331 | |
| | 104,000 | | | 4.200%, 9/15/2028 | | | 102,086 | |
| | | | Siemens Financieringsmaatschappij NV | | | | |
| | 350,000 | | | 4.200%, 3/16/2047h | | | 337,224 | |
| | | | Standard Industries, Inc. | | | | |
| | 295,000 | | | 5.500%, 2/15/2023h | | | 289,100 | |
| | | | Textron, Inc. | | | | |
| | 125,000 | | | 7.250%, 10/1/2019 | | | 129,238 | |
| | 275,000 | | | 3.375%, 3/1/2028 | | | 250,230 | |
| | | | United Rentals North America, Inc. | | | | |
| | 260,000 | | | 5.500%, 7/15/2025 | | | 253,338 | |
| | | | United Technologies Corporation | | | | |
| | 350,000 | | | 4.450%, 11/16/2038 | | | 338,070 | |
| | 220,000 | | | 4.050%, 5/4/2047 | | | 192,588 | |
| | | | | |
| | | | Total | | | 7,161,736 | |
| | | | | |
| |
| | Collateralized Mortgage Obligations (1.7%) | | | | |
| | | | Ajax Mortgage Loan Trust | | | | |
| | 600,000 | | | 4.360%, 9/25/2065, Ser. 2018-C, Class Ab,h | | | 599,012 | |
| | | | Alternative Loan Trust | | | | |
| | 205,466 | | | 6.000%, 8/1/2036, Ser. 2006-24CB, Class A9 | | | 174,712 | |
| | | | Angel Oak Mortgage Trust I, LLC | | | | |
| | 75,885 | | | 3.500%, 7/25/2046, Ser. 2016-1, Class A1* | | | 75,946 | |
| | 1,318,954 | | | 3.674%, 7/27/2048, Ser. 2018-2, Class A1b,h | | | 1,316,324 | |
| | | | Bayview Opportunity Master Fund Trust | | | | |
| | 390,808 | | | 3.500%, 5/28/2069, Ser. 2017-RT5, Class Ab,h | | | 386,533 | |
| | | | CHL Mortgage Pass-Through Trust | | | | |
| | 1,455,224 | | | 6.000%, 11/25/2037, Ser. 2007-18, Class 1A2 | | | 1,240,143 | |
| | | | CIM Trust | | | | |
| | 1,090,965 | | | 5.000%, 12/25/2057, Ser. 2018-R3, Class A1*,b | | | 1,128,929 | |
| | | | Citigroup Mortgage Loan Trust, Inc. | | | | |
| | 135,516 | | | 5.500%, 11/25/2035, Ser. 2005-9, Class 21A2 | | | 135,099 | |
| | | | COLT Mortgage Loan Trust | | | | |
| | 330,994 | | | 2.415%, 10/25/2047, Ser. 2017-2, Class A1Ab,h | | | 328,759 | |
| | | | Countrywide Alternative Loan Trust | | | | |
| | 257,150 | | | 4.025%, 10/25/2035, Ser. 2005-43, Class 4A1b | | | 225,492 | |
| | 179,497 | | | 6.500%, 8/25/2036, Ser. 2006-23CB, Class 2A3 | | | 114,223 | |
| | 84,547 | | | 6.000%, 1/25/2037, Ser. 2006-39CB, Class 1A16 | | | 80,399 | |
| | 557,685 | | | 5.500%, 5/25/2037, Ser. 2007-8CB, Class A1 | | | 465,576 | |
| | 560,795 | | | 7.000%, 10/25/2037, Ser. 2007-24, Class A10 | | | 348,792 | |
| | | | Countrywide Home Loans, Inc. | | | | |
| | 147,550 | | | 5.750%, 4/25/2037, Ser. 2007-3, Class A27 | | | 118,608 | |
| | | | Credit Suisse Mortgage Trust | | | | |
| | 747,523 | | | 3.850%, 9/25/2057, Ser. 2018-RPL9, Class A1b,h | | | 746,547 | |
| | | | Deutsche Alt-A Securities Mortgage Loan Trust | | | | |
| | 111,790 | | | 6.000%, 10/25/2021, Ser. 2006-AR5, Class 23A | | | 101,158 | |
| | | | Federal Home Loan Mortgage Corporation | | | | |
| | 764,745 | | | 3.000%, 4/15/2028, Ser. 4193, Class AIk | | | 62,979 | |
| | 691,237 | | | 3.000%, 2/15/2033, Ser. 4170, Class IGk | | | 76,720 | |
| | | | Federal National Mortgage Association | | | | |
| | 1,332,656 | | | 3.500%, 1/25/2033, Ser. 2012-150, Class YIk | | | 170,122 | |
| | | | Greenpoint Mortgage Funding Trust | | | | |
| | 597,296 | | | 2.481%, (LIBOR 1M + 0.200%), 10/25/2045, Ser. 2005-AR4, Class G41Bb | | | 534,505 | |
| | | | Impac Secured Assets Trust | | | | |
| | 662,880 | | | 2.521%, (LIBOR 1M + 0.240%), 9/25/2037, Ser. 2007-3, Class A1Bb | | | 557,022 | |
| | | | J.P. Morgan Mortgage Trust | | | | |
| | 34,630 | | | 4.225%, 10/25/2036, Ser. 2006-A6, Class 1A2b | | | 30,214 | |
| | 435,606 | | | 2.661%, (LIBOR 1M + 0.380%), 1/25/2037, Ser. 2006-S4, Class A8b | | | 237,654 | |
| | 533,946 | | | 6.250%, 8/25/2037, Ser. 2007-S3, Class 1A10 | | | 311,926 | |
| | | | MASTR Alternative Loans Trust | | | | |
| | 117,363 | | | 6.500%, 7/25/2034, Ser. 2004-6, Class 6A1 | | | 118,428 | |
| | 318,673 | | | 2.731%, (LIBOR 1M + 0.450%), 12/25/2035, Ser. 2005-6, Class 2A1b | | | 156,274 | |
| | | | Merrill Lynch Alternative Note Asset Trust | | | | |
| | 116,005 | | | 6.000%, 3/25/2037, Ser. 2007-F1, Class 2A1 | | | 91,138 | |
| | | | Mill City Mortgage Loan Trust | | | | |
| | 544,211 | | | 3.500%, 8/25/2058, Ser. 2018-3, Class A1b,h | | | 540,145 | |
| | | | MortgageIT Trust | | | | |
| | 878,286 | | | 2.481%, (LIBOR 1M + 0.200%), 4/25/2036, Ser. 2006-1, Class 1A2b | | | 779,849 | |
| | | | Preston Ridge Partners Mortgage Trust, LLC | | | | |
| | 564,653 | | | 3.470%, 9/25/2022, Ser. 2017-2A, Class A1*,i | | | 558,269 | |
| | | | Pretium Mortgage Credit Partners, LLC | | | | |
| | 304,967 | | | 3.250%, 8/27/2032, Ser. 2017-NPL4, Class A1h,i | | | 301,660 | |
| | | | Residential Accredit Loans, Inc. Trust | | | | |
| | 85,710 | | | 5.750%, 9/25/2035, Ser. 2005-QS13, Class 2A3 | | | 82,702 | |
The accompanying Notes to Financial Statements are an integral part of this schedule.
124
MODERATELY CONSERVATIVE ALLOCATION FUND
Schedule of Investments as of October 31, 2018
| | | | | | | | |
Principal
Amount | | | Long-Term Fixed Income (42.9%) | | Value | |
| | Collateralized Mortgage Obligations (1.7%) - continued | | | | |
| | $652,461 | | | 2.831%, (LIBOR 1M + 0.550%), 1/25/2037, Ser. 2007-QS1, Class 1A5b | | | $517,329 | |
| | | | Sequoia Mortgage Trust | | | | |
| | 638,283 | | | 3.984%, 9/20/2046, Ser. 2007-1, Class 4A1b | | | 528,985 | |
| | | | Towd Point Mortgage Trust | | | | |
| | 290,575 | | | 2.887%, (LIBOR 1M + 0.600%), 2/25/2057, Ser. 2017-5, Class A1b,h | | | 290,251 | |
| | | | Verus Securitization Trust | | | | |
| | 245,811 | | | 2.853%, 1/25/2047, Ser. 2017-1A, Class A1*,b | | | 243,737 | |
| | 402,729 | | | 2.485%, 7/25/2047, Ser. 2017-2A, Class A1*,b | | | 392,971 | |
| | | | WaMu Mortgage Pass Through Certificates | | | | |
| | 95,289 | | | 3.867%, 9/25/2036, Ser. 2006-AR10, Class 1A2b | | | 92,112 | |
| | 90,859 | | | 3.876%, 10/25/2036, Ser. 2006-AR12, Class 1A1b | | | 87,984 | |
| | | | | |
| | | | Total | | | 14,349,228 | |
| | | | | |
| |
| | Commercial Mortgage-Backed Securities (1.5%) | | | | |
| | | | BANK 2018-BNK13 | | | | |
| | 875,000 | | | 4.217%, 8/15/2061, Ser. 2018-BN13, Class A5 | | | 884,887 | |
| | | | Benchmark 2018-B5 Mortgage Trust | | | | |
| | 950,000 | | | 4.208%, 7/15/2051, Ser. 2018-B5, Class A4 | | | 961,501 | |
| | | | CSAIL Commercial Mortgage Trust | | | | |
| | 750,000 | | | 3.504%, 6/15/2057, Ser. 2015-C2, Class A4 | | | 734,253 | |
| | | | Federal Home Loan Mortgage Corporation Multifamily Structured Pass Through Certificates | | | | |
| | 700,000 | | | 3.900%, 4/25/2028, Ser. K076, Class A2l | | | 707,899 | |
| | | | Federal National Mortgage Association - ACES | | | | |
| | 475,000 | | | 2.485%, 12/25/2026, Ser. 2017-M3, Class A2b | | | 436,650 | |
| | 700,000 | | | 2.785%, 2/25/2027, Ser. 2017-M2, Class A2b | | | 658,091 | �� |
| | 900,000 | | | 2.961%, 2/25/2027, Ser. 2017-M7, Class A2b | | | 850,791 | |
| | 775,000 | | | 3.052%, 3/25/2028, Ser. 2018-M7, Class A2b | | | 730,761 | |
| | | | Federal National Mortgage Association Grantor Trust | | | | |
| | 923,973 | | | 2.898%, 6/25/2027, Ser. 2017-T1, Class Al | | | 860,251 | |
| | | | GS Mortgage Securities Trust | | | | |
| | 500,000 | | | 3.801%, 1/10/2047, Ser. 2014-GC18, Class A3 | | | 503,093 | |
| | 800,000 | | | 3.666%, 9/10/2047, Ser. 2014-GC24, Class A4 | | | 796,569 | |
| | 800,000 | | | 3.244%, 10/10/2048, Ser. 2015-GC34, Class A3 | | | 770,536 | |
| | | | Morgan Stanley Bank of America Merrill Lynch Trust | | | | |
| | 675,000 | | | 3.246%, 12/15/2047, Ser. 2014-C19, Class A3 | | | 655,474 | |
| | | | Morgan Stanley Capital I, Inc. | | | | |
| | 1,000,000 | | | 4.177%, 7/15/2051, Ser. 2018-H3, Class A5 | | | 1,008,157 | |
| | | | UBS Commercial Mortgage Trust | | | | |
| | 972,626 | | | 3.400%, 5/10/2045, Ser. 2012-C1, Class A3 | | | 969,198 | |
| | 725,000 | | | 4.241%, 6/15/2051, Ser. 2018-C11, Class A5b | | | 732,889 | |
| | | | Wells Fargo Commercial Mortgage Trust | | | | |
| | 500,000 | | | 3.617%, 9/15/2057, Ser. 2015-NXS3, Class A4 | | | 492,100 | |
| | | | | |
| | | | Total | | | 12,753,100 | |
| | | | | |
| |
| | Communications Services (1.7%) | | | | |
| | | | 21st Century Fox America, Inc. | | | | |
| | 190,000 | | | 6.900%, 3/1/2019 | | | 192,528 | |
| | 390,000 | | | 6.400%, 12/15/2035 | | | 475,239 | |
| | | | AMC Networks, Inc. | | | | |
| | 265,000 | | | 5.000%, 4/1/2024 | | | 253,459 | |
| | | | America Movil SAB de CV | | | | |
| | 164,000 | | | 5.000%, 10/16/2019 | | | 166,460 | |
| | | | American Tower Corporation | | | | |
| | 230,000 | | | 3.300%, 2/15/2021 | | | 228,082 | |
| | | | AT&T, Inc. | | | | |
| | 112,000 | | | 5.875%, 10/1/2019 | | | 114,702 | |
| | 75,000 | | | 3.316%, (LIBOR 3M + 0.930%), 6/30/2020b | | | 75,669 | |
| | 130,000 | | | 3.800%, 3/1/2024 | | | 127,599 | |
| | 177,000 | | | 4.100%, 2/15/2028h | | | 168,454 | |
| | 163,000 | | | 4.300%, 2/15/2030h | | | 153,178 | |
| | 175,000 | | | 5.250%, 3/1/2037 | | | 167,395 | |
| | 200,000 | | | 4.900%, 8/15/2037h | | | 183,449 | |
| | 120,000 | | | 6.350%, 3/15/2040 | | | 127,031 | |
| | 160,000 | | | 5.550%, 8/15/2041 | | | 154,472 | |
| | 160,000 | | | 4.750%, 5/15/2046 | | | 138,889 | |
| | 270,000 | | | 5.450%, 3/1/2047 | | | 256,122 | |
| | | | British Sky Broadcasting Group plc | | | | |
| | 140,000 | | | 3.125%, 11/26/2022h | | | 136,816 | |
| | | | CCO Holdings, LLC | | | | |
| | 400,000 | | | 5.875%, 4/1/2024h | | | 403,500 | |
| | | | CenturyLink, Inc. | | | | |
| | 340,000 | | | 6.450%, 6/15/2021 | | | 347,650 | |
| | | | Charter Communications Operating, LLC | | | | |
| | 77,000 | | | 6.834%, 10/23/2055 | | | 79,767 | |
| | 150,000 | | | 4.500%, 2/1/2024 | | | 150,181 | |
| | 225,000 | | | 4.200%, 3/15/2028 | | | 210,806 | |
| | 580,000 | | | 6.484%, 10/23/2045 | | | 592,796 | |
| | | | Clear Channel Worldwide Holdings, Inc. | | | | |
| | 240,000 | | | 6.500%, 11/15/2022 | | | 243,648 | |
| | | | Comcast Corporation | | | | |
| | 225,000 | | | 4.950%, 10/15/2058 | | | 220,430 | |
| | 185,000 | | | 4.049%, 11/1/2052 | | | 157,981 | |
| | 150,000 | | | 2.750%, 3/1/2023 | | | 144,614 | |
| | 75,000 | | | 3.038%, (LIBOR 3M + 0.630%), 4/15/2024b | | | 74,579 | |
| | 140,000 | | | 3.950%, 10/15/2025 | | | 139,608 | |
| | 225,000 | | | 4.250%, 10/15/2030 | | | 222,258 | |
| | 395,000 | | | 4.400%, 8/15/2035 | | | 375,484 | |
| | 212,000 | | | 4.750%, 3/1/2044 | | | 207,196 | |
The accompanying Notes to Financial Statements are an integral part of this schedule.
125
MODERATELY CONSERVATIVE ALLOCATION FUND
Schedule of Investments as of October 31, 2018
| | | | | | | | |
Principal
Amount | | | Long-Term Fixed Income (42.9%) | | Value | |
| | Communications Services (1.7%) - continued | | | | |
| | $125,000 | | | 4.600%, 8/15/2045 | | | $119,502 | |
| | | | Cox Communications, Inc. | | | | |
| | 225,000 | | | 3.350%, 9/15/2026h | | | 207,008 | |
| | 80,000 | | | 4.600%, 8/15/2047h | | | 71,214 | |
| | | | Crown Castle International Corporation | | | | |
| | 218,000 | | | 3.400%, 2/15/2021 | | | 216,630 | |
| | 418,000 | | | 5.250%, 1/15/2023 | | | 435,945 | |
| | 160,000 | | | 3.200%, 9/1/2024 | | | 151,119 | |
| | | | CSC Holdings, LLC | | | | |
| | 40,000 | | | 5.500%, 4/15/2027h | | | 38,400 | |
| | | | Digicel, Ltd. | | | | |
| | 570,000 | | | 6.000%, 4/15/2021*,j | | | 517,275 | |
| | | | Discovery Communications, LLC | | | | |
| | 220,000 | | | 4.900%, 3/11/2026 | | | 222,513 | |
| | 360,000 | | | 5.000%, 9/20/2037 | | | 335,913 | |
| | | | Gray Television, Inc. | | | | |
| | 270,000 | | | 5.875%, 7/15/2026h | | | 259,116 | |
| | | | Intelsat Jackson Holdings SA | | | | |
| | 155,000 | | | 8.500%, 10/15/2024h | | | 152,287 | |
| | | | Level 3 Communications, Inc. | | | | |
| | 380,000 | | | 5.375%, 1/15/2024 | | | 376,200 | |
| | | | Level 3 Financing, Inc. | | | | |
| | 135,000 | | | 5.375%, 5/1/2025 | | | 131,794 | |
| | | | Moody’s Corporation | | | | |
| | 110,000 | | | 2.750%, 12/15/2021 | | | 107,300 | |
| | | | Neptune Finco Corporation | | | | |
| | 281,000 | | | 10.875%, 10/15/2025h | | | 324,204 | |
| | | | Netflix, Inc. | | | | |
| | 320,000 | | | 4.875%, 4/15/2028h | | | 293,600 | |
| | | | Nexstar Escrow Corporation | | | | |
| | 124,000 | | | 5.625%, 8/1/2024h | | | 118,420 | |
| | | | Omnicom Group, Inc. | | | | |
| | 95,000 | | | 3.600%, 4/15/2026 | | | 89,341 | |
| | | | SES Global Americas Holdings GP | | | | |
| | 130,000 | | | 2.500%, 3/25/2019h | | | 129,637 | |
| | | | Sprint Communications, Inc. | | | | |
| | 235,000 | | | 6.000%, 11/15/2022 | | | 237,203 | |
| | | | Sprint Corporation | | | | |
| | 305,000 | | | 7.625%, 2/15/2025 | | | 316,819 | |
| | | | Telecom Italia SPA | | | | |
| | 235,000 | | | 5.303%, 5/30/2024h | | | 221,488 | |
| | | | Telefonica Emisiones SAU | | | | |
| | 250,000 | | | 4.665%, 3/6/2038 | | | 224,104 | |
| | | | Time Warner Entertainment Company, LP | | | | |
| | 270,000 | | | 8.375%, 3/15/2023 | | | 311,206 | |
| | | | Verizon Communications, Inc. | | | | |
| | 255,000 | | | 3.500%, 11/1/2021 | | | 255,072 | |
| | 393,000 | | | 5.150%, 9/15/2023 | | | 417,061 | |
| | 216,000 | | | 3.376%, 2/15/2025 | | | 208,561 | |
| | 100,000 | | | 3.414%, (LIBOR 3M + 1.100%), 5/15/2025b | | | 100,515 | |
| | 180,000 | | | 4.272%, 1/15/2036 | | | 165,381 | |
| | 320,000 | | | 4.862%, 8/21/2046 | | | 306,185 | |
| | 325,000 | | | 4.522%, 9/15/2048 | | | 294,779 | |
| | | | Viacom, Inc. | | | | |
| | 90,000 | | | 4.250%, 9/1/2023 | | | 89,869 | |
| | 180,000 | | | 6.875%, 4/30/2036 | | | 198,769 | |
| | 120,000 | | | 5.850%, 9/1/2043 | | | 119,795 | |
| | | | Virgin Media Secured Finance plc | | | | |
| | 265,000 | | | 5.250%, 1/15/2026h | | | 247,113 | |
| | | | Windstream Services, LLC | | | | |
| | 225,000 | | | 8.625%, 10/31/2025h | | | 210,375 | |
| | | | | |
| | | | Total | | | 14,911,755 | |
| | | | | |
| |
| | Consumer Cyclical (1.3%) | | | | |
| | | | Amazon.com, Inc. | | | | |
| | 100,000 | | | 3.150%, 8/22/2027 | | | 94,190 | |
| | 200,000 | | | 3.875%, 8/22/2037 | | | 188,334 | |
| | 120,000 | | | 4.050%, 8/22/2047 | | | 112,409 | |
| | | | American Honda Finance Corporation | | | | |
| | 185,000 | | | 2.000%, 2/14/2020 | | | 182,385 | |
| | | | Aptiv plc | | | | |
| | 230,000 | | | 3.150%, 11/19/2020 | | | 227,422 | |
| | | | Cinemark USA, Inc. | | | | |
| | 505,000 | | | 4.875%, 6/1/2023 | | | 493,006 | |
| | | | D.R. Horton, Inc. | | | | |
| | 200,000 | | | 2.550%, 12/1/2020 | | | 195,331 | |
| | | | Daimler Finance North America, LLC | | | | |
| | 160,000 | | | 3.140%, (LIBOR 3M + 0.620%), 10/30/2019b,h | | | 160,627 | |
| | 225,000 | | | 2.891%, (LIBOR 3M + 0.550%), 5/4/2021b,h | | | 225,108 | |
| | | | Delphi Jersey Holdings plc | | | | |
| | 310,000 | | | 5.000%, 10/1/2025h | | | 279,775 | |
| | | | Ford Motor Credit Company, LLC | | | | |
| | 200,000 | | | 2.943%, 1/8/2019 | | | 199,958 | |
| | 160,000 | | | 2.262%, 3/28/2019 | | | 159,453 | |
| | 80,000 | | | 2.459%, 3/27/2020 | | | 78,378 | |
| | 60,000 | | | 3.200%, 1/15/2021 | | | 58,552 | |
| | 125,000 | | | 3.656%, (LIBOR 3M + 1.270%), 3/28/2022b | | | 123,478 | |
| | 250,000 | | | 2.979%, 8/3/2022 | | | 234,506 | |
| | | | General Motors Company | | | | |
| | 275,000 | | | 3.227%, (LIBOR 3M + 0.900%), 9/10/2021b | | | 274,602 | |
| | 275,000 | | | 5.000%, 10/1/2028 | | | 263,137 | |
| | | | General Motors Financial Company, Inc. | | | | |
| | 80,000 | | | 3.366%, (LIBOR 3M + 0.930%), 4/13/2020b | | | 80,370 | |
| | 138,000 | | | 3.700%, 11/24/2020 | | | 137,736 | |
| | 92,000 | | | 4.200%, 3/1/2021 | | | 92,445 | |
| | 240,000 | | | 3.258%, (LIBOR 3M + 0.850%), 4/9/2021b | | | 239,983 | |
| | 210,000 | | | 3.150%, 6/30/2022 | | | 201,587 | |
| | 80,000 | | | 3.950%, 4/13/2024 | | | 76,868 | |
| | 250,000 | | | 4.300%, 7/13/2025 | | | 239,120 | |
| | | | Home Depot, Inc. | | | | |
| | 205,000 | | | 5.400%, 9/15/2040 | | | 230,522 | |
| | 120,000 | | | 4.250%, 4/1/2046 | | | 115,386 | |
| | 220,000 | | | 3.900%, 6/15/2047 | | | 200,164 | |
| | | | Hyundai Capital America | | | | |
| | 200,000 | | | 2.550%, 4/3/2020h | | | 196,356 | |
| | 138,000 | | | 3.000%, 10/30/2020h | | | 135,818 | |
| | | | Jaguar Land Rover Automotive plc | | | | |
| | 315,000 | | | 5.625%, 2/1/2023h | | | 300,038 | |
| | | | KB Home | | | | |
| | 160,000 | | | 4.750%, 5/15/2019 | | | 160,528 | |
The accompanying Notes to Financial Statements are an integral part of this schedule.
126
MODERATELY CONSERVATIVE ALLOCATION FUND
Schedule of Investments as of October 31, 2018
| | | | | | | | |
Principal
Amount | | | Long-Term Fixed Income (42.9%) | | Value | |
| | Consumer Cyclical (1.3%) - continued | | | | |
| | | | L Brands, Inc. | | | | |
| | $315,000 | | | 5.625%, 2/15/2022 | | | $319,725 | |
| | | | Landry’s, Inc. | | | | |
| | 260,000 | | | 6.750%, 10/15/2024h | | | 259,350 | |
| | | | Lear Corporation | | | | |
| | 165,000 | | | 5.250%, 1/15/2025 | | | 169,028 | |
| | | | Lennar Corporation | | | | |
| | 170,000 | | | 4.125%, 1/15/2022 | | | 165,971 | |
| | 465,000 | | | 4.875%, 12/15/2023 | | | 453,956 | |
| | | | Live Nation Entertainment, Inc. | | | | |
| | 215,000 | | | 4.875%, 11/1/2024h | | | 205,863 | |
| | 155,000 | | | 5.625%, 3/15/2026h | | | 155,000 | |
| | | | Macy’s Retail Holdings, Inc. | | | | |
| | 312,000 | | | 2.875%, 2/15/2023j | | | 291,401 | |
| | | | Mastercard, Inc. | | | | |
| | 290,000 | | | 3.950%, 2/26/2048 | | | 273,855 | |
| | | | McDonald’s Corporation | | | | |
| | 135,000 | | | 2.750%, 12/9/2020 | | | 133,504 | |
| | 160,000 | | | 2.625%, 1/15/2022 | | | 155,619 | |
| | 250,000 | | | 4.450%, 3/1/2047 | | | 233,789 | |
| | | | MGM Resorts International | | | | |
| | 380,000 | | | 6.000%, 3/15/2023 | | | 385,700 | |
| | | | Navistar International Corporation | | | | |
| | 300,000 | | | 6.625%, 11/1/2025h | | | 306,000 | |
| | | | New Red Finance, Inc. | | | | |
| | 275,000 | | | 4.250%, 5/15/2024h,j | | | 257,813 | |
| | | | Nissan Motor Acceptance Corporation | | | | |
| | 135,000 | | | 2.150%, 9/28/2020h | | | 131,665 | |
| | | | Prime Security Services Borrower, LLC | | | | |
| | 292,000 | | | 9.250%, 5/15/2023h | | | 308,556 | |
| | | | Six Flags Entertainment Corporation | | | | |
| | 270,000 | | | 4.875%, 7/31/2024h | | | 255,150 | |
| | | | Toll Brothers Finance Corporation | | | | |
| | 67,000 | | | 4.000%, 12/31/2018 | | | 66,833 | |
| | | | VOC Escrow, Ltd. | | | | |
| | 300,000 | | | 5.000%, 2/15/2028h | | | 282,000 | |
| | | | Wabash National Corporation | | | | |
| | 305,000 | | | 5.500%, 10/1/2025h | | | 274,500 | |
| | | | | |
| | | | Total | | | 11,042,850 | |
| | | | | |
| |
| | Consumer Non-Cyclical (2.1%) | | | | |
| | | | Abbott Laboratories | | | | |
| | 200,000 | | | 2.900%, 11/30/2021 | | | 196,420 | |
| | 70,000 | | | 3.400%, 11/30/2023 | | | 69,250 | |
| | 37,000 | | | 3.750%, 11/30/2026 | | | 36,432 | |
| | 340,000 | | | 4.750%, 11/30/2036 | | | 345,605 | |
| | 175,000 | | | 4.900%, 11/30/2046 | | | 180,499 | |
| | | | AbbVie, Inc. | | | | |
| | 310,000 | | | 2.500%, 5/14/2020 | | | 305,948 | |
| | 230,000 | | | 3.600%, 5/14/2025 | | | 219,459 | |
| | 94,000 | | | 4.700%, 5/14/2045 | | | 84,982 | |
| | | | Altria Group, Inc. | | | | |
| | 80,000 | | | 2.850%, 8/9/2022 | | | 77,750 | |
| | 100,000 | | | 2.625%, 9/16/2026 | | | 89,892 | |
| | | | Amgen, Inc. | | | | |
| | 264,000 | | | 2.200%, 5/11/2020 | | | 259,903 | |
| | 92,000 | | | 2.700%, 5/1/2022 | | | 89,182 | |
| | 75,000 | | | 3.125%, 5/1/2025 | | | 70,974 | |
| | | | Anheuser-Busch InBev Finance, Inc. | | | | |
| | 100,000 | | | 3.603%, (LIBOR 3M + 1.260%), 2/1/2021b | | | 102,129 | |
| | 462,000 | | | 3.650%, 2/1/2026 | | | 438,475 | |
| | 320,000 | | | 4.700%, 2/1/2036 | | | 305,155 | |
| | | | Anheuser-Busch InBev Worldwide, Inc. | | | | |
| | 500,000 | | | 4.750%, 4/15/2058 | | | 443,154 | |
| | 155,000 | | | 3.165%, (LIBOR 3M + 0.740%), 1/12/2024b | | | 154,915 | |
| | 250,000 | | | 4.375%, 4/15/2038 | | | 226,985 | |
| | 250,000 | | | 4.600%, 4/15/2048 | | | 225,075 | |
| | | | BAT Capital Corporation | | | | |
| | 80,000 | | | 2.297%, 8/14/2020h | | | 78,283 | |
| | 120,000 | | | 3.222%, 8/15/2024h | | | 113,250 | |
| | 160,000 | | | 4.540%, 8/15/2047h | | | 139,317 | |
| | | | Baxalta, Inc. | | | | |
| | 105,000 | | | 4.000%, 6/23/2025 | | | 102,348 | |
| | | | Bayer U.S. Finance II, LLC | | | | |
| | 270,000 | | | 4.250%, 12/15/2025h | | | 265,250 | |
| | 275,000 | | | 4.875%, 6/25/2048h | | | 256,412 | |
| | | | Becton, Dickinson and Company | | | | |
| | 187,000 | | | 3.734%, 12/15/2024 | | | 181,279 | |
| | 325,000 | | | 3.700%, 6/6/2027 | | | 305,249 | |
| | 132,000 | | | 4.669%, 6/6/2047 | | | 123,708 | |
| | | | Boston Scientific Corporation | | | | |
| | 90,000 | | | 6.000%, 1/15/2020 | | | 92,771 | |
| | 75,000 | | | 3.850%, 5/15/2025 | | | 73,969 | |
| | 125,000 | | | 4.000%, 3/1/2028 | | | 122,040 | |
| | 120,000 | | | 7.375%, 1/15/2040 | | | 153,741 | |
| | | | Bunge, Ltd. Finance Corporation | | | | |
| | 36,000 | | | 3.500%, 11/24/2020 | | | 35,923 | |
| | | | Celgene Corporation | | | | |
| | 350,000 | | | 2.875%, 8/15/2020 | | | 346,321 | |
| | | | Church & Dwight Company, Inc. | | | | |
| | 65,000 | | | 2.450%, 12/15/2019 | | | 64,533 | |
| | | | Clorox Company | | | | |
| | 270,000 | | | 3.100%, 10/1/2027 | | | 250,136 | |
| | | | Conagra Brands, Inc. | | | | |
| | 125,000 | | | 3.800%, 10/22/2021 | | | 125,290 | |
| | 175,000 | | | 4.300%, 5/1/2024 | | | 175,269 | |
| | | | Constellation Brands, Inc. | | | | |
| | 190,000 | | | 3.600%, 2/15/2028 | | | 175,325 | |
| | | | CVS Caremark Corporation | | | | |
| | 50,000 | | | 4.000%, 12/5/2023 | | | 49,722 | |
| | | | CVS Health Corporation | | | | |
| | 47,000 | | | 3.350%, 3/9/2021 | | | 46,794 | |
| | 94,000 | | | 3.700%, 3/9/2023 | | | 92,873 | |
| | 245,000 | | | 4.100%, 3/25/2025 | | | 242,149 | |
| | 520,000 | | | 4.875%, 7/20/2035 | | | 505,524 | |
| | 465,000 | | | 4.780%, 3/25/2038 | | | 445,449 | |
| | 270,000 | | | 5.050%, 3/25/2048 | | | 263,207 | |
| | | | EMD Finance, LLC | | | | |
| | 232,000 | | | 2.950%, 3/19/2022h | | | 225,651 | |
| | | | Energizer Holdings, Inc. | | | | |
| | 171,000 | | | 5.500%, 6/15/2025h | | | 166,297 | |
| | | | Express Scripts Holding Company | | | | |
| | 80,000 | | | 3.000%, 7/15/2023 | | | 76,742 | |
| | 355,000 | | | 4.800%, 7/15/2046 | | | 333,585 | |
| | | | Forest Laboratories, LLC | | | | |
| | 46,000 | | | 4.875%, 2/15/2021h | | | 46,994 | |
The accompanying Notes to Financial Statements are an integral part of this schedule.
127
MODERATELY CONSERVATIVE ALLOCATION FUND
Schedule of Investments as of October 31, 2018
| | | | | | | | |
Principal
Amount | | | Long-Term Fixed Income (42.9%) | | Value | |
| | Consumer Non-Cyclical (2.1%) - continued | | | | |
| | | | Grupo Bimbo SAB de CV | | | | |
| | $200,000 | | | 4.700%, 11/10/2047h | | | $175,450 | |
| | | | Halfmoon Parent, Inc. | | | | |
| | 50,000 | | | 3.326%, (LIBOR 3M + 0.890%), 7/15/2023b,h | | | 49,960 | |
| | 240,000 | | | 4.125%, 11/15/2025h | | | 237,251 | |
| | 295,000 | | | 4.800%, 8/15/2038h | | | 284,789 | |
| | | | HCA, Inc. | | | | |
| | 185,000 | | | 5.250%, 6/15/2026 | | | 188,237 | |
| | 155,000 | | | 4.500%, 2/15/2027 | | | 150,737 | |
| | | | Imperial Tobacco Finance plc | | | | |
| | 250,000 | | | 2.950%, 7/21/2020h | | | 246,777 | |
| | | | Iron Mountain, Inc. | | | | |
| | 150,000 | | | 4.875%, 9/15/2027h | | | 133,500 | |
| | | | JBS USA, LLC | | | | |
| | 310,000 | | | 5.750%, 6/15/2025h | | | 299,925 | |
| | | | Kellogg Company | | | | |
| | 275,000 | | | 3.250%, 5/14/2021 | | | 273,070 | |
| | | | Kimberly-Clark Corporation | | | | |
| | 220,000 | | | 3.900%, 5/4/2047 | | | 203,844 | |
| | | | Kraft Foods Group, Inc. | | | | |
| | 184,000 | | | 5.000%, 6/4/2042 | | | 168,841 | |
| | | | Kraft Heinz Foods Company | | | | |
| | 325,000 | | | 3.375%, 6/15/2021 | | | 324,011 | |
| | | | Kroger Company | | | | |
| | 105,000 | | | 2.800%, 8/1/2022 | | | 101,646 | |
| | | | Laboratory Corporation of America Holdings | | | | |
| | 75,000 | | | 2.625%, 2/1/2020 | | | 74,351 | |
| | | | Maple Escrow Subsidiary, Inc. | | | | |
| | 215,000 | | | 3.551%, 5/25/2021h | | | 213,998 | |
| | | | Mead Johnson Nutrition Company | | | | |
| | 92,000 | | | 3.000%, 11/15/2020 | | | 91,356 | |
| | | | Medtronic, Inc. | | | | |
| | 700,000 | | | 4.375%, 3/15/2035 | | | 696,497 | |
| | 90,000 | | | 4.625%, 3/15/2045 | | | 91,013 | |
| | | | Merck & Company, Inc. | | | | |
| | 80,000 | | | 2.716%, (LIBOR 3M + 0.375%), 2/10/2020b | | | 80,209 | |
| | 50,000 | | | 3.700%, 2/10/2045 | | | 45,495 | |
| | | | Mondelez International Holdings Netherlands BV | | | | |
| | 180,000 | | | 2.000%, 10/28/2021h | | | 171,339 | |
| | | | Mondelez International, Inc. | | | | |
| | 87,000 | | | 2.863%, (LIBOR 3M + 0.520%), 2/1/2019b | | | 87,080 | |
| | | | Mylan NV | | | | |
| | 88,000 | | | 5.250%, 6/15/2046 | | | 75,783 | |
| | | | Mylan, Inc. | | | | |
| | 55,000 | | | 3.125%, 1/15/2023h | | | 51,873 | |
| | 157,000 | | | 4.550%, 4/15/2028h | | | 145,296 | |
| | | | Nestle Holdings, Inc. | | | | |
| | 425,000 | | | 3.900%, 9/24/2038h | | | 402,374 | |
| | | | Newell Rubbermaid, Inc. | | | | |
| | 138,000 | | | 5.500%, 4/1/2046 | | | 118,949 | |
| | | | PepsiCo, Inc. | | | | |
| | 180,000 | | | 2.850%, 2/24/2026 | | | 168,467 | |
| | | | Perrigo Finance Unlimited Company | | | | |
| | 280,000 | | | 4.900%, 12/15/2044 | | | 246,122 | |
| | | | Pilgrim’s Pride Corporation | | | | |
| | 290,000 | | | 5.750%, 3/15/2025h | | | 270,425 | |
| | | | Reynolds American, Inc. | | | | |
| | 299,000 | | | 5.700%, 8/15/2035 | | | 306,923 | |
| | | | Roche Holdings, Inc. | | | | |
| | 138,000 | | | 4.000%, 11/28/2044h | | | 133,066 | |
| | | | Shire Acquisitions Investments Ireland Designated Activity Company | | | | |
| | 252,000 | | | 2.400%, 9/23/2021 | | | 242,189 | |
| | | | Simmons Foods, Inc. | | | | |
| | 295,000 | | | 5.750%, 11/1/2024h,j | | | 216,825 | |
| | | | Smithfield Foods, Inc. | | | | |
| | 200,000 | | | 2.700%, 1/31/2020h | | | 196,565 | |
| | 145,000 | | | 2.650%, 10/3/2021h | | | 137,995 | |
| | | | Tenet Healthcare Corporation | | | | |
| | 300,000 | | | 8.125%, 4/1/2022 | | | 312,375 | |
| | | | Thermo Fisher Scientific, Inc. | | | | |
| | 69,000 | | | 3.000%, 4/15/2023 | | | 66,506 | |
| | | | TreeHouse Foods, Inc. | | | | |
| | 210,000 | | | 4.875%, 3/15/2022 | | | 207,375 | |
| | | | Tyson Foods, Inc. | | | | |
| | 88,000 | | | 3.550%, 6/2/2027 | | | 82,034 | |
| | | | VRX Escrow Corporation | | | | |
| | 595,000 | | | 6.125%, 4/15/2025h | | | 547,222 | |
| | | | Zimmer Biomet Holdings, Inc. | | | | |
| | 305,000 | | | 3.089%, (LIBOR 3M + 0.750%), 3/19/2021b | | | 305,160 | |
| | | | Zoetis, Inc. | | | | |
| | 275,000 | | | 4.700%, 2/1/2043 | | | 270,217 | |
| | | | | |
| | | | Total | | | 18,490,702 | |
| | | | | |
| |
| | Energy (1.9%) | | | | |
| | | | Alliance Resource Operating Partners, LP | | | | |
| | 265,000 | | | 7.500%, 5/1/2025h | | | 274,937 | |
| | | | Anadarko Petroleum Corporation | | | | |
| | 265,000 | | | 4.850%, 3/15/2021 | | | 270,745 | |
| | 280,000 | | | 5.550%, 3/15/2026 | | | 291,338 | |
| | | | Antero Resources Corporation | | | | |
| | 305,000 | | | 5.125%, 12/1/2022 | | | 302,903 | |
| | | | BP Capital Markets plc | | | | |
| | 275,000 | | | 3.535%, 11/4/2024 | | | 270,780 | |
| | 50,000 | | | 3.119%, 5/4/2026 | | | 47,053 | |
| | 312,000 | | | 3.279%, 9/19/2027 | | | 293,803 | |
| | | | Buckeye Partners, LP | | | | |
| | 128,000 | | | 2.650%, 11/15/2018 | | | 127,973 | |
| | | | Canadian Natural Resources, Ltd. | | | | |
| | 150,000 | | | 3.450%, 11/15/2021 | | | 148,584 | |
| | 80,000 | | | 6.250%, 3/15/2038 | | | 90,119 | |
| | | | Canadian Oil Sands, Ltd. | | | | |
| | 115,000 | | | 9.400%, 9/1/2021h | | | 129,662 | |
| | | | Cenovus Energy, Inc. | | | | |
| | 175,000 | | | 3.800%, 9/15/2023 | | | 171,067 | |
| | | | Cheniere Corpus Christi Holdings, LLC | | | | |
| | 265,000 | | | 7.000%, 6/30/2024 | | | 286,531 | |
| | | | Cheniere Energy Partners, LP | | | | |
| | 370,000 | | | 5.625%, 10/1/2026h | | | 364,450 | |
| | | | Chesapeake Energy Corporation | | | | |
| | 155,000 | | | 7.000%, 10/1/2024 | | | 151,512 | |
| | | | ConocoPhillips | | | | |
| | 220,000 | | | 6.500%, 2/1/2039 | | | 274,986 | |
The accompanying Notes to Financial Statements are an integral part of this schedule.
128
MODERATELY CONSERVATIVE ALLOCATION FUND
Schedule of Investments as of October 31, 2018
| | | | | | | | |
Principal
Amount | | | Long-Term Fixed Income (42.9%) | | Value | |
| | Energy (1.9%) - continued | | | | |
| | | | Continental Resources, Inc. | | | | |
| | $176,000 | | | 5.000%, 9/15/2022 | | | $177,585 | |
| | 275,000 | | | 4.375%, 1/15/2028 | | | 265,901 | |
| | | | El Paso Pipeline Partners Operating Company, LLC | | | | |
| | 130,000 | | | 4.300%, 5/1/2024 | | | 130,285 | |
| | | | Enbridge Energy Partners, LP | | | | |
| | 220,000 | | | 5.875%, 10/15/2025 | | | 239,407 | |
| | | | Enbridge, Inc. | | | | |
| | 165,000 | | | 2.900%, 7/15/2022 | | | 159,282 | |
| | | | Encana Corporation | | | | |
| | 45,000 | | | 3.900%, 11/15/2021 | | | 44,954 | |
| | | | Energy Transfer Equity, LP | | | | |
| | 310,000 | | | 5.500%, 6/1/2027 | | | 315,130 | |
| | | | Energy Transfer Operating, LP | | | | |
| | 85,000 | | | 4.200%, 9/15/2023 | | | 84,622 | |
| | 275,000 | | | 6.000%, 6/15/2048 | | | 270,940 | |
| | | | Energy Transfer Partners, LP | | | | |
| | 155,000 | | | 4.900%, 3/15/2035 | | | 139,452 | |
| | 50,000 | | | 5.150%, 2/1/2043 | | | 44,075 | |
| | | | Eni SPA | | | | |
| | 275,000 | | | 4.000%, 9/12/2023h | | | 269,178 | |
| | | | EnLink Midstream Partners, LP | | | | |
| | 45,000 | | | 4.150%, 6/1/2025 | | | 41,832 | |
| | 50,000 | | | 4.850%, 7/15/2026 | | | 47,372 | |
| | | | Enterprise Products Operating, LLC | | | | |
| | 132,000 | | | 5.100%, 2/15/2045 | | | 131,327 | |
| | | | EQM Midstream Partners LP | | | | |
| | 275,000 | | | 4.750%, 7/15/2023 | | | 277,303 | |
| | | | EQT Corporation | | | | |
| | 118,000 | | | 8.125%, 6/1/2019 | | | 121,250 | |
| | 245,000 | | | 3.900%, 10/1/2027 | | | 222,950 | |
| | | | Exxon Mobil Corporation | | | | |
| | 80,000 | | | 4.114%, 3/1/2046 | | | 77,166 | |
| | | | Hess Corporation | | | | |
| | 390,000 | | | 3.500%, 7/15/2024 | | | 367,709 | |
| | 135,000 | | | 6.000%, 1/15/2040 | | | 132,969 | |
| | | | Kinder Morgan Energy Partners, LP | | | | |
| | 135,000 | | | 3.500%, 3/1/2021 | | | 134,387 | |
| | 215,000 | | | 6.500%, 9/1/2039 | | | 234,390 | |
| | | | Kinder Morgan, Inc. | | | | |
| | 225,000 | | | 6.500%, 9/15/2020 | | | 236,225 | |
| | | | Magellan Midstream Partners, LP | | | | |
| | 130,000 | | | 5.000%, 3/1/2026 | | | 135,920 | |
| | | | Marathon Oil Corporation | | | | |
| | 120,000 | | | 2.700%, 6/1/2020 | | | 118,373 | |
| | 300,000 | | | 6.600%, 10/1/2037 | | | 340,575 | |
| | | | Marathon Petroleum Corporation | | | | |
| | 70,000 | | | 3.400%, 12/15/2020 | | | 69,975 | |
| | 264,000 | | | 4.750%, 12/15/2023h | | | 271,967 | |
| | 160,000 | | | 6.500%, 3/1/2041 | | | 179,540 | |
| | | | MPLX, LP | | | | |
| | 264,000 | | | 4.875%, 6/1/2025 | | | 269,165 | |
| | 125,000 | | | 4.125%, 3/1/2027 | | | 119,268 | |
| | | | Nabors Industries, Inc. | | | | |
| | 250,000 | | | 5.750%, 2/1/2025 | | | 230,746 | |
| | | | Newfield Exploration Company | | | | |
| | 250,000 | | | 5.625%, 7/1/2024 | | | 257,500 | |
| | | | ONEOK Partners, LP | | | | |
| | 145,000 | | | 3.800%, 3/15/2020 | | | 145,438 | |
| | | | Parsley Energy, LLC | | | | |
| | 125,000 | | | 5.625%, 10/15/2027h | | | 123,221 | |
| | | | PBF Holding Company, LLC | | | | |
| | 225,000 | | | 7.250%, 6/15/2025 | | | 231,750 | |
| | | | Petrobras Global Finance BV | | | | |
| | 118,000 | | | 8.375%, 5/23/2021 | | | 128,720 | |
| | | | Petroleos Mexicanos | | | | |
| | 166,000 | | | 6.000%, 3/5/2020 | | | 168,281 | |
| | 61,750 | | | 2.378%, 4/15/2025 | | | 60,021 | |
| | 100,000 | | | 6.750%, 9/21/2047 | | | 86,140 | |
| | | | Phillips 66 | | | | |
| | 185,000 | | | 3.900%, 3/15/2028 | | | 177,234 | |
| | | | Pioneer Natural Resources Company | | | | |
| | 90,000 | | | 4.450%, 1/15/2026 | | | 90,544 | |
| | | | Plains All American Pipeline, LP | | | | |
| | 205,000 | | | 5.000%, 2/1/2021 | | | 209,210 | |
| | | | Regency Energy Partners, LP | | | | |
| | 160,000 | | | 5.875%, 3/1/2022 | | | 168,426 | |
| | 310,000 | | | 5.000%, 10/1/2022 | | | 319,418 | |
| | | | Sabine Pass Liquefaction, LLC | | | | |
| | 125,000 | | | 6.250%, 3/15/2022 | | | 133,189 | |
| | 150,000 | | | 5.625%, 4/15/2023 | | | 157,925 | |
| | 175,000 | | | 5.750%, 5/15/2024 | | | 185,346 | |
| | 310,000 | | | 5.625%, 3/1/2025 | | | 323,660 | |
| | | | Schlumberger Holdings Corporation | | | | |
| | 270,000 | | | 4.000%, 12/21/2025h | | | 267,071 | |
| | | | Shell International Finance BV | | | | |
| | 75,000 | | | 2.788%, (LIBOR 3M + 0.450%), 5/11/2020b | | | 75,457 | |
| | | | Southwestern Energy Company | | | | |
| | 295,000 | | | 7.500%, 4/1/2026j | | | 300,163 | |
| | | | SRC Energy, Inc. | | | | |
| | 300,000 | | | 6.250%, 12/1/2025 | | | 279,375 | |
| | | | Suncor Energy, Inc. | | | | |
| | 155,000 | | | 3.600%, 12/1/2024 | | | 152,222 | |
| | | | Sunoco, LP | | | | |
| | 105,000 | | | 5.500%, 2/15/2026h | | | 100,013 | |
| | 160,000 | | | 5.875%, 3/15/2028h | | | 149,200 | |
| | | | Tallgrass Energy Partners, LP | | | | |
| | 445,000 | | | 5.500%, 1/15/2028h | | | 439,909 | |
| | | | Transocean, Inc. | | | | |
| | 365,000 | | | 7.250%, 11/1/2025h | | | 354,963 | |
| | | | W&T Offshore, Inc. | | | | |
| | 145,000 | | | 9.750%, 11/1/2023h | | | 140,317 | |
| | | | Weatherford International, Ltd. | | | | |
| | 79,000 | | | 4.500%, 4/15/2022j | | | 59,250 | |
| | 191,000 | | | 8.250%, 6/15/2023j | | | 146,115 | |
| | | | Western Gas Partners, LP | | | | |
| | 176,000 | | | 4.000%, 7/1/2022 | | | 174,511 | |
| | 95,000 | | | 4.500%, 3/1/2028 | | | 90,441 | |
| | | | Williams Companies, Inc. | | | | |
| | 225,000 | | | 7.500%, 1/15/2031 | | | 266,286 | |
| | | | Williams Partners, LP | | | | |
| | 100,000 | | | 4.000%, 11/15/2021 | | | 100,492 | |
| | 70,000 | | | 3.600%, 3/15/2022 | | | 68,904 | |
| | 100,000 | | | 4.500%, 11/15/2023 | | | 101,406 | |
| | 155,000 | | | 3.750%, 6/15/2027 | | | 144,336 | |
| | 175,000 | | | 6.300%, 4/15/2040 | | | 185,879 | |
| | | | Woodside Finance, Ltd. | | | | |
| | 225,000 | | | 3.650%, 3/5/2025h | | | 214,927 | |
| | 90,000 | | | 3.700%, 3/15/2028h | | | 83,254 | |
The accompanying Notes to Financial Statements are an integral part of this schedule.
129
MODERATELY CONSERVATIVE ALLOCATION FUND
Schedule of Investments as of October 31, 2018
| | | | | | | | |
Principal
Amount | | | Long-Term Fixed Income (42.9%) | | Value | |
| | Energy (1.9%) - continued | | | | |
| | | | WPX Energy, Inc. | | | | |
| | $210,000 | | | 5.750%, 6/1/2026 | | | $208,950 | |
| | | | | |
| | | | Total | | | 16,467,127 | |
| | | | | |
| |
| | Financials (5.1%) | | | | |
| | | | ABN AMRO Bank NV | | | | |
| | 200,000 | | | 4.750%, 7/28/2025h | | | 198,580 | |
| | | | ACE INA Holdings, Inc. | | | | |
| | 138,000 | | | 4.350%, 11/3/2045 | | | 136,186 | |
| | | | AerCap Ireland Capital, Ltd. | | | | |
| | 90,000 | | | 3.750%, 5/15/2019 | | | 90,175 | |
| | 80,000 | | | 4.625%, 10/30/2020 | | | 81,180 | |
| | 215,000 | | | 5.000%, 10/1/2021 | | | 220,768 | |
| | 14,000 | | | 4.625%, 7/1/2022 | | | 14,183 | |
| | 160,000 | | | 3.500%, 1/15/2025 | | | 149,175 | |
| | | | Air Lease Corporation | | | | |
| | 220,000 | | | 3.375%, 1/15/2019 | | | 220,056 | |
| | 185,000 | | | 2.500%, 3/1/2021 | | | 180,357 | |
| | 75,000 | | | 3.500%, 1/15/2022 | | | 74,160 | |
| | | | Aircastle, Ltd. | | | | |
| | 325,000 | | | 5.000%, 4/1/2023 | | | 329,546 | |
| | | | Ally Financial, Inc. | | | | |
| | 210,000 | | | 3.750%, 11/18/2019 | | | 210,021 | |
| | 200,000 | | | 4.125%, 3/30/2020 | | | 199,750 | |
| | | | American Express Company | | | | |
| | 148,000 | | | 2.200%, 10/30/2020 | | | 144,516 | |
| | | | American Express Credit Corporation | | | | |
| | 125,000 | | | 2.887%, (LIBOR 3M + 0.550%), 3/18/2019b | | | 125,173 | |
| | 264,000 | | | 1.875%, 5/3/2019 | | | 262,566 | |
| | 380,000 | | | 2.200%, 3/3/2020 | | | 374,972 | |
| | | | American International Group, Inc. | | | | |
| | 65,000 | | | 3.300%, 3/1/2021 | | | 64,342 | |
| | 138,000 | | | 4.125%, 2/15/2024 | | | 137,169 | |
| | 255,000 | | | 3.750%, 7/10/2025 | | | 243,488 | |
| | 250,000 | | | 3.900%, 4/1/2026 | | | 238,187 | |
| | | | Anthem, Inc. | | | | |
| | 220,000 | | | 4.625%, 5/15/2042 | | | 208,469 | |
| | | | Ares Capital Corporation | | | | |
| | 395,000 | | | 3.875%, 1/15/2020 | | | 396,266 | |
| | | | ASP AMC Merger Sub, Inc. | | | | |
| | 275,000 | | | 8.000%, 5/15/2025h | | | 206,250 | |
| | | | Avalonbay Communities, Inc. | | | | |
| | 200,000 | | | 3.500%, 11/15/2025 | | | 193,905 | |
| | | | Aviation Capital Group, LLC | | | | |
| | 255,000 | | | 2.875%, 1/20/2022h | | | 246,480 | |
| | | | Banco Santander SA | | | | |
| | 200,000 | | | 6.375%, 5/19/2019b,m | | | 197,250 | |
| | 400,000 | | | 3.545%, (LIBOR 3M + 1.120%), 4/12/2023b | | | 401,073 | |
| | | | Bank of America Corporation | | | | |
| | 105,000 | | | 3.266%, (LIBOR 3M + 0.870%), 4/1/2019b | | | 105,307 | |
| | 110,000 | | | 2.369%, 7/21/2021b | | | 107,893 | |
| | 132,000 | | | 2.328%, 10/1/2021b | | | 128,862 | |
| | 225,000 | | | 3.499%, 5/17/2022b | | | 224,018 | |
| | 205,000 | | | 3.300%, 1/11/2023 | | | 200,438 | |
| | 175,000 | | | 2.881%, 4/24/2023b | | | 169,321 | |
| | 184,000 | | | 4.000%, 4/1/2024 | | | 183,715 | |
| | 500,000 | | | 4.000%, 1/22/2025 | | | 486,493 | |
| | 225,000 | | | 3.093%, 10/1/2025b | | | 213,059 | |
| | 138,000 | | | 3.500%, 4/19/2026 | | | 131,288 | |
| | 240,000 | | | 4.183%, 11/25/2027 | | | 230,486 | |
| | 180,000 | | | 3.824%, 1/20/2028b | | | 172,573 | |
| | 212,000 | | | 5.875%, 2/7/2042 | | | 241,835 | |
| | | | Bank of Montreal | | | | |
| | 205,000 | | | 2.896%, (LIBOR 3M + 0.460%), 4/13/2021b | | | 205,466 | |
| | | | Bank of New York Mellon Corporation | | | | |
| | 230,000 | | | 2.500%, 4/15/2021 | | | 225,399 | |
| | | | Bank of Nova Scotia | | | | |
| | 390,000 | | | 2.909%, (LIBOR 3M + 0.440%), 4/20/2021b | | | 390,944 | |
| | 185,000 | | | 2.700%, 3/7/2022 | | | 180,062 | |
| | | | Bank of Tokyo-Mitsubishi UFJ, Ltd. | | | | |
| | 55,000 | | | 2.850%, 9/8/2021h | | | 53,815 | |
| | | | Barclays Bank plc | | | | |
| | 46,000 | | | 10.179%, 6/12/2021h | | | 52,312 | |
| | | | Barclays plc | | | | |
| | 150,000 | | | 2.750%, 11/8/2019 | | | 148,953 | |
| | 310,000 | | | 3.250%, 1/12/2021 | | | 305,368 | |
| | 236,000 | | | 3.650%, 3/16/2025 | | | 219,507 | |
| | | | BB&T Corporation | | | | |
| | 65,000 | | | 3.151%, (LIBOR 3M + 0.715%), 1/15/2020b | | | 65,402 | |
| | | | BPCE SA | | | | |
| | 315,000 | | | 3.500%, 10/23/2027h | | | 283,066 | |
| | | | Capital One Financial Corporation | | | | |
| | 115,000 | | | 2.450%, 4/24/2019 | | | 114,747 | |
| | 154,000 | | | 2.500%, 5/12/2020 | | | 151,807 | |
| | 500,000 | | | 3.450%, 4/30/2021 | | | 497,829 | |
| | 160,000 | | | 3.050%, 3/9/2022 | | | 156,097 | |
| | | | Capital One NA | | | | |
| | 250,000 | | | 2.350%, 1/31/2020 | | | 246,845 | |
| | | | Cboe Global Markets, Inc. | | | | |
| | 100,000 | | | 1.950%, 6/28/2019 | | | 99,287 | |
| | | | Cigna Corporation | | | | |
| | 350,000 | | | 3.050%, 10/15/2027 | | | 312,262 | |
| | | | CIT Group, Inc. | | | | |
| | 375,000 | | | 5.000%, 8/15/2022 | | | 377,812 | |
| | | | Citigroup, Inc. | | | | |
| | 90,000 | | | 3.180%, (LIBOR 3M + 0.770%), 4/8/2019b | | | 90,218 | |
| | 185,000 | | | 2.700%, 3/30/2021 | | | 181,180 | |
| | 200,000 | | | 2.750%, 4/25/2022 | | | 193,208 | |
| | 139,000 | | | 4.050%, 7/30/2022 | | | 139,607 | |
| | 140,000 | | | 3.142%, 1/24/2023b | | | 136,681 | |
| | 370,000 | | | 4.400%, 6/10/2025 | | | 366,543 | |
| | 160,000 | | | 3.200%, 10/21/2026 | | | 146,622 | |
| | 240,000 | | | 3.668%, 7/24/2028b | | | 225,029 | |
| | 120,000 | | | 4.125%, 7/25/2028 | | | 113,923 | |
| | 225,000 | | | 3.520%, 10/27/2028b | | | 208,517 | |
| | 300,000 | | | 3.878%, 1/24/2039b | | | 266,195 | |
| | 162,000 | | | 4.650%, 7/23/2048 | | | 156,542 | |
| | | | Citizens Bank NA | | | | |
| | 250,000 | | | 2.200%, 5/26/2020 | | | 245,339 | |
| | | | Comerica, Inc. | | | | |
| | 75,000 | | | 3.700%, 7/31/2023 | | | 74,309 | |
| | | | Commerzbank AG | | | | |
| | 200,000 | | | 8.125%, 9/19/2023h | | | 225,269 | |
| | | | Commonwealth Bank of Australia | | | | |
| | 120,000 | | | 2.250%, 3/10/2020h | | | 118,345 | |
The accompanying Notes to Financial Statements are an integral part of this schedule.
130
MODERATELY CONSERVATIVE ALLOCATION FUND
Schedule of Investments as of October 31, 2018
| | | | | | | | |
Principal
Amount | | | Long-Term Fixed Income (42.9%) | | Value | |
| | Financials (5.1%) - continued | | | | |
| | $285,000 | | | 3.034%, (LIBOR 3M + 0.700%), 3/16/2023b,h | | | $285,909 | |
| | | | Compass Bank | | | | |
| | 150,000 | | | 2.750%, 9/29/2019 | | | 149,325 | |
| | 250,000 | | | 3.500%, 6/11/2021 | | | 247,946 | |
| | | | Cooperatieve Centrale Raiffeisen- Boerenleenbank BA | | | | |
| | 258,000 | | | 3.950%, 11/9/2022 | | | 255,599 | |
| | 528,000 | | | 4.625%, 12/1/2023 | | | 532,540 | |
| | | | Credit Agricole SA | | | | |
| | 105,000 | | | 3.236%, (LIBOR 3M + 0.800%), 4/15/2019b,h | | | 105,300 | |
| | 250,000 | | | 3.375%, 1/10/2022h | | | 244,743 | |
| | | | Credit Suisse AG | | | | |
| | 92,000 | | | 5.400%, 1/14/2020 | | | 93,984 | |
| | | | Credit Suisse Group AG | | | | |
| | 250,000 | | | 2.997%, 12/14/2023b,h | | | 237,713 | |
| | 200,000 | | | 7.250%, 9/12/2025b,h,m | | | 197,750 | |
| | 250,000 | | | 3.869%, 1/12/2029b,h | | | 231,624 | |
| | | | Credit Suisse Group Funding, Ltd. | | | | |
| | 100,000 | | | 3.125%, 12/10/2020 | | | 98,859 | |
| | 184,000 | | | 3.750%, 3/26/2025 | | | 176,141 | |
| | | | Deutsche Bank AG | | | | |
| | 156,000 | | | 2.700%, 7/13/2020 | | | 152,425 | |
| | 275,000 | | | 3.375%, 5/12/2021 | | | 267,817 | |
| | 100,000 | | | 4.250%, 10/14/2021 | | | 99,202 | |
| | 300,000 | | | 4.875%, 12/1/2032b | | | 255,591 | |
| | | | Digital Realty Trust LP | | | | |
| | 230,000 | | | 3.400%, 10/1/2020 | | | 229,534 | |
| | | | Discover Bank | | | | |
| | 135,000 | | | 8.700%, 11/18/2019 | | | 141,738 | |
| | 155,000 | | | 3.100%, 6/4/2020 | | | 153,834 | |
| | 260,000 | | | 4.682%, 8/9/2028b | | | 256,901 | |
| | | | Duke Realty, LP | | | | |
| | 50,000 | | | 3.875%, 2/15/2021 | | | 50,317 | |
| | 96,000 | | | 4.375%, 6/15/2022 | | | 98,120 | |
| | | | ERP Operating, LP | | | | |
| | 54,000 | | | 3.375%, 6/1/2025 | | | 52,183 | |
| | | | European Investment Bank | | | | |
| | 160,000 | | | 1.875%, 3/15/2019 | | | 159,590 | |
| | | | Fidelity National Financial, Inc. | | | | |
| | 250,000 | | | 5.500%, 9/1/2022 | | | 263,410 | |
| | | | Fifth Third Bancorp | | | | |
| | 112,000 | | | 2.875%, 7/27/2020 | | | 110,983 | |
| | 65,000 | | | 2.875%, 10/1/2021 | | | 63,752 | |
| | 135,000 | | | 2.600%, 6/15/2022 | | | 129,776 | |
| | | | Five Corners Funding Trust | | | | |
| | 445,000 | | | 4.419%, 11/15/2023h | | | 454,505 | |
| | | | GE Capital International Funding Company | | | | |
| | 675,000 | | | 4.418%, 11/15/2035 | | | 582,558 | |
| | | | Goldman Sachs Group, Inc. | | | | |
| | 488,000 | | | 5.375%, 3/15/2020 | | | 501,078 | |
| | 95,000 | | | 3.637%, (LIBOR 3M + 1.160%), 4/23/2020b | | | 96,050 | |
| | 300,000 | | | 5.375%, 5/10/2020b,m | | | 303,375 | |
| | 524,000 | | | 5.250%, 7/27/2021 | | | 544,909 | |
| | 285,000 | | | 2.876%, 10/31/2022b | | | 277,202 | |
| | 176,000 | | | 2.908%, 6/5/2023b | | | 169,562 | |
| | 300,000 | | | 3.691%, 6/5/2028b | | | 281,606 | |
| | 460,000 | | | 4.750%, 10/21/2045 | | | 447,570 | |
| | | | Hartford Financial Services Group, Inc. | | | | |
| | 334,000 | | | 5.125%, 4/15/2022 | | | 348,492 | |
| | | | HCP, Inc. | | | | |
| | 230,000 | | | 4.000%, 12/1/2022 | | | 228,348 | |
| | 100,000 | | | 3.400%, 2/1/2025 | | | 93,876 | |
| | | | HSBC Holdings plc | | | | |
| | 315,000 | | | 3.400%, 3/8/2021 | | | 313,459 | |
| | 200,000 | | | 6.875%, 6/1/2021b,m | | | 207,250 | |
| | 125,000 | | | 2.650%, 1/5/2022 | | | 120,878 | |
| | 350,000 | | | 3.900%, 5/25/2026 | | | 336,326 | |
| | | | HSBC USA, Inc. | | | | |
| | 255,000 | | | 2.350%, 3/5/2020 | | | 251,965 | |
| | | | Huntington National Bank | | | | |
| | 250,000 | | | 2.200%, 11/6/2018 | | | 249,985 | |
| | | | Icahn Enterprises, LP | | | | |
| | 115,000 | | | 6.750%, 2/1/2024 | | | 115,862 | |
| | 150,000 | | | 6.375%, 12/15/2025 | | | 149,063 | |
| | | | ING Groep NV | | | | |
| | 200,000 | | | 3.150%, 3/29/2022 | | | 194,507 | |
| | 250,000 | | | 4.100%, 10/2/2023 | | | 248,109 | |
| | | | International Lease Finance Corporation | | | | |
| | 80,000 | | | 5.875%, 8/15/2022 | | | 84,256 | |
| | | | Intesa Sanpaolo SPA | | | | |
| | 162,000 | | | 3.125%, 7/14/2022h | | | 147,168 | |
| | | | Iron Mountain, Inc. | | | | |
| | 125,000 | | | 6.000%, 8/15/2023 | | | 127,969 | |
| | | | J.P. Morgan Chase & Company | | | | |
| | 75,000 | | | 2.250%, 1/23/2020 | | | 74,112 | |
| | 170,000 | | | 3.001%, (LIBOR 3M + 0.680%), 6/1/2021b | | | 170,255 | |
| | 90,000 | | | 2.295%, 8/15/2021 | | | 87,102 | |
| | 230,000 | | | 4.500%, 1/24/2022 | | | 236,386 | |
| | 185,000 | | | 2.972%, 1/15/2023 | | | 179,014 | |
| | 134,000 | | | 3.200%, 1/25/2023 | | | 131,174 | |
| | 230,000 | | | 2.700%, 5/18/2023 | | | 219,823 | |
| | 105,000 | | | 3.717%, (LIBOR 3M + 1.230%), 10/24/2023b | | | 106,849 | |
| | 200,000 | | | 3.625%, 5/13/2024 | | | 196,930 | |
| | 145,000 | | | 3.125%, 1/23/2025 | | | 137,498 | |
| | 425,000 | | | 3.900%, 7/15/2025 | | | 419,136 | |
| | 150,000 | | | 3.300%, 4/1/2026 | | | 141,675 | |
| | 275,000 | | | 4.203%, 7/23/2029b | | | 270,871 | |
| | 260,000 | | | 3.882%, 7/24/2038b | | | 234,386 | |
| | | | J.P. Morgan Chase Bank NA | | | | |
| | 300,000 | | | 3.086%, 4/26/2021b | | | 298,854 | |
| | | | KeyCorp | | | | |
| | 220,000 | | | 2.900%, 9/15/2020 | | | 217,974 | |
| | | | Kimco Realty Corporation | | | | |
| | 320,000 | | | 3.300%, 2/1/2025 | | | 302,354 | |
| | | | Liberty Mutual Group, Inc. | | | | |
| | 80,000 | | | 4.950%, 5/1/2022h | | | 82,364 | |
| | | | Liberty Property, LP | | | | |
| | 216,000 | | | 3.750%, 4/1/2025 | | | 208,526 | |
| | | | Lloyds Bank plc | | | | |
| | 200,000 | | | 2.833%, (LIBOR 3M + 0.490%), 5/7/2021b | | | 200,260 | |
| | | | Lloyds Banking Group plc | | | | |
| | 225,000 | | | 2.907%, 11/7/2023b | | | 213,756 | |
| | | | MetLife, Inc. | | | | |
| | 210,000 | | | 4.050%, 3/1/2045 | | | 187,532 | |
The accompanying Notes to Financial Statements are an integral part of this schedule.
131
MODERATELY CONSERVATIVE ALLOCATION FUND
Schedule of Investments as of October 31, 2018
| | | | | | | | |
Principal
Amount | | | Long-Term Fixed Income (42.9%) | | Value | |
| | Financials (5.1%) - continued | | | | |
| | | | Mitsubishi UFJ Financial Group, Inc. | | | | |
| | $200,000 | | | 2.190%, 9/13/2021 | | | $192,429 | |
| | 280,000 | | | 3.455%, 3/2/2023 | | | 276,089 | |
| | 200,000 | | | 3.287%, 7/25/2027 | | | 186,941 | |
| | | | Morgan Stanley | | | | |
| | 80,000 | | | 5.550%, 7/15/2020b,m | | | 80,800 | |
| | 315,000 | | | 2.500%, 4/21/2021 | | | 306,927 | |
| | 200,000 | | | 2.625%, 11/17/2021 | | | 193,984 | |
| | 110,000 | | | 3.649%, (LIBOR 3M + 1.180%), 1/20/2022b | | | 111,238 | |
| | 198,000 | | | 2.750%, 5/19/2022 | | | 191,411 | |
| | 135,000 | | | 4.875%, 11/1/2022 | | | 138,912 | |
| | 185,000 | | | 3.125%, 1/23/2023 | | | 179,037 | |
| | 70,000 | | | 4.000%, 7/23/2025 | | | 68,749 | |
| | 275,000 | | | 4.350%, 9/8/2026 | | | 267,833 | |
| | 240,000 | | | 3.591%, 7/22/2028b | | | 224,810 | |
| | 225,000 | | | 3.772%, 1/24/2029b | | | 213,246 | |
| | | | MPT Operating Partnership, LP | | | | |
| | 325,000 | | | 6.375%, 3/1/2024 | | | 336,375 | |
| | | | Nasdaq, Inc. | | | | |
| | 110,000 | | | 3.850%, 6/30/2026 | | | 105,331 | |
| | | | National City Corporation | | | | |
| | 279,000 | | | 6.875%, 5/15/2019 | | | 284,767 | |
| | | | New York Life Global Funding | | | | |
| | 128,000 | | | 2.300%, 6/10/2022h | | | 122,707 | |
| | | | Park Aerospace Holdings, Ltd. | | | | |
| | 145,000 | | | 5.500%, 2/15/2024h | | | 143,586 | |
| | | | Prudential Financial, Inc. | | | | |
| | 65,000 | | | 2.350%, 8/15/2019 | | | 64,655 | |
| | | | Quicken Loans, Inc. | | | | |
| | 410,000 | | | 5.750%, 5/1/2025h | | | 395,138 | |
| | | | Realty Income Corporation | | | | |
| | 175,000 | | | 4.125%, 10/15/2026 | | | 173,631 | |
| | | | Regency Centers, LP | | | | |
| | 290,000 | | | 4.125%, 3/15/2028 | | | 282,089 | |
| | | | Reinsurance Group of America, Inc. | | | | |
| | 239,000 | | | 5.000%, 6/1/2021 | | | 247,230 | |
| | | | Reliance Standard Life Global Funding II | | | | |
| | 85,000 | | | 2.500%, 4/24/2019h | | | 84,821 | |
| | | | Royal Bank of Scotland Group plc | | | | |
| | 220,000 | | | 8.625%, 8/15/2021b,m | | | 231,275 | |
| | 200,000 | | | 3.875%, 9/12/2023 | | | 192,417 | |
| | 290,000 | | | 5.125%, 5/28/2024 | | | 287,100 | |
| | | | Santander UK Group Holdings plc | | | | |
| | 160,000 | | | 2.875%, 10/16/2020 | | | 157,658 | |
| | | | Simon Property Group, LP | | | | |
| | 70,000 | | | 2.500%, 9/1/2020 | | | 69,021 | |
| | 225,000 | | | 2.750%, 2/1/2023 | | | 216,791 | |
| | 160,000 | | | 4.250%, 11/30/2046 | | | 150,163 | |
| | | | SITE Centers Corporation | | | | |
| | 185,000 | | | 4.625%, 7/15/2022 | | | 188,220 | |
| | | | Skandinaviska Enskilda Banken AB | | | | |
| | 130,000 | | | 2.375%, 3/25/2019h | | | 129,663 | |
| | | | Societe Generale SA | | | | |
| | 132,000 | | | 4.750%, 11/24/2025h | | | 129,336 | |
| | | | Standard Chartered plc | | | | |
| | 168,000 | | | 2.100%, 8/19/2019h | | | 166,588 | |
| | | | State Street Corporation | | | | |
| | 104,000 | | | 3.222%, (LIBOR 3M + 0.900%), 8/18/2020b | | | 105,294 | |
| | | | Sumitomo Mitsui Financial Group, Inc. | | | | |
| | 160,000 | | | 2.784%, 7/12/2022 | | | 154,658 | |
| | 135,000 | | | 3.102%, 1/17/2023 | | | 131,402 | |
| | 120,000 | | | 3.010%, 10/19/2026 | | | 110,196 | |
| | | | Sumitomo Mitsui Trust Bank, Ltd. | | | | |
| | 225,000 | | | 1.950%, 9/19/2019h | | | 222,682 | |
| | | | SunTrust Banks, Inc. | | | | |
| | 175,000 | | | 2.250%, 1/31/2020 | | | 172,933 | |
| | | | Svenska Handelsbanken AB | | | | |
| | 150,000 | | | 2.824%, (LIBOR 3M + 0.490%), 6/17/2019b | | | 150,322 | |
| | | | Synchrony Financial | | | | |
| | 303,000 | | | 3.000%, 8/15/2019 | | | 301,761 | |
| | 60,000 | | | 3.578%, (LIBOR 3M + 1.230%), 2/3/2020b | | | 60,365 | |
| | 70,000 | | | 4.250%, 8/15/2024 | | | 66,483 | |
| | 350,000 | | | 3.950%, 12/1/2027 | | | 308,614 | |
| | | | Toronto-Dominion Bank | | | | |
| | 70,000 | | | 3.262%, (LIBOR 3M + 0.930%), 12/14/2020b | | | 71,003 | |
| | | | UBS Group Funding Jersey, Ltd. | | | | |
| | 138,000 | | | 4.125%, 9/24/2025h | | | 135,780 | |
| | | | UBS Group Funding Switzerland AG | | | | |
| | 190,000 | | | 3.491%, 5/23/2023h | | | 185,602 | |
| | | | UnitedHealth Group, Inc. | | | | |
| | 40,000 | | | 3.350%, 7/15/2022 | | | 39,715 | |
| | 225,000 | | | 2.950%, 10/15/2027 | | | 207,913 | |
| | 405,000 | | | 4.625%, 7/15/2035 | | | 416,760 | |
| | | | USB Realty Corporation | | | | |
| | 65,000 | | | 3.583%, (LIBOR 3M + 1.147%), 1/15/2022b,h,m | | | 58,338 | |
| | | | Vantiv, LLC | | | | |
| | 300,000 | | | 4.375%, 11/15/2025h | | | 283,125 | |
| | | | Ventas Realty, LP | | | | |
| | 190,000 | | | 3.100%, 1/15/2023 | | | 184,063 | |
| | 235,000 | | | 4.000%, 3/1/2028 | | | 224,583 | |
| | | | Voya Financial, Inc. | | | | |
| | 310,000 | | | 3.125%, 7/15/2024 | | | 291,943 | |
| | | | Wells Fargo & Company | | | | |
| | 95,000 | | | 3.200%, (LIBOR 3M + 0.680%), 1/30/2020b | | | 95,451 | |
| | 180,000 | | | 2.550%, 12/7/2020 | | | 176,357 | |
| | 190,000 | | | 2.625%, 7/22/2022 | | | 182,456 | |
| | 185,000 | | | 3.069%, 1/24/2023 | | | 179,195 | |
| | 160,000 | | | 3.450%, 2/13/2023 | | | 156,279 | |
| | 205,000 | | | 3.000%, 2/19/2025 | | | 191,824 | |
| | 175,000 | | | 3.000%, 4/22/2026 | | | 161,298 | |
| | 163,000 | | | 3.000%, 10/23/2026 | | | 149,219 | |
| | 307,000 | | | 4.900%, 11/17/2045 | | | 297,904 | |
| | | | Welltower, Inc. | | | | |
| | 75,000 | | | 3.950%, 9/1/2023 | | | 74,823 | |
| | 282,000 | | | 4.000%, 6/1/2025 | | | 275,067 | |
| | | | ZB NA | | | | |
| | 290,000 | | | 3.500%, 8/27/2021 | | | 288,506 | |
| | | | | |
| | | | Total | | | 44,552,285 | |
| | | | | |
| |
| | Foreign Government (<0.1%) | | | | |
| | | | Export-Import Bank of Korea | | | | |
| | 90,000 | | | 2.250%, 1/21/2020 | | | 88,962 | |
The accompanying Notes to Financial Statements are an integral part of this schedule.
132
MODERATELY CONSERVATIVE ALLOCATION FUND
Schedule of Investments as of October 31, 2018
| | | | | | | | |
Principal
Amount | | | Long-Term Fixed Income (42.9%) | | Value | |
| | Foreign Government (<0.1%) - continued | | | | |
| | | | Kommunalbanken AS | | | | |
| | $150,000 | | | 1.500%, 10/22/2019h | | | $148,035 | |
| | | | | |
| | | | Total | | | 236,997 | |
| | | | | |
| |
| | Mortgage-Backed Securities (11.7%) | | | | |
| | | | Federal Home Loan Mortgage Corporation Gold 30-Yr. Pass Through | | | | |
| | 11,770,000 | | | 4.000%, 11/1/2048d | | | 11,774,079 | |
| | | | Federal Home Loan Mortgage Corporation Multifamily Structured Pass Through Certificates | | | | |
| | 474,549 | | | 3.000%, 3/15/2045, Ser. 4741, Class GA | | | 463,473 | |
| | | | Federal National Mortgage Association | | | | |
| | 699,000 | | | 3.640%, 6/1/2028 | | | 688,053 | |
| | 300,000 | | | 3.710%, 7/1/2028 | | | 295,467 | |
| | | | Federal National Mortgage Association Conventional 15-yr. Pass Through | | | | |
| | 5,670,000 | | | 3.500%, 11/1/2033d | | | 5,665,238 | |
| | | | Federal National Mortgage Association Conventional 30-Yr. Pass Through | | | | |
| | 256,076 | | | 4.281%, (LIBOR 12M + 1.550%), 7/1/2043b | | | 264,018 | |
| | 26,250,000 | | | 3.500%, 11/1/2048d | | | 25,553,761 | |
| | 23,905,000 | | | 4.000%, 11/1/2048d | | | 23,904,900 | |
| | 28,675,000 | | | 4.500%, 11/1/2048d | | | 29,358,833 | |
| | 3,450,000 | | | 5.000%, 11/1/2048d | | | 3,600,129 | |
| | | | | |
| | | | Total | | | 101,567,951 | |
| | | | | |
| |
| | Technology (1.1%) | | | | |
| | | | Amphenol Corporation | | | | |
| | 66,000 | | | 2.550%, 1/30/2019 | | | 65,944 | |
| | | | Apple, Inc. | | | | |
| | 75,000 | | | 2.638%, (LIBOR 3M + 0.300%), 5/6/2020b | | | 75,298 | |
| | 110,000 | | | 3.000%, 2/9/2024 | | | 106,791 | |
| | 170,000 | | | 3.200%, 5/11/2027 | | | 161,643 | |
| | 200,000 | | | 3.000%, 6/20/2027 | | | 187,184 | |
| | 365,000 | | | 3.000%, 11/13/2027 | | | 340,773 | |
| | 215,000 | | | 4.500%, 2/23/2036 | | | 223,357 | |
| | 138,000 | | | 4.650%, 2/23/2046 | | | 142,360 | |
| | 220,000 | | | 4.250%, 2/9/2047 | | | 213,769 | |
| | 315,000 | | | 3.750%, 9/12/2047 | | | 282,536 | |
| | | | Applied Materials, Inc. | | | | |
| | 88,000 | | | 3.300%, 4/1/2027 | | | 83,040 | |
| | | | Avnet, Inc. | | | | |
| | 120,000 | | | 3.750%, 12/1/2021 | | | 119,698 | |
| | | | Baidu, Inc. | | | | |
| | 180,000 | | | 3.000%, 6/30/2020 | | | 178,373 | |
| | | | Broadcom Corporation | | | | |
| | 164,000 | | | 3.875%, 1/15/2027 | | | 150,394 | |
| | 405,000 | | | 3.500%, 1/15/2028 | | | 356,553 | |
| | | | CDK Global, Inc. | | | | |
| | 150,000 | | | 4.875%, 6/1/2027 | | | 140,437 | |
| | | | Cisco Systems, Inc. | | | | |
| | 100,000 | | | 2.821%, (LIBOR 3M + 0.500%), 3/1/2019b | | | 100,152 | |
| | | | CommScope Technologies Finance, LLC | | | | |
| | 270,000 | | | 6.000%, 6/15/2025h | | | 262,575 | |
| | | | Diamond 1 Finance Corporation | | | | |
| | 115,000 | | | 3.480%, 6/1/2019h | | | 115,143 | |
| | 325,000 | | | 4.420%, 6/15/2021h | | | 327,707 | |
| | 220,000 | | | 5.450%, 6/15/2023h | | | 227,858 | |
| | 295,000 | | | 6.020%, 6/15/2026h | | | 305,895 | |
| | | | Equinix, Inc. | | | | |
| | 210,000 | | | 5.750%, 1/1/2025 | | | 213,938 | |
| | | | Fidelity National Information Services, Inc. | | | | |
| | 91,000 | | | 3.625%, 10/15/2020 | | | 91,178 | |
| | | | Harland Clarke Holdings Corporation | | | | |
| | 280,000 | | | 8.375%, 8/15/2022h | | | 252,700 | |
| | | | Hewlett Packard Enterprise Company | | | | |
| | 260,000 | | | 3.059%, (LIBOR 3M + 0.720%), 10/5/2021b | | | 260,112 | |
| | 75,000 | | | 3.500%, 10/5/2021 | | | 74,786 | |
| | 115,000 | | | 4.400%, 10/15/2022 | | | 117,230 | |
| | | | Intel Corporation | | | | |
| | 140,000 | | | 3.700%, 7/29/2025 | | | 139,654 | |
| | 207,000 | | | 4.100%, 5/19/2046 | | | 196,991 | |
| | | | Marvell Technology Group, Ltd. | | | | |
| | 165,000 | | | 4.200%, 6/22/2023 | | | 163,129 | |
| | 220,000 | | | 4.875%, 6/22/2028 | | | 215,828 | |
| | | | Microsoft Corporation | | | | |
| | 280,000 | | | 4.750%, 11/3/2055 | | | 302,019 | |
| | 280,000 | | | 4.200%, 11/3/2035 | | | 283,898 | |
| | 625,000 | | | 3.700%, 8/8/2046 | | | 575,080 | |
| | 215,000 | | | 4.250%, 2/6/2047 | | | 216,203 | |
| | | | NetApp, Inc. | | | | |
| | 145,000 | | | 2.000%, 9/27/2019 | | | 143,556 | |
| | | | NXP BV | | | | |
| | 160,000 | | | 3.875%, 9/1/2022h | | | 154,400 | |
| | | | Oracle Corporation | | | | |
| | 184,000 | | | 2.400%, 9/15/2023 | | | 173,936 | |
| | 490,000 | | | 2.950%, 5/15/2025 | | | 464,806 | |
| | 225,000 | | | 3.850%, 7/15/2036 | | | 207,488 | |
| | | | Seagate HDD Cayman | | | | |
| | 150,000 | | | 4.750%, 1/1/2025 | | | 137,274 | |
| | | | Sensata Technologies UK Financing Company plc | | | | |
| | 240,000 | | | 6.250%, 2/15/2026h | | | 244,200 | |
| | | | Texas Instruments, Inc. | | | | |
| | 270,000 | | | 4.150%, 5/15/2048 | | | 258,928 | |
| | | | Tyco Electronics Group SA | | | | |
| | 40,000 | | | 3.450%, 8/1/2024 | | | 38,994 | |
| | 80,000 | | | 3.125%, 8/15/2027 | | | 73,338 | |
| | | | VMware, Inc. | | | | |
| | 55,000 | | | 2.950%, 8/21/2022 | | | 52,718 | |
| | | | Western Digital Corporation | | | | |
| | 295,000 | | | 4.750%, 2/15/2026 | | | 272,506 | |
| | | | | |
| | | | Total | | | 9,492,370 | |
| | | | | |
| |
| | Transportation (0.2%) | | | | |
| | | | Air Canada Pass Through Trust | | | | |
| | 50,563 | | | 3.875%, 3/15/2023h | | | 49,488 | |
| | | | American Airlines Pass Through Trust | | | | |
| | 221,872 | | | 3.375%, 5/1/2027 | | | 212,868 | |
The accompanying Notes to Financial Statements are an integral part of this schedule.
133
MODERATELY CONSERVATIVE ALLOCATION FUND
Schedule of Investments as of October 31, 2018
| | | | | | | | |
Principal
Amount | | | Long-Term Fixed Income (42.9%) | | Value | |
| | Transportation (0.2%) - continued | | | | |
| | | | Avis Budget Car Rental, LLC | | | | |
| | $190,000 | | | 6.375%, 4/1/2024h,j | | | $181,450 | |
| | | | Burlington Northern Santa Fe, LLC | | | | |
| | 130,000 | | | 5.750%, 5/1/2040 | | | 149,603 | |
| | 400,000 | | | 5.050%, 3/1/2041 | | | 422,714 | |
| | 130,000 | | | 4.450%, 3/15/2043 | | | 127,750 | |
| | | | CSX Corporation | | | | |
| | 98,000 | | | 3.700%, 11/1/2023 | | | 97,827 | |
| | | | Delta Air Lines, Inc. | | | | |
| | 95,000 | | | 2.875%, 3/13/2020 | | | 94,118 | |
| | 34,473 | | | 4.950%, 11/23/2020 | | | 34,610 | |
| | | | ERAC USA Finance, LLC | | | | |
| | 66,000 | | | 2.800%, 11/1/2018h | | | 66,000 | |
| | | | J.B. Hunt Transport Services, Inc. | | | | |
| | 60,000 | | | 3.300%, 8/15/2022 | | | 59,286 | |
| | | | United Continental Holdings, Inc. | | | | |
| | 300,000 | | | 4.250%, 10/1/2022 | | | 294,375 | |
| | | | XPO Logistics, Inc. | | | | |
| | 225,000 | | | 6.500%, 6/15/2022h | | | 230,625 | |
| | | | | |
| | | | Total | | | 2,020,714 | |
| | | | | |
| |
| | U.S. Government and Agencies (10.1%) | | | | |
| | | | Federal National Mortgage Association - ACES | | | | |
| | 1,200,000 | | | 3.639%, 8/25/2030, Ser. 2018-M12, Class A2b | | | 1,173,807 | |
| | | | U.S. Treasury Bonds | | | | |
| | 150,000 | | | 2.250%, 11/15/2027 | | | 139,576 | |
| | 6,000,000 | | | 2.875%, 5/15/2028 | | | 5,866,875 | |
| | 550,000 | | | 4.375%, 5/15/2040 | | | 637,484 | |
| | 2,000,000 | | | 3.000%, 5/15/2042 | | | 1,878,594 | |
| | 4,999,000 | | | 2.500%, 5/15/2046 | | | 4,198,965 | |
| | 1,005,000 | | | 3.000%, 5/15/2047 | | | 933,472 | |
| | 99,000 | | | 2.750%, 11/15/2047 | | | 87,279 | |
| | | | U.S. Treasury Bonds, TIPS | | | | |
| | 3,823,260 | | | 0.125%, 1/15/2023 | | | 3,679,567 | |
| | 3,914,287 | | | 0.375%, 1/15/2027 | | | 3,684,425 | |
| | 5,978,350 | | | 0.375%, 7/15/2027 | | | 5,625,954 | |
| | | | U.S. Treasury Notes | | | | |
| | 1,900,000 | | | 1.000%, 10/15/2019 | | | 1,869,645 | |
| | 5,400,000 | | | 1.500%, 10/31/2019 | | | 5,335,032 | |
| | 4,450,000 | | | 1.750%, 11/30/2019 | | | 4,403,414 | |
| | 1,170,000 | | | 2.250%, 3/31/2020 | | | 1,160,814 | |
| | 5,500,000 | | | 1.375%, 9/30/2020 | | | 5,348,320 | |
| | 130,000 | | | 1.875%, 12/15/2020 | | | 127,319 | |
| | 1,000,000 | | | 1.375%, 5/31/2021 | | | 961,953 | |
| | 9,210,000 | | | 1.125%, 8/31/2021 | | | 8,761,372 | |
| | 6,250,000 | | | 1.875%, 7/31/2022 | | | 6,010,254 | |
| | 22,765,000 | | | 2.000%, 11/30/2022 | | | 21,921,984 | |
| | 1,700,000 | | | 2.500%, 3/31/2023 | | | 1,666,863 | |
| | 1,350,000 | | | 2.125%, 7/31/2024 | | | 1,285,980 | |
| | 800,000 | | | 2.250%, 11/15/2024 | | | 765,188 | |
| | | | | |
| | | | Total | | | 87,524,136 | |
| | | | | |
| |
| | Utilities (1.3%) | | | | |
| | | | American Electric Power Company, Inc. | | | | |
| | 216,000 | | | 2.950%, 12/15/2022 | | | 210,308 | |
| | | | Appalachian Power Company | | | | |
| | 85,000 | | | 3.300%, 6/1/2027 | | | 79,931 | |
| | | | Arizona Public Service Company | | | | |
| | 80,000 | | | 2.200%, 1/15/2020 | | | 79,072 | |
| | | | Atmos Energy Corporation | | | | |
| | 85,000 | | | 3.000%, 6/15/2027 | | | 79,457 | |
| | | | Berkshire Hathaway Energy Company | | | | |
| | 55,000 | | | 2.400%, 2/1/2020 | | | 54,457 | |
| | 140,000 | | | 4.500%, 2/1/2045 | | | 135,697 | |
| | | | Calpine Corporation | | | | |
| | 150,000 | | | 5.375%, 1/15/2023 | | | 142,125 | |
| | | | CenterPoint Energy, Inc. | | | | |
| | 75,000 | | | 3.850%, 2/1/2024 | | | 74,949 | |
| | 140,000 | | | 4.250%, 11/1/2028 | | | 138,648 | |
| | | | CMS Energy Corporation | | | | |
| | 120,000 | | | 2.950%, 2/15/2027 | | | 109,288 | |
| | | | Commonwealth Edison Company | | | | |
| | 205,000 | | | 3.700%, 3/1/2045 | | | 181,429 | |
| | 65,000 | | | 4.350%, 11/15/2045 | | | 63,498 | |
| | | | Consolidated Edison, Inc. | | | | |
| | 92,000 | | | 2.000%, 5/15/2021 | | | 88,748 | |
| | 69,000 | | | 4.500%, 12/1/2045 | | | 68,792 | |
| | | | Consumers Energy Company | | | | |
| | 175,000 | | | 4.350%, 4/15/2049d | | | 173,838 | |
| | | | Dominion Energy, Inc. | | | | |
| | 180,000 | | | 2.962%, 7/1/2019 | | | 179,241 | |
| | 176,000 | | | 2.579%, 7/1/2020 | | | 173,307 | |
| | | | Dominion Gas Holdings, LLC | | | | |
| | 255,000 | | | 2.500%, 12/15/2019 | | | 253,014 | |
| | | | DTE Electric Company | | | | |
| | 115,000 | | | 3.700%, 3/15/2045 | | | 102,923 | |
| | 145,000 | | | 3.700%, 6/1/2046 | | | 128,758 | |
| | | | DTE Energy Company | | | | |
| | 30,000 | | | 2.400%, 12/1/2019 | | | 29,690 | |
| | | | Duke Energy Carolinas, LLC | | | | |
| | 315,000 | | | 3.700%, 12/1/2047 | | | 276,005 | |
| | | | Duke Energy Corporation | | | | |
| | 160,000 | | | 3.750%, 9/1/2046 | | | 135,767 | |
| | | | Duke Energy Florida, LLC | | | | |
| | 120,000 | | | 3.200%, 1/15/2027 | | | 114,061 | |
| | | | Duke Energy Indiana, LLC | | | | |
| | 185,000 | | | 3.750%, 5/15/2046 | | | 163,730 | |
| | | | Dynegy, Inc. | | | | |
| | 235,000 | | | 7.375%, 11/1/2022 | | | 243,812 | |
| | | | Edison International | | | | |
| | 180,000 | | | 2.950%, 3/15/2023 | | | 171,228 | |
| | | | Emera U.S. Finance, LP | | | | |
| | 125,000 | | | 2.150%, 6/15/2019 | | | 124,111 | |
| | | | Energy Transfer Operating, LP | | | | |
| | 280,000 | | | 5.200%, 2/1/2022 | | | 289,466 | |
| | | | Eversource Energy | | | | |
| | 200,000 | | | 2.500%, 3/15/2021 | | | 196,234 | |
| | | | Exelon Corporation | | | | |
| | 100,000 | | | 5.100%, 6/15/2045 | | | 102,675 | |
| | 138,000 | | | 4.450%, 4/15/2046 | | | 129,798 | |
| | | | Exelon Generation Company, LLC | | | | |
| | 189,000 | | | 5.200%, 10/1/2019 | | | 192,357 | |
| | 165,000 | | | 2.950%, 1/15/2020 | | | 163,952 | |
| | | | FirstEnergy Corporation | | | | |
| | 50,000 | | | 2.850%, 7/15/2022 | | | 48,191 | |
| | 320,000 | | | 4.850%, 7/15/2047 | | | 312,073 | |
| | | | ITC Holdings Corporation | | | | |
| | 66,000 | | | 4.050%, 7/1/2023 | | | 65,630 | |
| | 80,000 | | | 5.300%, 7/1/2043 | | | 86,484 | |
The accompanying Notes to Financial Statements are an integral part of this schedule.
134
MODERATELY CONSERVATIVE ALLOCATION FUND
Schedule of Investments as of October 31, 2018
| | | | | | | | |
Principal
Amount | | | Long-Term Fixed Income (42.9%) | | Value | |
| | Utilities (1.3%) - continued | | | | |
| | | | MidAmerican Energy Holdings Company | | | | |
| | $276,000 | | | 6.500%, 9/15/2037 | | | $333,026 | |
| | | | Mississippi Power Company | | | | |
| | 165,000 | | | 3.031%, (LIBOR 3M + 0.650%), 3/27/2020b | | | 165,017 | |
| | 165,000 | | | 3.950%, 3/30/2028 | | | 159,911 | |
| | | | Monongahela Power Company | | | | |
| | 150,000 | | | 5.400%, 12/15/2043h | | | 169,036 | |
| | | | National Rural Utilities Cooperative Finance Corporation | | | | |
| | 175,000 | | | 2.300%, 11/1/2020 | | | 171,332 | |
| | 90,000 | | | 3.900%, 11/1/2028 | | | 89,623 | |
| | | | NextEra Energy Capital Holdings, Inc. | | | | |
| | 115,000 | | | 2.300%, 4/1/2019 | | | 114,749 | |
| | | | NextEra Energy Partners, LP | | | | |
| | 295,000 | | | 4.250%, 9/15/2024h | | | 280,250 | |
| | | | NiSource Finance Corporation | | | | |
| | 88,000 | | | 3.490%, 5/15/2027 | | | 82,628 | |
| | 255,000 | | | 5.650%, 2/1/2045 | | | 275,404 | |
| | | | Oncor Electric Delivery Company, LLC | | | | |
| | 352,000 | | | 3.750%, 4/1/2045 | | | 319,274 | |
| | | | Pacific Gas and Electric Company | | | | |
| | 215,000 | | | 3.300%, 3/15/2027 | | | 193,191 | |
| | 175,000 | | | 3.300%, 12/1/2027 | | | 155,844 | |
| | 175,000 | | | 3.950%, 12/1/2047 | | | 141,258 | |
| | | | PPL Capital Funding, Inc. | | | | |
| | 78,000 | | | 3.500%, 12/1/2022 | | | 77,008 | |
| | 88,000 | | | 3.400%, 6/1/2023 | | | 86,250 | |
| | 225,000 | | | 5.000%, 3/15/2044 | | | 226,418 | |
| | | | PPL Electric Utilities Corporation | | | | |
| | 132,000 | | | 3.950%, 6/1/2047 | | | 122,317 | |
| | | | Public Service Electric & Gas Company | | | | |
| | 220,000 | | | 3.000%, 5/15/2027 | | | 206,800 | |
| | | | San Diego Gas and Electric Company | | | | |
| | 270,000 | | | 4.150%, 5/15/2048 | | | 254,820 | |
| | | | Sempra Energy | | | | |
| | 75,000 | | | 2.400%, 3/15/2020 | | | 74,023 | |
| | | | South Carolina Electric & Gas Company | | | | |
| | 350,000 | | | 5.100%, 6/1/2065 | | | 336,425 | |
| | | | Southern California Edison Company | | | | |
| | 175,000 | | | 4.000%, 4/1/2047 | | | 159,521 | |
| | 175,000 | | | 4.125%, 3/1/2048 | | | 162,236 | |
| | | | Southern Company | | | | |
| | 170,000 | | | 2.950%, 7/1/2023 | | | 162,331 | |
| | 215,000 | | | 3.250%, 7/1/2026 | | | 199,380 | |
| | 185,000 | | | 4.400%, 7/1/2046 | | | 169,662 | |
| | | | Southern Company Gas Capital Corporation | | | | |
| | 220,000 | | | 4.400%, 5/30/2047 | | | 201,716 | |
| | | | Southwestern Electric Power Company | | | | |
| | 65,000 | | | 3.900%, 4/1/2045 | | | 57,070 | |
| | | | TerraForm Power Operating, LLC | | | | |
| | 300,000 | | | 5.000%, 1/31/2028h | | | 268,125 | |
| | | | | |
| | | | Total | | | 10,777,389 | |
| | | | | |
| | | | | | | | |
| | | | | |
| | | | Total Long-Term Fixed Income (cost $381,263,892) | | | 372,409,649 | |
| | | | | |
| | |
| Shares | | | Registered Investment Companies (38.3%) | | Value | |
| | Affiliated Equity Holdings (20.4%) | | | | |
| | 901,262 | | | Thrivent Core International Equity Fund | | | 8,363,712 | |
| | 1,506,620 | | | Thrivent Core Low Volatility Equity Fundn | | | 15,879,780 | |
| | 2,500,175 | | | Thrivent Large Cap Growth Fund, Class S | | | 31,177,183 | |
| | 47,463 | | | Thrivent Large Cap Stock Fund, Class S | | | 1,275,816 | |
| | 2,752,709 | | | Thrivent Large Cap Value Fund, Class S | | | 63,037,043 | |
| | 606,458 | | | Thrivent Mid Cap Stock Fund, Class S | | | 17,017,212 | |
| | 3,627,422 | | | Thrivent Partner Worldwide Allocation Fund, Class S | | | 35,802,660 | |
| | 171,214 | | | Thrivent Small Cap Stock Fund, Class S | | | 4,511,488 | |
| | | | | |
| | | | Total | | | 177,064,894 | |
| | | | | |
| |
| | Affiliated Fixed Income Holdings (17.1%) | | | | |
| | 2,423,815 | | | Thrivent Core Emerging Markets Debt Fund | | | 21,911,292 | |
| | 4,748,326 | | | Thrivent High Yield Fund, Class S | | | 22,032,233 | |
| | 7,626,300 | | | Thrivent Income Fund, Class S | | | 66,348,810 | |
| | 3,110,740 | | | Thrivent Limited Maturity Bond Fund, Class S | | | 38,262,097 | |
| | | | | |
| | | | Total | | | 148,554,432 | |
| | | | | |
| |
| | Equity Funds/Exchange Traded Funds (0.5%) | | | | |
| | 2,016 | | | iShares Russell 1000 Growth Index Fund | | | 286,433 | |
| | 1,393 | | | iShares Russell 2000 Growth Index Fundj | | | 261,731 | |
| | 489 | | | iShares Russell 2000 Value Index Fund | | | 59,242 | |
| | 6,977 | | | ProShares Ultra S&P 500 | | | 765,028 | |
| | 445 | | | ProShares UltraPro S&P 500 | | | 20,190 | |
| | 11,372 | | | SPDR S&P 500 ETF Trust | | | 3,077,604 | |
| | 2,276 | | | SPDR S&P Biotech ETFj | | | 180,054 | |
| | 1,926 | | | SPDR S&P Retail ETFj | | | 90,792 | |
| | 1,396 | | | Vanguard REIT ETF | | | 109,335 | |
| | | | | |
| | | | Total | | | 4,850,409 | |
| | | | | |
| |
| | Fixed Income Funds/Exchange Traded Funds (0.3%) | | | | |
| | 37,500 | | | Invesco Senior Loan ETF | | | 862,875 | |
| | 32,000 | | | iShares Short-Term Corporate Bond ETF | | | 1,652,480 | |
| | | | | |
| | | | Total | | | 2,515,355 | |
| | | | | |
| | | | | | | | |
| | | | | |
| | | | Total Registered Investment Companies (cost $272,961,090) | | | 332,985,090 | |
| | | | | |
| | |
| Shares | | | Common Stock (13.1%) | | Value | |
| | Communications Services (0.6%) | | | | |
| | 870 | | | Alphabet, Inc., Class An | | | 948,805 | |
| | 505 | | | Alphabet, Inc., Class Cn | | | 543,769 | |
| | 9,834 | | | AT&T, Inc. | | | 301,707 | |
| | 1,866 | | | CBS Corporation | | | 107,015 | |
| | 9,380 | | | Comcast Corporation | | | 357,753 | |
| | 2,628 | | | DISH Network Corporationn | | | 80,785 | |
| | 4,829 | | | Facebook, Inc.n | | | 732,994 | |
| | 400 | | | Hemisphere Media Group, Inc.n | | | 5,388 | |
| | 1,030 | | | IAC/InterActiveCorporationn | | | 202,488 | |
| | 4,517 | | | Liberty Media Corporation - Liberty SiriusXMn | | | 186,416 | |
The accompanying Notes to Financial Statements are an integral part of this schedule.
135
MODERATELY CONSERVATIVE ALLOCATION FUND
Schedule of Investments as of October 31, 2018
| | | | | | | | |
| Shares | | | Common Stock (13.1%) | | Value | |
| | Communications Services (0.6%) - continued | | | | |
| | 950 | | | Liberty SiriusXM Groupn | | | $39,178 | |
| | 2,741 | | | Liberty Tripadvisor Holdings, Inc.n | | | 39,525 | |
| | 187 | | | Lions Gate Entertainment Corporation | | | 3,327 | |
| | 935 | | | Netflix, Inc.n | | | 282,164 | |
| | 13,760 | | | News Corporation, Class A | | | 181,494 | |
| | 5,808 | | | News Corporation, Class B | | | 77,479 | |
| | 5,227 | | | ORBCOMM, Inc.n | | | 49,813 | |
| | 3,425 | | | Twitter, Inc.n | | | 119,019 | |
| | 10,233 | | | Verizon Communications, Inc. | | | 584,202 | |
| | | | | |
| | | | Total | | | 4,843,321 | |
| | | | | |
| |
| | Consumer Discretionary (1.2%) | | | | |
| | 967 | | | Amazon.com, Inc.n | | | 1,545,276 | |
| | 3,325 | | | American Axle & Manufacturing Holdings, Inc.n | | | 50,440 | |
| | 998 | | | Aptiv plc | | | 76,646 | |
| | 710 | | | Ascent Capital Group, Inc.n | | | 682 | |
| | 163 | | | Booking Holdings, Inc.n | | | 305,557 | |
| | 3,750 | | | BorgWarner, Inc. | | | 147,787 | |
| | 3,399 | | | Bright Horizons Family Solutions, Inc.n | | | 390,579 | |
| | 1,959 | | | Burlington Stores, Inc.n | | | 335,949 | |
| | 811 | | | Century Casinos, Inc.n | | | 5,061 | |
| | 8,497 | | | Chico’s FAS, Inc. | | | 65,172 | |
| | 2,533 | | | Children’s Place, Inc. | | | 378,430 | |
| | 340 | | | Chipotle Mexican Grill, Inc.n | | | 156,512 | |
| | 6,293 | | | Core-Mark Holding Company, Inc. | | | 241,714 | |
| | 8,628 | | | Crocs, Inc.n | | | 177,219 | |
| | 1,725 | | | CSS Industries, Inc. | | | 22,666 | |
| | 1,578 | | | Culp, Inc. | | | 36,531 | |
| | 4,530 | | | Dollar Tree, Inc.n | | | 381,879 | |
| | 2,574 | | | Duluth Holdings, Inc.j,n | | | 79,099 | |
| | 741 | | | Emerald Expositions Events, Inc. | | | 10,833 | |
| | 1,807 | | | Expedia Group, Inc. | | | 226,652 | |
| | 11,120 | | | Extended Stay America, Inc. | | | 181,034 | |
| | 1,007 | | | Five Below, Inc.n | | | 114,617 | |
| | 31 | | | Genuine Parts Company | | | 3,036 | |
| | 2,434 | | | G-III Apparel Group, Ltd.n | | | 97,019 | |
| | 1,771 | | | Habit Restaurants, Inc.n | | | 22,492 | |
| | 5,089 | | | Harley-Davidson, Inc. | | | 194,502 | |
| | 572 | | | Haverty Furniture Companies, Inc. | | | 11,600 | |
| | 3,450 | | | Home Depot, Inc. | | | 606,786 | |
| | 2,339 | | | International Speedway Corporation | | | 87,736 | |
| | 2,872 | | | Las Vegas Sands Corporation | | | 146,558 | |
| | 398 | | | Laureate Education, Inc.n | | | 5,926 | |
| | 284 | | | Liberty Latin America, Ltd.n | | | 5,106 | |
| | 2,875 | | | LKQ Corporationn | | | 78,401 | |
| | 4,880 | | | Lowe’s Companies, Inc. | | | 464,674 | |
| | 425 | | | Lululemon Athletica, Inc.n | | | 59,810 | |
| | 1,411 | | | McDonald’s Corporation | | | 249,606 | |
| | 4,555 | | | Michaels Companies, Inc.n | | | 72,197 | |
| | 3,535 | | | Modine Manufacturing Companyn | | | 45,990 | |
| | 5,437 | | | NIKE, Inc. | | | 407,992 | |
| | 5,280 | | | Norwegian Cruise Line Holdings, Ltd.n | | | 232,690 | |
| | 6,774 | | | Nutrisystem, Inc. | | | 240,883 | |
| | 320 | | | O’Reilly Automotive, Inc.n | | | 102,640 | |
| | 1,600 | | | Oxford Industries, Inc. | | | 142,368 | |
| | 3,535 | | | Planet Fitness, Inc.n | | | 173,533 | |
| | 408 | | | Playa Hotels and Resorts NVn | | | 3,505 | |
| | 1,630 | | | Polaris Industries, Inc. | | | 145,037 | |
| | 1,209 | | | PVH Corporation | | | 146,035 | |
| | 550 | | | RHj,n | | | 63,640 | |
| | 2,760 | | | Ross Stores, Inc. | | | 273,240 | |
| | 3,298 | | | Six Flags Entertainment Corporation | | | 177,630 | |
| | 539 | | | Stamps.com, Inc.n | | | 108,970 | |
| | 1,660 | | | Tapestry, Inc. | | | 70,235 | |
| | 6,410 | | | Toll Brothers, Inc. | | | 215,761 | |
| | 4,653 | | | Tower International, Inc. | | | 138,148 | |
| | 750 | | | Ulta Beauty, Inc.n | | | 205,890 | |
| | 790 | | | Vail Resorts, Inc. | | | 198,543 | |
| | 730 | | | VF Corporation | | | 60,502 | |
| | 945 | | | Wingstop, Inc. | | | 59,176 | |
| | 2,360 | | | Zumiez, Inc.n | | | 54,894 | |
| | | | | |
| | | | Total | | | 10,303,086 | |
| | | | | |
| |
| | Consumer Staples (0.4%) | | | | |
| | 2,638 | | | Altria Group, Inc. | | | 171,576 | |
| | 5,272 | | | Archer-Daniels-Midland Company | | | 249,102 | |
| | 1,934 | | | Casey’s General Stores, Inc. | | | 243,897 | |
| | 12,181 | | | Cott Corporation | | | 183,202 | |
| | 3,900 | | | CVS Health Corporation | | | 282,321 | |
| | 368 | | | e.l.f. Beauty, Inc.n | | | 3,904 | |
| | 10,870 | | | Hain Celestial Group, Inc.n | | | 270,446 | |
| | 874 | | | Inter Parfums, Inc. | | | 51,557 | |
| | 1,287 | | | John B. Sanfilippo & Son, Inc. | | | 81,158 | |
| | 880 | | | Kimberly-Clark Corporation | | | 91,784 | |
| | 4,592 | | | Kroger Company | | | 136,658 | |
| | 245 | | | MGP Ingredients, Inc. | | | 17,437 | |
| | 2,032 | | | Molson Coors Brewing Company | | | 130,048 | |
| | 2,220 | | | Monster Beverage Corporationn | | | 117,327 | |
| | 7,450 | | | PepsiCo, Inc. | | | 837,231 | |
| | 442 | | | Seneca Foods Corporationn | | | 13,980 | |
| | 1,336 | | | SpartanNash Company | | | 23,848 | |
| | 9,708 | | | SunOpta, Inc.n | | | 72,033 | |
| | 3,337 | | | Turning Point Brands, Inc. | | | 137,151 | |
| | 2,257 | | | Wal-Mart Stores, Inc. | | | 226,332 | |
| | | | | |
| | | | Total | | | 3,340,992 | |
| | | | | |
| |
| | Energy (0.6%) | | | | |
| | 4,412 | | | Abraxas Petroleum Corporationn | | | 8,118 | |
| | 4,498 | | | Anadarko Petroleum Corporation | | | 239,294 | |
| | 22,983 | | | Archrock, Inc. | | | 235,806 | |
| | 568 | | | California Resources Corporationn | | | 17,801 | |
| | 17,233 | | | Callon Petroleum Companyn | | | 171,813 | |
| | 4,305 | | | Chevron Corporation | | | 480,653 | |
| | 1,912 | | | Comstock Resources, Inc.n | | | 13,862 | |
| | 966 | | | Concho Resources, Inc.n | | | 134,361 | |
| | 931 | | | Contura Energy, Inc.j,n | | | 67,916 | |
| | 5,019 | | | Denbury Resources, Inc.n | | | 17,316 | |
| | 1,240 | | | Diamondback Energy, Inc. | | | 139,326 | |
| | 1,813 | | | EQT Corporation | | | 61,588 | |
| | 1,420 | | | Era Group, Inc.n | | | 16,074 | |
| | 359 | | | Evolution Petroleum Corporation | | | 3,698 | |
| | 3,124 | | | Exterran Corporationn | | | 65,260 | |
| | 8,663 | | | Exxon Mobil Corporation | | | 690,268 | |
| | 7,927 | | | Forum Energy Technologies, Inc.n | | | 71,026 | |
| | 30,356 | | | Gran Tierra Energy, Inc.n | | | 92,586 | |
| | 4,150 | | | Halliburton Company | | | 143,922 | |
| | 5,085 | | | Helix Energy Solutions Group, Inc.n | | | 43,324 | |
| | 402 | | | Keane Group, Inc.n | | | 5,053 | |
| | 20,840 | | | Marathon Oil Corporation | | | 395,752 | |
| | 2,173 | | | Marathon Petroleum Corporation | | | 153,088 | |
| | 1,797 | | | Nabors Industries, Ltd. | | | 8,931 | |
| | 3,127 | | | Newpark Resources, Inc.n | | | 25,673 | |
| | 5,544 | | | Nine Energy Service, Inc.n | | | 205,294 | |
| | 5,403 | | | Northern Oil and Gas, Inc.n | | | 15,885 | |
| | 1,939 | | | ONEOK, Inc. | | | 127,198 | |
| | 4,236 | | | Pacific Drilling, Inc. Rightse,n | | | 44,111 | |
| | 1,720 | | | Parsley Energy, Inc.n | | | 40,282 | |
The accompanying Notes to Financial Statements are an integral part of this schedule.
136
MODERATELY CONSERVATIVE ALLOCATION FUND
Schedule of Investments as of October 31, 2018
| | | | | | | | |
| Shares | | | Common Stock (13.1%) | | Value | |
| | Energy (0.6%) - continued | | | | |
| | 14,762 | | | Patterson-UTI Energy, Inc. | | | $245,640 | |
| | 1,199 | | | Phillips 66 | | | 123,281 | |
| | 2,385 | | | Pioneer Energy Services Corporationn | | | 7,083 | |
| | 1,574 | | | Pioneer Natural Resources Company | | | 231,803 | |
| | 3,350 | | | SM Energy Company | | | 81,539 | |
| | 3,534 | | | Talos Energy, Inc.n | | | 92,096 | |
| | 7,750 | | | TechnipFMC plc | | | 203,825 | |
| | 4,183 | | | Teekay Tankers, Ltd. | | | 4,643 | |
| | 19,570 | | | Transocean, Ltd.j,n | | | 215,466 | |
| | 6,469 | | | Unit Corporationn | | | 149,628 | |
| | 23,330 | | | Weatherford International plcj,n | | | 31,495 | |
| | 4,000 | | | WPX Energy, Inc.n | | | 64,160 | |
| | | | | |
| | | | Total | | | 5,185,938 | |
| | | | | |
| |
| | Financials (2.5%) | | | | |
| | 1,050 | | | Affiliated Managers Group, Inc. | | | 119,343 | |
| | 3,380 | | | Aflac, Inc. | | | 145,577 | |
| | 534 | | | AG Mortgage Investment Trust, Inc. | | | 9,238 | |
| | 182 | | | Aircastle, Ltd. | | | 3,536 | |
| | 5,048 | | | Allstate Corporation | | | 483,195 | |
| | 2,800 | | | Ally Financial, Inc. | | | 71,148 | |
| | 2,115 | | | American Express Company | | | 217,274 | |
| | 7,804 | | | American Financial Group, Inc. | | | 780,634 | |
| | 1,870 | | | American International Group, Inc. | | | 77,212 | |
| | 775 | | | Ameris Bancorp | | | 33,240 | |
| | 2,615 | | | Arch Capital Group, Ltd.n | | | 74,187 | |
| | 2,142 | | | Argo Group International Holdings, Ltd. | | | 131,969 | |
| | 2,160 | | | Arthur J. Gallagher & Company | | | 159,862 | |
| | 7,840 | | | Assured Guaranty, Ltd. | | | 313,443 | |
| | 981 | | | Axos Financial, Inc.n | | | 29,783 | |
| | 67 | | | BancFirst Corporation | | | 3,844 | |
| | 4,375 | | | BancorpSouth Bank | | | 125,562 | |
| | 30,401 | | | Bank of America Corporation | | | 836,027 | |
| | 251 | | | Bank of Marin Bancorp | | | 21,332 | |
| | 204 | | | Bank of New York Mellon Corporation | | | 9,655 | |
| | 1,575 | | | BankFinancial Corporation | | | 22,239 | |
| | 2,281 | | | Berkshire Hathaway, Inc.n | | | 468,244 | |
| | 512 | | | BGC Partners, Inc. | | | 5,422 | |
| | 4,620 | | | Blackstone Group, LP | | | 149,503 | |
| | 893 | | | BOK Financial Corporation | | | 76,557 | |
| | 7,005 | | | Boston Private Financial Holdings, Inc. | | | 94,567 | |
| | 20,364 | | | BrightSphere Investment Group | | | 232,150 | |
| | 8,530 | | | Brown & Brown, Inc. | | | 240,375 | |
| | 6,171 | | | Capital One Financial Corporation | | | 551,070 | |
| | 5,374 | | | Cathay General Bancorp | | | 202,439 | |
| | 6,368 | | | Central Pacific Financial Corporation | | | 172,191 | |
| | 832 | | | Cherry Hill Mortgage Investment Corporation | | | 14,901 | |
| | 1,130 | | | Chubb, Ltd. | | | 141,148 | |
| | 1,595 | | | Cincinnati Financial Corporation | | | 125,431 | |
| | 20,131 | | | Citigroup, Inc. | | | 1,317,775 | |
| | 2,016 | | | Comerica, Inc. | | | 164,425 | |
| | 3,155 | | | Community Trust Bancorp, Inc. | | | 143,584 | |
| | 1,220 | | | Descartes Systems Group, Inc.n | | | 37,320 | |
| | 6,940 | | | Discover Financial Services | | | 483,510 | |
| | 12,119 | | | Dynex Capital, Inc. | | | 70,169 | |
| | 8,245 | | | E*TRADE Financial Corporation | | | 407,468 | |
| | 6,240 | | | East West Bancorp, Inc. | | | 327,226 | |
| | 1,386 | | | Ellington Residential Mortgage REIT | | | 14,636 | |
| | 3,151 | | | Employers Holdings, Inc. | | | 144,820 | |
| | 5,891 | | | Enterprise Financial Services Corporation | | | 255,964 | |
| | 1,446 | | | Essent Group, Ltd.n | | | 57,001 | |
| | 614 | | | FBL Financial Group, Inc. | | | 42,354 | |
| | 10,183 | | | Fifth Third Bancorp | | | 274,839 | |
| | 1,949 | | | Financial Institutions, Inc. | | | 55,644 | |
| | 3,618 | | | First American Financial Corporation | | | 160,386 | |
| | 3,211 | | | First Busey Corporation | | | 89,651 | |
| | 3,330 | | | First Commonwealth Financial Corporation | | | 44,955 | |
| | 4,387 | | | First Defiance Financial Corporation | | | 119,414 | |
| | 903 | | | First Financial Corporation | | | 41,412 | |
| | 25,427 | | | First Hawaiian, Inc. | | | 630,081 | |
| | 4,744 | | | First Interstate BancSystem, Inc. | | | 196,686 | |
| | 217 | | | First Merchants Corporation | | | 9,029 | |
| | 164 | | | First Mid-Illinois Bancshares, Inc. | | | 6,114 | |
| | 1,070 | | | First Midwest Bancorp, Inc. | | | 24,567 | |
| | 459 | | | First of Long Island Corporation | | | 9,276 | |
| | 825 | | | First Republic Bank | | | 75,067 | |
| | 2,168 | | | Goldman Sachs Group, Inc. | | | 488,602 | |
| | 3,357 | | | Great Southern Bancorp, Inc. | | | 181,781 | |
| | 4,145 | | | Hamilton Lane, Inc. | | | 159,085 | |
| | 3,831 | | | Hancock Whitney Corporation | | | 160,749 | |
| | 582 | | | Hanmi Financial Corporation | | | 12,210 | |
| | 578 | | | Hanover Insurance Group, Inc. | | | 64,378 | |
| | 11,022 | | | Hartford Financial Services Group, Inc. | | | 500,619 | |
| | 198 | | | Heartland Financial USA, Inc. | | | 10,522 | |
| | 12,858 | | | Heritage Commerce Corporation | | | 186,570 | |
| | 2,531 | | | Hometrust Bancshares, Inc.n | | | 68,995 | |
| | 2,145 | | | Horace Mann Educators Corporation | | | 84,256 | |
| | 3,052 | | | Horizon Bancorp, Inc. | | | 51,151 | |
| | 2,200 | | | Houlihan Lokey, Inc. | | | 90,596 | |
| | 20,654 | | | Huntington Bancshares, Inc. | | | 295,972 | |
| | 1,980 | | | IBERIABANK Corporation | | | 147,490 | |
| | 3,205 | | | Independent Bank Corporation | | | 70,927 | |
| | 433 | | | Interactive Brokers Group, Inc. | | | 21,394 | |
| | 7,182 | | | Intercontinental Exchange, Inc. | | | 553,301 | |
| | 546 | | | Invesco, Ltd. | | | 11,854 | |
| | 9,198 | | | Investment Technology Group, Inc. | | | 252,761 | |
| | 2,439 | | | J.P. Morgan Chase & Company | | | 265,900 | |
| | 9,210 | | | Jefferies Financial Group, Inc. | | | 197,739 | |
| | 2,107 | | | Kemper Corporation | | | 158,425 | |
| | 41,579 | | | KeyCorp | | | 755,075 | |
| | 898 | | | Ladder Capital Corporation | | | 15,122 | |
| | 1,403 | | | Lakeland Bancorp, Inc. | | | 23,107 | |
| | 8,412 | | | Loews Corporation | | | 391,663 | |
| | 90 | | | Markel Corporationn | | | 98,392 | |
| | 329 | | | MarketAxess Holdings, Inc. | | | 68,981 | |
| | 382 | | | Mercantile Bank Corporation | | | 12,132 | |
| | 13,147 | | | Meridian Bancorp, Inc. | | | 208,248 | |
| | 2,980 | | | MetLife, Inc. | | | 122,746 | |
| | 4,453 | | | MidWestOne Financial Group, Inc. | | | 128,291 | |
| | 3,285 | | | Morgan Stanley | | | 149,993 | |
| | 914 | | | National Bank Holdings Corporation | | | 30,857 | |
| | 20 | | | National Western Life Group, Inc. | | | 5,386 | |
| | 179 | | | NBT Bancorp, Inc. | | | 6,532 | |
| | 1,400 | | | Old Second Bancorp, Inc. | | | 19,908 | |
| | 934 | | | PacWest Bancorp | | | 37,939 | |
| | 51 | | | Park National Corporation | | | 4,661 | |
| | 6,324 | | | PCSB Financial Corporation | | | 118,385 | |
| | 837 | | | Peapack-Gladstone Financial Corporation | | | 22,591 | |
| | 390 | | | Peoples Bancorp, Inc. | | | 13,350 | |
| | 1,474 | | | Primerica, Inc. | | | 161,757 | |
| | 270 | | | Principal Financial Group, Inc. | | | 12,709 | |
| | 11,063 | | | Provident Financial Services, Inc. | | | 269,937 | |
| | 950 | | | Prudential Financial, Inc. | | | 89,091 | |
| | 2,081 | | | QCR Holdings, Inc. | | | 75,811 | |
| | 2,950 | | | Radian Group, Inc. | | | 56,610 | |
The accompanying Notes to Financial Statements are an integral part of this schedule.
137
MODERATELY CONSERVATIVE ALLOCATION FUND
Schedule of Investments as of October 31, 2018
| | | | | | | | |
| Shares | | | Common Stock (13.1%) | | Value | |
| | Financials (2.5%) - continued | | | | |
| | 495 | | | Raymond James Financial, Inc. | | | $37,962 | |
| | 5,121 | | | Sandy Spring Bancorp, Inc. | | | 182,052 | |
| | 6,917 | | | Santander Consumer USA Holdings Inc. | | | 129,694 | |
| | 6,447 | | | Seacoast Banking Corporation of Floridan | | | 169,621 | |
| | 8,026 | | | SLM Corporationn | | | 81,384 | |
| | 1,974 | | | State Auto Financial Corporation | | | 62,753 | |
| | 1,832 | | | State Street Corporation | | | 125,950 | |
| | 2,470 | | | Stifel Financial Corporation | | | 112,928 | |
| | 1,195 | | | SVB Financial Groupn | | | 283,490 | |
| | 10,394 | | | Synovus Financial Corporation | | | 390,399 | |
| | 600 | | | Territorial Bancorp, Inc. | | | 16,344 | |
| | 1,747 | | | TriCo Bancshares | | | 62,927 | |
| | 13,059 | | | TrustCo Bank Corporation | | | 97,812 | |
| | 2,900 | | | U.S. Bancorp | | | 151,583 | |
| | 2,749 | | | United Community Banks, Inc. | | | 68,368 | |
| | 5,018 | | | United Financial Bancorp, Inc. | | | 77,528 | |
| | 302 | | | United Fire Group, Inc. | | | 16,257 | |
| | 131 | | | Univest Corporation of Pennsylvania | | | 3,270 | |
| | 2,107 | | | Unum Group | | | 76,400 | |
| | 1,106 | | | Washington Trust Bancorp, Inc. | | | 56,793 | |
| | 4,272 | | | Wells Fargo & Company | | | 227,399 | |
| | 425 | | | Western Alliance Bancorpn | | | 20,502 | |
| | 3,512 | | | Wintrust Financial Corporation | | | 267,404 | |
| | 5,808 | | | WSFS Financial Corporation | | | 247,014 | |
| | 9,980 | | | Zions Bancorporations NA | | | 469,559 | |
| | | | | |
| | | | Total | | | 21,715,615 | |
| | | | | |
| |
| | Health Care (1.8%) | | | | |
| | 82 | | | ABIOMED, Inc.n | | | 27,978 | |
| | 846 | | | Aerie Pharmaceuticals, Inc.n | | | 44,990 | |
| | 900 | | | Aetna, Inc. | | | 178,560 | |
| | 1,831 | | | AmerisourceBergen Corporation | | | 161,128 | |
| | 3,138 | | | Amgen, Inc. | | | 604,975 | |
| | 1,103 | | | Ardelyx, Inc.n | | | 3,033 | |
| | 443 | | | Arena Pharmaceuticals, Inc.n | | | 15,797 | |
| | 3,989 | | | Asterias Biotherapeutics, Inc.n | | | 4,508 | |
| | 70 | | | Atrion Corporation | | | 47,753 | |
| | 4,011 | | | Baxter International, Inc. | | | 250,728 | |
| | 899 | | | Becton, Dickinson and Company | | | 207,220 | |
| | 1,227 | | | Biogen, Inc.n | | | 373,339 | |
| | 4,683 | | | BioMarin Pharmaceutical, Inc.n | | | 431,632 | |
| | 270 | | | Bio-Techne Corporation | | | 45,284 | |
| | 394 | | | Bruker Corporation | | | 12,344 | |
| | 1,011 | | | Cardinal Health, Inc. | | | 51,157 | |
| | 1,122 | | | Cardiovascular Systems, Inc.n | | | 31,472 | |
| | 5,129 | | | Catalent, Inc.n | | | 206,904 | |
| | 1,221 | | | Charles River Laboratories International, Inc.n | | | 148,742 | |
| | 809 | | | Concert Pharmaceuticals, Inc.n | | | 12,070 | |
| | 4,625 | | | Danaher Corporation | | | 459,725 | |
| | 2,280 | | | Dexcom, Inc.n | | | 302,716 | |
| | 1,843 | | | Edwards Lifesciences Corporationn | | | 272,027 | |
| | 1,396 | | | Epizyme, Inc.n | | | 11,238 | |
| | 1,584 | | | Evolent Health, Inc.n | | | 35,165 | |
| | 2,192 | | | Express Scripts Holding Companyn | | | 212,558 | |
| | 3,918 | | | GenMark Diagnostics, Inc.n | | | 20,883 | |
| | 227 | | | Genomic Health, Inc.n | | | 16,278 | |
| | 3,560 | | | Gilead Sciences, Inc. | | | 242,721 | |
| | 3,100 | | | GlaxoSmithKline plc ADR | | | 121,086 | |
| | 8,373 | | | Halozyme Therapeutics, Inc.n | | | 130,033 | |
| | 589 | | | Heska Corporationn | | | 59,030 | |
| | 2,046 | | | Hill-Rom Holdings, Inc. | | | 172,028 | |
| | 439 | | | Illumina, Inc.n | | | 136,595 | |
| | 931 | | | Immunomedics, Inc.n | | | 20,975 | |
| | 425 | | | Inogen, Inc.n | | | 80,567 | |
| | 1,289 | | | Intersect ENT, Inc.n | | | 36,169 | |
| | 355 | | | Intra-Cellular Therapies, Inc.n | | | 6,028 | |
| | 404 | | | Intuitive Surgical, Inc.n | | | 210,557 | |
| | 1,280 | | | Jazz Pharmaceuticals, Inc.n | | | 203,290 | |
| | 6,818 | | | Johnson & Johnson | | | 954,452 | |
| | 2,984 | | | LHC Group, Inc.n | | | 272,827 | |
| | 929 | | | Magellan Health Services, Inc.n | | | 60,441 | |
| | 992 | | | Medpace Holdings, Inc.n | | | 51,683 | |
| | 9,617 | | | Medtronic plc | | | 863,799 | |
| | 6,520 | | | Merck & Company, Inc. | | | 479,937 | |
| | 1,033 | | | Merit Medical Systems, Inc.n | | | 59,005 | |
| | 4,150 | | | Mylan NVn | | | 129,688 | |
| | 4,479 | | | Myriad Genetics, Inc.n | | | 201,689 | |
| | 1,600 | | | Natera, Inc.n | | | 35,136 | |
| | 1,199 | | | National Healthcare Corporation | | | 95,356 | |
| | 1,676 | | | Neurocrine Biosciences, Inc.n | | | 179,583 | |
| | 1,298 | | | Nevro Corporationn | | | 63,290 | |
| | 1,085 | | | Novocure, Ltd.n | | | 35,957 | |
| | 3,299 | | | NuVasive, Inc.n | | | 185,305 | |
| | 3,569 | | | Omnicell, Inc.n | | | 252,328 | |
| | 8,529 | | | Optinose, Inc.j,n | | | 90,237 | |
| | 1,647 | | | PerkinElmer, Inc. | | | 142,433 | |
| | 1,760 | | | Perrigo Company plc | | | 123,728 | |
| | 23,160 | | | Pfizer, Inc. | | | 997,270 | |
| | 689 | | | Ra Medical Systems, Inc.n | | | 7,372 | |
| | 507 | | | Sage Therapeutics, Inc.n | | | 65,241 | |
| | 3,537 | | | Syneos Health, Inc.n | | | 161,393 | |
| | 2,700 | | | Tactile Systems Technology, Inc.n | | | 176,796 | |
| | 1,744 | | | Teleflex, Inc. | | | 419,851 | |
| | 3,236 | | | Thermo Fisher Scientific, Inc. | | | 756,091 | |
| | 5,519 | | | UnitedHealth Group, Inc. | | | 1,442,391 | |
| | 2,540 | | | Universal Health Services, Inc. | | | 308,762 | |
| | 2,375 | | | Valeant Pharmaceuticals International, Inc.n | | | 54,340 | |
| | 2,382 | | | Veeva Systems, Inc.n | | | 217,596 | |
| | 2,598 | | | Vertex Pharmaceuticals, Inc.n | | | 440,257 | |
| | 733 | | | West Pharmaceutical Services, Inc. | | | 77,639 | |
| | 7,630 | | | Wright Medical Group NVn | | | 205,857 | |
| | 4,567 | | | Zoetis, Inc. | | | 411,715 | |
| | | | | |
| | | | Total | | | 15,628,728 | |
| | | | | |
| |
| | Industrials (1.8%) | | | | |
| | 3,239 | | | Acco Brands Corporation | | | 26,139 | |
| | 375 | | | Acuity Brands, Inc. | | | 47,115 | |
| | 3,014 | | | Advanced Disposal Services, Inc.n | | | 81,649 | |
| | 2,324 | | | AECOMn | | | 67,721 | |
| | 1,597 | | | Aegion Corporationn | | | 30,918 | |
| | 1,847 | | | Aerojet Rocketdyne Holdings, Inc.n | | | 65,236 | |
| | 2,279 | | | AGCO Corporation | | | 127,715 | |
| | 6,860 | | | AMETEK, Inc. | | | 460,169 | |
| | 883 | | | ASGN, Inc.n | | | 59,232 | |
| | 1,523 | | | AZZ, Inc. | | | 67,545 | |
| | 1,687 | | | Boeing Company | | | 598,649 | |
| | 609 | | | Brady Corporation | | | 24,537 | |
| | 825 | | | Brink’s Company | | | 54,714 | |
| | 975 | | | BWX Technologies, Inc. | | | 56,998 | |
| | 2,366 | | | Casella Waste Systems, Inc.n | | | 77,037 | |
| | 4,038 | | | CBIZ, Inc.n | | | 89,563 | |
| | 2,482 | | | Colfax Corporationn | | | 69,570 | |
| | 3,058 | | | Comfort Systems USA, Inc. | | | 163,542 | |
| | 6,639 | | | Costamare, Inc. | | | 35,187 | |
| | 4,166 | | | Crane Company | | | 362,609 | |
| | 162 | | | CSW Industrials, Inc.n | | | 7,457 | |
| | 6,849 | | | CSX Corporation | | | 471,622 | |
| | 73 | | | Cummins, Inc. | | | 9,978 | |
The accompanying Notes to Financial Statements are an integral part of this schedule.
138
MODERATELY CONSERVATIVE ALLOCATION FUND
Schedule of Investments as of October 31, 2018
| | | | | | | | |
| Shares | | | Common Stock (13.1%) | | Value | |
| | Industrials (1.8%) - continued | | | | |
| | 666 | | | Curtiss-Wright Corporation | | | $72,900 | |
| | 4,070 | | | Delta Air Lines, Inc. | | | 222,751 | |
| | 795 | | | Dycom Industries, Inc.n | | | 53,965 | |
| | 6,694 | | | EMCOR Group, Inc. | | | 475,140 | |
| | 4,993 | | | Emerson Electric Company | | | 338,925 | |
| | 2,735 | | | Encore Wire Corporation | | | 120,887 | |
| | 180 | | | Ennis, Inc. | | | 3,485 | |
| | 689 | | | ESCO Technologies, Inc. | | | 42,180 | |
| | 15,463 | | | Euronav NV | | | 142,260 | |
| | 3,251 | | | Federal Signal Corporation | | | 71,489 | |
| | 1,466 | | | Forrester Research, Inc. | | | 59,050 | |
| | 1,680 | | | Fortune Brands Home and Security, Inc. | | | 75,314 | |
| | 493 | | | Franklin Electric Company, Inc. | | | 20,913 | |
| | 2,191 | | | General Dynamics Corporation | | | 378,123 | |
| | 1,652 | | | Genesee & Wyoming, Inc.n | | | 130,888 | |
| | 357 | | | Global Brass and Copper Holdings, Inc. | | | 11,288 | |
| | 289 | | | GMS, Inc.n | | | 4,751 | |
| | 1,276 | | | Gorman-Rupp Company | | | 44,022 | |
| | 1,519 | | | Granite Construction, Inc. | | | 69,449 | |
| | 1,850 | | | Healthcare Services Group, Inc.j | | | 75,091 | |
| | 1,390 | | | Heico Corporation | | | 116,524 | |
| | 7,329 | | | Honeywell International, Inc. | | | 1,061,386 | |
| | 1,249 | | | Hubbell, Inc. | | | 127,023 | |
| | 625 | | | Huntington Ingalls Industries, Inc. | | | 136,550 | |
| | 321 | | | Hyster-Yale Materials Handling, Inc. | | | 19,404 | |
| | 417 | | | ICF International, Inc. | | | 30,708 | |
| | 824 | | | Illinois Tool Works, Inc. | | | 105,118 | |
| | 4,440 | | | Ingersoll-Rand plc | | | 425,974 | |
| | 8,226 | | | Interface, Inc. | | | 134,001 | |
| | 1,174 | | | Jacobs Engineering Group, Inc. | | | 88,156 | |
| | 1,870 | | | JB Hunt Transport Services, Inc. | | | 206,841 | |
| | 1,040 | | | Kadant, Inc. | | | 102,648 | |
| | 3,966 | | | KAR Auction Services, Inc. | | | 225,824 | |
| | 10,255 | | | KeyW Holding Corporationn | | | 80,297 | |
| | 2,796 | | | Kforce, Inc. | | | 86,173 | |
| | 953 | | | Kirby Corporationn | | | 68,559 | |
| | 3,895 | | | Korn/Ferry International | | | 175,820 | |
| | 1,090 | | | L3 Technologies, Inc. | | | 206,522 | |
| | 5,305 | | | Lincoln Electric Holdings, Inc. | | | 429,227 | |
| | 1,308 | | | Lindsay Corporation | | | 125,071 | |
| | 709 | | | Lockheed Martin Corporation | | | 208,340 | |
| | 2,870 | | | Masco Corporation | | | 86,100 | |
| | 1,715 | | | Masonite International Corporationn | | | 94,994 | |
| | 1,574 | | | Mercury Systems, Inc.n | | | 73,758 | |
| | 4,675 | | | Milacron Holdings Corporationn | | | 65,450 | |
| | 1,381 | | | Moog, Inc. | | | 98,810 | |
| | 15,871 | | | MRC Global, Inc.n | | | 251,238 | |
| | 1,814 | | | Mueller Industries, Inc. | | | 44,171 | |
| | 9,861 | | | NCI Building Systems, Inc.n | | | 120,797 | |
| | 12,114 | | | Nexeo Solutions, Inc.n | | | 126,591 | |
| | 1,971 | | | Norfolk Southern Corporation | | | 330,793 | |
| | 1,340 | | | Old Dominion Freight Line, Inc. | | | 174,763 | |
| | 69 | | | Orion Group Holdings, Inc.n | | | 326 | |
| | 2,425 | | | Oshkosh Corporation | | | 136,139 | |
| | 649 | | | Parker Hannifin Corporation | | | 98,408 | |
| | 8,021 | | | Primoris Services Corporation | | | 169,804 | |
| | 811 | | | Radiant Logistics, Inc.n | | | 4,412 | |
| | 1,257 | | | Raven Industries, Inc. | | | 54,654 | |
| | 1,824 | | | Regal-Beloit Corporation | | | 130,781 | |
| | 1,221 | | | Resideo Technologies, Inc.n | | | 25,702 | |
| | 675 | | | Resources Connection, Inc. | | | 11,016 | |
| | 1,231 | | | Ritchie Brothers Auctioneers, Inc. | | | 41,374 | |
| | 1,190 | | | Roper Industries, Inc. | | | 336,651 | |
| | 349 | | | Rush Enterprises, Inc. | | | 12,351 | |
| | 2,347 | | | SiteOne Landscape Supply, Inc.n | | | 159,690 | |
| | 9,040 | | | Southwest Airlines Company | | | 443,864 | |
| | 1,180 | | | SP Plus Corporationn | | | 37,713 | |
| | 2,816 | | | SPX Corporationn | | | 82,565 | |
| | 1,035 | | | SPX FLOW, Inc.n | | | 35,428 | |
| | 1,579 | | | Standex International Corporation | | | 128,088 | |
| | 2,757 | | | Terex Corporation | | | 92,056 | |
| | 3,364 | | | TPI Composites, Inc.n | | | 84,975 | |
| | 260 | | | TransDigm Group, Inc.n | | | 85,865 | |
| | 923 | | | TransUnion | | | 60,687 | |
| | 4,898 | | | TriMas Corporationn | | | 144,246 | |
| | 213 | | | UniFirst Corporation | | | 31,801 | |
| | 2,560 | | | United Continental Holdings, Inc.n | | | 218,906 | |
| | 1,143 | | | United Parcel Service, Inc. | | | 121,775 | |
| | 1,810 | | | United Rentals, Inc.n | | | 217,327 | |
| | 2,475 | | | United Technologies Corporation | | | 307,420 | |
| | 4,692 | | | Univar, Inc.n | | | 115,517 | |
| | 1,904 | | | Universal Truckload Services, Inc. | | | 51,732 | |
| | 848 | | | Valmont Industries, Inc. | | | 105,415 | |
| | 3,420 | | | Verisk Analytics, Inc.n | | | 409,853 | |
| | 1,711 | | | WABCO Holdings, Inc.n | | | 183,847 | |
| | 1,461 | | | WageWorks, Inc.n | | | 58,162 | |
| | 7,982 | | | Waste Connections, Inc. | | | 610,144 | |
| | 282 | | | Watsco, Inc. | | | 41,787 | |
| | 2,288 | | | Willdan Group, Inc.n | | | 69,098 | |
| | 1,265 | | | XPO Logistics, Inc.n | | | 113,066 | |
| | | | | |
| | | | Total | | | 16,128,049 | |
| | | | | |
| |
| | Information Technology (2.9%) | | | | |
| | 408 | | | 2U, Inc.n | | | 25,667 | |
| | 3,117 | | | Activision Blizzard, Inc. | | | 215,229 | |
| | 582 | | | Adobe, Inc.n | | | 143,032 | |
| | 11,045 | | | Advanced Micro Devices, Inc.n | | | 201,129 | |
| | 10,483 | | | Agilent Technologies, Inc. | | | 679,194 | |
| | 4,175 | | | Akamai Technologies, Inc.n | | | 301,644 | |
| | 600 | | | Alliance Data Systems Corporation | | | 123,708 | |
| | 702 | | | Ambarella, Inc.j,n | | | 24,416 | |
| | 602 | | | American Software, Inc. | | | 6,929 | |
| | 10,406 | | | Amphenol Corporation | | | 931,337 | |
| | 420 | | | ANSYS, Inc.n | | | 62,811 | |
| | 7,648 | | | Apple, Inc. | | | 1,673,841 | |
| | 4,156 | | | Applied Materials, Inc. | | | 136,649 | |
| | 751 | | | Arista Networks, Inc.n | | | 172,993 | |
| | 4,499 | | | Arrow Electronics, Inc.n | | | 304,627 | |
| | 745 | | | Atkore International Group, Inc.n | | | 14,349 | |
| | 1,150 | | | Atlassian Corporation plcn | | | 87,297 | |
| | 1,811 | | | Autodesk, Inc.n | | | 234,072 | |
| | 3,148 | | | Automatic Data Processing, Inc. | | | 453,564 | |
| | 1,407 | | | Belden, Inc. | | | 76,048 | |
| | 5,092 | | | Benchmark Electronics, Inc. | | | 111,158 | |
| | 4,092 | | | Blackline, Inc.n | | | 189,787 | |
| | 10,592 | | | Booz Allen Hamilton Holding Corporation | | | 524,728 | |
| | 1,472 | | | CDW Corporation | | | 132,495 | |
| | 700 | | | CEVA, Inc.n | | | 17,248 | |
| | 11,884 | | | Ciena Corporationn | | | 371,494 | |
| | 36,627 | | | Cisco Systems, Inc. | | | 1,675,685 | |
| | 781 | | | Cognex Corporation | | | 33,458 | |
| | 516 | | | Cognizant Technology Solutions Corporation | | | 35,619 | |
| | 4,301 | | | CoreLogic, Inc.n | | | 174,707 | |
| | 146 | | | CSG Systems International, Inc. | | | 5,125 | |
| | 6,561 | | | Dolby Laboratories, Inc. | | | 451,462 | |
| | 948 | | | Endurance International Group Holdings, Inc.n | | | 9,357 | |
| | 505 | | | Envestnet, Inc.n | | | 26,270 | |
The accompanying Notes to Financial Statements are an integral part of this schedule.
139
MODERATELY CONSERVATIVE ALLOCATION FUND
Schedule of Investments as of October 31, 2018
| | | | | | | | |
| Shares | | | Common Stock (13.1%) | | Value | |
| | Information Technology (2.9%) - continued | | | | |
| | 770 | | | Euronet Worldwide, Inc.n | | | $85,609 | |
| | 9,448 | | | EVERTEC, Inc. | | | 246,404 | |
| | 185 | | | ExlService Holdings, Inc.n | | | 11,859 | |
| | 645 | | | Fidelity National Information Services, Inc. | | | 67,145 | |
| | 5,789 | | | Fiserv, Inc.n | | | 459,068 | |
| | 17,690 | | | Flextronics International, Ltd.n | | | 139,043 | |
| | 7,000 | | | FLIR Systems, Inc. | | | 324,170 | |
| | 3,720 | | | Fortinet, Inc.n | | | 305,710 | |
| | 3,260 | | | Global Payments, Inc. | | | 372,390 | |
| | 2,447 | | | Guidewire Software, Inc.n | | | 217,710 | |
| | 10,749 | | | Keysight Technologies, Inc.n | | | 613,553 | |
| | 1,130 | | | Lam Research Corporation | | | 160,155 | |
| | 4,079 | | | M/A-COM Technology Solutions Holdings, Inc.n | | | 57,392 | |
| | 659 | | | ManTech International Corporation | | | 37,748 | |
| | 6,626 | | | MasterCard, Inc. | | | 1,309,761 | |
| | 1,400 | | | Maxim Integrated Products, Inc. | | | 70,028 | |
| | 16,292 | | | Microsoft Corporation | | | 1,740,149 | |
| | 192 | | | MicroStrategy, Inc.n | | | 24,186 | |
| | 1,538 | | | MoneyGram International, Inc.n | | | 6,521 | |
| | 2,644 | | | Monolithic Power Systems, Inc. | | | 312,309 | |
| | 937 | | | Monotype Imaging Holdings, Inc. | | | 16,426 | |
| | 5,402 | | | National Instruments Corporation | | | 264,536 | |
| | 1,679 | | | New Relic, Inc.n | | | 149,851 | |
| | 1,580 | | | Nice, Ltd. ADRn | | | 167,385 | |
| | 582 | | | Novanta, Inc.n | | | 33,878 | |
| | 1,260 | | | NVIDIA Corporation | | | 265,646 | |
| | 17,116 | | | Oracle Corporation | | | 835,945 | |
| | 1,280 | | | Palo Alto Networks, Inc.n | | | 234,291 | |
| | 6,628 | | | PayPal Holdings, Inc.n | | | 558,011 | |
| | 1,067 | | | Pegasystems, Inc. | | | 57,106 | |
| | 3,058 | | | Plexus Corporationn | | | 178,587 | |
| | 1,814 | | | Proofpoint, Inc.n | | | 164,983 | |
| | 2,907 | | | Q2 Holdings, Inc.n | | | 154,740 | |
| | 5,775 | | | Quantenna Communications, Inc.n | | | 103,719 | |
| | 2,705 | | | Red Hat, Inc.n | | | 464,286 | |
| | 1,341 | | | Rogers Corporationn | | | 165,023 | |
| | 3,280 | | | Rudolph Technologies, Inc.n | | | 68,191 | |
| | 5,487 | | | SailPoint Technologies Holdings, Inc.n | | | 142,881 | |
| | 4,884 | | | Salesforce.com, Inc.n | | | 670,280 | |
| | 1,036 | | | ScanSource, Inc.n | | | 40,280 | |
| | 7,157 | | | Sequans Communications SA ADRn | | | 7,515 | |
| | 1,690 | | | ServiceNow, Inc.n | | | 305,958 | |
| | 338 | | | Silicon Laboratories, Inc.n | | | 27,557 | |
| | 582 | | | SS&C Technologies Holdings, Inc. | | | 29,775 | |
| | 8,192 | | | Synopsys, Inc.n | | | 733,430 | |
| | 1,500 | | | Teradata Corporationn | | | 54,600 | |
| | 1,656 | | | Teradyne, Inc. | | | 57,049 | |
| | 6,051 | | | Texas Instruments, Inc. | | | 561,714 | |
| | 119 | | | Trimble, Inc.n | | | 4,448 | |
| | 1,073 | | | Tyler Technologies, Inc.n | | | 227,111 | |
| | 128 | | | Ultimate Software Group, Inc.n | | | 34,129 | |
| | 413 | | | Universal Display Corporationj | | | 50,803 | |
| | 4,794 | | | Verint Systems, Inc.n | | | 218,942 | |
| | 432 | | | VeriSign, Inc.n | | | 61,577 | |
| | 5,563 | | | Virtusa Corporationn | | | 275,869 | |
| | 4,993 | | | Visa, Inc. | | | 688,285 | |
| | 8,871 | | | Xilinx, Inc. | | | 757,317 | |
| | 8,210 | | | Zix Corporationn | | | 55,335 | |
| | 1,546 | | | Zuora, Inc.n | | | 31,569 | |
| | | | | |
| | | | Total | | | 25,107,067 | |
| | | | | |
| |
| | Materials (0.4%) | | | | |
| | 2,500 | | | Alcoa Corporationn | | | 87,475 | |
| | 727 | | | Balchem Corporation | | | 68,084 | |
| | 1,300 | | | Ball Corporation | | | 58,240 | |
| | 5,607 | | | Celanese Corporation | | | 543,543 | |
| | 2,800 | | | CF Industries Holdings, Inc. | | | 134,484 | |
| | 450 | | | Coeur Mining, Inc.n | | | 2,151 | |
| | 2,767 | | | Continental Building Products, Inc.n | | | 76,950 | |
| | 1,823 | | | Eastman Chemical Company | | | 142,832 | |
| | 3,560 | | | Ferroglobe Representation & Warranty Insurance Truste,n | | | 0 | |
| | 3,510 | | | Freeport-McMoRan, Inc. | | | 40,891 | |
| | 2,516 | | | Innospec, Inc. | | | 168,371 | |
| | 1,116 | | | International Paper Company | | | 50,622 | |
| | 117 | | | Koppers Holdings, Inc.n | | | 3,130 | |
| | 1,170 | | | Martin Marietta Materials, Inc. | | | 200,398 | |
| | 5,250 | | | Mercer International, Inc. | | | 79,852 | |
| | 1,830 | | | Minerals Technologies, Inc. | | | 100,193 | |
| | 3,004 | | | Myers Industries, Inc. | | | 47,643 | |
| | 2,931 | | | Newmont Mining Corporation | | | 90,627 | |
| | 2,440 | | | Nucor Corporation | | | 144,253 | |
| | 385 | | | Olympic Steel, Inc. | | | 7,261 | |
| | 9,467 | | | OMNOVA Solutions, Inc.n | | | 69,961 | |
| | 3,350 | | | Owens-Illinois, Inc.n | | | 52,495 | |
| | 636 | | | Packaging Corporation of America | | | 58,391 | |
| | 5,115 | | | Reliance Steel & Aluminum Company | | | 403,676 | |
| | 2,960 | | | RPM International, Inc. | | | 181,063 | |
| | 1,596 | | | Ryerson Holding Corporationn | | | 14,651 | |
| | 3,257 | | | Schweitzer-Mauduit International, Inc. | | | 103,963 | |
| | 2,411 | | | Scotts Miracle-Gro Company | | | 160,910 | |
| | 2,757 | | | Sensient Technologies Corporation | | | 178,819 | |
| | 1,516 | | | Sonoco Products Company | | | 82,743 | |
| | 2,315 | | | Steel Dynamics, Inc. | | | 91,674 | |
| | 178 | | | Stepan Company | | | 14,701 | |
| | 2,370 | | | Trinseo SA | | | 127,696 | |
| | 797 | | | United States Lime & Minerals, Inc. | | | 59,783 | |
| | 4,958 | | | WestRock Company | | | 213,045 | |
| | 2,284 | | | Worthington Industries, Inc. | | | 95,654 | |
| | | | | |
| | | | Total | | | 3,956,225 | |
| | | | | |
| |
| | Real Estate (0.6%) | | | | |
| | 450 | | | Alexandria Real Estate Equities, Inc. | | | 55,003 | |
| | 714 | | | Americold Realty Trust | | | 17,671 | |
| | 2,617 | | | Ares Commercial Real Estate Corporation | | | 37,868 | |
| | 12,698 | | | Armada Hoffler Properties, Inc. | | | 190,216 | |
| | 3,137 | | | Ashford Hospitality Trust, Inc. | | | 16,156 | |
| | 665 | | | Bluerock Residential Growth REIT, Inc. | | | 6,298 | |
| | 21,033 | | | Brixmor Property Group, Inc. | | | 340,735 | |
| | 700 | | | Camden Property Trust | | | 63,189 | |
| | 6,240 | | | Catchmark Timber Trust, Inc. | | | 55,224 | |
| | 20,111 | | | Cedar Realty Trust, Inc. | | | 75,818 | |
| | 4,680 | | | Chatham Lodging Trust | | | 91,260 | |
| | 1,657 | | | City Office REIT, Inc. | | | 18,260 | |
| | 5,720 | | | Cousins Properties, Inc. | | | 47,533 | |
| | 861 | | | Crown Castle International Corporation | | | 93,625 | |
| | 1,498 | | | CyrusOne, Inc. | | | 79,739 | |
| | 500 | | | Digital Realty Trust, Inc. | | | 51,630 | |
| | 14,106 | | | Douglas Emmett, Inc. | | | 510,496 | |
| | 2,150 | | | Duke Realty Corporation | | | 59,275 | |
| | 6,261 | | | Empire State Realty Trust, Inc. | | | 99,299 | |
| | 2,210 | | | Franklin Street Properties Corporation | | | 15,382 | |
| | 324 | | | Gaming and Leisure Properties, Inc. | | | 10,916 | |
| | 672 | | | Getty Realty Corporation | | | 18,030 | |
| | 321 | | | Gladstone Commercial Corporation | | | 6,096 | |
The accompanying Notes to Financial Statements are an integral part of this schedule.
140
MODERATELY CONSERVATIVE ALLOCATION FUND
Schedule of Investments as of October 31, 2018
| | | | | | | | |
| Shares | | | Common Stock (13.1%) | | Value | |
| | Real Estate (0.6%) - continued | | | | |
| | 9,581 | | | Highwoods Properties, Inc. | | | $408,534 | |
| | 3,609 | | | Hospitality Properties Trust | | | 92,463 | |
| | 3,139 | | | Host Hotels & Resorts, Inc. | | | 59,986 | |
| | 25,371 | | | Hudson Pacific Properties, Inc. | | | 768,741 | |
| | 17,922 | | | Monmouth Real Estate Investment | | | | |
| | | | Corporation | | | 268,113 | |
| | 5,293 | | | National Storage Affiliates Trust | | | 140,953 | |
| | 1,362 | | | One Liberty Properties, Inc. | | | 35,317 | |
| | 487 | | | Outfront Media, Inc. | | | 8,630 | |
| | 2,404 | | | Paramount Group, Inc. | | | 34,353 | |
| | 3,060 | | | Physicians Realty Trust | | | 50,735 | |
| | 510 | | | RE/MAX Holdings, Inc. | | | 19,069 | |
| | 17,639 | | | Retail Properties of America, Inc. | | | 216,430 | |
| | 461 | | | Saul Centers, Inc. | | | 22,017 | |
| | 1,650 | | | SBA Communications Corporationn | | | 267,580 | |
| | 19,997 | | | Spirit Realty Capital, Inc. | | | 156,377 | |
| | 227 | | | St. Joe Companyn | | | 3,448 | |
| | 2,773 | | | Terreno Realty Corporation | | | 103,793 | |
| | 5,726 | | | Urstadt Biddle Properties, Inc. | | | 114,005 | |
| | 16,835 | | | Weyerhaeuser Company | | | 448,316 | |
| | | | | |
| | | | Total | | | 5,178,579 | |
| | | | | |
| |
| | Utilities (0.3%) | | | | |
| | 436 | | | ALLETE, Inc. | | | 32,264 | |
| | 238 | | | Alpha Natural Resources Holdings, Inc.n | | | 8,330 | |
| | 895 | | | ANR, Inc.n | | | 31,325 | |
| | 1,093 | | | Artesian Resources Corporation | | | 39,993 | |
| | 16,870 | | | Clearway Energy, Inc., Class A | | | 327,615 | |
| | 2,661 | | | Clearway Energy, Inc., Class C | | | 52,182 | |
| | 860 | | | Consolidated Water Company, Ltd. | | | 10,578 | |
| | 1,790 | | | Edison International, Inc. | | | 124,208 | |
| | 825 | | | Entergy Corporation | | | 69,259 | |
| | 67 | | | IDACORP, Inc. | | | 6,248 | |
| | 6,078 | | | MDU Resources Group, Inc. | | | 151,707 | |
| | 590 | | | Middlesex Water Company | | | 26,550 | |
| | 1,408 | | | New Jersey Resources Corporation | | | 63,501 | |
| | 1,197 | | | NorthWestern Corporation | | | 70,336 | |
| | 6,947 | | | PG&E Corporationn | | | 325,189 | |
| | 2,396 | | | PNM Resources, Inc. | | | 92,030 | |
| | 1,914 | | | Portland General Electric Company | | | 86,283 | |
| | 1,450 | | | Public Service Enterprise Group, Inc. | | | 77,474 | |
| | 917 | | | Southwest Gas Holdings, Inc. | | | 70,857 | |
| | 314 | | | Spire, Inc. | | | 22,790 | |
| | 10,079 | | | UGI Corporation | | | 534,792 | |
| | 271 | | | Unitil Corporation | | | 12,875 | |
| | | | | |
| | | | Total | | | 2,236,386 | |
| | | | | |
| | | | | | | | |
| | | | | |
| | | | Total Common Stock (cost $95,931,012) | | | 113,623,986 | |
| | | | | |
| | |
| Shares | | | Collateral Held for Securities Loaned (0.5%) | | Value | |
| | 4,038,165 | | | Thrivent Cash Management Trust | | | 4,038,165 | |
| | | | | |
| | | | Total Collateral Held for Securities Loaned (cost $4,038,165) | | | 4,038,165 | |
| | | | | |
| | |
Shares or
Principal
Amount | | | Short-Term Investments (14.2%) | | Value | |
| | | | Federal Home Loan Bank Discount Notes | | | | |
| | 300,000 | | | 2.100%, 11/28/2018o,p | | | 299,510 | |
| | 900,000 | | | 2.110%, 11/30/2018o,p | | | 898,420 | |
| | 300,000 | | | 2.220%, 12/27/2018o,p | | | 298,959 | |
| | 200,000 | | | 2.255%, 1/8/2019o,p | | | 199,131 | |
| | 3,460,000 | | | 2.240%, 1/16/2019o,p | | | 3,443,198 | |
| | | | Thrivent Core Short-Term Reserve Fund | | | | |
| | 11,763,211 | | | 2.430% | | | 117,632,110 | |
| | | | U.S. Treasury Bills | | | | |
| | 110,000 | | | 2.126%, 12/13/2018o,q | | | 109,724 | |
| | 290,000 | | | 2.181%, 12/27/2018o,q | | | 289,004 | |
| | | | | |
| | | | Total Short-Term Investments (cost $123,170,602) | | | 123,170,056 | |
| | | | | |
| | | | Total Investments (cost $903,233,567) 111.9% | | | $971,741,372 | |
| | | | | |
| | | | Other Assets and Liabilities, Net (11.9%) | | | (103,222,170 | ) |
| | | | | |
| | | | Total Net Assets 100.0% | | | $868,519,202 | |
| | | | | |
a | The stated interest rate represents the weighted average of all contracts within the bank loan facility. |
b | Denotes variable rate securities. The rate shown is as of October 31, 2018. The rates of certain variable rate securities are based on a published reference rate and spread; these may vary by security and the reference rate and spread are indicated in their description. The rates of other variable rate securities are determined by the issuer or agent and are based on current market conditions. These securities do not indicate a reference rate and spread in their description. |
c | All or a portion of the loan is unfunded. |
d | Denotes investments purchased on a when-issued or delayed delivery basis. |
e | Security is valued using significant unobservable inputs. Further information on valuation can be found in the Notes to Financial Statements. |
f | Defaulted security. Interest is not being accrued. |
g | In bankruptcy. Interest is not being accrued. |
h | Denotes securities sold under Rule 144A of the Securities Act of 1933, which exempts them from registration. These securities may be resold to other dealers in the program or to other qualified institutional buyers. As of October 31, 2018, the value of these investments was $34,910,560 or 4.0% of total net assets. |
i | Denotes step coupon securities. Step coupon securities pay an initial coupon rate for the first period and then different coupon rates for following periods. The rate shown is as of October 31, 2018. |
j | All or a portion of the security is on loan. |
k | Denotes interest only security. Interest only securities represent the right to receive monthly interest payments on an underlying pool of mortgages or assets. The principal shown is the outstanding par amount of the pool as of the end of the period. The actual effective yield of the security is different than the stated coupon rate. |
l | All or a portion of the security is insured or guaranteed. |
m | Denotes perpetual securities. Perpetual securities pay an indefinite stream of interest and have no contractual maturity date. Date shown, if applicable, is next call date. |
n | Non-income producing security. |
o | The interest rate shown reflects the yield, coupon rate or the discount rate at the date of purchase. |
The accompanying Notes to Financial Statements are an integral part of this schedule.
141
MODERATELY CONSERVATIVE ALLOCATION FUND
Schedule of Investments as of October 31, 2018
p | All or a portion of the security is held on deposit with the counterparty and pledged as the initial margin deposit for open futures contracts. |
q | At October 31, 2018, $126,657 of investments were segregated to cover exposure to a counterparty for margin on open mortgage-backed security transactions. |
* | Denotes restricted securities. Restricted securities are investment securities which cannot be offered for public sale without first being registered under the Securities Act of 1933. The value of all restricted securities held in Moderately Conservative Allocation Fund as of October 31, 2018 was $13,844,456 or 1.6% of total net assets. The following table indicates the acquisition date and cost of restricted securities shown in the schedule as of October 31, 2018. |
| | | | | | | | |
Security | | Acquisition
Date | | | Cost | |
Angel Oak Mortgage Trust I, LLC, 7/25/2046 | | | 8/15/2016 | | | | $75,751 | |
Ares CLO, Ltd., 10/17/2030 | | | 8/17/2018 | | | | 550,000 | |
Babson CLO, Ltd., 10/17/2026 | | | 3/10/2017 | | | | 145,331 | |
Betony CLO, Ltd., 4/30/2031 | | | 6/5/2018 | | | | 548,560 | |
Buttermilk Park CLO, Ltd., 10/15/2031 | | | 8/27/2018 | | | | 925,000 | |
Carlyle Global Market Strategies CLO, Ltd., 7/15/2031 | | | 8/24/2018 | | | | 600,000 | |
Cent CLO 22, Ltd., 11/7/2026 | | | 11/1/2016 | | | | 175,000 | |
CIM Trust, 12/25/2057 | | | 4/23/2018 | | | | 1,131,920 | |
Digicel, Ltd., 4/15/2021 | | | 8/18/2014 | | | | 555,469 | |
Dryden Senior Loan Fund, 7/18/2030 | | | 8/28/2018 | | | | 500,000 | |
Edlinc Student Loan Funding Trust, 10/1/2025 | | | 2/28/2013 | | | | 72,990 | |
Galaxy XX CLO, Ltd., 4/20/2031 | | | 2/23/2018 | | | | 550,000 | |
Golub Capital Partners, Ltd., 10/20/2028 | | | 10/30/2018 | | | | 499,600 | |
Golub Capital Partners, Ltd., 1/20/2031 | | | 11/20/2017 | | | | 468,000 | |
Harley Marine Financing, LLC, 5/15/2043 | | | 5/9/2018 | | | | 1,283,736 | |
Limerock CLO III, LLC, 10/20/2026 | | | 1/30/2017 | | | | 500,000 | |
Madison Park Funding XIV, Ltd., 10/22/2030 | | | 10/12/2018 | | | | 300,000 | |
Magnetite XII, Ltd., 10/15/2031 | | | 8/14/2018 | | | | 525,000 | |
Mountain View CLO, Ltd., 7/15/2031 | | | 5/31/2018 | | | | 375,000 | |
Neuberger Berman CLO XIV, Ltd., 1/28/2030 | | | 4/19/2017 | | | | 525,998 | |
Neuberger Berman CLO, Ltd., 4/22/2029 | | | 4/27/2017 | | | | 110,000 | |
Octagon Investment Partners XVI, Ltd., 7/17/2030 | | | 6/15/2018 | | | | 100,000 | |
Octagon Investment Partners XX, Ltd., 8/12/2026 | | | 4/21/2017 | | | | 425,000 | |
OZLM VIII, Ltd., 10/17/2026 | | | 5/16/2017 | | | | 170,000 | |
PPM CLO, Ltd., 7/15/2031 | | | 7/2/2018 | | | | 349,580 | |
Preston Ridge Partners Mortgage Trust, LLC, 9/25/2022 | | | 9/27/2017 | | | | 564,599 | |
Race Point IX CLO, Ltd., 10/15/2030 | | | 8/28/2017 | | | | 375,000 | |
Shackleton CLO, Ltd., 7/15/2031 | | | 7/12/2018 | | | | 350,000 | |
Symphony CLO XV, Ltd., 10/17/2026 | | | 2/16/2017 | | | | 446,377 | |
Verus Securitization Trust, 7/25/2047 | | | 7/24/2017 | | | | 402,704 | |
Verus Securitization Trust, 1/25/2047 | | | 2/16/2017 | | | | 245,806 | |
Voya CLO 3, Ltd., 7/25/2026 | | | 12/13/2017 | | | | 152,287 | |
The following table presents the total amount of securities loaned with continuous maturity, by type, offset by the gross payable upon return of collateral for securities loaned by Thrivent Moderately Conservative Allocation Fund as of October 31, 2018:
| | | | |
Securities Lending Transactions | | | |
Taxable Debt Security | | $ | 2,787,795 | |
Common Stock | | | 1,138,470 | |
| | | | |
Total lending | | $ | 3,926,265 | |
Gross amount payable upon return of collateral for securities loaned | | $ | 4,038,165 | |
| | | | |
Net amounts due to counterparty | | $ | 111,900 | |
| | | | |
Definitions:
| | | | |
ACES | | - | | Alternative Credit Enhancement Securities |
ADR | | - | | American Depositary Receipt, which are certificates for an underlying foreign security’s shares held by an issuing U.S. depository bank. |
CLO | | - | | Collateralized Loan Obligation |
ETF | | - | | Exchange Traded Fund |
REIT | | - | | Real Estate Investment Trust is a company that buys, develops, manages and/or sells real estate assets. |
Ser. | | - | | Series |
SPDR | | - | | S&P Depository Receipts, which are exchange-traded funds traded in the U.S., Europe, and Asia-Pacific and managed by State Street Global Advisors. |
TIPS | | - | | Treasury Inflation Protected Security |
Reference Rate Index:
| | | | |
CMT 3M | | - | | Constant Maturity Treasury Yield 3 Month |
LIBOR 1W | | - | | ICE Libor USD Rate 1 Week |
LIBOR 1M | | - | | ICE Libor USD Rate 1 Month |
LIBOR 2M | | - | | ICE Libor USD Rate 2 Month |
LIBOR 3M | | - | | ICE Libor USD Rate 3 Month |
LIBOR 12M | | - | | ICE Libor USD Rate 12 Month |
PRIME | | - | | Federal Reserve Prime Loan Rate |
The accompanying Notes to Financial Statements are an integral part of this schedule.
142
MUNICIPAL BOND FUND
Schedule of Investments as of October 31, 2018
| | | | | | | | |
Principal
Amount | | | Long-Term Fixed Income (98.8%) | | Value | |
| | Alabama (0.4%) | | | | |
| | | | Alabama Public School and College Auth. Capital Improvement Rev. Refg. | | | | |
| | $1,500,000 | | | 5.000%, 5/1/2029, Ser. Aa | | | $1,523,280 | |
| | | | Auburn University, AL General Fee Rev. Refg. | | | | |
| | 1,000,000 | | | 5.000%, 6/1/2032, Ser. A | | | 1,121,140 | |
| | 1,250,000 | | | 5.000%, 6/1/2033, Ser. A | | | 1,396,675 | |
| | | | UAB Medicine Finance Auth. Rev. | | | | |
| | 2,000,000 | | | 5.000%, 9/1/2041, Ser. B2 | | | 2,168,420 | |
| | | | | |
| | | | Total | | | 6,209,515 | |
| | | | | |
| |
| | Alaska (<0.1%) | | | | |
| | | | Valdez, AK Marine Terminal Rev. Refg. (Exxon Mobil) | | | | |
| | 125,000 | | | 1.690%, 12/1/2029b | | | 125,000 | |
| | | | | |
| | | | Total | | | 125,000 | |
| | | | | |
| |
| | Arizona (1.2%) | | | | |
| | | | Arizona Board of Regents State University System Rev. Green Bonds | | | | |
| | 1,000,000 | | | 5.000%, 7/1/2042, Ser. B | | | 1,099,320 | |
| | | | Arizona Board of Regents State University System Rev. Refg. | | | | |
| | 750,000 | | | 5.000%, 7/1/2042, Ser. B | | | 831,053 | |
| | | | Arizona State Transportation Board Highway Rev. | | | | |
| | 1,500,000 | | | 5.000%, 7/1/2036, Ser. Aa | | | 1,608,045 | |
| | | | Glendale, AZ Industrial Development Auth. Rev. (Midwestern University) | | | | |
| | 2,515,000 | | | 5.000%, 5/15/2031 | | | 2,693,892 | |
| | | | Northern Arizona Capital Fac. Lease Rev. (Student & Academic Services, LLC) (BAM Insured) | | | | |
| | 750,000 | | | 5.000%, 6/1/2039c | | | 806,565 | |
| | | | Northern Arizona University Refg. C.O.P. | | | | |
| | 1,000,000 | | | 5.000%, 9/1/2022 | | | 1,085,790 | |
| | | | Northern Arizona University Refg. Rev. | | | | |
| | 1,180,000 | | | 5.000%, 6/1/2036, Ser. A | | | 1,291,994 | |
| | 750,000 | | | 5.000%, 6/1/2037, Ser. A | | | 818,580 | |
| | 320,000 | | | 5.000%, 6/1/2038, Ser. A | | | 348,153 | |
| | | | Phoenix, AZ Civic Improvement Corporation Airport Rev. | | | | |
| | 3,060,000 | | | 5.250%, 7/1/2033, Ser. Aa | | | 3,214,652 | |
| | 2,000,000 | | | 5.000%, 7/1/2047, Ser. A, AMT | | | 2,158,800 | |
| | | | Phoenix-Mesa Gateway Airport Auth. Special Fac. Rev. | | | | |
| | 1,450,000 | | | 5.000%, 7/1/2038, AMT | | | 1,527,691 | |
| | | | Yavapai County, AZ Industrial Development Auth. Hospital Fac. Rev. Refg. (Yavapai Regional Medical Center) | | | | |
| | 500,000 | | | 5.000%, 8/1/2036 | | | 536,785 | |
| | | | | |
| | | | Total | | | 18,021,320 | |
| | | | | |
| |
| | Arkansas (0.5%) | | | | |
| | | | Rogers, AR Sales and Use Tax Refg. and Improvement | | | | |
| | 1,135,000 | | | 4.000%, 11/1/2027, Ser. 2011a | | | 1,191,251 | |
| | | | University of Arkansas Rev. Refg. | | | | |
| | 900,000 | | | 5.000%, 11/1/2037, Ser. A | | | 1,000,089 | |
| | 1,300,000 | | | 5.000%, 11/1/2046, Ser. A | | | 1,427,387 | |
| | | | University of Arkansas Rev. Refg. Various Fac. Rev. (Pine Bluff Campus) | | | | |
| | 650,000 | | | 5.000%, 12/1/2029, Ser. A | | | 733,304 | |
| | | | University of Arkansas Rev. Student Fee (Community College at Morrilton) | | | | |
| | 570,000 | | | 5.000%, 5/1/2046 | | | 622,810 | |
| | | | University of Arkansas Rev. Various Fac. (Fayetteville Campus) | | | | |
| | 1,135,000 | | | 5.000%, 11/1/2039, Ser. A | | | 1,247,626 | |
| | 825,000 | | | 5.000%, 11/1/2041, Ser. A | | | 905,454 | |
| | | | | |
| | | | Total | | | 7,127,921 | |
| | | | | |
| |
| | California (11.4%) | | | | |
| | | | Anaheim Public Financing Auth. Lease Rev. (Anaheim Public Improvements) (AGM Insured) | | | | |
| | 3,950,000 | | | 6.000%, 9/1/2024, Ser. Ac | | | 4,497,707 | |
| | | | Beverly Hills Unified School District, Los Angeles County, CA G.O. (2008 Election) | | | | |
| | 10,000,000 | | | Zero Coupon, 8/1/2031 | | | 6,425,600 | |
| | | | California Department of Water Resources Rev. Refg. (Central Valley) | | | | |
| | 1,500,000 | | | 5.000%, 12/1/2031, Ser. AX | | | 1,761,630 | |
| | 1,000,000 | | | 5.000%, 12/1/2032, Ser. AX | | | 1,169,180 | |
| | | | California Educational Fac. Auth. Rev. (Stanford University) | | | | |
| | 6,000,000 | | | 5.250%, 4/1/2040 | | | 7,468,920 | |
| | 8,300,000 | | | 5.000%, 5/1/2045, Ser. U-6 | | | 10,160,362 | |
| | | | California Finance Auth. Refg. Rev. (California Lutheran University) | | | | |
| | 275,000 | | | 5.000%, 10/1/2025 | | | 311,490 | |
| | | | California Health Fac. Financing Auth. Rev. | | | | |
| | 1,750,000 | | | 5.000%, 8/15/2055, Ser. B | | | 1,896,423 | |
| | 6,225,000 | | | 5.000%, 11/15/2056, Ser. A | | | 6,771,866 | |
| | | | California Infrastructure and Economic Development Bank Rev. (Bay Area Toll Bridges Seismic Retrofit Rev.) (FGIC Insured) | | | | |
| | 5,000,000 | | | 5.000%, 7/1/2025, Ser. Aa,c | | | 5,836,250 | |
| | | | California Kindergarten - University Public Education Fac. G.O. | | | | |
| | 3,850,000 | | | 1.130%, 5/1/2034b | | | 3,850,000 | |
| | | | California Municipal Finance Auth. Refg. Rev. (Biola University) | | | | |
| | 2,000,000 | | | 5.000%, 10/1/2042 | | | 2,128,720 | |
| | | | California Municipal Finance Auth. Rev. (LINXS APM) | | | | |
| | 2,000,000 | | | 5.000%, 12/31/2043, Ser. A, AMT | | | 2,137,360 | |
| | | | California Municipal Finance Auth. Rev. Refg. (California Lutheran University) | | | | |
| | 300,000 | | | 5.000%, 10/1/2026 | | | 341,754 | |
| | | | California Various Purpose G.O. | | | | |
| | 3,565,000 | | | 5.500%, 4/1/2024 | | | 3,618,332 | |
| | 10,000 | | | 5.250%, 4/1/2029 | | | 10,028 | |
The accompanying Notes to Financial Statements are an integral part of this schedule.
143
MUNICIPAL BOND FUND
Schedule of Investments as of October 31, 2018
| | | | | | | | |
Principal
Amount | | | Long-Term Fixed Income (98.8%) | | Value | |
| | California (11.4%) - continued | | | | |
| | $3,230,000 | | | 6.000%, 4/1/2038 | | | $3,282,617 | |
| | 5,000,000 | | | 6.000%, 11/1/2039 | | | 5,192,450 | |
| | | | Chula Vista Industrial Development Rev. Refg. (San Diego Gas & Electric Company) | | | | |
| | 2,010,000 | | | 5.875%, 2/15/2034, Ser. C | | | 2,050,562 | |
| | | | Foothill-De Anza, CA Community College District G.O. | | | | |
| | 5,000,000 | | | 5.000%, 8/1/2040, Ser. Ca | | | 5,411,450 | |
| | | | Golden West Schools Financing Auth. Rev. (NATL-RE Insured) | | | | |
| | 420,000 | | | 5.800%, 2/1/2022, Ser. Ac | | | 465,028 | |
| | | | Los Angeles Unified School District G.O. | | | | |
| | 1,000,000 | | | 5.000%, 7/1/2032, Ser. A | | | 1,072,570 | |
| | 5,000,000 | | | 5.000%, 1/1/2034, Ser. I | | | 5,096,950 | |
| | | | Los Angeles, CA Department of Airports Rev. (Los Angeles International Airport) | | | | |
| | 8,000,000 | | | 5.000%, 5/15/2040, Ser. A | | | 8,290,880 | |
| | | | Los Angeles, CA Department of Water & Power System Rev. | | | | |
| | 7,000,000 | | | 5.000%, 7/1/2044, Ser. D | | | 7,689,570 | |
| | | | Pomona, CA Single Family Mortgage Rev. Refg. (GNMA/FNMA/FHLMC Collateralized) | | | | |
| | 1,795,000 | | | 7.600%, 5/1/2023, Ser. Aa,c | | | 1,999,127 | |
| | | | San Bernardino, CA Single Family Mortgage Rev. Refg. (GNMA Collateralized) | | | | |
| | 640,000 | | | 7.500%, 5/1/2023, Ser. Aa,c | | | 712,006 | |
| | | | San Diego County, CA C.O.P. | | | | |
| | 5,000,000 | | | 5.250%, 7/1/2030a | | | 5,264,500 | |
| | | | San Diego Unified School District G.O. | | | | |
| | 10,000,000 | | | Zero Coupon, 7/1/2033, Ser. Aa,d | | | 11,450,900 | |
| | | | San Francisco, CA City & County Airport Commission Rev. (San Francisco International Airport) | | | | |
| | 4,000,000 | | | 5.500%, 5/1/2028, Ser. A, AMT | | | 4,462,360 | |
| | 545,000 | | | 6.000%, 5/1/2039, Ser. Ea | | | 556,690 | |
| | 6,485,000 | | | 6.000%, 5/1/2039, Ser. E | | | 6,621,834 | |
| | 7,825,000 | | | 5.000%, 5/1/2044, Ser. A, AMT | | | 8,423,534 | |
| | 5,700,000 | | | 5.000%, 5/1/2047, Ser. B | | | 6,257,859 | |
| | | | San Jose, CA Redevelopment Agency Successor Agency Tax Allocation Refg. | | | | |
| | 6,000,000 | | | 5.000%, 8/1/2035, Ser. A | | | 6,867,300 | |
| | | | Santa Monica Community College District, Los Angeles County, CA G.O. | | | | |
| | 5,000,000 | | | Zero Coupon, 8/1/2025, Ser. C | | | 4,166,800 | |
| | | | University of California Limited Rev. Refg. | | | | |
| | 8,000,000 | | | 5.000%, 5/15/2032, Ser. I | | | 9,019,040 | |
| | | | University of California Rev. | | | | |
| | 2,765,000 | | | 5.250%, 5/15/2039, Ser. Oa | | | 2,817,895 | |
| | 810,000 | | | 5.250%, 5/15/2039, Ser. Oa | | | 825,495 | |
| | 1,425,000 | | | 5.250%, 5/15/2039, Ser. Oa | | | 1,452,260 | |
| | | | | |
| | | | Total | | | 167,835,299 | |
| | | | | |
| |
| | Colorado (4.0%) | | | | |
| | | | Colorado Educational and Cultural Fac. Auth. Charter School Refg. Rev. (Pinnacle Charter School, Inc. K-8 Fac.) | | | | |
| | 500,000 | | | 5.000%, 6/1/2019 | | | 507,700 | |
| | 200,000 | | | 5.000%, 6/1/2021 | | | 212,314 | |
| | | | Colorado Educational and Cultural Fac. Auth. Charter School Rev. (Crown Pointe Academy of Westminster) | | | | |
| | 1,000,000 | | | 5.000%, 7/15/2039 | | | 1,001,640 | |
| | | | Colorado Educational and Cultural Fac. Auth. Charter School Rev. (Pinnacle Charter School, Inc. High School) | | | | |
| | 3,000,000 | | | 5.125%, 12/1/2039 | | | 3,013,800 | |
| | | | Colorado Educational and Cultural Fac. Auth. Charter School Rev. Refg. (Union Colony School) | | | | |
| | 600,000 | | | 5.000%, 4/1/2038 | | | 652,062 | |
| | 475,000 | | | 5.000%, 4/1/2048 | | | 508,858 | |
| | | | Colorado Health Fac. Auth. Hospital Rev. (Parkview Medical Center, Inc.) | | | | |
| | 4,000,000 | | | 5.000%, 9/1/2046 | | | 4,244,320 | |
| | | | Colorado Health Fac. Auth. Hospital Rev. Refg. (Valley View Hospital Association) | | | | |
| | 500,000 | | | 5.000%, 5/15/2030, Ser. A | | | 549,505 | |
| | 385,000 | | | 5.000%, 5/15/2031, Ser. A | | | 421,344 | |
| | 300,000 | | | 5.000%, 5/15/2032, Ser. A | | | 327,861 | |
| | | | Colorado Health Fac. Auth. Rev. (Evangelical Lutheran Good Samaritan Society) | | | | |
| | 2,110,000 | | | 5.000%, 12/1/2024 | | | 2,259,620 | |
| | 500,000 | | | 5.625%, 6/1/2043 | | | 537,145 | |
| | | | Colorado High Performance Transportation Enterprise Rev. | | | | |
| | 6,300,000 | | | 5.000%, 12/31/2047 | | | 6,654,942 | |
| | | | Colorado School of Mines Institutional Enterprise Rev. | | | | |
| | 1,740,000 | | | 5.000%, 12/1/2047, Ser. A | | | 1,907,440 | |
| | | | Denver, CO Health and Hospital Auth. Healthcare Rev. | | | | |
| | 5,000,000 | | | 5.500%, 12/1/2030 | | | 5,198,850 | |
| | | | Denver, CO Health and Hospital Auth. Healthcare Rev. Refg. | | | | |
| | 1,500,000 | | | 5.000%, 12/1/2034, Ser. A* | | | 1,609,680 | |
| | | | Eagle County, CO Air Terminal Corporation Rev. (Airport Terminal) | | | | |
| | 1,000,000 | | | 5.000%, 5/1/2041, Ser. B, AMT | | | 1,063,290 | |
| | | | Park Creek, CO Metropolitan District Rev. | | | | |
| | 3,000,000 | | | 5.000%, 12/1/2041, Ser. A | | | 3,196,620 | |
| | 2,250,000 | | | 5.000%, 12/1/2046, Ser. A | | | 2,370,465 | |
| | | | Park Creek, CO Metropolitan District Rev. Refg. | | | | |
| | 1,220,000 | | | 5.000%, 12/1/2022 | | | 1,329,678 | |
| | 1,000,000 | | | 5.000%, 12/1/2024 | | | 1,117,460 | |
| | | | Plaza Metropolitan District No. 1 Rev. Refg. (City of Lakewood) | | | | |
| | 1,000,000 | | | 5.000%, 12/1/2021* | | | 1,054,180 | |
| | 500,000 | | | 5.000%, 12/1/2022* | | | 531,210 | |
The accompanying Notes to Financial Statements are an integral part of this schedule.
144
MUNICIPAL BOND FUND
Schedule of Investments as of October 31, 2018
| | | | | | | | |
Principal
Amount | | | Long-Term Fixed Income (98.8%) | | Value | |
| | Colorado (4.0%) - continued | | | | |
| | | | University of Colorado University Enterprise Rev. | | | | |
| | $1,250,000 | | | 5.375%, 6/1/2032, Ser. Aa | | | $1,274,788 | |
| | 3,250,000 | | | 5.000%, 6/1/2033, Ser. Aa | | | 3,679,747 | |
| | 9,790,000 | | | 5.000%, 6/1/2033a | | | 10,486,559 | |
| | 3,000,000 | | | 5.000%, 6/1/2034, Ser. Aa | | | 3,396,690 | |
| | | | | |
| | | | Total | | | 59,107,768 | |
| | | | | |
| |
| | Connecticut (<0.1%) | | | | |
| | | | Connecticut Health & Educational Facility Auth. Rev. Refg. (Sacred Heart University) | | | | |
| | 600,000 | | | 5.000%, 7/1/2042, Ser. I-1 | | | 643,992 | |
| | | | | |
| | | | Total | | | 643,992 | |
| | | | | |
| |
| | Delaware (0.1%) | | | | |
| | | | Kent County, DE Student Housing and Dining Fac. Rev. (CHF-Dover, LLC - Delaware State University) | | | | |
| | 870,000 | | | 5.000%, 7/1/2040, Ser. A | | | 906,966 | |
| | 500,000 | | | 5.000%, 7/1/2048, Ser. A | | | 518,195 | |
| | | | | |
| | | | Total | | | 1,425,161 | |
| | | | | |
| |
| | District of Columbia (0.8%) | | | | |
| | | | District of Columbia Income Tax Secured Rev. Refg. | | | | |
| | 5,225,000 | | | 5.000%, 12/1/2028, Ser. C | | | 5,383,683 | |
| | | | Metropolitan Washington DC Airports Auth. Airport System Rev. Refg. | | | | |
| | 6,000,000 | | | 5.000%, 10/1/2038, Ser. A, AMT | | | 6,442,140 | |
| | | | | |
| | | | Total | | | 11,825,823 | |
| | | | | |
| |
| | Florida (5.7%) | | | | |
| | | | Broward County, FL Fuel System Rev. (Fort Lauderdale Fuel Fac.) (AGM Insured) | | | | |
| | 1,155,000 | | | 5.000%, 4/1/2021, Ser. A, AMTc | | | 1,219,980 | |
| | 605,000 | | | 5.000%, 4/1/2022, Ser. A, AMTc | | | 648,439 | |
| | 700,000 | | | 5.000%, 4/1/2025, Ser. A, AMTc | | | 756,854 | |
| | | | Broward County, FL Water and Sewer Utility Rev. Refg. | | | | |
| | 1,000,000 | | | 5.000%, 10/1/2030, Ser. A | | | 1,130,680 | |
| | 1,500,000 | | | 5.000%, 10/1/2031, Ser. B | | | 1,692,015 | |
| | | | CityPlace Community Development District Special Assessment and Rev. | | | | |
| | 2,000,000 | | | 5.000%, 5/1/2026 | | | 2,175,440 | |
| | | | Florida State Municipal Power Agency Rev. | | | | |
| | 1,000,000 | | | 5.000%, 10/1/2030, Ser. B | | | 1,118,720 | |
| | 840,000 | | | 5.000%, 10/1/2031, Ser. B | | | 937,507 | |
| | | | Greater Orlando Aviation Auth. Airport Fac. Rev. | | | | |
| | 1,500,000 | | | 5.000%, 10/1/2039, Ser. Ca | | | 1,541,070 | |
| | | | Gulf Breeze, FL Rev. Refg. | | | | |
| | 2,020,000 | | | 5.000%, 12/1/2033 | | | 2,124,252 | |
| | | | Halifax Hospital Medical Center Rev. | | | | |
| | 755,000 | | | 5.000%, 6/1/2020 | | | 784,536 | |
| | | | Higher Educational Fac. Financing Auth. Rev. (Ringling College) | | | | |
| | 7,225,000 | | | 5.000%, 3/1/2042 | | | 7,580,687 | |
| | | | Jacksonville, FL Port Auth. Rev. Refg. | | | | |
| | 2,545,000 | | | 5.000%, 11/1/2038, Ser. A, AMT | | | 2,685,280 | |
| | | | Miami-Dade County Industrial Development Auth. (Pinecrest Academy, Inc.) | | | | |
| | 1,500,000 | | | 5.250%, 9/15/2044 | | | 1,552,695 | |
| | | | Miami-Dade County, FL Aviation Rev. (Miami International Airport-Hub of the Americas) | | | | |
| | 7,500,000 | | | 5.500%, 10/1/2036, Ser. Ba | | | 7,739,175 | |
| | 8,000,000 | | | 5.500%, 10/1/2041, Ser. Aa | | | 8,255,120 | |
| | | | Miami-Dade County, FL Public Fac. Rev. (Jackson Health System) | | | | |
| | 5,000,000 | | | 5.000%, 6/1/2035, Ser. A | | | 5,418,950 | |
| | | | Miami-Dade County, FL Public Fac. Rev. (Jackson Health System) (AGC Insured) | | | | |
| | 2,000,000 | | | 5.625%, 6/1/2034a,c | | | 2,042,540 | |
| | | | Orange County, FL Health Fac. Auth. Hospital Rev. (Orlando Health, Inc.) | | | | |
| | 5,010,000 | | | 5.125%, 10/1/2026 | | | 5,144,969 | |
| | | | Orlando-Orange County, FL Expressway Auth. Rev. | | | | |
| | 3,600,000 | | | 5.000%, 7/1/2030, Ser. Aa | | | 3,767,328 | |
| | 4,095,000 | | | 5.000%, 7/1/2035, Ser. Ca | | | 4,285,336 | |
| | | | Palm Beach County Health Fac. Auth. Rev. (Life Communities, Inc.) | | | | |
| | 2,000,000 | | | 5.000%, 11/15/2045, Ser. A | | | 2,118,140 | |
| | | | Palm Beach County Health Fac. Auth. Rev. Refg. (Lifespace Communities, Inc.) | | | | |
| | 3,000,000 | | | 5.000%, 5/15/2038, Ser. C | | | 3,072,120 | |
| | | | South FL Water Management District C.O.P. Refg. | | | | |
| | 4,000,000 | | | 5.000%, 10/1/2036 | | | 4,391,440 | |
| | | | St. Johns County Industrial Development Auth. Rev. (Presbyterian Retirement Communities) | | | | |
| | 6,490,000 | | | 5.875%, 8/1/2040, Ser. Aa | | | 6,890,628 | |
| | | | Tampa, FL Hospital Rev. Refg. (H. Lee Moffitt Cancer Center) | | | | |
| | 5,000,000 | | | 5.000%, 7/1/2037, Ser. B | | | 5,367,950 | |
| | | | | |
| | | | Total | | | 84,441,851 | |
| | | | | |
| |
| | Georgia (0.5%) | | | | |
| | | | Atlanta, GA Airport General Rev. | | | | |
| | 1,000,000 | | | 5.000%, 1/1/2033, Ser. C, AMT | | | 1,058,040 | |
| | 500,000 | | | 5.000%, 1/1/2034, Ser. C, AMT | | | 528,710 | |
| | 500,000 | | | 5.000%, 1/1/2037, Ser. C, AMT | | | 527,935 | |
| | | | Atlanta, GA Airport General Rev. Refg. | | | | |
| | 1,425,000 | | | 5.000%, 1/1/2033, Ser. B | | | 1,569,652 | |
| | | | Atlanta, GA Water & Wastewater Rev. Refg. | | | | |
| | 2,500,000 | | | 5.000%, 11/1/2031 | | | 2,793,175 | |
The accompanying Notes to Financial Statements are an integral part of this schedule.
145
MUNICIPAL BOND FUND
Schedule of Investments as of October 31, 2018
| | | | | | | | |
Principal
Amount | | | Long-Term Fixed Income (98.8%) | | Value | |
| | Georgia (0.5%) - continued | | | | |
| | | | Brunswick, GA Water and Sewer Rev. Refg. and Improvement (NATL-RE Insured) | | | | |
| | $290,000 | | | 6.100%, 10/1/2019a,c | | | $300,547 | |
| | | | Georgia Electric Auth. Rev. Refg. | | | | |
| | 610,000 | | | 5.000%, 1/1/2035, Ser. A | | | 648,827 | |
| | | | | |
| | | | Total | | | 7,426,886 | |
| | | | | |
| |
| | Guam (<0.1%) | | | | |
| | | | Port Auth. of Guam Rev. | | | | |
| | 250,000 | | | 5.000%, 7/1/2048, Ser. A | | | 264,110 | |
| | | | | |
| | | | Total | | | 264,110 | |
| | | | | |
| |
| | Hawaii (1.6%) | | | | |
| | | | Hawaii Airports System Rev. | | | | |
| | 3,040,000 | | | 5.250%, 7/1/2030, Ser. A | | | 3,189,051 | |
| | | | Hawaii Department of Budget and Finance Special Purpose Senior Living Rev. Refg. | | | | |
| | 1,000,000 | | | 5.125%, 11/15/2032 | | | 1,080,990 | |
| | 5,395,000 | | | 5.250%, 11/15/2037 | | | 5,821,205 | |
| | | | Hawaii Department of Transportation Airport Division Lease Rev. C.O.P. | | | | |
| | 1,600,000 | | | 5.000%, 8/1/2028, AMT | | | 1,717,808 | |
| | | | Hawaii Harbor System Rev. | | | | |
| | 6,000,000 | | | 5.250%, 7/1/2030, Ser. A | | | 6,276,060 | |
| | | | Honolulu, HI City & County Wastewater System Rev. | | | | |
| | 350,000 | | | 5.000%, 7/1/2036, Ser. A | | | 390,236 | |
| | | | Honolulu, HI City & County Wastewater System Rev. Refg. | | | | |
| | 4,505,000 | | | 5.000%, 7/1/2036, Ser. B | | | 5,022,895 | |
| | | | | |
| | | | Total | | | 23,498,245 | |
| | | | | |
| |
| | Illinois (6.6%) | | | | |
| | | | Chicago Metropolitan Water Reclamation District G.O. Refg. | | | | |
| | 8,700,000 | | | 5.250%, 12/1/2032, Ser. C | | | 10,169,343 | |
| | | | Chicago, IL G.O. Refg. | | | | |
| | 4,000,000 | | | 5.000%, 1/1/2023, Ser. C | | | 4,214,560 | |
| | | | Chicago, IL Midway International Airport Rev. | | | | |
| | 1,120,000 | | | 5.000%, 1/1/2026, Ser. A, AMT | | | 1,216,880 | |
| | | | Chicago, IL O’Hare International Airport Rev. | | | | |
| | 1,000,000 | | | 5.000%, 1/1/2047, Ser. G, AMT | | | 1,056,170 | |
| | 1,000,000 | | | 5.000%, 1/1/2047, Ser. D, AMT | | | 1,056,170 | |
| | | | Chicago, IL O’Hare International Airport Rev. Refg. | | | | |
| | 1,200,000 | | | 5.000%, 1/1/2029 | | | 1,321,320 | |
| | | | Illinois Finance Auth. Multifamily Housing Rev. (Better Housing Foundation Blue Station) | | | | |
| | 1,750,000 | | | 5.000%, 12/1/2043, Ser. A-1 | | | 1,688,190 | |
| | | | Illinois Finance Auth. Rev. (DePaul University) | | | | |
| | 4,075,000 | | | 6.000%, 10/1/2032, Ser. Aa | | | 4,428,995 | |
| | 1,000,000 | | | 5.000%, 10/1/2041 | | | 1,080,610 | |
| | | | Illinois Finance Auth. Rev. (Rosalind Franklin University) | | | | |
| | 1,750,000 | | | 5.000%, 8/1/2042, Ser. A | | | 1,841,018 | |
| | | | Illinois Finance Auth. Rev. (Rush University Medical Center) | | | | |
| | 1,000,000 | | | 5.000%, 11/15/2027, Ser. A | | | 1,112,250 | |
| | 3,000,000 | | | 7.250%, 11/1/2038, Ser. Aa | | | 3,000,000 | |
| | | | Illinois Finance Auth. Rev. (The Art Institute of Chicago) | | | | |
| | 20,000 | | | 5.000%, 3/1/2034a | | | 21,728 | |
| | 3,510,000 | | | 5.000%, 3/1/2034 | | | 3,739,975 | |
| | | | Illinois Finance Auth. Rev. Refg. (Northwestern Memorial Healthcare) | | | | |
| | 4,000,000 | | | 5.000%, 7/15/2042, Ser. A | | | 4,343,720 | |
| | | | Illinois Finance Auth. Rev. Refg. (Rosalind Franklin University) | | | | |
| | 2,100,000 | | | 5.000%, 8/1/2047, Ser. A | | | 2,199,855 | |
| | | | Illinois Finance Auth. Rev. Refg. (Rush University Medical Center) (NATL-RE Insured) | | | | |
| | 2,020,000 | | | 5.250%, 11/1/2035, Ser. Ba,c | | | 2,020,000 | |
| | | | Illinois Finance Auth. Student Housing & Academic Fac. Rev. (CHF - Chicago, LLC - University of IL at Chicago) | | | | |
| | 1,000,000 | | | 5.000%, 2/15/2047, Ser. A | | | 1,049,960 | |
| | | | Illinois G.O. | | | | |
| | 7,000,000 | | | 5.000%, 11/1/2023, Ser. D | | | 7,298,130 | |
| | 7,000,000 | | | 5.000%, 6/1/2024 | | | 7,282,870 | |
| | 5,000,000 | | | 5.000%, 3/1/2027 | | | 5,121,250 | |
| | 1,500,000 | | | 5.500%, 7/1/2033 | | | 1,581,720 | |
| | 1,750,000 | | | 5.500%, 7/1/2038 | | | 1,829,503 | |
| | | | Illinois G.O. Refg. | | | | |
| | 1,500,000 | | | 5.000%, 10/1/2021, Ser. B | | | 1,553,355 | |
| | | | Joliet, IL Regional Port District Marine Terminal Rev. Refg. (Exxon) | | | | |
| | 830,000 | | | 1.690%, 10/1/2024b | | | 830,000 | |
| | | | Metropolitan Pier and Exposition Auth., IL Refg. (McCormick Place Expansion) (NATL-RE Insured) | | | | |
| | 17,605,000 | | | Zero Coupon, 6/15/2020, Ser. Ac | | | 16,682,850 | |
| | 3,100,000 | | | Zero Coupon, 6/15/2024, Ser. Ac | | | 2,478,729 | |
| | 2,000,000 | | | Zero Coupon, 12/15/2024, Ser. Ac | | | 1,562,960 | |
| | | | Metropolitan Pier and Exposition Auth., IL Rev. Refg. (McCormick Place Expansion) | | | | |
| | 2,000,000 | | | Zero Coupon, 12/15/2047, Ser. Bd | | | 1,061,460 | |
| | | | Metropolitan Pier and Exposition Auth., IL Rev. Refg. (McCormick Place Expansion) (NATL-RE Insured) | | | | |
| | 920,000 | | | 5.500%, 6/15/2020c | | | 926,550 | |
| | | | Regional Transportation Auth., Cook, DuPage, Kane, Lake, McHenry and Will Counties, IL Rev. (NATL-RE Insured) | | | | |
| | 1,435,000 | | | 6.700%, 11/1/2021, Ser. Ac | | | 1,529,638 | |
The accompanying Notes to Financial Statements are an integral part of this schedule.
146
MUNICIPAL BOND FUND
Schedule of Investments as of October 31, 2018
| | | | | | | | |
Principal
Amount | | | Long-Term Fixed Income (98.8%) | | Value | |
| | Illinois (6.6%) - continued | | | | |
| | | | University of Illinois Auxiliary Fac. System Rev. | | | | |
| | $2,500,000 | | | 5.750%, 4/1/2038, Ser. Aa | | | $2,538,475 | |
| | | | | |
| | | | Total | | | 97,838,234 | |
| | | | | |
| |
| | Indiana (2.6%) | | | | |
| | | | Indiana Bond Bank Special Program Rev. (Clark Memorial Hospital) | | | | |
| | 7,000,000 | | | 5.500%, 8/1/2029, Ser. Da | | | 7,063,140 | |
| | | | Indiana Finance Auth. Hospital Rev. (Deaconess Hospital) | | | | |
| | 1,500,000 | | | 6.750%, 3/1/2039, Ser. Aa | | | 1,523,640 | |
| | | | Indiana Finance Auth. Wastewater Utility Rev. (CWA Auth., Inc.) | | | | |
| | 6,000,000 | | | 5.000%, 10/1/2041, Ser. A | | | 6,535,020 | |
| | | | Indiana Municipal Power Agency Power Supply System Rev. | | | | |
| | 1,750,000 | | | 5.250%, 1/1/2034, Ser. Aa | | | 1,974,543 | |
| | 4,155,000 | | | 5.000%, 1/1/2042, Ser. Aa | | | 4,459,894 | |
| | | | Indianapolis Local Public Improvement Bank Rev. (Waterworks) | | | | |
| | 980,000 | | | 5.750%, 1/1/2038, Ser. Aa | | | 986,272 | |
| | 4,020,000 | | | 5.750%, 1/1/2038, Ser. A | | | 4,044,723 | |
| | | | Knox County, IN Economic Development Rev. Refg. (Good Samaritan Hospital) | | | | |
| | 2,850,000 | | | 5.000%, 4/1/2037, Ser. A | | | 2,913,526 | |
| | 6,965,000 | | | 5.000%, 4/1/2042, Ser. A | | | 7,091,415 | |
| | | | Purdue University, IN Rev. Refg. | | | | |
| | 1,500,000 | | | 5.000%, 7/1/2028, Ser. A | | | 1,708,335 | |
| | | | | |
| | | | Total | | | 38,300,508 | |
| | | | | |
| |
| | Iowa (2.2%) | | | | |
| | | | Ames, IA Rev. Refg. (Mary Greeley Medical Center) | | | | |
| | 4,430,000 | | | 5.000%, 6/15/2032 | | | 4,861,571 | |
| | | | Cedar Falls Community School District, Black Hawk County School Infrastructure Sales, Services and Use Tax Rev. | | | | |
| | 3,165,000 | | | 5.400%, 6/1/2029a | | | 3,228,237 | |
| | | | Des Moines, IA Airport Auth. Rev. Refg. | | | | |
| | 1,205,000 | | | 5.000%, 6/1/2024, AMT | | | 1,277,384 | |
| | | | Iowa Finance Auth. Rev. (Lifespace Communities, Inc.) | | | | |
| | 4,000,000 | | | 5.000%, 5/15/2041, Ser. A | | | 4,095,720 | |
| | 1,500,000 | | | 5.000%, 5/15/2043, Ser. A | | | 1,537,680 | |
| | | | Iowa Finance Auth. Rev. Refg. | | | | |
| | 8,100,000 | | | 5.000%, 8/1/2036 | | | 9,197,712 | |
| | 3,000,000 | | | 5.000%, 8/1/2042 | | | 3,345,990 | |
| | | | Iowa Finance Auth. Senior Housing Rev. (PHS Council Bluffs, Inc.) | | | | |
| | 1,355,000 | | | 5.125%, 8/1/2048 | | | 1,319,580 | |
| | | | Waterloo, IA Community School District Tax Rev. Refg. | | | | |
| | 3,560,000 | | | 5.000%, 7/1/2029, Ser. Aa | | | 3,632,624 | |
| | | | | |
| | | | Total | | | 32,496,498 | |
| | | | | |
| |
| | Kansas (0.8%) | | | | |
| | | | Kansas Development Finance Auth. Rev. | | | | |
| | 3,575,000 | | | 5.000%, 5/15/2030, Ser. S | | | 3,656,081 | |
| | | | Lenexa, KS Health Care Fac. Rev. Refg. (Lakeview Village, Inc.) | | | | |
| | 2,750,000 | | | 5.000%, 5/15/2039, Ser. A | | | 2,821,280 | |
| | | | Sedgwick and Shawnee Counties, KS Single Family Mortgage Rev. (GNMA Collateralized) | | | | |
| | 10,000 | | | 6.700%, 6/1/2029, Ser. A-2c | | | 10,060 | |
| | | | University of Kansas Hospital Auth. Refg. Rev. | | | | |
| | 4,635,000 | | | 5.000%, 3/1/2047, Ser. A | | | 5,021,883 | |
| | | | | |
| | | | Total | | | 11,509,304 | |
| | | | | |
| |
| | Kentucky (1.3%) | | | | |
| | | | Kentucky Economic Development Finance Auth. Hospital Rev. (Owensboro Medical Health System, Inc.) | | | | |
| | 5,880,000 | | | 6.375%, 6/1/2040, Ser. Aa | | | 6,261,024 | |
| | | | Kentucky State Turnpike Auth. Economic Development Road Rev. | | | | |
| | 5,000,000 | | | 5.000%, 7/1/2028, Ser. Aa | | | 5,475,300 | |
| | | | Paducah, KY Electric Plant Board Rev. (AGC Insured) | | | | |
| | 2,500,000 | | | 5.250%, 10/1/2035, Ser. Aa,c | | | 2,534,400 | |
| | | | Paducah, KY Electric Plant Board Rev. (AGM Insured) | | | | |
| | 750,000 | | | 5.000%, 10/1/2035, Ser. Ac | | | 806,213 | |
| | | | Pikeville, KY Hospital Rev. (Pikeville Medical Center, Inc.) | | | | |
| | 3,540,000 | | | 6.500%, 3/1/2041 | | | 3,778,773 | |
| | | | | |
| | | | Total | | | 18,855,710 | |
| | | | | |
| |
| | Louisiana (2.8%) | | | | |
| | | | Alexandria, LA Utilities Rev. | | | | |
| | 5,000,000 | | | 5.000%, 5/1/2043, Ser. A | | | 5,374,200 | |
| | | | Lafayette Public Power Auth. Electric Rev. | | | | |
| | 375,000 | | | 5.000%, 11/1/2022 | | | 410,453 | |
| | 1,520,000 | | | 5.000%, 11/1/2031 | | | 1,649,823 | |
| | | | Louisiana Gas and Fuels Tax Rev. | | | | |
| | 5,000,000 | | | 5.000%, 5/1/2033, Ser. Ba | | | 5,210,350 | |
| | 7,000,000 | | | 5.000%, 5/1/2045, Ser. Ba | | | 7,294,490 | |
| | | | Louisiana Local Government Environmental Fac. & Community Development Auth. East Baton Rouge Sewer Rev. | | | | |
| | 4,900,000 | | | 5.000%, 2/1/2035, Ser. A | | | 5,281,759 | |
| | | | Louisiana Public Fac. Auth. Rev. (University of New Orleans Research & Technology Foundation, Inc. Student Housing) (AGM Insured) | | | | |
| | 1,355,000 | | | 5.000%, 9/1/2030c | | | 1,491,299 | |
| | 800,000 | | | 5.000%, 9/1/2031c | | | 878,680 | |
| | | | Louisiana Utilities Rev. (Parish of St. Tammany) | | | | |
| | 2,000,000 | | | 5.500%, 8/1/2035, Ser. B | | | 2,112,100 | |
| | | | New Orleans, LA Aviation Board Rev. | | | | |
| | 2,500,000 | | | 5.000%, 1/1/2040, Ser. B, AMT | | | 2,647,850 | |
The accompanying Notes to Financial Statements are an integral part of this schedule.
147
MUNICIPAL BOND FUND
Schedule of Investments as of October 31, 2018
| | | | | | | | |
Principal
Amount | | | Long-Term Fixed Income (98.8%) | | Value | |
| | Louisiana (2.8%) - continued | | | | |
| | $750,000 | | | 5.000%, 1/1/2048, Ser. B, AMT | | | $794,257 | |
| | | | New Orleans, LA G.O. Refg. | | | | |
| | 750,000 | | | 5.000%, 12/1/2026 | | | 847,582 | |
| | 850,000 | | | 5.000%, 12/1/2027 | | | 955,970 | |
| | 350,000 | | | 5.000%, 12/1/2029 | | | 391,034 | |
| | | | Port of New Orleans Board of Commissioners Port Fac. Refg. Rev. | | | | |
| | 1,365,000 | | | 5.000%, 4/1/2030, Ser. B, AMT | | | 1,449,180 | |
| | 1,500,000 | | | 5.000%, 4/1/2031, Ser. B, AMT | | | 1,589,985 | |
| | 525,000 | | | 5.000%, 4/1/2033, Ser. B, AMT | | | 552,762 | |
| | | | Port of New Orleans Board of Commissioners Rev. (AGM Insured) | | | | |
| | 1,500,000 | | | 5.000%, 4/1/2043, Ser. B, AMTc | | | 1,631,385 | |
| | | | | |
| | | | Total | | | 40,563,159 | |
| | | | | |
| |
| | Maryland (0.1%) | | | | |
| | | | Maryland Health & Higher Educational Fac. Auth. Rev. (Loyola University) | | | | |
| | 1,000,000 | | | 5.000%, 10/1/2045 | | | 1,088,390 | |
| | | | | |
| | | | Total | | | 1,088,390 | |
| | | | | |
| |
| | Massachusetts (3.5%) | | | | |
| | | | Massachusetts Bay Transportation Auth. Sales Tax Rev. (NATL-RE Insured) | | | | |
| | 5,000,000 | | | 5.500%, 7/1/2025, Ser. Bc | | | 5,905,250 | |
| | | | Massachusetts Development Finance Agency Rev. (Dana-Farber Cancer Institute) | | | | |
| | 6,500,000 | | | 5.000%, 12/1/2046, Ser. N | | | 6,963,385 | |
| | | | Massachusetts Development Finance Agency Rev. (Northeastern University) | | | | |
| | 750,000 | | | 5.000%, 10/1/2031 | | | 813,068 | |
| | | | Massachusetts Development Finance Agency Rev. (Wellesley College) | | | | |
| | 3,000,000 | | | 5.000%, 7/1/2042, Ser. J | | | 3,234,720 | |
| | | | Massachusetts Health & Educational Fac. Auth. Rev. (Massachusetts Institute of Technology) | | | | |
| | 15,295,000 | | | 5.250%, 7/1/2033, Ser. L | | | 18,900,643 | |
| | | | Massachusetts Health & Educational Fac. Auth. Rev. (Tufts University) | | | | |
| | 5,400,000 | | | 5.500%, 2/15/2028, Ser. M | | | 6,545,340 | |
| | | | Massachusetts Port Auth. Rev. | | | | |
| | 8,300,000 | | | 5.000%, 7/1/2042, Ser. A, AMT | | | 8,785,799 | |
| | | | | |
| | | | Total | | | 51,148,205 | |
| | | | | |
| |
| | Michigan (2.3%) | | | | |
| | | | East Lansing Building Auth., Ingham and Clinton Counties, MI Building Auth. Rev. (G.O. Limited Tax) | | | | |
| | 870,000 | | | 5.700%, 4/1/2020 | | | 894,951 | |
| | | | Flint Hospital Building Auth. Rev. Refg. (Hurley Medical Center) | | | | |
| | 3,000,000 | | | 5.000%, 7/1/2019, Ser. B | | | 3,034,860 | |
| | | | Grand Valley, MI State University General Rev. Refg. | | | | |
| | 650,000 | | | 5.000%, 12/1/2029, Ser. B | | | 722,514 | |
| | | | Grand Valley, MI State University Rev. | | | | |
| | 1,850,000 | | | 5.000%, 12/1/2031, Ser. A | | | 2,051,927 | |
| | | | Great Lakes, MI Water Auth. Water Supply System Rev. | | | | |
| | 10,000,000 | | | 5.000%, 7/1/2046, Ser. A | | | 10,908,900 | |
| | | | Kalamazoo Hospital Finance Auth. Rev. (Bronson Methodist Hospital) (AGM Insured) | | | | |
| | 2,210,000 | | | 5.250%, 5/15/2036a,c | | | 2,310,224 | |
| | 1,790,000 | | | 5.250%, 5/15/2036c | | | 1,851,361 | |
| | | | Kent County, MI G.O. | | | | |
| | 2,775,000 | | | 5.000%, 1/1/2024, AMT | | | 2,966,697 | |
| | | | Michigan State Finance Auth. Rev. (Beaumont Health Credit Group) | | | | |
| | 6,000,000 | | | 5.000%, 11/1/2044, Ser. A | | | 6,389,400 | |
| | | | Rochester Community School District, Oakland and Macomb Counties, MI School Building and Site G.O. (NATL-RE Q-SBLF Insured) | | | | |
| | 2,280,000 | | | 5.000%, 5/1/2019c | | | 2,315,158 | |
| | | | | |
| | | | Total | | | 33,445,992 | |
| | | | | |
| |
| | Minnesota (3.6%) | | | | |
| | | | Apple Valley, MN Senior Housing Rev. Refg. (PHS Apple Valley Senior Housing, Inc. - Orchard Path) | | | | |
| | 500,000 | | | 5.000%, 9/1/2043 | | | 520,495 | |
| | | | Goodhue County, MN Education District No. 6051 C.O.P. | | | | |
| | 250,000 | | | 5.000%, 2/1/2029 | | | 270,310 | |
| | 500,000 | | | 5.000%, 2/1/2034 | | | 536,635 | |
| | 750,000 | | | 5.000%, 2/1/2039 | | | 794,235 | |
| | | | Ham Lake, MN Charter School Lease Rev. (DaVinci Academy of Arts and Science) | | | | |
| | 340,000 | | | 5.000%, 7/1/2036, Ser. A | | | 337,222 | |
| | | | Housing and Redevelopment Auth. of St. Paul MN Rev. | | | | |
| | 1,000,000 | | | 5.000%, 10/1/2043* | | | 1,013,420 | |
| | | | Minneapolis, MN Student Housing Rev. (Riverton Community Housing) | | | | |
| | 500,000 | | | 5.000%, 8/1/2053e | | | 503,475 | |
| | | | Minnesota Higher Education Fac. Auth. Rev. (Augsburg College) | | | | |
| | 2,500,000 | | | 5.000%, 5/1/2046, Ser. A | | | 2,593,275 | |
| | | | Minnesota Higher Education Fac. Auth. Rev. (College of St. Scholastica, Inc.) | | | | |
| | 1,575,000 | | | 5.250%, 12/1/2035, Ser. H | | | 1,609,823 | |
| | 1,800,000 | | | 6.300%, 12/1/2040, Ser. 7J | | | 1,855,242 | |
| | | | Minnesota Higher Education Fac. Auth. Rev. Refg. (Gustavus Adolphus College) | | | | |
| | 4,250,000 | | | 5.000%, 10/1/2047 | | | 4,599,010 | |
| | | | Minnesota Higher Education Fac. Auth. Rev. Refg. (St. Catherine University) | | | | |
| | 1,015,000 | | | 5.000%, 10/1/2045, Ser. A | | | 1,082,802 | |
| | | | Minnesota Municipal Power Agency Electric Rev. | | | | |
| | 200,000 | | | 5.000%, 10/1/2029 | | | 223,360 | |
The accompanying Notes to Financial Statements are an integral part of this schedule.
148
MUNICIPAL BOND FUND
Schedule of Investments as of October 31, 2018
| | | | | | | | |
Principal
Amount | | | Long-Term Fixed Income (98.8%) | | Value | |
| | Minnesota (3.6%) - continued | | | | |
| | $150,000 | | | 5.000%, 10/1/2030 | | | $167,088 | |
| | 200,000 | | | 5.000%, 10/1/2032 | | | 222,326 | |
| | 175,000 | | | 5.000%, 10/1/2033 | | | 194,033 | |
| | 1,500,000 | | | 5.000%, 10/1/2047 | | | 1,638,060 | |
| | | | North Oaks, MN Senior Housing Rev. Refg. (Waverly Gardens) | | | | |
| | 4,000,000 | | | 5.000%, 10/1/2047 | | | 4,210,680 | |
| | | | Rochester, MN Health Care Fac. Rev. (Olmsted Medical Center) | | | | |
| | 1,000,000 | | | 5.875%, 7/1/2030 | | | 1,053,290 | |
| | | | St. Cloud, MN Health Care Rev. Refg. (CentraCare Health System) | | | | |
| | 125,000 | | | 5.125%, 5/1/2030, Ser. A | | | 130,149 | |
| | 1,915,000 | | | 5.125%, 5/1/2030, Ser. Aa | | | 1,997,632 | |
| | 1,000,000 | | | 5.000%, 5/1/2046, Ser. A | | | 1,073,600 | |
| | | | St. Louis Park, MN Health Care Fac. Rev. Refg. (Park Nicollet Health Services) | | | | |
| | 5,745,000 | | | 5.750%, 7/1/2039a | | | 5,884,661 | |
| | | | St. Paul, MN Housing & Redevelopment Auth. Health Care Fac. Rev. Refg. (HealthPartners Obligated Group) | | | | |
| | 5,945,000 | | | 5.000%, 7/1/2032, Ser. A | | | 6,544,910 | |
| | | | St. Paul, MN Housing & Redevelopment Auth. Health Care Rev. Refg. (Fairview Health Services) | | | | |
| | 6,945,000 | | | 5.000%, 11/15/2047, Ser. A | | | 7,412,885 | |
| | | | University of Minnesota Rev. (State Supported Biomedical Science Research Fac. Funding) | | | | |
| | 1,655,000 | | | 5.000%, 8/1/2030, Ser. B | | | 1,769,129 | |
| | | | Western Minnesota Municipal Power Agency Rev. | | | | |
| | 1,000,000 | | | 5.000%, 1/1/2033, Ser. A | | | 1,103,030 | |
| | 1,000,000 | | | 5.000%, 1/1/2034, Ser. A | | | 1,102,020 | |
| | 300,000 | | | 5.000%, 1/1/2035, Ser. A | | | 330,153 | |
| | 1,000,000 | | | 5.000%, 1/1/2040, Ser. A | | | 1,093,480 | |
| | | | Winona, MN Health Care Fac. Rev. Refg. (Winona Health Obligated Group) | | | | |
| | 500,000 | | | 5.000%, 7/1/2034 | | | 509,070 | |
| | | | | |
| | | | Total | | | 52,375,500 | |
| | | | | |
| |
| | Mississippi (0.4%) | | | | |
| | | | D’Iberville Tax Increment Refg. (Gulf Coast Promenade) | | | | |
| | 1,750,000 | | | 5.000%, 4/1/2033 | | | 1,834,875 | |
| | | | Mississippi Development Bank G.O. (Desoto County Highway Construction) | | | | |
| | 3,180,000 | | | 5.000%, 1/1/2030 | | | 3,425,782 | |
| | | | | |
| | | | Total | | | 5,260,657 | |
| | | | | |
| |
| | Missouri (0.4%) | | | | |
| | | | Missouri Health and Educational Fac. Auth. Health Fac. Rev. (Lake Regional Health System) | | | | |
| | 810,000 | | | 5.000%, 2/15/2019 | | | 815,225 | |
| | 925,000 | | | 5.000%, 2/15/2022 | | | 985,430 | |
| | 1,680,000 | | | 5.000%, 2/15/2034 | | | 1,737,439 | |
| | | | St. Louis, MO Airport Rev. (AGM Insured) | | | | |
| | 1,000,000 | | | 5.000%, 7/1/2047, Ser. Cc | | | 1,094,790 | |
| | | | St. Louis, MO Airport Rev. Refg. (Lambert-St. Louis International Airport) | | | | |
| | 1,000,000 | | | 5.000%, 7/1/2032, AMT | | | 1,067,070 | |
| | | | | |
| | | | Total | | | 5,699,954 | |
| | | | | |
| |
| | Nebraska (1.9%) | | | | |
| | | | Douglas County, NE Hospital Auth. No. 2 Health Fac. Rev. (Childrens Hospital Obligated Group) | | | | |
| | 2,105,000 | | | 5.000%, 11/15/2047 | | | 2,254,350 | |
| | | | Douglas County, NE Hospital Auth. No. 3 Health Fac. Refg. Rev. (Nebraska Methodist Health System) | | | | |
| | 2,000,000 | | | 5.750%, 11/1/2048a | | | 2,000,000 | |
| | | | Lincoln, NE Lincoln Electric System Rev. Refg. | | | | |
| | 2,500,000 | | | 5.000%, 9/1/2037 | | | 2,702,150 | |
| | | | Nebraska Public Power District Rev. | | | | |
| | 1,325,000 | | | 5.000%, 1/1/2033, Ser. A | | | 1,414,702 | |
| | | | Omaha, NE Public Power District Electric Rev. | | | | |
| | 8,150,000 | | | 5.000%, 2/1/2045, Ser. A | | | 8,905,179 | |
| | | | Omaha, NE Public Power District Electric Rev. Refg. | | | | |
| | 2,260,000 | | | 5.000%, 2/1/2042, Ser. A | | | 2,516,126 | |
| | | | Omaha, NE Sanitary Sewerage System Rev. | | | | |
| | 1,340,000 | | | 5.000%, 11/15/2034 | | | 1,494,783 | |
| | | | University of Nebraska Lincoln Student Fees and Fac. Rev. | | | | |
| | 1,000,000 | | | 5.000%, 7/1/2037 | | | 1,071,150 | |
| | | | University of Nebraska Lincoln Student Fees and Fac. Rev. Refg. | | | | |
| | 3,050,000 | | | 5.000%, 7/1/2038 | | | 3,296,379 | |
| | | | University of Nebraska Student Housing Rev. | | | | |
| | 1,680,000 | | | 5.000%, 5/15/2040, Ser. Ba | | | 1,753,769 | |
| | | | | |
| | | | Total | | | 27,408,588 | |
| | | | | |
| |
| | Nevada (0.4%) | | | | |
| | | | Carson City, NV Hospital Rev. Refg. (Carson Tahoe Regional Medical Center) | | | | |
| | 1,500,000 | | | 5.000%, 9/1/2042, Ser. A | | | 1,587,690 | |
| | 3,250,000 | | | 5.000%, 9/1/2047, Ser. A | | | 3,427,710 | |
| | | | Director of the State of Nevada Department of Business & Industry Rev. (Somerset Academy of Las Vegas) | | | | |
| | 500,000 | | | 5.000%, 12/15/2048, Ser. Ae | | | 493,075 | |
| | | | | |
| | | | Total | | | 5,508,475 | |
| | | | | |
| |
| | New Hampshire (0.2%) | | | | |
| | | | New Hampshire Health and Education Fac. Auth. Rev. Refg. (Dartmouth College) | | | | |
| | 500,000 | | | 1.660%, 6/1/2041, Ser. Bb | | | 500,000 | |
The accompanying Notes to Financial Statements are an integral part of this schedule.
149
MUNICIPAL BOND FUND
Schedule of Investments as of October 31, 2018
| | | | | | | | |
Principal
Amount | | | Long-Term Fixed Income (98.8%) | | Value | |
| | New Hampshire (0.2%) - continued | | | | |
| | | | New Hampshire State Turnpike System Rev. Refg. | | | | |
| | $2,000,000 | | | 5.000%, 10/1/2019 | | | $2,054,400 | |
| | | | | |
| | | | Total | | | 2,554,400 | |
| | | | | |
| |
| | New Jersey (1.5%) | | | | |
| | | | New Jersey Economic Development Auth. Rev. | | | | |
| | 4,350,000 | | | 5.000%, 6/15/2042, Ser. D | | | 4,491,201 | |
| | | | New Jersey Educational Fac. Auth. Rev. Refg. (Kean University) | | | | |
| | 1,000,000 | | | 5.500%, 9/1/2036, Ser. Aa | | | 1,029,240 | |
| | | | New Jersey Transportation Trust Fund Auth. Rev. | | | | |
| | 1,000,000 | | | 5.250%, 6/15/2033, Ser. AA | | | 1,069,020 | |
| | 1,645,000 | | | 5.250%, 6/15/2034, Ser. AA | | | 1,750,675 | |
| | | | New Jersey Transportation Trust Fund Auth. Transportation System Rev. | | | | |
| | 1,500,000 | | | 5.000%, 6/15/2026, Ser. A | | | 1,570,350 | |
| | | | Ocean County, NJ Utilities Auth. Waste Water Rev. (NATL-RE Insured) | | | | |
| | 3,180,000 | | | 5.250%, 1/1/2025c | | | 3,656,968 | |
| | | | Tobacco Settlement Financing Corporation Rev. Refg. | | | | |
| | 8,275,000 | | | 5.250%, 6/1/2046, Ser. A | | | 8,746,758 | |
| | | | | |
| | | | Total | | | 22,314,212 | |
| | | | | |
| |
| | New York (7.6%) | | | | |
| | | | Buffalo & Erie County, NY Industrial Land Development Corporation Rev. | | | | |
| | 1,500,000 | | | 5.000%, 8/1/2047, Ser. A | | | 1,534,335 | |
| | | | Hudson, NY Yards Infrastructure Corporation Rev. Refg. | | | | |
| | 2,000,000 | | | 5.000%, 2/15/2042, Ser. A | | | 2,194,460 | |
| | | | Metropolitan Transportation Auth. NY Rev. Refg. | | | | |
| | 2,190,000 | | | 5.000%, 11/15/2035 | | | 2,466,071 | |
| | | | Monroe County Industrial Development Corporation Rev. Refg. (University of Rochester) | | | | |
| | 1,000,000 | | | 5.000%, 7/1/2030, Ser. D | | | 1,149,910 | |
| | 800,000 | | | 5.000%, 7/1/2031, Ser. D | | | 914,032 | |
| | 1,550,000 | | | 5.000%, 7/1/2031, Ser. C | | | 1,770,937 | |
| | | | New York City Municipal Water Finance Auth. Water and Sewer System Rev. | | | | |
| | 3,250,000 | | | 5.375%, 6/15/2043, Ser. EE | | | 3,449,225 | |
| | | | New York City Transitional Finance Auth. Future Tax Secured Rev. | | | | |
| | 15,000,000 | | | 5.000%, 11/1/2033, Ser. D-1 | | | 16,080,900 | |
| | 19,000,000 | | | 5.000%, 2/1/2043, Ser. A | | | 20,839,770 | |
| | | | New York State Dormitory Auth. State Personal Income Tax Rev. | | | | |
| | 15,000 | | | 5.000%, 2/15/2029, Ser. Aa | | | 15,139 | |
| | 235,000 | | | 5.000%, 2/15/2029, Ser. A | | | 236,930 | |
| | 4,875,000 | | | 5.000%, 2/15/2029, Ser. Aa | | | 4,919,411 | |
| | 5,000,000 | | | 5.000%, 3/15/2039, Ser. C | | | 5,458,650 | |
| | | | New York State Dormitory Auth. State Personal Income Tax Rev. Refg. | | | | |
| | 8,330,000 | | | 5.000%, 2/15/2043, Ser. B | | | 9,194,737 | |
| | | | New York State Liberty Development Corporation Liberty Rev. | | | | |
| | 10,000,000 | | | 5.250%, 12/15/2043 | | | 10,791,900 | |
| | | | New York State Urban Development Corporation State Personal Income Tax Rev. (State Fac. and Equipment) | | | | |
| | 3,870,000 | | | 5.000%, 3/15/2036, Ser. B-1a | | | 3,916,169 | |
| | | | New York Transportation Development Corporation Special Fac. Rev. (LaGuardia Airport) | | | | |
| | 775,000 | | | 5.000%, 1/1/2036, AMT | | | 829,018 | |
| | | | New York, NY G.O. | | | | |
| | 1,920,000 | | | 5.000%, 8/1/2032, Ser. A | | | 2,127,667 | |
| | 515,000 | | | 1.700%, 3/1/2042, Ser. Fb | | | 515,000 | |
| | | | Port Auth. of New York & New Jersey Rev. | | | | |
| | 1,125,000 | | | 5.000%, 12/1/2024, Ser. 178, AMT | | | 1,241,426 | |
| | 2,500,000 | | | 5.000%, 9/1/2035 | | | 2,772,600 | |
| | 2,500,000 | | | 5.000%, 9/1/2036 | | | 2,768,350 | |
| | 5,000,000 | | | 5.000%, 9/1/2039 | | | 5,494,550 | |
| | | | Port Auth. of New York & New Jersey Rev. Refg. | | | | |
| | 5,000,000 | | | 5.000%, 9/15/2034, Ser. 207, AMT | | | 5,543,950 | |
| | 1,715,000 | | | 5.000%, 9/15/2048, Ser. 207, AMT | | | 1,856,196 | |
| | | | Triborough NY Bridge & Tunnel Auth. Rev. | | | | |
| | 2,550,000 | | | 5.000%, 11/15/2037, Ser. 2008B-3 | | | 2,835,396 | |
| | 1,000,000 | | | 5.250%, 11/15/2045, Ser. A | | | 1,124,420 | |
| | | | | |
| | | | Total | | | 112,041,149 | |
| | | | | |
| |
| | North Carolina (1.3%) | | | | |
| | | | Charlotte, NC, Rev. (Charlotte Douglas International Airport) | | | | |
| | 1,500,000 | | | 5.000%, 7/1/2042, Ser. A | | | 1,673,970 | |
| | | | North Carolina Capital Fac. Finance Agency Educational Fac. Rev. Refg. (Meredith College) | | | | |
| | 2,870,000 | | | 5.000%, 6/1/2038 | | | 3,040,593 | |
| | | | North Carolina Capital Fac. Finance Agency Rev. Refg. (Johnson and Wales University) | | | | |
| | 1,000,000 | | | 5.000%, 4/1/2032 | | | 1,079,080 | |
| | 1,000,000 | | | 5.000%, 4/1/2033 | | | 1,077,360 | |
| | | | North Carolina Eastern Municipal Power Agency Power System Rev. | | | | |
| | 2,580,000 | | | 5.000%, 1/1/2021, Ser. Aa | | | 2,736,271 | |
| | 1,475,000 | | | 6.000%, 1/1/2026, Ser. Aa | | | 1,646,306 | |
| | | | North Carolina Municipal Power Agency No. 1 Catawba Electric Rev. Refg. | | | | |
| | 925,000 | | | 5.000%, 1/1/2025, Ser. A | | | 929,301 | |
| | 360,000 | | | 5.000%, 1/1/2030, Ser. A | | | 361,638 | |
| | | | Raleigh Durham, NC Airport Auth. Rev. | | | | |
| | 4,895,000 | | | 5.000%, 5/1/2036, Ser. A | | | 5,072,982 | |
| | | | University of North Carolina at Wilmington, Rev. (Student Housing) | | | | |
| | 1,745,000 | | | 5.000%, 6/1/2022 | | | 1,894,739 | |
| | | | | |
| | | | Total | | | 19,512,240 | |
| | | | | |
The accompanying Notes to Financial Statements are an integral part of this schedule.
150
MUNICIPAL BOND FUND
Schedule of Investments as of October 31, 2018
| | | | | | | | |
Principal
Amount | | | Long-Term Fixed Income (98.8%) | | Value | |
| | North Dakota (0.7%) | | | | |
| | | | Grand Forks, ND Altru Health System Rev. | | | | |
| | $3,890,000 | | | 5.000%, 12/1/2042, Ser. A | | | $4,131,880 | |
| | | | North Dakota Public Finance Auth. Rev. (State Revolving Fund) | | | | |
| | 1,495,000 | | | 5.000%, 10/1/2031, Ser. A | | | 1,604,165 | |
| | | | University of North Dakota C.O.P. (Infrastructure Energy Improvement) | | | | |
| | 3,775,000 | | | 5.000%, 4/1/2048, Ser. A | | | 4,083,984 | |
| | | | | |
| | | | Total | | | 9,820,029 | |
| | | | | |
| |
| | Ohio (5.3%) | | | | |
| | | | American Municipal Power Ohio, Inc. Rev. (Greenup Hydroelectric) | | | | |
| | 1,000,000 | | | 5.000%, 2/15/2041, Ser. A | | | 1,074,380 | |
| | | | AMP Fremont Energy Center Rev. | | | | |
| | 3,000,000 | | | 5.000%, 2/15/2037, Ser. B | | | 3,189,210 | |
| | | | Buckeye, OH Tobacco Settlement Financing Auth. Rev. | | | | |
| | 14,505,000 | | | 5.125%, 6/1/2024, Ser. A-2 | | | 14,015,021 | |
| | | | County of Fairfield, OH Hospital Rev. Refg. and Improvement (Fairfield Medical Center) | | | | |
| | 3,470,000 | | | 5.250%, 6/15/2043 | | | 3,605,122 | |
| | | | Cuyahoga County, OH Sales Tax Rev. | | | | |
| | 1,000,000 | | | 5.000%, 12/1/2035 | | | 1,112,150 | |
| | | | Kent State University General Receipts Rev. | | | | |
| | 400,000 | | | 5.000%, 5/1/2021 | | | 426,568 | |
| | 2,000,000 | | | 5.000%, 5/1/2029 | | | 2,252,480 | |
| | 1,500,000 | | | 5.000%, 5/1/2037, Ser. A | | | 1,599,405 | |
| | | | Lucas County, OH Health Care System Refg. Rev. (Sunset Retirement Communities) | | | | |
| | 1,360,000 | | | 5.125%, 8/15/2025 | | | 1,428,449 | |
| | 1,750,000 | | | 5.500%, 8/15/2030 | | | 1,832,092 | |
| | | | Miami University OH Rev. | | | | |
| | 1,600,000 | | | 5.000%, 9/1/2036 | | | 1,699,136 | |
| | | | Ohio Higher Educational Fac. Commission Rev. (Case Western Reserve University) | | | | |
| | 750,000 | | | 6.500%, 10/1/2020, Ser. B | | | 788,850 | |
| | 2,745,000 | | | 5.000%, 12/1/2028 | | | 3,069,047 | |
| | | | Ohio Higher Educational Fac. Commission Rev. (Dayton University) | | | | |
| | 2,565,000 | | | 5.000%, 12/1/2035, Ser. A | | | 2,794,055 | |
| | | | Ohio Higher Educational Fac. Commission Rev. (Kenyon College) | | | | |
| | 3,025,000 | | | 5.000%, 7/1/2042 | | | 3,295,344 | |
| | | | Ohio Higher Educational Fac. Commission Rev. Refg. (Kenyon College) | | | | |
| | 3,235,000 | | | 5.250%, 7/1/2044a | | | 3,395,780 | |
| | 1,505,000 | | | 5.250%, 7/1/2044 | | | 1,572,484 | |
| | | | Ohio Hospital Rev. (Cleveland Clinic Health System Obligated Group) | | | | |
| | 5,000,000 | | | 5.000%, 1/1/2034 | | | 5,344,750 | |
| | | | Ohio State Turnpike Commission Rev. | | | | |
| | 8,570,000 | | | Zero Coupon, 2/15/2034, Ser. A-4d | | | 8,136,015 | |
| | | | Ohio State Turnpike Commission Rev. Refg. (NATL-RE Insured) | | | | |
| | 10,000,000 | | | 5.500%, 2/15/2026, Ser. Ac | | | 11,633,900 | |
| | | | Toledo, OH Water System Rev. and Improvements | | | | |
| | 2,455,000 | | | 5.000%, 11/15/2036 | | | 2,716,408 | |
| | | | Toledo, OH Water System Rev. Refg. and Improvements | | | | |
| | 2,500,000 | | | 5.000%, 11/15/2038 | | | 2,714,975 | |
| | | | | |
| | | | Total | | | 77,695,621 | |
| | | | | |
| |
| | Oklahoma (1.9%) | | | | |
| | | | Grand River, OK Dam Authority Rev. | | | | |
| | 7,815,000 | | | 5.000%, 6/1/2039, Ser. A | | | 8,595,562 | |
| | | | Oklahoma Agricultural and Mechanical Colleges General Rev. | | | | |
| | 3,000,000 | | | 5.000%, 8/1/2038, Ser. C | | | 3,260,730 | |
| | | | Oklahoma Development Finance Auth. Health System Rev. (OU Medicine) | | | | |
| | 4,275,000 | | | 5.250%, 8/15/2048, Ser. B | | | 4,526,242 | |
| | | | Oklahoma State Water Resources Board Loan Program Rev. | | | | |
| | 2,005,000 | | | 5.000%, 10/1/2040, Ser. A | | | 2,221,500 | |
| | | | Oklahoma Turnpike Auth. Rev. | | | | |
| | 500,000 | | | 5.000%, 1/1/2028, Ser. A | | | 527,890 | |
| | 2,500,000 | | | 5.000%, 1/1/2042, Ser. A | | | 2,732,375 | |
| | 5,665,000 | | | 5.000%, 1/1/2047, Ser. C | | | 6,217,224 | |
| | | | | |
| | | | Total | | | 28,081,523 | |
| | | | | |
| |
| | Oregon (0.3%) | | | | |
| | | | Clackamas County, OR Hospital Fac. Auth. Rev. (Legacy Health Systems) | | | | |
| | 300,000 | | | 5.500%, 7/15/2035, Ser. Aa | | | 307,410 | |
| | | | Port of Portland, OR Rev. Refg. (Portland International Airport) | | | | |
| | 1,025,000 | | | 5.000%, 7/1/2035, Ser. 23 | | | 1,130,360 | |
| | | | Salem-Keizer School District No. 24J, Marion and Polk Counties, OR G.O. | | | | |
| | 5,000,000 | | | Zero Coupon, 6/15/2028, Ser. B | | | 3,635,700 | |
| | | | | |
| | | | Total | | | 5,073,470 | |
| | | | | |
| |
| | Pennsylvania (2.4%) | | | | |
| | | | Allegheny County Hospital Development Auth. Rev. (University of Pittsburgh Medical Center) | | | | |
| | 2,100,000 | | | 5.625%, 8/15/2039 | | | 2,150,673 | |
| | | | Berks County, PA Industrial Development Auth. Healthcare Fac. Rev. Refg. (Highlands at Wyomissing) | | | | |
| | 460,000 | | | 5.000%, 5/15/2043 | | | 482,798 | |
| | 410,000 | | | 5.000%, 5/15/2048 | | | 426,158 | |
| | | | Cumberland County, PA Municipal Auth. Rev. (Diakon Lutheran Social Ministries) | | | | |
| | 205,000 | | | 6.125%, 1/1/2029 | | | 206,402 | |
| | 1,860,000 | | | 6.125%, 1/1/2029a | | | 1,872,258 | |
| | 1,350,000 | | | 5.000%, 1/1/2038 | | | 1,417,770 | |
The accompanying Notes to Financial Statements are an integral part of this schedule.
151
MUNICIPAL BOND FUND
Schedule of Investments as of October 31, 2018
| | | | | | | | |
Principal
Amount | | | Long-Term Fixed Income (98.8%) | | Value | |
| | Pennsylvania (2.4%) - continued | | | | |
| | | | Lycoming County, PA Auth. Health System Rev. (Susquehanna Health System) | | | | |
| | $7,075,000 | | | 5.750%, 7/1/2039, Ser. A | | | $7,250,318 | |
| | | | Pennsylvania Turnpike Commission Turnpike Rev. | |
| | 3,000,000 | | | 5.000%, 12/1/2040, Ser. B | | | 3,237,030 | |
| | 4,950,000 | | | 5.000%, 12/1/2046, Ser. A-1 | | | 5,327,784 | |
| | | | Pennsylvania Turnpike Commission Turnpike Rev. (AGM Insured) | |
| | 10,440,000 | | | 6.250%, 6/1/2033, Ser. Cc | | | 12,467,135 | |
| | | | | |
| | | | Total | | | 34,838,326 | |
| | | | | |
| |
| | South Carolina (1.4%) | | | | |
| | | | Beaufort-Jasper Water & Sewer Auth. Rev. Refg. | |
| | 425,000 | | | 5.000%, 3/1/2025, Ser. B | | | 485,771 | |
| | | | Charleston County, SC Airport System Rev. | |
| | 6,215,000 | | | 5.500%, 7/1/2031, Ser. A, AMT | | | 6,892,000 | |
| | | | Greenwood County, SC Hospital Fac. Rev. (Self Regional Healthcare) | |
| | 2,250,000 | | | 5.375%, 10/1/2039a | | | 2,317,140 | |
| | | | Greenwood County, SC Hospital Fac. Rev. Refg. (Self Regional Healthcare) | |
| | 1,120,000 | | | 5.000%, 10/1/2024, Ser. B | | | 1,206,867 | |
| | 2,890,000 | | | 5.000%, 10/1/2031, Ser. B | | | 3,085,855 | |
| | | | Piedmont, SC Municipal Power Agency Electric Rev. Refg. (NATL-RE Insured) | |
| | 4,000,000 | | | 6.250%, 1/1/2021c | | | 4,326,200 | |
| | | | South Carolina Jobs Economic Development Auth. Refg. (Life Communities, Inc.) | |
| | 2,000,000 | | | 5.000%, 11/15/2047, Ser. C | | | 2,114,780 | |
| | | | | |
| | | | Total | | | 20,428,613 | |
| | | | | |
| |
| | South Dakota (0.3%) | | | | |
| | | | South Dakota Board Of Regents Housing & Auxiliary Fac. System Rev. | |
| | 1,000,000 | | | 5.000%, 4/1/2033, Ser. B | | | 1,102,490 | |
| | | | South Dakota Health & Educational Fac. Auth. Rev. (Regional Health) | |
| | 1,000,000 | | | 5.000%, 9/1/2023a | | | 1,050,680 | |
| | 820,000 | | | 5.000%, 9/1/2025a | | | 861,558 | |
| | | | South Dakota Health & Educational Fac. Auth. Rev. (Sanford Health) | |
| | 1,250,000 | | | 5.500%, 11/1/2040 | | | 1,286,575 | |
| | | | | |
| | | | Total | | | 4,301,303 | |
| | | | | |
| |
| | Tennessee (0.3%) | | | | |
| | | | Jackson-Madison County General Hospital, Inc. | |
| | 555,000 | | | 5.625%, 4/1/2038 | | | 556,626 | |
| | 930,000 | | | 5.750%, 4/1/2041 | | | 932,772 | |
| | | | Tennessee State School Bond Auth. Rev. (2nd Program) | |
| | 500,000 | | | 5.000%, 11/1/2031 | | | 556,255 | |
| | 450,000 | | | 5.000%, 11/1/2032 | | | 499,585 | |
| | 1,275,000 | | | 5.000%, 11/1/2034 | | | 1,408,123 | |
| | 250,000 | | | 5.000%, 11/1/2036 | | | 274,665 | |
| | | | | |
| | | | Total | | | 4,228,026 | |
| | | | | |
| |
| | Texas (9.3%) | | | | |
| | | | Clifton, TX Higher Education Finance Corporation Education Rev. (IDEA Public Schools) | | | | |
| | 1,000,000 | | | 5.000%, 8/15/2042 | | | 1,035,460 | |
| | 2,000,000 | | | 6.000%, 8/15/2043 | | | 2,178,880 | |
| | | | Clifton, TX Higher Education Finance Corporation Education Rev. (IDEA Public Schools) (PSF-GTD Insured) | | | | |
| | 1,000,000 | | | 5.000%, 8/15/2036, Ser. Ac | | | 1,094,270 | |
| | 4,605,000 | | | 5.000%, 8/15/2039c | | | 4,993,846 | |
| | 2,000,000 | | | 5.000%, 8/15/2046, Ser. Ac | | | 2,163,140 | |
| | | | Clifton, TX Higher Education Finance Corporation Education Rev. (Uplift Education) | | | | |
| | 4,000,000 | | | 6.250%, 12/1/2045, Ser. Aa | | | 4,321,640 | |
| | | | Dallas and Fort Worth, TX International Airport Rev. Refg. | | | | |
| | 4,000,000 | | | 5.250%, 11/1/2033, Ser. F | | | 4,399,200 | |
| | | | Gulf Coast Waste Disposal Auth., TX Pollution Control Rev. Refg. (Exxon) | | | | |
| | 1,100,000 | | | 1.690%, 6/1/2020b | | | 1,100,000 | |
| | | | Harris County Health Fac. Development Corporation Hospital Rev. Refg. (Memorial Hermann Healthcare System) | | | | |
| | 2,015,000 | | | 7.250%, 12/1/2035, Ser. Ba | | | 2,023,664 | |
| | | | Harris County, TX Cultural Education Fac. Finance Corporation Rev. Refg. (Brazos Presbyterian Homes) | | | | |
| | 2,000,000 | | | 5.000%, 1/1/2037 | | | 2,081,440 | |
| | | | Houston, TX Water and Sewer System Rev. Refg. (AGM Insured) | | | | |
| | 10,000,000 | | | 5.750%, 12/1/2032, Ser. Aa,c | | | 12,872,100 | |
| | | | Lake Travis Independent School District G.O. Refg. (PSF-GTD Insured) | | | | |
| | 1,000,000 | | | 5.000%, 2/15/2031c | | | 1,137,080 | |
| | | | Lewisville,TX Independent School District U.T.G.O. Refg. (PSF-GTD Insured) | | | | |
| | 5,315,000 | | | Zero Coupon, 8/15/2019c | | | 5,230,438 | |
| | | | New Hope Cultural Education Facilities Corporation, TX Student Housing Rev. (Collegiate Housing College Station I LLC - Texas A&M University) | | | | |
| | 1,000,000 | | | 5.000%, 4/1/2029, Ser. A | | | 1,054,680 | |
| | | | North East Independent School District, Bexar County, TX G.O. Unlimited Tax Refg. (PSF-GTD Insured) | | | | |
| | 5,000,000 | | | 5.250%, 2/1/2028c | | | 5,951,300 | |
| | 2,000,000 | | | 5.250%, 2/1/2029c | | | 2,398,280 | |
| | | | North Texas Education Finance Corporation Education Rev. (Uplift Education) | | | | |
| | 4,500,000 | | | 5.125%, 12/1/2042, Ser. A | | | 4,659,570 | |
| | | | North Texas Tollway Auth. System Rev. | | | | |
| | 15,000,000 | | | 5.000%, 9/1/2030, Ser. Da | | | 16,094,700 | |
The accompanying Notes to Financial Statements are an integral part of this schedule.
152
MUNICIPAL BOND FUND
Schedule of Investments as of October 31, 2018
| | | | | | | | |
Principal
Amount | | | Long-Term Fixed Income (98.8%) | | Value | |
| | Texas (9.3%) - continued | | | | |
| | | | North Texas Tollway Auth. System Rev. Refg. | | | | |
| | $5,000,000 | | | 5.000%, 1/1/2042, Ser. B | | | $5,302,600 | |
| | | | North Texas Tollway Auth. System Rev. Refg. (AGC Insured) | | | | |
| | 5,000,000 | | | Zero Coupon, 1/1/2028, Ser. Dc | | | 3,651,300 | |
| | | | Northwest Independent School District G.O. (Denton, Tarrant and Wise Counties, TX) (PSF-GTD Insured) | | | | |
| | 5,705,000 | | | 5.000%, 2/15/2038c | | | 6,235,337 | |
| | | | Pharr, TX Higher Education Finance Auth. Education Rev. (Idea Public Schools) | | | | |
| | 2,500,000 | | | 6.250%, 8/15/2029, Ser. Aa | | | 2,581,775 | |
| | 350,000 | | | 6.500%, 8/15/2039, Ser. Aa | | | 362,100 | |
| | 1,650,000 | | | 6.500%, 8/15/2039, Ser. Aa | | | 1,707,700 | |
| | | | Red River Education Finance Corporation Rev. (St. Edwards University) | | | | |
| | 2,130,000 | | | 5.000%, 6/1/2046 | | | 2,252,326 | |
| | | | San Antonio Water System Rev. | | | | |
| | 7,875,000 | | | 5.000%, 5/15/2039, Ser. A | | | 8,785,035 | |
| | | | San Juan Higher Education Finance Auth. Education Rev. (IDEA Public Schools) | | | | |
| | 2,000,000 | | | 6.700%, 8/15/2040, Ser. Aa | | | 2,154,500 | |
| | | | Socorro, TX Independent School District G.O. (PSF-GTD Insured) | | | | |
| | 75,000 | | | 5.000%, 8/15/2034c | | | 78,508 | |
| | 1,925,000 | | | 5.000%, 8/15/2034a,c | | | 2,022,309 | |
| | | | Southwest TX Higher Education Auth. Rev. (Southern Methodist University) | | | | |
| | 1,700,000 | | | 5.000%, 10/1/2041a | | | 1,791,647 | |
| | | | Southwest TX Higher Education Auth. Rev. Refg. (Southern Methodist University) | | | | |
| | 600,000 | | | 5.000%, 10/1/2039 | | | 666,450 | |
| | 600,000 | | | 5.000%, 10/1/2040 | | | 664,998 | |
| | 700,000 | | | 5.000%, 10/1/2041 | | | 775,264 | |
| | | | Tarrant County Cultural Education Fac. Finance Corporation Hospital Rev. (Hendrick Medical Center) | | | | |
| | 2,640,000 | | | 5.000%, 9/1/2030 | | | 2,857,219 | |
| | | | Tarrant County Cultural Education Fac. Finance Corporation Hospital Rev. (Hendrick Medical Center) (AGC Insured) | | | | |
| | 1,250,000 | | | 5.250%, 9/1/2026, Ser. Bc | | | 1,279,500 | |
| | 2,000,000 | | | 5.250%, 9/1/2027, Ser. Bc | | | 2,046,860 | |
| | 1,000,000 | | | 5.250%, 9/1/2028, Ser. Bc | | | 1,023,260 | |
| | | | Tarrant County Cultural Education Fac. Finance Corporation Rev. Refg. (Trinity Terrace) | | | | |
| | 765,000 | | | 5.000%, 10/1/2044, Ser. A-1 | | | 797,138 | |
| | | | Texas G.O. Refg. | | | | |
| | 13,940,000 | | | 5.000%, 10/1/2044, Ser. A | | | 15,305,423 | |
| | | | | |
| | | | Total | | | 137,130,937 | |
| | | | | |
| |
| | Utah (1.7%) | | | | |
| | | | Salt Lake City, UT Airport Rev. | | | | |
| | 1,000,000 | | | 5.000%, 7/1/2042, Ser. A, AMT | | | 1,075,590 | |
| | 1,000,000 | | | 5.250%, 7/1/2048, Ser. A, AMT | | | 1,102,690 | |
| | | | Utah Associated Municipal Power Systems Rev. Refg. (Central-St. George Transmission) | | | | |
| | 6,000,000 | | | 5.250%, 12/1/2027a | | | 6,201,420 | |
| | | | Utah Charter School Finance Auth. Rev. (North Davis Preparatory) | | | | |
| | 1,000,000 | | | 6.250%, 7/15/2030 | | | 1,043,320 | |
| | | | Utah Charter School Finance Auth. Rev. (Utah Charter Academies) | | | | |
| | 800,000 | | | 5.000%, 10/15/2048 | | | 859,688 | |
| | | | Utah County, UT Hospital Rev. (IHC Health Services, Inc.) | | | | |
| | 1,085,000 | | | 5.000%, 5/15/2023, Ser. A | | | 1,206,043 | |
| | 3,175,000 | | | 5.000%, 5/15/2043 | | | 3,364,833 | |
| | 1,610,000 | | | 5.000%, 5/15/2045, Ser. A | | | 1,731,410 | |
| | 7,500,000 | | | 5.000%, 5/15/2046, Ser. B | | | 8,187,525 | |
| | | | | |
| | | | Total | | | 24,772,519 | |
| | | | | |
| |
| | Vermont (0.3%) | | | | |
| | | | Vermont Educational & Health Buildings Financing Agency Rev. Refg. (University of Vermont Medical Center) | | | | |
| | 3,000,000 | | | 5.000%, 12/1/2035, Ser. A | | | 3,299,370 | |
| | 1,000,000 | | | 5.000%, 12/1/2036, Ser. A | | | 1,096,300 | |
| | | | | |
| | | | Total | | | 4,395,670 | |
| | | | | |
| |
| | Virginia (2.9%) | | | | |
| | | | Fairfax County, VA Industrial Development Auth. Health Care Rev. (Inova Health System) | | | | |
| | 1,000,000 | | | 5.000%, 5/15/2025, Ser. Ca | | | 1,016,500 | |
| | 2,405,000 | | | 5.000%, 5/15/2044, Ser. A | | | 2,587,612 | |
| | | | Fairfax County, VA Industrial Development Auth. Health Care Rev. Refg. (Inova Health System) | | | | |
| | 675,000 | | | 5.250%, 8/15/2019 | | | 692,003 | |
| | | | Virginia Commonwealth Transportation Board Rev. | | | | |
| | 10,000,000 | | | 5.000%, 5/15/2034a | | | 10,692,000 | |
| | | | Virginia Small Business Financing Auth. Rev. (Elizabeth River Crossings Opco, LLC) | | | | |
| | 8,910,000 | | | 6.000%, 1/1/2037, AMT | | | 9,694,793 | |
| | | | Virginia Small Business Financing Auth. Rev. (Transform 66 P3) | | | | |
| | 610,000 | | | 5.000%, 12/31/2047, AMT | | | 640,573 | |
| | 6,175,000 | | | 5.000%, 12/31/2049, AMT | | | 6,470,782 | |
| | 11,010,000 | | | 5.000%, 12/31/2052, AMT | | | 11,505,010 | |
| | | | | |
| | | | Total | | | 43,299,273 | |
| | | | | |
| |
| | Washington (3.4%) | | | | |
| | | | Clark County, WA Public Utility District No. 1 Electric Rev. Refg. | | | | |
| | 785,000 | | | 5.000%, 1/1/2029 | | | 882,811 | |
| | | | FYI Properties Lease Rev. (State of Washington DIS) | | | | |
| | 2,555,000 | | | 5.500%, 6/1/2034 | | | 2,598,690 | |
The accompanying Notes to Financial Statements are an integral part of this schedule.
153
MUNICIPAL BOND FUND
Schedule of Investments as of October 31, 2018
| | | | | | | | |
Principal
Amount | | | Long-Term Fixed Income (98.8%) | | Value | |
| | Washington (3.4%) - continued | | | | |
| | | | Kalispel Tribe of Indians Priority Distribution WA Rev. | | | | |
| | $750,000 | | | 5.250%, 1/1/2038, Ser. A* | | | $775,860 | |
| | | | Pierce County, WA School District No. 10, Tacoma G.O. Refg. | |
| | 2,170,000 | | | 5.000%, 12/1/2039 | | | 2,391,101 | |
| | | | Port of Seattle Special Fac. Rev. Refg. (Seatac Fuel Fac., LLC) | |
| | 670,000 | | | 5.000%, 6/1/2019, AMT | | | 680,398 | |
| | 1,000,000 | | | 5.000%, 6/1/2020, AMT | | | 1,039,280 | |
| | | | Snohomish County, WA Edmonds School District No. 15 U.T.G.O. | |
| | 1,000,000 | | | 5.000%, 12/1/2033 | | | 1,107,460 | |
| | | | Washington Health Care Fac. Auth. Rev. (Kadlec Regional Medical Center) | |
| | 2,625,000 | | | 5.250%, 12/1/2030a | | | 2,785,808 | |
| | | | Washington Health Care Fac. Auth. Rev. (Providence Health & Services) | |
| | 5,000,000 | | | 5.250%, 10/1/2032, Ser. A | | | 5,198,250 | |
| | | | Washington Health Care Fac. Auth. Rev. (Seattle Cancer Care Alliance) | |
| | 5,010,000 | | | 7.375%, 3/1/2038a | | | 5,098,527 | |
| | | | Washington Higher Education Fac. Auth. Refg. Rev. (Gonzaga University) | |
| | 2,205,000 | | | 5.000%, 4/1/2029, Ser. Ba | | | 2,232,629 | |
| | 3,120,000 | | | 5.000%, 4/1/2029, Ser. Ba | | | 3,158,438 | |
| | | | Washington Higher Education Fac. Auth. Rev. Refg. (Whitworth University) | |
| | 1,290,000 | | | 5.875%, 10/1/2034a | | | 1,333,705 | |
| | 1,000,000 | | | 5.625%, 10/1/2040a | | | 1,031,630 | |
| | | | Washington State Housing Finance Commission Refg. (Hearthstone) | |
| | 825,000 | | | 5.000%, 7/1/2038, Ser. Ae | | | 835,676 | |
| | | | Washington Various Purpose G.O. | |
| | 12,095,000 | | | 5.000%, 8/1/2030, Ser. A | | | 13,348,888 | |
| | 5,310,000 | | | 5.000%, 8/1/2042, Ser. A | | | 5,880,135 | |
| | | | | |
| | | | Total | | | 50,379,286 | |
| | | | | |
| |
| | Wisconsin (2.8%) | | | | |
| | | | Kaukauna, WI Electric System Rev. (AGM Insured) | |
| | 3,000,000 | | | 5.000%, 12/15/2035, Ser. Ac | | | 3,235,620 | |
| | | | Monroe, WI Redevelopment Auth. Rev. (Monroe Clinic, Inc.) | |
| | 3,520,000 | | | 5.875%, 2/15/2039a | | | 3,559,987 | |
| | | | Public Finance Auth. Rev. (Denver International Airport Great Hall) | |
| | 2,500,000 | | | 5.000%, 9/30/2049, AMT | | | 2,645,400 | |
| | | | Wisconsin Health & Educational Fac. Auth. Rev. | |
| | 1,750,000 | | | 5.125%, 10/1/2048 | | | 1,704,220 | |
| | | | Wisconsin Health & Educational Fac. Auth. Rev. (Thedacare, Inc.) | |
| | 5,335,000 | | | 5.500%, 12/15/2038, Ser. A | | | 5,487,101 | |
| | 1,195,000 | | | 5.000%, 12/15/2039 | | | 1,259,912 | |
| | 2,500,000 | | | 5.000%, 12/15/2044 | | | 2,619,200 | |
| | | | Wisconsin Health & Educational Fac. Auth. Rev. Refg. (Ascension Health Credit Group) | |
| | 9,275,000 | | | 5.000%, 11/15/2039, Ser. A | | | 10,074,227 | |
| | | | Wisconsin Health & Educational Fac. Auth. Rev. Refg. (Marquette University) | | | | |
| | 8,000,000 | | | 5.000%, 10/1/2041 | | | 8,594,000 | |
| | | | Wisconsin Health & Educational Fac. Auth. Rev. Refg. (Marshfield Clinic Health Systems, Inc.) | | | | |
| | 2,000,000 | | | 5.000%, 2/15/2047, Ser. C | | | 2,115,180 | |
| | | | | |
| | | | Total | | | 41,294,847 | |
| | | | | |
| |
| | Wyoming (0.1%) | | | | |
| | | | Wyoming State Farm Loan Board Capital Fac. Refg. Rev. | | | | |
| | 1,310,000 | | | 5.750%, 10/1/2020 | | | 1,360,003 | |
| | | | | |
| | | | Total | | | 1,360,003 | |
| | | | | |
| | | | Total Long-Term Fixed Income (cost $1,437,112,780) | | | 1,452,973,512 | |
| | | | | |
| | |
Principal
Amount | | | Short-Term Investments (<0.1%)f | | Value | |
| | | | Federal Home Loan Bank Discount Notes | | | | |
| | 300,000 | | | 2.240%, 1/16/2019g | | | 298,543 | |
| | | | | |
| | | | Total Short-Term Investments (cost $298,581) | | | 298,543 | |
| | | | | |
| | | | Total Investments (cost $1,437,411,361) 98.8% | | | $1,453,272,055 | |
| | | | | |
| | | | Other Assets and Liabilities, Net 1.2% | | | 17,763,839 | |
| | | | | |
| | | | Total Net Assets 100.0% | | | $1,471,035,894 | |
| | | | | |
The accompanying Notes to Financial Statements are an integral part of this schedule.
154
MUNICIPAL BOND FUND
Schedule of Investments as of October 31, 2018
a | Denotes securities that have been pre-refunded or escrowed to maturity. Under such an arrangement, money is deposited into an irrevocable escrow account and is used to purchase U.S. Treasury securities or government agency securities with maturing principal and interest earnings sufficient to pay all debt service requirements of the pre-refunded bonds. |
b | Denotes variable rate securities. The rate shown is as of October 31, 2018. The rates of certain variable rate securities are based on a published reference rate and spread; these may vary by security and the reference rate and spread are indicated in their description. The rates of other variable rate securities are determined by the issuer or agent and are based on current market conditions. These securities do not indicate a reference rate and spread in their description. |
c | To reduce certain risks associated with securities issued by municipalities, which may include but are not limited to economic development in a specific industry or municipality, the principal and/or interest payments are guaranteed by the bond insurance company or government agency identified. |
d | Denotes step coupon securities. Step coupon securities pay an initial coupon rate for the first period and then different coupon rates for following periods. The rate shown is as of October 31, 2018. |
e | Denotes securities sold under Rule 144A of the Securities Act of 1933, which exempts them from registration. These securities may be resold to other dealers in the program or to other qualified institutional buyers. As of October 31, 2018, the value of these investments was $1,832,226 or 0.1% of total net assets. |
f | The interest rate shown reflects the yield, coupon rate or the discount rate at the date of purchase. |
g | All or a portion of the security is held on deposit with the counterparty and pledged as the initial margin deposit for open futures contracts. |
* | Denotes restricted securities. Restricted securities are investment securities which cannot be offered for public sale without first being registered under the Securities Act of 1933. The value of all restricted securities held in Municipal Bond Fund as of October 31, 2018 was $4,984,350 or 0.3% of total net assets. The following table indicates the acquisition date and cost of restricted securities shown in the schedule as of October 31, 2018. |
| | | | | | | | |
Security | | Acquisition
Date | | | Cost | |
Denver, CO Health and Hospital Auth. Healthcare Rev. Refg., 12/1/2034 | | | 8/23/2017 | | | $ | 1,654,545 | |
Housing and Redevelopment Auth. of St. Paul MN Rev., 10/1/2043 | | | 6/29/2018 | | | | 1,029,745 | |
Kalispel Tribe of Indians Priority Distribution WA Rev., 1/1/2038 | | | 5/17/2018 | | | | 734,874 | |
Plaza Metropolitan District No. 1 Rev. Refg. (City of Lakewood), 12/1/2021 | | | 1/23/2013 | | | | 1,040,478 | |
Plaza Metropolitan District No. 1 Rev. Refg. (City of Lakewood), 12/1/2022 | | | 1/23/2013 | | | | 523,442 | |
Definitions:
| | | | |
AGC | | - | | Assured Guaranty, Ltd |
AGM | | - | | Assured Guaranty Municipal Corporation |
AMT | | - | | Subject to Alternative Minimum Tax |
Auth. | | - | | Authority |
BAM | | - | | Build America Mutual |
C.O.P. | | - | | Certificate of Participation |
Fac. | | - | | Facility/Facilities |
FGIC | | - | | Federal Guaranty Insurance Company |
FHLMC | | - | | Federal Home Loan Mortgage Corporation |
FNMA | | - | | Federal National Mortgage Association |
GNMA | | - | | Government National Mortgage Association |
G.O. | | - | | General Obligation |
NATL-RE | | - | | National Public Finance Guarantee Corporation |
PSF-GTD | | - | | Permanent School Fund Guarantee Program |
Q-SBLF | | - | | Qualified School Bond Loan Fund |
Refg. | | - | | Refunding |
Rev. | | - | | Revenue |
Ser. | | - | | Series |
U.T.G.O. | | - | | Unlimited Tax General Obligation |
The accompanying Notes to Financial Statements are an integral part of this schedule.
155
OPPORTUNITY INCOME PLUS FUND
Schedule of Investments as of October 31, 2018
| | | | | | | | |
Principal
Amount | | | Bank Loans (32.9%)a | | Value | |
| | Basic Materials (2.7%) | | | | |
| | | | Arch Coal, Inc., Term Loan | | | | |
| | $1,676,490 | | | 5.052%, (LIBOR 1M + 2.750%), 3/7/2024b | | | $1,673,992 | |
| | | | Ball Metalpack Finco, LLC, Term Loan | | | | |
| | 269,325 | | | 6.802%, (LIBOR 1M + 4.500%), 7/31/2025b | | | 270,672 | |
| | | | Big River Steel, LLC, Term Loan | | | | |
| | 1,029,600 | | | 7.386%, (LIBOR 3M + 5.000%), 8/23/2023b | | | 1,039,896 | |
| | | | Chemours Company, Term Loan | | | | |
| | 1,303,450 | | | 4.050%, (LIBOR 1M + 1.750%), 4/3/2025b | | | 1,297,754 | |
| | | | CONSOL Energy, Inc., Term Loan | | | | |
| | 1,032,200 | | | 8.310%, (LIBOR 1M + 6.000%), 11/28/2022b | | | 1,054,568 | |
| | | | Contura Energy, Inc., Term Loan | | | | |
| | 1,708,288 | | | 7.300%, (LIBOR 2M + 5.000%), 3/17/2024b | | | 1,699,746 | |
| | 2,760,000 | | | 0.000%, (LIBOR 3M + 5.000%), 10/3/2025b,c,d | | | 2,746,200 | |
| | | | Peabody Energy Corporation, Term Loan | | | | |
| | 1,194,000 | | | 5.052%, (LIBOR 1M + 2.750%), 3/31/2025b | | | 1,190,633 | |
| | | | Pixelle Specialty Solutions, LLC, Term Loan | | | | |
| | 735,000 | | | 0.000%, (LIBOR 3M + 6.000%), 10/31/2024b,c,d | | | 717,544 | |
| | | | Starfruit US Holdco, LLC, Term Loan | | | | |
| | 920,000 | | | 5.506%, (LIBOR 1M + 3.250%), 10/1/2025b | | | 916,550 | |
| | | | Tronox Blocked Borrower, LLC, Term Loan | | | | |
| �� | 711,138 | | | 5.302%, (LIBOR 1M + 3.000%), 9/22/2024b | | | 710,135 | |
| | | | Tronox Finance, LLC, Term Loan | | | | |
| | 1,641,087 | | | 5.302%, (LIBOR 1M + 3.000%), 9/22/2024b | | | 1,638,773 | |
| | | | | |
| | | | Total | | | 14,956,463 | |
| | | | | |
| |
| | Capital Goods (1.4%) | | | | |
| | | | Advanced Disposal Services, Inc., Term Loan | | | | |
| | 1,805,892 | | | 4.460%, (LIBOR 1W + 2.250%), 11/10/2023b | | | 1,804,773 | |
| | | | GFL Environmental, Inc., Term Loan | | | | |
| | 2,170,000 | | | 0.000%, (LIBOR 3M + 3.000%), 5/31/2025b,c,d | | | 2,134,737 | |
| | 80,663 | | | 5.136%, (LIBOR 3M + 2.750%), 5/31/2025b | | | 79,352 | |
| | 647,714 | | | 5.136%, (LIBOR 3M + 2.750%), 5/31/2025b | | | 637,188 | |
| | | | Navistar, Inc., Term Loan | | | | |
| | 1,930,413 | | | 5.780%, (LIBOR 1M + 3.500%), 11/6/2024b | | | 1,932,015 | |
| | | | Sotera Health Holdings, LLC, Term Loan | | | | |
| | 1,149,333 | | | 5.302%, (LIBOR 1M + 3.000%), 5/15/2022b | | | 1,150,287 | |
| | | | | |
| | | | Total | | | 7,738,352 | |
| | | | | |
| |
| | Communications Services (8.8%) | | | | |
| | | | Altice France SA, Term Loan | | | | |
| | 802,775 | | | 5.052%, (LIBOR 1M + 2.750%), 7/31/2025b | | | 773,426 | |
| | 3,435,000 | | | 6.280%, (LIBOR 1M + 4.000%), 1/31/2026b | | | 3,359,877 | |
| | | | Altice US Finance I Corporation, Term Loan | | | | |
| | 1,110,937 | | | 4.552%, (LIBOR 1M + 2.250%), 7/28/2025b | | | 1,108,393 | |
| | | | CBS Radio, Inc., Term Loan | | | | |
| | 441,662 | | | 5.037%, (LIBOR 1M + 2.750%), 11/17/2024b | | | 439,233 | |
| | | | Cengage Learning, Inc., Term Loan | | | | |
| | 2,186,793 | | | 6.530%, (LIBOR 1M + 4.250%), 6/7/2023b | | | 2,023,462 | |
| | | | CenturyLink, Inc., Term Loan | | | | |
| | 3,176,000 | | | 5.052%, (LIBOR 1M + 2.750%), 1/31/2025b | | | 3,140,270 | |
| | | | Charter Communications Operating, LLC, Term Loan | | | | |
| | 1,890,713 | | | 4.310%, (LIBOR 1M + 2.000%), 4/30/2025b | | | 1,890,486 | |
| | | | CSC Holdings, LLC, Term Loan | | | | |
| | 1,472,575 | | | 4.530%, (LIBOR 1M + 2.250%), 7/17/2025b | | | 1,467,848 | |
| | | | Frontier Communications Corporation, Term Loan | | | | |
| | 1,900,938 | | | 6.060%, (LIBOR 1M + 3.750%), 6/15/2024b | | | 1,836,306 | |
| | | | HCP Acquisition, LLC, Term Loan | | | | |
| | 1,648,283 | | | 5.302%, (LIBOR 1M + 3.000%), 5/16/2024b | | | 1,644,986 | |
| | | | Intelsat Jackson Holdings SA, Term Loan | | | | |
| | 1,525,000 | | | 6.045%, (LIBOR 1M + 3.750%), 11/27/2023b | | | 1,525,000 | |
| | | | Level 3 Parent, LLC, Term Loan | | | | |
| | 2,765,000 | | | 4.530%, (LIBOR 1M + 2.250%), 2/22/2024b | | | 2,766,300 | |
| | | | Liberty Cablevision of Puerto Rico, LLC, Term Loan | | | | |
| | 2,275,000 | | | 5.936%, (LIBOR 3M + 3.500%), 1/7/2022b | | | 2,229,909 | |
| | 445,000 | | | 9.186%, (LIBOR 3M + 6.750%), 7/7/2023b,e | | | 409,400 | |
| | | | McGraw-Hill Global Education Holdings, LLC, Term Loan | | | | |
| | 3,851,220 | | | 6.302%, (LIBOR 1M + 4.000%), 5/4/2022b,c,d | | | 3,689,970 | |
| | | | Mediacom Illinois, LLC, Term Loan | | | | |
| | 880,575 | | | 3.970%, (LIBOR 1W + 1.750%), 2/15/2024b | | | 877,828 | |
| | | | NEP/NCP Holdco, Inc., Term Loan | | | | |
| | 1,160,000 | | | 0.000%, (LIBOR 3M + 3.250%), 10/22/2025b,c,d | | | 1,164,060 | |
| | | | Sable International Finance, Ltd., Term Loan | | | | |
| | 4,780,000 | | | 5.547%, (LIBOR 1M + 3.250%), 1/31/2026b | | | 4,774,646 | |
| | | | SBA Senior Finance II, LLC, Term Loan | | | | |
| | 1,261,838 | | | 4.310%, (LIBOR 1M + 2.000%), 4/11/2025b | | | 1,258,544 | |
The accompanying Notes to Financial Statements are an integral part of this schedule.
156
OPPORTUNITY INCOME PLUS FUND
Schedule of Investments as of October 31, 2018
| | | | | | | | |
Principal
Amount | | | Bank Loans (32.9%)a | | Value | |
| | Communications Services (8.8%) - continued | | | | |
| | | | Sprint Communications, Inc., Term Loan | | | | |
| | $3,240,650 | | | 4.813%, (LIBOR 1M + 2.500%), 2/2/2024b | | | $3,237,604 | |
| | | | Syniverse Holdings, Inc., Term Loan | | | | |
| | 542,275 | | | 7.280%, (LIBOR 1M + 5.000%), 3/9/2023b | | | 544,986 | |
| | | | Unitymedia Finance, LLC, Term Loan | | | | |
| | 1,840,000 | | | 4.530%, (LIBOR 1M + 2.250%), 1/15/2026b | | | 1,836,430 | |
| | | | Univision Communications, Inc., Term Loan | | | | |
| | 2,752,783 | | | 5.052%, (LIBOR 1M + 2.750%), 3/15/2024b | | | 2,638,790 | |
| | | | Virgin Media Bristol, LLC, Term Loan | | | | |
| | 2,410,000 | | | 4.780%, (LIBOR 1M + 2.500%), 1/15/2026b | | | 2,407,229 | |
| | | | WideOpenWest Finance, LLC, Term Loan | | | | |
| | 1,440,450 | | | 5.540%, (LIBOR 1M + 3.250%), 8/19/2023b | | | 1,386,433 | |
| | | | Windstream Services, LLC, Term Loan | | | | |
| | 547,208 | | | 6.290%, (LIBOR 1M + 4.000%), 3/30/2021b | | | 512,225 | |
| | | | | |
| | | | Total | | | 48,943,641 | |
| | | | | |
| |
| | Consumer Cyclical (4.2%) | | | | |
| | | | Burlington Coat Factory Warehouse Corporation, Term Loan | | | | |
| | 1,605,227 | | | 4.790%, (LIBOR 1M + 2.500%), 11/17/2024b | | | 1,605,227 | |
| | | | Eldorado Resorts, Inc., Term Loan | | | | |
| | 504,768 | | | 4.563%, (LIBOR 1M + 2.250%), 4/17/2024b | | | 504,612 | |
| | | | Four Seasons Hotels, Ltd., Term Loan | | | | |
| | 1,483,674 | | | 4.302%, (LIBOR 1M + 2.000%), 11/30/2023b | | | 1,482,873 | |
| | | | Golden Entertainment, Inc., Term Loan | | | | |
| | 2,605,312 | | | 5.300%, (LIBOR 1M + 3.000%), 10/20/2024b | | | 2,605,312 | |
| | 410,000 | | | 9.310%, (LIBOR 1M + 7.000%), 10/20/2025b | | | 412,050 | |
| | | | Golden Nugget, LLC, Term Loan | | | | |
| | 2,072,634 | | | 5.230%, (LIBOR 1M + 2.750%), 10/4/2023b | | | 2,073,609 | |
| | | | KAR Auction Services, Inc., Term Loan | | | | |
| | 819,625 | | | 4.938%, (LIBOR 3M + 2.500%), 3/9/2023b | | | 819,969 | |
| | | | Men’s Warehouse, Inc., Term Loan | | | | |
| | 1,195,000 | | | 5.506%, (LIBOR 3M + 3.250%), 4/9/2025b | | | 1,200,234 | |
| | | | Mohegan Gaming and Entertainment, Term Loan | | | | |
| | 2,063,778 | | | 6.302%, (LIBOR 1M + 4.000%), 10/13/2023b | | | 1,933,326 | |
| | | | Neiman Marcus Group, Ltd., LLC, Term Loan | | | | |
| | 823,516 | | | 5.531%, (LIBOR 1M + 3.250%), 10/25/2020b | | | 748,938 | |
| | | | Scientific Games International, Inc., Term Loan | | | | |
| | 4,278,500 | | | 5.046%, (LIBOR 1M + 2.750%), 8/14/2024b | | | 4,234,175 | |
| | | | Seminole Hard Rock Entertainment, Inc., Term Loan | | | | |
| | 903,188 | | | 5.146%, (LIBOR 3M + 2.750%), 5/14/2020b | | | 904,317 | |
| | | | Stars Group Holdings BV, Term Loan | | | | |
| | 2,817,938 | | | 5.886%, (LIBOR 3M + 3.500%), 7/10/2025b | | | 2,828,110 | |
| | | | Tenneco, Inc., Term Loan | | | | |
| | 895,000 | | | 5.052%, (LIBOR 1M + 2.750%), 10/1/2025b | | | 892,020 | |
| | | | Wyndham Hotels & Resorts, Inc., Term Loan | | | | |
| | 1,020,000 | | | 4.052%, (LIBOR 1M + 1.750%), 5/30/2025b | | | 1,018,939 | |
| | | | | |
| | | | Total | | | 23,263,711 | |
| | | | | |
| |
| | Consumer Non-Cyclical (6.0%) | | | | |
| | | | Air Medical Group Holdings, Inc., Term Loan | | | | |
| | 4,203,238 | | | 5.534%, (LIBOR 3M + 3.250%), 4/28/2022b | | | 4,075,039 | |
| | 491,287 | | | 6.530%, (LIBOR 1M + 4.250%), 3/14/2025b | | | 481,462 | |
| | | | Albertson’s, LLC, Term Loan | | | | |
| | 1,710,368 | | | 5.052%, (LIBOR 1M + 2.750%), 8/25/2021b | | | 1,707,067 | |
| | 1,391,524 | | | 5.381%, (LIBOR 3M + 3.000%), 12/21/2022b | | | 1,387,265 | |
| | 1,668,171 | | | 5.311%, (LIBOR 3M + 3.000%), 6/22/2023b | | | 1,659,830 | |
| | 2,250,000 | | | 0.000%, (LIBOR 3M + 3.000%), 10/29/2025b,c,d | | | 2,230,785 | |
| | | | Amneal Pharmaceuticals, LLC, Term Loan | | | | |
| | 1,670,425 | | | 5.813%, (LIBOR 1M + 3.500%), 5/4/2025b | | | 1,678,360 | |
| | | | Bausch Health Companies, Inc., Term Loan | | | | |
| | 3,266,250 | | | 5.274%, (LIBOR 1M + 3.000%), 6/1/2025b | | | 3,265,499 | |
| | | | CHS/Community Health Systems, Inc., Term Loan | | | | |
| | 1,024,348 | | | 5.563%, (LIBOR 3M + 3.250%), 1/27/2021b | | | 1,001,536 | |
| | | | Diamond BC BV, Term Loan | | | | |
| | 1,498,675 | | | 5.527%, (LIBOR 3M + 3.000%), 9/6/2024b | | | 1,478,068 | |
| | | | Endo International plc, Term Loan | | | | |
| | 2,569,311 | | | 6.563%, (LIBOR 1M + 4.250%), 4/27/2024b | | | 2,578,407 | |
| | | | Grifols Worldwide Operations USA, Inc., Term Loan | | | | |
| | 1,354,375 | | | 4.467%, (LIBOR 1W + 2.250%), 1/31/2025b | | | 1,354,984 | |
| | | | JBS USA LUX SA, Term Loan | | | | |
| | 3,166,775 | | | 4.844%, (LIBOR 3M + 2.500%), 10/30/2022b | | | 3,165,192 | |
The accompanying Notes to Financial Statements are an integral part of this schedule.
157
OPPORTUNITY INCOME PLUS FUND
Schedule of Investments as of October 31, 2018
| | | | | | | | |
Principal
Amount | | | Bank Loans (32.9%)a | | Value | |
| | Consumer Non-Cyclical (6.0%) - continued | | | | |
| | | | Mallinckrodt International Finance SA, Term Loan | | | | |
| | $3,129,275 | | | 5.517%, (LIBOR 3M + 3.000%), 2/24/2025b | | | $3,105,305 | |
| | | | Northriver Midstream Finance LP, Term Loan | | | | |
| | 1,475,000 | | | 5.646%, (LIBOR 3M + 3.250%), 10/1/2025b,c,d | | | 1,481,151 | |
| | | | Ortho-Clinical Diagnostics SA, Term Loan | | | | |
| | 1,811,700 | | | 5.544%, (LIBOR 1M + 3.250%), 6/1/2025b | | | 1,804,906 | |
| | | | Revlon Consumer Products Corporation, Term Loan | | | | |
| | 1,364,879 | | | 5.813%, (LIBOR 3M + 3.500%), 9/7/2023b | | | 996,743 | |
| | | | | |
| | | | Total | | | 33,451,599 | |
| | | | | |
| |
| | Energy (2.4%) | | | | |
| | | | BCP Raptor II, LLC, Term Loan | | | | |
| | 460,000 | | | 0.000%, (LIBOR 3M + 4.750%), 10/22/2025b,c,d,e | | | 456,550 | |
| | | | Calpine Corporation, Term Loan | | | | |
| | 1,499,501 | | | 4.890%, (LIBOR 3M + 2.500%), 1/15/2024b | | | 1,493,728 | |
| | | | Consolidated Energy Finance SA, Term Loan | | | | |
| | 977,550 | | | 4.784%, (LIBOR 1M + 2.500%), 5/7/2025b,e | | | 972,663 | |
| | | | GIP III Stetson I, LP, Term Loan | | | | |
| | 625,000 | | | 6.695%, (LIBOR 3M + 4.250%), 7/18/2025b | | | 625,781 | |
| | | | HFOTCO, LLC, Term Loan | | | | |
| | 2,693,250 | | | 5.060%, (LIBOR 1M + 2.750%), 6/26/2025b | | | 2,698,852 | |
| | | | McDermott Technology (Americas), Inc., Term Loan | | | | |
| | 2,440,237 | | | 7.302%, (LIBOR 1M + 5.000%), 5/10/2025b | | | 2,406,684 | |
| | | | MEG Energy Corporation, Term Loan | | | | |
| | 164,650 | | | 5.810%, (LIBOR 1M + 3.500%), 12/31/2023b | | | 164,821 | |
| | | | Pacific Drilling SA, Term Loan | | | | |
| | 2,187,888 | | | 0.000%, (PRIME + 4.500%), 6/3/2018b,f,g | | | 980,896 | |
| | | | Radiate Holdco, LLC, Term Loan | | | | |
| | 3,989,622 | | | 5.302%, (LIBOR 1M + 3.000%), 2/1/2024b | | | 3,955,431 | |
| | | | | |
| | | | Total | | | 13,755,406 | |
| | | | | |
| |
| | Financials (3.2%) | | | | |
| | | | Air Methods Corporation, Term Loan | | | | |
| | 2,635,619 | | | 5.886%, (LIBOR 3M + 3.500%), 4/21/2024b | | | 2,375,351 | |
| | | | Avolon TLB Borrower 1 US, LLC, Term Loan | | | | |
| | 2,997,487 | | | 4.280%, (LIBOR 1M + 2.000%), 1/15/2025b | | | 2,987,985 | |
| | | | Cyxtera DC Holdings, Inc., Term Loan | | | | |
| | 380,188 | | | 5.280%, (LIBOR 1M + 3.000%), 5/1/2024b | | | 378,762 | |
| | 235,000 | | | 9.530%, (LIBOR 1M + 7.250%), 5/1/2025b | | | 232,356 | |
| | | | Digicel International Finance, Ltd., Term Loan | | | | |
| | 2,560,606 | | | 5.570%, (LIBOR 3M + 3.250%), 5/10/2024b | | | 2,449,655 | |
| | | | Genworth Holdings, Inc., Term Loan | | | | |
| | 452,725 | | | 6.831%, (LIBOR 2M + 4.500%), 3/7/2023b | | | 461,499 | |
| | | | GGP Nimbus LP, Term Loan | | | | |
| | 2,715,000 | | | 4.795%, (LIBOR 1M + 2.500%), 8/24/2025b | | | 2,668,954 | |
| | | | INEOS U.S. Finance, LLC, Term Loan | | | | |
| | 3,295,100 | | | 4.302%, (LIBOR 1M + 2.000%), 3/31/2024b | | | 3,287,390 | |
| | | | MoneyGram International, Inc., Term Loan | | | | |
| | 1,529,051 | | | 5.552%, (LIBOR 1M + 3.250%), 3/28/2020b,e | | | 1,452,598 | |
| | | | Trans Union, LLC, Term Loan | | | | |
| | 1,569,150 | | | 4.302%, (LIBOR 1M + 2.000%), 4/9/2023b | | | 1,565,400 | |
| | | | | |
| | | | Total | | | 17,859,950 | |
| | | | | |
| |
| | Technology (2.4%) | | | | |
| | | | First Data Corporation, Term Loan | | | | |
| | 4,065,000 | | | 4.287%, (LIBOR 1M + 2.000%), 4/26/2024b | | | 4,041,301 | |
| | | | Harland Clarke Holdings Corporation, Term Loan | | | | |
| | 2,317,277 | | | 7.136%, (LIBOR 3M + 4.750%), 11/3/2023b | | | 2,166,654 | |
| | | | Micron Technology, Inc., Term Loan | | | | |
| | 671,565 | | | 4.060%, (LIBOR 1M + 1.750%), 4/26/2022b | | | 671,424 | |
| | | | Plantronics, Inc., Term Loan | | | | |
| | 885,000 | | | 4.802%, (LIBOR 1M + 2.500%), 7/2/2025b | | | 881,681 | |
| | | | Rackspace Hosting, Inc., Term Loan | | | | |
| | 2,218,002 | | | 5.348%, (LIBOR 3M + 3.000%), 11/3/2023b | | | 2,149,155 | |
| | | | SS&C Technologies Holdings Europe SARL, Term Loan | | | | |
| | 612,097 | | | 4.552%, (LIBOR 1M + 2.250%), 4/16/2025b | | | 608,694 | |
| | | | SS&C Technologies, Inc., Term Loan | | | | |
| | 1,579,198 | | | 4.552%, (LIBOR 1M + 2.250%), 4/16/2025b | | | 1,570,418 | |
| | | | TNS, Inc., Term Loan | | | | |
| | 1,452,279 | | | 6.320%, (LIBOR 3M + 4.000%), 8/14/2022b | | | 1,458,335 | |
| | | | | |
| | | | Total | | | 13,547,662 | |
| | | | | |
| |
| | Transportation (0.6%) | | | | |
| | | | Arctic LNG Carriers, Ltd., Term Loan | | | | |
| | 2,952,625 | | | 6.802%, (LIBOR 1M + 4.500%), 5/18/2023b | | | 2,952,625 | |
| | | | OSG Bulk Ships, Inc., Term Loan | | | | |
| | 448,566 | | | 6.770%, (LIBOR 1M + 4.250%), 8/5/2019b | | | 443,707 | |
| | | | | |
| | | | Total | | | 3,396,332 | |
| | | | | |
The accompanying Notes to Financial Statements are an integral part of this schedule.
158
OPPORTUNITY INCOME PLUS FUND
Schedule of Investments as of October 31, 2018
| | | | | | | | |
Principal
Amount | | | Bank Loans (32.9%)a | | Value | |
| | Utilities (1.2%) | | | | |
| | | | Core and Main, LP, Term Loan | | | | |
| | $1,202,850 | | | 5.317%, (LIBOR 3M + 3.000%), 8/1/2024b,e | | | $1,201,346 | |
| | | | EnergySolutions, LLC, Term Loan | | | | |
| | 892,762 | | | 6.136%, (LIBOR 3M + 3.750%), 5/11/2025b | | | 897,789 | |
| | | | Talen Energy Supply, LLC, Term Loan | | | | |
| | 959,907 | | | 6.302%, (LIBOR 1M + 4.000%), 7/6/2023b | | | 961,107 | |
| | | | TerraForm Power Operating, LLC, Term Loan | | | | |
| | 810,915 | | | 4.302%, (LIBOR 1M + 2.000%), 11/8/2022b | | | 810,915 | |
| | | | Vertiv Group Corporation, Term Loan | | | | |
| | 2,710,557 | | | 6.313%, (LIBOR 3M + 4.000%), 11/15/2023b | | | 2,680,063 | |
| | | | | |
| | | | Total | | | 6,551,220 | |
| | | | | |
| | | | | | | | |
| | | | | |
| | | | Total Bank Loans (cost $186,300,565) | | | 183,464,336 | |
| | | | | |
| | |
Principal
Amount | | | Long-Term Fixed Income (48.1%) | | Value | |
| | Asset-Backed Securities (7.1%) | | | | |
| | | | Apidos CLO XXIV | | | | |
| | 1,400,000 | | | 3.919%, (LIBOR 3M + 1.450%), 10/20/2030, Ser. 2016-24A, Class A1BR*,b | | | 1,399,987 | |
| | | | Assurant CLO III, Ltd. | | | | |
| | 1,350,000 | | | 3.389%, (LIBOR 3M + 1.230%), 10/20/2031, Ser. 2018-2A, Class A*,b | | | 1,349,930 | |
| | | | Babson CLO, Ltd. | | | | |
| | 1,350,000 | | | 5.369%, (LIBOR 3M + 2.900%), 7/20/2029, Ser. 2018-3A, Class D*,b | | | 1,341,849 | |
| | | | Bellemeade Re 2018-1, Ltd. | | | | |
| | 1,064,000 | | | 3.881%, (LIBOR 1M + 1.600%), 4/25/2028, Ser. 2018-1A, Class M1Bb,h | | | 1,069,551 | |
| | | | Business Jet Securities, LLC | | | | |
| | 1,130,757 | | | 4.447%, 6/15/2033, Ser. 2018-2, Class Ah | | | 1,130,094 | |
| | | | Cent CLO, LP | | | | |
| | 1,750,000 | | | 4.790%, (LIBOR 3M + 2.300%), 10/25/2028, Ser. 2018-27A, Class B*,b,e | | | 1,750,000 | |
| | | | College Ave Student Loans, LLC | | | | |
| | 756,005 | | | 3.931%, (LIBOR 1M + 1.650%), 11/26/2046, Ser. 2017-A, Class A1*,b | | | 771,368 | |
| | | | First Horizon ABS Trust | | | | |
| | 10,063 | | | 2.441%, (LIBOR 1M + 0.160%), 10/25/2034, Ser. 2006-HE1, Class Ab,i | | | 10,011 | |
| | | | Foundation Finance Trust | | | | |
| | 792,115 | | | 3.300%, 7/15/2033, Ser. 2017-1A, Class A* | | | 784,066 | |
| | | | GMAC Mortgage Corporation Loan Trust | | | | |
| | 217,739 | | | 2.781%, (LIBOR 1M + 0.500%), 8/25/2035, Ser. 2005-HE1, Class A2b,i | | | 237,688 | |
| | 119,945 | | | 4.184%, 9/19/2035, Ser. 2005-AR5, Class 5A1b | | | 112,858 | |
| | | | Harley Marine Financing, LLC | | | | |
| | 1,333,125 | | | 5.682%, 5/15/2043, Ser. 2018-1A, Class A2* | | | 1,233,141 | |
| | | | J.P. Morgan Mortgage Acquisition Trust | | | | |
| | 371,969 | | | 4.263%, 3/25/2047, Ser. 2007-HE1, Class AF4j | | | 265,312 | |
| | | | Lehman XS Trust | | | | |
| | 439,457 | | | 5.440%, 8/25/2035, Ser. 2005-2, Class 2A3Bj | | | 402,586 | |
| | | | Lendmark Funding Trust | | | | |
| | 900,000 | | | 2.830%, 12/22/2025, Ser. 2017-1A, Class Ah | | | 888,188 | |
| | | | Madison Park Funding XIV, Ltd. | | | | |
| | 1,250,000 | | | 3.869%, (LIBOR 3M + 1.400%), 10/22/2030, Ser. 2014-14A, Class A2RR*,b | | | 1,249,989 | |
| | | | Merrill Lynch Mortgage Investors Trust | | | | |
| | 823,455 | | | 4.004%, 6/25/2035, Ser. 2005-A5, Class M1b | | | 819,930 | |
| | | | Myers Park CLO, Ltd. | | | | |
| | 1,275,000 | | | 3.819%, (LIBOR 3M + 1.400%), 10/20/2030, Ser. 2018-1A, Class A2*,b | | | 1,274,902 | |
| | | | Oak Hill Advisors Residential Loan Trust | | | | |
| | 888,573 | | | 3.000%, 6/25/2057, Ser. 2017-NPL1, Class A1*,j | | | 874,989 | |
| | | | Octagon Investment Partners XX, Ltd. | | | | |
| | 850,000 | | | 5.888%, (LIBOR 3M + 3.550%), 8/12/2026, Ser. 2014-1A, Class DR*,b | | | 850,070 | |
| | | | OHA Credit Funding 1, Ltd. | | | | |
| | 1,085,000 | | | 4.089%, (LIBOR 3M + 1.450%), 10/20/2030, Ser. 2018-1A, Class A2*,b | | | 1,084,940 | |
| | | | OZLM Funding II, Ltd. | | | | |
| | 2,170,000 | | | 4.020%, (LIBOR 3M + 1.500%), 7/15/2031, Ser. 2012-2A, Class A1BR*,b | | | 2,169,996 | |
| | | | OZLM IX, Ltd. | | | | |
| | 2,000,000 | | | 4.019%, (LIBOR 3M + 1.550%), 10/20/2031, Ser. 2014-9A, Class A1BR*,b,d,e | | | 2,000,000 | |
| | | | Park Avenue Institutional Advisers CLO, Ltd. | | | | |
| | 2,200,000 | | | 3.910%, (LIBOR 3M + 1.500%), 10/20/2031, Ser. 2018-1A, Class A1B*,b,d,e | | | 2,200,000 | |
The accompanying Notes to Financial Statements are an integral part of this schedule.
159
OPPORTUNITY INCOME PLUS FUND
Schedule of Investments as of October 31, 2018
| | | | | | | | |
Principal Amount | | | Long-Term Fixed Income (48.1%) | | Value | |
| | Asset-Backed Securities (7.1%) - continued | | | | |
| | | | Preston Ridge Partners Mortgage Trust, LLC | | | | |
| | $242,125 | | | 4.250%, 1/25/2022, Ser. 2017-1A, Class A1*,j | | | $241,796 | |
| | 635,979 | | | 3.750%, 4/25/2023, Ser. 2018-1A, Class A1*,b | | | 629,935 | |
| | | | Pretium Mortgage Credit Partners, LLC | | | | |
| | 347,833 | | | 3.250%, 3/28/2057, Ser. 2017-NPL2, Class A1h,j | | | 345,395 | |
| | | | Renaissance Home Equity Loan Trust | | | | |
| | 1,198,641 | | | 5.608%, 5/25/2036, Ser. 2006-1, Class AF3j | | | 827,298 | |
| | 1,379,086 | | | 5.285%, 1/25/2037, Ser. 2006-4, Class AF2j | | | 735,216 | |
| | | | Sound Point CLO X, Ltd. | | | | |
| | 1,150,000 | | | 5.169%, (LIBOR 3M + 2.700%), 1/20/2028, Ser. 2015-3A, Class DR*,b | | | 1,149,982 | |
| | | | Sound Point CLO XXI, Ltd. | | | | |
| | 2,200,000 | | | 3.864%, (LIBOR 3M + 1.450%), 10/26/2031, Ser. 2018-3A, Class A1B*,b | | | 2,199,905 | |
| | | | Spirit Master Funding, LLC | | | | |
| | 1,639,689 | | | 4.360%, 12/20/2047, Ser. 2017-1A, Class A* | | | 1,626,437 | |
| | | | THL Credit Wind River CLO, Ltd. | | | | |
| | 1,150,000 | | | 5.286%, (LIBOR 3M + 2.850%), 7/15/2028, Ser. 2016-1A, Class DRb | | | 1,149,988 | |
| | 3,350,000 | | | 3.860%, (LIBOR 3M + 1.450%), 10/22/2031, Ser. 2014-3A, Class A2R2*,b | | | 3,349,906 | |
| | | | Vericrest Opportunity Loan Trust LXV, LLC | | | | |
| | 1,070,161 | | | 3.750%, 4/25/2048, Ser. 2018-NPL1, Class A1h,j | | | 1,064,995 | |
| | | | Wachovia Asset Securitization, Inc. | | | | |
| | 859,640 | | | 2.421%, (LIBOR 1M + 0.140%), 7/25/2037, Ser. 2007-HE1, Class A*,b,i | | | 825,293 | |
| | | | Wells Fargo Home Equity Trust | | | | |
| | 464,065 | | | 2.781%, (LIBOR 1M + 0.500%), 4/25/2034, Ser. 2004-1, Class M1b | | | 455,980 | |
| | | | | |
| | | | Total | | | 39,873,571 | |
| | | | | |
| |
| | Basic Materials (1.4%) | | | | |
| | | | Alcoa Nederland Holding BV | | | | |
| | 550,000 | | | 6.750%, 9/30/2024h | | | 577,500 | |
| | | | Anglo American Capital plc | | | | |
| | 234,000 | | | 4.125%, 9/27/2022h | | | 233,333 | |
| | 620,000 | | | 4.750%, 4/10/2027h | | | 597,028 | |
| | | | ArcelorMittal SA | | | | |
| | 276,000 | | | 6.125%, 6/1/2025k | | | 295,052 | |
| | | | BWAY Holding Company | | | | |
| | 555,000 | | | 5.500%, 4/15/2024h | | | 532,800 | |
| | | | CF Industries, Inc. | | | | |
| | 645,000 | | | 3.450%, 6/1/2023 | | | 612,750 | |
| | | | E.I. du Pont de Nemours and Company | | | | |
| | 233,000 | | | 2.200%, 5/1/2020 | | | 230,136 | |
| | | | First Quantum Minerals, Ltd. | | | | |
| | 559,000 | | | 7.000%, 2/15/2021h | | | 546,772 | |
| | | | FMG Resources Property, Ltd. | | | | |
| | 585,000 | | | 5.125%, 5/15/2024h,k | | | 555,750 | |
| | | | Kinross Gold Corporation | | | | |
| | 117,000 | | | 5.125%, 9/1/2021 | | | 119,516 | |
| | | | LyondellBasell Industries NV | | | | |
| | 140,000 | | | 5.000%, 4/15/2019 | | | 140,527 | |
| | | | Packaging Corporation of America | | | | |
| | 193,000 | | | 2.450%, 12/15/2020 | | | 188,895 | |
| | | | Peabody Securities Finance Corporation | | | | |
| | 535,000 | | | 6.375%, 3/31/2025h | | | 535,000 | |
| | | | Platform Specialty Products Corporation | | | | |
| | 420,000 | | | 5.875%, 12/1/2025h | | | 397,950 | |
| | | | Sherwin-Williams Company | | | | |
| | 232,000 | | | 2.250%, 5/15/2020 | | | 228,042 | |
| | | | Syngenta Finance NV | | | | |
| | 200,000 | | | 3.933%, 4/23/2021h | | | 198,994 | |
| | | | Trinseo Materials Operating SCA | | | | |
| | 615,000 | | | 5.375%, 9/1/2025h | | | 570,413 | |
| | | | United States Steel Corporation | | | | |
| | 680,000 | | | 6.250%, 3/15/2026 | | | 640,900 | |
| | | | Vale Overseas, Ltd. | | | | |
| | 180,000 | | | 4.375%, 1/11/2022 | | | 181,008 | |
| | | | Xstrata Finance Canada, Ltd. | | | | |
| | 175,000 | | | 4.950%, 11/15/2021h | | | 179,582 | |
| | | | | |
| | | | Total | | | 7,561,948 | |
| | | | | |
| |
| | Capital Goods (1.6%) | | | | |
| | | | AECOM | | | | |
| | 775,000 | | | 5.875%, 10/15/2024 | | | 788,562 | |
| | | | Ashtead Capital, Inc. | | | | |
| | 495,000 | | | 4.125%, 8/15/2025h | | | 459,112 | |
| | | | Bombardier, Inc. | | | | |
| | 520,000 | | | 7.500%, 3/15/2025h | | | 519,844 | |
| | | | Building Materials Corporation of America | | | | |
| | 825,000 | | | 6.000%, 10/15/2025h | | | 811,594 | |
| | | | Caterpillar Financial Services Corporation | | | | |
| | 188,000 | | | 1.850%, 9/4/2020 | | | 183,831 | |
| | | | Cemex SAB de CV | | | | |
| | 830,000 | | | 5.700%, 1/11/2025h | | | 811,076 | |
| | | | Cintas Corporation No. 2 | | | | |
| | 174,000 | | | 2.900%, 4/1/2022 | | | 169,479 | |
| | | | CNH Industrial Capital, LLC | | | | |
| | 180,000 | | | 4.875%, 4/1/2021 | | | 183,897 | |
| | | | Crown Americas Capital Corporation IV | | | | |
| | 675,000 | | | 4.500%, 1/15/2023 | | | 661,500 | |
| | | | Crown Cork & Seal Company, Inc. | | | | |
| | 530,000 | | | 7.375%, 12/15/2026 | | | 567,100 | |
| | | | General Electric Company | | | | |
| | 260,000 | | | 5.000%, 1/21/2021b,l | | | 239,850 | |
| | | | H&E Equipment Services, Inc. | | | | |
| | 675,000 | | | 5.625%, 9/1/2025 | | | 642,937 | |
| | | | L3 Technologies, Inc. | | | | |
| | 195,000 | | | 4.950%, 2/15/2021 | | | 199,955 | |
The accompanying Notes to Financial Statements are an integral part of this schedule.
160
OPPORTUNITY INCOME PLUS FUND
Schedule of Investments as of October 31, 2018
| | | | | | | | |
Principal Amount | | | Long-Term Fixed Income (48.1%) | | Value | |
| | Capital Goods (1.6%) - continued | | | | |
| | | | Lockheed Martin Corporation | | | | |
| | $160,000 | | | 2.500%, 11/23/2020 | | | $157,112 | |
| | | | Owens-Brockway Glass Container, Inc. | | | | |
| | 835,000 | | | 5.000%, 1/15/2022h | | | 824,563 | |
| | | | Rockwell Collins, Inc. | | | | |
| | 126,000 | | | 2.800%, 3/15/2022 | | | 122,136 | |
| | | | Roper Technologies, Inc. | | | | |
| | 60,000 | | | 2.800%, 12/15/2021 | | | 58,426 | |
| | | | Textron Financial Corporation | | | | |
| | 500,000 | | | 4.049%, (LIBOR 3M + 1.735%), 2/15/2042b,h | | | 427,500 | |
| | | | United Rentals North America, Inc. | | | | |
| | 855,000 | | | 5.500%, 7/15/2025 | | | 833,091 | |
| | | | United Technologies Corporation | | | | |
| | 235,000 | | | 3.950%, 8/16/2025 | | | 232,049 | |
| | | | | |
| | | | Total | | | 8,893,614 | |
| | | | | |
| |
| | Collateralized Mortgage Obligations (5.7%) | | | | |
| | | | Banc of America Alternative Loan Trust | | | | |
| | 397,688 | | | 6.000%, 11/25/2035, Ser. 2005-10, Class 3CB1 | | | 354,687 | |
| | 363,095 | | | 3.081%, (LIBOR 1M + 0.800%), 5/25/2046, Ser. 2006-4, Class 3CB1b | | | 282,057 | |
| | | | Banc of America Mortgage Securities, Inc. | | | | |
| | 168,256 | | | 4.368%, 9/25/2035, Ser. 2005-H, Class 2A1b | | | 163,037 | |
| | | | Banc of America Mortgage Trust | | | | |
| | 131,078 | | | 4.249%, 7/25/2035, Ser. 2005-F, Class 2A2b | | | 122,025 | |
| | | | CHL Mortgage Pass-Through Trust | | | | |
| | 800,938 | | | 4.109%, 12/20/2035, Ser. 2005-HYB8, Class 3A1b | | | 767,445 | |
| | 178,758 | | | 6.250%, 9/25/2036, Ser. 2006-13, Class 1A15 | | | 141,307 | |
| | 269,148 | | | 6.000%, 4/25/2037, Ser. 2007-3, Class A33 | | | 220,109 | |
| | 403,722 | | | 6.000%, 4/25/2037, Ser. 2007-3, Class A18 | | | 330,164 | |
| | 1,455,224 | | | 6.000%, 11/25/2037, Ser. 2007-18, Class 1A2 | | | 1,240,143 | |
| | | | CIM Trust | | | | |
| | 1,122,785 | | | 5.000%, 12/25/2057, Ser. 2018-R3, Class A1*,b | | | 1,161,856 | |
| | | | COLT Mortgage Loan Trust | | | | |
| | 178,352 | | | 2.750%, 9/25/2046, Ser. 2016-2, Class A1*,b | | | 177,472 | |
| | | | Countrywide Alternative Loan Trust | | | | |
| | 760,000 | | | 5.500%, 5/25/2035, Ser. 2005-J3, Class 1A5 | | | 686,015 | |
| | 783,249 | | | 5.500%, 10/25/2035, Ser. 2005-46CB, Class A8 | | | 734,485 | |
| | 323,094 | | | 6.500%, 8/25/2036, Ser. 2006-23CB, Class 2A3 | | | 205,602 | |
| | 421,943 | | | 6.000%, 1/25/2037, Ser. 2006-39CB, Class 1A16 | | | 401,241 | |
| | 328,050 | | | 5.500%, 5/25/2037, Ser. 2007-8CB, Class A1 | | | 273,868 | |
| | 258,600 | | | 7.000%, 10/25/2037, Ser. 2007-24, Class A10 | | | 160,838 | |
| | | | Countrywide Home Loan Mortgage Pass Through Trust | | | | |
| | 376,478 | | | 4.060%, 11/25/2035, Ser. 2005-22, Class 2A1b | | | 335,879 | |
| | | | Credit Suisse First Boston Mortgage Securities Corporation | | | | |
| | 157,871 | | | 5.250%, 10/25/2035, Ser. 2005-9, Class 1A3 | | | 155,394 | |
| | | | Deutsche Alt-A Securities, Inc., Mortgage Loan Trust | | | | |
| | 323,917 | | | 5.500%, 11/25/2035, Ser. 2005-5, Class 1A4b | | | 344,391 | |
| | | | Federal Home Loan Mortgage Corporation - REMIC | | | | |
| | 3,377,557 | | | 3.000%, 5/15/2027, Ser. 4046, Class GIm | | | 261,801 | |
| | 2,356,386 | | | 3.000%, 4/15/2033, Ser. 4203, Class DIm | | | 200,214 | |
| | | | Federal National Mortgage Association - REMIC | | | | |
| | 2,677,479 | | | 3.000%, 7/25/2027, Ser. 2012-73, Class DIm | | | 231,679 | |
| | 3,777,311 | | | 3.000%, 7/25/2027, Ser. 2012-74, Class AIm | | | 299,228 | |
| | 6,384,861 | | | 3.000%, 8/25/2027, Ser. 2012-95, Class HIm | | | 490,840 | |
| | 4,984,098 | | | 3.000%, 12/25/2027, Ser. 2012-139, Class DIm | | | 407,574 | |
| | 2,505,353 | | | 2.500%, 1/25/2028, Ser. 2012-152, Class AIm | | | 183,370 | |
| | 6,594,512 | | | 3.000%, 1/25/2028, Ser. 2012-147, Class EIm | | | 548,060 | |
| | 3,513,574 | | | 2.500%, 6/25/2028, Ser. 2013-87, Class IWm | | | 260,929 | |
| | | | First Horizon Alternative Mortgage Securities Trust | | | | |
| | 462,546 | | | 4.140%, 7/25/2035, Ser. 2005-AA5, Class 2A1b | | | 453,206 | |
| | | | GMAC Mortgage Corporation Loan Trust | | | | |
| | 278,601 | | | 3.801%, 5/25/2035, Ser. 2005-AR2, Class 4Ab | | | 266,407 | |
| | | | Greenpoint Mortgage Funding Trust | | | | |
| | 258,510 | | | 2.481%, (LIBOR 1M + 0.200%), 10/25/2045, Ser. 2005-AR4, Class G41Bb | | | 231,334 | |
| | | | Impac Secured Assets Trust | | | | |
| | 1,242,901 | | | 2.521%, (LIBOR 1M + 0.240%), 9/25/2037, Ser. 2007-3, Class A1Bb | | | 1,044,416 | |
| | | | IndyMac INDA Mortgage Loan Trust | | | | |
| | 720,984 | | | 3.897%, 8/25/2036, Ser. 2006-AR1, Class A1b | | | 712,436 | |
| | | | IndyMac INDX Mortgage Loan Trust | | | | |
| | 1,008,444 | | | 3.746%, 10/25/2035, Ser. 2005-AR19, Class A1b | | | 909,234 | |
| | 1,144,904 | | | 2.491%, (LIBOR 1M + 0.210%), 4/25/2046, Ser. 2006-AR2, Class 1A1Bb | | | 1,075,133 | |
| | | | J.P. Morgan Alternative Loan Trust | | | | |
| | 851,274 | | | 3.734%, 3/25/2036, Ser. 2006-A1, Class 2A1b | | | 771,381 | |
| | 465,334 | | | 6.500%, 3/25/2036, Ser. 2006-S1, Class 1A19 | | | 404,368 | |
The accompanying Notes to Financial Statements are an integral part of this schedule.
161
OPPORTUNITY INCOME PLUS FUND
Schedule of Investments as of October 31, 2018
| | | | | | | | |
Principal Amount | | | Long-Term Fixed Income (48.1%) | | Value | |
| | Collateralized Mortgage Obligations (5.7%) - continued | | | | |
| | | | J.P. Morgan Mortgage Trust | | | | |
| | $303,686 | | | 4.276%, 7/25/2035, Ser. 2007-A1, Class 2A1b | | | $305,876 | |
| | 216,440 | | | 4.225%, 10/25/2036, Ser. 2006-A6, Class 1A2b | | | 188,835 | |
| | | | Lehman Mortgage Trust | | | | |
| | 122,107 | | | 6.000%, 1/25/2036, Ser. 2005-3, Class 2A7 | | | 121,271 | |
| | | | Master Asset Securitization Trust | | | | |
| | 847,945 | | | 2.781%, (LIBOR 1M + 0.500%), 6/25/2036, Ser. 2006-2, Class 2A2b | | | 402,309 | |
| | | | Merrill Lynch Alternative Note Asset Trust | | | | |
| | 406,019 | | | 6.000%, 3/25/2037, Ser. 2007-F1, Class 2A1 | | | 318,983 | |
| | | | MortgageIT Trust | | | | |
| | 911,779 | | | 2.481%, (LIBOR 1M + 0.200%), 4/25/2036, Ser. 2006-1, Class 1A2b | | | 809,589 | |
| | | | Preston Ridge Partners Mortgage Trust, LLC | | | | |
| | 501,914 | | | 3.470%, 9/25/2022, Ser. 2017-2A, Class A1*,j | | | 496,239 | |
| | | | Radnor RE, Ltd. | | | | |
| | 1,000,000 | | | 3.681%, (LIBOR 1M + 1.400%), 3/25/2028, Ser. 2018-1, Class M1*,b | | | 1,001,584 | |
| | | | RCO 2017-INV1 Trust | | | | |
| | 1,053,497 | | | 3.197%, 11/25/2052, Ser. 2017-INV1, Class A*,b | | | 1,063,965 | |
| | | | Residential Accredit Loans, Inc. Trust | | | | |
| | 445,692 | | | 5.750%, 9/25/2035, Ser. 2005-QS13, Class 2A3 | | | 430,049 | |
| | 304,534 | | | 2.501%, (LIBOR 1M + 0.220%), 7/25/2036, Ser. 2006-QA5, Class 1A3b | | | 201,180 | |
| | 788,391 | | | 2.831%, (LIBOR 1M + 0.550%), 1/25/2037, Ser. 2007-QS1, Class 1A5b | | | 625,106 | |
| | 350,024 | | | 6.000%, 1/25/2037, Ser. 2007-QS1, Class 1A1 | | | 323,763 | |
| | 516,062 | | | 5.750%, 4/25/2037, Ser. 2007-QS6, Class A28 | | | 471,258 | |
| | 385,880 | | | 6.250%, 4/25/2037, Ser. 2007-QS6, Class A6 | | | 361,969 | |
| | | | Residential Asset Securitization Trust | | | | |
| | 390,858 | | | 6.203%, 8/25/2022, Ser. 2007-A8, Class 3A1b | | | 324,357 | |
| | 96,130 | | | 5.750%, 2/25/2036, Ser. 2005-A15, Class 5A1 | | | 69,626 | |
| | | | Residential Funding Mortgage Security I Trust | | | | |
| | 358,417 | | | 6.000%, 7/25/2037, Ser. 2007-S7, Class A20 | | | 337,503 | |
| | | | Sequoia Mortgage Trust | | | | |
| | 577,780 | | | 3.984%, 9/20/2046, Ser. 2007-1, Class 4A1b | | | 478,843 | |
| | | | Structured Adjustable Rate Mortgage Loan Trust | | | | |
| | 281,811 | | | 4.201%, 7/25/2035, Ser. 2005-15, Class 4A1b | | | 260,440 | |
| | | | Structured Asset Mortgage Investments, Inc. | | | | |
| | 704,983 | | | 2.591%, (LIBOR 1M + 0.310%), 12/25/2035, Ser. 2005-AR4, Class A1b | | | 675,025 | |
| | | | Toorak Mortgage Corporation 2018- 1, Ltd. | | | | |
| | 1,750,000 | | | 4.336%, 8/25/2021, Ser. 2018-1, Class A1*,j | | | 1,753,358 | |
| | | | WaMu Mortgage Pass Through Certificates | | | | |
| | 427,275 | | | 3.787%, 8/25/2036, Ser. 2006-AR8, Class 3A2b | | | 405,788 | |
| | 420,222 | | | 2.903%, 1/25/2037, Ser. 2006-AR18, Class 1A1b | | | 395,489 | |
| | 121,502 | | | 3.904%, 8/25/2046, Ser. 2006-AR8, Class 1A1b | | | 115,304 | |
| | 507,117 | | | 2.906%, (12 MTA + 0.960%), 9/25/2046, Ser. 2006-AR11, Class 1Ab | | | 464,509 | |
| | 930,384 | | | 2.826%, (12 MTA + 0.880%), 10/25/2046, Ser. 2006-AR13, Class 1Ab | | | 874,689 | |
| | 437,814 | | | 2.686%, (12 MTA + 0.740%), 1/25/2047, Ser. 2006-AR19, Class 1Ab | | | 414,429 | |
| | | | Wells Fargo Mortgage Backed Securities Trust | | | | |
| | 527,983 | | | 4.083%, 3/25/2036, Ser. 2006-AR2, Class 2A1b | | | 537,334 | |
| | 210,445 | | | 4.219%, 7/25/2036, Ser. 2006-AR10, Class 2A1b | | | 209,763 | |
| | 86,574 | | | 6.000%, 7/25/2037, Ser. 2007-8, Class 1A16 | | | 85,919 | |
| | 78,281 | | | 6.000%, 7/25/2037, Ser. 2007-10, Class 1A1 | | | 77,694 | |
| | | | | |
| | | | Total | | | 31,611,671 | |
| | | | | |
| |
| | Commercial Mortgage-Backed Securities (0.4%) | | | | |
| | | | Cascade Funding Mortgage Trust | | | | |
| | 890,837 | | | 4.580%, 6/25/2048, Ser. 2018-RM1, Class A1*,e | | | 889,510 | |
| | | | Wells Fargo Commercial Mortgage Trust | | | | |
| | 1,155,000 | | | 3.290%, 5/15/2048, Ser. 2015-C28, Class A3 | | | 1,119,339 | |
| | | | | |
| | | | Total | | | 2,008,849 | |
| | | | | |
| |
| | Communications Services (2.3%) | | | | |
| | | | Altice US Finance I Corporation | | | | |
| | 575,000 | | | 5.500%, 5/15/2026h | | | 560,085 | |
| | | | AMC Networks, Inc. | | | | |
| | 855,000 | | | 5.000%, 4/1/2024 | | | 817,765 | |
| | | | America Movil SAB de CV | | | | |
| | 134,000 | | | 5.000%, 10/16/2019 | | | 136,010 | |
| | | | American Tower Corporation | | | | |
| | 170,000 | | | 2.800%, 6/1/2020 | | | 168,211 | |
| | | | AT&T, Inc. | | | | |
| | 171,000 | | | 5.875%, 10/1/2019 | | | 175,126 | |
| | 117,000 | | | 5.200%, 3/15/2020 | | | 119,843 | |
| | | | British Sky Broadcasting Group plc | | | | |
| | 116,000 | | | 2.625%, 9/16/2019h | | | 115,354 | |
The accompanying Notes to Financial Statements are an integral part of this schedule.
162
OPPORTUNITY INCOME PLUS FUND
Schedule of Investments as of October 31, 2018
| | | | | | | | |
Principal
Amount | | | Long-Term Fixed Income (48.1%) | | Value | |
| | Communications Services (2.3%) - continued | | | | |
| | | | CCOH Safari, LLC | | | | |
| | $860,000 | | | 5.750%, 2/15/2026h | | | $851,400 | |
| | | | CenturyLink, Inc. | | | | |
| | 500,000 | | | 6.450%, 6/15/2021 | | | 511,250 | |
| | | | Charter Communications Operating, LLC | | | | |
| | 277,000 | | | 3.579%, 7/23/2020 | | | 276,632 | |
| | 80,000 | | | 4.464%, 7/23/2022 | | | 80,892 | |
| | 117,000 | | | 4.500%, 2/1/2024 | | | 117,141 | |
| | | | Clear Channel Worldwide Holdings, Inc. | | | | |
| | 835,000 | | | 6.500%, 11/15/2022 | | | 847,692 | |
| | | | Comcast Corporation | | | | |
| | 234,000 | | | 1.625%, 1/15/2022 | | | 220,393 | |
| | 118,000 | | | 3.700%, 4/15/2024 | | | 117,596 | |
| | 118,000 | | | 3.950%, 10/15/2025 | | | 117,670 | |
| | | | Crown Castle International Corporation | | | | |
| | 80,000 | | | 3.400%, 2/15/2021 | | | 79,497 | |
| | 553,000 | | | 5.250%, 1/15/2023 | | | 576,740 | |
| | 125,000 | | | 3.150%, 7/15/2023 | | | 119,981 | |
| | | | CSC Holdings, LLC | | | | |
| | 60,000 | | | 5.500%, 4/15/2027h | | | 57,600 | |
| | | | Digicel, Ltd. | | | | |
| | 779,079 | | | 6.000%, 4/15/2021*,k | | | 707,014 | |
| | | | Discovery Communications, LLC | | | | |
| | 120,000 | | | 2.200%, 9/20/2019 | | | 118,918 | |
| | 231,000 | | | 2.950%, 3/20/2023 | | | 219,569 | |
| | | | Intelsat Jackson Holdings SA | | | | |
| | 370,000 | | | 8.500%, 10/15/2024h | | | 363,525 | |
| | | | Level 3 Financing, Inc. | | | | |
| | 670,000 | | | 5.250%, 3/15/2026 | | | 643,200 | |
| | | | Meredith Corporation | | | | |
| | 650,000 | | | 6.875%, 2/1/2026h | | | 650,000 | |
| | | | Moody’s Corporation | | | | |
| | 117,000 | | | 2.750%, 12/15/2021 | | | 114,128 | |
| | | | Neptune Finco Corporation | | | | |
| | 306,000 | | | 10.875%, 10/15/2025h | | | 353,048 | |
| | | | Netflix, Inc. | | | | |
| | 690,000 | | | 4.875%, 4/15/2028h | | | 633,075 | |
| | | | Sprint Corporation | | | | |
| | 825,000 | | | 7.625%, 2/15/2025 | | | 856,969 | |
| | | | Verizon Communications, Inc. | | | | |
| | 287,000 | | | 2.946%, 3/15/2022 | | | 280,835 | |
| | 252,000 | | | 3.414%, (LIBOR 3M + 1.100%), 5/15/2025b | | | 253,298 | |
| | | | Viacom, Inc. | | | | |
| | 178,000 | | | 4.250%, 9/1/2023 | | | 177,740 | |
| | 245,000 | | | 5.875%, 2/28/2057b | | | 233,961 | |
| | | | Virgin Media Secured Finance plc | | | | |
| | 540,000 | | | 5.250%, 1/15/2026h | | | 503,550 | |
| | | | Windstream Services, LLC | | | | |
| | 495,000 | | | 8.625%, 10/31/2025h | | | 462,825 | |
| | | | | |
| | | | Total | | | 12,638,533 | |
| | | | | |
| |
| | Consumer Cyclical (3.0%) | | | | |
| | | | Allison Transmission, Inc. | | | | |
| | 870,000 | | | 5.000%, 10/1/2024h | | | 844,439 | |
| | | | American Honda Finance Corporation | | | | |
| | 175,000 | | | 2.000%, 2/14/2020 | | | 172,527 | |
| | | | BMW US Capital, LLC | | | | |
| | 200,000 | | | 1.500%, 4/11/2019h | | | 198,793 | |
| | | | Brookfield Residential Properties, Inc. | | | | |
| | 570,000 | | | 6.125%, 7/1/2022h | | | 558,600 | |
| | | | Cinemark USA, Inc. | | | | |
| | 394,000 | | | 4.875%, 6/1/2023 | | | 384,642 | |
| | | | D.R. Horton, Inc. | | | | |
| | 188,000 | | | 2.550%, 12/1/2020 | | | 183,611 | |
| | | | Daimler Finance North America, LLC | | | | |
| | 170,000 | | | 2.891%, (LIBOR 3M + 0.550%), 5/4/2021b,h | | | 170,082 | |
| | | | Delphi Jersey Holdings plc | | | | |
| | 720,000 | | | 5.000%, 10/1/2025h | | | 649,800 | |
| | | | Ford Motor Credit Company, LLC | | | | |
| | 232,000 | | | 2.262%, 3/28/2019 | | | 231,206 | |
| | 250,000 | | | 2.597%, 11/4/2019 | | | 247,032 | |
| | 174,000 | | | 3.336%, 3/18/2021 | | | 169,990 | |
| | | | General Motors Financial Company, Inc. | | | | |
| | 174,000 | | | 2.650%, 4/13/2020 | | | 172,147 | |
| | 125,000 | | | 3.258%, (LIBOR 3M + 0.850%), 4/9/2021b | | | 124,991 | |
| | 174,000 | | | 4.375%, 9/25/2021 | | | 175,509 | |
| | 116,000 | | | 3.150%, 6/30/2022 | | | 111,353 | |
| | | | Home Depot, Inc. | | | | |
| | 160,000 | | | 2.625%, 6/1/2022 | | | 156,219 | |
| | | | Hyundai Capital America | | | | |
| | 116,000 | | | 2.550%, 4/3/2020h | | | 113,886 | |
| | 116,000 | | | 2.750%, 9/18/2020h | | | 113,662 | |
| | | | Jaguar Land Rover Automotive plc | | | | |
| | 425,000 | | | 4.125%, 12/15/2018h | | | 424,575 | |
| | 376,000 | | | 5.625%, 2/1/2023h | | | 358,140 | |
| | | | KB Home | | | | |
| | 412,000 | | | 4.750%, 5/15/2019 | | | 413,360 | |
| | | | L Brands, Inc. | | | | |
| | 338,000 | | | 6.694%, 1/15/2027 | | | 317,720 | |
| | | | Landry’s, Inc. | | | | |
| | 560,000 | | | 6.750%, 10/15/2024h | | | 558,600 | |
| | | | Lennar Corporation | | | | |
| | 175,000 | | | 2.950%, 11/29/2020 | | | 170,187 | |
| | 66,000 | | | 4.125%, 1/15/2022 | | | 64,436 | |
| | 740,000 | | | 4.750%, 11/15/2022 | | | 732,748 | |
| | 58,000 | | | 4.875%, 12/15/2023 | | | 56,622 | |
| | 870,000 | | | 4.500%, 4/30/2024 | | | 831,394 | |
| | | | Live Nation Entertainment, Inc. | | | | |
| | 175,000 | | | 5.375%, 6/15/2022h | | | 176,313 | |
| | 355,000 | | | 4.875%, 11/1/2024h | | | 339,913 | |
| | 365,000 | | | 5.625%, 3/15/2026h,k | | | 365,000 | |
| | | | Macy’s Retail Holdings, Inc. | | | | |
| | 50,000 | | | 3.875%, 1/15/2022 | | | 49,663 | |
| | 86,000 | | | 2.875%, 2/15/2023 | | | 80,322 | |
| | | | McDonald’s Corporation | | | | |
| | 232,000 | | | 2.625%, 1/15/2022 | | | 225,648 | |
| | | | MGM Resorts International | | | | |
| | 620,000 | | | 6.000%, 3/15/2023 | | | 629,300 | |
| | 685,000 | | | 5.750%, 6/15/2025 | | | 667,875 | |
| | | | Navistar International Corporation | | | | |
| | 655,000 | | | 6.625%, 11/1/2025h | | | 668,100 | |
| | | | New Red Finance, Inc. | | | | |
| | 590,000 | | | 4.250%, 5/15/2024h,k | | | 553,125 | |
The accompanying Notes to Financial Statements are an integral part of this schedule.
163
OPPORTUNITY INCOME PLUS FUND
Schedule of Investments as of October 31, 2018
| | | | | | | | |
Principal
Amount | | | Long-Term Fixed Income (48.1%) | | Value | |
| | Consumer Cyclical (3.0%) - continued | | | | |
| | | | Nissan Motor Acceptance Corporation | | | | |
| | $175,000 | | | 2.000%, 3/8/2019h | | | $174,480 | |
| | | | Prime Security Services Borrower, LLC | | | | |
| | 588,000 | | | 9.250%, 5/15/2023h | | | 621,340 | |
| | | | Ralph Lauren Corporation | | | | |
| | 160,000 | | | 2.625%, 8/18/2020 | | | 158,174 | |
| | | | Royal Caribbean Cruises, Ltd. | | | | |
| | 799,079 | | | 5.250%, 11/15/2022 | | | 834,267 | |
| | | | Six Flags Entertainment Corporation | | | | |
| | 570,000 | | | 4.875%, 7/31/2024h | | | 538,650 | |
| | | | Toll Brothers Finance Corporation | | | | |
| | 266,000 | | | 4.000%, 12/31/2018 | | | 265,335 | |
| | | | Visa, Inc. | | | | |
| | 160,000 | | | 2.200%, 12/14/2020 | | | 156,731 | |
| | | | Volkswagen Group of America Finance, LLC | | | | |
| | 163,000 | | | 2.450%, 11/20/2019h | | | 161,376 | |
| | | | Wabash National Corporation | | | | |
| | 715,000 | | | 5.500%, 10/1/2025h | | | 643,500 | |
| | | | Yum! Brands, Inc. | | | | |
| | 870,000 | | | 5.000%, 6/1/2024h | | | 858,038 | |
| | | | | |
| | | | Total | | | 16,873,421 | |
| | | | | |
| |
| | Consumer Non-Cyclical (2.4%) | | | | |
| | | | Abbott Laboratories | | | | |
| | 234,000 | | | 2.550%, 3/15/2022 | | | 226,362 | |
| | 123,000 | | | 3.400%, 11/30/2023 | | | 121,682 | |
| | | | AbbVie, Inc. | | | | |
| | 234,000 | | | 2.500%, 5/14/2020 | | | 230,942 | |
| | 117,000 | | | 2.900%, 11/6/2022 | | | 113,268 | |
| | | | Albertsons Companies, LLC | | | | |
| | 750,000 | | | 6.625%, 6/15/2024 | | | 708,750 | |
| | | | Amgen, Inc. | | | | |
| | 250,000 | | | 3.875%, 11/15/2021 | | | 252,310 | |
| | 232,000 | | | 2.650%, 5/11/2022 | | | 224,154 | |
| | | | Anheuser-Busch InBev Finance, Inc. | | | | |
| | 165,000 | | | 2.650%, 2/1/2021 | | | 161,748 | |
| | 225,000 | | | 3.603%, (LIBOR 3M + 1.260%), 2/1/2021b | | | 229,790 | |
| | 117,000 | | | 3.300%, 2/1/2023 | | | 114,060 | |
| | | | Anheuser-Busch InBev Worldwide, Inc. | | | | |
| | 250,000 | | | 3.500%, 1/12/2024 | | | 243,344 | |
| | | | BAT Capital Corporation | | | | |
| | 120,000 | | | 2.297%, 8/14/2020h | | | 117,424 | |
| | 117,000 | | | 2.764%, 8/15/2022h | | | 112,000 | |
| | | | Bausch Health Co. Inc. | | | | |
| | 462,000 | | | 7.500%, 7/15/2021h | | | 468,930 | |
| | | | Bayer U.S. Finance II, LLC | | | | |
| | 225,000 | | | 3.500%, 6/25/2021h | | | 223,578 | |
| | | | Bayer US Finance, LLC | | | | |
| | 170,000 | | | 2.375%, 10/8/2019h | | | 168,653 | |
| | | | Becton, Dickinson and Company | | | | |
| | 232,000 | | | 3.125%, 11/8/2021 | | | 228,182 | |
| | | | Boston Scientific Corporation | | | | |
| | 110,000 | | | 6.000%, 1/15/2020 | | | 113,387 | |
| | | | Bunge, Ltd. Finance Corporation | | | | |
| | 160,000 | | | 3.500%, 11/24/2020 | | | 159,656 | |
| | | | Cardinal Health, Inc. | | | | |
| | 120,000 | | | 1.948%, 6/14/2019 | | | 119,231 | |
| | 120,000 | | | 2.616%, 6/15/2022 | | | 114,719 | |
| | | | Conagra Brands, Inc. | | | | |
| | 118,000 | | | 3.800%, 10/22/2021 | | | 118,274 | |
| | 118,000 | | | 4.300%, 5/1/2024 | | | 118,181 | |
| | | | CVS Health Corporation | | | | |
| | 255,000 | | | 3.350%, 3/9/2021 | | | 253,880 | |
| | 117,000 | | | 2.750%, 12/1/2022 | | | 111,833 | |
| | 382,000 | | | 3.700%, 3/9/2023 | | | 377,420 | |
| | | | Express Scripts Holding Company | | | | |
| | 117,000 | | | 4.750%, 11/15/2021 | | | 120,399 | |
| | | | Forest Laboratories, LLC | | | | |
| | 57,000 | | | 4.875%, 2/15/2021h | | | 58,232 | |
| | | | Halfmoon Parent, Inc. | | | | |
| | 235,000 | | | 4.125%, 11/15/2025h | | | 232,308 | |
| | | | HCA, Inc. | | | | |
| | 469,079 | | | 4.750%, 5/1/2023 | | | 473,770 | |
| | 285,000 | | | 5.250%, 6/15/2026 | | | 289,988 | |
| | | | Iron Mountain, Inc. | | | | |
| | 235,000 | | | 4.875%, 9/15/2027h | | | 209,150 | |
| | | | J.M. Smucker Company | | | | |
| | 123,000 | | | 2.200%, 12/6/2019 | | | 121,661 | |
| | | | JBS USA, LLC | | | | |
| | 855,000 | | | 5.750%, 6/15/2025h | | | 827,213 | |
| | | | Kellogg Company | | | | |
| | 254,000 | | | 3.125%, 5/17/2022 | | | 248,519 | |
| | | | Kraft Heinz Foods Company | | | | |
| | 248,000 | | | 5.375%, 2/10/2020 | | | 254,503 | |
| | 126,000 | | | 4.000%, 6/15/2023 | | | 125,343 | |
| | | | Kroger Company | | | | |
| | 122,000 | | | 2.800%, 8/1/2022 | | | 118,102 | |
| | | | Maple Escrow Subsidiary, Inc. | | | | |
| | 252,000 | | | 3.551%, 5/25/2021h | | | 250,825 | |
| | | | Mead Johnson Nutrition Company | | | | |
| | 160,000 | | | 3.000%, 11/15/2020 | | | 158,880 | |
| | | | Medtronic Global Holdings SCA | | | | |
| | 232,000 | | | 1.700%, 3/28/2019 | | | 231,077 | |
| | | | Mondelez International Holdings Netherlands BV | | | | |
| | 180,000 | | | 2.000%, 10/28/2021h | | | 171,339 | |
| | | | Mylan NV | | | | |
| | 126,000 | | | 3.150%, 6/15/2021 | | | 123,035 | |
| | | | Mylan, Inc. | | | | |
| | 126,000 | | | 3.125%, 1/15/2023h | | | 118,836 | |
| | | | Newell Rubbermaid, Inc. | | | | |
| | 15,000 | | | 3.150%, 4/1/2021 | | | 14,692 | |
| | | | PepsiCo, Inc. | | | | |
| | 175,000 | | | 2.938%, (LIBOR 3M + 0.530%), 10/6/2021b | | | 177,091 | |
| | | | Pernod Ricard SA | | | | |
| | 130,000 | | | 5.750%, 4/7/2021h | | | 136,135 | |
| | | | Perrigo Finance Unlimited Company | | | | |
| | 257,000 | | | 4.375%, 3/15/2026 | | | 248,306 | |
| | | | Reynolds American, Inc. | | | | |
| | 87,000 | | | 3.250%, 6/12/2020 | | | 86,715 | |
| | | | Shire Acquisitions Investments Ireland Designated Activity Company | | | | |
| | 185,000 | | | 1.900%, 9/23/2019 | | | 182,728 | |
| | 232,000 | | | 2.400%, 9/23/2021 | | | 222,968 | |
The accompanying Notes to Financial Statements are an integral part of this schedule.
164
OPPORTUNITY INCOME PLUS FUND
Schedule of Investments as of October 31, 2018
| | | | | | | | |
Principal
Amount | | | Long-Term Fixed Income (48.1%) | | Value | |
| | Consumer Non-Cyclical (2.4%) - continued | | | | |
| | | | Simmons Foods, Inc. | | | | |
| | $635,000 | | | 5.750%, 11/1/2024h | | | $466,725 | |
| | | | Smithfield Foods, Inc. | | | | |
| | 175,000 | | | 2.700%, 1/31/2020h | | | 171,995 | |
| | | | Tenet Healthcare Corporation | | | | |
| | 675,000 | | | 8.125%, 4/1/2022 | | | 702,844 | |
| | | | Teva Pharmaceutical Finance IV, LLC | | | | |
| | 60,000 | | | 2.250%, 3/18/2020 | | | 58,272 | |
| | | | Teva Pharmaceutical Finance Netherlands III BV | | | | |
| | 165,000 | | | 2.200%, 7/21/2021 | | | 154,058 | |
| | | | TreeHouse Foods, Inc. | | | | |
| | 550,000 | | | 4.875%, 3/15/2022 | | | 543,125 | |
| | | | Zimmer Biomet Holdings, Inc. | | | | |
| | 188,000 | | | 3.089%, (LIBOR 3M + 0.750%), 3/19/2021b | | | 188,098 | |
| | | | Zoetis, Inc. | | | | |
| | 175,000 | | | 3.450%, 11/13/2020 | | | 175,201 | |
| | | | | |
| | | | Total | | | 13,093,891 | |
| | | | | |
| |
| | Energy (3.4%) | | | | |
| | | | Alliance Resource Operating Partners, LP | | | | |
| | 545,000 | | | 7.500%, 5/1/2025h | | | 565,437 | |
| | | | Anadarko Petroleum Corporation | | | | |
| | 150,000 | | | 8.700%, 3/15/2019 | | | 152,978 | |
| | 60,000 | | | 4.850%, 3/15/2021 | | | 61,301 | |
| | 60,000 | | | 3.450%, 7/15/2024 | | | 57,004 | |
| | | | BP Capital Markets plc | | | | |
| | 117,000 | | | 2.315%, 2/13/2020 | | | 115,779 | |
| | 490,000 | | | 2.520%, 9/19/2022 | | | 470,303 | |
| | | | Buckeye Partners, LP | | | | |
| | 268,000 | | | 2.650%, 11/15/2018 | | | 267,944 | |
| | | | Canadian Natural Resources, Ltd. | | | | |
| | 120,000 | | | 2.950%, 1/15/2023 | | | 115,523 | |
| | | | Canadian Oil Sands, Ltd. | | | | |
| | 125,000 | | | 9.400%, 9/1/2021h | | | 140,937 | |
| | | | Cenovus Energy, Inc. | | | | |
| | 116,000 | | | 3.800%, 9/15/2023 | | | 113,393 | |
| | | | Cheniere Corpus Christi Holdings, LLC | | | | |
| | 625,000 | | | 7.000%, 6/30/2024 | | | 675,781 | |
| | | | Cheniere Energy Partners, LP | | | | |
| | 875,000 | | | 5.625%, 10/1/2026h | | | 861,875 | |
| | | | Chesapeake Energy Corporation | | | | |
| | 365,000 | | | 7.000%, 10/1/2024 | | | 356,787 | |
| | | | Continental Resources, Inc. | | | | |
| | 93,000 | | | 5.000%, 9/15/2022 | | | 93,837 | |
| | | | Crestwood Midstream Partners, LP | | | | |
| | 550,000 | | | 6.250%, 4/1/2023 | | | 561,000 | |
| | | | Diamondback Energy, Inc. | | | | |
| | 787,000 | | | 4.750%, 11/1/2024 | | | 765,357 | |
| | | | Enbridge, Inc. | | | | |
| | 120,000 | | | 2.900%, 7/15/2022 | | | 115,842 | |
| | | | Encana Corporation | | | | |
| | 215,000 | | | 3.900%, 11/15/2021 | | | 214,779 | |
| | | | Energy Transfer Equity, LP | | | | |
| | 855,000 | | | 5.500%, 6/1/2027 | | | 869,150 | |
| | | | Energy Transfer Operating, LP | | | | |
| | 126,000 | | | 4.200%, 9/15/2023 | | | 125,440 | |
| | | | Energy Transfer Partners, LP | | | | |
| | 170,000 | | | 4.150%, 10/1/2020 | | | 171,437 | |
| | | | Enterprise Products Operating, LLC | | | | |
| | 500,000 | | | 5.250%, 8/16/2077b | | | 447,802 | |
| | | | EOG Resources, Inc. | | | | |
| | 160,000 | | | 2.625%, 3/15/2023 | | | 153,276 | |
| | | | EQM Midstream Partners LP | | | | |
| | 178,000 | | | 4.750%, 7/15/2023 | | | 179,491 | |
| | | | EQT Corporation | | | | |
| | 134,000 | | | 8.125%, 6/1/2019 | | | 137,691 | |
| | 119,000 | | | 3.000%, 10/1/2022 | | | 114,169 | |
| | | | Exxon Mobil Corporation | | | | |
| | 200,000 | | | 1.708%, 3/1/2019 | | | 199,387 | |
| | | | Hess Corporation | | | | |
| | 126,000 | | | 3.500%, 7/15/2024 | | | 118,798 | |
| | | | Kinder Morgan Energy Partners, LP | | | | |
| | 120,000 | | | 9.000%, 2/1/2019 | | | 121,731 | |
| | 234,000 | | | 3.450%, 2/15/2023 | | | 228,211 | |
| | | | Marathon Oil Corporation | | | | |
| | 118,000 | | | 2.700%, 6/1/2020 | | | 116,400 | |
| | | | Marathon Petroleum Corporation | | | | |
| | 160,000 | | | 3.400%, 12/15/2020 | | | 159,943 | |
| | | | MEG Energy Corporation | | | | |
| | 86,000 | | | 6.375%, 1/30/2023h | | | 82,882 | |
| | | | MPLX, LP | | | | |
| | 175,000 | | | 4.500%, 7/15/2023 | | | 177,637 | |
| | | | Nabors Industries, Inc. | | | | |
| | 550,000 | | | 5.750%, 2/1/2025 | | | 507,642 | |
| | | | ONEOK Partners, LP | | | | |
| | 120,000 | | | 3.800%, 3/15/2020 | | | 120,362 | |
| | | | Parsley Energy, LLC | | | | |
| | 270,000 | | | 5.625%, 10/15/2027h | | | 266,158 | |
| | | | PBF Holding Company, LLC | | | | |
| | 475,000 | | | 7.250%, 6/15/2025 | | | 489,250 | |
| | | | Petrobras Global Finance BV | | | | |
| | 61,000 | | | 8.375%, 5/23/2021 | | | 66,542 | |
| | | | Petroleos Mexicanos | | | | |
| | 115,000 | | | 6.375%, 2/4/2021 | | | 117,666 | |
| | | | Plains All American Pipeline, LP | | | | |
| | 273,000 | | | 5.000%, 2/1/2021 | | | 278,606 | |
| | | | Regency Energy Partners, LP | | | | |
| | 675,000 | | | 5.000%, 10/1/2022 | | | 695,507 | |
| | | | Sabine Pass Liquefaction, LLC | | | | |
| | 117,000 | | | 6.250%, 3/15/2022 | | | 124,665 | |
| | 117,000 | | | 5.625%, 4/15/2023 | | | 123,181 | |
| | 805,000 | | | 5.625%, 3/1/2025 | | | 840,472 | |
| | | | Schlumberger Holdings Corporation | | | | |
| | 160,000 | | | 3.000%, 12/21/2020h | | | 158,281 | |
| | | | Southwestern Energy Company | | | | |
| | 635,000 | | | 7.500%, 4/1/2026k | | | 646,112 | |
| | | | SRC Energy, Inc. | | | | |
| | 650,000 | | | 6.250%, 12/1/2025 | | | 605,312 | |
| | | | Sunoco Logistics Partners Operations, LP | | | | |
| | 160,000 | | | 4.400%, 4/1/2021 | | | 161,856 | |
| | | | Sunoco, LP | | | | |
| | 235,000 | | | 5.500%, 2/15/2026h | | | 223,838 | |
| | 355,000 | | | 5.875%, 3/15/2028h | | | 331,038 | |
| | | | Tallgrass Energy Partners, LP | | | | |
| | 950,000 | | | 5.500%, 1/15/2028h | | | 939,132 | |
The accompanying Notes to Financial Statements are an integral part of this schedule.
165
OPPORTUNITY INCOME PLUS FUND
Schedule of Investments as of October 31, 2018
| | | | | | | | |
Principal
Amount | | | Long-Term Fixed Income (48.1%) | | Value | |
| | Energy (3.4%) - continued | | | | |
| | | | TransCanada Trust | | | | |
| | $600,000 | | | 5.875%, 8/15/2076b | | | $590,640 | |
| | | | Transocean Guardian, Ltd. | | | | |
| | 690,000 | | | 5.875%, 1/15/2024h | | | 683,100 | |
| | | | W&T Offshore, Inc. | | | | |
| | 700,000 | | | 9.750%, 11/1/2023h | | | 677,390 | |
| | | | Weatherford International, Ltd. | | | | |
| | 184,000 | | | 4.500%, 4/15/2022k | | | 138,000 | |
| | 443,000 | | | 8.250%, 6/15/2023k | | | 338,895 | |
| | | | Western Gas Partners, LP | | | | |
| | 120,000 | | | 4.000%, 7/1/2022 | | | 118,985 | |
| | | | Williams Partners, LP | | | | |
| | 250,000 | | | 4.000%, 11/15/2021 | | | 251,231 | |
| | | | WPX Energy, Inc. | | | | |
| | 480,000 | | | 5.750%, 6/1/2026 | | | 477,600 | |
| | | | | |
| | | | Total | | | 19,080,763 | |
| | | | | |
| |
| | Financials (6.8%) | | | | |
| | | | ACE INA Holdings, Inc. | | | | |
| | 160,000 | | | 2.875%, 11/3/2022 | | | 156,259 | |
| | | | AIG Global Funding | | | | |
| | 242,000 | | | 2.150%, 7/2/2020h | | | 236,913 | |
| | | | Air Lease Corporation | | | | |
| | 235,000 | | | 2.500%, 3/1/2021 | | | 229,102 | |
| | | | Aircastle, Ltd. | | | | |
| | 168,000 | | | 5.000%, 4/1/2023 | | | 170,350 | |
| | | | Ally Financial, Inc. | | | | |
| | 540,000 | | | 3.750%, 11/18/2019 | | | 540,054 | |
| | | | American Express Company | | | | |
| | 126,000 | | | 3.375%, 5/17/2021 | | | 125,727 | |
| | | | American Express Credit Corporation | | | | |
| | 116,000 | | | 2.678%, (LIBOR 3M + 0.330%), 5/3/2019b | | | 116,095 | |
| | 116,000 | | | 2.200%, 3/3/2020 | | | 114,465 | |
| | 160,000 | | | 3.382%, (LIBOR 3M + 1.050%), 9/14/2020b | | | 162,310 | |
| | | | Ares Capital Corporation | | | | |
| | 248,000 | | | 3.875%, 1/15/2020 | | | 248,795 | |
| | | | Athene Global Funding | | | | |
| | 187,000 | | | 4.000%, 1/25/2022h | | | 187,652 | |
| | | | Australia and New Zealand Banking Group, Ltd. | | | | |
| | 270,000 | | | 6.750%, 6/15/2026b,h,k,l | | | 277,087 | |
| | | | Banco Bilbao Vizcaya Argentaria SA | | | | |
| | 200,000 | | | 6.125%, 11/16/2027b,k,l | | | 172,250 | |
| | | | Banco Santander SA | | | | |
| | 600,000 | | | 6.375%, 5/19/2019b,l | | | 591,750 | |
| | 200,000 | | | 3.545%, (LIBOR 3M + 1.120%), 4/12/2023b | | | 200,536 | |
| | | | Bank of America Corporation | | | | |
| | 116,000 | | | 2.369%, 7/21/2021b | | | 113,778 | |
| | 254,000 | | | 2.328%, 10/1/2021b | | | 247,961 | |
| | 250,000 | | | 2.738%, 1/23/2022b | | | 245,013 | |
| | 252,000 | | | 3.499%, 5/17/2022b | | | 250,900 | |
| | 247,000 | | | 3.550%, 3/5/2024b | | | 242,407 | |
| | 119,000 | | | 3.864%, 7/23/2024b | | | 118,147 | |
| | | | Bank of Montreal | | | | |
| | 130,000 | | | 1.500%, 7/18/2019 | | | 128,682 | |
| | 182,000 | | | 2.100%, 6/15/2020 | | | 178,797 | |
| | | | Bank of New York Mellon Corporation | | | | |
| | 234,000 | | | 2.600%, 2/7/2022 | | | 227,696 | |
| | | | Bank of Nova Scotia | | | | |
| | 126,000 | | | 2.909%, (LIBOR 3M + 0.440%), 4/20/2021b | | | 126,305 | |
| | 174,000 | | | 2.700%, 3/7/2022 | | | 169,356 | |
| | | | Barclays plc | | | | |
| | 200,000 | | | 7.750%, 9/15/2023b,l | | | 199,540 | |
| | 200,000 | | | 4.338%, 5/16/2024b | | | 196,492 | |
| | | | BB&T Corporation | | | | |
| | 245,000 | | | 2.150%, 2/1/2021 | | | 238,674 | |
| | | | BNP Paribas SA | | | | |
| | 730,000 | | | 7.625%, 3/30/2021b,h,k,l | | | 758,287 | |
| | | | Capital One Financial Corporation | | | | |
| | 116,000 | | | 2.500%, 5/12/2020 | | | 114,348 | |
| | 354,000 | | | 3.050%, 3/9/2022 | | | 345,365 | |
| | | | Cboe Global Markets, Inc. | | | | |
| | 181,000 | | | 1.950%, 6/28/2019 | | | 179,710 | |
| | | | Central Fidelity Capital Trust I | | | | |
| | 310,000 | | | 3.436%, (LIBOR 3M + 1.000%), 4/15/2027b | | | 289,850 | |
| | | | CIT Group, Inc. | | | | |
| | 655,000 | | | 4.750%, 2/16/2024 | | | 645,175 | |
| | | | Citigroup, Inc. | | | | |
| | 234,000 | | | 2.450%, 1/10/2020 | | | 231,871 | |
| | 234,000 | | | 2.650%, 10/26/2020 | | | 230,426 | |
| | 363,000 | | | 2.350%, 8/2/2021 | | | 350,646 | |
| | 116,000 | | | 2.750%, 4/25/2022 | | | 112,061 | |
| | 125,000 | | | 3.199%, (LIBOR 3M + 0.690%), 10/27/2022b | | | 124,948 | |
| | 244,000 | | | 3.142%, 1/24/2023b | | | 238,215 | |
| | 800,000 | | | 5.950%, 1/30/2023b,l | | | 801,000 | |
| | | | Citizens Bank NA | | | | |
| | 250,000 | | | 2.200%, 5/26/2020 | | | 245,339 | |
| | | | CNA Financial Corporation | | | | |
| | 185,000 | | | 5.750%, 8/15/2021 | | | 194,909 | |
| | | | Commonwealth Bank of Australia | | | | |
| | 232,000 | | | 2.250%, 3/10/2020h | | | 228,801 | |
| | | | Compass Bank | | | | |
| | 250,000 | | | 3.500%, 6/11/2021 | | | 247,946 | |
| | | | Cooperatieve Centrale Raiffeisen-Boerenleenbank BA | | | | |
| | 232,000 | | | 3.950%, 11/9/2022 | | | 229,841 | |
| | | | Credit Agricole SA | | | | |
| | 116,000 | | | 3.375%, 1/10/2022h | | | 113,561 | |
| | 220,000 | | | 8.125%, 12/23/2025b,h,l | | | 235,965 | |
| | | | Credit Suisse Group AG | | | | |
| | 174,000 | | | 7.500%, 7/17/2023b,h,l | | | 177,045 | |
| | 588,000 | | | 7.500%, 12/11/2023b,h,l | | | 612,202 | |
| | | | Credit Suisse Group Funding Guernsey, Ltd. | | | | |
| | 350,000 | | | 3.800%, 9/15/2022 | | | 346,164 | |
| | | | Credit Suisse Group Funding, Ltd. | | | | |
| | 234,000 | | | 3.125%, 12/10/2020 | | | 231,330 | |
| | | | Deutsche Bank AG | | | | |
| | 125,000 | | | 2.700%, 7/13/2020 | | | 122,135 | |
| | 348,000 | | | 4.250%, 10/14/2021 | | | 345,224 | |
| | | | Deutsche Bank AG of New York | | | | |
| | 100,000 | | | 3.950%, 2/27/2023 | | | 96,009 | |
| | | | Digital Realty Trust, LP | | | | |
| | 185,000 | | | 2.750%, 2/1/2023 | | | 176,728 | |
| | | | Discover Bank | | | | |
| | 70,000 | | | 8.700%, 11/18/2019 | | | 73,494 | |
| | 247,000 | | | 3.100%, 6/4/2020 | | | 245,142 | |
The accompanying Notes to Financial Statements are an integral part of this schedule.
166
OPPORTUNITY INCOME PLUS FUND
Schedule of Investments as of October 31, 2018
| | | | | | | | |
Principal
Amount | | | Long-Term Fixed Income (48.1%) | | Value | |
| | Financials (6.8%) - continued | | | | |
| | | | Energizer Gamma Acquisition, Inc. | | | | |
| | $745,000 | | | 6.375%, 7/15/2026h | | | $745,000 | |
| | | | Fidelity National Financial, Inc. | | | | |
| | 184,000 | | | 5.500%, 9/1/2022 | | | 193,869 | |
| | | | Fifth Third Bancorp | | | | |
| | 175,000 | | | 2.600%, 6/15/2022 | | | 168,228 | |
| | | | Five Corners Funding Trust | | | | |
| | 275,000 | | | 4.419%, 11/15/2023h | | | 280,874 | |
| | | | Goldman Sachs Group, Inc. | | | | |
| | 232,000 | | | 5.375%, 5/10/2020b,l | | | 234,610 | |
| | 174,000 | | | 2.600%, 12/27/2020 | | | 170,638 | |
| | 234,000 | | | 5.250%, 7/27/2021 | | | 243,337 | |
| | 175,000 | | | 3.484%, (LIBOR 3M + 1.170%), 11/15/2021b | | | 177,131 | |
| | 234,000 | | | 3.000%, 4/26/2022 | | | 227,793 | |
| | 187,000 | | | 2.876%, 10/31/2022b | | | 181,884 | |
| | 120,000 | | | 3.366%, (LIBOR 3M + 1.050%), 6/5/2023b | | | 120,798 | |
| | | | Hartford Financial Services Group, Inc. | | | | |
| | 150,000 | | | 4.439%, (LIBOR 3M + 2.125%), 2/12/2047b,h | | | 138,000 | |
| | | | HCP, Inc. | | | | |
| | 139,000 | | | 3.750%, 2/1/2019 | | | 139,010 | |
| | | | Hospitality Properties Trust | | | | |
| | 150,000 | | | 4.250%, 2/15/2021 | | | 150,513 | |
| | | | HSBC Holdings plc | | | | |
| | 348,000 | | | 3.400%, 3/8/2021 | | | 346,298 | |
| | 234,000 | | | 6.875%, 6/1/2021b,l | | | 242,482 | |
| | 150,000 | | | 6.375%, 9/17/2024b,l | | | 145,350 | |
| | | | Huntington Bancshares, Inc. | | | | |
| | 200,000 | | | 3.150%, 3/14/2021 | | | 197,736 | |
| | | | Icahn Enterprises, LP | | | | |
| | 235,000 | | | 6.750%, 2/1/2024 | | | 236,763 | |
| | 325,000 | | | 6.375%, 12/15/2025 | | | 322,969 | |
| | | | ILFC E-Capital Trust II | | | | |
| | 1,165,000 | | | 5.030%, (H15T30Y + 1.800%), 12/21/2065b,h | | | 1,036,850 | |
| | | | ING Groep NV | | | | |
| | 225,000 | | | 4.100%, 10/2/2023 | | | 223,298 | |
| | | | International Lease Finance Corporation | | | | |
| | 234,000 | | | 4.625%, 4/15/2021 | | | 237,207 | |
| | 234,000 | | | 5.875%, 8/15/2022 | | | 246,450 | |
| | | | Iron Mountain, Inc. | | | | |
| | 360,079 | | | 6.000%, 8/15/2023 | | | 368,631 | |
| | | | J.P. Morgan Chase & Company | | | | |
| | 175,000 | | | 3.001%, (LIBOR 3M + 0.680%), 6/1/2021b | | | 175,263 | |
| | 250,000 | | | 4.625%, 11/1/2022b,l | | | 231,400 | |
| | 495,000 | | | 2.972%, 1/15/2023 | | | 478,983 | |
| | 174,000 | | | 2.776%, 4/25/2023b | | | 168,388 | |
| | 231,000 | | | 3.717%, (LIBOR 3M + 1.230%), 10/24/2023b | | | 235,067 | |
| | | | KeyCorp | | | | |
| | 223,000 | | | 2.300%, 12/13/2018 | | | 222,906 | |
| | | | Liberty Mutual Group, Inc. | | | | |
| | 54,000 | | | 5.000%, 6/1/2021h | | | 55,377 | |
| | | | Lincoln National Corporation | | | | |
| | 130,000 | | | 6.250%, 2/15/2020 | | | 134,495 | |
| | 135,000 | | | 4.669%, (LIBOR 3M + 2.358%), 5/17/2066b | | | 123,525 | |
| | | | Lloyds Bank plc | | | | |
| | 250,000 | | | 12.000%, 12/16/2024b,h,l | | | 300,109 | |
| | | | Lloyds Banking Group plc | | | | |
| | 250,000 | | | 6.657%, 5/21/2037b,h,l | | | 253,280 | |
| | | | Macquarie Bank, Ltd. | | | | |
| | 200,000 | | | 6.125%, 3/8/2027b,h,l | | | 179,500 | |
| | | | Mitsubishi UFJ Financial Group, Inc. | | | | |
| | 117,000 | | | 2.998%, 2/22/2022 | | | 114,679 | |
| | 250,000 | | | 3.455%, 3/2/2023 | | | 246,508 | |
| | | | Morgan Stanley | | | | |
| | 234,000 | | | 2.800%, 6/16/2020 | | | 231,899 | |
| | 232,000 | | | 5.500%, 7/28/2021 | | | 243,016 | |
| | 231,000 | | | 3.649%, (LIBOR 3M + 1.180%), 1/20/2022b | | | 233,600 | |
| | 116,000 | | | 2.750%, 5/19/2022 | | | 112,140 | |
| | 150,000 | | | 4.875%, 11/1/2022 | | | 154,346 | |
| | 250,000 | | | 3.125%, 1/23/2023 | | | 241,942 | |
| | | | MPT Operating Partnership, LP | | | | |
| | 550,000 | | | 5.500%, 5/1/2024 | | | 555,500 | |
| | | | National City Corporation | | | | |
| | 140,000 | | | 6.875%, 5/15/2019 | | | 142,894 | |
| | | | Nomura Holdings, Inc. | | | | |
| | 135,000 | | | 2.750%, 3/19/2019 | | | 134,943 | |
| | | | Park Aerospace Holdings, Ltd. | | | | |
| | 675,000 | | | 5.500%, 2/15/2024h | | | 668,419 | |
| | | | PNC Bank NA | | | | |
| | 234,000 | | | 2.450%, 11/5/2020 | | | 229,861 | |
| | | | Quicken Loans, Inc. | | | | |
| | 830,000 | | | 5.750%, 5/1/2025h | | | 799,913 | |
| | | | Realty Income Corporation | | | | |
| | 174,000 | | | 5.750%, 1/15/2021 | | | 181,389 | |
| | | | Regions Financial Corporation | | | | |
| | 135,000 | | | 3.200%, 2/8/2021 | | | 133,832 | |
| | 126,000 | | | 3.800%, 8/14/2023 | | | 124,718 | |
| | | | Reinsurance Group of America, Inc. | | | | |
| | 175,000 | | | 4.700%, 9/15/2023 | | | 179,787 | |
| | | | Royal Bank of Canada | | | | |
| | 232,000 | | | 2.125%, 3/2/2020 | | | 228,923 | |
| | | | Royal Bank of Scotland Group plc | | | | |
| | 650,000 | | | 7.500%, 8/10/2020b,l | | | 660,725 | |
| | 174,000 | | | 8.625%, 8/15/2021b,l | | | 182,918 | |
| | 685,000 | | | 5.125%, 5/28/2024 | | | 678,150 | |
| | 638,000 | | | 7.648%, 9/30/2031b,l | | | 795,905 | |
| | | | Santander UK Group Holdings plc | | | | |
| | 253,000 | | | 2.875%, 8/5/2021 | | | 245,104 | |
| | | | Simon Property Group, LP | | | | |
| | 160,000 | | | 2.500%, 9/1/2020 | | | 157,763 | |
| | 225,000 | | | 2.500%, 7/15/2021 | | | 219,513 | |
| | | | SITE Centers Corporation | | | | |
| | 195,000 | | | 4.625%, 7/15/2022 | | | 198,394 | |
| | | | Societe Generale SA | | | | |
| | 200,000 | | | 8.000%, 9/29/2025b,h,l | | | 203,000 | |
| | | | Standard Chartered plc | | | | |
| | 35,000 | | | 2.100%, 8/19/2019h | | | 34,706 | |
| | | | State Street Capital Trust IV | | | | |
| | 1,240,000 | | | 3.334%, (LIBOR 3M + 1.000%), 6/15/2047b | | | 1,088,918 | |
The accompanying Notes to Financial Statements are an integral part of this schedule.
167
OPPORTUNITY INCOME PLUS FUND
Schedule of Investments as of October 31, 2018
| | | | | | | | |
Principal
Amount | | | Long-Term Fixed Income (48.1%) | | Value | |
| | Financials (6.8%) - continued | | | | |
| | | | State Street Corporation | | | | |
| | $160,000 | | | 3.222%, (LIBOR 3M + 0.900%), 8/18/2020b | | | $161,990 | |
| | | | Sumitomo Mitsui Financial Group, Inc. | | | | |
| | 232,000 | | | 2.934%, 3/9/2021 | | | 228,886 | |
| | 116,000 | | | 2.784%, 7/12/2022 | | | 112,127 | |
| | | | Sumitomo Mitsui Trust Bank, Ltd. | | | | |
| | 250,000 | | | 2.050%, 3/6/2019h | | | 249,314 | |
| | | | SunTrust Banks, Inc. | | | | |
| | 125,000 | | | 2.900%, 3/3/2021 | | | 123,161 | |
| | | | Synchrony Financial | | | | |
| | 118,000 | | | 3.000%, 8/15/2019 | | | 117,518 | |
| | 75,000 | | | 3.578%, (LIBOR 3M + 1.230%), 2/3/2020b | | | 75,457 | |
| | | | Toronto-Dominion Bank | | | | |
| | 160,000 | | | 3.262%, (LIBOR 3M + 0.930%), 12/14/2020b | | | 162,292 | |
| | 170,000 | | | 2.550%, 1/25/2021 | | | 167,252 | |
| | | | UBS Group Funding Jersey, Ltd. | | | | |
| | 232,000 | | | 3.000%, 4/15/2021h | | | 228,334 | |
| | | | UnitedHealth Group, Inc. | | | | |
| | 160,000 | | | 3.350%, 7/15/2022 | | | 158,859 | |
| | | | USB Realty Corporation | | | | |
| | 747,000 | | | 3.583%, (LIBOR 3M + 1.147%), 1/15/2022b,h,l | | | 670,433 | |
| | | | Vantiv, LLC | | | | |
| | 660,000 | | | 4.375%, 11/15/2025h | | | 622,875 | |
| | | | Ventas Realty, LP | | | | |
| | 126,000 | | | 3.100%, 1/15/2023 | | | 122,063 | |
| | | | Wachovia Capital Trust II | | | | |
| | 100,000 | | | 2.936%, (LIBOR 3M + 0.500%), 1/15/2027b | | | 91,000 | |
| | | | Wells Fargo & Company | | | | |
| | 120,000 | | | 2.100%, 7/26/2021 | | | 115,205 | |
| | 122,000 | | | 2.625%, 7/22/2022 | | | 117,156 | |
| | 231,000 | | | 3.597%, (LIBOR 3M + 1.110%), 1/24/2023b | | | 233,628 | |
| | 200,000 | | | 3.757%, (LIBOR 3M + 1.230%), 10/31/2023b | | | 202,813 | |
| | | | Welltower, Inc. | | | | |
| | 174,000 | | | 4.950%, 1/15/2021 | | | 177,957 | |
| | | | Westpac Banking Corporation | | | | |
| | 195,000 | | | 3.172%, (LIBOR 3M + 0.850%), 8/19/2021b | | | 197,599 | |
| | | | | |
| | | | Total | | | 37,650,166 | |
| | | | | |
| |
| | Mortgage-Backed Securities (11.2%) | | | | |
| | | | Antler Mortgage Trust | | | | |
| | 2,257,676 | | | 4.335%, 7/25/2022, Ser. 2018-RTL1, Class A1*,e | | | 2,254,967 | |
| | | | Deutsche Alt-A Securities, Inc., Mortgage Loan Trust | | | | |
| | 1,125,601 | | | 5.250%, 6/25/2035, Ser. 2005-3, Class 4A6 | | | 1,138,213 | |
| | | | Federal Home Loan Mortgage Corporation | | | | |
| | 3,665,889 | | | 3.500%, 8/15/2035, Ser. 345, Class C8m | | | 580,346 | |
| | | | Federal Home Loan Mortgage Corporation Gold 30-Yr. Pass Through | | | | |
| | 10,475,000 | | | 4.000%, 11/1/2048d | | | 10,478,631 | |
| | | | Federal National Mortgage Association Conventional 30-Yr. Pass Through | | | | |
| | 9,025,000 | | | 3.500%, 11/1/2048d | | | 8,785,626 | |
| | 10,787,500 | | | 4.000%, 11/1/2048d | | | 10,787,455 | |
| | 22,850,000 | | | 4.500%, 11/1/2048d | | | 23,394,920 | |
| | 3,675,000 | | | 5.000%, 11/1/2048d | | | 3,834,920 | |
| | | | Merrill Lynch Alternative Note Asset Trust | | | | |
| | 2,073,242 | | | 2.431%, (LIBOR 1M + 0.150%), 1/25/2037, Ser. 2007-A1, Class A2Bb | | | 921,090 | |
| | | | | |
| | | | Total | | | 62,176,168 | |
| | | | | |
| |
| | Technology (1.3%) | | | | |
| | | | Alliance Data Systems Corporation | | | | |
| | 440,000 | | | 5.375%, 8/1/2022h | | | 441,650 | |
| | | | Apple, Inc. | | | | |
| | 232,000 | | | 2.850%, 5/6/2021 | | | 229,928 | |
| | 232,000 | | | 2.688%, (LIBOR 3M + 0.350%), 5/11/2022b | | | 233,740 | |
| | 240,000 | | | 2.400%, 1/13/2023 | | | 229,767 | |
| | | | Baidu, Inc. | | | | |
| | 122,000 | | | 3.000%, 6/30/2020 | | | 120,897 | |
| | | | Broadcom Corporation | | | | |
| | 247,000 | | | 2.650%, 1/15/2023 | | | 231,691 | |
| | 250,000 | | | 3.625%, 1/15/2024 | | | 239,368 | |
| | | | CDK Global, Inc. | | | | |
| | 320,000 | | | 4.875%, 6/1/2027 | | | 299,600 | |
| | | | CommScope Technologies Finance, LLC | | | | |
| | 690,000 | | | 6.000%, 6/15/2025h | | | 671,025 | |
| | | | Diamond 1 Finance Corporation | | | | |
| | 125,000 | | | 3.480%, 6/1/2019h | | | 125,156 | |
| | 234,000 | | | 5.450%, 6/15/2023h | | | 242,358 | |
| | | | Equinix, Inc. | | | | |
| | 540,000 | | | 5.750%, 1/1/2025 | | | 550,125 | |
| | | | Fidelity National Information Services, Inc. | | | | |
| | 90,000 | | | 3.625%, 10/15/2020 | | | 90,176 | |
| | 195,000 | | | 2.250%, 8/15/2021 | | | 187,577 | |
| | | | Harland Clarke Holdings Corporation | | | | |
| | 610,000 | | | 8.375%, 8/15/2022h | | | 550,525 | |
| | | | Hewlett Packard Enterprise Company | | | | |
| | 283,000 | | | 3.600%, 10/15/2020 | | | 283,444 | |
| | | | Intel Corporation | | | | |
| | 120,000 | | | 1.700%, 5/19/2021 | | | 115,735 | |
| | 160,000 | | | 3.100%, 7/29/2022 | | | 158,154 | |
| | | | Marvell Technology Group, Ltd. | | | | |
| | 126,000 | | | 4.200%, 6/22/2023 | | | 124,571 | |
| | | | Microsoft Corporation | | | | |
| | 234,000 | | | 2.400%, 2/6/2022 | | | 227,888 | |
| | | | NetApp, Inc. | | | | |
| | 185,000 | | | 2.000%, 9/27/2019 | | | 183,158 | |
| | | | NXP BV | | | | |
| | 415,000 | | | 3.875%, 9/1/2022h | | | 400,475 | |
| | | | Oracle Corporation | | | | |
| | 170,000 | | | 2.500%, 5/15/2022 | | | 164,558 | |
The accompanying Notes to Financial Statements are an integral part of this schedule.
168
OPPORTUNITY INCOME PLUS FUND
Schedule of Investments as of October 31, 2018
| | | | | | | | |
Principal
Amount | | | Long-Term Fixed Income (48.1%) | | Value | |
| | Technology (1.3%) - continued | | | | |
| | | | Seagate HDD Cayman | | | | |
| | $330,000 | | | 4.750%, 1/1/2025 | | | $302,003 | |
| | | | Texas Instruments, Inc. | | | | |
| | 65,000 | | | 1.750%, 5/1/2020 | | | 63,708 | |
| | | | VMware, Inc. | | | | |
| | 125,000 | | | 2.300%, 8/21/2020 | | | 122,023 | |
| | | | Western Digital Corporation | | | | |
| | 930,000 | | | 4.750%, 2/15/2026 | | | 859,087 | |
| | | | | |
| | | | Total | | | 7,448,387 | |
| | | | | |
| |
| | Transportation (0.4%) | | | | |
| | | | Air Canada Pass Through Trust | | | | |
| | 50,563 | | | 3.875%, 3/15/2023h | | | 49,488 | |
| | | | American Airlines Pass Through Trust | | | | |
| | 93,296 | | | 4.950%, 1/15/2023 | | | 95,316 | |
| | | | Avis Budget Car Rental, LLC | | | | |
| | 290,000 | | | 5.125%, 6/1/2022h | | | 297,433 | |
| | | | Delta Air Lines, Inc. | | | | |
| | 174,000 | | | 2.875%, 3/13/2020 | | | 172,384 | |
| | 63,618 | | | 4.950%, 11/23/2020 | | | 63,871 | |
| | | | J.B. Hunt Transport Services, Inc. | | | | |
| | 160,000 | | | 3.300%, 8/15/2022 | | | 158,096 | |
| | | | Ryder System, Inc. | | | | |
| | 236,000 | | | 3.500%, 6/1/2021 | | | 234,974 | |
| | | | Union Pacific Corporation | | | | |
| | 189,000 | | | 3.750%, 7/15/2025 | | | 187,555 | |
| | | | United Airlines Pass Through Trust | | | | |
| | 160,000 | | | 3.700%, 12/1/2022 | | | 157,984 | |
| | | | United Continental Holdings, Inc. | | | | |
| | 640,000 | | | 4.250%, 10/1/2022 | | | 628,000 | |
| | | | XPO Logistics, Inc. | | | | |
| | 375,000 | | | 6.500%, 6/15/2022h | | | 384,375 | |
| | | | | |
| | | | Total | | | 2,429,476 | |
| | | | | |
| |
| | Utilities (1.1%) | | | | |
| | | | Alabama Power Company | | | | |
| | 117,000 | | | 2.450%, 3/30/2022 | | | 112,934 | |
| | | | Ameren Corporation | | | | |
| | 160,000 | | | 2.700%, 11/15/2020 | | | 157,637 | |
| | | | Berkshire Hathaway Energy Company | | | | |
| | 240,000 | | | 2.400%, 2/1/2020 | | | 237,629 | |
| | | | Calpine Corporation | | | | |
| | 315,000 | | | 5.375%, 1/15/2023 | | | 298,462 | |
| | | | CenterPoint Energy, Inc. | | | | |
| | 120,000 | | | 2.500%, 9/1/2022 | | | 114,576 | |
| | | | Consolidated Edison, Inc. | | | | |
| | 117,000 | | | 2.000%, 3/15/2020 | | | 115,094 | |
| | | | Dominion Energy, Inc. | | | | |
| | 232,000 | | | 2.579%, 7/1/2020 | | | 228,450 | |
| | | | DTE Energy Company | | | | |
| | 242,000 | | | 2.400%, 12/1/2019 | | | 239,503 | |
| | | | Duke Energy Corporation | | | | |
| | 250,000 | | | 2.400%, 8/15/2022 | | | 239,251 | |
| | | | Dynegy, Inc. | | | | |
| | 775,000 | | | 7.375%, 11/1/2022 | | | 804,063 | |
| | | | Edison International | | | | |
| | 116,000 | | | 2.125%, 4/15/2020 | | | 113,771 | |
| | | | Emera U.S. Finance, LP | | | | |
| | 135,000 | | | 2.150%, 6/15/2019 | | | 134,040 | |
| | | | Eversource Energy | | | | |
| | 127,000 | | | 2.500%, 3/15/2021 | | | 124,609 | |
| | | | Exelon Generation Company, LLC | | | | |
| | 138,000 | | | 5.200%, 10/1/2019 | | | 140,451 | |
| | 175,000 | | | 2.950%, 1/15/2020 | | | 173,888 | |
| | | | FirstEnergy Corporation | | | | |
| | 184,000 | | | 2.850%, 7/15/2022 | | | 177,342 | |
| | | | Fortis, Inc. | | | | |
| | 160,000 | | | 2.100%, 10/4/2021 | | | 152,702 | |
| | | | NextEra Energy Capital Holdings, Inc. | | | | |
| | 125,000 | | | 2.300%, 4/1/2019 | | | 124,727 | |
| | | | NextEra Energy Partners, LP | | | | |
| | 620,000 | | | 4.250%, 9/15/2024h | | | 589,000 | |
| | | | NiSource, Inc. | | | | |
| | 177,000 | | | 3.650%, 6/15/2023h | | | 174,209 | |
| | 550,000 | | | 5.650%, 6/15/2023b,h,l | | | 539,110 | |
| | | | Pinnacle West Capital Corporation | | | | |
| | 120,000 | | | 2.250%, 11/30/2020 | | | 117,275 | |
| | | | PPL Capital Funding, Inc. | | | | |
| | 175,000 | | | 3.500%, 12/1/2022 | | | 172,775 | |
| | | | PSEG Power, LLC | | | | |
| | 143,000 | | | 3.000%, 6/15/2021 | | | 140,648 | |
| | | | Sempra Energy | | | | |
| | 75,000 | | | 2.400%, 3/15/2020 | | | 74,023 | |
| | | | Southern California Edison Company | | | | |
| | 55,000 | | | 2.400%, 2/1/2022 | | | 52,860 | |
| | | | Southern Company | | | | |
| | 100,000 | | | 1.850%, 7/1/2019 | | | 99,139 | |
| | 116,000 | | | 2.350%, 7/1/2021 | | | 112,216 | |
| | | | TerraForm Power Operating, LLC | | | | |
| | 695,000 | | | 5.000%, 1/31/2028h | | | 621,156 | |
| | | | | |
| | | | Total | | | 6,381,540 | |
| | | | | |
| | | | | | | | |
| | | | | |
| | | | Total Long-Term Fixed Income (cost $270,588,757) | | | 267,721,998 | |
| | | | | |
| | |
| Shares | | | Registered Investment Companies (15.6%) | | Value | |
| | Affiliated Fixed Income Holdings (14.1%) | | | | |
| | 8,667,585 | | | Thrivent Core Emerging Markets Debt Fund | | | 78,354,969 | |
| | | | | |
| | | | Total | | | 78,354,969 | |
| | | | | |
| |
| | Equity Funds/Exchange Traded Funds (<0.1%) | | | | |
| | 34,500 | | | AllianzGI NFJ Dividend Interest & Premium Strategy Fund | | | 414,000 | |
| | 42,409 | | | BlackRock Resources & Commodities Strategy Trust | | | 336,303 | |
| | | | | |
| | | | Total | | | 750,303 | |
| | | | | |
| |
| | Fixed Income Funds/Exchange Traded Funds (1.4%) | | | | |
| | 184,069 | | | Aberdeen Asia-Pacific Income Fund, Inc. | | | 723,391 | |
| | 131,500 | | | Invesco Senior Loan ETF | | | 3,025,815 | |
| | 128,976 | | | MFS Intermediate Income Trust | | | 475,921 | |
| | 121,590 | | | Templeton Global Income Fund | | | 740,483 | |
| | 19,445 | | | Vanguard Short-Term Corporate Bond ETF | | | 1,515,349 | |
| | 73,004 | | | Western Asset Emerging Markets Debt Fund, Inc. | | | 910,360 | |
The accompanying Notes to Financial Statements are an integral part of this schedule.
169
OPPORTUNITY INCOME PLUS FUND
Schedule of Investments as of October 31, 2018
| | | | | | | | |
| | |
| Shares | | | Registered Investment Companies (15.6%) | | Value | |
| | Fixed Income Funds/Exchange Traded Funds (1.4%) - continued | | | | |
| | 111,422 | | | Western Asset High Income Opportunity Fund, Inc. | | | $505,856 | |
| | | | | |
| | | | Total | | | 7,897,175 | |
| | | | | |
| | | | | | | | |
| | | | | |
| | | | Total Registered Investment Companies (cost $93,084,810) | | | 87,002,447 | |
| | | | | |
| | |
| Shares | | | Preferred Stock (1.1%) | | Value | |
| | Consumer Staples (0.1%) | | | | |
| | 14,320 | | | CHS, Inc., 7.100%b,l | | | 368,597 | |
| | | | | |
| | | | Total | | | 368,597 | |
| | | | | |
| |
| | Energy (0.3%) | | | | |
| | 58,690 | | | Crestwood Equity Partners, LP, 9.250%l | | | 563,424 | |
| | 35,650 | | | NuStar Logistics, LP, 9.170%b | | | 897,667 | |
| | | | | |
| | | | Total | | | 1,461,091 | |
| | | | | |
| |
| | Financials (0.7%) | | | | |
| | 7,320 | | | Agribank FCB, 6.875%b,l | | | 785,070 | |
| | 5,700 | | | CoBank ACB, 6.250%b,l | | | 587,100 | |
| | 850 | | | First Tennessee Bank NA, 3.750%b,h,l | | | 654,500 | |
| | 14,700 | | | GMAC Capital Trust I, 8.099%b | | | 386,022 | |
| | 14,300 | | | Morgan Stanley, 7.125%b,l | | | 389,961 | |
| | 889 | | | Wells Fargo & Company, Convertible, 7.500%l | | | 1,130,799 | |
| | | | | |
| | | | Total | | | 3,933,452 | |
| | | | | |
| |
| | Real Estate (<0.1%) | | | | |
| | 6,781 | | | Colony Capital, Inc., 8.75%l | | | 175,085 | |
| | | | | |
| | | | Total | | | 175,085 | |
| | | | | |
| | | | | | | | |
| | | | | |
| | | | Total Preferred Stock (cost $5,825,167) | | | 5,938,225 | |
| | | | | |
| | |
| Shares | | | Common Stock (0.8%) | | Value | |
| | Energy (0.2%) | | | | |
| | 12,424 | | | Contura Energy, Inc.k,n | | | 906,331 | |
| | 47,218 | | | Pacific Drilling, Inc. Rightse,n | | | 491,697 | |
| | | | | |
| | | | Total | | | 1,398,028 | |
| | | | | |
| |
| | Financials (0.4%) | | | | |
| | 152,438 | | | Apollo Investment Corporation | | | 788,104 | |
| | 69,173 | | | Ares Capital Corporation | | | 1,187,009 | |
| | | | | |
| | | | Total | | | 1,975,113 | |
| | | | | |
| |
| | Materials (0.1%) | | | | |
| | 23,820 | | | Verso Corporationn | | | 669,580 | |
| | | | | |
| | | | Total | | | 669,580 | |
| | | | | |
| |
| | Utilities (0.1%) | | | | |
| | 3,174 | | | Alpha Natural Resources Holdings, Inc.n | | | 111,090 | |
| | 11,942 | | | ANR, Inc.n | | | 417,970 | |
| | | | | |
| | | | Total | | | 529,060 | |
| | | | | |
| | | | | | | | |
| | | | | |
| | | | Total Common Stock (cost $2,681,047) | | | 4,571,781 | |
| | | | | |
| | |
| Shares | | | Collateral Held for Securities Loaned (1.0%) | | Value | |
| | 5,373,892 | | | Thrivent Cash Management Trust | | | 5,373,892 | |
| | | | | |
| | | | Total Collateral Held for Securities Loaned (cost $5,373,892) | | | 5,373,892 | |
| | | | | |
| | |
Shares or
Principal
Amount | | | Short-Term Investments (14.1%) | | Value | |
| | | | Federal Home Loan Bank Discount Notes | | | | |
| | 600,000 | | | 2.100%, 11/28/2018o,p | | | 599,019 | |
| | 400,000 | | | 2.110%, 11/30/2018o,p | | | 399,298 | |
| | 7,769,239 | | | Thrivent Core Short-Term Reserve Fund 2.430% | | | 77,692,386 | |
| | | | | |
| | | | Total Short-Term Investments (cost $78,690,761) | | | 78,690,703 | |
| | | | | |
| | | | Total Investments (cost $642,544,999) 113.6% | | | $632,763,382 | |
| | | | | |
| | | | Other Assets and Liabilities, Net (13.6%) | | | (75,539,883 | ) |
| | | | | |
| | | | Total Net Assets 100.0% | | | $557,223,499 | |
| | | | | |
a | The stated interest rate represents the weighted average of all contracts within the bank loan facility. |
b | Denotes variable rate securities. The rate shown is as of October 31, 2018. The rates of certain variable rate securities are based on a published reference rate and spread; these may vary by security and the reference rate and spread are indicated in their description. The rates of other variable rate securities are determined by the issuer or agent and are based on current market conditions. These securities do not indicate a reference rate and spread in their description. |
c | All or a portion of the loan is unfunded. |
d | Denotes investments purchased on a when-issued or delayed delivery basis. |
e | Security is valued using significant unobservable inputs. Further information on valuation can be found in the Notes to Financial Statements. |
f | Defaulted security. Interest is not being accrued. |
g | In bankruptcy. Interest is not being accrued. |
h | Denotes securities sold under Rule 144A of the Securities Act of 1933, which exempts them from registration. These securities may be resold to other dealers in the program or to other qualified institutional buyers. As of October 31, 2018, the value of these investments was $50,615,276 or 9.1% of total net assets. |
i | All or a portion of the security is insured or guaranteed. |
j | Denotes step coupon securities. Step coupon securities pay an initial coupon rate for the first period and then different coupon rates for following periods. The rate shown is as of October 31, 2018. |
k | All or a portion of the security is on loan. |
l | Denotes perpetual securities. Perpetual securities pay an indefinite stream of interest and have no contractual maturity date. Date shown, if applicable, is next call date. |
m | Denotes interest only security. Interest only securities represent the right to receive monthly interest payments on an underlying pool of mortgages or assets. The principal shown is the outstanding par amount of the pool as of the end of the period. The actual effective yield of the security is different than the stated coupon rate. |
n | Non-income producing security. |
o | The interest rate shown reflects the yield, coupon rate or the discount rate at the date of purchase. |
The accompanying Notes to Financial Statements are an integral part of this schedule.
170
OPPORTUNITY INCOME PLUS FUND
Schedule of Investments as of October 31, 2018
p | All or a portion of the security is held on deposit with the counterparty and pledged as the initial margin deposit for open futures contracts. |
* | Denotes restricted securities. Restricted securities are investment securities which cannot be offered for public sale without first being registered under the Securities Act of 1933. The value of all restricted securities held in Opportunity Income Plus Fund as of October 31, 2018 was $39,864,446 or 7.2% of total net assets. The following table indicates the acquisition date and cost of restricted securities shown in the schedule as of October 31, 2018. |
| | | | | | | | |
Security | | Acquisition
Date | | | Cost | |
Antler Mortgage Trust, 7/25/2022 | | | 9/21/2018 | | | $ | 2,257,649 | |
Apidos CLO XXIV, 10/20/2030 | | | 8/23/2018 | | | | 1,400,000 | |
Assurant CLO III, Ltd., 10/20/2031 | | | 7/27/2018 | | | | 1,350,000 | |
Babson CLO, Ltd., 7/20/2029 | | | 5/18/2018 | | | | 1,350,000 | |
Cascade Funding Mortgage Trust, 6/25/2048 | | | 6/29/2018 | | | | 890,826 | |
Cent CLO, LP, 10/25/2028 | | | 10/11/2018 | | | | 1,750,000 | |
CIM Trust, 12/25/2057 | | | 4/23/2018 | | | | 1,164,934 | |
College Ave Student Loans, LLC, 11/26/2046 | | | 7/11/2017 | | | | 756,005 | |
COLT Mortgage Loan Trust, 9/25/2046 | | | 9/9/2016 | | | | 179,337 | |
Digicel, Ltd., 4/15/2021 | | | 8/19/2013 | | | | 775,796 | |
Foundation Finance Trust, 7/15/2033 | | | 12/6/2017 | | | | 792,000 | |
Harley Marine Financing, LLC, 5/15/2043 | | | 5/9/2018 | | | | 1,333,111 | |
Madison Park Funding XIV, Ltd., 10/22/2030 | | | 10/12/2018 | | | | 1,250,000 | |
Myers Park CLO, Ltd., 10/20/2030 | | | 8/16/2018 | | | | 1,275,000 | |
Oak Hill Advisors Residential Loan Trust, 6/25/2057 | | | 8/8/2017 | | | | 888,573 | |
Octagon Investment Partners XX, Ltd., 8/12/2026 | | | 4/21/2017 | | | | 850,000 | |
OHA Credit Funding 1, Ltd., 10/20/2030 | | | 8/24/2018 | | | | 1,085,000 | |
OZLM Funding II, Ltd., 7/30/2031 | | | 8/17/2018 | | | | 2,170,000 | |
OZLM IX, Ltd., 10/20/2031 | | | 10/29/2018 | | | | 2,000,000 | |
Park Avenue Institutional Advisers CLO, Ltd., 10/20/2031 | | | 10/5/2018 | | | | 2,200,000 | |
Preston Ridge Partners Mortgage Trust, LLC, 9/25/2022 | | | 9/27/2017 | | | | 501,866 | |
Preston Ridge Partners Mortgage Trust, LLC, 4/25/2023 | | | 4/26/2018 | | | | 633,092 | |
Preston Ridge Partners Mortgage Trust, LLC, 1/25/2022 | | | 1/24/2017 | | | | 242,125 | |
Radnor RE, Ltd., 3/25/2028 | | | 3/13/2018 | | | | 1,000,000 | |
RCO 2017-INV1 Trust, 11/25/2052 | | | 11/6/2017 | | | | 1,053,480 | |
Sound Point CLO X, Ltd., 1/20/2028 | | | 6/5/2018 | | | | 1,150,000 | |
Sound Point CLO XXI, Ltd., 10/26/2031 | | | 8/29/2018 | | | | 2,200,000 | |
Spirit Master Funding, LLC, 12/20/2047 | | | 1/23/2018 | | | | 1,647,594 | |
THL Credit Wind River CLO, Ltd., 10/22/2031 | | | 9/21/2018 | | | | 3,350,000 | |
Toorak Mortgage Corporation 2018-1, Ltd., 8/25/2021 | | | 8/3/2018 | | | | 1,749,998 | |
Wachovia Asset Securitization, Inc., 7/25/2037 | | | 3/16/2007 | | | | 859,640 | |
The following table presents the total amount of securities loaned with continuous maturity, by type, offset by the gross payable upon return of collateral for securities loaned by Thrivent Opportunity Income Plus Fund as of October 31, 2018:
| | | | |
Securities Lending Transactions | | | | |
Taxable Debt Security | | | $4,381,735 | |
Common Stock | | | 860,810 | |
| | | | |
Total lending | | | $5,242,545 | |
Gross amount payable upon return of collateral for securities loaned | | | $5,373,892 | |
| | | | |
Net amounts due to counterparty | | | $131,347 | |
| | | | |
Definitions:
| | | | |
CLO | | - | | Collateralized Loan Obligation |
ETF | | - | | Exchange Traded Fund |
REMIC | | - | | Real Estate Mortgage Investment Conduit |
Ser. | | - | | Series |
Reference Rate Index:
| | | | |
12 MTA | | - | | 12 Month Treasury Average |
H15T30Y | | - | | U. S. Treasury Yield Curve Rate Treasury Note Constant Maturity 30 Year |
LIBOR 1W | | - | | ICE Libor USD Rate 1 Week |
LIBOR 1M | | - | | ICE Libor USD Rate 1 Month |
LIBOR 2M | | - | | ICE Libor USD Rate 2 Month |
LIBOR 3M | | - | | ICE Libor USD Rate 3 Month |
PRIME | | - | | Federal Reserve Prime Loan Rate |
The accompanying Notes to Financial Statements are an integral part of this schedule.
171
PARTNER WORLDWIDE ALLOCATION FUND
Schedule of Investments as of October 31, 2018
| | | | | | | | |
| Shares | | | Common Stock (86.3%) | | Value | |
| | Australia (4.8%) | | | | |
| | 94,484 | | | Accent Group, Ltd. | | | $83,614 | |
| | 89,466 | | | ALS, LTD. | | | 518,834 | |
| | 53,404 | | | Altium, Ltd. | | | 832,536 | |
| | 92,144 | | | Aristocrat Leisure, Ltd. | | | 1,736,356 | |
| | 314,559 | | | Australia and New Zealand Banking Group, Ltd. | | | 5,789,982 | |
| | 102,484 | | | Australian Pharmaceutical Industries, Ltd. | | | 111,317 | |
| | 745,881 | | | Beach Energy, Ltd. | | | 929,068 | |
| | 135,509 | | | BHP Billiton, Ltd. | | | 3,126,688 | |
| | 9,339 | | | Charter Hall Group | | | 45,707 | |
| | 35,549 | | | Charter Hall Retail REIT | | | 107,143 | |
| | 29,390 | | | CIMIC Group, Ltd. | | | 986,769 | |
| | 27,956 | | | CSL, Ltd. | | | 3,732,047 | |
| | 211,708 | | | Downer EDI, Ltd. | | | 1,042,314 | |
| | 5,923 | | | Evolution Mining, Ltd. | | | 12,537 | |
| | 75,741 | | | FlexiGroup, Ltd. | | | 82,535 | |
| | 34,196 | | | Genworth Mortgage Insurance Australia, Ltd. | | | 54,615 | |
| | 104,244 | | | Iluka Resources, Ltd. | | | 598,695 | |
| | 30,130 | | | Inghams Group, Ltd. | | | 83,305 | |
| | 35,939 | | | JB Hi-Fi, Ltd. | | | 585,635 | |
| | 25,270 | | | Macquarie Group, Ltd. | | | 2,107,321 | |
| | 1,834,068 | | | Medibank Private, Ltd. | | | 3,636,530 | |
| | 309,006 | | | Metcash, Ltd. | | | 603,939 | |
| | 521,075 | | | Nine Entertainment Company Holdings, Ltd. | | | 625,798 | |
| | 18,070 | | | Northern Star Resources, Ltd. | | | 112,887 | |
| | 235,894 | | | Qantas Airways, Ltd. | | | 915,683 | |
| | 75,894 | | | Regis Resources, Ltd. | | | 227,662 | |
| | 45,609 | | | Rio Tinto, Ltd. | | | 2,481,692 | |
| | 93,049 | | | Sandfire Resources NL | | | 439,969 | |
| | 59,320 | | | Seven Group Holdings, Ltd. | | | 749,411 | |
| | 99,138 | | | Seven West Media, Ltd.a | | | 54,945 | |
| | 103,035 | | | Sigma Healthcare, Ltd. | | | 38,055 | |
| | 22,838 | | | Smartgroup Corporation, Ltd. | | | 161,727 | |
| | 590,759 | | | South32, Ltd. | | | 1,523,658 | |
| | 93,469 | | | SpeedCast International, Ltd. | | | 238,959 | |
| | 228,005 | | | Super Retail Group, Ltd. | | | 1,169,261 | |
| | 169,119 | | | Treasury Wine Estates, Ltd. | | | 1,820,322 | |
| | 387,411 | | | Vita Group, Ltd. | | | 285,915 | |
| | 3,304 | | | Washington H. Soul Pattinson and Company, Ltd. | | | 67,739 | |
| | 17,650 | | | Wesfarmers, Ltd. | | | 584,528 | |
| | 174,869 | | | Whitehaven Coal, Ltd. | | | 604,045 | |
| | 18,143 | | | Wisetech Global, Ltd. | | | 207,496 | |
| | | | | |
| | | | Total | | | 39,117,239 | |
| | | | | |
| |
| | Austria (0.8%) | | | | |
| | 41,654 | | | Erste Group Bank AG | | | 1,695,619 | |
| | 60,123 | | | OMV AG | | | 3,338,767 | |
| | 2,281 | | | Osterreichische Post AG | | | 92,593 | |
| | 35,819 | | | Raiffeisen Bank International AG | | | 976,197 | |
| | 6,826 | | | S IMMO AG | | | 116,705 | |
| | | | | |
| | | | Total | | | 6,219,881 | |
| | | | | |
| |
| | Belgium (0.1%) | | | | |
| | 1,734 | | | Barco NV | | | 197,444 | |
| | 302 | | | Befimmo SA | | | 16,573 | |
| | 2,767 | | | Cofinimmo SA | | | 330,889 | |
| | 684 | | | Compagnie d’ Entreprises CFE | | | 72,525 | |
| | 2,635 | | | Fagron NV | | | 42,858 | |
| | 1,203 | | | Gimv NV | | | 64,176 | |
| | 2,563 | | | KBC Ancora | | | 118,439 | |
| | 1,110 | | | SA D’Ieteren NV | | | 43,902 | |
| | 522 | | | Warehouses De Pauw CVA | | | 67,697 | |
| | | | | |
| | | | Total | | | 954,503 | |
| | | | | |
| |
| | Brazil (1.7%) | | | | |
| | 351,400 | | | Ambev SA | | | 1,533,451 | |
| | 408,046 | | | Banco Bradesco SA ADR | | | 3,741,785 | |
| | 133,408 | | | BRF SAa | | | 782,201 | |
| | 178,715 | | | Lojas Renner SA | | | 1,809,480 | |
| | 232,998 | | | Multiplan Empreendimentos Imobiliarios SA | | | 1,441,877 | |
| | 111,190 | | | Ultrapar Participacoes SA | | | 1,314,620 | |
| | 224,696 | | | Vale SA ADR | | | 3,392,910 | |
| | | | | |
| | | | Total | | | 14,016,324 | |
| | | | | |
| |
| | Canada (2.1%) | | | | |
| | 50,768 | | | Alaris Royalty Corporation | | | 741,978 | |
| | 39,200 | | | Alimentation Couche-Tard, Inc. | | | 1,872,083 | |
| | 35,100 | | | Brookfield Asset Management, Inc. | | | 1,432,316 | |
| | 73,068 | | | CAE, Inc. | | | 1,288,799 | |
| | 39,948 | | | Canadian National Railway Company | | | 3,415,054 | |
| | 5,854 | | | CGI Group, Inc.a | | | 361,525 | |
| | 9,755 | | | CI Financial Corporation | | | 144,274 | |
| | 69,535 | | | Dollarama, Inc. | | | 1,923,179 | |
| | 43,202 | | | Entertainment One, Ltd. | | | 225,826 | |
| | 55,480 | | | Finning International, Inc. | | | 1,152,207 | |
| | 18,790 | | | Genworth MI Canada, Inc.b | | | 616,746 | |
| | 20,643 | | | Gluskin Sheff + Associates, Inc. | | | 175,939 | |
| | 10,228 | | | Granite REIT | | | 422,344 | |
| | 1,194 | | | Magna International, Inc. | | | 58,793 | |
| | 41,590 | | | Quebecor, Inc. | | | 815,719 | |
| | 7,501 | | | SmartCentres Real Estate Investment Trust | | | 171,393 | |
| | 59,935 | | | Stars Group, Inc.a | | | 1,246,550 | |
| | 38,700 | | | Suncor Energy, Inc. | | | 1,298,182 | |
| | | | | |
| | | | Total | | | 17,362,907 | |
| | | | | |
| |
| | Cayman Islands (1.8%) | | | | |
| | 17,193 | | | Autohome, Inc. ADRb | | | 1,244,429 | |
| | 594,000 | | | China Resources Land, Ltd. | | | 2,020,313 | |
| | 38,010 | | | Huazhu Group, Ltd. ADRa | | | 994,341 | |
| | 78,000 | | | Sa Sa International Holdings, Ltd. | | | 30,053 | |
| | 49,200 | | | Sunny Optical Technology Group Company, Ltd. | | | 429,559 | |
| | 183,300 | | | Tencent Holdings, Ltd. | | | 6,279,723 | |
| | 539,000 | | | Value Partners Group, Ltd. | | | 401,998 | |
| | 962,830 | | | WH Group, Ltd.c | | | 676,162 | |
| | 197,000 | | | Wharf Real Estate Investment Company, Ltd. | | | 1,224,185 | |
| | 59,000 | | | Wuxi Biologics (Cayman), Inc.a,c | | | 422,142 | |
| | 352,400 | | | Wynn Macau, Ltd. | | | 734,101 | |
| | | | | |
| | | | Total | | | 14,457,006 | |
| | | | | |
| |
| | Chile (0.3%) | | | | |
| | 40,046 | | | Banco Santander Chile SA ADR | | | 1,179,755 | |
| | 135,375 | | | S.A.C.I. Falabella | | | 1,020,280 | |
| | | | | |
| | | | Total | | | 2,200,035 | |
| | | | | |
| |
| | China (1.5%) | | | | |
| | 18,315 | | | 58.com, Inc. ADRa | | | 1,201,281 | |
| | 211,398 | | | China International Travel Service Corporation, Ltd. | | | 1,636,826 | |
| | 340,297 | | | Hangzhou Hikvision Digital Technology Company, Ltd. | | | 1,190,181 | |
The accompanying Notes to Financial Statements are an integral part of this schedule.
172
PARTNER WORLDWIDE ALLOCATION FUND
Schedule of Investments as of October 31, 2018
| | | | | | | | |
| Shares | | | Common Stock (86.3%) | | Value | |
| | China (1.5%) - continued | | | | |
| | 25,095 | | | Kweichow Moutai Company, Ltd. | | | $1,987,802 | |
| | 220,900 | | | Midea Group Company, Ltd. | | | 1,182,563 | |
| | 337,500 | | | Ping An Insurance Company of China, Ltd. | | | 3,190,736 | |
| | 262,682 | | | Shanghai International Airport Company, Ltd. | | | 1,876,733 | |
| | | | | |
| | | | Total | | | 12,266,122 | |
| | | | | |
| |
| | Denmark (1.8%) | | | | |
| | 11,153 | | | Carlsberg AS | | | 1,230,362 | |
| | 31,789 | | | GN Store Nord AS | | | 1,348,447 | |
| | 175,241 | | | Novo Nordisk AS | | | 7,568,055 | |
| | 3,304 | | | Per Aarsleff Holding AS | | | 108,061 | |
| | 6,152 | | | Rockwool International AS | | | 2,101,882 | |
| | 16,421 | | | Royal Unibrew AS | | | 1,165,271 | |
| | 7,493 | | | Scandinavian Tobacco Group ASc | | | 113,699 | |
| | 10,691 | | | SimCorp AS | | | 823,155 | |
| | 9,570 | | | Spar Nord Bank AS | | | 79,296 | |
| | 5,925 | | | Sydbank AS | | | 136,852 | |
| | 6,657 | | | Topdanmark AS | | | 316,431 | |
| | | | | |
| | | | Total | | | 14,991,511 | |
| | | | | |
| |
| | Faroe Islands (0.1%) | | | | |
| | 10,158 | | | Bakkafrost PF | | | 570,675 | |
| | | | | |
| | | | Total | | | 570,675 | |
| | | | | |
| |
| | Finland (1.5%) | | | | |
| | 11,098 | | | Cramo Oyj | | | 211,554 | |
| | 10,156 | | | Kesko Oyj | | | 593,134 | |
| | 15,064 | | | Metsa Board Oyj | | | 131,742 | |
| | 18,140 | | | Neste Oil Oyj | | | 1,489,560 | |
| | 12,930 | | | Raisio Oyj | | | 39,660 | |
| | 29,567 | | | Ramirent Oyj | | | 215,857 | |
| | 12,043 | | | Tieto Oyj | | | 387,652 | |
| | 239,832 | | | UPM-Kymmene Oyj | | | 7,710,258 | |
| | 54,834 | | | Valmet Oyj | | | 1,248,501 | |
| | | | | |
| | | | Total | | | 12,027,918 | |
| | | | | |
| |
| | France (5.0%) | | | | |
| | 114,614 | | | AXA SA | | | 2,868,393 | |
| | 12,311 | | | Beneteau SA | | | 204,102 | |
| | 26,382 | | | Capgemini SA | | | 3,221,351 | |
| | 10,984 | | | Cie Generale des Etablissements Michelin | | | 1,124,476 | |
| | 70,450 | | | CNP Assurances | | | 1,570,145 | |
| | 13,078 | | | Coface SA | | | 130,689 | |
| | 14,420 | | | Dassault Systemes SE | | | 1,805,152 | |
| | 15,029 | | | Eiffage SA | | | 1,467,753 | |
| | 2,786 | | | Eurofins Scientific SE | | | 1,403,976 | |
| | 4,523 | | | Gaztransport Et Technigaz SA | | | 334,293 | |
| | 6,262 | | | Ipsen SA | | | 868,243 | |
| | 4,997 | | | Ipsos SA | | | 133,062 | |
| | 3,985 | | | Jacquet Metal Service | | | 82,536 | |
| | 1,114 | | | Kaufman & Broad SA | | | 45,688 | |
| | 6,544 | | | Kering SA | | | 2,908,717 | |
| | 41,885 | | | Lagardere SCA | | | 1,144,909 | |
| | 7,031 | | | Legrand SA | | | 459,819 | |
| | 14,090 | | | LVMH Moet Hennessy Louis Vuitton SE | | | 4,274,960 | |
| | 30,004 | | | Metropole Television SA | | | 580,749 | |
| | 6,901 | | | Neopost SA | | | 221,985 | |
| | 32,216 | | | Peugeot SA | | | 765,795 | |
| | 14,494 | | | Rubis SCA | | | 747,801 | |
| | 29,343 | | | Safran SA | | | 3,791,912 | |
| | 5,438 | | | Sartorius Stedim Biotech | | | 673,824 | |
| | 37,323 | | | Schneider Electric SE | | | 2,698,853 | |
| | 2,341 | | | Sopra Group SA | | | 259,282 | |
| | 11,737 | | | Thales SA | | | 1,499,019 | |
| | 37,541 | | | Total SA | | | 2,202,722 | |
| | 300 | | | Trigano | | | 30,458 | |
| | 24,893 | | | UbiSoft Entertainment SAa | | | 2,232,954 | |
| | 13,629 | | | Vinci SA | | | 1,212,966 | |
| | | | | |
| | | | Total | | | 40,966,584 | |
| | | | | |
| |
| | Germany (4.3%) | | | | |
| | 11,032 | | | Aareal Bank AG | | | 410,402 | |
| | 24,141 | | | Allianz SE | | | 5,029,025 | |
| | 3,305 | | | Amadeus Fire AG | | | 378,092 | |
| | 52,436 | | | BASF SE | | | 4,023,841 | |
| | 13,733 | | | CANCOM SE | | | 559,942 | |
| | 13,041 | | | Carl Zeiss Meditec AG | | | 1,068,229 | |
| | 12,862 | | | CTS Eventim AG & Company KGAA | | | 482,194 | |
| | 11,219 | | | Deutsche EuroShop AG | | | 348,134 | |
| | 45,646 | | | Deutsche Pfandbriefbank AGc | | | 606,107 | |
| | 40,156 | | | Deutz AG | | | 298,668 | |
| | 53,066 | | | Evonik Industries AG | | | 1,641,630 | |
| | 86,291 | | | Evotec AGa | | | 1,700,937 | |
| | 2,104 | | | Freenet AG | | | 47,325 | |
| | 11,926 | | | Gerresheimer AG | | | 840,488 | |
| | 24,362 | | | Hannover Rueckversicherung SE | | | 3,276,204 | |
| | 73,567 | | | Infineon Technologies AG | | | 1,474,046 | |
| | 2,880 | | | Isra Vision AG | | | 123,538 | |
| | 12,583 | | | Jenoptik AG | | | 380,872 | |
| | 51,604 | | | Klockner & Company SE | | | 433,959 | |
| | 176 | | | MorphoSys AGa | | | 16,297 | |
| | 4,094 | | | Nemetschek SE | | | 538,185 | |
| | 22,753 | | | ProSiebenSat.1 Media AG | | | 525,398 | |
| | 2,703 | | | PUMA SE | | | 1,389,927 | |
| | 14,470 | | | Rheinmetall AG | | | 1,252,281 | |
| | 5,130 | | | Salzgitter AG | | | 205,034 | |
| | 3,095 | | | Scout24 AGc | | | 128,267 | |
| | 4,417 | | | Siltronic AG | | | 404,528 | |
| | 8,544 | | | Sixt SE | | | 868,537 | |
| | 15,543 | | | Software AG | | | 695,852 | |
| | 40,613 | | | TAG Immobilien AG | | | 926,465 | |
| | 198 | | | Takkt AG | | | 3,363 | |
| | 48,097 | | | TUI AG | | | 797,991 | |
| | 23,894 | | | Vonovia SE | | | 1,091,866 | |
| | 16,442 | | | Wirecard AG | | | 3,075,573 | |
| | 297 | | | XING AG | | | 89,298 | |
| | | | | |
| | | | Total | | | 35,132,495 | |
| | | | | |
| |
| | Hong Kong (1.2%) | | | | |
| | 374,800 | | | AIA Group, Ltd. | | | 2,851,121 | |
| | 26,000 | | | Champion REIT | | | 17,495 | |
| | 198,000 | | | China Mobile, Ltd. | | | 1,854,840 | |
| | 139,000 | | | CITIC Telecom International Holdings, Ltd. | | | 43,648 | |
| | 116,000 | | | Giordano International, Ltd. | | | 51,548 | |
| | 6,000 | | | Great Eagle Holdings, Ltd. | | | 27,400 | |
| | 877,000 | | | Haitong International Securities Group, Ltd. | | | 287,462 | |
| | 613,000 | | | Hang Lung Group, Ltd. | | | 1,509,168 | |
| | 61,794 | | | Hong Kong Exchanges & Clearing, Ltd. | | | 1,645,375 | |
| | 49,000 | | | Luk Fook Holdings International, Ltd. | | | 161,683 | |
| | 581,000 | | | Melco International Development, Ltd. | | | 997,161 | |
| | 7,000 | | | Sunlight Real Estate Investment Trust | | | 4,215 | |
| | | | | |
| | | | Total | | | 9,451,116 | |
| | | | | |
The accompanying Notes to Financial Statements are an integral part of this schedule.
173
PARTNER WORLDWIDE ALLOCATION FUND
Schedule of Investments as of October 31, 2018
| | | | | | | | |
| Shares | | | Common Stock (86.3%) | | Value | |
| | Hungary (0.1%) | | | | |
| | 25,217 | | | Richter Gedeon Nyrt | | | $468,418 | |
| | | | | |
| | | | Total | | | 468,418 | |
| | | | | |
| |
| | India (1.8%) | | | | |
| | 90,300 | | | Aditya Birla Capital, Ltd.a | | | 127,702 | |
| | 47,500 | | | Grasim Industries, Ltd. | | | 535,930 | |
| | 28,379 | | | Hero Motocorp, Ltd. | | | 1,059,498 | |
| | 72,040 | | | Hindustan Unilever, Ltd. | | | 1,581,602 | |
| | 157,848 | | | Housing Development Finance Corporation | | | 3,776,284 | |
| | 547,394 | | | ITC, Ltd. | | | 2,074,370 | |
| | 114,927 | | | Kotak Mahindra Bank, Ltd. | | | 1,739,152 | |
| | 70,836 | | | Tata Consultancy Services, Ltd. | | | 1,856,998 | |
| | 48,428 | | | Ultra Tech Cement, Ltd. | | | 2,291,578 | |
| | | | | |
| | | | Total | | | 15,043,114 | |
| | | | | |
| |
| | Indonesia (0.8%) | | | | |
| | 5,430,200 | | | Astra International Tbk PT | | | 2,824,601 | |
| | 1,071,600 | | | Indocement Tunggal Prakarsa Tbk PT | | | 1,222,722 | |
| | 1,439,800 | | | PT Bank Central Asia Tbk | | | 2,241,857 | |
| | | | | |
| | | | Total | | | 6,289,180 | |
| | | | | |
| |
| | Ireland (0.3%) | | | | |
| | 3,649 | | | Glanbia plc | | | 64,739 | |
| | 9,276 | | | ICON plca | | | 1,280,830 | |
| | 32,957 | | | Smurfit Kappa Group plc | | | 1,071,446 | |
| | | | | |
| | | | Total | | | 2,417,015 | |
| | | | | |
| |
| | Isle of Man (0.2%) | | | | |
| | 117,928 | | | GVC Holdings plc | | | 1,412,586 | |
| | | | | |
| | | | Total | | | 1,412,586 | |
| | | | | |
| |
| | Israel (0.3%) | | | | |
| | 178,427 | | | Bank Leumi Le-Israel BM | | | 1,112,618 | |
| | 5,554 | | | First International Bank of Israel, Ltd. | | | 119,603 | |
| | 97,805 | | | Israel Discount Bank, Ltd. | | | 319,623 | |
| | 31,544 | | | Plus500, Ltd. | | | 544,119 | |
| | 12,644 | | | Shufersal, Ltd. | | | 80,266 | |
| | | | | |
| | | | Total | | | 2,176,229 | |
| | | | | |
| |
| | Italy (1.9%) | | | | |
| | 616,425 | | | A2A SPA | | | 993,274 | |
| | 52,694 | | | Amplifon SPA | | | 933,433 | |
| | 59,885 | | | Anima Holding SPAc | | | 250,413 | |
| | 56,989 | | | Assicurazioni Generali SPA | | | 919,617 | |
| | 519,977 | | | Banca Monte dei Paschi di Siena SPAa,b | | | 853,668 | |
| | 15,821 | | | Banca Popolare Di Sondrio SCRL | | | 49,875 | |
| | 61,922 | | | Beni Stabili SPA | | | 53,020 | |
| | 61,922 | | | Beni Stabili SPA, Rightsd | | | 7 | |
| | 5,949 | | | Biesse SPA | | | 136,742 | |
| | 19,808 | | | DiaSorin SPA | | | 1,878,839 | |
| | 95,304 | | | Enav SPAc | | | 429,570 | |
| | 223,754 | | | Enel SPA | | | 1,097,075 | |
| | 40,753 | | | Eni SPA | | | 723,759 | |
| | 8,195 | | | ERG SPA | | | 152,870 | |
| | 130,921 | | | Fincantieri SPA | | | 190,736 | |
| | 190,854 | | | Iren SPA | | | 413,532 | |
| | 75,758 | | | Italgas SPA | | | 390,875 | |
| | 1,528 | | | Italmobiliare SPA | | | 33,748 | |
| | 6,287 | | | La Doria SPA | | | 68,376 | |
| | 38,395 | | | Maire Tecnimont SPA | | | 167,837 | |
| | 127,221 | | | Mediobanca SPA | | | 1,114,167 | |
| | 32,530 | | | Moncler SPA | | | 1,129,689 | |
| | 438,931 | | | Piaggio & C. SPA | | | 939,209 | |
| | 3,861 | | | Reply SPA | | | 213,951 | |
| | 321,580 | | | Saras SPA | | | 627,578 | |
| | 67,848 | | | Societa Iniziative Autostradali e Servizi SPA | | | 955,894 | |
| | 23,109 | | | Technogym SPAc | | | 252,356 | |
| | 102,503 | | | Unipol Gruppo Finanziario SPA | | | 412,521 | |
| | | | | |
| | | | Total | | | 15,382,631 | |
| | | | | |
| |
| | Japan (19.8%) | | | | |
| | 27,000 | | | Adastria Holdings Company, Ltd. | | | 439,957 | |
| | 15,100 | | | Adeka Corporation | | | 223,717 | |
| | 2,500 | | | AEON Fantasy Company, Ltd. | | | 78,125 | |
| | 19 | | | AEON REIT Investment Corporation | | | 20,927 | |
| | 46,700 | | | Aichi Corporation | | | 277,080 | |
| | 7,000 | | | Aisan Industry Company, Ltd. | | | 52,412 | |
| | 7,200 | | | Alpen Company, Ltd. | | | 120,992 | |
| | 25,500 | | | AOKI Holdings, Inc. | | | 335,862 | |
| | 25,700 | | | Aoyama Trading Company, Ltd. | | | 777,514 | |
| | 7,200 | | | Aozora Bank, Ltd. | | | 248,446 | |
| | 8,000 | | | Arcland Sakamoto Company, Ltd. | | | 104,760 | |
| | 27,600 | | | Arcs Company, Ltd. | | | 666,934 | |
| | 7,200 | | | Autobacs Seven Company, Ltd. | | | 115,878 | |
| | 26,300 | | | Benesse Holdings, Inc. | | | 733,471 | |
| | 12,400 | | | Bic Camera, Inc. | | | 163,709 | |
| | 59,600 | | | Bridgestone Corporation | | | 2,298,134 | |
| | 19,600 | | | Broadleaf Company, Ltd. | | | 113,189 | |
| | 22,300 | | | Canon Electronics, Inc. | | | 407,536 | |
| | 94,600 | | | Canon, Inc. | | | 2,694,531 | |
| | 63,900 | | | Capcom Company, Ltd. | | | 1,331,993 | |
| | 3,700 | | | Cawachi, Ltd. | | | 68,670 | |
| | 41,800 | | | Chiyoda Company, Ltd. | | | 805,807 | |
| | 2,300 | | | Chiyoda Integre Company, Ltd. | | | 46,187 | |
| | 161,300 | | | Citizen Watch Company, Ltd. | | | 928,437 | |
| | 28,400 | | | Coca-Cola Bottlers Japan, Inc. | | | 743,262 | |
| | 5,800 | | | Cocokara Fine, Inc. | | | 319,255 | |
| | 4,100 | | | Computer Engineering & Consulting, Ltd. | | | 88,216 | |
| | 5,800 | | | Cosel Company, Ltd. | | | 59,676 | |
| | 16,500 | | | Cosmo Energy Holdings Company, Ltd. | | | 606,847 | |
| | 5,700 | | | Daiichikosho Company, Ltd. | | | 263,088 | |
| | 35,400 | | | Daikyo, Inc. | | | 929,126 | |
| | 13,400 | | | DaikyoNishikawa Corporation | | | 128,000 | |
| | 300 | | | Daishi Hokuetsu Financial Group, Inc. | | | 10,795 | |
| | 32,800 | | | Daito Trust Construction Company, Ltd. | | | 4,324,299 | |
| | 110 | | | Daiwa Office Investment Corporation | | | 671,852 | |
| | 5,700 | | | Denka Company, Ltd. | | | 185,380 | |
| | 8,800 | | | Denso Corporation | | | 392,531 | |
| | 4,600 | | | DIC Corporation | | | 135,747 | |
| | 52,200 | | | DMG Mori Company, Ltd. | | | 753,151 | |
| | 8,400 | | | Doutor Nichires Holdings Company, Ltd. | | | 149,276 | |
| | 51,900 | | | DTS Corporation | | | 1,803,158 | |
| | 10,600 | | | DUSKIN Company, Ltd. | | | 241,100 | |
| | 34,800 | | | Ebara Corporation | | | 1,013,594 | |
| | 25,700 | | | EDION Corporation | | | 270,253 | |
| | 11,500 | | | EPS Holdings, Inc. | | | 224,554 | |
| | 10,800 | | | F@N Communications, Inc. | | | 59,878 | |
The accompanying Notes to Financial Statements are an integral part of this schedule.
174
PARTNER WORLDWIDE ALLOCATION FUND
Schedule of Investments as of October 31, 2018
| | | | | | | | |
| Shares | | | Common Stock (86.3%) | | Value | |
| | Japan (19.8%) - continued | | | | |
| | 22,000 | | | Fancl Corporation | | | $972,879 | |
| | 8,400 | | | Fields Corporation | | | 62,800 | |
| | 42,400 | | | Financial Products Group Company, Ltd. | | | 413,932 | |
| | 15,100 | | | Fuji Machine Manufacturing Company, Ltd. | | | 210,462 | |
| | 12,900 | | | Fuji Oil Holdings, Inc. | | | 372,069 | |
| | 11,300 | | | Fuji Soft, Inc. | | | 517,736 | |
| | 1,500 | | | Fujibo Holdings, Inc. | | | 43,703 | |
| | 1,700 | | | Fukui Computer Holdings, Inc. | | | 27,051 | |
| | 2,500 | | | Fuyo General Lease Company, Ltd. | | | 138,880 | |
| �� | 13,700 | | | Geo Holdings Corporation | | | 208,708 | |
| | 1,700 | | | Glory, Ltd. | | | 39,587 | |
| | 3,000 | | | Godo Steel, Ltd. | | | 57,579 | |
| | 3,000 | | | Goldcrest Company, Ltd. | | | 46,978 | |
| | 1,500 | | | GOLDWIN, Inc. | | | 106,925 | |
| | 64,500 | | | Gree, Inc. | | | 269,930 | |
| | 4,500 | | | Gunma Bank, Ltd. | | | 20,373 | |
| | 2,800 | | | Gunosy, Inc.a | | | 73,831 | |
| | 3,100 | | | H2O Retailing Corporation | | | 48,213 | |
| | 152,200 | | | Hachijuni Bank, Ltd. | | | 642,871 | |
| | 24,700 | | | Harmonic Drive Systems, Inc. | | | 750,866 | |
| | 40,400 | | | Heiwa Corporation | | | 923,950 | |
| | 219 | | | Heiwa Real Estate REIT, Inc. | | | 214,778 | |
| | 7,200 | | | Hino Motors, Ltd. | | | 68,920 | |
| | 28,200 | | | Hiroshima Bank, Ltd. | | | 173,940 | |
| | 2,100 | | | Hitachi Capital Corporation | | | 51,490 | |
| | 38,200 | | | Hitachi Chemical Company, Ltd. | | | 602,110 | |
| | 10,900 | | | Hitachi High-Technologies Corporation | | | 409,071 | |
| | 56,000 | | | Hitachi, Ltd. | | | 1,711,931 | |
| | 1,400 | | | Hogy Medical Company, Ltd. | | | 41,356 | |
| | 73,500 | | | Hokuetsu Corporation | | | 351,092 | |
| | 23,900 | | | Hokuhoku Financial Group, Inc. | | | 296,089 | |
| | 253,400 | | | Honda Motor Company, Ltd. | | | 7,233,438 | |
| | 34,800 | | | Hoya Corporation | | | 1,968,838 | |
| | 119 | | | Hulic REIT, Inc. | | | 173,159 | |
| | 43,100 | | | IBIDEN Company, Ltd. | | | 532,206 | |
| | 247 | | | Ichigo Real Estate Investment Corporation | | | 202,748 | |
| | 6,400 | | | Ichiyoshi Securities Co., Ltd. | | | 53,880 | |
| | 10,000 | | | INES Corporation | | | 116,704 | |
| | 1,130 | | | Invesco Office J-Reit, Inc. | | | 159,234 | |
| | 175 | | | Invincible Investment Corporation | | | 72,485 | |
| | 61,300 | | | Isuzu Motors, Ltd. | | | 803,677 | |
| | 9,600 | | | Itochu Enex Company, Ltd. | | | 90,391 | |
| | 14,000 | | | JAFCO Company, Ltd. | | | 539,424 | |
| | 13,300 | | | Japan Aviation Electronics Industry, Ltd. | | | 176,118 | |
| | 334 | | | Japan Excellent, Inc. | | | 433,058 | |
| | 349 | | | Japan Rental Housing Investments, Inc. | | | 273,916 | |
| | 284,500 | | | Japan Tobacco, Inc. | | | 7,310,321 | |
| | 113,600 | | | JVC Kenwood Corporation | | | 280,872 | |
| | 31,900 | | | Kabu.com Securities Company, Ltd. | | | 115,139 | |
| | 11,700 | | | Kadokawa Dwango Corporation | | | 116,810 | |
| | 2,700 | | | Kanematsu Electronics, Ltd. | | | 82,962 | |
| | 2,800 | | | Kato Sangyo Company, Ltd. | | | 86,281 | |
| | 99 | | | Kenedix Office Investment Corporation | | | 613,497 | |
| | 44,500 | | | Kewpie Corporation | | | 1,022,905 | |
| | 6,900 | | | Keyence Corporation | | | 3,370,787 | |
| | 6,900 | | | Kintetsu World Express, Inc. | | | 107,353 | |
| | 20,800 | | | KITZ Corporation | | | 165,739 | |
| | 6,400 | | | Kohnan Shoji Company, Ltd. | | | 160,121 | |
| | 25,200 | | | Kokuyo Company, Ltd. | | | 397,824 | |
| | 72,600 | | | Komatsu, Ltd. | | | 1,890,682 | |
| | 1,400 | | | KOMERI Company, Ltd. | | | 36,281 | |
| | 41,300 | | | Konoike Transport Company, Ltd. | | | 624,554 | |
| | 9,400 | | | K’s Holdings Corporation | | | 118,750 | |
| | 1,200 | | | Kura Corporation | | | 69,541 | |
| | 34,800 | | | KYB Company, Ltd. | | | 834,735 | |
| | 4,400 | | | Kyokuto Kaihatsu Kogyo Company, Ltd. | | | 62,814 | |
| | 49,100 | | | KYORIN Holdings, Inc. | | | 1,072,319 | |
| | 19,600 | | | Kyowa Exeo Corporation | | | 528,330 | |
| | 203 | | | LaSalle Logiport REIT | | | 186,930 | |
| | 11,600 | | | Macnica Fuji Electronics Holdings, Inc. | | | 167,699 | |
| | 14,600 | | | Makino Milling Machine Company, Ltd. | | | 555,648 | |
| | 6,900 | | | Mandom Corporation | | | 191,480 | |
| | 22,900 | | | Matsumotokiyoshi Holdings Company, Ltd. | | | 827,923 | |
| | 3,800 | | | Maxell Holdings, Ltd. | | | 48,422 | |
| | 50,700 | | | Mazda Motor Corporation | | | 540,010 | |
| | 9,400 | | | Meiko Network Japan Company, Ltd. | | | 82,557 | |
| | 2,500 | | | Milbon Company, Ltd. | | | 89,746 | |
| | 23,200 | | | Ministop Company, Ltd. | | | 428,368 | |
| | 14,000 | | | Miraca Holdings, Inc. | | | 340,816 | |
| | 39,200 | | | Mitsubishi Corporation | | | 1,103,296 | |
| | 2,700 | | | Mitsubishi Research Institute, Inc. | | | 84,292 | |
| | 5,900 | | | Mitsubishi Shokuhin Company, Ltd. | | | 152,054 | |
| | 23,600 | | | Mitsui Engineering & Shipbuilding Company, Ltd.a | | | 396,294 | |
| | 3,400 | | | Mitsui Sugar Company, Ltd. | | | 91,459 | |
| | 2,189,600 | | | Mizuho Financial Group, Inc. | | | 3,760,339 | |
| | 2,400 | | | Mizuno Corporation | | | 56,155 | |
| | 74 | | | Mori Hills REIT Investment Corporation | | | 91,531 | |
| | 406 | | | Mori Trust Sogo REIT, Inc. | | | 575,711 | |
| | 13,000 | | | Murata Manufacturing Company, Ltd. | | | 2,023,258 | |
| | 8,200 | | | Nagase & Co., Ltd. | | | 128,798 | |
| | 27,600 | | | NEC Networks & System Integration Corporation | | | 601,571 | |
| | 24,800 | | | Net One Systems Company, Ltd. | | | 519,220 | |
| | 239,200 | | | NHK Spring Company, Ltd. | | | 2,048,192 | |
| | 7,700 | | | NICHIAS Corporation | | | 167,785 | |
| | 38,300 | | | Nichi-Iko Pharmaceutical Company, Ltd. | | | 521,731 | |
| | 4,000 | | | Nihon Chouzai Company, Ltd. | | | 123,971 | |
| | 4,700 | | | Nihon Unisys, Ltd. | | | 102,997 | |
| | 6,100 | | | Nikkiso Company, Ltd. | | | 70,827 | |
| | 10,400 | | | Nikkon Holdings Company, Ltd. | | | 251,311 | |
| | 8,800 | | | Nintendo Company, Ltd. | | | 2,747,385 | |
| | 5,400 | | | NIPPO Corporation | | | 88,534 | |
| | 1,600 | | | Nippon Carbon Company, Ltd. | | | 90,479 | |
| | 112,700 | | | Nippon Kayaku Company, Ltd. | | | 1,341,263 | |
| | 297,500 | | | Nippon Light Metal Holdings Company, Ltd. | | | 627,307 | |
| | 36,400 | | | Nippon Paper Industries Company, Ltd. | | | 659,489 | |
| | 12,100 | | | Nippon Shokubai Company, Ltd. | | | 780,662 | |
| | 2,700 | | | Nippon Soda Company, Ltd. | | | 70,166 | |
| | 192,200 | | | Nippon Steel & Sumitomo Metal Corporation | | | 3,545,354 | |
| | 14,200 | | | Nippon Thompson Company, Ltd. | | | 82,117 | |
| | 13,400 | | | Nipro Corporation | | | 170,639 | |
| | 5,100 | | | Nishi-Nippon City Bank, Ltd. | | | 48,466 | |
| | 829,978 | | | Nissan Motor Company, Ltd. | | | 7,550,943 | |
| | 8,600 | | | Nisshin Oillio Group, Ltd. | | | 258,069 | |
| | 6,500 | | | Nissin Kogyo Company, Ltd. | | | 94,570 | |
| | 1,000 | | | Noevir Holdings Company, Ltd. | | | 42,538 | |
The accompanying Notes to Financial Statements are an integral part of this schedule.
175
PARTNER WORLDWIDE ALLOCATION FUND
Schedule of Investments as of October 31, 2018
| | | | | | | | |
| Shares | | | Common Stock (86.3%) | | Value | |
| | Japan (19.8%) - continued | | | | |
| | 29,100 | | | North Pacific Bank, Ltd. | | | $87,263 | |
| | 13,000 | | | NSD Company, Ltd. | | | 275,234 | |
| | 89,000 | | | NTT Data Corporation | | | 1,142,626 | |
| | 12,900 | | | OBIC Company, Ltd. | | | 1,174,416 | |
| | 4,875 | | | Okinawa Electric Power Company, Inc. | | | 90,826 | |
| | 21,600 | | | Okuma Corporation | | | 1,078,501 | |
| | 93,000 | | | Onward Holdings Company, Ltd. | | | 560,663 | |
| | 64,500 | | | ORIX Corporation | | | 1,050,770 | |
| | 183,500 | | | Osaka Gas Company, Ltd. | | | 3,355,481 | |
| | 2,400 | | | PAL Company, Ltd. | | | 70,318 | |
| | 6,900 | | | Paramount Bed Holdings Company, Ltd. | | | 290,317 | |
| | 18,200 | | | PC Depot Corporation | | | 91,380 | |
| | 270 | | | Premier Investment Corporation | | | 279,281 | |
| | 5,600 | | | Prima Meat Packers, Ltd. | | | 105,765 | |
| | 10,900 | | | Remixpoint, Inc. | | | 73,098 | |
| | 1,500 | | | Riken Vitamin Company, Ltd. | | | 46,249 | |
| | 19,800 | | | ROHTO Pharmaceutical Company, Ltd. | | | 627,116 | |
| | 58,100 | | | Round One Corporation | | | 689,114 | |
| | 27,200 | | | Ryoyo Electro Corporation | | | 390,060 | |
| | 1,100 | | | Saint Marc Holdings Company, Ltd. | | | 26,125 | |
| | 14,000 | | | Sangetsu Company, Ltd. | | | 269,266 | |
| | 17,900 | | | Sawai Pharmaceutical Company, Ltd. | | | 907,388 | |
| | 17,000 | | | SCSK Corporation | | | 720,384 | |
| | 16,800 | | | Seiko Holdings Corporation | | | 403,053 | |
| | 52,000 | | | Seino Holdings Company, Ltd. | | | 720,115 | |
| | 330,200 | | | Sekisui House, Ltd. | | | 4,846,354 | |
| | 12,900 | | | Senko Group Holdings Company, Ltd. | | | 100,255 | |
| | 5,200 | | | Shikoku Electric Power Company | | | 65,268 | |
| | 3,100 | | | Shimachu Company, Ltd. | | | 81,263 | |
| | 12,600 | | | SHIMAMURA Company, Ltd. | | | 1,059,843 | |
| | 100 | | | Shindengen Electric Manufacturing Company, Ltd. | | | 4,349 | |
| | 29,600 | | | Shinko Electric Industries Company, Ltd. | | | 206,081 | |
| | 12,000 | | | Ship Healthcare Holdings, Inc. | | | 433,871 | |
| | 27,000 | | | Showa Denko KK | | | 1,175,678 | |
| | 60,200 | | | SKY Perfect JSAT Holdings, Inc. | | | 267,314 | |
| | 6,300 | | | Sodick Company, Ltd. | | | 47,459 | |
| | 50,100 | | | SoftBank Group Corporation | | | 3,964,855 | |
| | 65,800 | | | Sony Corporation | | | 3,560,882 | |
| | 6,400 | | | Star Micronics Company, Ltd. | | | 90,915 | |
| | 30,500 | | | Sugi Holdings Company, Ltd. | | | 1,396,465 | |
| | 66,500 | | | Sumitomo Corporation | | | 1,008,584 | |
| | 388,500 | | | Sumitomo Electric Industries, Ltd. | | | 5,298,204 | |
| | 28,400 | | | Sumitomo Heavy Industries, Ltd. | | | 893,202 | |
| | 1,000 | | | Sumitomo Seika Chemicals Company, Ltd. | | | 49,911 | |
| | 37,400 | | | Suzuki Motor Corporation | | | 1,865,015 | |
| | 40,000 | | | Taiheiyo Cement Corporation | | | 1,177,067 | |
| | 11,300 | | | Taiho Kogyo Company, Ltd. | | | 101,897 | |
| | 500 | | | Taikisha, Ltd. | | | 14,109 | |
| | 23,500 | | | Takara Holdings, Inc. | | | 329,673 | |
| | 51,700 | | | Takara Leben Company, Ltd. | | | 148,952 | |
| | 15,800 | | | TDK Corporation | | | 1,362,435 | |
| | 40,900 | | | TIS, Inc. | | | 1,826,886 | |
| | 19,900 | | | Toho Holdings Company, Ltd. | | | 521,322 | |
| | 8,000 | | | Tokai Tokyo Financial Holdings, Inc. | | | 41,298 | |
| | 29,900 | | | Tokyo Dome Corporation | | | 263,181 | |
| | 167,000 | | | Toppan Printing Company, Ltd. | | | 2,360,951 | |
| | 400 | | | Topy Industries, Ltd. | | | 10,780 | |
| | 12,500 | | | Tosei Corporation | | | 114,258 | |
| | 15,800 | | | Toshiba Machine Company, Ltd. | | | 299,211 | |
| | 4,600 | | | Towa Pharmaceutical Company, Ltd. | | | 353,602 | |
| | 11,500 | | | Toyo Tanso Company, Ltd. | | | 299,629 | |
| | 74,100 | | | Toyoda Gosei Company, Ltd. | | | 1,598,164 | |
| | 16,800 | | | Toyota Motor Corporation | | | 984,160 | |
| | 33,800 | | | Tsubakimoto Chain Company | | | 1,297,798 | |
| | 77,300 | | | TV Asahi Holdings Corporation | | | 1,443,104 | |
| | 50,100 | | | Ube Industries, Ltd. | | | 1,091,312 | |
| | 1,700 | | | Vital KSK Holdings, Inc. | | | 17,778 | |
| | 7,400 | | | Wacoal Holdings Corporation | | | 204,025 | |
| | 14,700 | | | Wakita & Company, Ltd. | | | 158,430 | |
| | 40,600 | | | Yamato Holdings Company, Ltd. | | | 1,109,939 | |
| | 3,200 | | | Yellow Hat, Ltd. | | | 78,683 | |
| | 6,400 | | | Yodogawa Steel Works, Ltd. | | | 138,925 | |
| | 18,000 | | | Yokohama Reito Company, Ltd. | | | 142,760 | |
| | 20,500 | | | Yumeshin Holdings Company, Ltd. | | | 175,222 | |
| | 6,700 | | | Zenkoku Hosho Company, Ltd. | | | 242,905 | |
| | 11,700 | | | Zenrin Company, Ltd. | | | 291,116 | |
| | | | | |
| | | | Total | | | 161,863,820 | |
| | | | | |
| |
| | Jersey (<0.1%) | | | | |
| | 111,779 | | | boohoo group plca | | | 302,600 | |
| | | | | |
| | | | Total | | | 302,600 | |
| | | | | |
| |
| | Luxembourg (0.2%) | | | | |
| | 113,557 | | | B&M European Value Retail SA | | | 604,266 | |
| | 7,555 | | | Oriflame Holdings AG | | | 178,350 | |
| | 4,307 | | | RTL Group SA | | | 276,440 | |
| | 17,200 | | | Tenaris SA ADR | | | 502,756 | |
| | | | | |
| | | | Total | | | 1,561,812 | |
| | | | | |
| |
| | Malaysia (0.2%) | | | | |
| | 269,500 | | | Public Bank Berhad | | | 1,585,315 | |
| | | | | |
| | | | Total | | | 1,585,315 | |
| | | | | |
| |
| | Mexico (0.7%) | | | | |
| | 25,100 | | | Fomento Economico Mexicano SAB de CV ADR | | | 2,135,257 | |
| | 95,000 | | | Grupo Aeroportuario del Sureste, SAB de CV | | | 1,567,226 | |
| | 356,908 | | | Grupo Financiero Banorte SAB de CV ADR | | | 1,967,687 | |
| | | | | |
| | | | Total | | | 5,670,170 | |
| | | | | |
| |
| | Netherlands (2.8%) | | | | |
| | 9,410 | | | Aalberts Industries NV | | | 344,951 | |
| | 69,443 | | | ASR Nederland NV | | | 3,152,501 | |
| | 33,745 | | | Euronext NVc | | | 2,076,402 | |
| | 19,006 | | | Ferrari NV | | | 2,225,625 | |
| | 103,130 | | | Fiat Chrysler Automobiles NVa | | | 1,569,469 | |
| | 14,269 | | | Heineken Holding NV | | | 1,234,209 | |
| | 12,908 | | | Intertrust NVc | | | 208,227 | |
| | 20,941 | | | Koninklijke DSM NV | | | 1,828,324 | |
| | 36,094 | | | Koninklijke Philips NV | | | 1,346,149 | |
| | 7,846 | | | Koninklijke VolkerWessels NV | | | 139,522 | |
| | 28,677 | | | NN Group NV | | | 1,231,330 | |
| | 3,681 | | | NSI NV | | | 145,299 | |
| | 319,917 | | | Pharming Group NVa | | | 346,642 | |
| | 28,743 | | | SBM Offshore NV | | | 495,251 | |
| | 119,610 | | | Unilever NV | | | 6,427,209 | |
| | 4,942 | | | Vastned Retail NV | | | 195,607 | |
| | | | | |
| | | | Total | | | 22,966,717 | |
| | | | | |
| |
| | New Zealand (<0.1%) | | | | |
| | 65,058 | | | Air New Zealand, Ltd. | | | 118,949 | |
| | 64,795 | | | Infratil, Ltd. | | | 144,850 | |
| | | | | |
| | | | Total | | | 263,799 | |
| | | | | |
The accompanying Notes to Financial Statements are an integral part of this schedule.
176
PARTNER WORLDWIDE ALLOCATION FUND
Schedule of Investments as of October 31, 2018
| | | | | | | | |
| Shares | | | Common Stock (86.3%) | | Value | |
| | Norway (2.1%) | | | | |
| | 43,120 | | | Aker BP ASA | | | $1,414,111 | |
| | 46,763 | | | Aker Solutions ASAa | | | 307,693 | |
| | 15,929 | | | Austevoll Seafood ASA | | | 255,996 | |
| | 325,027 | | | DnB ASA | | | 5,872,068 | |
| | 255,438 | | | DNO International ASA | | | 488,283 | |
| | 14,140 | | | Entra ASAc | | | 191,333 | |
| | 63,470 | | | Leroy Seafood Group ASA | | | 585,093 | |
| | 44,683 | | | Marine Harvest ASA | | | 1,081,789 | |
| | 19,906 | | | SalMar ASA | | | 1,050,753 | |
| | 2,526 | | | SpareBank 1 Nord-Norge | | | 20,183 | |
| | 16,886 | | | SpareBank 1 SMN | | | 172,091 | |
| | 9,030 | | | Storebrand ASA | | | 75,047 | |
| | 248,636 | | | Telenor ASA | | | 4,558,832 | |
| | 25,922 | | | TGS Nopec Geophysical Company ASA | | | 865,917 | |
| | | | | |
| | | | Total | | | 16,939,189 | |
| | | | | |
| |
| | Philippines (0.5%) | | | | |
| | 11,120 | | | Ayala Corporation | | | 191,433 | |
| | 3,199,800 | | | Ayala Land, Inc. | | | 2,374,265 | |
| | 1,044,030 | | | Bank of the Philippine Islands | | | 1,605,265 | |
| | | | | |
| | | | Total | | | 4,170,963 | |
| | | | | |
| |
| | Poland (0.1%) | | | | |
| | 34,898 | | | Bank Pekao SA | | | 951,399 | |
| | | | | |
| | | | Total | | | 951,399 | |
| | | | | |
| |
| | Portugal (0.2%) | | | | |
| | 18,765 | | | Altri SGPS SA | | | 164,451 | |
| | 2,978,379 | | | Banco Espirito Santo SAa,d,e | | | 337 | |
| | 88,519 | | | Galp Energia SGPS SA | | | 1,539,182 | |
| | | | | |
| | | | Total | | | 1,703,970 | |
| | | | | |
| |
| | Russia (0.4%) | | | | |
| | 35,278 | | | Lukoil ADR | | | 2,630,290 | |
| | 9,789 | | | Magnit PJSC | | | 533,852 | |
| | | | | |
| | | | Total | | | 3,164,142 | |
| | | | | |
| |
| | Singapore (0.4%) | | | | |
| | 157,500 | | | CapitaLand Retail China Trust | | | 155,950 | |
| | 31,900 | | | China Aviation Oil (Singapore) Corporation, Ltd. | | | 31,790 | |
| | 97,300 | | | DBS Group Holdings, Ltd. | | | 1,650,931 | |
| | 90,100 | | | United Overseas Bank, Ltd. | | | 1,593,013 | |
| | 256,200 | | | Yanlord Land Group, Ltd. | | | 233,660 | |
| | | | | |
| | | | Total | | | 3,665,344 | |
| | | | | |
| |
| | South Africa (0.5%) | | | | |
| | 123,390 | | | Massmart Holdings, Ltd. | | | 803,279 | |
| | 177,800 | | | MTN Group, Ltd. | | | 1,032,472 | |
| | 6,300 | | | Naspers, Ltd. | | | 1,105,026 | |
| | 200,711 | | | Truworths International, Ltd. | | | 1,099,445 | |
| | | | | |
| | | | Total | | | 4,040,222 | |
| | | | | |
| |
| | South Korea (0.4%) | | | | |
| | 3,914 | | | Amorepacific Corporation | | | 310,752 | |
| | 6,588 | | | Amorepacific Group | | | 361,091 | |
| | 4,789 | | | LG Chem, Ltd. | | | 1,463,403 | |
| | 14,740 | | | NAVER Corporation | | | 1,484,382 | |
| | | | | |
| | | | Total | | | 3,619,628 | |
| | | | | |
| |
| | Spain (2.7%) | | | | |
| | 107,288 | | | ACS Actividades de Construccion y Servicios, SAa | | | 4,016,998 | |
| | 37,344 | | | Amadeus IT Holding SA | | | 3,007,094 | |
| | 330,173 | | | Bankinter SA | | | 2,705,094 | |
| | 2,708 | | | Bolsas y Mercados Espanoles SA | | | 80,105 | |
| | 605,860 | | | CaixaBank SA | | | 2,451,727 | |
| | 81,303 | | | CIA De Distribucion Integral | | | 1,962,934 | |
| | 1,033 | | | Construcciones y Auxiliar de Ferrocarriles SA | | | 38,778 | |
| | 136,583 | | | Enagas SA | | | 3,621,270 | |
| | 39,359 | | | Ence Energia y Celulosa SA | | | 330,608 | |
| | 8,678 | | | Euskaltel SAc | | | 72,652 | |
| | 18,265 | | | Global Dominion Access SAa,c | | | 97,540 | |
| | 13,205 | | | Lar Espana Real Estate SOCIMI SA | | | 130,870 | |
| | 4,443 | | | Let’s GOWEX SAa,d,e | | | 0 | |
| | 196,537 | | | Mediaset Espana Comunicacion SA | | | 1,336,413 | |
| | 91,927 | | | Merlin Properties Socimi SA | | | 1,151,846 | |
| | 21,680 | | | Prosegur Compania de Seguridad SA | | | 120,404 | |
| | 74,069 | | | Repsol SA | | | 1,323,521 | |
| | 8,631 | | | Telepizza Group SAc | | | 44,788 | |
| | | | | |
| | | | Total | | | 22,492,642 | |
| | | | | |
| |
| | Sweden (2.6%) | | | | |
| | 8,657 | | | AF AB | | | 185,668 | |
| | 28,313 | | | Ahlsell ABc | | | 143,306 | |
| | 51,444 | | | Arjo AB | | | 174,792 | |
| | 46,016 | | | Atlas Copco AB, Class B | | | 1,053,920 | |
| | 29,997 | | | Axfood AB | | | 535,117 | |
| | 27,132 | | | Betsson ABa | | | 235,587 | |
| | 13,266 | | | Biotage AB | | | 173,841 | |
| | 8,607 | | | Cloetta AB | | | 26,036 | |
| | 44,743 | | | Elekta AB | | | 567,418 | |
| | 21,722 | | | Fastighets AB Baldera | | | 544,771 | |
| | 40,754 | | | Granges AB | | | 430,856 | |
| | 47,111 | | | Hemfosa Fastigheter AB | | | 582,025 | |
| | 61,240 | | | Hexpol AB | | | 566,718 | |
| | 9,313 | | | Holmen AB | | | 213,208 | |
| | 14,132 | | | Intrum AB | | | 360,455 | |
| | 44,383 | | | Investor AB | | | 1,922,954 | |
| | 25,403 | | | Kungsleden AB | | | 177,570 | |
| | 2,212 | | | Loomis AB | | | 68,254 | |
| | 207,788 | | | Nobina ABc | | | 1,386,487 | |
| | 7,211 | | | Nolato AB | | | 332,037 | |
| | 6,045 | | | Peab AB | | | 53,212 | |
| | 146,726 | | | Sandvik AB | | | 2,319,561 | |
| | 144,905 | | | SKF AB | | | 2,323,135 | |
| | 197,908 | | | SSAB AB, Class A | | | 790,104 | |
| | 203,438 | | | SSAB AB, Class B | | | 659,760 | |
| | 24,669 | | | Swedish Match AB | | | 1,256,607 | |
| | 74,578 | | | Swedish Orphan Biovitrum ABa | | | 1,522,341 | |
| | 12,727 | | | Trelleborg AB | | | 229,626 | |
| | 142,607 | | | Volvo AB | | | 2,129,717 | |
| | 18,289 | | | Wihlborgs Fastigheter AB | | | 206,339 | |
| | | | | |
| | | | Total | | | 21,171,422 | |
| | | | | |
| |
| | Switzerland (5.8%) | | | | |
| | 467 | | | BKW FMB Energie | | | 29,620 | |
| | 260 | | | Bobst Group SA | | | 19,653 | |
| | 477 | | | Bossard Holding AG | | | 77,772 | |
| | 258 | | | Bucher Industries AG | | | 71,154 | |
| | 5,468 | | | Cembra Money Bank AG | | | 458,588 | |
The accompanying Notes to Financial Statements are an integral part of this schedule.
177
PARTNER WORLDWIDE ALLOCATION FUND
Schedule of Investments as of October 31, 2018
| | | | | | | | |
| Shares | | | Common Stock (86.3%) | | Value | |
| | Switzerland (5.8%) - continued | | | | |
| | 68 | | | Conzzeta AG | | | $60,806 | |
| | 29,373 | | | Ferguson plc | | | 1,980,315 | |
| | 64,265 | | | Ferrexpo plc | | | 171,082 | |
| | 6,245 | | | Flughafen Zuerich AG | | | 1,234,217 | |
| | 11,650 | | | Galenica AGa,c | | | 624,542 | |
| | 999 | | | Georg Fischer AG | | | 929,415 | |
| | 398,711 | | | Glencore Xstrata plc | | | 1,622,620 | |
| | 1,241 | | | Implenia AG | | | 68,988 | |
| | 501 | | | Inficon Holding AG | | | 240,287 | |
| | 93 | | | Kardex AG | | | 12,089 | |
| | 762 | | | Landis+Gyr Group AGa | | | 46,223 | |
| | 69,240 | | | Logitech International SA | | | 2,563,562 | |
| | 10,268 | | | Lonza Group AG | | | 3,228,664 | |
| | 86,458 | | | Nestle SA | | | 7,299,053 | |
| | 59,226 | | | Novartis AG | | | 5,186,561 | |
| | 7,487 | | | OC Oerlikon Corporation AG | | | 89,104 | |
| | 18,747 | | | Pargesa Holding SA | | | 1,376,218 | |
| | 2,544 | | | Partners Group Holding AG | | | 1,811,214 | |
| | 52,735 | | | Roche Holding AG | | | 12,833,717 | |
| | 5,839 | | | Roche Holding AG-BR | | | 1,421,548 | |
| | 29 | | | Schweiter Technologies AG | | | 32,931 | |
| | 970 | | | Siegfried Holding AG | | | 389,084 | |
| | 1,777 | | | Straumann Holding AG | | | 1,212,992 | |
| | 5,812 | | | Sunrise Communications Group AGa,c | | | 511,583 | |
| | 2,243 | | | Tecan Group AG | | | 505,993 | |
| | 3,944 | | | Valora Holding AG | | | 986,654 | |
| | | | | |
| | | | Total | | | 47,096,249 | |
| | | | | |
| |
| | Taiwan (0.7%) | | | | |
| | 764,362 | | | Taiwan Semiconductor Manufacturing Company, Ltd. | | | 5,738,358 | |
| | | | | |
| | | | Total | | | 5,738,358 | |
| | | | | |
| |
| | Thailand (0.4%) | | | | |
| | 175,850 | | | Siam Cement pcl | | | 2,184,232 | |
| | 210,400 | | | Siam Commercial Bank pcl | | | 873,151 | |
| | | | | |
| | | | Total | | | 3,057,383 | |
| | | | | |
| |
| | Turkey (0.1%) | | | | |
| | 84,296 | | | BIM Birlesik Magazalar AS | | | 1,198,303 | |
| | | | | |
| | | | Total | | | 1,198,303 | |
| | | | | |
| |
| | United Kingdom (12.9%) | | | | |
| | 112,049 | | | 3i Group plc | | | 1,254,648 | |
| | 35,230 | | | Abcam plc | | | 540,056 | |
| | 58,222 | | | Anglo American plc | | | 1,242,654 | |
| | 42,121 | | | Ashmore Group plc | | | 189,303 | |
| | 74,682 | | | Ashtead Group plc | | | 1,843,664 | |
| | 4,417 | | | ASOS plca | | | 307,713 | |
| | 43,825 | | | Associated British Foods plc | | | 1,336,084 | |
| | 81,726 | | | Aviva plc | | | 446,624 | |
| | 51,751 | | | BBA Aviation plc | | | 158,703 | |
| | 21,545 | | | Bellway plc | | | 790,219 | |
| | 258,590 | | | BHP Billiton plc | | | 5,158,533 | |
| | 19,848 | | | Bodycote plc | | | 201,561 | |
| | 482,432 | | | BP plc | | | 3,484,955 | |
| | 30,103 | | | Brewin Dolphin Holdings plc | | | 126,485 | |
| | 56,614 | | | BTG plca | | | 398,808 | |
| | 67,887 | | | Bunzl plc | | | 2,002,662 | |
| | 50,696 | | | Coca-Cola HBC AG | | | 1,497,489 | |
| | 14,403 | | | Computacenter plc | | | 202,141 | |
| | 38,177 | | | Daily Mail and General Trust plc | | | 341,341 | |
| | 22,400 | | | Derwent London plc | | | 837,619 | |
| | 135,111 | | | Diageo plc | | | 4,670,993 | |
| | 9,539 | | | Diploma plc | | | 159,959 | |
| | 541,263 | | | Direct Line Insurance Group plc | | | 2,274,539 | |
| | 2,095 | | | Domino’s Pizza Group plc | | | 7,579 | |
| | 30,247 | | | Drax Group plc | | | 154,932 | |
| | 65,422 | | | Electrocomponents plc | | | 517,976 | |
| | 7,605 | | | EMIS Group plc | | | 87,972 | |
| | 44,420 | | | Faroe Petroleum plca | | | 84,144 | |
| | 12,625 | | | Fevertree Drinks plc | | | 448,197 | |
| | 284 | | | Games Workshop Group plc | | | 11,155 | |
| | 367,903 | | | GlaxoSmithKline plc | | | 7,125,459 | |
| | 12,978 | | | Grainger plc | | | 44,836 | |
| | 92,853 | | | Great Portland Estates plc | | | 826,173 | |
| | 60,409 | | | Greene King plc | | | 371,781 | |
| | 8,922 | | | Greggs plc | | | 132,307 | |
| | 16,343 | | | Halma plc | | | 277,347 | |
| | 269,196 | | | Hansteen Holdings plc | | | 331,011 | |
| | 301,523 | | | Hays plc | | | 631,430 | |
| | 30,571 | | | Hiscox, Ltd. | | | 635,033 | |
| | 336,937 | | | Howden Joinery Group plc | | | 2,017,479 | |
| | 1,258,764 | | | HSBC Holdings plc | | | 10,359,128 | |
| | 26,927 | | | Ibstock plcc | | | 77,200 | |
| | 70,920 | | | Imperial Brands plc | | | 2,402,248 | |
| | 38,047 | | | Inchcape plc | | | 262,779 | |
| | 1,863 | | | Indivior plca | | | 4,484 | |
| | 130,069 | | | Intermediate Capital Group plc | | | 1,579,769 | |
| | 1,770,627 | | | ITV plc | | | 3,361,134 | |
| | 73,435 | | | JD Sports Fashion plc | | | 382,727 | |
| | 8,366 | | | Just Eat pcla | | | 64,899 | |
| | 7,439 | | | Keller Group plc | | | 61,615 | |
| | 374,895 | | | Legal & General Group plc | | | 1,202,992 | |
| | 992,728 | | | Lloyds TSB Group plc | | | 724,433 | |
| | 130,225 | | | Man Group plc | | | 258,380 | |
| | 411,188 | | | Marks and Spencer Group plc | | | 1,555,193 | |
| | 135,930 | | | Mondi plc | | | 3,200,996 | |
| | 153,188 | | | Moneysupermarket.com Group plc | | | 574,296 | |
| | 3,095 | | | Morgan Advanced Materials plc | | | 10,919 | |
| | 312,085 | | | National Express Group plc | | | 1,594,654 | |
| | 15,191 | | | Next plc | | | 1,009,181 | |
| | 36,155 | | | NMC Health plc | | | 1,630,214 | |
| | 5,441 | | | OneSavings Bank plc | | | 25,918 | |
| | 232,433 | | | PageGroup plc | | | 1,489,891 | |
| | 92,014 | | | Paragon Banking Group plc | | | 500,048 | |
| | 45,479 | | | Persimmon plc | | | 1,331,040 | |
| | 47,232 | | | Petrofac, Ltd. | | | 347,321 | |
| | 92,372 | | | QinetiQ Group plc | | | 327,194 | |
| | 47,119 | | | Redrow plc | | | 318,148 | |
| | 88,635 | | | RELX plc | | | 1,752,904 | |
| | 19,947 | | | Rio Tinto plc | | | 968,443 | |
| | 156,797 | | | Rotork plc | | | 600,395 | |
| | 66,627 | | | Royal Dutch Shell plc, Class A | | | 2,122,611 | |
| | 245,856 | | | Royal Dutch Shell plc, Class B | | | 8,018,086 | |
| | 127,262 | | | Royal Mail plc | | | 584,251 | |
| | 12,855 | | | Safestore Holdings plc | | | 87,776 | |
| | 5,599 | | | Saga plc | | | 8,524 | |
| | 106,244 | | | Senior plc | | | 370,045 | |
| | 101,050 | | | Smith & Nephew plc | | | 1,642,554 | |
| | 9,529 | | | Spectris plc | | | 260,711 | |
| | 6,772 | | | Spirax-Sarco Engineering plc | | | 559,367 | |
| | 288,514 | | | SSP Group plc | | | 2,459,824 | |
| | 105,952 | | | Stagecoach Group plc | | | 206,934 | |
| | 15,560 | | | Standard Chartered plc | | | 109,055 | |
| | 91,692 | | | Tate & Lyle plc | | | 788,375 | |
| | 766,676 | | | Tesco plc | | | 2,087,985 | |
| | 74,531 | | | Unilever plc | | | 3,947,881 | |
| | 9,596 | | | UNITE Group plc | | | 104,483 | |
| | 20,411 | | | Vesuvius plc | | | 141,613 | |
The accompanying Notes to Financial Statements are an integral part of this schedule.
178
PARTNER WORLDWIDE ALLOCATION FUND
Schedule of Investments as of October 31, 2018
| | | | | | | | |
| Shares | | | Common Stock (86.3%) | | Value | |
| | United Kingdom (12.9%) - continued | | | | |
| | 19,760 | | | Victrex plc | | | $668,406 | |
| | 14,192 | | | WH Smith plc | | | 352,775 | |
| | | | | |
| | | | Total | | | 105,671,363 | |
| | | | | |
| |
| | United States (0.4%) | | | | |
| | 14,090 | | | Nice, Ltd. ADRa | | | 1,492,695 | |
| | 51,187 | | | Yum China Holding, Inc. | | | 1,846,827 | |
| | | | | |
| | | | Total | | | 3,339,522 | |
| | | | | |
| | | | | | | | |
| | | | | |
| | | | Total Common Stock (cost $717,933,814) | | | 705,157,821 | |
| | | | | |
| | |
Principal
Amount | | | Long-Term Fixed Income (9.0%) | | | |
| | Albania (<0.1%) | | | | |
| | | | Albania Government International Bond | | | | |
| | $170,000 | | | 3.500%, 10/9/2025c,f | | | 191,683 | |
| | | | | |
| | | | Total | | | 191,683 | |
| | | | | |
| |
| | Angola (0.1%) | | | | |
| | | | Angola Government International Bond | | | | |
| | 760,000 | | | 8.250%, 5/9/2028c | | | 759,232 | |
| | | | | |
| | | | Total | | | 759,232 | |
| | | | | |
| |
| | Argentina (0.7%) | | | | |
| | | | Argentina Government International Bond | | | | |
| | 1,680,000 | | | 3.750%, 2/8/2019g | | | 61,912 | |
| | 150,000 | | | 4.500%, 6/21/2019 | | | 149,550 | |
| | 10,000 | | | 4.500%, 2/13/2020 | | | 9,475 | |
| | 700,000 | | | 35.765%, (BADLARPP + 3.25%), 3/1/2020g,h | | | 21,205 | |
| | 400,000 | | | 4.000%, 3/6/2020g | | | 13,482 | |
| | 8,345,000 | | | 42.819%, (ARPP7DRR FLAT), 6/21/2020g,h | | | 280,917 | |
| | 230,000 | | | 6.875%, 4/22/2021 | | | 220,225 | |
| | 1,225,000 | | | 37.717%, (BADLARPP + 2%), 4/3/2022g,h | | | 35,146 | |
| | 420,000 | | | 3.375%, 1/15/2023f | | | 397,332 | |
| | 460,000 | | | 7.500%, 4/22/2026 | | | 403,880 | |
| | 800,000 | | | 6.875%, 1/26/2027 | | | 669,200 | |
| | 240,000 | | | 5.875%, 1/11/2028 | | | 186,000 | |
| | 420,000 | | | 5.250%, 1/15/2028f | | | 365,108 | |
| | 151,371 | | | 7.820%, 12/31/2033f | | | 154,826 | |
| | 426,592 | | | 7.820%, 12/31/2033f | | | 434,859 | |
| | 14,021 | | | 8.280%, 12/31/2033 | | | 12,093 | |
| | 235,542 | | | 8.280%, 12/31/2033 | | | 200,567 | |
| | 850,000 | | | 7.125%, 7/6/2036 | | | 652,375 | |
| | 100,000 | | | 2.260%, 12/31/2038f,i | | | 63,326 | |
| | 820,000 | | | 2.500%, 12/31/2038i | | | 459,200 | |
| | 100,000 | | | 6.250%, 11/9/2047f | | | 83,662 | |
| | 620,000 | | | 6.875%, 1/11/2048 | | | 457,250 | |
| | | | Argentina Letras Del Tosoro | | | | |
| | 211,493 | | | Zero Coupon, 7/26/2019 | | | 205,148 | |
| | | | Argentina Treasury Bond BONCER | | | | |
| | 100,000 | | | 2.500%, 7/22/2021g | | | 4,408 | |
| | | | Cablevision SA | | | | |
| | 150,000 | | | 6.500%, 6/15/2021c | | | 146,625 | |
| | | | | |
| | | | Total | | | 5,687,771 | |
| | | | | |
| |
| | Azerbaijan (<0.1%) | | | | |
| | | | Azerbaijan Government International Bond | | | | |
| | $150,000 | | | 3.500%, 9/1/2032 | | | 122,928 | |
| | | | | |
| | | | Total | | | 122,928 | |
| | | | | |
| |
| | Belize (<0.1%) | | | | |
| | | | Belize Government International Bond | | | | |
| | 135,900 | | | 4.938%, 2/20/2034* | | | 76,783 | |
| | | | | |
| | | | Total | | | 76,783 | |
| | | | | |
| |
| | Bermuda (<0.1%) | | | | |
| | | | Digicel, Ltd. | | | | |
| | 200,000 | | | 6.000%, 4/15/2021* | | | 181,500 | |
| | 330,000 | | | 6.750%, 3/1/2023* | | | 265,238 | |
| | | | | |
| | | | Total | | | 446,738 | |
| | | | | |
| |
| | Brazil (0.2%) | | | | |
| | | | Banco do Brasil SA/Cayman | | | | |
| | 400,000 | | | 9.000%, 6/18/2024h,j | | | 412,800 | |
| | | | Brazil Government International Bond | | | | |
| | 227,000 | | | 10.000%, 1/1/2029k | | | 62,435 | |
| | | | Brazil Loan Trust 1 | | | | |
| | 274,558 | | | 5.477%, 7/24/2023* | | | 276,878 | |
| | | | Brazil Minas SPE via State of Minas Gerais | | | | |
| | 260,000 | | | 5.333%, 2/15/2028* | | | 251,875 | |
| | | | Embraer Netherlands BV | | | | |
| | 31,000 | | | 5.050%, 6/15/2025 | | | 31,736 | |
| | | | Samarco Mineracao SA | | | | |
| | 200,000 | | | 4.125%, 11/1/2022l | | | 150,750 | |
| | | | | |
| | | | Total | | | 1,186,474 | |
| | | | | |
| |
| | Cayman Islands (0.1%) | | | | |
| | | | China Evergrande Group | | | | |
| | 200,000 | | | 8.750%, 6/28/2025 | | | 156,750 | |
| | | | Embraer Overseas, Ltd. | | | | |
| | 20,000 | | | 5.696%, 9/16/2023 | | | 20,945 | |
| | | | Kaisa Group Holdings, Ltd. | | | | |
| | 200,000 | | | 8.500%, 6/30/2022 | | | 140,990 | |
| | 200,000 | | | 9.375%, 6/30/2024 | | | 130,031 | |
| | | | KSA Sukuk, Ltd. | | | | |
| | 490,000 | | | 4.303%, 1/19/2029c | | | 479,588 | |
| | | | | |
| | | | Total | | | 928,304 | |
| | | | | |
| |
| | Chile (0.1%) | | | | |
| | | | Chile Government International Bond | | | | |
| | 410,000 | | | 3.240%, 2/6/2028 | | | 383,965 | |
| | | | Itau CorpBanca | | | | |
| | 286,000 | | | 3.875%, 9/22/2019c | | | 286,365 | |
| | | | Sociedad Quimica y Minera de Chile SA | | | | |
| | 200,000 | | | 3.625%, 4/3/2023 | | | 193,000 | |
| | 200,000 | | | 4.375%, 1/28/2025* | | | 197,000 | |
| | | | | |
| | | | Total | | | 1,060,330 | |
| | | | | |
| |
| | Colombia (0.1%) | | | | |
| | | | Banco de Bogota SA | | | | |
| | 450,000 | | | 6.250%, 5/12/2026c | | | 456,750 | |
The accompanying Notes to Financial Statements are an integral part of this schedule.
179
PARTNER WORLDWIDE ALLOCATION FUND
Schedule of Investments as of October 31, 2018
| | | | | | | | |
Principal
Amount | | | Long-Term Fixed Income (9.0%) | | Value | |
| | Colombia (0.1%) - continued | | | | |
| | | | Colombia Government International Bond | | | | |
| | $30,000 | | | 8.125%, 5/21/2024 | | | $35,310 | |
| | 410,000 | | | 4.500%, 3/15/2029 | | | 404,469 | |
| | | | | |
| | | | Total | | | 896,529 | |
| | | | | |
| |
| | Costa Rica (0.1%) | | | | |
| | | | Banco Nacional de Costa Rica | | | | |
| | 220,000 | | | 4.875%, 11/1/2018c | | | 220,000 | |
| | | | Costa Rica Government International Bond | | | | |
| | 30,000 | | | 9.995%, 8/1/2020 | | | 31,020 | |
| | 200,000 | | | 5.625%, 4/30/2043 | | | 145,500 | |
| | 210,000 | | | 5.625%, 4/30/2043c | | | 152,775 | |
| | 240,000 | | | 7.158%, 3/12/2045c | | | 200,160 | |
| | | | Ecopetrol SA | | | | |
| | 60,000 | | | 7.625%, 7/23/2019 | | | 61,740 | |
| | | | | |
| | | | Total | | | 811,195 | |
| | | | | |
| |
| | Dominican Republic (0.3%) | | | | |
| | | | Aeropuertos Dominicanos Siglo XXI SA | | | | |
| | 270,000 | | | 6.750%, 3/30/2029c | | | 269,325 | |
| | | | Dominican Republic Government International Bond | | | | |
| | 4,000,000 | | | 15.000%, 4/5/2019m | | | 82,159 | |
| | 900,000 | | | 16.000%, 7/10/2020m | | | 19,785 | |
| | 400,000 | | | 7.500%, 5/6/2021 | | | 414,000 | |
| | 600,000 | | | 11.500%, 5/10/2024m | | | 12,483 | |
| | 290,000 | | | 8.625%, 4/20/2027 | | | 325,162 | |
| | 1,600,000 | | | 18.500%, 2/4/2028*,m | | | 43,485 | |
| | 2,900,000 | | | 11.375%, 7/6/2029m | | | 59,206 | |
| | 890,000 | | | 6.850%, 1/27/2045 | | | 876,650 | |
| | 470,000 | | | 6.500%, 2/15/2048c | | | 444,855 | |
| | | | | |
| | | | Total | | | 2,547,110 | |
| | | | | |
| |
| | Ecuador (0.3%) | | | | |
| | | | Ecuador Government International Bond | | | | |
| | 390,000 | | | 10.750%, 3/28/2022 | | | 401,700 | |
| | 740,000 | | | 7.950%, 6/20/2024 | | | 661,930 | |
| | 700,000 | | | 9.650%, 12/13/2026c | | | 654,500 | |
| | 240,000 | | | 9.625%, 6/2/2027c | | | 220,500 | |
| | 770,000 | | | 8.875%, 10/23/2027c | | | 676,830 | |
| | | | EP PetroEcuador | | | | |
| | 82,105 | | | 8.016%, (LIBOR 3M + 5.63%), 9/24/2019h | | | 81,900 | |
| | | | | |
| | | | Total | | | 2,697,360 | |
| | | | | |
| |
| | Egypt (0.1%) | | | | |
| | | | Arab Republic of Egypt | | | | |
| | 200,000 | | | 4.750%, 4/16/2026c,f | | | 212,027 | |
| | 390,000 | | | 5.625%, 4/16/2030c,f | | | 401,865 | |
| | | | Egypt Government International Bond | | | | |
| | 550,000 | | | 7.903%, 2/21/2048c | | | 491,882 | |
| | | | | |
| | | | Total | | | 1,105,774 | |
| | | | | |
| |
| | El Salvador (<0.1%) | | | | |
| | | | El Salvador Government International Bond | | | | |
| | 100,000 | | | 7.375%, 12/1/2019 | | | 99,850 | |
| | 30,000 | | | 7.750%, 1/24/2023 | | | 30,199 | |
| | 32,000 | | | 5.875%, 1/30/2025 | | | 28,640 | |
| | 109,000 | | | 6.375%, 1/18/2027 | | | 97,419 | |
| | 50,000 | | | 8.625%, 2/28/2029c | | | 50,875 | |
| | | | | |
| | | | Total | | | 306,983 | |
| | | | | |
| |
| | France (<0.1%) | | | | |
| | | | CMA CGM SA | | | | |
| | 100,000 | | | 5.250%, 1/15/2025c,f | | | 95,821 | |
| | | | | |
| | | | Total | | | 95,821 | |
| | | | | |
| |
| | Gabon (0.1%) | | | | |
| | | | Gabon Government International Bond | | | | |
| | 420,000 | | | 6.375%, 12/12/2024 | | | 381,587 | |
| | | | | |
| | | | Total | | | 381,587 | |
| | | | | |
| |
| | Guatemala (0.3%) | | | | |
| | | | Agromercantil Senior Trust | | | | |
| | 170,000 | | | 6.250%, 4/10/2019c | | | 170,410 | |
| | | | Guatemala Government International Bond | | | | |
| | 1,010,000 | | | 5.750%, 6/6/2022 | | | 1,030,311 | |
| | 230,000 | | | 4.500%, 5/3/2026c | | | 211,055 | |
| | 350,000 | | | 4.375%, 6/5/2027c | | | 318,500 | |
| | 500,000 | | | 4.875%, 2/13/2028 | | | 459,435 | |
| | | | | |
| | | | Total | | | 2,189,711 | |
| | | | | |
| |
| | Honduras (0.1%) | | | | |
| | | | Honduras Government International Bond | | | | |
| | 290,000 | | | 8.750%, 12/16/2020* | | | 312,269 | |
| | 400,000 | | | 8.750%, 12/16/2020 | | | 430,716 | |
| | | | | |
| | | | Total | | | 742,985 | |
| | | | | |
| |
| | India (0.1%) | | | | |
| | | | Bank of Baroda | | | | |
| | 790,000 | | | 4.875%, 7/23/2019 | | | 795,458 | |
| | | | Hindustan Petroleum Corporation, Ltd. | | | | |
| | 200,000 | | | 4.000%, 7/12/2027 | | | 178,307 | |
| | | | NTPC, Ltd. | | | | |
| | 100,000 | | | 2.750%, 2/1/2027f | | | 111,905 | |
| | | | Reliance Industries, Ltd. | | | | |
| | 300,000 | | | 3.667%, 11/30/2027c | | | 269,483 | |
| | | | | |
| | | | Total | | | 1,355,153 | |
| | | | | |
| |
| | Indonesia (0.7%) | | | | |
| | | | Indonesia Government International Bond | | | | |
| | 320,000 | | | 3.700%, 1/8/2022c | | | 314,668 | |
| | 843,000 | | | 5.875%, 1/15/2024 | | | 886,755 | |
| | 520,000 | | | 3.375%, 7/30/2025f | | | 623,607 | |
| | 180,000 | | | 8.500%, 10/12/2035 | | | 235,918 | |
| | 600,000 | | | 6.750%, 1/15/2044 | | | 690,172 | |
| | | | Perusahaan Penerbit SBSN Indonesia III | | | | |
| | 200,000 | | | 3.400%, 3/29/2022c | | | 194,900 | |
| | 260,000 | | | 4.325%, 5/28/2025 | | | 252,200 | |
| | 1,020,000 | | | 4.150%, 3/29/2027c | | | 957,525 | |
| | 1,440,000 | | | 4.400%, 3/1/2028c | | | 1,365,350 | |
| | | | | |
| | | | Total | | | 5,521,095 | |
| | | | | |
The accompanying Notes to Financial Statements are an integral part of this schedule.
180
PARTNER WORLDWIDE ALLOCATION FUND
Schedule of Investments as of October 31, 2018
| | | | | | | | |
Principal
Amount | | | Long-Term Fixed Income (9.0%) | | Value | |
| | Ireland (<0.1%) | | | | |
| | | | Phosagro OAO | | | | |
| | $220,000 | | | 3.949%, 4/24/2023c | | | $206,448 | |
| | | | | |
| | | | Total | | | 206,448 | |
| | | | | |
| |
| | Isle of Man (<0.1%) | | | | |
| | | | Gohl Capital, Ltd. | | | | |
| | 200,000 | | | 4.250%, 1/24/2027 | | | 187,016 | |
| | | | | |
| | | | Total | | | 187,016 | |
| | | | | |
| |
| | Italy (0.1%) | | | | |
| | | | Wind Tre SPA | | | | |
| | 240,000 | | | 2.625%, 1/20/2023c,f | | | 252,676 | |
| | 160,000 | | | 2.625%, 1/20/2023f | | | 168,451 | |
| | 340,000 | | | 5.000%, 1/20/2026c | | | 289,408 | |
| | | | | |
| | | | Total | | | 710,535 | |
| | | | | |
| |
| | Ivory Coast (0.1%) | | | | |
| | | | Ivory Coast Government International Bond | | | | |
| | 110,000 | | | 5.250%, 3/22/2030f | | | 113,934 | |
| | 100,000 | | | 6.625%, 3/22/2048c,f | | | 100,880 | |
| | 200,000 | | | 6.625%, 3/22/2048f | | | 201,760 | |
| | | | | |
| | | | Total | | | 416,574 | |
| | | | | |
| |
| | Japan (<0.1%) | | | | |
| | | | SoftBank Group Corporation | | | | |
| | 265,000 | | | 6.000%, 7/19/2023h,j | | | 231,811 | |
| | | | | |
| | | | Total | | | 231,811 | |
| | | | | |
| |
| | Kenya (0.1%) | | | | |
| | | | Kenya Government International Bond | | | | |
| | 220,000 | | | 6.875%, 6/24/2024 | | | 214,040 | |
| | 220,000 | | | 7.250%, 2/28/2028c | | | 207,482 | |
| | | | | |
| | | | Total | | | 421,522 | |
| | | | | |
| |
| | Kuwait (0.1%) | | | | |
| | | | State of Kuwait | | | | |
| | 340,000 | | | 3.500%, 3/20/2027 | | | 330,225 | |
| | | | | |
| | | | Total | | | 330,225 | |
| | | | | |
| |
| | Lebanon (<0.1%) | | | | |
| | | | Lebanon Government International Bond | | | | |
| | 10,000 | | | 6.000%, 1/27/2023 | | | 8,607 | |
| | 50,000 | | | 6.850%, 3/23/2027 | | | 40,466 | |
| | 10,000 | | | 6.650%, 2/26/2030 | | | 7,743 | |
| | | | | |
| | | | Total | | | 56,816 | |
| | | | | |
| |
| | Luxembourg (0.2%) | | | | |
| | | | Altice Financing SA | | | | |
| | 200,000 | | | 6.625%, 2/15/2023c | | | 197,960 | |
| | 400,000 | | | 7.500%, 5/15/2026 | | | 376,000 | |
| | | | Gazprom OAO Via Gaz Capital SA | | | | |
| | 200,000 | | | 9.250%, 4/23/2019 | | | 204,668 | |
| | | | Sberbank of Russia Via SB Capital SA | | | | |
| | $400,000 | | | 5.500%, 2/26/2024h | | | 399,400 | |
| | | | Telefonica Celular del Paraguay SA | | | | |
| | 200,000 | | | 6.750%, 12/13/2022 | | | 203,018 | |
| | | | | |
| | | | Total | | | 1,381,046 | |
| | | | | |
| |
| | Macedonia, The Former Yugoslav Republic Of (0.1%) | | | | |
| | | | Macedonia Government International Bond | | | | |
| | 280,000 | | | 5.625%, 7/26/2023c,f | | | 354,154 | |
| | 120,000 | | | 2.750%, 1/18/2025f | | | 131,666 | |
| | 460,000 | | | 2.750%, 1/18/2025c,f | | | 504,083 | |
| | | | | |
| | | | Total | | | 989,903 | |
| | | | | |
| |
| | Mauritius (0.1%) | | | | |
| | | | Greenko Investment Company | | | | |
| | 200,000 | | | 4.875%, 8/16/2023c | | | 178,600 | |
| | | | MTN (Mauritius) Investments, Ltd. | | | | |
| | 200,000 | | | 5.373%, 2/13/2022 | | | 192,080 | |
| | | | Neerg Energy, Ltd. | | | | |
| | 200,000 | | | 6.000%, 2/13/2022c | | | 187,794 | |
| | | | | |
| | | | Total | | | 558,474 | |
| | | | | |
| |
| | Mexico (0.4%) | | | | |
| | | | America Movil SAB de CV | | | | |
| | 2,010,000 | | | 6.000%, 6/9/2019n | | | 96,788 | |
| | | | Banco Santander Mexico SA | | | | |
| | 330,000 | | | 5.950%, 10/1/2028c,h | | | 330,241 | |
| | | | BBVA Bancomer SA | | | | |
| | 200,000 | | | 5.125%, 1/18/2033c,h | | | 176,452 | |
| | | | Gruma, SAB de CV | | | | |
| | 200,000 | | | 4.875%, 12/1/2024c | | | 202,000 | |
| | | | Mexican Bonos | | | | |
| | 1,460,400 | | | 6.500%, 6/9/2022n | | | 67,120 | |
| | 7,425,500 | | | 8.000%, 12/7/2023n | | | 355,303 | |
| | | | Mexico Government International Bond | | | | |
| | 128,000 | | | 5.750%, 10/12/2110 | | | 118,208 | |
| | | | Petroleos Mexicanos | | | | |
| | 400,000 | | | 6.375%, 2/4/2021 | | | 409,272 | |
| | 120,000 | | | 5.375%, 3/13/2022 | | | 119,976 | |
| | 10,000 | | | 3.500%, 1/30/2023 | | | 9,210 | |
| | 860,000 | | | 5.125%, 3/15/2023f | | | 1,061,838 | |
| | 80,000 | | | 6.875%, 8/4/2026 | | | 79,680 | |
| | 190,000 | | | 6.500%, 3/13/2027 | | | 184,110 | |
| | 20,000 | | | 6.375%, 1/23/2045 | | | 16,660 | |
| | 257,000 | | | 6.750%, 9/21/2047 | | | 221,380 | |
| | 82,000 | | | 6.350%, 2/12/2048c | | | 67,970 | |
| | | | Unifin Financiera SAB de CV SOFOM ENR | | | | |
| | 200,000 | | | 7.375%, 2/12/2026c | | | 186,500 | |
| | | | | |
| | | | Total | | | 3,702,708 | |
| | | | | |
| |
| | Netherlands (0.3%) | | | | |
| | | | Embraer Netherlands Finance BV | | | | |
| | 10,000 | | | 5.400%, 2/1/2027 | | | 10,322 | |
| | | | Greenko Dutch BV | | | | |
| | 290,000 | | | 5.250%, 7/24/2024c | | | 262,276 | |
| | | | Metinvest BV | | | | |
| | 225,000 | | | 7.750%, 4/23/2023c | | | 216,000 | |
The accompanying Notes to Financial Statements are an integral part of this schedule.
181
PARTNER WORLDWIDE ALLOCATION FUND
Schedule of Investments as of October 31, 2018
| | | | | | | | |
Principal
Amount | | | Long-Term Fixed Income (9.0%) | | Value | |
| | Netherlands (0.3%) - continued | | | | |
| | | | Minejesa Capital BV | | | | |
| | $200,000 | | | 4.625%, 8/10/2030 | | | $175,988 | |
| | | | Petrobras Global Finance BV | | | | |
| | 194,000 | | | 6.125%, 1/17/2022 | | | 201,033 | |
| | | | Syngenta Finance NV | | | | |
| | 100,000 | | | 1.250%, 9/10/2027f | | | 99,457 | |
| | 1,050,000 | | | 5.182%, 4/24/2028c | | | 993,447 | |
| | 300,000 | | | 5.676%, 4/24/2048c | | | 256,810 | |
| | | | | |
| | | | Total | | | 2,215,333 | |
| | | | | |
| |
| | Nigeria (0.2%) | | | | |
| | | | Nigeria Government International Bond | | | | |
| | 206,000 | | | 6.750%, 1/28/2021 | | | 212,470 | |
| | 200,000 | | | 6.375%, 7/12/2023 | | | 199,224 | |
| | 200,000 | | | 6.500%, 11/28/2027c | | | 183,508 | |
| | 430,000 | | | 7.143%, 2/23/2030c | | | 394,977 | |
| | 400,000 | | | 7.875%, 2/16/2032 | | | 384,472 | |
| | 440,000 | | | 7.696%, 2/23/2038c | | | 396,004 | |
| | 200,000 | | | 7.625%, 11/28/2047c | | | 176,328 | |
| | | | | |
| | | | Total | | | 1,946,983 | |
| | | | | |
| |
| | Oman (0.1%) | | | | |
| | | | Oman Government International Bond | | | | |
| | 1,140,000 | | | 6.750%, 1/17/2048c | | | 1,040,250 | |
| | | | | |
| | | | Total | | | 1,040,250 | |
| | | | | |
| |
| | Pakistan (0.1%) | | | | |
| | | | Pakistan Government International Bond | | | | |
| | 220,000 | | | 6.875%, 12/5/2027 | | | 203,105 | |
| | 490,000 | | | 6.875%, 12/5/2027c | | | 452,370 | |
| | | | Third Pakistan International Sukuk Company, Ltd. | | | | |
| | 290,000 | | | 5.625%, 12/5/2022c | | | 276,638 | |
| | | | | |
| | | | Total | | | 932,113 | |
| | | | | |
| |
| | Panama (<0.1%) | | | | |
| | | | Panama Government International Bond | | | | |
| | 200,000 | | | 4.500%, 4/16/2050 | | | 184,300 | |
| | | | Panama Notas del Tesoro | | | | |
| | 50,000 | | | 4.875%, 2/5/2021 | | | 51,875 | |
| | | | | |
| | | | Total | | | 236,175 | |
| | | | | |
| |
| | Papua New Guinea (<0.1%) | | | | |
| | | | Papua New Guinea Government International Bond | | | | |
| | 200,000 | | | 8.375%, 10/4/2028c | | | 198,250 | |
| | | | | |
| | | | Total | | | 198,250 | |
| | | | | |
| |
| | Paraguay (0.2%) | | | | |
| | | | Banco Regional SAECA | | | | |
| | 150,000 | | | 8.125%, 1/24/2019 | | | 149,842 | |
| | 180,000 | | | 8.125%, 1/24/2019c | | | 179,811 | |
| | | | Paraguay Government International Bond | | | | |
| | 410,000 | | | 4.625%, 1/25/2023 | | | 408,975 | |
| | 410,000 | | �� | 5.000%, 4/15/2026c | | | 409,488 | |
| | 350,000 | | | 4.700%, 3/27/2027c | | | 341,687 | |
| | $400,000 | | | 6.100%, 8/11/2044 | | | 402,000 | |
| | | | | |
| | | | Total | | | 1,891,803 | |
| | | | | |
| |
| | Peru (0.1%) | | | | |
| | | | Abengoa Transmision Sur SA | | | | |
| | 316,032 | | | 6.875%, 4/30/2043* | | | 351,190 | |
| | | | Corporacion Lindley SA | | | | |
| | 90,000 | | | 6.750%, 11/23/2021* | | | 95,963 | |
| | 260,000 | | | 6.750%, 11/23/2021 | | | 277,225 | |
| | 22,000 | | | 4.625%, 4/12/2023 | | | 22,178 | |
| | 80,000 | | | 4.625%, 4/12/2023c | | | 80,648 | |
| | | | | |
| | | | Total | | | 827,204 | |
| | | | | |
| |
| | Qatar (0.1%) | | | | |
| | | | Qatar Government International Bond | | | | |
| | 200,000 | | | 3.875%, 4/23/2023c | | | 200,440 | |
| | 210,000 | | | 4.500%, 4/23/2028c | | | 214,200 | |
| | 360,000 | | | 5.103%, 4/23/2048c | | | 365,400 | |
| | | | | |
| | | | Total | | | 780,040 | |
| | | | | |
| |
| | Romania (0.2%) | | | | |
| | | | Romania Government International Bond | | | | |
| | 170,000 | | | 2.375%, 4/19/2027c,f | | | 192,084 | |
| | 330,000 | | | 2.875%, 5/26/2028f | | | 375,641 | |
| | 490,000 | | | 3.375%, 2/8/2038c,f | | | 506,433 | |
| | 220,000 | | | 5.125%, 6/15/2048c | | | 203,488 | |
| | | | | |
| | | | Total | | | 1,277,646 | |
| | | | | |
| |
| | Russia (0.3%) | | | | |
| | | | Credit Bank of Moscow | | | | |
| | 210,000 | | | 8.875%, 11/10/2022h,j | | | 159,338 | |
| | | | Lukoil International Finance BV | | | | |
| | 200,000 | | | 6.125%, 11/9/2020 | | | 206,836 | |
| | | | Russia Government International Bond | | | | |
| | 200,000 | | | 4.875%, 9/16/2023c | | | 204,494 | |
| | 1,800,000 | | | 4.750%, 5/27/2026 | | | 1,775,700 | |
| | | | | |
| | | | Total | | | 2,346,368 | |
| | | | | |
| |
| | Senegal (<0.1%) | | | | |
| | | | Senegal Government International Bond | | | | |
| | 190,000 | | | 4.750%, 3/13/2028c,f | | | 200,590 | |
| | | | | |
| | | | Total | | | 200,590 | |
| | | | | |
| |
| | Singapore (<0.1%) | | | | |
| | | | ABJA Investment Company Pte, Ltd. | | | | |
| | 200,000 | | | 5.450%, 1/24/2028 | | | 172,327 | |
| | | | | |
| | | | Total | | | 172,327 | |
| | | | | |
| |
| | South Africa (0.4%) | | | | |
| | | | Eskom Holdings SOC, Ltd. | | | | |
| | 700,000 | | | Zero Coupon, 12/31/2018o | | | 46,370 | |
| | 400,000 | | | 6.750%, 8/6/2023 | | | 374,000 | |
| | 200,000 | | | 7.125%, 2/11/2025 | | | 187,000 | |
| | | | South Africa Government International Bond | | | | |
| | 900,000 | | | 5.875%, 9/16/2025 | | | 887,544 | |
| | 2,830,000 | | | 7.000%, 2/28/2031o | | | 152,384 | |
The accompanying Notes to Financial Statements are an integral part of this schedule.
182
PARTNER WORLDWIDE ALLOCATION FUND
Schedule of Investments as of October 31, 2018
| | | | | | | | |
Principal
Amount | | | Long-Term Fixed Income (9.0%) | | Value | |
| | South Africa (0.4%) - continued | | | | |
| | $7,963,000 | | | 8.250%, 3/31/2032o | | | $469,452 | |
| | 515,000 | | | 9.000%, 1/31/2040o | | | 31,026 | |
| | 570,000 | | | 6.500%, 2/28/2041o | | | 26,008 | |
| | 1,350,000 | | | 8.750%, 1/31/2044o | | | 78,943 | |
| | 650,000 | | | 5.650%, 9/27/2047 | | | 547,625 | |
| | | | | |
| | | | Total | | | 2,800,352 | |
| | | | | |
| |
| | South Korea (<0.1%) | | | | |
| | | | Shinsegae, Inc. | | | | |
| | 200,000 | | | 2.625%, 5/8/2045h | | | 193,541 | |
| | | | | |
| | | | Total | | | 193,541 | |
| | | | | |
| |
| | Sri Lanka (0.4%) | | | | |
| | | | Sri Lanka Government International Bond | | | | |
| | 350,000 | | | 6.250%, 10/4/2020 | | | 337,739 | |
| | 660,000 | | | 5.750%, 4/18/2023c | | | 593,227 | |
| | 400,000 | | | 6.125%, 6/3/2025 | | | 350,948 | |
| | 370,000 | | | 6.850%, 11/3/2025c | | | 335,797 | |
| | 200,000 | | | 6.825%, 7/18/2026 | | | 179,006 | |
| | 430,000 | | | 6.200%, 5/11/2027 | | | 367,546 | |
| | 640,000 | | | 6.750%, 4/18/2028c | | | 563,207 | |
| | | | | |
| | | | Total | | | 2,727,470 | |
| | | | | |
| |
| | Supranational (<0.1%) | | | | |
| | | | Eastern and Southern African Trade and Development Bank | | | | |
| | 200,000 | | | 5.375%, 3/14/2022 | | | 198,460 | |
| | | | | |
| | | | Total | | | 198,460 | |
| | | | | |
| |
| | Suriname (<0.1%) | | | | |
| | | | Suriname Government International Bond | | | | |
| | 280,000 | | | 9.250%, 10/26/2026c | | | 275,100 | |
| | | | | |
| | | | Total | | | 275,100 | |
| | | | | |
| |
| | Tunisia (<0.1%) | | | | |
| | | | Banque Centrale de Tunisie SA | | | | |
| | 210,000 | | | 6.750%, 10/31/2023c,f | | | 233,990 | |
| | | | | |
| | | | Total | | | 233,990 | |
| | | | | |
| |
| | Turkey (0.7%) | | | | |
| | | | Export Credit Bank of Turkey | | | | |
| | 200,000 | | | 5.875%, 4/24/2019 | | | 198,717 | |
| | | | Hazine Mustesarligi Varlik Kiralama AS | | | | |
| | 690,000 | | | 5.004%, 4/6/2023c | | | 640,141 | |
| | | | TC Ziraat Bankasi AS | | | | |
| | 200,000 | | | 5.125%, 5/3/2022 | | | 177,484 | |
| | | | Turkey Government International Bond | | | | |
| | 710,000 | | | 7.000%, 6/5/2020 | | | 714,590 | |
| | 600,000 | | | 6.250%, 9/26/2022 | | | 581,234 | |
| | 200,000 | | | 3.250%, 3/23/2023 | | | 171,500 | |
| | 640,000 | | | 5.750%, 3/22/2024 | | | 596,155 | |
| | 600,000 | | | 3.250%, 6/14/2025f | | | 612,457 | |
| | 400,000 | | | 6.000%, 3/25/2027 | | | 360,315 | |
| | 200,000 | | | 5.125%, 2/17/2028 | | | 168,750 | |
| | 370,000 | | | 6.125%, 10/24/2028 | | | 329,657 | |
| | 10,000 | | | 6.875%, 3/17/2036 | | | 8,891 | |
| | 100,000 | | | 6.750%, 5/30/2040 | | | 86,750 | |
| | 400,000 | | | 4.875%, 4/16/2043 | | | 283,672 | |
| | 840,000 | | | 5.750%, 5/11/2047 | | | 636,300 | |
| | | | | |
| | | | Total | | | 5,566,613 | |
| | | | | |
| |
| | Ukraine (0.4%) | | | | |
| | | | Ukraine Government International Bond | | | | |
| | 190,000 | | | 7.750%, 9/1/2021 | | | 186,905 | |
| | 380,000 | | | 7.750%, 9/1/2023 | | | 361,455 | |
| | 500,000 | | | 8.994%, 2/1/2024c,p | | | 495,625 | |
| | 450,000 | | | 7.750%, 9/1/2024 | | | 421,875 | |
| | 270,000 | | | 7.750%, 9/1/2025 | | | 248,078 | |
| | 150,000 | | | 7.750%, 9/1/2026 | | | 135,573 | |
| | 340,000 | | | 7.750%, 9/1/2027 | | | 304,035 | |
| | 740,000 | | | 9.750%, 11/1/2028c,p | | | 730,602 | |
| | | | | |
| | | | Total | | | 2,884,148 | |
| | | | | |
| |
| | United Arab Emirates (0.3%) | | | | |
| | | | Abu Dhabi Crude Oil Pipeline, LLC | | | | |
| | 790,000 | | | 4.600%, 11/2/2047c | | | 746,898 | |
| | | | Abu Dhabi Government International Bond | | | | |
| | 200,000 | | | 3.125%, 5/3/2026 | | | 189,000 | |
| | 500,000 | | | 3.125%, 10/11/2027c | | | 464,229 | |
| | | | Dolphin Energy, Ltd. | | | | |
| | 210,000 | | | 5.500%, 12/15/2021 | | | 219,967 | |
| | | | Ruwais Power Company PJSC | | | | |
| | 360,000 | | | 6.000%, 8/31/2036c | | | 390,600 | |
| | | | | |
| | | | Total | | | 2,010,694 | |
| | | | | |
| |
| | United States (0.2%) | | | | |
| | | | Cemex Finance, LLC. | | | | |
| | 140,000 | | | 4.625%, 6/15/2024f | | | 165,944 | |
| | | | Comcel Trust | | | | |
| | 200,000 | | | 6.875%, 2/6/2024 | | | 204,575 | |
| | | | Puerto Rico Sales Tax Financing Corporation Refg. Rev. | | | | |
| | 45,000 | | | 6.000%, 8/1/2031, Ser. Ce,l | | | 36,112 | |
| | 10,000 | | | 5.375%, 8/1/2038, Ser. Ce,l | | | 4,887 | |
| | 35,000 | | | 6.000%, 8/1/2038, Ser. Ce,l | | | 28,087 | |
| | 100,000 | | | 5.250%, 8/1/2041, Ser. Ce,l | | | 48,875 | |
| | 75,000 | | | 5.000%, 8/1/2043, Ser. A-1e,l | | | 36,656 | |
| | 5,000 | | | 5.250%, 8/1/2043, Ser. A-1e,l | | | 2,444 | |
| | | | Puerto Rico Sales Tax Financing Corporation Rev. | | | | |
| | 15,000 | | | 5.750%, 8/1/2057, Ser. Ce,l | | | 12,225 | |
| | 5,000 | | | 5.000%, 8/1/2021, Ser. Ce,l | | | 4,062 | |
| | 10,000 | | | 5.500%, 8/1/2022, Ser. Ae,l | | | 4,887 | |
| | 15,000 | | | 5.500%, 8/1/2028, Ser. Ae,l | | | 7,331 | |
| | 20,000 | | | 6.130%, 8/1/2029, Ser. Ae,l | | | 16,050 | |
| | 45,000 | | | 6.750%, 8/1/2032, Ser. Ae,l | | | 21,994 | |
| | 20,000 | | | 6.050%, 8/1/2036, Ser. Be,l | | | 16,050 | |
| | 50,000 | | | 5.750%, 8/1/2037, Ser. Ae,l | | | 24,438 | |
| | 10,000 | | | 5.375%, 8/1/2039, Ser. Ae,l | | | 4,887 | |
| | 15,000 | | | 5.000%, 8/1/2040, Ser. Ce,l | | | 12,187 | |
| | 95,000 | | | 5.250%, 8/1/2040, Ser. Ce,l | | | 77,188 | |
| | 65,000 | | | 5.500%, 8/1/2042, Ser. Ae,l | | | 31,769 | |
| | 25,000 | | | 5.000%, 8/1/2046, Ser. Ce,l | | | 20,312 | |
| | | | Puerto Rico Sales Tax Financing Corporation Rev. Refg. | | | | |
| | 5,000 | | | 6.130%, 8/1/2030, Ser. Ae,l | | | 4,013 | |
| | 5,000 | | | 6.000%, 8/1/2032, Ser. Ce,l | | | 4,013 | |
| | 5,000 | | | 4.850%, 8/1/2036, Ser. De,l | | | 3,988 | |
The accompanying Notes to Financial Statements are an integral part of this schedule.
183
PARTNER WORLDWIDE ALLOCATION FUND
Schedule of Investments as of October 31, 2018
| | | | | | | | |
Principal
Amount | | | Long-Term Fixed Income (9.0%) | | Value | |
| | United States (0.2%) - continued | | | | |
| | $5,000 | | | 6.050%, 8/1/2037, Ser. Be,l | | | $4,013 | |
| | 25,000 | | | 6.130%, 8/1/2037, Ser. Ae,l | | | 20,063 | |
| | 15,000 | | | 6.130%, 8/1/2038, Ser. Ae,l | | | 12,038 | |
| | | | Sasol Financing USA LLC | | | | |
| | 510,000 | | | 5.875%, 3/27/2024 | | | 513,824 | |
| | | | | |
| | | | Total | | | 1,342,912 | |
| | | | | |
| |
| | Uruguay (<0.1%) | | | | |
| | | | Uruguay Government International Bond | | | | |
| | 180,000 | | | 4.975%, 4/20/2055 | | | 166,950 | |
| | | | | |
| | | | Total | | | 166,950 | |
| | | | | |
| |
| | Venezuela (0.2%) | | | | |
| | | | Petroleos de Venezuela SA | | | | |
| | 5,360,000 | | | 6.000%, 10/28/2022l | | | 739,680 | |
| | 3,250,000 | | | 6.000%, 5/16/2024l | | | 560,625 | |
| | 637,000 | | | 6.000%, 11/15/2026l | | | 109,882 | |
| | 680,000 | | | 5.375%, 4/12/2027l | | | 120,700 | |
| | 70,000 | | | 5.500%, 4/12/2037l | | | 12,600 | |
| | | | Venezuela Government International Bond | | | | |
| | 123,000 | | | 9.250%, 5/7/2028l | | | 30,750 | |
| | | | | |
| | | | Total | | | 1,574,237 | |
| | | | | |
| |
| | Virgin Islands, British (0.1%) | | | | |
| | | | Central American Bottling Corporation | | | | |
| | 110,000 | | | 5.750%, 1/31/2027c | | | 108,406 | |
| | | | Huarong Finance 2017 Company, Ltd. | | | | |
| | 200,000 | | | 4.500%, 1/24/2022h,j | | | 185,994 | |
| | 200,000 | | | 4.000%, 11/7/2022h,j | | | 178,574 | |
| | | | | |
| | | | Total | | | 472,974 | |
| | | | | |
| |
| | Zambia (0.1%) | | | | |
| | | | Zambia Government International Bond | | | | |
| | 200,000 | | | 5.375%, 9/20/2022 | | | 134,646 | |
| | 400,000 | | | 8.500%, 4/14/2024 | | | 272,277 | |
| | 380,000 | | | 8.970%, 7/30/2027c | | | 258,020 | |
| | | | | |
| | | | Total | | | 664,943 | |
| | | | | |
| | | | | | | | |
| | | | | |
| | | | Total Long-Term Fixed Income (cost $81,286,698) | | | 73,482,090 | |
| | | | | |
| | |
| Shares | | | Preferred Stock (0.9%) | | | |
| | South Korea (0.9%) | | | | |
| | 223,270 | | | Samsung Electronics Company, Ltd. | | | 7,044,336 | |
| | | | | |
| | | | Total | | | 7,044,336 | |
| | | | | |
| | | | | | | | |
| | | | | |
| | | | Total Preferred Stock (cost $4,079,764) | | | 7,044,336 | |
| | | | | |
| | |
| Shares | | | Collateral Held for Securities Loaned (0.3%) | | | |
| | 2,491,545 | | | Thrivent Cash Management Trust | | | 2,491,545 | |
| | | | | |
| | | | Total Collateral Held for Securities Loaned (cost $2,491,545) | | | 2,491,545 | |
| | | | | |
| | |
Shares or
Principal
Amount | | | Short-Term Investments (3.1%) | | Value | |
| | | | Federal Home Loan Bank Discount Notes | | | | |
| | 5,200,000 | | | 2.150%, 12/4/2018q,r | | | $5,189,371 | |
| | 300,000 | | | 2.225%, 1/11/2019q,r | | | 298,639 | |
| | 450,000 | | | 2.263%, 1/16/2019q,r | | | 447,815 | |
| | | | Thrivent Core Short-Term Reserve Fund | | | | |
| | 1,895,753 | | | 2.430% | | | 18,957,525 | |
| | | | Volkswagen Credit, Inc. | | | | |
| | 250,000 | | | 2.550%, 1/7/2019q | | | 248,755 | |
| | 250,000 | | | 2.550%, 1/8/2019q | | | 248,735 | |
| | | | | |
| | | | Total Short-Term Investments (cost $25,391,420) | | | 25,390,840 | |
| | | | | |
| | | | Total Investments (cost $831,183,241) 99.6% | | | $813,566,632 | |
| | | | | |
| | | | Other Assets and Liabilities, Net 0.4% | | | 3,220,261 | |
| | | | | |
| | | | Total Net Assets 100.0% | | | $816,786,893 | |
| | | | | |
The accompanying Notes to Financial Statements are an integral part of this schedule.
184
PARTNER WORLDWIDE ALLOCATION FUND
Schedule of Investments as of October 31, 2018
a | Non-income producing security. |
b | All or a portion of the security is on loan. |
c | Denotes securities sold under Rule 144A of the Securities Act of 1933, which exempts them from registration. These securities may be resold to other dealers in the program or to other qualified institutional buyers. As of October 31, 2018, the value of these investments was $35,750,436 or 4.4% of total net assets. |
d | Security is valued using significant unobservable inputs. Further information on valuation can be found in the Notes to Financial Statements. |
e | In bankruptcy. Interest is not being accrued. |
f | Principal amount is displayed in Euros. |
g | Principal amount is displayed in Argentine Pesos. |
h | Denotes variable rate securities. The rate shown is as of October 31, 2018. The rates of certain variable rate securities are based on a published reference rate and spread; these may vary by security and the reference rate and spread are indicated in their description. The rates of other variable rate securities are determined by the issuer or agent and are based on current market conditions. These securities do not indicate a reference rate and spread in their description. |
i | Denotes step coupon securities. Step coupon securities pay an initial coupon rate for the first period and then different coupon rates for following periods. The rate shown is as of October 31, 2018. |
j | Denotes perpetual securities. Perpetual securities pay an indefinite stream of interest and have no contractual maturity date. Date shown, if applicable, is next call date. |
k | Principal amount is displayed in Brazilian Real. |
l | Defaulted security. Interest is not being accrued. |
m | Principal amount is displayed in Dominican Republic Pesos. |
n | Principal amount is displayed in Mexican Pesos. |
o | Principal amount is displayed in South African Rand. |
p | Denotes investments purchased on a when-issued or delayed delivery basis. |
q | The interest rate shown reflects the yield, coupon rate or the discount rate at the date of purchase. |
r | All or a portion of the security is held on deposit with the counterparty and pledged as the initial margin deposit for open futures contracts. |
* | Denotes restricted securities. Restricted securities are investment securities which cannot be offered for public sale without first being registered under the Securities Act of 1933. The value of all restricted securities held in Partner Worldwide Allocation Fund as of October 31, 2018 was $2,052,181 or 0.3% of total net assets. The following table indicates the acquisition date and cost of restricted securities shown in the schedule as of October 31, 2018. |
| | | | | | | | |
Security | | Acquisition
Date | | | Cost | |
Abengoa Transmision Sur SA, 4/30/2043 | | | 4/8/2014 | | | $ | 316,016 | |
Belize Government International Bond, 2/20/2034 | | | 3/22/2017 | | | | 90,451 | |
Brazil Loan Trust 1, 7/24/2023 | | | 7/25/2013 | | | | 279,911 | |
Brazil Minas SPE via State of Minas Gerais, 2/15/2028 | | | 3/22/2013 | | | | 276,685 | |
Corporacion Lindley SA, 11/23/2021 | | | 11/18/2011 | | | | 90,000 | |
Digicel, Ltd., 4/15/2021 | | | 1/20/2016 | | | | 182,089 | |
Digicel, Ltd., 3/1/2023 | | | 2/24/2015 | | | | 330,455 | |
Dominican Republic Government International Bond, 2/4/2028 | | | 3/6/2013 | | | | 45,271 | |
Honduras Government International Bond, 12/16/2020 | | | 12/11/2013 | | | | 290,000 | |
Sociedad Quimica y Minera de Chile SA, 1/28/2025 | | | 10/23/2014 | | | | 198,820 | |
The following table presents the total amount of securities loaned with continuous maturity, by type, offset by the gross payable upon return of collateral for securities loaned by Thrivent Partner Worldwide Allocation Fund as of October 31, 2018:
| | | | |
Securities Lending Transactions | | | | |
Common Stock | | $ | 2,476,946 | |
| | | | |
Total lending | | $ | 2,476,946 | |
Gross amount payable upon return of collateral for securities loaned | | $ | 2,491,545 | |
| | | | |
Net amounts due to counterparty | | $ | 14,599 | |
| | | | |
Definitions:
| | | | |
ADR | | - | | American Depositary Receipt, which are certificates for an underlying foreign security’s shares held by an issuing U.S. depository bank. |
Refg. | | - | | Refunding |
REIT | | - | | Real Estate Investment Trust is a company that buys, develops, manages and/or sells real estate assets. |
Rev. | | - | | Revenue |
Ser. | | - | | Series |
Reference Rate Index:
| | | | |
ARPP7DRR | | - | | Argentina Central Bank 7 Day Repo Reference Rate |
BADLARPP | | - | | Argentina Deposit Rates Badlar Private Banks |
LIBOR 3M | | - | | ICE Libor USD Rate 3 Month |
The accompanying Notes to Financial Statements are an integral part of this schedule.
185
| | (b) | Not applicable to this filing. |
| Item 7. | Disclosure of Proxy Voting Policies and Procedures for Closed-End Management Investment Companies |
Not applicable.
| Item 8. | Portfolio Managers of Closed-End Management Investment Companies |
Not applicable.
| Item 9. | Purchases of Equity Securities by Closed-End Management Investment Company and Affiliated Purchasers. |
Not applicable.
| Item 10. | Submission of Matters to a Vote of Security Holders |
There have been no material changes to the procedures by which shareholders may recommend nominees to registrant’s board of trustees.
| Item 11. | Controls and Procedures |
(a) Registrant’s principal executive and principal financial officers, or persons performing similar functions, have concluded that registrant’s disclosure controls and procedures (as defined in Rule 30a-3(c) under the Investment Company Act of 1940) are effective, based on their evaluation of these controls and procedures as of a date within 90 days of the filing date of this report.
(b) Registrant’s principal executive and principal financial officers, or persons performing similar functions, are aware of no change in registrant’s internal control over financial reporting (as defined in Rule 30a-3(d) under the Investment Company Act of 1940) that occurred during registrant’s most recent fiscal quarter that has materially affected, or is reasonably likely to materially affect, registrant’s internal control over financial reporting.
| Item 12. | Disclosure of Securities Lending Activities for Closed-End Management Investment Companies |
Not applicable
| | (a)(1) | Any code of ethics, or amendment thereto, that is the subject of the disclosure required by Item 2, to the extent that the registrant intends to satisfy the Item 2 requirements through filing of an exhibit: See EX-99.CODE attached hereto. |
| | (a)(2) | A separate certification for each principal executive officer and principal financial officer of the registrant as required by Rule 30a-2(a) under the 1940 Act (17 CFR 270.30a-2(a)) in the exact form set forth below: See EX-99.CERT attached hereto. |
| | (a)(3) | Any written solicitation to purchase securities under Rule 23c-1 under the 1940 Act (17 CFR 270.23c-1) sent or given during the period covered by the report by or on behalf of the registrant to 10 or more persons: Not applicable. |
| | (a)(4) | Change in the registrant’s independent public accountant: Not applicable |
| | (b) | If the report is filed under Section 13(a) or 15(d) of the Exchange Act, provide the certifications required by Rule 30a-2(b) under the 1940 Act (17 CFR 270.30a-2(b)), Rule 13a-14(b) or Rule 15d-14(b) under the Exchange Act (17 CFR 240.13a-14(b) or 240.15d-14(b)), and Section 1350 of Chapter 63 of Title 18 of the United States Code (18 U.S.C. 1350) as an exhibit. A certification furnished pursuant to this paragraph will not be deemed “filed” for purposes of Section 18 of the Exchange Act (15 U.S.C. 78r), or otherwise subject to the liability of that section. Such certification will not be deemed to be incorporated by reference into any filing under the Securities Act of 1933 or the Exchange Act, except to the extent that the registrant specifically incorporates it by reference: See EX-99.906CERT attached hereto. |
SIGNATURES
Pursuant to the requirements of the Securities Exchange Act of 1934 and the Investment Company Act of 1940, the registrant has duly caused this report to be signed on its behalf by the undersigned, thereunto duly authorized.
| | | | |
| Date: December 28, 2018 | | THRIVENT MUTUAL FUNDS |
| | |
| | By: | | |
| | | | /s/ David S. Royal |
| | | | David S. Royal |
| | | | President and Chief Investment Officer |
Pursuant to the requirements of the Securities Exchange Act of 1934 and the Investment Company Act of 1940, this report has been signed below by the following persons on behalf of the registrant and in the capacities and on the dates indicated.
| | | | |
| Date: December 28, 2018 | | By: | | |
| | | | /s/ David S. Royal |
| | | | David S. Royal |
| | | | President and Chief Investment Officer |
| | | | (principal executive officer) |
| | | | |
| Date: December 28, 2018 | | By: | | |
| | | | /s/ Gerard V. Vaillancourt |
| | | | Gerard V. Vaillancourt |
| | | | Treasurer and Principal Accounting Officer |
| | | | (principal financial officer) |